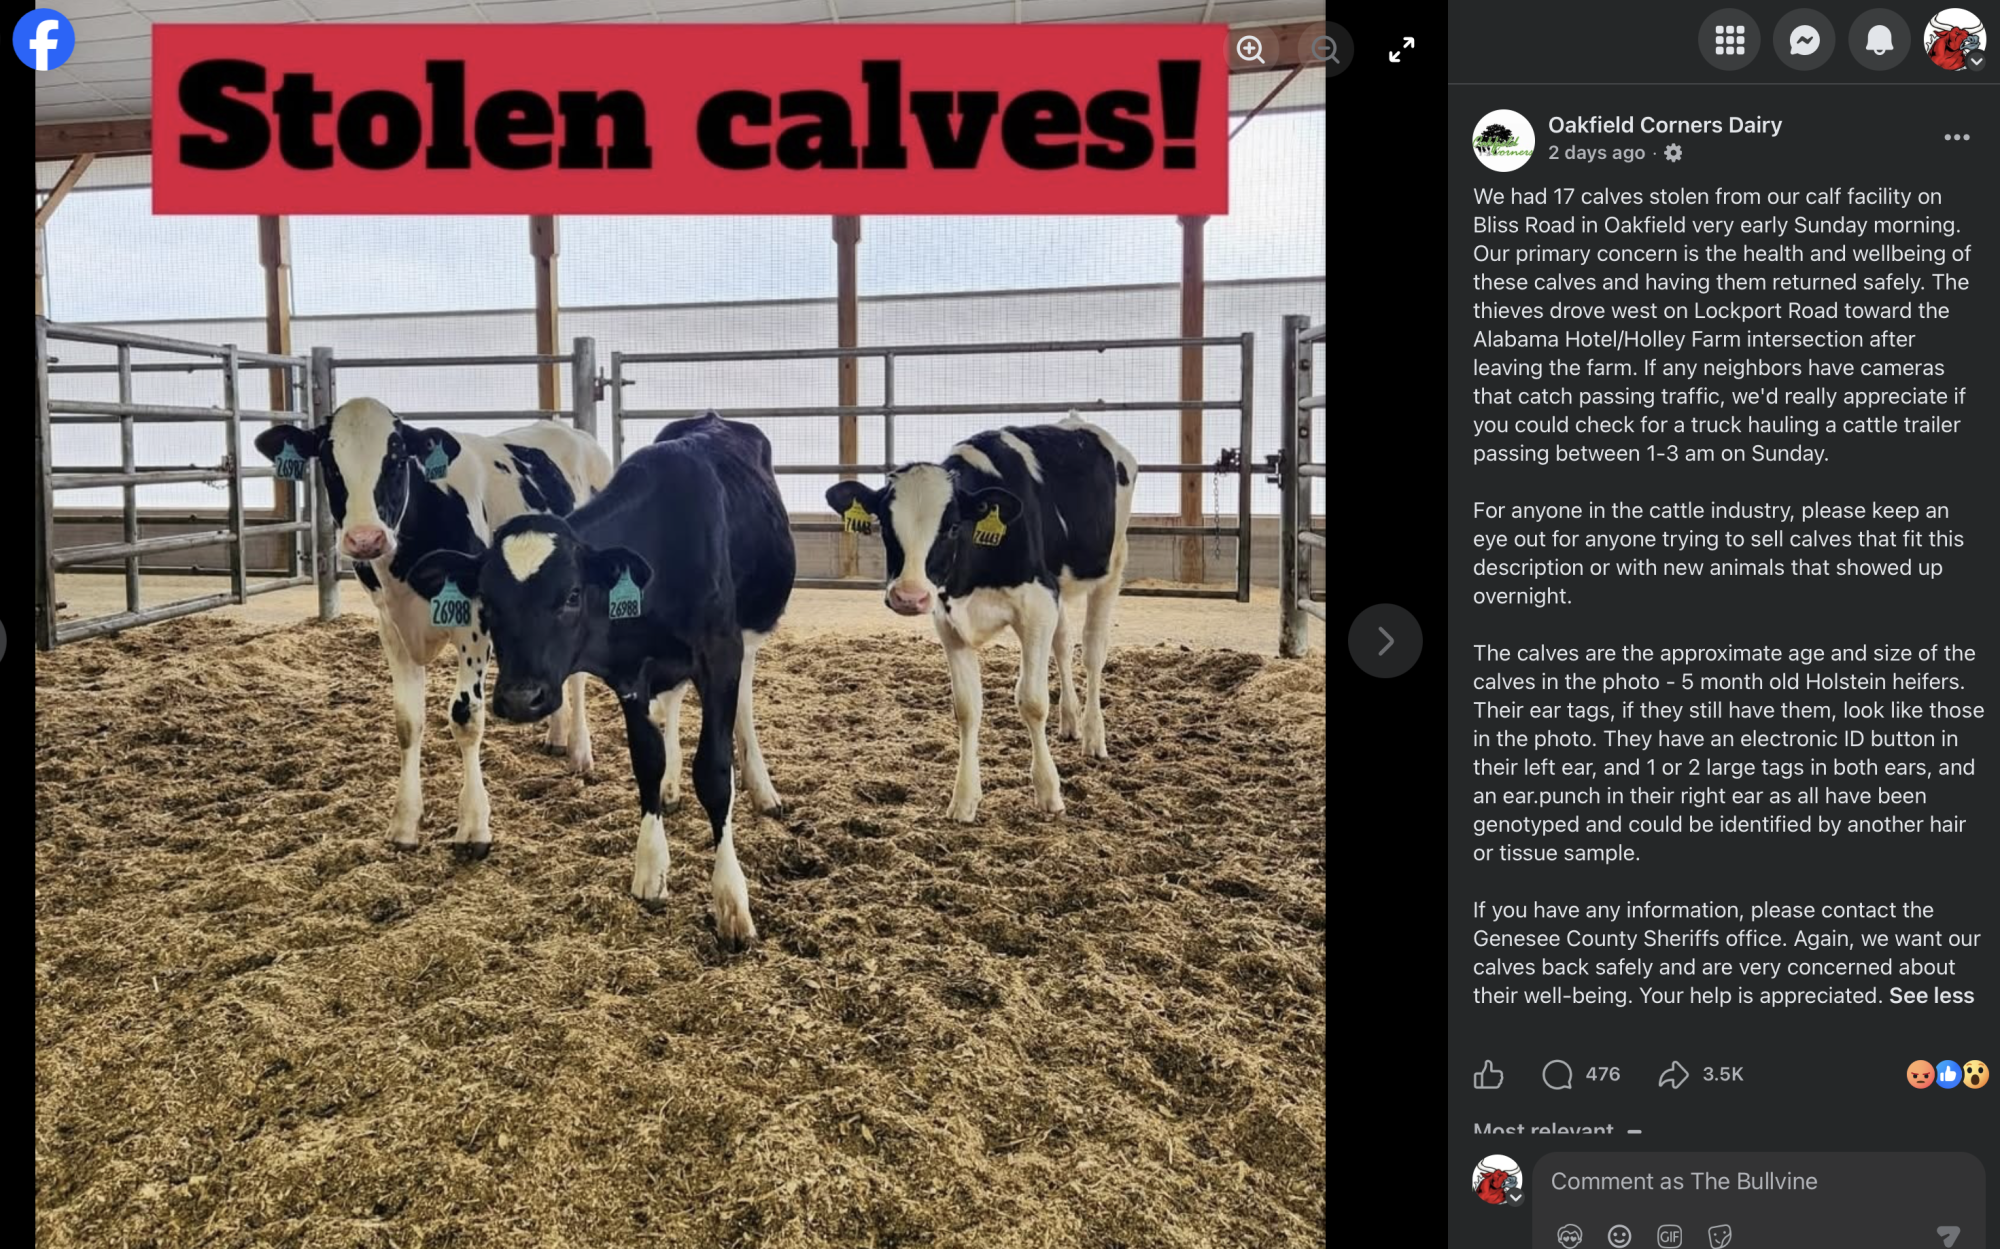
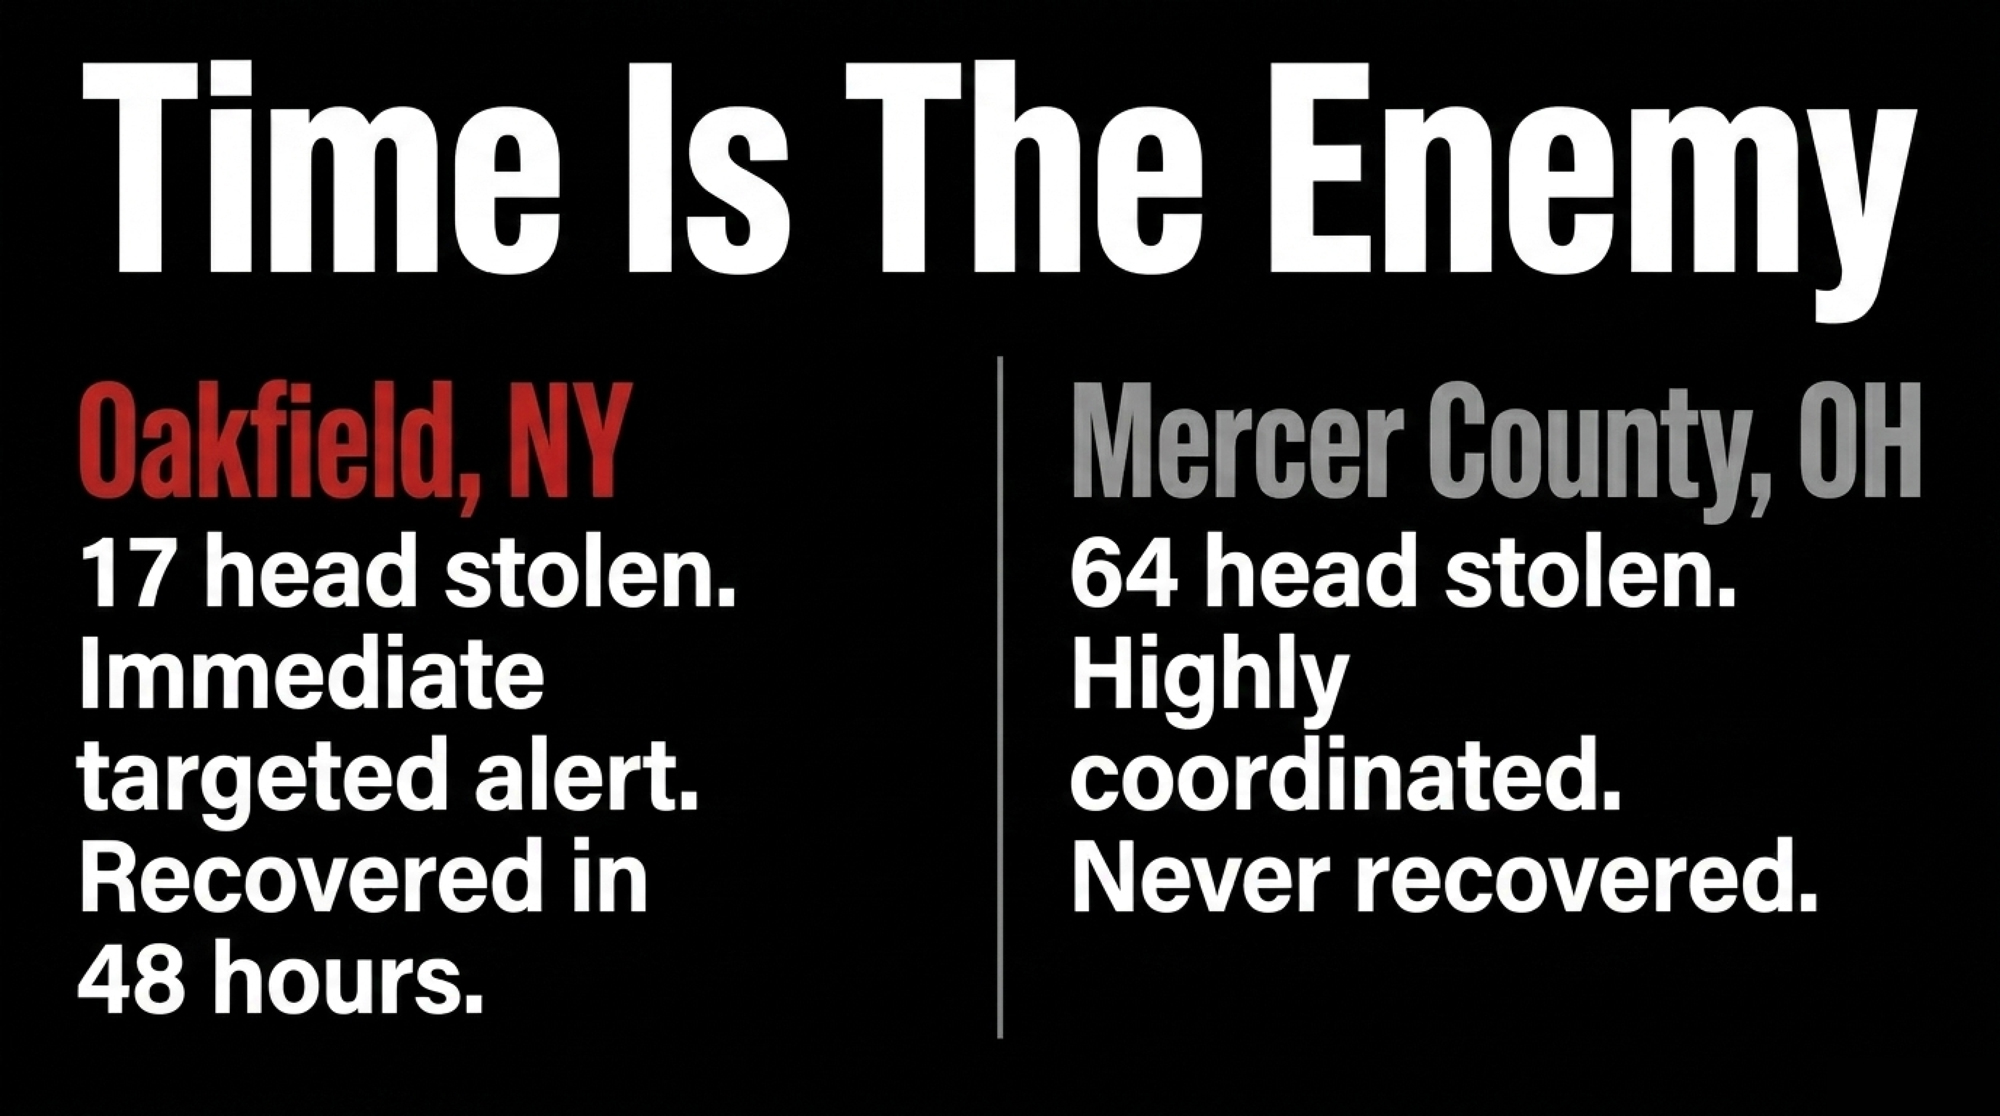
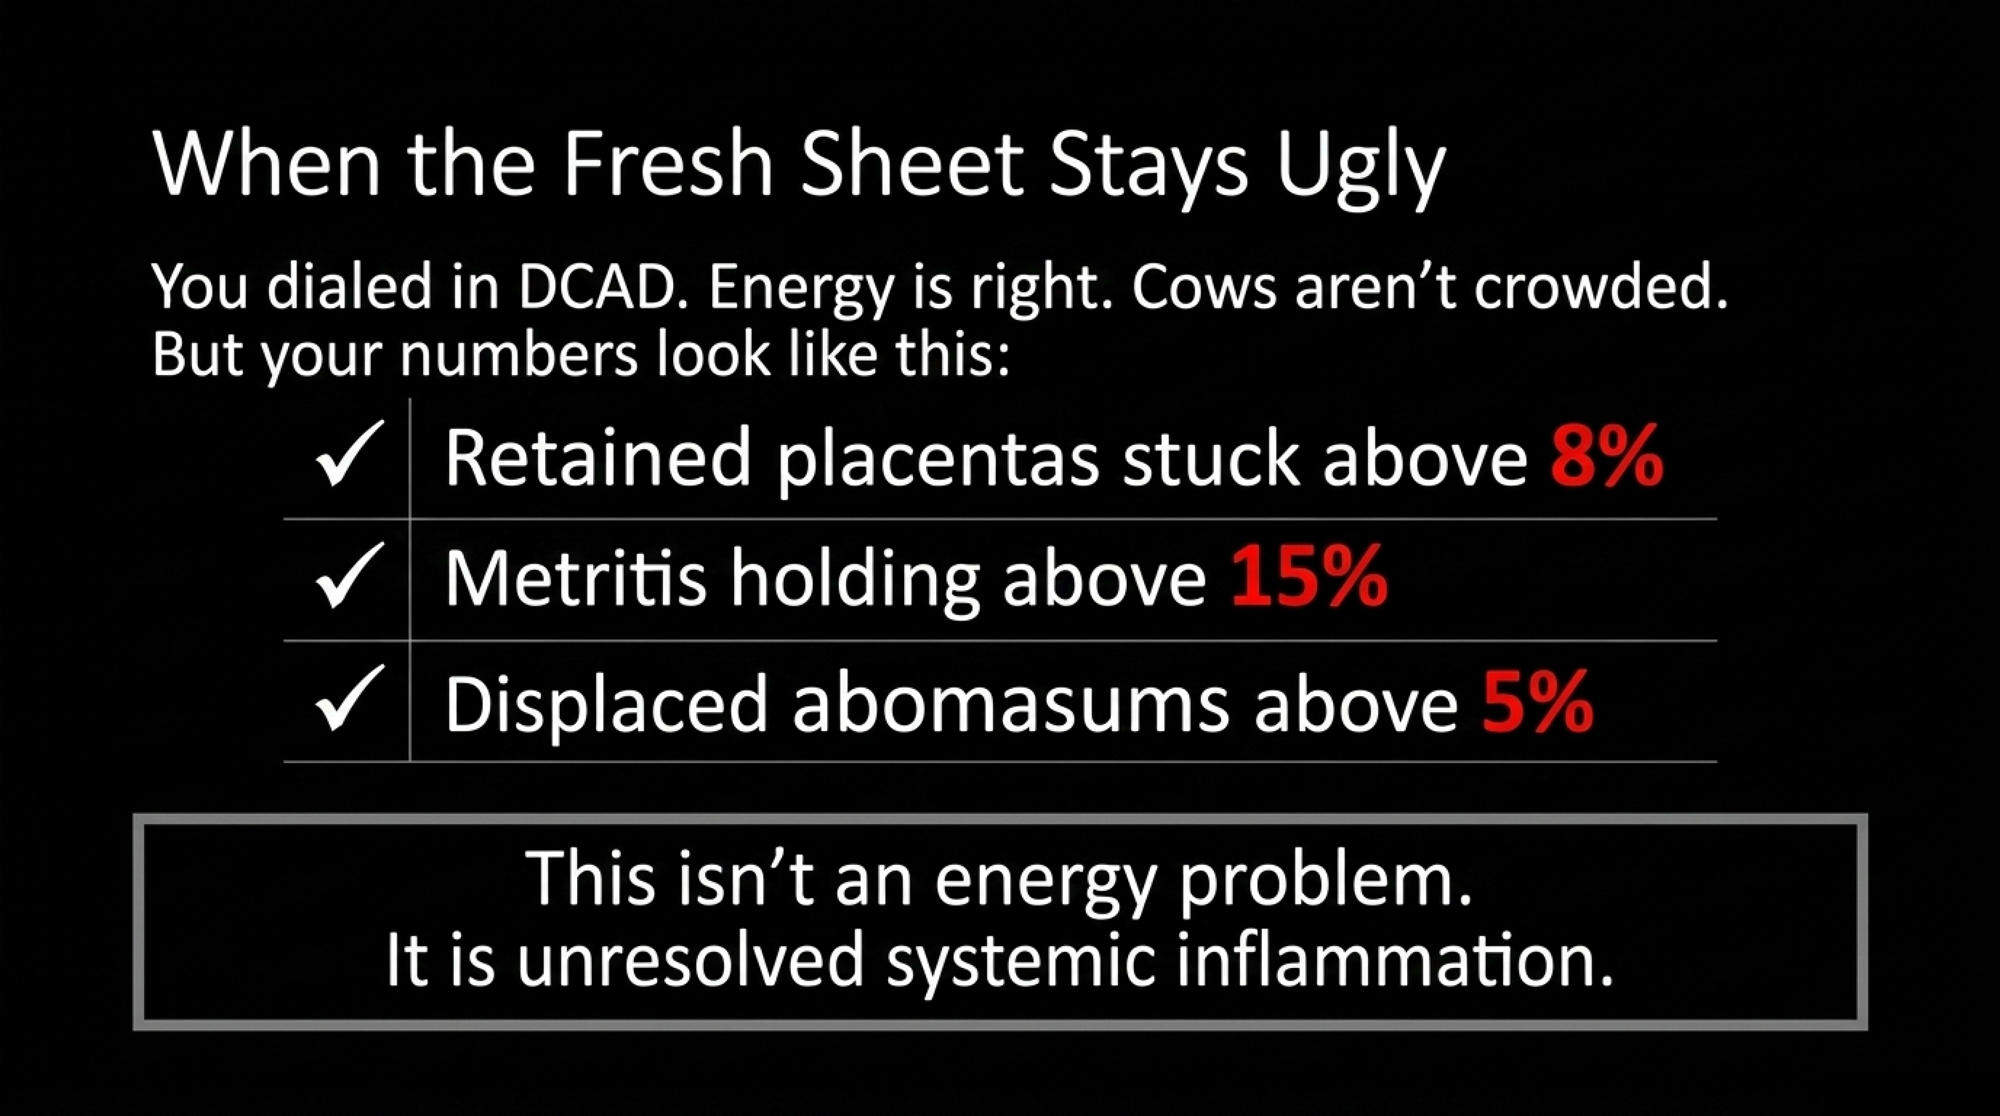
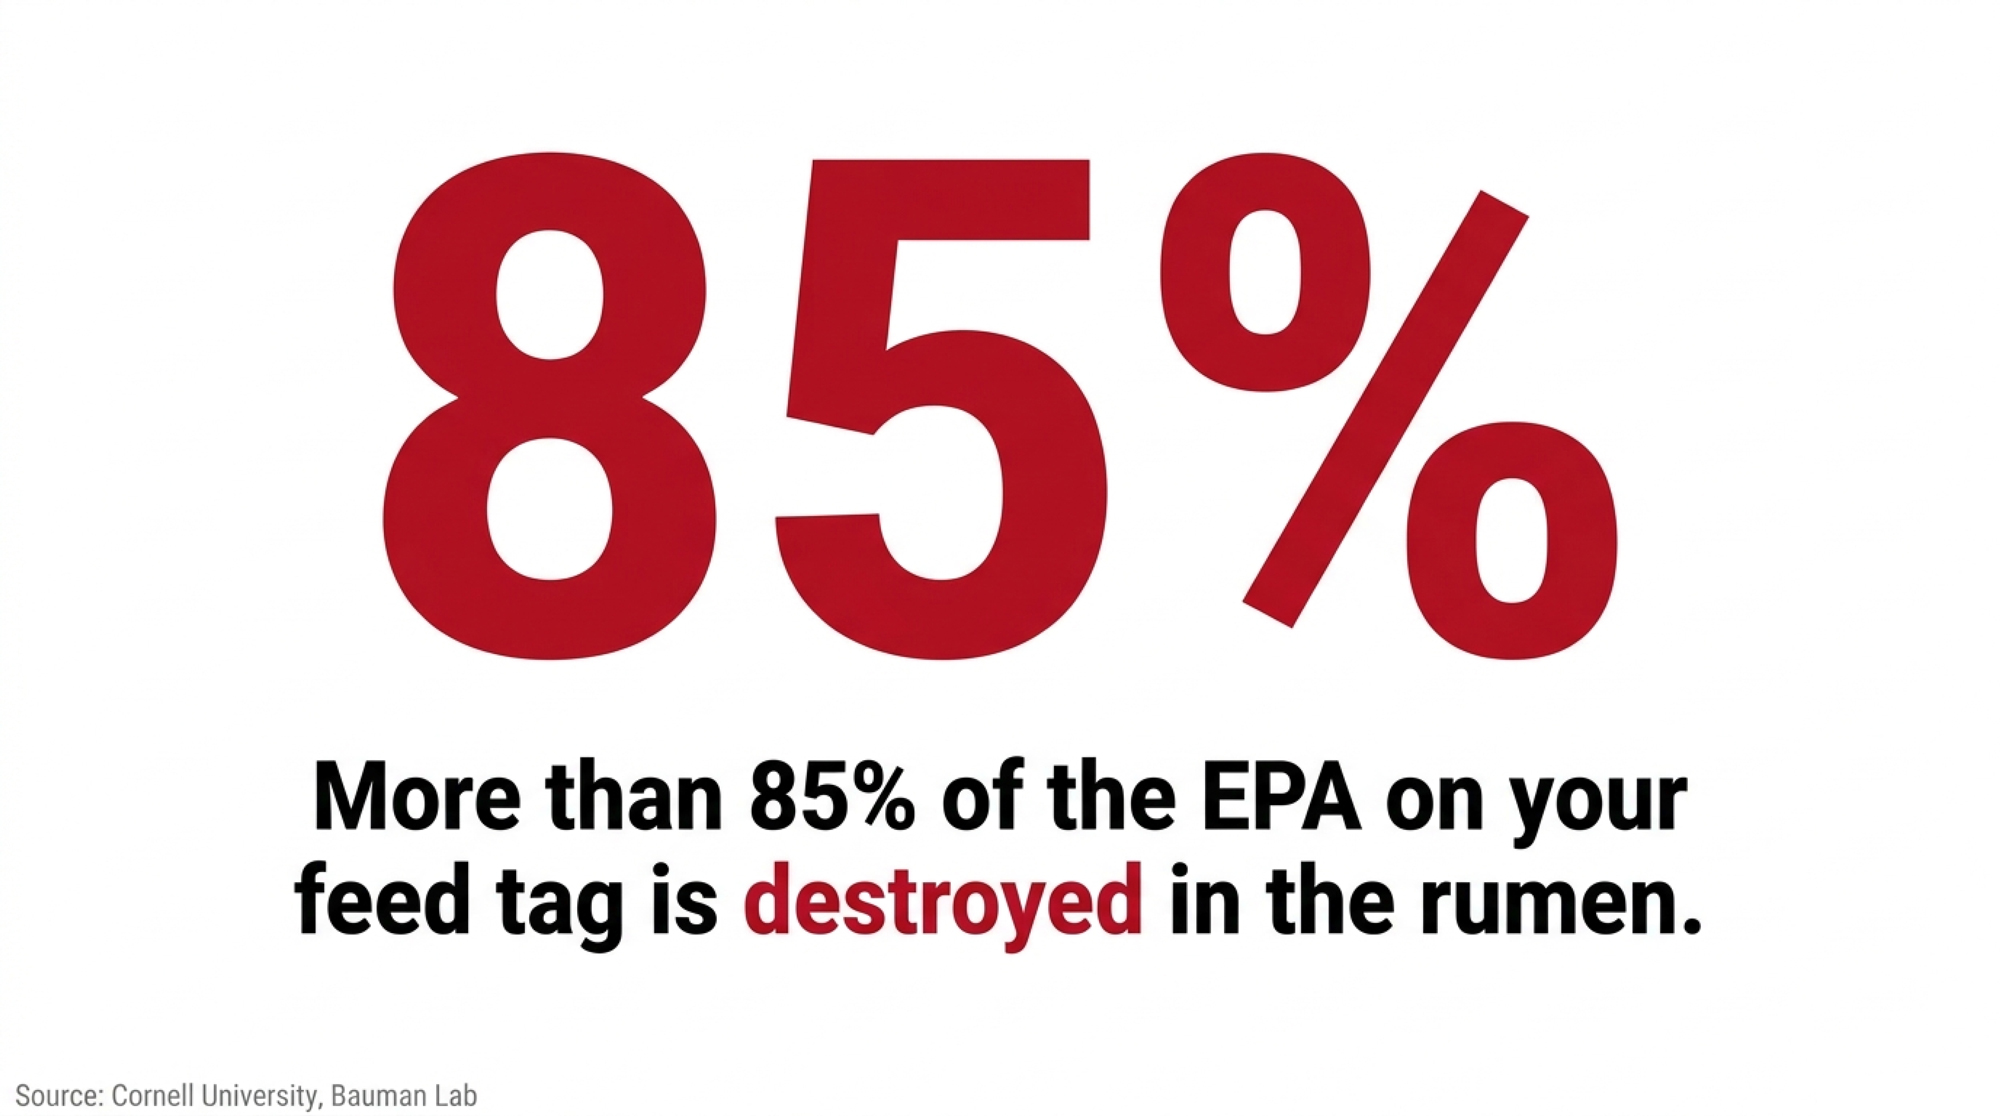
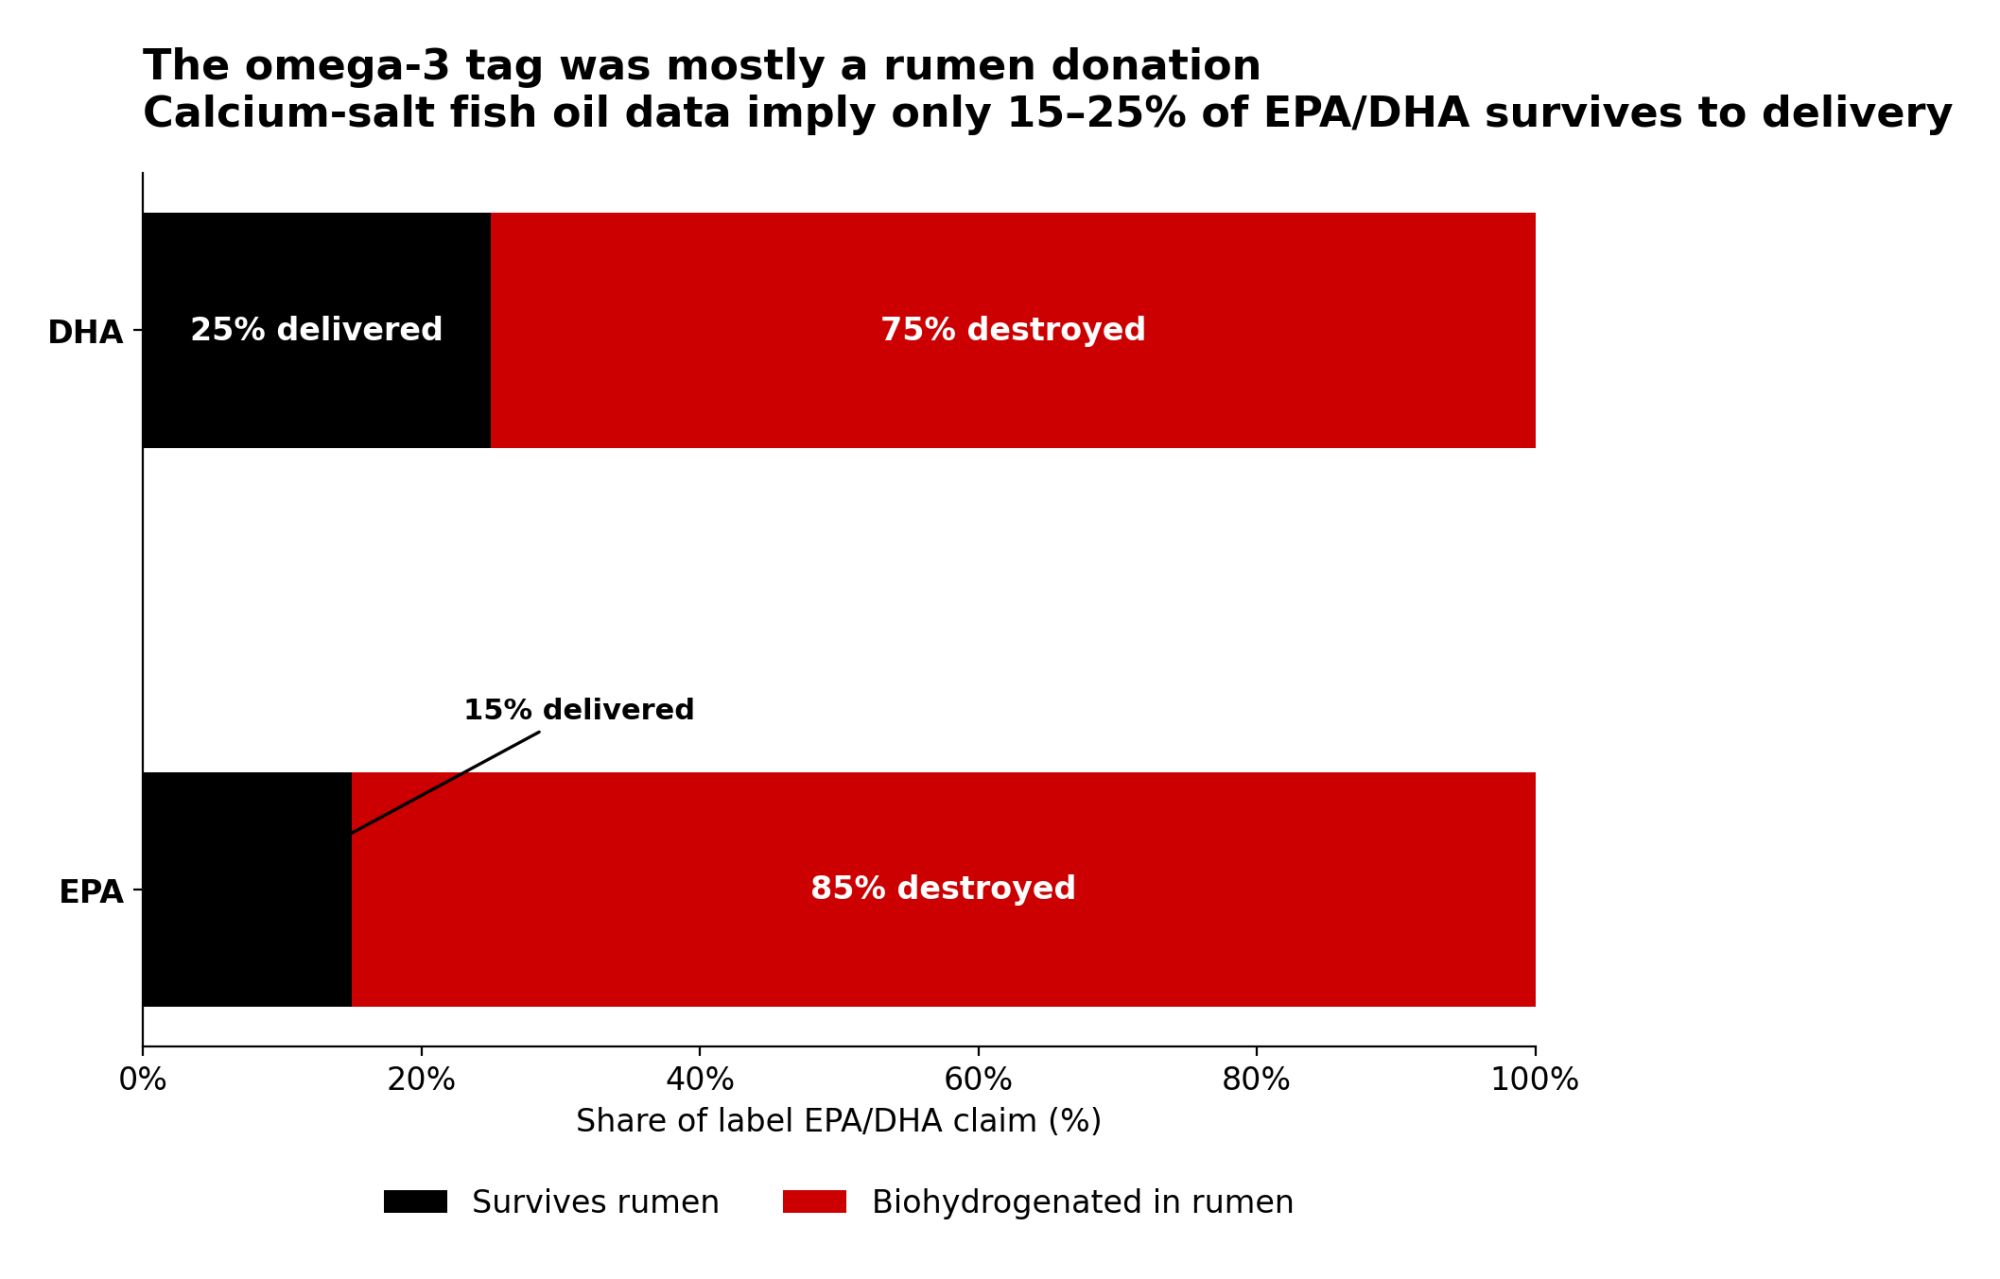
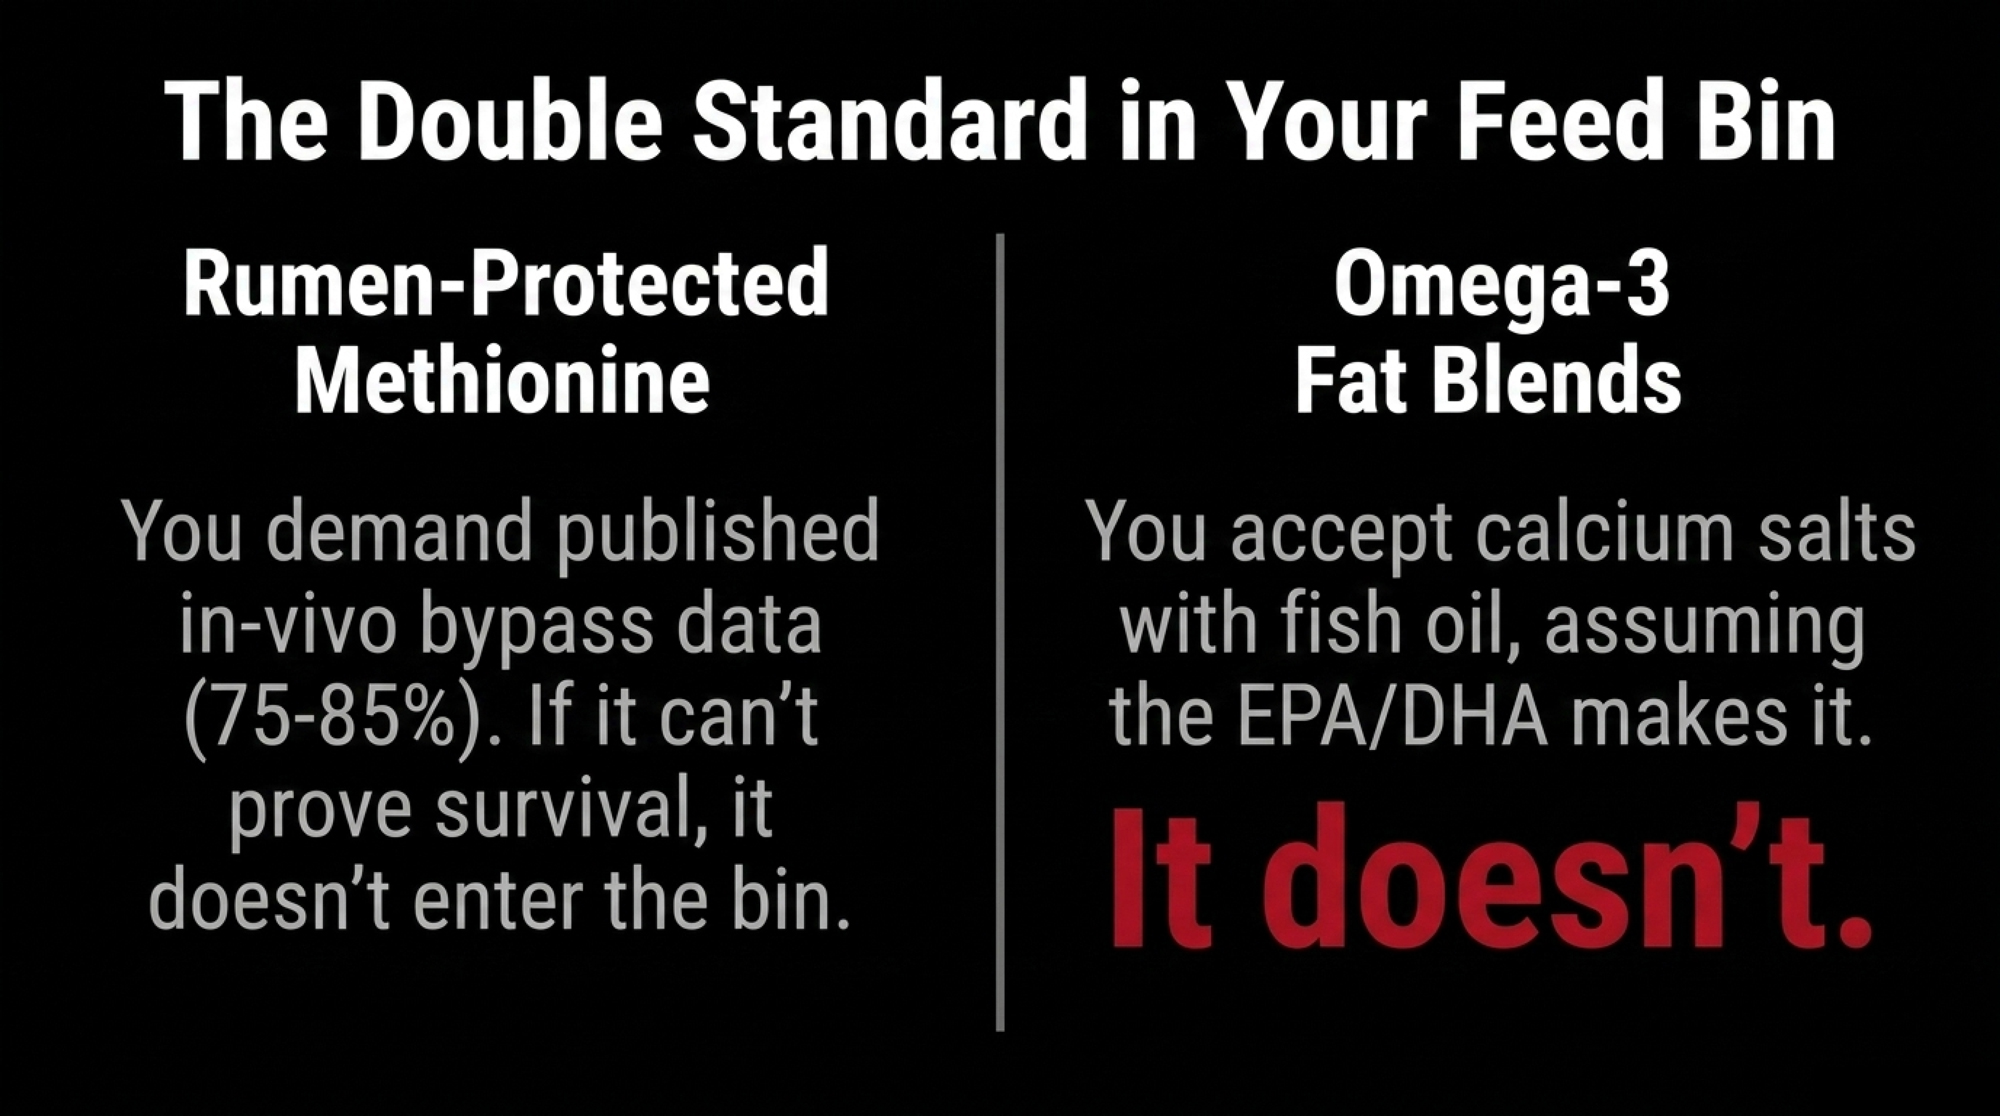
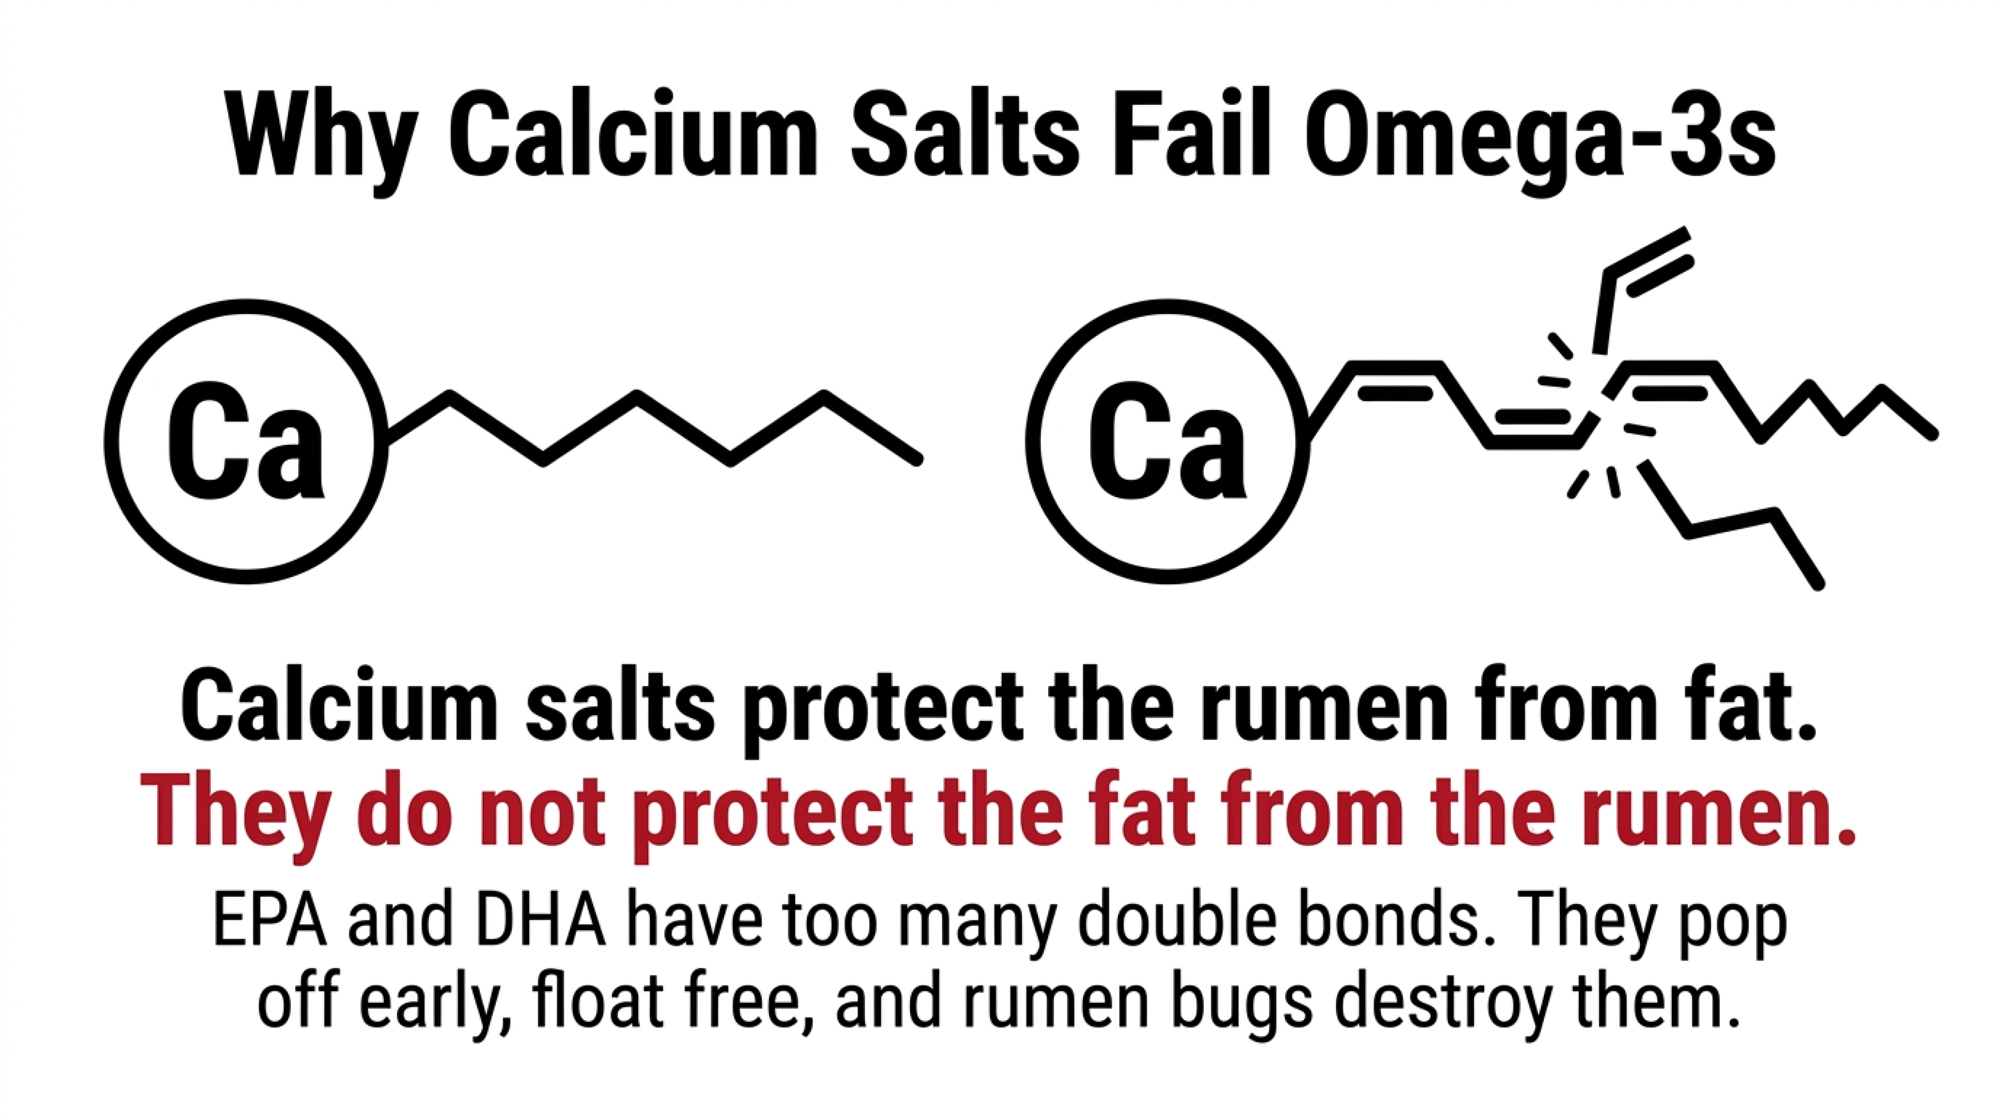
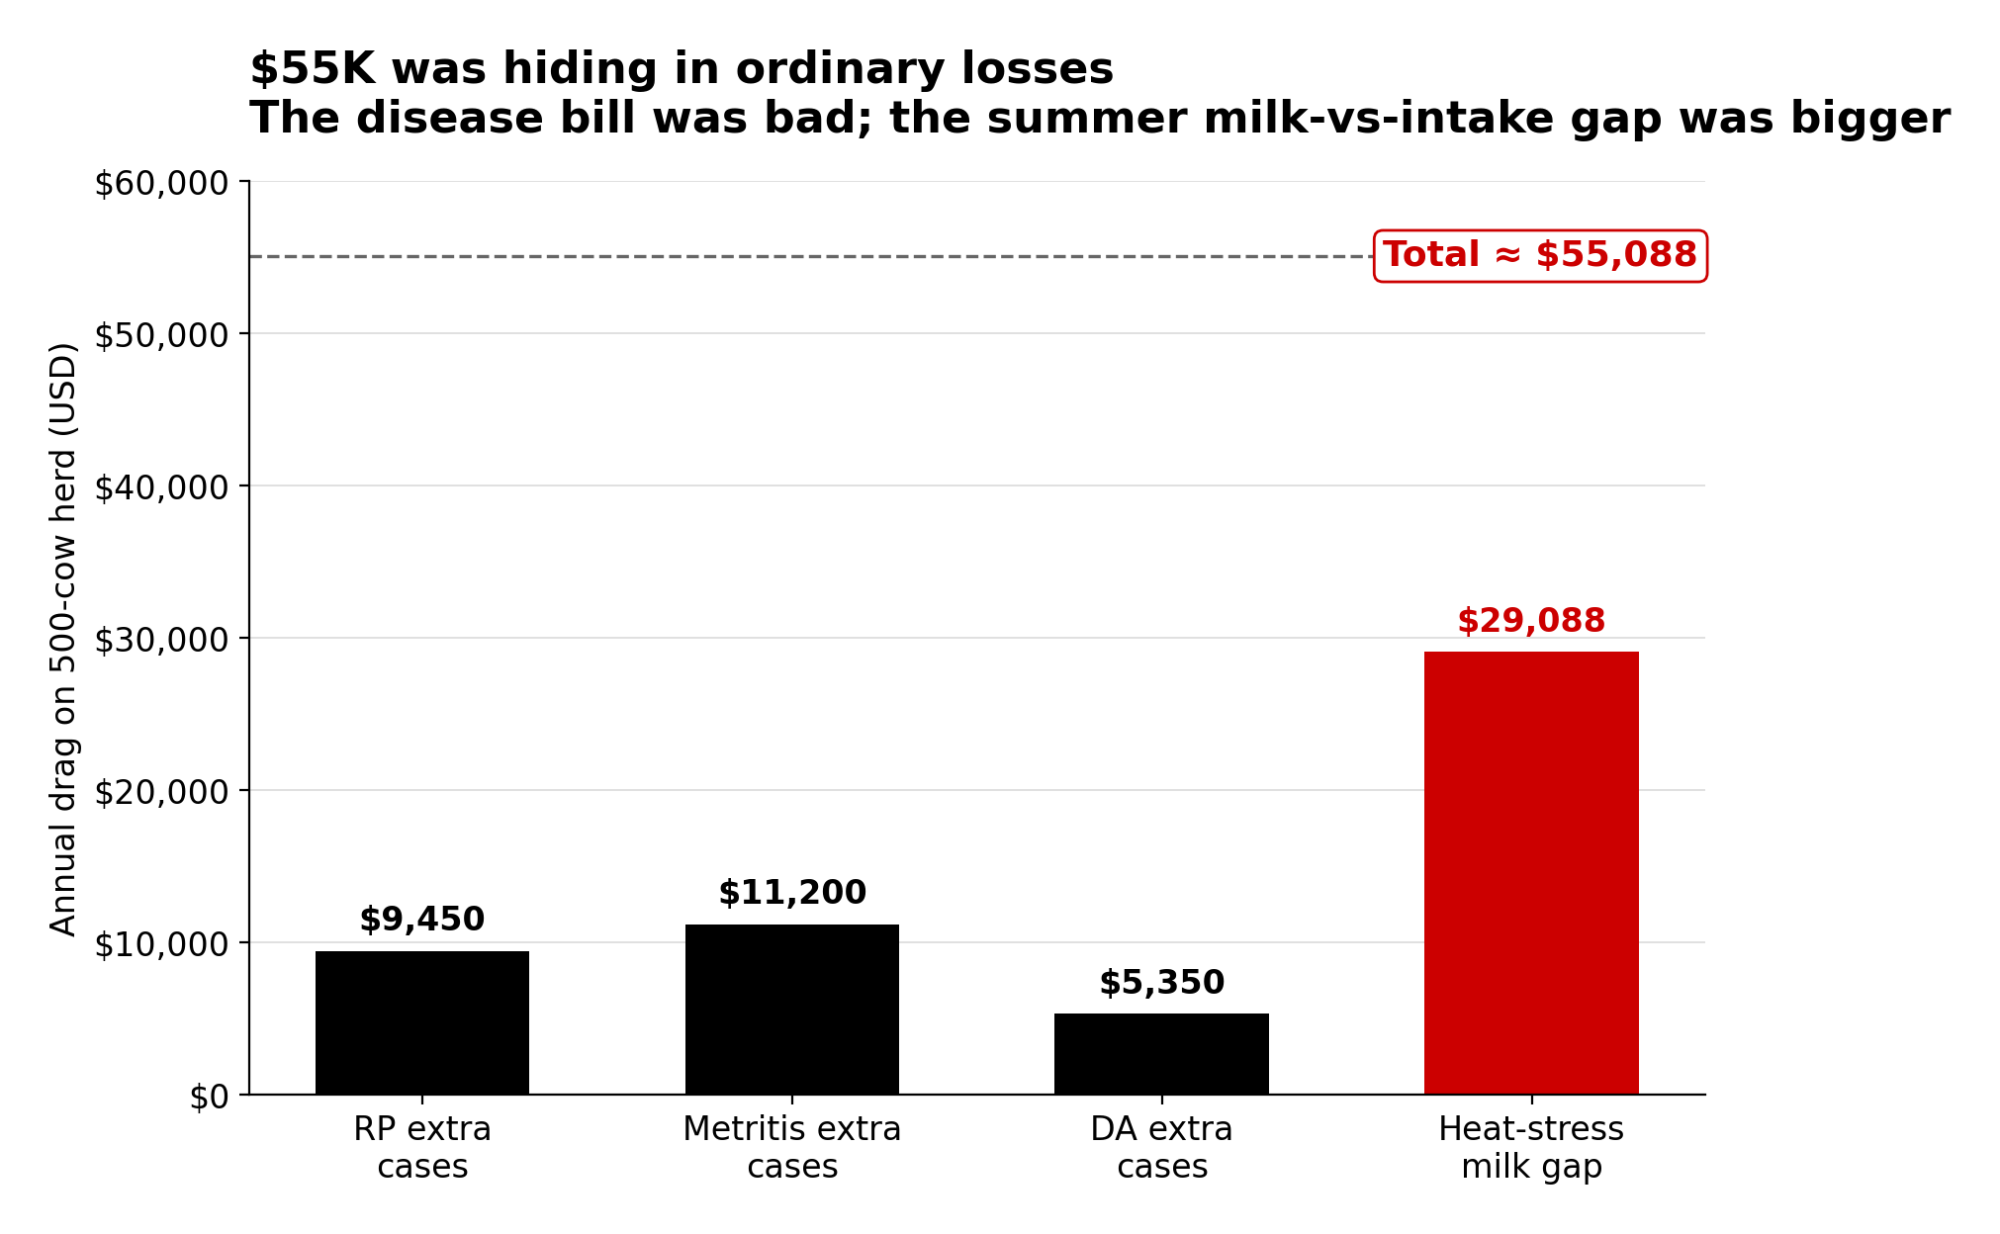
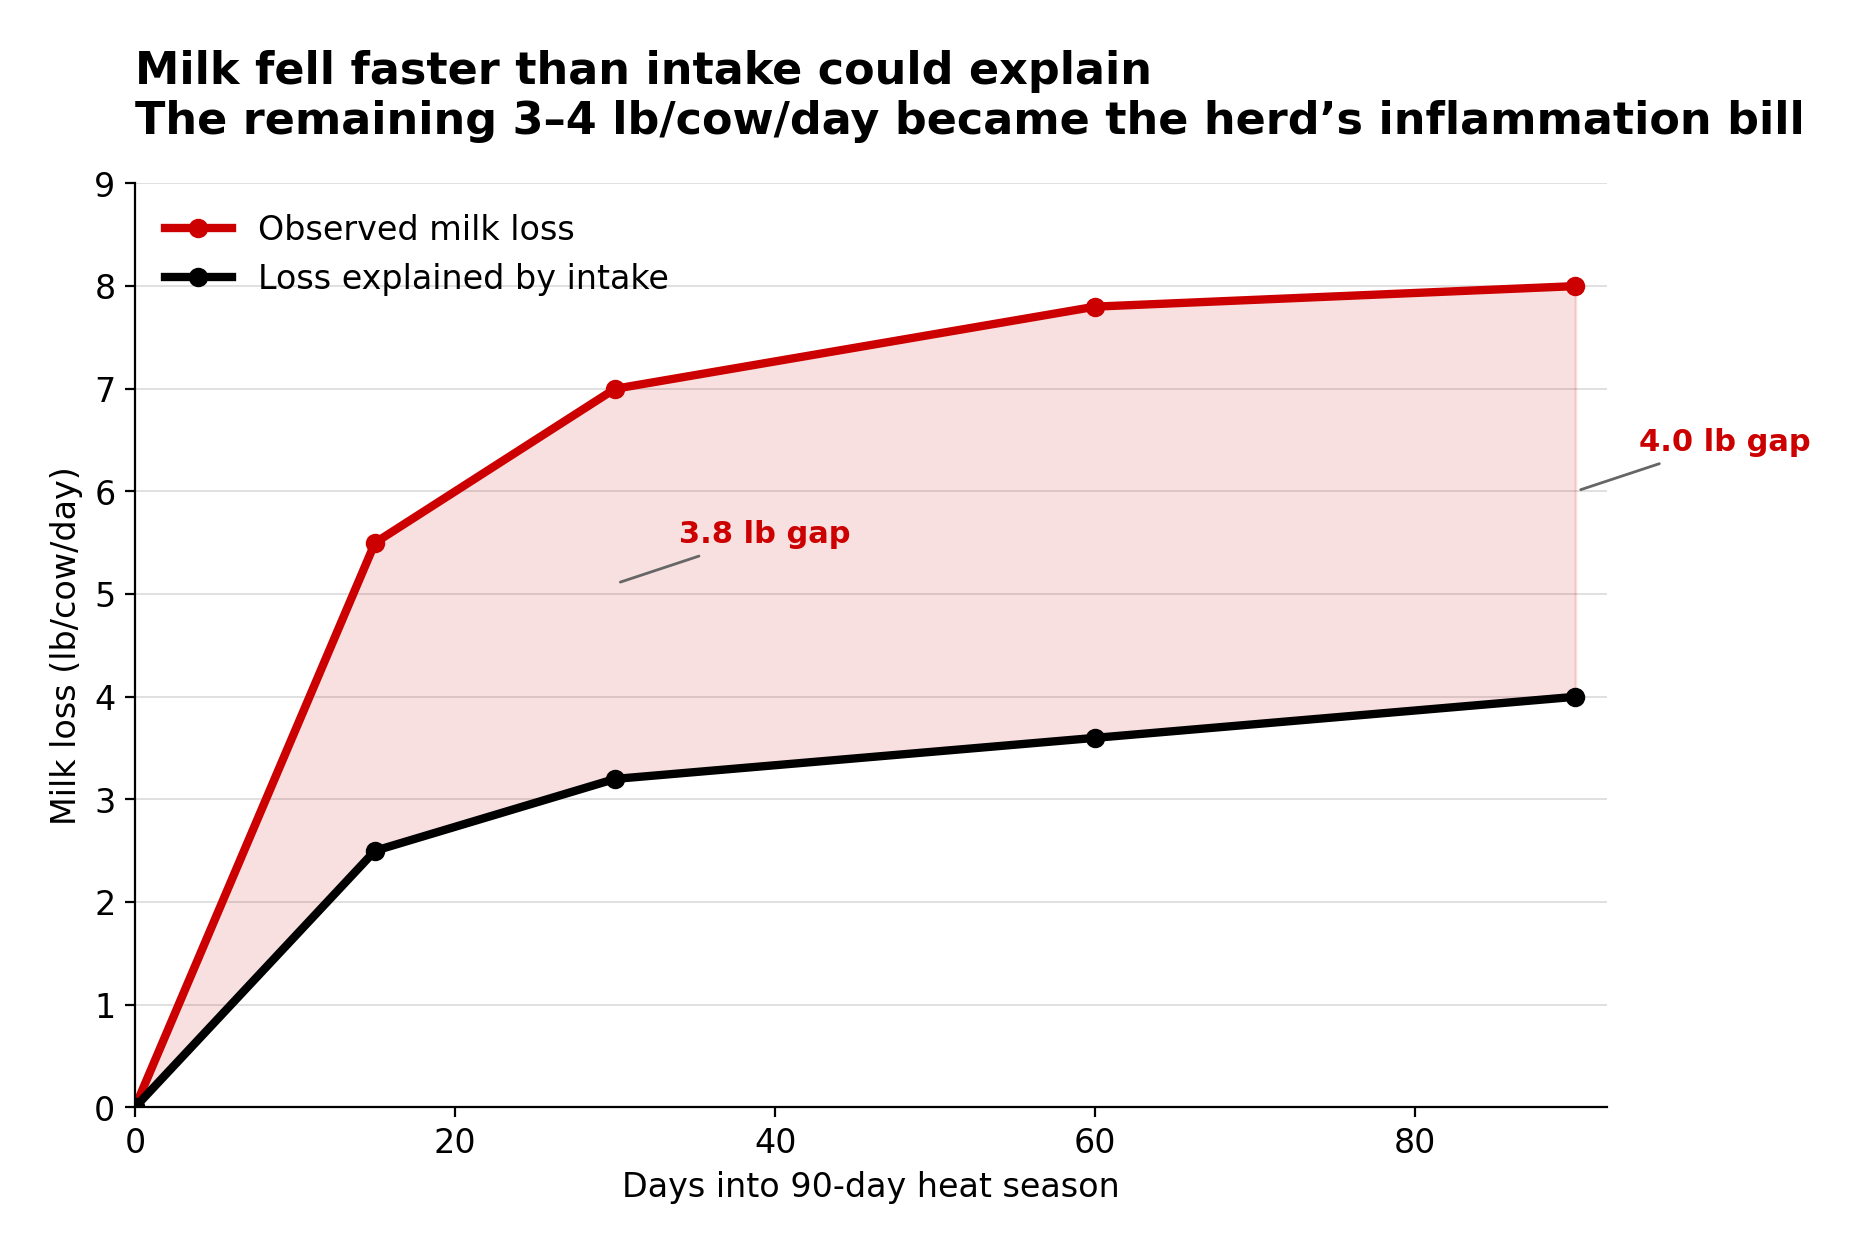
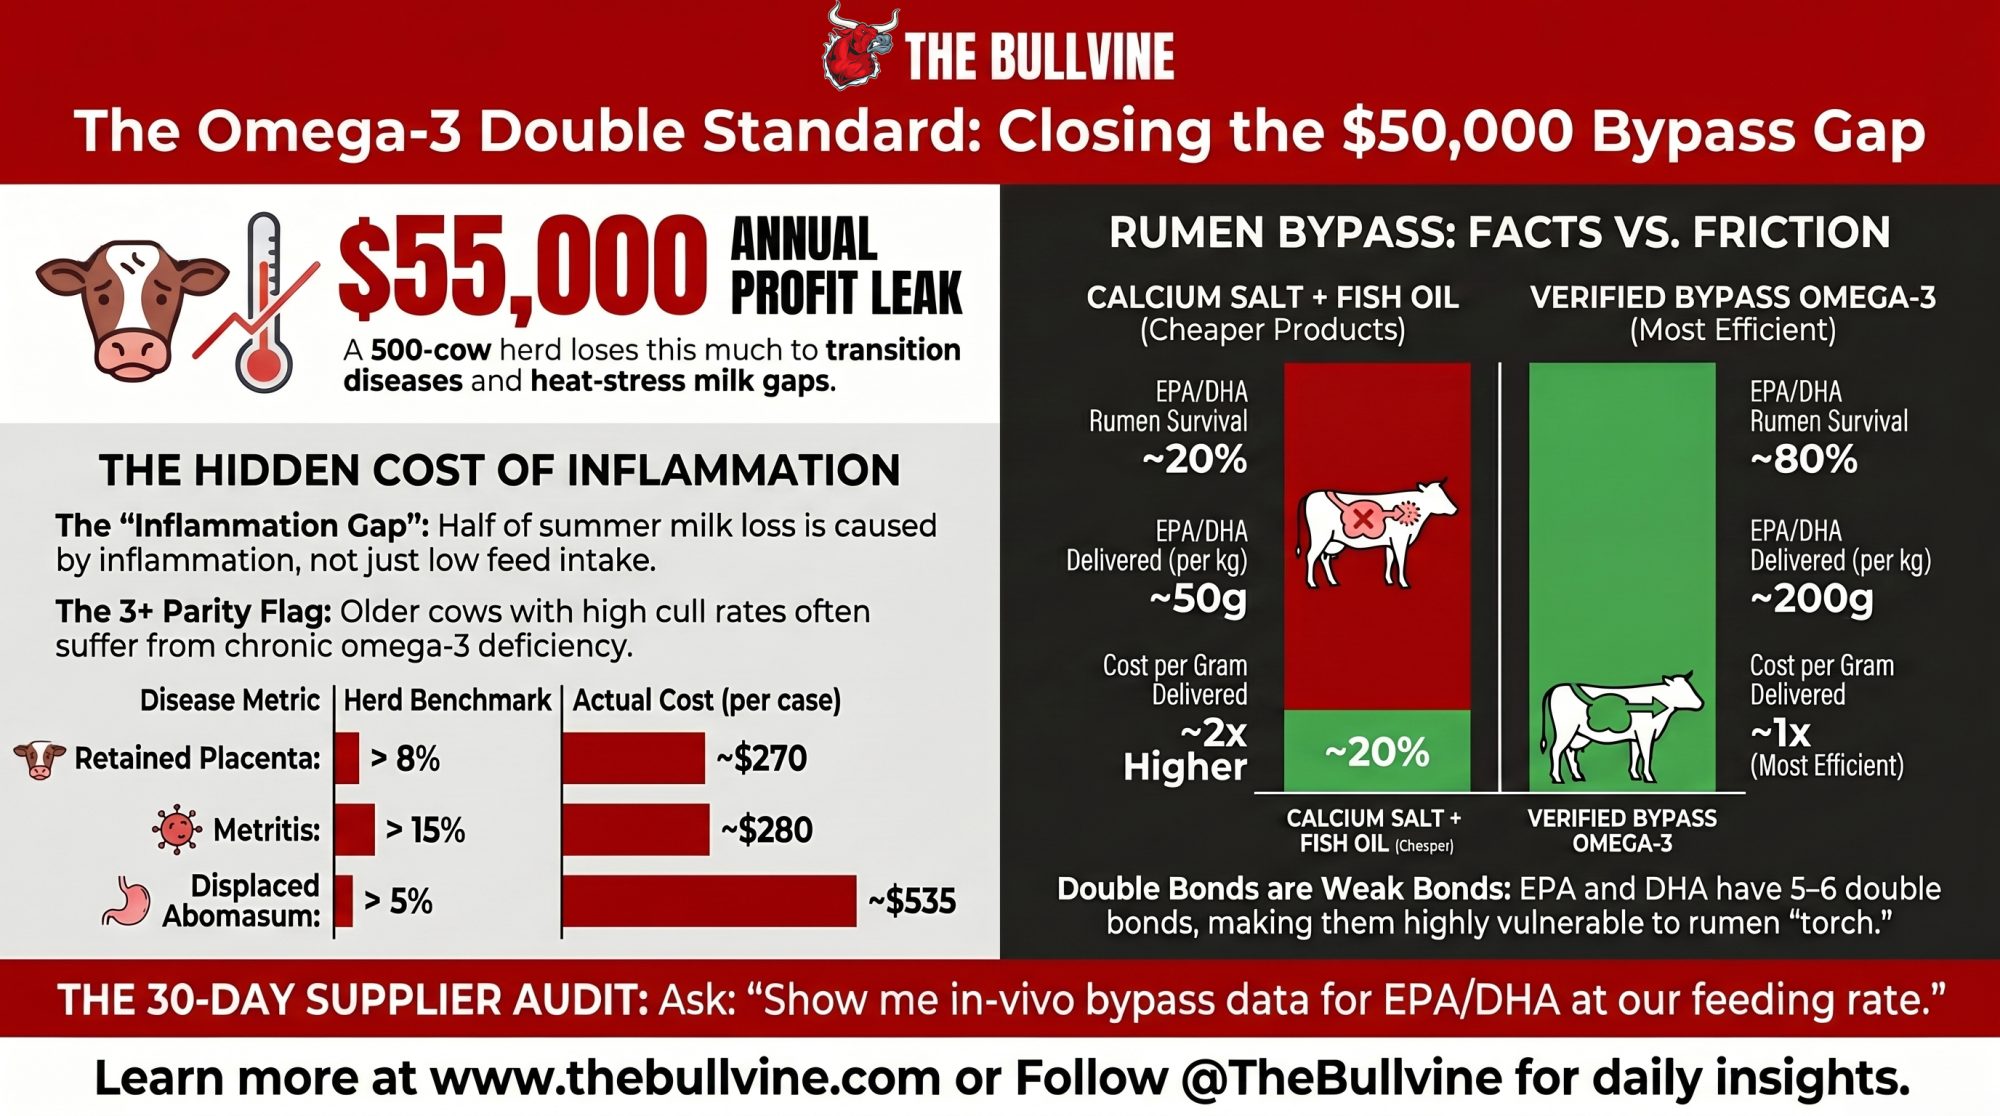
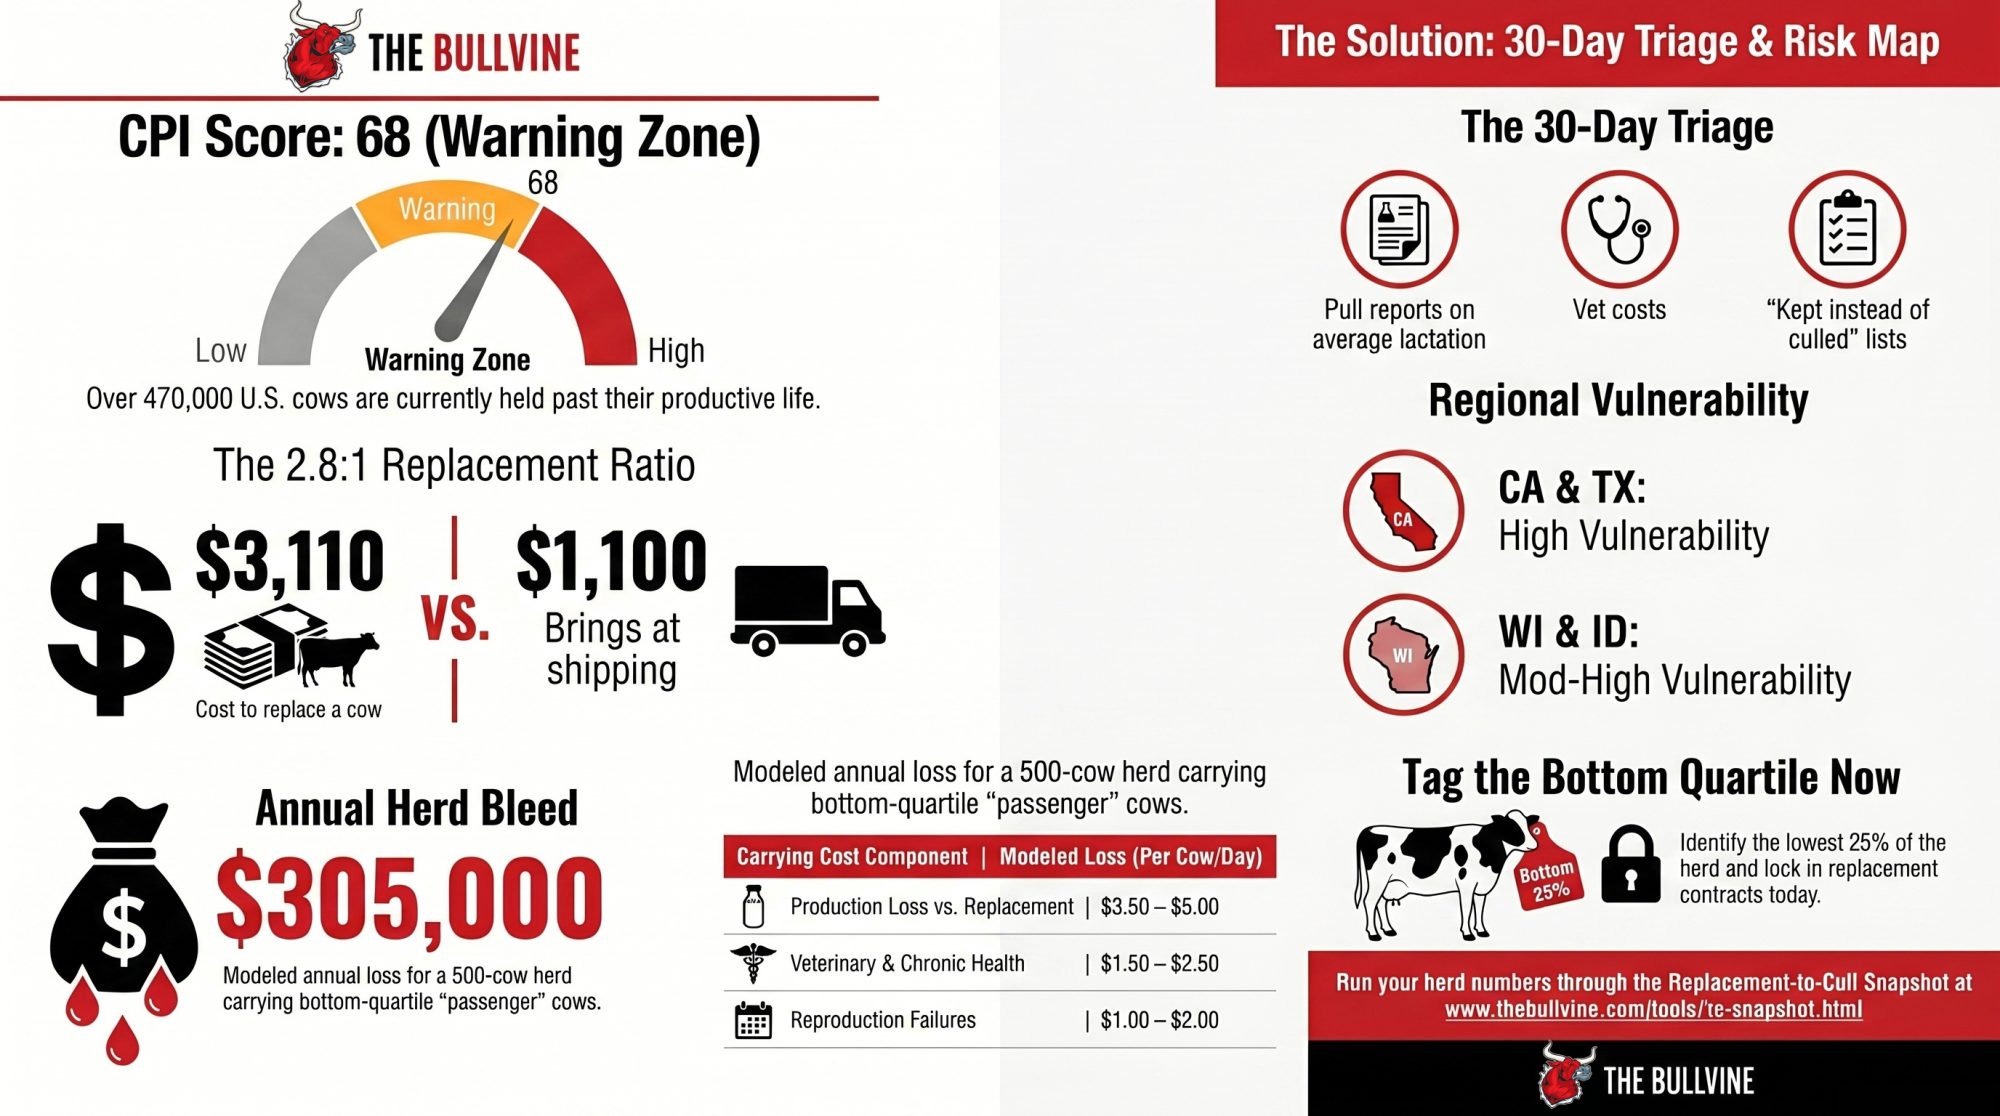
At 24.1% subclinical ketosis, a 400-cow herd writes off up to $27,800 a year — then spends again on “rumen-protected” choline that may degrade before it ever reaches the cow.
At a 24.1% subclinical ketosis rate — the benchmark average from a 2018 global prevalence study of 8,902 cows on 541 farms across 12 countries (published in the Journal of Dairy Science line of transition research; the earlier Suthar et al. 2013 European survey of 10 countries put it at 21.8%) — a 400-cow dairy is quietly writing off roughly $12,400 to $27,800 a year before anyone treats a single visibly sick cow. That’s the dairy on the hook, whether it sits in Wisconsin or Ontario. And here’s the trap it walks into in 2026: the money it spends to prevent that loss can be degraded in the rumen before it ever reaches the cow, because “rumen-protected” is a label with a definition but no delivery threshold.
Most of that ketosis loss never shows up as a vet bill. It shows up as milk that wasn’t produced, cows that left early, and breedings that didn’t take. The cost is invisible, and invisible costs don’t get managed.
Why this matters right now: feed and additive costs remain the largest single line on the 2026 ration sheet, and protected additives are among the priciest ingredients in the mix. When every gram is expensive, paying for grams that never reach the cow is no longer a rounding error. This isn’t a scare piece. Every number below carries a date, a scope, and a source. The point is narrow and sharp: the transition-additive purchase you make every season hinges on one piece of data the market is structured not to hand you.
What a 24% Ketosis Rate Costs a 400-Cow Herd
Start with prevalence, because that’s where most operations fool themselves. The 2018 global survey put average subclinical ketosis (SCK) at 24.1%, ranging from 8.3% up to 40.1% across countries. Well-run herds still land in the 15–30% range. On-farm, the gap between what a producer assumes and what testing finds can be ugly — extension work and recent on-farm testing have documented SCK rates of 40–46% even in herds management considered solid.
The per-case cost is settled science. The Cornell deterministic model (McArt and Nydam, Journal of Dairy Science, 2015) puts the total cost of a hyperketonemia case at $289, with lower-bound component estimates landing nearer $129 once you strip out the worst cascade cases. What drives the number, from the same body of transition research:
A cow with SCK gives up roughly 2.2 to 5.3 lbs of milk per day in her first week fresh. Severe cases reduce yield by up to 13.2 lbs/day during the first 30 days in milk, flattening her entire lactation curve.
SCK sharply increases the risk of displaced abomasum and co-occurs with other fresh-cow disorders, which is why the cost can double when one problem triggers the next.
Reproductive lag — extra days open, lower conception odds — and higher early-lactation culling risk make up the biggest, least visible share of the bill.
Run the prevalence against the herd, and the leak comes into focus:
Calculation
Result
400 cows freshening × 24.1% SCK rate
~96 affected cows/year
96 cows × $129 per case
$12,400/year (low)
96 cows × $289 per case
$27,800/year (high)
That’s the $12,400–$27,800 range you saw up top — and it climbs as prevalence runs hotter.
The table below breaks down each fresh-cow disorder into direct treatment costs and indirect costs, drawn from the McArt 2015 component model. The column that matters is the total per case, and the gap between the two cost columns. For nearly every disorder, the indirect loss — milk you never sold, cows you culled early, breedings that slipped — dwarfs the treatment bill. That’s the money a working transition program is fighting to claw back.
Disorder
Direct treatment
Indirect (milk/repro/culling)
Total per case
Subclinical ketosis
Minimal diagnostic
Substantial early-lactation milk loss
$129–$289
Clinical ketosis
$64 (labor/therapy)
Future milk, repro lag, culling
$111–$375
Displaced abomasum
High (surgical)
Severe milk loss, high cull risk
$432 (primiparous)–$639 (multiparous)
Metritis
Hormonal/uterine therapy
Reduced conception, more days open
$171 (primiparous)–$262 (multiparous)
Clinical mastitis
$77
Discarded + lactational milk loss
$325 (primiparous)–$426 (multiparous)
Source: McArt and Nydam, Journal of Dairy Science, 2015
Every figure in that table is the recoverable pool, which is exactly why the next question matters more than the price on the bag.
The Active Ingredient Is the Commodity. The Protection Is the Product.
Here’s the myth, said plainly. Most producers — and plenty of the nutritionists writing their rations — judge a transition additive by the active ingredient and the inclusion rate on the tag. Grams of choline. Grams of methionine. Price per bag.
The data says the active ingredient is close to a commodity. What decides whether it works is the protection technology wrapped around it.
The mechanism isn’t up for debate. Raw choline chloride is degraded in the rumen at rates above 99%. Across the B-vitamin complex, ruminal disappearance runs from roughly 45% for biotin to 97% for folic acid — measured, published rates. Raw lysine and methionine get chewed up the same way. Feed an unprotected version, and you’re not supplementing the cow. You’re feeding her rumen microbes and shipping the balance to the manure pit.
Protected products exist to solve a real problem. The catch is that protection quality swings wildly, and “rumen-protected” on a label tells you nothing about which end of that swing you bought. One product can carry an 80% active payload and deliver only a sliver of it to the small intestine. Another can post a 95% rumen-escape rate purely because its coating is indigestible — it survives the rumen and then passes straight through the cow without dissolving where she could absorb it. Both can legally print “rumen-protected” on the bag.
When the protection is real, the payback is on the record. The landmark rumen-protected choline meta-analysis (Arshad et al., Journal of Dairy Science, 2020), covering 21 transition experiments and 1,313 pre-calving cows, found that at a median 12.9 g/day of active choline ion, supplemented cows gained:
+3.5 lbs/day of milk (1.6 kg)
+3.7 lbs/day of energy-corrected milk (1.7 kg)
~12% better feed efficiency, with a tendency toward less retained placenta and mastitis
A separate 2025 meta-analysis in the Journal of Dairy Science landed in the same neighborhood — milk yield peaking around a 13 g/day dose with a ~1.29 kg/day lift. That’s the kind of independent cross-validation that should make you trust the category and question the product. Rumen-protected methionine meta-analyses show gains in milk protein and fat yields when supplementation starts before calving. The science behind the category is strong. The variance is in whether the specific product on your mill sheet delivers what its category can.
Why Won’t Suppliers Give You the One Number That Matters?
The number that settles it is the in vivo intestinal delivery rate — the percentage of the active ingredient that actually reaches the cow’s bloodstream, measured in live cows and confirmed by an independent, peer-reviewed trial. Not the in vitro screen. Not the company white paper. Not the rep’s testimonials.
The methods exist. In vivo plasma dose-response against a duodenal infusion calibration is the gold standard for amino acids. Fecal free amino acid recovery aligns well with it. The in situ nylon-bag technique is the one to watch out for — it measures rumen escape only, not intestinal absorption, so a product can ace it and still pass through undissolved. Knowing which method generated a number is half of reading the answer.
So why doesn’t the market publish it? Because the incentives are misaligned, not because of any one villain. Where a product’s protection technology is weaker, there’s little commercial incentive to publish delivery data that would expose a poor cost per gram absorbed. In many commercial setups, the same party recommends and supplies the product — a structural conflict that can dull the incentive to demand delivery data, regardless of any individual’s good faith. The journals and extension have done their part. The science is published. What hasn’t formed is the buying norm. “Demand the in vivo delivery rate” never became standard, unlike the bulk-tank somatic cell count, which became a standard milk-quality check.
And the label is thinner than it looks. AAFCO does define “rumen protected” — a nutrient fed in a form that increases the flow of that nutrient, unchanged, to the abomasum — but the definition attaches no minimum intestinal-release threshold, no percentage a product must meet to use the term. As of 2026, neither AAFCO in the US nor CFIA in Canada has pinned down a number. Without a threshold, the label is a direction, not a guarantee. The accountability gap is spread across the whole chain — manufacturer, channel, and the producer who never thought to ask.
Ontario vs. Wisconsin: Same Science, Different Math
The science doesn’t change at the border. The economics of the decision do, and that difference is the lens that should reframe how you read every quote a supplier gives you.
On a Wisconsin open-margin herd, a recovered ketosis case feeds straight into milk sold at a market price — the delivery-rate gamble plays out in volatile revenue, and a high-delivery additive is a hedge against a margin you don’t control. Miss on the delivery rate, and you’ve spent money to protect a margin you then failed to protect. The leak and the recovery both move with the milk check.
Under Canadian supply management, the math runs through a different gate. An Ontario herd within its quota doesn’t capture extra revenue by simply making more milk — the value of a recovered fresh cow shows up in lower involuntary culling, fewer replacements bought under quota-constrained economics, better component yield relative to the butterfat-weighted blend, and tighter days open. The recoverable pool is just as real. It just sits in cost avoidance and herd efficiency rather than in marginal milk sold. Same additive, same delivery question, different line on the page where the payback lands.
One more regional wrinkle: a US herd buys under AAFCO’s labeling regime, a Canadian herd under CFIA’s. Neither pins down “rumen-protected” with a release threshold, so the buyer’s homework is identical on both sides — but verify which country’s label you’re reading, because a product cleared for one market isn’t automatically carrying the same backing in the other.
Running the Numbers: What Does Your Protected Additive Actually Cost Per Gram Delivered?
This is the calculation that belongs on your phone, because it flips the purchase decision in about thirty seconds. Never buy a protected additive on cost per ton or cost per bag. Buy on cost per gram of nutrient that actually reaches the cow.
RUNNING THE NUMBERS — Cost per gram absorbed
The core formula:
Cost per gram ABSORBED = Cost per gram of active ÷ Verified delivery rate
The delivery rate is the multiplier that turns a cheap bag into an expensive program. Using the published target dose of 12.9 g/day of active choline ion (Arshad et al., 2020), here’s the active you have to feed to land that same delivered dose:
Product A — 75% delivery: 12.9 ÷ 0.75 = 17.2 g/day of active needed
Product B — 25% delivery: 12.9 ÷ 0.25 = 51.6 g/day of active needed
Product B requires three times the amount of the active ingredient to deliver the same dose.
Now run it against price. Take each product’s cost per gram of active off your supplier quote, then divide it by that product’s verified delivery rate — that’s your true cost per gram absorbed. For Product B to break even against Product A, it has to be priced at roughly one-third of A per gram of active. It rarely is.
Scaling the recoverable pool (400-cow herd, 2026):
96 cows × $129 per case = $12,400/year (low estimate)
96 cows × $289 per case = $27,800/year (high estimate)
Published RPC trial responses support clawing back a meaningful share of that pool — not all of it. A program delivering 75% of its payload competes for that money. A program delivering 25% competes for almost none of it while costing nearly the same on the bag.
The cheaper-looking bag is usually the more expensive program once you count what actually reaches the cow. Ask for the delivery rate before you ask for the price. The price means nothing without it.
The 30/90/365-Day Playbook for Any Herd Running a Transition Program in 2026
30-Day Actions — measure and ask
Pull your fresh-pen BHBA data. If you’re not blood- or milk-testing fresh cows for BHBA, start now. You can’t manage a 24% problem you’re estimating at 4%. Requires: a BHBA meter or a milk-test add-on, plus a consistent sampling routine throughout the full fresh window. Red-flag trigger: if measured SCK clears 25% on any recent batch, treat this as urgent this week, not next quarter. Backfire watch: one spot-check on day three isn’t a herd rate. Sample across days two through fourteen post-fresh before concluding.
Ask the delivery-rate question before your next meeting with your nutritionist — and don’t leave without an answer. Specifically: “What’s the verified in vivo intestinal delivery rate on this product, and was it measured in an independent peer-reviewed trial or an internal company study?” Requires: nothing but the nerve to ask it.Red-flag trigger: if the answer pivots immediately to price comparisons or testimonials, that’s data. Backfire watch: an in vitro number isn’t an in vivo number. Confirm which method was used.
Score the answer by the three-bucket rule. Published independent peer-reviewed trial — that’s real. Internal white paper — ask whether it has been peer-reviewed and, if so, in which journal. A pivot to price comparisons and testimonials without any delivery data — that’s your answer, and it tells you as much as a number would.
Supplier Response to “What’s Your In Vivo Delivery Rate?”
Evidence Quality
What It Signals
Buy Decision
Published, independent, peer-reviewed in vivo trial with intestinal release %
✅ Verified — highest tier
Manufacturer confident in real-world delivery
You’re buying a program
Internal white paper with peer-reviewed backing, journal named
⚠️ Acceptable — verify journal
Some accountability; assess independence of study design
Proceed with scrutiny
Internal white paper, no journal, no peer review
⚠️ Low tier — flag it
Delivery rate unverified by third party
Ask follow-up or retest
In vitro data only (nylon-bag or lab screen, no live-cow trial)
Product may pass rumen but not dissolve in small intestine
Do not equate with in vivo result
Price comparison, testimonials, and rep rep’s endorsement — no delivery data offered
❌ No data = data
Manufacturer likely knows delivery is poor
You’re buying a label at program prices
90-Day Actions — re-price the program
Run the cost-per-gram-absorbed math on every protected additive in your transition ration.Requires:supplier price-per-gram-active quotes and a verified delivery rate for each product currently on your mill sheet. Trigger: do this before renewing any contract or placing a seasonal order. Backfire watch: if a supplier can’t or won’t produce a verified delivery rate, treat the blank as a data point, not a pass. A blank answer and a weak answer mean the same thing.
Confirm your choline program covers the full transition window. Continuous pre- and postpartum RPC — roughly 21 days before calving through early lactation — is supported by the trial data. Recent work confirms the benefit is strongest when fed both before and after calving, not just on one side of the line. Backfire watch:prepartum-only feeding showed no lasting postpartum benefit in milk or ketosis in the published literature. Cutting off at calving leaves the cow unprotected exactly when her liver’s fat-export system faces peak demand. Don’t pay for half a program.
365-Day Moves — make the question a standard
Build the delivery-rate question into your annual supplier review the same way SCC sits in your milk-quality review — a standing agenda item, not an occasional challenge. Opportunity signal: a supplier who hands over independent in vivo data without hesitation is signaling confidence in their product. That’s a relationship worth consolidating. A supplier who deflects is telling you something, too. Backfire watch: don’t let a strong relationship substitute for the data. Relationships don’t show up in the fresh pen.
Weight your spend by how deep the evidence runs. Rumen-protected choline and methionine carry deep, peer-reviewed bioavailability data and consistent meta-analytic results. Microencapsulated organic-acid and botanical blends show strong in vitro stability and convincing in vivo heat-stress and performance trials, but delivery mechanisms are less directly measured in the transition literature. Rumen-protected vitamins beyond biotin have thinner published bioavailability literature in transition cows. Backfire watch: don’t pay proven-category prices for emerging-category evidence. The categories aren’t interchangeable.
For the mechanism underneath all of this — negative energy balance, NEFA mobilization, and how fatty liver tips into the ketosis spiral — see our deep dive on how your ketosis cut-point can leak $25,000 a year.
The disease math is settled. The science behind the additive categories is published, peer-reviewed, and cross-validated. The only variable left is whether the specific product you’re buying lands its payload in the cow or in the manure pit.
You gain real margin protection when the delivery rate is high and verified. You give up nothing but the discomfort of asking a question your supplier may not be used to hearing. That’s the trade.
So before the next mill sheet gets signed, pull the spec sheet for every protected additive in your transition ration and find the in vivo delivery number. If your supplier can show you an independent, peer-reviewed figure, you’re buying a program. If the answer is a price sheet and a testimonial, you’re buying a label — and paying program prices for it. What does the data on your current transition additive actually say about intestinal delivery — and who measured it?
Key Takeaways
At 24.1% subclinical ketosis, a 400-cow herd is bleeding $12,400 to $27,800 a year before a single visibly sick cow gets treated — most of it in lost milk, early culls, and missed breedings, not vet bills.
The active ingredient is close to a commodity; the protection technology is the product. “Rumen-protected” has a definition but no delivery threshold under AAFCO or CFIA, so the label guarantees nothing about what reaches the cow.
Buy on cost per gram absorbed, not cost per bag: divide cost per gram of active by the verified in vivo delivery rate. At 25% delivery you feed 51.6 grams to land the same dose; 75% delivery hits it with 17.2.
Before the next mill sheet, ask one question and grade the answer — an independent peer-reviewed in vivo number means you’re buying a program; a price sheet and a testimonial mean you’re buying a label.
The $1750 Calf: Is Your 2026 Breeding Plan Leaving $800 a Head on the Table? — Exposes how record-high bred heifer replacement costs and multi-billion dollar capacity investments require a strategic 3–5 year transition planning reframe, arming you with a critical calculation to stress-test your heifer inventory.
Selection for Increased Resistance to Metabolic Diseases — Delivers a forward-looking, game-changing genetic edge by showing how selecting sires for Metabolic Disease Resistance indexes reduces subclinical ketosis incidence by 5.5% and prevents long-term lactational milk losses.
The Sunday Read Dairy Professionals Don’t Skip.
Every week, thousands of producers, breeders, and industry insiders open Bullvine Weekly for genetics insights, market shifts, and profit strategies they won’t find anywhere else. One email. Five minutes. Smarter decisions all week.
A homozygous polled bull just sat at #1 on Canada’s August 2025 proven LPI list — ahead of every horned sire. The 15-year horn tax is gone. Is your iron still earning its keep?
At Embro, Ontario, breeder Mark Fraser keeps an 85-cow herd built around one VG-86 cow doing outsized work for the polled story. Her name is Fraholme Allday Arielle-P — a finalist for Holstein International’s 2025 Global Cow of the Year — and her homozygous polled sons Triton-PP, Apollo-PP, and Gideon-PP now sire some of the highest-ranked polled animals in Canada. A decade ago, a cow like Arielle-P would’ve been a curiosity. A novelty in a corner of the barn. Today she’s a blueprint.
And because of cows like her, the question on your operation has flipped. It used to be simple: can I afford the production hit that comes with polled? Now it’s sharper. Is the dehorning iron still earning its place in your calf protocol, or are you just heating it up out of habit?
Why did polled stop being a compromise?
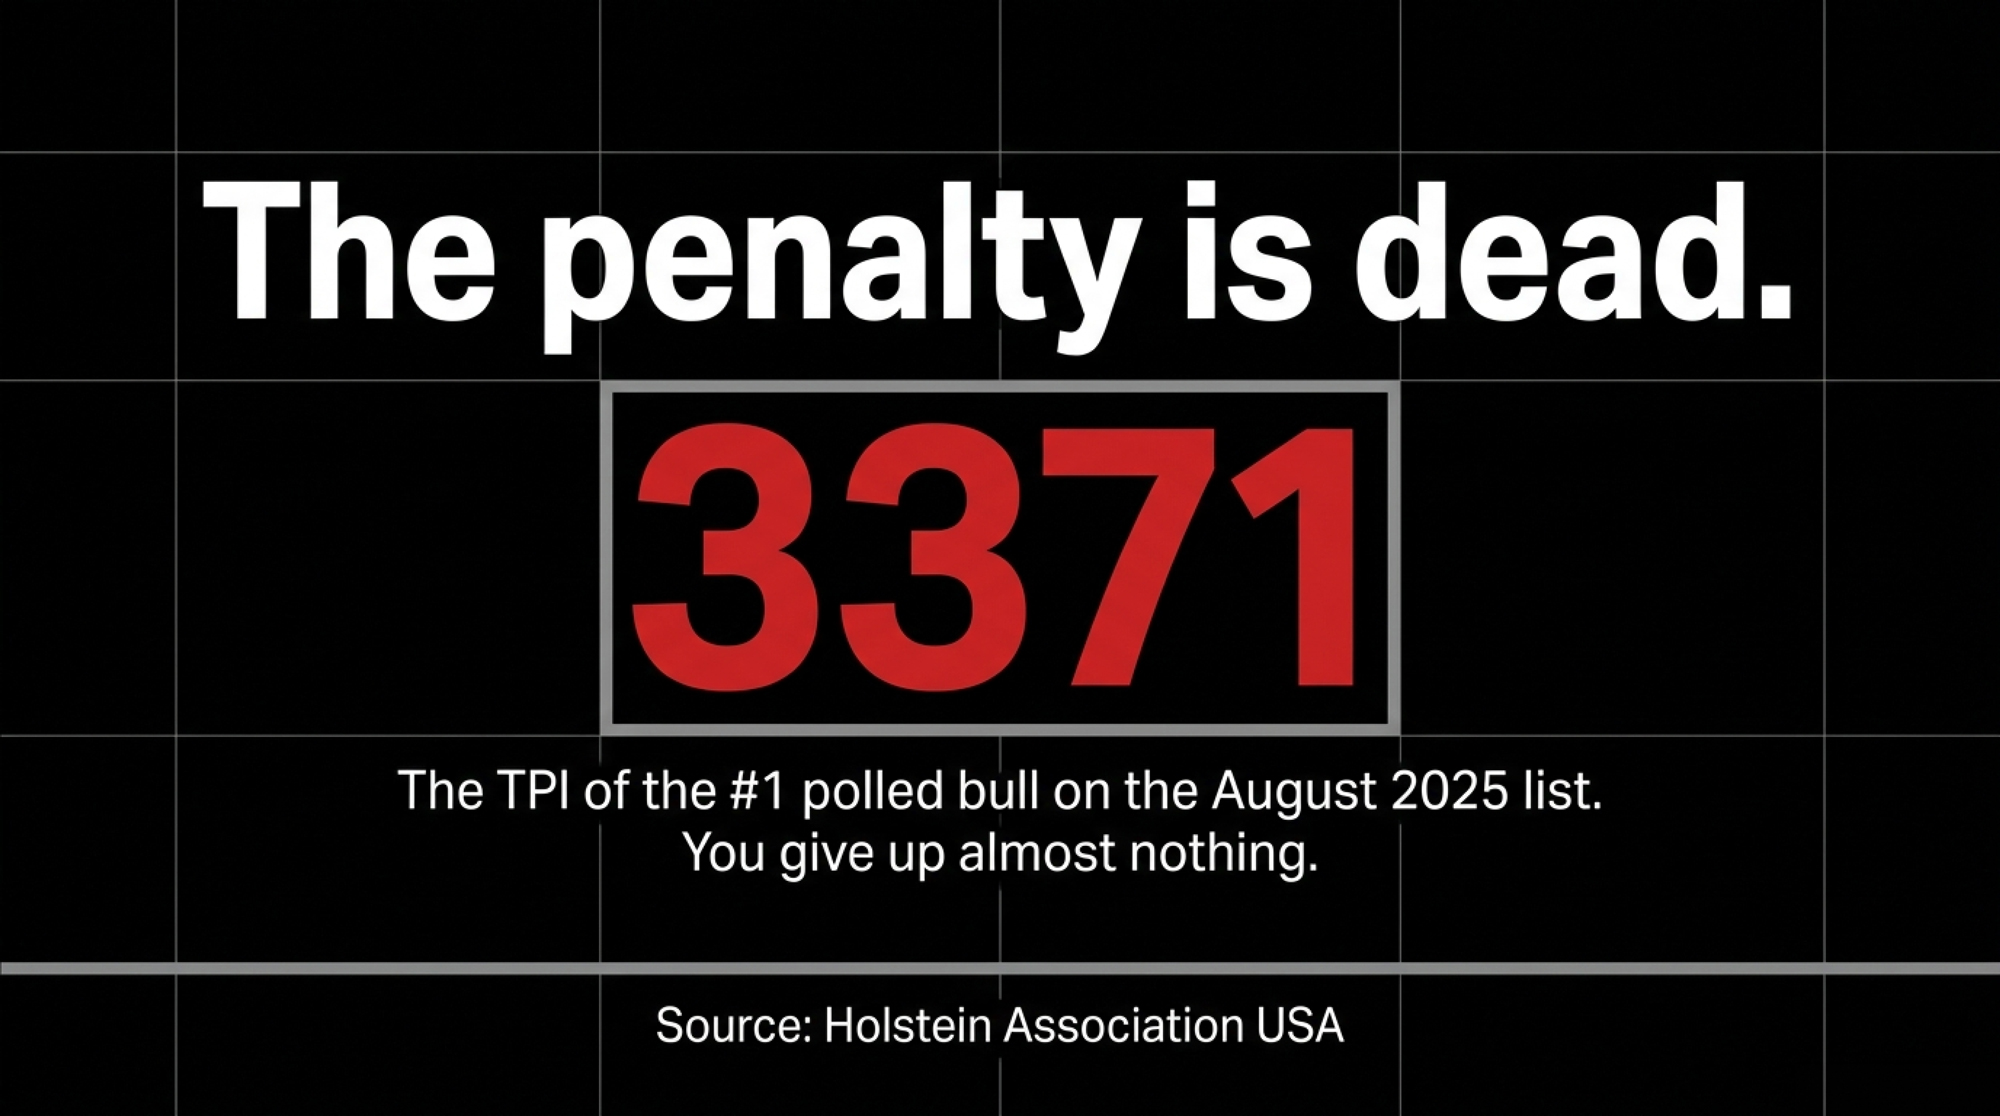
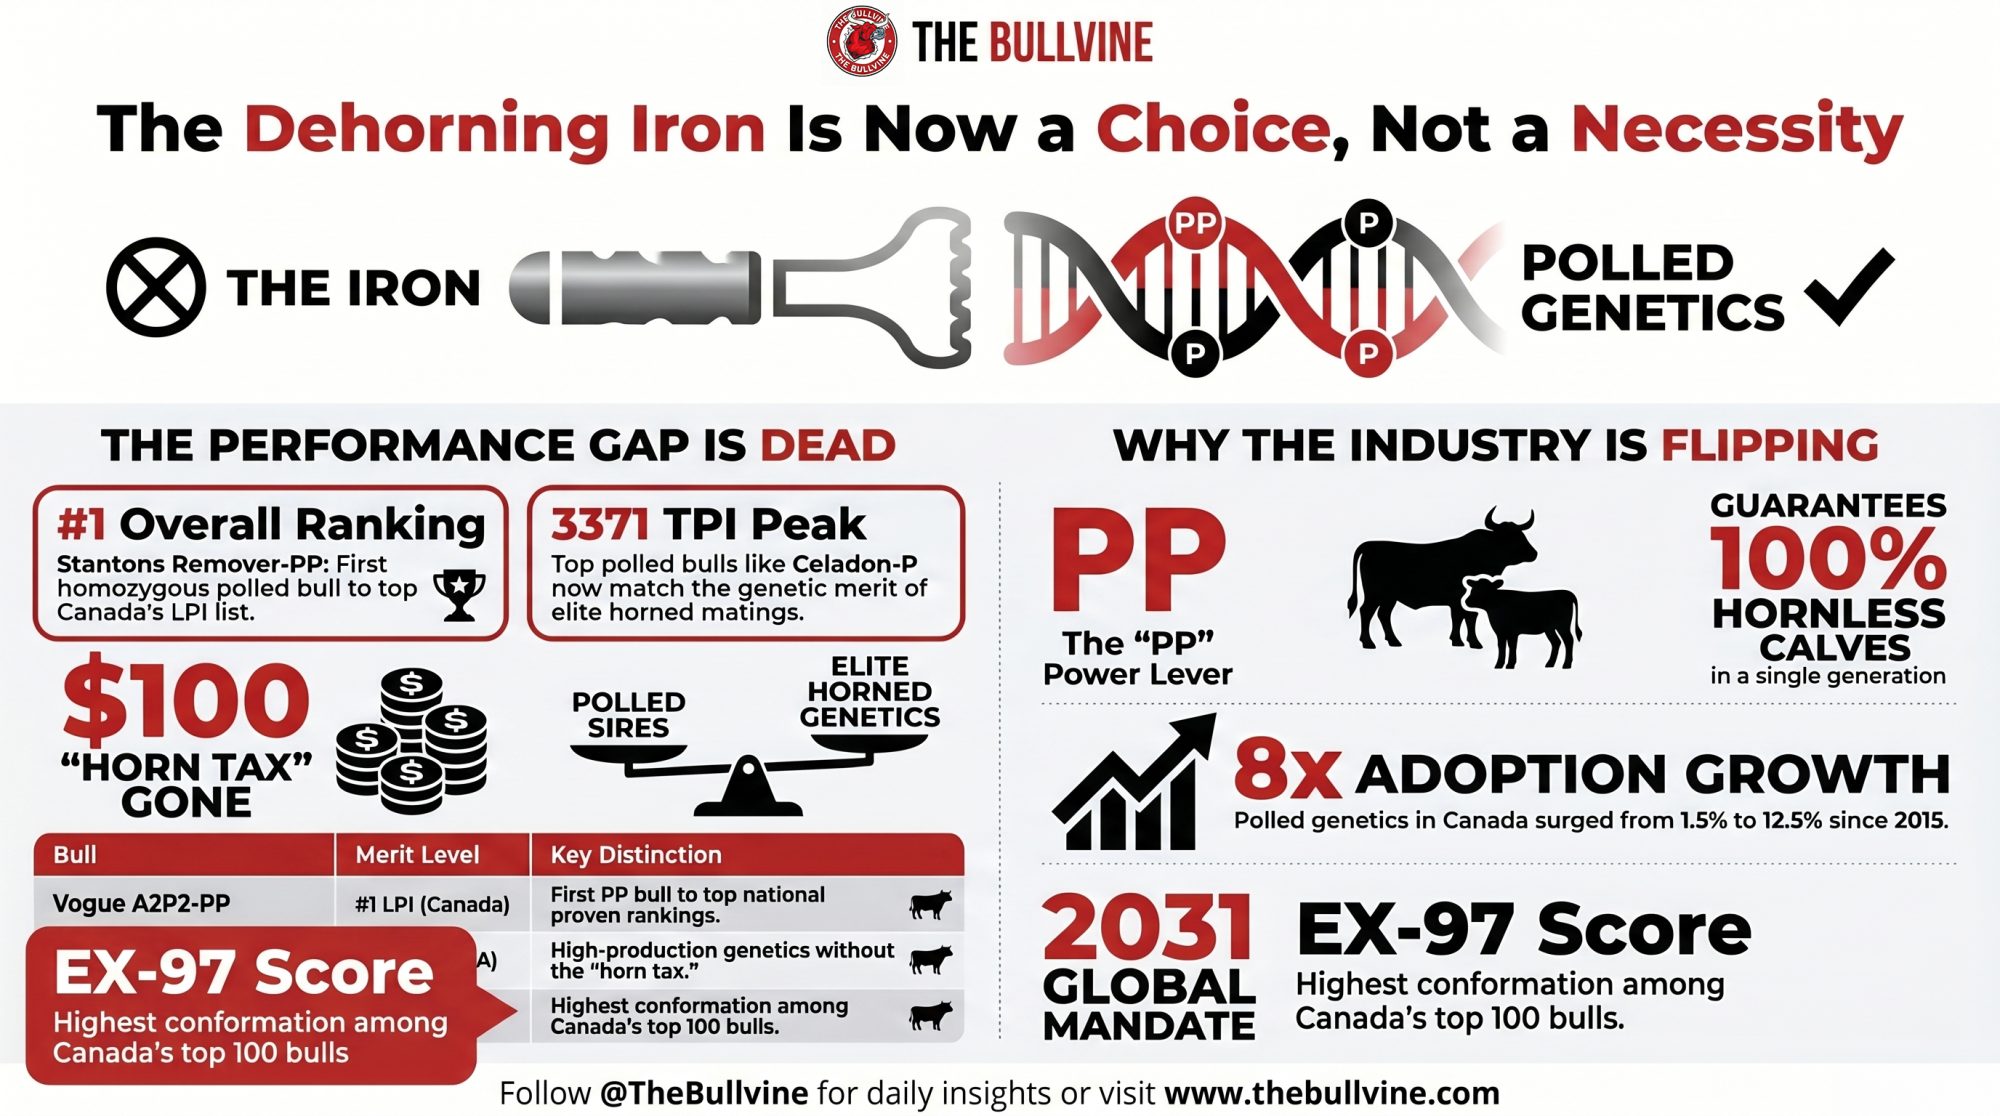
For years, breeding hornless meant paying a tax — in milk, in components, or in type. Pick your loss. That trade is gone. The top polled bull on Holstein USA’s August 2025 list, DeNovo 23201 Celadon-P, sits at 3371 TPI — close enough to your best horned matings that you give up almost nothing.
The genetics behind the shift aren’t complicated, which is exactly why polled moved through herds so fast. Polled is dominant; horned is recessive. One copy of the polled allele — that’s the “P,” a heterozygous bull — and you get a hornless calf. Breed that P sire to your horned cows and the next calf crop splits roughly 50/50 polled to horned.
Two copies — “PP,” homozygous — and the math changes entirely. A PP sire bred to anything, horned cows included, throws polled calves every single time. That’s the lever every serious polled breeder is pulling. PP is how you flip a herd to hornless in one generation instead of grinding through three.
The 15-year climb out of the bargain bin
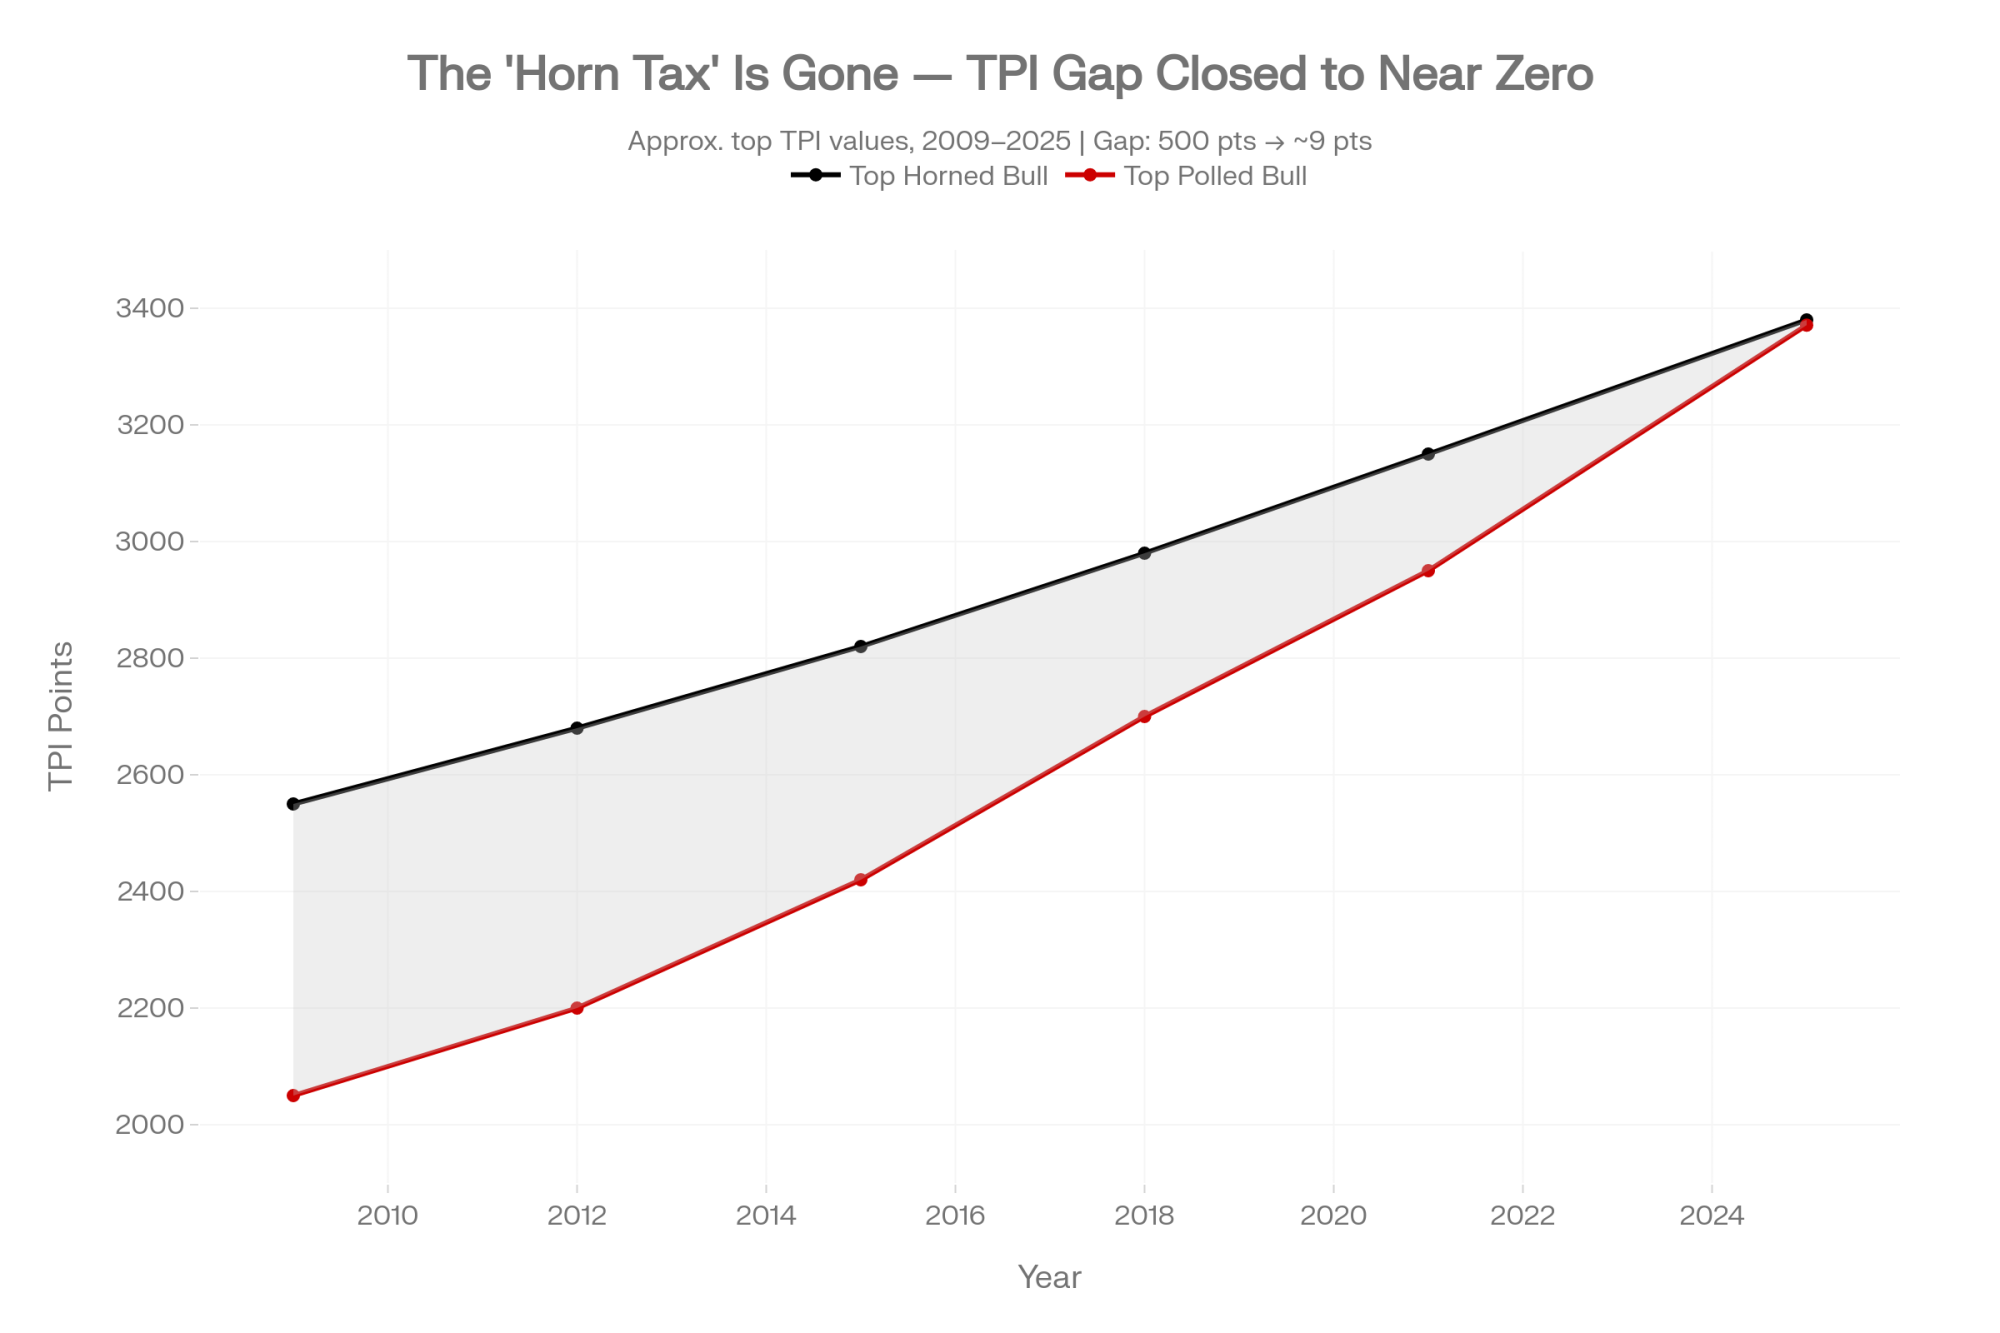
It’s worth remembering how bad the trade used to be, because that’s what makes the current numbers land. Back when genomic testing went mainstream around 2009, the polled bulls on offer were a study in compromise — pick one and you were trading away production, type, or both to get the hornless trait. Breeders who wanted polled weren’t chasing genetic merit. They were paying a horn tax and hoping the rest of the proof didn’t sink the mating.
The most-cited cautionary name was Aggravation Lawn Boy P-Red. He spread the polled trait widely through red-and-white pedigrees in the early 2010s, but breeders openly talked about working around him to avoid dragging down their other numbers — The Bullvine said as much in its own polled coverage back in 2013 and 2014. That’s the era in a sentence: polled was available, but using it cost you something real.
Later names like Mission-P — a daughter-proven polled sire that reached the +3000 LPI range in Canada — showed the gap starting to close. Polled was climbing the lists. It just wasn’t at the top yet, and almost all the progress was on the heterozygous side, where the trait is easier to carry without piling up the weaknesses that dogged the early homozygous bulls.
What changed was the math underneath. Each generation of polled-to-elite matings narrowed the gap, because breeders stopped treating polled as a separate, lesser pool and started crossing the best polled animals onto the best horned cows in the barn. Genomic selection sped that up — you could identify a high-merit polled calf at birth instead of waiting years for a proof. The trait rode along on animals that were getting genuinely good, not just hornless. By the early 2020s the homozygous bulls finally caught up, and once PP got competitive, the whole equation changed — because PP is the only version that flips a herd in one shot.
The bull who erased the penalty
If you want to know why the compromise finally died, start with one bull: Cherry-Lily Zip Luster-P. He was bred by Ron Hembury of Cherry-Lor in Pennsylvania and John Marshman of Tiger-Lily in New York, and stationed at Select Sires in Ohio. And he did something no polled bull had pulled off before — he sired daughters that could win in a heifer pen on type and still fill the bulk tank.
Holstein International reported that Select Sires sire analyst Jordan Siemers credited Luster-P with combining type and production rather than forcing a trade between them. That framing matters more than it sounds. For most of polled’s history, a breeder picked a polled bull despite his proof — to fix horns, you accepted a hole somewhere else on the sheet. Luster-P flipped that logic. You could use him on production cows to fix type, or on type cows to add production. He stopped being a compromise and started being a tool.
That’s why he sold. Select Sires says he is the highest-selling polled bull in its history, with lifetime semen sales of roughly 964,000 units — a figure the company reports and that we haven’t independently audited. His daughter base now runs north of 39,000 head. Luster-P himself is gone. But the genetics he turned loose are why the rest of this story exists.
His sons did what no polled bull had done
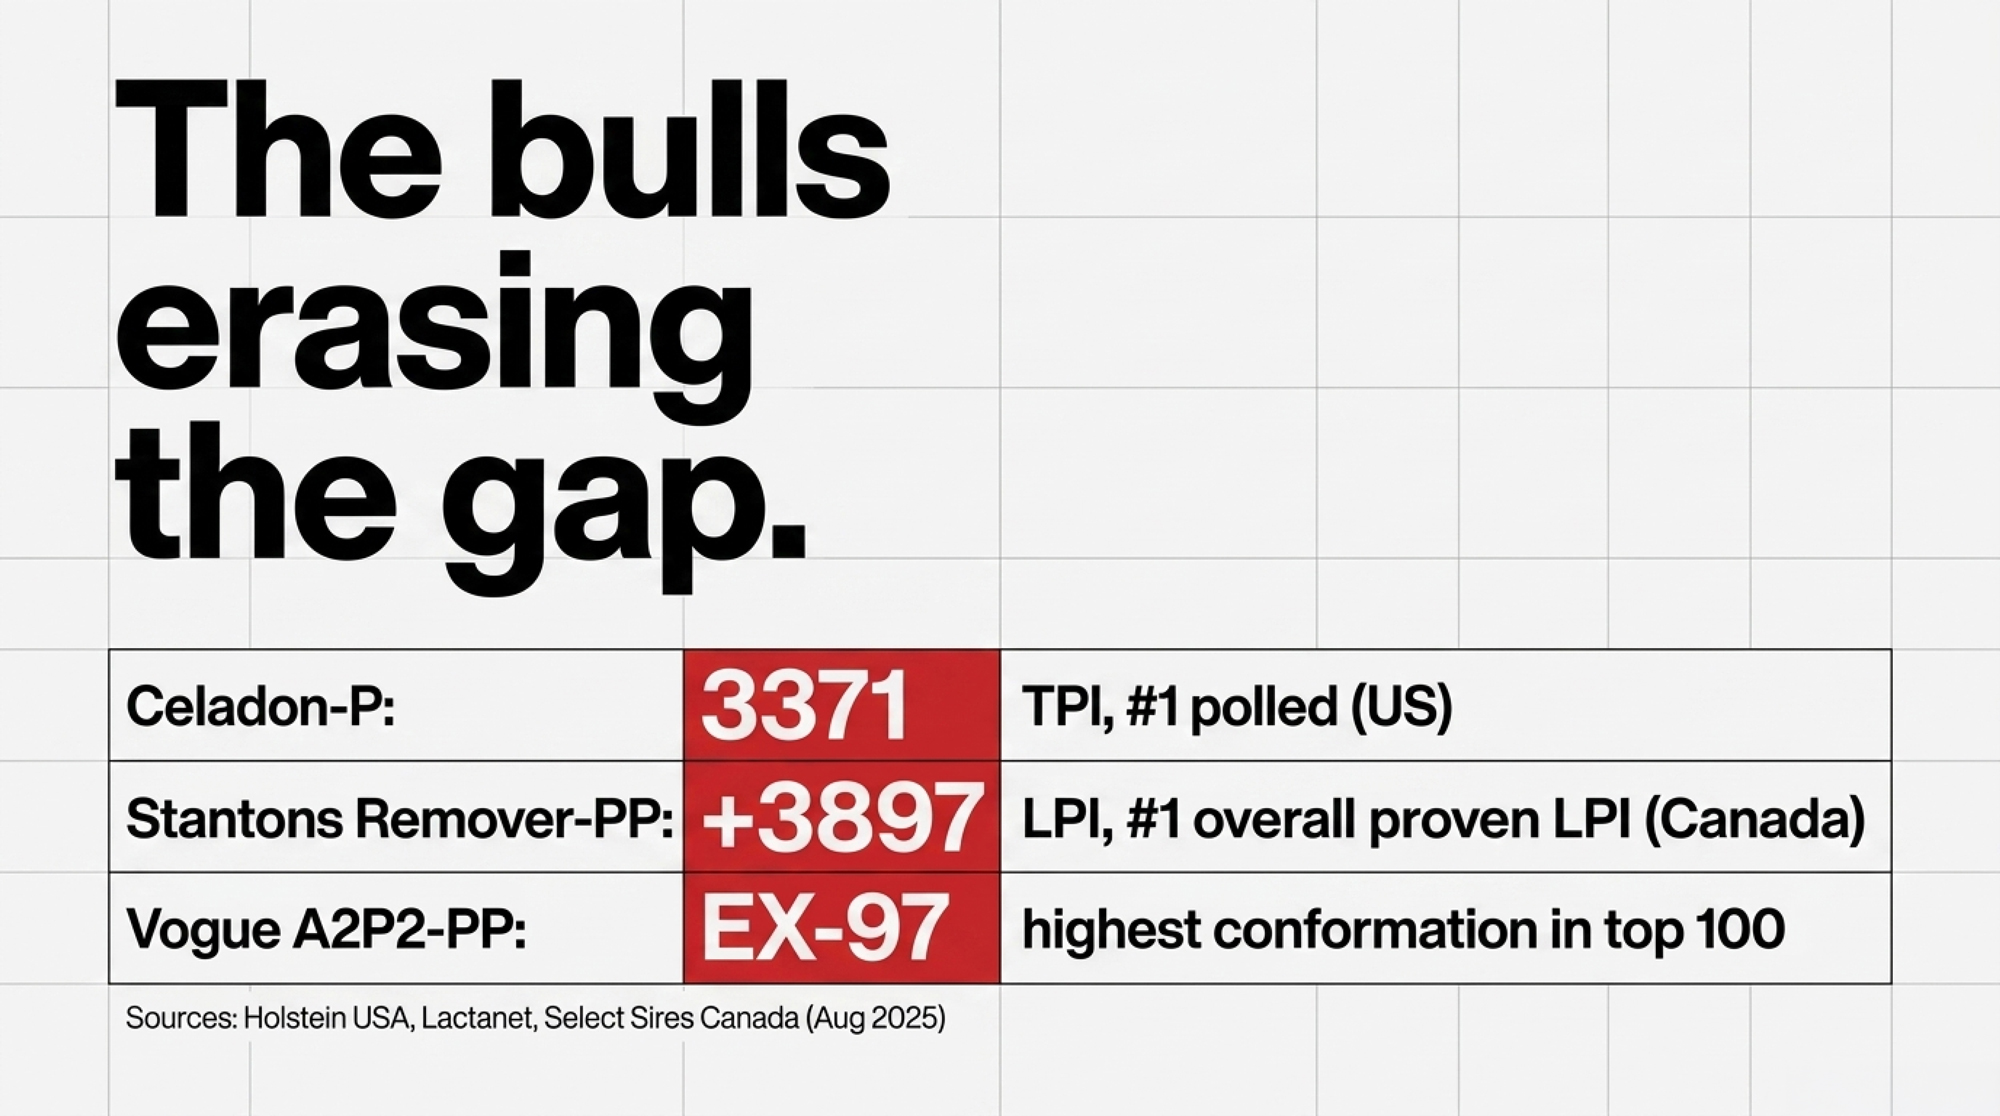
Here’s the part that should change how you read a proof sheet. Luster-P’s son Stantons Remover-PP went from #7 in April to #1 on Canada’s August 2025 Holstein LPI list — a homozygous polled bull topping a national proven ranking outright, ahead of every horned sire in the country. Read that again. Not a genomic prediction. Not a young-sire flier dressed up in a pedigree. A daughter-proven, homozygous polled bull sitting at the top of the list.
Vogue A2P2-PP — EX-97-5YR-CAN, +15 conformation at 99% reliability. He’s the only polled Holstein on record at EX-97 and the highest-type bull among Canada’s top 100 proven LPI sires (Select Sires Canada). Five years ago, a homozygous polled bull at this score would’ve been a typo. Now breeders mate toward him on purpose.
His other standout son, Vogue A2P2-PP, is the only polled Holstein sire on record to be classified EX-97, according to Select Sires Canada — scored EX-97-5YR-CAN with +15 conformation at 99% reliability, which makes him the highest-conformation bull among Canada’s top 100 proven LPI sires. Five years ago, a homozygous polled bull at that score would’ve been a typo. Now he’s a building block other breeders mate toward on purpose.
The numbers behind those two bulls — and the bull who sired them — read more cleanly side by side than buried in a paragraph:
Bull
Region / Index
Status
Daughters
Celadon-P (P)
🇺🇸 US — TPI
3371 TPI, #1 polled (Aug 2025 formula)
Genomic
Winstar Kvell-PP (PP)
🇺🇸 US — TPI
3224 TPI, top PP (Aug 2025 formula)
—
Stantons Remover-PP (PP)
🇨🇦 Canada — LPI
+3897 LPI, #1 Aug 2025; +3873, #2 Apr 2026
234
Vogue A2P2-PP (PP)
🇨🇦 Canada — type
EX-97-5YR-CAN, +15 conformation, 99% rel.
Highest conf. in top 100 proven LPI
Cherry-Lily Zip Luster-P(P, sire)
🇺🇸 US — Select Sires
~964,000 units sold (co-op-reported)
39,000+
Sources: Holstein Association USA Top 100 TPI Polled Bulls, Aug 2025; Eurogenes/Lactanet/Holstein International, Aug 2025 & Apr 2026; Select Sires Canada; Holstein Canada registry. US TPI figures are on the August 2025 formula — Holstein USA reweighted TPI in April 2026, so don’t line these up against post-April-2026 numbers. Indexes are not directly comparable across borders — see note below.
That’s the difference between “polled is improving” and “polled has arrived.” The improvement story has run for fifteen years. The arrival showed up on the male proven list in Canada — with daughters standing in real barns getting scored, not just genomic numbers on a screen. And Remover-PP’s slip from #1 to #2 between August and April isn’t a knock; a homozygous bull holding the top tier across multiple proof rounds is the signal that matters, not the single peak.
How fast is polled actually moving?
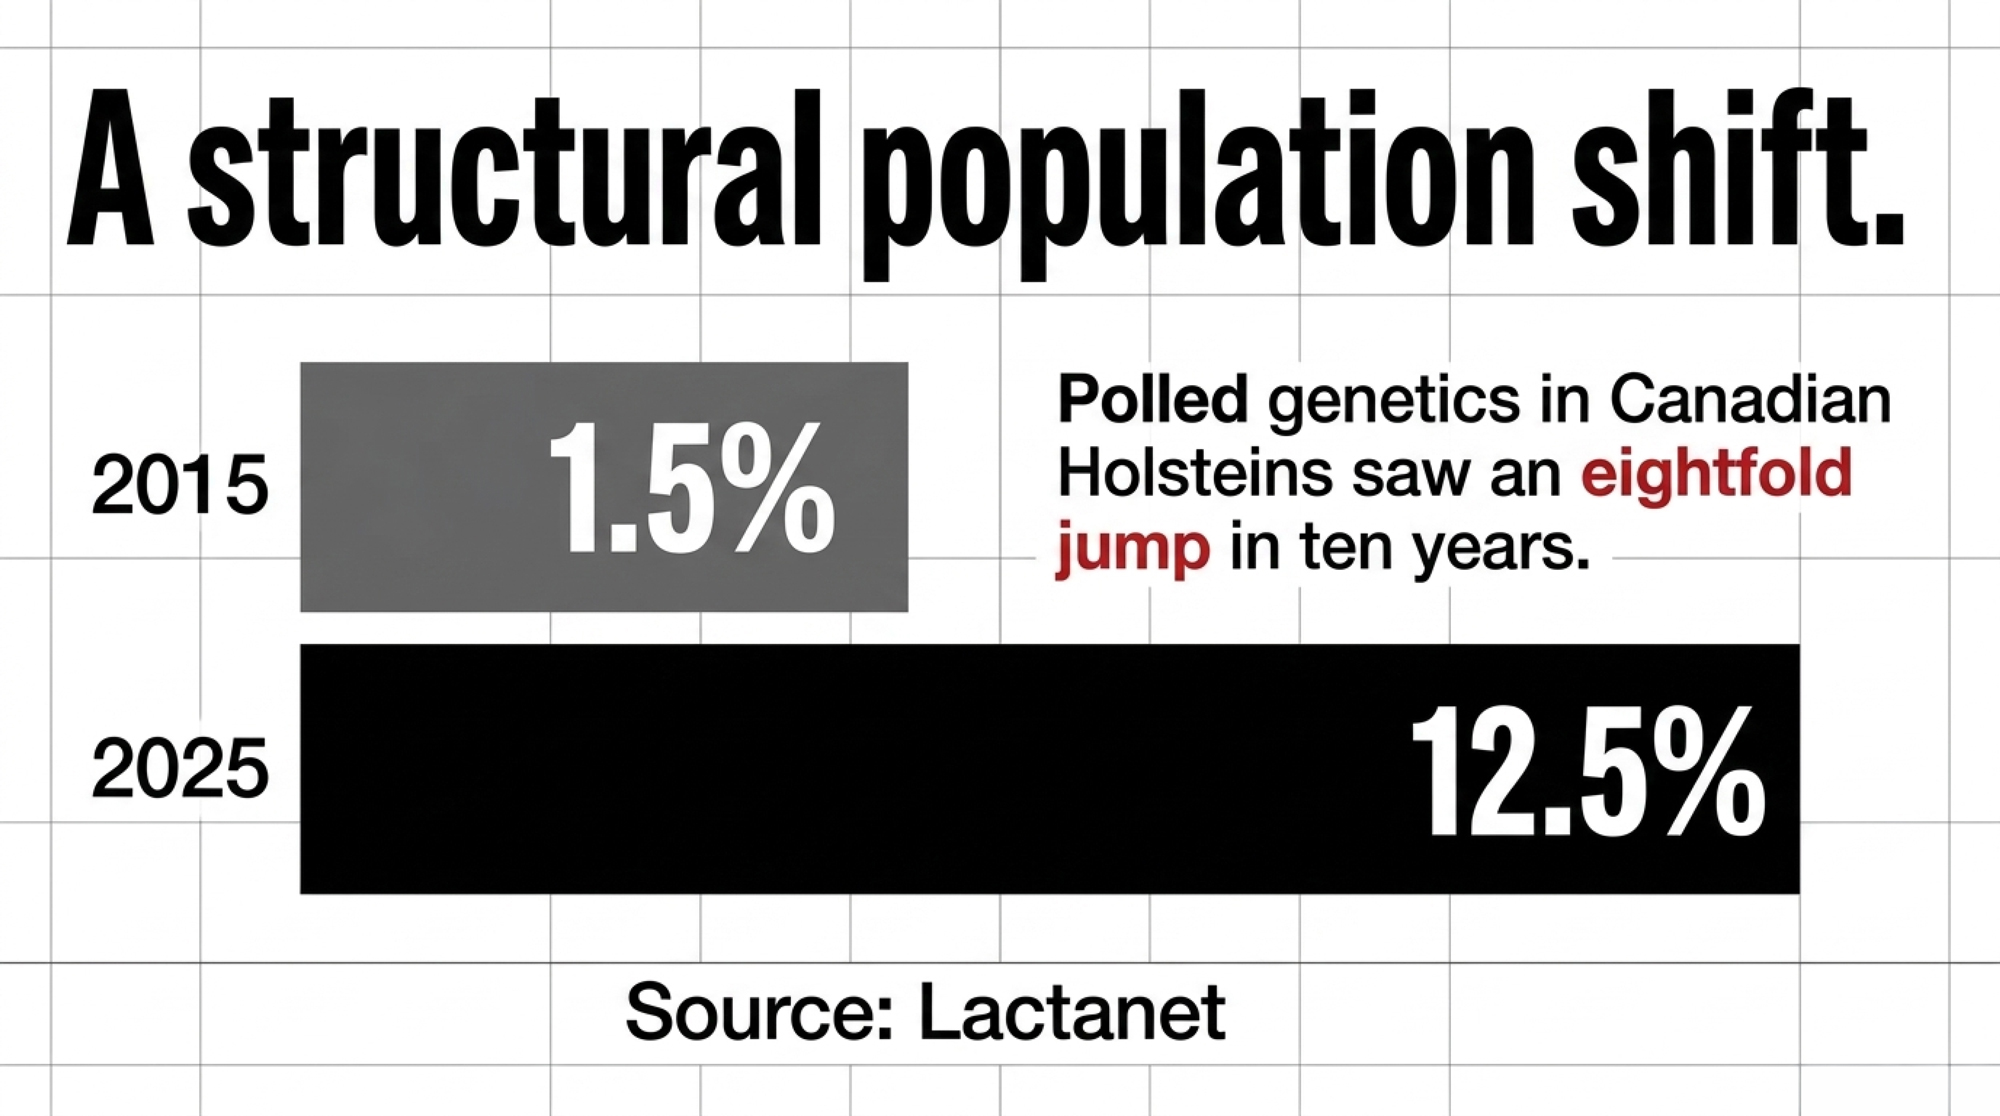
Look north for the clearest read. In Canada, polled genetics showed up in about 1.5% of Holsteins in 2015. By 2025 that figure hit 12.5%, according to Lactanet — better than an eightfold jump in a decade. That’s not a fad curve. That’s a structural shift in how an entire population is being bred. Nine polled bulls now rank inside Canada’s top 100 LPI.
The genetic gap that used to justify steering clear has nearly closed too. Top polled sires now average $1,108 Net Merit, and on Herd Health Profit Dollars — HHP$, Semex’s health-and-fertility measure — they sit less than $100 behind comparable horned NxGEN sires (per The Bullvine’s Semex NxGEN comparison; NxGEN is Semex’s elite proven sire program). A hundred dollars of HHP$ on a high-end mating is real, but it’s not the canyon polled breeders used to stare across.
Then there’s the data point that punctures the last emotional argument. In one Western Canadian herd, the polled cows out-milked their horned herdmates — 66.5 kg versus 65.9 kg per day, roughly 147 versus 145 lbs, per The Bullvine. One herd isn’t a population trend, and we’ll say that plainly. The sample’s too small to bank on. But it quietly kills the fear that hornless somehow means lesser — and that fear, more than any proof, is what kept the iron in the fire this long.
And that brings us back to Embro. The reason a short list of cow families now does so much of the breed’s polled heavy lifting is that bulls like Arielle-P’s son Fraholme Vec Triton-PP keep showing up at the top — Triton debuted at #30 on Canada’s genomic list at +3952 GLPI in the April 2025 run, billed by his marketers as the #1 homozygous polled bull in the breed (The Bullvine, April 2025 evaluations; Blondin Sires). That concentration is exactly the risk worth flagging now — hold the thought, because it lands in the action section.
Europe isn’t watching. It’s mandating.
Now cross the Atlantic — and watch the logic flip from choice to rule. North American breeders pick polled because the numbers finally pencil out. Parts of Europe are about to breed it because the law will require it. Follow the thread country by country, and you can see the same deadline pulling each market in the same direction.
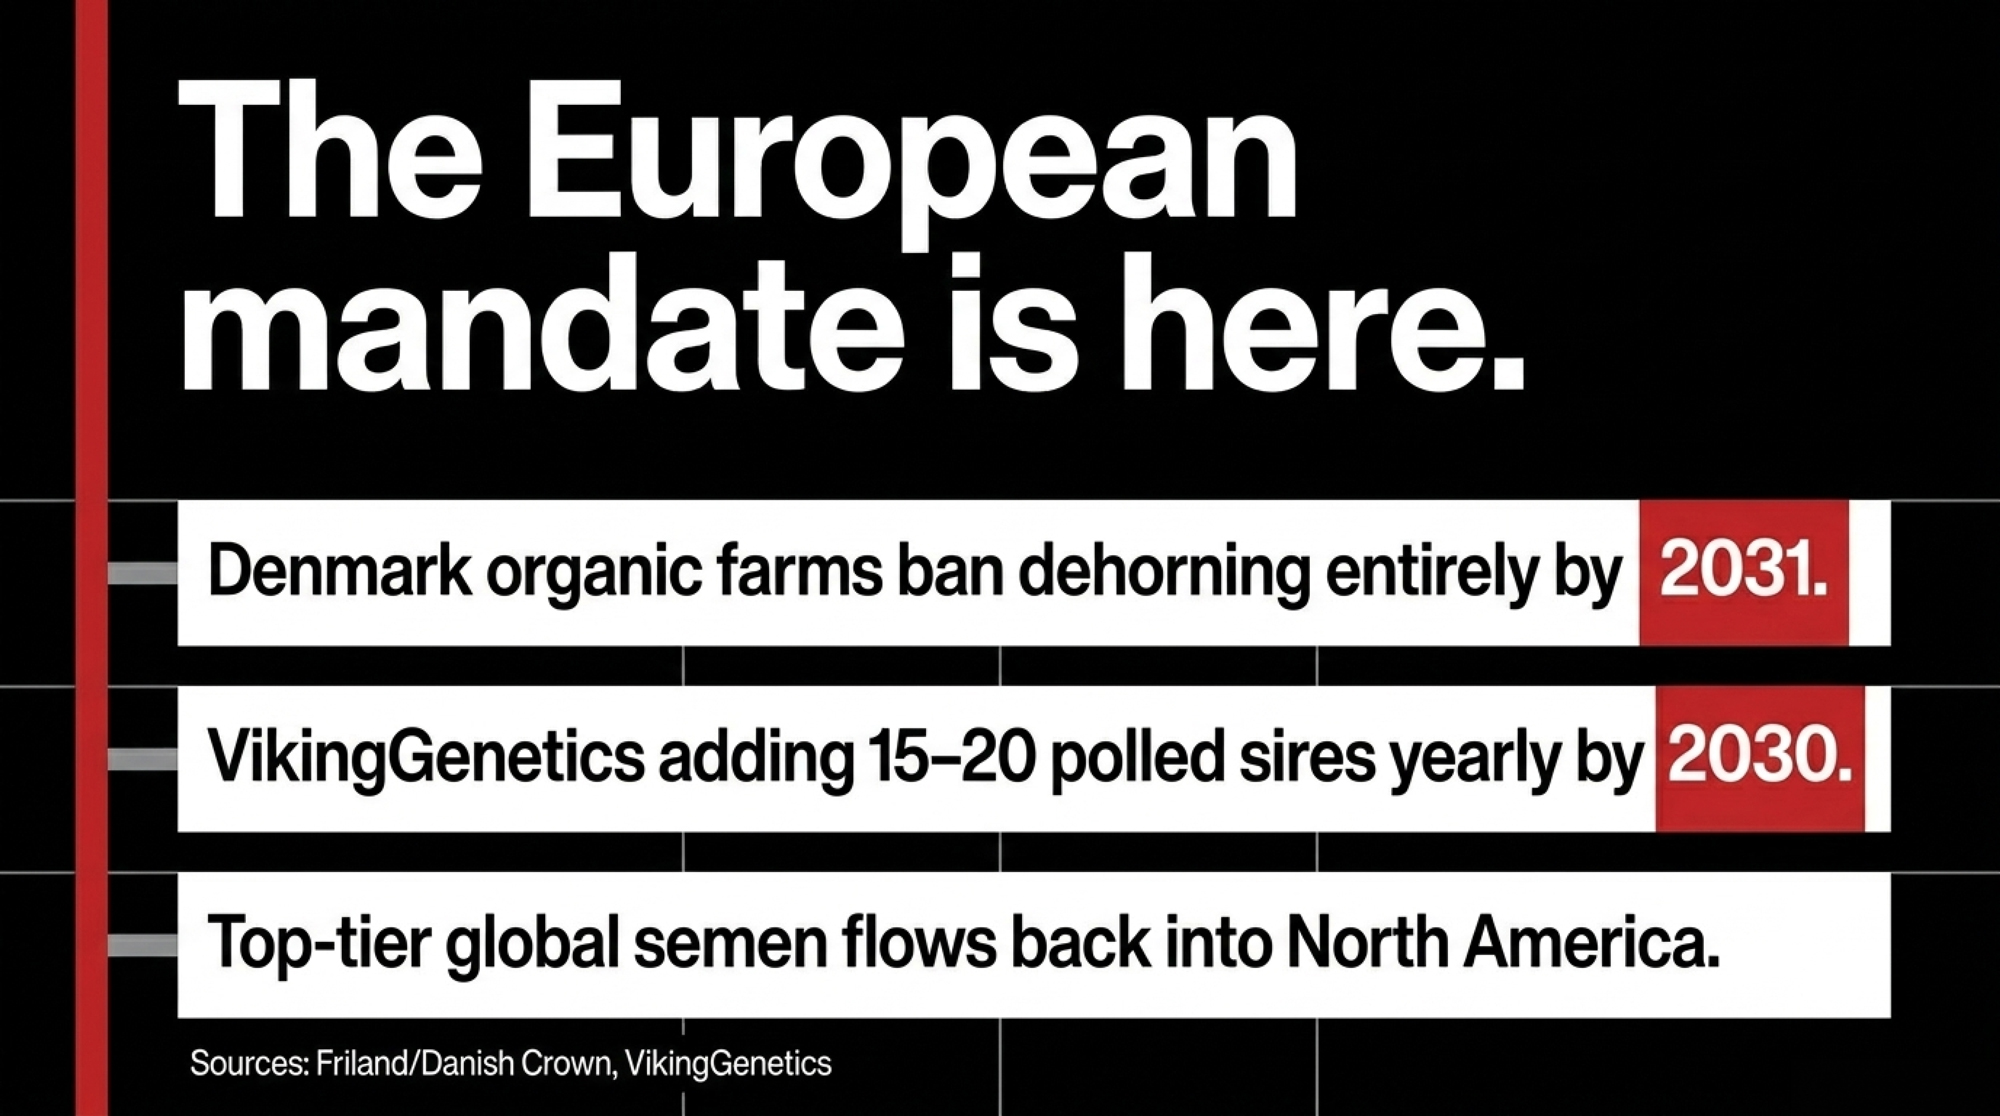
🇩🇰 Denmark — the deadline that started it. Denmark already runs organic standards stricter than the EU baseline: routine disbudding is restricted, permitted only as a vet-performed last resort, under anesthesia, with mandatory long-term pain treatment (Friland/Danish Crown welfare standards). Holstein International reports Danish organic farms will be barred from dehorning entirely as of January 1, 2031 — the regulatory direction is independently documented via Friland and INRAE. That single date is what every other move on this list is reacting to.
🇪🇺 EU-wide — the baseline it sits on. Only about 1% of dairy farms across the EU keep polled cattle today, but the Demeter organic standard already bans dehorning and disbudding outright (INRAE EU dehorning survey, 2020). The mandate edge is organic-first, then widening — which is why a 2031 organic deadline doesn’t stay confined to organic herds for long.
🌍 VikingGenetics (Nordic) — the supply response. That 2031 wall is already reshaping a major AI cooperative’s playbook. VikingGenetics says it intends to bring 15 to 20 new high-testing polled Holstein sires online each year from 2030, aiming for a standing lineup of 20 to 25. The pipeline’s already visible: as of the May 2026 proof run, VikingGenetics lists nine polled VikingHolstein bulls, three of them homozygous — and the new #1 bull on its own gNTM list, VH Mads-P, is itself polled (heterozygous) at +47 gNTM. When the top bull on a major program’s list happens to be hornless, that’s the tell.
🇩🇪 Germany — the head start that fed the pool. Germany has run its own polled engine for years, and it predates the North American surge. The Simon-P line in particular is a backbone of German polled breeding, with homozygous sons like Sampler-PP and transmitters like Signal-P anchoring the rankings (Holstein International). German breeders leaned in earlier and harder, partly because welfare pressure on the Continent arrived earlier — so when the rest of Europe started scrambling, Germany already had genetics to export.
🇳🇱 Netherlands — the red-and-white channel. CRV’s Delta Launch-PP-Red — among the world’s first and bestselling homozygous polled red sires — now counts roughly 16,000 milking daughters across several continents (Holstein International). The red-and-white channel matters because the polled trait has historically run strong through red genetics, giving breeders of red-and-whites an even deeper hornless bench.
Why should any of this land on your radar if you ship milk in Wisconsin or Ontario? Because the genetics don’t stop at the border. When a co-op of VikingGenetics’ size builds 20-plus elite polled bulls into its standing lineup to beat a 2031 deadline, that semen flows into the North American market too. Europe forcing the issue makes your sire list deeper — whether you ever sell a drop of organic milk or not.
One caution on every number above: TPI, LPI, GLPI, NM$, NTM, and RZG aren’t directly comparable across borders without an Interbull MACE conversion. Each figure lives inside its own system. The trend is real and global; the point totals don’t translate one-to-one.
Does the dehorning iron still pay its way?
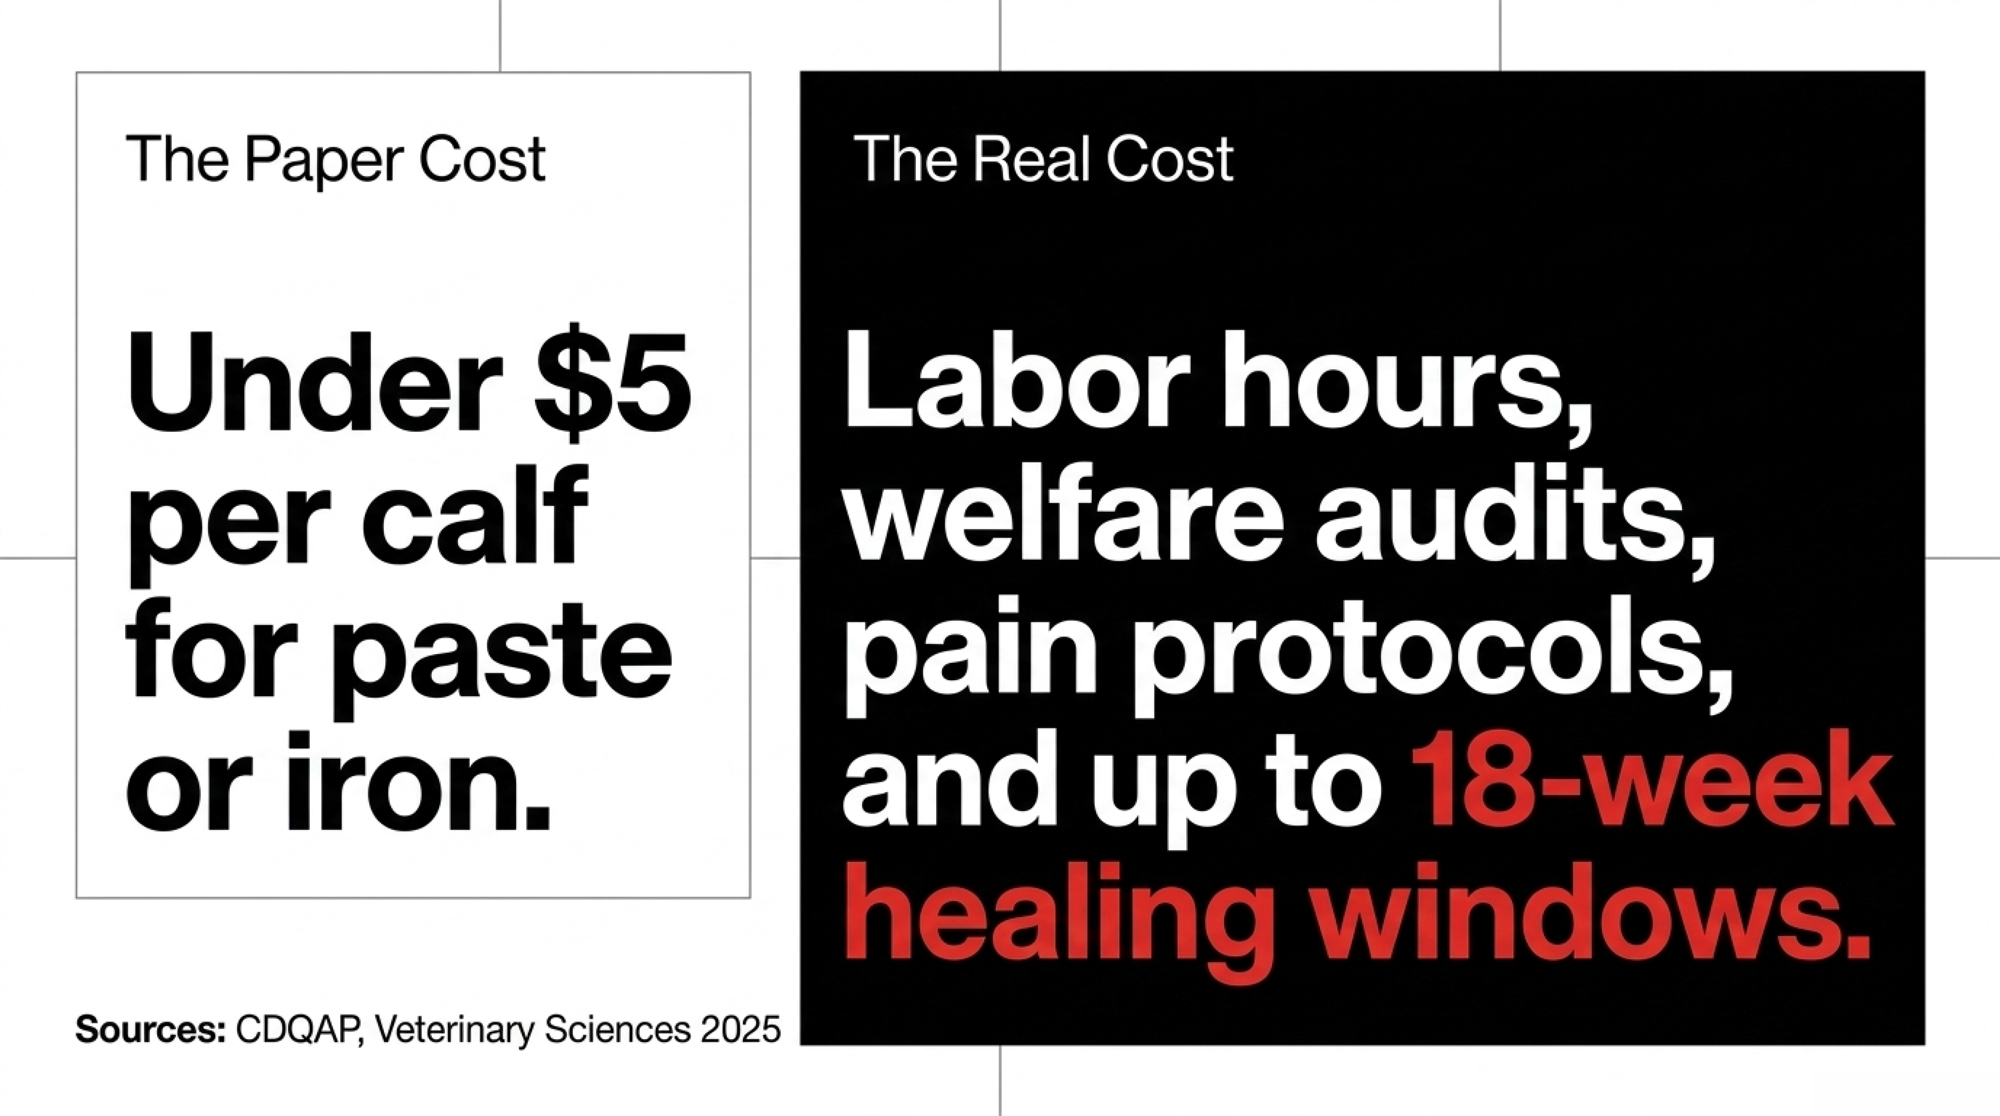
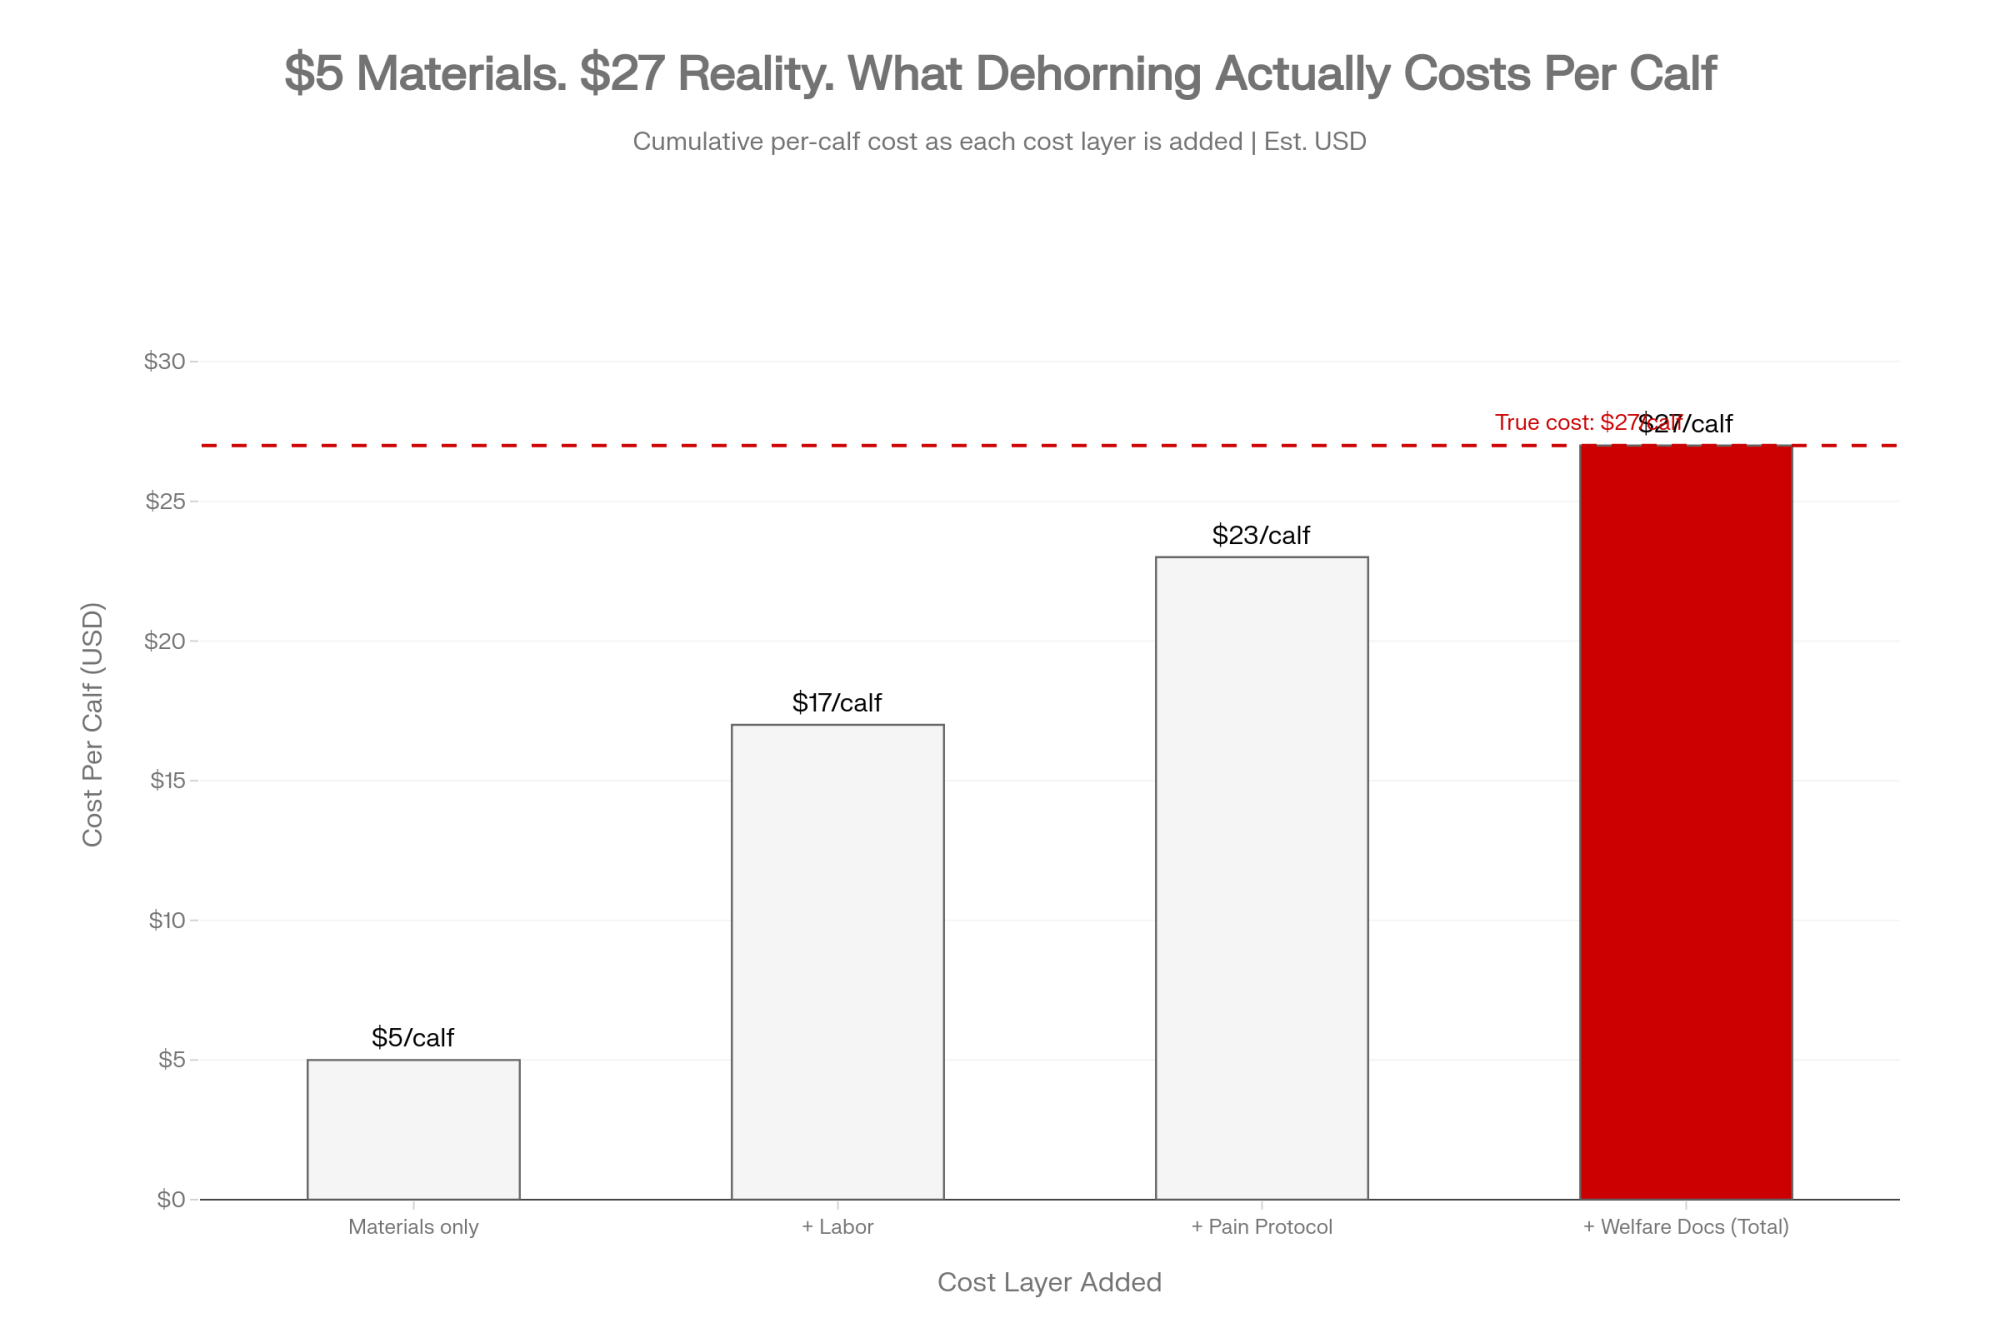
Strip away the proof sheets and here’s the on-the-ground case. Disbudding a calf, done early and well, is cheap on paper — extension estimates put hot-iron or caustic-paste disbudding at well under $5 per calf when farm staff do it, plus cents for pain control (CDQAP). Per calf, the materials aren’t what hurts.
What hurts is everything around it. The labor scheduling. The pain-management protocol your buyers increasingly expect you to document. The welfare scrutiny. The job nobody on the crew volunteers for. And the recovery window — healing from caustic paste alone can stretch up to 18 weeks in some calves (Veterinary Sciences, 2025). Research consistently flags polled genetics as the one approach that eliminates the procedure entirely: no pain, no healing window, no labor, no treatment cost.
So run it on your own scale, because the math reads differently depending on your barn. Say you raise 250 heifer calves a year. At $5 a head that’s only $1,250 in materials — but layer in the labor hours, the pain protocol, the recovery time, and a buyer audit you now have to log, and that line item stops being about $5. Now picture a 60-cow tie-stall raising maybe 30 replacements: the dollar total is smaller, but it’s likely one person doing every calf by hand, on top of milking, fieldwork, and everything else. For that operator the cost isn’t really money — it’s the morning they have to carve out for a job they dislike, on a calf that’s healing for weeks.
There’s a semen-cost angle too, and it’s worth doing on your own gun. A PP straw might run you a few dollars more than your usual horned pick — call it the price of skipping the index gap. But you’re buying out every disbudding that calf and her future daughters would have required, plus the labor and welfare paperwork attached to each one. On a heifer that stays in the herd and breeds replacements, that one-time premium amortizes across years of calves you never have to touch with an iron.
Either way, breed a PP sire and the whole job goes to zero. One mating decision, made once at the gun, against a recurring headache and a growing welfare liability. When the genetic penalty was real, the headache won every time. Now that the penalty’s gone, the headache has no defense left.
What This Means for Your Operation
You don’t need to convert the whole herd this fall. You need a deliberate position. Pick the row that matches where you are, then run the move next to it.
Your situation
The move
The trade-off
Testing the water(start this month)
Book a heterozygous (P) sire that ranks where you already breed onto a defined group of horned cows. The US Aug 2025 list runs from Celadon-P at 3371 down through dozens above 3200 TPI.
Half the calf crop is hornless; you’re still dehorning the other half. A toe in the water, not the finish line.
Moving fast (one-generation flip)
Use a homozygous (PP) sire like Remover-PP or A2P2-PP on a defined group. Every calf is polled, guaranteed, regardless of the dam.
Give up a little top-end index — 147 TPI points between the top P (3371) and top PP (3224) on the US Aug 2025 list. In Canada, the proven gap is now under .
Selling genetics / exporting
Build PP into the matings you’d market into the EU. VikingGenetics is stacking its lineup around the 2031 shift; PP animals are positioned to carry a premium where dehorning is banned.
Those are organic- and EU-specific signals — not a promise your local sale ring pays up tomorrow.
Any of the above
Spread your polled pedigrees. VikingGenetics is screening barely-used cow families on purpose to keep diversity. Do the same at home.
A short list of source families — Arielle-P’s among them — is doing most of the work, so stacking the same pedigree on every heifer imports inbreeding risk.
Your 30-day step, whatever row you’re in: pull your last three sire selections and check where the best polled bull ranked against what you actually used. That single comparison tells you how much — or how little — going polled would have cost you.
Factor
Heterozygous P Sire
Homozygous PP Sire
Polled calves guaranteed?
No — 50/50 split on horned cows
Yes — 100% polled, every calf
Top US TPI (Aug 2025)
3,371 (Celadon-P)
3,224 (Kvell-PP)
Top CA LPI (Aug 2025)
—
+3,897 (Remover-PP, #1 proven)
Index gap vs. top horned
~9 TPI points
~147 TPI points
Dehorning eliminated?
Partial (50% of calves still need iron)
Fully eliminated
Herd conversion speed
2–3 breeding cycles
One generation
Best use case
Testing adoption; maintaining top index
Flipping herd; exporting PP genetics
EU/export market value
Moderate
High — meets 2031 Danish organic standard
Pedigree diversity risk
Lower
Higher — monitor source families
Typical semen premium
Minimal
$3–8/straw above comparable horned
Key Takeaways
If your best polled option ranks within roughly 100 points of your best horned sire — and on the current Canadian lists it does — the old “production penalty” reason to skip polled no longer holds. Re-run that comparison before you book your next round.
If you want hornless calves guaranteed in one generation, breed PP and accept a modest index trade — 147 TPI points between the top P and top PP bull on the US Aug 2025 list. If you’re fine flipping the herd gradually, a high-ranking P sire on horned cows gets you halfway each cycle.
If you export or sell genetics into the EU, treat PP as a market-access decision, not just a welfare one — Denmark’s organic dehorning rules are tightening toward a reported January 1, 2031 deadline, and the German and Dutch polled pools are deep enough to compete with on merit.
If you’re moving toward polled, check the pedigrees before you commit. A short list of source families is doing most of the work, so spread your matings or you’ll stack inbreeding risk into your own herd.
So where does your iron stand?
Polled isn’t the future of the Holstein breed anymore. It’s the present — sitting at 3371 TPI on the US list, topping Canada’s August 2025 proven ranking, and getting written into European law. The iron didn’t become illegal. It became optional. The genetics that made it optional are on the sire list right now, and a cow named Arielle-P in an 85-cow barn at Embro is part of the reason why.
So here’s the real question for your next mating sheet: is the dehorning iron still earning its place in your calf protocol, or are you just heating it up out of habit? If the gap between your best polled option and what you actually bred last round surprises you — and it might — that’s your answer.
Run Your Numbers
Genomic Testing ROI Calculator — Before you build PP into your matings, run the calculator to see whether testing pays on your replacement costs and culling pressure. It flags the families where inbreeding risk needs tighter control — the exact trap when a short list of polled pedigrees does most of the work.
Complete references and supporting documentation are available upon request by contacting the editorial team at editor@thebullvine.com.
Learn More
Polled genetics – examine the pros and cons — Arms you with a line-by-line cost framework to calculate the direct milk volume and component fat sacrifices historically incurred when prioritizing hornless genetics over elite horned herdmates.
Gene-Edited Cows Are Legal. Your 2029 Milk Cheque Isn’t Safe. — Delivers a critical market warning about how emerging genetic modifications like SLICK technology disrupt conventional breeding paths while facing immediate processing bottlenecks and volatile corporate buyer compliance deadlines.
The Sunday Read Dairy Professionals Don’t Skip.
Every week, thousands of producers, breeders, and industry insiders open Bullvine Weekly for genetics insights, market shifts, and profit strategies they won’t find anywhere else. One email. Five minutes. Smarter decisions all week.
They’ll ask you to pose with a calf this June. Then you go home to the milk check: $1.97 of that $3.98 gallon is yours. The other $2.01 never reaches the tank — and a Wisconsin firm wants a say over your 15¢ next.
Editor’s note: “the Reillys” below is a composite scenario, modeled from public ERS price data and typical Northeast fluid-shipper economics — not a single real farm. Every number attached to them is sourced and real; the operation itself is illustrative, in the same way our $97,000 Breeding Meeting feature was framed.
Picture a 140-cow tie-stall in the St. Lawrence Valley — call them the Reillys, a stand-in for the fluid shippers across the Northeast doing exactly this math. June Dairy Month banners go up at the co-op, the FFA kids hand out string cheese at the county fair, and somebody asks the Reillys to pose with a calf for the local paper. They smile for it. Then they go home and look at the milk check.
Because here’s the question that’s been gnawing at operations like theirs: of the $3.98 a consumer paid for a gallon of whole milk in 2024, how much actually landed in their tank?
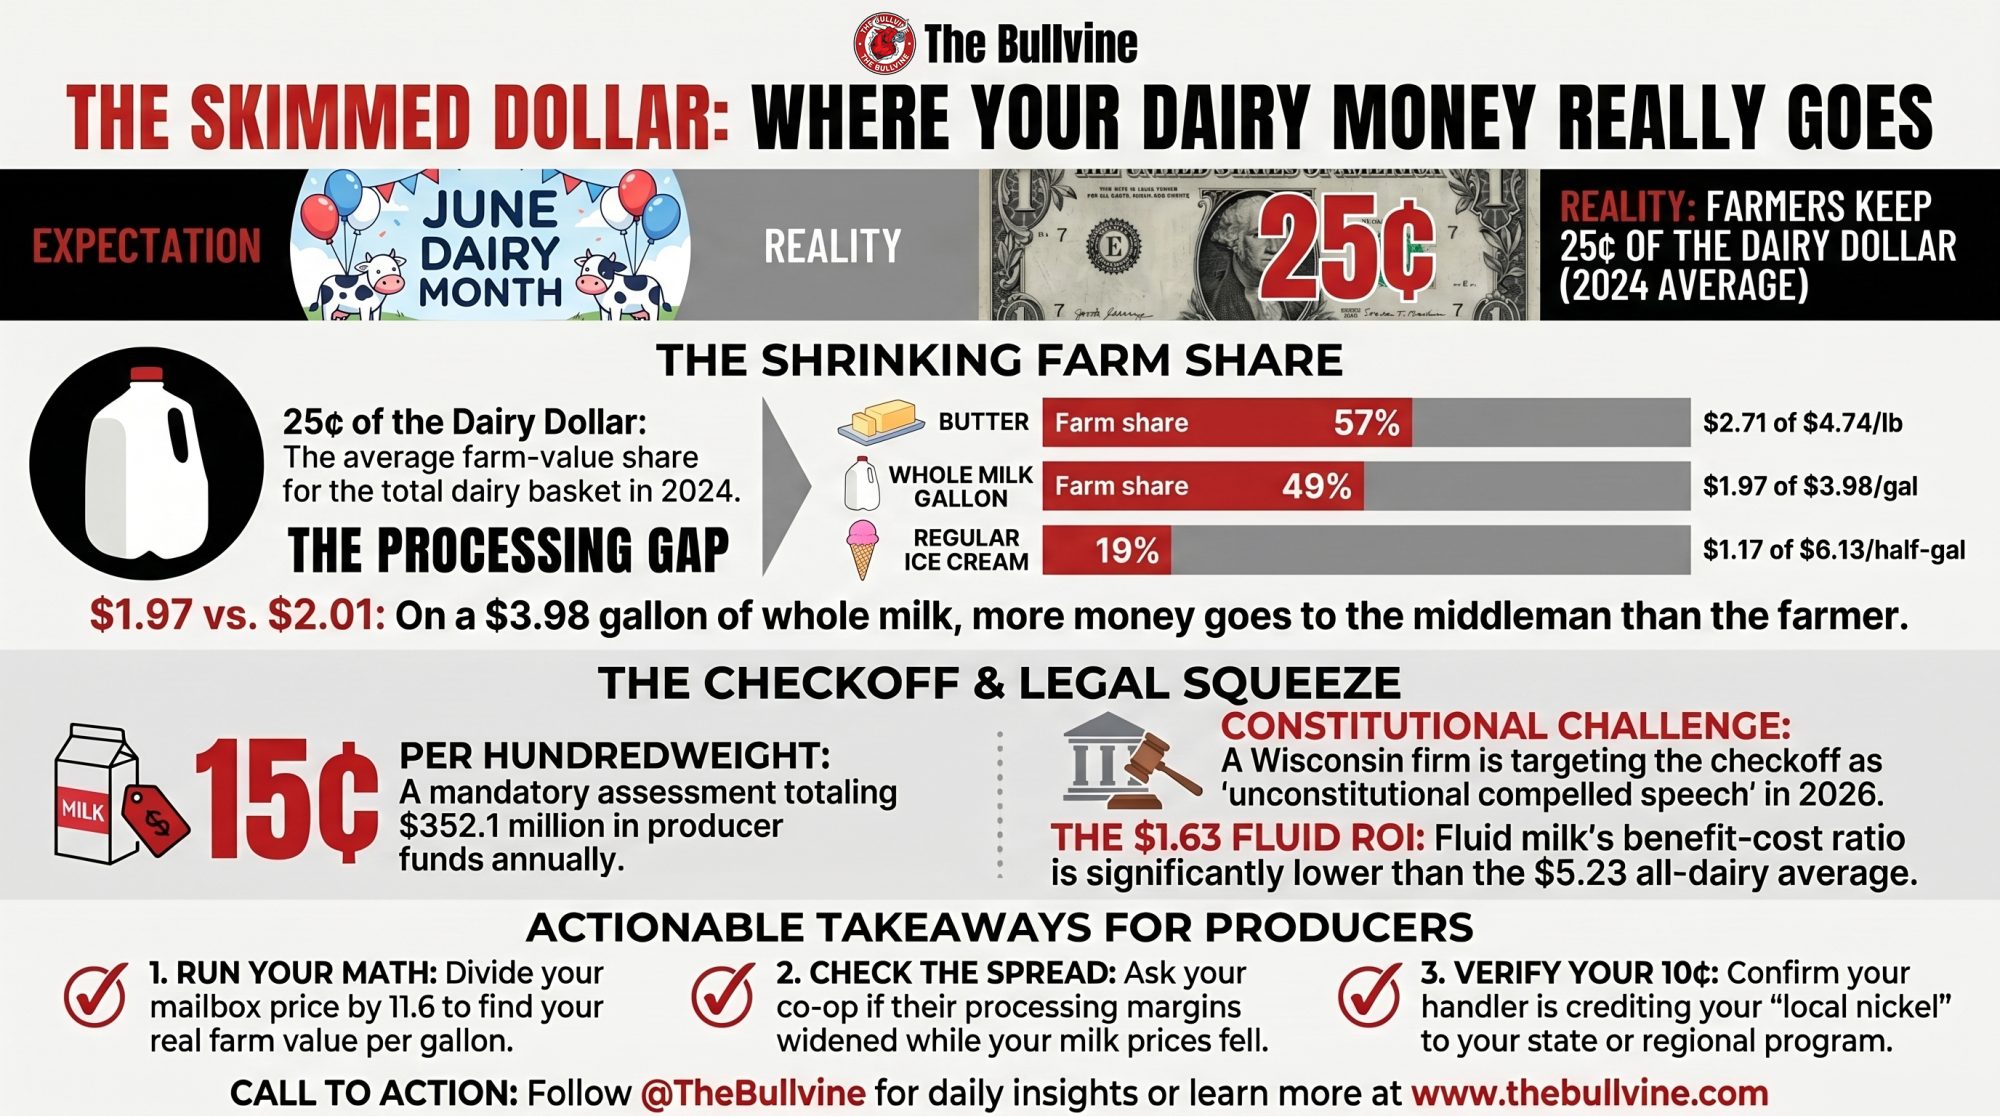
About $1.97. The other $2.01 went to everybody between the bulk tank and the dairy case.
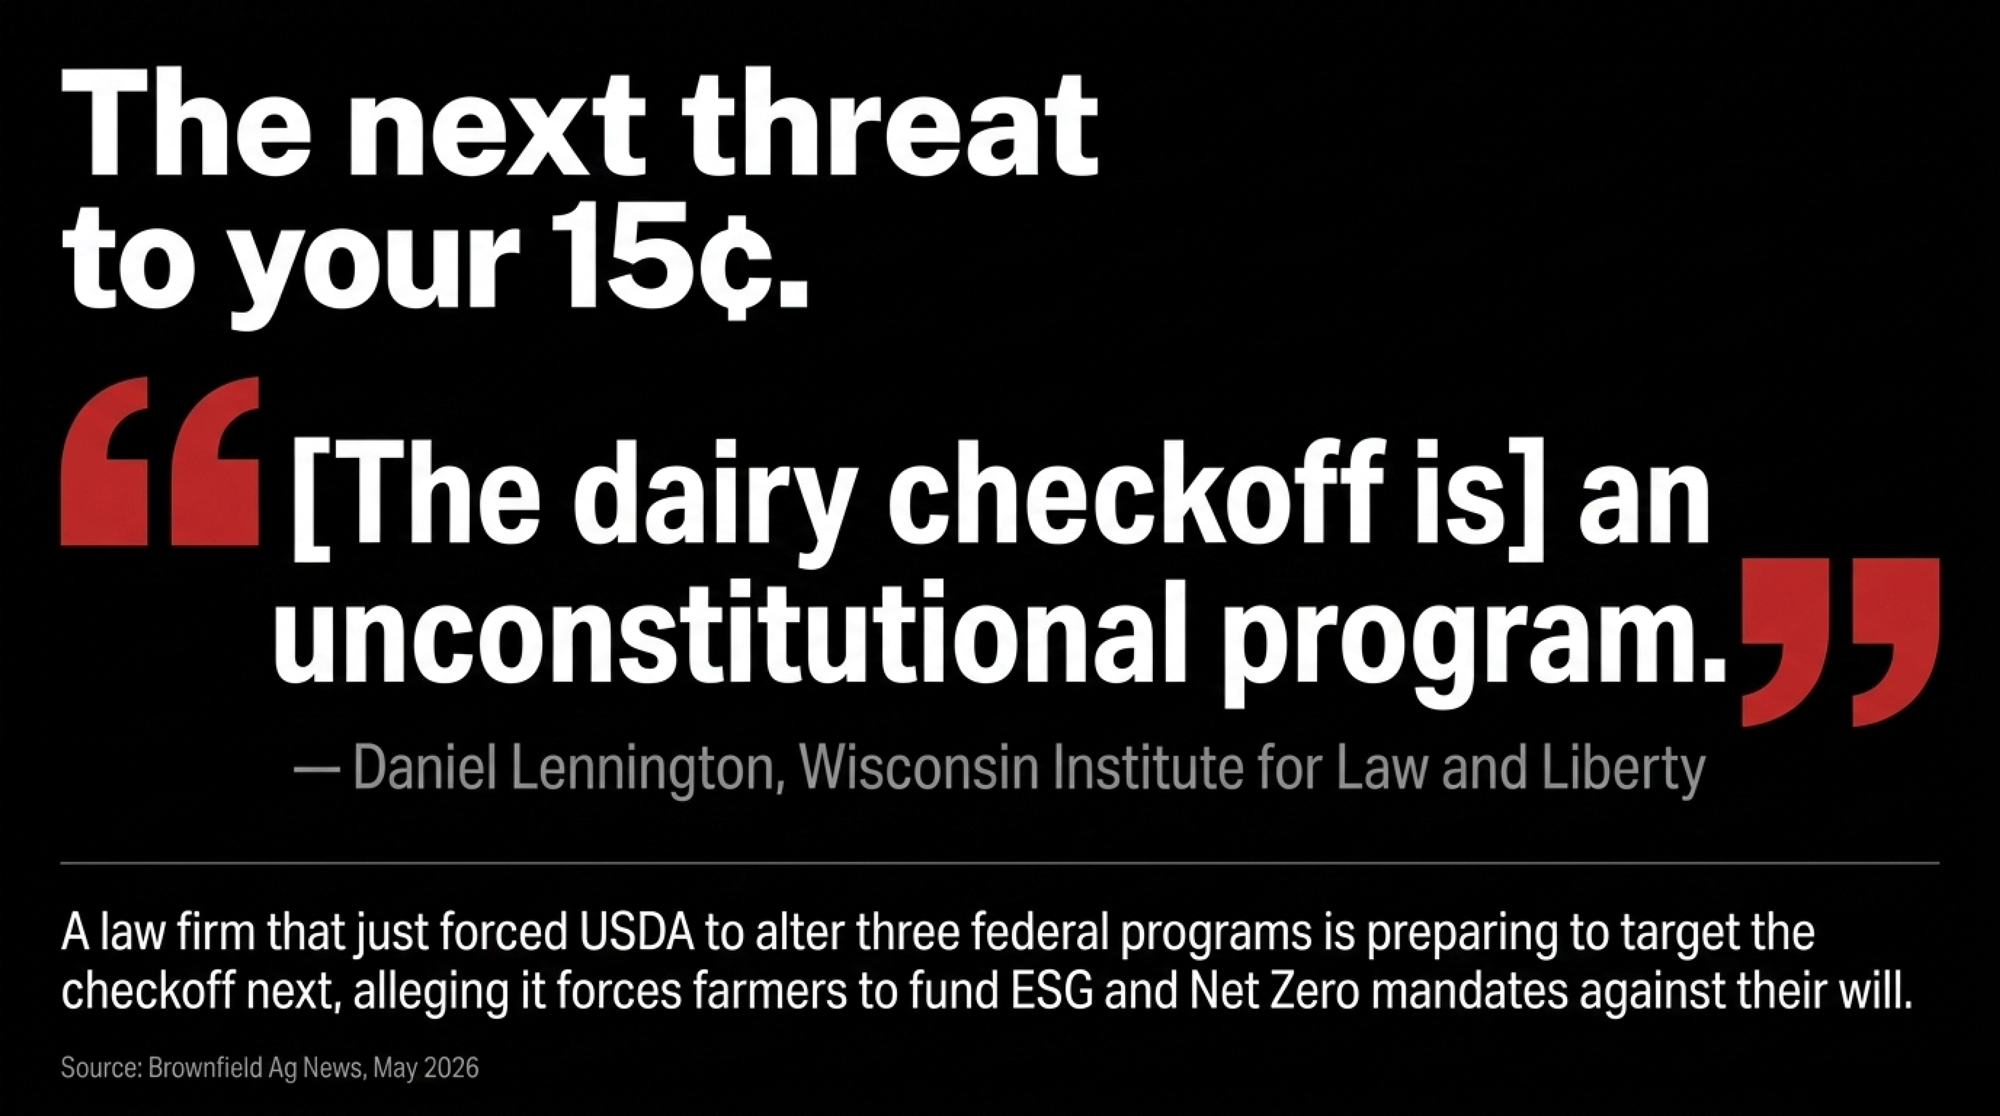
That’s not a grievance — it’s USDA Economic Research Service data, the agency’s own farm-share series, released June 2025. And honestly, for fluid whole milk, 49% isn’t a bad number. It’s the rest of the dairy aisle where the floor fell out. This June, that number collides with a courtroom: a Wisconsin law firm that just settled an 11-month case against USDA says the checkoff every farmer like the Reillys funds is its next target.
The lawyers showed up to the party uninvited
On May 27, 2026, Wisconsin Institute for Law and Liberty deputy counsel Daniel Lennington told Brownfield Ag News the dairy checkoff is “an unconstitutional program.” The timing isn’t subtle. He’s raising the fight during the one month of the year the checkoff is most visible.
Lennington alleges checkoff dollars are flowing into “ESG, environmental social governance programs (including) the Dairy Net Zero program” — work that, in his words, goes “to basically blame dairy farmers and blame cows for global warming,” while requiring “even small farmers to fill out all sorts of disclosures.” The program’s legal mandate, he says, is to promote the purchase of dairy products, “and nothing more.” There’s a factual core under the claim: the Foundation for Food & Agriculture Research announced a $10 million grant supporting dairy’s Net Zero Initiative in 2021, a program co-created with the Innovation Center for U.S. Dairy. The industry casts that work as protecting market access and meeting its 2050 stewardship goals — not as an attack on farmers.
This isn’t an idle threat. The same firm just settled the Adam Faust case, in which USDA agreed to strip race- and sex-based “socially disadvantaged” designations from three federal programs — the Dairy Margin Coverage fee, the Loan Guarantee Program, and EQIP — after the U.S. Department of Justice announced on February 9, 2026 that it would abandon its defense of two of them as unconstitutional. They win cases. So when they say the checkoff is next, the Reillys’ co-op delegate is right to pay attention.
To be clear about what this is and isn’t: these are allegations and legal arguments, not court findings. No complaint against the checkoff has been filed yet. And the legal ground is genuinely contested history. A federal appeals court actually struck the dairy checkoff down once — in Cochran v. Veneman (2004), the Third Circuit ruled that compelling Pennsylvania dairy farmers to fund generic milk promotion violated the First Amendment. Then the Supreme Court changed the landscape a year later: its 2005 Johanns v. Livestock Marketing Association decision — a beef checkoff case — held that checkoff promotion is the government’s own speech, and therefore immune from compelled-subsidy challenge. That government-speech doctrine has shielded the dairy program ever since. WILL’s new theory tries to thread that needle: if checkoff dollars fund environmental messaging that falls outside “promotion of the sale and consumption of dairy products,” is it still the government speech Johanns protects? That’s the question no court has been asked in those exact terms.
It’s not the only mandatory dairy program in court this spring, either. In a separate and unrelated case, Organic Valley, Horizon, and Aurora filed constitutional challenges to the Federal Milk Marketing Order system in spring 2026, with a group of Organic Valley farmers adding a Fifth Amendment takings claim. Different program, different argument — but a sign that the legal machinery underneath dairy’s mandatory structures is being tested from several directions at once.
June Dairy Month was always a marketing play — and that’s the point, not the insult
Start with the origin story, because it explains everything that followed. June Dairy Month launched in the late 1930s as “National Milk Month,” a response to a seasonal milk surplus. The goal wasn’t sentiment. It was inventory.
Refrigeration had improved, cows were flush on spring grass, and the market was drowning in milk. The industry needed Americans to drink the surplus before it spoiled. So it built a celebration around the problem.
Nearly nine decades later, the machine is bigger and the surplus never left. USDA’s February 2026 WASDE pegged the 2026 all-milk price at $18.95 per hundredweight, down from a revised $21.17 in 2025. And January 2026’s announced Class III price came in at just $14.59. The cows are still flush. The market’s still long. And June still arrives like clockwork to remind everyone how wholesome it all is.
Here’s the part nobody prints on the banner: the Reillys are paying for the party.
You fund the celebration at 15¢ per hundredweight — and you don’t control most of it
Every hundredweight the Reillys ship carries a 15-cent checkoff assessment, mandated under the federal Dairy Production Stabilization Act of 1983 and the Dairy Promotion and Research Order. Here’s the split most farmers can’t recite from memory: producers can direct up to 10¢ of that 15¢ to a qualified state, regional, or local program — and the other 5¢ goes to the national checkoff, the National Dairy Promotion and Research Board, which funds Dairy Management Inc.
Checkoff Tier
Amount (¢/cwt)
Who Controls Spending
Benefit-Cost Ratio (fluid milk context)
State/Regional Programs
Up to 10¢
Farmer-elected boards at state/regional level
Varies by program; farmer has direct delegate influence
National (NDPRB → DMI)
5¢ mandatory
Dairy Management Inc. — not direct farmer vote
$1.63 on fluid milk (1995–2022 eval) ⚠️
Total Producer Assessment
15¢
Split as above
$5.23 aggregate all-dairy (most recent Report to Congress)
The dollars are real money in aggregate. In 2022, the most recent audited year in USDA’s September 2024 Report to Congress, the 15¢ producer assessment added up to $352.1 million, plus another $79.7 million from fluid milk processors through MilkPEP. DMI is the entity that turns the national share into demand campaigns — the “undeniably dairy” work, the pizza-chain partnerships, the sports tie-ins.
DMI’s own 2024 audited financials show total revenue of $165.7 million, down from $178.3 million in 2023. Domestic marketing ran $127.1 million; export programs took another $23.7 million. The catch for a fluid shipper: most of where that money lands isn’t something the Reillys vote on.
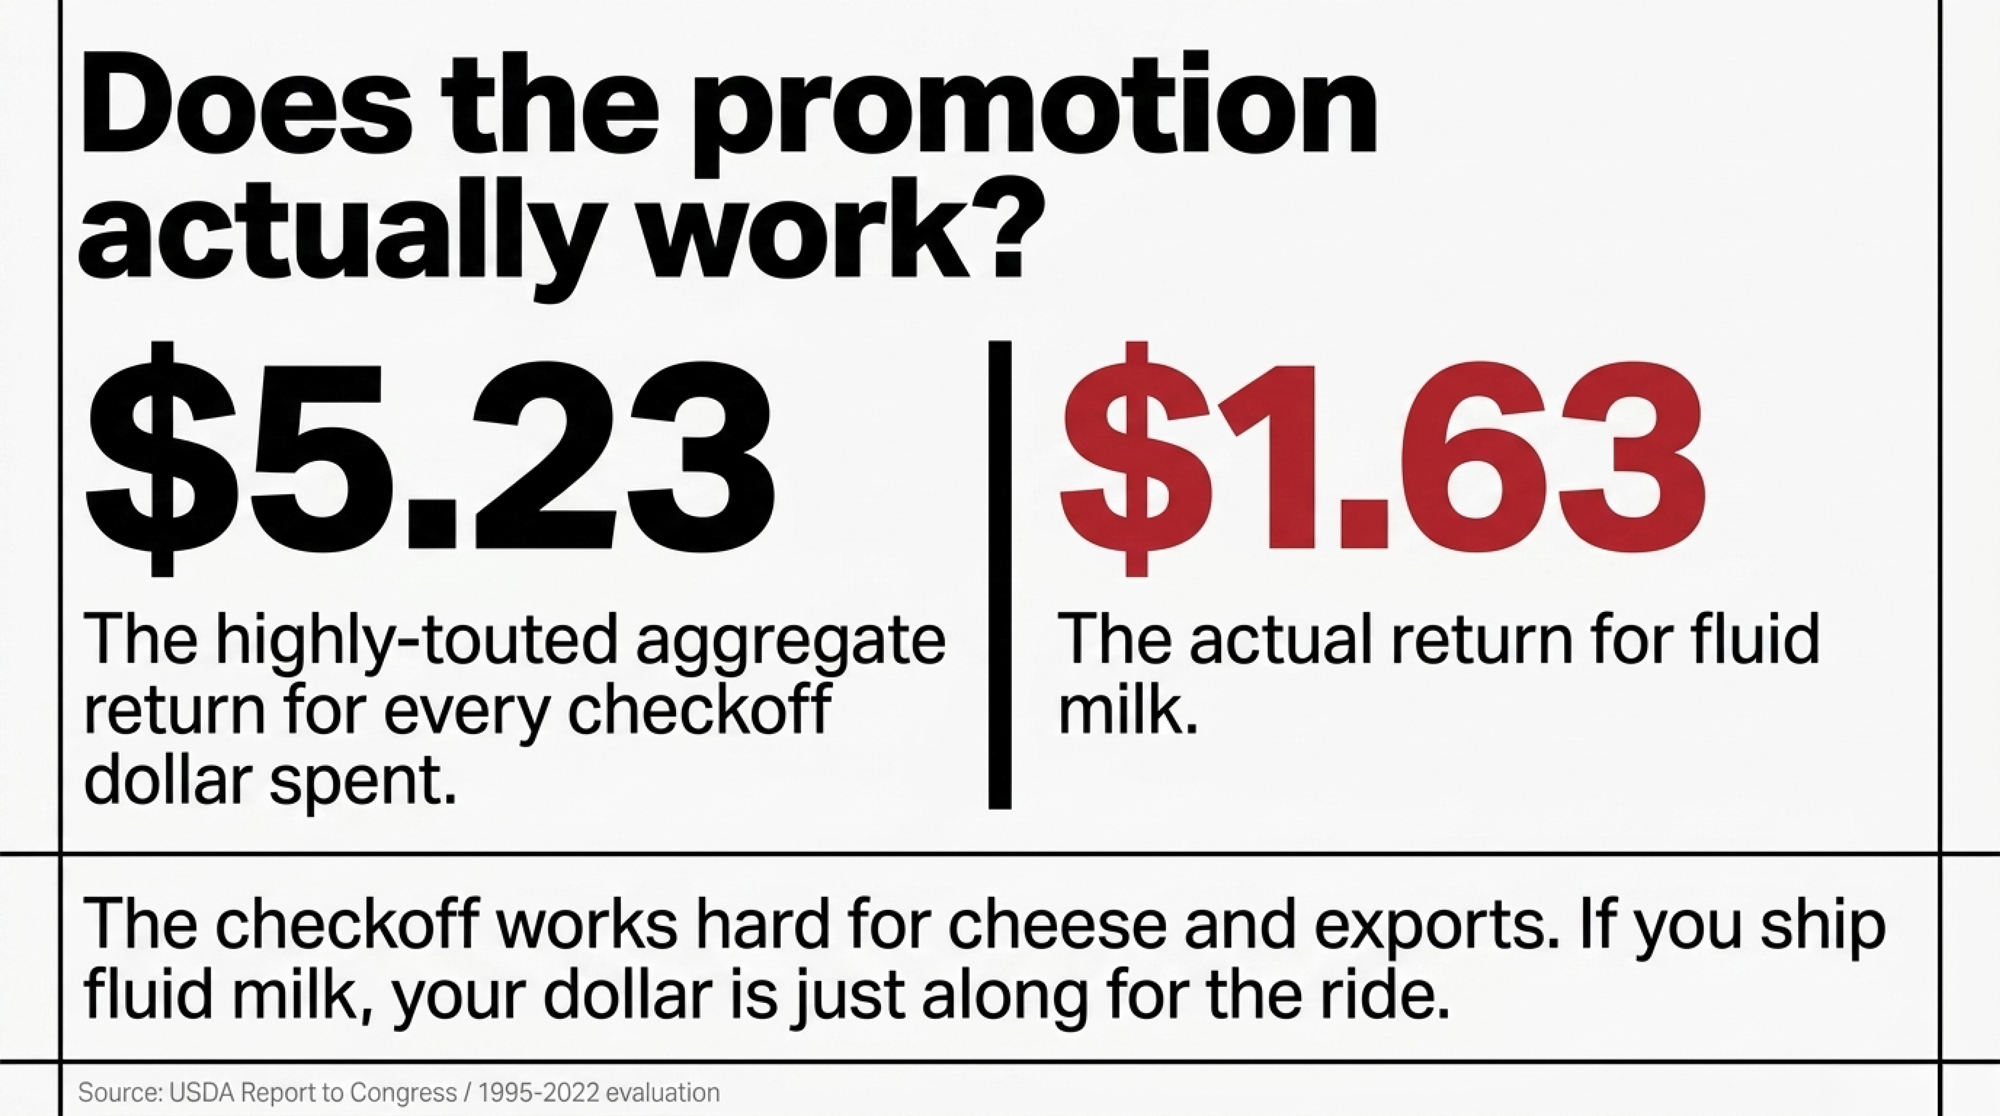
Does it work? Depends what you’re measuring. USDA’s congressionally mandated evaluation, authored by Texas A&M economist Oral Capps Jr., pegs the aggregate all-dairy benefit-cost ratio at $5.23 per dollar spent for the 1995–2022 period — meaning the model estimates $5.23 in economic value for every checkoff dollar. That’s a government-published number, and it’s the strongest case for the program.
But read the category breakdown in the same report, because not all dairy dollars perform alike. Butter returned $17.73 per dollar invested. Cheese returned $3.87. Exports, $8.63. And fluid milk — the product the Reillys anchor to — came in dead last at $2.68, the lowest-returning category of everything the checkoff promotes. Cheese, butter, and exports carry the program; the jug barely keeps pace. We laid that gap out in our recent breakdown of where the checkoff money actually goes. So when the checkoff celebrates June, the dollars are largely working for cheese and exports. The Reillys’ fluid-milk dollar is along for the ride.
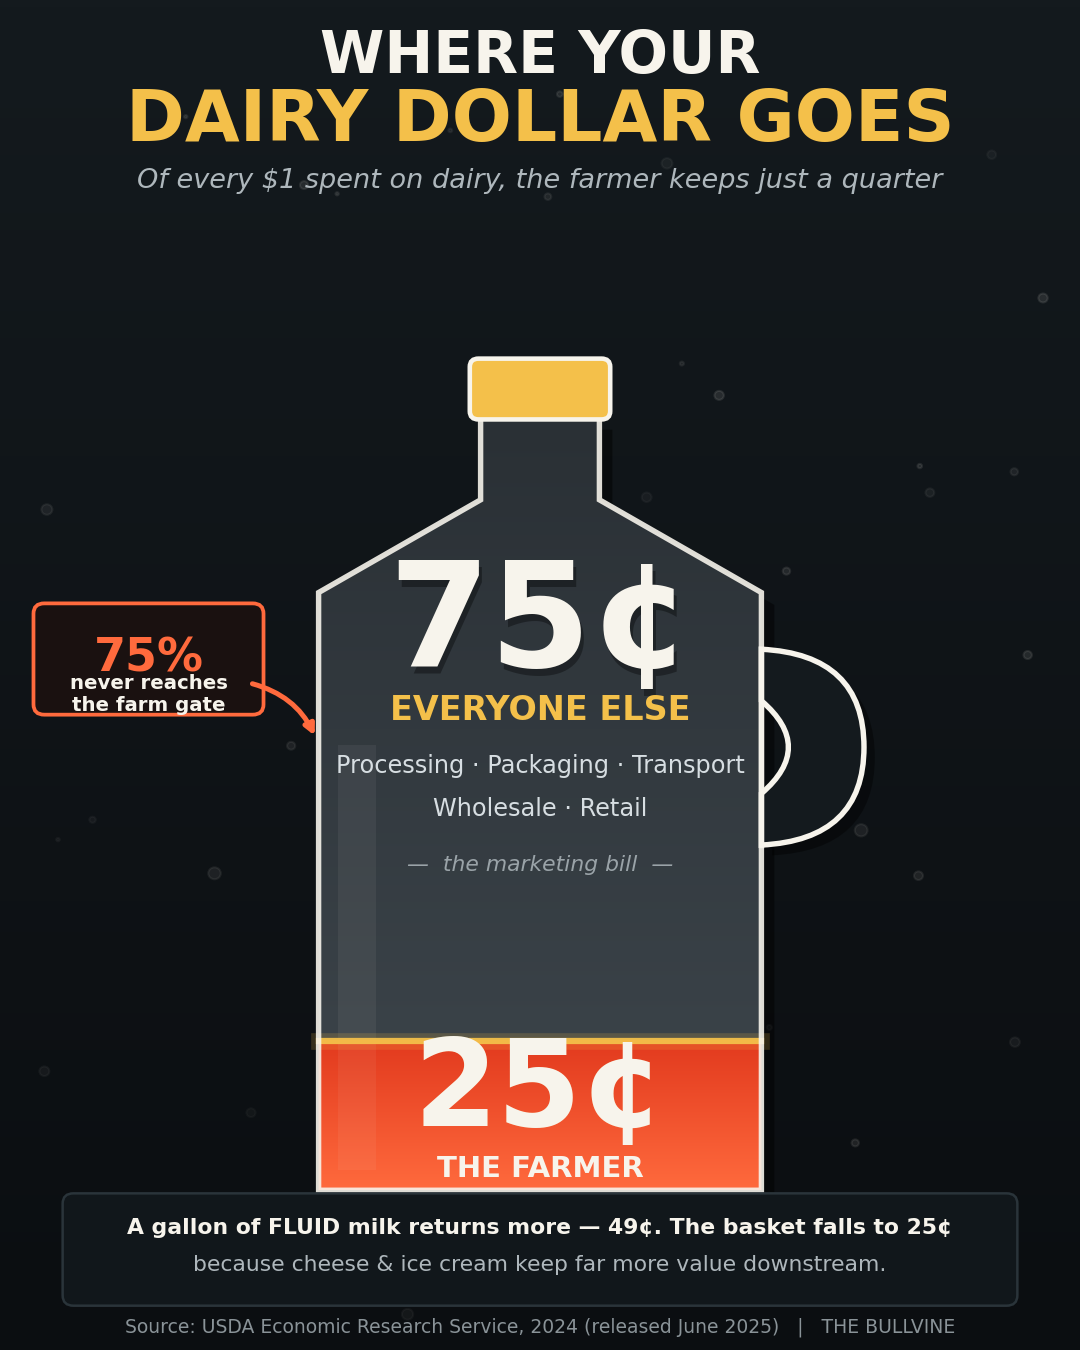
Why do you keep half a fluid gallon but only a quarter of the basket?
Now the line that matters most. And it needs a careful read, because two different USDA numbers get mashed together constantly.
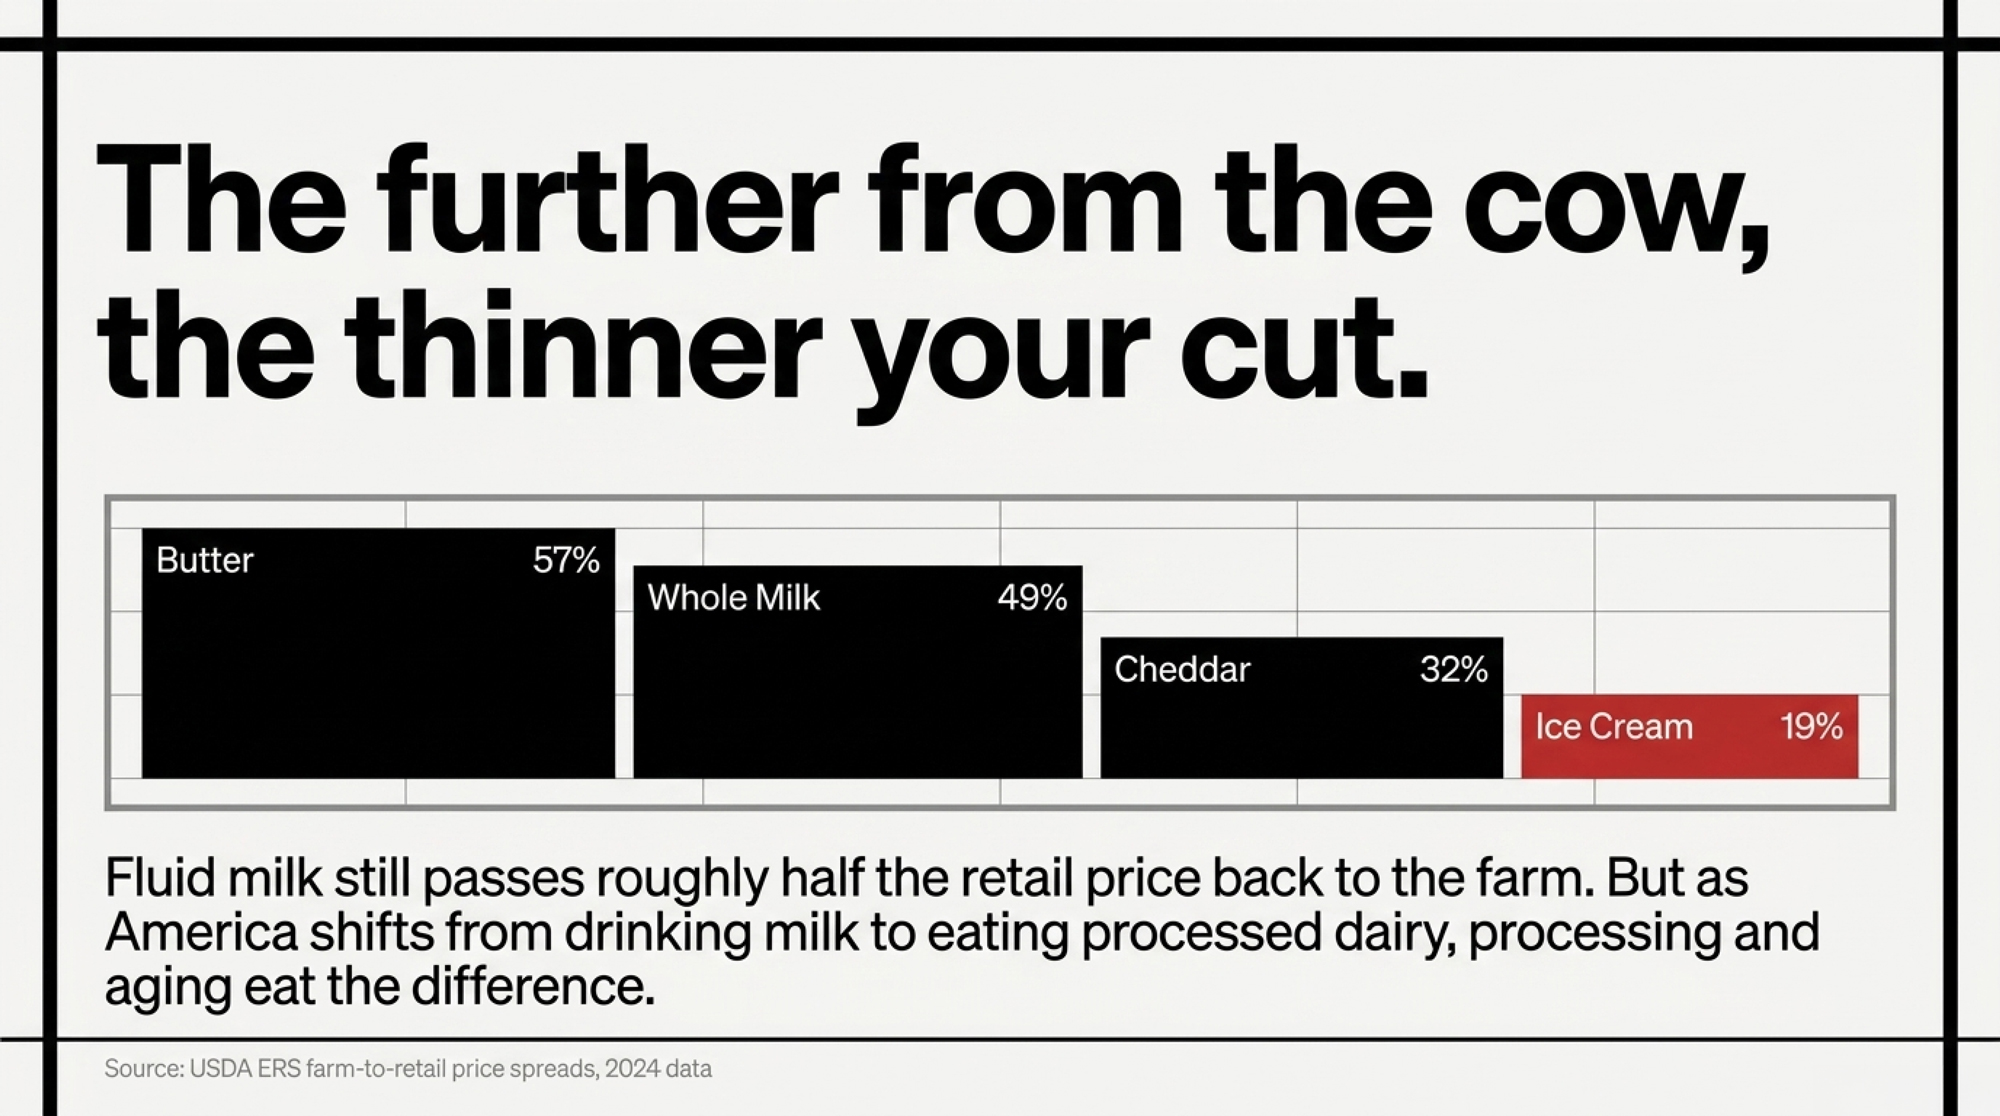
For a gallon of fluid whole milk, the farm share was 49% in 2024 — $1.97 of a $3.98 retail gallon, up from 47% the year before. The point figures move year to year, so treat any single year as a snapshot, not a trend line. Fluid milk still passes roughly half the retail price back to the farm.
For the total dairy basket — milk, cheese, butter, yogurt, ice cream, all of it — the farm-value share sat at 25% in 2024, up from 23% in 2023 but down from 28% in 2022. Here’s the contrast that should ruin the Reillys’ appetite:
What’s being measured
Farm share, 2024
What it tells you
Butter
57% ($2.71 of $4.74)
Less processing, bigger farm slice
Whole milk gallon
49% ($1.97 of $3.98)
Half the retail price still gets back to you
Cheddar cheese
32% ($1.80 of $5.66)
Processing and aging eat the difference
Total dairy basket
25%
Processed product keeps three-quarters downstream
Regular ice cream
19% ($1.17 of $6.13)
The further from raw milk, the thinner your cut
Source: USDA Economic Research Service, farm-to-retail price spreads, released June 2025. Butter and ice cream prices are per pound and per half-gallon, respectively.
Why the gap between 49% and 25%? Because America stopped drinking milk and started eating processed dairy. Cheese, ice cream, and value-added products carry far more processing and marketing value downstream — and almost none of it flows back to the farm gate. The more the dairy case tilts toward processed product, the smaller the Reillys’ slice of the total basket, even when their fluid share holds steady. We traced that erosion in our piece on how the milk dollar collapsed to 25¢. It’s the part of the story the June Dairy Month banner has never centered on.
“But milk’s a bargain” — true, and that’s exactly the trap
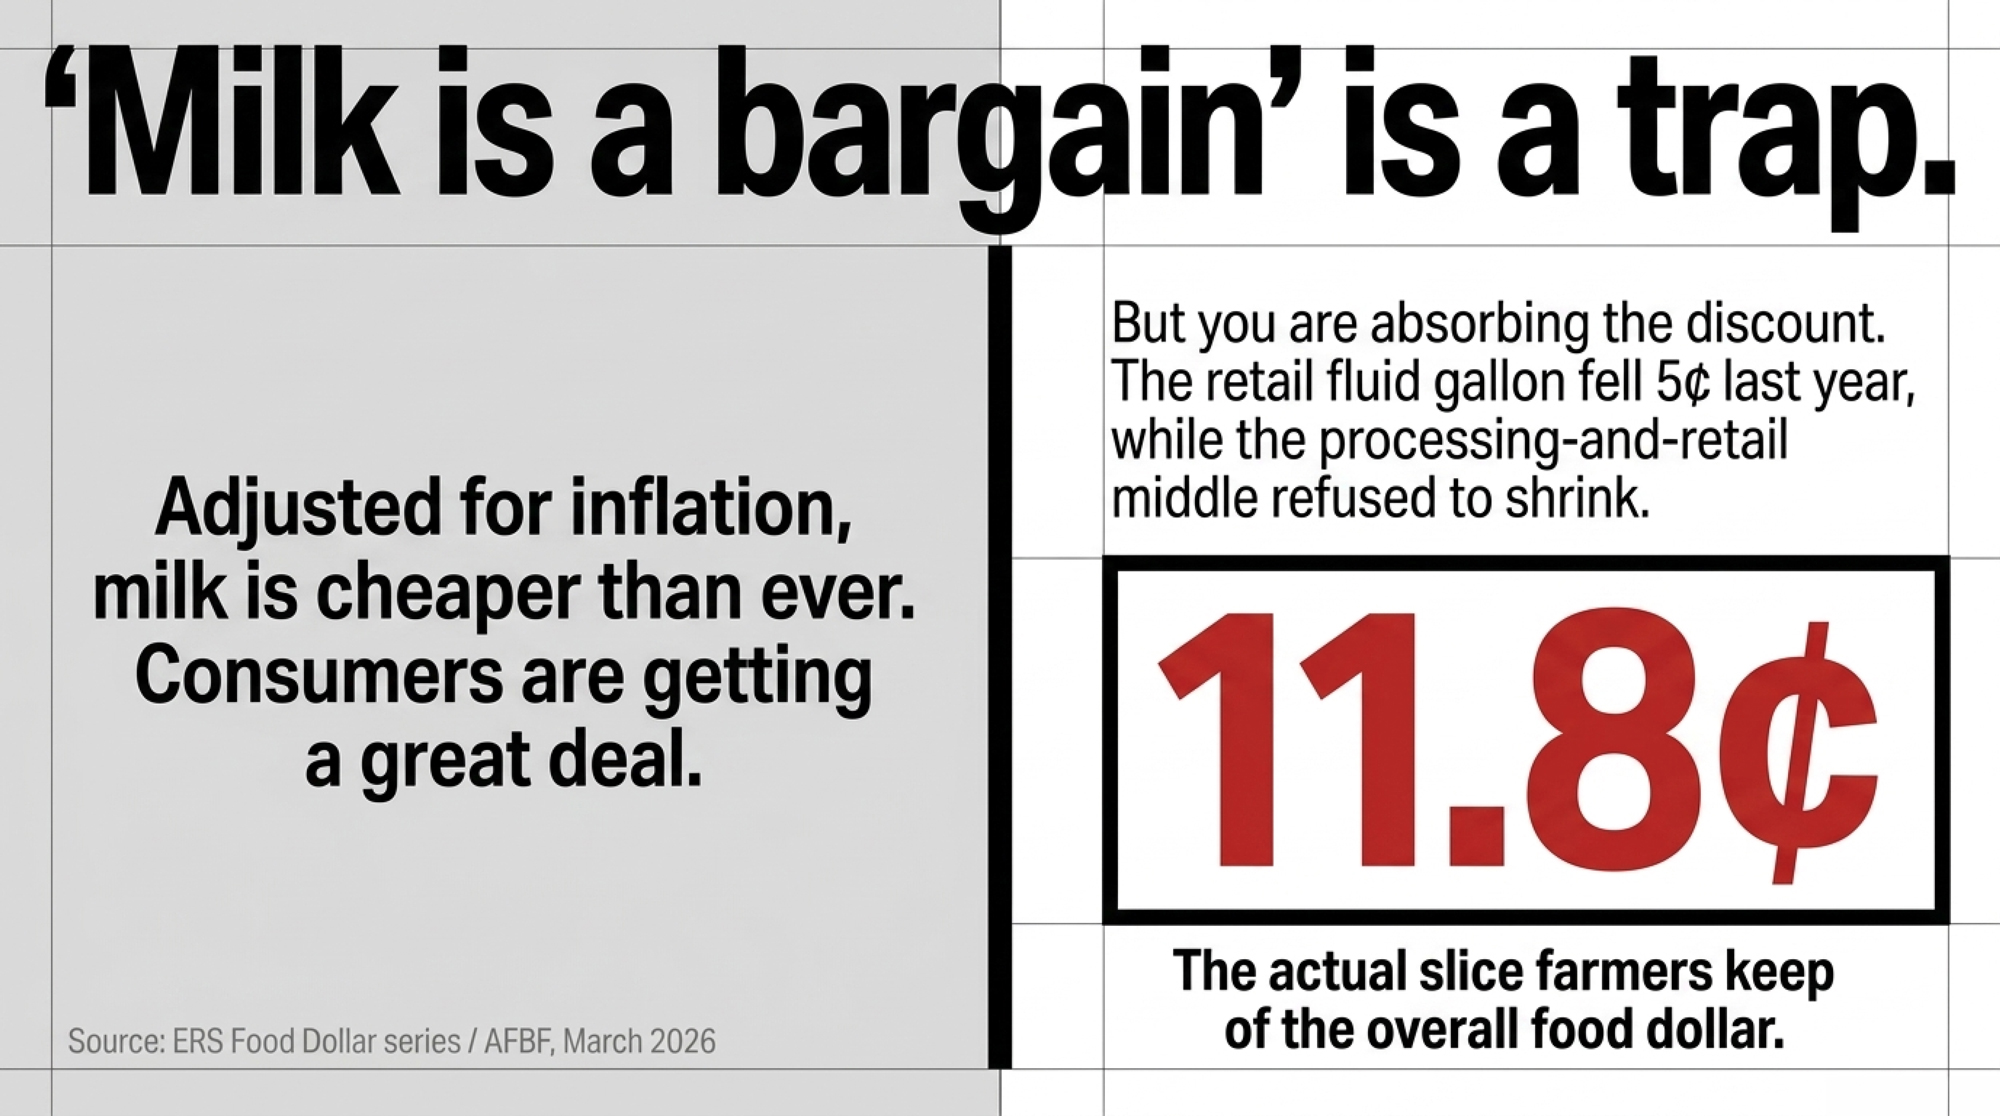
Here’s the defense you’ll hear, and it isn’t wrong. Adjusted for inflation, milk is cheaper than it was when the Reillys poured their last freestall. Consumers are getting a deal.
The problem is who’s absorbing the discount. The 2024 ERS data shows the moving parts: the retail whole-milk gallon actually fell five cents year over year, while the farm value rose nine cents — so that year, fluid milk’s farm share ticked up. But zoom out to all food and farmers kept just 11.8¢ of every dollar in 2024, down from 12.1¢ the year before, according to ERS’s Food Dollar series as summarized by the American Farm Bureau Federation in March 2026. After expenses, the same AFBF analysis puts farmers’ and ranchers’ combined net at 5.8¢ of the food dollar. The processing-and-retail middle is where the money sits, and it isn’t shrinking.
So “milk is a bargain” is true. The Reillys are just not the ones setting the price of the bargain.
How do you run the math on your own gallon — before the cake gets cut?
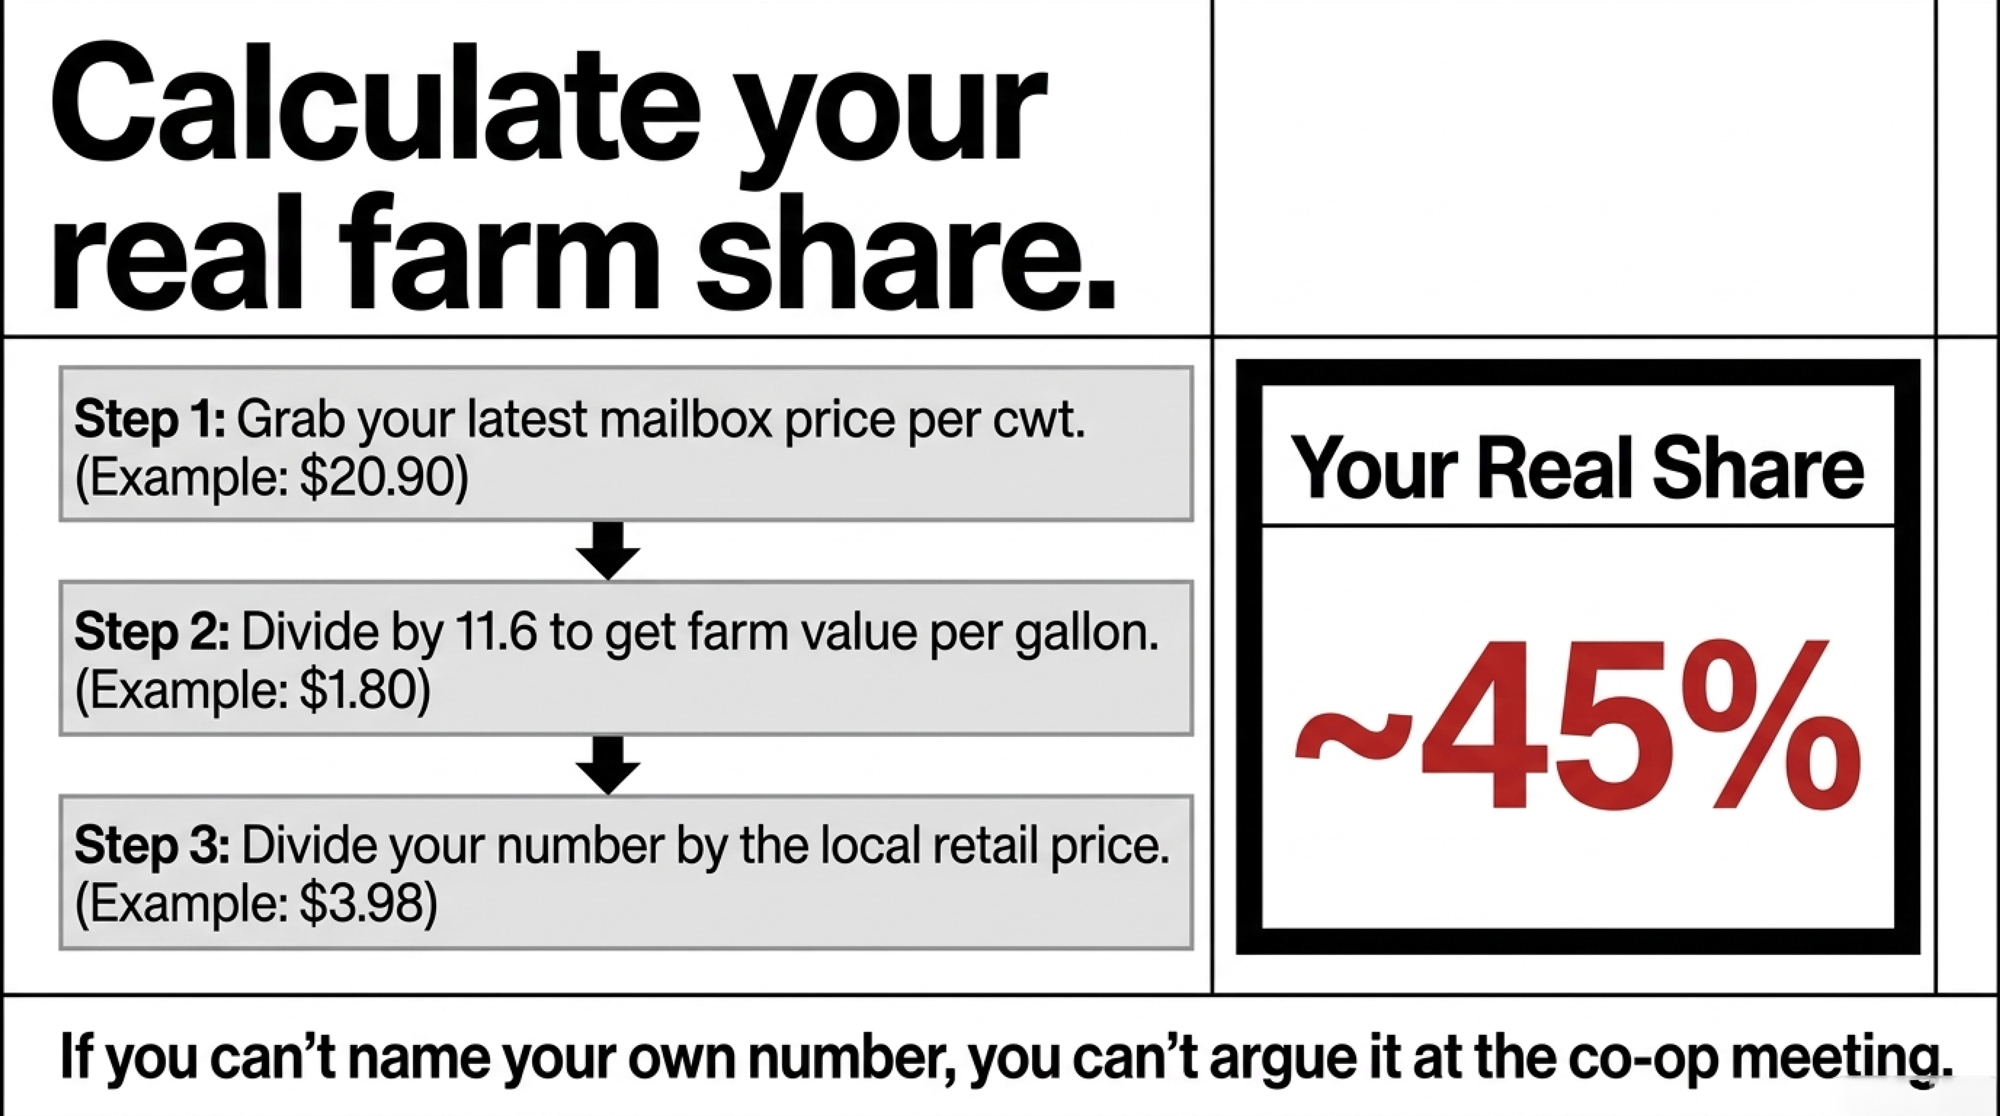
You don’t need a spreadsheet for this. Five minutes at the kitchen table turns a vague grievance into a number you can take to a lender or a co-op meeting. Here’s the four-step version the Reillys ran:
Step 1. Grab your latest mailbox price per hundredweight.
Step 2. Divide it by 11.6. (A gallon is about 8.6 lbs of milk, so a hundredweight covers roughly 11.6 gallons.) That’s your farm value per gallon.
Step 3. Stack it against the $3.98 retail gallon.
Step 4. Divide your number by $3.98. That’s your real farm share.
Run it at two prices and watch how exposed a fluid shipper is:
Milk price
Farm value per gallon
Share of the $3.98 gallon
$20.90 mailbox
~$1.80
~45%
$14.59 Class III (Jan 2026)
~$1.26
~32%
That bottom row uses a raw Class III base, not a mailbox price — so it’s a floor, not what actually hits a check after premiums and producer price differential. Either way, the point holds: you keep somewhere between a third and a half of a fluid gallon, and a lot less once the milk turns into cheese or ice cream.
Now the checkoff side. Shipping roughly 38,000 hundredweight a year (see the methodology note for the assumption behind that), the Reillys’ 15¢/cwt assessment comes to about $5,700 leaving the tank annually — and up to 10¢ of it can be directed to a qualified state program, with the national nickel funding DMI regardless. A 200-cow herd at the same per-cow output crosses $8,000; a 500-cow dairy clears $20,000. Small money per cow. Real money in aggregate — and most of it spent without a direct vote.
What does your processor’s product mix do to your check?
Here’s the operational piece the farm-share average hides. Two farms can ship identical milk and bring home different money, depending on what their buyer makes with it. A co-op spinning your milk into private-label fluid and commodity cheddar passes back a thinner slice than one selling branded specialty product, because every processing step downstream eats into the share that can flow back to raw milk.
That’s why the Reillys’ real exposure isn’t the national 25% — it’s their own buyer’s spread. If their co-op’s processing margin widened last year while the farmgate price fell, the squeeze this article describes is happening inside their own supply chain, not just in an ERS chart.
Options and trade-offs for your operation
This isn’t a problem you fix with a better breeding decision or a tighter ration. It’s structural. But three moves sit inside the Reillys’ control — and yours.
Pull your co-op’s annual report and check the spread — within 30 days. Find the processing margin alongside the farmgate price they announced. Then ask one question: did that spread widen when milk prices fell last year? You’re a member-owner. You’re allowed to ask. Costs nothing but an afternoon. The catch: a co-op that won’t break out processing margins has told you something too.
Confirm where your 10¢ is going, and weigh the checkoff against your product mix. You can’t opt out — it’s mandatory, and that’s exactly the fight WILL is picking. But up to 10¢ of your 15¢ can be credited to a qualified state or regional program where farmer-elected boards direct the spending. Pull a milk settlement statement, find the checkoff line, and confirm with your handler. And if you ship into a fluid market like the Reillys, fluid’s $2.68 benefit-cost ratio — the lowest of any category the checkoff funds — says the national promotion is doing the least for you. A reason to lean on your delegates, loudly.
Watch the WILL case as a real variable, not background noise. If a constitutional challenge is filed and advances, the assessment and how it’s spent could come under pressure within a couple of years. That’s not a reason to build your budget around it. It is a reason to know where your producer organizations stand before the question reaches you. The risk: these cases move slowly, and nothing may change for a long time.
Key takeaways
If you ship into a fluid market, the checkoff has returned $2.68 per dollar on your product — the lowest of any category it funds, versus $17.73 for butter — so push your co-op delegates on spending priorities rather than assuming the promotion works for you.
If you can’t name your own farm-share number, you can’t argue it. Run the four-step gallon math before your next lender or co-op meeting.
If your 10¢ isn’t credited to a qualified state program, you’re losing local governance, not money — confirm with your handler this week.
If your co-op won’t show you its processing margin next to the farmgate price, treat that opacity as data — and ask louder.
If the WILL challenge is filed and advances, expect the checkoff’s structure and spending to come under pressure; know your producer org’s position now.
So what’s your real number?
The cows don’t know it’s June. They’ll eat the same ration, fill the same tank, and somebody in a boardroom will still build a campaign around it. The party’s real. So is the 25¢. The Reillys will pose with the calf again next year, because that’s who they are — but they’ll do it knowing exactly what their gallon is worth and exactly what their 15¢ is buying.
Methodology note. Farm-share and price figures are from USDA Economic Research Service farm-to-retail price-spread data, released June 2025 (2024 reference year): whole milk farm share 49% ($1.97 farm value / $3.98 retail gallon, up from 47% in 2023); butter 57% ($2.71 / $4.74 per lb); cheddar 32% ($1.80 / $5.66 per lb); regular ice cream 19% ($1.17 / $6.13 per half-gallon); total dairy basket 25% (23% in 2023, 28% in 2022). The 11.8¢ all-food farm share and 5.8¢ net figure are from ERS’s Food Dollar series, 2024 reference year, as summarized by the American Farm Bureau Federation, March 2026. Checkoff structure: 15¢/cwt assessment under the Dairy Production Stabilization Act of 1983 and Dairy Promotion and Research Order; producers may direct up to 10¢ to qualified state/regional programs, with 5¢ going national to the National Dairy Promotion and Research Board, which funds Dairy Management Inc. (per USDA AMS). The 2022 assessment totals ($352.1M producer; $79.7M MilkPEP processor) and all benefit-cost ratios are from USDA’s 2022 Dairy Report to Congress (published September 2024; covering 1995–2022; quantitative evaluation by Texas A&M economist Oral Capps Jr.): aggregate all-dairy BCR 5.23; fluid milk 2.68; cheese 3.87; butter 17.73; export 8.63; DMI-specific spending 6.51. (The fluid-milk BCR had fallen across prior evaluations — 3.26, then 1.91, then 1.63 — before rising to 2.68 in the current report.) DMI revenue figures ($165.7M in 2024; $178.3M in 2023; $127.1M domestic marketing; $23.7M export) are from DMI’s 2024 audited financial statements. Milk prices are from USDA WASDE/ERS (February 2026 WASDE: 2026 all-milk $18.95/cwt; 2025 revised $21.17/cwt; January 2026 announced Class III $14.59/cwt). Legal matters: the checkoff challenge is attributed to Daniel Lennington of the Wisconsin Institute for Law and Liberty as reported by Brownfield Ag News (May 27–28, 2026); the Adam Faust settlement details are from WILL’s May 2026 release and reflect the DOJ’s February 9, 2026 announcement; the $10M FFAR grant to dairy’s Net Zero Initiative was announced in 2021. Cochran v. Veneman (3rd Cir. 2004) struck the dairy checkoff down on First Amendment compelled-speech grounds; Johanns v. Livestock Marketing Association (U.S. 2005), a beef-checkoff case, established the “government speech” doctrine that has shielded checkoff programs since. The Federal Milk Marketing Order challenges by Organic Valley, Horizon, and Aurora are separate from the checkoff and were filed in spring 2026. Barn math: the ~$5,700 figure assumes a 140-cow herd at approximately 75 lbs/cow/day over 365 days (~38,300 cwt) × $0.15/cwt; per-herd figures scale at the same per-cow output. Gallon conversion uses 1 gallon ≈ 8.6 lbs of milk. All figures are USD.
Limitations. National averages may not reflect your region, herd size, product mix, or operation. Single-year farm-share figures are snapshots, not trends. Benefit-cost ratios are model estimates from a single congressional evaluation, not farm-level guarantees.
Conflict of interest. The Bullvine has no business relationship with Dairy Management Inc., the Wisconsin Institute for Law and Liberty, the Foundation for Food & Agriculture Research, or any party named in this article.
Corrections. Spot an error? Tell us. We correct publicly, at the top of the article, dated.
This article is based on reporting and public records available as of June 1, 2026. The legal claims described are allegations, not court findings. “The Reillys” is a disclosed composite scenario, not a single real farm; all attached figures are sourced.
Every week, thousands of producers, breeders, and industry insiders open Bullvine Weekly for genetics insights, market shifts, and profit strategies they won’t find anywhere else. One email. Five minutes. Smarter decisions all week.
Marvin Nunes was $450 over budget when Vivian elbowed him to keep bidding. That $2,450 cow — bought partly on her teacher’s pension — seeded a herd that today, more than sixty years later, traces every animal back to her and averages 12.8 generations deep.
Ocean-View Sexation — the pitch-black Elevation son, bred in California in 1973, he couldn’t ship semen abroad — yet through his sons and embryos he stamped 96,689 daughters in the Netherlands alone, and built a herd that still traces every cow back to him.
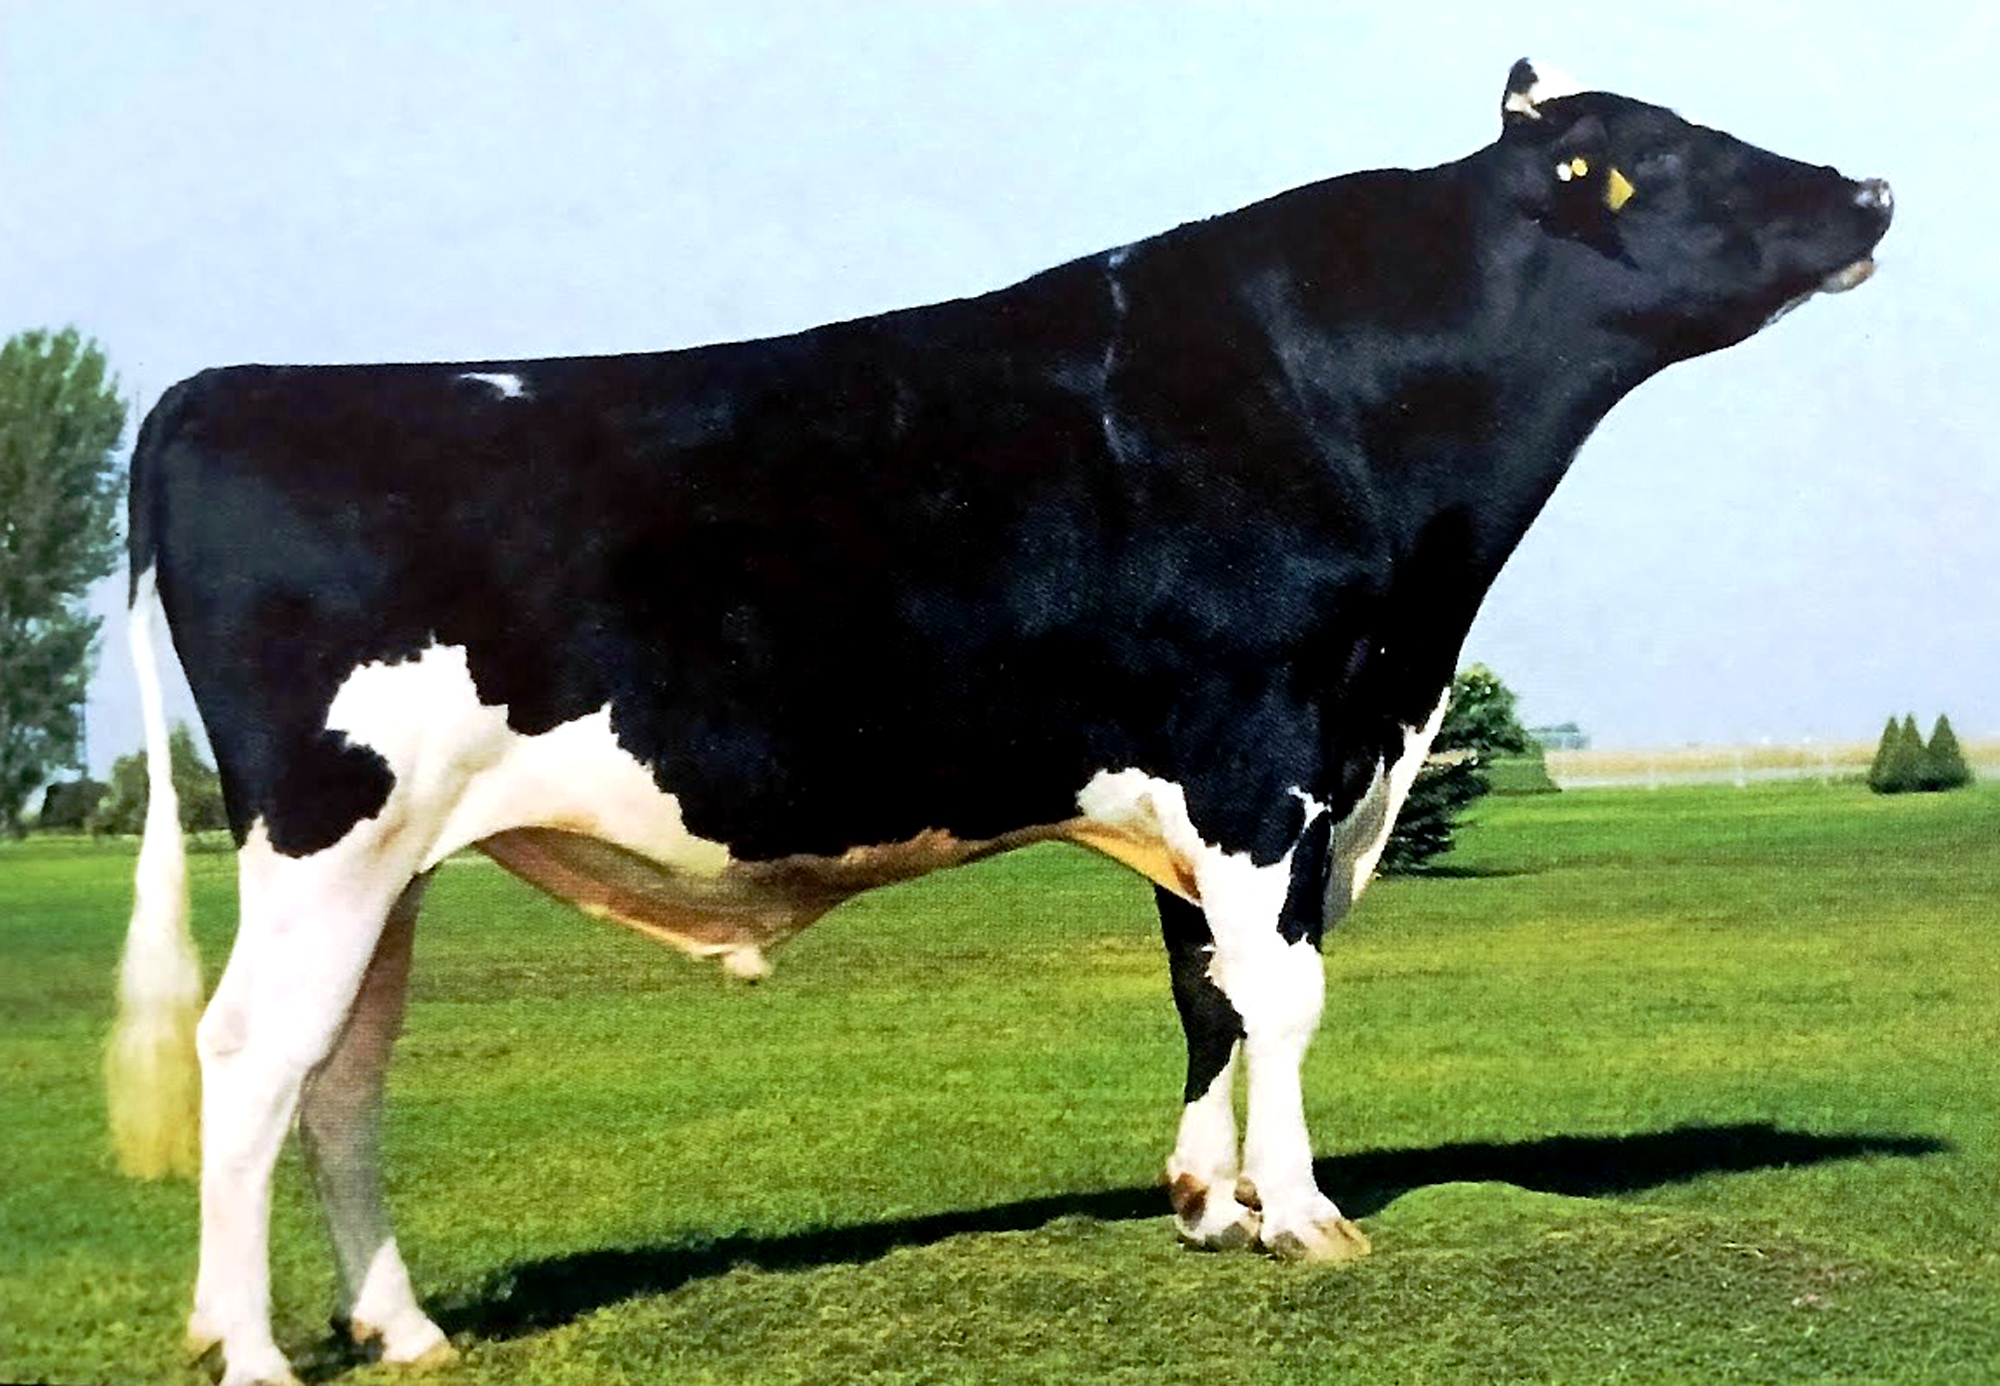
The papers came back in January 1980, and a pitch-black Elevation son standing at ABS in Colorado stopped being just another young sire with a pretty pedigree. Ocean-View Sexation, bred from the Steps family of Marvin and Vivian Nunes, had posted the rare combination breeders were chasing in that era: significant pluses for fat percentage and strong conformation, at a time when the United States still wasn’t even calculating a protein index and when Elevation sons were flooding the market.
Picture the dairy world he walked into. In 1980, before genomic shortcuts, before proofs moved at today’s speed, before every breeder carried a screen full of rankings in his pocket, a bull’s reputation traveled through proofs, phone calls, barn visits, semen reps, and the kind of coffee-shop talk that could make or break him. Sexation’s proof didn’t whisper. It kicked the door open.
By September 1979, ABS had already seen enough to move him to its Colorado facilities, before his first complete index was even released. Then January came, and with it the words that would follow him for the rest of his life: “Sexation mania.” Dairy farmers across the country wanted the attractive black Elevation son who could put fat and structure into daughters with the kind of balance that made cows last.
And the bull who stirred that national appetite was nearly trapped by geography. Because he was bred in California, Blue Tongue restrictions sharply limited the export of his semen, which meant Europe couldn’t simply use him the way American breeders did. What no one saw coming was that the restriction wouldn’t stop his influence. It would reroute it.
That’s the Ocean-View story in miniature: a barrier becomes a doorway, a cow family outlives fashion, and one careful mating keeps echoing through Holstein pedigrees long after the bull himself is gone.
Act I: The Family Before the Fire
To understand Sexation, you have to go back before the proof, before ABS, before the “mania.” You have to stand in a sale row in Salt Lake City in 1963, where Marvin and Vivian Nunes were studying a nearly four-year-old Burkgov daughter named Ideograph Burkgov Steps.
In that era, a breeder’s eye still carried enormous weight. Classification visits were events, production records were studied like scripture, and a truly deep cow family could pull grown men across state lines just to see the daughters and granddaughters in the flesh. The 1963 National Convention Sale, managed by M.B. Nichols and Whitie Thomson, included seven daughters of Burkgov Inka DeKol — the famous sire tied to the polkadot pattern, born on the farm of the Utah State Industrial School.
Steps had the goods on paper. Her dam, Ideograph Tidy Stars EX-91, had made 25,027 pounds of milk at 3.7% fat and 918 pounds of fat at twelve years old, and the maternal line ran back to Winona 6321 H.H.B., imported by W.K. Sexton of Howell, Michigan, in 1884. The sale catalog leaned hard on that pedigree — “Ross Gordon’s famous family!” — and listed Steps as a VG Burkgov daughter with a 1-11 record of 15,767 pounds of milk, 3.9% fat, and 622 pounds of fat.
Marvin and Vivian had set their limit at $2,000. The bidding reached the line, crept to $2,100, and Marvin stopped. One can imagine the pause — the auctioneer’s chant still rolling, the cow standing there, the future of a whole herd balanced on the stubborn fact of a budget. Vivian nudged him with her elbow and told him to keep going.
They bought her for $2,450. Part of that money came from Vivian’s teacher retirement fund.
If you’ve ever stretched for a heifer you believed in, that detail lands right in the ribs. This wasn’t spare change. This was a schoolteacher’s security turned into cow-family capital, and history would prove it one of the great agricultural investments in the breed.
Marvin never forgot what it bought. The most influential purchase Ocean-View ever made, he said, was Ideograph Burkgov Steps, adding, “To her we owe any success we have achieved in the registered Holstein business.” A 2017 sale-catalog account added that he’d seen the Steps family at Ross Gordon’s farm the day before the sale and remembered them as “the best group of animals from one family I have ever seen.”
That was the dream at Ocean-View. Not a one-hit wonder, not the fashionable sire of the month — a cow family built to stand the pressure of time.
Steps became a 2E-EX-90 Gold Medal Dam — the breed’s old mark for a proven producer of high-performing, high-classifying daughters — with a top record of 28,390 pounds of milk and 980 pounds of fat. Bred to Ida-Falls Stylemaster EX-GM, she produced Ocean-View Mistress Sonia VG-87. Sonia went to Rosafe Citation R. EX-Extra — the same great transmitter behind Glenridge Citation Roxy’s family — and the result was Ocean-View Citation Sheri VG.
Then came the mating that lit the fuse: Sheri to Round Oak Rag Apple Elevation. Four matings, fourteen years, one family climbing toward something — and the calf born from that last cross on September 11, 1973, was Ocean-View Sexation.
By 1981, the family had already earned the cover of the Holstein World Brood Cow Issue. The feature centered on Ocean-View Capsule Sharon EX-90, a sixth-generation Excellent descendant of Steps who made over 40,000 pounds of milk and more than 254,000 pounds lifetime. Think about what that cover meant in 1981 — no genomics, no shortcuts, just a magazine telling the breed that this California family could stamp Excellent daughters six deep. The story was already remarkable. The ink was barely dry on that cover before the family proved it was only getting started.
Looking back, the signs were there. Elevation gave Sexation the sire power of the age, Citation R. lent the old transmitter strength, and Steps supplied the maternal depth Marvin had risked real money to secure. But nobody standing in that barn in 1973 could have guessed this calf would one day put more than 27,000 daughters into production in the United States — or that, decades on, every animal in the family’s barn would trace straight back to him.
Act II: The Bull They Couldn’t Bottle Up
Sexation didn’t enter AI through some polished rollout. He got his chance because Nor-Cal Sires needed a solid, reasonably priced young bull, and Marvin Nunes was willing to lease him. In December 1974, at just fifteen months old, Sexation was launched as a young sire by Nor-Cal, a California AI company that worked with ABS.
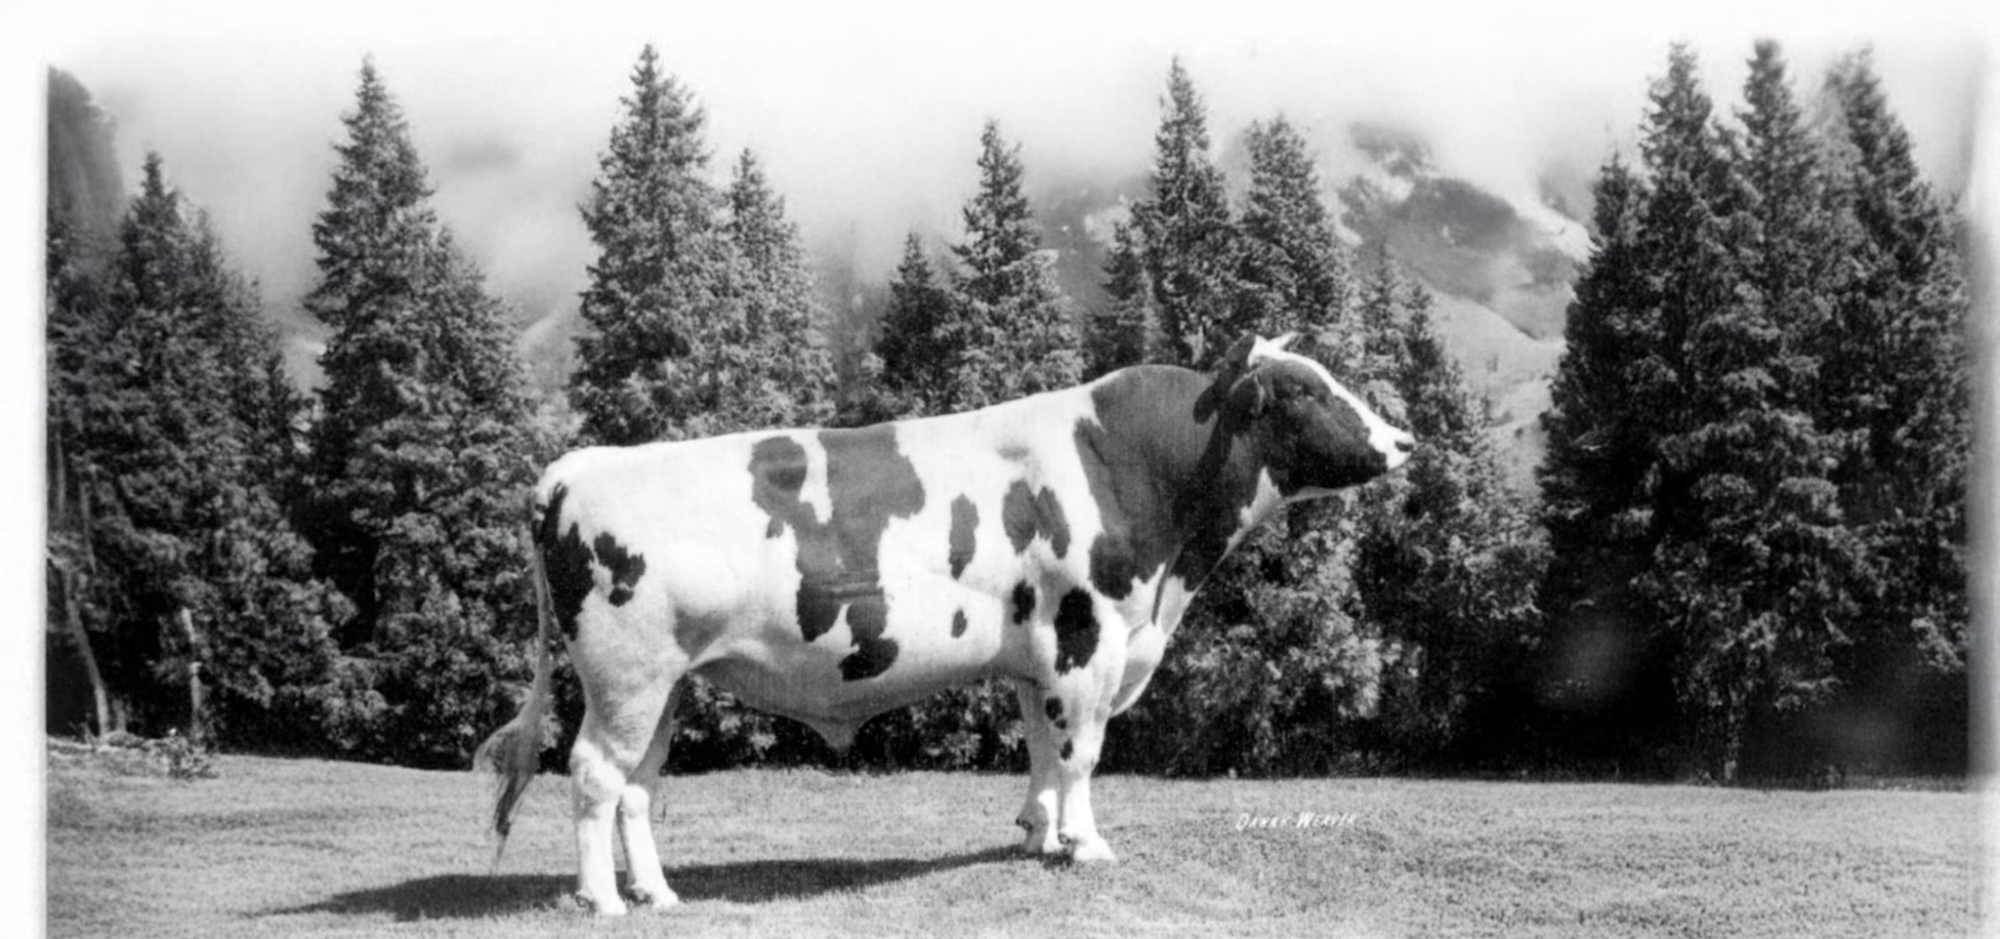
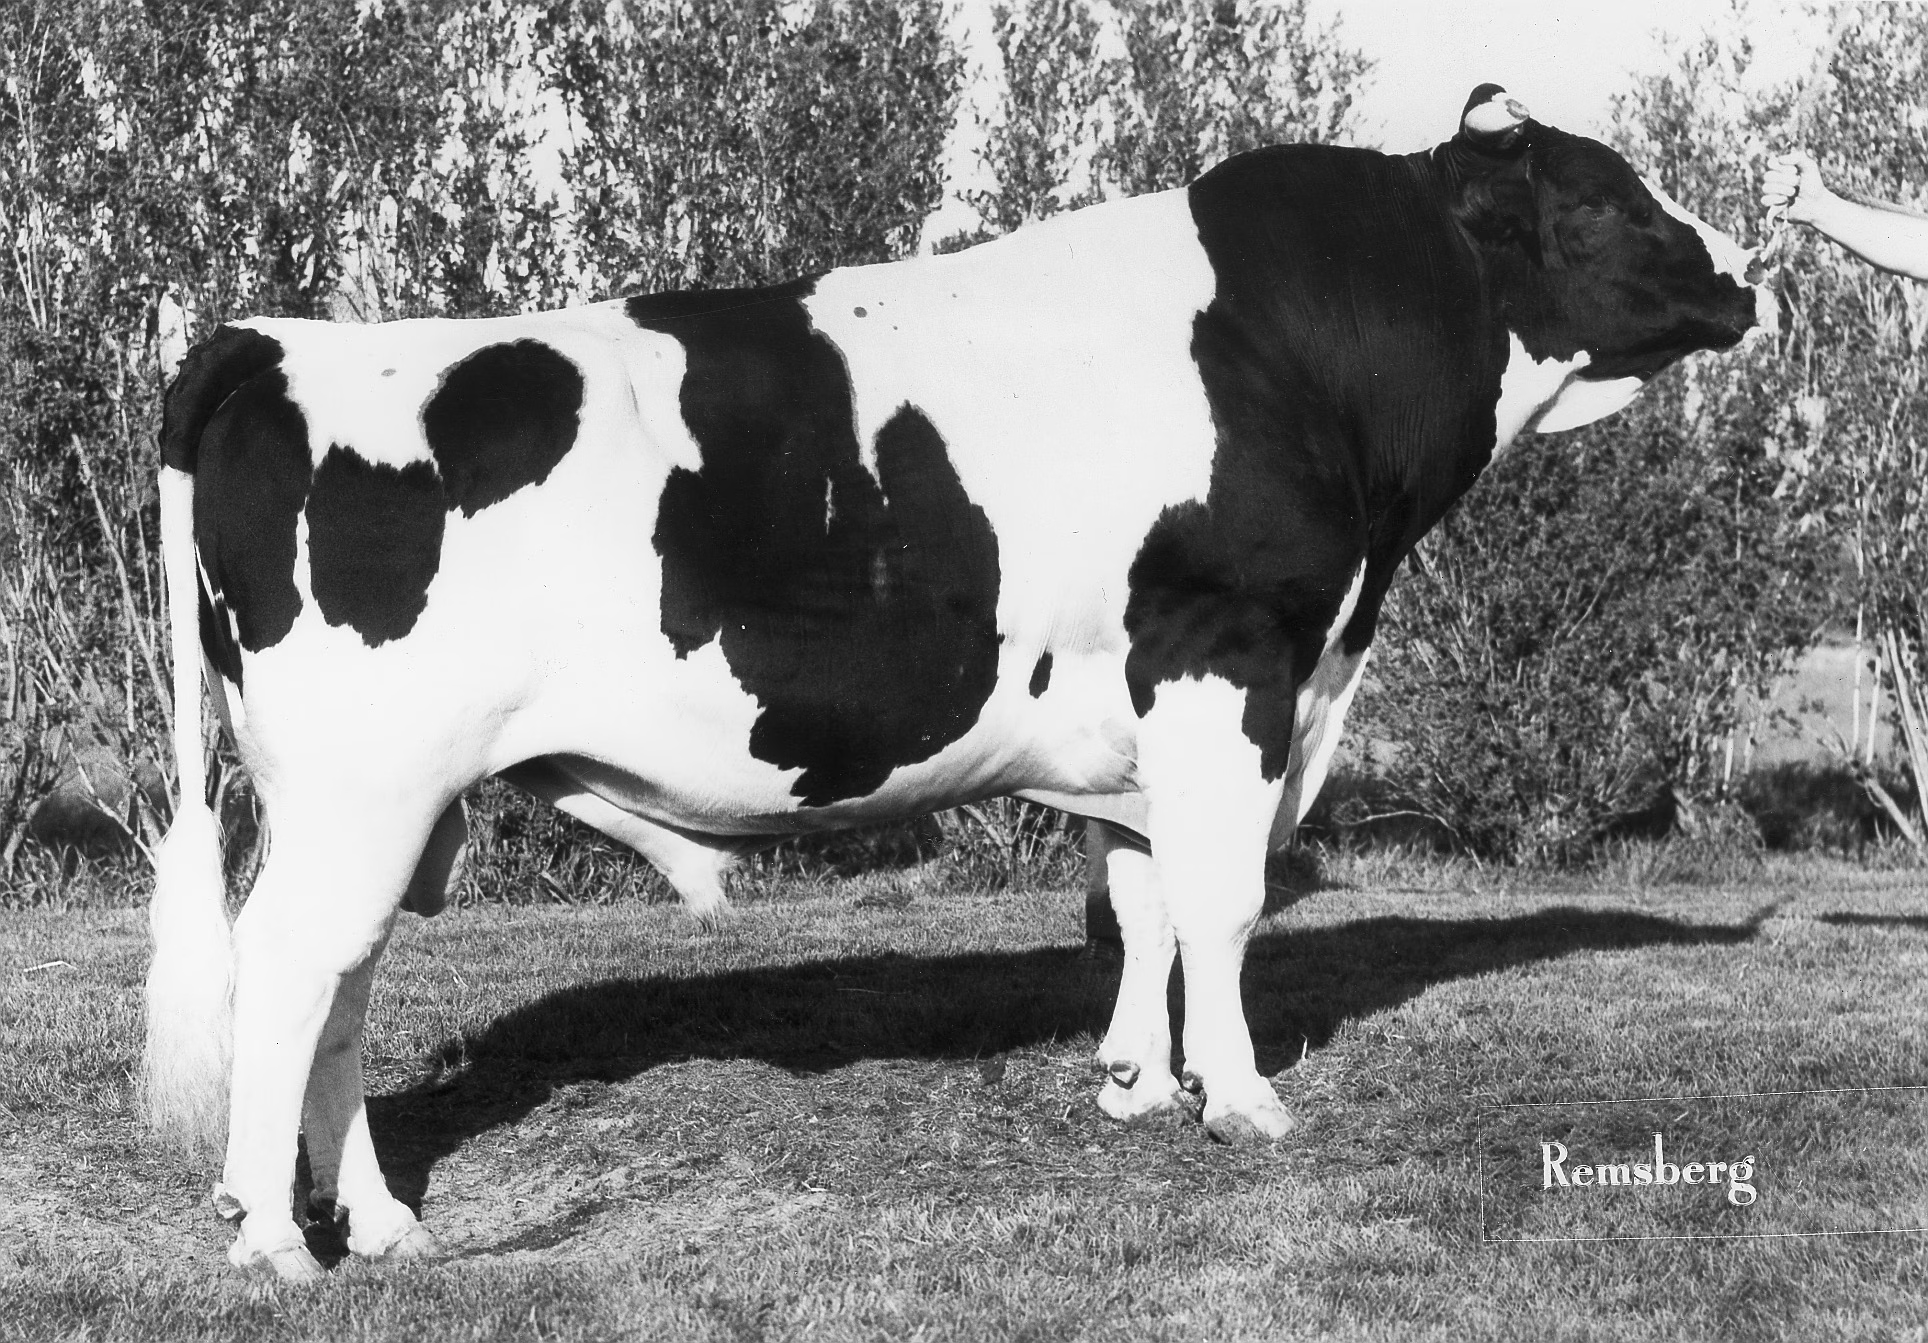
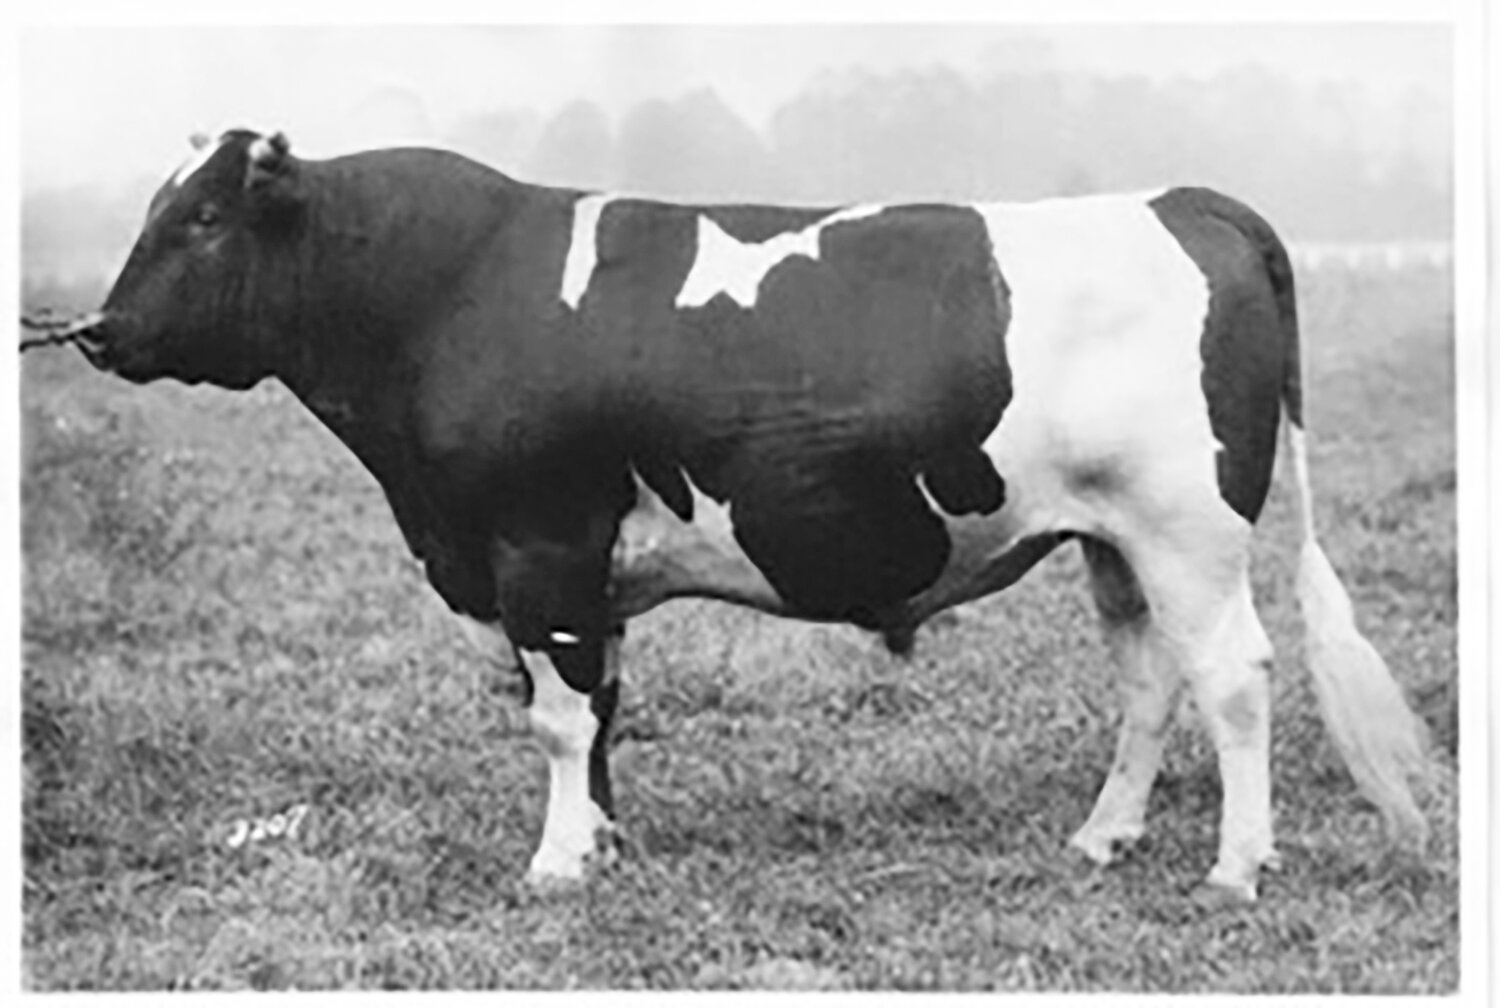
He cut a striking figure — solid black where most of the breed ran broken and patchy, the kind of dark, clean-coated bull that, by all accounts, photographed like a statue and made a stud parlor go quiet when he walked through. And the rest of the story fits that quiet entrance: no fireworks, no theatrical beginning, just a good bull from a good cow family, given a shot because the pedigree made sense and the economics worked.
The obstacles were real. He was one more Elevation son in a market already thick with Elevation sons. He was born in California, where Blue Tongue restrictions meant his semen could barely be exported. And as a sire of sons, his milk volume wasn’t strong enough to make him a runaway success in that role.
That last point matters, because legends don’t need to be sanded smooth. Sexation wasn’t perfect. What made him matter was that his daughters worked.
His daughters were cattle a farmer could live with. Read the 1989 Holstein World tribute and you can almost hear a herdsman nodding: he “truly transmitted the profile that corresponds to the expectations that every dairy farmer has for what a solid cow should look like,” and a Holstein International profile celebrated him the same way, as a source of females. In breeder language, that’s about as good as it gets.
Starting in 1980, after that first index revealed the rare fat-percentage strength for an Elevation son alongside real conformation, Sexation became an ABS icon. He died in 1983 at only nine years of age, yet by then his name was secure. More than 27,000 daughters came into production in the United States.
But the great twist — the part that still feels almost too perfect — was Europe.
Because direct semen export was restricted, European AI organizations went hunting for another route. They turned to Sexation sons born outside California or developed through embryos, and what came back is hard to believe even now. Start with Freebrook Sexation Amos, his maternal grandsire Astronaut: 70,100 daughters in the Netherlands. Then Paltzer Sexation Bert, out of an Apache-sired dam: 96,689 daughters — in one country. Dutch CRV statistics later pushed Bert’s cumulative total past 132,255.
Read those numbers again. That’s not influence sneaking through a side door. That’s influence arriving with a crowd behind it.
And the crowd kept growing. Triosex of KI Samen — whose dam was bred to Sexation in Belgium — reached roughly 15,000 daughters across eleven countries. Orlo, imported to Germany as an embryo, became the highest-TPI Sexation son in the world in the 2023 reporting — TPI being the breed’s all-around merit index — with 2,911 daughters in Germany. Back home, Indianhead Cherokee carried the U.S. flag as the highest-TPI domestic son, with 8,694 daughters of his own.
So Blue Tongue restricted him. And then it scattered his blood through sons, embryos, and AI programs on two continents. What was meant to contain him helped make him global.
His female line may be the deeper story. Ked Sexation Jasmine VG became the dam of Ked Mark Justine VG-88-GMD. Justine produced Ked Juror GP-GM, and she was the grandam of Ked Outside Jeeves, who recorded 51,467 daughters and appears through Jeeves in the pedigree of the powerful Frazzled. Sexation also stands behind the Prudence family, which Holstein International connects to the modern sire Ranger-Red. Most readers won’t memorize the path from Jasmine to Justine to Juror to Jeeves to Frazzled — but that’s exactly the point. A good cow family keeps finding the next open lane.
And here’s where the old bull reaches all the way into today. Pull up the April 2026 Top 100 lists — the PTA Type Females, the TPI Bulls — and Pam Nunes will walk you back through them name by name. Trace those modern sires back far enough, she says, and a striking share of them carry Sexation. Most run through Lew-Bro Sexation Cass; a handful — Superstition and Gold Chip among them — come instead through Juror. Follow those two lanes forward and his blood threads behind today’s heavyweights — Doorman, Doc, Lambda, Planet through Cass; Superstition and Gold Chip through Juror — often more than once in a single pedigree. Pam’s honest about the why. “Maybe today there are more bulls that can do that,” she says, “because it’s getting so inbred and crossed over. But I think it’s pretty cool.” She’s not claiming Sexation built those bulls single-handed. She’s just noticing that when you follow the breed’s best back to the foundation, his name keeps surfacing — and that’s a kind of legacy no proof sheet measures.
Some of his daughters became stars in their own right. Mansion-Valley Niagara, a Sexation daughter, sold through the 1983 Designer Fashion Sale for $280,000 to Hilltop-Hanover Farms, later classified EX-95, and completed an age-eleven record of 48,910 pounds of milk — described in the contemporary accounts as the highest record for age in North Carolina history.
And that was still only the beginning of what the covenant could do. Because then there was Zandra.
The Cow Who Turned a Chance Into a Legacy
“Can she walk?”
That was Marvin’s first question when Bill Kent called to say he’d just bought an Excellent cow for $1,600. The cow was Moore-Farms Valiant Smurf EX-90-GMD-DOM. She’d been scheduled to sell carrying a Sexation calf, but shortly before the sale she came back in heat — bred right back to Sexation — and the buyers got nervous. Reluctant to gamble on a cow that might not be settled, they let her go. Bill saw something different. “She’s a good one,” he told Marvin.
He was right. After the 3,000-mile haul to California, Smurf was confirmed pregnant to that sale-day service, and the resulting calf was Moore-Farms Sexy Zandra.
That calf — the one buyers hesitated over before she was even born — became one of the great living arguments for Sexation.
The Zandra family had started far from California, tracing to Quoque 7174 H.H.B., imported from Holland in 1884 by Wm. Koch of New York City, and it stayed in central New York for roughly seventy years before Smurf carried it west. Sexy Zandra classified EX-92-EEEEE-GMD — and produced 263,670 pounds of milk, 10,103 pounds of fat, and 8,476 pounds of protein across 3,337 days.
In a 1996 Holstein World advertisement, Marvin and Daryl Nunes — father and son writing it together, the younger already shaping the breeding argument as much as the marketing — argued that their Sexation two-year-olds were still outperforming more modern herdmates, and that the good young cows in the herd that weren’t Sexations usually had him somewhere in their pedigrees. “Tremendous type plus volumes of production,” they wrote, “equals calf after calf and years of adding to the bottom line.” That sentence could’ve been carved over the Ocean-View barn door.
Sexy Zandra’s greatest daughter was Ocean-View Mandel Zandra EX-95-2E-EEEEE-GMD-DOM, by Lutz-Meadows E. Mandel. E.Y. Morwick called her possibly the best all-round Mandel daughter — no small compliment, given how widely Mandel was used. She produced Ocean-View Zenith EX-GM, the Durham son proven through major AI systems, and at one point seventeen Excellent offspring of Mandel Zandra were confirmed.
OCEAN-VIEW MANDEL ZANDRA EX-95-2E-EEEEE — that frame, that udder. E.Y. Morwick called her possibly the best all-round Mandel daughter ever; her son Zenith spread her across the U.S. while her daughters sold overseas, and one Japanese breeder kept her photo as the screen saver on his phone. (Photo: Frank Robinson)
Here’s the export theme echoing again. When the Nuneses bred Mandel Zandra back to Sunshine, she had no living daughters — and because embryos couldn’t be exported from California, the natural move was to sell them internationally only. Her son Zenith spread her in the U.S.; her daughters spread her across continents. As the family puts it, the true measure of strong breeding isn’t how cows do in your own barn — it’s how they do in someone else’s. Pam Nunes later called Mandel Zandra the easiest cow they ever had to market, and told the story of a gentleman from Japan proudly showing them his phone — the screen saver was Zandra.
A phone screen saver. From Japan. For a cow bred out of a New York family, hauled to California through a sale-day accident, shaped by Sexation, and carried forward by Ocean-View. You couldn’t script Holstein history much better.
The Zandra line, still climbing: OCEAN-VIEW GOT THE Z FACTOR EX-92-2E EEEEE, a Doorman daughter and National Elite Performer who topped 57,130 lbs of milk as a five-year-old. She’s the eighth generation of an unbroken Zandra family averaging 90 points — her fourth dam is Mandel Zandra EX-95, her fifth dam Sexy Zandra, sired by Sexation himself. Sixty years on, the chance mating still pays out.
The Same Covenant, Tested Against Time
If Sexation proved a cow family could conquer the world through one bull, the Dixie family proved the same philosophy could outlast something harder: time itself.
In 1975, Marvin bought Fleetridge Mona Dixie EX-92-2E, carrying a Paclamar Bootmaker heifer calf. That unborn calf became Fleetridge Bootmaker Dixie EX-90-2E-GMD. Marvin didn’t just buy a cow that day. He bought the next chapter already inside her. Mona Dixie opened the family’s historic run in 1979 when, as a ten-year-old, she produced 40,010 pounds of milk and 1,413 pounds of fat.
Then a Dixie daughter went east. Brigeen Farms bought Ocean-View Elevation Debbie from Nunes and bred her to Valiant, and the resulting Brigeen Hanover Debra EX-91-2E set a national championship three-year-old record in 1986 with 42,910 pounds of milk and 1,882 pounds of fat. That’s the part that gets overlooked about a great cow family — it doesn’t stay home. The Nuneses sold a Dixie heifer east, a Maine breeder put a different sire on her, and the family answered just the same in someone else’s barn. A good family travels.
Now sit with that for a moment. A three-year-old. More than 42,000 pounds of milk. Nearly 1,900 pounds of fat. And she still carried the type to score Excellent.
That wasn’t a lucky lactation. It was the middle of a chain. In November 1998, Jerland Aero Delicate EX-92-2E became the breed’s first seventh-generation Excellent, 40,000-pound cow. By 2005, the Dixie family had stretched to nine consecutive generations of Excellent, 40,000-pound females — a sequence the source material describes as unprecedented in Holstein history.
Read that line twice, because the breeding math behind it is brutal. One Excellent 40,000-pound cow is special. Four generations is historic. Nine means the family kept answering the question over and over — through different sires, different herds, different managers, different decades, and tightening standards. No skips, no shortcuts. For a modern producer chasing longevity and lifetime efficiency, that’s not a museum piece. That’s the whole argument.
Marvin’s Herd Then — and the Sassys Now
If Sexation was the high point of the old story, the Sassys are the high point of the new one. The same philosophy that bought a teacher’s-pension cow in 1963 is still winning on colored shavings today — and it runs through one remarkable family.
The Sassy family is the clearest proof of the Ocean-View vision, because it blends both foundation lines into one cow: it traces straight to Sexation and Steps, while also carrying Zandra. During their era, Lindy Sheen and Mandel Zandra stood together in the show string, and visitors would ask which was the favorite. The honest answer was always the same — it was nearly impossible to choose. The Sassys carry the best of both.
What makes the family extraordinary is how it grew. Ocean-View Zenith Sassy EX-90 was never flushed. She produced four natural daughters, the old-fashioned way, and each one founded a branch:
Damion Sassy EX-95-3E — matriarch of a line that’s already produced three All-American descendants, the breed’s annual honor for the top animal in its age class nationwide.
Dundee Sassy EX-93-3E — a 303,000-plus-pound lifetime producer.
Sanchez Sassy EX-94-2E — a state and national fat leader, over 248,000 pounds lifetime and more than 11,000 pounds of fat.
Sterling Silver EX-94-2E — Holstein USA Star of the Breed and a Junior 3-Year-Old milk record holder.
Four sisters from one unflushed dam. Set that against a modern world of dozens of IVF siblings — this family elevated itself the slow way, naturally, and the Nuneses have leaned into it on purpose. Watch how Daryl and Pam mate this family and you see the covenant still working: faced with a herd full of choices, they keep reaching for sires carrying Sexation blood, because the family answers to those genetics. Sexy Shamma was a direct Sexation daughter; Benefit Sassy was sired by a Sexation son. More recently they’ve leaned on Diamondback and Master, both of which carry Sexation and Steps influence — natural complements to a family already proven to respond. It’s not linebreeding for its own sake. It’s protecting what already works.
OCEAN-VIEW SHEZ A SASSY EX-94 — garlanded and still grazing, a Diamondback daughter of Damion Sassy EX-95-3E who has already topped 43,000 lbs in a lactation. She’s the dam of Ocean-View Sassin Me Back, World Dairy Expo Junior Champion and All-American — and her own maternal line runs fourteen generations of EX and VG dams straight back through Sexy Shamma to Sexation himself and, beyond him, to Ideograph Burkgov Steps.
And the family is still announcing itself. At the 2025 International Junior Holstein Show at World Dairy Expo, the Ocean-View prefix landed in the Top 10 eight times across the heifer division — double the next-closest breeder prefix at the show. The newest star is Ocean-View Sassin Me Back, a WDE Junior Champion, Jr All-American and Reserve All-American. Her pedigree carries fourteen consecutive generations of Excellent and Very Good females averaging 90 points — and Steps appears six times within her extended pedigree. Six crosses to that 1963 cow, in a champion heifer winning today. When she sold in 2024 to a partnership with Doug Brown of Iowa, she wasn’t just a stylish heifer — she was nearly eighty years of breeding decisions standing on four good legs.
The arms fly up: Ocean-View Sassin Me Back is named Junior Champion of the World Dairy Expo Junior Show — also a winning Summer Yearling in both the Junior and Open shows and an All-American. A Diamondback daughter of Shez A Sassy, she carries fourteen generations of EX and VG dams that trace straight back through Sexation to the $2,450 cow Marvin and Vivian Nunes bought in 1963.
The Sassys aren’t alone, either. The Barbie family runs back through Juror, tying yet another Ocean-View line to that same Sexation thread. And that’s the thing about this herd — you can pick almost any branch, the Sassys, the Sheens, the Barbies, the Zandras, and follow it down to the same root.
Different branch, same answer: OCEAN-VIEW-MA DB ALANNAH EX-92, a Diamondback daughter standing eleven generations of Excellent deep — her ten closest dams average 92 points — and already topping 44,000 lbs in a lactation. From the Annie/Arabella line rather than the Sassys, she’s co-owned with Martin Artucio of Uruguay, proof that the Ocean-View covenant still measures itself far from home.
Act III: The Sale, the Silence, and the Echo
Every great herd eventually reaches the day the trailers line up.
For Ocean-View, that day was May 2, 2012, at the home farm. The herd had grown past 600 registered Holsteins, with more than 330 of the animals in that dispersal herd classified Excellent. Dallas Burton had predicted it would be remembered as one of the few distinguishing sales in Holstein history.
Imagine the sound of that day — the chant rolling for hours, cattle shifting in fresh bedding, old friends leaning on the gates, buyers paging through pedigrees that weren’t really pedigrees but family histories. The sale ran nine hours, and 524 lots averaged $2,742. All the cow families were represented. Steps. Dixie. Zandra. The names that built the herd, led through the ring one after another, and scattered into new barns.
But here’s the part most folks in the seats didn’t know that day. The top seller, an EX-92 Allen daughter of Mandel Zandra known as Allen Zamora, sold for $15,200 — and the buyers were the Nuneses themselves. They had Ronnie do the bidding so no one in the crowd could tell which lots they were quietly after, and by the end of the day they’d bought back ten head to add to the ones they’d already set aside. Think about that — a family dispersing its life’s work, and slipping back into its own sale under cover to make sure the best of it came home with them. That’s not sentiment. That’s a breeder who knew exactly what those cow families were worth.
Because a dispersal isn’t an ending — not when the genetics are real. Daryl and Pam Nunes carried the family commitment forward through Ocean View Genetics, now based in Deerfield, Wisconsin, where the core cow families kept going on a more individual scale. Their approach stayed faithful to the old lesson: keep the cows that make cows. Pam calls them the “factories” — a plain, working word that fits Ocean-View better than any polished slogan. Across the life of the prefix, 498 animals have earned the Excellent classification and 110 carry Gold Medal Dam status. Among the cows standing on the farm today, the highest lifetime producer, Ocean-View Roy Shari EX-94-5E, has milked 370,210 pounds in a lifetime.
And then 2019 arrived, and it brought the cruelest losses and one of the proudest records in the same twelve months.
OCEAN-VIEW STERLING SILVER EX-94-2E EEEEE, a Braxton daughter who twice topped 58,000 lbs of milk in a lactation and was named a National Elite Performer and the 2019 Holstein USA Star of the Breed. The thirteenth generation of EX and VG dams tracing through Sexy Shamma to Sexation and back to Steps — she died just after the honor was announced.
That year, Ocean-View Sterling Silver EX-94-2E was named Holstein USA Star of the Breed — a National Elite Performer who’d milked past 219,000 pounds lifetime, including a record junior-three-year-old lactation of 58,330 pounds of milk, 2,419 pounds of fat, and 1,640 pounds of protein, the thirteenth generation of Excellent or Very Good dams tracing to Steps. And then, heartbreakingly, she died right after the announcement. The cow reached the summit and laid down at the top of it.
That same year, on November 7, Marvin L. Nunes passed away at 83. He’d been honored with Holstein Association USA’s National Distinguished Breeder Award back in 2007, so he knew what he’d built. By every account he was a man who wanted no fuss for himself — but he deserved to be marked, and the symmetry of that year marks him whether he’d have wanted it or not. The man and the cow he made went out together. There’s grief in that, and there’s also a rare kind of peace in a breeder leaving behind families that still know exactly how to work.
The thesis, standing in a pasture: OCEAN-VIEW LINED IN SILVER *RC EX-91, an Awesome-Red daughter built on fourteen straight generations of Excellent and Very Good dams averaging 91 points — three of them, top to bottom, over 50,000 lbs of milk (her at 50,700, her dam Silver Lining at 52,680, her granddam Sterling Silver at 58,330). The line runs unbroken to the twelfth dam, Ideograph Burkgov Steps — the $2,450 cow that started it all. Pam Nunes doesn’t believe there’s another cow alive who carries all of it at once.
And here’s the thing — as proud as the family is of that thirteenth-generation record, Pam will tell you it isn’t even the cow that says the most about what Ocean-View built. That distinction belongs to Ocean-View Lined in Silver *RC, an EX-91 Awesome-Red daughter out of Ocean-View Silver Lining. Her pedigree reads like the whole story compressed into a single page: fourteen generations of Excellent and Very Good dams, every one of them, averaging 91 points. Her dam, Silver Lining, scored EX-94 EEEEE. Her second dam was Sterling Silver herself. And the tower behind them runs straight down through the Sassys to the twelfth dam — Ideograph Burkgov Steps — then Tidy Stars and, fourteen deep, Twelvelms Hartog Segis EX-92. Look at the top of that pedigree and you’ll find three generations in a row over 50,000 pounds of milk: Lined in Silver at 50,700, her dam at 52,680 and again at 52,100, her second dam topping out at 58,330. Pam doesn’t believe there’s another cow alive who carries all of it at once — that kind of type, that depth, that production, stacked in one female. That’s not a record. That’s a thesis statement.
There’s one thing about that barn that puzzles Pam in the best possible way. The Ocean-View string today is a patchwork of families that, on paper, have no business all peaking at once — Sassy, Sheen, Arabella, Heaven, Zandra, Dixie — eight distinct maternal lines averaging 12.8 generations deep, with a maternal classification score of 90.6 across the herd. “What it keeps telling me,” she’ll say, “is how different the herd is — to have SO many different cow families doing these things. And yet they all trace back to Sexation.” Then she answers her own question. “So maybe it makes sense.” That’s not a coincidence talking. That’s a covenant doing exactly what it was built to do.
Trace Sexation forward today and you don’t have to look far. You find him through Ked Sexation Jasmine to Justine, Juror, Jeeves, and Frazzled. Behind the Prudence family tied to Ranger-Red. You find him through Lew-Bro Sexation Cass and Juror, surfacing again and again in the April 2026 Top 100 lists, behind names like Doorman, Doc, Lambda, Planet, Superstition, and Gold Chip. And you find him in the most literal way imaginable: the entire Ocean-View herd standing in Wisconsin today traces back to him, averaging 12.8 generations deep. When Pam Nunes says her champion heifer carries six crosses to Sexation, she’s not reaching for a marketing line. She’s describing the architecture of her barn.
Here’s what Ocean-View finally proved. It didn’t change the Holstein breed by chasing the newest thing. It changed the breed by showing that deep maternal lines, functional type, production, fertility, and longevity could all be bred together — if a family was respected long enough to express it. Genomics can tell a breeder plenty, and no serious breeder today should pretend otherwise. But Ocean-View answers the older question the indexes still struggle with: will this family keep making the right kind of cow after the fashionable sire has come and gone? Marvin said it plainly — popular sires come and go every six months, but a program built on a solid foundation matters more than ever. The years proved him right.
Ocean-View was never just a place — not Windsor, California, and not Deerfield, Wisconsin. It was a promise kept across generations: buy the cow family, trust the cow family, breed it honestly, and let time decide whether you were right.
It began with a schoolteacher’s elbow and her pension money — the budget standoff, the “Can she walk?” phone call, the ten-year-old Dixie breaking 40,000 pounds, four Sassy sisters from one unflushed dam — and more than sixty years later it was still answering, in a barn 12.8 generations deep where every cow traces to one black bull bought as a calf in 1973. Sexation gave that promise a name the world would remember; Steps, Dixie, Zandra, and the Sassys gave it roots deep enough to outlive them all.
So the next time his blood surfaces in a modern pedigree — in a cow that milks hard, stands square, breeds back, and looks like she was built to stay — look twice. That’s the old Ocean-View lesson walking into the barn again, black and white, quiet, and permanent.
Key Takeaways
A restriction isn’t always a dead end. Blue Tongue kept Sexation’s semen home, but his sons and embryos rerouted that blood into 70,100 and 96,689 daughters in the Netherlands alone — and through Lew-Bro Sexation Cass and Juror, he still surfaces in today’s April 2026 Top 100 lists behind sires like Doorman, Lambda, and Planet.
The Ocean-View bet was never on the fashionable sire of the month; it was on the cow family. That’s what turned a $2,450 teacher’s-pension gamble into 498 Excellent animals, 110 Gold Medal Dams, and a Junior Champion at World Dairy Expo.
Great families can still be built the slow way. Zenith Sassy was never flushed, yet her four natural daughters — including Star of the Breed Sterling Silver — each founded a branch, and the line now crowns in Ocean-View Lined in Silver, fourteen generations of EX/VG dams deep.
The Golden Age of the Holstein: Farmer‑Bred Sires Who Built the Genomic Era — Exposes how elite, farmer-developed cow families historically bypassed industry gatekeepers to deliver long-term structural balance, establishing the very genetic foundation that safeguards today’s multi-million dollar genomic pipelines.
Roxy, Dellia and The Mothers Who Built the Breed – The Bullvine — Dismantles the false choice between type and high-volume output by tracking ten foundational maternal empires that permanently altered global breeding direction, proving that deep cow families outlast transient sire trends.
The Sunday Read Dairy Professionals Don’t Skip.
Every week, thousands of producers, breeders, and industry insiders open Bullvine Weekly for genetics insights, market shifts, and profit strategies they won’t find anywhere else. One email. Five minutes. Smarter decisions all week.
Seventeen genotyped Holsteins — $3,500 to $5,000 a head — gone from Lamb Farms’ pen overnight. No GPS found them. A fast-moving dairy network did, in roughly 48 hours.
Picture walking out to your calf facility at daybreak and finding the pen empty. That’s what happened at Lamb Farms on Bliss Road in Oakfield, New York, after 17 five-month-old Holstein heifers went missing between 1 and 3 a.m. Sunday, according to The Batavian’s report on the farm’s Facebook alert (The Batavian). About 48 hours later, WKBW reported that all 17 calves had been located and confirmed safe by the Genesee County Sheriff’s Office (WKBW).
UPDATE — June 5, 2026: Arrests made. A Lockport couple has been charged in the overnight theft of 17 calves from Lamb Farms.
A husband and wife from Lockport, New York, are facing multiple felony charges in connection with the 17 genotyped calves taken from Lamb Farms in Oakfield. Torrence A. Schmitt, 25, and Kerisa J. Schmitt, 26, were taken into custody Wednesday in Jamestown, with assistance from Chautauqua County sheriff’s deputies, and transferred to the Genesee County Jail to await arraignment, The Daily News reported.
Both are charged with third-degree burglary, third-degree grand larceny, tampering with evidence, and first-degree falsifying business records. Each is also accused of removing and destroying the identification tags from 16 of the calves — the genotyping ear tags that ultimately made the animals traceable.
The calves disappeared overnight on May 24. According to investigators, a neighbor’s security camera on Lockport Road in Alabama captured a heavy-duty pickup pulling a cattle trailer, followed closely by a second vehicle, at 1:21 a.m. The animals were recovered May 27 at Lebanon Valley Livestock Market in Pennsylvania — roughly halfway between Harrisburg and Reading — and returned to Lamb Farms. Their total value was placed at $41,000.
The investigation was led by the Genesee County Criminal Investigations Division. Both Schmitts were released under the supervision of Genesee Justice and are scheduled to appear in Genesee County Court at a later date.
The Schmitts are charged but have not been convicted; the allegations described above are drawn from law enforcement and court information as reported by The Daily News.
The original industry-wide alert, published May 24, follows below.
Oakfield Corners Dairy confirmed all 17 stolen heifers were located and safe in this May 26 update, crediting the dairy community and social media for the tips that brought them home — and deferring further comment to the sheriff’s ongoing investigation. (Oakfield Corners Dairy via Facebook)
That rarely happens. Calves move fast, tags get cut, and a trailer can be three counties gone before anyone’s had their first coffee. Oakfield beat the clock — and not because the system ran perfectly. It happened because a farm community moved fast enough to keep the animals visible. Here’s the whole story of how 17 genotyped Holstein heifers vanished and came home, and the playbook every registered herd should copy.
Why did the dairy community recover these calves before the trail went cold?
The Bullvine’s original alert pegged the group as 17 five-month-old genotyped Holstein heifers from Oakfield Corners Dairy, a division of Lamb Farms, hauled off in a truck and cattle trailer that headed west on Lockport Road (The Bullvine). With the Thruway right there, those calves could’ve been three states away by chore time.
Then the network kicked in. Public reporting confirms the recovery but leaves key details unanswered: where the heifers were located, which tip or tips moved the case, and whether any recovery details are being withheld because the investigation remains open (WKBW). That restraint matters. A clean public alert helps investigators; a rumor storm can wreck a case.
Investigators didn’t hide where the help came from. The Genesee County Sheriff’s Office confirmed the recovery, said the case is still open, and credited the ag community for the tips that moved it (WKBW).
That’s the real story here. A sheriff’s office can take the call. But it’s the farm community that makes stolen animals impossible to move — and then hands over the one tip that turns a missing-cattle report into a recovery.
How does a single tip beat a stolen trailer with a head start?
Run the timeline in your head. The heifers left Bliss Road overnight. By Sunday morning, the theft had been reported, and Lamb Farms had an alert up asking anyone who’d seen cattle being moved to speak up (The Batavian). About 48 hours after that, the calves were located out of state and headed home (WKBW).
That gap — head start versus recovery window — is the whole ballgame. Every hour the thieves move freely, the calves slide closer to a private sale or an informal channel where they stop looking stolen and start looking like inventory. What slammed that window shut wasn’t a GPS ping. It was a person who saw something that didn’t add up and knew exactly who to call.
And here’s the part worth sitting with: a watch list moving through the dairy community doesn’t stop at the county border. Neither does a trailer, a hauler, an order buyer, or a neighbor who clocks that a load of fresh five-month-old Holsteins showing up out of nowhere just doesn’t fit. Neither does a hauler, an order buyer, or a neighbor who clocks that a load of fresh five-month-old Holsteins showing up out of nowhere just doesn’t fit. That cross-border reach is exactly the kind of weak spot cattle thieves count on you not closing.
Social media did the one job rural networks couldn’t
Farmers have warned each other by phone tree, coffee shop, and sale-barn whisper network forever. Facebook just made that network visible — and fast. Lamb Farms’ Facebook alert asked neighbors with cameras to check for a truck hauling a cattle trailer between 1 and 3 a.m. Sunday and asked cattle people to watch for anyone trying to sell calves fitting the description (The Batavian). WKBW later reported that law enforcement credited the agricultural community’s tips as central to the recovery (WKBW).
Stolen cattle don’t vanish into thin air. They move through real places — roads, trailers, auctions, back lots, holding pens. The Bullvine’s alert asked sale barns, order buyers, auction yards, neighbors, folks with driveway cameras, and haulers to keep an eye out and call the Genesee County Sheriff’s Office (The Bullvine).
The Facebook alert Oakfield Corners Dairy posted hours after the theft, showing reference calves that match the stolen group’s age, size, and layered ID — 5-month-old genotyped Holsteins with an EID button, dual ear tags, and an ear-punch site. The post drew 3.5K shares and the description that fed the recovery tips. (Oakfield Corners Dairy via Facebook)
That’s where a post earns its keep. Not in outrage — in distribution. One good post puts a calf’s description in front of the guy unloading a trailer, the neighbor checking her camera, and the breeder who knows Oakfield cattle well enough to say, “That doesn’t belong there.”
The flip side writes itself: social media can also turn into a rumor mill with a keyboard. This one worked because the message stayed useful — missing calves, description, who to call, and a clear ask. No suspect names. No armchair detectives. And watch what Lamb Farms did after the recovery: they went quiet and let law enforcement work. That restraint is as much a part of the playbook as the alert itself.
These weren’t anonymous calves — and that changed everything
Oakfield Corners isn’t running feeder calves. It’s a division of Lamb Farms built on elite Holstein cow families, a large ET and IVF program, and both high-GTPI and show-quality stock (Oakfield Corners Dairy). GENEX’s profile of Alicia Lamb puts the combined operation at about 11,000 cows across three farms in western New York and one in western Ohio, with roughly 99% Holstein (GENEX).
So these weren’t commodity calves headed for a feedlot. The Bullvine’s original alert described them as fully genotyped heifers with layered ID — an EID button, visual management tags, and a tissue-punch site from which the genotype sample was taken (The Bullvine).
The Bullvine’s alert valued the group at $3,500 to $5,000 per head (The Bullvine). Do the kitchen-table math: 17 head at $3,500 is $59,500. At $5,000, you’re looking at $85,000 — and that’s before you factor in staff time, lost breeding opportunities, donor potential, or the gut-punch of losing animals from a program you’ve spent years building.
In New York, property worth more than $50,000 crosses into second-degree grand larceny, a class C felony (NY Penal Law 155.40). Nobody’s been charged with that here — the case is open, and charging calls belong to prosecutors (WKBW). But it tells you this isn’t a “couple kids grabbed a calf” story. It’s serious money, serious crime — and it landed in a replacement market where comparable animals are expensive and hard to source.USDA Agricultural Prices data, tracked by CoBank, put replacement heifers at an average of $3,010 per head nationally as of July 2025 — up 75% from $1,720 in April 2023 and near record highs (The Bullvine). When the pipeline’s that tight, stolen animals are that much harder to replace at any price.
Does a genotype actually help you get an animal back?
Honest answer: not directly, and public reporting has not confirmed that genomic data was used in this recovery. The break came from a tip, not a lab. What the records do change is what a thief can actually do with the animals once they’ve got them.
Think about where stolen calves usually disappear — a sale barn, an order buyer, a quiet private deal. That exit ramp is mostly closed when the calves are elite registered Holsteins. A pen of fresh five-month-old genotyped heifers from a program like Oakfield Corners isn’t anonymous in the registered world. People recognize this kind of cattle, and a load that shows up from nowhere raises eyebrows fast. That’s the same network The Bullvine alert leaned on when it asked sale barns, order buyers, and auction yards to watch (The Bullvine). The genotype doesn’t ping a location — but it can make calves harder to launder into legitimate cattle channels, which may buy time for tips, records, and investigators to catch up.
Here’s the formal backstop. ICAR defines animal-identification confirmation as the use of genomic markers to determine whether a tissue sample can be excluded as originating from a particular animal (ICAR). CDCB’s SNP-based parentage service runs those markers and returns a verdict — accepted, doubtful, or excluded (CDCB). Holstein Association USA will verify parentage when an animal’s ID gets challenged (Holstein Association USA).
In plain terms, with the records and a clean sample, a genotyped animal is a lot harder to sell into the legitimate cattle business. Not impossible. Harder. When a recovered calf shows up with a cut tag and a story that doesn’t hold, a genotype is the difference between “we think she’s ours” and “we can prove she’s ours.”
What a genotype won’t do is tell you where a calf spent Tuesday night, or prove who cut a tag, or replace video and witnesses. USDA APHIS is blunt: animal disease traceability exists to trace animals during disease outbreaks — it’s not a theft-tracking app (USDA APHIS). Still, biology’s a stubborn witness. Tags disappear. Paperwork gets creative. DNA’s a lot harder to argue with.
Your 840 EID tag is not a GPS — don’t bet your herd on it
This is where a few farms need a cold splash of water. An 840 tag tells the world an animal is who you say she is. It does not tell you where she is. Farm Progress reported in November 2024 that 840 tags carry no GPS and broadcast no location, at roughly $3 a head per NCBA (Farm Progress). USDA APHIS requires official eartags to carry a unique ID and be tamper-evident and high-retention — that’s identification infrastructure, not a tracking collar (USDA APHIS).
That matters because of how this theft actually ended. No tag pinged a location. A person did. The tag’s job starts later — once the animals are in hand, and someone has to prove who owns them before a prosecutor.
No single layer carries the load alone. EID proves identity. Genomics backstops it. Cameras show how she left. A social post turns one farm’s bad night into an industry-wide watch list. A tip from inside that network finds the animals. Law enforcement ties it together. Oakfield got its calves back because several of those layers fired at once — and the one that actually found them was human, not technological.
What happens to your insurance claim if those calves never come home?
If those 17 heifers hadn’t turned up, the ugly question follows fast: what were they insured as? Penn State Extension’s farm insurance guidance is clear that property coverage may include theft, but policies vary by company, limits cap what you can collect, and losses are valued at actual cash value, replacement cost, or functional replacement cost depending on the policy (Penn State Extension).
Here’s where the gap gets expensive. Take the worst-case spread: a policy that pays bare commodity actual cash value — the kind of payout a non-scheduled policy can default to — near the roughly $3,010-a-head replacement average reported by USDA and CoBank in mid-2025 (The Bullvine), set against the top of Oakfield’s genetics value at $5,000. On 17 head, that’s about $51,000 in your pocket against roughly $85,000 in real value — a gap of nearly $34,000 you’d eat, before any donor or show upside. Your insurer doesn’t pay for the cow family you spent a decade building unless the schedule says so.
There’s a sharper trap stacked on top. Penn State warns that animals being hauled in a truck or trailer often aren’t covered by the vehicle policy unless they’re specifically listed, and farms that move stock regularly need to confirm they’re covered under the farm owner’s policy (Penn State Extension).
A registered, genotyped Holstein heifer isn’t just “one head.” She might be a donor prospect, a bull-mother candidate, an IVF flush waiting to happen. If your insurance schedule doesn’t know that, neither will your claim. Plenty of registered operations are carrying a genetics portfolio on a commodity insurance frame — the same blind spot that makes genotyped females worth far more on paper than your balance sheet admits, and the kind of thing that should make any lender or herd advisor sit up.
Ohio shows the version where it doesn’t end well
Oakfield is the hopeful case. Ohio is the warning shot. Sixty-four Holstein calves were stolen from a farm near Coldwater in Mercer County sometime between 10 p.m. Saturday, May 2, and the early hours of May 3 — valued at up to roughly $128,000 for the group (Farm and Dairy, Dayton 24/7 Now).
Mercer County Sheriff Doug Timmerman called it “highly coordinated.” As of his office’s May 7 update, there were no suspects, and investigators were still asking anyone with information to call the detective division at 419-586-7724 (Farm and Dairy). As of the May 5 Dayton 24/7 Now report and the May 7 Farm and Dairy update, no recovery had been reported in those articles.
Same crime, very different ending. That doesn’t prove genomics or any single tool would’ve guaranteed Oakfield’s outcome — their break came from a tip, and tips don’t run on a schedule. What it proves is that every hour matters and every layer counts. Once calves are commingled, sold quietly, or pushed through informal channels, the trail thins. Once the alert goes cold, the tips dry up. Once the video overwrites, you’ve got nothing. The lesson isn’t that every theft ends well. It’s that fast, accurate, community-wide attention narrows the escape route — and the farms that get their cattle back are usually the ones who were ready before the trailer ever pulled in.
Options and trade-offs: building a theft plan that actually works
If you run registered cattle, your recovery plan can’t live in your head. Four layers do the heavy lifting. Here’s what each one takes — and where each one bites.
1. Build the animal packet (do this within 30 days)
What it is: current photos, official ID, visual tag number, registration info, genotype sample ID, dam and sire, birth date, and ownership docs on every high-value heifer — stored where your team can pull them at 2 a.m. Holstein USA notes you can tie TSU numbers to ID and test ordering through Enlight to make this less of a chore (Holstein Association USA).
When it works: recovery and insurance claims move fast, and you can prove ownership across a state line.
Where it bites: it’s tedious to build, and a packet nobody can find at 2 a.m. is worthless.
2. Wire up the alert list — not just your Facebook followers
What it is: sheriff, neighbors, employees, haulers, sale barns, order buyers, your vet, breed contacts, genetics reps, local dairy media. Program your county sheriff’s non-emergency line into every barn phone now, so your people have a clear place to send a tip, as Oakfield’s network did.
When it works: you get eyes on the real choke points, across regions — not just inside your county.
Where it bites: a list you’ve never tested goes stale fast.
3. Put cameras where trailers move, not where they look nice
What it is: coverage on the exits and load-out points, not the pretty barn shot. Farm Progress reported that a basic farm video setup can run a few hundred dollars if you already have internet, while a professional five-camera system with software can cost several thousand (Farm Progress). Retail cellular and solar cameras run roughly $100–$400 each, before data plans and installation (Tractor Supply).
When it works: you hand investigators a plate or a vehicle description within the first hour.
Where it bites: footage overwrites in days — review it fast or lose it.
4. Call your broker this week with one uncomfortable question
What it is: ask flat out, “If my top 20 genotyped heifers walk off tonight and never come back, what check do I actually get?” Penn State’s guidance makes it clear that your policy limits, valuation method, and scheduled coverage determine what a loss becomes when it becomes a claim (Penn State Extension).
When it works: you find the gap before the gap finds you.
Where it bites: closing it may cost more in premium — pay now or pray later.
Key Takeaways
Build the animal packet this month. Oakfield’s calves were found across a state line, and proof of ownership rides with the records, not the animal — if your team can’t pull photos and ID at 2 a.m., you can’t prove what’s yours.
Call your broker about hauling coverage. Penn State warns animals in a truck or trailer often aren’t covered unless they’re scheduled on the farm policy — don’t assume the vehicle policy has you (Penn State Extension).
Schedule your genetics, or expect a commodity check. A policy paying actual cash value lands closer to $3,010 per head than $5,000 — on 17 head, that’s roughly a $34,000 hole you eat, comparing the mid-2025 USDA/CoBank replacement average to the top of the genetics range.
Point your cameras at the exit. Investigators need the trailer route and the load-out, not the front gate — put the lenses where animals actually leave.
Alert first, then go quiet. Call law enforcement before you post, push one factual alert, then step back and let them work — the way Lamb Farms did to protect the prosecution.
Sample DNA the right way. If animals come back with cut or altered tags, ask law enforcement and your vet how to document samples without breaking the chain of custody — that’s what turns “looks like ours” into proof.
So, where does your operation actually sit? If 17 head walked off your place tonight, could you get a clean, shareable alert in front of the right people before sunrise — and would the insurance check match what those animals are really worth? Oakfield got its calves back because the community moved fast, the alert stayed useful, and someone with information got it to the right people. The next stolen trailer might not be theirs, and the next tip might not come in time.
Pull your numbers, walk your camera angles, and make the broker call you’ve been putting off. If you want the full breakdown on what genotyped females are really worth on your balance sheet — and how to schedule them so a claim pays out instead of leaving you $34,000 short — that’s coming in our upcoming piece on insuring genotyped females, landing first in The Bullvine Weekly. Oakfield got the calves back. The rest of us got the warning.
Complete references and supporting documentation are available upon request by contacting the editorial team at editor@thebullvine.com.
The DRP Window Sitting Open on Most Mid-Size Dairies — Delivers an operational game plan for shielding herd revenue by navigating complex cross-border policy changes and shifting regional market structures before key regulatory deadlines lock you out.
Every week, thousands of producers, breeders, and industry insiders open Bullvine Weekly for genetics insights, market shifts, and profit strategies they won’t find anywhere else. One email. Five minutes. Smarter decisions all week.
A 500‑cow freestall realized more than 85% of the EPA and 75% of the DHA on their feed tag were being destroyed in the rumen. Here’s how a stuck fresh‑cow sheet started looking like a fat‑program problem.
Editor’s Note: The 500‑cow Midwest dairy in this piece is a composite scenario modeled on common transition and heat‑stress patterns reported by progressive Midwest freestall operations. The disease rates, ration components, dialogue, and decision sequence are illustrative and representative of multiple herds, not drawn from a single named farm. All cited research, USDA prices, and published cost‑of‑disease ranges are real and sourced.
The calves were coming easy that February. The fresh‑cow sheet still looked ugly.
In the farm office, the owner, the herd vet, and the nutritionist leaned over a laptop. DCAD was dialed in. Rumen‑protected methionine sat in both close‑up and fresh rations. Energy density matched targets. Cows weren’t overstocked or overfat. The numbers wouldn’t move. Retained placentas wouldn’t drop into single digits. Metritis hung high. Every summer, milk fell harder than feed refusals could explain.
Then the vet pointed at one line on the ration sheet and asked the question nobody around that table had a clean answer for: what was the actual in‑vivo rumen bypass rate for EPA and DHA in their omega‑3 product, at the dose they were feeding?
When the team went digging, work from Cornell’s Bauman lab on calcium salts of fish oil showed rumen biohydrogenation of EPA above 85% and DHA above 75% in cows fed those products. More than three‑quarters of the omega‑3 they thought they were buying for inflammation control wasn’t getting past the rumen.
The product was protecting the rumen from the fat. It wasn’t protecting the fat from the rumen.
The Double Standard Hiding in Their Fat Program
By the time this dairy added rumen‑protected methionine, they were already treating bypass data as non‑negotiable. The nutritionist could rattle off the target — published in‑vivo bypass values land in the 75–85% range for the major RP‑Met products. If a Met source couldn’t show how much survived the rumen, it never made it into their bins.
The fat program ran on a fuzzier standard. The herd used a common calcium salt blend that included fish oil, and the tag listed EPA and DHA alongside palmitic and other fatty acids. For years, everyone around that office table assumed that ticked the omega‑3 box for retained placenta, metritis, and inflammation control.
Then they sat down with the Cornell biohydrogenation data and the Resolution of Metabolic Inflammation review out of Penn. Two things became hard to argue with. Calcium salts are excellent at keeping fat from burning the rumen. But published biohydrogenation data — including Cornell Bauman‑lab work on calcium salts of fish oil — show they’re substantially less efficient at delivering intact EPA and DHA than technologies designed specifically for omega‑3 protection.
Why Doesn’t the Calcium Salt Carry EPA and DHA Through?
The chemistry isn’t exotic. Rumens don’t like free polyunsaturated fats. Bugs like Butyrivibrio fibrisolvens hydrogenate double bonds to protect themselves, turning unsaturated fatty acids into saturated stearic acid. Calcium salts help by binding fatty acids at rumen pH so they don’t float free and nuke the microbes.
That works fine for palmitic and other less‑unsaturated fats. EPA carries five double bonds. DHA carries six. The more double bonds a fatty acid has, the weaker its bond with calcium at rumen pH gets. EPA and DHA pop off the calcium early, float free, and become exactly the kind of toxin rumen bacteria rush to saturate.
Some Ca‑salt manufacturers are working on improved omega‑3 protection chemistry, and that work may close part of this gap over time. The decision facing this herd today, though, was based on what their current product was actually delivering.
The end result is simple. Plenty of calories make it past the rumen as saturated fat. Very little EPA or DHA reaches the small intestine or gets built into tissue membranes. For this Midwest herd, the math suggested they were spending omega‑3 dollars and mostly getting saturated fat energy — while still living with sticky uteruses, summer milk loss, and DAs that wouldn’t budge.
That raised the harder question. If you’d never accept a methionine product with 15–25% bioavailability, why are you letting an omega‑3 product off the hook with the same profile?
How an Omega‑3 Failure Showed Up in the Fresh‑Cow Pen
On paper, this herd looked like a lot of progressive Midwest dairies. Close‑up DMI was steady. Body condition wasn’t a problem. Transition pens weren’t overcrowded. Fans and soakers were in. RP‑Met went in at the right rate. A fat blend with fish oil hit the mixer every day.
The fresh sheet kept telling a different story. Retained placentas wouldn’t get into single digits no matter what they tried with DCAD or close‑up grouping. Metritis stayed stubbornly high through whole calving stretches. DAs picked off cows who had given them no warning at all on the feed pad. None of it was catastrophic. It was just persistently “not where we want them.” Familiar?
The vet kept asking the same question every month at the meeting. If we’re doing all the obvious things right, what are we missing? Cow comfort wasn’t it. Energy wasn’t it. The team was running out of obvious answers.
When Heat Stress Stops Looking Like an Intake Problem
The vet’s question clicked into place with something else they’d been reading. Reviews on transition biology show systemic inflammation is almost universal right after calving, even when cows don’t look sick. That early fire is necessary; it helps deliver the calf and clear the uterus. The problem is what happens if the cow doesn’t have enough raw material to put it out.
Modern TMRs don’t help her. With corn silage, grains, and by‑products, omega‑6:omega‑3 ratios in dairy diets regularly run 10:1 to 25:1 instead of the 1–2:1 a grazing cow on lush pasture sees. Plenty of arachidonic acid to drive inflammatory pathways. Not much EPA or DHA to compete at the same enzymes.
Pasture‑heavy and graziers’ herds start in a different place. Fresh forage delivers meaningful baseline alpha‑linolenic acid, and the omega‑3 gap this herd was chasing is narrower in those systems. The math in this article is built for confinement and freestall operations whose cows see little or no grass.
Pair‑feeding research keeps showing only about half of heat‑stress milk loss is explained by intake. The other half is the physiological and inflammatory cost of being hot. Industry write‑ups summarizing recent heat‑stress trial work cite roughly 4.4 lb more milk per day and about 50% lower LBP — a blood marker of endotoxin load — in cows receiving abomasally infused or highly protected EPA/DHA. Treat those figures as a directional indicator drawn from secondary industry summaries rather than a fixed expectation pulled from a single named trial.
That sounded a lot like the “extra” milk this herd kept losing every July. They stopped assuming the fish oil line on the tag meant inflammation was covered.
The Day They Put Real Numbers to the Problem
Once the team accepted they had an inflammation problem, the next step was the kind of barn math any 500‑cow herd can run. They started by writing the actual numbers on the whiteboard. Retained placentas were running roughly 12%of calvings against a target near 5%. Metritis sat in the 16–18% range against a 10% target. DAs were holding at 4–5%against a target closer to 3%. Summer milk loss hit 7–8 lb/cow/day, and intake drops only explained 3–4 lb of it.
University benchmarks and field experience generally land under 5–8% RP, under 10–15% metritis, and under 3–5% DAs for Holsteins. This herd kept landing on the wrong side of every line — even after fixing the big stuff like DCAD and cow comfort.
Then they ran the disease math. RP at 12% versus a 5% target meant 35 extra cases a year. Metritis at 18% versus 10% meant another 40. DAs at 5% versus 3% meant 10 more. Not laboratory science. A realistic, conservative comparison for a herd doing most things right.
They pulled cost‑per‑case ranges from extension and economic summaries. RP runs about $150–$389/case. Metritis lands at $171–$386/case. DAs come in at $432–$639/case. Using mid‑range values: 35 × ~$270 ≈ $9,450. Forty × ~$280 ≈ $11,200. And 10 × ~$535 ≈ $5,350.
That’s roughly $26,000 a year in “above‑benchmark” transition disease cost without one clinical train wreck in the bunch. Worth keeping on the wall as a caveat: these are mid‑range cost‑per‑case values; actual herd costs vary with labor, lost milk, and culling assumptions.
Then they looked at heat stress. With 8 lb/cow/day of summer milk loss and intake explaining only 3–4 lb, that left a 4 lb “inflammation gap.” Over a 90‑day heat season, 4 lb × 500 cows × 90 days = 180,000 lb of milk. At a Class III milk price near $16.16/cwt — the figure carried through this thread for the March 2026 reference period — the math runs 180,000 ÷ 100 × $16.16 ≈ $29,088 in unexplained lost revenue. Run the same calculation against your current Class III or mailbox price before any decision; the dollar figure moves with the market, but the structural gap doesn’t.
Stack the two pieces and this 500‑cow herd was comfortably over $50,000 a year in avoidable transition disease and heat‑stress drag. Nobody at the table believed omega‑3 alone would erase that. Suddenly there was a big enough pot of money to justify checking whether their omega‑3 dollars were actually making it into cows.
“Cheap” Calcium Salts vs Real Omega‑3 Delivery: The Barn‑Math Flip
The farm wasn’t ready to throw calcium salts out of the ration. Palmitic‑based Ca‑salts still gave them the cheapest calories per pound of dry matter. But it was getting obvious they’d been expecting Ca‑salts to do a job they weren’t designed to do. The nutritionist drew up a comparison on the office whiteboard, using current commercial price ranges as the working assumption.
For the comparison, assume Product A is a calcium salt with fish oil at 250 g/kg EPA+DHA on the label, priced in the low single digits per kilogram. Product B is a verified bypass omega‑3 at the same 250 g/kg label claim, priced at roughly twice that. The ratio fits commonly observed price gaps but should be checked against your own supplier quotes before any commitment. Rumen data suggest roughly 80% of EPA and DHA are hydrogenated in Ca‑salt fish oil systems, leaving about 20% survival. The bypass technology is designed to protect EPA and DHA themselves; trials reported roughly 80% rumen bypass in protected forms.
Metric
Product A — Ca‑Salt + Fish Oil
Product B — Verified Bypass
Label claim EPA+DHA
250 g/kg
250 g/kg
Working price assumption
~1× (low single digits/kg)
~2× Product A
Rumen survival of EPA+DHA
~20%
~80%
EPA+DHA delivered per kg fed
~50 g
~200 g
Cost per gram delivered
~$0.06
~$0.03
kg/cow/day to deliver 10 g EPA+DHA past rumen
~0.20 kg
~0.05 kg
Relative $/cow/day at that delivered target
~2×
~1×
Cost‑per‑gram figures use a notional $3/kg for Product A and $6/kg for Product B to illustrate the 1×–2× price ratio described above. The ratio is what matters; replace with your own current supplier quotes before any commitment.
On the price assumptions above, the bypass product cost about half as much per cow per day to hit the same delivered EPA+DHA target. That changed the conversation from “bypass is too expensive” to “we’re paying more per gram of EPA/DHA delivered with this approach than we realized.” Calcium salts stayed in the ration for energy. The omega‑3 job moved.
Why They Started Treating EPA and DHA Like Methionine
This dairy was already paying for RP‑Met because they believed the biology. Methionine supports phosphatidylcholine and VLDL export from the liver, antioxidant systems like glutathione, and protein synthesis when cows are deep in negative energy balance. Let the rumen torch most of it and the cow pays for it later in early lactation.
EPA and DHA work a different but complementary side of the transition problem. EPA competes with arachidonic acid at COX and LOX enzymes, capping how hot and how long inflammatory peaks run. DHA is the precursor for resolvins, protectins, and maresins — molecules that actively shut inflammation down and promote tissue repair.
Work from Joseph McFadden’s lab at Cornell, with co‑supplementation findings reported in the Journal of Dairy Science, shows that when cows get both bypass EPA+DHA and rumen‑protected methionine, the story changes. Liver Functionality Index improves. Energy‑corrected milk goes up versus cows missing one or both. Reproductive performance within roughly 150 DIM tracks better in supplemented groups. Specific volume and issue numbers for the McFadden JDS co‑supplementation paper will be added at copy‑edit once the citation is pulled from the lab’s publication list.
For this herd, that was the last puzzle piece. Their methionine program was doing its job. Without enough EPA and DHA actually reaching tissues, the immune system was burning glucose longer than needed and the liver was fighting a bigger inflammatory load than it should — especially in older cows.
According to project communications from Australia’s Dairy UP program, lipidomic work led by researcher David Sheedy and colleagues drew on roughly two thousand blood samples from a cross‑section of commercial herds and tracked phospholipid fatty acids against health outcomes. The exact published sample frame and herd count will be reconciled with the Dairy UP source document at copy‑edit. Herds and cows with higher omega‑3‑rich lipid species tended toward better health and longevity. As cows moved into later parities, omega‑3 status dropped and risk of leaving the herd climbed. Not a controlled product trial. But it fit what this farm kept seeing: third‑ and fourth‑lactation cows were the ones that “didn’t bounce back” after calving or summer.
Options and Trade‑Offs for Farmers
Most dairies don’t need to copy this herd‘s ration to steal their decision process. The useful part is the framework, and there are several honest paths through it depending on your scale, labor, and risk tolerance.
Path 1 — Run the supplier audit first (30‑day action; works for any herd). Before you change a single pound of the ration, ask every “omega‑3” supplier this question: Show me in‑vivo rumen bypass or biohydrogenation data for EPA and DHA — not total fat or total PUFA — at the inclusion rate we’re feeding. If they can answer with real numbers, you’ve learned something useful. If they can’t, you’ve also learned something useful. Where it shines: zero ration risk, zero capital cost, immediate clarity on what you’re actually buying. Where it hurts: you might find out your favorite product can’t back up the line on the tag, and that’s an uncomfortable conversation.
Path 2 — Keep Ca‑salts for energy, move the omega‑3 job (most common). Palmitic‑based calcium salts still belong in high‑energy rations; nobody is arguing that. The flip is putting the EPA/DHA inflammation job on a product designed specifically for omega‑3 bypass, and feeding it where it pays — close‑up and the first 40–60 DIM, plus the heat‑stress window. Where it shines: lets you keep your cheapest energy source while finally putting real EPA/DHA into tissues. Where it hurts: higher per‑kg sticker on the bypass omega‑3 product even when the cost‑per‑gram‑delivered math goes the other way; expect pushback at first quote.
Path 3 — Run a paired on‑farm trial (90‑day action). Work with your nutritionist to compare a transition pen on calcium‑salt omega‑3 against a transition pen on documented‑bypass EPA/DHA. Track RP, metritis, DAs, early milk, and summer milk vs intake. Where it shines: turns a vendor argument into your own data. Where it hurts: requires real recordkeeping discipline, and small herds may not generate enough fresh cows in 90 days to make the numbers move convincingly.
Path 4 — Wait and watch the Ca‑salt category innovation. Some calcium salt manufacturers are working on improved omega‑3 protection chemistry. If your fresh‑cow numbers are already at benchmark and your summer milk loss is fully explained by intake drop, sitting tight while the category catches up is a defensible call. Where it shines:no change cost. Where it hurts: every summer and every transition cycle you’re above benchmark is real money walking off the farm — and “we’re already at benchmark” is a higher bar than most herds clear honestly.
The forward‑looking signal worth watching across all four paths: peer‑reviewed in‑vivo bypass data on calcium‑salt fish‑oil reformulations. If the gap closes, the math in Path 2 changes. Until it does, the gap is the gap.
What This Means for Your Operation
Apply your methionine standard to your fat bin. If your nutritionist demands in‑vivo bypass numbers on RP‑Met, they should be demanding the same on any product carrying EPA and DHA on the tag. One conversation, this month.
Read your fresh‑cow sheet for inflammation, not just energy. RP stuck above 8%, metritis above 15%, or DAs above 5% after DCAD, energy, and cow comfort are clean is a different problem than most herds are diagnosing.
Pull last summer’s milk and intake graphs side by side. If milk fell faster than intake — by 3 lb/cow/day or more — quantify the gap before next heat season. That’s your “inflammation bill” in real numbers, on your milk price.
Audit suppliers before you audit the ration. The 30‑day question — “show me in‑vivo EPA and DHA bypass data at our inclusion rate” — costs nothing and changes the buying conversation immediately.
Watch parity 3+ specifically. If your culls and transition wrecks cluster in older cows, treat that as an omega‑3 status flag, not a “those cows just got old” excuse. Dairy UP lipidomic work points the same direction.
Don’t throw the Ca‑salts out. Palmitic‑based calcium salts still earn their slot for energy. The job that moves is the EPA/DHA inflammation job — not the calorie job.
Keep watching Ca‑salt reformulations. If peer‑reviewed in‑vivo bypass data on next‑generation Ca‑salt fish oil ever closes the gap, the math in Path 2 changes. Until then, plan on the gap being real.
Key Takeaways
If you wouldn’t buy rumen‑protected methionine without in‑vivo bypass data, don’t let any product call itself your omega‑3 strategy unless it has in‑vivo EPA and DHA bypass numbers at the rate you feed.
If RP is stuck above 8%, metritis above 15%, or DAs above 5% even after fixing DCAD, energy, and cow comfort, you’re probably treating symptoms of unresolved inflammation rather than the nutritional gap that helps resolve it.
If summer milk regularly runs 3–5 lb/cow/day below what your intake drop predicts, you’re paying a real “inflammation gap” bill — and heat‑stress trials suggest verified bypass EPA/DHA can claw back roughly 4 lb of that in the right setups.
Calcium salts of palm fats still belong in high‑energy rations. For inflammation‑focused EPA and DHA delivery, the evidence reviewed here suggests omega‑3‑specific bypass technologies deliver more EPA/DHA per dollar than fish‑oil calcium salts.
If third‑ and fourth‑lactation cows are over‑represented in your transition wrecks or early culls, treat that pattern as a parity‑driven omega‑3 status flag — not a “those cows just got old” excuse.
This 500‑cow Midwest dairy didn’t fix everything in one ration change. They started by holding their fat program to the same standard they were already demanding from their amino acid program — and once they did, the cost of not doing it stopped looking abstract.
Look at your own fresh‑cow sheet and your last summer’s milk graph. Where would the gap have to be on your operation before you’d ask your nutritionist for in‑vivo bypass data on every “omega‑3” line on the tag — and what would it cost you to wait another transition cycle to find out?
Complete references and supporting documentation are available upon request by contacting the editorial team at editor@thebullvine.com.
The Heat‑Stress Milk You Can’t Blame on Intake — Exposes the hidden metabolic mechanisms behind hot-weather performance slumps, mapping out strategic adjustments to help your herd navigate regional multi-week heat events without suffering extensive physiological margins drop.
Rumen‑Protected Methionine in Transition: Where the ROI Actually Lives — Delivers a critical benchmark analysis for the transition pen, shifting the decision framework from simple feed expense lines to measurable health improvements, liver functionality indices, and early-lactation peak volume gains.
Cost‑of‑Disease 2026: What a Single Fresh‑Cow Case Really Runs Now — Follows the money on modern dairy health economics by breaking down hyper-inflated labor, treatment, and culling costs into updated per-case values to protect localized margins from systemic transition failures.
The Sunday Read Dairy Professionals Don’t Skip.
Every week, thousands of producers, breeders, and industry insiders open Bullvine Weekly for genetics insights, market shifts, and profit strategies they won’t find anywhere else. One email. Five minutes. Smarter decisions all week.
Henry Yoder had 10–12 cows out of the tank every single day. Same barns, same crew, same seven‑day treatments on repeat. Then he stopped reaching for the tubes first.
Henry Yoder of More‑To‑Do Farms in Durand, Wisconsin — the herd manager whose 1,100‑cow Holstein operation cut mastitis treatments 50–75% and dropped daily hospital cows from 10–12 down to 5–6 by putting biofilm‑first protocols in front of the antibiotic cabinet.
When Henry Yoder looked at his treatment logs for More‑To‑Do Farms’ 1,100 Holsteins in Wisconsin, he didn’t see a mastitis “program.” He saw the same cows cycling through seven‑day antibiotic treatments, over and over, with 10–12 cows out of the tank every single day. That’s a lot of milk in the hospital pen instead of on the milk check.
Two years later, Henry’s numbers look very different. Mastitis treatments are down 50–75%, hospital cows dropped to 5–6 a day, treatment duration shrank from seven days to two or three, and one barn has held bulk tank SCC under 100,000 for two straight months — on sawdust, not sand.
This isn’t a story about a magic new tube. It’s about changing what you aim at: biofilm‑protected udder infections that antibiotics alone were never designed to solve, and a different way to think about mastitis economics when replacement heifers are sitting around $3,000 a head.
What Changed on Henry’s Farm — And Why It Matters
Henry manages two Holstein dairies under the More‑To‑Do Farms umbrella in Wisconsin — about 1,150 milking and dry cows across two milking sites, plus roughly 650 head of heifers raised by a custom grower. The business was founded by Doug Knoepke in 1978 and has grown into a seven‑site operation united by a simple mission: “Passionate with Integrity and Ingenuity, for Our People, Our Cows, and Our Land.”
On paper, Henry’s herd looked solid. Cows were monitored with smaXtec boluses, which flag health problems via changes in internal temperature and rumination, roughly 24 hours before your milkers would spot them. His crew was steady. Stalls were clean. Milk was headed to Grassland for butter starting January 15, so every pound counted.
But the mastitis log told a different story. Cows were getting seven‑day courses of Spectrum SLC, clearing up, then flaring again a month later with the same quarter hot and the same cow back in red bands. Across the two dairies, they still averaged 10–12 cows out of the tank every day.
“We are not here to milk a cow for three years. We want long‑term cows that are going to be here for 10 years.” — Henry Yoder.
So Henry did something uncomfortable: he changed the order of operations. Instead of reaching for antibiotics first, he put AHV’s quorum sensing inhibition (QSI) boluses in front of the drug cabinet and let smaXtec call the shots on which cows to touch.
What’s Really Driving These Chronic Mastitis Cases?
You already know the basics. When bacteria first hit an udder, they’re floating free — planktonic — and that’s where your intramammary tubes do their best work.
Trouble starts when those bacteria get organized. Through quorum sensing, they “talk” to each other chemically. When enough of them are present, they build a biofilm: a slimy, protective fortress embedded in udder tissue that shields them from immune cells and antibiotics.
Here’s the ugly part:
Bacteria inside a biofilm can be 10–1,000 times less susceptible to antibiotics than the same strain floating free.
Biofilms are involved in roughly 80% of chronic and recurrent infections in people and animals.
So when you treat that high‑SCC cow and she looks good for a month, then blows up again after calving or a pen move, it’s not always “treatment failure.” Often, it’s biofilm success. You killed the scouts. The fortress stayed.
Henry saw it in his own barn: “If you use a certain drug for years and years and years, they’ve got to build some resistance to it. … With Spectrum, all of a sudden you’re treating her three times in a lactation.” With the AHV protocol, he says, “there are very few cows that we treat with Spectrum twice in their lactation.”
That’s the pattern this QSI approach is trying to break.
How Does Quorum Sensing Inhibition Fit In?
AHV’s whole play is built around quorum‑sensing inhibition — essentially jamming the communication channelsbacteria use to organize and form biofilms.
Instead of trying to force more antibiotics through the fortress, AHV’s boluses use plant‑derived compounds to disrupt bacterial signaling. Knock out communication, and bacteria can’t coordinate biofilm formation or switch on their virulence genes. They stay exposed, and the cow’s immune system has a fair shot again.
Dr. Gertjan Streefland, AHV’s founder and chief science officer, puts it in barn‑language:
“If you have a group of nasty people, you blindfold them and make them deaf. They cannot communicate anymore. So you’re immediately harmless.”
External RTI lab work backs up the lab‑side claims: AHV’s patented compounds inhibit biofilm formation in field bacteria from both gram‑positive and gram‑negative species, with no resistance development detected in their tests. Because you’re not killing bacteria directly — you’re disabling their communication — there’s less selective pressure for resistance.
That’s the science layer. The question is whether it actually moves the needle in real barns like yours.
What Did Henry Actually Change Day‑to‑Day?
Henry didn’t throw out antibiotics. He just stopped letting them be the first move every time a cow blipped.
Here’s his current play on mastitis‑type alerts:
Step 1: Let the tech holler first. smaXtec flags a health problem — usually a temperature or rumination change — often a full day before anyone in the parlor would have noticed.
Step 2: Hit biofilms first. The flagged cow gets an AHV Quick bolus right away, followed by Aspi. That’s the first line of defense now, not the last.
Step 3: Wait 2–3 days. They give the cow’s immune system time to work with the bolus. If she clears, they never open the antibiotic drawer. If she doesn’t, then they treat — but it’s the exception, not the rule.
“Before, they were treating these cows for seven days,” Henry says. “All of a sudden, they were treating these cows for two to three days, and then back in the tank. Then we put the protocol in that they’re going to wait two to three days after the pill before we start treating. After that, all of a sudden, we hardly had any treated cows.”
He still leans on the broader udder‑health protocol — Quick, Extra, Aspi, and Booster — around high‑risk windows like dry‑off and the first weeks fresh. But the everyday story is simple: detect early, hit biofilms first, only reach for tubes if you still need them.
There’s also a human piece. “Nobody likes treating the cow,” Henry says. “Anytime we don’t have to treat a cow and put red bands on it, it is a positive thing.” More‑To‑Do doesn’t run a separate sick‑cow pen, so fewer treated cows also mean fewer chances for withheld milk to sneak into the tank.
Step
Old Protocol (Antibiotic-First)
New Protocol (Biofilm-First)
Why It Changed
Detection trigger
Milker spots clinical signs in parlor
smaXtec temp/rumination alert ~24 hrs early
Earlier catch = smaller biofilm load
First intervention
7-day Spectrum SLC intramammary course
AHV Quick bolus + Aspi immediately
Target biofilm communication, not just planktonic bacteria
Wait window
Treat continuously for 7 days
Wait 2–3 days; let immune system work
Antibiotic decision made after biology has a chance
Antibiotic decision
Default YES on day 1
Only if cow doesn’t turn corner by day 3
Exceptions, not the rule
Avg treatment duration
7 days
2–3 days
Fewer withhold days, less labor
Retreatment rate
Same cow, same quarter, multiple times/lactation
Rare second treatment per lactation
Biofilm disruption reduces cycling
Cows out of tank
10–12/day
5–6/day (Farm 1); 1.5/day (Farm 2)
Hospital pen nearly eliminated on Farm 2
Milk dumped risk
High (red bands on multiple cows daily)
Low (red band cows are an exception)
Fewer chances for a missed band to dump a tank
Micro Barn Math: What Did That Change Put Back in the Tank?
Let’s run Henry’s numbers with today’s price deck so you can map it to your own herd.
USDA’s March 2026 WASDE pegs the 2026 all‑milk price at $19.70/cwt, down about $1.47 from 2025’s revised average of $21.17.
On Henry’s first farm, he went from 10–12 cows out of the tank daily to 5–6 cows. Call it 5.5 cows recovered on an average day.
Assume:
75 lbs/day per cow.
At $19.70/cwt, that’s $0.197 per lb.
Each recovered cow puts 75 × $0.197 ≈ $14.78/day back into saleable milk.
Over a year: 5.5 cows × $14.78 × 365 ≈ $29,680 of milk that used to live in the hospital pen. (Bullvine estimate using Henry’s reported reduction and USDA March 2026 WASDE price.)
That’s just the recovered milk, not counting fewer tubes, less labor catching treated cows, or the risk of dumping a whole tank if someone misses a leg band.
On Henry’s second site — 570 cows — he’s averaging just 1.5 cows out of the tank on a given day. That’s less than 0.3% of the herd. He actually has to pull some high‑SCC cows from the tank to have enough whole milk to feed calves — a problem you don’t hear often.
Now scale that down. If you’re a 500‑cow herd with, say, 5 cows out of the tank most days, and you cut that in half, you’re recovering roughly:
You can plug in your own pounds and price, but the shape of the math won’t change much.
How Big Is the Mastitis Hole in Your Own Budget?
You already know mastitis isn’t cheap. But putting some numbers around it helps you decide whether a protocol shift is worth the fight.
A few benchmarks:
Bovine mastitis is estimated to cost the global dairy sector up to $35 billion a year.
Dr. Pam Ruegg’s work on 37 Wisconsin dairies (averaging ~1,300 cows) found per‑case clinical mastitis treatment costs ranging from $120 to $330 for essentially the same disease, depending on how the farm managed days treated and drug choices.
In that same dataset, 83% of farms treated clinical mastitis longer than the label allows — meaning a big chunk of cost was self‑inflicted.
Now overlay today’s replacement math.
USDA and CoBank data show replacement heifers hitting about $3,010 per head in July 2025 — up roughly 164%from around $1,140 in April 2019. Later USDA estimates pushed that as high as $3,110 in late 2025 before backing off slightly, but top heifers in some regions still clear well above that.
According to AHV’s Benelux Longevity TIS, a multi‑farm dataset of 2,161 cows built on CRV records, the protocol works out to a lifetime ROI of $3,447.20 per cow, tied to:
8,653 kg more lifetime milk per cow.
About €0.44 more revenue per day of life.
A 19.8% lower replacement rate compared to Dutch CRV averages.
That’s not Henry’s own ROI sheet; it’s a multi‑farm European dataset. But it tells you this much: if you can safely keep cows productive longer and keep them out of the hospital pen, the compound economics are very real.
Can Other Farms Really Reproduce What Henry Is Seeing?
No two herds are the same. But Henry isn’t the only one seeing this kind of shift. AHV’s trial and field data, plus farm stories from different regions, point in the same general direction: less antibiotic use, fewer repeats, and more years on good cows.
Here’s what’s been measured so far:
Region
Farms / Cows
Key Results
Source & Timing
UK
14 farms, 2,774 cows
62% less antibiotic use for mastitis, 42% fewer clinical cases, +29.3% 1st‑service conception
AHV HHP Progress, 2023–2024
Germany
6 farms, 325 cows
75.7% drop in SCC (P<0.05), ROI 1.65, ≈€140 per cow
AHV Udder Health TIS, 2021–2022
Germany (Thünen Institute)
1 farm, 11 cows (pilot)
€1.54 return per €1 invested, ~260.6 kg less waste milk per cow
Federal research institute, 2024
USA (Reactive udder health)
8 farms, 3,316 cows
6 fewer hospital days per cow; $151.53 lower cost/cow from less waste milk and labor
AHV TIS, 2022–2023
Benelux (Longevity)
2,161 cows
+8,653 kg lifetime milk, €0.44 more per day, 19.8% lower replacement, $3,447.20 ROI/cow
AHV Benelux Longevity TIS, based on CRV data
USA (Transition & Fertility)
8 farms, 4,495 cows
+3.2 kg/day milk first 100 DIM, −34% metritis, ROI 5.04 (~$160.76 per cow)
AHV Transition/Fertility TIS, 2024
There’s also an independent trial you’ll want to watch: Texas A&M’s SARE project OS24‑178, “Evaluating a Non‑antibiotic Treatment of Mastitis in Organic Dairy Cows.” The project calls for about 120 lactating Holsteins in a Texas organic herd, randomized to AHV vs. organic standard care, with bacteriology, PCR, and SCC performed at TAMU.
That’s the kind of third‑party data vets like Ruegg have been asking for. Results are still pending. Until they land, you’re looking at:
Company‑associated multi‑farm field data.
A small but credible federal pilot (11 cows at Thünen).
Real‑world stories like Henry’s and Karl Gabrielse at Quonset Farms, where fresh cow problems dropped from 20% to 2% and conception rates climbed 6 points after implementing AHV protocols.
It’s not a slam‑dunk RCT portfolio yet. But it’s enough signal that serious producers are at least testing QSI, not just dismissing it outright.
Is the $3,447 ROI Number Something You Can Bank On?
You shouldn’t bank on anyone’s ROI number — ours, AHV’s, or your neighbor’s — without running your own. But you can use it as a reference point.
The $3,447.20 per cow comes from AHV’s Benelux Longevity TIS, built on CRV data across 2,161 cows. It represents extra lifetime milk, fewer replacements, and more revenue per day of life. It’s an average across many herds in a European system, not a guaranteed outcome for your barn in Wisconsin, Ontario, or New York.
Treat it like a sire proof:
Directionally useful.
Needs to be filtered through your milk price, your cull rate, and your vet’s comfort level.
If you want the deep dive on how longevity, replacement cost, and cull‑rate math actually stack up, that’s a follow‑up article on its own.
What Does This Look Like Operationally in Your Barn?
Switching any protocol — AHV or otherwise — creates friction. You’re asking people to change how they’ve done things for years.
Based on Henry’s experience and the trial data, you can expect a few things if you go down this road:
Less time in the hospital pen. AHV’s US reactive udder‑health TIS showed 6 fewer hospital days per cow, and Henry’s own numbers match that direction.
Shorter treatment windows. Seven‑day courses turned into two‑to‑three‑day interventions, often without tubes at all.
Fewer withhold headaches. Fewer drugged cows mean fewer chances for a red‑band miss to turn into a dumped tank.
Higher bar for milker prep. Henry is blunt: “It’s everything hand in hand. It’s on the milkers too — they have to do a good job of prepping. Clean stalls, everything plays hand in hand.”
If your stalls are sloppy and your prep is inconsistent, no bolus in the world is going to bail you out. Quorum sensing inhibition is a layer, not a shortcut past basic udder hygiene.
How Bad Is Your Udder Problem Really, and Is It Worth Changing Protocols?
First move is boring and free, but it’s the one most farms skip: audit your own records.
In the next 30 days, sit down with your DHIA reports and cull log and do three things:
Calculate udder‑related culls for the past 12 months.
What percentage of involuntary culls are tagged to mastitis, high SCC, or udder health?
If you’re north of 20%, you’ve probably got a structural udder‑health issue, not just bad luck.
Count your average hospital‑pen load.
On a typical day, how many cows are out of the tank?
If more than 1–1.5% of your herd lives there, you’re leaving more on the table than you think.
Pick three “problem cows” and follow the money.
How many times have you treated each this lactation?
How many days was each cow out of the tank per treatment?
Are they still in the string or on a truck?
Once you see those numbers on paper, you’ll know if a biofilm‑first approach is worth trialing — or if you’re mostly dealing with basics you can tighten up without changing products.
Metric
Green Zone
Yellow Zone
Red Zone — Act Now
Henry’s Farm 1 Start
Udder-related culls (% of involuntary culls)
< 10%
10–20%
> 20%
Not disclosed
Hospital pen load (% of herd on any day)
< 0.5%
0.5–1.5%
> 1.5%
~1.0% (10–12 of 1,100)
Avg treatment duration per clinical case
≤ 3 days
4–6 days
7+ days
7 days
Cow retreatment rate (same quarter, same lactation)
Rare (<1/cow/yr)
Occasional
Cycling repeaters on your list
Same cows monthly
Bulk tank SCC (cells/mL)
< 100,000
100,000–200,000
> 200,000
Not disclosed (Farm 2 now < 100k)
Replacement heifer cost (current regional price)
< $2,000
$2,000–$2,500
> $2,500
~$3,010 (national avg, July 2025)
If You Try a Biofilm‑First Protocol, Where Do You Start So It Doesn’t Blow Up in Your Face?
If your audit says, “Yeah, we’ve got an udder problem,” the next question is where to start without turning the barn upside down.
Best candidates for a trial:
Chronic repeaters you’re already thinking about culling.
High‑SCC cows caught early by monitoring systems (SCR, smaXtec, activity collars) before a quarter blows up.
Herds where stalls and prep are decent, but the same cows keep showing up on the treatment list.
Henry’s path looked like this:
Add smaXtec (or use what you already have) for early alerts.
When an alert hits, reach for Quick + Aspi first, not tubes.
Give it 2–3 days and let the cow’s immune system work with the bolus.
Only bring in antibiotics if she doesn’t turn the corner.
The big operational risk is confusion. Your team has to know:
Which cows are “AHV only.”
Which cows are on antibiotics.
Exactly when each cow is safe to go back in the tank.
The win is when “red‑band” cows become the exception — not a daily pattern your milkers are numb to.
Sponsored Post
Options and Trade‑Offs for Farmers
Path 1: 30‑Day Paper Audit (No Products, Just Records)
When it makes sense: If you don’t actually know your udder‑related cull rate or your average hospital‑pen load, this is your starting line.
What it requires:
One afternoon with your DHIA reports, cull records, and a notepad.
Maybe your lender, vet, or nutritionist on the phone for a second set of eyes.
What you get:
A clean “here’s where we stand” view on udder‑related culls, hospital‑pen load, and retreatment patterns.
The ability to plug your numbers into any ROI discussion — whether it’s AHV, a different product, or just tightening milking routines.
If your numbers are already good — low udder culls, low hospital counts, stable SCC — you may decide you’re doing enough. If they’re rough, at least you know you’re not imagining it.
Path 2: 90‑Day Pilot on Your Worst Group
When it makes sense: If your audit shows a clear udder problem and you’ve got a handful of chronic cows chewing up labor and drug spend, but you’re not ready for a whole‑herd flip.
What it requires:
Agreement with your herd vet on which cows qualify and how you’ll track them.
A written protocol — for example, “AHV Quick + Aspi on first alert, wait 2–3 days, then decide on antibiotics.”
Clean notes on SCC, hospital days, and total treatments over those 90 days.
What it costs:
We do know from German and US TIS data that:
In Germany, AHV’s udder‑health protocol showed an ROI of 1.65 and about €140 per cow benefit, driven by lower SCC and less waste milk (AHV Udder Health TIS, 2021–2022).
In US reactive udder‑health trials, farms saw 6 fewer hospital days per cow and about $151.53 per cow in reduced costs between waste milk and labor (AHV TIS, 2022–2023).
Risks and limits:
If your basics are weak, you might not see much improvement.
If your team isn’t on board, partial compliance will muddy the waters and make the trial look “inconclusive.”
At the end of 90 days, you should know if your chronic problem cows are still chronic — or if you’ve actually broken the cycle.
Path 3: 12‑Month Whole‑Herd Strategy Shift
When it makes sense: If you’ve nailed the basics, your hospital pen is still busier than you like, and you’re serious about pushing cows to fifth lactation and beyond — the way Henry is aiming for 20% of his herd there.
What it requires:
Full buy‑in from your vet, herd manager, and parlor crew.
A clear written protocol around dry‑off, fresh cows, and “alert” cows.
The patience to let biology catch up to your ideas — you’re changing the baseline, not flipping a switch.
Upside:
Higher probability of hitting the kinds of numbers seen in the AHV Benelux Longevity TIS — more older cows, lower replacement pressure, more milk per day of life.
A different relationship with antibiotics, which matters as regulations and consumer expectations tighten around antimicrobial use.
Risks and limits:
You’re betting on company‑associated data plus one small independent pilot and an in‑progress Texas A&M trial. The science of biofilms is solid, but product‑specific proof is still developing.
If milk prices or replacement markets swing again, the economics of longevity can shift too.
This is not a “set it and forget it” option. It’s a management philosophy change.
Key Takeaways
If more than ~20% of your culls are udder‑related or more than 1–1.5% of your herd lives in the hospital pen, you’ve got a structural udder‑health problem. Start with the 30‑day record audit before you try to buy your way out of it.
If the same cows keep cycling through mastitis treatments, there’s a good chance biofilms are part of your problem. That’s when it makes sense to at least pilot a biofilm‑first protocol with your vet, whether it’s AHV or another approach.
If replacement heifers are running in the $3,000 ballpark in your region, every cow you keep productive for one more lactation is worth a second look. Longevity‑driven ROI like the $3,447/cow figure (AHV Benelux Longevity TIS) comes from compounding effects — more older cows, fewer replacements, more milk per day of life — not just drug savings.
If your stalls are dirty, your prep is inconsistent, or your milking system is out of tune, fix those first. No QSI bolus, no matter how clever, will outrun bad basics. Even Henry is clear: the science helps, but it rides on cow comfort and routine.
You don’t have to be sold on AHV for this article to matter. You have to answer some uncomfortable questions about how many cows you’re really losing to udder health and how much milk is living in your hospital pen instead of on your milk check.
Henry didn’t change because of a white paper. He changed because his own numbers wouldn’t shut up.
In the meantime, pull your records, count your hospital cows, and ask yourself a simple question:
What would your barn feel like if half the red‑band cows disappeared from the string next month — for the right reasons?
Complete references and supporting documentation are available upon request by contacting the editorial team at editor@thebullvine.com.
Learn More
Robotic Milking & Mastitis: The Hidden Profit Killer in Your Barn — Overcome the unique udder health obstacles of automated systems with five targeted management strategies. This implementation guide exposes why subclinical mastitis drains $662 per cow annually and outlines the exact protocols to salvage leaking margins.
The $1700 Longevity Paradox: How One 1700-Cow Dairy Cut Udder Culls in Half — Disrupt conventional culling habits with an inspection of multi-farm, peer-reviewed data tracking biofilm intervention. This case study details how a massive 23% reduction in culling probability can add $1,700 in lifetime profit per cow.
The Sunday Read Dairy Professionals Don’t Skip.
Every week, thousands of producers, breeders, and industry insiders open Bullvine Weekly for genetics insights, market shifts, and profit strategies they won’t find anywhere else. One email. Five minutes. Smarter decisions all week.
The calf buyer wanted more. The spreadsheet said cap it at 35%. ERS forecasts 25.31B lbs of beef in 2027 and heifers near $3,800. The lever’s on your breeding sheet right now.
Editor’s Note: The following case study is a composite scenario modeled from multiple Eastern U.S. herds reviewed by The Bullvine and its consulting sources in Spring 2026.
The breeding meeting was a kitchen table, three coffees, and a stack of October calf tickets the buyer had been calling about for weeks. A 500-cow Eastern dairy was about to push beef semen from 45% of services up to 55%. Day-old beef-on-dairy calves were clearing roughly $1,200 a head. The math for “more beef” looked like free money.
By the end of the meeting, beef was capped at 35%. That single line on the consultant’s spreadsheet — going from 45% to 55% beef — carried roughly $97,000 a year in net profit risk under the herd’s real assumptions. That’s the beef-on-dairy economics 2026 story most spreadsheets aren’t catching.
What USDA Just Told Both Sides of the Barn
USDA’s Economic Research Service released its May 2026 Livestock, Dairy, and Poultry Outlook (LDP-M-383) in mid-May. The cattle headlines are loud. ERS forecasts U.S. beef production at 25.547 billion pounds in 2026 — down 243 million pounds from April’s projection — and 25.310 billion pounds in 2027, a 0.9% year-over-year decline and one of the lowest annual U.S. beef production figures of the past decade.
Feeder steers in the 750–800 lb range at the Oklahoma City National Stockyards traded near record territory the first week of May 2026, with reported daily averages around $388/cwt in the AMS Oklahoma City weekly summary. Slaughter steers ran in the same neighborhood, in the $258/cwt range on the AMS 5-Area Weekly Weighted Average for the same window. ERS expects new highs across feeder, slaughter, and cull cattle through 2027.
Then there’s the line dairy operators should read twice. ERS notes dairy cow slaughter is running at multi-year lows, partly because beef-cross calf returns are keeping marginal cows in the parlor longer.
That’s a feedback loop, not a coincidence. More beef-on-dairy calves means tighter beef supply means stronger cattle prices means even more beef-on-dairy calves. It also masks how thin your replacement pipeline has become.
The Other USDA Report Nobody’s Putting on the Same Page
Flip to NASS and CoBank, and the picture inverts. The January 30, 2026 NASS Cattle Inventory shows roughly 3.90 million dairy replacement heifers as of January 1, 2026 — the lowest count in the recent NASS historical series. CoBank Knowledge Exchange’s Q1 2026 dairy quarterly modeling has the U.S. short about 800,000 heifers through 2026, with 2027 adding back only around 285,000.
National replacement heifer prices sit near $3,010/head in current AMS National Dairy Market News reporting. Tight regional markets — Equity Cooperative Livestock Sales Association at Reedsville, Wisconsin and Northeast dairy auctions through April and May 2026 — have been clearing $3,800–$4,800/head. That’s the 2027 heifer pen showing up early.
Two charts. One collision. Beef-on-dairy calf revenue has rarely paid better. The dairy replacement pipeline has rarely been thinner. The same lever on your breeding sheet — beef semen percentage — controls both numbers, and the cost of getting it wrong is bigger in both directions than it was even two years ago.
Running the Numbers: 35% vs 55% Beef on a 500-Cow Eastern Dairy
Scenario
Heifers to First Calving
Net Heifer Status
Beef Calf Revenue
Net Calf+Heifer Balance
35% Beef
~231
+66 Surplus
$210,000
$408,000
45% Beef
~196
+31 Surplus
$270,000
$363,000
55% Beef
~160
-5 Deficit
$330,000
$311,000(–$97K vs 35%)
This is the spreadsheet that ended the meeting. Every figure here reflects the herd’s stated assumptions, not a regional benchmark. Plug your own numbers in and watch what happens.
The consultant who chaired the meeting summed up the cap this way: when the calf market is hot and the heifer market is hotter, you don’t pick the percentage that maximizes today’s revenue — you pick the one your 2028 milking string can survive. That’s the rule that landed beef at 35%.
The inputs:
500 cows, 30% cull rate
Age at first calving (AFC): 24-month target, 26-month actual
Heifer non-completion (born to first calving): 21% (79% completion), consistent with USDA NAHMS Dairy mortality and culling commentary
Beef-cross day-old calf value: $1,200/head
Replacement heifer purchase price: $3,800/head
Surplus heifer sale price: $3,000/head
Sexed dairy semen: 42% conception, 90% heifer ratio, 79% rearing-completion, drawn from the 85-herd commercial Holstein dataset associated with Dr. Michael Overton’s published Zoetis work
Beef semen conception: 57%
Services-per-pregnancy: 2.4 sexed dairy / 1.8 beef, consistent with the consultant’s economic matrix
The Forward Replacement formula every operator should know by heart:
Plug it in: 500 × (26/24) × 0.30 × 1.21 ≈ 197 heifers/year to hold herd size at this herd’s actual AFC and non-completion. Note the gap. The herd’s original spreadsheet baseline was 165 heifers, built off a 24-month AFC and a 10% non-completion default. The scenarios below run against that 165 figure — the same number the consultant’s spreadsheet used the day of the meeting. Run yours against your own real-world AFC and non-completion before quoting any of this as your own.
The table that ended the meeting
Scenario
Heifers to First Calving
Net Heifer Status
Beef Calf Revenue
Net Calf-and-Heifer Balance
35% Beef
~231
+66 (Surplus)
$210,000
$408,000
45% Beef
~196
+31 (Surplus)
$270,000
$363,000
55% Beef
~160
–5 (Deficit)
$330,000
$311,000
Net-net: 55% beef adds $120,000 in calf cheques and quietly costs $97,000 once the replacement bill arrives. Bigger top line. Smaller bottom line.
“The calf cheque got bigger. The bank account got smaller.”
What’s the Trap Hiding Inside a $1,200 Calf?
Timing. The calf cheque shows up tomorrow. The replacement bill shows up two breeding seasons from now.
That’s the whole trap. There’s no way to make it disappear. The biology runs on a 24-to-30-month clock, so by the time a thin pipeline shows up empty in the parlor, the cows that should have been bred to sexed dairy are dry, sold, or already gone. You can’t unwind a 2025 breeding decision in 2027. You can only pay for it.
Everyone assumed the calf cheque was pure upside. The math says it’s a loan against your 2028 milking string, and the interest rate depends on what replacements cost when the bill arrives.
Scaling Up: What This Looks Like at 1,200 Cows
Run the same Eastern-herd inputs at a 1,200-cow operation and the modeled gap between 35% and 55% beef widens to roughly $235,000 in net calf-and-heifer balance. Drop the calf price toward $900 — within the range U.S. markets have hit before — and the gap widens further, because the lost calf revenue inside the 55% scenario can no longer cover the locked-in heifer purchase exposure.
The October 2025 Warning Shot
AMS regional calf reporting in mid-October 2025 described day-old beef-on-dairy calf values dropping in the $150-plus per-head range over roughly two weeks of trade. Anyone running a breeding program built on top-of-cycle calf prices got an unwelcome stress test, fast.
What Does Your Calf Have to Clear to Beat a Sexed Dairy Service?
The right comparison isn’t calf price. It’s expected value per service. Here’s the cleanest version of the math.
Using the Overton/Zoetis 85-herd Holstein assumptions (42% sexed-dairy conception, 90% heifer ratio, 79% rearing-completion, 95% pregnancy survival), gross expected value per sexed-dairy service comes to roughly $854 at $3,010 replacements, ~$993 at $3,500, and ~$1,163 at $4,100. These are gross EV figures before rearing and opportunity-cost adjustments. Apply your own cost stack to land on a net EV for your operation. Beef-on-dairy at a $1,200 calf and 57% conception comes in around $650/service after a small marketing-and-mortality adjustment.
That sets the crossover — the day-old beef calf value where beef finally matches sexed dairy on EV. On a pure gross-EV equivalence (EV ÷ 0.57 conception), the crossovers come in at roughly $1,498 / $1,742 / $2,040 at $3,010 / $3,500 / $4,100 replacements. Layering in rearing and opportunity-cost terms — heifers cost real money to grow, and a sexed dairy service forecloses a beef calf that day — pushes the crossovers to roughly $1,580 / $1,931 / $2,262 in the consultant’s full cost-adjusted matrix.
Replacement Heifer Price
Gross EV Crossover ($/calf)
Full Cost-Adjusted Crossover ($/calf)
Typical Regional Market (May 2026)
Below Crossover?
$3,010/head
$1,498
$1,580
~$1,200
Yes — $380 below
$3,500/head
$1,742
$1,931
~$1,200
Yes — $731 below
$4,100/head
$2,040
$2,262
~$1,200
Yes — $1,062 below
$3,800 (AMS tight mkts)
$1,895
$2,100
~$1,200
Yes — $900 below
The exact crossover dollar varies by which cost stack you use. The conclusion doesn’t: most regional U.S. calf markets we’ve reviewed are clearing well below either set of numbers. A lot of breeding sheets look profitable on the calf invoice and quietly leak value on the replacement side.
Is Your Heifer Pipeline Already Telling You Something Your Spreadsheet Isn’t?
The metric most operators don’t track monthly: total replacement heifers in inventory divided by total milking cows. Treat it as a Bullvine planning framework consistent with Penn State Extension replacement-economics commentary.
0.80–0.90 = Optimal
0.70–0.80 = Caution
Below 0.70 = Red
In the 500-cow Eastern model this article is built on, the pipeline ratio sat at 0.70–0.75 when the breeding meeting started. Eighteen months out, with the modeled 35% beef cap and sexed dairy locked onto the top genomic and high-fertility cows, the projected ratio climbs into the mid-0.80s. That’s a model projection from the consultant’s spreadsheet — not a measured outcome — and the phase pattern is what’s worth borrowing even if your numbers don’t match.
Pregnancy mix typically shifts within ~90 days of a protocol change. Heifer birth pattern shifts at roughly six months.
The pipeline ratio itself doesn’t catch up until ~9 months out. It often lands behind the spreadsheet because real-world non-completion (closer to 21% than the 10% most working spreadsheets default to) and AFC drift take bigger bites than projected.
That gap — between NAHMS-documented heifer non-completion and the assumptions sitting inside most working spreadsheets — is the one most often catching operators by surprise. Run your own Forward Replacement formula with your actual AFC and your actual non-completion before you set a beef percentage. Not last year’s. This month’s.
Options and Trade-Offs for Farmers
Action 1: Execute the 30-Day Pipeline Audit
Pull your last 12 months of heifer births, multiply by 0.79 to estimate completions (that’s 1 minus the 21% non-completion rate), and stack it against your (herd size × cull rate). Calculate your heifers-per-cow ratio and your real annual replacement need. If your ratio drops below 0.80, your beef percentage is already too high — no matter what the calf buyer is promising today. Requires clean DHIA or on-farm records, two to four hours depending on how clean those records are, and the willingness to act on the answer. Where it backfires: sloppy birth or AFC records produce false confidence in either direction. Forward-looking signal: if ERS’s 2027 forecast holds and replacement prices stay firm into 2028, this audit is the cheapest defense against a 2028 milking-string shortage.
Action 2: Implement a Dynamic Breeding Band
Stop treating beef percentage as a static number. Base it at 35% only when your 21-day pregnancy rate stays above 30% and your pipeline ratio sits comfortably between 0.80–0.90. If either metric slips, aggressively choke beef back to 25–30%. Pull beef entirely if dairy pregnancies drop below 42% of weekly total for three consecutive weeks. Requires weekly repro reporting and someone with veto authority who can hold the cap when the calf market argues against it. Let the metrics run the cap, not the calf market.
Action 3: Enforce Strict Genomic Quartiles
Lock sexed dairy onto your top 25–30% cows by GTPI/NM$ and components. Beef goes on the bottom genomic quartile, repeat breeders, and old parities. Period. No “she looks good” overrides. That’s how the protocol collapses by month three.
What this requires in practice: genomic testing on every heifer (commercial Holstein testing runs $40–$50 per animal, varying by lab and CDCB nomination fees), a written eligibility rule, and an exception protocol that forces a one-for-one heifer trade rather than a one-way override. If average GTPI on your fresh 2-year-old string ticks up materially over 18 months, the protocol is working before the pipeline ratio fully catches up.
Action 4: Stress-Test the Plan at $900 Calves
If the math only works at $1,200, you don’t have a strategy. You have a bet on the top of the cycle. Build a scenario column at $1,200, $900, and $700 calves. Trigger: if 55% beef only beats 35% beef at $1,200+ calves, the cap stays at 35%. Pair it with USDA RMA’s Livestock Risk Protection coverage on feeder cattle and slaughter cattle if your calf marketing pattern fits the LRP coverage windows under current RMA program rules.
Key Takeaways
If your heifers-per-cow ratio is below 0.80, cap beef tighter than the calf market is asking — your 2028 milking string is already getting short.
If your 55% beef scenario only beats your 35% beef scenario at $1,200+ calves, your beef percentage stays at 35%. Don’t let the calf cheque run the breeding sheet.
If your AFC is 26 months instead of 24, you need about 8% more replacements per year to hold herd size. Real non-completion at 21% instead of 10% adds another 10% on top.
Your top genomic quartile getting beef semen because she’s a repeat breeder? She’s the first cow to move back to sexed dairy — not the last.
If your local calves are clearing under your crossover price, beef belongs capped tighter than your calf buyer is suggesting.
What’s Your Move?
ERS is telling you cattle prices stay strong through 2027. NASS and CoBank are telling you replacements stay short and expensive. So what does your breeding sheet actually say about heifers per cow, AFC, and real non-completion this month — and what does your calf buyer’s contract look like 18 months from now if you keep your beef percentage exactly where it is today?
Beef-on-Dairy’s $6,215 Secret: Why 72% of Herds Are Playing It Wrong — Exposes why a 20% reproductive cushion dictates your crossbreeding viability, breaking down field metrics that prove a 30% pregnancy rate shifts monthly beef-dairy cash flow threefold over mid-tier competitors.
Heifer calf mortality: the $40,000 barn math – The Bullvine — Delivers a strict hutch-level financial framework to prevent thousand-dollar genetic investments from dying young, proving that shaving two mortality points safeguards over $27,000 in locked-in pipeline value.
The Sunday Read Dairy Professionals Don’t Skip.
Every week, thousands of producers, breeders, and industry insiders open Bullvine Weekly for genetics insights, market shifts, and profit strategies they won’t find anywhere else. One email. Five minutes. Smarter decisions all week.
Ormiston paid $750 for the White Cow in 1956. To do what he did on a 300‑cow Holstein herd in 2026, you’ll write a $10,000–$15,000 cull cheque — and most breeders quit before it pays.
Roy Ormiston at his Roybrook desk, “The White Cow” crest on the wall behind him and bronzes of his Roybrook bulls within arm’s reach. Every banner, plaque, and statue in this room traces back to a $750 cow he bought in a Bowmanville barn in 1956. (Photo: Patty Jones) (Read more: Roy Ormiston: The Holstein Man’s Holstein Man Who Revolutionized Modern Breeding)
Frederick Roy Ormiston handed over $750 for a five‑year‑old Holstein in a modest Bowmanville, Ontario barn in 1956. He didn’t buy a proof or chase a hot sire stack. He bought a cow that wouldn’t leave his mind: Balsam Brae Pluto Sovereign — “The White Cow.”
Telstar, Starlite, Tempo, a bronze statue in Hokkaido, and a Holstein type template that still runs through modern pedigrees all trace back to that single decision. But the part that matters to a 300‑cow Holstein cow family in 2026 isn’t the statue or the show banners. It’s the line‑breeding math behind it — the culling bills Ormiston swallowed along the way, and whether anyone with a genomic mating app and a lender looking over their shoulder can actually do the same thing now.
What’s Really on the Line When You Line‑Breed a Holstein Cow Family
Balsam Brae Pluto Sovereign — “The White Cow,” circa 1956. Roy Ormiston paid $750 for her, then bred her so tight she stamped 185,327 lbs of lifetime milk, four Peterborough Grand Championships, and six straight All‑Canadian nominations into the Roybrook line. Every cow family decision in this article starts here.
Line‑breeding is just inbreeding when it works. Ormiston said it out loud and then proved it by tightening relentlessly on one cow family until the “Roybrook Look” bred true: long, clean necks, deep open ribs, flat bone, and cows that could live on forage and still hang banners. He wasn’t chasing hybrid vigor or the bull‑of‑the‑month. He was chasing prepotency — the ability of one cow to stamp her kind no matter what you bred her to.
The Roybrook program was simple and brutal:
Closed herd built around The White Cow.
Closely related matings to concentrate her genetics.
Intense culling any time recessives or structural weaknesses surfaced.
The biology hasn’t changed. To make a cow family prepotent, you’ve got to stack homozygosity around an outstanding ancestor instead of spreading your bets across every hot sire in the catalog. When you do that, you’ll surface defects and weak spots you’d never see in a more outcrossed herd.
Ormiston’s tools were visual stockmanship, family memory, and a willingness to ship anything that didn’t fit the mold. He had no haplotype screens, no genomic inbreeding reports, no optimal contribution software. He just culled what broke and kept tightening around The White Cow.
You’ve got something he didn’t: the ability to see carriers and inbreeding risk before you ever load the gun. The question now isn’t “Can line‑breeding work?” Roybrook answered that. The real question is whether you’ll still do what it takes when the numbers on the screen and the numbers on the milk cheque don’t agree — for years.
What Does a “Ruthless” Culling Bill Actually Cost a 300‑Cow Herd?
Let’s put some real structure under the part everyone flinches at.
The cost of raising a Holstein heifer to first calving has pushed to roughly $2,500 to $3,000 in 2026, driven by feed inflation and the high market value of replacements, according to current dairy herd health and reproduction benchmarks. A sound 1,300–1,400 lb cull Holstein cow typically clears the bottom end of that range at salvage, and the broader revenue picture is propped up by a beef‑on‑dairy market where dairy‑beef crossbred calves are now fetching $900 to $1,400 per head and adding an estimated $4.00–$4.50 per cwt to dairy revenue across North America, per current 2026 dairy farm economics data.
Net those numbers out, and every “extra” young cow you ship as part of a line‑breeding cleanup is costing you somewhere around $1,000 to $1,500 in true replacement cost — the rearing investment minus salvage value, with crossbred‑calf revenue propping up dairy revenue alongside it.
Now scale it to something that hurts.
If you identify a weak branch inside your chosen cow family and make yourself act the way Ormiston did, you might ship 10 young cows you’d originally circled as future donors or bull dams. On this math, you’re staring at a $10,000 to $15,000 decision in that one year.
That’s just the cheque. Behind it sit two years of raising each heifer, genomic tests, sexed semen, maybe IVF bills you justified because “she’s from the right family” — and the pride hit of cutting into the cow family you’ve been bragging about.
That’s the exact point where breeders start negotiating with themselves. You’re looking at a VG‑looking first‑calf heifer from your “White Cow” family, genomics say she’s fine, and your gut knows shipping her will cost four figures plus pride. It’s very easy to say, “She just needs one more chance with a different bull.”
Ormiston didn’t have a mating app to make that choice look smarter than it really was.
When Does That Cull Bill Start Paying You Back?
The only honest reason to swallow that kind of hit is if it turns into extra productive life on the right cows and fewer replacements over time.
Heifer‑rearing economics points to a hard truth: at $2,500–$3,000 per replacement and a North American heifer inventory at a 20‑year low, every cow you keep healthy through her third lactation and beyond is worth more than she has been in a generation. Quebec’s herd data illustrates the payoff — Lactanet’s 2025 management benchmarks show 46.6% of Quebec cows in their 3rd or later lactation, leading the P5 in longevity and significantly lowering replacement cost per cwt. That’s the prize.
So what is this “ruthless” cleanup supposed to buy you? More daughters that actually make it to those third and fourth lactations. Fewer fragile cows leaving in the first two. A tighter family where the daughters look and last like the cow you fell in love with — not like a genetic coin toss.
If that plays out, the barn math shifts. Lactanet’s 2025 management benchmarks back this up region by region:
Region / Metric
Median Annual Milk Value (Per Cow)
Longevity / Economic Impact
British Columbia
$10,930
Highest gross revenue potential per slot
Quebec
$10,304
P5 leader: 46.6% of cows reach 3rd+ lactation
Ontario
$10,206
High baseline; massive swing if mature cows drop
The Danger Zone
Retaining inferior cows
Loses $19 per cow slot annually
[EDITOR: render the Danger Zone row with a coloured highlight (warning amber) so the negative figure draws skim‑readers.]
Even modeled conservatively against feed and variable cost, every additional mature‑cow lactation you bank on a structurally sound cow keeps a meaningful share of that value on your side of the ledger — plus the $1,000–$1,500 in replacement cost you don’t have to spend on a heifer to fill her stall. Three extra cows reaching that fourth lactation translates into a five‑figure swing in your favor, on top of the avoided heifer bills.
Every herd’s inputs are different. But the structure is the point:
Year 0–1: You feel the culling hit. Cash leaves the account. Replacement rate spikes.
Years 2–3: The first cleaned‑up daughters enter the milking string. Heifer inventory stabilizes. Replacement rate starts trending down.
Years 3–5: Enough cows stay for that extra lactation that the math begins to catch up to the pain.
You’re often living with a two‑to‑three‑year lag between when the cull cheques clear and when any payoff shows up clearly in your own numbers. That lag is exactly where people bail out.
How Do You Know It’s the Family — and Not Just Bad Luck?
This is the knife edge. If you misread the problem, you’re not doing a Roybrook‑style cleanup. You’re just burning good cows.
A weak branch doesn’t reveal itself with one bad calf out of one mating. It shows up as consistent failure across sires, across sisters, and across time. One ugly calf out of a cow you like is noise. Three disappointing daughters out of four, from different bulls, with the same basic flaw? That’s a pattern.
You want to see that pattern survive three tests:
Sire change test. You’ve used at least two different bulls with different sire stacks on that line. The daughters still show the same structural issues — weak loin, narrow rib, coarse bone — or the same career arcs, leaving before second or third calving.
Sister comparison test. Inside your chosen family, one branch throws daughters that disappear early or never match the family type. Another branch, under the same management and similar sires, gives you cows that stand the test of time. When one sub‑branch consistently underperforms next to sisters that work, you’ve probably found the dead wood.
Management sanity check. Compare your culling patterns to pens, seasons, and management changes. If a whole age group from multiple families cratered in the year you changed transition diets, that’s a protocol problem. Once you’ve fixed the protocol, if the same branch keeps underperforming while the rest of the family stabilizes, that’s genetics talking.
Strike Test
What to Look For
Passes = Noise
Fails 3× = Pattern (Cull Branch)
Sire Change Test
Use ≥2 unrelated bulls on same line
Daughters vary — different strengths
Same flaw repeats regardless of sire
Sister Comparison Test
Compare daughters of this branch vs. sisters under same mgmt
One branch lags but not systematically
One branch consistently exits early or fails type
Management Sanity Check
Cross-reference against pen, season, feed protocol changes
Problem tracks a protocol change, not genetics
Branch underperforms after protocol is fixed and herd stabilizes
⚠️ Milk commercially. Do NOT propagate into nucleus.
A working rule that keeps you honest without turning you into a one‑calf executioner:
Three independent strikes and that branch is out.
Roybrook Valiant (VG‑GM) and his sire Roybrook Starlite (EX‑Extra) at United Breeders, Guelph, Ontario, May 1977. Two generations of the same tightened matings, standing side by side — the visible answer to the question every line‑breeder eventually has to ask: did the next generation hold up, or did the program quietly go backwards?
That means at least two different sires used, at least two different daughters evaluated, and the same basic structural or longevity problem showing up three times. When you hit three, you stop blaming the bull, the weather, or the classifier. You stop flushing that branch. You stop selling heifers from that line as “future donors.” You might keep milking the good ones, but you quietly demote that branch to commercial status inside your own program.
It’s ugly. But it’s also how Ormiston watched weak branches inside the Roybrook herd eliminate themselves, and tightened only on what stood up under pressure.
Build the Nucleus and Write the Rules
Here’s where your world really diverges from Ormiston’s.
You can pull up a laptop and see, in black and white, genomic inbreeding levels and runs of homozygosity on your cows, carrier status for lethal recessives and fertility‑wrecking haplotypes, and relationship coefficients between every cow and bull you’re thinking of using.
If you want to line‑breed a cow family on purpose without re‑creating the breed‑wide inbreeding mess inside your own herd, the sequence looks something like this.
Draw a hard box around your nucleus. Pick 15–20 females from the cow family you trust most — three or four generations of sound, trouble‑free cows behind them, the structural template you want, and no extreme outlier genomic inbreeding numbers. Everything else in the herd is commercial from a breeding standpoint, no matter how good they look on paper.
Roybrook Starlite EX‑Extra — the production half of the Telstar‑Starlite‑Tempo trifecta. Bred out of the same tightened Roybrook matings, Starlite’s sons and daughters pushed milk and fat yields hard enough to put Roybrook genetics on pedigrees well outside Ontario. Proof that line‑breeding for type doesn’t have to cost you the milk cheque. (Photo: Danny Weaver)
Peer note on inbreeding: Traditional pedigree charts only guess at genetic relationship percentages. Modern genomics map actual Runs of Homozygosity (ROH) — the identical DNA strands a calf actually inherited from both parents. That lets you line‑breed to an elite ancestor’s physical traits while making sure you aren’t accidentally doubling up on hidden, bad chunks of DNA elsewhere in the genome.
Write your inbreeding and defect rules before anyone opens the catalog. On paper, before the next mating season, decide: a per‑mating genomic inbreeding cap for that nucleus, a family‑level cap so your nucleus group’s average inbreeding doesn’t rocket past your herd average, and a hard “never” list for carrier‑to‑carrier matings on known lethal recessives and fertility‑wrecking haplotypes. These rules exist so that once you’re staring at a sexy cross on screen, you don’t talk yourself into it because “just this one won’t matter.”
Hand your mating program a brief, not a default. Most mating software is set up to avoid disasters and maximize index. You have to tell it to value your cow family. Tag your nucleus cows as a priority group. Ask the program to maximize their contribution over the next 5–10 years while obeying your inbreeding caps and defect rules. Let it suggest bulls that tighten on that family without stacking the same three global sires everyone else is stacking.
What the Software Can’t Do for You
Be picky about who’s allowed in the loop. For the nucleus cows, bulls are tools, not celebrities. They should be either sons or grandsons of your chosen family, or outcross‑ish bulls with rock‑solid structure and health that won’t drag you back into the sire stacks that created the Holstein bottleneck. If a bull is already heavy in the same high‑inbreeding global blood you’re trying to dilute, use him on your commercial cows, not your nucleus. If a bull doesn’t line up with your structural non‑negotiables, he doesn’t touch the nucleus, no matter how high his index sits.
Let the software manage risk — but don’t let it make the hard calls. The program can stop you from mating two carriers or creating a 14% inbreeding train wreck. It cannot cull for you. Every crop of tight‑mated calves out of the nucleus group needs a harsher eye than the rest of the herd. Any heifer that doesn’t look like the family template, shows chronic health or fertility issues early, or has structure you know won’t last gets demoted out of the nucleus, even if her genomic values look pretty. That’s where you either stay Ormiston‑honest or start lying to yourself with software.
If you run that play hard for five years and you picked the right family, you’re aiming to see two things: the nucleus daughters are more uniform and more durable than the herd average, and your whole‑herd genomic inbreeding drifts up slowly, not in a straight line to crisis levels.
Roybrook Tempo — the third leg of the Telstar‑Starlite‑Tempo trifecta and the proof that Ormiston’s program kept compounding. Tempo’s daughters and sons carried the Roybrook stamp for type, production, and longevity into herds well beyond Ontario, the trait combination that’s still the hardest thing to stack in 2026. (Photo: Jim Rose)
If you’re not seeing that, you’re not really line‑breeding a cow family. You’re just doing fancier inbreeding.
Why Most People Quit Halfway and Blame the Math
The hardest part of this isn’t the biology or the barn math. It’s the noise you’re trying to do it in.
Ormiston didn’t have proof runs every few months comparing his herd average to everybody else’s. He didn’t have an AI rep walking in with a laptop, pointing at his herd LPI, and telling him he was “leaving points on the table.” He didn’t scroll past a feed full of calves and donors from the latest “#1 genomic bull” every time he sat down for coffee. And he never had to explain to a farm partner or a lender why his average herd index was trending sideways while the neighbours’ was climbing.
You do. All of it, all the time.
There’s also a structural pressure Ormiston never faced: beef‑on‑dairy. With dairy‑beef crossbred calves bringing $900–$1,400 a head and adding $4.00–$4.50 per cwt to total farm revenue, that revenue stream is keeping genetically weaker cows in the barn longer than they should be. Producers are being told — correctly — to use beef‑on‑dairy only on the bottom 20–30% of genetics so they don’t starve a replacement pipeline already at a 20‑year low. Beef‑on‑dairy economics rewards you for keeping average cows as passive crossbred incubators. A true line‑breeding program demands the exact opposite: you must torture‑test the very cow family you are investing in, culling harder where it hurts the most. That contradiction is real, and it’s worth saying out loud.
Here’s the pattern that plays out on a lot of farms:
You take the pain. You ship the weak branch. Your replacement rate spikes.
Two years later, the first cleaned‑up daughters start calving. They look solid, but their genomic proofs aren’t anything special because the indexes still tend to weight raw volume and component numbers more heavily than structural durability and longevity.
Meanwhile, your neighbour’s herd average is climbing faster on paper because they’re chasing the catalog and letting the mating program manage inbreeding on autopilot. They’ve never written a five‑figure cull cheque in one shot, and their AI rep is thrilled with them.
Roybrook Telstar EX‑Extra, son of Roybrook Ace and Model Lass — and the proof that line‑breeding around The White Cow worked. Sold as a six‑month‑old at the 1964 National Sale for $25,000, Telstar went on to stamp Holstein type and production in pedigrees from Ontario to Hokkaido, where his life‑size bronze still stands. (Photo: Jim Rose)
If your only scoreboard is GTPI or LPI, your program can easily look like a failure for the first three to five years, even if the cows are quietly getting better where it matters.
Scoreboard Dimension
GTPI / LPI (Industry Default)
Barn-Level Line-Breeding Scoreboard
Primary metric
Genomic index points (volume, components)
Productive life by dam line (lactations completed)
Replacement rate signal
Not tracked
Tracked by dam family, flagged per branch
Daughter uniformity
Not assessed
Core KPI — daughters should look like The White Cow
Inbreeding tracking
Herd average / software default
Per-mating cap + family cap, written in advance
Carrier risk visibility
Flagged at mating
Hard “never” list before catalog opens
How you look in Yr 1–3
Sideways or declining average
Consistent with goals if barn KPIs move right
Beef-on-dairy interaction
Rewards keeping average cows in
⚠️ Conflicts — pressures you NOT to cull nucleus
Time horizon
Next proof run
5–10 year cow family development
Ormiston would recognize it?
No
Yes
The breeders who get through that window aren’t magically braver. They just build a different scoreboard. They track productive life by family — which cow families actually reach 3rd, 4th, 5th lactations. They track replacement events by dam line — which families are filling the cull list for the same reasons, over and over. And they track uniformity — which groups of daughters look like clones of the cow you wanted to replicate, and which ones look like the product of a bull catalog.
If your own scoreboard starts moving in the right direction — longer productive lives, fewer “surprise” culls, tighter family type — you’ve got the feedback Ormiston had long before the milk cheque made it obvious. If you rely only on the industry’s scoreboard, you’re going to bail out right when the biology finally starts to agree with you.
What This Means for Your Operation
Name your core family before you name your bulls. If you can’t point to one cow family that consistently gives you daughters past third lactation, you don’t have a Roybrook candidate yet. You have a herd. Start tracking cull reasons and productive life by dam line before you try to line‑breed anything.
Write your inbreeding and defect guardrails before the next mating run. Decide your per‑mating genomic inbreeding cap and your “never” list for carrier‑to‑carrier matings. Put them in writing. If they’re only in your head, you’ll talk yourself into exceptions as soon as a fancy cross shows up on screen.
Use the three‑strikes rule on branches, not calves. Don’t condemn a branch on one bad calf. But if you see the same structural or longevity problem three times across at least two sires and two daughters, stop flushing that branch. Keep daughters in the milking herd if they pay their way, but slide that line quietly out of your nucleus.
Be honest about how much pain your cash flow can take. If your replacement rate is already sitting in the high‑30s and your lender’s nervous, this probably isn’t the year to pile voluntary culls for genetic reasons on top of that. Make your involuntary culling smaller and more predictable first.
Don’t let beef‑on‑dairy revenue talk you out of culling your nucleus. $900–$1,400 calves are a great safety net for the bottom 20–30% of your herd. They’re a terrible reason to keep a structurally weak heifer from the family you’re trying to concentrate.
Choose your scoreboard now, not halfway through. Decide whether you’re going to judge this experiment by your herd’s average index or by your own numbers on productive life, replacement rate, and uniformity. If you try to serve both, you’ll end up fully committed to neither.
In the next 30 days, do one nucleus‑level audit. Tag your top 15–20 females from the family you like best. Pull their daughters’ cull reasons and productive lives. If you don’t like what you see in that one group, you just saved yourself from line‑breeding the wrong family.
Key Takeaways
If you’re not prepared to ship 5–10 “almost good enough” young cows from your chosen family over the next couple of years, you’re probably not ready to run a Roybrook‑style cleanup yet.
If you don’t have a written per‑mating genomic inbreeding cap and a carrier‑to‑carrier “never” list, you’re not really controlling inbreeding — you’re delegating it to software defaults.
If you can’t show, on paper, that one cow family gives you more daughters lasting past third lactation than the rest of the herd, you don’t have a White Cow yet. Keep looking and keep tracking.
If your only scoreboard is GTPI or LPI, a serious line‑breeding effort is going to look like a mistake on paper for three to five years. Build a barn‑level scoreboard — productive life by family, replacement rate by dam line, and daughter uniformity — before you start.
The real question isn’t whether Ormiston’s math still works. It’s whether you’re willing to step into the same gap he did — two or three years where the bank, the catalog, the proof sheet, and that one neighbour at the coffee shop all suggest you’re wrong, while the cows quietly start proving you right. Next time you stare at your “almost” heifer from your favourite family — are you reading the report, or are you reading the cow?
$3110 In, $1100 Out: The Cull Trap Holding 470000 U.S. Dairy Cows – CPI Hits 68 — Dismantles the profit-and-loss illusion of keeping older, inferior cows to defer expensive replacement bills. Delivers a strict dollar-per-day carrying cost breakdown illustrating how bottom-quartile animals bleed severe margin through hidden production drops.
Every week, thousands of producers, breeders, and industry insiders open Bullvine Weekly for genetics insights, market shifts, and profit strategies they won’t find anywhere else. One email. Five minutes. Smarter decisions all week.
Holstein Canada closed 2025 with $6.89M in reserve. HAUSA sits on $30.5M. One can absorb a DairyTrace contract loss. The other board just quietly took unlimited borrowing power.
Holstein Canada finished 2025 with $6.89 million in reserve against a roughly $16 million annual cost base. Holstein Association USA finished 2023, its most recent IRS Form 990, with $30.5 million in net assets on a revenue base of nearly $17.8 million. That’s the gap. One organization covers its operating losses with investment income and is now betting its 2026 budget on reversing four straight years of classification decline. The other is four years into a 3D camera classification system that could redefine how cows get evaluated, and can afford to be wrong while it figures out whether the technology works.
If you classify with either association, lend to operations that do, or sell genetics into either market, the breed association’s financial outlook for dairy in 2026 matters more than the marketing. Here’s what each path looks like through 2030, the survival odds with reasoning, the realistic solutions on the table, and the questions members need to start asking out loud if either organization’s legacy is going to survive the decade.
Two Numbers and What They Actually Mean
Holstein Canada’s $6.89 million reserve covers roughly six months of operations. Per Finance Chair Benoît Turmel at the April 2026 AGM, HC has run operational deficits in five consecutive years averaging $147,000, and the books only stay positive because investment income from the reserve subsidizes the gap. The reserve fund returned 9.28% in 2025, generating roughly $640,000. That’s more than enough to mask a true operating shortfall of about $400,000.
The 2025 reported surplus of $1.01 million was, in CEO Greg Dietrich’s own framing at the AGM, a “ghost.” About $780,000 of it came from staffing matters and staff positions HC didn’t fill. Strip the empty chairs, and the real 2025 operational position was a deficit of nearly $350,000.
Holstein Association USA’s $30.5 million in net assets sits on a balance sheet that’s been quietly deleveraging. Liabilities dropped from $13.3 million in 2020 to $7.6 million in 2023 per IRS Form 990 filings via ProPublica. Even at an aggressive $1 million annual loss, HAUSA has roughly 30 years of runway. HC’s cushion is thinner by a factor of six in absolute dollars.
That asymmetry is the entire story.
Will Holstein Canada Run Out of Money by 2030?
Not under base assumptions. But the trajectory depends on three variables most members don’t track: investment returns, classification volume, and HC’s two DFC-linked service contracts.
Run the numbers four ways.
Scenario
2026
2027
2028
2029
2030
Reserve End-2030
Status quo (9.28% returns hold, deficit ~$400K)
($584K)
($400K)
($400K)
($400K)
($400K)
~$4.5M
Strategy succeeds (+20K cows by 2027, both contracts stable)
($584K)
+$200K
+$300K
+$300K
+$400K
~$6.5M
Slow bleed (returns normalize to 5%, classifications keep falling)
($584K)
($700K)
($800K)
($900K)
($900K)
~$2.5M
DairyTrace contract lost ($2.989M revenue gone)
($584K)
($3.5M)
($3.5M)
—
—
Reserve gone by 2028
The bottom row is the one to watch. DairyTrace generated $2.989 million in 2024, 18.9% of total revenue per the HC 2024 Annual Report. HC administers DairyTrace customer service outside Quebec under contract with Lactanet, which holds the national DairyTrace program. Quebec is served by Attestra. HC DairyTrace services are the most durable line on HC’s books because they sit inside a single national contract for Canadian dairy cattle traceability, not a registration fee tied to a shrinking heifer pool. They’re also the line that, if lost or repriced at a competitive tender from Lactanet, doesn’t shave the deficit. It triples it.
A note on scope: DairyTrace is a national program, but Quebec’s parallel infrastructure runs through Attestra, so HC’s DairyTrace customer-service footprint runs primarily outside Quebec. That’s the same fault line that shapes how any future HC strategy plays at AGM.
proAction adds a second contract risk on a tighter clock. HC’s 2024 Annual Report notes a renewed two-year DFC contract for proAction Cattle Assessments, booked as “Animal Care Assessments” at $1.147 million in 2024. That’s a smaller line than DairyTrace, but the renewal window is sooner. Lose proAction at tender and the deficit doesn’t triple. It adds roughly $1.15 million to whatever the base case is.
The April 2026 bylaw rewrite passed by 65 of approximately 7,900 members, or 0.8%. It gave the board unlimited borrowing authority against association property without a member vote. That’s not a strategy. That’s the mechanism that gets pulled in a DairyTrace or proAction shock. Members would find out after. (Read more: Holstein Canada’s Governance Rewrite Passed. 0.8% of Members Voted.)
Running the Numbers: HC’s Volume Bet on a 218,000-Cow Base
Per the HC 2024 Annual Report, classification program revenue was $5,039,000 against 218,577 Holstein cows classified. Work it out:
HC’s stated 2026 target: classify 10,000 more cows than 2025
Incremental revenue at $23.06/cow: 10,000 × $23.06 = ~$230,600 CAD
2026 budgeted deficit: $584,000
Coverage of deficit from perfect execution of classification program: ~40%
Even hitting the volume target closes about 40% of the planned deficit. That’s not a turnaround. That’s a contribution against a hole that’s still getting deeper.
For your operation, the same math runs in reverse. A 200-cow Holstein herd classified annually pays roughly $4,600/year for the service. If HC defends revenue by raising per-cow fees to $30 instead of recovering volume, that’s another $1,400/year coming out of your operating account. HC member Pascal Martin from Quebec asked the right question from the AGM floor: how does the budget assume 10,000 more classifications when you just lost 5,000? The board’s answer was classification visit scheduling tweaks and a new business development hire. No demand evidence was offered.
The structural headwinds aren’t subtle. Per Agriculture Canada and Statistics Canada livestock inventory data, Canadian dairy cow inventory fell from 975,100 in 2018 to 962,400 in 2025. HC-registered calves dropped 17% from 2019 to 2022. Member herds went from 8,621 in 2022 to 8,124 in 2024. Beef-on-dairy keeps reducing the registerable heifer pool.
You can’t manufacture demand that isn’t there. Scheduling efficiency only helps if the cows exist to schedule.
Four Years In, HAUSA’s Camera System Still Hasn’t Survived a Winter
Three time-of-flight 3D depth cameras mounted at a milking parlor exit alley. RFID identification. Twenty-six linear traits measured automatically as the cow walks past. Body condition and locomotion indicators on top. Patent pending. Data piped directly to HAUSA for genetic evaluation integration. [INTERNAL LINK: Bullvine October 2025 deep-dive on HAUSA’s Build a Better Cow camera rollout]
The program has been in development for four years under Dr. Jeff Bewley, HAUSA’s Executive Director of Genetic Programs and Innovation. The primary public documentation is Bewley’s 2025 World Dairy Expo presentation and Bullvine’s October 2025 analysis.
What the system doesn’t do, in Bewley’s words at World Dairy Expo: capture final score. “Final score is harder — it’s a 40,000-foot view of the animal that the camera can’t fully capture.” Human classifiers stay in the workflow. The cameras supplement. They don’t replace.
What the system also doesn’t do is pencil out below 500 cows. The estimated installed cost is around $150,000 per farm. The U.S. has roughly 26,290 dairy operations per HAUSA’s Pulse Fall 2024 data. Per USDA NASS structure-of-dairy-farms data, roughly 500 to 800 of them milk above 1,000 cows. That’s the addressable market. Per the same USDA NASS dataset, about 60% of U.S. dairies milk under 100 cows and aren’t part of this conversation at any price.
Cold-climate parlors are also a real problem. Camera condensation in winter milkings shows up in Wisconsin, Vermont, New York, and even most of Canada. Heat shutdowns occur above 105°F and limit Sun Belt deployment. Commercial launch is projected for 2027–2028. The system hasn’t survived a commercial winter yet.
The Governance Tax on Every Other Strategy
Three HC CEOs in four years. Mid-term board president resignation in June 2024. D&O insurance for provincial branches was cancelled in August 2024, with a reinstatement resolution that received no formal progress report a year later. The April 2026 bylaw rewrite, passed by 0.8% of members, referenced regional boundary maps that didn’t exist at time of approval, raised from the floor by Amanda Jeffrey.
Compare that to HAUSA’s transition. John Meyer retired December 31, 2024, after 23 years. Lindsey Worden, an 18-year HAUSA veteran and former COO, took over January 1, 2025. No drama. No revolving door. The 10th CEO in 140 years.
Stability isn’t a strategy. But instability is a tax on every other strategy you try to run.
Survival Odds Through 2030
These are informed editorial judgments, not statistical outputs. Reasonable analysts working from the same data could land 10 to 15 points different in either direction.
Holstein Canada, solvent in 2030: ~80%. Reserve at $6.89 million, true deficit closer to $400K net of investment income, status quo lands the reserve around $4.5M by 2030. The realistic threats are a DairyTrace shock or a non-renewed proAction contract, neither of which appears imminent. Solvent, yes.
Holstein Canada, strategically relevant in 2030: ~30–40%. Classification volume has fallen for four straight years. Member herds are contracting from 8,621 in 2022 to 8,124 in 2024. With Lactanet already holding the national DairyTrace program above HC, and without a credible shared-services arrangement or a defensible expansion of HC’s contract footprint, the trajectory is toward an organization that exists but doesn’t matter much.
HAUSA, solvent in 2030: ~95%. No realistic five-year scenario runs HAUSA out of money. The 5% accounts for catastrophic events not visible in current data.
HAUSA, strategically relevant in 2030: ~55–70%. The high end assumes cameras deploy by 2028, 200–500 large herds adopt, and continuous conformation data becomes what AI companies and dairy farms pay for. The low end is cold-weather problems plus large-herd drift to genomic-only evaluation via Zoetis CLARIFIDE and other DNA testing organizations. Solvent in either case. The gap between 55% and 70% is whether the camera bet works.
What Could Save Holstein Canada and HAUSA by 2030?
Neither board can fix everything. But there are specific paths that could change the trajectory, sorted by how plausible they actually are.
1. Sustainability data services layered on the DairyTrace customer-service role.Probability: ~35%. Upside if it works: $1–3M CAD/year in new revenue. HC sits on the customer-service interface for the only national Canadian dairy cattle traceability dataset, even though Lactanet holds the program. Processors and federal programs need carbon intensity, antibiotic use, and longevity metrics for ESG (environmental, social, governance) reporting, supply contracts, retailer audits, and federal climate programs. The raw material exists. What’s missing is a productization strategy negotiated with Lactanet and a data licensing framework HC has never built. This is the single highest-leverage move on the board, and it requires a partner conversation HC can’t dodge.
2. HC–Lactanet shared services arrangement.Probability: ~50%. Upside: $500K–$2M CAD/year in HC cost reduction, plus extended relevance. A formal split where HC handles classification field work plus DairyTrace customer service and Lactanet handles data infrastructure and genetic evaluation. Not a merger. Quebec representation at 43% of HC membership and Lactanet’s DFC mandate make full consolidation politically unworkable, especially since Quebec runs its own parallel traceability through Attestra. But Dietrich spent ten years on Lactanet’s Genetic Evaluation Board. The relationships are deep enough to negotiate this. The risk: branch politics treats it as the first step toward HC dissolution, and Quebec resolutions block it at AGM.
3. HAUSA cameras commercialize on schedule.Probability: ~55%. Upside: $250K–$1M USD/year in incremental data subscription revenue, plus relevance retention with the 500–800 large U.S. herds that drive genetic progress. The science is published. The patent is filed. The cold-climate condensation problem is engineering, not physics. HAUSA has four years of R&D and the balance sheet to absorb a delayed launch. The risk is adoption stalling at 50–100 farms because the $150K capital outlay doesn’t pencil for operators who already get most of what they need from Zoetis CLARIFIDE or other genomic testers.
4. Phenotypic data licensing to genomics companies.Probability: ~25% near-term, higher long-term. Upside: $500K–$3M/year for either organization if pursued aggressively. Both associations sit on decades of individual animal conformation scores correlated with production and health records. Zoetis, Semex, and ABS have built machine learning models that need exactly this kind of data. HAUSA is structurally better positioned because of AgriTech Analytics in Visalia and Bewley’s analytics mandate. HC has higher-quality national data but no disclosed commercialization infrastructure. Neither has made it a public priority. That’s the missed opportunity, not the impossible one.
5. Premium tiering: charging serious genetics customers high prices.Probability: ~40% at HAUSA, ~15% at HC.HAUSA already has Holstein COMPLETE, Classic, and Standard tiers. The cameras are inherently a premium product for large operations. Repositioning is structurally feasible. HC has a much harder version of this problem because its DairyTrace customer-service role and national herdbook role require it to serve all members, not just elite breeders. Two-tier service models within a national registry are politically expensive to execute and tend to fracture branch and provincial relationships.
6. Cross-border merger of HC and HAUSA.Probability: under 5%. Upside: theoretically substantial. Practically: not happening. Discussed informally for 20+ years. The cultural gap between the Canadian bilingual branch structure and the U.S. state federation, plus regulatory differences and currency complexity, makes it implausible. Given HC’s current governance turmoil, HAUSA would be absorbing a liability rather than gaining a partner. Useful to mention so it can be set aside.
Missed opportunity for both — neither has built the infrastructure
Premium tiering (elite vs standard service)
~15%
Modest
~40%
Moderate
HAUSA feasible; HC can’t tier a national registry
Cross-border HC–HAUSA merger
< 5%
Theoretically large
< 5%
Theoretically large
Not happening — set it aside
The high-probability moves aren’t transformational. The transformational move, sustainability and adjacent data-service expansion negotiated through Lactanet, is low-to-medium probability and entirely dependent on whether HC’s leadership has the political capital and credibility to execute it.
What Members Need to Ask, Out Loud, On the Record
Boards respond to the questions members put in writing. Both organizations were built by breeders who showed up. The next decade depends on whether enough members still do.
Five questions HC members should be putting to the board in writing:
What is the DairyTrace contract renewal date with Lactanet, and what’s the plan if HC’s customer-service delivery role goes to competitive tender?
HC’s 2024 Animal Care Assessment revenue from the proAction Cattle Assessments contract was $1.147 million. What’s the renewal date on the current two-year DFC agreement, and what’s the plan if the contract isn’t renewed or goes to tender?
Under what circumstances would the board exercise the unlimited borrowing authority granted in the April 2026 bylaw rewrite, and what disclosure will members receive before debt is taken on?
What is the formal status of HC’s working relationship with Lactanet, and is a shared-services arrangement under discussion?
What does the 2030 strategic plan look like under three scenarios: both contracts stable, DairyTrace lost to a Lactanet tender, and proAction not renewed?
For HAUSA members, the three open questions that matter most are the realistic commercial launch date for the Build a Better Cow camera system against the original four-year timeline, how the cold-climate condensation problem gets solved before deployment in Wisconsin, the Northeast, and the Upper Midwest, and what HAUSA’s data licensing strategy with AI companies actually looks like, including how member-generated phenotypic data gets valued and protected. The 12% nominal decline in program services revenue over the last 11 years sets the clock on all three.
For both HC and HAUSA members, there are two questions every member should answer for themselves before the next AGM or convention. What does your last classification or registration invoice actually buy you in dollar terms, marketing premium, export eligibility, show eligibility, breeding value, and if that line item disappeared tomorrow, what changes in your P&L and what doesn’t? And: is your breed association still your partner, or has it become your competitor for the same data, the same dollars, and the same producer attention?
These aren’t gotcha questions. They’re the questions any breeder with three generations in a herdbook should be able to ask without apology. The April 2026 HC bylaw rewrite passed because 99.2% of members didn’t vote. That’s the math. Boards govern as much as members let them.
Boards of directors also have an obligation to direct management to communicate the association’s vision for 2030 and beyond, including the concrete plan to deliver value for breed membership and breed services.
Neither association is in great shape. One of them can afford to be wrong while it figures out the next moves. The other can’t.
If your most recent classification invoice is up materially from 2023, where did the increase come from, and does the value you get back justify the trend?
How We Know What We Know
Sources used in this analysis:
Holstein Canada 2024 Annual Report (revenue lines, classification volumes, DairyTrace customer-service revenue of $2.989M / 18.9% of total revenue, Animal Care Assessment revenue of $1.147M from the renewed two-year DFC proAction Cattle Assessments contract, member-herd counts)
Holstein Canada April 2026 AGM — public remarks by Finance Chair Benoît Turmel and CEO Greg Dietrich; floor questions from Pascal Martin and Amanda Jeffrey; bylaw vote results
Lactanet as the national DairyTrace program holder; HC delivers customer service outside Quebec under contract with Lactanet
Attestra as the Quebec traceability service provider running parallel to DairyTrace
Holstein Association USA IRS Form 990 filings (2020, 2023) via ProPublica Nonprofit Explorer (net assets, liabilities, program services revenue). HAUSA’s 2024 and 2025 Form 990s were not yet posted on ProPublica at the time of analysis.
HAUSA Pulse Fall 2024 (U.S. dairy operation count of ~26,290)
USDA NASS structure-of-dairy-farms data (herd-size distribution: ~60% of U.S. dairies under 100 cows; ~500–800 operations above 1,000 cows)
Dr. Jeff Bewley, World Dairy Expo 2025 presentation (Build a Better Cow camera system specifications, “final score” quote, and timeline)
Survival probabilities (HC ~80% solvent / ~30–40% strategically relevant; HAUSA ~95% solvent / ~55–70% strategically relevant) and the six-solution probability/upside ranges are informed editorial judgments based on the sources above. They are not statistical outputs. Reasonable analysts working from the same data could land 10–15 points different in either direction.
Limitations: Holstein Canada does not publish full line-item financials at the granularity this analysis would prefer. The DairyTrace customer-service contract sits under Lactanet’s national program, and the proAction Cattle Assessments contract sits directly with DFC on a two-year cycle, so the two contract risks operate on different counterparties and different timelines. HAUSA’s IRS Form 990 reports program services revenue in aggregate and does not split out registration, classification, and AgriTech Analytics revenue at the line-item level.
Key Takeaways
Holstein Canada’s $6.89M reserve covers about six months of operations, and the real operating deficit is closer to $400K once you strip out investment income and unfilled staff positions. HAUSA’s $30.5M gives it roughly 30 years of runway to absorb mistakes Holstein Canada can’t afford.
HC carries two DFC-linked contract risks, not one. DairyTrace customer service ($2.989M in 2024) sits under a Lactanet contract and turns a $584K deficit into a $3.5M one if lost at tender. proAction Cattle Assessments ($1.147M in 2024) sits under a renewed two-year DFC contract on a tighter renewal clock and adds roughly $1.15M to whatever the base case is if not renewed. The April 2026 bylaw rewrite already handed the board unlimited borrowing power to plug either gap without member approval.
HAUSA’s camera bet only pencils above 500 cows at roughly $150K installed, and it hasn’t survived a commercial winter yet. Solvency isn’t the question for HAUSA. Relevance with the 500–800 large U.S. herds that drive genetic progress is.
Members need to decide whether their breed association is still a partner or has become a competitor for the same data, the same dollars, and the same producer attention, and whether the board they vote for is the one making that call.
Complete references and supporting documentation are available upon request by contacting the editorial team at editor@thebullvine.com.
The $7,200 Lameness Fix That Beats $45,000 Technology (40-50% Reduction Proven) — Dismantles the tech-first industry narrative with raw financial data proving that low-cost, disciplined herd-management protocols deliver a rapid 4–6 month payback while outperforming six-figure data platforms on commercial operations.
The Sunday Read Dairy Professionals Don’t Skip.
Every week, thousands of producers, breeders, and industry insiders open Bullvine Weekly for genetics insights, market shifts, and profit strategies they won’t find anywhere else. One email. Five minutes. Smarter decisions all week.
Larenwood hasn’t bought a heifer since Eisenhower. Lactanet just put Holstein heifer inbreeding at 9.99% — and on a 500-cow herd, that gap models out to $54,665 a year in lost milk alone.
Chris McLaren’s breeding story doesn’t start with a catalog bull. It starts with cow families his grandfather built outside Drumbo, Ontario, beginning in 1956.
Chris McLaren in the Larenwood tie-stall outside Drumbo, Ontario — sixth generation on a farm that hasn’t bought an outside female since 1956. The udder under his hand was bred from cow families his grandfather started 70 years ago, the same maternal lines that earned Larenwood its 2019 Master Breeder shield and a multi-year run at the top of Canada’s National Herd Management Score. Photo: Holly McFarlane. Read more: The Magic Behind Larenwood Farms: How Chris McLaren is Redefining Dairy Excellence)
Larenwood Farms milks roughly 110–115 registered Holsteins off those same maternal lines today. Per Holstein Canada records, the operation ships well above the Ontario Holstein average on milk and components, with somatic cell counts well below the provincial DHI average — and has done it while keeping a closed herd for roughly 70 years. No purchased heifers. No outside cows walking in the lane.
Run a typical 500-cow Holstein herd at the 9.99% Lactanet 2024 heifer-inbreeding average against a pre-genomic 4% baseline, and the modeled milk-loss gap works out to roughly $54,665 a year under the upper-bound Doekes/Makanjuola coefficient and a Class III milk price near $16.90/cwt — a figure consistent with USDA AMS Class III monthly announcements across recent quarters. That’s before any fertility, embryo-loss or longevity drag stacks on top. It’s the bill the open-catalog model quietly hands the average herd. The four farms profiled here almost certainly carry a smaller version of it, but none publish a herd-level inbreeding figure. The point isn’t that closing the herd erases inbreeding. It’s that they’re the ones who actually know what they’re paying.
In 2019, Larenwood took home a Holstein Canada Master Breeder shield. In the mid-2010s they topped Canada’s National Herd Management Score list (then administered by CanWest DHI, now Lactanet), scoring in the high 980s out of 1,000 across multiple consecutive years. McLaren has framed the program in Semex’s published Larenwood profile as a generational match-and-improve approach — making each generation of daughters better than her mother and investing in the cow families that built the herd.
For two decades the industry pitch has been the opposite: progress comes in a tank, not a cow family. If you want to keep up, you buy what you can’t breed.
But when you dig into the numbers, there’s a different story sitting underneath.
What’s Changing and Why
The genomic era was supposed to put elite genetics in every herd. Shorter generation intervals, sharper indexes, sexed semen — any operation could tap into “the top 1%” as long as the credit line held.
Pawnee Farm Arlinda Chief (1962–1978). His sons and grandsons were used so heavily that today, more than 60 years after he was born, an estimated 14% of the Holstein genome in North America still traces directly to him — and 99.84% of active Holstein AI bulls share his Y-chromosome or Round Oak Rag Apple Elevation’s. The bottleneck this article opens with starts here. (Read more: The $4,300 Gamble That Reshaped Global Dairy Industry: The Pawnee Farm Arlinda Chief Story)
In practice, it stacked a lot of cows on a very narrow base. Pedigree analysis of active Holstein AI bulls shows the overwhelming majority — published estimates place the figure above 99% — still trace back to two foundational patriarchs. They aren’t a clean two-grandfather story. Pawnee Farm Arlinda Chief (born 1962) and Round Oak Rag Apple Elevation (born 1965) are overlapping fountainhead ancestors born three years apart, with pedigrees that thread through nearly every modern North American Holstein. More than 60 years on, Chief alone still contributes a meaningful double-digit share of the modern Holstein genome per published pedigree analyses.
Round Oak Rag Apple Elevation (1965–1979). Bred at Round Oak Farm in Virginia and proven through ABS, Elevation became the most-used Holstein sire of his era and the second pillar of the modern bottleneck — every active North American Holstein AI bull that doesn’t trace paternally to Chief traces here. Together they account for 99.84% of the breed’s active Y-chromosome. (Read more: Round Oak Rag Apple Elevation: The Bull That Changed Everything)
National inbreeding numbers climbed right alongside that concentration. Lactanet’s August 2025 update set the Canadian Holstein heifer average at 9.99%, gaining about 0.25 points per year — more than double the rate in Jersey, Ayrshire and Brown Swiss. U.S. Holstein cohorts run just under that on recent CDCB expected-future-inbreeding figures.
To be fair to the AI side: every major supplier — Semex, Select Sires, ABS, STgenetics — already offers EPI caps, haplotype blocking and outcross sire programs as part of their mating tools. The product set is there. What separates the four farms in this piece isn’t access to better software. It’s how disciplined they are about turning the right settings on and rotating the bull list with intent.
Closed herds aren’t immune to inbreeding. They use outside AI semen pulled from the same Chief-and-Elevation–descended bull pool as everyone else. The difference is how they use it — deliberate sire rotation, hard EPI caps, and a willingness to bring back outcross lines (Red Holstein, older AI sires through stored semen, European bloodlines) that most catalog-driven herds never look at twice. Run the top-20 list and you drift toward the national average. Curate the list like a closed-herd breeder does and you can hold heifer-crop inbreeding meaningfully below 9.99%.
Per Holstein Canada and Holstein USA records, four operations have built that kind of curation into multi-decade closed-female programs.
The Four Farms at a Glance
Operation
Region
Herd Size
Standout Number
Closed-Herd Status
Operational Style
Larenwood
Drumbo, ON
~110–115 cows
Multi-year topper of Canada’s National Herd Management Score
None are filling stalls with purchased outside females.
How This Plays Out on Real Farms
Put Larenwood beside a typical open-catalog herd of the same size and the operating model differs in ways the herdbook can document.
Per Holstein Canada’s Master Breeder citation, Larenwood’s mating program is run by Chris McLaren in collaboration with his father Grant, with multi-generation breeding records cross-referenced to classification outcomes. Holstein Canada credits the operation with maintaining its breeding direction across decades through that record discipline. They genomic test, but those numbers get read in the context of cow families they’ve watched calve, break in and finish multiple lactations.
In a 110-cow herd built mainly off a top-20 bull list, the genetics on offer are strong and the software is capable. The piece that’s harder to bottle is decades of on-farm context — which cow families pay off in which barn, and which need a different environment to perform. Some open-catalog herds carry that context internally. Many don’t.
The Bokma family on stage with their 2025 Holstein Canada Master Breeder shield — the third-generation Dutch-Canadian operation in Shubenacadie, Nova Scotia that filled seven DeLaval robots with homebred replacements rather than purchased heifers, and built the breeding program around udders, feet and temperaments suited to robot flow. (Read more: 21 Master Breeders. 16 Years Each: Holstein Canada’s 2025 Master Breeders Just Crossed the Finish Line)
Bokma takes the same closed-female logic and bolts it onto robots. Per Holstein Canada’s 2025 Master Breeder citation and DeLaval’s published case material, the Bokma family — third-generation Dutch-Canadian operators in Shubenacadie, Nova Scotia — milks roughly 700 cows through seven DeLaval robots. The expansion to seven robots was supported by homebred replacements rather than purchased heifers, with the breeding program selecting for udders, feet and temperaments suited to robot flow.
The ninth and tenth generations at Brigeen Farms in Turner, Maine — a family operation that has worked the same ground since 1777, and has grown the registered Holstein herd from about 60 cows to 580 over the last 25 years on homebred replacements. Left side, back row: Jon and Chloe Chapman of Gil-Tex Holsteins, Vivian Briggs. Front row: Kate, Alexis and Nichole Teixeira. Right side: Will Bullard, Bill Bullard, Mary Briggs, Betsy Bullard, Sydney Bullard and Steve Briggs. Read more: From 35 Cows to a WDE Grand Champion: 4 Breeders Using Sales, Embryos & Presentation to Make Registered Holsteins Pay
Brigeen tells the long version. Per Holstein USA records and Hoard’s Dairyman trade-media coverage, the Briggs–Bullard family has farmed the Turner, Maine ground since 1777 — the operation predates the U.S. Constitution. Over the last 25 years they’ve grown from about 60 cows to 580 registered Holsteins, while building one of the top type herds in the country: BAA 108.1, 50 EX, and a National Dairy Quality Gold Award. Per Hoard’s coverage, Betsy Bullard has run the mating program since returning to the farm in 2000 from a career with Cargill, leaning on deep maternal branches and homebred donors built up over two decades of breeding decisions. Bullard has publicly described her approach as measurement-driven, with classification scoring at the center of her breeding feedback loop.
Disclosure: Brigeen runs as a closed-female-replacement operation, not a fully closed herd. The commercial milking herd is built on homebred replacements, but per Holstein USA herdbook records and Hoard’s Dairyman coverage, the family has imported outside donor genetics for marketing and show-ring projects, kept separate from the commercial replacement pipeline.
Dominique Bard and Amélie Tremblay of Saintour / Ferme Barjo with daughters and the 2025 Maître-Éleveur (Master Breeder) plaque from Holstein Canada — a Quebec herd that has held a Herd Performance Index of 99 for 16 consecutive years, ranked #1 nationally in 2010, and earned its first Master Breeder shield in 2025 under the family motto “L’amélioration, une génération à la fois.” (Read more: 21 Master Breeders. 16 Years Each: Holstein Canada’s 2025 Master Breeders Just Crossed the Finish Line)
At Saintour, the story is in the index. Per Holstein Canada’s 2025 Master Breeder citation and Lactanet’s historical records, the Quebec herd, operated under Ferme Barjo by Dominique Bard and Amélie Tremblay, has held a Herd Performance Index (HPI) of 99 — a 99th-percentile herd performance ranking — for 16 consecutive years, ranked #1 nationally in 2010, and earned a first Master Breeder shield in 2025. The farm’s published tagline, “L’amélioration, une génération à la fois,” captures the program in five words: improvement, one generation at a time.
Disclosure: A co-ownership model in partnership with Ferme Bard inc. lets Saintour access elite outside female genetics — a structure designed to bring in outcross blood without opening the home replacement pipeline.
The Barn Math: What 9.99% Actually Costs
Here’s the mechanism behind that $54,665 figure, run for the average open-catalog herd — not for the four named farms.
Take a 500-cow Holstein herd whose heifer crop sits near the 9.99% Lactanet August 2025 average against a pre-genomic 4% baseline. The Doekes (2018) and Makanjuola (2020) regressions estimate milk loss in the 80 to 108 lbs per cow per 305-day lactation range for every 1% increase in pedigree inbreeding. Use the upper end and the math runs:
The 500-Cow Open-Catalog Calculation
Step
Value
Source
Heifer-crop inbreeding
9.99%
Lactanet, Aug 2025
Pre-genomic baseline
4.00%
CDCB / Lactanet historical
Delta
5.99 points
derived
Upper-bound coefficient
108 lbs / 1% / 305-day lactation
Doekes 2018 / Makanjuola 2020 (JDS)
Modeled milk loss per cow
~647 lbs / yr
derived
Class III milk price
~$16.90 / cwt
USDA AMS Class III monthly announcements, recent quarters
Loss per cow
~$109
derived
Loss on 500 cows
~$54,665 / yr
derived
Lower-bound check: Use the lower-bound coefficient (80 lbs / 1%) and the same herd loses about $40,500 a year in milk alone. Either way, you’re looking at the cost of a small pickup truck. And that’s just milk — fertility, replacement turnover and stillbirth losses sit on top.
Sensitivity note: Drop the Class III price by $1.00/cwt and the 500-cow figure shifts roughly $3,200 in either direction. The underlying milk-loss volume — 647 lbs/cow/yr at the upper-bound coefficient — is the figure that matters; the dollar tag rides whichever Class III month you anchor to at publish.
Here’s the part the four named farms get right that the average herd doesn’t: closing the gates doesn’t eliminate that tax. Curating the bull list does. A closed herd that runs the same lazy top-20 catalog can still drift toward 9.99%. A closed herd that rotates 15–20 deliberately diverse sires, caps single-sire usage at 10–12% of the calf crop, and sets a hard EPI cap below the national average tends to land below it. Per Holstein Canada Master Breeder profiles, the four farms in this piece lean hard on the second model.
That’s the genetic tax an open-catalog herd quietly pays when the relationship math gets away from it. Closed herds still pay some of it. They’re usually just the only ones in the room with a full picture of the bill.
The Mechanics Behind the Outcomes
Why do closed herds with disciplined sire rotation keep posting type and longevity numbers most open herds chase with catalog orders? Three things actually do the work, per Lactanet, CDCB and peer-reviewed literature on closed-population breeding.
Stack bulls on cow families they know. Closed herds don’t spread semen like peanut butter. They pick 15 to 20 bullsand use them deliberately across maternal lines they’ve watched for decades. Each bull is there to correct something specific — udder depth, heel depth, chest width — not just to hit a TPI or LPI target. The bull list is a multi-year working document, not a quarterly catalog refresh.
Cap inbreeding instead of just minimizing it. Most mating software defaults to “minimize inbreeding,” which sounds responsible until you read the settings. Closed herds that survive this long set hard caps on Expected Progeny Inbreeding (EPI) — typically around 9.0–9.5% — and refuse matings that cross the line. They flip the switch that blocks HH1 through HH6, HCD and CVM carrier-by-carrier matings. That’s how you avoid the bottleneck Chief built, where the HH1 mutation, before testing was widespread, has been linked in CDCB and VanRaden literature to several hundred thousand pregnancy losses globally and substantial heifer-value losses.
Run classification as a feedback loop, not a courtesy visit. In open-catalog herds, mating decisions often default to whatever the AI program suggests. In Master Breeder operations, classification day is an audit — which cows moved up, which lines stalled, what last decade’s mating decisions look like in the flesh. When Brigeen hits 108.1 BAA with 50 EX in a 580-cow herd, that’s not a fluke. It’s what happens when on-farm scoring closes the loop on every breeding decision.
A fair caveat: not every closed herd outperforms. Some hit a genetic ceiling, drift into founder bottlenecks, and stagnate without disciplined outcross rotation. The four farms in this piece are the ones who got the discipline right. The model works when you do the work.
How Much Is Your Inbreeding Actually Costing?
This is the question that drives the economics, and most herds can’t answer it.
Most operations know their rolling herd average. Fewer can tell you average pedigree inbreeding on the current heifer crop. Almost none have translated that number into dollars.
The math isn’t complicated, but you have to look at it. Under the upper-bound coefficient (108 lbs/1%), 2 percentage points of excess inbreeding — call it 10% instead of a disciplined 8% — costs roughly 160 to 216 lbs of milk per cow per year. On a 1,500-cow herd at Class III near $16.90/cwt, that lands in the $40,500 to $55,000 a year range in milk loss alone. A high-component herd capturing full butterfat and protein premiums on a strong mailbox price will see that figure run materially higher.
Then add the rest:
Modeled mid-term abortions and embryo losses when you stack recessive haplotypes — in the $20,000 to $40,000/year range for commercial herds at +2 points of excess inbreeding.
Shorter productive life forcing 20 to 30 extra replacements a year.
Replacement-cost reality check: U.S. springing-heifer values reported in USDA NASS Agricultural Prices monthly data averaged near $3,010 across mid-2025 reports, with replacement inventory at a 47-year low per the January 2025 NASS Cattle inventory report. Every extra cull that walks out the gate is now a four-figure decision, not a routine one — and that’s hitting open-catalog herds harder than it has in a generation.
Add it up — milk drag, modeled abortion and embryo losses, plus 20 to 30 net additional replacements at roughly $3,010 each — and the modeled hidden tax on a 1,500-cow herd with unmanaged inbreeding lands somewhere in the $90,000 to $180,000 a year range, depending on coefficient choice, component-price assumptions and how much of that replacement cost is already baked into your normal turnover budget. Closed herds with disciplined sire rotation typically carry a fraction of that, but not zero. The number you actually pay depends on how curated your bull list is — not whether your gates are open or shut.
You don’t have to close your herd to hate that number. You do have to know it.
Is Your Herd’s Genetic Strategy Already Behind?
This is the operational question Master Breeder herds force everyone else to answer.
If you’re picking bulls mainly off TPI or LPI lists, you’re already a step behind where these four farms operate. They aren’t ignoring the indexes — Holstein Canada and Holstein USA records show they use them as one filter among several. The real work happens in the barn and in the records.
A few honest questions:
Who actually owns the mating program at your place — and could they tell a stranger why, off the top of their head?
Do they know which cow families paid for the last parlour or the last robot?
When a classifier knocks a cow down a point, does that change the next bull list, or does the score just get filed?
The closed herds documented in this story share one trait: a single person, or a tight team, who can answer those questions without opening a laptop. You don’t need to copy their model. But if nobody in your operation can name the cows that built the place and the bulls that kept them around, you’re running a breeding program on autopilot — and autopilot is what the 9.99% number is built on.
Options and Trade-Offs for Farmers
Most herds won’t go fully closed. That’s fine. What matters is knowing where you sit on the spectrum and what each option actually costs.
Path 1: Stay Open, but Put a Price Tag on Inbreeding
When it makes sense: You’re growing fast, need outside females to fill stalls, or you rely on ET and IVF to sell genetics and scale replacements.
What it requires: A real handle on your herd’s inbreeding levels — pedigree and ideally genomic. At least one barn-math exercise: what does a 2-to-3-point inbreeding bump cost you in milk and replacement budget?
Risks/limits: Apply the upper-bound coefficient to a 200-to-300-cow herd at 2 points of excess inbreeding and the modeled milk-loss drag at Class III near $16.90/cwt runs roughly $5,500 to $11,000 a year before fertility, embryo-loss and replacement costs. Layer those on and the all-in modeled tax can run two to three times the milk-only figure. You’re betting ET and high-priced semen will out-earn that drag. Some herds do. Many don’t.
When it makes sense: You want biosecurity and herd consistency, but you also sell embryos, show cattle, or want diversification on a few specific families.
What it requires: Treating the homebred replacement stream as sacred. Outside embryos go into clearly labeled marketing or show projects, not into the commercial replacement line. Clear rules about how many outside matings and where they fit.
Risks/limits: It’s easy to slide from “semi-closed” into “we bought three heifers this year because the numbers looked good.” You need the same record discipline as a fully closed herd, plus the stomach to say no when somebody offers you a hot heifer. Per Hoard’s Dairyman coverage and Holstein USA records, Brigeen runs this model — closed on female replacements, selective on imported embryos for marketing cows. Saintour’s Ferme Bard co-ownership model is the same idea on a smaller scale.
Path 3: Fully Closed on Females, Curated Outcross Semen
When it makes sense: You know your cow families inside out, and you’ve got a successor — or at least a willing trainee — to carry the mental load.
What it requires: A hard stop on outside heifers and cows. A deliberate 15-to-20 bull rotation with caps on how much any one sire can contribute to your calf crop, often around 10–12%, and a willingness to use Red Holstein, European outcross sires and older AI bulls through stored semen to break up the Chief stack. Classification and on-farm notes back at the center of breeding decisions.
Risks/limits: Expansion is harder. Every extra stall has to be filled with a calf you bred. Cash-flow shocks bite deeper, because slashing cow numbers in a bad year cuts into the families the whole program depends on. The upside in 2026? With springing heifers near $3,010 and inventory at a 47-year low, closed herds are insulated from the heifer market that’s choking open-catalog cash flow. Per Holstein Canada records, Larenwood lives here — no outside females since 1956, Larenwood-prefix bulls in AI distribution, a Master Breeder shield earned the slow way.
Path 4: Closed-Herd Thinking Without Closing the Gates (the 30-day move)
When it makes sense: You’re not ready to change replacement policy, but you’re done paying dumb inbreeding tax.
What it requires: Within 30 days, sit down with your genetics rep and turn on inbreeding caps and haplotype blocking — set the EPI cap around 9.0–9.5% and switch on HH1–HH6, HCD and CVM blocking before the next semen order goes in. Within 90 days, identify your top three cow families by lifetime production, classification trajectory and longevity, and decide which gets sexed semen and which gets beef. Add at least two outcross sires to your rotation — Red Holstein, European bloodlines, or older AI bulls through stored semen — to break up the Chief stack.
Risks/limits: It’s easy to tell yourself you’re “breeding like a closed herd” while still buying cows that don’t fit your barn. Without someone owning the long-term vision, the settings drift back to convenience. This is probably the best 30-day starting point for most herds — flip a few toggles, pull a couple of reports, and at least see whether you’re carrying the same $54,665-style tax the 500-cow example shows.
Key Takeaways
If your average heifer inbreeding is above 9.5%, assume you’re paying a five-figure annual penalty under current Doekes/Makanjuola assumptions and treat it like any other cost line — not a footnote.
If three or more people share bull-selection authority with no one accountable for long-term direction, you’re not set up for closed-herd thinking — even if you stop buying cows tomorrow.
If your mating software is set to “minimize inbreeding” rather than capped at a hard EPI threshold, you have a 30-day fix sitting in front of you. Set the cap around 9.0–9.5% and turn on HH1–HH6, HCD and CVM blocking before the next semen order.
If your bull list this year shares a sire grandfather across more than half your matings, you’re stacking Chief whether you can see it or not — add at least two outcross lines before the next round.
If you can’t name your top three cow families by lifetime contribution, stop sending their daughters to beef and start treating those lines as a 10-year asset.
If springing-heifer prices near $3,010 are bending your cash flow, lean harder on homebred replacements before you lean harder on the auction barn.
So which side of the $54,665 line is your herd on — and would you actually know if you didn’t run the numbers?
If Larenwood can carry a 70-year closed herd in Ontario and put Larenwood-prefix bulls into AI distribution, and if Brigeen can hit 108.1 BAA with 50 EX in a 580-cow Maine herd, the question isn’t whether the closed-herd model “wins.” It’s how curated your bull list is, how disciplined your mating caps are, and whether your operation is set up for the long mental load that goes with both. For now, the next move is yours: pull your inbreeding report and see where you sit.
Complete references and supporting documentation are available upon request by contacting the editorial team at editor@thebullvine.com.
Run Your Numbers
Genomic Testing ROI Calculator — Before you decide which heifer calves deserve a stall and which ones get a beef straw, run the Genomic Testing ROI Calculator. It puts a dollar value on testing the calf crop, sorting the bottom quartile out, and managing the inbreeding risk the $54,665 example pressure-tests for the average open-catalog herd.
Learn More
Holstein inbreeding hit 9.99%: the Bell 2.0 trap— Arms you with a step-by-step technical framework to flip hidden software toggles, adjust loose mating parameters, and protect your IVF donor pens from severe genetic relationship caps.
Every week, thousands of producers, breeders, and industry insiders open Bullvine Weekly for genetics insights, market shifts, and profit strategies they won’t find anywhere else. One email. Five minutes. Smarter decisions all week.
On a 500‑cow herd with 220 heifer calves a year, even 4% pre‑weaning mortality buries about $27,000 in lost heifers alone — at $3,010 per head, before genomics or sexed semen. At 5–6%, that same line item passes $40,000. Still think your $30 calf program is “good enough”?
Replacement heifers are at their lowest U.S. inventory since 1978, and CoBank analyst Abbi Prins doesn’t expect supplies to really recover until 2027 — with replacements already averaging over $3,000 a head in many markets. Out by the hutch row, that doesn’t feel like a market report. It feels like a dead calf that suddenly got a whole lot more expensive. In a heifer market that’s roughly 800,000 head short over 2025–2026, every calf that dies in the hutch row isn’t bad luck. It’s a four‑figure hole in a pipeline you can’t easily refill.
We Built the Beef‑on‑Dairy Exit. Now We’re Paying for the Entrance Back In.
Ken McCarty of McCarty Family Farms in Colby, Kansas, still remembers standing by the loading chute when Holstein bull calves were “two for $5” and nobody wanted them. That kind of pain helps explain why so many U.S. dairies were quick to shift more cows to beef‑on‑dairy as calves started bringing $600, then $1,000, then $1,400 a head in some markets. For a while, the bottom‑tier “beef exit” finally worked — cash today, fewer problem calves tomorrow.
At the same time, sexed dairy semen quietly went from niche tool to default button on the better cows. NAAB’s 2024–2025 semen data — which The Bullvine unpacked in “NAAB’s $327.6 Million Semen Boom vs. $3,000 Heifers” — shows just under 66 million bovine semen units sold and $327.6 million in export value. Inside the roughly 16.5 million dairy units used on U.S. cows, the mix has flipped: about 10.6 million are gender‑selected dairy semen (64%of dairy units), around 6.0 million are conventional dairy, and about 8.1 million units are beef semen used on dairy cows. Put simply, you’re running roughly 43% sexed dairy, 24% conventional dairy, and 33% beef‑on‑dairy across all semen used on dairy cows in the U.S. today.
That cocktail made sense when replacement heifers were cheap and the pipeline was full. It doesn’t anymore. USDA NASS’s January 2025 Cattle report put U.S. dairy replacement heifers 500 pounds and over at 3.914 million head — down 0.9% from 2024 and the lowest level since 1978. CoBank’s August 2025 analysis projects inventories will shrink by an estimated 800,000 head over 2025–2026 before starting to rebound in 2027, with replacement prices likely to “climb well above $3,000 per head.”
McCarty’s “two for $5” bull calves are gone. The heifers replacing them are $3,010 animals riding on the thinnest replacement pipeline you’ve seen in your career. His generation gave away bull calves. Yours is leaking value in the heifer hutches — just more expensively. In that reality, you can’t afford to run a $30 calf program and call it good enough.
How $3,010 Heifers Die on $30 Calf Programs
Let’s put some barn math under the gut feeling.
Take a 500‑cow herd freshening about 220 heifer calves per year. NAHMS 2014, analyzed by Urie and colleagues, reported 5.0% pre‑weaning mortality in U.S. heifer calves nationally, with many real‑world herds today running closer to 3–5% when records are tight. Use 4% as a realistic working number for your operation. That’s about 9 dead heifer calves before weaning.
At $2,660 per head — the U.S. average replacement cow price in January 2025 — those 9 deaths represent about $24,000 in lost heifers. At $3,010–3,110 per head — mid‑ to late‑2025 averages in several U.S. markets — you’re burying roughly $27,000–28,000 in heifers alone. If your number drifts up toward 5–6%, that line item climbs past $33,000–40,000 quickly — and that’s the math behind this article’s headline.
And that’s just the heifer value. It doesn’t include:
$40–50 per heifer in genomic testing, with CLARIFIDE®‑type programs commonly around $43/head.
A $15–30 per straw premium for sexed semen over conventional, consistent with economic work and current semen price sheets.
IVF or ET on your top donors — often hundreds of dollars per live heifer calf after you spread donor, flush, lab, and recipient costs across pregnancies.
When a genomic‑tested, sexed semen heifer calf dies in the hutch at 19 days, you’re not just losing “a calf.” You’re losing a four‑figure replacement you can’t easily buy back — plus the semen and IVF bills stacked underneath her.
Investment Item
Cost per Calf
Running Total
Sexed Semen Premium
$15–$30
$15–$30
Genomic Test
$40–$50
$55–$80
IVF/ET (per live calf)
$200–$400
$255–$480
Subtotal (Genetics)
—
$255–$480
Extra Nutrition (Penn State)
$42–$50
$297–$530
TOTAL PER HEIFER CALF
—
$297–$530
The slower leak is the one that doesn’t show up in the dead loss column, but still costs you. Calves that survive scours or pneumonia but limp along on growth often freshen late, give less milk in early lactations, and leave the herd sooner. On a 500‑cow dairy, a couple dozen of those “almost fine” cows can flatten herd progress for years without ever making the problem list.
Buying the Ferrari, Using Regular Gas: The $30 Management Leak
You’re already paying for the Ferrari with sexed semen, genomic tests, and IVF on your best cows. The question is whether you’re still putting regular gas in it.
Colostrum and passive transfer. U.S. calf‑health work shows that on many dairy operations, 20–40% of calves still fail to achieve adequate passive transfer [VERIFY: cite Lombard et al. 2020 review or NAHMS Dairy 2014 — confirm exact source/date]. A major review of passive transfer failures found that these calves are about twice as likely to get sick or die early as calves that reach target IgG levels. The reasons are painfully familiar: first feeds drifting past the 2‑hour mark, “we got about two quarts in” instead of a full volume, and colostrum “quality” judged by color and cow parity instead of a Brix reading. A Brix refractometer costs less than one‑tenth of a dead heifer at $3,010.
Related Reading: [INTERNAL LINK: Bullvine calf-mortality-economics piece — hidden gem candidate] → Suggested anchor text: “The Critical Economics of Calf Mortality: Why Every Life Counts More Than Ever.”
Pre‑weaning nutrition. Soberon and Van Amburgh’s work pulled data from a Cornell research herd and a commercial herd. For each 1 kg/day increase in pre‑weaning average daily gain, first‑lactation milk yield increased by about 850 kg in the research herd and 1,113 kg in the commercial herd. A 2016 Journal of Dairy Science review confirmed that keeping average daily gain above 0.5 kg/day with adequate nutrients is linked to higher milk, fat, and protein yields in first lactation. But if that extra nutrition is going into dirty bottles, under‑bedded hutches, or calves that never got decent passive transfer, you’re just buying more expensive scours.
Disease pressure. Urie et al. reported that digestive and respiratory disease together account for a majority of pre‑weaning heifer deaths on U.S. dairies. Other studies have linked early‑life disease to reduced growth, higher treatment costs, and greater odds of early culling. In the “two for $5” bull‑calf era, you could absorb a handful of fragile replacements. In a market where USDA has heifer inventories at their lowest since 1978, every sick, slow‑growing calf is a capital asset you may never fully earn back.
Every weak link in the first 60 days turns a high‑genetic heifer into either a dead loss or a lower‑yield, shorter‑lived cow. That’s always been bad management. At $3,000‑plus per heifer, it’s pipeline suicide. The herds that flip those numbers don’t do it with a new binder — they do it by giving one person clear ownership of the hutch row, which is exactly what the I‑29 case in Option 3 below shows.
How Much Is “Cheap” Calf Nutrition Actually Saving You on $3,010 Heifers?
Here’s where the “we can’t afford a better replacer” argument starts to fall apart.
Penn State’s 2023 bulletin “Economics and Effects of Accelerated Calf Growth Programs” compared a standard 20:20 milk replacer at $80 per 50‑lb bag to a higher‑quality replacer at $100 per bag in a 56‑day feeding program (2023 prices — adjust to your current bag cost). In a scenario where calves moved from gaining 1.1 lb/day to 1.5 lb/day, feed cost increased by about:
$41.92 per calf on the $80/bag program.
$50.26 per calf on the $100/bag program.
Spread over 56 days, that works out to roughly:
$0.75 per calf per day extra on the cheaper program.
$0.90 per calf per day extra on the higher‑quality program.
Round it, and you’re talking about $42–50 extra per calf to run a higher plane of nutrition. On 200 heifer calves a year, that’s an additional $8,400–10,000 in milk replacer cost.
Now put today’s heifer prices on the other side of the ledger. At $3,010 per head, if tightening up colostrum and stepping up nutrition together drop heifer calf mortality from 4% to 2% on those 200 heifers, that’s 4 extra heifers alive. Four at $3,010 is $12,040 — more than enough to cover the $8,400–10,000 in extra feed.
You don’t even need a full 2‑point drop to break even. If you spend $10,000 more on calf feed and each heifer is worth $3,010, you need to save about 3.3 heifers. On 200 heifers a year, that’s roughly 1.6 percentage points of mortality improvement. At the lower feed cost ($8,400), the breakeven is closer to 1.4 points. Either way, you’re still only aiming to save one to two extra heifers per 100 born.
Will every farm see that from a replacer change alone? No. Colostrum timing, housing, bedding, and people following the protocol all matter. But at current heifer values, the breakeven for a better calf program has moved much closer than it used to be.
What’s the Real Cost of Your Calf Program?
The easiest way to dodge this question is to say, “Our calf program is fine.” The harder way is to pull the numbers and see if it actually matches the genetics bill you’re paying.
Start with last year’s heifer calf crop. If you had 220 heifer calves born and lost 4% before weaning, that’s about 9 heifer calves dead. At your replacement value — anywhere from $2,660 in early 2025 to $3,110 by late 2025 — you’re looking at a $24,000–28,000 line item just for dead heifers. Then add in the extras: sexed semen premiums, genomic tests, and any IVF work you did on the cows those heifers came from. If that number doesn’t make you uncomfortable, check it again.
Now compare your calf program spend to that loss. Penn State’s math shows an extra $42–50 per calf in replacer cost on 200 heifer calves — call it $8,400–10,000 per year — can break even if you save just one or two extra heifers per hundred born at $3,010 each. Does your current calf program pass or fail that simple barn‑math test?
Who Really Owns the Hutch Row?
On paper, you might say, “Our calf team handles it.” In practice, that often means whoever finishes milking first or whoever drew the short straw that week.
Ask yourself one blunt question: if you walked into the office right now and asked, “Who owns calf outcomes here?” would you get one name in under five seconds — or a vague, “We all do”? Herds that win this game usually have a single person who owns colostrum, calves, and the key numbers: FPT %, heifer calf mortality, and weaning weights.
You don’t need a fancy HR plan to get there. You need to pick the person who notices calves first, give them clear authority over calf protocols, and put their numbers on the board every month next to pregnancy rate and SCC. When calf care is shared across whoever has time, even $3,010 heifers can quietly get less focused attention than they really need.
Metric
What It Measures
Target
Action Threshold
FPT %
Calves failing passive transfer (serum total protein <5.2 g/dL)
<10%
>15%
Pre-Weaning Heifer Mortality %
Heifer calves dead before weaning
<3%
>4%
Average Daily Gain (Pre-Weaning)
Pounds gained per day, birth to weaning
>1.5 lb/day
<1.1 lb/day
Weaning Weight
Average weight at 8 weeks
>200 lb
<180 lb
Days to First Calving
Age at first calving
<24 months
>26 months
Options and Trade‑Offs for Farmers
You don’t have to fix everything this month. But you do need to stop running a $30 calf program under a $3,010 heifer reality. Here are four paths, how they work, and where they can bite you.
1. Lock Down Colostrum — Your 30‑Day Action
If your heifer replacements are worth more than about $2,500 and your heifer calf mortality is over roughly 3–4%, that’s a strong signal that this is where you start.
In the next 30 days, pull the last 12 months of heifer‑calf data and calculate your actual pre‑weaning heifer mortality. Not a gut feel — the real number from your records. Brix‑test colostrum from every fresh cow for at least one full week and draw a hard line: nothing under 22% Brix goes into heifer calves. Then draw blood from every calf born during that week at 24–48 hours and run serum total protein. If more than 10–15% of those calves fall below the accepted passive‑transfer threshold, your most expensive pipeline leaks.
When this path makes sense: any time replacements are valuable, and you haven’t done a proper FPT audit in the last 12 months. What it requires: a Brix refractometer, some blood tubes, a small lab bill, and a willingness to change how quickly and how much colostrum gets fed. Where it fails: you collect the numbers and then write them off as “just a bad week” instead of changing milking‑fresh, storage, and first‑feeding routines.
2. Upgrade Calf Nutrition With Numbers, Not Hope
This path is for herds already investing in genomics and sexed semen but still seeing 4–5% heifer calf mortality and a thick treatment notebook.
You’re basically asking one question: does the extra $42–50 per calf Penn State lays out for a higher‑plane program pay off at $3,010 per heifer in your barn? Use their math as the backbone and plug in your own replacer price, mixing rate, and days on feed. Then compare that extra spend to what saving one or two extra heifers per hundred born is worth in your herd.
You’ll also need to tighten mixing accuracy, feeding schedule, and hygiene. A better bag doesn’t fix dirty bottles or inconsistent solids.
When this path makes sense: you’ve already got decent colostrum numbers but still see too many sick, slow‑growing calves. What it requires: shifting away from “whatever 20:20 is cheapest” toward a consistent, all‑milk‑protein replacer and enforcing protocol discipline. Where it fails: you upgrade the replacer but leave colostrum, housing, and staff training the same. That’s just a more expensive way to keep the same problems.
3. Put Real Ownership on the Calf Barn
On some dairies, the calf barn turns not because a consultant writes a binder, but because one person quietly decides, “These calves are mine.”
Maybe it’s the herdsman’s daughter who has a knack for spotting dull eyes and droopy ears. Maybe it’s the feeder who hates seeing the same calf on the treatment list twice. On one 600‑cow I‑29 herd a consultant works with, the turning point was simple: the owner told their sharpest young employee, “You own hutches and colostrum. I’ll measure you on FPT %, death loss, and weaning weights — and I’ll back you when you need changes.” Within a year, that farm’s heifer calf mortality had dropped, and the owner quit saying, “Our calves are just weaker.”
When this path makes sense: nobody in your place can answer “Who owns calf outcomes here?” without looking around. What it requires: giving one person clear authority over calf protocols and tying their success to three KPIs: FPT %, heifer calf mortality, and weaning weights. Then sitting down monthly to review those numbers alongside repro and SCC. Where it fails: you give someone the title but not the time, training, or authority. If calf chores are still what happens when people finish everything else, the numbers won’t move.
4. Benchmark Calves the Way You Benchmark Cows
With CoBank’s shortage timeline and beef‑on‑dairy locked in for 2026, flying blind on calf performance is the wrong gamble.
When this path makes sense: you genuinely don’t know how your calf metrics stack up against herds that look like yours. What it requires: pull a year of heifer‑calf data and break mortality into 0–3 days, 4–21 days, and 22 days to weaning. Add FPT % and weaning weights. Then work with your vet, nutritionist, or a university project to benchmark against peer herds. Where it fails: you see that your numbers sit in the bottom third and decide “our calves are just weaker” instead of changing something.
Key Takeaways
If your heifer replacement value is above roughly $2,500 and your heifer calf mortality is over 3–4%, stop treating that as background noise. Treat it like an economic leak. Multiply last year’s dead‑heifer count by $2,660–3,110 and ask whether you’d accept that line item if it showed up as a bill from your vet or semen rep.
If you’re running a high beef‑on‑dairy percentage without a locked‑in heifer plan, you’re stacking two bets: that beef calf premiums stay strong and that replacements will be there when you need them. CoBank’s 800,000‑head shortfall and USDA’s lowest‑since‑1978 inventory should make you nervous about the second part.
If you’re willing to spend about $43 per heifer on genomics and pay a $15–30 sexed‑semen premium,balking at an extra $42–50 per calf on a better colostrum and nutrition program doesn’t pencil. The breakeven is saving roughly one to two heifers per 100 born at $3,010 each.
If nobody on your farm “owns” calf outcomes with data, your calf program is still operating more like a chore than a managed system. Name a calf manager and give them three numbers to live by: FPT %, heifer calf mortality, and weaning weights.
If you haven’t Brix‑tested colostrum and run serum total protein on a batch of calves in the last 12 months, your colostrum program is still a story, not a fact. Make that your 30‑day project.
Your Calf Barn Checklist — Print This and Take It Outside
☐ The Brix Test: Is every gallon of colostrum for heifer calves testing at or above 22% Brix before it goes into a bottle?
☐ The 2‑Hour Rule: Are calves reliably getting their first colostrum within 2 hours of birth, or are there still “shift change” calves waiting longer?
☐ The FPT Audit: Have you checked serum total protein on the last 10 heifer calves born? What percentage cleared the passive‑transfer threshold?
☐ The Mortality Number: Can you write down your actual 12‑month pre‑weaning heifer calf mortality rate — not a guess, but the number from your records?
☐ The Cost‑Per‑Death: Take that mortality rate, multiply by your annual heifer calf crop, then by $3,010. That’s what lost heifers cost you last year — before you add in genomics, sexed semen, or IVF.
☐ The Replacer Math: How much does your current milk replacer cost per calf through weaning? What would an upgrade cost? How many extra heifers per 100 born would need to live for that to pay off at $3,010 per head?
☐ The Pipeline Check: How many bred heifers and springers do you have on hand right now, divided by how many replacements you actually need each year? If that ratio is under 1.0, you’re already short. Under 0.8, you’re in trouble if CoBank’s 2027 recovery timeline holds.
☐ The Owner Question: Is there one name — not “the team” — on this farm who owns those calf numbers?
Heifers aren’t about to get cheaper. USDA NASS’s January 2025 report and follow‑up analysis put replacement heifers at 3.914 million head, the lowest since 1978, and CoBank’s best‑case scenario has inventories just starting to recover in 2027. The genetics you’re putting into cows today are some of the most expensive you’ve ever bought. The calf barn is where you decide whether that money turns into cows or compost.
So here’s the real question: do your calf numbers match the genetics bill you’re paying — or are you still running a $30 program under a $3,010 heifer reality?
Run Your Numbers
Bullvine Pipeline Index Calculator — This free tool turns your heifer pipeline into a single 0–100 score and shows whether your current calf losses, beef-on-dairy use, and cull rate can actually support tomorrow’s herd. Use it to see if your $30 calf program matches your $3,010 heifer reality.
Learn More
Beef-on-Dairy Calf Profit: The $150 Leak Killing Your Premium — Arms you with precise weaning strategies and protocol adjustments to eliminate a hidden $130–$225 per head value leak. It details why feedlots slash bids on calves carrying subclinical health issues, protecting your immediate revenue.
Beef-on-Dairy’s $6,215 Secret: Why 72% of Herds Are Playing It Wrong — Delivers an unarguable reproductive matrix that proves why herds with under a 20% pregnancy rate capture zero net profit from beef crossbreeding. It dismantles generic breeding advice, forcing a rigorous re-evaluation of your sexed semen allocation.
The Sunday Read Dairy Professionals Don’t Skip.
Every week, thousands of producers, breeders, and industry insiders open Bullvine Weekly for genetics insights, market shifts, and profit strategies they won’t find anywhere else. One email. Five minutes. Smarter decisions all week.
WDE draws 53,000+ from 95 countries. The Royal matches its class‑for‑class. Japan’s Grand Prix runs once every five years. Eight more shows follow — and most serious breeders haven’t been to any of them.
Ferme Jacobs is loading semis in Cap‑Santé before sunrise on a Tuesday in late August. Pierre Boulet’s string is already three hours up the road. Somewhere in Wisconsin, a fitter is checking a flight to Cremona for the second leg of a fall trip that started in Madison and ends with espresso. None of them calls this a vacation. They’ve stopped pretending it isn’t one.
Right now, somebody you know is standing barefoot on a beach holding a drink with an umbrella in it. You’re not jealous.
You’re checking in a string at 6:47 a.m. in a barn that smells like fresh shavings, tail adhesive, and possibility. Your back hurts. You’ve slept for four hours. The coffee is bad. And in eleven hours, when the senior three‑year‑old class hits the colored shavings, and the crowd leans forward as one organism, you’ll feel something no swim‑up bar has ever delivered.
That feeling has a name now.
Showcation. Time off spent at a cattle show — or in a cattle show universe — instead of a “real” vacation. Side effects: ruined tolerance for sitting still, an uncontrollable urge to book flights based on judging cards, and the gradual realization that the rest of the world’s “world cities” — Milan, Tokyo, New York — are pretenders. Your world cities are Madison, Toronto, Cremona, Castro, Quito, and a few sleepers so good you almost don’t want to tell anyone.
Almost.
This is the world tour. Eleven shows. Five continents. Ranked, opinionated, and honest about what’s elite, what’s underrated, and which one will absolutely change your life.
Pick two. Book them before you close this tab. Let’s go.
What Makes a Cattle Show Worth Traveling For?
A showcation is the full package: the flights, the planning, the sale catalog you read on the plane, the bar tab the night before the big class, the farm tours you bolt on, and the part where you come home with a notebook full of ideas and a phone full of cow photos and the unmistakable feeling that you’ve been reset.
You come back with a sharper eye and a worse tolerance for staying home. Both are features, not bugs.
It pays for itself, too. File it under continuing education, marketing, R&D, or “competitive intelligence” — pick your favorite and own it. Because watching 1,800 of the best cows on earth in a four‑day window is genuinely the most efficient learning week any breeder will ever have, for a deeper dive into how those cows actually get sorted in the ring, check out our Judging and Ring Craft Fundamentals guide to walk through what the cards are really telling you.
If you only ever export your cows or your carcass once in your life, make it Madison. That isn’t a slogan. It’s just true.
WDE pulls more than 53,000 attendees from 95 countries into a single Wisconsin fairgrounds for one week every October — roughly 1,800 dairy cattle on the grounds, 650+ companies in the trade show, and dairy people from Chile, China, Cremona, and Cache Valley walking the same alley between the Holstein barns and the trade pavilion.
Here’s what hits first‑timers like a kick in the chest: the heifer that won her class at your national show is fighting for seventh in Madison. The depth resets your eye permanently. You’ll never look at a class the same way again — and if you want our complete breakdown of the rings that defined the recent season.
Then the Coliseum. When the Senior Cow class loads up — when a great mature cow with that kind of width and presence and rear udder walks under the lights, and the building leans in — there’s no equivalent moment in any vacation, anywhere, ever. It’s the closest thing in agriculture to a championship fight. You can feel the building hold its breath.
Outside the ring, the trade show is sensory overload in the best way. Robotics demos, embryo programs, semen contracts, startup gadgets you’ve never heard of, all crammed into ten minutes of walking. Teat sealants, flush programs, and genomic strategy in a single aisle. The whole global dairy industry fits inside one fairgrounds for seven days.
Madison, the city, is the bonus round. Lakes, the Capitol, a Saturday farmers’ market that looks like a magazine spread, cheese curds at midnight at The Old Fashioned, and a bar scene where the person beside you is probably a herdsman from Italy.
Insider Notes:
Lodging Strategy: Book hotels early in the summer, or stay slightly farther out and eat downtown to offset the premium rates.
Can’t-Miss Event: Plan for a minimum of three days. Stay through the Parade of Champions and never miss the International Holstein Show.
Networking Hub: Tanbark Café happy hours and trade show after‑parties are where the real conversations happen. Don’t skip them for sleep. Sleep is for December.
2. Royal Agricultural Winter Fair — Toronto, Canada
Madison’s equal in the ring. Then you walk outside, and you’re in a world city.
The handshake that says you just won The Royal. Altona Lea Unix Herminie — Grand Champion Holstein at the Royal Agricultural Winter Fair, Toronto. The moment that settles the Madison-vs-Royal argument every November. (Read more: Canadian National Holstein Show 2025 – The Royal)
Settle this once and for all: for Holsteins, The Royal is on par with World Dairy Expo in ring quality and depth. Not close. Not “if you squint.” Equal.
The National Holstein Shows at the RAWF run in November, when cattle are at peak condition after a full season, and the cards read accordingly. Holstein Canada has already locked in Nathan Thomas and Joel Phoenix to judge the 2026 National Holstein and Red & White Shows, which tells you exactly how seriously the committee takes the standard.
Here’s what The Royal has that nobody else does: more than a century of history (the fair celebrated its centennial in 2022), an arena in the middle of Canada’s biggest city, and a “fair” wrapping around the show that’s the size of most countries’ national exhibitions. One ring over from a five‑year‑old Holstein walking under the spotlights, there’s a world‑class show jumping class. Downstairs, kids are seeing their first butter sculpture. Saturday Night at The Royal — when the Holsteins finish and the city lights up outside the doors — has its own electricity.
Then. You. Walk. Outside.
You’re in Toronto. Tie‑ups to one of the world’s great food cities in 20 minutes flat. Multicultural neighborhoods, Leafs and Raptors at Scotiabank, live music in Kensington, and the kind of restaurants that make non‑dairy spouses suddenly very supportive of your hobby. This is the showcation you sell to your partner first. You can’t lose pitching it.
Insider Notes:
Commuting Pro-Tip: Stay downtown. Take the subway or a short Uber to Exhibition Place. Don’t try to fight Toronto traffic from the outer suburbs.
Barn Access: Walk the cattle barns at 6 a.m. The morning light through the old rafters is gorgeous, and breeders are actually approachable before the massive crowds arrive.
Booking Windows: Secure downtown hotels by early fall. November in Toronto fills fast due to winter conventions.
3. Le Suprême Laitier — Saint‑Hyacinthe, Québec
Quebec’s summer championship. French passion. North American show cows. Barn parties that go too late.
That udder. That rib. That topline. Valepierre Artisan Alice taking Grand Champion Holstein at Le Suprême Laitier 2025 — the cow that explains why serious breeders fly to Saint-Hyacinthe in August. (Read more: Supreme Dairy Show – Holstein 2025)
Pull up the recent results sheet and try not to start booking flights. Ferme Jacobs is anchoring multiple divisions. Comestar. Pierre Boulet is doing what Pierre Boulet does. The top of the ring reads like a who ‘s-who of modern global cow families — and it’s all happening in one barn, in late August, in the most beautiful agricultural region of Québec.
Nowhere else in North America does the European emotion of dairy meet North American show cow power quite like this. French‑Canadian breeders bring something different to the ring — louder, more familial, more multi‑generational, more theatrical in the best possible way. Grandfathers who led calves here in 1975 watch their grandkids show direct descendants of those exact cow families. The pride is real. The barn parties go later than they should. Your French gets better around midnight.
The vacation twist: rural Québec in late August. Poutine from a proper roadside casse‑croûte after the Holstein show. Cheese factories, sugar shacks, microbreweries, and small‑town festivals every weekend. Montréal is 45 minutes away if you want a city anchor for non‑show days.
Insider Notes:
Inventory Alert: Because of the prime August timing, lock down your dates early. Saint‑Hyacinthe hotel inventory is notoriously tight.
Genetic Capital: Watch for the embryo and elite livestock sales running concurrently alongside the show. Some of the most valuable genetic conversations of the year happen in those aisles.
Local Secret: Bring cash for the rural roadside casse‑croûtes. Trust us on this one.
4. Cremona International Dairy Show — Cremona, Italy
Heir to Swiss Expo. A fashion show for cows. Espresso instead of energy drinks.
When Swiss Expo wound down, the European show world held its breath. Cremona stepped in and didn’t just fill the gap — it took the throne.
The 80th edition in November 2025 was the proof of concept that erased any remaining doubt. Fantasy Darsena tapped Supreme Champion and Grand Champion Holstein. DORAL RED daughters owned the Red & White ring. Nathan and Jenny Thomas ground through marathon judging days across multiple breeds. An Austrian alpine herd of just 60 cows — Schönhof — walked away as Premier Breeder and Premier Exhibitor in both Red & White and All Breeds. That kind of result doesn’t happen by accident; that’s a continental championship operating at full power.
But Cremona’s signature is the production. Darkened arenas. Theatrical lighting. Music cues. Tight crowds packed close to the cattle. This is a fashion runway built for Holsteins, and the Italians lean into it without apology. After two days, you start wondering why every show back home isn’t lit like this.
Step outside and you’re in Northern Italy. Risotto alla Milanese. Real espresso. Parmigiano-Reggiano right from the source. Lombardy and Emilia‑Romagna farm tours show you some of Europe’s most interesting Holstein and Brown Swiss herds operating at high‑input, high‑output intensity. Cremona quickly becomes the one trip your non‑dairy friends will spend years asking you about.
Insider Notes:
Transit Strategy: Runs in late November. Fly into Milan Linate or Bergamo. Grab a rental car or catch the train—the trip to Cremona is a beautiful ride under two hours.
The Evening Scene: Stay right in the historic city centre. Gathering in the piazza post‑show with a glass of wine alongside continental breeders is the whole point of the trip.
Simplified Logistics: Group tours organized through regional or state Holstein associations are an underrated way to bypass logistical headaches and unlock otherwise closed farm gates.
5. All Japan Holstein Grand Prix — Hokkaido, Japan
Once every five years. Worth every second of the wait.
EX-95. Tied for the second-highest classification score in Japanese history. Couldn’t stand eight weeks before the show. Sakurand Doorman Rocket — Grand Champion at the 16th All Japan Holstein Grand Prix. The cow that walked out and won supreme. (Read more: ROCKET Blasts Into Japanese History: EX-95 Ties for Nation’s Second-Highest Score Ever)
Japan is one of the most serious Holstein countries on Earth, and almost no one outside the inner genetic circle knows it. Near‑100% AI usage. Obsessive type and pedigree work. Show prep so meticulous it makes North American fitters look casual. Breeders like Tommy Araki, who spent 50 years bridging Japanese and North American genetics, producing legendary cows like ROCKET — EX‑95 — who tied the second‑highest classification score in Japanese history, and L’Espoir ReganStar Hagen, the nation’s solitary EX‑96 champion.
The catch? The All Japan Holstein Grand Prix happens only once every five years.
The historic 16th edition took place in Abira Town, Hokkaido, celebrating the 150th anniversary of Holsteins in Japan. 380 world-class cows from 38 prefectures went head-to-head. And the Grand Champion? She literally couldn’t stand eight weeks before the show. They got her up. She walked out and won supreme. Try writing that on a beach itinerary.
The atmosphere is profoundly disciplined. Japanese showmen bring a level of focus to clipping, toplines, and ring craft that western visitors describe as entirely humbling.
Insider Notes:
Planning Horizon: Because of the strict five‑year cycle, lock in your transpacific flights as soon as the next dates are released.
The Route: Fly into New Chitose Airport to access Hokkaido’s dairy heartland. Save a bullet train trip south to Tokyo for your second week.
Overcoming the Barrier: Connect with the Holstein Cattle Association of Japan (HCAJ) or a local genetics distributor before departing. Japanese hospitality is unmatched, but a local guide can triple what you can experience.
6. Agroleite — Castro, Paraná, Brazil
Latin America’s flagship. Where the crowd reacts like a football match — and you’re glad they do.
Two fists up. Striped tent overhead. A Castro crowd that reacted like she’d just scored in the 89th minute. Grand Champion Jersey at Agroleite 2024 — this is what a Brazilian dairy show actually feels like.
Agroleite completely rewires your understanding of how big and loud the global dairy sector truly is. The event is built around the powerhouse Castrolanda Cooperative, founded in 1952 by 50 pioneering Dutch dairy families who arrived in Brazil with just 61 cows and a massive vision.
Today, Castrolanda processes well over 200 million liters annually and commands staggering business volumes of north of R$500 million during a single Agroleite show week. Combining an elite Dairy Tournament, Fodder Park exhibits, dynamic machinery demonstrations, and deep breed shows, it easily eclipses the scope of most regional North American exhibitions.
While international judges like Brian Carscadden, Jamie Black, and Ryan Krohlow provide the rings with rigorous global calibration, the defining element here is raw energy. Brazilians watch a dairy class like a World Cup football match. Expect thunderous crowd reactions to structural placing moves in real time, entire multi-generational families filling the stands, and singing barn crews cheering their strings into the ring.
The travel add-ons are spectacular: authentic Brazilian churrasco, coastal getaways to nearby Florianópolis, and late-night barn hospitality where you’ll find yourself talking sire stacks at 2 a.m. in a mix of broken Portuguese and pure cow passion.
Insider Notes:
Logistics Check: Hosted in Castro every August. Fly into Curitiba International Airport and rent a car for the straightforward two-hour drive inland.
Vocabulary Prep: Learn at least 20 core Portuguese dairy and conformation terms before you land. It instantly turns hosts into lifelong friends.
The Extension: Always split the trip. Spend three days at the show, and sneak in a coastal weekend on the backend to balance the pace.
7. Ecuador National Holstein Fair — Valle de los Chillos, Quito
A volcano in your show photos. Genetics shaped by the Andes. The world’s best‑kept showcation secret.
Three breeds lined up. Rosettes to the ground. The Bullvine banner ringside. Supreme Junior Champion selection at Feria Holstein Ecuador 2025, Quito — one of the best showcations almost nobody has booked yet.
This is the hidden gem that nobody openly talks about—and that is exactly why it is worth the trek. Stand in the center of the ring at Ecuador’s National Holstein Fair, located in the gorgeous Valle de los Chillos just outside Quito, and look upward. An active volcano frames the backdrop of the cattle. Situated at an elevation of 2,500 meters, the light is unreal. Every photo looks like a postcard with a Holstein in it — only better.
The underlying genetics are stellar. Ecuador’s Holstein populations have been meticulously bred in the central Andes since the 1950s at elevations scaling up to 3,000 meters. That altitude, that climate, those gradients — they select hard for functional, durable, heat‑tolerant animals. The breeding associations have been running MOET since the late 1990s and IVF since the mid‑2000s, and pedigrees here reference the same global AI sires you’re using at home. The bloodlines here trace back to the same elite global AI sires milking in your home barn.
The local breeding community is incredibly welcoming, eager to share traditional food, pull you into their strings, and discuss deep pedigree trees long into the night. Turn the trip into an unforgettable vacation by leveraging Quito as a launchpad for cloud forest hikes, historic highland markets, or a direct flight out to the Galápagos Islands.
Insider Notes:
Altitude Adaptation: Fly straight into Quito, but budget your first 24 hours strictly for leisure and hydration to acclimate to the 2,500+ meter elevation before hitting the barns.
The Ultimate Add-on: If your farm budget permits, add a 4-day cruise extension to the Galápagos on the back end. It is an unmatched bucket-list pairing.
Mindset Shift: Leave your assumptions at home. Ecuadorian dairy operations utilize world-class technology and intense management strategies that surprise Western visitors.
8. Agroter — Terceira Island, Azores, Portugal
A volcanic Atlantic island. NZ‑style pasture dairying. A small show with massive pride.
Hands up over a Holstein on volcanic ground. Champion selection at Agroter, Terceira Island — 1,500 km out in the Atlantic, on grass year-round, and the udders show up anyway.
Terceira is one of those legendary, off-the-radar destinations passed quietly among well-traveled cowmen. Anchored 1,500 kilometers out in the Atlantic Ocean, right between Lisbon and New York, this volcanic island utilizes an intensive pasture-based dairy model that reflects New Zealand far more than mainland Europe.
Cows rotate through stone-hedged volcanic paddocks in a temperate maritime climate that drives exceptional forage growth nearly 365 days a year. This high-quality grass directly fuels the production of famous artisanal São Jorge and Ilha cheeses, resulting in some of the lowest component production costs in the developed world.
Agroter, the island’s agricultural exhibition, runs competitive breed shows every summer that showcase purebred Holsteins and innovative crossbreds optimized to excel in this specific high-grazing ecosystem. The show is intimate; you will comfortably meet nearly every single exhibitor before the conclusion of day one. The island’s pride is immense, and because it hosts very few international agronomists, visitors are treated like extended family.
The setting is surreal: the host city of Angra do Heroísmo is a protected UNESCO World Heritage site, the seafood is plucked straight from the Atlantic daily, and the dramatic coastal cliffs will make you completely rethink your concept of dairy geography.
Insider Notes:
Flight Routing: Route through Lisbon or Ponta Delgada into Lajes Airport on Terceira. SATA/Azores Airlines handles the inter-island connectors seamlessly.
Duration Guide: Plan for at least four full days. The island’s geography, volcanic caves, and coastal roads cannot be properly appreciated on a fast fly-in schedule.
The Real Value: Work with local extensions to book a formal guided pasture tour. Seeing how these cows manage steep slopes and volcanic forage will give you concrete ideas for improving grazing efficiency at home.
9. PDFA International Dairy & Agri Expo — Jagraon, Punjab, India
300,000 visitors. Three days. One cow lifted in front of a stadium‑sized crowd. You will never forget it.
Red banner. Orange dastar. A Class Winner Holstein Friesian at the 19th PDFA International Dairy & Agri Expo in Jagraon, February 2026 — the show roughly 300,000 people walked through in three days. Now imagine your county fair.
Read this number again: roughly 300,000 visitors over three days at the 19th PDFA International Dairy & Agri Expo in February 2026, per organizer reporting. Three. Hundred. Thousand.
This is exactly what agriculture looks like when it forms the absolute backbone of a regional economy. In Punjab, dairy farming is central to rural life—it is a vital economic engine, a profound marker of family social status, and a source of deep generational pride. The PDFA stages an event that mirrors that massive scale. The Grand Champion Holstein Friesian is crowned in front of concrete stadium stands packed to the rafters like an international soccer final, surrounded by beating drums and roaring crowds.
The cattle shown represent an interesting cross-section of pure imported North American/European genetics and highly adapted local Friesian crosses. The event features rigorous multi-day milking competitions, highly competitive type conformation classes, and massive trade rows that stretch for miles. It is loud, vibrant, intensely colorful, and presents an educational shock-and-awe that fundamentally recalibrates your view of global milk production.
For a true life reset, the magnificent Golden Temple in Amritsar—one of the most spiritually profound sites on earth—is less than an hour’s drive from the showgrounds.
Insider Notes:
Weather Window: Held annually in early February. This gives you the ideal cool, dry, and clear winter weather window for comfortable travel in northern India.
Arrival Vector: Fly directly into New Delhi or pick up a connecting flight to Amritsar. Arrange a dedicated private road transfer to Ludhiana or Jagraon through your hotel.
The Mandatory Stop: Visit the Golden Temple, a non-negotiable part of your itinerary. It provides an unparalleled cultural perspective that rounds out the trip.
10. NZ DairyEvent — Feilding, New Zealand
The sleeper. The one show people quietly tell each other to bump up the bucket list.
Snow on the Southern Alps. Cows on grass. A pivot in the back paddock. This is the system that produces milk for less than almost anyone on earth — and the reason serious cow people fly down for NZ DairyEvent and stay a week to walk the farms.
Two international judges who’ve gone to evaluate the NZ DairyEvent admitted, on record, that they were genuinely surprised by the cattle when they got there. That tells you everything. That tells you everything you need to know about this quiet powerhouse.
Staged every January at Manfeild Park in Feilding, the NZDE draws the absolute best Holstein, Jersey, and Ayrshire strings from both the North and South Islands. The competitive field routinely clears 370+ head, with class depth climbing rapidly every year. Look at operations like Ferdon Genetics out of Otorohanga—they have captured eight Grand Champion Jersey wins, four Supreme Dairy Cow titles, and nine consecutive Premier Jersey Exhibitor banners. Their legendary matriarch, Ferdon Comerica Viyella, won Grand Champion Jersey five times and Supreme three times on this very grass. This is elite-level generational breeding.
The overall vibe is classic Kiwi: welcoming, intensely practical, and entirely free of pretense. Yet the competitive fire in the ring is world-class.
The seasonal timing is a massive selling point: it offers a perfect midsummer escape in January. You can step off the showgrounds and immediately study some of the most efficient, low-input pasture dairy management models on earth, running at stocking rates that challenge conventional northern hemisphere economic models. Add a trip through Marlborough wine country or a flight down to Queenstown, and you have the ultimate ag-travel package.
Insider Notes:
Cultural Advantage: Held in late January. The show features free public gate admission, fostering an open, community-driven event culture where networking is incredibly easy.
Travel Hubs: Fly into Auckland or Wellington, then catch a quick domestic flight straight into Palmerston North to access Feilding.
System Analysis: Do not limit yourself to the North Island. Take the ferry or a flight south; analyzing the stark operational contrasts between the regional grazing systems is worth the price of admission alone.
11. Western Spring National Holstein Show — Richmond, Utah
Laid‑back, community‑driven, with a national park down the road.
The Moulton Barn under the Tetons. A few hours north of the Western Spring National show ring — and the reason you book two extra days at the back end. Mid-May means baby bison, calving elk, and zero tour bus traffic.
Not every world-class showcation requires a passport or an international cell phone plan. The Western Spring National Holstein Show in Richmond, Utah, proves that elite cattle, sharp judging, and awe-inspiring alpine scenery can easily be packaged into a long weekend rather than a multi-week international expedition.
The show aggregates the absolute finest strings from across the western United States—drawing top exhibitors from Utah, Idaho, Nevada, California, and Oregon into one competitive barn every mid-May. The show features top-tier national judges like Pat Lundy and Andy Reynolds sorting through highly competitive fields.
The tight-knit dairy community in Cache Valley is the true differentiator here. If you show up with genuine curiosity, breeders will instantly pull you into their alleys. The barns are exceptionally clean and walkable, the master breeders are highly approachable, and the conversations about genetic strategy are as authentic as they get. The mid-May timing means you get to see fresh, high-yielding early-lactation cows and the very first calves from last winter’s flush choices making their debut.
The structural bonus of Richmond is its location. The iconic Yellowstone National Park sits just three hours north, with Grand Teton National Park positioned along the same mountain route. Traveling in early May allows you to witness baby bison herds, calving elk, and active grizzly bears emerging for the season—all entirely before the chaotic summer tourist traffic clogs the park roads.
Insider Notes:
The Route: Fly directly into Salt Lake City International Airport. Rent a truck and drive an easy, scenic two hours north into Cache Valley.
The Itinerary: Block out two to three extra days specifically for the mountain parks. This shoulder-season timing is the ultimate trick for avoiding tourist crowds.
Packing Strategy: Pack high-quality layers. Utah spring weather in the mountains is notoriously unpredictable and can swing from warm sunshine to a sudden valley snow flurry in a single afternoon.
How Do You Decide Which Showcation to Book First?
To maximize the return on your time and travel capital, run your decision through three distinct operational filters:
Filter 1: Where Is Your Eye Right Now?
If you have never stood ringside at a national-level show outside your own immediate region, Madison is your mandatory starting point. WDE will permanently calibrate your eye for dairy conformation, and every other show on this list reads differently after you’ve experienced the Coliseum. However, if you have already done Madison and Toronto multiple times, you do not need a third trip to the same barns—you need to push your comfort zone and head to Cremona, Japan, or Brazil to observe how the global genetic game is played when you don’t speak the native language.
Filter 2: What Is Your Primary Structural Goal?
For Pure Type Conformation & Pedigree Design: Focus your travel on Madison, Cremona, and the Royal Agricultural Winter Fair.
For Commercial Management Perspective & Systems Reset: Head straight to the grazing and high-altitude models of Ecuador, the Azores, or New Zealand.
For Pure Cultural Shock-and-Awe: Book the PDFA Expo in Punjab to witness dairy integrated into society at an unmatched scale.
For Elite Regional Networking: Head to Utah for the Western Spring National to connect with progressive western operations.
Filter 3: What Is the Reality of Your Farm Calendar?
If your home herd experiences a massive calving cluster every October, accept it and pass on Madison this year. Instead, pivot and schedule Cremona in late November or the NZDE in January when your fresh cows are settled. If crops are still standing or the silage harvest falls within a critical window in late August, Le Suprême and Agroleite can wait for the next rotation.
The Ultimate Takeaway: A proper showcation is not about abandoning your home operation; it is about strategically matching the right global ring to the exact window when your farm can safely run on automated protocols.
Why You’ll Never Stop Doing This
Once you do one proper showcation, you start scheduling your year around the next one. It’s not a phase. It’s a permanent rewiring.
Take Steve, a Canadian breeder who plans his calendar the way other people plan cruises. Three years ago: Madison and Cremona, same trip. Last year: Agroleite and Ecuador back‑to‑back, because “if I’m already halfway there.” His non‑dairy wife is now the one taking screenshots of Jersey heifers at 11 p.m. and demanding they book the Azores.
Then there’s Claire, a young breeder who sold her parents on her first WDE trip at 22 by writing “continuing education” in the farm budget. She came back with a notebook full of ideas, ringside contacts at major AI firms, and a permanently sharper eye.
Ask either of them why they keep booking flights, and they will point to the same three pillars:
1. Sharpens Your Eye: Watching the best cows on earth, in person, in high volume, permanently sharpens your eye. The compounding returns on your domestic breeding decisions are real. 2. Expands Your Network: The breeders you lean against the gate with become the people who answer your DMs five years later when you’re making a tough flush or sire selection. Zoom cannot replicate this. 3. Provides a Mental Reset: A week entirely away from your bulk tank, your fences, and your daily breakdowns gives you the high-level perspective needed to grow your operational business.
Yes, it costs money. Yes, it takes you off the farm. So does buying a new mixer wagon—and that won’t hand you a notebook full of breeding ideas, a global network, and the memory of a Senior Cow class in the Coliseum that you’ll think about while feeding calves twenty years from now. Stop apologizing for it. Call it what it is: an investment in your eye, your network, and your business headspace.
Key Takeaways
If you’ve never been to Madison, that’s your next 12 months. Everything else on this list reads differently after WDE. Book it before September fills.
If you’ve done WDE and The Royal twice, your next trip must be international. Cremona, Japan, Brazil, or Ecuador will change how you think about the global dairy industry in ways no livestream replicates.
If the partner test is your friction point, anchor the show to a destination they want. Royal + Toronto, Cremona + Italy, Western Spring + Yellowstone. The math gets easier when the trip sells itself.
If “someday” has been your answer for three years running, execute the 30‑day move. Pick one show. Put dates on the family calendar this month. Price flights this week. Conversion from intent to commitment is the highest‑ROI action you’ll take this quarter.
If budget is the real hurdle, run the math against an equipment upgrade. A flush program or genetic purchase informed by what you actually observed at Madison or Cremona is harder to put a price on than a piece of iron—and far easier to justify.
So — Which One Are You Crossing Off First?
Pick two shows. Right now. Not “someday.” Not “if the milk price holds.” Two shows, on a calendar, with flights attached, before you close this tab.
When somebody at the coffee shop asks why you spent your vacation at a cattle show, don’t get defensive. Just smile. Pull out your phone. Show them the third photo. By photo five, they’ll be asking how to get tickets.
You can keep the beach loungers, the cruise buffets, and the all‑inclusive bracelets. For the rest of us, the best vacation on earth still starts with loading the trailer.
If you want our deeper coverage of the cards, classes, and breeding decisions coming out of these rings — the kind of breakdowns that turn a good showcation into a productive one — that’s what our Bullvine show reports deliver every week. The Bullvine Weekly newsletter pulls the highlights into one place.
We’ll see you ringside.
The Sunday Read Dairy Professionals Don’t Skip.
Every week, thousands of producers, breeders, and industry insiders open Bullvine Weekly for genetics insights, market shifts, and profit strategies they won’t find anywhere else. One email. Five minutes. Smarter decisions all week.
Haugen runs an organic dairy across the highway from Joint Base Lewis-McChord. 9% of U.S. farmers served. Just 0.4% of them milk cows. That gap is roughly 3,700 trained operators dairy isn’t recruiting.
Burt Haugen at his organic dairy near Buckley, Washington — across the highway from Joint Base Lewis-McChord, where the helicopters still pull him back to 1968. Drafted into the 4th Battalion, 9th Infantry — the Manchus — and wounded twice during Tet, Haugen spent thirty years trying to outrun the war. The parlor is what finally let him stop. He’s one of the 0.4%.
Burt Haugen has spent most Memorial Day mornings of the last half-century at his organic dairy near Buckley, Washington — across the highway from Joint Base Lewis-McChord. He was a draftee in 1968. A machine gunner and radio operator with the 4th Battalion, 9th Infantry — the Manchus — in-country during Tet, when 49 men in his battalion were killed in a single day. He was wounded twice. A bullet went through the webbing of his helmet. He spent thirty years trying to forget what came after that.
He doesn’t anymore.
What pulled him out, he told this magazine in 2013, wasn’t a program. It wasn’t a counselor. It was the parlor.
“I like to work by myself. It’s quiet when you’re milking in the morning.” — Burt Haugen, Buckley, Washington
Haugen calls it “a living and a healing.” Busy hands, busy mind. He credits the rhythm of dairying — and the fraternity of fellow Manchus, with whom he reconnected through a brigade reunion website — with helping him live with PTSD and survivor’s remorse for half a century. The cows did what no civilian career could.
The 0.4% Problem
Haugen is one of 305,753 U.S. farm producers with military service counted in the 2022 Census of Agriculture. That’s 9% of every producer in America, working 289,372 operations and roughly 108 million acres (USDA NASS, Producers with Military Service, 2024). Across every sector of the U.S. economy, agriculture over-indexes hard for veterans. Dairy is the exception. That’s the story.
In the 2022 Census, 0.4% of veteran producers named dairy cattle and milk production as their primary commodity. Among non-veteran producers, the share was 1.6% (Farm Credit Administration analysis of the 2022 Census). Read it the way a recruiter would: a veteran who chooses agriculture is four times less likely than a civilian entering agriculture to land in dairy.
Where do they go instead? Beef cattle (28.4%), hay and field crops (27.1%), grains (12.7%) — pastures and combines and tractors, almost anywhere but the parlor (FCA, 2024).
The Two Flags Don’t Sit Easy
Every veteran in dairy carries two identities at once. The soldier and the dairyman. The medic and the calf manager. The flag at the door goes up, the boots go on, the parlor turns at 4 a.m. — Memorial Day, Christmas, the Tuesday after a funeral. The two flags don’t sit easy on the same pole.
Haugen’s version is the one nobody puts in a press release. Farm work — its solitude, its physical labor, its predictable rhythm — has quietly become one of the most effective and least-funded therapeutic environments combat veterans access in this country. The Farmer Veteran Coalition has been documenting that since 2008 (FVC History).
“We talk about our experiences. It’s almost embarrassing to talk with anyone else.” — Burt Haugen
The “we” is other Vietnam vets. The talking happens in barns and shops and parlors. Not in waiting rooms.
When his Manchus brigade visited the Vietnam Memorial together, the wall listed 600 of “my guys” killed during Tet — more than 100 of them from Haugen’s battalion alone. He learned about PTSD and survivor’s remorse the way a lot of Vietnam vets eventually did — through VA classes, decades after the fact. Helicopters in the distance from Joint Base Lewis-McChord still pull him back to the medevac runs of the war. Some things you don’t forget. You just learn to milk through them.
What Does Air Force Discipline Look Like in a 10,000-Cow Parlor?
What works for one man and a small organic herd at dawn doesn’t necessarily scale. Or does it? Drive across the country to Trenton, Florida, and you’ll find the same operating discipline running at a different altitude entirely.
Adam Jackanicz at the calf pens at Alliance Dairies in Trenton, Florida — about 10,000 cows under his hand at any given time. Veterinarian by training, Public Health Officer for the 932nd Medical Squadron, U.S. Air Force Reserve by commission. He runs his shifts the way the Air Force taught him to run a flight line: pre-shift brief, written checklist, after-action review. His regret about the uniform? “Not signing up sooner.”
Adam Jackanicz is a veterinarian and the Public Health Officer for the 932nd Medical Squadron, U.S. Air Force Reserve (The Bullvine, 2024). For years, he ran milk quality and animal health for Alliance Dairies in Trenton — about 10,000 cows under his hand at any given time.
Picture a Tuesday at 5:40 a.m. in the office off the parlor. The day-shift lead’s notebook is open on the desk. Pre-shift brief — three minutes, standing. What changed overnight? Which fresh cows need eyes today? Where did yesterday’s somatic cell trend on the bulk tank? It’s the same checklist culture that runs a flight line, transplanted into rubber boots. Jackanicz says the Air Force values of integrity and excellence are “indispensable” in a 10,000-cow string — not as a slogan but as the reason the same mistake doesn’t repeat in the parlor on Wednesday.
He enlisted during veterinary school after being told his eyesight ruled out aviation. He re-enlisted as fast as the paperwork would clear after 9/11, moved from enlisted to a commission, served until 2009, and came back in 2020 — in the middle of a pandemic that landed on his family and his herd at the same time. His regret? “Not signing up sooner.”
You don’t run 10,000 cows on vibes. You run them on briefs and after-action reviews and somebody who knows what to do at 2 a.m. when the calving doesn’t go right. That’s the gift a veteran brings to a parlor. Not the war movie. The way the chores actually get run.
So Why Aren’t Veterans Choosing Dairy?
Read the standard list of reasons and none of it actually fits the candidate. Capital requirements. The 24/7 cycle. Hard physical labor. Long stretches without a day off. That’s not what scares a veteran. That’s basic training with a milking schedule.
Veterans are entirely comfortable with 24/7 shifts, grueling labor, and high stress — if there’s a clear mission and a clear structure. They’ve already lived 18-month deployments on rotating watch. They’ve already done it in 110°F with 80 pounds on their back. The 4 a.m. milking isn’t the obstacle.
The obstacle is what the 4 a.m. milking is run on. Dairy, more often than industries the military funnels people into, runs on tribal knowledge instead of written protocol. The protocol lives in one person’s head. The chain of command shifts depending on who’s in the parlor that morning. The same mistake repeats on Wednesday because nobody documented what went wrong on Tuesday. To a veteran, that isn’t difficulty. That’s chaos.
The Farmer Veteran Coalition’s own programming — Fellowship Fund grants, Homegrown By Heroes, mentor networks — is built around the same observation: veterans entering ag want documented systems, not improvisation. The 0.4% number isn’t a labor problem. It’s a structure problem. And dairy can fix structure faster than it can fix a milk price.
A Family That Started With a Boot Camp
Haugen carried discipline into a one-parlor operation. Jackanicz carried it into a 10,000-cow string. In northeast Texas, Kyle Hayes carried it into the next generation — into a son who works inside the operating manual every day.
Kyle Hayes on his northeast Texas dairy — a first-generation operation he’s kept running for more than thirty years, while the U.S. herd count fell from 130,800 farms in 1992 to 24,470 by the end of 2023. Navy, 1971 to 1975. Beef cattle first, then dairy. He calls boot camp “reminiscent of a scene from Forrest Gump” and the parlor the same education in a different uniform. His son Kyle Jr. works alongside him now — raised inside the operating manual his father brought home from the service.
Hayes served in the Navy from 1971 to 1975, came home to beef cattle, switched to dairy more than thirty years ago, and built a first-generation operation by hand. His son, Kyle Jr., works alongside him now (The Bullvine, 2024).
Hayes describes boot camp as a transformative experience — “reminiscent of a scene from Forrest Gump,” in his words — and dairying as the same education in a different uniform. Hard work. Sacrifice. A job that doesn’t care if you’re tired. The discipline he learned in the Navy is what’s kept a Texas dairy alive for three decades, while the U.S. dairy farm count fell from 130,800 herds in 1992 to 24,470 by the end of 2023 — a national contraction Texas hasn’t escaped.
That’s the second flag. The one that doesn’t get a uniform of its own. Kyle Jr. didn’t follow him into the Navy. But he was raised inside the operating manual his father brought home from it. Multiply that by 289,372 farms with at least one producer who served, and you start to see what’s actually sitting inside American agriculture’s organizational DNA.
How Many Veteran Producers Actually Choose Dairy?
Here’s the uncomfortable barn math.
If you run a 1,200-cow herd and you’re trying to fill a herdsperson opening this spring, the U.S. veteran producer pool is about 305,753 people deep. The dairy slice of that pool? Roughly 1,223 veterans listed dairy as their primary commodity in the 2022 Census (305,753 × 0.4%). If veterans had chosen dairy at the same rate as non-veteran producers — 1.6% — that number would sit closer to 4,900. The gap is roughly 3,700 trained, leadership-tested workers who chose any commodity but the parlor.
Now run those numbers against the talent picture dairy keeps complaining about. McKinsey’s January 2025 dairy executive analysis put talent as the top priority for 67% of dairy leaders — up from 44% in 2022 (McKinsey, January 2025). The same complaint shows up every quarter in The Bullvine’s labor and leadership coverage.
Dairy is leaving the most disciplined mid-career talent pool in the country on the table. Every year. And then asking where the herdspeople went.
What Could a Veteran Hire Actually Fix on Your Operation?
Read what a 1,200-cow operation needs from a manager in 2026, and the overlap is almost unfair:
Lead 8 to 15 people across language and shift barriers. That’s a squad. Veterans run squads.
Execute a written checklist under pressure. Vaccination protocols, fresh-cow handling, mastitis treatment SOPs. Each one’s a battle drill in different clothes.
Make a clean call at 2 a.m. on a hard calving. Triage. The military trains exactly that.
Lead younger people through a crisis you’ve never personally seen. HPAI in the tank, a tunnel-fan failure in 102°F, a positive antibiotic test you have to dump on. That’s an after-action review made flesh.
Veterans don’t bring magic. They bring muscle memory for stress.
Here’s the part dairy still under-discusses out loud. In 2017 occupational data, male farmers, ranchers, and agricultural managers died by suicide at a rate of 43.2 per 100,000 — roughly 3.5 times the general population, and more than three times the rate of fatal farm accidents (12.4 per 100,000) (The Bullvine, January 2026, citing the National Rural Health Association).
Combat veterans have spent years inside formal frameworks for that exact risk. Buddy checks. After-action talks. VA peer groups. Haugen calls his fellow Manchus “a fraternity, ’cause you can relate.” A dairy that hires a veteran isn’t just hiring a herdsperson. It’s importing a mental-health vocabulary the industry has been begging for — and refusing to write down.
The Programs Exist. Dairy Has Barely Touched Them.
The Farmer Veteran Coalition has been operational since 2008, when founder Michael O’Gorman left commercial organic farming to run it full-time. The Coalition crossed 50,000 members nationwide in August 2024 — Fellowship Fund recipients, Homegrown By Heroes-certified producers, mentor-network participants, and state-chapter members (FVC, August 2024). USDA’s veteran-farmer provisions, established under the 2014 Farm Bill, opened microloans and conservation programs to veterans on preferred terms. NCAT’s Armed to Farm program, running since 2013, has now supported more than 3,500 military-veteran farmers through trainings, workshops, networking events, and one-on-one technical assistance (NCAT Armed to Farm).
Most of those success stories are produce, beef, mushrooms, value-added meat. The dairy column’s thin. The Coalition’s 2024 highlight reel surfaced one prominent dairy-side example: Army Captain Bob Miller, who resigned his commission in 2009 after two tours in Iraq with the 10th Mountain Division and launched Nice Farms Creamery on his family’s 201-acre Maryland farm — a pasture-based A2/A2 Jersey operation selling milk, butter, yogurt, and ice cream to local markets (Farmer Veteran Coalition, September 2024).
One feature. In a year. In a sector with 24,470 commercially licensed dairy farms as of the end of 2023. That’s a business-development gap, not a values gap.
Here’s what the FVC milestone actually means in barn terms. Even 1% of that 50,000-member network — recruited into U.S. dairy as herdspeople, parlor leads, calf managers, or first-generation operators — is roughly 500 trained, leadership-tested workers entering an industry where 67% of executives say they can’t find the talent they need. Won’t fix 24,470 farms. But it’s more than most operators are pulling from any single recruiting channel today.
Options and Trade-Offs for Your Operation
Four paths. Each one starts on a different scale, and each one carries its own honest trade-off.
Path 1 — Run your first After-Action Review (AAR) within 30 days.
When it makes sense: Any operation, any size. Even before you hire a single veteran.
What it requires: 15 minutes after something goes wrong — a missed heat-detection batch, a milk fever cluster, a tank dump. Three questions: What did we expect? What happened? What changes? No blame.
The trade-off: It’ll feel awkward the first three times. The senior person in the room has to be the one who admits a mistake first to break the blame culture. Then it becomes the most exportable tool from the military to dairy — and almost no dairy uses it.
Forward signal: Operators we’ve talked to who run AARs tend to have written SOPs in place within a year. Path 1 leads to Path 3.
Path 2 — Post your next hire through the Farmer Veteran Coalition member network.
When it makes sense: Any herdsperson, parlor lead, feed crew lead, or assistant manager opening you’d otherwise list on Indeed or AgCareers.
What it requires: A free listing through a 50,000-member national network.
The trade-off: The candidate pool is smaller than a major job board. But it’s pre-screened for ag intent and often shows up with formal leadership experience already on the résumé. Cheapest recruiting experiment you can run this year.
Path 3 — Convert one verbal protocol into a written SOP this month.
When it makes sense: Every operation that’s ever lost a step because the person who knew it was off that day.
What it requires: An hour with whoever currently runs that protocol.
The trade-off: Small ego cost on the front end — the person you ask is usually proud of holding the protocol in their head. The veterans you eventually hire won’t just follow SOPs. They’re the ones who’ll finally make you build them.
Path 4 — Treat mental-health vocabulary as an imported skill, not a soft one.
When it makes sense: Any operation with a crew.
What it requires: Identifying the veterans already on your payroll — most won’t volunteer it; ask — and letting them lead the conversation when a colleague is struggling.
The trade-off: This only works if you take crew mental health as seriously as you take a parlor breakdown. They’ve had buddy checks drilled into them since basic. Your nutritionist hasn’t.
If you’re a veteran-owned dairy reading this, get on the FVC member map this week. Homegrown By Heroes certification, buyer relationships, peer connections, and Fellowship Fund eligibility most dairy producers don’t even know exist — one online form opens all of it.
Key Takeaways
If you’ve had any operational misstep in the last 30 days, you have everything you need to run an AAR this week. Three questions. No software. No consultant.
If your next hire is a herdsperson, parlor lead, or assistant manager, post the opening through Farmer Veteran Coalition before you pay for a third-party listing. Free, targeted, leadership-screened — pulling from a 50,000-member national pool.
If your operation runs on verbal protocols that live in one person’s head, that’s a single-point-of-failure problem a veteran-grade SOP will fix. Pick the one that scares you most. Write it down this month.
If you’ve ever lost a colleague, neighbor, or employee to suicide — or come close — the buddy-check vocabulary your veterans already speak is the most underused mental-health tool in dairy. Ask who served. Let them lead.
If you’re a veteran-owned dairy and you’re not on the FVC member map, you’re leaving certification, peer support, and program eligibility on the table every week. That fix is a single online form.
The Last Flag
Nathan Roth — Vietnam-era Navy veteran, second-generation dairyman, 250 cows and 1,600 acres in Mountain Grove, Missouri, alongside his children. A year in country, then home on the G.I. Bill for an accounting degree before the family operation pulled him back. He carries the dual identity openly: veteran and dairyman, neither one a hobby. The uniform on a hanger, the hand on the herd.
Nathan Roth — a Vietnam-era Navy veteran who served a year in country and came home to use the G.I. Bill on an accounting degree before turning back to the family operation — runs 250 cows and 1,600 acres in Mountain Grove, Missouri, alongside his children (The Bullvine, 2024). He carries the dual identity openly: Vietnam veteran and second-generation dairyman, neither one a hobby. Kyle Hayes and Kyle Jr. are still working that northeast Texas dairy, a first-generation operation that outlasted most of the state’s. Adam Jackanicz, somewhere between his Reserve drill and his veterinary work, lives the same calendar as everybody else in dairy — uniform on a hanger, hand on the herd.
And near Buckley, Washington, the parlor where Burt Haugen learned to live with what Tet left him will turn the way it has turned for half a century — in the kind of quiet that, fifty-eight years ago, didn’t exist for him.
So here’s the question worth carrying past this Memorial Day: when you ran your last after-action review, who was in the room? And if the honest answer is we don’t run those yet — what would change next year if the person you hired had run a hundred of them before they ever set foot in your parlor?
Methodology Note
This article draws on the 2022 U.S. Census of Agriculture (USDA NASS, Producers with Military Service, released April 2024); Farm Credit Administration analysis of that release; McKinsey’s January 2025 article “Dairy industry executives are pressured but optimistic for 2025,” reporting the 2024 dairy executive survey results; occupational suicide-mortality data aggregated by The Bullvine in January 2026 from the National Rural Health Association (reflecting 2017 U.S. data for male farmers, ranchers, and agricultural managers); the U.S. dairy herd count from Progressive Dairy’s 2024 U.S. Dairy Statistics; the Farmer Veteran Coalition’s August 2024 50,000-member milestone announcement; NCAT’s Armed to Farm program reporting on its 3,500+ veteran reach; and prior Bullvine reporting on veteran dairy producers (2013 and July 2024). All named individuals (Burt Haugen, Adam Jackanicz, Kyle Hayes, Nathan Roth, Bob Miller) are drawn from previously published profiles linked in-line. Veteran-share figures are national averages — concentration varies meaningfully by state. Corrections, additions, or veteran-dairy stories we should be covering: editor@thebullvine.com.
Every week, thousands of producers, breeders, and industry insiders open Bullvine Weekly for genetics insights, market shifts, and profit strategies they won’t find anywhere else. One email. Five minutes. Smarter decisions all week.
One $4,400 heifer calf in 1987 became the most copied type sire of his generation — and a 1.3kb APOB insertion that reached 17% of Canadian heifers and 4.4% of CDCB’s 2015 run.
Maughlin Storm (HOCAN5457798), VG-Extra — born August 1991, bred by Sandy McPhedran of Rockwood, Ontario. The Aerostar son out of a $4,400 Inspiration heifer became the most copied type sire of his generation. The 1.3kb APOB insertion he carried wouldn’t be identified until 2015 — twenty-four years and one global pedigree footprint later.
Prologue — Orlando, July 2015
You can picture the room. The kind of hotel conference space where Interbull holds its summer meetings — bad coffee on a side table, the hum of overworked HVAC, a screen at the front that’s been showing variations of the same haplotype slide for two days running. Outside, Florida is doing what Florida does in July. Inside, a researcher from VIT Germany clicks to his next slide.
That slide changes the Holstein breed.
Kipp and his colleagues had been chasing a pattern of unexplained calf losses across multiple countries — chronic diarrhea, emaciation, mortality before six months — and the pedigree work had finally converged. Every line, every affected calf, every confirmed case ran back through generation after generation to one bull. A Canadian. Born in 1991. Class Extra at C.I.A.Q. A name every breeder in that room knew by heart, because his sons and grandsons were standing in their barns and walking their show rings at that very moment.
Maughlin Storm.
You can imagine how the air shifted in that room. Not panic — geneticists don’t panic — but the quiet click of recognition that comes when a mystery you’ve been chasing for two years finally has a face on it.
And here’s what’s worth holding onto from the start. Storm hadn’t done anything wrong. Storm had done everything right. He’d been bred from one of the great cow families on the continent. He’d transmitted exactly what breeders asked him to transmit. His sons led the LPI rankings. His grandson Goldwyn was, at that very moment, the most decorated show-ring sire in Holstein history.
What Storm had also done — invisibly, silently, across two decades and into pedigrees on every dairy continent — was carry a 1.3 kilobase fragment of misplaced DNA tucked inside the APOB gene on chromosome 11. A piece of code so small you’d never see it on a 50K SNP chip without knowing exactly where to look.
This is the story of how that bull got built, and how he conquered a generation. And how, decades later, he taught the breed something it desperately needed to learn.
Act I — How You Build a Legend (Without Knowing You’re Doing It)
Two Brothers and a Steamship
Long before there was a Maughlin Storm, there were two Dutch brothers on a boat.
Ted and John VanWyk crossed from Holland to Canada in 1951. They didn’t bring much with them. Working capital? None. Connections? None. What they brought was a work ethic forged in postwar Europe and a faith that good cows reward patient people.
For two years, they worked the rough edges of southwestern Ontario agriculture — tobacco, sugar beets, and tomatoes. The kind of stoop-labor that ages a man’s hands fast. By 1953, they’d scraped together enough to buy a farm at Woodstock, and the Wykdale herd was born.
The part that ought to stop every breeder cold is the foundation of that herd — the genetic floor on which everything that came after was built. Three cows. Three. Bought at three different sales in 1953 for a combined $885.
One of those three was a registered female by the name of April Expectation Dewdrop (GP).
She wasn’t flashy. She’d never have caught your eye in a sale ring crowded with imports. But she was deeply bred, structurally sound, and — as the VanWyks would discover, lactation by lactation — she could milk. April finished her career with 107,526 lbs of milk at 3.91% fat and made the Honor List in 1956.
In 1956, those numbers were extraordinary. April’s real value, though, wasn’t in her own record. It was in what she could throw, and what her daughters could throw, and what their daughters could throw. Cow families work that way. The matriarch is just the first chapter.
The Dewdrop Cows
What followed in the VanWyk barn over the next two decades reads almost like a tall tale — except every number is documented.
April’s maternal granddaughter, Wykdale Cavalier Dewdrop, knocked out 198,933 lbs of milk at 4.0% fat across ten lactations and earned five Star Brood Cow points. Her daughter, Wykholme Dewdrop Debbie, went and posted 274,487 lbs at 4.0% across her own ten lactations. Ten lactations. Two hundred and seventy-four thousand pounds. In an era when most cows were lucky to see four lactations, the Dewdrops were treating longevity like a family heirloom they refused to lose.
Word got around. Breeders started making the drive to Woodstock to walk the barn. The Dewdrops weren’t show cows in the catalog-cover sense — they were farm cows, the kind that quietly built equity for thirty years while the flashier herds blew up and dispersed. Classifiers respected them. Economists envied them.
In 1978, the breed made it official. At the Canadian Holstein annual meeting that year, Dick Brooks — President of the Holstein Association of America at the time — handed Ted and John VanWyk the Master Breeder Shield. Two immigrants who’d arrived twenty-seven years earlier with empty pockets and dirty fingernails were now standing on the breed’s highest stage.
That should have been the end of the story. Master Breeder Shield, a great cow family, applause, and a quiet retirement to the porch.
It wasn’t.
Sandy McPhedran’s $4,400 Bet
The Cormdale High Index Sale rolled through Ontario in 1987 the way these sales did back then — a few hundred breeders crowded into a sale arena, a catalog thumbed soft at the corners, and a kind of tense, half-joking energy that said somebody here is going to overpay, and somebody else is going to steal one.
A breeder from Rockwood, Ontario, named Sandy McPhedran, was reading his catalog carefully.
The lot in front of him: a two-month-old heifer calf. Wykholme Dewdrop Tacy-ET. Sired by Hanover-Hill Inspiration (EX-Extra) — a name that, in 1987, made type-minded breeders sit up straight. Out of Wykholme Dewdrop Gail (EX-10*), 6 lactations, 180,490 lbs of milk, 6,992 lbs of fat. The kind of dam record that made experienced breeders mark their catalogs and sit back in their chairs.
Deep Dewdrop blood, Inspiration on top, type and production stacked. McPhedran knew what he was looking at.
What it cost him to take her home was $4,400.
For a two-month-old calf in 1987, that was real money. You could buy a working cow for that. McPhedran wasn’t buying a cow, though. He was buying a maternal line, with the patience to wait three years to see what she could give him.
When Tacy reached three, McPhedran did what any breeder in his shoes would have done — contract-mated her to the hottest production sire in the country, Madawaska Aerostar (EX-Extra), through the Centre d’Insémination Artificielle du Québec at St-Hyacinthe.
Madawaska Aerostar (EX-Extra) — the hottest production sire in Canada when Sandy McPhedran picked up the phone to St-Hyacinthe in 1994. The Aerostar × Inspiration cross on Wykholme Dewdrop Tacy was a textbook production-on-type mating. What it produced, in August 1991, was Maughlin Storm.
A bull calf hit the ground in August 1991.
McPhedran and his son were Guelph Storm fans — the OHL hockey team had just been founded the year before. The calf got named for the team.
A bull named after a hockey franchise. A foundation cow bought for less than three hundred bucks at a roadside sale forty years earlier. Hard to script that.
What was about to happen next, though, was forty years of patient cow-family breeding meeting the right outcross at the right moment in history.
Act II — Class Extra: When Storm Took Over the Holstein World
What “Class Extra” Actually Meant
The dairy industry of the mid-1990s was deep in what the trade press called the Type Revolution. Production alone wasn’t enough anymore. Breeders wanted depth. They wanted a dairy character. They wanted udders that hung correctly into a sixth lactation, and cows that could win at Madison and still milk as they meant it.
Startmore Rudolph (EX-Extra) — Storm’s paternal half-brother and the bull who shared the C.I.A.Q. Class Extra stage with him in 1996. Two Aerostar sons, two top-tier proofs, debuted side by side. From day one, breeders gravitated to Storm.
When Storm joined the C.I.A.Q. proven sire lineup in 1996 — that being the era when Quebec’s stud was effectively setting the elite-type standard for the whole country, exporting semen worldwide — he carried the designation “Class Extra,” the top tier the organization handed out, and one not given lightly. He came onstage alongside his paternal half-brother Startmore Rudolph (EX-Extra), and from day one, breeders gravitated to Storm.
Why?
Two reasons, really. He excelled for rump — flat, wide, correctly set, the structural foundation classifiers love, and udders need. And he transmitted a high fat percentage from an Aerostar son. Most breeders did a double-take when those proofs came back, because Aerostar daughters weren’t supposed to be fat-test cows. Atypical meant valuable.
Stack on top of that the maternal grandsire — Hanover-Hill Inspiration (EX-Extra) — and you had a sire whose pedigree read like a wish list. Breeders ordered. And ordered. And ordered.
The Sons That Built the Empire
By the early 2000s, Storm wasn’t just popular. His sons were rewriting the Canadian sire lineup almost yearly.
Comestar Stormatic (EX-Extra) — the first Storm son progeny-tested in Canada and the bull who broke the C.I.A.Q. record with nine first-crop VG-2-year-olds in a single proof. Twice #1 LPI, he carried the Storm look into the next generation through sons like Alexander and Sanchez.
Comestar Stormatic (EX-Extra) was the first Storm son progeny-tested in Canada, and he did something nobody had done before — set the C.I.A.Q. record for the most first-crop Very Good 2-year-olds, with nine in a single proof. He hit #1 LPI in Canada twice. His daughters carried the Storm look forward into a whole new generation, and his own sons — Golden-Oaks ST Alexander and Gen-Mark Stmatic Sanchez — kept the chain moving.
Hartline Titanic (EX-Extra), out of Docu Leadman Tenacious (VG-88), hit #1 LPI in Canada in November 2003. In the LPI-obsessed Canadian breeding culture of that era, that wasn’t a ranking. It was a coronation. Titanic semen moved.
Ladino Park Talent (EX-ST) — the red-factor Storm son out of Markwell Leader Rose-ET who pulled off a rare double, sampled simultaneously by Semex in Canada and Australia and rated #1 for type in both countries at once. In 2004, Canada’s #1 bull for mammary systems. His daughter Rainyridge Talent Barbara would walk to unanimous All-American honors in 2010.
Ladino Park Talent (EX-ST), a red-factor Storm son out of Markwell Leader Rose-ET (EX-91-2E) — herself the Kinglea Leader daughter of the legendary Stookey Elm Park Blackrose, the red-and-white matriarch every R&W breeder of that era could name from memory — was sampled simultaneously by Semex in Canada and Australia. At one point, he was the top-rated bull for type in both countries at the same time, and in 2004, he was Canada’s #1 bull for mammary systems. His daughters included Rainyridge Talent Barbara (EX-95), a unanimous All-American and All-Canadian 5-year-old in 2010.
Pursuit September Storm (EX-ST), another red-factor son, came out of a sixth-generation VG-or-better tail-female line — Glen Drummond Shimmer, by Starbuck, out of Glen Drummond Shower (EX-10*). That kind of pedigree depth on a red carrier opened doors into the colored-Holstein market that had been mostly closed before.
And on it went. Granduc Tribute. Braedale Spy. Braedale Freeman. Brigeen Givenchy. Blondin Courage. Each one a different mating, a different cow family, a different breeder’s bet — and every one of them landed. Storm sons broke into the Canadian Top 100 LPI list with the regularity of weather reports.
None of that prepared the industry for what came next.
Then Goldwyn Happened
Braedale Baler Twine (VG-86) — the Storm daughter out of 2003 Cow of the Year Braedale Gypsy Grand who posted 30,906 lbs at 4.9% fat as a 2-year-old in 1995 and went on to a 33-Star Brood Cow career. Bred to Shoremar James, she’d deliver the bull calf the breed knows as Braedale Goldwyn — and stitch Maughlin Storm into the maternal half of every Goldwyn pedigree on earth.
Storm had a daughter named Braedale Baler Twine (VG-86) — a Canadian 33-Star Brood Cow, eventually, out of the 2003 Cow of the Year Braedale Gypsy Grand (VG-88-31*). Baler Twine herself put up a 2-year-old record of 30,906 lbs of milk at 4.9% fat. Most herds in 1995 didn’t have a single mature cow doing 30,000 pounds at any test percentage. A 2-year-old doing it at nearly five percent fat? You read that proof twice and called somebody to confirm it wasn’t a typo.
Bred to Shoremar James, Baler Twine produced a bull calf who would become Braedale Goldwyn (GP-Extra). The Braedale prefix — the Beaton family’s program in Ontario, the same operation that had bred Gypsy Grand herself — had stacked the deck on this mating, and the deck delivered.
Bonaccueil Maya Goldwyn EX-95 — Supreme Champion of the 2013 World Dairy Expo. Look at the rump, the dairy strength, the udder. Every line of her traces back through Goldwyn to Baler Twine, and through Baler Twine to Maughlin Storm. This is what “Goldwyn daughters owned the ring” actually looked like on the colored shavings at Madison.
You don’t need a long explanation of what Goldwyn became. He was the dominant show-ring sire of his era — perennial Premier Sire at World Dairy Expo, his daughters stacking up championships from Madison to Cremona to Sydney. When Goldwyn straws moved, they moved by the thousands. When his daughters walked into a ring, judges leaned forward.
Running through every single one of those daughters, woven into the maternal half of every Goldwyn pedigree, was Maughlin Storm.
By the late 2000s, the “Storm line” wasn’t a preference anymore. It was an assumption. If you were breeding for elite type in the Holstein breed, you almost couldn’t avoid Storm if you tried. Goldwyn, Buckeye, and Dolman together held roughly 12% of all Holstein registrations in 2008. That isn’t influence. That’s a genetic monoculture.
What nobody knew yet — what the eye had no way of seeing, what no classification card could score — was that the same maternal pathway delivering the rump, the fat percent, the dairy character, and the championship banners was also delivering something else.
And somewhere in a Bavarian barn, a calf was already dying.
Act III — The Calf That Wouldn’t Thrive
A Veterinary Mystery
Before Orlando 2015, before VIT Germany figured it out, before any of it — there were the calves.
Picture a herd manager in Bavaria. Or Ontario. Or Wisconsin. Doesn’t matter where. A heifer calf hits the ground from a high-end Goldwyn-line mating. Looks normal. Nurses well. The first week, fine. The second week, fine.
Then the diarrhea starts.
Not the kind that responds to electrolytes. Not the kind that responds to antibiotics. Not the kind that responds to anything you’ve got in the medicine cabinet, the vet’s truck, or the consultant’s playbook. The calf keeps eating. Keeps trying. By six weeks, she looks like a different animal than the one you pulled out of the calving pen. By twelve weeks, she’s emaciated despite an appetite that won’t quit.
And then, somewhere before her sixth month, she’s gone.
Then it happens again. Same line, same progression, and the next clean-blooded calf you raise grows like she’s supposed to. You start checking everything — colostrum protocol, milk replacer, pen sanitation, water source. Twice. Nothing’s wrong with any of it. The mystery sits there unanswered while you bury another one.
That’s what HCD looked like from the barn floor — not a statistic but a grief, a budget loss, a quiet shame some farmers carried for years before anyone had a name for it. As one carrier-herd manager later put it in trade-press coverage of the discovery — and any breeder who lived through those losses will recognize the sentiment — we were chasing the look, and the look was carrying something.
What VIT Germany Found
The biology, when it finally came clear, was almost cruel in its simplicity.
The APOB gene on bovine chromosome 11 codes for apolipoprotein B, the protein the body uses to package and ship dietary fat through the bloodstream. Two forms: APOB-48 in the gut for absorbing dietary lipids, APOB-100 in the liver for moving fats out as VLDL and LDL particles. Without working APOB, an animal cannot absorb fat from its food. Cannot mobilize fat from its liver. Cannot convert energy into tissue.
What Kipp and his team identified, and what was confirmed in the peer-reviewed Animal Genetics literature shortly after, was a 1.3-kilobase ERV2-1 transposable element — a piece of ancestral retroviral DNA — wedged into exon 5 of APOB. The result is a truncated, non-functional protein.
In a heterozygous animal — a carrier — one good copy of the gene is enough. The animal is healthy, productive, and often exceptional. In a homozygous animal — two bad copies — the system collapses. Total cholesterol drops below 15 mg/dL, sometimes near zero. The calf cannot make fat. The calf cannot absorb fat. The calf, eventually, cannot live.
Source: Maughlin Storm. The mutation traced cleanly back to him.
The Goldwyn Paradox
Where the story gets uncomfortable — and important — is what happens when researchers start measuring the carriers themselves.
A 2015-era study in the Journal of Dairy Science looked at heterozygous animals (one bad copy, one good) and found something nobody expected. Carriers had blood cholesterol levels roughly 25–30% lower than non-carriers. They milked faster. And — the kicker — they tended to place better at World Dairy Expo than their non-carrier herdmates.
Sit with that for a moment.
RF Goldwyn Hailey EX-97 — Supreme Champion of World Dairy Expo in 2012 and 2014, the bookends to Maya’s 2013 crown. Three Supreme banners in three years, all Goldwyn daughters, all carrying Maughlin Storm’s blood through their dam side. The “Storm line” wasn’t a preference by then. It was the breed’s idea of a champion.
The very phenotype the breed had been chasing for thirty years — the refined skin, the angular dairy character, the openness of rib, the milking speed — was, at least in part, being driven by the sub-clinical effects of carrying a single copy of a lethal mutation.
“Every time a judge tapped a refined cow over a meatier one, the breed’s HCD frequency edged a little higher. Every time a breeder reached for the catalog and ordered the sharper-looking sire, the math got a little worse.”
By 2012, HCD carrier frequency among Canadian Holstein heifers peaked at roughly 17%. In some heavily Storm-and-Goldwyn-concentrated herds, it cleared 40%. When CDCB ran the population in June 2015, 35,793 confirmed carriers showed up across roughly 822,000 evaluated animals — 4.4% of the population, with another 1.6% sitting in “suspect” status because of a genetic technicality.
That technicality matters. Worth a moment to unpack it.
The Mark Anthony Problem
Deep in Storm’s maternal line sits a bull called Fairlea Royal Mark (VG-Extra) — Wykholme Dewdrop Gail’s sire, and therefore Storm’s third-dam sire. Royal Mark also sired Willowholme Mark Anthony (born 1975), a bull who carried what geneticists now call the normal version of the relevant chromosome 11 haplotype.
Willowholme Mark Anthony (HO 219, EX) — bred by Howard Elliott of Lowbanks, Ontario, born February 3, 1975. A Fairlea Royal Mark son out of a Marquis Ned dam. Decades later, his haplotype on bovine chromosome 11 would look almost identical to Storm’s on a 50K SNP chip — same surrounding markers, same block, but clean of the 1.3kb APOB insertion. The reason ~13,000 high-end animals got flagged “suspect” in 2015 before the direct gene test could tell them apart.
The mutated version — the one in Storm — looks almost identical to the normal Mark Anthony version on a standard 50K SNP chip. Same surrounding markers. Same haplotype block. The lethal insertion sits in a place the chip can’t see.
So when CDCB started haplotype reporting in 2015, a whole population of high-end cattle that traced back to bothMark Anthony and Storm got flagged as “suspect” — Code 3, suspect carrier; Code 4, suspect homozygous. Roughly 13,000 animals. Bulls like Comestar Leader, Lee, Outside, and Lheros, who’d received the Mark Anthony version through their dam lines, got falsely lit up before targeted research could clear them. The Dudoc Mr. Burns case became a famous example of probability models needing to catch up to reality.
The fix, eventually, was the direct gene test — a sequencing-based assay that looks specifically for the 1.3kb APOB insertion rather than the surrounding markers. Today, it’s available through Holstein Association USA and Lactanet, and it resolves Code 3 status definitively.
The lesson is worth tattooing on every breeder’s mating program: until science had a tool sharp enough to see the difference, the safe and the lethal looked exactly the same.
Act IV — What This Means for Your Barn
Don’t Blame, Manage
Let’s get this part out of the way clean.
Sandy McPhedran didn’t do anything wrong in 1987 when he paid $4,400 for Tacy. C.I.A.Q. didn’t do anything wrong in 1996 when they certified Storm as Class Extra. The thousands of breeders who used Storm in the late ’90s and his sons through the 2000s were using the best science available to them. The mutation had been hiding in plain sight for who knows how many generations before Storm — possibly all the way back through the maternal line to Musette 3213 H.H.B., the B.B. Lord import who anchors the family tree. Storm didn’t create HCD. He inherited it, and because he was extraordinary, he transmitted it everywhere.
What changed in 2015 wasn’t the breed’s character. It was the breed’s eyesight. Genomic sequencing finally got sharp enough to see what classification cards never could. Call that what it actually is — progress.
HCD Code Quick Reference
Before you read the playbook, this is the chart to bookmark. Print it, screenshot it, tape it inside the cabinet door above the breeding-records book.
HCD Genetic Code
Designation
Breed Impact & Meaning
Required Management Action
Code 0
Confirmed Non-Carrier
Free of the 1.3kb APOB insertion.
Safe to mate to any bull or cow family.
Code 1
Confirmed Carrier (HCD-C)
Single-copy carrier. Healthy and often highly productive, but transmits the mutation.
Can be used safely on Code 0 animals. Never mate to another Code 1 or Code 3 animal.
Code 3
Suspect Carrier
Haplotype matches Storm, but may be a false positive from the clean Mark Anthony line.
Run a direct APOB gene test immediately to verify status before any culling or elite mating decision.
Code 4
Suspect Homozygous
Probability models indicate two copies of the mutation.
High calf-mortality risk. Direct gene test immediately to confirm; do not breed forward until cleared.
The Practical Playbook
Storm’s story isn’t a cautionary tale you tell and walk away from. It’s a working manual. What every serious Holstein breeder should have running in 2026:
Verify the HCD code on every sire, every mating. Code 0 is safe anywhere. Code 1 is fine on non-carrier cows but never on another carrier. Code 3 gets treated as a carrier until the direct gene test says otherwise.
Screen your cow families. If your herd is heavy in Barbie, Roxy, or Apple blood — and most elite-type herds are — you’ve got Storm and Goldwyn in there somewhere. Genomic test every heifer. The ROI on testing-to-avoid versus losing a four-month-old calf runs about 5:1.
Cap expected inbreeding at 9.5%. With Holstein genomic inbreeding pushing past the 10% threshold globally in recent CDCB and Lactanet runs, this isn’t an aspiration anymore. It’s a brake pedal.
Don’t disqualify carriers with elite merit. A +3,200 GTPI HCD-C bull is more valuable than a +2,800 GTPI clean bull, full stop. The trick is carrier management — using him only on Code 0 cows. You harvest the genetics; you sidestep the homozygous risk.
Watch your calves. Chronic, treatment-resistant diarrhea in a two-to-eight-week-old calf, especially out of a Storm-line mating? Pull a serum chemistry panel. Total cholesterol under 40 mg/dL is a strong HCD tell.
That’s the whole defense. None of it is rocket science, and all of it is the difference between an industry that learns from its history and one that repeats it.
Epilogue — The Standing Stones
Storm’s own ending isn’t well-documented in the public record — typical for an AI sire of his era. By all accounts, the bull himself faded out of active service in the late 1990s as his sons came online and made him obsolete. His straws kept moving, though. They moved through the Goldwyn revolution of the 2000s, into the maternal sides of bulls like Buckeye and Dolman that, alongside Goldwyn, anchored that 12% registration share in 2008.
You can’t unwind that. You wouldn’t want to. The Storm line is also why your barn is full of cows that classify well, milk persistently, and look like the breed standard rather than something a hundred kilos heavier from the 1970s. Every refined topline you can run a hand along, every well-attached fore udder, every cow that walks correctly into a sixth lactation — Storm earned a piece of that, and it belongs to him as fully as the carrier code does.
Bruynland Storm Kendra 3E-97 — bred by Bruynland Farm of London, Ontario, born April 17, 2000. All-American 125,000 lb. Cow in 2009, three-time Excellent at the breed’s ceiling, and dam of Pierstein Goldwyn Kiss 3E-94. Look at the topline. Look at the udder texture at lifetime production. This is what Storm transmitted — the cow the breed built around for twenty years. Photo: Cybil Fisher.
Walk into a modern Holstein barn — any of them, anywhere — and run your hand along a topline. Look at the rump on that fresh second-calver. Watch how a Goldwyn-line cow moves into the parlor. Storm is in there. The VanWyk brothers are in there, too, and so is the Master Breeder Shield they earned in 1978. Sandy McPhedran’s $4,400 hunch is in there. April Expectation Dewdrop’s hundred-thousand-pound lifetime is in there, six and seven and eight generations deep.
So is the lesson the breed had to learn the hard way — that what you can see is never the whole picture. The most important thing about a great bull is sometimes the thing you need a microscope to find. That genomics didn’t replace the breeder’s eye. It completed it.
Storm’s not in the Hall of Fame in spite of HCD. He’s there, and he’s the reason we have the tools to manage HCD. Both of those truths belong on the same plaque.
That’s the legacy.
Honor him by reading the codes.
Maughlin Storm (HOCAN000005457798), VG-Extra. Born August 26, 1991. Bred by Sandy McPhedran & Family, Rockwood, Ontario. Proven at C.I.A.Q., St-Hyacinthe, Quebec. Sire: Madawaska Aerostar (EX-Extra). Dam: Wykholme Dewdrop Tacy-ET (VG-89-5*). Maternal granddam: Wykholme Dewdrop Gail-ET (EX-10*) by Fairlea Royal Mark. Haplotype status: HCD-C. Genetic codes: B/R TV TL. Tail-female line traces to April Expectation Dewdrop (GP), the VanWyk foundation cow purchased in 1953 for less than $300.
Key Takeaways
If your herd carries Goldwyn, Buckeye, or Dolman blood — and most elite-type herds do — you’ve got Storm in there somewhere. Genomic-test heifers and treat HCD codes as non-negotiable on every mating sheet.
Don’t blacklist carriers with elite merit. A +3,200 GTPI HCD-C bull beats a +2,800 GTPI clean bull all day, as long as you mate him only to Code 0 cows. That’s harvesting the genetics without buying the risk.
Code 3 (suspect) traces back to Mark Anthony, not necessarily Storm. Run the direct APOB gene test through Holstein Association USA or Lactanet before you cull a bull or a cow family on a haplotype flag alone.
Chronic, treatment-resistant scours in a calf two to eight weeks old, especially out of a Storm-line mating? Pull a serum chemistry panel. Total cholesterol under 40 mg/dL is a strong tell — and the 5:1 ROI on testing versus losing that calf is the only barn math that matters.
Durham vs. Goldwyn: A Clash of Two Titans — Shaped by the same forces that prioritized extreme type, this retrospective details the titanic 2000s breeding wars. It exposes how the global obsession with show-ring style built the very genetic monoculture that accelerated the HCD crisis.
When Lightning Strikes: The Braedale Goldwyn Story That Changed Everything — Carrying forward what Storm started, his grandson Goldwyn took global Holstein architecture to its absolute zenith. This profile tracks that historic lineage from a singular Canadian lightning strike to the complex genomic realities we manage today.
The Sunday Read Dairy Professionals Don’t Skip.
Every week, thousands of producers, breeders, and industry insiders open Bullvine Weekly for genetics insights, market shifts, and profit strategies they won’t find anywhere else. One email. Five minutes. Smarter decisions all week.
A 500-cow Southwest dairy booked corn silage at $60/ton. Shrink-adjusted, the cows ate $220/ton DM. Same pit, same lab sheet, $0.89/cow/day bleeding out before the milk hit the tank.
Run that $0.89 daily leak across 500 cows for 365 days and you land at $162,000 a year — the cash cost of treating a forage report as a lab score instead of a delivered-cost statement. Hubbard Feeds’ 2021 shrink-cost work documents the per-cow-per-day mechanics behind that order of magnitude on a comparable 300- to 500-cow herd running an $8 ration with loose shrink discipline. That’s what a forage economics blind spot costs in cash on a Southwest dairy in 2026.
Editor’s note: This walkthrough is an explicitly composite scenario, modeled by The Bullvine from documented forage-economics research and editorial observation across early-2026 Southwest feed-center conversations. No individual farm, operator, processor, or lab is identified. One Southwest dairy nutritionist is quoted on background at their request. Figures are modeled within documented research ranges; your own numbers will move with herd size, milk price, ration cost, regional shrink exposure, and group structure.
“The harvest report told them the silage was clean. The bunker face told a different story by February.” That’s how one Southwest dairy nutritionist, speaking to The Bullvine on background in early 2026, described the pattern.
Your forage report isn’t a report card. It’s a financial statement. Plenty of 300- to 500-cow dairies still read it as lab scores instead of delivered-cost economics, and the gap never shows up on the forage sheet — it shows up on the feed-cost-per-cwt line.
Why a “Good” Forage Test Can Still Hide a $0.89 Leak
The composite operation has the structural setup typical of a 300- to 500-cow Southwest dairy: multiple milking groups, dry-cow pens, and on-farm forage storage. The 2025 harvest report looked clean — RFV in a solid range, CP where it should be, NDF inside the window. On paper, the high group had no reason to stall.
It stalled anyway.
Everyone assumed the lab sheet was the answer. The lab sheet is a starting point, not a destination. The trap has three layers, and a herd like this pays into all three at once.
Layer one: shrink as a ghost line. On-farm corn silage and haylage shrink typically runs 5–17%; wet-byproduct shrink runs 12–40% (Hubbard Feeds, 2021). Hubbard’s own shrink math shows that moving ration shrink from ~8% to ~4% cuts true feed cost by about $0.28/cow/day on an $8 ration. Cornell PRO-DAIRY’s published feed-shrink case work on commercial dairies has reported similar per-head-per-day savings — in the same order of magnitude — from cutting ingredient shrink in half. Neither figure lives on the ration sheet. Both show up as “feed cost per cwt feels high,” and nothing more specific.
Layer two: DM drift, with Southwest 2026 heat as the accelerant. Penn State Extension’s 2023 feed-inventory guidance is blunt: wet forages need frequent DM testing through winter and at every weather change. In a 2026 Southwest summer, the bunker face isn’t drifting — it’s cooking. Sustained heat speeds secondary aerobic fermentation at the exposed face, where yeasts and molds metabolize residual sugars and lactic acid the moment oxygen reaches them (Kung, U Delaware; Shaver, UW–Madison Extension, Silage Spoilage and Aerobic Stability). DM disappears as CO₂ and water before the loader touches it.
A corn silage face booked at 35% DM in late summer can drift to 31% DM by February — illustrative for the composite, but inside published Penn State and Miner Institute field ranges. The high-group feeding rate doesn’t move. Real delivered DM drops by (35 − 31) / 35, or about 11%. At a 50-lb as-fed feeding rate, that’s ~2 lb of silage DM per cow per day the ration model thinks it’s feeding and isn’t.
Layer three: group misallocation. The better lot runs across every pen — high, mid, close-up, far-off dry — because it’s closest to the mixer. UW–Madison Extension’s 2021 Does Forage Quality Pay? bulletin is direct: feed the most digestible forage to cows in early lactation. Michigan State puts the uNDF240 gut-fill ceiling near 0.4% of body weight for high-producing cows; Miner Institute and Cornell peg the rumen uNDF240 pool ceiling at roughly 0.48–0.62% of body weight.
Dry cows don’t convert extra NDFd into salable milk. Often, they benefit from more uNDF240 by design. Feeding your highest-NDFd silage to far-off dry cows isn’t being kind to the cows — it’s an expensive way to produce high-quality manure.
Three leaks. One ration model that can’t see any of them. And a regional milk-price picture that won’t forgive the drift.
How Much Milk Is 4 NDFd30 Points Actually Worth on Your Operation?
Oba and Allen’s 1999 Journal of Dairy Science meta-analysis is still the anchor: about 0.25–0.55 lb per day of 4% fat-corrected milk per one-unit bump in in vitro NDF digestibility within a forage class, with a central estimate near 0.47 lb. A four-point NDFd miss on the bunker face actually feeding your high group pencils to roughly 1.9 lb of milk per cow per day the model promised and the cow never delivered.
Bill Weiss’s 2022 California Alfalfa & Forage Symposium paper translated that biology into ration economics at roughly $2.40 to $4.86 per ton of DM per IVNDFD unit, scaled to milk-price band. The same NDFd unit is worth effectively zero in far-off dry cows.
Same ton of silage. Two entirely different economies. One pen pays you for quality. The other doesn’t.
What’s the Difference Between $/Ton As-Fed and Shrink-Adjusted $/Ton DM?
“Once we re-priced the silage on what the cows actually got, the cheap pit wasn’t cheap anymore.” That’s how the same Southwest nutritionist framed the moment the math flipped.
The shift isn’t complicated. It’s arithmetic most farms never run.
Priced two ways, the same lot tells two different stories. The ration software has a lot booked at $60/ton as-fed and 35% DM. Cost per ton DM on the invoice: $60 ÷ 0.35 = $171/ton DM. Re-run the same lot at the real 31% DM and a 12% shrink loss, and the true cost per delivered ton of DM is $60 ÷ (0.31 × (1 − 0.12)) = $220/ton DM. That’s a 28% hidden premium on a feed the software treated as cheap.
Before vs After: What Your Ration Software Thinks vs What the Bunker Delivers
Feed
Book DM %
Actual DM %
Shrink %
$/ton as-fed
Software $/ton DM
True $/ton DM
Hidden Premium
Corn silage
35%
31%
12%
$60
$171
$220
28% warning
Haylage
40%
36%
10%
$80
$200
$247
24% warning
Wet distillers
35%
33%
18%
$70
$200
$259
30% warning
Wet byproduct, high-risk shed
32%
30%
25%
$72
$225
$320
42% warning
Re-price every forage and wet feed on shrink-adjusted DM and two things happen fast. Ingredients that looked cheap on invoice slide off the inclusion list. Forages that looked expensive suddenly pencil, because the “cheap” alternative was hauling an 18% shrink penalty (AgProud, 2022, wet-byproduct range: 12–40%). Distillers at 18% shrink in an open commodity shed under Southwest summer heat isn’t hypothetical — it sits comfortably inside AgProud’s documented 12–40% range, and the heat that drives face fermentation drives commodity-shed shrink right alongside it.
The second move is a forage allocation map. One page, one ID per lot, with NDFd30, uNDF240, 7-hour IVSD, CP, and starch tagged on each, and a written group assignment. Fresh and high groups get NDFd30 above 55% and uNDF240 below 10% of DM — inside MSU, Miner, and Cornell thresholds. Dry cows get the higher-uNDF, lower-digestibility lot on purpose. Not by accident. Not by loader convenience.
The myth — “good forage is good for everyone” — dies on that whiteboard.
Group
Best-Fit Forage Profile
Economic Logic
Warning if Misallocated
Fresh cows
NDFd30 >55%, uNDF240 <10% DM, strong 7-hr IVSD
Converts digestibility into milk, components, and early-lactation intake
Lost peak milk and slower start
High group
Highest NDFd lot, stable face, current DM test
Pays for premium forage through milk response
1.9 lb milk/cow/day at risk on 4-point NDFd miss
Mid/late lactation
Moderate NDFd, consistent DM, balanced starch
Protects margin without burning the best lot
Overfeeding quality where response is smaller
Far-off dry cows
Higher uNDF, lower digestibility, controlled energy
Fill and rumen health matter more than salable milk
Running the Numbers: A 500-Cow, 90-Day Forage Economics Walkthrough
Modeled composite scenario. Inputs drawn from documented 2020–2026 response ranges applied to a 500-cow Southwest baseline. Milk price working figure: $0.20/lb, approximating the early-2026 US all-milk price band reported in USDA NASS’s Agricultural Prices monthly release. Federal Milk Marketing Order pool prices and basis will move the end result materially in the Northeast versus the Southwest, and Canadian producers should adjust for their provincial board component-pricing structure. Ration cost working figure: $8/cow/day, from Hubbard Feeds 2021 carried forward — 2026 ration costs may run higher; scale your $/cow/day savings proportionally. NDFd30 lab cost: ~$25–$40/sample at recently published rates from DairyOne, Rock River Laboratory, and Cumberland Valley Analytical.
Step 1 — Shrink correction (Days 1–30). Ration shrink moves ~8% → ~4%. Hubbard Feeds (2021): about $0.28/cow/day saved on an $8 ration. 500 × $0.28 × 30 = $4,200.
Step 3 — Group allocation fix (Days 30–60). Top lot routed to fresh and high; mid lot to mid and late; lowest-quality lot to dry cows. UW–Madison 2021 documents per-cow-per-day IOFC gains above $2.00 in top-responding high groups. Applied here as a conservative herd-weighted midpoint of $0.75/cow/day (range $0.50–$1.00 in documented cases, scaled by the share of cows in the high group). 500 × $0.75 × 30 = $11,250.
Running total through Day 60: ~$18,450.
Step 4 — Honest NDFd and IVSD on the current bunker face (Days 60–90). Updated NDFd30 and 7-hour IVSD; ration rebalanced. Capture half of a 4-unit NDFd miss on the high group, weighted to herd average — assuming the high group represents the bulk of milk production: ~1.5 lb milk/cow/day × $0.20 = $0.30/cow/day. Add $0.15 in smarter concentrate use as the ration stops chasing phantom forage energy. 500 × $0.45 × 30 = $6,750.
90-day total: ~$25,200. That’s roughly $0.56/cow/day captured across the 90-day window — closing about 63% of the $0.89/cow/day baseline leak in a single quarter. Most of that capture is structural, not seasonal.
Don’t annualize that linearly. Shrink correction and the allocation fix are one-time structural captures; their ongoing run-rate continues only if the discipline holds. A modeled first-year range, with the fixes held in place all year, is $60,000–$100,000 on 500 cows — an editorial projection from the 90-day walkthrough, not a Bullvine-surveyed benchmark. A modeled Year-2 ongoing benefit lands closer to $40,000–$60,000, driven by sustained shrink discipline and NDFd accuracy rather than fresh structural fixes.
Breakeven check for premium forage purchases: buy up when (IVNDFD unit gain × milk response × milk price per lb) > (cost/ton DM premium ÷ feeding rate in lb DM per cow per day). Plug in your own herd size, ration cost, milk price, and shrink estimate. The formula doesn’t care about your logo.
What Does a Shrink-Adjusted Ration Mean for Your Operation in 2026?
Many commercial ration models drift on three inputs at once: as-fed prices instead of shrink-adjusted DM prices, stale forage DM that no longer matches the face, and a harvest-composite NDFd that stopped reflecting reality the day the bunker opened. Fix those three, and group allocation, grain inclusion, and protein strategy all start optimizing against what’s actually in the ration — not a report card from last August.
Weiss’s 2022 framework puts the quality premium at roughly $2.40–$4.86 per ton of DM per IVNDFD unit in lactating cows, and effectively zero in far-off dry cows. On a farm burning top-tier forage on dry cows, that’s money lit on fire every day.
Regional exposure varies, and Southwest 2026 is its own category. Heat-driven secondary fermentation lengthens the spoilage zone behind the face, raises commodity-shed shrink on wet byproducts, and chews through DM in the carryover pit between morning and afternoon feedings. Midwest farms with shorter feedout windows and tighter-packed bunkers tend to land near the low end of published shrink ranges. Northeast operations on haylage-heavy rations face a different DM-drift exposure, and FMMO pool prices shift the milk-response math.
Canadian producers under supply management run the same biology with a different economic overlay. An Ontario dairy on DFO component pricing earns most of its forage-quality return through butterfat and protein yield, not fluid volume — quota cost, butterfat differential, and the provincial blend price all change what one extra pound of NDFd-driven milk is actually worth in a given month. Same shrink math, same allocation logic, different milk-revenue side of the equation.
One watch-out: when shrink and DM fixes expose previously masked energy deficits, don’t let grain creep solve a forage problem. Higher-digestibility forage matched to honest intake is the goal. A bigger concentrate line is not a substitute.
When peak milk stalls, the first number to re-check isn’t CP or RFV. It’s NDFd30 on the current bunker face — not the harvest report. A single retest can be worth more than a day’s milk response on a four-unit NDFd miss on a 300-cow herd.
A working benchmark some lenders and nutritionists watch: if your feed cost per cwt drifts more than ~8% against your regional DHIA or extension benchmark for two consecutive quarters with no ration change, the problem is almost certainly upstream of the ration. Your lender is already looking at that drift, even if you aren’t.
The 30/90/365-Day Playbook for Southwest 500-Cow Operations
30-Day Actions — stop the bleeding.
Pull a current DM on every wet forage and wet byproduct this week. Trigger: any silage face not DM-tested recently, per Penn State Extension’s 2023 guidance to test frequently and at every weather change. Under Southwest summer heat with visible heating at the face, tighten the editorial floor to weekly. Requires: a Koster or microwave test and one ration update. Backfire risk: sampling only the center of the face — pull top, middle, and bottom.
Re-price every forage and wet feed on shrink-adjusted DM, not invoice. Use a real shrink estimate from the AgProud 2022 range (5–17% silages, 12–40% wet byproducts). Red-flag trigger: if nobody on your team can state your current ration shrink percentage in one sentence, this goes to the top of the list.
Pull an updated NDFd30 and 7-hour IVSD on the exact bunker face feeding your high group — not a harvest composite. Cost: ~$25–$40/sample at recently published rates from DairyOne, Rock River, and Cumberland Valley. Backfire risk: a single sample tells you one point — pull two across the face.
Build a one-page forage allocation map. Every open lot gets an ID and a written group assignment based on NDFd30, uNDF240, IVSD, CP, and starch. Related reading: Fine-Tuning Haylage and Cereal Silage Quality for Different Life Stages Within the Dairy Herd — thebullvine.com/haylage-cereal-silage-life-stages
90-Day Actions — structural change.
Split rations more aggressively. Route top-tier forage to fresh and high (NDFd30 >55%, uNDF240 <10% of DM, inside MSU/Miner/Cornell thresholds). Push higher-uNDF forage to dry cows and heifers by design. Requires: nutritionist time, two weeks of baseline IOFC data, and loader-route discipline. Backfire risk: mid group squeezed on energy when the top lot moves — monitor DMI and milk in mid cows for 14 days post-change.
Reconcile what the ration thinks you feed against what actually leaves the feed center. The composite 500-cow walkthrough above closes about 63% of a $0.89/cow/day baseline leak on this reconciliation alone. Related reading: The 89¢ Per Cow Per Day Leak Found in a Feed Center — thebullvine.com/89-cent-per-cow-leak-feed-center
Re-run breakeven milk response on every premium forage purchase before the next growing season, using Weiss’s 2022 $2.40–$4.86/ton DM per IVNDFD unit framework at your milk-price band. Backfire risk: anchoring on milk-price highs — model at both a conservative and an optimistic band before committing.
Watch palatability and DMI when you trim wet byproducts. You can gain $0.20/cow/day on ingredient cost and lose it right back on a 1.5-lb DMI drop.
365-Day Moves — strategic positioning.
Rebuild your harvest plan around time-in-silo economics and Southwest face-management reality. UW–Madison Extension and Penn State silage-fermentation work, including 2023 Journal of Dairy Sciencepublications on zein protein matrix proteolysis, show corn silage 7-hour IVSD climbing roughly 10–15 percentage units over four to six months of ensiling. Opportunity signal: if your IVSD at pit-opening is below 70% and you have carryover inventory, defer feeding that lot to the high group by 60–90 days rather than blending it in early.
Move to lot-level forage accounting. Each bunker, bag, or stack gets an ID, a lab sheet, a shrink estimate, and a written group assignment. Forage inventory becomes a portfolio with assigned margin roles, not a pile.
Stand up a quarterly review with your nutritionist and lender where feed cost per cwt, IOFC, feed efficiency (ECM lb / DMI lb), and shrink percentage all sit on the same page. Trigger: feed cost per cwt drifts more than ~8% against your regional DHIA or extension benchmark for two consecutive quarters with no ration change — escalate. Opportunity signal: shrink holds under 5% and NDFd30 stays above 55% on your high-group face for two quarters — you’ve earned room to buy premium hybrids for the next harvest without blowing your ration cost ceiling.
The Contract Check That Closes the Loop
The acres didn’t change. The cows didn’t change. The forage math did. That’s the entire story.
You gain margin when you price forage on shrink-adjusted DM, allocate it by digestibility, and re-test the bunker face rather than the harvest core. What you give up is the comfort of a single “good” lab sheet and a loader route that treats every pen identically. That’s the trade-off. It’s worth making.
Calculate What Your Forage Is Really Worth
Your forage test isn’t a report card. It’s a margin signal. Use The Bullvine Forage Quality Value Calculator to turn lab results into cost, milk response, break-even, and ration-group decisions.
Two questions before your next nutritionist meeting. What is the real shrink-adjusted DM cost of the forage feeding your high group this week? And when was NDFd30 on that specific bunker face last re-tested — not the harvest report, the current face?
If you can’t answer both in under two minutes, your forage report isn’t a report card. It’s a financial statement you’re not reading.
What does your current ration sheet actually price your silage at — invoice, or truth?
Methodology: This walkthrough is an explicitly composite scenario. It blends documented per-cow-per-day response ranges from Oba & Allen (1999, Journal of Dairy Science), Weiss (2022, California Alfalfa & Forage Symposium), Hubbard Feeds (2021), AgProud / Progressive Forage (2022), UW–Madison Extension (2021, Does Forage Quality Pay?), Michigan State Extension, Miner Institute, Cornell PRO-DAIRY, and Penn State Extension (2023), with editorial observation drawn from Bullvine Q1 2026 Southwest feed-center conversations.
Key Takeaways
Price every forage and wet feed on shrink-adjusted DM, not invoice. The $60/ton silage that eats $220/ton DM after shrink and drift is a 28% hidden premium your ration software won’t flag.
Same ton of silage, two different economies. NDFd is worth $2.40–$4.86/ton DM per unit in lactating cows and effectively zero in far-off dry cows — feed your best lot to fresh and high, not to the closest pen.
The 90-day fix on a 500-cow Southwest herd closes about 63% of a $0.89/cow/day leak. Most of that is shrink discipline, group allocation, and an honest NDFd30 retest on the current bunker face.
If your feed cost per cwt has drifted more than ~8% against your regional benchmark for two quarters with no ration change, the problem is upstream of the ration — and your lender is already looking at it.
Complete references and supporting documentation are available upon request by contacting the editorial team at editor@thebullvine.com.
Learn More
Feed Shrink: The Silent Profit Killer — Recover $0.30/head/day through an audit of commodity bay protocols and loader operator discipline. Arms you with a checklist to identify exactly where “ghost” tons vanish before reaching the mixer.
Dairy Farm Profitability: Strategies for 2025 — Secure your feed-cost-per-cwt against 2027 market volatility by quantifying the multi-year ROI of bunker infrastructure upgrades. Dismantles the myth that weather alone dictates your silage quality and bottom line.
Precision Dairy Farming: The Future of Feed Management — Capture a technical edge using automated bunk-monitoring sensors and real-time DM adjustment tools. Follows the money on hardware that replaces the Koster tester with laser-accurate intake data for high-producing groups.
The Sunday Read Dairy Professionals Don’t Skip.
Every week, thousands of producers, breeders, and industry insiders open Bullvine Weekly for genetics insights, market shifts, and profit strategies they won’t find anywhere else. One email. Five minutes. Smarter decisions all week.
A 50¢ diesel move costs a 19,000-cow dairy roughly $427,500 a year. The McCartys book ~90% of next year’s gallons before Jan 1 — and treat beating the bottom as luck, not skill.
According to a May 8, 2026 report and an industry strategic-analysis brief, McCarty Family Farms aims to enter each fiscal year with roughly 90% of its diesel needs already booked for the next 12 to 18 months, working with Compeer Financial economist Dr. Megan Roberts on a layered procurement plan. Applied to a 45 gal/cow proxy at McCarty’s roughly 19,000-cow scale, a single 50-cent move on diesel would represent about $427,500 in annual exposure. That’s the kind of budget hole the McCarty hedging system is designed to prevent.
The system was built by four brothers — Mike, Clay, Dave, and Ken — who took a 15-cow Pennsylvania herd, moved it to western Kansas in 1999, and grew it into a roughly 19,000-cow operation across Kansas, Nebraska, and Ohio, with a workforce that has grown beyond the 130-plus head count cited in earlier coverage, and a long-term Danone milk contract. Right now, with U.S. retail on-highway diesel sitting at $5.64/gal as of May 12, 2026 per EIA’s weekly update — roughly a 61% jump from a year earlier — that discipline is the difference between funding the next generation and funding the pump.
📌 Editor’s Perspective: Where This Fits in the Bullvine Universe
This piece is the energy-risk leg of a margin story we’ve been mapping all month. Bullvine’s May 2026 Corridor Trap analysis pegged the annual drag at roughly $221,760 on a 600-cow Upper Midwest herd as basis slid from –$0.35 to –$0.85/cwt. The Corridor Trap is what happens to your milk check on the revenue side. The McCarty diesel rule is what locks down the cost side. Same farm. Same lender meeting. Different lever.
What’s Changing — and Why It Hits 24/7 Operations Hardest
Diesel isn’t a line item on a modern dairy. It’s the bloodstream. Feed delivery, manure hauling, milk hauling, cropping, generators, and third-party freight surcharges all move with the price of crude. Brownfield Ag News reported in early May 2026 that one dairy producer’s milk check was running close to .00/cwt while feed and fuel were eating the margin alive — part of a broader 2026 ag-economist warning from David Widmar’s April 28, 2026 Managing for Profitcolumn that energy-market volatility is now a primary 2026 cost-side risk.
For a 24/7 operation, a 50-cent move isn’t an inconvenience. It’s a quarterly-budget derailment. And it’s landing on top of the FMMO Make-Allowance 2025 update — effective June 1, 2025, per the USDA AMS final rule — which trimmed an estimated $0.85–$0.93/cwt off Class III–IV values, with Class III near $0.92/cwt. Stack those two numbers and you can see why lenders are starting to ask for a written energy-risk plan before they renew a line of credit.
The farms feeling it first are the ones running the most equipment hours per cow — large freestall operations with custom hauling contracts, long milk routes to a tightening number of plants, and irrigation. If that’s you, the math below isn’t theoretical.
How This Plays Out on Real Farms — The Energy Risk Management Math
Here’s the back-of-the-envelope every dairy CFO should run today. Using an industry proxy of roughly 45 gallons of diesel per cow per year — covering feeding, manure, and basic forage transport — a 500-cow herd burns about 22,500 gallons annually. A 50-cent spike costs that herd $11,250. A dollar move costs $22,500. At 5,000 cows, the same 50-cent move costs $112,500. At McCarty’s roughly 19,000-cow scale, illustrative math points to about $427,500 in exposure on that one move.
Herd Size
Annual Diesel (gal)
25¢ move
50¢ move
$1.00 move
500 cows
22,500
$5,625
$11,250
$22,500
1,000 cows
45,000
$11,250
$22,500
$45,000
5,000 cows
225,000
$56,250
$112,500
$225,000
McCarty (~19k)
855,000
$213,750
$427,500
$855,000
40,000 cows
1,800,000
$450,000
$900,000
$1,800,000
Source: 45 gal/cow/year industry proxy. Your actual intensity moves with cropping system, hauling distance, manure logistics, and how much fuel sits on a custom operator’s invoice rather than yours. Farms growing most of their own forage will run hotter than this proxy.
🎯 The Magic Number: $0.09/cwt
That’s the cost of a 50-cent diesel move on a 200-cow herd shipping 24,000 lbs/cow (9,000 gallons × $0.50 = $4,500; ÷ 48,000 cwt of milk ≈ $0.09/cwt). On its own, a rounding error. Stacked on the FMMO Make-Allowance 2025 drag of roughly $0.92/cwt and a basis slide, it can be the number that breaks the bank — and on a marginal book, the variable that tips a Debt Service Coverage Ratio below 1.25x.
The Mechanics: Three Pillars of the McCarty System
The McCarty system rests on three pillars: proactive layering, historical benchmarking, and mitigation over speculation. They don’t try to call the bottom — the McCartys are described as treating that as luck, not skill. As forward months become available, the team books physical gallons in increments — 20–25% at a time — smoothing what the Compeer team has publicly framed as the “fat tails” of the energy market.
Success isn’t beating the spot price. It’s landing in the bottom third or bottom half of the 5- to 10-year historical average — or simply staying consistent year over year — so milk margins can be calculated with precision before the cows ever produce them. Compeer’s Chief Risk Officer Bill Moore calls it “controlling the controllables.” Translation: lock down breakeven, watch the consensus, and stress-test what happens if ad-hoc government payments fall or Class III drops below $15/cwt.
The 18-month plan is a family-business mechanism for the McCarty brothers — Mike, Clay, Dave, and Ken — built on the same data discipline behind their genetics program, their 2012 Rexford milk condensing plant, and the long-term Danone partnership that anchors their revenue side. None of this is about the next quarter. It’s a question every multi-generational operation faces: whether the next generation inherits a balance sheet they can run, or one they have to dig out from under.
The Hidden Exposures a Hedge Doesn’t Cover
Worth saying out loud: a 90% fuel hedge is not a shield. Three exposures still run through the system the contracts can’t reach.
Hauling adjusters. Milk haulers and commodity deliverers run fuel surcharges that re-price weekly off the EIA index. Your tank is locked. Their truck isn’t.
The processing paradox. As regional plant capacity tightens, dairies get pushed to longer milk routes to find an accepting plant. Longer routes mean more surcharge surface area.
Embedded energy. Mineral premixes, plastic resin, distillers grains, equipment parts — all carry crude-oil cost inside the invoice. Lock the diesel; the inflation still leaks in.
That’s why the 90% target matters. Shrinking the surface area of the things you can’t control is the entire point.
How Much Does Skipping the Hedge Actually Cost You?
Run your own number. If you milk 500 cows and diesel moves $1.00 — and weekly EIA retail diesel did exactly that, climbing roughly $2.14/gal year-over-year through May 2026 — that’s $22,500 you didn’t budget for. On 1,000 cows, $45,000. That’s well above the USDA NASS national livestock-worker average of $17.51/hr for the October 2024 reference week, per the November 20, 2024 Farm Labor release — i.e., real wage money, regardless of region. It’s also more than seven times the bid on a single replacement heifer at the USDA AMS national average of $3,010/head, with USDA NASS’s January 30, 2026 Cattle Inventory printing 3.90 million dairy replacement heifers — the lowest since 1978, per Farm Progress’s February 16, 2026 reporting on the same release.
Every dollar you don’t lose to a fuel spike is a dollar that stays in the business — for cows, for people, for technology, for principal paydown.
Is Your Lender Already Asking About This? — The Energy Risk Management Conversation
In Bullvine’s May 2026 Corridor Trap analysis, a corridor-aware stress test pegs the annual drag at roughly $221,760 on a 600-cow Upper Midwest herd as basis slid from –$0.35 to –$0.85/cwt — and lenders increasingly want to see that same kind of stress test applied to your fuel budget. A documented energy-risk plan — even a one-pager showing how you forward-book diesel — improves your risk profile. In a corridor-aware stress test, an unhedged fuel budget can be the variable that tips a marginal Debt Service Coverage Ratio from acceptable to constrained.
If your bank hasn’t asked yet, your next renewal conversation is the right moment to bring the document yourself.
Options and Trade-Offs for Farmers — Including Dairy Margin Coverage Stacking
You don’t need a 19,000-cow footprint or a quant analyst on retainer to copy the discipline. You do need to pick a lane.
Strategy
Primary Benefit
The Price You Pay
Best-Fit Dairy
Watch This Metric
Lock fixed diesel price
Budget certainty before the fiscal year starts
Lose upside if spot diesel falls
Any dairy with predictable annual fuel use
Coverage above 90% can leave no room for usage surprises
Stabilizes more of the milk, feed, and fuel margin
Premium cost plus more paperwork
Margin-managed dairies with lender scrutiny
Net margin after premium, not gross protection
Keep spot-market exposure
Maximum upside if diesel falls
No protection when the market jumps
Only farms with low fuel intensity or strong cash reserves
50¢ move exposure before Jan. 1
Co-op forward booking — the 500-cow blueprint. Work with your local fuel co-op to forward-contract gallons 12 months out. Lock 25% in September for Q1 delivery. Another 25% in December for Q2. And so on. By the time the calendar flips, you’ve layered four price points instead of betting on one. When it works: you’ve got working capital and a lender comfortable with prepaid inventory. Risk: if spot prices fall below your locked rate, you’ll pay more than the neighbor who didn’t hedge. You’re buying budget certainty, not the bottom of the market.
The “Jan 1, 90%” rule. Set a hard target to have 90% of next year’s diesel booked before the fiscal year starts. When it works: any size farm running an annual budget. Requires: 12 months of clean fuel-use data. Limit: leaves 10% open for genuine consumption surprises — herd expansion, new acreage, beef-on-dairy intensity.
30-day on-ramp. This month, pull last year’s fuel invoices, calculate your gallons-per-cow, and call your fuel supplier to ask what forward-contract terms they offer. That’s the entire starting move. No working capital required to make the phone call.
Integrate fuel with milk and feed risk. Fuel hedging is one piece of a margin toolkit. Compeer’s published framework treats it alongside DRP for component-based revenue protection, LGM-Dairy for bundled feed risk, and Dairy Margin Coverage as a Tier 1 backstop that’s often too small for large herds. None of these tools work alone. Pair them.
The trade-off table — benefit vs. cost, plain English:
Strategy
Primary Benefit
The “Price” You Pay
Locking price
Budget certainty
Loss of “downside” opportunity if spot falls
Layering 25% increments
Cost averaging across the cycle
Increased admin and supplier time
Prepaying forward gallons
Lender confidence in your risk plan
Working capital tied up
Pairing with DRP / LGM-Dairy
Margin certainty across feed + milk
Premium cost on the policy
Key Takeaways
If you can’t say what you paid per gallon over the last 12 months, you don’t have a fuel strategy — you have a fuel bill.
If your fuel exposure on a 50-cent move would change a hire, an expansion, or a debt payment, you have a hedging case. Run the test: gallons/cow × $0.50 × your herd size.
If you can hit 50% coverage by January 1, you’re ahead of the spot-market crowd. 90% is the McCarty benchmark, not the entry point.
If you book a layer, book another. One fixed price isn’t a strategy — three or four staggered layers is.
If you hedge fuel without hedging milk or feed, you’ve stabilized one leg of a three-legged stool. Pair it with DRP, LGM-Dairy, or a forward milk contract.
If your milk hauling, mineral premix, or replacement heifer bills are climbing faster than diesel, the embedded energy is leaking in. Track those line items separately.
If your next lender meeting is inside 90 days, bring a one-page energy-risk plan before they ask for it.
The Real Question
The next 50-cent diesel move is coming. The only question is whether your operation has decided in advance who it’s going to hurt — the market, or you. Where does your fuel coverage sit on January 1, and what would you have to change this month to get it closer to 90? The McCarty brothers built a 12–18 month answer to that question. Many multi-generational dairy families face the same calculus when planning for succession — and yours can do the same work at a smaller scale.
Reporting in this article is based on published trade-press coverage (Dairy Herd Management, Brownfield Ag News, Farm Progress, Bullvine archive), public Compeer Financial materials, USDA AMS and NASS data (USDA NASS Farm Labor 11/20/2024; USDA NASS Cattle 01/30/2026), EIA weekly retail diesel data, and an industry strategic-analysis brief. The Bullvine did not independently interview McCarty Family Farms or Compeer Financial for this piece. Diesel-cost figures are illustrative calculations using a 45 gal/cow industry proxy and will vary by farm.
Complete references and supporting documentation are available upon request by contacting the editorial team at editor@thebullvine.com.
Every week, thousands of producers, breeders, and industry insiders open Bullvine Weekly for genetics insights, market shifts, and profit strategies they won’t find anywhere else. One email. Five minutes. Smarter decisions all week.
A 700-cow Kansas freestall tests 250 heifer calves at $45/head, files the report, and breeds the herd the same way it bred last year. The 2026 modeled gap: $149,840.
For U.S. commercial freestall dairies in the 500–1,500-cow band, it costs $2,651 to raise one Holstein heifer to calving, per Iowa State University Extension’s heifer cost of production work. The $45 line on your genomic testing invoice is the cheapest number in the stack. The expensive number is what that test didn’t change in the alley at 4:30 a.m.
Run that math on a 700-cow Kansas freestall that tests its full 2024 heifer crop and then keeps every heifer anyway, and the 2026 dairy economics of genomic testing produce a modeled 9,840 annual gap between testing spend and routing discipline. That figure is a scenario comparison against an enforced genomic-routing benchmark, built from a $45-per-head lab contract and published Iowa State Extension, CDCB, Lactanet, and Bullvine inputs. Not a P&L forecast.
Same test. Different decisions. Different milk checks.
Is Genomic Testing Worth It for Commercial Dairy Herds in 2026?
U.S. benchmark pricing on commercial genomic tests has held in the $40–$45/head range through 2024–2026. Reliability on Net Merit and Productive Life now runs 73–79%, with Daughter Pregnancy Rate around 74%, based on CDCB-published reliability tables cited in that same guide. Genetic gain in NM$ has accelerated to roughly per year under genomic selection, consistent with CDCB’s published national trend data reported in the Bullvine May 2025 guide.
Trait
CDCB Reliability Range
What It Means in Practice
Enforcement Implication
Net Merit (NM$)
73–79%
High confidence — ranking is stable across re-runs
Safe to print on breeding sheet as decision rule
Productive Life (PL)
73–79%
Longevity signal strong at this reliability
Bottom-quartile PL animals are real culling targets
Daughter Pregnancy Rate (DPR)
~74%
Solid — fertility signal actionable at farm level
Use to flag beef-routing candidates, not just sire selection
Fat Yield (PTA Fat)
~78–82%*
Highest reliability in the index post-2025 revision
31.8% NM$ weight now makes this the dominant sort variable
Feed Saved
~65–70%*
Improving but widest confidence band in the index
Use directionally; don’t cull solely on Feed Saved at this stage
Layer in the 2025 NM$ revision. CDCB’s April 2025 NM$ formula revision moved PTA Fat near 31.8% relative emphasis and Feed Saved to roughly 14%, as reported in the May 2025 guide and anchored to the CDCB primary release linked there. On paper, the case writes itself.
Some commercial herds use genomic data primarily for sire selection and donor identification, where ROI capture doesn’t require the kind of cull-and-route discipline this article emphasizes. Those strategies have their own economics. The case below is built for the much larger commercial cohort that buys the test, files the report, and breeds the herd the way it bred last year.
For Canadian and other supply-managed readers, the cull-and-route economics shift under quota systems — the beef-cross premium and rearing-avoidance lines still apply, but the replacement-pressure math changes when quota expansion governs herd growth rather than market-priced milk volume. The thesis below is built for U.S. market-priced systems.
The recommended commercial playbook surfacing across major U.S. genomic test provider strategy guides and university extension materials The Bullvine has reviewed across 2024–2026 looks consistent: test the full heifer crop at the lab’s $40–$45 contract rate, cull the bottom 15–20% as calves, route the bottom cows to beef semen, pull donor candidates from the top 5%.
Plan on paper. Plan in practice: often barely touched.
What Does It Cost When a 700-Cow Herd Tests Every Heifer But Culls None?
The pattern The Bullvine has documented across commercial freestalls in 2024–2026 breaks one assumption flat. Everyone assumed genomic data and genomic decisions were the same thing. The 2024 barns say otherwise.
A run of transition wrecks tightens springer inventory. A load of heifers moves at a strong price right after calving and tightens it further. By the time the genomic reports land, the quiet decision has already been made in herds this size: keep every heifer, use the rankings to pick donors, move on.
In herds The Bullvine reviewed during 2024–2026 where genomic testing was paid for but routing wasn’t enforced on paper, the observable pattern is that breeding decisions often continue to follow visual and temperament cues rather than the genomic ranking. The ranking isn’t wrong. It just isn’t the rule. Where the ranking isn’t printed on the daily breeding sheet, it’s rarely the operative input at the tank. That’s an enforcement pattern, not a technician failing.
Three forces keep this pattern alive in 500–1,500-cow herds. Muscle memory beats spreadsheets when the tech is working in the dark. Visual bias defends favorite cow families against any ranking that contradicts them. Pay structures tie breeding staff to pregnancy rate and services-per-conception, not to whether the semen pulled matched the genomic tier.
Strategy without enforcement drifts into decoration. That’s what the testing line item is paying for when it pays for nothing else.
How the Execution Leak Happens — The Genomic Routing Funnel
Three Cash Flows That Move the Wrong Way
Against an enforced routing benchmark, three lines on the 700-cow Kansas scenario’s 2024 cash flow move in the wrong direction.
Rearing dollars not recaptured. Rearing dollars not recaptured. A $45 × 250-heifer test flags a clear bottom-quartile group — roughly 50 animals running below the top half on NM$ and components. Pull 30 as calves under a disciplined sort-and-cull plan modeled on The Bullvine’s February 2026 execution-leak work, and you avoid roughly 30 × $2,651 in rearing cost over the next 24 months. Pull three instead of 30, and the other 47 stay on feed, in pens, on the balance sheet.
Beef-cross revenue not captured. The beef-cross premium over a straight Holstein bull calf ran $350–$700 per head through late 2024 and into 2025, consistent with USDA AMS bull calf price ranges over the same period. That’s a national/trade-press benchmark; Kansas and Plains-region premiums vary, so cross-check against local sale barn or regional trade reporting before applying this range to your own math. At 450 cows bred in a cycle and an enforced top-half-dairy/bottom-half-beef rule — a framework consistent with routing discipline operators have described to The Bullvine in 2024–2026 interviews — 220–225 cows land in the beef-eligible bucket. When a herd this size books 95 beef-cross calves for the year, the modeled gap sits at roughly 125 additional cows not routed (rounded to 120 in the table below for arithmetic simplicity).
Stall value that ages poorly. A third- or fourth-lactation cow can carry genetics $250–$400 behind the 2023–2024-born heifers coming up behind her, derived from 85/year NM$ gain (CDCB national trend data). The Bullvine’s November 2025 Retention Payoff framework puts the three-year advantage of swapping a genetically lagging cow for a top-index replacement at roughly $1,350 per cow, with an approximate $233 per cow per year genetic opportunity cost derived from that same gain rate. Without genomic culling pressure, stalls age in the wrong direction.
Running the Numbers — Modeled Kansas Scenarios at 400, 700, and 1,000 Cows
This is a modeled comparison, not any single operation’s P&L. Inputs come from Iowa State Extension’s 2024 heifer cost work, CDCB trend figures, Lactanet 2024 inbreeding data, The Bullvine’s 2024–2025 reporting, and a $45/head lab contract. Convention: Year-1 gap = rearing avoided + beef premium captured + stall drag. Testing investment is shown separately as the ante. Beef-routing line uses 120 cows at the 700-cow scenario for table simplicity (exact math = 125).
Stall drag: ~$233/cow/year, derived from 85/year NM$ gain (CDCB national trend data).
Rearing line is realized over 24 months; beef premium and stall drag are Year-1.
Cull depth and beef-eligible count move with your replacement strategy, not just your herd size.
Separate three-year frame (700-cow scenario)
Retention Payoff on 70 stall upgrades: 70 × $1,350 = $94,500 across three years, or roughly $31,500 per year amortized (Bullvine, November 2025). Don’t fold this into the Year-1 number. It’s a different horizon.
Plug in your own cull depth, routing rate, and beef premium midpoint. The range is directional.
Why the Testing Line Is the First Thing Lenders Ask About in 2026
The turn is showing up in Q4 lender meetings, not in the barn.
In The Bullvine’s 2025–2026 editorial conversations with commercial dairy operators in the 500–1,500-cow segment across the U.S. Midwest and Plains, multiple operators reported that their regional ag lenders raised a version of the same question at 2025 working capital renewals: the genomic testing line is up, where is it showing up on the milk check? Operators who can’t tie specific animals on the ranking report to specific routing decisions are finding those conversations harder to navigate than in prior cycles. That pattern aligns directionally with widely reported 2024–2025 ag-credit tightening across U.S. dairy.
One 2025 Lender Conversation, Illustrative and Anonymized
Read this as composite, not verbatim. The figures below are derived from the modeled 700-cow Kansas scenario above, not from any single operator’s records. It reflects the pattern operators have described to The Bullvine across the U.S. Midwest and Plains during 2025 renewal cycles, not any single exchange.
Lender: Your testing line went from $7,400 in 2023 to $11,250 in 2024. Walk me through what changed on the milk check.
Operator: We’re testing every heifer now.
Lender: I can see that. Your beef-cross calf count went from 82 to 95. Your springer inventory is up eleven head year-over-year. Which animals on the 2024 ranking report did you cull or route differently because of what the test said?
Operator: (pause) We’d have to pull the list.
That silence is the product. Not the $45 invoice.
A 2024 DSCR under 1.2 — the working-capital threshold widely used by U.S. ag lenders — sitting on the ledger next to a five-figure genomic testing bill and a ranking report whose bottom-quartile heifers are still in the springing pen answers the lender’s question for them. The test wasn’t the product. The decision rule was.
The other half of the pattern shows up at the barn level. The list wasn’t the rule, so the list wasn’t the input. Visual appraisal won because nothing in the daily workflow required anything else. That single dynamic explains most of the daylight The Bullvine has been documenting across commercial dairies reviewed in 2025–2026.
The 30/90/365-Day Playbook for Herds Testing Without a Rule
The fix isn’t more testing. It’s less freelancing. This playbook blends the restructured 2025–26 protocols The Bullvine has reviewed, the routing discipline operators have described, and the February 2026 execution-leak findings.
30 Days: Stopping the Bleed
Tag the bottom 20% so the alley can see them. Rank every heifer on hand by NM$ from your 2024 and 2025 genomic reports. Tag the bottom 20% with a physical signal — leg band, ear tag color, pen flag — within 30 days. Requires one morning with your genomicist and your software. Red-flag trigger: if your genomic testing spend is up year-over-year and your beef-cross calf count hasn’t moved, this is week one. Backfire watch: over-culling into a replacement shortage if your sexed semen program isn’t already creating surplus. Pull your 12-month projected heifer inventory before acting.
Print the ranking on the daily breeding sheet. Rewrite the daily breeding sheet with your AI tech. Every line prints with an assigned semen type — SEXED DAIRY, CONVENTIONAL DAIRY, or BEEF — derived from genomic tier, not tech discretion. Requires 2–3 hours in your herd management software (DairyComp, MPT, or equivalent). Trigger: if semen calls are being made at the tank rather than from a printed list, this is the highest-leverage 30-day fix.
Track tier compliance for one month. Target 95% by day 30, per The Bullvine’s editorial recommendation. Watch for excuses that start with “she looked good.”
90 Days: Systematizing the Rule
Install the one barn rule in writing. Band the breeding herd into top 30% sexed dairy only, middle 40% conventional or flex, bottom 30% beef only. Publish it in writing to everyone who touches the tank. Requires current genomic indexes on every eligible animal, a family meeting, and a plan for cultural pushback before it happens at 4:30 a.m. Threshold: if compliance runs below 90% in month two, the rule isn’t the rule yet. Backfire watch: resentment if you enforce without backing the tech when a well-presenting cow in the bottom band gets beef. The rule isn’t the rule until the tech has been backed up in front of the owner.
Pay for the rule, not just the pregnancy. Rewrite your breeding tech’s performance metric to include tier compliance alongside conception rate, tracked as paired numbers on the same weekly dashboard. Requires one conversation and one line change. Watch for gaming — compliance without conception progress isn’t the goal.
Audit inbreeding before the next mating cycle. Have your genomicist generate genomic inbreeding coefficients and Genomic Future Inbreeding scores for every breeding candidate. Flag any potential mating over 9% projected progeny inbreeding. Canadian Lactanet 2024 data points to roughly $60–$78 per cow per lactation of drag per additional 1% inbreeding. On a 300-cow herd, a 2-point reduction held across three lactations pencils to about 300 × 2 × $70 × 3 = $126,000 in avoided lifetime drag, using the $70 midpoint of the Lactanet $60–$78 range.
365 Days: Repositioning the Operation
Re-baseline the heifer pen around enforced culling. By end of year one, your heifer pen should be smaller, genetically stacked at the top, and funding a visible beef-cross calf revenue line on the cash flow your lender reviews. Requires one full breeding cycle under the rule. Opportunity signal: if your 2026 calf crop shows beef-cross count rising while springer projections hold within your 24-month replacement target, you have room to tighten the top tier further.
Run the donor program on index, not pedigree alone. Commercial IVF pregnancies typically run into the several-hundred-dollar range per confirmed pregnancy; confirm current rates with your provider before committing. The Bullvine’s editorial view on donor economics: the strongest pedigrees don’t always produce the strongest genomic profiles, and donor economics work best when the index decision leads the pedigree decision. For the legacy view of how disciplined index-led mating built famous breeding programs.
Rebuild sire selection around the 2025 NM$ weightings. Review sire selection through a component and inbreeding lens, not a top-10 list lens. Align your bull roster to the 2025 NM$ weightings and layer genomic relationship checks on top. Requires your mating software provider’s current release and a half-day with your genetics consultant.
What This Means for Your Operation
Testing isn’t the product. The rule is. That’s why the same $45 test lands as a six-figure decision on one farm and a line item on another.
The trade-off is plain. You gain margin by letting genomic ranks decide who gets raised, who gets bred dairy, who gets beef. You give up the comfort of family tradition, eye appraisal, and the peace of never arguing with your herdsman at 4:30 a.m. You also need a sexed semen program already doing real work. No surplus, no cull room. No cull room, no ROI on the test.
Across the commercial herds The Bullvine reviewed in 2025–2026 that installed a printed tier-routing rule, the editorial pattern has been beef-cross calf counts rising in the first full breeding cycle under the rule, testing spend holding roughly flat, and tier compliance converging on the 90–95% range within a quarter. The sample is the herd cohort described in the Behind the Numbers toggle below, not a national survey. October 2026 working capital reviews are five months out. The math is already moving on the herds that rewrote their breeding sheets this spring.
▶ RUN YOUR NUMBERS — Open the Genomic Testing ROI Calculator
The calculator walks you through your own herd’s test cost, cull depth, beef-routing rate, and replacement value in under ten minutes. Pull it up before your next breeding-sheet review.
Pull your 2024 and 2025 genomic reports. Answer one question honestly. Which specific animals did you actually treat differently — culled, routed to beef, moved out of the replacement pipeline — because of what the test said? Walk to the office. Find last week’s breeding sheet. Count the semen assignments that came from the genomic tier versus the tech’s judgment.
Key Takeaways
The $45 invoice isn’t the cost. The $149,840 modeled gap on a 700-cow Kansas freestall is what happens when the ranking lives in the office and the breeding sheet doesn’t change.
Genomic ROI shows up only when the rule is printed: top 30% sexed dairy, middle 40% conventional, bottom 30% beef — and the tech gets backed up the first time a well-presenting cow in the bottom band gets beef.
Tag the bottom 20% in 30 days, install the routing rule in writing in 90, and re-baseline the heifer pen by the 2026 calf crop. Your October 2026 working capital review is the deadline, not your next lab invoice.
If your testing line is up year-over-year and your beef-cross calf count hasn’t moved, your lender already knows the answer. Pull last week’s breeding sheet before they ask again.
What does your current breeding protocol actually say, on paper, about the bottom 30% — and when did it last change a single decision at the tank?
This article draws on The Bullvine’s 2024–2026 editorial review of commercial freestall dairies in the 500–1,500-cow segment, built from aggregated operator interviews and on-farm record reviews conducted across the U.S. Midwest and Plains during that window. The cohort referenced in the article reflects herds The Bullvine has reviewed in that segment during 2024–2026; specific herd counts are not disclosed to protect operator anonymity. The 700-cow Kansas scenario is modeled, not drawn from any single operation’s records.
The anonymized 2025 lender conversation is composite and illustrative, constructed from the pattern of exchanges operators described to The Bullvine during 2025 working capital renewal cycles. The dialogue’s specific figures are derived from the modeled 700-cow Kansas scenario inputs, not from any single operator’s ledger. No individual operator, herdsman, or lender is named or profiled. The DSCR-under-1.2 threshold reflects a working-capital line widely used by U.S. ag lenders and is cited as a common-practice benchmark, not as a specific institution’s policy.
Learn More
Beef-on-Dairy Calf Profit: The $150 Leak Killing Your Premium — Exposes the hidden financial penalty feedlots charge when crossbred calves arrive with poor passive transfer. Arms you with weaning protocols to protect up to $88,000 annually before the auction block permanently discounts your farm’s reputation.
Dairy Cattle Genetics 2026: TPI, NM$ and Genomics — Breaks down the latest index overhaul pushing Feed Saved to nearly eighteen percent of Net Merit. Recalibrates your sire roster for modern efficiency benchmarks, ensuring you capture the maximum lifetime profit gap from genomic testing.
The Sunday Read Dairy Professionals Don’t Skip.
Every week, thousands of producers, breeders, and industry insiders open Bullvine Weekly for genetics insights, market shifts, and profit strategies they won’t find anywhere else. One email. Five minutes. Smarter decisions all week.
A senior PDFA officer called it in 2018. GADVASU signed the MOU in August 2025. By 2029, Rs 960 imported Holstein straws face Rs 200 locally proven bulls. Who modeled that?
First place at the 19th PDFA International Dairy & Agri Expo in Jagraon, February 7–9, 2026. Cows like this one are the dam pool GADVASU is drafting from — and the reason Rs 960 imported Holstein semen has a 2029 problem.
Every North American AI company still counting India as a growth market has a 2029 math problem it hasn’t solved publicly. It’s the moment local reliability meets a roughly 75% price discount. Rs 960 imported conventional semen on one side. A projected Rs 150–250 locally proven GADVASU dose on the other — The Bullvine’s projection, extrapolated from government-subsidized semen pricing and the Progressive Dairy Farmers Association of Punjab’s own 2018 “much cheaper” aspiration. GADVASU hasn’t published commercial pricing. It doesn’t need to yet.
That moment has a source document. In August 2025, PDFA signed a formal MOU with Guru Angad Dev Veterinary and Animal Sciences University — GADVASU, the Ludhiana-based agricultural university that’s been producing HF crossbred semen for years but never at commercial scale. GADVASU Vice-Chancellor JPS Gill described the objective in the language of an import substitution program, noting that high cost and irregular supply of imported semen are hindering genetic improvement at the farm level. The partnership is designed to fix that.
The Warning Shot Everyone Missed in 2018
A senior PDFA officer told ArthaImpact in 2018 exactly what would happen once the pedigree data existed. Punjab farmers, the officer said, would start selling semen to each other at much cheaper rates than the Rs 200–600 they’d been paying for imported straws since the mid-1990s. Almost nobody outside the association heard it properly.
Seven years later, that sentence reads less like an ambition and more like a timeline. The August 2025 MOU is the operational expression of the 2018 promise — elite male calves from PDFA member cows, produced into semen through GADVASU infrastructure, daughter-tested inside the same herds already winning the Jagraon Holstein show. Every structural piece the 1960s-era state programs couldn’t assemble is now in one contract.
The Death of the Export Premium
Punjab isn’t a typical Indian dairy region, and its graduation from genetics buyer to genetics seller isn’t a typical emerging market story. Milk output in the state has grown approximately 172% since 1990. Cattle population over the same period shrank 31%, per eDairy News reporting in August 2025. That arithmetic is the product of 25 years of commercial HF crossbreeding, built on imported North American semen and distributed through a private association infrastructure that operates alongside — but largely independent of — the state government AI system. Bullvine readers tracking India’s 80 million smallholder dairy base will recognize why this commercial elite lane matters so much inside a country still dominated by two-cow households.
PDFA imported its first frozen semen doses from the USA before 2010. World Wide Sires opened direct Punjab operations that year, having already moved 88,000 doses through local distributors, per Business Standard reporting in September 2010. By February 2026, ABS India and Maharashtra’s Chitale Dairy imported live Holstein bulls with TPI values exceeding 3,000 — among the highest-TPI Holstein bulls imported commercially into India on public record. ABS India currently lists bull Oscar (NAAB 29HO22333, TPI 3261, NM$ 844 per the most recent CDCB evaluation published in ABS India’s 2026 Sire Directory**)** at Rs 960 conventional and Rs 2,700 sexed. Those prices sit an order of magnitude or more above what a farmer pays for government-subsidized domestic semen — roughly 48 times for Oscar’s conventional straws and over 130 times for the sexed product versus typical Rs 20 subsidized semen.
Punjab’s commercial dairy farmers have been paying that premium willingly for a generation because the yield math worked. Until now.
How Much Does Imported Holstein Semen Actually Cost a 50-Cow Punjab Dairy?
The 2029 Math Problem is straightforward: the moment GADVASU’s first progeny-proven bulls reach commercial distribution, local reliability meets a roughly 75% price discount on conventional semen. A progressive 50-cow operation breeding 40 animals a year absorbs that shift directly on the input line.
The conventional-to-conventional savings isn’t transformational on its own. The real shift is somewhere else.
Expense Category
Current (Imported)
Projected (GADVASU)
Savings / Impact per 50-Cow Herd
Conventional Semen
Rs 38,400 (@ Rs 960)
Rs 8,000 (@ Rs 200)
Rs 30,400/year
Sexed Semen
Rs 108,000 (@ Rs 2,700)
Import-only through 2033
Minimal near-term shift
Conception Risk
Higher (U.S. proofs vs 45°C)
Lower (Local daughter data)
1–2 repeat services avoided
Reliability Moat
U.S. CDCB infrastructure
Local PDFA member herds
Loss of import data monopoly
A TPI 3261 North American bull is evaluated for fertility on daughter records collected across U.S. commercial herds — temperate freestall environments, not 45°C Punjab heat. A GADVASU bull with daughter data generated inside PDFA member herds — same TMR formulations, same parlor routines, same ambient conditions — removes that translation risk. That’s margin that was accruing to North American genetics suppliers to begin with, and in the post-graduation market, it disappears from the value chain.
Why This Isn’t Another Government Semen Program That Won’t Scale
India has been running progeny testing programs since the 1960s. None cracked the premium commercial market, for structural reasons that have nothing to do with capability.
Government programs tested bulls from government herds, which meant the genetic ceiling was set by average-quality dams. They distributed semen through government AI networks at subsidized prices, which killed the price signal that would tell the program which bulls the market actually valued. And they struggled to generate rigorous daughter data because smallholder farmers don’t maintain structured milk recording.
The PDFA-GADVASU arrangement flips every one of those failure modes. Elite male calves will be selected from PDFA member cows — the same animals that win the Jagraon Holstein show, the ones already averaging 5,000+ litres per lactation per 2018 ArthaImpact reporting on the original PDFA pedigree plan. The PDFA has 25 years of documented farmer willingness to pay Rs 200–600 for imported premium semen, which is the demand signal telling the program what traits matter. And PDFA member farms already track yield data to justify their purchasing decisions, so the daughter records flow back into the evaluation system through commercial channels that already exist.
What remains is execution risk, not structural risk. The one worth watching: Indian progeny testing protocols require daughter records from several hundred animals per bull, distributed across multiple herds and agro-climatic zones. If PDFA’s participating farms cluster too tightly geographically, the resulting proofs could be challenged as region-specific rather than broadly applicable. That’s a known stumble point in previous Indian programs, and a real thing to monitor over the next three years.
How Fast Does Punjab’s Semen Advantage Actually Arrive?
Cattle have a roughly 9-month gestation, and a heifer reaches first calving around 24 months of age. First lactation records require another 305 days. Add the daughter-record threshold and multi-zone distribution requirement, and that sets the biological floor on how fast a proven bull can reach market. NDDB documentation describes conventional progeny testing as under a five-year cycle from calf selection to proven bull status.
Which puts the GADVASU timeline in approximate terms. Bull calf selection active now through 2026–2027. Test mating distribution 2027–2028. First daughter data and commercial proven bulls landing 2029–2031 at the earliest. Full progeny-tested domestic lineup with genomic layer operational 2032–2035.
The market compression doesn’t hit when GADVASU launches. It hits when the first Punjab-validated proven bulls arrive at roughly a fifth of imported pricing, carrying conception rate data from PDFA herds. That’s a four-to-six-year window. Whether it gets used to build the next business or to extract the last revenue from the current one depends on ownership structure — cooperatives like CRV and Semex are structured to tolerate that investment horizon, as NAAB’s record $327.6 million export year coverage makes clear about the cooperative-vs-corporate revenue divide. For publicly-traded genetics businesses answerable to quarterly reporting, in our view the organizational case is harder to build.
What Changed Between 2015 and 2025
In 2015, the Punjab government briefly proposed restricting imported semen, in a move USDA FAS reporting from August of that year framed as protecting the state AI delivery system that competed with private distributors. Ten years later, the same state government publicly backed the GADVASU genomics infrastructure underpinning the PDFA partnership.
The political economy flipped for four reasons worth studying if you’re a progressive breeder in a state that hasn’t made this transition.
Punjab’s per-cow yield gap became a government accountability problem rather than a technical observation. The national policy frame shifted toward genomics through the Rashtriya Gokul Mission, making state genetics investment a path to central matching funds rather than a standalone expense. The smallholder constituency that state semen stations were designed to serve eroded as Punjab’s dairy sector consolidated into commercial operations. And the PDFA, with a large and well-attended annual Jagraon expo and documented yield improvements across member farms, became a constituency the state government could no longer afford to work around.
That’s the playbook other Indian states will need to execute. Build the commercial network first, accumulate demonstrated results, organize the political constituency, then approach the state government for infrastructure backing. PDFA took years of steady network-building to complete that sequence. No MOU shortcuts it. Gujarat, with Amul’s cooperative scale and existing milk recording density, is the obvious candidate state to watch for the next credible replication attempt — but Amul’s smallholder orientation may cut against the elite-dam selection that makes the Punjab model work.
The Data Monopoly Is the Only Moat Left
Here’s the part most trade coverage misses. North American genetics companies aren’t just selling straws into India. They’re selling certainty — the TPI number, the NM$ number, the reliability percentage, the whole decades-long apparatus of CDCB evaluation infrastructure that makes Oscar’s TPI 3261 a credible purchase decision for a farmer 12,000 kilometres away. It’s the same data moat that underpins the broader battle for Holstein’s genetic direction in every major dairy market.
That certainty is the moat. Price was never the moat. Indian farmers have always had cheaper options; they paid Rs 960 because the data was real and the domestic equivalents weren’t.
The moment GADVASU starts generating its own certainty — Punjab-validated daughter data from PDFA herds, under local heat stress and local management — the moat evaporates. What’s left is a straw-for-straw price comparison that North American suppliers cannot win.
Which puts a question on the table that’s uncomfortable enough nobody in the industry wants to ask it out loud: are the big AI houses ready to compete on price, or are they going to keep selling U.S. daughter-proof certainty to farmers in a 45°C Punjab summer? Because those are the two options. There isn’t a third.
The 2031 Survival Checklist: Strategic Directives
Strategic Directive 1 — Commercial HF operator in Haryana, Maharashtra, or Karnataka: The replication window is approximately now through 2028. State programs launched before GADVASU’s proven bulls establish interstate market share will have a defensible position. Programs launched after 2030 will be competing against a validated Punjab reference population they can’t match on reliability. What it demands: a private farmer association with procurement scale, a university research partner willing to produce commercial semen, and elite commercial dam density sufficient for rigorous progeny testing. Chitale Dairy has the institutional capacity to anchor a Maharashtra version. Where it backfires: if your state’s smallholder-focused cooperative sector blocks the commercial elite program politically, or if your farmer base lacks the recording discipline that makes daughter data usable.
Strategic Directive 2 — Progressive breeder in UP, Rajasthan, or MP: You’ll be a buyer of Punjab genetics, not a competitor. Start positioning now to access PDFA-network semen when it reaches interstate distribution. The generational commercial HF adoption lag in these states isn’t closable on a useful timeline. This month, pull your last two lactation records and benchmark your top 10% cows against published GADVASU or NDRI crossbred HF performance data. If your best cows sit where Punjab’s middle tier sat five years ago, you’re buying Punjab genetics in 2030, not building your own.
Strategic Directive 3 — Importer of premium North American semen today: Conventional imported semen at Rs 960 is the product category most exposed to domestic substitution once GADVASU’s proven bulls reach market. Sexed semen at Rs 2,700 holds longer because the flow cytometry technology doesn’t get domestically replicated on the same timeline. Shift your import mix toward sexed product and genomic-tested young bulls with defensible Indian-condition fertility data. The elite operation running 200+ cows will always have a reason to access the top 1% of global genetics. On the pricing and quality trajectory this article describes, the case for bulk-purchasing commodity conventional imports starts to erode around 2031.
Strategic Directive 4 — ABS, CRV, Semex, ST Genetics strategist: Each of these companies operates comparable international genomic evaluation, embryo, and sexed semen programs globally. The India-specific question is how quickly the local entity activates those capabilities for Punjab-network farms. If you don’t have a local progeny or genomic partner anchored inside India by 2027, the 2029–2031 compression window will arrive with your leverage already gone. At that point, the options narrow to pricing the conventional product at domestic parity, retreating to sexed and embryo specialty, or shifting the growth narrative to the next emerging market.
A realistic caveat before you plan around this timeline. The scenario above assumes GADVASU executes on the MOU at the pace PDFA needs. Previous Indian progeny testing programs have stumbled on exactly this point. If execution slips three years, the compression window moves with it — but it doesn’t close.
What This Means for Your Operation
Are your replacement heifers being bred to genetics that will still command a premium in 2031, or are you paying import prices for a product category about to see domestic substitution pressure?
If your state has elite commercial HF herds but no PDFA equivalent, who in your region is positioned to organize one — and what’s your role in that conversation?
Does your current farm recording system generate data rigorous enough to contribute to a regional genomic reference population if one gets built?
For breeders outside Punjab: have you mapped which imported bulls are producing the best daughters under your specific management conditions, or are you buying on catalog TPI alone?
Is your sexed semen penetration where it should be given the shifting economics of conventional product?
The genetic distance between your top-tier cows and your commercial middle — wider or narrower than five years ago? That ratio determines your exposure to market-leveling genetics arriving at low prices.
If you’re an AI distributor or dealer in India, what does your 2031 revenue model actually look like, and have you pressure-tested it against a scenario where Punjab-proven semen is commercially available at Rs 200 per dose?
Key Takeaways
If you’re commercially breeding HF crossbreds outside Punjab and your state has no PDFA equivalent in motion by 2028, you’re positioned as a genetics customer — not a producer — through at least 2040. Plan your sourcing relationships accordingly.
If your operation currently pays Rs 900+ per conventional imported straw, assume that product category will face meaningful domestic substitution pressure by 2031. Migrate your premium spend toward sexed semen and genomic-tested young sires in the next 24 months.
If you’re a genetics company with India exposure, the 2026–2028 window is the one where pricing leverage and data-relationship leverage are still on your side. After GADVASU’s first proven bulls land, both compress in the same direction.
If you’re evaluating a state-level genetics program in Haryana, Maharashtra, or Karnataka, the non-negotiable variables are elite commercial dam density, a university production partner, and structured daughter-recording discipline. Missing any one and the program produces interesting research, not commercial competition.
The Question Sitting in Your Parlor
The comfortable read on Punjab’s story is that it’s an outlier — specific conditions, specific institutional history, not replicable in your state or your operation. That read is half-true and half-excuse. The generational lag in HF commercial crossbreeding is real biology. The PDFA network’s years of social infrastructure aren’t instantiated by decree. Those barriers are genuine.
But the policy lever that could compress the replication timeline from fifteen years to seven exists, and it’s not expensive. A national HF crossbred genomic reference population — tens of thousands of genotyped daughters across multiple states, linked to NDDB’s existing milk recording infrastructure — would make genomic pre-selection viable everywhere commercial dairy farms exist. The cost is a rounding error in the current national genetics budget. The decision to build it hasn’t been made because the political constituency organized around it hasn’t been assembled.
So the question for readers outside Punjab isn’t whether the graduation is coming. It’s whether your state’s commercial dairy sector — and your own barn within it — will be a supplier or a customer when it arrives.
Complete references and supporting documentation are available upon request by contacting the editorial team at editor@thebullvine.com.
Learn More
Stud Wars April 2026 — The Empire Strikes Back — Follows the money on the latest CDCB evaluation reshuffle, revealing how single studs capture 36% of top-100 lists. Arms you with hard market-share data to negotiate next year’s contracts before global price compression hits.
The $45 Holstein Genomic Test: Three Blind Spots CDCB’s April Reset Missed — Hidden premiums exist outside the commercial index. Exposes the structural flaws in standard $45 SNP chips that completely ignore maternal DNA, showing why legacy breeders flushing proven cow families hold a pricing edge technology cannot replicate.
The Sunday Read Dairy Professionals Don’t Skip.
Every week, thousands of producers, breeders, and industry insiders open Bullvine Weekly for genetics insights, market shifts, and profit strategies they won’t find anywhere else. One email. Five minutes. Smarter decisions all week.
Same cows. Same management. A different corridor — and a $221,760 annual drag. Basis went from ‑$0.35 to ‑$0.85/cwt while the FMMO make‑allowance took another $0.92 off Class III. The herd report still looks clean.
On a 600‑cow Upper Midwest dairy we’ll call Maple Ridge, the all‑in basis on the milk check has moved from roughly ‑$0.35/cwt in 2024 to about ‑$0.85/cwt in early 2026. Same cows. Same management. A different corridor.
USDA ERS’s April 2026 Livestock, Dairy, and Poultry Outlook puts 2026 all‑milk near $20.40–$20.50/cwt, while CME Class III futures for mid‑2026 contracts have traded mostly in the mid‑$16s to upper‑$17s through early Q2 2026 sessions. That $2–$3/cwt gap is the budget anchor argument every dairy lender is now having. Maple Ridge’s gap isn’t on the screen. It’s on the milk check.
Maple Ridge is a composite operation drawn from Bullvine reporting and the Processing Paradox 2024–2026 dataset, used here so we can show real numbers without exposing a real farm’s milk check. The rule‑change inputs are verified against published USDA and Bullvine analysis. The herd‑level inputs are illustrative. Plug in your own.
A 2,000‑cow Western dairy we’ll call Dos Arroyos — also a composite, modeled on the kind of core‑supply contracts Bullvine has documented along the High Plains and I‑29 corridor — is staring at the same kind of basis pressure and adding 400 cows anyway. The processing capacity dairy 2026 question lives right in the gap between those two decisions.
This isn’t a story about milk per cow. It’s about whether your region’s plants want your next pound or not.
Bullvine Definition — Corridor Math (n.): The calculation of farm profitability based on regional processing capacity, hauling distance to marginal plants, and local basis, rather than national Class III averages. Two farms with identical herd reports can sit on opposite ends of Corridor Math if their plants, hauling lanes, and basis trends diverge.
Quick note for Ontario and Canadian readers: Corridor Math applies under supply management too. The levers change — base allocation, P5 pooling, plant access, CDC pricing signals — but the question is the same: does your buyer’s plant want your next hectolitre, and at what net mailbox price?
How Maple Ridge’s $221,760 Annual Drag Hid Inside a Clean Herd Report
Maple Ridge ships into a cheese‑heavy Upper Midwest milkshed inside Federal Order 30. Components are solid, somatic cell count is low, and debt per cow sits under the $3,500/cow “strong” threshold cited in Cornell PRO‑DAIRY Dairy Farm Business Summary–style benchmarks referenced in the Processing Paradox analysis (Cornell PRO‑DAIRY DFBS, 2024 edition). By the herd report, nothing’s wrong.
The corridor changed around them.
Bullvine’s Processing Paradox reporting — drawing on USDA AMS Dairy Market News and operator public statements — documented reduced weekend and overtime processing at several Upper Midwest cheese plants through 2024–2025, alongside tighter volume caps and base‑excess plan use. Operators cited labor and energy costs.
Regional herd consolidation in the same buyer’s draw radius tightened the local milk‑to‑capacity ratio over 2024, consistent with the relocation and consolidation patterns Bullvine has documented along the I‑29 corridor.
USDA AMS Dairy Market News reported Midwest spot Class III milk trading flat to as much as $7.00 under Class III during the spring 2025 flush cycle, with the deepest discounts in the week ending May 2, 2025 (USDA AMS DMN, April–May 2025 weekly issues).
Stack those forces and a 50¢/cwt basis slide isn’t a mystery. It’s the price tag on a corridor that quietly went long on milk.
The 2025 FMMO modernization sits on top of all this. Bullvine’s April 2026 analysis, The New FMMO Rule Costs a 500‑Cow Dairy $97,750 a Year, pegs the make‑allowance update at roughly $0.85–$0.93/cwt off Class II–IV values once fully phased in, with Class III near $0.92/cwt, based on USDA AMS, Final Rule on Amendments to Federal Milk Marketing Orders (January 2025) and the University of Wisconsin Extension review of the AMS final decision (2025). That’s before a single mile of freight. Before basis. Before a balancing fee.
What Does a 50¢/cwt Basis Slide Actually Cost a 600‑Cow Dairy in 2026?
This is where you stop talking corridors and run the numbers like your banker would.
The Maple Ridge 2026 Reality — 600 Cows, Upper Midwest, Illustrative Composite
Factor
2024 Impact (per cwt)
2026 Impact (per cwt)
Annual Bottom‑Line Shift vs 2024
FMMO Make‑Allowance
$0.00
(‑$0.92)
(‑$132,480)
Regional Basis
(‑$0.35)
(‑$0.85)
(‑$72,000) on the 50¢/cwt move
Marginal Hauling (weighted)*
$0.00
(‑$0.12)
(‑$17,280)
Total Drag vs 2024 Baseline
(‑$0.35)
(‑$1.89)
(‑$221,760)
Weighted across marginal loads, assuming ~30% of volume moves as overflow at an extra $0.40/cwt above the $0.80/cwt core rate documented in the Processing Paradox dataset. At a 15% marginal share, the hauling line is closer to ‑$0.06/cwt, or about ‑$8,640/year.
How to read this table: The Regional Basis line shows the delta vs 2024 — the 50¢/cwt move, not the full 2026 basis cost. The Total Drag row sums the 2026 deltas against that 2024 baseline.
Running the Numbers — Maple Ridge, 600 Cows, Upper Midwest, 2024 vs 2026 (illustrative composite)
Verified inputs: USDA NASS Milk Production 2025 annual production averages; USDA AMS Final Rule on Amendments to FMMOs (January 2025); UW Extension AMS final‑decision review (2025); Bullvine April 2026 New FMMO Rule analysis; Bullvine Processing Paradox 2024–2026 dataset. Illustrative inputs: Maple Ridge’s herd‑level basis trend, marginal‑load share, and hauling differential. Plug in your own numbers and your own statements.
1,000 cows shipping ~240,000 cwt: same move = ~$120,000/year.
The herd report didn’t flinch. The mailbox check did. That’s the gap most barn KPIs aren’t built to catch.
The Continental Divide: Rationing Space vs Pre‑Selling It
While the Upper Midwest is rationing space, the High Plains is pre‑selling it. The difference isn’t the cows. It’s the contract.
Factor
Maple Ridge (Upper Midwest)
Dos Arroyos (High Plains/I-29)
Herd size
600 cows
2,000 cows (+ 400 planned)
Federal Order
FO-30 (cheese-heavy)
High Plains / non-pooled
2026 All-in Basis
-$0.85/cwt
~-$0.35/cwt (core supply)
FMMO Class III impact
-$0.92/cwt (2025 rule)
-$0.92/cwt (same rule)
Marginal hauling (overflow)
$1.10–$1.20/cwt
<$0.80/cwt within 60 mi
Plant capacity status
Rationing / base-excess
Pre-sold / volume ramp
Core supply status
Swing/dispensable
Written core-supply contract
Total 2026 annual drag vs 2024
-$221,760
Largely offset by contract premiums
Robot/capex DSCR (corridor case)
1.05–1.10× (yellow light)
>1.25× (green)
Strategic path
Pivot, exit, or reposition
Scale with concrete
Regional farm count trend
-630 farms, 2022–2025
Expansion corridor
Most producers can name the bull behind their best heifer. Few can name the closest plant project in their draw radius. Dos Arroyos can.
Their state, by the headline numbers in Processing Paradox 2024–2026 (USDA NASS state‑level Milk Production, 2014 vs 2024), looks bad. New Mexico shed roughly 2.2 billion pounds of annual milk and about 83,000 cows over that decade. California gave back more than 2.0 billion pounds and around 72,000 cows. The Ogallala Aquifer projection — up to 70% of the aquifer’s saturated thickness potentially unusable in the Texas Panhandle expansion zone within 20 years, per the Texas Tech and USGS‑linked aquifer research cited in Processing Paradox — isn’t a footnote.
Their corridor still tells a different story.
Dos Arroyos isn’t ahead because they’re better farmers. They’re ahead because they bought Processing Security in writing before they bought concrete. The era of producing milk and hoping for a check is over inside their basin.
The corridor’s public cheese build‑out — Hilmar (Lubbock, TX project announced 2021), Leprino (Lubbock, TX complex announced 2022), and Valley Queen (Milbank, SD expansion announced 2022) — sets the public context, per each operator’s project announcements and Processing Paradox.
The contract terms described below are a Bullvine composite of corridor practice, drawn from Processing Paradox. They are not attributable to Hilmar, Leprino, Valley Queen, or any other named processor.
Dos Arroyos’s milk feeds into the $1.6 billion High Plains and I‑29 cheese build‑out underway since 2020.
Their 2025 supply agreement, as composited from Processing Paradox, carries defined base‑excess terms, component premiums tied to plant product mix, and a written volume ramp.
That ramp is what makes the 400‑cow expansion pencil. In the composite, throughput is committed in writing before concrete is poured. The base‑excess clause prices growth pounds inside core‑supply terms for the duration of the ramp, not at swing‑load discounts.
Their marginal load travels under 60 miles to a plant still bidding for volume, not rationing it.
The assumption that “Western dairy is doomed” doesn’t survive a corridor‑level read. The assumption that Upper Midwest dairy is structurally safe because it’s always been there doesn’t either. The Upper Midwest lost roughly 630 farms between 2022 and 2025 while regional milk climbed to 43.2 billion pounds (Bullvine Processing Paradox, drawing on USDA NASS, 2024–2026). The volume stayed. The mid‑size families didn’t.
Why Maple Ridge’s Owner Stopped Trusting the Old Lender Spreadsheet
The turn for Maple Ridge came in early 2026, in a robotic milking conversation with a regional ag lender.
The opening was familiar. Rolling 12‑month averages. A USDA‑style price near $20.40/cwt for 2026, pulled from ERS and WASDE ranges. A generic stress test at $15/cwt with a flat ‑$0.25/cwt basis. Ag operating loans in the mid‑7% range, consistent with the lender environment Federal Reserve district and Purdue Center for Commercial Agriculture outlooks have tracked through late 2025 and into early 2026.
On those numbers, robots penciled.
Maple Ridge’s owner put three different numbers on the table.
A real trailing 24‑month all‑in basis: ‑$0.85/cwt, not ‑$0.25/cwt.
Marginal hauling reality from this composite operator’s dispatch profile: about $1.10–$1.20/cwt on overflow loads, versus the $0.80/cwt core rate documented across Processing Paradox herds.
Post‑FMMO Class III math reflecting the ~$0.92/cwt make‑allowance hit per the UW Extension review and the Bullvine April 2026 analysis, instead of pre‑2025 class values.
Bullvine’s 2025–2026 lender reporting describes the same pattern in plainer terms. The binding constraint isn’t a lower headline price. It’s a lower effective floor once basis, hauling, and post‑FMMO Class values are layered in.
A robotic milking project at this herd profile typically carries roughly $360,000/year in annual debt service on the parlor and related infrastructure portion of the loan, drawn from Bullvine’s prior reporting on robotic ROI in the 300–600 cow range and standard amortization on 7%‑range term money. Re‑run with the corridor inputs above against that debt service, the project moved from comfortably above 1.25× DSCR into the 1.05–1.10× range under a $15/cwt corridor stress case — the “yellow light” zone Cornell DFBS‑style benchmarks (referenced in Processing Paradox) flag for tighter scrutiny.
The DSCR shift is illustrative. The inputs that drove it are real: the basis trend, the marginal hauling, the post‑FMMO Class values, and the debt service.
The robots didn’t become impossible. They became a different decision.
The question is no longer “how do we squeeze more milk out of this barn.” It’s “do we want to leverage 7%‑range money against a corridor that’s losing capacity, or use that equity to reposition?”
What Maple Ridge’s 24‑Month Basis Trend Means For Your Operation
Maple Ridge’s herd report stayed clean while its corridor quietly repriced every cwt. That’s the lesson worth carrying off this page: cost per cwt and milk per cow defend the milk check only as far as your buyer’s plant has room for your next pound. Corridor structure decides how much of any cost or component advantage you actually keep.
There are three honest paths from here, and you don’t get to skip the diagnosis to pick one.
Scale with a processor. Real only if your buyer puts core‑supply status, base terms, and component premiums in writing, and your corridor‑aware DSCR holds.
Pivot to a premium or niche channel. Smaller volume, higher complexity, slower onboarding, but partial escape from commodity basis.
Plan an orderly exit or relocation. Preserves equity in a structurally bad basin; forecloses generational continuity in the existing barn.
The trade‑off underneath all three: speed of decision versus depth of corridor diagnosis. Move too fast and you lock in the wrong path. Stall and the basis keeps deciding for you.
The 30/90/365‑Day Playbook for Herds Like Maple Ridge’s
Adapt the thresholds to your own statements and your own basin. Don’t copy them.
30‑Day Actions — urgent checks
Pull 24 months of milk checks and graph all‑in basis: mailbox − announced price, including hauling and any “marketing” or “balancing” adjustments.
Requires: bookkeeping time, statements, a spreadsheet.
Red‑flag trigger: basis widened by more than 25¢/cwt over 18 months without a corresponding national price move.
Backfire risk: averaging across very different months hides flush‑season pain. Look at flush separately.
Separate loads into core versus marginal. Calculate actual hauling cost per cwt on overflow loads.
Requires: dispatch tickets, co‑op statements, an hour of cross‑checking.
Red‑flag trigger: marginal‑load hauling 50% or more above your core rate.
Watch for: milk‑check formats that combine freight with basis or place it under “other,” making marginal hauling hard to isolate.
Confront your field rep with three direct questions, on the record. Are we core, swing, or dispensable supply over the next 5–10 years? Where do our marginal loads physically go, and at what discount, when milk is long? What plant additions or closures are in your 3–5‑year network plan?
Requires: one meeting, no spin in your own answers.
Red‑flag trigger: vague answers or “we’ll get back to you” on all three.
Escalate if your DSCR has been under 1.20× for three straight months on your lender’s or CPA’s standard method. This list moves to the top of the next 30 days.
90‑Day Actions — structural adjustments
Input
Standard Lender Model
Corridor-Aware Model
Difference
All-milk price used
$20.40–$20.50/cwt (USDA ERS 2026)
$15.00/cwt (corridor floor)
-$5.40–$5.50/cwt
Basis assumption
-$0.25/cwt (generic flat)
-$0.85/cwt (trailing 24-month actual)
-$0.60/cwt
FMMO Class III values
Pre-2025 class values
Post-rule: -$0.92/cwt make-allowance
-$0.92/cwt
Marginal hauling %
0% (core rate only)
15–30% of volume at overflow rate
+$0.06–$0.12/cwt
Effective floor (combined)
~$20.15/cwt
~$13.71/cwt
-$6.44/cwt
Robot project DSCR result
>1.25× ✓ (pencils)
1.05–1.10× ✗ (yellow light)
Crosses freeze threshold
Capex decision
Proceed
Freeze or resize
Material divergence
Risk to lender if national model used
Low (on paper)
High (basis keeps widening)
Model blind spot
Force a corridor‑aware stress test at your bank. Two scenarios, side by side.
National case: USDA‑style all‑milk price, flat basis, generic hauling.
Corridor case: post‑FMMO Class values reflecting the 2025 make‑allowance changes (per the UW Extension review and Bullvine’s April 2026 analysis), your trailing 12–24‑month basis minus another 25–50¢/cwt, and marginal‑load hauling on at least 15–30% of volume.
Requires: milk check history, dispatch records, current contract, lender model.
Threshold: corridor‑case DSCR below 1.20× should freeze any non‑essential capital project.
Backfire risk: if a lender won’t run the corridor case alongside the national case, factor that into your read of how flexible the relationship is likely to be when margins tighten.
Pressure‑test a “minus 10–15% intake” scenario. If your primary buyer cut your base by 10–15% tomorrow, where does that milk go, and at what discount?
Requires: honest conversations with two or three alternative buyers.
Threshold: if you can’t name a plant and a realistic price within two to three weeks, your marketing risk is bigger than your production risk.
Watch for: verbal interest that disappears when you ask for a number.
Revisit any contracted or planned capital project — robots, freestall expansion, parlor upgrade — against the corridor case, not the national case.
Requires: vendor flexibility, willingness to walk back announced plans.
Threshold: re‑size, re‑time, or shelve if the corridor case pushes DSCR below 1.20×.
Backfire risk: sunk‑cost thinking on deposits and engineering work.
Pick your lane on a written timeline: scale, pivot, or exit. Bullvine’s December 2025 piece, Squeezed Out? A 12‑Month Decision Guide for 300–1,000 Cow Dairies, lays out the logic.
Requires: a family or partnership meeting that ends with a decision, not another meeting.
Opportunity signal: if a buyer puts core‑supply status, base terms, and component premiums in writing, and your corridor‑aware DSCR stays above 1.25×, scaling is defensible.
Backfire risk: leveraging into hope without both a written commitment and a corridor‑aware model.
Condition any expansion on a written processor commitment. No contract, no concrete.
Requires: legal review of base‑excess and force‑majeure clauses.
Threshold: walk away if base‑excess deductions are deeper or longer than the plant’s own escape clauses.
Evaluate relocation or premium transition before equity erosion makes the call, if you sit in a legacy region with no new steel within reasonable hauling distance. Processing Paradox closure analysis documents a $15,000–$45,000/quarter equity erosion range across negative margin cycles (Bullvine, 2024–2026).
Requires: appraisals, tax planning, succession conversations 12–24 months before any move.
Opportunity signal: if a growth‑corridor buyer expresses written interest in backing a relocated supply, that timing window is real but short.
Watch for: emotional attachment overriding the math. This is where families lose the most.
Maple Ridge’s 50¢/cwt basis slide didn’t show up in herd software, ration sheets, or somatic cell graphs. It showed up in 24 months of milk checks — and it turned a robot decision into a corridor decision. Dos Arroyos sees the same pressure on the horizon and is leaning into it because its composite contract and its plants give it room.
Your next pound of milk is worth what your corridor is willing to pay for it, less what hauling and base‑excess take on the way there.
Pull your current milk supply agreement and your last three milk checks tonight. Find the language that governs base‑excess, hauling, and any “marketing” or “balancing” adjustments. Match that language against the basis trend you’ve actually lived since 2024.
What does your current processor contract say about basis and base‑excess when your region’s milk goes long — and does that language describe the corridor you’re still in, or the one you used to be in?
Key Takeaways
A clean herd report won’t save you from a bad corridor. Maple Ridge’s 50¢/cwt basis slide plus the post‑2025 FMMO Class III hit stacks to ~$1.89/cwt — about $221,760/year on 600 cows shipping ~144,000 cwt.
Stress‑test on your real basis, not the USDA all‑milk price. If your lender won’t run a corridor case with trailing 24‑month basis and 15–30% marginal hauling, the spreadsheet that says robots pencil isn’t the one you should bet on.
The capex question changed shape. Below 1.20× DSCR on the corridor case, freeze any non‑essential project. Below 1.25× even with national‑case math, scaling isn’t defensible without a written core‑supply commitment.
Pick your lane on a written timeline — scale, pivot, or exit — inside 12 months. Stall, and the basis keeps deciding for you while $15K–$45K/quarter of equity quietly walks off the farm.
This analysis uses composite operator profiles (Maple Ridge, Dos Arroyos) drawn from Bullvine’s Processing Paradox dataset. Contract structures described are illustrative composites and do not describe the actual contracts of any named processor.
Squeezed Out? A 12-Month Decision Guide for 300-1,000 Cow Dairies — Delivers a tactical 12-month survival framework to protect family equity as mid-size dairies face a $5-7/cwt cost disadvantage. This guide helps you identify your strategic path—scale, specialty, or exit—before market forces choose for you.
Dairy Lending 2026: Why Your Banker Says No at 7% Money — Exposes the cold math inside your banker’s underwriting model as 7% interest rates add $1.07/cwt to debt service. This briefing reveals the stress-test thresholds needed to secure capital while protecting your 1.0× debt-service coverage ratio.
The Sunday Read Dairy Professionals Don’t Skip.
Every week, thousands of producers, breeders, and industry insiders open Bullvine Weekly for genetics insights, market shifts, and profit strategies they won’t find anywhere else. One email. Five minutes. Smarter decisions all week.
Roxy, Dellia, Blackrose and seven more didn’t just make famous pedigrees. They built the cow families still showing up in bull books, embryos and your best heifers.
Mother’s Day in the dairy business doesn’t look much like the card aisle.
It looks like a cow family that just keeps paying rent.
You know the kind. Pull up a pedigree in a good Holstein barn, go back four generations, then six, then eight, and suddenly there she is. Maybe it’s Roxy. Maybe Dellia. Maybe Blackrose, Laurie Sheik, Altitude, Missy, or Barbie.
And you catch yourself thinking: “There she is again.”
That’s the thing about great donor cows. They don’t really leave. They just stop standing in the barn and start showing up everywhere else.
This isn’t a show-cow ranking. It isn’t a prettiest-picture contest either, though some of these cows could stop you cold in a photograph. This is a Mother’s Day history piece about the cows that kept giving the breed daughters, sons, granddaughters, embryos, sale-ring moments, AI sires, and cow families breeders are still building around.
So pour the coffee. Let’s talk about ten mothers who helped build the Holstein breed.
Glenridge Citation Roxy: The Queen Who Made the Picture Famous
Glenridge Citation Roxy didn’t become a legend because of one perfect photo. The photo became famous because Roxy kept showing up where it mattered most: in daughters, cow families, bull books, and pedigrees breeders still recognize generations later. Read more: Glenridge Citation Roxy: The Legendary “Queen of the Breed”
There’s a famous story about Glenridge Citation Roxy getting photographed at Mil-R-Mor in Dundee, Illinois. Bob Miller took one shot. Just one. Roxy was clipped, filled, and standing like she knew exactly who she was.
But honestly, the photo didn’t make Roxy great.
Roxy made the photo great.
Born April 15, 1968, at Lorne Loveridge’s Glenridge herd in Saskatchewan, Roxy became one of those rare cows whose name moved from pedigree line to breed language. The Bullvine profile records her as EX-97-4E-GMD, a third-generation 200,000-pound milk producer, and the first Holstein cow reported to have ten Excellent daughters. She eventually had 16 Excellent daughters . A Holstein Plaza family report also lists Roxy as the dam of 16 Excellent daughters, seven of them Gold Medal daughters.
That’s not a cow family. That’s a franchise.
Her daughter Mil-R-Mor Roxette became Canada’s first 30-star brood cow. Branches through Roxette, Lana Rae, Tony Rae, Debutante Rae, and others kept sending the Roxy influence into type, production, red-carrier lines, sale-ring value, and modern pedigrees.
Roxy sits at the top because she wasn’t just a great individual. She became a structure the breed kept building on.
That’s what great mothers do. They don’t just have a moment. They create a direction.
Snow-N Denises Dellia: The Cow Who Ended the Either-Or Argument
Snow-N Denises Dellia looks almost quiet here, but her influence wasn’t. Through Durham, Die-Hard, Million and generations of daughters, she helped prove type and production didn’t have to live on opposite sides of the barn. Read more: Snow-N Denises Dellia: The Holstein Legend Who Redefined Dairy Genetics
Before Dellia, breeders loved to argue like type and production had to live on opposite sides of the barn.
Then Snow-N Denises Dellia walked in and made the argument feel a little tired.
Born in 1986 on Bob Snow’s Wisconsin farm, Dellia was a Walkway Chief Mark daughter from Snow-N Dorys Denise, a Bell-family cow with the kind of maternal depth breeders spend lifetimes trying to stack. ALH Genetics describes Dellia as the breeder of Regancrest Elton Durham and the source of influential cattle including Die-Hard, Million, and Altiota.
And then there was Durham.
Regancrest Elton Durham became one of those sires who connected eras. He had enough cow sense for breeders who still trusted their eyes, and enough transmitting power for the modern proof-sheet crowd. Through Durham, Die-Hard, Million, and the wider Dellia family, her influence spread through elite type, commercial usefulness, and genomic-era pedigrees.
The reason Dellia ranks this high is simple. She changed what breeders believed could come in one package.
She wasn’t just pretty. She wasn’t just productive. She wasn’t just useful.
She was all three, and she passed enough of it on that people had to stop treating balance like a compromise.
Stookey Elm Park Blackrose: The Bankruptcy Calf Who Became Genetic Gold
Some cow families start with perfect timing, polished facilities, and everyone already paying attention.
Blackrose didn’t get that kind of entrance.
The Bullvine’s Blackrose story starts in the middle of financial wreckage: Jack Stookey’s collapse, Curt Prange’s rescue work, and a calf that could easily have been scattered into history before anyone understood what she was . That calf was Stookey Elm Park Blackrose, a To-Mar Blackstar daughter from Nandette TT Speckle-Red.
And what a cow she became.
The Bullvine profile records Blackrose as EX-96, a 42,229-pound producer at five years old, All-American as a junior two-year-old and junior three-year-old, and Grand Champion at the 1995 Royal Winter Fair . Holstein Plaza also identifies her as EX-96-3E-GMD-DOM .
But Blackrose’s real Mother’s Day case isn’t one banner. It’s what came after.
Her family helped shape Red and White breeding through cattle like Indianhead Red-Marker and Lavender Ruby Redrose-Red, the Red and White cow who went on to become Supreme Champion at World Dairy Expo , .
That’s why Blackrose belongs here. She’s the reminder that breed history isn’t always tidy. Sometimes the cow that changes everything comes out of a mess, lands with people who can see past the noise, and spends the rest of her life proving them right.
Comestar Laurie Sheik: The Cow That Built an Empire
Comestar Laurie Sheik was already making people look twice at Madison in 1989. The bigger story came later, when that same cow became the foundation of a Comestar family that kept winning, breeding, and travelling far beyond Quebec. Read more: The Cow That Built an Empire: Comestar Laurie Sheik’s Unstoppable Genetic Legacy
Comestar Laurie Sheik didn’t begin as the obvious global answer.
That’s part of why her story is so good.
Marc Comtois bred Elysa Anthony Lea to Puget-Sound Sheik, and in December 1986, Comestar Laurie Sheik arrived . She would become VG-88-23*, the foundation of one of the most recognizable cow families in the world, and the cow behind a Comestar line that travelled far beyond Quebec .
Holstein International describes Laurie Sheik as the inaugural Canadian Cow of the Year in 1995. That same article notes that family member Comestar Lamadona Doorman EX-94 won Canadian Cow of the Year in 2022, which tells you something important: this wasn’t a one-generation firework .
Laurie Sheik’s family runs through cattle like Lylehaven Lila Z and Comestar Goldwyn Lilac, and through a wider maternal line that helped make the Comestar name feel almost like shorthand for balanced breeding , .
You don’t build that by accident.
Laurie Sheik belongs near the top because she did what only the best brood cows do. She made a prefix mean something. When breeders saw the name, they didn’t just see ancestry. They saw expectation.
Kamps-Hollow Altitude-ET RC: The Red Gene That Became a Revolution
Kamps-Hollow Altitude-ET RC carried red quietly, but her descendants made sure the breed noticed. Through Advent, Apple, Acme, Jotan and the generations that followed, she turned a recessive gene into a serious breeding lane. Read more: Kamps-Hollow Altitude: The Red-Carrying Cow Who Rewrote Breeding History
Kamps-Hollow Altitude carried red quietly.
Her descendants did not.
Altitude was a Durham daughter born January 11, 2000, later classified EX-95, and remembered as one of the defining brood cows in modern Red Holstein breeding . ALH Genetics reported that Kamps Hollow Durham Altitude RC EX-95 died at 15 years old and identified her as the mother of Advent, Acme, and Jotan, the grandmother of Amor Red, Absolute Red, Big Apple, and Armani, and the great-grandmother of Aikman and Addiction P Red .
And of course, there was Apple.
KHW Regiment Apple-Red was the daughter who made Altitude impossible to ignore. She took the red carrier story from pedigree talk to center ring, then sent it back into breeding programs through a cow family everyone wanted a piece of. Read more: KHW Regiment Apple-Red – Beauty, performance, and even more record accomplishments
ALH names KHW Regiment Apple Red EX-96 as Altitude’s best-known daughter . That alone would put Altitude in the conversation. But when you add Advent-Red, Acme, Jotan, Aiko, Absolute, Armani, Addiction P, and the later Apple branches, you get something bigger than one popular cow family , .
You get a turning point.
Altitude made the red factor feel less like a novelty and more like a serious breeding lane. She gave Red and White breeders style, marketability, type, and sons people actually wanted to use.
That’s why she’s here. In the right cow, behind the right udder, with the right people paying attention, a recessive trait stops being a footnote.
It becomes history.
Wesswood-HC Rudy Missy: The Phone Call That Rewired the Genomic Era
Wesswood-HC Rudy Missy didn’t need a show-ring spotlight to change the breed. One phone-call purchase put her in the right hands, and her family later surfaced through genomic-era names like Shauna, Supersire, Mogul, Silver and Balisto. Read more: The Phone Call That Built a Genetic Empire: The Wesswood-HC Rudy Missy Story
The Rudy Missy story has one of those scenes you can almost hear.
A sale. Buyers drifting. Interest softening. A cow that should have been getting more attention than she was.
Then a phone call.
The Bullvine profile tells the story of Matt Steiner buying Wesswood-HC Rudy Missy by phone and follows the family into Pine-Tree, Ammon-Peachey Shauna, Supersire, Mogul, Silver, and Balisto . Holstein International reports that Rudy Missy was selected as its Global Cow in 2014 after finishing second in 2012 and 2013 . The same article points to Mogul, Supersire, Silver, and Balisto as examples of her influence .
Missy’s power was not sentimental. It was practical. She hit the genomic era where it mattered: influential sires, high-use pedigrees, elite females, and commercial relevance.
That’s why she ranks ahead of some cows with more glamorous stories. Missy’s family didn’t just look good in a feature. It moved through breeding programs at scale.
The lesson is pretty simple, and a little uncomfortable.
The next great mother may not be the cow everyone is clapping for in the sale ring. She may be the one one person quietly refuses to let go cheap.
Larcrest Cosmopolitan: The Spotted Heifer From Minnesota
Larcrest Cosmopolitan never needed much noise to make her point. From a spotted Minnesota cow came a family that made Larcrest mean repeatability in bull books, embryo lists and the genomic-era pedigrees breeders kept coming back to. Read more: Larcrest Cosmopolitan: How a Spotted Minnesota Cow Built a Dynasty
Larcrest Cosmopolitan’s story doesn’t come at you with fireworks.
It sneaks up on you.
She was a Picston Shottle daughter born in September 2005 at Jon and Ann Larson’s Larcrest herd in Albert Lea, Minnesota . The Bullvine traces the family back through Larcrest Juror Chanel and the registered heifers Raymona Larson bought with her teacher’s retirement savings , .
That detail always gets me.
A teacher’s savings. A few heifers. A cow family that eventually becomes one of the most recognizable maternal lines of the genomic era.
Cosmopolitan turned that family into a brand. The Bullvine identifies Larcrest Crimson as her daughter and describes Crimson’s sons Calibrate, Camelot, Chavez, Conquest, Casual, and Cyclone as AI-stud staples . The same profile points to Larcrest Commander as another later family example with cross-border relevance in U.S. TPI and Canadian LPI conversations .
Cosmopolitan wasn’t loud. She didn’t need to be.
She made Larcrest mean repeatability. That’s a different kind of fame, and in many barns, a more useful one.
Harborcrest Rose Milly: The Cow Who Came Over the Hill
Harborcrest Rose Milly was the kind of cow that made people stop talking when she came over the hill. Her bigger legacy came through Paclamar Astronaut, turning one great cow into thousands of daughters and decades of Holstein influence. Read more: Harborcrest Rose Milly: From Pig Money to Holstein Royalty
Some cattle stories need a whole crowd.
Milly just needs one hill.
The Bullvine profile tells the scene from June 1961 in West Salem, Ohio: Dick Brooks visiting John Snoddy, cows coming over the rise, and Harborcrest Rose Milly walking at the head of the line . You can almost see it. The kind of cow that makes the conversation stop for a second.
Milly was later recorded as EX-97-GMD, a three-time All-American Aged Cow, and the dam of Paclamar Astronaut . The King Barn Dairy MOOseum also identifies Astronaut as born in early 1964 to Harborcrest Rose Milly and describes Milly as a widely known All-American cow with a strong dairy record .
Her legacy runs through Astronaut.
The Bullvine profile credits Astronaut with 59,949 tested daughters and connects his daughters to later breed-shaping lines including Hanoverhill Starbuck and Startmore Rudolph . ABS Global’s bull database identifies Paclamar Astronaut as a proven Holstein bull born January 19, 1964 .
We don’t need to overstate it. The verified story is strong enough.
Milly produced Astronaut. Astronaut carried her influence into thousands of daughters. Those daughters helped open pathways into some of the most important bloodlines that followed.
That is maternal influence at breed scale.
One son. Thousands of daughters. Decades of echo.
Plushanski Chief Faith: The Cow Her Owner Would Not Sell
The Bullvine profile frames Plushanski Chief Faith around Charlie refusing to sell her before mating her to Pawnee Farm Arlinda Chief . Faith was born in November 1968, classified EX-94-4E-GMD, and credited in the profile with lifetime production of 242,863 pounds of milk and 11,353 pounds of fat . Holstein Plaza also identifies Plushanski Chief Faith EX-94-4E-GMD as a foundation cow in the Quality Gibson Finsco pedigree .
Faith’s strength came through daughters.
The Bullvine identifies Plushanski Valiant Fran, Plushanski Job Fancy, Plushanski Dawn Fayne, and Plushanski Star Faith as daughters that carried different parts of the family forward . The profile also connects the Faith line to Quality BC Frantisco, the EX-96 cow who became a two-time Royal Winter Fair Grand Champion through the Fran branch , .
This one feels less like a glossy genetics story and more like something every breeder understands.
Sometimes the whole future turns on a cow you decide not to sell.
Charlie Plushanski didn’t know he was protecting history. He just knew enough to trust the cow in front of him.
That’s not luck. That’s stockmanship.
Regancrest-PR Barbie: The Brood Cow Who Made Type Personal
Regancrest-PR Barbie looked good enough to get attention.
Then her daughters made her impossible to ignore.
The Bullvine profile places Barbie at the 2004 Minnesota State Fair as Reserve Grand Champion and follows her into one of the most concentrated type-transmitting stories of the modern era . By 2010, the profile says Barbie had produced eight Excellent and 19 Very Good daughters, with all but one of her 27-plus daughters classified VG or better on first lactation . The Bullvine’s earlier Golden Dam finalist profile also treated Barbie as one of the defining donor females of her era .
That’s the kind of family where even people who don’t follow every branch still recognize the landmarks . Eurogenes has also continued to identify top PTAT animals tracing back to Regancrest-PR Barbie, which shows the family remained visible in modern type rankings .
Barbie ranks tenth here only because the first nine cows have longer historical arcs or wider breed-building records. In almost any other feature, she could be the headline.
That says more about this list than it does about Barbie.
What These Mothers Knew
There’s a funny habit in dairy history. We talk about the bulls.
The bull got the stud code. The bull got the proof sheet. The bull got the semen tank, the ad, the argument, the daughters counted in tidy rows.
But behind the bull was usually a cow someone believed in first.
Roxy gave the breed a family that reproduced excellence. Dellia made type and production feel less like enemies. Blackrose turned a financial wreck into Red and White power. Laurie Sheik made Comestar a global name. Altitude made red serious. Rudy Missy helped wire the genomic era. Cosmopolitan made Larcrest repeatable. Milly gave Astronaut the maternal base to move through the breed. Faith rewarded one farmer’s refusal to sell. Barbie reminded everyone that type still needed mothers.
That’s the real Mother’s Day story.
Not the soft-focus version. Not the greeting-card version.
The real story is quieter and better. It’s a breeder standing in a barn, looking at a cow, and thinking, “There’s something here.”
Sometimes they’re right.
And when they’re really right, the rest of us are still seeing that cow generations later. In the heifer pen. In the bull book. In the embryo catalog. In the sale ring. In the pedigree of the cow that just freshened better than expected.
So walk the barn a little slower this Mother’s Day.
Find the cow that always breeds back. The one whose daughters freshen right. The one nobody makes much noise about because she simply works.
Pull her pedigree. Go back far enough.
Odds are, one of these mothers is waiting there.
Key Takeaways
Don’t give the bull all the credit. The cow family behind him often tells you more about repeatability, risk, and long-term value.
Pull the pedigrees on your best heifers and look for the mothers that keep showing up. That’s where the next breeding decision starts.
Great cow families aren’t built from one perfect mating. They come from breeders who notice the right cow early and keep stacking the right daughters.
Legacy still has barn value. If a family keeps breeding back, classifying well, and making useful daughters, don’t let fashion talk you out of it.
Continue the Story
From Laurie Sheik to Robotic Milking: Bois Seigneur Holstein’s Journey of Innovation – While Laurie Sheik provided the maternal spark, Marc Comtois built the engine. Step into the Quebec barns where this exact historical timeline played out, proving what happens when visionary stockmanship meets the right foundation cow at the perfect moment.
Edward Young Morwick – Country Roads to Law Office – Every legendary sire in a stud book traces back to a mother someone refused to cull. Explore the bull side of this history through the eyes of a Master Breeder, where names like Astronaut and Durham pushed maternal foundations into millions of modern pedigrees.
KHW Regiment Apple-Red-ET – Everything and more – When Altitude made the red factor a serious breeding lane, she laid the groundwork for an absolute dynasty. Trace how her most recognizable daughter took that exact foundation and relentlessly dominated both the shavings and the global genomic era.
The Sunday Read Dairy Professionals Don’t Skip.
Every week, thousands of producers, breeders, and industry insiders open Bullvine Weekly for genetics insights, market shifts, and profit strategies they won’t find anywhere else. One email. Five minutes. Smarter decisions all week.
The judge’s first glance in September is shaped by decisions you made eight months earlier at 2 a.m. — and the research on why that’s true keeps getting harder to argue with.
Picture the walk-in at your county show next September. The judge takes three seconds per heifer on that first pass — silhouette, topline, the way she moves off the halter. By the time the ribbons get handed out, the class was basically decided long before anyone touched a clipper. It was decided in a maternity pen at 2 a.m. the previous January, when somebody either got up to catch that calf or didn’t.
That’s the part nobody puts on a show poster. The clipping, the washing, the fitting — that’s the last five percent. The other ninety-five got settled in the first 12 hours of her life. Most show people know this is true. Running a real show heifer development program like you actually believe it is a whole different thing.
What’s Really at Stake Here
A show heifer is an athlete. Like any athlete, her ceiling gets set early. Miss a step in the first few weeks and you don’t just fall a little behind — you cap how good she can ever be. By the time she walks into the ring as a yearling, the work you did before she was a week old is what the judge is actually grading.
The people winning consistently on the 2026 circuit aren’t doing anything magical. They’re running a Brix refractometer on their colostrum. They’re weighing and measuring their heifers every month against a written target. They’re paying attention to what genomic tests say about how much feed each calf actually needs. They treat the whole thing — maternity pen through show day — as one connected system. Not a string of tricks they pull out the week before fair.
One simple trick before we go further: walk your heifers in the morning before they’ve eaten, then walk them again that evening after full feed. That silhouette should change. If it doesn’t, something’s off. We’ll come back to why.
Why Does Waiting Six Hours Cost You 28% of Her Immunity?
Here’s the single most important thing a young showman can learn about calf care. Colostrum isn’t just “the first milk.” It’s a time-sensitive protection package — and the decay clock isn’t about the colostrum itself going bad in the bottle. The colostrum in the pitcher stays full of antibodies all morning. What collapses is her ability to absorb them.
That’s worth reading twice. The 28% loss is an absorption efficiency loss, not a quality loss. The calf is born with specialized cells in her small intestine that pull whole IgG antibodies out of colostrum and ship them into her bloodstream intact. Those cells close — gradually at first, then fast — over the first 24 hours of life. Feed her at two hours and those gates are wide open. Feed her at six hours and they’re already partly shut. Same colostrum, same volume, different destination. The antibodies that don’t make it into her blood don’t protect her.
Research from Dr. Sandra Godden at the University of Minnesota and colleagues, synthesized in the Journal of Dairy Science colostrum management literature and echoed in Morrill’s published calf nutrition work, shows that missing the early window cuts achieved serum IgG by roughly a quarter to a third. Not cuts colostrum quality. Cuts what ends up in her blood, which is the only thing that actually matters for protecting her.
Think about that. A quarter of her disease protection — gone. Not because you fed bad colostrum. Because you fed it at chore time instead of right after she calved.
The target has moved, too. The old benchmark was 10 mg/mL of IgG in her blood — the minimum to keep her from getting sick. The current standard, set by the 2020 Lombard consensus paper in Journal of Dairy Science and adopted by the Dairy Calf and Heifer Association, pushes way higher: you want at least 40% of your calves hitting 25 g/L or better, and fewer than 10% coming in below 10 g/L. Calves in that top “excellent” range get sick less and die less than calves in the merely “okay” range. For a show heifer, getting sick as a baby means growth stalls you can never get back. You build frame once, or you don’t.
The Colostrum Decision Table
Metric
“Excellent” Target
“Fair / Poor” — Action Required
Colostrum quality (Brix)
> 22% (roughly ≥ 50 g/L IgG)
< 22% — pull from freezer bank or use replacer
Serum IgG (calf blood, 24–48 hrs old)
> 25 g/L
< 10 g/L — failure of passive transfer
Feeding window from birth
Within 2 hours
After 6 hours — roughly 28% lower serum IgG achieved
Volume at first feeding
4 L (or 10% of body weight)
Less than 3 L — under-dosed
Second feeding
2 L by 12 hours
Skipped — missed top-up absorption
Pro tip — Tube vs. bottle, and why it’s not close. A slow bottle feeder can burn an hour of your peak absorption window. Research summarized by the DCHA and university extension guidance consistently shows that tubing 4 liters immediately is often superior to waiting for a “slow starter” to nurse it, because tubing guarantees the volume hits the gut during the 0–2 hour peak absorption window. You can always bottle-feed her the next meal once she’s built protection. You can’t re-open the absorption gates once they’ve closed.
If you’ve ever heard a judge or a fitter complain that a heifer has “hay belly,” you’ve heard about a problem that starts with feed, not with looks. And it’s more interesting than most people realize.
Her rumen — that big first stomach — has to grow in two ways at once. Picture the inside wall covered in thousands of tiny fingers called papillae, each one reaching into the rumen fluid to grab volatile fatty acids and pull them into her bloodstream. Grain fermentation produces butyrate, and butyrate is what makes those fingers grow longer and thicker. Think of it as building shag carpet on the inside of the rumen — more surface area, more nutrient uptake. On a calf fed almost no grain, that wall stays smooth and pale, like bathroom tile. Lots of room for feed. Almost no ability to absorb it.
Meanwhile, the rumen also needs muscular wall and volume, and that comes from forage stretching it out. So grain builds the absorption surface. Forage builds the container. Neither one alone gets you there.
Here’s the trap. Cheap, mature, stemmy hay has a lot of what we call uNDF240 — indigestible fiber that just sits in the rumen for up to ten days without breaking down. It fills her up without feeding her. She stops eating grain because she’s already full. No grain means no butyrate means no papillae. Now you’ve got a heifer with a smooth-walled, oversized container hanging forward off her barrel instead of tucking up like a dairy cow should.
The Silhouette Test: Chronic Fill vs. Real Growth
A real working rumen fills during the day and empties overnight. Morning: trimmer. Evening: fuller. Same animal, different silhouette. If your 6-month-old looks identical at 6 a.m. and 6 p.m., she’s got chronic fill, and the forage is the suspect.
If you run both breeds, you already know Jerseys are easier keepers. The why goes deeper than most people think, and it changes how you feed them.
Holsteins hit early lactation with a much deeper tissue energy deficit than Jerseys — roughly double at nadir on a body-reserve-mobilization basis, per the Journal of Dairy Science comparative metabolism literature — because they’re pulling milk out of their body reserves. So a Holstein heifer needs to come into calving with some condition to draw on. A Jersey at the same body condition score is already over-conditioned for what she’s actually going to need. She got there on less feed, because she converts feed to milk solids more efficiently than a Holstein does on an ECM/DMI basis.
In a commercial herd, that efficiency is a win. In a show heifer program, it’s a trap. Feed your Jersey yearling the same ration as your Holstein yearling of the same age, and your Jersey gets fat while your Holstein stays right. Fat Jerseys mean mushy udders at freshening. Mushy udders at freshening mean a mammary score that kills her in the ring at two years old.
Breed-Specific Management Cheat Sheet
Factor
Holstein
Jersey
Feed conversion efficiency (ECM/DMI)
Lower
Higher — gets same job done on less
Early-lactation tissue energy deficit
Deeper (roughly 2× at nadir)
Shallower
Over-conditioning risk on a shared ration
Lower
Higher — gets fat first
Clinical hypocalcemia rate
Lower
Measurably higher per JDS breed comparisons
Pre-calving anionic salt strategy
Standard DCAD
More aggressive DCAD, per Penn State / Wisconsin extension
Grouping rule
By metabolic age, not calendar age
By metabolic age — a 7-mo Jersey ≈ a 10-mo Holstein
Jerseys also handle calcium differently at calving. They show measurably higher clinical hypocalcemia rates than Holsteins across multiple Journal of Dairy Science breed-comparison studies — a pattern attributed in part to differences in intestinal vitamin D receptor density — and you have to be more aggressive with anionic salts pre-calving than you would for a Holstein, per current Penn State and University of Wisconsin extension guidance.
The fix is simple once you see it. Don’t group Jerseys and Holsteins by calendar age. Group them by where they are in their growth. A 7-month-old Jersey and a 10-month-old Holstein sit at about the same spot on their growth curve. Put those two in the same pen on the same ration and you’re actually feeding them right. Calendar age is a trap with mixed breeds.
Why the Yearling Stretch Is Where Most Programs Leak
The ration that was right at 6 months is wrong at 12 months if nothing changes. NASEM 2021’s protein math shifts as she approaches mature size, because crude protein requirements for lean tissue accretion drop relative to her body weight as her growth curve flattens.
In plain English: the same ration that was building frame and muscle at 8 months starts laying down fat at 12 months. You didn’t change anything. She did.
Fat at 12 months means a yearling whose fore udder is getting laid down wrong, before she’s ever seen a milker. And the mammary system still carries the biggest single weighting on the PDCA unified scorecard. That one weighting is why an over-conditioned yearling costs you more ring points than any other single management miss.
The Ferrari Problem: What Feed Efficiency Actually Means in Your Barn
Lactanet’s Canadian Holstein evaluation publishes Feed Efficiency as a relative breeding value, and this is where genomic testing starts paying dividends beyond sire selection.
Here’s the practical framing. A heifer with a high Feed Efficiency breeding value is a Ferrari that runs on regular gas. Give her premium volume and she’s going to store it as fat faster than her pen mates — she’s literally bred to make more out of less. That’s a gift in the tank. It’s a liability in the show ring, where a BCS over 3.5 means she’s over-conditioned and her udder is getting laid down wrong.
The low-FE heifer in the same pen has the opposite problem. She needs the calories to hold condition. Feed them both the same ration and one ends up fat while the other ends up thin.
This is why genomic data shouldn’t end at sire selection. Pull Feed Efficiency RBVs on your replacement heifers. The high-FE tier needs less volume, lower energy density, or both. The low-FE tier needs what you’d consider a “normal” ration. Segmenting pays off fastest on bigger operations — small groups can’t justify the separate pens — but even a two-pen split on FE tier will save feed and protect udder development on your show prospects.
Here’s the part nobody tells 4-H kids often enough: if you don’t write it down, you don’t actually know.
Monthly weights. Monthly BCS. Monthly height measurements against the breed standard. Forage tests. Dates of every health event and every treatment. Not because the fair committee asked for it — because you literally cannot improve a program you aren’t measuring. Which heifers hit their target weights? Which ones drifted and when? Which batch of hay lined up with the hay belly problem in that pen? Which bull’s daughters are growing differently than the others?
The 2026 Breed Benchmarks: Target show heights for all major dairy breeds from birth to 24 months. Use these curves to ensure your heifer is hitting her frame potential without over-conditioning. or check out our NEW Show Heifer Growth Check Tool
Run the maternity pen like a hospital. Refractometer on every batch. Four liters in the first two hours, tubed if she won’t nurse it. Two more liters at 12 hours. About $200 in gear and fifteen minutes of labor per calf gets you most of the way there. The one thing that can blow it all up: dirty equipment. Bacterial contamination undoes the whole protocol in one feeding, so wash and dry your gear every single time.
Use the genomic data you already paid for. If you’re genomic-testing, pull the Feed Efficiency values and segment your rations where group size supports it. Feed the Ferraris less. Feed the work trucks normal.
BCS your heifers every month. Same person. Same target: 3.0 to 3.5. Pre-commit to what you’ll do if she’s over — usually pull grain or switch pens. Here’s the part that’s hard: don’t break the rule because she’s your favorite or because the fair is in three weeks. Get somebody outside your family to eye her, too. Phones and photos help you see what you can’t see when you’re in the barn with her every day.
Have a written re-entry plan for show animals. Isolate returning animals for 7 to 14 days and watch them, consistent with AABP and university extension biosecurity guidance. A September show heifer who came home with a respiratory bug can set back your whole yearling pen through October if you don’t catch it.
What This Means for Your Operation
Are you actually testing your colostrum, or just hoping it’s good? If you’re not Brix-testing at harvest, you don’t actually know what you’re feeding.
Pull a forage test on your growing-heifer hay and check NDFD30 and uNDF240. High uNDF240 creates hay belly even when intake looks reasonable.
When did you last BCS your yearlings against a written target, with a non-family reviewer’s input? If the answer is “never” or “I don’t remember,” the emotional filter is running your program.
Are your Jerseys in the same pen as Holsteins of the same calendar age? If yes, your Jerseys are getting fat. Match them by metabolic age instead.
Walk them at 6 a.m. and again at 6 p.m. Does the silhouette change? If not, diagnose the forage before diagnosing the animal.
Do you know your heifers’ Feed Efficiency values? A high-FE daughter on the same ration as a low-FE pen mate is going to get fat first.
What’s your plan when a show animal comes home? If it’s informal, it’s a disease event waiting to happen.
Key Takeaways
If a calf isn’t fed colostrum within 2 hours of birth, her achieved serum IgG is already roughly 28% lower than it should be — and the rest of the program is working uphill from there.
If your heifers show the same silhouette at 6 a.m. and 6 p.m., your forage is failing before your grain program has a chance to succeed.
If you’re running one ration across Holsteins and Jerseys of the same calendar age, you’re over-conditioning one breed and under-fueling the other.
If your genomic data ends at sire selection and doesn’t inform ration design, your high-FE heifers are quietly getting fat on the ration that’s keeping your low-FE heifers right.
If BCS scores over 3.5 don’t trigger a pre-committed, automatic ration change, emotional bias is deciding your program — not the data.
📌 Your 30-Day Move
In the next month, sit down with your herd vet and set up a serum total protein check on the next 30 calves born on your place. That number tells you exactly how well your colostrum program is actually working — not how well you hope it’s working. You can’t fix what you aren’t measuring, and this is the highest-leverage window in the whole show heifer program. Full stop.
The 90-Day and 365-Day Plays
Next 90 days: Get a forage test on your growing-heifer hay and pull a BCS on every animal in the yearling pen. Put the numbers in writing. Buy the $200 refractometer if you don’t own one. Walk the morning-versus-evening silhouette check once a week.
Next 365 days: Pull your heifers’ genomic Feed Efficiency values if you’re testing. Start segmenting rations by FE tier if your group size supports it. Build a written post-show re-entry protocol, sign-off and all. And by the time this cycle closes, you should have month-over-month growth and BCS data on every single replacement — not a feeling, not a memory, a spreadsheet.
The Question That Decides the Class
The walk doesn’t lie. You can fit a mediocre heifer to look impressive standing still. You can’t fit her to move like a champion. That effortless, ground-covering stride is what comes out when everything was done right from day one. You either earn that walk in the maternity pen, or you don’t get it at all.
So here’s the one worth sitting with tonight. Of the calls you’re making this month — whether to get up for that 2 a.m. calving, whether to switch hay loads, whether to pull the grain on that heifer who’s looking a little thick — which one will you see in the ring next September? And which one are you going to wish you’d made differently?
The class gets decided a long time before the shavings go down. The only real question is whether your program runs like you know that.
Is She Big Enough?
Monitor whether your show heifers are on track to hit critical weight and height targets at each development stage using industry-validated benchmarks. This tool compares your heifer’s current measurements against breed-specific growth curves and mature body weight percentages, flagging whether she’s running ahead, on pace, or falling behind where she needs to be for optimal development and show ring readiness. Access the Show Heifer Growth Check
Learn More
Feed to Win: How to Maximize Your Dairy Show Heifers Potential — Secure your heifer’s growth trajectory with specific grain-to-forage ratios and monthly monitoring schedules that bridge the gap between baby calf health and yearling ring readiness. High-protein protocols prevent the growth stalls that cap ultimate frame.
The Ultimate Dairy Show Guide for 2026: Judging, Classification & Ring Craft — Align your breeding program with the massive 2026 PDCA scorecard overhaul, revealing why judges now penalize extreme stature and prioritize robot-ready teat placement over traditional height. Knowing these shifts secures your herd’s future classification rank.
Every week, thousands of producers, breeders, and industry insiders open Bullvine Weekly for genetics insights, market shifts, and profit strategies they won’t find anywhere else. One email. Five minutes. Smarter decisions all week.
USDA set March protein at $2.0905/lb against butterfat at $2.0220. On a 500-cow Order 30 herd at 75 lbs/day, that tenth is worth $28,614 a year — $938 more than fat. First sustained flip in a decade.
At the March 2026 Federal Milk Marketing Order announcement, USDA AMS set the protein price at $2.0905/lbagainst butterfat at $2.0220/lb — the first sustained stretch in a major cycle where a pound of milk protein outvalues a pound of milk fat. For a 500-cow Wisconsin or Minnesota shipper into Order 30 moving 75 lbs/cow/day, a single tenth-of-a-percent gap in protein now runs $28,614 a year; fat lands close behind at $27,676.
That’s the stake for a mid-size Upper Midwest herd still calibrated to the old fat-premium world. The trap: a decade of fat-first genetics, fat-first rations, and fat-first contracts running headlong into roughly $10 billion in new cheese capacity that needs protein and doesn’t much care about the butter side anymore.
Dairy component economics 2026 isn’t a theme. It’s the math on your next milk check.
This is Issue #1 of The Bullvine Component Value Tracker — a monthly read translating the FMMO announcement into herd-specific dollar decisions, ranking nutrition break-evens against current prices, and scoring where the month’s highest-return component moves actually sit. May 2026 baseline: 58/100 — Maintain and Reposition Toward Protein.
The Signal the Market Already Sent
For eight of the ten years leading into 2025, butterfat paid more per pound than protein. Producers answered the signal. Genetics companies bred for fat. Nutritionists optimized rations for butterfat response. It worked — arguably too well.
U.S. butterfat climbed 0.58 points between 2015 and 2025, from 3.75% to a record 4.33%, per USDA NASS data compiled by FMMA30 — a 15.5% lift off the 2015 baseline. Over the same window, EU butterfat gained roughly 2.4% and New Zealand roughly 2.5%, per FMMA30’s international comparison. Protein climbed too — 3.11% to 3.29% — but that 5.8% gain only looks healthy until you stack it next to fat running at nearly triple the pace.
CoBank’s lead dairy economist Corey Geiger flagged the problem in the bank’s September 25, 2025 Knowledge Exchange brief, warning that excessive butterfat can compromise cheese quality and that cheesemakers target a protein-to-fat ratio near 0.80, with ratios significantly below that threshold reducing yield efficiency. At the time, the ratio sat at 0.77. Seven months later, with full-year 2025 butterfat averaging 4.33% against protein stuck at 3.29%, it’s dropped to 0.760 (3.29 ÷ 4.33 = 0.7598).
Over half of U.S. milk now moves into cheese. Those plants were calibrated for 0.82. The milk arriving at the dock doesn’t match the equipment on the other side.
Why Should Upper Midwest Producers Care About the 0.75 Threshold?
From 2000 to 2017, the U.S. protein-to-fat ratio held flat between 0.82 and 0.84, per CoBank’s Knowledge Exchange. That’s the band processors built their plants around. Starting in 2018, the line bent.
Year
P-to-F Ratio
Context
2000–2017
0.82–0.84
Stable — cheese plants calibrated here
2018
~0.81
Decline begins
2020
~0.80
Geiger’s “near 0.80” cheese-quality target
2023
~0.79
Decline accelerates
2025 full-year
0.760
FMMA30 / USDA NASS annual
Bullvine crisis threshold
0.75
Named in this issue
Projected arrival
Late 2027 (~16 months out)
Bullvine projection, ~0.008/year decline
The Bullvine is putting a stake in the ground: the U.S. protein-to-fat ratio crosses 0.75 within roughly 16 months at current decline rates, and that’s where standardization costs, whey-stream fat losses, and processor basis negotiations visibly reprice Upper Midwest milk checks. If the ratio turns upward before late 2027, the Tracker will say so in writing and retire the call. If it doesn’t, this stops being a chart. It’s the basis for a pricing correction that’s already started.
The structural driver keeping the ratio suppressed is genetics, and the indexes don’t agree on which way out. Holstein USA’s April 2026 TPI revision shifted production weights to 24% protein and 14% fat — a 5-point move in each direction. Top-10% bulls saw an average 34-point TPI decline, with 26.6 of those points attributable to the formula change itself rather than routine evaluation updates. USDA’s Net Merit 2025 moved the opposite direction — 31.8% fat, 13.0% protein. Two major indexes. Two opposite signals. One breeder trying to mate cows this week.
Running the Numbers: What 0.1% Is Worth on a 500-Cow Order 30 Herd
Before you read the rest of this issue, run this math on your own operation.
Scope. 500-cow Wisconsin or Minnesota shipper into FMMO Order 30. 75 lbs/cow/day rolling average. March 2026 FMMO prices.
Formula:
Incremental annual revenue = 0.001 × daily lbs/cow × number of cows × 365 × FMMO component price per lb
Where the $83,000–$140,000 bulk-tank gap comes from. A 500-cow Order 30 shipper at 4.0% fat against a 2025 national average of 4.33% is carrying a 0.33-point fat gap. Three 0.1% increments × $27,676 = roughly $83,000/year in fat alone. Add a 0.2-point protein gap (3.09% vs. 3.29% national), and 2 × $28,614 pulls another ~$57,000/year. The $140,000 upper bound is a composite of two gaps on two components, not one factor. The low end is fat alone.
That’s the money. Not theoretical. Sitting in the bulk tank every month it ships short of county average.
If you’re leveraged. On a 500-cow shop running DSCR closer to 1.1 than 1.3, a captured $56,290 from a combined 0.1%/0.1% component move is the difference between a lender conversation you choose when to have and one your lender chooses for you. Component revenue doesn’t carry the manure tax added volume does — no extra cow, no extra parlor time, no extra lagoon capacity. It’s the highest-leverage margin move currently on the table.
Run the Numbers on Your Herd: The Bullvine Component Value Tracker
Every calculation above is scoped to a 500-cow Wisconsin or Minnesota shipper at 75 lbs/cow/day against March 2026 FMMO prices. Your operation isn’t that one.
The Tracker runs the +0.1% value, the component-gap dollars, and the $17 Class III capital stress-test against your actual numbers — same methodology, your inputs. Plug in your cow count, production level, fat and protein tests, and the dollar numbers move in real time.
Launch the Tracker pre-loaded with this article’s May 2026 baseline — 500 cows, 75 lbs/day, 4.33% fat, 3.29% protein, $2.0220 fat price, $2.0905 protein price, $19.70 USDA all-milk forecast, $16.16 CME Class III futures:
Bookmark the result once you’ve loaded your own cow count, production, and last month’s component tests — that’s your personal Tracker baseline for the Issue #2 refresh against May FMMO prices.
Why Does Chasing a Better Protein-to-Fat Ratio Cost You Money?
Here’s the assumption the “protein market” headlines set up: the right sire in a protein-premium cycle is the one with the best protein-to-fat ratio. Run the dollars at March 2026 prices, and that logic breaks.
Two sires. Identical on everything else.
Sire
Fat PTA (lbs)
Protein PTA (lbs)
Fat Value
Protein Value
Total per Daughter/Lactation
Winner
Sire A
+45
+35
45 × $2.0220 = $90.99
35 × $2.0905 = $73.17
$164.16
✅ +$19.88
Sire B (prettier ratio)
+30
+40
30 × $2.0220 = $60.66
40 × $2.0905 = $83.62
$144.28
—
Sire B has the prettier protein-to-fat ratio. Sire A has the heavier check — by $19.88 per daughter per lactation, in a protein-premium market. Total CFP pounds drive the milk check. Ratio doesn’t.
The flip point isn’t where headline logic puts it. Setting Sire A’s value equal to Sire B’s and solving for protein against flat fat at $2.0220/lb:
(45 × $2.0220) + (35 × P) = (30 × $2.0220) + (40 × P) 15 × $2.0220 = 5 × P P = $6.07/lb protein
At flat fat, protein would have to triple from $2.09 to roughly $6/lb before Sire B’s ratio edge overcomes Sire A’s 15-lb CFP advantage. Sire A’s win isn’t marginal. It’s structural — the total-pounds gap is large enough that no realistic protein price flips it.
Picture a Brown County 500-cow operation — a hypothetical herd representative of Order 30 shippers we’ve modeled — that filtered its April sire list on protein-to-fat ratio and surfaced Sire B at the top. Across a typical replacement pipeline of 150 heifers/year and 2.8 lactations per cow in the milking string (Bullvine modeling assumption), that single $19.88/daughter/lactation delta compounds to roughly $8,350/year in steady-state drag once the selection cycles through the lactating herd (150 × 2.8 × $19.88). Filter-the-whole-sire-list style ratio-first selection — not just one sire swap — carries materially more drag; The Bullvine’s April 2026 TPI analysis modeled it at roughly $17,500/year for herds that filtered broadly on ratio across multiple placements.
The ruleset for this mating season:
Primary filter: Net Merit or Cheese Merit — both balance full economics, not just protein percent
Sort by: total CFP pounds
Tie-breaker: protein PTA, when CFP is equivalent
Don’t: select on protein-to-fat ratio at the expense of total CFP
There’s an interpretive tension inside TPI itself worth flagging — this is Bullvine analysis, not a Holstein USA position. Under the April 2026 formula, one pound of PTA protein carries roughly 1.7× the leverage of one pound of PTA fat in the index. TPI’s own Feed Efficiency formula still values fat at $1.86/lb against protein at $1.75/lb. Same index. Two signals. Trust the price on the milk check, not the coefficient on the ranking sheet.
Which Supplements Still Pencil at $2.09/lb Protein?
Component prices shifted. Not every ration has caught up. Break-evens below are scoped to a 500-cow, 75 lbs/cow/day Order 30 operation at March 2026 FMMO prices.
Rumen-Protected Methionine: Conditional Yes
A peer-reviewed meta-analysis in Animals (PMC9219501, 2022) puts RPM’s protein response range at +0.07% to +0.15%, with yield gains of 27–43 g/day. The 2025 combined RPLM paper (Animals, PMC12691028) confirms response is heavily dependent on basal diet and a roughly 3:1 lysine-to-methionine target.
At $0.10/cow/day, +0.05% response:
Extra protein: 0.0005 × 75 = 0.0375 lbs/cow/day
Break-even protein price: $0.10 ÷ 0.0375 = $2.67/lb
Current: $2.09/lb — marginally negative
At $0.10/cow/day, +0.10% response:
Extra protein: 0.075 lbs/cow/day
Break-even: $0.10 ÷ 0.075 = $1.33/lb
Margin vs. current: +$0.76/lb — strongly positive
Methionine pays when the cost is low and the response is real. It doesn’t pay when either assumption slips. That’s a ration-audit conversation, not a standing order.
Rumen-Protected Lysine: Don’t Spend
Commercial RPL response on Holsteins runs +0.03% to +0.08% protein at $0.08–$0.15/cow/day, per trial work summarized in PLOS ONE (pone.0243953, 2021).
At $0.10/cow/day, +0.05% response: break-even $2.67/lb
At $0.10/cow/day, +0.03% response: break-even $4.44/lb
Current protein: $2.09/lb. Unless you’ve got 30+ days of bulk-tank data proving outlier response on your herd, lysine’s a ration tax right now. Not a component strategy.
The flip point. Protein above $2.75/lb sustained before lysine pencils at typical commercial response — $0.66/lb of price movement away.
Rumen-Protected Fat: Hold
At March 2026 butterfat of $2.0220/lb, the break-even for RP fat lands at $2.67/lb (at $0.20/cow/day cost and a +0.10% response: $0.20 ÷ 0.075 = $2.667). Current butterfat sits $0.65 below that threshold. The math works only at lower cost or higher verified response — $0.15/cow/day against the same +0.10% response drops break-even to $2.00/lb, right at the current FMMO.
A year ago, with butterfat peaking at $2.95/lb in January 2025 before collapsing 46% to $1.58/lb by December 2025, the math worked early and not at all by year-end. Any response shortfall flips the decision today.
The flip point. Butterfat sustained above $2.67/lb at typical $0.20/cow/day cost, or contract RP fat below $0.15/cow/day with herd-specific +0.10% response confirmed.
Supplement
Cost/Cow/Day
Response Range
Break-Even (typical)
Current FMMO
Verdict
RP Lysine
$0.08–$0.15
+0.03–0.08% protein
~$2.67–$4.44/lb
$2.09/lb
Don’t spend
RP Methionine
$0.10–$0.14
+0.07–0.15% protein
$1.33–$2.67/lb (response-dependent)
$2.09/lb
Conditional yes — low cost + verified response only
RP Fat
$0.15–$0.30
+0.10–0.20% butterfat
$2.00–$4.00/lb (cost- and response-dependent)
$2.02/lb
Hold — break-even at or above current FMMO
Response ranges: Animals 2022 (PMC9219501); Animals 2025 (PMC12691028); PLOS ONE 2021 (pone.0243953). Herd response varies by basal ration, stage of lactation, and product specification.
How Much Does Your FMMO Order Change the Protein Payoff?
Same genetics move. Same ration tweak. Different milk check — because FMMO class utilization dictates how much the market pays for what you improved.
Order 30 (Upper Midwest) routes 83.9% of producer milk to Class III cheese use, per FMMA30 2025 annual data. Wisconsin contributes 69.6% of Order 30 volume; Minnesota adds 21.0%. In a cheese-heavy order, protein dominates.
FMMO / Region
Class Utilization
P-to-F
Priority
Upper Midwest (30)
83.9% Class III
0.759
Protein first at current FMMO prices — highest protein ROI among major orders
FMMA30 Upper Midwest 2025 annual; ratios derived from regional component averages in FMMO reporting.
Texas production ran +10.6% in 2025, Kansas +11.4%, per USDA NASS. Idaho regained the nation’s #3 spot at 18.26 billion lbs of milk, edging Texas’s 18.21 billion by roughly one day’s worth of production. The processing gravity wells driving that growth:
Hilmar Cheese, Dodge City, KS — $600M, operational since March 2025
Leprino Foods, Lubbock, TX — approximately $1B complex, ~600 employees, designed for ~1M lbs cheese/day
Valley Queen, Milbank, SD — expansion completed 2025, anchoring the I-29 corridor
Leprino, Lemoore East, CA — closing in 2026, driving California capacity losses
Early-2026 trade coverage of High Plains and I-29 corridor contract offers has flagged structural premium tiers rewarding herds that reach roughly 4.2% fat and 3.3% protein. The specific cwt figure varies heavily by plant, co-op, and volume commitment — verify premium language against your own contract before building the number into a budget. What matters here isn’t the exact number at any one plant. It’s that the premium structure exists where the cheese capacity is landing, and it didn’t exist 18 months ago.
California production ran -5.74% in 2025 (USDA NASS), on water scarcity, regulatory pressure, and lost processing capacity. For the dairies that stay, the shift from fat-heavy checks toward protein-relevant ones is a repositioning window. Not a crisis.
Trade-offs to Watch
Net Merit or Cheese Merit over TPI as your primary screen gives up benchmarking some buyers still reference for genetic marketing. You gain pricing accuracy on the milk check. You give up pedigree shorthand at the auction ring.
Locking 60–75% of feed at $3.90–$4.10 corn needs equal-weight milk-side coverage. One-sided hedging is worse than no hedge — if corn drops and milk drops with it, you’re paying above-market for feed into a weaker check.
Genomic-testing 100% of heifers at ~$40/head runs roughly $6,000/year on a 150-heifer pipeline. Payback only lives in the sorting decision. Testing without changing which heifers breed to elite component sires is a $6,000 data subscription.
What Does a 58/100 Component Opportunity Score Actually Tell You to Do?
Each Tracker issue compresses four market conditions into one score. May 2026 baseline:
Sub-Score
Weight
Reading
Score
Marginal Value ($/0.1% at current FMMO)
30%
$27,676 fat + $28,614 protein on 500-cow Order 30 — off 2025 peaks but meaningful
70
Forward Price Trajectory (CME 6-month)
25%
Butter and cheese in slight contango from depressed levels — stabilizing, not surging
65
Genetic Improvement Rate (CDCB trends)
20%
Fat PTA still outpacing protein PTA; April 2026 TPI starts the correction, pipeline lag is real
55
Nutrition ROI Opportunity
25%
Lysine negative; methionine conditional; RP fat break-even at or above current FMMO
Component premiums justify significant new nutrition + genetics spending
Maintain and Reposition
50–70
Premiums positive but compressed; genetics and market positioning carry highest forward returns
Hold
<50
Premiums don’t justify added investment
A 58 doesn’t mean spend everywhere. It means stay in the component game and be ruthless about which marginal dollar goes where. The 40 on nutrition reflects real margin compression — methionine’s the only consistent winner, and only at the low end of cost. The 55 on genetics reflects the lag between what the market wants and what the CDCB pipeline delivers today.
What pushes the score toward 80+: protein sustaining above $2.50/lb as new cheese plants come online; butterfat stabilizing above $2.25/lb; FMMO reform that increases component weight in pricing.
What drops it below 40: both prices falling below $1.75/lb; a feed-cost spike raising all break-evens; component tests plateauing nationally.
The 30/90/365-Day Playbook for a 500-Cow Order 30 Shipper
30-Day Actions
1. Pull last month’s milk check this week and run the 0.1% formula on your own numbers. Compare your protein test to the Order 30 average near 3.29%. The gap has a dollar sign in front of it — and at current prices, that gap’s worth more per pound than it was 18 months ago. Plug actual fat and protein tests into the embedded Tracker at March 2026 FMMO prices.
Requires: three milk statements, herd size, daily lbs/cow average.
Red-flag trigger: protein test more than 0.15 points below the Order 30 average = over $40,000/year on the table for a 500-cow herd at current prices. Urgent.
Watch for: seasonal variation. Compare trailing 12 months, not just last month.
2. Audit every rumen-protected supplement — and stop RP Lysine this month if response isn’t documented. Pull the invoice cost per cow per day. At $2.09/lb protein and typical commercial lysine response rates, the math is underwater by roughly $0.60 to $2.35/lb depending on your inputs. If you can’t show 30 days of bulk-tank data proving outlier response, it’s a ration tax.
Red-flag trigger: any supplement with implied break-even above $2.09/lb protein or $2.02/lb fat, and no 30-day before-and-after data proving the response — cost to eliminate.
Watch for: products bundled into larger mixes where per-cow-per-day cost is hard to isolate. Ask for it in writing.
3. Put a methionine kill switch in writing with your nutritionist. +0.05% protein minimum, $0.12/cow/day maximum. Review date on the calendar. No exceptions.
Red-flag trigger: either threshold violated for 30 consecutive days — pull the product, reset the ration, re-baseline before adding back.
Watch for: “the response will show up next month.” Put a review date on the calendar and hold it.
4. Before your next breeding decision, ask two questions. “What’s this bull’s total CFP in pounds?” Then: “What’s that worth per lactation at $2.0905 protein and $2.0220 fat?” That conversation surfaces the ratio trap before it ends up in your herd — at current prices, a 15-lb CFP gap between two sires is worth ~$20/daughter/lactation, and no realistic protein price flips that math.
Requires: current sire-list CFP data, March 2026 FMMO prices in the genetic advisor’s conversation.
Red-flag trigger: advisor defaults to protein-to-fat ratio or last year’s prices — stop the meeting and reset the reference numbers.
Watch for: marketing materials built on 2024 component prices. The math has moved.
90-Day Actions
5. Rebuild sire selection criteria around total CFP. Shift from protein-ratio filters to Net Merit or Cheese Merit as the primary screen. Sort by total CFP pounds. Protein PTA as tie-breaker only.
Requires: a conversation with your genetic advisor using March 2026 FMMO prices, not 2024’s. Bring current herd-average component tests.
Threshold: if your current bull lineup’s average CFP sits below the breed top 50% on the current CDCB run, you’re leaving component revenue on the table genetics-to-barn is slow to fix.
Watch for: over-tilting toward protein at the expense of health and fertility. Net Merit and Cheese Merit already hold that balance. Don’t override the index manually for ratio.
6. Stress-test every capital project at $17 Class III, not $19.70 all-milk. USDA’s March 2026 LDP-M-381 outlook projects 2026 all-milk at $19.70/cwt; CME Class III futures at the same moment traded closer to $16.16/cwt. A $3.54/cwt gap between the government forecast and the market’s own price signal is real-money exposure on any capital underwriting. On a 500-cow herd shipping roughly 136,875 cwt/year (500 × 75 × 365 ÷ 100), that’s approximately $484,540/year of revenue sensitivity between the two benchmarks — enough to break a project that only pencils at the USDA forecast. The gap between the government forecast and the futures board is the gap between a project that survives and one that breaks the operation.
Requires: your CPA or lender running sensitivity on barn, robot, and equipment purchases at $17 Class III.
Threshold: if a project’s DSCR drops below 1.2 at $17 milk for three consecutive months, treat as a luxury, not a necessity.
Watch for: contractors and equipment sellers pitching against the USDA forecast. The futures market is the one you hedge.
7. Lock in 60–75% of feed needs when corn projects at $3.90–$4.10/bu. Per the source economic analysis cited in this issue’s methodology, corn in that band yields roughly $11.56/cwt feed cost — manageable against current Class III.
Requires: cash flow for the hedging strategy, or a relationship with your co-op’s risk management service.
Threshold: corn in-band → lock. Corn above $4.25/bu with basis strengthening → wait for pullback or shorten coverage horizon.
Watch for: locking feed without also locking enough milk. You want both sides covered, not just the cost side.
365-Day Moves
8. Map your FMMO basis against the processing gravity wells. If you sit within draw radius of Lubbock, Dodge City, or an I-29 corridor plant, you have pricing leverage producers 200 miles farther out don’t. Structural demand from ~$10B in new cheese processing supports protein prices for the next two to three years. Renegotiate before capacity is fully committed.
Requires: 12 months of basis data against your plant vs. Order 30 statistical uniform price.
Opportunity signal: basis tightened to within $0.30/cwt of the Statistical Uniform Price while your component tests exceed county average — room to ask for contract improvements.
Watch for: short-term premiums written with pull-back triggers tied to volume. Read the basis-when-volumes-fall clause specifically. It’s the clause nobody reads until it triggers.
9. Track the 0.75 milestone quarterly. If the national ratio hits 0.75 on the late-2027 projected timeline, processor standardization costs accelerate and basis pressure increases on fat-heavy, protein-light herds. Herds repositioned 12–18 months ahead feel it least.
Requires: Tracker updates plus your own herd’s component trend line.
Opportunity signal: national ratio stabilizing above 0.76 for three consecutive months = evidence the market is self-correcting. Different strategy.
Watch for: short-term seasonal swings masking a trend reversal. Quarterly, not monthly.
10. Genomic-test for component direction, not just rank. At $30–$40/head, genomic testing identifies the top 20–30% of heifers worth breeding back to elite component sires. Bottom tier goes beef-on-dairy to capture beef-cross value while the pipeline tightens on components.
Requires: ~$40 × testing population + time to integrate results into breeding decisions.
Threshold: if your current replacement pipeline runs less than 25% genomic-tested heifers and you milk 500+, the sorting decision pays back within the replacement cycle at current component prices.
Watch for: testing without changing what you do with the data. ROI lives in the sorting decision, not the test itself.
The market already repriced. Your milk check is catching up. Every month the operation stays calibrated to the old fat-premium world is a month of compounding gap against herds that already moved. You gain cushion on components here. You give up flexibility on ration-by-habit there.
Two questions to take to your next milk meeting. What does your processor contract actually say about basis when Order 30 cheese utilization exceeds 85%? And what’s your real margin over feed per cwt this month versus 90 days ago — at $2.0905 protein, not last year’s number?
Key Takeaways
March 2026 FMMO flipped the component stack: protein at $2.0905/lb now beats butterfat at $2.0220, and on a 500-cow Order 30 herd at 75 lbs/day, every tenth of protein is worth $28,614 a year.
The national protein-to-fat ratio hit 0.760 in 2025 against cheese plants calibrated for 0.82; if you ship into Order 30, you’ve got roughly 16 months before the 0.75 line starts showing up in basis conversations.
At current prices, total CFP pounds drive the milk check — not protein-to-fat ratio. If your sire list is sorted on ratio, you’re leaving roughly $20 per daughter per lactation on the table and you won’t outrun that math until protein triples.
Stress-test every 2026 capital project at $16.16 CME Class III, not USDA’s $19.70 all-milk forecast. The $3.54/cwt gap is about $484,540/year of revenue sensitivity on a 500-cow herd — the difference between a project that survives and one that doesn’t.
Methodology and Sources
Scope. All barn math uses March 2026 USDA AMS FMMO component prices (protein .0905/lb, butterfat .0220/lb) on a 500-cow Wisconsin/Minnesota operation shipping into FMMO Order 30 at 75 lbs/cow/day, unless stated otherwise. Prices refresh with each month’s FMMO announcement. The interactive Component Value Tracker at thebullvine.com/tools lets readers substitute their own herd parameters against the same formulas and price inputs.
Bullvine projections, labeled as such. The 0.75 crisis threshold, the ~16-month timeline, the Component Opportunity Score methodology, the ~$8,350 Brown County single-sire-swap scenario, the $17,500 broad-filter ratio-trap estimate, and the 150-heifer/2.8-lactation replacement-pipeline assumptions are proprietary Bullvine modeling — published here for the first time.
External sources. USDA AMS FMMO March 2026 component prices; FMMA30 Upper Midwest 2025 annual class utilization and international component comparison; USDA NASS Milk Production Reports, February and March 2026; USDA ERS Livestock, Dairy, and Poultry Outlook, March 2026 (LDP-M-381); CoBank Knowledge Exchange, “While U.S. Leads Milk Component Growth, Butterfat May Be Growing Too Fast,” September 25, 2025; Holstein Association USA Geneticist Insights, April 2026; Select Sires / CDCB April 2025 Base Change documentation; Animals meta-analysis of rumen-protected methionine (PMC9219501, 2022); Animals combined RPLM supplementation study (PMC12691028, 2025); PLOS ONE rumen-protected methionine trial (pone.0243953, 2021).
Every week, thousands of producers, breeders, and industry insiders open Bullvine Weekly for genetics insights, market shifts, and profit strategies they won’t find anywhere else. One email. Five minutes. Smarter decisions all week.
$3,110 to replace her. $1,100 to ship her. That ratio is why ~470,000 U.S. cows are still in stalls they’d have left in 2019 — and why The Bullvine’s CPI just flipped to 68. Warning Zone.
Picture a 500‑cow Wisconsin‑style herd sitting across from its lender this spring. Margin over feed dairy 2026 math says $255,000–$305,000 a year is walking out of that barn in the Bullvine model — a $205,500 milk‑over‑cost gap plus $50,000–$100,000 in bottom‑quartile carrying cost. Every culling decision runs into the same wall: the October 2025 USDA NASS Agricultural Prices release (the most recent heifer series) recorded replacement dairy heifers at a record $3,110/head.
The scene above is a composite drawn from Bullvine modeling on a representative Wisconsin 200–700 cow family operation. Milk price and cost‑of‑production inputs are national ranges applied to a Federal Order 30 (Upper Midwest) representative herd; your Order and cost structure will shift the output. Numbers throughout this piece are USDA and industry sourced; the operator is illustrative.
The cull check on the other side? Roughly $1,100/head for dairy utility cows, with better cuts clearing $1,400–$1,600in hot beef markets (USDA AMS National Weekly Cull Cow & Bull Summary, Q1 2026 range — see methodology appendix for the specific weekly reports used). That puts the replacement‑to‑cull ratio between 1.9:1 and 2.83:1.
Market Case
Cow/Heifer Value
Replacement-to-Cull Ratio
Editorial Read
Dairy utility cull
$1,100/head
2.83:1
Maximum pressure to defer culling
Strong beef-market cull
$1,400/head
2.22:1
Still expensive to replace
Hot beef-market cull
$1,600/head
1.94:1
Better exit value, but not enough relief
Replacement dairy heifer
$3,110/head
Baseline
The price wall driving the trap
When replacing a cow costs nearly three times what she brings as beef, the economics override the biology. That’s how you get to The Bullvine’s modeled estimate of roughly 470,000 U.S. cows held past their productive life — the first piece of the trap.
“The most expensive cow in your barn isn’t the high‑index yearling you just bought. It’s the lame third‑lactation cow you can’t afford to cull.”
The Most Expensive Cow In Your Barn Isn’t The Heifer
The most expensive cow in your barn isn’t the high‑index yearling you just bought.
It’s the lame third‑lactation cow you can’t afford to cull.
She’s giving somewhere around 60 lb/day. Vet bills stack. Repro has stalled. Every instinct says ship her — until you look at the heifer market and flinch.
That flinch, repeated across the country for 18 months, is the structural story of 2026 U.S. dairy.
The Retention Trap Your P&L Won’t Show You
On paper, the U.S. herd looks strong. USDA NASS reports February 2026 milk cow inventory at 9.62 million head, up 211,000 year‑over‑year — the largest U.S. monthly inventory since 1994 per the NASS historical milk cow series (specific comparison month cited in methodology appendix). Total 2025 milk output ran roughly 232 billion lb, up about 2.6% over 2024.
Everyone assumed that meant expansion. It doesn’t. It’s hoarding — and the slaughter data says so in plain English.
Since September 2023, U.S. producers have culled an estimated 611,600 fewer dairy cows than the five‑year rolling pace, per USDA AMS weekly Federally Inspected slaughter data (Sept 2018–Aug 2023 baseline, roughly 3.0M head/yr; full baseline table in the methodology appendix). 2025 dairy cow FI slaughter totaled around 2.53 million head — the lowest U.S. annual FI total since 2011 based on AMS federally inspected series.
Co‑op briefings track the heifer shortage daily. Almost nobody is tracking what’s piled up on the other side of the barn.
The Shadow Loss Your P&L Won’t Flag
Your P&L is lying by omission. It tracks what you spent on feed, but it ignores the 10 lbs of milk you didn’t ship because a lame cow is occupying a prime stall. That’s the Shadow Loss — and it’s the most dangerous number in your barn.
The Bullvine‑modeled $50,000–$100,000/year bottom‑quartile drag on a 500‑cow herd isn’t a P&L line. It’s a shadow loss. Modeled range; actual values vary by herd, region, and breeding program. The underlying carrying‑cost methodology draws on USDA price data, typical herd records, and extension‑style budgets, triangulated against the Cornell Dairy Profit Monitor framework, Miner Institute reproductive economics, and Penn State Extension dairy decision tools.
Want your own number fast? The Bullvine Replacement‑to‑Cull Snapshot at thebullvine.com/tools/rc-snapshot.html takes your herd size, current heifer price, local cull value, and deferred‑cow count and spits out a herd‑specific pressure read with a prioritized bottom‑quartile action list. Same math as the published CPI. Your inputs.
How Deferred Culling Bleeds A 500‑Cow Wisconsin Herd
The Bullvine CPI workup models the bottom 20–25% of a typical herd carrying roughly – per cow per day in drag once production loss, vet cost, reproduction failures, and stall opportunity cost are stacked. These are Bullvine‑modeled ranges built on extension‑style budgets, not cited external point values; the full derivation sits in the carrying‑cost worksheet.
Carrying‑Cost Component (Bottom Quartile)
Modeled $/Cow/Day
Why It Matters
Production loss vs a younger replacement
.50–.00
Aging cows commonly trail herd average at –/cwt milk, per CDCB lactation‑curve data and extension references cited in the worksheet.
Veterinary costs (lameness, mastitis, metabolic)
.50–.50
Chronic issues compound with lactation number.
Reproduction failures (extra days open, repeats)
.00–.00
Each extra open day past mid‑lactation costs real margin.
Stall opportunity cost
.00–.50
Every bottom‑quartile cow blocks a springing heifer.
Total modeled carrying cost
.00–.00
The barn math on the “cheap” cow you kept.
Running the Numbers: 500‑Cow Wisconsin‑Style Herd
Inputs: 500 cows | 75 lb/cow/day | –/cwt milk (national range) | –/cwt all‑in cost of production (national range) | Federal Order 30 representative; your Order and cost structure will shift the output | Modeling base: Bullvine CPI using USDA ERS Cost of Milk Production framing.
Net of replacement‑cost offset: the “drag” is the incremental loss from keeping the old cow versus a replacement in the same stall — it nets out the replacement cow’s own production contribution, her own vet/feed load, and ordinary depreciation. The Bullvine model assumes ~75% of the gross carrying cost offsets against that counterfactual, leaving ≈$50,000–$100,000/year net drag. Full derivation in the carrying‑cost worksheet.
Step 4 — Total modeled bleed
Loss Layer
Low Case
High Case
What It Means
Annual production
136,875 cwt
136,875 cwt
500 cows × 75 lb/day
Milk-over-cost gap
$205,500/year
$205,500/year
Negative margin at $1.50/cwt gap
Net bottom-quartile drag
$50,000/year
$100,000/year
Deferred cows occupying better stalls
Total modeled bleed
$255,500/year
$305,500/year
The lender-facing number
Per cow equivalent
$511/cow/year
$611/cow/year
Pain spread across the whole herd
Modeled for an illustrative 500‑cow Wisconsin operation on national milk and COP ranges. Your number will differ. Plug your own cow count, pounds, COP, and bottom‑bucket count into the Replacement‑to‑Cull Snapshot at thebullvine.com/tools/rc-snapshot.html for a herd‑specific output.
That’s the formula your lender is already running. Write it on your own whiteboard.
The CPI exists because no one else was tracking the inverse of the heifer shortage. Every co‑op briefing reports how few heifers are coming. None publish how many cows are still in the barn that should have already left.
To The Bullvine’s knowledge, the CPI is the first published composite index scoring deferred culling and the replacement shortage together as a single trackable number. USDA doesn’t publish it. Land‑grant extensions don’t. The gap was real. The math could be done. Here’s how.
How The CPI Reads The Herd
Four components composite into a 0–100 score, updated monthly. Inputs and weights are public.
Component
What It Measures
Current Value
Sub‑Score
Weight
Deferred Culling
Cows retained past productive life
~470,000 head
75
30%
Replacement‑to‑Cull Ratio
Economic incentive to defer
2.83:1
72
25%
Production Lag
Genetic potential vs actual yield
~144 lb implied vs 200–220 lb trend
50
20%
Trigger Odds
Probability of a correction catalyst
Borderline high
58
25%
Composite CPI
April 2026
—
68
—
The Volatility Premium: Why The Reading Is 68, Not 65
The straight weighted composite lands at 65.0 (75×0.30 + 72×0.25 + 50×0.20 + 58×0.25 = 22.5 + 18 + 10 + 14.5). The published reading of 68 carries a three‑point Volatility Premium on top of the raw math.
Here’s why. The four sub‑scores weight correction risks as if they add linearly. They don’t. HPAI exposure doesn’t just stack on top of deferred culling — it multiplies the weight of it, because the same aging cows are the animals most likely to drop hard in a disease event. Class III sub‑$16 for multiple prints doesn’t just add pressure — it compounds against a heifer market above $3,000, because producers facing both can’t cull or replace their way out.
The Volatility Premium quantifies that convergence risk in a single digit. Future monthly releases publish both the raw weighted composite and the premium‑adjusted reading side by side, so you can see when trigger‑convergence is doing the work and when it isn’t.
Deferred Culling — 30% weight
USDA AMS weekly FI slaughter since September 2023 runs ~611,600 head below the five‑year rolling baseline (Sept 2018–Aug 2023, roughly 3.0M head/yr; baseline table in the methodology appendix). Net of eventual exits and natural attrition, The Bullvine’s central estimate is ~470,000 head retained past productive life — plausible range 350,000–550,000 depending on assumed mortality and voluntary exit rates.
Even at 350,000, this component still scores in the 70+ band. The Warning Zone read doesn’t depend on the headline number being exact.
Replacement‑to‑Cull Ratio — 25% weight
$3,110 October 2025 USDA heifers against a $1,100 dairy utility cull gives a headline 2.83:1. On a stronger cull (~$1,600 in hot beef markets), the ratio drops toward 1.9:1. Either read, the economics tell producers to wait.
Production Per Cow — 20% weight
USDA NASS puts 2025 per‑cow production at 24,390 lb, up 218 lb over 2024 — essentially on pace with the 200–220 lb/yr genetic trend implied by CDCB data. February 2026 per‑cow production came in at 1,899 lb, just 12 lb above February 2025. If that February pace held for all 12 months, the implied annual gain would run near 144 lb — short of genetic potential.
That’s a conditional read, not a measured 12‑month result. But it’s where the Warning Zone signal lives.
Trigger Probability — 25% weight
Class III: $14.59 Jan 2026, $14.94 Feb 2026, $16.16 Mar 2026 (USDA AMS class prices).
April 2026 WASDE projects 2026 average Class III at $16.90/cwt.
IDFA capacity tracker tallies $11B+ in new or expanded U.S. dairy processing capacity through 2028, across 50+ projects in 19 states (October 2025 release).
One more sub‑$16 Class III print and this leg alone pushes CPI deeper into Warning — before the Volatility Premium even recalculates.
What The CPI Doesn’t Tell You
The CPI is a national composite. It reads industry‑wide pressure — not your barn.
Regional variance. California and New York face different correction probabilities at the same national score.
Herd‑size variance. Large‑herd financial dynamics differ from family operations.
Genetic merit. Strong and weak breeding programs feel the same national CPI differently.
Beef‑on‑dairy mix. Herds heavy on beef‑cross calf revenue face different replacement math.
Trade shock. Export collapse shows up only through sustained Class III pressure inside Component 4.
Regional and herd‑size CPIs are in development as Phase 2. For a herd‑specific read today, run your numbers through the Replacement‑to‑Cull Snapshot at thebullvine.com/tools/rc-snapshot.html.
What Does CPI 68 + $3,000 Heifers Mean For Your Herd?
The Bullvine built this Decision Matrix so this doesn’t stay theoretical.
Cull lowest quartile only as fast as replacements allow.
Cull aggressively; secure replacements now.
Maximize herd turnover.
80+ (Correction Imminent)
Cull aggressively only if replacements secured.
Cull now; expect heifer prices to react.
Full herd refresh, if balance sheet allows.
At CPI 68 with >$3,000 heifers, the U.S. sits in the 50–70 × >$3,000 cell. Translation: tag your bottom quartile and pre‑position replacement access now — not after the correction starts.
Older, deferred cows aren’t only an economic problem. They’re also the animals most at risk in a disease event.
Immune function declines with age. Third‑, fourth‑, and fifth‑lactation cows carry more cumulative stress, more chronic inflammation, and slower recovery than first‑ and second‑lactation cows. They’re more likely to carry subclinical mastitis, lameness, or metabolic issues that blunt immune response — a pattern consistent with published veterinary literature on age‑linked immune competence in lactating cattle in the Journal of Dairy Science and Veterinary Clinics of North America: Food Animal Practice.
In an HPAI event, those are the cows that drop hard in milk, recover slowly, and are most likely to be culled post‑outbreak. A herd that has been deferring culls for 18 months is, by definition, stacked with those animals. CPI 68 plus an HPAI event isn’t risk on top of risk. It’s the same risk hitting the same cows twice. That’s what the Volatility Premium is pricing.
The $11 Billion Sorting Machine
Processors are pouring concrete for plants the deferred herd can’t fully service. IDFA tracks $11B+ in new and expanded U.S. dairy processing capacity through 2028 — 50+ projects in 19 states, heavy on cheese, whey, and high‑protein ingredients. Those plants are built for high‑component, low‑SCC milk running 12 months a year.
What does $11 billion in new concrete actually need? Components. SCC that doesn’t kill shelf life. Supply they can count on.
Two farm‑level outcomes:
High‑component, low‑SCC herds get base volume and more secure deals.
Average‑component, higher‑SCC herds drift into “swing supplier” territory — first cut when plants are long, last in line for premiums.
This component/quality gap partially overlaps with Step 2 in the barn‑math box above. Don’t stack them.
Missing $1.50–$2.00/cwt in component and quality premiums on 136,875 cwt is $205,000–$274,000/year in Bullvine modeling. Same order of magnitude as the deferred‑culling bleed. You don’t close that gap with a slogan. You close it by changing which cows stand in your stalls.
The culling mess exists because of the heifer mess.
CoBank’s Dairy Heifer Inventories to Shrink Further Before Rebounding in 2027 (August 2025), read alongside USDA Cattle inventory data, implies approximately 355,000 fewer dairy replacements in 2025 than 2024, and another ~440,000 fewer in 2026 than 2025 (specific CoBank table referenced in the methodology appendix). Dairy heifers over 500 lb now sit just under 4 million head, a 20‑year low per USDA Cattle Jan 2026.
The deficit traces to the 2023–24 beef‑on‑dairy wave — sexed semen on the top, beef semen on the rest, beef‑cross calves clearing $400–$800/head above Holstein bull calves per Livestock Marketing Information Center weekly summaries and trade‑press auction reporting across 2023–24. Calf checks cashed. Replacement gap now.
CoBank’s outlook is blunt: inventories shrink through 2026 and only start rebounding in 2027. Until then, a structural heifer deficit runs underneath everything. That’s why The Bullvine runs the CPI and the Pipeline Tracker™ as a pair — one asks how many cows should have already left, the other asks how many heifers are actually coming 24 months out.
When 470,000 Cows Finally Move
Deferred culling doesn’t unwind politely. When some producers ship, more follow. The Bullvine’s scenario modeling, anchored to USDA slaughter and production data, sketches four plausible paths.
Scenario
Trigger
Cows Exiting
Timeline
Milk Impact
Modeled Class III Effect
Slow Release
No major trigger
~150,000
~12 months
~ –1–2%
+$0.50–$1.00/cwt
Moderate
Class III <$16 for 3+ months
~300,000
6–9 months
~ –3%
+$1.50–$2.50/cwt
Full Correction
Multiple financial triggers converge
~470,000
~90 days
~ –5%
+$2.00–$3.00/cwt
Extreme (tail risk)
Financial triggers + disease event
≥600,000
<3 months
~ –6% or more
+$3.00–$5.00/cwt
These are modeled illustrative scenarios, not forecasts. The Extreme row is tail risk — a correction lining up with an HPAI event — and it’s the shape lender stress tests commonly include.
Drop Full Correction onto a 1,000‑cow, 75 lb/cow/day herd: 1,000 × 75 ÷ 100 × 365 = 273,750 cwt/year × $2.50/cwt = $684,375/year extra gross milk revenue if the rally lands in your tank.
Not evenly. Vulnerability scoring below reflects structural variables — herd size, replacement sourcing, cost structure — and is not an assessment of any individual operation or lender book.
State
Feb 2026 Herd (000 head)
YoY Change
Vulnerability
Key Risk
California
1,712
+3
HIGH
Largest herd; high costs; culled hard and early in the 2018–19 exit wave.
Texas
718
+34
HIGH
Expansion built on purchased replacements.
Wisconsin
1,290
+25
MODERATE–HIGH
200–700 cow backbone squeezed on costs.
Idaho
724
+24
MODERATE–HIGH
Growth state; replacement‑dependent.
New York
653
+21
MODERATE
Aging infrastructure; cash‑flow‑driven deferral.
Data source: USDA NASS Milk Production, February 2026.
California carries 1.712M cows and added just 3,000 head YoY. High replacement costs, water, and regulation load every culling decision. When margins compressed in 2018–19, California culled hard and early — a likely early indicator pattern worth watching in the national herd this cycle.
Texas grew by 34,000 cows to 718,000 — the biggest state gain, leaning most heavily on purchased replacements. A correction mid‑ramp means depreciating cows paid for at the top.
Wisconsin added 25,000 cows to 1.29M, but the backbone is still 200–700 cow herds. Those operators don’t carry the contract leverage of mega‑herds and are most likely holding marginal cows because no replacement path pencils without torching cash flow.
Idaho grew by 24,000 cows to 724,000 — replacement‑intensive throughput. Correction mid‑expansion is a double squeeze.
New York added 21,000 cows to 653,000, behind a cluster of announced regional processing projects tracked by The Bullvine against IDFA and New York State Ag & Markets filings. Specific project‑dollar totals are posted on the CPI methodology subpage. Deferred culling there is often cash‑flow‑driven.
Lender screening rule: fastest growth + highest reliance on purchased replacements = most exposed when the CPI climbs.
Breeding Your Way Out Of The Next Trap
If CPI 68 says clear your bottom 25%, the next question is who stands in those stalls next.
Paying $3,110 for a replacement only pencils if she stays out of the bottom quartile long enough to earn back. Extension cost work implies roughly a three‑lactation payback window at today’s heifer prices and milk values, while average U.S. productive life continues to run well short of that window in CDCB genetic trend reporting.
More herds are quietly shifting sire lists away from one more notch of yield and toward Productive Life, Daughter Pregnancy Rate, and health traits. In a $3,000‑heifer world, you’re better off with cows you still like in third lactation than cows you’re debating at second.
The 30/90/365‑Day Playbook for 200–700 Cow Deferred Herds
30‑Day Actions: Triage
Pull three reports from your herd software. Average lactation, vet cost per cow YoY, and a “kept instead of culled” list (cows you held in 2024–25 that would have shipped in 2019–20). Feed those numbers into the Replacement‑to‑Cull Snapshot the same afternoon. Requires: DHI and repro records, 20 minutes. Trigger: Average lactation >2.8 and vet cost/cow up YoY = you’re in the deferred cohort. Backfires when: You cull off software rank alone without checking repro status; some bottom‑rank cows are fresh and will climb.
Build your bottom‑quartile list. Rank by production, SCC, lameness, and days open. Tag each cow “ship within 6 months” or “re‑test at 6 months.” Requires: DHIA records and DC305/PCDart. Trigger: If your DSCR has been under 1.2 for three consecutive months on your lender’s reporting standard, treat the top third as urgent. DSCR covenant language varies — confirm with your loan officer. Backfires when: You empty stalls you can’t refill. Pair with the 90‑day replacement step below.
90‑Day Actions: Structural
Ship 25–35 cows from the bottom‑quartile list (8–12/month). Start with obvious passengers. Recheck vet cost/cow, bulk tank SCC, and daily shipped milk at Month 3. Requires: Replacement access or accepted lower cow count; freight and packer capacity. Trigger: If none of those three indicators improve, the hole is deeper than culling alone can fix. Backfires when: You ship without securing replacements and permanently shrink your base — fine if that’s the plan, a problem if it isn’t.
Lock replacement access. Heifer‑raising contracts, forward purchase agreements, or more sexed semen on your top 35–40%. Requires: 6–9 months for sexed semen to move through the pipeline; legal review on any forward contract. Trigger: Heifer prices break above $3,200 nationally, or your local replacement market tightens — pull this forward. Backfires when: Forward contracts signed at the top lock in peak prices. Build optionality where you can.
Tighten sire criteria on PL, DPR, and health.Requires: Genomic testing infrastructure and a breeding advisor aligned on PL/DPR weighting. Trigger: Average lactation trending up while production lags genetic trend = aging structurally, not just cyclically.
365‑Day Moves: Strategic
Clear 80–100 of the original bottom‑quartile cows; re‑run the diagnostic.Requires: Committed 12‑month cull and replacement schedule; lender in the loop. Trigger: Modeled annualized losses narrow by $50,000+ and cash‑flow draw slows — keep restructuring. Opportunity signal: If your components and SCC move you up a processor premium tier while Class III rallies into the Moderate or Full Correction band, you capture margin expansion your aging‑cow peers won’t. Backfires when: You keep a cow just to “earn back” the $1,000 you already spent on her vet bills. That vet check is gone. The only question left is what she produces tomorrow forward versus what a replacement produces in the same stall. Sunk cost is not a strategy.
Decide honestly at Month 12. Narrow the losses and rebuild, or plan a managed exit while cattle and heifer values still give you an equity‑preserving off‑ramp. Requires: Real data, not optimism. Accountant and lender at the table. Trigger:Equity ratio drifting below your lender’s covenant floor + two consecutive years of sub‑1.2 DSCR = managed‑exit conversation, not “one more year.” Backfires when: You wait for “one more good year” while deferred peers finally ship. That’s when heifer prices correct against you and cull prices soften.
Lender/advisor move: map CPI against your regional herd mix. Fastest‑growth, purchased‑replacement states (TX, ID) sit in a different risk band than flat regions. Portfolio exposure isn’t uniform.
The Turn: When Culling Becomes A Competitive Move
Run that same 500‑cow Wisconsin‑style herd forward 12 months in the model.
Average lactation is down. Vet cost per cow is flattening. Components trend toward the processor’s premium tier. The $205,500 margin gap hasn’t disappeared — but the $50,000–$100,000 bottom‑quartile drag has mostly retired.
A deferred‑herd peer down the road is still waiting. When the correction hits, everyone ships the same month. That’s when the lender’s “Can we afford to cull?” question flips to the only one that matters: Can we afford not to?
The CPI is a pressure gauge, not a guilt trip. Some cows are worth holding — young age structure, flat vet cost, production matching genetic expectations. If those conditions don’t describe your barn, the math isn’t ambiguous. Just uncomfortable.
What This Means For Your Operation
Pull those three reports in the next 30 days and set them beside your last three milk checks. If you won’t, you’re not managing this risk — you’re hoping it doesn’t land on you.
Run your numbers through the Replacement‑to‑Cull Snapshot today. Three minutes of inputs, a herd‑specific pressure score, a prioritized bottom‑quartile list, and a 30/90/365 plan calibrated to your barn.
Three or more “yes” answers on the CPI diagnostic puts your behavior inside the 470,000‑cow deferred bucket. Fix it with a 12‑month plan, not one cull load.
Watch Class III and your local heifer market together. Three straight sub‑$16 prints + heifer softening = shift from “prepare” to “act.”
Plan culls, replacements, and sire selection on one whiteboard. A CPI‑driven cull plan that isn’t tied to replacement access and sire strategy just sets up the next deferred trap.
Lenders and co‑ops: TX and ID expansion herds sit in a different risk tier than flat Northeast regions. Map your portfolio accordingly.
I grew up on a dairy farm where we knew every cow by name. We also knew when it was time to let one go.
That instinct hasn’t changed. But at $3,110 a replacement, the economics have overridden the instinct for hundreds of thousands of U.S. producers. The CPI is how we get the instinct back into the data.
— Andrew Hunt, Founder, The Bullvine
Run Your Herd Through The Replacement‑to‑Cull Snapshot
The Bullvine Replacement‑to‑Cull Snapshot
Your herd. Your numbers. Your pressure score.
Enter your cow count, current heifer price, local cull value, average lactation, vet cost per cow, and deferred cull count in the form below. The tool returns:
A herd‑specific pressure score with sub‑component breakdown.
A prioritized bottom‑quartile action list.
A 30/90/365 plan calibrated to your inputs.
A shareable PDF output you can bring to your lender or co‑op advisor.
Tool is editorial. Inputs are anonymized unless you opt in to a consulting follow‑up. The pressure score uses the same component math and weights as the published CPI and is not influenced by consulting engagements — see methodology below.
Methodology Note: How The Culling Pressure Index™ Is Built
The Culling Pressure Index™ is a monthly composite that quantifies deferred culling pressure in the U.S. dairy herd and estimates correction probability.
Update cadence. Published monthly, on the second Tuesday after the USDA NASS Milk Production release. Next update: Tuesday, May 12, 2026.
Version. CPI v1.0, April 2026.
Data inputs by component.
Component 1 — Deferred Culling (30%). USDA AMS weekly FI Dairy Cow Slaughter vs a five‑year rolling baseline (Sept 2018–Aug 2023, ~3.0M head/yr). Full baseline table in appendix.
Component 2 — Replacement‑to‑Cull Ratio (25%). USDA NASS Agricultural Prices for replacement heifers; USDA AMS National Weekly Cull Cow & Bull Summary for cull values (specific weekly reports cited in appendix).
Component 3 — Production Lag (20%). USDA NASS Milk Production monthly data vs CDCB published genetic trends.
Component 4 — Trigger Probability (25%). CME Class III futures, USDA Agricultural Prices, USDA WASDE corn stocks‑to‑use, IDFA processing capacity announcements.
Weighting rationale. 30% deferred culling (lagging indicator of accumulated risk); 25% ratio (economic driver of deferral); 20% production lag (herd‑quality drag); 25% trigger probability (correction timing).
Composite reading. The straight weighted composite for April 2026 is 65.0. The published reading of 68 includes a three‑point Volatility Premium for trigger‑convergence signals (HPAI × deferred culling, sustained sub‑$16 Class III × $3,000+ heifers). Future releases publish the raw and premium‑adjusted readings side by side.
Governance. The CPI score is editorial and is not influenced by Bullvine consulting engagements. Methodology changes are disclosed in monthly updates and historical scores are restated side‑by‑side. The embedded Replacement‑to‑Cull Snapshot at thebullvine.com/tools/rc-snapshot.html uses the same component math and weights as the published CPI.
Known limitations. State‑level data lags national data by 30–60 days. CDCB genetic trend data is smoothed annually. The natural‑attrition assumption behind the 470,000 retained‑cow estimate carries a sensitivity range of 350,000–550,000 head.
Versioning. v1.0 → v1.1 → v2.0. Material methodology changes will be flagged in monthly updates. Historical scores will be restated and presented as “as‑published” and “restated” series.
FAQ
What is the CPI? A monthly composite index, published by The Bullvine, scoring deferred culling pressure in the U.S. dairy herd and estimating correction probability.
Where does the data come from? USDA AMS FI slaughter, USDA NASS Milk Production and Agricultural Prices, CDCB genetic trends, CME dairy futures, USDA WASDE corn stocks‑to‑use. All inputs public.
What is the Volatility Premium? A qualitative adjustment on top of the raw weighted composite that prices trigger‑convergence risk — specifically HPAI exposure multiplying (not just adding to) deferred‑culling risk, and sustained sub‑$16 Class III compounding against $3,000+ heifer prices.
How is the Replacement‑to‑Cull Snapshot different from the published CPI? The published CPI scores the national herd monthly. The Snapshot at thebullvine.com/tools/rc-snapshot.html applies the same component math to your herd’s inputs and returns a herd‑specific score and action list. Both use the same methodology.
How is CPI different from the Pipeline Tracker™? Pipeline Tracker projects replacement heifer supply 24 months out. CPI measures retained‑cow pressure today. Together they form the most complete U.S. dairy supply read published.
Can I cite it? Yes. Recommended format: “The Bullvine Culling Pressure Index™, [Month Year]”
Does The Bullvine sell anything based on it? Yes — disclosed plainly. The Bullvine offers herd‑specific consulting engagements applying the CPI framework. The published CPI score and the Snapshot tool output are editorial; neither is influenced by consulting engagements.
Challenge The Model
Substantive challenges to the methodology are welcome. Write to cpi-feedback@thebullvine.com. Every substantive critique gets reviewed. Material responses are published in monthly updates.
Every week, thousands of producers, breeders, and industry insiders open Bullvine Weekly for genetics insights, market shifts, and profit strategies they won’t find anywhere else. One email. Five minutes. Smarter decisions all week.
Braintree, 1794. Her land paid 2%. Her bonds paid up to 24%. She ordered 72 milk pans, fired the quidlings, and out‑managed half the Founding Fathers from a farmhouse desk.
Braintree, 1776. While John argued independence in Philadelphia, Abigail was at the kitchen table running the farm, the books, and — quietly, through a trusted middleman — a bond portfolio that would out‑earn Adams land twelve to one.
Act I — Cannons, Cream Pans, and a Woman with a Quill
The cannons had barely cooled.
It was April 11, 1776. Boston Harbor still carried the faint bite of gunpowder from months of siege. British warships had rattled windows from Roxbury to Braintree, and every farmhouse along that stretch of coast had learned to flinch at the sound of distant artillery.
A few miles south of town, in a plain wooden farmhouse in Braintree, Massachusetts, the air was different. Woodsmoke. Damp wool drying by the hearth. The sour‑sweet tang of yesterday’s milk resting in shallow tin pans in the buttery, throwing off a bit of chill as the cream lifted. Somewhere beyond the kitchen wall, a cow bawled for her calf, and a team of horses clinked past with harness and chain.
At the kitchen table, a woman dipped her quill in ink instead of cream.
Her husband was in Philadelphia, arguing over phrases that would soon cut an empire in half. She’d heard the cannon fire. She’d watched neighbor boys drill on stony pastures and disappear down the road toward armies that might never send them back. She could have written about fear. Loneliness. The price of salt.
She wrote about ambition.
“I hope in time to have the Reputation of being as good a Farmeress as my partner has of being a good Statesmen.”
That’s the voice that opens this story. Abigail Adams, thirty‑one years old, the wife of a lawyer‑turned‑revolutionary, sitting in a working farmhouse with milk cooling in the pantry and a war rumbling just beyond her door. In one sentence, she planted a flag most of her contemporaries couldn’t even see. Inside twenty years, that same quill hand would be buying discounted government notes through a trusted middleman while John was off in Paris — returns her husband would sneer at and her household would quietly live on.
Here’s what most folks miss about that line.
When Abigail wrote “Farmeress,” she wasn’t being cute. She wasn’t reaching for a romantic title to tuck into a letter. In an era when a married woman legally couldn’t own so much as her own butter churn under the doctrine of coverture, she was staking out a professional identity. She was telling her absent husband — and, quietly, the future — that while he built a country, she intended to build a farm worth remembering.
Most people know Abigail as the one who told the Founders to “Remember the Ladies.” That quote wins posters and school projects. But if you actually sit with the 2,100‑plus letters she and John traded over forty years, a different Abigail steps forward. One who talked hay yields, cheese hundredweights, laborer contracts, and discounted government notes with the same cool attention most Revolutionary leaders reserved for treaties.
She wasn’t alone in her era, though she was rare. Down in South Carolina, another woman about her age — Eliza Lucas Pinckney — was quietly perfecting indigo cultivation on her father’s plantations and reshaping a whole colony’s export economy. Different crop, different geography, darker moral footprint given Pinckney’s reliance on enslaved labor, but the same unmistakable pattern: the Revolution‑era colonies had a handful of brilliant women managing serious agricultural operations while the men were off tending to war, politics, or empire. Abigail was New England’s entry in that short, extraordinary list.
What nobody sitting at that kitchen table could have seen, that spring morning in 1776, was this: the woman writing about being a “Farmeress” would one day become the reason a founding family kept its farm when other, more famous Founders lost theirs.
Every dairy farmer reading this knows her type, whether they know her name or not.
Born to Books, Married to the Land
Abigail Smith came into the world on November 11, 1744, in Weymouth, Massachusetts. Her father, William Smith, preached from a Congregational pulpit. Her mother, Elizabeth Quincy, carried a family name already woven into colonial politics and property.
No schoolroom ever held her. Girls of that time simply didn’t get that luxury. But the parsonage was effectively a library with a kitchen attached, and young Abby grazed those shelves the way a good heifer grazes first‑cut alfalfa — thorough, selective, and hungry. Theology. Law. History. Poetry. Richard Cranch, a young tutor who would later marry her sister Mary, helped shape her reading. It showed.
You know the type. You’ve met her at breakfast on a show morning. Quiet in the corner, coffee in hand. Knows every pedigree at the table and doesn’t need to prove it. Standards as high as a first‑lactation Excellent score — and no patience for shortcuts.
She married John Adams in 1764 and stepped onto the Braintree farm that would define the next fifty years of her life. This was no sprawling Virginia plantation. It was a rocky New England operation: patches of stony upland, strips of salt hay cut from the tidal marshes, an orchard, a garden, a few fields in rotation, a small herd of dairy cows, some sheep, and a house that by modern standards would have leaked heat faster than it held it.
Put that in period context. A typical New England farm in the late 18th century ran somewhere around 50 to 100 acres of cleared and uncleared ground, produced most of what the family needed, and kept “a cow” the way we think of “a truck” — one, maybe two, for household milk, butter, and cheese. The Adams place wasn’t enormous by those standards, but in ambition, in dairy scale, and in the way it was run, it was about to leave the neighbors in the dust.
John, at that point, was a lawyer. Lawyers travel. Then he became a revolutionary. Then a diplomat. Then vice president. Then president. Every promotion translated into one reality back home: longer absences, and farther. From 1774 to 1777 he was in Philadelphia at the Continental Congress. From 1778 to 1788 — a full ten years — he was in Europe, bouncing between Paris, Amsterdam, and London. After that came New York, Philadelphia, and the raw new capital on the Potomac.
Someone had to keep the cows fed, the hay in, the cider sound, the taxes current, and the hired help from walking off mid‑season. Someone had to make sure there was still a farm to come home to when the speeches ended.
That someone was Abigail.
At first because she had to. Then — and you can feel this shift in the letters — because she was very, very good at it.
The Farm You’d Recognize, and the One You Wouldn’t
Most Braintree neighbors worked subsistence‑scale places: a yoke of oxen, a couple of house cows, a few sheep, maybe a pig out back. The wider New England dairy economy of the 1770s and 1780s was built around exactly that kind of small, diversified operation — no commercial herds in the modern sense, no milk buyers, no bulk tanks.
The Adams farm was different. Horses, sheep, and dairy cows. Salt hay cut from the coastal marshes for winter feed. Orchards feeding a serious cider operation — John liked to credit a morning “jill of cyder” with his digestion and longevity. A garden. Fish from the coast to stretch rations for family and laborers. Tenant families on outlying acreage, including land they called Thayers place.
Sitting inside all of it, like the bulk tank humming at the center of a modern parlor, was the dairy. No cold chain. No stainless. No pipeline. Milk was a race against spoilage won with cool cellars, clean pans, fast hands, and people who understood what “clean” really meant in a world of wooden churns, tin, and open flame. Cheese and butter weren’t luxuries — they were the storage strategies that turned perishable cream into marketable surplus. That was the world Abigail stepped into as manager, and later, as architect.
The Year the Hay Fell Short
If this all sounds like tidy success, 1777 is the year that tests the story.
By midsummer, John was deep in the Continental Congress’s committee work, writing home to Braintree with both affection and advice. In a July 1777 letter, he gently pressed her on what he already suspected: the farm wanted manure, the hay crop was short, and the cattle needed a plan. “The true Maxim of profitable Husbandry is to contrive every Means for the Maintenance of Stock,” he wrote. “Increase your Cattle and inrich your Farm.”
Easy counsel from Philadelphia. Much harder in Braintree.
Abigail was the one actually staring at the hay mow as it came up lighter than last year. “Northern storms,” British warships strangling coastal trade, labor shortages because young men were off with the militia, currency so unreliable that farmers sometimes barely knew what their hay was worth in any given week. Every manager knows that knot in the stomach when you climb the ladder to the loft and realize the stacks don’t quite reach where they should.
She didn’t write back fussing. She wrote back managing.
The record suggests she tightened stocking numbers where she could, negotiated for hay and feed at prices that were anything but friendly, and pushed hard to recycle every pound of fertility back onto the fields — doing, in practice, exactly what John was preaching in theory. She translated his “true Maxim” into messy, real‑world decisions in a war economy.
Here’s the piece that tends to get missed. A short hay year isn’t just a budget problem. It’s a welfare problem. If you don’t stretch your feed carefully — if you don’t cull the right animals, protect the deepest milkers, keep condition on your stock — cows pay the price first. Abigail’s whole approach, from the manure plan to the way she watched salt hay and orchard yields, reads as someone who understood that her cattle weren’t line items. They were the engine. Starve the engine, and the whole farm grinds to a halt.
You can picture her at the edge of the field late in the day. Light slanting through the last of the timothy. A laborer waiting for a decision about which cows stay, which go, which piece of ground gets more manure before snow. The war is somewhere else. The winter is only weeks off. The cows don’t care about the Continental Congress.
That’s the first obstacle. Hay, weather, war. And she didn’t just survive it. She came out the other side ready to expand.
Managing People Like a Pro Herdsman
Every dairy operator knows the hard truth: cows are the easy part. People are the real job.
Abigail’s letters from the 1790s read like a modern dairy’s HR file, except everything’s in ink and there’s nothing remotely politically correct about the assessments.
In February 1794, with John serving as vice president in Philadelphia, she sat down with the Richards family — son and daughters of a household known in the area for handling dairies “upon a large scale.” She didn’t just shake hands. She set her terms. Then she ran them past her uncle, Dr. Cotton Tufts, for a character check before committing. That’s a vetting process any modern herd manager would respect.
She rotated two hands, Arnold and Copland, on alternating schedules to keep their rivalry from poisoning the crew. She offered Mr. Shaw and Alice terms “not quite as liberal” as other candidates, partly to see if they were serious about the work or shopping for the easiest paycheck.
Porter, a tenant whose wife she judged too weak for the pace of the operation, got dismissed with a biting word that still stings across the centuries — “quidling.” She refused to renew his terms. Faxon, known for a “contrary” nature, proved unreliable for teaming animals when the season demanded it.
If you’ve ever had a hired hand who can fix any piece of iron on the place but sinks morale every time he opens his mouth at breakfast, you recognize what she was up against.
She understood output, too. When she heard that a woman known only as Joy’s wife had made “nine hundred weight of Cheese last year from six cows,” she filed it away. In today’s terms, that’s hearing a neighbor turn out a level of per‑cow performance that makes the rest of the county look tired. Abigail wanted that kind of capability on her payroll.
You could feel the difference between farms under her eye and farms where nobody was counting.
By Letter and by Ledger
One of the gifts Abigail left us is that she didn’t just run the farm. She documented it, week after week, in letters that still exist.
In March 1794, her order sheet reached John’s hands. Six dozen milk pans. Six cream pots. Eight milk pails. Two cheese tubs. Plus assorted odds and ends to outfit an expansion of the dairy.
Stop and think about that for a second.
Seventy‑two milk pans. In a community where most families were making do with a handful. This wasn’t a house cow and a couple of pans for Sunday company. This was capital investment in volume‑scale dairying at a time when the average New England farm considered two or three milk cows a serious herd.
No dabbler orders that much tin and wood in a single request.
She was also weighing logistics in a way that would sound perfectly modern to any multi‑site operator today: should the dairy stay centralized at Thayers place, or split across multiple properties? Each option carried labor, hygiene, and quality tradeoffs, and she was the one running the math.
Meanwhile, from Philadelphia and from Europe, John sent down homilies on husbandry and maxims on soil he’d never apply with his own hands. The affection between them is real, but so is the gap. He gave her theory. She sent back crops, cheese, cider, and a working enterprise.
One can imagine her reading a particularly self‑satisfied paragraph of his by candlelight, smiling a thin smile, setting the letter aside, and going right back to solving problems he’d only ever see in summary.
Act II — The Farm Widow Who Became a Merchant
Running a working farm while your husband’s at court in Boston is one level of hard. Running it while he’s across an ocean, the British navy is choking your coastline, and everyone’s guessing whether the new “United States” will survive another fiscal year — that’s a different animal entirely.
From 1778 to 1788, John was abroad, chasing loans and treaties and legitimacy for the young country.
Abigail stayed home with children, hired help, tenants, debts, and weather.
And she did something almost no woman of her station even considered.
She went into business for herself.
She realized, early, that scarcity was opportunity. Pins, needles, ribbons, tea, fine fabrics — small, high‑margin goods Americans still wanted but couldn’t easily get during wartime — were gold. “The cry for pins is so great,” she wrote in 1775, that prices had tripled. So she asked John to buy a bundle of six thousand in Europe and ship them home.
By 1780, she’d gotten more surgical. She told him exactly which linens and handkerchiefs to send — items that would “turn to good account sold for hard Money.” She noted that “small articles have the best profit,” and specifically requested gauze, ribbons, feathers, and flowers “to make the Ladies Gay.”
That’s a market analyst.
She wasn’t keeping a little novelty shop. She was running a transatlantic supply chain powered by her husband’s diplomatic access and her own ground‑level knowledge of what New England would pay for.
For a woman of her class and time, this was deeply unusual, even faintly scandalous. For Abigail, it was practical math. The farm needed cash flow. Her children needed schooling. John’s public salary wouldn’t stretch. So she built a second income stream — the cushion she’d need for her next move.
And this is where it gets interesting.
The Stock‑Jobber in the Sitting Room — The Turning Point
Like most men of his generation, John Adams trusted land. You could walk it, fence it, mortgage it, leave it to your children. In his world, land meant dignity, stability, and status.
Abigail looked at the ledger and saw something else entirely.
The Adams holdings in Braintree and later at Peacefield brought in, by her accounting, something like two percent a year in real returns once you stripped out taxes, labor, and upkeep. Those acres were necessary. They fed the family, fed the cows, fed the cider. But as profit centers, they weren’t exactly pulling freight.
Meanwhile, after the Revolution, the new federal government was broke and nobody was sure it would honor its paper. State and federal notes — pieces of debt paper issued during and after the war — traded at deep discounts because public confidence was low, as the correspondence preserved by the Massachusetts Historical Society makes clear.
Abigail saw those notes for what they were: undervalued assets in a temporarily spooked market. A lot like a good heifer calf out of a cow that just hasn’t caught anyone’s eye yet.
The catch? Coverture law said anything she owned legally belonged to John. She couldn’t march into a broker’s office under her own name.
So she worked the edges. She quietly set aside “pin money” and proceeds from her retail operation. She asked Cotton Tufts to act as her trustee. Through him, she began buying government State Notes while they were still trading cheap.
The numbers are almost hard to believe.
Land, around two percent. Her bond portfolio, at its peak, up to twenty‑four percent a year as federal credit recovered and the notes rose back toward face value.
Twenty‑four percent.
Think about that in today’s dairy terms. You work a 600‑cow herd, fight for every basis point of margin, sweat milk price and feed cost and interest rates, and you know what another point or two on operating return would mean. Now imagine a side investment returning ten or twelve times what the ground under your feet is paying.
One can imagine the moment a statement came back from Tufts in Boston, ink still drying on figures that made her breath catch. The fields she’d fought through storms, labor drama, short hay, and war to keep productive had finally thrown off enough surplus to invest. And that surplus, in her hands, was doing what no acre of Braintree ever could.
John hated this “stock‑jobbing.” He warned her off Vermont land speculation in a famously sharp line — “Don’t meddle anymore with Vermont” — and clung to the comfort of real property.
But the truth was stubbornly the truth. His instinct led toward land‑heavy, illiquid, debt‑prone futures. Hers led toward a modest but steady stream of interest that could cushion public‑service shortfalls and buffer the farm against bad years.
That, right there, is the climax of her story.
Before the bonds, the Adams household was one bad harvest or one political setback from genuine trouble. After the bonds, they had margin. Not riches. Margin. And in a world of volatile currency, endless political stress, and a founding class routinely living beyond its means, margin was oxygen.
Fast‑forward a few decades and look at the scoreboard.
Thomas Jefferson — brilliant, charming, land‑obsessed, debt‑soaked — died so deeply in the red that his heirs were forced to auction off Monticello and the enslaved people who’d built and sustained it to settle creditors.
The Adamses? Peacefield stayed in the family. The farm, the herd, the orchard, the house — still standing, still theirs, still working.
Strip away the quills and frock coats and you’re looking at a farm manager’s dream playbook. Take the surplus from a carefully run mixed farm and dairy. Put a portion into high‑yield, relatively low‑maintenance assets that nobody else trusts yet. Balance land, livestock, and securities. Diversify.
Today we call it risk management. Back then, John called it “stock‑jobbing,” and Abigail Adams became one of the first women in American history to do it at that level.
What It Cost Her
It would be tidy to end there and skip the price she paid. The letters won’t let us.
Abigail wasn’t superhuman. She was a woman living alone on a farm far more than she ever wanted to, carrying weight meant to be shared. In December 1783, after years of separation while John negotiated in Europe, she wrote him bone‑tired and blunt:
“If my dear Friend you will promise to come home, take the Farm into your own hands and improve it, let me turn dairy woman. And assist you in getting our living this way; instead of running away to foreign courts and leaving me half my Life to mourn in widowhood.”
Read that aloud. That’s a line any farm spouse in 2026 can feel in their teeth. She wasn’t asking him to quit the public work. She was asking to share it. Trade the courts for the cows. Trade distant glory for a life pulled in the same direction.
When John finally spent real time at home, he wrote — half joking, half confessing — that he was “jealous” the neighbors might think “Affairs more discreetly conducted” in his absence than at any other time. It’s his way of admitting what we can now see clearly. She’d been running things better than he would have.
Later, when she joined him in Europe from 1784 to 1788, she wrote Tufts from London and Paris about taxes, repairs, plantings, tenants, orchard health, cider barrels. Any producer who’s ever left a good herdsman in charge for a week at World Dairy Expo or the Royal Winter Fair knows exactly where her attention sat. You can be physically anywhere in the world. Your mind stays in the tie‑stall with the fresh cow who looked off this morning.
Act III — Peacefield, Politics, and Her Last Years
Eventually, the politics ran their course. At least for John.
He lost the election of 1800 to Thomas Jefferson. After a bitter campaign, the Adamses packed up Washington and went home to the farm in Quincy they’d come to call Peacefield.
John embraced the role of “Farmer John,” pruning trees, walking fences, writing letters about the weather. And he did put in the hours. But he was moving through systems Abigail had shaped for decades: tenant arrangements, investment income, dairy infrastructure, orchard cycles.
What most people don’t realize is that during his presidency she hadn’t exactly been soft‑pedaling either. She was his political partner as much as his farm partner. She pushed hard for the Alien and Sedition Acts of 1798, seeing them as a shield for her husband and her son, John Quincy, against opposition editors she considered dangerous and “licentious.” She supported the Judiciary Act of 1801 and the “midnight judges,” eager to see Federalists secure the federal courts before Jefferson could reshape them.
Those choices don’t always flatter her by modern standards, and this story doesn’t pretend they do. But they show her seeing herself — correctly — as a co‑executive of the Adams enterprise, political and agricultural both.
On other issues, her moral compass pointed further ahead of her peers than history sometimes remembers. In her March 31, 1776, letter, she told John to “Remember the Ladies” in the new code of laws and warned against putting “such unlimited power into the hands of the Husbands,” adding that “all Men would be tyrants if they could.” On slavery, she asked how colonists could “fight ourselves for what we are robbing the Negroes of” and backed that up by supporting the education of a Black youth named James despite neighborhood opposition.
Back at Peacefield after 1801, her body slowly started to cash checks her years of work had written. Age. Typhoid. The slow erosion of strength. Through it, she kept insisting on plain living: “neither my habits, or My Education or inclinations, have led Me to an expensive stile of living.”
She died at Peacefield on October 28, 1818. She was seventy‑three.
Her passing hit John hard. Later accounts preserve his private wish — to lie down beside her and die too. For a man who’d leaned on her strength, her judgment, and her farm for half a century, that grief was as honest as it gets.
Seven years later, their son John Quincy Adams took the oath of office as the sixth president of the United States. Abigail didn’t live to see it. But follow her letters — her insistence on his reading, his manners, his duty, his moral seriousness — and you can see her fingerprints all over that moment. She and Barbara Bush remain the only two women in American history who’ve been both the wife of a U.S. president and the mother of one.
The monuments can tell that part of the story.
The fields and the cows and the ledgers tell the rest.
What the Farmeress Still Teaches Every Dairy Today
So why should a producer standing in a robot barn in 2026 — worrying about milk price volatility, feed costs, interest rates, and the quota or base rules in your region — care about a woman who ran a farm with no electricity, no refrigeration, and no milk truck ever backing into her yard?
Because a dairy isn’t just cows and milk. It’s systems. Labor. Infrastructure. Cash flow. Land. Markets. She hired families like the Richards because they could handle scale. She rotated rivals like Arnold and Copland to keep the crew workable. She fired the quidlings without flinching. Every time you sit at the kitchen table and debate whether to keep a marginal employee one more season, you’re walking a fence line she already walked.
She treated hardware as investment, not indulgence. Six dozen milk pans, six cream pots, eight milk pails, two cheese tubs. That was capacity planning in tin. Today it might be a robot upgrade, a new freestall pack, a pack barn expansion, or finally buying a decent feed wagon that doesn’t break down every third load. Same instinct. Build the infrastructure before the cows are standing in it waiting.
She refused to bet the family on land alone. The Adams acres fed them. They also ate cash in taxes and labor. Her bonds — the ones John sneered at as “stock‑jobbing” — paid out at roughly twelve times the rate of the ground in a good year. When you weigh whether to put every last dollar into another quarter section versus saving for a robot retrofit, new housing, a feed‑price cushion, or an honest‑to‑goodness rainy‑day fund, you’re running her math. Today’s weather is different. The volatility isn’t. Milk markets, feed spikes, rising interest rates, a wet fall that destroys a corn silage plan — every one of these is a 21st‑century version of her 1777 short‑hay year. The families that come through them are, almost without exception, the ones with some margin tucked somewhere that isn’t soil.
And she knew the hardest work in a dairy isn’t always done in rubber boots. Sometimes it’s done at the desk, before sunrise, staring at numbers, deciding which bill can wait and which can’t. Signing the loan or walking away from it. Every farm woman today who signs the financing, chairs the board meeting, runs the books, negotiates with the lender, or quietly keeps three generations of dairy history alive under one roof is working in space Abigail Adams carved out of a much narrower legal world.
She never milked a cow, as far as we know. She also never stopped managing the ones that did.
A Legacy Worthy of a Hall of Fame
Strip the politics off the story and tell it the way breeders tell each other stories at the rail at World Dairy Expo or over late coffee at the Royal, and here’s what you’ve got.
A farm kid who educated herself out of her father’s library, married into a modest New England place, and ended up running it on her own for years at a stretch while her partner chased history at someone else’s table. A manager who stared down short hay years, stubborn workers, wild markets, wartime blockades, and decades of loneliness — and refused to let the operation slip. A woman who took the hard‑earned surplus from a stony Braintree farm and a wartime side hustle and quietly put it into the one asset class that would outpace everything her neighbors were doing.
You won’t find her name in Holstein pedigrees. She didn’t walk a heifer into the colored shavings at Madison or the Royal, because those rings didn’t yet exist. There’s no bull stud with her initials, no modern bloodline that traces directly to her barn.
But you see her anyway.
You see her in every operation where the person doing the hiring and the books and the long‑range thinking isn’t the one with their name on the banner. You see her in the multi‑generation outfits where Mom or Grandma never sat in the judge’s chair but made sure there was still a farm for the next set of 4‑H calves. You see her in the farm women who sign the financing, work through the cash flow spreadsheets at midnight, and make sure the family doesn’t bet the whole place on a single idea that feels good at the moment. You see her every time a dairy couple divides the labor between the public face and the quiet, relentless work of management — and the quiet one keeps them standing.
Looking back, the signs were always there. From that April morning in 1776 when she wrote about wanting to be as good a Farmeress as her husband was a statesman, to the quiet line of state notes bought on her behalf by a country doctor in Boston, to the farm that was still in the family long after more famous founding estates had gone under the auctioneer’s hammer.
Read her story out loud at a breeders’ banquet tonight and watch heads nod around the room. They’ll know the type. The one who doesn’t need the spotlight but won’t let things slide. The one who refuses to let the numbers lie. The one who, without ever setting foot in the pit, makes sure every cow on the place has what she needs — and makes sure the farm is still there in the morning.
Abigail Adams was America’s first farmeress in more than just name.
For anyone who has ever carried a dairy on their back so someone else could stand in a different light, she isn’t a distant First Lady in a history book.
She’s family.
Key Takeaways
Abigail ran the Adams farm like a modern dairy CFO — labor, infrastructure, and off‑farm capital all on one ledger. If your operation only tracks cows and crops, you’re leaving her 24% on the table.
Land fed the family at 2%. Bonds protected it at up to 24%. The families that survive short‑hay years and feed spikes today are still the ones with margin tucked somewhere that isn’t soil.
Seventy‑two milk pans wasn’t vanity — it was capacity planning before the cows needed it. Whether it’s a robot retrofit or a better feed wagon, build the infrastructure before you’re standing in the problem.
Fire the quidlings. Vet the Richards. The person signing the financing and running the books at midnight is doing Abigail’s job — and deserves to be named like it on the operation.
Continue the Story
They Kept the Barn Lights On – History banners usually bear one name, but the operation relies on the partner staying behind. This retrospective on the wives of Dairy Shrine Pioneers honors the same quiet, relentless management Abigail practiced, proving the foundation held because they ran it.
Every week, thousands of producers, breeders, and industry insiders open Bullvine Weekly for genetics insights, market shifts, and profit strategies they won’t find anywhere else. One email. Five minutes. Smarter decisions all week.
One $43 test, one $160 million lab acquisition, and one Danone preferred-provider letter — and the cooperative system 75 years of dairy farmers built has months, not years, to answer for itself.
The next time URUS, ABS Global, Genex/CRI, ST Genetics, or your Select Sires / Semex -affiliated co-op holds a district meeting on your calendar, look at the slide deck the regional manager hands out. Then ask, out loud, in front of your neighbors: “What’s our plan for the GeneSeek close?”
If the room goes quiet, you already have your answer. The publicly announced 2026 dairy genetics stack — Clarifide Plus at $43 a head, the $160 million Zoetis–Neogen lab deal, Danone’s Partner for Growth letter naming Zoetis as preferred testing provider — is reshaping every AI cooperative’s negotiating position through 2030. As of May 1, 2026, none of the major cooperatives most exposed to that shift has published a strategy response.
Your seat at that table. Your kids’ equity in the co-op. The genotyping pipeline three generations of member-owners built. All of it is being decided right now, in rooms where the question hasn’t been asked out loud yet.
This article is built on published program terms, public corporate filings, CDCB evaluation data, NAAB’s 2025 year-end report, USDA NASS Milk Production data, and a peer-reviewed 2025 Journal of Dairy Science study.
What Zoetis Built While the Cooperatives Were Quiet
Zoetis doesn’t sell a single straw of semen. But it now sits at four points of leverage in the U.S. dairy genetics chain, and each one was announced publicly, in plain sight.
The test. Clarifide Plus runs $43 per Holstein head at Holstein Association USA’s published member rate, accessed May 1, 2026.¹ It’s already among the most widely used genomic tests in U.S. dairy.
The index. Zoetis owns DWP$, the Dairy Wellness Profit index. In April 2026, the company added Milk Methane Intensity (Z_MI) and a new sub-index called DWP$ Heat — built for herds experiencing heat stress 20% or more of the year, roughly 73 days. That’s Florida, Texas, Arizona, the southern San Joaquin, and increasingly the lower Midwest in late summer. For the back-story on how the index was assembled and what’s actually inside it, see our deeper piece on how Zoetis built the DWP$ index.
The lab. In March 2026, Zoetis announced it would acquire Neogen’s animal genomics business — including GeneSeek’s Igenity and GGP portfolios — for 0 million, subject to customary closing adjustments. That business runs roughly $90 million in annual genomics revenue, operates labs across the U.S., Brazil, Australia, China, and the U.K., and serves customers in more than 120 countries. Close is expected in the second half of 2026, pending regulatory approval.
The processor. Zoetis is the preferred genetic testing provider for Danone’s global Partner for Growth program, with DWP$ as the selection index. The two later expanded that partnership to scale testing across Danone’s supplier base for sustainability reporting — methane intensity, nitrogen efficiency, the metrics that feed scope 3 disclosures.
A company with no semen catalog is now the preferred testing provider for one of the world’s largest dairy processors, owns the index that ranks bulls inside that program, and is acquiring the lab that genotypes much of the rest of the industry. That’s the stack. On one page.
Leverage point
What it is
Key figure
Status / trigger date
The test
Clarifide Plus genomic panel
$43 / Holstein head
Holstein Assn. USA member rate, May 1, 2026
The index
DWP$ (Dairy Wellness Profit$)
Z_MI + DWP$ Heat sub-index added
April 2026
The lab
Neogen animal genomics (GeneSeek, Igenity, GGP)
$160M acquisition, ~$90M annual revenue
Close expected H2 2026, pending regulatory approval
The processor
Danone Partner for Growth preferred provider
DWP$ as selection index
Active; expanded for scope 3 reporting
What 75 Years of Member-Owners Actually Built
Three generations of dairy farmers pooled capital, semen, risk, and bull power so no single member would have to face the genetics market alone. Genex/CRI. Semex. Select Sires-affiliated co-ops — different banners, same logic. Member-owned, member-governed, member-equity. The genotyping pipeline that feeds every NM$ proof you’ve ever read off a sire summary was built on that infrastructure. What’s at stake in the post-GeneSeek environment isn’t whether your cooperative survives. It’s whether the genotyping data, the female reference population your co-op contributes to, and the negotiating leverage your manager carries into a Danone or Saputo or Schreiber meeting — whether all of that stays member-controlled, or gets routed around inside 18 months. That’s not a Zoetis policy question. It’s a member-governance question. And it’s the one your district director almost certainly hasn’t been asked yet.
To be fair to the boards at the major cooperatives, they’re navigating something the cooperative system wasn’t built for. Corporate entities move at the speed of capital. Cooperatives move at the speed of consensus — that’s a feature, not a bug, and it’s the same governance model that built the negotiating leverage worth protecting in the first place. But in 2026, consensus is a luxury members can no longer afford to wait through quietly. The fairness is real. The clock is also real. Both can be true.
Two Questions to Bring to Your Next District Meeting
This is the action that matters most this month. Open the notes app on your phone. Type these two questions out. Read them aloud in front of the room when the floor opens for member questions:
“What’s our plan to own or control female genotyping capacity so members aren’t dependent on a single outside provider for health and fertility genetic gain after the GeneSeek close?”
Write the answer down. Date it. A serious answer names specific partners — Embrapa, Trans Ova, a domestic IVF lab — with dollar commitments and timelines beating 2028. An answer without partners, dollars, or dates is a signal to keep asking. Re-raise in 90 days. Document each round.
Boards move when members raise issues. The question is whether you’re the member raising this one.
What Data Are Processors Actually Building Their Scope 3 Programs Around?
A 2025 Zoetis–Dairy Management Inc. study published in the Journal of Dairy Science— “Reduction of environmental effects through genetic selection” — analyzed cows from the top and bottom DWP$ quartiles across 11 U.S. commercial dairies. Top-quartile cows produced 12.9% lower methane intensity, 9.5% lower manure nitrogen intensity, 7.3% lower phosphorus intensity, and 18.1% lower herd turnover than bottom-quartile herdmates. That’s the dataset processors are now building scope 3 programs around.
Whether your milk check rewards those exact traits is a different question. Whether your cooperative has a counter-proof on the table is a third.
How DWP$, NM$ and TPI Differ on the Traits Processors Now Care About
Trait category
DWP$ (Zoetis)
NM$ (CDCB)
TPI (Holstein Assn.)
Methane efficiency
Direct trait (Z_MI), added 2026
Not a direct trait in 2025 NM$ revision
Not a direct trait weight
Heat resilience
Direct sub-index (DWP$ Heat), added 2026
Indirect (fertility, livability)
Indirect (fertility, longevity)
Wellness traits
Signature, heavy weighting
Captured via Health$ subindex
Limited direct weighting
Components (fat, protein)
Balanced vs wellness/longevity
Substantial weight
Heaviest weight historically
Productive Life
Strong weight
Strong weight
Strong weight
Type / Conformation
Modest direct weight
Modest direct weight
Heaviest of the three
Direction, not exact percentages. Each index answers a different question. Your milk check decides which one matters most. Your co-op’s catalog depth decides whether you have alternatives.
How Much Is the Processor Premium Really Worth on Your Operation?
Here’s the barn math. Plug your own herd into one of these and see where the net-out lands.
Scenario A — 1,500-cow Holstein operation, 90 lb/cow/day
Input
Value
Cows in milk
1,500
Daily production per cow
90 lb (above the U.S. herd average of ~66–67 lb/day implied by USDA NASS Milk Production, late 2025)²
Total annual production
49,275,000 lb = 492,750 cwt
Premium at $0.20/cwt
$98,550
Annual Clarifide Plus testing (1,500 × 35% × $43)³
~$22,575
Net at $0.20/cwt before sexed-semen differential
~$75,975
Scenario B — 250-cow Midwest herd, 80 lb/cow/day
Input
Value
Cows in milk
250
Daily production per cow
80 lb
Total annual production
7,300,000 lb = 73,000 cwt
Premium at $0.15/cwt
$10,950
Annual Clarifide Plus testing (250 × 35% × $43)³
~$3,763
Net at $0.15/cwt before sexed-semen differential
~$7,187
These are gross figures. Before the sexed-semen price differential. Before any component-yield drift if your contract pays butterfat and protein harder than DWP$ weights them. Before any year-one Danone signing subsidy.
The 1,500-cow operation has the volume to absorb the friction. The 250-cow operation is one bad component-pay swing from breakeven. If you’re a Wisconsin cheese-milk herd paid hard on components, or a Southern operation whose biggest profit leak is summer fertility — exactly the herds Zoetis is targeting with DWP$ Heat — DWP$ alignment may or may not match how your milk check actually gets built. Run your own math against your own contract before you renew.
Where Will Catalog Pressure Show Up First in Your AI Rep’s Order Sheet?
Indexes improve by consuming data. The one with preferred-provider testing across thousands of farms refines itself faster than one relying on voluntary contributions. Over five to seven years, in our analysis, DWP$ is on track to lead among major U.S. indexes on the traits processors care about — methane, feed efficiency, wellness — because of Zoetis’s vertically integrated testing-plus-index position. The 2025 JDS study is the first peer-reviewed proof point for that thesis.
The compounding runs downstream fast. More processors layer in Clarifide. Studs feel pressure to shift young-sire sampling toward DWP$-ranking bulls. Sampling slots are finite. A slot that doesn’t fit processor demand is a slot unlikely to recover cost.
That’s not Zoetis policy in any direct sense. It’s market dynamics responding to a structural shift. By April 2026, in our analysis of the public NAAB genomic young-sire list, the top tier of genomic Net Merit young bulls in the U.S. showed sharp concentration in a single stud’s NAAB code (methodology available on request). That’s the precedent for what catalog compression looks like when it works through to a published bull list.
NAAB’s 2025 year-end report shows U.S. bovine semen sales down roughly 4% year-over-year. Export value reached a record $327.6 million even as total export units fell. China exited the U.S. market in early 2025. Dairy units exported settled at 28.3 million; beef exports rose to 5.5 million. U.S. genetics now reach 124 countries, up from 108 the prior year — and a clear majority of all dairy semen produced by NAAB members in 2025 left the country.
The structural pressure to watch is catalog compression outside the flagship top tier. The bulls most exposed in your cooperative’s next two catalogs are the slot 40–80 specialists: outcross health-trait sires, daughter-pregnancy-rate-leading bulls without methane-efficiency rank, show-type longevity sires whose proofs were built around classification rather than wellness data, A2A2-plus-component specialty sires for cheese-milk niches DWP$ doesn’t reward. That’s our read, not NAAB-confirmed sampling-mix data. Your cooperative’s next two catalogs will tell you if it’s right.
Pull slots 40–80 in the next catalog. Count what’s missing.
Options and Trade-Offs
Pick the path that fits how your milk check is built and how much room you’ve still got.
Path 1 — Participate with a parallel scorecard. Stay in Clarifide/DWP$ for processor compliance. Run your own mating logic underneath it, weighted to what your milk check actually pays for. Works when the processor premium is meaningful and your contract pays traits DWP$ underweights. Requires a breeding consultant or software workflow that shows DWP$ and NM$ rankings side by side. The risk: your AI rep’s default view is DWP$-framed. You have to actively ask for the second view every time.
Path 2 — Diversify your testing providers now, while you still can. Before you renew any testing contract, negotiate data-portability terms or split testing between Clarifide and an alternative — Neogen-GeneSeek pre-close, CDCB-based panels, a cooperative-run program. The H2 2026 close narrows the window on pre-close options. The risk: your nutrition software, vet platform, and mating program increasingly default to one data feed. Break one integration and three break with it.
The Switching-Cost Trap — read this before you sign anything.
The harder cost in Path 2 isn’t the per-head test fee. It’s what happens to three years of historical rankings if you switch later.
Genomic indexes don’t translate cleanly across providers. The underlying SNP genotype usually does — once a genotype is on file with CDCB, it gets imputed to the same 80K-marker reference base regardless of which chip generated it. What doesn’t translate is the index ranking. DWP$ is Zoetis. NM$ is CDCB. TPI is Holstein Association. Each one weights traits differently, and a cow’s rank on one is not her rank on another.
So if you stay on Clarifide for three breeding crops and then want to move to a CDCB-based panel or a co-op program, the question isn’t whether to re-test the cattle. It’s whether your testing contract gives you export rights to the raw SNP file — and whether your genotypes were deposited with CDCB at the time of original testing. With those two boxes checked, a parallel evaluation costs a fraction of a re-test. Without them, you’re stuck either re-pulling samples or accepting that your historical DWP$ rankings and your forward-going scorecard live on different rulers.
Before you sign any testing contract this year, ask three questions in writing: Who owns the genotype file? Can you receive the raw SNP data, not just the index output? And can you re-run that data through a competing index without paying for a second test? Get the answers in the contract, not over the phone.
Path 3 — Source heat-tolerant genetics directly. If you’re in the South, parts of the West, or the lower Midwest, build a relationship with a Brazilian genetics supplier or a domestic IVF program working with Gyr-Holstein or SLICK-edited genetics. Trigger: summer THI in the upper-70s-to-low-80s range across an extended window — roughly where Zoetis itself recommends DWP$ Heat — and conception rates dropping by more than 5 percentage points across three consecutive summers. The risk: your traditional cooperative supplier probably can’t serve this need, creating a sourcing split you’ll need to manage.
Worth saying plainly as we head into the May–September heat window: DWP$ Heat is a software answer to a hardware problem. Genomic selection inside an existing Holstein population can shift what your daughters inherit at the margin. It cannot change what a Holstein is — a black-and-white animal selected over 75 years for cool-climate fluid-milk production, with body mass and coat type that limit how she dissipates heat at peak summer THI. Gyr-Holstein crosses and SLICK-edited cattle are a different physical platform: shorter coats, smaller body mass, sweat-gland density bred for the tropics. The honest question isn’t “is my DWP$ Heat score high enough?” It’s “do I need a different cow?” For most herds the answer is no — Holsteins still pay best where heat stress is occasional. For Florida, South Texas, Arizona, and the southern San Joaquin, where the answer is increasingly maybe, the Path 3 conversation isn’t optional anymore.
Path 4 — Stay loud at the cooperative. This is the 30-day action. The two questions earlier in this article aren’t a one-time ask. Walk them into the next district meeting on your calendar. Bring them on your phone. Read them aloud. Write the answer down, date it. Talk to two neighbors before the meeting and ask them to do the same. Re-raise in 90 days. Boards respond to repeated, specific, member-coordinated pressure. They do not respond to a single member raising an issue once. The cost is your time and a little social friction. The alternative is having the answer handed to you in 2028 by someone who wasn’t elected by your district.
The 30/90/365 Horizon
Horizon
Action
Trigger
30 days
Read data-ownership clauses (raw SNP file, portability, re-run rights); bring district-meeting questions; talk to two neighbors
Renewal letter on file or expected within 12 months
90 days
Negotiate portability terms; open tropical-genetics conversation; re-raise at next district meeting
THI / fertility decline ORrenewal date inside H2 2026
365 days
Track slots 40–80; commit to scorecard or diversification path; document board responses
Next two catalog cycles published
Key Takeaways
If your processor has mentioned Clarifide, sustainability testing, or scope 3 reporting in any conversation this year, assume a similar letter could land within 6 to 18 months. Negotiate data-portability terms — including raw SNP file access — before you sign, not after.
If DWP$ rankings on your last 30 sire selections diverge from your NM$ or TPI rankings by more than your milk-check structure can absorb, you’re breeding against a scorecard that doesn’t match how you get paid.
If your summer conception rate has dropped more than 5 points across three consecutive summers, the question isn’t whether to chase a higher DWP$ Heat score. It’s whether the Holstein is the right physical platform for your zip code at all. Put tropical, SLICK-edited, or DWP$ Heat-aligned genetics on your supplier conversations this quarter.
If your cooperative can’t name partners, dollar commitments, and timelines when asked the Path 4 questions, treat that as an unanswered question. Re-raise in 90 days. Keep asking.
If thinning shows up at slots 40–80 in your cooperative’s next two catalogs, that’s the leading indicator of R&D compression — visible 18 to 24 months before it shows up in flagship marketing.
What Kind of Cooperative Do You Want to Belong to in 2030?
Three generations of dairy farmers decided no member should face the genetics market alone. That decision built shared genotyping pipelines, member-owned data, and the negotiating leverage that has kept U.S. genetics competitive in 124 export markets and in your own barn. None of that is guaranteed to survive a structural shift it doesn’t see coming.
The cow-level economics — full DWP$-versus-NM$ math broken down by contract type and herd size — live in next week’s Bullvine Weekly. That’s where the spreadsheet sits: plug in your own components, your own premium, your own replacement rate, and see where the net-out lands.
But the question that actually matters this month isn’t the spreadsheet. It’s the one you bring to your next district meeting, in front of the neighbors whose kids might still be milking cows in 2050. What kind of cooperative do you want them to belong to?
Editorial note: This article reflects publicly available information as of May 1, 2026. Updates and any post-publication responses will be reflected in subsequent coverage.
¹ Holstein Association USA, Genomic Testing Services price schedule, accessed May 1, 2026: Clarifide Plus Medium-Density SNP Test + Dairy Wellness Traits & Polled at $43 per Holstein animal (member rate). Industry-wide practical costs typically run $40–$50 per head depending on volume and program tier.
² USDA NASS Milk Production monthly report, late-2025 release: U.S. average production per cow for the most recent reported month was 1,963 lb, putting annualized U.S. herd-average in the 24,000–24,400 lb/cow/year band, equivalent to roughly 66–67 lb/day on a steady-state basis.
³ 35% reflects a typical Holstein heifer-replacement rate; operations generally run 30–40% depending on cull rate. Figures rounded to the nearest dollar; testing-cost rows reflect 35% of milking herd as a straight multiplier. Adjust to your own heifer inventory before applying.
Disclaimer: The Zoetis–Neogen $160 million transaction is structural in scope, but individual outcomes vary by state, processor contract, regional milk pricing, herd size, and cooperative affiliation. The barn-math figures above are illustrative benchmarks, not universal forecasts. Run your own numbers against your own contract before any breeding, testing, or supplier decision.
The Dairy Mirage: How the Industry’s ‘Fixes’ Are Finishing Off the Farmer — Dismantles the illusion that industry ‘solutions’—from co-ops to proprietary indices—are designed for your benefit. Exposes the extraction system that profits from farm losses, urging a pivot toward scale or specialization before the system cashes you out.
Every week, thousands of producers, breeders, and industry insiders open Bullvine Weekly for genetics insights, market shifts, and profit strategies they won’t find anywhere else. One email. Five minutes. Smarter decisions all week.
On a 300‑cow Wisconsin dairy, the milk‑replacer invoice said: “smart.” The heifer ledger quietly said the opposite.
Dave runs 300 Holsteins in central Wisconsin. For nearly a decade, he weaned every calf at 42 days and figured he was saving about $55 per head on milk replacer compared with an 8‑week program — roughly $6,600 a year across 120 heifers.
On the milk‑replacer invoice, that math looked good. When his vet put a $260 price tag on each pneumonia case, and they walked through what that did to age at first calving, the ledger flipped. The “cheap” 6‑week program looked a lot more like an $11,000 drag on the heifer enterprise.
Where Dave’s $6,600 Weaning “Savings” Actually Came From
Start with what Dave was paying for liquid feed.
He was on a 20/20 all‑milk replacer. His contracted price sat around $1.80 per pound — right in the middle of what many dairies are seeing, with 50‑lb bags often running from the mid‑$60s to the $120 range depending on formulation and brand.
His 6‑week program looked like this:
1.25 lb/day of milk replacer powder
42 days on milk
1.25 × 42 = 52.5 lb of powder per calf
At $1.80/lb:
52.5 lb × $1.80 = $94.50, call it $94 per calf
An 8‑week scenario at a slightly higher feeding rate:
1.5 lb/day of powder
56 days on milk
1.5 × 56 = 84 lb of powder
At the same $1.80/lb:
84 lb × $1.80 = $151.20, call it $151 per calf
On paper:
6‑week: ≈ $94/head
8‑week: ≈ $151/head
That’s a $55/head difference. Across 120 heifers a year:
120 × $55 ≈ $6,600 per year
If you stop the spreadsheet at day 42 or 56 and never look past the bottle, you’d call that a win.
Dave’s vet didn’t start with rumen theory. He started with the sick sheet.
“How many calves are you actually treating for pneumonia after weaning?” he asked.
Over the previous couple of years, Dave’s records showed roughly 20% of his heifers — about one in five — were treated for BRD in the 30 days after weaning. Not every respiratory case hits right after the last bottle, but that’s where the spike was.
Like most producers, Dave guessed those cases cost him forty or fifty bucks each. A couple of drugs, a vet call, and some extra labor.
A 2020 paper in Animal Health Research Reviews priced it differently. Overton and colleagues looked at 104,100 U.S. dairy replacement heifers and compared animals with and without a BRD history in the first 120 days of life. They reported:
36.6% of heifers had at least one BRD case in that early‑life window.
The estimated cost per incident BRD case was about $252 or $282 per heifer, depending on whether anticipated future milk differences were included.
That cost rolled in:
Treatment drugs and vet time
Lost growth and delayed breeding
Higher culling risk as heifer and cow
Lower first‑lactation milk in affected animals
So the drugs are the cheapest part of the bill.
To keep the math grounded, Dave and his vet agreed on $260 per BRD case as a working number — basically the midpoint of the $252–282 range.
On 120 heifers a year, with a 20% post‑weaning BRD rate:
20% of 120 = 24 cases
24 × $260 = $6,240 per year in BRD cost
Compare that to the milk line:
Milk‑replacer “savings”: $6,600/year
BRD cost: $6,240/year
On Dave’s books, the money he “saved” on milk replacer was almost entirely eaten by pneumonia, before they even put a number on delayed calving.
Rumen Biology Doesn’t Care About Your Calendar
The next question was simple: “Why are so many calves getting sick after weaning?”
Dave’s nutritionist pulled out rumen‑development work from Jim Quigley and the latest weaning review from Aarhus University.
Quigley, through Calf Notes and a 2019 Journal of Dairy Science review, has pushed a specific biological threshold: a calf needs roughly 15 kg of cumulative non‑fiber carbohydrates (NFC) from starter — about 33 lb of fermentable carbohydrate — before the rumen is truly ready to take over.
The Bullvine walked through his math earlier this year:
On a typical 8‑week program with 6 L of milk per day, many calves only get to around 11.5–13 kg of cumulative NFC from the starter by day 56 — 1.5–3.5 kg short of the 15 kg target.
On higher‑milk programs, calves often don’t hit that 15 kg NFC mark until week 9 or 10, because liquid keeps them full and slows grain intake.
A 2024 systematic review in the Journal of Dairy Science by Welk, Neave, and Jensen compiled 44 studies on weaning practices. Their conclusions matched the barn experience:
Calves weaned later, over longer durations, based on starter intake, or using step‑down milk removal, were more likely to show positive growth and intake responses.
Weaning based on starter intake produced superior growth and feed intake compared with fixed‑age, earlier weaning.
When pre‑weaning milk allowances were adequate (over about 6 L/day), weaning after 8 weeks supported superior weight gain.
At 42 days, when Dave pulled the last bottle, most of his calves were barely at a pound of starter a day. Some less. Nowhere near the 2+ lb/day that corresponds to Quigley’s 15 kg NFC target over time.
The milk disappeared anyway.
Extension recommendations from Penn State, Cornell, and the Canadian Dairy Code of Practice all push in the same direction: don’t fully wean Holstein‑size calves until they’re consistently eating roughly 2–3 lb of starter per day for several consecutive days. That’s just a practical way of making sure biology has caught up.
When you wean on a calendar date instead of an intake gate, you’re betting that rumen development is done just because the chart says “day 42.”
How a Rough Weaning Turns Into a 25‑Month Calving Problem
The pneumonia cases were obvious. The weaning slump was there too: calves coughing, sulking, backing off the starter for a week or ten days, then slowly coming around.
What wasn’t obvious was how those ten days of weaning showed up in the heifer yard.
The Welk review and several individual trials report that calves weaned later and more gradually not only eat more starter but also gain more weight per day around weaning and carry a bodyweight advantage through the post‑weaning period, especially when milk is generous pre‑weaning. Those gaps don’t magically close.
Now put heifer economics on top of that biology.
Iowa State University’s 2024 “What’s it Cost to Raise Your Dairy Best Heifer?” budget for a conventional 26,000‑lb herd shows:
Total cost to raise a heifer to 24 months: about $2,651
Daily heifer cost: roughly $2.65/head/day when you underload labor, up to about $3.15/head/day when labor is fully charged
The same ISU sheet runs the economics of tightening that up:
Cutting the heifer‑raising period from 24 to 23 months saves about $93 per heifer.
Work it the other way:
Take a midpoint of $2.75 per day
One extra month ≈ 30 × $2.75 = $82.50 per heifer
When Dave’s team pulled his calving records, plenty of heifers were freshening closer to 25 months than 24. Many of those files carried simple notes like “small, waited.”
60 × $82.50 ≈ $4,950 per year in extra heifer costs
Stack that on top of the BRD bill:
BRD: $6,240/year
Extra heifer month: $4,950/year
Total downstream cost: $11,190/year
Compare that to the weaning savings:
Milk‑replacer “savings”: $6,600/year
BRD + AFC cost: $11,190/year
On Dave’s farm, the 6‑week calendar program wasn’t saving money. It was quietly burning about ,600 a year once the heifer and health costs were on the same page.
For simplicity, Dave’s team rounded this up to about $1,500 per year to stay close to ISU’s $93 per heifer‑month and acknowledge some extra variation.
Total:
$18,120 + $1,560 + ~$1,500 ≈ $21,180 per year
Even with conservative rounding, the intake‑based 7–8‑week program came out roughly $1,300/year cheaper than the old 6‑week system on Dave’s farm.
Change the incidence rates or costs, and the gap will move. In some herds with very low BRD and tight AFC, 6‑week weaning might still hold its own on a full ledger.
The point is: until you put your own numbers into a similar layout, you’re guessing.
Why Those Dollars Matter More at $3,000 Heifer Values
If replacements were cheap and plentiful, you might treat this like a nice‑to‑have improvement.
That’s not the market you’re in.
USDA’s Agricultural Prices reports and Ag Proud coverage show U.S. replacement cow prices averaging about $3,110 per head in October 2025, up roughly 3% from July and 16% from October 2024. By early 2026, averages had eased to around $2,860, but they were still high compared with prior years.
A Bullvine analysis across multiple datasets pegged average replacement heifers at about $3,010 per head in early 2026, with U.S. heifer inventories likely to tighten further before any meaningful rebuild around 2027.
At those values, every replacement in your place quietly carries a $2,800–$3,100 asset tag.
A BRD case that knocks a heifer out of your pipeline or drags down her first‑lactation performance is not just a sick‑calf problem. It’s an equity decision.
The same goes for age at first calving. If your heifers are freshening closer to 25 months than 22–24, you’re not just feeding a little extra grain. You’re tying up capital in animals that aren’t milking yet.
So the real question stops being, “How can I save $55 per calf on milk replacer?”
It becomes:
“At $3,000 per heifer, how much BRD and delayed calving am I willing to buy for a milk‑replacer ‘savings’ that only shows up if I ignore biology and time?”
What Changed in Dave’s Barn: From Calendar to Intake
Dave didn’t flip his program because somebody told him 6‑week weaning was “wrong.” He changed because his own numbers — and a few published ones — said the calendar was costing him.
The decision they made was simple:
The calendar no longer decides when a calf is weaned.
The calf’s starter intake does.
Three practical changes were made that are real.
1. Intake Became a Gate, Not a Guess
They added one line to the calf card:
“3 days at ~2 lb starter before full wean? Y/N”
Then they did a five‑minute exercise:
Weighed a full scoop of their calf starter and wrote on the wall: “1 scoop ≈ X lb.”
From that point forward:
No calf was fully weaned until she had eaten roughly 2 lb of starter per day for three consecutive days — verified with the scoop.
If she wasn’t there at day 42, she kept her last feeding until she hit that gate.
This lines up with Quigley’s 15 kg NFC concept — calves need to accumulate around 31–34 kg of starter at typical NFC levels to reach that threshold — and with Drackley’s extension‑level recommendation of ≥1.5 kg/day (3.3 lb) of starter dry matter for several days before full weaning.
It also mirrors what Penn State, Cornell, and the Canadian Code of Practice have been saying in plainer language: use starter intake as your weaning trigger, not age alone.
2. They Stretched Weaning Into a Planned 10–14‑Day Step‑Down
Cut milk volume by about 50%, roughly two weeks before the earliest possible weaning window.
Held that reduced feeding while watching starter intake.
Pulled the last feeding only after the intake gate was met.
In practice, that meant:
Step‑down starting somewhere in week 6
Full weaning happens in week 7 or 8 for most calves, depending on their starter intake
That’s exactly the pattern the 2024 Welk review found supported smoother growth: calves weaned later, over longer durations, and based on intake had better performance through the transition, particularly when pre‑weaning milk allowances were higher.
3. They Changed the Starter to Pay for the Program
The last piece was feed, not philosophy.
Dave and his nutritionist swapped out a fine, dusty pellet for a textured starter with visible grain and enough fermentable starch to actually drive rumen development. If you want calves to hit 2 lb/day before weaning, the starter has to be something they want to eat.
They also moved to a starter that included a Saccharomyces cerevisiae fermentation product (SCFP). A 2022 Journal of Dairy Science trial found that calves fed SCFP had better post‑weaning growth and feed efficiency and required fewer respiratory treatments through four months of age, even though pre‑weaning gains were similar between groups. A 2024 review on SCFP as a postbiotic outlined how these products may support immune and rumen function in calves and cows.
Weaning Feature
6‑Week Calendar Program
Intake‑Based 7–8 Week Program
Weaning trigger
Fixed age (42 days)
Starter intake (~2 lb/day × 3 days)
Weaning duration
Abrupt, <3 days step‑down
Planned 10–14 day step‑down
Post‑weaning BRD in first 30 days
20% of heifers (24/120)
5% of heifers (6/120)
Typical starter intake at full wean
Often <1 lb/day
2–3 lb/day
Heifers calving ≥1 month late (per yr)
60 head
30 head (about 10 days late)
Annual extra AFC + BRD cost
≈$11,190
≈$3,060
You can waste a lot of money on additives that don’t pay. In this case, the economics looked reasonable:
If better palatability and SCFP‑supported gut health pull starter intake forward and trim just a handful of $252–282 BRD cases per year.
The extra cost of a higher‑end starter becomes cheap insurance relative to $3,000 heifers.
Three Economic Paths for Your Weaning Program
Not every herd is Dave’s herd. Your BRD rates, milk replacer price, labor, and heifer inventory pressure will look different.
But the decision paths are similar.
Path 1: Defend 6‑Week Weaning With Your Own Data
Early weaning can still make economic sense in some herds.
When this path works:
Your post‑weaning BRD incidence in the first 30 days is consistently in the single digits.
Calves are reliably eating 2+ lb of starter per day by day 40–42.
Your heifers are calving around 22–24 months without a pattern of “small, waited” notes.
What it demands:
At least 12–24 months of calf treatment and AFC records you actually trust.
A simple intake check to avoid assuming calves are at 2+ lb when they aren’t.
If those numbers look good, your 6‑week program may genuinely be a savings strategy rather than a hidden cost.
If you don’t have the records, you’re not defending 6‑week weaning. You’re just hoping it’s fine.
Path 2: Triage High‑Risk Calves Into 7–8‑Week Intake‑Based Weaning
You don’t have to flip the whole calf barn at once.
Triage play:
Keep the 6‑week target as your default on paper.
Any calf that hasn’t hit your 2 lb/day intake gate by day 40–42 gets pushed into a 10–14‑day step‑down and weaned later, once she meets the gate.
Track BRD and 90‑day weights for this group separately.
Economics:
You spend more milk replacer only on calves that are biologically behind the curve.
These are often the same calves driving your post‑weaning BRD and extra heifer months, so improvements here have outsized ROI.
This path works well for herds that have:
Reasonable calf labor and discipline.
Chronic trouble with a specific band of high‑risk calves.
Path 3: Redesign Weaning Around Heifer ROI and $3,000 Replacements
If your post‑weaning BRD rate is in the teens or higher and your average AFC is drifting toward 24.5–25+ months, it may be time for a full reset.
What a redesign includes:
A standard intake gate (for example, “3 days at ~2 lb starter before full wean”).
A built‑in 10–14‑day step‑down that fits your chore rhythm.
A starter that calves actually consume, with formulation aimed at hitting Quigley’s 15 kg NFC before milk disappears.
Routine pricing of BRD and heifer days off your own numbers — not generic assumptions — at least once a year.
When this path pays fastest:
You’re raising your own replacements in a high heifer‑value environment ($2,800–3,100/head).
You have a clear pattern of post‑weaning disease and delayed calving.
You’re thinking about heifers as capital investments, not just “the young stock.”
What This Means for Your Operation
If your post‑weaning BRD incidence is above roughly 15–20% and you’re weaning at 6 weeks, assume your weaning program is a financial risk, not an efficiency. Once each case is priced around $252–282, and you add the cost of extra heifer days, the milk‑replacer “savings” look a lot like Dave’s — quickly eaten up by disease and delayed calving.
If your average age at first calving is north of 24 months, treat that as a calf‑program red flag, not just a breeding issue. ISU’s 2024 budget puts the cost of an extra heifer month around $80–100, depending on labor. Until you understand why your heifers are late, your biggest heifer‑cost lever is probably in the calf barn.
If you don’t have a simple starter‑intake gate built into your weaning protocol, you’re making a capital decision with no biological checkpoint. A weighed scoop and a “3 days at ~2 lb starter? Y/N” checkbox turn that into a gate you can manage and adjust.
If you’re valuing or buying heifers at $2,800–3,100 and still treating BRD as a $40 problem, you’re underpricing your own risk. Using the $252–282 per‑case economics for heifer BRD puts you in the right ballpark for capital‑level decisions, not just vet‑bill conversations.
If you want a 30‑day move that doesn’t blow up your chores, start with a BRD + AFC audit. In the next month, pull 12–24 months of calf/heifer records, count your BRD cases in the first 120 days (especially the 30 days post‑weaning), calculate your own BRD cost (cases × ~$260), measure how much later BRD heifers calved, and put that next to your milk‑replacer “savings.” That one piece of paper will tell you whether your current weaning program is defensible or overdue for a redesign.
Key Takeaways
If your post‑weaning BRD rate is roughly 15–20% and you’re relying on a 6‑week calendar, the odds are high that you’re not actually saving money on milk replacer once you factor in BRD and delayed calving.The $6,600 that looks like savings in the calf‑feed column can be more than offset by $11,000‑plus in disease and extra heifer days on a 300‑cow herd.
If your average age at first calving is over 24 months, each additional month quietly costs you about $80–100 per heifer. Until that distribution is under control, your fastest heifer‑cost improvement usually sits in intake‑based weaning and grower management, not just semen choice or breeding targets.
If you’re not using starter intake as a weaning gate, your weaning program is a guess, not a strategy.Adding a simple intake trigger and a 10–14‑day step‑down is one of the cheapest, cleanest risk‑management moves you can make in the heifer enterprise.
If you’re handling $3,000 heifers in a tight inventory market, treating pneumonia and late calving as “normal noise” is an equity decision. The question isn’t just “Can we live with it?” It’s “Is this the risk position we want to own at today’s heifer values?”
The Bottom Line
Dave didn’t walk away from the 6‑week weaning because someone told him it was outdated. He walked away because, once he stacked his milk‑replacer spend, post‑weaning BRD cases, and ages at first calving on the same ledger, the numbers said the calendar was quietly burning cash.
If you pulled the same reports for your herd and laid them out side by side, would your weaning program look like a savings strategy — or like a risk position you haven’t really priced yet?
The numbers above are built on a 300-cow Wisconsin example with one contractor milk-replacer price and two BRD incidence scenarios. Your herd runs on different inputs — and the answer changes fast when you swap in your own BRD rate, your own replacer cost, and your own AFC. Use the calculator below to run the same ledger with your numbers.
Learn More
Dairy Calf Nutrition for Healthier, Higher-Producing Cows — Arm your calf crew with a biological timeline of rumen development. This phased implementation protocol maps out the exact milk and starter combinations required to transition calves smoothly, preventing the post-weaning growth crashes that trigger costly respiratory treatments.
$3,010 Per Heifer. 800,000 Short. Your Beef-on-Dairy Bill Is Due. — Follow the money on the national replacement shortage reshaping farm equity. With heifer inventories at historic lows, the math proves why accepting a high post-weaning sickness rate on $3,000 animals is a direct threat to your 2028 milking string.
Dr. Bray’s $5 Sodium Bisulfate Gamble: Zero Lung Lesions and the Real Cost of Calf Barn Ammonia — Dismantle traditional ventilation assumptions using a $5 bedding chemistry protocol. By neutralizing ammonia directly at the calf’s nose level, this unconventional trial delivered zero lung lesions and measurable downstream milk advantages, proving proactive prevention beats any antibiotic.
The Sunday Read Dairy Professionals Don’t Skip.
Every week, thousands of producers, breeders, and industry insiders open Bullvine Weekly for genetics insights, market shifts, and profit strategies they won’t find anywhere else. One email. Five minutes. Smarter decisions all week.
STgen owns 36% of the proven TPI top 100. Select Sires took 29.5% of the genomic top 200. United Sires — an independent breeder partnership founded in 2024 — grabbed 15% of the genomic top 200. And Zoetis just bought the lab pipes everyone else’s DNA flows through.
Three things hit at once on April 7, 2026.
Holstein Association USA detonated a TPI formula change that dropped Garza 125 points, Captain 72, and Sheepster 92 — without a single new daughter. STgen’s elite proven army still owns 36 of the top 100 proven TPI sires even after the formula loss — but the genomic young bull lists tell a different story. Select Sires now owns 59 of the top 200 genomic young bulls (29.5%) — the broadest genomic depth of any single stud. Semex took 40 sires (20%) of the top 200, with 9 of the top 20 spots. United Sires — the breeder-owned independent that launched in 2024 — has grabbed 30 sires (15%) of the top 200 out of nowhere. The genetic galaxy reshuffled overnight.
Meanwhile, the DOJ pulled the Select Sires + STgenetics merger off the shelf and is now “nearing a decision” on whether the largest cooperative distributor in North America gets to merge with the company that owns global sexed-semen patents. And Zoetis — a company that doesn’t sell a single straw of semen — wrote a 0 million check for the lab infrastructure that processes everyone else’s DNA. ABS, meanwhile, completed its full takeover of De Novo Genetics. Three consolidation moves. All upstream of the farmer.
The Bullvine’s position on consolidation hasn’t changed: it’s structural, it’s accelerating, and pretending it isn’t doesn’t help anyone. Whether the DOJ, the FTC, or anyone in Washington is paying attention is another question. The April 2026 sire share analysis isn’t a cleanup of 2025. It’s a structural reset.
Last April we called the run The Force Awakens — an emerging order taking shape, polled and gNM$ rebellions challenging the dominant studs. Twelve months later, the Empire is striking back: STgen holding its proven army through a hostile formula change, Select Sires lining up the largest cooperative consolidation in dairy genetics history, and Zoetis executing a vertical lock on the lab pipes that read everyone’s DNA. The rebels who took the genomic top 20 — Semex’s Progenesis line, a brand-new breeder partnership called United Sires — won a battle. The Empire is positioning to win the war.
Methodology: Same Battlefield, New Rules of Engagement
Following the precedent set in our April 2025 analysis, we again use top 200 sires for genomic TPI, top 100 for proven TPI, and the official Holstein Association USA April 2026 evaluation lists drawn from the official CDCB run published April 7, 2026 (Holstein USA; CDCB).
Holstein Association USA implemented the TPI 2026 formula change in this run — production weights shifted from 19% PTA Protein / 19% PTA Fat to 24% PTA Protein / 14% PTA Fat. That’s a 5-point bump for protein and a 5-point cut for fat. Daughter data didn’t change. The math behind the rankings did. This is the largest single TPI formula adjustment in recent memory, and it explains why bulls who were untouchable in December 2025 dropped 70 to 125 TPI points in April without milking a single new daughter (The Bullvine).
Methodology: All April 2026 stud-share figures in this analysis are independent counts of the official Holstein Association USA April 2026 lists, performed using the official NAAB marketing codes as the source of truth for stud assignment. Genomic TPI counts use the Holstein USA Top 200 TPI® Genomic Young Bulls (April 2026, 85% genomic reliability minimum). Proven TPI counts use the Holstein USA Top 100 TPI Bulls (April 2026, ACTIVE or LIMITED semen status, 80% traditional reliability minimum).
Key NAAB code → marketing organization assignments per the official NAAB table: 1 = GENEX Cooperative; 7/9/14/250/507/509 = Select Sires; 11 = Alta Genetics USA; 29/94 = ABS Global; 97 = CRV Holding; 200/777 = Semex Alliance; 288 = ASCOL; 523/551/646 = STgenetics (Inguran); 596/796 = United Sires, LLC (independent breeder partnership founded 2024); 599/799 = Blondin Sires; 719 = RuAnn Genetics. URUS-owned brands (GENEX, Alta, Jetstream, Trans Ova) are reported as separate codes per NAAB and consolidated where editorially useful. April 2025 baselines were independent counts performed at original publication using a different methodology that lumped some breeder codes together; year-over-year comparisons in this article are made cautiously.
Read that table. Five of the top 10 genomic young bulls in the world are 200HO — Semex Alliance. Two are Select Sires (S-S-I lines). Two are Alta/URUS (Peak AltaGoldenGate, Pen-Col AltaGlimpse). One is United Sires (OCD Whoops Sabotage, 796HO). Zero are STgen. The Progenesis line — Timetraveler, Superfreak, Tapas — locked down the top of the list. The 49-point spread between #1 (3563) and #10 (3514) is statistical noise at 65–80% genomic reliability. But the stud ownership pattern? That’s where the story lives.
Genomic TPI Stud Share — Top 200 Holstein Genomic Young Bulls (Verified Counts)
Stud (NAAB code)
Apr 2026 count
% of top 200
Select Sires (7, 14, 250)
59
29.5%
Semex Alliance (200, 777)
40
20.0%
United Sires (596, 796)
30
15.0%
STgen (523, 551)
27
13.5%
ABS / Genus (29, 94)
12
6.0%
Alta / URUS (11)
11
5.5%
GENEX / URUS (1)
9
4.5%
CRV (97)
8
4.0%
Independents (El Toro 508/708, A.I. Total 515, Genesis MX 706)
URUS umbrella — GENEX (1HO) + Alta (11HO) combined = 20 sires (10.0%), the third-largest cooperative group when consolidated.
Two notes on this table.
First, the April 2025 baseline used a different and less rigorous methodology — it lumped “Sexing Tech / Genosource” with breeder-affiliated codes that have since been revealed by official NAAB lookup to be a different organization entirely. With the corrected NAAB-code accounting, the year-over-year comparison should be read as: STgen alone has 13.5% of the genomic top 200 in April 2026 (down from the 39.5% “STgen / Genosource” lumped figure published in 2025). United Sires LLC — a separately-owned independent breeder partnership founded in 2024 with no ownership relationship to STgen — holds a separate 15.0%. The two are independent organizations with independent ownership and independent NAAB codes.
Second, Semex’s 20% matches their own self-reported claim closely. Their Facebook post on April 10 (Semex) reported “45% of the Top 20, 34% of the Top 50, 26% of the Top 100, 20% of the Top 200.” Our verified counts: 45% of top 20, 34% of top 50, 27% of top 100, 20% of top 200. They were on the money.
If you’re keeping score: the 24P/14F formula change penalized bulls heavy on fat — exactly the profile that built Captain, Garza, and Dominance into STgen’s elite proven army. STgen’s deep gNM$ pipeline still benefits from protein-heavy production traits. But on the genomic young bull TPI list — the leading indicator of where the next proven army comes from — Semex’s Progenesis and Beyond pipelines and Select Sires’ S-S-I and Stagger lines, protein-tilted by design, ate the formula change.
This is the imperial-consolidation reversal nobody scripted. STgen didn’t lose because their bulls got worse. They lost because Holstein Association USA changed what “best” means, and Select Sires, Semex, and a brand-new breeder cooperative were already breeding for the new definition.
Proven TPI: STgen’s Empire Holds Despite the Formula
First, STgen still owns three of the top 8 proven bulls — Dominance, Captain, Garza. Sheepster lost 92 TPI points without losing a daughter. He still sits at rank #1 with 2,359 daughters and 99% reliability. Garza lost 125 points. Captain lost 72. STgen’s elite proven army took the worst formula hit of any stud’s lineup, and they’re still here.
Second, the protein-formula winners are clear. Peak Powerhouse jumped +119 TPI in a single run to become the #2 proven bull in the world (Bullvine). Powerhouse carries the 1HO primary code = GENEX Cooperative (a URUS subsidiary), with secondary URUS codes 511HO and 122HO; the bull is the same Peak-branded URUS production line as the Alta-coded bulls. Peak AltaSamson at #10 carries 11HO = Alta Genetics, also URUS. Combined, URUS owns positions 2 and 10 of the proven top 10. Cookiecutter Horseshoe at #8 is registered under the 208HO Korean code as primary, but the bull is commercially distributed in North America via Semex (secondary codes 200HO and 777HO). Peak Powerstar’s debut at #9 gives Semex a new proven top-10 entry.
Third, the depth still belongs to STgen. 36 of the top 100 proven TPI bulls carry 551HO codes — STgenetics-Inguran, the largest single-stud share in any category we measured.
URUS umbrella — Alta (11HO) + GENEX (1HO) combined = 10 sires (10.0%) of the top 100, tied with ABS/Genus.
STgen’s depth on proven TPI is the most surprising finding in this entire run. Despite Garza, Captain, and Dominance each losing ground to the formula change, the broader STgen pipeline behind those flagship names — Brockington, Capn Miguel, Cap Mad Max, Captn Penza, Cap Volos, Cap Rivera, Capn Rodman, Cap Diggory, and dozens more — held position across the top 100. Select Sires gained ground on the genomic side; STgen held depth on the proven side. Both can be true simultaneously.
Running the Numbers: What the 24P/14F Formula Costs (or Saves) Your Mating Program
Take Garza as the worked example. SDG Cap Garza-ET sat at +3464 TPI in December 2025 and dropped to +3339 TPI in April 2026 — a −125 TPI swing with zero new daughter data. His PTA Fat (+140 lbs) and PTA Protein (+50 lbs) didn’t move. The index weighting did.
Practical impact on a 500-cow Holstein herd: if your mating program selects service sires above a +3400 TPI threshold, Garza was in in December and is out in April — same bull, same daughters, same fertility. Multiply that across STgen’s elite proven army (Captain −72, Dominance −21) plus Sheepster (−92) on the Select Sires side, and roughly 30–40% of a typical commercial farm’s previous top-tier proven sire list now sits below older threshold cutoffs.
The fix is mechanical: drop your TPI cutoff by ~75–125 points, or rebuild your selection from PTA Protein and PTA Fat directly instead of relying on the headline index. The math hasn’t changed for milk in the tank. It’s changed for which bulls your computer flags as elite.
Specialty Forces: Type and Red & White
Headline gTPI and proven TPI tables tell you who’s winning the index war. Specialty rankings tell you who’s winning the niches — the breeders who keep buying for udder, feet, and frame; for component-heavy red herds; for a typier cow regardless of what TPI is doing this April. We’ve cross-referenced the EuroGenes April 2026 ranked top-50 lists for Type (PTAT) and Red & White TPI. Both pull from the same Holstein USA April 2026 evaluation as the headline gTPI lists but isolate subsets that don’t surface in the broader rankings.
Type (PTAT): The Spanish Empire You Forgot About
Rank
Bull
NAAB
TPI
PTAT
Stud
1
Ruann Karat-45955-ET
719HO45955
+2647
+3.92
RuAnn Genetics
2
Shg Lego
515HO00486
+2307
+3.84
A.I. Total (NL)
3
Redcarpet Story Arc-ET
730HO00005
+2215
+3.78
Redcarpet Sires
4
Stone-Front Eyecandy Apollo
288HO00352
+2448
+3.72
ASCOL (Spain)
5
Genosource Seenofear-ET
551HO05904
+2791
+3.71
STgen
6
Jimtown Nelson-ET
288HO00321
+2426
+3.69
ASCOL
7
Curlys Admire
734HO00157
+2600
+3.63
URUS (Jetstream)
8
Eclipse Milio-ET
551HO03708
+1982
+3.58
STgen
9
Eskdale Hulu Shoutout-ET
288HO00364
+2889
+3.56
ASCOL
10
Mr Legacy-Ranch E Atlas-ET
100HO12395
+2423
+3.55
JLG Custom
Source: Drawn from the official Holstein USA April 2026 evaluation.
Type (PTAT) Stud Share — Top 50 Bulls
Stud (NAAB code)
Apr 2026 count
% of top 50
ASCOL (288)
15
30.0%
STgen (523, 551)
7
14.0%
Semex Alliance (200, 777)
6
12.0%
A.I. Total (515)
5
10.0%
Other independents (Showbox 744, Holstein Svc 712, AG3NexGen 733)
6
12.0%
Blondin (799)
2
4.0%
RuAnn (719)
2
4.0%
URUS / Jetstream (734)
2
4.0%
Redcarpet (730)
1
2.0%
ABS / Genus (94)
1
2.0%
Select Sires (250)
1
2.0%
Swissgenetics (196)
1
2.0%
The headline finding is the one nobody outside Europe will see coming: ASCOL — the Spanish breeder cooperative — owns 30% of the top 50 PTAT bulls in the U.S. evaluation, and 3 of the top 10. Stone-Front Eyecandy Apollo, Jimtown Nelson, and Eskdale Hulu Shoutout are all 288HO bulls, all PTAT ≥3.55. STgen has 7 (14%) and a top-10 presence with Genosource Seenofear at #5 and Eclipse Milio at #8. The big U.S. cooperatives — Select Sires (1), ABS (1), GENEX (0) — barely register at the top of the type rankings.
This is not new. PTAT has historically been the most fragmented stud-share category because elite type bulls come from individual breeder programs that license through niche distribution channels rather than the big-five cooperative pipelines. April 2026 just confirms the pattern with verified NAAB-code accounting.
Red & White TPI: ABS’s Quiet Empire
While the gTPI top 200 reshuffled around STgen and Select Sires, the R&W lineup tells a different story — ABS / Genus owns 17 of the top 50 R&W TPI bulls (34%) including 5 of the top 10. The De Novo acquisition is showing up in the rankings.
Rank
Bull
NAAB
TPI
Stud
1
Denovo 21873 Okafor-Red-ET
029HO00951
+3194
ABS / Genus
2
Aprilday Hrok Athens-Red-ET
250HO18217
+3180
Select Sires
3
Stgen Ocean-Red-ET
551HO06846
+3179
STgen
4
Ocd Morris Spirit-Red-ET
551HO06757
+3177
STgen
5
Aprilday Orphs Aesop-Red-ET
029HO00954
+3177
ABS / Genus
6
Sfh Scudetto Red ET
029HO22554
+3177
ABS / Genus
7
3star Patser-Red-ET
200HO08526
+3175
Semex
8
Siemers Rle Papaya-Red-ET
007HO17695
+3174
Select Sires
9
Sfh Saviero Red ET
029HO22562
+3170
ABS / Genus
10
Aprilday Orph Lyon-Red-ET
029HO00956
+3168
ABS / Genus
Source: Drawn from the official Holstein USA April 2026 evaluation.
Red & White TPI Stud Share — Top 50 Bulls
Stud (NAAB code)
Apr 2026 count
% of top 50
ABS / Genus (29, 94)
17
34.0%
STgen (523, 551)
10
20.0%
Select Sires (7, 14, 250)
8
16.0%
Semex Alliance (200, 777)
4
8.0%
JLG / Holstein Svc (100, 712)
3
6.0%
Alta / URUS (11)
2
4.0%
GENEX / URUS (1)
1
2.0%
United Sires (796)
1
2.0%
Other independents (Cogent 522, Inseme 643, A.I. Total 515, Intermizoo 198)
4
8.0%
The story in this table is the consolidation of red-and-white genetics under ABS/Genus’s roof. The top R&W bull, Denovo 21873 Okafor-Red-ET (029HO00951) at +3194 TPI, is a De Novo bull — the same De Novo program ABS completed its full takeover of in early 2026. Five of the top ten R&W bulls carry 029HO codes. Of the next 40, ABS owns another 12. Total: 17 of 50 (34%) — the largest single-stud share in any specialty category we counted.
STgen’s 20% share comes from a different angle. The 551HO R&W lineup — Ocean, Spirit, Red Lion, Redwood-P, Remington, Sizzler, Genosource Morris, Silver-Elite Ferrari, Silver-Elite Malibu — reflects STgen’s bid to keep R&W relevance through the Genosource production pipeline. Select Sires shows up with 8 bulls (16%), led by Aprilday Hrok Athens-Red at #2.
If you breed red Holsteins commercially, the practical implication is straightforward: the R&W elite is concentrating, not fragmenting. ABS, STgen, and Select Sires together own 70% of the top 50 R&W TPI bulls in April 2026. Independent breeder lines that historically carried R&W (Aprilday, Denovo, Genosource, Stgen) are increasingly inside one of those three corporate umbrellas.
The Economic Theater: NM$ and the Sire-Count Totals
TPI is the breeding-decision proxy. Net Merit (NM$) is the dollars-per-cow-per-lactation proxy — USDA’s lifetime profit estimate for a daughter sired by that bull. If TPI tells you who’s winning the index war, NM$ tells you who’s winning the economics. And nobody who reads sire summaries will be surprised by what the NM$ tables show: STgen owns the NM$ rankings the way Saudi Arabia owns crude oil.
Genomic NM$: STgen’s 90% Empire
Rank
Bull
NAAB
NM$
TPI
Stud
1
Genosource Valkyrie-ET
551HO07040
+1308
+3464
STgen
2
Farnear Collateral-ET
551HO07100
+1304
+3410
STgen
Source: April 2026 CDCB / Holstein USA evaluation, top 100 genomic young bulls ranked by Net Merit. NAAB-code-verified.
Genomic NM$ Stud Share — Top 100 Bulls
Stud (NAAB code)
Apr 2026 count
% of top 100
STgen (523, 551, 558)
90
90.0%
Select Sires (7, 14, 250)
4
4.0%
GENEX / URUS (1)
3
3.0%
Semex Alliance (200, 777)
2
2.0%
Alta / URUS (11)
1
1.0%
This is not a typo. 90 of the top 100 genomic NM$ young bulls in the April 2026 evaluation carry STgen NAAB codes (551HO or 558HO). Select Sires has 4. GENEX/URUS has 3. Semex has 2. Alta has 1. Everyone else combined has zero. The Genosource production pipeline — anchored by Captain, Charl, Ripcord, Dominance, and Thorson as foundation sires — is producing genomic young bulls so deep on Net Merit that the rest of the industry barely registers.
This is also the strongest single argument for why the DOJ + Select Sires merger matters. If the deal clears, Select Sires gets distribution rights to 90% of the world’s top genomic NM$ pipeline. If it blocks, every cooperative in North America that wants to sell elite NM$ young bulls has to negotiate with STgen on STgen’s terms.
Proven NM$: A Different Five-Way Fight
The proven NM$ list is a different story — wider, more competitive, and shaped by which studs have managed to get high-NM$ Genosource-pipeline bulls daughter-proven before they age out of relevance.
Proven NM$ Stud Share — Top 100 Bulls
Stud (NAAB code)
Apr 2026 count
% of top 100
STgen (523, 551)
29
29.0%
Select Sires (7, 14)
22
22.0%
GENEX / URUS (1)
18
18.0%
ABS / Genus (29, 94)
17
17.0%
Semex Alliance (200, 777)
7
7.0%
Alta / URUS (11)
7
7.0%
Proven NM$ is the most balanced category in the entire April 2026 analysis. Six studs all sit between 7% and 29%. STgen leads at 29% — their proven Genosource pipeline (Dominance #1, Thorson #2, Garza #3, Captain, Jack, John, Vito, Brockington) sweeps the top of the list. But Select Sires (22%), GENEX/URUS via Peak (18%), and ABS/Genus via De Novo (17%) are all within striking distance. The competitive structure here is healthier than anywhere else in the article — four studs have real depth, and any one of them can compete on commercial pricing.
Total NM$: STgen Owns 60% of Both Lists Combined
When you dedupe the Genomic NM$ Top 100 and the Proven NM$ Top 100 by NAAB code, you get 200 unique sires(no bull appears on both lists at the same time). Of those 200, STgen owns 119.
Total NM$ Stud Share — 200 Unique Sires
Stud
Combined count
% of 200 unique sires
STgen
119
59.5%
Select Sires
26
13.0%
GENEX / URUS
21
10.5%
ABS / Genus
17
8.5%
Semex Alliance
9
4.5%
Alta / URUS
8
4.0%
STgen owns 59.5% of the combined NM$ map. Select Sires — the largest cooperative distributor in North America — owns 13%. URUS umbrella combined (Alta + GENEX) sits at 14.5%. The DOJ decision is, fundamentally, about who gets to sell the 60% slice that STgen currently produces.
The Combined Sire Count: Who Has the Deepest Bench
The per-category tables tell you who’s winning specific battles. The combined-count tables tell you whose bench is deepest — across every list a commercial breeder might shop from. We’ve deduped each combination by NAAB code so a bull that appears on both the TPI and the NM$ list only counts once.
Total TPI — Genomic + Proven Combined (299 Unique Sires)
Stud
Combined count
% of 299 unique sires
Select Sires
82
27.4%
STgen
63
21.1%
Semex Alliance
52
17.4%
United Sires
30
10.0%
ABS / Genus
22
7.4%
Alta / URUS
17
5.7%
GENEX / URUS
13
4.3%
CRV
13
4.3%
Independents
7
2.4%
[CHART: Total TPI — Combined Genomic + Proven (299 Unique Sires), April 2026]
Select Sires owns the broadest TPI footprint at 27.4% of all unique TPI-ranked sires (genomic + proven combined). STgen sits at 21.1% — less depth than NM$ but still substantial. Semex’s 17.4% reflects their genomic top-200 strength (40 bulls). United Sires’ 10% from a single year of operation remains the most surprising data point in the entire analysis.
Total Genomic Sires — All Genomic Lists Combined (288 Unique Sires)
Stud
Combined count
% of 288 unique sires
STgen
108
37.5%
Select Sires
63
21.9%
Semex Alliance
39
13.5%
United Sires
30
10.4%
GENEX / URUS
12
4.2%
Alta / URUS
12
4.2%
ABS / Genus
12
4.2%
CRV
8
2.8%
Independents
4
1.4%
[CHART: Total Genomic Sires — All Genomic Lists Combined (288 Unique Sires), April 2026]
When you combine the Genomic TPI Top 200 and Genomic NM$ Top 100 — deduped — STgen pulls ahead of Select Sires at 37.5% to 21.9%. The NM$ dominance is what does it: 90 STgen genomic NM$ bulls plus 27 STgen genomic TPI bulls, deduped to 108 unique entries. The genomic future, on these two metrics combined, is overwhelmingly Genosource-pipeline genetics.
Total Proven Sires — All Proven Lists Combined (178 Unique Sires)
Stud
Combined count
% of 178 unique sires
STgen
47
26.4%
Select Sires
45
25.3%
ABS / Genus
27
15.2%
GENEX / URUS
22
12.4%
Semex Alliance
16
9.0%
Alta / URUS
13
7.3%
CRV
5
2.8%
Independents
3
1.7%
[CHART: Total Proven Sires — All Proven Lists Combined (178 Unique Sires), April 2026]
Proven sire counts — across both TPI and NM$ — are the most balanced in the entire article. STgen and Select Sires are within one bull of each other (47 vs 45). ABS, GENEX, and Semex all have meaningful proven depth. This is the category most resistant to consolidation pressure: proven sires take 5-7 years to develop, the pipeline can’t be acquired overnight, and four to five studs all have genuine elite proven inventory.
Total Overall — Every NAAB-Verified List Combined (466 Unique Sires)
Stud
Combined count
% of 466 unique sires
STgen
155
33.3%
Select Sires
108
23.2%
Semex Alliance
55
11.8%
ABS / Genus
39
8.4%
GENEX / URUS
34
7.3%
United Sires
30
6.4%
Alta / URUS
25
5.4%
CRV
13
2.8%
Independents
7
1.5%
This is the master scoreboard. Combine the Genomic TPI Top 200, Proven TPI Top 100, Genomic NM$ Top 100, and Proven NM$ Top 100 — dedupe everything by NAAB code — and you get 466 unique elite sires in the April 2026 evaluation. Of those, STgen owns 155 (one in three). Select Sires owns 108 (just under one in four). Together those two studs control 56.5% of the entire elite sire universe.
If the DOJ approves the merger, a single combined entity controls 56.5% of the elite Holstein sire population in North America — by deduplicated NAAB count, across every metric Holstein USA and CDCB rank. Every conversation about whether the merger is pro-competitive or anti-competitive starts with that number — but it’s not the whole story.
What the Rankings Don’t Tell You
We owe readers the second half of this conversation, because the rankings analysis above tells one true thing and is silent on a second, equally true one.
What the rankings tell you: who supplies the bulls that clear the elite-tier reliability and ranking thresholds Holstein USA and CDCB use to publish official lists. That’s a useful filter. If you’re looking for the deepest bench of high-NM$ genomic young bulls, the data says you go to STgen. If you’re looking for the broadest spread of TPI-ranked sires across both genomic and proven categories, you go to Select Sires.
What the rankings do not tell you: how many straws of semen each stud actually sells. And the gap between those two numbers is wider than most articles in our category admit.
The honest read — the one most stud-share articles avoid because it complicates the headline numbers — is that today’s farmers don’t buy semen on an index. They buy on minimum thresholds across multiple traits, then on price, then on relationships, then on what the rep happens to be selling that month. Index rank is a filter on the upstream side; it’s a smaller input to the downstream purchase decision than ranking articles like this one tend to suggest. Senior executives at every major U.S. stud will say that privately. Some will say it on the record. The structural argument is sound, and it’s been sound for at least a decade.
The 4,000-Bull Universe
NAAB’s 2025 year-end report — the official trade-association volume data — puts U.S. bovine semen production at just under 66 million units across all categories (NAAB 2025 Year-End Report, March 11, 2026). Holstein dairy semen alone accounts for roughly 13.8 million units, or 83.5% of total dairy units sold (dairynews.today summary of NAAB 2025).
At an industry-average of roughly 15,000 straws sold per active bull per year, doing the math says the U.S. Holstein semen market requires roughly 4,000 actively-selling bulls to produce that 60-million-unit volume. The Holstein USA Top 200 Genomic + Top 100 Proven combined represents 300 bulls. The combined NM$ Top 200 represents another 200 (with significant overlap to TPI). The full “NAAB-verified elite universe” we counted in the prior section — 466 unique sires — represents roughly 12% of the bulls that actually move semen in the U.S. market.
The other 88% — roughly 3,500 bulls — don’t appear in any of the rankings this article counts. They sell straws anyway, often in significant volume, into market segments the rankings don’t capture.
Twenty Sub-Markets, Not One
The U.S. dairy genetics market isn’t one market. It’s at least 20 sub-markets with overlapping combinations. Every farmer who has shopped a sire catalog already knows this. The rankings industry tends to flatten it:
Component-driven herds buying for fat and protein percentage
Type-focused herds buying for udders, feet, and frame regardless of TPI
Polled-only buyers paying premiums for heterozygous P/PP genetics
Sexed-conventional split decisions varying by parity and reproduction protocol
Beef-on-dairy programs filtering on terminal-cross profitability, not Net Merit
Geographic preferences — a Wisconsin component buyer and a California production buyer don’t shop the same sires
Each of those segments has its own minimum thresholds across multiple traits, its own price ceilings, and its own bull preferences. A bull ranked #50 on the genomic TPI list may be the wrong choice for 18 of those 20 sub-markets and the right choice for two. The rankings are a starting filter, not a buying decision.
Rank Doesn’t Equal Price (or Volume)
The price-list reality every commercial breeder has noticed but the rankings industry rarely addresses: the difference in semen price between a bull ranked #50 and a bull ranked #500 is, on most published stud price lists, pennies. Once a bull clears a buyer’s minimum thresholds — NM$ above some floor, PTA Protein above some floor, fertility and calving ease acceptable — price is determined more by the buyer’s price ceiling than by the bull’s rank. Studs know this. Buyers know this. The rankings industry rarely admits it.
The practical implication: a stud with 90% of the genomic NM$ top 100 does not have 90% of U.S. dairy semen market share. Not 80%. Not 70%. Not even 30%. STgen’s actual share of U.S. domestic dairy semen volume sits in the single digits by NAAB volume data, well below their 33.3% share of the deduplicated elite-rankings universe and dramatically below their 90% genomic NM$ concentration.
ABS Global is the cleanest counter-example. ABS holds roughly 6% of NAAB-verified elite genomic + proven counts (12 genomic top 200 bulls, 10 proven top 100 bulls) but commands a much larger share of actual U.S. straws sold than that ranking presence would suggest — driven by R&W depth (34% of the R&W TPI top 50), polled depth, beef-on-dairy programs, and decades of cooperative-distribution relationships with commercial herds. The rankings undercount ABS’s commercial footprint by a substantial multiple.
The Bigger Consolidation Story Sits at the Lab Level
The rankings analysis above counts bulls. The bull-distribution mergers in the next section reshuffle which studs sell which bulls. But the most consolidated structural shift in U.S. dairy genetics in 2025–26 is happening at a layer most articles in this category don’t even count: the genomic-test labs.
The Zoetis + Neogen GeneSeek merger consolidates the genomic-test infrastructure layer, not the bull-distribution layer. Neogen describes itself in its own filings as a “leader in U.S. beef and dairy genomics,” operating five labs serving 120+ countries with $90 million in annual genomics revenue (Zoetis-Neogen $160M deal coverage, March 2, 2026). Zoetis already operates the Kalamazoo, Michigan, genetics lab that processes a substantial share of CDCB-approved CLARIFIDE Plus tests.
CDCB does not publish lab-by-lab volume breakdowns publicly, so the post-merger Zoetis + Neogen share of CDCB-approved genomic-test volume isn’t independently auditable from open sources. Multiple senior industry executives we’ve talked to put the post-close concentration above 75% of U.S. CDCB-approved genomic test volume. We’re reporting that estimate as the directional industry view, not as a CDCB-published statistic. The directional case is supported by Zoetis’s stated Precision Animal Health strategy, Neogen’s self-description as the dominant U.S. genomics service provider, and the absence of any third CDCB-approved lab operating at comparable scale.
If the post-close concentration is even directionally in that range, the lab-pipe consolidation is a more concentrated structural shift than any of the bull-distribution mergers in this article. Every breeding decision driven by genomic data — whether the test is branded CLARIFIDE Plus, Igenity, GGP, or a breed association card — increasingly flows through one corporate parent’s lab infrastructure. The DOJ + Select Sires + STgenetics decision shapes who sells your bulls. The Zoetis + Neogen close in H2 2026 shapes who reads your DNA. The second is harder to escape than the first.
What This Means for How You Read This Article
Everything in the rankings tables above is verified, NAAB-coded, and accurately describes who supplies bulls that clear Holstein USA’s and CDCB’s elite-tier thresholds in April 2026. None of it tells you what straws are selling, where, at what price, to whom. The rankings are inputs to a small fraction of the buying decision. The actual U.S. dairy semen market is structured by component preferences, R&W demand, polled preference, beef-on-dairy economics, sub-regional buyer relationships, and price ceilings — and most of those signals don’t appear in any ranked list.
The studs who run the largest sire-summary marketing campaigns know this. The breed associations who publish the rankings know this. Now you know it too. Use the rankings as one filter among many, not as a proxy for who controls the market.
The Corporate Battlefield: Three Wars, One Year
Here’s where the April 2026 installment diverges hardest from any prior Stud Wars piece. The sire-share tables tell you who’s winning the bull selection war. The corporate tables tell you who controls the rules.
Battle 1: The DOJ Decision That Reshapes Everything
In August 2023, Select Sires (Plain City, OH) and Inguran LLC — better known as STgenetics — signed a letter of intent to combine production and R&D functions (Select Sires/STgen press release). The deal would marry STgen’s roughly 60 global sexed-semen sorting facilities and the patent-backed SexedULTRA 4M technology with Select Sires’ cooperative distribution to about 30,000 farmer-owners across 27 U.S. states.
The Biden DOJ shelved it. Antitrust concern: combining the dominant sexed-semen technology platform with the dominant cooperative farm-level distribution channel creates dual gatekeeping at both critical bottlenecks.
Then in July 2025, Select Sires’ annual report stated the organization was again pursuing the combination — “hoping for better chances with the second Trump administration” (Farm Progress, April 20, 2026; Beef Magazine, April 24, 2026).
As of April 2026, the DOJ is “nearing a decision.”
If the merger clears: the combined entity pairs the largest U.S. cooperative distribution network with the sexed-semen sorting technology behind roughly 30% of sex-selected semen sold globally. ABS keeps building IntelliGen, CRV keeps running its own sorting facility, and every other stud has to either license the combined entity’s sorting technology or develop independent sorting from scratch. Smaller cooperatives without access to either technology face a hard squeeze.
If the merger blocks again: STgen and Select Sires reach a strategic dead end. STgen has built sorting capacity ahead of demand it expected the merger to channel. Select Sires has been unable to acquire significant intellectual property of its own. Both organizations would need to find new strategic paths in a market where the cost-of-entry for sorting tech is climbing.
This isn’t an academic concern. The DOJ decision changes who can sell what to whom, at what cost, on what timeline, for the next decade. It’s the most consequential pending transaction in North American dairy genetics. And the call is coming.
Battle 2: Zoetis Buys the Pipes
On March 2, 2026, Zoetis Inc. announced a definitive agreement to acquire Neogen Corporation’s animal genomics business for $160 million (Neogen Investor Relations; The Bullvine).
That price — about 1.8× the unit’s annual revenue of roughly $90M — almost undersells what Zoetis is actually buying.
Neogen GeneSeek operates 5 genomic labs (U.S., Brazil, Australia, China, UK), serves customers in 120+ countries, and includes the Igenity and GGP platforms. These labs process DNA tests for AI companies, breed associations, public genetic evaluation systems, and farmers running parentage and genomic predictions. Many of those customers compete directly with Zoetis’s own CLARIFIDE Plus genomic test.
Post-close — expected second half of 2026, pending regulatory clearance — Zoetis owns:
The branded test product (CLARIFIDE Plus, DWP$)
The wellness index used to rank bulls (DWP$ — recently updated to add residual feed intake, methane, and heat resilience traits)
The lab infrastructure that processes competitor DNA
If you’re a breed association routing samples through GeneSeek labs, those labs are now owned by the company whose proprietary index (DWP$) competes with your association’s official rankings. If you’re a non-Zoetis AI company, the lab handling your young-bull screening and parentage tests just changed parents. If you’re a farmer on a Danone supply contract, the company that mandated your CLARIFIDE Plus testing also owns the lab pipeline behind it — same vendor, both ends.
This is the kind of structural move that doesn’t show up in NAAB volume tables but reshapes who has leverage at every contract negotiation for the next decade. No DOJ challenge has been announced. The deal is on track to close on Zoetis’s timeline.
Battle 3: The Gene-Editing Door Opens
On April 30, 2025, the U.S. FDA granted approval to Genus PIC’s PRRS-resistant pig (PIC press release; National Hog Farmer). On January 23, 2026, Health Canada and CFIA followed (PIC).
That’s the first FDA approval for a gene-edited food animal — period. Bigger context: Genus PLC went on to form an accelerated joint venture with Beijing Capital Agribusiness for PIC China (51% BCA / 49% Genus, formed January 31, 2026), receiving $160M in gross cash on the deal (Genus plc preliminary results; Vox Markets).
For dairy cattle genetics, the implications are direct:
The regulatory pathway works. The FDA “low-risk determination” framework is no longer theoretical. It’s been used.
The constraint on commercial gene-edited cattle is no longer FDA approval — it’s processor and retailer acceptance.
The Genus China JV structure is a working template for getting gene-edited livestock genetics into restricted markets.
Acceligen’s PRLR-SLICK heat-tolerant cattle got their FDA low-risk determination back in 2022 (FDA risk assessment). Brazil’s CTNBio approved gene-edited Holsteins in 2023, and commercial herds are in production. The UK Precision Breeding Act took full effect on November 13, 2025, covering livestock. The EU reached provisional agreement on its New Genomic Techniques regulation on December 4, 2025 — focused initially on plants, with livestock to follow.
For Stud Wars purposes: gene editing isn’t the stud-versus-stud fight yet. It’s the regulatory ceiling everyone’s waiting on. April 2025 to April 2026 is the year that ceiling started moving up.
The IVF Sub-War: URUS vs. Semex
While the headlines went to mergers and gene editing, Trans Ova Genetics (URUS subsidiary) and Boviteq (Semex subsidiary) executed parallel franchise-style IVF expansion campaigns through 2025 and into 2026. The independent IVF market is being divided between URUS and Semex on a country-by-country basis.
Operator
2025–2026 Moves
Trans Ova (URUS)
Acquired ReproLogix (Sept 2025); Quebec IVF lab with Evolygen (Sept 2025); Saskatchewan lab with Bovigen (Mar 2026); Ireland Extension Site with Target Genetics (Mar 2026); small-ruminant expansion with RSG (Mar 2026)
Boviteq (Semex)
Nosawa as Japan licensee (Jan 2025); Boviteq Arizona OPU/IVF lab at Arizona Dairy Co. (May 2025); Diamond Genetics as Netherlands partner (Feb 2026)
Vytelle, the largest non-aligned IVF player, hasn’t announced new funding in our research window but stayed active at CattleCon and rolled out its Vytelle.io data platform and ASSURE recipient screening tool (Vytelle). The independent IVF lane is narrowing.
On December 19, 2025, Semex purchased Semex Holland from Bles Dairies, effective December 31, 2025, adding direct distribution in the Netherlands, Denmark, and Belgium (Semex) — 2.6 million cows of new direct-distribution territory.
CRV (Dutch co-op) announced a 150-FTE restructuring on November 12, 2024, in response to projected decline in Dutch and Belgian dairy/beef cattle numbers (CRV). FY2024–25 results showed €3.8 million operating profit, recovering from a €4.2 million loss the prior year (CRV January 2026 update). On the bull side, CRV’s Terra-Calroy Zuri-ET sits at #5 in the Holstein USA proven top 100 — the only CRV bull in the global proven top 10.
VikingGenetics quietly executed two structural moves that won’t show up in NAAB stats for years: a direct U.S. subsidiary operationalized in 2025, and a first internal IVF lab at the Assentoft bull station in Denmark (VikingGenetics 2024 Annual Report). Total revenue €35.1 million; small absolute numbers, but structurally Viking is positioning for a direct-to-American-farmer model that bypasses traditional U.S. distribution. That’s not an Empire move. That’s a flanking maneuver.
The Volume Game: NAAB 2025 Numbers
Stud market share doesn’t pay anyone’s bills. Semen sales do. The NAAB 2025 year-end report (published March 11, 2026) shows the headline numbers North American studs are working with:
Metric
2025
YoY
Total U.S. bovine semen units
~66M
−4%
Total domestic dairy units
16.5M
+2%
Gender-selected dairy
10.6M
+6%
Gender-selected as % U.S. dairy AI
64%
+3 pts
Conventional dairy domestic
6.0M
−5%
Beef-on-dairy domestic
8.1M
0%
Heterospermic beef (pooled)
~2M
−28%
Total dairy exported
28.3M
−8%
Beef semen exported
5.5M
+13%
Total export value (record)
$327.6M
+0.6%
The story in those numbers: gender-selected dairy semen is now 64% of all U.S. dairy AI — up another 3 points in a single year and well past 60% as a permanent baseline. Beef-on-dairy looks saturated at 8.1M units, flat for two consecutive years, capped by farms unable to afford losing more replacement heifers. Heterospermic beef (pooled multi-sire) crashed 28% off its 2024 peak — the trial bubble has burst, and traditional sire-identified beef-on-dairy is reasserting.
Crucially, in February 2025, China effectively closed to U.S. semen exports through retaliatory tariffs (NAAB analysis cited in industry coverage). China was the #1 export market four years running. Total dairy exports fell 2.5 million units. Other markets and beef-semen growth absorbed the dollar value, keeping the export total at a record 7.6 million — but the volume hit landed on every major U.S. stud’s books.
For Stud Wars positioning, the volume story rewards three things in 2026: dominant sexed-semen production capacity, beef-on-dairy lineup depth, and meaningful non-China export reach. STgen has #1. Select Sires has #2. URUS and ABS are in #3 contention with growing IVF and beef-cross programs.
At-a-Glance: Where Each Stud Stands After April 2026
Stud (NAAB codes)
Genomic top 200
Proven top 100
Specialty position
Biggest 2025–26 catalyst
Select Sires (7, 14, 250)
29.5%(59/200)
23.0% (23/100)
Federation distribution; balanced TPI depth
DOJ decision on STgen merger
Semex Alliance(200, 777)
20.0%(40/200)
13.0% (13/100)
Progenesis/Beyond pipelines; 12% of Type top 50
Holland acquisition; Boviteq IVF expansion
United Sires(596, 796)
15.0%(30/200)
0.0% (0/100)
Independent breeder partnership founded 2024; Whoops/Howland-P pipeline
Emergence as 4th-largest genomic player in 18 months
STgen (523, 551)
13.5% (27/200)
36.0%(36/100)
Proven depth; gNM$ leadership
Pending DOJ + Select Sires merger; formula loss on TPI
ABS / Genus (29, 94)
6.0% (12/200)
10.0% (10/100)
R&W TPI 34% (17/50); 5 of top 10; De Novo pipeline
Genus FY25 +53% AOP; De Novo full takeover
Alta / URUS (11)
5.5% (11/200)
6.0% (6/100)
URUS Peak production line via Alta
Powerhouse +119 (carried by GENEX code)
GENEX / URUS(1)
4.5% (9/200)
4.0% (4/100)
URUS Peak production line via GENEX
Powerhouse #2 proven
URUS umbrella combined (Alta + GENEX)
10.0% (20/200)
10.0% (10/100)
Trans Ova IVF franchise; Genetics Australia JV
Powerhouse +119; Australia JV
CRV (97)
4.0% (8/200)
5.0% (5/100)
Terra-Calroy Zuri (#5 proven); data platform pivot
Restructuring; €3.8M profit recovery
ASCOL (288)
n/a (gTPI)
n/a (proven)
Type 30% (15/50); 3 of top 10 PTAT
Spanish breeder co-op dominates U.S. PTAT rankings
Independents
2.0% (4/200)
3.0% (3/100)
Niche specialty (proven: RuAnn 719, A.I. Total 515, Korea 208; genomic: El Toro 508/708, A.I. Total 515, Genesis MX 706)
RuAnn Karat #1 PTAT (+3.92); Cookiecutter Horseshoe at #8 proven
Zoetis (non-stud)
n/a
n/a
DNA lab + DWP$ + Danone
$160M Neogen GeneSeek deal
Acceligen / LIC / gene-edit
n/a
n/a
Regulatory watchers
Genus PRP FDA + Canada approvals
The Bullvine Bottom Line
This is the most structurally consequential Stud Wars installment we’ve published since the series started in 2013.
The TPI 24P/14F formula change cost STgen significant headline TPI position on the genomic young bull list and rewarded protein-tilted Select Sires, Semex, and URUS-affiliated lineups (Peak via both GENEX 1HO and Alta 11HO codes). But STgen’s proven army held — 36 of the top 100 proven TPI bulls still wear 551HO (STgenetics-Inguran). The Empire didn’t fall on the proven list. They got reshuffled on the genomic young bulls.
The DOJ decision on the Select Sires + STgen merger is the next domino. It will reshape U.S. sexed-semen access, cooperative leverage, and the cost-of-entry for every smaller stud and every farmer-owned organization for the next decade. Either outcome — clearance or block — locks the industry into a path with no easy reversal.
The Zoetis + Neogen GeneSeek transaction is the deal nobody outside genomics testing fully understood at the time. Owning the test, the index, the processor mandate, and the lab infrastructure simultaneously is a vertical lock. Neither the DOJ nor the FTC has signaled concern. That alone should worry breed associations, AI cooperatives, and farmers who care about who reads their genomic data.
The PIC PRRS-resistant pig FDA approval and Canadian clearance unlock a gene-editing pathway that cattle programs have been waiting on. Acceligen, LIC, ABS, and CRV all have programs in motion. Three to five years out, the bull catalog conversation could include polled, heat-tolerant, and disease-resistant edits — and the studs who positioned early will lead.
NAAB’s 2025 numbers tell the underlying market story. Sexed semen is 64% of U.S. dairy AI. Beef-on-dairy hit a saturation ceiling at 8 million units. China’s tariff closure took a 2.5 million unit chunk out of dairy exports. Total volume down 4%, total export dollars at record. Less semen, sold at higher prices, into more diverse markets.
The April 2026 run is the moment the genomic balance of power shifted. Semex took the genomic top 20 — 9 of the top 20 genomic young bulls in the world are 200HO. Select Sires owns the broadest genomic depth at 29.5% of the top 200. STgen still owns proven depth (36%) and gNM$ economics. United Sires — a brand-new breeder partnersip — captured 15% of the genomic top 200 in 18 months from a standing start. The IVF map is being redrawn weekly. And the corporate rules of the game are about to be rewritten by the DOJ and Zoetis, not by anyone breeding bulls.
Last April’s run was a New Hope. This April’s is the Empire striking back — not at any single bull or breeder, but at the genomic insurgency itself, through formula changes, mergers, and a vertical lock on the lab pipes. STgen’s army held the proven floor. The corporate empire is positioning to define every contract negotiation, every lab routing decision, and every cooperative’s leverage for the next decade.
And the rankings that everyone in this article has been counting? They’re a useful filter for who supplies elite-tier bulls. They’re not a measure of who sells the straws. STgen owns 90% of the genomic NM$ top 100 and a single-digit share of U.S. domestic dairy semen volume. ABS has a 6% ranking presence and a much larger commercial footprint than that suggests. The 4,000-bull selling universe is shaped by 20-some sub-markets, minimum-threshold buying, and price ceilings the rankings don’t capture. The studs know it. Now readers know it too.
In the immortal words of Yoda: “Always in motion, the future is.” Especially when Holstein USA changes the formula, the DOJ wakes up, and Zoetis writes a $160 million check.
May the Force — and a sharp eye on stud share — be with you.
What This Means for Your Operation
Re-rank your active sire list against the 24P/14F formula. Bulls you trusted on TPI in December 2025 may be 50–125 points lower in April 2026 with no daughter data shift. If your mating program drives selection from a TPI cutoff, reset the threshold or risk over-narrowing or over-widening your bull list.
Audit your single-source dependencies before the corporate rules change. Whether the Select Sires + STgen merger clears or blocks, the industry’s structure in 2027 will be meaningfully different. If you’re locked into single-source semen supply or single-source genomic testing, build optionality now.
Watch the Zoetis–Neogen close in H2 2026. If you’re on CLARIFIDE Plus, a Danone supply contract, or any breed-association DNA test routed through GeneSeek labs, your genomic data is moving to a single corporate owner. Know who reads your DNA.
Key Takeaways
24P/14F formula reshuffled the entire genomic deck: Garza −125 TPI, Sheepster −92, Captain −72, all without daughter changes. Powerhouse +119 became the run’s signature winner.
Type (PTAT) top 50 verified counts: ASCOL 15 (30.0%), STgen 7 (14.0%), Semex 6 (12.0%), A.I. Total 5 (10.0%). RuAnn Karat-45955-ET is the #1 PTAT bull at +3.92.
Red & White TPI top 50 verified counts: ABS/Genus 17 (34.0%), STgen 10 (20.0%), Select Sires 8 (16.0%), Semex 4 (8.0%). Denovo 21873 Okafor-Red-ET tops R&W at +3194 TPI — a De Novo (ABS) bull.
Genomic NM$ top 100 — STgen owns 90 of 100 sires (90.0%): Select Sires 4, GENEX/URUS 3, Semex 2, Alta/URUS 1. The single most concentrated category in the entire analysis.
Proven NM$ top 100: STgen 29 (29.0%), Select Sires 22 (22.0%), GENEX/URUS 18 (18.0%), ABS/Genus 17 (17.0%), Semex 7 (7.0%), Alta/URUS 7 (7.0%) — the most balanced category.
Total Overall (466 unique elite sires across all 4 NAAB-verified lists): STgen 155 (33.3%), Select Sires 108 (23.2%), Semex 55 (11.8%), ABS/Genus 39 (8.4%), GENEX/URUS 34 (7.3%), United Sires 30 (6.4%), Alta/URUS 25 (5.4%). Combined STgen + Select Sires = 56.5% of the entire elite sire universe.
United Sires LLC — a breeder-owned independent partnership founded in 2024 (596/796 NAAB codes) — captured 15% of the genomic top 200 from a standing start. Largest emergent player of the year.
STgen still owns the proven floor: 36 of the top 100 proven TPI bulls. Even with Garza, Captain, Dominance taking formula hits, the depth held.
Cookiecutter Horseshoe at #8 proven is registered under the 208HO Korean code as primary, but commercially distributed in North America via Semex (200HO/777HO secondary codes).
DOJ decision on Select Sires + STgenetics merger is imminent and will define 2027–2030 industry structure.
Zoetis paid $160M for Neogen GeneSeek — controlling test, index, processor mandate, and lab pipes simultaneously. Closes H2 2026.
NAAB 2025: sexed dairy at 64% of all dairy AI; beef-on-dairy flat at 8.1M units; China tariff closure cost ~2.5M dairy units of exports.
Methodology Note
All April 2026 stud-share figures are independent counts of official Holstein Association USA April 2026 evaluation lists, drawn from the official CDCB run published April 7, 2026 (CDCB). NAAB-code-to-stud assignments follow the official NAAB marketing codes table as the source of truth.
Specialty Type (PTAT) and Red & White TPI counts are independent NAAB-code counts of the April 2026 ranked top-50 PTAT and R&W bull lists, which are curated from the same Holstein USA April 2026 evaluation as the headline gTPI/proven lists but isolate the type and R&W subsets.
Genomic NM$ Top 100 and Proven NM$ Top 100 counts are independent NAAB-code counts of the official CDCB April 2026 high-ranking bull lists sorted by Net Merit. Combined-category totals (Total NM$, Total TPI, Total Genomic Sires, Total Proven Sires, Total Overall) are produced by deduplicating across each component list by NAAB code so a sire that appears on multiple lists is counted exactly once.
Polled gTPI, polled NM$, and Jersey JPI ranked lists weren’t available in the same downloadable format this run; standalone polled and Jersey stud-share tables are held until bull-by-bull verification is possible rather than relying on stud self-reports.
Key NAAB code → stud assignments used in this analysis: 1 = GENEX Cooperative; 7/9/14/250 = Select Sires; 11 = Alta Genetics USA; 29/94 = ABS Global; 97 = CRV Holding; 200/777 = Semex Alliance; 288 = ASCOL; 523/551/558/646 = STgenetics-Inguran (Sexing Technologies / Genosource collapse to a single STgen entry); 596/796 = United Sires LLC (independent breeder partnership founded 2024, no STgen relationship); 599/799 = Blondin Sires; 719 = RuAnn Genetics. Where bulls have multiple secondary codes (e.g., Cookiecutter Horseshoe primary 208 with secondary 200/777), the primary code is used for stud assignment.
The URUS umbrella encompasses Alta Genetics (11HO), GENEX Cooperative (1HO), Jetstream Genetics (534/634/664/734), Trans Ova Genetics (264), and VAS data services. We report Alta and GENEX separately at the official NAAB level and consolidate as “URUS umbrella” where editorially useful.
April 2025 baselines as published in the original Stud Wars: April 2025 used a less-rigorous methodology that lumped breeder-affiliated codes together. Year-over-year comparisons in this article have been made cautiously and are noted where the methodology has tightened.
National averages may not reflect your region or operation. Have data we got wrong? Email editor@thebullvine.com
Every week, thousands of producers, breeders, and industry insiders open Bullvine Weekly for genetics insights, market shifts, and profit strategies they won’t find anywhere else. One email. Five minutes. Smarter decisions all week.
Butlerview’s Banner Day, Led by a Pair of Powerhouse Five-Year-Olds
Judge: Pierre Boulet Location: Wisconsin Dairy Showcase 2026
When Judge Pierre Boulet slapped the final tap on Oby-Crest Victor Aria, the barn already knew it had witnessed something special. From a heifer ring brimming with depth to a mature cow class Boulet himself called “unbelievable quality,” the 2026 Midwest Spring National delivered a day where every class reward went to cattle that checked every box — udder, frame, feet and legs, and the kind of balance that turns heads on the colored shavings.
The Final Drive — Grand Champion Honors
Oby-Crest Victor Aria
Boulet’s Grand Champion ring belonged to a pair of five-year-olds, and he made no apologies for it. Oby-Crest Victor Aria (Butlerview Farm, Chebanse, IL) wins the purple and also earned Best Udder of Show — a complete cow with a tremendous udder, correct feet and legs, width through the rump, and the textured, quality mammary system the judge called “vacant” and “high-quality.” Stablemate-turned-rival Eixdale Pwrup Alongside (Milk Source LLC, Kaukauna, WI) stood Reserve on power, dairyness, and a standout udder of her own. Rounding out the tricolor, Winright Sidekick Champagne (Butlerview Farm) earned Honorable Mention — a reminder that the future is bright when Intermediate Champions are already this correct.
Grand Champion: Oby-Crest Victor Aria (Victor) — Butlerview Farm, Chebanse, IL
Reserve Grand Champion: Eixdale Pwrup Alongside (Alongside) — Milk Source LLC, Kaukauna, WI
Junior Show Grand Champion — Asalia Caps a Lifetime of Work
The Junior Show saved its biggest ovation for Luck-E Merjack Asalia (Tessa & Stella Schmocker, Whitewater, WI), the Lifetime Production winner who swept to Senior and Grand Champion of the Junior Show. Boulet highlighted her tremendous udder, openness of rib, balance, and — most impressively — a mammary system that has held up over many lactations. Ms-AOL Alpha Ralpha (Hayden Burrus, Friona, TX) took Reserve Grand with dairy strength, length, and bone quality that earned her Intermediate Champion honors earlier in the day. Liddleholme KingDoc Morgan(Osinga family, Hico, TX) added Reserve Senior and HM Grand to a strong four-year-old showing.
Intermediate Champions — Young Cow Power on Full Display
Winright Sidekick Champagne
Boulet called the Intermediate lineup “a tremendous show of young cows,” and the tricolor reflected that depth. In the Open ring, Winright Sidekick Champagne led on udder quality and dairy balance, edging Reserve Ms-AOL Alpha Ralpha and Honorable Mention Fleury Lambda Beast-ET (Butlerview Farm) — the Spring Junior 2-Year-Old winner who pushed hard on her dairy, angular frame and best udder of that class. In the Junior Show, Ralpha took Intermediate Champion with Stone-Front King Doc Herbie (Schmocker & Kropf, Whitewater, WI) Reserve and Delcreek Crash My Party (Addison Lortie, Albion, IN) taking HM.
Junior Champions — Glitter Girl’s Winter Yearling Takes the Top
Butlerview Glitter Gir
The heifer ring belonged to Butlerview Glitter Girl-ET (Butlerview, A. Clark, P. Conroy & K. Doeberiener), the Winter Yearling winner Boulet picked on pure balance, bone quality, and dairyness — “not the biggest, but the most complete.” Go-Sho Detect Revenge-ET (Butlerview Farm) stood Reserve off a dominant Spring Yearling win, and MS Buckmeadow BE Rosabel-ET (Buckley & Carrier, Lawrenceburg, KY) earned HM — and went on to claim Junior Champion of the Junior Show plus Champion Bred & Owned on the strength of her Fall Calf victory. Butlerview Master Shock-ET (Addison Lortie) took Reserve Junior of the Junior Show, and Kamps-Rx Abercombi Abella(Kamps family, Darlington, WI) rounded out the tricolor.
Premier Awards
Butlerview Farm absolutely owned the banner board — claiming Premier Breeder & Exhibitor of the Heifer Showas well as Premier Exhibitor Overall — a jaw-dropping run built on Glitter Girl, Revenge, Champagne, Aria, Zany, and Beast, among others. Luck-E Holsteins (Hampshire, IL) capped it off as Premier Breeder Overall, underscoring the depth of their breeding program across the ring. The Junior Best Three Females banner went to Butlerview Farms, with Walk-Era Farms in second and Crave Bros. in third. Luck-E Holsteins also took Senior Best Three Females.
Judge’s Takeaway
Boulet didn’t mince words. “What a show — and what a great show cow,” he said after the final tap, calling out the organizers, photographers, social media team, and especially the exhibitors for delivering a class of cattle that made every decision difficult. From Winter Calves with genuine spring of rib to mature cows carrying textured udders and stout bone quality, the 2026 Midwest Spring National proved this event has earned its seat at the national table.
Congratulations to every breeder and exhibitor who made this one a show to remember. 👏
Winter Calf (20)
St-Yle-SA Carry The Joy-Red (Kevin) — Blake Schroeder, Belmont, WI (B&O)
Opsal Call My Name-ET (Master) — Troy Opsal, Blue Mounds, WI
Milkboyz Major Aura-ET (Major) — Trace Johnson & Bryce Cullen, Poplar Grove, IL
Red-Violet Major Dutchess-ET (Major) — Claire & Luke Ziemba, Cambridge, WI
Tree-Hayven Awsome Mae (Awesome) — Colton Riedel & Logan Sorg, Pardeeville, WI (2nd Jr)
Group Classes
Junior Best Three Females (3):
Butlerview Farms, Chebanse, IL
Walk-Era Farms, Wisconsin Dells, WI
Crave Bros., Waterloo, WI
Senior Best Three Females (1):
Luck-E Holsteins, Hampshire, IL
Legend: BU = Best Udder of Class – B&O = Bred & Owned – Jr = Junior Show placing
The Sunday Read Dairy Professionals Don’t Skip.
Every week, thousands of producers, breeders, and industry insiders open Bullvine Weekly for genetics insights, market shifts, and profit strategies they won’t find anywhere else. One email. Five minutes. Smarter decisions all week.
Ontario Spring Discovery 2026: Mixin Moos Rylah Crowned Supreme, Jerseys Seize the Biggest Moment of the Day
Ancaster, Ontario delivered exactly what a spring show is supposed to deliver on April 22, 2026 — hidden gems, young cows that read like a promise, and one Jersey two-year-old who walked out of the ring carrying the Supreme Champion banner over a very good Holstein. Judge Jeff Stephens worked the Jersey ring with sharp, economical reasons; Brent Howe, backed by associate Devin O’Hara, sorted a deep Holstein show alongside — and when the smoke cleared, the Burgess family’s Golden Jerseys swept both junior and senior Premier Breeder and Exhibitor honours, while Mixin Moos took home the biggest prize of the day.
The Headline: Supreme Champion Mixin Moos Victorious Rylah
The Supreme selection came down to a measured debate between three judges — Stephens, Howe, and a tiebreaking third opinion — and it broke in favour of the Jersey on fewer faults and superior mobility. Stephens summed it up plainly: “When you see great cows, greatness in the ring — today our Jersey has fewer faults. A younger cow, but very mobile, very good on her feet and legs, really nice on her pasterns”
.
Mixin Moos Victorious Rylah — bred by Jenna Elliott and Craig Stephens, now owned by Pierre Boulet and Clark Valley — took Intermediate Champion, Grand Champion, and Supreme Champion Cow of the show out of the Winter Two-Year-Old class. She’s a River Valley Victorious daughter out of an Excellent 92 Charlyn-bred Showdown Roxy, VG-87 herself with an 88-point mammary. Stephens called her “a very, very handy winner… extreme balance, dairy quality, spring of rib, great set of feet and legs, and that long fore udder with width, height and quality”.
Reserve Grand went to Thaxter Cattle Company’s Perennial Bontino Eve (4-year-old winner), with Honourable Mention to Golden Jerseys’ Golden Joyride Louisa (Mature Cow winner) — both described by Stephens as balanced, angular cows with correct feet and legs and snugly attached mammaries.
Junior Champion: A Spring Yearling That Walks Like a Cat on a Fence
The Junior Champion moment belonged to Colin and Karen Leach’s Leachland Minnie Mouse K, the Spring Yearling winner — a daughter of Avonlea Chip Cranksman Tractor out of four generations of excellent Avonlea K-family cows. Stephens kept his reasons tight: length all the way up through the shoulder, real balance, and a great set of feet and legs when she moved out.
Reserve Junior went to Golden Jerseys’ Golden Joyride Emmy (Summer Yearling winner), with Honourable Mention to AJ Genetics & Braemont’s Sparks Kaymanor ACC Daytona — a Chocochip heifer with 17 generations of excellent and very good dams behind her. Stephens pointed to Emmy’s chest width and dairy cut, and Daytona’s length, balance and tremendous feet and legs.
The junior end of the show ran through some serious heifers. Golden Joyride Emmy (Golden Jerseys, Mildmay) anchored her summer yearling class and walked out with Reserve Junior Champion, rewarded for chest width, a long angular cut, and a springy rib. Sparks Kaymanor ACC Daytona (AJ Genetics & Braemont) took Honourable Mention Junior Champion out of the fall yearlings on the strength of length, balance, and an outstanding set of feet and legs.
Stephens rewarded a consistent profile all day: long-framed, balanced, dairy-strong heifers that moved correctly on their rear legs. Golden Jerseys stamped their name on multiple classes, Echo Glen collected a bred-and-owned class win, and Sandy MacGillivary’s partnership bred two of the sharpest heifers on the tanbark. For Ontario Jersey breeders, Ancaster set the tone for the 2026 season — and the bench is deep.
Winter Heifer Class
🥇 ECHO GLEN CLASSIC JOLENE — Echo Glen Farm, ON (B&O, sponsored by Unique Designs)
🥈 GOLDEN MB BENTLEY — Golden Jerseys, Mildmay, ON
🥉 WILLOW CREEK RVV AURORA — Willow Creek Jerseys, Hagersville, ON
MAKER GOLDDUST SASSALEA — Maker Farms Inc., Rockwood, ON
SPRUCE BRIAR VICTORIOUS PLUM ET — Brandon & Brock Bartlett, Westmeath, ON
Judge’s Take: Jolene walked in and owned it — square hooks to pins, tracking true front and rear, the handy kind of balance you can’t fake. Bentley’s cut from the same cloth with that springy rib and clean bone, just asking for a touch more middle to challenge on top. Aurora’s long-framed and loaded with angles, but Bentley simply moves cleaner behind. Sassalea brings frame and stature, giving way to Aurora’s extra dairy quality. Plum rounds out a sharp group — still a genuinely nice dairy calf in fifth.
Summer Yearling Class
🥇 GOLDEN JOYRIDE EMMY — Golden Jerseys, Mildmay, ON (Reserve Junior Champion)
🥈 CERTIFIED VICTORIOUS KALYPSO — Sandy MacGillivary, ON
VALLEY-FOLTS VICTORIOUS SECRET — Plum Valley, Hidden View & Mason Buckley, Elmira, ON
CLARKVALLEY CC BUCKIE — Granhaven Jerseys, Oshawa, ON
Judge’s Take: Two heifers floated to the top, and the split came head-on. Emmy wins it with more chest width and a wider stance up front, paired with that long, angular, dairy cut and a springy rib. Kalypso answers with serious midsection volume from the side — just gives up that front-end width. Three and four run tight: Emilia, the youngest in the class, edges Secret with a cleaner chine and freer movement through the rear flank and legs. Secret bounces back over Buckie on cleaner bone and a better-set hock.
Winter Yearling Class
🥇 GOLDEN CC SERENE — Golden Jerseys, Mildmay, ON
🥈 MAKER SIDESHOW RUBY RED — Maker Farms Inc., Rockwood, ON
Judge’s Take: A small but mighty class with two really nice individuals to sort through. Serene takes the top call on length — she’s longer-bodied all the way through, from front end to pins, and carries that stretch with style. Ruby Red pushes her hard with a gorgeous springy rib you can’t help but admire, but she gives up just a touch of that overall length and extension to the winner. Two quality heifers that showed exactly why Ontario Jersey breeders keep raising the bar.
Fall Yearling Class
🥇 BENRISE MASTER BAD HABIT — Coxlyn Farms Ltd. & Frankhaven Holsteins, Uxbridge, ON
🥉 INTENSE ALPHA GALLY — Story Book Holsteins, Owen Sound, ON (1st Red & White)
JOREN HNF WIGGLE — Joren Holsteins & Tarten Inn Holsteins, Wilmot, ON
Judge’s Take: Two really nice individuals at the top, and the split came down to stretch versus spring. Bad Habit wins it on length from end to end — she’s simply longer all the way through, giving up a bit of rib spring to do it. Izzy answers with that lovely springy rib and plenty of breed character, but can’t match the frame and reach of the class winner. Gally steps forward in third on pedigree depth and a beautifully balanced frame out of the Alexvale G family, with Wiggle rounding out a quality group.
Judge Jeff Stephens (Troy, ON) sorted the Jersey milk cow classes at Ancaster on April 22, 2026, and his reasons were the kind you wish every judge delivered — economical, specific, and unafraid to make the hard calls on mammary, mobility, and dairy strength. Here’s how each class read, cow by cow, in Stephens’ own words cleaned and tightened for the ringside ear.
Spring Two-Year-Old
Placings:
🥇 QUALITY V I P WHIMSY — Quality Farms Inc., Woodbridge, ON
🥈 LOTHMANN VIC LYNDY — Markus & Brenda Lothmann, East Garafraxa, ON
Stephens’ Take: “Just two young cows in this class, but two nice dairy individuals. Our first individual has that added width through her front end, that sweep and openness all the way through her rib cage, a hardness of loin, and she wears a really nice blending of mammary system from forward to rear. The second-place cow — just love to change her rump structure and loin structure, and give her a little more chest width to move her into first today. But two dairy individuals to start the Jersey show out today”.
Whimsy’s pedigree did the talking before she walked in — a Venus VIP daughter out of the Excellent 94 Starcrest Weapon of Choice, a cow with a championship resume of her own and 11,500 kg of milk behind her. Lyndy, a River Valley Victorious out of an Excellent 91 FDL Barcelona and already milking over 30 kg a day as a young two-year-old, gave her everything she had.
Winter Two-Year-Old
Placings:
🥇 MIXIN MOOS VICTORIOUS RYLAH — Mixin Moos, Corunna, ON (Intermediate Champion – Grand Champion – Supreme Champion Cow)
🥈 LOTHMANN VICTORIOUS LENA — Markus & Brenda Lothmann (Best B&O)
🥉 EDGELEA FRANK ROXANNA — Joel Bagg, Little Britain, ON
LOTHMANN VICTORIOUS LINDY — Markus & Brenda Lothmann
Stephens’ Take: “A really nice class of winter two-year-olds. Our first cow — extreme balance, dairy quality, a lovely spring of rib, a great set of feet and legs. She wears her mammary extremely well, with a long fore udder showing lots of width, height and quality. A very, very handy winner. The second-place cow is very typy and dairy in her own right, just gives up a little in the blending and attachment of fore udder to our winner today. Third falls in nicely — more strength and more substance — but gives up dairyness to the pair above her. And fourth, a cow that’s just a touch plainer in the mammary system than the three ahead of her, but still a nice individual to round out the top four”.
Rylah — a River Valley Victorious ET daughter out of an Excellent 92 Charlyn-bred Showdown dam, bred by Jenna Elliott and Craig Stephens — went on from this class to take Intermediate, Grand, and ultimately Supreme Champion over the Holstein.
Junior 3-Year-Old
Placings:
🥇 CHARLYN VIDEO SMORES — Charlyn Jerseys, Warwick Twp, ON (HM Intermediate Champion)
Stephens’ Take: “A lone entry, but one that deserves her standing in this class. A really dairy young cow, long and angular through her frame, with a nicely blended mammary system and real style about her head and neck. The kind of individual you’d love to have more of to sort through”.
Smores is a St Lo Video daughter with deep type behind her — exactly the profile Stephens rewarded all day.
Senior 3-Year-Old
Placings:
🥇 WILLOW CREEK FLAME SCHANTEL — Willow Creek Jerseys, Hagersville, ON (Best Udder – B&O sponsored by Unique Designs – Reserve Intermediate Champion)
🥈 HERITAGE VICTORIOUS JANE — Echo Glen Farm, ON
🥉 EMILOU AMERICA COLTON GOOSE — Maker Farms Inc., Rockwood, ON
Stephens’ Take: “Our winner here wears the best udder of the class — a mammary that’s high and wide in the rear, well attached at the fore, with real quality of texture. She’s a mature-looking, dairy-strong individual with two calves under her belt and openness of rib and flat bone to go with it. Second-place cow types in beautifully, just gives up a little in that udder floor and blending of the fore udder. Third, a really nice cow in her own right, gives up dairyness through the front end and a little rump width to the pair ahead of her today”.
Schantel’s Best Udder selection set her up as Reserve Intermediate Champion behind Rylah.
4-Year-Old
Placings:
🥇 PERENNIAL BONTINO EVE — Thaxter Cattle Company, ON (Reserve Grand Champion)
🥈 WILLOW CREEK BB TESS — Willow Creek Jerseys, Hagersville, ON
Stephens’ Take: “Two really nice mature dairy individuals. Our winner — a cow with extreme balance from end to end, angular, wears a mammary that’s snugly attached front and rear with real height and width in that rear udder. She moves out correctly on a great set of feet and legs. Second-place cow, a really dairy individual, just gives up a touch in the mammary system — a little more mass and a little less snugness of attachment than the cow that wins the class today”.
Eve went on to claim Reserve Grand Champion honours behind Rylah — a testament to her maturity and balance.
5-Year-Old
Placings:
🥇 GOLDEN JOYRIDE KARMA — Golden Jerseys, Mildmay, ON
🥉 GOLDEN JOYRIDE DANIKA — Golden Jerseys, Mildmay, ON
Stephens’ Take: “Our winner today — a cow that walks into the ring with presence, extreme angularity through her front end, openness and spring of rib, and a mammary system that’s well-veined and well-attached with strong udder support. The second-place cow is a powerful, dairy individual, just gives up a little in the cleanness and quality of her udder to the cow that wins. Third — a really typy cow in her own right, gives up length of frame and some rear udder height to move her further up today”.
The Joyride sire line — already scarce and in demand — showed up twice in this class for Golden Jerseys.
Mature Cow
Placings:
🥇 GOLDEN JOYRIDE LOUISA — Golden Jerseys, Mildmay, ON (HM Grand Champion)
Stephens’ Take: “A mature cow that still reads as a genuinely dairy individual — long through her frame, angular, with a mammary system that’s held up remarkably well. Strong on top, correct on her feet and legs, and carries herself with the kind of ring presence you want in a cow at this stage of her career”.
Louisa rounded out a day where Golden Jerseys stamped every age division with quality — and earned her Honourable Mention Grand Champion banner to prove it.
The Pattern That Won the Day
Across every milk cow class, Stephens rewarded the same profile: mammary floor and attachment first, dairy strength and openness of rib second, and mobility on a correct set of feet and legs as the tiebreaker. He wasn’t afraid to move cows on snugness of fore udder or cleanness of udder quality — and in a show where Victorious daughters dominated the championship bracket, his consistency made every switch make sense.
Winter Heifer
Born December 1st, 2025 to February 28th, 2026
ECHO GLEN CLASSIC JOLENE, JECANF15441708 Bred & Owned sponsored by Unique Designs ECHO GLEN FARM, ON
GOLDEN MB BENTLEY, JECANF15357531 GOLDEN JERSEYS, MILDMAY, ON
WILLOW CREEK RVV AURORA, JECANF15388896 WILLOW CREEK JERSEYS, HAGERSVILLE, ON
MAKER GOLDDUST SASSALEA, JECANF15431751 MAKER FARMS INC, ROCKWOOD, ON
SPRUCE BRIAR VICTORIOUS PLUM ET, JECANF15214574 BRANDON AND BROCK BARTLETT, WESTMEATH, ON
Fall Heifer
Born September 1st, 2025 to November 30th, 2025
PERENNIAL CLASSIC EUCHRE, JECANF15349397 SANDY MACGILLIVARY & NATHAN WADE, ON
WILLOW CREEK DTB SUPERSTITION, JECANF15388871 WILLOW CREEK JERSEYS, HAGERSVILLE, ON
LOTHMANN ACCESS ORILLIA, JECANF15475083 MARKUS & BRENDA LOTHMANN, EAST GARAFRAXA, ON
MIXIN MOOS TRAINSTATION BELLE, JECANF15495763 MIXIN MOOS, CORUNNA, ON
GOLDEN GOLD DYNASTY, JECANF15357525 GOLDEN JERSEYS, MILDMAY, ON
GOLDEN GOLD LUCRETIA, JECANF15357520 GOLDEN JERSEYS, MILDMAY, ON
MAKER FOGERTY COWGIRL, JECANF15431741 MAKER FARMS INC, ROCKWOOD, ON
MIXIN MOOS GETAWAY REESE, JECANF15495764 MIXIN MOOS, CORUNNA, ON
LIBERTY GEN VIDEO VICTOIRE, JECANF15402197 SUNSPARK FARMS INC., SOUTH BRUCE PENINSULA, ON
BRENBE RECKLESS GAMBLE, JECANF15268788 BRANDON & BROCK BARTLETT, ON
Summer Yearling
Born June 1st, 2025 to August 31st, 2025
GOLDEN JOYRIDE EMMY, JECANF15357515 Junior Champion – Reserve GOLDEN JERSEYS, MILDMAY, ON
CERTIFIED VICTORIOUS KALYPSO, JECANF15438603 SANDY MACGILLIVARY, ON
MIXIN MOOS EDUCATED GUESS EMILIA, JECANF14982743 MIXIN MOOS, CORUNNA, ON
VALLEY-FOLTS VICTORIOUS SECRET, JEUSAF8403313993114 PLUM VALLEY, HIDDEN VIEW & MASON BUCKLEY, 50 ACRES LANE, ELMIRA, ON
CLARKVALLEY CC BUCKIE, JECANF15200657 GRANHAVEN JERSEYS, OSHAWA, ON
WILLOW CREEK RBE NIGHTTIME, JECANF15388861 WILLOW CREEK JERSEYS, HAGERSVILLE, ON
LOTHMANN DREAM-MAKER KORIE, JECANF15475079 MARKUS & BRENDA LOTHMANN, EAST GARAFRAXA, ON
MAKER C ALPHABET, JECANF15431731 MAKER FARMS INC, ROCKWOOD, ON
LOTHMANN CC TRINA, JECANF15155540 MARKUS & BRENDA LOTHMANN & TREVOR MARTIN, ON
KARNATION GOLD MARSHMALLOW, JECANF15317537 DEREK KARN, WOODSTOCK, ON
Spring Yearling
Born March 1st, 2025 to May 31st, 2025
LEACHLAND MINI MOUSE K, JECANF14902402 Junior Champion COLIN & KAREN LEACH, LINDSAY, ON
CHARLYN EG ROWDY, JECANF15292693 CHARLYN JERSEYS, WARWICK TWP, ON
MAKER SS CHIT CHAT, JECANF15080292 MAKER FARMS INC, ROCKWOOD, ON
MIXIN MOOS RESPECT RHIANNA, JECANF14982731 MIXIN MOOS, CORUNNA, ON
R-A ANDREAS VIALIS, JECANF12764965 RIVERDOWN/ALLARWAY, ON
MAKER GC RAMONA, JECANF15080289 MAKER FARMS INC, ROCKWOOD, ON
GOLDEN CC SERENE, JECANF15011393 GOLDEN JERSEYS, MILDMAY, ON
MAKER SIDESHOW RUBY RED, JECANF15080282 MAKER FARMS INC, ROCKWOOD, ON
Fall Yearling
Born September 1st, 2024 to November 30th, 2024
SPARKS KAYMANOR ACC DAYTONA, JECANF14869840 Junior Champion – Honourable Mention AJ GENETICS & BRAEMONT, ON
SOUTH MTN & CO CHOCOCHIP CHLOE ET -JE840F 32676696, JE840F3267669647 MAKERFARMSINC/ERICDUPASQUIER/QUALITY/BECKRIDGE, ON
ALEXVALE GOGO GLITTER, JECANF14841683 JAMES ALEXANDER/GRACE BECKETT/BECKRIDGE HOLSTEINS, ON
Junior Breeder Herd
GOLDEN, GOLDEN JR Golden Jerseys Golden Jerseys, Mildmay, ON
Maker, MAKER JR Maker Farms Inc, Kerry Alexander Alexander, rockwood, ON
MIXIN MOOS, MIXIN MOOS Jenna Elliott, Sarnia, ON
LOTHMANN, LOTHMANN Markus Lothmann, East Garafraxa, ON
Willow creek, WILLOW CREEK JR Richard and Teresa Osborne, Hagersville, ON
Spring 2 Year Old
Born March 1st, 2024 to May 31st, 2024
QUALITY V I P WHIMSY, JECANF14627405 QUALITY FARMS INC., WOODBRIDGE, ON
LOTHMANN VIC LYNDY, JECANF15047122 MARKUS & BRENDA LOTHMANN, EAST GARAFRAXA, ON
Winter 2 Year Old
Born December 1st, 2023 to February 29th, 2024
MIXIN MOOS VICTORIOUS RYLAH, JECANF14531495 Intermediate Champion Grand Champion Supreme Champion Cow MIXIN MOOS, CORUNNA, ON
LOTHMANN VICTORIOUS LENA, JECANF14710275 MARKUS & BRENDA LOTHMANN, EAST GARAFRAXA, ON
Edgelea Frank Roxanna, JECANF14221007 JOEL BAGG, LITTLE BRITAIN, ON
LOTHMANN VICTORIOUS LINDY, JECANF15047118 MARKUS & BRENDA LOTHMANN, EAST GARAFRAXA, ON
Junior 3 Year Old
Born March 1st, 2023 to August 31st, 2023
CHARLYN VIDEO SMORES, JECANF14718487 Intermediate Champion – Honourable Mention CHARLYN JERSEYS, WARWICK TWP, ON
Senior 3 Year Old
Born September 1st, 2022 to February 28th, 2023
WILLOW CREEK FLAME SCHANTEL, JECANF13930727 Best Udder Bred & Owned sponsored by Unique Designs Intermediate Champion – Reserve WILLOW CREEK JERSEYS, HAGERSVILLE, ON
HERITAGE VICTORIOUS JANE, JECANF121030435 ECHO GLEN FARM, ON
EMILOU AMERICA COLTON GOOSE, JECANF13262058 MAKER FARMS INC, ROCKWOOD, ON
4 Year Old
Born September 1st, 2021 to August 31st, 2022
PERENNIAL BONTINO EVE, JECANF14260714 Grand Champion – Reserve THAXTER CATTLE COMPANY, ON
WILLOW CREEK BB TESS, JECANF13930708 WILLOW CREEK JERSEYS, HAGERSVILLE, ON
5 Year Old
Born September 1st, 2020 to August 31st, 2021
GOLDEN JOYRIDE KARMA, JECANF13998660 GOLDEN JERSEYS, MILDMAY, ON
GLENHOLME GUNMAN ALEXA TW, JECANF13527675 GLENHOLME JERSEYS INC., TAVISTOCK, ON
GOLDEN JOYRIDE DANIKA, JECANF13998677 GOLDEN JERSEYS, MILDMAY, ON
Mature Cow
Born prior to September 1st, 2020 , in milk.
GOLDEN JOYRIDE LOUISA, JECANF13272682 Grand Champion – Honourable Mention GOLDEN JERSEYS, MILDMAY, ON
Senior Breeder Herd
GOLDEN, GOLDEN Golden Jerseys Golden Jerseys, Mildmay, ON
LOTHMANN, LOTHMANN Markus Lothmann, East Garafraxa, ON
Junior Exhibitor
GOLDEN JERSEYS MILDMAY, ON
MAKER FARMS INC ROCKWOOD, ON
MIXIN MOOS CORUNNA, ON
Junior Breeder
GOLDEN JERSEYS / GOLDEN JERSEYS GOLDEN JERSEYS (GOLDEN) MILDMAY, ON
MAKER / MAKER FARMS INC, KERRY ALEXANDER ALEXANDER (MAKER) ROCKWOOD, ON
MIXIN MOOS / JENNA ELLIOTT (MIXIN MOOS) SARNIA, ON
WILLOW CREEK / RICHARD AND TERESA OSBORNE (WILLOW CREEK) HAGERSVILLE, ON
Ontario Spring Discovery 2026: A Deep, Dairy Show in Ancaster
Spring shows used to be the place where you forgave a heifer for looking a little green. Not in 2026. The cattle that walked into the ring at the Ontario Spring Discovery Show looked mid-summer ready — hair set, udders full, heads up, feet tracking clean. Judge Brent Howe (Howe’s Holsteins, Elmira, ON), assisted in the ring by Devin O’Hara of Dandelion Holsteins, got the Holstein assignment.
What followed was a full day of real dairy cows and heifers, hair-splitting line-ups, and two judges who delivered concise, specific reasons that anyone from a 4-H first-timer to a Madison veteran could follow.
Here’s how it broke down — class by class, champion by champion — plus the sires, families, and storylines worth watching as we head into the summer circuit.
🌟 Supreme Junior Champion Heifer: ECHO GLEN MASTER IRINA — Beckridge Holsteins — a “no-fault” heifer with width, sharp shoulder, hard top, open spring of rib and clean bone. She edged the Jersey on strength and power up front. Reserve Supreme: LEECHLAND MINNIE MOUSE K (Jersey) — Colin & Karen Leach Honourable Mention Supreme: BLONDIN ALPHA WHIPPET-RED — Ronald Grandy
Red & White Junior Champion: Blondin Alpha Whippet-Red | Reserve: Ember-Lit Believe Lucky-Red (B & B Donnay/Lizzy Partnership) | HM: Royhaven Warrior Freedom (Mt. Elgin)
Holstein Premier Breeder & Exhibitor: Karnview Farms, Woodstock, ON (Junior Breeder Herd went to Echo Glen) Jersey Premier Breeder & Exhibitor: Golden Jerseys, Mildmay, ON
The judges’ through-line: Howe rewarded open, angular rib, width through the rump, and correct, comfortable feet and legs — front and rear. The Supreme call came down to Irina’s extra power and front-end strength edging a very fancy Jersey.
Intermediate Champion
🏆 Intermediate Champion (& Best Udder): GLEANN LAMBDA QUALIFY — Andrew den Haan, Mount Kolb Farm & Plum Valley Holsteins, Fergus, ON
🥈 Reserve (& Best Udder of division): MAIFIELD LAMBDA MONIQUE — Blondin Sires & Ferme Blondin, Saint-Placide, QC
Judge Brent Howe: “A great young-cow show — dairyness, mammary quality, and structure with real futures on every one of these. My Champion wins on more width and height at the top of the rear udder, more capacity through the fore udder with a smooth blend, and a silky-hided, true-dairy look that moves beautifully on her front legs. Reserve and Honourable Mention were tight — it came down to Reserve’s extra width through the rear udder over a cow that’s fuller, deeper in the rear flank with real vein on my Honourable Mention. Three cows with big runs ahead of them.”
Grand Championship
Grand Champion (& Best Udder): Carleton Bad to the Bone — Hodglynn Holsteins
Reserve Grand: Gleann Lambda Qualify — den Haan/Mount Kolb/Plum Valley
Grand Champion Red & White: Beauvair Baba Revere — Mt. Elgin Dairy Farms
Howe’s take: “Look at these three cows. My Grand Champion has had five calves and still walks out gracefully on balanced, true-type feet and legs. My Reserve — a three-year-old — you could split a teardrop on her shoulder.” Both Reserve and HM were three-year-olds Howe kept together for their whole run through the championship line-up.
Premier Awards & Herd Honours
Premier Breeder: Fraeland Farms (Fergus, ON) — a fitting win on a day when Fraeland names appeared in class after class, from the Energy Brie winner down to the Midnight Actress veteran. Premier Exhibitor: Mt. Elgin Dairy Farms (Guelph, ON) — depth across both heifer and cow show. Premier Sire: Farnear Delta-Lambda-ET — the common thread on many top udders. Junior Premier Sire: Golden-Oaks Master-ET — dominant through the heifer classes, including Irina, Izzy, Winnie, Eloise, Alabama and more. Senior Breeder Herd: Fraeland (Steven Fraser, Fergus, ON). Junior Breeder: Karnview Farms Inc (Woodstock), Echo Glen Farm (Dorchester), Ferme Jean-Paul Petitclerc & Fils Inc. Junior Exhibitor: Karnview Farms Inc, Butlerview/Clarkvalley, Echo Glen Farm.
A final nod: Howe used a significant chunk of his Grand Champion microphone time to thank the Spring Discovery show committee, sponsors, volunteers, ring man Doug Green, his associate Devin O’Hara, the fitters in the barns, and the 4-H kids working alongside seasoned veterans. “It’s been in my blood a long time. It’s an honour to be here.”
🥈 Reserve Junior Champion: BUDJON LCOURAGE BOSTON-ET — Story Book Holsteins, Owen Sound, ON
🎖️ Honourable Mention: MARFLOACRES MAJOR MARINO — Butlerview Farm & Clarkvalley Holsteins, Chebanse, IL
Judge Brent Howe: “You’ve got to admire the correctness of my top two — both balanced, both open and deep through the midsection, and both tracking beautifully on their feet and legs. I kept them together right down to the wire. My Junior Champion gets the nod on that extra length of body we talked about in class. Reserve edges the Honourable Mention on strength through the front end, a crisper top line, and a straighter, cleaner walk on her rear legs. A great group of efforts — a great show all the way through.”
And IRINA didn’t stop there — tapped Supreme Champion Heifer to cap the day. 🌟
Winter Heifer Calf
BESLEA LAMBDA CAPONE — Clarkvalley Holsteins, Woodville, ON
KARNVIEW MAJOR ABYSS — Karnview Farms Inc, Woodstock, ON
REDCARPET SOLO DANCER-ET — Joel Phoenix / Red Carpet / Unique Holsteins, Cannington, ON
SILVERDREAM MASTER MIDNITE — Jeff Stephens, Troy, ON
Judge Brent Howe: “My winner puts it all together — balance from end to end, feminine through the head, strong over the shoulder, and tracking correctly on her feet and legs. She takes it handily over second on crop strength, body length, and fullness through the middle. Third is a pretty, feminine red calf with length and spring of rib, but second wins on body depth. Fourth gives up length of neck and rump, while fifth is an open, deeper-ribbed calf that can’t match fourth’s rear leg quality or tail-head setting. Beautiful class to start the day.”
FRAELAND LADY GLITTER SPARKLES — Beckridge Holsteins, Keswick, ON
Judge Brent Howe: “My top pair are both balanced efforts, but the winner takes it on a feminine head, a hard top, and real width through the rump, hooks, and pins — plus more drop and spring to her midsection. Second beats third on length from nose to tail, a sharper head and neck, and correct feet and legs. Third comes forward on balance, openness of rib, and a more comfortable set to her front and rear legs with stronger pasterns than fourth. Fourth wins on added body mass and length over a refined, clean-boned fifth-place calf.”
Summer Yearling
ECHO GLEN MASTER IRINA — Beckridge Holsteins, Keswick, ON
BUDJON LCOURAGE BOSTON-ET — Story Book Holsteins, Owen Sound, ON
BLONDIN ALPHA WHIPPET-RED — Ronald Grandy, Oshawa, ON
PETITCLERC ANEESH PAULA — Butlerview Farm, Clarkvalley Holsteins & Pierre Boulet, Chebanse, IL
Judge Brent Howe: “My winner — the July heifer — puts it all together: high style, extra length, a beautiful open turn of rib, and width from end to end. She captivates the eye anywhere in the ring and edges second on midsection length and a cleaner set to the hock. Second over third on width of chest, more comfortable front legs, and deeper rear flank with more spring of rib, over a very long-bodied third. Third wins on rump width and length from hooks to pins and nose to tail. Fourth takes fifth on bone quality through the hock and a more comfortable stride, over another dairy heifer with a big open rib.”
Spring Yearling
MARFLOACRES MAJOR MARINO — Butlerview Farm & Clarkvalley Holsteins, Chebanse, IL
ECHO GLEN MASTER ELOISE — Echo Glen Farm, Dorchester, ON
FRAELAND BECKRIDGE EN BEATRIX — Beckridge Holsteins & Fraeland Farms, Keswick, ON
EMBER-LIT BELIEVE LUCKY-RED — B & B Donnay & The Lizzy Partnership
Judge Brent Howe: “My top pair are similar-made, balanced, dairy heifers — but the winner takes it on a smoother blend of head and neck into the shoulder, a more level rump from hooks to pins, and a big open turn of rib. She’s high style and tracks correctly on her feet and legs. Second beats third on a stronger pastern and cleaner rear leg — she doesn’t knuckle over — plus more refined bone overall. Third comes forward on length of body and greater openness, depth, and capacity through the midsection viewed from behind. Fourth wins on dairyness, bone quality, a cleaner flank, and wider chest over a red heifer in fifth with real ring presence and a wide muzzle.”
PETITCLERC JERRY ADINE — Ronald Grandy, Oshawa, ON
CENTURY STAR JERRY LEWIS GIFT — Mt. Elgin Dairy Farms, Guelph, ON
CHARBEND MASTER DESIREE (B&O) — Charbend Farm, Brantford, ON
WCG UNIX COPYCAT — Willowcreek Genetics, Hagersville, ON
Judge Brent Howe: “Not the biggest class, but quality from top to bottom. My winner fits the style we’ve rewarded all day — more feminine through the head, longer in the neck, thinner-thighed and cleaner all the way through, and most importantly walking straighter and more comfortably on her rear feet and legs than second. Second earns her spot on a wider muzzle and chest, more drop to the fore rib, and real openness and spring over third. Third beats fourth on length of body against a longer-necked calf. Fourth takes fifth on cleaner bone in the leg and a more correct set to the front feet, over a nice open-ribbed heifer in fifth.”
Fall Yearling
BENRISE MASTER BAD HABIT — Coxlyn Farms Ltd & Frankhaven Holsteins, Uxbridge, ON
INTENSE ALPHA GALLY — Story Book Holsteins, Owen Sound, ON
JOREN HNF WIGGLE — Joren Holsteins & Tarten Inn Holsteins, Wilmont, ON
Judge Brent Howe: “Small class, real quality. My winner takes it on length of body, a neater-set tail head, a wider chest, and more drop to the fore rib — opening into a capacious midsection second can’t match. Second beats third on overall length from nose to tail and a more refined bone quality. Third — our red heifer — steps up on a harder top line, more open spring of rib, and straighter tracking on her rear feet over a very open-ribbed fourth-place calf. A really nice group to work with.”
Summer 2-Year-Old
🥇 FRAELAND BECKRIDGE ENERGY BRIE — Best Udder (Bred & Owned) — Beckridge Holsteins & Fraeland Farms, Keswick, ON
SARMAR ALLIGATOR PAULA — Mt. Elgin Dairy Farms, Guelph, ON
BECKHOLM CHIEF RAVEN — Beckholm Holsteins, Sunderland, ON
EXTRAMILE AMBROSE WRATH RED — 1st Red & White — Mt. Elgin Dairy Farms, Guelph, ON
Judge Brent Howe: “My winner rises to the top handily — feminine, long-necked, dairy, wearing the best udder in the class. She stands square and wide through the chest, carries a hard top, and blends smoother into the forearm than second, with more openness and drop of rib. Second beats third on a stronger pastern and a more comfortable walk around the ring. Third is a real dairy individual, winning on dairyness and mammary volume over a fresh red-and-white fourth — nicely attached udder, veins coming, just needs a month on her to develop and compete higher.”
MAGOLAIT LAMBDA CHARLIE — Joel Phoenix & T. & L. Cattle Ltd, Cannington, ON
VALE-O-SKENE LAMBDA BELLINI — M & G Lintvedt, R Shore & B Verthein / Vale-O-Skene Holsteins, Woodville, ON
Judge Brent Howe: “My winner wears the best udder — feminine, thin-thighed, wide through the muzzle and chest, with the flattest udder floor, sharper median suspensory, and more width at the top of the rear udder. Second is a silky, angular two-year-old who beats third on sheer dairyness, openness of midsection, and correct feet and legs. Third earns the bump on udder volume, length of frame, and extra length from hooks to pins. Fourth takes fifth on a snugger fore udder, more vein, a cleaner cut and stronger loin, over a very dairy fifth with an admirable wide rear udder.”
CADDEDALE MASTER AOK — Ethan Bloomfield, Ilderton, ON
Judge Brent Howe: “My winner is modern dairy with the best udder in the class — width from end to end, a big open spring of rib, smooth fore-udder blend, strong veination into the rear udder, and textbook median suspensory. Second is a powerful, feminine cow that gives up only overall dairyness. Second beats third on chest width, a more level udder floor, wider top of rear udder, smoother fore-udder attachment and stronger pasterns — even though third captivates you on length of neck and style. Fourth earns it over fifth on a snugger udder and cleaner bone, over a promising young cow with real muzzle, chest and a hard top.”
Fall 2-Year-Old
🥇 MARTIN-VIEW BULLSEYE CROSBY — Best Udder (Bred & Owned) — Breamont Holsteins & David Martin, Tavistock, ON
CYRMO LEGEND RAMONA — Clarkvalley Holsteins & Pierre Boulet, Woodville, ON
WEBHAVEN EYECANDY ERMINA — Jeff Stephens, Troy, ON
DANDYLAND HIA TARTAR SAUCE — Clarkvalley Holsteins, Woodville, ON
Judge Brent Howe: “Side profile is one thing — when you line them up shoulder to shoulder, it’s another. My winner steps up on a wider chest, carries her milk higher and wider at the top of the rear udder, and shows more width throughout over a high-style, feminine, clean-thighed second. Second beats third on a smoother fore-udder blend into the body wall and style over a very dairy third. Third earns the bump on balance, length from nose to tail and harder pasterns. Fourth takes fifth on more dairyness, thinner thigh and cleaner bone through the rear hock, over a fifth with real rump strength and a beautiful mammary that just needs a cleaner leg.”
Junior 3-Year-Old
🥇 GLEANN LAMBDA QUALIFY — Best Udder — Andrew den Haan, Mount Kolb Farm & Plum Valley Holsteins, Fergus, ON
BRENLAND AVENGER HAZEL (B&O) — Brenland Holsteins, Millbank, ON
DUCKETT LAMBDA NOLA-ET — Royal Lynn Holsteins, Cayuga, ON
HATCHLEY LEGEND DAIRY 396 — Talsma Farms Inc, Harley, ON
Judge Brent Howe: “My winner is a dairy machine — milked through, thin-hided, with all kinds of dairy strength. The call came down to the mammary: height and width at the very top of the rear udder put her above a beautiful side-profile second. Second beats third on fore-udder volume blending smoothly into a big open rib — just wants a little more lift at the top of the rear udder to challenge for the win. Third earns it over fourth on added vein, a smoother attachment and sharper median suspensory. Fourth takes fifth on added dairy strength, a lower udder floor and cleaner bone through the hock.”
FRAELAND LEGEND ESPIONAGE — Fraeland Farms, Fergus, ON
JACOBS UNSTOPABULL LISA-RED — Fraeland Farms, Fergus, ON
POPLARVALE SIDEKICK LILLIAN — Mt. Elgin Dairy Farms, Tavistock, ON
ANDREANE LAMBDA BUBLY — Clarkvalley Holsteins & Pierre Boulet, Woodville, ON
Judge Brent Howe: “My winner wears the best udder in the class — body, dairy strength, a level udder floor and real width, height and carry through the rear udder. Second is high-style, feminine, thinner-thighed, longer in the neck and cleaner in the bone — just doesn’t match the winner’s udder volume. Third — and take nothing away from this red cow — has a gorgeous side profile, strength and width of chest, and edges fourth on openness and spring of rib through the rear flank. Fourth earns the bump on length of body and a quality fore udder over a fifth with a wide muzzle, wide chest and a big open rib that can milk.”
4-Year-Old
🥇 ALLEGRO THUNDER STRUCK CABELL — Best Udder — Frankhaven Holsteins, Ingersoll, ON
BEAUVAIR BABA REVERE — 1st Red & White — Mt. Elgin Dairy Farms, Guelph, ON
Judge Brent Howe: “More frame in this class — and the top pair separates on the mammary. My winner carries huge width through the rear udder, a textbook median suspensory top to bottom, and a capacious fore udder that blends smoothly into the body wall. Wide muzzle, wide rump, real dairy cow. Second beats third on more correct front feet, wider chest, stronger pasterns and sharper median suspensory in the rear udder. Third — feminine, dairy all the way through — wins on mammary quality over a fresh 5-week fourth that will really bloom in another 40–50 days. Fourth takes fifth on openness through the midsection and a more comfortable walk, over a fifth with a high, wide rear udder.”
Mature Cow
🥇 CARLETON BAD TO THE BONE — Best Udder — Hodglynn Holsteins, Kincardine, ON
TOLAMIKA DIAMONDBACK BLAINE — Ronald Grandy, Oshawa, ON
Judge Brent Howe: “Wouldn’t you like to milk a pair of cows like this every day? My winner has had five calves and still shows a wide muzzle, a feminine, long body, and open-angular dairyness. She earns it on stronger loin, a better pin set, and a mammary system with more length into the fore udder, a more level floor and a sharp median suspensory. Second is a wide-muzzled, long-bodied cow in her own right — she just needs to tighten up in the loin and dairy up a touch more to push for top honours. A real nice pair.”
Longtime Production Cow (70,000 kg)
🥇 RUTI CHIEF NATALIA — Best Udder — Marthaven Holsteins & Skipwell Farms Inc, Woodstock, ON
Judge Brent Howe: “Two six-calf veterans and a tough decision, but my winner takes it on dairyness — feminine through the head, thinner-hided, with plenty of width through the rump and cleaner bone through the hock. The mammary closes the deal: a more level udder floor and a fore udder that blends just a touch smoother into the body wall. Take absolutely nothing away from second — she’s a heck of a cow with real dairy strength, a wide flare muzzle, wide chest and big rear-udder width. First is simply a touch more refined in the bone and more feminine throughout. What a pair.”
At Double Creek in Merced, eight DeLaval V300s milk 500 cows and reportedly save $171K a year pellet-free. Run the same play in a 240-cow free-flow retrofit and the first-year math looks very different.
At Double Creek Dairy in Merced, California, eight DeLaval VMS V300s milk roughly 500 cows. In a DeLaval-produced promotional video, operator Matt Strickland reports annual savings of about $171,000 from going nearly pellet-free — only seven of his cows still get any pellet at all. That figure comes from manufacturer marketing material, not an independently audited result, and it reflects the economics of his barn and his transition. Spread across the full herd, it works out to roughly $342 per milking cow per year, based on Bullvine arithmetic, not a figure Strickland or DeLaval has published.
None of what follows is a claim that Strickland’s number is wrong for his operation. The composite scenario later in this piece is a separate illustration of what the same move can cost in a very different barn. That distinction matters because his number is moving fast at spring 2026 dealer meetings, and the barn-design context that makes it work isn’t always moving with it. If your barn doesn’t look anything like Double Creek — and most AMS retrofits don’t — pulling pellets can quietly stack into a mid-five-figure hole inside the first year, before any savings show up on the P&L. The Barn Math Table below shows how.
The AMS Pitch Shifted. The Barns Didn’t.
Three years ago, pellet-free robotic milking was a niche conversation. Now it’s the “next evolution” line in a lot of proposals, backed by a handful of flagship farms and some genuinely useful research. The science is real. What’s getting glossed over is the structural condition that makes it work.
University of Wisconsin Extension says it plainly: in free-flow barns, the primary reason cows voluntarily visit the robot is the pellet dispensed there. Jack Rodenburg’s widely cited traffic data — still the figure most carried through the AMS literature — pegs average fetch rates at roughly 16% of the herd per day in free-flow versus about 8.5% in guided-flow. European AMS research in guided-flow systems has consistently reported lower rates of unproductive visits than free-flow comparisons, though specific figures vary by study.
None of those traffic numbers show up on a typical AMS proposal’s ROI sheet. All of them decide whether a pellet-free move survives contact with your barn. The operators most exposed are mid-size and large producers running existing free-flow retrofit barns — long alleys, one robot at the end of a pen, no selection gate between rest and feed. Industry benchmarks have long placed the majority of U.S. AMS installations in the retrofit free-flow category, and the pitch at spring 2026 dealer meetings is aimed squarely at that population.
Colby, Wisconsin: What a Barn Built for This Looks Like
The Heeg family’s robotic facility near Colby, Wisconsin, came online in late 2023. Eight DeLaval units, tunnel ventilation, guided-flow from day one, no pellets at startup or since. Early-morning return traffic cycles cleanly through the selection gate, and the fetch list sits where you’d hope.
What the Heeg build illustrates is the pattern extension specialists keep describing on guided-flow startups: cows coming out of existing parlors carry habituated behavior that takes weeks to unlearn, while fresh cows and heifers introduced directly into a robot barn adapt faster and hold production better. In the documented guided-flow new-builds, it wasn’t the feed table that made pellet-free possible. It was the concrete, the gates, and a cohort of cows that had no old routine to fall back on.
Now sit the new-build story against a more typical one. A 240-cow herd — a composite scenario built from extension field observations, not a single named operation — in an existing free-flow freestall installs two robots, runs pellets for two years, then decides to go pellet-free after hearing the Strickland number at a spring meeting. Bullvine modeling, drawing on extension observations of retrofit transitions, puts the typical adjustment curve at a 10–15% milk drop in the first two weeks, then weeks three through ten running 9–12% below baseline. Picture it at 4 p.m. on a Tuesday in week six: the fetch list is longer than anyone wants to admit, a third-lactation cow who used to walk herself through is parked in a stall, the gate has cycled through an empty approach twice, and the nutritionist’s phone is ringing again.
Barn Math Table
240-cow composite herd, 80 lbs/cow/day baseline. Milk price assumed at $22/cwt (U.S. Class III reference band, spring 2026); if current Class III is running higher, every dollar in the left column moves against you. Skilled farm labor at $22/hour. All figures are Bullvine-composed estimates in USD, not audited operator outcomes.
Metric
Low-End Impact
High-End Impact
Source / Assumption
Transition milk loss
$26,600
$35,500
10-week window, 9–12% drop below baseline, 240 cows at 80 lbs, $22/cwt
Annual fetch labor
$10,278
$20,500
16% fetch rate, 2 vs 4 min per cow at $22/hr, 365 days
Early cull costs
$8,000
$15,000
Low: 4 culls × $2,000/head. High: 8 culls × $1,875/head. Replacement cost band reflects Bullvine editorial estimate based on current regional springing heifer markets.
Total first-year drag
$44,878
$71,000
Bullvine composite
The annual fetch labor line runs over a full 12 months. The bottom row reflects compound drag across the first full year, not six months. The low end assumes a barn close to guided-flow functionality and a well-managed transition. The high end assumes a long-alley retrofit, no selection gate, and a nutritionist who wasn’t fully looped in. Most free-flow retrofits sit closer to the right-hand column than the left.
Why Do Pellets Work in Some Barns and Not Others?
The mechanics are less about feed formulation and more about concrete. In a free-flow barn, the pellet isn’t “feed” — it’s a bribe. Pull the bribe without changing the gates, and the only cows you’ll see at the robot are the ones who got lost on the way to the water trough. That’s not a management problem you can nutrition your way out of. It’s a traffic problem poured into the foundation.
Three strands of research converge on the same conclusion. Gregory Penner’s work at the University of Saskatchewan (Western Canadian Dairy Seminar, 2019) and Alex Bach’s 2007 Journal of Dairy Science paper both found that varying pellet allocations in controlled conditions had little to no effect on milk yield, with Bach reporting cow substitution of partial mixed ration for robot feed at ratios between 0.62 and 1.58 kg of PMR per kg of pellet. Commercial data pushes the same direction: a Vita Plus Upper Midwest AMS herd survey reported that robot pellet cost showed a negative relationship with income over feed cost across the sample, and visit frequency itself had no measurable effect on IOFC. Stack those three together and pellets start to look less like a feed input and more like the cost of running a barn that can’t move cows without them.
But the science supports pellet reduction only where both the barn and the forage can carry the load. The working principle in published guidance from the Penner lab at Saskatchewan and the DeVries lab at Guelph is straightforward: if your undigested neutral detergent fiber at 240 hours is too high, the PMR isn’t palatable enough to drive the barn on its own, and pulling the pellet pulls the only reason a cow had to walk. Specific uNDF240 thresholds depend on your forage program and herd; the most current figures should come from your nutritionist or the published work of those labs, not from a dealer’s rule of thumb. Published AMS barn-design guidance also shows barns with more than 15 stalls between resting area and the first crossover, or dead-end return alleys, produce measurably less milk per robot regardless of ration.
How Do You Know If Your Barn Is Free-Flow or Guided-Flow?
Walk it. Count the stalls between a cow’s resting area and the nearest crossover alley. Trace her route to the feed bunk — does it force her past the robot, or can she reach feed and water without going near it? Watch what happens to a timid cow at the approach gate when a dominant animal is standing there.
If she can get to feed and water without ever passing a milking decision point, you have a free-flow barn. The published evidence for pellet-free success in that layout, without structural changes, is thin. That’s not an argument against pellet-free milking. It’s an argument for doing it with your eyes open — priced, modeled, and stress-tested against your own operation’s numbers, not on the strength of a $171,000 figure from a different barn in a different state.
How Much Does Waiting Until Year-End Actually Cost?
Here’s the numeric version of procrastination. That same 240-cow composite, four months in, milk still running 8–10% below baseline instead of recovering. Fetch labor up noticeably at current wages. Do nothing for the rest of the year and the compound drag — lost milk, extra fetch labor, early culling — can stack into the $44,000–$71,000 range before you have the hard conversation. That’s before you touch working capital or debt service.
Sustained pressure on debt service coverage triggers lender conversations well before the operating line runs out. Published AMS lending guidance from the major U.S. and Canadian farm lenders gets more specific on the numbers, and your own lender’s current thresholds should be the ones you plan against. USDA’s Economic Research Report 356, released January 2026, pegs robotic milking at higher net return on average than conventional parlor systems — on the other side of a multi-year payback curve.
A pellet-free retrofit that isn’t working stacks a second valley on top of the first.
Options and Trade-Offs for Farmers
There’s no universal right answer. The right path depends on your barn’s bones, your balance sheet, and how long you plan to milk cows in that building.
Path 1 — Stay on pellets, but cut cost per ton. The Vita Plus Upper Midwest AMS survey found pellet costs ranging from $132 to $500 per ton across its herds on functionally similar rations. That spread is real, and it’s worth a hard conversation with your nutritionist before you commit to any structural change. The Bullvine’s earlier look at the true labor math behind robot debt digs into why the cost stack is bigger than a feed-only conversation captures. When it makes sense: free-flow retrofit with limited capital for barn work. Risk: you’re financing the barn-design problem through pellet costs rather than solving it.
Path 2 — Partial reduction by group. Keep pellets for fresh cows, heifers, and the chronic fetch list. Pull them from mature, mid-lactation animals in the pens closest to the robot. Done well with a nutritionist who can build and monitor differential feed tables, you bank most of the available savings without the structural exposure. Done poorly, you’ve added a spreadsheet problem on top of a barn problem. When it makes sense: partially functional barn layout, strong nutritionist relationship, a service tech who isn’t already at capacity on calls. Risk: management complexity and the temptation to expand the pellet-free group faster than the data supports.
Path 3 — Structural changes before pulling pellets. Selection gate between stalls and feed, mid-barn crossover, commitment pen, shorter return lanes. This means tearing out concrete, rerouting lanes, and absorbing real production downtime. Not a weekend project, and the economics vary sharply by barn geometry and regional contractor rates. The Bullvine’s $17,000-per-cow retrofit reality is the companion read here — price any structural path against a current quote before you commit. When it makes sense: five or more years of robot life ahead, equity to invest, a lender who can model the long game. Risk: some retrofit barns won’t accept the gates cleanly, and not all the concrete math works out.
Path 4 — Do this within 30 days if you’re already stuck. If you’ve been pellet-free for four months or more and milk hasn’t returned to within roughly 3% of baseline (an editorial benchmark, not a published standard), stop waiting. Check your own numbers against these red flags — any one should trigger the meeting, and two or more should trigger it this week. These are editorial thresholds drawn from the Rodenburg 16% fetch baseline and common herd-management practice, not published standards:
Fetch list consistently above 20% of the herd. That’s well north of the free-flow baseline and deep into labor-burn territory.
Bulk tank variance above 5% week-over-week. Pellet-free herds trying to find their footing often shake the tank before the fetch list tells you why.
Somatic cell count spikes with no clear infection pattern. Irregular milking intervals from missed robot visits show up in SCC before they show up in the fetch log.
Operating line quietly absorbing monthly shortfalls. If you’re moving money from operating to cover feed and labor, you don’t have a feed problem. You have a cash problem dressed up as one.
If any of those are live, get three people in a room this month: your nutritionist, your AMS service specialist, and your lender or farm financial adviser. Bring the last 120 days of production data, fetch logs, SCC reports, and cash flow. Decide which path above you’re actually on, or put pellets back in the highest-need groups while you reset the timeline. Then set two checkpoints: day 90 (production recovered or structural path committed) and day 365 (full pellet-free vs. pellets-restored P&L review). Risk of not doing this: another two or three months of drag lands on the operating line before an adviser forces the conversation at a less favorable moment.
Key Takeaways
If your barn is free-flow with one robot at the end of a long pen and no selection gate, treat any pellet-free pitch as a capital decision, not a feed decision — you’re being asked to accept permanently higher fetch labor or to fund a structural reconfiguration.
If herd size × current lbs/cow × 9–12% drop × milk price × 10 weeks of transition, plus a full year of elevated fetch labor, exceeds your comfortable draw on your operating line, you don’t have the financial headroom to run the experiment.
If your fetch list sits above 20%, bulk tank variance runs above 5% week-over-week, or SCC is spiking with no infection source, schedule the joint nutritionist–service–lender meeting inside 30 days.
If your current pellet cost per ton is anywhere near the high end of the Vita Plus $132–$500 range, you may capture most of the available savings without touching the feed table at all.
If a proposal you’re reviewing doesn’t include a transition milk-loss line in dollars, a chronic fetch labor line at or above 15% fetch rates, and a value for stranded pellet infrastructure, ask for those lines before you sign. Proposals that leave them out understate the true cost picture.
If your barn has more than 15 stalls between the resting area and the first crossover, address the geometry before you address the ration. Your nutritionist should be setting the uNDF240 target, not your dealer.
If sustained pressure on debt service coverage is already forcing the operating line to absorb shortfalls, the course correction is overdue — not early.
If your forage program is soft on NDF digestibility or TMR moisture consistency, fix that before the feed table.
The Question Worth Taking Into the Barn
Strickland’s $171,000 is real to him and to Double Creek. The Heegs’ barn in Colby is real too — guided-flow, no pellets, and a different kind of decision about how cows move through the building. Neither of those outcomes happened in a retrofit free-flow barn, and neither started with a dealer ROI calculator. So when you’re standing at your own robot tomorrow morning watching who’s on the fetch list, the question isn’t “should I go pellet-free?” It’s “does my concrete, my gates, my forage program, and my working capital look anything like the farms showing up in marketing materials right now?”
If even one of those answers is soft, what you’re looking at isn’t an evolution. It’s an experiment you pay for twice — once in the transition, once more in the barn you should have reconfigured first. For the full economic model — cost-per-cwt by herd size, the five-question lender sidebar, and a side-by-side retrofit vs. new-build cash flow walkthrough — keep an eye on Bullvine Weekly, where the barn-by-barn math runs.
Sources: USDA Economic Research Report 356 (January 2026); University of Wisconsin–Madison Extension AMS publications; Bach, A. et al., Journal of Dairy Science (2007); Penner, G., Western Canadian Dairy Seminar proceedings (2019); DeVries lab, University of Guelph; Vita Plus Upper Midwest AMS herd survey; Rodenburg, J., AMS barn-design and traffic research; published AMS financing guidance from major U.S. and Canadian farm lenders; and publicly available operator materials including a DeLaval-produced promotional video featuring Matt Strickland. Dollar figures are USD unless otherwise noted.
The Sunday Read Dairy Professionals Don’t Skip.
Every week, thousands of producers, breeders, and industry insiders open Bullvine Weekly for genetics insights, market shifts, and profit strategies they won’t find anywhere else. One email. Five minutes. Smarter decisions all week.
FDA cleared SLICK Holsteins in 2022. Health Canada cleared gene-edited pork in January. No processor has agreed to pay base price for gene-edited milk in 2029 — and you’d own the cows.
The opening scene reflects composite conditions and conversations common across Arizona and Brazilian heat-belt dairies in summer 2025–2026. No specific farm or individual is portrayed. Forward-looking dollar scenarios in this article are scenarios, not predictions.
Casa Grande, Arizona. July. THI past 80, parlor crew soaked through. The herd manager on a 5,000-cow open-lot operation is weighing the same SLICK Holstein heat-stress pitch dozens of hot-belt dairies heard this spring. First-service conception sits well below 20%, squarely inside the 20–35% summer drop documented in the heat-stress literature. Two weeks earlier, a 5,000-cow dairy outside Goiânia sat through the same slide deck in Portuguese, with the same numbers, and the same silent partner nobody in the room talked about: the milk buyer.
Published work from the University of Arizona — including shade-management research from Dairy Extension Specialist Dr. Duarte Diaz (“Shade Management Systems to Reduce Heat Stress for Dairy Cows in Hot, Humid Climates,” UA Experts) — has long documented the productivity and welfare returns of cooling infrastructure in hot-humid systems. The comparison to gene-editing economics in this article is Bullvine’s own, not Dr. Diaz’s, and Dr. Diaz was not interviewed for this piece.
That silent partner is the whole story. FDA, CTNBio, Health Canada, and the UK’s new precision-breeding regime have all cleared a regulatory path for gene-edited livestock. Not one major processor has publicly committed to accepting gene-edited milk in a branded supply chain. For a hot-belt herd bleeding –4 million a year on heat stress, the SLICK pitch sounds like rescue. The math says write a different cheque first — and it’s not a gene-editing one.
What’s Actually Changed in the Last 18 Months
The regulatory ladder moved faster than most producers noticed. FDA issued a low-risk determination for Acceligen’s two PRLR-SLICK cattle and their progeny on March 7, 2022, covering meat, milk, semen, and embryos from those lines (FDA V-006378 Risk Assessment Summary). Brazil’s CTNBio has approved SLICK as non-GMO, and Embrapa — working with the Brazilian Angus Association — announced the country’s first gene-edited calves in May 2025: five Angus calves born between late March and early April 2025, with at least two confirmed carrying the edited slick-coat trait. The Holstein phase is still in the pipeline.
Health Canada’s January 23, 2026 statement approved PRRS-resistant gene-edited pigs for use in food and feed without mandatory labeling — the first animal approved under the new framework — concluding the pork is “as safe and nutritious” as conventional Canadian pork (Health Canada, January 23 2026; duBreton, January 28 2026; CBAN, January 25 2026). The UK’s Precision Breeding Act — enacted in 2023, with secondary regulations phased through 2024–2025 — opens a clear path for precision-bred organisms.
What hasn’t moved: the part of the chain that actually signs your milk cheque. As of April 2026, no processor has issued a blanket acceptance for gene-edited dairy in a branded product line. Bullvine reviewed public disclosures from the ten largest North American and European dairy processors through April 2026 and found none. If your processor has issued such a commitment and we missed it, we want to see it.
Dairy-ingredient procurement has also run cautiously through early 2026 against a background of several high-profile food-safety events in adjacent categories, keeping buyers risk-averse on novel-genetics adoption. Nobody in procurement is feeling bold about novel genetics right now.
That’s the gap producers keep missing. A regulator saying “this is safe” and a processor saying “we’ll pay base price for this milk in 2029” are not the same statement, by the same people, on the same timeline. Treat them as one and you’ve bought permanent genetics riding on a policy that hasn’t been written.
Milestone
Status (April 2026)
What It Means for Your Milk
FDA low-risk determination (SLICK)
✅ Cleared March 2022
Meat, milk, semen, embryos covered
Brazil CTNBio non-GMO ruling
✅ Approved
First gene-edited calves born May 2025
Health Canada gene-edited pork
✅ Approved January 2026
No mandatory labeling required
UK Precision Breeding Act
✅ Enacted 2023, regs phased 2024–25
Clear path for precision-bred organisms
Major processor accepting GE milk at base price
❌ NONE (0 of top 10)
No commitment through 2029
Retailer “no gene-edited dairy” policy
⚠️ Not yet issued
Could force processor reversal overnight
How This Plays Out on a Real Farm — The Arizona Math
Put real numbers on that 5,000-cow heat-belt operation. Summer conception drops of 20–35% are well-documented in heat-stressed Holsteins across the U.S. Southwest and tropical production regions. St-Pierre et al. (2003, J. Dairy Sci.) pegged U.S. dairy heat-stress losses at roughly $897 million a year under minimum abatement, and Key, Sneeringer & Marquardt (USDA-ERS ERR-175, September 2014) projected U.S. milk production declines of 0.6–1.3% by 2030under climate change, with the dairy sector bearing over half of current livestock heat-stress costs. Hoard’s Dairyman’s June 2025 coverage of the financial consequences of heat stress on U.S. dairy farms confirms the magnitude of the hit is trending up, not down.
Chen et al.’s Iowa State work — “Extreme Heat and Livestock Production: Cost and Adaptation in the US Dairy Industry,” now published as “Vulnerability of US dairy farms to extreme heat” in Food Policy (ScienceDirect S0306919225000259) — quantifies 4 million in lost Midwestern dairy revenue over five years (2012–2016)using animal-level production data, with yield loss per cow on an extreme-stress day nearly triple that of a medium-stress day. In hot-climate confinement, published per-cow losses fall between $400 and $800/cow/year, depending on THI load and abatement already in place. On 5,000 cows, that’s a $2–4 million annual bleed — real money, every year, compounding with every degree of climate drift.
Here’s the micro barn-math moment. Take that 5,000-cow hot-belt herd averaging 90 lb/day at a placeholder $18/cwt mailbox price — swap in your current Federal Order or processor schedule if you’re running a different component mix. That’s 32,850 lb/cow/year and $5,913/cow of gross milk revenue. If better cooling recovers even 4–6% of lost summer milk (consistent with Mauger et al., “Projected heat stress challenges and abatement opportunities for U.S. milk production,” PMC6438606, which models Minimal/Moderate/High/Intense abatement across nine U.S. climatic regions), you’re looking at 1,314–1,971 lb/cow/year back in the tank. Multiply by $18/cwt and you get $236–$354/cow/year. On 5,000 cows that’s .2–.8 million/year in recovered yield alone. Scale it down: at 500 cows the same math runs $118,000–$177,000/year — before reproduction gains or the next-generation tail from dry-cow cooling.
The capital to do it right? Not cheap, but bounded. High-capacity fans (36″–48″, sized at roughly 800–900 cfm per stall per Kansas State University guidance) plus soakers run $250–$400 per stall, consistent with Ontario OMAFRA’s (2020) soaker-cycle design of 21–27°C every 15 min, 27–32°C every 10 min, >32°C every 5 min. Dry-cow and close-up cooling runs about $100–$200 per stall, with benefit-cost ratios near 1.45 and payback around 5.7 years in USDA-region modeling (Ferreira et al., 2016, J. Dairy Sci.; University of Florida IFAS AN342 spreadsheet on economic feasibility of cooling dry cows). Holding-pen cooling and shade add $150–$250 per cow equivalent when spread across the herd. Partial-budget work puts payback in the 3–5 year range at current milk prices. Scale the framework down — a 1,000-cow operation in West Texas or a 500-cow family dairy in Mato Grosso do Sul is looking at roughly a tenth to a fifth of that capex, with similar payback arithmetic per cow.
Infrastructure Capex (5,000 Cows, Low-End Build)
Strategy
Capex (5,000-Cow Herd)
Annual Recovery
Payback Period
Processor Risk
High-capacity fans + soakers
~$1.25M
$1.2–$1.8M/yr
3–5 years
None
Dry-cow & close-up cooling
~$80K
BCR ~1.45
~5.7 years
None
Conventional polled genetics
$0 incremental
Labor + welfare savings
Immediate
None
CLARIFIDE Plus heat traits (Apr 2026)
$0 incremental
Improved sire selection accuracy
Immediate
None
SLICK gene-editing pilot (5% cohort)
$37.5K–$75K/yr semen
$200K–$300K/yr (est.)
Unknown — no processor commitment
HIGH
Genetic & Operational Ramp (over 2–4 years)
Component
Estimated spend
Notes
Tunnel retrofit
~$0.45M
Open-lot to cross-vent conversion, partial
3-year genotyping ramp
~$0.27M
CLARIFIDE Plus across replacement heifers
Operational subtotal
~$0.72M
Total low-end build
~$2.80M
Full range runs to $4.8M
Tunnel-retrofit and three-year genotyping ramp figures are Bullvine internal estimates; operators should replace with quotes from their preferred ventilation contractor and genetic-testing provider before committing capital.
The Mechanics: Why SLICK Works, and Why That’s Only Half the Problem
SLICK is an edit to the prolactin receptor (PRLR) gene — exon 10 in the Bos taurus genome — that truncates the receptor and mimics a coat mutation found naturally in Senepol and Criollo cattle. What you see in the barn: shorter, sparser coats, measurably more sweat, and vaginal temps that stop climbing when THI crosses 68. Puerto Rican SLICK Holsteins maintain lower vaginal temperatures, greater mammary blood supply, and higher milk yield than wild-type Holsteins under tropical heat stress (Dikmen et al., 2023–2024, J. Dairy Sci.; Ortiz-Colón et al., “Thermotolerance capabilities, blood metabolomics, and mammary gland transcriptomics of slick-haired Holstein cattle”). Tropical datasets from Puerto Rico and Florida have consistently shown lower heat-related mortality and better sustained production in SLICK cattle versus wild-type Holsteins in extreme heat.
The catch isn’t biology. It’s supply chain power. And the power sits two or three links upstream of your milk tanker.
The Danone–Zoetis CLARIFIDE partnership is the template. Zoetis and Danone publicly characterize their September 25, 2024 agreement as a “strategic partnership,” building on Zoetis’s role as preferred genetic-testing provider under Danone’s global “Partner for Growth” program since 2023, with CLARIFIDE Plus and DWP$ leveraged across Danone’s supplier base to drive sustainability and cow longevity outcomes. When a buyer that size rolls specific genomic-testing expectations into its supplier programs, processors tend to align quickly — often inside a year — rather than waiting multiple proof runs to see how it plays out. In Bullvine’s view, gene-edited dairy procurement is likely to follow a similar supplier-programs-first pattern — but with more brand risk and more consumer and NGO scrutiny than a genomic-testing rollout carries. Neither Danone nor Zoetis has publicly stated any such plan.
When major North American and European retailers have moved on supply-chain standards in the past — BST-free milk, cage-free eggs, no-antibiotics-ever poultry — processors have tended to follow within roughly a year to 18 months of a first-mover retailer commitment (Bullvine analysis of past retailer-driven pivots). Expect a similar, though not identical, pivot window on gene-edited dairy once a retailer breaks cover.
The Canadian Protein Trap: Why Lactanet’s 40/60 Flip Hits SLICK Harder Than You Think
The April 2026 index changes just reshaped the genetic chassis under any edit you make. Holstein Association USA reweighted TPI’s production slice from a 19:19 Fat:Protein ratio to 14:24 Fat:Protein (Holstein USA, TPI Formula — April 2026). Canada’s Lactanet flipped LPI Holstein production weighting from 60% Fat / 40% Protein to 40% Fat / 60% Protein (Lactanet, March 24 2026). This TPI formula update does put NM$ and TPI at opposite ends of the Fat to Protein ratio spectrum, meaning the two indexes are moving farther apart.”
Here’s what that means if you’re Canadian and thinking about SLICK. LPI just moved 20 points of production weighting from Fat to Protein in a single formula release. If your proposed SLICK donor bull is elite on heat tolerance but sits in the bottom third of his proof for Protein, you’re not “waiting to see” on gene editing — you’re actively locking in a genetic base that devalues your future quota-filling under Canada’s protein-weighted component pricing. The trait is permanent. The 60/40 Protein weight is the new LPI reality through at least the next formula review. Bullvine’s own reporting already flagged this as a potential $17,500/year protein trap on a 500-cow herd in U.S. Class III component grids; the Canadian quota-fill math is arguably worse because protein carries the weight and the cheque.
How Much Does Waiting for Processor Sign-Off Actually Cost?
This is the question that separates strategy from wishful thinking. If heat stress is costing your operation $2–4 million a year today, “waiting” feels reckless. But the cooling-and-conventional-genetics playbook doesn’t make you wait. It attacks the loss immediately, with payback inside five years, and it doesn’t depend on any retailer, any processor, or any regulator picking your side.
Run it out to 2029. A herd that spent $3–4 million on serious cooling and pushed Zoetis’s new heat-resistance traits — added to CLARIFIDE Plus and DWP$ in the April 2026 update, alongside environmental stewardship — has probably cut its residual heat-stress loss from $2–4 million down to roughly $0.8–$1.5 million a year under our scenario assumptions. SLICK layered on top of that might recover another $200,000–$300,000/year once a meaningful share of the herd carries the allele. Real money. But not rescue money. (These residual-loss and SLICK-recovery figures are scenario estimates derived in this article, not published findings.)
At an estimated SLICK semen premium of roughly $15–$30 per straw — a Bullvine working estimate, since PRLR-SLICK dairy sire pricing isn’t publicly listed by Acceligen, Select Sires, ABS Global, or ST Genetics as of April 2026 — on about 2,500 SLICK doses a year, roughly half of breedings in a 5,000-cow program once a pilot has ramped up, you’re spending $37,500–$75,000 to capture $200,000–$300,000 in residual savings. A modest uplift — single-digit percent against the pre-abatement loss — on a problem you’ve already mostly solved with cooling. Direct confirmation of that premium range from a stud rep or Acceligen licensing desk is the single most useful number a producer can put into this math before signing anything.
Is Your Herd’s Genetic Strategy Already Behind on the Wrong Thing?
Here’s the shift that matters most and often gets buried in the index debates: indexes are volatile, traits are permanent. You’re used to sire lists moving when TPI or LPI formulas change. You pivot next proof run. Fine.
Gene editing breaks that symmetry. Once PRLR-SLICK is in your herd, it’s there for decades — even if the index you used to pick the donor bull gets rewritten three times, even if a major North American or European retailer were to publish a “no gene-edited dairy” procurement policy in 2029 that your processor had to honour or lose the account. rBST was a management decision you could stop making. SLICK is a cow standing in your parlor for five more lactations whether anyone wants her milk or not. Assume the index will change. Assume the trait won’t. Only commit to edits where that asymmetry still looks good under multiple scenarios.
Options and Trade-Offs for Farmers
Four paths producers are actually running, and where each one wins and loses.
Path
Best For
Capital Required (5,000 Cows)
Processor Risk
Reversible?
Decision Trigger
1. Infrastructure-first, SLICK-later
Most heat-belt herds, 2026–2028
$2.8–$4.8M over 2–4 yrs
None
Yes (equipment)
THI >72 for 60+ days; fan/soaker below KSU recs
2. Conventional polled
Herds with dehorning pain points
$0 incremental (sire selection)
None
Yes (breeding pivots)
Single-digit NM$ gap vs. elite horned bulls
3. Bounded SLICK pilot (≤5%)
5,000+ cow optimized herds
$37.5K–$75K/yr semen
HIGH
No — permanent
Written processor acceptance + mid-merit females only
4. Five-question letter
Every producer, right now
$0 (stamp + envelope)
None
N/A
Before any GE dollar moves
Path 1: Infrastructure-first, SLICK-later (most heat-belt herds, 2026–2028) When it works: you’re bleeding real money on heat stress and haven’t maxed cooling and conventional heat-resilience genetics. What it requires: $2.8–$4.8M in cooling and genotyping capital over 2–4 years on a 5,000-cow herd — the kind of capex large Pinal County and Maricopa County operations already started running in 2022–2023. Named case studies of retrofits at this scale, with year-one recovered-production figures attached, would sharpen this path further and Bullvine is actively sourcing them for follow-up coverage. Decision trigger: if your summer THI exceeds 72 for more than 60 days and current fan/soaker coverage is below published Kansas State or Florida IFAS recommendations, Path 1 is the first cheque. Scale proportionally for 500- or 2,000-cow herds. Layer the April 2026 Zoetis heat-resistance traits into sire selection at zero incremental cost. Risks/limits: slower to swing than bolting SLICK onto the existing system. But every dollar pays back regardless of what any retailer or your processor eventually decide.
Path 2: Conventional polled now, skip gene-edited polled entirely When it works: dehorning labor, welfare, and staff safety are real pain points. What it requires: shifting to homozygous polled (PP) bulls from the VikingGenetics polled lineup, ABS Global’s expanded polled offering, and proven polled options ranked in Australian and European systems. Specific sire codes and current homozygous status should be pulled from the April 2026 catalogues by your breeding advisor before committing. Polled is a dominant trait; a herd can go effectively polled in 3–4 generations. Risks/limits: a single-digit-to-low-double-digit Net Merit gap versus absolute elite horned bulls — shrinking every proof run, and far cheaper than the combined regulatory and processor risk of gene-edited polled.
Path 3: Bounded SLICK pilot on a ≤5% cohort (5,000+ cow heat-zone herds) When it works: documented summer conception losses above 20%, infrastructure already optimized, and your processor is at least willing to have the conversation in writing. What it requires: written processor acceptance with duration language, a defined cohort of mid-merit females (never top-genomic replacements), and the financial ability to absorb the downside if retailer policy hardens by 2029. Risks/limits: SLICK is permanent. Your milk buyer isn’t. If your processor’s biggest retail customer moves against you, you still own the cows.
Path 4: Do-this-in-30-days — the five-question procurement letter The cheapest, fastest action on this list. Before any gene-editing dollar moves, send this to your milk buyer’s procurement contact, in writing, with a response date.
📋 THE FIVE QUESTIONS — PRINT THIS AND HAND IT TO YOUR FIELD REP
Send to your milk buyer’s procurement contact. In writing. With a response date.
Does our contract currently prohibit, allow, or not address milk from gene-edited animals?
If we breed SLICK daughters in 2027, will their milk be accepted at base price when they freshen in 2029?
What’s your written position on labeling, traceability, and auditability of gene-edited milk?
Do your downstream retail or branded customers have commitments that would force a no-GE policy?
If a competing processor accepts gene-edited supply first, are existing producers grandfathered?
Bullvine decision rule: If they can’t or won’t answer questions 1 and 2 in writing, you aren’t pioneering. You’re gambling with a 2029 freshening date.
Key Takeaways
If your processor hasn’t returned written acceptance of gene-edited milk with duration language through at least 2033, SLICK isn’t a genetics bet. It’s a policy bet — and you’re holding the cows if the policy moves. Send the five-question letter this month.
When summer conception sits below 80% of your seasonal benchmark for two or more seasons — a Bullvine rule of thumb, not an industry standard — the first $2.8–$4.8 million of heat-stress capital belongs in cooling, shade, dry-cow and holding-pen upgrades before a single SLICK straw enters the tank. Payback is 3–5 years. That’s math, not opinion.
Still treating polled as a “compromise” bull list? Pull the current VikingGenetics and ABS polled lineups before your next sire-selection meeting. A single-digit-to-low-double-digit Net Merit gap is a rounding error compared to betting your herd on a retailer that hasn’t written the policy yet.
Rerun your CLARIFIDE Plus reports with the April 2026 heat-resistance and environmental stewardship traits before your next sire-selection meeting. Both are free to layer in. Both carry zero processor risk. There’s no reason not to.
Check your top SLICK candidate bull’s Protein-to-Fat ratio before you commit. Below 0.50, re-sort on NM$ or Cheese Merit — and if you’re Canadian, re-sort on the April 2026 LPI before you even think about it. The 49th parallel just split your catalog in two.
Cap any SLICK pilot at 5% of replacements on mid-merit females. Never top-genomic animals. Pioneering is fine. Betting your best genetics on a procurement policy nobody’s written yet is not.
Watching for the signal that the market is actually moving? Watch the first retailer move. Not the first processor press release. Retailers write the cheques processors cash.
The Question Worth Taking to Your Next Sire-Selection Meeting
When you sit down with your breeding advisor this month, the real question isn’t whether gene editing is coming. It’s whether your operation is positioned to move within 90 days when a retailer finally greenlights it — or whether you’ll be 24 months behind because you either waited entirely or bet too early. Where does your cooling capital budget actually sit for the 2026–2027 fiscal year? And have you asked your processor the five questions, in writing, with a response date?
The full per-cow cooling capital model by herd size, and the contract language producers should be drafting for their processors right now, are what we’re breaking down in next week’s Bullvine Weekly. That’s where the deeper numbers live — and where the conversation with your nutritionist, your genetics advisor, and your lender actually starts.
Complete references and supporting documentation are available upon request by contacting the editorial team at editor@thebullvine.com.
Every week, thousands of producers, breeders, and industry insiders open Bullvine Weekly for genetics insights, market shifts, and profit strategies they won’t find anywhere else. One email. Five minutes. Smarter decisions all week.
One of North Dakota’s last 18 Grade A dairies just got directed to a new milk market twice in 30 months. The nearest plant that’ll take the load sits five hours one way.
By early 2026, one of North Dakota’s last 18 Grade A dairies — the regulatory tier that can ship fluid milk, out of roughly 18–25 licensed dairies statewide — had been directed to a new milk market twice in 30 months. Not because production slipped. Not because a lender called a note. Because the state lost nearly every in-state processing option, and the nearest plant willing to take the load sat roughly five hours one way in Perham, Minnesota.
The Bullvine reported in February 2026 that the operators — the Holle family’s 1,000-cow Holstein herd 12 miles south of Mandan — described the freight reality as “really, really hard” and said they didn’t know what they were going to do. That’s not a 60-cow retirement story. It’s a professionally run operation telling the industry, in plain language, that the corridor under its feet doesn’t pencil anymore. And the 2025 FMMO make-allowance update — effective June 1, 2025, per the final rule published in the Federal Register on January 17, 2025 — trimmed another 85–93¢/cwt off the class prices that underwrite their milk check.
Why This Matters
The 2025 FMMO make-allowance change alone can pull an estimated $97,750–$106,950 a year off a 500-cow herd at 230 cwt/cow/year — before a dollar of freight gets layered in.
Upper Midwest hauling charges averaged $0.6137/cwt in May 2023 and $0.7969/cwt in May 2024 — roughly 30% — on a per-farm basis in Federal Order 30 staff data. (Volume-weighted, the order-wide average is lower — $0.50/cwt in 2024 — because large-volume producers negotiate cheaper freight. The per-farm average better captures what small and mid-size herds actually pay.)
North Dakota holds roughly 18 Grade A dairies — and about 25 regular-milk dairies milking 10,000 cows statewide, per Dairy Star’s June 2025 reporting — with at least one 1,000-cow herd now on a five-hour haul to Minnesota. That’s the map today, not a projection.
How Two Plant Closures in 30 Months Cornered a Professional Dairy
North Dakota’s processing contraction is among the most documented in modern U.S. dairy. In September 2023, Prairie Farms’ Bismarck plant — the primary Class I destination for central and western North Dakota — ceased processing and converted to distribution-only operations.
North Dakota Agriculture Commissioner Doug Goehring didn’t mince words:
“This will directly affect the dairies who currently have their milk trucked to Prairie Farms. With no other processors nearby, those dairies will likely pay for shipping longer distances that will be deducted from their milk checks. This will have a dramatic impact on their bottom line.”
On August 30, 2024, DFA’s dairy ingredient facility in Pollock, South Dakota, shut down, eliminating 33 full-time and 4 part-time positions and removing the regional backup. That left one processing facility inside North Dakota state lines: Cass-Clay in Fargo, pressed against the Minnesota border.
Another North Dakota producer, roughly 50 miles northwest of Bismarck, got rerouted 151 miles to Pollock after the Bismarck conversion — at a freight surcharge of about $0.55/cwt — and invested in a second bulk tank to handle every-other-day pickups. Then Pollock closed too. That’s a bulk tank on the balance sheet against a plant that didn’t outlast the depreciation schedule.
Federal Order 30 staff data shows hauling charges on a per-farm basis climbing from $0.6137/cwt in May 2023 to $0.7969/cwt in May 2024 — roughly 30%, with North Dakota posting the order’s highest hauling cost. Stack that freight on a January 2026 Class III price of $14.59/cwt — down $1.27 from December, and the lowest Class III print since July 2023 — and the haul alone eats whatever margin the board hands back.
What the Dairy Farm Extinction Clock Is — and Why We Built It
The Bullvine’s Dairy Farm Extinction Clock is a tracking tool we built using USDA NASS-licensed dairy herd counts going back to 2013. For each state, we calculated the 5-year and 10-year average annual attrition rates, then applied a compound decay model — the same math behind radioactive half-life — to estimate how many years remain before the herd count falls below the USDA NASS disclosure threshold at its current rate.
The classification is simple. Red Zone: extinction projected before 2045. Yellow Zone: 2045–2060. Green Zone:longer runway. Extinct: states already below the USDA disclosure threshold with suppressed data. As of the February 2026 Milk Production Report, the scoreboard reads 11 Red, 1 Yellow, 36 Green, and 2 Extinct — with 26 states showing accelerating attrition.
We built the Clock because national production totals hide the map underneath. The U.S. shipped 226.4 billion pounds of milk in 2022. That number looks fine. What it doesn’t show is that 19,925 licensed herds disappeared in a decade, the Southeast lost 80%+ of its dairy farms since 1992, and states like North Dakota and Arkansas are two to three years from the disclosure threshold on current attrition math.
The Clock doesn’t predict the future. It describes the present, precisely — and it tells you which direction the math is running.
Where the Major Dairy States Stand Right Now
Top 15 U.S. dairy states by 2025 herd count, plus North Dakota for reference. Data from the USDA NASS Milk Production Report, February 2026. Attrition rates are annualized averages. “Accelerating” means the 5-year rate exceeds the 10-year rate — the decline is getting worse, not better. “Clock” = year at which the state is projected to fall below the USDA NASS disclosure threshold (typically ~5 herds), at which point reporting is suppressed. Projections assume current 5-year attrition rates hold.
State
Herds (2025)
5-Yr Attrition
10-Yr Attrition
Accelerating?
Clock
Zone
North Dakota
20
19.3%
13.5%
Yes
2028
RED
Wisconsin
5,375
5.4%
5.9%
No
2179
GREEN
Pennsylvania
4,360
4.3%
4.3%
No
2217
GREEN
New York
2,760
5.4%
5.4%
No
2167
GREEN
Minnesota
1,605
7.3%
7.4%
No
2122
GREEN
Ohio
1,365
4.8%
6.7%
No
2172
GREEN
California
960
4.6%
4.1%
Yes
2171
GREEN
Michigan
825
7.0%
7.8%
No
2117
GREEN
Iowa
675
6.9%
6.7%
Yes
2116
GREEN
Indiana
675
3.5%
5.6%
No
2210
GREEN
Vermont
470
5.9%
5.7%
Yes
2125
GREEN
Illinois
405
5.0%
5.0%
Yes
2141
GREEN
Idaho
350
4.4%
3.8%
Yes
2155
GREEN
Missouri
345
13.6%
11.6%
Yes
2065
GREEN
Texas
280
4.9%
4.2%
Yes
2137
GREEN
Washington
280
3.7%
5.2%
No
2173
GREEN
Every state on this list except North Dakota is Green. Every state is still losing farms. The spread is the signal: Indiana at 3.5% annual attrition has a runway past 2200. Missouri at 13.6% — accelerating — hits the disclosure threshold by 2065 despite starting with 345 herds. Green doesn’t mean safe. It means you have time to act. How much time depends on which row you’re sitting in.
Safe State, Dangerous Corridor: Is Your Route Actually a Green Zone?
The Clock classifies Wisconsin as a Green Zone and North Dakota as a Red Zone. Clean on paper. Messier on the road.
Structural Metric
Wisconsin (Green Zone)
North Dakota (Red Zone)
What It Means for You
Licensed herds, Feb 2026
~5,375
~18–25
ND has <0.5% of WI’s farm base
5-yr annual attrition
5.4%
19.3%
ND is losing ~1 in 5 herds a year
Processing redundancy
Dense, multi-plant network
One effective in-state option
Single point of failure = hostage equity
Projected disclosure-threshold year
2179
2028
ND: 2-year runway, not a generational one
Typical one-way haul to backup plant
<2 hours
~5 hours (Perham, MN)
Freight alone can eat Class III margin
You can live in a Green Zone state and still be sitting on a wasting asset if your hauling corridor is thinning faster than the statewide average. The Clock tells you when a state runs out of farms. It doesn’t tell you when your road runs out of trucks.
Terry Sears of DM&D Milk Haulers in Erie, Kansas, profiled by John Deere’s The Furrow in March 2023, shows what route erosion looks like in practice. The company’s tanker now runs 60 miles back to Erie, then another 205 miles one-way to a DFA plant in Cabool, Missouri, per The Furrow’s reporting. Same line of work Sears started in 1975, covering two counties. A very different map.
That’s the feedback loop most producers don’t see on paper. One farm exits. The route gets longer. Hauling costs rise. Another farm loses margin. Another route thins. Consolidation doesn’t just remove farms — it taxes the survivors.
How the Make-Allowance Update Lands on a 500-Cow Milk Check
Bigger deductions, smaller milk checks. The math is that direct.
FMMO make allowances — the processing-cost deductions pulled out of class prices before your check is calculated — hadn’t been updated since 2008. The final rule published by USDA AMS on January 17, 2025, with make-allowance changes effective June 1, 2025, set the updated deductions in the Class III and IV formulas at $0.2519/lb for cheese, $0.2272/lb for butter, $0.2393/lb for nonfat dry milk, and $0.2668/lb for dry whey. And while North Dakota was losing plants, producers nationally were losing 85–93¢/cwt on the milk they could still ship.
The producer northwest of Bismarck is carrying both hits at once. He’s paying added freight to reach a plant, and taking the FMMO haircut on every cwt once he gets there. That’s the compound problem Red Zone operators are now running inside.
AFBF economist Daniel Munch estimated the first-quarter impact on the producer pool value under the new rule at more than $337 million. “Higher make allowances have imposed the most significant cost to dairy farmers, cutting $337 million from pool revenues and lowering class prices across the board,” Munch wrote in his Market Intel analysis, as reported by Michigan Farm News. That figure covers all 11 federal orders — the 85–93¢/cwt reduction applied against first-quarter pooled volume nationally. Commodity-heavy regions — especially the Upper Midwest — absorbed the deepest cuts.
Barn Math: Walk It on Your Own Herd
Here’s the formula. Take your herd size. Multiply by 230 cwt/cow/year — a conservative national proxy, since USDA NASS reported 2024 production per cow in the U.S. averaged 24,178 pounds. If your herd ships 250 or 270 cwt, scale accordingly. Multiply total cwt by the 85–93¢/cwt reduction. That’s the revenue that moved from your milk check to processor cost recovery under the new make allowances.
Herd size
Production assumption
FMMO hit
Annual milk-check loss
300 cows
230 cwt/cow/year
$0.85–$0.93/cwt
$58,650–$64,170
500 cows
230 cwt/cow/year
$0.85–$0.93/cwt
$97,750–$106,950
700 cows
230 cwt/cow/year
$0.85–$0.93/cwt
$136,850–$149,730
Walk the 500-cow row. At 230 cwt/cow/year, you move 115,000 cwt. Multiply by 85 cents, and you get $97,750. Multiply by 93 cents, and you get $106,950. That range — $97,750 to $106,950 gone from the milk check over 12 months — doesn’t include freight. At USDA NASS national livestock-worker wages of $17.51/hr in October 2024, that’s roughly two full-time dairy employee salaries once you factor payroll taxes and benefits — erased by a single rule change.
Class I differentials and advanced-pricing factors were reworked in the same final rule, but the benefit skewed toward fluid-heavy orders. Add the 30% jump in per-farm hauling on Federal Order 30 between 2023 and 2024, and the net effect on the milk check looks less like modernization and more like a reallocation from producers to processors.
Whatever you call it, it’s a withdrawal.
Cost Driver
Rate
Applied to 500-Cow Herd (115,000 cwt/yr)
Annual Impact
FMMO make-allowance update (low case)
$0.85/cwt
115,000 cwt × $0.85
$97,750
FMMO make-allowance update (high case)
$0.93/cwt
115,000 cwt × $0.93
$106,950
FO30 per-farm hauling, May 2024
$0.7969/cwt
115,000 cwt × $0.7969
$91,644
FO30 hauling increase vs. May 2023
+$0.1832/cwt
115,000 cwt × $0.1832
+$21,068 YoY
Stacked drag (high FMMO + May 2024 hauling)
—
—
~$198,594/yr
The Route Math Most Producers Never See
Cooperatives track route economics internally. Every hauler, every loop, every stop — there’s a model somewhere that says where the margin is and where the routes are becoming uneconomic. That kind of planning information isn’t typically shared at the producer level, and producers rarely get advance notice when a route is at risk of restructuring.
The Holles were directed to a new market twice in 30 months. The producer northwest of Bismarck invested in a second bulk tank — and lost his plant eight months later. Whether that’s a communication gap, a competitive information issue, or a structural feature of how co-ops plan, the practical result for members is the same: you won’t see the route map until a decision has already been made. So if you’re a 500-cow operator in a Green Zone state, it’s worth asking your field rep directly about route density in your corridor. The willingness to engage the question tells you something. So does the reluctance.
The Turn: You Can’t Buy Your Way Back Out
Here’s the turn nobody priced in. Recovery isn’t just a margin problem anymore. It’s a biology problem.
Dairy replacement heifer inventories fell to 3.914 million head as of January 2025 — the lowest level since 1978, per USDA’s January 2025 Cattle report. The number of heifers expected to calve fell to 2.5 million head — the lowest figure in decades, per the same Cattle report. In its February 2025 WASDE report, USDA cut its 2025 milk production forecast by 400 million pounds, citing a tighter heifer supply revealed in the Cattle Inventory and Milk Production reports.
That changes what “fix this” even looks like. If you can’t buy your way out of a thinning corridor with replacements, you have to manage your way out — lower breakevens, tighter loan discipline, stronger reproduction, and decisions that match your corridor rather than your hopes. Even if milk prices rally, the cows aren’t there to repopulate fragile regions quickly.
Dawson Holle — sixth-generation dairy farmer, Northern Lights Dairy co-operator, and North Dakota state representative — told Dairy Star in June 2025 that the market access problem isn’t about herd size: “As markets move, laws must move too. Whether you are large scale with 10,000 cows or small scale with just 10 cows, you should have a place in the market.” He added, “If we can keep milk in-state and add more processing options in the center, that would be a big step forward.”
Dairies in thin corridors are carrying more system risk than the ones sitting in dense corridors, not less.
As The Bullvine reported in our analysis of America’s 800,000-heifer crisis, the industry-wide shift toward beef-on-dairy breeding has driven roughly 800,000 fewer replacement heifers into the national pipeline — with replacement values averaging $3,010 nationally and premium springers in California and Minnesota pushing $3,500–$4,000. And every heifer you do raise is a $2,300–$2,700 capital asset before she ever hits the parlor, per Iowa State’s 2024 budgets — which means how you feed her in week one directly shapes whether that investment pays back or washes out.
What 2,013 Farms Holding 66% of U.S. Milk Means for Your Risk
The 2,013 U.S. farms with 1,000 or more cows accounted for 66% of all U.S. milk sales in the 2022 Census of Agriculture, up from 57% in 2017, per analysis from the University of Illinois’ farmdoc project using USDA NASS data. Total U.S. milk production rose from 215.5 billion pounds in 2017 to 226.4 billion pounds in 2022. That’s the headline the industry points to when it says consolidation is working.
Production stability is masking infrastructure thinning. Rabobank analysis found that dairy operations with fewer than 500 head represented 86% of total farms but produced just 22% of the milk, roughly 20,631 operations at the time of that analysis. So if you’re one of the tens of thousands of herds under 1,000 cows, the 66% figure isn’t about you. The attrition figure is.
North Dakota is betting on size to solve the processing gap from the other direction. Minnesota-based Riverview LLP has obtained environmental permits for a 12,500-cow dairy near Wahpeton and a 25,000-cow herd near Hillsboro, both along the I-29 corridor on the Minnesota border. An environmental group filed a legal challenge to the Hillsboro permit in October 2025. If both go in, North Dakota’s cow count jumps roughly fourfold overnight — but it jumps into the state’s single existing processing corridor, not the western void where the Holles sit.
The Playbook: Scale, Pivot, or Exit Before Your Next Loan Review
If your milk has only one realistic destination within two to three hours, you’re not in a market. You’re in a dependency. Use the next 12 months to figure out which of the three paths your numbers actually support.
Scale into a backbone corridor. Where it helps: dense processing regions with recent plant investment, sound debt-to-asset, and equity rising. You gain leverage and route redundancy. You give up some flexibility and take on more fixed costs concentrated in one place.
Pivot your revenue mix. Where it helps: mid-size herds in thinning corridors with strong genetics or component-rich milk. Robotics, precision systems, component-focused genetics, and beef-on-dairy income can trim your effective breakeven even when the corridor is unfriendly. Trade-off: more management complexity and, in some cases, added biosecurity exposure.
Structure a planned exit. Where it helps: operators past 55 with debt-to-asset above 60%, no committed successor, and a corridor where hauling plus FMMO drag is already eating 2%+ of gross revenue. You keep optionality around cows, equipment, and genetics while the market still rewards them.
Do This in the Next 30 Days
☐ Call your co-op field rep and your hauler. Ask how many herds remain on your route versus five years ago, whether the loop’s geographic footprint has grown, and whether there’s any talk of route optimization or minimum volumes. If they won’t answer, that’s an answer too.
☐ Pull the last 12 months of milk checks. Isolate hauling and stop/fuel surcharges. Compare the total to the same period three years ago. If hauling is rising faster than your mailbox price, your corridor is already taxing your margin.
☐ Name your backup plant. If you can’t identify a second processor within two to three hours that would take your volume tomorrow, you have a single point of failure. Write the plant’s name on paper — or admit you don’t have one.
☐ Sit down with your lender. Ask directly: “What corridor assumption are you using when you underwrite my long-payback projects?” Their answer tells you how they’re stress-testing the same risk you’re living.
Do This in the Next 90 Days
☐ Run a real breakeven. Include family labor at realistic hourly rates and depreciation at replacement cost. If the gap between your breakeven and your mailbox has widened for three years running, that’s a trajectory, not a cycle.
☐ Recalculate debt-to-asset. Under ~50% with equity rising keeps your options open. Over ~60% with equity declining three years running turns the exit conversation from optional to overdue.
☐ Pressure-test your replacement plan. With heifer inventories at a 47-year low and replacements averaging $3,010 nationally, any expansion that depends on buying animals needs a much tighter business case than it did five years ago.
Do This in the Next 365 Days
☐ Commit, or document why you’re still evaluating. By this time next year, you should have a committed corridor decision — scale, pivot, or exit — or a written reason you’re still evaluating. Drift is itself a decision, and it’s rarely the one you’d pick deliberately.
☐ Watch one structural signal. If hauling plus FMMO drag eats more than 2% of gross revenue for two consecutive years — a working threshold The Bullvine uses to separate cyclical stress from structural stress — treat that as a signal to reopen the corridor conversation with your lender.
What This Means for Your Operation
Single-destination risk is structural risk. If your milk has only one realistic buyer within three hours, your equity is a hostage. You aren’t managing a business — you’re managing a countdown. Write the name of a real second buyer on paper, or admit you don’t have one.
Run the FMMO math on your own herd. Take your cwt shipped last year, multiply by 85–93 cents, and that’s your estimated annual make-allowance hit. A 500-cow herd at 230 cwt/cow lands at roughly $97,750–$106,950 a year before freight. If your debt-service coverage ratio (the ratio of your net farm income to annual debt payments) sits below 1.2 — the floor most ag lenders watch — that hit alone can move you into the danger band.
Find your row on the Clock. Look up your state in the 16-state table above. If your 5-year attrition rate is higher than your 10-year rate, you’re in an accelerating state — the decline is getting worse, not better. That’s a decision input for every long-payback project on your desk.
Match your loan horizon to your corridor, not your stainless. If your corridor has lost more than a third of its dairies in the last decade, the route functionally behaves like a wasting asset. Long-payback projects deserve extra scrutiny.
Don’t count on buying your way out. With replacement inventories at a 47-year low and an 800,000-heifer deficit driven by beef-on-dairy breeding, growth plans that assume available heifers at reasonable prices are already out of date. The heifers you do raise are $2,300–$2,700 capital assets — treat them accordingly from day one.
Talk to your lender before your lender talks to you. Ask what corridor risk, hauling inflation, and make-allowance drag are doing to their underwriting model on dairy paper this year. If they haven’t run those numbers, now you both have a problem to solve.
If you’re in a dense corridor, protect the advantage. A Green Zone state with fresh stainless going into nearby plants is the closest thing to a structural tailwind in this market. Don’t squander it by running someone else’s numbers on your own barn.
Six Checks Before Your Next Loan Review
If your FMMO drag plus hauling eats 2%+ of gross revenue for two years running, treat that as a structural trigger — not a bad cycle — and put a corridor conversation on your lender’s calendar.
If your debt-service coverage ratio is already below 1.2, the FMMO rule change alone can push you into covenant territory before any other input moves. Run the 85–93¢/cwt number on your own cwt shipped before your next review.
If your state’s 5-year attrition rate exceeds its 10-year rate on the Clock table, you’re in an accelerating corridor. That’s a signal, not noise.
If you can’t name a second buyer inside a two-to-three-hour radius, your equity is riding on one plant’s business case, not yours.
If your 10-year expansion plan assumes available, affordable replacements, rebuild it. The January 2025 heifer inventory is the lowest since 1978, and the pipeline tightened before the rule did.
If you’re in a dense processing corridor, that’s not luck — it’s a structural tailwind. Don’t let someone else’s growth playbook talk you out of it.
Federal Order 30 staff, USDA NASS, farmdoc, AFBF’s Daniel Munch, and North Dakota’s own agriculture commissioner are all saying the same thing from different angles: route access and policy drag are structural inputs in the dairy financial model now, not cyclical ones. Operators like the Holle family at Northern Lights Dairy got caught on the wrong side of that timing. The window to decide which side of the math you want to be on isn’t closing today, but on current attrition trends in Red Zone states, it’s narrowing year over year. Put your own map on paper, set your breakeven beside it, and answer the only question that actually matters:
Are you financing a dairy, or a route that’s already disappearing?
Complete references and supporting documentation are available upon request by contacting the editorial team at editor@thebullvine.com.
Every week, thousands of producers, breeders, and industry insiders open Bullvine Weekly for genetics insights, market shifts, and profit strategies they won’t find anywhere else. One email. Five minutes. Smarter decisions all week.
In a British Columbia ballroom on a Saturday morning, sixty-five Canadians signed away a century of member-governed dairy democracy. The herd book will outlive the organization. And almost nobody noticed.
Editor's note — April 19, 2026: Former Holstein Journal editor Bonnie Cooper, has pointed out that the language "Resolutions are not binding upon the Board" in the new §4.15 is not new to the 2026 by-laws — the identical sentence appears in §10.5.1 of the prior by-laws and has been operative for years. The Bullvine has updated the relevant passages below to reflect that §4.15 carries forward, rather than introduces, that language. The article's broader argument — that the April 18 rewrite expanded board authority through §2.05 (unlimited borrowing), §2.09 (sole discretion over operating policies), and §5.05 (appointed directors), and that the 2025 member accountability resolutions received no formal progress report — stands unchanged. Our thanks to Bonnie for the correction.
The Slido screen at the front of the room showed a number. It was not a big number.
Sixty-five in favour. Some abstentions. A handful against. The chair — outgoing, warm, measured — announced that the motion had carried. The by-law section was adopted. The meeting moved on. Somewhere in the ballroom, a scrutineer named Pascal Lemire logged the result.
There are 7,900 members of Holstein Canada. Sixty-five of them voted. That is 0.8%.
By the end of that Saturday morning, those sixty-five people had adopted a wholesale governance rewrite of the 141-year-old association that governs the Canadian Holstein breed. The by-law rewrite carried forward existing language stating future member resolutions would not bind the board. The board would have “sole discretion” to write the operating policies governing elections, director conduct, and member discipline. The board could borrow against and mortgage any Association property without a member vote, with no stated cap. Two voting directors could, going forward, be appointed by the board itself rather than elected.
None of those four clauses drew a single challenge from the floor.
We read every speaker. We matched every quote. We cross-referenced every vote. And the conclusion we have arrived at is not the one the board would like us to reach. It is not a conclusion about bad actors or institutional conspiracy. It is something quieter and, in its way, more damaging.
Holstein Canada is not being taken over. It is being left.
That is a harder problem than takeover. Takeover can be fought. Abandonment has no opposing side.
And if the trend lines set at this AGM hold for another five to ten years, the specific legal institution that holds the Canadian Holstein herd book, administers the Master Breeder program, and represents Canadian breeders internationally may not survive in any form that a 2020s breeder would recognise. The breed will continue. Holstein genetics are too globally entrenched to care whether any single national association endures. But the member-governed, branch-based, bilingual democratic Association of Canadian Holstein breeders is not a law of nature. It is an institution. Institutions die when their members stop showing up.
On April 18, 2026, in British Columbia, sixty-five (of 7,900) members showed up and changed an association … for ever?
The Million-Dollar Surplus That Wasn’t
The most honest moment of the AGM came from a man who had been in the CEO’s chair for less than five months.
Greg Dietrich, new to the role, new to the podium, walked the room through the 2025 financial statements. On paper: $16.78 million in revenue, $16.35 million in expenses, an operating surplus of $426,000. Add investment returns from the reserve fund and the headline jumped to $1.01 million.
One million. Surplus. A good year.
Then Dietrich did something his predecessors had not done.
“We had about $780,000 that we did not pay for staffing or labor resources,” he told members. “If we consider that into the full staffing, then our operational position could be more about a $350,000 deficit. So as we look at 2025, it may appear at the beginning that we had a fantastic year. Our truer position is actually closer to a bit of a deficit, if we’re being… looking at it with a close eye. We achieved that, not necessarily in the right way.”
The new CEO stood up in front of the members and told them the million-dollar surplus was a ghost. Jobs they couldn’t fill had produced the illusion of growth.
Finance chair Benoît Turmel of Ferme Beauçoise, Quebec then walked members through a ten-year chart. Expenses above revenues for an entire decade, with one COVID-era exception. “For the past five years,” Turmel said, “our operational deficit has been negative for an average of $147,000. We’ll have to be proactive and use our imagination.”
Five consecutive years of operational losses. A decade of expenses running ahead of income. The books are only held up by investment income from a reserve fund — $6.89 million at year-end, returning 9.28% in 2025, according to the Finance Committee report — that Holstein Canada is now, at management instruction, being moved from RBC to Burgundy Asset Management in an explicit attempt to grow the reserve toward one full year of operating expenses. At present, it covers about six months.
And the 2026 budget members approved without a single challenge? A projected $584,000 deficit, deliberately. Severances are baked in. Consulting fees are baked in. Legal fees for the governance rewrite are baked in. Dietrich framed it as “investment in rebuilding.” It is also a draw on the reserve, and a bet on two specific operational turnarounds that the financials do not yet support.
The bet: Holstein Canada will classify 10,000 more cows in 2026 than in 2025. That is the assumption underpinning the budget.
The reality: Holstein Canada classified 5,000 fewer cows in 2025 than in 2024.
Pascal Martin of Quebec, one of the sharpest members in the room, called the contradiction from the floor. The board did not rebut the substance. They explained the plan — new four-month classification rounds, a two-month interval service for large herds, a new business development hire — and moved on.
There is a word in financial reporting for budgeting aggressive growth into a business line that has been contracting. The polite word is “ambitious.” The less polite word is “unsubstantiated.”
The room accepted it without a recorded vote.
Fred Hofstra Stood Up
The only by-law section that drew real opposition was Section 5.05, which creates up to two appointed voting directors — board members chosen by the board rather than elected by the membership.
Fred Hofstra runs Corlane Holsteins in Alberta. He is president of the Alberta Holstein Branch. He is not a perennial critic; later in the same meeting he delivered one of the warmest tributes to the board’s recent progress. He is the kind of member the board wants in the room.
He walked to the microphone. He gave his name, his prefix, his province — the ritual of the AGM floor — and he said this:
“You’re taking a pretty big swing at switching to external members, which are not voted members. They’re going to be appointed. And you’re saying they’re going to be a two-year appointment, but yet they’re going to be making decisions and voting on behalf of your membership. We have to trust the board, but we also have to question the board, because without questions, we don’t get answers. So we can’t just trust you blindly. I really believe that this needs to be thought out at a longer term so that we can bring this back to our membership.”
Stefan Allery of Quebec echoed him. So did Dennis Weary and Rob Bumstead of Ontario. Amanda Jeffrey of Ontario pointed out that the regional boundary maps referenced in the new Section 5.02 did not exist yet — members were being asked to approve a framework and let the board draw the lines after.
The sharpest procedural observation came from Bumstead. Minutes earlier, the meeting had adopted Section 4.11, granting members the right to vote electronically in future meetings. Bumstead said it plainly:
“Those people do not have a chance to vote here today. And I think this is a pretty significant change to your bylaws. And also, we just passed a motion under section four giving them the right to vote.”
In other words: you have just told the membership they have a right to vote remotely. Now you are refusing to defer a major governance decision until you can actually give them that right. Use it, or the provision you just passed is decorative.
Section 5.05 passed anyway.
What did not happen — what no speaker raised, what no member flagged, what no branch president asked the board to defend — was the rest of the rewrite. Section 2.05, giving the board unlimited borrowing and mortgage authority without a member vote and without a cap. Section 2.09, giving the board sole discretion to write the operating policies governing elections, discipline, and director conduct. And Section 4.15, one of the quietest clauses, carried forward from the prior by-laws and again unchallenged:
“Resolutions are not binding upon the Board.”
Nobody raised it. Nobody asked about it. It passed in a bundled section vote in under five minutes. The most important governance sentence in the rewrite received zero seconds of floor debate.
There is a Bullvine question worth asking plainly. How does a clause that explicitly strips the binding authority from every future member resolution pass, in a single meeting, unchallenged, at an association whose members passed seven member resolutions that same morning?
The only coherent answer is that the members in the room did not read the document carefully enough. Or they read it, and they did not feel empowered to challenge it. Or they read it, they understood it, and they accepted it.
None of those three answers is good news.
The Accountability Ghost
August 2024. Somewhere in Canada, a branch treasurer opened an email from Holstein Canada’s head office and learned that Directors and Officers liability insurance for branches had been cancelled. No consultation. No transition. No replacement coverage. Volunteer branch boards — retirees, working farmers, young leaders doing the unpaid work that holds the federation together — were personally exposed to liability on the decisions they had already been making for years.
The 2025 AGM in Halifax responded with a direct resolution: reinstate it. Alongside that, members passed a set of equally blunt directives. Reinstate the in-person National Joint Branch Meeting. Require HC leadership to attend provincial AGMs. Commit to detailed financial statements. Restore classifier autonomy after reports that breeders had been pressuring classifiers to skip low-scoring cows. Fix bilingual service delivery for a membership that is 43% francophone. Drive progress on crampy bull identification.
Now go to the 2026 transcript. Search for “D and O.” Search for “directors and officers insurance.” Search for “branch insurance.”
Not a single mention. A year after the resolution, the issue that exposed volunteer branch boards to personal liability did not rate a sentence of follow-up. Not from the chair. Not from the CEO. Not from the finance chair. Not in a committee report. Not from a member asking at the microphone. The single sharpest accountability demand of the 2025 AGM — the one that came from branch volunteers who learned they were suddenly personally exposed to liability — appears nowhere in the 2026 AGM transcript.
Classifier autonomy? The outgoing chair said this, precisely: “Given the importance of strengthening the management team for this key department, we have no conclusions to share with you this morning.” A new classification manager, Valerie Trembley, has been hired. Members were told to wait.
Bilingualism? The meeting itself was fully bilingual with simultaneous translation. Dietrich made a personal effort in French. But there was no systemic update, no metrics, no service delivery audit.
Crampy bulls? The 2025 resolution evidently did not produce the change breeders wanted, because a 2026 resolution was required to mandate the same lobbying. Roberto Dufour of Sandrian brought it back. It passed at 69%.
This is the context in which Section 4.15 — resolutions are not binding on the board — was adopted without debate.
Put it together. A membership, a year ago, handed the board a specific accountability list. The board addressed some items, ignored others, made partial progress on the rest, and declined to report back on progress in any organised way. And in the same meeting, that board asked the membership to re-adopt governing language stating future resolutions of this kind would not bind them — and the membership did, without debate.
The members said yes.
If Section 4.15 is the formal codification of how the 2025 resolutions were already being handled in practice, then what members accepted on April 18 is not a change in the relationship between the membership and the board. It is a written acknowledgment of a relationship that had already changed years ago.
The 0.8% of members who voted on April 18 were the ones who showed up to ratify that relationship.
The Resolutions That Landed — and the Test They Now Face
It would be unfair to skip what the membership did pass.
Holstein Québec brought a resolution demanding full transparency on the All-Canadian voting system — complete results for every nominee, named judges, published vote proportions. It passed at 89%. This is a direct win that breeders can measure. If the next All-Canadian results appear in Info Holstein without the breakdowns and the judges, members will know Section 4.15 has teeth.
The review of Cow of the Year weightings — greater weight to daughters’ results, a lowered minimum classification threshold so influential cows below 92 points can still be nominated — passed at 71%. This is overdue. Many of the breed’s most influential modern matriarchs would not clear a 92-point bar. The weighting should reflect what the breed is actually using these cows for.
Saskatchewan’s resolution requiring lactation numbers and fresh dates on show cards passed at 88%. Hofstra again from the floor: “On the ethics side of it, I think this is just common sense.”
Roberto Dufour’s crampy bull resolution passed at 69%. “Crampiness is a big breed issue. If they get crampy at third lactation, we have to cull them, and that damages the entire cow family.”
And the most strategically important resolution of the day — joint Holstein Ontario and Manitoba Holstein Branch — passed at 85%. More on that in a moment.
Two resolutions were defeated. Quebec’s move to mandate bull classification at AI centres went down 61% against, primarily because Alberta’s Doug Blair delivered a surgical floor speech on how weakly bull conformation correlates with daughter proof — Gold Chip at 82 as a three-year-old, Cinema, Starbuck — and members listened. Quebec’s motion to allow breeders to enter group show classes based on the “breeders” tab rather than the registration prefix was defeated 60% against, killed in one sentence from Ontario’s Dean Karen: “I’m old school — the prefix on the animal, that should be the group you represent.”
Seven passed, two defeated. In a functional association, this is a productive AGM on member business.
But under the by-laws adopted at this same meeting, the board is now explicitly not bound by any of the seven. Whether these resolutions are implemented, ignored, or partially delivered will be the test of whether Section 4.15 is a safety valve the board uses sparingly or a license it uses casually.
We will be watching. The 2027 AGM should publish, as a standing agenda item, a full implementation scorecard for every 2026 resolution. If that scorecard does not appear, members will have their answer.
The Robotic Milking Question — Where 2035 Actually Gets Decided
If the Canadian Holstein breed is still relevant in 2035, it will be because the people and the institutions around it solved a single technical-political problem in time. Not breeding strategy. Not show ring fashion. Not Master Breeder point weightings. Data.
Roughly 20% of Ontario dairy barns now run robotic milking systems. In Manitoba, it’s well beyond 50%, and across Canada new operations and rebuilds are overwhelmingly free-stall designs built for the robot era. Every milking generates real-time component data — fat, protein, and somatic cell count. The robots know. The herd management software knows. The farm owner knows.
But official milk recording — the foundation of the Canadian dairy genetic evaluation system, and the prerequisite for staying in the Master Breeder program — does not accept that data as official. A farm running Lely or DeLaval robots is asked to also run separate DHI sampling on top, duplicating labour and cost, or to walk away from the program.
An increasing number of farms are choosing door number two.
Resolution 5 at the 2026 AGM — moved by Alan Hawthorne of Bobmar Farms, Ontario, vice-president of Holstein Ontario, and seconded by Monica Kagi of Red Lodge, Ontario — calls on Holstein Canada to “fully support development of a working group with all relevant stakeholders” to get robotic sensor data accepted as official test data, keeping members engaged in milk recording and the Master Breeder program.
It passed at 85%. The strongest mandate of the day.
Holstein Canada’s formal response to that 85% mandate after the vote? Silence. No timeline. No named working group lead. No budget allocation. No visible dialogue with Lactanet on the floor. The resolution is on the books.
Overlay that silence with two other things Greg Dietrich said almost in passing during his CEO address. First, Holstein Canada is “researching 3D cameras for AI and animal measurements” — machine-vision evaluation of conformation, an in-house project. Second, the Association is preparing a plan for the board on “multi-breed opportunities” — an expansion of the herd book beyond pure Holsteins.
Then overlay that with what Lindsay Warden, CEO of Holstein Association USA, told the same room when she took the mic. Holstein USA is running a parallel machine-vision project called “Build a Better Cow,” still in development, explicitly aimed at using cameras to support conformation evaluation. An Alberta member stood up and asked the obvious question: should Holstein Canada and Holstein USA be building one system together, or two systems apart?
Dietrich’s response was warm and non-committal: “We’ve already started some similar discussions. We’re already excited to have some of those discussions as a group.”
Here is the decade-defining fork.
In 2035, the Canadian Holstein breed will be evaluated primarily by machines. Robots will capture production. Cameras will capture conformation. Genomic predictions will overlay both. The question that decides whether Holstein Canada — the institution — still has a reason to exist is whether it becomes the trusted Canadian custodian of the breed data pipeline, or whether Lactanet, the robotics companies, the genomic companies, and the AI vendors simply route around it.
On this exact question, the 2026 AGM delivered an 85% mandate and no plan. It disclosed an in-house 3D camera project and no partnership. It hosted the CEO of the American counterpart organisation and produced no joint announcement.
This is a strategic vacuum. It is the exact kind of vacuum the market fills on its own terms, on its own timeline, without waiting for the national breed association to catch up.
And it is, not coincidentally, the exact kind of file on which Section 4.15 matters most. The board is not bound by the resolution. The board is not bound to publish a timeline. The board is not bound to name a lead. The board is not bound to report back.
If Holstein Canada is still relevant in 2035, this is the file that will have proven it.
The Generational Gap Nobody Talked About
There is a line item in the 2026 reports that deserves more attention than it received.
The Young Leader program age range has been changed from 19–30 to 21–35.
Read that again. The organisation’s flagship pipeline program for the next generation of Canadian Holstein breeders has quietly moved its upper limit up five years. The lower limit moved up two. This is not a cosmetic adjustment. It is an admission that the 19-year-olds and 20-year-olds the program was designed for are not engaging in meaningful numbers, and that the Association’s “young leaders” are now in their thirties.
Look at the floor of the 2026 AGM. Look at the names The Bullvine has quoted in this piece: Hofstra, Blair, Dufour, Martin, Allery, Weary, Bumstead, Jeffrey, Karen, and Hawthorne. These are names that have been on microphones at Holstein Canada meetings for decades. The institutional memory in the room is extraordinary. The institutional youth is not.
There is no single voice in the transcript under 35 making a sustained governance argument. There is no generational cohort standing up and saying: this by-law is what I’ll inherit, and I’m not sure I want it. The silence on Section 4.15, on Section 2.05, on Section 2.09 is not only a silence about the document. It is a silence about the future users of the document.
A Holstein herd book is a 141-year-old asset. It is worth, in the loosest accounting sense, an enormous amount. But it is worth nothing at all if the next generation does not file registrations against it, does not classify animals into it, does not trust the body that holds it. If the under-35 generation is watching this AGM — and a growing number of them are, on the live stream that the new §4.11 will eventually make more accessible — what did they see?
They saw their parents’ generation pass a by-law making their resolutions non-binding. They saw the Young Leader age range creep upward to accommodate the fact that they are not there in sufficient numbers. They saw a CEO they have never met deliver a deficit disclosure that was, in its honesty, the most reassuring thing in the meeting.
Whether they come to the 2027 AGM in a number greater than sixty-five will determine more about the next decade than anything the board in that ballroom voted on.
The Dietrich Variable
No piece about the April 18 meeting is complete without sitting honestly with Greg Dietrich.
The Bullvine has been sharp in this article. It has to be equally honest about what Dietrich did right.
His financial candour was without recent precedent at Holstein Canada. He walked members into an unpleasant truth they could have been allowed to miss. His repeated line — “Talking is one thing, but what are the deliverables? We can talk here this year, and if we come up here next year and talk the exact same thing, then that’s a fail” — is the language of a leader who intends to move an organisation. His decision to move the investment portfolio to Burgundy, his preparation of a multi-breed herd book plan, his willingness to budget severances explicitly, his hiring of a new business development role, his extension of the Young Leader range, his visible attempt to speak French to a 43% francophone membership — these are active management decisions. Several are overdue.
Dietrich is also the person who used the projected $584,000 deficit as the justification for the appointed-director clause, from the floor, while the vote was live. He is the person who defended each contested by-law section as it came up. He is the person who will now operate, with sole board discretion under Section 2.09 and without binding member resolutions under Section 4.15, the governance architecture that just passed.
The guardrails on the CEO role at Holstein Canada are now the weakest they have been in the modern era, and the CEO in the seat is the strongest the organisation has hired in a decade. That is either the best news in this story or the most dangerous sentence in it, depending on who Dietrich decides to be.
His own framing, offered to members in his own voice on the morning of April 18: “The pyramid is reversed. The members are in charge of the board, who is in charge of the Association.”
There is now nothing structural in the by-laws preventing him from changing his mind about that.
He has probably earned the benefit of the doubt in 2026. The 2027 AGM will be the proof.
Does Anyone Care?
Return to the question at the top.
Look at the evidence. 0.8% of members voted on a governance rewrite that reassigned the relationship between the board and the membership. The most consequential clauses were never challenged on the floor. The organisation has lost money on operations for ten straight years. It lost 5,000 classifications in a single year. It budgeted a $584,000 deficit for 2026 on an assumption — doubled classifications — that the trend does not support. It received an 85% mandate on robotic milking and announced no plan. It did not report back on the accountability resolutions of its last AGM. It abolished the binding nature of future member resolutions at the same meeting in which the previous year’s resolutions were, visibly, partially unimplemented. Its Young Leader program has quietly aged upward to cope with generational disengagement. Its financial stability depends on a reserve fund it is now actively drawing down.
And in the face of all of that, Ontario and Quebec — the two provinces representing the overwhelming majority of Canadian Holstein members — did not appear in British Columbia in sufficient numbers to influence a by-law rewrite that will govern them for a decade.
They were not silenced. They were not barred. They simply were not there.
A healthy membership would have filled the ballroom. A healthy branch federation would have insisted on electronic voting before a governance rewrite of this magnitude was scheduled. A healthy board would have treated a 65-vote bar as embarrassing rather than sufficient. A healthy CEO — and Dietrich may yet prove to be exactly that — would have privately urged deferral rather than publicly defending passage.
None of that happened. What happened was a small, earnest, loyalist group in a hotel in British Columbia handed the keys to the new leadership and went home, and the national herd was asked to trust that the new leadership will steward the institution well enough that the guardrails will not be needed.
The Canadian Holstein breed will survive the 2030s. Holstein genetics are globally distributed, privately owned, and commercially valuable in ways that do not depend on any single national association. The cows will be fine. The farms will be fine. The semen market will be fine.
What may not survive the 2030s is Holstein Canada itself — the specific legal institution, member-governed, branch-based, bilingual, democratic, headquartered in Brantford. It may end the next decade smaller. It may end it as a service contractor to Lactanet. It may end it as a subsidiary of a combined North American registry. It may end it as a multi-breed data broker. All of these are consistent with what was approved on April 18. The outcome inconsistent with what was approved on April 18 is the one where the Association grows: rising membership, binding resolutions, branch autonomy, financial surplus from its own services.
That door was open going into the meeting. Sixty-five people closed it.
The Bullvine is not here to mourn. There is still time. The branch federation can request a Special General Meeting, with electronic voting, specifically to revisit Sections 2.05, 2.09, 4.15, and 5.05. Members can demand an implementation scorecard for the 2025 and 2026 resolutions. Resolution 5 already entitles them to a timeline, a budget, and a named lead on the robotic milking working group. A direct public answer on branch D&O insurance is years overdue. An annual reconciliation between board slide decks and KPMG-audited figures — the reconciliation Harry Vanderlinde asked for from the floor years ago — is a thing the board can simply choose to provide.
None of it happens without members who show up. There is no governance fix for 0.8%.
The real question the 2026 AGM raised is not whether Holstein Canada will legally exist in 2035.
The real question is whether enough of its members will care, in time, to make sure that when it exists, it still means something.
On April 18, 2026, out of 7,900 of them, sixty-five voted.
We will see how many show up next April.
Key Takeaways
Sixty-five members — 0.8% of Holstein Canada’s 7,900 — passed a wholesale by-law rewrite that makes future member resolutions non-binding, gives the board unlimited borrowing authority, and allows up to two voting directors to be appointed rather than elected.
Financials are worse than the headline suggests: the reported $1M surplus normalizes to a $350K operational deficit once unfilled-position savings are stripped out, extending a ten-year trend of expenses exceeding revenues, with another $584K deficit budgeted for 2026.
Resolution 5 — robotic milking sensor data as official test data — earned the day’s strongest mandate at 85%, but HC announced no working group lead, no timeline, and no budget, leaving the single most important strategic file for the breed’s 2035 relevance without a plan.
The 2025 accountability resolutions (branch D&O insurance, classifier autonomy, bilingual service, crampy bull identification) received no formal progress report at the 2026 AGM — the same meeting that codified §4.15, which now lets the board ignore future resolutions by default.
Branches should coordinate a Special General Meeting request with electronic voting specifically to revisit Sections 2.05, 2.09, 4.15, and 5.05; without that pressure, the governance centralization passed on April 18 becomes permanent and the 2027 AGM becomes a ratification meeting, not a deliberative one.
The Bullvine will continue reporting on Holstein Canada’s governance, financials, classification strategy, and data partnerships through 2026 and beyond. Tips, source documents, and branch communications are welcomed at the usual address. If you were in the room on April 18 and your voice has not been captured here, we want to hear from you.
Complete references and supporting documentation are available upon request by contacting the editorial team at editor@thebullvine.com.
Learn More
New Genomic Option for Canadian Dairy Breeders to Bypass Herdbook Requirements — Reclaim management control by leveraging new rules that allow genomic testing without mandatory registration fees. This protocol shift arms you with critical DNA data while cutting through bureaucratic red tape and avoiding unnecessary association costs.
Are Dairy Cattle Breed Associations Nearing Extinction? — Exposes the structural rot threatening legacy organizations and delivers a survival blueprint through modernized leadership. Evaluate whether your membership dollars still purchase a seat at the table or simply fund a failing, apathetic institution.
The Future of Dairy Breed Societies: Will Innovation or Irrelevance Prevail? — Master the industry’s digital shift by studying Holstein Canada’s pivot toward high-tech service provision over simple record-keeping. Learn how emerging genetic tools replace traditional registries, ensuring your herd stays competitive in an increasingly automated marketplace.
The Sunday Read Dairy Professionals Don’t Skip.
Every week, thousands of producers, breeders, and industry insiders open Bullvine Weekly for genetics insights, market shifts, and profit strategies they won’t find anywhere else. One email. Five minutes. Smarter decisions all week.
A trial judge valued six years of working the Metske family dairy at $405,000. The Ontario Court of Appeal cut it to $31,700. The $373,300 gap is what a handshake is worth in court.
All facts about the Metske family in this article are drawn from the public Court of Appeal decision Metske v. Metske (2025 ONCA 418) and publicly available legal commentary on that decision from Lerners LLP, Hull & Hull LLP, Weilers LLP, Blaney McMurtry LLP, the Ontario Bar Association, and Law360 Canada. The Bullvine has not contacted the Metske family; the analysis and editorial views are The Bullvine’s alone.
Tim Metske didn’t lose his family’s 152‑acre Ontario dairy because he misread the milk market. According to the published Court of Appeal decision in Metske v. Metske, 2025 ONCA 418, the key expectations about the barn, the quota, and the land were never reduced to enforceable written terms. The decision records that in spring 2018, after six years of work on his parents’ farm, his mother, Roseanne, notified him and his wife, Amanda, that they had to vacate the property by the end of May.
The court record shows they shipped 96 head through a catalog sale at OLEX — Ontario Livestock Exchange — and moved off‑farm during that transition. A trial judge valued their succession claim at $405,000. The Ontario Court of Appeal reduced that to $31,700 — the net value of $33,700 in concrete and equipment upgrades left behind, minus $2,000 in farmhouse damage. That $373,300 gap is what the court determined informal assurances were worth once enforceable property rights were tested.
If your own dairy farm succession plan mostly lives in people’s heads, the same legal trap sits closer to your parlor than it feels. The core problem: legal structure almost always lags behind the kitchen‑table understanding.
A note on scope: Metske was decided in Ontario, but proprietary estoppel — the legal doctrine at the heart of this case — is a cornerstone of Common Law systems across the U.S., Canada, the U.K., and Australia. The handshake trap doesn’t stop at the border. Probate fees, estate tax thresholds, and Medicaid/long‑term care rules vary by state and province. The probate and Medicaid math below uses Wisconsin as a reference point. Your numbers will differ. The lesson won’t.
Why the Stakes Are Higher in 2025–2026
The legal doctrines behind Metske aren’t new. The economics around them are. USDA NASS 2025 data put Wisconsin farm real estate at about $6,420 per acre and cropland around $7,250 per acre, with most dairy regions across the U.S. and Canada seeing steady or rising land values heading into 2026. A 300‑cow dairy with 400 acres of usable cropland, buildings, equipment, and herd can easily land in the –6 million range on a full balance sheet at those numbers.
The farm count keeps dropping, too. USDA NASS reported 23,609 licensed U.S. dairies on average in 2025 — a loss of 1,202 operations from 2024, a 4.6% national decline in a single year. Pennsylvania alone accounted for 490 of those exits, an 11.7% single‑year hit (Farmshine, February 2026). Milk price and input costs drive plenty of those exits. But ag lawyers and lenders keep flagging a different pattern: estate disputes, probate delays, and succession breakdowns are turning otherwise viable operations into dispersal catalogs.
Here’s the tension. Your lender won’t advance a $500,000 operating line without a signed note. Your processor won’t pick up milk without a contract. And yet the biggest financial transfer your family will ever attempt — moving a multi‑million‑dollar dairy to the next generation — still runs on handshakes and “we all know how this ends” on a lot of farms. Metske shows exactly how little that holds up before a judge.
How the Metske Arrangement Unfolded on Paper
The arrangement described in the court decision follows a pattern common to many family dairy transitions. According to the reasons for judgment, Tim and Amanda bought about 60 cows for roughly $90,000 using a bank loan co‑signed by his father, Martin. They leased the quota, barn, and house from Martin and Roseanne, with the expectation that they would eventually buy 44 kg of quota and, later, the barn and land on terms the trial judge described as “favorable but undefined.”
The business plan filed with the bank assumed fair market value for those purchases. No written discount, no sweat‑equity formula, no fixed price per acre. When Tim sought financing for dairy quota in 2013, the bank required a 10‑year amortization that the projected cash flow couldn’t support. The Court of Appeal found Tim and Amanda’s own bank documents — showing they expected to buy at fair market value — directly contradicted any claim of a guaranteed below‑market transfer.
From 2013 to 2017, the court record shows that Tim and Amanda continued to operate as if a transfer would eventually occur. Martin had twice mentioned a $2 million buyout price in conversation, but nothing was ever written down. They took on barn and building repairs on the understanding that these expenses would fall to the incoming operators. They grew the herd from roughly 60 to 96 head.
In April 2018, Roseanne notified Tim and Amanda that they had to vacate by the end of May. They sent the 96 cows through OLEX and received roughly the same amount for the full herd that they had paid for their original 60 head six years earlier.
From a farm‑family perspective, those years looked like a time of building equity. Legally, the court treated the arrangement as a lease and service relationship — not a transfer of ownership rights.
📌 Go Deeper: We’ve already run the milk cheque math on what delayed succession costs a 400‑cow Wisconsin dairy in “The $2.30/cwt Succession Trap.” That piece covers the per‑cwt bleed. This one covers the legal trap that makes the bleed permanent. Read them together.
Why the Court Said “No Enforceable Promise”
Legally, Tim and Amanda relied on proprietary estoppel — the doctrine that if someone encourages you to believe you’ll get an interest in their land, and you reasonably act on that promise to your detriment, a court can enforce it or compensate you. The core logic is the same whether you’re in Ontario, Wisconsin, or Queensland, even if the labels differ.
The Court of Appeal concluded the test wasn’t met. The judges looked for three things and found gaps in all of them:
A clear promise or assurance about who would own what, on what terms.
Reasonable reliance — that it made sense for Tim and Amanda to act as if that promise were real.
Detriment linked to that promise.
On the promise, the court required a “clear and unambiguous assurance” — not vague encouragement, not general family goodwill, not a willingness to negotiate someday. Twice‑mentioned buyout figures and “favorable but undefined” terms didn’t clear that bar. The Court of Appeal characterized the arrangement as an “agreement to agree,” which Ontario law does not enforce as a property right.
On reliance, the Court of Appeal found that the bank’s cash‑flow concern and the fair‑market‑value assumption in the filed business plan undercut the estoppel argument. The court concluded that continued reliance on a “favourable” transfer — while operating under loan documents that assumed full market value — was not reasonable.
On detriment, the court treated low wages, hard work, and routine herd costs as the ordinary risks of operating a business, rather than losses tied to a broken promise. The only detriment the appeal court quantified was improvements left behind: $33,700 in concrete and equipment upgrades, minus $2,000 for farmhouse damage, leaving $31,700.
Six years. Ninety‑six cows. And, according to the Court of Appeal, the claimed equity resolved to the value of some leftover farm improvements. The decision didn’t turn on character or motive. It turned on a straightforward rule: if you want succession rights, you need a binding agreement, not hope that “we’ll work it out.”
How Much Does Probate Really Eat on a $5 Million Dairy?
That’s the “founder is still alive” side of the trap. The “when Dad dies” side is probate.
If a founder dies with land, buildings, cows, and accounts in their personal name — no trust, no entities — everything falls into the probate estate. For a $5 million operation in Wisconsin, based on published fee ranges from Wisconsin probate practitioners, a realistic probate bill looks more like a feed contract than a rounding error:
Expense category
Low estimate (USD)
High estimate (USD)
Court & filing fees (~0.2%)
$10,000
$10,000
Personal representative fee (~2%)
$100,000
$100,000
Attorney fees (~3% of estate)
$150,000
$150,000
Accounting, tax prep & valuations
$35,000
$100,000
Bond premiums & misc. court costs
$10,000
$30,000
Total cost of dying without a plan
$305,000
$390,000
Cost of a professional succession plan
$10,000
$25,000
These figures bracket what Wisconsin probate practitioners typically quote for contested farm estates, though every case varies.
Read those last two rows again. Nobody writes a $20,000 legal cheque cheerfully. It still beats letting the state perform a $390,000 autopsy on your life’s work.
That’s roughly 6–8% of farm value consumed by process over 12–36 months, before anyone touches land transfer tax or income tax. Here’s the barn math you can run right now on your own numbers: take your total estate value, multiply by 0.065 to 0.08, and set it next to a planning fee. If the gap doesn’t make you reach for the phone, read it again.
What Happens to Your Parlor When the Estate Is Frozen?
When an owner dies, the law’s job is to preserve estate value for creditors and heirs — not to keep your parlor on a 10‑minute rotation. Your vet still needs to be paid. Your hauler still backs in before 5 a.m. The probate court doesn’t care.
If Dad dies with everything in his name, here’s what can unfold on a dairy:
Bank accounts in his sole name may be frozen or restricted until the court appoints a personal representative and issues letters, a process that can take weeks.
The milk cheque that used to say “John Smith” now belongs to “Estate of John Smith.” The processor might keep paying, but legally, only the court‑appointed rep is supposed to endorse cheques or open new accounts.
Cows, feed, and equipment in Dad’s name become estate assets. Selling culls, signing feed contracts, or taking on new loans falls to the personal representative — not the widow, not the on‑farm kid — and only after the court signs off.
In real barns, families do whatever it takes to keep cows fed. But if a sibling or creditor later questions those decisions — “Why did you sell those cows?” — the person who stepped up can end up defending every move in front of a judge.
A revocable living trust sidesteps most of that. When the trust owns the land and business interests and names a successor trustee, the hand‑off at death or incapacity occurs under the trust document rather than before a probate judge. Milk cheques keep getting signed. Feed trucks keep backing in. Your parlor doesn’t care who just died.
Only about 12% of family dairy farms make it to the third generation — a number we’ve documented in our coverage of the generational cliff — and how succession choices drive it.
How a 5‑Year Medicaid Look‑Back Turns a “Family Deal” Into a 66‑Month Penalty
Here’s the quiet trap that collides with succession planning as founders age.
Consider an illustrative scenario: a 68‑year‑old owner transfers 150 acres to his son for $500,000 when an appraisal would peg the fair market value at $1.2 million. On paper, it’s a sale. Around the kitchen table, it feels like a family deal. Four years later, he has a stroke and moves into a nursing home. The family applies for Medicaid long-term care.
Medicaid doesn’t just look at what you own the day you apply. It looks back 60 months to find what you gave away or sold below fair market value.
Medicaid sees that land transfer inside the window. It compares $500,000 to the $1.2 million appraised value and treats the $700,000 difference as a divestment — a gift. Wisconsin’s divestment divisor is $352.06 per day, per Wisconsin DHS Operations Memo 25‑20, effective for applications filed on or after January 1, 2026.
The penalty math:
$700,000 ÷ $352.06 ≈ 1,988 days
1,988 days ÷ 30 ≈ 66 months
Medicaid’s answer: “You’re otherwise eligible, but we’re not covering your nursing‑home bill for roughly 66 months.” At Wisconsin’s monthly average private‑pay nursing home rate of $10,708.49 (same memo), the family faces roughly $707,000 out of pocket before coverage kicks in.
The “discount” you thought you were giving the next generation can boomerang as a long‑term care penalty when it falls inside the five‑year window. Mitigation options exist — partial return of assets, narrow hardship waivers — but they’re complicated and fact‑specific. The cleanest path is timing: if you’re going to use irrevocable trusts or deep discounts, do it well outside the look‑back period. This example uses Wisconsin’s 2026 Medicaid rules; specifics vary by state and province.
If any founder in your family is north of 65 and the plan is “we’ll start the transfer after the next project,” you’re not just playing chicken with milk price. You’re playing chicken with that clock.
✅ The Seven Legal Pieces That Keep You Out of a Metske‑Style Trap
Save this. Print it. Tape it to the office wall next to the milk cheque.
Lawyers love making this sound like wizardry. It isn’t. The farm plans that actually hold up — in court and on the balance sheet — share the same seven pieces. Miss even one, and there’s a gap a judge or a Medicaid caseworker can drive a truck through.
☐ 1. CLEAN DEEDS THAT MATCH YOUR STORY. Every parcel needs to be titled in the name of the person or entity your plan assumes. If everyone talks like “the LLC owns the land,” but the county recorder still shows Dad on the title, the judge and the bank go with the deed, not the family story. Your 30‑day action: pull every deed from the county recorder’s office and check whose name is actually on it.
☐ 2. AN LLC OR PARTNERSHIP OPERATING AGREEMENT THAT SAYS WHO OWNS WHAT.Percentages, voting rights, profit splits, exit rules — this is where they live. Many dairies now hold land in one entity and cows and equipment in another so that the operating business can transition separately from the dirt. If you don’t have one, you don’t have a business. You have a handshake with a tax ID number.
☐ 3. A BUY–SELL AGREEMENT. The absence of a written buy–sell arrangement is a significant reason the Metskecourt found no enforceable succession rights. A buy–sell spells out who buys if someone dies, divorces, or wants out; how the price is calculated; and how the payments happen. Without one, you’re back to an “agreement to agree,” and Metske shows exactly how courts treat that.
☐ 4. A REVOCABLE LIVING TRUST FOR FOUNDERS. The trust owns the land and entity units. Founders act as trustees while they’re capable. When they die or can’t act, the successor trustee takes over without forcing a full probate on every acre. This is the single document that keeps the probate table above from becoming your family’s reality.
☐ 5. DURABLE FINANCIAL POWER OF ATTORNEY. Gives someone authority to sign cheques, refinance loans, and enter into contracts if the owner is alive but incapacitated. On a dairy, it’s the difference between a stroke triggering an emergency guardianship fight and the on‑farm kid keeping the milk truck rolling.
☐ 6. HEALTHCARE DIRECTIVE AND HEALTHCARE POA. Keeps ugly medical fights from bleeding into succession decisions. When everyone already knows who makes the call on end‑of‑life care, nobody has to use the farm as leverage in those conversations.
☐ 7. A MEDICAID‑SAVVY TRANSFER PLAN FOR ANYONE OVER 65. This is where the five‑year look‑back gets built into the timeline. Maybe it’s an irrevocable trust funded well before any likely nursing‑home stay. It could be a sale at fair market value with installment notes instead of big gifts. The key is that your ag attorney and your elder‑law advisor need to be looking at the same balance sheet.
On a 200–600 cow dairy, getting all seven pieces right typically runs $10,000–$25,000 in professional fees [NEEDS: source — published ag‑law firm fee range or UW Extension farm transfer publication; Menn Law Firm and Ruder Ware LLSC have published fee guidance consistent with this range]. Nobody pretends that’s nothing. Line it up against a $305,000–$390,000 probate bill or a roughly $707,000 Medicaid penalty, and it starts looking like the cheapest insurance policy on the farm.
Are Your “Family Discounts” Worth Anything on Paper?
This is the part nobody wants to talk about at the kitchen table.
Maybe you’ve charged below‑market rent for years because “the kids are taking over anyway.” Maybe you’ve been paying yourself less than a hired manager would cost because you see it as “building equity.” Maybe the on‑farm kid uses equipment at a rate no neighbor could ever negotiate.
Metske illustrates a hard legal reality: unless those breaks live in formal documents — a buy–sell formula, a unit‑ownership schedule, a written discount on an appraised price — a court may not treat them as the next generation’s equity.
The Court of Appeal recognized only $31,700 of net improvements as Tim and Amanda’s recoverable interest. Six years of reduced wages, reinvested labor, and herd‑building didn’t translate into equity because the court found no clear and unambiguous assurance the farm would transfer on favorable terms — and the bank documents pointing to fair market value undercut any claim it would.
Same principle in non‑quota systems. If your on‑farm heir rents 400 acres well under market rate, that discount is real money. But unless it’s baked into an ownership formula or a buy–sell agreement, it won’t automatically convert to equity before a judge. It’s worth understanding how marriage, divorce, and ownership structure can quietly shift who actually owns your dairy — because those dynamics compound the same risk.
Options and Trade‑Offs for Farmers
You don’t have to turn your family into a boardroom. But you do have to choose a path on purpose.
Path 1: Treat the farm plan like a bank loan. When it makes sense: clear on‑farm successor, serious land value, at least one off‑farm heir. What it requires: over the next 90 days, sit everyone down and answer three questions — who gets the operating business, who gets the land, and what “fair” looks like for non‑farm heirs. Take those answers to an ag‑savvy attorney and build or update the LLC agreement, buy–sell, trust, and POAs. Risks: you’ll surface hard feelings now instead of letting them detonate at the funeral. Someone may hear “no” for the first time. That conversation is hard. Probate is harder.
Path 2: Use insurance to level the table — and keep it fresh. When it makes sense: the farm can’t cash‑flow a full‑value buyout of off‑farm heirs, but you can afford premiums. What it requires: a realistic valuation of land, cows, and buildings every 5–10 years, with life insurance sized to roughly cover what off‑farm heirs won’t get in dirt or cows. Risks: policies that made sense when the farm was $1.5M can be wildly undersized at $5M. Skip the updates, and you’re handing your off‑farm kids a lawyer’s phone number instead of a cheque.
Path 3: Admit it’s a business sale, not a gift. When it makes sense: the next generation can’t stroke a cheque for fair market value today but can run a profitable operation over time. What it requires: a clear valuation formula — appraisal with a defined sweat‑equity discount — long‑term amortization, and often a “farm pension” where founders live off land rent or entity distributions. Risks: successors have to run lean enough to service the buyout. Founders may need to accept that the final transfer step happens at death to get the tax result everyone wants. If any founder is nearing long‑term care, this path has to be coordinated with elder‑law counsel to stay outside the 60‑month window.
Path 4 — Your 30‑Day Move: Stop pretending the handshake is a plan. When it makes sense: if you’ve read this far, it’s you. What to do this month:
Pull every deed, will, LLC/partnership document, and life insurance policy tied to the farm.
Make two lists: who thinks they’re getting the farm, and whose names are actually on those documents.
If those lists don’t match, book an agricultural attorney within 60 days. Bring both lists and your latest balance sheet.
Risks: You may discover the story you’ve been telling around the kitchen table never had a legal backbone. That’s a lousy Monday morning. But it beats finding out at the funeral — or in a courtroom, as the published Metske decision makes painfully clear.
Key Takeaways
If your succession plan only exists in conversations, assume a court could treat your on‑farm heir as a tenant, not a future owner. Don’t shake hands on another season — book an attorney meeting before your next herd check.
If any founder in your family is over 65 and you’re planning a deep “family discount” on land or quota, assume Medicaid will count the gap as a divestment if nursing‑home care arrives within five years. Build the transfer outside the 60‑month window or reframe it as a documented sale at fair market value.
If your total asset value exceeds your state’s small‑estate threshold (for example, $50,000 in Wisconsin under Wis. Stat. §867.03), treat a revocable living trust as mandatory — not optional. The probate math on a $5M dairy puts the break‑even against planning fees inside the first death in the family.
If the names on the deed, the LLC units, the life insurance beneficiary form, and the will don’t all point to the same successor, fix the mismatch this quarter. That gap is exactly what fuels the next Metske‑style dispute.
If you’re counting on sweat equity or a family discount to reduce your buyout price, require it in writing before you invest another year of labor. Courts won’t back‑fill a formula just because “everyone knew what we meant.”
You don’t have to draft contracts at the kitchen table. But you do have to accept that courts, banks, Medicaid offices, and title companies all speak one language — and it isn’t “you know what we mean.”
Ask yourself this week: if a judge looked only at your paperwork tomorrow — no stories, no memories, no handshake promises — who would they say owns your dairy? How much would they say it’s worth? And who would they say has the right to run it? If that answer doesn’t match what you thought, now’s the time to fix it. For the deeper milk‑cheque math on how delayed succession quietly bleeds dollars per cwt off your operation, we unpacked that in “The $2.30/cwt Succession Trap.” That’s where the spreadsheets live. This piece is your nudge to pick up the phone before your own handshake becomes Exhibit A.
Complete references and supporting documentation are available upon request by contacting the editorial team at editor@thebullvine.com.
Every week, thousands of producers, breeders, and industry insiders open Bullvine Weekly for genetics insights, market shifts, and profit strategies they won’t find anywhere else. One email. Five minutes. Smarter decisions all week.
JM Valley Sidekick Jacuzzi — Grand Champion, Quebec Spring Show 2026. The Five-Year-Old, shown here by Joel Lepage, earned the banner on her powerful front end, tight fore udder blend, and a mammary system that also took Best Udder in the Five-Year-Old class. Owned by Butlerview Farm and Pierre Boulet she goes back to the legendary Loyalyn Goldwyn June.
Pat Lundy called it “an unreal experience.” After a full day of sorting through what might be the deepest collection of Holsteins this show has ever assembled, the New York judge pointed to JM Valley Sidekick Jacuzzi as Grand Champion — a Five-Year-Old with the mass, the mammary, and the front-end power to stand above them all.
But the Grand Champion is only half the story from Victoriaville. Behind her, Ferme Jacobs ran the table — Junior Champion, Intermediate Champion, and Reserve Grand Champion, all bred and owned. And Pierre Boulet bookended the day with Grand and Honorable Mention Grand through two different partnerships.
This wasn’t a show with one dominant cow. It was a show with three dominant programs.
Grand Champion: The Five-Year-Olds Ruled
Six cows stood in the Grand Champion callout — all square, balanced, open through the midsection, and carrying what Lundy described as “incredible mammary systems”. He didn’t take long to decide. The five-year-olds took Grand and Reserve.
Jacuzzi earned it on her fore udder blend, a more comfortable topline, and more width through the chest than any cow in the ring. She’s campaigned by Butlerview Farm and Pierre Boulet — and her pedigree reads like a masterclass in stacking the right matings. Sidekick × Crushtime × Cindadoor × Loyalyn Goldwyn June — one of the most legendary show cows in Canadian Holstein history. Four generations deep and every one of them contributed something to what stood in that ring: Sidekick’s power and mammary, Crushtime’s frame, Cindadoor’s dairy strength, and June’s genetic engine underneath it all. You don’t get a Grand Champion by accident. You get one by building a cow family that transmits.
Jacobs Unix Carful
Jacobs Unix Carful EX-92 took Reserve — and honestly, in most years, she’d be the story. A Cael daughter bred and owned by Ferme Jacobs, she countered with extreme end-to-end length and a rear udder that Lundy said “just really spells milk”. Reserve Grand at Quebec Spring is a serious line on any cow’s résumé.
Pierstein Dempsey Lexi
Pierstein Dempsey Lexi earned Honorable Mention for the third consecutive year at this show — Grand in 2024, HM in 2025, HM again in 2026. Carful edged her on mammary symmetry and rear udder bloom. But the fact that Lexi is still in the Grand Champion conversation at this stage of her career says everything about her durability.
Three Banners for Ferme Jacobs
When the dust settled, Ferme Jacobs walked out of Victoriaville with Junior Champion, Intermediate Champion, and Reserve Grand Champion. All bred and owned. That’s not a lucky day — that’s a program operating at peak output across every age group.
Jacobs Knowhow Bike. Bred and owned. Ferme Jacobs. Her sister, Ms Bradly Lambda Briar, placed 4th in Spring Yearlings on the same day. Same dam — a VG-86-2YR 3*. Two daughters, two classes, two top-five finishes. That’s not a mating. That’s a cow family. Knowhow’s show daughters are starting to do exactly what his proofs promised. And Ferme Jacobs collected three championship banners yesterday — Junior, Intermediate, and Reserve Grand. All bred and owned.
Junior Champion went to Jacobs Ambrose Bonbon, a Fall Two-Year-Old with so much spring and expansion to her midsection that Lundy made her Best Udder in class immediately. She’s by Progenesis Ambrose *RC — a sire whose show daughters are starting to validate what the genomics promised.
A month ago, Millen Lambda Amelia was a fresh VG‑88 selling in the Kingsway TAG Sale. Today she has been resold and walked out of Victoriaville as Intermediate Champion and Best Udder for her new owners at Ferme Jacobs — beating a loaded lineup on sheer dairyness and rear‑udder turn.
Intermediate Champion was Millen Lambda Amelia, a Junior Three-Year-Old purchased by Ferme Jacobs and presented with enough dairyness and rear udder turn to top a lineup of six contention cows that included the Senior Three-Year-Old class winner. Lundy was clear: the Junior Threes were dairier framed, sharper throughout, and carried better mammary quality than the older cows behind them.
Milk&Honey Im A Sexy Baby
The Intermediate Championship told an interesting story about freshness versus maturity. Milk&Honey Im A Sexy Baby — the Senior Three class winner, just two weeks fresh — took HM Intermediate behind both Junior Threes. She earned Best Udder in her class but couldn’t match the frame balance and udder floor levelness of the two cows ahead of her. Lundy specifically noted that Amelia’s fore udder blended more smoothly into the body wall and she showed more width and strength through her front end.
Pierre Boulet: The Quiet Force
Pierre Boulet doesn’t get the social media spotlight that some programs enjoy. But his presence across this show was enormous.
Grand Champion (Jacuzzi, co-owned with Butlerview). Third in the Five-Year-Old class (Clayhaven Crushabull Lysanna). First in the Mature Cow class (Pierstein Dempsey Lexi, co-owned with Jim Butler). Second in the Four-Year-Old class (Pierstein Lambda Atlantic). HM Grand Champion (Lexi, again).
That’s influence across every mature cow division, with cattle from multiple sire lines and multiple partnerships. Boulet has been Premier Exhibitor at the National Holstein Show and judged it in 2017. He’s won Grand here before, earned Supreme Champion of the show in 2023 with a Jersey, and placed in Grand Champion contention at Quebec Spring for three straight years. Victoriaville is his ring.
The Mature Cow Class: Mass vs. Quality
The Mature Cow class was a study in contrasts at the top.
Pierstein Dempsey Lexi won on sheer presence — width through the front end, width back through the rump, and that width carrying directly into her mammary. More volume, more openness, more drape to her rib than any cow behind her.
Jacobs Sidekick Bee took second and Best Udder — a different kind of cow entirely. Where Lexi overpowers you, Bee seduces you with quality: a fore udder that melts into the body wall, stunning rear udder height, and veination that Lundy highlighted specifically. Her feet-and-legs advantage is what separated her from Mactalla Sidekick Rayban in third.
Three of the top five were Sidekick daughters (Bee, Rayban, Fortale Sidekick Ivy in fifth). That sire’s stamp — depth, mammary quality, and longevity — dominated the mature ring.
The Four-Year-Olds: Lambda’s Class
If you want to understand Lambda’s legacy, look at the Four-Year-Old class.
Fortale Lambda Loa
Fortale Lambda Loa won the class, won Best Udder, and did it bred and owned by Ferme Fortale — a smaller operation out of Saint-Christophe-d’Arthabaska. She was Intermediate Champion at this show last year as a Senior Three. Now, recently fresh with her third calf, she’s angular, sharp through the shoulder, long and clean through the neck, and carrying a mammary that just keeps getting better.
Pierstein Lambda Atlantic
Pierstein Lambda Atlantic placed second. Raypien Lambda Adou placed third. Three of the top five are Lambda daughters — and they all share the same stamp: square frames, hard tops, and quality mammaries. Lambda isn’t just a genomic number anymore. He’s a proven cow-maker, and his daughters hold up with age.
Lundy’s break between first and second was instructive: Loa showed more sharpness and dairyness throughout, plus more quality to both fore and rear udder. Atlantic mirrored her squareness and level rump but lost on mammary detail. The break between second and third came down to feet and legs — Atlantic moved better. Third to fourth was about front-end mass and udder bloom. Fourth to fifth was purely feet and legs — comfort underneath herself.
The Milking Classes: What Lundy Was Looking For
Across nine milking classes, Lundy’s priorities were remarkably consistent: mammary systems first, frame balance second, feet and legs third.
Rear udder was the deciding factor at nearly every placing break. Height, width, bloom, turn, symmetry — he used every dimension of the rear udder to sort cows. Fore udder blend into the body wall was his secondary mammary criterion. And when two cows were close on mammary, feet and legs or dairyness through the frame became the tiebreaker.
Class
Winner
Key Winning Trait
Best Udder
Fall Two-Year-Old
Jacobs Ambrose Bonbon
Midsection expansion, rear udder height/width
Bonbon
Junior Three-Year-Old
Millen Lambda Amelia
Dairyness throughout, mammary quality
Amelia
Senior Three-Year-Old
Milk&Honey Im A Sexy Baby
Mammary bloom at two weeks fresh
Sexy Baby
Four-Year-Old
Fortale Lambda Loa
Angular frame, fore and rear udder quality
Loa
Five-Year-Old
JM Valley Sidekick Jacuzzi
Front-end width, fore udder blend, topline
Jacuzzi
Mature Cow
Pierstein Dempsey Lexi
Width and mass throughout, mammary volume
—
Best Udder in the Mature Cow class went to second-place Jacobs Sidekick Bee — the only class where the winner and Best Udder were different cows. facebook
Bred and Owned: The Real Scorecard
The bred-and-owned tally tells you who’s building programs, not just buying cattle.
Ferme Jacobs: Bonbon (Junior Champion), Carful (Reserve Grand Champion), plus multiple class placings — all bred and owned.
Ferme Fortale: Loa (Four-Year-Old class winner, Best Udder) — bred and owned by a mid-size operation proving you don’t need 500 head to compete at the top.
Ferme Yvon Sicard: Sicy Unix Adriene (2nd Senior Three-Year-Old) — bred and owned, a Unix daughter that held her own against two Ferme Jacobs entries.
Petitclerc: Chief Anton (4th Junior Three-Year-Old) — bred and owned. The Petitclerc program from St. Basile has been quietly placing in the top five across multiple classes for years.
What This Show Told Us
Quebec Spring 2026 confirmed three things.
Lambda daughters age well. From Four-Year-Olds to class winners, Lambda’s frame and mammary stamp holds up through multiple lactations. If you’re still debating whether to use him on your best cows, the debate is over.
Ferme Jacobs is operating at a level that’s hard to match. Three championship banners, all bred and owned, across the full age spectrum. Their depth of inventory — from Ambrose calves to EX-92 mature cows — means they’re not relying on one lucky mating. They’re running a system.
Pierre Boulet remains the most consistent showman in Quebec. Grand Champion, HM Grand, and class placings across every mature division. He campaigns cattle from multiple partnerships, multiple sire lines, and multiple breeding programs — and wins with all of them. Three consecutive years in Grand Champion contention at this show isn’t luck. It’s stockmanship.
Pat Lundy said it best when he thanked the Holstein Québec association and called the experience “unreal.” After a day of sorting through this kind of depth, it’s hard to argue with him.
Génisse hiver
Née entre le 1er décembre 2025 et le 28 février 2026
When a 600‑cow Wisconsin herd tried to save $286 per calf on milk replacer, it looked like smart cost‑cutting. Three years later, the heifer records told a different story.
In early 2023, the team at a 600‑cow Holstein herd in central Wisconsin sat down with their nutritionist and lender to “trim the fat” out of their youngstock program. Feed and labor had pushed their heifer‑raising cost toward the $2,300–$2,600 per head range Iowa State budgets were warning about for herds of their size. They moved from a premium all‑milk replacer to a cheaper 20/20 blend, cutting about $286 per heifer out of the total preweaning milk program when you include both bag price and the way they fed it — roughly $30,000 – $35,000 ‘saved’ over four heifer crops on 120 replacements a year.
At the time, that felt like a win. When they ran first‑lactation records three years later and lined those heifers up against their previous all‑milk program, the pattern — exactly what Cornell’s calf data has been screaming for a decade — was hard to ignore. The calves raised on the cheaper program were behind on first‑lactation milk, behind on age at first calving, and more likely to leave early. When you added it up, the realistic value gap sat around $260–$310 per heifer, stacked against that $286 “saving” on replacer. You weren’t just cutting a feed bill. You were detuning a $2,500 capital asset.
Metric
Budget 20/20 (plant protein)
Premium all‑milk program
Preweaning ADG (kg/day)
0.65
0.85
Replacer cost per heifer (USD)
Base – 286
Base
Lifetime milk value per heifer (3 lactations, USD)
Base
+ 218.88
Days to first calving
Base
–21 days (~52.50 saved)
Net impact per heifer (before survival, USD)
+ 286 “saved” feed
–14.62 vs budget
What’s Really Changing in Those First 56 Days
If you’ve followed calf work over the last 10–15 years, you’ve watched the question flip. We used to ask, “How little milk can we get away with?” Now the serious conversation is, “What does early growth really do to lifetime production?”
Felipe Soberon and Mike Van Amburgh at Cornell pushed that shift hard in their 2012 Journal of Dairy Science study. They tracked 1,244 heifers in the Cornell research herd and 624 heifers on a commercial dairy, tying their preweaning average daily gain (ADG) back to first‑lactation milk. For every 1.0 kg/day of preweaning ADG, they saw about 850 kg more milk in first lactation at Cornell and 1,113 kg more in the commercial herd. Later datasets pushed that first‑lactation response up to around 1,550 kg per 1 kg/day of preweaning ADG in some datasets.
Even if you stick with the conservative end of that range, you’re looking at roughly 1,100 kg of milk tied to how a calf grew while she was on replacer. At the 2024 All Federal Order mailbox average of about $21.80/cwt — roughly $0.48/kg — that’s around $528 per heifer in first‑lactation milk value that lives or dies on those preweaning gains. Cornell’s longer‑term modeling says that in cows that make it through three lactations, each extra 1 kg/day of preweaning ADG can be worth about 2,280 kg more milk over three lactations — another $1,090 or so per heifer at that same milk price.
ADG bump (kg/day)
Extra milk 3 lactations (kg)
Lifetime value (USD, $0.48/kg)
0.00
0
0
0.10
228
109
0.15
342
164
0.20
456
219
0.25
570
274
0.30
684
329
Meanwhile, the cost to get a heifer from the hutch to the parlor keeps climbing. Iowa State’s 2024 budgets put the total cost to raise a heifer to calving between about $2,258 (pasture‑based, 18,000‑lb herd) and $2,651 (confinement, 26,000‑lb herd). Back that into a per‑head, per‑day cost, and you’re looking at roughly $2.50–$3.00 once you include feed, bedding, facilities, and labor. You already treat each replacement like a $2,300–$2,700 capital asset before she ever hits the parlor.
Preweaning is the most expensive phase per day in the heifer program. It’s also the one with the cleanest, most measured link between what you feed and what that genetic investment actually does in the tank.
How This Math Shows Up in a Real Herd
Back to that 600‑cow Wisconsin herd. On paper, the change looked harmless. The monthly feed report even looked better.
On the budget replacer program, they switched into:
20/20 milk replacer with plant protein listed in the top half of the tag.
Feeding rate around 0.7 kg of powder per day.
Preweaning ADG averaged about 0.65 kg/day across Holstein heifers in hutches.
On their earlier all‑milk program:
Higher‑cost replacer using only milk‑derived proteins.
Feeding rate closer to 0.9 kg/day, split into two or three feedings.
Preweaning ADG averaged about 0.85 kg/day under similar genetics and housing conditions.
That’s a 0.20 kg/day ADG advantage for the all‑milk program across a roughly 56‑day preweaning window. Here’s the barn math — the same math they walked through when they finally put numbers to it.
0.20 kg/day × 56 days = 11.2 kg more gain to weaning. Call it about 24–25 lb of extra bodyweight when you pull the nipples. Now plug that into the Cornell relationships:
0.20 × 850 = 170 kg more milk in first lactation (Cornell herd).
0.20 × 1,113 = 223 kg more milk in first lactation (commercial herd).
Split the difference, and you’re looking at roughly 180–200 kg extra milk in first lactation from that 0.20 kg/day ADG gap. At $0.48/kg, that’s about $86–$96 more milk per heifer in her first trip through the parlor.
Over the longer run, Cornell reported that cows reaching three lactations could produce about 2,280 kg more milk per 1 kg/day increase in preweaning ADG. On that same 0.20 kg/day bump:
0.20 × 2,280 = 456 kg more milk over three lactations.
456 × $0.48 ≈ $219 lifetime milk value per heifer.
Here’s how that stacks up for this herd, using the conservative Cornell numbers and Iowa State’s cost ranges:
Metric
Budget Program (Plant)
Premium Program (All‑Milk)
Difference (All‑Milk vs Budget)
Preweaning ADG
0.65 kg/day
0.85 kg/day
+0.20 kg/day
Lifetime Milk (3 lactations)
Base
+456 kg
+$218.88
Approx. AFC (days to calving)
Base
−21 days
+$52.50 (at $2.50/day)
Direct Replacer Cost
−$286
Base
−$286.00
Net (milk + AFC, before survival)
−$14.62 per heifer
So before you even talk about survival, the higher‑nutrition, all‑milk program is essentially breaking even on this conservative model, down roughly $15 per heifer once you net lifetime milk, earlier calving, and replacer cost. That’s not exciting on its own. The story changes when you look at which heifers actually stick around to use that extra capacity.
On this herd, the calves from the all‑milk program reached breeding weight sooner and freshened several weeks earlier on average, resulting in fewer non‑productive days and burning $2.50–$3.00/day in feed and yardage. Stack that across 120 heifers a year and add in even modest improvements in early survival, and the decision to “save” $286 per calf added up to more than $30,000 in lost potential over a few heifer crops — right in line with the research linking rough starts to higher culling and lower lifetime performance.
What Is That $286 “Saving” Really Doing to Your Herd?
If you’re trying to decide whether your “cheap” replacer is actually saving you money, you have to stack three pieces together:
Lever
Key stat (red in design)
Take‑home message
Lifetime milk
~$219 per heifer from 0.20 kg/day ADG bump
Extra early gain keeps paying for three lactations.
Days to first calving
~$40–$90 saved per heifer
15–30 fewer non‑productive days at $2.50–$3.00/day.
Survival risk
+5.1% culling risk per extra month; 5.52× risk after 30 mo calving
Late, slow‑grown heifers are the riskiest “investments”.
1. Lifetime Milk: Around $200–$220 per Heifer
A 0.20 kg/day ADG difference across preweaning realistically buys you about 456 kg more milk over three lactationsin the cows that stay in the herd. At $0.48/kg, that’s right around $219 per heifer in lifetime milk value.
Even if your herd only captures half of that response because of other bottlenecks, you’re still in the $100+ per heiferrange tied directly to preweaning gain.
2. Days to First Calving: Roughly $40–$90 per Heifer
Better‑grown calves hit breeding weight sooner and freshen earlier. They don’t spend extra months standing around eating your money while you wait for the scale to catch up.
On‑farm work in the UK, looking at 11 herds, found restricted‑milk calves running well under 0.6 kg/day, while higher‑intake calves in the same systems were closer to 0.7 kg/day or better in the first month. Those early gaps don’t just disappear; they follow heifers right up to breeding targets.
Research on age at first calving (AFC) and survival shows that the sweet spot for first‑lactation milk and lifetime performance is around 22–24 months, with performance dropping off when you push heifers much later than the mid‑20s. When you feed calves so they reach breeding size sooner instead of dragging them through extra months on low gain, you’re realistically shaving a couple of weeks to a month off the calendar for a lot of heifers.
Even a 15–30 day shift at a daily maintenance cost of $2.50–$3.00 per head — in line with recent heifer‑raising and housing cost work — is worth roughly $38–$90 per heifer in feed, bedding, and overhead you don’t have to burn.
3. Survival and Longevity: Real Money, Even if the Exact Number Varies
The third piece is messier but important. Slow‑grown, disease‑hit heifers are more likely to leave early and less likely ever to pay back what you put into them.
Fodor and colleagues followed 35,128 Holstein heifers across 33 herds and found that each additional month of age at conception increased culling risk by 5.1%, and heifers calving after 30 months were 5.52 times more likely to be culled within the first 50 days in milk compared with heifers calving before 22 months. In plain language: the later and rougher you bring her in, the more likely she is to leave before she’s repaid her replacement cost.
Putting a single dollar figure on “improved survival” across all herds isn’t honest. The value depends on your replacement cost, culling patterns, and the number of cows that actually reach second and third lactation. What the Fodor data do say clearly is that the late, slow‑grown heifer is a much higher‑risk investment than the one that grew well and calved on time. For most herds, even a slight drop in early culling tied to better early growth adds real money on top of the 9 in milk and – in earlier calving.
So even if you ignore survival completely and stack the ~$219 in lifetime milk with a conservative $40–$90 from shaving non‑productive days, you’re looking at roughly $260–$310 of value per heifer against a $286 replacer gap. Add any survival benefit on top, and the “cheap” program stops looking cheap.
On a 600‑cow herd raising 120 heifers a year, that per‑head swing quickly adds up to tens of thousands of dollars in capital performance — one way or the other.
Why Protein Source in Week 1–3 Matters So Much
If those 1,100–1,550 kg of milk per 1 kg/day of preweaning ADG still feel too large, it helps to look under the hood. In those first weeks, you’re not just putting on frame. You’re building the factory, wiring the control system, and deciding how often it breaks.
You’re building a mammary factory. Trials comparing restricted and enhanced preweaning feeding show calves on higher planes of nutrition develop substantially more mammary parenchyma — the secretory tissue — by eight weeks of age. More parenchyma now means more secretory cells later. That’s literal milk‑making capacity you either build or you don’t.
You’re resetting the growth hormone axis. Calves fed higher planes of milk nutrition show higher circulating IGF‑1 and insulin, and mammary gene expression patterns that favor development. One regression, Soberon and Van Amburgh reported — roughly milk yield = −106 + 1,551 × ADG in one model — isn’t magic; it’s what happens when better early nutrition rewires how that calf allocates nutrients and grows.
You’re wiring immunity and gut health — and protein source is a big part of it. Back in the late 1980s, researchers showed that replacing milk protein with isolated soy protein reduces the ileal digestibility of indispensable amino acids from about 82% to around 62% in neonatal calves. CalfCare.ca and similar extension programs are blunt: calves under three weeks of age should be on an all‑milk protein milk replacer, because their abomasal enzymes aren’t built to handle soy or wheat proteins efficiently yet.
When you push plant protein too early, you’re not just wasting protein. You’re buying more loose stools, depressed intake, and a gut barrier under stress right when the immune system is still spooling up. Add in research tying preweaning disease events to poorer fertility and lower first‑lactation milk later on, and it’s not surprising that preweaning ADG explained about 20–22% of the variation in first‑lactation milk yield in the Cornell models.
How Much Is Your Calf Milk Replacer Really Costing You?
Here’s the Cornell‑style math in a version you can actually drop your own numbers into.
Say your calves are averaging 0.7 kg/day preweaning ADG right now. You’re looking at a move to an all‑milk, higher‑plane program that you expect will push that to 0.8–0.9 kg/day. Trials and field data put a 0.1–0.2 kg/day improvement well within reach when you upgrade both protein quality and feeding rate and keep housing and health decent.
Take the conservative end: a 0.1 kg/day bump in ADG.
Using Soberon’s 850–1,113 kg/kg ADG range:
0.1 × 850 = 85 kg more milk in the first lactation.
0.1 × 1,113 = 111 kg more milk in the first lactation.
At $0.48/kg, that’s around $41–$53 extra milk per heifer in first lactation. Over three lactations, that same 0.1 kg/day bump scales to:
0.1 × 2,280 = 228 kg more milk over three lactations.
228 × $0.48 ≈ $109 lifetime milk value per heifer.
Now compare that to your replacer cost. If your all‑milk program runs roughly $200–$286 more per calf than a budget plant‑protein 20/20 replacer, and even that conservative 0.1 kg/day improvement is worth roughly $41–$53 in first‑lactation milk and around $109 over three lactations, you’re at $150–$162 of milk value before you even think about days to first calving or survival.
In herds where a full 0.2 kg/day improvement is realistic, the lifetime milk advantage roughly doubles. That’s how you land in the ~$219 milk value range you saw in the Wisconsin herd’s model. So if your replacer choice is “saving” $286up front, but even a cautious reading of the data says you’re giving up $219–$300 in lifetime value before you add survival, that bag isn’t cheap. It’s a capital trade‑off.
Sponsored Post
Is Your Calf Barn Measuring the Right Number?
Most calf barns can answer two questions without opening a laptop: “Did she live?” and “What did she weigh at weaning?” Helpful, but not enough.
If you want to know whether your replacer program is building the cows your genetic plan paid for, the number you need to start treating as non‑negotiable is preweaning ADG.
Here’s a 30‑day action that doesn’t require a new feeder or building:
Weigh or tape every heifer calf at birth and at weaning. Use a platform scale if you have it, or a consistent heart‑girth tape on dry calves if you don’t.
Calculate ADG for each calf and each birth month. (Weaning weight − birth weight) ÷ days on milk. Write it somewhere you’ll actually look — a whiteboard in the calf barn beats a forgotten tab in the herd software.
Write the replacer product and lot number at the top of each month’s record. When a group suddenly averages 0.6 kg/day and treatments spike, you’re not guessing whether a formulation change or batch issue was involved.
Cross‑check ADG against your genomic rankings. Are your highest‑index calves actually outgrowing the lower‑index calves preweaning? If not, the bottleneck isn’t genetics. It’s what’s in the bucket.
Metric
Solid target (black text)
Red‑flag zone (red text in design)
Preweaning ADG (kg/day)
0.8–0.9 kg/day when housing and health are decent.
<0.7 kg/day = nutrition/housing bottleneck.
Cost per kg of gain (preweaning)
Lower on all‑milk, higher‑plane programs because calves grow faster and stay healthier.
“Cheap” program shows higher cost per kg of gain than premium.
Age at first calving
22–24 months sweet spot for milk and lifetime performance.
Regularly calving >26–27 months.
Heifer investment lens
View each heifer as a $2,300–$2,700 capital asset.
Decisions driven only by bag price, not lifetime ROI.
Holstein herds using higher‑plane milk programs in trials and field reports commonly hit0.8–0.9 kg/day preweaning when housing and health are decent. If your 30‑day snapshot says you’re living under about 0.7 kg/day, something in your replacer, feeding rate, housing, or health is capping the genetic engine you paid for.
Options and Trade-Offs for Farmers
How Much Is Your $286 “Saving” Really Costing?
When it makes sense: Any time your feed supplier or spreadsheet says, “We can save you $X per calf on milk replacer.”
What it requires:
A realistic estimate of preweaning ADG on your current program and on the program you’re considering — even a month of tape weights is better than guessing.
A simple ADG‑to‑milk conversion using the Cornell ranges: 850–1,113 kg per 1 kg/day ADG in first lactation, about 2,280 kg over three lactations for survivors.
One milk‑price assumption used consistently across your math (for now, $0.48/kg based on 2024 mailbox).
Risks/limits: Your first pass won’t be perfect. But it’s better than letting the bag price decide for you.
Make Preweaning ADG a Non‑Negotiable KPI (30‑Day Action)
When it makes sense: Any herd raising replacements — whether you’re milking 80 cows or 1,800.
What it requires:
Birth and weaning weights (or tape equivalents) for every heifer calf over the next month.
A starting target: work toward 0.8–0.9 kg/day preweaning. Treat anything consistently under 0.7 kg/day as a red flag, not a detail.
Risks/limits: It’s one more habit to build. Once it’s in place, it becomes one of the most useful numbers in your heifer program.
Why it matters: Once ADG is on your dashboard, replacer changes, seasonality, housing tweaks, and staff shifts all show up in hard numbers. You stop arguing “calves look good” and start asking “Are they growing fast enough to justify the genetics we paid for?”
Shift From Least‑Cost to Fixed‑Formulation, All‑Milk Protein Replacer
When it makes sense: When you’ve seen calf performance bounce around with no obvious changes in housing, staff, or weather — or when you’re pretty sure your replacer is being sold on price first and formulation second.
What it requires:
A direct question to your supplier: “Is this replacer least‑cost formulated, or are the ingredient sources fixed?”
Confirmation that protein sources are all milk‑derived — whey, whey protein concentrate, skim — especially in the first three weeks.
A habit of tying replacer lot numbers to calf ADG and health in your own records.
Risks/limits: Bag price will almost always go up compared with aggressive, least‑cost options. And some mills aren’t eager to talk about how often they swap ingredient sources under a least‑cost model.
Why it matters: Least‑cost formulation is built to swap ingredients as commodity markets move while keeping the 20/20 tag on paper. On some herds, those quiet shifts show up as an invisible “volatility tax” on calf performance when ingredient changes affect how calves respond. Fixed‑formulation, all‑milk replacers don’t make calves bulletproof, but they remove one of the biggest hidden variables in your heifer program.
Compare Programs by Cost per Pound of Gain, Not Cost per Bag
When it makes sense: Anytime you’re comparing a “cheap” replacer against a higher‑priced option — especially if someone is trying to sell you on bag price alone.
What it requires:
For at least two recent calf groups:
Total preweaning cost per calf: replacer, starter, meds, plus a realistic estimate for labor and bedding.
Total gain: weaning weight − birth weight.
The simple metric:
Cost per lb (or kg) of gain = Total preweaning cost per calf ÷ Total gain.
Economic modeling of preweaning programs shows that while higher‑nutrition, all‑milk programs increase total preweaning cost per calf, they often lower cost per kg of gain because calves grow faster and stay healthier. In one 2019 analysis, preweaning costs ranged from about $258.56 to $582.98 per calf across different feeding strategies, but the higher‑milk programs produced more gain per dollar invested.
Risks/limits: You need enough calves in each group to avoid chasing noise. And pulling real cost numbers takes a bit of time.
Why it matters: If your cost per pound of gain is higher on the “cheap” program, that saving isn’t real. You’re paying more for slower, riskier gain.
Reframe the Lender Conversation as Heifer ROI
When it makes sense: When your lender or business partner tells you calf costs need to come down this year.
What it requires:
A one‑page summary that shows, for your herd:
Current preweaning cost per heifer (from your cost‑per‑gain work).
Projected extra spend per heifer on an improved replacer program (for example, around +$200–$286).
A conservative payback story, grounded in the research: roughly $150–$300 in lifetime milk and fewer non‑productive days per heifer from even a 0.1–0.2 kg/day ADG bump, plus the survival risk differences Fodor documented for late‑calving heifers.
Risks/limits: Some lenders think in 12‑month cycles, not three‑lactation ROI. You may have to walk them through replacements as capital assets, not just an expense line.
Why it matters: When you can say, “We’re asking to invest an extra $286 in each heifer to realistically capture more than that in lifetime value and reduce early culling risk,” it changes the tone of the meeting. You’re not defending “expensive powder.” You’re explaining a capital decision on an asset your lender already helped finance.
Partner Perspective: Consistency as the Antidote to Volatility
Consistency is the antidote to the batch‑to‑batch volatility problem you’ve probably felt in your calf barn. Industry partners like Kalmbach Feeds have leaned into that with their Generations™ All Milk 20/20 and 22/20 Milk Replacers, using milk‑derived proteins in a fixed formulation and including LifeGuard® immune support, as described in Kalmbach’s product literature. The idea is simple: keep ingredient sources consistent from batch to batch so you’re not chasing unexplained intake or performance dips tied to formulation changes when you’re making a capital decision on a $2,300–$2,700 animal. Knowing what’s actually in the bag matters.
Key Takeaways
If your preweaning ADG is consistently under about 0.7 kg/day, don’t start by chasing a cheaper bag. Start by asking why your calf barn is putting a governor on the genetics you’re paying for.
If your highest‑index calves aren’t outgrowing your lower‑index calves preweaning, genetics aren’t the weak link — your nutrition program is. That’s a bottleneck you can actually fix.
If your “cheap” replacer program has a higher cost per pound of gain than an all‑milk or higher‑plane program, that saving isn’t real. You’re paying more for slower, riskier gain.
If scours and treatment rates swing when replacer lots change, treat that as a sign that the least‑cost formulation is adding volatility you never agreed to pay for.
If you’re walking into a lender meeting under pressure to cut calf costs, go in with a three‑part story — milk, days to first calving, and survival risk — instead of a single bag price. Let the math make the case for you.
You don’t need to turn your calf barn into a research station. You do need to know whether the milk replacer in your mixer is building the cows your genetic plan is paying for — or quietly turning that investment into scrap value.
So here’s the challenge. Over the next 30 days, weigh a run of calves at birth and weaning. Calculate ADG. Tie it to replacer lots and genomic rankings. Then ask yourself, with your own numbers in front of you: is that 6 “saving” actually putting money in your pocket — or is it the most expensive cut you make all year?
Run Your Own Milk Replacer Math
Learn More
Dairy Calf Nutrition for Healthier, Higher-Producing Cows – This implementation guide delivers a phased roadmap for optimizing gut health and enzyme development. You’ll gain concrete measurement baselines to identify exactly what’s working, cutting the guesswork and waste from your preweaning nutrition program.
Every week, thousands of producers, breeders, and industry insiders open Bullvine Weekly for genetics insights, market shifts, and profit strategies they won’t find anywhere else. One email. Five minutes. Smarter decisions all week.
200 beef services on a 500‑cow herd work out to $117,000 in lost replacement value. The calves look good today. The pipeline doesn’t in 2027.
A 500‑cow Panhandle dairy shipping to one of the new plants outside Amarillo needs 135 replacement heifers a year at a 27 percent turnover rate. At the current national average of $3,010 per head (USDA Agricultural Prices, July 2025), that’s a $406,350 annual replacement line — closer to $500,000 in the premium bands Texas and California producers are actually paying. And the Bullvine Replacement Pipeline Tracker shows only 4.29 million heifers entering the national milking herd in 2027 from 2025 breedings, against a herd of 9.35–9.57 million cows and billion in new processing steel that needs milk.
Meanwhile, that same herd’s breeding sheet is probably still heavy on beef‑on‑dairy. Two years ago, beef‑cross calves brought $900–$1,400 in the right programs. Today, a sexed dairy straw generates an expected value of roughly $856while a beef straw sits near $271 at a $500 calf price. Every beef service on a cow that could carry a viable dairy pregnancy is a $585 gap in expected replacement value. How many of those services can your 2027 herd absorb before you’re buying someone else’s genetics at $3,500+?
The Pipeline Math: From Semen Straw to Milking Cow
The Bullvine Replacement Pipeline Tracker takes NAAB’s domestic semen sales and applies biological conversion rates. Not vibes. Multiplication.
From the NAAB 2025 Year‑End Report (released March 2026), domestic units only:
10.6 million units of sexed dairy semen (+644,000, up 6 percent vs. 2024).
6.0 million units of conventional dairy (down about 280,000).
8.1 million units of beef‑on‑dairy (flat).
NAAB members exported 63 percent of the dairy semen they produced in 2025. Those export doses never enter U.S. cows. Only the domestic units drive your pipeline.
Sexed semen now represents 64 percent of domestic dairy units, up from roughly 58 percent a year earlier. That shift matters enormously in the pipeline math because of what happens at each biological step.
The conversion rates — documented by Dr. Michael Overton of Zoetis from field data across 85 commercial Holstein herds:
Parameter
Sexed
Conventional
Conception rate
42 percent (range 40–45)
57 percent (range 55–60)
Pregnancy survival
95 percent
95 percent
Sex ratio (heifer)
90 percent
50 percent
Completion rate (calf to milking cow)
79 percent
79 percent
That 79 percent completion rate is the one most producers underestimate. Twenty‑one out of every 100 heifer calves born alive never make it to the milking string. Disease. Death. Failed breeding. Culled before first calving. That’s not rounding error — it’s a fifth of your rearing investment walking out the door.
Run the national numbers:
Stage
Sexed Dairy
Conventional
Total
Domestic Semen Units
10.60M
6.00M
16.60M
Pregnancies
4.45M
3.42M
7.87M
Live Calves
4.23M
3.25M
7.48M
Heifer Calves
3.81M
1.62M
5.43M
Milking Herd Entries
3.01M
1.28M
4.29M
That’s your 4.29 million heifers for 2027. The USDA Cattle Inventory (January 2025) counted just 3.91 millionreplacement heifers on U.S. farms — the lowest in nearly five decades and 18 percent below the 2018 peak. Corey Geiger and the CoBank team (CoBank Knowledge Exchange, August 2025) project the heifer trough extending through 2026 — roughly 438,844 fewer heifers vs. 2025 — before a partial rebound of about 285,387 more in 2027. Geiger’s CoBank model works at the national level with annual NAAB data, which is a huge step forward, and the Bullvine version builds on it in three ways. First, we overlay weekly USDA dairy cow slaughter data so that the projections adjust as culling behavior shifts, rather than waiting for the next annual semen report. Second, we break the projections down by state, because a heifer surplus in Idaho doesn’t help a short herd in New York once you factor in freight, biosecurity, and breed mix. Third, we bolt on a beef‑on‑dairy tipping‑point calculator that turns semen mix trends into an expected‑value crossover number — like the ,580 beef‑calf price where beef finally matches sexed dairy — so breeding decisions can move now, not a year from now.
That 2027 rebound is real. But it’s a rebound from a historic low, into a herd that’s expected to fill $11 billion in new processing capacity across more than 50 projects in 19 states.
That conversion pipeline — semen to pregnancy to live calf to heifer to milking cow, with losses at every step — is the spine of the Bullvine Replacement Pipeline Tracker and the reason it can tell you today what your 2027 cow supply will look like.
How Many Replacement Heifers Do 2025 Breedings Actually Produce?
Here’s where that national number lands on your farm. If you’re running 500 cows with a 27 percent replacement rate, you need 135 heifers a year. To produce 135 heifers internally, you need your sexed dairy services generating enough heifer calves — multiplied by 0.79 — to cover that number.
A herd using 50 percent beef‑on‑dairy on the bottom tier produces almost exactly the number of heifers it needs to hold size after applying Overton’s 79 percent completion rate. Zero margin for error. One bad calfhood disease event, one stretch of below‑average conception rates, and you’re short. That’s not a plan — that’s a coin flip with $406,350consequences.
Quick check: your last 12 months of heifer‑calf births × 0.79 vs. herd size × your replacement rate — that spread is your 2027–2028 problem. If you land at 110 or 115 instead of 135, your future herd is already under‑built. No market rally generates animals that aren’t in your pipeline.
Sexed dairy expected value per straw: $3,010 × 0.42 × 0.95 × 0.90 × 0.79 ≈ $856.
Beef expected value per straw (at a $500 pre‑weaned calf): $500 × 0.57 × 0.95 ≈ $271.
More than three times the expected value for dairy. But the scenario table tells the full story:
Beef Calf Price
Beef EV/Straw
Sexed Dairy EV
Dairy Advantage
Verdict
$200
$108
$856
$748
Dairy dominates
$500
$271
$856
$585
Dairy wins
$1,000
$542
$856
$314
Dairy still ahead
$1,500
$812
$856
$44
Near breakeven
$1,580
$856
$856
$0
Crossover
$2,000
$1,083
$856
–$227
Beef wins
Beef calves have to clear $1,580 per newborn/pre‑weaned calf to match sexed dairy’s expected value at a $3,010heifer. Current beef‑cross calf prices from dairy herds range from $200 to $500+, depending on genetics and region. Some high‑end weaned feeders at 500–700 pounds push higher in program and video sales, but at the breeding‑decision level — the straw going in the gun — the math isn’t close.
Three behavioral reasons explain why producers haven’t caught up. Cash flow timing: a beef calf brings a check in weeks; a heifer generates milk in about 24 months. Strategy inertia: programs built when calves pulled $900–$1,400haven’t been rewritten. The lag itself: any heifer you aim to calve in 2028 has to be conceived now, and that feels like forever when feed bills hit monthly.
None of that makes the choice crazy in the moment. It just explains why behavior hasn’t caught up to the math — and why the pipeline keeps bleeding.
The Turn: $117,000 on One Panhandle Breeding Sheet
Here’s where this gets personal for that 500‑cow Panhandle herd.
Say the operation’s been running 35 percent beef‑on‑dairy on cows classified as bottom‑third — roughly 200 beef services a year on animals that could carry a dairy pregnancy. At a $585 per‑service expected‑value gap:
200 beef services × $585 ≈ $117,000 in expected replacement value traded away per year.
Cost Driver
Annual $ Exposure
Category
Base Replacement Budget (27% rate × $3,010/head)
$406,350
Base Budget
TX/CA Premium Band Uplift
$93,650
Direct Cost Premium
Lost EV: 200 Beef Services × $585
$117,000
Hidden Risk (Red)
Potential 2027 Bid Premium ($3,500+ vs. $3,010)
$295,000
Future Risk (Red)
That’s not a clean line item on the P&L. It’s future cow inventory value you’re choosing not to create — and then buying back at $3,010+ when the auction ring gets to it. The number shifts with your calf price and your local heifer cost, but the direction doesn’t. At current market levels, that Panhandle herd’s breeding sheet is quietly writing checks that the pipeline can’t cash in 2027.
This is where the conversation should change. Not “heifers are tight” — which is weather talk — but “how much expected value am I giving up per service, and can my pipeline absorb it?”
600,000 Retained Cows and the Cliff Underneath
The industry’s been masking the pipeline gap with cow retention. Iowa State Extension’s NW Iowa Dairy Outlook has tracked it since late 2023: from September 2023 through mid‑May 2025, weekly dairy cow slaughter ran behind year‑earlier levels in 86 of 88 weeks. January–April 2025 slaughter came in at roughly 889,900 head — the lowest start to a year since 2008. By the second half of 2025, culling ticked up 2.7 percent as the herd reached 9.57 millionhead — its largest since the early 1990s — but levels remain historically low.
Bullvine’s modeling extends that documented deficit through late 2025 and estimates the cumulative “extra cows kept” at roughly 600,000–611,600 head vs. the normal culling pace. These aren’t USDA’s numbers — they’re our extrapolation from ISU’s documented weekly deficit. But the direction is consistent: producers kept cows they would normally have shipped because replacements were either too expensive or literally unavailable.
Those retained cows carry the milk volume today. When margins compress further — Class III was $14.59/cwt in January 2026, $14.94 in February, and $16.16 in March (USDA Class and Component Prices). — producers start culling harder. If a meaningful share exit simultaneously, the void can’t be filled by a pipeline set two years earlier. And the cows being retained to supply the $11 billion in new processing capacity are, by definition, the least productive animals in the herd.
Month
Class III Price
January 2026
$14.59/cwt
February 2026
$14.94/cwt
March 2026
$16.16/cwt
The Bullvine Pipeline Index: 43.5 and 4.5 Points from Red
We built a single composite score to track the pipeline’s health. It runs 0 (crisis) to 100 (abundant), weighted across four components:
Yellow Zone (40–69). Barely. The Red threshold is 39.
This Index is sensitive to culling. If slaughter normalizes and the Culling Pressure Score drops from 25 to 15, the Index slides to 41.5. If sexed semen adoption stalls at the same time — possible if cash‑strapped herds revert to cheaper conventional — you’re at 38. Red Zone. No catastrophe needed. Just normal economics catching up.
For that Panhandle herd, the Index confirms what the breeding sheet already showed: the semen mix momentum is the only indicator keeping the pipeline above the critical threshold. And that momentum takes roughly 24 months to yield a single milking cow. The race is whether retained cows hold long enough for the 2025 breeding surge to reach the milking string in 2027.
How Did We Get to 43.5? The Two‑Year Trend Nobody Tracked
A single Index reading is a snapshot. The trajectory tells you whether you’re healing or bleeding. We back‑calculated the Pipeline Index at five points from mid‑2024 through early 2026, using the same four‑component framework and the best available USDA, NAAB, and ISU Extension data at each snapshot.
The Index hit its trough in mid‑2025 at 40.0 — sitting exactly on the Yellow/Red boundary. It’s recovered 3.5 points since, but remains 5.9 points below where it stood just 18 months earlier. That’s not a rebound. That’s a bounce off the floor.
What Drove the Decline
Three components deteriorated simultaneously between mid‑2024 and mid‑2025:
Heifer Supply fell from 63 to 48 as the replacement ratio dropped from roughly 31 heifers per 100 cows (the 2016 peak) through 27 per 100 (January 2025 USDA inventory), and USDA’s July 2025 mid‑year report showed milk replacement heifers at just 3.50 million against a herd that was still growing.
Price Signal fell from 42 to 30 as national average heifer prices climbed from roughly $2,660 (mid‑2024) to $3,010–$3,110 (mid‑to‑late 2025), with premium markets in California and Minnesota already clearing $4,000+.
Culling Pressure fell from 42 to 25 as the industry moved from early retention (fall 2023) to 86 of 88 weeks of below‑year‑earlier slaughter by May 2025. January–April 2025 dairy cow slaughter — roughly 889,900 head — marked the lowest four‑month start to a year since 2008.
Each of those moves alone would’ve been a yellow flag. All three at once is why the Index nearly hit Red without ever making a headline.
What’s Driving the Recovery — and Why It’s Fragile
The partial bounce from 40.0 to 43.5 is driven almost entirely by one component: Semen Mix Momentum climbed from 35 to 60 as sexed dairy’s domestic share rose from 49 percent (2022 NAAB) to 64 percent (2025 NAAB). That’s the pipeline’s one genuine tailwind — producers shifted breeding behavior, and it showed up in the semen tank before it’ll show up in the milking string.
The other three components? Flat to worse.
Heifer Supply recovered modestly (48 → 55) because the 4.29 million pipeline projection from 2025 breedings suggests future improvement — but the current on‑farm inventory remains at a multi‑decade low.
Price Signal is stuck at 30. Heifers haven’t gotten cheaper.
Culling Pressure is stuck at 25. The retention overhang of 600,000+ cows hasn’t broken, and the herd is now 9.57 million — its largest since the early 1990s.
That means the entire recovery is riding on a single behavioral shift (sexed semen adoption) that won’t produce a milking cow for 24 months. If that growth stalls — possible if cash‑strapped herds in a $14–$16 Class III environment revert to cheaper conventional or beef — the Index reverses course with no backstop.
The V‑Shape and Your Breeding Barn
Here’s the practical read. In mid‑2024, you had a buffer. The Index at 49.4 meant the pipeline was tight but functional — you could run a moderately heavy beef‑on‑dairy program and still source replacements without panic pricing. By mid‑2025 at 40.0, that buffer was gone. Any herd that didn’t adjust breeding protocols during that 18‑month slide locked in a thinner pipeline for 2027–2028.
The recovery to 43.5 buys time. It doesn’t buy safety. The structural vulnerabilities — expensive heifers, a massive retention overhang, and $11 billion in new processing demand — haven’t improved. They’ve been offset by breeding behavior that won’t yield results for two more years.
If you adjusted your beef‑on‑dairy split in 2025, your pipeline will reflect that in 2027. If you didn’t, the trend chart above shows exactly how thin your margin is — and the Index is still closer to Red than it is to the Green Zone.
Where the Shortage Bites First
State
Share of herd
Est. 2027 pipeline
Replacement ratio
Heifer price range
Status
California
~18 percent
~772,000
~25 per 100
$4,000–$4,500+
Critical
Wisconsin
~14 percent
~600,000
~28 per 100
$2,800–$3,750
Tight
Texas
~7.5 percent
~322,000
~24 per 100
$3,200–$4,000
Critical
Idaho
~7.5 percent
~322,000
~26 per 100
$3,100–$3,900
Tight
New York
~6.5 percent
~279,000
~28 per 100
$3,000–$3,600
Tight
Minnesota
~4.7 percent
~202,000
~27 per 100
$2,800–$3,850
Tight
Bullvine Pipeline Tracker estimates based on USDA cow inventory, NAAB data, and regional replacement ratios.
California has a 25‑per‑100‑cow replacement ratio, heavy HPAI reproductive fallout (750‑plus dairies affected from August 2024–March 2025, with some reporting a 7 percent drop in conception rate), and premium Central Valley springers routinely selling for over $4,500. Texas added 39,000 cows in 2025 — 70 percent of the state’s cows sit on just 5 percent of its dairies in the Panhandle. When one 4,000‑cow dairy needs 1,200 heifers, the regional market feels it. The traditional overflow from Wisconsin and Minnesota shrinks as small operations exit — 230 farms lost in Wisconsin and 120 in New York in 2025 alone.
What This Means for Your Operation
In the next 30 days:
Run your pipeline math. Pull 12 months of heifer‑calf births. Multiply by 0.79. Compare to herd size × replacement rate. If you’re short, that gap is baked into 2027–2028 regardless of what happens to prices.
Audit beef‑on‑dairy with your own prices. EV_beef = your calf price × 0.57 × 0.95. EV_dairy = your local heifer cost × 0.42 × 0.95 × 0.90 × 0.79. If the dairy advantage looks anything like $585, decide how many beef services you keep on viable dairy dams. You gain near‑term cash. You give up future replacement inventory at today’s expected‑value spread.
Call your heifer suppliers this week. Ask how far they’re booked and whether they’ll lock in numbers 12–18 months out. If “I’ll just buy later” is your plan, find out whether the supply actually supports that.
In the next 90 days:
Tier your herd and write it into SOPs. Top genetics go to sexed dairy. The middle tier is a mix. True terminal cows only get beef. Don’t let beef creep back onto viable dams just because the straw is cheaper that day.
Cull on profit, not habit. Keep productive older cows if SCC and repro allow. Ship chronic mastitis, repeat breeders, and low‑index animals. A retained cow buys you time. She doesn’t buy you margin.
Over the next 365 days:
Align your herd plan to your plant. If you’re near new processing steel, decide whether you’re growing, holding, or shrinking. Your pipeline, beef percentage, and culling strategy need to match that call.
Set hard floors and ceilings. Floor: the minimum beef‑calf price where beef services still make cash‑flow sense. Ceiling: the maximum percentage of breedings you’ll put to beef on viable dairy dams. The $1,580crossover is your north star.
Key Takeaways
If your 12‑month heifer‑calf count × 0.79 doesn’t cover herd size × replacement rate, you’re already short on future cows. That shortage is baked into 2027–2028 and can only be solved with purchased heifers, breeding changes, or culling adjustments starting now.
Every beef service on a viable dairy dam trades away roughly $585 in expected replacement value at current prices. The crossover requires beef calves at $1,580 per head. Most markets aren’t in the same zip code. Run the expected‑value calculation with your own calf receipts before your next breeding round.
The Pipeline Index sits at 43.5 — Yellow Zone, 4.5 points from Red. Semen mix momentum is the only component holding the score up, and it takes about 24 months to turn semen into a milking cow. One bad culling quarter pushes the national pipeline into critical territory.
Before your next lender review or processor supply meeting, print the EV table and your pipeline math side by side. Ask yourself one question: does your current breeding program produce the cows your operation will need in 2028, or are you planning to compete for someone else’s heifers at $3,500+? The breeding decisions locking in that answer are being made right now. Biology won’t wait for the market to make them comfortable.
We’ll update the Bullvine Replacement Pipeline Tracker and Pipeline Index quarterly as NAAB and USDA data refresh, with the next full reading publishing after the Q3 2026 NAAB report and fall culling data are in.
Methodology Note: Pipeline and economic data in this article comes from the NAAB 2025 Year‑End Report (March 2026), USDA Cattle Inventory (January 2025), USDA Agricultural Prices (July 2025), USDA Class and Component Prices (January–March 2026), CoBank Knowledge Exchange (August 2025), and ISU Extension NW Iowa Dairy Outlook (May and December 2025). Biological conversion rates reference Dr. Michael Overton/Zoetis field data from 85 commercial Holstein herds. The 600,000–611,600 retained‑cow estimate is Bullvine’s extrapolation from ISU’s documented weekly deficit data, not a USDA statistic. National averages may not reflect your specific region, herd size, or management system. All dollar figures are USD. We welcome producer feedback and corrections at editor@thebullvine.com
Every week, thousands of producers, breeders, and industry insiders open Bullvine Weekly for genetics insights, market shifts, and profit strategies they won’t find anywhere else. One email. Five minutes. Smarter decisions all week.
Four Minnesota farmers bet $25,000 on a calf they could still pick up. A century later, his hidden gene produced a World Dairy Expo Supreme Champion.
Sir Inka May at Carnation Milk Farms, the “Crown Prince” whose black‑and‑white frame quietly carried the red gene that would reshape Holstein history and help pave the way to a Red & White Supreme Champion.
The auctioneer’s chant bounced off the rafters in that Philadelphia sale barn like hoofbeats on a wooden bridge. It was the Fourth Brentwood National Sale in 1925—one of those days when you could look down the rows and see every kind of dairyman, from small‑town breeders in their Sunday coats to corporate buyers with sharper suits and even sharper pencils. Then the next lot stepped into the ring: a two‑year‑old bull with that big‑time show bloom and a catalog page that read like a wish list. Sir Inka May. When the gavel finally crashed at 12,000 dollars to Carnation Milk Farms out in Seattle—and word buzzed through the crowd that Carnation had been willing to go to 30,000 if they had to—you didn’t need a crystal ball to know this bull was going to matter.
What nobody in that ring could see—not the auctioneer, not the Minnesota men who’d raised him, not even the Carnation buyer signing off on the biggest bull check of his career—was that this wasn’t just a sale. It was the opening scene of a story that would run a hundred years, stretch from a 75‑cow outfit in Austin, Minnesota, to the colored shavings at World Dairy Expo, and peak with a Red & White cow named Golden‑Oaks Temptres‑Red‑ET walking out of Madison as Supreme Champion. The thread that ties those moments together is the bull the Mower County News once called the “Crown Prince of the Inka herd”—and one small, recessive gene the Holstein world wanted nothing to do with at the time.
Act I – A Crown Prince in a Little Powerhouse
To really understand Sir Inka May, you’ve got to start in Austin, Minnesota. Not the Seattle of Carnation advertisements, but a place where cream cans rattled down gravel roads, and neighbors knew which barns housed the good cows.
In 1919, Vere Culver and his partner Alpha Eberhard set out to build more than just a herd there. They created the Minnesota Holstein Company. On the surface, it was a small Holstein operation. In reality, it was an early boutique genetics program. The herd never topped 75 head, youngstock included, yet in eight years they piled up 85 first‑place ribbons and 14 championships at national Holstein shows. In 1925, they attended the National Cattle Congress in Waterloo, Iowa, and returned with both the Premier Breeder and Premier Exhibitor banners. Think about that for a second: a herd you could walk through in under an hour, being called the best in the country that year.
Here’s what made that possible. Her name was May Walker Ollie Homestead.
May Walker Ollie Homestead (left) on the showgrounds, 1924—the cow whose 31,608 lbs of milk and 1,521 lbs of butterfat made test sheets look like misprints and gave Sir Inka May the maternal firepower that changed a breed.
By all accounts, she was the kind of cow that made people change their travel plans. On December 18, 1922, just as winter settled in, she wrapped up a lactation that made test sheets look like misprints—31,608.6 pounds of milk and 1,521.59 pounds of butterfat. This was the era of hand milking, wooden stanchions, and hay and grain. That record didn’t just push the envelope; it blew it right open. Her butterfat record held nearly five years. She went on to be the dam of three All‑Americans and an All‑American produce of dam, and the Farmers Independent noted that no other animal had performed so “sterlingly for the upbuilding of the dairy industry.”
Now, put yourself in Culver and Eberhard’s boots. You’ve got a cow like that in your barn. You’ve watched the milk scales, felt the spring in her pasterns after months of that kind of production, seen her hold condition. What keeps you up at night? The hope that she’ll give you a son who can pass it on.
On April 8, 1923, hope hit a straw. May Walker Ollie Homestead calved a bull by Sir Inka Superior Segis. The Mower County News didn’t play coy. “This introduces you to the Crown Prince of the Inka herd,” they wrote, adding that he was being “groomed to keep up the family trait of being American champion of something.” That’s rural Minnesota in 1923—half humor, half prophecy.
Sir Inka Superior Segis already had a reputation for siring winners. The Minnesota Holstein Company had six All‑Americans on the farm at one time; this calf came from the very center of that genetic storm. No wonder breeders were watching.
Sir Inka May’s pedigree page in The Carnation Milk Farms News—a 1920s proof sheet showing the “Crown Prince” as the only All‑American sire of two All‑American daughters, backed by May Walker Ollie Homestead’s record 31,608‑lb lactation and a stack of red‑carrier ancestors the breed didn’t yet understand.
A few months later, four breeders from McLeod County sat down at a kitchen table with that calf’s future in front of them. By all accounts, that’s when talk turned to numbers that made thumbs drum against the tabletop. They decided to buy a 50% interest in Sir Inka May for $ 25,000. In today’s money, that’s around 476,000. That’s not “let’s see how he does” money. That’s a level of risk that makes your stomach feel light when you sign.
You can picture it. Catalogs pushed aside, coffee cups cooling, someone saying, “We’re not going to see another one out of a cow like May Walker any time soon.” Another answering, “If he sires like she milks, we’ll be glad we did it. If he doesn’t…” Silence. Then somebody pushes his chair back, walks over to the desk, and does the hardest part of any breeding decision: puts pen to paper.
The next year, 1924, the wider Holstein world got its first real look at the “Crown Prince.” The All‑American program had just been formalized in the Holstein‑Friesian World in 1922. Sir Inka May went into the junior yearling bull classes and came out as an All‑American Junior Yearling—one of the first bulls to carry that new national “ideal” All‑American title beside his name. According to dairy historian Ron Eustice, he didn’t stop there. He became the first All‑American bull to sire an All‑American daughter, proving that his show-ring quality wasn’t going to stop with him.
Back home in Minnesota, he was doing the quieter work that really builds a legacy. During his tenure there, Sir Inka May sired at least 70 calves in the state, more than 30 of them in those McLeod County herds. This was still pre‑A.I. If his daughters looked good, the neighbors saw them. If they milked like their granddam, the talk at the local creamery reflected it.
Nobody in those conversations was thinking about coat color genetics. Red calves popped up here and there in the breed, usually met with frowns or quiet culls. The Holstein identity was black and white. Folks talked about Segis, Rag Apple, and Clothilde; recessive alleles were still a mystery. Sir Inka May’s promise, as far as anyone knew, was about more milk and better-looking cows, period.
Act I ends in that sale ring, with a great Minnesota hope going west—and a gene nobody understood hitching a ride in his semen.
Act II – Carnation, Red Calves, and a Breed That Wasn’t Ready
Now, the thing about that 1925 Brentwood Sale is that it wasn’t just a fancy auction; it was a snapshot of where the Holstein breed was headed. The sale grossed 88,950 dollars—serious money in an era when the average cow was a 3,000‑pound milker. Buyers came from 18 states and three countries. Breeders sent cattle there to make statements.
Carnation Milk Farms didn’t come to watch. They came to buy.
Carnation King Sylvia on tour in 1918—E.A. Stuart’s $106,000 “whistle‑stop” calf, paraded under the CARNATION STOCK FARMS banner, proving long before Sir Inka May that big Holstein bulls and bigger cheques could turn genetics into nationwide marketing.
Owned by the Carnation milk products company—which would later end up under Nestlé—Carnation Milk Farms was built around a simple idea: breed cows so productive that their numbers alone would sell semen back to the dairymen whose milk Carnation was hauling. At a time when the national average cow gave about 3,000 pounds of milk in 1900 and 7,000 pounds by 1950, Carnation was recording herd outputs of 37,000 pounds as early as 1927. They weren’t there to hang ribbons. They were using genetics as part of a corporate business plan. (Read more: When Cows Were Kings: Revisiting Carnation’s Golden Age of Dairy Breeding)
Carnation’s own ad for Sir Inka May on the July 1, 1930 cover of The Holstein‑Friesian Register—proof that the “Crown Prince” from Minnesota had become the headline sire in a program built on turning big records into even bigger semen sales.
Sir Inka May arrived in Seattle with exactly what they were looking for: All‑American credentials, a dam with a world‑record butterfat test, and a growing reputation for prepotency. The fact that they’d been prepared to pay 30,000 if necessary tells you just how badly they wanted him in their bull barn.
One can imagine those first Sir Inka May daughters freshening in the Carnation barns. Long, airy concrete barns, lime dusting the floor, the new sound of milking machines chugging where hand milking used to echo. Herdsmen with clipboards, watching test weights and butterfat numbers, circling the ones that made their eyebrows go up.
Within a few years, his calves had already racked up over 90 blue ribbons in the 1926 and 1927 show seasons. By October 1940, Holstein‑Friesian World wrote that he had 11 daughters over 1,000 pounds of fat and 45 over 800—more than any other living sire of any breed. In the records, only Matador Segis Ormsby sat ahead of him. The magazine concluded that “the Sir Inka May production and his influence on the breed today is perhaps greater than that of any other sire now living.” Carnation’s own people later said no bull had ever had more impact on their program.
Sir Inka May featured in a 1927 issue of The Carnation Milk Farms News—pitched as the All‑American champion sire whose daughters and All‑American heifers, Inka Pontiac and Inka Bonnie, were proving that one Minnesota bull could stamp both type and production across Carnation’s herd.
Behind those numbers were bulls and cows that carried his name. By 1940, Sir Inka May had sired four of Carnation’s main herd sires, and at least six of his grandsons were also serving as herd bulls there. At that point, you could walk down the bull line and see his influence in every pen.
But while the production records were climbing, something in the calving pens was making the company nervous.
Between 1928 and 1937, Sir Inka May sired at least 13 red‑and‑white calves at Carnation. His sons, used in that same herd, also threw red. This wasn’t entirely new—Carnation’s records show a red calf as early as 1915, and a bull named Carnation Segis ProspectRC siring red calves in 1923–24. But when your top sire, the bull you’ve hitched your program to, starts throwing that color in your best cow families, the stakes feel higher.
Picture a scene from those years. A Carnation herdsman, coat collar turned up against Washington drizzle, is in a box stall with a Sir Inka May daughter whose test sheet has been making everybody smile. The calf hits the straw; they wipe it off with a sack; the lantern light hits the coat, and it’s not black. Not mostly black with a funny cast. It’s clearly red and white. There’s probably a long pause. Maybe a muttered, “Well, that’s not what we ordered.”
Breeders hate mysteries in a pedigree. To explain the red calves, a story started that you still hear in some corners today: that Sir Inka May’s red gene came from an unrecorded Ayrshire in his background—a fence‑jumper somewhere along the line. It was a convenient way to pretend “true” Holsteins didn’t carry that gene.
Eustice’s research shuts that down. The red factor was already present in the Holstein breed through imported Dutch cattle such as Clothilde and Coronet. Sir Inka May’s sire, Sir Inka Superior Segis, was a known red carrier. His full sister, May Walker Inka Segis—sold to Senator A.C. Hardy in Ontario at the Minnesota Holstein Company dispersal—was a red carrier. A maternal brother, Sir Bess Ormsby May, went to Osborndale Farm in Connecticut and sired red calves. The gene was woven into some of the breed’s most elite families. No Ayrshire needed.
Carnation, though, had a brand to protect. As late as 1963, long after Sir Inka May was gone, their own magazine ran a line that many old‑timers still remember: “The red factor is becoming so much a problem in some places that it does not seem advisable to run the risk of further spreading the factor throughout the breed.” One Carnation editor, looking back on the red calves those years later, wrote that they made some folks “nervous” even when the numbers on their dams were spectacular—numbers like Sir Inka May’s daughters were posting. That tension between what the eye liked and what the ledger demanded was playing out in real time in their barns.
They weren’t alone in that attitude. Both the Holstein‑Friesian Association of America and its Canadian counterpart held the line for decades against registering Red & Whites. Some state associations placed ads arguing that adding red cattle to the herdbook would damage the Holstein “brand.” Red calves were not just unfashionable; they were seen as a threat.
Sir Inka May himself kept doing the only job he knew. He worked at Carnation until about a year before his death. On July 15, 1943, they euthanized him at the farm. He was 20 years old, a venerable age for a bull that had seen the breed shift from hand milking to milking machines and watched new bulls come and go while his daughters stayed in the milking string.
By then, his official record was sealed: 18 All‑Americans and 15 Reserves, 33 banners in total; 11 daughters with 1,000‑pound fat records and 45 with 800 pounds or more, more than any living bull of any breed at the time; four sons and six grandsons at work in the Carnation bull barns. If his story had ended right there, he would still be remembered as one of the great sires of that era.
But the gene nobody wanted was still out there, riding quietly in the pedigrees of the cows and bulls he’d made famous.
And this is where the story that started with that 12,000‑dollar bid in 1925 starts climbing toward its peak.
Act III – Sovereign, Outcasts, and a Red & White Supreme
The Minnesota Holstein Company itself didn’t last long on paper. In 1927, after only eight years, they dispersed the herd. At that sale, 61 head averaged 1,078 dollars—about three times the industry’s average cow price of 376 dollars at the time. The buyers might not have been thinking about recessive color genes, but they definitely recognized elite cattle when they saw them.
Minnesota Holstein Company Dispersal Makes History with $1,078.69 Average” — the 1927 Holstein‑Friesian World spread that proved Culver and Eberhard’s 75‑cow “boutique” herd was no hobby, with buyers from across North America paying triple the going rate for cows like May Walker Ollie Homestead and the families behind Sir Inka May.
Looking back, Eustice wrote that through its cattle, the Minnesota Holstein Company “unknowingly and irrevocably disseminated the recessive gene for red hair color throughout the North American Holstein population.” That word “unknowingly” sits heavily. Culver, Eberhard, and the McLeod County breeders—they were chasing performance, type, and banners. They didn’t set out to change the breed’s palette. They just happened to put a powerful red gene carrier at the center of a very influential program.
The survival and eventual triumph of that gene runs through one key link: Montvic Rag Apple Sovereign.
Sovereign was born April 17, 1942, at Mount Victoria Farm in Hudson Heights, Quebec, under the eye of another legend: T.B. Macaulay. Macaulay had a very specific vision. He wanted Holsteins that could consistently test 4% butterfat with udders that would stand the strain year after year. At a time when breeders sometimes accepted leaky udders in exchange for big production, that was a clear, disciplined breeding philosophy.
Montvic Rag Apple Sovereign—born at T.B. Macaulay’s Mount Victoria in 1942, sold as a two‑month‑old for $4,075, and then, through early A.I., the great‑grandson of Sir Inka May whose semen spread the red gene into more Holstein pedigrees than any other bull of his era.
Sovereign was a great‑grandson of Sir Inka May. When the Mount Victoria dispersal came in 1942, he was only a two‑month‑old calf, but he still fetched 4,075 dollars from Tom Dent and Clark Brown. That price told you everything: people believed in the breeding behind him, not his size on sale day.
Here’s where timing helped. Artificial insemination was stepping out of its experimental phase. Sovereign became one of the bulls to ride that first real wave of A.I. At one point, he had more registered offspring in the Canadian herdbook than any other sire. Instead of influencing a handful of herds the way a natural service bull would, his genetics spread coast to coast—and beyond.
The line sharpened again at ABC Farms in Brampton, Ontario. There, ABC Inka May EX showed what Sir Inka May’s family could do from the female side—a four‑year‑old All‑Canadian with a record of 24,141 pounds of milk and 1,128 pounds of fat. She was sired by Inka Supreme Reflection and traced back to Temple Farm May, a 400‑dollar purchase that turned out to be one of those cows whose price looks comically small in hindsight.
When ABC Inka May was mated to Montvic Rag Apple Sovereign, they produced A.B.C. Reflection Sovereign EX‑Extra. The bull books tell you what happened next. Reflection Sovereign dominated the show ring in the 1950s, siring seven All‑Canadian Gets and five All‑American Gets. Breeders across North America built cow families on his daughters. Because he carried the red gene from Sir Inka May, those lines quietly banked that recessive factor even as the official herdbooks still refused to print “Red & White” beside a registration number.
A.B.C. Reflection Sovereign EX‑Extra—the Sovereign son from ABC Inka May whose daughters dominated the 1950s show strings, with seven All‑Canadian Gets and five All‑American Gets, quietly banking Sir Inka May’s red gene in the very cow families the breed was most proud of.
Meanwhile, the institutional resistance was still in full swing. The Holstein‑Friesian associations in both the U.S. and Canada stood firm against the registration of Red & Whites. Some state associations ran ads warning that letting red cows into the registry would tarnish the Holstein image. As late as 1963, Carnation’s magazine was still warning that the red factor was “becoming so much a problem… that it does not seem advisable to run the risk of further spreading the factor.” That line tells you all you need to know about how deep the prejudice ran.
But the cows—and the data—were winning. Around the world, demand for high‑production Holstein genetics often meant buying semen from bulls that happened to carry the red gene. The first Red & White show at World Dairy Expo was held in 1968. Canada opened its herdbook to Red & Whites in 1969. The U.S. followed in 1970. In 1969, Carnation themselves—the same outfit that had spent years trying to breed red out of their own herd—introduced Red & White bulls into their A.I. lineup to meet global demand. Talk about coming full circle.
By that point, as Eustice notes, almost all Red & White and red‑carrier Holsteins in the world could be traced back to Montvic Rag Apple Sovereign. Follow that line back a little farther, and you land squarely on Sir Inka May. A bull who’d once been valued for his black‑and‑white daughters and fat records had become, through his great‑grandson, the backbone of a color variety the breed had spent decades trying to keep out.
And this is where the story that started with that high price in Philadelphia finally hits its peak.
Fast‑forward to Madison, Wisconsin, 2025. If you’ve been to World Dairy Expo, you can smell it just thinking about it—sawdust, coffee, hoof black, and cool fall air. In the International Red & White Show, Golden‑Oaks Temptres‑Red‑ET walks into the ring. The minute she does, you can tell the class has just changed. Classified EX‑94, she’s got that welded‑on udder, that long, clean frame, that way of carrying herself that makes judges forget their lunch breaks.
There’s that familiar hush in the Coliseum—the kind where you can hear a shank chain rattle three rows over—while the Supreme lineup stands under the lights. Then there are her numbers. As a three‑year‑old, Temptres had already rung up 37,030 pounds of milk and 1,510 pounds of butterfat in 365 days. Put that beside May Walker Ollie Homestead’s 1922 record—31,608.6 pounds of milk, 1,521.59 pounds of fat—and it sends a little chill up your spine. Different eras, different rations, different technology, same kind of ridiculous capability in the milking parlor.
Her pedigree is a Red & White road map. Dam: Miss Pottsdale DFI Tang‑Red EX‑94. Granddam: Al‑N‑Tine Debonair Tart‑ET EX‑92 3E. Further back, C Alanvale Inspiration Tina EX‑95 2E, plus a list of elite red and red‑carrier names that any modern breeder will recognize. Underneath it all, if you walk the branches back far enough, you find Sovereign, Reflection Sovereign, and the Inka lines that lead back to Sir Inka May.
When the announcer in Madison finally says it—Temptres named Supreme Champion of World Dairy Expo 2025—everything that had come before folds into that moment. This isn’t just a Red & White cow winning her color show. This is a Red & White cow, carrying elite production and elite type, standing as the top Holstein on the grounds. The gene Carnation, once called “a problem,” and the associations that once wouldn’t register are under the spotlight, and nobody’s complaining.
That’s the climax. That’s the peak. A story that started with a record cow in Minnesota, a high‑priced bull calf, and some red calves that made people mutter in the barn has finally walked to the colored shavings and taken the whole show.
Golden-Oaks Temptres-Red Supreme Champion – World Dairy Expo 2025 Milk Source, Fischer, Steincrest & Crescentmead Kaukauna, WI
Why Sir Inka May Still Matters in Today’s Barns
So why should a producer in 2026, juggling feed costs, labor, and breeding decisions, care about a bull born in 1923?
First off, Sir Inka May is living proof that influence in this breed doesn’t spread out evenly. If you’ve ever flipped through a pile of pedigrees and seen the same name pop up three, four, five times in four generations, you’ve seen what happens when one bull ends up at the center of multiple powerful herds. Put a highly prepotent sire in a boutique show herd like the Minnesota Holstein Company, then move him to a corporate production herd like Carnation, and you’re not just making a good bull. You’re laying down a genetic highway that his traits can travel for generations.
Another thing his story says, loud and clear: you don’t get to choose which genes tag along with the ones you’re chasing. We assess milk, fat, udder quality, feet and legs, and health traits. The rest of the package—fertility quirks, disease resistance, coat color—climbs into the trailer with them. Sir Inka May was used heavily because he made the kind of daughters Carnation needed and sired sons that bred true. The red gene never asked permission. It just stayed in the blood and kept moving forward.
Stand him between Culver and Eberhard at that kitchen table in Austin and the Carnation team reading test sheets in Seattle, and you can watch the breed walk from kitchen tables to conference rooms. On one side, you have a small herd, big goals, and a lot of faith in what you can see in front of you. On the flip side, you have herd records, planned matings, and a corporate mindset that uses genetics as a tool in a larger business machine. Sir Inka May is a reminder that the tension you feel today between what the computer says and what the cow in front of you looks like has long been part of this breed.
And if you’re milking Red & Whites today—or even just using red‑carrier bulls in a black‑and‑white herd—this isn’t ancient history. Every time you trace a Red & White pedigree back and find Sovereign or Reflection Sovereign, every time you see RC show up in a bull’s proof and shrug because his daughters are exactly what you want in your free stalls, you’re staring right down the line that runs back to Sir Inka May. Every Supreme Champion Red & White at Madison, Temptres included, is another banner hanging on the same genetic rope he helped string.
A Quiet July Day, and a Long Echo
Let’s go back, one last time, to Carnation Milk Farms in July of 1943. By then, Sir Inka May had been walking those alleys for nearly two decades. He’d seen the barn change around him—new paint on the walls, new milking units, new bulls on either side of his stall. His daughters had filled the milking strings, and his grandsons were already standing in the bull pens.
The records tell us, not the memories, that he was euthanized on July 15. One can imagine the day. Summer haze over the fields. A few of the long‑time herdsmen pause as they walk by his pen, thinking of the calves they’d pulled from his daughters, the fat tests that had rolled off the tester’s scale, the herd sires with his name on their registration papers. For them, the bull wasn’t just a list of numbers; he was a fixture.
By then, Holstein‑Friesian World had already called his influence on the breed “perhaps greater than that of any other sire now living.” Carnation had acknowledged that no bull had shaped their program more. On paper, his story was staggering: 18 All‑Americans, 15 Reserves; more 1,000‑pound‑fat daughters than any other living sire of any breed; four sons and six grandsons in the Carnation bull barns.
If that were all he’d done, Sir Inka May would still deserve his place in Holstein history. But we know now that the deepest part of his legacy wasn’t visible in those 1940s scorecards. It was in the quiet way a recessive gene slipped out from under the shadow of prejudice, stayed alive in elite families, and eventually walked into the center ring at Madison with a Supreme banner over its head.
Without Sir Inka May, Carnation’s production records would have different numbers beside them. Mount Victoria’s breeding experiments might have taken a different turn. Sovereign’s widespread impact on A.I. would look different in the herdbook. Without him, the Red & White pedigrees behind cows like Temptres would read another way, and it might have taken longer for the breed to admit what the cows had been saying all along: that excellence comes in black and white—and in red and white.
Every time a breeder today opens a catalog and sees RC next to a bull’s name, every time a Red & White calf hits the straw and the reaction is a smile instead of a sigh, there’s a little bit of Sir Inka May in that moment. When Golden‑Oaks Temptres‑Red‑ET walked out of the ring in 2025 as Supreme Champion of World Dairy Expo—with a 37,000‑pound record and a pedigree that leads back through Sovereign to Minnesota’s Crown Prince—that was his echo, loud and clear.
In 1923, a small-town newspaper introduced a newborn bull as the “Crown Prince of the Inka herd” and joked that he’d be groomed to be “American champion of something.” A hundred years later, we can say they were right in ways they never could have imagined. He helped lift a little Minnesota herd into the spotlight. He gave Carnation the sires they needed to rewrite what “high production” meant. And he quietly carried a red gene that turned out to be one of Holstein history’s greatest stories of redemption.
So the next time you watch a Red & White cow circle the ring at Madison, or look at a red‑carrier bull’s proof, wondering how his daughters will look in your barn, remember that quiet July day at Carnation and that loud day in the Philadelphia sale ring. Remember the world‑record cow in Austin, the four farmers betting 25,000 dollars on her son, and a corporate herd that tried to keep the red gene behind the curtain even as it rode their best pedigrees.
You’re not just looking at color. You’re looking at the long echo of a bull born in 1923 whose influence ran farther and lasted longer than anyone in that first barn could have guessed.
Crown Prince, indeed.
Key Takeaways:
Sir Inka May turned a 75‑cow Minnesota show string into a global genetic force, anchoring both Carnation’s record herds and the emerging A.I. era.
His daughters’ 1,000‑lb fat records and multiple All‑Americans made him a sire-of-sires at Carnation—even as his red calves were treated as a problem to erase.
The red gene he carried spread quietly through elite lines to Montvic Rag Apple Sovereign and A.B.C. Reflection Sovereign, seeding almost all modern Red & White and RC Holsteins.
Association resistance to Red & Whites finally broke in 1968–1970, setting the stage for cows like Golden‑Oaks Temptres‑Red‑ET to stand Supreme at World Dairy Expo.
For today’s breeders, his story is a reminder that you can’t cherry‑pick only the “good” genes—concentrated influence always brings hidden passengers along for the ride.
Continue the Story
The Vision of Mount Victoria: T.B. Macaulay’s Holstein Legacy – In the same era Sir Inka May was transforming Carnation, T.B. Macaulay was applying actuarial science to create the Rag Apple bloodline. This profile explores how Macaulay’s quest for 4% butterfat parallelled the high-production dreams born in Minnesota.
Sire Spotlight: The Backup Bulls Who Created Holstein History – Deepen your understanding of the historical world these bulls were navigating. This retrospective examines the industry forces and “backup” status of legends like O-Man and Elevation, proving that the foundation held even when the experts looked elsewhere.
A.B.C. Reflection Sovereign – Trace the line from Sir Inka May’s hidden gene to the bull who carried it into the modern era. This analysis shows how Reflection Sovereign became the ultimate genetic bridge, proving that excellence and color could finally walk the same path.
The Sunday Read Dairy Professionals Don’t Skip.
Every week, thousands of producers, breeders, and industry insiders open Bullvine Weekly for genetics insights, market shifts, and profit strategies they won’t find anywhere else. One email. Five minutes. Smarter decisions all week.
To provide the best experiences, we use technologies like cookies to store and/or access device information. Consenting to these technologies will allow us to process data such as browsing behavior or unique IDs on this site. Not consenting or withdrawing consent, may adversely affect certain features and functions.
Functional
Always active
The technical storage or access is strictly necessary for the legitimate purpose of enabling the use of a specific service explicitly requested by the subscriber or user, or for the sole purpose of carrying out the transmission of a communication over an electronic communications network.
Preferences
The technical storage or access is necessary for the legitimate purpose of storing preferences that are not requested by the subscriber or user.
Statistics
The technical storage or access that is used exclusively for statistical purposes.The technical storage or access that is used exclusively for anonymous statistical purposes. Without a subpoena, voluntary compliance on the part of your Internet Service Provider, or additional records from a third party, information stored or retrieved for this purpose alone cannot usually be used to identify you.
Marketing
The technical storage or access is required to create user profiles to send advertising, or to track the user on a website or across several websites for similar marketing purposes.
To provide the best experiences, we and our partners use technologies like cookies to store and/or access device information. Consenting to these technologies will allow us and our partners to process personal data such as browsing behavior or unique IDs on this site and show (non-) personalized ads. Not consenting or withdrawing consent, may adversely affect certain features and functions.
Click below to consent to the above or make granular choices. Your choices will be applied to this site only. You can change your settings at any time, including withdrawing your consent, by using the toggles on the Cookie Policy, or by clicking on the manage consent button at the bottom of the screen.
Functional
Always active
The technical storage or access is strictly necessary for the legitimate purpose of enabling the use of a specific service explicitly requested by the subscriber or user, or for the sole purpose of carrying out the transmission of a communication over an electronic communications network.
Preferences
The technical storage or access is necessary for the legitimate purpose of storing preferences that are not requested by the subscriber or user.
Statistics
The technical storage or access that is used exclusively for statistical purposes.The technical storage or access that is used exclusively for anonymous statistical purposes. Without a subpoena, voluntary compliance on the part of your Internet Service Provider, or additional records from a third party, information stored or retrieved for this purpose alone cannot usually be used to identify you.
Marketing
The technical storage or access is required to create user profiles to send advertising, or to track the user on a website or across several websites for similar marketing purposes.











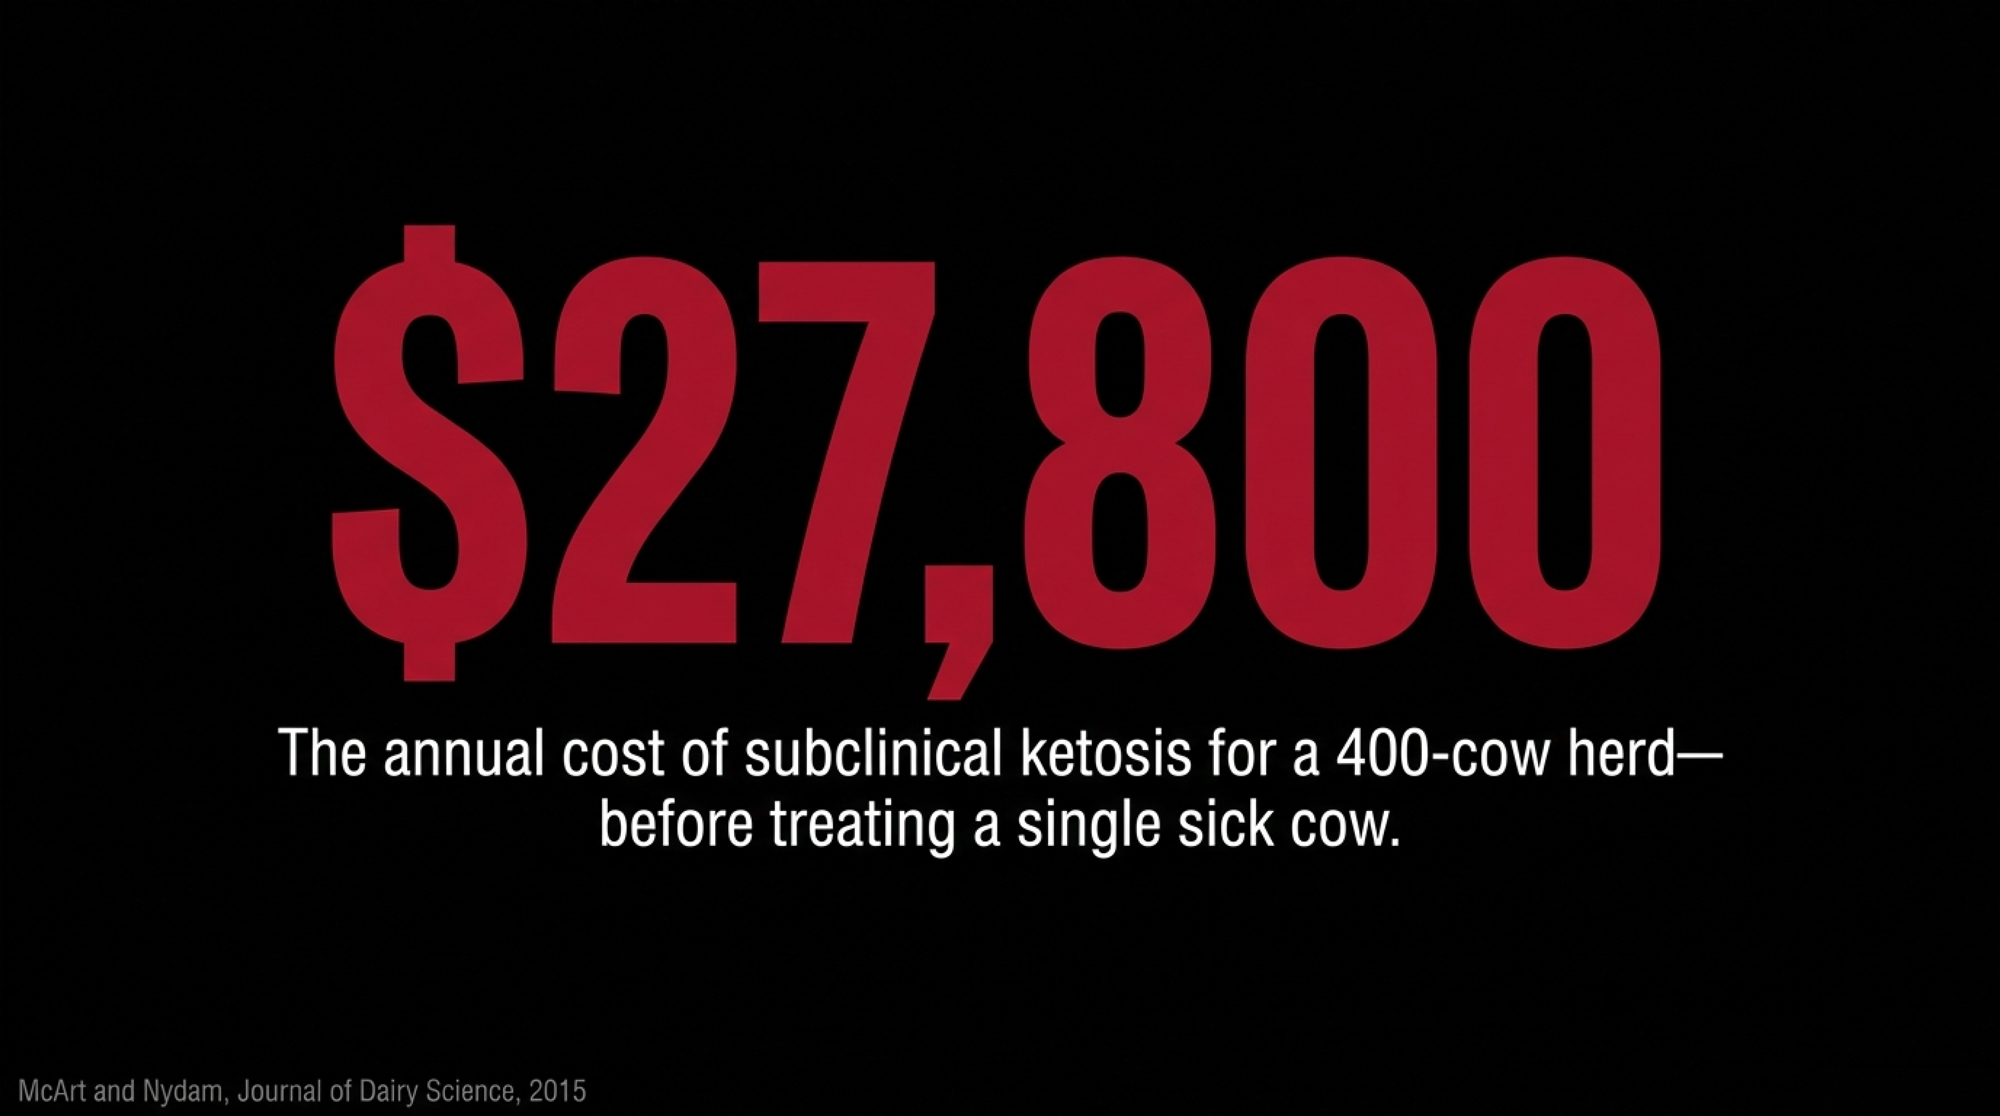
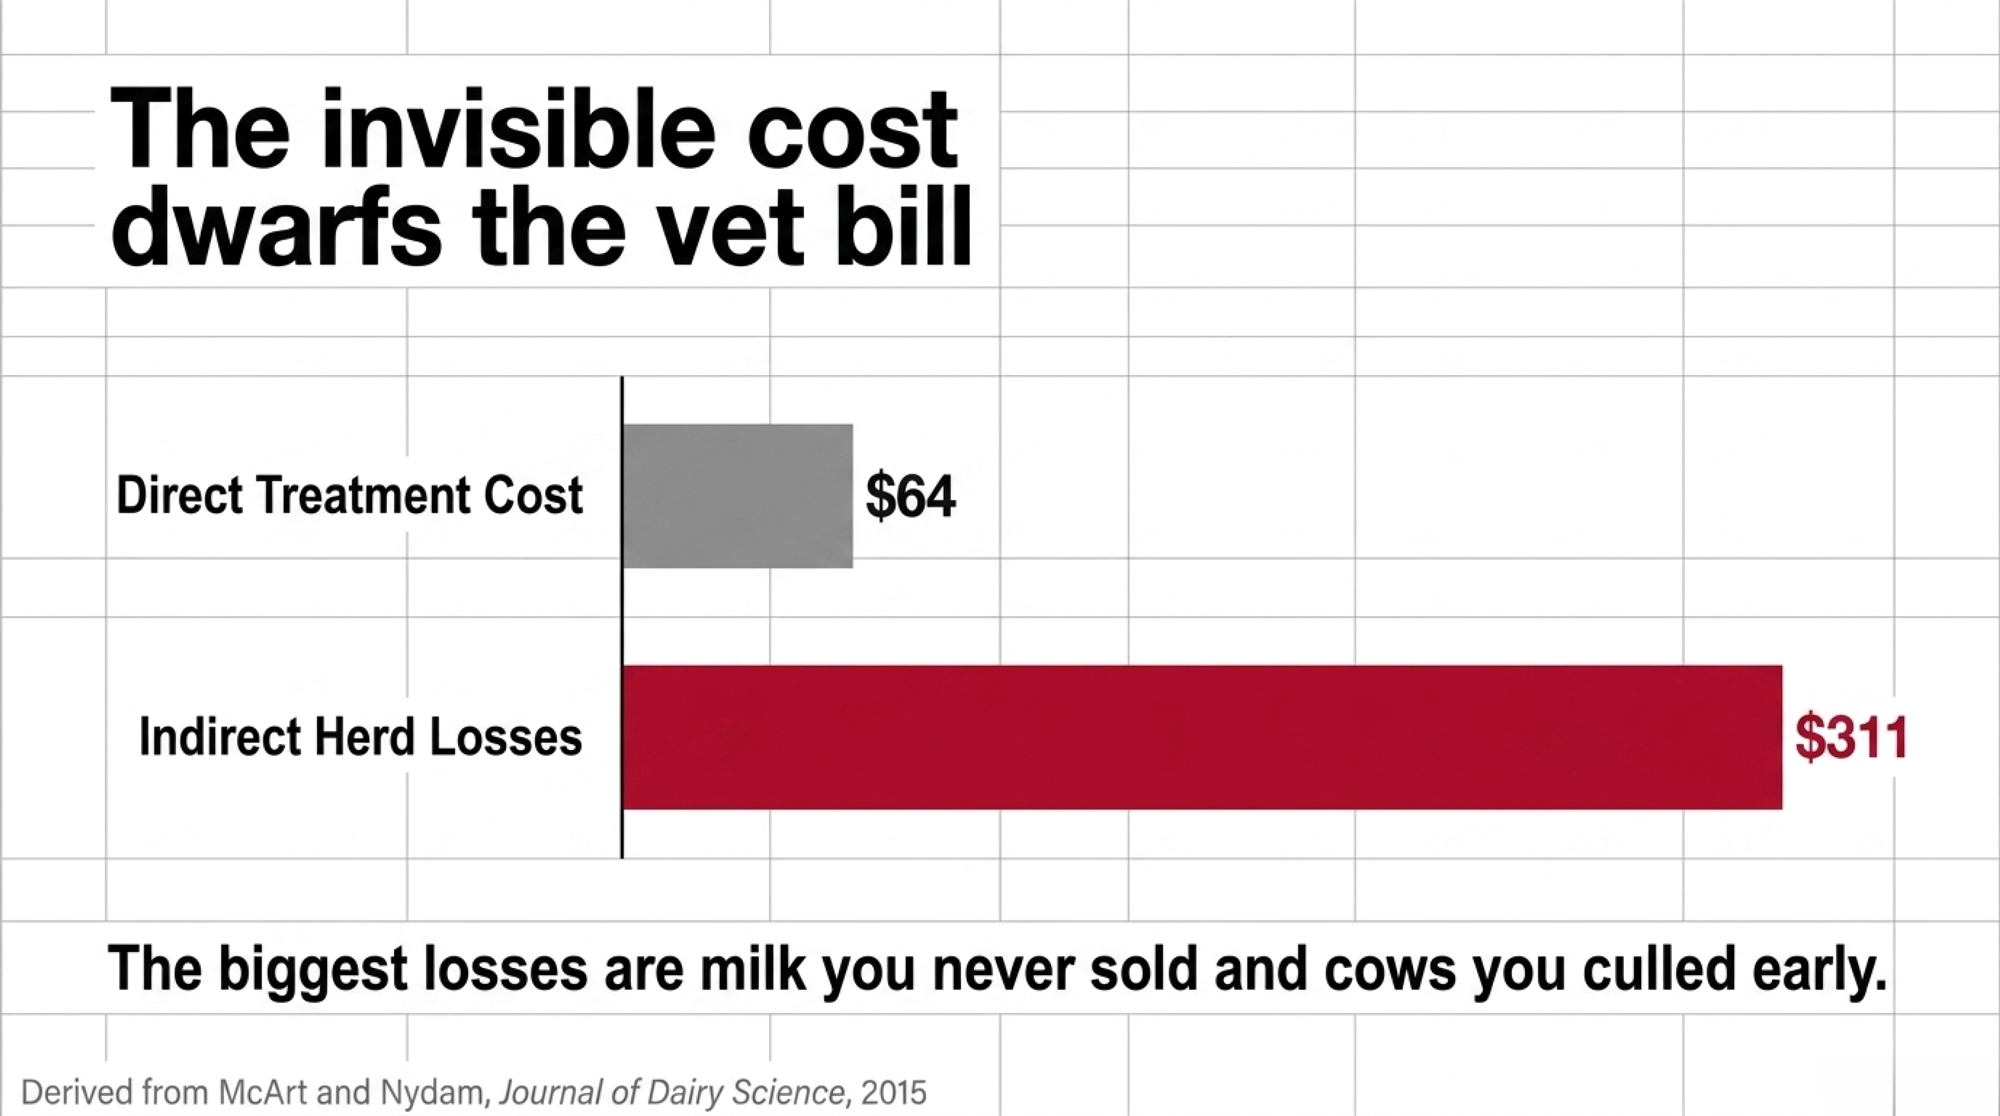
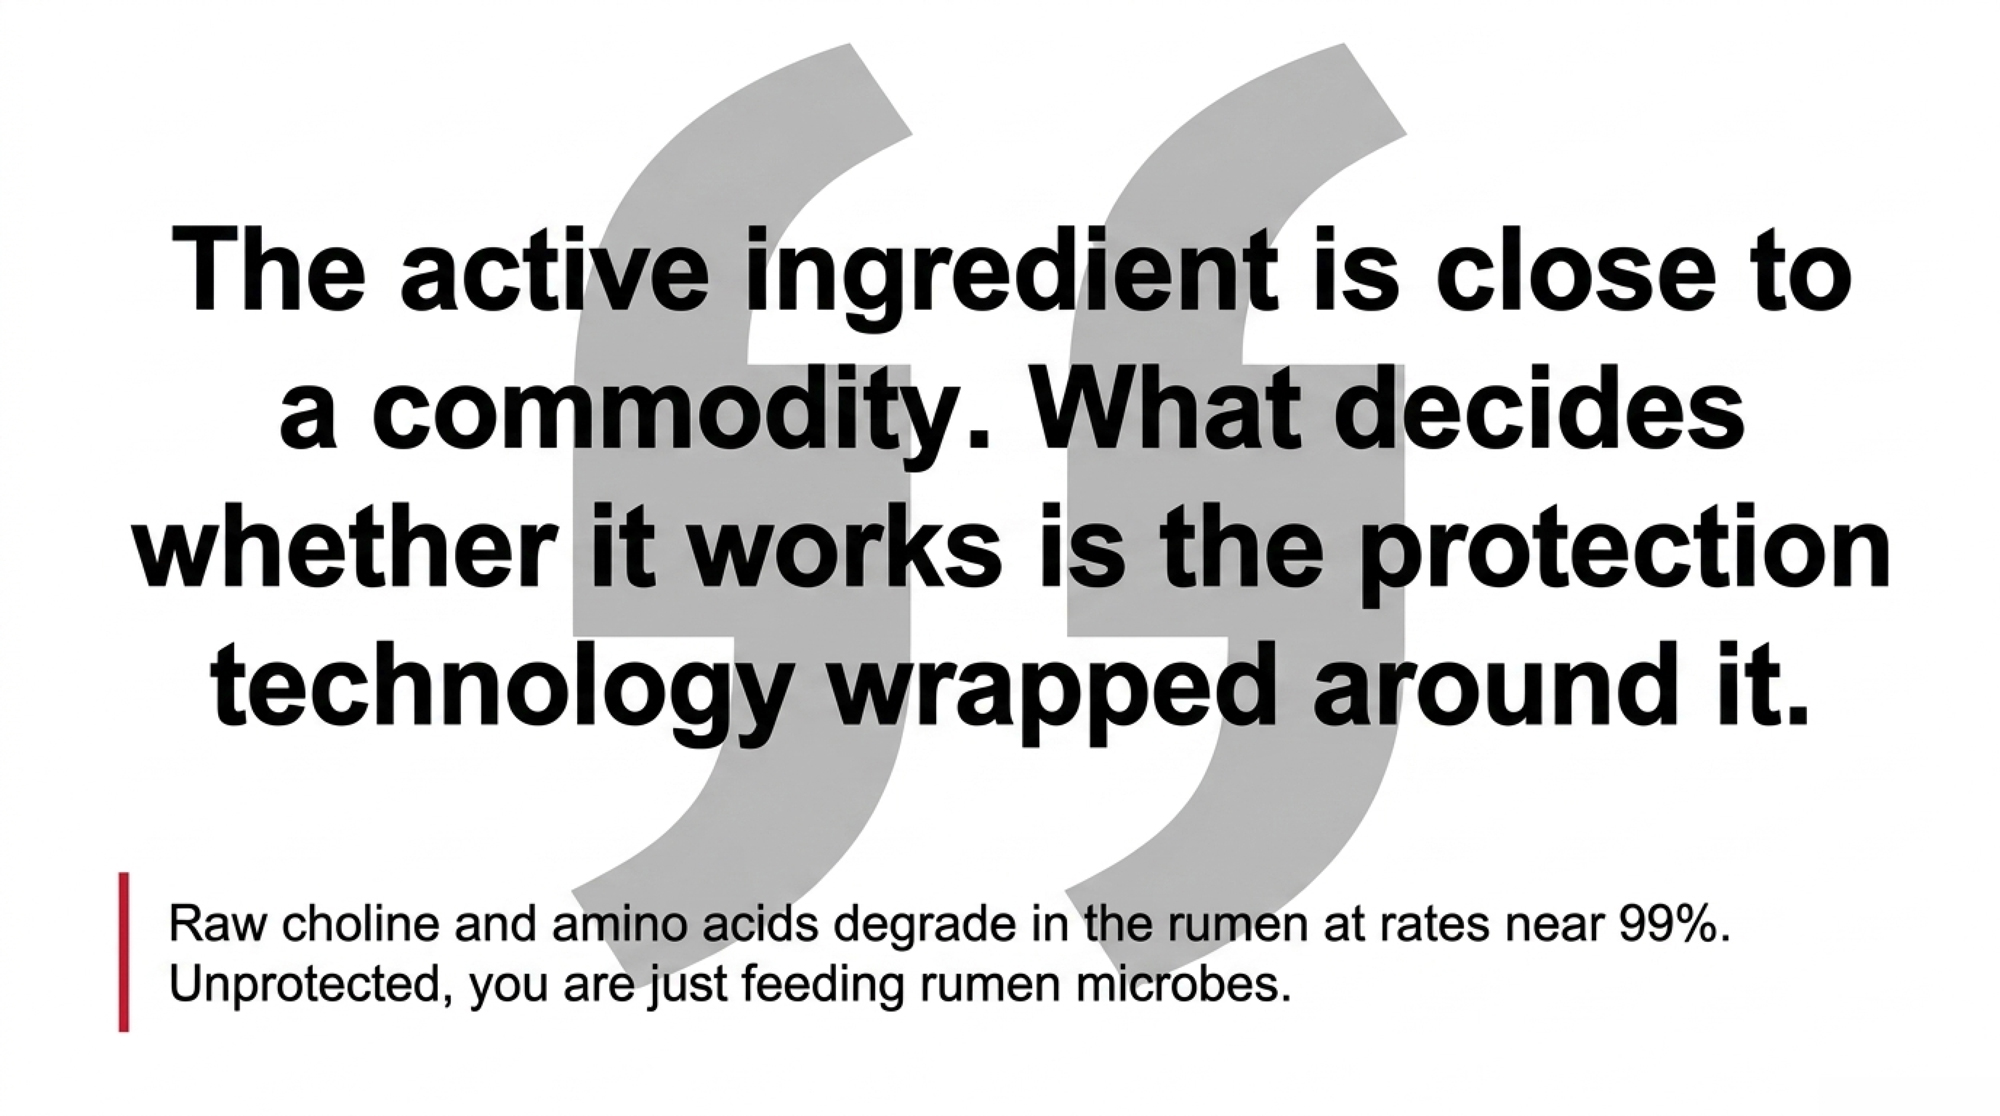
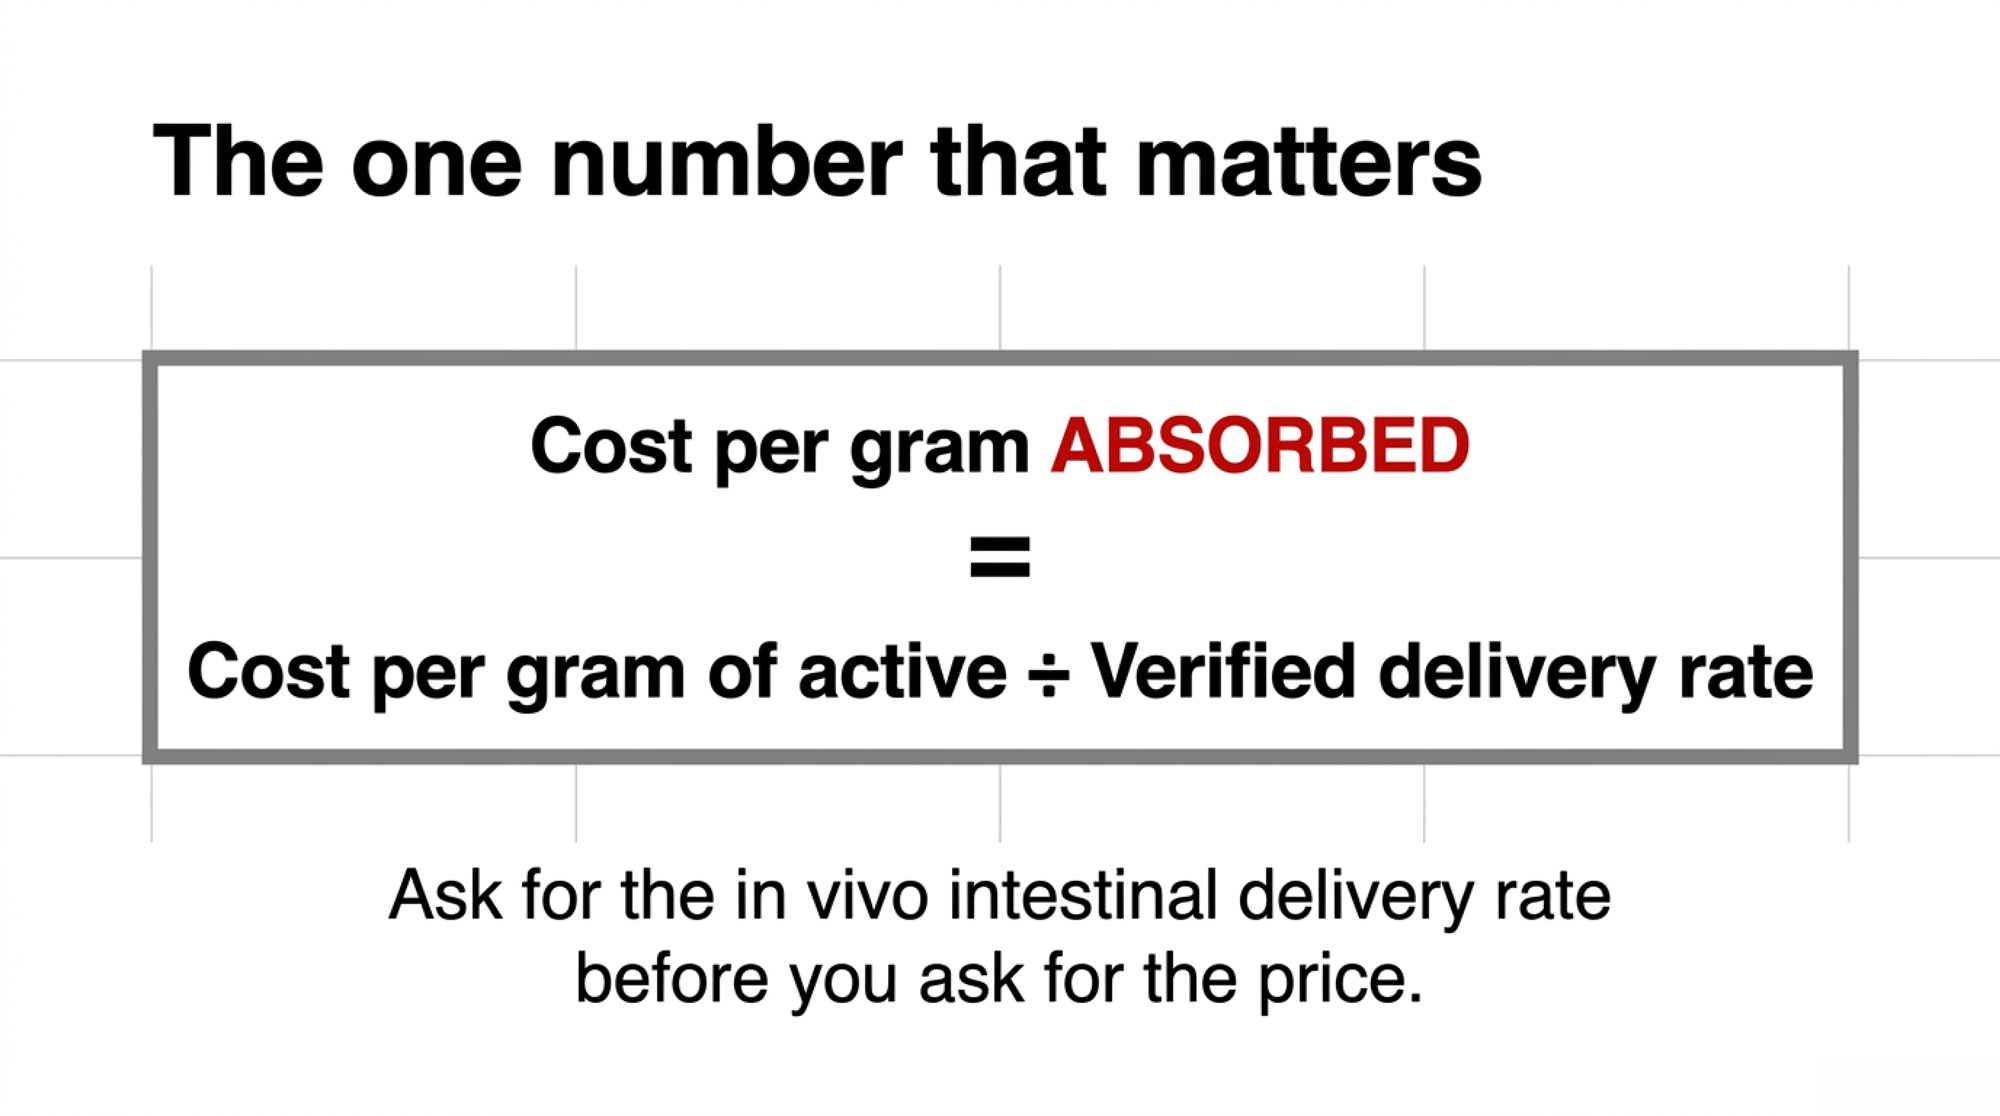
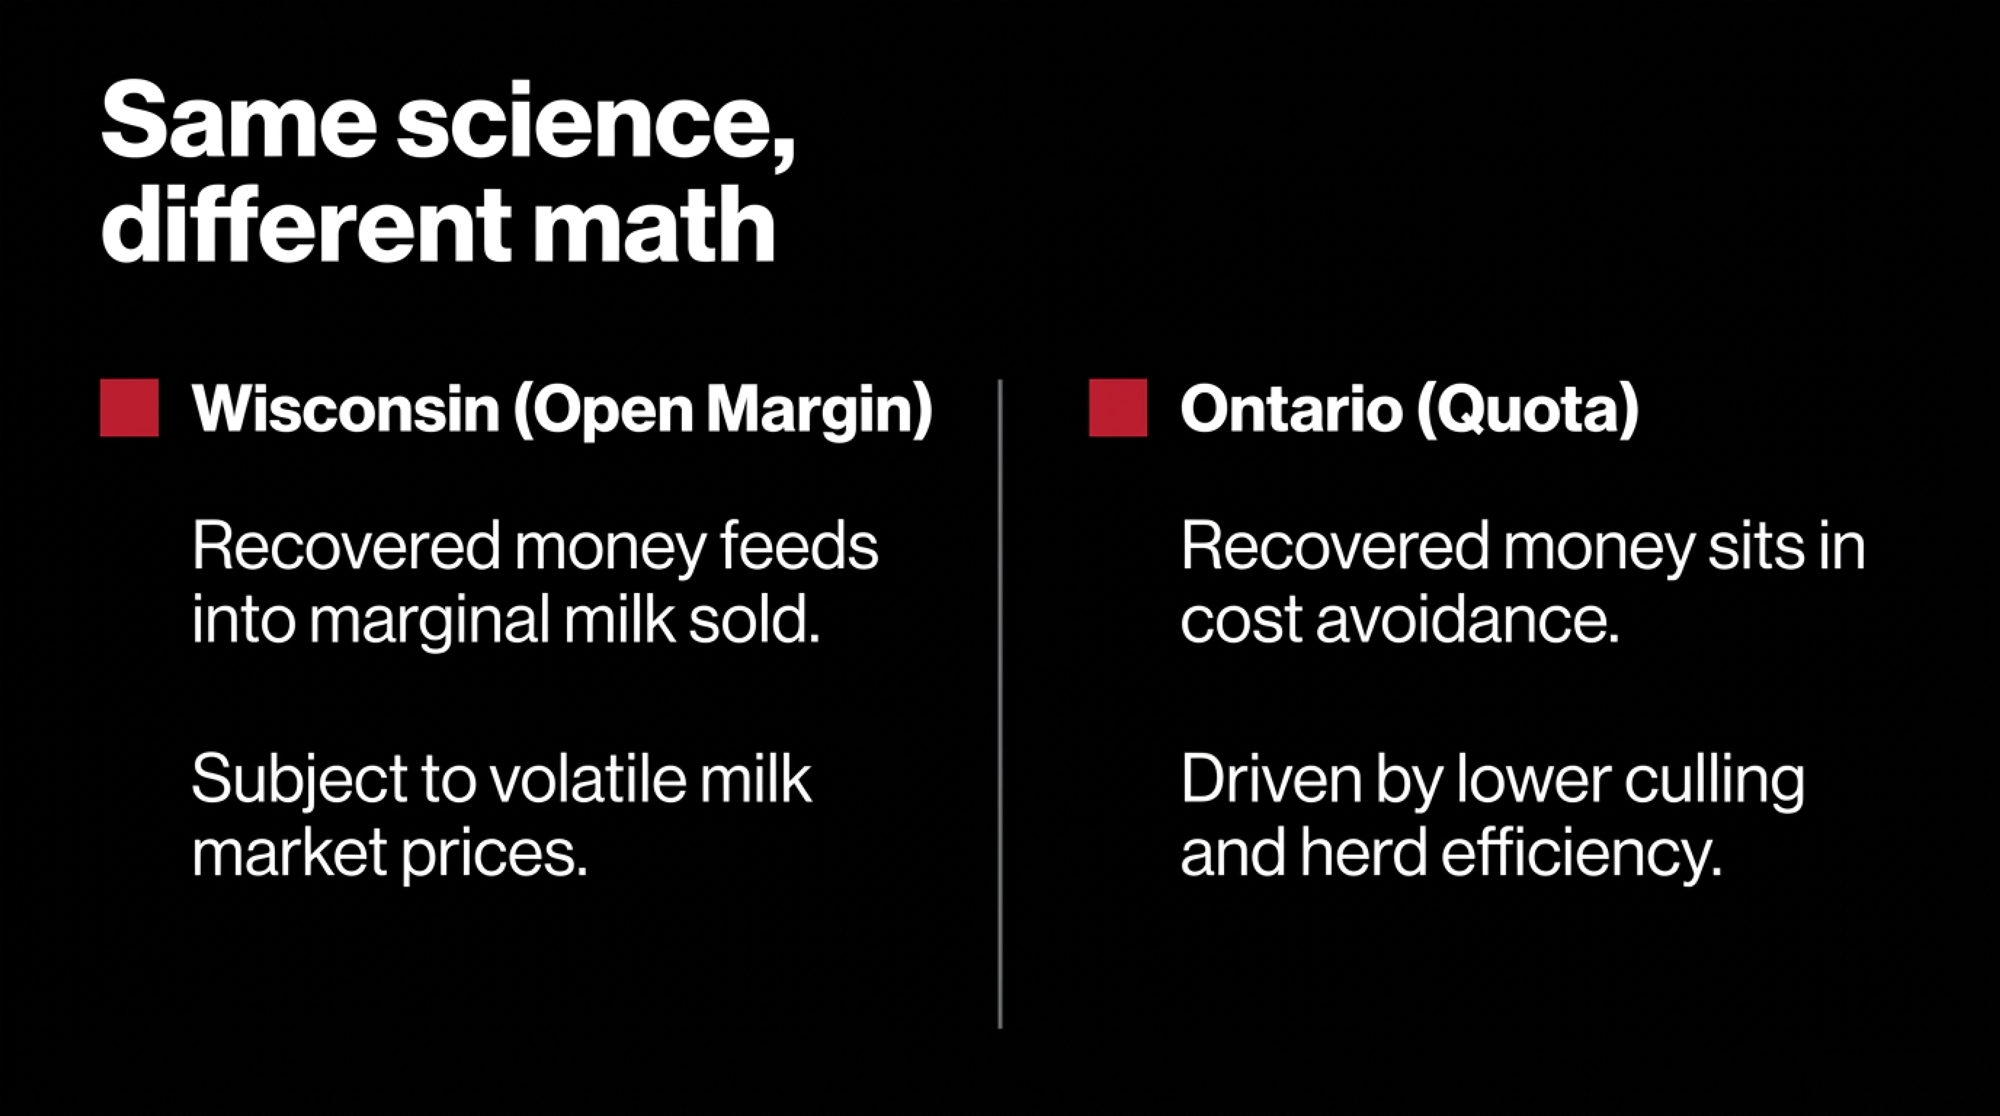
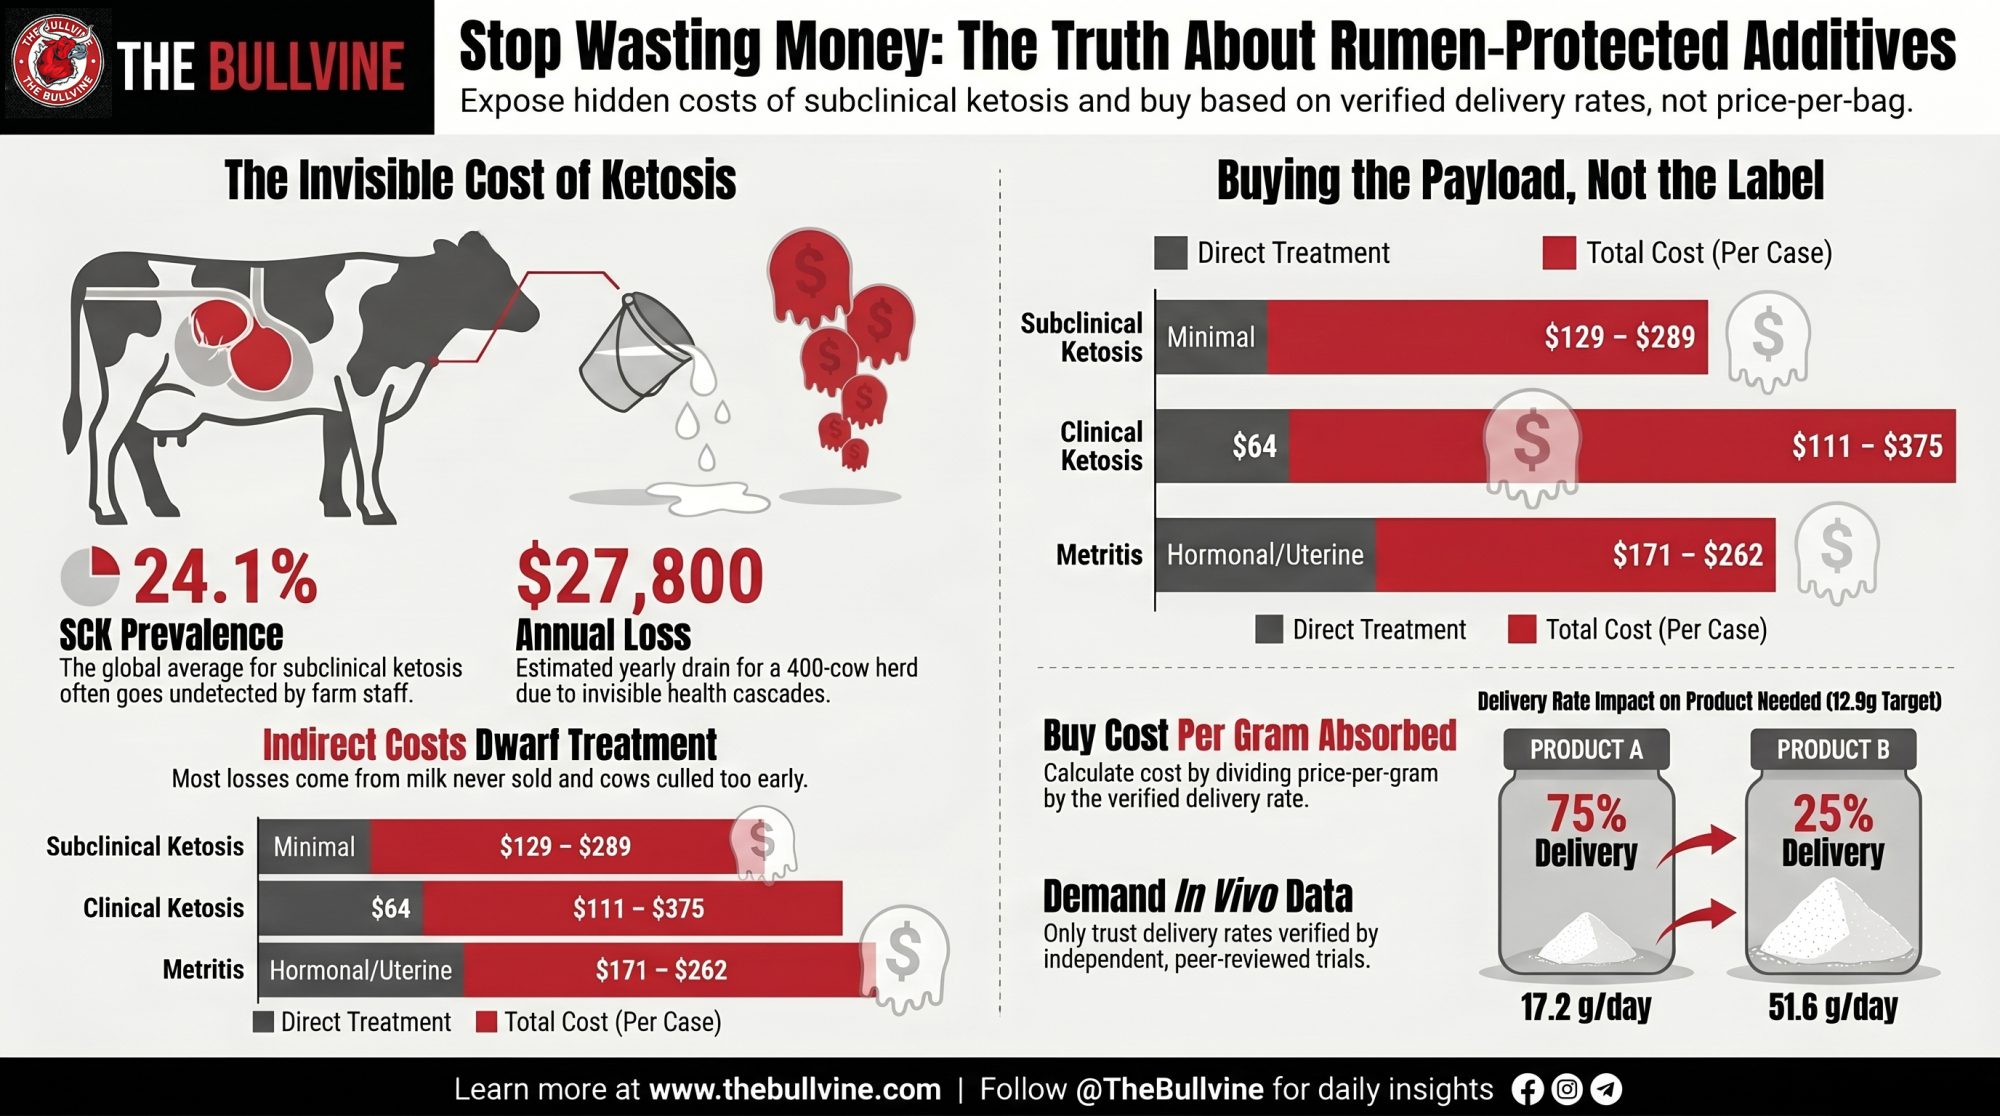
 The Sunday Read Dairy Professionals Don’t Skip.
 The Sunday Read Dairy Professionals Don’t Skip.