


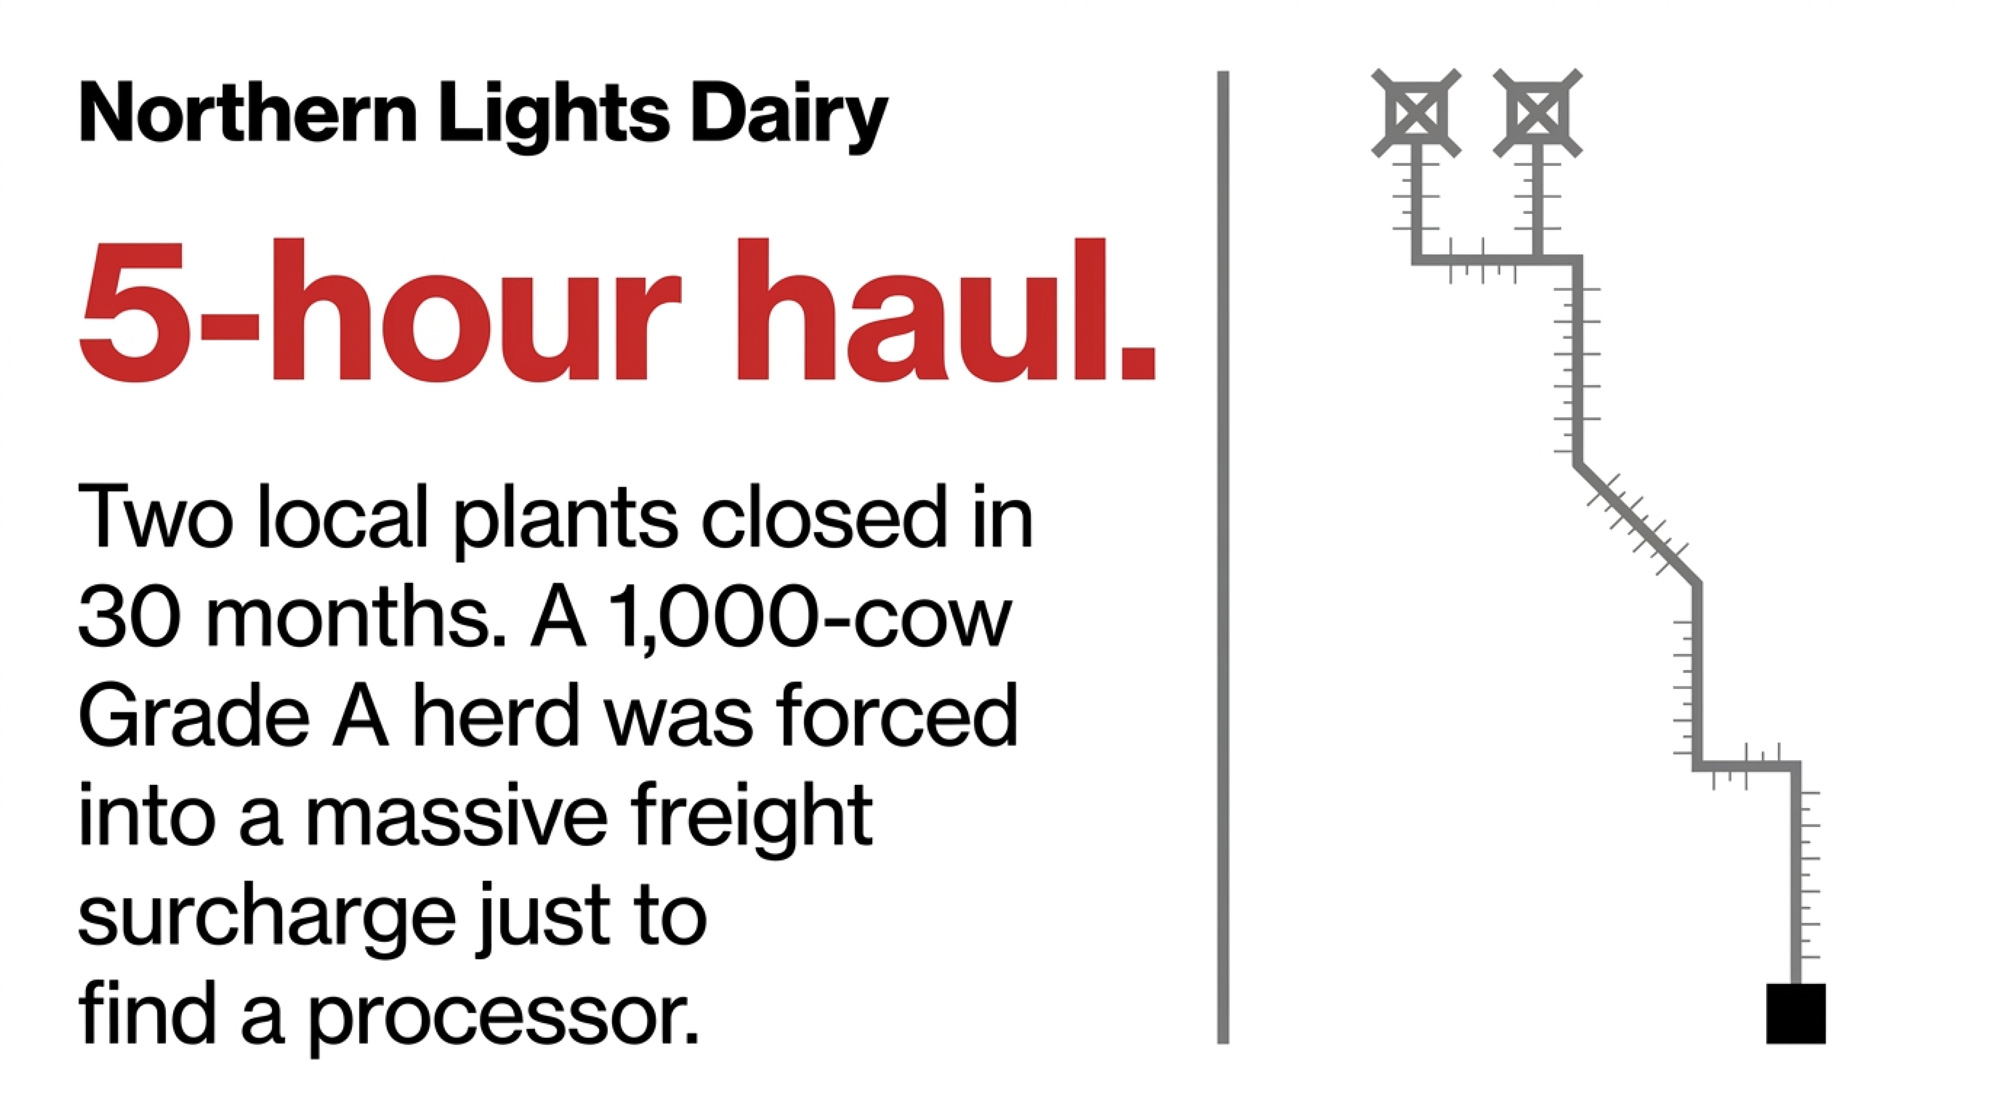
One of North Dakota’s last 18 Grade A dairies just got directed to a new milk market twice in 30 months. The nearest plant that’ll take the load sits five hours one way.
By early 2026, one of North Dakota’s last 18 Grade A dairies — the regulatory tier that can ship fluid milk, out of roughly 18–25 licensed dairies statewide — had been directed to a new milk market twice in 30 months. Not because production slipped. Not because a lender called a note. Because the state lost nearly every in-state processing option, and the nearest plant willing to take the load sat roughly five hours one way in Perham, Minnesota.
The Bullvine reported in February 2026 that the operators — the Holle family’s 1,000-cow Holstein herd 12 miles south of Mandan — described the freight reality as “really, really hard” and said they didn’t know what they were going to do. That’s not a 60-cow retirement story. It’s a professionally run operation telling the industry, in plain language, that the corridor under its feet doesn’t pencil anymore. And the 2025 FMMO make-allowance update — effective June 1, 2025, per the final rule published in the Federal Register on January 17, 2025 — trimmed another 85–93¢/cwt off the class prices that underwrite their milk check.
Why This Matters
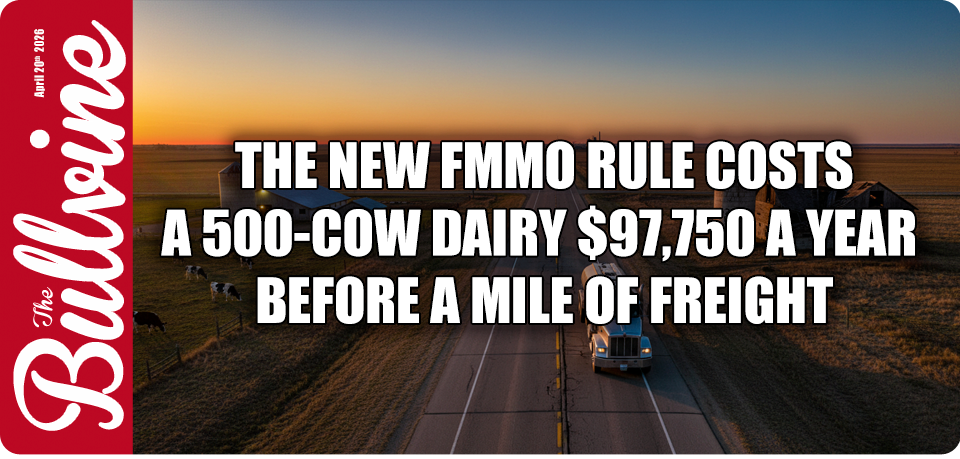
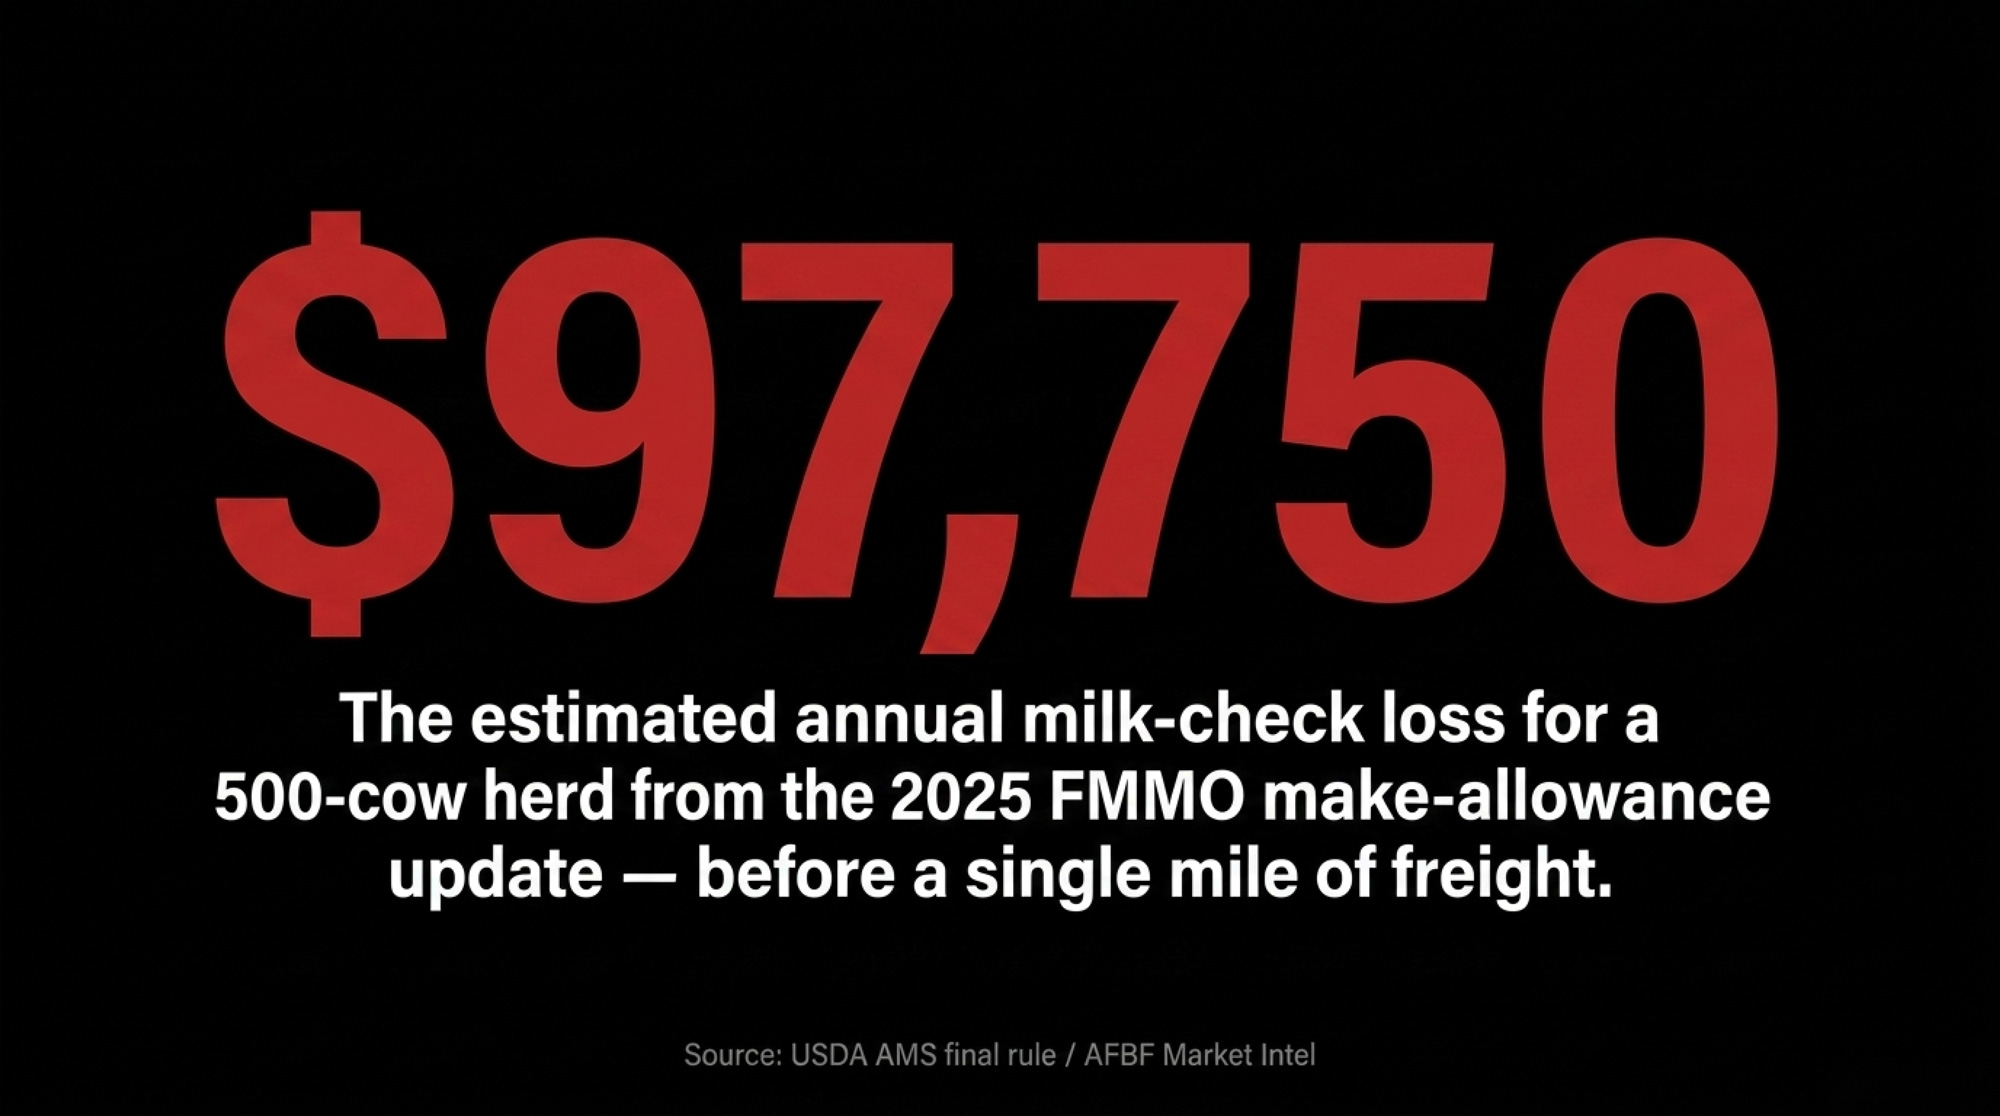
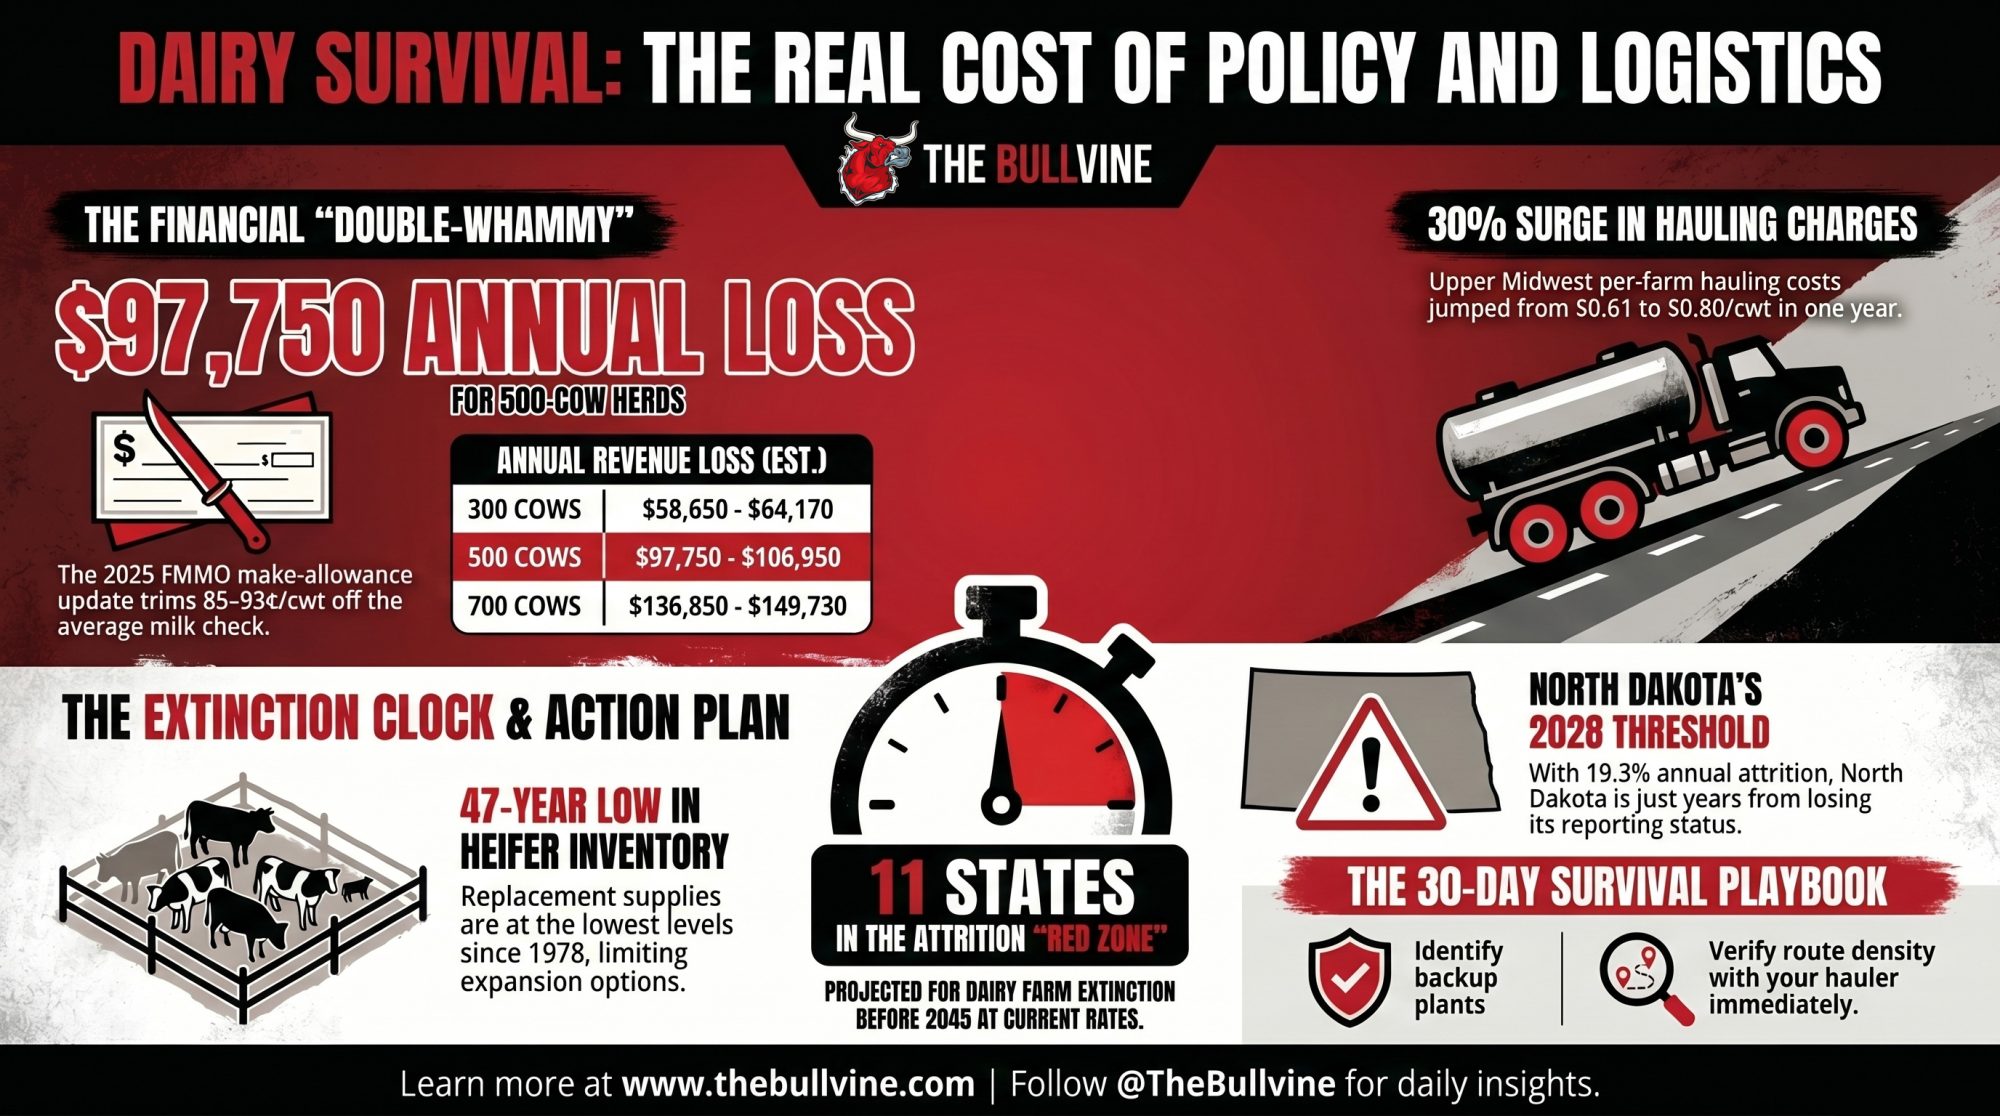
- The 2025 FMMO make-allowance change alone can pull an estimated $97,750–$106,950 a year off a 500-cow herd at 230 cwt/cow/year — before a dollar of freight gets layered in.
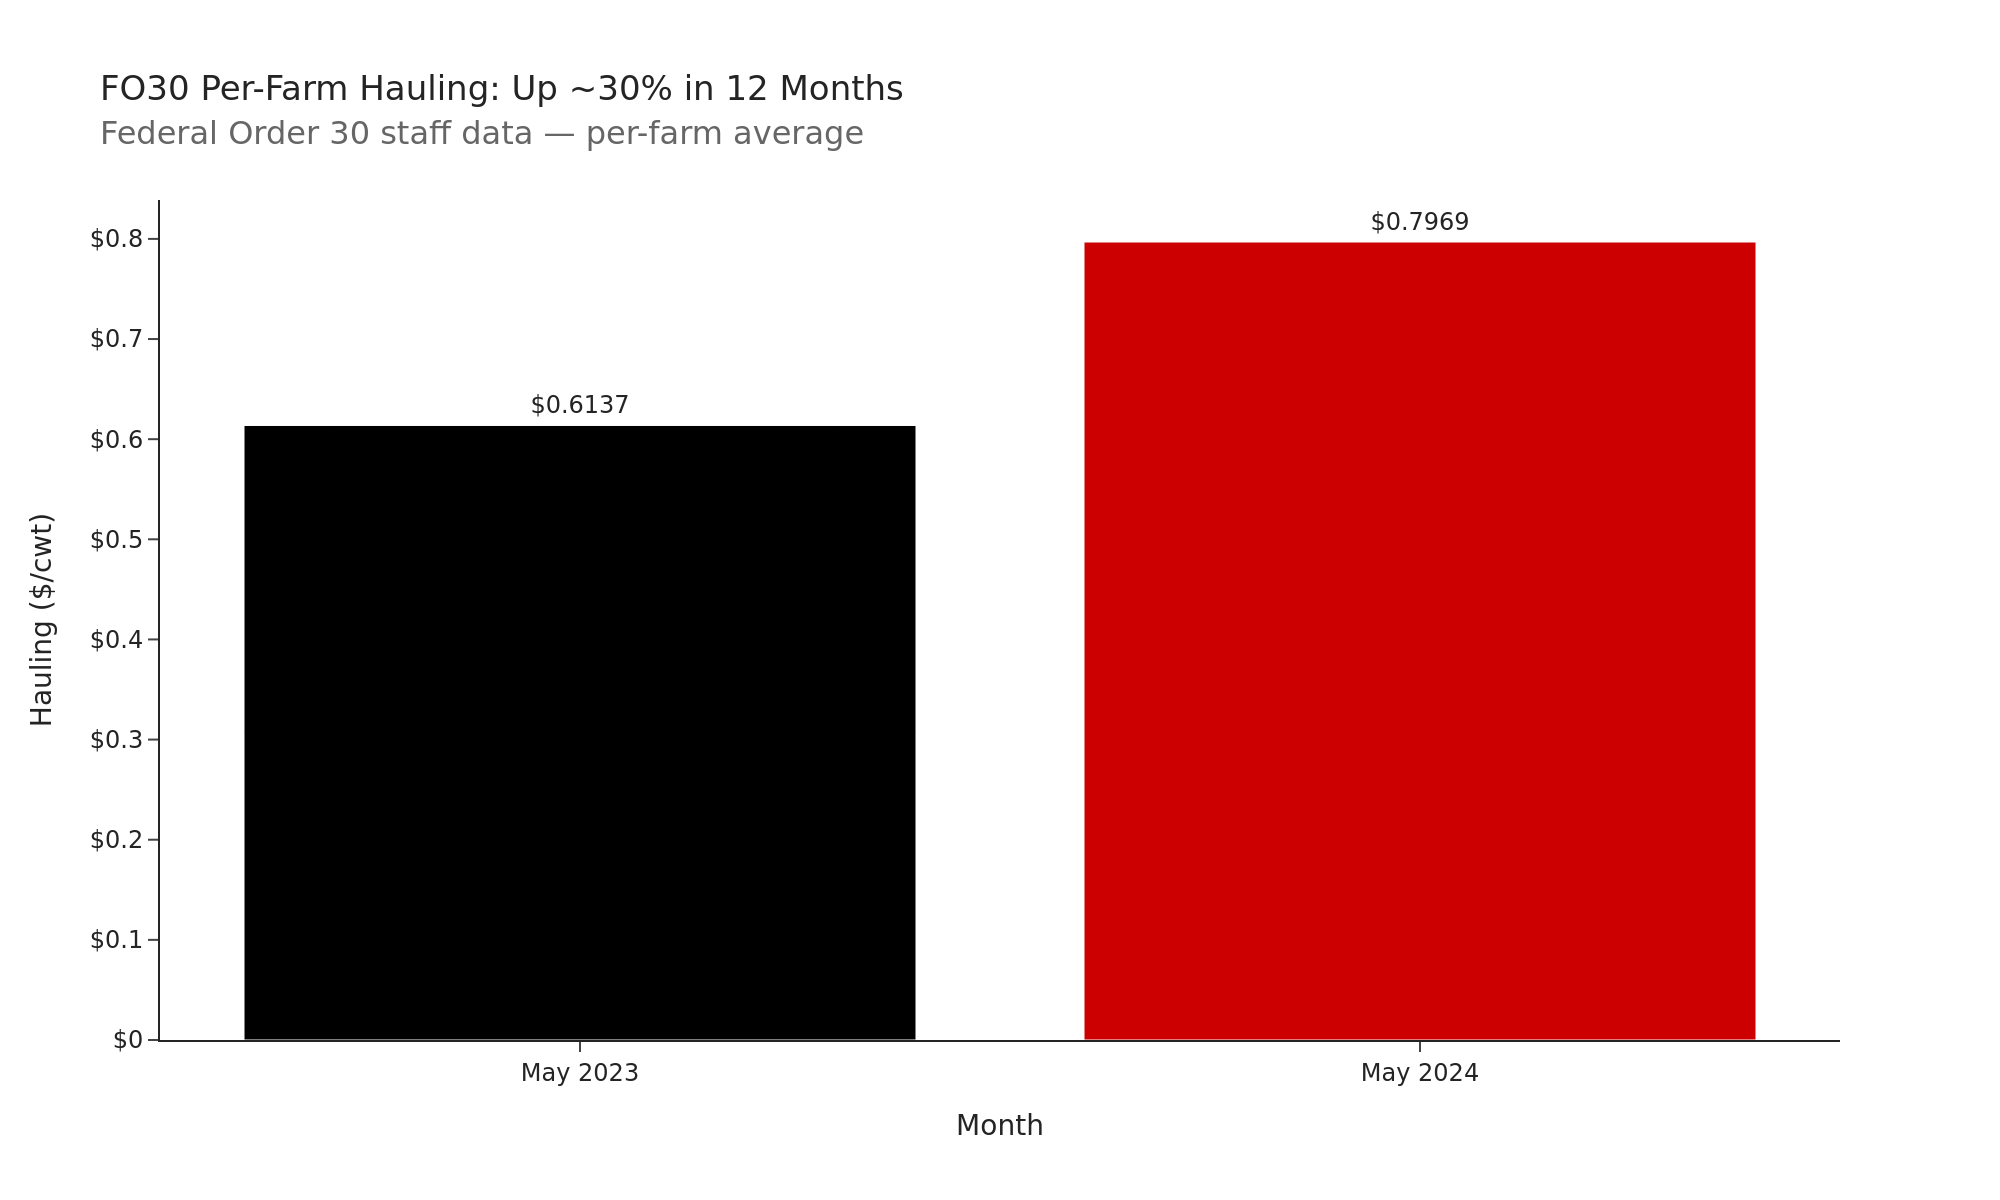
- Upper Midwest hauling charges averaged $0.6137/cwt in May 2023 and $0.7969/cwt in May 2024 — roughly 30% — on a per-farm basis in Federal Order 30 staff data. (Volume-weighted, the order-wide average is lower — $0.50/cwt in 2024 — because large-volume producers negotiate cheaper freight. The per-farm average better captures what small and mid-size herds actually pay.)
- North Dakota holds roughly 18 Grade A dairies — and about 25 regular-milk dairies milking 10,000 cows statewide, per Dairy Star’s June 2025 reporting — with at least one 1,000-cow herd now on a five-hour haul to Minnesota. That’s the map today, not a projection.
How Two Plant Closures in 30 Months Cornered a Professional Dairy
North Dakota’s processing contraction is among the most documented in modern U.S. dairy. In September 2023, Prairie Farms’ Bismarck plant — the primary Class I destination for central and western North Dakota — ceased processing and converted to distribution-only operations.
North Dakota Agriculture Commissioner Doug Goehring didn’t mince words:
“This will directly affect the dairies who currently have their milk trucked to Prairie Farms. With no other processors nearby, those dairies will likely pay for shipping longer distances that will be deducted from their milk checks. This will have a dramatic impact on their bottom line.”
On August 30, 2024, DFA’s dairy ingredient facility in Pollock, South Dakota, shut down, eliminating 33 full-time and 4 part-time positions and removing the regional backup. That left one processing facility inside North Dakota state lines: Cass-Clay in Fargo, pressed against the Minnesota border.
Another North Dakota producer, roughly 50 miles northwest of Bismarck, got rerouted 151 miles to Pollock after the Bismarck conversion — at a freight surcharge of about $0.55/cwt — and invested in a second bulk tank to handle every-other-day pickups. Then Pollock closed too. That’s a bulk tank on the balance sheet against a plant that didn’t outlast the depreciation schedule.
Federal Order 30 staff data shows hauling charges on a per-farm basis climbing from $0.6137/cwt in May 2023 to $0.7969/cwt in May 2024 — roughly 30%, with North Dakota posting the order’s highest hauling cost. Stack that freight on a January 2026 Class III price of $14.59/cwt — down $1.27 from December, and the lowest Class III print since July 2023 — and the haul alone eats whatever margin the board hands back.
What the Dairy Farm Extinction Clock Is — and Why We Built It
The Bullvine’s Dairy Farm Extinction Clock is a tracking tool we built using USDA NASS-licensed dairy herd counts going back to 2013. For each state, we calculated the 5-year and 10-year average annual attrition rates, then applied a compound decay model — the same math behind radioactive half-life — to estimate how many years remain before the herd count falls below the USDA NASS disclosure threshold at its current rate.
The classification is simple. Red Zone: extinction projected before 2045. Yellow Zone: 2045–2060. Green Zone:longer runway. Extinct: states already below the USDA disclosure threshold with suppressed data. As of the February 2026 Milk Production Report, the scoreboard reads 11 Red, 1 Yellow, 36 Green, and 2 Extinct — with 26 states showing accelerating attrition.
We built the Clock because national production totals hide the map underneath. The U.S. shipped 226.4 billion pounds of milk in 2022. That number looks fine. What it doesn’t show is that 19,925 licensed herds disappeared in a decade, the Southeast lost 80%+ of its dairy farms since 1992, and states like North Dakota and Arkansas are two to three years from the disclosure threshold on current attrition math.
The Clock doesn’t predict the future. It describes the present, precisely — and it tells you which direction the math is running.
Where the Major Dairy States Stand Right Now
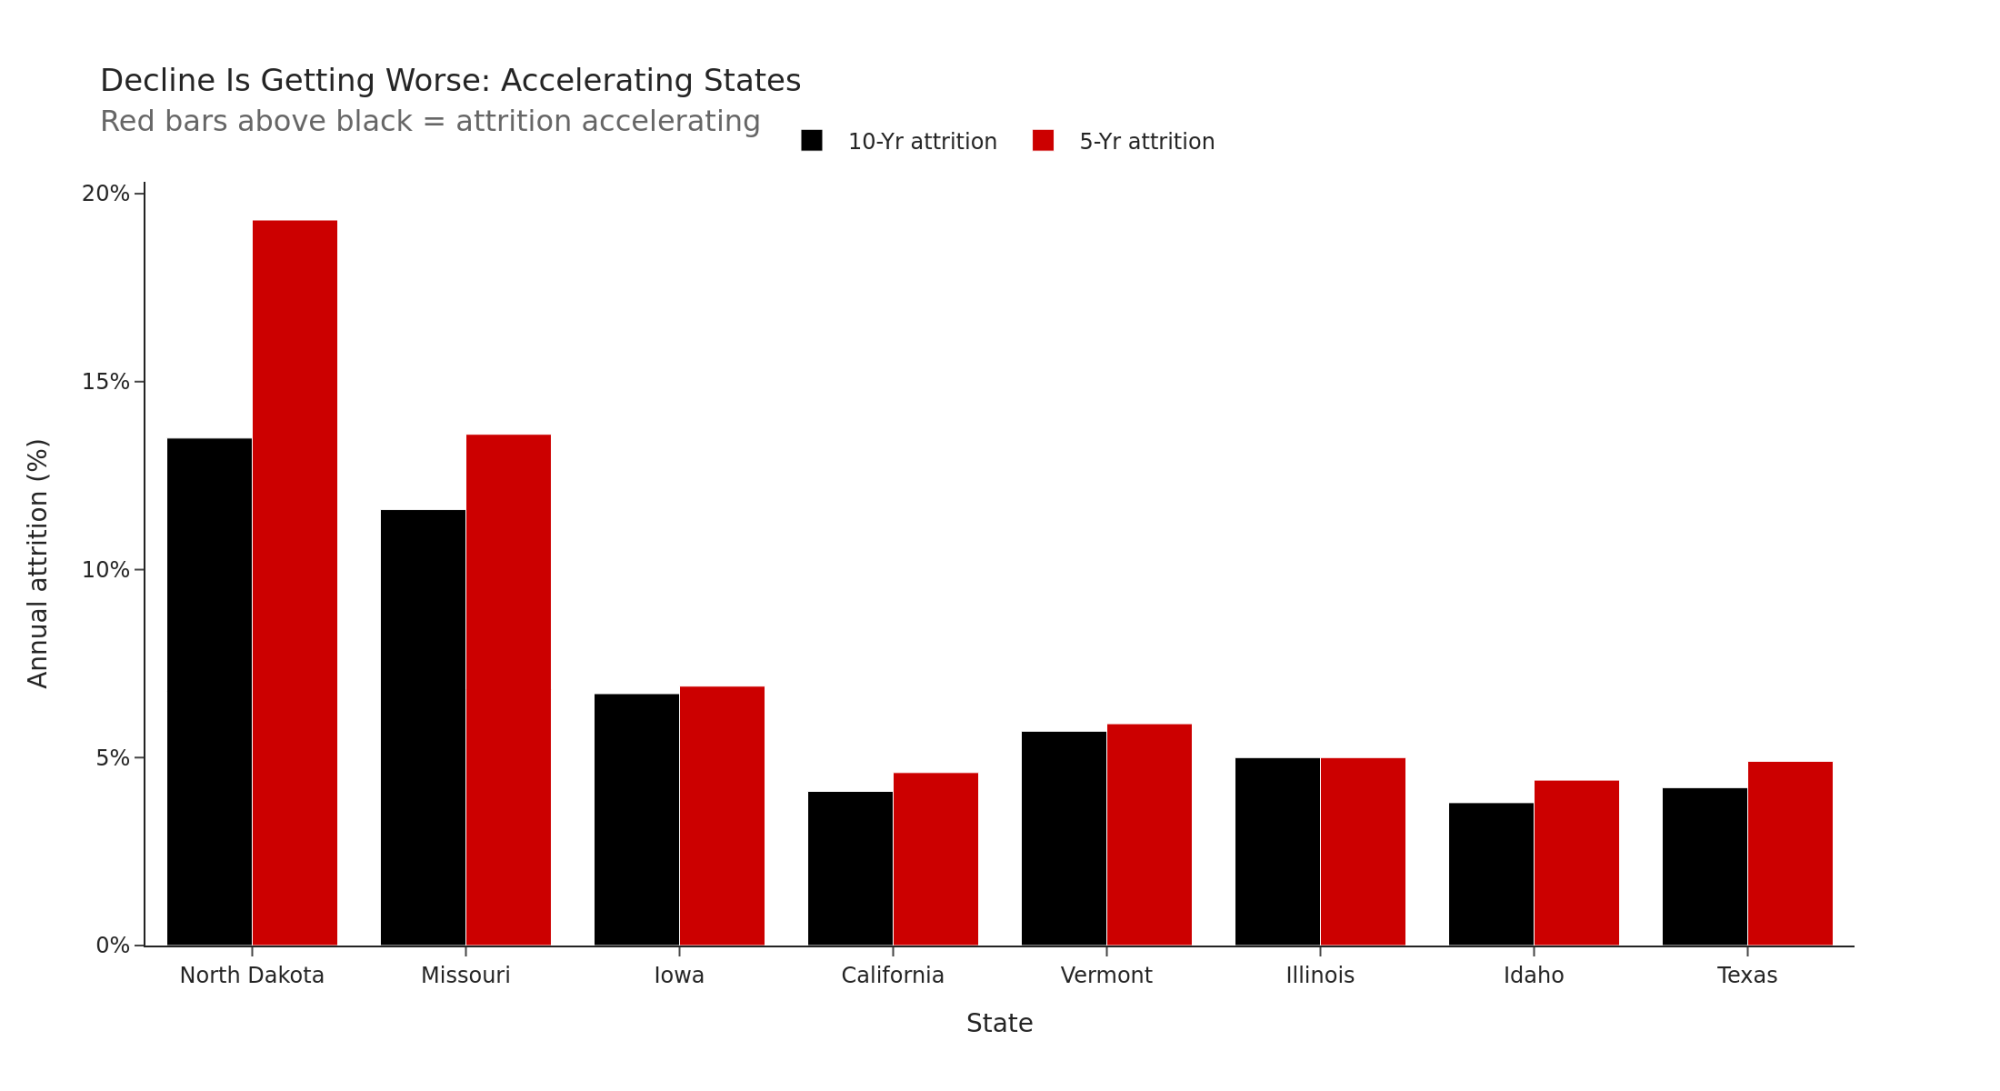
Top 15 U.S. dairy states by 2025 herd count, plus North Dakota for reference. Data from the USDA NASS Milk Production Report, February 2026. Attrition rates are annualized averages. “Accelerating” means the 5-year rate exceeds the 10-year rate — the decline is getting worse, not better. “Clock” = year at which the state is projected to fall below the USDA NASS disclosure threshold (typically ~5 herds), at which point reporting is suppressed. Projections assume current 5-year attrition rates hold.
| State | Herds (2025) | 5-Yr Attrition | 10-Yr Attrition | Accelerating? | Clock | Zone |
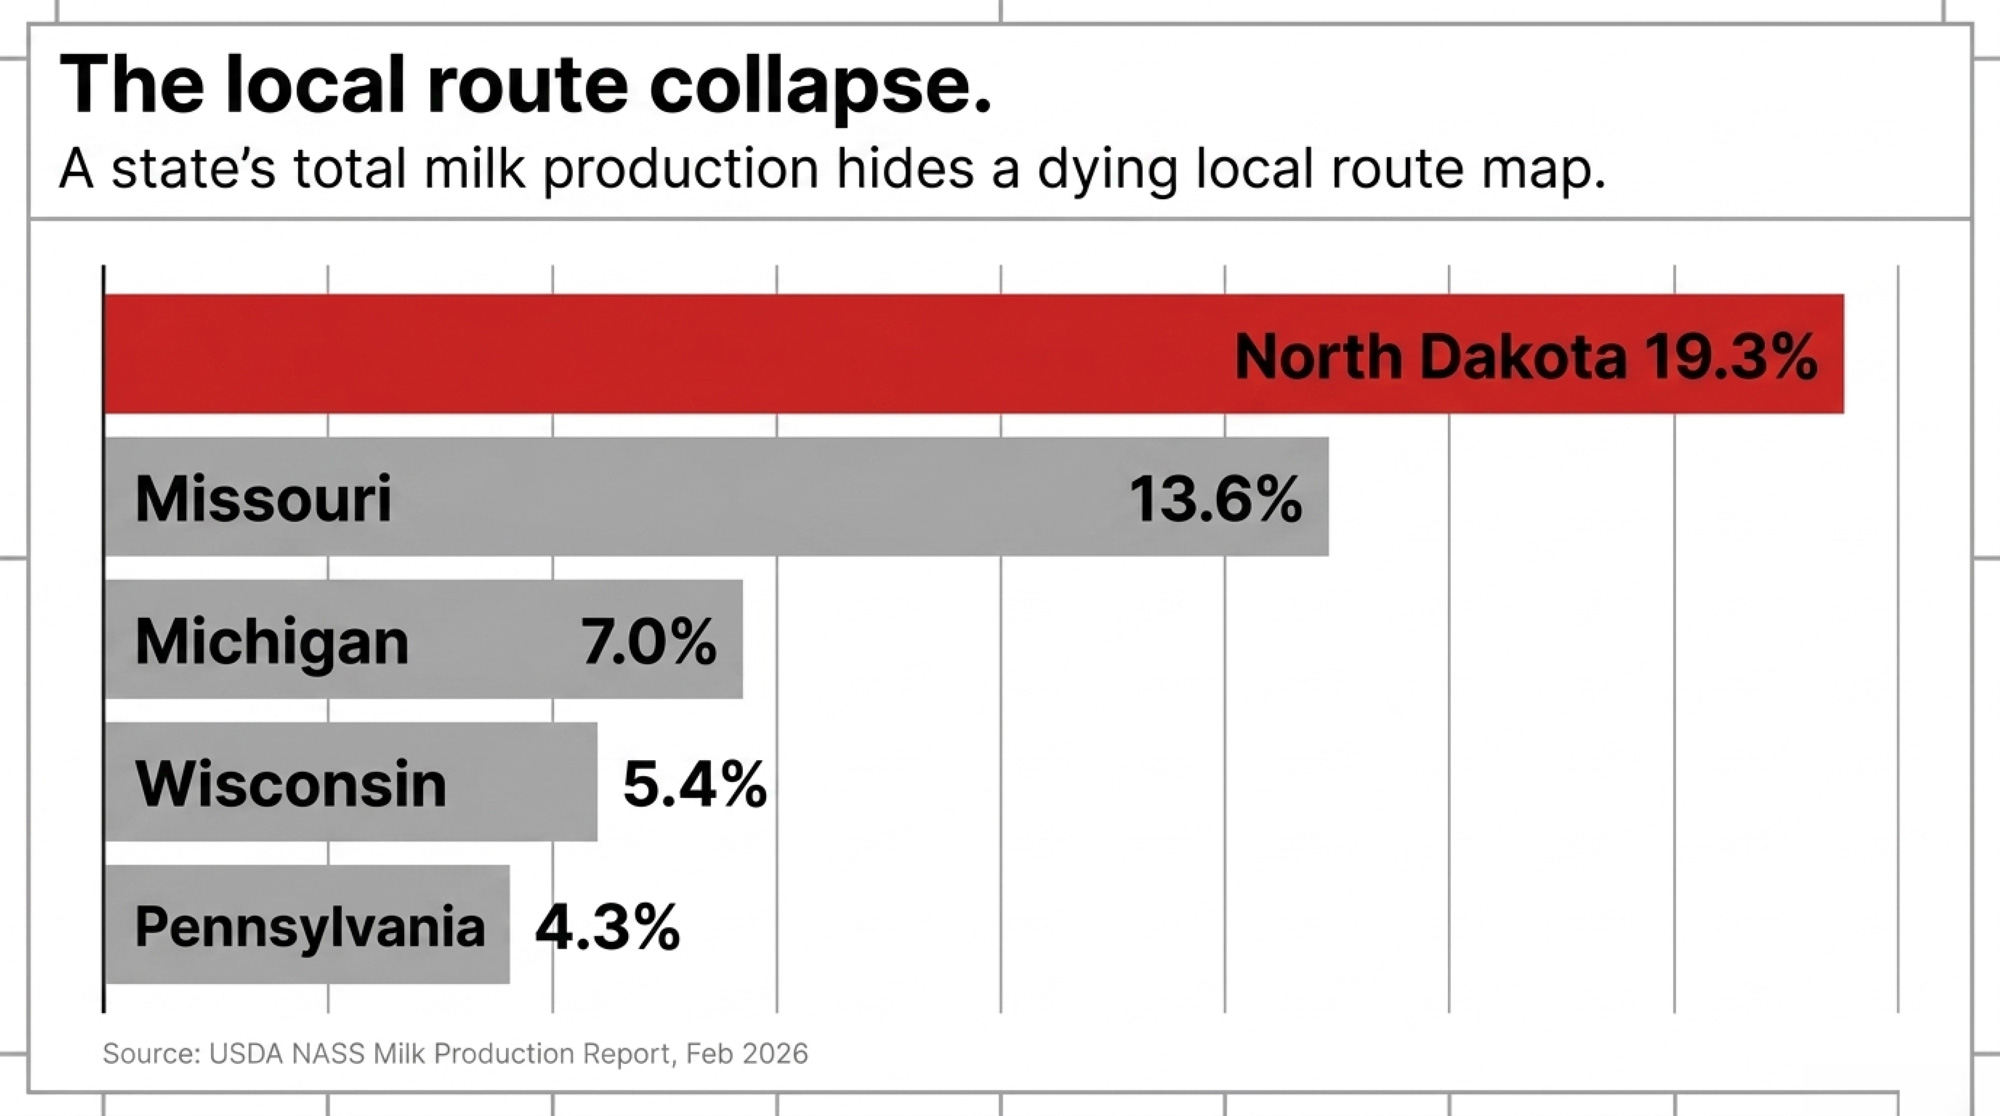
| North Dakota | 20 | 19.3% | 13.5% | Yes | 2028 | RED |
| Wisconsin | 5,375 | 5.4% | 5.9% | No | 2179 | GREEN |
| Pennsylvania | 4,360 | 4.3% | 4.3% | No | 2217 | GREEN |
| New York | 2,760 | 5.4% | 5.4% | No | 2167 | GREEN |
| Minnesota | 1,605 | 7.3% | 7.4% | No | 2122 | GREEN |
| Ohio | 1,365 | 4.8% | 6.7% | No | 2172 | GREEN |
| California | 960 | 4.6% | 4.1% | Yes | 2171 | GREEN |
| Michigan | 825 | 7.0% | 7.8% | No | 2117 | GREEN |
| Iowa | 675 | 6.9% | 6.7% | Yes | 2116 | GREEN |
| Indiana | 675 | 3.5% | 5.6% | No | 2210 | GREEN |
| Vermont | 470 | 5.9% | 5.7% | Yes | 2125 | GREEN |
| Illinois | 405 | 5.0% | 5.0% | Yes | 2141 | GREEN |
| Idaho | 350 | 4.4% | 3.8% | Yes | 2155 | GREEN |
| Missouri | 345 | 13.6% | 11.6% | Yes | 2065 | GREEN |
| Texas | 280 | 4.9% | 4.2% | Yes | 2137 | GREEN |
| Washington | 280 | 3.7% | 5.2% | No | 2173 | GREEN |
Every state on this list except North Dakota is Green. Every state is still losing farms. The spread is the signal: Indiana at 3.5% annual attrition has a runway past 2200. Missouri at 13.6% — accelerating — hits the disclosure threshold by 2065 despite starting with 345 herds. Green doesn’t mean safe. It means you have time to act. How much time depends on which row you’re sitting in.
Safe State, Dangerous Corridor: Is Your Route Actually a Green Zone?
The Clock classifies Wisconsin as a Green Zone and North Dakota as a Red Zone. Clean on paper. Messier on the road.
| Structural Metric | Wisconsin (Green Zone) | North Dakota (Red Zone) | What It Means for You |
| Licensed herds, Feb 2026 | ~5,375 | ~18–25 | ND has <0.5% of WI’s farm base |
| 5-yr annual attrition | 5.4% | 19.3% | ND is losing ~1 in 5 herds a year |
| Processing redundancy | Dense, multi-plant network | One effective in-state option | Single point of failure = hostage equity |
| Projected disclosure-threshold year | 2179 | 2028 | ND: 2-year runway, not a generational one |
| Typical one-way haul to backup plant | <2 hours | ~5 hours (Perham, MN) | Freight alone can eat Class III margin |
You can live in a Green Zone state and still be sitting on a wasting asset if your hauling corridor is thinning faster than the statewide average. The Clock tells you when a state runs out of farms. It doesn’t tell you when your road runs out of trucks.
Terry Sears of DM&D Milk Haulers in Erie, Kansas, profiled by John Deere’s The Furrow in March 2023, shows what route erosion looks like in practice. The company’s tanker now runs 60 miles back to Erie, then another 205 miles one-way to a DFA plant in Cabool, Missouri, per The Furrow’s reporting. Same line of work Sears started in 1975, covering two counties. A very different map.
That’s the feedback loop most producers don’t see on paper. One farm exits. The route gets longer. Hauling costs rise. Another farm loses margin. Another route thins. Consolidation doesn’t just remove farms — it taxes the survivors.
How the Make-Allowance Update Lands on a 500-Cow Milk Check
Bigger deductions, smaller milk checks. The math is that direct.
FMMO make allowances — the processing-cost deductions pulled out of class prices before your check is calculated — hadn’t been updated since 2008. The final rule published by USDA AMS on January 17, 2025, with make-allowance changes effective June 1, 2025, set the updated deductions in the Class III and IV formulas at $0.2519/lb for cheese, $0.2272/lb for butter, $0.2393/lb for nonfat dry milk, and $0.2668/lb for dry whey. And while North Dakota was losing plants, producers nationally were losing 85–93¢/cwt on the milk they could still ship.
The producer northwest of Bismarck is carrying both hits at once. He’s paying added freight to reach a plant, and taking the FMMO haircut on every cwt once he gets there. That’s the compound problem Red Zone operators are now running inside.
AFBF economist Daniel Munch estimated the first-quarter impact on the producer pool value under the new rule at more than $337 million. “Higher make allowances have imposed the most significant cost to dairy farmers, cutting $337 million from pool revenues and lowering class prices across the board,” Munch wrote in his Market Intel analysis, as reported by Michigan Farm News. That figure covers all 11 federal orders — the 85–93¢/cwt reduction applied against first-quarter pooled volume nationally. Commodity-heavy regions — especially the Upper Midwest — absorbed the deepest cuts.
Barn Math: Walk It on Your Own Herd
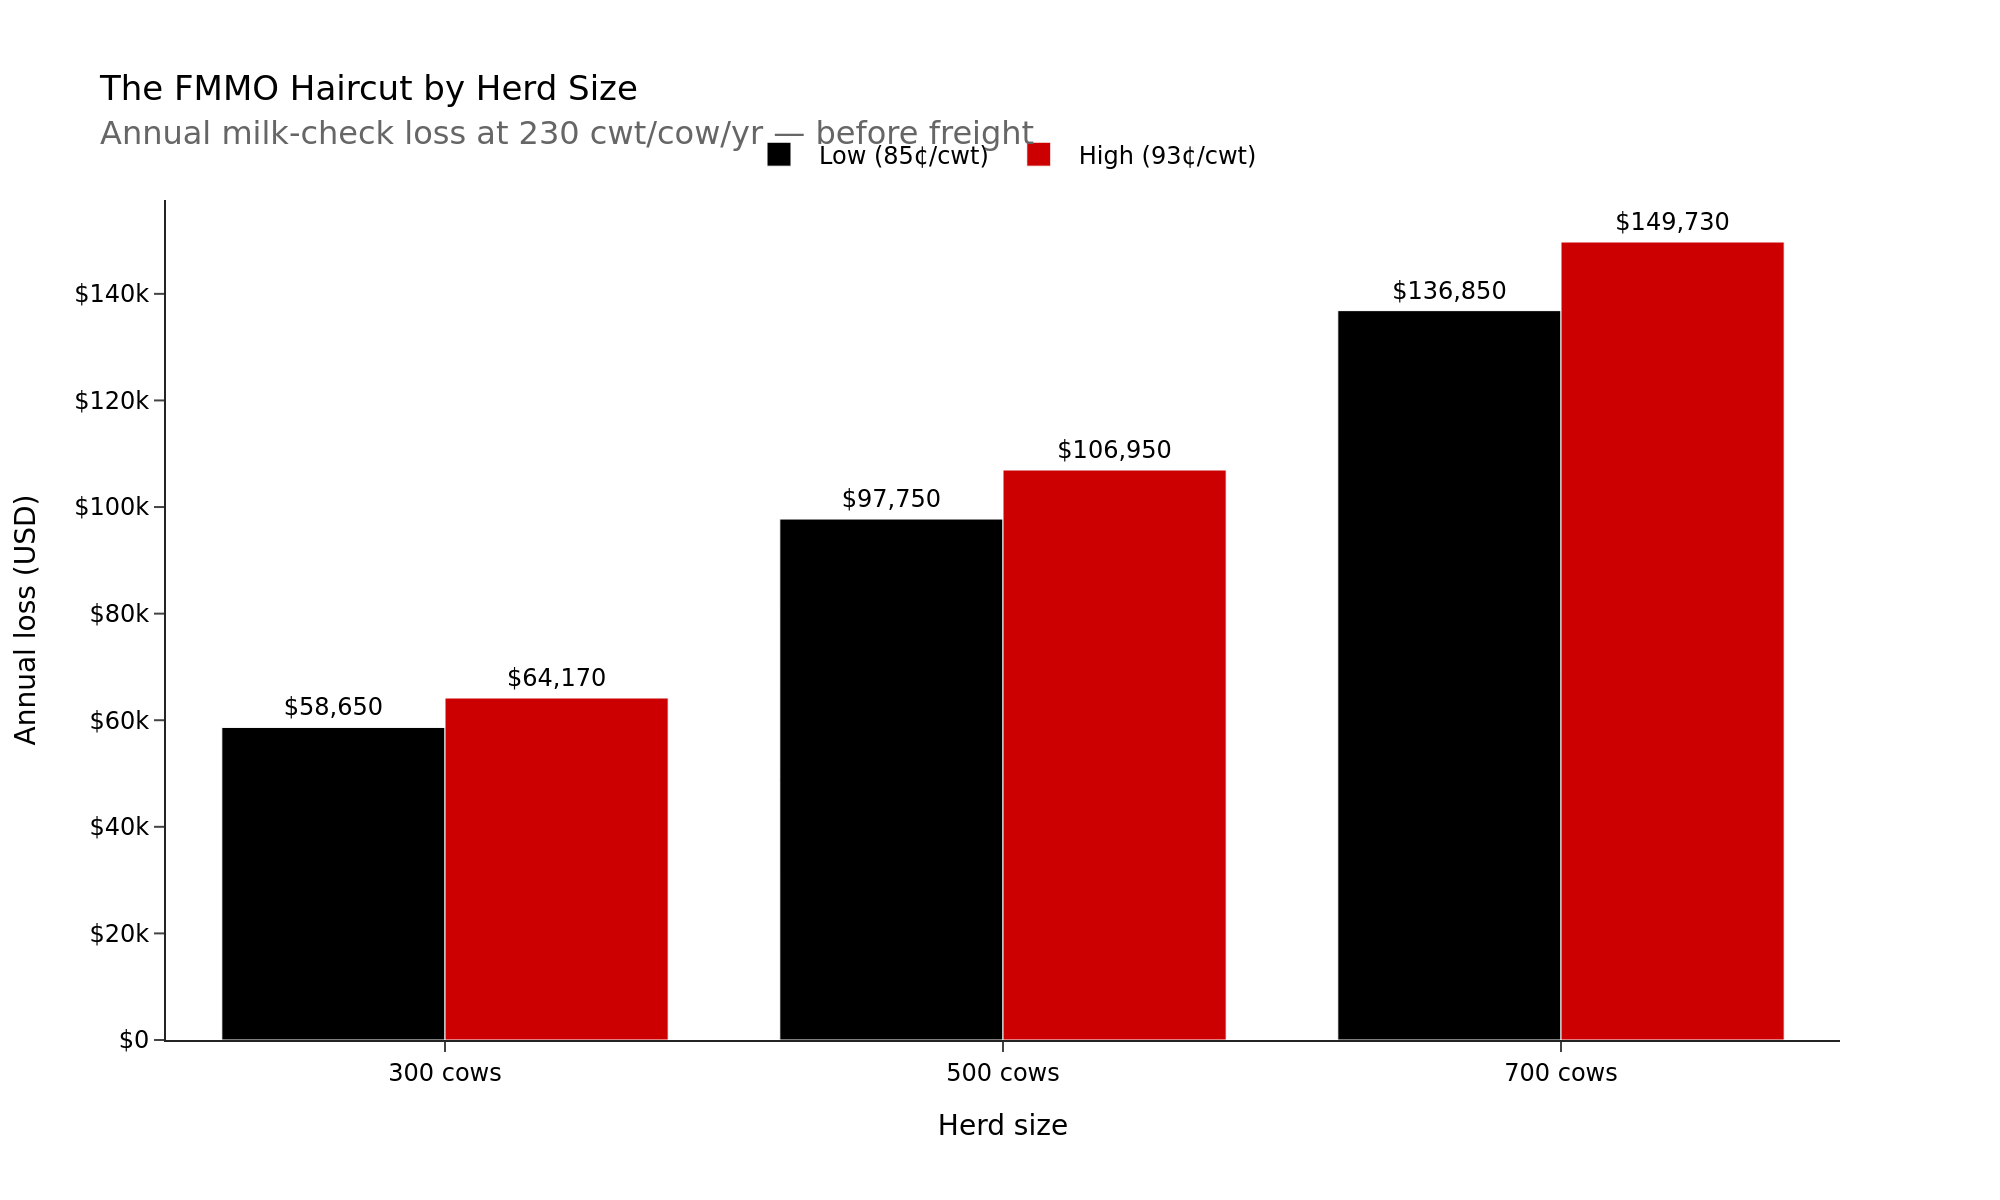
Here’s the formula. Take your herd size. Multiply by 230 cwt/cow/year — a conservative national proxy, since USDA NASS reported 2024 production per cow in the U.S. averaged 24,178 pounds. If your herd ships 250 or 270 cwt, scale accordingly. Multiply total cwt by the 85–93¢/cwt reduction. That’s the revenue that moved from your milk check to processor cost recovery under the new make allowances.
| Herd size | Production assumption | FMMO hit | Annual milk-check loss |
| 300 cows | 230 cwt/cow/year | $0.85–$0.93/cwt | $58,650–$64,170 |
| 500 cows | 230 cwt/cow/year | $0.85–$0.93/cwt | $97,750–$106,950 |
| 700 cows | 230 cwt/cow/year | $0.85–$0.93/cwt | $136,850–$149,730 |
Walk the 500-cow row. At 230 cwt/cow/year, you move 115,000 cwt. Multiply by 85 cents, and you get $97,750. Multiply by 93 cents, and you get $106,950. That range — $97,750 to $106,950 gone from the milk check over 12 months — doesn’t include freight. At USDA NASS national livestock-worker wages of $17.51/hr in October 2024, that’s roughly two full-time dairy employee salaries once you factor payroll taxes and benefits — erased by a single rule change.
Class I differentials and advanced-pricing factors were reworked in the same final rule, but the benefit skewed toward fluid-heavy orders. Add the 30% jump in per-farm hauling on Federal Order 30 between 2023 and 2024, and the net effect on the milk check looks less like modernization and more like a reallocation from producers to processors.
Whatever you call it, it’s a withdrawal.
| Cost Driver | Rate | Applied to 500-Cow Herd (115,000 cwt/yr) | Annual Impact |
| FMMO make-allowance update (low case) | $0.85/cwt | 115,000 cwt × $0.85 | $97,750 |
| FMMO make-allowance update (high case) | $0.93/cwt | 115,000 cwt × $0.93 | $106,950 |
| FO30 per-farm hauling, May 2024 | $0.7969/cwt | 115,000 cwt × $0.7969 | $91,644 |
| FO30 hauling increase vs. May 2023 | +$0.1832/cwt | 115,000 cwt × $0.1832 | +$21,068 YoY |
| Stacked drag (high FMMO + May 2024 hauling) | — | — | ~$198,594/yr |
The Route Math Most Producers Never See
Cooperatives track route economics internally. Every hauler, every loop, every stop — there’s a model somewhere that says where the margin is and where the routes are becoming uneconomic. That kind of planning information isn’t typically shared at the producer level, and producers rarely get advance notice when a route is at risk of restructuring.
The Holles were directed to a new market twice in 30 months. The producer northwest of Bismarck invested in a second bulk tank — and lost his plant eight months later. Whether that’s a communication gap, a competitive information issue, or a structural feature of how co-ops plan, the practical result for members is the same: you won’t see the route map until a decision has already been made. So if you’re a 500-cow operator in a Green Zone state, it’s worth asking your field rep directly about route density in your corridor. The willingness to engage the question tells you something. So does the reluctance.
The Turn: You Can’t Buy Your Way Back Out
Here’s the turn nobody priced in. Recovery isn’t just a margin problem anymore. It’s a biology problem.
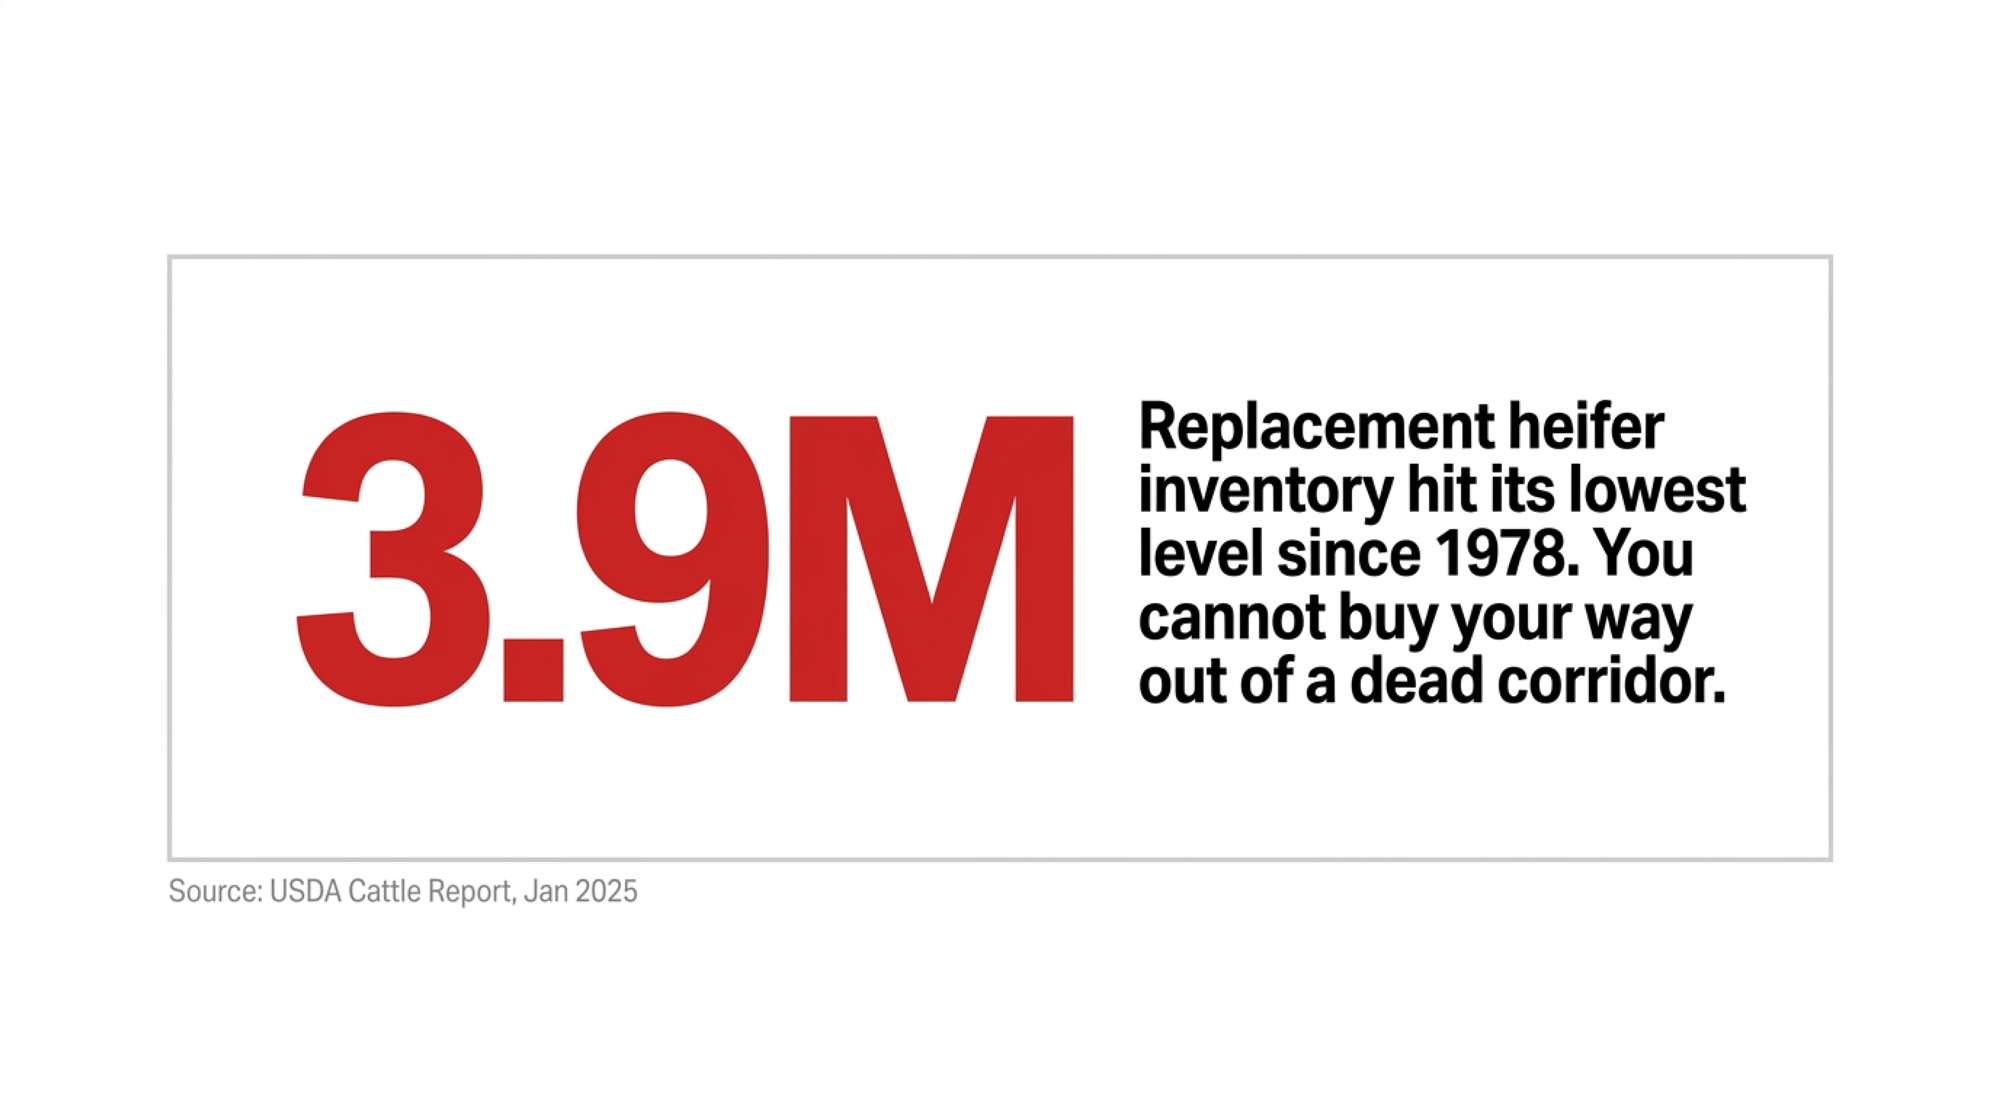
Dairy replacement heifer inventories fell to 3.914 million head as of January 2025 — the lowest level since 1978, per USDA’s January 2025 Cattle report. The number of heifers expected to calve fell to 2.5 million head — the lowest figure in decades, per the same Cattle report. In its February 2025 WASDE report, USDA cut its 2025 milk production forecast by 400 million pounds, citing a tighter heifer supply revealed in the Cattle Inventory and Milk Production reports.
That changes what “fix this” even looks like. If you can’t buy your way out of a thinning corridor with replacements, you have to manage your way out — lower breakevens, tighter loan discipline, stronger reproduction, and decisions that match your corridor rather than your hopes. Even if milk prices rally, the cows aren’t there to repopulate fragile regions quickly.
Dawson Holle — sixth-generation dairy farmer, Northern Lights Dairy co-operator, and North Dakota state representative — told Dairy Star in June 2025 that the market access problem isn’t about herd size: “As markets move, laws must move too. Whether you are large scale with 10,000 cows or small scale with just 10 cows, you should have a place in the market.” He added, “If we can keep milk in-state and add more processing options in the center, that would be a big step forward.”
Dairies in thin corridors are carrying more system risk than the ones sitting in dense corridors, not less.
As The Bullvine reported in our analysis of America’s 800,000-heifer crisis, the industry-wide shift toward beef-on-dairy breeding has driven roughly 800,000 fewer replacement heifers into the national pipeline — with replacement values averaging $3,010 nationally and premium springers in California and Minnesota pushing $3,500–$4,000. And every heifer you do raise is a $2,300–$2,700 capital asset before she ever hits the parlor, per Iowa State’s 2024 budgets — which means how you feed her in week one directly shapes whether that investment pays back or washes out.
What 2,013 Farms Holding 66% of U.S. Milk Means for Your Risk
The 2,013 U.S. farms with 1,000 or more cows accounted for 66% of all U.S. milk sales in the 2022 Census of Agriculture, up from 57% in 2017, per analysis from the University of Illinois’ farmdoc project using USDA NASS data. Total U.S. milk production rose from 215.5 billion pounds in 2017 to 226.4 billion pounds in 2022. That’s the headline the industry points to when it says consolidation is working.
Production stability is masking infrastructure thinning. Rabobank analysis found that dairy operations with fewer than 500 head represented 86% of total farms but produced just 22% of the milk, roughly 20,631 operations at the time of that analysis. So if you’re one of the tens of thousands of herds under 1,000 cows, the 66% figure isn’t about you. The attrition figure is.
North Dakota is betting on size to solve the processing gap from the other direction. Minnesota-based Riverview LLP has obtained environmental permits for a 12,500-cow dairy near Wahpeton and a 25,000-cow herd near Hillsboro, both along the I-29 corridor on the Minnesota border. An environmental group filed a legal challenge to the Hillsboro permit in October 2025. If both go in, North Dakota’s cow count jumps roughly fourfold overnight — but it jumps into the state’s single existing processing corridor, not the western void where the Holles sit.
The Playbook: Scale, Pivot, or Exit Before Your Next Loan Review
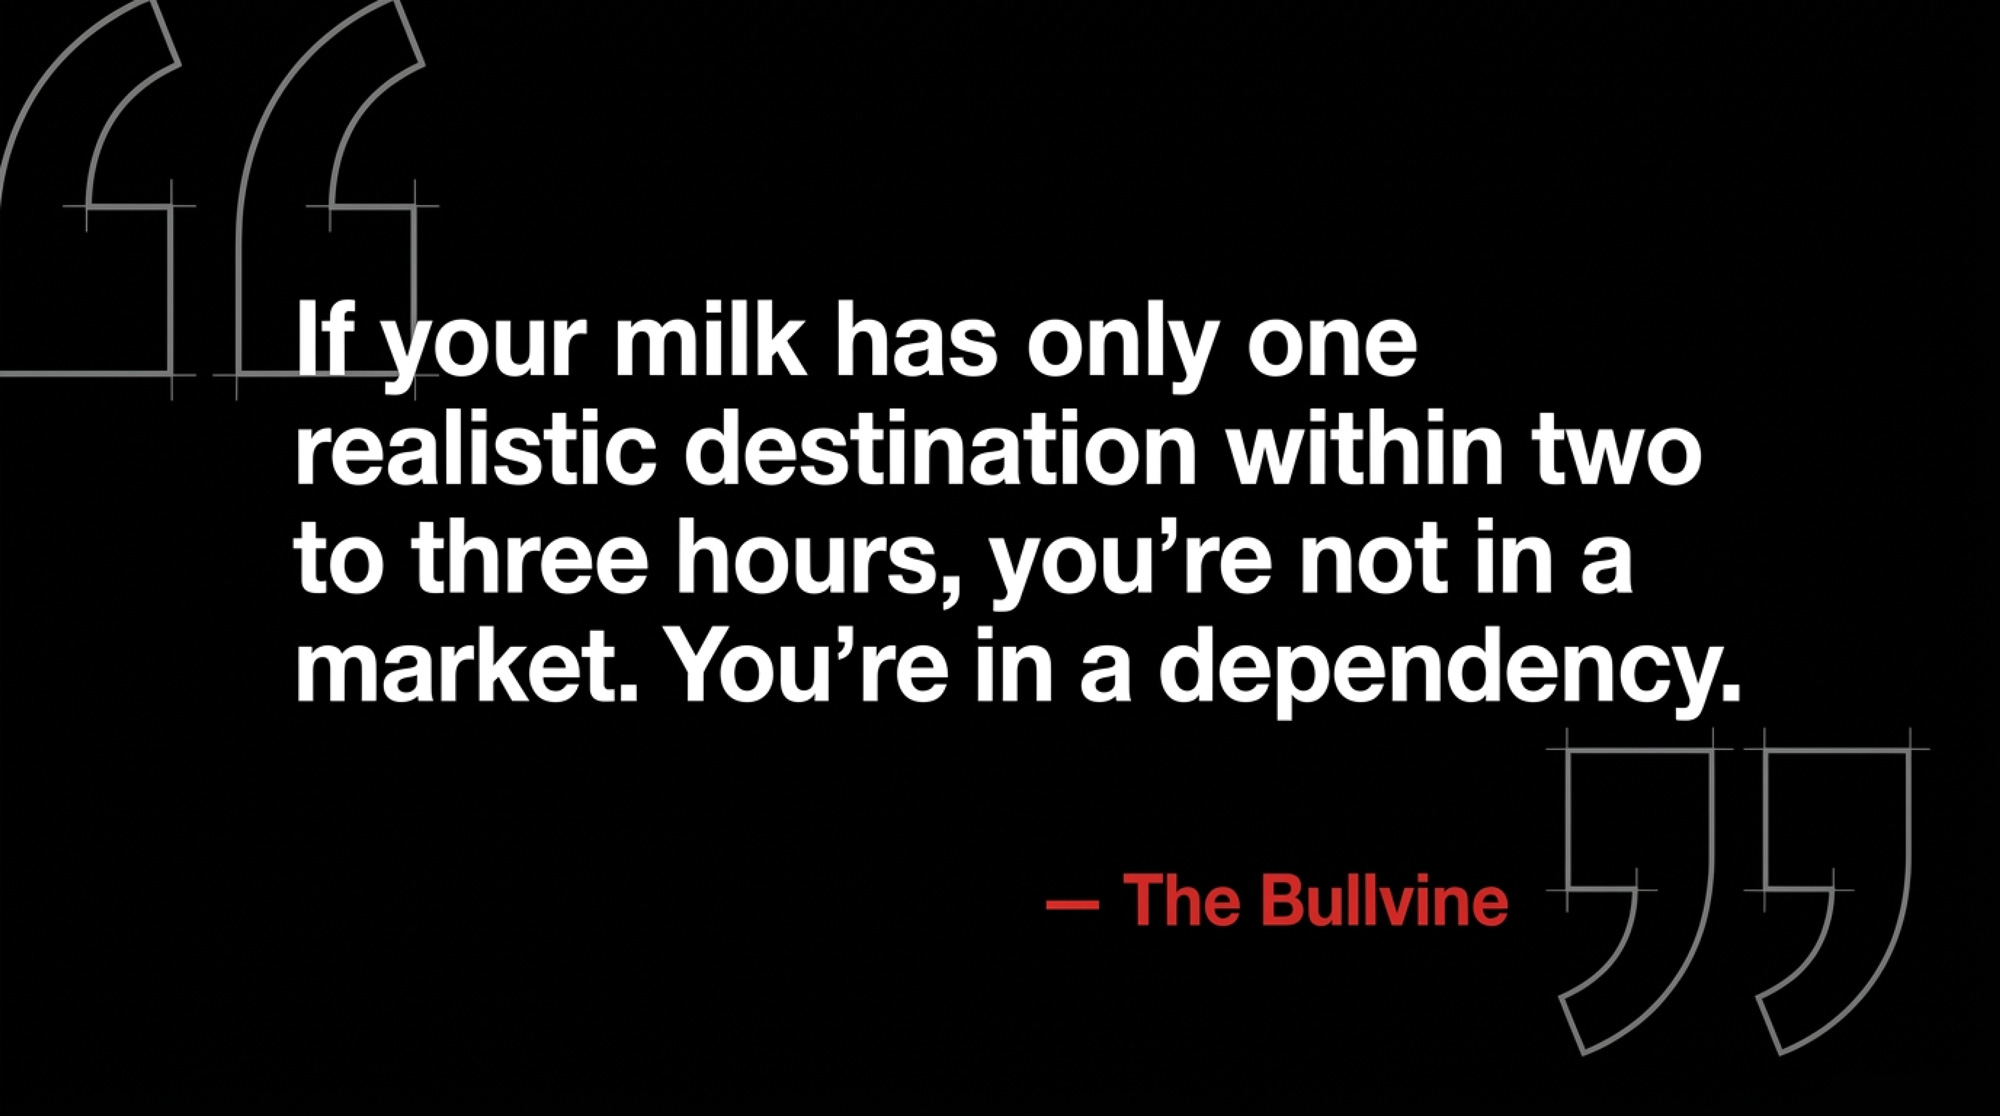
If your milk has only one realistic destination within two to three hours, you’re not in a market. You’re in a dependency. Use the next 12 months to figure out which of the three paths your numbers actually support.
Scale into a backbone corridor. Where it helps: dense processing regions with recent plant investment, sound debt-to-asset, and equity rising. You gain leverage and route redundancy. You give up some flexibility and take on more fixed costs concentrated in one place.
Pivot your revenue mix. Where it helps: mid-size herds in thinning corridors with strong genetics or component-rich milk. Robotics, precision systems, component-focused genetics, and beef-on-dairy income can trim your effective breakeven even when the corridor is unfriendly. Trade-off: more management complexity and, in some cases, added biosecurity exposure.
Structure a planned exit. Where it helps: operators past 55 with debt-to-asset above 60%, no committed successor, and a corridor where hauling plus FMMO drag is already eating 2%+ of gross revenue. You keep optionality around cows, equipment, and genetics while the market still rewards them.
Do This in the Next 30 Days
- ☐ Call your co-op field rep and your hauler. Ask how many herds remain on your route versus five years ago, whether the loop’s geographic footprint has grown, and whether there’s any talk of route optimization or minimum volumes. If they won’t answer, that’s an answer too.
- ☐ Pull the last 12 months of milk checks. Isolate hauling and stop/fuel surcharges. Compare the total to the same period three years ago. If hauling is rising faster than your mailbox price, your corridor is already taxing your margin.
- ☐ Name your backup plant. If you can’t identify a second processor within two to three hours that would take your volume tomorrow, you have a single point of failure. Write the plant’s name on paper — or admit you don’t have one.
- ☐ Sit down with your lender. Ask directly: “What corridor assumption are you using when you underwrite my long-payback projects?” Their answer tells you how they’re stress-testing the same risk you’re living.
Do This in the Next 90 Days
- ☐ Run a real breakeven. Include family labor at realistic hourly rates and depreciation at replacement cost. If the gap between your breakeven and your mailbox has widened for three years running, that’s a trajectory, not a cycle.
- ☐ Recalculate debt-to-asset. Under ~50% with equity rising keeps your options open. Over ~60% with equity declining three years running turns the exit conversation from optional to overdue.
- ☐ Pressure-test your replacement plan. With heifer inventories at a 47-year low and replacements averaging $3,010 nationally, any expansion that depends on buying animals needs a much tighter business case than it did five years ago.
Do This in the Next 365 Days
- ☐ Commit, or document why you’re still evaluating. By this time next year, you should have a committed corridor decision — scale, pivot, or exit — or a written reason you’re still evaluating. Drift is itself a decision, and it’s rarely the one you’d pick deliberately.
- ☐ Watch one structural signal. If hauling plus FMMO drag eats more than 2% of gross revenue for two consecutive years — a working threshold The Bullvine uses to separate cyclical stress from structural stress — treat that as a signal to reopen the corridor conversation with your lender.
What This Means for Your Operation
- Single-destination risk is structural risk. If your milk has only one realistic buyer within three hours, your equity is a hostage. You aren’t managing a business — you’re managing a countdown. Write the name of a real second buyer on paper, or admit you don’t have one.
- Run the FMMO math on your own herd. Take your cwt shipped last year, multiply by 85–93 cents, and that’s your estimated annual make-allowance hit. A 500-cow herd at 230 cwt/cow lands at roughly $97,750–$106,950 a year before freight. If your debt-service coverage ratio (the ratio of your net farm income to annual debt payments) sits below 1.2 — the floor most ag lenders watch — that hit alone can move you into the danger band.
- Find your row on the Clock. Look up your state in the 16-state table above. If your 5-year attrition rate is higher than your 10-year rate, you’re in an accelerating state — the decline is getting worse, not better. That’s a decision input for every long-payback project on your desk.
- Match your loan horizon to your corridor, not your stainless. If your corridor has lost more than a third of its dairies in the last decade, the route functionally behaves like a wasting asset. Long-payback projects deserve extra scrutiny.
- Don’t count on buying your way out. With replacement inventories at a 47-year low and an 800,000-heifer deficit driven by beef-on-dairy breeding, growth plans that assume available heifers at reasonable prices are already out of date. The heifers you do raise are $2,300–$2,700 capital assets — treat them accordingly from day one.
- Talk to your lender before your lender talks to you. Ask what corridor risk, hauling inflation, and make-allowance drag are doing to their underwriting model on dairy paper this year. If they haven’t run those numbers, now you both have a problem to solve.
- If you’re in a dense corridor, protect the advantage. A Green Zone state with fresh stainless going into nearby plants is the closest thing to a structural tailwind in this market. Don’t squander it by running someone else’s numbers on your own barn.
Six Checks Before Your Next Loan Review
- If your FMMO drag plus hauling eats 2%+ of gross revenue for two years running, treat that as a structural trigger — not a bad cycle — and put a corridor conversation on your lender’s calendar.
- If your debt-service coverage ratio is already below 1.2, the FMMO rule change alone can push you into covenant territory before any other input moves. Run the 85–93¢/cwt number on your own cwt shipped before your next review.
- If your state’s 5-year attrition rate exceeds its 10-year rate on the Clock table, you’re in an accelerating corridor. That’s a signal, not noise.
- If you can’t name a second buyer inside a two-to-three-hour radius, your equity is riding on one plant’s business case, not yours.
- If your 10-year expansion plan assumes available, affordable replacements, rebuild it. The January 2025 heifer inventory is the lowest since 1978, and the pipeline tightened before the rule did.
- If you’re in a dense processing corridor, that’s not luck — it’s a structural tailwind. Don’t let someone else’s growth playbook talk you out of it.
Federal Order 30 staff, USDA NASS, farmdoc, AFBF’s Daniel Munch, and North Dakota’s own agriculture commissioner are all saying the same thing from different angles: route access and policy drag are structural inputs in the dairy financial model now, not cyclical ones. Operators like the Holle family at Northern Lights Dairy got caught on the wrong side of that timing. The window to decide which side of the math you want to be on isn’t closing today, but on current attrition trends in Red Zone states, it’s narrowing year over year. Put your own map on paper, set your breakeven beside it, and answer the only question that actually matters:
Are you financing a dairy, or a route that’s already disappearing?
Complete references and supporting documentation are available upon request by contacting the editorial team at editor@thebullvine.com.
Learn More
- USDA’s Make Allowance Just Pulled $105,000 From a 400‑Cow Milk Check – Nobody Sent a Bill — Exposes the $0.94/cwt structural formula cut that silently drains six figures from mid-sized herds. Breaks down the widening gap between all-milk and mailbox prices, arming you with the margin-tracking numbers your co-op isn’t sharing.
- 2025 Dairy Year in Review: Ten Forces That Redefined Who’s Positioned to Thrive Through 2028 — Dismantles the 800,000-heifer inventory hole and tracks the ten economic shifts defining the 2028 winner’s circle. Delivers a critical culling framework that turns $3,000 replacement costs into a strategic decision rather than a reactive expense.
- Robots Won’t Save Your Dairy If You’re Alone: 5 Hard Truths About Labor and Robotic Milking ROI Under 500 Cows — Reveals why robotic milking remains a capital trap unless your loaded labor costs exceed $28/hour. Following the money on the hybrid parlor-plus-tech alternative, this strategy captures efficiency gains without betting the farm on high-maintenance automated systems.
 The Sunday Read Dairy Professionals Don’t Skip.
 The Sunday Read Dairy Professionals Don’t Skip.
Every week, thousands of producers, breeders, and industry insiders open Bullvine Weekly for genetics insights, market shifts, and profit strategies they won’t find anywhere else. One email. Five minutes. Smarter decisions all week.
