The National Dairy Shrine 2026 Awards slate just dropped — and it’s a landmark one. Pine-Tree Dairy takes the Distinguished Dairy Cattle Breeder Award, four Pioneers join a roll that now exceeds 360 names, Vita Plus’s Bob Hagenow is named Guest of Honor, and a brand-new Emerging Leader category debuts with four under-40 honorees.
Executive Director Mike Opperman announced the winners live on the Uplevel Dairy Podcast with host Peggy Coffeen, broadcasting from the Shrine’s Fort Atkinson office beside the original 1949 Dairy Shrine Club sign.
Pine-Tree Dairy: A Legacy That Rewrote the Pedigree Chart
If you’ve opened a Holstein sire summary in the last decade, you’ve probably read Pine-Tree’s fingerprints without realizing it. The Steiner family operation in Marshallville, Ohio — now in its fourth generation — takes the 2026 Distinguished Dairy Cattle Breeder Award, a category dating to 1973.
The operation today: 1,400 milking cows, 1,500 heifers, and 140 bulls across Holstein, Jersey, and Brown Swiss, with a 28,658-lb rolling herd average, 1,000+ embryos produced annually, and 19 consecutive years of Progressive Genetic Herd designation.
Why they reshaped the breed: Matt Steiner was selecting for NM$, cheese merit, daughter fertility, productive life, and calving ability before those traits carried real weight in official indexes. That commercial-first philosophy traced back to one $8,100 phone bid in 2003 — Wesswood-HC Rudy Missy at the Wisconsin Holstein Convention Sweetheart Sale. She grew into an EX-92 GMD DOM brood cow, exceeded 40,000 lbs of milk, and earned Holstein International Global Cow of the Year honors in 2014. (Read more: The $8,100 Gamble on Missy, 198 Dragged Genes, and the 20-Year Breeding Blind Spot Hiding in Your Herd)
Seagull-Bay Supersire — generational commercial sire, from the Missy branch via Ammon-Peachey Shauna
Mountfield SSI Dcy Mogul — one of the most-used Holstein sires in history, from the Missy Miranda branch
De-Su Balisto — highest-ranked Holstein sire ever in Australia, majority Rudy Missy maternal line
AltaOak, Pursuit, Sid, Burley (2021 HI Outcross Sire of the Year), Heroic — all trace back to Pine-Tree
The kicker stat from Opperman’s announcement: 48 of 50 heifers at the 2025 World Dairy Expo World Classic Sale traced back to a Pine-Tree prefix. Matt, Gail, and the next generation also supply A2A2 milk to two small processors, farm entirely on non-GMO inputs, and earned Wayne County Soil & Water Conservation District’s Conservation Farm of the Year — a stewardship legacy started when grandfather Ezra co-founded Wayne SWCD in 1947.
The 2026 Pioneers: Four Careers That Built the Modern Industry
Over 360 Pioneer Awards have been handed out since 1949. Four more join in 2026 — three academics and the duo behind “send her to Sunshine.”
Dr. Larry Chase — Professor Emeritus, Cornell University. Built a dairy nutrition research and extension program where applied research answered real producer questions and moved rapidly into on-farm practice. His research and extension arms reinforced each other, creating immediate industry impact.
Dr. Dennis “Denny” Funk. BS, MS, PhD from Iowa State. Managed Holstein sire development at Holstein Association USA starting in 1988, moved to an assistant professor role at UW–Madison, then joined ABS Global in 1995 as director of genetic programs. His career spans research, education, genetic evaluation systems, global germplasm commerce, and the commercial rollout of reproductive and genomic tech.
Dr. Rick Grant — Past President and Trustee, William H. Miner Agricultural Research Institute. 13 years at the University of Nebraska as professor of ruminant nutrition and extension dairy specialist, then 28 years at Miner with adjunct appointments at Vermont, Cornell, and SUNY Plattsburgh. Thirty-five years of field-shaping work in dairy nutrition, cow comfort, and producer-focused outreach.
Drs. Chris Simon and Dr. Dan Hornickel — the “Sunshine Boys.” University of Illinois vet school classmates in the 1970s who left their practices in 1983 to found Sunshine Genetics in Whitewater, Wisconsin. They built one of the world’s most respected embryo transfer operations — so respected that “send her to Sunshine” became industry shorthand for flushing your best cow at the gold-standard facility.
Emerging Leader Award: Dairy Finally Honors the Under-40s
Dairy has always honored grey hair. It hasn’t always honored the 30-somethings quietly reshaping the industry right now. The Shrine closed that gap in 2026 with a new category for leaders 40 and under — Opperman admits he missed eligibility himself by about six months.
The inaugural class (alphabetical, not ranked):
Bo Harstine — VP Technical Initiatives and Innovation, Select Sires. Driving innovation management and strategic alignment at Select, plus curriculum work with Ohio’s Department of Education ag and environmental systems advocacy committee.
Allison Ryan — Director of Marketing and Communications, MVP Dairy. The force behind two state-of-the-art dairy education visitor centers in Ohio and Kansas, plus active roles with Mercer County Farm Bureau and Fairgrounds.
Lucas Sjostrom — Account Manager, Specialty Herd Solutions; head distiller at Redhead Creamery. By 39, he’d logged trade missions with Russian investors, federal milk marketing order hearings, and leadership roles with Midwest Dairy and Midwest Milk — while co-building Redhead Creamery with his wife Elise as a value-added model for family farm sustainability.
Emily Yeiser Stepp — Senior Director of Industry Affairs, Fairlife. Helped establish the Center for Dairy Excellence Foundation, trained 400+ evaluators through the National Dairy FARM Program, and managed an on-farm social responsibility program covering 99% of U.S. fluid milk supply, 150+ co-ops and processors, and 26,000+ farms.
Guest of Honor: Bob Hagenow
The 84th Guest of Honor in Shrine history is Bob Hagenow, sales manager at Vita Plus Corporation, where he’s clocked 39 years. Dairy knows Bob from somewhere else entirely — the colored shavings at World Dairy Expo, where he’s served as ringmaster for the Holstein and Brown Swiss shows and as secretary-treasurer on the WDE board of directors, keeping Expo on solid financial footing.
Bob Hagenow’s firm handshake reaches your soul, reflecting his 40-year commitment to transforming the dairy industry. From the show ring to the boardroom, Bob’s servant leadership and genuine passion for helping others succeed have made him a trusted voice and mentor, shaping the future of dairy one connection at a time. (Read more: Bob Hagenow: A Legacy Built on a Handshake)
Beyond Expo, he’s board president of the Wisconsin 4-H Dairy Fund, coaches county 4-H judging teams, announces state youth shows including Wisconsin State Fair, serves as off-campus advisor to UW–Madison’s Badger Dairy Club, and mentors University of Minnesota students. As Opperman put it, nobody’s ever seen Bob on a bad day — and if he had one, he’d smile through it.
Save the Date: 2026 Awards Banquet
All 2026 honorees will be recognized at the National Dairy Shrine Annual Awards Banquet on Monday, September 28, 2026, at the Alliant Energy Center Exhibition Hall in Madison, Wisconsin — kicking off World Dairy Expo week.
Capacity is roughly 320 seats, and the 2025 banquet sold out a couple of weeks early. Tickets open July 1 via dairyshrine.org/banquet/. World Dairy Expo itself runs September 29 through October 2, 2026, at the Alliant Energy Center. Winners are permanently installed in the Hall of Fame at the Shrine’s Fort Atkinson museum, with accompanying video interviews.
Also on deck from the Shrine: scholarship winners from a record 207 applications will be announced over the coming weeks, and the May 13 webinar at noon Central tackles “Maximizing Internships in Dairy and Agriculture Careers” with panelists from Midwest Dairy, Oklahoma State, Holstein Association USA, and Cargill.
Your Genetics Rep Has Bad News – But Won’t Tell You Until January — Secure your genetics contracts before an impending $12,000 annual price hike hits your operation. The latest financial data follows the money on the Select Sires combination, exposing why replacement costs are surging and how to strategically defend your margins.
David vs. Goliath: Strategies for Small Dairy Farmers to Challenge Large Processors — Margin protection requires outsmarting the massive processors currently strangling farms with 1-3% profits. Our team dismantles the rigged dairy pricing system and delivers a proven value-added blueprint—inspired by today’s emerging leaders—to help you drastically increase per-cwt revenue.
The Sunday Read Dairy Professionals Don’t Skip.
Every week, thousands of producers, breeders, and industry insiders open Bullvine Weekly for genetics insights, market shifts, and profit strategies they won’t find anywhere else. One email. Five minutes. Smarter decisions all week.
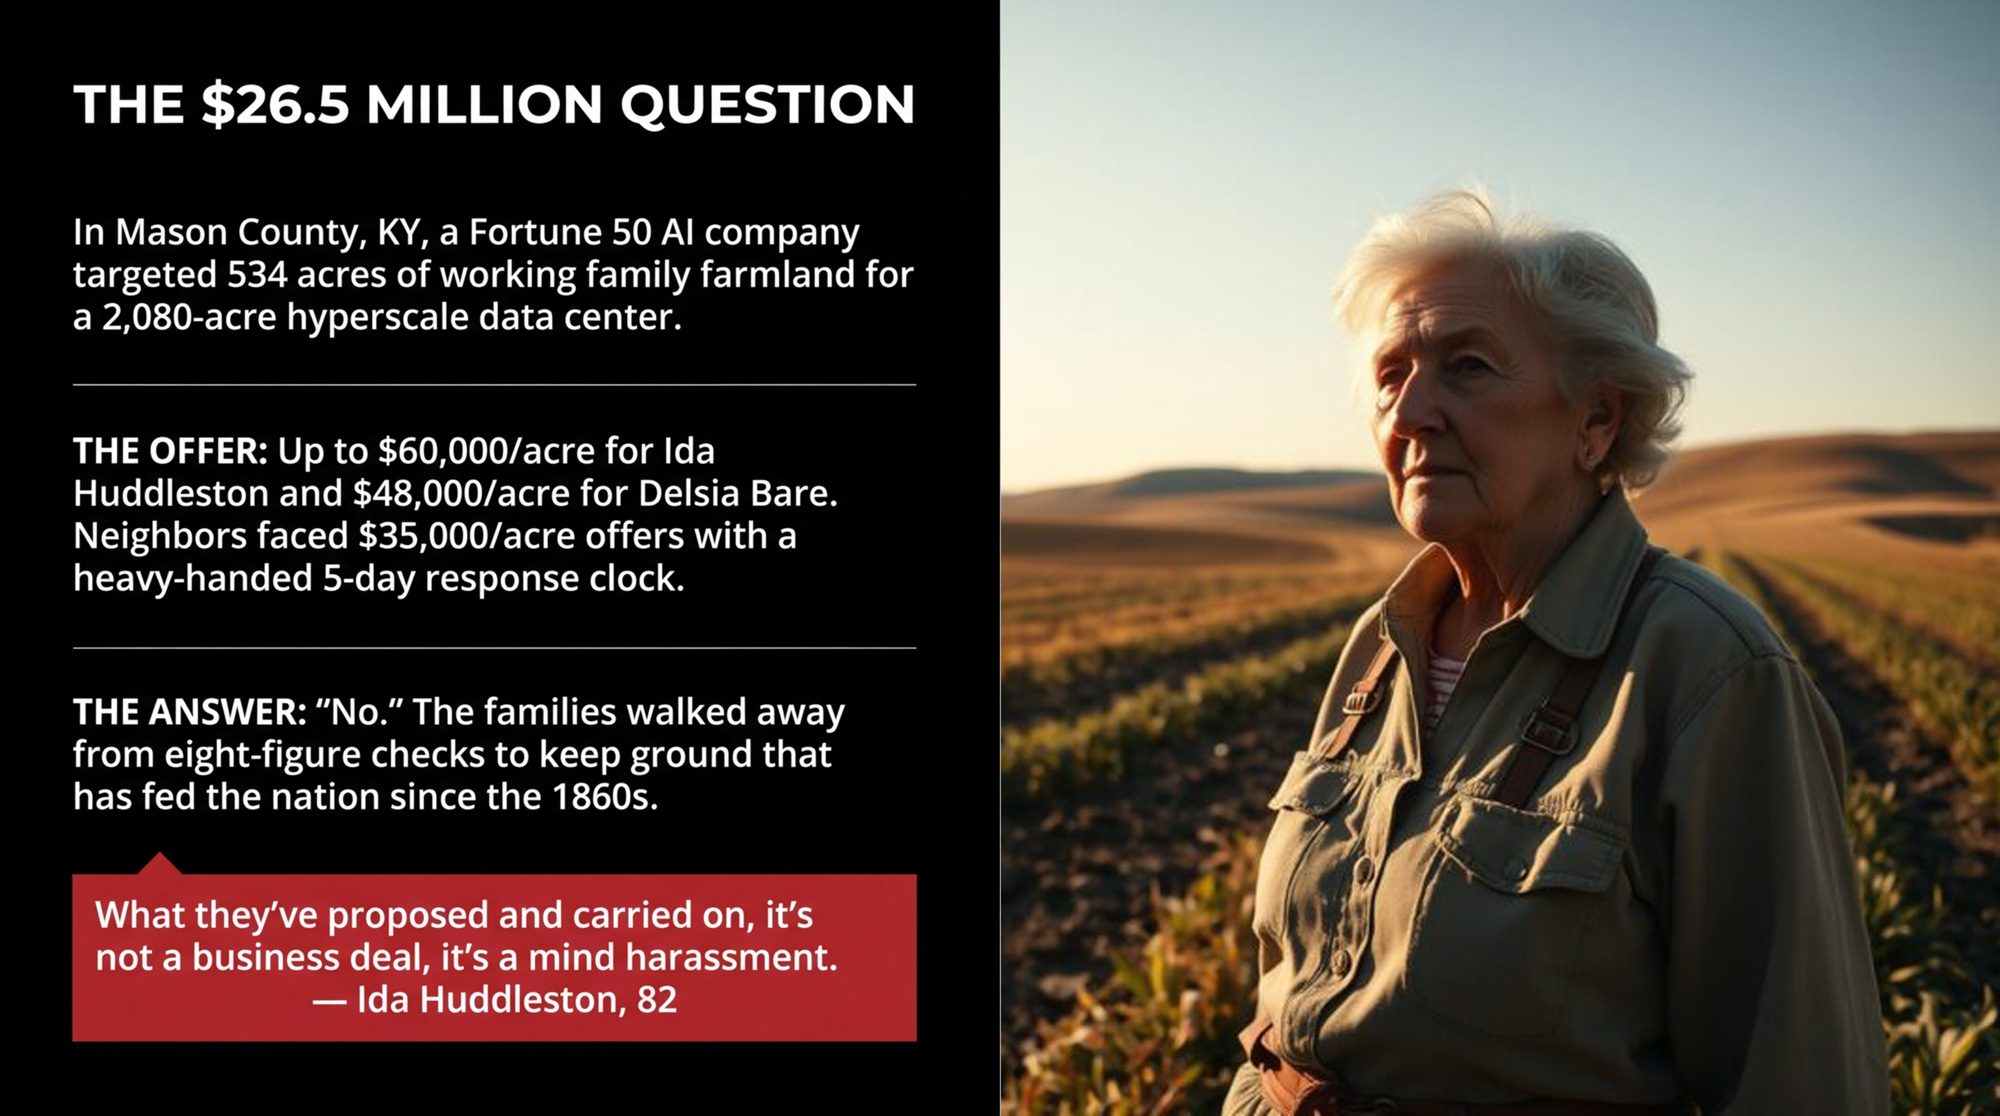
In Mason County, up to $60,000 an acre was on the table for working farmland — and at least four families still walked away, forcing every serious producer in a growth corridor to ask what their own ground is really worth.
Ida Huddleston is 82 and owns 71 acres of farmland outside Maysville, Kentucky. Her daughter, Delsia Bare, holds another 463 acres nearby. Together, according to local coverage, the family operates roughly 1,200 acres of ground that has supported them since the 1860s— through wheat in the Depression and working farmland still today.
Last year, a group representing an unnamed Fortune 100 company — described as Fortune 50 in more recent reporting — came looking to buy a big piece of that ridge for an AI data center. WLEX reporting cited by People magazine says the group offered Huddleston $60,000 per acre for her 71 acres and Bare $48,000 per acre for her 463 acres — more than $26 million combined for 534 acres.
“My grandfather and great-grandfather and a whole bunch of family have all lived here for years, paid taxes on it, fed a nation off of it,” Bare told CBS affiliate WKRC. “Even raised wheat through the Depression and kept bread lines up in the United States of America when people didn’t have anything else.”
They said no.
The offers that came with a five-day clock
The Huddleston family’s story hit regional news in mid-March 2026 and went national within days. But the land chase started much earlier — and their neighbors felt the same pressure.
Down the road, cattleman Dr. Timothy Grosser and his son Andy raise cattle on their place along KY 3056. In March 2025, a group representing the same data-center development offered them $35,000 per acre, according to LEX18 — nearly $8 million for their farm.
“They stressed that time was of the essence and they wanted responses really fast, like within the next five days,” Andy told LEX18. Despite the money and the rush, he was blunt: “We do not want to sell. The farm is my dad’s, and it means everything to him.”
Local 12’s segment on the Grossers emphasized the same theme: that kind of money “can buy a lot,” one line went, but Dr. Grosser made it clear it couldn’t buy what the place means to him.
Local 12 also reported in late March 2026 that the company’s representatives now have contracts “ready to go” on 28 properties as part of the proposed data-center complex. The company itself hasn’t been publicly identified “because of nondisclosure agreements,” the station said.
So you’ve got a Fortune 50–caliber tech client that no one is allowed to name yet, dozens of farms under contract, and a handful of families — like the Huddlestons and the Grossers — who’ve decided they won’t cash out, even at numbers that would make most advisors choke on their coffee.
“It’s not a business deal, it’s mind harassment.”
Huddleston didn’t sugarcoat how the process felt. In an interview with NBC affiliate WLEX, she described months of pressure in plain language: “What they’ve proposed and carried on, it’s not a business deal, it’s a mind harassment.”
She also told WKRC she doubted the data center would deliver the kind of jobs and growth its boosters promised. “It’s a scam,” she said in that interview, according to TechCrunch and WKRC’s original report. These are Huddleston’s characterizations of the proposals she received, reflecting her experience as a landowner who’s been repeatedly approached. The Bullvine hasn’t independently investigated the company’s economic claims, and the company itself hasn’t been publicly identified.
Bare talked less about the meetings and more about what the land means. “There’s nothing that can destroy me if I’ve got this land,” she told WKRC.
Huddleston has been just as blunt about how she thinks farmers are being treated in the process. “They call us old stupid farmers, you know, but we’re not,” she told WKRC in a separate segment. “We know whenever our food is disappearing, our lands are disappearing, and we don’t have any water — and that poison. Well, we know we’ve had it.”
Whatever you make of their language, there’s no question they’re speaking from long experience, not from a tweet. When a family that fed people through the Depression and kept bread on other tables says the money doesn’t move them, that hits differently than a talking point in a planning meeting.
The 2,080-acre plan: what’s actually coming to Mason County?
On the power side, the outlines are more concrete than the company name. East Kentucky Power Cooperative owns the Spurlock Station power plant in Mason County, a four-unit coal facility capable of generating about 1,608 megawatts— a little over 40 percent of EKPC’s total capacity. Planning documents from regional grid operator PJM show EKPC studying new transmission and substation options near Maysville, including a new Mason County substation tied into a 345-kV line to serve a potential large industrial load.
In a March 19, 2026 opinion piece in Kentucky Living and Building Kentucky, EKPC president and CEO Don Mosierwrote that the co-op has been in talks “for more than a year” with a Fortune 100 company evaluating a data-center site near Maysville and Spurlock Station. Mosier said any such customer would be responsible for paying the costs of required transmission upgrades under EKPC’s tariff.
At a special meeting at Maysville Community and Technical College, attorney Tanner Nichols of FBT Gibbons outlined a plan for a six-building “hyperscale” data-center complex on more than 2,080 acres, with about 2,000 construction jobs and 400 permanent positions, at a cost of more than 5 million — costs he told the commission the company would cover 100 percent. Coverage from WEKU described the company as a “Fortune 50 tech firm,” while WCPO summarized it as “Fortune 500” in a separate report from the same hearing. For consistency, this article follows WEKU’s “Fortune 50” phrasing and flags the discrepancy for readers.
Opponents, including We Are Mason County treasurer Janet Garrison, argue the permanent job number could be far lower. “We are not anti–data center or anti–progress at all,” she told Realtor.com. “But we want this thing to go in an industrial park. They want farmland, and that’s just not a very efficient use of 2,000 acres when they might only hire 50 people.”
Attorney Hank Graddy, representing residents, pressed Nichols on why the public had to address questions to an attorney for the industrial development authority and not directly to the company itself. A grassroots citizens’ group called We Are Mason County filed suit on March 27 against the Mason County Fiscal Court and Planning Commission, arguing the rezoning that enables the data center violates the county’s comprehensive plan and that “zoning without planning is illegal.”
For any dairy or mixed-livestock producer, this isn’t just a tech story in Kentucky. It’s about whether land that grows your forages — or your neighbor’s corn silage and hay — ends up under barns and pivots, or server halls and parking lots. When 534 acres of mostly working ground disappear into an industrial site, you’re not just losing asset value. You’re punching a hole in the local forage base that might be impossible to patch later.
What Does $26 Million Buy That 534 Acres of Kentucky Farmland Can’t?
Here’s where the barn-math gets real, and it starts with the fact that the offers were not one flat number.
Based on WLEX reporting cited by People magazine:
Huddleston’s 71 acres at $60,000/acre ≈ , $4,260,000.
Bare’s 463 acres at $48,000/acre ≈ , $22,224,000.
Together, those two offers total roughly $26.5 million for 534 acres.
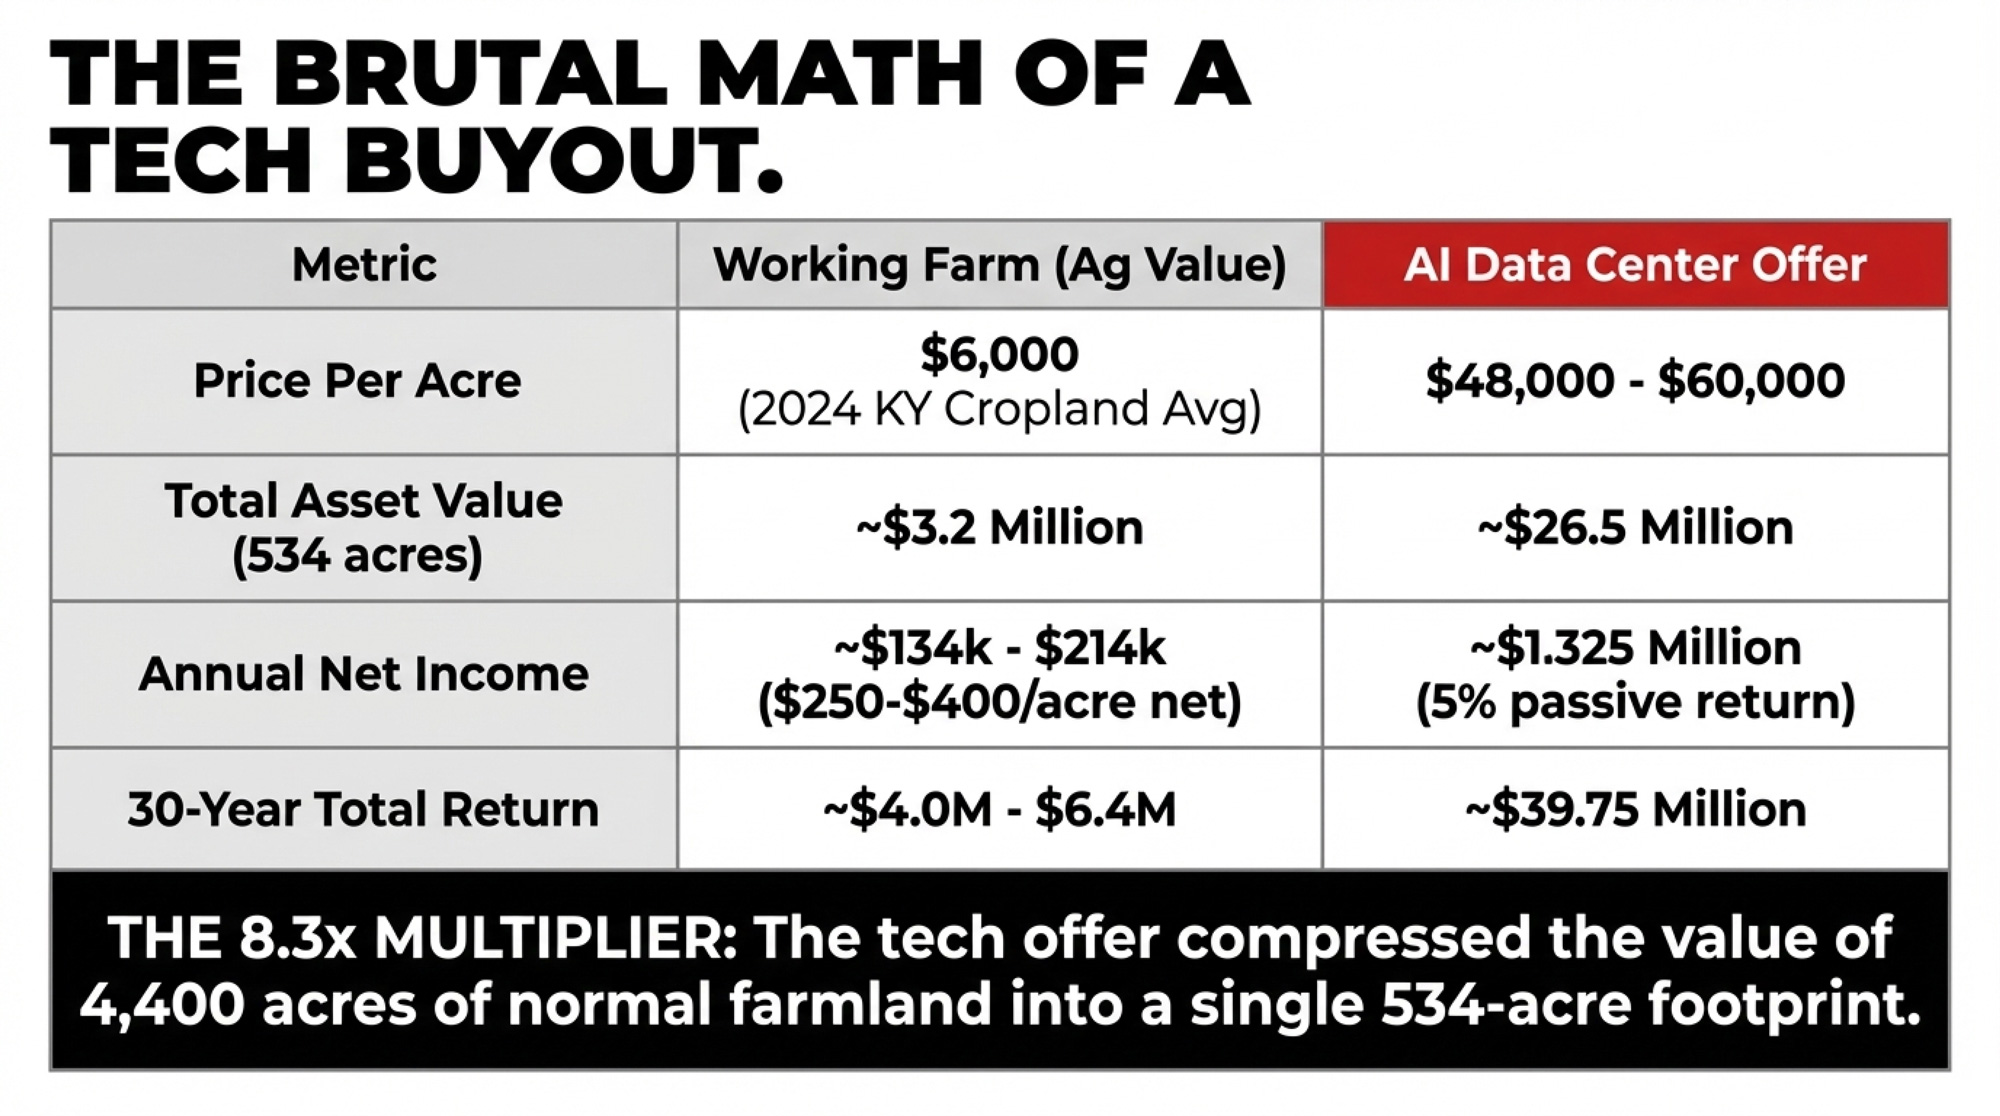
Now, stack that against what farmland is usually worth. USDA’s 2024 Land Values Summary puts average U.S. farm real estate at $4,170 per acre, with cropland at about $5,570 and pasture at $1,830. Kentucky-specific data puts average farm real estate around $5,300/acre and cropland near $6,220/acre. Bare herself told WKRC that land in Mason County is valued at “about $6,000 an acre,” and that the offer she received was roughly ten times that amount.
If you use a ballpark $6,000 per acre as a benchmark for good Kentucky cropland — consistent with both USDA data and Bare’s own description of local values — the math looks like this:
At that ag value, 534 acres ≈ $3.2 million.
The AI offer of ≈ $26.5 million is roughly 8.3× that number.
Or, said differently: the company compressed the land value of more than 4,400 acres of average U.S. farmland into one family’s 534-acre footprint.
Now switch from asset values to income, because that’s the part you live on.
If the family took the .5M and invested it at a conservative 5% annual return, that portfolio could throw off about .325 million a year before tax. No drought risk. No $4 diesel. No 4 a.m. milking unless somebody wants to get up anyway.
There’s no single “standard” net-income-per-acre figure for Kentucky, but extension budgets and Census-level data suggest a lot of mixed grain/forage acres end up in the low hundreds after expenses in an average year. To keep this useful, not hypothetical, treat $150–$400 per acre as a rough net range you can swap your own numbers into.
At $250 net/acre, 534 acres × $250 = $133,500/year net farm income.
At $400 net/acre, 534 acres × $400 = $213,600/year.
Compare that to the $1.325M passive return. You’re talking about turning down something like six to ten times your likely annual net, every single year, for as long as you’d hold the investments.
Over 30 years, without even compounding that 5%, the simple math is:
Passive: $1.325M × 30 = $39.75M.
Farm net: $133,500–$213,600 × 30 = $4.0–$6.4M.
Here it is side-by-side:
Ag Value vs. AI Tech Offer (Huddleston–Bare, 534 Acres)
Metric
Working Farm (Ag Value)
AI Data Center Offer
Price Per Acre
$6,000 (ballpark benchmark, in 2024 KY cropland range)
$48,000–$60,000 (Bare at $48k, Huddleston at $60k)
Total Asset Value (534 acres)
~$3.2 million
~$26.5 million
Annual Income
~$134k–$214k (net farm income at $250–$400/acre, illustrative)
~$1.325 million (5% return on $26.5M)
30-Year Total (no compounding)
~$4.0–$6.4 million
~$39.75 million
The Multiplier
1×
~8.3× (offer vs. farm-use value)
On a yellow pad, that looks like a once-in-a-lifetime chance to cash out, erase debt, fund retirement, and maybe even restart somewhere cheaper if you wanted to. For a lot of operations, it would be.
But you’d also be permanently trading control over this dirt — this ridge, these fence lines, that water — for a brokerage balance somewhere else.
If you’ve just poured serious money into new barns, parlors, robots, or a creamery, that math gets even more brutal. High per-acre offers can blow up the amortization schedule you built for that infrastructure. Suddenly, you’re wondering whether to walk away from a system that hasn’t had time to earn its keep, just because the ground underneath it is now worth more to servers than to cows.
From what Bare and Huddleston have told reporters, keeping their family’s ground in production still matters more to them than what any spreadsheet says those acres could generate in passive income. You don’t have to land on the same answer. But you do need to know what your own numbers say before a truck pulls into your lane.
Is Your Estate Plan Ready for a $60,000-Per-Acre Offer You Didn’t Ask For?
Most farm estate plans quietly assume your land will be valued somewhere near its agricultural use value. They weren’t built for a world where one project takes land from $6,000/acre to $48,000–$60,000/acre a couple of miles away.
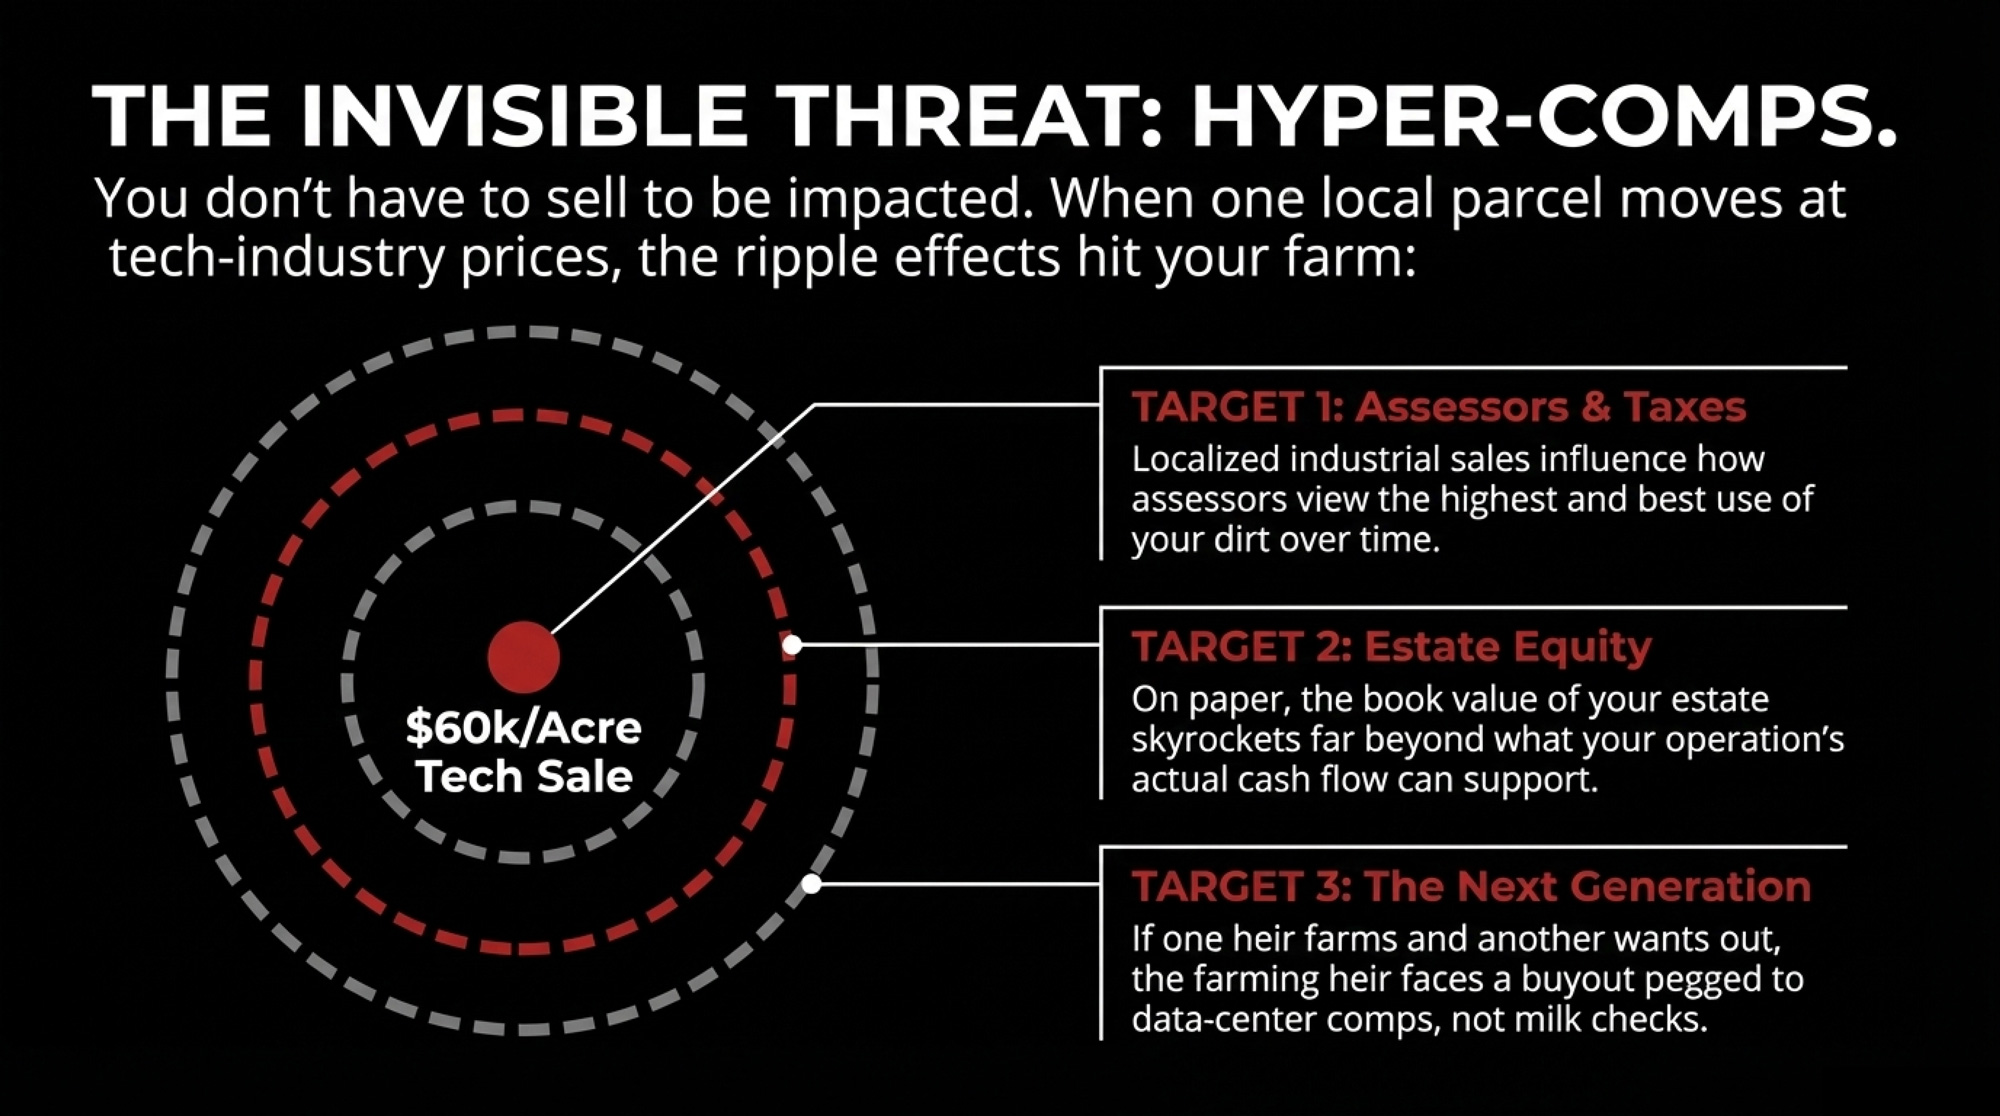
Kentucky has an agricultural use-value system for property tax, where cropland assessments are based on capitalized rental income and typically work out to a few hundred dollars per acre, not full market value. That helps keep annual tax bills in line with what the ground earns. It doesn’t stop eye-popping industrial sales from influencing how your lender, your non-farming heirs, or a future buyer thinks about what the place is “worth.”
Even with use-value on the tax rolls, assessors and boards still see those comps, and over time that can change how they think about “updating” values.
On paper, the book value of your estate can jump far beyond what your operation’s cash flow supports.
If only one heir wants to farm and the others want a buyout, that farming heir could be staring at buyout numbers pegged to data-center comps, even though the ground still only earns like farmland.
When families like the Huddlestons and the Grossers refuse these offers, the ripple goes beyond their own payouts — it also shapes whether their kids or grandkids inherit land that’s still valued as farmland, or land priced at data-center comps that could force a sale on someone else’s terms.
The result, whether they’d frame it this way or not, is that they’re preserving a future where farming stays on the table for the next generation — even though it means walking away from a number that would solve a lot of short-term problems.
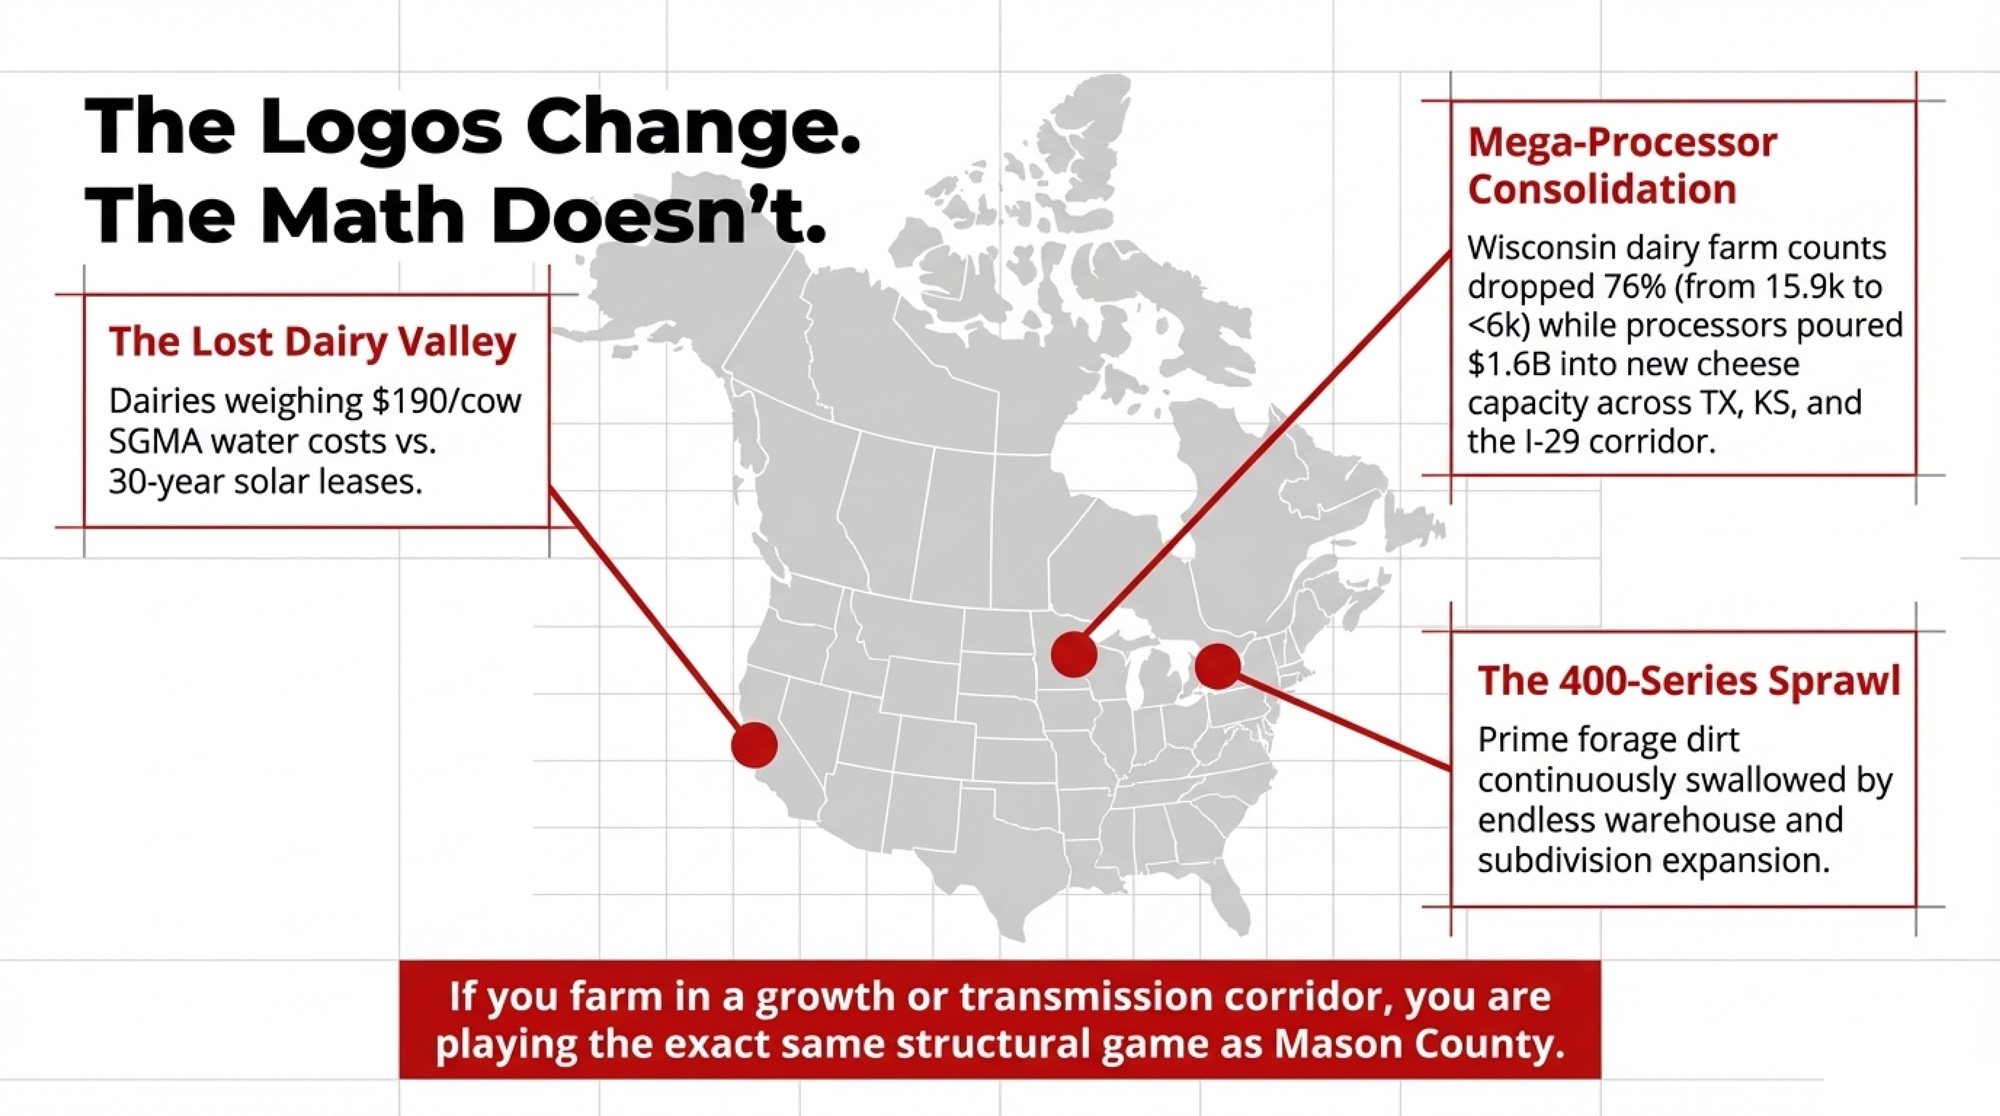
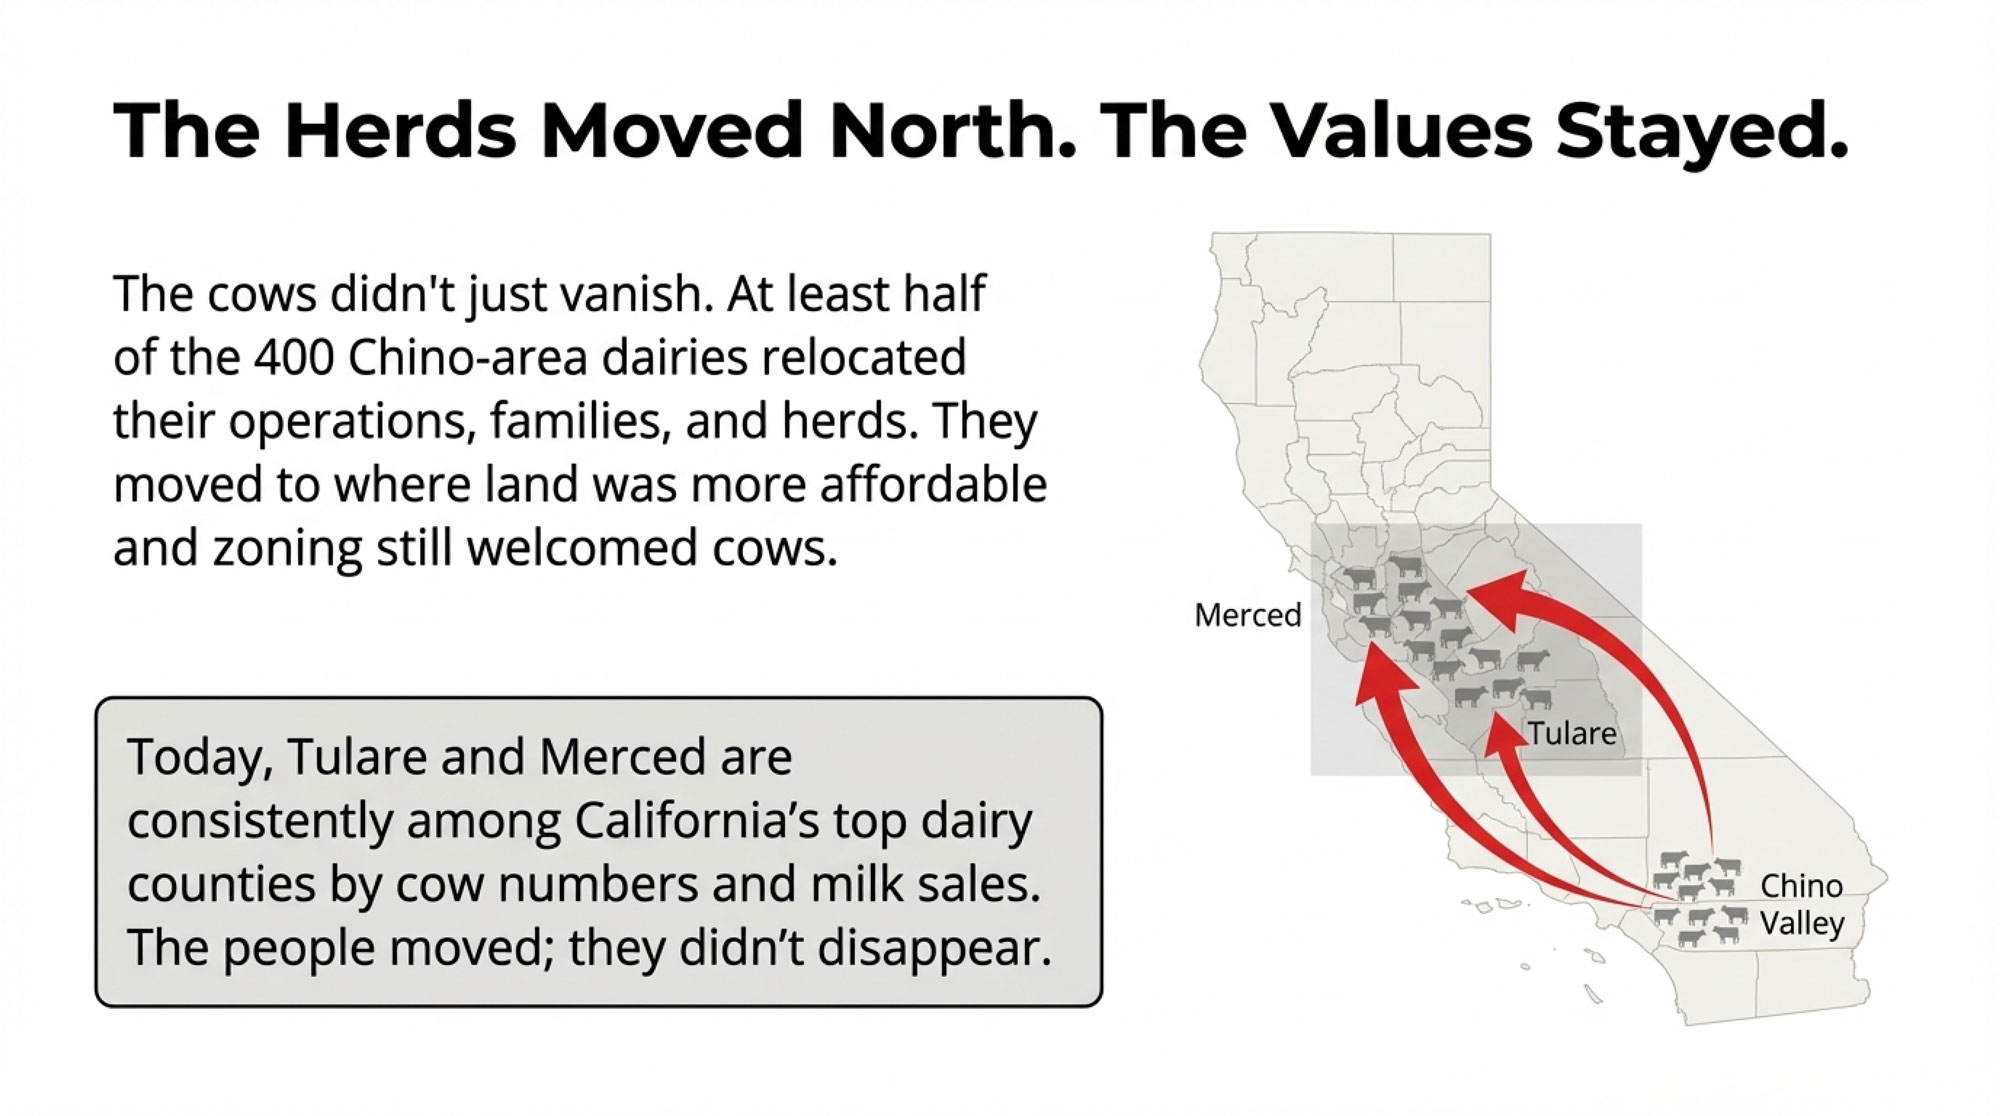
If you’ve got land in any kind of growth or transmission corridor — the I‑29 and I‑35 corridors, California’s Tulare and Kings counties, the Snake River plain, the I‑5/99 belt, or the outer rings of major Canadian cities — you’re in the same structural game. The names and logos change. The math doesn’t.
In California, dairies in what some now call the “Lost Dairy Valley” have already had to weigh roughly 0‑per‑cowSGMA water costs against 30‑year solar leases — and some concluded the land was worth more as someone else’s energy platform than as their own forage base.
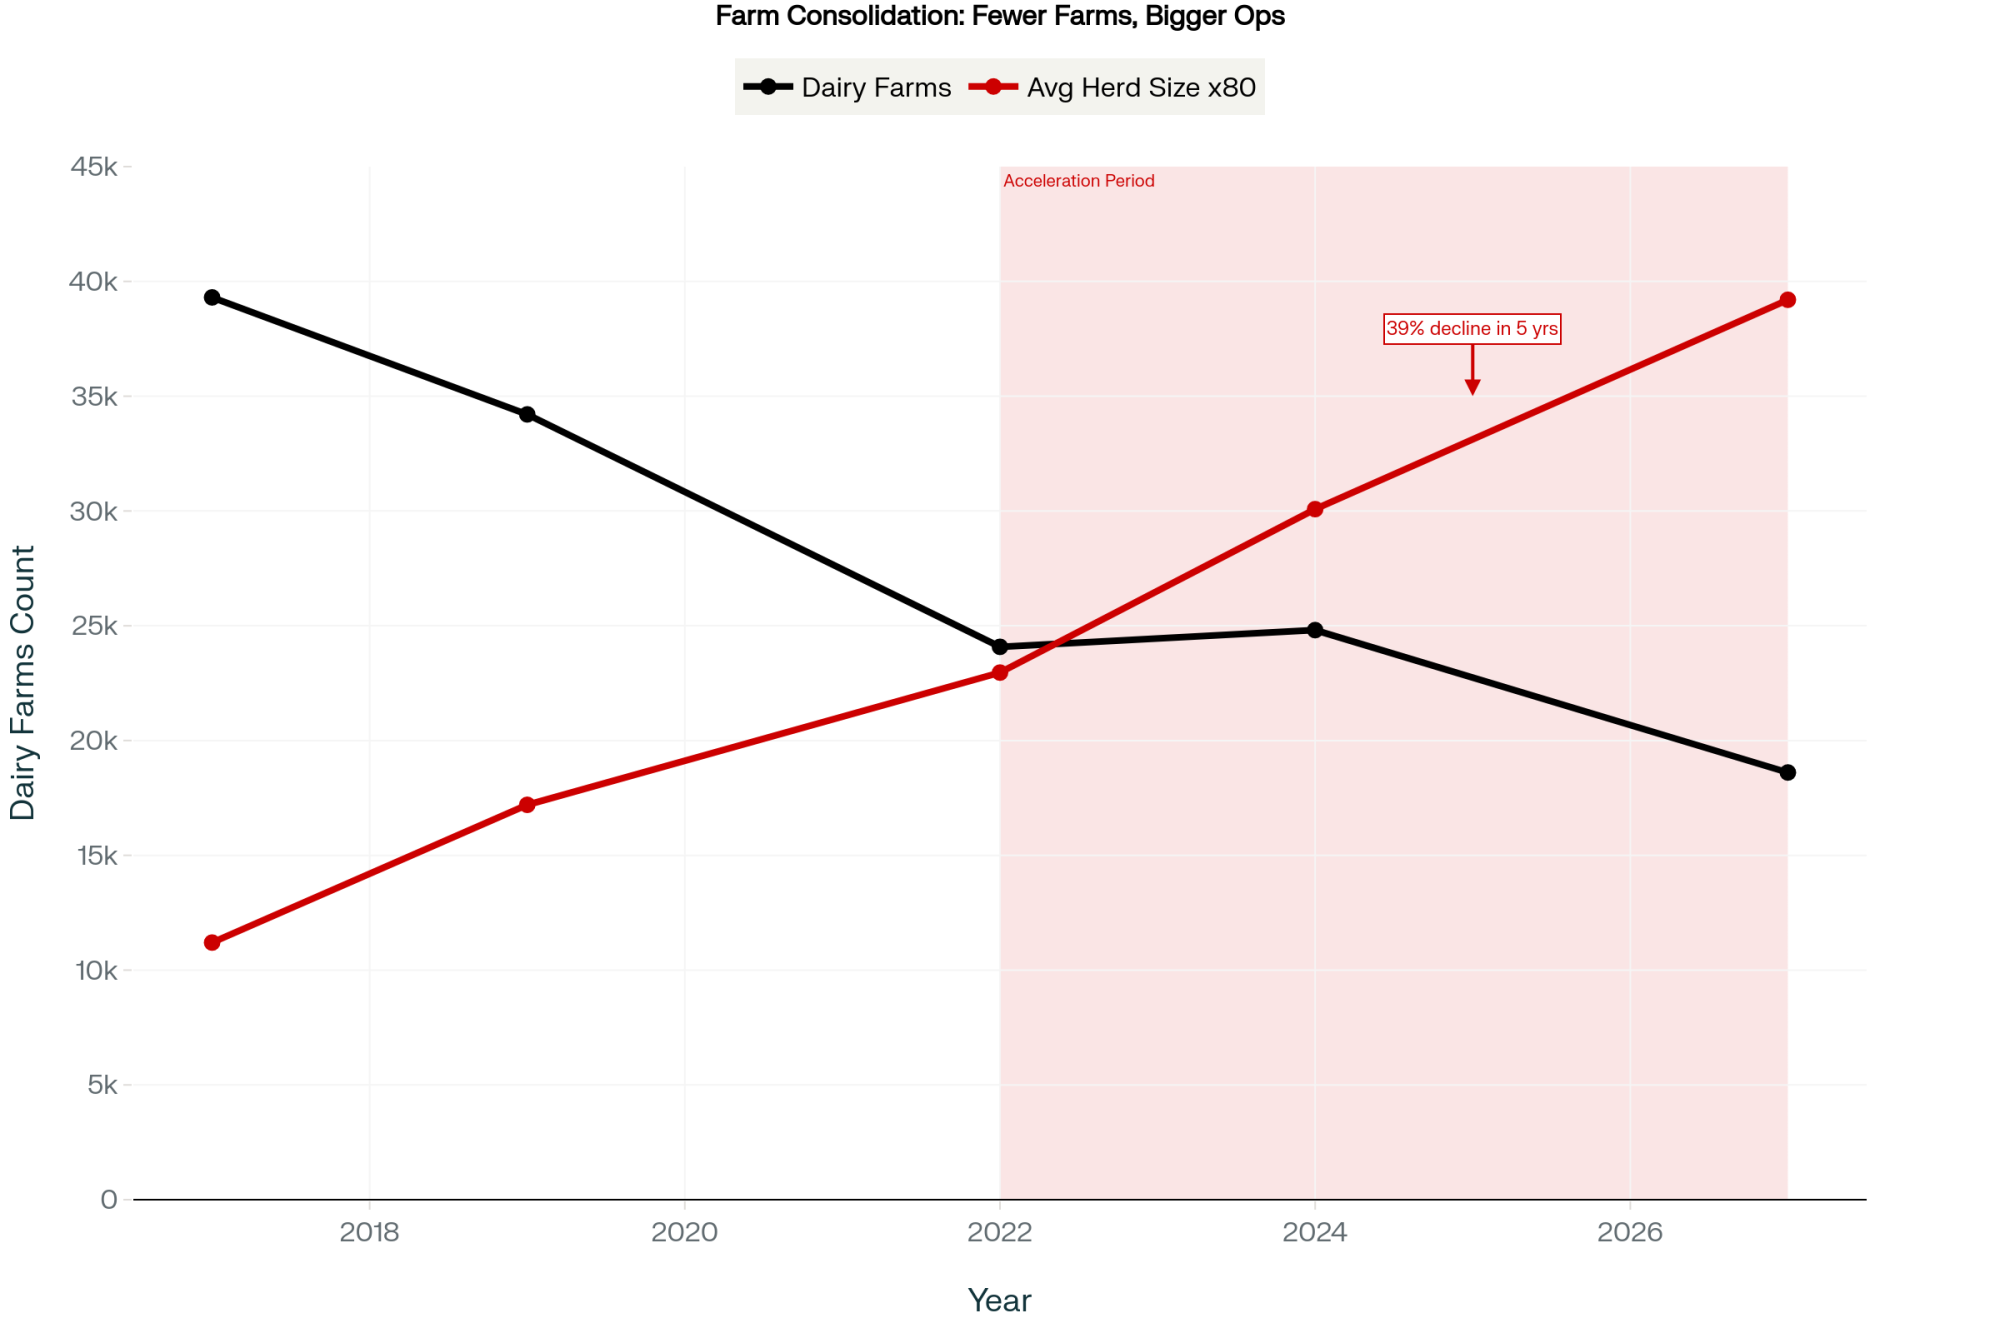
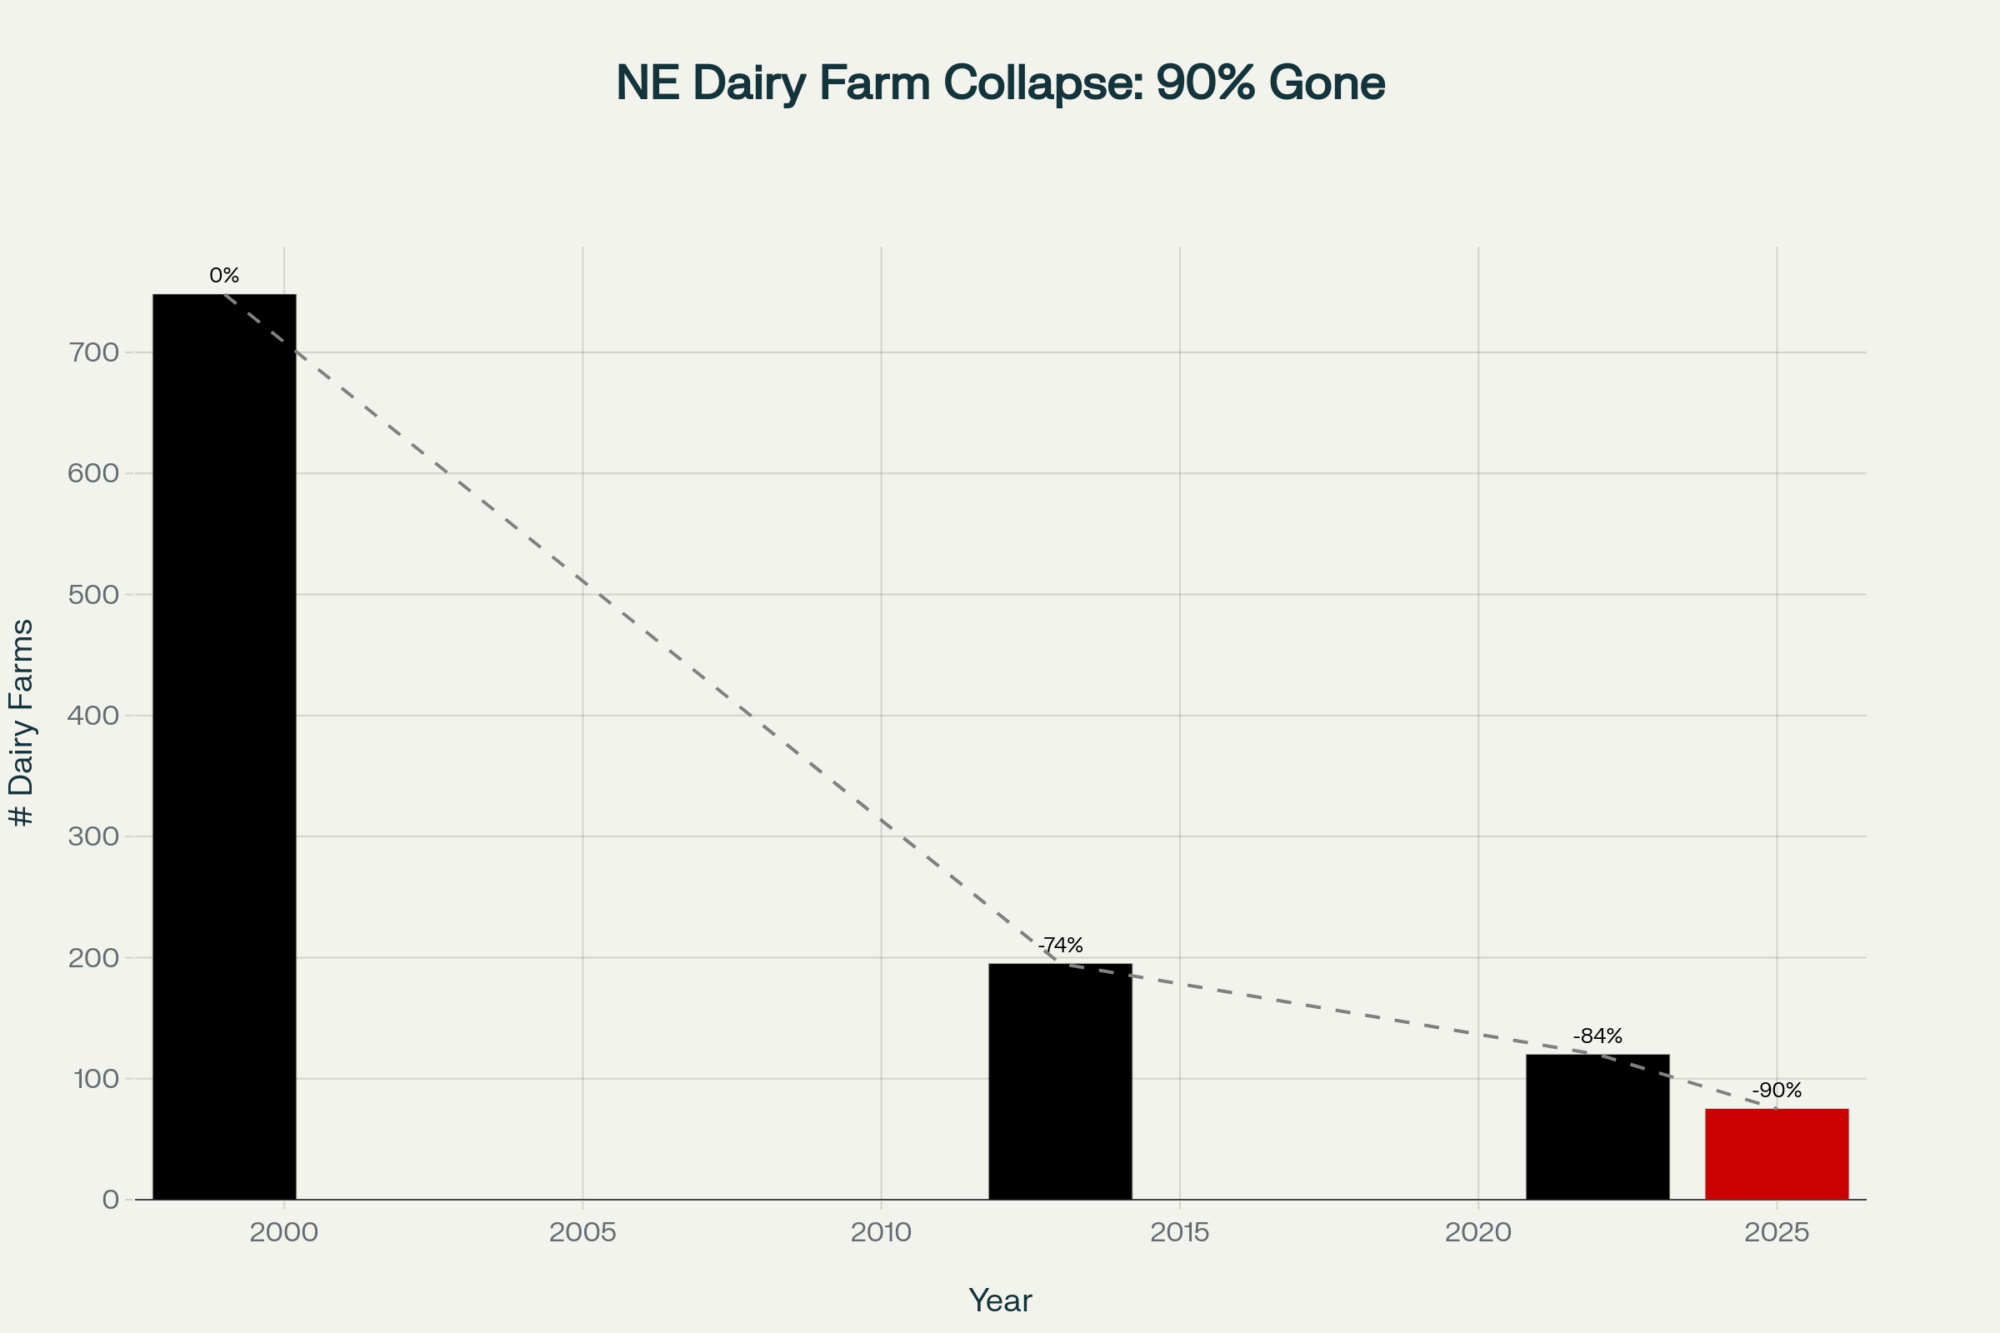
In Wisconsin and the Upper Midwest, processors like Hilmar, Leprino, and Valley Queen have committed about $1.6 billion in new cheese capacity across Texas, Kansas, and the I‑29 corridor since 2020, according to prior Bullvine analysis and company announcements. Over the same stretch, Wisconsin’s dairy farm count fell from more than 15,900operations to fewer than 6,000, a drop of roughly 76% driven by consolidation, labor, and processing pull.
If you’re milking in the northern edge of the GTA — places like Vaughan, Caledon, or Bradford — you’ve watched good dirt along the 400‑series corridors disappear under warehouses and subdivisions. You don’t need an AI logo to know how fast the math can flip under your boots.
The Kentucky story adds AI data centers to that list. The real question isn’t “Would I sell?” It’s “Have we done enough math and paperwork that, if an offer comes, our answer doesn’t blow up the family?”
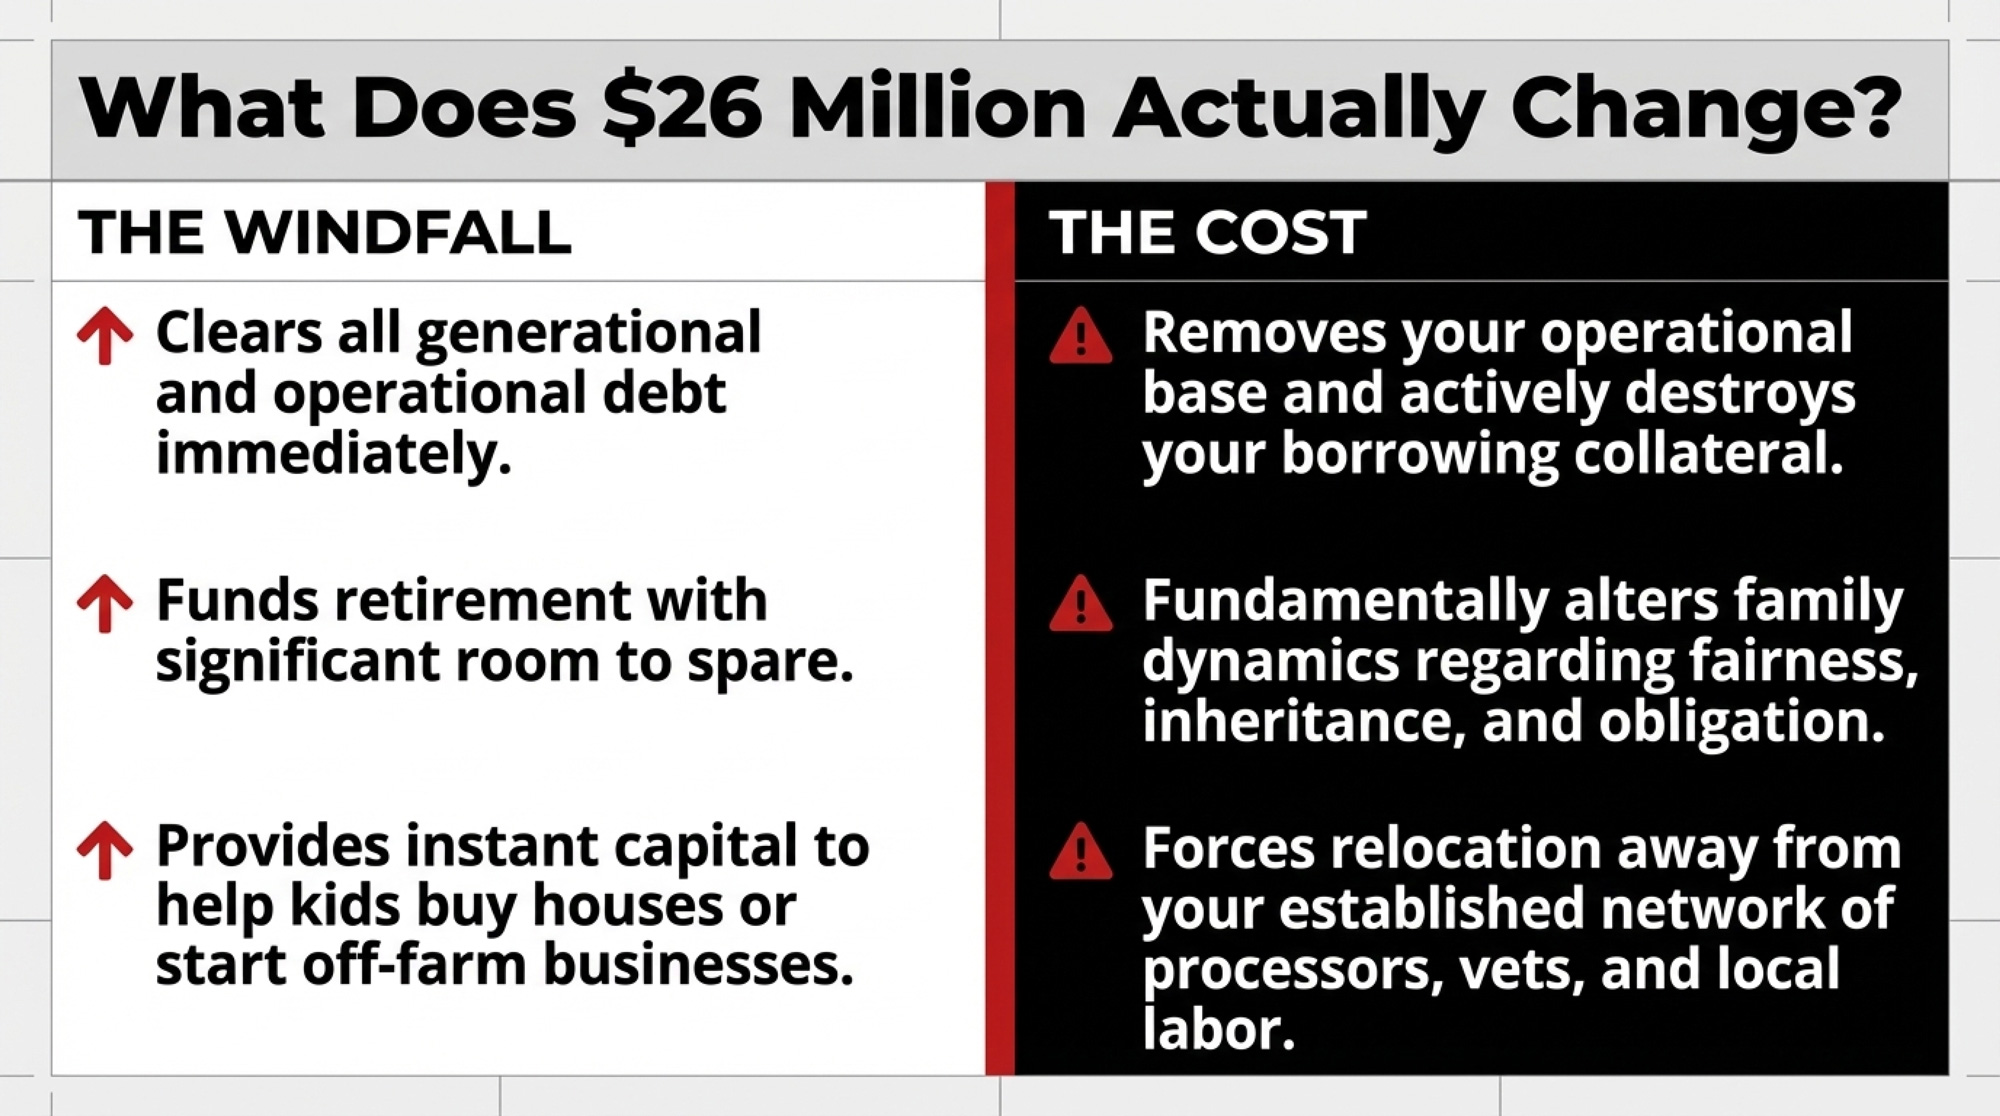
What Does $26 Million Really Change for Your Operation?
At one level, it’s obvious. A check in the eight figures:
Clears debt.
Funds retirement with room to spare.
Lets you help kids buy houses, go to school, or start their own businesses.
But it also:
Removes your operating base and, in many cases, your collateral.
Changes how your family thinks about fairness, inheritance, and obligation.
Might take you away from a region where your network, processors, and help are.
That’s why the barn-math in the last section matters. If your place looks anything like the Huddleston/Bare situation, an AI-style offer doesn’t just tilt the scales. It flips them.
The harder part is deciding whether you want to live in the world on the other side of that decision — and whether your current estate plan gives the next generation any chance to answer that question on their own terms.
What Are Your Real Options If a Developer Shows Up?
You don’t get to pick whether a data center, warehouse, or solar farm wants your neighborhood. You do get to decide how prepared you are when their rep calls. Practically, you’ve got three real paths.
Decision Path
Best Fit For
Key Requirement
Financial Signal
Biggest Risk
Hold — Keep Producing
At least one heir wants to farm; manageable debt load
Written family agreement + updated estate plan using ag-use valuation
Farm net: ~4k–4k/yr on 534 ac
Creeping tax pressure as industrial comps arrive nearby
Full Exit — Cash Out
No farming heirs; already near a planned exit window
Concrete reinvestment plan + tax/legal advice before signing
Passive: ~.325M/yr at 5% on .5M
Loss of operating identity; starting over in a new region at 50+
Map-level analysis of feed, manure, expansion impact + lender review
Hybrid: debt cleared + partial passive income stream
Boxed in between non-ag neighbours; manure/silage haul complaints
Do Nothing / Ignore
—
—
—
Hands all decisions to someone else, usually on a bad day
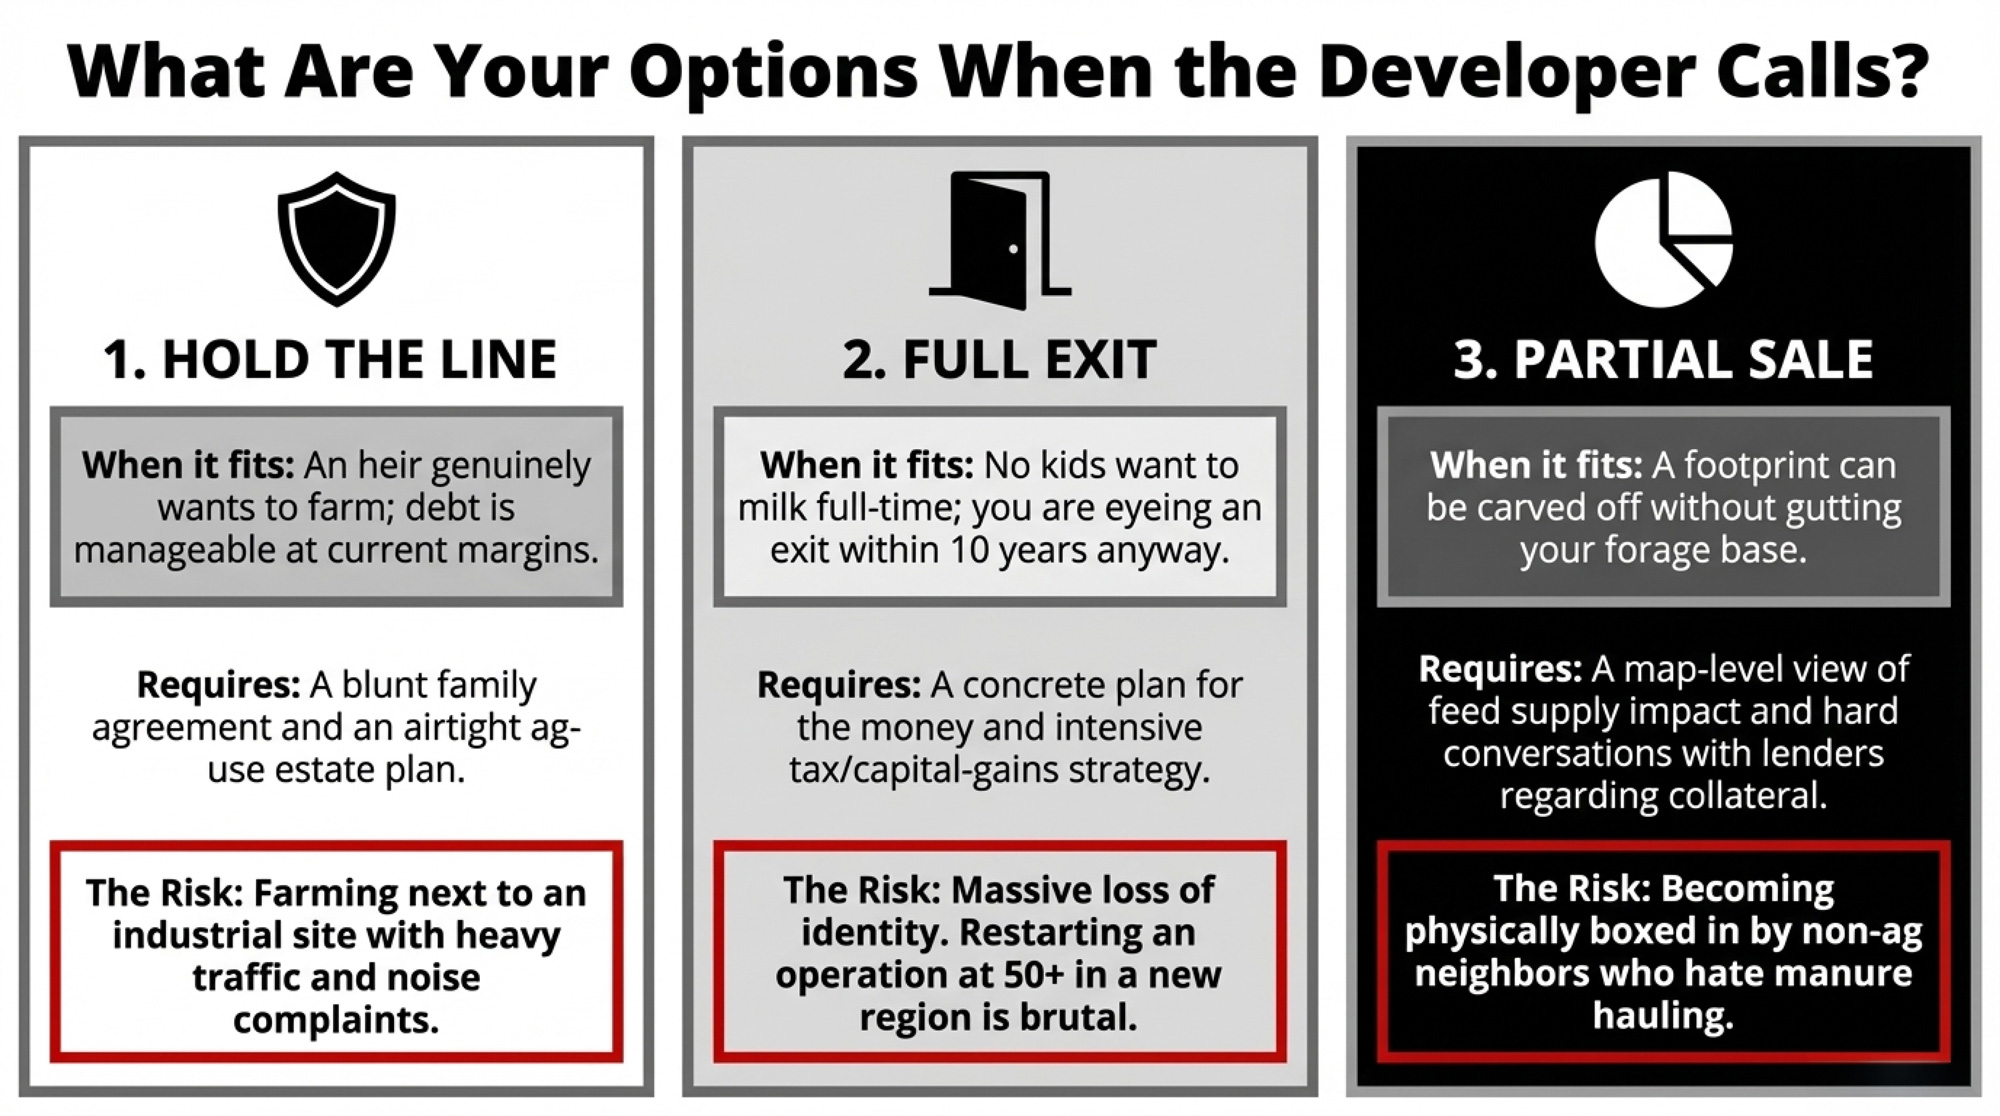
1. Hold the line and keep producing
When it makes sense:
At least one heir genuinely wants to farm.
Your debt is manageable at current margins.
No per‑acre number anyone can write feels worth trading away the place.
What it requires:
A blunt family meeting where everyone agrees that below a certain number, you’re staying, and understands what that means for future buyouts, lifestyle, and retirement timing.
An estate plan that uses current‑use or ag‑use valuation tools where they exist and doesn’t leave heirs scrambling if nearby land sells high.
Risks and limits:
Property taxes and political pressure can still creep up as industrial projects arrive in the county.
You may end up farming next to an industrial site with heavier traffic and neighbors who don’t share farm‑country expectations about noise, manure, or late‑night lights.
2. Take a full exit and restart on your own terms
When it makes sense:
None of your kids or key family members want to milk or farm full‑time.
Your own numbers already have you eyeing an exit in the next decade.
The offer clearly exceeds what you’d reasonably earn from operating another 20–30 years on the same acres.
What it requires:
A concrete plan for where the money goes — debt settlement, retirement, a smaller place, off‑farm business, investments — not just “we’ll figure it out.”
Tax and legal advice before signing; long‑held land comes with capital‑gains and estate questions you don’t want to discover after closing.
Risks and limits:
Once you sell, you’re not a producer anymore. For people who built their identity around the farm, that’s a bigger shock than any interest‑rate change.
Moving to cheaper land in a new region means new markets, weather, rules, and community. Starting over at 50+ isn’t simple.
3. Partial sale or conversion — keep farming on fewer acres
When it makes sense:
The proposed site can be carved off one side without gutting your forage base or your core facilities.
The proceeds can fund debt retirement, facility modernization, or the purchase of replacement ground that has better cash flows.
What it requires:
A map‑level view of how losing those acres affects feed supply, manure management, and any long‑term expansion you were planning.
Hard conversations with your lender about how they view a farm that’s now part dirt, part liquid assets, and what that does to covenants and collateral.
Risks and limits:
You could end up boxed in between non‑ag neighbors and an industrial load, where hauling manure or silage turns into complaint calls to the county.
Replacement land that’s further out adds trucking time, fuel, and weather risk into a system that might already be running tight.
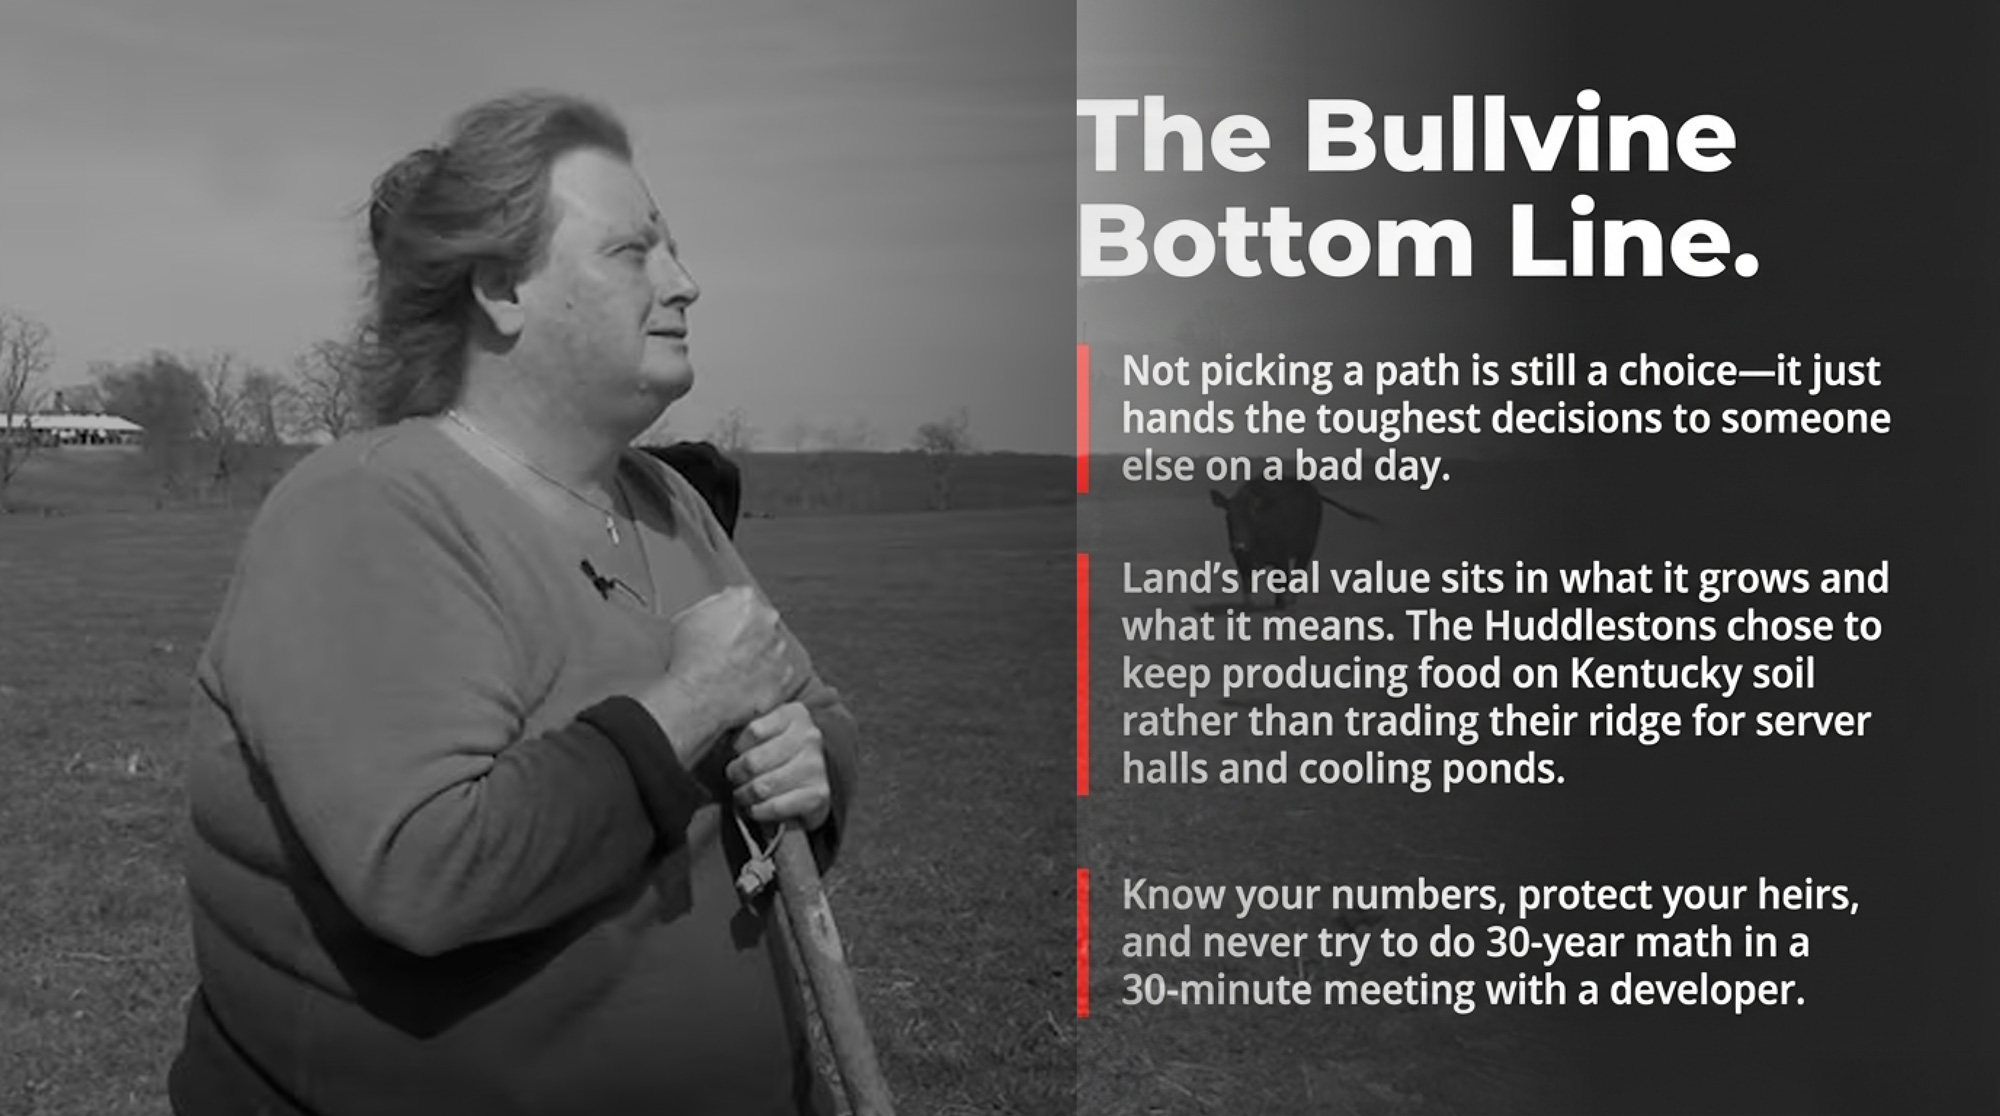
Not picking a path — not looking at fair‑market and ag‑use values, not updating your estate plan, not talking to your heirs — is still a choice. It just hands the toughest decisions to somebody else, usually on a bad day.
As you watch your own area, pay attention to forward‑looking signals:
New transmission lines or substation plans are hitting county maps.
Utility filings talking about a “large industrial load” or “data center.”
Land signs on neighboring farms with unfamiliar LLC names instead of local families or operations.
Each one is someone else already doing the math on your neighborhood.
Options and Trade-Offs for Farmers
Do this within 30 days.
Pull your county’s planning and zoning agendas, plus your power co‑op or utility filings. Search specifically for “data center,” “technology park,” or “solar” within about 10 miles of your home.
Call your accountant or estate attorney and ask one simple question: “If land around me sold for $50,000 an acre next year, what would that do to my taxes and my estate plan?”
Within 90 days
Get both a fair‑market appraisal and an agricultural‑use appraisal on your ground. The gap between those two numbers is the same pressure the Huddlestons and the Grossers are staring at — and you need that gap on paper.
Sit down with your advisor and update your estate documents so they match today’s land reality, not the values you were carrying 15 years ago.
Within 365 days
If you’re in any growth or transmission corridor, put a written family agreement in place about if, when, and at what per‑acre number you’d even consider a non‑ag sale. It doesn’t lock anyone in. It just keeps your kids from having their first real conversation about it at the lawyer’s office.
Key Takeaways
If any serious offer on your land comes in at several times recent farm‑land sales in your county, treat it as a strategic decision that affects your heirs — not a side conversation — and run the barn‑math both ways before you say a word.
If you’ve got more than one heir and only one wants to farm, assume high‑value industrial comps will make future buyouts far more expensive, and bake that into your estate plan now with written agreements — not just good intentions.
If you decide you’ll “never sell,” back that conviction with paperwork: a current appraisal, a use‑value tax strategy where available, and an updated will or trust so your kids aren’t trying to manage big‑number assessments on a farm‑income business model.
If you’re already seeing power‑line upgrades, rezoning, or new tech projects within 10 miles, treat that as your 30‑day clock to check local filings, talk to your advisor, and start a family conversation — before someone else writes a number on your kitchen table for you.
The Bottom Line
Based on what Bare and Huddleston have told reporters, their answer, for now, is simple: land’s real value sits in what it grows and what it means, not just what someone’s willing to pay to pave it. They’ve chosen to keep producing food on Kentucky soil instead of trading their ridge for eight‑figure passive income backed by server halls and cooling ponds.
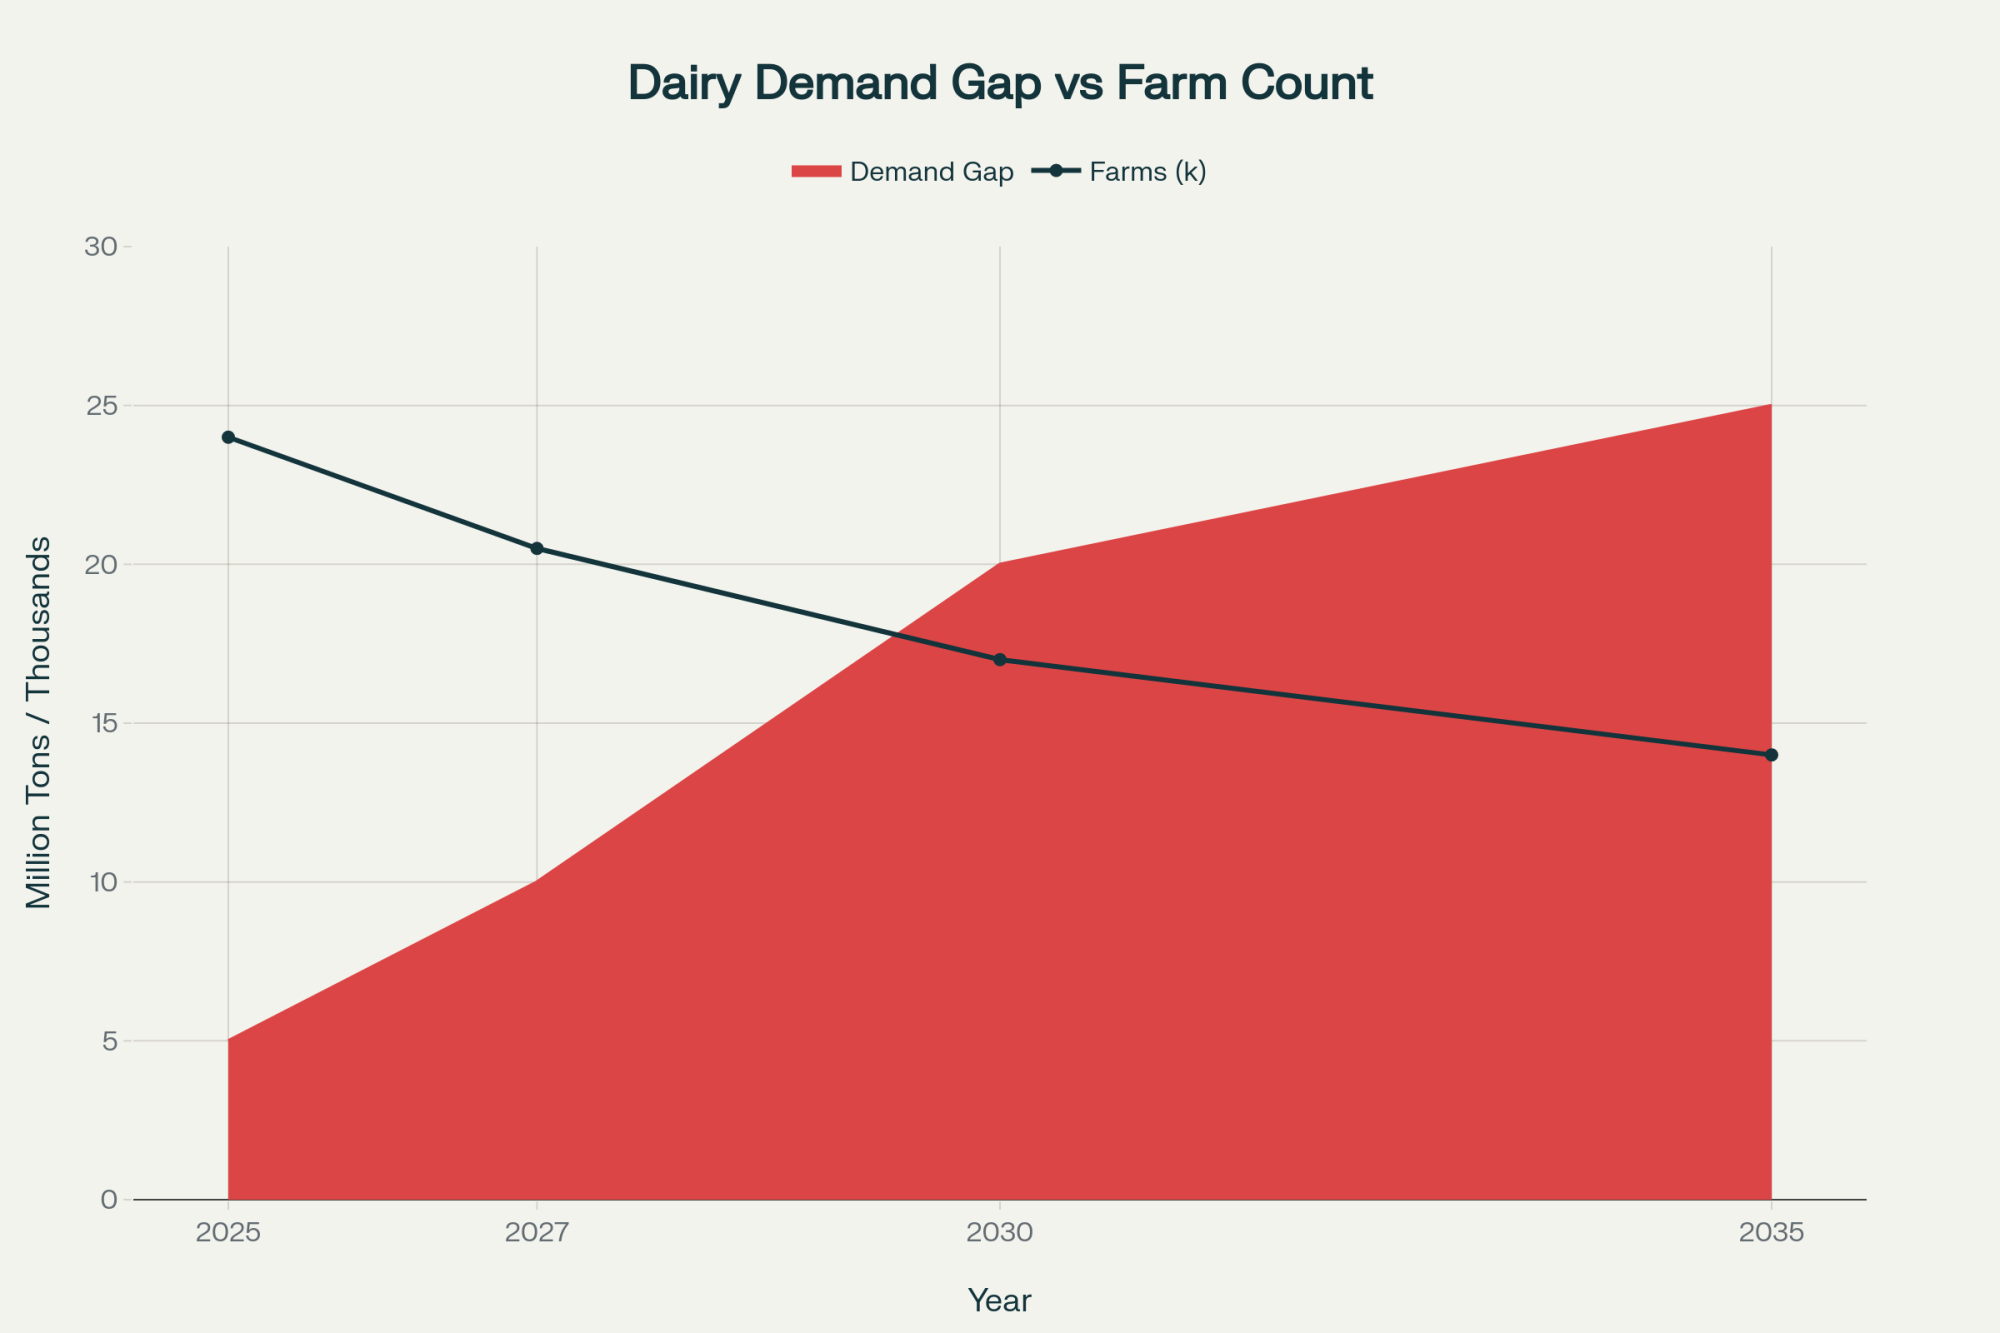
You don’t have to make the same call. But you should know your own numbers well enough that if a Fortune 50 company offered you eight times your current land value tomorrow, you wouldn’t be trying to do 30‑year math in a 30‑minute meeting. If you want the deeper economics — the full SGMA water‑vs‑solar math in California or the structural Dairy Curve that’s shrinking U.S. operations toward 10,000 by 2035 — dive into our Tier 2 and Tier 3 follow‑ups and make sure you’re getting the Bullvine Weekly so those playbooks land in your inbox, not just your feed.
Then ask one more question at your own kitchen table: what’s the real “make‑me‑move” number for your home farm — and have you actually told your heirs, or are you leaving them to guess when the offer shows up?
Complete references and supporting documentation are available upon request by contacting the editorial team at editor@thebullvine.com.
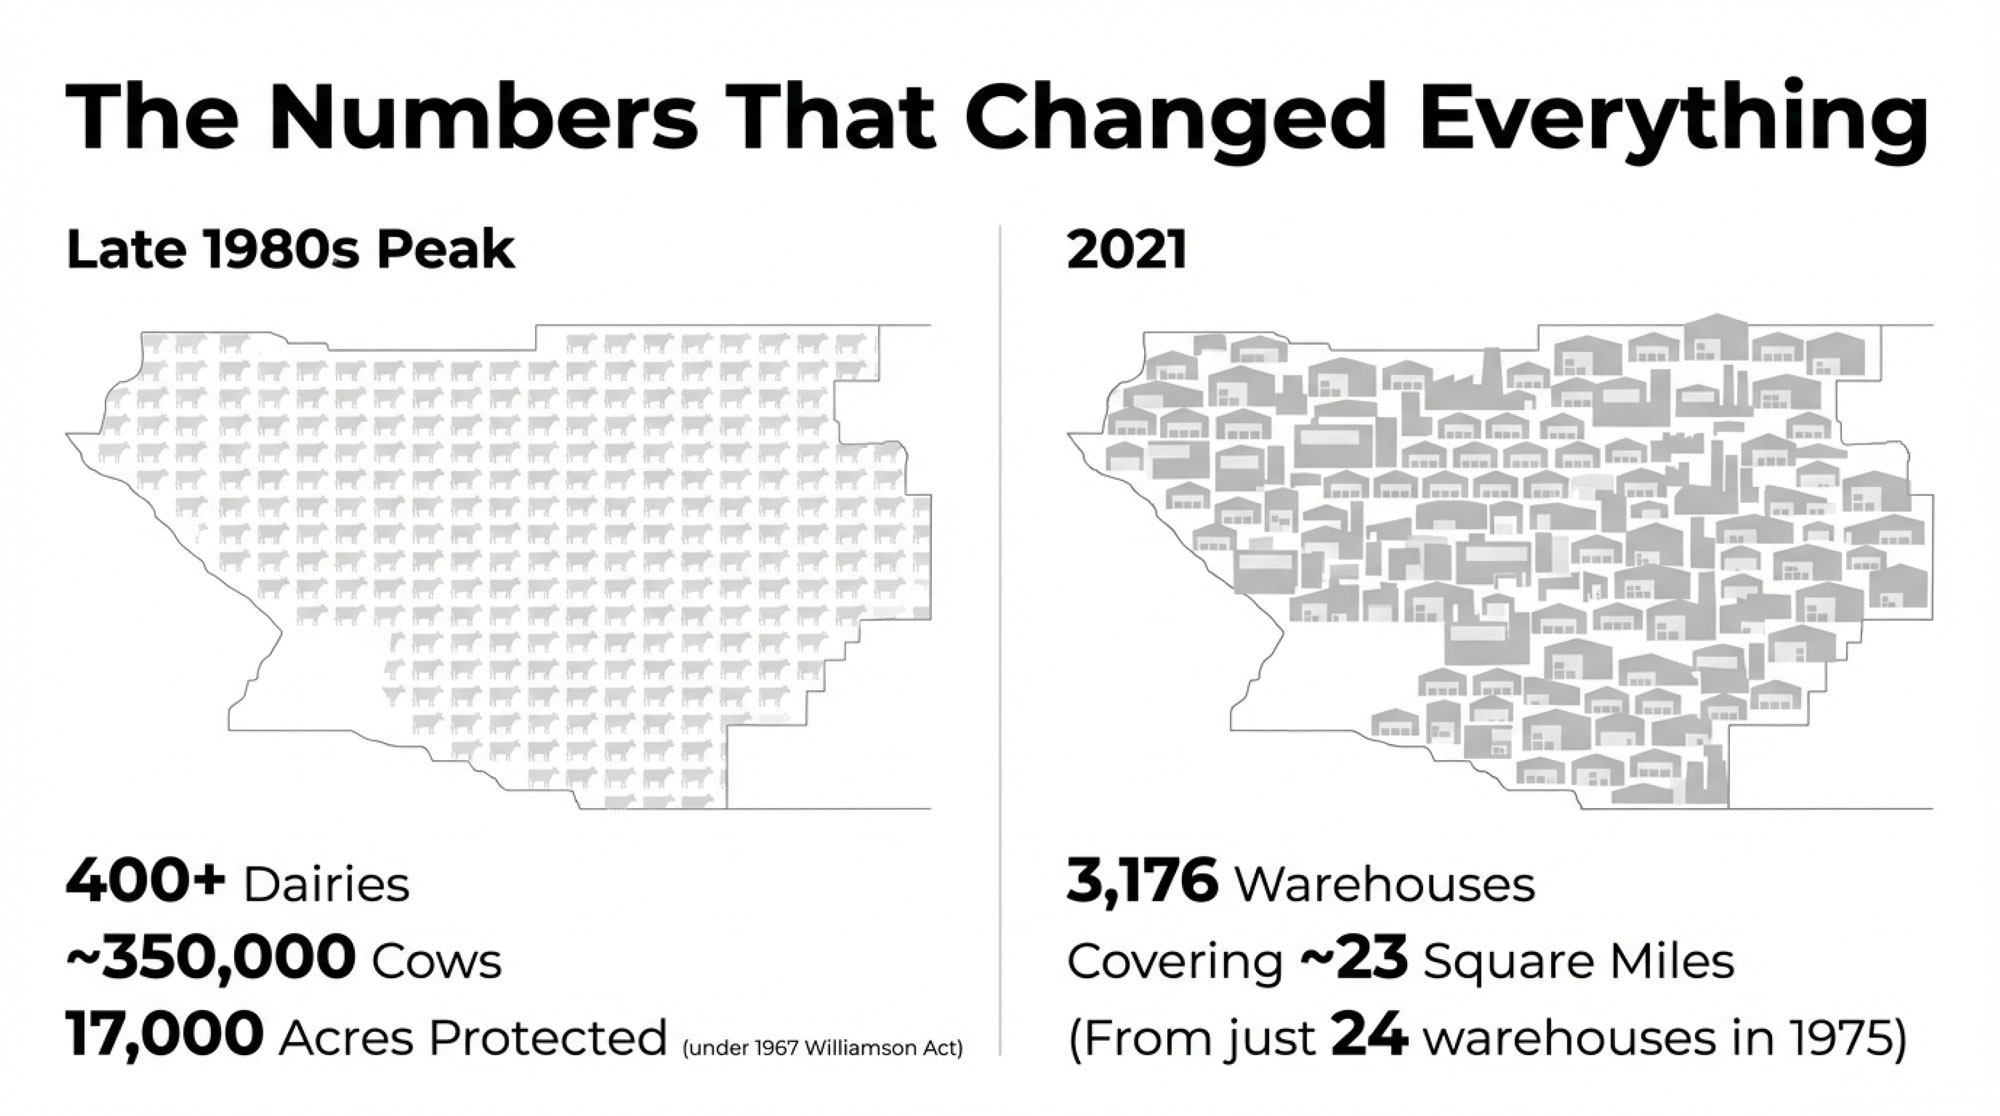
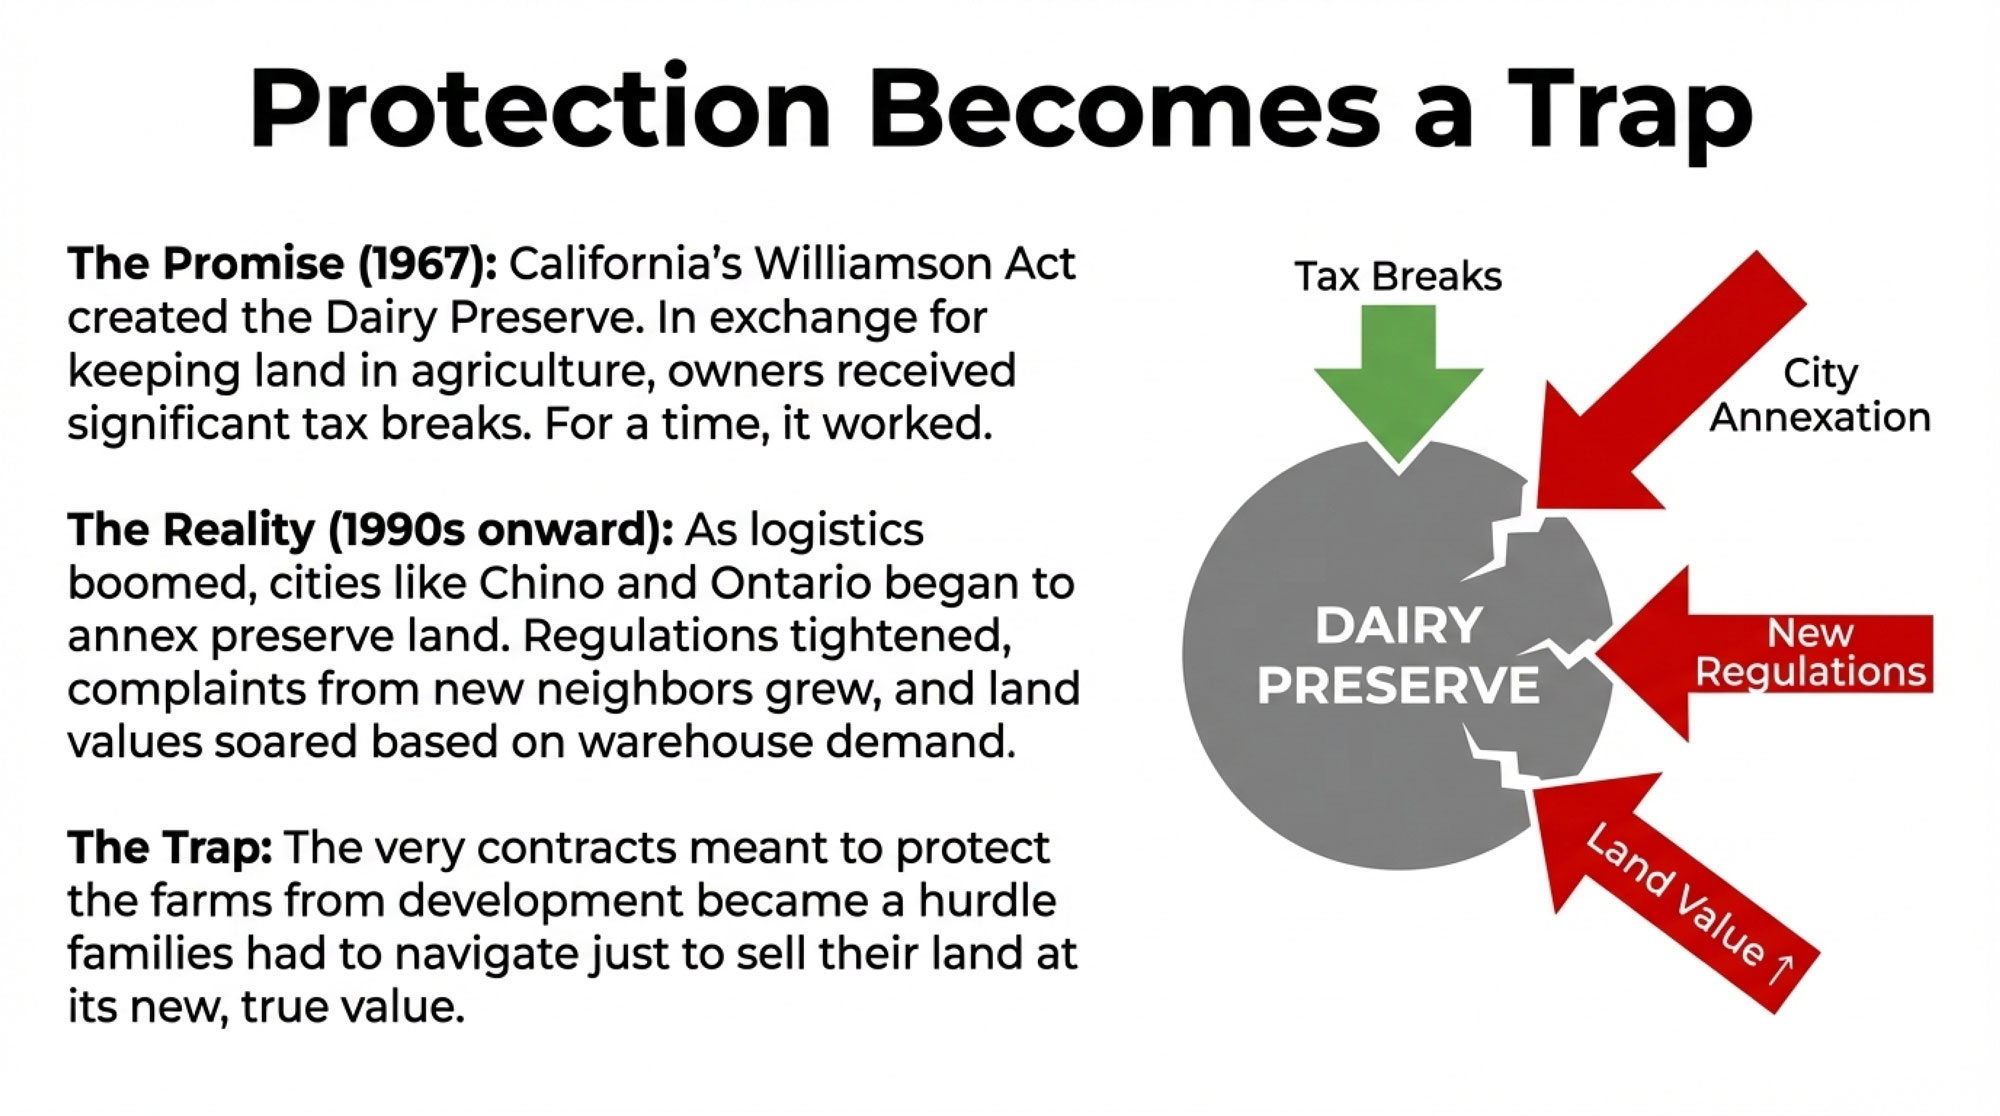
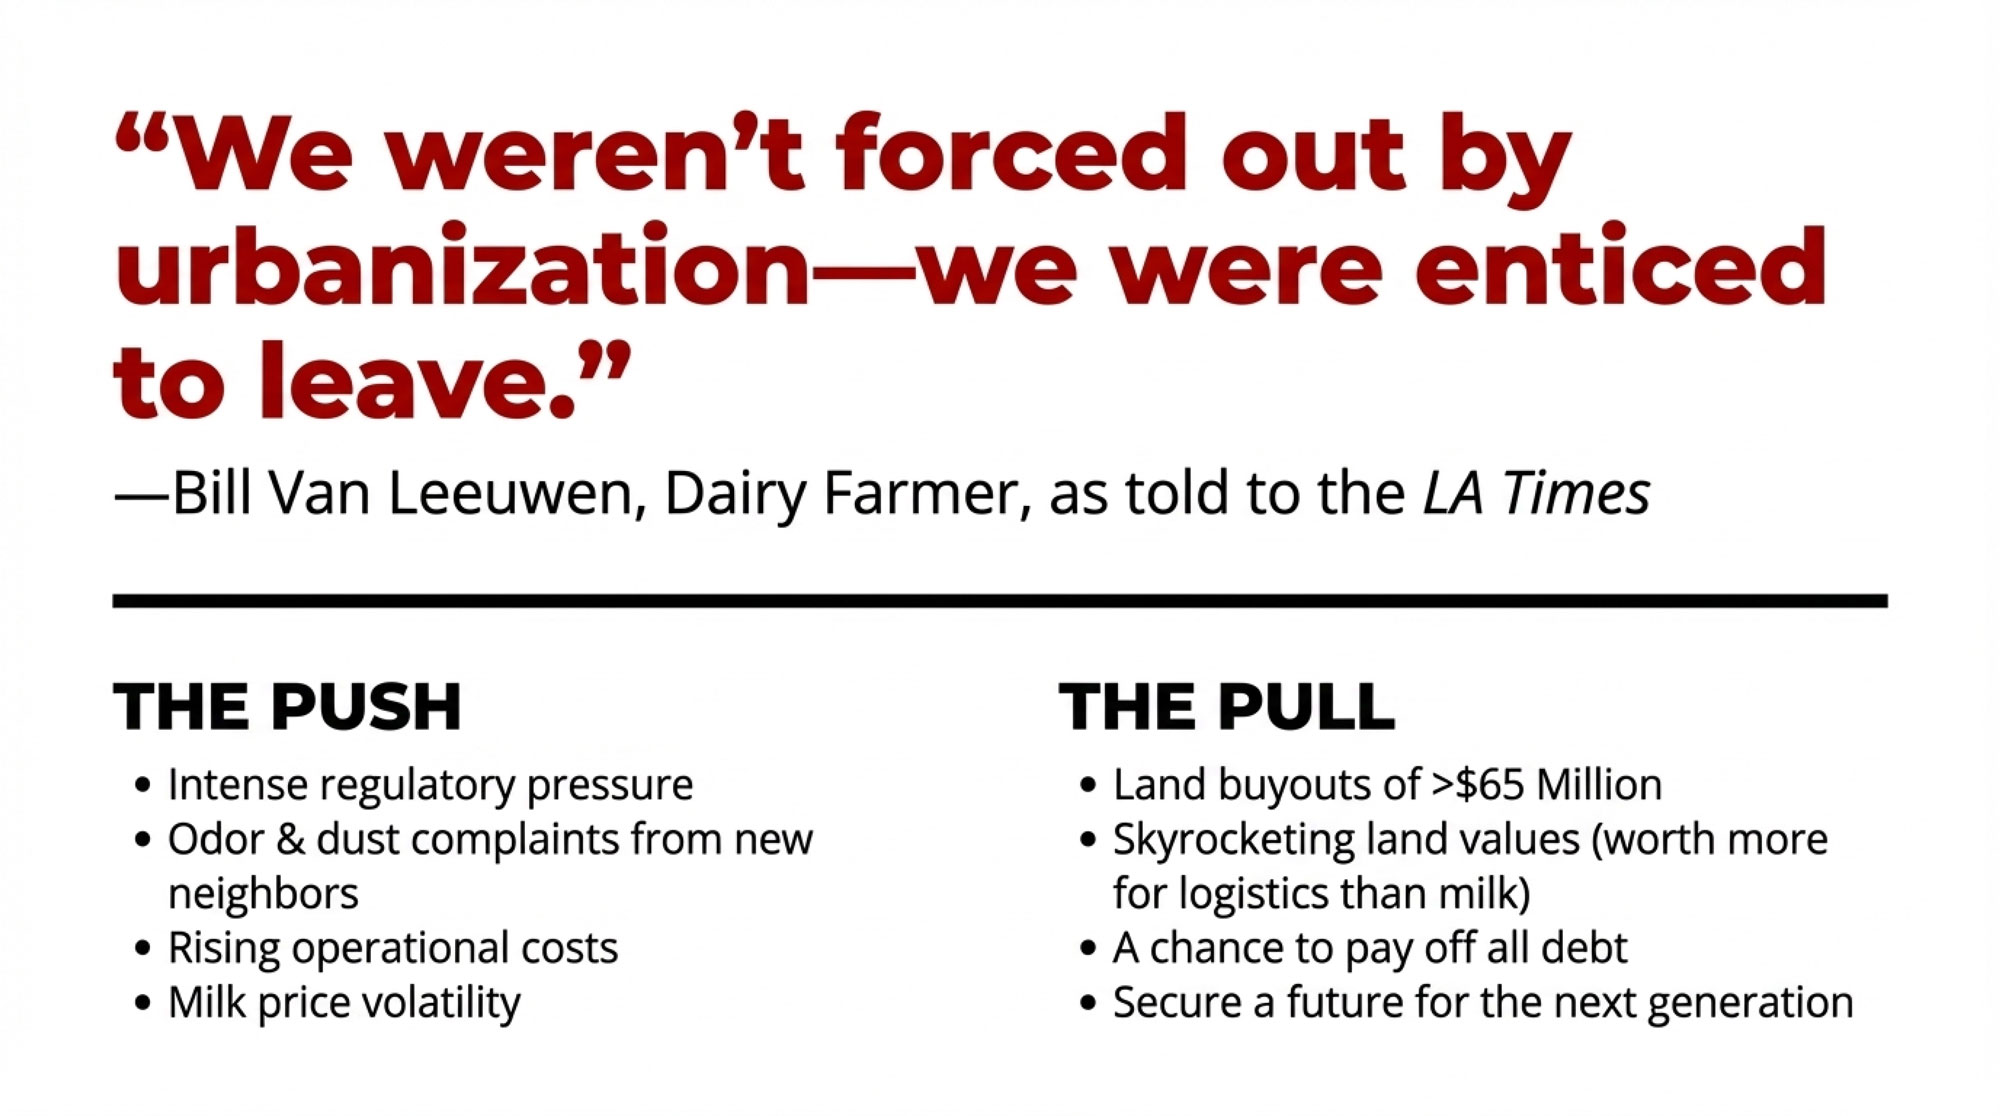
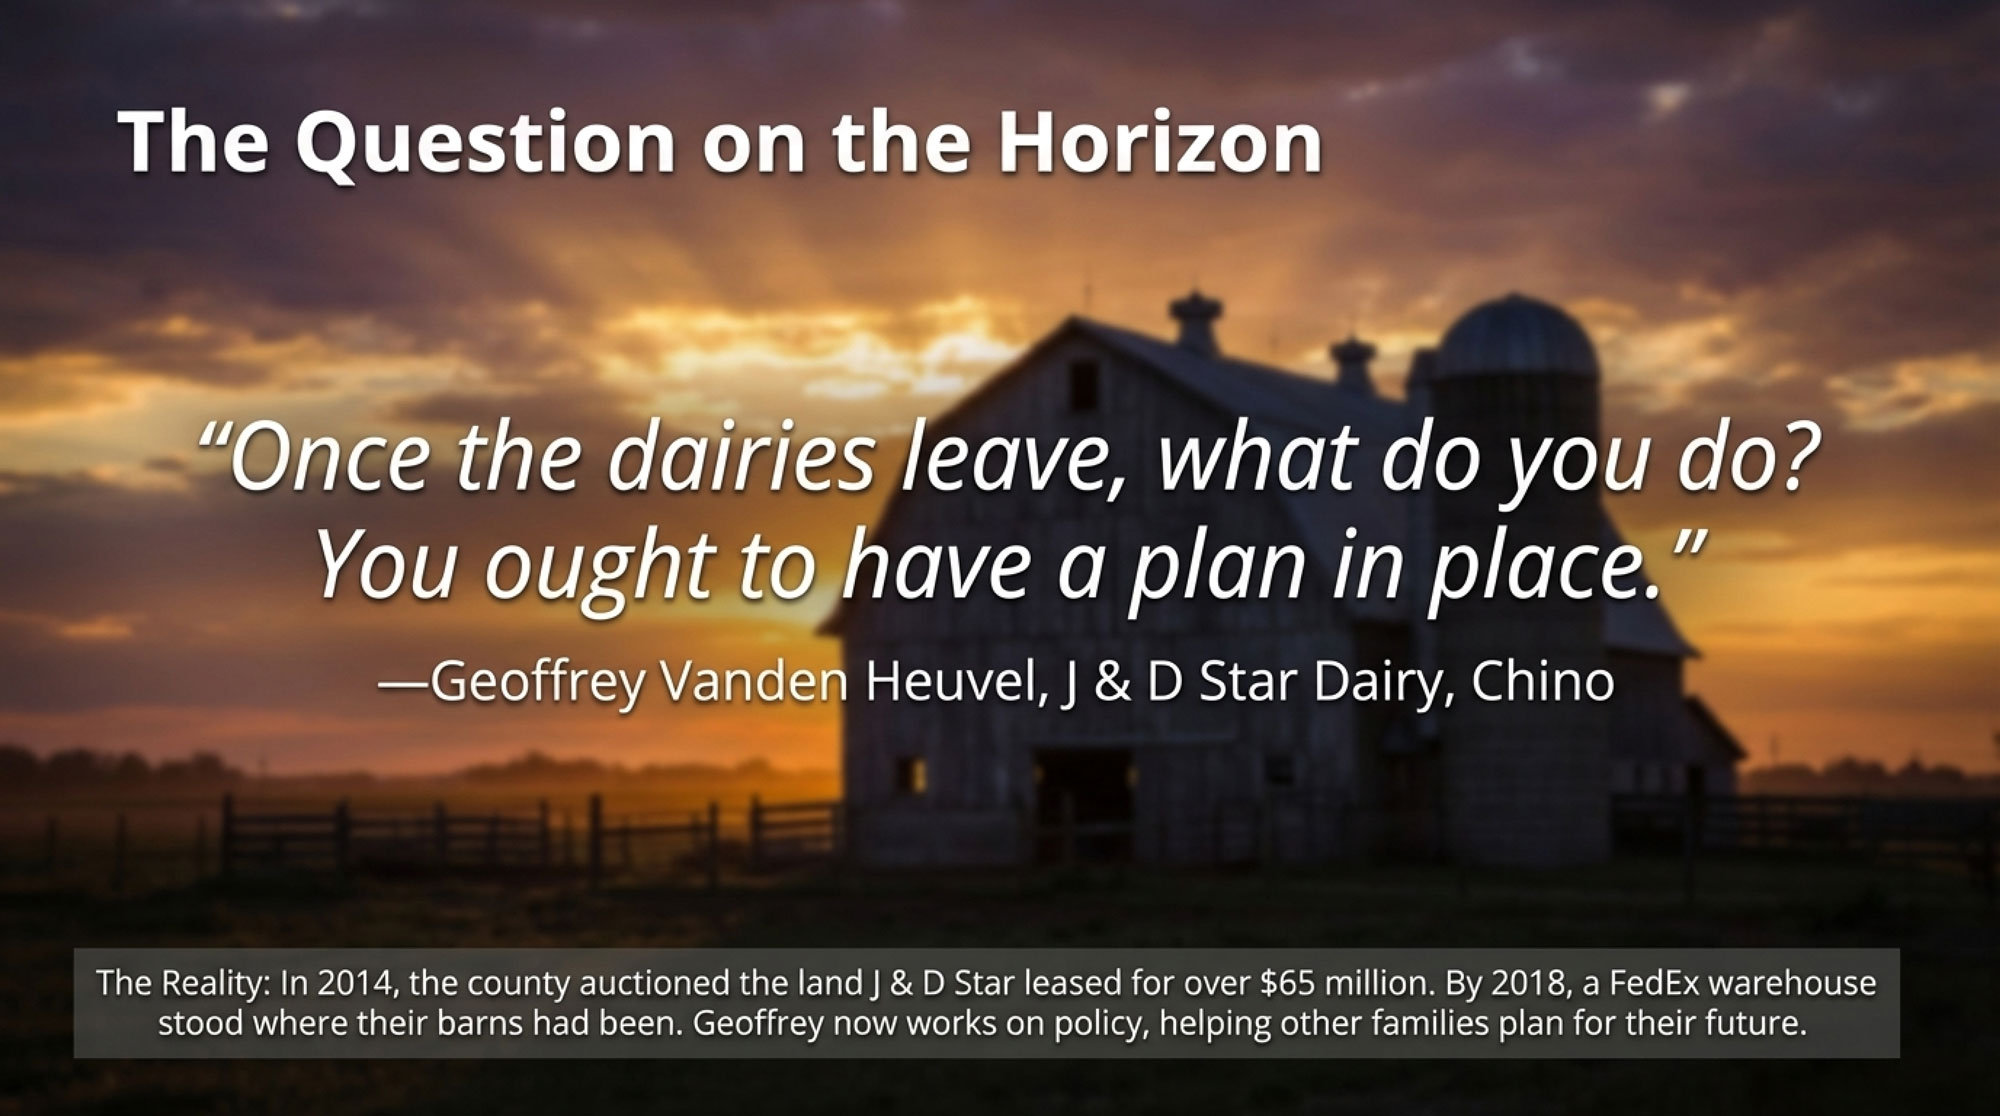
When Land Is Worth More Than Milk in California’s Lost Dairy Valley – Navigate land-value wake-up calls with a kitchen-table framework used by families who watched 17,000 acres vanish into logistics. This case study delivers the courage to protect your legacy, whether in the barn or elsewhere.
The Sunday Read Dairy Professionals Don’t Skip.
Every week, thousands of producers, breeders, and industry insiders open Bullvine Weekly for genetics insights, market shifts, and profit strategies they won’t find anywhere else. One email. Five minutes. Smarter decisions all week.
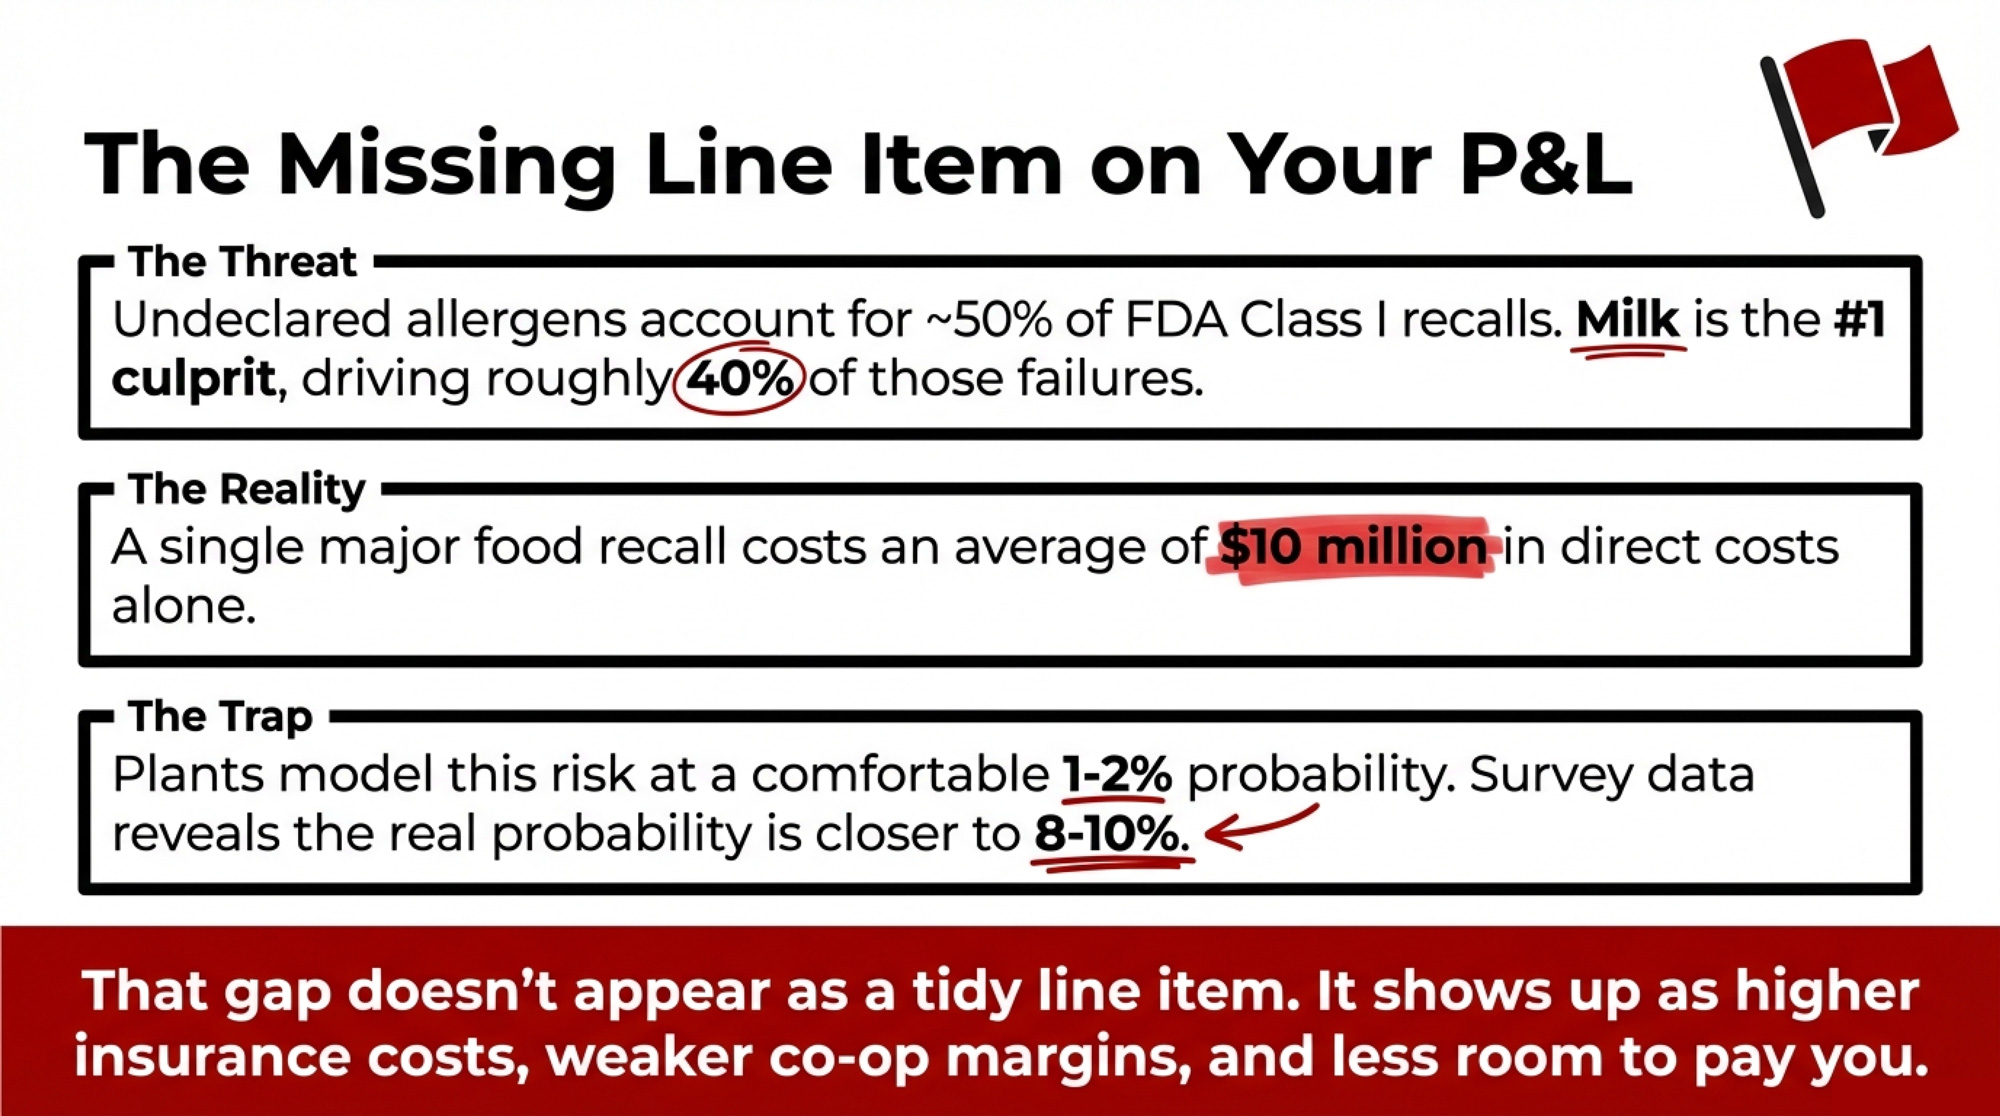
Your plant may be modeling a $100K recall risk. The real odds point to $800K — and roughly $2,000 per cow quietly baked into your milk check.
Executive Summary: Dairy’s allergen recall problem isn’t just a QA issue — it’s an invisible $2,000‑per‑cow risk that can end up baked into your milk check. Industry data puts the average direct cost of a food recall near $10 million, and undeclared allergens now account for almost half or more of FDA Class I recalls, with milk the single most commonly undeclared allergen. Many plants still model recall probability at 1–2%, but survey‑based numbers point closer to 8–10%, turning what looks like a $100,000 exposure into an $800,000 hit on a single high‑mix line supplied by about 400 cows. That gap doesn’t appear as a tidy line item; it shows up as higher insurance costs, weaker co‑op margins, and less room to pay you on components or volume. The story follows Ontario processor Mark Leduc and co‑op director Janet as they confront this math, run a targeted cleaning‑validation pilot on one yogurt line, and use real near‑miss data to renegotiate with insurers, customers, and their own board. You finish with a 30/90/365‑day playbook and specific questions to ask your plant and co‑op — from “What recall probability are we actually modeling?” to “Who pays if an in‑plant allergen failure triggers a $10 million recall?”
On paper, Mark’s 500‑cow supply base looks solid heading into 2026. Volumes are steady, co‑op contracts are locked, and the private‑label yogurt and ice cream runs are full. The allergen recall risk sits off to the side — until it doesn’t.
The $250 vs. $2,000 Per Cow Recall Gap
Before you get lost in SOPs and swab types, it helps to see the recall gap at a glance. This is the difference between the old “1–2% recall” rule of thumb and what more recent recall and survey data actually suggest for complex, multi‑allergen plants.
Industry and trade‑group analyses built on work from the Grocery Manufacturers Association and Food Marketing Institute often peg the average direct cost of a food recall around $10 million per event. At the same time, one published survey of food businesses with allergen plans reported that, while almost all respondents said they had a plan, roughly two in five still had at least one allergen‑related recall in five years. That works out closer to a high single‑digit annual probability than a comfortable 1–2%.
Here’s what that means for a 400‑cow supply block feeding a single high‑risk line:
Scenario
Annual Recall Probability
Average Recall Cost
Expected Annual Loss
Cost Per Cow (400-cow block)
Who’s Paying the Gap
“Rule of Thumb” (Plant Model)
1–2%
$10,000,000
$100,000–$200,000
$250–$500
Insurance premiums (manageable)
Survey Reality (Multi-Allergen Plants)
8–10%
$10,000,000
$800,000–$1,000,000
$2,000–$2,500
Your milk check
The Gap
6–8 percentage points
—
$600,000–$800,000
$1,500–$2,000
Underwritten by co-op members
Those numbers are simple math:
At 1% recall probability, expected annual cost = 0.01 × $10M = $100,000 → $250 per cow across 400 cows.
At 8% recall probability, expected annual cost = 0.08 × $10M = $800,000 → $2,000 per cow across the same 400 cows.
The plant’s profit‑and‑loss statement doesn’t show “,000 per cow allergen risk.” It shows higher insurance premiums, occasional big hits when things go wrong, and thinner margins for the co‑op and its members. If your co‑op owns or supplies that plant, you’re underwriting the difference, whether anyone has written it down or not.
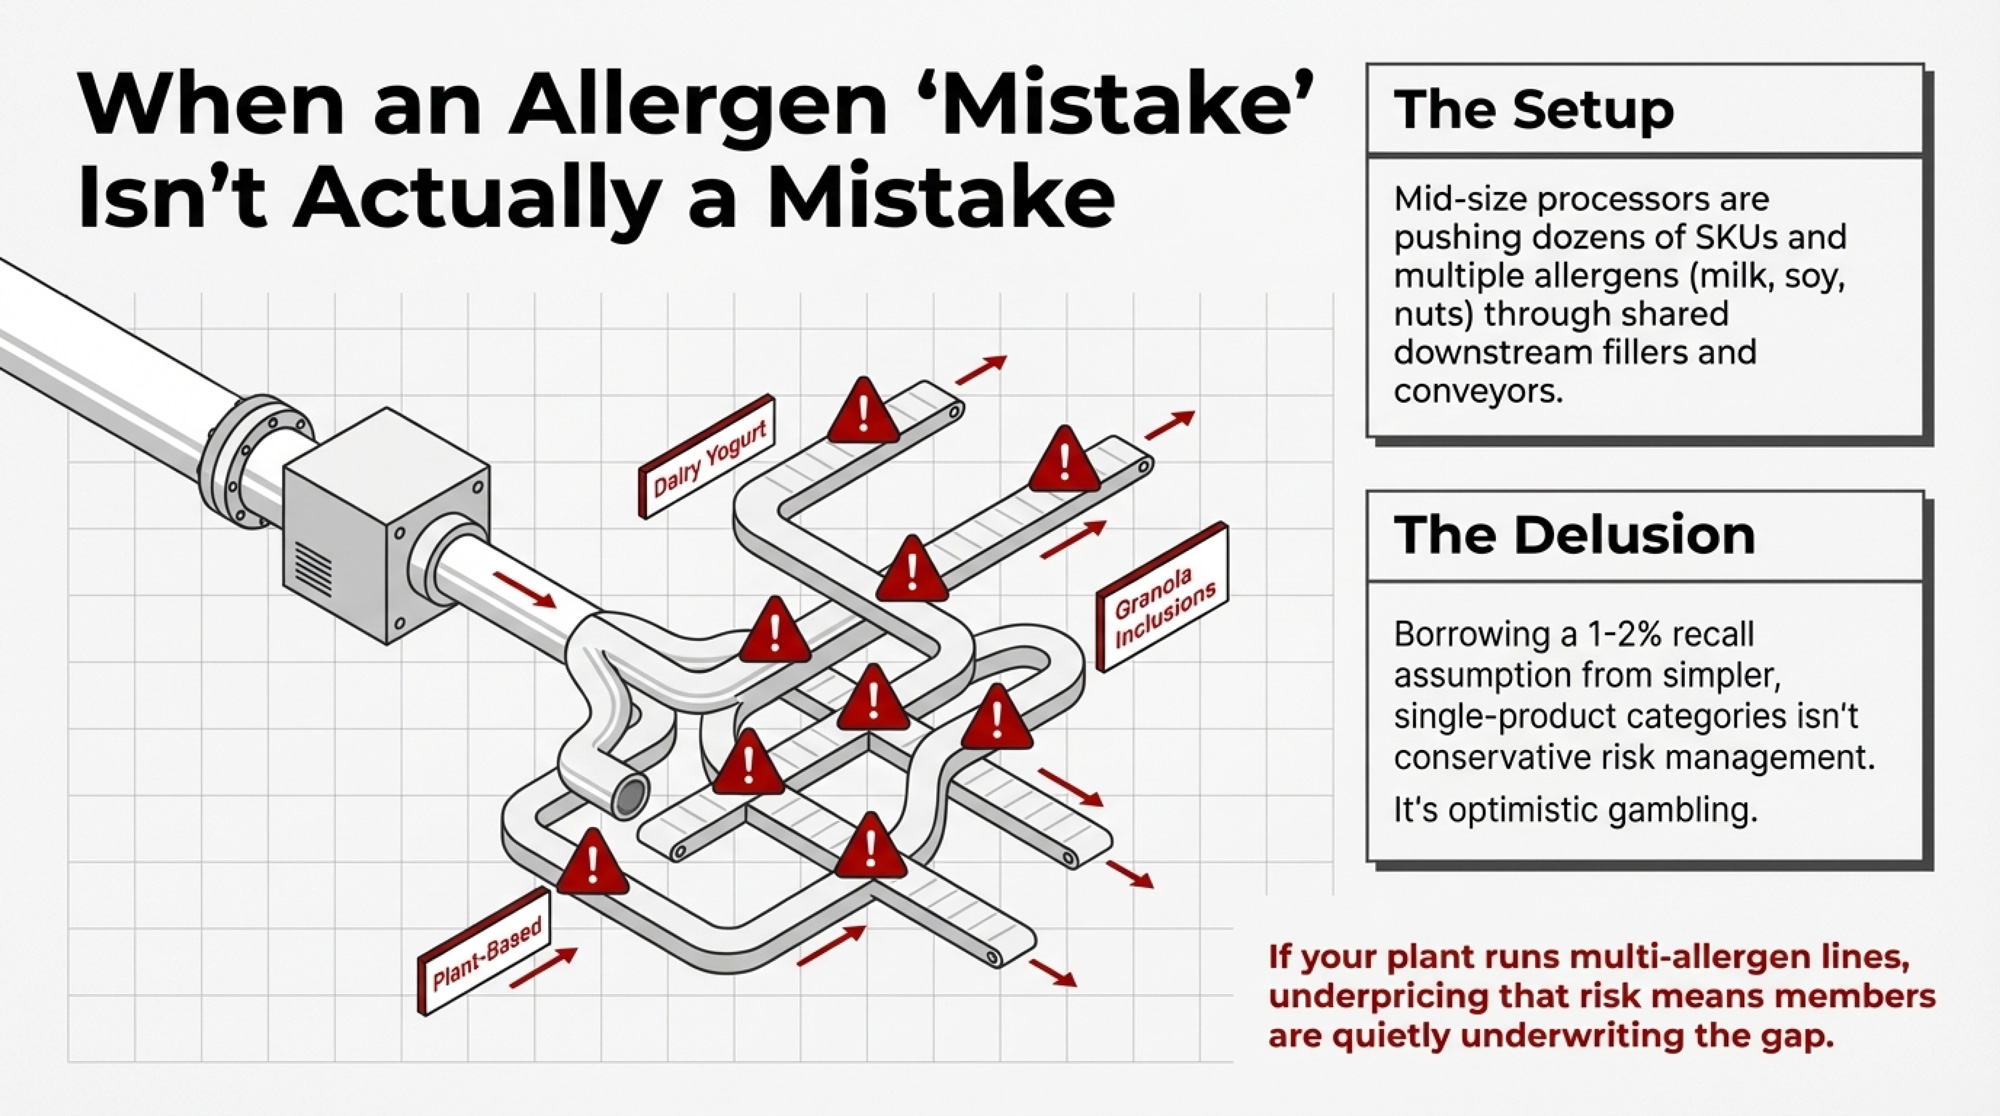
When the Dairy Allergen “Mistake” Isn’t Really a Mistake
Mark did what a lot of mid‑size processors have done over the past decade: he tried to push more SKUs through the same stainless. His highest‑risk yogurt line has all the classic features:
Dozens of SKUs — plain, fruit‑on‑the‑bottom, granola‑topped, high‑protein, kids’ flavors.
Multiple allergens — milk, soy from inclusions, sometimes nuts.
Shared downstream equipment — fillers, conveyors, packaging, and labels touching everything from whole‑milk Greek to “plant‑based” cups.
On the QA whiteboard, the plan looks fine: visual checks, routine cleaning, periodic swabs. On the risk model, the assumption is simple: if the chance of a major allergen recall is 1–2% per year and the average direct cost is about million, the expected annual hit is 0,000–0,000 — uncomfortable but “manageable” with insurance and standard controls.
The reality is harsher. Undeclared allergens have become the leading cause of U.S. food recalls. One Trustwell analysis found that undeclared allergens accounted for 47% of all FDA Class I recalls in 2022 and 63% from January to August 2023. A 2024 review of U.S. recall patterns reported that undeclared allergens helped push total recall counts to a post‑pandemic high, with losses in the billions once direct and indirect costs are included.
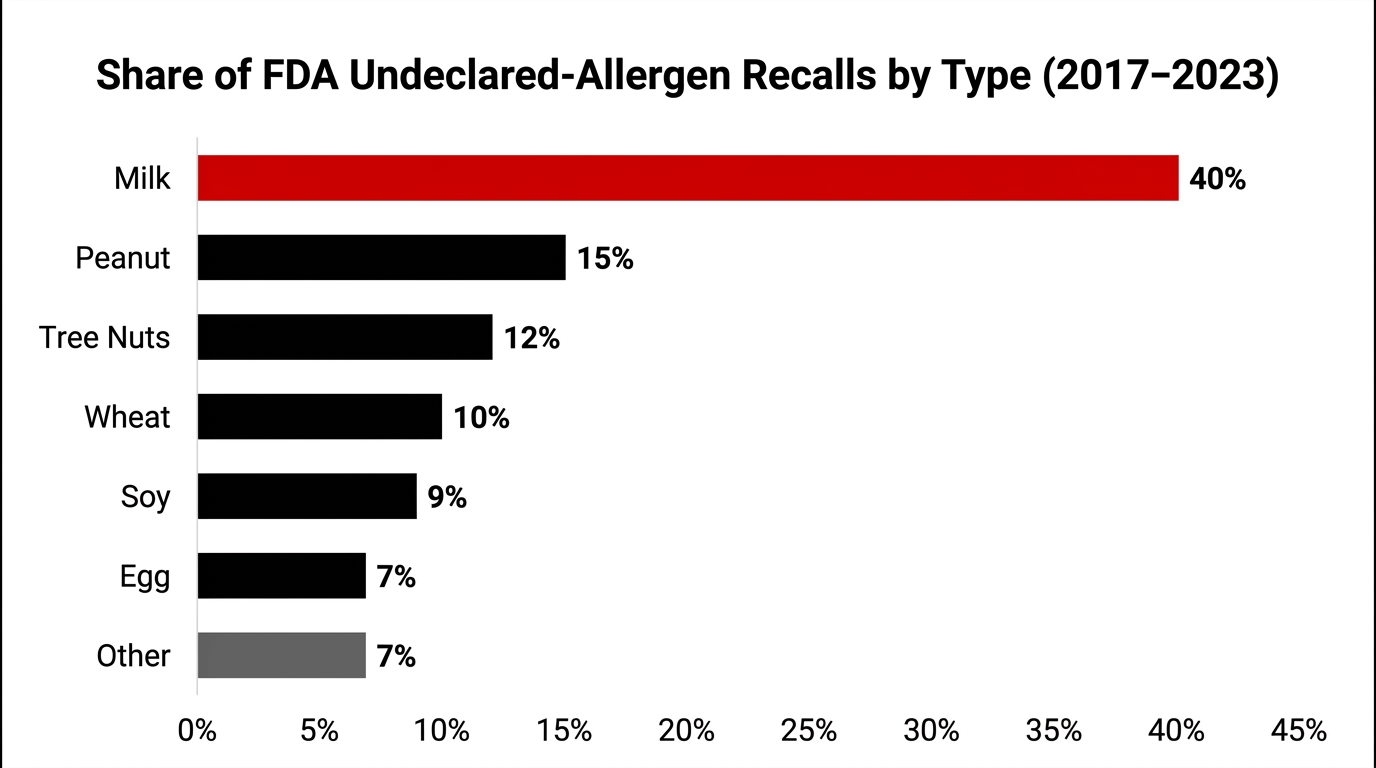
Milk is at the center of that. An analysis of more than 620 FDA undeclared‑allergen recalls since 2017 found that around 40% were due to undeclared milk, making milk the single most commonly undeclared allergen.
So if your plant is built on milk and runs multi‑allergen, high‑mix lines, borrowing a 1–2% recall assumption from simpler categories isn’t conservative. It’s optimistic. And in a co‑op or supply‑based system, underpricing that risk is another way of saying your members are quietly underwriting the gap.
What Does a $10M Allergen Recall Really Mean for 400 Cows?
Mark’s highest‑risk yogurt line pulls milk from a group of farms totaling roughly 400 cows’ worth of production. Think of that as one 400‑cow block whose fortunes are tied to that line’s allergen performance.
From the available data:
The average direct recall costs $10 million per major event.
“Rule‑of‑thumb” recall probability: 1–2% per year.
Survey‑based probability for companies with allergen plans: roughly 8–10% per year over a five‑year window.
Step through the math so you can plug in your own numbers later.
How the $10M Recall Risk Lands on a 400‑Cow Block
Scenario A – Underpriced Risk (1% modeled annual probability)
Over the same 400 cows, that’s $2,000 per cow per year.
Now you’re not talking about a rounding error. You’re talking about a material drain on what that plant can afford to pay for milk, especially when margins are already tight from 2024–26 feed, labor, and energy costs.
The plant’s P&L doesn’t show “$2,000 per cow in allergen recall exposure.” It shows:
Higher recall and contamination insurance premiums.
Occasional large costs when the product is pulled and destroyed.
Less margin left for co‑op dividends, capital projects, and milk premiums.
If you sit on a board, the question isn’t, “Do we have an allergen control plan?” It’s, “Are we modeling recall probability at 1–2% when our own near‑miss data — and broader survey and recall stats — point much higher?”
The Boardroom Questions You Aren’t Asking Yet
Janet sits on the co‑op board and ships from a 350‑cow herd into Mark’s plant. She’s not just looking at somatic cell counts and butterfat anymore. She’s looking at who’s underwriting the plant’s allergen gamble.
The Question
Why It Matters
If You Can’t Answer This…
“Where exactly is the line between farm-origin hazards and plant-origin failures in our contracts?”
Residues at intake ≠ allergen cross-contact after the plant owns the milk. If contracts blur this line, your herd backs plant QA failures.
Your members may be underwriting recall costs they can’t control — and won’t know until the invoice arrives.
“How many allergen near-misses and label errors occurred on our highest-risk lines in the last 12–24 months?”
“We’re fine” isn’t data. Near-miss counts show whether your plant catches problems before they ship — or relies on luck and insurance.
You’re guessing at recall probability, not managing it.
“If there’s a $10M plant-origin allergen recall tomorrow, what indemnity rights do we have against members?”
Plant-side allergen failures can trigger member clawbacks if contracts aren’t clear. Know the split before the lawyer does.
You’ll find out during the recall — when it’s too late to negotiate.
If you’re in her chair — board member, delegate, advisory council — these are three questions that belong on your next agenda:
“Where exactly is the line between farm‑origin hazards and plant‑origin failures in our contracts?” Ask counsel and management to point to the clauses that separate residues or pathogens at intake from allergen cross‑contact and mislabeling that happen after the plant owns the milk. If they can’t show you that line in writing, your members may be underwriting risks they can’t control.
“In the last 12–24 months, how many allergen‑related near‑misses and label errors occurred on our highest‑risk lines — and who would pay if one of those shipped?” “We’re fine” isn’t an answer. You want a count of near‑misses, how they were caught, and how a miss would flow through your recall insurance, the co‑op’s balance sheet, and member returns.
“If there’s a $10 million plant‑origin allergen recall tomorrow, what specific indemnity or clawback rights do we have against members — and does that match our intent?” This isn’t about letting sloppy farms off the hook. It’s about making sure plant‑side allergen failures aren’t being patched with member‑funded indemnity language by default.
Once those questions hit the minutes, allergen control stops being just a QA metric. It becomes a risk‑underwriting decision, which is where it belongs for a co‑op.
Sesame’s Shortcut: When Labels Beat Cleaning
If you want to see how regulators behave when cleaning and labels collide, look at sesame.
The Food Allergy Safety, Treatment, Education, and Research (FASTER) Act made sesame the ninth major U.S. food allergen, with mandatory labeling and allergen‑control requirements taking effect January 1, 2023. After that date:
Allergy advocates and consumer groups documented cases where bakers and restaurants intentionally added sesame to products and updated labels rather than paying for full cleaning between runs.
The FDA said it was concerned about impacts on sesame‑allergic consumers but acknowledged that adding sesame and labeling it doesn’t automatically violate the law, as long as the label is accurate.
The message is uncomfortable: regulators were willing to accept cost‑saving allergen strategies as long as the label stayed accurate, even when those choices hurt allergic consumers. In practice, regulators have focused more on what’s on the label than what’s left on the stainless — at least so far.
If your plant runs “dairy‑free” or alt‑dairy products on shared equipment, that should get your attention. You can solve a milk‑protein problem on paper with wording, but if buyers and consumers lose confidence in “dairy‑free” claims coming out of your plant, that premium evaporates — and so does the extra value flowing back to your herd.
“May Contain Milk”: Precaution or Crutch?
Dairy doesn’t just live with milk as a top allergen. It also lives with a labelling tool that makes it easy to hedge liability in a grey zone: precautionary allergen labelling (PAL) — all the “may contain” and “processed in a facility” statements.
The research keeps pointing to the same problem:
PAL is often used inconsistently and, in many markets, without a specific regulatory framework, which reduces its value for people with food allergies.
Analytical surveys have found products with PAL that contained no detectable allergen, and products without PAL that did contain measurable allergens.
The 2024 paper “Time to ACT‑UP: Update on precautionary allergen labelling (PAL)” describes current PAL use as problematic and pushes for a risk‑based, regulated system tied to agreed reference doses and contamination data.
Regulators are tightening expectations:
FDA’s draft Compliance Policy Guide on major food allergen labeling and cross‑contact makes it clear that advisory statements can’t substitute for adequate cross‑contact controls and must be truthful and not misleading under the Federal Food, Drug, and Cosmetic Act.
Health Canada and CFIA guidance say PAL must be truthful and clear and “not be a substitute for Good Manufacturing Practices,” and should only be used where inadvertent presence of an allergen is unavoidable.
EU and UK guidance on “free‑from” claims increasingly expects “dairy‑free” to mean essentially no detectable milk protein, backed by documented risk assessments and agreed reference doses.
That leaves your plant or co‑op with two real PAL strategies:
PAL as a blanket shield. You put “may contain milk” on entire product lines to protect the lawyer, even when your own validation data shows very low actual risk.
PAL as a last resort. You reserve it for scenarios where documented risk assessments show you can’t get risk below a defined threshold despite fully applied controls.
If your own cleaning and testing suggest low milk‑protein risk but your labels still blanket “may contain milk,” you’re writing the plaintiff’s opening argument for them: you had enough information to do better and chose not to. And if a “dairy‑free” product tests positive for milk under that setup, PAL will look more like evidence of a business choice than a shield.
PAL isn’t going to carry this forever. As more regulators and retailers move toward risk‑based allergen labelling, plants that use “may contain” instead of validation will have a much weaker story to tell.
What Mark and His Co‑op Actually Did With One Yogurt Line
Once the recall math and near‑miss history were on the same page, Janet pushed for something simple: evidence instead of assumptions.
When QA first pitched a full allergen validation, Mark wanted more than theory before tying up his busiest line. The external numbers were ugly:
Validation for that filler and conveyor system sat in the five‑figure range per phase, with phases between $5,000 and $80,000 depending on scope and sample size.
The bigger fear was lost throughput — repeated clean–swab–reclean cycles on a line already overbooked with private‑label and alt‑dairy contracts.
Janet cut through the noise with one question:
“What’s actually cheaper for our members — validating one line properly, or living with the real recall odds on that filler and hoping our insurance and contracts keep us whole?”
Mark didn’t have an immediate answer. But he agreed to a focused first step: a pilot allergen cleaning validation on a single high‑risk yogurt line.
Over roughly a month, his team:
Picked the line with the widest allergen mix and the most sensitive customer contracts.
Left the core cleaning SOP in place but added high‑sensitivity ATP swabs on specific “worst‑case” surfaces after each changeover.
Used protein swabs where ATP passed, then ran milk allergen tests once ATP and protein were consistently passing.
The early results were uncomfortable:
Several “visually clean” changeovers failed ATP or protein — exactly the kind of runs that would have gone into production before.
After changing tools, chemistry, and a few SOP steps, first‑pass cleaning success climbed; once ATP and protein were reliably passing, milk allergen tests came back clean.
The pilot cost real money — test kits, labor, and some lost line time. But it bought three assets Mark and Janet had never had:
A measured first‑pass cleaning rate on their riskiest line.
A count of near‑misses that would have shipped under the old system.
A one‑pager that they could show their insurer, their biggest retail customer, and their members when they talked about risk and premiums.
Janet’s line at the next board meeting was blunt:
“I’d rather see us spend five figures hunting our own near‑misses than watch eight figures disappear from the milk check because we never bothered to look.”
That was the turn. Not a new law. Not a hardware upgrade. Just one pilot on one line and a decision to move allergen recall risk out of the shadows and into the budget.
The 90‑Day Allergen Recall Risk Playbook for Mid‑Size Dairy Plants
You don’t have to rebuild your whole plant to change your allergen recall risk profile. You need 90 days of disciplined work that puts real numbers next to your milk check.
In the Next 30 Days: Name Your Riskiest Line and Your Blind Spots
1. Pick your highest‑risk line on purpose.
Ask:
Which line runs the most SKUs and allergen combinations (milk plus soy, nuts, eggs)?
Which line has the tightest changeover windows?
Which line touches your “dairy‑free,” “non‑dairy,” or premium private‑label contracts?
That’s your pilot line. Don’t overthink it.
2. Pull a 12–24‑month allergen and label‑error history for that line.
With your QA team, pull:
All failed ATP, protein, and allergen swabs on that line.
All label or packaging deviations involving milk or other allergens.
Any incidents where the wrong product or label was caught before shipping.
If you can’t generate that report in a clean, credible way, you’re not managing recall risk. You’re gambling.
30‑Day Check:
By your next board or advisory meeting, you should be able to say:
“In the last 12 months, our riskiest line had [X] allergen‑related near‑misses, and here’s how we caught them.”
If you don’t know X, the recall model you’re using on your P&L isn’t reality.
Over the Next 90 Days: Run the Pilot and Put a Price Tag on Prevention
3. Run a 2–4 week cleaning validation pilot on that line.
You’re not trying to build a PhD thesis. You’re trying to establish a baseline:
Start from your existing cleaning SOP.
Add ATP swabs on 5–10 “worst‑case” surfaces after cleaning.
Add protein swabs where ATP passes.
Once ATP and protein are consistently passing, run milk allergen tests at agreed intervals (end of selected changeovers, high‑risk product switches).
Track:
How many first‑round cleans fail ATP or protein?
How many re‑cleans are needed to pass?
How many allergen tests do you run, and what are their results?
The goal isn’t zero failures in week one. The goal is a baseline you can act on.
4. Track pilot costs and compare them to your modeled recall risk.
During that pilot:
Log extra minutes or hours per changeover.
Log overtime or schedule shifts caused by re‑cleans.
Log the cost of ATP, protein, and allergen kits plus any lab fees.
At the end, stack those numbers against your recall risk math:
A low‑thousands‑of‑dollars pilot is realistic on a line like this over a month.
At an 8% annual recall probability and a $10M recall cost, your expected annual exposure is $800,000 on that line — or $2,000 per cow on a 400‑cow block.
That’s a conversation your insurer, your retailer, and your members all understand: pay a known amount now to reduce the odds of an eight‑figure hit later.
Over the Next 365 Days: Move Recall Risk into Governance and Contracts
5. Put allergen recall risk in front of your board and members once, in writing.
At your next major meeting:
Share a one‑page pilot summary: cost, failures caught, changes made.
Walk through the recall math at 1–2% and 8–10% probabilities, using your own line as the example.
Ask in plain language:
“Are we comfortable modeling recall risk at 1–2% per year when our own near‑miss data — and broader survey and recall data — point much higher?”
Once that question is in the minutes, allergen recall risk becomes a governance item, not just a QA report.
6. Take your data to your insurer and your biggest retail or brand customer.
Use the pilot numbers:
With your insurer: “Here’s our high‑risk line and the validation data. How does this impact recall coverage and premiums at renewal?”
With your largest customer: “We’ve validated cleaning and reduced allergen risk on your line. Can we talk about longer terms, preferred status, or modest premiums tied to this control?”
You’re not asking for charity. You’re negotiating with evidence.
7. Rewrite one clause at renewal so producers aren’t underwriting plant‑side failures.
At the next contract renewal:
Make sure raw milk supply agreements clearly separate farm‑origin hazards (residues, pathogens at intake) from plant‑origin allergen and labeling failures (cross‑contact, mislabeling, wrong packaging) that occur after milk crosses the hose.
If you’re a producer, ask your co‑op or plant rep:
“If there’s an allergen recall caused by cross‑contact or mislabeling in the plant, how much of that cost can be pushed back onto members under our current wording?”
If plant‑origin failures can be pushed back on your herd, you’re underwriting risks you can’t directly control.
What This Means for Your Operation
You don’t need to own a plant to be tied to this. If your milk goes into a high‑mix facility, allergen recall risk is already baked into your milk check.
If your milk feeds a plant running yogurt, ice cream, cheese blends, or alt‑dairy on shared lines, assume your recall exposure looks more like an 8–10% scenario than a safe 1–2% — unless someone shows you data that says otherwise.
In the next 30 days, ask your plant or co‑op for a simple allergen near‑miss and label‑error report for their riskiest line. If they can’t pull it, you know they’re leaning harder on recall insurance and “may contain” labels than on validated allergen control.
If you sit on a board, push to have allergen recall risk discussed once a year alongside milk price, capital spending, and debt coverage. That discussion should include near‑miss counts, cleaning validation pass rates, and recall history on products made with your milk.
Before you sign your next supply agreement, read the indemnity and contamination clauses with allergens in mind. If in‑plant failures can be pushed back onto members, your herd is backing liabilities you never meant to underwrite.
If you ship into “dairy‑free” or alt‑dairy contracts, treat PAL as a last resort, not a business model. Premiums in that space exist because consumers trust the label; once that trust cracks, the premium disappears.
Use the $250 vs. $2,000 per cow math as a sanity check. If you can spend a low‑thousands‑of‑dollars pilot to materially reduce an $800,000 expected recall exposure on a single line, that’s not just QA spend. That’s risk management.
Key Takeaways
If your plant models allergen recall risk at 1–2% per year while survey data show roughly two in five companies with allergen plans still had a recall over five years, you’re probably underpricing that risk by a factor of four.
A focused cleaning‑validation pilot on your riskiest line is a realistic 90‑day project that can turn “we think we’re fine” into numbers your board, insurer, retailer, and members can actually use.
“May contain milk” is not a long‑term strategy. As regulators and retailers move toward risk‑based allergen labelling and tighter “dairy‑free” claims, plants that leaned on PAL instead of validation will have the weakest story to tell.
If your co‑op or plant contracts don’t clearly separate farm‑origin hazards from plant‑origin allergen and labeling failures, your herd may be backing liabilities you never agreed to carry.
The Bottom Line
Mark and Janet now expect one simple answer every year:
“On our highest‑risk line, what’s our real cleaning pass rate, what did it cost us to prove it, and how much of that recall risk is already baked into our milk check?”
Don’t wait for a $10 million mistake to discover who’s actually liable. Send this article to your co‑op field rep or plant contact and ask: “Where is our allergen validation data — and what recall probability are we really modeling?”
Complete references and supporting documentation are available upon request by contacting the editorial team at editor@thebullvine.com.
Learn More
The Hidden Contract Clause That Could Cost Your Dairy $55,000 in 2026 – This tactical guide arms you with a 30-day action plan to dodge the massive liability shifts appearing in new milk contracts. It exposes how processor-level failures are being legally offloaded onto farms and delivers the leverage needed to protect your profit.
The $11 Billion Reality Check: Why Dairy Processors Are Banking on Fewer, Bigger Farms – This strategic deep dive reveals the $11 billion processing wave reshaping the industry through 2028. It breaks down why processors are locking in supply with mega-dairies, allowing you to position your operation before regional consolidation closes your window to negotiate.
More Milk, Fewer Farms, $250K at Risk: The 2026 Numbers Every Dairy Needs to Run – This disruptive analysis exposes the brutal “more milk, fewer farms” era and the $250,000 margin gap facing mid-size dairies in 2026. It delivers the precise math required to choose between scaling, specializing, or exiting while you still own your equity.
The Sunday Read Dairy Professionals Don’t Skip.
Every week, thousands of producers, breeders, and industry insiders open Bullvine Weekly for genetics insights, market shifts, and profit strategies they won’t find anywhere else. One email. Five minutes. Smarter decisions all week.
When the same logo sits on your genomic test, your wellness index, and now the lab behind a big slice of the industry’s DNA cards, the number that matters isn’t just $160 million — it’s the $86,000 you quietly push through that pipeline over five years.
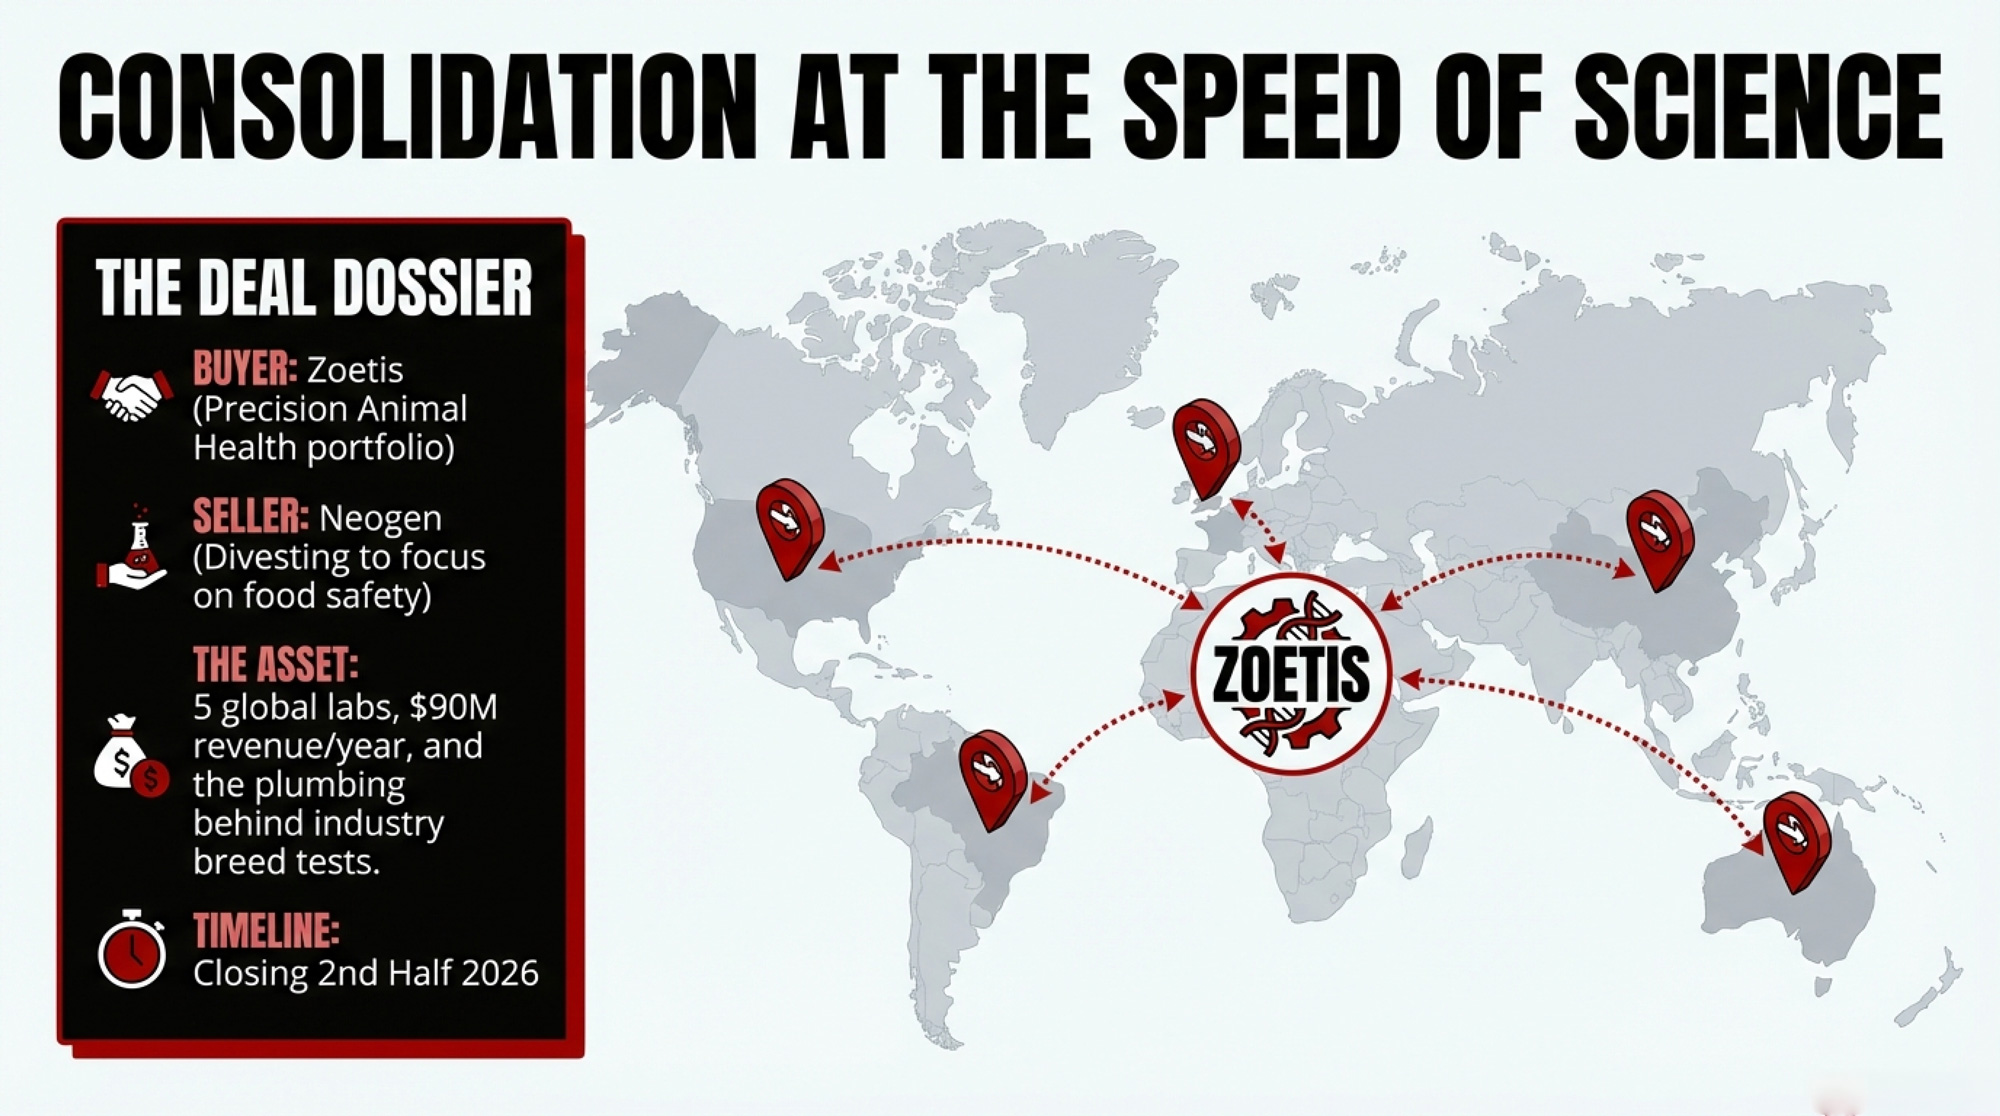
Executive Summary: Zoetis’ just-announced $160 million purchase of Neogen’s animal genomics business is a bet on owning the global DNA pipeline, not just another test brand. Neogen’s unit brings in $90 million in genomics revenue, operates five labs across the U.S., Brazil, Australia, China, and the U.K., and serves customers in 120+ countries, dropping a ready‑made lab network into Zoetis’ Precision Animal Health machine. For a 750‑cow Holstein herd using CLARIFIDE Plus at roughly $43/head, that means around $17,200 a year — about $86,000 over five years — flowing through one company’s genomic loop that now influences breeding, wellness traits, and health protocols. The article shows how that integration can genuinely help (sharper predictions, smoother software, simpler decisions) while also raising switching costs and shifting leverage away from herds, breed associations, and AI programs toward a handful of platforms. It then gives a concrete 30/90/365‑day playbook: audit genomics contracts for data ownership and use, secure export rights, pilot a non‑Zoetis lab as Plan B, and stop letting any single index be the only lens on your genetics and health risk. The core message: you can stay in the Zoetis ecosystem, but before this deal closes in the second half of 2026, you need to decide — and document — who owns your genotypes, how portable they are, and how hard it would really be to change course later.
On March 2, 2026, Zoetis announced it would pay 0 million to acquire Neogen’s animal genomics business, including its GeneSeek laboratories and livestock/companion animal genomics portfolio. Neogen says the net proceeds will primarily go toward debt reduction and a tighter focus on its food safety and animal safety markets, and both companies expect the deal to close in the second half of calendar year 2026, subject to regulatory approvals.
The real question for 2026 is blunt: How much control over your genomics and data are you handing to one company — and on what terms — when this closes?
What $160 Million Actually Buys — and What It Doesn’t
Here’s what’s actually changing.
Buyer: Zoetis Inc. (NYSE: ZTS), “the world’s leading animal health company,” positioning the deal as strengthening its Precision Animal Health portfolio. Jamie Brannan, Zoetis’ Chief Commercial Officer, says the acquisition “brings complementary capabilities that expand predictive insights and individualized care, enabling us to deliver added value to customers.”
Seller: Neogen Corporation (NASDAQ: NEOG), calling this a “planned divestiture” of its animal genomics business, so it can simplify operations, focus on core food and animal safety markets, and reduce debt. CEO and President Mike Nassif says the sale “allows the company to accelerate de‑leveraging and improve profitability.”
Asset: Neogen’s animal genomics business, which:
Generates about $90 million in annual sales as of Neogen’s fiscal 2025.
Operates five laboratories in the United States, Brazil, Australia, China, and the United Kingdom, plus an office in Canada.
Serves customers in more than 120 countries, using fixed‑array and sequencing technologies with associated software to support genetic testing.
Zoetis describes it as a leader in U.S. beef and dairy genomics.
Price:$160 million, a clean ~1.8× revenue multiple on that $90 million sales base.
Timeline: Zoetis expects to complete the acquisition in the second half of 2026, and Neogen expects to close by the first half of its 2027 fiscal year, pending regulatory approvals.
That 1.8× revenue multiple tells you how each side sees this. For Neogen, it signals that genomics is a scale‑dependent service line — valuable, but not its primary growth engine, compared with food and animal safety. For Zoetis, rolling a ~$90‑million genomics business into a much larger animal health portfolio is easy to justify if it deepens their Precision Animal Health strategy and tightens the link between genetics, medicines, vaccines, diagnostics, and digital tools.
Zoetis isn’t starting from zero on genomics. They already had:
CLARIFIDE and CLARIFIDE Plus for dairy, built around genomic predictions and the Dairy Wellness Profit Index (DWP$), with wellness traits aimed at mastitis, metritis, displaced abomasum, ketosis, lameness, twinning, abortion, and more.
INHERIT Select for beef, positioned as a genomic tool for commercial herds.
A genetics lab in Kalamazoo, Michigan, is part of their existing Precision Animal Health infrastructure.
What they’re buying now is plumbing and reach: a global lab footprint, thousands of customers who’ve used GeneSeek as their processor, and a large base of Igenity and GGP genotypes feeding evaluations and management tools across species.
Asset
Zoetis Holdings (Before Deal)
After $160M Neogen Acquisition
Genomic Products
CLARIFIDE Plus (dairy), INHERIT Select (beef), DWP$ wellness index
All existing products + Neogen’s Igenity, GGP platforms, sequencing technologies
Lab Footprint
1 genetics lab (Kalamazoo, Michigan)
6 total labs: U.S., Brazil, Australia, China, U.K., Canada
Customer Reach
North America focus via existing distribution
120+ countries served through acquired lab network
Annual Genomics Revenue
Est. $400M+ (within Precision Animal Health segment)
Adds $90M from Neogen genomics business
Strategic Control
Owned genomic testing pipeline for proprietary indexes
Also processes DNA for competitors, associations, AI companies
Competitive Position
Leading dairy genomics brand
Owns both the test brand AND much of the third-party lab infrastructure
The 750‑Cow Herd Caught in the New Loop.
Now pull this into a barn you recognize.
Picture a family‑run 750‑cow Holstein herd that’s all‑in on CLARIFIDE Plus:
Every heifer gets genotyped through CLARIFIDE Plus.
The breeding program leans heavily on DWP$ and wellness traits that Zoetis positions as predictors of health and profitability.
The herd‑management software — through Zoetis or partner integrations — pulls genomics directly into the cow card, so DWP$ and wellness scores sit alongside repro, health, and production records.
Meanwhile, another herd in the same region runs Igenity or GGP tests through a breed or AI program that sends DNA cards to Neogen’s GeneSeek labs.
As of March 2, 2026, those routes are set to converge:
Neogen’s animal genomics business — including its five labs and software — is under a definitive agreement to be sold to Zoetis.
Zoetis says integrating Neogen’s genomic technologies and data solutions will expand “predictive insights, individualized care, and greater value” across major livestock and companion species.
From the 750‑cow herd’s side of the fence, that means:
The lab processing a significant share of breed/AI genomics — Neogen’s business — is on track to have the same corporate parent as CLARIFIDE Plus and other Zoetis genomics offerings.
The company that runs your genomic test, defines your wellness index, integrates with your herd software, and sells you disease‑prevention products will also own a big chunk of the lab capacity behind your neighbors’ tests and some association pipelines you rely on.
That might pencil out just fine. But it’s no longer the same arm’s‑length relationship you started with.
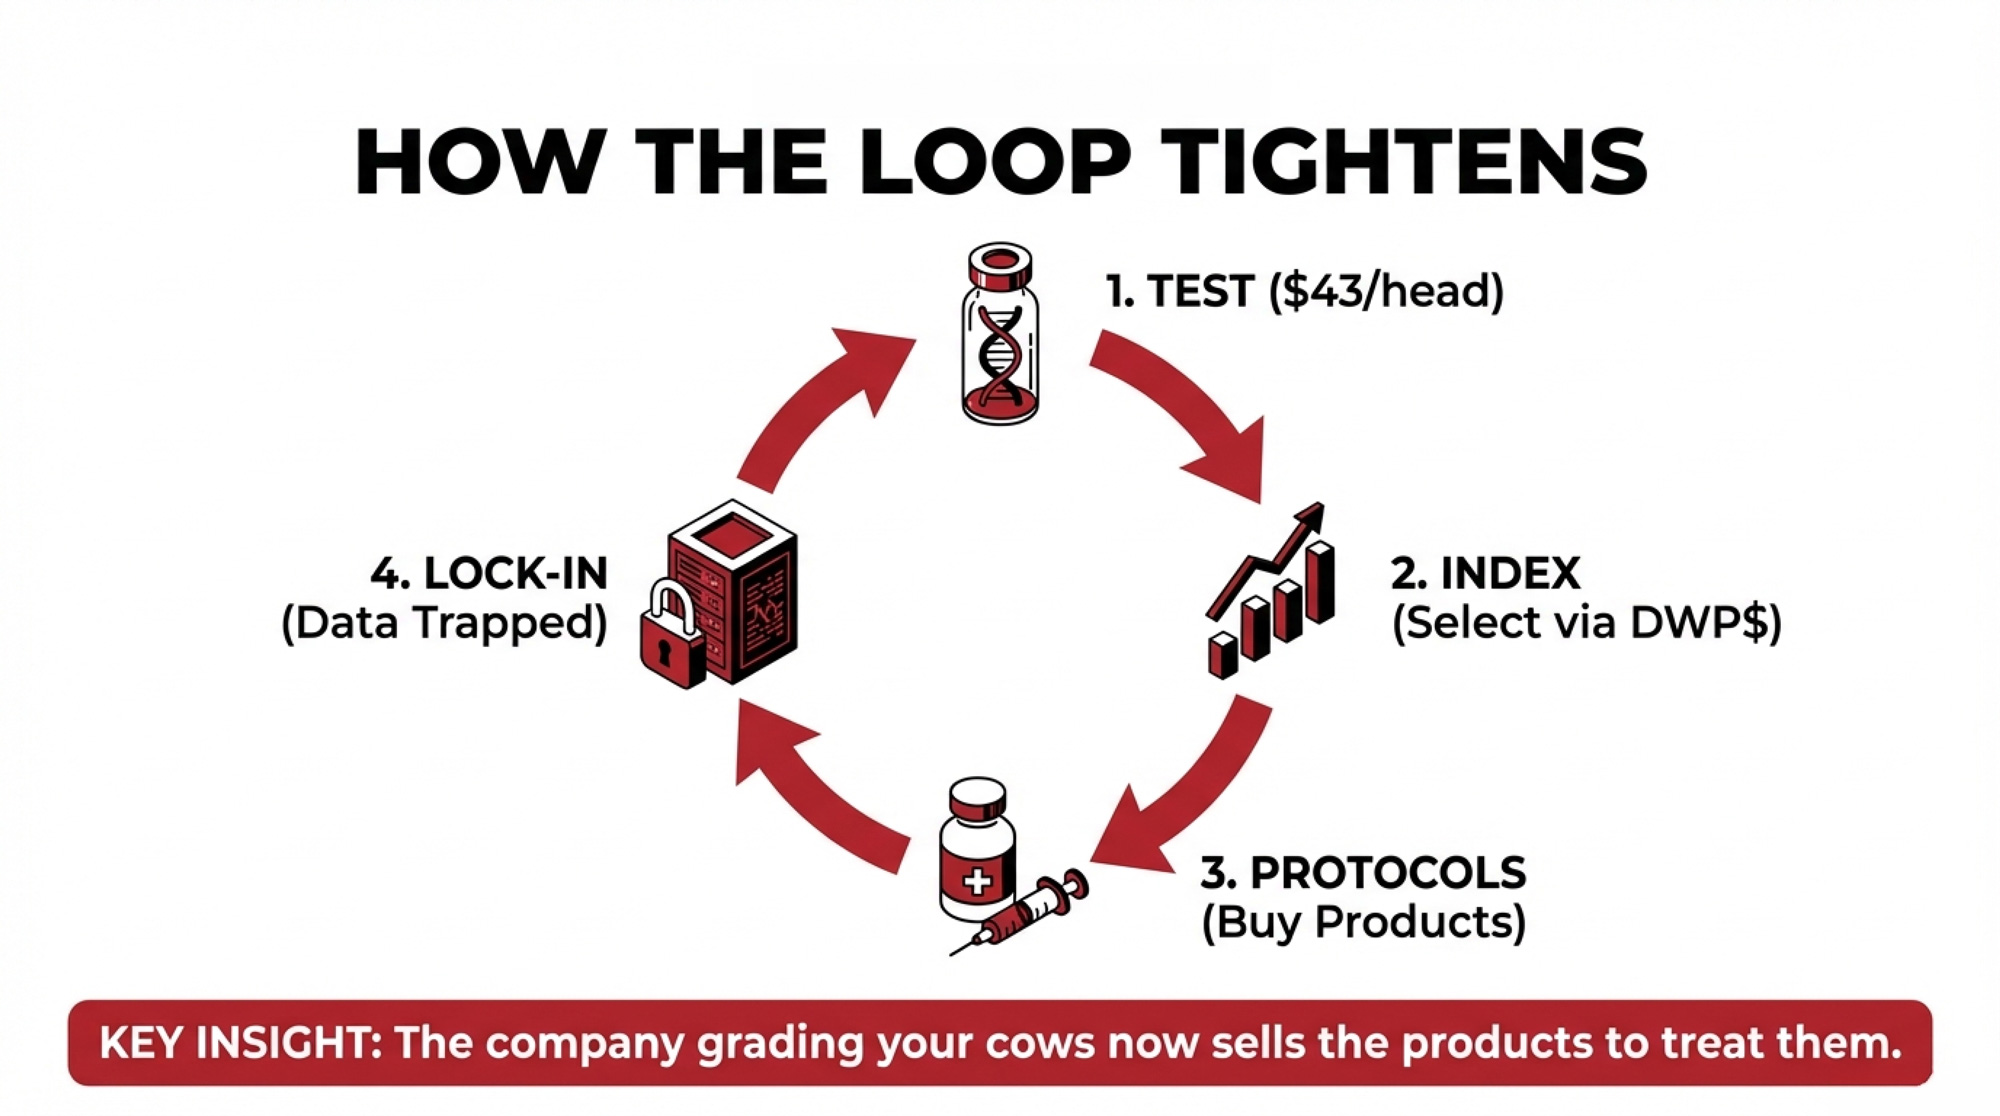
The Genomics Loop: $43 Per Head, 2,000 Animals, One Company
CLARIFIDE Plus isn’t a mystery line item. Holstein Association USA lists CLARIFIDE Plus at around $43 per Holstein animal, with practical costs for many herds in the $40–$50 per head band depending on volume and program.
Step
Annual Activity
5-Year Total
Who Benefits
Direct Testing
400 tests × $43 = $17,200/year
$86,000
Zoetis (lab revenue)
Genetic Direction
Selection/culling decisions based on DWP$ index
2,000 animals shaped by one platform’s trait priorities
Zoetis (proves index “works”)
Protocol Adjustments
Est. $10/cow/year targeted health spend (750 cows)
$37,500
Zoetis (wellness-linked product sales)
Switching Friction
Staff retraining, advisor realignment, dual-index period
Opportunity cost: $15,000–$25,000
Zoetis (customer retention)
Total Economic Exposure
$24,700/year
$123,500+
Platform lock-in achieved
Now run realistic barn math for that 750‑cow herd:
You test 400 head per year — heifers plus some key cows.
You keep that up for 5 years.
You use one platform’s genomic test and index to steer breeding and culling.
Step 1: Direct testing spend
Using $43 per head as a concrete, sourced test price:
400 tests/year × $43 = $17,200 in genomics fees per year.
5 years × 400 tests/year = 2,000 animals genotyped.
2,000 tests × $43 = $86,000 in direct testing spend over five years.
Your invoices might come in a little lower or higher with discounts and bundling, but you’re still in that neighborhood.
Step 2: Genetic direction
Each year, you and your advisors use those scores to:
Push sexed semen on the top DWP$ heifers.
Push beef semen or early culling on low‑index animals.
Make earlier do‑not‑breed calls when low‑index animals also underperform in the parlor or maternity pen.
After five years, a large share of your milking herd has been shaped by one company’s definition of “profitable genetics” — the way DWP$ weights milk, fat, protein, fertility, and wellness traits.
That’s powerful if DWP$ lines up with your economics. It’s limiting if you ever decide you want different trade‑offs.
Step 3: Downstream product spend
Those wellness traits don’t just sit in a report. They steer protocols.
Zoetis describes its Precision Animal Health vision as predicting, preventing, detecting, and treating disease using integrated tools across medicines, vaccines, diagnostics, and digital solutions. On a CLARIFIDE Plus herd, that often turns into:
High mastitis‑risk genetics? More aggressive mastitis prevention and treatment programs.
High lameness risk? Tighter hoof‑health schedules, trims, and monitoring.
Transition disease risk? Higher‑touch dry‑cow and fresh‑cow protocols backed by specific products.
Nobody’s forcing these choices, but when the same company provides the risk scores and sells the tools, it’s easy for more of your per‑cow health spend to gravitate there over time.
Even modest shifts add up. If wellness‑driven protocols increase targeted health spend by:
$10 per cow per year across 750 cows, that’s $7,500/year.
Over 5 years, it’s $37,500 in additional health spending guided by the same platform.
You may get every dollar of that back in avoided disease. The point is that your genomics, protocols, and product choices are now tightly coupled to one ecosystem.
Step 4: Switching cost
Fast‑forward to 2031.
You decide you’d like to:
Move some or all genotyping to a non‑Zoetis, CDCB‑approved service lab, or
Shift your primary emphasis from DWP$ to a national index like NM$, TPI, or PRO$, alongside your own KPIs.
You’re not just changing who prints your reports.
You’re:
Re‑training staff who’ve lived in DWP$ bands and wellness trait lists.
Re‑aligning conversations with genetics advisors, vets, and lenders.
Managing a period where different indexes don’t always agree on which cows are “top” and which are “bottom.”
Each turn of the loop made the system easier. It also raised the friction if you ever want to step partly outside it.
What Does This Deal Change for a 750‑Cow Herd?
Step
What You Do/Spend
What Zoetis Gains
1. Testing
400 tests/year → $17,200/year → $86,000over 5 years
Lab revenue and a larger genomic dataset
2. Selection
Herd bred and culled to a single platform index
Evidence their index “works” + genetic direction aligned to their trait priorities
3. Protocols
Wellness traits steer more targeted health programs
Product sales linked to genomic risk and integrated Precision Animal Health offerings
4. Switching
Higher friction if you try to move labs or indexes after 5+ years
Stickier customers and more leverage in commercial negotiations
That’s the decision pipeline Zoetis is paying $160 million to tighten.
Why Many Producers Will Choose the Loop Anyway
There are plenty of good reasons herds will lean into this ecosystem on purpose.
Zoetis and Neogen both emphasize that combining their genomics businesses will expand “predictive insights,” “individualized care,” and “highly accurate, scalable genetic testing,” giving customers deeper views on animal health, productivity, and sustainability across species.
For a 700‑cow operation juggling labor, data overload, and disease pressure, that upside looks like:
Sharper predictions. A larger combined genomics business — more samples, traits, and species — can support more robust trait predictions, especially for wellness and health.
Less friction. Results that feed directly into herd software and decision tools cut the time you spend moving files and reconciling systems.
Cleaner conversations. When your genomics, wellness traits, and protocols use the same language, it’s easier for your team to pull in the same direction.
So it’s perfectly rational for a herd to say: “We’ll accept more dependence if the tools keep improving and the economics hold up.”
The risk isn’t using the loop. It’s using the loop without knowing how to exit it or what happens to your data if you ever need to.
When “Neutral” Labs Aren’t Neutral Anymore
For breed associations, AI companies, and public genomics projects, the immediate tension isn’t about convenience. It’s about governance.
From Zoetis and Neogen’s own descriptions, Neogen’s genomics business has been:
Serving customers in more than 120 countries,
Operating five laboratories in the U.S., Brazil, Australia, China, and the U.K., plus an office in Canada, and
Acting as a leader in U.S. beef and dairy genomics.
For years, much of that work sat under Neogen as a third‑party service:
Associations sent member DNA for genotyping under genomic‑enhanced evaluations.
AI companies used Neogen’s platforms (Igenity, GGP) to genotype bulls and commercial heifers.
Government and research projects used its lab network for large‑scale testing.
Once those labs move under Zoetis’ roof, the questions change:
What do the firewalls really look like? Zoetis says it’ll integrate Neogen’s genomic technologies and data solutions into its Precision Animal Health offering while “supporting continuity for colleagues and customers” and building on Neogen’s genomics legacy. Partners will want clarity on how individual customer data is segregated and protected.
What visibility does a lab owner get, even without individual IDs? Aggregate volume, array choice, and project timing can reveal a lot about what breeds, studs, and associations are doing.
Who benefits most from data aggregation? Associations may own members’ genotypes, but Zoetis’ ownership of the lab business gives it more visibility into patterns than a standalone, service‑only lab would.
Zoetis is open about using this acquisition to “advance animal health through innovation, data, and technology,” and to empower customers with tools for healthier animals and sustainable production. That’s legitimate. The flip side is that it also concentrates influence — as both lab vendor and product competitor — in fewer hands.
If Consolidation Keeps Rolling, Where Does It End?
The Zoetis–Neogen deal fits a familiar pattern from seeds, crop protection, and precision ag:
Products evolve into platforms.
Platforms build data moats.
Data moats raise switching costs — and leverage shifts toward the platform owners.
In animal genetics, current signals already point to:
A global market where animal genetics and genomics continue to grow as producers chase productivity, health, and sustainability gains.
A small top tier of players — Zoetis, major genetics companies, and large animal health providers — controlling most of the genomics and evaluation stack.
If current consolidation trends continue, it’s easy to picture a world where:
Four to six dominant platforms effectively steer most genetics and health decisions on commercial herds.
Genomics becomes a feature inside integrated solutions (software + products + advisory) rather than a standalone service you can easily shop for.
Independent labs focus on niche work or act as backup routes for organizations that deliberately keep a second lane open.
For mid‑size dairies, the risk creeps in quietly:
Platform indexes and wellness scores become the default language for your team and advisors.
The easiest tools — usually the ones tied to your main platform — get used by default.
By the time you question the relationship, your replacement strategy, cull logic, and protocols may all be tuned to a single system.
The myth is: “If this stops working, we’ll just switch.”
The reality, if you don’t plan, is: “We’d like to switch, but the friction is too high, and the whole farm thinks in one platform’s numbers.”
The Turn: It’s Not “Stay or Go” — It’s “On What Terms?”
You’re not going to stop Zoetis and Neogen from closing this deal. Regulatory reviews may tweak conditions, but the labs will likely sit under Zoetis by late 2026.
What you do control is how boxed in you are when that happens.
The real decision over the next 12–18 months is:
Do you keep using Zoetis‑linked genomics on default terms, or
Do you keep using them while locking in better data and exit terms to maintain leverage?
Most producers and associations will stay in the ecosystem because:
The tools are strong and already integrated.
The workflows are familiar.
Evaluating alternatives takes time and focus.
That’s fine — as long as you treat lab and data contracts like infrastructure decisions, closer to choosing a milk buyer or lender than picking a glove supplier.
That means pushing for:
Clear language that your farm or organization owns your raw genotypes.
Guaranteed data portability — the right to export complete genotype files with IDs in standard formats if you move some or all volumes.
Tight data‑use provisions — especially around using your genotypes, even de‑identified, to train proprietary tools.
A transition clause that obligates cooperation if you shift business elsewhere.
You don’t have to leave. You don’t want to discover your options are gone the day you actually need them.
The Playbook Before This Deal Closes
Here’s a practical, time‑bound framework.
In the Next 30 Days: Read the Fine Print Like It’s a Milk Contract
Before the announcement fades:
Pull your genomics agreement or program terms. That might be with Zoetis directly, a stud, a breed association, or a vet/genetics service that bundles testing.
Circle language on:
Data ownership
Data use (especially “de‑identified,” “aggregated,” “research,” “product development”)
Term, automatic renewal, and termination
Ask your contact three blunt questions:
Who legally owns my raw genotype files — me, the association, the vendor, or some combination?
Can I get a full export, with animal IDs, in a standard format if I move labs?
Will my herd’s genotypes be used to train proprietary tools without a separate, explicit data‑sharing agreement?
If the answers are fuzzy and the contract doesn’t match them, that’s not a problem for tomorrow. That’s a now problem.
In the Next 90 Days: Build a Real Plan B Lab
You may never use it. You’ll still sleep better knowing it exists.
Identify at least one non‑Zoetis, cattle‑focused genotyping lab that’s compatible with CDCB or your national evaluation system. holsteinusa Get specifics: pricing, turnaround time, data formats, and how they deliver results back to you or your association.
Run a pilot batch.
Choose a defined group (e.g., a heifer cohort).
Send samples through both your current program and the alternative lab.
Confirm that:
Results from the alternative lab plug into your existing evaluation system.
Service and communication are solid.
You can easily map data back into your farm or association records.
Spending roughly the cost of 50 tests to learn how hard it is to move volume is cheap insurance compared to discovering you’re stuck mid‑dispute.
In the Next 365 Days: Rebalance Who Really Steers Your Decisions
As the Zoetis–Neogen integration moves from press release to day‑to‑day reality:
For 300–1,500‑cow herds:
Split your steering wheel.
Keep using CLARIFIDE Plus, DWP$, and wellness traits if they’re working; Zoetis and its partners built those tools for a reason.
But cross‑check big moves with at least one independent lens:
National indexes (NM$, TPI, LPI, PRO$, etc.).
Your own data on culls, mastitis, lameness, stillbirths, and reproduction.
Get your advisory team aligned. Sit down with your genetics advisor, vet, nutritionist, and lender and ask:
“Whose index are we effectively breeding to?”
“How much of our herd strategy assumes this one platform’s view of genetic value and health risk is the truth?”
For breed associations and genetics committees:
Write a lab and data policy on purpose, not by default.
Decide how often you’ll review lab partnerships and under what conditions you’ll diversify volume.
Keep a non‑Zoetis lane open.
Even if most samples continue flowing through Zoetis‑owned labs for cost and performance reasons, maintain a meaningful stream through at least one other approved lab.
That stream is your insurance policy; you don’t want to build it from scratch under pressure.
What This Means for Your Operation
Turn this from news into checks you actually run.
In the next 30 days, read your genomics contract line by line. If it doesn’t clearly say who owns your genotypes and how you can export them, that’s your first negotiation target.
Ask for written data‑use boundaries. Push for language that says your genotypes won’t be used to train proprietary tools without a separate, explicit agreement you sign.
Know at least one backup lab by name and price. Make a call, get a quote, and ask exactly what it would take to send 50 heifers through their system.
Test the switching friction with a small pilot. Don’t wait until you’re unhappy with pricing or terms to find out your data is badly stuck in one ecosystem.
Stop letting any single index be the only truth. On your next breeding or cull list, compare your platform index with at least one national index and your own health and cull data before you finalize.
If you’re on a genetics committee, get this on the agenda. Ask staff to map where member DNA goes, who has access, and what it would take to move 10–20% of volume elsewhere over the next 1–3 years.
Treat genomics and lab choice like a processor or lender decision, not a glove order. The wrong glove order is annoying. The wrong lab contract can shape your herd’s genetics and negotiating power for a decade.
Key Takeaways
Zoetis isn’t just buying five labs and $90 million in sales. It’s buying a global genomics business that plugs into its Precision Animal Health strategy and tightens the loop between your DNA, your herd software, and its products.
At roughly 1.8× revenue, Neogen is signaling genomics is a scale‑driven service line for them, not their main growth engine. For Zoetis, that same business is another gear in a much larger machine for animal health and diagnostics.
A typical 750‑cow herd testing 400 head a year at around $43/head is putting roughly $17,200/year — about $86,000 over five years — through one genomic loop. That loop shapes genetics, protocols, and, eventually, your flexibility.
Mid‑size dairies (roughly 300–1,500 cows) are often the most exposed to platform lock‑in. You’re big enough that the loop meaningfully affects your economics, but not always big enough to dictate terms.
There are real upsides — sharper predictions and cleaner workflows — that many herds will choose on purpose. The smart play is to enjoy those benefits while making sure your data ownership, portability, and Plan B lab are nailed down in writing before the labs change hands.
The Bottom Line
When you sit down at the desk tonight, don’t just skim the $160 million headline.
Pull your latest genotyping invoice, find the program terms it points to, and circle every line that spells out who owns your data, who can use it, and what it takes to walk away.
Then ask yourself, honestly: Is that language strong enough for the $17,200 a year you’re putting through this pipeline?
Complete references and supporting documentation are available upon request by contacting the editorial team at editor@thebullvine.com.
The Hidden Cost of Lameness: Is AI Exposing Dairy’s Biggest Profit Thief? – This feature reveals how AI-driven camera monitoring is becoming the new frontier for slashing $337-per-case lameness losses. It delivers a high-tech roadmap for early detection and precision breeding that provides an immediate, massive early-adopter advantage.
The Sunday Read Dairy Professionals Don’t Skip.
Every week, thousands of producers, breeders, and industry insiders open Bullvine Weekly for genetics insights, market shifts, and profit strategies they won’t find anywhere else. One email. Five minutes. Smarter decisions all week.
New Mexico can track every cow that left Woodcrest Dairy. It can’t tell you which bottle their milk ended up in. That gap is your problem too.
Sometime in 2025, roughly 2,000 dairy cows left Woodcrest Dairy near Roswell, New Mexico — not to be confused with the New York breeding operation of the same name, known for Select Sires’ Woodcrest King DOC. Livestock records reviewed by KOB-TV show that those Roswell animals were sold to Harry Dewit of Westland Dairy in Clovis. KOB-TV reported that the sale occurred shortly before the release of an undercover video from the facility. There is no public evidence indicating Dewit was aware of the pending investigation at the time of the transaction. Federal business filings list Dewit — a past Innovative Dairy Farmer of the Year honoree who milks 4,400 cows at High Plains Dairy in Texas — as CEO of Blue Sky Farms and as a director and treasurer of Select Milk Producers, the cooperative that helped launch the Fairlife milk brand before Coca-Cola acquired full ownership in 2020. Dewit has not been named as a defendant in the federal welfare lawsuit, and no public allegations of wrongdoing have been made against him personally.
Here’s the problem that should keep every co-op member awake tonight: New Mexico has no system for tracking which dairy’s milk ends up in which branded bottle on which store shelf. That’s not a welfare story. That’s a supply chain story. And it has direct implications for every producer whose milk moves through a cooperative network.
The $21 Million Promise
In 2022, Fairlife and Coca-Cola paid $21 million to settle a class-action lawsuit accusing the company of misleading consumers with marketing that suggested cows received “extraordinary care and comfort.” The companies denied wrongdoing but agreed to implement animal welfare standards and third-party audits as part of the court-approved settlement.
Animal Recovery Mission says those reforms didn’t work. ARM alleges its operative — hired as a milker at Woodcrest and later promoted to the birthing and medical units — recorded footage from December 2024 through approximately March 2025 that ARM describes as showing workers striking cows with shovels and wrenches, forcing metal rods down animals’ throats, and dragging calves through dirt. These allegations, first reported publicly by ARM and subsequently by KOB-TV (February 22, 2026), are now part of a federal lawsuit proceeding in the Central District of California. The Bullvine has not independently verified them, and no criminal charges have been filed as of publication. ARM presented its findings to six agencies — the Chaves County Sheriff’s Department, the New Mexico Livestock Board, the FDA, the New Mexico Department of Agriculture, the USDA, and the FSIS — in May 2025, before going public. ARM says it has investigated other dairies linked to Fairlife in the past.
Fairlife says Woodcrest was not a supplier during 2024 or 2025. ARM’s investigation claims Woodcrest was “directly tied to Coca-Cola’s bottling operations in Dexter, NM, with frequent raw milk pickups by Ruan Trucking.” Those two claims are difficult to reconcile — and the federal lawsuit will likely examine exactly how Fairlife defines “supplier” and whether the cooperative pooling structure creates connections the company’s statement doesn’t acknowledge.
Where Did the Cows Go?
This is where the welfare story becomes a supply chain story — and where The Bullvine’s angle diverges from every other outlet covering this.
KOB-TV’s investigation traced the roughly 2,000 cows from Woodcrest to Westland Dairy, which operates within the Select Milk Producers network. NM Livestock Board investigative records show that by early summer 2025, Woodcrest’s pens were empty, and remaining animals were set to be sold within weeks. Cows from that redistribution remain within the broader Select Milk cooperative framework. But here’s the gap: New Mexico doesn’t track milk from individual dairies to retail brands. The state can trace cows — livestock records document the transfers. What it can’t trace is the milk those cows produce once it enters the cooperative pipeline.
Translation: if a Fairlife bottle tests clean for safety, nobody is required to know whose cows produced it. That’s a food safety system, not a brand integrity system.
The FDA’s FSMA Food Traceability Rule, which took effect January 20, 2026, addresses traceability for high-risk foods — but fluid milk isn’t on the Food Traceability List. Ultra-filtered products like Fairlife’s fall into a regulatory gap: the Pasteurized Milk Ordinance addresses safety, but farm-to-brand sourcing remains voluntary and processor-controlled. The industry’s Innovation Center for U.S. Dairy has built traceability infrastructure, but it’s designed for processor-lot tracking and recall response — not for answering the question “which farm’s milk is in this bottle?”
New Mexico runs roughly 95 dairy operations milking approximately 240,000 cows as of 2024, down from 150 farms a decade ago — a 37% decline even as the state’s cow numbers fell 26% from 323,000 (USDA 2025). Average herd size exceeds 2,500 — among the largest in the nation. These are big operations where co-op relationships and brand supply chains matter enormously to the bottom line. And New Mexico’s mailbox milk prices already run roughly $2.00/cwt below the national average — among the lowest in the country, according to USDA data. When your base price is already that thin, the brand premium isn’t a bonus. It’s your margin.
Metric
New Mexico
U.S. National Average
Mailbox Price Disadvantage
$2.00/cwt BELOW national avg
—
Operating Dairies (2014→2024)
150 → 95 farms (−37%)
−26% nationally
Cow Inventory (2014→2024)
323K → 240K (−26%)
Slight increase nationally
Average Herd Size
2,500+ cows (among largest in U.S.)
~350 cows
Can Your Co-op Prove Your Milk Is Clean?
That’s the question this story forces into the open. And the honest answer, for most co-op members, is probably not.
Select Milk Producers — a cooperative of 99 family dairy farm members based in Texas and New Mexico — said in a statement to KOB-TV: “Select Milk Producers is committed to the highest standards of animal care.” In court filings, Select argues that plaintiffs have not shown Woodcrest was supplying milk to Fairlife at the time of the alleged abuse. Fairlife has similarly stated that Woodcrest was not a supplier during 2024 or 2025 and said its supplying farms are subject to animal welfare standards and third-party audits.
The structural problem remains: when cows transfer between operations within the same cooperative network — as 2,000 did from Woodcrest — and when state regulators can’t trace milk to brands, the burden of proving supply chain integrity falls on the processor’s word. Not on verifiable records. Not on independent audit trails.
The owner of Woodcrest declined to comment on camera to KOB-TV and distanced himself from Fairlife, directing questions to his former co-op, Select Milk Producers. According to KOB-TV’s reporting, Select Milk did not respond to specific questions about Dewit’s business affiliations or the co-op’s role in the sale of the cows.
If you’re a co-op member — in New Mexico or anywhere — this matters to you even if your operation has never been within 1,000 miles of Roswell. The question isn’t whether you treat your cows right. The question is whether your co-op can prove, with documentation, that the milk carrying a premium brand label actually came from farms that met that brand’s welfare standards. The Woodcrest situation raises the question of whether most can.
Double Legal Exposure in the Same District
The welfare lawsuit isn’t the only legal problem facing Select Milk Producers in federal court in New Mexico.
In a separate case (Othart Dairy Farms LLC et al v. DFA Inc. et al, No. 2:22-cv-00251, filed April 2022), dairy farmers including Othart Dairy Farms of Veguita, New Mexico, along with Pareo Farm, Desertland Dairy of Vado, Del Oro Dairy of Mesquite, Bright Star Dairy, and Sunset Dairy alleged that DFA and Select Milk conspired through their Greater Southwest Agency to suppress milk prices paid to producers in New Mexico and portions of Texas, Arizona, Kansas, and Oklahoma from January 2015 through at least June 2025. Judge Margaret Strickland ruled the case could proceed in March 2024. A $34.4 million settlement — $24.5 million from DFA and $9.9 million from Select Milk — received preliminary judicial approval in the summer of 2025. Neither cooperative admitted liability. The complaint alleged that DFA and Select controlled at least 75% of all raw Grade A milk in the Southwest, and that more than 85% of the region’s milk moves through cooperatives.
Beyond the settlement payments, both co-ops agreed to dissolve Greater Southwest Agency — the joint marketing entity the lawsuit alleged was the main vehicle for the conspiracy — and to implement antitrust training for marketing staff and better pay transparency for members (August 2025). DFA has a history of antitrust litigation. The cooperative paid $140 million to settle a price-fixing suit in the Southeast in 2013 (without admitting liability) and $50 million in the Northeast in 2015 (also without admission). Combined with the Southwest settlement, DFA’s total antitrust settlement obligations across three regions now exceed $225 million.
Two federal lawsuits in the same district, involving the same cooperative network — one alleging welfare failures in the supply chain, the other alleging price suppression. Whether that’s a coincidence or something more structural is a question Select Milk’s members deserve to ask. The Bullvine explored the real math behind who controls your milk check in “The American Dairy Heist: Who Really Owns Your Milk Check.”
The Barn Math
Here’s where this gets personal for your operation. Brand-premium milk programs — Fairlife included — typically command $1.50 to $2.50/cwt above commodity pricing for qualifying farms (exact premiums vary by contract and aren’t publicly disclosed). On a 1,000-cow herd producing at New Mexico’s state average of 24,717 lbs/cow/year, a $2.00/cwt premium works out to roughly $494,000 per year.
That premium exists because consumers pay more for a brand that promises higher welfare standards. A welfare investigation — at your farm, your co-op partner’s farm, or anywhere in your cooperative’s supply chain — puts the brand at risk. And when that happens, the premium is what evaporates. Not the base milk price. The premium. In a state where mailbox prices already sit $2.00/cwt below the national average, that premium isn’t extra income — it’s the difference between positive margins and red ink. The question isn’t whether you can afford traceability — it’s whether you can afford not to have it. (For more on how management alone can’t close the gap when structural economics shift, read “Exposing Dairy’s Biggest Lie: Management Can’t Save You.”)
Herd Size
Annual Production (lbs)
Premium Value ($2.00/cwt)
Potential Loss
500 Cows
12,358,500
$247,170
A New Tractor
1,000 Cows
24,717,000
$494,340
A New Parlor Wing
2,500 Cows
61,792,500
$1,235,850
The Entire Margin
And here’s the other number worth sitting with: that $34.4 million price-fixing settlement — in which, again, neither cooperative admitted liability — covers roughly 8,000 producers who marketed milk during the affected timeframe (per the settlement class definition). That works out to approximately $4,300 per farm before legal fees. The potential brand-premium loss from a welfare scandal dwarfs that. Unlike a one-time settlement, premium erosion compounds every month the brand stays damaged.
What Corporate Statements Actually Tell You
Fairlife’s position, stated to KOB-TV and multiple other outlets: “Woodcrest Dairy in New Mexico is not a supplier to fairlife” during the period in question, and the company has “zero tolerance for animal abuse.” Select Milk Producers maintains it is “committed to the highest standards of animal care.”
These are the corporate statements as provided. But note what they don’t address: the structural traceability gap. Saying Woodcrest “is not a supplier” is a claim about a business relationship. And in an industry where “not a supplier” can have multiple contractual meanings — not a direct supplier, not during a specific period, not under a particular agreement — the precision of the language deserves closer scrutiny than the reassurance it may offer. That traceability gap isn’t Fairlife’s creation — it’s a structural feature of how cooperative milk marketing works in most states. But it does mean that corporate assurances about supply chain integrity rest on voluntary self-reporting rather than on independently verifiable records.
The judge overseeing the welfare case recently dismissed certain claims against Coca-Cola and Select Milk but allowed others tied to Fairlife’s branding and consumer assurances to proceed. Plaintiffs have been given time to amend their complaint. On the state level, KOB-TV confirmed the Livestock Board has an active investigation — spokesperson Belinda Garland told the station, “The Woodcrest Dairy is an ongoing investigation in this agency,” adding, “We’ll hold them accountable if we feel that we have probable cause and the evidence to support it.” Garland noted that proving extreme animal cruelty can be difficult, particularly when allegations surface after the fact. The Chaves County Sheriff’s Office referred the matter to the NM Livestock Board. Woodcrest Dairy itself has since shut down — pens empty, cows dispersed across the network.
Within 30 days: Audit your own audit. Call your cooperative and ask three questions: Who selects your third-party welfare auditor? How often are audits conducted? Can you get the most recent audit summary for every farm in your pool? Get the answers in writing. If your co-op can’t or won’t answer, that tells you something.
Audit Question
Why This Matters
Red Flag Answer
Who selects your third-party welfare auditor?
If the co-op picks its own auditor, independence is compromised. Best practice: member-elected oversight board selects auditor.
“Management handles that” or “We don’t know”
How often are member farms audited?
Annual audits are industry standard for premium brands. Less frequent = gaps where problems can develop undetected.
“Every 2-3 years” or “Only problem farms get audited”
Can you access audit summaries for every farm in your pool?
If you can’t see audit results, you can’t verify supply chain integrity. Transparency = accountability.
“That’s confidential” or “Only management sees those”
Does your marketing agreement address brand-contamination risk from other member farms?
Without explicit clauses, you carry exposure from other farms’ welfare failures but have no legal recourse for lost premiums.
“We don’t have specific language on that” or “Never thought about it”
Within 90 days: Review your marketing agreement. Look for brand-contamination clauses — language that addresses what happens to your premiums if another member farm in your supply chain gets investigated. If that language doesn’t exist, you’re carrying risk you haven’t priced. Talk to your ag attorney.
Within 12 months: Push for traceability infrastructure. This is the harder conversation, and it costs money. Canada’s DairyTrace program, launched in 2021, tracks individual animals from birth to disposal — it’s a livestock traceability system, not a milk-to-brand system — and it’s further than what most U.S. cooperatives have built. The real gap is at the processor level: can your co-op’s system document which farms’ milk went into which branded product on which date? The Woodcrest situation raises that question for every cooperative in the country. That gap is a business risk that will only grow as consumers, regulators, and plaintiffs’ attorneys get more sophisticated about dairy supply chain questions. If you’re rethinking your operation’s positioning in that environment, “Transform Your Dairy Before Consolidation Decides for You” maps out the decision framework.
The trade-off is real. Better traceability protects premiums but adds cost. Voluntary industry programs are cheaper to implement but harder to defend in court. And waiting for regulators to mandate traceability means you’re letting someone else set the terms.
Key Takeaways
If your co-op can’t tell you who audits its member farms or when, your premium is built on trust, not verification. That’s fine until it isn’t.
If your milk marketing agreement doesn’t address brand-contamination risk from other member farms, you’re exposed. The Woodcrest situation shows how one operation’s investigation can call into question the entire cooperative network’s brand relationships.
The traceability gap is real and unregulated. Most states — including New Mexico — can’t trace milk from individual farms to retail brands. That means the burden of proving “clean” supply chains rests entirely on processor self-reporting. Ask yourself: Is that enough?
Two federal lawsuits in the same cooperative network raise questions that Select Milk’s members deserve to ask. When your co-op is simultaneously settling antitrust claims and facing welfare allegations, governance isn’t optional — it’s fiduciary.
The Gap Nobody’s Closing
The dairy industry spent decades building a system optimized for food safety and efficient pooling. That system works — it moves milk safely from farm to shelf on an enormous scale. But it wasn’t built to answer the question premium branding now requires: whose milk is this, and can you prove the cows that produced it were treated as the label promises?
Woodcrest Dairy is shut down. The cows are dispersed across the Select Milk network. The lawsuits are proceeding in narrowed form after some claims were dismissed and others allowed to continue. And somewhere between Roswell and a Fairlife bottle on a grocery store shelf, there’s a traceability gap that no settlement check, no third-party audit, and no corporate press statement has closed.
Your operation might never make national news. But your co-op’s ability to prove where your milk went — and that it came from farms meeting the standards your brand premiums depend on — is now a question with a dollar sign attached. Can yours?
Executive Summary:
A New Mexico welfare investigation at Woodcrest Dairy has exposed a deeper problem: once 2,000 cows were sold out of that herd, nobody could clearly trace which branded products their milk now supplies. Fairlife and Coca-Cola previously paid $21 million to settle animal welfare marketing claims and now say Woodcrest wasn’t a supplier in 2024–25, while ARM’s undercover footage and new federal filings paint a murkier picture of what “supplier” actually means in this system. At the same time, Select Milk Producers is dealing with a separate $34.4 million price-fixing settlement it reached with DFA in the Southwest, without admitting liability, after farmers accused it of using a joint agency to hold down milk checks. For you, the real risk isn’t the courtroom drama — it’s what happens to brand premiums that can be worth around $494,000 a year on a 1,000-cow New Mexico herd if a welfare scandal hits your co-op’s supply chain. Because New Mexico can trace cattle movements but not milk from farm to brand, most co-op members still can’t independently prove where their milk went or whether every supplying farm actually met a premium label’s welfare standards. This piece breaks down that traceability gap and gives you concrete moves — from grilling your co-op on audit practices in the next 30 days to stress-testing your marketing agreement for brand-contamination clauses — so you’re not finding out about your exposure when the premium disappears.
Update, 25/02/2026: Fairlife responded to The Bullvine’s request for comment. A Fairlife spokesperson stated: “Woodcrest Dairy is not a supplier to fairlife, which means no milk from this dairy is received by fairlife for fairlife products.” Fairlife did not address questions regarding the transfer of approximately 2,000 Woodcrest cows to Westland Dairy, milk-to-brand traceability within cooperative pools, Harry Dewit’s role within Select Milk Producers, or the company’s welfare verification process.
This article is based on published reporting by KOB-TV (February 22, 2026), federal court filings, USDA data, and other public sources cited throughout. Fairlife’s and Select Milk Producers’ positions are presented as stated to KOB-TV and in court filings. Harry Dewit has not been named as a defendant in the federal welfare lawsuit.
Learn More
Exposing Dairy’s Biggest Lie: Management Can’t Save You – Stop chasing marginal efficiencies while your foundation crumbles. This breakdown reveals why “perfect” management fails when structural economics shift—and arms you with the strategy to pivot before the market forces the move for you.
The American Dairy Heist: Who Really Owns Your Milk Check? – How much of your check is lost to cooperative “pooling” and marketing fees you never approved? This deep dive exposes opacity in your payout and delivers the leverage needed to challenge your board’s status quo.
Every week, thousands of producers, breeders, and industry insiders open Bullvine Weekly for genetics insights, market shifts, and profit strategies they won’t find anywhere else. One email. Five minutes. Smarter decisions all week.
Six farms, four countries, zero marketing budget — and more reach than $102.7M in anti‑dairy campaigns. Are you letting strangers explain your barn?
Nathan Ranallo — Nate the Hoof Guy — in west-central Wisconsin. He’d never edited a piece of footage before 2020. The 880 million views came because he didn’t bother starting.
Nathan Ranallo had been trimming hooves in west-central Wisconsin for more than two decades when he started filming his work and posting it online in 2020. “Maybe a year prior to that, I was still using a flip phone,” he told Wisconsin Public Radio. “I had never edited a single piece of footage in my life.” His reasoning, as he later told Wisconsin Public Radio: push back on viral clips that made standard procedures look like torture, and show what proper hoof care actually looked like.
Here’s why this matters to you, even if you never plan to post a single video: these farmers are building something the dairy industry has struggled to buy for decades — real consumer trust. If you’re not shaping the public story of your operation, someone else is telling it for you. They probably won’t get it right.
He told Wisconsin Public Radio he figured other farmers might watch — he never anticipated the broader audience. Two of his most popular TikTok videos have since pulled more than 150 million views combined (Wisconsin Public Radio, July 2024). His YouTube channel — launched in February 2020 — has grown to more than 1.7 million subscribers and passed 880 million total views as of February 2026 (Social Blade; VidIQ).
On TikTok, he’s at roughly 2 million followers. Facebook has 1.6 million users (The Tilt, August 2024). Ranallo — now known to the internet as Nate the Hoof Guy — didn’t see it coming. “Little did I know that it wouldn’t be just farmers watching this, but it would be many more people,” he told Wisconsin Public Radio. “It kind of exploded on me.”
What a Cow Pedicure Teaches About Trust
Social license sounds like something a consultant made up for a PowerPoint. But the concept is dead simple: it’s the informal permission the public gives your industry to keep operating. Lose it, and you get ballot initiatives, regulatory crackdowns, and retail buyers who want to talk to somebody else.
Ranallo builds social license without ever using the phrase. His videos look intense — paring overgrown claw, draining abscesses, clearing stones. But he explains every step.
Hoof horn is dead tissue, he tells viewers, much like a fingernail. “The analogy I like to use is: The hard hoof part that they walk on is like a boot that we would wear. We wouldn’t ever feel it if we were taking a rock out of the sole of our boot,” he told Wisconsin Public Radio. The lesions inside the claw are painful, and he’s clear about that, but careful trimming relieves the pressure — you can see the cow walk easier right after treatment.
For millions of viewers who’ve never set foot on a dairy, that’s the moment the industry stops being scary. The psychology mirrors power-washing videos and pimple-popping compilations: a visible problem, methodical work, satisfying relief. Ranallo adds something those genres don’t have — context and education.
The content side isn’t a hobby anymore, either. VidIQ’s algorithmic estimates — based on public view counts, not confirmed earnings — placed Ranallo’s monthly YouTube revenue at $8,000–$24,000 as of fall 2025. Those aren’t guaranteed numbers, and your mileage will vary wildly — but they’re worth weighing against the 30 to 50 hours a week he puts into content production. He also runs a Facebook paid-subscriber tier at $1.99/month and sells merchandise (The Tilt, August 2024). He told WiscNews that he spends 45 to 50 hours a week on hoof trimming and another 30 to 50 hours on content — essentially two full-time jobs.
At the low end — $8,000 a month from YouTube, 30 hours a week producing content — that works out to about $62 an hour. At the high end — $24,000 a month, 50 hours a week — closer to $111. You won’t touch those numbers; he’s an extreme outlier with more than 1.7 million subscribers. But the real value for most farm creators isn’t ad revenue. It’s the consumer trust that already exists before a crisis hits your county. And if you want to understand the real cost of lameness — and why hoof health is your most underrated profit driver, the connection between what Ranallo shows on camera and what’s happening in your barn is tighter than you’d think.
When Polished Transparency Shatters
And crises do hit. In June 2019, undercover footage from Fair Oaks Farms in Indiana went viral overnight (CBS News, June 2019). This wasn’t some anonymous operation with no public face — Fair Oaks was the Midwest’s premier agritourism destination, drawing more than 600,000 visitors a year to guided dairy tours and a birthing barn where visitors watched calves being born (Guardian, June 2019; IndyStar, June 2019).
Fair Oaks Farms in Indiana — 600,000 visitors a year, guided tours, a calf birthing barn. The actual working barns weren’t on the route. That gap is what collapsed in June 2019.
Retailers pulled Fairlife products from shelves. Owner Mike McCloskey posted a widely circulated video apology. Fair Oaks had invested more in public engagement than almost any dairy in the country — but it was the polished, curated kind. Guided bus tours and gift shops sat along the visitor route while the actual working barns didn’t (Center for Land Use Interpretation, 2013; IndyStar, June 2019).
When undercover footage showed what happened where the tours didn’t go, the gap between the brand and the barn destroyed trust more thoroughly than if there’d been no public face at all. That’s the distinction Ranallo, Pemberton, and Payne demonstrate in their own content: showing the raw, sometimes ugly, daily reality weathers scrutiny. A visitor center shatters under it.
A New York dairy that faced a PETA campaign offers the flip side. The owner called an AP reporter who’d requested an interview and invited her to the farm. The reporter declined the visit — but dropped the story entirely.
In her research, she’d found a news release from the New York Animal Agriculture Coalition about the farm’s NYSCHAP certification and contacted Cornell’s PRO-DAIRY program, which confirmed the farm’s reputation (Bovine Veterinarian, May/June 2016). The difference wasn’t size or budget. It was whether authentic trust existed before the camera showed up. That story — and others like it — speak to why social license is the issue dairy can’t afford to ignore.
Can a 4,500-Cow Operation Feel Personal?
One of the most stubborn myths in the public dairy conversation — and one your consumers almost certainly believe — is that scale automatically equals cruelty. MVP Dairy in Celina, Ohio, is proving that assumption wrong one TikTok at a time.
MVP is owned and operated by two fourth-generation farming families: the McCartys of Colby, Kansas, and the VanTilburgs of Celina, Ohio. The operation milks 4,500 cows and supplies Danone North America (PR Newswire, June 2020). “As 4th generation farmers, we know the care we provide to our cows, land, and team members today can help create a more sustainable world tomorrow,” co-owner Ken McCarty told Dairy Reporter when MVP earned its B Corp Certification (Dairy Reporter, June 2020).
That certification carries weight. To become a B Corp, MVP completed B Lab’s Impact Assessment — covering governance, workforce, community, and environmental performance — scoring 106.3 at its initial 2020 certification, well above the 80-point minimum (PR Newswire, June 2020). B Lab’s current listing shows a score of 102.7 following recertification (bcorporation.net, accessed February 2026). The farm is also DairyCARE certified through Where Food Comes From and was named the 2020 Innovative Dairy Farm of the Year.
Those credentials sit behind the TikTok feed. On social media, MVP doesn’t look like a sustainability report — it looks like cow-comfort walkthroughs, parlor routines, and “pampering the girls” trends, shot by real people in the barn. An audit score north of 100, plus a person in coveralls talking to the camera? That combination makes a 4,500-cow dairy feel like a place you could walk through, not a place you’d protest outside.
MVP took that principle offline, too. The Dairy Learning Center, a nonprofit onsite, invites the public to explore interactive displays, view cows being milked on a carousel, and shuttle through the free-stall barns (dairylearningcenter.com; TripAdvisor, 2026). Unlike Fair Oaks, MVP pairs the physical experience with daily, unpolished social content and third-party verification. It’s the combination that builds durable trust.
Inside MVP Dairy’s Learning Center in Celina, Ohio — a 4,500-cow operation that invites the public through the barns, not around them. B Corp certified. DairyCARE audited. Hands-on, not hands-off.
Should Your Dairy Farm Be on Social Media?
That’s the real question this whole trend forces. And the honest answer is: it depends on what you’re trying to accomplish, how much time you can spare, and what you’re protecting against. But the farmers building a real farm social media presence share patterns worth studying.
Tom Pemberton runs a mixed dairy-and-beef operation at Birks Farm near Lytham in Lancashire, England (BBC, November 2019). His YouTube channel has grown to 591,000 subscribers and more than 228 million views across over 1,000 uploads as of early 2026 (Social Blade, January 2026). What makes Pemberton worth your attention is what he doesn’t hide — the slurry, the silage, the equipment breakdowns, the days when nothing works. His audience returns not for highlights but because the full picture, grim days included, feels real.
What Makes a Cow Go Viral?
Down in Ikamatua on New Zealand’s West Coast, herd manager Chloe Payne took a completely different route to the same destination. She manages 600 mixed-breed cows — mainly Fleckvieh — on a 240-hectare milking platform, and owns 26 personally, all with names (Guardian Online, May 2024). Her Instagram account, Cows of New Zealand (@cowsofnewzealand), reached 325,000 followers by mid-2024 after gaining 270,000 in a single year.
Chloe Payne and friend, Ikamatua, New Zealand. The tattoo on her arm is Brown Sugar — a Jersey she loved enough to ink permanently. 325,000 Instagram followers showed up for exactly this.
A cow named Popcorn was one of her first viral stars — Payne told the Guardian that people still follow her account years later because of Popcorn. Then came Barbie, a Fleckvieh-Friesian calf whose photo pulled 2.4 million likes on Instagram and wound up on Khloe Kardashian’s account (NZ Dairy Exporter, January 2024). And Brown Sugar, a Jersey so beloved that Payne had a tattoo of her inked on her thigh (NZ Dairy Exporter, January 2024).
When Gingerbread — Brown Sugar’s daughter died in the spring of 2023, Payne compiled a video tribute to her life and shared it with her followers, many of whom had watched the calf grow up on their feeds (NZ Dairy Exporter, January 2024). “They see what happens on the farm and get to see that cows here are not just a number,” she told the NZ Dairy Exporter.
“If We Don’t Show It, Someone Else Will”
Jan Kielstra — SaskDutch Kid on YouTube — rounds out the picture from Saskatchewan. His parents, Bruce and Vicki, started milking 42 cows in 1996; today, Kielstra Holsteins runs roughly 380 head (YouTube channel description, 2026). His YouTube has grown to 223,000 subscribers and 63 million views (VidIQ, January 2026). His take on why he does it is the simplest version of the argument: “If we don’t show how we do things on a farm, someone will” (Sweet Peas Evening Ag News, March 2020).
Real dirt, real names, real problems outperform polish. They always have. For a different kind of story about the family that chose dairy chores over the NHL draft, the theme is the same — showing that the real thing beats selling the shiny version.
What Does Farm Social Media Actually Cost?
Chloe Payne is honest about the money. She told the Guardian in May 2024 that her Instagram is still a hobby and doesn’t generate much income — though she’d love to earn enough to eventually retire her pet cows. Even with 325,000 followers, the direct revenue isn’t there yet.
Big Farmer Andy — a third-generation dairy farmer in Australia whose grandfather emigrated from Holland in 1936 — started on TikTok almost by accident (Australian Farmers podcast, September 2022). A nose operation in November 2020 left him stuck inside for two weeks, so he posted some old farm videos to kill time. They blew up. His TikTok following stood at 449,200, with 14.5 million likes, as of early 2026 (TikTok, January 2026).
Big Farmer Andy — “Full time farmer, part time washed up tiktoker” — surrounded by what are very clearly not dairy cows. His humour built a TikTok audience of 449,200. His honesty about three mates lost to suicide is why they stayed.
Andy’s hook is humour — his bio reads “Full time farmer, part-time washed-up TikToker.” But his most important content isn’t funny. He’s one of the few agricultural creators willing to talk openly about the mental health toll of farming. “I also know, in my life, three young men who have died from suicide,” he told the Australian Farmers podcast.
“I know there are a lot of people in the community who struggle and suffer in silence,” Andy said in the same interview. “I just want people to know how preventable suicide is.” He grew a fundraising mullet to raise money for Australia’s Black Dog Institute and directs followers to mental health resources (Australian Farmers podcast, September 2022; 4BC, March 2023).
That’s the trade-off nobody puts in the marketing deck. Social media gives dairy farmers a tool for consumer engagement, yes. But for isolated operators, it can also be a lifeline — a bridge to the outside world during stretches when the only conversations you’re having are with the herd. The flip side is real, too: visibility invites hate comments, trolls, and scrutiny you didn’t ask for. Payne told the Guardian she focuses on the followers who genuinely want to learn about the industry — that’s the right line. And if isolation is a factor on your operation, Andy’s experience points to something worth reading: the suicide risk dairy farmers face — and what your operation can do about it.
The $102.7 Million You’re Up Against
None of this replaces solid genetics, good nutrition, or profitable management. A TikTok account won’t fix your production costs. But consider what you’re up against.
PETA alone spent $77.6 million in its fiscal year ending July 2024 (PETA financial report). Mercy for Animals reported another $25.1 million in consolidated spending for its FY 2024 (MFA audited financial statements, year ending December 31, 2024). That’s $102.7 million from just two organizations — before counting Humane World for Animals (formerly the Humane Society of the United States, rebranded February 2025), which dwarfs both. When you look at who really owns your milk check, the money flowing against dairy’s public image is part of the same picture.
You’re not going to outspend them. You can out-trust them — but only if the trust is already built before the camera shows up. Fair Oaks showed how fast a curated public image can collapse when the reality behind it doesn’t match. Ranallo, Pemberton, and Payne are showing the raw, unfiltered version holds up to scrutiny.
Herd Size
Daily Production per Cow (lbs)
Milk Price ($/cwt)
Daily Revenue Loss
30-Day Total Loss
300 cows
75
$18
$4,050
$121,500
300 cows
75
$21
$4,725
$141,750
500 cows
75
$18
$6,750
$202,500
500 cows
75
$21
$7,875
$236,250
Think of it this way: if your 300-cow operation lost a processor contract for even 30 days over a consumer-trust crisis — at even $18/cwt on 75 lbs/day, and that’s conservative; USDA’s 2025 all-milk price ran around $21 (USDA WASDE, 2025) — that’s roughly $121,500 in milk revenue with nowhere to go. At $21/cwt, the hit climbs past $141,000. The cost of one phone and 20 minutes a week looks different against those numbers.
Creator / Operation
Platform(s)
Total Reach / Followers
Herd Size / Scale
Core Content Approach
Nate the Hoof Guy (Nathan Ranallo)
YouTube, TikTok, Facebook
880M+ YouTube views, 1.7M subscribers
Hoof-trimming service
Unedited hoof-care procedures with methodical explanations
Large operations supplying consumer-facing brands or in high-scrutiny regions
Turn scale into asset via third-party verification + raw content + public access
Don’t quit—this is crisis insurance, not an experiment
Path 1: The 30-day test — just start. Film three short videos (60–90 seconds) of daily operations. Phone only. No editing, no script. Post on whichever platform your local consumers use most. Ranallo went from a flip phone to 880 million YouTube views — his early videos were rough, and that didn’t matter.
Kielstra’s advice: “Just pick up your phone and start taking pictures and videos of what you do around the farm” (Sweet Peas Evening Ag News, March 2020). Your goal in the first month isn’t to build an audience — it’s to discover what about your operation people find interesting. It’s rarely what you’d guess. Cost: 20 minutes per video. Time to first post: this week.
Path 2: Build a weekly rhythm — the 90-day commitment. Pick one platform and post consistently once or twice a week. Engage with every comment — Kielstra has said the early comments on each upload make the effort feel worthwhile. Find your farm’s “oddly satisfying” moment: the one thing a non-farmer would watch twice.
This path takes 2–4 hours per week. The trade-off is real time diverted from operations. The payoff is a growing audience that trusts you before any controversy hits. If you’re getting zero engagement after 90 days, switch platforms before quitting.
Path 3: Stack the receipts—the 365-day strategy. If you’re a larger operation, pair third-party audits (DairyCARE, B Corp, FARM Program) with a consistent digital presence. MVP Dairy’s model — a B Corp score well above the 80-point threshold, plus daily human-scale content, plus a physical learning center — is the strongest shield available when consumer perception is a direct business risk.
If you sell fluid milk or supply a processor with a public brand, this is you. The investment is significant, but it turns your size into an asset rather than a liability. Pair it with unpolished digital content and independent verification, or you’re building a facade instead of a foundation.
One caution across all three paths: don’t build your entire presence on a single platform. TikTok faced a U.S. divestiture mandate for most of 2025 before a joint venture deal closed on January 22, 2026 (Axios, January 2026) — Pemberton’s strength is YouTube, a long-form, searchable platform that doesn’t depend on any one app’s survival. Whichever path you’re on, the broader forces reshaping dairy operations aren’t slowing down. It’s worth understanding what consolidation means for your operation’s next move.
Key Takeaways
If you supply a processor with a consumer-facing brand, your operation’s public visibility isn’t optional — it’s part of the trust chain. Ask your fieldman or co-op what their transparency expectations look like this month.
If your region has faced activist campaigns or ballot initiatives, an established digital presence is cheaper insurance than crisis PR after the fact. One New York dairy’s years of NYSCHAP participation killed a PETA-driven AP story before it ran (Bovine Veterinarian, May/June 2016). Start with Path 1 this week — three videos, twenty minutes each.
If you’re running a large operation with no authentic public face, study MVP Dairy’s model — then study what happened to Fair Oaks when curated transparency met undercover footage. The combination that holds is third-party audit, plus raw content, plus a willingness to let people see the real barn.
If isolation is a factor on your operation — and on a dairy, it almost always is — content creation can serve double duty. Andy’s experience isn’t unusual. The digital connection matters even when the audience is small.
The Bottom Line
A herd manager in Ikamatua has 325,000 followers who know her cows by name. A hoof trimmer in Wisconsin — a guy who told Wisconsin Public Radio he’d never edited a single piece of footage in his life — built an audience of 880 million views. So who’s telling your story right now?
Complete references and supporting documentation are available upon request by contacting the editorial team at editor@thebullvine.com.
Learn More
Zero Mastitis Tubes Since March: The Real Cost of Lameness – Delivers a brutal reality check on your bottom line. You’ll gain a high-precision method for calculating the hidden drain of lameness, transforming invisible losses into a targeted, actionable strategy for immediate profit recovery.
The American Dairy Heist: Who Really Owns Your Milk Check? – Exposes the financial machinery syphoning your margins. This analysis arms you with the hard data on processor consolidation and global shifts, revealing exactly how to position your equity for the next five years of volatility.
Social License: Why it is the biggest threat to the dairy industry – Reveals why “doing a good job” isn’t enough anymore. This deep dive breaks down how the industry’s boldest mavericks are weaponizing transparency to secure their social license and dominate the high-value consumer market.
The Sunday Read Dairy Professionals Don’t Skip.
Every week, thousands of producers, breeders, and industry insiders open Bullvine Weekly for genetics insights, market shifts, and profit strategies they won’t find anywhere else. One email. Five minutes. Smarter decisions all week.
She wasn’t allowed to milk cows. She now runs a $22B company. How many daughters is your dairy quietly pushing off the lane?
Diane Hendricks, a Wisconsin dairy daughter who wasn’t allowed to milk cows, now leads multi‑billion‑dollar ABC Supply—an example of what the industry loses when it doesn’t see daughters as future owners.
Iowa State research says a big part of the “succession crisis” on family farms isn’t that kids don’t want to farm. It’s who you actually develop for leadership in the first place. If you’re within shouting distance of a transition between now and 2030—thinking about slowing down, selling out, or handing over shares—this is for you.
The payoff is simple: a clearer read on your real successor bench and a practical way to widen it without blowing up the farm or the family.
The 57/8 Split: What the Research Actually Found
Among Iowa farmers who’ve already named a successor, 57% choose sons, and only 8% choose daughters. That comes straight out of Iowa State University’s “How Gender Affects Successions and Transfers of Iowa Farms,” based on the 2019 Iowa Farm Transfer Survey and published as a CARD working paper in 2022, then as a journal article in 2023.
In Canada, survey work tied to recent Census of Agriculture data suggests that only a small minority of farmers—roughly one in eight in a 2019 Farm Financial Survey analysis—have a completed written succession plan, with about 13% saying they have one in progress. That leaves many producers over 55 running full‑time herds with no formal, written plan for what happens next. Around the kitchen table, that usually gets boiled down to one line: “The kids don’t want it.”
The Iowa work tells a different story. When the researchers dug into the data, they found sons get picked far more often than daughters, even when both have farm experience. This isn’t just about willingness. It’s about who you treat as a serious option.
The Iowa Numbers Sitting at Your Kitchen Table
The Iowa team—Qianyi Liu, Wendong Zhang, Alejandro Plastina, and colleagues—worked with 589 responses to the 2019 Iowa Farm Transfer Survey. Among farms that had already identified a successor:
57% chose a son.
8% chose a daughter.
In their models, the gap gets even clearer:
Daughters without agricultural experience had about a 5.4% chance of being chosen.
Daughters with agricultural experience jumped to 20.7%.
Sons without agricultural experience had 36.3% odds.
Sons with agricultural experience went to 65.2%.
Same parents. Same cows. Same parlor. Almost triple the odds for an inexperienced son compared to an experienced daughter.
The authors don’t dance around why. They point to “cultural norms of gender roles” and differences in farming‑related investments and education for sons versus daughters as major drivers of the gap. Strip the academic language away, and you get this: it’s easy to say “no one wants it.” It’s harder to admit “we trained one kid like an owner and one like a helper.”
From Osseo to ABC Supply: What Dairy Let Walk Away
Diane Hendricks in front of ABC Supply, the multi‑billion‑dollar company she built after leaving her family’s Wisconsin dairy—showing exactly what can walk away when a farm doesn’t see its daughters as future owners.
Diane Hendricks grew up on her parents’ dairy farm near Osseo, Wisconsin—population around 1,800—as one of nine daughters. She’s said many times that the farm gave her the work ethic, cost control, and ownership mindset she later used to build ABC Supply.
Today, ABC Supply is one of the largest roofing and siding distributors in North America. In 2021, the company reported $20.4 billion in revenue and operated more than 900 branches across the United States. Forbes, CNBC, and Guinness now list Hendricks as the richest self‑made woman in America, with a net worth north of $20 billion and 100% ownership of ABC Supply.
Here’s the part that stings if you’ve ever told a daughter to “leave the heavy stuff to your brother.” Hendricks has said her father never allowed her to milk cows or drive tractors. As a ten‑year‑old, watching her parents grind through the work, she made herself a promise:
“I don’t want to be a farmer, and I don’t want to marry a farmer.”
She loved the life. She was never developed to run the business. Dairy taught her the discipline and the numbers, then watched the ROI walk straight out of the lane and into roofing.
How Exclusion Actually Happens on Real Farms
Nobody sits at the table and says, “You’re out because you’re a daughter.” That’s not how it works.
It happens in a thousand small choices over twenty‑plus years:
Who learns to back the stock trailer at 14.
Who gets pulled into banker, nutrition, and vet calls.
Who hears “What are your plans for the farm?” versus “You can do anything.”
Australian farmer Katrina Sasse spent her 2017 Nuffield Scholarship looking at daughters and succession across several countries. Her conclusion was blunt: daughters “aren’t afforded equal opportunity of succession” and are “rarely thought of as future leaders in farming.” The ones who did take over weren’t unicorns. They’d been in the core of the operation early—milking, feeding, driving, troubleshooting—right alongside their brothers.
Hendricks’ story fits that pattern. She talks warmly about growing up with cows, chickens, dogs, and cats. She loved the farm. She just wasn’t allowed to milk or run equipment. She was raised as labour, not leadership.
It doesn’t only cost daughters. It can box sons in, too. When daughters are quietly taken off the board, sons don’t always feel chosen. They feel drafted. That’s a heavy way to step into a multi‑million‑dollar asset with your name on every note.
Most of this isn’t deliberate. It’s what you absorbed from your own parents and neighbours—and then passed on unless you consciously decide to do it differently.
Four Forces Working Against Qualified Daughters
The Iowa work and related research point to four big forces that keep daughters off the “successor” list even when they’re more than capable.
1. The “Better Farm, Better Son” Effect
In the Iowa sample, stronger farms were more likely to go to sons than daughters. When there’s more equity, more land, and better cows, a lot of parents treat sons as the “safe” choice. It’s not really about capability. It’s about perceived risk.
2. The Surname Concern
In outreach around the Iowa research and in succession advising, you hear some parents say they don’t want to be the ones who “gave the farm away from our name.” On paper, that has nothing to do with whether your daughter can manage robots, genetics, staff, and cash flow. In practice, it’s one more quiet mark in the “no” column when she’s 16, and your son is 14. Modern transition plans can include holding companies or LLCs that keep the farm name intact, regardless of the successor’s legal surname.
3. The Sibling Competition Asymmetry
The sibling mix matters.
In families with only sons, the vast majority chose a son as successor—close to nine out of ten in one Iowa extension summary.
In families with both sons and daughters, daughters’ odds drop sharply while sons’ odds stay high.
Sons compete against the fact that they’re sons. Daughters compete against brothers. That’s not a level starting line.
4. The Validation Gap
Family business research keeps finding the same thing: when fathers explicitly tell daughters, “you could run this place if you wanted to,” and then hand them real responsibility, a lot of bias disappears. Sons usually don’t need that sentence because the assumption is already baked in. Daughters read the silence loud and clear.
Breaking the Pattern: Where You Actually Start
You’re not going to fix Iowa’s 57/8 split on your own. You can absolutely change what happens in your own kitchen and in your own parlor.
Early Operational Inclusion
In almost every successful daughter‑succession story, she wasn’t “helping.” She was responsible.
Task Area
Helper Track(Warning Zone)
Owner Track(Successor Zone)
Equipment
Washes the mixer; told to “leave the tractor to your brother”
Runs skid steer, mixer, robot; troubleshoots breakdowns solo
Breeding Decisions
Files genomic reports; enters matings into software
Chooses sires, defends choices to AI rep, owns herd genetic direction
Financial Meetings
Not invited; “we’ll fill you in later”
In the room with lender, accountant, nutritionist—treated as a voice
Big Purchases
Told the decision after it’s made
Gets 2 quotes, runs ROI, recommends which one and why
Responsibility
“Help your brother with…”
Owns calves, transition cows, repro, or parlor performance—held accountable
Future Conversations
“You can do anything you want” (translation: leave)
“If you wanted to run this place, what would that look like?”
On your farm, that might look like:
Teaching your daughter to run the skid steer, mixer, or robot before she’s out of high school.
Having her in the room with your lender, nutritionist, and vet, and treating her as a voice, not a spectator.
Giving her clear responsibility for calves, transition cows, repro, or parlor/robot performance—and holding her accountable for results.
Here’s one that gets overlooked: mating decisions. A lot of daughters end up with the paperwork—registrations, DHI printouts, genomic reports—but not the genetic direction of the herd. That’s a missed opportunity.
Understanding pedigrees, reading genomic proofs, and knowing how to balance Net Merit (NM$) against your herd’s weak spots is exactly the kind of high‑value, strategic work that builds a successor. The 2025 revision of NM$ from USDA‑ARS and CDCB updated economic weights across traits to keep Net Merit focused on lifetime profit, with more emphasis on component‑based pricing, feed efficiency, and fertility while still rewarding cow livability and health. If your daughter can explain why you’re using a particular sire on a particular cow—and defend that choice against your AI rep’s suggestion—she’s doing owner‑level thinking, not helper‑level filing.
Danish farmer Connie Linde is one example from outside North America. When it wasn’t clear she’d have a stake in the home place, she bought her own dairy in her mid‑twenties and later went on to manage a larger, investor‑owned Holstein operation—earning recognition as Denmark’s Young Farmer of the Year along the way. She didn’t get there by endlessly “helping.” She got there by being in charge.
Task‑Based Development Instead of Vague Promises
“Someday this could all be yours” is not a development plan.
If you want real successors—sons or daughters—you’ve got to hand them decisions, not just chores. For example:
“We’ve got two ventilation quotes with different prices and energy savings. Dig into both and tell me which you’d choose and why.”
“We’re looking at beef‑on‑dairy contracts. Work out what that does to replacement heifers, cash flow, and risk, and bring me your recommendation.”
If they’re going to steer a multi‑million‑dollar business someday, they need reps making decisions that move a few hundred or a few thousand dollars now. That’s true whether you’re picking sires, signing a milk contract, or deciding how far you lean into robotic milking ROI.
Explicit Succession Conversations with Every Child
If your succession plan is based on assumptions you’ve never checked, you’re flying blind.
Good advisors keep coming back to the same point: talk to each child individually with open‑ended questions. “If the farm being part of your life was genuinely an option, what would you want that to look like?” opens a better door than “Do you want to farm?”
You don’t sell. You don’t defend your past. You listen. If what you hear doesn’t match your current plan, that’s your signal to bring in your accountant, lawyer, or a neutral succession advisor over the next few months while everyone is still talking. If those conversations show real conflict between siblings or between you and your successor, that’s not failure. That’s your early‑warning system.
A simple rule of thumb: if, after those one‑on‑ones, you and your kids are clearly not on the same page about who’s in, who’s out, and on what terms, that’s when you bring in outside help instead of letting it stew.
What This Means for Your Operation
Here’s where all the numbers land back in your lane.
If you’ve got daughters already involved on the farm—even part‑time—you can change their odds by changing the kind of work they do. Moving them from “helping” to “owning” pieces of the operation shifts them from low‑probability successors to realistic options.
If your daughters are off‑farm in other careers, that doesn’t mean the door is closed. But if they’ve never been treated as real candidates, start by owning that. A simple, “We never really offered you a clear path here, and that’s on us,” leads to a very different conversation than, “Do you want to come back?”
If you’re five years or less from wanting out of the day‑to‑day, this isn’t just a fairness question. It’s risk management. A narrow successor pool means:
Less competition if you need to sell.
Less flexibility with lenders.
More pressure on whichever child steps up—or on you, if nobody does.
You’re also trading off legacy decisions. Keeping the surname on the sign at all costs may feel safer today, but it can mean giving up future resilience if the most capable successor is the one who’d change their name on marriage or bring a different surname onto the mailbox.
If you’re already past succession—papers signed, son’s name on the notes—your leverage is in the next generation. Your grandkids are watching who you take seriously. They’re listening when you say, “She could run this place,” or when you never say it at all.
The Iowa numbers aren’t somebody else’s problem. They’re a mirror. You get to decide if your farm’s reflection stays the same or moves.
The Technology Window That’s Open Right Now
For decades, one unspoken reason for keeping daughters on the edge of the operation was the physical grind. Parlors are hard on shoulders and backs. Handling cows isn’t light. Long days on a tractor beat up anybody’s body.
Technology is changing that.
A 2016 Swedish study in Frontiers in Public Health compared dairy farmers’ musculoskeletal problems over 25 years and found farmers using robotic milking systems reported fewer shoulder and lower‑back issues than those in conventional parlors. Robots took over some of the most repetitive, strength‑based jobs.
Task Category
1990s Conventional Parlor(Physical Grind)
2025 Robotic Dairy(Data & Decisions)
Milking Labor
4–6 hrs/day in parlor; repetitive unit attachment, heavy lifting, shoulder/back strain
No(capability = data literacy + cow sense, not upper body strength)
Dairy Farmers of Canada told the same story from a different angle in a 2024 International Women’s Day profile. Alicia, a Saskatchewan dairy farmer and equal partner in her operation, talked about taking the lead on the technology side—keeping robots running, managing data, and handling herd‑health records—while her husband focuses more on cropping and outside work. Her point was simple: robotics and digital tools have knocked out a lot of the “you’re not strong enough” arguments that used to keep women out of core decision‑making.
The Bullvine’s own coverage of automation shows why that matters. In our look at robotic systems, herds using robots routinely push more milk per full‑time worker than comparable parlor setups when management is dialled in—one clear example of technology turning physical grind into data‑driven management gains. That’s not about biceps. That’s about brains and attention.
If you’ve already invested in robotic milking or other automation, you can make that money work twice. The robot doesn’t care whether it’s a son or daughter reading reports and making calls. It just needs somebody who understands cows, data, and risk.
That’s exactly what you need in a successor.
The 2025–2044 Window: Why This Matters Now
This isn’t just a family‑feelings story. It’s a survival story for the next 20 years.
The 2022 USDA Census of Agriculture shows U.S. farms with milk sales dropped 39% between 2017 and 2022—from 40,336 to 24,470 farms. That’s almost 16,000 dairies gone in five years. Coverage of the 2022 Census has described it as one of the steepest dairy farm declines between Census periods in decades, and there’s nothing in the numbers that suggests consolidation suddenly stops.
At the same time, the Census counted about 1.2 million female producers—around 36% of all producers—a roughly 26% jump over the previous decade. About 33% of female producers and 28% of male producers are classified as “beginning” farmers who’ve been on the land for ten years or less.
Put all that together, and you get a simple picture: fewer dairies, bigger herds, and a producer base that’s getting more female, faster.
Farm Credit Canada has argued that closing revenue gaps for female operators would add billions of dollars to Canadian agriculture’s economic output. Global scenarios from the FAO and World Bank suggest that closing gender gaps in agriculture could unlock very large gains—up to hundreds of billions of dollars in economic output in some models.
On your farm, that shows up as your successor bench. Are you building it from all of your kids—or just from the ones tradition told you to look at?
Key Takeaways
The 57%/8% split is real and recent. Among Iowa farms that have named a successor, sons are chosen seven times more often than daughters, based on 2019 data published in 2022–23.
Experience helps daughters, but doesn’t erase the gap. In the Iowa models, agricultural experience lifts a daughter’s chance of being chosen from about 5.4% to 20.7%, but experienced sons still sit at 65.2%.
You don’t create successors with chores; you create them with decisions. If a daughter never gets to make calls that swing a few hundred or a few thousand dollars, you’re not truly developing her to run the place.
Robots and genomics have killed most of the “too physical” excuses. Robotic milking and automation reduce physical strain and shift the job toward managing data, people, cows, and breeding decisions—skills that daughters and sons can both own.
Patterns compound across generations. The Iowa study shows that women who’ve run farms are roughly twice as likely to name daughters as successors (12.4% vs 5.9%). Change your pattern now, and you change your grandkids’ options later.
Succession risk is business risk. A narrow, male‑only successor pool doesn’t just limit opportunity. It can cost you options with lenders, buyers, and family, especially when things change quickly.
Next Moves This Year
Timeframe
Action Item
Who’s Involved
Success Metric
This Month
Hand your daughter one operational decision worth $500+ (protocol, purchase, contract). Commit to following her call.
You + daughter
Decision made, implemented, results tracked over 30 days
This Month
Audit each child’s ownership (not “help”) of specific farm areas. Write it down.
You (solo reflection)
Written list: name, responsibility area, decision authority
This Quarter
Bring all children (on-farm + off-farm) into one major financial discussion: robot quote, land rent, milk contract, lender review.
All kids + you (+ spouse if applicable)
Kids ask questions, offer input, see real numbers
This Quarter
If expectations misaligned after financial discussion, schedule meeting with accountant or lawyer to map real succession options.
You + advisor + successor candidates
Calendar appointment booked within 60 days
Before Year-End
One-on-one conversation with each child: “If the farm were truly an open option, what would you want?”
You + each child individually
You listen more than talk; assumptions challenged
Before Year-End
Based on those conversations, update written succession plan and individual development roadmaps for each potential successor.
You + accountant/lawyer
Written plan exists (or is started); kids know you have a plan
This month
Hand your daughter one operational decision with at least a few hundred dollars at stake—a protocol choice, a purchase, or a contract—and commit to following her call.
Take a notepad and write down each child’s name with the specific parts of the operation they truly own today. Not what they “help with.” What they’re responsible for, including any say in breeding and bull selection.
This quarter
Bring all children—on‑farm and off‑farm—into one major financial discussion: a robot quote, a parlor upgrade, a land rent or milk contract negotiation, or a lender review.
If those conversations expose big gaps in expectations, schedule time with your accountant or lawyer to map out real options while everyone’s still talking.
Before year‑end
Have a one‑on‑one conversation with each child about what they’d want if the farm were truly an open option—not a foregone conclusion.
Based on what you hear, update your written succession plan and your “development list” for each potential successor. If you don’t have a written plan yet, that’s the homework.
The Bottom Line
Diane Hendricks didn’t leave dairy because she couldn’t hack the work. She left because, as a ten‑year‑old girl on a Wisconsin dairy, every signal from the barn said, “This life is not for you.”
She took the work ethic, cost control, and ownership mindset she learned there and used them to build ABC Supply—a company with $20.4 billion in 2021 revenue and more than 900 branches across the U.S.
The question isn’t whether your daughter could run a dairy. Women prove that every day in other industries—and on plenty of farms that opened the door.
The question is what your farm is telling her now, in who you teach, who you trust, and who you call when something really matters. What did she learn from you yesterday? And what do you want her to believe is possible tomorrow?
Complete references and supporting documentation are available upon request by contacting the editorial team at editor@thebullvine.com.
Where the Robots Hum and the Cows Stay Calm: The Four Oak Farms Way – Carries forward the story into a future where technology and partnership finally dismantle tradition. Paige and Marcus prove the point that when “lanes” are built on strengths, the farm finds a sustainable rhythm.
The Sunday Read Dairy Professionals Don’t Skip.
Every week, thousands of producers, breeders, and industry insiders open Bullvine Weekly for genetics insights, market shifts, and profit strategies they won’t find anywhere else. One email. Five minutes. Smarter decisions all week.
She trusted the formula. Her baby spent days in the hospital. Nestlé’s $1 billion recall just exposed the supply-chain failure that leads straight back to your milk cheque.
Executive Summary: Nestlé, Danone, and Lactalis have recalled infant formula across more than 60 countries after a heat-stable toxin called cereulide was traced to contaminated ARA oil from a Chinese supplier. Barclays estimates Nestlé’s worst-case hit at CHF 1 billion; Danone faces up to €100 million. Two infant deaths in France are under investigation, though no causal link has been established. The unsettling part: the contaminated ingredient had been classified as “low-risk”—not subject to the same scrutiny as raw milk or base powders. If your processor makes infant formula or high-spec powders, this matters directly to your operation: when premium outlets choke, the value of your milk gets more fragile. This piece maps the full timeline, explains why standard pasteurization couldn’t prevent this toxin, and lays out the specific questions you should be asking your co-op board right now.
The call came on a cold January morning that no parent ever wants to get. A UK mother was standing next to her three-month-old’s hospital crib, watching doctors perform two lumbar punctures on her baby boy. According to her account shared with Sky News, he’d spent days violently vomiting and struggling with diarrhoea, his skin mottled and his feet turning blue in the days after feeds of Nestlé’s SMA formula. “I trusted the brand,” she said—and you could hear that trust shatter in her voice.
Doctors diagnosed meningitis and treated him with antibiotics. Only later did his mother learn that the SMA product she’d been feeding was among those Nestlé recalled, though no official link has been established between the formula and his illness. Nestlé has said cereulide “does not lead to meningitis” and that there’s no evidence its product caused the baby’s condition. The mother has called for a full investigation, saying, “we don’t have the full picture of what has happened.”
While she was living that nightmare, another family in Belgium was riding out 10 days of vomiting and watery diarrhoea after their baby drank Nestlé formula. In Brazil, two more infant illnesses linked to the recalled formula. In Singapore, a consumer with “mild symptoms likely associated with cereulide exposure.” And in France, prosecutors opened investigations into the deaths of two babies whose parents reported they had been fed Nestlé’s Guigoz formula in the days before they died.
At the same time, Nestlé, Danone, and Lactalis were scrambling to pull product from shelves in more than 60 countries, watching billions in market value evaporate, and tracing the crisis back to a single contaminated input: ARA oil from a supplier in China.
Here’s what you need to understand: this isn’t just a baby food story. It’s a live-fire stress test of the global dairy supply chain. If your milk ends up in powder or infant formula—directly or through your co-op—this hits your processor’s risk profile and, on many plants, eventually works its way back into the milk price you see.
Sick Babies, Scared Parents, and Two Death Investigations
We’re going to start where this actually matters: in the nursery, not the boardroom.
In Belgium, authorities were more definitive about the toxin itself. Joris Moonens, spokesperson for the Flemish Department of Care, confirmed that stool samples from an affected child contained cereulide and were linked to consumption of recalled formula. The child recovered after about ten days.
Brazil’s national health surveillance agency reported two infants sickened after consuming Nestlé formula that has since been recalled. Singapore’s Food Agency noted one consumer who developed mild symptoms and later recovered.
France is where the story turns tragic—and where nuance matters most. One baby born on December 25, 2025, died on January 8, 2026, at Haut-Lévêque Hospital in Pessac; the child’s parents told investigators she had been fed Guigoz formula between January 5 and 7. A second case involves a 27-day-old girl who died on December 23, 2025, in Angers; her mother likewise reported Guigoz consumption.
Angers prosecutor Eric Bouillard has called the formula a “serious lead” but stressed it’s “far too early” to say there’s a causal link. France’s health and justice ministries have reiterated that, as of late January 2026, no scientific evidence links the formula to these deaths, and toxicology and epidemiological investigations are ongoing. French prosecutors and health authorities are still gathering medical records, toxicology results, and feeding histories from the families involved. Any formal conclusions on whether the formula contributed to these deaths are expected to take weeks or months.
This is the emotional core that can get lost in corporate timelines: parents feeding their babies what’s supposed to be the safest, most regulated dairy product on the shelf—and then watching those babies get sick.
How One “Low-Risk” Ingredient Brought Down Three Giants
So how did three of the biggest dairy-adjacent players on the planet end up here?
The common thread is a specialty ingredient called arachidonic acid (ARA) oil—a long-chain fatty acid added to infant formulas to mimic components of breast milk and support brain and retina development. It’s typically produced by fermenting a particular fungus, then extracting and purifying the oil.
In this scandal, Nestlé traced the contamination to ARA oil from an unnamed “leading supplier” based in China. Market indicators and reporting from Chinese outlet Yicai Global have linked the ARA supply used by Nestlé to Cabio Biotech, a Wuhan-based producer whose 2024 financial report notes significant growth in its ARA business and lists major clients such as Nestlé and Danone—though Nestlé has not publicly named the supplier. Once this story broke, Cabio’s shares dropped nearly 12%, according to Yicai Global.
Here’s the part that should make every QA manager sit up: industry quality experts reported that, in many specialized nutrition HACCP plans, ARA oil had been treated as a “low-risk” ingredient. That label meant it received routine quality checks, but not nearly the scrutiny given to raw milk, base powders, or the final product.
Ingredient Type
HACCP Classification (Pre-Recall)
Testing Protocol (Pre-Recall)
HACCP Classification (Post-Recall Expected)
Testing Protocol (Post-Recall Expected)
Raw Milk
High-Risk
Every lot tested; full pathogen panel
High-Risk
Every lot tested; full pathogen panel
Base Powder (SMP/WPC)
High-Risk
Every lot; identity + moisture + micro
High-Risk
Every lot; identity + moisture + micro
ARA Oil (specialty lipid)
Low-Risk
Skip-lot; routine identity checks
High-Risk
Every lot; cereulide + B. cereus panel
DHA Oil (specialty lipid)
Low-Risk
Skip-lot; routine identity checks
High-Risk
Every lot; toxin screening
Vitamin Premixes
Low-Risk
Certificate of Analysis (CoA) accepted
Medium-High-Risk
Quarterly audit; CoA + third-party verification
An industry insider put it bluntly: “Normally, low-risk ingredients aren’t monitored as closely—you just have your routine checks.” The same coverage predicts that ARA oil will now be upgraded to high-risk status by most serious players.
From the Chinese supplier, the ARA oil was shipped to Europe via a Dutch intermediary. French authorities have confirmed the ingredient was manufactured in China and “sold by a Dutch company” to European manufacturers. That oil was then used at:
Nestlé plants, including its Nunspeet factory in the Netherlands, making BEBA, NAN, SMA, Guigoz, Nidal, and Alfamino
Danone facilities in Wexford and Macroom, Ireland, producing Aptamil, Cow & Gate, and Nutrilon
Lactalis plants making Picot infant formula for 18 countries
The problem isn’t just the bacteria. It’s the toxin.
Cereulide is extremely heat-stable. Once it’s formed in a food or ingredient, it survives boiling water, pasteurization, spray-drying—the whole toolbox of typical dairy processing. C&EN’s January 2026 explainer made it clear that cereulide can withstand the high temperatures used in infant formula manufacturing and remain active. If the ARA oil arrived at the plant already laced with cereulide, no amount of standard processing heat would “cook it out.”
The “high-risk” raw milk that everyone obsesses over wasn’t the issue. The “low-risk” micro-ingredient that was supposed to be safe enough for skip-lot testing is what brought the house down.
The Timeline: Who Knew What, and When?
The timing is where consumer groups and regulators are focusing their anger—and where your own risk radar should start buzzing.
Late November 2025 — Routine checks at Nestlé’s Nunspeet plant detect low levels of cereulide; further testing confirms trace amounts.
December 9, 2025 — Nestlé informs Dutch food safety authorities.
December 10, 2025 — Nestlé France announces a limited recall of 25 batches in 16 countries.
December 12, 2025 — Italy logs the first entry in the EU Rapid Alert System for Food and Feed (RASFF).
January 5, 2026 — Nestlé publicly announces a major recall across 49 countries.
January 14, 2026 — Nestlé executive Philipp Navratil releases a video statement, saying parents “trust us to provide products that are safe and of high quality,” and insisting the company followed each national authority’s guidance.
January 17, 2026 — Singapore Food Agency orders Danone to recall Dumex Dulac 1 after detecting cereulide.
January 21–22, 2026 — Lactalis recalls Picot infant formula in 18 countries.
January 22–25, 2026 — French prosecutors open investigations into two infant deaths.
January 23–26, 2026 — Danone recalls specific Aptamil batches in Ireland and the UK.
January 30, 2026 — Le Monde reports Nestlé acknowledges a 10-day delay between initial detection and the first precautionary recall.
Consumer group Foodwatch has hammered both the companies and regulators. Their legal filings argue that Dutch authorities were informed on December 9, yet the full cross-border risk wasn’t shared with other EU countries or consumers immediately. Foodwatch says, “by the time scandals are uncovered, it is often too late: the products have been consumed, and people have fallen ill.”
Nestlé’s public line is that, as soon as it confirmed the issue, it “engaged proactively with the respective health and food safety authorities…and followed their guidance.” That might pass the legal test. It doesn’t fix the trust gap for parents—and it doesn’t reduce the operational shock for plants or the farmers behind them.
Worth noting: some markets have not been affected. Canada’s Food Inspection Agency stated that recalled products were not distributed in Canada.
The Billion-Dollar Hit
Let’s pull the numbers together—because they’re real.
Nestlé — Barclays estimates a worst-case impact of around CHF 1 billion (~$1.29B USD) when you combine product write-offs, logistics, and brand damage, according to Reuters and FoodIngredientsFirst. Nestlé has said the recalled batches represent less than 0.5% of annual group sales, but infant nutrition still accounts for roughly 5% of total revenue. Shares fell around 8% in the weeks following the January 5 announcement.
Danone — Infant formula is about 21% of Danone’s business, according to Reuters. Barclays pegs a worst-case hit near €100 million (~$118.5M). Stock dropped 8–10% around the recall announcements and traded near a one-year low.
Cabio Biotech — Shares fell nearly 12% once the contamination was linked to the Chinese ARA oil supply, per Yicai Global.
Combined — Total direct and indirect losses comfortably exceed $1 billion, according to analyst estimates.
Company
Product Write-Offs & Destruction
Logistics & Recall Execution
Brand Damage & Legal Reserves
Stock Market Loss (Red)
Total Impact (USD)
Nestlé
$320M
$180M
$290M
$500M
$1,290M
Danone
$30M
$18.5M
$20M
$50M
$118.5M
Cabio Biotech
$10M
—
$10M
$30M
$50M
For dairy, the lesson in those numbers isn’t sympathy for multinationals. It’s how fast value can evaporate when one high-value outlet—infant formula—goes sideways. Plants don’t magically keep every litre at the same value when they’re forced to downgrade product, shift volumes into lower-margin streams, or run under capacity.
That shows up in processor margins—and on many plants, shocks like this eventually work their way back into the milk price farmers see.
Why Cereulide Is Different
Sixty seconds on the chemistry, because you need to understand why this hazard is so nasty.
Cereulide is a small, cyclic dodecadepsipeptide toxin produced by certain emetic strains of Bacillus cereus. Unlike the bacteria itself—which you can often kill with heat—cereulide is:
Extremely heat-stable — survives boiling and spray-drying
Fat-soluble — accumulates in fatty ingredients like oils
Fast-acting — symptoms typically start within 30 minutes to 5 hours
Typical symptoms: sudden nausea, repeated vomiting, diarrhoea, abdominal cramps, lethargy, dehydration. In babies, that often shows up as intense crying and refusal to feed. Most cases resolve within 6–24 hours, according to EFSA and Food Standards Australia New Zealand guidance. But severe intoxication has been associated with acute liver failure and life-threatening outcomes, especially in vulnerable populations.
The key takeaway: once cereulide is present in an ingredient, no standard pasteurization step in your plant will remove it. Prevention and supplier control are your only real levers.
Pathogen / Toxin
Typical Source
Survival at Pasteurization Temps (72°C / 161°F, 15 sec)
Survival at Spray-Drying Temps (180–200°C)
Salmonella spp.
Raw milk, environment
Killed
Killed
Listeria monocytogenes
Raw milk, equipment biofilm
Killed
Killed
E. coli O157:H7
Raw milk, fecal contamination
Killed
Killed
Bacillus cereus (bacteria)
Soil, environment, ingredients
Killed
Killed
Cereulide toxin
Produced by B. cereus in fatty ingredients
SURVIVES
SURVIVES
Botulinum toxin
Anaerobic environment, poor sanitation
Heat-labile (destroyed)
Destroyed
Staphylococcal enterotoxin
Human handling, poor hygiene
SURVIVES
SURVIVES
The Processor Playbook: Five Questions for Your Board
If you’re in a plant, on a co-op board, or responsible for quality systems, this should feel like a fire drill with the alarm still ringing.
1. Which of our ingredients are still tagged “low-risk” that could carry high-impact hazards?
Go beyond raw milk and water. Look at ARA, DHA, vitamin premixes, specialty proteins going into infant and medical nutrition lines. If your HACCP documents still treat these inputs like table salt, that’s a problem.
2. Do we test every lot of critical micro-ingredients, or are we still on skip-lot protocols?
Health Canada’s guidance for infant formula manufacturing makes it clear: every lot of incoming material must be sampled and tested unless you have robust historical data demonstrating consistent compliance—and even then, every lot requires identity testing. “We trust Supplier X” isn’t a methodology.
Decision rule: Test every lot of specialty lipids until you have 12+ consecutive compliant lots documented, with full traceability to upstream manufacturing sites.
3. Could we trace any recalled ingredient to the finished product within hours, not days?
That means real-time digital traceability down to specific batches and pack codes—not spreadsheets and binders that take all weekend to reconstruct. If you can’t answer “Which exact facility made the ARA in this batch?” without phoning three people, your traceability is paperwork, not practice.
4. Are we over-dependent on any single plant or supplier for infant or medical nutrition ingredients?
You don’t need to double your ingredient costs, but you should qualify at least one alternate supplier for each critical input. Use contracts that require upstream transparency—suppliers should tell you when they change their own sources or face investigations.
5. Is our crisis communication plan designed to make regulators comfortable—or to keep parents informed?
Be honest: are you building statements for legal teams, or for the mothers and fathers in the NICU?
Decision rule: Target customer notification within 24 hours of a confirmed serious hazard—not “when the regulator tells us to.”
Question for Your Co-op Board
Weak Answer (Red Flag)
Strong Answer (What to Demand)
Which ingredients are still tagged “low-risk”?
“We follow industry standards for all ingredients.”
“We’ve reclassified ARA, DHA, and all specialty lipids to high-risk. Every lot now tested for B. cereus and cereulide.”
Do you test every lot of critical micro-ingredients?
“We use skip-lot protocols for ingredients with strong supplier histories.”
“We test every lot of ARA, DHA, and vitamin premixes until we have 12+ consecutive clean batches—then quarterly audits.”
Can you trace recalled ingredients within hours?
“We maintain full traceability records in compliance with regulations.”
“Digital traceability down to batch codes and upstream manufacturing sites. We can answer ‘Which facility made this?’ in under 2 hours.”
Are you over-dependent on any single supplier?
“We’ve built strong relationships with our key ingredient partners.”
“We’ve qualified at least two suppliers for every critical input. Contracts require 48-hour notification of upstream source changes.”
Is your crisis plan designed for parents—or lawyers?
“We have robust protocols and follow all regulatory guidance.”
“Target 24-hour customer notification for confirmed hazards—before regulators mandate it. Parent trust > legal comfort.”
What This Means for Your Operation
If you’re milking cows and shipping to a processor with any infant formula business, you’re in this story whether you’ve ever seen a can of SMA or Aptamil or not.
Infant formula is a premium outlet—when it’s running.
Ireland is a good example. Around 90% of Irish dairy production is exported in some form, and infant nutrition products are a well-publicized part of that export mix. Danone’s plants in Wexford and Macroom were expanded specifically to serve global infant formula markets, supplying Aptamil, Cow & Gate, and Nutrilon across Europe and beyond.
When those plants run flat out, they’re a value-add engine for Irish milk. When they have to slow, rework, or divert volumes because of an ingredient issue, that milk has to go somewhere else—more volume pushed into lower-value commodities, less ability to pay premiums on nutrition-grade product, potential pressure on base price.
We saw a different version of this dynamic in the US after the Abbott infant formula recall in 2022. The shutdown of Abbott’s Sturgis plant triggered major shifts in import flows, emergency approvals for foreign formula, and ripple effects in powder markets. If you weren’t paying attention to how formula plant disruptions can cascade through the broader dairy supply chain, that was your wake-up call. This is your second one.
Nobody has a clean $/cwt figure yet for this cereulide recall, and it will vary hugely by plant and contract. The point is simple: when your processor’s premium channel chokes, the value of your milk becomes more fragile.
Three Conversations to Have with Your Co-op
You can’t control where a Chinese supplier sources its raw materials. You can control how informed and engaged you are with the people who sell your milk.
1. “How much of our milk is tied to infant formula and high-spec powders?”
It’s not prying to ask roughly what share of plant output goes to infant formula versus cheese, butter, or commodity ingredients. A plant with 5% of volume in infant nutrition is in a very different risk position than one sitting at 25–30%. The upside in good times is bigger. So is the downside when something goes wrong.
2. “What changed here after the Nestlé–Danone–Lactalis recalls?”
You’re looking for specific moves: revisiting HACCP risk rankings for micro-ingredients, reviewing supplier qualification for overseas sources, and running crisis simulations. If you get answers like “we’re monitoring the situation” or “we’re fully compliant,” that’s nice—but it’s not the same as “this is what we’ve changed.”
3. “If something goes wrong upstream, how will you protect the farmer reputation?”
We’ve all seen how fast social media can paint with a broad brush: “dairy” gets blamed long before anyone distinguishes between a Chinese ingredient plant and your bulk tank. Ask whether your co-op has a clear stance on how they’ll communicate when an issue isn’t farm-level.
Trust on Trial—Again
Part of why this story has so much heat is that it sits on top of a long, ugly history.
Lactalis salmonella (2017–2018) — 35 babies in France were infected with Salmonella Agona after consuming Lactalis infant formula, prompting a recall of 12 million boxes across 83 countries, according to Eurosurveillance reporting. The same Craon facility had been linked to an outbreak in 2005. In 2023, Lactalis was criminally charged with aggravated deception and involuntary injuries.
China’s melamine scandal (2008) — Adulterated milk powder killed at least six babies and caused kidney damage in an estimated 300,000, according to WHO figures. Trust in Chinese infant formula never fully recovered.
Nestlé’s 1970s marketing practices — Aggressive promotion of infant formula in developing countries contributed to serious illness and death. The resulting boycott, starting in 1977, has shadowed Nestlé’s infant nutrition brand ever since.
When infant formula brands stumble, they don’t just damage their labels. They erode trust in the idea that highly processed, highly regulated dairy products are bulletproof.
You and your co-op don’t control that history. But you’re living in the shadow of it.
Key Takeaways
If you’re a processor or on a board:
Re-score ingredient risks so nothing that can quietly carry a toxin sits in the “low-risk” bucket without hard justification
Map critical supply chains at least two tiers back, and audit upstream plants where needed
Build a 24-hour recall and communication playbook that leads with consumer safety, not legalese
Stress-test your business mix so a shock in infant formula doesn’t take down your whole value structure
If you’re a farmer:
Get clear on how much of your milk rides on infant formula and high-spec powders
Push for straight answers on how your buyer is adjusting sourcing and safety systems post-recall
Keep your own house in order on quality and documentation—so if a crisis hits upstream, you’re part of the solution, not the question mark
The Fork in the Road
Let’s be honest: none of this is comfortable. It’s hard enough to manage feed bills, labour, fresh cow management, breeding decisions, and maybe a robot payment without worrying what some ingredient plant halfway around the world is doing.
But that’s the reality of the market we’re in now. Your milk doesn’t just become cheese for the local deli anymore. It becomes powder for Jakarta, formula for Dublin, ingredients for Dubai.
We can treat this as a PR mess for three multinationals in far-off factories. Shake our heads, hope regulators patch a few things, and carry on.
Or we can treat it as what it really is: a warning shot that says every link between your bulk tank and a baby’s bottle has to withstand this level of scrutiny.
Because at the end of the day, this isn’t just about one Chinese supplier or Nestlé or a Dutch broker. It’s about whether parents can keep trusting dairy-based formula to nourish their babies—and whether you can keep trusting the brands and plants that turn your milk into that promise.
If we want to keep that trust, it’s on all of us—from the parlour to the boardroom—to tighten the weak links we’ve been willing to live with.
Your future milk cheque, and a lot of babies’ futures, are riding on the same thing: whether this industry can look in the mirror after a billion-dollar recall and say, honestly, “We’ve learned from this—and we’ve changed.”
Editor’s Note: This analysis draws on official statements and reporting from national food safety agencies, Reuters, FoodNavigator, Le Monde, Euronews, C&EN, Yicai Global, and Foodwatch between December 2025 and January 2026. Investigations into potential links between specific infant illnesses and recalled products are ongoing; where causality is not established, we’ve said so. Economic impacts will vary by processor, region, and contract structure.
The $50,000 Biofilm Crisis Your ATP Test Will Expose – Breaks down the invisible $50,000 profit leak hiding in your equipment while revealing how advanced monitoring catches pathogens. Mastering this tech prevents catastrophic grade-outs and secures your reputation as a top-tier supplier in high-scrutiny markets.
The Sunday Read Dairy Professionals Don’t Skip.
Every week, thousands of producers, breeders, and industry insiders open Bullvine Weekly for genetics insights, market shifts, and profit strategies they won’t find anywhere else. One email. Five minutes. Smarter decisions all week.
51 sick babies and 55 organic farms show how one powder plant can flip your dairy’s risk, premiums, and lender conversations overnight.
Executive Summary: The ByHeart infant botulism outbreak—51 hospitalized babies in 19 states tied to powdered formula—has turned one organic whole milk powder chain into a live stress test for dairy contracts and supply‑chain risk. At the center are 55 organic farms shipping to Organic West, DFA’s Fallon, Nevada plant drying that milk into organic whole milk powder, and ByHeart’s premium “clean label” formula that used the powder before FDA testing found botulinum toxin in both sealed cans and the ingredient. With the investigation still open and the FDA already tightening oversight of the infant formula sector following earlier recalls and shortages, any producer whose milk ends up in infant formula or other products now has to assume more scrutiny, not less. The article walks through the outbreak timeline and the science of spores that can survive standard milk processing, then translates that into four practical ripple effects on the farm: tougher quality expectations, tighter traceability, more complex recall and indemnity risk, and sharper scrutiny of organic and “clean label” claims. It closes with a clear playbook for progressive dairies—measure how much of your milk flows into powder and infant channels, pull three to five years of quality and audit records into one place, reread contracts with recall liability in mind, sit down with your insurer about contamination and business‑interruption coverage, and decide how much exposure to infant markets fits your long‑term margin and survival strategy.
Fifty‑one hospitalized babies tied to an infant formula outbreak have just changed how every one of us should think about milk heading into a powder plant. In late 2025, FDA and CDC investigators connected this infant botulism cluster—51 infants in 19 states, all hospitalized, with no deaths reported as of mid‑December—to ByHeart’s powdered infant formula. Regulators then traced the problem back to an organic whole milk powder ingredient used in that formula, which is where dairy producers like us suddenly get pulled into the story.
This isn’t some theoretical scenario. It’s a real supply chain made up of 55 organic farms, an ingredient plant in Nevada, and a premium “clean label” formula brand that, on paper, looked like one of the safest systems out there.
How a “Clean” Infant Formula Ended Up at the Center of an Outbreak
Let’s start with what’s on solid ground. By mid‑December 2025, federal and pediatric sources reported 51 suspected or confirmed infant botulism cases across 19 states, all involving babies who’d consumed ByHeart Whole Nutrition infant formula. Every one of those infants was hospitalized, but no deaths had been reported at that point.
ByHeart isn’t a bargain‑bin product. It’s a U.S. infant nutrition company that came to market with a lot of fanfare: “from scratch” formulation, organic grass‑fed whole milk, no corn syrup, no maltodextrin, no soy or palm oil. Clean Label Project awarded ByHeart its Purity Award and later its “First 1,000 Day Promise” certification for testing against hundreds of contaminants. That’s the kind of branding you and I see and think, “Okay, they’re serious about safety.”
On the ingredient side, you’ve got Organic West Milk Inc. Co‑owner Bill Van Ryn has said his company collects milk from 55 certified organic dairies, mainly in California, and that this milk is processed into organic whole milk powder. That powder, in turn, is produced at Dairy Farmers of America’s ingredient plant in Fallon, Nevada. When the plant was built, local reporting pegged it at roughly a 70‑million‑dollar project, designed to handle around 2 million pounds of milk a day and produce in the neighborhood of 250,000 pounds of powder and other dried ingredients daily.
Van Ryn has also been clear on two key points. First, Organic West hasn’t supplied organic whole milk powder to any infant formula manufacturer other than ByHeart. Second, after FDA testing found Clostridium botulinum in a sample of their powder, they paused sales of powder for products used in infant and children’s foods while the investigation runs its course.
At the same time, FDA testing found the same type of botulinum toxin in sealed cans of ByHeart formula and in infants’ stool samples. So regulators know the spores are somewhere in that system. As of late January 2026, though, they haven’t pinned down exactly where the contamination entered—on farm, in the powder plant, at the blending step, or somewhere further downstream.
It’s worth noting that the CDC and FDA don’t call something an outbreak lightly. Infant botulism is rare, and having this many cases associated with a commercial formula is extremely unusual. Guidance from CDC and the American Academy of Pediatrics has long noted that spores are widespread in soil and dust and that infants under one year are more vulnerable because their gut and microbiome aren’t fully mature. The basic message is simple: spores and infant foods don’t mix.
The Timeline: August to December, 51 Infants in 19 States
The way this rolled out will feel familiar if you’ve watched other food safety issues, just with higher stakes.
In August 2025, California’s Infant Botulism Treatment and Prevention Program started seeing more Type A infant botulism cases than usual. The common thread they noticed was the consumption of ByHeart powdered formula. That triggered further investigation.
By early November, CDC and FDA had identified 13 infants in 10 states who’d been hospitalized with suspected or confirmed infant botulism and had received BabyBIG antitoxin. All of those babies had a history of consuming ByHeart formula. As more cases came in, FDA’s public updates ticked up to 39 cases by early December—spread across 18 states, with ages ranging from just a few weeks to about 8 or 9 months, and illness onset between early August and late November.
By December 17, 2025, the American Academy of Pediatrics’ Red Book online summary had the number at 51 infants in 19 states, all with suspected or confirmed infant botulism and all linked to ByHeart formula exposure. Through all of that, the headline stayed the same: hospitalized, no deaths.
So when the FDA released an update on January 22, 2026, saying they had identified organic whole milk powder as the ingredient associated with the outbreak—and that testing had found botulinum toxin in that powder—that’s when the dairy side of the supply chain landed squarely in the frame. For the 55 farms shipping through Organic West, and for anyone with milk flowing into infant formula powder plants, this stopped being “someone else’s problem.”
What the Science Says About Spores, Heat, and Why This Matters to Dairies
You probably know the basics, but it helps to pull it together.
With infant botulism, babies aren’t usually ingesting pre‑formed toxin. Instead, they ingest spores, which then germinate and produce toxin in the gut. Older children and adults can often ingest spores without symptoms because their gut environment is more mature and resistant to colonization.
The problem for us on the milk side is that Clostridium botulinum spores are built to survive. Scientific work and public‑health guidance agree: spores are highly heat‑resistant. Standard milk pasteurization and typical spray‑drying conditions do not reliably destroy them. It takes more severe treatments—like those used for shelf‑stable canned foods—to inactivate spores consistently, and that’s not how we process fluid milk or most powders.
Pathogen or Spore
Standard Milk Pasteurization (161°F, 15 sec)
Spray-Drying (160–200°F typical)
What It Actually Takes to Kill
Present in ByHeart Outbreak?
Salmonella
✓ Killed
✓ Killed
161°F+ for 15 sec
No—destroyed by pasteurization
Listeria
✓ Killed
✓ Killed
161°F+ for 15 sec
No—destroyed by pasteurization
Cronobacter
✓ Killed
✓ Killed
161°F+ for 15 sec
No—destroyed by pasteurization
E. coli O157:H7
✓ Killed
✓ Killed
155°F+ for 15 sec
No—destroyed by pasteurization
Clostridium botulinum SPORES
✗ SURVIVES
✗ SURVIVES
250°F+ for 3+ min (pressure canning)
YES—found in powder & sealed cans
Bacillus cereus spores
✗ Survives
✗ Survives
250°F+ for extended time
Not reported
Historically, most infant botulism cases have been linked to environmental exposure and honey, not commercial formula. So the track record for the formula has been quite good. But when you look at the FDA’s published focus on powdered formula safety, it has leaned heavily on organisms such as Cronobacter and Salmonella. This outbreak is a hard reminder that spores are a different challenge. They don’t behave like standard bacteria, and they can ride along in dust, soil, and dried residues in ways that are easy to underestimate.
For farms shipping to ingredient plants serving infant markets, that matters. It’s not just about plate counts, fresh cow management, and keeping butterfat levels where they need to be. It’s also about whether your milk and your plant’s environment are being managed with spore risk in mind, even if the odds of a problem are low.
Mapping the Chain: From Organic Herds to Fallon
Let’s walk through the supply chain as credible reporting has laid it out.
On the farm end, 55 certified organic dairies ship to Organic West. Many of these are in California’s main organic regions, with at least some milk coming in from outside the state, such as Oregon. These are full‑time commercial herds, not hobby operations. They’ve gone through organic certification, pasture requirements, and the paperwork that comes with chasing organic premiums rather than just taking a basic blend price.
Organic West then moves that milk into DFA’s Fallon ingredient plant in Nevada. That facility was promoted as a major anchor for regional dairy when it was built. Contemporary coverage described roughly $70 million in capital investment, the capacity to handle about 2 million pounds of milk per day, and finished output of about a quarter‑million pounds of powder and other dried ingredients per day. Economic development folks projected that the area herd would need to grow significantly to feed the plant, and that the regional dairy sector could see a sizable boost as the plant ramped up.
From Fallon, the organic whole milk powder goes out as an ingredient. In ByHeart’s case, they use that powder at blending and packaging facilities in multiple states to make finished infant formula. That formula is then sold nationwide. That’s how a problem at the ingredient level can end up with 51 sick babies across 19 states: one product, one brand, lots of distribution.
Supply-Chain Stage
Entity
Volume/Scale
Contamination Entry Risk
Who Controls Quality Here?
Your Farm’s Visibility
1. Farm
55 certified organic dairies (CA, OR)
Unknown total volume
Soil, dust, feed, environment
Individual farm protocols
HIGH
2. Collection
Organic West Milk Inc. (Bill Van Ryn)
Pooled multi-farm milk
Tanker hygiene, cross-contamination
Hauler + farm coordination
MEDIUM
3. Processing
DFA Fallon, NV ingredient plant
~2M lbs milk/day → ~250K lbs powder/day
Plant environment, dryer surfaces, packaging
DFA plant SOPs + FDA oversight
LOW
4. Ingredient Supply
Organic West powder to ByHeart
Unknown tonnage to infant formula only
Warehouse storage, handling, moisture
Ingredient supplier + buyer specs
VERY LOW
5. Formula Blending
ByHeart facilities (multiple states)
National distribution scale
Blending equipment, other ingredients
ByHeart manufacturing SOPs
NONE
6. Retail/Consumer
Nationwide (19 states affected)
51 hospitalized infants (Dec 2025)
Post-production handling (rare for spores)
Retailers + consumer storage
NONE
FDA’s public position is careful but clear. They’ve reported that organic whole milk powder used in ByHeart formula tested positive for botulinum toxin, and that they believe the ingredient supplier is likely where contamination entered the chain. At the same time, they’ve emphasized that the investigation is ongoing and that they’re still working to determine exactly where and how spores got into the system. So while Organic West and DFA Fallon are under extra scrutiny, regulators have not issued a final ruling on the specific contamination issue.
From Van Ryn’s vantage point—and many of us can relate—he’s stressing that a positive test in a powder sample doesn’t automatically prove that the milk leaving his farm or any of the 55 farms was the original source. Somewhere between the cow, the tanker, the dryer, the warehouse, and the formula blender, spores found a way in. The job now is to figure out where.
What This Means If Your Milk Goes Into Powder or Infant Products
If you’re one of those 55 farms, or your milk runs into a similar system somewhere else, there’s a tough reality: from a buyer’s or regulator’s vantage point, they see the pool, the plant, and the product more than your individual track record.
Those farms are still milking. Their organic milk can be redirected into other organic products, such as fluids, cheese, yogurt, and various powders. But that infant formula outlet, which probably helped justify the cost and effort of organic certification and all the detail that goes into feed, dry cow, and transition management in organic herds, is effectively shut off for now. That’s real opportunity cost, even without putting a dollar value on it.
Many Midwest producers will recognize the feeling from other situations: you can be doing a great job on your own place—sound fresh cow programs, strong transition period performance, consistent components—and still get caught up in problems that start at a plant or in another part of the chain. In Wisconsin, for instance, herds shipping to specialty plants have had to live with added oversight because of issues at the plant, even when their own farm tests were clean.
Here, the worry for those 55 families isn’t just this month’s test results. It’s the next lender meeting, the next renewal conversation, the next buyer negotiation. Will lenders and buyers still view them as low‑risk suppliers a year or two from now? Or will there always be a quiet mental note attached: “This milk shipped into the ByHeart chain during the botulism investigation”?
The other piece is premiums. Organic whole milk powder used in infant and specialty ingredient markets generally trades above conventional nonfat dry milk and standard whole milk powder. You don’t need a specific spread to know that losing or clouding that outlet tightens margins. USDA price data and market commentary have consistently shown that organic powders command higher prices than their conventional counterparts; that’s part of why farms put up with the extra requirements.
For some of these families, the question isn’t just about this year’s milk check. It’s whether the farm they hoped to pass on will still be welcome in the highest‑value markets ten years from now.
Four Ripple Effects for Anyone Shipping Into Powder or Infant Ingredients
What many of us have seen, watching how the FDA handles food incidents, is that a case like this sends ripples through the entire sector. For anyone whose milk ends up as powder or an ingredient in infant products, four of those ripples matter a lot.
1. Quality Programs Will Tighten
If your milk, or your co‑op’s milk, finds its way into powder that feeds infant or pediatric products, expect more questions. Processors are likely to push harder on:
How suppliers are approved.
What documentation is on file.
Whether there’s any on‑farm testing or extra audits tied to high‑risk outlets.
It’s not about assuming farms are doing something wrong. It’s about buyers understanding that the FDA now has fresh evidence of spores in an ingredient used in a sensitive product, and that everyone in that chain will be scrutinized more carefully next time. They’ll want more than “we meet requirements” when it comes to plant hygiene, environmental monitoring, and escalation when something looks off.
2. Traceability Has to Be Airtight
The work the FDA and CDC have done on this outbreak shows they can trace from hospital beds back to brands, lots, ingredients, and facilities. If your paper trail—hauler tickets, plant receipts, lab results—is scattered across different desks and systems, you’re behind where buyers and regulators are going.
Traceability is the supply‑chain version of watching fresh cows closely in the transition period. When something goes wrong, you need to be able to quickly and clearly see where your milk went and what its quality profile looked like over time. That’s what gives you a fighting chance to show your farm has been doing its part.
3. Contracts and Insurance Will Turn Into Homework
Premium markets bring premium liability. In 2023, the FDA sent warning letters to several infant formula manufacturers, including ByHeart, over Cronobacter control and plant sanitation. Those letters came months after inspections and findings, and during that time, plants and suppliers alike were operating under a cloud.
If your milk is tied into infant or high‑risk ingredient markets, it’s worth pulling your contracts and policies out of the drawer and asking a few blunt questions:
If there’s a recall, who pays for product destruction and logistics when the dust settles?
If a buyer has to pause purchases while they deal with regulators, what happens to your milk check during that time?
Can your co‑op or processor pass legal costs or settlements down to member farms if a case gets ugly?
If your exposure to these markets is modest and your contracts spell out recall and indemnity in a way you can live with, you may decide the trade‑off is acceptable. If a big share of your milk is in these channels and the contract language is vague or one‑sided, that’s a signal to either push for clearer terms or re‑think how much exposure you’re willing to carry.
4. “Organic” and “Clean Label” Will Draw More Scrutiny
One of the ironies here is that this outbreak happened in a brand sold as cleaner and more thoroughly screened than the competition. That doesn’t mean organic or “clean label” is unsafe. But it does mean organic dairies and ingredient plants will feel more scrutiny.
Consumers often treat organic labels as a shortcut for “safer” or “more natural.” When something like this hits the news, retailers, regulators, and parents start asking tougher questions about what’s behind the label:
How is the supply chain actually controlled?
What’s different about how these plants manage environmental and spore risk?
Producers in those markets will feel that in the form of more documentation requests, tighter specifications, and, sometimes, more probing conversations with auditors and buyers.
How Long Does This Hang Over a Supply Chain?
Recent infant formula incidents tell us these investigations don’t wrap up in days. They run for weeks or months, from the first cluster of cases through inspections, product sampling, environmental testing, and finally public warning letters or closing summaries.
Here, we’re talking about:
51 infants.
19 states.
One branded formula manufacturer, an ingredient plant, and a multi‑farm organic pool.
FDA has said it’s still working to determine whether there’s a common source of contamination and exactly where it sits in the chain. Meanwhile, ByHeart has recalled all its powdered infant formula and told parents not to use it. For everyone connected to that chain, that means living with regulators’ attention until they decide the story is closed.
For the 55 farms shipping to Organic West, that “limbo” looks like talking with lenders, accountants, and family members about what happens if that premium infant formula outlet doesn’t come back soon—or comes back with new requirements and tighter testing. In Midwest and Northeast operations, many folks know that feeling from times when a cheese plant or processor has had a major issue, and everyone in the patron pool has had to live with new testing regimes and contract changes.
All of this unfolds while feed bills, staff wages, and loan payments keep rolling in, right on schedule.
So What Do You Actually Do on Your Farm?
You can’t control the FDA. You can’t control exactly how a plant handles its environmental monitoring. But you can decide how much exposure to these markets you want in your business model, and how prepared you’ll be if your name ever shows up in an investigator’s notes.
Here’s a practical way to think about it.
LOW Exposure (<10% volume to powder/infant)
HIGH Exposure (>30% volume to powder/infant)
STRONG Documentation (3–5+ years records)
QUADRANT 1: Low Risk, Well-Positioned- Limited downside in recall- Can prove cleanliness to lenders- Premium markets optional- Action: Monitor & maintain
QUADRANT 2: High Exposure, Defensible- Significant premium upside- Can defend farm if investigated- Still vulnerable to plant failures- Action: Review recall liability, add interruption coverage
WEAK Documentation (<3 years records)
QUADRANT 3: Low Risk, Under-Prepared- Minimal immediate threat- Can’t prove history if asked- Lender confidence at risk- Action: Build documentation file NOW
QUADRANT 4: HIGH RISK, FLYING BLIND- Major premium exposure + weak defense- Can’t prove cleanliness in investigation- Lender nightmare if recall hits- Action: URGENT—exit infant markets OR fix docs/contracts
1. Map Your Exposure
Sit down and answer three simple questions:
Does any of my milk go into powder?
Does any of that powder end up in infant or pediatric products?
Roughly what share of my total volume is tied up in those higher‑risk outlets?
If only a small share of your milk flows into these channels and you’re comfortable with your buyer’s programs, you may decide your main job is to keep doing the basics well—milk quality, herd health, clean transition management—and to stay tuned to how your buyer responds to this case.
If a big chunk of your milk—say, a quarter or more—is tied into powder or infant ingredients, it’s reasonable to treat that as a high‑exposure segment of your business. That doesn’t mean you should walk away from it. But it does mean you should spend some time understanding the contracts, insurance, and documentation requirements for that segment.
2. Build a Documentation File You Can Put on the Banker’s Desk
On many farms, lab reports and records are scattered. Some with the vet, some in the co‑op’s system, some on paper in the office. If you’re in sensitive markets, it’s worth pulling that into one place.
A practical target is to be able to show three to five years of:
Milk quality records (SCC, PI counts, standard screens your buyer runs).
Any relevant environmental or product test results your processor shares.
Audit reports if you’re organic or in other quality programs.
Many buyers and insurers are already thinking in multi‑year horizons when they assess risk. If you’re above roughly 30% exposure to powder or infant ingredients and can’t pull together at least three solid years of documentation, it’s a sign you’re in a high‑risk corner of the grid from a paperwork standpoint, even if your day‑to‑day practices are excellent.
3. Read the Contracts You Signed
It’s not fun work, but it’s cheaper to read contracts with a cup of coffee than with a lawyer on the phone.
Look specifically for:
Indemnity and recall language—who pays for what.
Suspension clauses—what happens to your milk if purchases are paused.
Cost‑sharing for legal defense, settlements, or extra testing.
If you find terms that would be devastating for your farm in a worst‑case scenario, that doesn’t necessarily mean you have to bail on the market. But it does mean you should decide whether to:
Ask for changes or clarifications.
Limit how much of your volume you expose to that channel.
Set aside reserves or add insurance to backstop that risk.
Contract/Insurance Question
✓ Good Answer (Protects Farm)
✗ Dangerous Answer (Exposes Farm)
Where 55 ByHeart Farms Likely Stood
1. Who pays for product destruction in recall?
Processor/co-op covers; farm only liable if proven source
Farm pays pro-rata, regardless of fault
Likely pro-rata = liable even if not at fault
2. What happens to milk check if plant pauses purchases?
This is the fine print your lender and insurer will want to understand if something goes sideways.
4. Talk With Your Insurer Like a Risk Partner
Make sure your agent understands:
That some of your milk may be going into powder and possibly infant products.
What coverage do you have for product recall, contamination, and business interruption tied to food safety issues.
Ask directly: “If my milk ends up being part of an investigation—even if it’s never proven to be the source—how would this policy respond?” Better to have that conversation now than in the middle of a crisis.
5. Decide How Far You Want to Go on Extra Testing
Some farms, especially larger ones with significant exposure to infant ingredient markets, may decide to partner with their buyer on additional testing or environmental monitoring. That can:
Strengthen your position with risk‑sensitive buyers.
Give you more data about what’s happening in your part of the chain.
But it also:
Costs time and lab money.
Can raise tough questions if the results are borderline, even when you’ve done nothing wrong.
There’s no universal right answer. It comes down to your scale, your markets, your tolerance for risk, and your relationship with your processor.
The Trade-Off You Can’t Dodge
For Bill Van Ryn and those 55 organic families, the coming months will determine whether they’re remembered as farms that got swept up in a rare supply‑chain event or as the case everyone points to when they talk about infant formula risk. In the meantime, they’re still doing what all of us do: milking cows, managing fresh cow groups, balancing rations for butterfat and components, and keeping up with bills and certifications.
If your milk runs into similar pipelines, your real decision isn’t whether risk exists. It’s whether you want that risk as part of your business model—and, if you do, how intentional you’re going to be about managing it.
Staying in high‑value powder and infant markets usually means better pricing than a generic blend check, but it also brings more paperwork, more questions, and more eyes on your operation and your buyer’s plant. Stepping away from those markets means giving up some upside but also sleeping a bit easier when you read stories like this.
So if you only have time for a short checklist over coffee, here’s where to start in the next 30 days:
Find out exactly how much of your milk ends up as powder or infant/pediatric products, and through which plants.
Sit down with your processor and insurer to walk through contracts, recall liability, and coverage tied to food safety events.
Pull your lab and audit records into one place, so you’re not scrambling if someone asks for them under pressure.
You don’t need to panic. But you do need to decide how much of this risk you’re willing to own—and then build your playbook around that choice.
At the end of the day, a ‘Clean Label’ doesn’t protect your equity—only a clean contract does. Don’t wait for the FDA to audit your life; audit your own risk before the next tanker pulls into the yard.
Key Takeaways
51 babies, 19 states, one ingredient: FDA found botulinum toxin in ByHeart infant formula and in the organic whole milk powder used to make it—the entire supply chain is now under investigation.
55 organic farms in one pool, all under the same microscope: Milk from certified organic dairies flows through Organic West to DFA’s Fallon, Nevada plant, then into ByHeart’s premium formula. One positive test implicates them all.
Spores survive what kills most pathogens: Clostridium botulinum spores can persist through pasteurization and spray-drying—standard milk quality programs aren’t designed to catch this risk.
Contracts, premiums, and lender confidence are all on the table: Expect tighter traceability, tougher quality audits, more complex recall and indemnity language, and sharper scrutiny of organic and “clean label” claims.
Your 30-day playbook: Map your milk’s path into powder and infant products, consolidate 3–5 years of quality and audit records, review contract recall clauses, and sit down with your insurer about contamination and business-interruption coverage.
Complete references and supporting documentation are available upon request by contacting the editorial team at editor@thebullvine.com.
Learn More
Don’t Get Burned: The Producer’s Guide to Negotiating Watertight Milk Contracts – Exposes the lethal fine print in modern supply agreements and delivers a step-by-step negotiation framework. Use these tactics to shield your equity from lopsided recall liabilities before the next market disruption hits your milk check.
The $50,000 Biofilm Crisis Your ATP Test Will Expose – Reveals how hidden pathogen reservoirs in your equipment bypass standard wash cycles and identifies the advanced monitoring tools that catch them. Mastering this tech prevents catastrophic grade-outs and secures your reputation as a top-tier supplier in high-scrutiny markets.
The Sunday Read Dairy Professionals Don’t Skip.
Every week, thousands of producers, breeders, and industry insiders open Bullvine Weekly for genetics insights, market shifts, and profit strategies they won’t find anywhere else. One email. Five minutes. Smarter decisions all week.
When the Comps’ parlor burned, nobody asked about herd average or sire stack. They asked: ‘How many cows can we take?’ That’s dairy’s real safety net.
Executive Summary: This article looks at four real dairy stories—a 1,100‑cow Ohio fire, a New Brunswick barn loss, a 100‑cow Wisconsin family dairy, and a South Dakota robot‑plus‑creamery farm—to show that your strongest risk‑management tool might actually be your neighbors, not your next piece of steel. When Comp Dairy’s parlor burned in 2024, more than 1,100 cows were rehomed to 14 farms overnight, protecting milk flow, genetics, and processor relationships that could easily have vanished. The Titus family saw a similar pattern after their New Brunswick barn fire, as nine fire departments and multiple local dairies stepped in to keep surviving cows milking and a family operation alive after major losses. On the proactive side, the Daluges’ 100‑cow “four incomes” model and Stenslands’ robot‑and‑creamery setup show how building tours, camps, and on‑farm retail into the business can create both margin and community without adding cows. Backed by current research on farm stress, depression, and suicide risk, the piece argues that the “tough, silent farmer” image is a liability, and that asking for help is a leadership move, not a weakness. It closes with a five‑step playbook—who’s on your 2 a.m. list, one regular touchpoint, one kid brought in on purpose, visible mental‑health contacts, and community baked into your risk plan—so owners and managers can start strengthening their own safety net right now.
On a Sunday night in late September 2024, the sky over northeast Ohio glowed the kind of orange every dairy farmer dreads. The Comp family’s parlor was on fire. Flames were rolling through the building while more than 1,100 cows stood in pens that suddenly didn’t feel safe anymore.
Cleanup crews work through the wreckage of the Comp family’s parlor as trucks fill the lane across the road—proof that when 1,100 cows needed a plan, the community showed up first.
Somebody grabbed a phone. Then another.
Very quickly, trucks and stock trailers started coming down the lanes in the dark as neighbors from counties away dropped everything to come help. By the time the sun came up, cows were walking down ramps onto new farms across Ohio and Pennsylvania. Before the end of Monday, every animal had a place to go—spread across about 14 dairies that opened gates, made room in pens, and simply said, “We’ll take some.”
Ohio Farm Bureau’s Mandy Orahood remembers the look on one of the Comp daughters’ faces as strange trucks loaded up their best cows. “She said, ‘How am I supposed to trust all these people with my girls?’” Mandy told Brownfield. “At that moment, you have no choice. You trust that the community’s going to do the right thing.”
They did.
Strip away the smoke and sirens, and that night in Ohio is a harsh reminder of something we all know but don’t always plan around: when your world tilts in a single phone call, the difference between surviving and folding isn’t your last proof sheet or your robot capacity. It’s who shows up in your yard.
When Neighbors Become Your Survival Plan
Here’s what’s really going on in nights like that.
Brownfield Ag News reports that more than 1,100 milking cows in northeast Ohio needed new temporary homes overnight after the Comp Dairy parlor caught fire late on a Sunday in September 2024. Farm & Dairy adds that the fire started around 7 p.m. on September 22, that more than 70 firefighters from multiple counties showed up, and that the milking parlor was a total loss for the nearly 1,100‑cow, 3x herd that had been running 24 hours a day.
There was no grant program, no government coordinator. Orahood told Brownfield that after she put out calls through the farm community and on Facebook, hundreds of supporters from “Canada to Texas and Missouri to Vermont” reached out to help. By the end of Monday, all cows were accounted for and placed on about 14 farms across Ohio and Pennsylvania, with those partner herds using their own feed initially and sending photos and texts so the Comps could see how their cows were doing.
Same story, different postal code. In early 2022, on the Kingston Peninsula in New Brunswick, the Titus family’s dairy barn in the Gorham’s Bluff area caught fire before the evening milking. CBC reports that the January 23 fire destroyed a major section of the barn, killed 43 cows and 10 barn cats, and left surviving animals needing immediate care. Atlantic Farm Focus details how nine volunteer fire departments tankered water through the afternoon and night, and how a logging winch was used late in the rescue to pull cows from the smoke‑filled tie‑stall section when they refused to leave on their own.
Flames and smoke pour from the Titus family’s New Brunswick dairy barn on a bitter January day in 2022, as cows and neighbours gather outside and the community begins the long work of saving what it can.
By the time the smoke cleared:
About 38 lactating cows that survived the fire were hauled to four different area farms where they could be milked, including operations run by the Frazee, Sharp, Wesselius, and other local families.
A local contractor dug up and repaired the waterline to the Titus home, restoring running water to the family.
Neighbors kept arriving for days with food, labour, equipment, and offers to keep cows until a new barn could be built.
That isn’t a “program.” That’s culture. It’s the quiet kind of neighbourliness a lot of us grew up with—people aren’t keeping a ledger, they’re just making sure one family’s disaster doesn’t turn into a generational write‑off.
If you zoom out and think like an owner instead of just a survivor, it’s also a brutal but clear lesson in risk management:
Cows placed quickly keep milking instead of being culled or standing dry because there’s nowhere to go—that’s milk cheques, not just animal welfare.
Genetics you’ve spent 15–20 years building don’t disappear in one night because nobody had room for them.
You protect your processor relationship and future shipping volume, which matters the next time contracts or plant capacity are on the table.
On paper, consultants will call this “business continuity” or “disaster‑risk mitigation.” On your yard, it’s just your neighbors making sure one bad night isn’t the last chapter for your herd or your family.
Raising Cows, Raising Kids, Raising a Customer Base
Not every turning point is a fire call. A lot of them happen at the kitchen table when the next generation says, “I want to come back—but not like this.”
Take the Daluge family in Wisconsin. On paper, they’re “just” a 100‑cow Holstein dairy near Janesville. In reality, they’re running one of the most creative 100‑cow business models in North America. Media coverage lays it out: fifth‑generation family, 100 cows, and four adults now making full‑time incomes off that platform.
The catch? They built it during a period when more than 500 other Wisconsin dairies disappeared, many of them much larger operations. Doubling cow numbers wasn’t their survival plan. Community was.
According to published feature articles:
They opened their farm to tours, school field trips, and summer camps, where kids bottle‑feed calves, learn where milk actually comes from, and see cows up close instead of on a carton.
They created “Milkin’ Mamas,” a brand aimed at rural women that started as a way to “restore the voice and label of milk” by sharing real, unfiltered farm life—including the not‑so‑pretty parts.
Between the dairy, camps, tours, and Milkin’ Mamas social channels, they’ve built an audience of more than 45,000 followers and turned that attention into multiple revenue streams, including an online boutique.
Today, four family members are drawing income from about 100 cows by stacking milk, experiences, and retail, instead of just pushing more cows through the parlor.
Megan Daluge sums it up in one line: “There’s not freedom financially, but there is freedom with time.” That’s not a fluffy Instagram quote. That’s a real management choice. Time flexibility lets you coach 4‑H, attend a school concert, or sit still long enough to make deliberate decisions about genetics, facilities, and loans instead of bouncing from crisis to crisis.
Different state, similar mindset. Stensland Family Farms in South Dakota traces its dairy roots back to around 1915. For a long time, it operated as a fairly standard commodity dairy. In the last decade, the younger generation has added robotic milking, grown to roughly 250 cows, and built an on‑farm creamery plus retail stores to sell ice cream and dairy products directly to consumers in Sioux Falls and on the farm.
In Family Business Magazine, Doug Stensland talks about the pride of seeing his sons run both the robot barn and the creamery, and why having the family name on the store sign matters. The land isn’t just turning out litres and cwt anymore; it’s producing a place where neighbors, city families, and tourists show up, buy ice cream, see cows, and connect the dots between the tank and the cone.
From a business standpoint, both the Daluges and the Stenslands are doing the same three things:
Diversifying margin off the same cows—adding high‑margin products and experiences instead of only chasing volume.
Building brand and goodwill with the people who ultimately decide whether dairy has a social license in their region.
Making it attractive for the next generation to come back to a business that feels modern, connected, and flexible, not just like a treadmill of chores.
From a community‑resilience perspective, they’re also creating literal places where people bump into each other and talk. That matters a lot more than we like to admit when the crises aren’t on fire.
The Quiet Crises You Can’t Photograph
We’re great at rallying around smoke and sirens. The tougher challenge is rallying around the stuff that never makes it to Facebook.
Let’s be honest: the mental load on farm families right now is heavier than most people want to admit, but it’s not a lost cause. Recent research on farm and ranch families has found very high rates of at least mild depressive and anxiety symptoms among both adults and adolescents, and links between farm stress and mental‑health strain. Other work from Canada and the U.S. shows farmers report higher stress, anxiety, depression, and emotional exhaustion than the general population, and that suicidal thoughts can be roughly twice as common in farm populations as in non‑farm groups. One analysis highlighted that suicide rates among farmers and ranchers may be more than three times higher than in the general population, which is a hard number to ignore.
The good news is there’s movement in the right direction. A 2024 feasibility trial of remote mental‑health tools for farmers found that tailored cognitive‑behavioural support delivered at a distance was both acceptable and showed promising improvements in participants’ wellbeing. Studies of farmer‑specific mental‑health programs and provider perspectives also point out that when support is made farm‑friendly—delivered through trusted ag organisations, by people who understand agriculture, and in ways that respect time pressure and privacy—farmers are far more likely to use it.
What providers and farm‑family advocates keep coming back to is this: the old picture of the “tough, silent farmer who never needs help” is actually a risk factor, not a badge of honour. In interviews, farmers’ spouses and advisers consistently say that being willing to talk, to listen, and to pick up the phone early is what keeps families and businesses on their feet. In that sense, asking for help—whether it’s a neighbour, a spouse, a trusted advisor, or a helpline—isn’t weakness; it’s a leadership move that protects your cows, your people, and your future.
The catch is you can’t always see when the person across the lane is hitting a wall. We don’t post a selfie when the bank calls, when a kid says, “I’m not sure I want this,” or when you’re doing math in your head and wondering if the next generation should take this on. But those quiet moments have just as much power to knock out a herd as a barn fire.
This is where the same instincts that move 1,100 cows in a night need to get pointed at the things you can’t photograph. It’s still community work—and it’s smart management—when you sit in the buddy seat and say, “How are you really doing?” and then follow it up with, “If you ever need more than I can give you, let’s make that call together.”
How Strong Dairy Communities Actually Work
If you layer the Comp and Titus fires over what’s happening at farms like Daluge and Stensland, and then stack the mental‑health data on top, a few patterns start to stand out.
They’re not complicated. But they’re easy to ignore until you need them.
They make “I need help” part of the management playbook. On the healthiest farms, asking for help stopped being a last‑ditch confession and became a normal tool—same category as calling your nutritionist or hoof trimmer early. You see it in simple things: a text that says “short a milker, can you spare someone?” or “I’m not sleeping, can we talk?” That mindset is usually in place before the fire, not invented after.
They build places where people bump into each other. Livestock auctions, co‑op meetings, farm bureau events, 4‑H clubs, creamery stores, and farm camps are not just “nice extras.” They’re where people notice who’s missing, who looks worn down, and who’s suddenly quiet. The Daluges’ farm camps and the Stenslands’ creamery are as much mental‑health and community infrastructure as they are business units, whether anyone calls them that or not.
They give every generation a real role. On a lot of strong farms, Grandma may not throw square bales anymore, but she still knows every fresh cow by name. Younger kids might not run the mixer, but they can halter calves, greet visitors, make TikToks about feeding calves, or help Grandma with calf records. That sense of “I matter here” carries weight if you’re 70 and wondering who you are without the barn, or 15 and trying to decide if you want to be the sixth generation or not.
They think beyond their own lane. Some of the most robust support networks run through co‑ops, milk boards, and producer organizations that take mental wellbeing seriously. In Canada, for example, producer mental‑health resource hubs promoted by Dairy Farmers of Canada and provincial organizations are putting farmer‑specific tools in places where producers already go. When farms actually use those resources, it doesn’t make them look weak—it makes them look like they’re planning to be here in 10–20 years.
They understand resilience is a profit strategy. A community that can move cows overnight is the same community that can:
Help you source feed when there’s a local feed shortage.
Share labour when you’re down a milker.
Partner on equipment or trucking to drop the cost per cow and spread risk.
That doesn’t show up as a neat line on your cost‑of‑production sheet, but it shows up in who’s still shipping milk after a drought, a price crash, a barn failure, or a health crisis.
What This Means for Your Farm and Your Town
You don’t have to wait for a fire, a flood, or a mental‑health crisis to find out how strong your circle is. Here are moves you can make in the next month that will pay off in ways your banker, your processor, and your family will feel—even if they never show up in your milk cheque line items.
1. Decide who’s on your 2 a.m. list
Grab a pen and be brutally honest.
Write down three people you’d call if:
Your barn roof gave way under snow or wind.
Your parlor or robot room went down for more than a day.
You hit a mental wall and needed someone who actually understands your world.
Then flip it: who would put you on their list? If you can’t name anyone, that’s your first project. If you can, tell them: “You’re on my 2 a.m. list. If you ever need me, call—day or night.”
It feels awkward until the night you actually need it. After that, it’ll feel like one of the smartest risk‑management tools you’ve built.
2. Build one small, regular touchpoint
We all say we don’t have time. Fair. But most of us still find time to scroll. Carve out a sliver of that time and put it back into real‑life contact.
Pick one:
Monthly coffee at the sale barn with two or three neighbors.
A rotating “barn talk” night where two or three of you walk someone’s facility and then sit in the shop for an hour.
A simple potluck that moves between farms every month or two.
No agendas. No pressure. Just a reason to walk off your own yard and a chance to notice if somebody’s eyes look a little more tired than last month. That hour might be the difference between a neighbor quietly spiralling on their own and feeling like they’ve got someone in their corner—and sometimes, that really does change the outcome.
3. Bring at least one kid in on purpose
If you want dairy to exist in your area 20 years from now, somebody’s kid needs a good first experience with it. That doesn’t happen by accident.
Options:
Host a 4‑H clipping, showmanship, or calf‑care clinic on your farm so kids get hands‑on with cattle and learn real skills.
Invite a neighbor’s kid to help with calves every Saturday for a month and pay them like it matters.
Offer your place as a tour stop or camp partner the way the Daluges did, even if you start small with one class or one club.
From a purely selfish standpoint, that kid could be your future employee, your next‑gen partner, your nutritionist, your vet, or the only family member who ever seriously considers running the place. You’re not just giving them a memory; you’re investing in your own labour and succession pipeline.
4. Put mental‑health resources where people will see them
Don’t make it weird. Just normalize it.
Post a simple list of key contacts:
988 or your country’s crisis line.
Any farm‑specific helplines available in your state or province—many producer groups and departments of agriculture list them on their sites.
Local counselor or support programs you trust, plus a couple of online options designed for farmers and rural residents.
Put that list where people stand still: in the parlor, by the robot screen, on the office fridge, near the medicine cupboard. You don’t need a speech. The paper itself says, “We know this matters, and it’s okay to use this.”
5. Treat the community as part of your risk‑management plan
Your lender and your processor might not write it into the contract, but if you talk to people who assess farm risk every day, you’ll often hear the same observation: farms with strong community connections usually have more options when things go sideways than those that try to operate completely on their own.
When you can point to people who will help you move cows, chop silage, share a tanker, or talk through a hard decision, you’re showing that you’ve thought about what happens when things don’t go to plan. That makes the next conversation about financing, facility upgrades, or passing the farm on a lot easier to have with a straight face.
What This Really Means for All of Us
Looking at where dairy sits right now—tight margins, consolidation, and tech decisions that can easily run into seven figures—it’s easy to think the winners will just be the ones with the sharpest Net Merit list, the fanciest PTAT, the lowest feed cost per cwt, or the smoothest robot fetch curve. All of that matters, and The Bullvine will keep beating that drum. But when the barn burns, when the milk price drops below your breakeven, or when your brain says “I’m done,” none of that is what saves you first.
When the Comp family’s parlor lit up the sky in Ohio, nobody paused to ask what their herd average was or which sires they were using. They asked, “How many cows can we take?”
When the Titus family’s tie‑stall burned on the Kingston Peninsula, nobody checked how many kilos of butterfat they’d shipped that month before they hooked onto a trailer or fired up a logging winch. They dragged cows out of the smoke, hauled water, dug up a buried line, and came back the next day with skid steers and shovels.
When the Daluge sisters decided to build a future on 100 cows, they didn’t just chase more stalls—they built more community and more revenue streams around the same cow numbers. When the Stenslands added robots and a creamery, they didn’t just chase more litres—they built a place where neighbors could show up, sit down, and see exactly who they were buying from.
Those choices don’t show up on a proof sheet. But they absolutely show up in who survives the next round of market shocks, policy changes, disease scares, or personal crises.
So ask yourself—honestly:
Who would you call at 2 a.m. if your barn was on fire?
Who would call you if they were in the same spot?
What are you doing in the next 30 days to make those answers stronger?
You’re not going to control Class III futures or interest rates from your kitchen table. You are 100% in control of how strong your circle is before the next storm hits.
And if there’s one thing the last few years have proven—from more than 1,100 cows rehomed in the wake of a single Ohio fire, to barn disasters in Atlantic Canada, to a 100‑cow Wisconsin dairy and a South Dakota creamery turning farms into community hubs—it’s this: we’re a lot more resilient, and a lot more profitable over the long haul, when we stop pretending we’re in this on our own.
Key Takeaways
Community is risk management. When Comp Dairy’s parlor burned in 2024, neighbors moved 1,100+ cows to 14 farms overnight—saving milk flow, genetics, and processor relationships that insurance alone couldn’t replace.
The pattern holds across borders. After a barn fire killed 43 cows at a New Brunswick dairy, nine fire departments and four neighboring farms kept the surviving herd milking and the family in business.
You don’t need more cows to build a future. The Daluges run a 100-cow Wisconsin dairy that now pays four adults full-time by adding tours, camps, and retail, rather than chasing herd size.
The “tough, silent farmer” myth is a liability. Research shows farmers face significantly higher rates of stress, depression, and suicide risk—and asking for help early is a leadership move, not a sign of weakness.
Start this month. Define your 2 a.m. list, build one regular neighbor touchpoint, bring a kid onto the farm on purpose, post mental-health contacts visibly, and treat the community as part of your written risk plan.
Complete references and supporting documentation are available upon request by contacting the editorial team at editor@thebullvine.com.
Continue the Story
Rising From the Ashes: The Unbreakable Spirit of the Dairy Family – This narrative walks a similar path to the Comp family, proving that when disaster strikes, our community doesn’t just offer sympathy—they bring trailers, open gates, and ensure no farmer ever has to face the fire alone.
Mental Health in Agriculture: Breaking the Silence – This piece wrestles with the same questions of survival and stress, pulling back the curtain on the industry forces shaping our mental wellbeing and explaining why vulnerability is finally becoming a vital management tool on the farm.
The Next Generation of Dairy Leaders: Building a Sustainable Future – Proving the point that the future is built on more than just genetics, this article explores how the next generation carries forward a legacy of resilience by turning their farms into literal hubs of community and connection.
The Sunday Read Dairy Professionals Don’t Skip.
Every week, thousands of producers, breeders, and industry insiders open Bullvine Weekly for genetics insights, market shifts, and profit strategies they won’t find anywhere else. One email. Five minutes. Smarter decisions all week.
5,100 herds left. Fewer barns, same milk. The real story? The nights when the barn lights stay on—and who pulls in the driveway.
Executive Summary: Wisconsin starts 2026 with about 5,100 licensed dairy herds—roughly half as many as ten years ago and only a third of what there were two decades back. The cows and the milk are still there; what’s changing is which farm lanes the milk truck turns into, and how those roads feel when it stops coming to one more yard. This feature takes readers into the kitchens, barns, and sale rings where neighbors quietly scrub parlors on last‑milk days, pull into yards when barn lights stay on too late, and line rural roads with headlights when one family can’t carry it alone. It shows how consolidation, beef‑on‑dairy economics, and aging owners collide with real tools like Wisconsin’s Farmer Wellness Program, 4‑H and FFA projects for non‑farm kids, and lease‑to‑own and non‑family succession paths that keep some barns in use a little longer. The heart of the story isn’t the numbers—it’s the people: farm families, youth, vets, nutritionists, pastors, and co‑op folks who refuse to let each other fall alone. And it closes with simple, realistic ways any reader can strengthen their own road, from checking on late barn lights to opening their barn to one more kid who wants to learn.
Author’s Note:The scenes in this article are composite narratives—distilled from years of conversations and patterns seen across Wisconsin dairy communities. While no single family is portrayed, the moments here reflect a shared reality. The data is current; the emotions are real; and these acts of community happen far more often than the outside world ever sees.
I’ll never forget sitting at a kitchen table in western Wisconsin, steam rolling off a coffee mug that had already been reheated twice between chores. The farmer across from me stared out at a road he’d driven his whole life and said, “There used to be 13 dairies down this stretch. Now we’re down to two.”
Outside, the barns were still there. Silos still reached into the sky. But a lot of those bulk tanks were cold now. No fresh milk truck tracks in the gravel. No kids racing to the bus in chore clothes. Just a road that used to echo with the sound of milk pumps and skid steers, now a little too quiet.
If you’ve milked cows in this state for a while, you don’t need anyone to explain the numbers. Wisconsin has started 2026 with right around 5,100 licensed dairy herds—the fewest in decades and just over half the number that were operating about ten years ago, roughly a third of what there were a couple of decades back. The total number of cows being milked across the state has stayed close to the same, and milk production keeps inching upward as more milk comes from larger, higher‑yield herds. The milk is still coming. It’s just coming from fewer farm lanes and fewer kitchen tables.
On paper, the reasons look straightforward: high costs that squeeze small and mid‑size farms, consolidation into larger herds, and a lot of older farmers deciding they can’t keep doing this level of work into their sixties and seventies. Strong demand for beef and beef‑on‑dairy has nudged some herds toward different choices, too—cull checks and beef cross calves sometimes make selling out or shifting focus a little less painful than it would’ve been a generation ago. The charts and reports will tell you all of that.
What they can’t really show is how it feels when those numbers land on your own road—or how, against all odds, the people on that road keep finding ways to show up for each other.
When Neighbors Became Family
The call to the neighbor came before dawn.
On a short dead‑end road not all that different from yours, everyone knew a family’s last load of milk was scheduled. The signs had been there for a while—fewer replacements in the heifer yard, an auction flyer tucked under a magnet on the fridge, conversations drifting from “next year’s ration” to “how long can we keep this up?”
Nobody made a big announcement. The news moved the old‑fashioned way—mentioned at the elevator, in the church entry, over a pickup hood in the school parking lot.
By mid‑morning, that yard felt different.
One neighbor backed in with a skid steer on a trailer because he knew there’d be pens to clean, gates to move, heavy things to lift. Another truck pulled up and a friend climbed out with a couple of casseroles and a stack of paper plates. She just said, “You’re not going to want to cook tonight,” and set them on the counter. Someone else walked straight to the milk house, opened the door, and started wiping down the tank and washing windows so the last memories in that room wouldn’t be of clutter and chaos.
What moved everyone most was how quietly people walked into that space and got to work. No speeches. No “you should’ve done this or that.” Just steady hands on scrub brushes, someone sweeping the parlor, somebody else checking that the light bulbs worked and the breakers were labeled so the next person who came along would be able to find their way.
A couple of neighbors made sure the kids had somewhere else to be that afternoon—a cousin’s house, a 4‑H leader’s place—so they didn’t have to stand in the yard and watch the milk truck pull away.
When the time came, a few people stood with the family at the end of the lane as the stainless trailer eased down the driveway. Nobody said much. There were a few stories about “that old cow who always kicked off the unit” and a little laughter through tears, the way you do when you’re trying to hold it together. Then there was just the sound of the truck, the crunch of gravel under tires, and a quiet that felt heavier than usual.
Over coffee at the co‑op a few days later, a neighbor tried to put words to it. He said you can’t always change the math, but you can make sure a family doesn’t have to walk out of that milk house by themselves. Everyone around the table just nodded. They knew exactly what he meant.
Most of you reading this have seen some version of that day. Maybe you’ve stood in the yard. Maybe you’ve been the one backing in with the skid steer. Either way, it’s the kind of day that changes how you look at the road you live on.
Standing in the Parlor, Not Alone
The text from the neighbor could’ve gone unnoticed on any other night.
It was one of those bitter January evenings when the wind drives snow under every door and makes the short walk from the house to the barn feel a mile long. The cows were milked. The line was washed. But a dairyman found himself just standing in the parlor, staring at a small stack of unpaid bills on the shelf by the wash sink, feeling that tight, heavy weight that doesn’t care how strong your back is.
Down the road, a neighbor drove past and saw the lights still blazing like milking had just started instead of being long finished. He’d noticed it the night before. And the night before that. There’s a difference between “running late” and “stuck,” and after enough years in the neighborhood, you can feel it.
A little while later, that neighbor’s truck rolled into the yard. He didn’t lay on the horn or make a big entrance. He pulled in, shut the truck off, and walked into the barn. He nodded and said something along the lines of, “You done with calves yet? Thought I’d see if you needed a hand.”
They didn’t launch into a deep talk about depression or interest rates. They fed calves together. They grumbled about the weather. They fixed a broken pail handle. The next night, the neighbor came back at the same time. And the next. They didn’t solve everything, not even close. But the chores got done, and the silence didn’t feel quite so sharp.
Somewhere between talking about dry cow shots and the next co‑op meeting, the farmer said, “You know that number they talked about at that meeting? I think I’m going to call it.”
In recent years, Wisconsin has put real muscle behind those numbers. Through the Farmer Wellness Program and the Farm Center, the state offers a 24/7 helpline for farmers and their families, free tele‑counseling sessions you can do from the kitchen table, counseling vouchers that cover in‑person visits with local providers, and online support groups designed specifically for farmers and farm couples. It’s all free to Wisconsin farm families, no matter the size of the operation.
The debt didn’t disappear when he picked up the phone. The milk price didn’t jump. But calling for help stopped feeling like stepping off a cliff and started feeling more like reaching for another tool in the box—right there next to the wrench you grab when the vacuum pump acts up.
We’ve all been taught to tough it out and fix things ourselves. On a lot of farms now, the bravest move isn’t working another couple of hours in the barn. It’s admitting you can’t fix it alone.
Most of you know that feeling, either because you’ve had someone show up for you, or because you’ve pulled into a driveway when the lights were on too late and just said, “Hey, I’m here.”
Programs and hotlines matter. They save lives. But they work best in communities where it’s already normal to keep an eye out for each other, to notice when the barn lights stay on too long, and to show up without making a big deal out of it.
Raising Kids, Cows, and Community
The first time you watch a kid from town lead a heifer into the show ring, you realize something important: dairy culture isn’t only passed down by blood. It’s handed across fence lines, loaned through halters, and shared in the corners of fair barns that smell like shavings, coffee, and nerves.
If you really want to see how this works, spend a day in a Wisconsin dairy barn at fair time or sit in on a 4‑H dairy project meeting.
You’ll see the familiar scenes: kids in white jeans wrestling with halters, parents trying to keep a nervous heifer clean, ag teachers and 4‑H leaders juggling clipboards, show schedules, and pep talks. You’ll hear the usual ring talk about udders and toplines and who’s judging this year.
Listen a little closer, though, and you’ll notice how many of those kids don’t live on working dairies anymore. Plenty come from town. Others live on farms that crop now instead of milk. Their connection to cows exists because somebody with a barn decided to open the door.
In a lot of counties, ag teachers and 4‑H leaders lean into that reality. They match “barn kids” who grew up knowing how to mix milk replacer and clip heifers with classmates who’ve never scrubbed a water tub but are eager to learn.
The conversations start small. A text from a farm kid: “Can I bring a friend to chores tomorrow?” A 4‑H leader saying, “We’ve got a family with an extra calf—anyone want to learn how to work with her?”
Before long, you’ve got a couple of extra pairs of boots in the mud room before school. A kid from town learning how to set up a milking stall. A former dairyman, now retired, volunteering to help coach dairy judging because he misses talking about cows and wants to pass something on.
At the next 4‑H meeting, you can feel the difference. The kids who used to hang back at the edge of the barn are suddenly talking about feed, show strings, and cow families. One signs up for dairy bowl. Another spends Saturday mornings milking for a neighbor. A few just carry the experience with them, knowing they were trusted in a barn when it really counted.
The barn starts to look less like a place for one family and more like a gathering place for a whole community—a barn that helped raise the kids, whether those kids lived on the farm or not. And in a state where the number of farms keeps shrinking, that widening circle might be one of the most hopeful things we’ve got.
The Question at the Kitchen Table
The hardest conversations often start after chores.
You know the scene. Barn boots lined up by the back door. Kids finally in bed. The hum of the refrigerator louder than usual in a quiet farm kitchen. Somewhere between the last bite of supper and the first bill on the table, someone says it.
“We can’t keep doing this forever. So what happens next?”
Over the last several years, that question has stopped being hypothetical for a lot of dairy families. Owners are getting older. Backs and knees don’t bounce the way they used to. The next generation is juggling off‑farm jobs, spouses’ careers, school events, and sports schedules. The cost of buying into a dairy—land, cows, equity in the business—is enough to make even the most determined young person swallow hard.
At the same time, there are young folks who would love nothing more than to get their own herd started. Some grew up on dairies that sold their cows. Others discovered their love for cows through 4‑H or FFA and never had a family farm to go back to. They’re hungry for a chance, but the numbers and the structures don’t always make it easy.
In that gap, more extension educators and farm business advisors have started helping families talk through options: lease‑to‑own agreements where a younger producer rents facilities and gradually buys into the herd, non‑family partnerships with clear roles and exit plans, or longer‑term land leases that keep ground in agriculture even if the parlor goes quiet. None of these paths are perfect. They’re messy, full of hard conversations and what‑ifs. But at least they open a door that used to stay shut.
At one meeting, a producer stood up and said he didn’t walk away from milking because he stopped loving cows. He stepped away because he loved his family too much to keep them under that level of pressure forever. The room went quiet for a moment. Then you could see heads nodding all around. Most of the people there had run those same calculations across their own kitchen tables.
Not every story ends with a perfect handoff and a young couple moving into the farmhouse. Some end in a sale ring crowded with neighbors who come to buy a gate or a water tank and end up standing a little longer than they need to, just to say thank you. But more families are getting the chance to write that ending with intention, and more neighbors are learning how to show up for both the ones who stay and the ones who step away.
The Night the Road Filled With Headlights
Nobody expected the whole road to line up with headlights that night.
In one dairy community, folks had been watching a family wrestle with a tough stretch. You could see it in their faces at the feed mill, in the way they left meetings early, in the number of times they said, “We’ll see,” instead of “See you next year.”
Then the news settled into something heavier. The bank had laid out a few options, and none of them were easy or pretty. The family hadn’t asked for help. They were still doing what dairy folks do—putting their heads down and trying to outwork the problem.
But the community had been talking, too.
A cousin quietly set up an online fundraiser. A friend who worked with a lender said, “If they’re willing, I’ll ask my boss to look things over.” The pastor mentioned it at the end of church: “If you’ve got some time or tools next weekend, there’s a family that could use a hand.” A 4‑H leader sent a message to the parents’ group: “We’re going to the farm on Saturday. If your kids want to help, bring boots and gloves.”
By late afternoon, as the sun dropped behind the silos, trucks started turning onto their road. Skid steers on trailers. Pickups full of teenagers in hoodies. Hired hands from neighboring operations who’d finished their own chores and came anyway. The nutritionist’s car. The vet’s truck. Co‑op folks, church families, 4‑H kids, neighbors from up and down the line.
They didn’t show up with a grand plan. They showed up with work gloves.
Someone tackled the broken boards and sagging gates that had been bugging everyone for months. A couple of people sat at the kitchen table with the family, sorting mail into piles—“urgent,” “call about this,” “we’ll figure this out later.” Others took over feeding calves and bedding pens so the owners could sit for a couple of hours and have real conversations with the banker and the advisor who’d stopped in. At some point, someone fired up a grill. Kids ran parts and fetched tools. People drifted in and out of the house and barn, carrying both coffee and paperwork.
What happened next didn’t erase the debt. It didn’t suddenly double the milk price. But it changed something deeper.
“It made it easier to go into town after that,” one of them said later. “We weren’t just ‘the people in trouble.’ We were the family the whole road decided was worth standing behind.”
They still had sleepless nights. The story is still being written. But that night, in the glow of those headlights, everyone there got a clearer picture of what kind of community they lived in—a community that refused to let them fall alone.
And in the months that followed, that same family showed up when someone else’s barn roof needed shoveling, and when a younger neighbor wanted to talk through a lease‑to‑own offer on a small herd. The help didn’t just land in one yard and stop. It kept moving, in ways none of them expected when those first trucks pulled in.
What You Can Do on Your Road
All of this can sound big and far away until you ask a simple question: “Okay, so what can we actually do where we live?”
It doesn’t have to be complicated. It might look like:
Noticing when a neighbor’s barn lights are on much later than usual for a few nights in a row, and choosing to pull in instead of just wondering.
Bringing one non‑farm kid into your barn this year through 4‑H, FFA, or your own show string, so they can learn what it feels like to be trusted in that space.
Keeping the farmer wellness numbers where you and your neighbors can find them—on the fridge, in the milk house, taped to the bulletin board in the shop—so calling for help feels like using a tool, not admitting defeat.
If you’re thinking about succession, talking with your lender, extension, or a farm business advisor about options like leasing, non‑family buy‑ins, or gradual transitions before a health scare or a bad year forces your hand.
Checking in, now and then, with the folks who left dairying in your area—inviting them to the fair, the breakfast on the farm, or the next co‑op meeting—so they know they’re still part of the story.
Saying “yes” when the pastor, the 4‑H leader, or the co‑op board asks if you’ll show up at a meeting about farm stress or succession, because your voice might be the one that helps somebody else take the next step.
None of these things fix the structural pressures on dairy. They don’t rewrite market reports or change how many zeroes are on the check from the plant. But they change what it feels like to live through those pressures. They turn lonely math into shared load‑bearing.
Community and Legacy: What This Means for All of Us
Over the last decade, Wisconsin has watched its dairy herd count slide to levels that would’ve sounded impossible when a lot of today’s producers were kids. You can see it in the empty yards, the lone silos, the “For Sale” signs at the ends of lanes that used to have cows in every window. At the same time, statewide data keeps showing roughly the same total number of cows and steady or rising milk production, as animals move into larger herds and farms lean harder on efficiency.
That’s the big picture. But if you sit at enough kitchen tables and walk through enough barns and community halls, you start to see something those numbers can’t measure: a stubborn, shared determination that even if we can’t save every farm, we can make sure the people on those farms don’t have to go through this alone.
We can’t control the markets, but we can control whether we notice when a neighbor’s barn lights are on too late and check in.
We can’t guarantee a successor for every farm, but we can help kids from town and from former dairy families find their way into the barn through 4‑H, FFA, or a neighbor’s show string.
We can’t erase every hard decision, but we can make sure families who leave dairying still feel welcome at the co‑op, in the sale barn café, and in the fair barn aisles.
You know who your “call list” is—the people you’d phone if something really went wrong at your place. Maybe this week is the time to add one more name to that list. Or to be that name for somebody else.
Most of you reading this have your own version of these stories. A time when someone showed up for you. A time when you dropped everything to show up for someone else. A moment when it hit you that what kept you going wasn’t just the cows—it was the people around you.
The last light on a rural lane doesn’t have to be a lonely one. It’s up to all of us, up and down these roads, to decide whether we’re just watching from a distance—or pulling in the driveway when it matters.
Key Takeaways
The numbers are stark: Wisconsin starts 2026 with about 5,100 dairy herds—half as many as a decade ago, a third of twenty years back—while cow numbers and milk production hold steady as larger operations absorb the volume.
The pressures haven’t changed: high costs squeezing margins, consolidation into bigger herds, owners aging out, and beef‑on‑dairy economics that sometimes make stepping away less painful than holding on.
Community still shows up: neighbors scrubbing parlors on last‑milk days, pulling into driveways when barn lights stay on too late, lining rural roads with headlights when one family can’t carry it alone—and then paying it forward when the next neighbor needs a hand.
Help is available and free: Wisconsin’s Farmer Wellness Program offers a 24/7 helpline, tele‑counseling, counseling vouchers, and online support groups at no cost to farmers and their families.
You can strengthen your own road today: notice late barn lights and check in, bring a non‑farm kid into your barn through 4‑H or FFA, post wellness numbers where neighbors can see them, and keep ex‑dairy families part of the community.
Complete references and supporting documentation are available upon request by contacting the editorial team at editor@thebullvine.com.
Continue the Story
Beyond the Milk Check: Finding Hope in the Hardest Seasons – This story walks a similar path, following a family that wrestled with the same weight of tradition versus survival. It proves that while the milk truck may stop, the identity of the farmer remains rooted in the community.
The Consolidation Crossroads: Understanding the Numbers Behind the Barn Doors – This piece deepens our understanding of the economic forces shaped by 2025’s market shifts. It explains the “lonely math” of consolidation, showing how larger herds and genetic efficiency are fundamentally rewriting the landscape of America’s Dairyland.
Leasing the Legacy: The New Wave of Non-Family Farm Successions – Linking directly to the next chapter of our story, this article explores the young producers carrying forward the work of those without heirs. It’s a hopeful look at how the barn doors stay open through creative, non-traditional handoffs.
The Sunday Read Dairy Professionals Don’t Skip.
Every week, thousands of producers, breeders, and industry insiders open Bullvine Weekly for genetics insights, market shifts, and profit strategies they won’t find anywhere else. One email. Five minutes. Smarter decisions all week.
‘I was so jealous of the dairy princesses. That wasn’t in the cards for me.’ Twenty years later, she’s standing in a working parlor—cameras rolling, cows listening.
A corn kid with a guitar, serenading Holsteins from the barn door—cornfield behind her, dairy world finally in front. Image courtesy of Havas Formula.
Growing up, Hailey had her eye on the crown—or at least the butter sculpture that came with it. “The princesses told me you had to be a dairy princess to get your own bust, and I was so jealous,” she admits. But because her dad farmed corn and soybeans rather than cows, she didn’t quite meet the credentials. “We’ve never done anything with cows, which is a requirement to be a dairy princess,” she laughs, “so that wasn’t in the cards for me.”
Twenty years later, she got her dairy moment anyway.
It was fall 2025, and there on my screen was this self-described “corn kid” from Iowa stepping out of a pickup onto a Land O’Lakes member-owned dairy farm in Minnesota. The Bovine Serenade campaign footage showed what looked like any working dairy: a parlor that’s seen some years, cows walking through their routine, real people doing real chores.
No polished set. No barn where no cow has ever actually lived. Just a farm that could’ve been down the road from a lot of us.
Hailey looked around that working dairy like she recognized it. Like she’d grown up near places just like it.
Because she had.
What struck me most wasn’t the music or the marketing. It was seeing a farm that looked like ours treated as a place worth putting on a national stage. And knowing that the artist standing in that barn came from the same kind of roads and communities where a lot of us learned to work, to show up, and to keep going.
Raising a Cornfield Kid
Before any cameras, there was a baby blue trailer in a cornfield.
Hailey’s parents brought her home from the hospital to a single-wide baby blue trailer parked in the middle of an Iowa cornfield near the little town of Shueyville, tucked between Cedar Rapids and Iowa City. “They brought me home from the hospital to a single wide baby blue trailer in the middle of a cornfield,” she told Countrytown in 2025.
Her dad worked nights at the corn plant—ADM, doing the shifts nobody else wanted. “He was always doing the stuff nobody wanted to do, you know, working night shifts and long shifts,” she’s said. Her mom raised the kids and stretched every dollar.
Hailey laughs about it now. “We didn’t have a pot to piss in,” she’s told interviewers. But she always follows that up with how hard her parents worked to put food on the table and build something better.
Around them were aunts and grandparents whose livelihoods were tied to the land:
Her Aunt Cindy had a small place with pigs, chickens, turkeys, and sometimes ducks
Her grandpa ran a sod farm where “all the boys were always working in the field with grandpa, growing grass,” as she described it on the Like a Farmer podcast
Her dad farmed crops on top of his plant job
That mix of family farms and shift work at the plant—that’s the backbone of the work ethic she still leans on.
If you’ve ever watched a county dairy princess wave from a parade float or hand out ribbons at a 4-H show, you know that role carries real weight in rural communities. For a corn kid looking in from the outside, that world looked pretty appealing.
She’s talked about the cornfield behind her parents’ house as the spot she’d go to sit and think, especially after she started spending more time away. If you’ve ever slipped out behind the freestall at dusk or walked a headland just to clear your head after a rough day, you know exactly what she means. Those quiet corners are where you sort out more than just the chores.
If you’ve grown up in dairy country, you know the rest of the backdrop: school buses rattling down gravel roads in the dark, Friday nights in small-town gyms, church basements full of hot dishes and coffee, county fairs where somebody from your road is always clipping a heifer or leading a 4-H calf into the ring.
You can hear all of that in Hailey’s music—cornfields, plant shifts, small-town families who’ve been on the same ground for a long time. It sounds like it could belong to families a lot of us already know.
The Choice Every Farm Kid Knows
The text from the neighbour comes before sunrise when the pipeline freezes. The decision to leave the farm takes a lot longer.
When Hailey was about fifteen, she and her mom made their first trip to Nashville. “I’d never been to any city before, not even Chicago, three hours east of where I grew up,” she told Lonesome Highway. Suddenly they were walking down streets where live music poured out of almost every doorway, tip jars sat on tiny stages, and songwriters were pouring their hearts out to rooms that were mostly bar stools.
Back in Iowa, her classmates were doing what a lot of rural kids do:
Learning to read cloud lines and radar apps
Heading to 4-H meetings and FFA chapter nights
Leaning toward herd health, agronomy, nursing, welding, or teaching
Loving show cattle but not sure what that meant long-term
Standing on that Nashville sidewalk, halfway between the gravel roads she knew and a city that felt like another planet, something shifted. When she went back home, she sat down at the same kind of kitchen table where seed guides, milk cheques, vet bills, and school papers pile up, and told her parents she wanted to move to Nashville after high school.
You know that moment. Pride, because raising a kid brave enough to chase something that hard means you’ve done a lot right. Fear, because you’re not sure what it means for the farm, for your own future, for the cows you’ve been building a herd around. And that knot in your stomach quietly asking, “If they go… what happens here?”
Hailey’s been honest about her parents being “very blue-collar”—her dad now owns an excavation business and still farms, her mom runs a trucking company. They were excited for her, but not entirely convinced that “move to Nashville and become a country singer” was a realistic plan. It sounds a lot like the conversations you hear in farm kitchens when a kid talks about vet school, moving across the country for an apprenticeship, or taking a job that has nothing to do with agriculture.
Her parents did what a lot of farm parents do when a storm they can’t control rolls in. They let her go—because they’d raised her to follow through.
So at seventeen, she packed her things and headed to Nashville. The cornfields stayed. The neighbours still waved. Church folks still asked her parents how “Nashville” was going.
In dairy communities all over—whether you’re milking in Ontario, Wisconsin, Iowa, or Friesland—you see the same thing: the community doesn’t stop caring just because a kid’s postal code changes.
When Nashville Said “Not Yet”
Nashville has a reputation as a “ten-year town.” Give it a decade, people say, and you’ll know if it’s going to work out. Hailey’s joked that her song “Ten Year Town” came from being twelve years into that supposed ten-year timeline, and that extra couple of years weren’t pretty.
During that long stretch, she worked whatever jobs would keep her afloat while still leaving space for co-writes and gigs—nannying, front-desk work, late shifts. She put out music independently when nobody in the industry was paying much attention. She watched other artists get record deals, tour slots, and radio spins while her own phone stayed quiet.
There were plenty of stretches where the math didn’t make much sense. Money went out and didn’t always come back in. “I had been so bitter and so frustrated and just tired with the music business,” she told The Boot in 2020. There wasn’t any guarantee that the time, money, and heart she’d poured into Nashville would ever return.
If you’ve carried a dairy through enough rough years—the kind where transition problems pile up, components slip, interest chews into every cheque, and the bank starts asking harder questions—you know that feeling. You’re doing everything you know how to do, and it still feels like you’re stuck.
What kept her going wasn’t some shiny motivational slogan. It was the same mindset she’d watched in that little Iowa community: her dad rolling out for night shifts at the plant and then working crops, her mom keeping kids and bills sorted on not much, neighbours who just kept going whether anyone saw them or not.
Honestly, that’s not far from how most barns survive bad years. No big hero moment. Just the next milking. The next fresh cow check. The next calf. The next payment.
The Night the Road Filled with Headlights
Nobody expects to look out and see the whole road lined with tractors and pickups. But if you talk to enough farmers, it doesn’t take long before you hear about the night when, for somebody, it did.
Sometimes it’s a barn fire and people arrive from three townships—skid steers, stock trailers, and half-tons parked wherever they can fit. Sometimes it’s a sudden illness or accident and one partner ends up in the hospital while the other is staring down fresh cow lists, milking shifts, school pickups, and feed deliveries that aren’t going to wait.
In the rural world that shaped Hailey, and in a lot of ours, support often comes as a string of small rescues more than one big dramatic moment.
Grandparents stepping in so parents can haul one more load or catch two hours of sleep
Neighbours pulling in with a tank spreader when they hear your pit is one heavy rain away from trouble
Church folks quietly leaving groceries or a gas card on a step, then driving away before anyone can say thank you
The vet who leans on the tailgate and asks how you’re doing after a brutal calving run
The 4-H leader who walks into the show ring beside a nervous kid and stays until their knees stop shaking
When it matters most, the community shows up in farm T-shirts and chore boots, not capes.
That same thing is what lets kids leave, too. You don’t head off to Nashville, college, an apprenticeship, or a job on another continent unless you have some sense that the community you’re leaving will still have your family’s back.
As doors slowly opened for Hailey—more co-writes, better slots, albums like The Dream and Raised, and eventually Corn Queen—that hometown web didn’t disappear. Local bars would put the TV on if they thought she might be featured. Old classmates would send photos of her on a screen back to her parents’ phones.
For a lot of people back home, the moment that changed how they saw their neighbours wasn’t just seeing her on TV. It was realizing how many folks were watching with them, cheering from the same gym bleachers and church pews where they’d always been.
The Bovine Serenade: When Real Barns Became the Stage
By the time Corn Queen rolled around, Hailey wasn’t trying to sand the country out of her story. She was doubling down on it.
“Fans started calling me the ‘Corn Queen’ because I’m from Iowa,” she explained to Big Loud Records. “At first, it seemed kind of silly, but the more I thought about it, the more I loved the duality of it. Corn is this simple, humble crop, and ‘queen’ implies royalty passed down through blood.”
The album is packed with Midwest-rooted tracks that’ll land with anyone who grew up around here. “High on the Hog” opens the record with a twangy origin story about paying dues and keeping your head up. “Casseroles” is a wrenching account of living through grief after “the casseroles stop comin'”—and if you’ve ever been to a church basement potluck after a funeral or a 4-H awards banquet, that title alone will hit you somewhere deep. “Wagon” rounds out the collection of songs that feel like they could’ve been written about families down the road from any of us. (Corn Queen is available on all major streaming platforms.)
In fall 2025, she partnered with Land O’Lakes for the Bovine Serenade campaign, visiting a member-owned dairy farm in Minnesota to capture everyday dairy life as it actually is: mud, stainless steel, worn parlor floors, big fans humming, kids trying to act natural around a camera.
Whitters bottle-feeds a young calf during her visit to a working Land O’Lakes member dairy farm, leaning into the everyday chores she grew up around rather than a staged set.
In the campaign footage, you can see her genuinely light up around the animals. “Oh here’s the babies… Hi! Look at you with your cute little pink nose,” she says in one clip, crouching down to greet young calves. Anyone who’s spent time in a calf barn knows that reaction doesn’t need staging.
For that corn kid who was once jealous of the dairy princesses with their busts at the county fair, standing in a working parlor and having it broadcast to the world looks a lot like a full-circle moment. Maybe not the crown she couldn’t earn as a kid—but something close.
According to Ads of the World, Land O’Lakes partnered with Hailey specifically for “her genuine farm roots, appreciation for farmers and farm life, and shared values of hard work, ownership, and cooperation.”
For producers watching those clips, this isn’t “some singer in a barn.” It’s someone who grew up on the same kinds of roads and in the same kinds of communities, standing in a parlor that looks like theirs, treating it like the main stage instead of a prop.
The Song About Losing the Farm
If you’re going to tell the truth about rural life, you can’t just sing about tailgates and sunsets.
“Middle of America,” which Hailey recorded with American Aquarium, is one of those songs that makes a lot of rural listeners go quiet. She’s talked about how it came from driving through western Iowa and seeing signs that read “Stop the Airport. Save the Farms,” then realizing for the first time what eminent domain really meant for the families behind those signs.
“I remember driving through western Iowa—it was the first time I kind of learned about eminent domain,” she told Wide Open Country. “Seeing all these signs saying, ‘Stop the Airport, Save the Farms,’ and I was like, ‘What are they talking about?’ That was the first time I realized the government can take farms to build an airport. That kind of blew my mind a little bit.”
Those conversations aren’t limited to Iowa. In Ohio, the Farm Bureau has made eminent domain reform one of its top policy priorities, pushing back against what they see as overreach that threatens family farms across the state. Whether it’s airports, pipelines, highways, or industrial development, the pressure on agricultural land is a live issue in dairy regions all over the country.
A lot of dairy producers don’t need a song to tell them that story. They’ve lived their own versions: fighting a pipeline route, watching development creep up to their hedgerows, seeing highways and subdivisions change the view out the kitchen window, or just watching neighbours disperse because the math stopped working and the next generation’s life was heading somewhere else.
What the song does is say it out loud in a space where our kind of stress usually gets turned into clichés. There’s no easy resolution in the lyrics. No promise that every farm will be saved. But there is a line in the sand that says, “This is happening to real families, in real towns, in the middle of America.”
Sometimes that’s what art can do for us—give us language for something we’ve been watching for a long time.
Whitters leans into her “corn kid” roots in cut-off overalls and white boots, standing in the mud with Holsteins behind her instead of on a polished TV set. Image courtesy of Havas Formula.
When the Kids Don’t Come Back
Standing in the milk house late at night, when it’s just the fans, a couple of cows shifting in the sand, and the glow of the bulk tank readout, it’s pretty common now to wonder who’ll be standing there in ten or twenty years.
In a lot of dairy regions—whether we’re talking Wisconsin freestalls, Ontario tie-stalls, Dutch robot barns, or Iowa parlors—only a fraction of family dairies stay in the same hands across three or four generations. Some herds transition beautifully. Some land in the hands of cousins or neighbours. Some quietly disappear.
You hear these stories in co-op boardrooms, at Holstein club meetings, behind the side curtains at junior shows, and around the coffee pot at extension events like Iowa State’s Dairy Directions series. The official agenda might be transition cow health or beef-on-dairy economics. The hallway talk is often about kids, succession, and whether the farm can—or should—stretch one more generation.
Hailey’s story doesn’t provide a simple answer for who should stay and who should go. What it does is widen our idea of what “carrying on the farm story” looks like when kids don’t take over the parlor.
In her case, it looks like carrying the voices, images, and values of rural communities into rooms most of us will never see: writing rooms, studios, bigger stages, and co-op campaigns. It looks like insisting that those stories stay grounded in gravel roads, cornfields, and barns instead of being smoothed into something generic.
That doesn’t make it hurt any less when a freestall empties out or a tie-stall is unlatched for the last time. But it does remind us that sometimes the legacy walks out the lane and keeps talking somewhere else.
What They’re Paying Forward Now
Here’s where it loops back to barns like yours and mine.
As more farmer-rooted stories have surfaced in dairy promotion—campaigns like Wisconsin’s “Born to Dairy” effort—you started to hear those pieces pop up in places far from ad agencies. In ag classrooms. At 4-H meetings. In church youth groups. In co-op annual meeting slide decks.
In some FFA classrooms and 4-H barns, teachers and leaders are using those videos and songs as conversation starters. “If we made a video about farms around here, whose places would you show? What would you want people to understand about calving, transition pens, or what happens in the parlor at 4 a.m.?”
Missouri’s 4-H dairy cow camps have become a model for that kind of hands-on youth connection. In 2025 the state hosted its largest camp ever—seventy kids spending days in real barns, washing, feeding, working with animals, and hearing directly from dairy families. Organizers emphasized that the goal goes beyond teaching skills—it’s about showing young people that dairy families are real, approachable, and worth knowing.
One evening in the barn can shape how a kid sees farmers for years to come.
Three Ways to Strengthen Your Community This Year
So what does all of this mean when you go back to your own barn?
Most of us aren’t looking for a fairy tale. We’re looking for anything that makes us feel a bit less alone and gives us a few ideas that might actually fit into a world of 4 a.m. alarms, fresh cow checks, and numbers that don’t always add up.
One youth night. Pick one evening—FFA, 4-H, Junior Holstein—that works around your milking schedule. Let kids see chores, ask questions, and warm up in the shop afterward. Team up with a neighbour if the workload feels like too much for one farm.
One neighbour check-in. When you notice someone’s lights on too late, too many nights in a row, stop by or send a text. “Saw your lights—everything okay?” is enough.
One honest conversation. Invite your vet, banker, or extension rep to sit down with a few neighbours and talk about stress, succession, and the next ten years. Not a lecture—a conversation where everybody gets to speak.
None of that will change the mailbox price next month. But it keeps people connected enough that when the bottom drops out—or when something unexpectedly good happens—you’ve got someone to call who understands the stakes.
And when the weight feels like too much for one kitchen table, it’s more than okay to reach further—to your doctor, to a counsellor who understands agriculture, to a peer group that gets what dairy life is like. Organizations like the Do More Agriculture Foundation or Farm Aid’s farmer hotline (1-800-FARM-AID) exist for exactly these moments.
What This Means for Our Barns, Our Roads, Our People
Maybe your farm will never see a film crew in the yard. Maybe nobody from your concession road will ever stand on a big award-show stage singing about cornfields and co-ops.
Honestly, that’s alright.
What sticks with a lot of people is this: when someone who grew up in a baby blue trailer in a cornfield can stand in front of the world and sing about the pressure on rural families—and people outside agriculture actually stop and listen—it says something about the strength of the places we come from.
Every dairy community has people like that simmering under the surface.
A kid scribbling lines about feeding calves in a January wind on the back of a feed sheet
A young herdswoman who can put a nervous visitor at ease in two sentences in the parlor
A retired breeder who can tell you a cow family story three generations deep without looking anything up
A vet who can tell, just from how you answer “How’s it going?” by the bulk tank, that it’s time to ask again
So the real question isn’t, “Will we produce the next Corn Queen?”
The real question is, “Will we notice the gifts sitting around our own kitchen tables and barn aisles—and make a little room for them—rather than letting them get buried under one more load of chores?”
When you think back over the hardest seasons, the ones you weren’t sure you’d get through, there’s usually more to the story than genetics and feed efficiency. It’s the neighbour who pulled in when your lights were still on long after they should’ve been. It’s the employee who stayed that extra hour when you were at the end of your rope. It’s the youth leader who kept a kid showing just long enough for them to feel like they belonged. It’s the community that quietly shifted from “down the road” to “like family” when your back was against the wall.
We can leave home. But if we keep calling, visiting, and telling each other the truth, home doesn’t have to leave us.
Because at the end of the day, what’s kept most of us going hasn’t just been the cows.
It’s been the people around them.
And around us.
If this story reminded you of your own community—your own “headlights in the lane” moment—share it. Not just this article. Your story. That’s how these things spread.
KEY TAKEAWAYS
The crown she couldn’t have: Hailey Whitters grew up jealous of dairy princesses, but her family farmed corn. Twenty years later, she’s serenading cows in a Land O’Lakes parlor—full circle.
Twelve years of rejection, then Corn Queen: Nashville said “not yet” the same way bad components and tight margins say it to your five-year plan. She kept showing up. Sound familiar?
This isn’t celebrity fluff: Succession. Kids who leave. Mental health. The question of who’ll be standing in your milk house in twenty years. Her story mirrors what a lot of us live.
Three small moves for your community this year: One youth night on your farm. One check-in when a neighbor’s lights are on too late. One honest conversation about stress and the next decade.
Letting them leave is how they stay: The community that supports a kid chasing something far from the barn is the same one that keeps them calling home—and telling your story to the world.
EXECUTIVE SUMMARY:
Hailey Whitters grew up jealous of the dairy princesses—but her family farmed corn in Iowa, so that crown was never in the cards. She came home from the hospital to a baby blue trailer in a cornfield, watched her dad work night shifts at the plant, and learned what it means to keep showing up when nobody’s watching. Twelve years of Nashville rejection later, she broke through with Corn Queen, an album that sounds like it was written about families down the road from any of us. When Land O’Lakes brought her to a member-owned dairy farm for their Bovine Serenade campaign last fall, she crouched down to greet the calves like she’d done it her whole life—because in a way, she had. Her story hits close to home for dairy communities wrestling with succession, kids who leave, and the question of what legacy really means when the next generation takes a different path. If you’ve ever stood in the milk house late at night wondering who’ll be there in twenty years, this one’s for you—and it comes with three small ways to strengthen your own community this year.
Complete references and supporting documentation are available upon request by contacting the editorial team at editor@thebullvine.com.
Every week, thousands of producers, breeders, and industry insiders open Bullvine Weekly for genetics insights, market shifts, and profit strategies they won’t find anywhere else. One email. Five minutes. Smarter decisions all week.
A margarine cup on a farm kid’s tray in Iowa County helped spark Wisconsin’s school butter bill—and proved what grassroots dairy advocacy can still do.
Executive Summary: A Wisconsin farm kid came home from school with a margarine cup instead of butter, and when that story hit a local Farm Bureau meeting, dairy neighbors and legislators turned it into a bipartisan “Butter in Our Schools” bill. Senator Howard Marklein and Representative Todd Novak, both raised on farms, responded to calls from family farmers by drafting Wisconsin Senate Bill 645, which would bar schools from using margarine in place of butter except for students with specific dietary needs. Their effort landed just as President Donald Trump signed the Whole Milk for Healthy Kids Act, allowing schools nationwide to offer whole and 2% milk again, excluding milk fat from saturated‑fat limits, and—via USDA’s SP 01‑2026 memo—giving districts immediate authority to adjust their National School Lunch menus. Even so, a Class I base price around $16.35/cwt and butter in the $1.30–$1.37/lb range show that markets remain tough, and policy wins alone won’t repair farm balance sheets. This feature uses that Iowa County story to show how a single kitchen‑table frustration, when channeled through Farm Bureau, associations, and responsive lawmakers, can still move dairy policy—and why producers who care about school milk and butter choices should see local advocacy as a practical lever, not a feel‑good extra.
The story starts the way so many do in dairy country—with a kid, a school lunch tray, and something that just didn’t sit right.
Somewhere in Iowa County, Wisconsin, a young boy came home from school one afternoon in the fall of 2025 and told his mother something that stuck with her. There’s no more butter, he said. They’re giving us margarine now.
For most families, it might have been a footnote. A shrug. But for this family dairy farm—shipping milk every day, building their lives around what their cows produce—it landed differently. In America’s Dairyland, their own child was being handed a foil‑topped cup of something made from vegetable oil instead of the real thing.
The family didn’t make a scene. They didn’t call the newspaper. But they did bring those margarine packets to the next Iowa County Farm Bureau meeting. And when they set them on the table and told their story, something shifted in that room.
“They’re dairy farmers, and it really irritated them,” State Senator Howard Marklein later told reporters. “This is America’s Dairyland, and so I don’t think it’s unreasonable to expect that our schools will serve something that comes from our dairy cows.”
That September meeting in a community hall somewhere in southwestern Wisconsin became the spark for something much bigger than one family’s frustration. It became a reminder of what happens when dairy people decide they’ve had enough of being quietly written out of the story—and when their neighbors, associations, and lawmakers actually listen.
When a Room Full of Neighbors Said “Enough”
Nobody recorded what happened in that Farm Bureau meeting. There’s no transcript, no viral video. Just the memory of farmers gathered after chores, talking about the usual things—milk prices, weather, the impact of new Federal Milk Marketing Order changes coming in June—when one family spoke up about something smaller and somehow bigger at the same time.
The margarine packets sat on the table like evidence.
The concern resonated. According to Representative Todd Novak, the bill that followed was “a response to calls from family farmers who voiced strong opposition” to margarine replacing butter in at least one local school—this wasn’t just one family’s frustration. Others in the room had heard similar stories from their own schools, their own kids.
Novak, whose district includes some of the most agriculture‑dependent townships in the state, heard about it soon after. He’d grown up milking cows himself. When the story reached him, he didn’t file it away as a minor complaint. It hit differently, he said, because most schools in his area still serve butter, which made this one school’s quiet switch feel less like a budget decision and more like an erasure.
“After attending a local Farm Bureau meeting, I was shocked to hear a local school was no longer serving butter with lunches, but instead an artificial alternative with a long list of ingredients,” he said.
Within weeks, Novak and Senator Marklein—both raised on farms, both still deeply connected to the dairy communities they represent—had drafted a bill. By mid‑November 2025, Wisconsin Senate Bill 645 was introduced, with bipartisan support: fourteen Republicans and two Democrats backing a measure that would require schools to serve real butter, not margarine, unless a student’s dietary needs required otherwise.
The family who brought those packets to the meeting? They’ve stayed mostly out of the spotlight. Their names haven’t appeared in the news coverage. But their frustration—and their willingness to say something instead of just stewing at the kitchen table—set something in motion that’s still moving today.
“This Is the Type of Bill I Love”
There’s a certain kind of bill that doesn’t come from lobbyists or think tanks. It comes from someone’s kitchen, someone’s school, someone’s kid coming home with the wrong thing on their tray.
For Novak, that’s exactly what makes this one matter.
“I grew up milking cows,” he told reporters. “This is kind of the type of bill I love doing because it’s constituent‑oriented.”
Wisconsin already has laws restricting the use of margarine in certain settings. Restaurants can’t substitute it for butter unless they’re explicitly asked, and prisons serve the real thing. But schools had slipped through the cracks, quietly swapping to cheaper alternatives as budgets tightened and nobody was watching too closely.
Chad Zuleger, who advocates for dairy farmers through the Dairy Business Association, has been pushing for the bill since he first heard the story. The image stuck with him: a young boy walking through the door after school, confused and a little upset, telling his mom that butter was gone.
“A young boy came home and told his mother that there’s no more butter and they’re giving us margarine,” Zuleger recounted. “People are looking at cheaper alternatives, and everybody is looking to save a buck.”
But for Zuleger and the families he works with, this isn’t just about saving money. It’s about what message gets sent to farm kids when their own schools quietly stop serving what their parents produce.
“I think with the new dietary guidelines and the Whole Milk for Healthy Kids Act being signed, we’re going to have a resurgence in dairy,” he said. “We want to make sure butter is part of that.”
Whole Milk Comes Home—and Butter Wants to Follow
The timing of Wisconsin’s butter push couldn’t be more fitting.
On January 14, 2026, President Donald Trump signed the bipartisan Whole Milk for Healthy Kids Act into law, restoring whole and 2% milk options in U.S. schools for the first time in more than a decade. For dairy families who’d watched school milk consumption plummet after whole and reduced‑fat milk were pushed out of cafeterias, it felt like a long‑overdue correction.
USDA followed the same day with an implementation memo, SP 01‑2026, telling school districts they could immediately expand their milk offerings within the National School Lunch Program. In simple terms, here’s what changed for schools:
Schools can now offer whole, reduced‑fat (2%), low‑fat (1%), and fat‑free milk at lunch, including lactose‑free options, in both flavored and unflavored forms.
Milk fat in fluid milk is excluded from the weekly saturated fat limit, making it easier for nutrition directors to offer whole and 2% milk without failing federal nutrition audits.
Schools may also offer nondairy beverages that are nutritionally equivalent to milk as substitutes, with simplified rules for parents to request them.
The new 2025–2030 Dietary Guidelines for Americans, released just a week earlier, had already endorsed full‑fat dairy as part of a healthy diet—a major shift from years of low‑fat messaging that had shaped school meal rules since 2012.
School Year
Whole
2%
1%
Fat-Free
Total
Notes
2008–09
850M
900M
180M
70M
2,000M
Pre-mandate baseline
2009–10
820M
920M
190M
90M
2,020M
2010–11
795M
945M
210M
120M
2,070M
Trend shift begins
2011–12
700M
900M
350M
200M
2,150M
Final year before mandate
2012–13
180M
520M
800M
450M
1,950M
Low-fat mandate → cliff
2013–14
160M
480M
850M
510M
2,000M
2014–15
140M
420M
900M
540M
2,000M
2018–19
100M
350M
950M
600M
2,000M
Stabilized at new low
2020–21
80M
280M
920M
720M
2,000M
COVID impact
2023–24
95M
310M
940M
655M
2,000M
Pre-reversal
2025–26
540M
650M
400M
410M
2,000M
Projected post-Whole Milk Act
For the farmers who pushed for the return of whole milk, the win was real. Industry groups estimate the law could add meaningful butterfat demand to the Class I pool over time, especially in high‑fluid markets where kids actually drink their milk when they like the options. But the celebration came with a sober reminder: the January 2026 Class I base price sat around $16.35 per hundredweight—the lowest in nearly five years—and butter was trading around $1.30 to $1.37 a pound, more than a third lower than the year before.
Year
Whole + 2% Milk (%)
Policy Context
2012
65%
Pre-low-fat mandate
2014
42%
3 years post-mandate
2016
38%
Continued decline
2018
35%
Plateau begins
2020
33%
COVID disruption
2024
32%
Pre-Trump/SP 01-2026
2026
65% (projected)
Whole Milk for Healthy Kids Act signed Jan 14
The policy was finally catching up to what dairy families had been saying for years. The milk check? Not so much.
That’s part of what makes Wisconsin’s butter bill feel like more than just a quirky state law. It’s a signal that dairy communities aren’t waiting for Washington to fix everything. They’re pushing on the levers they can reach—school boards, state legislatures, local Farm Bureau chapters—because those levers are closer to home and sometimes move faster.
Month
Butter ($/lb)
Class I ($/cwt)
Context
Jan 2024
$2.10
$18.50
Year ago baseline
Apr 2024
$2.05
$18.10
Jul 2024
$1.95
$17.80
Summer softness
Oct 2024
$1.85
$17.20
Fall decline
Jan 2025
$1.68
$16.80
School year trends
Apr 2025
$1.52
$16.50
Jul 2025
$1.45
$16.20
Oct 2025
$1.38
$16.35
SB 645 introduced (Nov)
Dec 2025
$1.32
$16.35
Trump signs Whole Milk Act (Jan 14)
Jan 2026
$1.30–$1.37
$16.35
Policy win, prices flat
Senator Marklein put it simply: “I don’t think it’s unreasonable to expect that our schools will serve something that comes from our dairy cows.”
What One Family’s Frustration Taught a Community
The family who started all this didn’t set out to make headlines. They just wanted someone to listen.
And here’s what still strikes you about this story: they found listeners. Not just one sympathetic neighbor, but a whole room of them. Not just a friendly ear at the co‑op, but an association that carried their concern to the capitol. Not just a vague promise to “look into it,” but an actual bill with bipartisan support, moving through committee as this goes to press.
That doesn’t always happen. Anyone who’s tried to push back against institutional inertia knows how often small frustrations get swallowed up by bigger problems, filed away, forgotten. But in Iowa County, something different happened. A community decided that a margarine cup was worth fighting over—not because it was the biggest issue on their plate, but because it symbolized something that mattered.
Their kids were being taught, in small, quiet ways, that what their families produced wasn’t good enough for their school cafeteria.
And the community said: “Not here. Not in Wisconsin.”
The Quiet Work That Makes It Possible
Stories like this don’t happen without a web of relationships that most people never see.
There’s the Farm Bureau chapter that holds monthly meetings even when turnout is thin, and the agenda feels routine. There’s the association staffer who picks up the phone when a frustrated farmer calls and doesn’t dismiss the concern as too small. There’s the lawmaker who still remembers what it felt like to haul milk before school and hasn’t forgotten where he comes from.
There are also the neighbors who show up when someone speaks up, the ones who’ve been shipping milk alongside you for years, standing next to you at the show ring, answering the phone at odd hours when something goes wrong in the barn. The kind of people who don’t let a moment pass without adding their voice when it counts.
None of that is automatic. It’s built over years—over church potlucks and auction barns, over 4‑H meetings and FFA banquets, over the slow accumulation of trust that comes from showing up when it matters.
Wisconsin’s butter bill is still in committee. There’s no guarantee it will pass. The family who brought those margarine packets to the meeting may never see their names in print, and that’s probably fine with them. What they wanted wasn’t fame. They just wanted their community to care about the same things they cared about.
And for a little while, in a community hall in southwestern Wisconsin, they found out it did.
What This Means for the Rest of Us
Policy Lever
Decision-Maker
Dairy Family Influence
Timeline to Impact
School meal standards (butter vs. margarine, milk fat %)
6–18 months (direct access to local leadership; implementation variable)
Farm-to-school direct-market programs (branded farm milk in local schools)
School district + individual farm negotiations
High
3–12 months (local relationships; direct farm-to-school partnerships most agile)
You don’t have to live in Iowa County to recognize something familiar in this story.
Most dairy communities have their own version of the margarine cup—some small moment when it became clear that the wider world had quietly moved on from something that still mattered deeply at home. Maybe it was the day flavored milk disappeared from the cooler. Maybe it was a budget meeting where ag programs got cut. Maybe it was a school board decision that nobody thought to fight until it was already done.
The question isn’t whether those moments will come. They will. The question is what happens next.
Do you stew at the kitchen table and let it go? Or do you bring it to the next meeting, set it on the table, and see who else feels the same way?
Here’s what one Wisconsin family learned: sometimes, people are just waiting for someone to go first.
If you’ve been thinking about speaking up at your local Farm Bureau, your co‑op meeting, your school board—this might be the nudge you needed. You don’t have to have all the answers. You don’t have to be a polished speaker. You just have to be willing to say, “This bothers me, and I think it should bother us.”
And then you have to trust that the community you’ve been building, year after year, might just show up when it counts.
Small Cups, Big Questions
A margarine packet is a small thing. It fits in a child’s hand, gets torn open in seconds, and ends up in the trash before the lunch bell rings.
But what it represents isn’t small at all.
It’s about whether dairy families feel like their own state—their own schools, their own kids’ cafeterias—still believes in what they produce. It’s about whether the slow erosion of dairy’s place in American food culture can be pushed back, one policy at a time, one school board at a time, one Farm Bureau meeting at a time.
It’s about whether communities still have the power to say, “Not here.”
Wisconsin’s butter bill may pass or stall. The Whole Milk for Healthy Kids Act is just beginning to be implemented, and nobody knows yet how many districts will actually change. The markets are tough, the margins are thin, and there are plenty of reasons to feel like the world has moved on from the kind of farming that built places like Iowa County.
But here’s what this story keeps coming back to: a family showed up to a meeting with a handful of margarine packets and a story about their kid. And instead of being ignored, they were heard. Instead of being told it was too small to matter, they watched their neighbors and their lawmakers say, “This matters to us too.”
That’s not nothing. In a time when it’s easy to feel like nobody’s listening, it might be everything.
The butter isn’t back in Wisconsin schools yet. But the conversation is. And sometimes, that’s how change starts—not with a grand announcement, but with a parent, a packet, and a room full of neighbors who heard something in that story that sounded like their own.
Key Takeaways
One margarine cup sparked a bill: A Wisconsin farm kid came home with margarine instead of butter—and after that story hit a local Farm Bureau meeting, Senator Marklein and Rep. Novak introduced SB 645, a bipartisan bill requiring schools to serve real butter.
Whole milk returns to schools: President Trump signed the Whole Milk for Healthy Kids Act on January 14, 2026, restoring whole and 2% milk in school lunch programs and exempting milk fat from weekly saturated‑fat limits.
USDA greenlights immediate action: SP 01‑2026 gives districts authority to expand milk options right away—but local school boards and supplier contracts will determine how fast anything changes on the tray.
Policy wins, prices don’t: Class I base near $16.35/cwt and butter around $1.30–$1.37/lb are the lowest in years—good policy alone won’t fix a tough milk check.
Local advocacy still works: Farm Bureau chapters, dairy associations, co‑ops, and school boards remain the places where dairy families can actually shape what kids eat and drink—and this story proves it.
Senate Bill 645 is currently in committee in the Wisconsin State Legislature. The Bullvine will continue to follow its progress. If your community has a story like this—about showing up, speaking out, and finding out that your neighbors were waiting for someone to go first—we’d like to hear it.
Complete references and supporting documentation are available upon request by contacting the editorial team at editor@thebullvine.com.
The $200K Dairy Margin Trap: What Cheap Feed Won’t Tell You About 2026 – Exposes the $200,000 margin trap hiding behind cheap feed in 2026. This analysis arms you with a strategic checklist—from beef-on-dairy to component audits—to protect your operation against the forecast $1.80 drop in the all-milk price.
Every week, thousands of producers, breeders, and industry insiders open Bullvine Weekly for genetics insights, market shifts, and profit strategies they won’t find anywhere else. One email. Five minutes. Smarter decisions all week.
400 dairies became 3,176 warehouses. Before you face that math, see how one California dairy valley made its hardest choice.
Executive Summary: At its peak in the late 1980s, California’s San Bernardino County Dairy Preserve around Chino and Ontario covered roughly 17,000 acres, with over 400 dairies and 350,000 cows producing most of Southern California’s milk. By 2021, logistics growth had turned much of that “dairy valley” into an industrial landscape, as San Bernardino County’s warehouses expanded from 24 in 1975 to 3,176, covering about 23 square miles—including former preserve land. This article traces how families like the Van Leeuwens, Alta Dena’s founders, and Geoffrey and Darlene Vanden Heuvel of J & D Star Dairy navigated that shift, balancing regulatory pressure and neighbor conflicts against rapidly rising land values and multimillion‑dollar buyout opportunities. It follows the northward move of many herds to Central Valley counties such as Tulare and Merced, now among California’s leading dairy counties by cow inventory and milk sales, and shows how the region’s milk production footprint changed without the people or their values simply disappearing. For today’s producers facing their own land‑value wake‑up calls, the piece offers a practical kitchen‑table framework: put your equity on paper, sketch three realistic paths (stay and reinvest, stay and scale back, or plan an exit), and ask which choice your family will be most at peace with five years from now. Above all, it argues that legacy in dairy isn’t defined only by keeping a specific farm operating, but by the courage to protect your family and carry forward the values you built in the barn—whether that’s on the same acres, in a new county, or in a different role in the industry.
I still remember the first time I watched her hesitate at that kitchen table.
The documentary about the San Bernardino County Dairy Preserve had just started. On paper, it was a history lesson: roughly 17,000 acres brought under California’s Williamson Act in 1967, more than 400 dairies and about 350,000 cows at the peak, supplying most of Southern California’s milk. The numbers lined up neatly on the screen.
But the moment that changed everything for me wasn’t a statistic. It was one daughter trying to talk about her dad.
She’s sitting at a table that looks like it’s hosted more milk checks, arguments, and late‑night coffees than anyone could count. In the film—shared by her family so people could understand what the preserve meant—she explains that her father grew up on São Jorge in the Azores. Out there, it was all pastures and cattle. Milking and raising animals were what he knew, so when he came to California, that’s what he did.
“It’s all pastures,” she says quietly, “so that’s what my father grew up doing—was milking the cows, raising cattle.”
And then she stops.
It’s barely half a second. Her eyes drift down, her fingers tighten a little on the mug, and there’s this small, fragile silence you can feel right through the screen. What moved me most was that silence. In that breath, you can hear everything her father carried: a young immigrant stepping into a strange country, barns rising on leased land, cows that paid the bills and anchored the family, a valley that once smelled like silage and warm milk—and the slow realization that the world around those barns had changed.
If you’ve ever looked across your own yard and wondered what happens if the land under your freestalls becomes worth more to somebody else than your milk will ever justify, you already know this story is closer to home than any map shows.
No One Thought This Dirt Would Be a Dairy Giant
No one driving past that dusty patch of southern California in the 1940s would’ve guessed it would become one of the most intense dairy regions in the country.
After World War II, waves of farm families came into places like Chino and Ontario. Dutch and Portuguese names began appearing on mailboxes and milk tankers. Historical accounts show Azorean Portuguese immigrants climbing the ladder one step at a time: first as hired hands, then as herdsmen, then as partners, and finally as owners. There were no consultants or five‑year plans—just people who knew cows and were willing to work.
They built more than rows of stalls.
Community histories describe how those families rooted D.E.S. halls and Holy Ghost festas across California’s dairy regions. You can almost smell the smoke from the churrasqueira and hear the clatter of plates as you read them: tents sagging over rough tables, kids in red sashes weaving between chairs, elders arguing in Portuguese about which donated animal was the best offering that year. No one’s marketing budget sponsored those gatherings. They were paid for out of parlors up and down the valley.
Then there were families like the Van Leeuwens. A Los Angeles Times feature tells how Bill Van Leeuwen’s grandfather left the Netherlands in the 1920s and started a dairy in Paramount with about 60 cows, all milked by hand. Later, Bill’s father bought a 17‑acre dairy in Norwalk in 1945, grew it to roughly 180 cows with mechanical milking, and watched houses press in tighter every year. When the city got too close, they sold that Norwalk farm in 1957 for about $17,000 and moved again—this time to Chino, where the land was cheaper and zoned for dairies.
On a timeline, that looks straightforward: buy, build, sell, move. On the ground, it’s a lot messier. It’s loading your best cows onto someone else’s trailer at an auction you never wanted to hold. It’s kids landing in new schools and trying to explain why their boots smell the way they do. It’s lying awake at night, wondering if uprooting everyone—again—was a brave move or a terrible mistake.
Against all odds, families kept choosing to move when staying put stopped making sense. Not because they weren’t scared. Because they were, and they did it anyway.
The Preserve That Was Supposed to Keep Them Safe
The preserve was supposed to be the part of the story where the pressure finally eased.
In 1967, under California’s Williamson Act, San Bernardino County created what became known as the San Bernardino County Dairy Preserve. Owners who agreed to keep their land in agriculture for ten‑year stretches got a tax break. About 17,000 acres around Ontario and Chino were drawn into a zone where dairies were not just tolerated—they were officially wanted.
For a while, that line on the map did exactly what it was meant to do.
By the late 1980s, that preserve held more than 400 dairies and around 350,000 cows, widely described as the largest single dairy concentration in the United States and the source of most of Southern California’s milk. A University of California report at the time described roughly 280,000 cows in about 300 herds across 20 square miles, with average herd sizes over 900 and nearly all of them family‑owned and managed.
Then the world outside the fence changed faster than the rules inside it.
PBS SoCal’s Earth Focus reporting and county data show how, starting in the 1970s and accelerating through the 1990s and 2000s, San Bernardino County became a logistics hotspot. In 1975, there were just 24 warehouses. By 2021, there were 3,176, covering about 23 square miles of what had once been open land. More and more of those roofs went up on former dairy ground, including pieces of the preserve.
Cities like Ontario and Chino annexed big chunks of that rural area as they expanded, pulling dairy land into city limits and long‑range development plans. At the same time, dairies in the preserve were wrestling with environmental rules, odor and dust complaints, rising costs, and the same milk price volatility everyone else knows.
On the surface, some of those operations looked stronger than ever: bigger herds, better parlors, more milk shipped. Underneath, the math was bending. The ground under those freestalls suddenly carried a price tag driven more by warehouse demand than by milk checks, and the contracts that had once offered protection were now one more factor to navigate before a family could even think about selling.
The fence that was drawn to keep the bulldozers out had quietly become part of the puzzle families had to solve just to protect themselves.
Standing in the Barn When It Starts to Feel Smaller
The call that changes everything doesn’t always come from a lawyer or a city planner. Sometimes it comes while you’re just standing in your own parlor.
Producers interviewed in planning documents and local reporting talk about that moment without always naming it. They had moved when the cities pushed in. They had signed onto the preserve. They had doubled down and built bigger. They had done everything they were told “serious” dairies had to do.
In 1993, San Bernardino County began formally phasing out the agricultural preserve. Over the years that followed, planning reports show that at least half of the roughly 400 dairies moved out, many heading for Central Valley counties like Tulare and Merced, where land was cheaper and zoning still openly welcomed cows. Others tried to hang on as long as they could.
Some of those who stayed told county officials and reporters something very simple: they didn’t want special treatment; they wanted the same right as any other landowner to sell their land at its true value when that was what their family needed.
Imagine finishing cleanup, leaning your arms on the pit rail, and realizing that on paper, your entire life’s work sits on land that’s suddenly worth more to a trucking company than your milk will ever justify—and knowing that the system built to protect you now plays a big role in how easily you can step away. That’s not just a business problem. That’s something that gets into your bones.
When your whole sense of self starts with “I’m a dairyman” or “I’m a dairywoman,” even letting the thought “Maybe we should sell” float across your mind for more than a second can feel like treason. Not against the land. Against who you’ve always believed you are.
When Neighbors You Trust Suddenly See Different Futures
The deepest cracks didn’t only come from policy or developers. They also ran right between neighbors who had once stood shoulder to shoulder.
As the county moved to unwind the preserve and cities annexed more land, dairy families found themselves standing on opposite sides of a line no one had deliberately drawn. In broad strokes, many older or smaller operations, worn down and boxed in, wanted the option to sell to developers at full value. Larger, heavily invested herds with newer facilities wanted the land to stay agricultural and the cluster intact.
Planning reports describe how some producers saw the preserve as some of the best dairy ground anywhere, and grieved the idea of losing it under concrete. Others looked at appraisals and felt that not being able to sell freely at those prices effectively pinned their families in a corner they hadn’t chosen.
Nobody in those meetings loved cows less than anyone else. They were just looking at the same valley from different kitchen tables.
“We Weren’t Forced Out. We Were Enticed.”
One line in this story still hits like a punch.
In a Los Angeles Times piece about the area’s dairies leaving, Bill Van Leeuwen said:
“Dairy farmers will say they were forced out by urbanization, but really, we were enticed to leave.”
He could have just said “forced out” and left it there. Urbanization, annexations, and changing rules absolutely pushed. But Bill knew there was another side to the ledger.
PBS SoCal and county documents spell out what was happening: as warehouse demand surged and land prices climbed, developers offered high purchase prices for dairy parcels. At the same time, San Bernardino County created mechanisms for early withdrawal from Williamson Act contracts and began auctioning county‑owned parcels, like the land under J & D Star Dairy. In 2014, that auction drew more than $65 million from warehouse and logistics buyers.
On one side: long days, regulatory pressure, neighbor complaints, aging bodies, and kids whose attachment to the cows may not look the same as yours. On the other: a cheque big enough to pay off debt, help children into their own futures, and maybe ease some of the strain.
Bill’s sentence doesn’t try to make anyone a hero or a victim. It simply admits that families were pushed and pulled at the same time. That honesty is part of what makes this whole valley’s story so powerful.
“Once the Dairies Leave, What Do You Do?”
Sometimes the most important question gets asked long before anyone’s ready to answer it.
In archival footage tied to the recent documentary about the San Bernardino Dairy Preserve, Geoffrey Vanden Heuvel stands in front of J & D Star Dairy in Chino. He and his wife, Darlene, had built that dairy, on land leased from the county, into a notable family operation in the preserve.
Looking into the camera, Geoffrey says, “Once the dairies leave, what do you do? You ought to have a plan in place.”
At the time, that must’ve felt like talking about a storm still sitting on the far horizon. The preserve was still in place on paper. A lot of people didn’t want to imagine a valley without dairy barns.
But the record shows how accurate he was. San Bernardino County began phasing out the preserve in 1993. As years passed, many of the preserve dairies moved to Central Valley counties like Tulare and Merced, which have consistently ranked among California’s top dairy counties for cow numbers and milk sales over the past decade.
J & D Star stayed longer than most. Then, in 2014, the county auctioned the land it was leasing, and developers bought it as part of a package worth over $65 million. By 2018, PBS SoCal reports that a FedEx warehouse and a large parking lot sat at Merrill and Flight avenues, where J & D Star’s corrals and barns had stood.
Geoffrey didn’t simply disappear from the industry when the dairy closed. Today, he serves as Director of Regulatory and Economic Affairs for the Milk Producers Council, working on policy and economic issues that shape the future for other dairy families across California. The same man who said, “You ought to have a plan in place,” now spends his days helping others think ahead.
When a Founder Admits Grit Isn’t Always Enough
If you zoom out beyond the Chino preserve, another name keeps showing up in California’s dairy story: Harold Stueve.
The Los Angeles Times recounts how he and his brother Edgar founded Alta Dena Dairy in Monrovia in 1945 with 61 cows and a milk wagon. By the 1960s, they had grown it into one of the largest dairies in the world. When the family sold a majority interest in 1989, Alta Dena had annual sales of more than $125 million and over 70 family members working in the business.
Later, as legal battles over raw milk, regulatory scrutiny, and urban growth intensified around their operations, Alta Dena sold most of its Chino-area dairy land. On paper, it reads like just another corporate transition. When you look closer, you see decades of pushing, innovating, and eventually hitting constraints you can’t simply outwork.
Over the years, Harold acknowledged that there comes a point where you can’t keep a large dairy going if houses and schools completely hem you in. You need open ground, a supportive community, and workable rules. If those disappear, even the toughest operator runs into walls that grit alone can’t knock down.
Sometimes courage is setting your alarm for 3:30 AM for the thousandth day in a row. Sometimes courage is admitting that the rules have changed enough that the old plan can’t get you where you hoped to go.
The Questions That Decide Everything (and They Don’t Show Up on a Spreadsheet)
The biggest turning points in this story didn’t happen at county hearings or in courtrooms. They happened at kitchen tables like yours.
The kids finally fall asleep. The second milking is done. The only sounds are the fridge humming and someone turning pages in a stack of bills. Maybe there’s an appraisal in there. Maybe a letter from the lender. Maybe just your own notes with numbers you’ve run three times and still don’t like.
Somebody stares at the paper. Somebody else stares at the wall. Someone says, “We’re okay,” but nobody really believes it.
The details are different from farm to farm, but the same questions keep trying to surface—even if they first show up as half sentences and long pauses instead of clean bullet points.
What are we actually protecting here?
Not “the family farm” as an idea. This exact operation. These cows. This land. These loans. This level of stress on your body. These kids are watching you, trying to decide if this is a life they can see themselves in.
Sometimes the moment that changes everything isn’t when some letter shows up in the mailbox. It’s when someone finally whispers, “Are we protecting the farm, or are we protecting our family?” and nobody rushes to shut it down.
Five years from now, what decision will we be most at peace with?
Nobody typically says it that neatly across the table. It comes out as, “I can’t keep this up forever,” or “If we walk away, who am I?”
But underneath, that’s the question. If you could look back from five years ahead, what would you be most grateful you did now? Pushed through one more round of changes? Took a serious offer while it was on the table? At least they laid every option out honestly and listened to each other?
There’s no path with zero regret. The real choice is which regret you can live with.
What does legacy really mean to us?
Is legacy only an unbroken line of your farm name on this specific piece of land?
Or is legacy your kids carrying your values—work ethic, care for animals, honesty—in whatever work actually lets them build a life? The historical record from the Chino milk shed shows families moving their herds to Tulare or Merced to keep milking, while others stepped into different roles within the industry. The barns changed. The values didn’t.
Are we still running this farm, or are we just holding a very expensive ticket in a game we no longer control?
When you sketch out your net worth and realize most of it is tied up in land whose price swings more with zoning decisions, warehouse demand, or policy than with what you ship in the tank, that’s a different kind of risk. For some families, that risk still feels worth it. For others, it feels like a clock ticking in the background.
There’s no single right answer baked into these questions. The only real mistake is refusing to ask them because you’re afraid of where the conversation might go.
A Kitchen‑Table Playbook You Can Actually Use
This isn’t a mastitis protocol or a robot ROI spreadsheet. It’s simpler and, in some ways, harder. But if anything in the Chino story hits you in the gut, here’s a framework you can adapt to your own table.
1. Put your equity on paper—for yourselves.
Not a formal statement. Just an honest sketch. How much of your net worth is in cows, machinery, and working capital versus land and buildings? It doesn’t have to be down to the dollar. It just has to be real enough that everyone around the table can see its shape.
2. Sketch three paths, even if you hate all of them at first.
One where you stay and reinvest: what would you actually change—facilities, herd size, contracts?
One where you stay but intentionally scale back or shift direction.
One where you sell or transition over a defined timeline—maybe to family, maybe not.
You’re not signing anything. You’re just admitting that these are the real options, not the ones you wish you had.
3. Ask the five‑year question out loud.
“If we look back from five years out, which of these paths will we be most at peace with—even if it’s hard in the short term?”
Let everyone answer from where they sit—owner, spouse, next generation. Don’t rush to smooth it over. Let there be a few uncomfortable silences. Sometimes that’s where the truth finally slips out.
You don’t owe social media or the neighbors a tidy narrative. You owe the people at that table your best effort at the truth.
What’s Left When the Barns Are Gone
If you drive through that valley today with no idea what it used to be, you’ll mostly see concrete and loading bays.
PBS SoCal shows how the J & D Star Dairy land, once home to corrals, lagoons, and barns, is now a FedEx warehouse and a large parking lot at Merrill and Flight avenues. The same reporting and county data map out thousands of warehouse roofs across roughly 23 square miles of what was some of the most productive dairy ground anywhere in the state.
In some of those industrial parks, bronze cow statues are standing in front of office doors—a nod to the cows that once lived there. To someone just passing through, it might look like a quirky design choice. To someone who grew up milking there, it probably feels more like walking into an empty barn and hearing phantom pulsators.
The cows didn’t all vanish; they moved. Industry data and USDA Census snapshots over the past decade consistently place Tulare and Merced among California’s top dairy counties for cow numbers and milk sales, reflecting the shift of herd concentration into the Central Valley.
Holy Ghost festas still pack D.E.S. halls in Portuguese communities, including in places tied back to the preserve story. The names on some of those banners are the same names that once hung over dairy lanes near Chino. Some of those families are still milking, just in different counties. Others are working in roles that keep them connected to cows and producers in new ways.
The valley’s role in the dairy map changed. The people who built it didn’t just evaporate.
If You’re Standing on That Edge Yourself
You might be nowhere near California. Your pressure might come from quota rules, a processor that’s gotten too big, labor you can’t find, interest rates that keep you up at night, or climate policy that makes your head spin. The details are different, but that feeling in your gut can be exactly the same.
If you’ve ever sat at your own kitchen table with a stack of envelopes, your stomach in a knot, and that little voice saying, “We can’t keep doing it like this forever,” then you are closer to those San Bernardino families than you might want to admit.
This story isn’t here to talk you into staying or to talk you into leaving. That’s not anyone else’s job.
What it can do is give you a few things their journeys made painfully clear:
You’re not weak for questioning whether the current path still makes sense.
You’re not a failure if, in your situation, protecting your family means exiting an operation your grandparents poured their lives into.
You’re not alone if, some nights, the place that once held all your dreams now feels like it’s squeezing them.
The strength that comes through the Chino story isn’t just the toughness it took to build those dairies in the first place. It’s the quiet courage it took to keep going while the landscape and the rules shifted underneath them—and then, when the time came, to admit that the bravest move for their family might be a different one than they expected.
The Part of Your Legacy No One Can Pave Over
I keep going back to that woman at the kitchen table and that half‑second pause before she could talk about her dad.
He didn’t leave São Jorge, cross an ocean, and put his whole life into cows and concrete barns so his name would stay attached to one particular parcel of land forever. He did it to give his family a chance—to keep them secure and part of a community that knew their name.
For a long time, dairy was the best way he knew to do that. The barns, the cows, the milk checks—they mattered. They helped hold households and community institutions together in that valley.
But the legacy he left her didn’t live in a legal description on a deed. It lives in the way she carries his story, in the values and work ethic he passed on, and in her willingness to share that story so other families can see themselves in it.
Your legacy isn’t only the cows you milk or the acres that carry your name.
Your legacy is the courage to do what it takes to give the people you love a future they can live with—whether that means staying and reinventing your operation, moving and rebuilding somewhere that fits better, or blessing the next generation as they carry your values into a different part of the dairy chain or into something else entirely.
Sometimes that’ll mean doubling down: investing in cow comfort, air, and shade; tightening up decisions; bringing your kids into the real conversations instead of just handing them a pitchfork. Sometimes it’ll mean cheering them on as they walk into a feed lab, a vet clinic, or another barn with your lessons in their back pocket, not your name on their pay stub.
And sometimes, it might mean sitting at that same table that’s seen more milk checks than you can count and finally saying, with your voice catching just a bit:
“We can’t carry on this business the way it is, not here. And that’s okay. We’ll find another way.”
If you’re anywhere on that edge right now—half anchored in the life you’ve always known, half staring into a fog of what‑ifs—this story isn’t here to push you in either direction.
It’s here to give you permission to ask the hard questions, to listen to each other without flinching, and to remember something the Chino valley proved in its own hard way:
The barns may change. The land may change. The way we milk and get paid will keep changing, just like it did there.
But that quiet, stubborn determination at the core of this way of life—the part that keeps you getting up on the mornings when nothing on the ledger looks pretty—that’s yours. No auction, no zoning vote, no warehouse, and no milk price can ever take that from you.
Key Takeaways
The numbers tell the story: At its peak, California’s Chino–Ontario dairy preserve held 400+ dairies and ~350,000 cows on 17,000 acres; by 2021, San Bernardino County’s warehouses had grown from 24 (1975) to 3,176, paving roughly 23 square miles—including much of that preserve.
Pushed and pulled at once: As one longtime dairyman said, families weren’t simply “forced out by urbanization”—they were “enticed to leave” by land values that dwarfed what milk checks could ever justify.
The herds moved, they didn’t vanish: At least half the preserve’s dairies relocated to Central Valley counties like Tulare and Merced, which now rank among California’s top dairy counties by cow inventory and sales.
A kitchen-table playbook for today: If you’re facing land-pressure decisions, start here—put your equity on paper, map three paths (reinvest, scale back, or exit), and ask which choice your family will be most at peace with five years from now.
Legacy isn’t acreage—it’s values: The Chino story proves that what you pass on isn’t a deed or a barn; it’s the courage to protect your family and carry forward what you built, wherever that takes you.
Complete references and supporting documentation are available upon request by contacting the editorial team at editor@thebullvine.com.
Learn More
Decide or Decline: 2025 and the Future of Mid-Size Dairies – Gain the clarity needed to stop the drift and start leading. This guide delivers the hard financial benchmarks—from debt ratios to precision feeding ROI—that move mid-sized dairies from fatigue into a model of aggressive profitability.
Every week, thousands of producers, breeders, and industry insiders open Bullvine Weekly for genetics insights, market shifts, and profit strategies they won’t find anywhere else. One email. Five minutes. Smarter decisions all week.
The 90% cost-share headline looks great. The fine print? You pay first. USDA reimburses later. That timing gap breaks some dairy farms.
Executive Summary: Here’s what the $700 million headline won’t tell you: USDA’s new Regenerative Pilot Program offers up to 90% cost-share—but it’s reimbursement, not upfront cash. Dairy farmers must front infrastructure costs (often $30,000-$50,000+ for comprehensive grazing systems) before federal dollars arrive. That capital gap is why beginning farmers participate in federal programs at just 33% compared to 41% for established operations, per November 2024 Congressional Research Service data. Dairy operations do hold a structural advantage—cows and manure address multiple NRCS resource concerns simultaneously, which boosts ranking scores—but transition economics add real risk. A March 2025 WWF-UK study found regenerative transitions typically produce “lowered or negative profitability” in early years before long-term resilience benefits kick in. This program works best as an accelerator for operations already moving toward grazing and soil health, with strong balance sheets to bridge the gap between writing checks and receiving reimbursement.
Picture this: You’re at the kitchen table, coffee getting cold, scrolling through the USDA’s December 10th press release about a new $700 million regenerative agriculture pilot program. The words “farmers first,” “soil health,” and “lower production costs” jump out. Your spouse looks over and asks, “Is this something we should look into?”
It’s a fair question. And the honest answer is: it depends on where your operation stands today.
USDA’s new Regenerative Pilot Program is generating significant interest across dairy country, with good reason. The program bundles EQIP and CSP funding into a single application focused on whole-farm planning, soil testing, and measurable outcomes. For dairies already exploring rotational grazing, improved nutrient management, or soil health practices, the timing could work well.
What I’ve found after digging into the program mechanics and reviewing the financial modeling is that this opportunity fits some operations better than others. The farms positioned to benefit most are those already headed in this direction, with healthy balance sheets to weather a multi-year transition.
Let me walk you through what’s actually going on here.
What the Regenerative Pilot Program Actually Does
The basics are straightforward enough. According to the USDA’s December 10, 2025 announcement, the agency is directing $400 million through EQIP and $300 million through CSP in fiscal year 2026 specifically for regenerative practices.
Producers can now submit a single application covering both programs instead of navigating two separate processes—which, if you’ve dealt with NRCS paperwork before, represents a meaningful improvement.
The whole-farm focus is useful. NRCS staff are directed to address all major resource concerns in your operation—soil erosion, nutrient loss, water quality, habitat, and livestock needs—within a single conservation plan.
Here’s something worth paying attention to: participants must agree to perform soil health testing in the first and last years of the contract, at a minimum, to establish a baseline and record changes over time. That accountability piece matters for demonstrating results.
What’s interesting is the explicit invitation for corporate partnerships. The announcement states that companies interested in partnering can contact the USDA directly. That language opens some doors we’ll explore later.
For dairy, the program’s emphasis on integrating livestock with land management aligns naturally with regenerative principles: keeping soil covered, minimizing disturbance, maintaining living roots, and diversifying species. Cows, manure, forages, and pasture already form an interconnected system on most operations.
The Dairy Advantage: Why Your Operation Scores Well
This is where the technical picture gets interesting. NRCS doesn’t fund applications based on who writes the best narrative. They use the Conservation Assessment Ranking Tool (CART), which scores proposals against national resource concerns covering soil, water, air, plants, and animals.
Dairy operations with cows and manure naturally touch more of those concerns at once than a typical row crop farm. Issues such as nutrient management, water quality protection, and forage balance are explicitly listed as resource concerns in NRCS documentation.
When a dairy installs a well-designed rotational grazing system with improved fencing, waterlines, and better nutrient management, NRCS can score improvements across multiple concerns simultaneously—forage balance, water availability, pathogen risk, erosion, and habitat.
I recently spoke with a Wisconsin producer who went through the EQIP process last year. His observation was telling: “We didn’t realize how many boxes we were checking just by having cows on the land.”
That multi-benefit profile tends to drive higher ranking scores than many single-issue cropland practices. Dairy does have a structural advantage in competing for these dollars—but that advantage comes with its own complexity.
The Watershed Factor: Regulatory Context You Need to Know
This doesn’t get enough attention in press releases. Many of the watersheds where regenerative practices are most encouraged are also under Total Maximum Daily Load (TMDL) constraints for nutrients or pathogens under the Clean Water Act.
If you’re in one of these areas, you already know it:
Chesapeake Bay watershed
Wisconsin’s Fox River basin
California’s Central Valley
These are places where state agencies are required to allocate pollution “budgets” among all sources, and permitted CAFOs face increasing scrutiny.
For a dairy in one of these basins, regenerative funding can serve two different purposes. It can be a financial tool to get ahead of emerging standards, using cost-share to build practices that might eventually be required anyway. It also creates documentation showing proactive engagement with water quality concerns.
In many cases, that documentation of good-faith efforts is exactly the right approach. But if you’re in a watershed with active enforcement attention, talk to someone who understands the regulatory landscape before signing a multi-year contract.
The Cash Flow Trap: Why 90% Cost-Share Isn’t Free Money
One of the most eye-catching features of USDA conservation programs is the up-to-90% cost-share rate available to historically underserved producers: beginning farmers, socially disadvantaged farmers, veterans, and limited-resource operations. On paper, that represents meaningful support.
The participation data reveals some challenges worth understanding.
According to a November 2024 Congressional Research Service report on beginning farmers:
33% of beginning farmers received direct payments from federal agricultural programs (2013-2017)
41% of established operations received payments in the same period
For participants, payments accounted for 20% of net cash farm income for beginning farmers vs. 14% for established farms
OPERATION CHARACTERISTIC
BEGINNING FARMERS
ESTABLISHED OPERATIONS
Federal Program Participation Rate
33%
41%
Participation Gap vs. Established
↓ 24% lower
baseline
Payment Share of Net Cash Income*
20%
14%
Typical Debt-to-Asset Ratio
Higher
Lower
Farm Equity Position
Lower
Higher
Dominant Land Tenure
Rented/Short-term
Owned/Long-term
*Among participating operations only Source: Congressional Research Service, November 2024 (2013-2017 data)
What’s happening here? Part of it is awareness and application complexity. But the more significant factor is access to capital.
Here’s the catch: 90% cost-share still means 10% cash upfront—and cost-share is typically reimbursed after the practice is installed, not before.
For a rotational grazing system—fencing, water systems, pasture establishment—the out-of-pocket costs can range from several thousand dollars for basic setups to $50,000 or more for comprehensive systems, depending on your acreage, existing infrastructure, and how much you’re building from scratch. That’s before accounting for the working capital you’ll need during the transition period when milk production may temporarily decline.
System Type
Total Cost
Farmer 10%
Reimbursement Float
USDA 90%
Basic (50 ac)
$15,000
$1,500
$2,250 avg
$13,500
Mid-Size (150 ac)
$35,000
$3,500
$7,000 avg
$31,500
Comprehensive (300 ac)
$50,000
$5,000
$25,000 avg
$45,000
The CRS report confirms that beginning farmers typically carry higher debt-to-asset ratios and have less farm equitythan established operations. Many rely on off-farm income to balance the books. They often farm rented or short-term-leased land, which makes it difficult to justify permanent infrastructure investments.
The bottom line: The farmers these enhanced rates are designed to help sometimes face the greatest barriers to participation, regardless of the cost-share percentage.
Regional Reality Check: One Program, Different Impacts
These dynamics vary considerably by geography.
Wisconsin: Dairy operations are dense, and cooperatives have historically been strong. Farmers have more options for pooling resources and sharing knowledge about conservation practices. The state’s nutrient management regulations are relatively mature, so many operations have already implemented foundational practices. For these farms, the regenerative pilot might represent an incremental step rather than a major pivot.
California (Central Valley): The scale is different—larger operations with significant water constraints and air quality regulations layered on top of nutrient concerns. The capital requirements and regulatory complexity are both amplified. But so is the potential impact when operations do commit to regenerative practices.
A Central Valley producer I spoke with recently put it bluntly: “We’ve got CARB breathing down our necks on methane, the water board on nutrients, and now there’s federal money for soil health. The question isn’t whether to do something—it’s whether this particular program fits our timeline and our cash position.”
Northeast: Smaller average herd sizes and proximity to premium urban markets create different opportunities. Grass-fed and organic premiums have more traction here, which can make the transition economics more favorable. But land costs are higher, and available acreage is often tighter, which affects grazing system design.
A $700 million program announced from Washington looks different depending on where you’re standing. Local NRCS offices understand these regional dynamics—those conversations are worth having early.
REGION
TYPICAL HERD SIZE
INFRASTRUCTURE COST
REGULATORY COMPLEXITY
PREMIUM MARKET ACCESS
TRANSITION CHALLENGE
Wisconsin
150-250 cows
$25K-$45K
Moderate (nutrient mgmt)
Moderate (co-op support)
MODERATE
California Central Valley
800-2,000+ cows
$75K-$150K+
HIGH(water/air/nutrients)
Low-Moderate
HIGH
Northeast (NY, VT, PA)
80-150 cows
$15K-$35K
Low-Moderate
HIGH (organic premiums)
LOW-MODERATE
Upper Midwest (MN, IA)
200-400 cows
$30K-$55K
Moderate
Moderate
MODERATE
Southeast (GA, FL, NC)
100-300 cows
$20K-$40K
Moderate-High (water)
Low
MODERATE-HIGH
Corporate Partnerships: Opportunity Meets Fine Print
Corporate regenerative programs have become increasingly significant, and they offer real benefits to participating farms. I’ve heard from producers across several states who have developed productive relationships with their buyers.
The upside: Danone North America has enrolled dairies across thousands of acres in its regenerative program, with documented outcomes such as reduced erosion and improved soil carbon. Benefits can include:
The complexity: Processors and brands typically control the regenerative standard, the verification protocol, and the use of on-farm data—including soil tests that public dollars may partly fund. Contracts may include termination clauses, volume limits, or pricing formulas that provide the buyer flexibility if market conditions shift.
We saw how that flexibility works in practice when Danone adjusted its supply chain in August 2021, ending contracts with 89 Northeast organic dairy farms due to what the company described as “growing transportation and operational challenges in the dairy industry, particularly in the northeast.”
Those operations needed to find alternative markets quickly. Many did—Stonyfield announced plans to bring some affected farms into their direct supply program, and Organic Valley welcomed 65 of the displaced operations into their cooperative.
What’s encouraging is how the producer community responded. Farmer-owned cooperatives like Organic Valley offer a different structure—one where every farmer-member has a vote on decisions that impact the co-op, including animal care standards and pay prices. That model has its own trade-offs (cooperative governance isn’t always fast or simple), but for some operations it provides a middle path.
Key questions before signing: Who owns your soil data? What happens if the buyer changes strategy? Will the infrastructure investment still make sense if the premium structure changes?
These aren’t reasons to avoid partnerships—they’re reasons to read contracts carefully.
The Transition Valley: When Soil Improves Faster Than Cash Flow
This brings us to something that deserves more attention: the transition economics.
USDA and regenerative advocates often reference “measurable improvements within 2-3 crop seasons.” That’s accurate for soil biology indicators—surface organic matter, infiltration rates, and microbial activity can respond relatively quickly to practices like cover cropping and adaptive grazing.
But dairy economics operate on a different timeline.
Research published in the journal Animals examined what happens when dairy cows experience housing and management transitions. In a 2017 study, cows moved from stanchion-stall housing to free-stall systems showed an immediate milk production drop of 23.3% on the first day following the transfer—from an average of about 31 kg to around 24 kg. Production partially recovered over two weeks.
This study examined housing transitions rather than pasture conversion specifically—but it illustrates an important point: significant management changes affect cow productivity in the short term, with implications for cash flow.
The most comprehensive recent modeling on regenerative transition economics comes from a March 2025 WWF-UK study conducted by Cumulus Consultants and the Andersons Centre. Now, I know what you’re thinking—UK data for American operations? Here’s why it still matters: the biological lag time of soil adaptation is universal. Whether you’re in Devon or Wisconsin, soil biology follows the same fundamental timeline. The microbial communities rebuilding your soil structure don’t care which side of the Atlantic they’re on.
Their findings: across all farm types modeled, the initial years of transition led to “lowered or negative profitability” due to investment costs and lower yields outweighing operational savings in the short term.
The report describes a “fallow years period” where dairy farmers can expect reduced profitability, with the transition timeline varying by starting point. The farms that came out ahead financially were either:
High-cost intensive operations with significant room to reduce input costs, or
Already-extensive grazing systems with lower transition costs
What’s encouraging: Regenerative farms often showed greater resilience to input price shocks and extreme weather compared to intensive operations. That long-term stability matters—particularly given recent volatility in feed costs. But you have to navigate the transition successfully to realize those benefits.
Year
Soil Health Index
Farm Profitability Index
Performance Gap
0
100
100
0
1
105
88
+17
2
115
82
+33
3
120
85
+35
4
123
95
+28
5
125
105
+20
6
126
112
+14
7
127
118
+9
The bottom line on timing: Soil biology may show improvement within 2-3 seasons, but cash flow and profitability often take considerably longer to recover fully.
The Political Wild Card
Conservation programs exist within a political framework that changes over time.
The Inflation Reduction Act dedicated approximately $19.5 billion in additional conservation funding, much of it for climate-smart agriculture. Subsequent policy developments have affected how some of that funding flows. In February 2025, USDA announced the release of approximately $20 million in previously paused IRA funding that had been under review—confirming that payment timing had affected some producers waiting on expected funds.
The new regenerative pilot is associated with current USDA leadership priorities. That provides momentum now, but program emphases can shift with administration changes.
EQIP and CSP, as core Farm Bill programs, have demonstrated durability across administrations. Pilot structures and specific funding levels built on top of them may be more variable.
For a farm planning a multi-year transition: plan as if federal dollars are a helpful accelerator, not the foundation of your business plan.
The Five Questions That Actually Matter
So how do you decide whether this program makes sense for your operation?
These aren’t the questions NRCS will ask on your application. They’re the questions worth answering honestly with your banker, your family, and yourself before starting the process.
1. Are your financial ratios positioned for a multi-year transition? Work with your lender to review your debt-to-equity position, current ratio, and working capital. If the numbers are already tight, adding transition stress may stretch the operation further than is comfortable, even with cost-share support.
2. What’s your breakeven milk price if production temporarily declines? This is your stress test. If your breakeven moves into a price range the market rarely supports for extended periods, you’re counting on premium contracts or federal payments to bridge the gap.
3. Do you have a secured premium milk buyer? There’s a meaningful difference between a signed contract and a general intention to pursue premium markets. If the market isn’t locked in before transition, that’s additional uncertainty.
4. Can you cover the upfront costs and manage the reimbursement timeline? Cost-share is reimbursement, not an advance payment. The capital needs to be available when practices are installed, not when NRCS processes the paperwork.
5. Does regenerative transition align with where your operation was already heading? This might be the most important question. If you were already exploring more grazing and soil health practices, federal dollars can accelerate that direction. If the funding is the primary motivation, the transition may prove more challenging.
CRITICAL QUESTION
STRONG POSITION ✓
RISK SIGNAL ⚠️
1. Financial Ratios for Multi-Year Transition
Debt-to-equity <40%; working capital covers 6+ months
Debt-to-equity >60%; operating loan near limit
2. Breakeven Milk Price If Production Temporarily Declines
Breakeven $16-18/cwt; margins absorb 10-15% production dip
Breakeven $20+/cwt; no cushion for production drop
3. Premium Milk Buyer Secured?
Signed contract with locked pricing ($3-5/cwt+ premium)
“Exploring options” or unsigned interest letters
4. Upfront Capital Access for Full Project Cost
Can cover 100% project cost + 6mo working capital reserve
Need reimbursement to proceed; only have 10% share
5. Regenerative Direction Alignment
Already grazing/soil-focused; program accelerates existing path
Program is primary motivation; practices otherwise unlikely
The Bottom Line
The $700 million program is real, and for operations that fit the profile, it represents a meaningful opportunity. Dairy operations do have structural advantages in the ranking system. Well-designed rotational grazing and nutrient management can deliver environmental and economic benefits over time.
This program works best as an accelerator for farms already moving in a regenerative direction, with solid financial foundations and clear market positioning.
For operations that hope federal dollars will address underlying financial challenges or for operations without clear premium market access, the program may not change the fundamental economics. And the transition period—that stretch where soil improvement runs ahead of cash flow recovery—requires adequate reserves to navigate successfully.
The farms that will do well with this aren’t necessarily the largest or most aggressive in pursuing funding. They’re the ones that did the financial homework, understood their market position, and made the decision based on where their operation was already heading.
If you’re sitting at that kitchen table wondering whether to apply, start with the five questions. Have honest conversations with your lender. Run the stress tests.
If the answers align, this could be a good opportunity—the kind of match between federal support and farm direction that doesn’t come along every year.
And if the answers suggest waiting? There’s real wisdom in building your foundation first and learning from how the first wave of participants fare.
The best opportunities are the ones you’re genuinely positioned to capture.
We’ll be tracking how early adopters navigate this program and sharing their experiences in future coverage. If you’re applying or have questions about the process, reach out—your perspective helps us all learn.
For more information on the Regenerative Pilot Program, visit nrcs.usda.gov or contact your local NRCS service center. Additional resources on dairy financial analysis are available through your state’s extension dairy specialists.
Key Takeaways
The 90% cost-share catch: It’s reimbursement, not an upfront cash payment. You front $30K-$50K+ for infrastructure; USDA pays after installation. Cash-tight operations feel that gap hardest.
Dairy holds a ranking advantage. Cows and manure address multiple NRCS resource concerns at once—nutrient management, water quality, and forage balance—boosting your score against row crop competition.
Budget for a profitability dip. WWF-UK’s March 2025 study found regenerative transitions produce “lowered or negative profitability” in early years. Soil responds in 2-3 seasons; cash flow recovery takes longer.
Beginning farmers face the steepest barrier. November 2024 CRS data: 33% participation vs. 41% for established operations. Higher cost-share rates don’t solve capital access problems.
The real question: accelerator or lifeline? This program rewards farms already moving toward grazing and soil health. If federal dollars are your rescue plan, the math probably won’t work.
Complete references and supporting documentation are available upon request by contacting the editorial team at editor@thebullvine.com.
The Wall of Milk: Making Sense of 2025’s Global Dairy Crunch – Provides the essential global market context for your transition decision, detailing how simultaneous expansion in the U.S., EU, and New Zealand is reshaping milk prices and creating a “24-month trap” for ill-timed investments.
Every week, thousands of producers, breeders, and industry insiders open Bullvine Weekly for genetics insights, market shifts, and profit strategies they won’t find anywhere else. One email. Five minutes. Smarter decisions all week.
66% of US milk money goes to 834 farms. The other 23,000 farms? Fighting for scraps. Which side are you on?
You know, looking at the American dairy landscape right now, you’d think we’re swimming in success. And in some ways, we are. The numbers are massive—we’re talking about a $111-120 billion industry that’s breaking production records while processors pour $11 billion into new facilities through 2028.
But here’s what’s interesting: while the industry gets bigger, the number of farmers running it keeps getting smaller.
The 2024 Dairy Power Rankings: Who Controls Your Milk Check
So let’s talk about who actually controls the milk flowing from America’s farms to consumers’ fridges—and more importantly, what that means for your operation.
The Giants: Who Owns the Checkbook?
Company
2024 Revenue
The Real Story
Lactalis
$31.9 Billion
The Global King: French giant buying everything in sight.
DFA
$23 Billion
The Co-op Giant: Your “partner” with 44 processing plants.
Land O’Lakes
$16.8 Billion
Diversified Domestic: 23.2% US market share.
Saputo
$13.9 Billion
The Aggressive Expander: 8.4% growth, highest in industry.
Nestlé N.A.
$6.5-7.5 Billion
The Diversifier: Infant formula to coffee creamers.
Schreiber
$7 Billion
The Hidden Giant: Supplies every major retailer.
Danone N.A.
$5.5-6.5 Billion
The Yogurt King: Pushing plant-based hard.
Leprino
$3.6 Billion
The Pizza Emperor: Controls 85% of US pizza cheese.
Lactalis, that French dairy behemoth, sits firmly at the global summit with .9 billion in worldwide dairy sales as of 2024. They’ve been on quite the acquisition spree lately. Just this year, they grabbed General Mills’ US yogurt business for $1.5 billion, and they’re in the process of acquiring Fonterra’s consumer operations for another $2.3 billion. Their Président cheese brand alone jumped 45% in brand value this year to $3.2 billion. That’s… well, that’s a lot of cheese.
Now, Dairy Farmers of America—that’s where things get complicated for American producers. DFA reported $23 billion in total revenue for 2024, making them the third-largest dairy company globally. They marketing milk for over 11,000 members and handle roughly 30% of US milk production. But here’s the rub that’s got farmers talking: DFA now owns 44 processing plants.
Think about what that means. When you’re selling milk to your own cooperative that also owns the processing plants, who’s really benefiting when margins get tight? Industry data shows that when milk prices crashed 30-40% in 2023, processors with integrated operations captured margin expansion while producers absorbed the losses. It’s something worth considering when you’re evaluating your marketing options.
“You’re not their partner; you’re their raw material supplier.”
The Department of Justice had concerns as well. When DFA bought Dean Foods’ assets for $433 million in 2020, they had to agree to strict conditions to prevent market manipulation. That tells you something about the concentration of power we’re dealing with here.
Land O’Lakes rounds out the domestic powerhouses with $16.8 billion in 2023 revenue, though they’ve been navigating tough waters lately. Despite the challenges, they maintain a 23.2% market share in US dairy product production and continue expanding their Tulare, California, facility. You’ve probably noticed their increased focus on value-added products—that’s not accidental.
Foreign Money, American Milk: The International Takeover
What’s fascinating—and maybe a bit concerning—is how foreign companies are carving up the American dairy market. Nestlé North America pulls in around $6.5-7.5 billion, though that includes infant nutrition and coffee creamers alongside traditional dairy. Their global dairy segment has been flat for three years running at about billion. Danone North America generates $5.5-6.5 billion, pretty much dominating the yogurt space while pushing hard into plant-based alternatives.
And then there’s Saputo, the Canadian giant. They posted $13.9 billion in 2024 with an impressive 8.4% growth rate—the highest among the top players, actually. They’re operating 29 US plants and have been particularly aggressive in cheese production and fluid milk processing. Their success shows what focused expansion with strong financial backing can accomplish.
You know what’s interesting about these international players? They often bring different approaches to their relationships with farmers. Many producers in the upper Midwest have mentioned that some of these companies maintain more consistent field presence than we’ve seen from domestic processors in recent years. Whether that translates to better prices… well, that’s another conversation.
The Silent Empire: Why Leprino Controls Your Pizza
Here’s something that might surprise you: America produced a record 14.25 billion pounds of cheese in 2024, with Wisconsin alone cranking out 3.75 billion pounds—that’s 26.3% of the nation’s total. But the real story is who controls that production.
Now, Leprino Foods—they’re the ones you might not hear much about, but they’re actually the world’s largest mozzarella producer with about $3.6 billion in revenue. They control roughly 85% of the US pizza cheese market. Think about that next time you’re eating pizza… pretty much any pizza. Meanwhile, Schreiber Foods, with $7 billion in revenue, is another major player in the cheese game, though they’re more diversified across different cheese types.
Together with Sargento, these companies hold about 30% of the shredded cheese market. Wisconsin might make the cheese, but increasingly, a handful of companies decide its fate.
What’s particularly telling—and this is something many of us have been watching—is that while overall cheese production hit records, output actually fell in three of the top six cheese-producing states last year. Pennsylvania’s production plummeted 11% to 463.5 million pounds, and Iowa dropped 2% to 387.7 million pounds. Here’s what’s happening: processors are consolidating production in states with the largest, most efficient operations. California, which produces about 20% of the nation’s milk, keeps gaining market share while smaller dairy states lose processing capacity. The cheese plants follow the milk, and the milk increasingly comes from fewer, larger farms. It’s geographic consolidation on top of farm consolidation.
Export Boom or Bust: Where Your Milk Really Flies
Let’s talk about the export boom, because this is genuinely exciting for producers near the right facilities. The US hit $8.2 billion in dairy exports in 2024—that’s the second-highest total ever, only behind 2022’s $9.7 billion. Mexico has become America’s dairy lifeline, purchasing $2.47 billion worth—that’s 29% of all our dairy exports. They’re buying 919 million pounds of nonfat dry milk and skim milk powder, plus 352 million pounds of cheese.
But—and there’s always a but, isn’t there?—the processors investing in export-capable facilities are banking on milk from specific types of farms. That $11 billion in planned dairy manufacturing expansions through 2028 isn’t being built for 24,000 small dairies. These facilities need consistent, large-volume supply chains. The new large-scale powder plants being built across the Midwest and West are increasingly working with limited numbers of high-volume suppliers to ensure consistency.
The Brutal Math: 24,000 Farms and Falling
15,866 Farms Vanished in 5 Years: Every size category collapsed except mega-dairies (2,500+ cows), which grew 17%. This isn’t natural attrition—it’s industrial restructuring designed to eliminate family farms
BY THE NUMBERS:
15,000 farms lost in 5 years
834 farms control 66% of revenue
$11 billion in new facilities, excluding small farms
1,400-1,600 farms are disappearing annually
The 2022 Census of Agriculture laid it bare: America had 24,082 dairy farms, down from 39,303 just five years earlier. We’re losing farms at a breathtaking pace.
But what’s really reshaping the industry—and you probably see this in your own community—is where the milk comes from. Today, 65% of America’s dairy herd lives on farms with 1,000 or more cows. The 834 largest dairies, those with 2,500-plus head, control 66% of US milk sales by value. Meanwhile, 80% of dairy operations have fewer than 500 cows but produce less than 25% of the nation’s milk.
Think about what that means for processor relationships. If you’re running 150 cows in Pennsylvania, you’re competing for processor attention against operations running 5,000 head in New Mexico or Idaho. The processors are making what they see as rational business decisions—it’s more efficient to work with fewer, larger suppliers. But that efficiency comes at the cost of market access for smaller producers.
The $11 Billion Bet Against Small Farms
According to the International Dairy Foods Association, we’re seeing the biggest ag investment surge in US history—$11 billion flowing into 53 new or expanded dairy manufacturing facilities across 19 states between 2025 and 2028. That’s not just expansion; that’s transformation.
The $11 Billion Message: New processing capacity designed for 1,000+ cow operations only. Every dollar of this investment assumes smaller farms won’t exist to supply it. This isn’t market evolution—it’s systematic elimination
These aren’t small cheese plants or local bottling operations. We’re talking about massive facilities designed for export markets, specialized ingredients, and value-added products. They need a consistent, year-round milk supply in volumes that would have seemed impossible a generation ago.
The companies making these investments—DFA, Saputo, Land O’Lakes, and the foreign multinationals—they’re not betting on the current farm structure. They’re betting on continued consolidation. They’re pre-securing milk supply through exclusive contracts with mega-dairies because they know smaller operations will struggle to meet their volume and consistency requirements.
“Solo farms are dead farms.”
Metric
Small Farms (<200 cows)
Mega-Dairies (2,000+ cows)
Advantage
Cost per cwt
$42.70
$19.14
Mega: -$23.56
Annual cost/cow
$8,540
$3,828
Mega: -$4,712
Processor relationships
Competing for attention
Direct contracts/premiums
Mega: Priority
Export facility access
Minimal
Direct supply agreements
Mega: Locked in
Component premiums
$0-2/cwt
$2-4/cwt
Mega: +$2
Survival rate 2017-2022
-42%
+17%
Mega: Growing
Your Survival Playbook: Size-Specific Strategies That Work
Despite everything, there are reasons for optimism—if you know where to look and how to adapt.
For the Small Herd (<200 Cows): Think Outside the Tank
Go Organic: The organic dairy sector grew 7.7% to $8.5 billion in 2024, with organic whole milk sales up 13.2%. Organic fluid milk now holds 7.1% market share, up from just 3.3% in 2010.
Form Strategic Alliances: Regional cooperative marketing efforts have shown promising results, with small dairy groups in Pennsylvania and other states reporting premiums of $2-4/cwt when supplying specialty markets.
Direct Marketing: On-farm processing, farmstead cheese, agritourism.
Specialty Production: A2A2 milk, grass-fed certification, local brand development.
For the Middle Ground (200-1,000 Cows): The Tough Spot
Quality Premiums: Producer quality alliances in the Upper Midwest have successfully negotiated component premiums averaging $2-3/cwt by guaranteeing consistent butterfat above 4.0% and low somatic cell counts.
Component Specialization: High-component Jersey operations in California consistently achieve butterfat levels above 5.0% and protein above 3.7%, earning substantial component premiums.
Technology Adoption: Robotic milking systems can significantly reduce labor requirements while improving the milking consistency that processors demand.
Producer Alliances: Pool milk with similar-sized operations to negotiate directly with processors.
For the Big Players (1,000+ Cows): Maintain Your Leverage
Contract Flexibility: Never forward contract more than 60-70% of production.
Transportation Control: Own your hauling or maintain multiple options.
Price Protection: Demand escalators tied to feed costs in long-term contracts.
Market Diversification: Don’t depend on a single processor—maintain relationships with 2-3 buyers.
Component Focus: Invest in genetics and nutrition to maximize component premiums.
What seems to work best across all sizes? Collaboration without consolidation. Producer groups that maintain independence while negotiating collectively are seeing success in various regions. They’re still independent farms, but they’re learning to work together when it makes sense.
Five Questions That Could Save Your Farm
Looking at all this market concentration, here are the critical questions you should be asking:
What percentage of your milk goes to export markets versus domestic?
How does your pay price compare to farms of similar size in neighboring states?
What quality premiums are available, and what’s required to earn them?
Are there volume commitments that could lock you into unfavorable terms?
What happens to your market if this processor closes or consolidates facilities?
The Bottom Line
The American dairy industry is being reshaped by forces beyond any individual farm’s control. The players are getting bigger—Lactalis will likely crack $35 billion globally within two years. The processors are getting pickier—they want consistent, large-volume suppliers. The exports are getting more critical—without Mexico and Canada, we’d be drowning in surplus.
Your challenge isn’t just producing quality milk anymore. It’s navigating a market where your cooperative might be competing for the same margins you need, where foreign companies control major segments, where 66% of value comes from 2,000 farms while 22,000 others fight for the remainder.
Knowledge really is power in this environment. Know who you’re selling to. Understand their global strategy. Recognize that the $111-120 billion American dairy industry looks impressive from 30,000 feet, but at ground level, it’s increasingly controlled by fewer hands making bigger bets on a future that might not include every farm—unless farms adapt to their reality or create their own path.
The dairy industry’s future is being written right now in boardrooms from Paris to Kansas City. Make sure you understand the script, because whether you’re milking 50 cows or 5,000, these companies aren’t just buying your milk—they’re determining whether your next generation will have a market at all.
Key Takeaways
Your Real Competition: It’s not other farmers—it’s your own co-op. DFA owns 44 processing plants, controls 30% of US milk, and profits when farm milk prices crash.
The 66% Rule: Just 834 mega-dairies now control 66% of all US milk revenue ($73 billion), while 23,000 smaller farms split the remaining $38 billion. Every processor’s future plans assume you won’t exist.
The Foreign Takeover No One’s Discussing: Lactalis (French, $31.9B), Saputo (Canadian, $13.9B), and Nestlé (Swiss, $6.5B) control more American dairy than you think—and they’re buying more every year.
Your Three Survival Paths: (1) Scale to 1,000+ cows for processor attention, (2) Capture premiums via organic/specialty markets (+$4-8/cwt), or (3) Form producer alliances to negotiate collectively.
The 2028 Deadline: $11 billion in new processing capacity comes online by 2028, designed for mega-farms only. If you haven’t adapted by then, you won’t have a market.
Executive Summary:
Your milk check is now controlled by eight companies—three of them foreign—who’ve captured a $111 billion industry while 15,000 American dairy farms vanished in five years. The betrayal runs deep: DFA, your ‘farmer-owned’ cooperative, owns 44 processing plants and pocketed profits as milk prices crashed by 40%, while members lost billions. Today’s reality: 834 mega-farms control 66% of all US milk revenue while 23,000 smaller farms compete for the remaining third. With processors pouring $11 billion into facilities designed exclusively for 1,000+ cow operations, the message is unmistakable. This isn’t market evolution—it’s deliberate elimination of family dairy farms.
Editor’s Note:Market data cited reflects 2024 financial reports and USDA statistics through November 2025. Company revenues include total sales, not exclusively dairy operations. Regional variations apply.
The Robot Truth: 86% Satisfaction, 28% Profitability – Who’s Really Winning? – Delivers a critical ROI analysis of robotic milking, uncovering the dangerous “profitability gap” for 60-120 cow herds and identifying exactly which operational metrics drive actual financial returns versus just saving labor.
We predicted it. Lost $4.3B fighting it. 11,000 farms died waiting. Whole milk’s finally back—but the industry that won isn’t the one that warned.
EXECUTIVE SUMMARY: Whole milk returns to schools after a 13-year ban that cost dairy $4.3 billion and killed 11,000 farms—but the survivors who’ll benefit aren’t the ones who warned Congress this would happen. University of Toronto research confirmed what producers always knew: whole milk reduces childhood obesity by 40% compared to skim milk, completely debunking the policy’s premise. However, consolidation during the fight means only mega-dairies (1,500+ cows) can access school contracts worth $40-80K annually, while 97% of remaining farms are effectively locked out. The window for action is narrow: producers must contact their cooperatives NOW to position for RFPs releasing January 2026, with contracts locking by July. Small operations should forget institutional milk and leverage whole milk’s vindication for premium direct sales, while mid-sized farms face a brutal choice between fighting for scraps or pivoting to specialty markets. The lesson is unforgiving: in agricultural policy, being right means nothing if you don’t survive long enough to collect.
You know, looking at what happened in the Senate last Tuesday—unanimous passage of the Whole Milk for Healthy Kids Act—you’d think we’d all be celebrating. And yeah, it’s definitely a victory. After watching kids dump skim milk down cafeteria drains for 13 years while our neighbors went under, whole milk’s finally coming back to schools.
But here’s what’s been keeping me up at night, and I’ve been hearing the same thing from producers all over. The dairy industry that gets to capture this opportunity? It looks nothing like the industry that warned Congress this would happen back in 2012. We’ve lost 11,000 farms during this fight. The survivors are entirely different breeds—either massive operations with 2,500-plus cows or specialty producers who found their niche. That 300-cow family dairy that needed this policy most? Most of ’em are gone.
Herd Size
2012 Farms
2025 Farms
Change %
Milk Share 2025 %
Under 100 cows
28141
16334
-42
7
100-499 cows
8868
5889
-34
15
500-999 cows
1580
1025
-35
10
1,000-2,499 cows
1000
900
-10
22
2,500+ cows
714
834
17
46
What I’m finding as I talk to folks trying to figure out what this means for their operations is that winning the policy battle doesn’t reverse the structural war we’ve already lost. So let me walk you through what actually happened, what it cost us, and—here’s the important part—what you can actually do about it in the next six months.
The Scale of What We Lost: More Than Just Milk Sales
Year
Per Capita (lbs/year)
School Policy Phase
Annual Decline Rate %
2009
190
Pre-Ban
0.75
2012
185
Ban Implemented
2.6
2015
172
Ban Effect
2.6
2018
155
Accelerated Decline
2.6
2021
141
Continued Fall
2.6
2023
130
Record Low
1.5
2025
128
First Increase Signal
-0.8
I’ve been going through the numbers with economists at Cornell and Wisconsin, and it’s worse than most of us realize. When the National Milk Producers Federation testified to the USDA back in April 2011 that restricting schools to skim and 1% milk would hurt consumption, they actually underestimated what would happen. You can look it up in their comments if you’re curious—docket USDA-FNS-2011-0019.
School milk represents about 7 to 8 percent of total U.S. fluid milk demand, according to the USDA’s Economic Research Service—we’re talking roughly a billion dollars annually. Sounds manageable, right? But here’s what nobody calculated: when you tell 30 million kids for 13 years that whole milk is unhealthy, you don’t just lose school sales. You lose a generation.
Before 2012’s restrictions kicked in, fluid milk consumption was declining at about 3/4 of 1 percent per year—concerning but manageable, according to the International Dairy Foods Association’s market reports. After? That rate exploded to 2.6 percent annually. That’s not evolution; that’s acceleration.
A Wisconsin producer I know who runs about 450 cows put it best: “We watched our school contracts evaporate overnight. But worse was watching those kids grow up thinking milk was bad for them. Now they’re adults buying oat milk.”
The direct hit to producer revenue over 13 years? Based on Federal Milk Marketing Order pricing data, it’s about $1.38 billion. But that’s just the beginning. When Class I utilization drops in the federal orders, it drags down the blend price every producer receives—University of Missouri’s policy research folks calculated another $182 million spread across all farms.
Then you’ve got the supply chain multiplier effect. USDA’s Economic Research Service uses standard agricultural multipliers of around 1.8 times for dairy. So that lost producer revenue of $1.38 billion means a total supply chain impact of around $2.49 billion. Haulers, feed suppliers, equipment dealers—everybody took a hit.
Add in competitive losses to plant-based alternatives—Euromonitor International’s dairy alternatives tracking pegged it at about $650 million in institutional market share—plus the waste. And the waste is mind-boggling. The Center for Science in the Public Interest estimates that about 45 million gallons annually that kids refused to drink, worth nearly a billion dollars at Class I pricing.
Category
Amount ($ Billions)
Percentage
Direct Producer Revenue Loss
1.38
32.1
Blend Price Impact (All Farms)
0.182
4.2
Supply Chain Multiplier Effect
1.112
25.9
Competitive Losses to Alternatives
0.65
15.1
School Milk Waste
0.976
22.7
When you combine all these factors—the direct losses, blend price impacts, supply chain effects using those standard multipliers, competitive losses, and waste values—you’re looking at a total economic impact approaching $4.3 billion. Though I should note that nobody’s done a comprehensive study pulling all these pieces together. We’re aggregating from multiple sources here.
“That’s not just a policy mistake, folks. That’s a generational disaster.”
What Science Now Shows: We Had It Backwards All Along
Metric
Whole Milk
Skim/Low-Fat Milk
Childhood Obesity Odds
40% LOWER
Baseline
Overweight Risk Reduction
40% lower odds
No reduction found
Added Sugar Content
0g (natural)
8-12g (added)
Satiety Factor
High (natural fats)
Lower
Fat-Soluble Vitamin Delivery
Superior (vitamins A,D,E,K)
Reduced effectiveness
Studies Supporting
18 of 28 studies
0 of 28 studies
This is the part that really gets me—and I’m hearing the same frustration everywhere I go. The whole scientific foundation for banning whole milk? It’s completely collapsed.
Dr. Jonathon Maguire, up at the University of Toronto, published this meta-analysis in the American Journal of Clinical Nutrition back in December 2020—looked at 28 studies with 21,000 children. The finding? Kids drinking whole milk had 40 percent lower odds of being overweight or obese compared to those drinking reduced-fat milk. Not one study—not a single one—showed skim milk reducing obesity risk.
As Maguire wrote in the journal, children who followed the current recommendation to switch to reduced-fat milk at age two weren’t any leaner than those who consumed whole milk.
What’s interesting here—and this is what really burns me—is what schools actually did to make fat-free milk palatable. They added sugar. Lots of it. The Center for Science in the Public Interest did an analysis showing that fat-free chocolate milk in schools contains up to 12 grams of added sugar per carton. That’s nearly half what the American Academy of Pediatrics says kids should have in a whole day, based on their 2019 policy statement.
Think about that for a minute. We removed natural milk fat, which provides satiety and fat-soluble vitamins, and replaced it with processed sugar. A dietitian I know at Penn State Extension—she’s been doing this for 30 years—called it the most backwards nutritional policy she’d ever seen.
How Dairy Finally Won: The Coalition Nobody Expected
I’ve been covering dairy politics for two decades, and what happened this year was unlike anything I’ve seen. After failed attempts in 2016, 2019, and that unanimous consent block by Senator Stabenow last December, how’d we suddenly get unanimous passage?
The breakthrough came from the most unlikely place: the Physicians Committee for Responsible Medicine. Now, this group has historically opposed dairy consumption, right? But Senator Welch’s team made a strategic calculation—they added language guaranteeing schools could serve, and I quote, “nutritionally equivalent nondairy beverages that meet USDA standards.”
A Senate Agriculture Committee staffer familiar with the negotiations told me, “We realized we couldn’t win by fighting everyone. So we found ways to give opposition groups something they wanted while still achieving our core goal.”
The senator pairing was brilliant, too. Peter Welch from Vermont brought the economic urgency—his state’s lost more than 500 dairy farms since 2012, according to the Vermont Agency of Agriculture’s latest data through 2024, a crushing 55 percent decline. Roger Marshall from Kansas, an OB-GYN with 25 years of practice before Congress, provided medical credibility that transcended typical ag lobbying. When you’ve got a physician-senator arguing for whole milk’s nutritional benefits, it carries a different weight than dairy executives making the same case.
But the real game-changer came from school food service directors testifying about operational reality. One Pennsylvania director told legislators that the amount of waste they were throwing away each day was disheartening—kids just wouldn’t drink the skim milk.
That operational reality, from public sector administrators rather than industry advocates, changed the conversation entirely.
And then there’s the RFK Jr. factor. When the incoming HHS Secretary calls whole milk restrictions “nutrition guidance based on dogma, not evidence” in public statements, dairy’s position suddenly aligns with a broader health reform movement. FDA Commissioner nominee Dr. Martin Makary went even further at his confirmation hearing, saying we’re ending the 50-year war on natural saturated fat.
The Harsh Reality: Small Farms Can’t Access This Opportunity
Now here’s where I need to level with you about what this actually means for different operations. I’ve been talking to procurement specialists at DFA, Land O’Lakes, and regional cooperatives across the midwest, and the reality’s tough for smaller farms.
For Large Operations (1,500+ cows)
If you’re milking 1,500-plus head, this is a genuine opportunity. Based on current Class I differentials from the November federal order announcement and institutional pricing models, you could see $40,000 to $80,000 in additional annual revenue. These operations typically have what schools need—cooperative relationships for procurement access, daily volume to meet district minimums (usually 2,000-plus pounds), and standardized equipment to hit that 3.25 percent butterfat spec.
A large-herd operator in Wisconsin told me that his co-op has been preparing bid packages since October. “We’ve got the volume, the testing protocols, everything schools require,” he said.
For Mid-Size Operations (500-1,000 cows)
The opportunity exists, but it’s complicated. You might see $15,000 to $30,000 annually—helpful but not transformational. The challenge? You’re competing with larger operations for cooperative priority.
One Central Valley producer milking 650 told me, “I could supply our local district easily. But our co-op prioritizes the 5,000-cow operations because the logistics are simpler. One truck stop instead of eight.”
Down in Texas, the situation’s even tougher. A producer with 725 Holsteins outside Stephenville explained they’re 45 minutes from the nearest processor. “School contracts require daily delivery. The math just doesn’t work unless you’re right next to a bottling plant or have 2,000-plus cows to justify dedicated hauling.”
In Nebraska—right in Senator Marshall’s backyard—the consolidation’s been particularly stark. A producer near Grand Island, milking 550 cows, explained that their cooperative had merged with two others in the past five years. “We used to have direct say in school milk contracts. Now we’re competing with operations five times our size for the same procurement slots.”
For Small Operations (Under 300 cows)
I hate to say this, but institutional whole milk offers almost no direct opportunity for operations under 300 cows. School procurement requires minimums you can’t meet independently—typically 500 gallons per day, based on what I’ve seen in Michigan and Iowa district RFPs.
The path forward is different. A Vermont producer milking 180 Jerseys told me they’re focusing on farmers markets and local retail. “Whole milk’s vindication helps our direct marketing—we can tell customers the government was wrong, and they believe us now.”
In Georgia, small producers are finding similar alternatives. One producer with 220 cows near Quitman explained they can’t compete for Atlanta school contracts. “But we’re selling to three local private schools at $4.50 a gallon. They want local, and whole milk’s return legitimizes premium pricing.”
Farm Size
Annual Revenue Potential
Market Access
Number of Farms
Access Probability %
2,500+ cows
$60-80K
Direct/Priority
834
95
1,500-2,499 cows
$40-60K
Direct/Competitive
900
75
500-999 cows
$15-30K
Limited/Co-op Only
1025
30
300-499 cows
$5-10K
Minimal
3200
5
Under 300 cows
$0-2K
None
18109
2
The Seven-Month Sprint: Your Action Timeline
Date
Action
Producer Action
Critical Level
Nov 2025
Senate passes bill unanimously
Contact co-op NOW
HIGH
Jan 2026
School RFPs released
Review district opportunities
HIGH
Feb-Mar 2026
Producer positioning window
Submit commitments
CRITICAL
Apr-May 2026
Bids due to districts
Finalize agreements
FINAL DEADLINE
Jul 1 2026
New contracts begin
Begin deliveries
GO-LIVE
Aug 2026+
Market locked (incumbents only)
Wait 1-3 years for next cycle
LOCKED OUT
What’s catching producers off-guard is how fast this moves. We’re operating on school procurement timelines, not legislative calendars.
📅 The Critical Dates You Can’t Miss:
➤ January–March 2026: School districts release RFPs ➤ April–May 2026: Bids are due (If you aren’t positioned, you’re out) ➤ July 1, 2026: New contracts begin
After July 2026, breaking into the school supply means displacing an incumbent. Good luck with that—I’ve seen it happen maybe twice in 20 years covering dairy markets.
☎️ Your Homework: Call Your Milk Handler TODAY
Don’t wait until next week. Pick up the phone and ask these exact questions:
1. “Are you bidding on school whole milk contracts for 2026-27?”
2. “What commitments do you need from member farms?”
3. “What’s our current butterfat running?” (National average hit 4.23% in October per USDA)
4. “Can you standardize our 4.2% fat down to 3.25%?”
5. “What’s the premium for institutional Class I vs. our current blend?”
6. “Which school districts can we realistically reach?”
A procurement director at one of the midwest regional cooperatives told me they’re getting 50 calls a day about this. The producers who commit early get priority when bid packages go out.
The Genetics Question: Don’t Panic About Your Breeding Program
I’m getting panicked calls from producers worried their genetics are wrong for whole milk. Here’s what Dr. Kent Weigel, who chairs dairy science at UW-Madison, explains: You don’t need to change your genetics. You need standardization capability.
Current U.S. herds are averaging 4.23 percent butterfat according to USDA’s October milk production reports—a record high driven by cheese market premiums. School whole milk needs exactly 3.25 percent. That seems like a problem, but it’s actually an opportunity.
Patricia Stroup, who’s COO at Horizon Organic, explained to me that they standardize all their institutional milk. “Higher butterfat means more cream to separate and sell at premium prices. It’s additional revenue, not a problem.”
Your 4.2 percent milk becomes 3.25 percent whole milk. The separated cream? That’s going into premium butter—CME spot prices have been running around $3.20 a pound lately. You’re not losing value; you’re creating two revenue streams.
Butterfat has a heritability of 0.40 to 0.50 according to USDA’s genetic evaluation summaries—high enough to adjust if truly needed. But genetic changes take 3 to 5 years, depending on generation intervals. This opportunity window might shift again before your genetics catch up.
Dr. Chad Dechow, who does dairy cattle genetics at Penn State, advises keeping your breeding focused on components. “The cheese market isn’t going away, and standardization solves the institutional specifications,” he told me.
Market Outlook: What Economists See Coming
[CHART: Fluid milk consumption trends 2010-2025 with projections]
Looking beyond just the school opportunity, the broader market dynamics matter for positioning. Dr. Marin Bozic, the dairy economist at the University of Minnesota, sees structural shifts ahead.
“We’re entering a period where fluid milk might stabilize at 140 to 150 pounds per capita,” Bozic explained when we talked. “That’s not growth, but it ends the bleeding. For producers, predictable Class I demand at 22 to 23 percent of total utilization beats continued decline to 18 to 20 percent.”
The generational damage is real, though. Kids who drank skim milk in schools from 2012 through 2025 are adults now. They’re not suddenly switching to whole milk because policy changed. But their kids might—if whole milk’s available when they enter school.
IDFA reported in their August 2025 dairy market update that producers sold 0.8 percent more fluid milk than in 2023—the first increase since 2009. Whole milk specifically showed real strength. Conventional whole milk’s up 1.3 percent year-over-year according to IRI’s retail tracking data. Organic whole milk’s up 6.2 percent based on SPINS organic market reports. Flavored whole milk’s up 20 percent in peak months per Nielsen beverage category data.
Whole milk now represents 42 percent of retail sales—the highest since 2001.
The Consolidation Truth: Understanding Today’s Industry
This is the hardest conversation I have had with producers, but we need to face reality. Between 2012 and 2025, based on the USDA’s Census of Agriculture data and structural analyses, the changes are stark.
Farms under 100 cows are down 42 percent, from 28,141 to 16,334. The 100 to 499 cow operations dropped 34 percent. Mid-sized farms with 500 to 999 cows fell 35 percent. But farms with 2,500-plus cows? They’re up 17 percent.
The only category growing is mega-dairies. They now produce 46 percent of U.S. milk while representing just 3 percent of farms, according to USDA-NASS farm structure data.
A former Ohio dairyman who sold 350 cows during the 2015 price crash told me, “The whole milk policy would’ve saved our farm in 2015. But it’s too late now. We’re out, and the neighbor who bought our cows is milking 3,000.”
Wisconsin’s story is particularly telling. They’ve been losing 8 to 10 dairy farms per week from 2014 to 2024, according to data from the Wisconsin Agricultural Statistics Service. The survivors? Either massive operations with economies of scale or boutique producers selling $8 a gallon milk at farmers markets.
Vermont’s even starker. Of their remaining 480 farms—down from 973 in 2012, per the Vermont Agency of Agriculture—73 percent have fewer than 200 cows, accounting for 30 percent of production. Meanwhile, 9 percent are over 700 cows, producing 40 percent of milk.
The mid-sized farms that whole milk could’ve helped? They’re mostly gone.
What This Victory Actually Means
Let me be straight with you about what this moment represents, because false hope doesn’t help anybody make good decisions.
Yes, the science vindicated us—whole milk is better for kids than skim. The University of Toronto research is bulletproof. Yes, we built a coalition that achieved unanimous Senate passage. That’s remarkable in today’s politics. And yes, there’s real money here for farms positioned to capture it.
But let’s acknowledge what this victory can’t do. It can’t bring back the 11,000 farms we lost. It can’t reverse the consolidation that accelerated while we fought this policy. And it can’t transform the fundamental economics pushing dairy toward fewer, larger operations.
A Wisconsin farmer who sold his 450-cow operation in 2018 reflected, “This would’ve been transformational in 2012. Now it’s a nice win for the big guys who survived.”
What strikes me most is the gap between being right and having it matter. The dairy industry accurately predicted everything—consumption collapse, waste, and pressure to consolidate. NMPF’s 2011 testimony to USDA reads like prophecy now. But being right didn’t change the timeline.
“Policy moves on political schedules, not farm survival schedules.”
Your Strategic Choices for the Next Six Months
Based on conversations with successful operators across different scales, here’s what’s actually working.
If You’re Large (1,500+ cows)
Move aggressively on institutional contracts. You’ve got the scale schools need. Lock in that volume before competitors organize. One 5,000-cow operator in Idaho told me they’re dedicating a full-time person just to manage school RFPs through spring 2026.
If You’re Mid-Sized (500-1,000 cows)
You’re in the squeeze zone. Evaluate carefully whether institutional margins justify participation rather than premium-market opportunities. A 750-cow producer in Michigan shared their analysis: “School milk at $22 a hundredweight beats our current blend by $1.50. That’s $40,000 annually—worth pursuing but not transformational.”
Don’t sacrifice premium positioning for commodity institutional volume. If you’re already selling to local cheese plants at premiums, keep that relationship.
If You’re Small (Under 300 cows)
Institutional whole milk isn’t your play. But use the narrative shift. “Whole milk is healthy again” is powerful marketing for farmstead products. One 200-cow Vermont farm just raised its farm-store milk price by 50 cents per gallon, explicitly citing the Senate vote in its newsletter.
Focus on what you can control: direct sales, agritourism, and value-added products. Let the big operations fight over school contracts while you capture consumers wanting “real milk from local farms.”
Looking Forward: The Next Policy Battle
What worries me—and what should worry every producer—is how this pattern might repeat. Some policies constrain the industry; farms adjust or die. Then the policy reverses after structural damage.
The next fight’s already visible: methane regulations, water usage restrictions, carbon credit requirements. Each sounds reasonable in isolation. But we’ve learned what happens when agriculture loses narrative control to health or environmental advocates.
Dr. Kathleen Merrigan, who was USDA Deputy Secretary from 2009 to 2013 and now runs the Swette Center at Arizona State, advises starting to build coalitions now, before you need them. “Dairy can’t win these fights alone anymore,” she told me.
The producers surviving another decade won’t just be efficient operators. They’ll be politically savvy, coalition-aware, and positioned for multiple market channels. School whole milk is one opportunity, but it’s not salvation.
The Essential Reality
After covering this industry through 2009’s depression, 2014’s price spike, the 2015-16 collapse, and COVID’s chaos, here’s what I know: The farms still standing have survived things that should’ve killed them. They’re tougher, smarter, and more adaptable than any generation before.
Whole milk returning to schools is vindication that we were right all along. But it’s arriving to an industry that’s fundamentally restructured from the one that needed it most. The 300-cow farms that testified in 2012 about survival needs? Most are gone. The 3,000-cow operations capturing school contracts in 2026? They would’ve survived anyway.
Understanding that gap—between policy victory and structural reality—that’s what helps you make clear-eyed decisions about your operation’s future. Position for opportunities that match your scale. Build coalitions before you desperately need them. And remember that being right about policy doesn’t guarantee policy changes in time to matter.
The next six months determine who captures the institutional whole milk opportunity. But the next six years determine who’s still farming when the next policy crisis hits.
Plan accordingly, folks.
KEY TAKEAWAYS
Action TODAY: Call your milk handler immediately with six specific questions (provided in article)—cooperatives report 50 calls/day with early callers getting priority for $40-80K contracts
Critical 6-month window: School RFPs release January 2026 → Bids due April → Contracts lock July 1. After July, breaking in requires displacing incumbents (nearly impossible)
Harsh economics: The same consolidation that killed 11,000 farms now blocks 97% of survivors from accessing institutional opportunities—whole milk’s return helps those who survived despite the policy, not because of it
Complete references and supporting documentation are available upon request by contacting the editorial team at editor@thebullvine.com.
Every week, thousands of producers, breeders, and industry insiders open Bullvine Weekly for genetics insights, market shifts, and profit strategies they won’t find anywhere else. One email. Five minutes. Smarter decisions all week.
Three dairy producers. One expanded. One optimized. One sold. All three are winning. Here’s why your path matters more than your size.
EXECUTIVE SUMMARY: A perfect storm is reshaping dairy: heifer inventory at historic lows (3.9M—lowest since 1978), processors desperately seeking milk with $150K+ annual premiums, and global production hitting environmental and biological walls. This convergence creates an 18-month window in which your decision determines whether you thrive, survive, or exit by 2030. Three proven paths exist: strategic expansion ($3.5-4M investment yielding up to $731K annually), optimization without debt ($200-300K profit improvements), or planned exit (preserving $400-680K more wealth than distressed sales). The window is real—processor premiums evaporate after 18 months, and with heifers requiring 30 months from birth to production, today’s decisions lock in your 2027-2028 position. Your farm’s future isn’t determined by size or history, but by making the right choice for YOUR situation in the next 90 days.
You know that feeling when you’re at the co-op meeting and everyone’s dancing around the same question? “Is something big happening here, or is this just another cycle?” Well, here’s what’s interesting—I think we’re all sensing the same thing because this time actually is different.
What I’ve found in the data lately is that we’re not seeing the typical supply hiccup or price swing. The International Farm Comparison Network released its projection last October, showing a 6 million tonne global milk shortage by 2030. Now, the International Dairy Federation? They’re suggesting it could hit 30 million tonnes. Even if we land somewhere in the middle… well, that’s not just a shortage. That’s a structural shift.
What’s Actually Driving This Supply Crunch
So here’s where it gets really interesting, and it’s the combination that matters.
The FAO and OECD put out their Agricultural Outlook last July—2024, not this year—showing global milk demand climbing by 140 to 208 million tonnes by 2030. We’re adding another 1.5 billion people to the planet, but what caught my attention is this: per capita consumption is jumping by 16% as developing regions gain purchasing power. Southeast Asia alone—according to IFCN’s April analysis—will command 37% of total global milk demand. I mean, think about that for a minute.
But production? That’s where things get complicated.
I was talking with a Wisconsin extension specialist last week, and she nailed it: “We’re watching three major dairy regions hit walls at the same time, and they’re different walls.” She’s absolutely right. DairyNZ’s latest statistics show New Zealand’s dairy cattle numbers dropped from 5.02 million back in 2014/15 to 4.70 million last year. The EU Commission’s December forecast? Milk production is declining by 0.2% this year, with growth capped at just 0.5% annually through 2031. That’s their greenhouse gas reduction targets at work, and those aren’t going away.
And then there’s our heifer situation here in North America—honestly, this one really concerns me.
The Heifer Shortage That’s Reshaping Everything
The USDA’s January Cattle report came out showing U.S. dairy heifer inventory at 3.914 million head. You know what that is? The lowest since 1978. We’re down 18% from 2018 levels.
CoBank’s research team published some sobering analysis in August—they’re projecting we’ll lose another 800,000 head over the next two years before we see any recovery. Think about that. We’re already at historic lows, and we’re going lower.
What’s driving this? Well, the National Association of Animal Breeders’ data shows beef-on-dairy breeding hit 7.9 million units in 2024. That trend alone—just that one factor—created nearly 400,000 fewer dairy heifers in 2025. Every beef-on-dairy calf born today is a heifer that won’t be entering your neighbor’s milking string in 30 months.
Dr. Jeffrey Bewley from Kentucky’s dairy extension program explained it perfectly when we talked last month: “The pipeline is essentially fixed for the next 30 months. It takes 24-30 months from birth to first lactation. The calves being born today won’t produce milk until 2027-2028, and we’re simply not producing enough of them.”
You’re probably already seeing this in heifer prices. The USDA’s Agricultural Marketing Service data from February showed prices running $2,660 to $3,640 per head—up 29% year-over-year. A Vermont producer told me last week he’s paying $4,000 for quality bred heifers… when he can find them. California operations? Some out there can’t source adequate replacements at any price. This dairy heifer shortage in 2025 is fundamentally different from past cycles.
Here’s a development that’s really worth watching, especially if you’re within reasonable hauling distance of new facilities.
The dairy processing sector is investing billions—we’re talking serious money—in dozens of new and expanded plants across the country. The International Dairy Foods Association has been tracking these milk processing expansion opportunities, and what fascinates me is how predictable processor behavior has become.
The University of Wisconsin’s Center for Dairy Profitability documented this pattern, and it’s remarkably consistent. In that first year after a facility announces expansion? They’re hungry for milk—offering premiums of $1.50 to $2.50 per hundredweight. But here’s what happens: by months 13 through 18, when they’ve locked in about 60-70% of what they need, those premiums drop to maybe $0.75 to $1.25. After 18 months? Standard market pricing.
Mark Stephenson from UW-Madison’s Dairy Policy Analysis program put it well: “We’re seeing farms within 75 miles of new facilities locking in bonuses worth $150,000 or more annually for a 500-cow dairy. But that opportunity has an expiration date. Once processors hit about 70-80% of their target volume, the welcome mat stays out, but the red carpet gets rolled up.”
I’ve seen this play out in Wisconsin, Pennsylvania, Idaho… same pattern everywhere. And what’s happening in Europe and Australia right now? Similar dynamics—processors scrambling for supply in tight markets, then becoming selective once they’ve secured their base needs.
Three Strategic Paths Forward
What’s fascinating to me—and I’ve been talking to producers all over—is how clearly folks are sorting themselves into three camps. Each one makes sense depending on where you’re at.
Strategic Expansion for Positioned Operations
Operations taking this route generally have strong balance sheets—we’re talking debt-to-equity ratios under 0.50. They’ve got established management systems, often with a clear succession plan in place.
Current construction costs? You’re looking at $3.5 to $4.0 million for a 500-to-1,000 cow expansion, based on what I’m hearing from contractors and extension budgets. Freestall construction alone runs $3,000 to $3,500 per stall. And financing… well, at 7-8% interest, that changes everything compared to three years ago.
A Pennsylvania producer expanding from 450 to 900 cows walked me through his thinking: “With milk projected at $21-23 per hundredweight through next year and geographic premiums adding another buck-fifty, we’re looking at $731,250 in additional annual income. Yeah, the interest rates hurt—we’re paying $840,000 more over the loan term than we would’ve three years ago. But we think the opportunity justifies it.”
Benchmarking suggests you need breakevens below $18 per hundredweight to weather potential downturns. That’s a narrow margin for error.
But here’s something worth noting—smaller operations aren’t necessarily excluded from expansion opportunities. I know a 150-cow operation in Ohio that’s adding just 50 cows, focusing on maximizing components and securing a local processor contract. Sometimes expansion doesn’t mean going big—it means going strategic.
Optimization Without Expansion of Debt
Now, this is where things get interesting for many operations. Dr. Mike Hutjens—he’s emeritus from Illinois but still consulting—has been documenting some impressive results.
Component optimization through precision nutrition, which typically costs $15-25 per cow per month, can generate $75 per cow annually just by improving butterfat and protein levels. Reproductive efficiency improvements? Those are yielding $150 in annual benefits per cow. And here’s one that surprised me: extending average lactations from 2.8 to 3.4 adds about $300 per cow in lifetime value.
“We’re documenting operations improving net income by $200,000 to $300,000 annually through systematic optimization,” Hutjens comments. “For producers who don’t want additional debt or can’t expand due to land constraints, this approach offers substantial returns.”
I’m seeing this work particularly well for operations in areas where expansion just isn’t feasible—whether due to land prices, environmental regulations, or personal preference. With this summer’s heat-stress issues reminding us of the importance of cow comfort and fresh cow management, there’s real money in getting the basics right.
For smaller herds—say, under 200 cows—optimization might be your best bet. Focus on what you control: breeding decisions, feed quality, cow comfort. One 120-cow operation in Vermont improved their net income by $85,000 annually just through better reproduction and component management. No debt, no expansion stress, just better management of what they already had.
Strategic Transition While Values Hold
This is the conversation nobody wants to have at the coffee shop, but it needs to be part of the discussion.
Cornell’s Dyson School research shows that well-planned transitions preserve $400,000 to $680,000 more wealth compared to distressed sales. That’s real money—generational wealth we’re talking about.
A farm transition specialist I know in Wisconsin—he’s been doing this for 30 years—shared something that stuck with me: “Strategic transition isn’t giving up. It’s maximizing value for the family’s future. I’m working with a 62-year-old producer right now, with no identified successor. If he transitions in 2026, he preserves about $2.1 million in equity. If he waits, hopes things improve, maybe faces forced liquidation in 2028? We’re looking at maybe $1.2 million.”
For our Canadian friends, it’s a different calculation. Ontario’s quota exchange is showing values around $24,000 per kilogram of butterfat. That’s substantial equity tied up in quota that needs careful planning to preserve.
The Human Side We Can’t Ignore
I need to bring up something we don’t talk about enough—the mental and emotional toll of these decisions.
A University of Guelph study from last year found that 76% of farmers experienced moderate to high stress levels. Dairy producers? We’re showing some of the highest rates. This isn’t just about personal wellbeing—though that matters enormously. Research in agricultural safety journals shows that chronic stress directly impacts decision-making quality. Poor decisions made under stress can affect operations for years.
A Minnesota producer was remarkably honest with me recently: “The weight of these decisions—expansion, optimization, or transition—it affects the whole family. Having someone to talk to, someone outside the immediate situation, has been invaluable.”
The Iowa Concern Line—that’s 1-800-447-1985—expanded nationally this year. Organizations like Farm State of Mind provide crucial support. Using these resources isn’t a weakness—it’s smart business. You wouldn’t run a tractor with a blown hydraulic line, right? Why run your operation when your decision-making capacity is compromised?
Risk Management in Uncertain Times
Now, I’d be doing you a disservice if I didn’t acknowledge what could go wrong with this thesis.
A severe recession? It’s possible, though the Federal Reserve currently puts the probability of a 2008-level event pretty low—less than 15%. Technology breakthroughs in genetics or reproduction could accelerate supply response, but biological systems don’t change overnight. We’ve been improving sexed semen for 15 years—sudden miraculous breakthroughs seem unlikely. Environmental policy reversals? Given current trajectories in the EU and New Zealand, I wouldn’t count on it.
And here’s something we haven’t talked about enough—feed price volatility. As many of you know, grain markets have been all over the map lately. USDA projections show significant price variability ahead for both corn and soybean meal over the next 18 months. These aren’t small moves. A dollar change in corn prices can shift your cost of production by $1.50 to $2.00 per hundredweight, depending on your feeding program. That’s why managing feed costs remains critical to any strategy you choose.
Smart producers are hedging their bets. The Dairy Margin Coverage program lets you lock in $9.50 or higher income-over-feed-cost margins for most of your production—and that “feed cost” component is key here. When feed prices spike, DMC payments help offset the pain. University of Minnesota Extension shows diversifying through beef-on-dairy programs adds $4-5 per hundredweight in supplemental revenue. These aren’t huge numbers individually, but together they provide meaningful buffers against both milk price drops and feed cost spikes.
And let’s not forget weather impacts—the drought conditions we’ve seen in parts of the Midwest and the heat-stress challenges—are adding another layer of complexity to these decisions. Climate variability isn’t going away, and it directly affects both production and feed costs.
Your 90-Day Action Framework
After talking with dozens of producers and advisors, here’s the framework that seems to resonate:
Weeks 1-2: Pull your real numbers. Not what you think they are—what they actually are. Calculate your true production costs, debt ratios, and stress-test at $16 milk for 18 months. If your breakeven’s above $20 or debt-to-equity exceeds 0.80, expansion probably isn’t your path.
Weeks 3-4: Map your market position. Meet with every processor within 150 miles. Understand which contracts are available and which premiums exist. Geography matters more than ever in this market.
Weeks 5-6: Have the succession conversation. I know—it’s uncomfortable. But if you’re over 50 without a clear successor, a strategic transition might preserve more wealth than holding on indefinitely.
Weeks 7-8: Determine actual borrowing capacity. Today’s 7-8% rates are a world apart from those of three years ago. Know your real numbers before making commitments.
Weeks 9-10: Make your choice—expansion, optimization, or transition—based on data, not emotion or tradition. This is where the rubber meets the road.
Weeks 11-12: Start executing. Delays mean missing opportunities and facing higher costs down the line.
The Global Context and What’s Ahead
What strikes me most is how this moment accelerates trends we’ve been watching for years. Industry consolidation? That’s mathematical reality. Hoard’s Dairyman’s October analysis suggests 25-40% of current operations will transition by 2030. That’s sobering… but it also creates opportunities for those positioned to capture them.
Looking globally, we’re seeing similar patterns in Australia with their drought recovery challenges, in Europe with environmental constraints, and in South America with infrastructure limitations. This isn’t just a North American phenomenon—it’s a global realignment of dairy production and consumption patterns.
A colleague at Penn State Extension said something that resonates: “Success won’t necessarily correlate with size or history. It’ll favor those who accurately assess their position and act decisively within this window.”
The 18-month timeframe isn’t arbitrary—it reflects the convergence of heifer biology, processor contracting patterns, and construction cost trajectories already in motion. While heifer availability remains fixed for 30 months ahead, the processor premium window closes in 18 months, making that the more urgent decision-making timeline. Multiple paths can succeed, but each requires honest assessment and willingness to act on that understanding.
For an industry built on multi-generational commitment and remarkable resilience, this period calls for something additional: recognizing when adaptation is necessary and positioning thoughtfully for what comes next.
Whether through expansion, optimization, or transition, the key is making intentional choices aligned with your operational realities and family goals. The decisions ahead aren’t easy—they never are. But as we’ve seen throughout dairy’s history, producers who engage thoughtfully with change, rather than hoping it passes, tend to find sustainable paths forward.
And that, ultimately, is what this is all about—finding your path forward in a changing landscape. The opportunity is real, the challenges are significant, and the window for decisive action is open… but not indefinitely.
KEY TAKEAWAYS:
The 18-month window is biology meeting economics: Heifers at 3.9M (lowest since ’78) + 30-month production lag + processors desperately needing milk NOW = your decision window
Three strategies, all winners: Expand if you’re positioned ($3.5M investment → $731K annual returns) | Optimize what you have ($200-300K profit, no debt) | Exit strategically ($680K more than waiting)
Your report card determines your path: Breakeven under $18/cwt ✓ | Debt-to-equity under 0.50 ✓ | Clear succession ✓ = expand. Missing any? Optimize or exit.
Location drives premiums: New processing within 75 miles = $150K+ annual bonus, but these premiums evaporate after 18 months—first come, first served
The 90-day sprint: Weeks 1-2: Pull real numbers | Weeks 3-4: Map processor contracts | Weeks 5-6: Succession reality check | Weeks 7-12: Commit and execute
Complete references and supporting documentation are available upon request by contacting the editorial team at editor@thebullvine.com.
Learn More:
Building a Beef-on-Dairy System: Capturing $360,000 in Annual Farm Profit – Reveals how dairy farms are transforming the heifer shortage challenge into opportunity by leveraging beef genetics, with breeding jumping from 50K to 3.2M head and boosting calf revenue from 2% to nearly 6% of total farm income.
Every week, thousands of producers, breeders, and industry insiders open Bullvine Weekly for genetics insights, market shifts, and profit strategies they won’t find anywhere else. One email. Five minutes. Smarter decisions all week.
What the End of Government Relief Really Meant—and How Smart Farms Are Turning Uncertainty Into Opportunity
EXECUTIVE SUMMARY: From Shutdown to Showdown: How Dairy’s 2026 Wake-Up Call Is Redefining Survival” details how the end of the government shutdown set the stage for a year of unprecedented challenge—and opportunity—in the dairy sector. Instead of relief marking the finish line, the reopening exposed new processor contract demands, profit headwinds from make allowance adjustments, and a high-stakes shift to protein-centric pricing, all verified through university extension findings and current market data. The article demonstrates how farms that capitalize on narrow timing windows, lean into peer networks, and embrace collaborative learning are gaining margin and flexibility amidst change. Practical checklists, region-specific examples, and expert-backed insights make it useful at the barn and the boardroom table alike. By weaving in both the pressures and pathways open to all sizes of operation, the story embodies The Bullvine’s commitment to presenting real decisions, not just headlines. In the end, it shows that survival—and success—are less about official relief and more about being prepared to adapt, connect, and strategize for what 2026 brings next.
You know, as much as we all soaked in the relief of those USDA payments and the delayed Milk Production reports this past fall, the lesson of the moment is clearer than ever: what matters most heading into 2026 is how quickly and thoughtfully we respond to the challenges—not just what help the government sends. What I’ve noticed—confirmed by producers in Wisconsin, Florida, and even out west—is that “relief” doesn’t make the difference for your bottom line. It’s how you move with the changing facts, the shifting contracts, and the farm realities in front of you.
Pull up a stool. Here’s how that’s actually playing out in barns, co-op meetings, and balance sheets, with credible trail markers for farms of all sizes.
Speed Kills (Complacency): Margins in the Data Gaps
What farmers are finding is that, in this climate, the winners are the ones ready to act. When the USDA’s October Milk Production report was missing for weeks, extension specialists and loan officers across the Midwest were fielding anxious calls. Herds that moved quickly—hedged milk at $17.35/cwt right after the report, or locked in feed at $4.10—wound up with $2,000-$2,500 more on every 500 cows compared to those who waited. CME and Wisconsin extension data both show how waiting for “certainty” can shrink margins before you even see the warning.
It’s not luck. It’s keeping your strategy loose, your phone handy, and your local data bookmarked. Fresh cow management, feed contracts, and market windows—they all demand being both alert and decisive, especially as 2026 approaches.
Make Allowance Leaks: When Efficiency Quietly Costs You
The Allowance Shift: June 2025 Make Allowance Increase Transfers ~$0.50/cwt from Producer Milk Checks to Processor Margins
Let’s lay out the dollars and cents. Thanks to FMMO make allowance changes last summer, about $82 million annually has shifted from producer checks into processor cost recovery, according to the American Farm Bureau and university research. That hits particularly hard for 400-600 cow herds in the Midwest, where $8,000-$15,000 in value quietly vaporized from family budgets in 2025 alone. While vertically integrated co-ops sometimes recoup some through patronage, for most, these quieter cost shifts are exactly what force new choices—do we hold, reinvest, cut inputs, or consider transitioning out?
The lesson? It’s time to double down on IOFC, watch every transition group closely, and look at every feed and labor line as a matter of survival, not just habit.
Premium Contracts: New Growth, New Hurdles
The Processor Divide: Expanded Capacity and Premium Contracts Favor Large Operations—Small Farms Face Component Quality Barriers Worth $4.40/cwt
Let’s get real about processor expansion. Yes, IDFA and DFO confirm $11 billion in new milk-processing capacity, but the “growth” headlines come with some fine print. Today’s direct contracts expect you to consistently deliver volume (often 1,000+ cows), protein over 3.2%, and sub-Grade A somatic cell counts.
Why the clampdown? Processors need stable, high-quality components to secure export and retail channels, invest in automation, and deliver on food safety for globally diverse buyers. UW reports and field officers say this shift is now woven into most new plant supplier specs.
It’s not all doom. Farms who began investing in butterfat genetics, precision feed systems, and herd data management years ago are fielding more calls, not fewer. Those focusing just on short-term barn expansion are finding that you can’t rush a protein curve or a culture of quality management. Extension and Minnesota case studies show that slow, steady moves—targeting milk components and recordkeeping upgrades first—put herds in the fast track for premium deals.
December’s 3.3% Rule: Protein as the Baseline
Speed Kills Complacency: How Quick Response to Market Data Translates to $1,400+ More Per 500 Cows
Here’s what’s interesting: this year’s biggest structural shift might be USDA’s new baseline for protein—up from 3.1% to 3.3% (USDA Final Rule). It’s been a long time coming, and peer-reviewed research had foreshadowed the change for several years. Genetics, feeding, and savvy fresh cow management have all nudged national averages upward. But it’s the local impacts—from blend checks to contract premiums—that hit home.
What does that mean practically? A 0.2% difference in protein, per 100 cows, adds up to $400-800 in annual check value, per the latest Midwest and Ontario extension data. Above 3.3%? You’re in the bonus column. Below? Now’s the time to pull out the ration notes and see where you can tweak, swap, or invest before the next round of pricing hits.
More importantly, more farms are opening up the books—digitizing records, crowdsourcing advice in peer groups, and trading input strategy tips without fear of “giving away secrets.” As more transition into 2026, collaborative learning is proving, in the field and in extension trials, to be a margin driver as real as any piece of steel.
Transition Planning: The Strongest Exit Isn’t Running—It’s Timing
One of the biggest takeaways this year is that transition can be a strength, not a sign of retreat. USDA NASS land reports peg the Midwest ground firmly above $25K/acre; extension planners increasingly help herds time “retirement” or partner transitions before the next storm hits. The real win? Leaving with financial options and the pride of calling the shot on your terms.
Herds still thinking big? UW and DFO studies show that the best results come when expansion is built on several years of component improvement and a fresh-cow strategy—not as a panic reaction to price. Dry lot and fresh group upgrades, pooled input efforts, and peer feedback show up again and again in success stories.
And for those holding steady, including herds in the 200-700 cow bracket, “optimization” is earning a new respect. Peer networks and beef-on-dairy strategies (with calves bringing $400-600, latest UMN data) are now front-line tools, and regular peer benchmarking is ensuring that the smartest changes don’t just sit on paper—they get put into practice.
Are You Fast Enough for 2026?
Pulling together farmer panels and co-op roundtables, it’s clear: being nimble, not just knowledgeable, is the new shield against margin loss. Extension economic analysis calls it “window management”—profits are made in these small, rapid openings, not in broad trends or after-the-fact decision meetings.
Facing Protein Gaps? Your Action Checklist
Bring three years of production and component records to a dairy-literate advisor.
Model the value and cost of boosting protein (and the status quo if you don’t).
Sit down with a local extension or farm business group—where are your best, region-specific levers hiding?
Use your peer network: tested approaches and hard-learned lessons are worth more than a new gadget.
So if there’s one sure thing heading into our “2026 wake-up call,” it’s that resources, relationships, and rapid response matter. Let’s keep those mugs full and the learning real—together, we’ll keep setting the pace for the next curve in dairy.
KEY TAKEAWAYS:
Farms that respond swiftly to new information—securing prices or input deals as data shifts—routinely outperform those waiting for a “clear signal.”
The new normal: Processor contracts and milk pricing now demand higher protein, stricter quality, and more documentation, making management upgrades and peer collaboration must-haves.
Smart transition planning—whether exiting, scaling, or realigning—can be a competitive edge, helping farm families lock in value rather than react to crises.
Operational resilience is increasingly about connecting with peer networks, bulk-buying alliances, and benchmarking tools—not just individual innovation.
For 2026, the most resilient farms will be those that adapt fastest to changing rules, seize learning opportunities, and stay proactive in their markets.
Complete references and supporting documentation are available upon request by contacting the editorial team at editor@thebullvine.com.
Every week, thousands of producers, breeders, and industry insiders open Bullvine Weekly for genetics insights, market shifts, and profit strategies they won’t find anywhere else. One email. Five minutes. Smarter decisions all week.
6:47 AM: Routine swab positive. Thursday: FDA shuts three lines. Cost: $900K. But this Wisconsin dairy recovered in 90 days. Here’s how.
EXECUTIVE SUMMARY: A routine Tuesday morning swab changed everything for a Wisconsin dairy family—one positive result near (not in) their product triggered FDA intervention, shut three production lines, and cost $900,000 despite 50 years of perfect inspections. They’re not alone: dairy now leads global food recalls with 400 incidents in Q1 2025, each averaging $10 million in direct costs. Here’s the uncomfortable truth: your current monitoring program likely misses 70% of contamination, your ATP testing can’t detect allergen proteins that trigger anaphylaxis, and your paper documentation could turn a routine audit into business extinction. Yet operations that invest $75,000-100,000 annually in comprehensive monitoring are transforming their risk profile in just 90 days—one Idaho dairy’s $42,000 investment yielded $280,000 in new contracts after eliminating all contamination. The fix starts with a two-hour facility walk that typically reveals 30-50 blind spots you’re not testing. In today’s enforcement environment, you’re either systematically finding problems or waiting for regulators to find them for you.
You know that feeling when a routine phone call changes everything? That’s what happened to a Wisconsin processing family at 6:47 on a Tuesday morning. One environmental swab—the kind they’d been taking every week for years—came back positive for Listeria. Not in the product, thankfully. Not even on food contact surfaces. Just one positive from a motor housing on their filling line, maybe eight inches from where the product flowed.
By Thursday afternoon? Well, their whole world had shifted. The FDA audit team is walking the floor. Three production lines shut down. Nearly $900,000 in inventory is sitting in quarantine. And here’s what really gets me—their largest customer, representing 40% of their volume, suspended shipments pending resolution.
The 70% Detection Gap: Why conventional 25-site monitoring programs miss most contamination—and what comprehensive testing reveals about your facility’s blind spots
What’s particularly troubling about this story —and why I’m sharing it with you —is that it wasn’t some corner-cutting operation. These folks passed every annual inspection. Their SQF certification was current. Customer audits? Clean as a whistle. They genuinely believed—as many of us do—that their food safety program was bulletproof.
But what they discovered over the next 90 days… well, it’s reshaping how dairy operations across North America are thinking about the gap between compliance and actual protection. And if you’re sitting there thinking “we’re different,” I get it. That’s exactly what they thought, too.
The Numbers We Need to Talk About
The $254 Million Question: One positive swab cascades into direct recall costs, multiplied indirect expenses, insurance spikes, lost contracts, shareholder panic, and permanent brand erosion—all preventable with proactive monitoring
Let me tell you what’s happening out there right now. The data from FDA’s Q1 2025 recall analysis—Food Safety magazine pulled it all together in May—shows dairy products leading all food categories in recall volume. We’re talking nearly 400 recalls out of 1,363 total food recalls tracked globally. Not meat, folks. Not produce. Dairy.
And the financial side? It’s brutal. The Consumer Brands Association’s research from their 2024 recall impact study puts the average cost of a food recall at $10 million just in direct expenses. That’s before you factor in lost business, damaged reputation, all that.
The Dairy Recall Explosion: From 85 incidents in Q1 2020 to 400 in Q1 2025—a 371% surge making dairy the food industry’s #1 recall category, accounting for 29% of all global food safety failures
But here’s what really keeps me up at night: Remember the 2008 Canadian Listeria outbreak at Maple Leaf Foods? Fifty-seven confirmed cases, 24 people lost their lives, and according to the Public Health Agency of Canada’s economic analysis, the final price tag hit $242 million. For one facility. We’re not talking about quality hiccups anymore—these are business extinction events.
I’ve noticed that there’s this disconnect between what operations think they’re monitoring and where contamination actually lives. It’s like we’ve been looking for our keys under the streetlight because that’s where the light is good, not because that’s where we dropped them.
Three Blind Spots Every Operation Has (Yes, Even Yours)
The Hidden Zone: Zone 2 surfaces—equipment housings, motor casings, frameworks just inches from food contact—harbor 8% contamination rates, yet most programs barely test there
Environmental Monitoring: The 60% You’re Not Testing
So there’s this fascinating research from Dr. Matthew Stasiewicz at the University of Illinois. His team spent 18 months implementing environmental monitoring programs in eight small-to-medium dairy facilities across Illinois and Wisconsin—and published the results in early 2024. I bet you’ve noticed what they found hits home: Listeria species showed up in 13% of environmental samples. Across all facilities.
But here’s the kicker that really made me rethink everything: Pre-operation sampling—after cleaning and sanitation—showed 15% positive rates. Mid-operation? 17%. Virtually identical. The cleaning between shifts wasn’t eliminating the problem; it was just… moving it around.
A PCQI-certified consultant I’ve worked with—she’s been auditing Midwest dairy facilities for two decades—put it this way: “Conventional monitoring programs catch maybe 30-40% of actual contamination. The rest is hiding in places standard HACCP plans never even consider.”
Think about your own facility for a minute. When’s the last time you swabbed:
That floor-wall junction where water always seems to pool during washdown?
Inside those equipment legs that—surprise!—might actually be hollow?
The overhead condensation points that drip onto your Zone 2 surfaces?
Those cable conduits and junction boxes hanging above your production lines?
A 2024 study published in the Journal of Food Protection tracked Listeria in cheese processing facilities for 3 years. Same genetic strain, living in the same drains and floor cracks, for three straight years—despite aggressive cleaning protocols and regular staff training. That should terrify all of us.
Allergen Control: Why ATP Testing Gives You False Confidence
Here’s a story that played out last September. HP Hood had to recall 96-ounce containers of Lactaid milk across 27 states. The issue? Potential almond contamination was discovered during routine maintenance, according to the FDA recall notice. Not during production. Not through finished product testing. During maintenance.
Now, that facility was running cleaning validations between allergen and non-allergen runs. They had ATP testing showing surfaces were “clean.” Everything looked good on paper. But—and this is crucial—ATP testing measures organic residue and microbial load. It doesn’t specifically detect allergen proteins.
Dr. Joseph Baumert, who co-directs the Food Allergy Research and Resource Program at the University of Nebraska-Lincoln, explains it well: “You can have a microbiologically spotless surface, passes ATP with flying colors, and still harbors enough milk protein to trigger anaphylaxis. Milk proteins, especially casein, bind to stainless steel and can persist through standard CIP cycles.”
The UK Food Standards Agency’s 2024 audit data really drives this home—dairy allergen compliance rates were just 51%, compared to 73% for other allergens. The main problem? Improperly cleaned equipment that passed microbial testing but retained allergen proteins.
What’s interesting here is the aerosol issue in powder operations. You’re blending milk powder in one room, thinking your allergen-free products in the next room are protected by a wall. But those particles? They become airborne, travel through doorways, and settle on equipment, packaging, and even workers’ clothing. Your “dairy-free” line isn’t dairy-free anymore.
I visited an operation down in Texas that learned this the hard way. Mid-size facility, producing both regular and plant-based products on separate lines, on different days even. Still had cross-contamination through their shared air-handling system. Cost them $180,000 in recalls and two major contracts. And as robotic milking systems become more common, we’re seeing new environmental monitoring challenges around them too—condensation in different places, changing traffic patterns, and new dead zones that didn’t exist in conventional parlors.
Documentation: The Gap That Turns Routine into Crisis
Now this one… this hits close to home for a lot of us. Back in 2019, British Columbia’s Ministry of Environment audited dairy processors, and what they found was eye-opening: all seven facilities with site-specific permits had compliance violations. Not because of contamination. Not because of poor sanitation. Documentation gaps.
Missing monitoring records. Late annual reports. Required testing that happened but wasn’t documented properly. These aren’t food-safety failures—they’re paperwork problems that turn routine inspections into comprehensive investigations.
A senior insurance underwriter who’s been specializing in food industry coverage for over 15 years with one of the major carriers told me something that stuck: “The difference between operations that survive recalls and those that don’t often comes down to one thing—can you prove you were finding and fixing problems proactively? Because if your documentation shows you avoided comprehensive monitoring not to find contamination, that’s willful blindness in court.”
The Insurance Reality Nobody Wants to Talk About
Let’s be real about insurance coverage for a minute. Your standard Commercial General Liability policy? It explicitly excludes most recall-related costs. Product retrieval, disposal, business interruption, crisis management—none of that’s covered unless you’ve added specific endorsements.
Even with Product Contamination Insurance—and that’s a separate policy, not just an add-on—coverage depends on demonstrating comprehensive preventive controls. Several major carriers are now conducting their own facility risk assessments. If your environmental monitoring program covers 25 sites when industry best practice suggests 80-100, I’ve noticed what happens next: Your premium doubles. Sometimes triples. Or they just decline to renew.
CRC Group published guidance in October specifically for dairy producers, noting that recall events can trigger losses far exceeding policy limits. They’re seeing claims where actual costs hit 3-4 times what operations thought they were covered for.
What Successful Operations Are Actually Doing
Looking at operations that are thriving versus those that are struggling, what’s interesting is that it’s not about size or budget. It’s about mindset.
I know a producer in northern Wisconsin—150 cows, small processing operation, been in the family since 1962. Three years ago, after a near-miss with a Zone 3 positive, they completely overhauled their approach. Went from 22 sampling sites to 87. Found contamination in places they’d never looked—inside hollow table legs, above the homogenizer where condensation collected, in that floor crack under the bulk tank nobody thought about.
The initial findings were rough—23 positives in the first month. But here’s what matters: they documented everything, implemented targeted fixes, and verified effectiveness. By month six? Down to zero positives. Their insurance premium dropped 30%. And they picked up two new contracts from processors looking for reliable suppliers with robust food safety programs.
It works for even smaller setups, too. Take a southern Idaho operation with just 85 cows—they invested $42,000 in comprehensive monitoring, went from 18 sites to 72, and saw an initial spike of 19 positives in the first 60 days. Now? Zero positives for 8 months, insurance down to $12,000 annually from $18,000, and new contracts worth $280,000 a year from 7 processors, including national brands. That kind of ROI shows even modest operations can transform their risk profile.
Compare that to operations still running minimal programs because “we’ve never had a problem.” They’re testing the same 25 sites they’ve tested for a decade. Getting the same negative results. Thinking they’re safe. Meanwhile, research consistently shows 60-70% of contamination lives in places they’re not even looking.
Out west, there’s a 2,500-cow operation in California’s Central Valley that took a different approach. Brought in UC Davis Extension specialists to map their entire facility. Found 112 potential harborage sites. The owner told me, “We’d been so focused on the milking parlor and tank room, we completely missed the processing area risks.”
And I’ve seen similar transformations out east, too. A processor in Vermont—a family operation since the 1970s—discovered contamination in their aging facility’s infrastructure that newer buildings wouldn’t have. Different regions, different challenges, same fundamental issue: we’re not looking everywhere we need to look.
The Math That Matters: Real dairies, real numbers—$42K to $95K investments delivering 3x to 9.5x returns within 90 days through prevented recalls, new contracts, and insurance savings
What You Can Do Starting Tomorrow: The 90-Day Transformation
Here’s what I tell every producer who calls: You don’t need to solve everything at once. You need to start finding out what you don’t know.
Week One: The Reality Walk
Get your whole team together—I mean ownership, operations, QA, maintenance, everyone—and walk your facility during production. Don’t send them a report. Don’t show them those slides. Just walk the floor together.
Everyone brings their phones. Take pictures of every place where water pools, every piece of equipment in a dead zone, and every condensation drip point. Most operations identify 30-50 unsampled locations in a two-hour walk.
A quality manager at a 500-cow operation in upstate New York described their walk to me: “My operations manager saw water pooling at a floor-wall junction we’d never sampled. Maintenance pointed out three hollow equipment legs—we had no idea they were there. When you see 40 potential contamination sites that aren’t in your monitoring program, you can’t unsee it.”
Weeks 2-4: Zone 2 Expansion
Start simple. Add 10-15 sampling sites within 12 inches of your current Zone 1 testing points. These Zone 2 areas—equipment housings, control panels, adjacent floors—that’s where contamination migrates to the product.
Budget impact? Maybe $2,000-3,000 for a month of additional testing. That’s nothing compared to a recall. But it tells you whether contamination is living right next to your food contact surfaces.
A creamery operator in Minnesota started with 12 additional Zone 2 sites. Found positives in four locations the first week—the motor housing on the separator, framework under the filler, two spots on the floor within inches of equipment legs. They’d been testing two feet away and missing all of it.
Months 2-3: Building the System
Once you know where problems hide, you can build systematic solutions. This is when you expand to comprehensive coverage—those 80-100 sites the research suggests. Implement allergen-specific testing if you’re running both allergen and allergen-free products. Transition from paper logs to digital documentation systems.
The cost sounds prohibitive until you do the math. Cloud-based food safety management systems cost $200-500 per month. Expanding to 80 sampling sites could add $30,000-40,000 in annual testing costs. Combined with improvements to allergen validation and documentation, you’re looking at an annual investment of $75,000-100,000.
Compare that to the average recall cost of $10 million. Or the 40% revenue loss when your largest customer suspends shipments. Or the insurance claim denial because you couldn’t demonstrate comprehensive preventive controls.
I’ve watched operations in Oregon, Idaho, and New Mexico make this transformation. Different climates, different challenges—summer condensation in the Pacific Northwest, dust infiltration in the Southwest—but the same systematic approach works.
The Choice Every Operation Faces Right Now
I’ve been around this industry long enough to see patterns. Are the operations thriving today? They made a decision years ago: invest in finding problems before customers or regulators do. They’re not perfect—nobody is. But they’ve built systems that demonstrate continuous improvement.
Are the operations struggling? They optimized for compliance minimization. Did the bare minimum to pass inspections. Assumed their historical track record would continue forever. Now they’re scrambling to implement improvements under external pressure—customer ultimatums, insurance threats, regulatory enforcement.
As we sit here in November 2025, with dairy leading global recall statistics and enforcement intensifying monthly, that assumption has become the costliest bet in our industry.
The Bottom Line
Remember that Wisconsin family I started with? They invested $95,000 over 90 days. Expanded monitoring from 25 to 92 sites. Found contamination they’d never suspected. Fixed it systematically. Documented everything.
Today, 18 months later? They’re running at capacity with a waiting list of customers who value suppliers that take food safety seriously. Insurance costs dropped 25%. That the large customer who suspended shipments? They’re back, with a longer-term contract and 10% volume increase.
Most importantly, they sleep at night knowing a routine swab won’t destroy three generations of hard work.
The gap between passing inspections and being protected isn’t about perfection. It’s about systematically finding and fixing problems before they find you. In today’s dairy industry, with the stakes this high, that’s not just good business—it’s survival.
Making the Numbers Work: A Reality Check
What You Invest
Annual Cost
What It Prevents
Expanded monitoring (80 sites)
$35,000-40,000
Contamination reaching the product
Allergen-specific testing
$15,000-20,000
Undeclared allergen recalls
Digital documentation
$2,400-6,000
Legal/insurance claim denials
Mock audits (quarterly)
$12,000-16,000
Surprise inspection failures
Total Prevention
$75,000-100,000
Potential $10M+ recall
Based on current industry pricing and FDA/Consumer Brands Association 2024-2025 recall cost data
Where to Get Help:
FDA’s got comprehensive environmental monitoring guidance at FDA.gov/food-safety
The Innovation Center for U.S. Dairy has excellent pathogen control resources
Your state’s dairy extension specialists—for example, producers can contact their local university extension office (like UW-Madison Extension) for guidance
The National Milk Producers Federation has member resources that really help
Look, I’ve spent 15 years working with dairy operations across North America on food safety implementation. I’ve seen both sides—the devastating impact of recalls and the transformative power of proactive monitoring programs. The difference between the two? Usually, about 90 days of focused work and the willingness to look where you haven’t been looking.
What’s your next step going to be?
KEY TAKEAWAYS
You’re Testing Wrong: Conventional 25-site programs miss 70% of contamination hiding in hollow equipment legs, floor-wall junctions, and condensation zones—expand to 80-100 sites or stay vulnerable
ATP Testing Won’t Save You: It detects organic residue, not the allergen proteins that trigger recalls—HP Hood’s 27-state recall proved “clean” ATP results mean nothing for allergen control
Small Operations Are Proving the Math: 85-cow Idaho dairy: $42K investment → zero contamination → $280K new contracts. ROI in under 12 months beats hoping you’re not next
Your Monday Morning Assignment: Two-hour facility walk with ops/QA/maintenance teams, photograph every water pooling spot and equipment dead zone—expect to find 30-50 blind spots
The Bottom Line Choice: Invest $75-100K annually in comprehensive monitoring now, or lose $10M+ when one swab destroys three generations of work
Complete references and supporting documentation are available upon request by contacting the editorial team at editor@thebullvine.com.
Learn More:
The Biosecurity Changes That Stuck: What Dairy Producers Say Actually Works (And Pays) – This article provides a tactical, producer-focused guide on the ROI of low-cost biosecurity. It demonstrates how to implement practical prevention protocols for traffic, visitors, and documentation—a perfect “how-to” for the preventative mindset the main article demands.
Discover What Dairy Consumers Really Think: Eye-Opening Insights for the Dairy Farmer – The main article outlines the $10M internal cost of a recall; this piece reveals the external market risk. It details how consumer trust in sustainability and transparency directly impacts sales, reinforcing why a robust safety program is a vital marketing tool.
Key Technologies Revolutionizing the Dairy Farming – The “90-Day Fix” requires better data and documentation. This article shows you the tools—from real-time health sensors to data management systems like DairyComp 305—that enable the comprehensive, automated monitoring needed to close your blind spots for good.
The Sunday Read Dairy Professionals Don’t Skip.
Every week, thousands of producers, breeders, and industry insiders open Bullvine Weekly for genetics insights, market shifts, and profit strategies they won’t find anywhere else. One email. Five minutes. Smarter decisions all week.
New reports reveal coordinated legal strategies, AI-powered surveillance, and strategic economic pressure that go far beyond traditional protests—here’s what dairy farmers need to know about this transformed threat landscape
EXECUTIVE SUMMARY: Animal activists aren’t college kids with protest signs anymore—they’re an $865 million corporate operation with Harvard lawyers and AI technology that’s mapped 27,500 farms, probably including yours. While brutal economics closed 2,800 dairy farms in 2024, these organizations strategically exploit those same vulnerabilities through legal warfare, regulatory pressure, and coordinated campaigns designed to accelerate consolidation. The surprise: farmers are winning battles that matter. Fourteen Wisconsin operations eliminated activist threats entirely with a free WhatsApp group, and individual farmers’ authentic social media consistently outperforms ASPCA’s $131 million advertising budget in building consumer trust. This report exposes their complete playbook—from shareholder lawsuits to biosecurity weaponization—while delivering practical defense strategies that work regardless of operation size.
You know, I’ve been tracking activist groups for nearly two decades, and what’s happening now is completely different from what we dealt with back in the early 2000s. Here’s what’s interesting—the Animal Agriculture Alliance’s latest reports show these organizations now command $865 million in annual revenue. That’s up from $800 million just last year, and if you look back five years, we’re talking about growth from $650 million.
But what really gets my attention isn’t the money itself—it’s how they’re using it that should have every dairy farmer paying attention.
The Alliance released two reports this fall—”Radical Vegan Activism in 2024″ and their updated “Major Animal Activist Groups Web”—and honestly, some of what’s in there surprised even me. Sure, we documented 189 actions against agriculture in 2024, including 59 vandalism cases, 43 animal thefts, and 31 trespassing incidents. But here’s the thing: those are just the incidents we can see.
What the Alliance found is that these groups aren’t just showing up with protest signs anymore. The FBI actually refers to some of its activities as “intelligence operations.” They’re coordinating legal strategies across multiple states, and they’re systematically targeting what they see as weak points in animal agriculture’s economic foundation.
For dairy farmers trying to make it work with USDA data showing 2,800 operations closing in 2024—that’s out of roughly 28,000 total dairy operations nationwide—well, understanding this new landscape isn’t really optional anymore. It’s survival.
The Evolution of Animal Activism: From $650M to $865M in Five Years
The $865 Million War Chest: How activist organizations grew their combined budgets by 33% in five years—from $650M to $865M—giving them unprecedented resources to target dairy farmers through legal warfare, shareholder campaigns, and AI-powered farm mapping
Year
Combined Revenue
Key Development
2020
$650 million
Traditional protest focus
2024
$800 million
Corporate structure emerging
2025
$865 million
Full corporate operations
Beyond the Protest Line: This Isn’t Your Father’s Activism
I remember twenty years ago—maybe you do too—when activists were mostly college kids with spray paint and strong feelings. Today? We’re looking at something else entirely.
While theatrical street protests like this PETA demonstration are highly visible, the real threat has evolved. The new battle is fought by corporate legal teams, not just street performers.
Organizations like the ASPCA (pulling in $379 million annually according to 2023 tax filings), the Humane Society of the United States (HSUS) ($208 million), and PETA ($85.7 million in revenue) have built operations that look more like corporate headquarters than grassroots movements. And here’s what they’ve got working for them:
Legal teams with attorneys from Yale, Harvard, University of Chicago—the works
Media departments spending serious money—ASPCA alone shows a combined $131 million spent on fundraising ($70M) and advertising ($61M) on their 2023 Form 990
Lobbying operations working at both the federal and state levels
Tech divisions using AI to map agricultural facilities
Take PETA’s setup. They’ve got multiple deputy general counsels running different divisions. One handles litigation for strategic impact cases. Another manages corporate governance and planned giving. These aren’t volunteers anymore—they’re attorneys who cut their teeth at places like Steptoe and DLA Piper before jumping to animal advocacy.
What I find fascinating—and concerning—is how this changes the game for farmers. When Direct Action Everywhere launched Project Counterglow (their map showing 27,500 animal ag facilities using satellite imagery and crowdsourced data), the FBI took it seriously enough to create a dedicated email inbox for reporting these activities.
WIRED dug into this with public records requests, and what they found is… well, both sides are playing intelligence games now. The Animal Agriculture Alliance has databases tracking over 2,400 individual activists. Meanwhile, activist groups are using similar tactics to identify targets and coordinate campaigns.
Industry security advisors tell me they’re hearing similar stories from Wisconsin producers—activists showing up who know shift changes, delivery schedules, even which gates don’t always get locked. That’s not protesting, folks. That’s reconnaissance.
“The level of preparation we’re seeing suggests systematic reconnaissance rather than spontaneous action. They know our operations better than some of our seasonal workers.” — Wisconsin dairy security consultant, speaking to industry advisors
“I had someone show up claiming to be interested in buying feed, but the questions they asked… it was clear they were mapping our operation, not buying anything.” — Central Valley dairy producer, speaking at a recent California Dairy Quality Assurance Program workshop
The Legal Game: They’re Playing Chess While We’re Playing Checkers
Now this is where it gets sophisticated, and I’ll be honest—most of us aren’t ready for this level of strategic thinking.
Take Wayne Hsiung’s case. He’s the co-founder of Direct Action Everywhere, who was convicted in 2023 for trespassing on Sonoma County farms. The guy has a law degree from the University of Chicago, worked at major firms, but he represented himself at trial and turned down plea deals that would’ve kept him out of jail.
Why would anyone do that?
Harvard Law Review spelled it out in their February 2024 piece on “Voluntary Prosecution and the Case of Animal Rescue”—for these activists, the trial IS the strategy. They’re using prosecutions to force public discussions about farming practices. The courtroom becomes their stage.
Meanwhile—and this is happening at the same time—Legal Impact for Chickens is going after companies through shareholder lawsuits. Their president, Alene Anello (Harvard undergrad, Harvard Law, previously worked at PETA and the Animal Legal Defense Fund), targeted Costco, claiming that its executives violated their duties by failing to address animal welfare laws properly.
Here’s the kicker: even though their first case got dismissed, the court left the door open for shareholders to file formal demands. So LIC did exactly that in July 2023, forcing Costco’s board to spend months investigating and publicly defending their practices.
What dairy farmers need to watch for:
Arguments that activists have a legal “right” to rescue animals
Shareholders are forcing companies to address welfare complaints
Challenges to ag-gag laws (they’ve already knocked down dozens)
Expanding definitions of what counts as animal cruelty
Even when they lose these cases, they win something—media coverage, legal precedents, and they force agricultural operations to burn through time and money defending themselves.
When Biosecurity and Security Collide: The H5N1 Wake-Up Call
The 2024 H5N1 outbreak that hit nearly 200 dairy herds across multiple states taught us something important: the same protocols that protect against disease also protect against activists. And vice versa.
USDA’s Animal and Plant Health Inspection Service identified how H5N1 spreads: shared equipment and vehicles, people moving between farms, and animal movements. Think about that—those are exactly the same ways activists gain access to facilities.
Professor Timm Harder from Germany’s Friedrich-Loeffler-Institut (which runs its national reference lab for avian influenza) has been speaking at international briefings about comprehensive containment measures. What he doesn’t say outright—but what’s becoming obvious to those of us watching both threats—is that these measures work for both.
The basics that work for both:
Visitor logs showing who’s on your property and when
Vehicle cleaning protocols (and tracking who’s coming and going)
Background checks for new hires
Cameras at access points
Tracking which employees work at multiple facilities
What’s interesting here is how the same infrastructure that keeps disease out also keeps unwanted visitors out. It’s not about building Fort Knox—it’s about knowing who’s on your property and why.
Double-Duty Defense: The same $8,300 basic security package that protects against H5N1 spread also blocks activist infiltration—cameras, visitor logs, and vehicle tracking stop both disease vectors and unwanted “investigators,” proving Andrew’s point that smart biosecurity is also smart security
The Trust Game: Your Story Still Matters
Despite all this corporate machinery against us, dairy farmers have one advantage that money can’t buy. I’ve watched this play out again and again—authentic relationships with consumers.
Agricultural communications research keeps showing the same thing: authenticity predicts consumer trust better than anything else. Better than credentials, better than sustainability claims, better than fancy branding.
Look at what Tara Vander Dussen’s doing as the New Mexico Milkmaid. She’s been at it for years, and her approach is simple: build relationships so people feel comfortable asking questions. When some activist video goes viral, her followers message her first—they want to hear her side before making up their minds.
You know why this works? Marketing folks have documented something they call the micro-influencer effect. Accounts with 1,000 to 100,000 followers get seven times the engagement of bigger accounts. Why? Because people can smell authenticity, and they know when someone’s being paid to say something versus when they actually believe it.
ASPCA runs those tear-jerker ads that reach millions. But investigative reporters have shown that only 2% of ASPCA’s $379 million budget actually reaches local shelters. Their CEO makes close to a million dollars. Their 2023 tax filings show the organization has over $550 million in net assets.
The Corporate Activist Reality: ASPCA’s $379 million budget allocates $57 of every $100 to staff and office costs, $28 to advertising and fundraising, and only $6 to veterinary services and grants—while their CEO makes $1.2 million annually. This is activism as big business
When people find that out—and they do—trust disappears instantly.
Meanwhile, farmers posting real content from their barns are connecting with consumers in a completely different way. It’s not about guilt—it’s about understanding.
Industry communications advisors describe producers who’ve started posting daily farm videos getting fascinating results. Nothing fancy—just showing what they actually do. They report consumers from urban areas messaging to say they were worried about dairy farming until they started following these pages. Now they specifically look for those cooperatives’ brands. One person at a time, but it multiplies.
Regional Reality Check: Know Your Risk Level
Know Your Risk Level: The top three states—Massachusetts (37), California (36), and New York (34)—account for 57% of all documented activist actions in 2024, while regional cooperation in Wisconsin (14 actions) demonstrates effective farmer networks can reduce targeting
Looking at where those 189 documented actions occurred in 2024, there’s a clear pattern: most activity is concentrated in Massachusetts, California, and New York.
If you’re within 50 miles of a major city in California, the Northeast, or the Pacific Northwest, you’re in what I’d call the primary zone. You’ve got activist populations nearby, sympathetic media, and prosecutors who might not pursue charges aggressively.
The Upper Midwest—Wisconsin, Minnesota, Michigan—plus the Mid-Atlantic states see periodic waves, usually coordinated campaigns hitting multiple farms at once. The good news? We’ve seen regional cooperation work really well in several Wisconsin counties.
The Great Plains, Mountain West (except around Denver), and the Deep South see less activity. Not because activists don’t care, but because distance, logistics, and the political climate make operations more difficult.
But—and this is important—Project Counterglow mapped 27,500 facilities nationwide. Geographic isolation isn’t the protection it used to be. If you fit their criteria, you could be targeted regardless of location.
What’s interesting is that our Canadian neighbors face similar patterns around Toronto, Vancouver, and Montreal, while European producers tell me they’re seeing coordinated campaigns across borders there too. Australian dairy farmers are dealing with their own version of this, particularly in Victoria and New South Wales. New Zealand’s seeing it around Auckland and Wellington. This really is becoming a global challenge, not just an American one.
The Economics Nobody Wants to Talk About
Here’s what I think many farmers miss —and what took me years to see clearly: activists aren’t causing the economic crisis hitting mid-size dairies—they’re making it worse.
Look at those 2,800 closures in 2024. Maybe 50 to 100 were directly because of activist actions—vandalism, theft, campaigns that destroyed reputations. The rest? Regional production costs are running $19-21/cwt while Class III milk prices average $17-18/cwt according to Dairy Market News. That’s just brutal economics.
But activists know how to exploit these vulnerabilities:
Prop 12-style regulations are a prime example. While that law targeted pork and eggs, similar future legislation for dairy could be devastating. National Pork Producers Council (NPPC) economist Holly Cook has laid out analyses showing Prop 12 compliance can cost $600-700 per sow for retrofits alone, or over $3,000 per sow for new construction. Using the pork retrofit numbers as an analogy, a 500-cow dairy facing similar per-animal costs would be looking at a $300,000-$350,000 capital expense, not including lost production time. Most operations don’t have that kind of capital.
The Brutal Math: While activists documented 189 direct actions against agriculture in 2024, 2,800 dairy farms closed—exposing how activists exploit economic vulnerabilities rather than cause them directly, accelerating the consolidation that’s killing mid-size operations
For smaller operations—say, 100-150 cows—even basic security upgrades can strain budgets. That’s why I tell these folks to think about pooling resources with neighbors. Share the cost of cameras, coordinate patrols, and work together on visitor protocols. You don’t have to go it alone.
Grand View Research and others project that plant-based alternatives will reach $32-34 billion globally by 2030, up from about $20 billion now. Every percentage point of market share they take hurts mid-size producers far more than it does big operations with 2,000-plus cows.
And here’s what really worries me: as farm numbers drop, the infrastructure disappears. Vets close their practices. Equipment dealers shut down. Processing plants consolidate. The whole support system collapses.
Jim Mulhern, who led the National Milk Producers Federation for over a decade before retiring in 2023, used to talk about this all the time—consolidation was happening anyway. What’s different now is that activists have figured out how to speed it up.
What Actually Works: Practical Steps You Can Take
Based on what we saw in 2024 and what’s developing now, here’s what I tell producers who ask:
This Month—Get Started:
Week 1: Connect with your state dairy association’s alert system. If they don’t have one, push them to create one. The Animal Agriculture Alliance has monitoring services—use them.
Week 2: Look at your camera situation. Basic coverage for access points runs $2,000-$3,000. That’s nothing compared to what you could lose. If that’s too steep right now, talk to neighbors about sharing costs.
Week 3: Talk to your employees one-on-one. Just ask: “Has anyone approached you about filming here? Offered money for information?” You might be surprised.
Week 4: Get 5-10 neighbors together for a simple communication network. Group text, whatever works. When something happens, everyone knows fast.
Next Three Months:
Build relationships with local law enforcement now, not during a crisis
Write down who talks to the media if something happens (hint: pick one person)
Actually use visitor logs—every person, every time
Check your insurance—does it cover losses related to activism?
Long-Term Thinking:
This is harder, but it’s where real protection comes from:
Technology that helps you compete with bigger operations
Finding your market niche—organic, A2, grass-fed, whatever works for you
Building consumer relationships before you need them
Getting involved in advocacy at whatever level you can manage
Learning from Success: The Wisconsin Example
Let me tell you about something that worked. Industry security advisors describe a situation in Central Wisconsin last spring in which 14 dairy farms across three counties began sharing information after one farm caught activists conducting surveillance.
Within 48 hours, everybody in that network knew the vehicle descriptions, the tactics, even the specific questions activists asked when they pretended to be feed salespeople. They’d created a simple WhatsApp group—nothing fancy, just quick communication.
When the activists came back two weeks later, targeting a different farm, that producer was ready. Cameras got everything. Law enforcement responded immediately because they already had relationships with the community. The activists got prosecuted for criminal trespass, and here’s the important part—that network hasn’t seen activity since.
As the security advisors explain, success came from working together, not from individual measures. They eliminated the easy targets by coordinating. Simple as that.
What This Means for Your Operation
Looking at everything that’s happening, what’s changed isn’t just money or sophistication—it’s how all these threats are converging at once.
Activist organizations operate like corporations, with combined budgets of billions of dollars. They’re targeting economic viability, not just arguing ethics. Technology gives both sides capabilities we didn’t have before. Biosecurity and activist infiltration have become the same problem. And economic pressure makes farms vulnerable to everything else.
But here’s what still works: authentic farmer voices build trust that money can’t buy. Local coordination multiplies your defenses. Basic security stops most opportunistic actions. And adapting your business—not just defending it—is still essential.
The uncomfortable truth? You’re not just dealing with activists anymore. You’re navigating economic forces that activists know how to exploit. The operations that’ll make it aren’t the ones with the highest walls—they’re the ones that transform their businesses while defending against pressure designed to stop exactly that transformation.
Industry leaders keep saying things will stabilize eventually. They’re probably right. The question is whether your operation will still be around when that happens.
The next year and a half are critical for many operations. Understanding what you’re really up against—not just protesters, but coordinated campaigns with serious money and long-term strategy—that’s your starting point.
Next step? Actually doing something about it. Because in this business, we all know that knowledge without action doesn’t get the cows milked or the bills paid.
These organizations are playing a long game. Question is: are you ready to play it too?
KEY TAKEAWAYS:
Activists aren’t protesters anymore—they’re an $865M corporation with Harvard lawyers who mapped 27,500 farms using AI, but 14 Wisconsin farmers stopped them with a WhatsApp group
Your biosecurity is your security: The same protocols preventing H5N1 also prevent infiltration—just add $2-3K in cameras and actually use those visitor logs
You’re already winning the trust war: Your iPhone videos beat ASPCA’s $131M advertising because authenticity crushes their 2%-to-shelters reality
The clock is ticking: Prop 12 hit pork with $600/animal costs; dairy’s next; but farmers who coordinate locally report zero incidents since organizing
Monday morning action plan: Text 5 neighbors to create an alert network (30 min), install doorbell cameras on barn entrances ($300), ask each employee about suspicious contacts (1 hour)
Complete references and supporting documentation are available upon request by contacting the editorial team at editor@thebullvine.com.
Learn More:
The Clarkson Effect: What It Really Means for Your Dairy’s Marketing – This guide provides a tactical playbook for leveraging public curiosity, demonstrating how to build an authentic social media presence that educates consumers and wins the “trust game” the main article identifies as critical.
Every week, thousands of producers, breeders, and industry insiders open Bullvine Weekly for genetics insights, market shifts, and profit strategies they won’t find anywhere else. One email. Five minutes. Smarter decisions all week.
Your grandfather milked 50. You milk 500. China milks 500,000. This ends one of three ways.
Having spent the better part of two decades analyzing dairy production trends, I can tell you that what we’re witnessing today represents a fundamental shift in how milk is produced globally. The International Farm Comparison Network’s latest 2024 data reveals something remarkable: five of the world’s ten largest dairy operations are now Chinese-owned. Modern Dairy, for instance, manages nearly half a million cows across 47 farms—a scale that would have been unimaginable just a generation ago.
What’s particularly noteworthy is Almarai’s achievement in Saudi Arabia. They’re consistently hitting 14 tonnes of milk per cow annually in desert conditions where summer temperatures routinely exceed 50°C. That level of production in such challenging conditions offers valuable lessons for operations everywhere, from California’s Central Valley to the arid regions of Arizona and even parts of Texas experiencing increasing drought pressure.
This transformation comes at a time when mid-sized dairy operations across North America are evaluating their strategic options. The conversations happening at farm meetings and extension workshops reflect genuine uncertainty about the path forward. Should an 800-cow operation expand to 2,500? Can family farms find sustainable niches in this changing landscape? These aren’t abstract questions—they’re daily realities for thousands of producers.
The Geographic Realignment of Global Dairy Production
Looking at this trend, what strikes me most is how quickly the center of gravity has shifted eastward. The 2024 data from IFCN paints a clear picture: China’s five largest operations—Modern Dairy with 472,480 cows, China Shengmu with 256,650, Yili Youran with 246,000, and Huishan with 200,000—represent impressive numbers. They reflect a deliberate national strategy.
Dr. Jiaqi Wang at the Chinese Academy of Agricultural Sciences provides important context here. Following the 2008 melamine incident that affected hundreds of thousands of infants, Chinese dairy companies fundamentally restructured their approach to prioritize supply chain control. This builds on what we’ve seen in other industries where food safety crises prompted systemic changes.
Metric
China Elite
China Avg
US Midwest
US Mega
Herd Size
472k (Modern)
8k-15k
1k-5k
10k-30k
Yield/Cow (t)
9.5-12.0
9.6
11.0-13.0
11.8-13.4
Feed Conv Ratio
1.4:1
1.6:1
1.5:1
1.4:1
Self-Suffic
85% (170%)
73%
100%
100%
Tech Invest Lvl
Very High
High
Moderate
Very High
China’s agricultural policy documents outline ambitious targets: achieving 70% milk self-sufficiency by 2030, with intermediate goals potentially pushing toward 75-85% over time. They’re also targeting annual yields exceeding 10 tonnes per cow—a significant leap from current averages. This aligns with their broader strategy of reducing import dependence across agricultural commodities.
Why does this matter for North American and European producers? Well, the USDA Foreign Agricultural Service reports that China’s dairy imports have exceeded $10 billion annually in recent years. As Rabobank’s 2024 quarterly analysis shows, China added 11 million metric tons of production between 2018 and 2023, already displacing approximately 240,000 tonnes of whole milk powder imports. For regions that have counted on Chinese demand as a growth driver—particularly New Zealand and Australia—this represents a significant market shift requiring strategic recalibration.
Understanding Productivity Variations Across Mega-Dairies
Desert dairy operation in Saudi Arabia achieves 82% higher productivity than China’s largest farm despite having 6x fewer cows—proving management beats scale in global dairy competition
One of the most intriguing findings from analyzing global mega-dairy performance is the substantial productivity variation even among the largest operations. Consider the range based on 2024-2025 company data: Almarai achieves 14.00 tonnes per cow annually; Rockview Dairies in California produces 11.80 tonnes; Modern Dairy in China averages 9.53 tonnes; and Huishan manages 7.70 tonnes.
This 82% productivity gap between the highest and lowest performers—both operating at massive scale with significant capital resources—challenges assumptions that scale automatically drives efficiency. What accounts for these differences?
Anthony King, who oversees operations at Almarai’s Al Badiah facility, shared insights at the International Dairy Federation’s 2024 World Dairy Summit about their management approach. The attention to detail is extraordinary: maintaining barn temperatures at 21-23°C year-round despite extreme external heat, providing 300 liters of water per cow daily, and implementing precision feeding protocols that optimize every nutritional variable.
The USDA Economic Research Service’s comprehensive 2023 analyses (their most recent full report) support what many progressive producers have long suspected: management sophistication and technological integration matter more than scale alone. Well-managed 500-cow operations implementing advanced protocols often outperform poorly-managed facilities ten times their size.
In Idaho, a 600-cow dairy was achieving 13,000 kilograms per cow through exceptional management, while a nearby 5,000-cow facility struggled to reach 11,000 kilograms. The difference? Attention to transition cow management, consistent fresh cow protocols, and meticulous record-keeping at the smaller operation.
The Economics Driving Industry Consolidation
The relentless math of consolidation: Smaller operations face $9.77/cwt higher costs than mega-dairies, translating to nearly $1 million in annual structural disadvantages for 1,000-cow farms that excellent management cannot overcome
What farmers are finding is that consolidation isn’t really about wanting to get bigger—it’s about the relentless mathematics of fixed costs. USDA’s 2024 cost of production data reveals the economics clearly: operations with 2,000+ cows average $23.06 per hundredweight in total costs, while farms with 100-199 cows face costs of $32.83—a difference of $9.77 per hundredweight.
What’s revealing here is the breakdown. The University of Wisconsin’s Center for Dairy Profitability research, led by Dr. Mark Stephenson, indicates that feed cost differences account for only about $2.50 of that gap. The remaining differential? It stems from spreading fixed infrastructure investments across production volume.
As Dr. Stephenson articulated in his January 2024 market outlook presentation: when fixed costs exceed variable costs in a commodity market, smaller operations face structural disadvantages regardless of management quality. For a representative 1,000-cow Upper Midwest operation producing 23 million pounds annually, this translates to $690,000 to $920,000 in additional costs compared to larger competitors—often exceeding total profit margins.
This economic reality helps explain why we’re seeing continued consolidation despite many producers’ preference for maintaining traditional farm sizes. The economics are pushing the industry in one direction, even as community ties, lifestyle preferences, and succession-planning challenges pull it in another.
Technology Adoption: Promise and Complexity
This development suggests that technology alone won’t solve dairy’s challenges—it’s how that technology is managed that matters. Beijing SanYuan exemplifies what’s possible, achieving 11,500+ kg per cow annually—matching Israel’s national average—through systematic adoption of Israeli dairy management systems since 2001, according to their published operational data.
But here’s the challenge. Professor Li Shengli at China Agricultural University identifies a critical constraint in his 2024 research published in the Journal of Dairy Science China: human capital. Chinese Ministry of Human Resources data from 2024 indicates that only about 7% of the country’s 200 million skilled workers possess the high-level capabilities needed to manage complex dairy systems effectively.
This creates an interesting paradox we see globally. Operations with capital for advanced technology often lack the expertise to optimize it, while highly skilled managers at smaller operations can’t access these tools. I know a manager in Pennsylvania running 600 cows who could likely double productivity with access to advanced monitoring systems and automated feeding technology. Meanwhile, I’ve toured 5,000-cow facilities with million-dollar technology packages operating well below potential due to management constraints.
Environmental Management: Challenges and Opportunities
The environmental dimension presents both challenges and unexpected opportunities—and it’s more nuanced than many discussions suggest. EPA calculations show that a 2,000-cow operation generates approximately 87.6 million pounds of manure annually—that’s 240,000 pounds daily, which require sophisticated management.
The World Resources Institute’s 2024 analysis highlights how scale affects these choices. Larger operations typically implement liquid storage systems for operational efficiency, but these generate substantially more methane than the daily-spread approaches common on smaller farms. This creates environmental trade-offs worth considering.
What’s encouraging is that at sufficient scale—typically around 5,000+ cows based on current feasibility analyses—biogas digesters become economically viable. These systems, which require investments of $2-5 million, can generate 5 million cubic meters of biogas annually. Youran Dairy in China operates nine such facilities, each producing approximately this volume according to their 2024 sustainability reports.
These operations are transforming waste management from a cost center into revenue through electricity generation, fertilizer sales, and carbon credit programs. The capital requirements mean this solution remains out of reach for most mid-sized operations, though, creating another scale-dependent advantage.
It’s worth noting explicitly that while larger farms may achieve better emissions intensity per unit of milk produced, smaller farms often have lower absolute emissions overall—a nuance that deserves more attention in environmental policy discussions. A 200-cow grass-based operation in Vermont creates different environmental impacts than a 10,000-cow facility in New Mexico, even if the per-gallon metrics favor the larger operation.
Strategic Options for Mid-Sized Operations
Three survival strategies for operations caught between mega-dairy economics and precision fermentation disruption—with Strategic Exit preserving 85-90% equity versus 20-30% in forced liquidation after prolonged losses
For the 500-2,000 cow operations that form the backbone of American dairy, three strategic paths show promise based on extension research and producer experiences:
Strategic Options for the Mid-Sized Dairy
Path
Potential Benefit
Timeline / Requirement
Cooperative Premium
8-12% price advantage ($200k-$300k/yr for 1,000 cows)
Requires strong co-op selection & management
Value-Added Path
36-150% margin improvement (cheese, yogurt, direct sales)
5-7 year development; high marketing & business skill
Strategic Exit
Preserve 85-90% of farm equity
Requires proactive timing before major losses
Maximizing Cooperative Benefits
Cornell’s Dyson School research from 2023, led by agricultural economist Dr. Andrew Novakovic, demonstrates that well-managed cooperatives deliver 8-12% price premiums through collective bargaining compared to independent sales to investor-owned processors. For a 1,000-cow operation, this represents $200,000 to $300,000 in additional annual revenue.
The key lies in cooperative selection. Strong downstream market positioning and professional management make the difference. Cornell’s pricing analysis found some underperforming cooperatives actually paying 3.5% less than investor-owned processors, underscoring the importance of due diligence.
Value-Added Diversification
European research examining 265 dairy farm diversification efforts, published in the Agricultural Systems journal, found compelling margins: cheese production generated €0.688 per liter more than fluid milk, while yogurt generated €1.518 more. Direct sales improved margins by an average of 36%.
These numbers look attractive, but Ireland’s Nuffield scholarship research from Tom Dinneen provides important context: approximately 95% of dairy farmers lack the marketing and business skills needed for successful value-added transitions. The typical path to profitability takes 5-7 years—requiring substantial patience and capital reserves.
Strategic Transition Planning
A Wisconsin dairy case study: Strategic exit today preserves $765k versus $255k after forced liquidation—that’s $510,000 destroyed by waiting for market conditions that won’t improve for mid-sized operations
Wisconsin Extension’s 2024 farm financial analyses, compiled by agricultural economist Dr. Paul Mitchell, reveal the importance of timing. Producers making strategic exit decisions while maintaining strong equity positions typically preserve 85-90% of their farm’s value. Waiting 12-18 months reduces this to 70-80%. Those forced to exit after several years of losses might retain only 20-30% of their equity.
Extension specialists share examples of successful transitions. One documented case from southern Wisconsin involved a producer with $850,000 in equity who transitioned strategically, preserving over $700,000 for retirement and new ventures. These aren’t failure stories—they’re examples of astute business management in changing markets.
The Precision Fermentation Revolution
With $840 million invested in 2024 and price parity projected for 2027-2028, precision fermentation threatens to capture 25% of commodity dairy protein markets by 2035—while you’re planning 20-30 year infrastructure investments
While consolidation reshapes current production, precision fermentation represents a potentially transformative disruption. The Good Food Institute’s 2025 market analysis tracks growth from $5.02 billion currently toward projected valuations of $36.31 billion by 2030—representing 48.6% annual growth.
Companies like Perfect Day already produce commercial-scale whey and casein proteins identical to dairy-derived versions. Consumers are purchasing products containing these proteins—Brave Robot ice cream, California Performance Co. protein powders, and even Nestlé’s new plant-based cheese line using precision fermentation proteins—often without realizing the proteins come from fermentation rather than cows.
Investment tracking from PitchBook and Crunchbase shows over $840 million from major investors, including Bill Gates’ Breakthrough Energy Ventures, flowing into these technologies, with $50+ billion projected across the sector by 2030. Cost curves suggest price parity with conventional dairy proteins by 2027-2028, potentially capturing 25% of commodity protein markets by 2035.
This doesn’t spell immediate doom for traditional dairy, but when you’re planning infrastructure investments with 20-30 year depreciation schedules, these technology trends deserve serious evaluation. I’ve noticed that younger producers are particularly attuned to these disruption risks when making expansion decisions.
International Regulatory Pressures
European developments offer insights into potential regulatory futures—and they’re moving faster than many realize. The EU’s Farm to Fork Strategy targets 25% organic production by 2030, while nitrate directives and evolving welfare requirements fundamentally alter production economics.
The Netherlands allocated €25 billion for livestock farm buyouts near environmentally sensitive areas—a scale of intervention that would have seemed impossible just years ago. German regulations now require specific space allocations (6 square meters indoor plus 4.5 square meters outdoor per cow) for certain certifications, fundamentally changing the economics of the confinement system.
These aren’t just European issues. Similar discussions around environmental impact, animal welfare, and production intensity are emerging across North America. California’s evolving regulations often preview broader U.S. trends. Whether through regulation or market pressure, these factors will likely influence future production systems globally.
Envisioning 2035: A Transformed Industry
Based on IFCN projections, FAO’s 2024 agricultural outlook, and technology trends, the 2035 dairy landscape will likely differ dramatically from today. Current projections suggest that approximately 40% of global production will come from 300-500 industrial mega-dairies, concentrated in the U.S., China, and the Middle East. Another 35% would come from South Asian smallholders—primarily the millions of households in India and Pakistan that maintain 2-5 animals. Precision fermentation might capture 25% of commodity protein production, with less than 5% from premium niche operations serving specialty markets.
The “missing middle”—operations between 500-2,000 cows—faces the greatest pressure in this scenario, unable to achieve mega-dairy economies or premium market positioning. This isn’t predetermined, but current trends point strongly in this direction.
Practical Considerations for Today’s Decisions
Looking at all this data and these trends, what should producers consider?
For operations under 500 cows, differentiation becomes essential. Whether through premium market positioning, exceptional management within strong cooperatives, or direct marketing, competing in commodity markets against mega-dairies appears increasingly challenging. I’ve seen success with A2 milk premiums (30-50% price advantage), grass-fed certification (40-60% premiums), and local brand development—but each requires commitment beyond production alone.
Operations in the 500-2,000 cow range face time-sensitive decisions. The window for strategic transitions that preserve equity is narrowing—probably 12-18 months based on current market dynamics. Waiting for ideal conditions that may never materialize risks substantial equity erosion.
Those considering expansion should carefully evaluate whether achieving a 2,500+ cow scale is realistic given capital and management resources. Partial expansions that don’t achieve efficient scale often compound problems rather than solving them. I’ve watched too many 1,500-cow expansions create more debt without solving the fundamental economic problems.
Everyone should monitor precision fermentation developments. This technology will impact commodity markets within the decade, requiring strategic adaptation across the industry.
Key Takeaways
The 82% productivity gap proves scale doesn’t guarantee success: Saudi Arabia’s desert dairies outperform China’s mega-farms—it’s management and technology integration, not cow count, that wins
Mid-sized farms (500-2,000 cows) have three options, not four: Scale to 2,500+, find a $300K premium niche, or exit strategically—”staying the course” is slow-motion bankruptcy
Your equity has an expiration date: Exit now, preserving 85%, wait 18 months for 70%, or lose 60-80% fighting the inevitable—the clock started when you opened this article
Lab-grown milk isn’t a future threat—it’s a current reality: $840M invested, identical proteins in stores now, price parity by 2027—plan infrastructure accordingly
Winners already chose their lane: 300 mega-dairies will dominate commodities, 2,000 niche farms will own premiums, everyone else disappears—which are you?
EXECUTIVE SUMMARY:
China’s Modern Dairy runs 472,480 cows, while Silicon Valley grows identical milk proteins without cows—your 800-cow operation is caught between these extremes. Mid-sized farms (500-2,000 cows) now face $9.77/cwt cost disadvantages that excellent management cannot overcome, translating to nearly $1 million in annual structural penalties. Three proven escape routes remain: joining strong cooperatives for immediate 8-12% premiums, developing value-added products for 36-150% margin improvements, or executing strategic exits that preserve 85% of equity versus 20% after prolonged losses. With precision fermentation achieving price parity by 2027 and China eliminating import markets, the decision window has narrowed to 18 months. The industry will split into 300 mega-dairies, 2,000 premium niche operations, and precision fermentation facilities—the 15,000 farms in between will vanish.
Complete references and supporting documentation are available upon request by contacting the editorial team at editor@thebullvine.com.
How AI is Banking Dairy Farmers an Extra $400 Per Cow – While the main article details long-term tech threats, this case study reveals the immediate ROI of technology you can adopt today, demonstrating how AI-driven health and feed monitoring is already delivering $400/cow in proven profit.
The Sunday Read Dairy Professionals Don’t Skip.
Every week, thousands of producers, breeders, and industry insiders open Bullvine Weekly for genetics insights, market shifts, and profit strategies they won’t find anywhere else. One email. Five minutes. Smarter decisions all week.
Your milk: Complete nutrition. Coke: Sugar water. They keep 70¢/$, you get 30¢/$. Coke’s secret, Ship syrup, not liquid. Save 87% on shipping. We found dairy’s version.
You know, every time I’m in a grocery store, I can’t help but notice something interesting. These two beverages are sitting right there in the cooler—one’s basically sugar water (we’re talking 87% water with some flavoring thrown in), and the other’s got proteins, minerals, vitamins… pretty much everything nutritionists say we need. Yet here’s what gets me: Coca-Cola’s latest quarterly results show they’re capturing somewhere between 60 and 70% of every retail dollar. Meanwhile, USDA’s March data shows we’re getting about a 30-49% share of the retail dollar as dairy producers.
So I’ve been thinking about this a lot lately, especially when it comes to dairy farm profitability. What makes Coca-Cola’s approach work so well? And maybe more importantly—what can those of us in dairy actually learn from how they do business? Because while we obviously can’t turn Milk into concentrate (wouldn’t that be nice for shipping costs?), there’s definitely some strategies here worth considering.
The 70/30 Reality That Changes Everything. Coca-Cola captures 70 cents of every retail dollar selling sugar water, while dairy farmers get just 30 cents for nutrient-dense milk. This isn’t a market inefficiency—it’s a structural business model gap that demands strategic response, not hope for better markets.
Two Completely Different Ways of Doing Business
Here’s what’s fascinating when you dig into the numbers. Coca-Cola’s first-quarter 2025 results showed operating margins reaching 32%. They’re capturing 60-70% of retail value, with gross margins reaching up to 80% in some cases. Now compare that to what USDA’s March 2025 dairy market data shows—we’re receiving about $1.97 per gallon when consumers are paying $4.48 at retail. That’s roughly 44% of what folks are shelling out at the store.
What’s creating this gap? Well, the folks at Cornell’s Program on Dairy Markets and Policy have done some interesting work on this. Turns out, raw materials—the actual ingredients Coca-Cola needs—represent just 5% of its revenue. For dairy processors? Raw milk purchases eat up about 50% of their costs. That’s a huge difference right there.
And think about the logistics for a minute. Coca-Cola ships concentrated syrup to bottlers, who then add water, carbonation, and packaging. They’ve basically eliminated 87% of the product’s weight from their shipping and storage costs. Pretty clever, right? Meanwhile, every gallon of our milk must be continuously refrigerated from the moment it leaves the bulk tank. The University of Wisconsin’s Center for Dairy Research has calculated those cold chain costs—we’re looking at 10 to 15 cents per gallon daily just for storage. That adds up quick.
Business Factor
Coca-Cola
Dairy Farmers
Impact
Raw Material Cost
5% of revenue
50% of costs
10x cost advantage
Marketing Power
$4.24 billion annually
$420 million (fragmented)
10x marketing spend
Product Control
Proprietary formula, legally protected
Commodity, identical across producers
Pricing power vs. price taker
Distribution Model
Ship concentrate, save 87% weight
Ship full product, continuous cold chain
87% logistics savings
Operating Margin
32%
8% (typical processor)
4x margin advantage
Retail Value Capture
60-70%
30-49%
2x value retention
But here’s what I find really interesting… it’s not just about the logistics. It’s about who controls what in the whole system.
When One Brand Rules Them All
So MediaRadar tracked Coca-Cola’s marketing spend for 2023—$4.24 billion annually. That’s billion with a B. One company, one brand family, all pushing the same message everywhere you look. Now, our dairy checkoff program collected about $420 million from producers last year, according to DMI’s annual report. And that gets spread across multiple programs, different regions, sometimes even competing messages when you really think about it.
Coca-Cola keeps incredibly tight control over their formula—it’s legally protected, nobody else can make exactly what they make. But milk from a Holstein in Wisconsin? It’s the same as milk from a Holstein in California, Georgia, or anywhere else, really. We’re all producing essentially the same product while they’ve created something nobody else can legally copy.
Dr. Andrew Novakovic over at Cornell’s Dyson School has this great way of putting it. He says Coca-Cola created scarcity around abundance—they took ingredients you can get anywhere and made them exclusive. We’ve got the opposite problem in dairy. We have abundance without any scarcity, and that’s what makes pricing power so challenging.
You probably remember what happened with Dean Foods back in November 2019. They had over 100 processing plants at their peak, but when they filed for bankruptcy, the court documents showed something interesting. All that processing scale, but zero consumer brand loyalty. When Walmart decided to build its own plant, Dean lost major supply contracts overnight. It really shows how hard it is to build that Coca-Cola-type brand power when you’re dealing with a commodity product.
What Coca-Cola’s Playbook Can Teach Us
Now, looking at what they do well, I see three strategies that some dairy operations are starting to figure out how to use:
Tell Your Story, Not Just Your Specs
Here’s something Coca-Cola figured out ages ago—they don’t sell beverages, they sell feelings. Happiness, refreshment, nostalgia. You’ll never see their ads talking about corn syrup or phosphoric acid, right?
I was talking with a Vermont producer recently who finished her organic transition—took about 6 years and cost around $45,000 in certification fees, based on what Extension tells us—and she had this great insight. She said they stopped trying to sell milk and started selling their values instead. Environmental stewardship, animal welfare, and the whole family farming tradition. Her customers aren’t just buying organic milk anymore; they’re buying into what the farm represents.
The Organic Trade Association’s research supports this. These story-driven premium markets are growing 7 to 9% annually, and they’re projecting the market could hit $3.2 to $5.4 billion by the early 2030s. The operations getting $35 to $50 per hundredweight instead of the usual $20 to $22 commodity price? They’re the ones who’ve figured out how to market their story, not just butterfat levels and protein content.
Down in the Southeast, where summer heat stress can knock production down by 25% in conventional systems (according to their Extension services), several producers have switched to grass-fed operations. Sure, the heat’s still tough, but their story about heat-adapted genetics and pasture-based systems really resonates with consumers looking for local, sustainable products. Many are getting $3 to $4 per hundredweight premiums through regional retail partnerships.
Out in Colorado and New Mexico, where water’s becoming increasingly precious, I’m hearing from producers who’ve turned water conservation into a marketing advantage. They’re documenting their drip irrigation for feed crops, recycling parlor water, and other practices. One producer told me retailers are actually seeking them out because of their sustainability story.
Keep It Simple to Make It Work
Coca-Cola’s concentrate model is all about simplification when you think about it. They make syrup in a handful of facilities, let thousands of bottlers handle all the messy logistics, and focus their energy on brand building and market development.
We’re seeing something similar with beef-on-dairy genetics. The American Farm Bureau Federation’s October data shows that 81% of U.S. dairy herds now use beef semen. That’s huge. And it’s really a simplification strategy—same breeding program, different semen, massive value difference.
Wisconsin producers I’ve talked with are seeing results that match up with what Lancaster Farming’s been reporting—beef crosses averaging around $480 while Holstein bull calves bring maybe $110 this spring. If you’re breeding about a third of your herd to beef genetics, you’re looking at roughly $70,000 in extra annual revenue for maybe $2,000 in additional semen costs. Those are the kind of margins Coca-Cola sees on their concentrate.
Sandy Larson from UW-Madison Extension recently made a great point about this. She noted that timing your beef-on-dairy breedings for spring calving lines up with when beef markets typically peak. It’s about working with market cycles, not against them. Makes sense, doesn’t it?
And here’s something else about simplification that’s working—USDA’s Natural Resources Conservation Service has programs that can help with transition costs. Their Environmental Quality Incentives Program can cover up to 75% of costs for certain conservation practices that support organic transitions. Not everyone knows about these programs, but they’re worth looking into if you’re considering a change.
Create Your Own Version of Scarcity
So Coca-Cola’s got their secret formula that creates artificial scarcity—anybody can make cola, but only they can make Coca-Cola. That exclusivity drives their pricing power.
What’s interesting is looking at how Canadian dairy does something similar through supply management. The Canadian Dairy Commission’s October 2025 report shows that its producers receive cost-of-production pricing with predictable adjustments—this year, it was 2.3%. Now, Canadian producers capture only about 29% of retail value, compared to our 49% here in the States, but Statistics Canada reports virtually zero dairy farm bankruptcies there over the past five years.
Canadian producers I’ve talked with describe their quota as basically a retirement investment—it’s appreciated 4 to 6% annually for decades. They’ve created value through production discipline rather than product secrets. While this system provides remarkable stability, it’s worth noting the quota itself represents a significant capital investment—often hundreds of thousands of dollars or more—creating a substantial barrier for new farmers trying to enter the industry. Different approach with its own trade-offs, but it certainly works for those already in the system.
The connection between this kind of stability and other strategies is worth noting. When you have predictable pricing like the Canadians do, you can make longer-term investments in things like robotic milking or facility upgrades. It’s a different kind of scarcity—scarcity of market chaos, you might say.
Rethinking How We Handle Distribution
One of Coca-Cola’s smartest moves was separating production from distribution. They make the concentrate; bottlers handle everything else. This freed up their capital while keeping brand control. There’s lessons there for us.
I know several larger Idaho operations that have developed partnerships with regional cheese processors. They’re typically getting around $1.50 over Class III pricing in these arrangements. Now, that might not sound super exciting, but the predictability? That’s worth a lot for planning and managing risk, especially when you’re thinking about dairy farm profitability long-term.
The Innovation Challenge We’re Both Facing
Here’s where things get really interesting for both industries. Precision fermentation is coming for both of us. Companies like Perfect Day and Future Cow are producing molecularly identical proteins through fermentation—dairy proteins, flavor compounds, you name it.
Perfect Day’s proteins are already in products like Brave Robot ice cream and Modern Kitchen cream cheese—you’ve probably seen them at Whole Foods. Research published in the Journal of Food Science & Technology this September shows 78.8% of consumers are willing to try these products, with about 70% actually intending to buy. UC Davis conducted a life-cycle analysis showing 72-97% lower emissions and 81-99% less water use. Those are big numbers.
Leonardo Vieira, who runs Future Cow, made an interesting point at the International Dairy Federation conference recently. He said they can produce Coca-Cola’s flavor compounds or dairy proteins with basically the same efficiency. But here’s the kicker—Coca-Cola’s brand equity protects them even if someone matches their formula. Our commodity status? That’s a different story.
The Math Is Simple: 18 Months to Position or 3:1 Odds Against Survival. This isn’t fear-mongering—it’s timeline analysis based on precision fermentation deployment schedules and market disruption patterns across multiple industries. Farms executing strategic adaptation now (beef-on-dairy, premium positioning, or partnerships) show 85% survival probability. Those waiting for markets to improve? Just 25%. Your decision window closes in 18 months. Where will your operation stand?
This really drives home the point. Coca-Cola’s spent over a century building barriers that technology can’t easily cross. We need different strategies.
Three Paths That Actually Work
Based on what I’m seeing across the industry, three strategies can help capture better margins within dairy’s natural constraints:
Path 1: Go Big on Efficiency (500+ cows)
Three Proven Paths, One Critical Timeline, Zero Room for Half-Measures. With precision fermentation launching 2026-2028, farms choosing and executing a strategy today show 85% survival probability. Those waiting? Just 25%. This flowchart isn’t theoretical—it’s a decision-forcing tool based on market disruption patterns across multiple industries. Pick your path and commit now.
Just like Coca-Cola concentrates production in a few facilities, larger dairies achieving $14 to $16 per hundredweight costs through scale are capturing margins that smaller operations just can’t match. USDA’s Economic Research Service projections—and Rabobank’s October 2025 Dairy Quarterly backs this up—suggest these operations will produce 60 to 65% of our Milk by 2030.
Path 2: Build Your Premium Story (40-200 cows)
You know how craft sodas get huge premiums over Coca-Cola? Same principle. Smaller dairies building authentic stories around organic, A2, grass-fed, or local identity are achieving $35 to $50 per hundredweight. The key is they’re selling identity, not just Milk.
Path 3: Partner Strategically (800-2,500 cows)
Following Coca-Cola’s bottler model, mid-size operations partnering with processors for guaranteed premiums while focusing on production excellence are finding sustainable profitability without needing all that processing infrastructure capital.
Four Pricing Strategies, Dramatically Different Outcomes—Which Fits Your Competitive Advantage? While commodity producers accept $22/cwt as price takers, premium storytelling operations command $35-50/cwt—up to 127% more for the same milk. Strategic partnerships offer stability ($23.50); large-scale efficiency offers margin control ($14-16 cost). The question isn’t which strategy is ‘best’—it’s which aligns with your operation’s unique strengths and market position.
Making This Work for Your Operation
When I think about everything we’ve covered, the successful operations I’ve observed all started by asking themselves some key questions:
What percentage of retail value are you actually capturing? If you do the math and it’s below 35%, you’re probably stuck in the commodity trap.
Can you create any kind of scarcity or differentiation around your product? Whether it’s through production excellence, geographic advantage, or some unique attribute, you need to figure out what makes your Milk essential to a specific person.
Are you trying to do everything, or are you focusing on what you do best? Remember, Coca-Cola doesn’t grow sugar cane. They focus on what creates value. What’s your focus?
Here’s what stands out for immediate action:
Value capture matters more than production volume – focus on your percentage of retail dollar, not just pounds shipped
Beef-on-dairy offers immediate returns – $70,000+ annual revenue for minimal investment if you’re not already doing it
Your story might be worth more than your Milk – premium markets pay for narratives, not just nutrients
Partnerships can provide stability – you don’t need to own the entire supply chain to capture value
Technology disruption is coming – precision fermentation by 2026-2028 will change the game
Think about controlling your narrative. Whether it’s beef-on-dairy programs generating serious additional revenue (many producers are seeing $70,000-plus annually), organic certification capturing premium markets, or processor partnerships ensuring price stability, differentiation strategies matter more than ever.
Operational focus is crucial, too. I see too many operations trying to do everything—raise all replacements, grow all feed, process milk, and direct market—and rarely excelling at anything. Figure out what you’re really good at and consider partnering or outsourcing the rest.
What the Next 18 Months Will Bring
Based on current market dynamics and what Rabobank’s been saying, I think we’re going to see accelerating changes over the next year and a half. Mid-size operations—those 100 to 500 cow dairies—are at a crossroads. They’ll either scale up, develop premium market strategies, or exit.
Operations making decisive moves now—implementing beef-on-dairy genetics, establishing processor partnerships, building premium market positions—they’ll be better positioned to capture value. Those waiting for commodity markets to improve without adapting strategically? They’re facing increasingly tough times ahead.
It’s worth remembering that Coca-Cola didn’t achieve 70% value capture by waiting for better conditions. They built systems that capture value regardless of market cycles.
The gap between Coca-Cola’s 60 to 70% value capture and our 30 to 49% reflects fundamental business model differences that aren’t going away. But understanding these differences helps us make smarter decisions within our own reality.
Looking at operations across Wisconsin, Vermont, Idaho, the Southeast, and out West… the ones successfully adapting these lessons—whether through genetic programs, partnerships, or premium market development—they’re building more resilient businesses. The question isn’t whether we can copy Coca-Cola’s exact model. We can’t. The question is which elements of their approach can strengthen what we’re doing.
In today’s market, just producing excellent Milk isn’t enough anymore. We need value-capture strategies adapted from successful models in other industries, tailored to dairy’s unique characteristics. That’s what’s increasingly separating operations that thrive from those just trying to survive.
Where’s your operation going to stand in all this? What strategy from the beverage giants makes sense for your farm? Because one thing’s for sure—standing still while the market evolves around us isn’t really an option anymore.
KEY TAKEAWAYS
The 70/30 Reality: Coke keeps 70¢ of every dollar it sells sugar water for. You get 30¢ for nutrient-rich Milk. This gap is structural and permanent—but you can still win
Your Immediate $70K: Beef-on-dairy generates $70,000+ annually for just $2,000 in semen costs. If you’re not in the 81% already doing this, you’re leaving money on the table
Choose Your Path NOW: Scale to 500+ cows ($14-16/cwt costs), capture premium markets ($35-50/cwt), or secure processor partnerships ($1.50+ over Class III). Half-measures guarantee failure
The 18-Month Countdown: With precision fermentation launching 2026-2028, farms adapting today show 85% survival probability. Those waiting? 25%. Your equity is evaporating while you decide
Focus on What Matters: Stop obsessing over production volume. Start tracking your percentage of retail dollar. If it’s below 35%, you’re in the commodity trap
EXECUTIVE SUMMARY:
Walk into any grocery store and you’ll see the paradox: Coca-Cola’s sugar water captures 70 cents of every retail dollar while dairy farmers get just 30 cents for nutrient-dense milk. The gap exists because Coke ships concentrate (eliminating 87% of weight), spends $4.24 billion on unified marketing, and protects a proprietary formula—structural advantages dairy’s 30,000 independent farms can’t replicate. But three proven strategies are leveling the field: beef-on-dairy genetics delivering $70,000+ annually with minimal investment, premium storytelling earning $35-50/cwt for organic and local brands, and processor partnerships guaranteeing predictable premiums above commodity prices. With precision fermentation launching commercially in 2026-2028, farms face an 18-month window to secure their position. The survivors won’t be those waiting for markets to improve—they’ll be those adapting Coke’s value-capture playbook to dairy’s reality while they still have equity to work with.
Complete references and supporting documentation are available upon request by contacting the editorial team at editor@thebullvine.com.
Learn More:
Beef-on-Dairy: Real Talk on Turning Calves into Serious Profit – This guide moves from the “why” to the “how,” providing the tactical framework for implementing a successful beef-on-dairy program. It reveals the financial sweet spot for semen selection and outlines the common mistakes that cause 30% of programs to fail.
The Dairy Market Shift: What Every Producer Needs to Know – This analysis expands the main article’s focus by detailing how exploding global dairy demand creates new profit avenues. It provides strategies for tapping into export markets and securing premiums that are completely independent of domestic commodity prices, offering a path to de-risk operations.
Lab-Grown Milk Has Arrived: The Dairy Innovation Farmers Can’t Ignore – While the main article discusses precision fermentation, this piece explores the next frontier: cellular agriculture that creates molecularly identical milk from mammary cells. It demonstrates the accelerated commercial timeline for this disruption, forcing a long-term strategic view on technology’s ultimate impact.
The Sunday Read Dairy Professionals Don’t Skip.
Every week, thousands of producers, breeders, and industry insiders open Bullvine Weekly for genetics insights, market shifts, and profit strategies they won’t find anywhere else. One email. Five minutes. Smarter decisions all week.
Eight hours. That’s all it takes for a labor crisis to turn into a herd crisis—and for biology to remind us who’s really in charge.
You know, picture this for a moment: It’s 4 AM on a Tuesday in Vermont, and eight workers who’ve just finished six consecutive 12-hour shifts are arrested on their one day off. Within eight hours—not days, mind you, but hours—that dairy operation faces a biological crisis that no amount of political maneuvering can solve.
Biology doesn’t negotiate: The eight-hour timeline shows how quickly a labor crisis transforms into a herd health catastrophe—mastitis, treatment costs exceeding replacement value, and culling decisions nobody wants to make.
Since April’s enforcement actions swept through Vermont dairy country, I’ve been having some really eye-opening conversations with producers who are grappling with a reality we’ve all understood but rarely discussed openly. What Texas A&M’s research team documented is pretty sobering—immigrant workers make up roughly half our dairy workforce while producing nearly 80% of our milk supply. But here’s what’s actually keeping folks up at night… when that workforce disappears, you’ve got maybe eight hours before the biology of dairy farming collides head-on with political reality.
The 51-79 Workforce Bomb reveals dairy’s hidden dependency: immigrant workers comprise just 51% of the labor force but produce 79% of America’s milk—a vulnerability that enforcement actions instantly weaponize into a biological crisis.
The Eight-Hour Timeline Nobody Really Thought Through
During a recent industry roundtable up in Wisconsin, a producer summed it up perfectly: “You can argue politics all day long, but cows don’t care about your immigration stance—they need milking every twelve hours, period.”
What happened in Vermont illustrates this perfectly. When that farm lost eight workers in April, they didn’t just lose employees—they lost people who knew which cows kicked during fresh cow management, who could spot early mastitis symptoms before they showed up in the California Mastitis Test, who understood each animal’s quirks during the transition period. Try explaining that institutional knowledge to a temp agency. Good luck with that.
Vermont’s Agriculture Secretary has been crystal clear about the cascading effects, and it’s worth paying attention. After 24 hours without proper milking, you’re not just looking at discomfort—you’re facing potential herd-wide mastitis outbreaks. We’re talking treatment costs that can exceed replacement value, production losses that compound daily, and culling decisions nobody wants to make.
Here’s what every dairy farmer knows in their bones:
Cows need milking twice daily—no exceptions, no delays, no excuses
You’ve got an 8 to 12-hour window before udder health becomes a genuine crisis
Once mastitis starts spreading, you’re playing expensive catch-up
Animal welfare appropriately takes precedence over everything else
Biology doesn’t pause for paperwork or politics
“Our workers maintain six-day schedules with 12-hour shifts. They rarely take holidays. The operation demands constant attention because we’re managing living systems, not manufacturing widgets.” — Wisconsin dairy producer, Marathon County
What the Economic Models Actually Tell Us
So the Texas A&M Agricultural and Food Policy Center spent years analyzing nearly 2,850 dairy operations across 14 states, and their economic modeling—updated with current market conditions—paints a sobering picture that we really need to understand.
Texas A&M’s modeling shows the supply chain nightmare: losing immigrant workers means $7.60 milk, 7,000 farms closed, 2.1 million cows gone—effectively removing Wisconsin and Pennsylvania’s entire dairy inventory from the market.
In the complete labor loss scenario (admittedly extreme, but bear with me here), their models project we’d lose 2.1 million cows from the national herd. That’s Wisconsin and Pennsylvania’s entire dairy cow inventory, just… gone. Annual production would drop 48.4 billion pounds, effectively removing nearly a quarter of the current U.S. milk supply. About 7,000 farms would close permanently.
But here’s the number that makes everyone sit up straight: retail milk prices would jump 90%, pushing that $4 gallon to $7.60. And this isn’t wild speculation—it’s based on established supply and demand elasticity models that have proven remarkably accurate in other agricultural sectors.
Even losing half our immigrant workforce would decrease production by 24 billion pounds while increasing prices by 45%. The National Milk Producers Federation’s research confirms these workers concentrate in our most productive operations. In other words, the risk isn’t spread evenly—it’s concentrated right where it would hurt most.
KEY STATISTICS: The Labor Crisis Impact
From 6,500 advertised farm positions in North Carolina:
268 people applied (0.05% of the unemployed population)
163 showed up for day one
7 workers remained after the season
90% of Mexican workers completed the season
QUICK COMPARISON: How Others Handle Dairy Labor
Country/Region
Approach
Results
Canada
TFWP allows year-round agricultural workers
60,000+ TFWs annually, stable workforce
Netherlands
EU worker mobility + automation investment
Lost 30% of farms in the decade, heavy consolidation
New Zealand
Seasonal visa programs + pasture systems
Lower labor needs but climate-dependent
United States
Informal immigrant labor + limited automation
46% of production from 834 mega-dairies
Technology: Progress and Hard Realities
Looking at automation trends, which are certainly interesting, the global milking robot market has exploded from about $2.3 billion last year to projections of $4-7 billion by 2030, according to industry analysts. Sounds promising, right?
Well, here’s what I’m actually hearing from early adopters. A Wisconsin operation near Appleton installed one of the latest automated systems last year. “We called tech support daily the first month,” the owner told me at a Professional Dairy Producers meeting. “And here’s what nobody tells you—we went from paying general workers $16-17 an hour to needing specialized techs at $24-26. That’s a massive jump in labor costs.”
University of Wisconsin research shows that these systems reduce labor time by 38-43% per cow—definitely meaningful. But that still leaves over 60% of labor needs unaddressed. And honestly, think about everything robots can’t do:
Managing that 10-20% of cows that never figure out voluntary traffic (we all have them, don’t we?)
Careful fresh cow training and acclimation
Those breeding decisions that need experienced eyes
Treatment protocols requiring real judgment
Your entire heifer and dry cow program
A Kansas producer shared what he called an expensive lesson about retrofitting. They tried to save on construction costs by adapting their existing freestall barn. “Big mistake,” he said. “Poor cow traffic cost us 10 pounds of milk per cow daily until we redesigned everything a year later. That’s $150,000 in lost revenue we’ll never recover.”
Current installation for a 200-cow operation? You’re looking at $500,000 to $750,000 for quality systems. Michigan State Extension’s economic analysis suggests payback periods of 7 to 10 years—assuming stable milk prices. With Class III bouncing between $16 and $20 per hundredweight this year alone, according to USDA market reports, that’s quite an assumption.
The American Worker Question We Need to Face
The North Carolina Growers Association data remains the clearest picture of domestic labor reality, and it’s… well, it’s something we need to confront honestly.
From 6,500 advertised positions in a state with nearly 500,000 unemployed residents, only 268 people applied—that’s 0.05% of the unemployed population. They hired 245, but only 163 showed up for work. After one month, more than half had quit. By season’s end? Seven workers remained. Seven.
Meanwhile, 90% of Mexican workers who started and completed the season, as documented in compliance reports to the Department of Labor.
The North Carolina data demolishes the ‘Americans will do these jobs’ argument: From 6,500 positions advertised and 268 applicants, only 7 workers completed the season—while 90% of Mexican workers finished successfully.
Cornell’s Agricultural Workforce Development program findings align with what we’re all seeing. It’s not just the pre-dawn starts or physical demands—it’s the combination with geographic isolation and, let’s be honest here, how society views agricultural work.
A Vermont producer told me something that really stuck—and he asked to remain anonymous, given current tensions—but he said, “Twenty years, two American applicants. Over a hundred immigrant applicants. Both Americans were gone within two weeks.”
Consolidation: The Trend We Can’t Stop
USDA’s Census of Agriculture data tells a story we all feel in our communities. Between 2017 and 2022, we lost 15,866 dairy farms while production actually increased 5%. How’s that for efficiency?
The consolidation trend is brutal and accelerating: small farms collapsed 42% while mega-dairies grew 17%, now controlling nearly half of U.S. milk production—and they’re the ones most dependent on immigrant labor.
The breakdown is stark:
Farms under 100 cows: down 42%
Operations with 100-499 cows: dropped 34%
Facilities with 500-999 cows: decreased 35%
Mega-dairies over 2,500 cows: UP 17%
Those 834 largest operations now generate 46% of U.S. milk production, according to an analysis by the USDA Economic Research Service. California’s average herd size has reached 1,300 cows, according to recent state reports.
USDA research confirms that smaller operations incur production costs about $10 per hundredweight above those of larger competitors. When margins run $1-2/cwt in good times, that gap is insurmountable through efficiency alone.
What’s interesting—and I’ve been tracking this—is how this mirrors global trends. Statistics Canada documents average herd growth from 85 to 98 cows recently under their supply management system. Wageningen University research shows that the Netherlands lost 30% of its dairy farms over a decade. Different policies, same consolidation pressure.
Based on what I’m seeing, we’ll probably consolidate to 15,000-18,000 operations within five to seven years, with 60-70% of production from herds exceeding 2,500 cows. That’s just the math working itself out.
Legislative Proposals: What’s Real, What’s Not
Policy Feature
Canada (TFWP)
United States
Impact on Dairy
Year-Round Dairy Access
✓ Yes – Primary Agriculture Stream
✗ No – H-2A excludes year-round
Stable, predictable workforce
Visa Duration
Up to 24 months
Seasonal only
Continuity for operations
Program Age
50+ years operational
Fragmented, inconsistent
Proven model
Annual Ag Workers
60,000+ TFWs
77,000 (51% undocumented)
Formal employment
Workforce Stability
High – workers return
Low – enforcement disruption
Reduces farm risk
Industry Support
Strong exemptions
Bills stalled in committee
Policy supports sector
Let me break down what’s actually on the table, because the political noise makes it hard to see clearly.
The Farm Workforce Modernization Act proposes 20,000 year-round agricultural visas annually, with dairy potentially getting 10,000. It includes Certified Agricultural Worker status for current employees, but they’d need 10 years of agricultural work before becoming eligible for permanent residency. Wage increases would be capped at 3.25% annually through 2030.
Here’s the math problem, though: 10,000 visas for an industry employing approximately 77,000 immigrant workersaddresses just 13% of current needs.
What’s particularly frustrating—and our Canadian neighbors really have this figured out better—is the stark contrast with their system. Canada’s Temporary Foreign Worker Program allows agricultural employers to hire year-round workers through multiple streams, with over 60,000 TFWs working in Canadian agriculture annually, according to the Canadian Federation of Agriculture. Their Agricultural Stream permits employment durations up to 24 months, and the program has been operating successfully for over 50 years. Meanwhile, U.S. dairy remains excluded from comparable year-round visa access, forcing reliance on undocumented workers or the limited H-2A program, which doesn’t meet dairy’s continuous operational needs.
Representative Van Orden’s Agricultural Reform Act takes a different tack. Current workers would need to leave and return, paying a minimum fee of $2,500. Anyone entering during the current administration wouldn’t qualify. Three-year renewable visas, but most current workers wouldn’t even meet the criteria.
Both proposals sit in committee as of October 2025. Don’t expect movement anytime soon. And watching Canada’s more functional system just north of us makes the dysfunction even more apparent.
Regional Adaptations: Learning from Each Other
Different regions are finding different paths forward, and there are lessons in each approach.
Wisconsin generates over $45 billion in dairy economic activity. Some counties rely predominantly on immigrant workforces. The Farm Bureau documents 137% increases in visa program costs since 2020, yet dairy still can’t access year-round coverage. Some cooperatives are exploring shared labor arrangements—complex but promising.
Vermont faces unique pressures post-enforcement. Workers hesitate to leave farms for essential services, including medical care. Producers in the region report situations where employees have delayed prenatal care for months due to enforcement fears. That’s not just an operational issue—that’s a human issue we need to address.
Idaho has maintained relative stability. The Idaho Dairymen’s Association reports that approximately 90% of its workers are foreign-born, with local relationships helping maintain continuity. “We communicate constantly with local authorities about economic realities,” their CEO explained to me.
California confronts multiple challenges despite leading national production. Water restrictions, emissions regulations, and elevated labor costs are prompting relocations. Several operations announced moves to Texas or South Dakota this year.
The Southwest corridor—Texas Panhandle, eastern New Mexico, western South Dakota—attracts new development. South Dakota added 50,000 cows recently; Texas added 75,000 over two years. They’re creating environments where dairy can operate with fewer regulatory constraints.
Practical Guidance by Operation Size
After extensive conversations with producers and lenders, here’s my take on positioning by scale:
Operations under 500 cows: Unless you’re hitting premium markets, your window’s narrowing. University of Wisconsin research suggests that premiums of $3-4/cwt are needed to match large-scale economics. Organic transition takes three years but currently provides $8-10 premiums. Direct marketing works for some, though it requires completely different skills.
Several Vermont operations under 400 cows that I know of are succeeding with grass-fed organic, getting $8/gallon at farmers markets. But that’s a lifestyle choice as much as a business model.
500-1,500 cow operations: You’re caught in the squeeze—too big for most niche markets, too small for optimal efficiency. Successful paths include expansion to 2,500+ (requiring $3-5 million per thousand cows based on recent construction), strategic partnerships, or contract production. Standing still isn’t viable when your production costs run $18-19/cwt versus $15-16 for larger competitors.
1,500-2,500 cow operations: Decision time. Expansion to 5,000+ requires $15-20 million based on recent facility costs. Consider your state’s long-term regulatory trajectory carefully. This scale attracts serious buyers if you’re considering exit—several Wisconsin operations this size achieved favorable sales this summer.
Operations exceeding 2,500 cows: You’re positioned to weather the storm, but don’t get complacent. Invest in professional HR infrastructure, documented compliance programs, and diversified labor strategies now. Automation should target genuine efficiency gains, not promised labor savings that rarely materialize fully.
THREE FUTURES: Where This Could Go
Most Probable Scenario: Continued consolidation with 10,000-13,000 farms closing over five years. Survivors will be professionally managed operations with established political relationships. Milk supply remains adequate, prices are relatively stable, but rural communities continue hollowing out.
Growing Possibility: Foreign investment accelerates as Canadian processors, European companies, and private equity acquire distressed assets. American dairy farming becomes American dairy management—owners become employees.
High-Impact Outlier: Coordinated enforcement triggers actual supply disruption. Milk hits $7-8/gallon, cheese and butter prices double. Recovery requires 5-10 years and fundamental industry restructuring.
Success Stories Worth Studying
Not everything’s challenging—let me share what’s working according to producers and extension professionals in different regions.
Central New York producers working with Cornell Extension have reportedly developed innovative training programs. They’re bringing in community college students and offering competitive salaries of around $65,000, plus benefits, for five-year commitments. Some have successfully retained American workers beyond two years this way. That’s not a complete solution, but it’s progress.
Industry groups report that operations investing heavily in quality housing—actual apartments, not dormitories—alongside automation are seeing turnover drop from 45% to 15% annually. Treating workers well, regardless of origin, generates measurable returns.
Wisconsin cooperatives are exploring rotating labor pools, enabling actual weekends off. Workers move between farms on a scheduled rotation. Complex coordination, but those trying it report maintaining workforce stability through recent challenges.
What This Means for Consumers at the Grocery Store
Here’s something we haven’t touched on yet—what happens when consumers actually face those $7-8 gallons of milk? USDA research on price elasticity suggests demand would drop 15-20% at those levels, with lower-income families hit hardest. We’d likely see major shifts to plant-based alternatives, not because people prefer them, but because dairy becomes a luxury item.
The ripple effects go beyond milk. Cheese prices doubling means pizza costs jump. Butter at $8/pound changes baking economics. School lunch programs would need emergency funding increases. It’s not just a farm crisis—it’s a food system shock.
Looking Forward with Clear Eyes
Here’s the reality we need to accept: The industry developed around workers accepting conditions that don’t align with typical American employment expectations, at compensation levels that primarily depend on international wage differentials.
April’s enforcement actions didn’t create these dependencies—they revealed vulnerabilities we’ve been managing around for decades. That eight-hour biological timeline isn’t going away. It’s the unchanging reality of dairy production.
Will technology eventually provide comprehensive solutions? Maybe, though current projections suggest 15-20-year development timelines for systems that match human adaptability. The robots coming to market now are tools, not replacements.
Will Americans suddenly embrace dairy work? The North Carolina data says no, definitively. Even at higher wages, the lifestyle requirements eliminate most potential domestic workers.
Immigration reform will likely formalize existing relationships rather than fundamentally alter workforce composition. And honestly? That might be the best realistic outcome.
Here’s what gives me cautious optimism: Consumer demand remains strong, with Americans consuming about 650 pounds of dairy products annually, according to USDA food availability data. Production will continue. The question is which operations will provide it.
The successful operations will be those that accurately assessing current realities and adapting accordingly. They’ll build strong relationships with workers, maintain professional compliance, and position strategically for whatever comes next.
Because at the end of the day—or more accurately, at 4 AM and 4 PM every single day—those cows need milking. Biology doesn’t negotiate. And until we figure out how to change that fundamental reality, we need to work with the labor force willing to meet biology’s demands.
Plan accordingly. The fundamentals of dairy production remain sound. It’s the operational environment that requires our careful navigation. And despite all the challenges, I still believe there’s a profitable future for operations that see clearly and adapt wisely.
After all, somebody’s going to produce that milk. Might as well be those of us who understand what it really takes.
Key Takeaways:
Dairy’s reality is biological, not political—miss a milking, and biology wins. That’s the eight-hour breaking point.
Immigrant labor sustains half the U.S. workforce and nearly 80% of milk output, proving the system’s hidden dependency.
Automation eases routine strain but can’t replace skilled hands—robots handle less than half the work.
Mega-operations now produce 46% of all U.S. milk, while small farms face growing costs and tough survival math.
Long-term strength depends on modern workforce reform—year-round access like Canada’s TFWP could stabilize both herds and livelihoods.
Executive Summary:
In dairy, biology always wins. Lose your labor force for eight hours, and cows—not politics—set the agenda. Immigrant workers make up half of America’s dairy workforce and produce nearly 80% of our milk, according to Texas A&M research. When that labor disappears, production drops, animal welfare suffers, and consumers ultimately face $7 milk and $8 butter. Automation helps, but can’t replace skilled hands, while smaller farms keep closing as mega-dairies dominate production. Canada’s Temporary Foreign Worker Program shows how year-round access to labor stabilizes an entire agricultural system. For U.S. producers, acknowledging that biology doesn’t wait—and acting accordingly—is the only sustainable path forward.
Complete references and supporting documentation are available upon request by contacting the editorial team at editor@thebullvine.com.
Learn More:
Dairy’s Next Big Challenge: Attracting and Retaining Top Talent – While the main article outlines the labor crisis, this piece provides a tactical blueprint for solving it. It details actionable strategies for creating a winning work culture to improve employee retention and build a more resilient, high-performing team.
The Dairy Industry’s New Reality: Navigating the Toughest Economic Headwinds in a Decade – This analysis unpacks the market forces driving consolidation. It moves beyond labor to explore how interest rates, high input costs, and global demand are reshaping the industry, offering strategic insights for protecting your margins against extreme economic volatility.
Robotic Milking Systems: Are They the Silver Bullet for Dairy’s Labor Woes? – For those considering automation, this article delivers a detailed ROI analysis. It moves past the hype to reveal the true costs, efficiency gains, and management changes required, helping you decide if this multi-million dollar investment is right for your operation.
The Sunday Read Dairy Professionals Don’t Skip.
Every week, thousands of producers, breeders, and industry insiders open Bullvine Weekly for genetics insights, market shifts, and profit strategies they won’t find anywhere else. One email. Five minutes. Smarter decisions all week.
Why would anyone sell butter at a 60% loss? Because destroying farms is more profitable than butter.
EXECUTIVE SUMMARY: That cheap butter at your store? Retailers lose $8 per pound selling it—intentionally. Four chains controlling 85% of Germany’s grocery market use algorithms that synchronize prices without human intervention, accepting dairy losses to profit from everything else in your cart. This strategy has already eliminated 28,000 German dairy farms, with 2,800 more exiting annually. By 2030, only 18,000 of today’s 47,000 farms will remain—a 60% collapse. The same algorithmic playbook is now hitting Wisconsin, California, and even Canada’s protected market. Farmers face a stark choice: adapt through diversification and collective action, or become casualties of the algorithm economy.
You know that moment when you see a price that just doesn’t make sense? I had one of those last month in Bavaria, standing in a Lidl looking at butter on promotional pricing—€1.39 for a 250-gram pack.
Now, I’ve been tracking dairy economics for about 25 years, and this stopped me cold. Because when you run the numbers… well, let me walk you through what I discovered.
THE BREAKDOWN: Where €1.39 Butter Really Comes From
The Economics of Intentional Loss: How Retailers Weaponize Butter
€11.50 – Raw milk cost (21.5 kg milk × €0.535/kg)
€1.25 – Processing (energy, labor, packaging)
€0.95 – Logistics & distribution
€13.70 – Total actual cost per kilogram
€5.56 – Retail selling price per kilogram
€8.14 – Loss per kilogram
The Math That Started This Conversation
So here’s what we all know—it takes about 21.5 kilograms of milk to make a kilogram of butter. Basic dairy conversion, right? The German Farmers’ Association reported in September that Bavarian producers were getting between €0.53 and €0.54 per kilo for their milk. Pretty standard for the region this time of year.
Quick math tells you that’s €11.50 per kilogram of butter in raw milk. Just the milk, nothing else.
But here’s where it gets interesting. I’ve been talking with folks in processing, and German processor associations are reporting their members face costs anywhere from €1.15 to €1.35 per kilogram—that’s energy, labor, packaging, the whole nine yards. Add in transportation and warehousing, and you’re looking at a total cost of around €13.70 per kilogram of butter. Minimum.
That promotional price at Lidl? Works out to €5.56 per kilogram.
That’s more than an €8 loss per kilo, folks. And this isn’t a one-off mistake—this is happening across Germany right now.
The Illusion of Choice: Market Concentration’s Death Grip
What I’ve found is that when you dig into the market structure—and the Bundeskartellamt, Germany’s federal cartel office, has documented this thoroughly—you see that four retail chains control about 85% of the German food market. We’re talking Edeka, Rewe, the Schwarz Group (they run Lidl and Kaufland), and Aldi. When you’ve got that kind of concentration… well, the dynamics change completely.
How Retail Pricing Actually Works These Days
This builds on something we’ve all been noticing—pricing isn’t what it used to be. These retailers are now using algorithmic systems —computer programs that monitor competitor prices and adjust automatically. The UK’s Competition and Markets Authority has done some fascinating work documenting this.
What happens—and university researchers at places like MIT and Carnegie Mellon have tracked this in real time—is pretty remarkable. When Lidl’s system sees Aldi drop butter to a certain price, it automatically matches or beats it. No meetings, no phone calls. Within 48 hours, sometimes less, all four major chains end up at basically the same price.
And here’s the kicker: this is completely legal under EU competition law. Article 101 requires explicit agreement for a violation, and these algorithms… they’re just responding to market conditions. Game theorists call it finding the Nash equilibrium—basically, the point where nobody benefits from changing their strategy alone.
But what’s this mean for us as dairy producers? As a processor recently told me, “We’re not really negotiating with buyers anymore. We’re dealing with machines programmed to optimize the entire shopping basket, not individual products like milk or butter.”
The Cross-Subsidization Strategy
So how can retailers lose €8 per kilo of butter and still stay in business? Well, that’s where it gets clever—and honestly, a bit frustrating if you’re on the production side.
Why Retailers Love Losing on Your Milk: The 146% Sacrifice Strategy
Market research firms like GfK have studied this extensively. When shoppers come for that cheap butter, they don’t leave with just butter. The whole shopping trip tells a different story.
Those dairy products bringing people in the door? They’re losing money. But look at what else goes in the cart. Private-label products—and industry benchmarking suggests these run at much higher margins. Store-brand pasta might hit margins of 40-45%. Their cheese? Often 50% or more. Those fresh-baked items that smell so good when you walk in? We’re talking 50-60% margins, easy.
And those middle-aisle specials Aldi and Lidl are famous for—the tools, seasonal items, random clothing? Import data suggests those can run 60-70% margins.
A typical €40 shopping trip might lose a bit on dairy but generate €15-20 in overall gross profit. The dairy loss? It’s basically their customer acquisition cost.
What really gets me—and I hear this from producers all the time—is that retailers have thousands of products to balance. We’ve got milk. When our single product gets priced below production cost, we can’t make it up by selling garden tools or Christmas decorations.
What This Means for the Next Generation
Let me share something that really brings this home. I recently spoke with a Bavarian producer—I’ll call him Johann to respect his privacy—who runs about 85 cows near Rosenheim. Good operation, been in the family for four generations.
His son was planning to come back after finishing his ag degree. “Was” being the key word.
German Farmers’ Association data shows that when milk prices drop even €0.02 to €0.03 per kilogram, operations of his size can see income swings of €35,000 to €45,000 annually. For Johann, that recent price movement? It eliminated the salary he’d planned for his son.
The kid’s studying engineering in Munich now. Can’t say I blame him.
What we’re seeing across Germany matches this perfectly. Federal statistics show they’re down to 46,849 dairy farms—that’s from about 75,000 just ten years ago. Average farmer age has crept past 52. And the Thünen Institute’s research shows that only about 37% have identified successors.
The Extinction Curve: 60% of German Dairy Farms Gone by 2030
When your margins compress below 7%—and many German operations are there right now—succession planning basically stops. Young people see their parents dealing with transition cow challenges, managing butterfat levels through these hot summers, working 70-hour weeks during calving season… all for marginal returns. They find other paths. And honestly? Who can blame them?
Two Paths Forward
Looking at where this could go by 2030, I see two pretty distinct scenarios developing.
If Current Trends Continue
Based on German federal statistics showing about 2,800 farms leaving each year, we’re looking at 18,000 to 20,000 dairy farms by 2030. That’s a 60% drop from today.
Average herd size would probably expand to 250-300 cows. Different world entirely—you’d need parlors built for that scale, different fresh cow protocols, probably shift from component feeding to TMR systems… it’s a fundamental operational change.
And here’s what concerns me: remember 2022? During those supply chain disruptions, consumer price monitoring showed German butter hitting €2.19 to €2.49 per pack in some areas. Nearly double today’s promotional prices.
Rabobank’s 2025 dairy outlook makes a solid point here—every farm that exits permanently reduces the system’s ability to respond to shocks. When the next crisis hits, whether it’s drought affecting forage quality or another geopolitical disruption, the system won’t have the capacity to respond. Prices won’t just increase—they’ll spike hard.
If Reforms Take Hold
Now, there’s another path, and we’re seeing pieces of it work in Spain and France.
Both countries introduced cost-based pricing regulations—Spain in 2013, France in 2018. According to Eurostat data, yes, their dairy prices run 8-12% higher than Germany’s. But their farm exit rates? Less than half of Germany’s, according to their ag ministries.
I’ve talked with French producers at conferences, and while it’s not perfect, they can at least plan. They know costs will be covered plus a small margin. That lets them invest—better cooling systems for heat stress, improved transition cow facilities, things that pay off long-term.
What’s encouraging is that the French Young Farmers Association reports over 1,200 new dairy operations started in 2024. Not huge numbers, but it’s growth versus decline. That matters.
What’s Actually Working Out There
After talking with producers across Europe and North America, here’s what I’m seeing work in practice.
For Younger Operations with Succession Plans
If you’re under 45 and have someone to take over someday, you’ve got options, but you need to think strategically.
Automation’s one path. Research from Wageningen University and Michigan State shows robotic milking systems can reduce labor costs 10-18%. But honestly, it’s as much about lifestyle as labor savings. Robots don’t need Christmas morning off, you know?
More important, though—join a producer organization if you haven’t already. The bigger German co-ops, their annual reports show, they’re getting 3-5% premiums over spot markets. When you’re facing these concentrated buyers, that collective voice might be your only real leverage.
What’s really interesting is operations finding ways around the commodity trap. Direct marketing, organic certification, value-added processing—anything that breaks that pure price-taker relationship.
I know several Bavarian producers who’ve shifted 30-40% of their production to on-farm processing. It’s not easy—we’re talking investments of €150,000 to €200,000, learning cheese-making or yogurt production, and dealing with food safety regulations. But they’re capturing €0.90 to €1.00 per liter equivalent versus €0.53 for commodity milk. That’s the difference between surviving and actually building something.
For Late-Career Producers
This is tough to talk about, but it needs saying. And I know it’s not easy to hear, especially if you’ve poured your life into your operation.
European Network for Rural Development research is pretty clear—farmers who make exit decisions within 18 months of sustained margin pressure typically preserve 60-80% of their equity. Those who hold on for three years or more, hoping for recovery… many lose everything.
If you’re in this position, do the math. Divide your available credit and savings by your monthly shortfall. If that number’s less than 18 months, you need to start planning now. Not next season. Now.
I understand the emotional weight of this decision. This isn’t just a business—it’s your heritage, your identity, your life’s work. But preserving what you’ve built —ensuring you have something to pass on or retire with —matters more than holding on until there’s nothing left.
Strategies That Work Regardless
No matter where you are in your career, some things just make sense.
Document your costs religiously. Everything—feed, labor, what you spent on that metritis outbreak last month, depreciation on equipment, your own time. The Dutch dairy board has excellent templates if you need them. When policy discussions happen, farmers with solid numbers have credibility.
Build relationships with your processor. FrieslandCampina’s 2024 supplier report and Arla’s recent guidelines both indicate they’re increasingly open to longer-term contracts with producers who maintain quality parameters and keep somatic cell counts in check. It won’t completely protect you from market swings, but it helps.
And please, connect with other producers. Research on agricultural mental health consistently shows that peer support makes a huge difference in stress management. Plus, collective action’s the only thing that moves policy. Look at what French farmers achieved with their early 2024 protests—they got real concessions because they worked together.
The North American Parallel
What’s happening in Germany isn’t unique. Let me give you a Wisconsin perspective, because I was just talking with producers there last month.
USDA Economic Research Service data from September shows four beef packers control 85% of U.S. processing. Different commodity, same dynamics. But in dairy, it’s playing out differently region by region.
In Wisconsin, where I spent time with a 200-cow operation near Eau Claire, the processor consolidation is real, but the retail dynamic’s different. They’ve got Kwik Trip—a regional chain that’s actually built relationships with local producers. The owner told me, “We’re getting $18.50 per hundredweight, which isn’t great, but it’s stable. The co-op knows if they squeeze us too hard, we’ve got options.”
That’s the difference—options. When you’ve got multiple buyers—even if they’re not perfect—you’ve got leverage.
Now, the Federal Milk Marketing Order system in the U.S. adds another layer of complexity. It sets minimum prices based on end use—Class I for fluid milk, Class III for cheese, and so on. But even with that safety net, when retail concentration hits a certain level, those minimums become maximums real quick.
Down in California, it’s another story entirely. The mega-dairies with 5,000-plus cows? They’re basically price-takers from the big processors. One operator near Tulare told me they’re looking at getting into renewable natural gas from manure just to diversify revenue. They’re projecting $3-4 million annually from RNG versus $12 million from milk on 6,000 cows. “Milk’s becoming a byproduct of our energy business,” he said. Wild to think about, but that’s adaptation.
Even Canada—with their supply management system that’s supposed to protect producers—the Canadian Dairy Commission’s recent quarterly report shows pressure. Retail concentration there means that even with production quotas, processors are getting squeezed, and that rolls downhill.
Innovation Born from Necessity
But here’s what gives me hope—farmers are incredibly innovative when pushed.
German agricultural organizations are documenting some fascinating adaptations. Operations near tourist areas are building serious secondary income through agritourism—farm stays, educational programs, even “adopt a cow” initiatives that create direct consumer relationships.
I visited one operation in the Black Forest region that’s pulling in €85,000 annually from agritourism versus €92,000 from milk. They’ve got six vacation apartments in a renovated barn, and offer farm breakfasts with their own products. “The cows became the attraction, not just production units,” the owner told me.
When Commodity Pricing Fails, Innovation Wins: Revenue Streams That Actually Work
Energy production’s another avenue. The German Biogas Association reports that over 3,000 dairy farms have added anaerobic digesters in recent years. Depending on whether you’re running a dry lot or free stall system, a 300-500 cow operation can generate 1.5 to 3.5 megawatts. With feed-in tariffs in some regions, that’s income that doesn’t depend on milk prices.
What’s really intriguing is watching cooperatives move beyond commodity processing. FrieslandCampina’s latest annual report shows it pushing hard into specialized nutrition—sports recovery proteins and specific components for infant formula. These aren’t commodity products. The margins are multiples of the standard milk powder price.
They’ve realized they can’t compete with retailers on commodity terms, so they’re changing the game entirely. Smart move, if you ask me.
And you know what? This innovation isn’t just happening in Europe. I’m seeing U.S. producers getting creative, too. There’s a group in Vermont making cultured butter that sells for $24 a pound at farmers markets. A Wisconsin operation partnered with a local brewery to make milk stout—they’re getting paid double for that milk. These aren’t solutions for everyone, but they show what’s possible when you think outside the bulk tank.
The Bridge to Tomorrow
Here’s something I’ve been thinking about lately—we’re in this weird transition period where the old model is clearly broken but the new one hasn’t fully emerged yet.
The consolidation in retail and processing, the algorithmic pricing, the pressure on margins… these aren’t going away. But I’m also seeing the seeds of something different. Direct-to-consumer models are enabled by technology. Energy diversification that makes farms less dependent on milk prices alone. Cooperatives are moving up the value chain into specialized products.
It reminds me of the shift from cans to bulk tanks back in the day. That transition was brutal for some, an opportunity for others. The difference now? The pace of change is faster, and the imbalance of market power is more extreme.
Questions Worth Asking Yourself
As we’re having this conversation, here are some questions every producer should be thinking about:
What percentage of your milk goes to buyers with more than 30% market share? If it’s over 70%, you’re vulnerable to these dynamics we’ve been discussing.
How would a sustained 10% price cut affect your operation? Really run those numbers—including impacts on your replacement program, equipment maintenance, everything. If the answer involves burning through savings or taking on debt just to keep going, you need a Plan B.
Are you connected with producer organizations? If not, why not? In this market structure, that collective voice might be your only leverage.
Have you calculated what your operation’s worth—both as a going concern and in a wind-down scenario? It’s not fun math, but knowing those numbers helps you make strategic decisions.
The View from Here
That €1.39 butter in Bavaria isn’t just a crazy promotional price. It’s showing us where agricultural markets are heading when retail concentration meets algorithmic coordination.
“Every farm that exits permanently reduces the system’s ability to respond to shocks. When the next crisis hits, the system won’t have capacity. Prices won’t just increase—they’ll spike hard.”
These dynamics are going to reach every commodity ag sector within the next decade—if they haven’t already. The question isn’t whether these forces will affect your market. They will.
The question is whether you’ll be ready.
The German dairy sector’s giving us all a preview. Part warning, part roadmap. The warning’s clear: traditional market relationships are being fundamentally restructured by technology and concentration. Producers who don’t recognize and adapt to these new realities face serious challenges.
But there’s also a roadmap. We’ve navigated big changes before—the shift from cans to bulk tanks, quota eliminations in Europe, multiple price cycles that tested but didn’t break us. This one’s different in its mechanisms, but it’s still calling for the same farmer ingenuity we’ve always had.
Successful adaptation means understanding these dynamics, building collective strength, exploring value-added opportunities, and—this is crucial—making decisions based on data rather than hope or tradition.
I’ve spent 25 years watching this industry evolve, and I’ve never seen changes this fundamental happening this fast. But you know what? I’ve also never seen dairy producers fail to adapt once they understand what they’re facing.
That €13.70 production cost, butter selling for €1.39? It’s not sustainable, it’s not accidental, and it won’t fix itself through normal market forces. But understanding it—really grasping what it means—that’s your foundation for not just surviving but potentially thriving despite these new realities.
TAKE ACTION THIS WEEK:
Calculate Your Runway:
Monthly cash burn rate ÷ available reserves = months until crisis
If less than 18 months, start planning NOW
Connect With Support:
Producer Organizations: Find yours at www.euromilk.org/members
Mental Health Support: Agricultural crisis hotlines available 24/7
Cost Tracking Tools: Free templates at www.dairynz.co.nz/business/budgeting
Build Your Network:
Join or form a local discussion group
Connect with processors about long-term contracts
Explore value-added opportunities with other producers
The path forward requires clear thinking, collective action, and continued innovation, which have always been the hallmarks of successful dairy operations. These are challenging times, no doubt about it. But they’re far from insurmountable for those willing to see clearly and adapt accordingly.
Stay strong, stay connected, and keep asking the tough questions. We’re going to need all three to navigate what’s ahead.
KEY TAKEAWAYS:
Retailers lose $8/pound on butter BY DESIGN: They profit from 40-70% margins on everything else while using dairy as bait—enabled by 85% market concentration
Algorithms replaced negotiations: Pricing bots at four major chains synchronize within 48 hours, creating legal coordination that individual farmers can’t fight
2,800 farms vanish annually: Germany down from 75,000 to 47,000 farms in a decade—60% of survivors won’t make it to 2030 without adaptation
Your decision window is 18 months, not years: Exit within 18 months = 60-80% equity preserved. Wait 3 years hoping for recovery = total loss
Only three strategies are working: Join producer co-ops (+3-5% prices), add revenue streams ($40-120K from energy/agritourism), or time your exit strategically
Complete references and supporting documentation are available upon request by contacting the editorial team at editor@thebullvine.com.
Building a Beef-on-Dairy System: Capturing $360,000 in Annual Farm Profit – Demonstrates one of the most successful diversification strategies mentioned in the main article, with specific revenue calculations showing how beef-on-dairy shifted from 2% to 6% of total farm income for early adopters.
The Sunday Read Dairy Professionals Don’t Skip.
Every week, thousands of producers, breeders, and industry insiders open Bullvine Weekly for genetics insights, market shifts, and profit strategies they won’t find anywhere else. One email. Five minutes. Smarter decisions all week.
$320K today or $3.7M over 10 years? When your bank’s calling and debt’s at 7%, that’s not really a choice. 88% of farmers agreed.
Executive Summary: Yesterday’s 88.47% vote to sell Fonterra’s brands for $4.22 billion was mathematical destiny: farmers trading $3.7M in future value for $320K in immediate debt relief. With 75% of recipients sending payouts straight to banks, this wasn’t a strategy—it was survival. The predictable outcome followed 13 years of structural changes: tradeable shares (2012), flexible shareholding (2021), and production-weighted voting that gave debt-heavy large farms control. The same pattern—debt pressure, governance changes, asset sales—is unfolding from Arla-DMK to DFA. As Keith Woodford warns: ‘The best time to protect your cooperative is when you don’t desperately need to.’ For farmers whose cooperatives show warning signs (debt-funded growth, executive pay spikes, voting reforms), Fonterra’s story isn’t distant news—it’s your preview unless you organize now.”
Picture this familiar scene: you’re in the milking parlor at 5:30 AM, checking your phone between rotations while the cows move through their routine. That’s exactly where many Fonterra farmers found themselves yesterday morning, October 31st, absorbing the news.
The vote had closed—88.47% of shareholders approved selling Anchor, Mainland, and Kāpiti to French dairy company Lactalis for NZ$4.22 billion.
What makes this particularly noteworthy isn’t just the sale itself. It’s what this decision reveals about how dairy cooperatives are evolving to meet modern challenges—something we’re seeing from California’s Central Valley to the Netherlands’ dairy regions.
Fonterra’s voting approval rates climbed from 66.45% to 88.47% over 13 years—not because farmers gained enthusiasm, but because debt left them no choice. Each governance “reform” tightened the noose
Transaction Overview:
Sale price: NZ$4.22 billion (approximately US$2.42 billion)
Shareholder approval: 88.47% on October 30, 2025
Capital distribution: NZ$3.2 billion returning to shareholders
Per-farm benefit: NZ$320,000 average (ASB Bank analysis suggests closer to $392,000)
Brands transferred: Anchor, Mainland, Kāpiti, plus various licensing agreements
Looking at BakerAg’s October survey of 164 Fonterra suppliers, the findings align with what we’re hearing across dairy regions globally. Three-quarters plan to use their capital distribution primarily for debt reduction.
Farmers traded $3.7 million in projected 10-year brand value for $320K immediate cash—a 91% discount driven by 7% interest rates they couldn’t afford to ignore
The average farm expects to send about 72%—roughly NZ$230,400—straight to debt servicing.
Keith Woodford, who spent three decades as a Lincoln University professor tracking New Zealand dairy economics, puts it simply:
“The debt servicing relief is what drove this vote. When you’re paying 7% interest on half a million in debt, that’s $35,000 annually just in interest. The ability to cut that in half changes your whole operation’s viability.”
This resonates with Wisconsin operations facing similar pressures. Immediate financial relief often takes precedence over longer-term considerations—not because producers lack vision, but because survival math is unforgiving.
What’s interesting here is the performance of these consumer brands. Fonterra’s May financial report shows NZ$319 million in quarterly operating profit—up 103% year-over-year.
These weren’t struggling assets. They were growing rapidly.
But when you need capital today, tomorrow’s potential becomes someone else’s opportunity.
Miles Hurrell, Fonterra’s CEO since 2018, emphasized during the August announcement that this lets them focus on ingredients and foodservice—their core strengths. The consumer business generated NZ$5.4 billion in revenue, but accounted for less than 7% of total milk solids. We’re hearing the same efficiency argument in European cooperatives, too.
How Voting Power Actually Works
Here’s something that surprises many outside observers. Fonterra doesn’t use one-member-one-vote like smaller Midwest cooperatives.
They have production-weighted voting—one vote per 1,000 kilograms of milk solids, backed by paid shares.
DairyNZ’s 2023-24 statistics show the average New Zealand herd runs about 441 cows producing 393 kg of milk solids each. Do the math: that’s roughly 173,000 kg MS annually, giving that farm 173 votes.
Large Canterbury farms wield 2.27x the voting power of average operations and receive 3x the capital—meaning the most indebted farms controlled the sale that was supposed to save everyone
But a 1,000-cow Canterbury operation? They’re producing 393,000 kg MS—that’s 393 votes, more than double.
Peter McBride, Fonterra’s Chairman, calls this outcome a clear mandate showing farmer control. Technically true, though it highlights how voting structure shapes outcomes.
ASB Bank’s analysis shows the payout distribution mirrors this structure:
Smaller operations (100,000-150,000 kg MS): $150,000-$230,000
Large Canterbury farms (350,000+ kg MS): $700,000 or more
The Path That Led Here
Understanding yesterday requires examining the past decade’s progression.
2012: Trading Among Farmers
TAF addressed redemption risk—the potential crisis if many farmers exited simultaneously. It passed with 66.45% approval on June 25, 2012, though about a third opposed or abstained.
Dutch cooperative expert Onno van Bekkum warned TAF would separate ownership from control in fundamental ways. Opposition leader Lachlan McKenzie called it “morally wrong” in media interviews.
But the board proceeded, creating tradeable shares and opening the Fonterra Shareholders’ Fund to outside investors.
2021: Flexible Shareholding
In December 2021, 85.16% approval was granted for shareholding, increasing from 33% to 400% of production requirements.
Fonterra’s August 2024 report shows the results:
1,422 farms now exceed 120% of the standard shareholding
552 hold minimal 33% positions
John Shewan, chairing the Shareholders’ Fund, called it a mixed blessing, noting a 20% decline in unit value during consultation.
2025: The Pattern Emerges
Notice the progression: 66.45%, then 85.16%, now 88.47%.
Keith Woodford observes that each restructure makes the next more likely:
“Once you start down this path, reversal becomes increasingly difficult.”
Global Patterns Worth Watching
Fonterra’s not alone here. The June announcement of Arla and DMK merging into a €19 billion entity sparked similar discussions.
Kjartan Poulsen, an Arla member who also heads the European Milk Board, stated bluntly in October:
“Co-operatives have ceased to be the representatives of producers’ interests they claim to be on paper.”
In North America, DFA acquired 44 Dean Foods facilities after the 2020 bankruptcy, becoming both the largest milk producer and processor.
The subsequent class action by Food Lion and Maryland and Virginia Milk Producers alleges this creates dynamics that “compel cooperatives and independent dairy farmers to either join DFA or cease to exist.”
CEO Miles Hurrell’s $8.32M compensation package dwarfs the $150K average farmer return by 55.5x—raising questions about whose interests drive ‘cooperative’ decisions
The New Zealand Herald reported in October 2024 that Fonterra’s CEO compensation hit NZ$8.32 million. Base salary runs about NZ$1.95 million, with incentives tied to Return on Capital Employed and share price performance.
Here’s where it gets interesting. Improving ROCE by selling capital-intensive assets—even profitable ones—can trigger bonuses, regardless of the long-term impact on members.
It’s what academics call a principal-agent problem: decision-makers’ incentives potentially diverging from those they represent.
This pattern extends beyond Fonterra. Cooperative executive packages increasingly mirror corporate structures, raising questions about alignment.
Current Debt Reality
NZ dairy debt peaked at $41.7B in 2018 and dropped to $35.3B by 2025—progress, yes, but at 7% interest, that remaining $35B still costs the sector $2.47 billion annually
Reserve Bank of New Zealand data shows dairy sector debt at NZ$64 billion. DairyNZ’s 2023-24 survey found that debt-to-asset ratios increased by 1.8 percentage points last season, reversing the progress in deleveraging.
Input costs compound this. Consider a typical Waikato farm with NZ$500,000 in debt at 7%—that’s $35,000 in annual interest.
When offered $320,000 to cut that burden by two-thirds, philosophical debates about cooperative principles take a back seat.
Producers consistently report they’re not selling eagerly. They’re protecting against scenarios where consecutive tough seasons force a complete exit. That capital buffer might determine whether the next generation continues farming.
Supply Agreement Details
The Lactalis deal includes two key contracts:
10-year Raw Milk Supply Agreement: Up to 350 million liters annually, plus 200 million more at premium pricing
Global Supply Agreement: Three years initially for ingredients, auto-renewing unless terminated with 36 months’ notice
Miles Hurrell notes that Lactalis becomes a cornerstone customer.
Winston Peters, New Zealand’s Deputy Prime Minister with a farming background, sees it differently. His October 7 letter warns:
“After three years, Lactalis gains flexibility on milk sourcing for these brands—potentially diluting with alternatives.”
Fonterra clarifies that the 36-month notice effectively guarantees a minimum of 6 years. Still, Peters’ point about long-term leverage resonates with farmers remembering past processor consolidations.
Practical Insights for Producers
Drawing from Fonterra’s experience, several patterns merit attention:
Warning Signals
Debt-financed growth rather than retained earnings
Executive compensation outpacing member returns
Share trading or ownership flexibility proposals
External strategic reviews
Rising approval rates on successive changes
The intervention window closes quickly. Once voting concentrates and pressure intensifies, changing course becomes exponentially harder.
Breaking the Isolation
BakerAg’s survey revealed widespread isolation among farmers with reservations. Many assumed neighbors supported the proposal, creating silence that reinforces itself.
Research consistently shows that producers with strong peer networks resist short-term pressures more effectively when evaluating strategic choices.
Action Steps
Near-term:
Talk with neighbors about governance—you’d be surprised how many share your concerns
Understand your voting system
Seek compensation transparency
Track debt trajectories
Medium-term:
Strengthen balance sheets for voting independence
Consider board service or supporting aligned candidates
Advocate for appropriate approval thresholds
Build communication networks
Long-term:
Diversify market relationships
Educate the next generation on cooperative principles
Document experiences for future members
Looking Forward
The Fonterra vote illuminates tensions between immediate needs and long-term positioning that define modern dairy economics. That 88.47% likely reflects not enthusiasm but recognition of limited alternatives.
The generational dimension adds complexity. Families who built these brands face wrenching decisions, trading legacy for relief. Yet when survival’s uncertain, strategic control becomes secondary.
For cooperatives not facing acute pressure, Fonterra offers valuable lessons. Decisions about capital structure, voting, and debt create compounding path dependencies.
Keith Woodford’s wisdom bears repeating:
“The best time to protect your cooperative is when you don’t desperately need to. Once you’re in crisis, options narrow dramatically.”
As farmers await capital distributions, the industry watches. Emmanuel Besnier, Chairman of Lactalis, highlighted in August his company’s strengthened positioning across Oceania, Southeast Asia, and Middle Eastern markets.
Lactalis now controls brands developed by New Zealand farmers over generations.
For global dairy producers, the implications are clear: cooperative structures remain viable but require active protection. Forces favoring consolidation—debt, scale requirements, global competition—aren’t abating.
What’s encouraging is the quality of current discussions. Producers worldwide are sharing experiences, analyzing outcomes, and considering alternatives. This collective learning might help some organizations navigate challenges more successfully.
The critical question: Will cooperative members recognize patterns early enough to maintain meaningful options?
Fonterra’s experience suggests that once certain changes occur, reversal becomes exceptionally difficult.
The conversation continues, shaped by each cooperative’s circumstances, member priorities, and market position. What remains constant is the need for engaged, informed membership making deliberate choices—before circumstances make those choices for them.
KEY TAKEAWAYS:
Debt math is brutal: Farmers knowingly traded $3.7M in future value for $320K today because $35K annual interest payments can’t wait for tomorrow’s profits
Large farms control your fate: Production-weighted voting gives a 1,000-cow operation (393 votes) more than double the power of an average farm (173 votes)—and they vote their debt, not your interests
The timeline is always 13 years: Tradeable shares (Year 1) → Flexible ownership (Year 9) → Asset sales (Year 13)—once step one passes, the rest becomes mathematical inevitability
Watch executive pay like a hawk: When your co-op CEO makes NZ$8.32M while average farmers net $150K, those aren’t cooperative incentives—they’re corporate ones
You have exactly ONE intervention point: Between your first governance “modernization” proposal and passing it—after that, you’re not protecting your cooperative, you’re negotiating its sale terms
Complete references and supporting documentation are available upon request by contacting the editorial team at editor@thebullvine.com.
Learn More:
The Real Cost of Producing Milk and Why It Matters Now More Than Ever – This tactical guide provides a framework for mastering your farm’s true cost of production. It reveals methods for gaining financial clarity to combat the exact debt pressures highlighted in the Fonterra vote, empowering you to strengthen your operation’s financial resilience.
The Future of Dairy Farming: Navigating the Next Decade of Change – This strategic analysis unpacks the market forces, consumer trends, and policy shifts shaping the industry’s next decade. It provides essential context for the Fonterra vote, demonstrating how to anticipate future challenges and strategically position your operation for long-term survival.
AI in the Parlor: How Artificial Intelligence is Redefining Dairy Herd Management – This piece explores how adopting cutting-edge technology can create a competitive advantage. It demonstrates how AI-driven herd management directly boosts efficiency and profitability, providing a powerful internal solution for building the financial strength needed to resist external market pressures.
The Sunday Read Dairy Professionals Don’t Skip.
Every week, thousands of producers, breeders, and industry insiders open Bullvine Weekly for genetics insights, market shifts, and profit strategies they won’t find anywhere else. One email. Five minutes. Smarter decisions all week.
31,000 farms today. 19,000 by 2035. The 920% Asia growth gap reveals exactly who survives—and how.
Executive Summary: When Danone reported 13.8% growth in Asia versus 1.5% in North America—a 920% difference—it exposed what every dairy farmer already feels: the game has fundamentally changed, and your response determines whether you’re still milking in 2035. Three paths are proving profitable today. Wisconsin farmers optimizing protein for export processors are capturing an extra $140,000-225,000 annually, while small Vermont organic operations are netting $489 per cow—six times conventional returns. Large-scale operations over 1,000 cows achieve $250,000-375,000 higher profits through efficiency, but here’s what any farm can implement tomorrow: beef-on-dairy crossbreeding delivers $122,500-183,750 extra revenue on 500 cows for just $23,500 investment. Geography now matters as much as management, with farms over 100 miles from processors facing $10,000+ annual disadvantages. December 1st’s Federal Order reforms will lock in advantages for those who’ve already optimized components, making the next 30 days critical. Of today’s 31,000 dairy farms, only 19,000 will survive to 2035—and the market is already choosing winners based on who adapts fastest to these new realities.
You know that feeling when you’re looking at your milk check and wondering if you’re missing something? I had that exact conversation with a Wisconsin dairy farmer last month—let’s call him Tom. He’s got his October statement in one hand, tablet in the other showing Danone’s latest earnings report. “Makes you wonder,” he said, pushing back from his kitchen table, “if we’re even in the same business anymore.”
Here’s what caught both our attention: Danone’s reporting 13.8% growth in their Asia-Pacific specialized nutrition business while North America’s crawling along at 1.5%. That’s a 920% difference, folks. Not a typo—920%.
And you know what? That conversation’s been rattling around in my head ever since, because it’s not really about Danone at all. It’s about what’s happening to all of us.
The stark reality: Danone’s 13.8% Asia-Pacific growth dwarfs North America’s 1.5%—a 920% differential that reveals exactly where dairy value is accumulating globally and which farmers are positioned to capture it.”
What’s Really Behind Those Numbers
So here’s what’s interesting—everyone immediately jumps to China’s infant formula market when they see these growth figures. Sure, China represents about two-thirds of the global infant formula market according to industry tracking, somewhere north of $90 billion. Can’t ignore that.
But there’s more going on here, and this is what I’ve been digging into…
The USDA’s Foreign Agricultural Service has been tracking something remarkable: 670 million people have joined Asia’s middle class since 2000. We’re talking about twice the entire U.S. population moving into dairy-consuming income brackets. And get this—another 80 million are expected by 2030.
Now, what really puts this in perspective is per capita consumption. In China, they’re consuming about 42 kilograms of dairy annually. Meanwhile, we’re sitting at 653 pounds per person here in the States according to USDA’s Economic Research Service data from 2024.
That’s… well, that’s about seven times more. Think about that for a second. Seven times more room to grow.
Meanwhile—and this is where it gets uncomfortable for those of us in North America—Dairy Management Inc.’s been tracking fluid milk consumption, and it’s declined for 70 consecutive years. Not quarters, not even decades. Seven decades straight.
The International Dairy Foods Association published some research in September showing Gen Z drinks about 20% less milk than millennials did at their age.
So we’ve got this massive growth potential over there, and over here? We’re basically rearranging deck chairs, fighting over market share in a pie that’s not getting any bigger.
I’ve been talking with economists and processor reps about this disconnect, and what keeps coming up is how differently they’re positioning themselves depending on whether they’re chasing Asian markets or focusing on domestic sales. And that positioning—here’s the kicker—directly affects what kind of milk they need from us.
Three Approaches That Are Actually Working
What I’ve found visiting farms from Vermont to California over the past few months is that there are basically three models that seem to be working. Not perfectly, mind you, and not for everyone, but they’re working.
The brutal math of survival: From 31,000 farms today to 19,000 by 2035, with conventional operations collapsing (red) while strategic ingredient suppliers (black), premium producers (dark grey), and large-scale operators (light grey) capture the future. Which category are you in?
The Strategic Ingredient Approach
I visited a 680-cow operation in Wisconsin recently where the owner showed me something that made my eyes pop. He’s pulling $3.40 per hundredweight above Federal Order minimums. Not from organic. Not from grass-fed. From protein optimization.
“Started working with the university folks on amino acid balancing,” he explained, spreading out his ration sheets on the office desk. “We’re adding about $75 per cow annually in rumen-protected lysine and methionine. But here’s the thing—we went from 3.12% to 3.38% protein in about eight weeks.”
Now, the University of Wisconsin Extension’s research backs this up. They’re showing farms implementing these protocols typically see returns of 2.5 to 1, sometimes up to 5.5 to 1, within 90 days. Income over feed cost improvements of forty to fifty cents per cow daily. That’s real money, not theoretical projections.
What’s driving this demand? Well, the U.S. Dairy Export Council’s been tracking how processors are investing in ultrafiltration systems to extract whey protein isolate. When that product’s selling for $5 to $8 per pound to medical nutrition companies in Singapore or Seoul, that extra 0.3% protein per tanker? Makes a huge difference to their bottom line.
Here’s what this looks like on the ground:
Getting your protein to 3.4-3.6%, butterfat to 4.0-4.2%—mostly through nutrition tweaks, not waiting for genetic progress
Keeping somatic cells under 100,000—Michigan Milk Producers Association’s paying forty to sixty cents per hundredweight bonuses for this
Finding processors who are actually investing in fractionation technology
Capturing $2 to $4 per hundredweight above base pricing
Premium Markets That Actually Pencil Out
I’ll be honest with you—I used to roll my eyes at some of these premium market stories. Seemed like a lot of work for uncertain returns.
Then I spent time with an 85-cow operation in Vermont that netted $489 per cow last year according to the Northeast Organic Farming Association’s financial benchmarks.
That’s… let me repeat that… nearly six times what similar-sized conventional operations are achieving.
What really opened my eyes was data from the University of Minnesota’s farm management folks showing Upper Midwest organic operations averaging $131,839 in total net farm income. This isn’t just a Vermont thing anymore. Wisconsin alone sold $125.7 million in organic milk in 2023—that’s third nationally, only behind California and New York.
“Can’t change the global market, but I can sure change how I respond to it.” —Wisconsin dairy farmer
And then there’s this A2 angle that’s fascinating. Visited a small operation in Pennsylvania—maybe 40 cows total—selling A2 milk at their farm store for $8.50 per gallon. “Testing cost us about $40 per cow through one of the genetics companies,” the farmer told me. “One-time expense. Now we’re capturing premiums that make the whole operation work.”
The market research on A2 is pretty compelling—we’re looking at a market that hit $15.4 billion last year and is projected to reach $50.9 billion by 2033. That’s over 14% compound annual growth. Not a fad when you see numbers like that.
Current premium pricing based on what I’m seeing in the market:
Organic’s running $31 to $39 per hundredweight versus $18 to $24 conventional
Grass-fed with intensive grazing: $36 to $52
A2 milk’s capturing 50% to 100% retail premiums
Direct-to-consumer: $6 to $10 per gallon versus $2 to $3 commodity
Scaling Up—If You’ve Got What It Takes
Now let’s talk about the other end of the spectrum. Visited a 2,100-cow operation in California that’s expanding to 2,800. Their production costs? $14.80 per hundredweight.
Cornell’s dairy farm business folks show 500-cow operations typically running $16.30 to $17.80. That’s… that’s a massive difference when you multiply it out over millions of pounds.
“Look, this isn’t for everyone,” the owner told me straight up, standing next to his new rotary parlor. “We’re $4.2 million into this expansion. Both my kids have advanced degrees—one’s got an MBA, the other’s a vet. Without that next generation ready and committed? I wouldn’t even consider it.”
USDA’s Economic Research Service data from September backs up what he’s experiencing—operations over 1,000 cows are capturing roughly $250,000 to $375,000 more in annual profit than 500-cow dairies. It’s mostly about labor efficiency and input cost advantages.
But man, that capital requirement…
Your Strategic Options: Side-by-Side Comparison
Business Model
Investment Required
Typical Annual Returns*
Timeline to Profit
Best Suited For
Strategic Ingredient Supply
$20,000-30,000
$140,000-225,000
3-6 months
Operations near processors, 300-1,000 cows
Premium Differentiation
$10,000-50,000**
$130,000-245,000
1-3 years
Farms near urban markets, any size
Strategic Scale
$2-5 million
$250,000-500,000
3-5 years
Operations with capital access, next generation
*Returns based on actual farm performance data from University of Wisconsin Extension (ingredient supply), Northeast Organic Farming Association and University of Minnesota benchmarks (premium markets), and USDA Economic Research Service analysis (scale operations). Individual results vary based on management, location, and market conditions.
**With USDA organic transition assistance covering 50-75% of costs
The Beef-on-Dairy Opportunity (Seriously, Do This Yesterday)
If there’s one thing—just one thing—that every dairy farmer should’ve started yesterday, it’s beef-on-dairy. And I mean that literally. The economics are almost too good to believe, but the numbers absolutely check out.
UC Davis has been tracking this, and crossbred calf production’s jumped from about 50,000 head in 2014 to 3.2 million in 2024. Current market data shows these crossbred calves averaging around $1,300. Holstein bulls? You’re lucky to get $250 to $600 on a good day.
Talked with a Pennsylvania producer in October who’s all over this. “We genomic test every heifer calf—costs about $40 per head. Bottom third of our genetics gets bred to beef. Using Angus and SimAngus semen at maybe $22 per straw versus $8 for conventional Holstein. But those beef-cross calves? They’re selling for $1,400 at three days old. Three days!”
Stop leaving $131,250 on the table: Beef-cross calves at $1,300 versus Holstein bulls at $425 means a 500-cow operation captures an extra $131,250 annually for just $23,500 investment—this isn’t optional anymore.
CattleFax’s October analysis projects beef-on-dairy could represent one-sixth of the entire fed beef market within two years. Why? Because the U.S. beef cattle herd hit 73-year lows—we’re at 28.2 million head as of January 2024. That shortage isn’t fixing itself anytime soon.
Here’s your action plan—and I mean implement this now:
Test your herd if you haven’t already ($40 per cow, one-time expense)
Breed the bottom 30-35% to beef (but keep that 25-30% replacement rate)
Budget for $600 premiums long-term, not today’s $1,000-plus
On 500 cows? You’re looking at $122,500 to $183,750 in additional revenue first year
December 1st splits the industry permanently: Federal Order reforms lock in advantages for farms optimizing components now, with premiums jumping from $0 to $3.80 per CWT—this 30-day window determines who captures profit and who faces deductions.
Critical: Federal Order Changes Coming Fast
Effective December 1, 2025:
Protein factors jump from 3.1% to 3.3% per hundredweight
Other solids increase from 5.9% to 6.0%
If you’re below these levels, you’re facing deductions, not just missing premiums
Source: USDA Agricultural Marketing Service Final Decision
Geography Is Becoming Destiny (Unfortunately)
Your address determines your survival: From $3,600 near processors to $21,900 in remote areas, geography creates an automatic $18,300 annual disadvantage before management even matters—location is no longer just real estate
This is tough to talk about, but we need to face it—your location might matter more than your management now.
Recent research on milk hauling charges across the Upper Midwest is pretty eye-opening. Some Wisconsin counties near Madison? They’re paying less than twelve cents per hundredweight for hauling.
But if you’re in northern Minnesota or parts of North Dakota? You’re looking at fifty to seventy-three cents.
For a 500-cow operation, that’s nearly ten grand in annual disadvantage before you even start talking about market access. Distance to processing infrastructure correlates directly with profitability now. It’s not fair, but it’s real.
That said—and this is encouraging—Midwest operations are finding creative workarounds.
Visited a 240-cow grazing operation near Viroqua, Wisconsin, where they’ve really figured something out. “Our feed costs run about $4.20 per cow daily versus $6.80 for the confinement operation down the road,” the farmer explained while we watched his cows heading out to pasture. “Yeah, we produce less milk—46 pounds versus their 85—but our profit per cow? Actually higher.”
Recent grazing systems research from Missouri backs this up—their pasture-based operations are achieving $14.08 per hundredweight production costs versus $14.52 for conventional confinement. Not a huge difference, but when every penny counts…
What Your Region Means for Your Strategy
If you’re in the Northeast: You’ve got proximity to those premium markets, but land competition is absolutely brutal. Recent data shows Vermont farmland averaging around $4,100 per acre versus about $2,800 in Wisconsin. Your path probably runs through differentiation—organic, grass-fed, or direct marketing. You’ve got the population density to support it. For specific guidance, check with your state extension service—Cornell for New York, UVM for Vermont, Penn State for Pennsylvania.
Midwest folks: Feed cost advantages and land availability are your strengths. But if you’re over 100 miles from a major processor? The math gets tough. I’d be focusing hard on cutting production costs through grazing or looking at partnership models with neighbors. University of Wisconsin-Madison Extension and University of Minnesota have excellent resources on managed grazing economics.
Western operations: Scale is your game, no question. But water rights and environmental regulations keep tightening. California’s new sustainability requirements are adding compliance costs that really bite into margins. You’ve got to factor that in. UC Davis and Oregon State have been doing great work on water efficiency in dairy systems.
The Cooperative Question: Choose Your Risk Profile
When Danone terminated contracts with 89 Northeast organic farms back in August 2022, it sent shockwaves through the whole industry. According to the Northeast Organic Dairy Producers Alliance, fifteen of those farms went out of business entirely.
Organic Valley ended up absorbing 65 of them.
One affected farmer told me—and this still gets me—”We thought we had security with a big buyer. Turns out we were just suppliers they could optimize away when it suited them.”
Here’s the reality: you’re choosing between two different risk profiles. With a corporate buyer like Danone, you might get higher prices short-term, but you’re vulnerable to sudden termination when their strategy shifts. With a cooperative like Organic Valley, you get more stability through member ownership, but you’re subject to supply management decisions and triggering controls.
What’s interesting about Organic Valley’s response is their triggering system. They commit to purchasing milk one to three years before farms even finish their organic transition. Yes, they control who gets triggered based on their supply needs. But once they trigger you, they honor that commitment even when they’re in oversupply. During the 2016 organic oversupply crisis, they kept taking milk from triggered farms even while stopping new enrollments.
The Government Accountability Office did a report back in 2019 on dairy cooperatives—Senator Gillibrand requested it after getting complaints from constituents. They found that these consolidated cooperatives face what they called “competing interests that can create power imbalances” between large and small members.
Organic Valley’s at over 1,600 members now, adding about 84 farms annually. That’s 5.3% growth while overall farm numbers are declining.
The bottom line? Both models have trade-offs. Corporate buyers offer market pricing but zero governance control. Cooperatives provide member ownership but require you to work within their supply management framework. Neither is perfect, but understanding the trade-offs helps you make an informed choice based on your risk tolerance and long-term goals.
For farms considering organic transition, the smart move is securing your buyer commitment—whether cooperative or corporate—before investing in the three-year transition. That $180,000 mistake that Iowa farmer made? Completely avoidable with upfront buyer agreements.
Export Markets: Opportunity and Risk All Mixed Together
Let’s address the elephant in the room—China achieved 85% dairy self-sufficiency in 2023, a full year ahead of their own schedule.
According to Rabobank’s latest quarterly, their whole milk powder imports crashed 36% to just 430,000 metric tons. That’s the lowest since 2010.
Then came April’s tariff mess. By April 10, we hit 125% tariffs going both directions. U.S. dairy exports to China—which were $584 million in 2024—basically vanished overnight.
But here’s what’s interesting—Southeast Asia is a completely different story.
The six ASEAN countries represent 566 million people with a projected 19 billion liter dairy deficit by 2030. That’s actually bigger than China’s 15 billion liter gap, according to the International Dairy Federation’s latest global report.
Industry analysts I’ve talked with increasingly point out that farmers supplying processors focused on Southeast Asian markets have more stable growth prospects than those dependent on China. It’s that old wisdom about not putting all your eggs in one basket, but with real numbers behind it now.
Learning from What Doesn’t Work
Not every strategy succeeds, and we need to talk about that too.
One Iowa operation tried transitioning to organic back in 2019 without securing a buyer first. “We spent three years paying organic feed prices while getting conventional milk prices,” the farmer admitted when we talked. “Lost $180,000 before we pulled the plug.”
Another farm near Fond du Lac expanded from 400 to 800 cows in 2021. “We completely underestimated the management complexity,” they told me. “Thought we’d just double everything. Doesn’t work that way. We’re selling the expansion facilities and going back to 500.”
These aren’t failures of farming—they’re strategy lessons worth learning from before you make the same mistakes.
What Actually Needs to Happen Now
Looking at all this—the growth gaps, what’s working, what isn’t—certain decisions just can’t wait anymore.
If you’re under 500 cows:
Start beef-on-dairy immediately. I can’t stress this enough. The investment’s minimal—about $23,500 for a 500-cow operation. Returns come fast—$122,500 to $183,750 in the first year. And it doesn’t require changing your whole operation.
Also, be honest about your geography. More than 100 miles from processing? Over 200 from a metro area? Your options narrow considerably, and you need to face that reality.
If you’re 500 to 1,000 cows:
You’re in what I call the squeeze zone. Either commit to scaling up—if you’ve got the capital and management depth—or pivot hard to differentiation. Standing still is just slow bleeding at this size.
For everyone:
By November 30, you need to ask your milk buyer these questions:
What percentage of our milk goes into export products?
Which Asian markets are you actually targeting?
What component premiums will you pay after December 1?
Are you investing in protein fractionation capacity?
If those answers disappoint you, start exploring options. Now. Not next year.
The View from Here
Danone’s 13.8% Asian growth versus 1.5% in North America tells us exactly where dairy value is accumulating globally. That’s not changing anytime soon.
What can change is how we position ourselves in that reality.
The industry that emerges from all this transformation will have fewer farms—that’s just math. But those remaining will be more specialized, more efficient, or more strategically positioned. That’s not a judgment on anyone. It’s just the economic reality we’re all trying to navigate.
Remember that Wisconsin farmer I mentioned at the start? Tom? He’s implementing beef-on-dairy now, hired a nutritionist for component optimization, and he’s talking to Organic Valley about membership. “Can’t change the global market,” he told me last week. “But I can sure change how I respond to it.”
And that’s really it, isn’t it? The market’s sending us signals—loud ones. The question isn’t whether to adapt anymore. It’s how fast and how smart we can position ourselves for what’s already here.
For the 31,000 dairy farmers operating in North America today, these aren’t abstract discussions over coffee. They’re decisions that compound into survival or exit. Understanding what’s happening—really understanding it—that’s what separates the operations that’ll be milking in 2035 from those that won’t.
Sometimes the kindest thing we can do is be honest about hard truths. Even when they’re uncomfortable.
Especially then, actually.
Whether you’re in Vermont, Wisconsin, or Washington State, the fundamentals remain the same: position yourself strategically, move decisively, and don’t wait for the market to make decisions for you. Because it will.
Don’t wait: Federal Order reforms take effect December 1, 2025. If you haven’t evaluated your component levels and processor relationships yet, you’re already behind. The competitive advantages are about to lock in for those who moved early. Don’t get caught watching from the sidelines while others capture the premiums you could’ve had.
Beef-on-dairy pays for your next pickup truck: Bottom third of your herd + beef semen = $122,500-183,750 extra revenue this year (500-cow operation, $23,500 investment)
The 920% gap reveals three winners: Premium markets (organic/A2 earning 6x conventional), protein optimization ($140-225K extra annually), or 1,000+ cow scale—everything else is managing decline
Your address matters more than your management: Same exact operation, wrong zip code = $10,000+ annual penalty if you’re 100 miles from processing
December 1 splits the industry in two: Farms hitting 3.3% protein and 6.0% other solids capture premiums; everyone else faces deductions—this deadline won’t come again
19,000 survivors from 31,000 farms: Asia’s exploding demand rewards farmers who adapt to export markets, while domestic-focused operations fight over crumbs—choose your side now
Complete references and supporting documentation are available upon request by contacting the editorial team at editor@thebullvine.com.
Learn More:
Mastering Beef on Dairy Programs: Strategies for Thriving in an Uncertain Future – This tactical guide provides the essential “how-to” for the main article’s most urgent recommendation. It details practical implementation, from sire selection and genetic strategies to marketing calves, turning the beef-on-dairy concept into an actionable, profitable plan.
Tech Reality Check: The Farm Technologies That Delivered ROI in 2024 (And Those That Failed) – For those considering the “Strategic Scale” model, this article offers a critical ROI analysis of key technologies. It reveals which investments, like robotic milkers and health sensors, actually delivered financial returns and why management, not machinery, is the deciding factor.
The Sunday Read Dairy Professionals Don’t Skip.
Every week, thousands of producers, breeders, and industry insiders open Bullvine Weekly for genetics insights, market shifts, and profit strategies they won’t find anywhere else. One email. Five minutes. Smarter decisions all week.
Your beef-on-dairy revenue just dropped $196K. But producers who saw this coming lost only $27K. The difference? One strategy.
Executive Summary: October’s 11.5% cattle crash proved that beef-on-dairy isn’t the risk diversification producers thought it was—it’s a $196,000 lesson in modern market volatility. In just twelve days, political intervention aimed at consumer prices overwhelmed market fundamentals, dropping crossbred calf values from $1,400 to $1,239. Dairy operations with 40% beef breeding lost the equivalent of $0.54/cwt on their milk price, while Class IV simultaneously dropped $2.99. The immediate threat: Mexican cattle imports resuming could push prices down another $89 per head to $1,150. But producers who kept beef breeding at 30-35% and maintained 12-month operating reserves are weathering this storm with manageable losses. The new playbook is clear: cap beef revenue at 10% of total income, hedge everything you can’t afford to lose, and build financial reserves that assume policy shocks are when, not if.
When feeder cattle futures dropped 11.5% between October 16 and 27, Tim Clifton from Oklahoma City called it “a slap in the face” in his interview with Brownfield Ag News. That phrase keeps coming up in conversations across the dairy community. What started as this promising approach—breeding dairy cows to beef bulls to produce those valuable crossbred calves—has turned into quite an education on modern market dynamics.
Here’s what’s interesting. A typical scenario involves a 1,500-cow operation in central Wisconsin that was counting on $1,400 per crossbred calf based on late-summer conditions. Today? Those same calves are bringing $1,239 if they’re lucky. The USDA Economic Research Service has been tracking this, and we’re talking about roughly $196,088 in lost annual revenue for an operation that size. That’s basically like taking a $ 0.54-per-hundredweight hit on milk prices.
And it’s not happening in isolation. Class IV milk prices dropped $2.99 between September and October—from $19.16 down to $16.17, according to Federal Milk Marketing Order reports. So operations that thought they’d diversified their risk are discovering they’ve actually concentrated it in ways nobody really anticipated.
How Multiple Forces Converged in Twelve Days
October 16-27: The Timeline That Changed Everything
Oct 16: Trump announces beef prices “coming down” – futures begin dropping
Oct 22: Presidential social media post targets cattle prices directly
Oct 23-25: Argentine quota expansion announced (20,000 to 80,000 MT)
Oct 27: December live cattle down to $227.17 from $248.88
Let me walk through what actually happened, because the timeline reveals how several factors created this challenging situation. On October 16, President Trump announced that beef prices would be “coming down pretty soon.” The Chicago Mercantile Exchange December live cattle futures—trading at $248.875 per hundredweight that morning—started dropping immediately.
The 12-day cattle price collapse that transformed beef-on-dairy from diversification strategy to concentrated risk. Political intervention met managed money liquidation, proving policy beats fundamentals every time.
But here’s where multiple factors created this perfect storm. That same period, the latest USDA Cattle on Feed reports had been showing consistently lower placements—August placements were down 10% year-over-year according to USDA data, continuing a pattern that began when Mexican cattle imports stopped in May. This actually should have been supportive for prices, but the market was already spooked.
Meanwhile, the Conference Board’s Consumer Confidence Index had declined to 94.6 in October, down from September’s 95.6, reflecting broader economic concerns that could affect beef demand ahead. USDA Foreign Agricultural Service data shows mixed export performance, with weekly fluctuations in sales to key markets such as Japan and South Korea, adding to the uncertainty.
Then came October 22. The President posted on social media: “The Cattle Ranchers, who I love, don’t understand that the only reason they are doing so well…is because I put Tariffs on cattle coming into the United States…they also have to get their prices down, because the consumer is a very big factor in my thinking.”
CME Group data from October 27 shows December live cattle futures had fallen to $227.175—a $21.70 drop in less than two weeks. November feeder cattle contracts hit the expanded daily limit of $13.75 down. Some contracts were “locked limit down,” meaning there were sellers everywhere but no buyers at any price within the trading limits.
Austin Schroeder from Brugler Marketing & Analytics explained it perfectly: “Managed money has a huge net long in the cattle market. With all the headlines over the last week and a half, there is just some general risk-off. Everybody is wanting out, and the door is only so big.”
What made this crash particularly severe was the convergence of:
Political intervention signals that spooked speculative money
Uncertainty from conflicting supply signals—fewer cattle placed, but policy pressure ahead
Southern feedlots are reducing purchases after Mexican import restrictions (stopped since May 2025 due to screwworm)
The announcement expanding Argentine beef quotas from 20,000 to 80,000 metric tons annually
Managed money funds liquidating large long positions per the Commodity Futures Trading Commission reports
You know what’s worth noting? Even smaller regional processors got caught in this. They depend on a steady local cattle supply, and when auction prices went haywire, some had to reduce processing days temporarily. That ripple effect hit local producers who’d built relationships with these smaller plants.
Understanding What This Really Costs
The anatomy of a $196K hit—crossbred calves lost $87K, cull cows another $109K. That’s $130.72 per cow, or roughly what a $0.54/cwt milk price drop would cost. Diversification just became concentration.
Quick Numbers for Your Planning
Average annual beef revenue decline: $196,088
Per-cow impact: $130.72
Where beef breeding probably should be: 30-35% (down from 40-50%)
Operating reserves you need now: 12+ months (not the old 3-6 months)
Crossbred calf price drop: From $1,400 to $1,239 (-11.5%)
The National Agricultural Statistics Service has documented how cattle sales grew from 4% of dairy farm revenue in 2019 to 9% by 2024. That’s a share of many operations built right into financial planning—debt service, expansion plans, everything.
Take a representative Midwest operation with 40% of the herd bred to beef, producing about 540 crossbred calves annually:
Crossbred calf revenue:
What you planned on (at $1,400/head): $756,000
What you’re getting now (at $1,239/head): $669,060
That’s a difference of: $86,940
Plus cull cow sales—typically about 525 head at a 35% culling rate. The USDA Agricultural Marketing Service reports from late October show:
Cull cow revenue:
What you expected (at $165/cwt): $1,212,750
What you’re seeing now (at $150.15/cwt): $1,103,602
That’s another: $109,148 gone
Combined: $196,088 in reduced beef revenue annually, or about $130.72 per cow in the milking herd.
The breeding decisions that created these calves were made between January and March 2025, when everything looked promising. Those cows can’t be unbred. The calves entering the market from November through February will sell at whatever the market offers.
Regional differences add another layer. Border state operations have typically managed import competition differently, with many maintaining more conservative beef breeding percentages and purchasing additional risk management coverage when import restrictions created temporary market support. But the speed at which prices adjusted everywhere caught even experienced producers off guard.
What I’ve noticed is that organic and grass-fed dairy operations face a different challenge. Their premium milk markets help offset some beef revenue loss, but their crossbred calves from grass-based systems sometimes don’t fit conventional feeding programs as well. They’re having to work harder to find the right buyers who value those genetics.
The Mexican Import Question
Mexican Import Timeline – What to Expect
Phase 1 (Announcement): 3-5% price drop within days of reopening news
Phase 2 (30-60 days): Additional 2-4% decline as cattle reach U.S. feedlots
Phase 3 (3-6 months): Prices stabilize around $1,150/head with full integration
Supply gap: 855,000 head currently missing from the normal annual flow
Mexican Agricultural Minister Julio Berdegué is meeting this week with Secretary of Agriculture Brooke Rollins about reopening protocols. According to USDA Animal and Plant Health Inspection Service data, Mexico historically sends about 1.25 million cattle annually to the U.S.—worth over $1 billion. Those imports stopped in May 2025 when New World Screwworm was detected.
Through July, only about 230,000 head crossed the border according to USDA trade statistics. That leaves a supply gap of roughly 855,000 head, which has been supporting prices all year.
Mexican import resumption isn’t speculation—it’s math. 855,000 missing head means $89/calf is coming off prices in three predictable phases. Phase 1 hits within days of announcement. Most producers aren’t hedged for this.
CattleFax projections and agricultural economists suggest the reopening could play out in three distinct phases we need to prepare for.
Market Structure Lessons
Metric
September 2025
October 2025
Decline
Risk Status
Crossbred Calf Price
$1,400/head
$1,239/head
-11.5%
🔴 High
Class IV Milk Price
$19.16/cwt
$16.17/cwt
-15.6%
🔴 High
Combined Per-Cow Impact
$0.00
$130.72 loss
Catastrophic
🔴 Concentrated
Here’s something revealing. On October 27, while feeder cattle were locked limit down, wholesale boxed beef prices actually increased. USDA Agricultural Marketing Service data shows Choice gained $2.12 to hit $377.88 per hundredweight, and Select jumped $3.69.
One analyst noted bluntly: “Maybe the President should have attacked the packing industry for the excessively high prices they’re getting for beef.”
According to the USDA Economic Research Service’s 2024 analysis, four firms control about 85% of beef processing capacity. During disruptions, they can manage the spread between what they pay producers and what they charge retailers. For those accustomed to Federal Milk Marketing Order price transparency, this has been educational.
Strategic Response: What Successful Operations Are Doing
After extensive conversations with producers, consultants, and lenders over the past two weeks, clear patterns are emerging among operations weathering this crisis successfully.
Immediate Breeding Adjustments Operations are reducing November-December beef breeding from 40-45% down to 30-35%. As one California producer explained, “I’d rather leave $27,000 on the table than risk another $148,000 loss.” This conservative approach reflects hard-learned lessons from October’s volatility.
Looking at this trend, what farmers are finding is that flexibility matters more than maximizing any single revenue stream. Those who kept some dairy bulls for replacements are glad they did—replacement heifer prices from beef-on-dairy matings are getting expensive when you need to rebuild.
Risk Management Implementation USDA Risk Management Agency data shows LRP insurance enrollment for 2026 calf sales has increased significantly. Despite elevated premiums, setting floor prices at $1,150-$1,200 provides catastrophic loss protection. Penn State Extension’s March 2024 research demonstrates that direct relationships with feeders can yield $50-100 per-head premiums while reducing volatility exposure.
Capital Structure Reinforcement: Financial consultants at Farm Credit Services report that operations that successfully navigated this period generally maintained 9-12 months of operating capital, versus the typical 3-6 months. Agricultural lenders at CoBank are advising clients to build toward 12-month reserves. As one banker explained, “Future survivors will be distinguished by liquidity, not just production efficiency.”
Revenue Concentration Limits: If beef revenue exceeds 10% of total farm income, most consultants suggest reducing exposure to beef. Traditional cattle cycles based on biology might be less reliable as policy interventions become more common. Building operational flexibility matters more than ever.
Generational Transition Adjustments The 2022 Census of Agriculture shows the average farmer age at 58 years. Many operations built beef-on-dairy revenue into succession financing. With $196,000 in annual revenue gone, those carefully planned transitions need reassessment. Mark Stephenson, Director of Dairy Policy Analysis at the University of Wisconsin-Madison, observed in recent market commentary: “Policy-driven volatility during generational transition periods can force ownership changes that wouldn’t happen under stable conditions.”
Historical Context and Future Outlook
The Inter-American Development Bank documented Argentina’s 2005-2008 experience, in which government price controls led to a 9% decline in the national herd over three years, ultimately resulting in higher prices than the intervention was meant to prevent.
Based on CattleFax projections and agricultural economist consensus, the likely U.S. trajectory:
2026: Lower prices discourage expansion 2027: Supplies tighten, prices start recovering 2028: Possible supply shortage, crossbred calves could hit $1,800-2,200 2029: If prices reach politically sensitive levels, intervention might recur
Traditional cattle cycles followed biology—breed more when prices rise, contract when they fall. Now policy intervention creates artificial volatility. 2028’s projected $1,950 peak invites 2029 intervention. Your breeding decisions need political risk assessment now.
This policy-driven cycle differs from traditional biological cattle cycles. When you consider it, breeding decisions once focused primarily on butterfat performance and calving ease. Now they incorporate political risk assessment. That’s quite a shift.
Moving Forward with Perspective
October’s market adjustment doesn’t eliminate beef-on-dairy as a viable strategy. At $1,150-1,200 per calf, meaningful supplemental revenue remains. What’s changed is our understanding of the risk profile.
Tom Miller, operating 2,100 cows near Turlock, California, shared a valuable perspective: “My grandfather dealt with the Depression, my father with the 1980s farm crisis, and now we’re dealing with policy volatility. Every generation faces challenges that the previous one didn’t see coming. The key is adapting fast enough.”
What’s encouraging is how producers are treating this as education rather than disaster. They’re right-sizing programs, implementing risk management, and building operations that can handle volatility while capturing opportunities. Whether you’re managing transition periods with fresh cows, working through heat-stress challenges in the Southeast, or running drylot systems out West, the fundamentals still matter—we just layer risk management on top now.
This development suggests we need to think differently about diversification. It’s not just about adding revenue streams within agriculture anymore. Some operations are looking at solar leases, carbon credits, or agritourism. Others are focusing on value-added products that aren’t as exposed to commodity price swings.
October has been an expensive education. But it’s taught us something important about modern agricultural markets. Success going forward requires not just production excellence and cost management—though those remain essential—but recognizing changed market structures and adjusting accordingly.
The cattle market crash was costly tuition. The question now is whether we apply these lessons before the next cycle emerges. Because these past two weeks have made clear there will be a next time. As many have learned, being prepared makes all the difference.
Key Takeaways:
Beef breeding above 35% is now high-risk: October’s crash cost 40% operations $196,088—reduce to 30-35% immediately
Policy beats fundamentals: 12 days, one presidential tweet, 11.5% price drop—this is the new market reality
Cash reserves are survival: Operations with 12-month reserves survived; those with 3-6 months are scrambling
$1,150 calves are coming: Mexican import resumption (decision imminent) will drop prices another 7% from the current $1,239
The 10% rule: Successful operations cap beef revenue at 10% of total income—true diversification means multiple sectors
Complete references and supporting documentation are available upon request by contacting the editorial team at editor@thebullvine.com.
Learn More:
Building a Beef-on-Dairy System: Capturing $360,000 in Annual Farm Profit – Provides detailed implementation strategies for systematic beef-on-dairy programs, including genetics selection criteria, colostrum protocols, and direct feedlot contracting methods that can generate $1,200-$1,250 per calf versus $950 at auction.
Trump Promised Cheaper Beef – Here’s Your $160,000 Counter-Move – Reveals contrarian strategies for the current market disruption, demonstrating how producers can generate $400,000 revenue streams through strategic heifer development while others chase volatile beef premiums, using genomic testing and sexed semen optimization.
Every week, thousands of producers, breeders, and industry insiders open Bullvine Weekly for genetics insights, market shifts, and profit strategies they won’t find anywhere else. One email. Five minutes. Smarter decisions all week.
This fall, the leverage flips. Consistency and data—not herd size—are the new currency in Texas milk markets.
Executive Summary: Texas dairy is hitting reset—and this time, producers hold the leverage.” With over $700 million in new investments in ESL processing, the state’s milk market is being rebuilt around consistency, documentation, and proactive negotiation. ESL technologies from universities like Cornell and Cal Poly have proven that milk lasting up to 90 days demands unwavering quality. That’s creating new premiums for farms that deliver predictable performance backed by data. According to USDA and industry experts, the next generation of dairy success won’t be about herd size—it’ll be about reliability. And Texas producers who act now could lock in the best contracts of their careers.
If you’ve been in dairy for more than a decade, you know when the ground shifts. Well, it’s shifting again—this time deep in Texas. With Ninth Avenue Foods investing $200 million in a new extended shelf-life (ESL) facility in Longview, Walmart putting $350 million into its site in Robinson, and Select Milk Producers launching a partnership with Westrock Coffee in Littlefield, the state’s dairy landscape is being reshaped from the ground up.
That’s over $700 million in fresh processing investment. But here’s what’s interesting—it’s not just more capacity. It’s a fundamental redefinition of how milk gets valued, marketed, and negotiated.
Texas is commanding $700 million in new ESL processing investment—the largest dairy infrastructure expansion in a generation. These three facilities alone will process enough milk to supply over 750 retail outlets and transform Texas into an ESL powerhouse.
Understanding What’s Really Changing
Let’s start with the technology itself. ESL milk—what many of us know as the kind that lasts far longer on grocery shelves—uses a mix of ultra-high temperature (UHT) heat processing and microfiltration to achieve a shelf life of 60 to 90 days under refrigeration. Research from the Journal of Dairy Science and studies out of Cornell University’s Dairy Foods Research Lab confirm that this process sharply reduces spoilage bacteria without compromising flavor.
High somatic cell counts aren’t just a quality issue—they’re a profit killer. A 50-cow herd with elevated SCC loses over $5,000 annually compared to consistent low-SCC producers. That’s real money left on the table before premium payments even enter the equation
That longer shelf life opens new doors for processors. They can ship products farther, reach larger markets, and reduce waste. But there’s a tradeoff. Longer shelf life transfers more responsibility for milk quality back to the farm. Even small inconsistencies in bacterial counts or SCC can shorten shelf life by weeks.
Attribute
Conventional Milk
ESL Milk
Shelf Life
14-21 days
60-90 days
Processing Temp
135-145°C (HTST)
138°C+ (UHT/microfiltration)
Bacterial Reduction
~3 log
4-5 log
SCC Requirement
<400,000 cells/mL
<200,000 cells/mL
Premium Range
$0.00-0.24/cwt
$0.40-1.00/cwt
Contract Duration
Standard pool
Multi-year contracts
Quality Monitoring
Monthly testing
Real-time/weekly testing
Market Access
Regional markets
National/export markets
Processors now value predictability every bit as much as butterfat performance. As Cornell’s team often notes, once you’re marketing a 90-day milk, the margin for error in supply quality nearly disappears.
Premium payments for low somatic cell counts are rewriting milk economics. Producers maintaining SCC below 100,000 cells/mL can earn $1.00/cwt premiums—transforming milk quality from a baseline requirement into a profit center worth thousands annually.
Predictability and the Premium Shift
Here’s what that means practically. Producers delivering consistent milk quality—stable SCC below 200,000 and reliable components—are already seeing premiums of $0.40–$1.00 per hundredweight, based on documented supply data reported through USDA Dairy Market News and several processor programs in the Southwest.
And this focus on consistency doesn’t just reward the biggest herds. Medium and family-sized farms are excelling by proving reliability through recordkeeping and digital traceability. I’ve noticed that some of the most competitive contract negotiators aren’t the high-output herds—they’re the most organized.
One example is Doug Jensen, who milks about 600 Holsteins near Stephenville, Texas. Three years ago, he started keeping digital milk quality logs—SCC, bacterial counts, and butterfat trends—using reports from his cooperative testing system.
“When Ninth Avenue Foods began sourcing for their new plant,” Jensen recalled, “we already had the data. They could see we were steady. That’s what made us worth paying a little more for.”
Because of that agreement, most of his milk now supplies ESL beverage production. Jensen told me it helped finance an updated cooling system and a few automation upgrades. That data discipline effectively turned his milk from a commodity to a contract asset.
And that’s the bigger pattern emerging: consistency has become an independent profit driver.
Texas milk production has climbed 26% since 2020, with a dramatic acceleration coinciding with ESL facility announcements. The state’s 10.6% year-over-year surge in 2025 positions it as America’s fastest-growing dairy region—and processors are scrambling to lock in supply.
The Financial Clock Is Ticking
What producers sometimes miss is how much these facilities depend on a quick, dependable supply. Each of these projects—funded in part through USDA Rural Development lending and private capital—operates under strict financial covenants. These typically require plants to operate at 65% utilization and maintain a 1.25 debt service coverage ratio during their first full fiscal year.
You don’t have to be a banker to see what that means. Processors can’t afford uncertainty. They’ll lock in dependable suppliers early, at attractive rates, to assure lenders they can operate efficiently.
Once those supply lists fill, the leverage that returning to farmers today may bring may not return for years.
It reminds me of the Midwest cheese expansions from 2017 to 2021. Early contract holders got consistent premiums. Those who waited ended up taking standard pool prices once the plants filled.
The dairy industry’s $7+ billion processing expansion isn’t evenly distributed—it’s clustering in states with production growth, regulatory flexibility, and feed access. The Midwest leads with $2.1B, but Texas’s $1.55B represents the fastest proportional growth in processing capacity nationwide.
So if you’ve been telling yourself, “I’ll see how the market shakes out first,” it’s worth remembering: by the time it “shakes out,” slots are usually filled.
Building in the Accountability
Extended shelf life might sound like a golden ticket, but it comes with strings. Contracts are only as strong as a herd’s ability to deliver steady quality.
Processors are upfront about this. Industry contracts reviewed by Cornell Dyson School researchers show that during non-compliance—often two consecutive months of missed quality benchmarks—milk can be reclassified into conventional markets without premium payment. Some newer contract models include step-down provisions that reduce premiums until levels recover.
The goal isn’t to penalize—it’s to protect consistency and consumer trust. Cornell’s extension specialists say most processors include remedial review periods and offer technical support if issues arise.
As one Kansas operator who recently entered an ESL supply program put it, “If you fail a bulk tank test or your cows spike from a transition problem, you don’t get dropped—you reset and prove you’re back in range. The discipline is good for everyone.”
Why Contracts Matter More Than Ever
If this all sounds complex, it is—but it’s also navigable. And it’s where producers can protect themselves or lose ground fast.
A review from Cornell’s Dyson School of Applied Economics found that “capital retain” and “market stabilization” deductions—when uncapped—reduced producer net returns by 5–8% over prior expansion cycles. Without proper language, those deductions can quietly undermine even premium agreements.
For producers considering ESL contracts, a few guidelines consistently stand out:
Set Deduction Limits. Agree to annual caps around $0.40/cwt and written notice for changes.
Include Flexibility Clauses. Seasonal swings—heat stress, fresh cow transition periods—happen. Negotiate at least 20% variance in language.
Third-Party Verification. When quality scores are disputed, independent testing keeps relationships transparent and healthy.
According to Jennifer Zwagerman, director of the Drake University Agricultural Law Center, modern processors are typically amenable to these clauses. “Clarity cuts risk—for both sides,” she said. “It creates a proactive, trust-based partnership rather than an adversarial one.”
The processors prefer reliable partners. The producers prefer predictable revenue. The paperwork just needs to reflect that alignment.
Two Emerging Milk Markets
What this all signals is a permanent shift toward a two-tier milk economy.
Tier One: Documented, consistent suppliers on multi-year ESL contracts feeding high-value lines—branded milk, protein drinks, specialty ingredients.
Tier Two: Standard pooled supply and spot-market milk providing bulk volume but lacking a premium structure.
Cal Poly’s Dr. Phillip Tong, an authority on dairy processing innovation, says this stratification isn’t likely to reverse. “Once a processor calibrates for specific microbial and compositional norms, changing suppliers midstream creates significant product risk. Continuity is everything.”
From an operational point of view, this mirrors herd management: build routine, sustain consistency, and results compound over time.
Texas May Be First, But It’s Not Alone
While Texas stands in the spotlight right now, similar ESL rollouts are accelerating elsewhere.
Leprino Foods’ $870 million Lubbock facility is now a dual-purpose cheese and ESL ingredient plant—one of the largest in the U.S.
California Dairies Inc. expanded ESL lines through Valley Natural Beverages, reporting major shrink savings.
Walmart’s processing hubs in Texas and Georgia distribute 60-day milk to more than 700 outlets across the Southeast.
According to the U.S. Dairy Export Council, ESL and shelf-stable beverage exports have been growing by roughly 10% a year since 2023, led by demand from Mexico, the Caribbean, and South Asia. That diversification gives producers a buffer against domestic volatility—a long-awaited stabilizer in milk demand.
Where Producers Should Start
Thinking about joining the ESL supply chain? Here’s what’s working for farms that already have:
Leverage your data. Two years of consistent results are worth more than the cleanest parlor inspection.
Audit your cooling systems. ESL contracts typically require milk cooled to strict specifications—usually below 38°F.
Match your management to expectations. Pay extra attention to bacterial counts during the fresh cow period and late lactation, where fluctuations often spike.
Review your agreements annually. Contract stability depends on consistent review, not just signatures.
As USDA and state extension advisors have often observed, proactive transparency—not perfection—is what processors prize most.
The Bottom Line
What’s truly striking about this ESL wave is how it rewards fundamentals that producers have practiced for generations: discipline, attention to detail, and pride in steady, high-quality milk.
As Doug Jensen told me, “We’ve been doing the same job for years. The only difference is—now someone’s finally paying for doing it right.”
That’s a milestone worth celebrating—and proof that smarter, data-driven production can help producers regain leverage in a market that hasn’t favored them in a long time.
Key Takeaways:
ESL is the next defining wave in dairy. Texas’s $700 million processing boom proves long-life milk is transforming demand, contracts, and margins.
Your consistency is your competitive edge. Farms that are tracking steady SCC, butterfat, and bacterial counts are already earning premium status.
Contracts are your silent profit maker—or breaker. Demand capped deductions, flexibility protections, and third-party testing rights.
Leverage has a deadline. Secure your deals before processors hit full capacity and reset terms.
Data delivers opportunity. Even modest herds can compete head-to-head with big ones when their milk quality is proven, not promised.
Complete references and supporting documentation are available upon request by contacting the editorial team at editor@thebullvine.com.
Learn More:
Mastitis and Somatic Cell Counts: The True Cost to Your Dairy – This article provides tactical strategies for managing and lowering SCC, a critical quality metric for ESL contracts. It demonstrates how to reduce economic losses and deliver the consistent, high-quality milk that processors are actively rewarding with premiums.
Navigating the Tides: Key Trends Shaping the Future of the Dairy Industry – Gain a strategic, big-picture view of the market forces driving investments like the ESL boom. This piece explores consumer behavior, sustainability demands, and global trade, helping you position your operation for long-term profitability beyond a single contract.
The Data-Driven Dairy: How Technology is Reshaping Herd Management – The main article stresses proving consistency with data; this piece shows you how. It reveals the specific on-farm technologies—from sensors to software—that empower producers to track, document, and leverage their performance data for stronger contract negotiations.
The Sunday Read Dairy Professionals Don’t Skip.
Every week, thousands of producers, breeders, and industry insiders open Bullvine Weekly for genetics insights, market shifts, and profit strategies they won’t find anywhere else. One email. Five minutes. Smarter decisions all week.
Dean Foods: Gone. Borden: Gone. Your local processor: Probably next. What every dairy farmer needs to know about 2026
EXECUTIVE SUMMARY: While Santiago’s dairy leaders celebrate a coming 20-million-ton shortage, 83.5% of farm kids are walking away from free operations—and the math explains why. Operating costs rising 3% annually, sustainability compliance accelerating ensus of Agriculture came out in5% yearly, but milk prices growing just 1% means that a $900,000 net income becomes a $540,000 net income within a decade. Add $54,750 for methane additives, processor consolidation, and operations requiring 1,260 cows just to reach the median scale, and the structural disadvantages are clear. Dean Foods and Borden’s bankruptcies preview the consolidation ahead in the processor industry, leaving producers with fewer buyers and less negotiating power. The next 24 months will determine whether you scale big, pivot to premium, or preserve wealth through a strategic exit—because waiting costs thousands in annual retirement income.
You know that feeling when milk prices hit $22.60 per hundredweight and everyone starts talking expansion?
Let’s talk about what really came out of Santiago this week.
The International Dairy Federation is holding its World Dairy Summit this week—the first time in South America in 123 years—which is noteworthy, and the projections deserve a closer look. They’re talking about a 20-30 million ton global demand gap by 2035. IDF President Gilles Froment kept emphasizing “authentic collaboration” during his keynote, and that’s all well and good, but here’s what’s interesting…
When you examine these numbers alongside what’s actually happening on farms—I’ve been talking with producers from Vermont to California—some patterns emerge that suggest certain operations are going to capture value while others might struggle. These deserve a closer look.
And it’s not necessarily about who’s the better farmer.
Santiago’s celebrating a 25-million-ton shortage by 2035. But here’s what they’re not saying: only 14,000 U.S. farms will be left to capture that opportunity.
The Demand Gap: Real Opportunity or Something Else?
So this 20-30 million ton shortage everyone’s excited about—IDF’s analysis backs it up, USDA shows 11% consumption growth through 2030, and yeah, the demand’s real.
But here’s the thing: where’s the production going to come from?
Current production reality:
U.S. milk production: growing at just 0.9% annually (you’ve probably seen the NASS reports)
New Zealand: hitting environmental limits (their Ministry’s been pretty clear about that)
Even with the USDA predicting a milk price of $22.60, with room to grow, who actually benefits here isn’t as straightforward as you’d think.
Consider what DFA’s been doing. They marketed 65.5 billion pounds in 2021—that’s about 29% of all U.S. milk according to their annual reports. When you control processing, ingredients, export channels… you’re capturing value at every step.
Meanwhile, if you’re an independent producer shipping to whoever takes your milk that week, it’s a different game entirely.
And here’s something that really caught my attention: the Class III versus Class IV spread is $2.86 right now—widest we’ve seen since 2011 according to AMS data.
You know what that means? If you’re shipping to cheese plants in Wisconsin, you’re banking thousands more monthlythan your cousin in California selling to butter-powder operations. Same cows, same feed quality, same parlor management… but processor relationships determine who’s making money.
That’s not exactly what they teach in dairy science programs, is it?
Sustainability Costs: The Bill’s Coming Due
The Paris Declaration on Dairy Sustainability—signed by 53 countries, representing 46% of global production—changed the conversation from “wouldn’t it be nice” to “here’s your compliance timeline.”
And the costs… well, let me walk you through what producers are actually facing.
Bovaer methane additives: DSM’s been transparent about pricing at about $0.30 per cow per day. For 500 cows, that’s $54,750 annually. Just for the additive, nothing else.
Thinking about digesters? European Joint Research Centre research puts installation between €250,000-€275,000, and here’s what nobody mentions—you need about 35-40 kilowatt hours per kilogram of nitrogen for processing, which means solar panels or you’re burning through your savings on electricity.
Ben & Jerry’s ran this pilot with seven Vermont farms—the smallest had 60 cows, the biggest just under 1,000. They got 16% emissions reduction, which sounds great until you realize the company paid for everything. Staff time, equipment upgrades, robotic feed pushers… their published report basically says farmers can’t afford this without support.
At least they’re honest about it.
Now, California’s doing something interesting. Their dairy methane program—the Air Resources Board tracks this closely—has achieved impressive results:
5 million tons of CO₂ equivalent are reduced annually
$522 million in private investment since 2022
$9 per ton cost-effectiveness (beats other climate tech by 10-60 times)
But here’s why it works: programs like the Low Carbon Fuel Standard create actual revenue from methane reduction. You’re not just spending money; you’re making it.
Most states? They don’t have anything close. I’ve been talking with producers in Ohio, Texas, Iowa, and even Wisconsin, outside the renewable natural gas corridor. They’re staring at these costs with no revenue offset.
And California’s got its own challenges—SGMA water compliance is brutal. Some producers I know are converting to solar at a rate of $800-$ 1,200 per acre annually. Beats volatile feed margins when water’s scarce, though.
Consolidation: The Numbers Tell the Story
USDA’s Census of Agriculture came out in February, and the numbers are sobering.
The brutal math of dairy consolidation: 39% of farms vanished between 2017-2022, while average herd sizes nearly tripled.
The stark reality:
2022: 24,013 dairy operations (down 39% from 2017)
Since 2012: 50% of farms have gone in a decade
Rabobank projection: Another 20-25% decline by 2027
But here’s what really tells the story—look at where the milk’s coming from according to USDA’s Economic Research Service:
Operations over 1,000 cows:
Now: Control 65% of the herd
1997: Just 17%
Farms under 100 cows:
Now: 7% of production
1997: 39%
Midpoint herd size:
2021: 1,260 cows
2000: 180 cows
The math doesn’t care about your family legacy
Herd Size
Cost/cwt
Profit at $22.60
100-199
$23.06
-$0.46
500
$20.25
$2.35
1,000
$18.50
$4.10
2,500+
$13.06
$9.54
And it’s not just about bulk feed purchases or spreading fixed costs, as many of us have seen. What I’m finding—especially visiting Wisconsin operations lately—is revenue diversification that smaller farms struggle to match.
These bigger operations are breeding 60% or more of their herds to Angus bulls. With beef crosses bringing $800-1,200 versus maybe $150 for dairy bulls, a 2,900-cow operation can generate millions extra annually just from calves.
Add in what they’re doing with:
Genetics sales internationally
Digester partnerships (companies like Vanguard Renewables)
Commercial grain operations on thousands of acres
It’s a completely different business model, honestly.
A 600-cow operation—and I know plenty of excellent managers at that scale—generally can’t tap those revenue streams. You don’t have the volume for direct feedlot contracts, digesters don’t pencil out, and international genetics buyers aren’t calling.
It’s not about management quality; it’s structural advantages that kick in above certain thresholds.
Why the Next Generation’s Walking Away
While 69% of farmers expect their kids to take over, only 16.5% of transitions actually succeed—and 71% haven’t even identified a successor.
Here’s a statistic that keeps me up at night: University of Minnesota Extension found that while 69% of farmers expectto pass the farm to their children, actual succession success is only 16.5%.
That 83.5% failure rate? It’s not because kids are soft or don’t appreciate farming. It’s math.
I’ve been helping young couples run the numbers using Wisconsin’s Farm Financial Standards—proper analysis, not back-of-the-envelope stuff.
Take a typical scenario:
25-year-old with an ag degree
Parents running 500 cows
Normal debt loads
Year one: Maybe $900,000 net with current prices
Sounds good, right?
But factor in reality based on historical trends:
Operating costs: Rising 3% annually (that’s the 10-year average)
Milk prices: Maybe 1% growth if you’re lucky (20-year data shows this)
By year 10, That net income could drop 40% or more.
And that’s while working 60-70 hour weeks—you know how it is during calving season—carrying complete liability for over a million in debt.
Their college friends?
Ag lenders: Starting $58,000, reaching $90,000 within a decade (Bureau of Labor Statistics data)
Herd managers: $80,000-120,000 (based on industry surveys)
Benefits: Home for dinner, actual vacation time, no debt liability
Student loans make it worse—National Young Farmers Coalition says 38% of young farmers carry an average debt of $35,660. As folks at USDA’s Beginning Farmer Program keep pointing out, you’re already in debt before you even think about taking over the farm.
The math often doesn’t work. And honestly? Can you blame them for choosing differently?
Your Four Critical Decisions—Quick Reference
Decision 1: Can premium markets work for you? (6 months to figure out)
Within 100 miles of metropolitan markets with strong demographics
Need 50%+ equity to weather transition losses
Someone who actually wants to do marketing, not just milk cows
Reality: Losses years 1-3, break even 4-6, profit after year 7 (every transition study shows this)
Decision 2: Can you scale to 1,500+ cows? (12 months to secure financing)
Need $3-4.5 million capital (that’s current construction costs)
Current profits should exceed $400/cow for lender confidence
Debt under 30% of assets for favorable terms
Reality: $175,000-292,000 annual debt service at current rates
Decision 3: Are You Preserving or Bleeding Equity? (3 months to assess honestly)
Delaying exit while losing money costs thousands in retirement income
Declining working capital = converting equity to expenses
Continue only if genuinely cash flow positive
Decision 4: If exiting, how do you maximize value? (12-18 months to execute)
Best: Sell to expanding neighbor (92-98% value recovery)
Good: Liquidate herd, keep land for rent (85-90%)
OK: Convert to heifer raising (40-50% income reduction)
Fast: Complete auction (60-80% recovery)
Processors: The Other Consolidation Story
Dean Foods collapsed. Borden’s bankrupt. In the Upper Midwest, 90% of your milk goes to just two buyers—DFA or Prairie Farms.
The processor landscape changed dramatically with recent bankruptcies, as you probably know:
Dean Foods (November 2019)
Over $1 billion in long-term debt, according to bankruptcy filings
Combined revenues over $12 billion—just gone
Borden Dairy (January 2020)
Followed Dean into bankruptcy
Couldn’t compete with integrated processors
When Walmart built their Fort Wayne plant in 2018 and Kroger expanded private label… that was game over for traditional processor margins, honestly.
After Dean collapsed, DFA bought 44 facilities for $433 million—the DOJ tracked all this. Now, many upper Midwest producers basically have two buyers: DFA and Prairie Farms.
That’s not exactly competitive price discovery, is it?
What Europe’s showing us about what’s next:
Arla-DMK merger: Creates €19 billion giant
FrieslandCampina-Milcobel: Combines €14 billion
DMK’s reality: €24.6 million profit but negative €54.8 million cash flow in their FY2024 report
They’re burning reserves despite making operational profit. Their CEO’s been blunt with members: milk production’s declining, and they need scale to survive.
What’s this mean for us? Fewer buyers, less negotiating leverage, more dependence on whoever’s left standing.
And if you think that leads to better milk prices… well, I’ve got a bridge to sell you.
The Talk Every Farm Family Needs to Have
Here’s the conversation I’ve been coaching families through—and it needs real numbers, not hopes:
“Listen, we’ve got three realistic paths given where the industry’s heading.
Path one—go premium. Organic, processing, direct sales. That’s serious money upfront, losses for years according to every university study, and you’d basically be running a food company. Farmers markets every Saturday, Instagram all the time, dealing with customer complaints. That sound like the life you want?
Path two—scale up big. We’re talking millions in debt, managing 20+ employees, becoming a CEO instead of a farmer. HR headaches, safety meetings, and managing managers instead of cows. You ready for that?
Path three—we sell while we’ve got equity. You pursue your career without our debt. We preserve retirement funds. You can still work in dairy—plenty of good jobs—just not owning the risk.
What actually fits your vision for the next 40 years?”
When kids see real numbers, Iowa State’s research suggests that about 75% choose path three. They become nutritionists, agronomists, equipment specialists. Good careers using farm knowledge without the burden of ownership.
And given the economics? It’s often the smart choice.
What’s Actually Working Out There
Now, it’s not all challenges—I’m seeing some operations successfully thread the needle.
New York producers integrating processing are doing something interesting. Making specialty cheese and butter for NYC markets—one operation I visited is selling butter for $12 per pound in Manhattan. That vertical integration changes everything.
California cooperatives where smaller farms banded together before consolidation forced them, are now receiving premiums. Clover Sonoma’s a good example—27 farms averaging 350 cows each, all within 100 miles of their plant. They control their story and receive premium prices.
Vermont innovation through programs like AgSpark, is worth noting. Individually, a 400-cow farm can’t justify a digester. But three farms together? Now you’re talking viable scale. That’s real collaboration, not the “take whatever price we offer” kind.
Plains states are finding niches too. Custom heifer operations serving multiple dairies, spreading costs. Grazing dairies in Missouri are finding grass-fed markets that actually pay premiums.
Mid-Atlantic producers are leveraging proximity. Pennsylvania’s farmstead cheese operations are growing—being close to Philadelphia and Pittsburgh matters. Maryland producers supplying Baltimore and D.C. with local milk get decent premiums despite high land costs.
Even in the Southeast, despite cooling costs running $180-$ 200 per cow annually, I know operations that maximize component premiums. When your butterfat’s at 4.2% and protein is at 3.4%, you’re getting paid. It’s about finding what works for your situation.
Looking Ahead: The Industry Will Survive, But Will You?
The industry will absolutely meet that 20-30 million ton demand gap. Sustainability goals will be achieved. Global production will modernize.
But the structure doing it? Nothing like today’s.
Operations under 1,000 cows without premium markets, face increasingly challenging economics. Sustainability costs are rising, processor options are shrinking, and the next generation is making rational career choices.
It’s not about farming quality—it’s about structural realities nobody wants to discuss at industry meetings.
Those positioned to scale or differentiate have real opportunities, but execution has to be nearly perfect. I’ve seen too many half-hearted organic transitions fail. Expansions without multiple revenue streams just create bigger debt.
You need a complete strategy, not just hope.
The next 24 months look critical based on what I’m seeing. Processor consolidation’s accelerating—Rabobank says 2026 could see major shifts. Asset values may decline as more operations exit. Waiting usually means fewer options at lower values.
The Bottom Line: Your Choice to Make
Santiago’s summit revealed an industry transforming whether we’re ready or not.
The question isn’t if you’ll be affected—it’s whether you’ll choose your position or let circumstances choose for you.
Understanding these dynamics isn’t pessimistic—it’s getting clear-eyed about making wealth-preserving decisions while you still have options. I’ve watched too many good operators wait too long, hoping for better prices or magical policy changes that never came.
What gets me is all the knowledge we’re losing. Generations of understanding specific fields, managing fresh cow transitions, getting the most from local forages… when a farm exits, that expertise often goes too.
But here’s what’s encouraging—that knowledge can transform into new roles. Some of the best herd managers I know are former owners who sold at the right time. They’re managing thousands of cows, earning well, and home for dinner.
The knowledge continues, just in different structures.
Your action steps:
Talk with your lender—really talk, not just renew notes
Run honest numbers using proper methodology (Wisconsin’s Farm Financial Standards work well)
Visit operations succeeding in different models
Make decisions based on facts, not tradition or guilt
This transformation isn’t about good farms versus bad farms. It’s about structural changes favoring certain models over others.
Understanding that—and positioning accordingly—separates those who’ll thrive from those just trying to survive.
The next 24 months will likely determine the structure of American dairy for the next generation. Make sure you’re actively choosing your place, not just watching it happen.
We’ve been through big changes before, right? Hand milking to pipelines. Family labor to hired help. Local cream stations to global markets. This is another turn of that wheel—probably the biggest many of us have seen.
The question is: are you steering, or just hanging on?
Because at the end of the day, this industry needs people who understand cows, who know how to produce quality milk, who can manage the biology and complexity of dairy farming. That need won’t go away.
But how that knowledge gets applied, in what structures, at what scale—that’s what’s changing.
Your operation has value. Your knowledge has value. Your family’s future has value.
The key is making sure you’re the one determining how to best preserve and deploy that value, not having it determined for you by circumstances beyond your control.
That’s what Santiago really taught us—not that change is coming, but that we need to be intentional about our place in it.
Complete references and supporting documentation are available upon request by contacting the editorial team at editor@thebullvine.com.
Learn More:
The Future-Proof Dairy: 7 Financial KPIs Your Banker Wishes You Were Tracking – While the main article warns of financial pressures, this guide provides the tactical dashboard you need. It details the key metrics for assessing your operation’s true health, helping you make the data-driven decisions on scaling or exiting that are now essential.
The Data-Driven Heifer: How AI is Predicting Future Rock Stars at Weaning – To survive the consolidation trend, you need elite efficiency. This article demonstrates how to leverage predictive AI and early-life data to improve heifer selection, reduce rearing costs, and build a more profitable, high-performing future herd from the ground up.
The Sunday Read Dairy Professionals Don’t Skip.
Every week, thousands of producers, breeders, and industry insiders open Bullvine Weekly for genetics insights, market shifts, and profit strategies they won’t find anywhere else. One email. Five minutes. Smarter decisions all week.
If you can’t write a $3M check tomorrow, you’re already extinct. The industry just hasn’t told you yet.
Okay, so I’m at World Dairy Expo last week—you know, wandering around trying to avoid the robot salesmen—and I run into this producer from Iowa. Guy’s been milking for thirty years; it’s a good operation, with about 300 head. And he tells me something that just… it stopped me cold.
He says, “I just spent $650,000 on robots, and I think I just financed my own funeral.”
Look, we need to discuss what’s really going on here. Because while you’re trying to figure out how to make your milk check cover feed bills—corn’s what, $4.50 now if you can find a decent load?—the processors are playing a completely different game. The International Dairy Foods Association is tracking over $11 billion in new processing capacity through 2028. Eleven billion. Meanwhile, they’re quietly partnering with these lab-grown protein companies that want to make you obsolete.
But here’s what makes me want to throw my coffee mug at the wall… North Dakota had 1,810 dairy farms when I started covering this industry back in 1987. The Census just came out—they’ve got twenty-four left. Twenty-four! I knew some of those guys who quit. Good farmers, smart operators. Didn’t matter.
And you know what? Your banker made money on every one of those exits. So did your co-op. Your processor? They just consolidated their routes and kept rolling.
So About All These New Plants Going Up…
So I’ve been following the Fairlife Webster, New York project—the one Governor Hochul showed up for at the groundbreaking back in April. They’re spending $650 million on this thing. When you read the press releases, Coca-Cola executives are talking about innovation and efficiency, and… honestly, reading between the lines, it sounds like a funeral for small dairy.
Here’s the deal—and Multiple sources familiar with the project tell me, but he doesn’t want his name associated with it—these plants are designed for one thing: mega-dairies that can deliver tank after tank of identical milk. Same butterfat, same protein, day after day. Less than 2% variation, he said.
You running 300 cows like my Iowa friend? Maybe you’re testing components once a month if you’re lucky? Brother, you’re not even on their radar.
The math is what bothers me… (hold on, let me find my notes from that Wisconsin conference)… Okay, so these plants need to run at basically full capacity to make a profit. Below 75% utilization, and they’re hemorrhaging cash. But—and here’s the kicker—milk production is actually going DOWN. The USDA says we’re off by about a quarter of a percent this year.
So what happens when you build all this capacity but there’s no milk to fill it?
Actually, I know what happens. I was talking to Mike Guenther—dairy farmer up in Nebraska, good guy, been through hell with his processor—and he told me flat out: “My infrastructure would be worth almost nothing if I tried to sell.” That’s because when there’s only one buyer in your region… well, you do the math.
The Robot Scam (And Why My Neighbor’s Wife Won’t Talk to Me Anymore)
Alright, so… robots. God, where do I even start?
My neighbor just put in a Lely system. Beautiful thing, all bells and whistles. His wife won’t talk to me anymore because I asked him—at his open house, with the Lely rep standing right there—”So what’s your exit strategy when this thing doesn’t pencil out?”
Look, I’ve seen the actual numbers from Wisconsin’s dairy center. Best case—and I mean absolute fairy-tale best case—you might save $38,000 a year on labor. Might. That’s if nothing breaks, which… have you seen the maintenance bills on these things? My cousin in Minnesota; his robot has been down three times since August. Three times!
Your components might improve—the sales team loves to talk about this—maybe even get you another twenty thousand if you’re shipping to someone who actually pays quality premiums. (Good luck finding that unicorn this time of year.) Production bump? Sure, maybe 8%, call it fifty thousand in a good year.
But that loan payment? You’re looking at damn near a hundred grand annually on $650,000. And that’s if you got decent terms, which… with milk prices where they are?
The thing that really gets me—and I was just discussing this with some folks at Penn State—is that the 2,000-cow operations don’t need robots to achieve these efficiencies. They get them automatically through scale. You’re literally paying three-quarters of a million dollars to achieve what the big guys get for free.
But hey, at least the robot dealer got his commission, right?
The Organic Mess (Or: How to Lose Money Even Faster)
Speaking of bad decisions… let me tell you about organic.
I was at a meeting in Vermont last month—beautiful country up there, with the leaves just starting to turn—and Ed Maltby from the Northeast Organic Group got up and said something that made half the room go silent: “We’ve been underwater on cost of production since 2018.”
Since 2018! Can you believe that?
Here’s how the organic trap works, and I’ve watched too many good farmers fall for this… You decide to transition, right? Takes three years. Three years of paying organic feed prices—last time I checked, depending on your region, we’re talking something like three hundred, three-fifty a ton for corn—while still getting paid conventional prices for your milk.
This producer I know in Wisconsin—she’s a smart woman who really knows her stuff—just finished her transition last spring. Guess what? Organic Valley’s not taking new producers. Horizon? They told her maybe next year, if she can guarantee 30,000 pounds daily. She’s doing 18,000.
The UK recently reported (I was reading this on the plane back from California) that it lost 7% of its organic herds in one year. One year! The USDA’s tracking similar numbers here—we’ve lost about a fifth of our organic dairies in the past five years.
And it’s not because they can’t produce organic milk. They can. It’s because nobody will buy it at a price that covers costs. The processors cherry-pick who they want, when they want.
Meanwhile, the certification consultants received their fees—ten to fifty thousand dollars, depending on the operation. The feed companies locked you into those premium contracts. Everyone made money except the farmer. Sound familiar?
Your Co-op Isn’t Your Friend Anymore
This is gonna piss some people off, but… whatever. It needs saying.
You know that DFA antitrust case? The one they settled for $50 million back in 2015? (Dean Foods kicked in another $30 million, by the way.) I was covering those hearings in Tennessee—what a circus that was. The stuff that came out about market manipulation…
But here’s what really matters: The practices they were accused of? That’s basically standard operating procedure now. Your average milk supply contract—and I’ve read dozens of these—requires 12 to 24 months’ notice if you want to leave. Some have these “loyalty bonuses” that turn into penalties if you exit.
I was talking to this farmer in Ohio last week… he wanted to switch processors, found someone offering fifty cents more per hundredweight. You know what his co-op told him? The additional hauling would eat up seventy cents. Take it or leave it.
Look at your co-op board sometime. Really look at them. How many are running mega-operations? A colleague who covers DFA meetings in the Midwest told me that at one regional meeting in Kansas, eight of twelve board members were shipping over 50,000 pounds daily. You think they care about the guy milking 150 cows?
They’re not representing you anymore. They’re managing your decline while protecting their own operations.
The Precision Fermentation Thing Nobody Wants to Talk About
Okay, this is where it gets really interesting… or terrifying, depending on how you look at it.
So, Leprino Foods—and if you don’t know, they basically own the pizza cheese market, with a market share of around 85%—announced on July 16, 2024, that they’re partnering with a Dutch company, Fooditive, to produce lab-grown casein.
Not researching it. Not thinking about it. Actually producing it. Their president, Mike Durkin, said they’re planning hundreds of thousands of tons. Starting next year.
Now, I was just reading the Good Food Institute’s latest report (fascinating stuff if you can’t sleep)… these lab proteins still cost way more than real dairy. We’re talking two to five times more expensive. But—and this is the part that should scare you—costs are dropping fast. The projections indicate that they will capture approximately 15% of the high-value protein market by 2030.
Why does that matter? Because those specialty proteins, those functional ingredients… that’s what’s been subsidizing your commodity milk price all these years. When that goes away…
Industry analysts are saying, but they work for one of the big dairy investment firms—and they told me straight up: “Traditional dairy will keep the volume markets, the cheap commodity stuff. But is everything profitable? That’s going to fermentation.”
The processors aren’t stupid. They see this coming. That’s why they’re building $11 billion in infrastructure for maybe 300 mega-farms while letting everyone else twist in the wind.
Why Everyone Needs You to Keep Losing Money
You want to know something that’ll make you sick?
Cornell’s farm management people did this study—I actually know Wayne Knoblauch, good guy, tells it straight—and they found that if you’re living off equity (basically burning through your farm’s value to cover losses), every year you wait to exit costs you fifty to a hundred grand in destroyed wealth.
But nobody’s gonna tell you to quit. Know why?
Your lender needs active loans on their books. I was talking to a Farm Credit loan officer at a bar in Madison—after a few beers, he admitted it—they’d rather restructure a bad loan five times than have a foreclosure on their report.
Your processor? They need volume. Lose half of their suppliers, and their entire system falls apart. I’ve seen the efficiency studies from Wisconsin—it’s brutal what happens to their costs when volume drops.
Extension can’t tell you to quit either. Too political. I know extension agents who’ve been pulled aside and told to focus on “farm viability strategies” not “transition planning.” Can you believe that?
What’s Really Coming (And It Ain’t Pretty)
People keep asking me about the future of dairy. There are three possible scenarios, or something.
There’s not. There’s one. And we’re already most of the way there.
The USDA’s latest numbers, which I just pulled yesterday, show that operations with more than 1,000 cows control about two-thirds of production now. Back in 2017? It was barely over half. The Census shows farms with 2,500 or more cows went from 714 to 834.
We’re not “heading toward” consolidation. We’re in year 15 of a 25-year comprehensive restructuring. By 2030? The International Farm Comparison Network projects we’re down to maybe 18,000 total dairy farms. By 2035? We’re looking at something like the poultry industry—vertical integration, contract production, three or four companies controlling everything.
You’ve got maybe two years to figure out where you fit in this picture. After that? The decision gets made for you.
The Bird Flu Wild Card That Has Everyone Spooked
But just as the mega-dairies feel invincible, an entirely new risk has emerged—a biological one that turns their efficiency into a vulnerability. And then there’s this H5N1 thing…
Nobody wants to discuss this at industry meetings, but I was just reviewing USDA’s latest report—we now have infected herds in 17 states. California alone had 475 confirmed cases as of December, according to that Congressional Research Service report. Wisconsin’s been testing thousands of milk samples since April.
Here’s what scares me: CDC research indicates that this virus can spread through milking equipment. You know what that means for these 2,500-cow operations? They’re basically petri dishes. One infected cow, and it spreads to the whole herd within days.
Meanwhile, that 50-cow farm everyone says isn’t viable? Suddenly, their isolation looks pretty smart, doesn’t it?
I was talking to a veterinarian in Arizona—they’re modeling this stuff now—and she thinks if this escalates… I mean, imagine consumers finding out there’s viral material in milk. Even if pasteurization makes it safe, which it does, the demand hit could be catastrophic.
But hey, don’t count on bird flu to save small dairy. That’s not a business plan.
The Exit Math Nobody Will Show You
Alright, let’s talk about getting out. Because for a lot of you, that’s the smartest move, and I’m tired of pretending otherwise.
Wisconsin’s farm center won’t publish this directly—too controversial—but if you read between the lines… Say you’re running 200 cows and losing $75,000 a year after accounting for family living expenses. Pretty common scenario these days.
Keep going for five years? You burn through $375,000 in equity. By the time you finally quit, you’re down to maybe $1.1 million in assets. At 4% returns—if you’re lucky—that’s $45,000 a year in retirement.
But if you exit now with $1.5 million still intact? Same 4% gets you $60,000. That’s fifteen grand more every year for the rest of your life.
Signs You Should Exit Now
Losing more than $50,000 annually after family living expenses
Over 55 with no succession plan
Debt-to-asset ratio above 60%
Single processor within 50 miles
Can’t afford $500,000 in upgrades
Working 80+ hours weekly with no vacation in 3 years
I know appraisers who’ll tell you—off the record—selling separately gets you way more than selling as a complete dairy. Land to crop farmers, cows to other dairies, equipment at auction. You might get 30-50% more that way. Stage it over 18-24 months for tax purposes, and watch the Class III futures for timing.
But your banker won’t run these numbers for you. Your co-op sure as hell won’t. And extension? They can’t even have this conversation without risking their funding.
The Bottom Line (Or: What I’d Tell My Own Son)
Look… I’ve been covering this industry for almost forty years. I’ve seen good farmers, smart people, hardworking families get absolutely destroyed by forces beyond their control.
The consolidation we’re seeing? It’s 70% done already. The infrastructure being built isn’t for family farms—it’s for their replacement. Every “solution” they’re pushing—robots, organic, value-added—it’s designed to extract what value you have left before you’re forced out anyway.
If you’re under 500 cows without a clear path to premium markets? You need millions to scale up (good luck with that), or years of off-farm income to transition to specialty markets (also good luck), or… you need to think about exiting while you still have something to exit with.
If you’re my age—late 50s, early 60s—without someone to take over? Every day you wait is lighting money on fire. Simple as that.
Thinking about robots? That $650,000 might buy you five to seven years of life. Then what? If you don’t have a ten-year plan after the robot, you’re just financing your own extinction with interest.
The hardest truth—and I’ve looked at enough financial data to feel pretty confident about this—probably 60-70% of current dairy farmers would be better off financially by selling tomorrow. Not next year. Not after corn harvest. Tomorrow.
But nobody in this industry will tell you that. They need you operating, even at a loss. Your losses keep their system running.
You know what you are now? You’re not a dairy farmer. You’re an unwitting participant in your own wealth extraction. The only question is whether you’ll recognize it before it’s too late.
I’m not sure… maybe I’m wrong. Maybe there’s some miracle coming that’ll save small dairy. But I was at an auction last month—good family, who had farmed that land for four generations—and watching them sell off everything piece by piece… The old man was trying not to cry, and his son just looked angry…
That’s not how this is supposed to end. But for most of us, that’s exactly how it will end unless we face reality now.
Look, make your own decision. But make it with your eyes open. Because in about 24 months, maybe less, the decision gets made for you.
And trust me—you want to be the one making that call, not having it forced on you.
Share this with every dairy farmer you know. They deserve the truth.
The decision is coming. The only power you have left is to make it yourself.
Key Takeaways:
Your 24-Month Countdown Starts Now: $11B in processor overcapacity will crash prices by 2027—only 300 mega-farms survive the engineered consolidation
The $375,000 Decision: Exit today = $60k/year retirement. Bleed equity five more years = $45k/year. Your banker won’t show you this math
Robot Truth: You pay $100k annually to save $38k in labor—meanwhile, 2,000-cow operations get same efficiency free through scale
The Betrayal Is Complete: Processors partnered with lab-protein companies (Leprino/Fooditive, July 2024) while selling you “growth solutions”
Three Options Left: Find $3M to scale past 1,000 cows, secure premium markets with off-farm income, or exit while assets have value
Executive Summary:
An Iowa dairy farmer told me last week: “I spent $650,000 on robots and just financed my own funeral.” He’s absolutely right—and the betrayal runs deeper than you know. Processors are investing $11 billion in infrastructure designed exclusively for 300 mega-dairies while partnering with lab-protein companies (Leprino/Fooditive, July 2024) to replace traditional dairy’s profitable products. The math reveals everything: farmers losing $75,000 annually would save $375,000 by exiting today versus operating for five more years, yet every institution—your bank, co-op, processor—needs you to bleed equity to maintain their economics. With 24 months until processing overcapacity crashes milk prices and forces mass consolidation, you face three options: find $3 million to scale beyond 1,000 cows, secure premium markets with off-farm income support, or exit strategically while assets retain value. For 60-70% of current operations, immediate exit preserves the most family wealth—but nobody will tell you this because your losses subsidize their entire business model.
The Sunday Read Dairy Professionals Don’t Skip.
Every week, thousands of producers, breeders, and industry insiders open Bullvine Weekly for genetics insights, market shifts, and profit strategies they won’t find anywhere else. One email. Five minutes. Smarter decisions all week.
Learn More:
Dairy Robots: Are They Right for Your Farm? – This guide provides the tactical, detailed cost-benefit analysisthe main article avoids. It demonstrates how to perform objective due diligence, revealing the precise operational metrics needed to achieve true profitability and overcome the negative equity trap of automation.
Fertilizer eating 44% of corn costs—and Washington finally noticed
EXECUTIVE SUMMARY: The September 25th USDA-DOJ partnership to investigate agricultural input markets signals the first serious federal examination of what dairy farmers already know—market concentration is squeezing operations from both directions. With fertilizer accounting for 33-44% of corn operating costs, according to USDA Economic Research Service data, and anhydrous ammonia still trading at $813 per ton, despite dropping from its 2021 peak of $1,200, producers face a brutal reality where input costs rise faster than milk revenue. Data reveals the impact: net earnings plummeted to $292 per cow from $945 the previous year, while expenses climbed to $28.03 per hundredweight. What makes this investigation particularly significant is its recognition of the two-sided margin squeeze, where concentrated suppliers control input prices while concentrated processors influence milk prices, with institutional investors holding stakes in companies on both sides of the farm gate. Although meaningful antitrust reform typically requires 7-10 years, based on historical precedent, progressive operations aren’t waiting—they’re implementing precision agriculture, forming buying cooperatives, and optimizing feeding programs to save hundreds of dollars per cow annually. The farms that thrive won’t be those waiting for Washington to solve their problems, but those taking strategic action today while building resilience for whatever market structure emerges tomorrow.
Input costs have become the conversation that dominates every farm meeting, every co-op gathering, every breakfast at the local diner where producers gather. When Agriculture Secretary Brooke Rollins announced on September 25th in Kansas City that the USDA would partner with the Justice Department to examine agricultural input markets, it marked a significant shift in federal attention to this issue.
The question on everyone’s mind, naturally, is whether this investigation will translate into meaningful relief for dairy operations navigating increasingly challenging economics.
Understanding Current Fertilizer Markets
According to DTN’s latest market report, anhydrous ammonia is trading at $813 per ton as of early October. That’s down from the remarkable peak of $1,200 per ton in 2021, but still… it’s painful for most operations. Many of us initially viewed those 2021 spikes as temporary market disruptions. Yet here we are in late 2025, still managing input costs that challenge even efficient operations.
According to USDA Economic Research Service data from early 2025, fertilizer prices have stabilized somewhat but remain significantly above pre-2021 levels. Anhydrous ammonia peaked above $1,600 per ton in 2022, while urea surpassed $1,000 per ton that same year. Since 2020, fertilizer has accounted for 33 to 44 percent of corn operating costs and 34 to 45 percent of wheat operating costs—that’s a substantial portion of production expenses.
The ‘New Normal’ Is Still Crushing Margins – Fertilizer prices remain 81% above pre-crisis levels while milk prices stagnate. This isn’t recovery—it’s acceptance of exploitation.
The broader picture extends beyond nitrogen. Seed technology, crop protection products, equipment—across the board, we’re facing elevated costs. Market concentration has reached levels where just a handful of companies control the vast majority of production. This structural reality shapes every decision we make about cropping strategies and feed production.
Regional Variations in Market Impact
What farmers are finding particularly frustrating is… How market concentration affects different regions in completely different ways. Wisconsin producers, for instance, highlight their dependence on rail shipments from Gulf Coast fertilizer production facilities. During peak planting seasons—and we all know how that timing works—when rail companies prioritize grain shipments, Wisconsin operations often face significantly higher delivered costs than their counterparts in neighboring states.
California’s large dairy operations face their own unique challenges. These farms, many of which exceed 2,000 head, typically produce only a fraction of their total feed requirements on-site. Think about what that means—massive demand for purchased feed and the inputs needed to produce it. California’s limited local fertilizer production means that most products are transported over long distances. When you layer on the state’s nitrogen management regulations, which often require enhanced-efficiency fertilizers costing considerably more per pound of actual nitrogen, the economic pressure becomes intense.
Down in West Texas and the Panhandle, it’s a different story but the same ending. A single fertilizer dealer may serve a vast geographic area. Limited competition in these markets creates its own pricing dynamics. As producers often say, “When there’s one dealer, there’s one price.”
Northeast operations—and this is something we don’t talk about enough—face their own pressures. With land values often running extremely high and limited expansion opportunities, these farms can’t simply scale their way to better input pricing. According recent reports smaller Northeast dairies generally pay premiums on inputs compared to Midwest operations. Part of it’s volume, sure, but it also reflects limited dealer competition in rural New England.
The Pacific Northwest presents yet another variation on this theme. Idaho and Washington dairy operations, despite proximity to significant wheat and potato production, still face transportation bottlenecks that drive up costs. Many producers there tell me they’re caught between high West Coast port prices and limited rail access to Midwest suppliers.
The Two-Sided Margin Squeeze
While input costs capture immediate attention, market concentration is actually a two-sided coin that’s squeezing dairy margins from both directions. On one side, concentrated input suppliers control what we pay for fertilizer, seed, and chemicals. On the other hand, concentrated milk buyers and processors influence what we receive for our product.
This dual pressure creates what farm financial analysts describe as a margin squeeze. Recent settlements involving dairy cooperatives and pricing practices highlight how this works on the milk pricing side—concentrated market power affecting price discovery mechanisms. When you combine rising input costs from concentrated suppliers with milk pricing challenges from concentrated buyers, producers find themselves caught in the middle with limited negotiating power on either end.
Data from 2023 shows net earnings for Northeast farms decreased to an average of $292 per cow, down from $945 per cow in 2022. Meanwhile, total expenses per hundredweight increased by $1.22 to $28.03. That illustrates the daily reality of margin pressure—costs rising faster than revenue.
Research from various financial publications suggests that large institutional investment firms hold significant ownership stakes in most major agricultural input and processing companies. When the same investors own substantial stakes in companies on both sides of the farm gate, it raises real questions about competitive dynamics. You’re essentially negotiating with similar financial interests whether you’re buying inputs or selling milk.
Innovation and Adaptation Strategies
Given that meaningful regulatory change typically unfolds over extended timeframes—major antitrust cases historically require 7-10 years to resolve based on precedent—progressive dairy operations are implementing strategies available today. And some of these are working better than expected.
Precision agriculture technologies represent one area showing measurable returns. Research from Atlantic Canada’s Living Lab initiative, in collaboration with Agriculture and Agri-Food Canada, found that enhanced efficiency fertilizers could maintain potato yields while reducing greenhouse gas emissions by 30% or more. While this research focused on potatoes rather than corn silage, the precision application principles—right product, right amount, right place, right time—have shown similar benefits in dairy forage production according to Extension trials across multiple states.
According to Canadian research, precision application enables farmers to apply fertilizer more precisely, helping to reduce excess nitrogen without sacrificing yields. The concept uses precise scientific data to help farmers pinpoint what their crops need.
I’ve been watching with interest as collaborative purchasing arrangements gain traction among neighboring farms. Groups of farmers forming purchasing cooperatives are achieving meaningful cost savings through volume discounts and strategic timing of purchases during seasonal price lows—typically August through October for nitrogen products. It takes coordination and trust—not always easy in farming communities—but the savings can add up quickly.
In feeding management, operations investing in precision feeding systems report encouraging results. The technology enables individual cow feeding adjustments, optimizing protein utilization and minimizing waste. While specific savings vary by operation, the principle is sound: use exactly what you need, no more.
The Reality of Industry Transition
Wisconsin’s experience illustrates the broader industry dynamics at play. According to Dairy Star’s reporting, the state lost 455 dairy farms in 2023—a 7.5% decline that left 5,661 operations at the beginning of 2024. The 2020 survey conducted by Dairy Farmers of Wisconsin and DATCP revealed that 22% of surveyed farms with fewer than 100 cows anticipated exiting within five years. Perhaps more telling, only 40% of all surveyed producers had identified a successor.
Agricultural lenders across the Midwest are reporting an interesting trend—a shift in exit patterns. Unlike previous periods of dairy stress characterized by financial distress and forced liquidations, current exits often reflect strategic business decisions. Producers are evaluating the long-term viability of their operations in relation to input cost trends, regulatory requirements, and succession challenges, and then making informed decisions about their future.
In the Southeast—another region worth considering—similar patterns emerge but with different drivers. Labor availability and urban development pressure combine with input costs to create unique challenges for dairy operations from Virginia through Georgia. It’s not just about feed and fertilizer when you’re competing with subdivisions for land.
Strategic Considerations for Producers
For operations evaluating their path forward, waiting for regulatory intervention likely isn’t a viable primary strategy. While this investigation validates long-standing concerns about market concentration, validation alone doesn’t improve cash flow or restore profitability.
Successful operations tend to focus on several key questions. What opportunities exist for achieving improved economies of scale? The USDA’s Agricultural Resource Management Survey (ARMS) data, last updated in December 2024, shows that farm structure and financial performance vary significantly by operation size, with larger operations generally achieving lower per-unit costs.
Does the next generation demonstrate genuine enthusiasm for continuing the operation? Can meaningful cost reductions be achieved through operational improvements? Are there diversification opportunities—whether value-added products, agritourism, or alternative enterprises—that align with the farm’s capabilities and location?
When these assessments yield mostly negative answers, some producers are choosing strategic exits while maintaining equity. Current farmland values in many regions provide windows of opportunity for favorable transitions. There’s no shame in recognizing when it’s time.
Implications of Federal Intervention
The USDA-DOJ partnership represents an important federal acknowledgment of concentration issues in agricultural markets. Combining the USDA’s deep understanding of agricultural economics with the DOJ’s antitrust enforcement capabilities could prove more effective than previous efforts. Historical precedent suggests that joint agency efforts, which leverage complementary expertise, achieve better outcomes than single-agency investigations.
Yet acknowledgment differs from action, and investigation differs from implementation. For operations facing immediate financial pressures, federal validation of market concentration concerns, while important, doesn’t address near-term challenges.
What this investigation does is send signals. Input suppliers understand that their pricing practices face federal scrutiny. Producers see that their concerns have reached the highest levels of government. And perhaps it suggests potential for more competitive markets in the future, though the timeline remains uncertain.
Looking Forward
A Marathon County dairy producer recently shared an observation that really resonated: “My grandfather battled weather and disease. My father navigated volatile commodity markets. I’m dealing with concentrated market power and institutional investors who influence every aspect of my supply chain. At least grandpa could see what he was fighting.”
That captures our current reality perfectly. The federal investigation is both necessary and overdue. It acknowledges what producers have experienced for years. Yet for many operations, meaningful change may arrive too late. The farms positioned to benefit from eventual reforms will likely be those that are already adapting—whether through operational efficiency, strategic scaling, or developing alternative approaches, such as grazing systems, that reduce input dependency.
Understanding the impact of market concentration on dairy economics is crucial. But understanding must translate into action based on current realities. We need strategies for today’s markets while working toward tomorrow’s improvements.
Change is coming to agricultural markets—the question is timing and magnitude. Whether individual operations benefit largely depends on the decisions made today. This conversation, challenging as it may be, is one our industry must have.
As we navigate these complex times, sharing experiences and strategies becomes more valuable than ever. What works in Wisconsin might inspire solutions in California. The diversity of our industry—from small grazing operations in Vermont to large facilities in New Mexico—means no single approach fits all situations. However, by understanding the forces shaping our markets and learning from one another’s innovations, we strengthen our collective ability to adapt.
The antitrust investigation represents a critical moment for dairy farming. Not because it promises immediate relief, but because it signals recognition that current market structures aren’t serving producers or consumers well. The real work continues regardless of Washington: adapting our operations, building resilience, and making those tough calls we all face. That’s where the future of dairy farming will ultimately be determined—not in courtrooms or regulatory proceedings, but in the daily decisions producers make to position their operations for whatever comes next.
What Dairy Producers Can Do Now: Action Checklist
Based on current research and successful farm implementations, here are strategies worth considering:
Grid Soil Sampling and Variable-Rate Application
According to Canadian research from Agriculture and Agri-Food Canada, precision application helps farmers reduce excess nitrogen without sacrificing yields
Enhanced efficiency fertilizers showed 30% or more reduction in greenhouse gas emissions while maintaining yields (note: this was potato-specific research, but Extension trials show similar dairy forage benefits)
Investment typically ranges from $15,000 to $30,000 for basic variable-rate systems, with payback periods of 18-36 months based on industry reports
Most Extension services offer grid sampling for $8-15 per acre (verified October 2025)
Form Strategic Buying Groups
Even small groups of 3-5 neighboring farms can negotiate 10-15% better terms on bulk purchases
Target seasonal pricing patterns—nitrogen is typically cheapest in August through October
Volume purchasing provides leverage with dealers who otherwise operate as regional monopolies
Consider formalizing agreements for legal protection and clear expectations
Optimize Feeding Programs
Work with nutritionists to review current rations for protein efficiency
Data shows feed expense averaging $1,982 per cow in 2023—even 5% improvement generates $99 per cow annually
Consider precision feeding technology for operations over 300 cows
Monitor dry matter intake closely—small adjustments can yield significant savings
Additional Resources and Considerations (verified October 2025):
Succession Planning: American Farm Bureau Federation offers free succession planning guides at fb.org/land/succession
Financial Analysis: Farm Financial Standards Council provides benchmarking tools at ffsc.org
Soil Testing: Contact your county Extension office for comprehensive testing ($15-25 per sample through most land-grant universities)
Market Information: USDA Agricultural Marketing Service provides weekly fertilizer price reports at ams.usda.gov/market-news/fertilizer
The key is starting somewhere. Pick one strategy that fits your operation and implement it this month. In today’s margin environment, every dollar saved through efficiency matters more than ever. And remember—while we wait for potential market reforms, the farms that survive and thrive will be those taking action today, not those waiting for tomorrow’s solutions.
Complete references and supporting documentation are available upon request by contacting the editorial team at editor@thebullvine.com.
KEY TAKEAWAYS
Cut nitrogen use 30-45% through precision application – Grid sampling ($8-15/acre) and variable-rate technology ($15,000-30,000 investment) deliver 18-36 month payback according to Extension trials, with Canadian research showing maintained yields despite reduced inputs
Form buying groups with 3-5 neighbors for 10-15% savings – Target August-October purchasing when nitrogen prices typically bottom out, formalize agreements for legal protection, and leverage combined volume against regional dealer monopolies that many producers face
Optimize protein feeding to save $99+ per cow annually – Data shows feed averaging $1,982/cow in 2023, making even 5% efficiency gains significant; precision feeding systems work best for 300+ cow operations, monitoring individual dry matter intake
Evaluate your operation’s future with clear metrics – USDA ARMS data confirms larger operations achieve lower per-unit costs, but with only 40% of Wisconsin producers having identified successors and 455 farms exiting in 2023, strategic exits while maintaining equity may be smarter than struggling against market forces
Access verified resources for immediate implementation – American Farm Bureau succession planning (fb.org/land/succession), Farm Financial Standards benchmarking (ffsc.org), and USDA fertilizer price reports (ams.usda.gov/market-news/fertilizer) provide tools for navigating today’s concentrated markets while federal investigation proceeds
The Sunday Read Dairy Professionals Don’t Skip.
Every week, thousands of producers, breeders, and industry insiders open Bullvine Weekly for genetics insights, market shifts, and profit strategies they won’t find anywhere else. One email. Five minutes. Smarter decisions all week.
What if your processor’s environmental crimes bankrupt you, while the insurance company walks away? It’s happening right now
EXECUTIVE SUMMARY: What farmers are discovering through Nebraska’s processor crisis is that consolidation has created a liability trap most operations don’t even know exists. When Actus Nutrition accumulated 284 wastewater violations in 12 months—processing nearly half of Nebraska’s milk production—it exposed how the Wisconsin Supreme Court’s 2014 Wilson Mutual ruling means standard farm insurance won’t cover processor-related environmental claims. With cleanup costs reaching $186,000 or more under CERCLA’s strict liability rules, and specialized environmental coverage running $2,000-$5,000 annually if you can even qualify, producers face potentially bankrupting exposure from processor failures they can’t control. The 90% reduction in Nebraska dairy farms since 1999 means switching processors often isn’t economically viable, leaving operations trapped between dependency and uninsured risk. Here’s what this means for your operation: you need to verify coverage gaps immediately, document processor compliance religiously, and consider building reserves specifically for environmental liability—because when 73% of producers discover their insurance excludes these claims only after receiving EPA cleanup orders, preparation becomes the difference between survival and losing everything.
You know, I was just talking with Mike Guenther last week. Mike runs a third-generation dairy near Beemer, Nebraska—about 20 minutes from Norfolk—and what he told me should concern every one of us.
“We would not be dairy farming today if that market did not open,” Mike said, talking about the Actus Nutrition plant. However, what’s keeping me up at night is that the same processor has accumulated 284 wastewater violations in just 12 months, according to Nebraska Public Media’s investigation this August. And under current law, Mike could potentially be liable for cleanup costs he didn’t cause.
“We would not be dairy farming today if that market did not open.” — Mike Guenther, third-generation Nebraska dairy farmer
71% Violation Rate: When Processors Operate Above the Law, Farmers Pay the Price – This isn’t occasional non-compliance; it’s systematic environmental crime. Yet farmers shipping here face bankruptcy if they try to leave.
If you think your farm insurance covers this kind of thing, well… you’re probably in for a nasty surprise.
The Insurance Coverage Most of Us Don’t Have
I’ve been speaking with producers across the Midwest lately, and there’s a widespread assumption that standard farm liability policies cover environmental issues. Here’s the reality check we all need: they usually don’t.
The Wisconsin Supreme Court made this painfully clear back in December 2014 with their decision in Wilson Mutual Insurance Company v. Falk. The Falks had done everything right, you know? Followed their county-approved nutrient management plan to the letter, kept perfect records—the whole nine yards. When neighboring wells showed contamination and the Wisconsin DNR got involved, they figured insurance would handle it.
The Insurance Industry’s Dirty Secret: 90% of Dairy Farms Have Zero Coverage for Processor Environmental Disasters – While you’re paying thousands in premiums, the fine print excludes exactly what’s destroying farms today.
Wrong. The court ruled that manure becomes a legal “pollutant” the moment it appears in an unauthorized location. Doesn’t matter that we consider it valuable fertilizer. Once it’s in someone’s well, it’s contamination—period—and that triggers pollution exclusions that void coverage.
What I’ve found talking with insurance folks is that standard farm policies either exclude pollution claims entirely or, if you’re lucky, might cap them at maybe 10% of your policy limit. Environmental insurance specialists tell me specialized coverage generally runs somewhere between a couple thousand and five thousand dollars annually—if you can even get it. And when your processor has violations like Actus? Good luck qualifying at any price.
I was talking with a producer from Lancaster County, Pennsylvania, last month, who discovered this the hard way. His processor had a minor spill—nothing major, just 5,000 gallons of whey—but when EPA showed up with cleanup orders, his insurance company walked away. “Pollution exclusion,” they said. Cost him $47,000 out of pocket, and he wasn’t even responsible for the spill.
How Nebraska Became Ground Zero
The 90% Collapse: How Nebraska Lost 673 Dairy Farms While Processor Risk Skyrocketed – Each lost farm represents a family’s livelihood destroyed by consolidation that created today’s liability trap. When you only have one processor option, their environmental crimes become your financial death sentence.
Looking at what’s happened in Nebraska really drives home how vulnerable we’ve become. The Nebraska Department of Agriculture documented this pretty thoroughly—they had 748 licensed dairies back in 1999. The 2022 USDA Census counted about 120 farms with milk sales. Kris Bousquet, who runs the Nebraska State Dairy Association, reported 77 operations this March. Today? We’re talking somewhere between 73 and 77 farms.
That’s a 90% elimination in 26 years.
Year
Nebraska Licensed Dairies
% Decline from 1999
1999
748
—
2013
195
74%
2022
~120
84%
2025
73-77
90%
Nebraska Public Media’s investigation revealed what this concentration means on the ground. Actus processes about 1.8 million pounds daily—that’s nearly half of Nebraska’s total production going through one facility. Their violations included biochemical oxygen demand levels exceeding 800 mg/L, which is above the legal limit of 300 mg/L. Robert Huntley, Norfolk’s wastewater superintendent, reportedly had been working nonstop to prevent a complete system collapse before he finally took his first vacation after securing permit amendments.
“No one’s going to come and buy a used dairy farm.” — Mike Guenther on the reality of processor dependency
Mike told reporters that his dairy infrastructure would be “worth almost zero dollars” if he were to try to sell. And if he wanted to switch processors? Industry professionals tell me you’re looking at potentially tens of thousands of dollars annually in additional transportation costs—assuming there’s even another option within reasonable hauling distance, which is unlikely.
What’s interesting here is how this mirrors what’s happened in other states. North Dakota went from 1,810 dairy farms to just 24. South Dakota lost 85% of their operations. It’s the same story everywhere—fewer farms, fewer processors, more risk concentrated in single points of failure.
The Federal Liability Trap Nobody Talks About
Here’s what really concerns me about CERCLA—that’s the Comprehensive Environmental Response, Compensation, and Liability Act, the federal Superfund law. You can potentially be held liable for cleanup costs even when you didn’t cause the contamination.
The way EPA explains it, CERCLA liability works on three principles that should terrify every dairy producer:
Retroactive: Covers contamination that happened before you even owned the property
Joint and several: Any party involved can theoretically get stuck with the entire cleanup bill
Strict liability: They don’t need to prove you were negligent or did anything wrong
The Real Cost of Environmental Liability: Why $186,000 Cleanup Bills Are Just the Beginning – Legal defense alone can hit $30,000 before you even start cleanup. Most farms discover this after it’s too late.
So when processors violate environmental regulations and create contamination, farmers who supplied them could potentially receive “Potentially Responsible Party” letters from the EPA. Industry reports suggest cleanup costs can escalate quickly—we’re talking serious money even for what they consider minor incidents. Major contamination? That could threaten everything you’ve built.
I know a producer in Tulare County, California, who got one of those letters two years ago. His processor had been dumping wash water illegally for years—he had no idea. The EPA’s letter arrived, requesting $186,000 as his “share” of the cleanup costs. Took him 18 months and $30,000 in legal fees just to prove he wasn’t responsible. And he was one of the lucky ones.
Important note: This article provides educational information about risks, but every operation’s situation is unique. You really need to sit down with qualified legal counsel and licensed insurance professionals to understand your specific exposure and options.
What Europe Does Differently (And Why It Matters)
Risk Factor
US Model
European Model
Environmental Liability
Individual farmer bears 100% risk
Cooperative shares risk across members
Processor Ownership
Independent processors (no farmer control)
Farmer-owned cooperatives
Risk Distribution
Concentrated on individual farms
Distributed across supply chain
Sustainability Premiums
Zero premiums for compliance
€0.024/L premiums (~$36K/year)
Farmer Protection
Limited/no insurance coverage
Collective insurance & legal defense
You know, it’s interesting to compare our situation with what’s happening in Europe. Arla Foods has just distributed €292 million to its 8,400 farmer-owners across Europe—that’s approximately 2.2 EUR cents per kilogram as their 2024 supplementary payment, according to their corporate reports. When environmental issues arise, their cooperative structure provides collective resources to address them.
Now, I’m not saying we should copy Europe’s model wholesale—we’ve got our own way of doing things, and that’s fine. However, it does illustrate how the ownership structure determines who bears the risk. Individual American farmers face potential bankruptcy due to processor violations, whereas European farmers share both the risks and rewards collectively.
Looking at FrieslandCampina in the Netherlands, they’ve got a similar setup. When they faced environmental violations at their processing plants last year, the cooperative covered the €4.2 million in fines and cleanup. No individual farmer got stuck with a bill. That’s the difference ownership makes.
Your Action Plan Starting Monday Morning
After talking with insurance specialists and producers who’ve been through these issues, here’s what I think needs to happen immediately:
1. Get Real About Your Insurance (This Week)
Sit down with your licensed insurance agent—in person, not over the phone. Get written answers to:
What specific pollution exclusions exist in your policy?
Is processor-related contamination covered at all?
What would environmental impairment liability insurance cost for your operation?
Does coverage include both gradual and sudden pollution events?
2. Start Documenting Everything (Today)
Begin keeping records of:
Your processor’s violation reports (these are public records—you can request them)
Any unusual milk routing or quality rejections that seem off
Emergency diversions or capacity issues
All processor communications about compliance
3. Know Your Alternatives (This Month)
Even if switching processors seems impossible, run the numbers:
What would additional transportation cost?
How would it affect your premiums and quality programs?
Do your loan documents require specific market relationships?
What permit implications would different facilities bring?
4. Consider Building Reserves (Starting Now)
Consider setting aside $10,000 to $20,000 specifically for potential environmental liability. With Dairy Margin Coverage at $9.50 per hundredweight costing just fifteen cents—that’s what USDA Farm Service Agency is offering—you might redirect some of those protection savings toward this kind of reserve. Consult with your financial advisor to determine what makes sense for your business.
Regional Realities, Same Federal Framework
Whether you’re managing butterfat depression during California heat stress, dealing with spring mud season in Wisconsin, or navigating drought conditions in Texas, CERCLA doesn’t care about regional differences. The liability framework stays the same.
What does vary is your alternatives. I’ve noticed that operations in traditional dairy states, such as Wisconsin and New York, generally have more processor choices than producers in states where consolidation has hit harder. Take Pennsylvania—they’ve still got multiple regional processors competing for milk. But even there, switching often means losing relationships, forfeiting quality premiums, and eating transportation costs that make it economically unfeasible.
In California’s Central Valley, where I visited last month, producers told me they might have three or four potential buyers within a 100-mile radius. Sounds good, right? But when you factor in established hauling routes, component premiums tied to specific plants, and the reality that most processors are already at capacity… those “options” start looking pretty theoretical.
Down in Texas, it’s even tougher. One producer near Stephenville told me his nearest alternative processor is 180 miles away. “That’s $40,000 a year in extra hauling,” he said. “Might as well shut down.”
Why This Industry Structure Creates Vulnerability
USDA Economic Research Service data shows about two-thirds of U.S. milk now comes from operations with 1,000 or more cows. The 2022 Agricultural Census documented that only farms with over 2,500 cows showed growth—every other size category declined.
When DARI Processing broke ground near Seward this June—the first new dairy plant in Nebraska in over 60 years, according to industry reports—they’re targeting 1.8 million pounds daily. Same as Actus. Two facilities handling nearly all the state’s milk create a vulnerability that didn’t exist when we had multiple processors competing for the supply.
“Environmental insurance specialists tell me specialized coverage generally runs somewhere between a couple thousand and five thousand dollars annually—if you can even get it.”
Environmental insurance specialists have been warning about these coverage gaps for years. What underwriters are telling me lately is pretty sobering:
Agricultural pollution exclusions are expanding, not shrinking
EPA keeps adding chemicals to their hazardous substances lists
Processor violations make their suppliers harder to insure
Claims denials are becoming more common and more comprehensive
This development suggests we’re heading toward a crisis point. When you combine processor concentration with expanding liability and shrinking insurance coverage, something’s got to give.
The Bottom Line for All of Us
Norfolk’s 284 violations aren’t just Nebraska’s problem—they’re revealing how processor dependency creates uninsured environmental liability throughout the modern dairy industry. Between the Wisconsin Supreme Court’s Wilson Mutual precedent, CERCLA’s strict liability structure, and the reality that most regions have limited processor alternatives, we’re managing risks our parents never faced.
What really gets me? We have almost no control over this. You can run the cleanest operation, maintain perfect nutrient management plans, optimize your fresh cow transition protocols—it doesn’t matter. You may still face liability due to your processor’s failures.
The conversation Mike and I had reflects what I’m hearing everywhere. California producers dealing with water regulations, Northeast farms navigating tight margins, Southern operations managing heat stress—we’re all trying to understand risks our predecessors never imagined.
This isn’t about creating panic—that helps nobody. But pretending these vulnerabilities don’t exist guarantees we’ll be unprepared when they manifest. And they will manifest for somebody.
As we head through 2025’s final quarter, take concrete steps. Review your insurance with qualified professionals. Document processor compliance. Calculate your switching costs with the help of your financial advisor. Build reserves if you can. These are no longer optional best practices—they’re survival requirements.
Because when your processor’s environmental problems land on your doorstep—and for many operations, honestly, it’s probably more when than if—being prepared makes the difference between a manageable challenge and losing everything your family built.
The next crisis in dairy isn’t milk prices or feed costs. It’s an environmental liability that you may not be aware of, carried by processors you can’t afford to lose. Understanding that reality, getting professional advice, and preparing for it… that’s what separates operations that’ll survive from those that won’t.
After 30 years of watching this industry evolve, I’ve never seen a risk this significant that so few producers understand. That needs to change. Starting now.
KEY TAKEAWAYS:
Your standard farm liability insurance excludes pollution claims 90% of the time—the Wisconsin Supreme Court ruled manure becomes “pollutant” triggering exclusions, leaving producers exposed to processor-related cleanup costs averaging $47,000-$186,000 with zero coverage
Schedule an insurance review on Monday morning to get written confirmation of what pollution exclusions exist, whether processor contamination has any coverage, and what environmental impairment liability insurance ($2,000-$5,000/year) would cost for your specific operation
CERCLA makes you liable for cleanup even when you didn’t cause contamination—the law’s retroactive, joint-and-several structure means farmers supplying violating processors can receive EPA “Potentially Responsible Party” letters demanding payment regardless of fault
Document everything starting today: request public records of processor violations, track unusual routing or quality rejections, maintain compliance communications—this paper trail becomes critical if EPA issues cleanup orders
Build a $10,000-$20,000 environmental liability reserve using savings from Dairy Margin Coverage ($9.50/cwt protection for $0.15/cwt)—with processor switching costs often exceeding $40,000 annually in transportation alone, financial cushions protect against trapped dependency
Complete references and supporting documentation are available upon request by contacting the editorial team at editor@thebullvine.com.
Learn More:
MANURE TO MONEY: How Smart Dairy Farmers Are Turning Waste into Serious Profits – This tactical guide reveals how to turn a potential environmental liability into a profit center through strategic composting and anaerobic digestion, providing a direct solution to some of the risks discussed in the main article. It includes ROI and equipment cost estimates.
Every week, thousands of producers, breeders, and industry insiders open Bullvine Weekly for genetics insights, market shifts, and profit strategies they won’t find anywhere else. One email. Five minutes. Smarter decisions all week.
Judge calls it: Juniors dominated to the extent that the open show was ‘unsuspenseful.’ The pros never stood a chance.
EXECUTIVE SUMMARY: On September 29, at World Dairy Expo, juniors stopped preparing for dairy’s future and started owning it. Judge Mark Rueth watched teenagers crush seasoned professionals in the open shows, calling the outcome “unsuspenseful”—these kids brought cattle with the structural excellence and genomic superiority that veterans couldn’t match. With replacement heifers at $3,010 and climbing, the youth displaying “width to the chest floor” genetics that extend productive life aren’t just showing cattle—they’re demonstrating economic survival skills most established operations lack. Minnesota’s third consecutive collegiate judging victory and SUNY Cobleskill’s Post-Secondary sweep confirm that this isn’t just youth development—it’s industry succession happening in real-time. The brutal truth from Madison: farms partnering with these genomic-native juniors will thrive, while those still referring to them as “kids” are managing their own obsolescence.
MADISON, WIS — Let me tell you what happened on September 29 at World Dairy Expo, because if you weren’t standing ringside, you missed watching the dairy industry’s power structure flip on its head.
Judge Mark Rueth from Oxford, Wisconsin, stepped into those colored shavings Monday morning to evaluate the International Guernsey Show, and by the time he was done, everyone knew we’d witnessed something special. But it wasn’t just the cattle quality that had folks talking — it was who was winning.
When the Kids Beat the Pros at Their Own Game
Here’s what’s got me and every other industry watcher scratching our heads: the juniors didn’t just compete well — they dominated the open show so thoroughly that Judge Rueth actually called the outcome “a little unsuspenseful”.
Now I’ve been around long enough to remember when junior shows were about learning the ropes. You’d bring your decent heifer, gain some experience, and maybe place in the middle of the pack if you worked hard. Not anymore. These kids are bringing cattle that would’ve been grand champions five years ago, and they’re beating professionals who’ve been breeding cattle longer than these juniors have been alive.
Take Donnybrook Ammo Stevie, owned by Brittany Taylor and Laylaa Schuler from New Glarus. This cow didn’t just win the Junior Show — she took Reserve Grand in the open competition. When teenagers are placing ahead of operations that have been perfecting genetics for generations, something fundamental has shifted.
The Guernsey Show: Where Excellence Met Economics
The Grand Champion that wrapped things up Monday afternoon tells you everything about where this industry’s headed. Kadence Fames Lovely, owned by Kadence Farm, swept the whole show — Grand Champion, Best Bred and Owned, Best Udder, Total Performance Winner. That’s what we call a clean sweep, and it doesn’t happen by accident.
What really caught my attention was what Rueth was looking for. He kept talking about “power and some front end” and specifically “width to the chest floor”. Now, for those of you milking cows every day, you know what that means — these are cows built to last. With replacement heifers selling for $3,010 per head, according to the USDA’s July numbers, and some markets reaching $4,000 for springers, every extra lactation is money in the bank.
Valley Gem Farm from Cumberland, Wisconsin, took Premier Breeder while Springhill from Big Prairie, Ohio, grabbed Premier Exhibitor. But here’s the kicker — Springhill James Dean was Premier Sire for the heifer show, showing how AI has leveled the playing field. When everyone has access to the same genetics, it’s management and cow care that makes the difference.
Jersey and Ayrshire: California Meets the Midwest
The Jersey heifer show started at 7 a.m. sharp on Monday, and California came to play. Kash-In Video Stop and Stare-ET, owned by Kamryn Kasbergen and Ivy Hebgen from Tulare, took both open and junior division Junior Champion titles. That’s West Coast genetics making a statement.
But don’t count out the Midwest. The Millers Joel King Majesty, owned by the partnership of Keightley-Core, Millers Jerseys, and junior members Rhea and Brycen Miller from Oldenburg, Indiana, didn’t just take Reserve — they earned the Junior Champion Bred & Owned award. That’s homegrown genetics saying, “we can compete with anybody.”
The Ayrshire show on Monday afternoon was the Bricker Farms show, as plain and simple as that. Their Reynolds daughter, Bricker-Farms R Cadillac-ET, swept Junior Champion honors in both divisions. When you’ve got Todd and Lynsey working with their kids, Allison, Lacey, and Kinslee, plus partners like Carli Binckley and Wyatt Schlauch, that’s three generations of knowledge in one cow.
The Judging Contests: Tomorrow’s Leaders Today
While the cattle shows grab headlines, what happened in the judging pavilion on Sunday might be even more important. The University of Minnesota just three-peated the National Intercollegiate contest with a score of 2,505. That’s not luck — that’s a program.
Brady Gille, Alexis Hoefs, and Keenan Thygesen didn’t just pick the right cattle; they explained why, taking top honors for oral reasons with 821 points. When you can articulate why one cow beats another under pressure, you’re developing skills worth real money. These are the folks who’ll be making million-dollar genetic decisions in five years.
SUNY Cobleskill’s performance in the Post-Secondary division was even more dominant — they swept everything. Connor MacNeil’s 769-point individual score demonstrates what happens when farm kids take education seriously. Coach Carrie Edsall has these students thinking like they already own the farm.
The 4-H contest? Five points separated Minnesota and Wisconsin — 2,058 to 2,053. Campbell Booth from Wisconsin had the high individual at 708, but Minnesota’s depth carried the day. These aren’t just kids learning to show — these are future herd managers, nutritionists, and geneticists cutting their teeth.
What Monday’s Shows Mean for Your Operation
Looking at what went down on September 29, a few things jump out at me.
First, if you’re not investing in youth programs, you’re missing the boat. When Rueth talks about the Guernsey breed’s “family-oriented” and “welcoming” culture, which fosters this success, he’s onto something. The farms bringing juniors to Madison aren’t doing charity work — they’re building their future. With 6 million kids in 4-H and another million in FFA, we are witnessing the largest agricultural education movement in history unfold right now.
Second, cow longevity has just became your most important profit center. With replacement costs where they are — Wisconsin seeing a 69% spike year-over-year to $2,850 per head — keeping cows healthy for that fourth and fifth lactation isn’t optional anymore. Research shows extending productive life by just one lactation can reduce replacement needs by 25%. At current prices, that’s serious money.
Third, the genomic revolution has democratized excellence. When Judge Rueth praised these “milkier” Guernseys with exceptional “strength” and “balance,” he was describing genetic progress that would’ve taken decades before the advent of genomics. The 2025 genetic base change indicates that we’ve made significant progress in five years, requiring us to recalibrate the scale.
The Real Story from the Colored Shavings
Standing there on Monday, watching these young exhibitors parade cattle that made seasoned breeders take notice, I kept thinking about what this meant for the dairy industry’s future.
See, it’s not just that the kids are good — it’s that they’re approaching cattle breeding differently. They grew up with genomics as a given. They’ve never known a world without EPDs and PTAs. While some of us learned to evaluate cattle with our eyes first and data second, these juniors learned both simultaneously.
The economics support them as well. CoBank’s research indicates that heifer inventories could decline by another 800,000 head before recovering in 2027. With processing capacity expanding — we’re talking $10 billion in new facilities coming online — the producers who can navigate this shortage while maintaining quality will write their own ticket.
Monday’s Bottom Line
September 29, 2025, won’t go down as just another day at World Dairy Expo. It’ll be remembered as the day we saw the future take the halter and lead.
When juniors consistently beat open competition, when genomic data matters as much as visual appraisal, and when cow longevity becomes the difference between profit and loss, you’re not watching gradual change — you’re watching revolution.
The message from Madison is clear: The next generation isn’t preparing to enter the industry. They’re already here, they’re already winning, and they’re already changing the rules. The question isn’t whether you’ll adapt to their way of doing things — it’s how quickly you can learn from what they’re already doing better.
For those of us who’ve been in this industry awhile, Monday was either a wake-up call or validation, depending on how much we’ve invested in bringing young people along. For the juniors? It was just Monday — another day of doing what they’ve been trained to do since they could walk: evaluate, select, compete, and win.
The colored shavings have witnessed a great deal of history over the years. But mark my words — September 29, 2025, will be remembered as the day dairy’s future became its present.
Learn More:
Canada’s Young Breeders Take Europe by Storm – Discover how North American youth programs are creating international champions, with tactical insights on training methods and mentorship structures that produce juniors who dominate against 13 countries’ best talent.
Why Raising Your Heifers Just Became Profitable Again – With replacement heifers hitting $3,010 nationally, this analysis reveals why raising your own is now 54% cheaper than buying, including genomic selection strategies that cut heifer losses by 40% and deliver $2,810 more lifetime revenue.
Component Gold Rush: Are You Still Breeding for Volume While Your Neighbors Cash In? – Learn how genomics doubled genetic progress rates since 2009, why butterfat at 4.23% changes your breeding priorities, and specific sire selection criteria that progressive farms use to mine component profits while others chase outdated volume metrics.
The Sunday Read Dairy Professionals Don’t Skip.
Every week, thousands of producers, breeders, and industry insiders open Bullvine Weekly for genetics insights, market shifts, and profit strategies they won’t find anywhere else. One email. Five minutes. Smarter decisions all week.
When butterfat improvements create processing problems, it’s time to rethink what “better” means
EXECUTIVE SUMMARY: What farmers are discovering across the country is that we’re not facing a typical market downturn—we’re navigating the collision of three fundamental industry shifts that require different thinking altogether. Processing plants built decades ago now struggle with today’s high-component milk, forcing producers to haul further while watching deductions climb. Meanwhile, the genetic improvements we’ve celebrated—butterfat up 12% over fifteen years according to genetic evaluation data—have created processing inefficiencies that ripple through the entire supply chain. Add China’s shift to selective importing and suddenly export markets that once promised growth look increasingly unpredictable. Yet here’s what gives me optimism: producers who recognize these aren’t temporary problems but new realities are finding profitable paths forward. Whether it’s negotiating directly with specialty processors, balancing component ratios for better premiums, or exploring beef-on-dairy programs that generate $875-1,100 extra per calf, the operations adapting thoughtfully to these changes are positioning themselves for long-term success in ways that benefit their bottom lines and their communities.
You know, looking at current milk prices and listening to producers at recent meetings, we’re clearly facing something different from typical market cycles. Whether you’re milking 100 cows in Vermont or managing 5,000 head in Arizona, we’re dealing with three major forces hitting simultaneously—processing capacity constraints, genetic evolution complications, and global trade shifts. And it’s their interaction that’s creating today’s uniquely challenging situation.
Processing Capacity: When Infrastructure Meets Its Limits
So let’s start with what many of us are experiencing firsthand. The USDA’s Dairy Market News has been documenting increasing transportation distances and rising hauling costs across most dairy regions, and we’re all seeing this directly in our milk checks—those hauling deductions just keep climbing, don’t they?
Progressive Dairy and Hoard’s Dairyman have both been covering these processing capacity constraints, particularly in traditional dairy regions. What’s interesting is that these plants were built decades ago for completely different times—different production levels and, honestly, milk with different characteristics altogether.
Here’s what really concerns me: every additional mile your milk travels is pure cost with zero added value. But there’s an even deeper issue…
The milk we’re producing today has fundamentally different characteristics than what these plants were designed to handle. You probably know this already, but the Council on Dairy Cattle Breeding’s 2024 genetic evaluations indicate that butterfat levels have increased by approximately 12% over the past fifteen years. We’ve achieved exactly what we aimed for when premiums rewarded higher components.
But think about what this means practically. When butterfat levels increase significantly across millions of pounds of milk, that requires more cream volume to be separated. Different standardization requirements. Entirely different processing protocols. It’s like… well, it’s like we souped up the engine but forgot the transmission needs upgrading too.
Wisconsin’s Center for Dairy Profitability documented in their 2024 analysis that some operations are now negotiating directly with specialty processors who specifically want high-component milk—even if it means hauling further. These producers are often getting better prices despite the extra transportation costs, which tells you something about where the market’s heading.
I talked with a producer near Fond du Lac who made this shift last year. He’s hauling an extra 45 miles now, but getting 6% better pricing because his milk fits perfectly with what that specific cheese plant needs. Makes you think, doesn’t it?
What’s genuinely encouraging, though, is seeing adaptation in unexpected places. Southeast operations—particularly in North Carolina and Georgia, where they lack extensive legacy infrastructure—are building new processor relationships from scratch. And these facilities, designed for today’s milk characteristics, often capture opportunities that established regions miss because they’re locked into existing systems.
Even in the Pacific Northwest and Idaho, smaller processors are finding niches by specifically targeting high-component milk for specialty products. Innovation happens when necessity demands it, right?
The Genetics Evolution: When Success Becomes a Challenge
This really builds on the genetic progress we’ve made over recent decades. The data from genetic evaluation services shows we’ve achieved remarkable improvements in both butterfat and protein levels. And we should be proud of that achievement—it represents decades of careful breeding work.
Think about the logic here: producers did exactly what market signals told them to do. Federal Milk Marketing Order pricing has consistently rewarded butterfat at premium levels—often significantly higher than the premiums for protein. So naturally, breeding decisions followed the money. That’s not just smart business; it’s a rational response to clear economic incentives.
But now processors are telling a different story. Cornell’s PRO-DAIRY program published research in 2024 showing optimal component ratios for different dairy products, and many herds have shifted outside those ideal ranges. This creates processing inefficiencies that ripple through the entire system.
What I’ve found interesting is that several major cooperatives have been working with their members to address component balance—not abandoning improvement goals, but thinking strategically about what ratios work best for their specific processing capabilities. Some have even introduced premium schedules that reward balanced components rather than just high butterfat.
One Minnesota cooperative reported at their annual meeting that members who balanced components saw 7% better returns than those chasing maximum butterfat alone. Another cooperative in Ohio found similar results—their balanced-component producers averaged $0.85 more per hundredweight over the year.
The response varies dramatically by region, as you’d expect. Many Upper Midwest operations are adjusting their breeding strategies, while California and Southwest producers with different processor relationships may maintain their current approaches. And yes, beef-on-dairy has definitely become part of the equation. USDA Agricultural Marketing Service data from August 2025 showed beef-dairy crossbred calves averaging $875-1,100 premiums over straight Holstein bull calves at major auction markets.
Though opinions really do vary on this strategy—and understandably so. Some producers, especially those with robust genetic programs, are concerned about the long-term quality of replacements. Others see it as essential income diversification. I think both perspectives have merit depending on your specific situation. These patterns could shift with policy changes, but currently, it presents a real opportunity for many operations.
Global Trade: The Rules Keep Changing
Now, the international dimension adds complexity that affects all of us, whether we think about exports daily or not. The USDA Foreign Agricultural Service tracks global dairy trade patterns, and recent trends suggest we’re seeing fundamental shifts rather than temporary disruptions.
China’s dairy sector has undergone significant evolution. Their domestic production has grown significantly in recent years, and they’ve achieved substantial self-sufficiency in basic dairy products. What’s worth noting is that they’ve become selective importers, focusing on products they can’t efficiently produce domestically—such as whey proteins and specialized ingredients—rather than broad purchasing across all categories.
This represents strategic thinking about food security that makes sense from their perspective, even if it complicates our export planning. They’re essentially doing what we’d probably do in their position, aren’t they?
Mexico remains relatively stable thanks to USMCA provisions, maintaining its position as a major export market for U.S. dairy products. However, even there, European competitors are increasing pressure, and recent trade agreements could further shift the dynamics.
These patterns suggest—and this is concerning—that export markets, which once promised growth, are becoming increasingly unpredictable. So how do we build resilient operations in this environment?
The Human Dimension: Decisions That Go Beyond Spreadsheets
Here’s something that profoundly affects our industry yet rarely makes headlines. The USDA’s 2022 Census of Agriculture—our most recent comprehensive data—shows the average dairy farmer is now 57.5 years old. This creates decision-making challenges that transcend simple economic considerations.
Consider what many operations face right now: robotic milking systems typically cost $250,000-$ 400,000 per unit, according to equipment dealers. Parlor upgrades can go even higher, and facility improvements often pencil out over decade-plus horizons. These often make economic sense on paper. But when you’re 60 years old with kids established in careers off-farm… well, those calculations become deeply personal, right?
Extension programs across dairy states have been highlighting this challenge—it’s not just about return on investment anymore. It’s about aligning investments with life goals, family situations, and quality of life considerations. Neither aggressive investment nor maintaining the status quo is inherently right or wrong. Both reflect rational choices given individual circumstances.
What’s genuinely encouraging is seeing creative transition models emerging. Share milking arrangements are gaining traction in states like Wisconsin and New York. Long-term leases to younger farmers, gradual transitions to key employees—these aren’t traditional succession paths, but they’re creating real opportunities for the next generation.
A study from the University of Vermont Extension found that operations using these alternative transition models typically take 18-24 months to see full benefits from strategic adjustments, but report higher satisfaction rates for both exiting and entering parties.
Practical Pathways: What’s Actually Working
Given these challenges, what approaches show real promise? Well, it varies enormously, but patterns are definitely emerging from extension research and field observations.
Larger operations often benefit from comprehensive systems integration. University dairy programs consistently show that operations using integrated data management see meaningful improvements in feed efficiency—typically 15-25% gains with good implementation, according to a 2024 multi-state extension survey. It’s really about seeing breeding, feeding, health, and marketing as interconnected rather than separate enterprises.
Mid-size operations—let’s say 300 to 1,000 cows—frequently find success through selective modernization. Upgrading specific bottleneck areas while maintaining the functionality of existing systems. Cornell’s PRO-DAIRY program, as documented in their 2024 case studies, found that these targeted investments often deliver better returns than wholesale modernization attempts.
The Michigan State Extension reports that many operations are investing modestly in feed management improvements while starting to market a portion of their calves as beef crosses. A 600-cow farm near Lansing made these changes and saw 14% better margins without taking on overwhelming debt—and that’s smart adaptation if you ask me.
Smaller operations need different strategies entirely. Many thriving small farms are creating value through differentiation. The Vermont Agency of Agriculture’s 2024 report showed that 23% of dairy farms with fewer than 200 cows now engage in some form of direct marketing or value-added production. Whether it’s farmstead cheese, on-farm bottling, agritourism, or organic certification—these require different skills but can deliver margins 35-50% above those of commodity markets, according to their data.
Technology: Tool or Solution?
About technology adoption—and this is crucial—equipment alone doesn’t determine success. Integration into management systems does. Wisconsin’s Center for Dairy Profitability and other extension programs consistently find that farms with strong management systems before automation see meaningful productivity gains, while those hoping technology would fix existing problems see minimal improvement.
The key question isn’t “Should we adopt technology?” It’s “What specific problem needs solving, and what’s the most cost-effective solution?” Sometimes that’s expensive automation. Sometimes it’s modest investments in cow comfort or feed management that deliver similar gains. It all depends on your specific constraints and opportunities.
Looking Forward: Your Action Plan
So where does this leave us? The USDA Economic Research Service acknowledges significant uncertainty in their outlooks, but current projections suggest we’re in a fundamental transition, not a temporary disruption.
These three forces—processing constraints, genetic evolution, and shifts in global trade—will shape our industry for years to come. They’re realities to navigate, not problems that’ll magically resolve themselves.
However, what genuinely gives me optimism is that dairy farmers consistently demonstrate remarkable adaptability. Think about what we’ve navigated—the shift to Grade A standards, massive consolidations, environmental regulations, and technology revolutions. Each time, those who adapted thoughtfully found ways to thrive.
Success going forward will look different for different operations. A large dairy in Texas follows a completely different path than a grass-based farm in Missouri. And that diversity—that’s what strengthens our entire industry.
Begin by analyzing your operation in relation to these three forces. Where are you most vulnerable? What single change could provide the most impact? Whether it’s negotiating with a different processor, adjusting your breeding program, or exploring value-added opportunities—identify your highest-priority action and take that first step this week.
What matters most is an honest assessment of your situation, decisions aligned with your operation’s capabilities and goals, and willingness to adapt as conditions evolve. Whether that means expansion or right-sizing, new technology or perfecting current systems, global markets or local customers—multiple paths can succeed with the right strategy.
We’re part of something essential here—feeding people, maintaining rural communities, stewarding agricultural lands. The methods might evolve, the scale might shift, markets will definitely change, but that fundamental purpose… that endures.
As we navigate these challenges, remember that we’re stronger when we share experiences and learn from one another. Whether through cooperatives, extension programs, discussion groups, or just coffee with neighbors, staying connected helps us all make better decisions.
These are challenging times, no question. However, there are also times when thoughtful adaptation—not panic, nor stubbornness, but thoughtful adaptation—can position operations for long-term sustainability. The key is clear-eyed assessment, strategic planning, and supporting each other through this transition.
Because at the end of the day, that’s what dairy farmers do. We figure out how to keep moving forward, keep producing, keep feeding our communities. The specifics change, but that core mission… that’s what endures.
KEY TAKEAWAYS
Processing partnerships pay off: Wisconsin producers negotiating directly with specialty cheese plants report 6-8% better pricing despite hauling 30-45 extra miles—the key is matching your milk’s component profile with specific processor needs rather than accepting commodity pricing
Component balance beats maximum butterfat: Minnesota and Ohio cooperatives document that producers maintaining 0.80-0.85 protein-to-fat ratios earn $0.85-1.00 more per hundredweight than those chasing maximum butterfat alone, while processors actively seek this balanced milk
Strategic beef-on-dairy delivers immediate returns: With crossbred calves commanding $875-1,100 premiums over Holstein bulls (USDA data, August 2025), using beef semen on 25-35% of your herd’s lower genetic merit cows generates $90,000-100,000 extra annually for a 1,000-cow operation
Targeted modernization outperforms wholesale tech adoption: Extension research shows mid-size dairies (300-1,000 cows) achieve 15-25% feed efficiency gains by upgrading specific bottlenecks rather than complete system overhauls, with 18-24 month payback periods
Alternative transitions create opportunities: Share milking, long-term leases, and gradual employee transitions offer viable paths forward for the 57% of dairy farmers approaching retirement without traditional succession plans, maintaining farm continuity while respecting personal goals
Complete references and supporting documentation are available upon request by contacting the editorial team at editor@thebullvine.com.
Learn More:
From Breeding Chaos to Strategic Cash: How 2025’s Smartest Dairies Connect Every Decision – This article provides a tactical, how-to guide for integrating genomics with risk management. It reveals how producers are using three-tier breeding strategies to segment herds, generating extra cash from beef-on-dairy calves while maintaining long-term genetic progress.
Robotic Milking Revolution: Why Modern Dairy Farms Are Choosing Automation in 2025 – This piece offers a deep dive into technology adoption, busting common myths about robotic milking systems. It presents real-world data and case studies demonstrating how automation delivers a clear return on investment by reducing labor and improving herd health and productivity.
The Sunday Read Dairy Professionals Don’t Skip.
Every week, thousands of producers, breeders, and industry insiders open Bullvine Weekly for genetics insights, market shifts, and profit strategies they won’t find anywhere else. One email. Five minutes. Smarter decisions all week.
For twenty years, I’ve covered this industry, writing about milk prices, genetics, and herd management. But this isn’t a story about any of that. This is a story about a young man fighting to walk again, and what happens when an entire industry decides to be family.
The phone call came to Vince Steiner at 3 AM New Zealand time. The kind of call every parent dreads.
Your son’s been in an accident. It’s serious. You need to get here. Now.
Twenty-four hours later, Vince was holding his unconscious son’s hand in a Canadian hospital, not knowing if Quinn would ever walk again. What I witnessed in the days that followed changed how I see this industry—and ourselves—forever.
When Everything Stops
Quinn Steiner was supposed to be celebrating. Twenty years old, working on a grain farm in Saskatchewan, feeling invincible the way young people do. He wasn’t even driving that night—just a passenger with friends, heading home after birthday drinks.
Three rolls later, his world was shattered.
The surgeon’s words still echo: “Two millimeters in any direction would have meant instant death. Another two millimeters the other way? Paralyzed from the waist down.”
Two millimeters. That’s the width of a dairy cow’s whisker. That’s how close we came to losing Quinn Steiner forever.
His C3 vertebra was “smashed,” as his father put it. Emergency spinal fusion surgery. C2-C4 fused together. T1-T6 stabilized. Medical terms that don’t capture the terror of that phone call or the desperation of racing across an ocean, not knowing what you’d find.
The Moment That Broke My Heart
Here’s what moves me most about this story, what I keep coming back to when I close my eyes.
When Vince arrived at that Canadian hospital, Quinn was barely conscious but somehow aware that his father was there. “The first seven hours with him, he held my hand the whole time. Even when he was asleep, he wouldn’t let go,” Vince told me, his voice breaking.
Picture that scene. A young man whose spine had been destroyed, whose future hung by millimeters, holding onto his father like an anchor in a storm. That image—of a father and son connected through the darkest night of their lives—that’s what this story is really about.
Not the medical details or the fundraising. It’s about what happens when everything else falls away and only love remains.
The Response That Changed Everything
I thought I knew how our community responds to tragedy. I was wrong.
Complete strangers in Hudson Bay, Saskatchewan—people who barely knew Quinn—started tracking down his boss, calling his worried mother in New Zealand, organizing support before his family even knew what they needed.
The nurse at Hudson Bay Hospital who cared for Quinn during those first critical hours? She reached out to his mother personally. Not because she had to. Because she wanted to.
Carrfields immediately stepped up, offering to handle the Brookview calf auction for free. Industry professionals from four continents began calling—not because Quinn was famous, but because he represented something precious: a young person choosing to build his future in the dairy industry.
What I witnessed was extraordinary. This wasn’t charity. This was family choosing to be family.
Against All Odds
The photo his family shared shows Quinn standing again, wearing a neck brace but with something unbreakable in his eyes. The surgeon’s prognosis suggests he might recover 80% of his neck movement—miraculous considering the alternative was complete immobilization or death.
But recovery timelines are sobering: 6 to 18 months for bone healing, potentially two years for nerve damage to fully resolve. That’s two full seasons, two calving cycles, two years of life on hold.
Quinn isn’t just standing physically. He’s standing as proof that getting back up is possible. Every dairy family facing crisis can look at that photo and remember: survival isn’t just about making it through the worst day. It’s about believing in tomorrow.
Why Brookview Matters
You can’t understand the industry response without knowing what Brookview Genetics represents.
Under Vince’s leadership, they’ve been the most successful exhibitor at 11 of the 12 annual New Zealand Dairy Events. They’ve produced more Excellent-classified Ayrshire cows than any other breeder in New Zealand over the past five years. Their genetics improve herds from New Zealand to Kenya, from the UK to South Africa.
But statistics don’t explain why people from four continents are opening their wallets for Quinn’s recovery.
The real story is decades of Vince Steiner sharing knowledge, sharing genetics, building relationships that span oceans. When your breeding program helps a small family farmer in Kenya or a large-scale operation in the UK, you’re not just running a business—you’re building a legacy of generosity.
Now, when his family needs help, those relationships matter in the most meaningful way possible.
The Money Reality
Let’s be honest about what Quinn’s family faces. No medical insurance. Emergency spinal fusion surgery in Canada. Ongoing rehabilitation costs that will easily exceed $100,000 before Quinn can safely travel home.
That’s potential financial devastation for a farming family. The kind of crisis that destroys futures, not just because of initial costs but because of long-term care requirements.
Here’s how your support translates to real help:
$50 covers a day of specialized rehabilitation therapy
$200 pays for weekly recovery accommodation
$500 helps fund the specialized medical transport Quinn needs to get home safely
Every dollar matters because it’s not just about money—it’s about a young man’s future.
When Crisis Reveals Character
What moves me is watching an industry that argues about everything—breeds, feeding systems, regulations—drop those disagreements instantly when it matters.
We can be territorial, opinionated, sometimes downright stubborn. But when a young person’s future hangs in the balance, none of that matters.
What matters is the stranger in Saskatchewan wanting to help. The auction company is waiving fees. The farmers contributing money they might not have because helping Quinn feels more important than financial caution.
This response revealed something I’ve always suspected but never seen proven so powerfully: beneath all our competition and market pressures, we’re family.
The Lessons Only Crisis Teaches
Every contribution to Quinn’s Givealittle page represents someone making a choice: my family’s security matters, but so does yours. Every share of his story says: this young man’s future is worth my time.
For any farming family reading this who’s facing their own crisis—financial, medical, personal—Quinn’s story offers proof that you’re not alone.
This industry’s greatest strength isn’t our technology or genetics, or marketing systems. It’s our willingness to hold each other up when life goes sideways.
That’s not sentiment. That’s a survival strategy. Because dairy farming is hard enough when everything goes right. When disaster strikes, having people who’ll hold your hand through the darkness isn’t just nice—it’s essential.
The Homecoming We’re Fighting For
I can picture Quinn stepping off that plane in New Zealand, probably still wearing his neck brace, probably tired, but home. His family is waiting. The community rallied around him, celebrating not just his survival but also his return.
That moment will represent more than one young man’s recovery. It will represent the power of human connection in an industry that sometimes forgets its heart.
Behind every herd number and genetic evaluation, there’s a family. Behind every business transaction, some people care about each other beyond profit margins.
How This Story Continues
Quinn’s recovery is far from over. The road ahead includes months of rehabilitation, potential setbacks, and the long process of adapting to life after traumatic injury.
But he won’t walk that road alone.
Every dollar contributed shortens the distance between where he is now and home. Every message reminds his family they’re not forgotten. Every act of solidarity proves that our industry family isn’t just marketing talk—it’s living reality.
The young man holding his father’s hand through seven hours of uncertainty represents all of us holding onto hope when circumstances seem impossible.
And that’s the promise we make to every young person choosing to build their future in this industry: whatever happens, we’ve got your back.
The road ahead is long, but every dollar you contribute shortens the distance between where he is now and home. Donating to the “Get Quinn Home” Givealittle page isn’t just a transaction; it’s an act of solidarity. It’s our way of telling Quinn and the Steiner family: You are not walking this road alone.
World’s largest dairy dodged €1B in taxes while 500,000 French cows vanished—coincidence?
EXECUTIVE SUMMARY: Here’s what we discovered: while independent farmers struggled with rising costs and regulatory compliance, Lactalis—the world’s largest dairy corporation—systematically avoided €475 million in taxes through Luxembourg shell companies from 2009 to 2020, using the savings to undercut honest competitors. French workers are now demanding €570 million for allegedly manipulated pension and benefit calculations, bringing total contested payments to over €1 billion from a company reporting just €359 million in 2024 profits. During this same period, France lost roughly 500,000 dairy cows and thousands of family operations that couldn’t compete against artificially subsidized pricing. The pattern extends globally—Australia fined Lactalis AU$950,000 in 2023 for contract violations designed to silence farmer criticism, while Dutch producers file complaints over unilateral pricing changes. This isn’t market consolidation through efficiency—it’s systematic regulatory arbitrage that gives multinational processors unfair advantages over operations playing by the rules. Every producer needs to understand: you’re not just competing against scale and technology, you’re competing against corporations that treat compliance as optional and reinvest the savings into market conquest.
So I’m sitting in the hotel bar at a conference last week, right? And this European consultant I’ve known for fifteen years—can’t name him but you’d recognize the company—slides over these legal documents about Lactalis. What I saw… honestly, it’s got me wondering if we’ve all been played for suckers while arguing over protein percentages and somatic cell counts.
You know that sick feeling when your butterfat drops, but somehow the big processors are still posting record profits? Like when corn hit $8 a few years back, but your feed costs never came back down to earth? Well, get this…
French dairy workers just launched what might be the most consequential labor revolt in European history. They’re demanding €570 million from Lactalis for allegedly unpaid benefits—and this is coming right after the company had to cough up €475 million to French tax authorities to settle fraud charges that investigators have been building since 2018.
I mean… Christ, that’s over a billion euros in contested payments from a company that only reported €359 million in profit last year.
The math doesn’t work. Unless the whole game is rigged.
When Shell Companies Become Weapons Against Family Farms
So here’s what really pisses me off about this whole mess—and I mean gets right under my skin in ways that make me question twenty-plus years of covering dairy consolidation.
From 2009 to 2020, eleven goddamn years, Lactalis was funneling profits through Luxembourg and Belgian shell companies using what French prosecutors now call “fictitious debts and paper transactions.” And I’m not talking about legitimate tax planning that your farm accountant might suggest when corn futures go sideways.
This was organized fraud designed to generate French profits… poof. Gone.
The scale? In 2017 alone—right when European milk prices were tanking and fresh cow costs were all over the map—French investigators tracked €1.99 billion flowing to empty shell companies with no employees, no operations, nothing except helping Lactalis dodge taxes they legally owed while competing against honest operations.
Now, I wish I could give you exact French farm closure numbers, but honestly? Their ag ministry data’s messier than a flooded lagoon, depending on who’s counting what and how they’re defining “active operations.” But here’s what I can tell you—and CLAL’s dairy sector tracking is usually solid on this stuff—France went from roughly 3.6 million dairy cows down to around 3.1 million during this same eleven-year period when Lactalis was playing shell games.
The Smoking Gun: 500,000 Dairy Cows Vanished While Lactalis Avoided €475M in Taxes – This isn’t coincidence. As tax avoidance funded below-market pricing, honest French farmers couldn’t compete. The correlation reveals how regulatory arbitrage destroys independent agriculture.
That’s half a million fewer cows producing milk. Half a million.
And before you say “well, that’s just productivity improvements,”—which, let’s be honest, we’ve all heard that line when farm numbers tank—let me tell you something about French dairy that most American producers don’t get. These weren’t 5,000-head confinement operations getting swallowed by efficiency. Most French dairy farms still run moderate-sized herds in places like Normandy and Brittany. Family operations milking maybe 80, 100 cows that should’ve been viable.
Should’ve been. But try competing against someone who’s literally playing with stolen money.
The Seven-Year Investigation That Wasn’t Really Investigating Anything
Want to know what really grinds my gears about regulatory enforcement these days?
I’ve got a buddy in Wisconsin who got audited by the IRS over a $3,000 feed deduction. Took them eight months to resolve, and it cost him more in accounting fees than the deduction was worth. Meanwhile, French authorities launched their criminal investigation into Lactalis in 2018. Tax raids happened in 2019. Settlement didn’t come until this year—2025.
Seven. Bloody. Years.
Seven years of “investigations” while Lactalis kept operating, kept expanding, kept using that deferred tax money to do whatever the hell they wanted with it. And what did they want? Market conquest, apparently.
Here’s the kicker about that €475 million settlement… I did some back-of-the-napkin math based on their latest financial reports, and that represents maybe eighteen months of current earnings. When penalties take the better part of a decade to materialize and can be spread across multiple fiscal years as operational expenses—like depreciation on a new parlor—they’re not really penalties anymore.
They’re interest-free loans for market manipulation.
Let me back up because I want you to really understand how this enforcement shell game works in practice. When you’ve got the treasury and legal firepower to drag out investigations for seven, eight years—and obviously most independent operations don’t have teams of lawyers on retainer—those eventual “fines” become something entirely different from what they’re supposed to be.
If you can avoid paying €50 million in taxes this year, invest that money in undercutting competitors and grabbing market share, then pay it back seven years later with some paperwork and PR damage control… what have you really lost?
Nothing. You’ve gained seven years of competitive advantage funded by money that was never legally yours to begin with.
Meanwhile, every honest dairy operation in France—guys running 60-head herds in Normandy, family farms that’ve been there for generations—was funding their growth, equipment purchases, seasonal cash flow needs… all of it out of their own pockets, in real time, competing against artificially subsidized pricing that they had no way of understanding or matching.
Can you believe that? While you’re worrying about whether to upgrade your parlor or fix the feed mixer, these guys are literally using unpaid taxes to fund below-market milk contracts.
The Employee Revolt That Changes The Whole Game
Okay, so this is where it gets weird. I mean, weird in maybe a good way? Never thought I’d be rooting for French lawyers, but here we are…
France completely overhauled their class action laws back in April—made it dramatically easier for employee groups to challenge corporate giants. Workers only need to prove contractual violations affecting multiple employees. No need to demonstrate corporate intent or calculate individual damages or any of that legal complexity that usually protects big companies from accountability.
The €570 million employee claim that just got filed alleges systematic manipulation of pension contributions, profit-sharing calculations, and benefit payments across thousands of workers over multiple years. Same playbook as the tax dodge, just applied to different victims who couldn’t fight back individually.
Makes you wonder what else they’ve been manipulating while we weren’t looking, doesn’t it?
But what gives me hope—and I’m not usually the optimistic type when it comes to corporate accountability—is that it’s not just happening in France anymore. The pattern’s emerging globally.
Down in Australia, and this is well documented through their competition authority, Lactalis got slapped with an AU$950,000 fine in 2023 for systematically breaking dairy farmer protection codes. They were using contract clauses specifically designed to silence producers who criticized payment practices publicly. You complain about your milk check in the local paper? Contract violation. Legal action.
Over in the Netherlands, farmers are filing competition complaints about unilateral price changes and hidden fees that they can’t even audit or verify. Same tactics, different countries, same pattern of… well, let’s call it creative contract interpretation that always benefits the processor.
Starting to see a pattern here? I am.
The Global Pattern Corporate Communications Won’t Discuss
You know what really keeps me up at night thinking about all this? And I was just talking about this with some Holstein guys from New York at the genetics meeting…
Lactalis operates in roughly 100 countries worldwide, and they adjust their compliance strategy—I’m being diplomatic, calling it that—based on how tough enforcement is in each jurisdiction. Strong regulators get one approach. Weak enforcement gets… something else entirely.
Think about what that means for fair competition. While independent producers everywhere are paying full tax rates, meeting all labor obligations, funding growth from actual profits earned through legitimate dairy operations… you’ve got this global corporation deferring tax payments for over a decade, manipulating employee calculations, reinvesting those savings into market conquest and pricing strategies that honest operations simply can’t match.
It’s like playing poker against someone who’s seeing your cards. And stealing your chips. At the same time.
And even after paying that massive settlement? They still reported €30.3 billion in revenue for 2024, up 2.8% from the previous year. The penalty barely shows up as a blip in their growth trajectory.
When your avoided costs are so massive that a €475 million fine doesn’t even impact your expansion plans… well, you’re not really running a dairy processing business anymore, are you?
You’re running something else entirely.
What This Actually Means When You’re Milking At 4 AM
So here’s the deal—and I mean really think about this next time you’re out there in the parlor at four in the morning, watching your bulk tank fill up while corn’s at six bucks and diesel’s hitting your budget like a sledgehammer.
You’re not competing against operational efficiency or economies of scale or better genetics or any of the traditional advantages we’ve always talked about in this industry. You’re competing against corporations that treat regulatory compliance as optional and use the cost savings to subsidize operations that honest farmers simply cannot match through legitimate means.
A producer I know in Lancaster County—a third-generation guy, runs about 150 head, declined to be named, but you might know him from the Holstein shows—said something that stuck with me. He said, “We’ve been told for years we need to get more efficient to compete. But how do you get more efficient than free money?”
How do you compete with free money? That’s the question that should be keeping all of us up at night.
Because when I see tax avoidance schemes lasting eleven years, employee benefit manipulation across thousands of workers, contract violations designed to silence farmers, pricing strategies that seem to ignore actual input costs… it all connects back to the same fundamental problem: some players are operating under completely different rules while we’re all pretending it’s still a fair game.
Actually, let me tell you about a conversation I had with a dairy economist—can’t name the university, but it’s Big Ten—at a farm management conference last spring. He said something that’s been eating at me ever since: “The biggest competitive advantage in modern agriculture isn’t technology or genetics. It’s regulatory arbitrage.”
Regulatory arbitrage. That’s the fancy academic term for what Lactalis has been doing: exploiting differences in enforcement between countries, between agencies, between legal systems to generate competitive advantages that have nothing to do with actually being better at producing or processing milk.
What You Can Actually Do About It Right Now
So what can you do? Because I know that’s what you’re thinking—this is all great to know, but what does it mean for my operation when the truck shows up tomorrow morning?
Well, first off—and I learned this the hard way, dealing with a processor dispute about five years ago that cost me more in legal fees than I care to remember—document everything. Every payment, every contract modification, every pricing conversation, every settlement negotiation. When these schemes finally get exposed (and they do get exposed, eventually, though it takes way too long), documentation becomes crucial evidence.
I keep telling producers: take photos of delivery tickets, save email chains, document phone calls with timestamps. Your smartphone’s probably recording everything anyway—might as well make it work for you.
Second, understand your legal options. These new class action frameworks spreading across Europe could apply to supplier relationships, not just employment disputes. Know what contractual violations might trigger collective challenges in your jurisdiction. Get to know other producers’ experiences. Talk to your co-op board members. Ask uncomfortable questions.
And third… build coalitions. I know, I know—dairy farmers organizing is like herding cats in a thunderstorm. But connect with other independent operations. Share information about pricing patterns, contract terms, payment delays, and suspicious competitive behavior. These manipulation schemes become visible when individual experiences get put together.
There’s actually a WhatsApp group I’m in with about forty producers from across the upper Midwest, and we share pricing information weekly. Started noticing patterns none of us would’ve seen individually. Patterns that made us ask better questions about our own contracts.
Because honestly? What happened in France with those shell companies and deferred tax obligations… that’s not just a European problem. That’s a business model. And if we don’t start recognizing these patterns and pushing back collectively—and I mean really pushing back, not just complaining at coffee shop meetings about how tough things are getting—the next wave of “inevitable market consolidation” might include your operation.
The question isn’t whether you can out-farm corporate efficiency through better management or lower feed costs, or genetic improvements. The question is whether you’re willing to demand that everyone play by the same regulatory rules—and what you’ll do when they systematically don’t.
But that’s probably enough for one morning. Right now, I’ve got to get back to figuring out why my protein’s been running low all month… though after seeing these Lactalis documents, I’m starting to wonder if the problem isn’t in my feed room at all.
KEY TAKEAWAYS:
Document everything systematically: Every processor payment, contract modification, and pricing conversation becomes crucial evidence when these schemes get exposed—delayed enforcement means violations compound for years before penalties hit
Recognize regulatory arbitrage red flags: Competitors offering consistently below-market pricing, complex corporate structures spanning multiple jurisdictions, and contract terms preventing suppliers from discussing pricing with others signal systematic manipulation
Build producer coalitions for pattern recognition: Individual experiences reveal manipulation schemes when aggregated—French workers’ €570 million class action succeeded because new laws require only proof of contractual violations affecting multiple parties
Leverage strengthening legal frameworks: Europe’s enhanced class action laws and coordinated enforcement across borders mean systematic corporate violations face real-time scrutiny rather than decade-long delays that previously enabled market manipulation
Understand the true competitive landscape: The €1+ billion in contested Lactalis payments proves consolidation advantages often come from regulatory violations, not operational efficiency—demanding equal enforcement levels the playing field for honest operations
Complete references and supporting documentation are available upon request by contacting the editorial team at editor@thebullvine.com.
Learn More:
Verified Strategies for Navigating 2025’s Dairy Price Squeeze – This article provides a tactical, how-to guide for managing operational costs and market volatility. It offers specific, actionable advice on locking in feed costs, maximizing component premiums, and using risk management tools like the DMC program to protect your cash flow from the market manipulation discussed in the main piece.
Robotic Milking Revolution: Why Modern Dairy Farms Are Choosing Automation in 2025 – This piece highlights how technology is an essential tool for navigating a distorted market. It details the tangible benefits of robotic milking, from labor savings to improved data collection, and demonstrates how these innovations offer a path to efficiency gains that are crucial for survival when your competition isn’t playing by the rules.
The Sunday Read Dairy Professionals Don’t Skip.
Every week, thousands of producers, breeders, and industry insiders open Bullvine Weekly for genetics insights, market shifts, and profit strategies they won’t find anywhere else. One email. Five minutes. Smarter decisions all week.
39% of dairy farms disappeared in 5 years while co-ops got richer—here’s what really happened?
EXECUTIVE SUMMARY: Here’s what we discovered: The Fonterra strike “settlement” that made headlines last month? It changes nothing—workers at Bayswater are still getting paid less than colleagues doing identical work at other facilities. But that’s just the surface. The same cost-optimization tactics cooperative executives used to suppress those wages are being deployed against farmer-members worldwide, accelerating farm consolidation beyond what market forces alone would drive. USDA data shows 15,221 dairy operations vanished between 2017 and 2022, while operations over 2,500 cows increased by 120 farms, now controlling nearly half of all production. Meanwhile, mid-size farms (100-499 cows) dropped from 8,700 to 6,200—the backbone operations that built rural America. Regulatory immunity, afforded through laws like the Capper-Volstead Act, protects these modern cooperatives from antitrust scrutiny while they prioritize financial engineering over member equity. The data reveal a troubling pattern: cooperatives are using “farmer ownership” rhetoric to justify the systematic extraction of value that benefits management and large-volume suppliers at the expense of family operations. Smart farmers are already building alternatives—such as direct marketing, regional processors, and independent pricing — that deliver $2+ premiums per hundredweight for quality milk.
So I’m sitting here two weeks after watching the dairy trade press lose their minds over Fonterra’s Australian strike “resolution,” and… honestly? Made me wonder if these reporters actually looked at any numbers. Because what I found wasn’t a settlement at all.
It was basically a masterclass in how to screw workers while making it look like cooperation.
Look, here’s the deal. Those Fonterra workers at Bayswater? They’re still getting paid less than their buddies at Cobden and Stanhope for doing the exact same work. I mean, we’re talking identical cheese lines here, same equipment headaches, same problems with fresh cows coming in hot during summer months… Hell, they’re producing the same Perfect Italiano and Western Star sitting in every grocery cooler from Sydney to Perth.
Neil Smith—who serves as National Dairy Coordinator for the United Workers Union and actually knows what he’s talking about—has been documenting pay gaps between these facilities for months. And the gap is real. Not some accounting trick or regional cost-of-living thing. Real money.
That’s not what I’d call “resolved.” That’s systematic wage discrimination with some fancy PR paint slapped on top.
Now, I get it—cooperative labor disputes aren’t exactly groundbreaking news. But here’s why this matters to every single farmer reading this: the same tactics Fonterra used to suppress worker wages are being deployed by cooperatives worldwide to extract value from farmer-members. It’s not some grand conspiracy… it’s just good old-fashioned profit maximization disguised as “farmer ownership.”
Fonterra’s Playbook: Settlement Theater That Changes Nothing
Alright, let me back up and explain what Smith’s been documenting, because the union paperwork tells a story that management desperately doesn’t want farmers to understand.
We’re talking about workers doing identical jobs—running the same lines, dealing with the same maintenance issues, probably the same pain-in-the-ass equipment that breaks down right when you’re trying to get a load of milk processed before it goes off spec. But somehow, magically, the guys at Bayswater are making less than their counterparts at other facilities.
The union’s been tracking what they describe as significant pay disparities for months now, and it’s the kind of money that matters when you’re trying to keep up with the mortgage and feed your family.
And the recent “settlement”? Did absolutely nothing—and I mean nothing—to fix the underlying wage structure that creates these gaps.
Management threw around all this language about “collaborative workplace committees” and “modernized approaches.” You know the drill. Corporate speak that sounds great in press releases but doesn’t change what shows up in your paycheck. Meanwhile, these workers are still subsidizing Fonterra’s margin targets through suppressed wages.
Actually, you know what? Let me tell you about the timing here, because it reveals the deeper issue. These strikes erupted right while Fonterra was finalizing their massive $3.4 billion asset sale to Lactalis. Workers are fighting for basic pay equity while their “farmer-owned” employer is literally selling their jobs to French corporate control.
Settlement Theater vs. Reality: What Fonterra’s ‘Resolution’ Actually Changed (Spoiler: Nothing That Matters) – Management got headlines about ‘collaborative approaches’ while pay disparities stayed locked in place. This playbook works whether you’re dealing with wage gaps in Australia or milk price gaps in Wisconsin.
That’s where the rubber meets the road. When push comes to shove, cooperative management prioritizes financial transactions over both worker welfare and member interests.
The Legal Framework That Protects Systematic Exploitation
Here’s where things get really infuriating… New Zealand’s Dairy Industry Restructuring Act gives Fonterra regulatory immunity as long as they maintains “farmer ownership” status. I’ve been reviewing Commerce Commission submissions and industry reports on this framework, and the protection appears to be quite comprehensive.
This legal shield lets them set raw milk prices unilaterally, control supplier access, and coordinate supply volumes—all without the competition oversight any regular corporation would face. The Australian Competition and Consumer Commission approved Lactalis’ sale despite farmer warnings about reduced competition because cooperative structures supposedly protect agricultural interests.
But here’s what makes this relevant to U.S. farmers: similar regulatory protections exist here through the Capper-Volstead Act of 1922, which grants cooperatives antitrust immunity for “mutual help” activities. The problem is, there’s no clear definition of what constitutes legitimate mutual help versus profit extraction at member expense.
The Numbers Don’t Lie: How Cooperative Policies Accelerate Farm Elimination
Now, you might be thinking, “That’s Australia, what’s this got to do with my operation?” Fair question. Let me connect the dots with some hard data from the USDA’s 2022 Census of Agriculture that’ll make your head spin.
Between 2017 and 2022, farms selling milk dropped by 39%—that’s 15,221 dairy operations gone. We went from 39,303 farms down to 24,082. Meanwhile, operations with 2,500+ cows increased from 714 to 834 farms, now controlling nearly half of all production according to agricultural economists at institutions like the University of Wisconsin.
The Consolidation Crisis: How 15,221 Family Dairy Operations Vanished While Corporate Farms Expanded – This isn’t market evolution—it’s systematic elimination enabled by cooperative policies that favor volume over member equity. Notice how mid-size farms got squeezed hardest, dropping 2,500 operations while mega-dairies grew by 120 farms.
Here’s the thing that really gets me: this isn’t happening in a vacuum. U.S. cooperatives are deploying the same cost-optimization strategies I documented at Fonterra to favor large-volume suppliers over smaller members. It’s not necessarily malicious—it’s rational business behavior enabled by regulatory structures designed when the average dairy farm had maybe 20 cows.
Farms with 100-499 cows dropped from 8,700 to 6,200 during this period, based on the USDA census data. These mid-size operations face the worst of both worlds: too large to qualify for beginning farmer programs, too small to negotiate favorable processing terms with their own cooperatives.
The complexity here is real—some consolidation reflects genuine efficiency gains, technological advancement, and changing consumer preferences. Research from University extension programs consistently shows that larger operations often achieve better environmental outcomes per unit of production. But—and this is crucial—when cooperative structures systematically amplify these natural consolidation pressures through pricing policies that favor volume over member equity, they accelerate the elimination of family farms beyond what market forces alone would drive.
How Federal Pricing Policy Enables the Squeeze
Federal Milk Marketing Orders create the regulatory foundation that enables this value extraction, and I’ll use the Upper Midwest FMMO as an example since that covers a lot of dairy country.
According to USDA Agricultural Marketing Service data, the Class I differential in Minneapolis runs about $1.60 per hundredweight above the base Class III price, but farmers in that region typically see maybe 50-60 cents of that premium depending on their cooperative’s policies. Different FMMO regions have different formulas, but the pattern is consistent nationwide: farmers receive regulated minimum prices while processors capture value-added premiums.
This isn’t inherently problematic—until you factor in how cooperatives use their dual role as both farmer representatives and milk marketers. When your cooperative also owns processing facilities (like most major co-ops do), it benefits from keeping your milk price low while maximizing processing margins.
During the fall breeding season, when cash flow tightens for most operations, this pricing differential really hits home. You’re dealing with higher feed costs from drought conditions across corn-growing regions, trying to get cows bred back for next year’s production, and your co-op benefits from the margin between what they pay you and what they charge their processing operations.
When Cooperatives Choose Corporate Profits Over Farmer Members
Let me give you some specific instances where this plays out, because the pattern is documented across multiple organizations and court records:
Dairy Farmers of America faced a significant class action lawsuit in 2016 (Dahl v. Dairy Farmers of America), where plaintiffs alleged that DFA manipulated milk prices to benefit their processing operations at member expense. While DFA denied wrongdoing and the case was settled, the litigation revealed internal documents showing how cooperative leadership systematically balanced member returns against processing profitability—and processing usually won.
Land O’Lakes’ transformation illustrates this tension perfectly. In 2019, they restructured from a traditional farmer cooperative to a hybrid model where farmer-members own the dairy business but professional investors control the feed and agricultural technology divisions. This shift reflects how modern cooperatives struggle to balance member interests against growth opportunities that require outside capital.
More recently, Organic Valley producers have expressed concerns about pricing disparities between regions and organic premiums that don’t seem to reach farmer members consistently. While Organic Valley maintains public transparency about their pricing formulas, the complexity of their regional payment systems makes it difficult for individual farmers to verify they’re receiving equitable treatment compared to members in other areas.
I’m not saying these organizations are inherently evil—they’re dealing with genuine market pressures and competitive challenges that would break smaller entities. But the regulatory framework that grants them antitrust immunity was designed when cooperatives were simple milk marketing organizations, not vertically integrated food companies with complex financial structures and competing priorities.
The Complexity That Cooperative Executives Don’t Want You to Understand
Look, I need to acknowledge something here that makes this whole situation more frustrating. The consolidation we’re seeing isn’t just about cooperative policies; it’s also about effective governance. Consumer preferences, retail concentration, environmental regulations, labor costs, and technology adoption—all these factors interact in ways that make simple explanations inadequate.
Some large operations genuinely achieve better environmental outcomes per unit of production. University of Wisconsin research consistently shows that farms with over 1,000 cows often have lower carbon footprints per pound of milk than smaller operations. Some small farms struggle with basic food safety compliance, which is increasingly expensive to maintain as regulations tighten.
Technology investments, such as robotic milking systems, precision feed management, and automated monitoring, require capital investments that make more economic sense for larger herds, where fixed costs can be spread across more production.
But here’s what really burns me up—when cooperative structures systematically amplify these natural consolidation pressures through pricing policies that favor volume over member equity, they accelerate the elimination of family farms beyond what market forces alone would drive. The Fonterra case matters because it shows how “farmer-owned” cooperatives can prioritize financial engineering ($3.4 billion asset sales) while using settlement theater to avoid addressing fundamental inequities in how they treat different groups of members.
Follow the Money: How Fonterra’s $3.4 Billion Asset Sale Coincided with Strike ‘Settlement’ That Changed Nothing – Workers fought for pay equity while management sold their jobs to French corporate control. When push comes to shove, cooperative executives prioritize financial transactions over member interests.
Smart Farmers Are Finally Fighting Back
Here’s where I see some encouraging developments that give me hope—producers are getting smarter about distinguishing between legitimate cooperative functions and value extraction disguised as member services.
Some are quietly shifting portions of their volume to independent processors as bargaining leverage. A producer I know in central Wisconsin—a guy’s been farming for thirty years, runs about 400 head—started sending 30% of his milk to a regional cheese plant that pays a $2-per-hundredweight premium for high-quality milk with low somatic cell counts. His cooperative suddenly got very interested in “working with him” on pricing adjustments when they realized he had alternatives.
Others are building direct marketing channels that capture more of the consumer dollar. Regional cheese plants and smaller processors are seeing increased interest from farmers who want transparent pricing relationships where they can actually see how their milk gets valued.
The common thread? Farmers who stop accepting “that’s just how cooperatives work” and start demanding accountability for how their organizations actually serve member interests versus management interests.
The Bottom Line
I’m not advocating for dismantling the cooperative system—when it works properly, it provides crucial market power for individual farmers who couldn’t negotiate processing terms on their own. However, the current regulatory framework needs to be updated to reflect the realities of modern agricultural markets, where cooperatives have evolved into major food companies.
Document everything. Compare your cooperative’s pricing with every regional alternative during both peak production periods in late spring and when milk’s tight during summer heat stress. Calculate the real cost of membership by looking at opportunity costs, not just obvious fees and deductions.
Demand transparency. Push for detailed financial reporting that shows how cooperative operations actually benefit members versus enriching management or processing divisions. Ask for specific data on how pricing premiums flow through to member payments and why pricing varies between regions or facility types.
Build alternatives. Direct marketing, regional processors, and farmer-controlled marketing groups all provide competitive pressure that keeps cooperatives honest. Even if you don’t switch completely, having alternatives changes the negotiating dynamic with your current co-op.
Support policy reform. Antitrust immunity should require demonstrable member benefit, not just cooperative structure. When cooperatives become major food companies with processing operations competing against other processors, they should face the same regulatory scrutiny as other corporations.
The farms that survive this consolidation wave will be those that recognize the difference between legitimate cooperative functions and systematic value extraction. The Fonterra settlement shows exactly how the latter operates—fancy press releases about “collaborative approaches” while fundamental inequities remain unchanged.
Your cooperative isn’t automatically your ally just because you own shares in it. Judge them by results, not rhetoric. The numbers don’t lie, even when the press releases do.
What’s it gonna take for you to start asking the hard questions about your own cooperative membership?
KEY TAKEAWAYS:
Document your losses: Calculate monthly pricing gaps between your co-op and regional alternatives—some producers discovered they’re leaving $2,000+ on the table monthly by staying locked into cooperative pricing that favors volume over quality
Leverage competitive alternatives: Central Wisconsin producers using partial volume shifts to independent processors gained immediate $2/cwt premiums and forced their cooperatives to negotiate better terms within 90 days
Demand transparency now: Push for detailed financial reporting showing how pricing premiums flow to members vs. processing divisions—cooperatives hate this question because it exposes where your milk money really goes
Build exit strategies: Direct marketing channels and regional cheese plants are paying significant premiums for high-quality milk (low SCC, high butterfat) while cooperatives suppress prices to feed their processing operations
Support policy reform: Antitrust immunity should require demonstrable member benefit—when cooperatives become major food companies competing against other processors, they should face the same regulatory scrutiny as corporations
Complete references and supporting documentation are available upon request by contacting the editorial team at editor@thebullvine.com.
Learn More:
Boost Your Dairy Profits: Proven Breeding Strategies Every Farmer Must Know – This article provides a tactical guide on breeding strategies, like using beef and sexed dairy semen, to increase profitability and generate new revenue streams. It gives actionable, on-farm strategies for maximizing herd genetics and financial returns.
Dairy Trends for 2025: High-Protein and Lactose-Free Growth – This analysis of market trends for 2025 reveals how companies are capitalizing on consumer demand for high-protein and lactose-free products. It offers a strategic view on how farmers can align their operations with emerging consumer preferences to capture more value beyond commodity pricing.
AI and Precision Tech: What’s Actually Changing the Game for Dairy Farms in 2025? – This article provides a deep dive into how modern technology like AI health monitoring, precision feeding, and robotic milking can offer tangible returns on investment. It’s a must-read for anyone looking to use technology to cut costs and boost milk yields.
The Sunday Read Dairy Professionals Don’t Skip.
Every week, thousands of producers, breeders, and industry insiders open Bullvine Weekly for genetics insights, market shifts, and profit strategies they won’t find anywhere else. One email. Five minutes. Smarter decisions all week.
200+ Irish farmers stormed their own co-op HQ over 5c/L price cuts— is your co-op’s next?
EXECUTIVE SUMMARY: Here’s what we discovered: When 200+ Irish farmers stormed their own Dairygold cooperative headquarters on September 18th, they exposed the biggest lie in modern agriculture—that farmer-owned cooperatives actually serve farmers. The math is brutal: Dairygold farmers lose €2,290 monthly compared to Carbery suppliers getting 50c/L versus their 45c/L rate, while management operates four inefficient processing sites against competitors’ single streamlined facilities. This isn’t isolated to Ireland—the 1922 Capper-Volstead Act grants antitrust immunity to cooperatives regardless of performance, creating legal frameworks that protect management from farmer accountability while enabling systematic value extraction. Dairygold’s own 2024 annual report shows that 1.38 billion liters were processed (down 2.1%) across its scattered facilities, proving that operational incompetence costs farmers serious money monthly. The concerned shareholders demanding “one man, one vote” representation aren’t radicals—they’re the last line of defense against corporate-style exploitation wearing cooperative clothes. Every dairy farmer needs to calculate exactly what their cooperative’s underperformance costs them monthly, because this revolution is spreading fast.
KEY TAKEAWAYS
Calculate your monthly losses now: Compare your co-op’s milk price with every regional processor, multiply by your volume—Irish farmers discovered they were losing €2,290 monthly to competitors paying 5c/L more
Document everything that doesn’t add up: Board decisions celebrating corporate metrics while farmers lose money, strategic initiatives benefiting the organization while hammering member returns, and emergency concerns getting shuffled to “strategic reviews” weeks later
Build relationships outside official channels: Coffee shop conversations and social media groups where you can share real competitive data—management counts on farmers staying isolated and accepting whatever explanations they’re given
Demand transparent competitive benchmarking: Monthly price comparisons with every regional alternative, processing costs broken down by facility, and management compensation tied to farmer-relevant metrics—not corporate-speak about “commercial sensitivity”
Start exploring alternative marketing options: Even if you can’t switch immediately, having real options changes the entire power dynamic with cooperative management who depend on farmer loyalty and switching costs to avoid accountability
Look, I don’t usually get fired up about stuff happening across the Atlantic, but this story just grabbed me and wouldn’t let go.
September 18th. Over 200 Irish farmers literally stormed their own cooperative’s headquarters in Mitchelstown. Not some faceless corporation screwing them over. Their own damn co-op. The organization they supposedly “owned.”
And when I started digging deeper into what pushed these farmers to that breaking point… well, hell, I couldn’t sleep right for days.
Because what happened at Dairygold? It’s basically a masterclass in how cooperatives can systematically rob farmers while claiming to protect them.
These farmers were getting hammered on milk price every month, while their board knew full well that competitors were paying way more. And management’s brilliant response to 200+ pissed-off farmers showing up at their door?
Schedule a meeting. Five weeks later.
The Math That’ll Make Your Stomach Turn
Farm Volume (Liters/Year)
Monthly Volume
Loss per Liter
Monthly Loss (€)
Annual Loss (€)
300,000
25,000
€0.05
€1,250
€15,000
550,000
45,833
€0.05
€2,292
€27,500
800,000
66,667
€0.05
€3,333
€40,000
1,200,000
100,000
€0.05
€5,000
€60,000
Okay, so I’ve been looking at dairy financials for… what, twenty-something years now? And these numbers just floored me.
Dairygold dropped their August milk price to 45 cents per liter after a brutal 3-cent cut. Meanwhile, Carbery’s paying 50 cents per liter. Kerry’s at 47.5.
That’s a 5-cent difference between Dairygold and Carbery. Five cents!
Now, I won’t pretend to have exact Irish farm census data sitting in front of me, but any producer knows what a 5-cent differential does to your bottom line when you’re moving serious volume. Think about it—that’s the difference between making your loan payment or calling the banker for an extension. Between fixing that TMR mixer that’s been acting up since spring or nursing it through another season.
For what? For being a loyal member of your own cooperative.
The Efficiency Disaster That Explains Everything
Here’s where it gets really maddening, and honestly, this quote from Nigel Sweetnam—one of the farmers leading this whole revolt—it just says everything about what’s wrong with Dairygold’s operation.
During those September protests, he laid it out crystal clear: “Carbery have four co-ops supplying milk to one site, whereas we have one co-op supplying milk to four sites—think of all the duplication of resources and inefficiencies.”
Think about that for a second. Four processing sites. Dairygold’s runs milk through Mitchelstown, Mallow, Mogeely, plus their other facilities, while their competitor takes milk from four different cooperatives and runs it all through one streamlined operation.
And what does Dairygold management call this operational nightmare? “Professional oversight.” “Strategic diversification.”
Their own 2024 annual report shows they’re processing 1.38 billion liters annually—down 2.1% from the previous year. So, the volume’s declining, costs are scattered across all these different sites, and farmers are getting hammered on price… but at least the organizational chart looks impressive.
You know what strikes me about this whole thing? It’s like watching a train wreck in slow motion, except the passengers are the ones paying for the tickets.
The 1922 Legal Framework That Enables This Whole Scam
Now this is where most people’s eyes start glazing over because who wants to hear about century-old federal law? But stick with me, because this is the key to understanding how cooperatives can get away with this.
The Capper-Volstead Act from 1922 basically gives agricultural cooperatives a get-out-of-jail-free card on antitrust laws. They can coordinate pricing, control regional markets, eliminate competition—stuff that would land any other business in federal court.
Back then, the idea made sense. Help small farmers compete against the big corporate processors. But here’s the thing nobody talks about: those antitrust exemptions apply whether the cooperative actually serves farmers or not.
No performance benchmarks. No accountability requirements. Nothing.
So you end up with situations like Dairygold paying farmers 5 cents less per liter while maintaining regional market control. And farmers? They’re stuck because switching processors means new equipment, renegotiating contracts, changing your whole operation…
It’s like if your bank could charge whatever interest rate they wanted because they called themselves “member-owned” and you couldn’t practically switch without moving to another state.
The Board Game Where Management Always Wins
You know what really gets me about this mess? The governance theater.
These Irish farmers demanding “one man, one vote” representation… that shouldn’t be revolutionary. That should be basic democracy. But Dairygold’s got these committee structures and membership requirements that basically lock most farmers out of any real say.
The concerned shareholders who organized this initiative have been documenting problems for months, and they’ve shown exactly how management presents boards with these so-called “strategic options” that are, in reality, just different flavors of the same corporate thinking.
When you’ve got farmers losing serious money and the board’s response is to schedule a meeting five weeks out… well, that tells you everything about who’s actually running the show.
And you know what happens when farmers bring up operational problems? Fresh cow issues become “market volatility.” Butterfat’s tanking? “Global supply dynamics.” Dry lot turns into a swamp because management didn’t maintain the drainage properly? Act of God, nothing they could’ve done about it.
Makes you wonder—when did we start accepting explanations that would get a farm manager fired?
Warning Signs Every Producer Should Watch For
The red flags are pretty obvious once you know what to look for.
Management constantly explaining away competitive disadvantage with vague market talk? When your co-op’s consistently paying less than what other processors offer and board meetings are all about “global market dynamics” instead of fixing operational problems… that’s trouble brewing.
Emergency concerns getting shuffled off to committees and “strategic reviews”? When you’re bleeding money and management’s response is scheduling discussions for weeks later—that’s damage control, not governance.
Can you actually get real competitive data from your co-op? Not cherry-picked statistics that make management look good, but honest comparisons with every other processor in your area. Cost breakdowns by facility. Management compensation tied to metrics that actually matter to your bottom line.
If your cooperative starts throwing around phrases like “commercial sensitivity” when you ask for transparency… well, that’s basically management telling you they don’t work for you anymore.
And here’s something I’ve noticed—cooperatives that are really serving farmers don’t mind talking about their competitive position. It’s the ones getting their asses kicked that suddenly get all secretive about “proprietary information.”
What You Can Actually Do About It
This whole situation is depressing as hell, but those Irish farmers proved something important—when farmers organize and apply real pressure, even the most insulated management has to pay attention.
First thing? Figure out exactly what your cooperative’s underperformance is costing you. Get real numbers. Compare your milk price with every other processor in your area, factor in your actual volume, and calculate what management decisions are costing your operation every month.
Then start talking to other members outside the official cooperative channels. Coffee shop conversations, social media groups, whatever works in your area. Management counts on farmers staying isolated and just accepting whatever explanation they’re given.
Document everything. Board decisions that don’t make financial sense. Annual reports that celebrate corporate metrics while farmers lose money. Strategic initiatives that somehow benefit the organization while hammering member returns.
And honestly? Start building relationships with alternative marketing options. Even if you can’t switch right away, having real options changes the whole power dynamic.
Don’t just take my word for it—look at what these Irish farmers accomplished. They went from being ignored by their own board to having management scrambling to schedule emergency meetings. That’s the power of organized farmer pressure.
The Revolution’s Already Started
Those 200+ Irish farmers who showed up at Dairygold’s headquarters figured out what every dairy producer needs to understand eventually.
Cooperative management depends on farmer loyalty, switching costs, and legal complexity to avoid accountability. They’ll use all the right language about farmer solidarity while systematically extracting value from the very farmers they claim to serve.
But here’s the thing about information… it spreads now. Social media, direct price comparisons, organized farmer pressure—the information monopoly that made this whole system possible is breaking down fast.
The only question is whether you’ll figure it out before your monthly milk check starts getting hammered by people who claim they’re protecting your interests.
Because if Irish farmers can organize 200+ people to storm their own headquarters over pricing that doesn’t make sense… what’s stopping you from demanding real accountability from your own cooperative?
And look, I’ll be honest with you—this trend makes me wonder how many other cooperatives are running the same scam, just more quietly. How many farmers are getting systematically underpaid while their boards celebrate “operational excellence” and “strategic positioning”?
We’ll keep digging into these cooperative governance issues because somebody’s got to tell farmers the truth when their own organizations won’t.
Complete references and supporting documentation are available upon request by contacting the editorial team at editor@thebullvine.com.
The $400-Per-Cow Advantage: How AI Is Redefining Dairy Profitability | The Bullvine – This article offers an innovative, future-oriented perspective, demonstrating how technology and data analytics can empower farmers to gain a competitive edge. It shows how targeted tech investments can boost profitability and help producers demand accountability from their co-ops.
The Sunday Read Dairy Professionals Don’t Skip.
Every week, thousands of producers, breeders, and industry insiders open Bullvine Weekly for genetics insights, market shifts, and profit strategies they won’t find anywhere else. One email. Five minutes. Smarter decisions all week.
When cancer struck young farmer Isaac Davies, family, friends, neighbors and even Isaac’s rugby coach instantly offered to help.
I’ll never forget the moment I first heard about Isaac Davies—a young man whose dreams stretched as wide as the Welsh valleys his family called home.
It was November 1, 2024, when everything changed. Isaac, just 17 and brimming with plans for his future in Holstein breeding, was told he had a brain tumor. Being a fit, strong and healthy young man this came as a shock to family, friends and the wider rural community.
And yet… what grew from that moment of devastation was something I’m still struggling to put into words.
Isaac wasn’t just any teenager. He was the kind of young man who made you believe in the future of farming—a passionate Holstein breeder doing his second year on farm from Hartpury College, a rugby captain whose teammates at Crymych RFC looked up to his quiet strength. His hands already knew the rhythm of his family’s Castellhyfryd operation, supplying milk to Pembrokeshire Creamery and Blas y Tir.
Then came November 13. Surgery at Heath Hospital in Cardiff. The beginning of a journey that would test everything this family thought they knew about endurance.
When Darkness Falls, Light Finds a Way
While Isaac facedsurgery, months of proton beam therapy in London, and chemotherapy that would push his body to its limits, something extraordinary was happening back home. The farm—that steady heartbeat of the Davies family’s life—never missed a beat.
Staff, family, friends and neighbours all offered to help support the family in their time of need.
The moment that changed everything for me was understanding what Simon Davies was actually doing during those long hospital stays. Picture this: sterile corridors in London, the constant hum of medical equipment, worried families huddled in waiting areas. And cutting through all of that—Simon’s calm voice directing activities of the farm two hundred miles away.
“Move the heifer from the top pen to the middle pen,” he’d say into his phone, then turn back to Isaac’s bedside. “Give silage to the cow in the calving pen.” The nurses found it amusing at first that this farmer couldn’t stop farming, even in a children’s cancer ward.
But I understood something they didn’t. Simon wasn’t being stubborn or a workaholic. Farming doesn’t stop for anything. Milking cows is a 7 day a week job. Something people not involved in farming fail to see.
The Weight of Unexpected Courage
Into this storm of uncertainty stepped Elliott, the younger brother whose life was about to change in ways no 15-year-old should have to navigate.
Elliott, balanced preparation for GCSEs with farming duties and was always prepared to help to keep things going. Also a keen showman Elliott has worked hard to prepare the team of Castellhyfryd Holsteins for the showring. In a bid to maintain some element of normality the Davies’s continued to show at the Royal Welsh Show, Pembrokeshire County Show and the local community show at Clunderwen. Elliott has been rewarded for his hard work and dedication winning Champion Handler at the Royal Welsh, Pembrokeshire and Clunderwen shows. He has also qualified for the All Britain Calf Show in September.
Love Made Visible
Then came the community response that restored my faith in what’s possible when people refuse to let their neighbors carry burdens alone.
The “In It With Isaac” fundraiser wasn’t just an event—it was a love letter written by an entire community. Farmer and ex-international referee Nigel Owens officiated the rugby match, bringing together players who’d grown up with Isaac. The promise auction overflowed with donations that told stories: sexed semen from prized bulls, cow brushes, calf cakeand all sorts of agricultural treasures given without hesitation.
The bicycle ride across the rugged Preseli mountains saw cyclists pedaling not just for distance, but for hope—each mile a declaration that Isaac wouldn’t face this alone.
Together, they raised over £80,000 for cancer charities that had supported Isaac’s treatment.
But walking through that crowd, what captured my heart wasn’t the impressive total. It was the absence of grand speeches or ceremony. Instead, I witnessed something rarer: love in its working clothes.
. Family and friends who drove the Davies’s to and from hospital in Cardiff and London and a community, desperate to help organised numerous fund-raising events. Two members of Clunderwen Young Farmers’ Clubcycled 100 miles from Cardiff to Tenby, raising £5,500. The local chapel where Isaac and Elliott had attended Sunday School hosted a coffee morning that generated £4,600. There’s also been a bingo night, carol singing and rugby matches and Holstein South Wales and the Young Breeders are planning a dinner for March 2026—proof that this community’s commitment runs deeper than crisis response.
The Long Road Home
Isaac’s recovery continues, measured not in dramatic breakthroughs but in small, precious victories that farming families understand better than most.
The surgery left him unable to speak or see initially. Balance issues meant relearning to walk. But with the same work ethic that comes from a lifetime around agriculture, Isaac has thrown himself into rehabilitation with quiet determination.
“We’ve had two clear MRI scans so Isaac is recovering well. Isaac is physically strong and very determined. He’s been very positive from the beginning and is working very hard on his physio and rehabilitation.” —Sian Davies
There’s no timeline for healing like this.. Just the daily choice to keep moving forward, one step at a time.
What strikes me about Isaac’s approach to recovery is how it mirrors everything I’ve learned about successful farming: you can’t control the weather, but you can control your response to it. You prepare for challenges you hope never come. You celebrate small victories because they’re all part of something larger.
What This Really Means
This story doesn’t offer a tidy resolution or manufactured inspiration. It offers something more vital: proof that agricultural communities have developed social infrastructure that transforms individual crisis into collective strength.
The Davies family discovered what many farming families already know but rarely talk about: when crisis strikes, rural communities don’t just offer sympathy—they provide operational support that keeps families afloat while they navigate the unnavigable.
Their experience reveals profound truths about resilience that extend far beyond agriculture:
Love multiplies when it becomes action. The Davies family received more than emotional support—they received practical infrastructure that maintained their livelihood during months of medical uncertainty.
Strength often looks ordinary. Elliott’s championship wasn’t heroic—it was the result of showing up every day despite the worries about Isaac , the kind of quiet courage that builds character one choice at a time.
Hope requires community. Individual determination matters, but sustainable hope grows from relationships built over years of shared commitment to each other’s welfare.
Legacy is preserved through daily choices. The community’s ongoing support ensures that whatever Isaac’s recovery brings, the Davies family’s agricultural identity will endure.
For Anyone Carrying Heavy Burdens
To those reading while wrestling with your own impossible circumstances, I offer what I learned from watching the Davies family navigate their darkest season:
The courage to continue isn’t always a choice—sometimes it’s the only option that lets you live with yourself. But what the Davies family taught me is that you don’t have to carry those burdens alone, not if you’re part of a community that understands the weight of shared responsibility.
Farming has always required faith in processes you can’t control. You plant seeds without knowing the weather. You breed cattle without guaranteeing outcomes. You build relationships without knowing when you’ll need them most.
But when crisis comes—and it always comes—those investments in community pay dividends that no insurance policy can match.
The Truest Harvest
Farming is more than soil and seasons, more than milk prices and genetic programs. It’s the covenant between people who understand that individual success depends on collective resilience. It’s the unspoken promise that when one family faces the unthinkable, others will step forward without being asked.
In West Wales, watching neighbors become family and community become lifeline, I witnessed something that gives me hope for all of us: love that refuses to let anyone face the darkness alone.
The Davies family’s story continues—with the steady persistence that defines both recovery and farming. Isaac works daily on rehabilitation. Elliott continues developing as both a student and an agriculturalist. Simon and Sian maintain their Holstein operation while supporting their sons’ different but equally important journeys.
And their community stands ready, as agricultural and rural communities always have, to provide whatever support tomorrow might require.
That’s not just inspiration—that’s infrastructure. The kind of social foundation that makes life sustainable when individual strength isn’t enough.
In the Davies family’s continuing journey, I see the harvest of hope that grows when love becomes action, when neighbors become family, and when community becomes something stronger than the sum of its parts.
The Sunday Read Dairy Professionals Don’t Skip.
Every week, thousands of producers, breeders, and industry insiders open Bullvine Weekly for genetics insights, market shifts, and profit strategies they won’t find anywhere else. One email. Five minutes. Smarter decisions all week.
To provide the best experiences, we use technologies like cookies to store and/or access device information. Consenting to these technologies will allow us to process data such as browsing behavior or unique IDs on this site. Not consenting or withdrawing consent, may adversely affect certain features and functions.
Functional
Always active
The technical storage or access is strictly necessary for the legitimate purpose of enabling the use of a specific service explicitly requested by the subscriber or user, or for the sole purpose of carrying out the transmission of a communication over an electronic communications network.
Preferences
The technical storage or access is necessary for the legitimate purpose of storing preferences that are not requested by the subscriber or user.
Statistics
The technical storage or access that is used exclusively for statistical purposes.The technical storage or access that is used exclusively for anonymous statistical purposes. Without a subpoena, voluntary compliance on the part of your Internet Service Provider, or additional records from a third party, information stored or retrieved for this purpose alone cannot usually be used to identify you.
Marketing
The technical storage or access is required to create user profiles to send advertising, or to track the user on a website or across several websites for similar marketing purposes.
To provide the best experiences, we and our partners use technologies like cookies to store and/or access device information. Consenting to these technologies will allow us and our partners to process personal data such as browsing behavior or unique IDs on this site and show (non-) personalized ads. Not consenting or withdrawing consent, may adversely affect certain features and functions.
Click below to consent to the above or make granular choices. Your choices will be applied to this site only. You can change your settings at any time, including withdrawing your consent, by using the toggles on the Cookie Policy, or by clicking on the manage consent button at the bottom of the screen.
Functional
Always active
The technical storage or access is strictly necessary for the legitimate purpose of enabling the use of a specific service explicitly requested by the subscriber or user, or for the sole purpose of carrying out the transmission of a communication over an electronic communications network.
Preferences
The technical storage or access is necessary for the legitimate purpose of storing preferences that are not requested by the subscriber or user.
Statistics
The technical storage or access that is used exclusively for statistical purposes.The technical storage or access that is used exclusively for anonymous statistical purposes. Without a subpoena, voluntary compliance on the part of your Internet Service Provider, or additional records from a third party, information stored or retrieved for this purpose alone cannot usually be used to identify you.
Marketing
The technical storage or access is required to create user profiles to send advertising, or to track the user on a website or across several websites for similar marketing purposes.


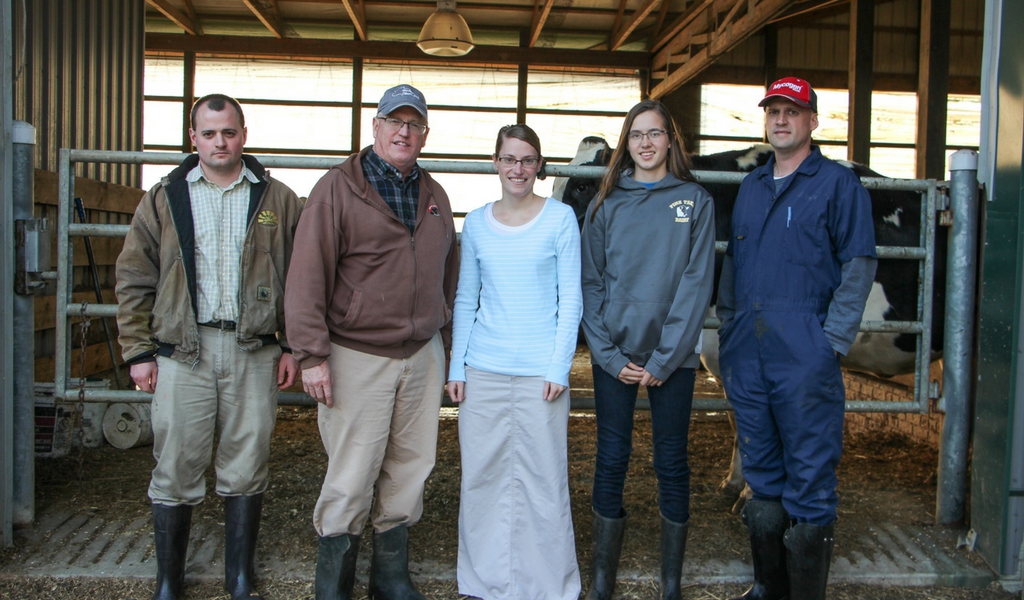

 The Sunday Read Dairy Professionals Don’t Skip.
 The Sunday Read Dairy Professionals Don’t Skip.