How will China’s shrinking dairy demand shift global markets? Are you ready to tackle the changes and find new opportunities?
Summary:
Is the traditional global dairy market ready for a shakeup? As China’s appetite for dairy products shows signs of weakening, this once-booming market might be on the brink of a transformation. Recent figures highlight a sharp decline in China’s imports of whole and skim milk powders, while cheese remains a rare bright spot with increased imports. This trend poses a significant challenge for exporters, especially for New Zealand, the world’s largest dairy supplier, forcing them to rethink their strategies and explore alternative markets. The fluctuations in Chinese demand underscore the intricate web of the global dairy trade, where dependency on a single market can lead to vulnerabilities. China’s economic slowdown has significantly decreased demand for dairy products, impacting global markets. The GDP growth figure of 4.6% for the July-to-September quarter was below Beijing’s growth target of 5%, reflecting broader economic challenges influencing consumer behavior. This downturn is particularly evident in the dairy sector, as Chinese consumers re-evaluate their spending priorities, leading to declining demand for imported dairy products. In September, China imported only 10,372 metric tons of whole milk powder (WMP), more than 45% less than a year ago. Skim milk powder (SMP) imports also dropped significantly, plummeting nearly 51% year over year to just 9,571 MT. However, China’s cheese imports surged to 12,565 MT, representing an impressive nearly 6% increase over the same month last year. New Zealand, a major supplier to China, may find itself at a crossroads as the drastic drop in China’s appetite for milk powders indicates it must adapt its strategies. Policymakers and industry stakeholders must strategize beyond traditional markets and explore new, more stable regions for their dairy exports.
Key Takeaways:
- The Chinese economy is experiencing a slowdown, with growth rates not meeting Beijing’s targets, impacting the demand for dairy imports.
- Whole milk powder and skim milk powder imports by China have dropped significantly to their lowest levels in recent years, indicating a shift in dairy consumption patterns.
- Despite declining milk powder imports, cheese imports have increased, suggesting changing consumer preferences.
- New Zealand, a major dairy exporter to China, may need to diversify its market focus due to reduced Chinese demand, potentially intensifying global competition in dairy products.
- The current scenario underscores the vulnerability of global dairy markets to economic fluctuations in major importing countries like China.

Have you ever wondered what happens when the world’s largest consumer of dairy products starts to pull back on their appetite? As China’s economic growth continues to lag, its demand for dairy is taking a hit, leaving ripple effects across global markets. The strength of the Chinese economy has always been a bellwether for international trade patterns, and a slowdown in their dairy demand signals turbulent times ahead for exporters worldwide. “In September, China imported only 10,372 metric tons (MT) of whole milk powder (WMP), more than 45% less than a year ago.” Understanding these shifts is crucial for those deeply entrenched in the dairy industry. The dynamics aren’t just about numbers but strategy and adaptability. So, what does this mean for you, perhaps a farmer or a professional working with dairy exporters? Stay tuned as we dive deeper into the currents driving this change and what it might mean for markets beyond Beijing’s horizon. Remember, adaptability is key in these challenging times.
China’s Economic Slowdown and Its Ripple Effects on Global Dairy Markets
A notable deceleration has marked China’s recent economic performance. The GDP growth figure of 4.6% for the July-to-September quarter was a dip from the previous quarter’s 4.7% growth. This slowdown, below Beijing’s growth target of 5%, reflects broader economic challenges influencing consumer behavior across the country.
The impact of this economic downturn on consumer behavior is particularly evident in the dairy sector. With reduced purchasing power, Chinese consumers are re-evaluating their spending priorities, leading to declining demand for imported dairy products. This decrease is not solely due to economic factors but also compounded by changing consumer preferences and market dynamics within China.
As disposable incomes are under pressure, consumers opt for cheaper local alternatives instead of high-priced imported goods. This shift in consumption patterns is causing ripples through the global dairy market, as suppliers who once relied heavily on China are now being forced to adapt to this significant downturn in demand.
Contrasting Trends in China’s Dairy Imports: Milk Powder Down, Cheese Up
Shifting dynamics in China’s dairy import trends have revealed considerable contrasts among various dairy categories. According to recent statistics, China imported a mere 10,372 metric tons (MT) of whole milk powder (WMP) in September, reflecting a striking decline of over 45% compared to last year. This marked the lowest import level for any month since 2016, mirroring the broader economic downturn.
Furthermore, skim milk powder (SMP) imports demonstrated an even more pronounced drop, plummeting nearly 51% year over year to just 9,571 MT. This reinforces the downward trajectory of milk powder imports, with SMP purchases hitting their lowest level since 2016.
Conversely, China’s cheese imports painted a different picture. They surged to 12,565 MT in September, representing an impressive nearly 6% increase over the same month last year. Year-to-date statistics cement cheese as a growing category, with imports ranking third highest on record, trailing only 2021 and 2023.
Butter imports in September decreased by almost 8% compared to the previous year, amounting to 6,532 MT. Despite this, year-to-date butter imports rose by 4.4% to 75,664 MT, marking the third-highest total.
Meanwhile, whey imports slightly fell below the levels from September a year ago. Nonetheless, they remain robust, registering as the third-highest on record, behind only 2021 and 2023.
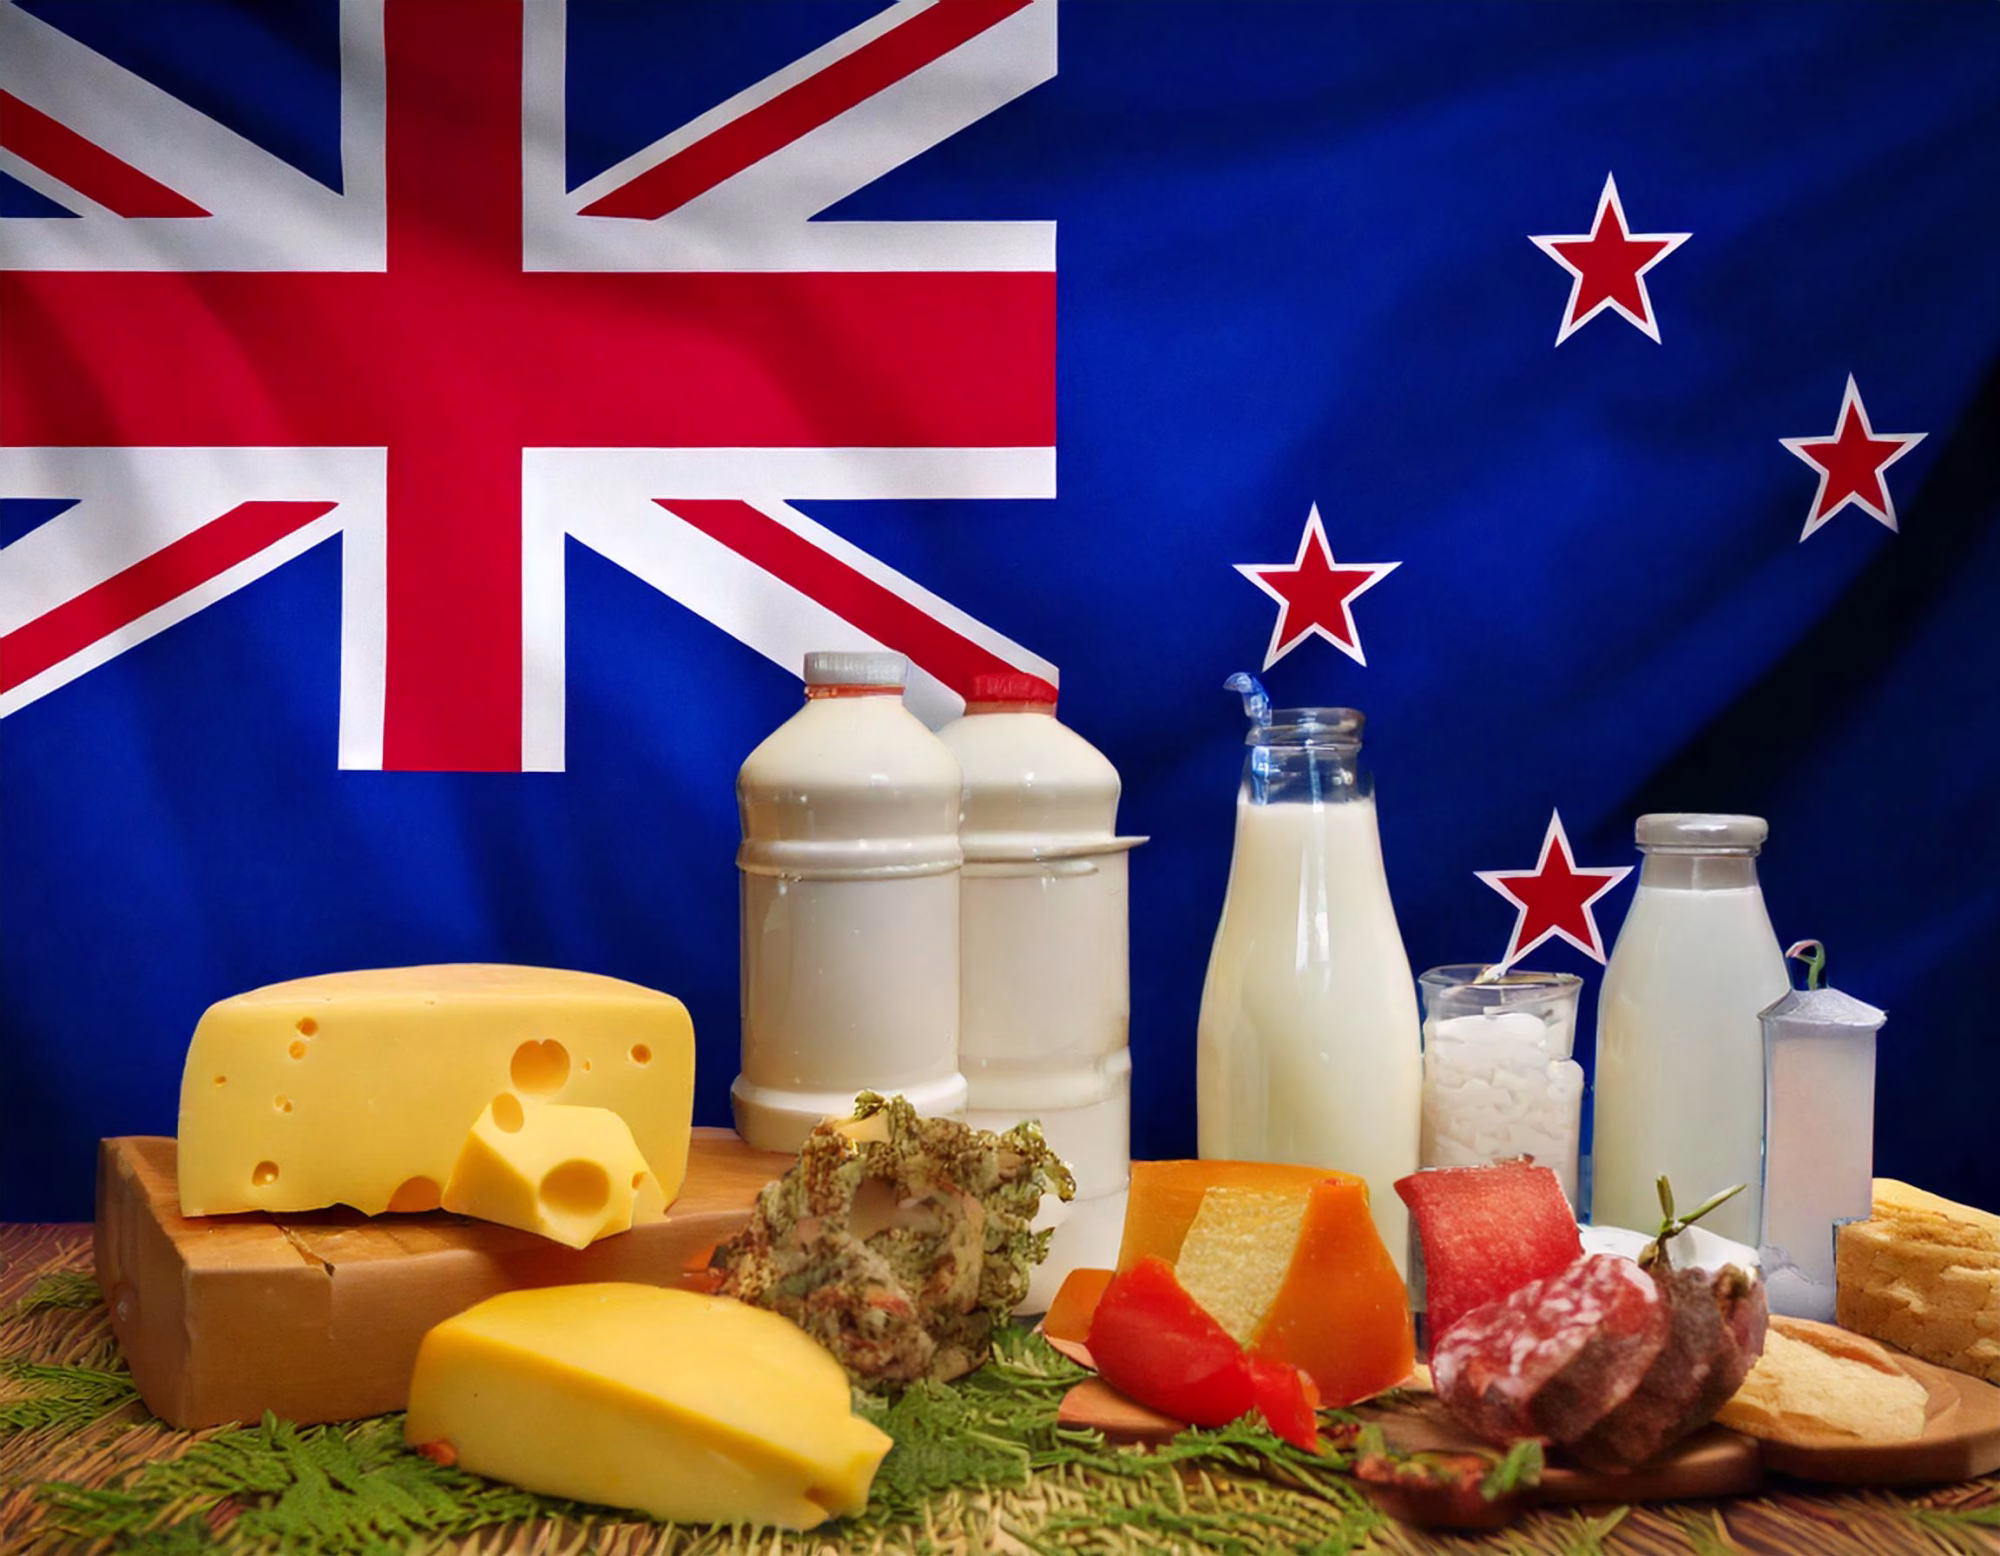
New Zealand at a Crossroads: From Milk Powder to Cheese in Response to China’s Waning Demand
The diminished demand for dairy from China sends ripples across the global market, putting pressure on exporters to seek alternative markets. Notably, New Zealand, a major supplier to China, may find itself at a crossroads. The drastic drop in China’s appetite for milk powders—evident in the fall to their lowest levels since 2015 for WMP and 2016 for SMP—means New Zealand must adapt its strategies.
One potential pivot for New Zealand in response to China’s waning demand is transitioning more milk production from powder to cheese. This strategy could address immediate powder demand reductions but comes with challenges. Chinese cheese imports show resilience, which offers a glimmer of opportunity but also points to intensified competition. As New Zealand and other exporters potentially ramp up cheese production, markets could become flooded, exerting downward pressure on prices. This could have significant implications for New Zealand’s dairy industry and its economy as a whole.
This increased competition could strain profit margins and destabilize existing trade patterns. Exporters must weigh whether the shift from powder to cheese production merits the risk of increased operational costs and market saturation. Adaptability and agile market strategies will be crucial for New Zealand and other exporters navigating these turbulent waters. Could this be an opportunity in disguise or a precursor to more significant market upheavals?
Rethinking Global Dependency: China’s Economic Impact and Dairy Market Vulnerabilities
The current global dairy market draws attention to the broader ramifications of China’s economic policies and trade practices. It’s essential to ask how much influence a single country should wield over international markets. China’s economic slowdown and reduced demand for dairy products signal the fragility of overreliance on any one partner.
Many argue that China’s economic strategies, including currency manipulation and state-sponsored industry subsidies, create imbalances that reverberate across global markets. These practices challenge the principles of fair trade and competitive equity. For dairy farmers and companies, this is a reminder to diversify markets and reduce dependency on markets like China, which can shift unpredictably based on internal policies. Diversifying markets for dairy exports is a crucial strategy for mitigating the impact of China’s economic slowdown on the global dairy market.
Consider this: If China’s demand fluctuations can upend international dairy norms, what stops it from exerting similar pressures on other sectors? Policymakers and industry stakeholders must strategize beyond traditional markets and explore new, more stable regions for their dairy exports.
The current scenario also calls for more robust international trade agreements that ensure fair play and prevent any nation from disproportionately affecting global supply chains. A reevaluation of trade partnerships could lead to a push for policies that level the playing field and generate a more resilient and diversified export strategy.
Ultimately, this isn’t just about dairy but the giant geopolitical chessboard. Are we ready to adapt and counterbalance the uncertainties tied to China’s economic rhythm? It’s crucial for the sustainability of dairy markets and maintaining global economic equilibrium. What measures should be in place to mitigate such impacts in the future?
The Bottom Line
China’s economic deceleration and decreasing demand for dairy have sent shockwaves through global markets, highlighting vulnerabilities that could have enduring repercussions. While imports of milk powders have dwindled, the increase in cheese imports poses potential shifts, especially for nations like New Zealand, leading to intensified competition in global dairy supply chains. Dairy professionals worldwide must strategize and adapt to these changing dynamics, seeking diversification and new markets to mitigate risks. It’s crucial to consider the potential long-term effects of China’s economic slowdown on the global dairy market and to prepare for these changes.
Now, we want to hear from you. How do you think these shifts will affect the dairy industry’s future? Are there strategies or innovations that could help buffer against these changes? Share your thoughts in the comments below, engage in discussions, and if you’ve found this article insightful, share it with colleagues and peers to broaden the conversation within the industry.
Learn more:
- Slow Global Dairy Price Recovery Anticipated, Rabobank Analysis Shows: Unpacking the Market Trends
- Global Dairy Trade: Key Insights Every Dairy Farmer Should Know
- China’s Dairy Self-Sufficiency Reshapes Global Markets: New Zealand’s Export Strategy Shifts
 Join the Revolution!
 Join the Revolution!
Bullvine Daily is your essential e-zine for staying ahead in the dairy industry. With over 30,000 subscribers, we bring you the week’s top news, helping you manage tasks efficiently. Stay informed about milk production, tech adoption, and more, so you can concentrate on your dairy operations.