When beef plants close, dairy basis widens. Here is the economic playbook used to squeeze producer margins—and how to protect your operation
EXECUTIVE SUMMARY: Tyson claims ‘unprecedented cattle shortages’ justified closing their Lexington plant—yet cattle inventory is down just 3% and the company paid $2 billion MORE for cattle this year, not less. This closure eliminates 30% of Nebraska’s processing capacity, extracting .5 million annually from producers through wider basis—the gap between futures prices and what farmers actually receive. Dairy farmers are already living this reality: processor consolidation costs the average 1,000-cow dairy ,000-14,000 yearly in reduced cull cow values alone. With four firms controlling 85% of beef processing (up from 25% in 1977), capacity decisions become price controls—no conspiracy required, just strategic plant closures. The same playbook that eliminated 61% of dairy farms over 25 years is now accelerating in beef. This investigation reveals how basis compression works, why consolidation makes it worse, and what producers can do to protect their operations before they become the next casualty.

When Tyson Foods announced the closure of their Lexington, Nebraska, beef processing plant on November 21st—citing “unprecedented cattle shortages”—it sparked conversations across agricultural communities. The facility processes 5,000 head daily, employs 3,000 workers in a town of 10,000, and will shut down by January 2026. That represents roughly 30% of Nebraska’s beef processing capacity disappearing in a single corporate decision. While this is a beef industry headline, the blueprint is identical to the consolidation already squeezing dairy margins—and understanding these mechanics could mean the difference between adapting successfully or becoming another farm closure statistic.
What makes this particularly relevant for dairy operations is how the actual cattle inventory data appears to tell a different story than the corporate narrative suggests. For those of us who’ve watched dairy consolidation over the past decade, these patterns feel remarkably familiar.
Understanding Basis Pricing: The Mechanism Behind Local Markets
Let me share something that becomes increasingly important as markets consolidate—the concept of “basis” and how it affects what producers actually receive versus what they see on commodity screens.
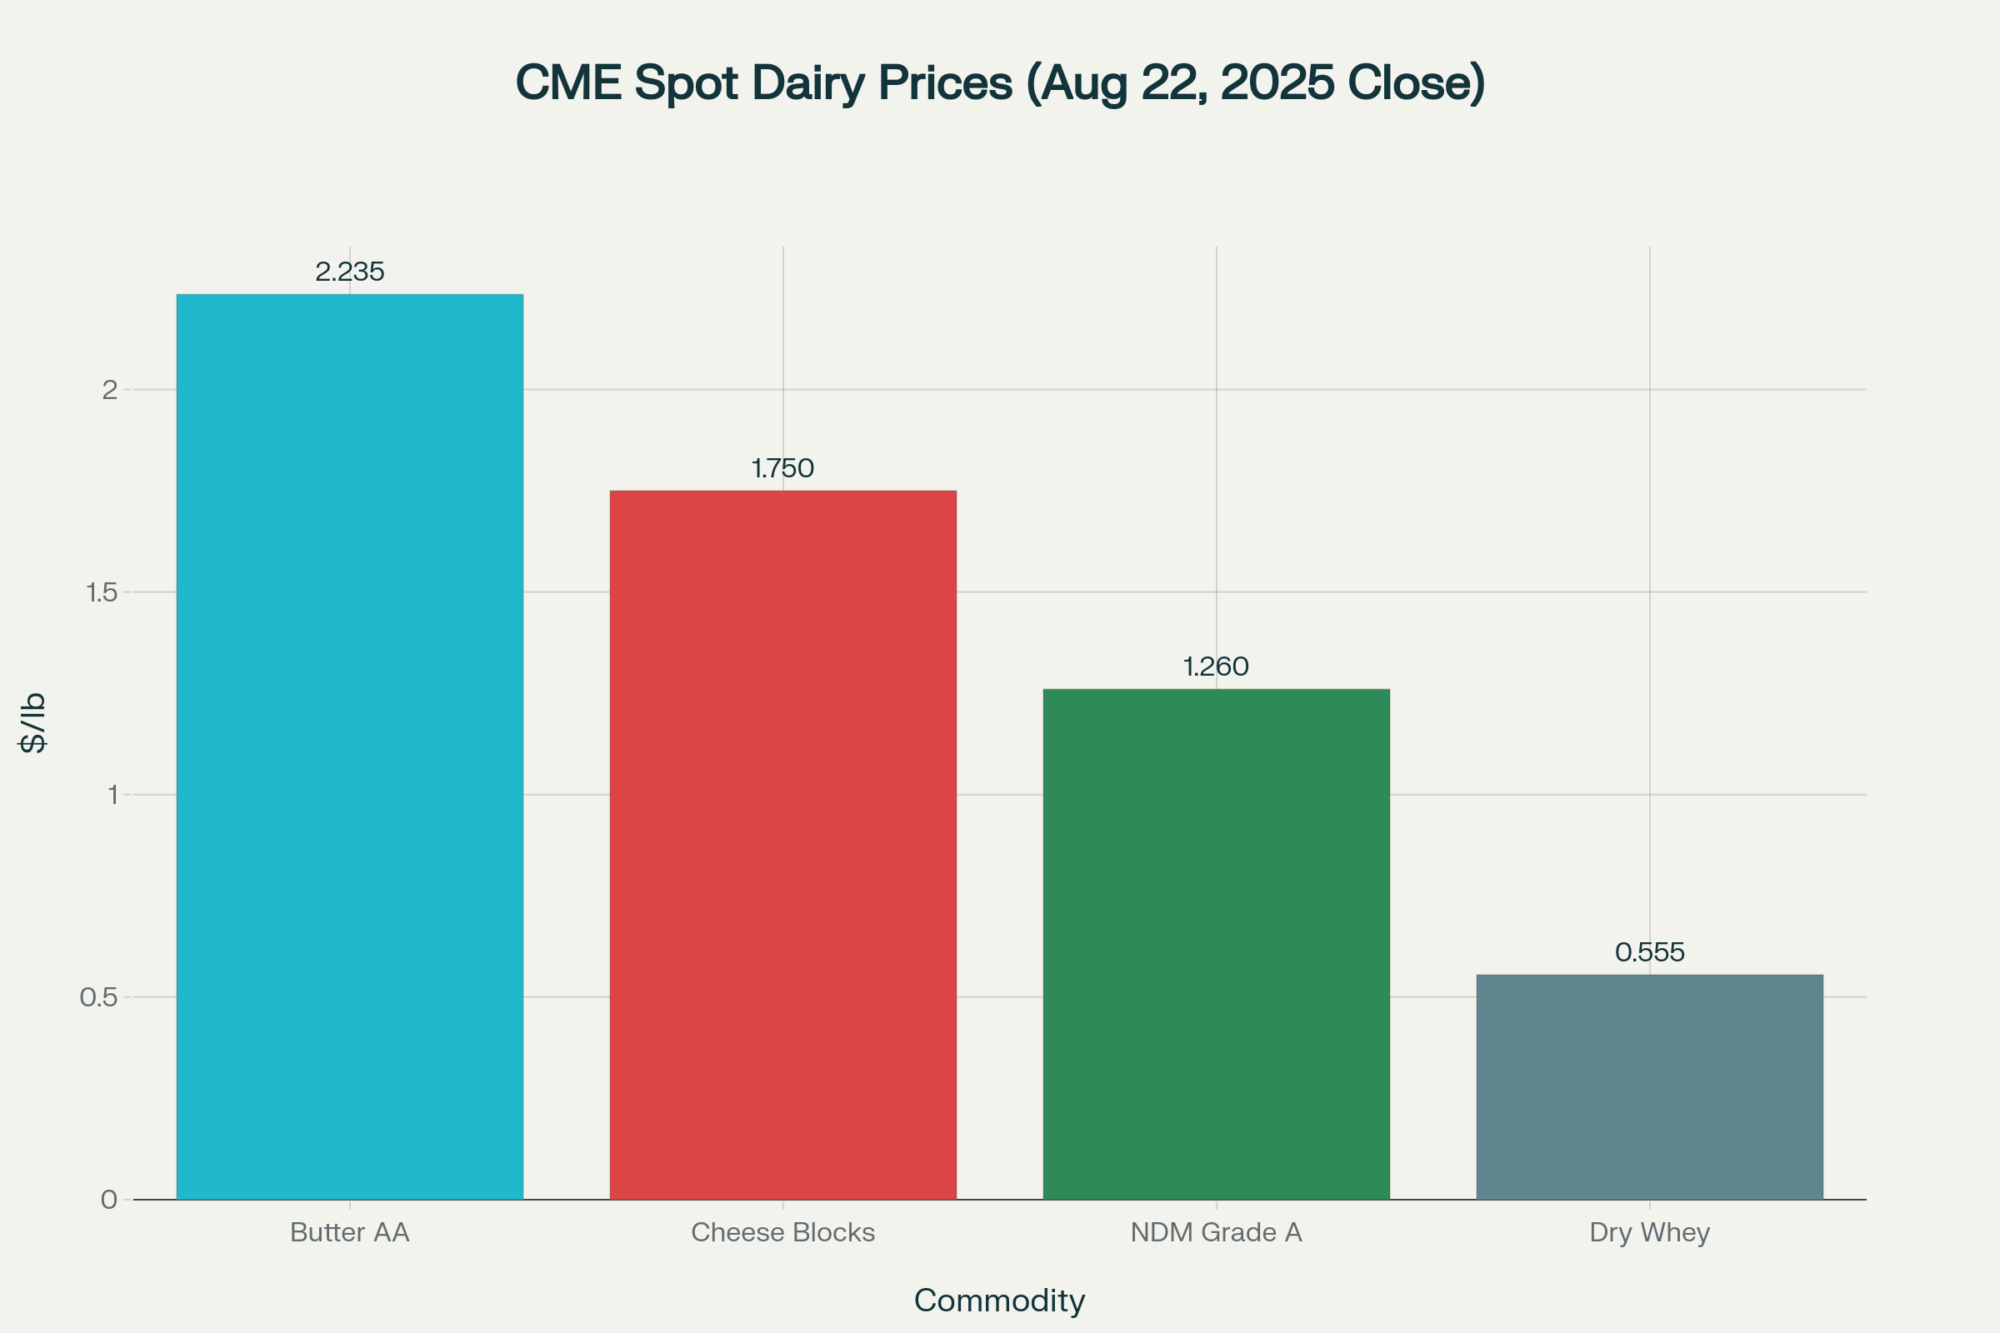
Basis represents the difference between futures prices—those numbers flashing on Chicago Mercantile Exchange screens—and the actual cash price producers receive at their local market. Think of it as your regional market adjustment. In dairy, we see this same dynamic between Class III futures and mailbox prices, and the parallels are instructive.
The agricultural economics team at the University of Nebraska-Lincoln has extensively documented these patterns through its research publications. Their findings show that in competitive markets, feedlot operators typically receive the futures price minus a modest basis adjustment—perhaps 5 to 15 cents per hundredweight — for transportation and regional supply-and-demand factors.
What’s particularly noteworthy is how dramatically this changes when processing capacity leaves a region:
In a competitive market scenario: A feedlot 50 miles from multiple processors might see:
- Basis of approximately -$0.05/cwt
- Multiple competitive bids arriving weekly
- Cash price around $193.95/cwt on a 1,250 lb steer, yielding $2,424
After significant capacity reduction: That same operation now shipping 180+ miles might experience:
- Transportation costs are adding $33 per head (based on USDA-tracked rates of $5.50 per loaded mile)
- Basis weakening to -$2.50/cwt or more
- New cash price dropping to $191.50/cwt, or $2,394 per head
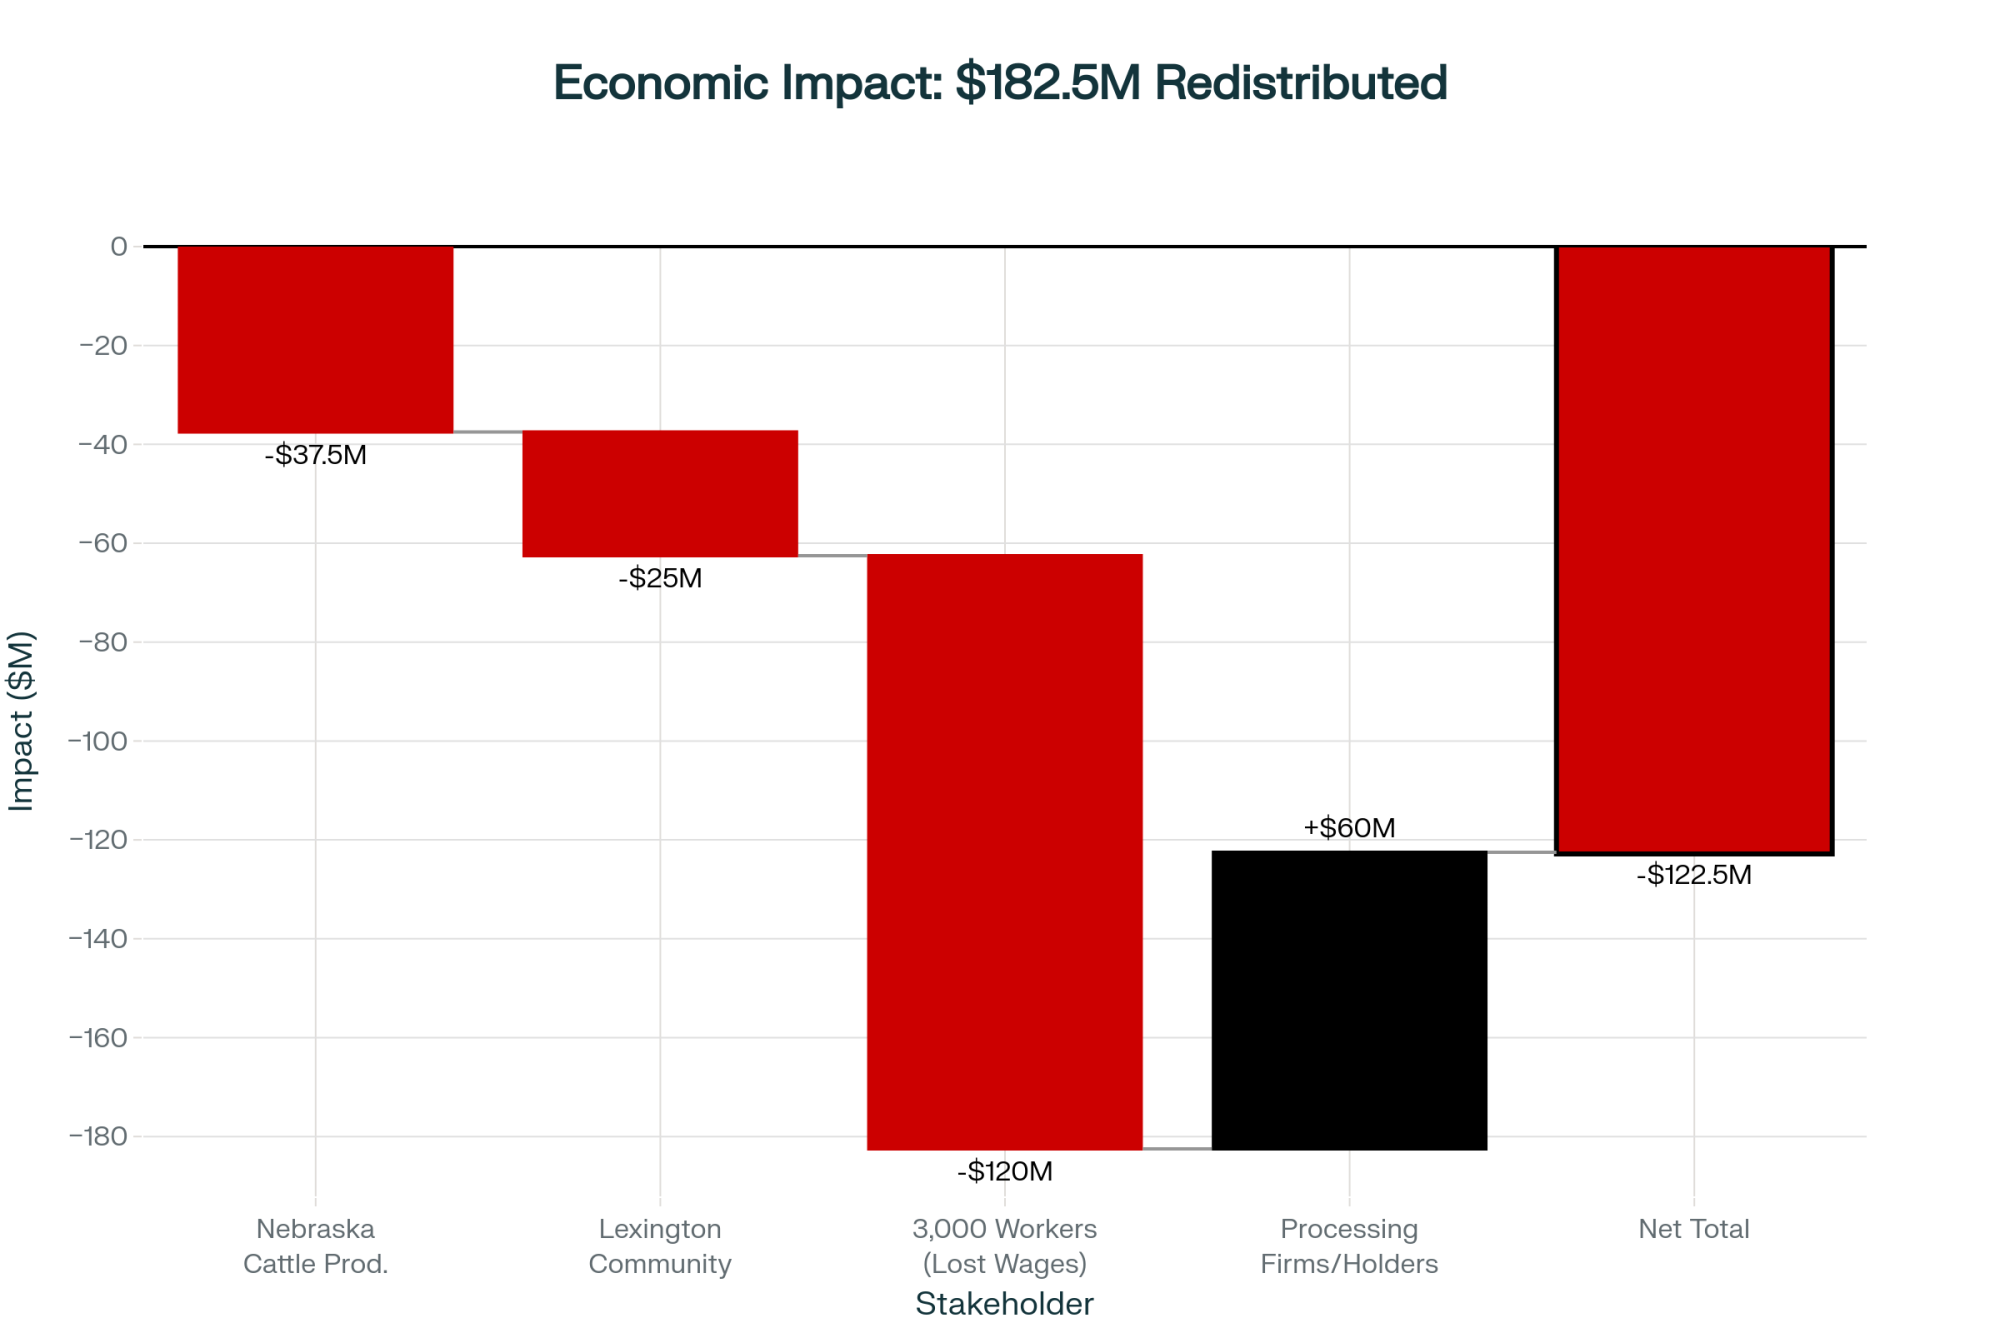
When you calculate that $30 per head difference across the 1.25 million head annually processed at Lexington, Nebraska producers potentially face $37.5 million in reduced annual revenue—not from market fundamentals, but from structural changes in competitive dynamics.
The Cull Cow Connection: What This Means for Your Bottom Line
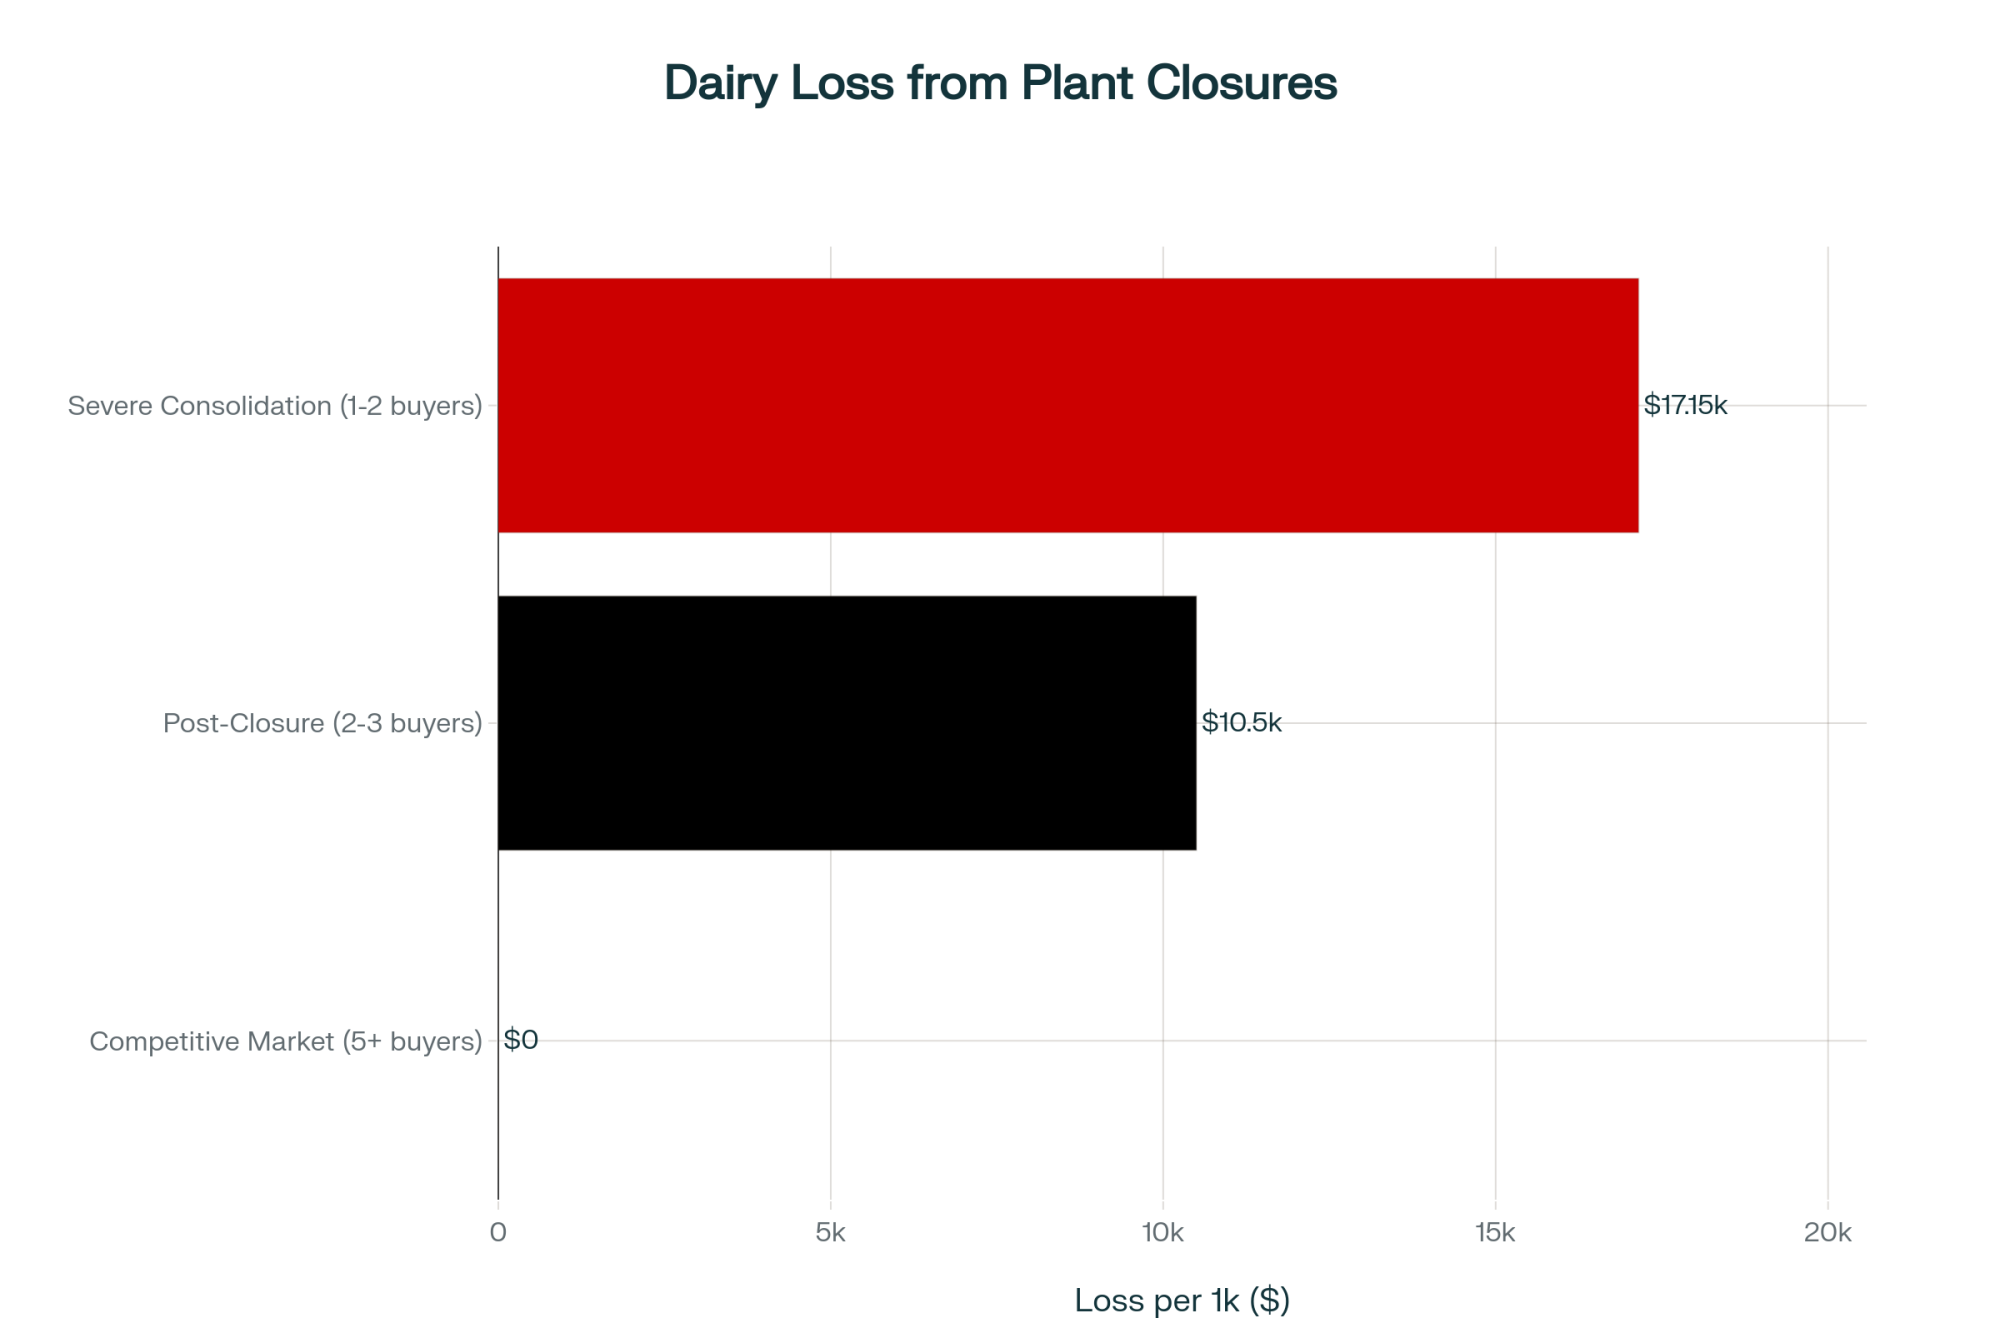
Here’s something every dairy producer needs to understand about processing capacity: it directly affects your cull cow revenue. For a 1,000-cow dairy culling 35% annually, that’s 350 cull cows heading to market each year. When regional processing capacity shrinks, the basis on those cull cows widens just like it does for fed cattle.
Using current market dynamics, if basis widens by just $2.00/cwt due to reduced processing competition, that represents approximately $10,000 to $14,000 in lost annual cash flow for that 1,000-cow operation (assuming 1,400 lb cull cows at current prices). For many dairies, that’s the difference between profit and break-even—or between staying in business and selling out.
Examining the Supply Narrative: What the Data Actually Shows
The interesting thing about market narratives is how they sometimes diverge from documented data. USDA’s National Agricultural Statistics Service reported Nebraska’s January 2025 cattle inventory at 6.05 million head, down just 3% from the previous year. The state’s cattle-on-feed inventory in September 2025 stood at 2.43 million head, showing remarkable stability through recent reporting periods.
What’s particularly revealing—and this comes from Tyson’s own SEC filings—is that the company reported cattle costs increased by $2 billion in fiscal 2025 compared to the prior year. That pattern typically suggests competitive bidding for supply rather than genuine scarcity.
Dr. Derrell Peel at Oklahoma State University, who’s done extensive work on livestock markets, has observed that when processors simultaneously report supply challenges and increased input costs, it often indicates competitive pressure rather than actual shortage conditions. This aligns with what many market observers have noted.
Tyson’s beef segment reported an adjusted operating loss of $426 million in fiscal 2025, with forward guidance suggesting losses of $400-600 million in fiscal 2026. The closure removes 6,700 head of daily processing capacity from the market when you include reductions at their Amarillo facility—a significant structural change to regional competition.
Learning from Dairy’s Consolidation Journey: Regional Patterns Emerge
The dairy industry’s experience with consolidation offers a valuable perspective on these dynamics—and it’s playing out differently across regions.

When Dean Foods filed for bankruptcy in November 2019, they operated 57 facilities across 19 states—essentially the largest fluid milk processor in America. Dairy Farmers of America’s 2020 acquisition of 44 of those plants for 3 million represented a significant concentration of processing capacity.
The Northeast Experience
Vermont exemplifies how consolidation pressures compound. The November 2025 Class I base price hit $16.75/cwt, down $1.29 from October, despite relatively stable national commodity markets. With 78% of Vermont experiencing severe drought conditions according to U.S. Drought Monitor data, producers face what economists describe as converging pressures—rising feed costs coinciding with price compression from national oversupply.
The Midwest Transformation
Wisconsin’s story shows how quickly landscapes change. Saputo’s recent optimization strategy provides a textbook example. Between 2024 and 2025, they’ve closed facilities in Belmont, Big Stone (South Dakota), Lancaster, Tulare (California), South Gate (California), and Green Bay. Each announcement emphasized “network optimization” and “operational efficiency.”
The Suamico, Wisconsin, closure eliminated 240 positions according to state workforce notifications. What’s particularly significant for smaller operations is that Saputo’s new Franklin, Wisconsin, facility requires 4-5 million pounds of milk daily for efficient operation—volume typically sourced from larger operations rather than traditional family-scale dairies.
Wisconsin has seen three major facility closures in 18 months. For producers in central regions, buyer options have decreased from five to perhaps two or three—a fundamental shift in market structure. International Dairy Foods Association tracking shows $11 billion in new processing capacity announced nationwide, with significant investment flowing to Texas, Idaho, and New Mexico—regions with operational scales different from traditional Midwest dairy.
I recently spoke with a Wisconsin producer milking around 400 cows who shared their experience after the Lancaster closure. Their milk hauling distance jumped from 45 miles to 110 miles, adding roughly 90 cents per hundredweight to their costs—assuming truck availability, which isn’t always guaranteed in tight transportation markets.
The Western Perspective
A California producer I connected with last month offered a different perspective. “We’ve watched consolidation reshape our market for two decades,” she explained. “When you’re down to two buyers for your milk in a 200-mile radius, the conversation changes completely. It’s not negotiation anymore—it’s take it or leave it.”
The progression seems consistent across all regions:
- Processors announce efficiency-driven network optimization
- Regional processing options decrease
- Basis differentials widen as competition diminishes
- Margin pressure intensifies for producers
- Scale becomes increasingly critical for survival
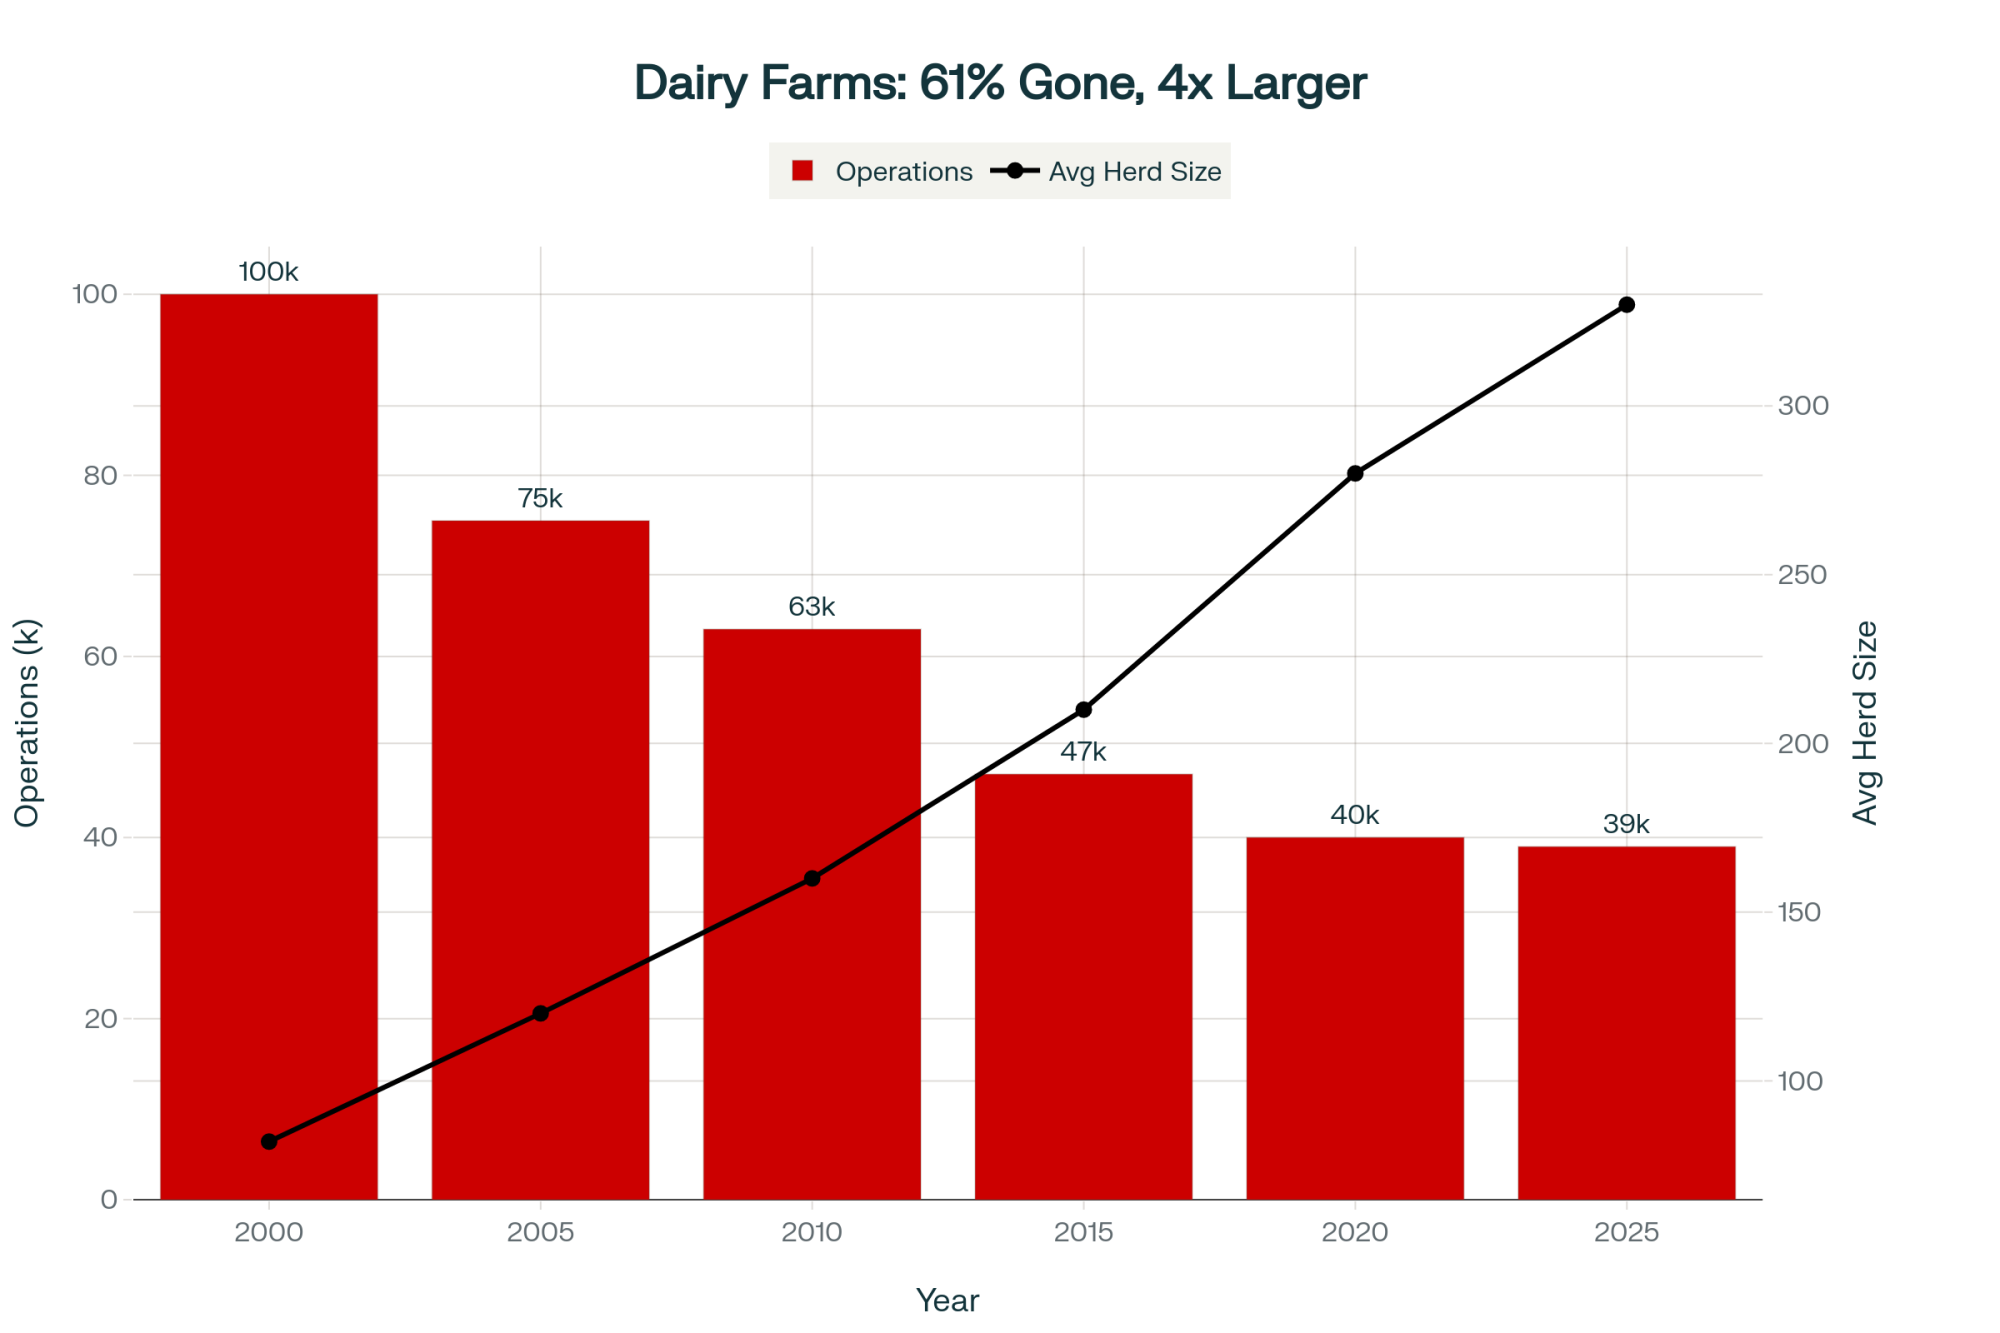
USDA Economic Research Service data documents this trajectory in dairy—from approximately 100,000 operations to 39,000 over 25 years, a 61% reduction. American Farm Bureau projections suggest 2,800 dairy operations may exit in 2025 alone, though market conditions could affect these estimates.
Understanding Make Allowance Impacts
The June 2025 Federal Milk Marketing Order adjustments increased make allowances in ways that the National Milk Producers Federation analysis suggests will shift approximately $91 million annually from producer revenues to processor margins. University of Wisconsin dairy enterprise budgets indicate a typical 300-cow operation that might have netted $10,000 annually could face $61,000 in losses under current conditions—challenging math for any operation.
The Economics of Community Impact
Rural development researchers have modeled the economic ripple effects of major facility closures, suggesting impacts of around $300 million over time for a community like Lexington—roughly $30,000 per capita in a town of 10,000. This encompasses lost wages, reduced tax revenue, diminished retail activity, and the broader multiplier effects that flow through rural economies.

Understanding where economic value flows in these transitions helps explain the dynamics:
For processing companies and shareholders: Industry analysis suggests potential margin improvements of $40-80 million annually through strategic capacity management and reduced regional competition. Tyson’s dividend program distributes $353 million annually to shareholders, with share buyback authorizations exceeding $1 billion in fiscal 2025.
For producers: Transportation cost increases alone could reach $42 million annually for cattle previously processed at Lexington. Add basis compression and reduced negotiating leverage, and the economic pressure compounds significantly.
For communities: Property tax revenue losses estimated at $15-25 million annually create budget pressures that affect schools, infrastructure, and essential services—impacts that persist long after the initial closure.
Monitoring Market Consolidation: Warning Signs to Watch
Language That Warrants Attention:
When processors use terms like “network optimization,” “reducing duplicate capacity,” or “investing in next-generation facilities,” it often precedes structural changes. Similarly, phrases about “managing supply challenges” or “consolidating operations” deserve careful consideration.
Market Indicators to Track:
- Widening gaps between announced prices and actual payments
- Shifting regional price differentials
- Increasing hauling distances to remaining processors
- Investment patterns favoring certain regions over others
Proactive Steps to Consider:
- Maintain detailed records of basis trends
- Build information networks with regional producers
- Request transparency in pricing calculations
- Preserve operational flexibility where possible
Price Discovery: The Foundation of Fair Markets
One fundamental shift deserves particular attention—the evolution of price discovery mechanisms. Iowa State University research documents that in the 1990s, approximately 80% of fed cattle were traded through transparent cash markets. Today, that figure has dropped to around 20%, with formula contracts dominating transactions.
Why does this matter? When price discovery depends on limited transactions, those prices become both less representative and potentially more influenced by strategic behavior. Academic research shows that as formula contracts grew from 20% to 80% of volume, the packer-to-retail price spread effectively doubled.

Dairy maintains relatively better price transparency through Federal Order reporting, which explains why the June 2025 make allowance changes generated immediate producer response—the impacts were visible and quantifiable. Markets operating primarily through private formula contracts offer less transparency for impact assessment.
Strategic Considerations for Producers
While consolidation trends seem likely to continue, producers have options for navigating these changes:
Near-term Risk Management:
- Document basis patterns systematically—tracking announced versus actual prices monthly reveals trends that inform decisions
- Build information networks—comparing experiences with regional producers helps identify systematic patterns versus individual situations
- Seek pricing transparency—understanding calculation methodologies helps identify where value gets captured
- Maintain operational flexibility—long-term commitments may limit options during structural market shifts
Longer-term Positioning:
- Evaluate differentiation opportunities—value-added production or direct marketing can provide alternative revenue streams, though these require different skill sets and market development
- Strengthen collective representation—producer organizations provide platforms for information sharing and advocacy
- Engage in policy discussions—market structure issues ultimately require policy responses
- Assess scale strategically—understanding where your operation fits in evolving market structures informs investment decisions
Essential Questions for Processors:
- What methodology determines base pricing, and is the underlying data accessible?
- What proportion of supply comes through formula versus cash transactions?
- How does pricing compare across similar regional suppliers?
- Where are capital investments being directed geographically?
- How will any facility changes affect net returns after transportation?
Broader Implications for Agricultural Markets
The Tyson Lexington situation illustrates how market concentration—with four firms controlling 81-85% of beef processing, up from 25% in 1977—fundamentally alters market dynamics. Similar patterns in dairy, with comparable concentration levels, suggest these aren’t isolated incidents but structural trends.
What’s becoming increasingly clear:
- Processor capacity decisions significantly influence regional pricing dynamics
- Economic impacts flow predictably from rural communities toward corporate returns
- Reduced price transparency through formula contract dominance creates structural advantages for processors
- These patterns appear consistent across protein sectors
What remains less certain:
- The potential for meaningful antitrust enforcement or policy intervention
- Timeline and effectiveness of producer collective action
- Whether technological or market innovations might create alternatives
- How consumer preferences might influence market structures
Understanding these dynamics isn’t about pessimism—it’s about realistic assessment. Market structures have evolved significantly from previous generations’ experience. Success requires recognizing these changes, adapting strategically, and working collectively where appropriate to maintain competitive markets.
The fundamental question isn’t whether consolidation will continue—current trajectories suggest it likely will. The question becomes how producers can best position themselves within evolving market structures while advocating for policies that preserve competitive dynamics.
What unfolds in Lexington over the coming months may preview developments in other agricultural regions. Producers who understand mechanisms like basis compression, price discovery evolution, and formula contract implications will be better positioned to navigate these changes. Those who don’t may find themselves questioning why returns diminish even as demand appears stable.
Markets evolve. Producers who recognize and adapt to structural changes while maintaining operational excellence will be best positioned for long-term success. And perhaps, with sufficient understanding and collective action, we can influence how these markets develop rather than simply reacting to changes imposed upon us.
INDUSTRY RESOURCES
- Wisconsin Farmers Union: 715-723-5561, www.wisconsinfarmersunion.com
- Northeast Organic Dairy Producers Alliance: 413-772-0444, www.nodpa.com
- National Milk Producers Federation: 703-243-6111, www.nmpf.org
KEY TAKEAWAYS
- The $10,000 Question: When processors close regional plants, your cull cow basis widens $2-3/cwt—costing a 1,000-cow dairy $10,000-14,000 annually in lost revenue
- Decode the Language: “Network optimization” = plant closures coming. “Supply challenges” = margin restoration through consolidation. “Efficiency improvements” = fewer buyers for your milk
- The Math That Matters: 4 firms control 85% of processing + only 20% cash market trading = they set prices, you take them
- Your Action Plan: Track basis monthly (the gap between futures and your check), build regional producer networks for price transparency, and avoid long-term contracts during consolidation periods
- The Pattern Is Clear: The same consolidation that eliminated 61% of dairy farms in 25 years is accelerating—understanding it is your best defense
Complete references and supporting documentation are available upon request by contacting the editorial team at editor@thebullvine.com.
Learn More:
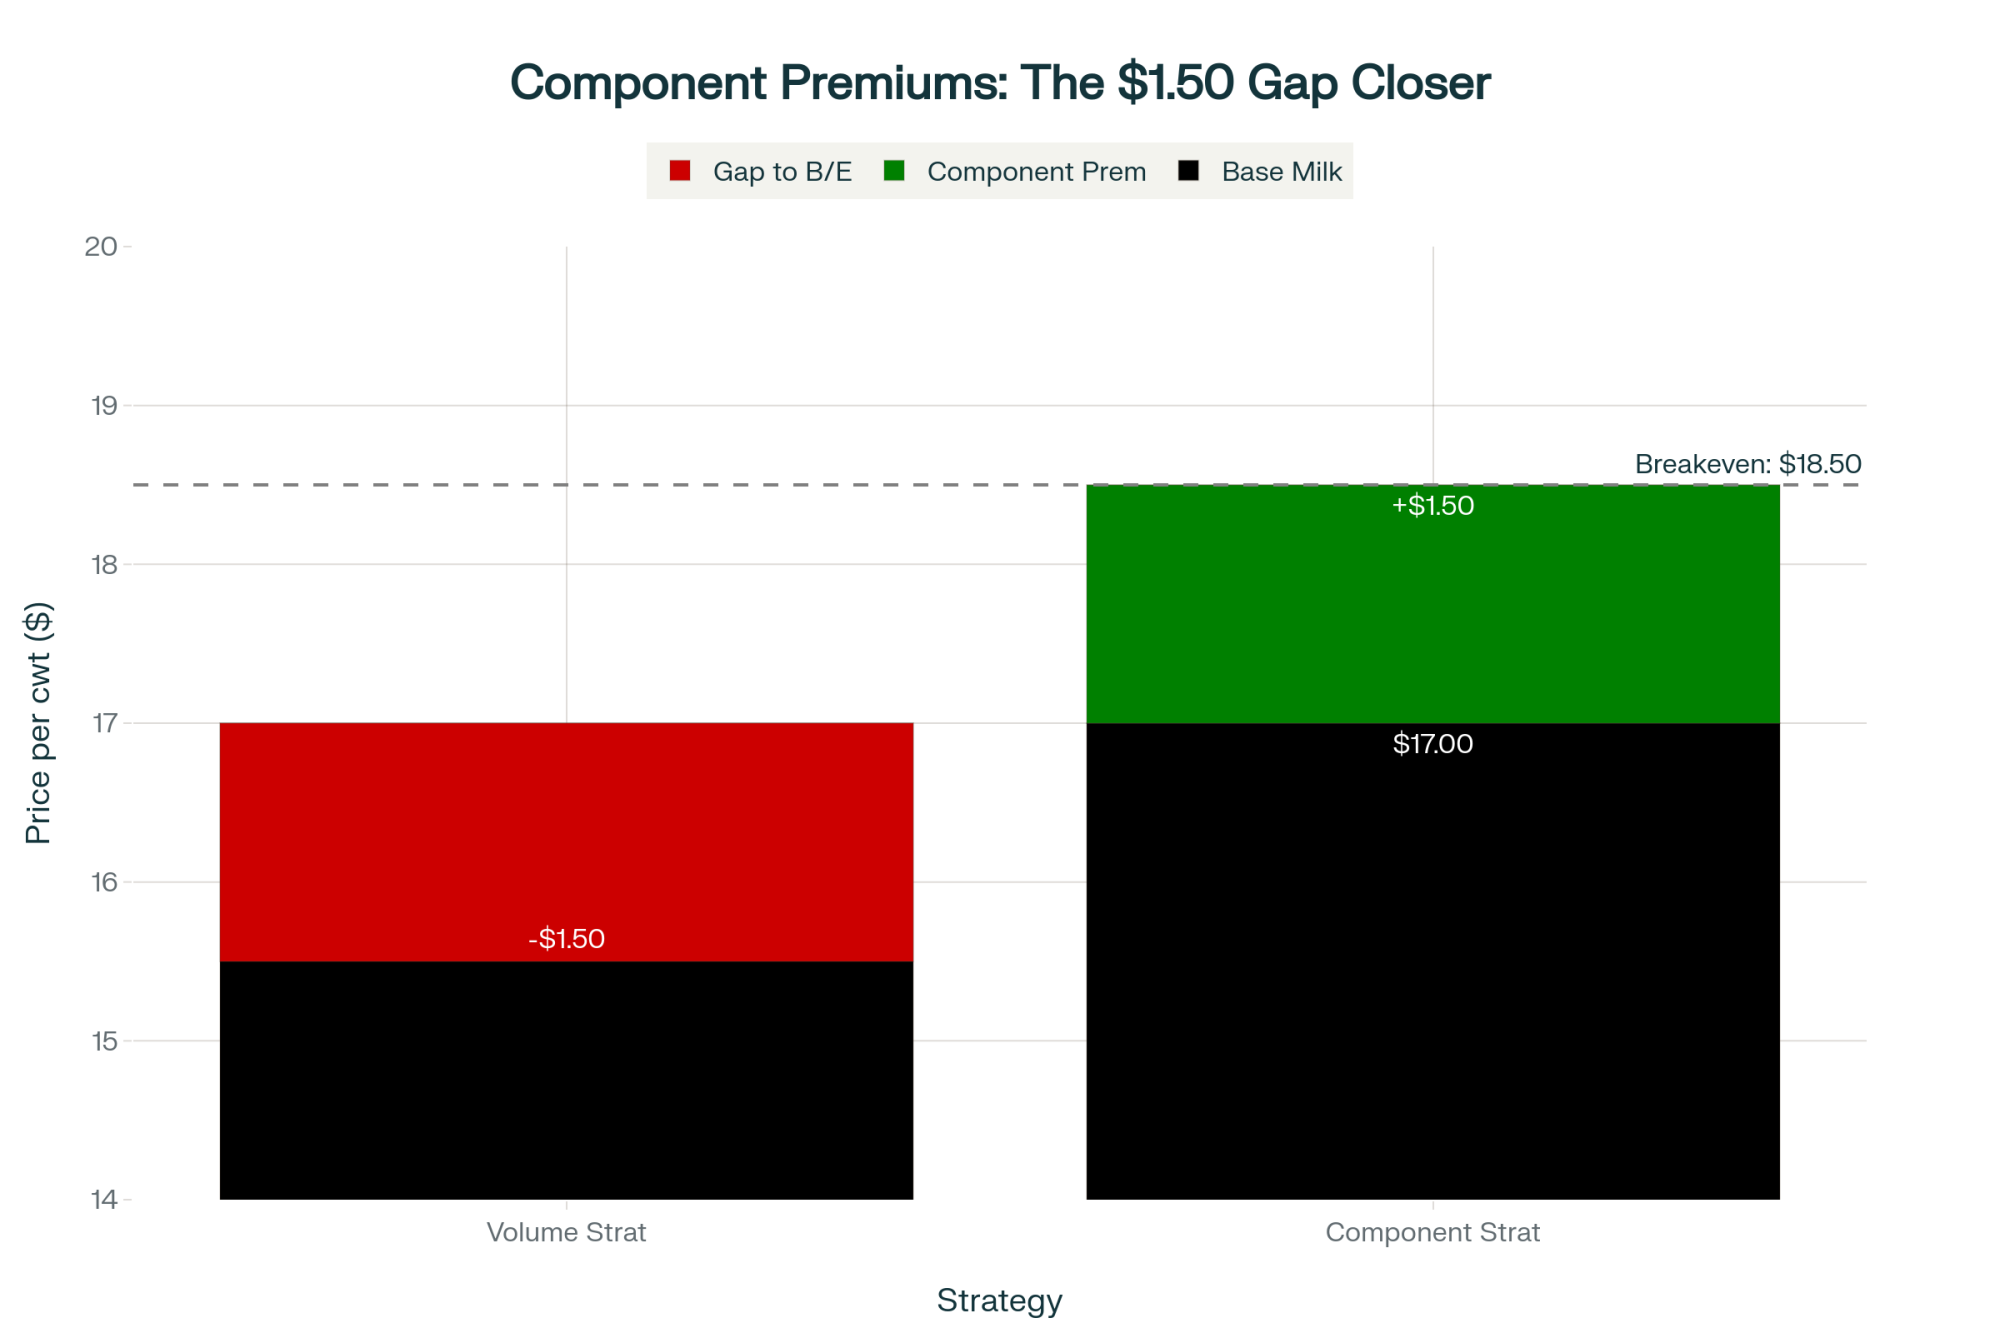
- The 90-Day Dairy Pivot: Converting Beef Windfalls into Next Year’s Survival – Provides a tactical roadmap for protecting margins when beef plants close, detailing specific culling thresholds and component strategies that generate an additional $266 per cow while navigating the volatile basis spreads affecting cull values.
- Why Dairy Markets Can’t Self-Correct Anymore – Delivers a deep strategic analysis of the “economic handcuffs” and structural consolidation patterns—identical to those seen in the Tyson case—that are preventing traditional market corrections and permanently altering regional milk pricing dynamics.
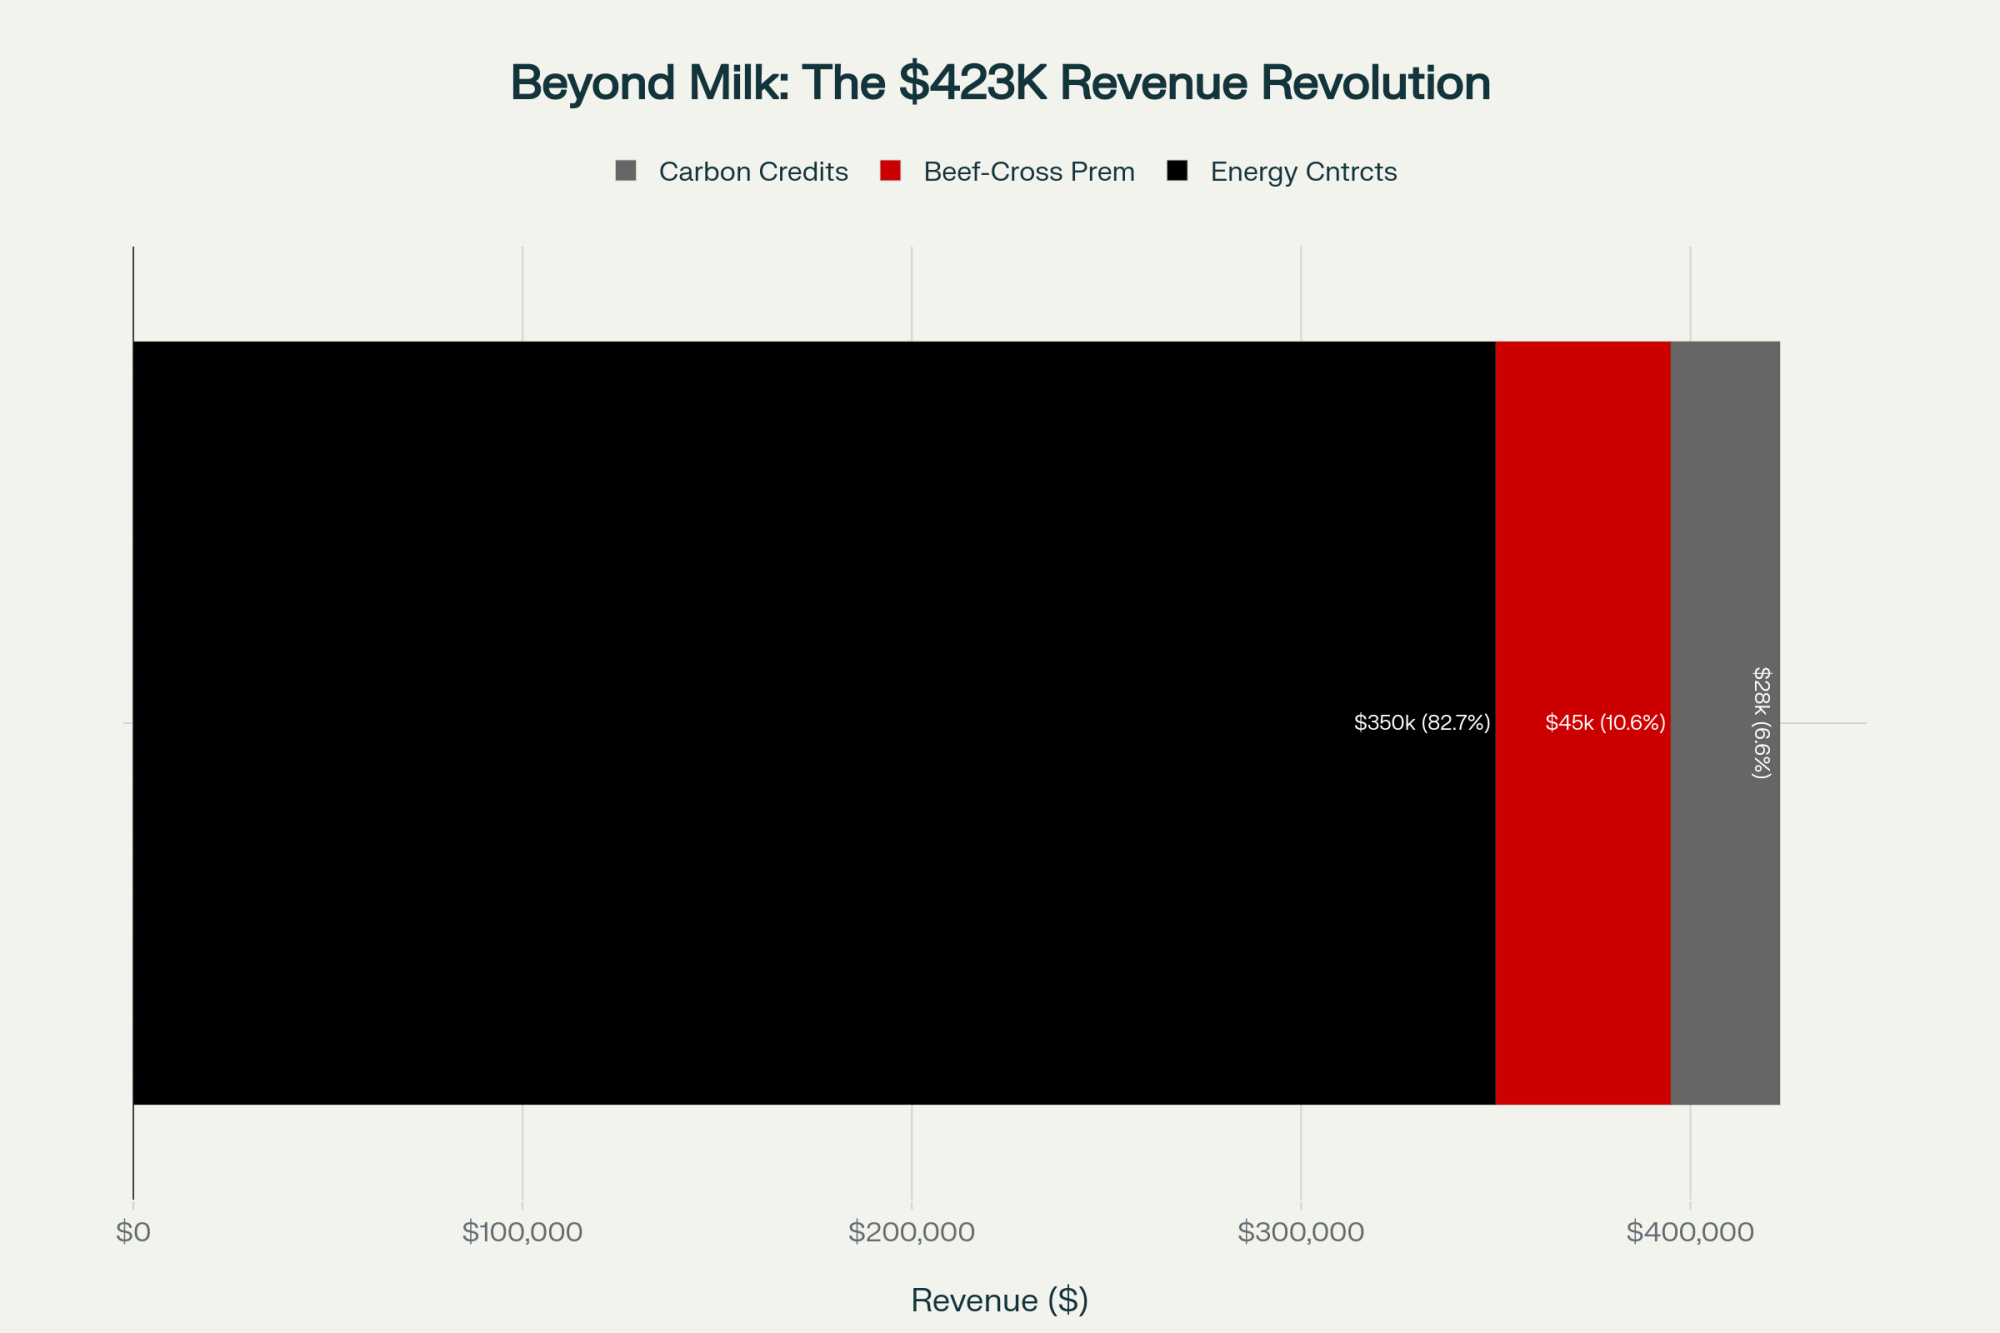
- Dairy Wins, Beef Loses: Inside the 18-Month Window Where $1,400 Calves Meet Record Component Premiums – Reveals how progressive herds are using genetic innovation to counter the beef industry’s contraction, demonstrating how to capture $600-$700k in new revenue by filling the supply void left by the very cattle shortages Tyson is citing.
 The Sunday Read Dairy Professionals Don’t Skip.
 The Sunday Read Dairy Professionals Don’t Skip.
Every week, thousands of producers, breeders, and industry insiders open Bullvine Weekly for genetics insights, market shifts, and profit strategies they won’t find anywhere else. One email. Five minutes. Smarter decisions all week.