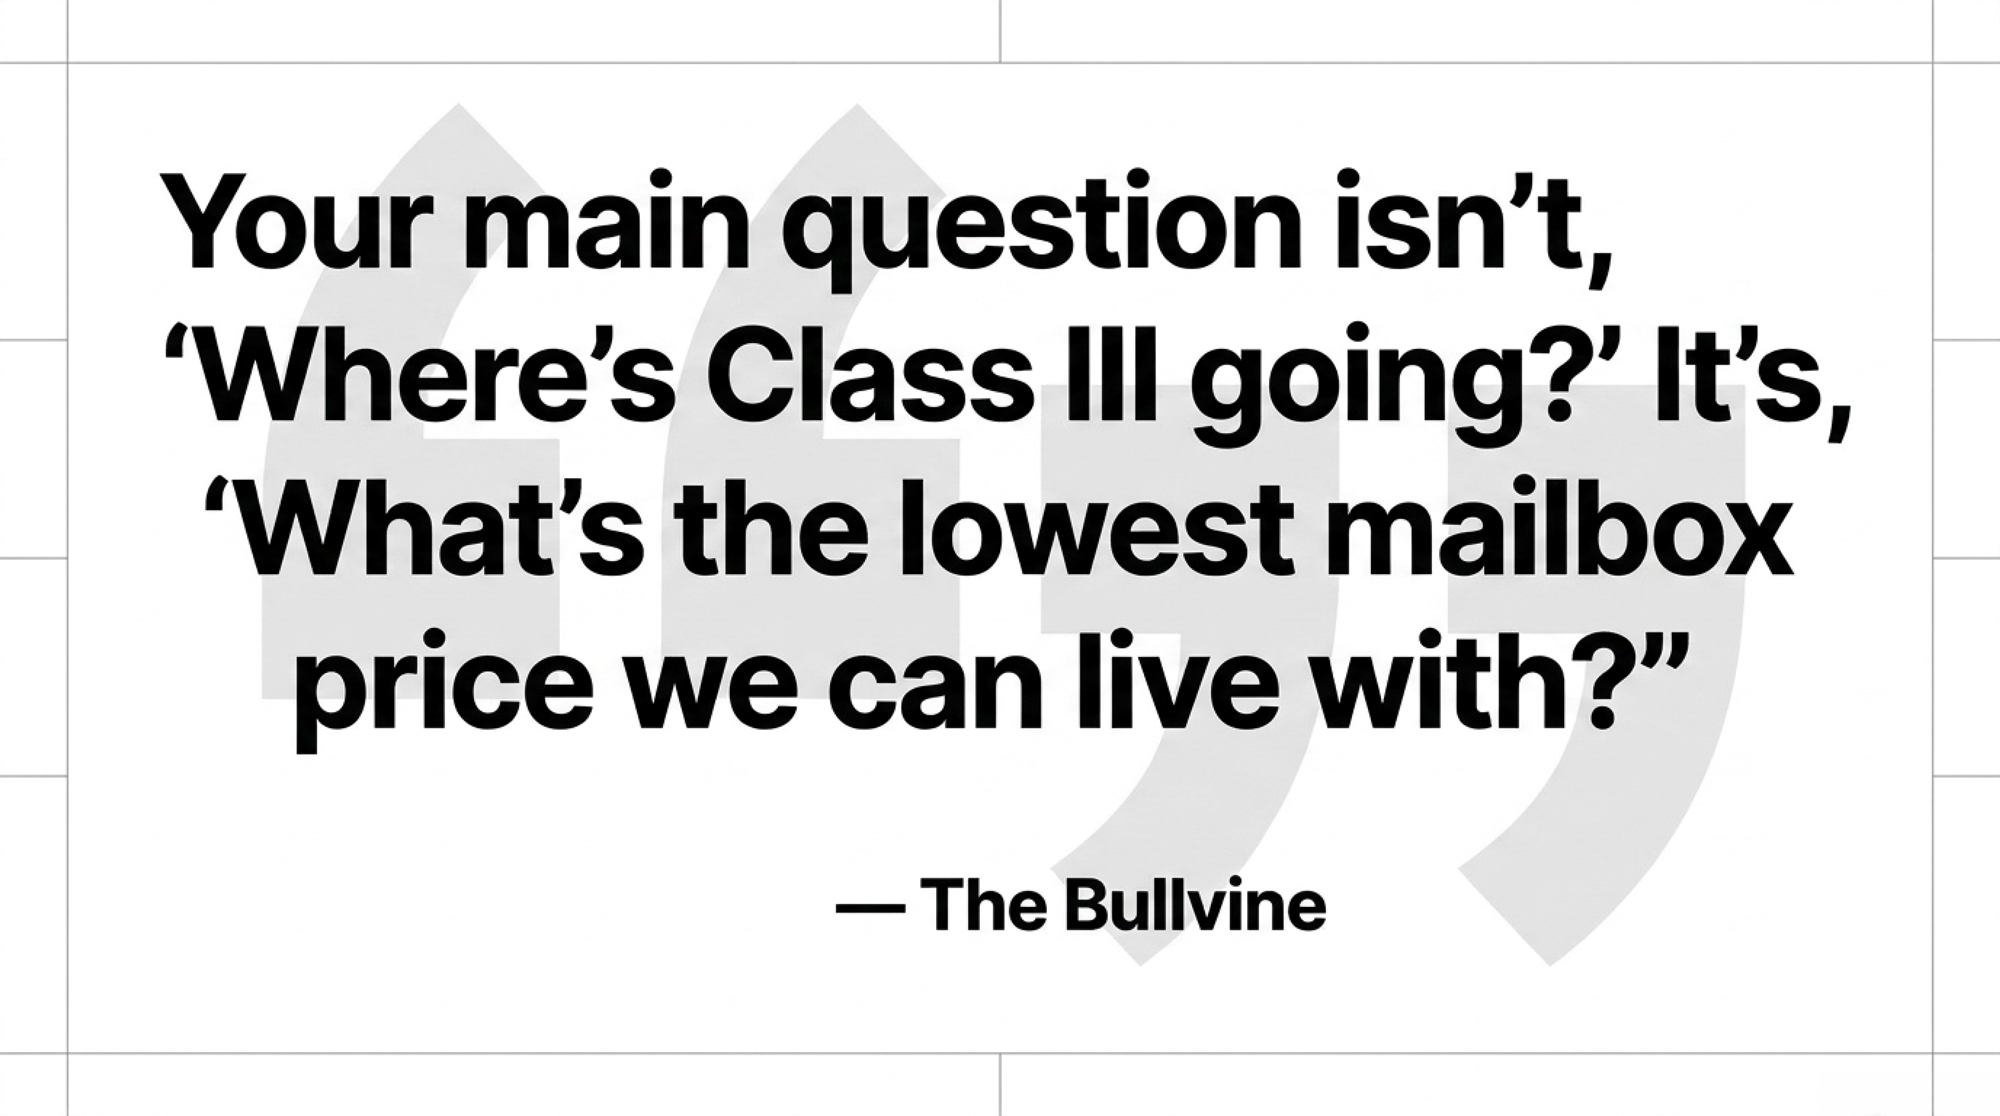
Your check says soft market. Hold June’s cheese, butter, powder, and whey flat, run both formulas, and $1.01/cwt is pure reform — permanent, and it doesn’t leave when cheese comes back.
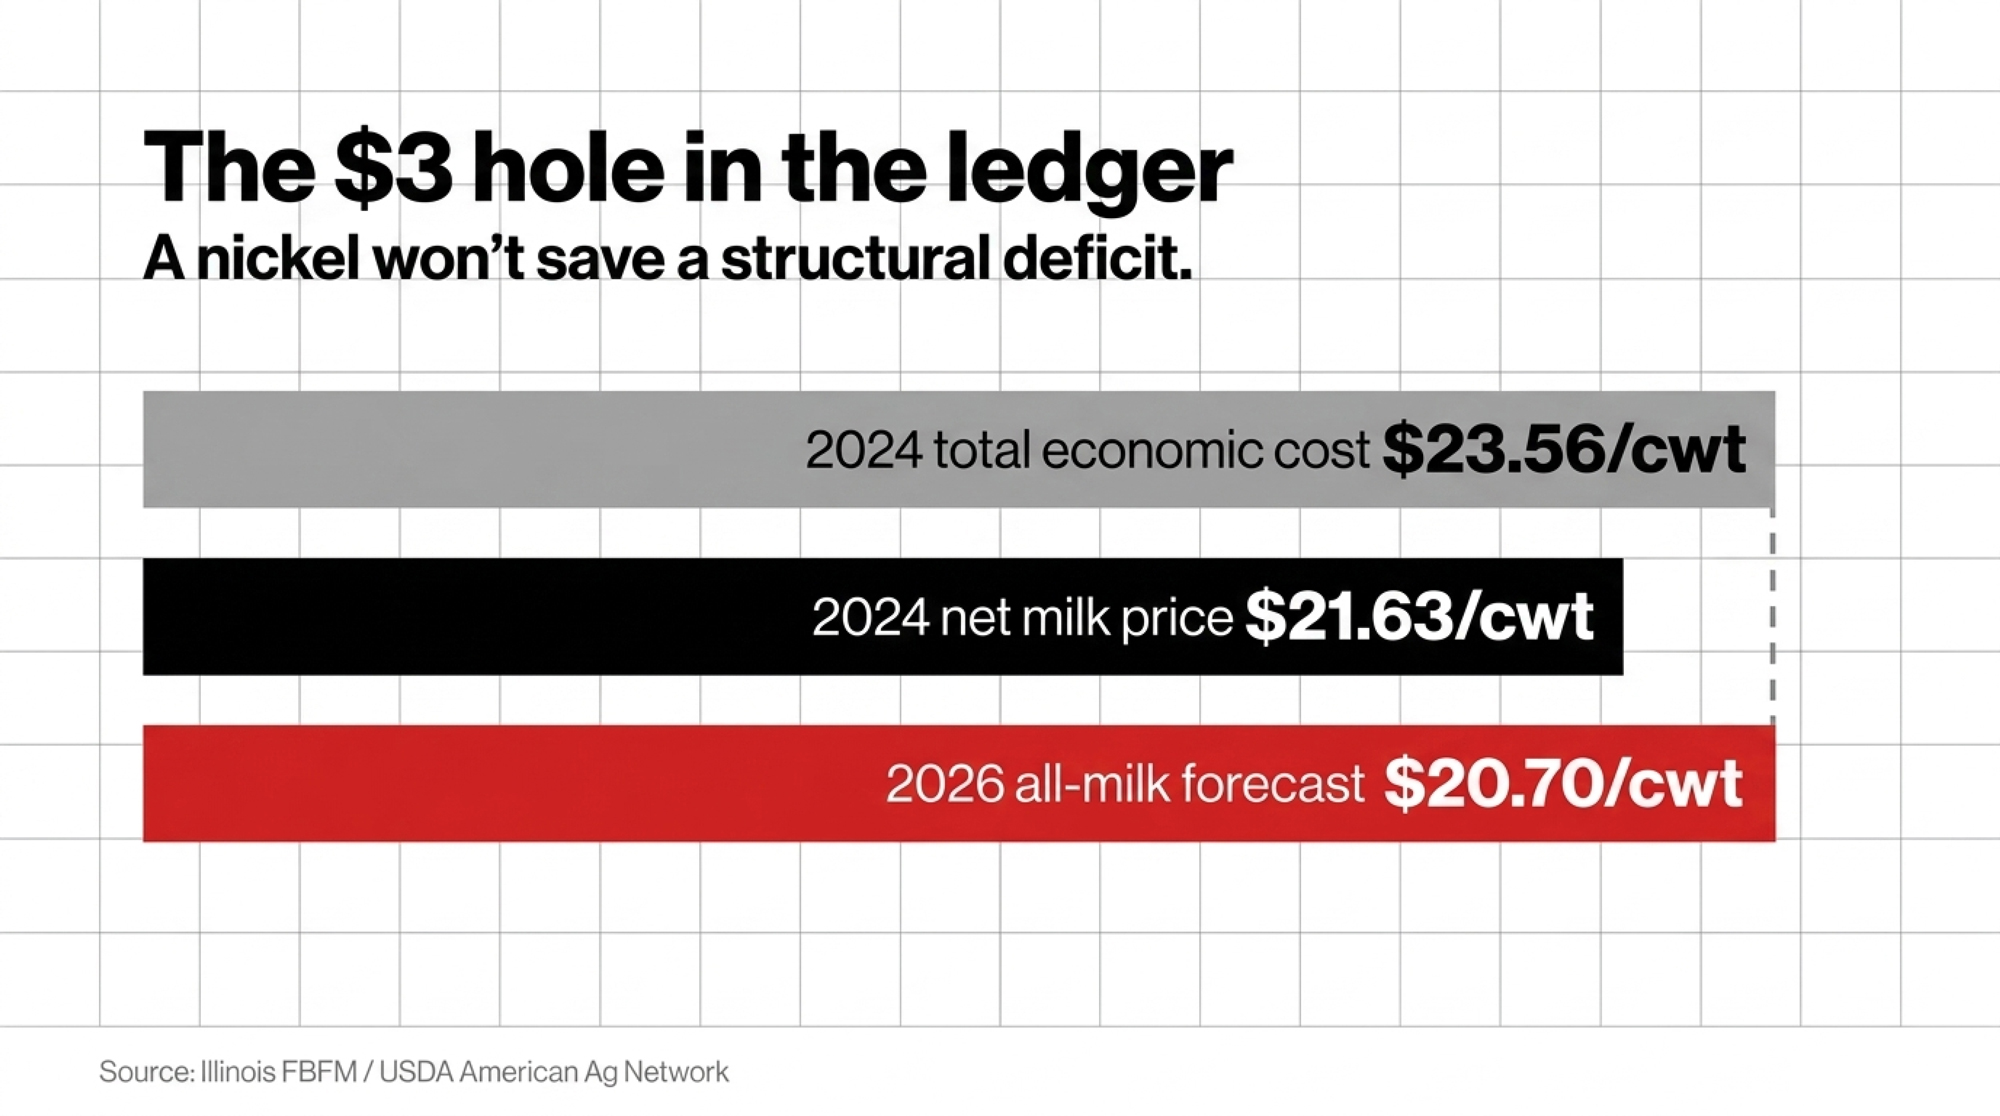
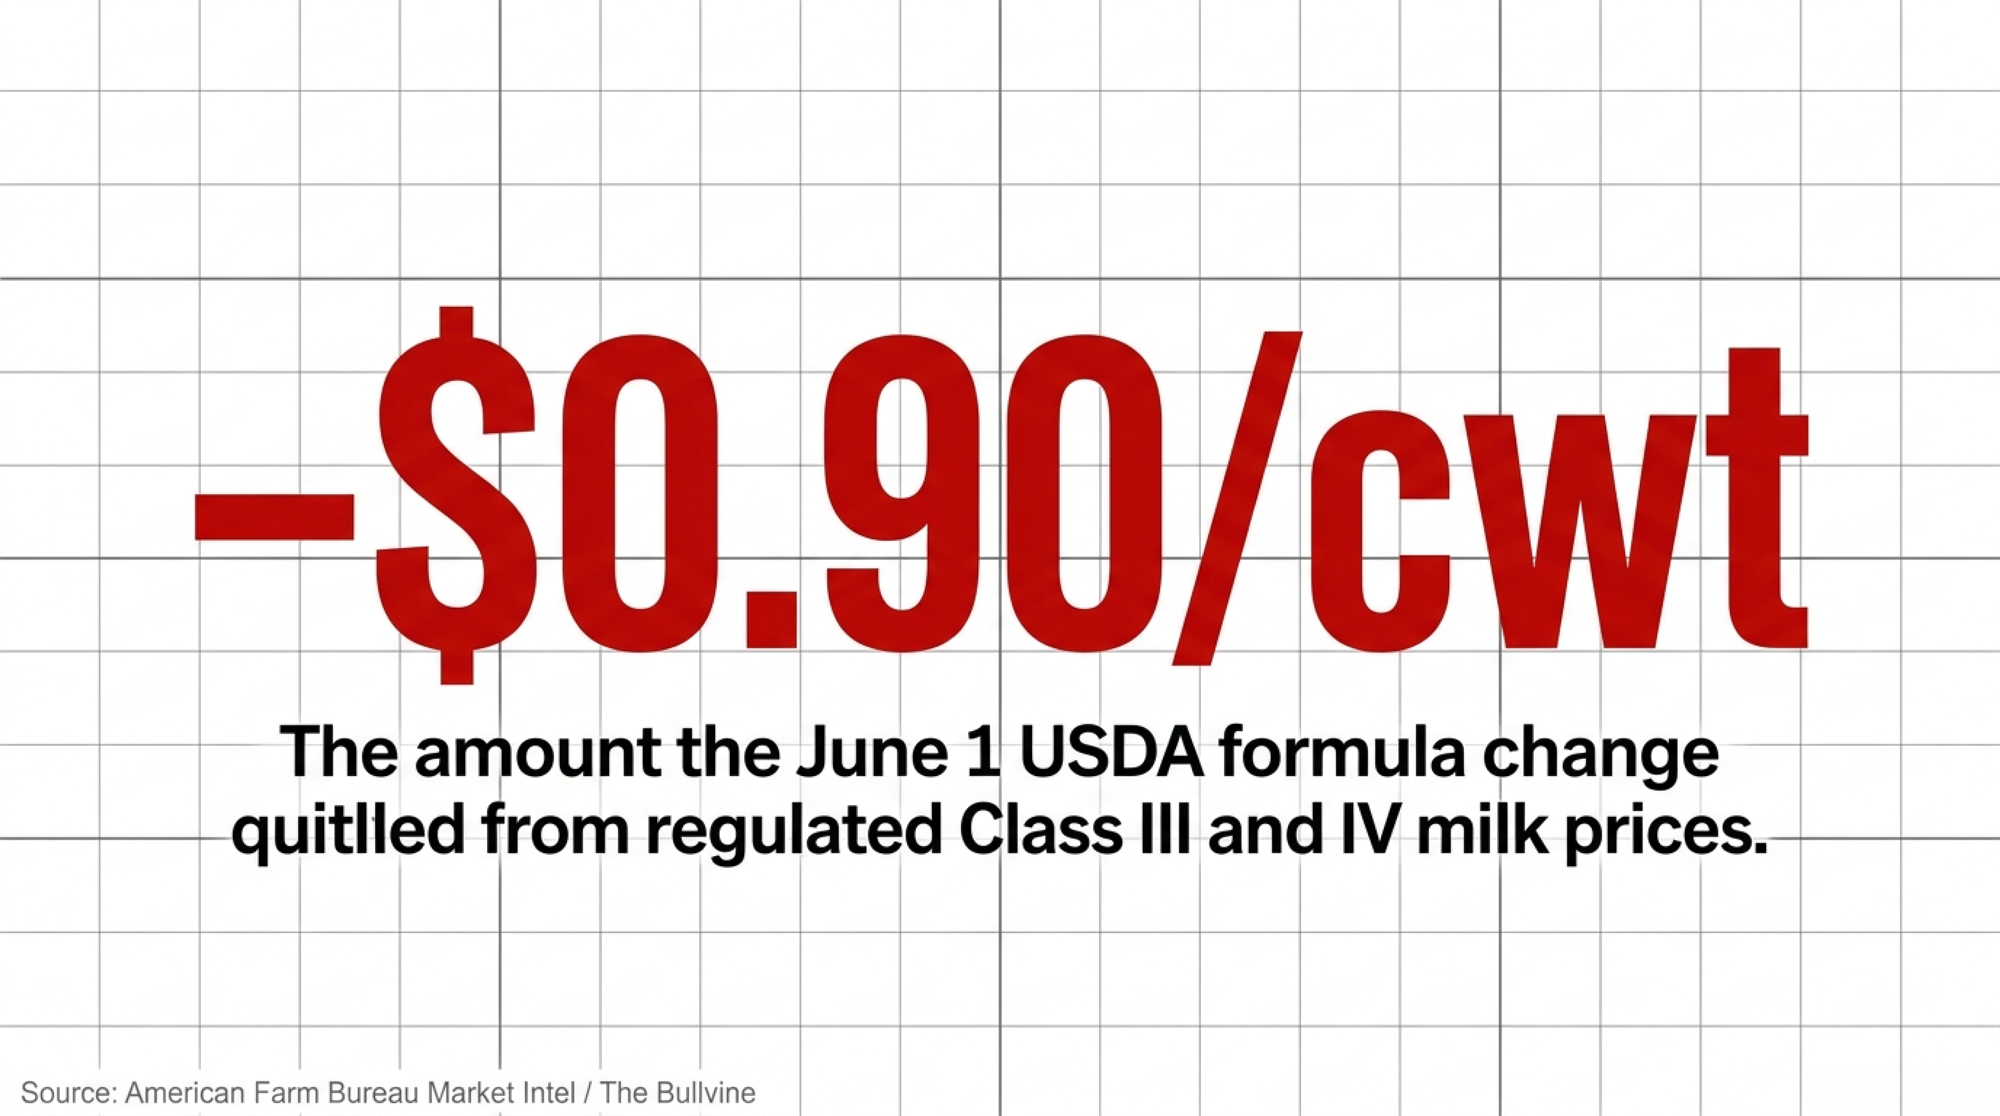
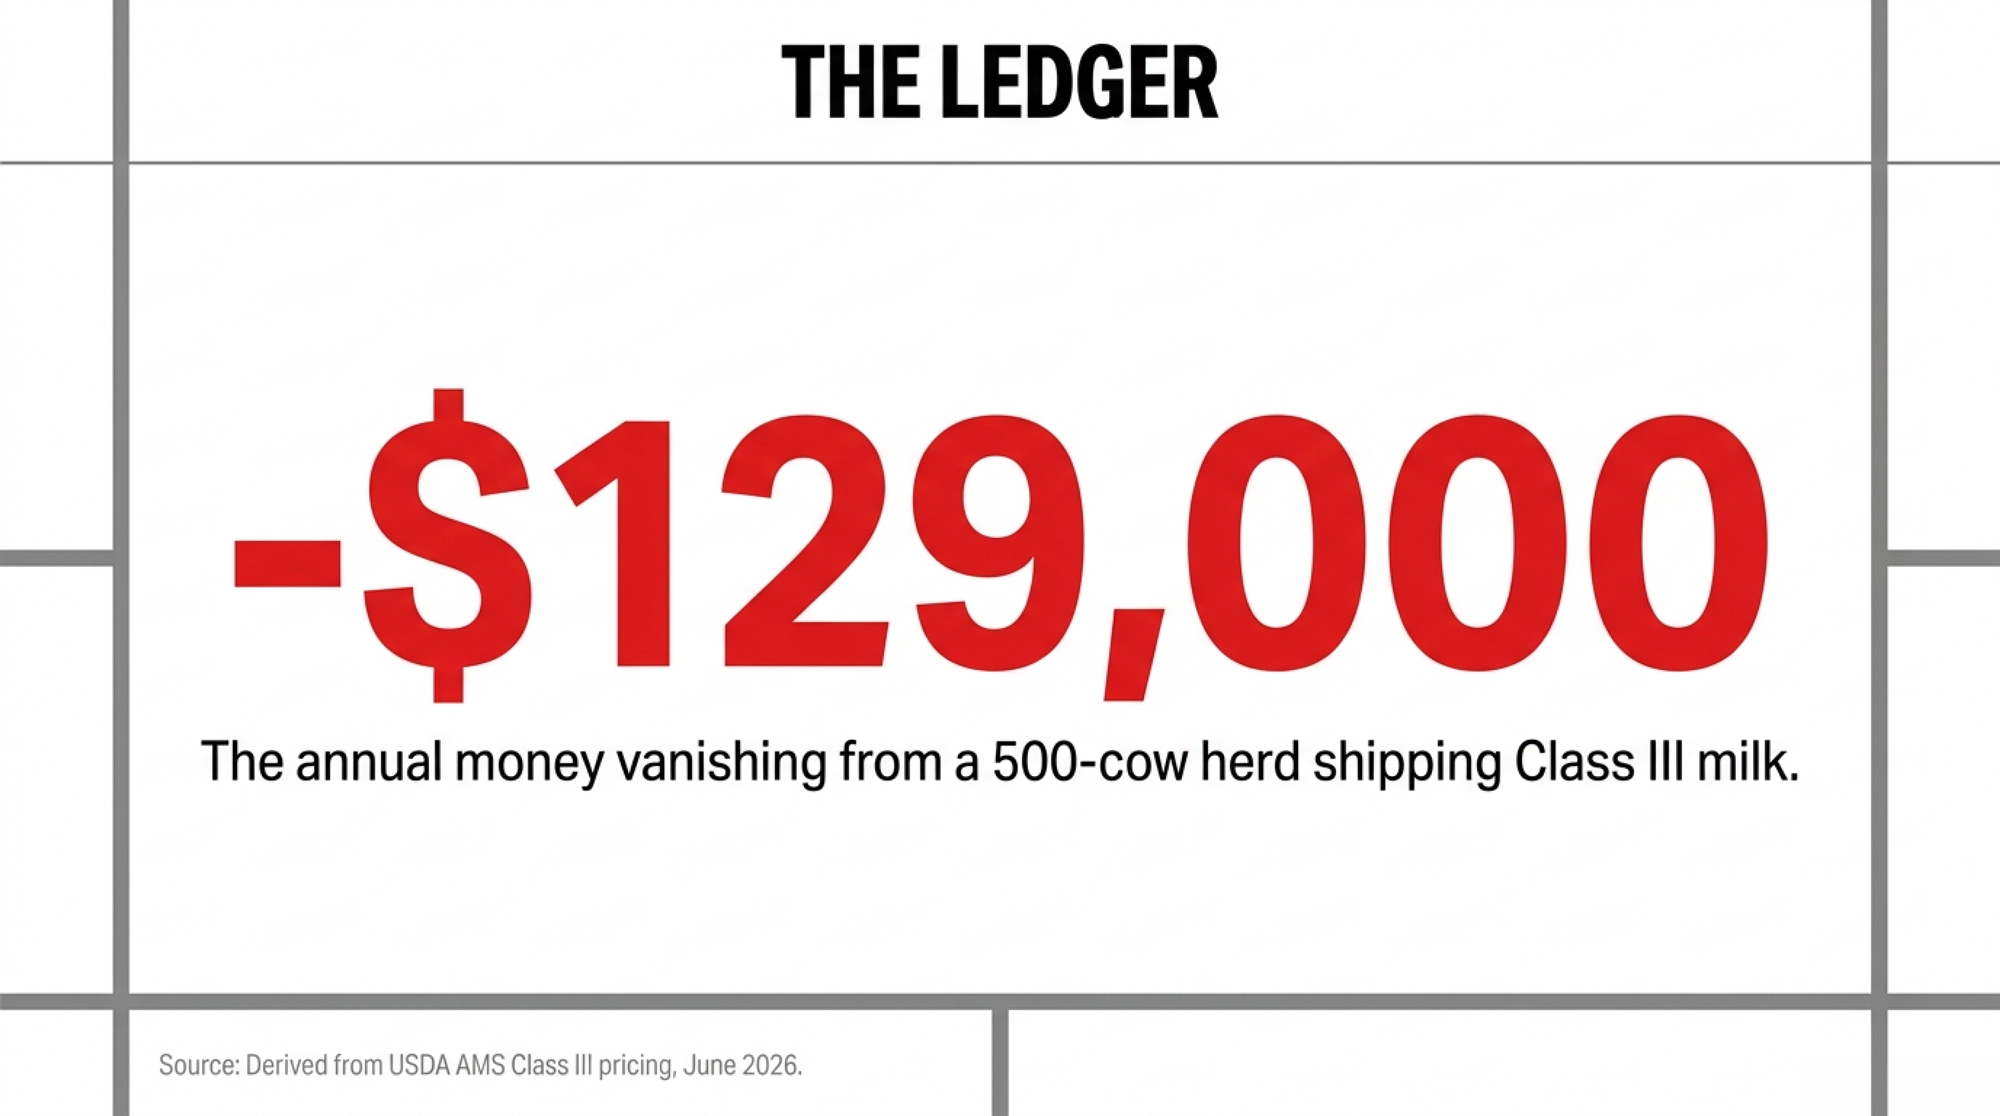
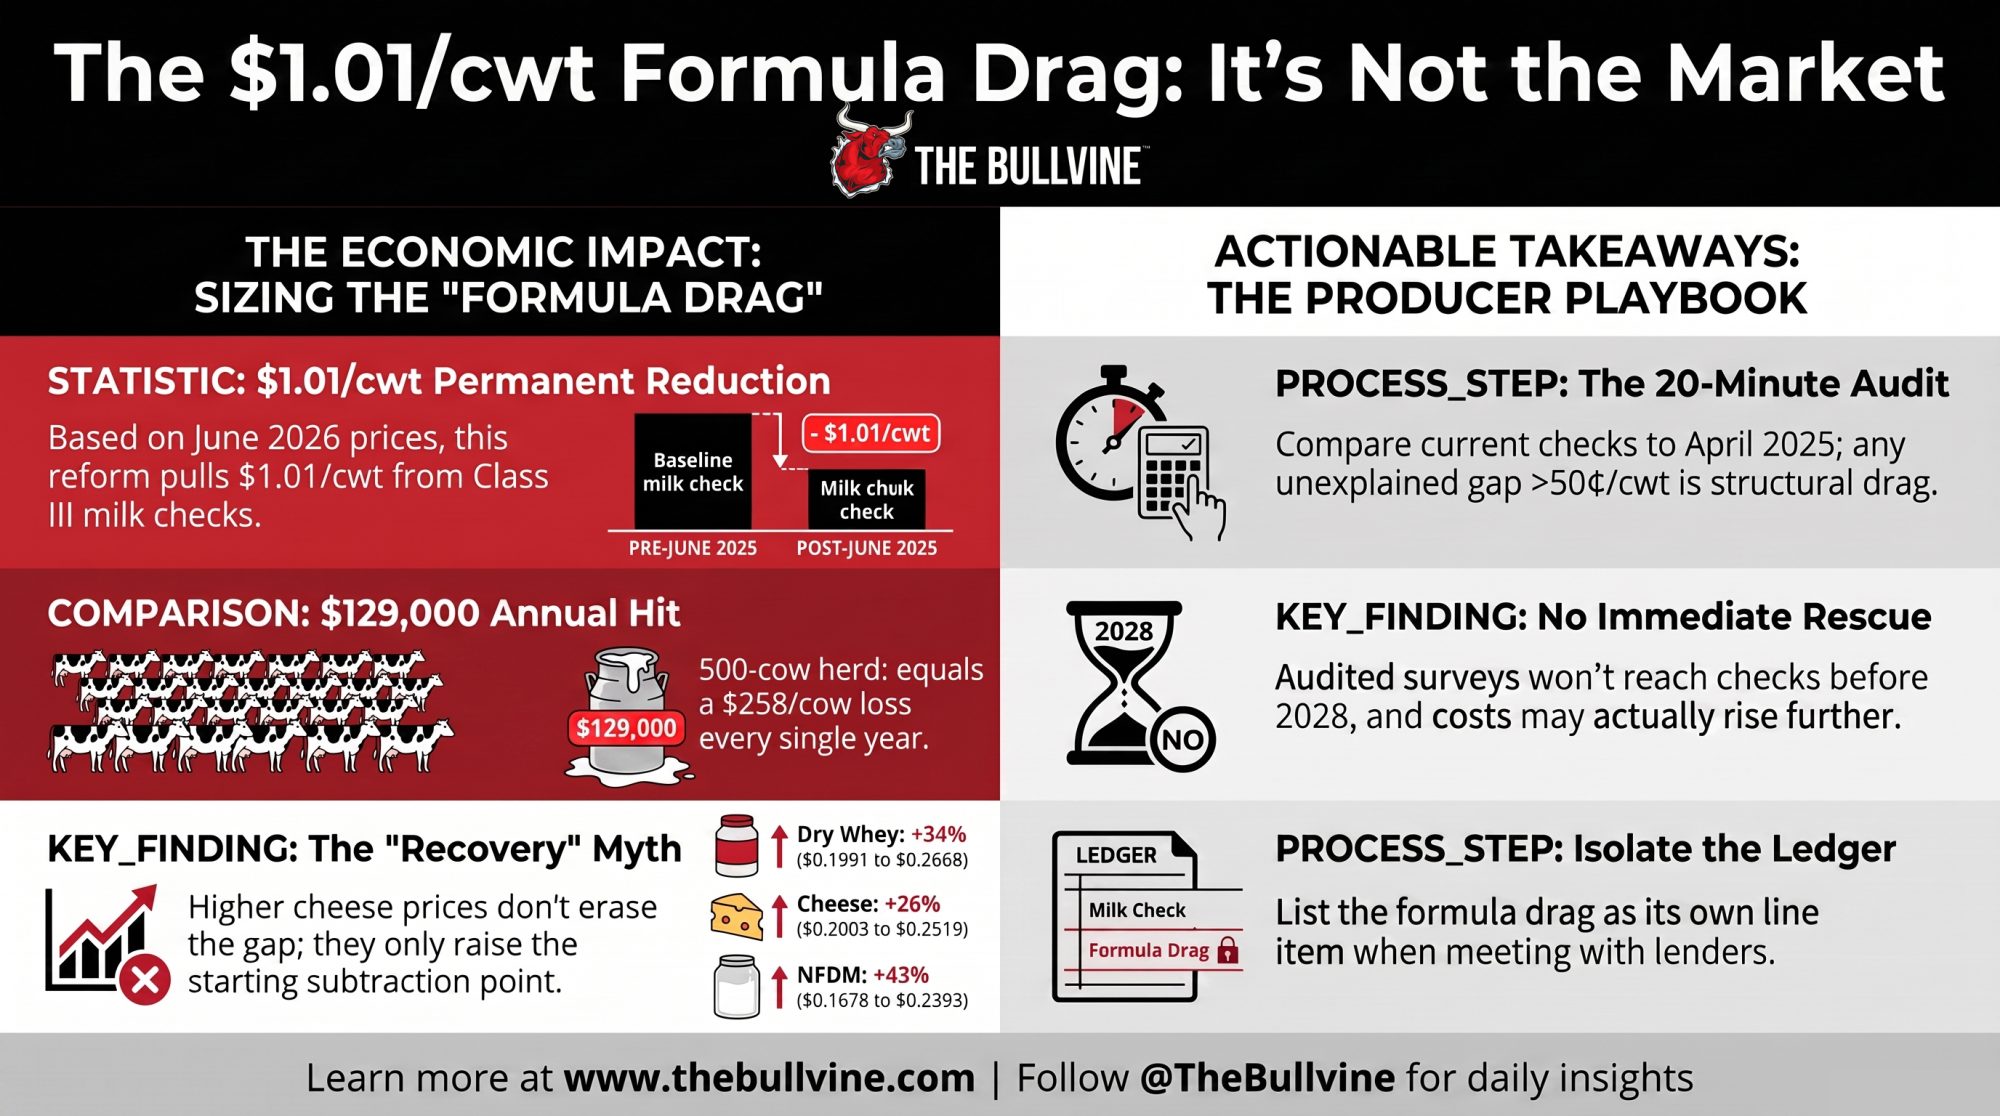
Executive Summary: At June 2026’s confirmed USDA prices, the June 2025 make-allowance reform is costing Class III $1.01/cwt — and that dollar is pure formula, not market. Hold the month’s butter, cheese, powder and whey flat, run them through the pre-June-2025 formula and the current one, and Class III comes out $16.99 the old way versus $15.98 today; the gap is the reform, isolated from every price swing you’ve been blaming. On a 500-cow herd shipping Class III, that’s about $258/cow and roughly $129,000 a year — permanent, and it doesn’t disappear when cheese recovers, because higher cheese raises the number the allowance gets subtracted from. If your blended price is down and you can’t fully explain it with Class III/IV and butter moves, run the 20-minute audit inside — anything unexplained north of 50¢/cwt is structural, and it belongs on its own line in front of your lender.

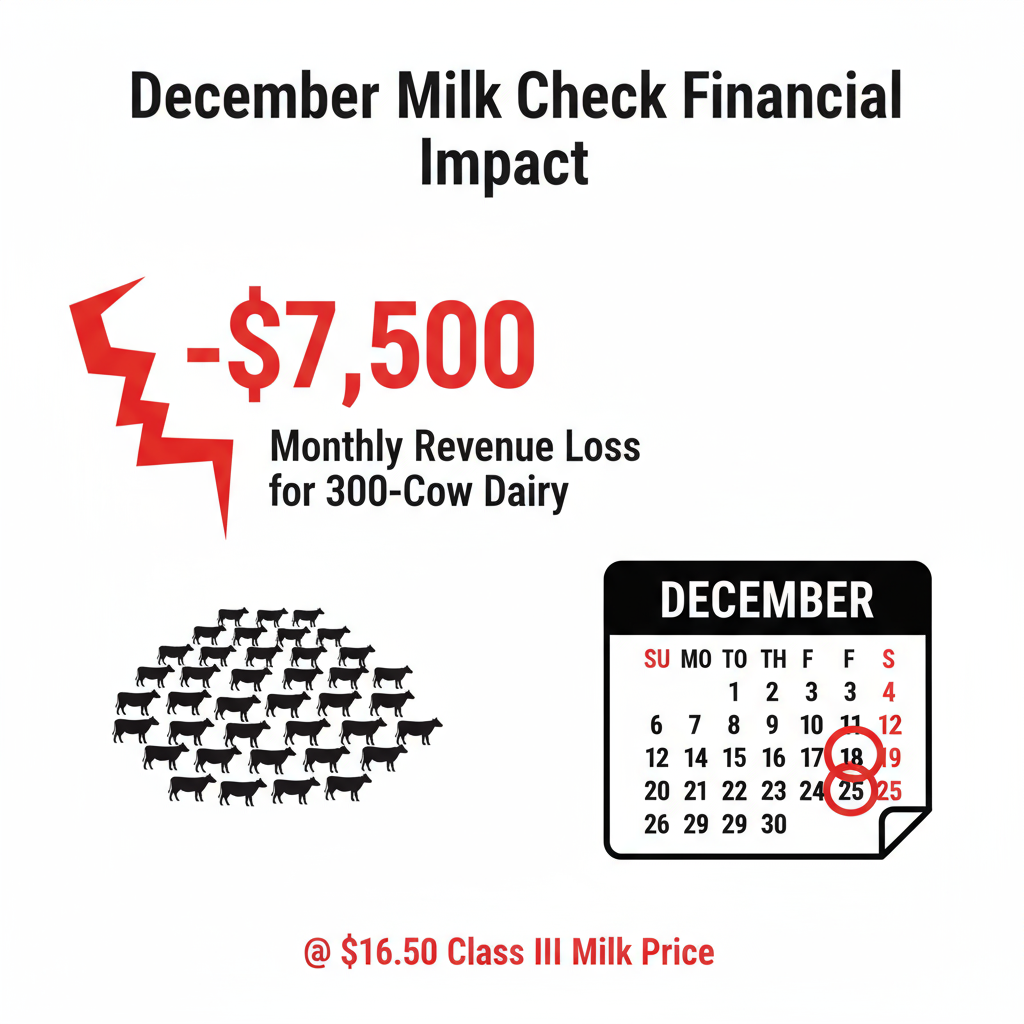
At the Wisconsin Farmers Union delegate session this March, WFU president Darin Von Ruden described a neighbor running 300 cows who watched roughly $50,000 disappear from his milk checks — same herd, same plant, same management (Brownfield Ag News, “Delegate session highlights dairy farmer losses under new Federal Milk Marketing Order,” March 9, 2026). “It’s hard for dairy farmers to recover from that,” Von Ruden said (Brownfield Ag News, March 9, 2026). His cows didn’t slip. The 2025 FMMO make-allowance change moved under him, and his milk check never spelled it out.
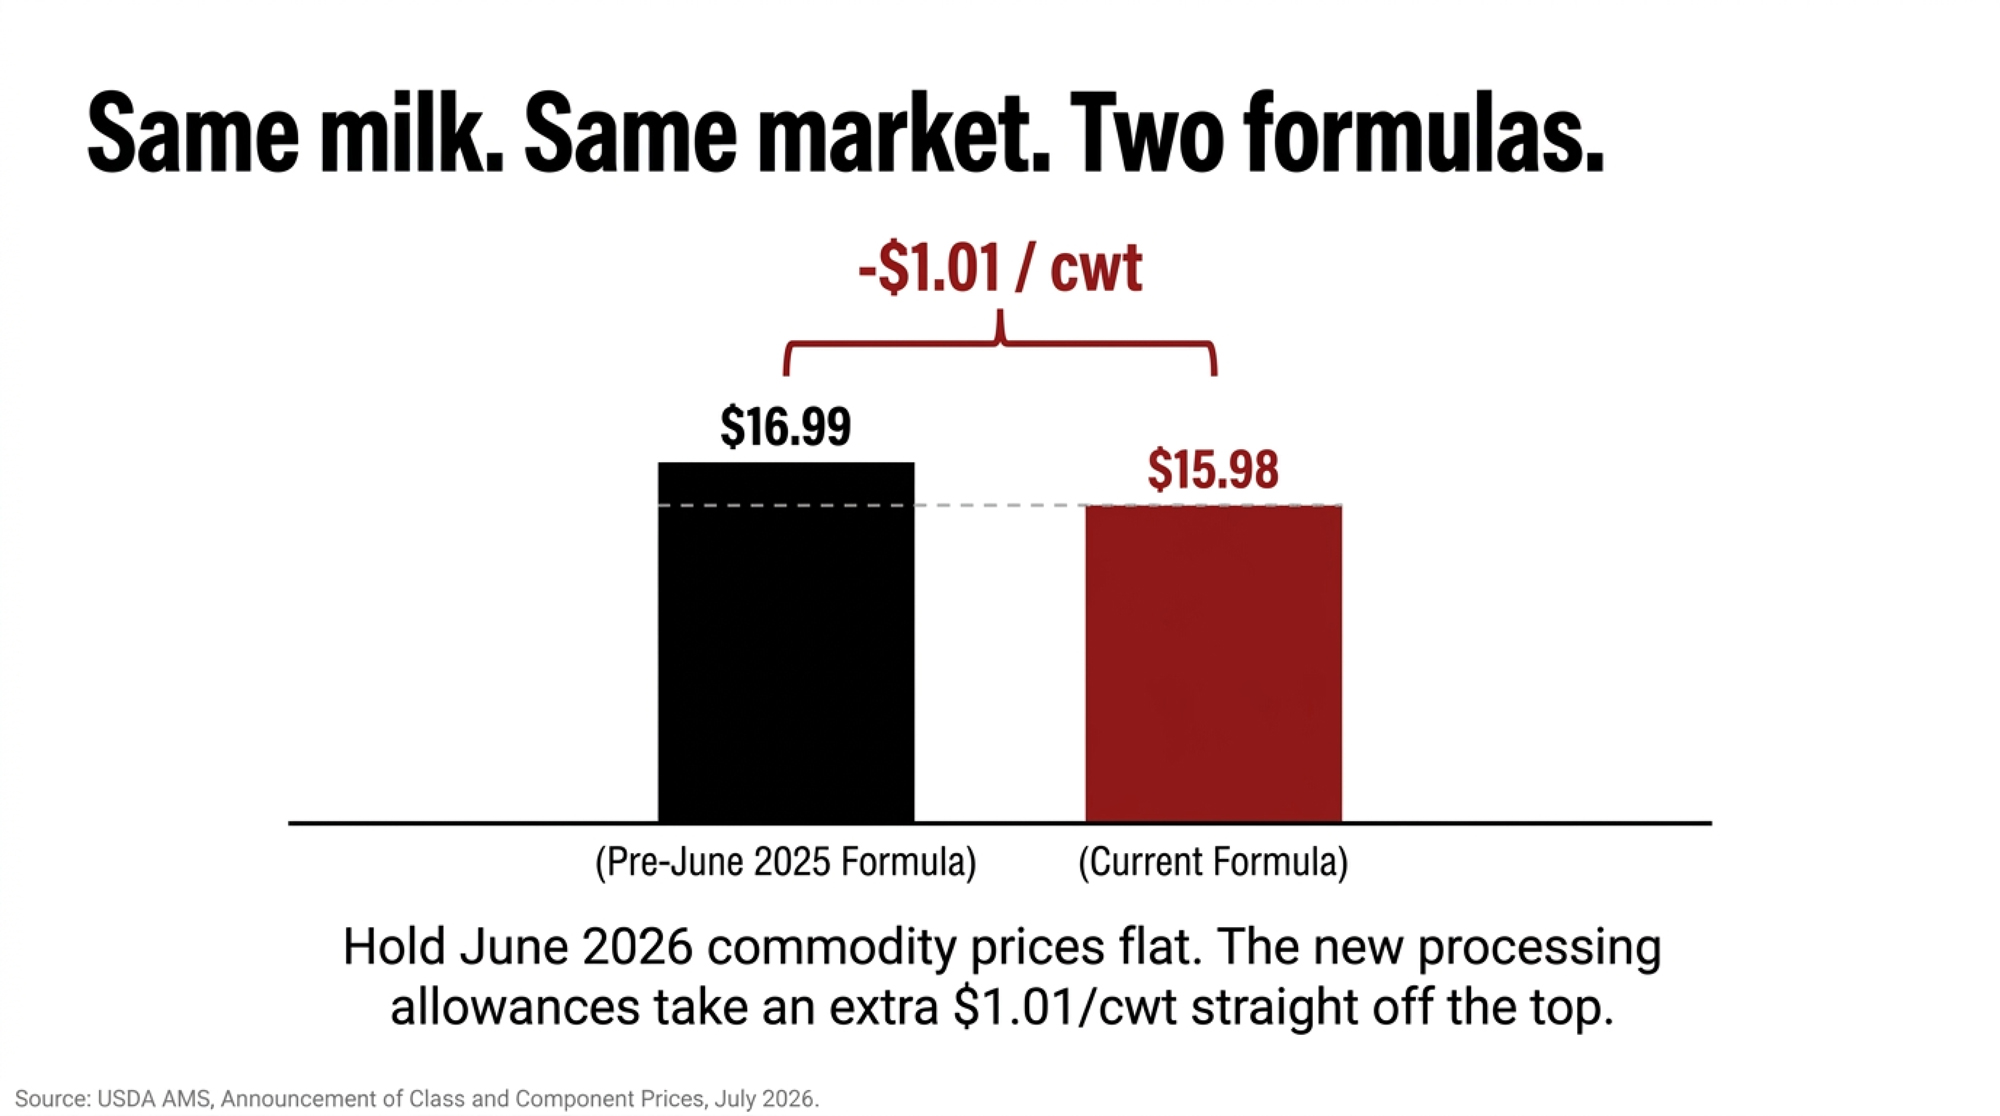
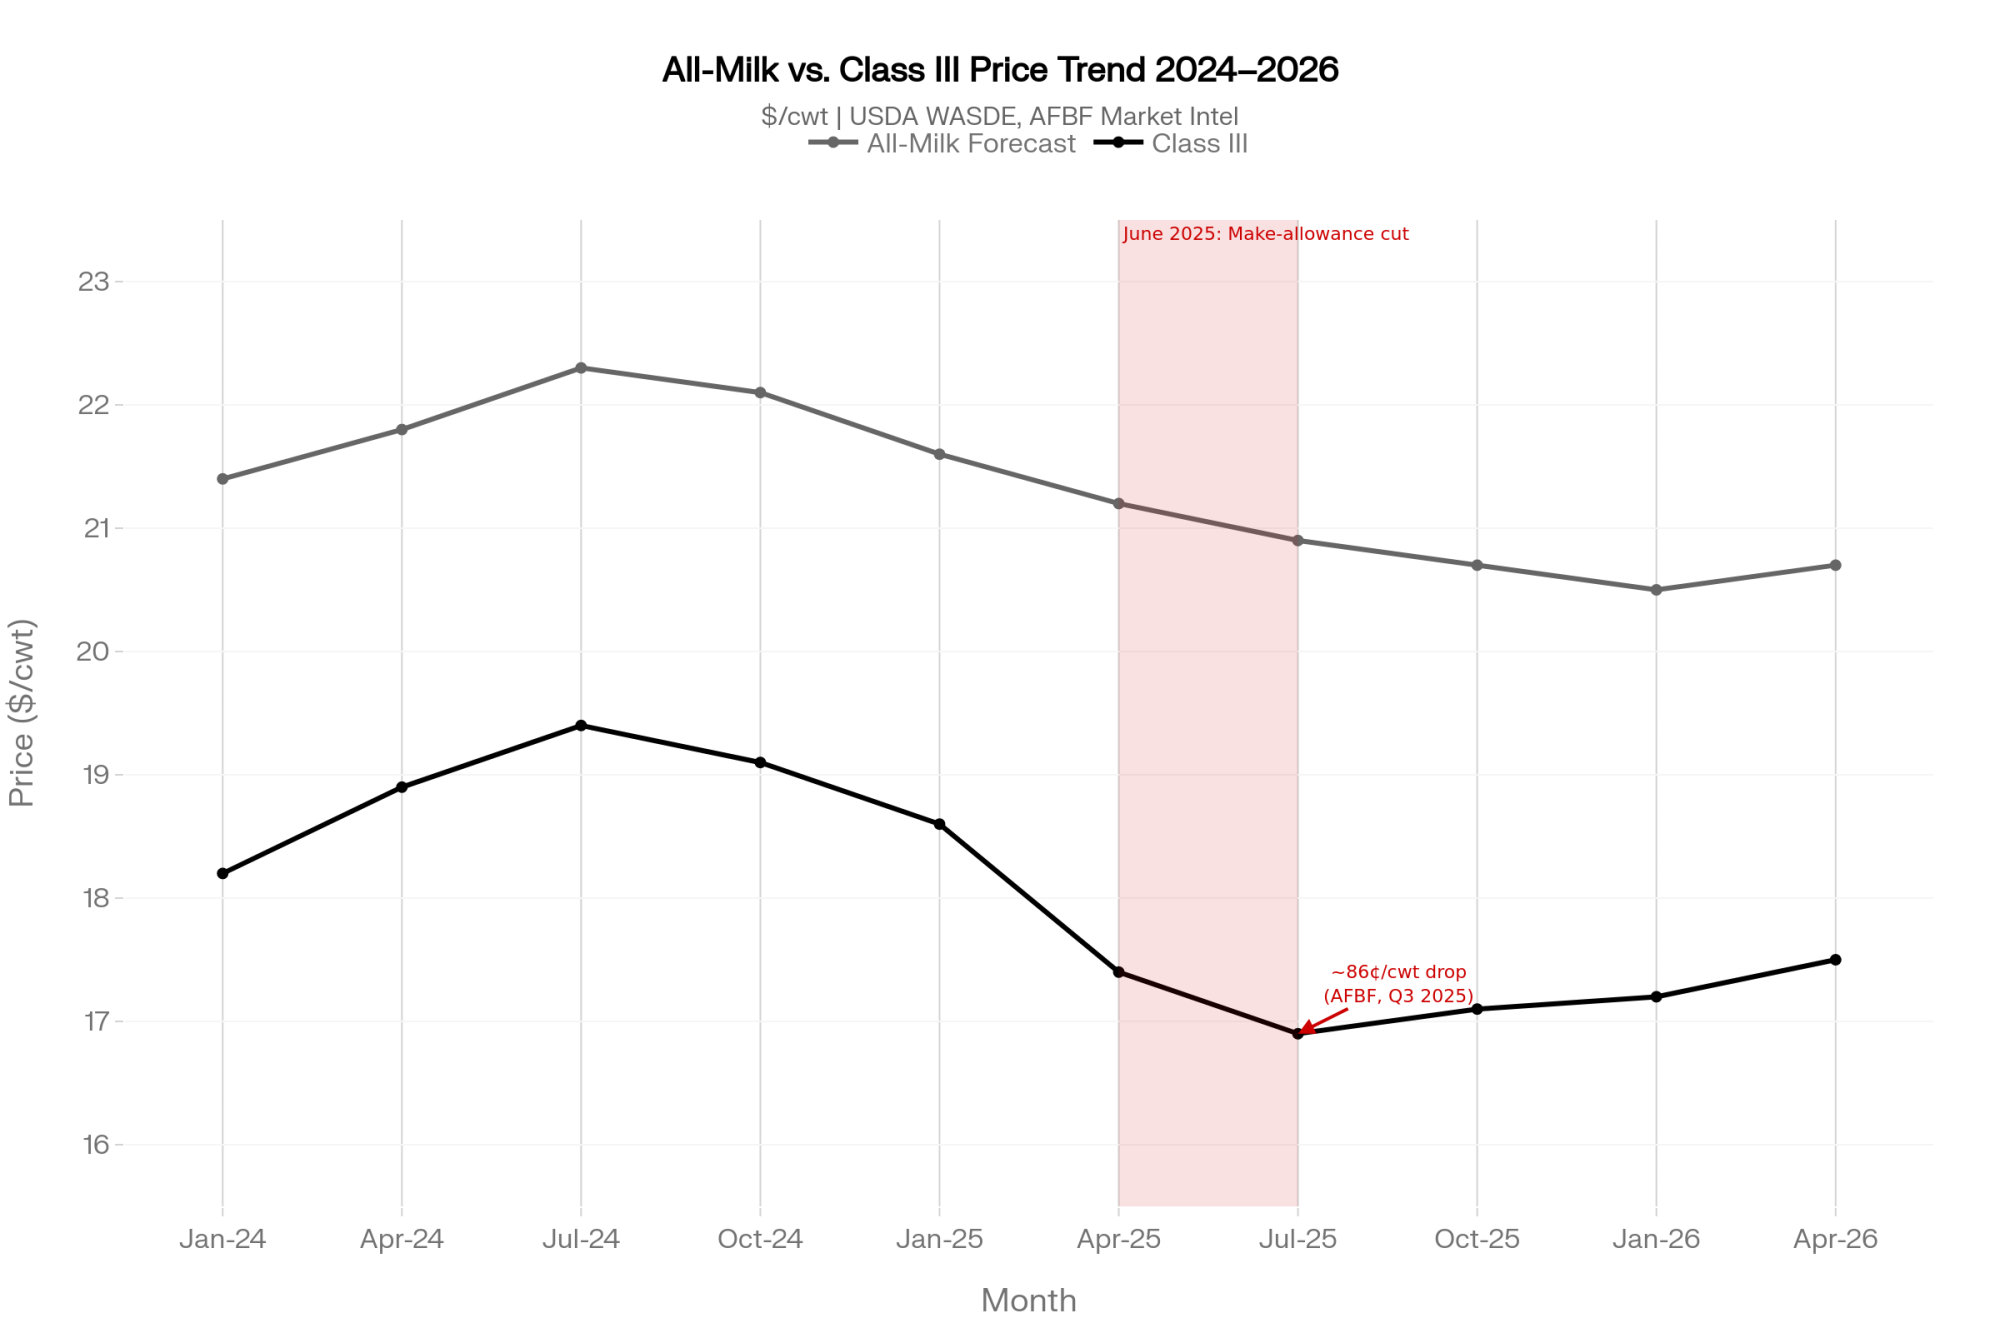
Here’s the number that explains that quarter. June 2026 Class III milk settled at $15.98/cwt (USDA AMS, Announcement of Class and Component Prices, CLS-0626, July 1, 2026). Hold that month’s exact butter, cheese, powder, and whey prices constant, then run them through the pricing formula as it stood on May 31, 2025 — the day before reform took effect. Class III comes out at $16.99. That $16.99 is the same June commodity prices run through the pre-June-2025 make allowances instead of the current ones; the component-by-component reconstruction is in our companion breakdown, The USDA Formula Change No Milk Check Explains (July 1, 2026). Same milk, same commodity prices, two formulas. The gap is $1.01/cwt.
That dollar isn’t market noise. It’s policy, and it’s permanent until Washington changes it again.
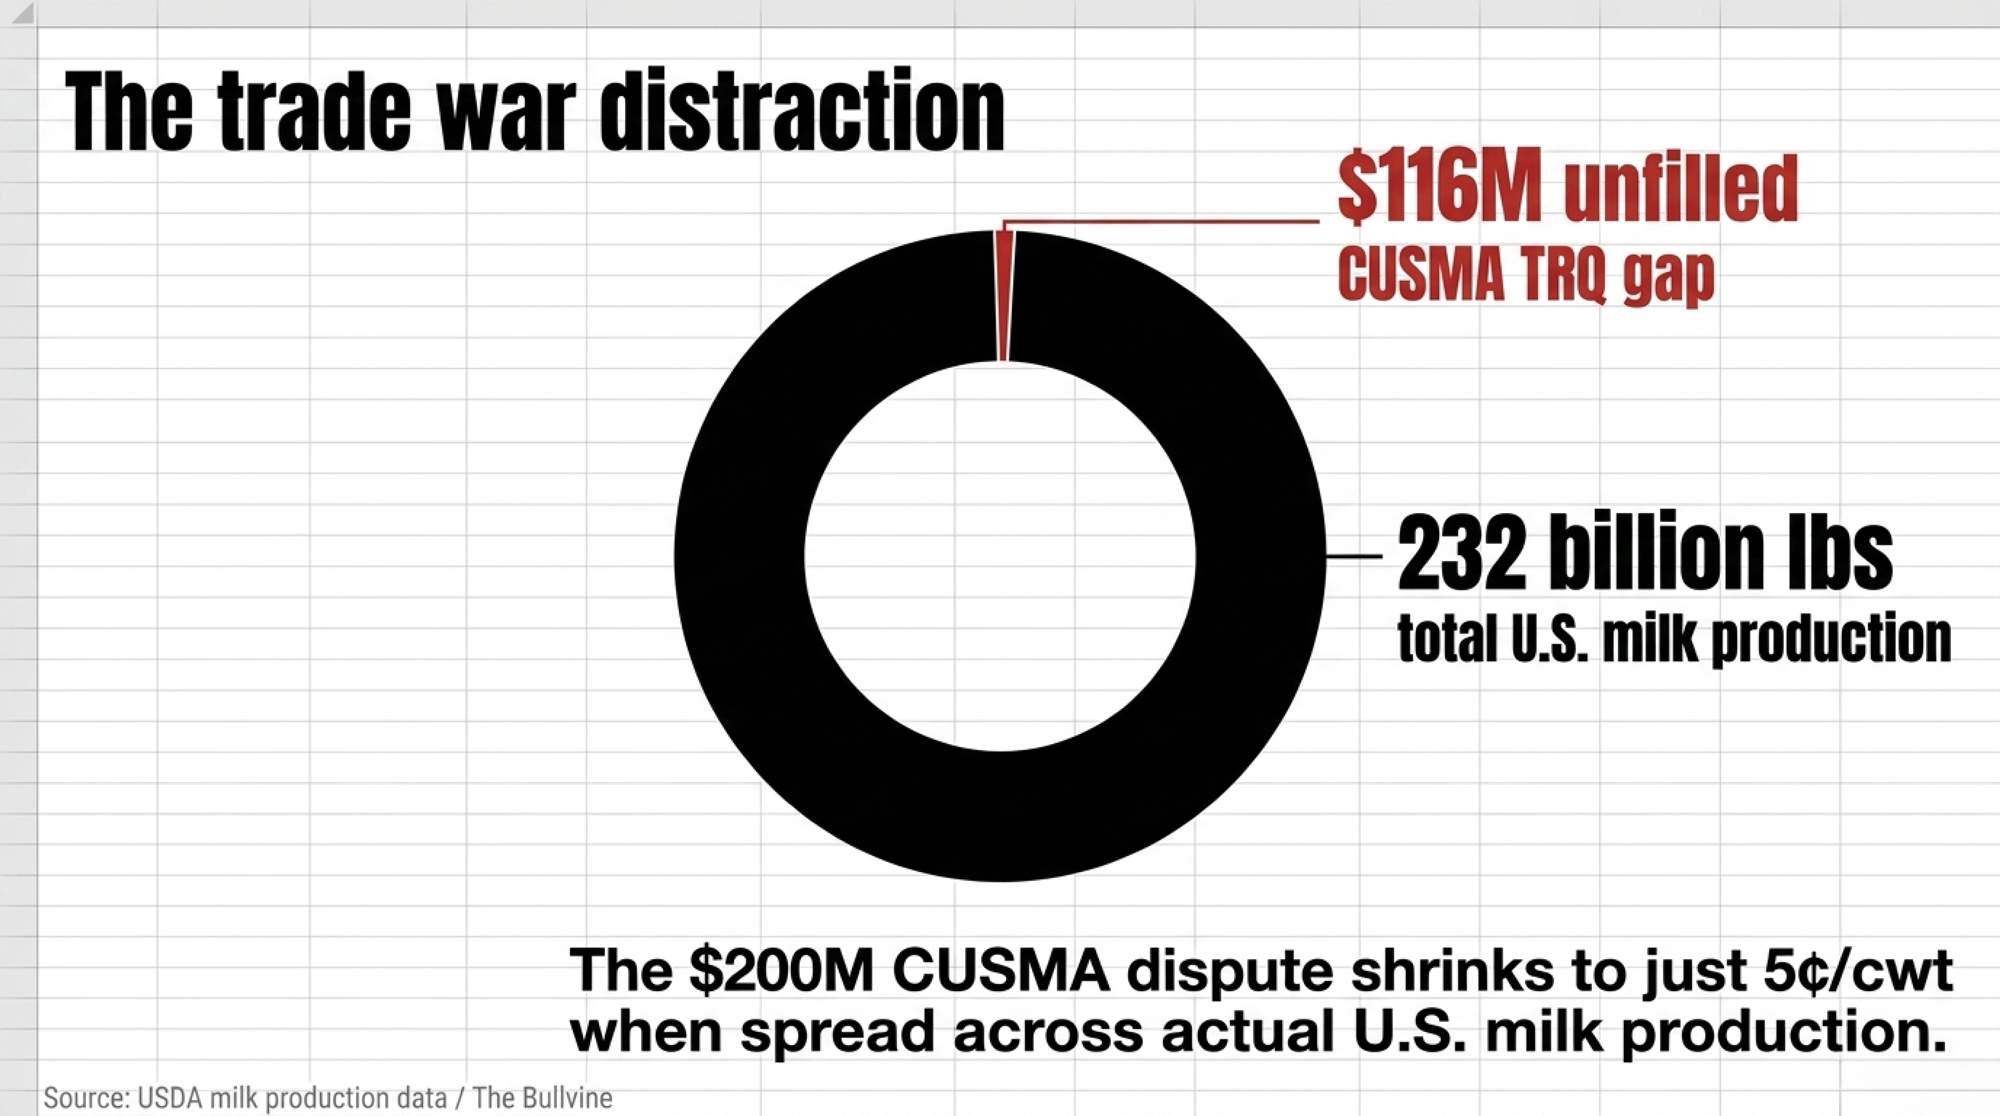
One boundary before the math: this is a U.S. Federal Milk Marketing Order mechanism. Canadian producers under supply management price milk a completely different way — read this as a look at your export competitors’ cost base, not your own check.
What Actually Changed on June 1, 2025
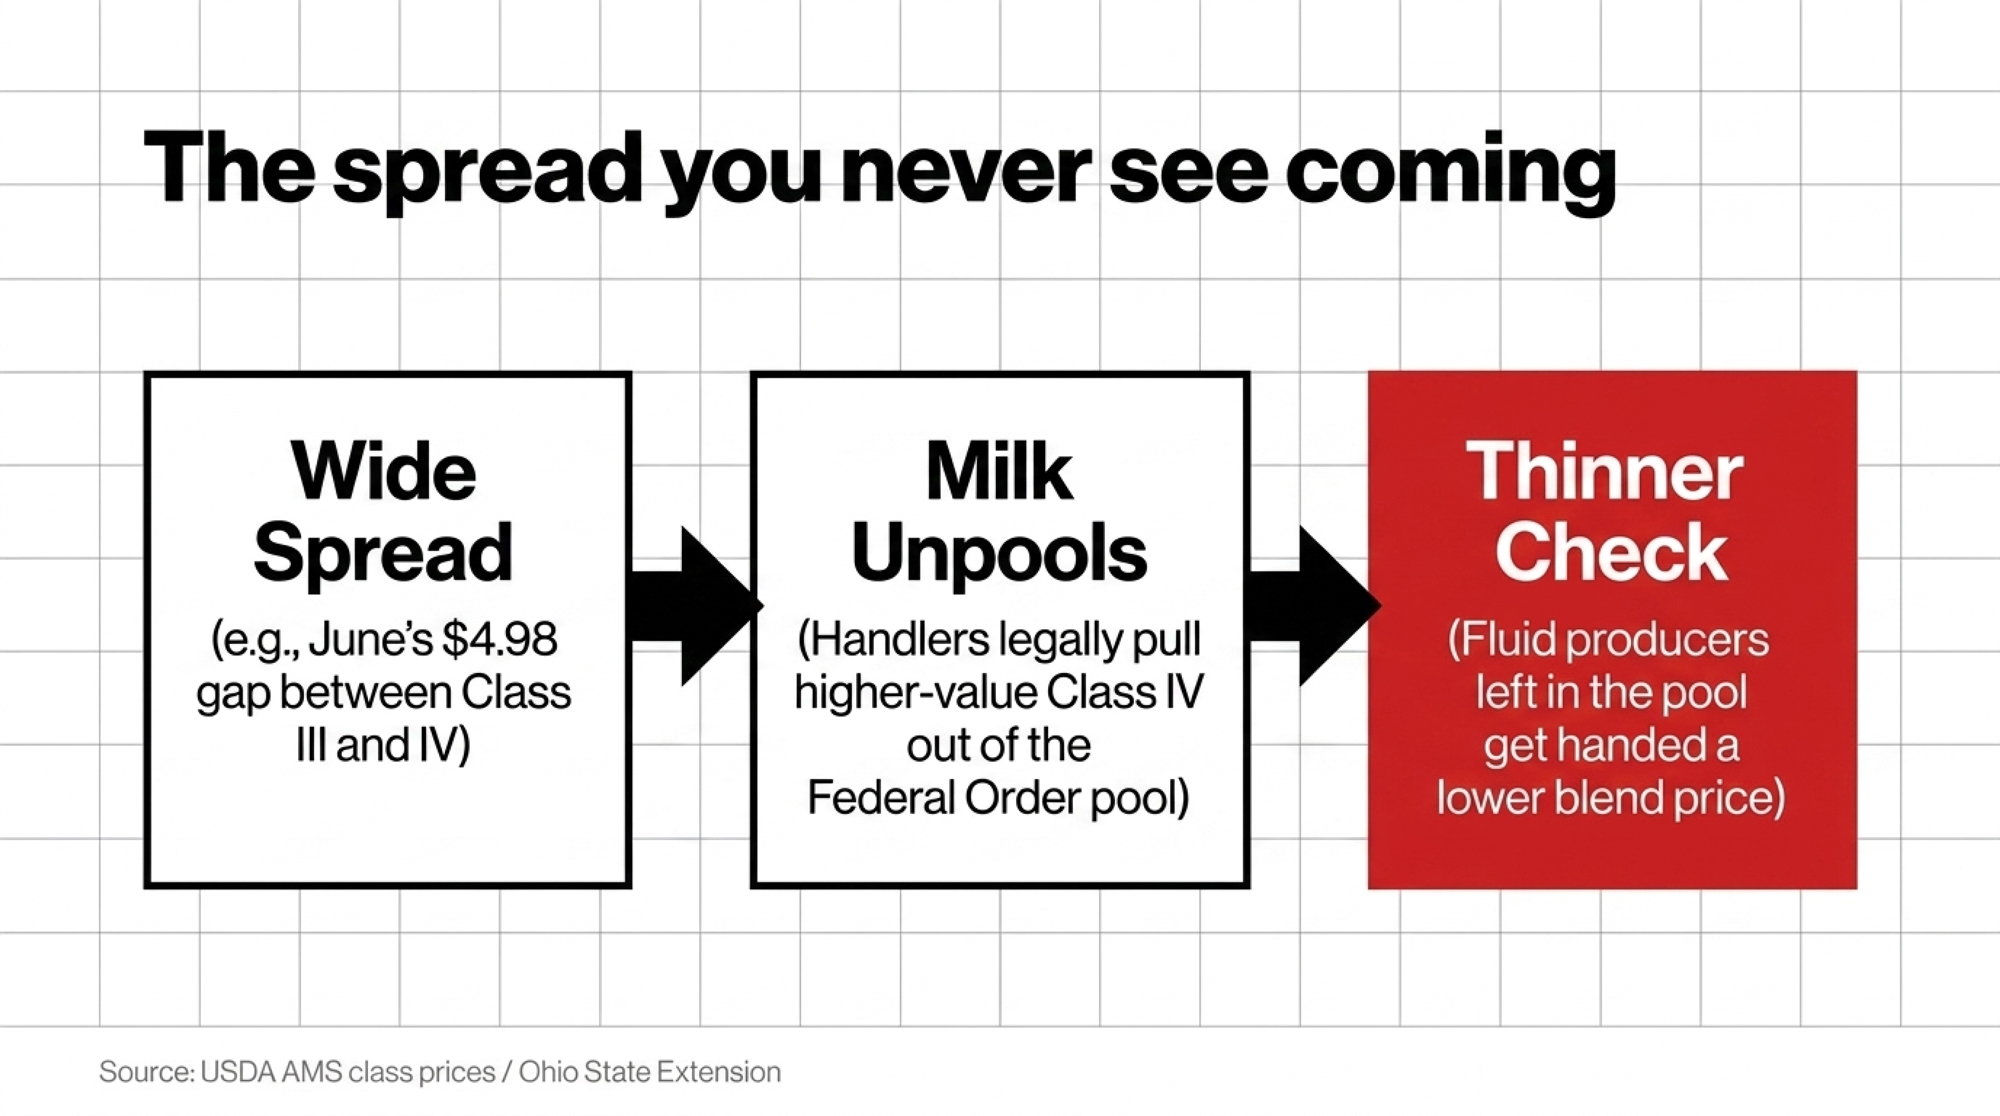
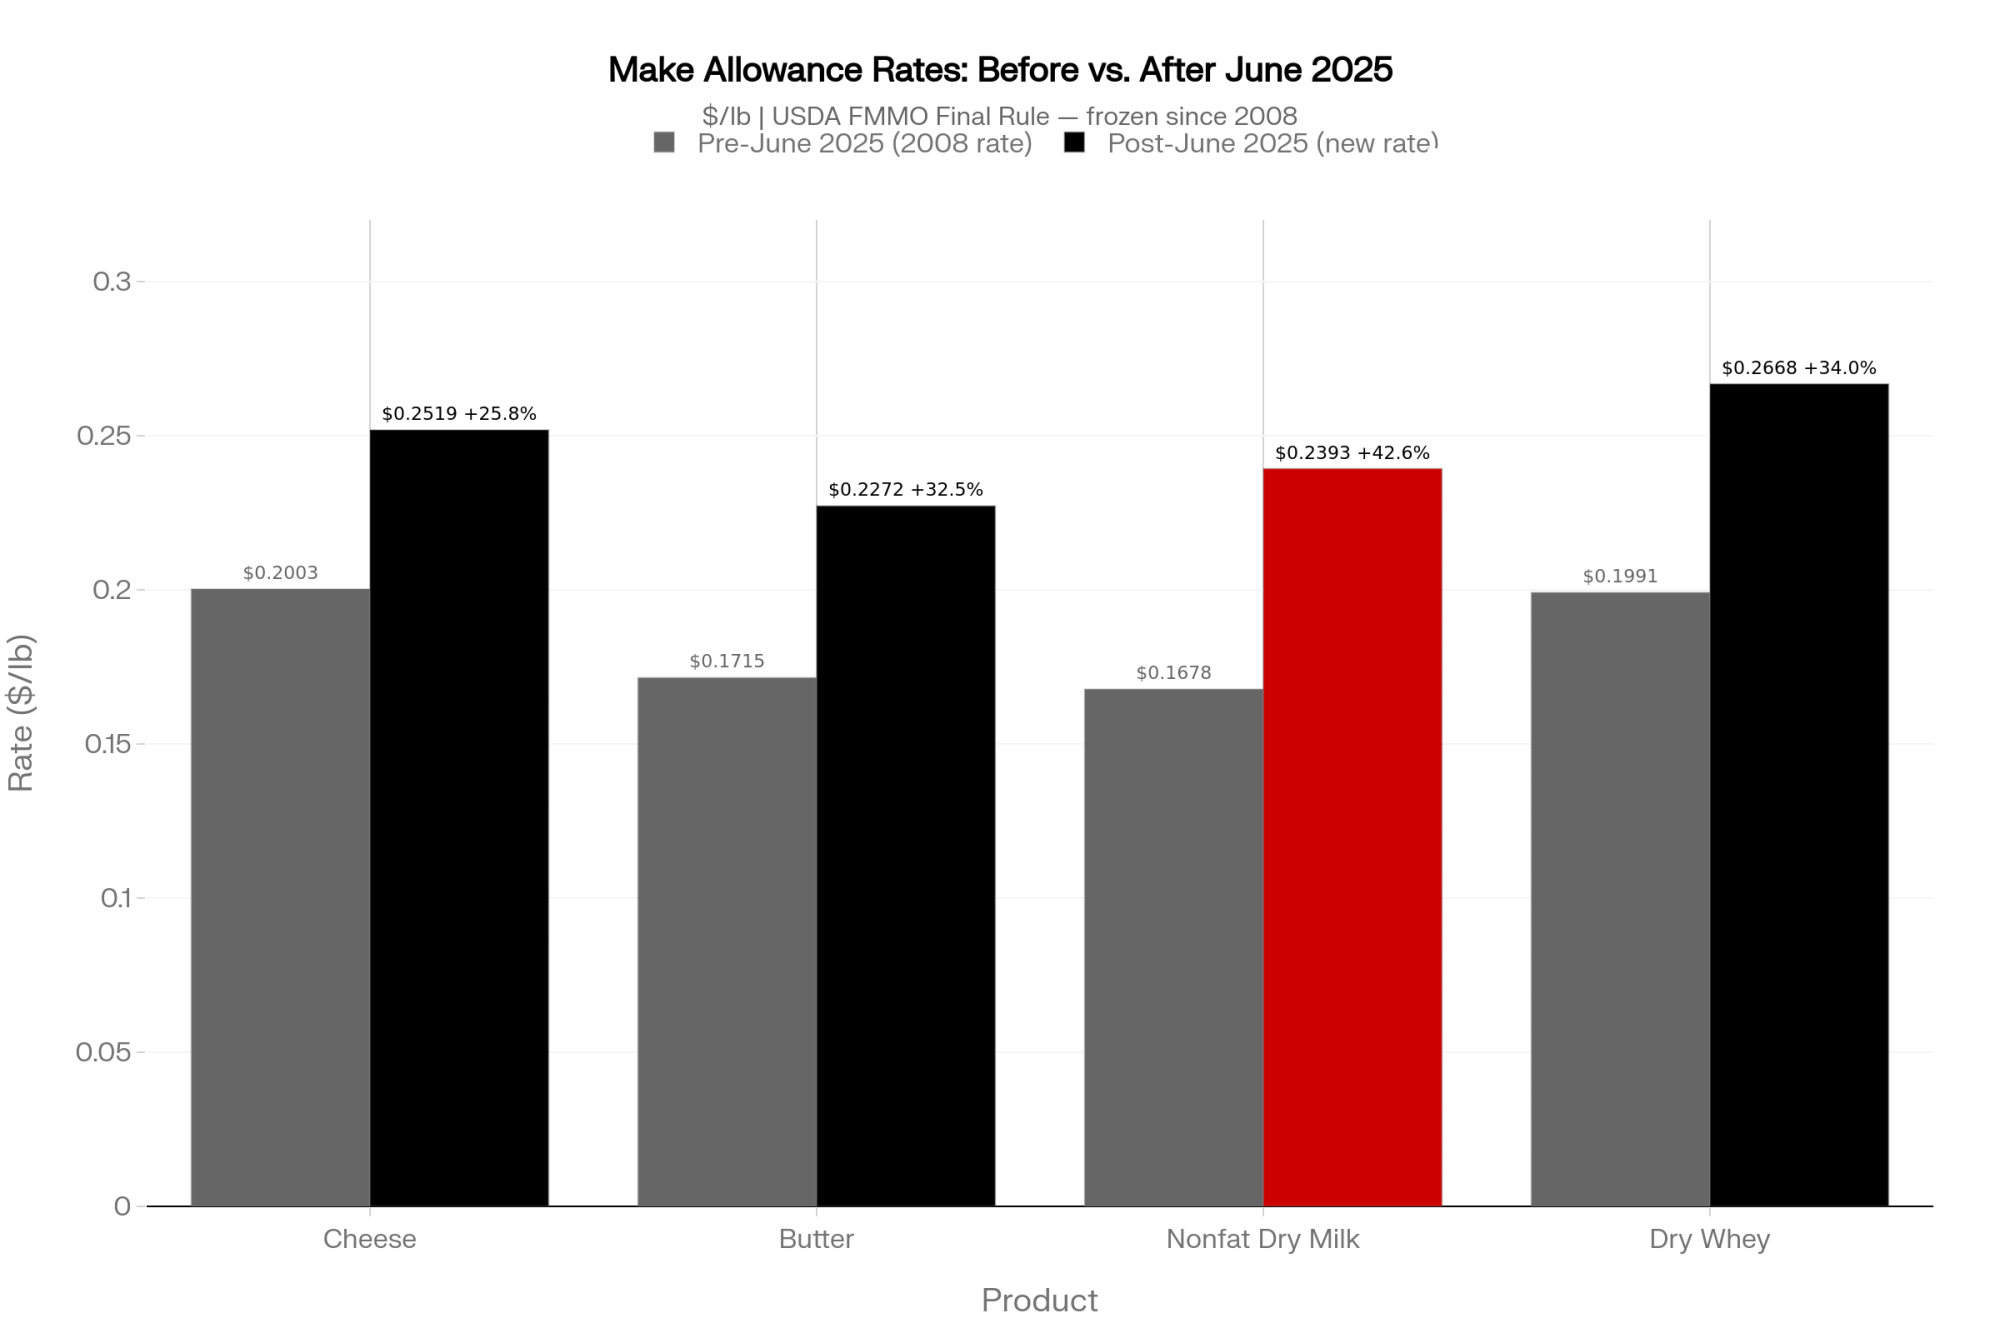
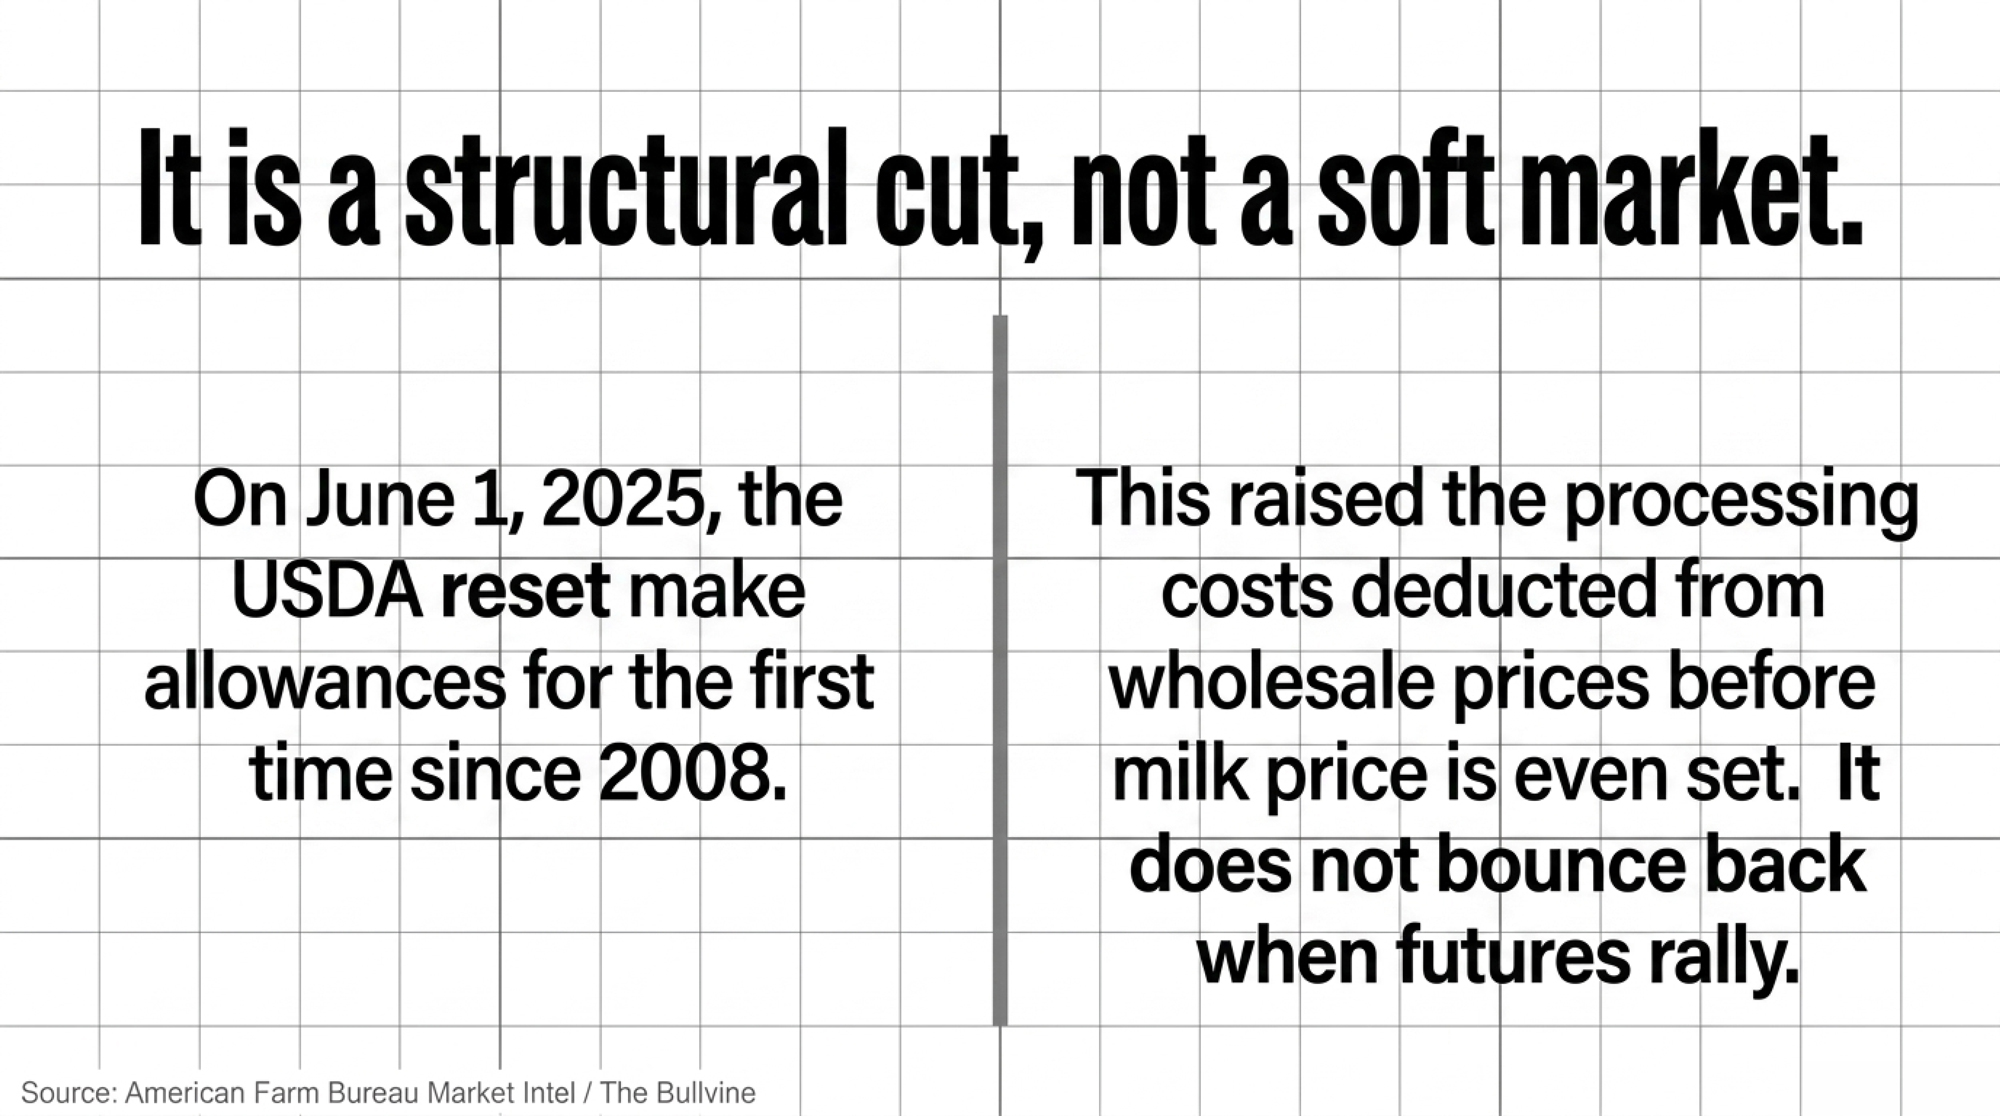
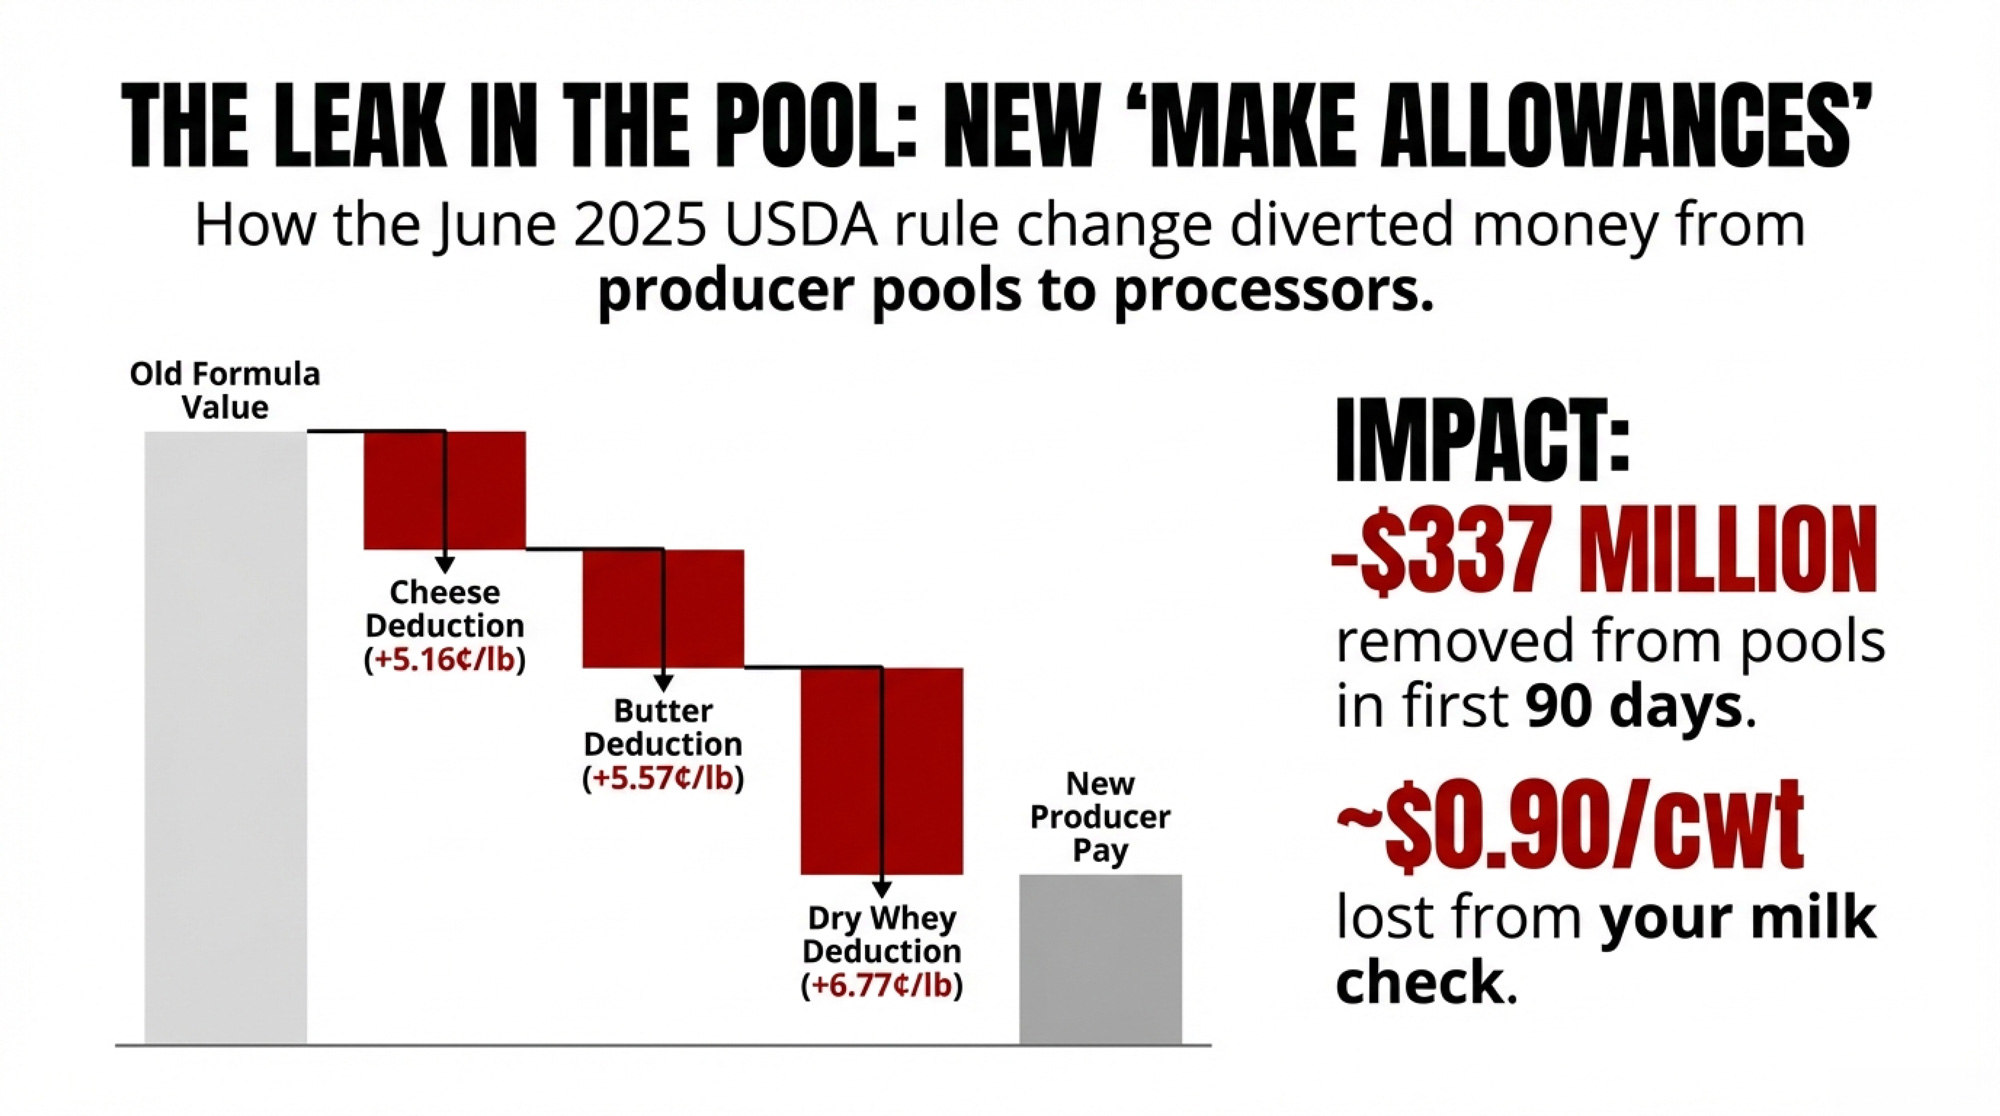
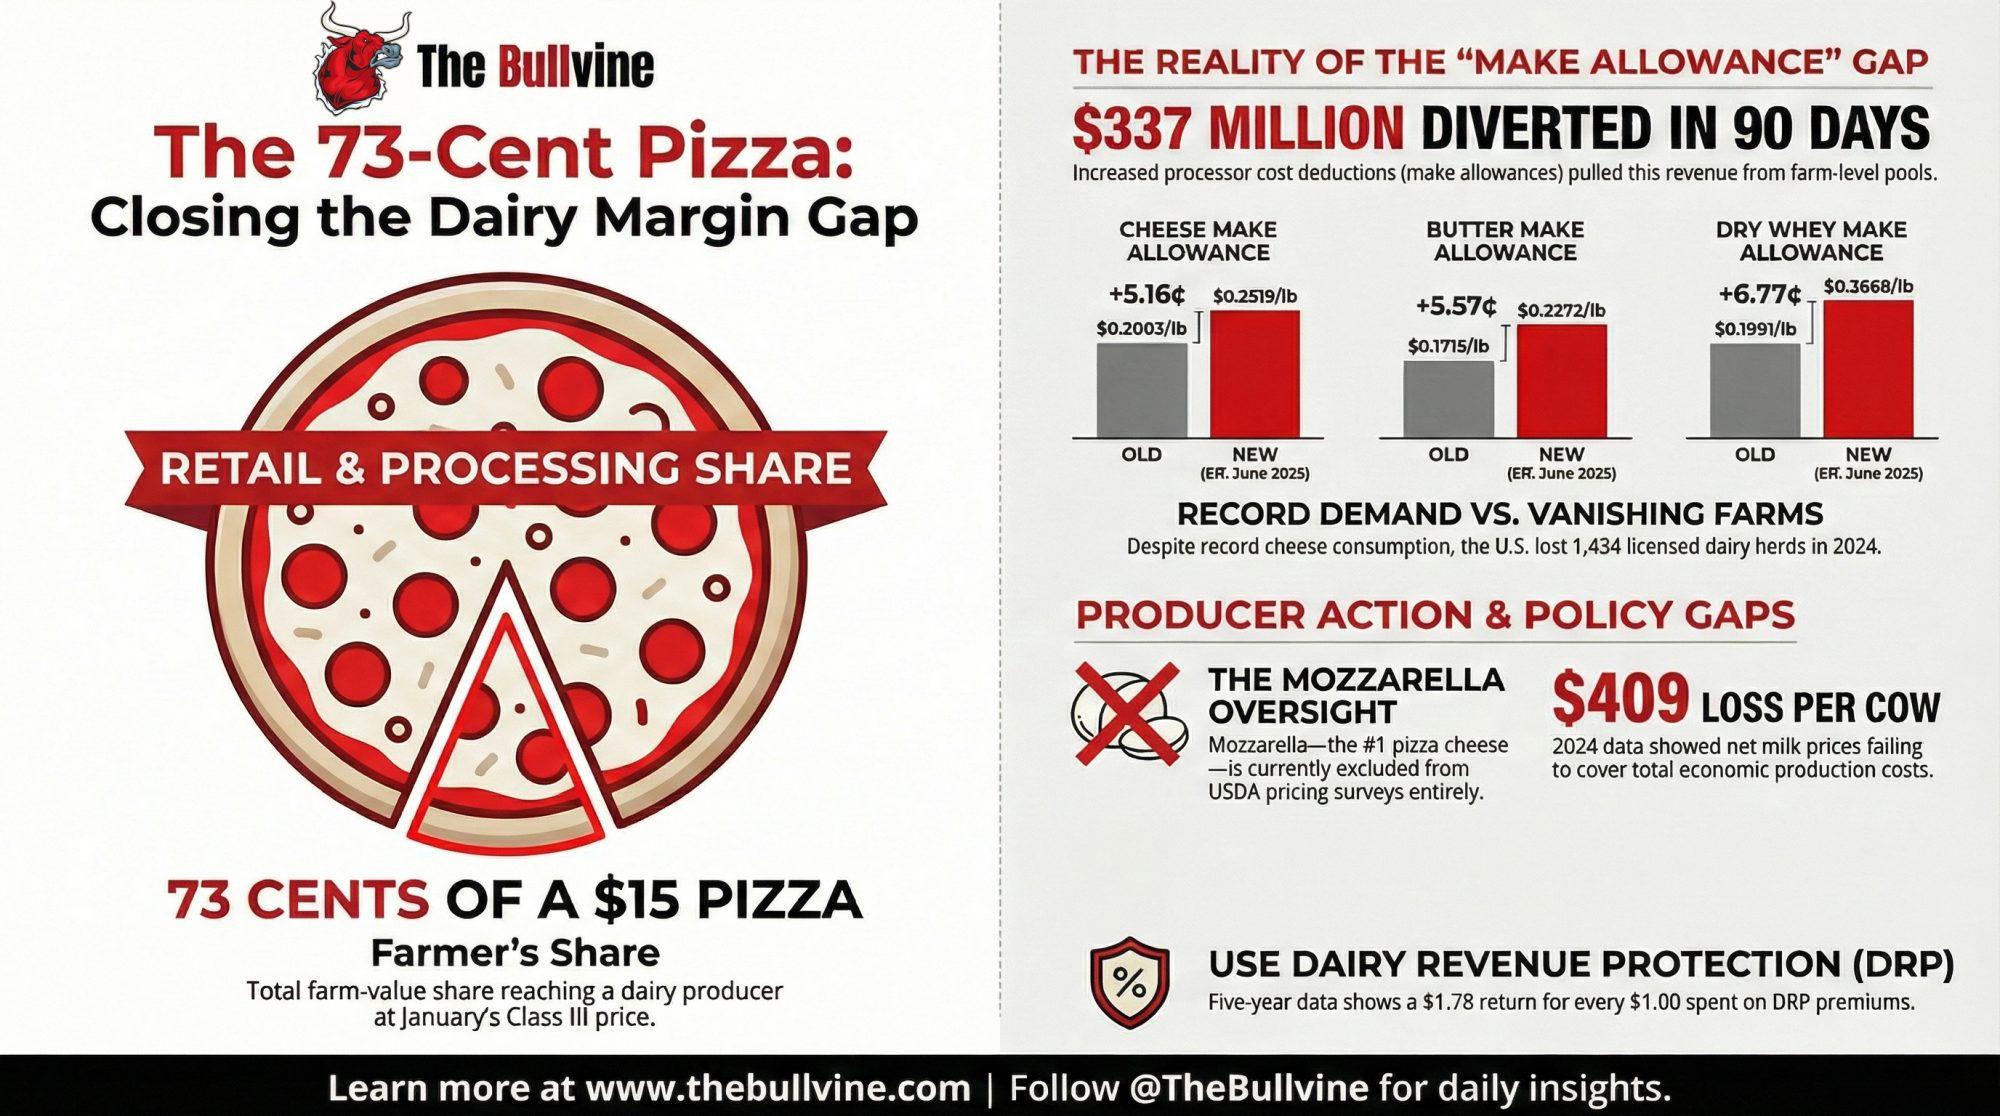
On June 1, 2025, USDA updated the make allowances inside the FMMO formulas for the first time since 2008 (Farm Credit Services of America, “New Federal Milk Marketing Order Rules Now Effective,” June 9, 2025). A make allowance is USDA’s assumed cost for a processor to turn your raw milk into cheese, butter, powder, or whey — subtracted before your component prices are set. Bigger subtraction, smaller check.
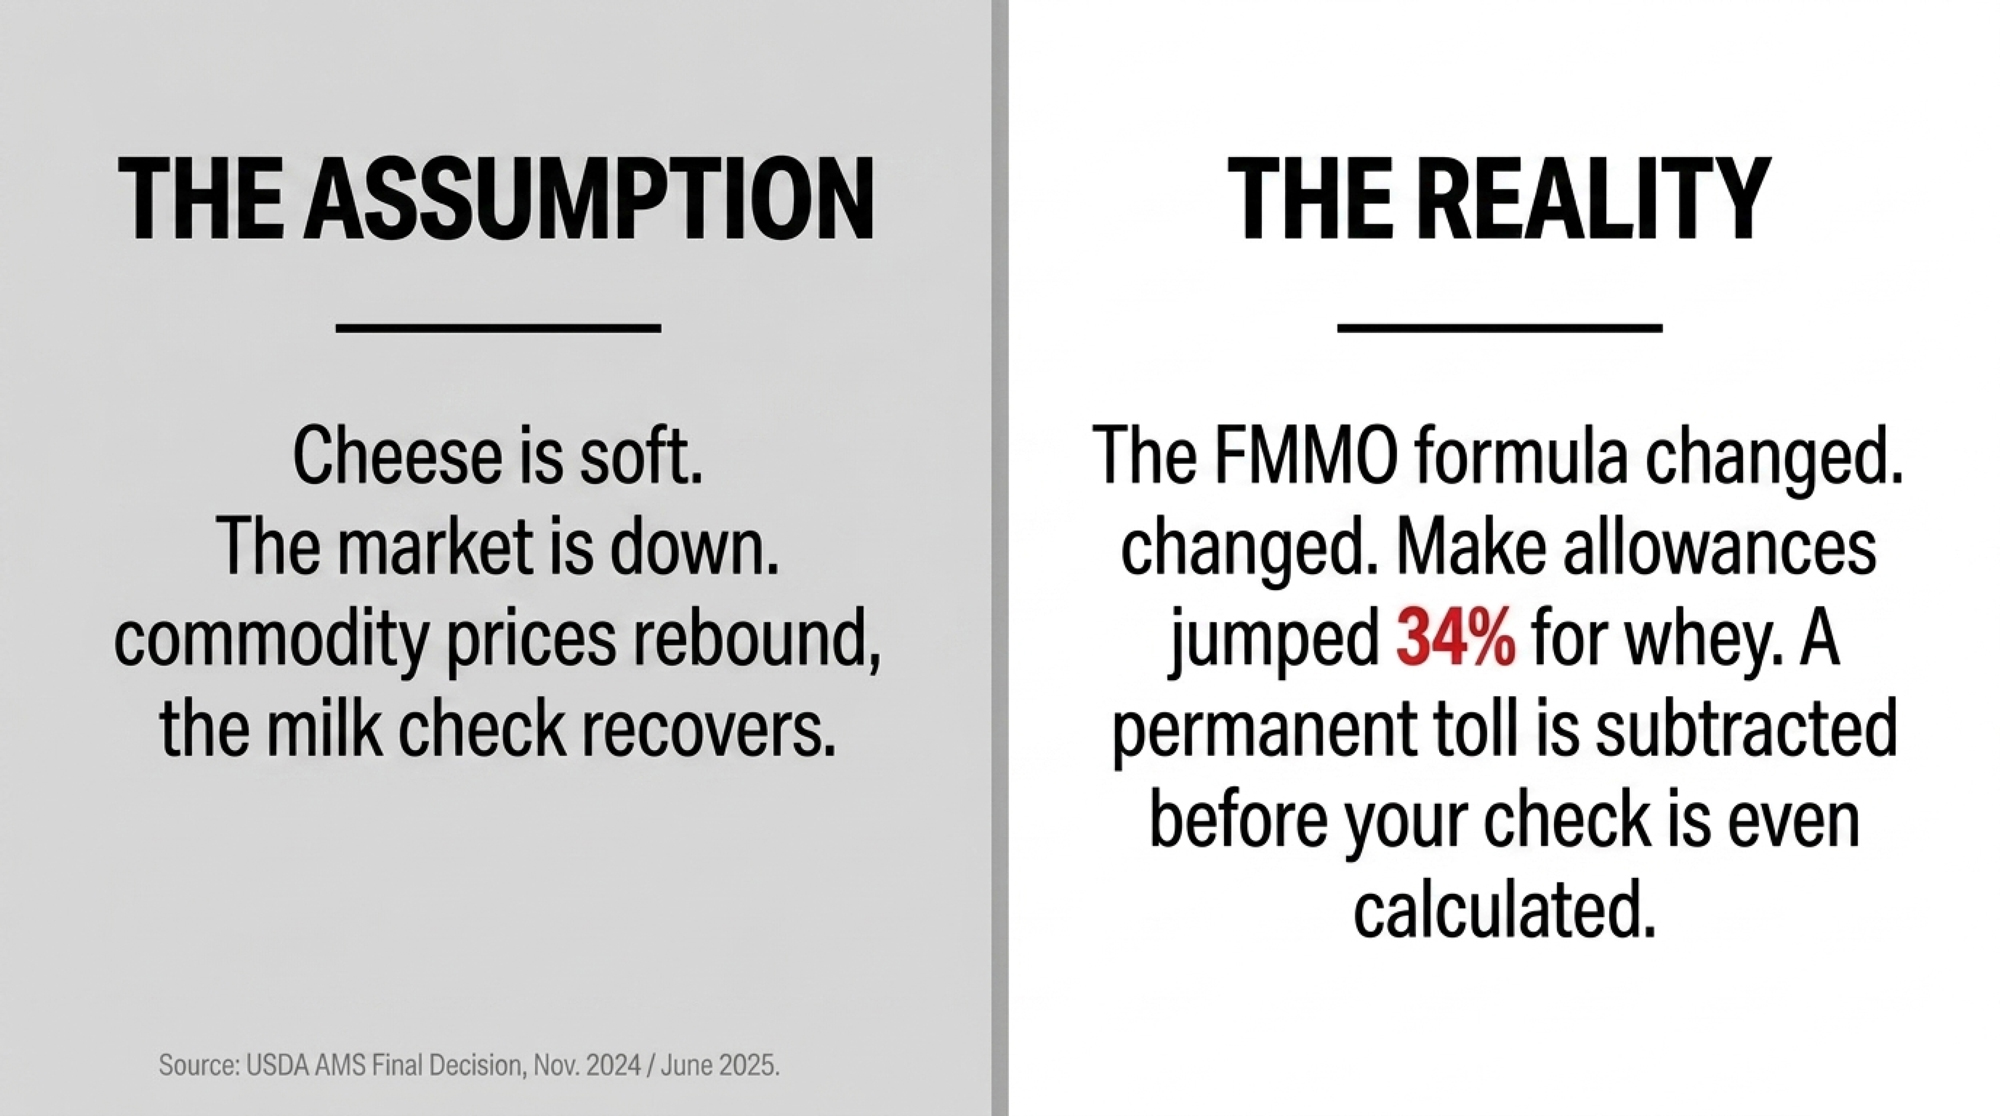
All four jumped at once: cheese to $0.2519/lb, butter to $0.2272, nonfat dry milk to $0.2393, dry whey to $0.2668 (USDA AMS Final Decision, Nov. 11, 2024; effective June 1, 2025). Dry whey took the steepest jump of the four — up 34%, from $0.1991 to $0.2668/lb (USDA AMS Final Decision, 2024). That single number is why this isn’t a cheese-shipper problem: whey feeds the other-solids price that touches every Class III check in the country.
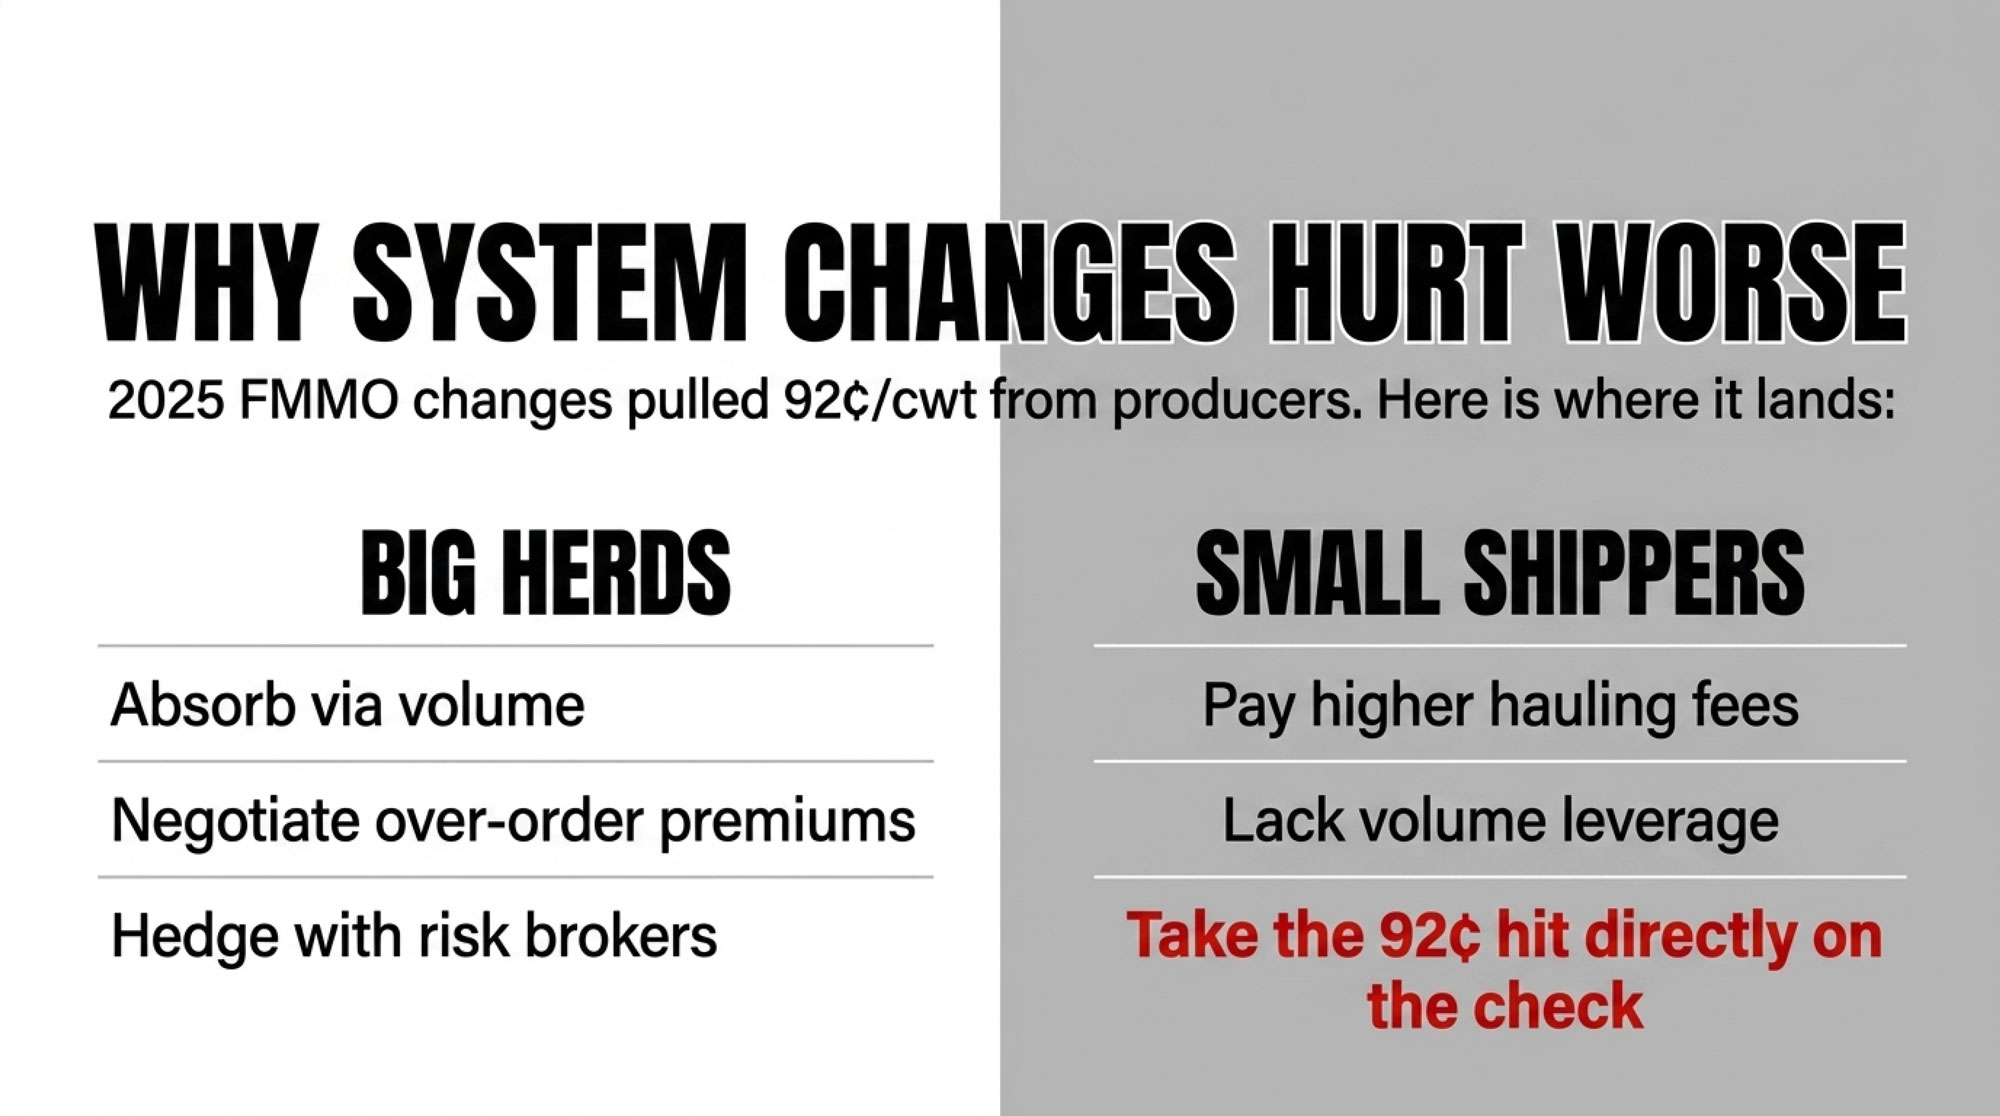
The American Farm Bureau Federation ran the first published scoring. Over the reform’s first three months, the higher allowances cut Class III by 92¢/cwt and Class IV by 85¢/cwt — a gross hit of about $337 million to pool revenues in 90 days, with the deepest bites in the Upper Midwest, the Northeast, and California (AFBF Market Intel, “Three Months In,” Daniel Munch, Sept. 21, 2025). Net the reform’s offsetting pieces — higher Class I differentials and the return to the higher-of mover — and the number lands closer to $231.9 million on The Bullvine’s accounting of AFBF’s figures. Keep those two straight. The gross is the make-allowance damage; the net is what producers lost after the give-backs. Anyone quoting $337 million as the bottom line is skipping a step.
To be fair about it: USDA and processors argued the old allowances were nearly two decades stale, that real plant costs had climbed, and that updating them keeps processing capacity alive — the plants that buy your milk (Farm Credit Services of America, June 9, 2025). IDFA testified that the make allowance covers the costs manufacturers incur in turning raw milk into finished dairy products, and needed to reflect what those costs had actually become (IDFA testimony to USDA AMS, FMMO hearing record). That’s a real position. The fight isn’t whether costs rose. It’s how big the number should be, whether anyone checked it, and who’s carrying it.
Why Can’t You See This on Your Milk Check?
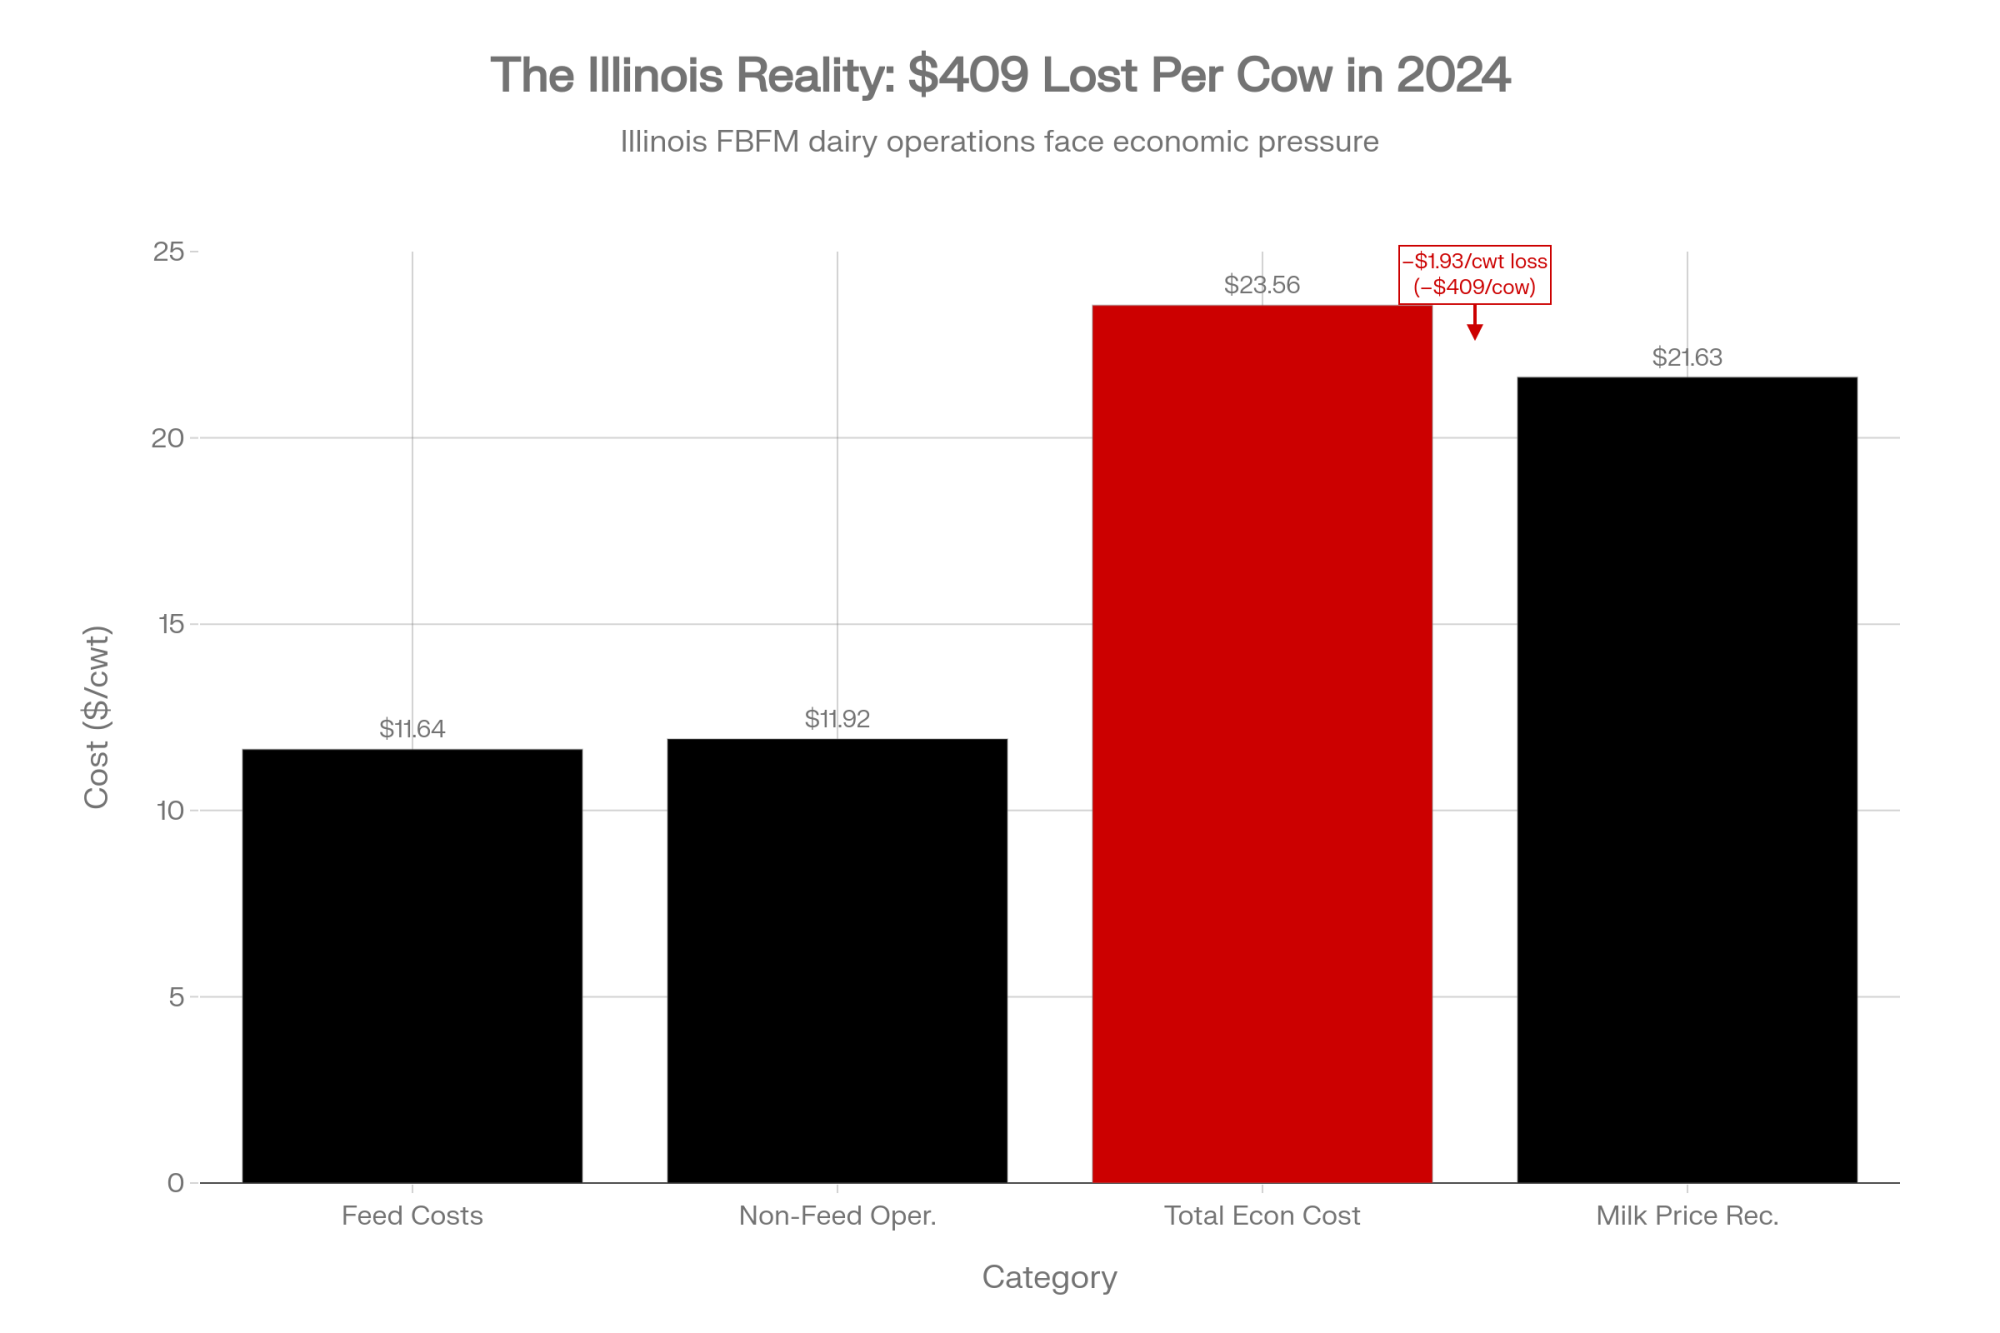
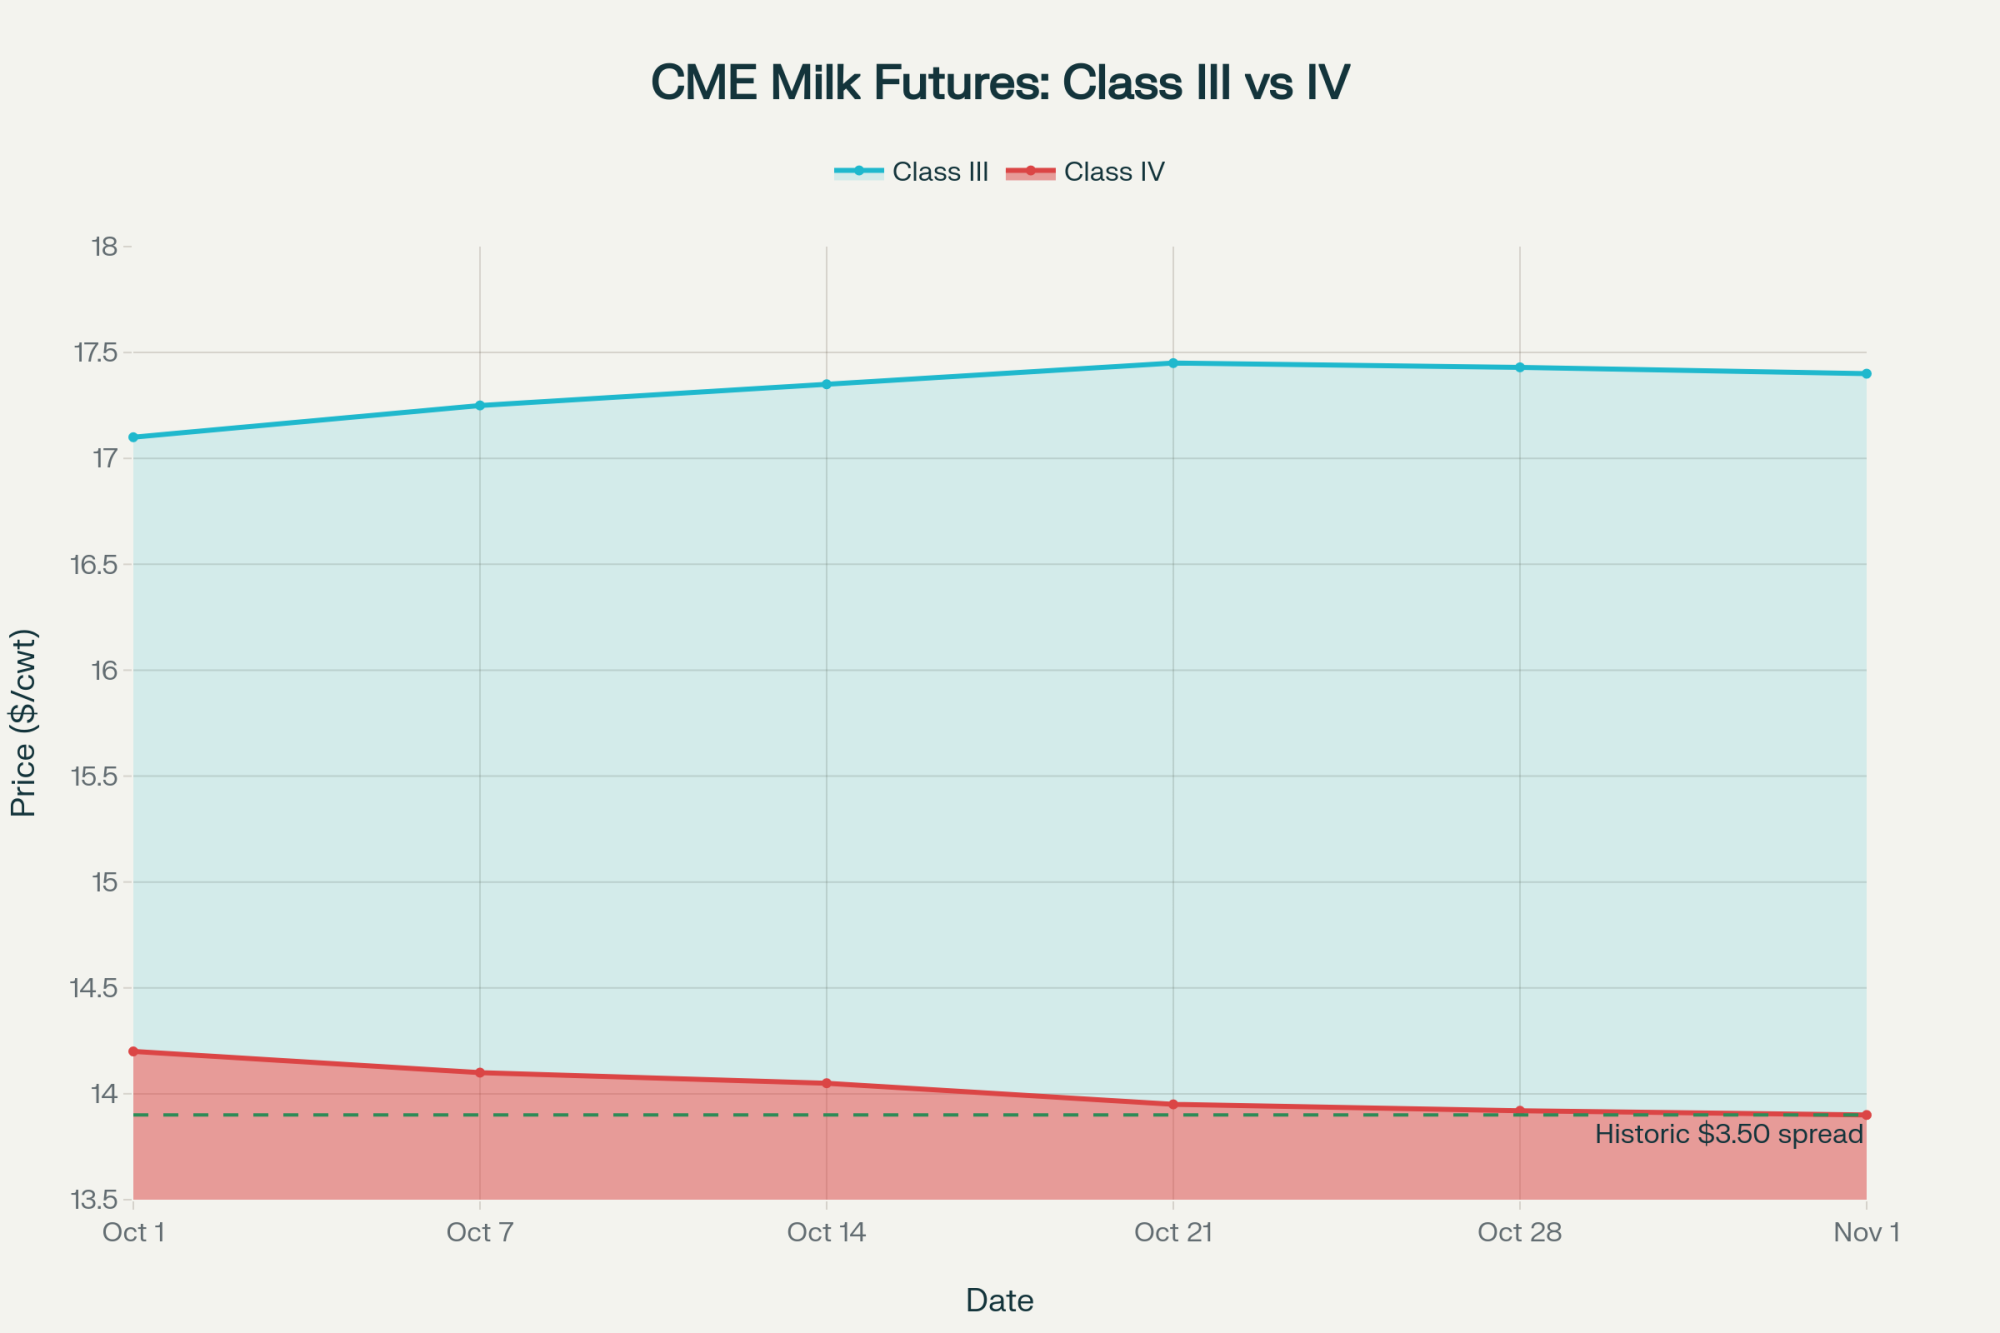
Here’s the trap. You get your check, see a smaller number, and hear the same line everybody hears: cheese was soft, the market was down. Both can be true at once. Class III did run well below its early-2025 levels — USDA’s February 2026 Class III component value worked out to about $15.46/cwt, down from $21.55 a year earlier, a $6.09/cwt drop (USDA AMS February 2026 component prices, at 3.8% fat / 3.2% protein / 5.7% other solids). That part is real market movement. But underneath the noise, a fixed piece keeps working. And it doesn’t leave when cheese comes back.
Everyone assumed a cheese rebound would wash the pain out. It won’t. Higher cheese prices don’t shrink the make-allowance subtraction — they raise the number it’s subtracted from. The dollar stays.
The 2026 Reality Check: The make allowance isn’t a line item on your statement. It’s subtracted inside the formula, before your check is ever calculated — so you never watch the dollar leave, because it was never on the page to begin with.
That’s how Von Ruden’s neighbor lost that money without a single line naming the cause. It’s the difference between riding out a normal price cycle and paying a fixed toll on every hundredweight, in good months and bad. For the human side of that gut punch, read Von Ruden’s full account of the 300-cow hit.
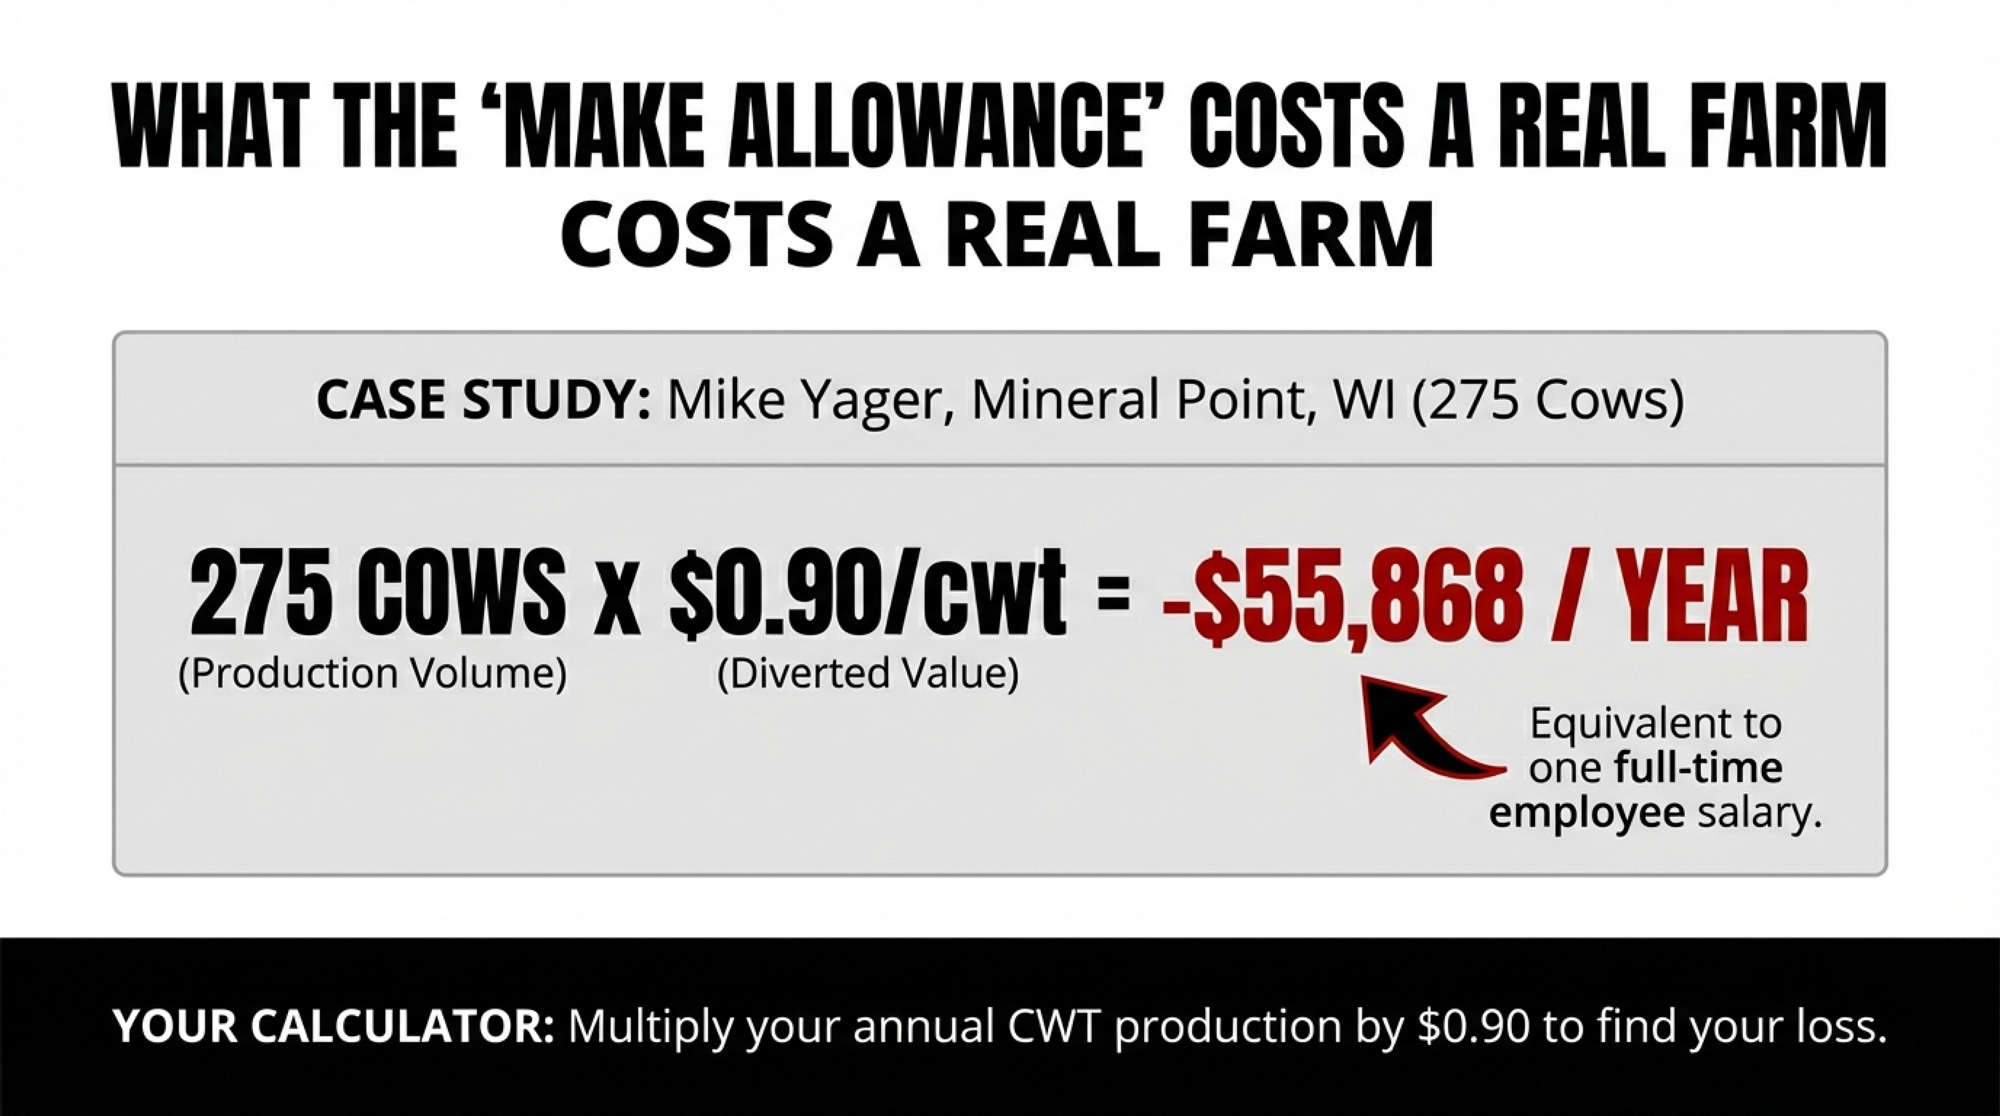
Running the Numbers: What $1.01/cwt Does to a 500-Cow Herd
The math is simpler than the formula that produces it. Here’s the drag on an illustrative 500-cow dairy — then plug in your own herd.
The 500-Cow Herd Impact (At a Glance)
| Metric | Baseline Figure | Annual Impact |
| Herd Size | 500 milking cows | — |
| Daily Production | ~70 lbs / cow / day | — |
| Total Annual Milk | 127,750 cwt | — |
| Formula Reform Drag | $1.01 / cwt | –$129,027 / year |
| Per-Cow Toll | — | –$258 / cow / year |
Illustrative Class III herd only. Production assumption based on USDA NASS Milk Production (Jan. 2026, major states): 2,082 lbs/cow/month, roughly 68–69 lbs/day, so 70 is a fair working figure.
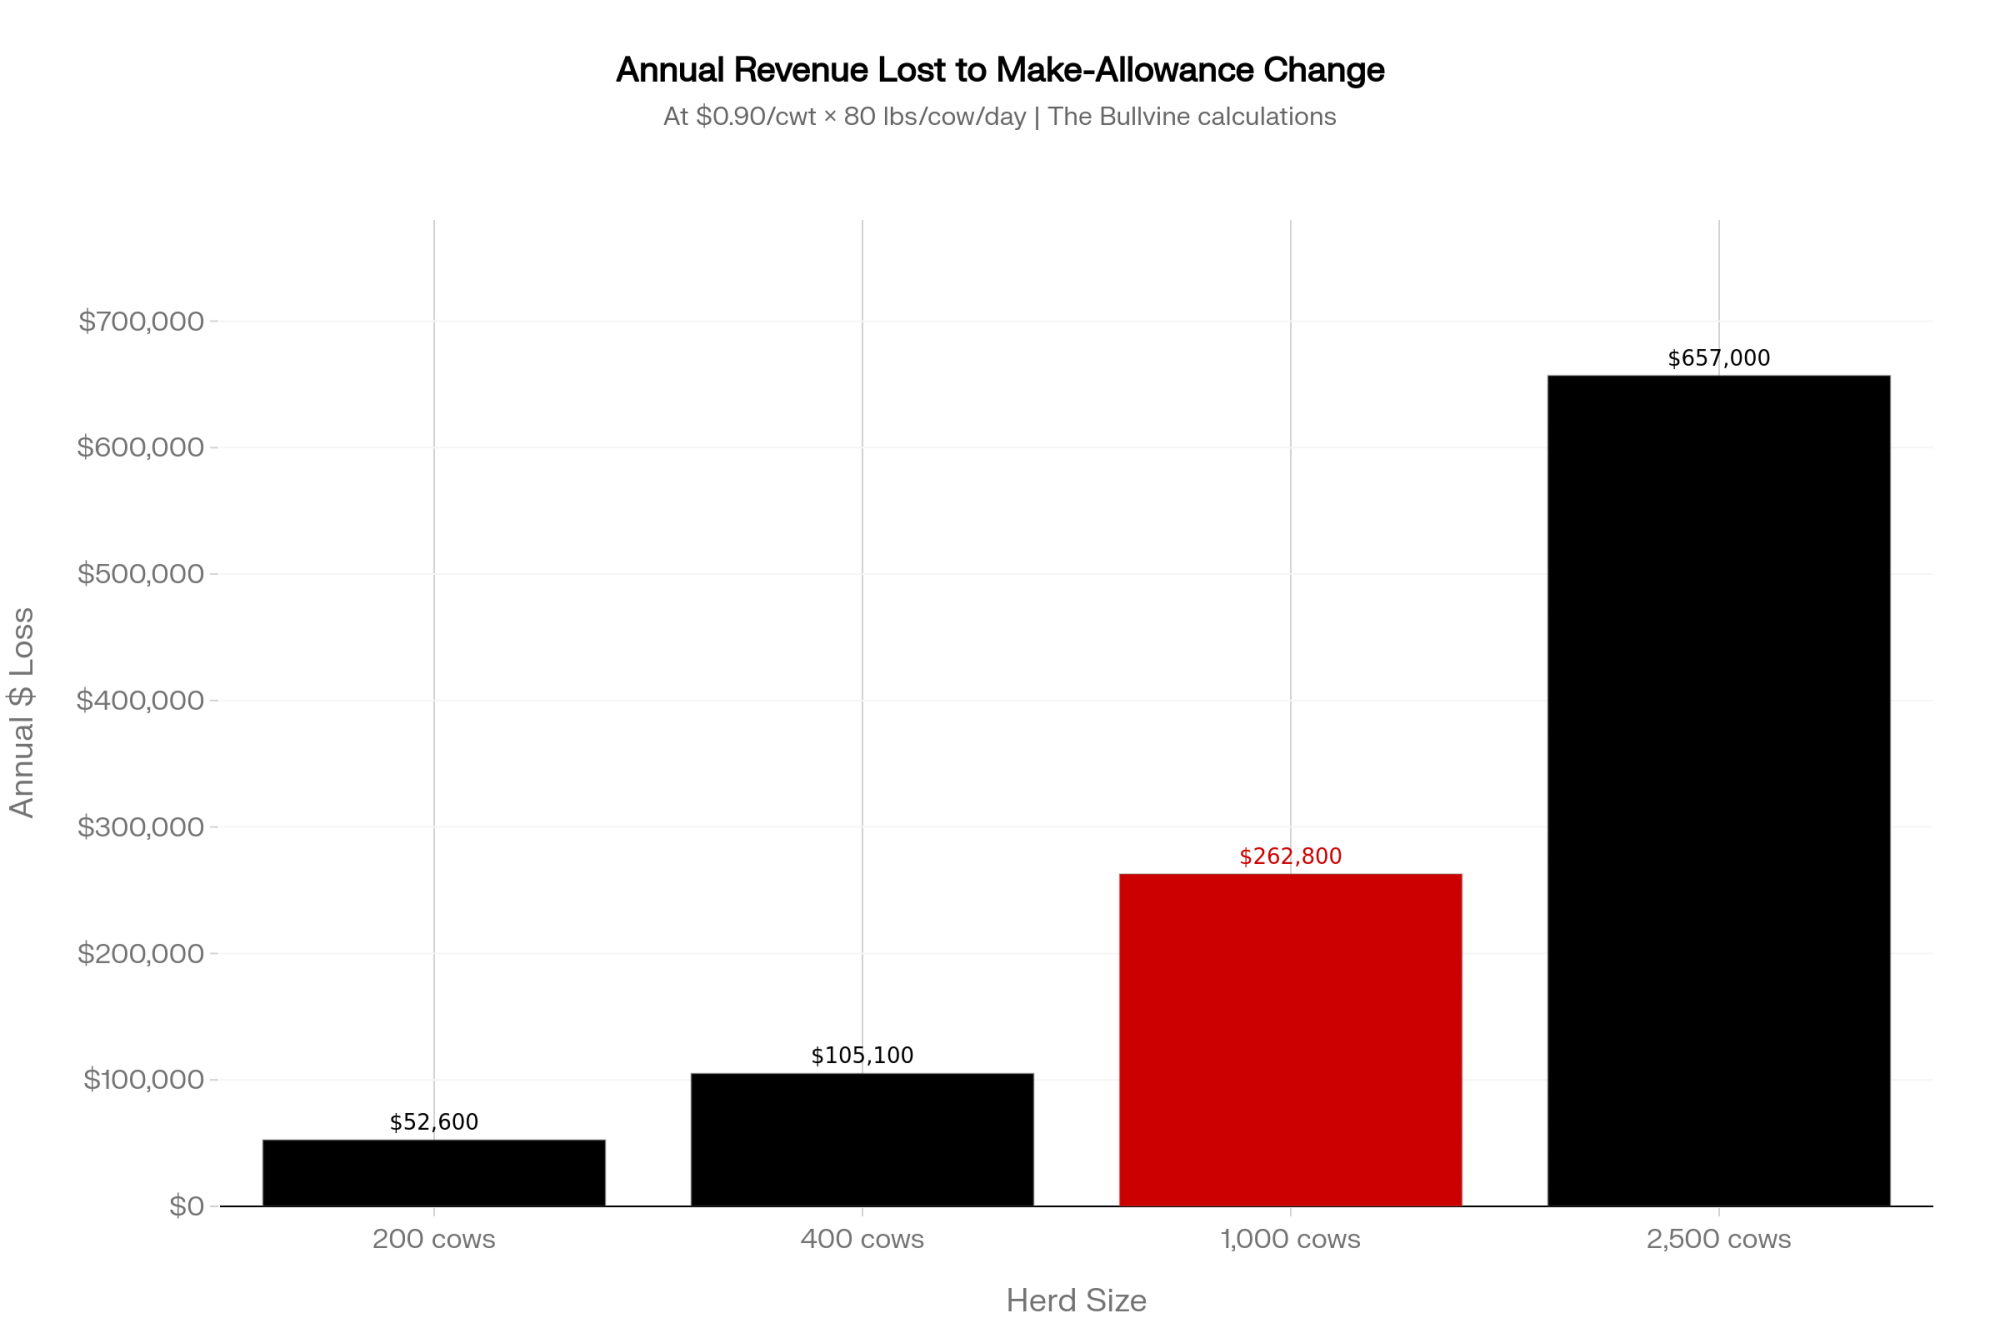
Adjust the pieces for your operation. A herd averaging 80 lbs/cow/day pushes the drag to about $147,000. Weight your utilization toward Class IV and the per-cwt hit eases toward 85¢. The exact figure isn’t the point. The point is that this is a five- to six-figure annual number for a mid-size dairy, hiding inside a price you’ve been calling “the market.”
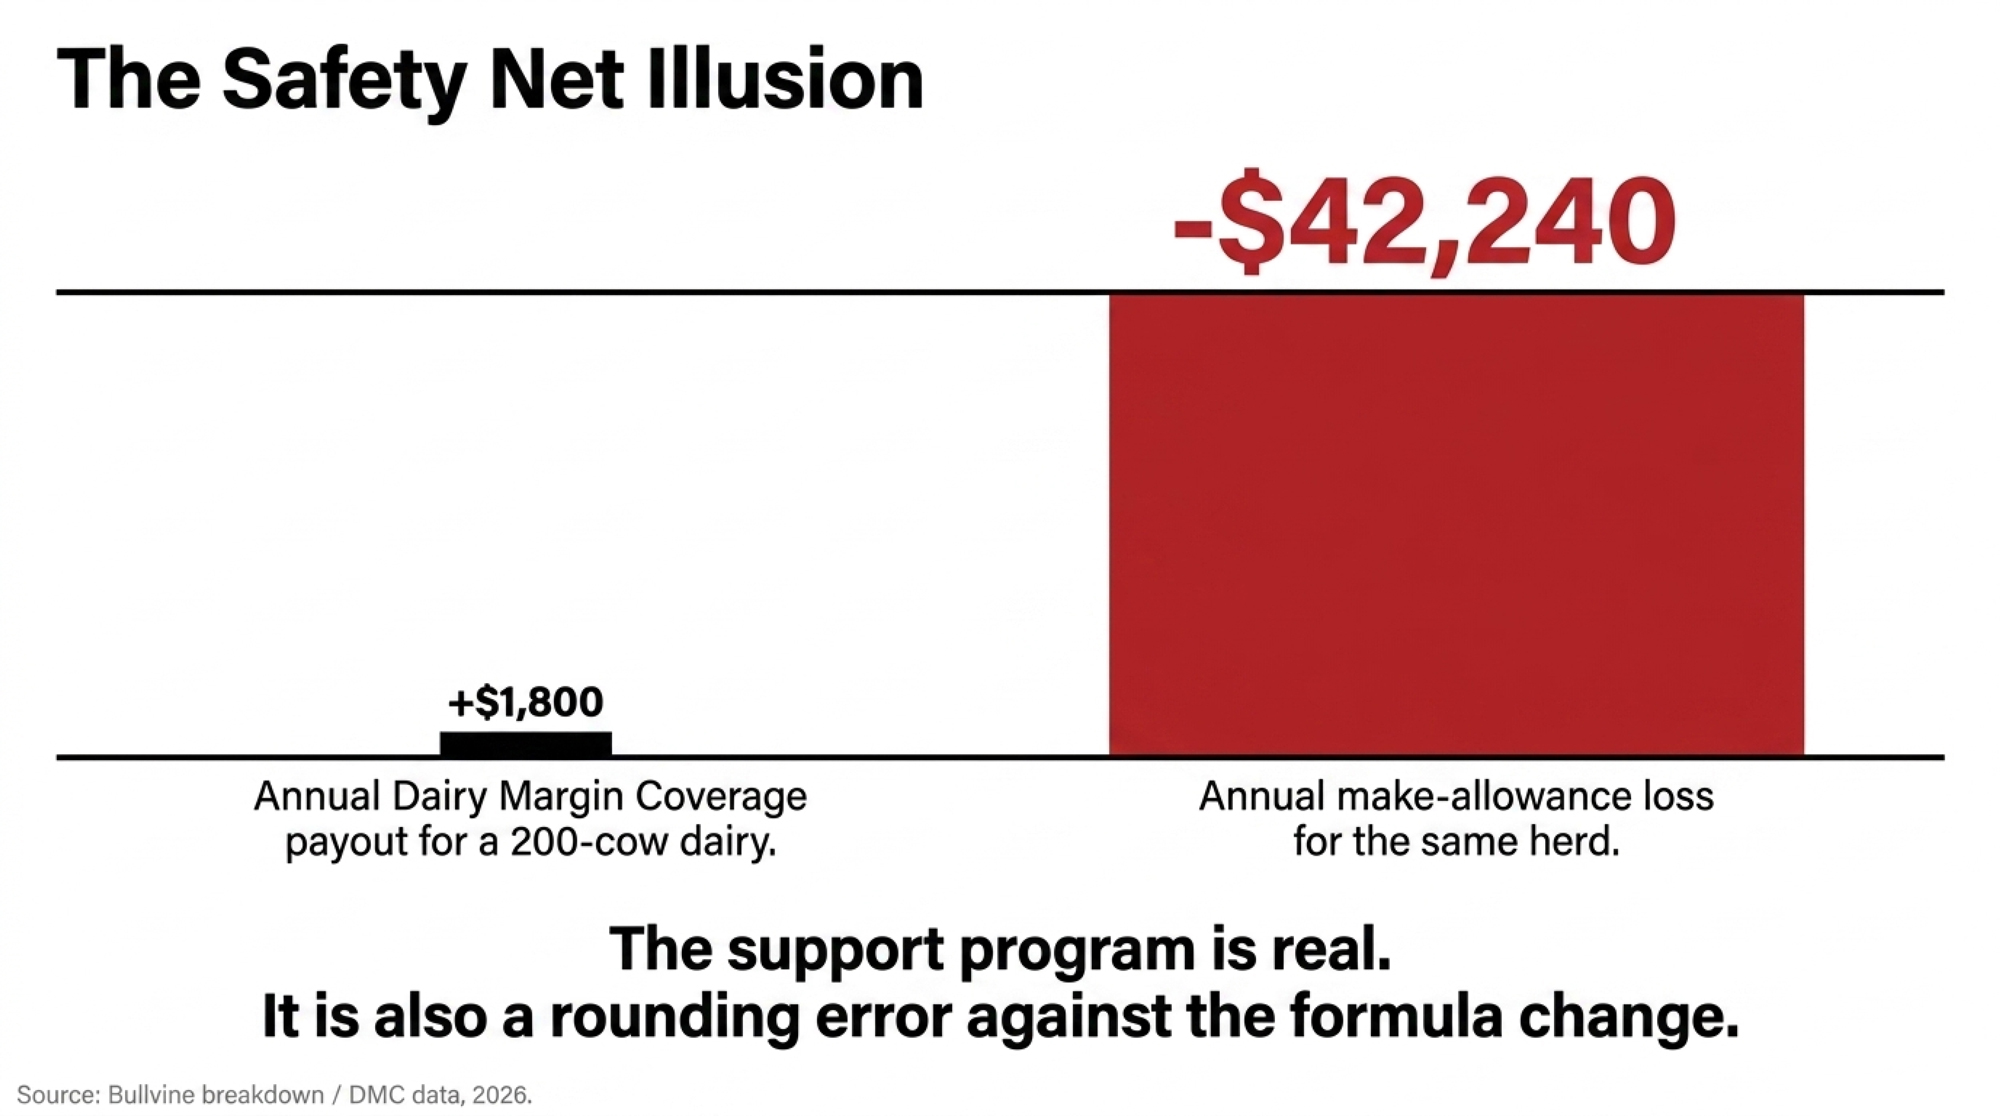
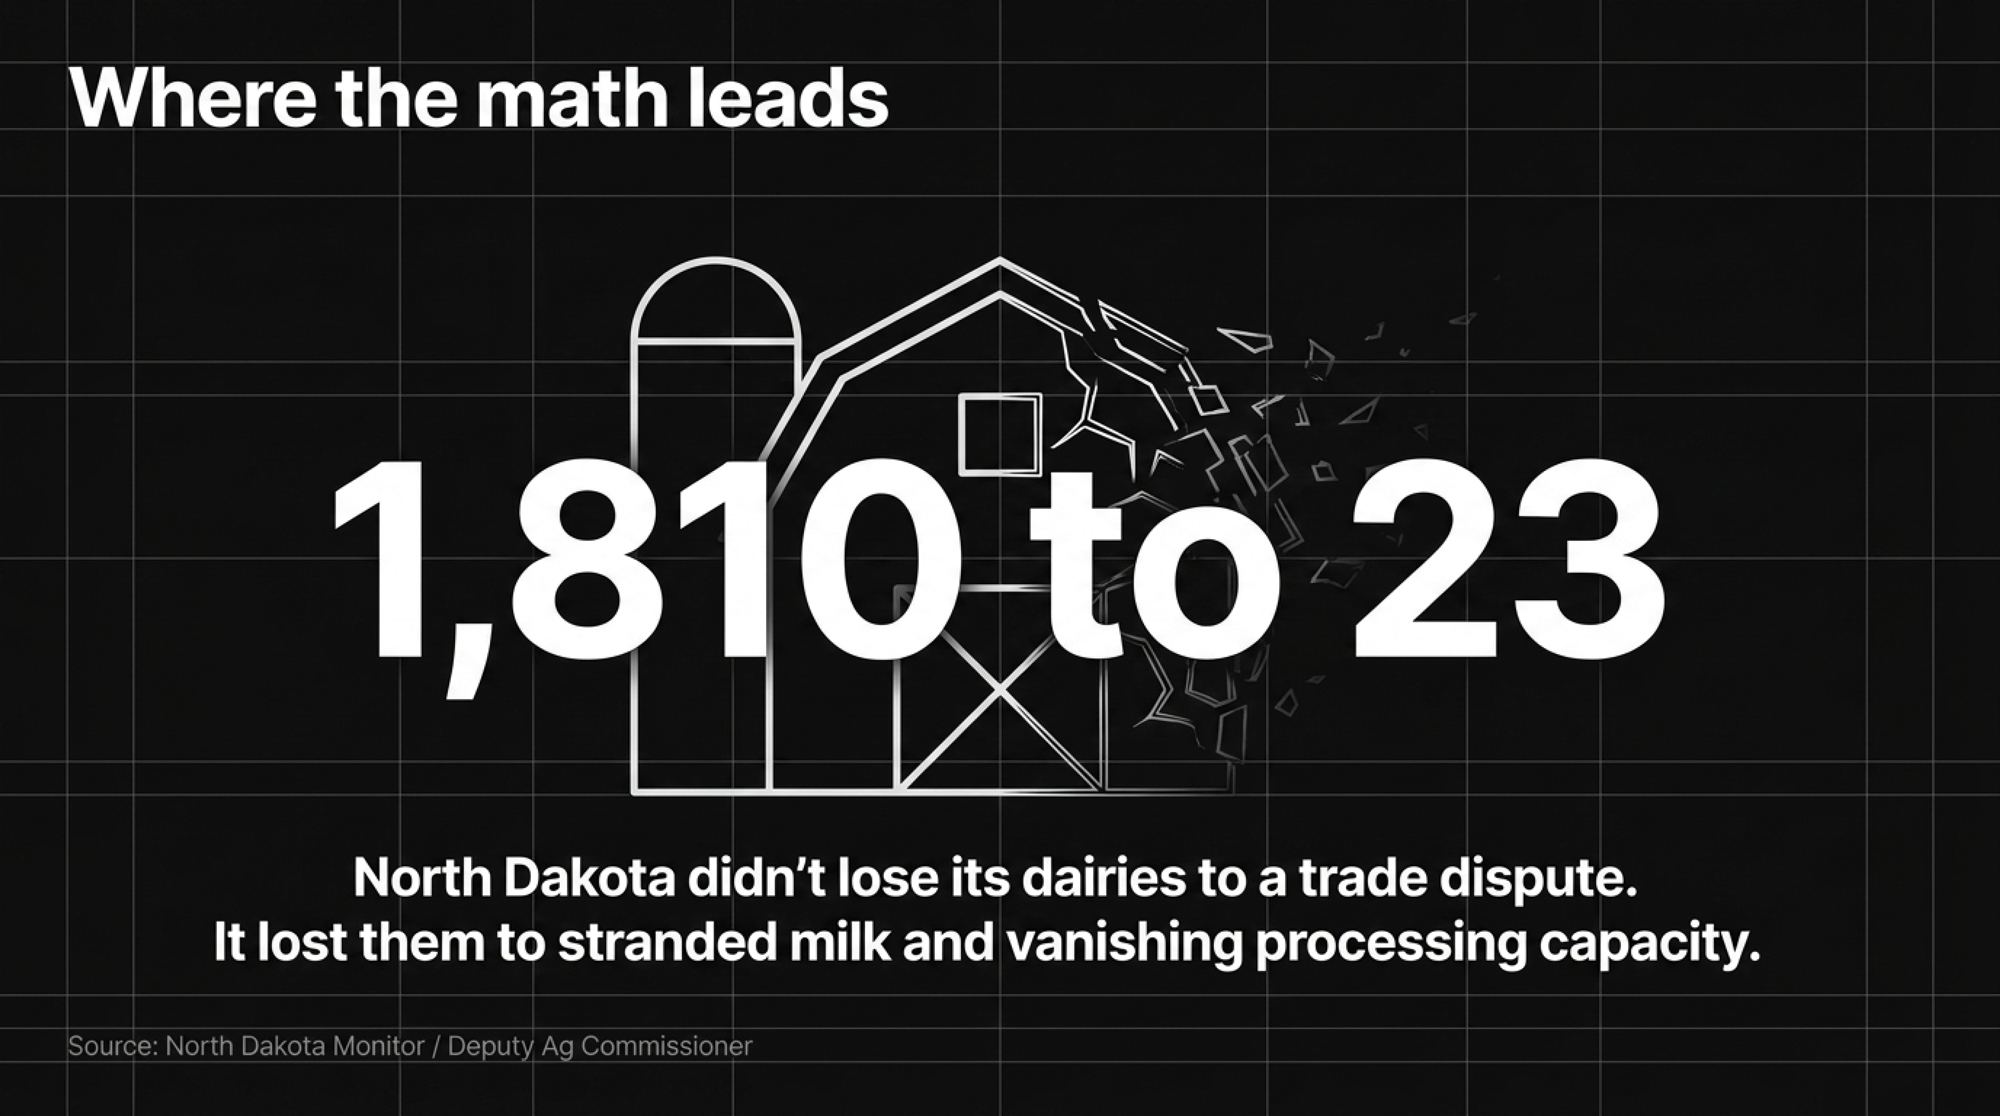
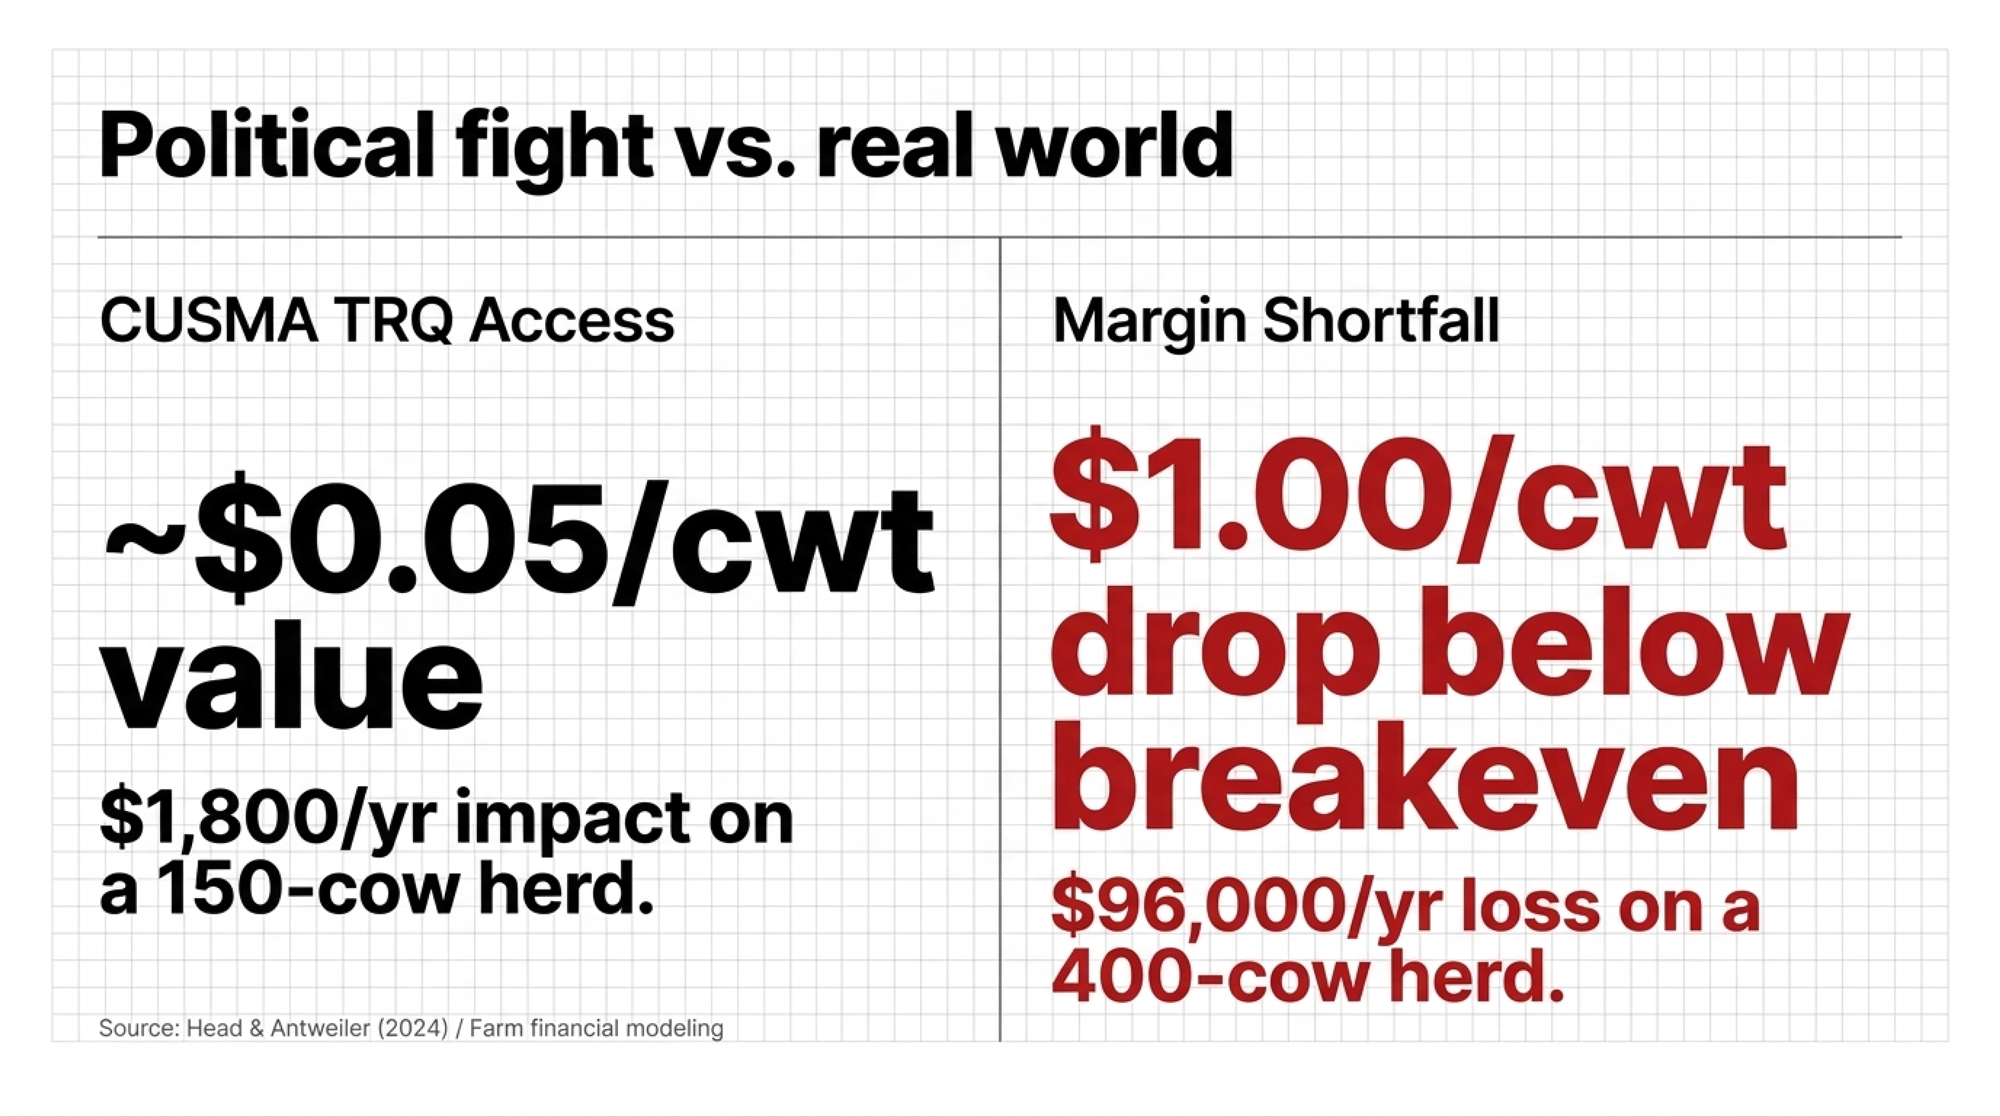
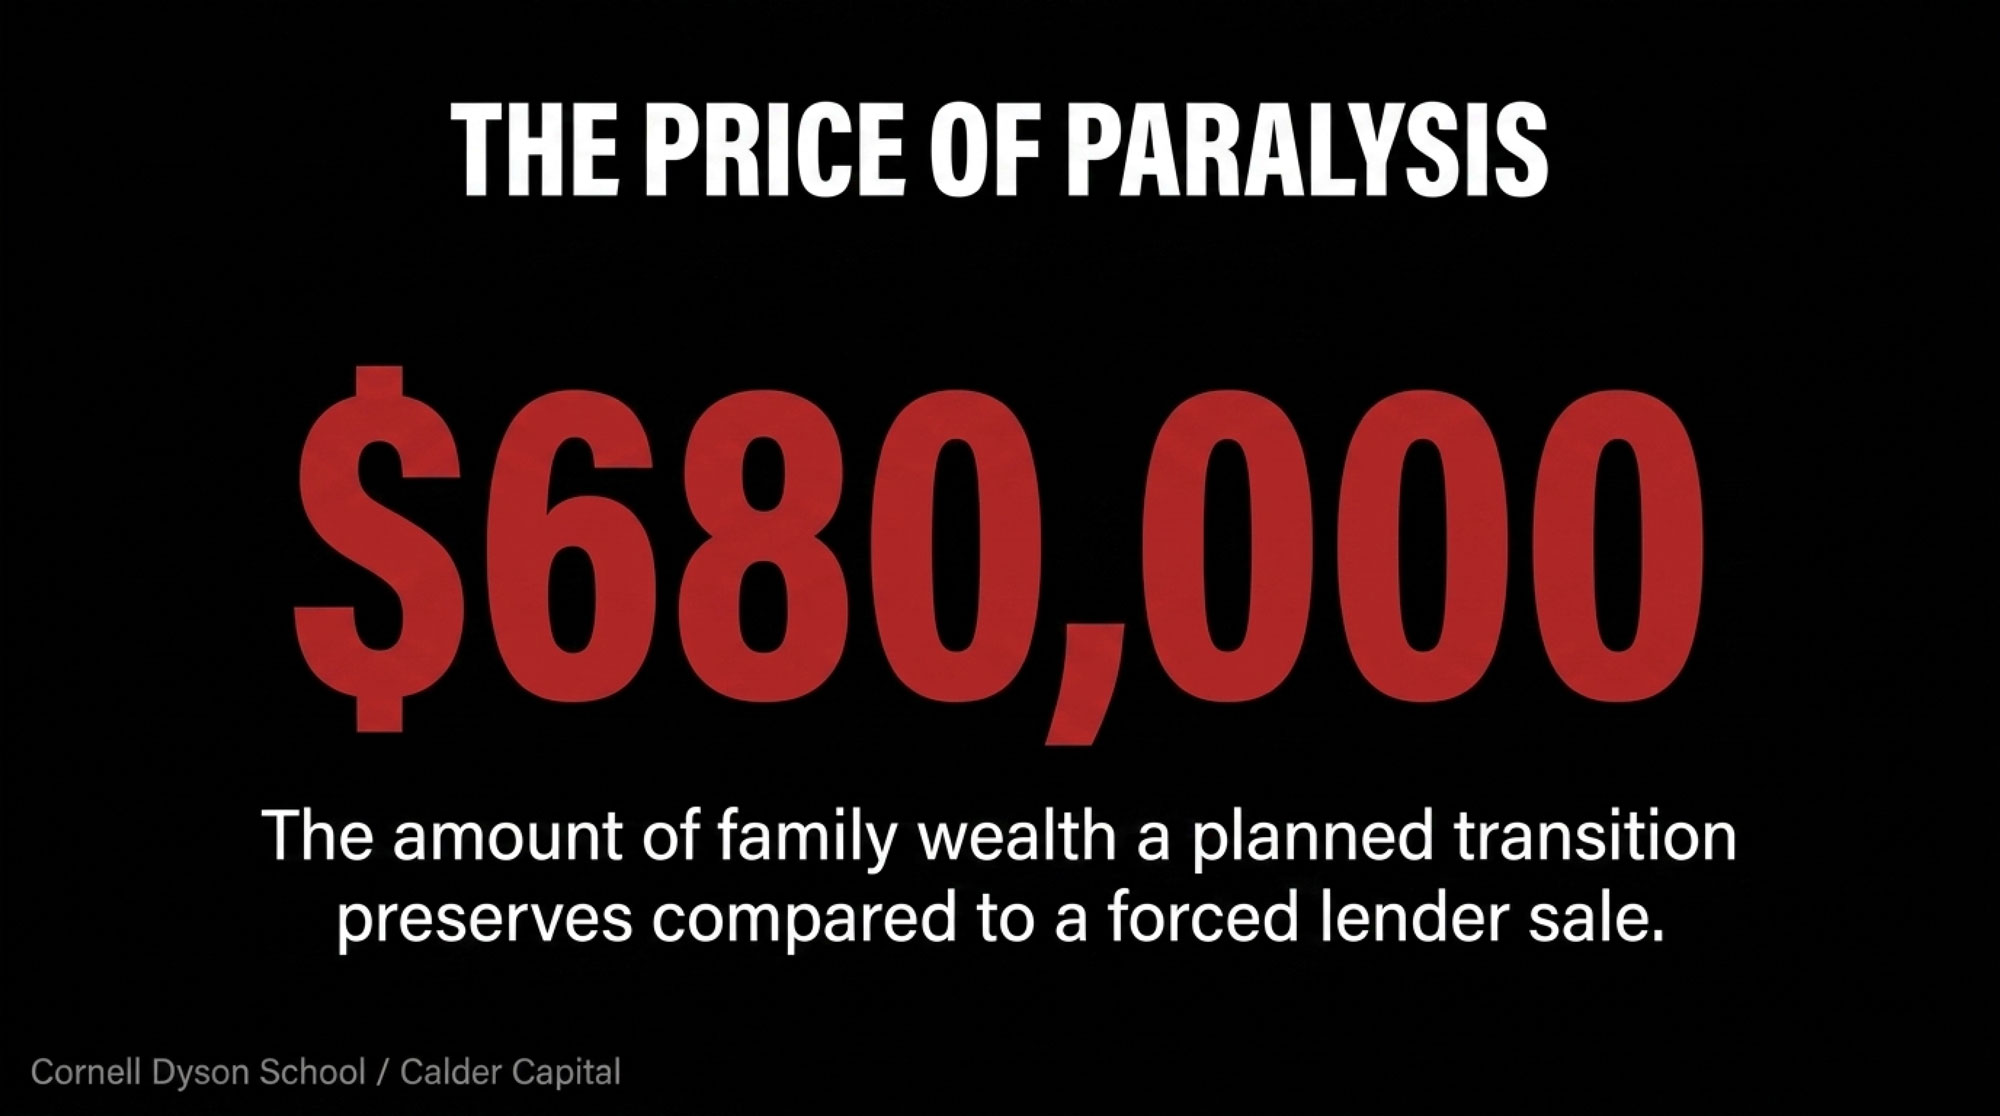
Set that toll next to the safety net, and it stings worse. A Bullvine breakdown put a 200-cow dairy’s Dairy Margin Coverage payout at about $1,800 in a year against roughly $42,240 lost to make allowances — a 23-to-1 gap. The support program is real. It’s also a rounding error against the formula change.
👉 Companion Analysis: See the full safety-net math in GT Thompson’s 2026 Farm Bill Math: DMC Pays Your 200-Cow Dairy $1,800, Make Allowances Cut $42,240 (Feb. 17, 2026).
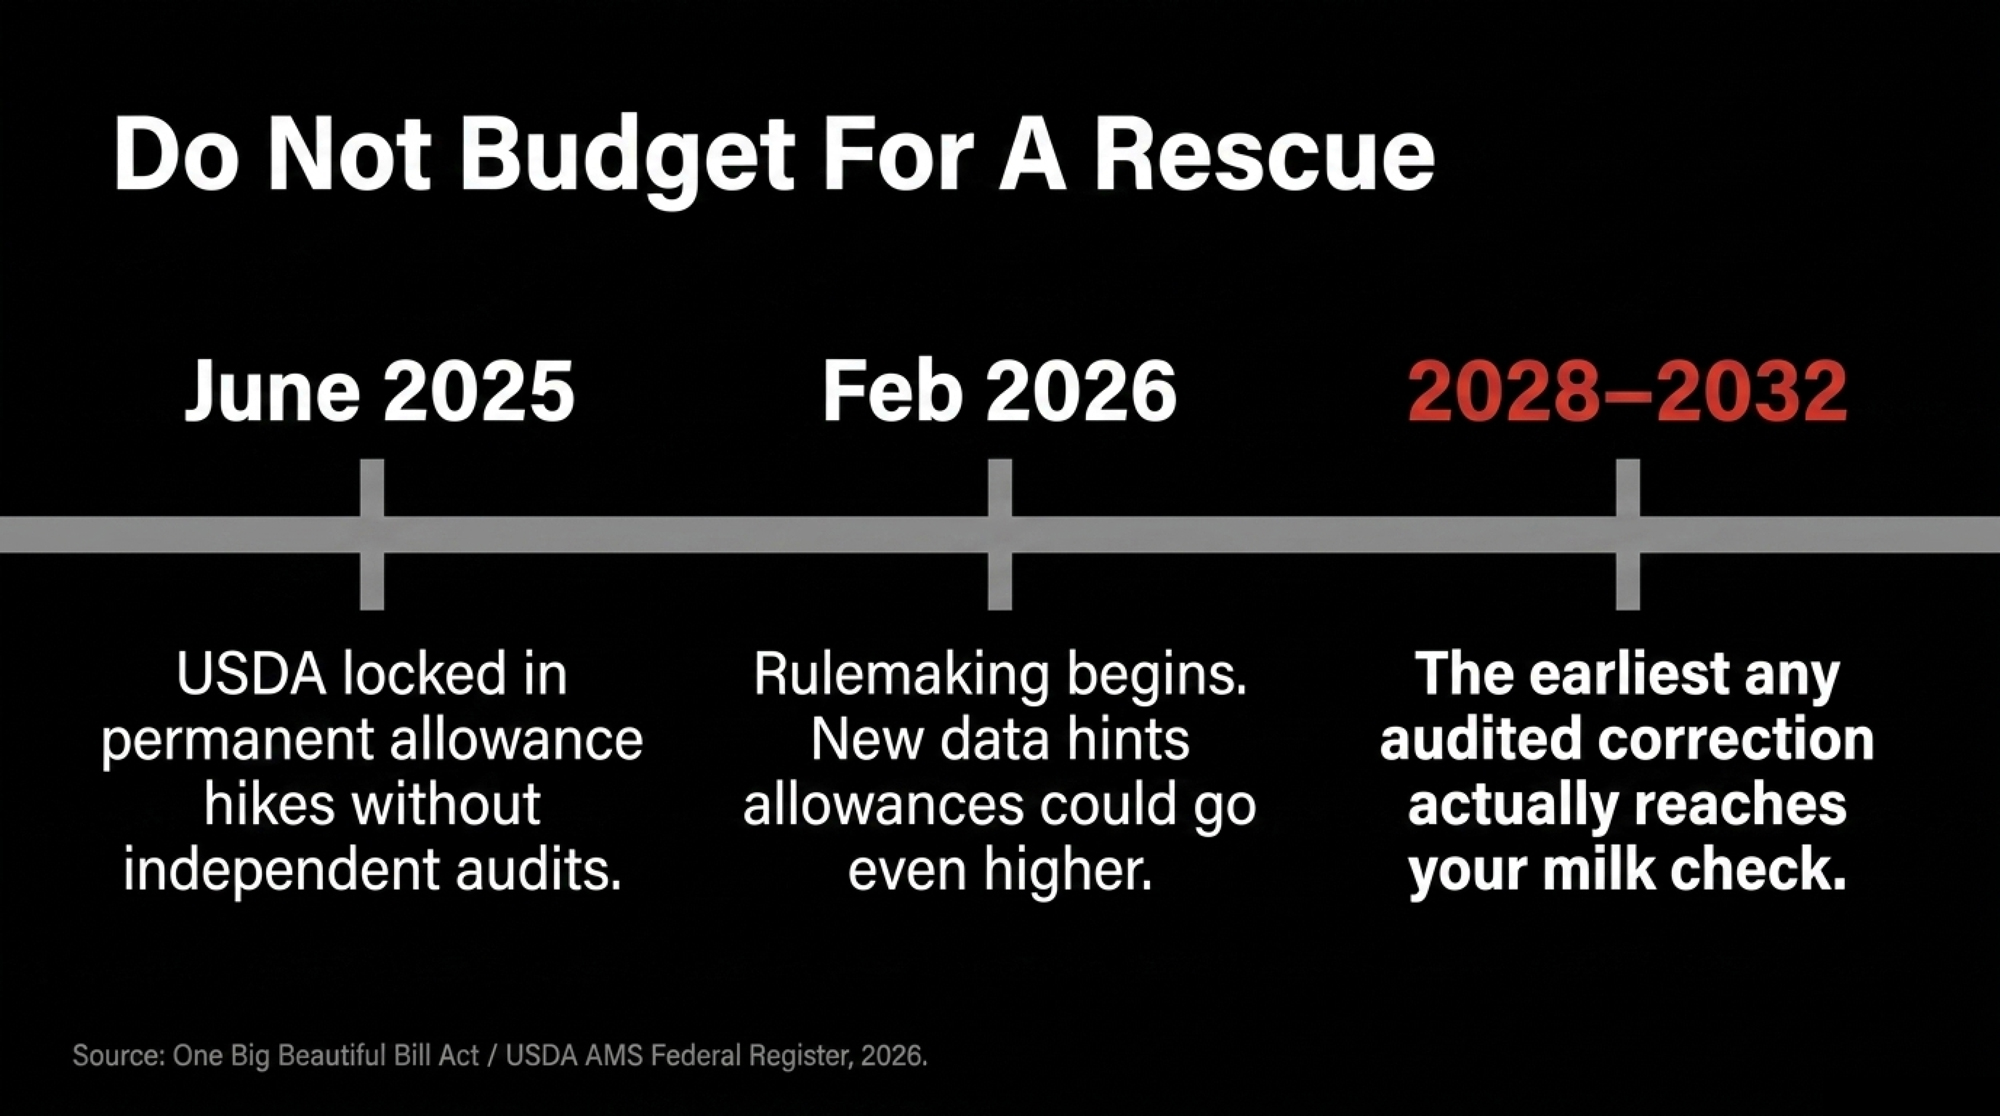
Will the Mandatory Cost Survey Actually Lower Your Make Allowance?
This is where the story turns on the people waiting for Washington to fix it. Producers assumed the reform’s cost data would eventually get audited, corrected, and walked back. The first part is happening. The second might go the wrong way.
The 2026 Reality Check: The permanent, nationwide formula that did five figures in damage to mid-sized herds was built on voluntary processor cost surveys that USDA never independently audited before locking them in.
AFBF’s Munch called the increase “very disappointing because it’s based on voluntary processor cost-of-production surveys and doesn’t necessarily reflect the true cost of production” (Brownfield Ag News, July 8, 2024). A number doing that kind of damage was set without independent verification.
Congress agreed that wasn’t good enough. The One Big Beautiful Bill Act, signed on July 4, 2025, mandates biennial, audited processor cost surveys and allocates $9 million for them. USDA is moving — AMS issued an Advanced Notice of Proposed Rulemaking on Feb. 27, 2026, and released an updated 2021 processing-cost study covering 61 plants (USDA AMS; Federal Register, Feb. 27, 2026). As of July 12, 2026, the mandatory-survey rule wasn’t finalized.
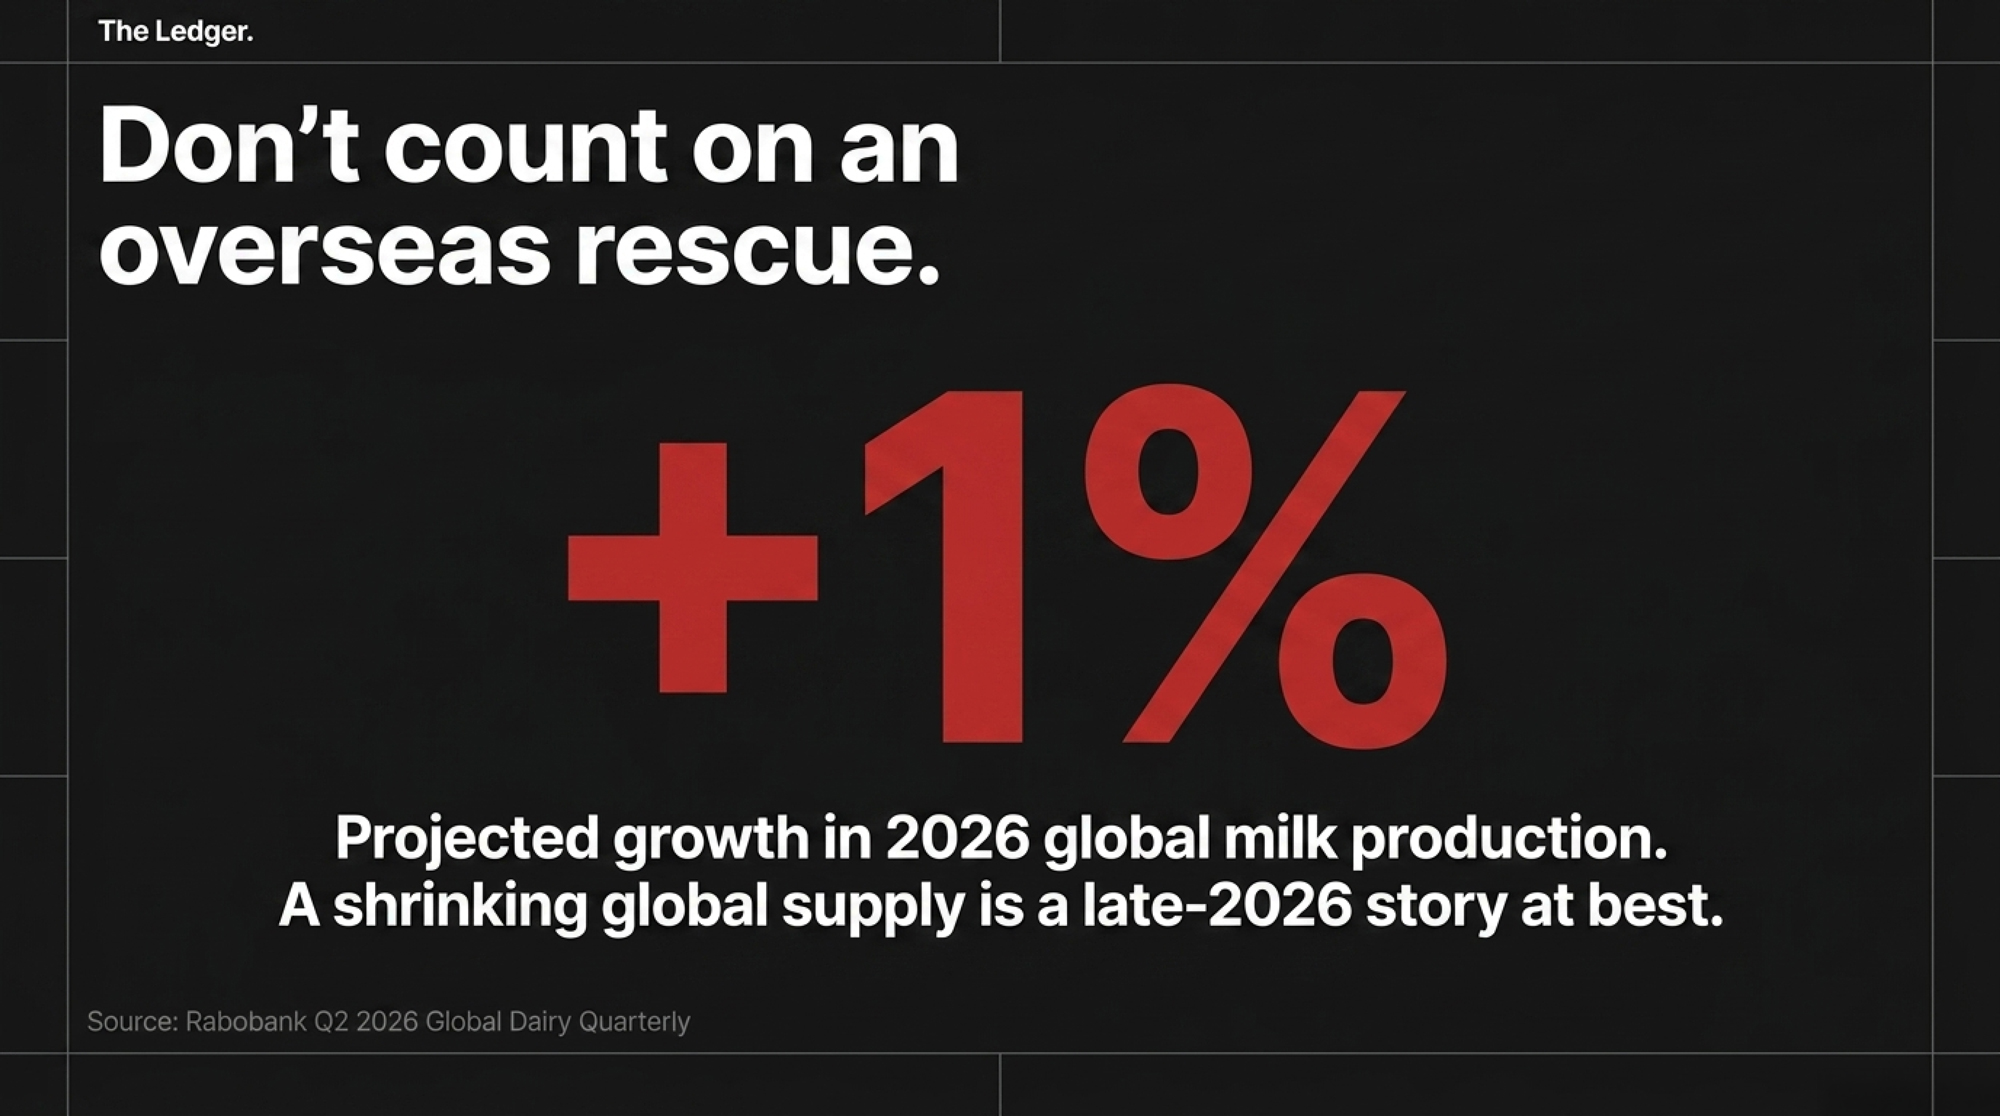
Read the study before you cheer. It suggests costs have climbed enough that allowances on cheese, whey, and NFDM could go higher, not lower — only butter looks like it drops (AFBF Market Intel, Feb. 13, 2026). And on Munch’s read, any change is unlikely to reach milk checks before 2028, with the full hearing track pointing closer to 2031–2032. The audit is coming. It might raise your drag, and it won’t arrive fast. Plan around that, not around a rescue.
How Do You Size Your Own Loss in 20 Minutes?
You don’t need the full component math. Take your annual Class III cwt and multiply by roughly 90¢–$1.01 — that’s your working estimate of the yearly formula drag. Then check it against reality. Pull your blended $/cwt from April–May 2025 (before reform) and set it alongside July–September 2025. Strip out the known Class III/IV and butter moves. Whatever gap is left over and unexplained above about 50¢/cwt, treat as structural drag, not a bad month.
If the leftover is 50¢ or more, you’ve found the formula in your own statement. For most mid-size herds, this ranges from $80,000 to $130,000 per year. That’s expansion-decision money, not coffee-shop-gripe money.
| Herd Size | Daily Production (lbs/cow) | Annual Class III cwt | Annual Formula Drag @ $1.01/cwt |
|---|---|---|---|
| 200 cows | 70 | 51,100 cwt | $51,611 |
| 400 cows | 70 | 102,200 cwt | $103,222 |
| 500 cows | 70 | 127,750 cwt | $129,027 |
| 500 cows (80 lbs/day) | 80 | 146,000 cwt | $147,460 |
Size Your Loss —
Pencil It In Line A — Your annual Class III milk: __________ cwt
Line B — Your drag estimate: $0.90 to $1.01 per cwt
Line C — Estimated annual formula drag: Line A × Line B = $__________
Gut check: Your blended $/cwt (Apr–May 2025) minus (Jul–Sep 2025), less known Class III/IV and butter moves = your unexplained gap. Over 50¢? That’s structural, not a bad month.
The 30/90/365-Day Playbook for Herds Like the Von Ruden Neighbor’s
30-Day Window — Urgent Checks
Pull your statements. Run the 20-minute audit above, comparing April–May 2025 to your recent 2026 checks.
- The trigger: any unexplained gap over 50¢/cwt is your structural formula drag.
- The danger: subtract genuine market and component moves first, or you’ll overstate it.
Isolate the cash flow. Put the drag on its own line in your ledger, separate from feed, DRP, or DMC.
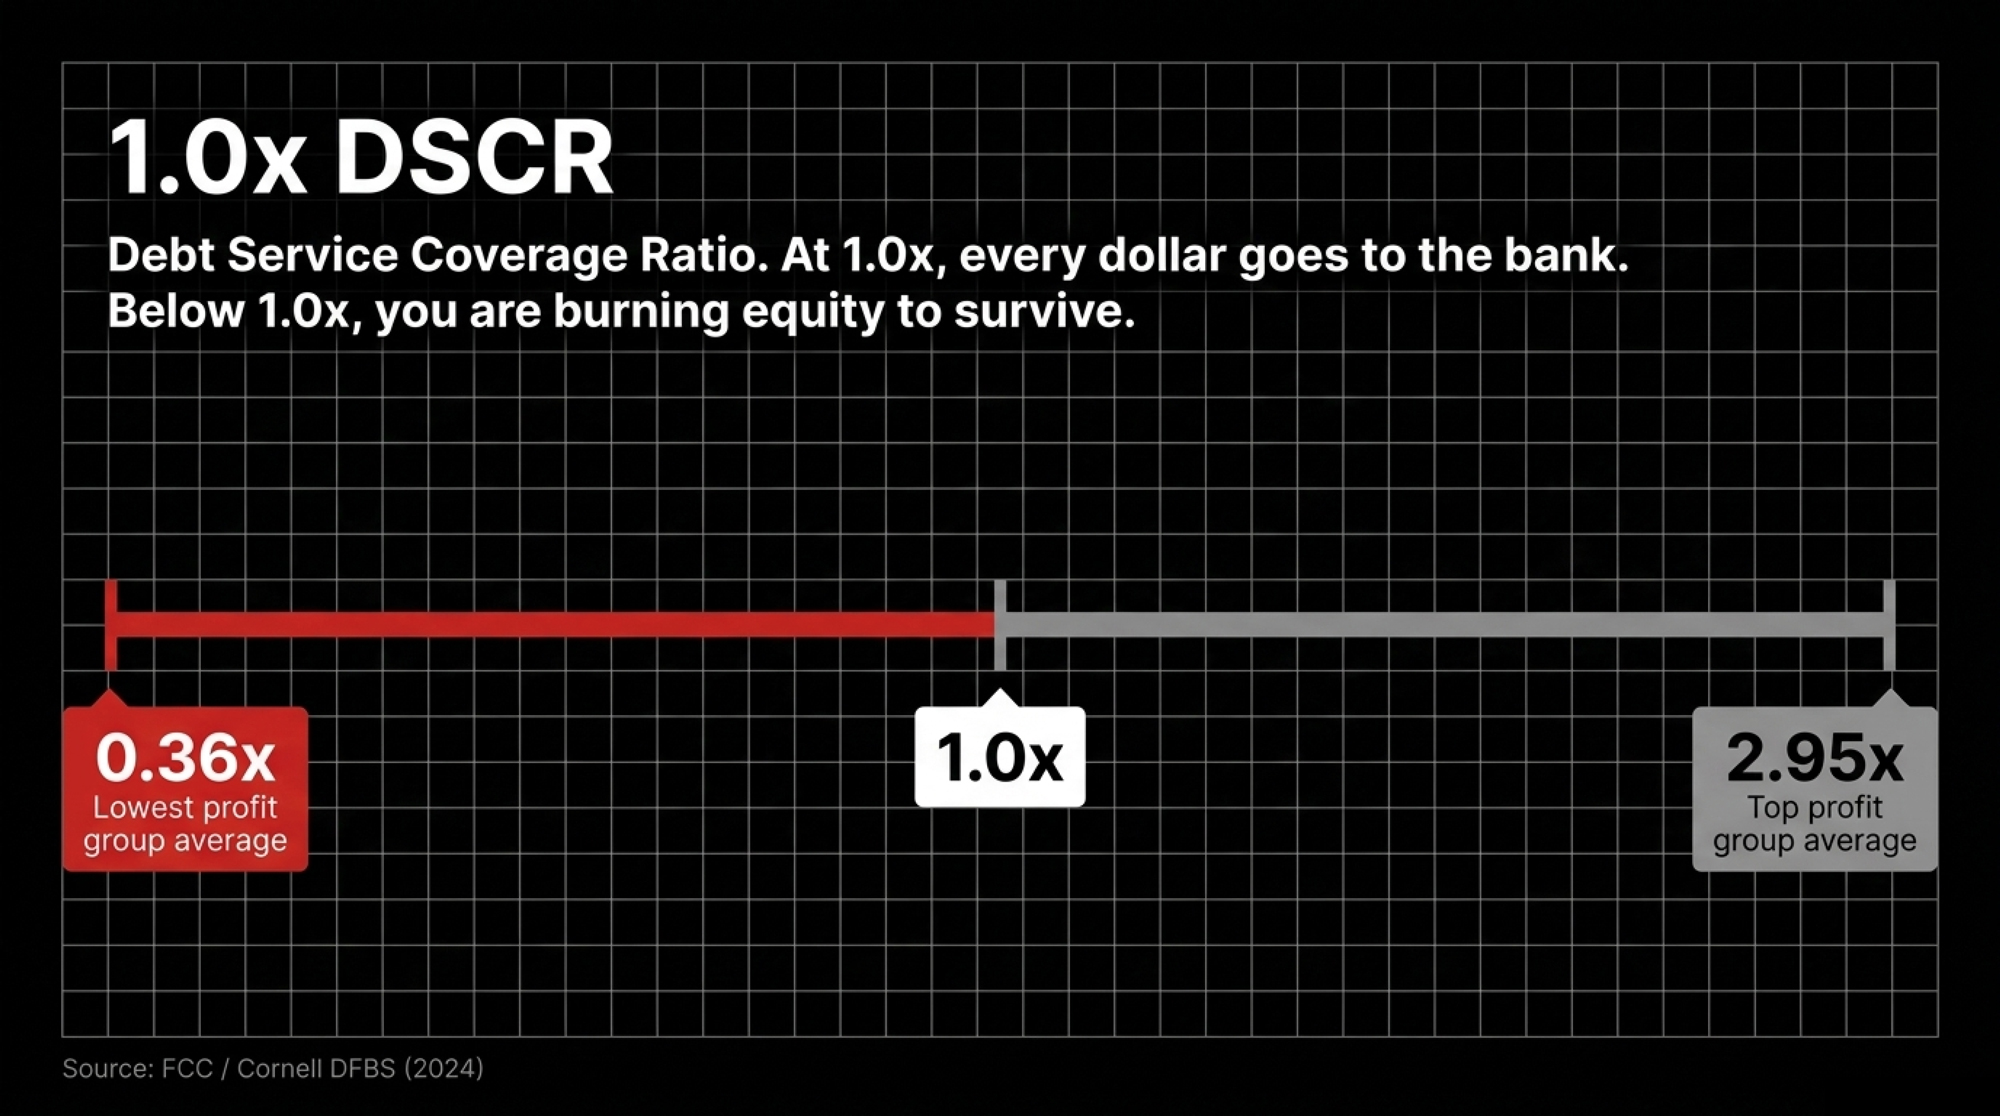
- The trigger: if your debt-service coverage has been below 1.2 for three straight months using your lender’s or CPA’s method, treat this as an operational emergency, not an academic one.
- The danger: a lender who sees the number buried inside “market” can’t help you plan around it.
90-Day Window — Structural Adjustments
Take the number to the table. Bring your documented $/cwt drag into your next operating-loan and co-op conversation, in writing, with herd size and order attached.
- The trigger: schedule it before your next renewal, not after.
- The danger: a round guess instead of your real number kills your credibility fast.
Stress-test your mix. Review your class breakdown and whether component or manufacturing shifts change your exposure.
- The trigger: if you’re heavily Class III in the Upper Midwest or Northeast, you’re carrying the top of the 85¢–$1.01 range.
- The danger: don’t chase a class mix that wrecks your milk market or hauling economics to dodge a formula.
365-Day Window — Strategic Positioning
Get on the record. The mandatory-survey rulemaking is live now — comment with your herd size, order, and real drag.
- The opportunity: this is a rare window in which a documented farm-level number carries weight. Anonymous aggregate losses don’t move USDA. Named math does.
- The danger: comment periods close. Miss it, and you’re arguing after the number is locked.
Budget for no rescue. Plan your multi-year path as if relief doesn’t reach checks before 2028 — and could tilt against you if cheese, whey, and NFDM allowances rise.
- The opportunity: if your margin over feed holds while your structural drag is fully accounted for, you’ve got room to make cull, expansion, or refinancing calls on real numbers instead of hope.
- The danger: expanding on the assumption the audit walks the drag back. It may not.
👉 Companion Analysis: For the line-by-line version of that first check, see Surviving the $0.94/cwt Dairy Make Allowance Hit (April 19, 2026) — how a 400-cow dairy separates formula effects from component and market moves.
Is This a Temporary Dip or a Permanent Shift?
Not close. The loss is structural, and it stays until the allowances change through regulation — a process that, on Munch’s read, likely won’t affect your check before 2028 and could be pushed to 2031–2032. Every year you call this “a bad year” is a year you didn’t name the real problem. Name it, size it, build it into your plan. That’s the difference between Von Ruden’s neighbor knowing where his money went and just absorbing it.
Von Ruden has argued for years that U.S. producers need a more stable domestic price rather than chasing export volume (Wisconsin Public Radio, Jan. 9, 2024). You can agree or disagree with his fix. But the trade-off at the heart of this one is blunt. Processors got cost recovery; they say they needed it to keep plants running. You got a permanent per-cwt reduction built on cost figures nobody independently audited before they took effect. Both can be true — and only one of them shows up on your statement.
So before you accept anyone’s tidy explanation of why your check got smaller, run your own gap. Then ask the question that actually matters at your kitchen table: what’s your real margin over feed per cwt this month versus a year ago — and how much of that difference is the market, and how much is a formula you never got a vote on?
Key Takeaways
- At June 2026 prices, the make-allowance reform is pulling $1.01/cwt out of Class III — about $258/cow and roughly $129,000 a year on a 500-cow herd. That’s formula, not market, and it’s permanent.
- A cheese rebound won’t save you. Higher cheese raises the number the allowance gets subtracted from, so the dollar stays whether prices are up or down.
- Run the 20-minute check: compare your blended $/cwt from April–May 2025 to recent 2026, back out the known Class III/IV and butter moves, and anything unexplained over 50¢/cwt is structural drag. Put it on its own line in front of your lender.
- Don’t budget for a rescue. The audited cost survey won’t touch checks before 2028, maybe 2032, and could push cheese, whey, and NFDM allowances higher, not lower.
Run Your Numbers
Dairy Farm Corridor Score Calculator — This article gives you the $1.01/cwt make-allowance drag. The Corridor Score puts it in dollars for your operation, layers in your hauling cost, and flags whether your location is quietly turning that formula hit into a red-zone milk-check risk.
Complete references and supporting documentation are available upon request by contacting the editorial team at editor@thebullvine.com.
Learn More
- You Bred for Butterfat. Make Allowances Took $337M – and Retailers Took the Provenance Premium. — Exposes how the combination of hidden formula skims and unrewarded component gains leaves high-component herds holding an empty bag, while retail brands pocket the premium.
- The $15800 DMC Decision Every Dairy Needs to Make Before February 26 — Delivers the exact financial blueprint to extract missing premium savings from updated federal program tiers, helping mid-sized operations recapture cash leaking through the processing formula.
- The $16600 DMC Farm Bill “Win” vs a 0.9x DSCR: The 2026 Decision for 400‑Cow Herds — Dismantles the illusion of safety-net rescues by matching real debt-service realities against rigid cost formulas, arming producers with the raw math needed for hard operational calls.
 The Sunday Read Dairy Professionals Don’t Skip.
 The Sunday Read Dairy Professionals Don’t Skip.
Every week, thousands of producers, breeders, and industry insiders open Bullvine Weekly for genetics insights, market shifts, and profit strategies they won’t find anywhere else. One email. Five minutes. Smarter decisions all week.