










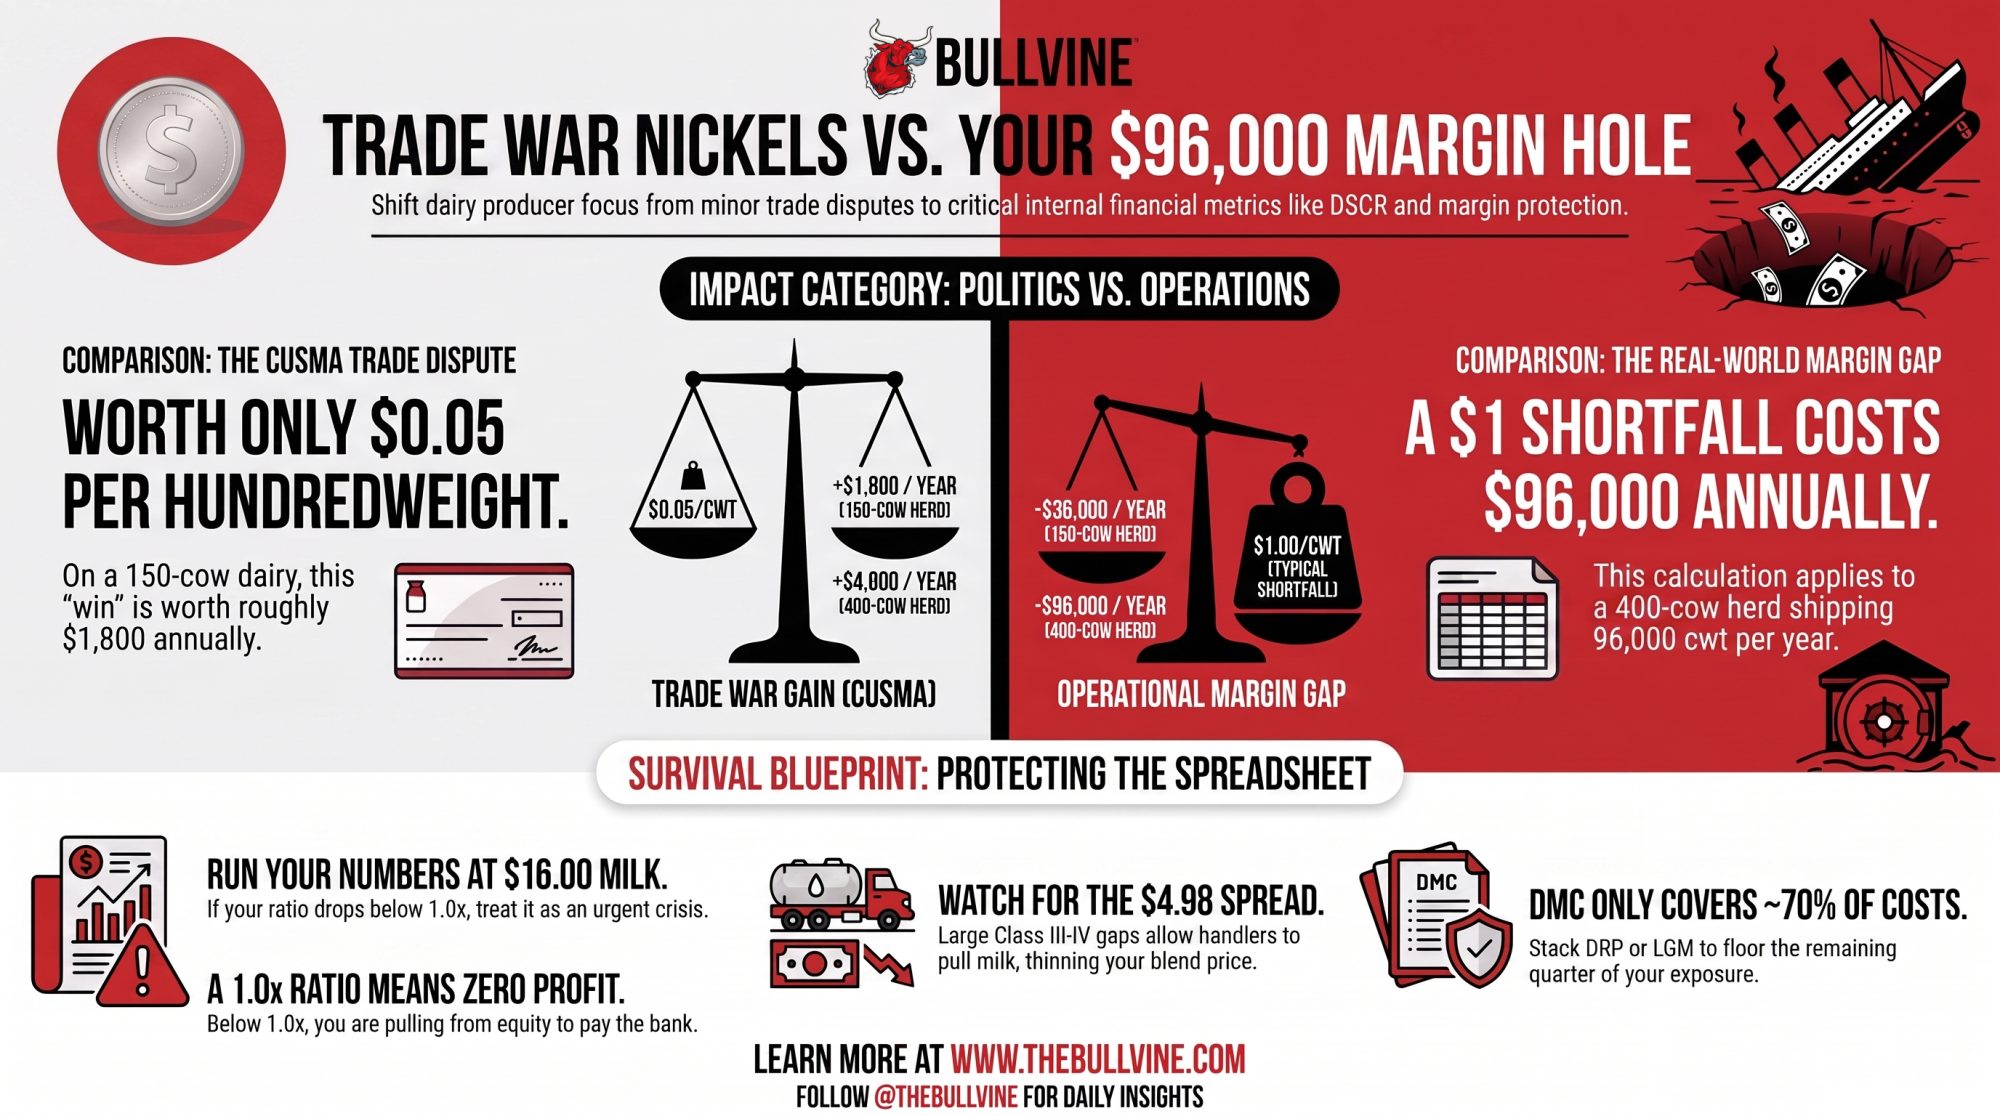
That border fight is worth about 5¢/cwt. The $96,000 hole already in your milk check is the one that decides if you’re still milking in 2030.
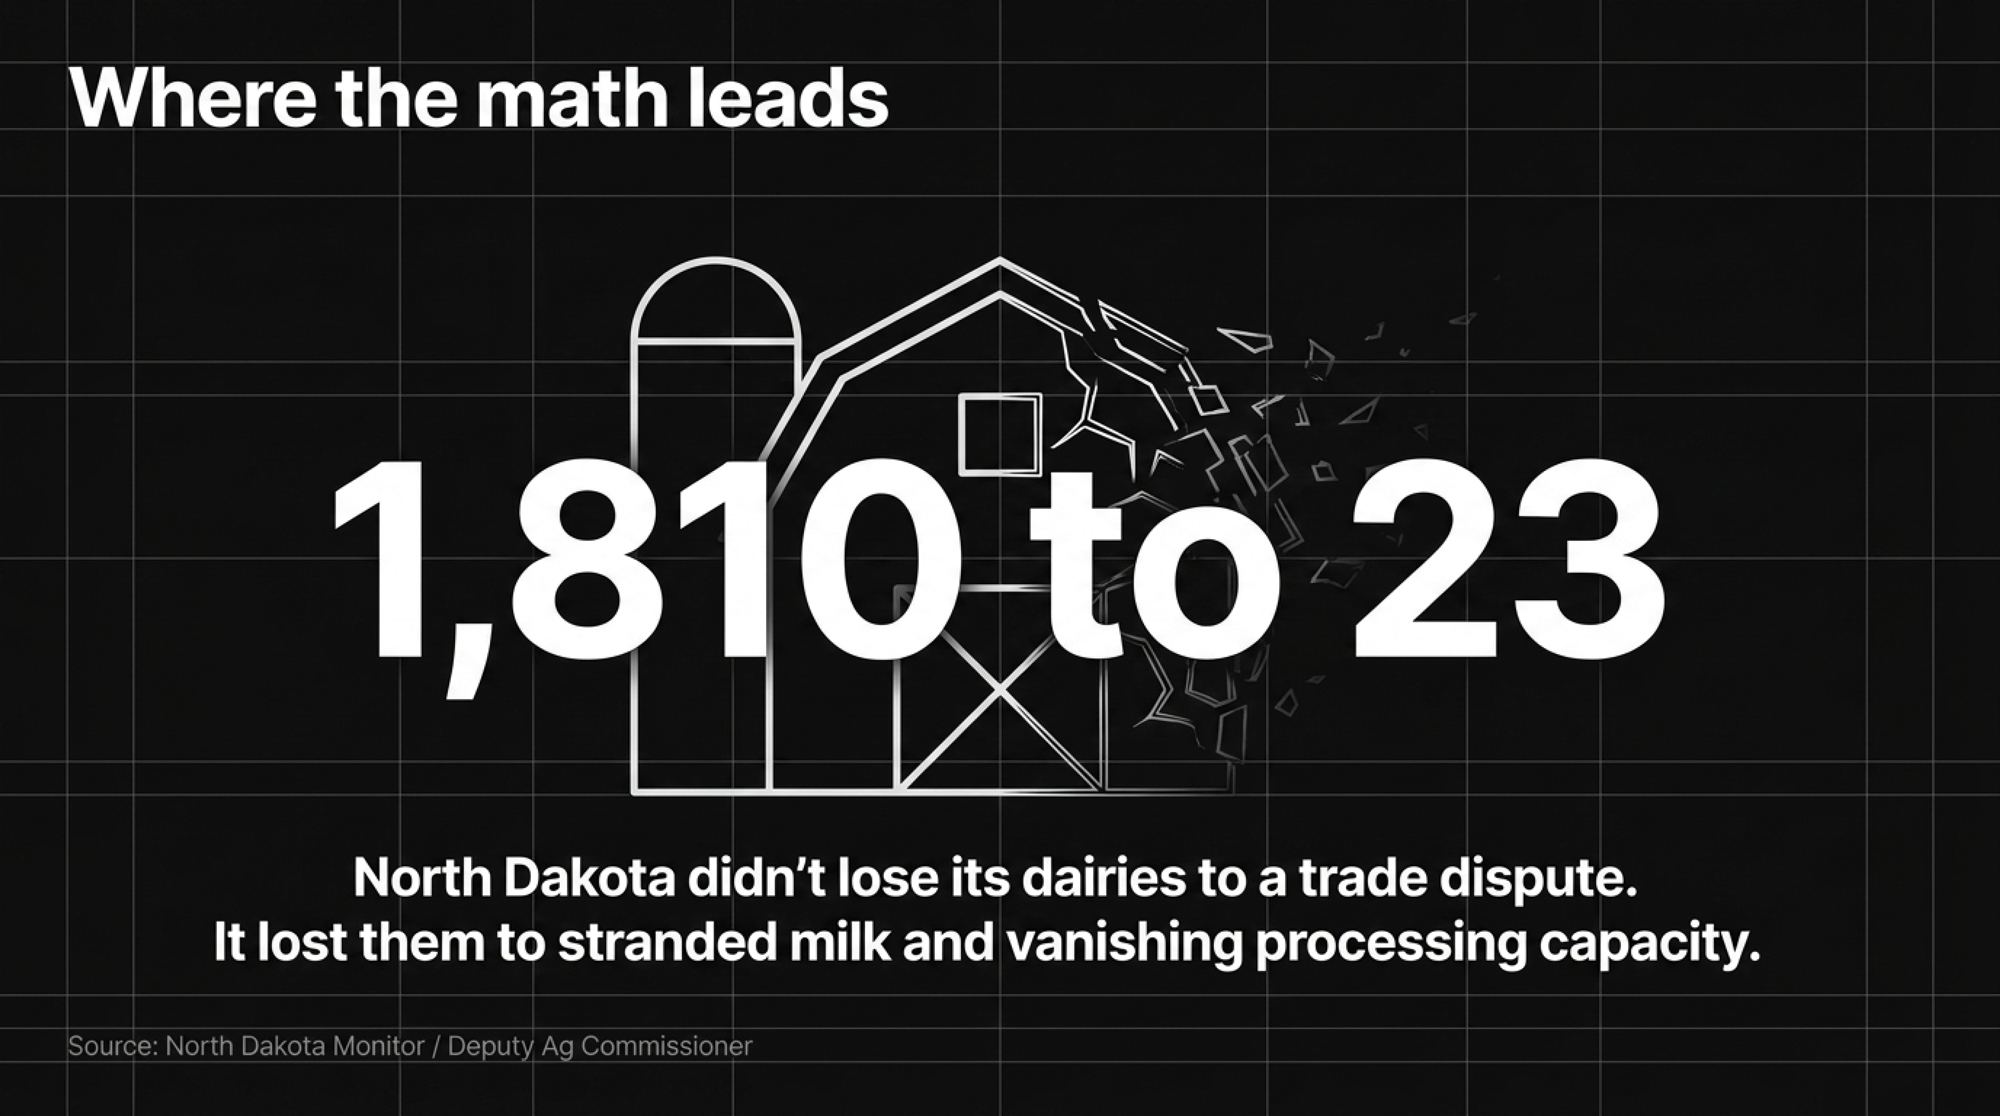
North Dakota once counted 1,810 dairy farms. By March 2025, Deputy Agriculture Commissioner Tom Bodine told state lawmakers just 23 permitted operations were left — one of them not even milking — running about 8,700 cows between them (North Dakota Monitor). That’s not a rough market cycle. That’s a state’s dairy industry going quiet, one processing plant and one lender conversation at a time.
Here’s the part that should stop you cold. While farms like those disappeared, the loudest fight in dairy policy has been about Canadian tariff quotas — a dispute that, run through the actual numbers, lands on your milk check as a nickel per hundredweight (USDA milk production data). The border fight has a flag and a villain. The thing pulling barns under has a spreadsheet and a month-end accounting entry. And it’s winning.
Do the Math on the $200 Million and It Shrinks to a Nickel
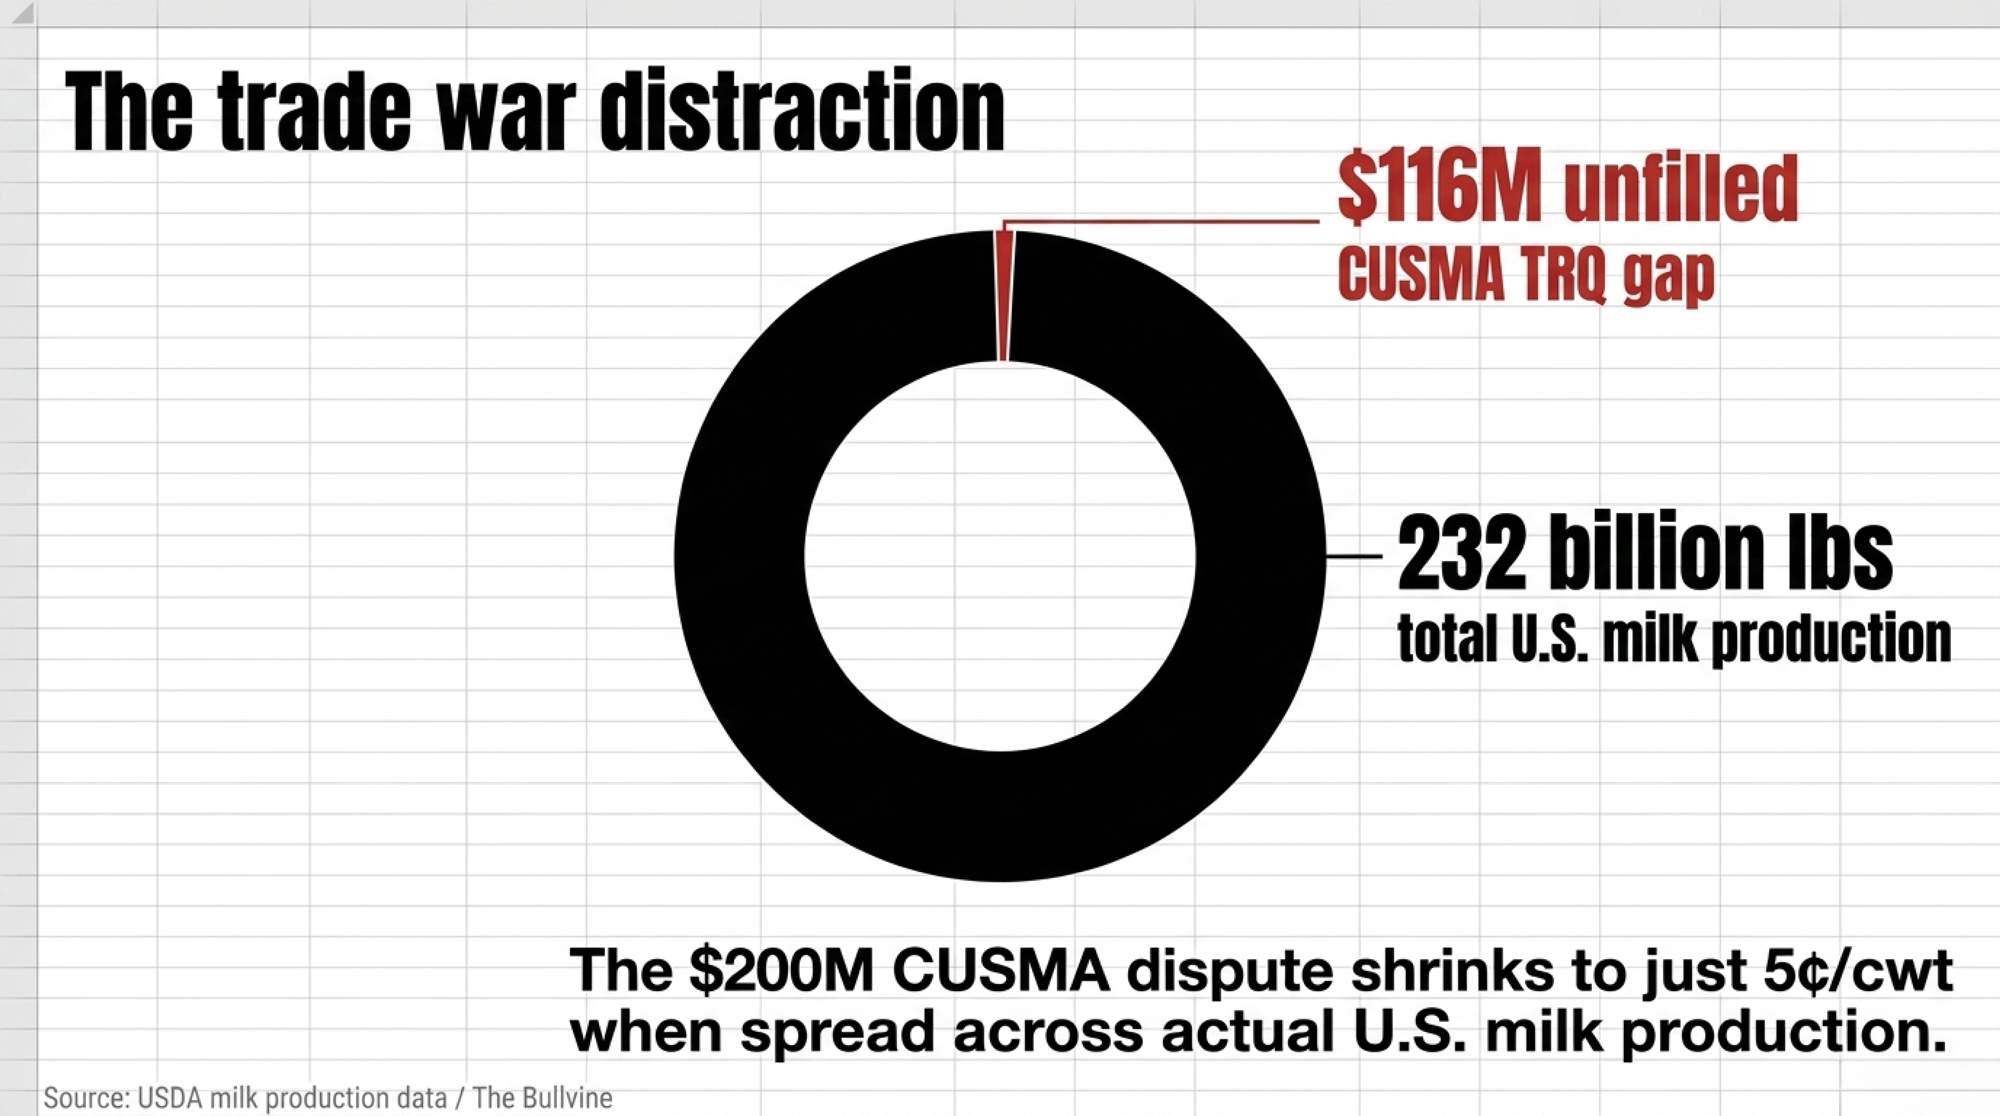
U.S. dairy groups say Canada owes them roughly $200 million a year in market access under CUSMA. Real money — until you spread it across the 232 billion pounds of milk this country produced in 2025. Divide the full $200 million across that production and you get about 8.6 cents per hundredweight. Because only 42% of the access actually gets used, though, roughly $116 million goes unfilled each year — and spread across production, that’s about a nickel per cwt.¹ (The Bullvine: North American dairy trade)
Economists Keith Head and Werner Antweiler said it plainly in a 2024 working paper: any remedy to the TRQ dispute “would likely result in only modest economic gains to the United States.” On a 150-cow dairy shipping around 24,000 pounds per cow, that nickel is worth roughly $1,800 a year (Head & Antweiler, SSRN 2024). That’s the fight burning political capital in Washington and Ottawa through the 2026 review.
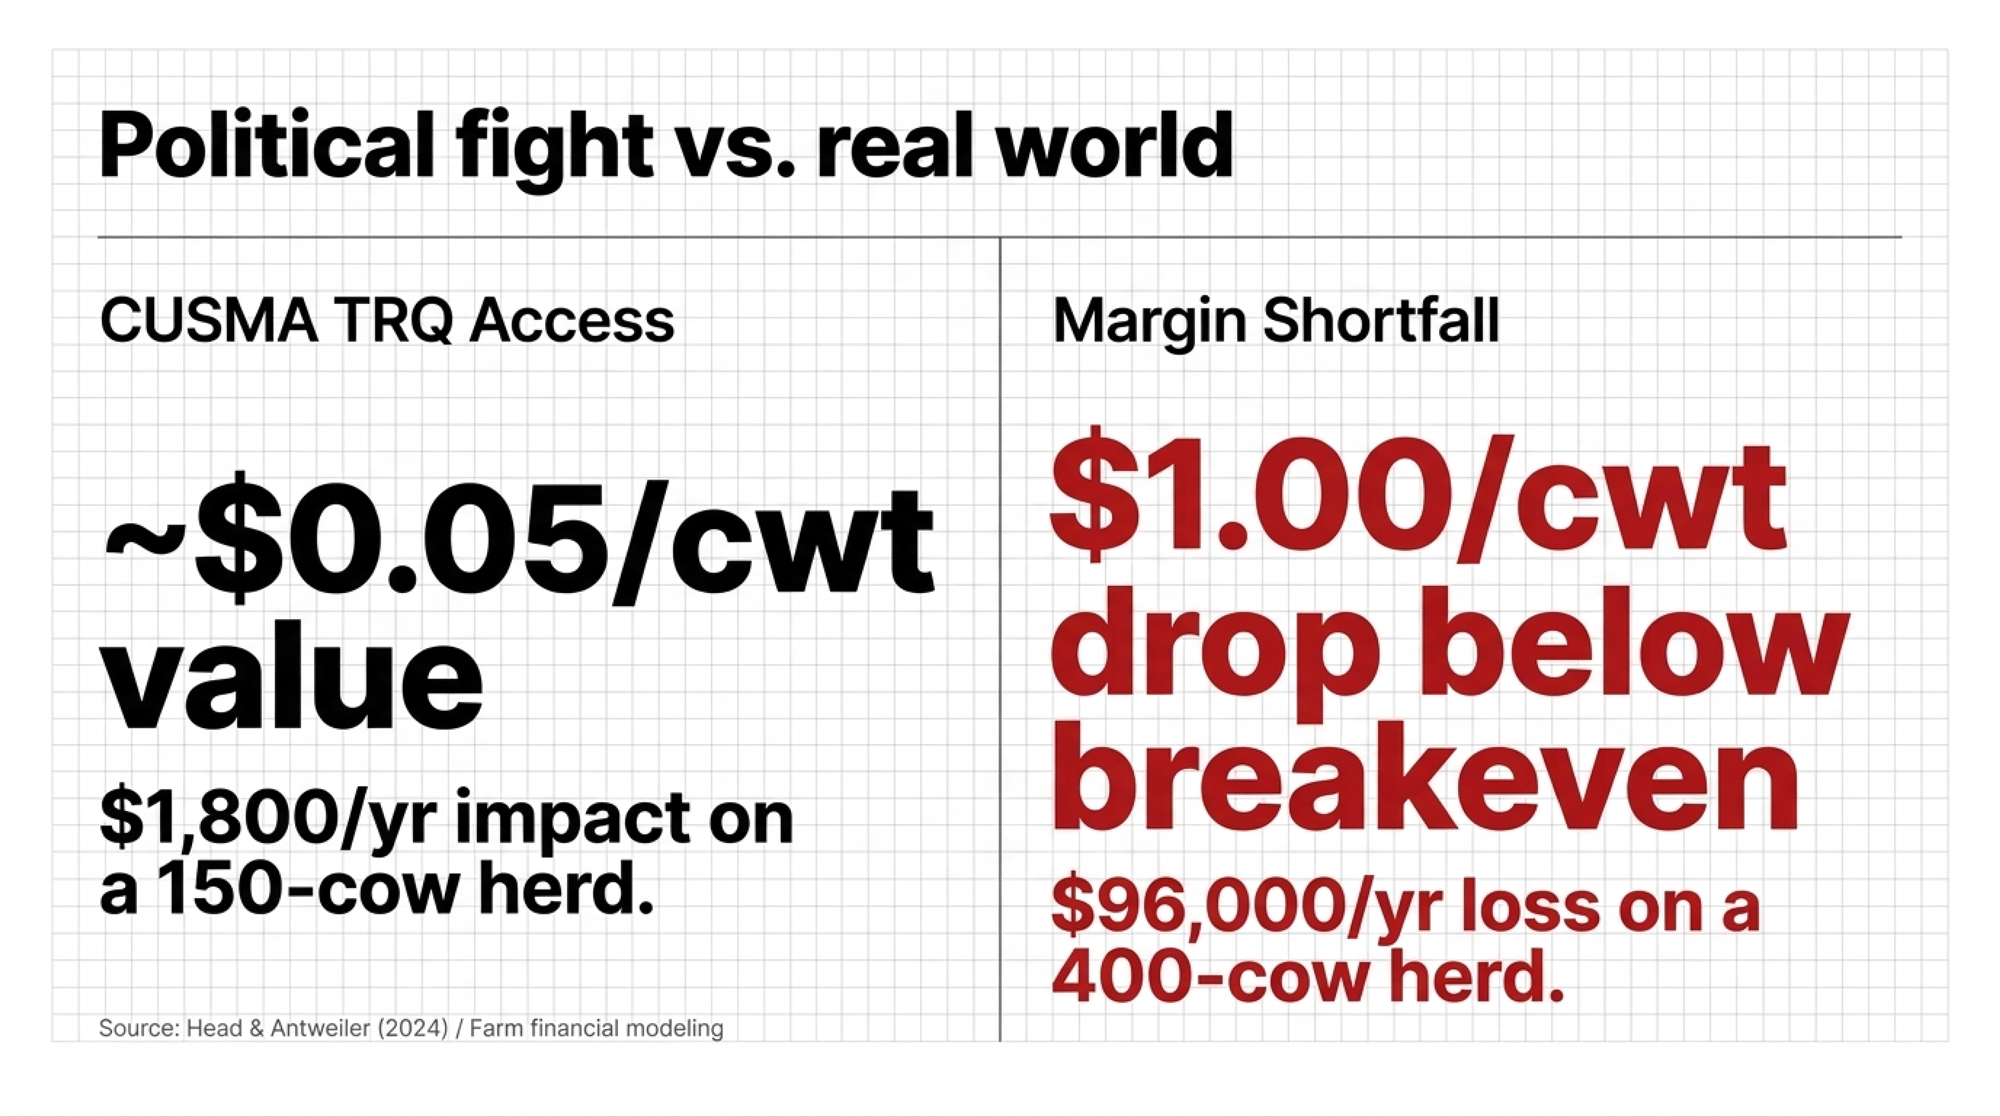
| Dimension | The Political Fight (CUSMA TRQ) | The Real-World Margin Pressure |
| Value per cwt | ~$0.05/cwt | Class III drop to $14.59/cwt (Jan 2026) |
| Annual impact, 150-cow herd | ~$1,800/yr | — |
| Annual impact, 400-cow herd | — | $96,000 lost on a $1/cwt shortfall |
| What it actually decides | Burns political capital in DC & Ottawa | Whether the bank pulls your credit line |
Now hold that nickel next to what’s happening inside your own milk check.
Fewer Farms, More Milk — and No Column for the Ones That Vanish
From the outside, dairy looks healthy. U.S. exports hit a record $9.51 billion in 2025, up 15% over the year before, and production set its own record (IDFA). Zoom in and the story flips.
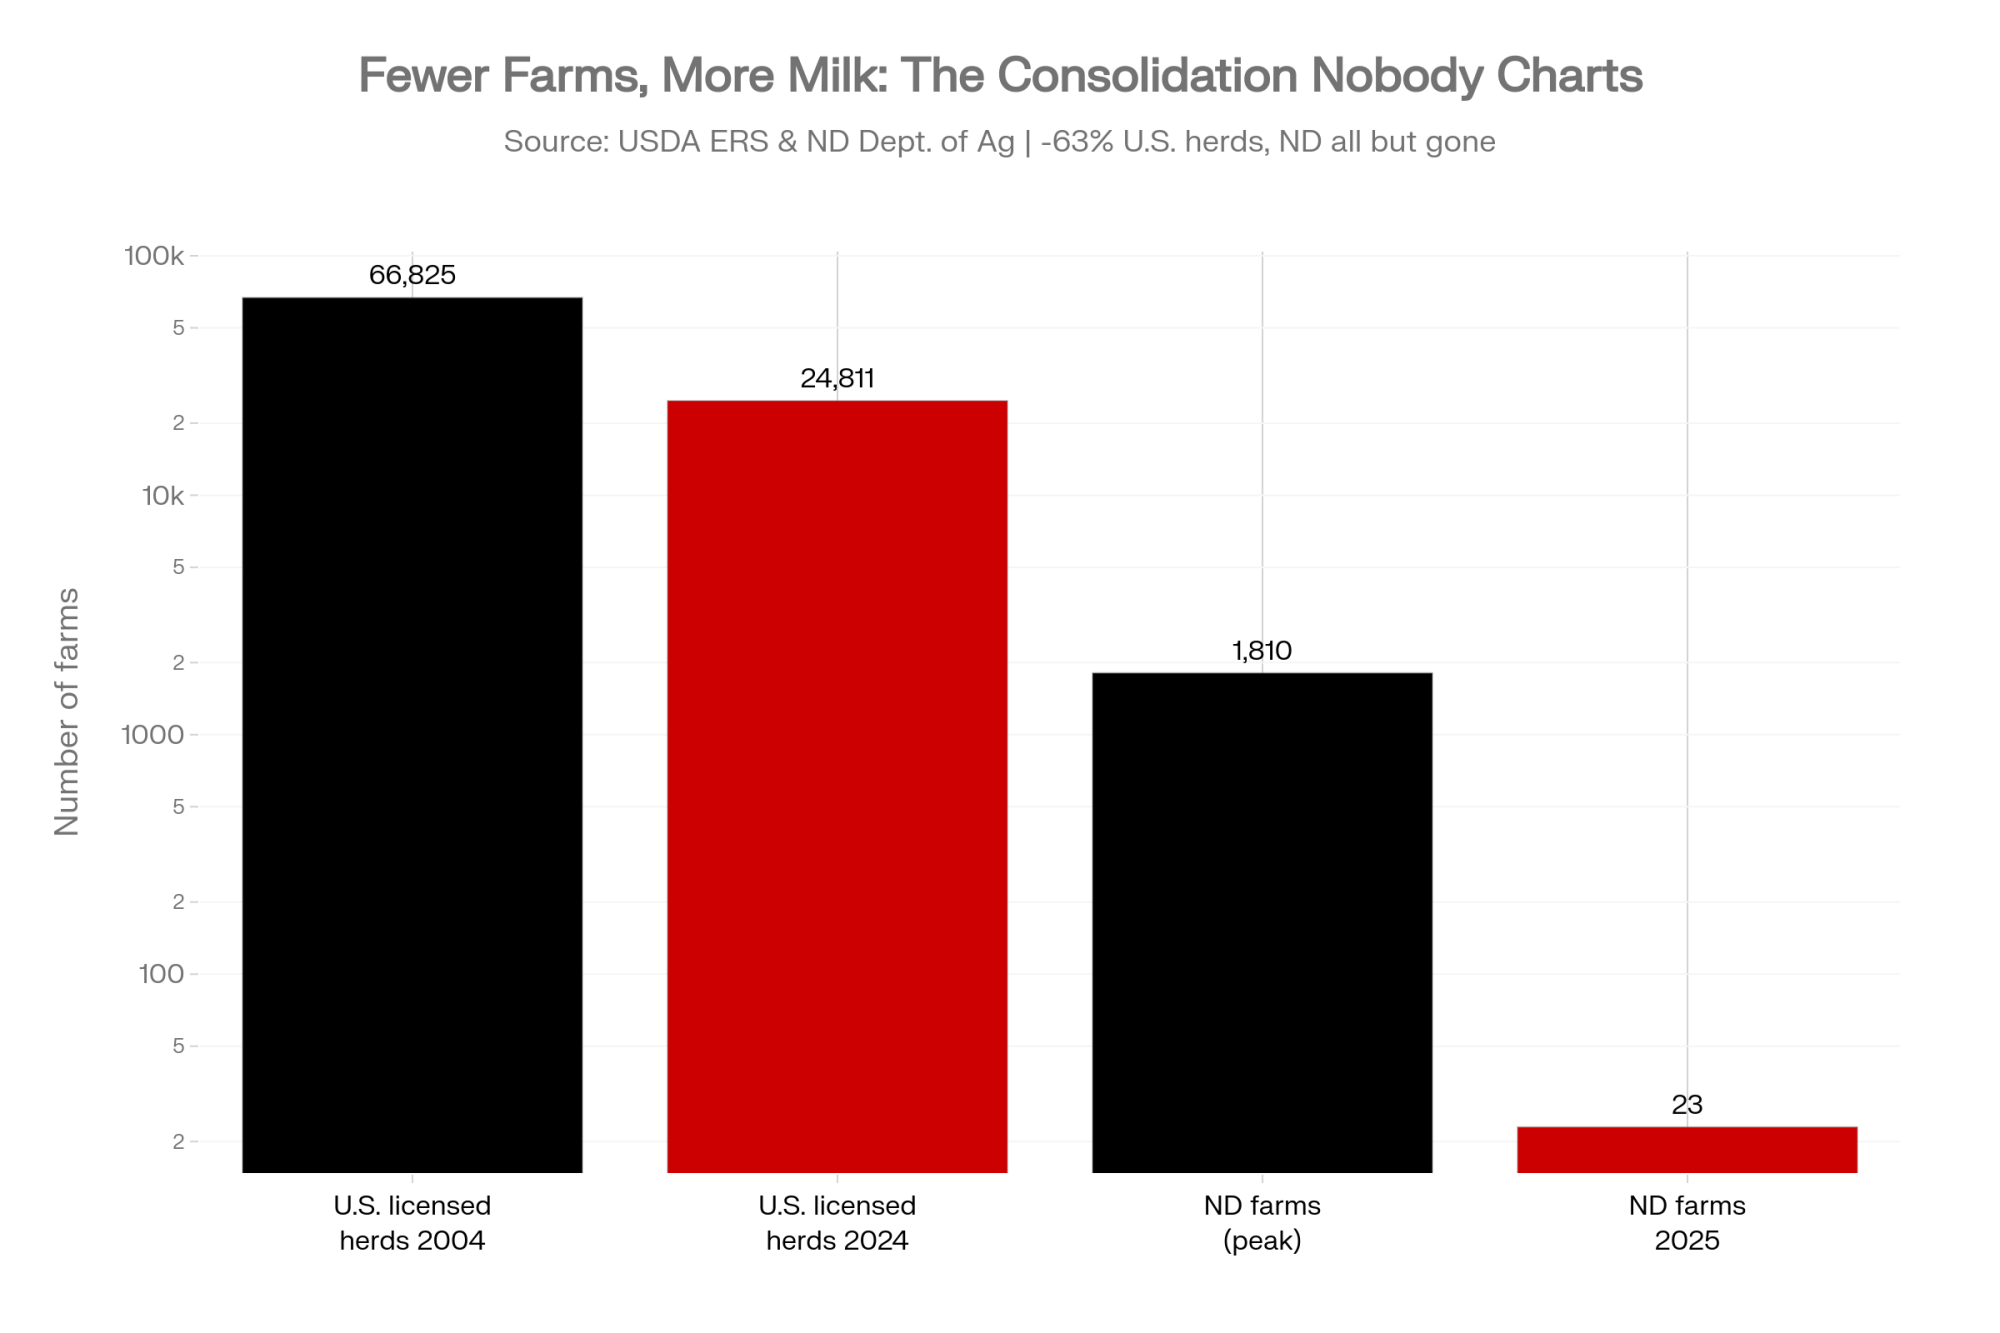
USDA’s Economic Research Service reports the number of licensed U.S. dairy herds fell 63% — from 66,825 in 2004 to 24,811 in 2024 — even as output climbed. The 2022 Census of Agriculture put the drop at 39% in just five years, with farms selling milk falling from about 39,000 in 2017 to 24,000 in 2022. Every herd size shrank except operations with 2,500 cows or more (USDA ERS). The dashboards driving dairy policy measure production, exports, and cost per unit — not how many families stay in business. ERS frames it as efficiency, and the numbers back that framing: in 2021, producing 100 pounds of milk cost $42.71 on herds under 50 cows versus $19.14 on farms with 2,000-plus. By that math, fewer, larger farms making more milk is a win. There’s just no line on the spreadsheet for North Dakota’s missing 1,787 dairies — where the consolidation curve is heading by 2035.
How This Plays Out on a Real Farm
A DSCR breach isn’t a number. It’s a sequence that lands on a real family over months.
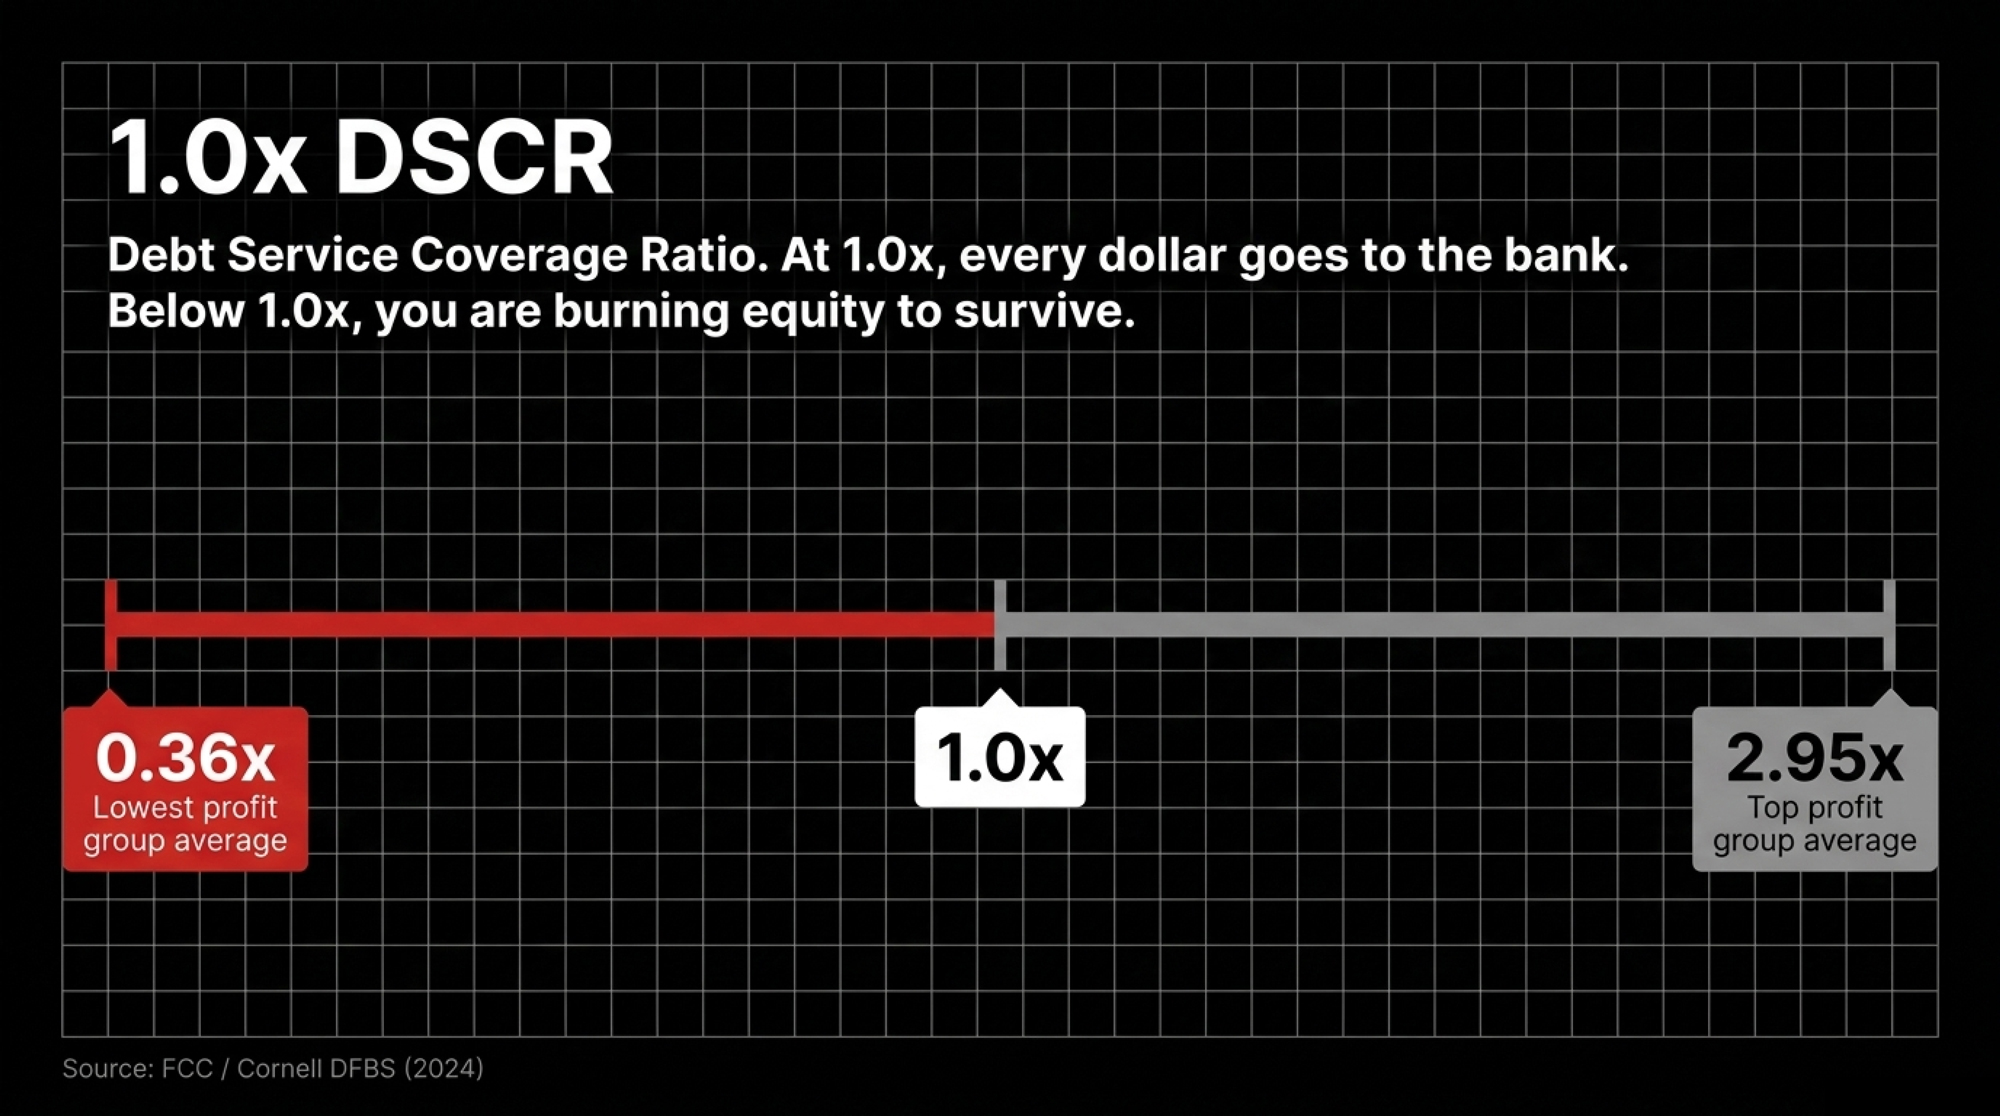
What DSCR means: Your debt service coverage ratio is the cash your operation throws off measured against the loan payments you owe. At 1.0×, every dollar of margin goes straight back to the bank — you’re running the parlor to break even with the lender, nothing left over. Below 1.0×, the milk check no longer covers the debt, and you’re pulling from equity to make the payment. (FCC)
North Dakota shows the squeeze in real time. As local processing capacity thinned out, the January 2026 Class III price had already dropped to $14.59 per hundredweight — the lowest since April 2021 — leaving farms with fewer places to send milk at a workable price. It got tight enough that Dawson Holle, whose family runs the 1,000-cow Northern Lights Dairy near Mandan, told a House committee they’d researched building their own processing — after being forced to switch milk markets twice (North Dakota Monitor). That’s the trap: it isn’t always low prices alone. Sometimes it’s the buyer disappearing and stranding your milk.
Run the barn math on a herd that size. On a 400-cow dairy shipping roughly 96,000 hundredweight a year — that’s about 24,000 pounds per cow — a $1/cwt shortfall against your breakeven is about $96,000 gone in twelve months. Stack that against the nickel the TRQ fight might return. One of those numbers decides whether you re-amortize the parlor note. The other you’ll never feel — how North Dakota’s processing collapse played out.
The $4.98 Spread Most Producers Never See Coming
Here’s the mechanism almost nobody in the trade conversation talks about: depooling. It’s a legal, disclosed feature of how voluntary pooling works — and it’s where the structural pressure quietly builds, in plain sight.
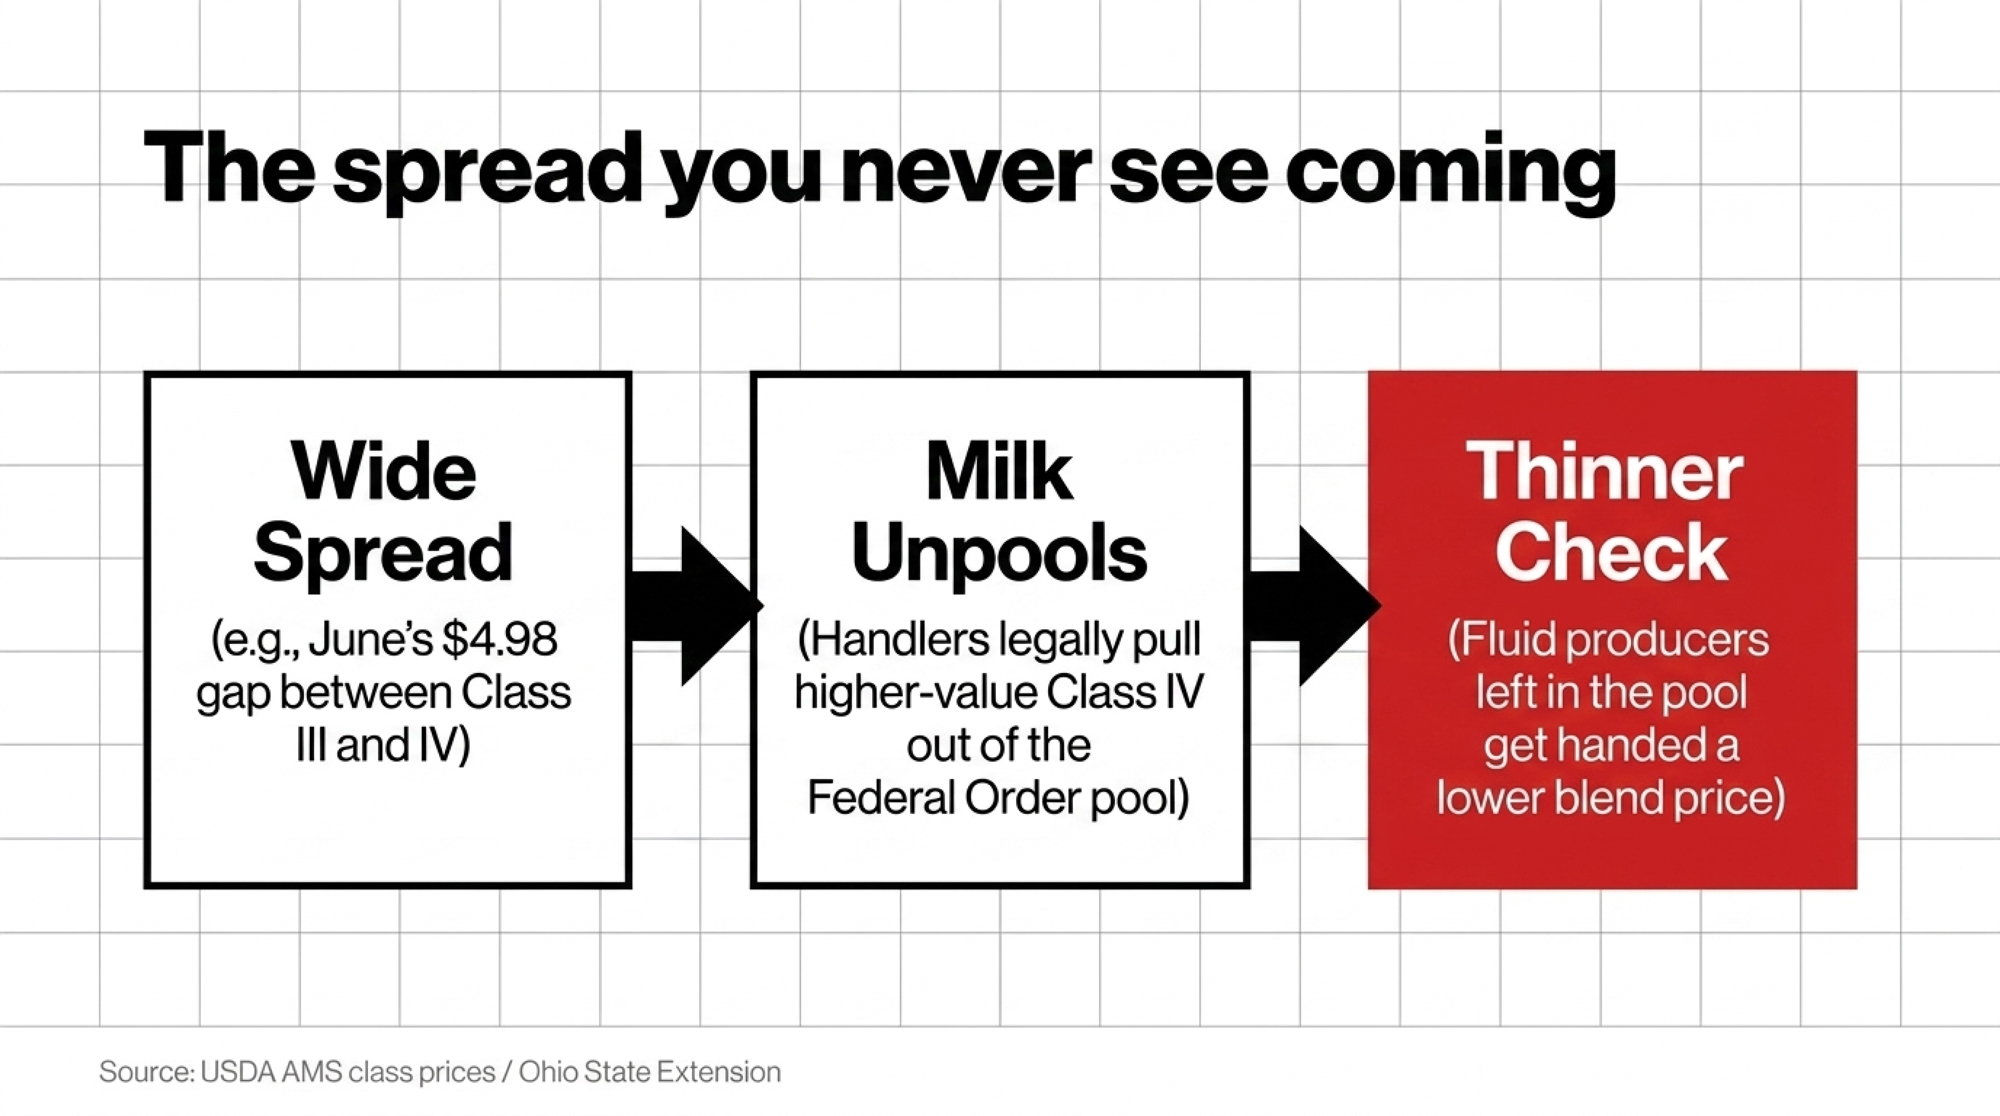
Under Federal Milk Marketing Orders, fluid milk has to be pooled, but manufacturing milk — Classes II, III, and IV — is pooled voluntarily. When a manufacturing-class price climbs well above the order’s blend price, a handler can simply choose not to pool it. As Ohio State’s dairy economists put it, “A Class II, III, or IV price which exceeds the Uniform price signals reduced pooling of that class.” The call gets made at month’s end, once every price is known. (Ohio State Extension)
Watch what happens when the spread blows out. In June 2026, USDA announced Class III at $15.98/cwt and Class IV at $20.96/cwt — a spread of $4.98 (USDA AMS class prices). That gap is a green light for handlers to pull their higher-value Class IV milk out of the Order pool. And when that milk walks out the door, the money it would have contributed to the blend walks with it — so the fluid producers left in the pool get handed a thinner blend price and choppier basis they never voted on. The decision is lawful and routine. But it’s made quietly at month-end, and the first place you notice it is your own check — how depooling thins your blend price.
How Much Does the TRQ Fight Actually Change Your Bottom Line?
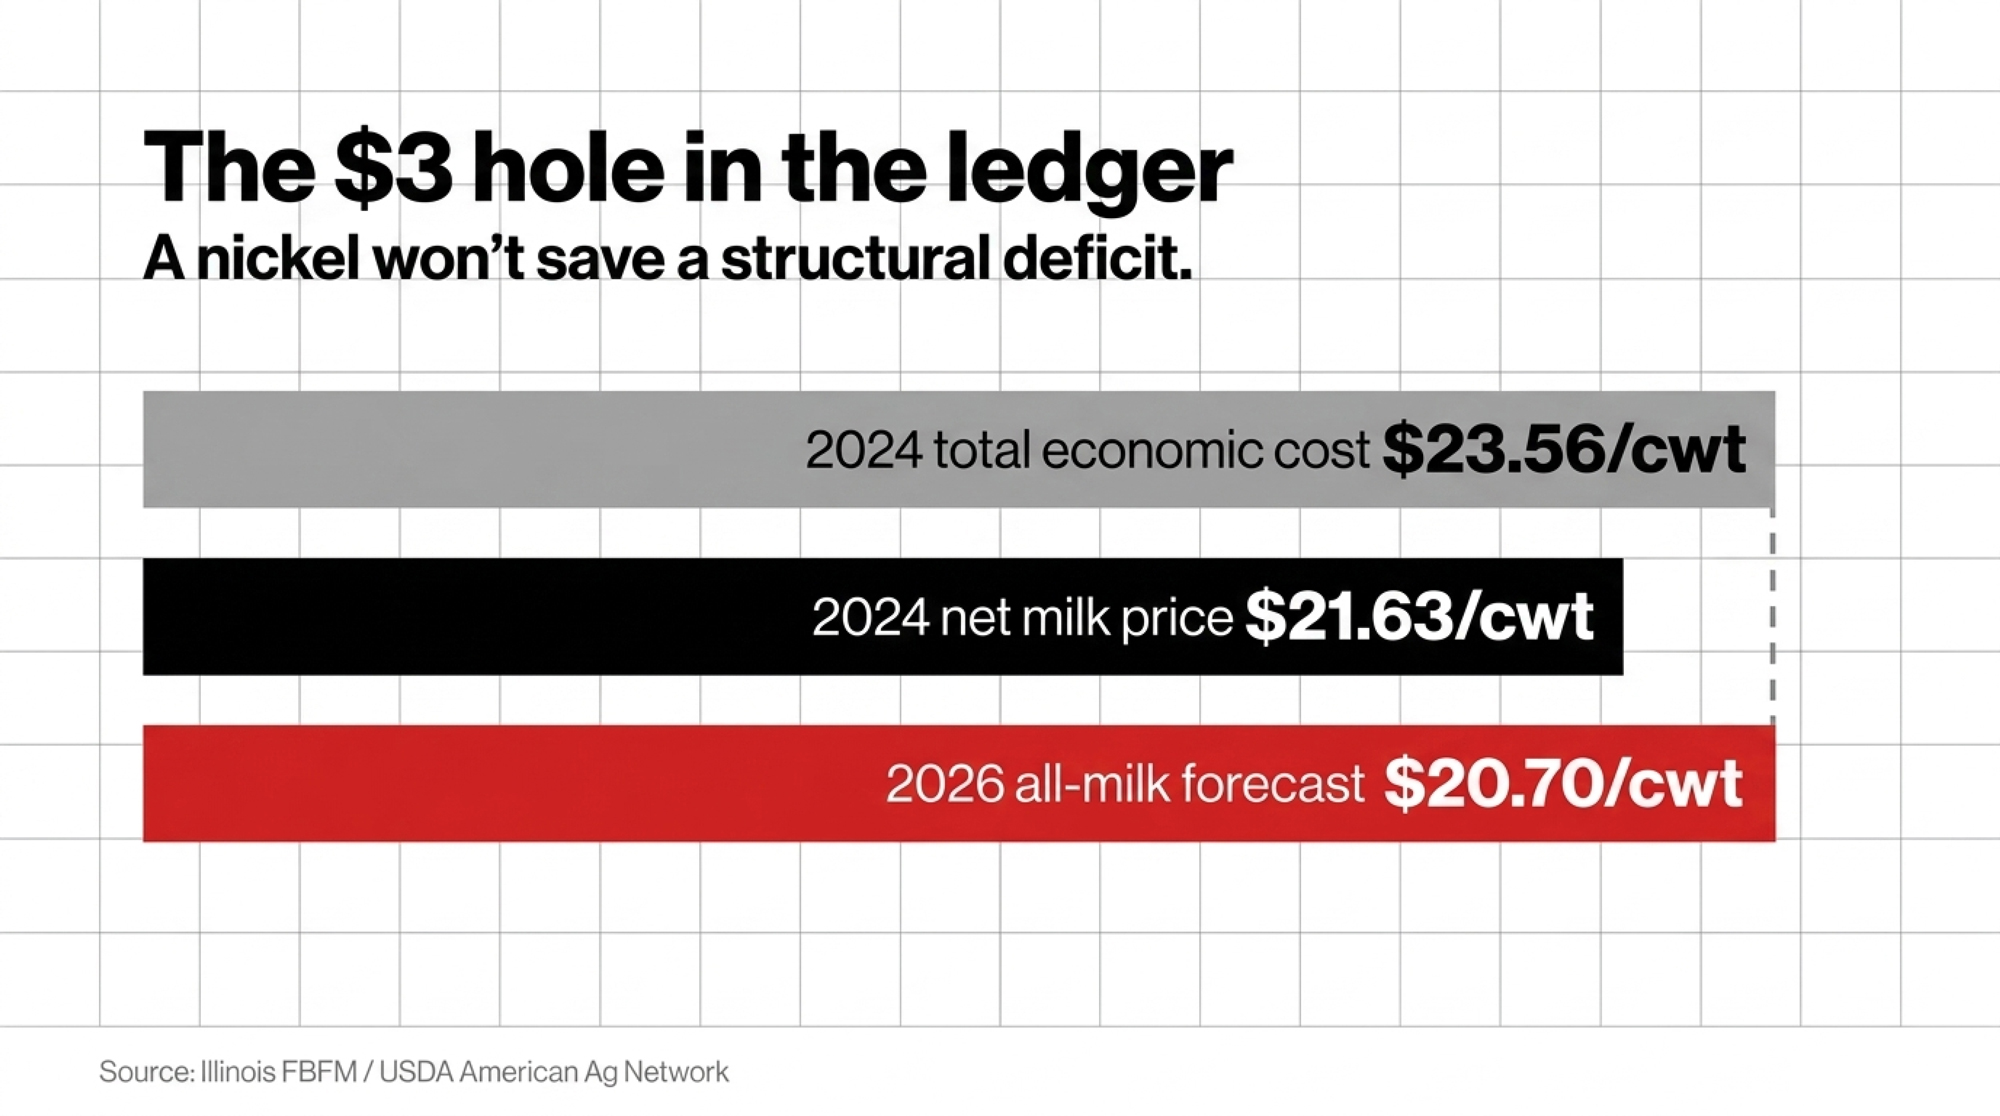
The answer is a hard no. Line up that political nickel against a real-world cost structure — Illinois FBFM pegged total economic cost, unpaid family labor and equity included, at $23.56/cwt for 2024, against a net milk price of $21.63, a loss of $409 per cow — with an all-milk price USDA now forecasts at $20.70/cwt for 2026 (American Ag Network). That gap is measured in dollars, not cents.
So if both sides “win” their version of the CUSMA review — full enforcement for the U.S., intact supply management for Canada — it doesn’t fix either farmer’s structural problem. It just decides who bleeds a little slower. Chasing the border fight while your own cost of production runs $3 over your milk price is a losing trade. Where does your breakeven actually sit right now?
Is Your Lender Already Seeing Trouble You Haven’t Named Yet?
Probably. Farm financial research shows lenders often see the strain building well before producers are ready to name it — they’re running rolling DSCR and margin models most farms aren’t (The Bullvine: The 18-Month Window). In that gap, the story a farmer tells himself is simple: we’ve milked through worse, we’ll milk through this. The bank’s spreadsheet already knows a multi-dollar structural gap doesn’t close with more hours in the parlor.
| Metric | Healthy Position | Watch Zone | Distress / Act Now |
| DSCR (Cornell DFBS 2024) | 2.95× (top group) | ~1.0× breakeven | 0.36× (lowest-profit group) |
| What the milk check covers | Debt + margin left over | Debt only, nothing left | Pulling from equity to pay |
| Total economic cost (IL FBFM 2024) | Below milk price | $23.56/cwt vs. $21.63 net | –$409 per cow |
| Lender response | Restructuring room | Stress test at $16 milk | Gets the letter, not the plan |
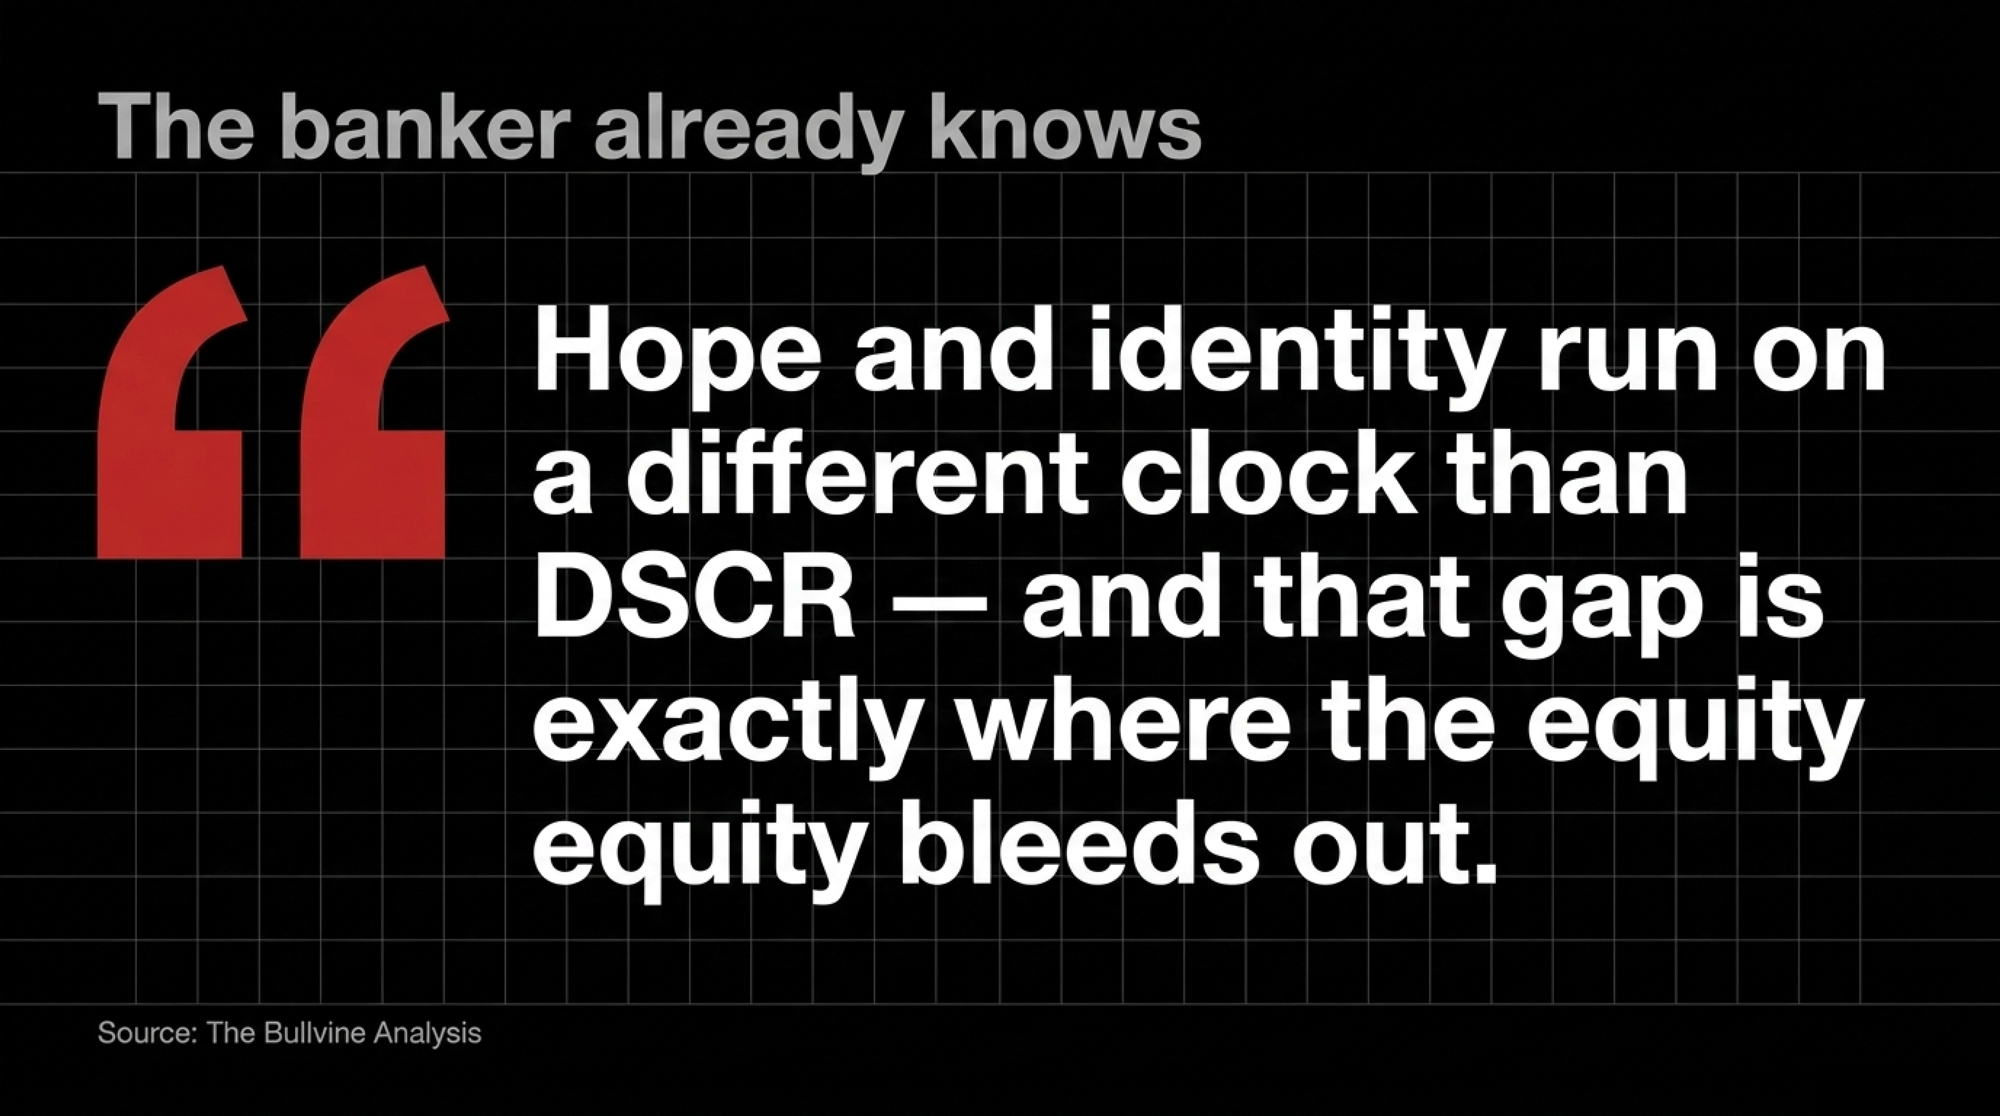
Cornell’s Dairy Farm Business Summary shows how thin the bottom end runs. In the 2024 DFBS, the lowest-profit group averaged about 0.36× debt coverage — roughly a third of what a healthy loan needs — while the top group ran 2.95×. The farms that get restructuring room walk into the bank with a stress test at $16 milk and a real plan. The ones that get letters walk in saying “it’ll turn around.” Hope and identity run on a different clock than DSCR — and that gap is exactly where the equity bleeds out. Run your DSCR before your lender does.
Your Four-Step Survival Blueprint
Nobody’s hopeless here. But the farms that get flexibility show up with numbers, not hope. Work these in order.
1. Run a rolling DSCR stress-test — within 30 days. Calculate your honest 12-month cost per cwt, then re-run your last twelve milk checks against $20.70, $18.00, and $16.00 milk (USDA ERS dairy outlook). Pay close attention if you’ve recently repriced operating or term debt into 7–8% money. The number might rattle you — that’s the point. On a leveraged herd, acting now instead of six months from now can preserve well into six figures of equity, per Bullvine’s exit-timing analysis.
2. Audit your handler’s utilization reports — monthly. Ask your cooperative or independent handler exactly where your milk pools each month. Watch whether Class IV depooling is shaving your basis when the Class III–IV spread stretches past normal — it hit $4.98 in June (USDA AMS). You may not have leverage to change it, but you can’t manage what you can’t see.
3. Layer secondary margin protection — quarterly. Basic Dairy Margin Coverage offsets just 67–74% of total costs for many operations, leaving a quarter or more of your real economic cost exposed (Farm Bureau). Stack Dairy Revenue Protection or LGM underneath DMC to floor the balance during sustained down-cycles. Premiums cost money up front, and no TRQ win rescues a negative-margin farm — survival still comes down to cost control.
4. Set a hard balance-sheet threshold — strategic horizon. Not everyone should stay, and the worst exit is the one the bank times for you. Identify the exact equity floor where a structured, 12-to-24-month orderly exit preserves family wealth. If your models show DSCR sliding past 0.86× with no processing relief in sight, transition early rather than letting a forced liquidation dictate terms (The Bullvine: 18-month countdown).
Key Takeaways
- If you haven’t run your DSCR at $20.70, $18.00, and $16.00 milk in the last 90 days, do it this week — that’s the number your lender is already watching.
- If your blend price or basis has gotten erratic, ask your handler where your milk pools before you blame the market — the June III–IV spread hit $4.98.
- If DMC is your only coverage, check whether it’s leaving a quarter of your costs uncovered, and whether DRP fills the gap.
- If your stress test drops below 1.0× DSCR, treat it as urgent, not strategic — acting at month 8 instead of month 14 can save well into six figures of equity on a leveraged herd.
- If you’re tracking CUSMA headlines closer than your own cost of production, you’re guarding the nickel and ignoring the $3/cwt hole.

Where’s Your Breakeven — Really?
North Dakota didn’t lose 1,787 dairies to a trade dispute. It lost them to processing that dried up, prices that ran under cost, and lenders who saw the math before the families were ready to name it. Even the Holles — a 1,000-cow operation with a legislator in the family and a state grant program on the books — looked at the cost of building their own plant and told The Bullvine, “We don’t know what we are going to do” (The Bullvine: From 1,810 Dairy Farms to 18). The 2026 review will keep making headlines. Your DSCR won’t make a single one.
A note on the count: North Dakota’s dairy tally varies by definition — Bodine’s March 2025 testimony cited 23 permitted operations, the Holles reported 18 Grade A farms in early 2026, and Dairy Star put the figure at 25 in mid-2025. All three describe the same collapse from a peak of 1,810. (North Dakota Monitor)
¹ Nickel math: $200M ÷ 232B lb = $200M ÷ 2.32B cwt ≈ $0.086/cwt. At 42% TRQ utilization, ~$116M goes unfilled, so the realized gap is roughly $0.05/cwt.
Learn More
- Small herd cost of production: the $20.70 milk trap — Exposes the deep structural asymmetries and processing limitations that leave mid-sized herds highly vulnerable, delivering a clear framework to evaluate whether scaling up or a planned transition protects your family equity.
- Class III Milk Price, DRP, and Your Spring 2026 Risk Plan — Reveals how identical 500-cow operations end up $15,000 apart in a single month based on pooling exposure, sorting your risk management into actionable defensive, balanced, or aggressive paths.
- June Dairy Month Turns 89 — and Farmers Now Keep Just 25¢ of Every Dairy Dollar — Dismantles the retail dairy value chain to show how downstream processors capture margins, arming you with the precise numbers to assess long-term survival against structural consolidation.
The Sunday Read Dairy Professionals Don’t Skip.

Every week, thousands of producers, breeders, and industry insiders open Bullvine Weekly for genetics insights, market shifts, and profit strategies they won’t find anywhere else. One email. Five minutes. Smarter decisions all week.
