Archive for Farm Economics & Management

A 200-Cow Dairy Can Afford $268,683 in H-2A Costs and Still Be Denied

Replacing half a crew costs $268,683 under current Virginia wage floors. But as the June 17 USCIS memo proves, clearing the financial hurdle doesn’t mean you clear the regulatory one.
H-2A dairy costs
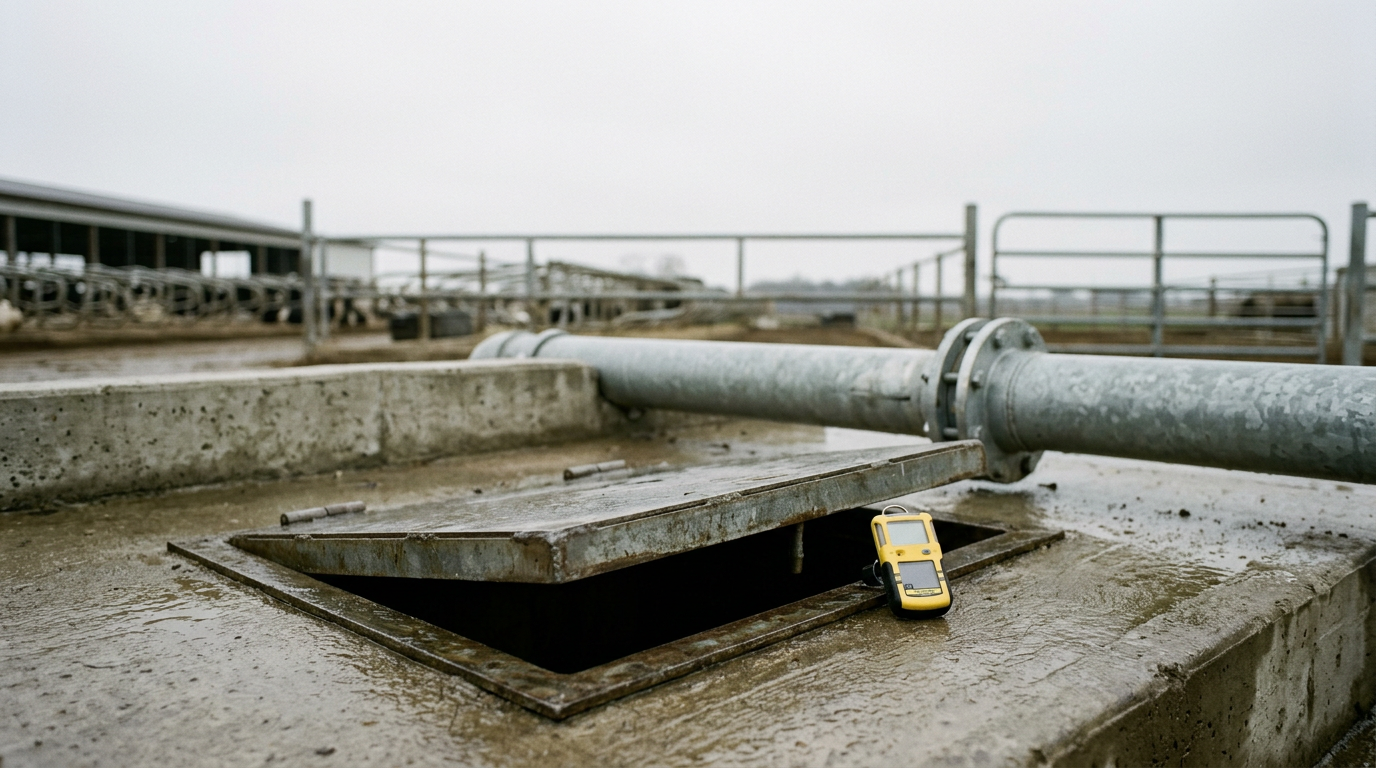
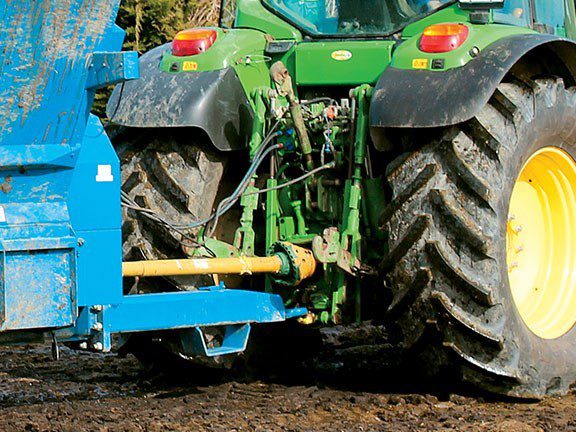
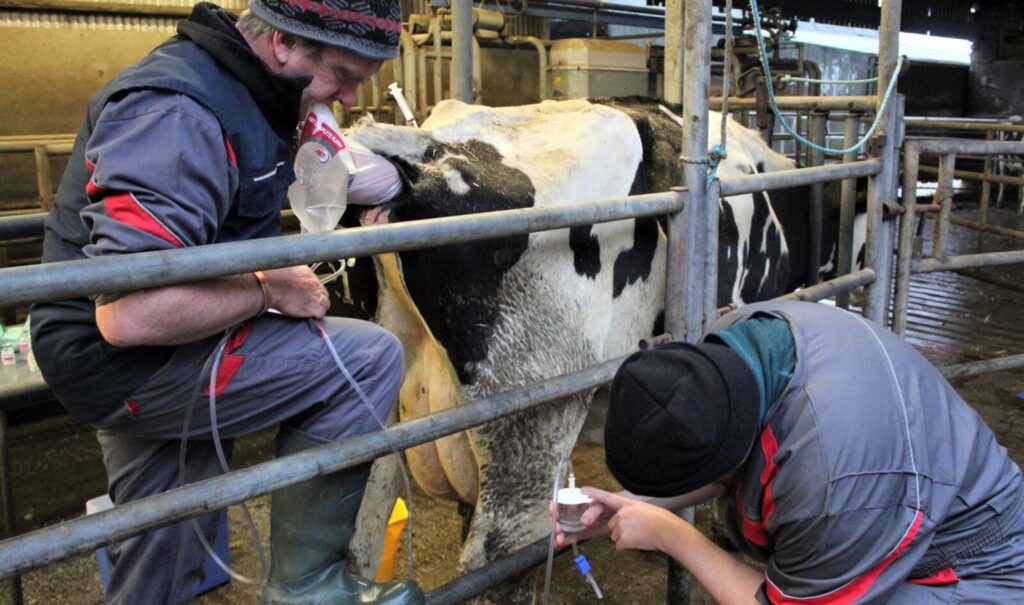
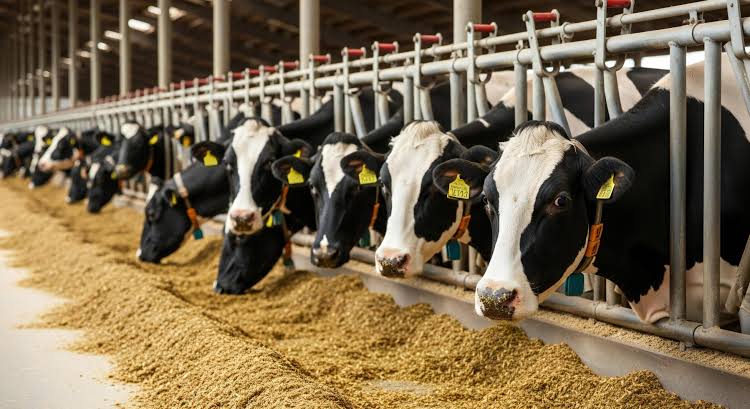
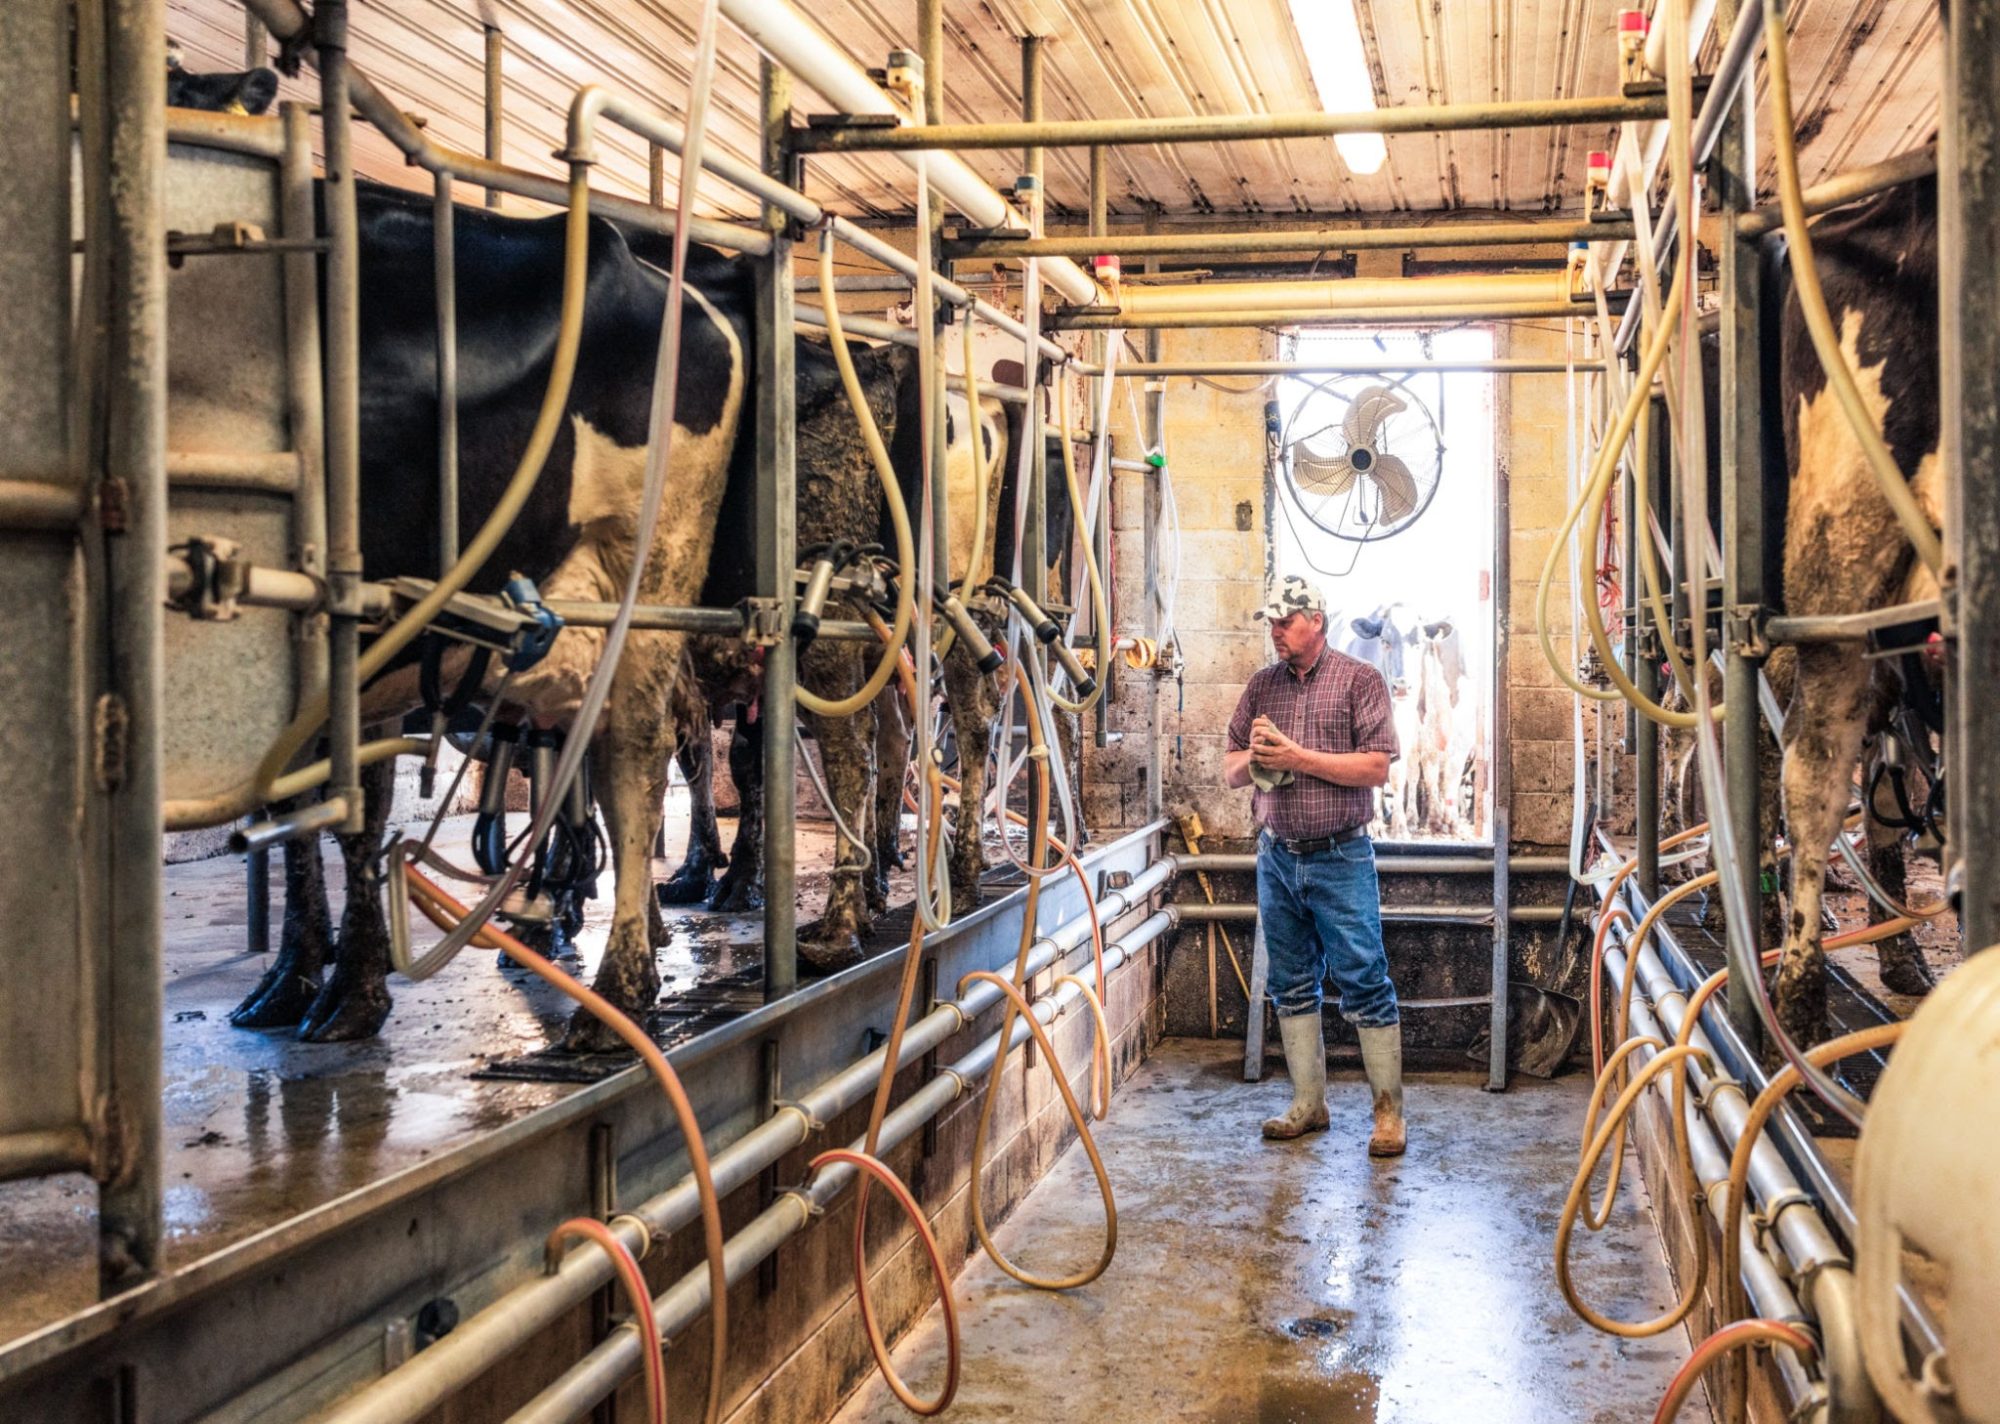
A farmer checking the cows and milking equipment in the cowshed during milking.

Virginia’s H-2A wage floor didn’t move August 3 with most states — it moved August 17, under the court order in Kansas et al. v. U.S. Dep’t of Labor. Two costs almost nobody budgets: the housing obligation reaches domestic workers in corresponding employment, and the three-fourths guarantee turns the wage line into a floor you owe whether the work is there or not. USCIS opened dairy petitions June 17, but case by case, on proven temporary or seasonal need. The Bullvine ran the four-worker model on a 200-cow Virginia dairy across 12,480 annual hours.
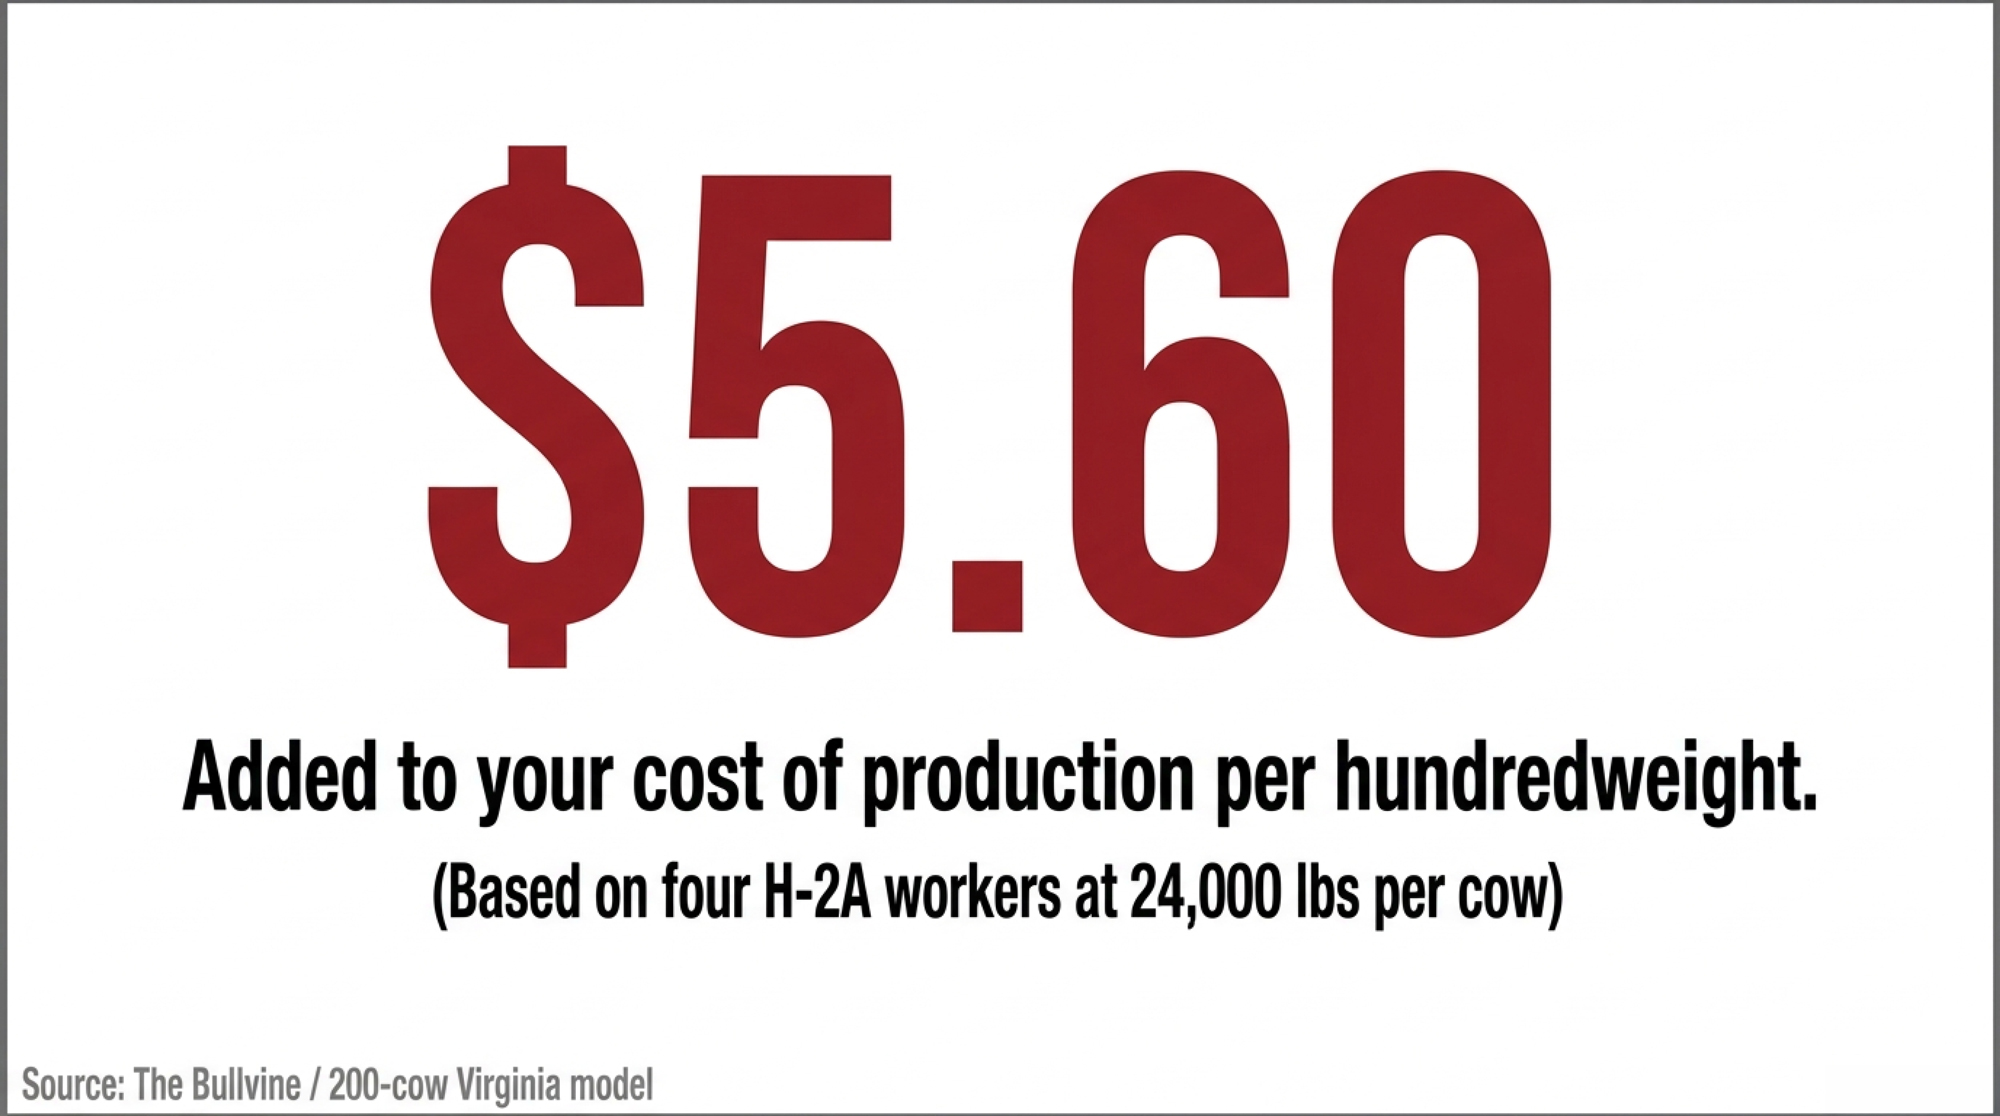
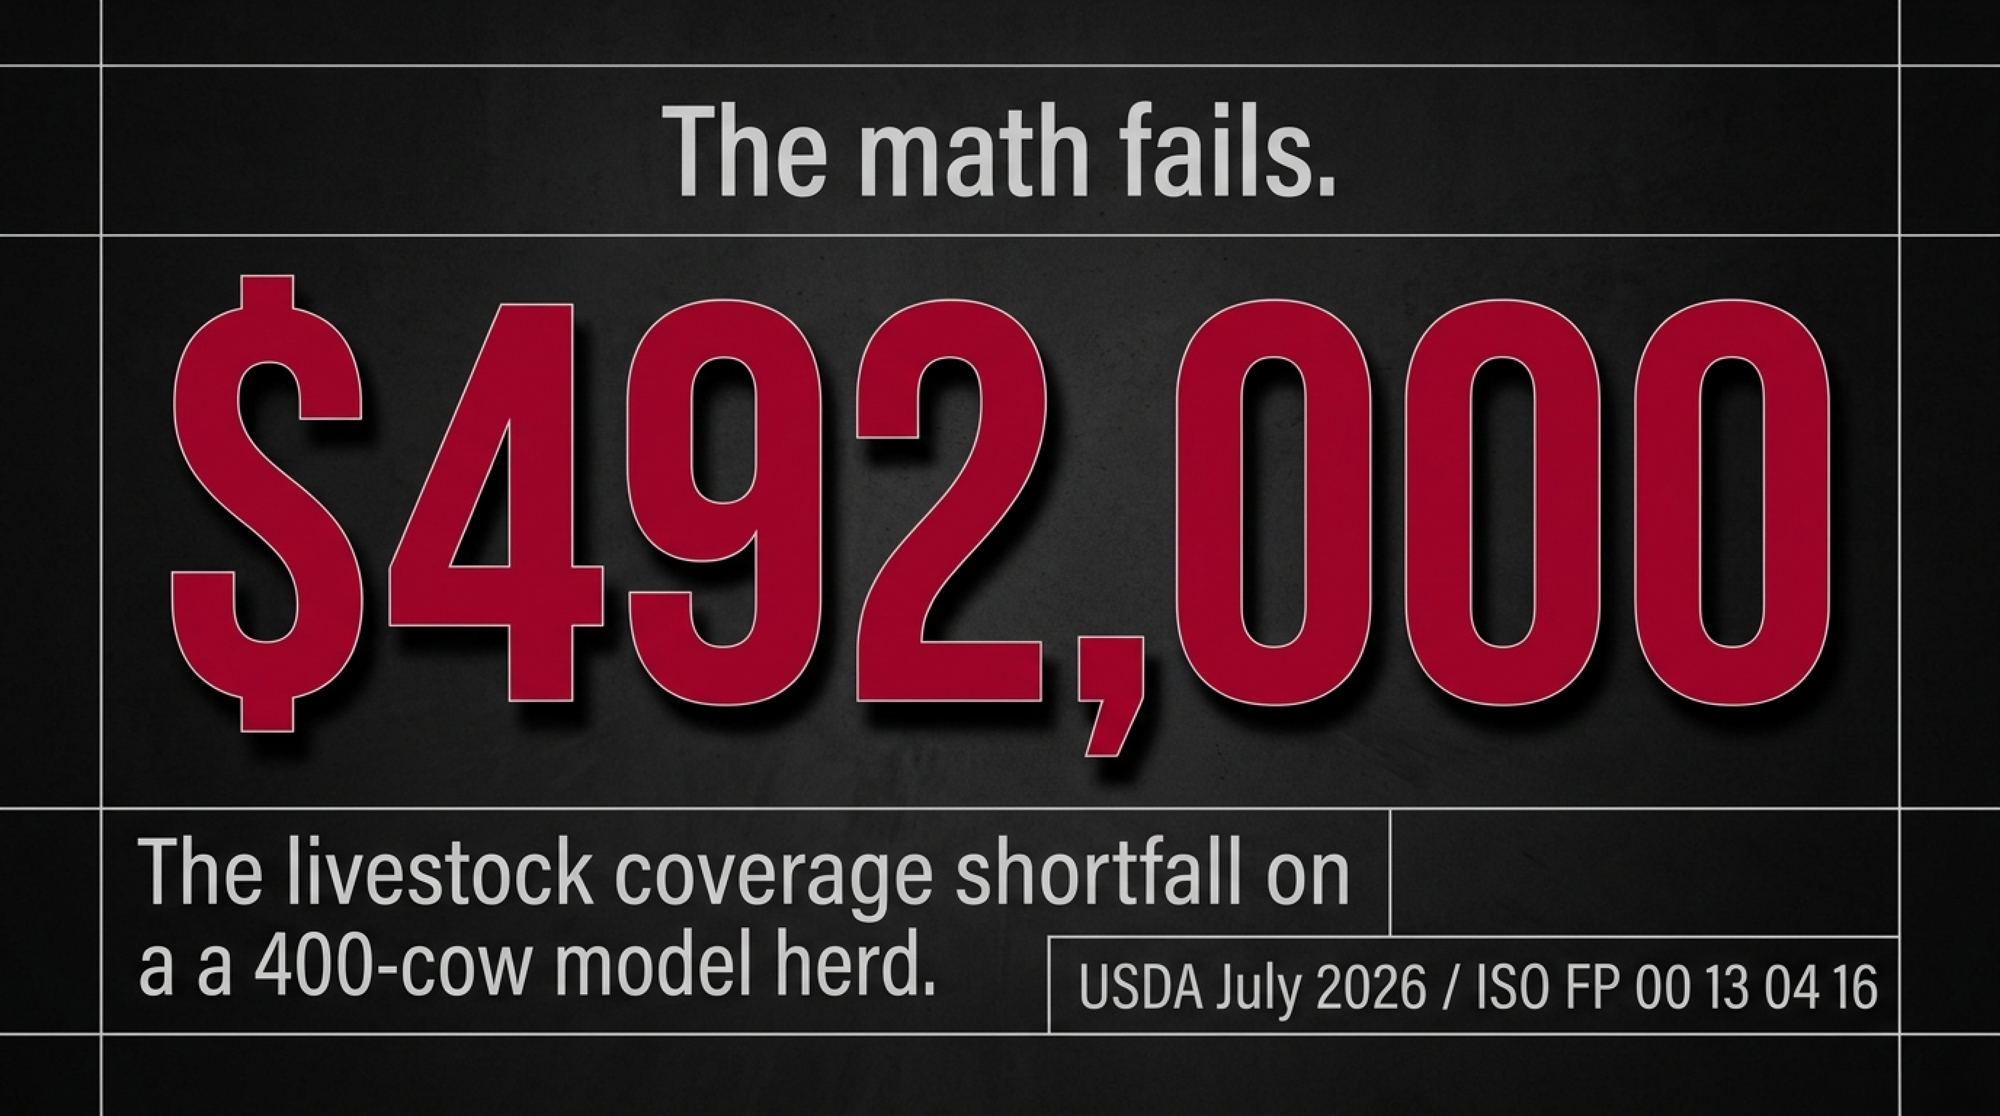
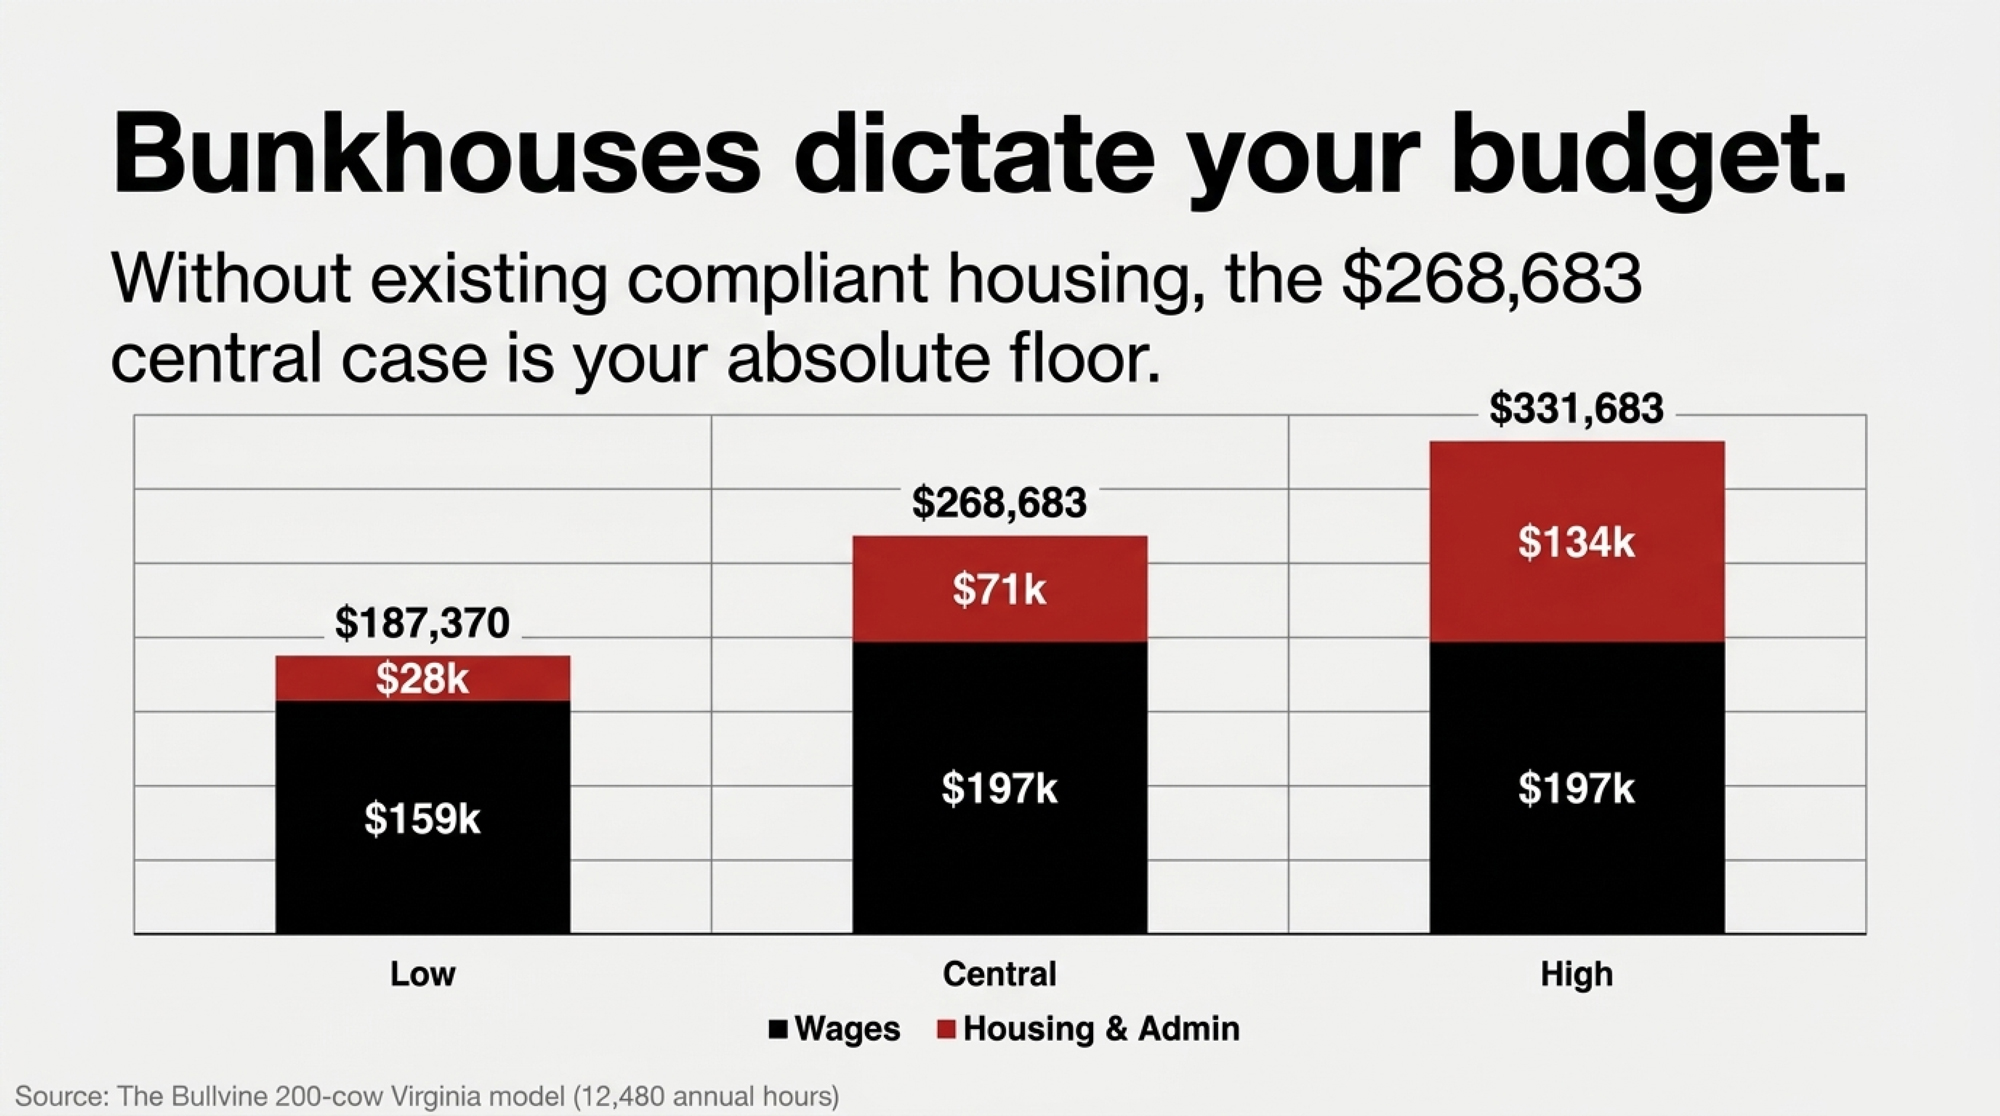
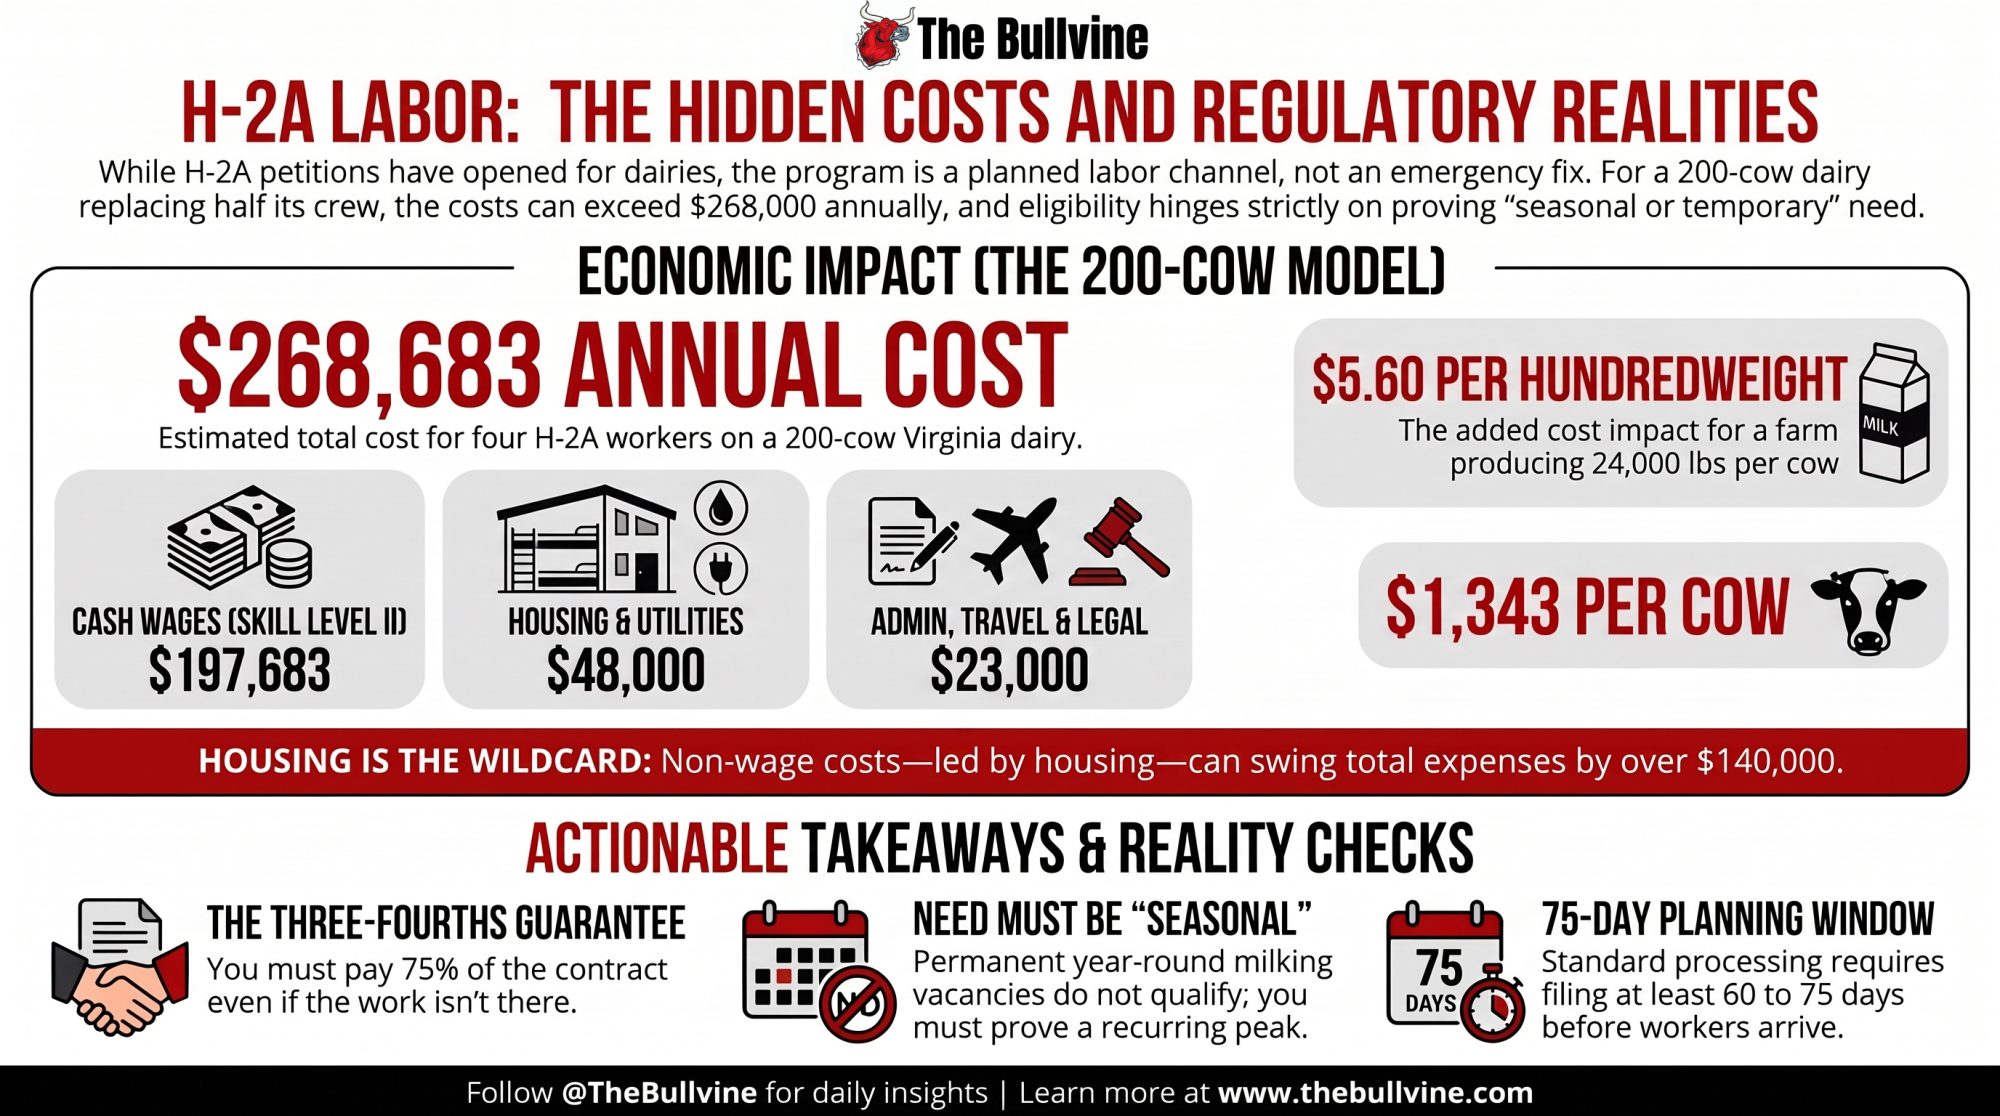
A 200-cow Virginia dairy replacing four of eight employees through H-2A is looking at roughly $268,683 a year — $67,171 per worker, $1,343 per cow, and $5.60 per hundredweight at 24,000 pounds per cow. Low case: $187,370; high case: $331,683; and the spread is almost entirely housing. Two things worth checking before you file: your state’s effective date may not be August 3, and the housing credit that lowers the H-2A wage doesn’t reach your domestic crew. Cost is still the second question. The first is whether those four jobs qualify at all.
What Happened in June

On June 12, 2026, U.S. Immigration and Customs Enforcement conducted a regional operation in Page County, Virginia. ICE confirmed 16 arrests in an action coordinated with the Page County Sheriff’s Office, Greene County Sheriff’s Office, and Gordonsville Police Department.

WMRA reported on August 10 that four of eight employees at a Luray-area dairy were among those detained, and that all four were removed during June. ICE confirmed two removals to Honduras and did not publicly confirm the other two in its response to the station. The Bullvine has not independently verified the farm-level details in this paragraph; all of them are WMRA’s reporting, attributed as such.

Five days later, on June 17, U.S. Citizenship and Immigration Services issued Policy Memorandum PM-602-0200, opening H-2A petitions to dairies that can demonstrate temporary or seasonal need. Nothing connects those two events. The interval is a coincidence of timing and is treated as one here.

The sequence does illustrate something structural: the policy channel that exists runs on a calendar measured in months. A crew loss runs on a calendar measured in hours.

The Dates That Move Your Wage Bill

DateEventEffect
May 2026BLS publishes OEWS estimates used to set new ratesFloor reflects May 2025 OEWS wage estimates (BLS)
June 17, 2026USCIS issues PM-602-0200, effective immediatelyDairy petitions adjudicated case by case on temporary or seasonal need (USCIS)
August 3, 2026DOL publishes 2026–2027 AEWRs at 91 FR 48946Two-tier skill-based structure replaces single state rate (Federal Register)
August 17, 2026New rates take effect in VirginiaDelayed effective date for 17 states under Kansas et al. v. U.S. Dep’t of Labor, 749 F. Supp. 3d 1363 (S.D. Ga. 2024) (Federal Register, DATES)
September 2, 2026DOL OFLC implementation noticeCurrent rates stand; future wage adjustments possible (DOL OFLC)

The other 16 states on the August 17 schedule: Arkansas, Florida, Georgia, Idaho, Indiana, Iowa, Kansas, Louisiana, Missouri, Montana, Nebraska, North Dakota, Oklahoma, South Carolina, Tennessee and Texas.

What June 17 Changed, and What It Didn’t

PM-602-0200 did not create a dairy visa. It told adjudicators that dairying can fall within H-2A where the petitioning employer proves that its need — not the existence of dairy work generally — is temporary or seasonal.

Temporary need generally runs no longer than one year absent extraordinary circumstances. Seasonal need must tie to a recurring time-of-year pattern that pushes labor requirements materially above the farm’s ongoing level.

USCIS gave examples, not blanket approval. A defined calving season could support a petition up to 10 months. A farm without concentrated calving might qualify if herdsman duties and labor demand change materially in identifiable periods. Year-round milking doesn’t automatically kill a petition — but a permanent year-round milking vacancy doesn’t become seasonal because the paperwork says so.

Adjudicators can pull payroll, schedules, staffing levels, contracts, workload records, prior petitions, and the gaps between requested employment periods. Back-to-back petitions covering substantially identical work without a meaningful break support a finding that the need is permanent.

USCIS also caps the stay: classification runs up to the certification period, extends in increments of up to one year, and maxes at three years — after which the worker must leave for at least 60 uninterrupted days (USCIS, H-2A Temporary Agricultural Workers).

Urgency is not eligibility. Losing four permanent employees creates the first and does nothing for the second.

The Lead Time You Don’t Have

USDA’s Farmers.gov guidance puts the standard process at 60 to 75 days — state job order 60 to 75 days ahead of the requested start, federal temporary labor certification filed at least 45 days out (USDA, Farmers.gov).

Emergency filing can waive parts of the 45-day schedule. It does not erase DOL review, USCIS adjudication, consular processing, or worker travel. H-2A is a planned labor channel. It is not four people waiting outside the milkhouse.

The Four-Worker Model

Four positions at 60 hours a week across 52 weeks: 3,120 hours per worker, 12,480 hours across four.

The 52-week frame is a costing device, not a petition. A genuine 52-week need is precisely what fails the USCIS temporary-or-seasonal test. This annualizes exposure so it can be compared against a current wage bill. It is not a claim that USCIS would certify a full-year dairy petition.

Which wage floor applies

Dairy work sits in SOC 45-2093, Farmworkers, Farm, Ranch, and Aquacultural Animals — one of the occupation codes in the field-and-livestock (combined) category (BLS, SOC 45-2093; occupational coverage at 91 FR 48946).

DOL now sets rates at two skill levels from BLS OEWS data: Level I for entry positions requiring no formal credential, Level II for experienced or fully proficient workers (91 FR 48946, methodology).
Virginia’s listed field-and-livestock figures for H-2A workers receiving free housing are $11.76 at Skill Level I and $15.84 at Skill Level II (DOL OFLC, H-2A Adverse Effect Wage Rates). Three qualifications attach:

The lower figure is conditional. It reflects a downward “H-2A Adverse Compensation Adjustment,” calculated from HUD Fair Market Rents for a four-bedroom unit, and applies only where the employer provides compliant housing at no cost (20 CFR 655.120(b)(3); adjustment methodology at 91 FR 48946).

The “highest of” rule overrides it. Employers pay the highest of the adjusted AEWR, the prevailing wage, any collective bargaining rate, the federal minimum, or the state minimum (20 CFR 655.120(a)). Virginia’s 2026 minimum wage is $12.77, so no Virginia H-2A dairy job can be budgeted at $11.76 (Virginia Department of Labor and Industry). Planning floors: $12.77 (Level I) and $15.84 (Level II).

Worker / planning categoryListed or assumed wage floorWhat actually controls the budgetCompliance and cost implication
H-2A Skill Level I with compliant free housing$11.76/hrVirginia’s 2026 minimum wage of $12.77/hr overrides the adjusted AEWRDo not budget a Virginia Level I dairy job at $11.76/hr
H-2A Skill Level II with compliant free housing$15.84/hrThe applicable “highest of” wage testCentral four-worker model uses $15.84/hr across 12,480 annual hours
Domestic corresponding employmentFull unadjusted AEWR appliesSame-job domestic workers must receive no less than the H-2A offerMixed crews can require a higher domestic wage code than the H-2A Level I rate
Corresponding worker unable to return home dailyWage plus housing exposureHousing obligation extends beyond visa headcountHousing capacity may exceed the four-worker petition count
Four-worker central H-2A model$197,683 cash wagesLevel II wage assumption at 12,480 hoursThree-fourths guarantee puts roughly $148,262 of that wage line at risk regardless of workload

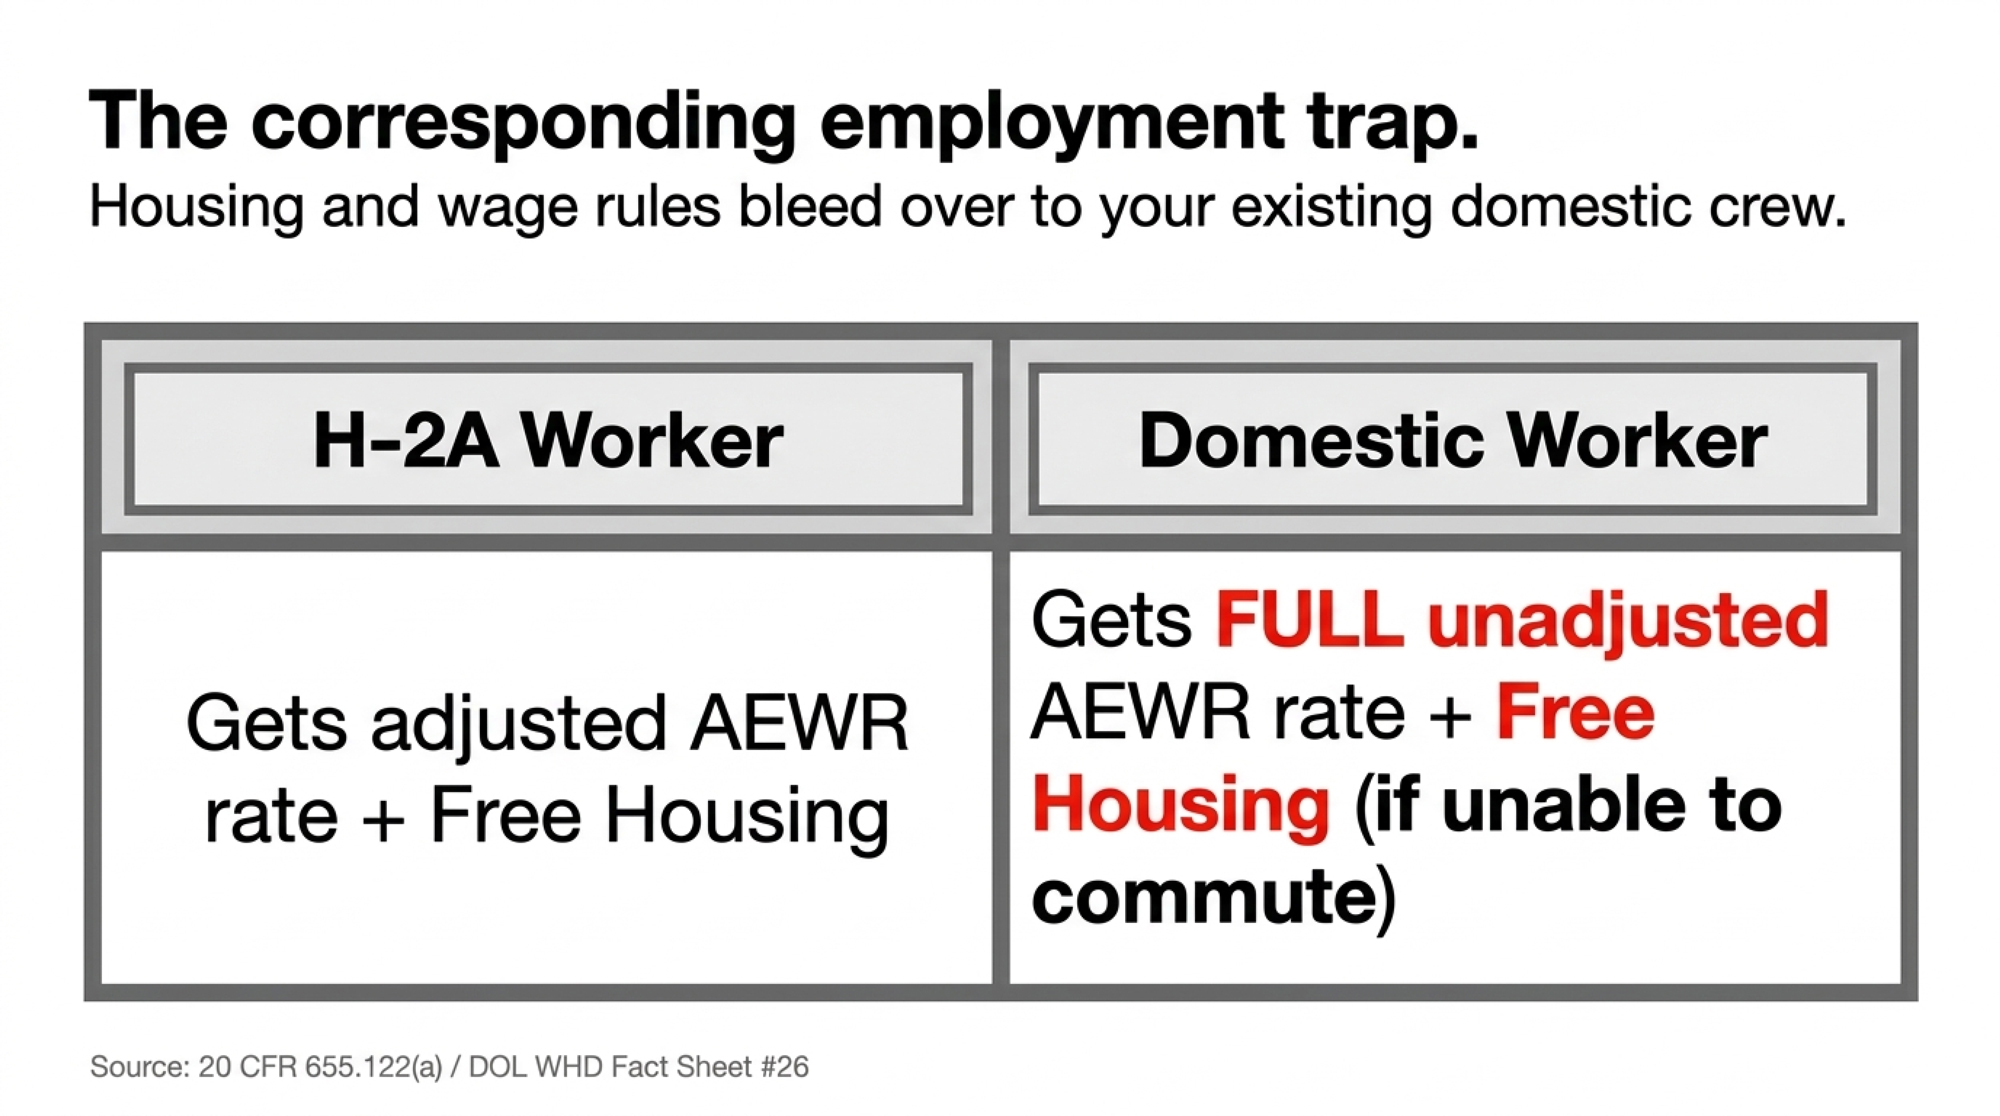
Then the corresponding-employment trap, which runs two ways. The job offer must give U.S. workers in corresponding employment no less than the H-2A workers receive, and the housing adjustment applies to H-2A workers only — so a domestic worker on the same job takes the full, unadjusted AEWR (20 CFR 655.122(a)). And the housing obligation itself extends past your H-2A crew: employers must provide housing at no cost to H-2A workers and to corresponding-employment workers who aren’t reasonably able to return to their residence the same day (DOL Wage and Hour Division, Fact Sheet #26).

Run a mixed crew, and you are running two wage codes; the domestic one is higher, and your housing headcount may be larger than your visa headcount.

The guarantee that makes the wage line a floor

Under 20 CFR 655.122(i), the employer guarantees work equal to at least three-fourths of the workdays in the contract period. The ETA-790A clearance order carries the same commitment (DOL ETA-790A).

That changes the character of the number, not just its size. The $197,683 central wage line is not a dial you turn down in a slow month — roughly three-quarters of it is an obligation you owe whether the work materializes or not. A domestic crew you can send home early. An H-2A contract you largely cannot.

Non-wage inputs, benchmarked

Two government figures anchor this. The Congressional Research Service, citing USDA, puts H-2A housing at $9,000 to $13,000 per worker and transportation at $400 to $650 per worker, and identifies housing as the major non-wage cost in the program (Congressional Research Service, R48614, July 31, 2025). Working from the same USDA 2024 estimates, Choices magazine puts minimum total non-wage cost near $10,000 per worker (Choices, Agricultural and Applied Economics Association).

Those are national seasonal-contract benchmarks, not Virginia dairy figures. They do not cover a farm building or substantially retrofitting housing.
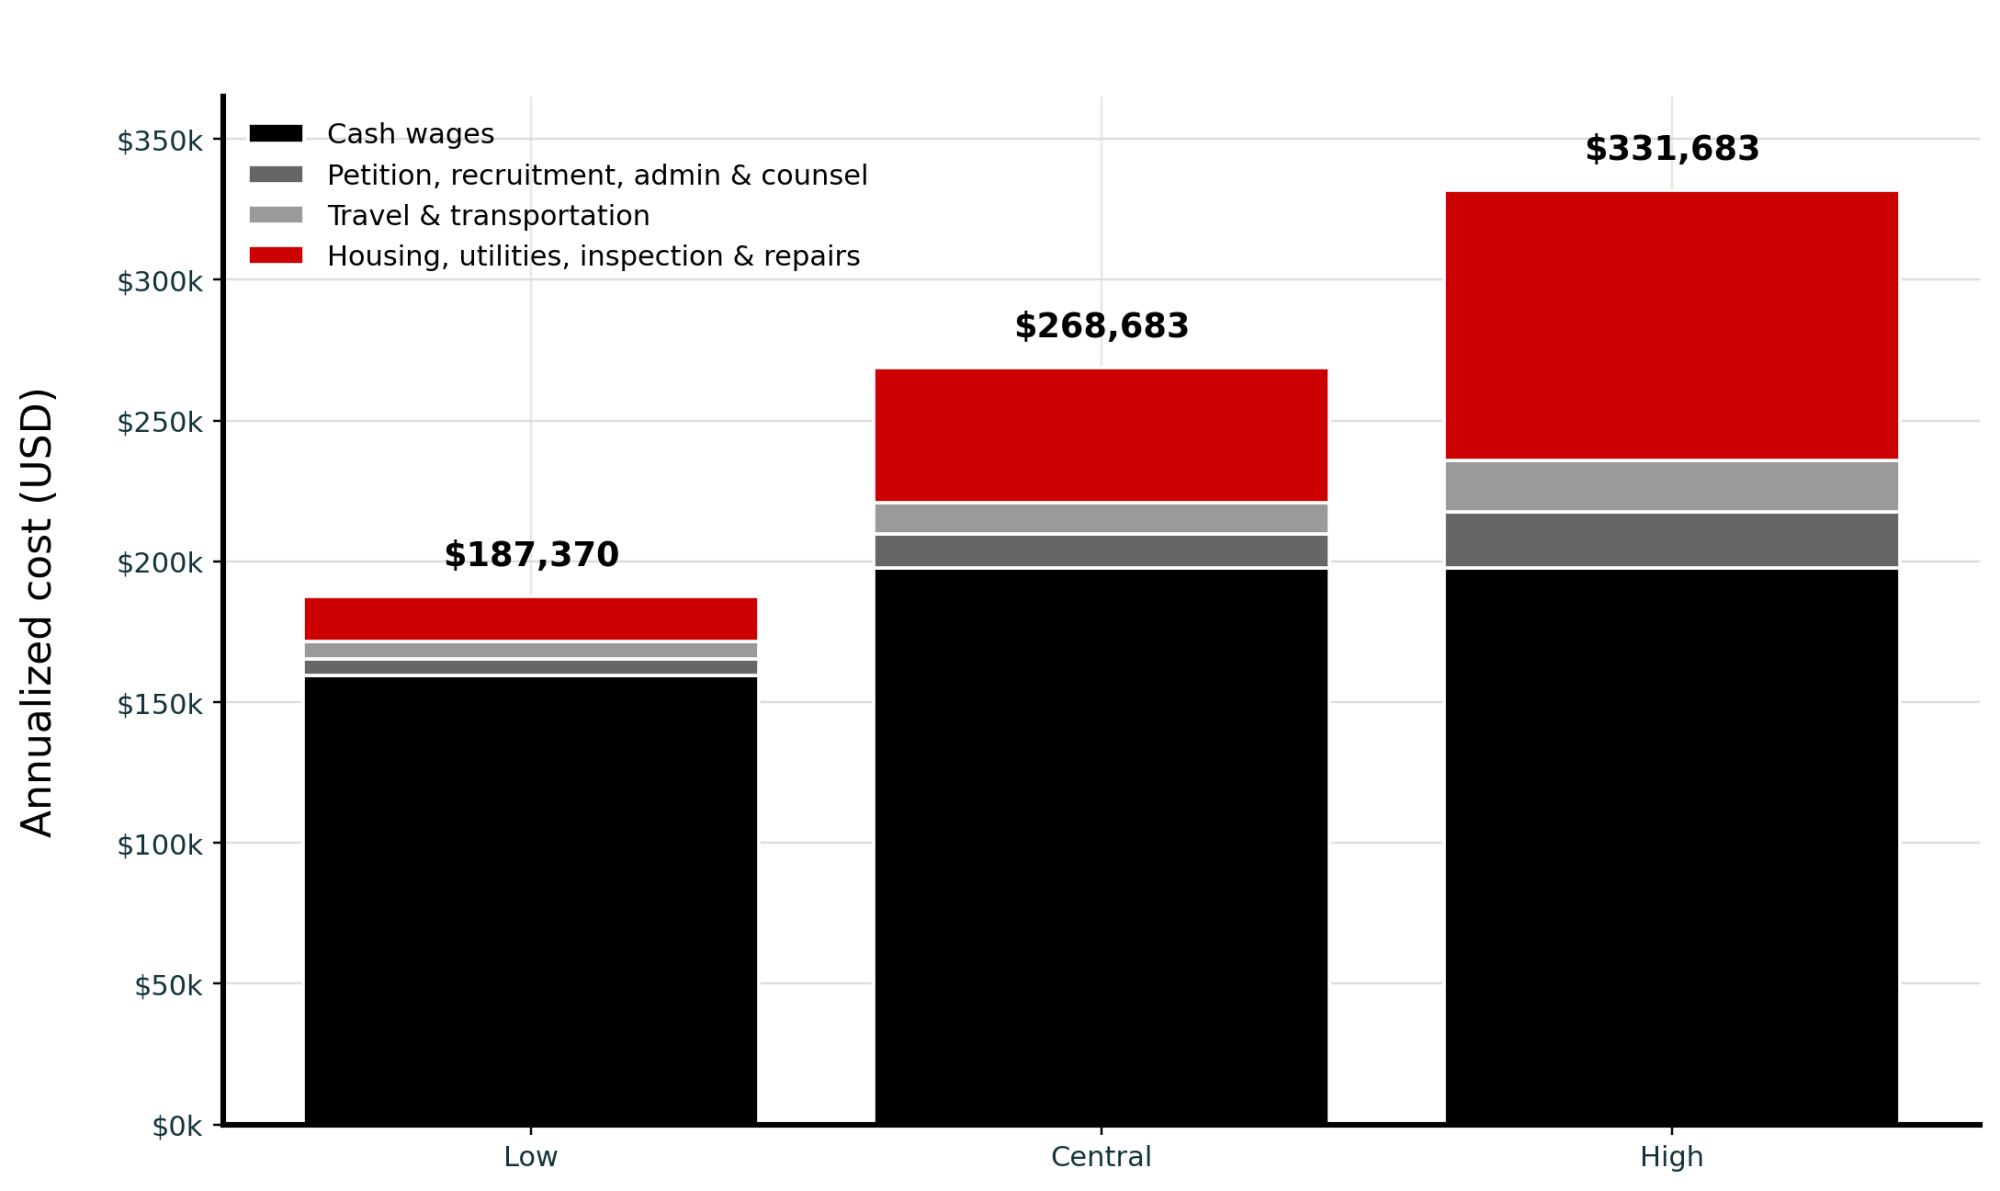
Input, four workersLowCentralHigh
Annual labor hours12,48012,48012,480
Wage assumption$12.77 (Level I, VA min.)$15.84 (Level II)$15.84 (Level II)
Cash wages$159,370$197,683$197,683
Petition, recruitment, admin, counsel$6,000$12,000$20,000
Travel and transportation$6,000$11,000$18,000
Housing, utilities, inspection, repairs$16,000$48,000$96,000
Non-wage subtotal$28,000$71,000$134,000
Total annualized$187,370$268,683$331,683
Per worker$46,843$67,171$82,921
Per cow at 200 cows$937$1,343$1,658

Per-worker non-wage cost runs $7,000 / $17,750 / $33,500. Read the low case carefully — at $7,000 it sits below the roughly $10,000 minimum in the USDA data. It is only reachable with compliant housing already built and paid for. If you’re planning from zero, the central case is your floor, not your midpoint.

Transportation is built from the CRS $400–$650 travel benchmark plus daily work transport — vehicle, fuel, insurance, maintenance — which is an employer obligation for workers in employer-provided housing. Timing matters as much as the amount: inbound transportation and subsistence are reimbursed once the worker completes 50% of the contract period, and return transportation is owed on completion (DOL Wage and Hour Division, Fact Sheet #26).

Subsistence has its own caps. USDA’s guidance lists a maximum daily meal charge of $16.78, with higher reimbursement available against receipts (USDA, Farmers.gov). DOL updates these rates annually by Federal Register notice — confirm the current figures before you file, not from this table.

Excluded from all three cases: payroll taxes, workers’ compensation, benefits, overtime exposure, emergency relief labor, meals or cooking-facility costs, and the production cost of running short-handed.

Per hundredweight

These figures cover the four replacement positions only — not your total farm labor bill. Production levels are reader inputs; substitute your own shipped hundredweight.
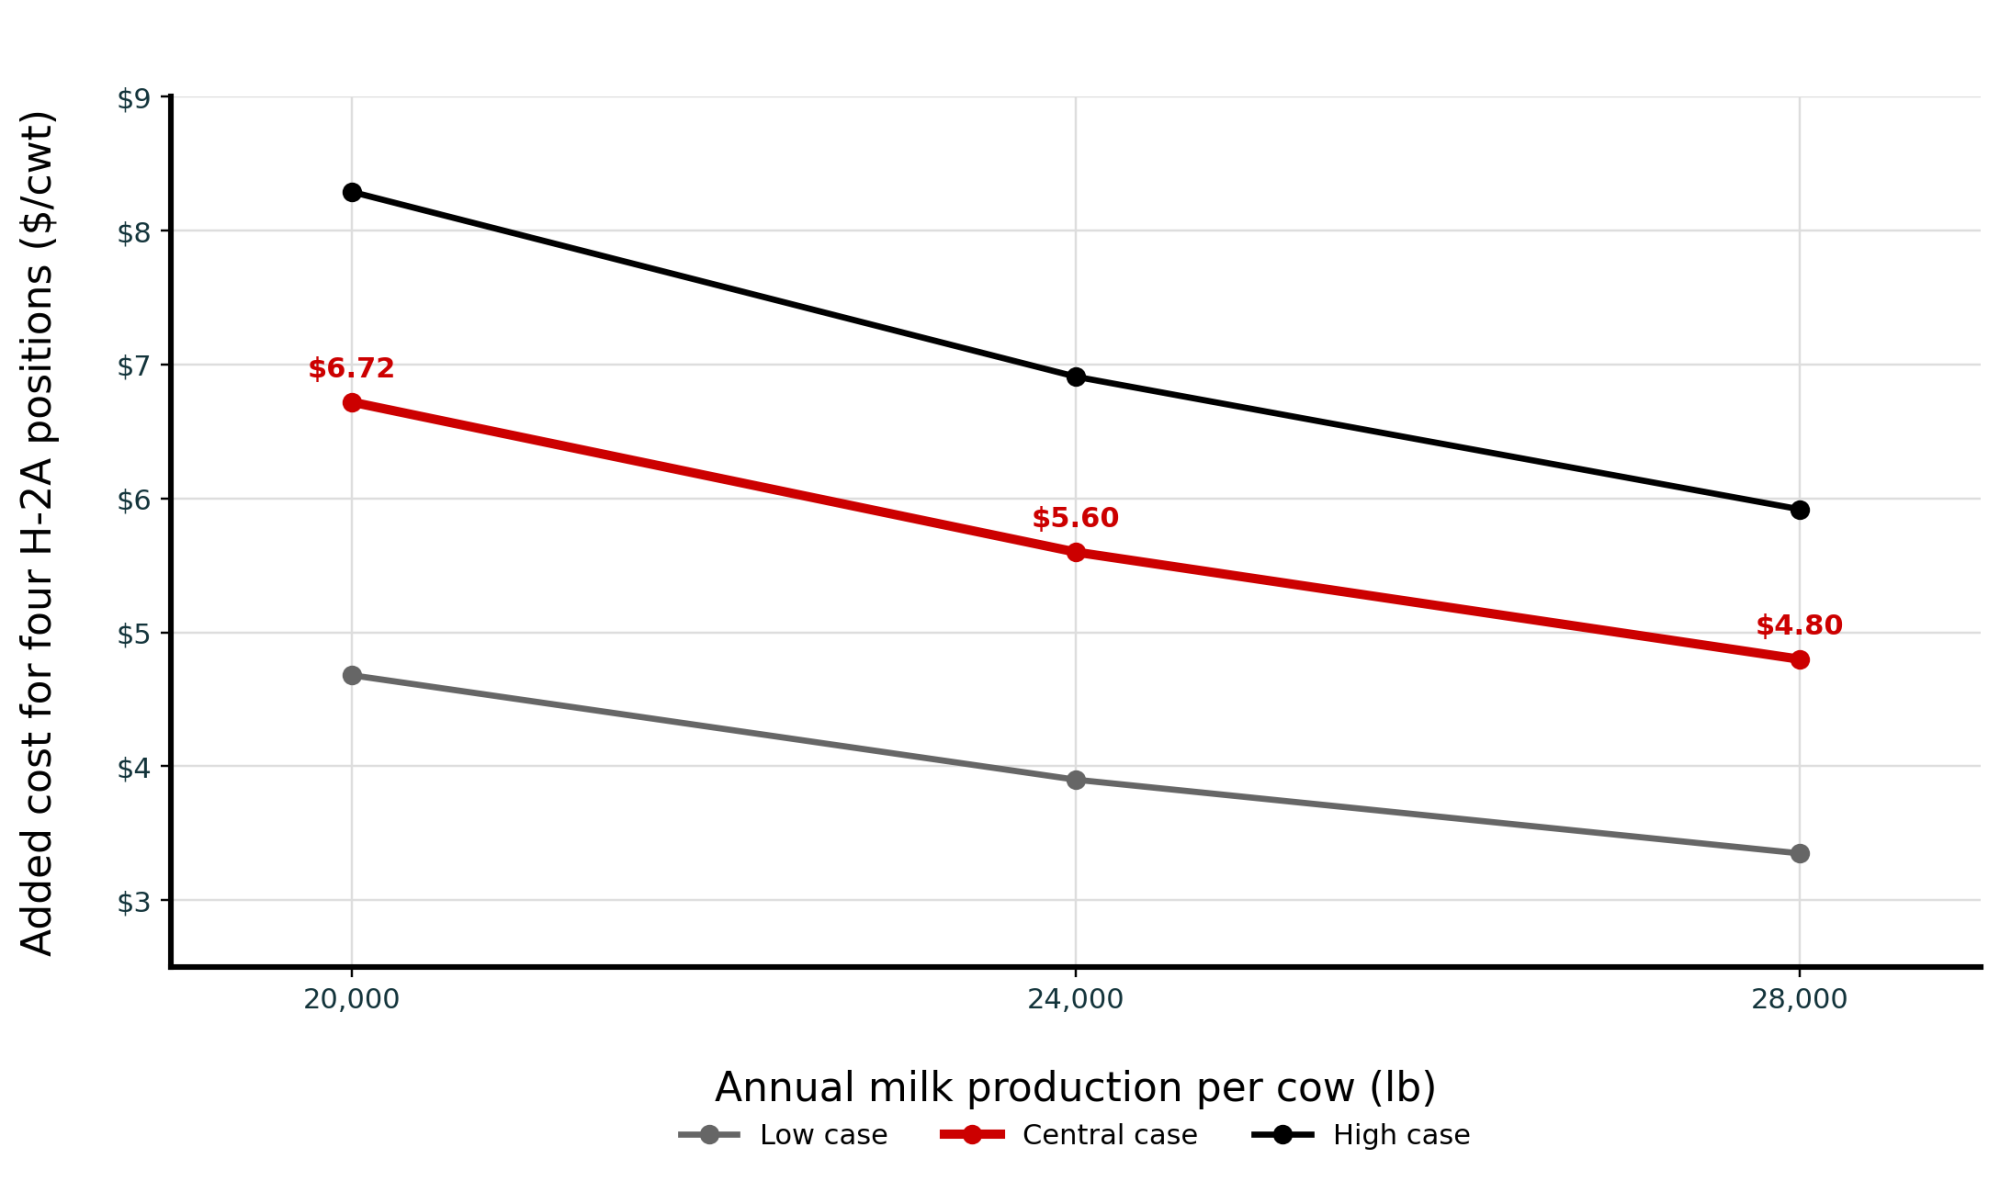
Annual milk per cowTotal cwt (200 cows)LowCentralHigh
20,000 lb40,000$4.68$6.72$8.29
24,000 lb48,000$3.90$5.60$6.91
28,000 lb56,000$3.35$4.80$5.92

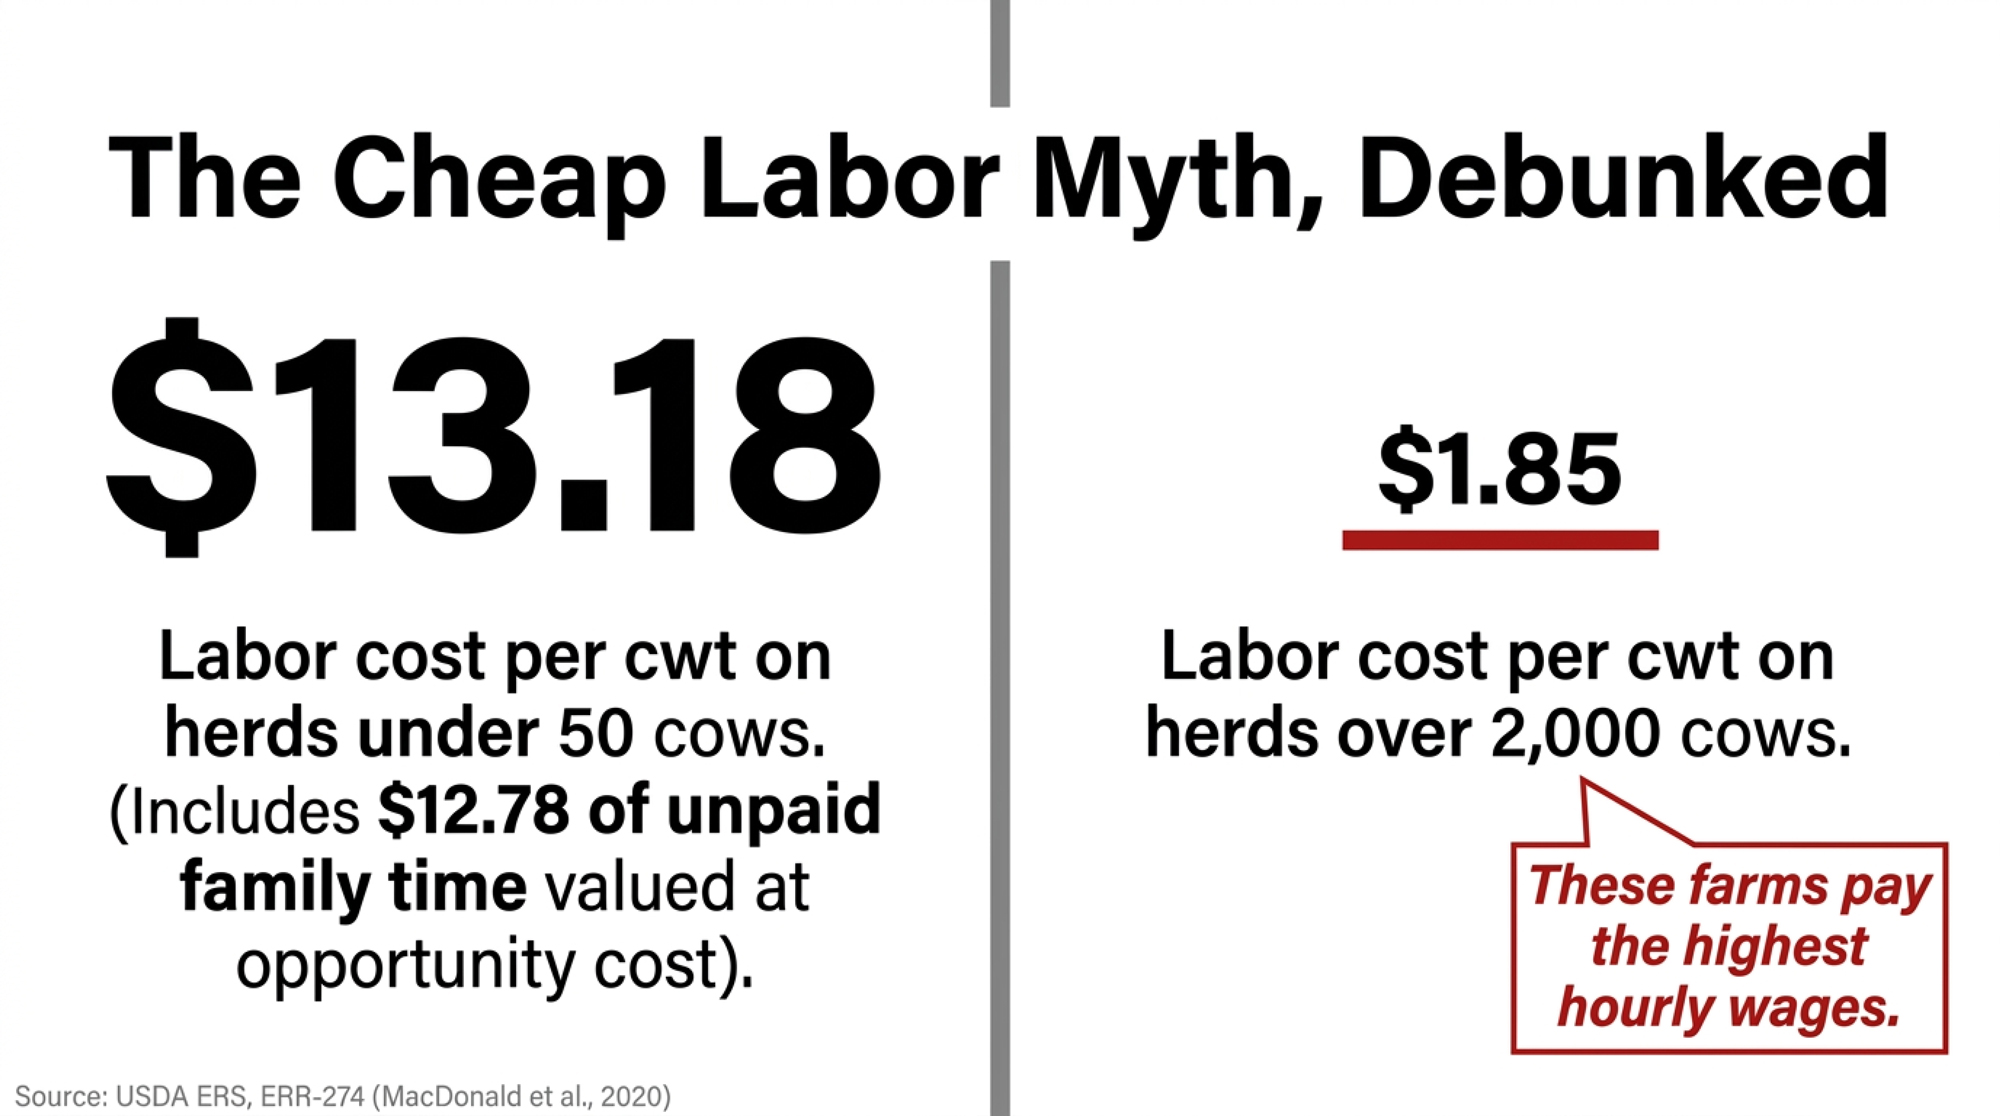
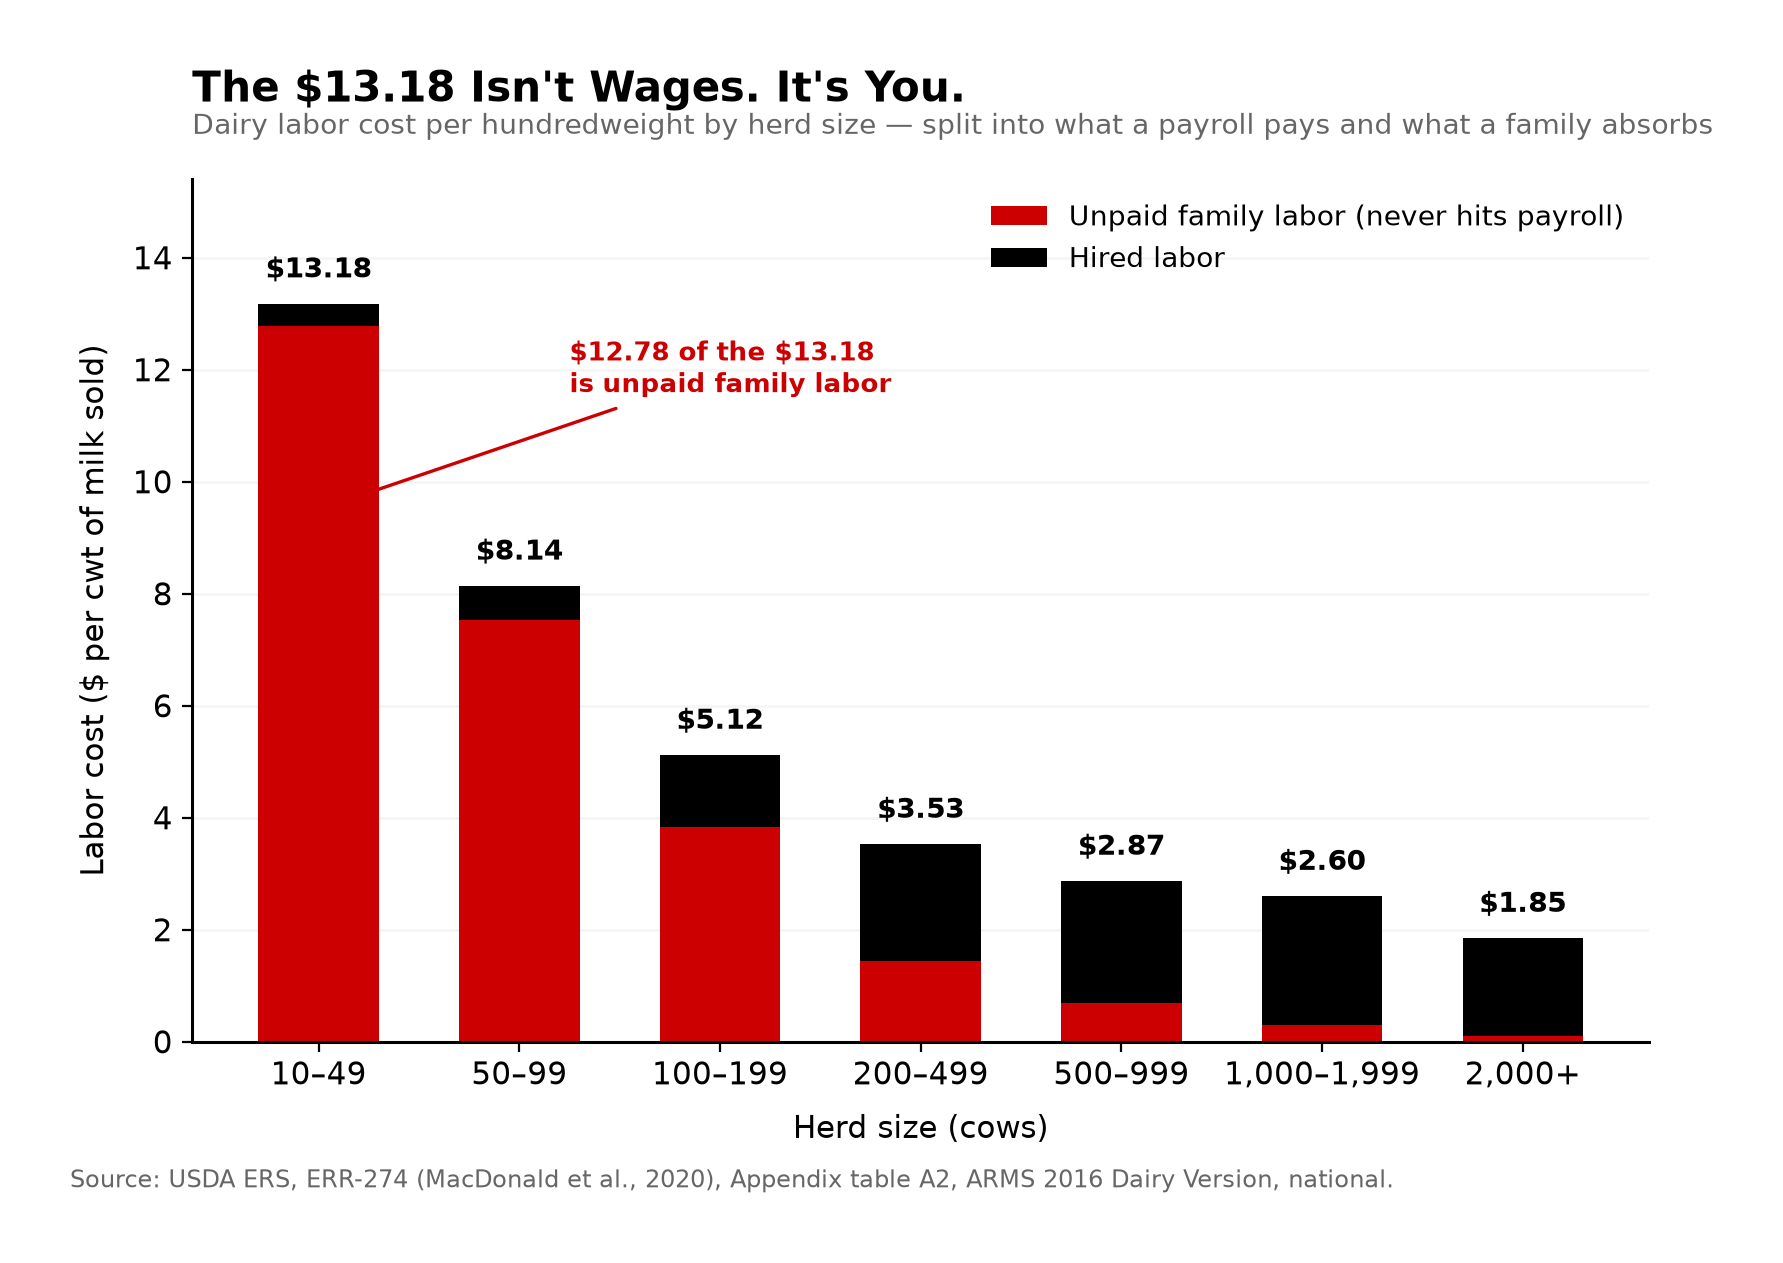
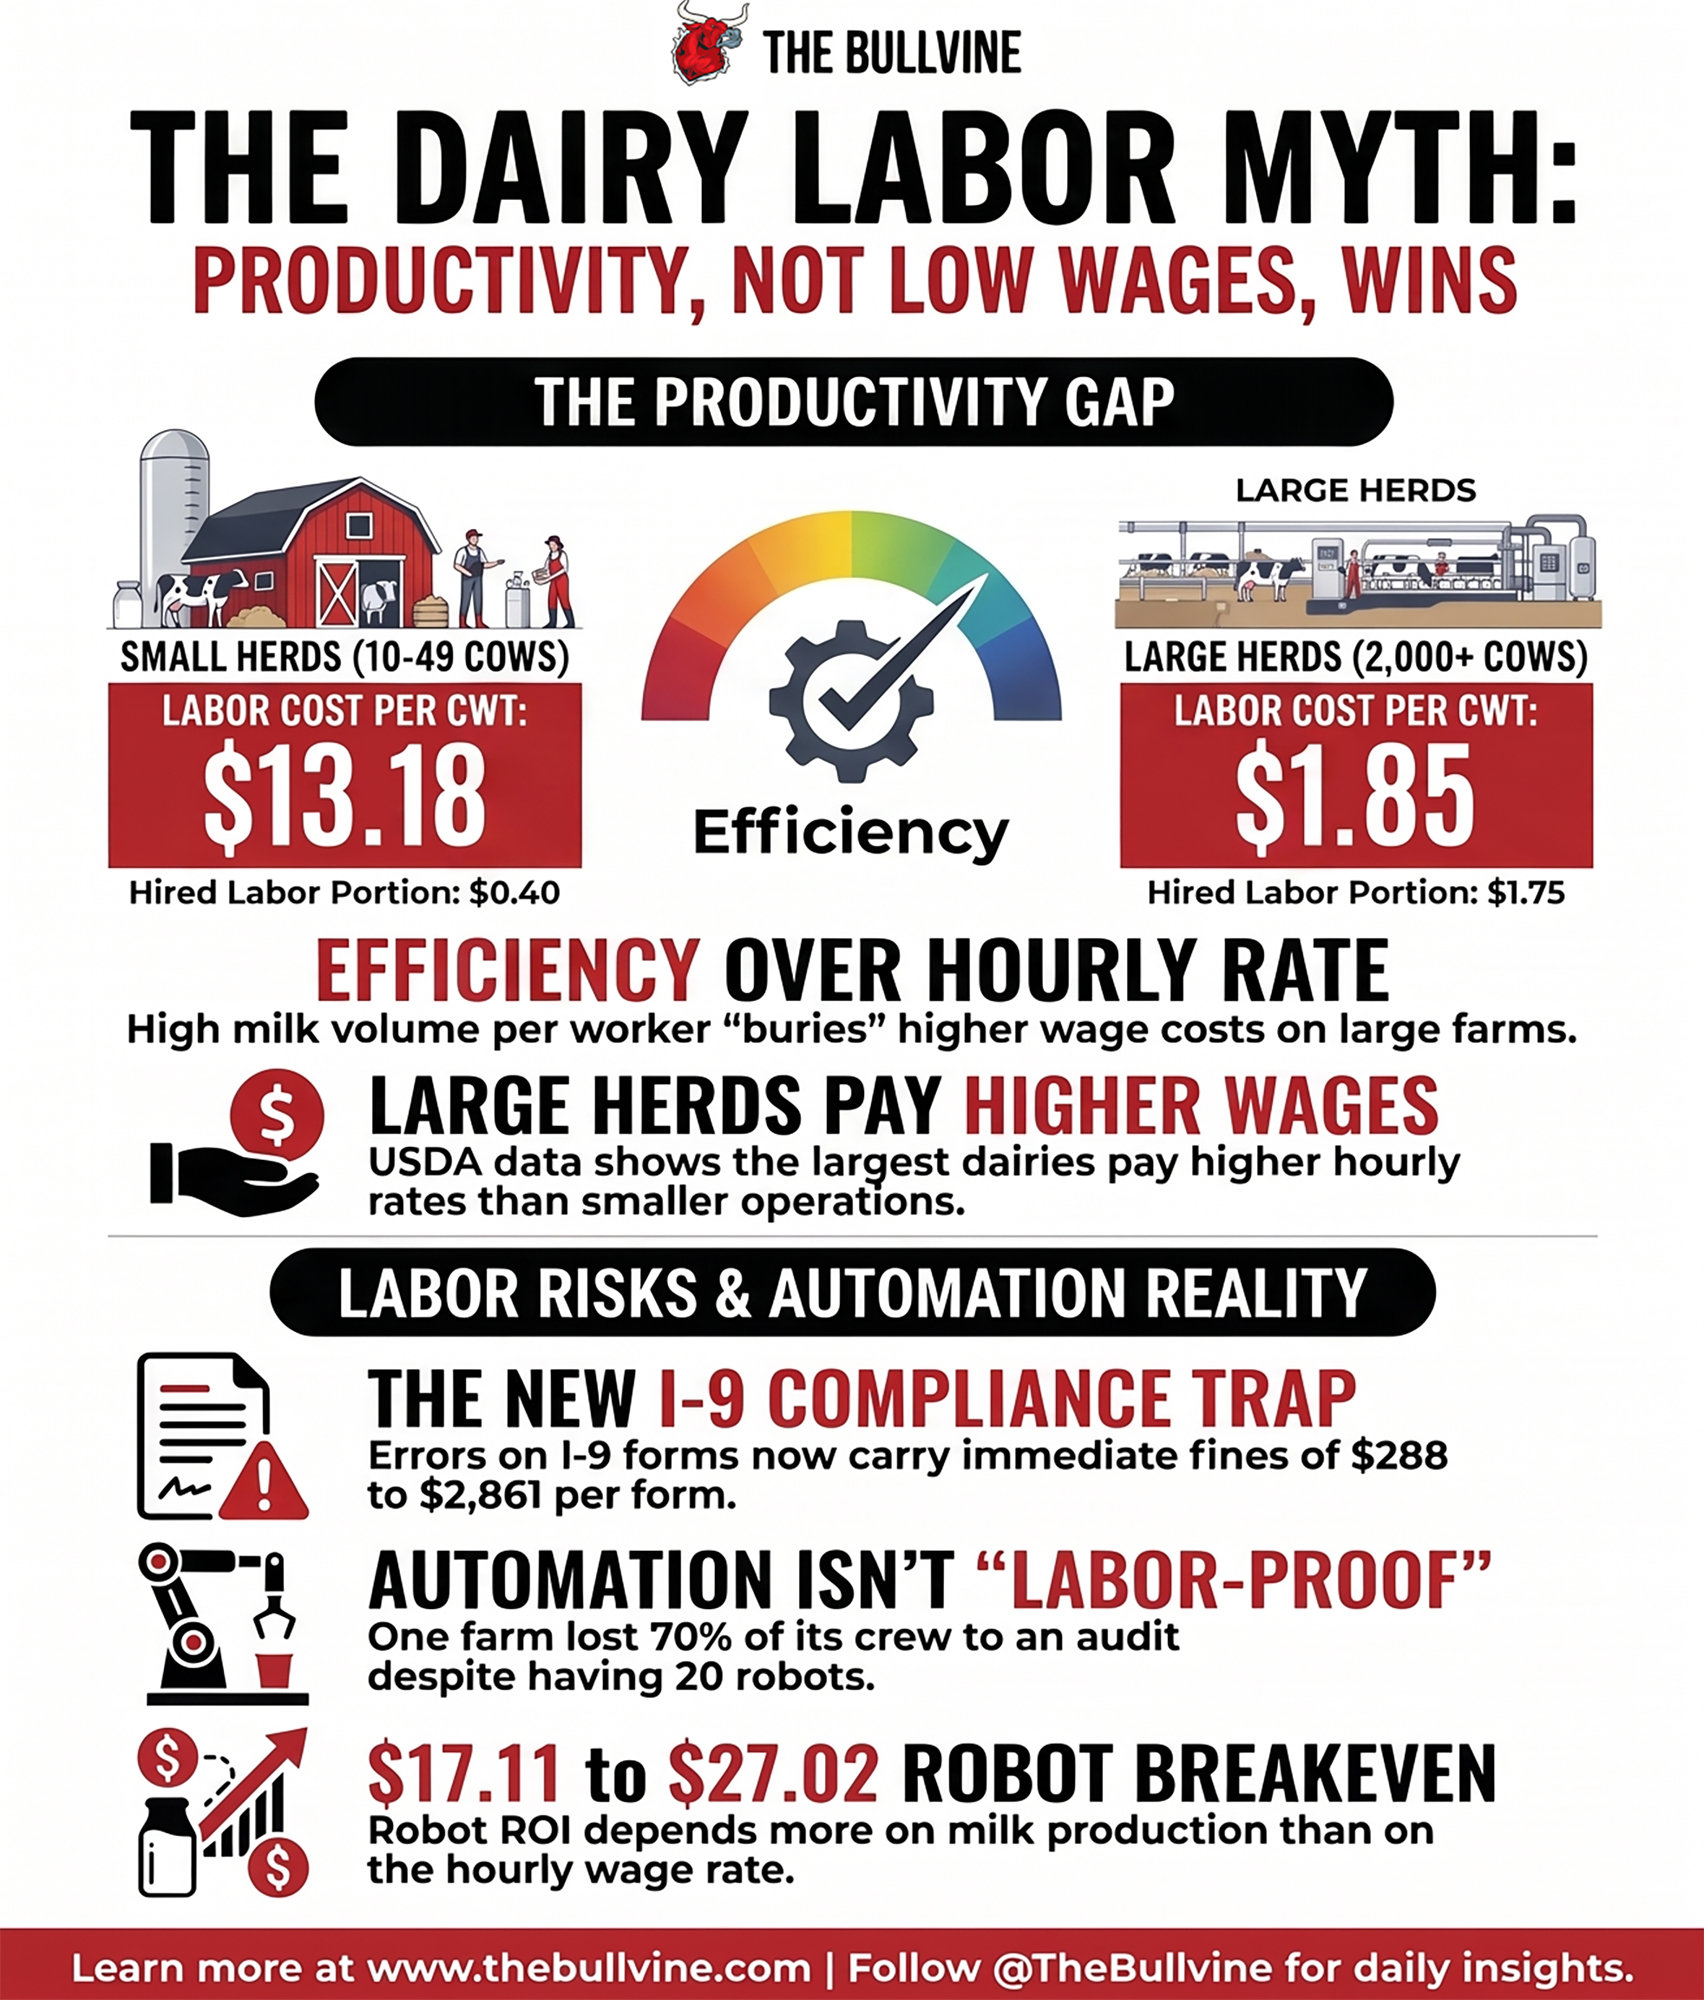
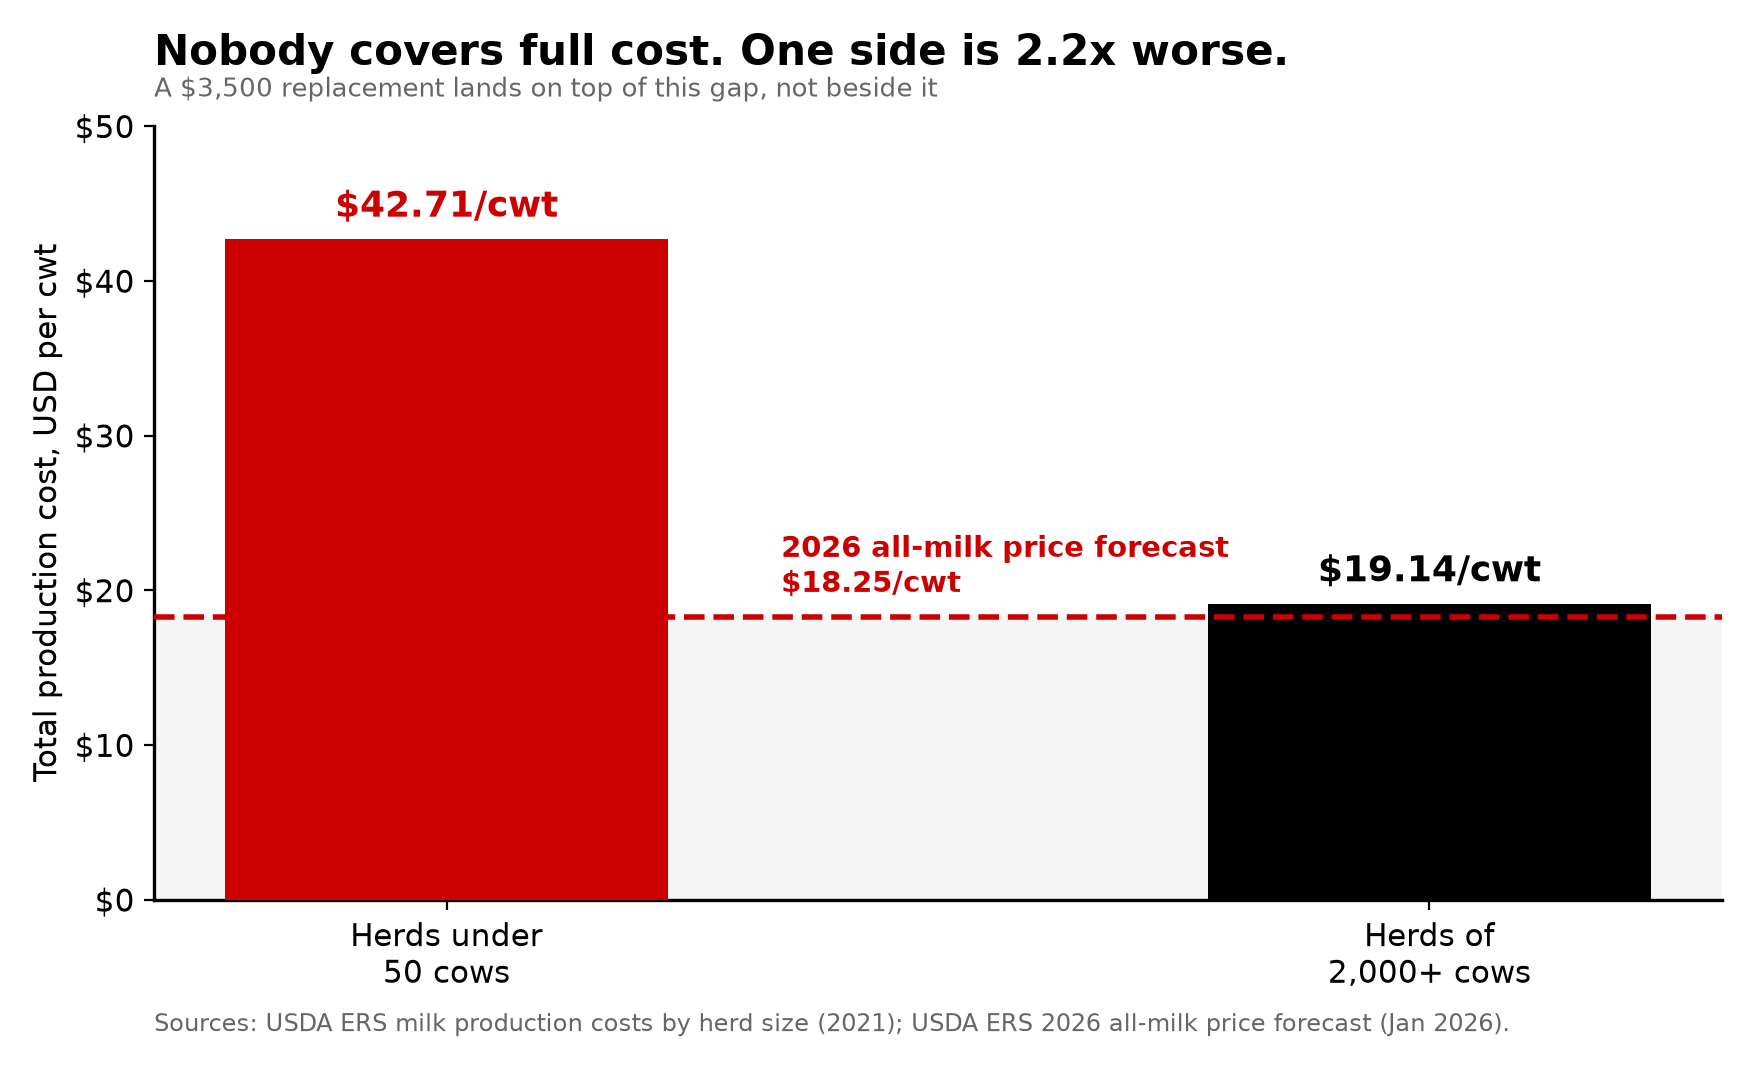
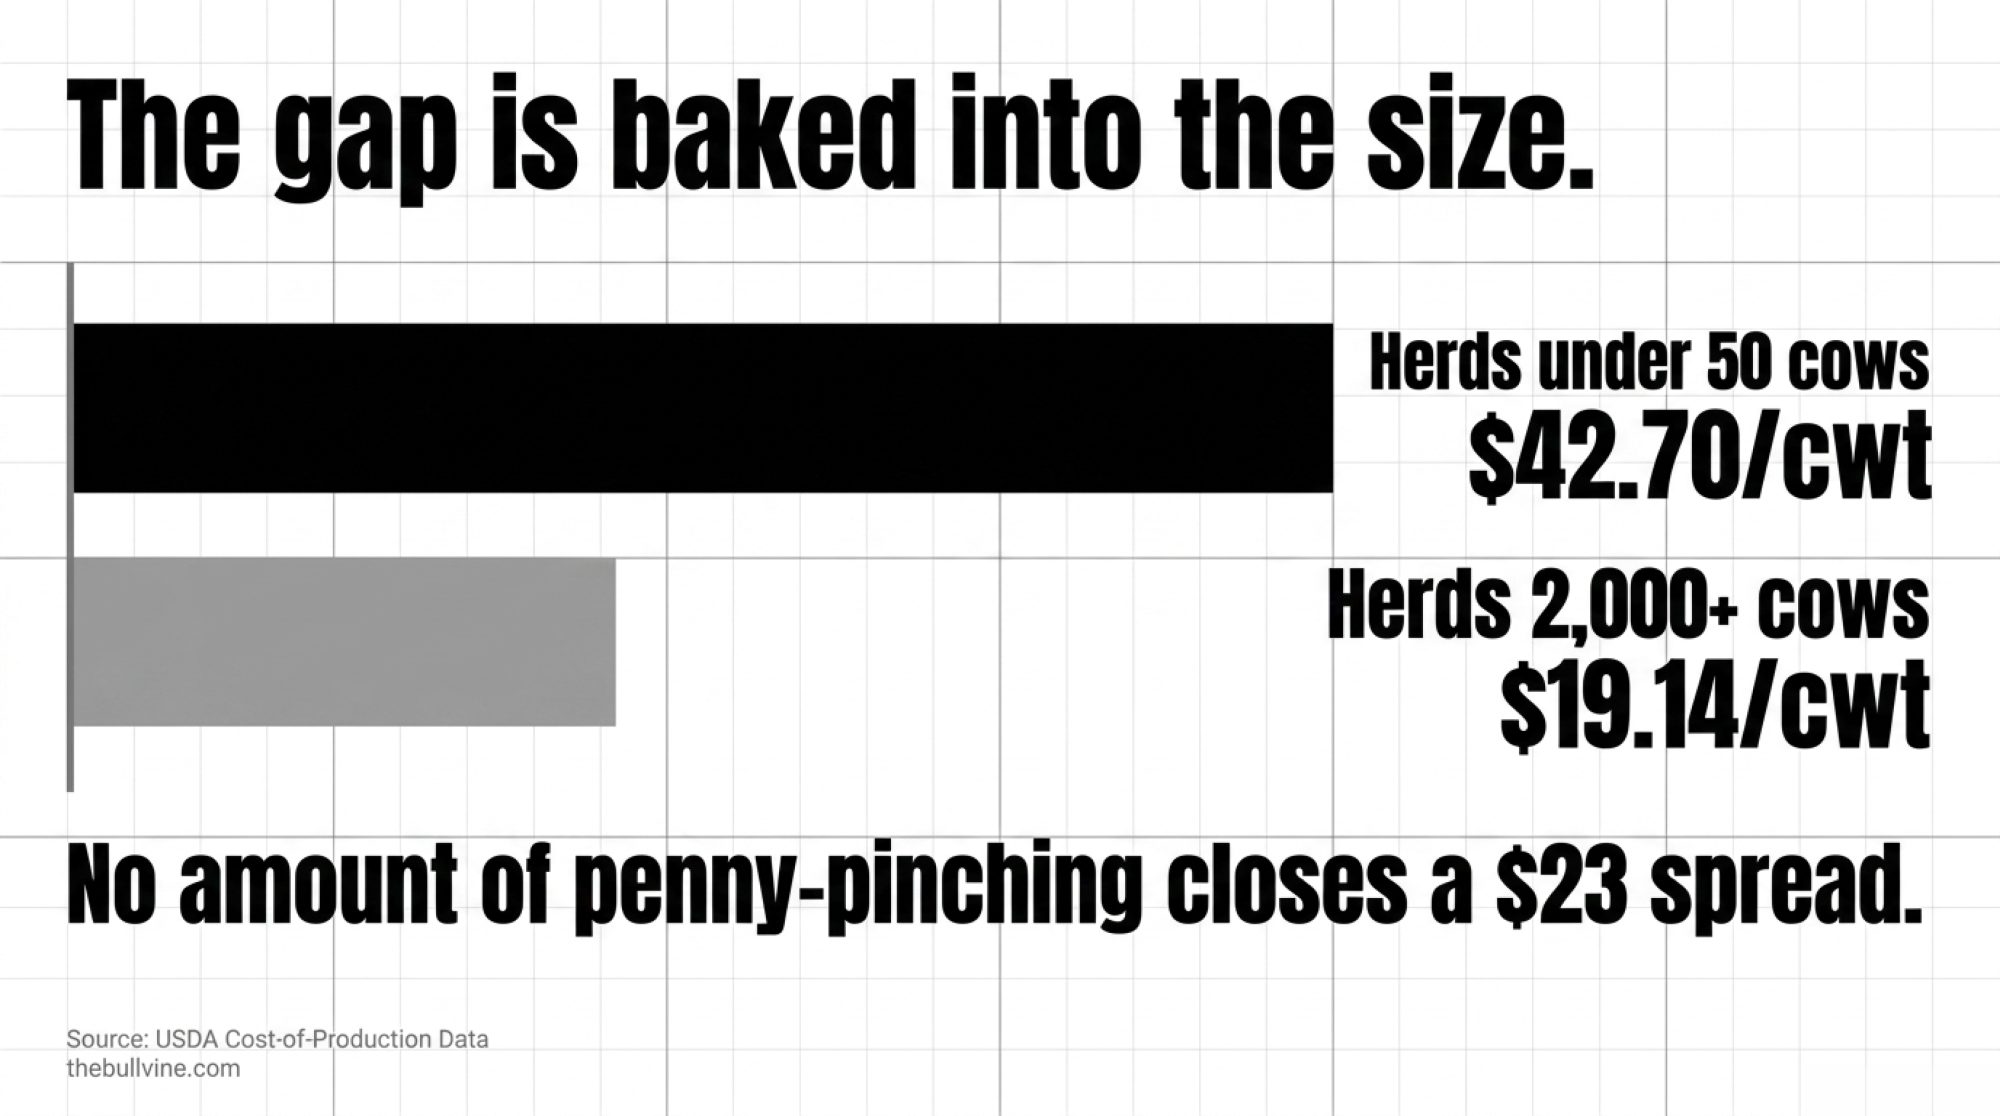
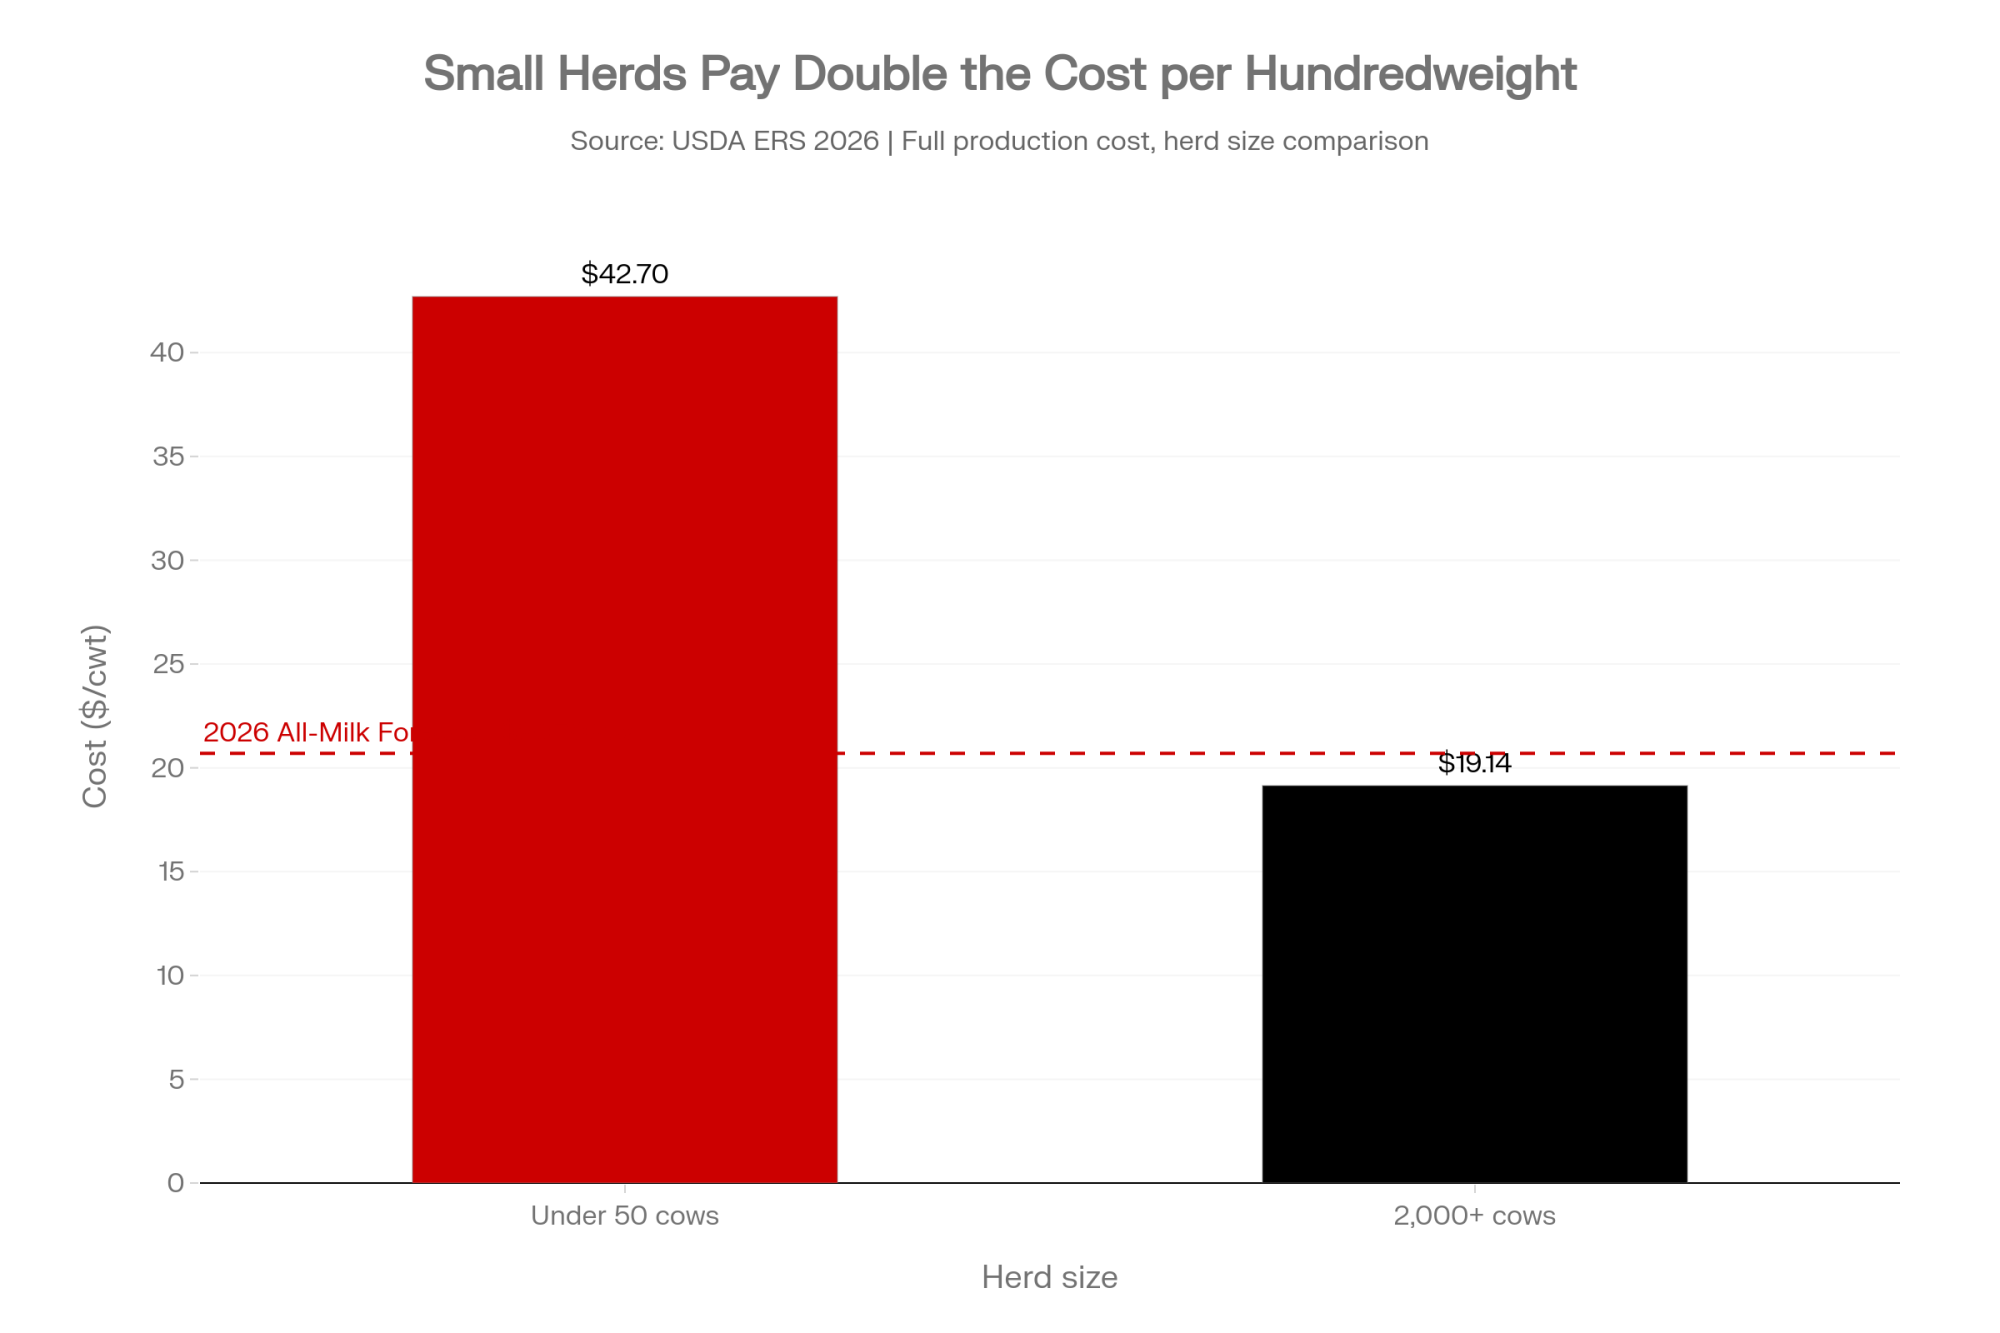
For scale — and this is a different unit — USDA ERS puts total labor at $13.18 per cwt on herds under 50 cows and $1.85 per cwt above 2,000 cows (USDA Economic Research Service, Milk Cost of Production Estimates). Four H-2A positions at 200 cows consuming $5.60 of that is not a like-for-like comparison, but it tells you the program doesn’t fix a scale disadvantage. It prices one.

Against a domestic crew

The comparison farm’s actual wage bill isn’t public. Labeled planning rates:

CaseAssumed local billH-2A modelDifference
Low$187,200 at $15/hr$187,370+$170
Central$212,160 at $17/hr$268,683+$56,523
High$249,600 at $20/hr$331,683+$82,083

Central runs about $56,500 above a $17-per-hour domestic cash-wage bill, and $48,000 of that gap is housing. On a 200-cow dairy, the bunkhouse decision matters nearly as much as the wage rate.

The low case reaching near-parity is not a finding that H-2A is cheap. It’s a finding that H-2A is cheap for a farm that already owns compliant housing — which is the farm least likely to need this analysis. And even at parity, the three-fourths guarantee means the two columns don’t carry the same risk.

Dairy’s Exposure, Correctly Dated

The National Milk Producers Federation — which represents dairy cooperatives and advocates for agricultural labor reform — reports immigrant employees at 51% of U.S. dairy labor and farms employing immigrant workers producing 79% of the nation’s milk (NMPF, Labor and Immigration Reform). Both figures come from an NMPF-sponsored Texas A&M study published in 2015, built on a producer survey and economic model (NMPF, The Economic Impacts of Immigrant Labor on U.S. Dairy Farms, 2015). Not a current federal workforce count. Any piece citing them without that date and sponsor is overstating their authority.

What This Means for Your Operation

Map a 50% crew loss this week. Who covers milking, feeding, calves, treatments, and manure handling if 25% or 50% of the crew is gone tomorrow? One name in three essential jobs is not a plan.

Run the per-cwt number today. Annual payroll divided by hundredweight shipped, then compare against the ERS bracket for your herd size. You’re looking for the gap between what you pay now and the $4.80–$6.72 range four H-2A positions would add at 200 cows.

Start 75 days early or don’t start. A June 1 need belongs on the calendar by mid-March.

Build a month-by-month labor curve. Hours by duty and month — milking, maternity, calves, breeding, fieldwork, maintenance. Twelve months of payroll and schedules is how you demonstrate a seasonal increase exists, or admit it doesn’t.

Cost housing before you cost counsel. Benchmark against $9,000–$13,000 per worker, then get your actual structures evaluated. A farmhouse or camper already occupied by employees is not automatically compliant. Sleeping rooms require at least 50 square feet per person, and 100 square feet per person where workers cook, live, and sleep in the same room (DOL WHD, Fact Sheet #26G).

Count your housing headcount, not your visa headcount. Corresponding employment domestic workers who can’t get home the same day are owed housing too. Budget it before you file, not after an audit.
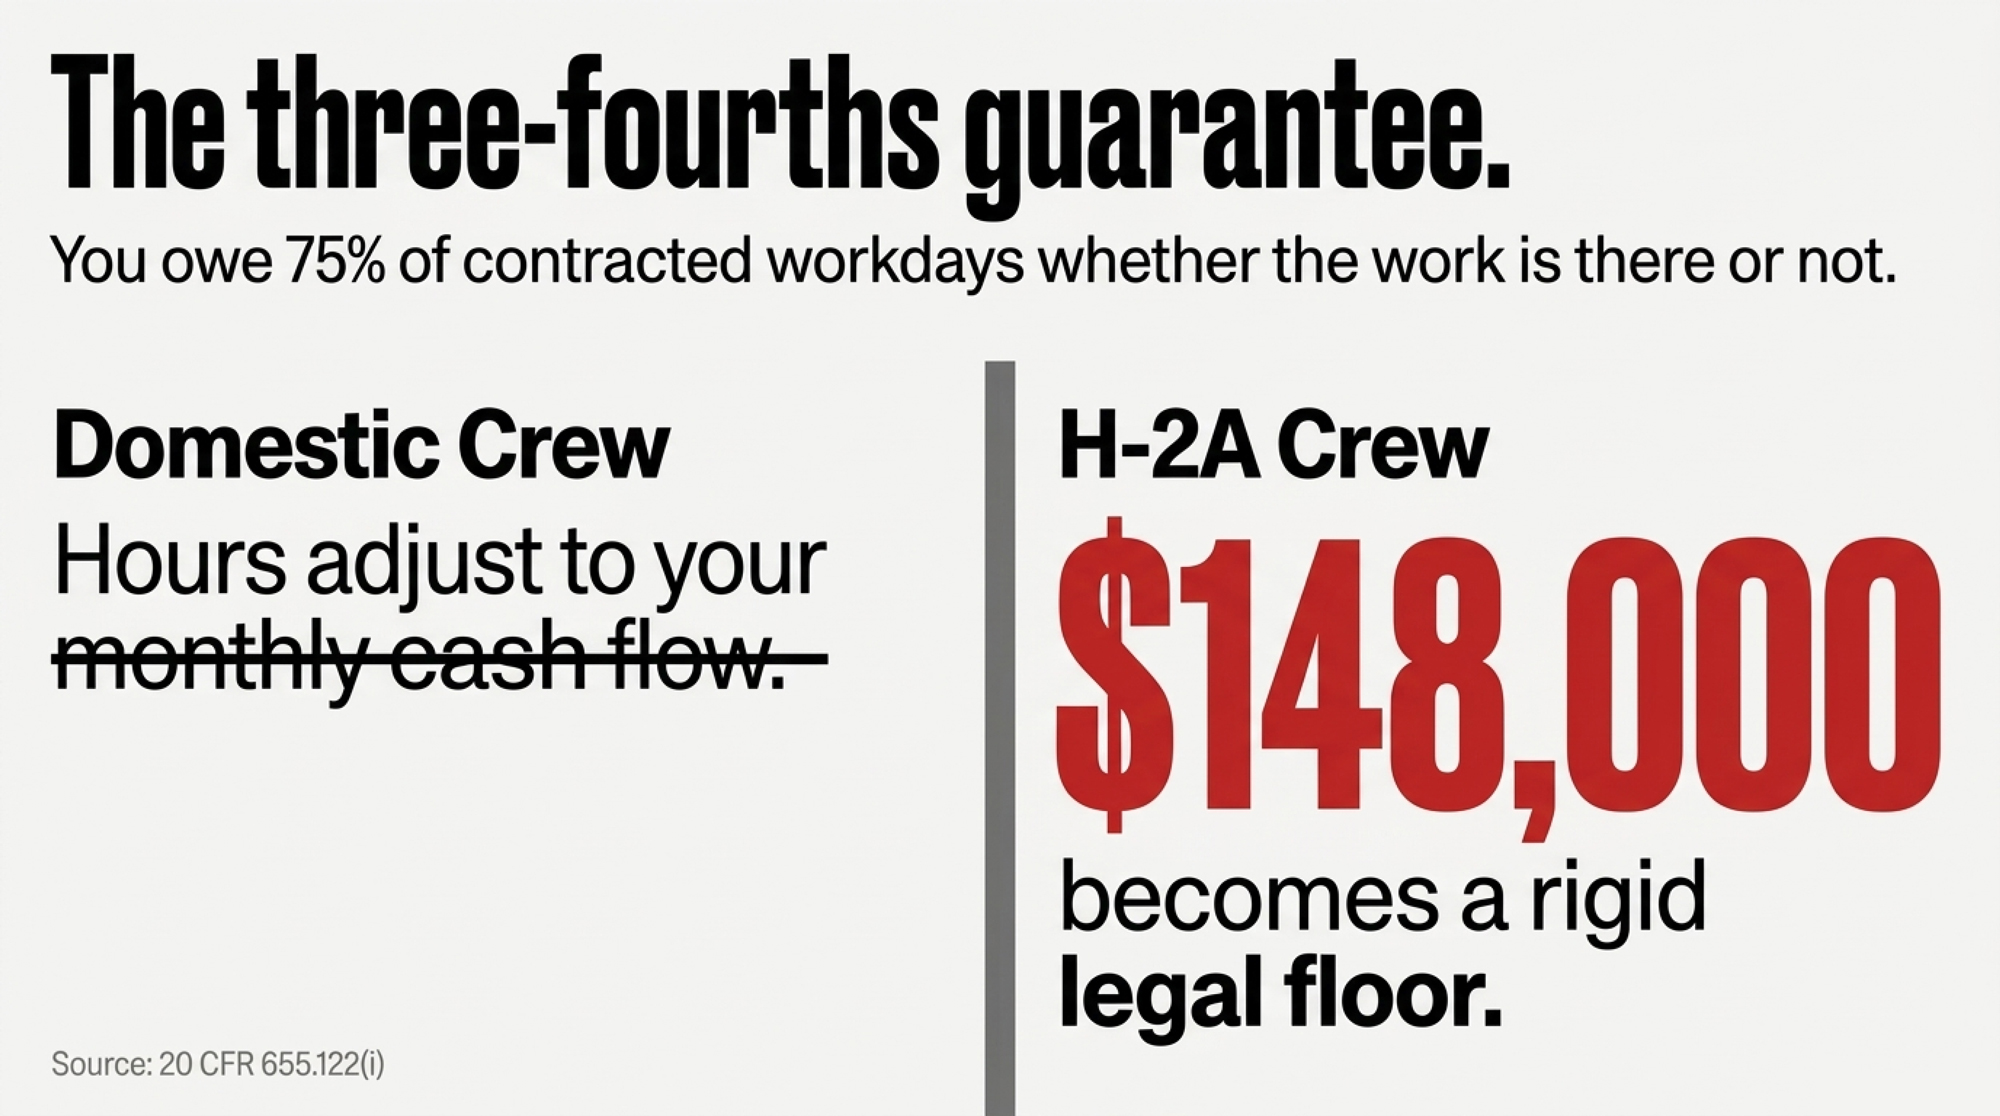
Model the three-fourths guarantee, not just the hourly rate. Under 20 CFR 655.122(i), you owe roughly 75% of contracted workdays regardless of workload, on the central case that’s roughly $148,000 of the $197,683 wage line owed whether the work is there or not. Run your slowest quarter against the contract and see what you’d be paying for.

Price both skill levels and check your state’s effective date. Virginia after August 17: $12.77 and $15.84 before housing and travel. Sixteen other states share that date; the rest moved August 3 (Federal Register, FR Doc. 2026-15673).

Set up three pay codes now. H-2A Level I, H-2A Level II, and domestic corresponding employment at the full unadjusted rate — the structure 20 CFR 655.122(a) requires once you run a mixed crew. A blended average hides a mid-season duty shift, and that is exactly what a DOL reclassification dispute looks for.

Keep wage records tight after September 2. Workers employed during the court-identified period may later qualify for adjustments. Nothing is owed yet. That is not the same as nothing being owed.

Run a privileged I-9 review while the crew is intact. Through qualified immigration counsel, not a DIY audit. Reverifying foreign-born employees on your own creates discrimination exposure of its own.

The Next 30 to 90 Days

DOL’s replacement wage methodology. The September 2 notice signals a rule is coming. Until it publishes, every Virginia H-2A wage you pay is provisional.

The Securing Agriculture’s Workforce Act (H.R. 9535), introduced June 30, 2026, would open H-2A to more categories of agricultural work, set entry wages at the 17th percentile and experienced wages at the 50th, eliminate the prevailing wage, fix contract wages for the contract duration, allow multiyear housing certifications and permit capped housing deductions tied to HUD fair market rent (Alston & Bird analysis; bill text at Congress.gov). Introduced, not law.

H.R. 3227 proposes a limited pool of non-temporary H-2A visas with a dairy reservation (Congress.gov). Also introduced, but not law.

None helps a staffing decision this week. All three change a 2027 budget, and the housing provisions in H.R. 9535 would move the largest single line in the model above.

The policy that exists was never built to refill half a permanent crew after the barn is already short. It was built to be planned for. Cost the four-worker case, test whether the work is genuinely seasonal, and inspect the housing while everyone is still showing up.
Key Takeaways

  • Four replacement workers on a 200-cow Virginia dairy run $187,370 to $331,683 a year across 12,480 hours — housing swings nearly the whole spread, so price the bunkhouse before you price the petition.
  • Check your effective date. Virginia’s new AEWR didn’t start August 3 with most states; it started August 17 under the Kansas v. DOL order, and a wage line filed on the wrong date is a compliance problem, not a rounding error.
  • The housing credit that lowers your H-2A wage doesn’t reach domestic workers in corresponding employment — they get the full unadjusted rate, and some of them are owed housing too.
  • Under 20 CFR 655.122(i), you owe three-fourths of contracted workdays whether the work is there or not. Clearing $268,683 doesn’t clear eligibility either, so build the labor curve while the crew’s intact.
The Bullvine H-2A Replacement Cost Calculator

Run the math on wages, housing, and regulatory liabilities before you file a petition.

1. Labor Needs

2. Annual Cost Inputs

3. Farm Scale & Comparison

Total Annualized H-2A Cost
$0
Wages + Housing + Admin + Travel
Cost Per Cow
$0
Cost Per Cwt
$0.00
3/4 Guarantee Liability
$0
75% of cash wages owed whether work exists or not.
Premium Over Local Crew
+$0
How much extra this H-2A crew costs vs local hires at your specified domestic wage.

Complete references and supporting documentation are available upon request by contacting the editorial team at editor@thebullvine.com.

Learn More

  • How to Attract and Retain Exceptional Labor for Your Dairy Farm — Arms you with concrete retention strategies that cut turnover expenses and protect your parlor’s efficiency. Dismantles the idea that wages alone keep teams intact, showing how structured communication and performance tracking reduce labor flight by up to 25 percent.
  • Dairy Farm Economics 2026: Milk Pricing, Margins & Risk Playbook — Exposes the structural margin squeeze hitting your 2026 milk check, delivering a playbook for navigating a projected $23.66/cwt economic cost. Breaks down how formula modernizations and risk management caps dictate whether you optimize, expand, or exit.
  • Robotic Milking Labor Math: Fix the Problem or Grow Debt? — Follows the money on automation, pitting a $48,000 variable wage hike against fixed $150,000 debt payments. Reveals why eight percent of early adopters save zero labor hours and forces you to stress-test dealer proposals against $18 milk.

The Sunday Read Dairy Professionals Don’t Skip.

Every week, thousands of producers, breeders, and industry insiders open Bullvine Weekly for genetics insights, market shifts, and profit strategies they won’t find anywhere else. One email. Five minutes. Smarter decisions all week.
NewsSubscribe
First
Last
Consent

$2.4 Million on a Welfare Label Alexandre’s Own Buyers Held Since 2020 and 2021

Check the roster. Alexandre took up American Humane Certified in January. Rumiano’s had it since 2020. Organic dairy certification plus welfare and regenerative labels means five separate lists — and on a grass-fed A2A2 regenerative herd, $2.4 million a year riding on which one you can prove.

When Alexandre Family Farm replaced the Certified Humane seal on its cartons with American Humane Certified in January 2026, the move looked like a routine certifier change. A premium label carries $21.82 to $40.15 per hundredweight depending on which band a herd ships into. But cross-referencing American Humane’s producer roster against Alexandre’s federal milk filing shows a supply-chain reality neither document carries alone. Alexandre adopted a program two of its named buyers had already held for years.

American Humane certified Organic West Milk of Ripon in a July 2021 announcement. Rumiano Cheese Company of Crescent City, in Alexandre’s own town, had its organic dairies certified under the program by November 2020, and Rumiano describes its supplier farms as American Humane Certified within a 100-mile radius.

So the label Alexandre picked up in January 2026 was already in its own supply chain, and had been for at least four years. Nobody here did anything improper, and none of this suggests coordination.

Why does a buyer’s certificate matter to a shipper? Rumiano’s own description puts American Humane Certified inside its sourcing standard, which makes the credential part of how that buyer presents its retail claim. The structure is worth understanding before you sign onto a welfare scheme: where a buyer has already built its own claim on a specific certifier, the choice of program may not sit entirely with the farm.

What the Filing and the Roster Each Say

The buyer list comes from Alexandre’s own words to a federal regulator. In its 2023 Federal Milk Marketing Order filing, the farm stated: “We sell our organic milk to: Rumiano Cheese, Humboldt Creamery, Organic West Milk, and our own Alexandre Family Farm creamery.” That filing is dated September 14, 2023, and we could not independently confirm that the three external buyer relationships remain current.

Those three aren’t equivalent businesses. Humboldt Creamery, based in Fortuna, has been a brand of Crystal Creamery, the dairy division of Foster Farms Dairy, since 2009, when the original 1929 cooperative sold its assets in bankruptcy. So Alexandre’s disclosed buyer list runs from a family cheese company in its own town to a conglomerate brand, and the certification picture differs across them.

Buyer disclosed in Alexandre’s 2023 FMMO filingBusiness context cited in articleAmerican Humane evidence in articleEditorial read
Rumiano Cheese CompanyCrescent City family cheese company; in Alexandre’s townOrganic dairies documented as American Humane Certified by November 2020Buyer-side welfare credential predates Alexandre’s January 2026 change
Organic West MilkRipon, California milk marketer/processorAmerican Humane announced certification in July 2021Buyer-side credential predates Alexandre’s January 2026 change
Humboldt CreameryFortuna brand of Crystal Creamery/Foster Farms Dairy since 2009No American Humane certification for Humboldt or Crystal establishedDo not infer certification from Foster Farms’ broiler certification
Alexandre Family Farm creameryAlexandre’s own creamery operationAlexandre adopted American Humane Certified in January 2026Separate from the external-buyer evidence

American Humane’s roster is public and searchable, and it spans large commercial operations including Butterball alongside smaller family farms. Certified Humane maintains its own separate public list. The two programs share no database, which is the practical point for any shipper carrying more than one welfare label: there is no single place to check what you or your buyers currently hold.

The farm’s website also lists branded partners using its milk, including Serenity Kids toddler formula and Once Upon a Farm organic A2 products.

Why “Certified Regenerative” Is the Hardest Word to Check

Here’s the sequence, which took three exchanges with the farm and a direct inquiry to the certifier to establish, and which we got wrong the first time.

Alexandre’s Regenerative Organic Certified status for the dairy went through three stages, according to the account the farm gave us on July 9 and confirmed on July 10, 2026, through an NSG Global representative writing on its behalf, with co-owner Stephanie Alexandre copied to confirm attribution. The farm says ROC temporarily suspended it, then reinstated it after follow-up inspections and a review of its records. Only after that reinstatement, the farm says, did it elect not to seek renewal. The farm supplied reinstatement documentation, which we reviewed. 

We asked the Regenerative Organic Alliance directly on July 9, 2026 whether the certification had been suspended in 2025, on what date and why, and whether it was subsequently reinstated. We received no reply. So the sequence above is the farm’s account, supported by documents we examined, and not independently confirmed by the certifier that issued the certificate.

On the record: the certification that didn’t lapse. Alexandre held a separate regenerative certification throughout. Bullvine reviewed the Land to Market certificate, issued by the Savory Institute, valid November 19, 2025 through November 19, 2026. The farm told us it “continued to have a valid regenerative certification at the time of the news conference” and that “we continue to be certified regenerative to this day.” We published a correction on July 9, 2026, after an earlier version of our reporting said the certification had been “pulled” and that the farm had lost two premium labels. The USDA Report of Investigation findings and the litigation status are separately sourced to federal records and court filings, and those stand.

So a farm can be suspended by one regenerative program, reinstated by it, decline to renew, hold a second regenerative certification the whole time, and have “no longer certified regenerative” and “still certified regenerative” both be defensible statements. That’s not a loophole anyone exploited. It’s what happens when a term carries no federal definition.

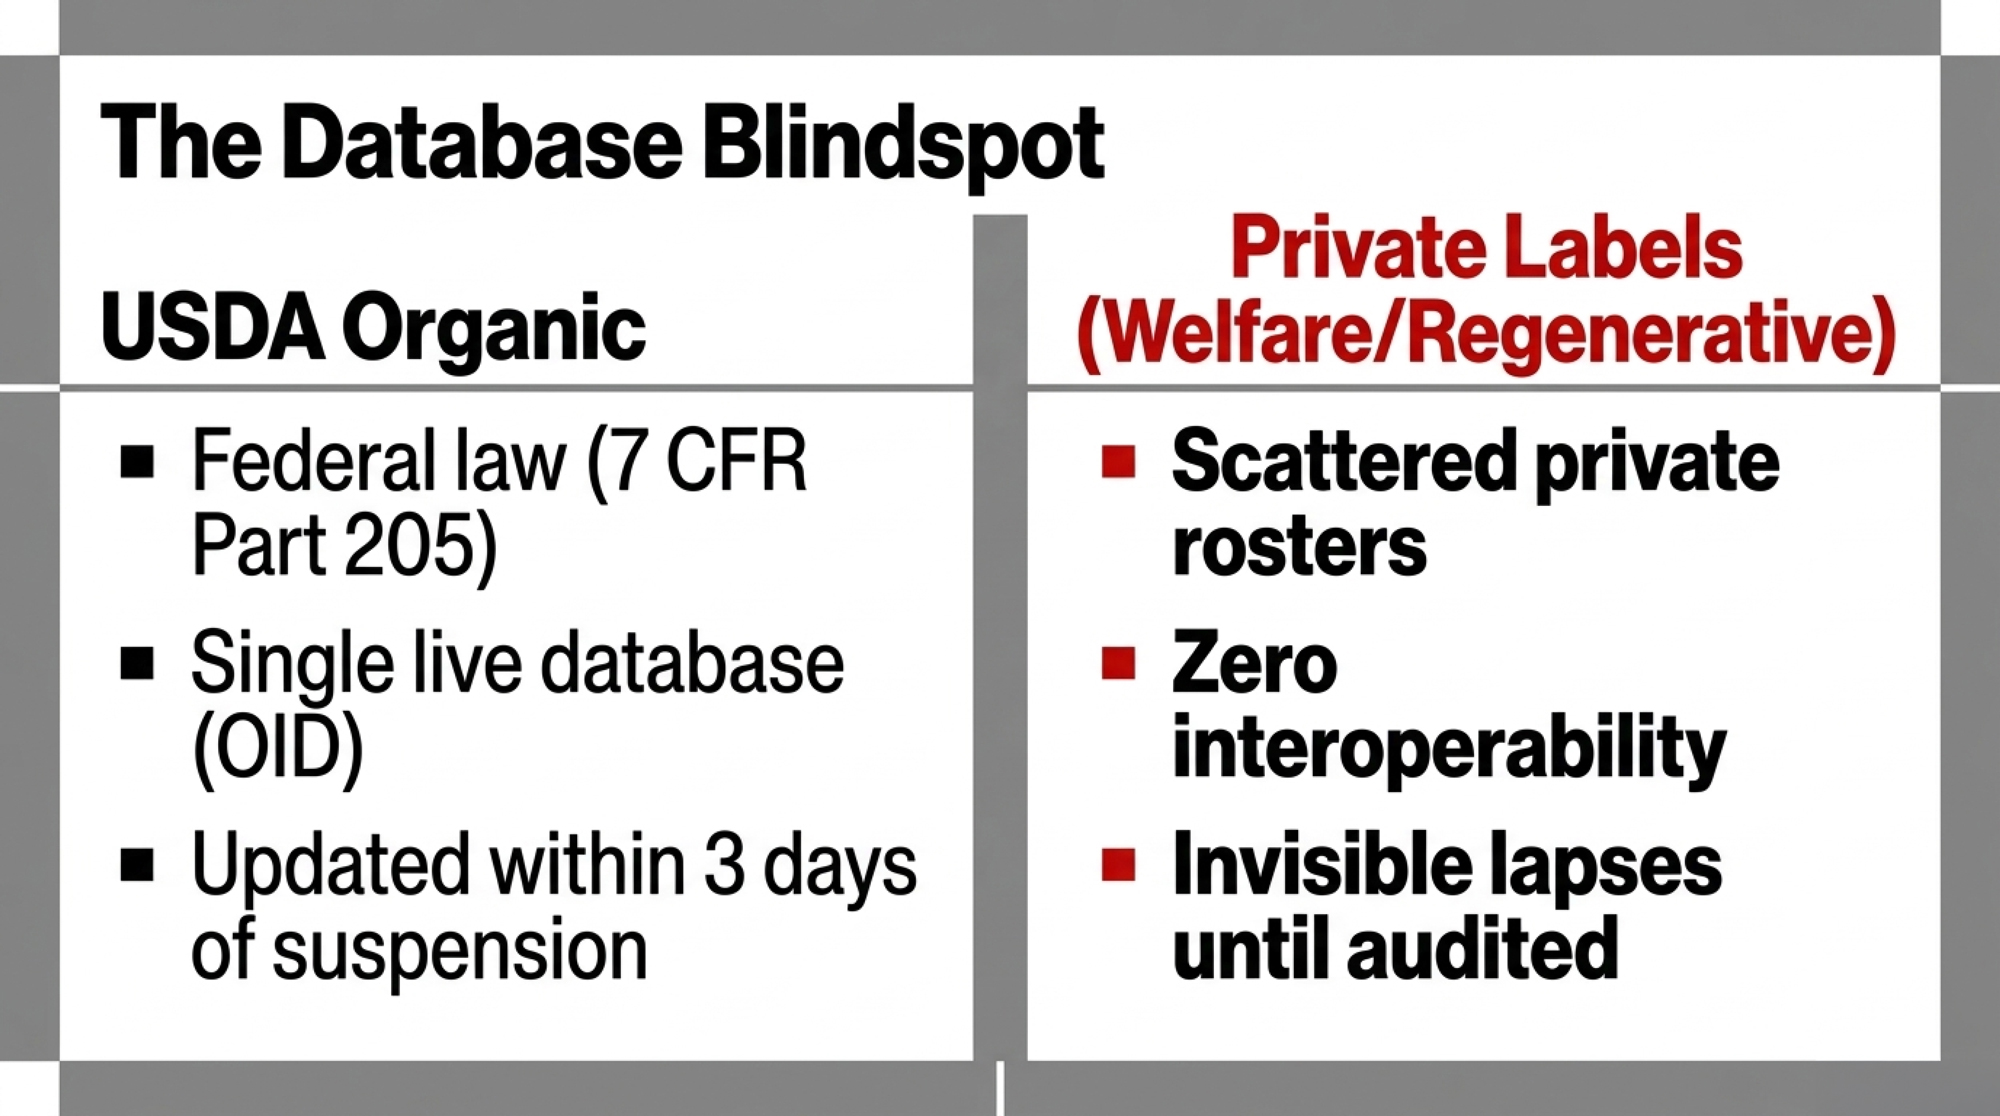
“Organic” is governed under 7 CFR Part 205, with certification, inspection, and enforcement behind it. “Regenerative” has none of that. There is no USDA standard, no federal registry, and no single authority. The Regenerative Organic Alliance administers ROC, and the Savory Institute administers Land to Market; both are private nonprofits. When USDA launched its $700 million Regenerative Pilot Program on December 9–10, 2025, and spotlighted Alexandre as a model regenerative operation, per The New Lede’s December 11, 2025 reporting, it amplified a category it doesn’t define or verify. EQIP and CSP, the two programs carrying that money, are established Farm Bill conservation cost-share vehicles whose eligibility doesn’t turn on a marketing claim at all.

While Alexandre’s record stays contested across a FOIA’d federal file and two civil suits, the systemic vulnerability it exposes applies to every premium shipper carrying a stacked label.

What’s a Welfare or Organic Premium Actually Worth Per Hundredweight?

This is the part that reaches your milk check, and it doesn’t depend on how anyone characterizes Alexandre’s certificates.

Bullvine calculation.

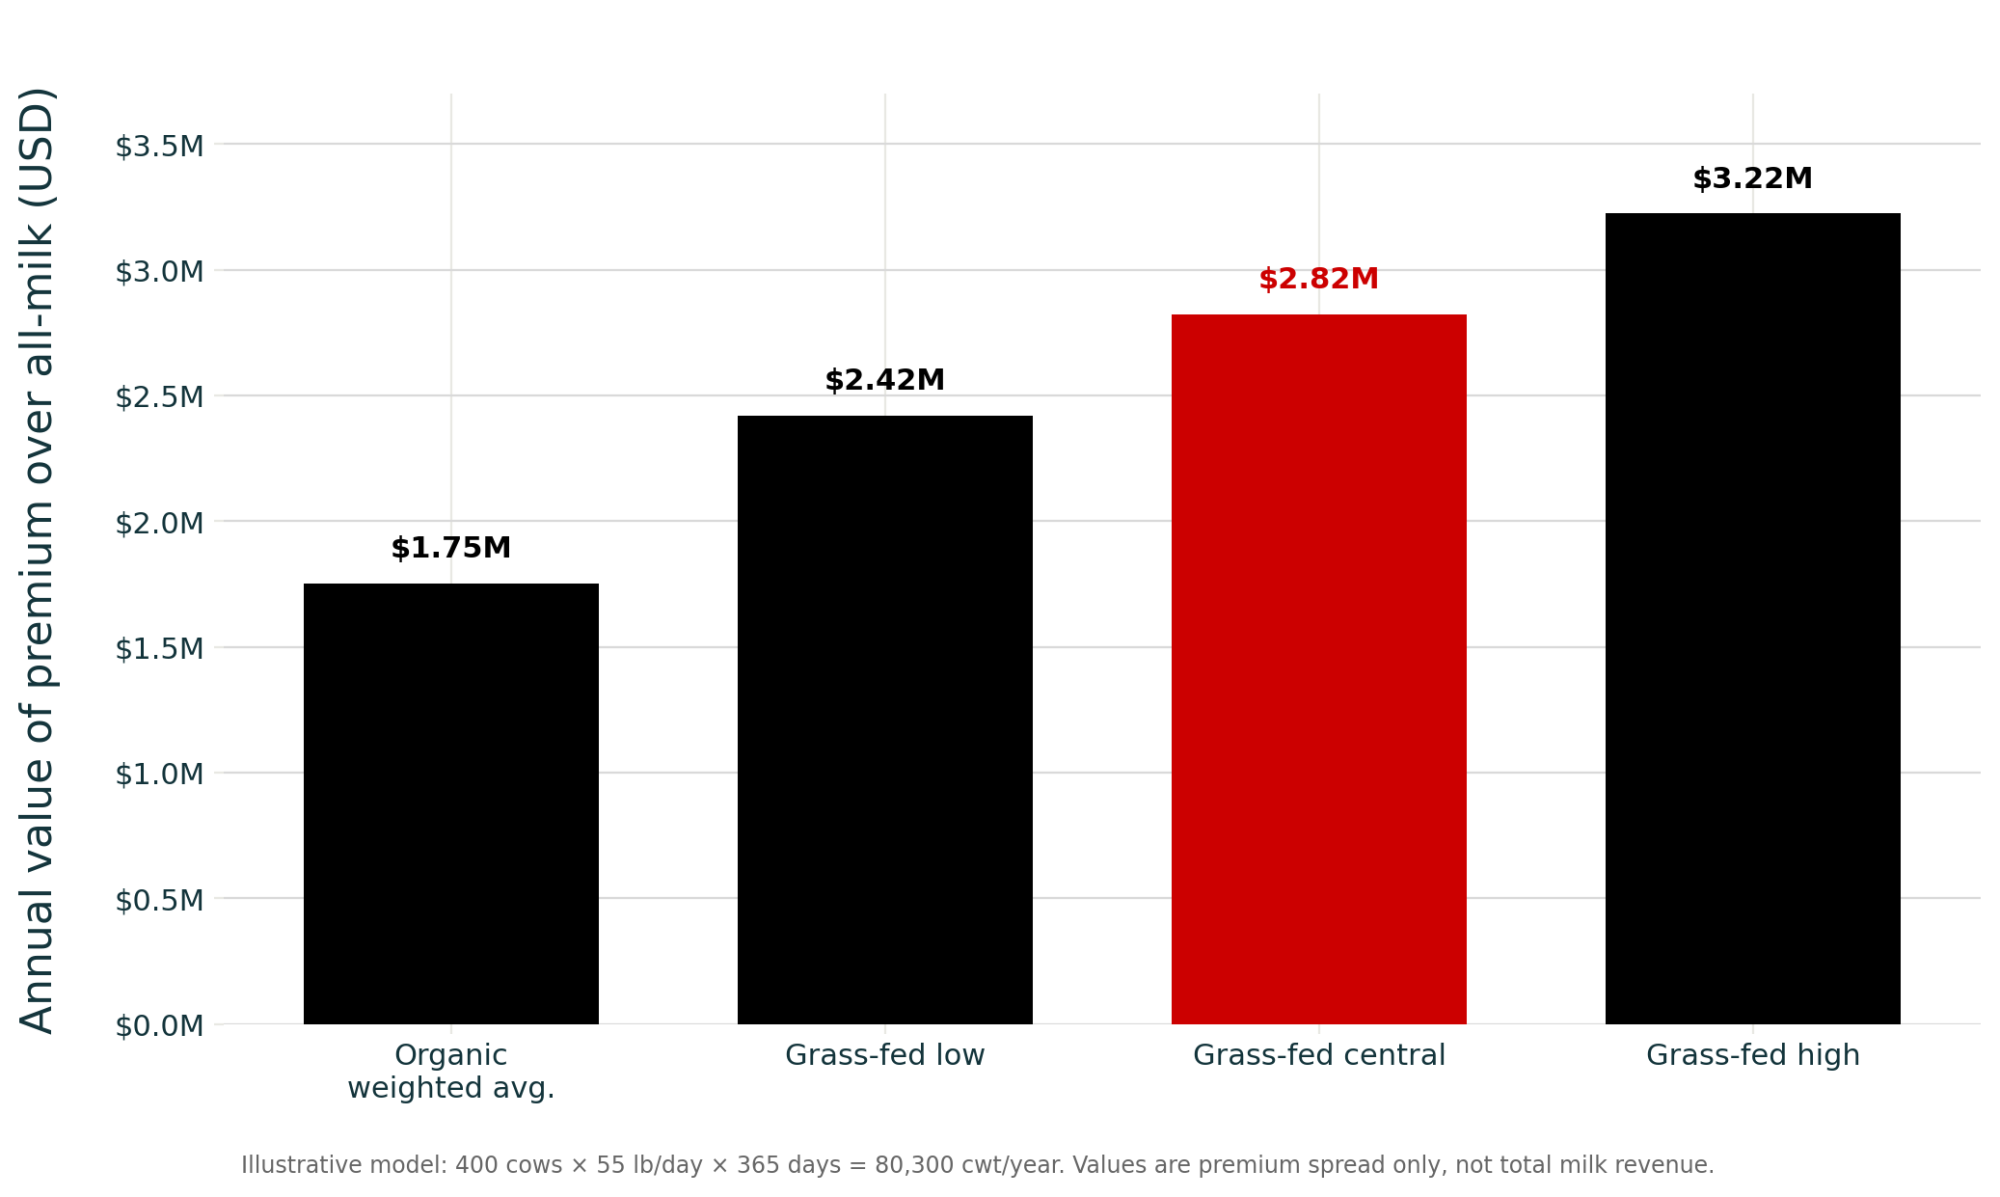
Certification LevelBenchmark Pay PriceSpread over All-Milk ($19.85/cwt)Annual Value of the Spread (400 cows / 80,300 cwt)
All-Organic Weighted Avg.$41.67/cwt+$21.82/cwt$1,752,146
Grass-Fed / A2A2 / Regenerative — low$50.00/cwt+$30.15/cwt$2,421,045
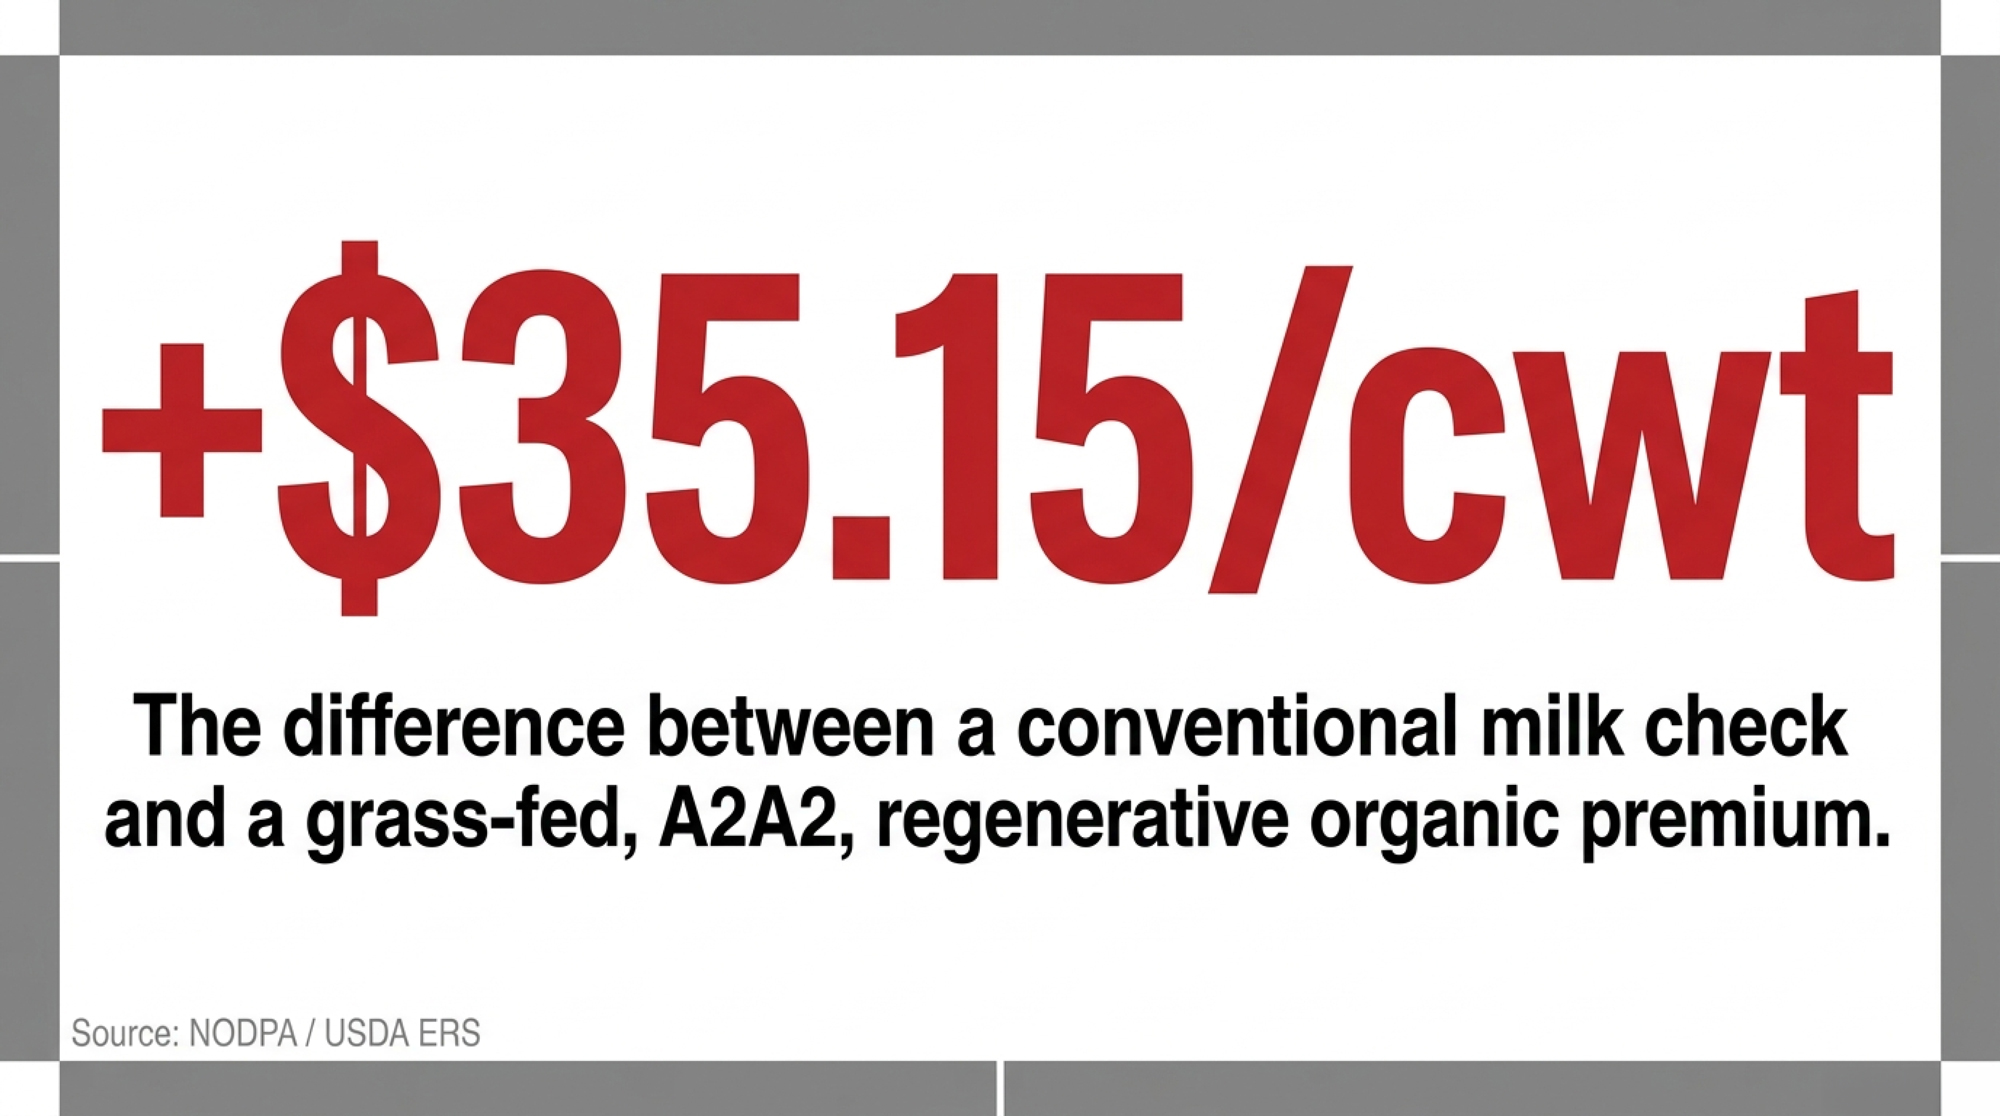
Grass-Fed / A2A2 / Regenerative — central$55.00/cwt+$35.15/cwt$2,822,545
Grass-Fed / A2A2 / Regenerative — high$60.00/cwt+$40.15/cwt$3,224,045

The right-hand column is the value of the premium alone, not the total milk check. At $41.67/cwt, the same 400-cow herd’s gross would run about $3.35 million. The three grass-fed rows apply the same 55 lbs/day assumption as the all-organic row, and grass-fed systems commonly ship less per cow — run those rows on your own shipped volume before treating the totals as comparable.

The herd baseline is an illustrative 400-cow operation at an assumed 55 lbs/day over 365 days, which works out to 80,300 cwt a year. That 55 lbs is our assumption, not a sourced figure.

Published evidence: The Northeast Organic Dairy Producers Alliance, a grassroots producer organization whose pay-price figures come from member reporting rather than an audited series, put the weighted-average organic pay price for Q1 2026 at $41.67/cwt, range $40.05 to $42.62, before hauling deductions, in its July 2026 Pay and Feed Prices report. In its September 2026 report, NODPA puts grass-fed, A2A2, regenerative, organic-certified herds at $50 to $60/cwt, and Northeast spot fluid organic at $45–55/cwt, eased from the $60 range reported earlier in the year. USDA’s Economic Research Service revised its 2026 all-milk forecast down to $19.85/cwt on August 19, 2026.

One year on, the gap is wider. NODPA’s full-year 2025 weighted average was $38.39/cwt, which we used to price the $19.89 risk on your farm on May 27, 2026. Its Q1 2026 quarterly average came in $3.28/cwt higher, up 8.5%. That’s one annual average against one quarter rather than a trend line, so treat it as a marker rather than a direction. On the same 400-cow model, $3.28/cwt is roughly $263,000 a year. For how the same math lands on a cheese plate rather than in a tanker, see Jasper Hill gets $22 a wedge.

The Audit Reality: The Live Feed Versus the File Drawer

The USDA Organic Integrity Database is free, public, and searchable by farm name. Federal regulation requires certifiers to update it within three business days of any suspension, revocation, or surrender, under 7 CFR § 205.662(e)(3). CCOF’s own guidance puts it plainly: “Information in OID will be more accurate than any PDF certificate you receive.” A certificate in your file drawer is a photograph. The database is the live feed.

But OID covers federal organic status only. Every private label you carry, whether welfare, regenerative, grass-fed, or breed-specific, lives on a separate roster maintained by whoever issues it, and none of them talk to each other. That lack of interoperability is where the risk sits during a contract audit. A buyer’s compliance team verifying you has to check each issuing body separately, and if one private certificate has lapsed or changed program, nothing surfaces it.

Consider what it took us to establish one farm’s regenerative history: three exchanges with the operation, an unanswered inquiry to the certifier, and a reinstatement document supplied by the subject rather than the issuer. Rumiano’s certification date took two separate sources. Humboldt Creamery’s Foster Farms parentage took three, and none of them was the federal filing that named it. A farm stacking three claims checks three lists, and so does anyone verifying that farm.

Claim or programPrimary verification routeWhat the check can establishAudit vulnerability
USDA OrganicUSDA Organic Integrity DatabaseCurrent federal organic certification status; suspensions, revocations, or surrender updatesOID does not verify private welfare, grass-fed, breed, or regenerative claims
American Humane CertifiedAmerican Humane producer roster and issuer recordsParticipation in that specific welfare-certification programSeparate roster; it does not confirm Certified Humane or regenerative status
Certified HumaneCertified Humane public list and issuer recordsParticipation in that distinct welfare-certification programSeparate program and database from American Humane
Regenerative Organic CertifiedRegenerative Organic Alliance issuer records and farm documentationStatus within ROC’s private programNo federal USDA definition or registry for “regenerative”
Land to MarketSavory Institute certificate and issuer recordsStatus within Land to Market’s distinct regenerative frameworkA Land to Market certificate does not establish ROC status, and vice versa

Status Check: Where Alexandre’s CCOF Settlement Stands Today

Alexandre’s USDA Organic certification remains active. CCOF’s certifier directory, updated May 17, 2026, lists the operation as a member out of Crescent City.

Separately, a two-year CCOF settlement agreement covering the farm reached its term around February 2026. The farm entered that agreement on February 16, 2024, after a Combined Notice of Noncompliance and Proposed Suspension, and it required annual unannounced inspections. As of September 2026, we found no public statement from CCOF or USDA describing what followed it, and no public outcome has been announced.

The underlying investigation file, case NOPI-LS-00240-2024, reviewed 14 animal-welfare allegations. Ten were confirmed by CCOF or acknowledged by Alexandre. Three were denied or not substantiated. One drew no response. A June 2024 unannounced inspection confirmed corrections to substantiated items. Our fuller accounting is in what a pulled label really costs a farm’s balance sheet.

Options and Trade-Offs

Action 1: Audit OID and Private Rosters — do this within 30 days

Action: Run your farm name through the USDA Organic Integrity Database, then check each private roster separately: Savory Institute for Land to Market, the Regenerative Organic Alliance for ROC, Certified Humane and American Humane for welfare. Check your buyers too, and check who owns them.

Constraint: OID updates federal organic status only. A private lapse sits invisible until an audit or a buyer catches it.

Action 2: Disaggregate Your Premium per CWT

Action: Separate your base organic pay price from every stacked claim, whether grass-fed, welfare, or breed-specific, using your last three milk checks and your processor’s price sheet by certification type.

Constraint: If you can’t calculate your exact per-label premium in under an hour, your margin is exposed, and you don’t yet know by how much.

Action 3: Keep Your Own Certification Paper Trail

Action: Hold suspension notices, reinstatement letters, and renewal decisions in one file, with dates. Audit your web copy and carton text against those actual certificates, and be specific about which program a claim rests on. Land to Market and ROC are not interchangeable.

Constraint: “Regenerative” carries no legal USDA definition comparable to organic under 7 CFR Part 205. If a reporter or a buyer ever asks you to reconstruct a certification sequence, the only record that will settle it is yours.

Key Takeaways

  • If you carry more than one welfare or regenerative label, you’re checking more than one roster. There is no combined registry, and OID won’t show you the private ones.
  • If your buyer already holds a welfare certification, find out which one before you choose yours. Alexandre’s buyers have carried American Humane Certified since 2020 and 2021.
  • If you don’t know who owns your buyer, find out. One of the three creameries on Alexandre’s federal filing has been a Foster Farms Dairy brand since 2009.
  • If you ship grass-fed A2A2 regenerative organic, you’re in NODPA’s $50–60/cwt band, not the $41.67 weighted average. At a central $55/cwt and your own shipped volume, that’s roughly $2.8 million a year in certification-dependent revenue on 400 cows.
  • If your certification status ever changes, keep the suspension notice and the reinstatement letter. A farm’s own paper is often the only record that can reconstruct the sequence.

Pull your last three milk checks and separate what you’re paid for organic status from every welfare or regenerative claim stacked on top. We’re tracking the CCOF settlement’s outcome and both active Alexandre lawsuits as they move.

Methodology Note — Certification dates: Organic West Milk certified by American Humane per the organization’s July 22, 2021 announcement; Rumiano Cheese Company’s organic dairies documented as American Humane Certified Free Farmed in trade press dated November 2020 and confirmed on the Cornucopia Institute’s dairy scorecard, October 2025. Vendor and retailer pages date Rumiano’s certification to 2016; we’ve used the conservative, independently published date. ROC sequence: the suspension, reinstatement, and non-renewal sequence is the account Alexandre Family Farm provided on July 9 and confirmed on July 10, 2026, through a representative of NSG Global, with co-owner Stephanie Alexandre copied to confirm attribution, supported by reinstatement documentation we reviewed. We asked the Regenerative Organic Alliance to confirm the sequence directly on July 9, 2026, and received no reply. Corporate ownership: Humboldt Creamery, founded in 1929 in Fortuna, California, has been a brand of Crystal Creamery, the dairy division of Foster Farms Dairy, since 2009. Foster Farms has held American Humane Certified status for its broiler chicken operations since 2013; we have not established any American Humane certification covering Humboldt Creamery or Crystal Creamery, and readers should not infer one. Premium spread: NODPA Pay and Feed Prices, July 2026 report, Q1 2026 weighted-average producer pay price $41.67/cwt, range $40.05–$42.62, before hauling deductions, USD; $50–60/cwt band from NODPA’s September 2026 report, with the $55/cwt central case ours; 2025 full-year weighted average $38.39/cwt from NODPA’s May 2026 report. NODPA is a Northeast-based grassroots producer organization, and its figures are member-reported, not audited. Conventional comparator: USDA Economic Research Service All Milk Price forecast of $19.85/cwt for 2026, released August 19, 2026, U.S. national. Four caveats. NODPA’s figure is a realized pay price, while USDA’s is a forecast. NODPA’s reporting is Northeast-weighted, while the ERS forecast is national. USDA’s all-milk aggregate includes organic milk. And the grass-fed rows carry the all-organic volume assumption, which grass-fed systems commonly won’t match. Herd model: illustrative 400-cow operation at an assumed 55 lbs/day over 365 days, not a named farm’s books. National and regional averages may not reflect your operation.

Learn More

The Sunday Read Dairy Professionals Don’t Skip.

Every week, thousands of producers, breeders, and industry insiders open Bullvine Weekly for genetics insights, market shifts, and profit strategies they won’t find anywhere else. One email. Five minutes. Smarter decisions all week.
NewsSubscribe
First
Last
Consent

Federal Order 30’s Hauling Number Is 16 Months Old. Midwest Diesel Is Up 81.7%.

Diesel set a record twice in two weeks. The only federal file measuring what you pay to haul milk was built on $3.44 diesel in May 2025 — and nothing newer exists.

Executive Summary: Bullvine joined Federal Order 30’s May 2025 hauling file to this week’s EIA print: on a 100-mile route, fuel now runs 9.0 to 10.6 cents per hundredweight higher than the benchmark that file was built on — $8,650 to $10,214 a year on a 400-cow Wisconsin herd. Whether any of it reaches the milk check turns on whether the hauling charge is flat or indexed. Most Upper Midwest handlers use a flat value, which means the increase arrives as a rate letter, not a surcharge line. The federal data says handlers absorbed most of the last fuel spike. That record stops at May 2025.

National on-highway diesel crossed $6 a gallon for the first time in the week ending September 14, 2026, printing $6.285, with Midwest at $6.250. The U.S. Energy Information Administration’s previous weekly record was $5.810, set in June 2022; the series broke it a week earlier at $5.967, then cleared $6 seven days later. A year ago the same series read about $3.71. Reuters, Forbes and TIME all attribute the run to supply disruption from the U.S.–Iran conflict and Ukrainian strikes on Russian refineries.

The last time a federal file measured what producers actually pay to move milk, diesel was $3.439. That was May 2025, 16 months ago, and no newer number exists.

The Upper Midwest Federal Milk Marketing Order 30 Market Administrator measured May 2025 hauling charges against that $3.439 Midwest benchmark. Midwest diesel is up $2.811 a gallon since then, or 81.7%.

On a 100-mile route, the fuel inside one load now costs 9.0 to 10.6 cents per hundredweight more than at that benchmark, depending on whether the clause assumes 6.5 or 5.5 miles per gallon. No source we could locate joins those two figures. The contract, not the pump, decides who absorbs the difference — and the same federal paper recorded what happened the last time fuel moved like this.

9.0 to 10.6¢ per cwt. $8,650 to $10,214 a year on 400 cows.

Bullvine model on stated assumptions — full inputs at the foot of this article.

What the hauling file actually says about pass-through

Staff Paper 25-03, written by Dr. Areerat Kichkha of the Market Administrator’s Minneapolis office, examined payroll data for 7,805 producers and reported a weighted-average hauling charge of $0.5087 per cwt for May 2025, up from $0.5033 for May 2024. Total hauling charges came to $23,591,329.54 on 4,637,343,232 pounds of producer deliveries.

Its Table 4 sets May Midwest diesel against May hauling charges across eleven years, using a longer-run hauling series calculated on the pre-2011 methodology — $0.7902 per cwt for May 2025 against $0.7969 for May 2024. That series is not the $0.5087 figure, and the two should never be added or compared.

What Table 4 shows is the pass-through record, measured rather than modeled. In May 2022, the fuel price rose 68.35% year over year while the average hauling charge rose 21.43%. In May 2024, fuel fell 2.79% while hauling charges rose 29.85%. The paper’s conclusion is blunt: “Given the handlers’ tendency to subsidize hauling charges, this smaller volatility indicates a strong tendency to resist passing through the increased hauling costs,” and its summary states that the order’s weighted average hauling charges “show handlers passed on little of the recent changes in fuel costs to farmers.”

That finding runs through May 2025 and stops there. It does not predict what happens to your September 2026 statement, and the paper makes no such claim.

How much does milk hauling cost per hundredweight in 2026?

Cross a state line and the same decision costs differently. Staff Paper 25-03’s Table 3 puts Wisconsin’s weighted average at $0.4711 per cwt, Illinois at $0.8038, Iowa at $0.7036, North Dakota at $0.7027, Michigan’s Upper Peninsula at $0.6951, South Dakota at $0.5543, and Minnesota at $0.4585. Every figure here is Upper Midwest — producers under other federal orders, provincial boards, or quota systems face the same clause questions on different numbers.

Herd size moves it harder. The smallest bracket, shipping under 50,000 pounds a month, paid about $1.14 per cwt weighted; the largest, at 5 million pounds or more, paid 39 cents. Inside Wisconsin, the same spread runs $1.04 down to 33 cents. Scale does the rest: 9% of farms produced 63.3% of the milk and paid 54% of total hauling charges.

At the county level, the appendix runs from about 44 cents a hundredweight in Clark County, Wisconsin, to $1.29 in Juneau — the spread Bullvine mapped against thinning farm density earlier this month.

On the truck’s side of the ledger, the American Transportation Research Institute put the 2025 average operating cost at $2.336 per mile, fuel at roughly $0.482 and non-fuel costs at a record $1.854, up 4.2%, with tank carriers averaging 4.0% operating margins. ATRI surveyed general freight carriers, not milk assembly fleets.

One more line in the file matters before you compare your own deduction to any of it. Strip out the 410 farms reporting no hauling deduction — 915,980,511 pounds — and the order-wide figure rises from 50.9 cents to 63.4 cents, with Wisconsin at 60.1 cents. The paper is careful about why those zeros exist: waiving the charge as a procurement tool, hauling self-funded outside the handler, or a third-party hauler not captured in payroll records. It says substantial anecdotal evidence indicates the latter two account for nearly all of them.

What the diesel move costs per hundredweight

Running the Numbers — Bullvine calculation. Fuel cost inside a milk route: (diesel price ÷ mpg) × route miles ÷ payload cwt. Diesel moves from the $3.439 May 2025 benchmark in Staff Paper 25-03 Table 4 to EIA’s $6.250 Midwest print for the week ending September 14, 2026.

Route length, at 5.5 mpg and 480 cwt

Route distance per loadFuel cost at $3.439 dieselFuel cost at $6.250 dieselFuel-only increase
50 miles6.51¢/cwt11.84¢/cwt5.32¢/cwt
100 miles13.03¢/cwt23.67¢/cwt10.64¢/cwt
200 miles26.05¢/cwt47.35¢/cwt21.28¢/cwt
100 miles at 6.5 mpg11.03¢/cwt20.04¢/cwt9.01¢/cwt
100 miles, 300-cwt payload20.85¢/cwt37.88¢/cwt17.04¢/cwt

Sensitivity, per hundredweight

VariableScenarioPer cwt
Fuel economy, 100 mi6.5 mpg vs 5.5 mpg9.01¢ vs 10.64¢
Payload, 100 mi at 5.5 mpg480 cwt vs 300 cwt10.64¢ vs 17.04¢
One-week index lagOff the Sept 7 print of $5.9461.15¢
Monthly index lagOff the Aug 10–31 average of $5.4563.01¢

What that is in herd dollars. On a 400-cow Wisconsin herd shipping 96,000 cwt a year over a 100-mile route, the fuel delta runs $8,650 to $10,214 a year, or $25.54 per cow. Shorten the route to 50 miles, and it’s $5,107; stretch it to 200, and it’s $20,429. Per load, the incremental fuel on 100 miles at 5.5 mpg is $51.11. On a monthly-reset clause, roughly $433 a month per route goes unfunded at the current spread.

Every figure in this section is a Bullvine model on the stated assumptions, not a measured cost. Full inputs, exclusions, and the monthly-versus-weekly basis note are at the foot of this article.

Who eats the increase, your hauler, your co-op, or you?

Start with the structure the paper documents: “the vast majority of handlers on this market charge producers a flat hauling value, regardless of the size or volume of milk being marketed.” A flat charge has no fuel term in it. Diesel can run to $6.250, and that producer’s deduction does not move until somebody reopens the rate.

A flat rate through an 81.7% diesel move is not insulation. Table 4 shows the adjustment arriving unevenly. Fuel rose 68.35% in 2022, and the hauling average moved 21.43% the same year. Hauling then slipped 0.66% in 2023, before rising 29.85% in 2024 — a year fuel fell 2.79%.

That 2024 line is the one to sit with. The paper does not attribute the rise to any single cost, and non-fuel operating costs have been climbing on their own: ATRI put them at a record $1.854 per mile in 2025, up 4.2%. Fuel is one candidate for what moves a hauling rate. It is not the only one, which is why the clause matters more than the pump price.

When a fuel term exists, the reset schedule determines who finances the gap. AAA Cooper Transportation’s published schedule sets its surcharge off the national weekly diesel average, with the new rate effective the Wednesday after Monday’s index. That is a documented one-week lag in general freight, not milk, and it is the clearest public illustration of the mechanic your clause may or may not share.

Six terms decide the rest, and they sit in the agreement rather than on the statement.

  • Benchmark index. National, a regional series, or a local rack price. Gulf Coast diesel ran $5.754 the week of September 7 while the West Coast ran $6.987, a spread of $1.233, or 21.4%.
  • Base fuel price. Sets the surcharge’s level. Under a linear formula, it does not change the cost of the next dollar of diesel.
  • Contract mpg. 6.5 mpg yields 9.01¢ per cwt on 100 miles against the May 2025 benchmark; 5.5 mpg yields 10.64¢.
  • Eligible miles. At $6.250 and 5.5 mpg, 20 uncounted miles burn $22.73 of fuel per load, of which $10.22 is the increase above the $3.439 benchmark — 2.13¢ per cwt at 480 cwt. A nine-cent difference between two regional indexes moves the same route 0.34¢.
  • Payload rule. Actual hundredweights, a standard load, or rated capacity. Thin routes get expensive when the formula assumes a full tank.
  • Cadence and symmetry. Weekly, monthly, or quarterly reset. A true-up decides who finally pays it, and the downward language decides whether the charge retreats when diesel does.

Tim Neubauer, listed as chair of the Wisconsin Milk Haulers Association and owner of Tim Neubauer Trucking in Sparta, told Wisconsin Public Radio on March 31, 2026, that spring road bans push milk trucks into more trips and “with the high diesel price, that’s costing a lot more money.” The association represents haulers, and that is published commentary rather than a disclosed contract term.

Why your statement can’t answer the question

Two producers can ship into the same order and hold opposite rights to an itemized federal statement. That is not a co-op practice. It is written into the order.

Under 7 CFR 1030.73(f)(7), a handler paying you directly must furnish a supporting statement showing “the amount, or rate per hundredweight, or rate per pound of component, and the nature of each deduction claimed by the handler,” alongside pounds, components, somatic cell count, and the rates used. Ship to a regulated plant that pays you, and the itemization is required under the order.

The same subsection then carves out the other route. The obligation runs to each producer “except a producer whose milk was received from a cooperative association handler described in § 1000.9(a) or (c).” If your milk reaches the plant through a cooperative association handler, that federal itemization requirement does not reach you. Many co-ops itemize anyway, but no rule in that subsection compels it.

The federal aggregate has the same problem from the other end. The Market Administrator’s own reporting field accepts a single hauling line that “can include, but is not limited to, stop charges, fuel charges, or a flat fee,” with some handlers using a combination — which is why even the order-wide average cannot be decomposed into fuel, stops, and base rate. What reaches your statement is governed separately by (f)(7), if it reaches you at all. Itemizing an amount is not the same as publishing the index, base price, mpg, eligible-mile definition, and payload rule behind it. Your statement hands you the answer to a calculation you cannot independently run — the co-op exemption Bullvine traced to a single line of federal code in August.

Two reporting notes belong in the open. As of September 17, 2026, no 2026 member notice from a named co-op changing a hauling deduction or fuel-surcharge formula could be located in public sources, and the newest federal hauling paper remains the May 2025 file. 

The 90-Day Playbook for herds shipping under a hauling deduction

The thresholds below use the Order 30 figures. The questions transfer to any order, board, or quota system; only the numbers change.

30 days

1. Pull four statements.

  • Action: June through September 2026. Record hauling rate per cwt, any separate fuel line, stop charges, and cwt shipped for each month.
  • Requires: Four statements, 20 minutes.
  • Threshold: A month-over-month move above 3.8¢ per cwt on a 100-mile route exceeds what a $1.00 diesel change explains at 5.5 mpg, and 3.2¢ at 6.5 mpg. Above that, ask for the calculation.
  • Backfire: Volume and component swings move per-cwt math too. Divide by shipped cwt every time.

2. Establish flat or indexed — before anything else.

  • Action: Ask your buyer which structure your charge uses.
  • Requires: One question.
  • Threshold: If it is flat, stop watching for a surcharge line. Start watching for a rate-reset letter, because that is how any cost increase will reach you.
  • Backfire: An unchanged flat rate is not evidence you are insulated. Staff Paper 25-03 says most Upper Midwest handlers use a flat value, and Table 4 shows those rates moving in steps rather than with the pump.

3. Get the clause in writing.

  • Action: Request the fuel clause and current rate schedule from your field rep or hauler.
  • Requires: One email.
  • Threshold: If nobody can name the index, base price, mpg, eligible miles, and reset date, the charge is not auditable.
  • Backfire: Some terms are genuinely confidential. Ask for the formula, not another producer’s rate.

4. Settle the mileage question.

  • Action: Ask whether the surcharge pays loaded miles or every mile the truck runs for your pickup.
  • Requires: One question, same email.
  • Threshold: 20 uncounted miles is $22.73 of fuel per load at current prices.
  • Backfire: Excluded empty miles may already sit inside the base rate. Get the whole structure before deciding anyone is short.

5. Red-flag trigger — debt service.

  • Action: Divide your hauling deduction by net mailbox pay for each of the last six months.
  • Requires: Six milk statements, fifteen minutes.
  • Threshold: Order 30’s weighted average is 50.9 cents against a Wisconsin all-milk price north of $21 — roughly 2.4% of gross. If yours is running above 4%, route geometry or load size is the cause, not the diesel price, and the fix is in the schedule rather than the clause.
  • Backfire: Rate pressure has limits. ATRI put tank-carrier operating margins at 4.0% in 2025 — general freight rather than milk assembly, but the direction holds. Push a hauler on rate without offering route efficiency or flexible pickup timing and you can lose the slot.

90 days

6. Reconcile one month end to end.

  • Action: Match the clause against the month’s shipped cwt, route mileage, and the buyer’s calculation.
  • Requires: The clause, the statement, your route miles.
  • Threshold: Any variance above one rounding increment goes back in writing before the next statement closes.
  • Backfire: You may find your handler absorbed part of it, which is what the federal data says handlers have historically done. That changes how you open the conversation.

7. Price the reset cadence.

  • Action: Find the observation period and effective date in the clause.
  • Requires: The clause, ten minutes.
  • Threshold: A monthly reset on a rising series leaves roughly $433 per route per month unfunded at the current spread.
  • Backfire: A lagging clause overcharges on the way down unless it adjusts both directions. Ask for the downward language in the same request.

8. Test route density against the payload assumption.

  • Action: Compare your actual average load to the payload the formula assumes.
  • Requires: Pickup frequency, tank size, actual average load.
  • Threshold: Average loads near 300 cwt against a 480-cwt assumption run 60% higher per cwt.
  • Backfire: Fewer, fuller pickups extend standing time and shift quality risk onto you.

365 days

9. Put hauling in the annual contract review.

  • Action: Review it beside base price and premiums, not after them.
  • Requires: The agreement, notice periods, every rate notice received this year filed by date.
  • Threshold: Any notice that changed a rate without a stated formula goes to your accountant before renewal.
  • Backfire: Opening the hauling schedule can reopen the base rate. Know your route economics first.

10. Opportunity signal — route density.

  • Action: Price a fuller load or a shared route with a neighboring shipper.
  • Requires: Volume projections, a willing partner, your co-op’s route consent.
  • Threshold: Within Wisconsin, Staff Paper 25-03 records $0.3326 per cwt in the largest size bracket against $1.0433 in the smallest. That gap is the return on density — and plant geography moves it too, as the 24 extra one-way miles after the St. Albans idle showed. Model it before adding cows, because the pickup schedule sets the ceiling, not the parlor.
  • Backfire: Consolidation strands you if the partner farm exits.

Federal data says handlers absorbed most of the last fuel spike through May 2025, and Table 4 above shows the catch-up arriving in steps rather than with the pump. Midwest diesel is now $2.811 a gallon above the benchmark that file used, and no newer federal number exists. Pull your September statement and your hauling agreement tonight, and find three things: whether your charge is flat or indexed, what the base price is, and which miles count.

Key Takeaways

  • The federal number everyone cites for milk hauling is measuring a diesel market that no longer exists. Staff Paper 25-03 priced May 2025 at $3.439 a gallon; EIA printed $6.285 for the week ending September 14.
  • Bullvine’s join of those two figures puts the fuel gap at 9.0 to 10.6 cents per cwt on a 100-mile route, or $8,650 to $10,214 a year on a 400-cow herd — before anyone decides who absorbs it.
  • Flat or indexed is the first question, and it changes everything after it. Most Upper Midwest handlers use a flat value, which means the increase arrives as a rate letter rather than a surcharge line.
  • Two producers shipping into the same order can hold opposite rights to an itemized statement. Under 7 CFR 1030.73(f)(7), a handler paying you directly must itemize every deduction. Milk routed through a cooperative association handler is carved out.
Interactive Tool

Milk Hauling Fuel Delta Calculator

Calculate your unhedged fuel exposure: benchmarked against Staff Paper 25-03 ($3.439/gal) vs. Current Diesel ($6.250/gal).

Estimated Rate & Cash-Flow Impact:
Per Hundredweight
+10.64¢
Annual Herd Exposure
+$10,214
Monthly Impact
+$851
Per Cow / Year
+$25.54
Methodology: FO 30 Staff Paper 25-03 ($3.439 base) • The Bullvine

Methodology and what we excluded

Diesel, current: EIA weekly retail on-highway, national and PADD 2, weeks ending August 10 to September 14, 2026, USD per gallon. The August figure used in the lag row is the mean of the four verified weekly prints — August 10, 17, 24, and 31 — at $5.456; the August 3 print is excluded because it was not confirmed against the release, so this is not the full-month average. Records cited are nominal, not inflation-adjusted, and refer to the EIA weekly series — AAA’s daily average and GasBuddy’s index crossed $6 several days earlier on different methodologies.

Diesel, benchmark: the $3.439 May 2025 figure published in Staff Paper 25-03 Table 4, which the paper’s footnote 3 sources to EIA’s monthly Midwest No. 2 diesel retail series, EMD_EPD2D_PTE_R20_DPG. Same agency, same region, different frequencies — $3.439 is a monthly average, $6.250 a single weekly observation — so read the delta as a level comparison rather than a like-for-like series change.

Fuel economy and payload: USDA AMS stated assumptions from the Federal Register of September 13, 2006 — 20 years old, sensitivity-tested above, not a measured 2026 fleet average. Herd scenario: stated assumption, 400 cows, Wisconsin, 96,000 cwt shipped annually.

Fuel only. Driver wages, equipment, insurance, maintenance, tires, wash, sampling, and stop-and-wait time are excluded, so this is not a hauling rate. Deadhead is excluded unless counted in route miles. Published evidence, stated assumptions, and Bullvine math stay visibly separate throughout, and a 400-cow illustration is nobody’s books.

Learn More

The Sunday Read Dairy Professionals Don’t Skip.

Every week, thousands of producers, breeders, and industry insiders open Bullvine Weekly for genetics insights, market shifts, and profit strategies they won’t find anywhere else. One email. Five minutes. Smarter decisions all week.
NewsSubscribe
First
Last
Consent

The National Heifer Number Fits Wisconsin and California. Almost Nobody Else.

Wisconsin sits at 40.3 replacements per 100 cows. California at 40.4. National is 41.9 — so a third of the herd is fine using it, and everyone else has been quoting a stranger’s number.

Executive Summary: USDA’s replacement-heifer pool fell 769,700 head between 2020 and 2025 while the milk-cow herd held flat, and a DRMS analysis of continuously DHIA-tested Holstein herds shows third-and-later-lactation culling down 7.6 points across the same years — even as cull cows hit a record US$157.00 per cwt. Joining two USDA columns nobody had joined shows why: national freshening capacity for a 500-cow herd fell from 151 head to 134, leaving a 33%-turnover herd 31 short. State coverage runs 49 points wide, from 28.6 to 77.8.

dairy replacement heifer coverage

Cull-cow prices hit their highest monthly average on record in July 2025 and herds on DRMS records were culling less, not more. The average price received for cows, beef cows and cull dairy cows sold for slaughter reached US$157.00 per cwt that month, US$15.00 above July 2024. In the same year, a DRMS analysis of Holstein herds on continual DHIA test, shared publicly on LinkedIn by DRMS’s Dr. Robert Fourdraine, put third-and-later-lactation culling at 46.1%, down 7.6 points since 2020.

Behind that retention sits a supply problem. The dairy replacement heifer inventory reported by USDA’s National Agricultural Statistics Service fell 769,700 head between January 1, 2020 and January 1, 2025 on the agency’s revised figures, while the national milk-cow herd finished essentially unchanged. Replacement pressure contributed to lower culling. That is an inventory signal, not proof that beef semen caused it.

Where the culling actually went

Nothing moved in 2021. First-lactation culling sat at 25.2% in 2020 and 25.3% in 2021. Second lactation went from 31.7% to 31.5%. Third-plus edged up from 53.7% to 54.0%.

The break starts in 2022 and holds through 2025 in all three groups — four consecutive declining years, not a two-point wobble.

Lactation group202020212022202320242025ChangeRelative
1st25.2%25.3%24.0%24.0%22.4%21.6%-3.6 pts-14.3%
2nd31.7%31.5%29.9%29.5%27.2%26.7%-5.0 pts-15.8%
3rd and later53.7%54.0%50.5%49.9%47.0%46.1%-7.6 pts-14.2%

The 7.6-point move is the biggest in absolute terms. Look at the relative declines, though: 14.3%, 15.8%, 14.2%. Nearly identical. This isn’t only older cows getting a reprieve. Exits slowed across the whole productive herd, and the head-count effect landed hardest where turnover was always highest.

Run it on a 500-cow herd carrying 150 third-and-later-lactation cows. A 7.6-point drop is about 11 of those cows staying who would have left in 2020.

Does 41.9 mean anything in your state?

The national 41.9 is where every story about this shortage stops. For most herds, it’s also where it stops being useful.

The Bullvine Replacement Coverage Ratio divides milk-replacement heifers by milk cows and multiplies by 100. Both inputs come from the same NASS table each January. Run it on the state pages and coverage ranges from 28.6 replacements per 100 cows in Michigan to 77.8 in Kansas on January 1, 2025 — a 49-point spread the national number hides completely.

StateMilk cows (1,000 head)Milk replacements (1,000 head)Replacements per 100 cows
Michigan440.0126.028.6
Texas675.0220.032.6
Minnesota440.0165.037.5
Wisconsin1,265.0510.040.3
California1,710.0690.040.4
Pennsylvania465.0200.043.0
Idaho680.0305.044.9
New York630.0320.050.8
Arizona189.0130.068.8
Kansas180.0140.077.8
United States9,349.33,914.341.9

Bullvine calculation. Published evidence: USDA NASS, Cattle, January 31, 2025, state tables, January 1, 2025 inventory, head. Bullvine math: state milk replacements ÷ state milk cows × 100. Ratios built on small cow bases move further on the same absolute change — Kansas and Arizona each carry under 200,000 milk cows against Wisconsin’s 1.27 million, so treat the extremes as directional rather than precise.

One caution before you locate yourself on that list. NASS counts heifers where they physically stand, not who owns them. Kansas at 77.8 and Arizona at 68.8 carry custom-raised animals destined for herds in other states, and the reverse holds too — a Michigan or Texas herd may own heifers growing out of state, which makes its real position better than 28.6 or 32.6 suggests. This is a location map, not an ownership ledger. Check your contracts before you treat a state number as your supply.

The two biggest dairy states land closest to the national figure — Wisconsin at 40.3 and California at 40.4, inside 1.6 points of 41.9. Together they hold roughly a third of the U.S. herd on that same table, so for that third the national number is a fair proxy. The other two-thirds are reading a number that isn’t theirs.

A 500-cow herd’s share of the state pool runs 143 head in Michigan, 163 in Texas, and 254 in New York. Same national headline, three different decisions.

Is the heifer pipeline really that tight?

The obvious response to a shrinking heifer supply is to buy replacements, not keep older cows. The national trend says why that stopped working.

Most beef-on-dairy programs rest on one assumption: a shortfall can be bought out. That assumption holds when replacements are plentiful, and through 2021 the national pool held above 48 replacements per 100 cows. Both series turn in the same window — coverage drops below 48 in 2022, and the DRMS culling decline starts in 2022. Coverage is a January 1 inventory and culling an annual rate, so read the alignment as directional rather than same-day.

Replacement numbers haven’t been this low in absolute terms since 1978. The Bullvine put a price on that low in January: 800,000 missing heifers, and who pays the bill? What the 1978 framing misses is coverage — how many replacements stand behind each cow, year by year.

January 1Milk-replacement heifersMilk cowsReplacements per 100 cows
20204.684 million (revised)9.3426 million50.1
20214.60 million9.44 million48.7
20224.4406 million9.3770 million47.4
20234.3372 million9.4025 million46.1
20243.9512 million9.3468 million42.3
20253.9143 million9.3493 million41.9

Bullvine calculation. Methodology Note — published evidence: USDA National Agricultural Statistics Service, Cattle, U.S. national, head, January 1 inventory. The 2020 and 2021 rows come from the January 29, 2021 release, the 2022 and 2023 rows from the January 31, 2023 release, and the 2024 and 2025 rows from the January 31, 2025 release, using revised figures where a later release supersedes an earlier one. The January 2020 release originally reported 4.64 million replacements; the January 2021 release revised that to 4.684 million, and the revised figure is used throughout. Stated assumption: milk-replacement heifers weighing 500 pounds and over represent the available replacement pool, which is broader than heifers expected to calve within the year. Bullvine math: heifers ÷ cows × 100. The 2021 row derives from figures published to three significant figures and is accurate to roughly ±0.2.

Coverage fell from 50.1 to 41.9 — about eight fewer replacements behind every hundred cows. The pool contracted 16.4%, while milk cows moved 6,700 head, a difference well inside the agency’s own revision range.

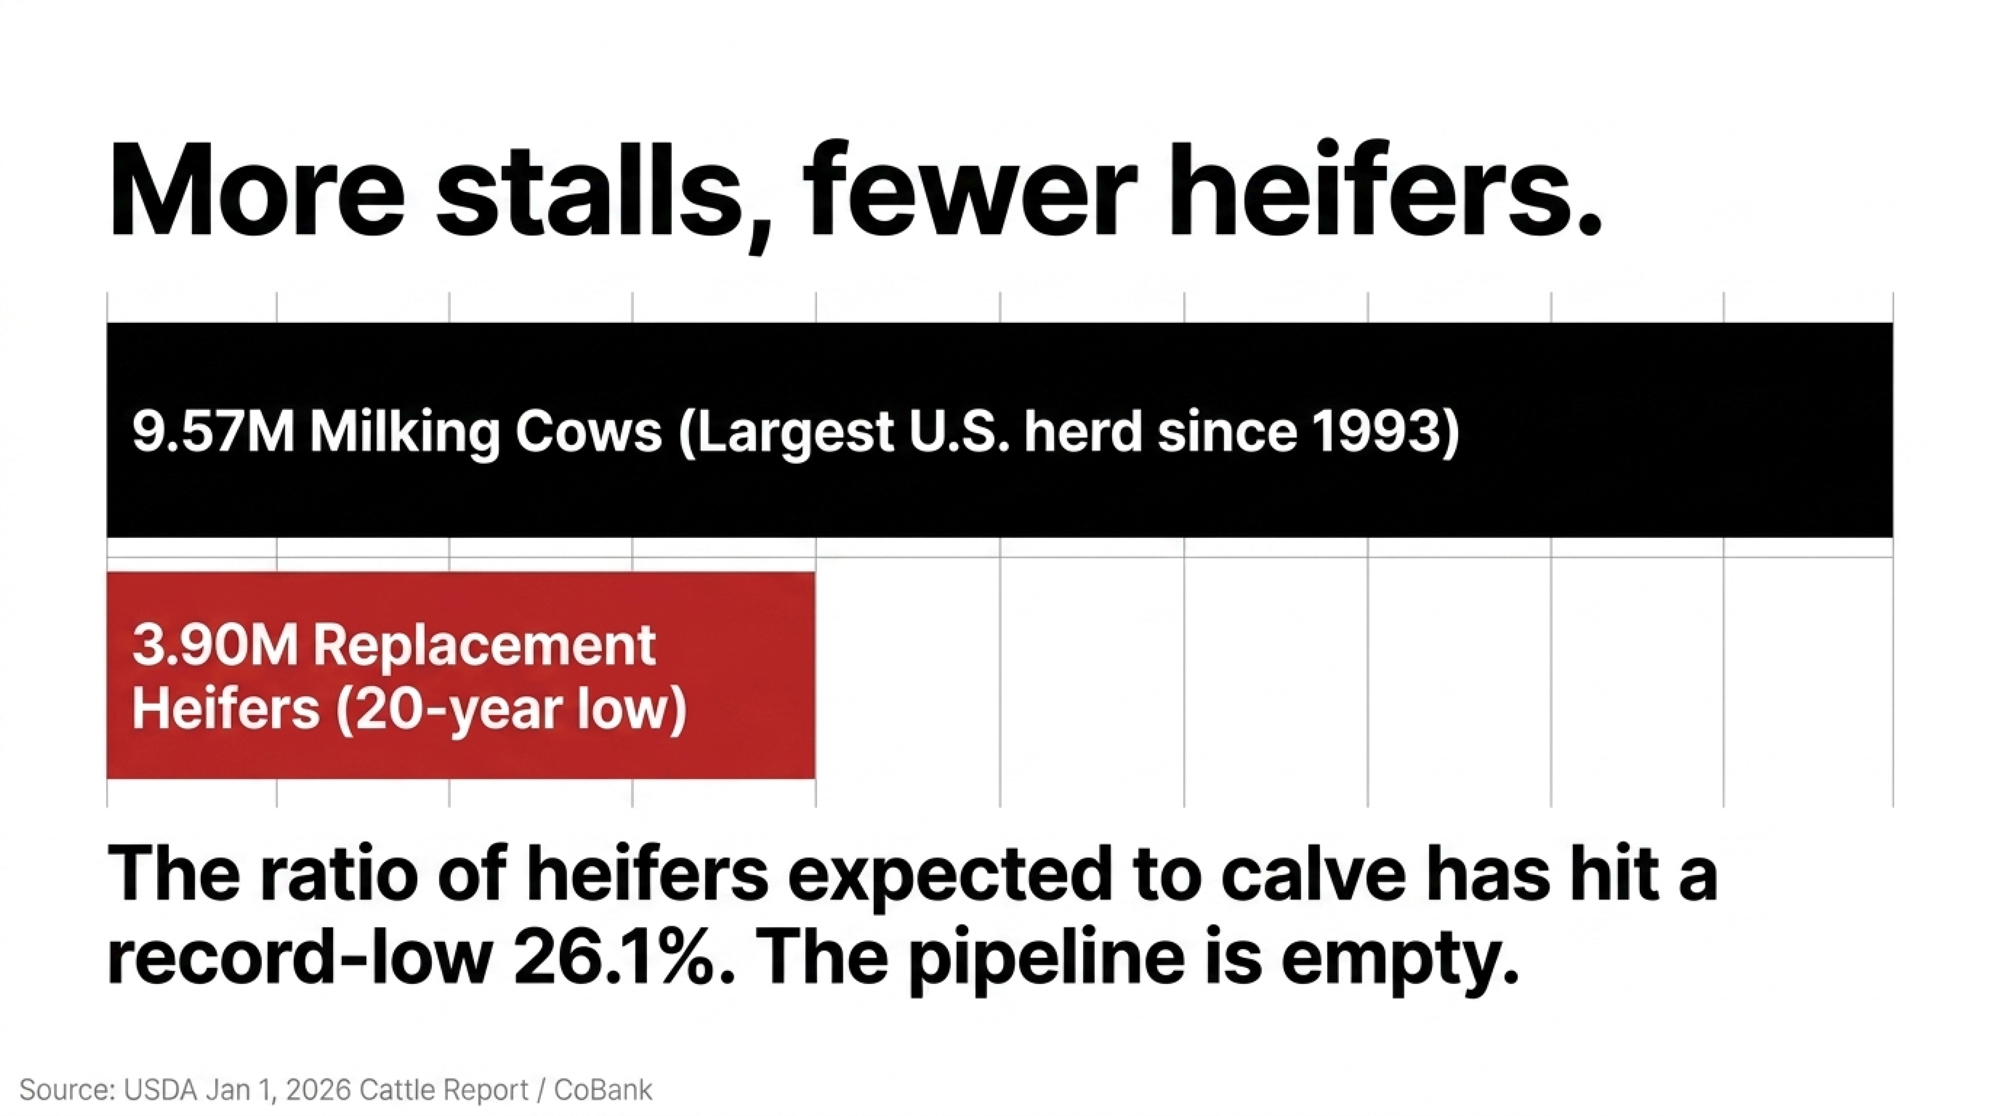
It hasn’t released either. The January 30, 2026 Cattle report put milk replacements at 3.90 million, down slightly again, while milk cows climbed 2% — about 220,000 head — to 9.57 million. We called this America’s worst replacement crisis in 47 years in August 2025, and the 2026 count didn’t soften it. More stalls, fewer heifers behind them.

What beef semen is and isn’t doing

A 2023 Journal of Dairy Science analysis of U.S. Holstein and Jersey females found sexed-dairy and beef-semen inseminations both rose from 2019 through 2021, allocated differently by parity and service number, with larger herds driving most of the increase. University of Wisconsin–Madison Extension reported that in 2020, 20% of Holstein females were bred with sexed semen while beef semen accounted for 23% of inseminations — two different bases, as the source expresses them.

That’s a deliberate two-job strategy. Replacements come from selected females, beef-cross value from the rest. It works when conception, calf survival, heifer growth, and freshening all land near plan.

It breaks when any one of four assumptions misses: pregnancy rate slips, heifer attrition rises, the herd expands, or cow exits run above what the breeding plan assumed.

The timing is what hurts. A beef mating pays a calf cheque in weeks. The missing replacement shows up two years later, long after the decision is made.

How many replacements does a 500-cow herd actually need?

Running the Numbers

Scope: 500-cow Holstein herd, U.S. national basis, 12-month window, head and USD. Herd size held flat, no purchased replacements.

NASS publishes a second line most coverage ignores: milk-replacement heifers expected to calve during the year. That removes any need to assume an entry rate.

January 1Heifers expected to calveMilk cowsFreshenings per 100 cowsPer 500-cow herd
20222.8262 million9.3770 million30.1151
20232.7694 million9.4025 million29.5147
20242.5089 million9.3468 million26.8134
20252.4998 million9.3493 million26.7134

Bullvine calculation. Published evidence: the NASS Cattle releases linked above — 2022 and 2023 from the January 2023 report, 2024 and 2025 from the January 2025 report. Bullvine math: expected-to-calve ÷ milk cows × 100, then × 5 for a 500-cow herd. No entry-rate assumption is used anywhere in this box.

Layer 1 — sourced arithmetic. A 500-cow herd’s share of the national freshening pool fell from 151 head in 2022 to 134 in 2025.

Seventeen fewer fresh heifers a year, on the same cow numbers.

Layer 2 — demand against that supply. Turnover scenarios below are the Bullvine model, not a NASS figure.

TurnoverReplacements neededAvailable at 2025 coverageGap
26%130134+4
33%165134-31
40%200134-66

A low-turnover herd sits in balance. At 33% turnover, the herd is 31 head short, and at 40% it’s 66 short. The conservative figure the takeaways use is 31.

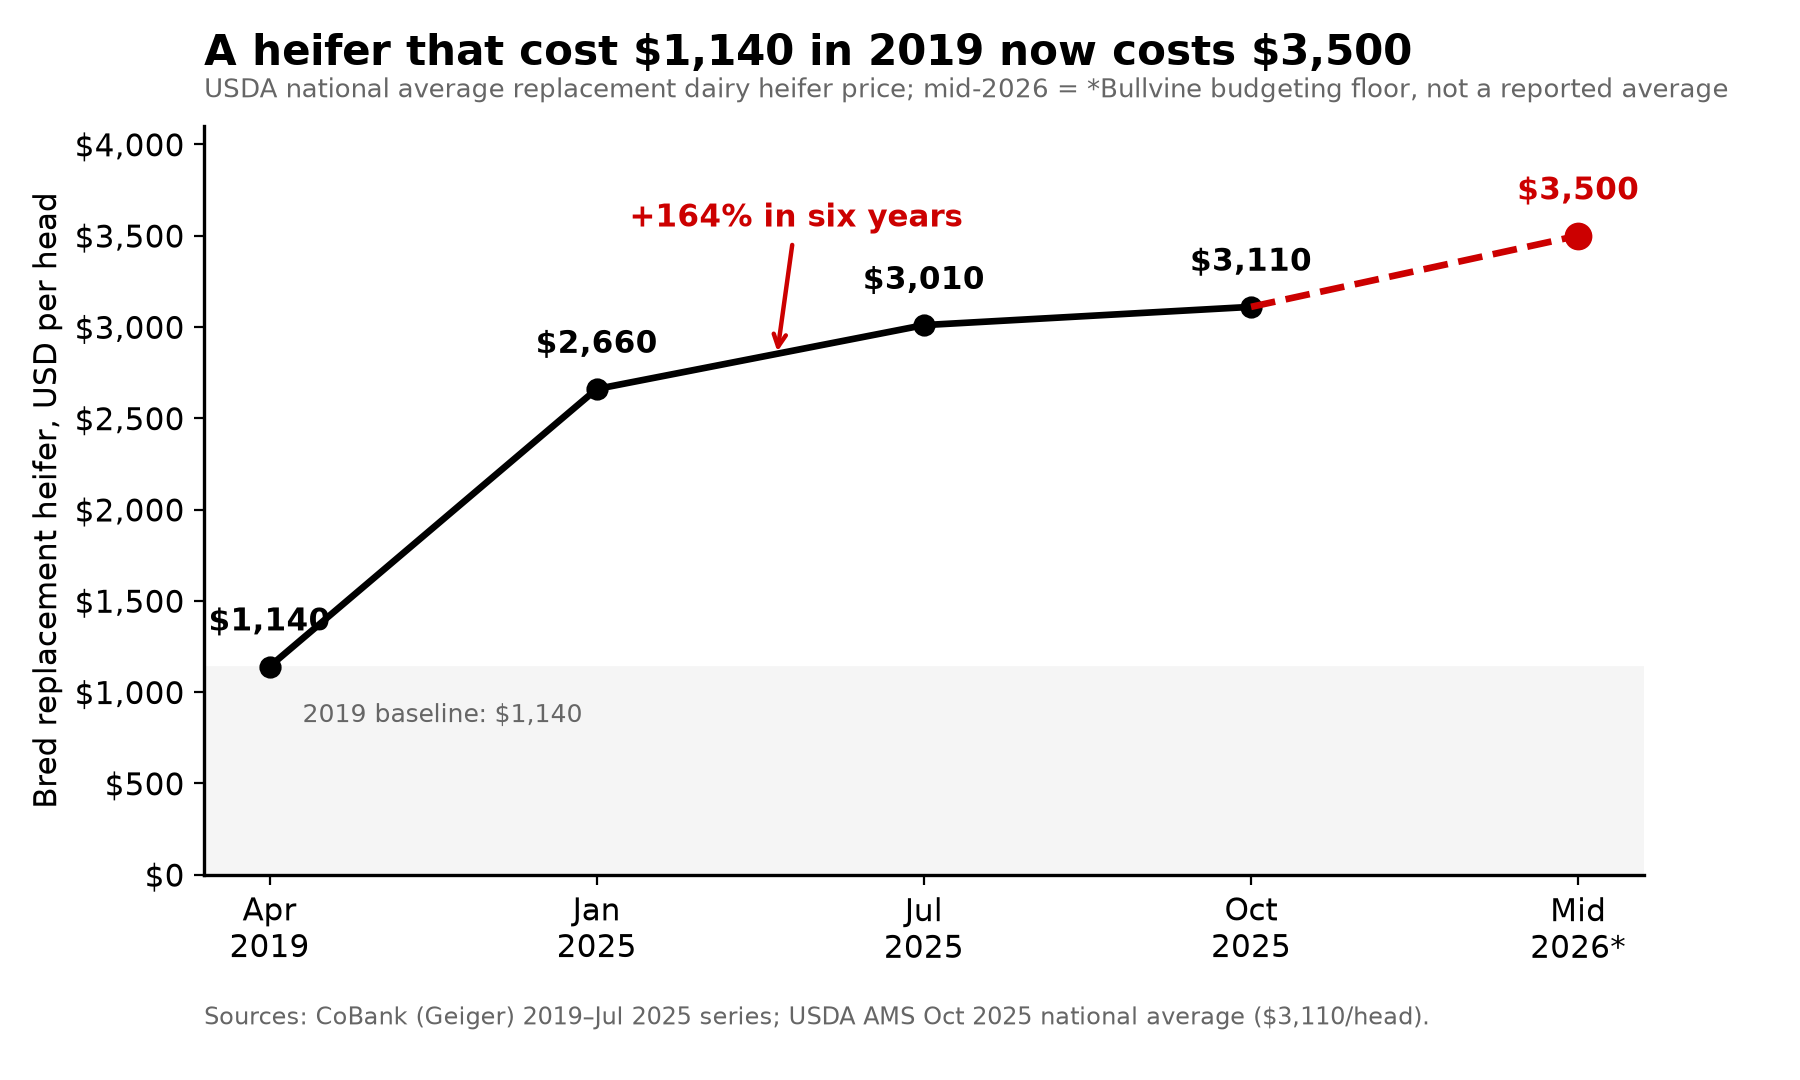
The NASS average price received for milk cows — animals sold for dairy herd replacement only, reported quarterly — hit US$3,010 per head in July 2025, up from US$2,360 in July 2024, per the August 29, 2025 Agricultural Prices release. Buying out of a 31-head gap at that price is roughly US$93,000. Buying back the 17-head decline in freshening capacity is roughly US$51,000. Both are model outputs conditional on the herd choosing to buy rather than retain, and neither is any farm’s books.

What this means for your operation

Next 30 days.

  • Calculate replacement demand as herd size × your own annual turnover rate, using mean cow inventory as the denominator — the method the 2006 Journal of Dairy Science culling review recommends. Requires 12 months of exit records. Red-flag trigger: if you can’t produce a turnover rate from your own records, freeze beef-eligibility decisions until you can. Backfires when the denominator is inventory plus culls: that review’s worked example shows the same herd reading 25% instead of 34%, and 32% instead of 46%.
  • Count heifers due to freshen in the same window, then deduct expected pregnancy loss, deaths, sales, and animals that won’t meet your entry standard. Threshold: projected freshenings under 90% of projected need moves this to the top of your list. Benchmark against your own state’s coverage, not the national 41.9.
  • Pull your last three cull-cow settlements and check them against the US$157.00 per cwt July 2025 average. If your marginal cows are worth that and you’re still keeping them, name the reason out loud.

Next 90 days.

  • Rank females for sexed-dairy semen and release beef eligibility only once the replacement target is covered. Requires current index or genomic ranking plus a reproduction forecast. Threshold: reset the ratio whenever pregnancy rate moves more than two points. Backfires if the ranking is done once and left, because the eligible pool shifts monthly.
  • Where the gap is real, choose openly among four levers: fewer beef matings, fewer avoidable exits, purchased replacements, or a smaller expansion. Debt load decides this one more than herd size does — a heavily leveraged herd is buying replacements with borrowed money at US$3,010 a head, which makes retention and fewer beef matings the cheaper levers even when the cows are marginal. Keeping every marginal cow by default isn’t a fifth lever.

Running the retention number

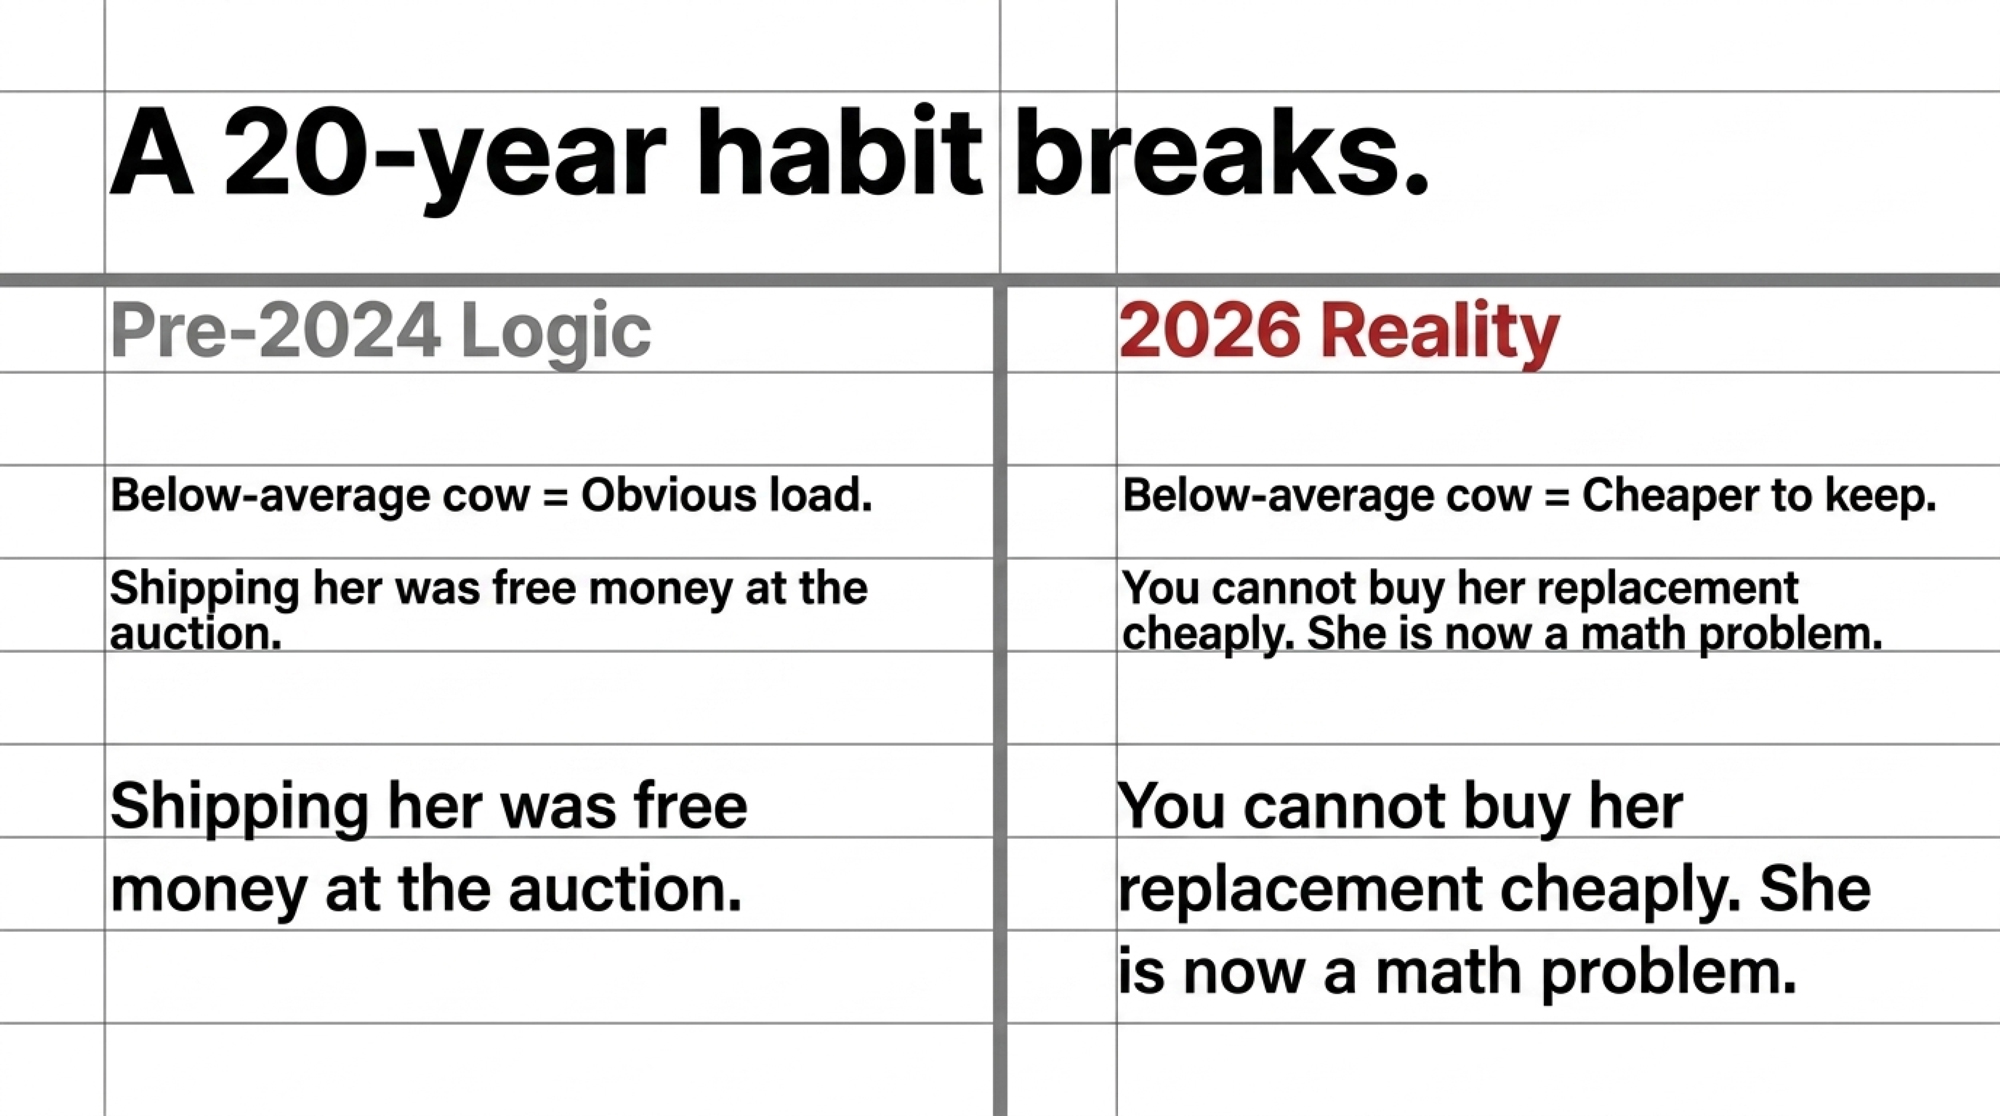
The direction of this one confuses people, so run it rather than eyeball it. Keeping an older cow is not free. You give up her salvage cheque, and you accept a production and component gap against the heifer who would have replaced her. What you avoid is the purchase price.

Net cost of retention = salvage you gave up + the twelve-month cash margin gap against a fresh heifer  the purchase price you avoided. Positive means retention is the expensive choice.

Fill it with your own three numbers: your cull weight at US$157.00 per cwt live, your own cash milk and solids difference between her and a first-lactation animal over twelve months, and US$3,010 or your actual quote.

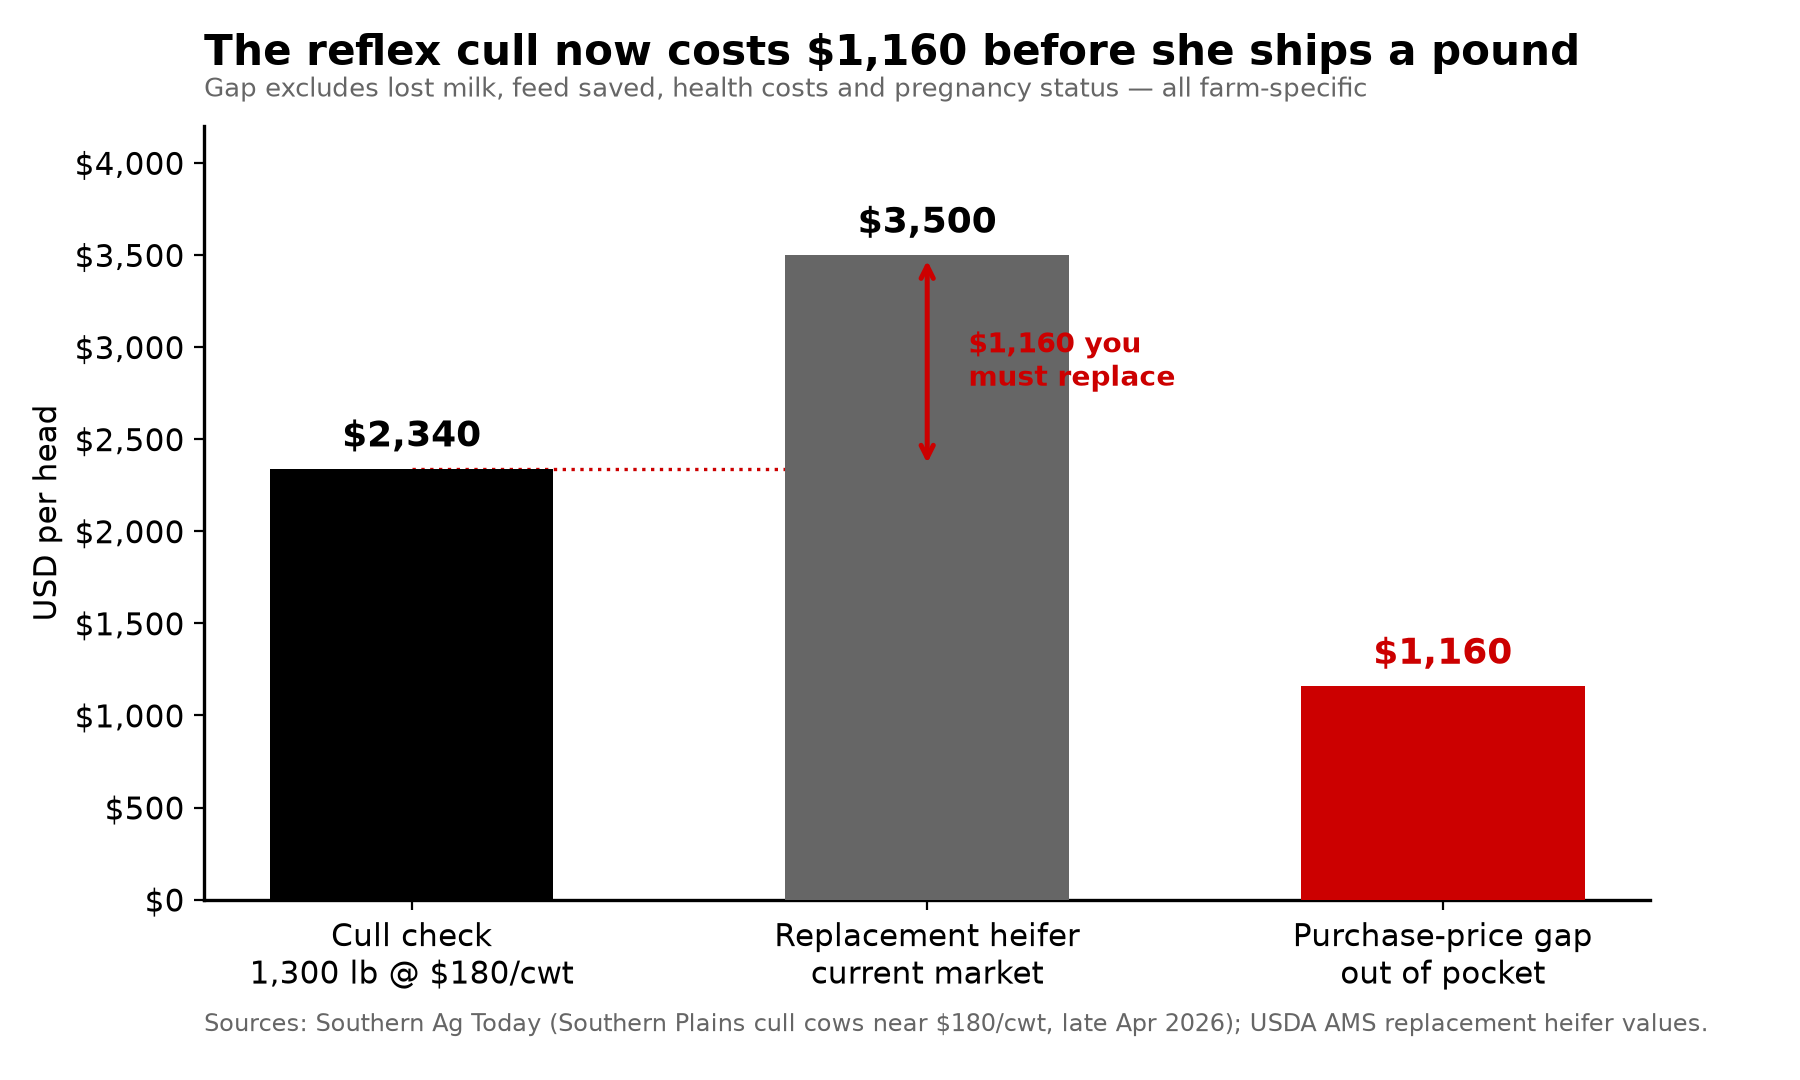
At a 1,400-pound cull weight, salvage runs about US$2,200 — roughly 73% of that July heifer price, which is why the margin gap usually decides this rather than the price spread. Run that gap on your own contract’s pay basis: a component-based milk cheque and a volume-based one weight solids and pounds differently, so the same two cows produce a different gap depending on how you get paid. Compute it from your statement, not from hundredweights.

One caveat: this is a twelve-month frame, and over multiple lactations the heifer’s longer remaining life and her own eventual salvage tilt it further toward replacement. Requires your own DHI records. We’re not supplying a margin figure because it moves too much by herd to model honestly.

Next 365 days.

  • Rebuild the forecast quarterly on actual pregnancies, attrition, and exits. A plan built at 26% turnover misses badly at 40%.
  • Opportunity signal: herds holding freshening coverage above the national 26.7 per 100 cows while running beef on the bottom end capture calf revenue and keep the option to sell springing heifers into a market that showed no sign of loosening in the January 2026 count. In a low-coverage state like Michigan at 28.6, that option is worth more.
  • Before benchmarking your parity rates against this analysis, get your cow count in each lactation group. The 21.6%, 26.7%, and 46.1% figures answer three different parity questions and can’t be averaged unweighted into a herd number. And know that DRMS excludes cows sold for dairy from these rates — so if you calculate turnover on all exits, your figure will read higher and the two aren’t comparable. Strip dairy sales out of your own numerator first, or you’ll conclude you’re culling harder than you are.
  • We’ve argued the flip side of the retention trade before: the longer a healthy cow keeps producing, the less exposed you are.

What the chart cannot tell you

The DRMS analysis is consistent with farms protecting cow inventory. It does not identify beef-semen exposure by herd, link any individual cow’s exit to projected heifer supply, or separate replacement pressure from better transition management, reproduction, udder health, facilities, labor, or planned expansion.

DRMS has now confirmed the methodology. The denominator is the average number of cows across all included herds in each year — the mean-inventory approach the 2006 Journal of Dairy Science review by Fetrow, Nordlund and Norman recommends. The numerator covers cows recorded as sold for feet and legs, low production, reproduction, injury, mastitis, disease, udder, reason not reported, and died. Cows sold for dairy — animals that go on milking in another herd — are excluded.

So this isn’t herd turnover rate. That same 2006 review defined culling to include dairy sale, slaughter or salvage, and death, and warned that dropping a destination distorts the comparison. Excluding dairy sales makes this a measure of exits that aren’t sales to other dairies — closer to what the industry means by involuntary culling than to total turnover, and lower than total turnover by the size of the dairy-sale category.

One more feature of the population worth knowing: these are herds that stayed on DHIA test for six straight years. Continuously enrolled herds aren’t a random sample of the national herd, and nothing in the analysis claims they are.

One counter-signal makes the retention read stronger. Culling fell in all three groups during 2025 — first lactation 22.4% to 21.6%, second 27.2% to 26.7%, third-plus 47.0% to 46.1% — in the same year that cow price series hit its record. Herds on DRMS records kept more cows while the beef market paid the most it ever had to take them away.

Proving beef-on-dairy changed cow-level exit decisions needs semen allocation, heifer inventory, and disposal records linked inside the same herds. DRMS says that linkage is possible but would take additional work, and it deferred two of our five questions — the cow count by lactation group, and whether herd-level beef-semen use can be tied to disposal records — to a World Dairy Expo session on October 1: Improving Calf Health: What the Data Shows and How New Traits Can Be Used, with Dr. Robert Fourdraine of DRMS and Katie Schmitt of the Council on Dairy Cattle Breeding, 11:30 a.m., Mendota 1. DRMS says that presentation will include Beef × Dairy calf numbers, herd size and replacement animals entering the herd. We’ve accepted an interview afterward and will report it.

Which leaves one number worth more than any of these. Pull your heifer inventory report, count how many animals are due to freshen in the next twelve months, and compare that to the turnover rate your own exit records produced last year.

Key Takeaways

  • The national 41.9 replacements per 100 cows fits Wisconsin and California almost exactly and almost nobody else — Michigan sits at 28.6, Kansas at 77.8, and state figures count where heifers stand, not who owns them.
  • Joining USDA’s two heifer columns shows freshening capacity for a 500-cow herd fell from 151 head in 2022 to 134 in 2025. At 33% turnover, that’s 31 short; at 26% you’re fine.
  • Retention isn’t the cheap default anymore. At US$3,010 a head, salvage recovers about 73% of a replacement’s cost, so the twelve-month margin gap decides the trade, not the price spread.
  • Culling fell across every lactation group in the same year cull cows hit US$157.00 per cwt. Replacement pressure contributed to that — but nothing here proves beef semen caused it, and DRMS excludes dairy sales, so your own all-exits number won’t match these.
The Bullvine Tool

Heifer Supply & Retention Trade-off Calculator

Audit your pipeline deficit and test whether holding a marginal older cow beats taking the slaughter salvage check.

(After death loss/sales)
(USDA July avg: $3,010)

Cow Retention vs. Replacement Trade-Off

(Heifer advantage over cow)
12-Mo Pipeline Balance
-31 head
Buyout cost: $93,310
Net Retention Cost (Per Cow)
-$162
Salvage covers 73.0% of heifer
Retention Warning

Your heifer pipeline falls short of expected exits. While retaining an older cow is currently cheaper than buying a replacement on the open market, verify if your margin gap includes somatic cell penalties and mastitis treatments.

Source Data: USDA NASS & DRMS Extracts • thebullvine.com

UPDATE, September 18, 2026: DRMS has responded to our September 18 request and confirmed the methodology behind the culling figures. The analysis covers Holstein herds on continual DHIA test across six years from January 1, 2020; the denominator is the average number of cows across those herds each year; and the rates exclude cows sold for dairy. This article has been updated to reflect that, and to correct the description of how the figures reached us — they were shared publicly on LinkedIn by DRMS’s Dr. Robert Fourdraine, not supplied privately to The Bullvine. DRMS will present fuller herd trends, including Beef × Dairy calf numbers, herd size and replacement animals entering the herd, at World Dairy Expo on October 1, and has offered an interview afterward.

Methodology, limitations, and corrections. Inventory and price figures come from the USDA National Agricultural Statistics Service releases linked above, on U.S. national and state bases as labeled, in USD. Livestock prices are prices received on a live-weight basis. The Replacement Coverage, state coverage, and Freshening Coverage ratios and the 500-cow scenarios are Bullvine calculations on those published inputs; national averages will not match your region, herd size, or management system, and the turnover scenarios are a model rather than any farm’s books. The culling figures come from a DRMS analysis shared publicly on LinkedIn by Dr. Robert Fourdraine. DRMS confirmed the methodology to The Bullvine on September 18, 2026: Holstein herds on continual DHIA test across six years from January 1, 2020, with annual rates calculated against the average number of cows across those herds and cows sold for dairy excluded. Factual corrections: editor@thebullvine.com

Learn More

The Sunday Read Dairy Professionals Don’t Skip.

Every week, thousands of producers, breeders, and industry insiders open Bullvine Weekly for genetics insights, market shifts, and profit strategies they won’t find anywhere else. One email. Five minutes. Smarter decisions all week.
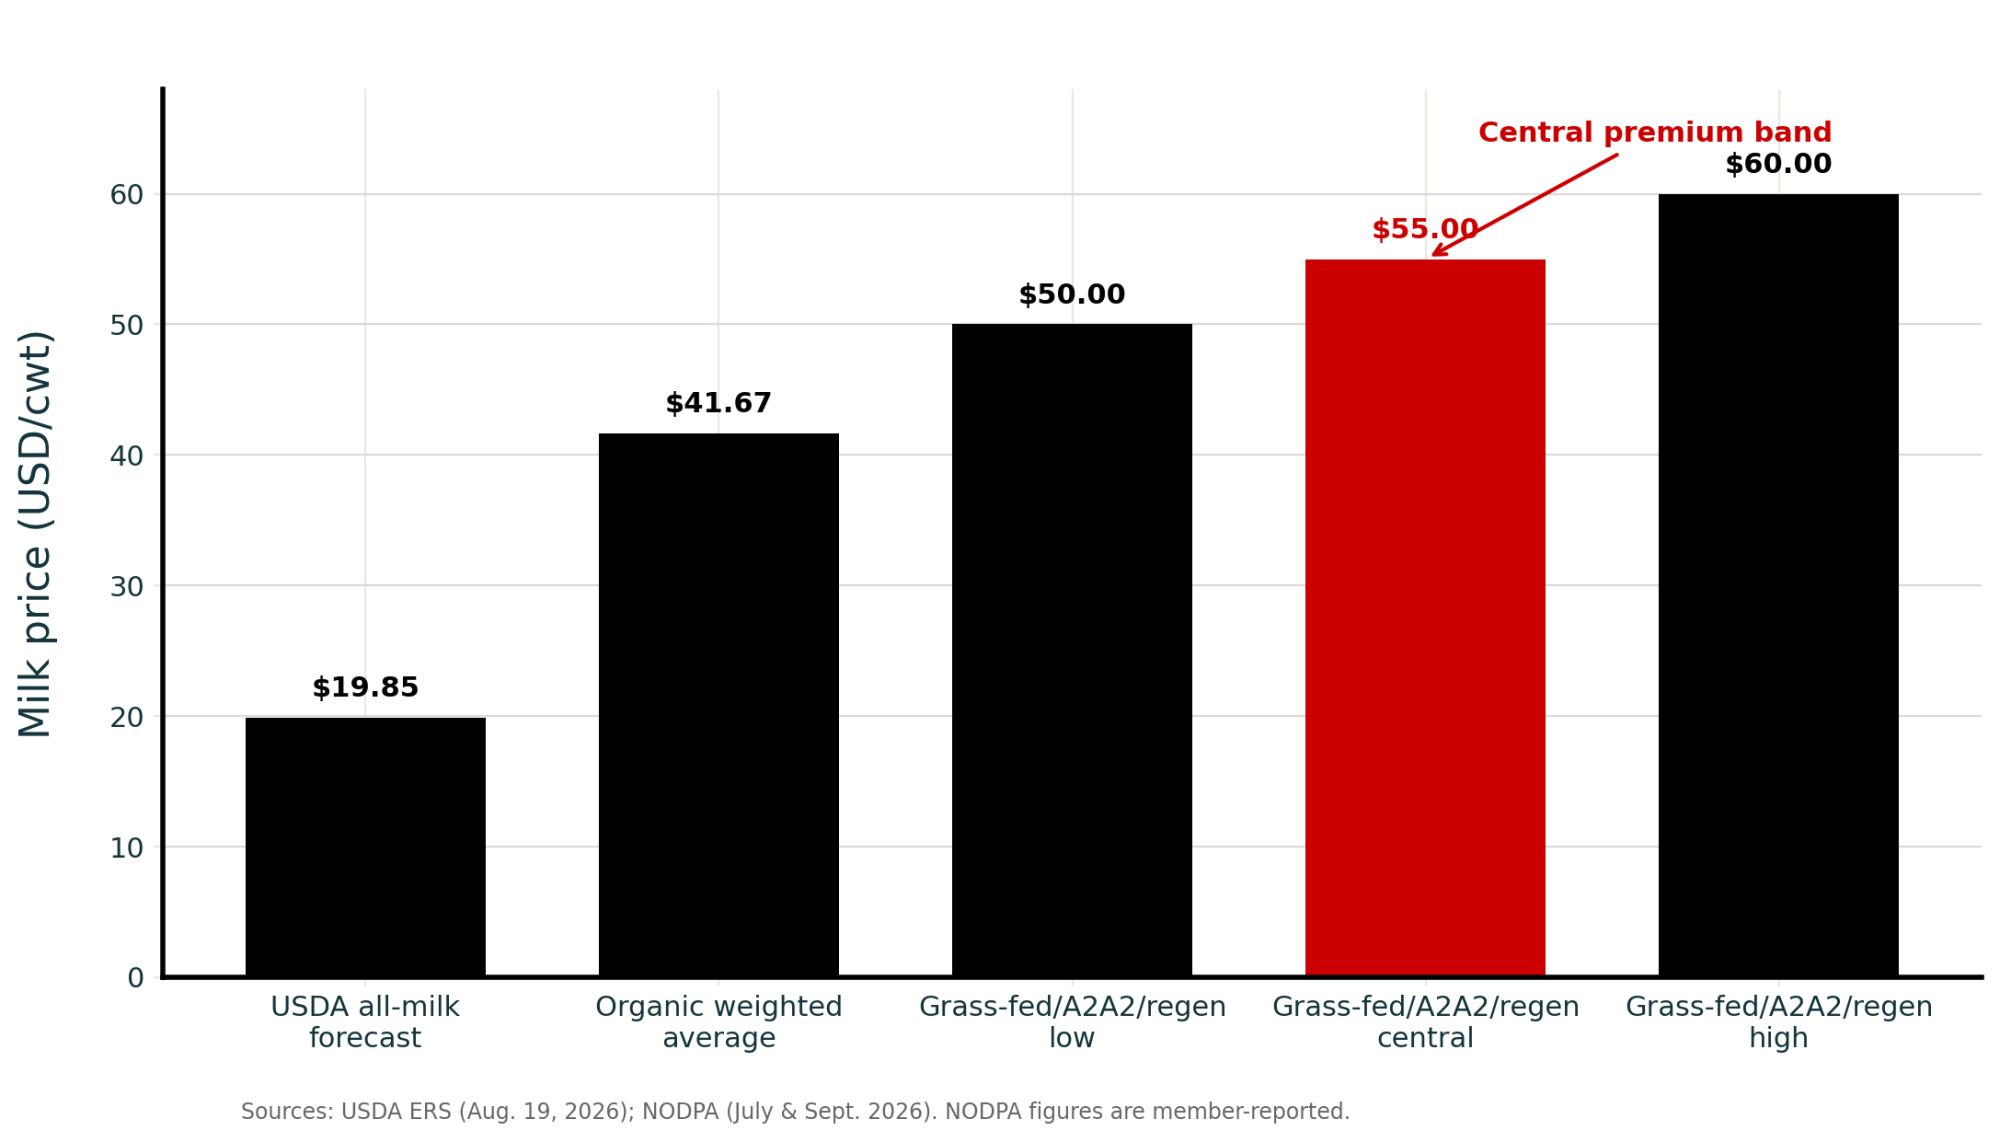
NewsSubscribe
First
Last
Consent

Three Feed Inputs Set the DMC Margin. Diesel Isn’t One, and It Rose 65%.

Eight primary documents, one modeled 500-cow herd, and a correction to our own March numbers.

Two federal series, same year. One says the margin improved. The other says the fuel bill got away.

 PeriodStartEndChange
USDA FSA — DMC marginJan to Jun 2026$7.81/cwt$10.88/cwt+$3.07 · +39.3%
U.S. EIA — on-highway dieselFeb 23 to Sep 14 2026$3.809/gal$6.285/gal+$2.476 · +65.0%

January’s $7.81 margin triggered a $1.69/cwt indemnity at the $9.50 Tier 1 level. By June the margin reached $10.88, and the payments had been off for four months.

Diesel isn’t in the formula. Run it on a modeled 500-cow herd growing its own forage, and one excluded cost line comes to $31,980 against $4,317.50 net from the program. What follows is Bullvine’s own join of the two series, with the ERS cost line that sits between them.

What the FSA documents establish

Go to FSA’s own Prices and Updates table, not the trade-press recap of it. It publishes every input and output of the calculation, month by month. Notice DMC-99 confirms January’s result independently, along with the February 27 payment release.

How the program works. DMC pays when the margin between the national all-milk price and average feed cost falls below a coverage level the producer elects. Coverage runs from $4.00 to $9.50 per hundredweight in fifty-cent steps, on 5% to 95% of established production history. Tier 1 covers the first 6 million pounds in 2026, with production history based on the highest of 2021, 2022, or 2023. Tier 2 handles anything above that and isn’t offered above the $8.00 level, which means every herd over 6 million pounds is uninsurable at the coverage level Tier 1 herds buy. Payments are calculated monthly on one-twelfth of covered production history, so no two enrolled farms get the same dollars from the same national margin.

Premium at $9.50 in Tier 1 is $0.1500/cwt. Catastrophic coverage at $4.00 carries no premium beyond the $100 annual administrative fee, and FSA waives that fee for limited resource, beginning, socially disadvantaged, and veteran producers. The 2026 enrollment period closed February 26. The One Big Beautiful Bill Act reauthorized DMC through 2031, and as of September 18, FSA hadn’t announced the 2027 window. Treat any indemnity as taxable farm income and settle the reporting treatment with your accountant before you book it against a 2026 expense.

How the feed number is built. The formula sits in 7 CFR §1430.411, and it’s short enough to read in one sitting. National average feed cost per hundredweight of milk is three products added together: 1.0728 multiplied by the price of corn per bushel, plus 0.00735 multiplied by the price of soybean meal per ton, plus 0.0137 multiplied by the price of alfalfa hay per ton. The regulation sets the hay price as the full-month U.S. price received for high-quality alfalfa, which it defines as premium and supreme grades, from USDA NASS’s monthly Agricultural Prices.

Read it as a recipe. To make 100 pounds of milk, the formula assumes 60.08 pounds of corn at a 56-pound bushel, 14.70 pounds of soybean meal and 27.40 pounds of alfalfa hay, all at national averages. That’s 102.18 pounds of feed as fed. No line for diesel, hauling, nitrogen, electricity, labor, or interest.

Cost lineFormula coefficientAssumed per 100 lb milk2026 movement
Corn1.0728 × $/bu60.08 lb (56-lb bu)Eased into June
Soybean meal0.00735 × $/ton14.70 lbEased into June
Alfalfa hay (premium & supreme)0.0137 × $/ton27.40 lbIncluded in +5.5% feed line
DieselNone0+65.0%
Hauling & marketing deductionsNone0Netted out of all-milk before it enters
Nitrogen fertilizerNone0Urea benchmark +80% Feb→Apr
ElectricityNone0~+5.0%
Labor and interestNone0Not measured in the formula

University of Minnesota Extension put it plainly during 2026 enrollment: the margin is calculated “by a predetermined USDA formula that is the same nationwide and is not determined by your dairy farm’s margin.”

The revenue side has its own gap. University of Wisconsin–Madison Extension noted in August that the formula uses the NASS All-Milk Price, a gross figure collected before hauling, cooperative dues, marketing assessments, and promotion deductions. The margin is built from a milk price above what lands in the tank check and a feed cost that excludes most of what it takes to make the feed.

That’s the boundary the program was built with. What the document settles is what gets measured, not whether anyone oversold it.

What our own spring coverage got wrong, and what that shows

Bullvine’s spring analysis of Hormuz and dairy input costs ran its model on $4.16 diesel. That was our scenario input at the time, not a market forecast, and the EIA weekly series has since printed $6.285. We were $2.13 low.

The direction was right, and the magnitude was off by half. A cost input can double the gap between a farm’s budget and its invoices inside two quarters while the federal margin that farm watches moves the other way.

We’re labeling that March page’s $4.16 diesel and $18.95 milk forecast as March 2026 scenario inputs before this piece links to it.

Is the DMC margin still tracking your margin in 2026?

FSA’s published series for the 2026 program year. National, USD per hundredweight, retrieved September 17. The all-milk price underlying it comes from USDA NASS and is subject to revision. FSA hadn’t published August as of that retrieval.

Month, 2026All-milkFeed costMarginTier 1 indemnity at $9.50
January$17.50$9.69$7.81$1.69/cwt
February$18.30$9.84$8.46$1.04/cwt
March$19.70$10.13$9.57none
April$20.80$10.26$10.54none
May$21.30$10.68$10.62none
June$21.10$10.22$10.88none
July$20.30$10.37$9.93none

Six consecutive monthly increases from January through June, then a $0.95 retreat in July that left the margin 43 cents above the trigger. Six points in one direction clears the four-point test comfortably. March was the first month of the program year above $9.50, and the payments stopped there.

The milk price did the lifting. Across January to June, all-milk rose $3.60/cwt while the feed calculation rose $0.53. June ran the other way: all-milk eased from $21.30 to $21.10 while feed fell from $10.68 to $10.22, so cheaper corn and soybean meal carried that month. June’s $10.88 sat $1.38 above the trigger, the widest gap of the program year so far.

April shows how fast the switch flips. All-milk jumped $1.10, from $19.70 to $20.80, pushing the margin to $10.54 and generating no payment at any coverage level for a second straight month.

The forecast record is its own small story. Penn State Extension’s January 21 enrollment article, working from projections then available, put the 2026 full-year average margin at $8.84/cwt. Bullvine calculation: the seven published months average $9.69/cwt, $0.85 higher. Anyone who budgeted off January’s outlook has been carrying a better milk price than expected and a fuel bill the January outlook didn’t include.

Against the longer record, 2026 isn’t an outlier. A University of Wisconsin–Madison Extension review of 84 months from 2019 through 2025 found an average margin of $9.48/cwt, with 39 of those months below $9.50. The same team’s August 2026 read is the sentence worth pinning above the desk: feed costs were elevated, but milk prices kept pace through most of the run, so the formula margin compressed less than producers’ on-farm costs did.

Running the Numbers: the modeled 500-cow scorecard

Modeled 500-cow herd at 24,000 lb, 120,000 cwt shipped, forage grown on-farm, 95% coverage, Tier 1 at $9.50.This is a model, not a farm’s books. No named farm, no invoices, no milk statements.

500-cow modelFinancial valueBasis and constraint
DMC net indemnity received+$4,317.50$12,967.50 on 57,000 covered cwt (Jan and Feb below trigger), less $8,550 premium and the $100 fee
Conservative added fuel cost−$31,980.00120,000 cwt whole-herd exposure, 50% fuel share of the $0.82/cwt ERS line, moved by +65.0%
Net operational gap−$27,662.507.4 to 1 excluded-cost-to-payout deficit

At the 25% six-year lock-in discount, the program side improves to $6,455.00, and the gap narrows to $25,525.00. At 60% and 70% fuel shares, the added cost runs $38,376 and $44,772.

Published evidence:

  • January margin $7.81/cwt, February $8.46/cwt — USDA Farm Service Agency, DMC Prices and Updates, national, USD, retrieved September 17, 2026
  • Tier 1 first 6 million lb; $0.1500/cwt premium at $9.50; $100 annual administrative fee — USDA FSA, DMC fact sheet and premium schedule, January 2026, in force
  • Diesel $3.809/gal February 23 to $6.285/gal September 14, 2026, up 65.0% — U.S. Energy Information Administration, Weekly Retail Gasoline and Diesel Prices, U.S. national, on-highway
  • Fuel, lube and electricity combined, $0.82 per hundredweight sold, Southern Seaboard region, no size breakout, 2025 estimate — USDA Economic Research Service, Milk Cost of Production, regional estimates, row read directly off the ERS dataset. This is an operating-cost line item, not ERS full economic cost, which imputes owned land and unpaid family labor and can run 40% or more above a farmer’s cash cost

Bullvine math, program side: 6,000,000 lb × 95% = 57,000 cwt/yr, or 4,750 cwt/month. January ($9.50 − $7.81) × 4,750 = $8,027.50. February ($9.50 − $8.46) × 4,750 = $4,940.00. Premium $0.15 × 57,000 = $8,550.00.

Bullvine math, fuel side: $0.82 × 50% = $0.410/cwt baseline. $0.410 × 65.0% = $0.2665/cwt added. $0.2665 × 120,000 = $31,980. Figures computed before rounding.

Why the on-highway price is the conservative input

Two objections land on this calculation from anyone who buys dyed fuel by the transport load. Both cut in the article’s favor, and here’s the arithmetic.

Off-road diesel is cheaper in absolute terms, not in percentage terms. IRS Publication 510 puts the federal tax on diesel at $0.244 per gallon, and only the $0.001 leaking-underground-storage-tank levy applies to dyed diesel, so the federal differential is $0.243 before state fuel taxes that also don’t apply and vary by state. On-farm and off-highway business use are listed as nontaxable uses. The farm tank price therefore sits below the EIA retail number all year.

But the exemption is a fixed amount per gallon, not a discount rate. Take an illustrative $0.40 off both ends of the EIA move, and $3.409 becomes $5.885 — a 72.6% increase, not 65.0%. The tax-free base is smaller, so the same cents-per-gallon jump is a larger percentage. Using the on-highway percentage understates what the dyed-fuel buyer absorbed.

Electricity sits in the same ERS bucket and moved nowhere near 65%. EIA’s May 2026 Short-Term Energy Outlook has U.S. residential electricity averaging 18.2 cents per kilowatt-hour in 2026 against 17.30 cents in 2025, which EIA describes as a nearly 5% increase. That’s why the conservative case assumes petroleum fuel and lube are only half the $0.82 line. Applying 65% to the whole bucket would treat a 5% electricity move as a 65% one.

Why the next four months matter more than the last seven

July’s margin sat 43 cents above the trigger. The Center for Dairy Excellence, a Pennsylvania industry organization, projected in its June 30 market review that all-milk would fall to $19.43 in August before recovering to $21.11 by December, with feed costs climbing from $9.32 in June to $9.60 in December.

Milk down and feed up is what walks the national margin back toward $9.50. Every operation enrolled at that level is about to find out whether the program switches back on in the same months its diesel bill is still running above February. The two have no mechanical connection.

Two links in the chain stay unevidenced here. How much of the 2026 diesel move traces to the Gulf conflict rather than refinery, inventory, and demand factors is not established. Neither is whether higher fertilizer costs have already moved into 2027 corn, meal and hay bids, which would put part of this shock inside the formula and turn the signal around again.

Nitrogen or potash: which line does the 2027 fertilizer call hinge on?

Nitrogen, and it isn’t close. The Food and Agriculture Organization put the affected Gulf region at roughly one-third of globally traded urea and one-fifth of ammonia. The World Bank reported the urea benchmark above US$850 per metric ton in April, 80% above February. Its 2026 forecast for muriate of potash is a rise of about 12%.

Potash rides a different supply chain. The U.S. Geological Survey reports Canada supplied 79% of U.S. potash imports across 2021 through 2024, with Russia at 12% and Israel at 3%. Freight and energy costs still travel. The chokepoint doesn’t.

If you’re pricing one nutrient hard this fall, price the nitrogen. And if your hauling deduction moved this year too, that’s the same diesel showing up in a second line the formula can’t see.

The 90-day playbook for herds enrolled at $9.50

30 days.

Put your actual monthly operating margin per cwt beside FSA’s published margin for the same month, twelve months back. Net milk revenue after hauling and deductions, minus accrual-adjusted feed, minus defined non-feed operating costs. Requires twelve milk statements and twelve months of expense detail. If you don’t have twelve, run six, or pull four quarters from your accountant’s working papers. The shorter series will diagnose a divergence, but it won’t set a band you can trust. Threshold: if the two moved opposite directions in two consecutive months, the national margin has stopped working as your proxy. Sharper trigger if you carry term debt: if your lender’s own debt-service coverage calculation has sat below its covenant floor for three consecutive quarters, this goes to the front of the list, because you no longer have room to absorb a gap you haven’t measured. Backfires if you use check-book cash flow, where a January tank fill reads as a January cost.

Put a name and a monthly due date on that reconciliation. Requires a decision, not a purchase. Threshold: if nobody owns it by month-end, it won’t happen. Watch for it drifting to whoever is least equipped to produce it.

Compute your own mailbox-to-all-milk gap from six consecutive checks, then set it against the right published number. Net pay divided by cwt shipped, compared with your own federal order’s monthly uniform price or producer price differential, not the national all-milk figure, which is collected gross and averaged across every order. Requires six milk statements and your market administrator’s monthly report. Threshold: whatever your six-month gap is, that’s a second basis you carry on top of the first, and it belongs in the same worksheet. Backfires if you benchmark against a national number and conclude your handler is the problem when the order is.

90 days.

Price 2027 nitrogen in dollars per pound of actual N, delivered and applied, netting out a current manure analysis. Requires written dealer quotes with expiry dates, your acres, and a nutrient plan. Threshold: act when a quote’s expiry falls inside your cash-flow window, not on a calendar rule. Backfires by converting price risk into prepay, storage, and counterparty risk.

Decide what job Tier 2 is doing. At the $8.00 level, FSA’s 2026 premium schedule sets Tier 1 at $0.1000/cwt and Tier 2 at $1.8130. That’s 18.1 times the price for identical coverage on milk from the same tank, and $8.00 is the ceiling. Threshold: under three months of fixed-cost runway, Tier 2 is survival coverage. Over six months, it’s a resizing conversation with your lender. Requires your accessible cash and your true monthly fixed costs, not an estimate. Our full breakdown of the Tier 2 premium election runs the 84-month version of that math.

Get your 2027 forage acres costed at current nitrogen prices before you finalize the cropping plan. Requires the dealer quotes above plus your agronomist’s rates. Threshold: if homegrown feed is still carried at last year’s fertilizer cost, your breakeven is wrong and so is every margin you calculate off it.

365 days.

Write a trigger for the farm-versus-DMC gap. A dollar limit and a direction limit, each with an attached action. Requires 36 to 60 months of matched data to set the band honestly, which is the real reason to start the reconciliation now. Opportunity signal: current fertilizer benchmarks point toward higher 2027 feed replacement costs, and if that moves into corn, meal and hay bids, the formula starts seeing part of this shock. Coverage economics at $9.50 improve for whoever kept the matched series current and can prove where their own margin sat.

Key Takeaways

  • FSA’s margin formula recognizes three feed inputs — corn, soybean meal and alfalfa hay, per 7 CFR §1430.411. Diesel, hauling, nitrogen, electricity, labor, and interest aren’t in it, and never were.
  • On a modeled 500-cow herd, one excluded cost line ran $31,980 against $4,317.50 net from the program to date in 2026. Different denominators, and only one of them shows up on your invoices.
  • The all-milk price feeding that formula is collected gross, before hauling, dues, assessments, and promotion, so the margin is built from a milk price above what lands in your tank check.
  • FSA doesn’t offer Tier 2 above $8.00, so every herd over 6 million pounds is locked out of the $9.50 level Tier 1 herds buy. At $8.00, Tier 2 costs 18.1 times Tier 1 for identical coverage.

Two statements, one check

The trade-off isn’t whether to carry DMC at fifteen cents. It’s whether you keep reading a national milk-over-feed number as a verdict on your own business while the costs it excludes move faster than the ones it includes.

So pull your January 2026 milk statement and your July 2026 statement. Net pay divided by cwt shipped, both months. Set them beside FSA’s published margins, $7.81 and $9.93. If the federal number improved more than yours did, what does your own expense ledger say moved in the gap?

Audit Your Herd: DMC Safety Net vs. Uncovered Fuel Deficit

Plug in your production history, actual cow numbers, and local forage baseline to test if 2026 DMC payments bridged your fuel bill.

Milking Herd Size 500 cows
Production Per Cow / Year 24,000 lbs
Diesel Price Increase (%) +65%
ERS Base Fuel & Electricity $0.82/cwt
2026 DMC Net Payout
+$4,317
Capped at Tier 1 (57k cwt)
Added Fuel Cost
-$31,980
Whole-herd volume (50% share)
Net Cash-Flow Gap
-$27,663
Deficit: 7.4 to 1
The Denominator Reality: Your herd ships 120,000 cwt, but DMC Tier 1 caps at 57,000 cwt. For every $1.00 this program deposited in net margin help, your operation absorbed $7.41 in unhedged fuel inflation.
*Math applies official 2026 FSA published margin indemnities through July (Jan $1.69, Feb $1.04, Mar–Jul $0.00). Assumes conservative 50% petroleum fuel/lube allocation of ERS baseline to isolate electricity. Whole herd production is modeled on farm-grown forage.

Methodology and limitations

All dollar figures are USD unless otherwise noted.

Sources. DMC margin, all-milk price, and feed cost figures come from USDA Farm Service Agency’s DMC Prices and Updates table, 2026 program year, retrieved September 17, 2026, national scope. The all-milk price underlying that table originates with USDA NASS and is subject to revision; it’s collected gross, before hauling, cooperative dues, marketing assessments, and promotion deductions. The feed formula and the premium-and-supreme alfalfa pricing basis are stated in 7 CFR §1430.411. Diesel prices come from the U.S. Energy Information Administration’s weekly retail on-highway series, U.S. national, February 23 and September 14, 2026. Federal diesel tax rates and the dyed-fuel treatment come from IRS Publication 510 (rev. 12/2025); the statutory exemption sits at 26 U.S.C. §4082. Electricity prices come from EIA’s Short-Term Energy Outlook, May 2026 edition.

The fuel line. Fuel, lube, and electricity combined, from USDA Economic Research Service’s Milk Cost of Production regional estimates (2025), Southern Seaboard region, no size breakout, based on the 2021 ARMS survey updated annually for price changes. It’s an operating-cost line item, not ERS full economic cost. The Southern Seaboard is the higher of the two regions we pulled, so these figures are not a national low; a lower-cost region produces a smaller number. We’re not publishing a second regional case because the second row wasn’t confirmed in this pass, and one verified input beats two where one is an estimate.

The model and its limits. The 500-cow calculation assumes forage grown on-farm; a dairy buying all its feed carries almost no field diesel, and its exposure sits in the hauling deduction and the delivered feed price instead. Substitute your own gallons before you use any figure here. The program side counts only the two months below trigger, so it’s complete for 2026 to date, while the fuel side annualizes the current price gap and therefore overstates a partial-year exposure. The program net is earned on 57,000 covered cwt against fuel spread over 120,000 shipped cwt, two different denominators reported side by side rather than netted into a single rate. No hauling, fertilizer, or electricity increase is added, which avoids double counting against either the ERS line or the DMC feed formula. The fuel-and-lube share of the ERS line is an assumption, varied across three cases, with the lowest used in every headline figure. The $0.40 per gallon used in the off-road comparison is illustrative, not a market quote. National averages may not reflect your region, herd size, management system, debt position, or market access.

If your own numbers differ, send them. We publish producer data and case studies, and we correct factual errors visibly at the top of the article rather than editing silently. Corrections and data: editor@thebullvine.com

Learn More

The Sunday Read Dairy Professionals Don’t Skip.

Every week, thousands of producers, breeders, and industry insiders open Bullvine Weekly for genetics insights, market shifts, and profit strategies they won’t find anywhere else. One email. Five minutes. Smarter decisions all week.
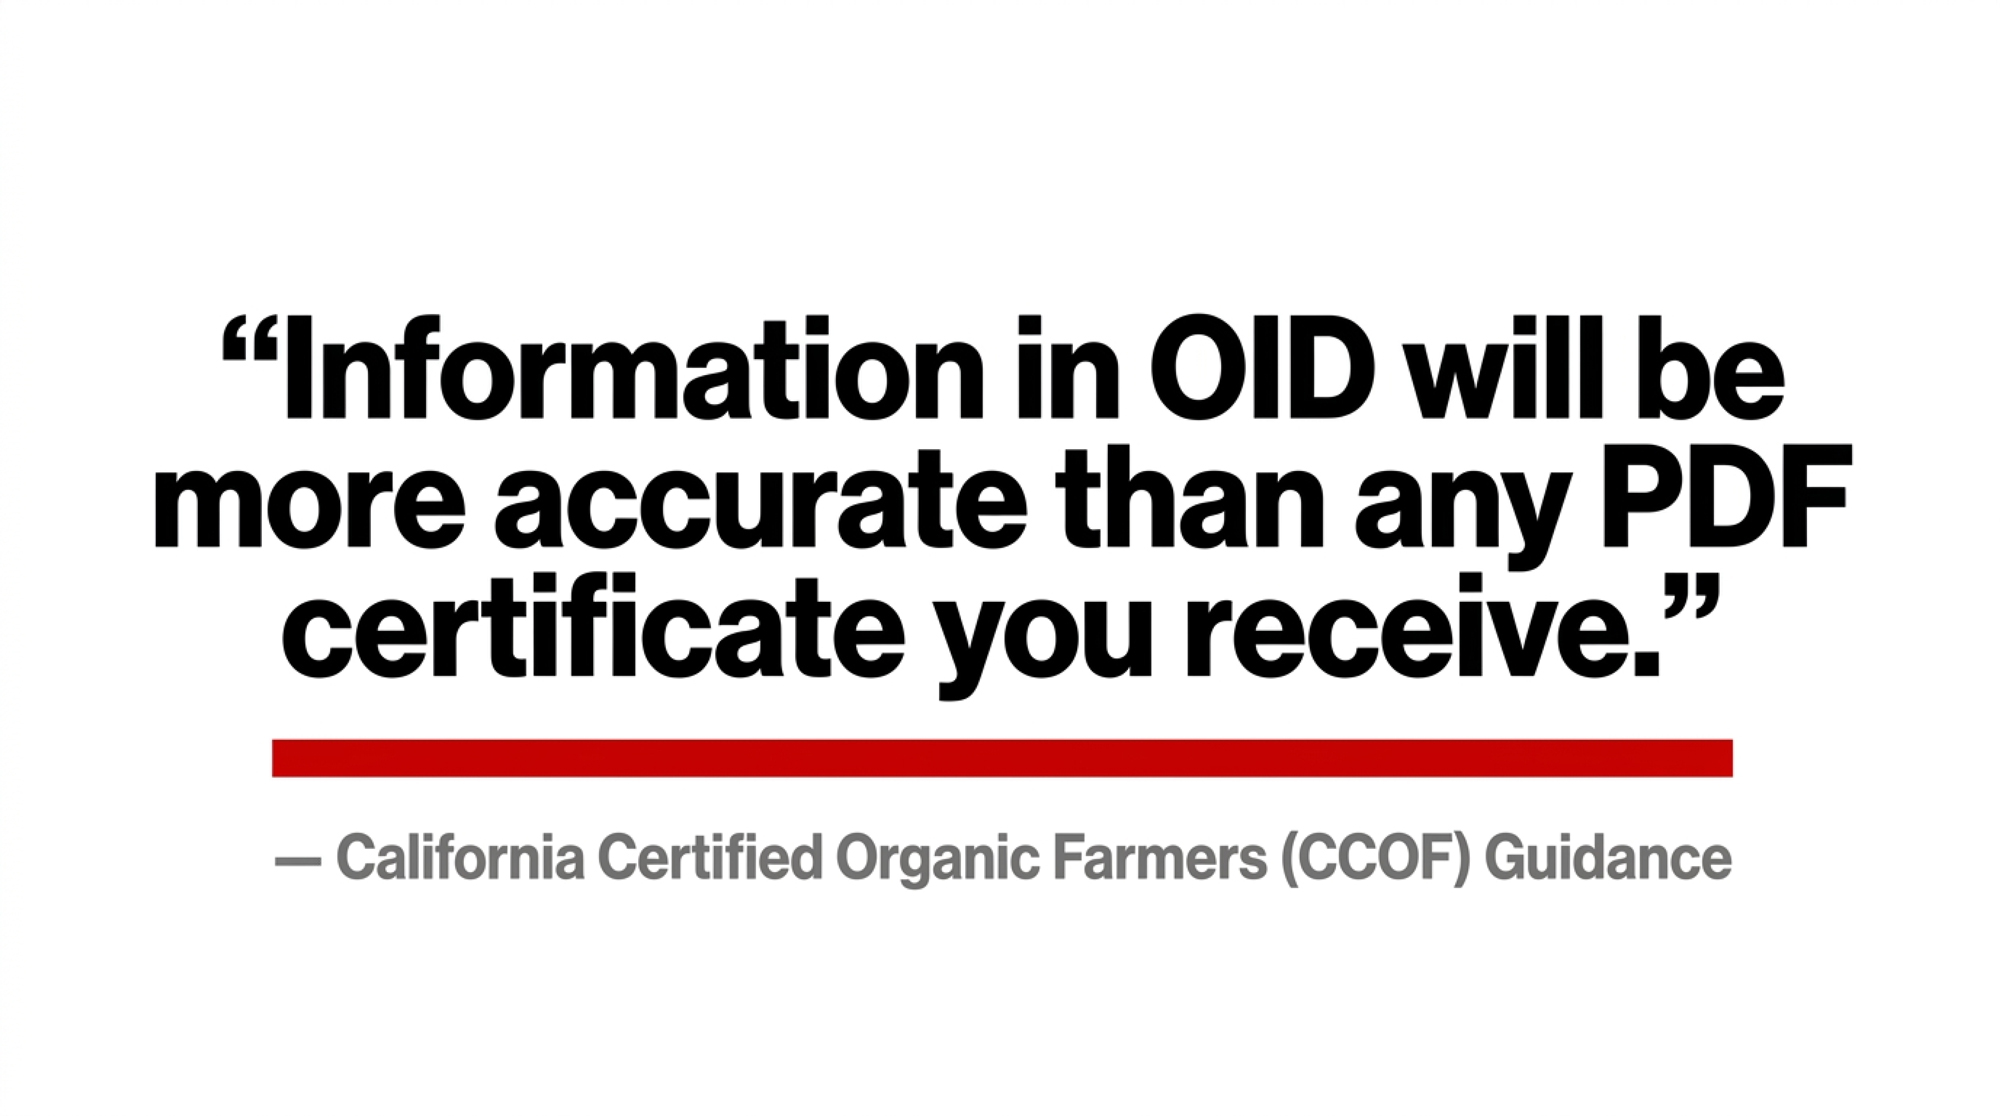
NewsSubscribe
First
Last
Consent

Treasury Moved the 45Z Manure Math. One Undefined Word Decides US$105,100 on 2,000 Cows

Treasury moved the 45Z manure math on September 8. On 2,000 cows, “25% of the credit” pays US$187,800 or US$82,700 depending on one undefined word. Which one does your contract use?

Notice 2026-53, issued September 8, splits dairy manure from swine in the 2026 45Z emissions rate table and ties the carbon intensity to a farm’s own pre-digester manure practices — practices a taxpayer must substantiate or lose the avoided emissions entirely. Dairies holding feedstock agreements signed before that date carry the exposure, since those contracts allocated a number that didn’t exist yet. On the conservative yield, gross credit runs US$188 per cow at low CI and US$563 at high. Bullvine’s own cascade math traces where it goes: the fixed US$150,000 of transaction costs leaves a farm with 24% of its nominal quarter-share at low CI against 51% at high.

45Z manure credit

The Internal Revenue Service issued Notice 2026-53 on September 8, 2026, and it does something no earlier guidance did. The carbon intensity behind the 45Z manure digester credit in 2026 can now turn on your own farm’s prior manure management practices, and the notice states that a taxpayer who cannot substantiate those practices “will not have avoided emissions included in the 45ZCF-GREET model for such farm’s portion of the taxpayer’s manure inputs.”

Not reduced. Not averaged to a national default. Not included.

That is the reframe. Under the prior approach, manure-derived gas leaned on an alternative fate built from the national average of all animal waste management practices, which made your own lagoon history irrelevant to the number. The notice replaces that averaging with your farm’s documented practices, and states the averaging approach is incompatible with the statute for fuel produced after 2025.

The “Paper Baseline” Trap

The maximum-exposure operation is specific: a large herd with a genuine pre-digester uncovered lagoon, a signed agreement assigning environmental attributes, and no indexed file proving what that lagoon handled. Physical baseline strong, paper baseline thin, contract silent. Leverage sharpens it — an operation carrying the digester on its own borrowing has less room to walk away from a bad clause than one hosting a developer-owned system on a lease.

The same notice adds U.S. dairy manure and U.S. swine manure as separate primary feedstocks in the calendar-year 2026 emissions rate table, for fuel produced after December 31, 2025 only, and confines the old generic animal-manure row to fuel produced before January 1, 2026.

The prevailing-wage multiplier: 4.95×

For all transportation fuel produced and sold in calendar 2026, IRS Notice 2026-41 sets two amounts on a 2026 inflation adjustment factor of 1.0929:

Applicable amount, 2026 salesPer gallon gasoline equivalent
Base amount22 cents
Where the qualified facility meets prevailing-wage and apprenticeship requirementsUS$1.09

Same gas, same lagoon, same model. A workforce compliance question moves the credit by a factor of 4.95. The per-cow effect is in Running the Numbers, below.

Manure is also the one feedstock that keeps a negative emissions rate after 2025. Every other pathway gets floored at zero.

So US$1.09 is not the ceiling. It is the multiplier, and for manure the emissions factor can run above 1.0.

What the two documents establish, and what they don’t

Notice 2026-53 is guidance, effective on and after September 8, 2026. The DOE document is the September 2026 revision of the 45ZCF-GREET guidelines, which now display separate life-cycle results for fuel produced in 2025 and fuel produced after December 31, 2025. The regulations at 91 F.R. 5160, published February 4, 2026, are proposed and not in force. Anyone treating §1.45Z-2 as settled is running ahead of the record.

The mechanism, in the notice’s own terms. A taxpayer determines a distinct emissions rate by entering the number of animals by type and the share of manure managed under each prior practice in place immediately preceding the earlier of two dates: the commencement of digester operation, or September 8, 2026. Where manure went off-site, the commencement date is when the farm first began diverting to any off-site digester. A digester counts as operational once it starts capturing, using, or destroying biogas after a start-up period that cannot exceed nine months.

Recognized prior practices include uncovered lagoons, deep pits, liquid/slurry, pasture/range/paddock, dry lot, and solid storage. A farm, for this purpose, is any animal feeding operation with or without a nutrient management plan.

Two limits matter for anyone building. A farm that begins operations after September 8, 2026 gets no farm-specific alternative fate until Treasury issues further guidance; the notice says a new farm “could be incentivized to select the highest emitting practices on startup.” Poultry and beef manure pathways are anticipated rather than published, and the notice tells those producers to wait rather than petition for a provisional emissions rate.

What neither document contains is a dairy CI figure. The 2026 table names the feedstock and directs you to the most recent 45ZCF-GREET version. The number comes out of a workbook run on your animals, your prior practices, your gas.

Running the Numbers

Bullvine calculation. Gross statutory 45Z value on modeled dairy RNG, before any contract sharing.

Methodology note — two inputs, stated separately.

  • Yield spread, MMBtu per cow per year. NREL’s 2021 case study of the Aurora Organic Dairy High Plains Complex in Gill, Colorado (NREL/BR-6A50-80381) modeled 170,322 MMBtu of upgraded RNG a year from 13,000 cows: 13.10 MMBtu per cow. Bartlett & West, an engineering and consulting firm working on biogas projects, puts the figure nearer 10 MMBtu per cow in its producer guidance — a consultancy estimate rather than an agency or peer-reviewed figure, used here only as the conservative bound. That is a 31% spread on the single input every dollar below depends on, so the tables run on the conservative 10, and NREL’s modeled result appears as the upper bound. Both are models; neither is your barn, and regional climate, bedding, solids separation, and digester type all move it.
  • Statutory conversion and brackets. 116,090 Btu per GGE on a lower-heating-value basis per the DOE September 2026 guidelines, giving 8.614 GGE per MMBtu. Applicable amount: US$1.09/GGE, 2026 sales, prevailing-wage and apprenticeship conditions met. Emissions factor (50 − CI) ÷ 50, rounded to the nearest 0.1 under §45Z(b)(2). The three CI values are stated sensitivity points chosen to bracket the arithmetic — not 45ZCF-GREET outputs, and no dairy should treat them as its own result.

(Swipe horizontally to view all herd sizes.)

Sensitivity CI (kg CO2e/MMBtu)Emissions factorGross per cow, 10 MMBtuGross per cow, 13.10 MMBtu500 cows1,500 cows4,000 cows
−50 (low)2.0US$188US$246US$93,900US$281,700US$751,100
−150 (central)4.0US$376US$492US$187,800US$563,400US$1,502,300
−250 (high)6.0US$563US$738US$281,700US$845,100US$2,253,400

Herd columns run on the conservative 10 MMBtu yield. At NREL’s modeled yield, they rise about 31%.

Arithmetic at 500 cows, central, conservative yield: 500 × 10 = 5,000 MMBtu, × 8.614 = 43,070 GGE, × US$1.09 × 4.0 = US$187,800. Swap to the 22-cent base amount and the low case drops to US$38 per cow.

What a missing nutrient management plan costs. Take the 2,000-cow model at central sensitivity on the conservative yield: US$751,100 of gross statutory credit. The negative CI driving that number comes from avoided methane, and the notice excludes avoided emissions entirely for an unsubstantiated farm’s share of manure inputs. Remove that contribution and the emissions rate moves toward and past the 50 kg CO2e/MMBtu eligibility ceiling, where the emissions factor reaches zero, and the credit attributable to that farm’s manure goes with it. Exposure runs from a partial reduction up to the full US$751,100, depending on where the model lands. That range is directional and bounded by the arithmetic above, not a model output. The bottom of it is not a haircut.

Take the conservative row and hold it. US$188 per cow per year of gross federal credit rides on a calculation that sits inside a workbook the dairy usually never sees.

Does my feedstock contract still price the 45Z manure digester credit right?

Probably not, and bad faith is not required to get there. These agreements were drafted to allocate RINs, LCFS credits, and gas revenue. One publicly filed RNG interconnection agreement defines environmental attributes to reach every attribute, compliance credit, benefit, emission reduction, offset, and allowance arising from the gas, whether it exists at signing or comes into being afterward. Public company disclosure describes biogas projects secured through long-term gas rights, manure supply agreements, and property leases. Trade guidance has flagged compensation and environmental incentives as critical manure-supply terms since 2022.

None of it anticipated a federal calculation that pays for documented lagoon history.

Bullvine calculation — the credit-definition cascade. One modeled 2,000-cow herd, central sensitivity CI, conservative yield, PWA met, gross statutory value US$751,100. The contract says the dairy gets 25%.

What “the credit” is defined asProducer’s figureDairy’s 25%Gap vs. face value
Gross statutory creditUS$751,100US$187,800
Credit claimed on returnUS$751,100US$187,800US$0
Credit allowed after substantiation reviewUS$600,900US$150,200US$37,600
Cash after credit transferUS$480,700US$120,200US$67,600
Net proceeds after defined deductionsUS$330,700US$82,700US$105,100

Illustrative Bullvine model — not a project payment.

Assumptions, stated plainly: 20% of the claimed credit disallowed or reserved, 20% transfer discount, and US$150,000 of contract-permitted third-party costs covering brokerage, credit insurance, tax counsel, verification, and an indemnity reserve. These are scenario assumptions built to test one contract phrase.

Run the same cascade at all three sensitivity points and something worth knowing falls out.

Sensitivity CIGross statutory creditDairy’s 25% of grossDairy after the full cascadeShare of nominal payment retained
−50 (low)US$375,600US$93,900US$22,60024%
−150 (central)US$751,100US$187,800US$82,70044%
−250 (high)US$1,126,700US$281,700US$142,80051%

Illustrative Bullvine model — not a project payment.

2,000 cows, conservative yield, same disclosed assumptions at every row, US dollars. At NREL’s modeled yield, the central row’s gap widens to US$126,060.

The fixed US$150,000 is what does that. Percentage deductions scale with the credit; transaction costs largely don’t. So the weaker your project’s carbon intensity, the more of your nominal quarter-share those fixed costs eat — 76% of it at the low row against 49% at the high row. A farm negotiating a percentage of net proceeds on a modest-CI project is negotiating for a fraction of a fraction.

The 2,000-cow figure is a modeling convenience. It describes no actual operation, none of the percentages above is drawn from any real agreement, and no real developer’s conduct is described or implied.

The percentage never moved. The denominator did.

Why your old paperwork is now an asset, not an errand

Here is the part of Notice 2026-53 that runs in your favor, and it hasn’t been said plainly anywhere yet.

The taxpayer claiming the credit is generally the fuel producer rather than the farm. The proposed regulations would define that producer as the party processing the gas until it is interchangeable with fossil natural gas, and those regulations are not final. What the notice does put beyond argument is where the substantiation burden sits: the taxpayer must be able to substantiate the farm-specific prior manure management practices “for all collected manure” where those data establish the alternative fate. Fail, and the model carries no avoided emissions for that farm’s portion of the manure inputs.

Read that against the cascade. The producer’s negative-CI position on your manure rests chiefly on inputs your farm’s history supplies — animals by type, and the share managed under each prior practice at the cutoff date. Your nutrient management plan, your engineering drawings, your herd inventories, and, where you report under 40 CFR Part 98 Subpart JJ, the manure-fraction allocation you already file. Documents you built for a permit fight or a lender, now sitting upstream of a federal tax calculation.

That is a negotiating position, and it has a shelf life. Where your agreement doesn’t already compel disclosure on terms set before September 8, 2026, the records are an asset you still control the pricing of. Where it does compel disclosure, the price of that cooperation was fixed before this calculation existed, which is its own argument for reopening the clause rather than filling the request.

Two cautions, because leverage cuts both ways. Check what your agreement already obligates you to provide before you treat the file as unencumbered — many do. And a developer may be able to reconstruct part of the baseline from public permits, agency files, or its own engineering record, so the position is strong rather than absolute.

One correction to our own file, while the cascade is still in front of you. Bullvine’s May 19, 2026 analysis, $80M on her land, $0 in carbon credits, reported dairy manure RNG carbon intensity as “often −250 to −270 g CO2e/MJ,” and used it to explain why the credit stack on a herd’s manure was worth more than the gas. That framing is now retired for tax purposes. Post-2025, dairy stands as its own feedstock, and the number depends on your animals and your documentation rather than a range that travels between farms.

The contract conclusion from that piece held up better than the CI number did. Curtis Creek Dairy in Newton County, Indiana had its cows, manure, and ground sitting behind a 15-to-25-year supply contract recorded against the property, with the developer holding the LCFS and RIN stack, according to that reporting. Whether that structure serves the operation well is a question only its own numbers can answer, and we make no claim either way. What it shows is the mechanism: where a supply agreement assigns the credit stack and carries no revision clause, later federal methodology changes accrue to whoever holds the attributes.

No executed feedstock agreement was made available to Bullvine for this analysis. The clause questions below are drawn from the primary documents, not quoted from any contract.

What records do I need to prove my old lagoon?

The ones describing the farm you ran before the digester, tied to animal counts and manure shares at the notice’s cutoff date.

Here is the part that runs against intuition. A dairy that flushed to an uncovered lagoon for fifteen years holds the higher-value baseline, while a dairy on solid storage and daily spread holds a weaker one. The notice pays on substantiation rather than physics. So the exposed operation is the one with the widest distance between what happened in the yard and what survives in a file.

Where that file usually sits:

  • Your nutrient management planner — the plan nearest the cutoff, describing collection, storage, and transfer. EPA requires NPDES-permitted CAFOs to implement nutrient management plans.
  • Your engineer — lagoon drawings, capacity, pipelines, separator layout, construction and retrofit dates. NRCS Conservation Practice Standard 359, Waste Treatment Lagoon, October 2017, requires the lagoon be planned, designed, and constructed to documented specifications.
  • Federal reporting files — 40 CFR Part 98 Subpart JJ, as currently codified, requires operations that report under it to determine the fraction of total manure by weight managed in each on-site system component. That is the closest existing analog to what the model now asks for, and if you file it, you are further along than you think.
  • Your own office — herd inventories by class, pumping logs, hauling and custom-applicator tickets, invoices, dated photographs. Before you hand over a page of it, get the data terms in writing: what the records may be used for, who else sees them, whether they leave with the developer if the project is sold, and how the credit value they support is attributed and paid. Send copies, keep originals, and log what went where and when.
  • The developer — delivery volumes, meter data, digester start-up date. Rarely your historical baseline.

Aerial imagery proves a lagoon existed. It does not prove what share of manure from which animal class reached it, and that gap is where a claim gets thin.

What This Means for Your Operation: The 90-Day Playbook

Next 30 days — establish the record

  • Find the attribute clause. Pull the executed agreement, not the term sheet, and mark every reference to environmental attributes, tax credits, carbon intensity, GREET, and change in law. Requires the signed original and all amendments. Urgent once the producer starts assembling its 2026 return. Backfires if you negotiate from a summary against language that isn’t in the document.
  • Read your own data obligations before you read anything else. Find what the agreement already requires you to hand over, on what notice, and at whose cost. Requires the same executed copy. Urgent before any records request arrives. Backfires if you treat the file as yours to price when the contract already committed it.
  • Send one written request. Ask for the model version, your farm-specific inputs, the output CI and emissions factor, the volume attributed to your manure, and the provision governing what happens if your records raise the credit. Requires an email and a deadline. Backfires on verbal assurances, so get it in writing.
  • Date your cutoff. Use the earlier of digester commencement or September 8, 2026, and, for off-site digestion, the date manure first left the farm. Requires start-up records and first delivery tickets. Backfires if you assume your longest-running system is the relevant one.
  • Red-flag trigger: if the agreement pays a percentage of net proceeds and does not define permitted deductions in a schedule you can read, this moves to the top of the list today. On the low-CI row above, that structure returns 24 cents of every nominal dollar.

Next 90 days — build and price the file

  • Index the evidence before you buy any of it. Mark every model input as documented, corroborated, estimated, or unsupported. Requires your planner, your engineer, and someone who knows the pre-digester manure flow. Urgent ahead of any filing. Backfires if you fund forensic reconstruction before knowing whether the contract shares what it produces.
  • Price any new offer against a benchmark. One from our earlier work: if a developer-owned offer clears under about US$80 per cow per year in avoided costs on your own numbers, look harder at what the manure is worth before signing. Requires your own cost figures for bedding, hauling, storage, and nutrient value. Urgent before signature, not after. Backfires if you treat a benchmark as a valuation, because a single number cannot price your site, your gas, or your term.
  • Negotiate the uplift term. Ask for a share of the gross incremental credit attributable to your substantiated alternative fate, measured against a baseline run with all other inputs held constant, before discounts and deductions. Requires your lawyer and your accountant, plus roughly two weeks of turnaround. Backfires if you demand a percentage without demanding the controlled comparison that proves the increment.
  • Split the attribute schedule. Separate 45Z from RINs, LCFS value, and voluntary claims rather than leaving one undefined bundle. Backfires into an anti-double-crediting problem you created by selling the same molecule twice.

Next 365 days — reposition

  • Preserve your own data room. Keep originals, share dated copies, log what went where. The opportunity signal sits here: a dairy with a clean indexed historical file becomes the preferred feedstock partner in a market where substantiation now sets the credit.
  • Put a true-up in writing. Same formula on the way up and the way down, tied to credit allowed or cash received, surviving termination. Backfires if the clause recovers developer losses from you but never shares developer gains. Watch for a reserve that never releases.

The same discipline that priced a twelve-month Wisconsin permit stall at US$2.14M against a US$96K legal billapplies here, and the file you built for that fight is now part of a tax file. On the ration side, the arithmetic behind the US$73-a-cow gap on a 2027 Bovaer contract is worth rerunning too, because feed and bedding changes move feedstock chemistry and can move CI with it.

The number check before you sign anything

Notice 2026-53 did not make every dairy contract unfair. It made the value of every dairy contract’s silence visible, and silence is what most of these agreements say about a calculation that didn’t exist when they were signed.

Put your agreement on the table and answer five questions in writing. Which GREET version does it name? Who elects a later version released during the production year? Is your percentage applied to gross statutory credit, credit allowed, transfer cash, or net proceeds? Who pays to retrieve the historical records? Who absorbs an IRS adjustment three years out?

If your contract cannot answer all five, you do not have a price for your manure. You have a placeholder.

Then ask the developer the question that settles it: if my old lagoon records increase your 45Z value, show me the clause that pays me for that increase, and if there isn’t one, show me the clause that says I must spend money finding them.

Key Takeaways

  • “Net proceeds” is where the money goes. Four contract definitions of the same word — gross statutory, claimed, allowed, net of deductions — produce a US$105,100 spread on a modeled 2,000-cow herd.
  • Fixed transaction costs hit hardest where the carbon intensity is weakest. A farm keeps 24% of its nominal quarter-share at low CI against 51% at high, because the US$150,000 doesn’t scale down with the credit.
  • Records built for a permit fight or a lender are now tax-file inputs. The taxpayer must substantiate a farm’s pre-digester practices for all collected manure, and where it can’t, that manure contributes no avoided emissions at all.
  • The window that matters is the one just before your digester started, not your longest-running system. Fix the earlier of digester start-up or September 8, 2026, and check what your contract already obligates you to hand over before you price the file as yours.
BULLVINE INTERACTIVE TOOL

45Z Dairy Manure Credit & Cascade Calculator

IRS Notice 2026-53 ties 45Z value to farm-specific lagoon history. Calculate your gross statutory credit and test what remains after contract deductions and transaction fees.

head
Typical commercial scale modeled in Bullvine benchmarks.
A 4.95× swing rides purely on developer workforce compliance.
Contract Waterfalls & Cascade Assumptions
GROSS STATUTORY 45Z VALUE (ANNUAL)
$751,100
$376 / cow / year • Emissions Factor: 4.0×
Notice 2026-53 Warning: Unsubstantiated lagoons forfeit 100% of avoided emissions.
Contract Definition of “The Credit” Project Total Dairy Share () Gap vs. Face Value
Gross Statutory Credit
Raw model output before filing adjustments
$751,100 $187,800
Credit Allowed After Review
After audit reserves and substantiation holdbacks
$600,900 $150,200 -$37,600
Cash After Transfer Discount
Actual cash realized on transfer market
$480,700 $120,200 -$67,600
Net Proceeds (After Fixed Deductions)
What your check actually is if contract says “Net Proceeds”
$330,700 $82,700 -$105,100
44%
Under a “Net Proceeds” definition, fixed transaction costs eat 56% of your nominal quarterly payout. The farm leaves $105,100 on the table relative to gross statutory credit.

Methodology and corrections: credit values here are estimates built on the assumptions and sensitivity points shown, in US dollars, for fuel produced and sold in calendar 2026. This is not tax, accounting, or legal advice — eligibility, registration, emissions modeling, transferability, and contract ownership require review by qualified advisers. Modeled figures may not reflect your region, herd size, digester configuration, gas yield, or contract terms. If your agreement is structured differently, or your own 45ZCF-GREET runs land somewhere else, send us the numbers and we’ll report what they show. Factual corrections: contact the editor through The Bullvine’s contact page and we’ll publish a visible correction note.

Learn More

The Sunday Read Dairy Professionals Don’t Skip.

Every week, thousands of producers, breeders, and industry insiders open Bullvine Weekly for genetics insights, market shifts, and profit strategies they won’t find anywhere else. One email. Five minutes. Smarter decisions all week.
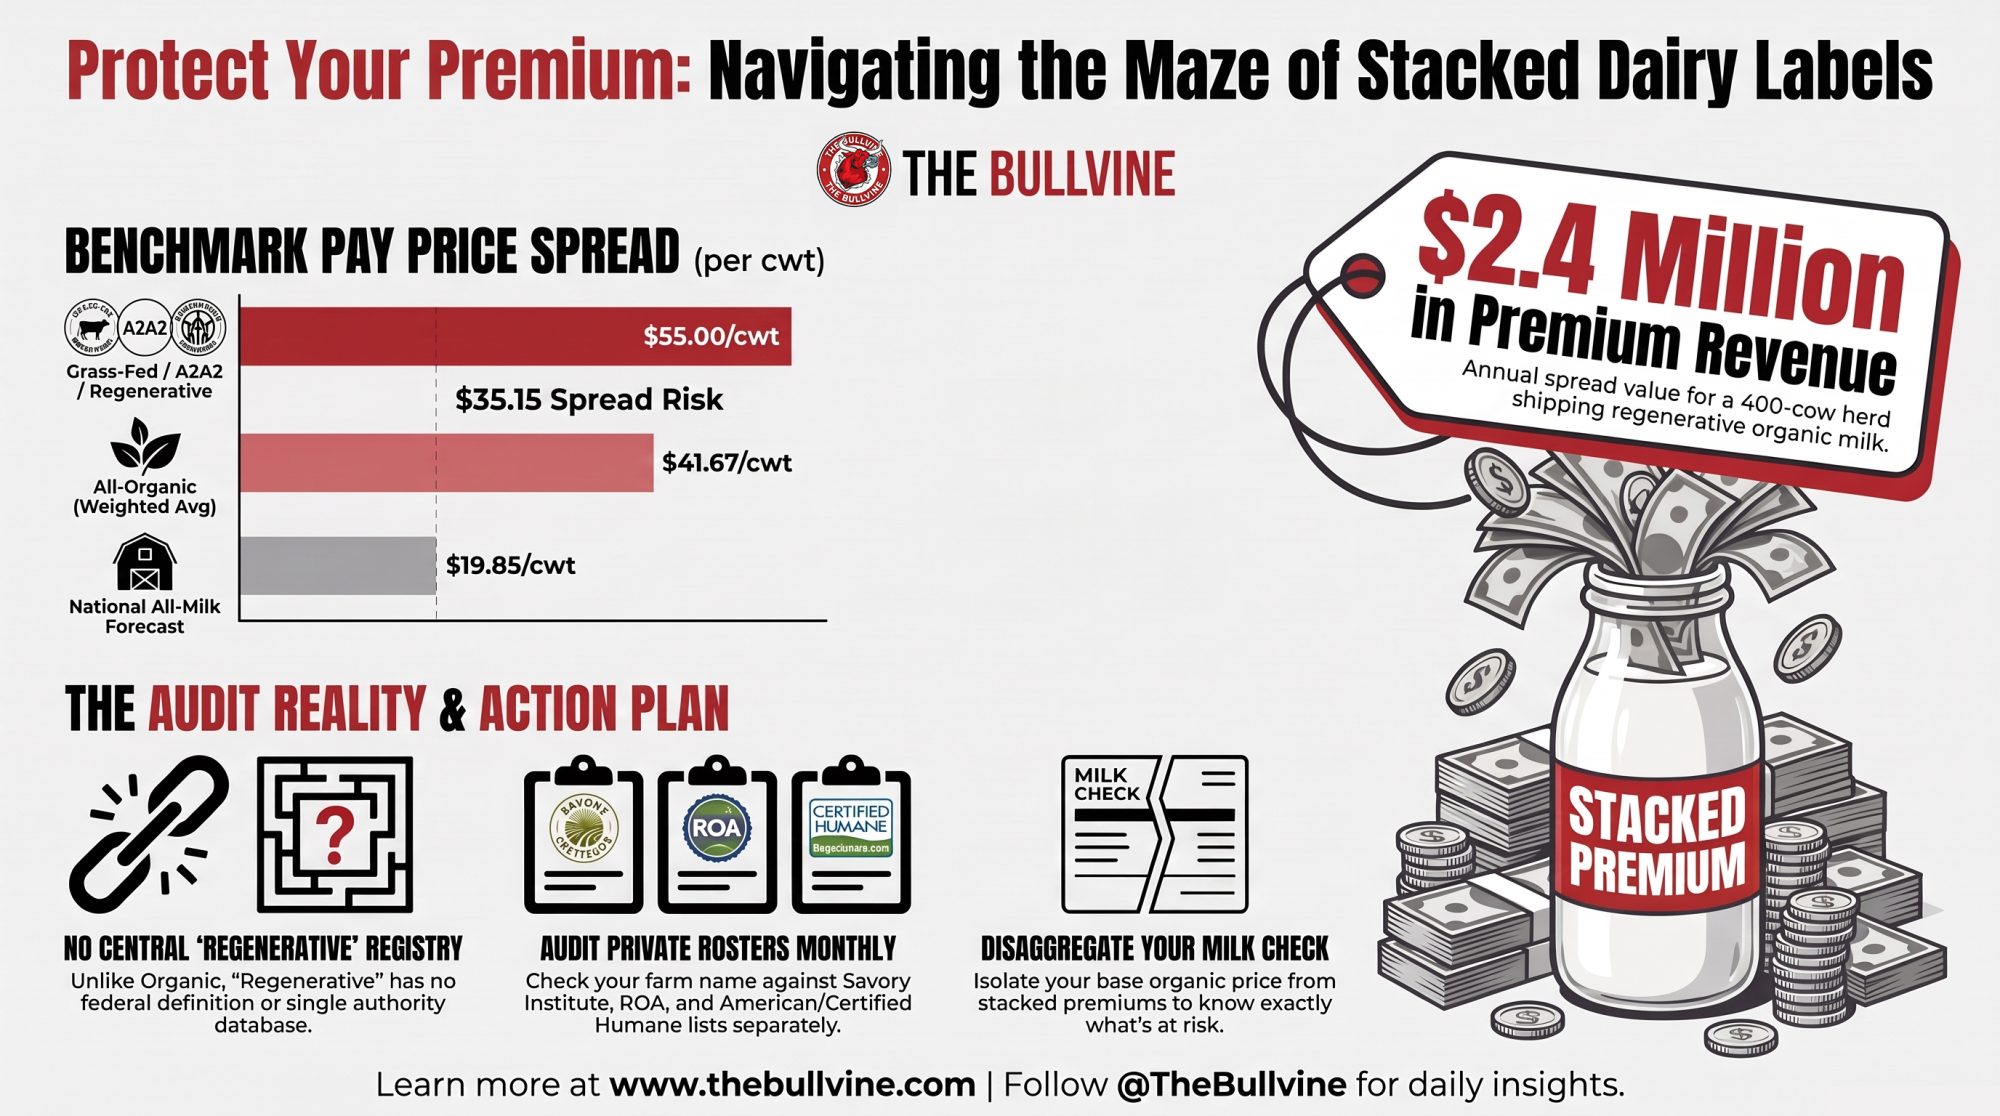
NewsSubscribe
First
Last
Consent

Iowa’s Manure Penalty Never Left $5,000. The Restitution Ran 6.7 Times Higher.

Four Iowa consent orders held the penalty between $5,000 and $8,000, whether the kill was zero fish or 126,469, on herds from 330 cows to about 4,200. Restitution ran 6.7 times higher. In Ohio, roughly 789 dead fish produced a federal conviction, 15 months of probation and a $25,000 fine for one man.

A creek in Mercer County tested between 120 and 150 parts per million of ammonia on December 12, 2022. Thirteen ppm is considered chronic toxicity to aquatic life and 1 ppm is normal, according to Mercer Soil and Water Conservation District officials. Daily Standard Three years and nine months later, in a dairy Clean Water Act sentencing that named one man, U.S. Magistrate Judge Darrell A. Clay handed down 15 months of probation, a $25,000 fine and 100 hours of community service.

The judgment names Teunis Jan Willemsen, 54, who was serving as manager of Heartland Dairy in December 2022. USAO-NDOH The operation at 3101 Tama Road southwest of Rockford, formed in 2010 and formerly known as Rockford Dairy, is run by Heartland Dairy Holdings, LLC. Daily Standard, 2017 Lima News He pleaded guilty on May 8, 2026, to negligently discharging a pollutant under 33 U.S.C. §§ 1311(a) and 1319(c)(1)(A). DOJ Environmental Crimes Bulletin Read that provision closely, because it is the part most operators get wrong: it reaches a person who “negligently violates” the Act, so the government does not have to prove intent, a plan, or a willful act. It carries $2,500 to $25,000 per day of violation, up to a year in prison, or both.

Now put that beside Iowa. A January 2026 consent order in Winneshiek County carried a $5,000 penalty and $33,470.39 in restitution and investigative costs, $38,470.39 in total, for 126,469 dead fish over 10.2 miles. Iowa DNR order 2026-AFO-02 Ohio’s federal case produced a $25,000 criminal fine and 15 months of probation on a kill of roughly 789 fish. USAO-NDOH The operations most exposed are in delegated-permit states, with a leachate or manure structure within hose reach of a swale, tile inlet, or culvert.

What the records establish, and where they disagree

DOJ’s two publications give the outcome. The mechanism comes from the Mercer district’s own field investigation, presented at its January board meeting and reported January 6, 2023, by Leslie Gartrell in The Daily Standard. Bullvine requested the district’s minutes and complaint file on September 17 and had not received them before publication, so the account that follows is that newspaper’s report of a public meeting.

The account runs on a clock. Then-Ohio DNR Mercer County wildlife officer Brad Buening called then-district technician Matt Heckler at 8:25 a.m. on December 12, 2022, reporting discolored water and dead fish where Little Black Creek crosses Erastus Durbin Road. Heckler notified Dave Schilt, then at Ohio EPA’s Division of Environmental Response and Revitalization, and Frances Springer, then at ODA’s Division of Soil and Water. Crews walking the creek found a 10- to 12-inch tile discharging foaming water above 10 ppm ammonia. At the facility, they found a pump in the silage leachate collection system with a hose running over the collection wall and discharging into the clean water swale on the north side of the operation.

Heckler described silage leachate as a corn byproduct, high in nutrients and land-applicable, and called it one of the worst potential pollutants. By 12:35 p.m., a manure applicator working for the dairy told officials he had plugged the tile in the catch basin and closed the inline water control structure. Total contamination: 5.1 miles of creek. The district found a valid pollution complaint and referred it to ODA-DLEP and Ohio EPA for enforcement. Daily Standard No state enforcement outcome has been verified, and the district had not responded before publication to a September 17 request for comment.

Three places where the records do not line up, stated rather than smoothed. DOJ’s May bulletin locates the dairy in “Rockland, Ohio,” while the county-level record puts it at Rockford in Mercer County. DOJ Daily Standard DOJ describes wastewater pumped from a settling basin into a nearby ditch, consisting of manure and silage leachate, while the district found a pump in the leachate collection system feeding a clean water swale. And the May bulletin puts the non-fish toll at 1,370 animals, attributed to the Ohio Department of Agriculture, while the September release says 1,371. DOJ USAO-NDOH Neither DOJ publication states the discharge volume.

Nor does either explain how they counted the roughly 789 dead fish. Iowa publishes its method: in the Winneshiek County matter, DNR Fisheries staff Theresa Shay, Josh Hefflefinger, Caleb Schnitzler and Steve Pecinovsky surveyed 10.2 miles between March 11 and 14, 2025, using the “Narrow Stream, Incompletely Accessible” method from American Fisheries Society Special Publication 35, and the order names the method on its face. Iowa DNR order 2026-AFO-02 Iowa also runs a public fish-kill database that logs each event’s mechanism and the surveyed distance in yards, with GPS coordinates for the endpoints. Iowa DNR Fish Kill Database Ohio’s count arrives without a method.

The federal record establishes the bridge to the defendant. The bulletin says Willemsen “stated he was responsible for employees pumping the contents from the settling basin into a nearby drainage ditch.” DOJ Special Agent in Charge Allison Landsman of EPA’s criminal enforcement program in Ohio said in the sentencing release: “The defendant oversaw a discharge of ammonia-laden wastewater to Little Black Creek in the Maumee River, Ohio watershed that poisoned the water for miles and killed thousands of fish and other aquatic animals.” “Reckless and careless business practices that threaten Ohio’s environment and wildlife will not be tolerated,” U.S. Attorney David M. Toepfer said.

Employees ran the pump. The manager carried the charge. Assistant U.S. Attorney Matthew D. Simko prosecuted with EPA Regional Criminal Enforcement Counsel Sasha Reyes assisting. USAO-NDOH The reviewed federal materials identify no corporate co-defendant, which is not the same as DOJ clearing the company: Bullvine has not read the judgment, the charging document, the plea agreement, or the full docket in No. 3:26-mj-08002, and no public document explains the charging decision between entity and individual.

How does a clean water swale become a Clean Water Act charge?

Your state permit did not keep federal investigators out of this barn. Ohio EPA has held authority over the base NPDES permit program since March 11, 1974. EPA EPA’s Criminal Investigation Division, the Ohio Attorney General’s Bureau of Criminal Investigation, and Ohio EPA’s Special Investigations Unit still worked this file with support from Ohio DNR.

The pathway had three links and no independent check on any of them. A pump sat in a leachate collection system. A hose crossed a wall into a swale built for clean water. That swale fed an outlet tile connected to Little Black Creek. Daily Standard The statute reaches negligence, and the tile worked exactly as designed.

Two details raise the stakes for anyone whose permit file looks clean. Springer sent Heckler a Mercer County auditor aerial image from March 2021 showing a pump and hose already present in the leachate collection system, and the district said it cannot verify whether contamination had been continuous since then. Daily Standard No document reviewed establishes when that pump was placed, how often it was used, or whether it discharged before December 2022. Worth sitting with: that image came from the county auditor’s aerial photography, so the yard was documented years before anyone walked it. Ohio county auditors publish aerial imagery, and many county assessors elsewhere do the same. Check what your county publishes, then look at what a hose, a pump, or a stained swale would show from above.

Separately, then-ODA-DLEP program administrator Nancy Cunningham said in December, during a five-year permit-to-operate renewal, that the facility had no infractions since its permit was first granted. Daily Standard Heartland Dairy Holdings, LLC was asked on September 17 to respond to each of those findings, including the aerial image and the referral, and to say whether the company was ever charged or resolved any civil or administrative matter. It had not responded before publication. ODA-DLEP was asked the same day for the outcome of the December 2022 referral, the facility’s current permit status, and whether the no-infractions characterization was accurate. It had not responded.

Ohio already requires you to name the people who will execute your plan. Administrative Code 901:10-2-17 requires an emergency response plan identifying those responsible for implementing it, and 901:10-2-14 requires manure management procedures that minimize loss or spillage in transport with prompt cleanup.

What Bullvine got wrong in 2024, and the exact correction

On August 27, 2024, this publication told operators to designate an incident leader and split shutdown, containment, and communication duties. Bullvine, 2024 The instinct was right, and the four-hour gap between Buening’s 8:25 a.m. call and the 12:35 p.m. containment report shows why somebody has to own the response.

The wording was not right. That piece framed the assignment as settling “who is liable for what,” and internal assignments do not decide who a regulator or prosecutor may charge. Section 1319(c)(1)(A) does not read your org chart, and the Alternative Fines Act at 18 U.S.C. § 3571 means the $25,000 daily figure should not be treated as a universal individual ceiling. That page requires correction before this article links to it.

The replacement rule has four roles instead of one: an authorizer, a second trained verifier who is not the pump operator, anyone on the crew with authority to stop the pump, and a named incident leader for the response. Cornell Cooperative Extension recommends that every employee, including those not running waste equipment, know the system and how to shut valves. Cornell CCE Purdue’s response order starts with controlling the source by stopping pumps, closing valves, and breaking the siphon.

Iowa’s orders show what regulators ask for after the fact, and it is close to the same list. Foresight Farms was ordered to develop a standard operating procedure for employee training and equipment inspection. Iowa DNR order 2026-AFO-01 Jochum Agri-Services was ordered to produce five years of manure-application training records and to write mandatory release reporting into its updated procedure. Iowa DNR, Feb 27, 2025 The Winneshiek County operator was ordered to submit a professional engineer’s report on manure storage capacity, rework the grass waterway feeding the tile intake, and write a feedlot maintenance plan.

Does an LLC keep your manager’s name off the caption?

Across one federal case and five resolved state actions read from the orders, consent-order bulletins, and releases themselves, all of them Midwestern, the actor named changes with the conduct and the forum, not with the corporate form.

ActionWho was namedDocumented eventMoneyLegal form
Willemsen, N.D. Ohio, sentenced Sept 8, 2026Individual dairy managerDischarge reached Little Black Creek; roughly 789 fish and 1,371 other aquatic animals$25,000 fine, 15 months probation, 100 hours serviceCriminal conviction on guilty plea
Jochum Agri-Services, Inc., Iowa DNR, penalty due Feb 18, 2025Sioux County respondent, ordered to produce five years of manure-application training recordsManure release$5,000 administrative penaltyConsent order
Foresight Farms, L.C., Iowa DNR order 2026-AFO-01, signed Jan 7, 2026Dairy LLC, 1,098 animal units at signing, GarnavilloUmbilical hose coupler separated Oct 4, 2025; manure reached an unnamed tributary of Buck Creek; four dams and two pumps kept it out of Buck Creek, which showed no ammonia$5,000 administrative penalty, no restitutionConsent order, appeal rights waived
Iowa DNR order 2026-AFO-02, signed Jan 30, 2026An individual dairy operator, Winneshiek County, 330 mature dairy cattle at signingOpen-feedlot runoff entered a tile intake and an unnamed tributary of Dry Run Creek, March 2025; 126,469 fish killed over 10.2 miles; earthen basin below two-foot freeboard$5,000 penalty plus $33,470.39 restitution and investigative costs, $38,470.39 total on a four-payment planConsent order
Roorda Dairy LLC, Iowa DNR, incident July 2024, enforcement Jan 16, 2025Dairy LLC, roughly 4,200 dairy cattle per Iowa Capital Dispatch reporting on DNR records, PaullinaBlown tile during land application sent manure to Mud Creek; 107,373 fish killed, with dead fish logged along 16,900 yards, or 9.6 miles, to the Mill Creek confluence src$8,000 penalty plus $30,791.07 fish restitution, $38,791.07 totalConsent order
Spring Valley Holsteins, Inc. and its operator, Monroe County Circuit Court, approved Dec 23, 2025Norwalk, Wisconsin dairy corporation and its operator at the time of the judgmentComplaint alleged a faulty manure transfer system let manure escape into an unnamed tributary and Moore Creek; dead brown trout, white suckers, and dace reported May 13, 2024$120,000, including $90,000 to Wisconsin DNR to remedy fish-kill effectsStipulated judgment resolving alleged violations

Read the Iowa column down, and the pattern is hard to miss. The administrative penalty sits at $5,000 for a manure release in Sioux County, $5,000 for a contained release with no fish kill at Foresight Farms, $5,000 for a kill of 126,469 fish in Winneshiek County, and $8,000 for a kill of 107,373 at Roorda. Iowa DNR Foresight order Winneshiek order Roorda The penalty barely moves, and it does not track herd size either: $5,000 on a 330-cow operation, $8,000 on one running about 4,200. What moves is restitution, which ran 6.7 times the penalty in Winneshiek County and 3.8 times at Roorda.

Iowa priced that kill at $30,923.54 for 126,469 fish, about 24 cents a fish, and added $1,750.63 in Fisheries costs and $796.22 in field office costs. Winneshiek order Apply that rate to Ohio’s 789 fish, and the natural-resource value is roughly $190. On a kill Iowa’s own rate would value near $190, Ohio’s outcome was a $25,000 criminal fine.

MetricWinneshiek Co., IowaRoorda Dairy, IowaWillemsen, N.D. Ohio
Fish killed126,469 over 10.2 miles107,373 over 9.6 milesroughly 789
Count method publishedYes — AFS Special Pub. 35, “Narrow Stream, Incompletely Accessible,” four named DNR staffYes — DNR fish-kill database, 16,900 yards logged with GPS endpointsNo method stated
Natural-resource value$30,923.54 (~$0.24/fish)$30,791.07 fish restitution~$190 at Iowa’s rate
Money ordered$38,470.39$38,791.07$25,000 fine
Ordered money ÷ Iowa-rate fish value1.2x1.3x~132x

The Winneshiek County operator and Spring Valley Holsteins were both asked on September 17 to comment on the figures reported here, including Bullvine’s calculation that restitution ran 6.7 times the penalty. Neither had responded before publication.

Different statutes, different forums, different standards of conduct. That is the point. A negligent discharge charged criminally under federal law produced a personal judgment on a small kill, while administrative water-quality violations on kills more than 130 times larger produced payment plans against two operations and one operator.

Running the Numbers

Bullvine calculation: one resolved manure discharge on a 500-cow dairy. USD, U.S. Midwest, single incident, before any capital work.

Published evidence, two inputs. Enforcement and environmental payment, from resolved dairy outcomes: $5,000, the Foresight Farms penalty for a release with no fish kill. $38,470.39, the Winneshiek County total. $120,000, the Spring Valley stipulated judgment. Defense rates: the 2026 federal appointed-counsel rate of $177 per hour, and a $349 U.S. average lawyer hourly rate from Clio’s Legal Trends data as reported in 2026.

Stated assumptions, kept separate. Fifty, 150, and 300 defense hours are Bullvine assumptions, not case figures. Every scenario assumes a single incident and no trial.

Bullvine math. Low: $5,000 plus 50 × $177, or $8,850, giving $13,850. Central: $38,470 plus 150 × $349, or $52,350, giving $90,820. High: $120,000 plus 300 × $349, or $104,700, giving $224,700.

ScenarioIncident total500 cows1,200 cows3,000 cows
Low$13,850$27.70/cow$11.54/cow$4.62/cow
Central$90,820$181.64/cow$75.68/cow$30.27/cow
High$224,700$449.40/cow$187.25/cow$74.90/cow

Excluded, deliberately. Capital retrofit, the professional engineer’s report Iowa ordered in the Winneshiek County matter, the grass-waterway rework, permit and consulting response, lost milk, business interruption, premium increases, and lender reserve demands.

The cleanup line nobody has priced. Ohio State University Extension advises being prepared to pump 20 to 25 times the volume of manure that entered a stream. OSU Extension Heartland pumped water from Little Black Creek from December 12 until December 30, 18 days elapsed. Daily Standard Neither DOJ publication states the discharge volume, and no agency published the pumping cost, so this one stays an equation rather than a number: recovered volume equals released volume times 20 to 25, and cash cost equals that volume times your contractor’s per-gallon transfer rate. Both inputs are yours to obtain. Call your vacuum or dragline contractor for the per-gallon figure before you need it, because it is the only line in this article you can price today, and nobody has priced it for you.

Carry the conservative figure: $13,850, or $27.70 per cow at 500 cows. That case assumes a contained release, no fish kill, no restitution, and no trial. The moment fish die, Iowa’s own arithmetic says the bill multiplies by four to seven.

Against that, the control. Assume 100 transfers a year and 12 minutes for authorization, independent route verification, and first-flow confirmation. That is 20 labor hours, and at an assumed loaded $30 per hour, it is $600 a year, or $1.20 per cow on 500 cows. The $25,000 Ohio fine alone equals 41.7 years of that figure. To be exact: $600 is a Bullvine labor-time model on the two assumptions just named, not a Heartland cost and not evidence that any protocol would have changed this case.

A $600 protocol is not immunity, and nothing in these records says it would have stopped this discharge. What it buys is the ability to prove who authorized a transfer, who independently checked it, and who could stop it, on a day when a regulator is standing in your swale. Here is how to audit your transfer line over the next quarter.

The 90-Day Playbook for Herds Moving Manure in a Delegated-Permit State

30 days

  • Walk every clean water swale, catch basin, and outlet tile and write down where each discharges. Requires two hours and a map. Threshold: any swale within hose reach of a leachate or manure structure, the configuration documented at Rockford. Backfire: a map filed and forgotten, so post it at the pump.
  • Split the transfer decision. One authorizer, one independent verifier who is not the pump operator, logged with a time. Threshold: any transfer within sight of a tile inlet, ditch, or culvert. Backfire: an unfilled log is worse evidence than none, so audit five entries monthly.
  • Put stop-work authority in writing for every worker on the place, in every language your crew reads. Write the non-retaliation clause so the person holding the valve does not have to weigh his job against a shutdown, and name who guarantees it. Cornell Extension recommends that every employee, including those not running waste equipment, know the system and how to shut valves. Cornell CCE Threshold: new hire, new hose route, night pumping. Backfire: a policy the day shift can read and the night crew cannot is not a policy.
  • Pull five years of manure-application training records and see whether they exist. Iowa ordered exactly that from Jochum Agri-Services. Iowa DNR Red-flag trigger: if you cannot produce three of the last five years, this moves to the top of today’s list.
  • Find your own reporting window in your permit to operate and ODA’s published discharge procedure, and post the number by the pump.

90 days

  • Get two answers from your insurer in writing: whether the pollution exclusion reaches manure and silage leachate, and whether a named manager’s criminal defense is funded. Requires the policy, your broker, and one hour. Threshold: renewal date. Decision rule: if either answer is no, you are self-insuring that exposure, and the figure to reserve is the $90,820 central case rather than the $13,850 low one. Backfire: an oral assurance a claims file will not honor.
  • Ask your lender which environmental events trigger notice, default, a borrowing-base cut, or an added reserve. USDA’s Farm Service Agency treats environmental risk screening as due diligence before taking a security interest in real estate, and FDIC agricultural-lending procedures cover identifying environmental concerns and on-farm inspections. FSA FDIC If your loan documents carry an environmental covenant, the notice clause fires before the penalty is even assessed; if they carry none, the same event lands as a straight liquidity draw. Threshold: if your DSCR has been under 1.25 for three consecutive months on your lender’s calculation, a $90,820 central case is a covenant conversation, not a check.
  • Get a per-gallon transfer quote from your vacuum or dragline contractor and put it in the emergency file next to the storage volumes. Requires one phone call. Threshold: before the wet season. Backfire: a quote with no volume beside it, so record both.

365 days

  • Commission a professional engineer’s report on manure storage capacity before a regulator orders one. Iowa ordered one within 30 days of signature in the Winneshiek County matter. Iowa DNR order 2026-AFO-02 Opportunity signal: an operation that arrives at a permit conversation with drawings and a price negotiates timing; one that arrives empty negotiates nothing.
  • Build a five-record incident standard: structure levels, pump logs, employee assignments, weather, notifications. Threshold: any transfer season where staffing turns over. Backfire: records that contradict each other, so assign one owner per file.

The number check

Pull your permit to operate, your last three transfer records, and your liability policy onto one desk tonight, then walk the swale on the north side of your own facility and find out what its tile is connected to. Heartland Dairy Holdings, LLC held a permit that ODA-DLEP described in December as carrying no infractions since it was first granted, and a hose over a collection wall still put 5.1 miles of Little Black Creek above 100 ppm ammonia and one man’s name on a federal judgment. Daily Standard USAO-NDOH What does your own emergency response plan actually say about who can stop the pump without asking permission?

Two Bullvine files worth pulling alongside this one: whether a permit that promises no discharge survives contact with a watershed, and the same contractor-control question inside a manure-gas enforcement file.

Footnote on scope. This comparison is limited to U.S. Midwestern actions, where federal Clean Water Act authority and delegated state administrative programs operate on the same facility. For a non-U.S. reference point outside that framework: Lacpatrick Dairies (NI) Ltd, a Lakeland-owned processor, was fined £115,000 at Strabane Magistrates’ Court on August 13, 2026, after guilty pleas to 16 offenses affecting the Glenmornan River, £70,000 on seven permit offenses and £45,000 on nine water-pollution offenses.

This article is based on court and agency records available as of September 17, 2026. Comment was sought from every party named critically on September 17, with a stated deadline.

Key Takeaways

  • The Clean Water Act’s negligent-discharge provision reaches any person, not just the permit holder. Intent isn’t an element, which is how Willemsen drew a $25,000 fine and 15 months’ probation on a guilty plea.
  • Across four Iowa consent orders the penalty never left $5,000 to $8,000, whether the kill was zero fish or 126,469, on herds from 330 cows to about 4,200. Restitution is what moved, running 6.7 times the penalty.
  • Roughly 789 dead fish in a federal criminal case cost more in fine than 126,469 did in Iowa state penalty. The forum you land in prices the harm more than the body count does.
  • ODA-DLEP described Heartland’s permit as carrying no infractions since it was first granted, yet a March 2021 county aerial already showed a pump and hose in the leachate system. A clean file isn’t a clean yard.

Run Your Numbers

Farm Benchmark Snap Check — The DVI Risk Check reads your hedge position, debt load, feed share, and working capital, then bands you Strong, Watch, or Risk. Run it before you decide whether a $90,820 incident is a covenant conversation or a cash crunch.

The Sunday Read Dairy Professionals Don’t Skip.

Every week, thousands of producers, breeders, and industry insiders open Bullvine Weekly for genetics insights, market shifts, and profit strategies they won’t find anywhere else. One email. Five minutes. Smarter decisions all week.
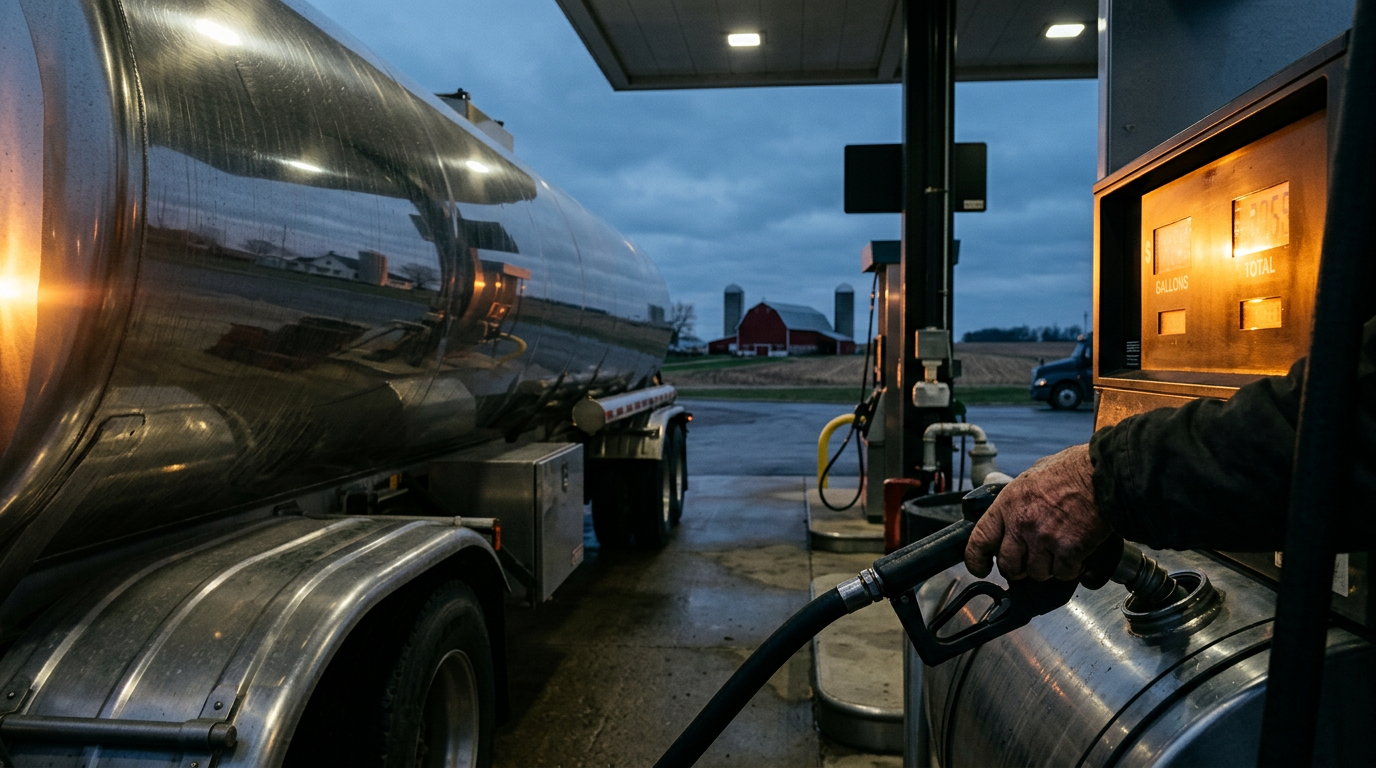
NewsSubscribe
First
Last
Consent

ISO Caps a Dairy Cow at $2,000. Pennsylvania Replacements Averaged $3,230.

Thirty-five cows died on Blackburn Road in February. USDA prices the replacements at $3,230 a head. ISO’s farm form pays $2,000 — and that’s before depreciation and coinsurance.

Executive Summary: The Bullvine built a dated 2026 U.S. dairy barn-fire ledger — three events cleared five inclusion gates, eight candidate reports failed at least one — then read ISO Farm Property form FP 00 13 04 16 and AAIS form FL-6 Ed 1.0 in full. The per-head livestock cap is one of three stacked reductions, alongside depreciated actual cash value and an 80% coinsurance test. On a modeled 400-cow Pennsylvania herd, the shortfall runs $492,000 against USDA NASS’s July 2026 state average. Herds carrying registered or high-genomic-merit cattle are most exposed, and raising the class limit past $666,667 adds nothing per animal.

farm insurance livestock limit

Thirty-five dairy cows died in a barn on Blackburn Road in Jordan Township, Clearfield County, Pennsylvania, on February 10. Fifteen got out. Dave O’Donnell, then deputy fire chief of the Irvona Fire Co., told Lancaster Farming in February that firefighters were alerted at 3:54 p.m. No cause has been published.

Price those 35 head against USDA National Agricultural Statistics Service’s Agricultural Prices, released August 31, 2026, and the animals alone come to $113,050. That uses Pennsylvania’s July 2026 average of $3,230 per head for cattle sold as dairy-herd replacements, USD per head, a survey-weighted state mean of producer sales to first buyers.

Valuation measureUSD per mature cowDifference from Pennsylvania July average35-cow value or recovery
Pennsylvania July 2026 dairy replacement average$3,230Baseline$113,050
ISO Coverage F mature-livestock special limit$2,000−$1,230/head (−38.1%)$70,000
AAIS Coverage G mature-livestock special limit$2,500−$730/head (−22.6%)$87,500
ISO uncovered amount at the benchmark$1,23038.1% of replacement value$43,050
AAIS uncovered amount at the benchmark$73022.6% of replacement value$25,550

Now open the form most farm policies are built on. Under ISO’s Farm Property — Farm Personal Property Coverage Form FP 00 13 04 16, Coverage F covers unscheduled farm personal property, and its Special Limits are flat: $1,000 on any one horse, mule or head of cattle under one year of age, and $2,000 on any one head of livestock not included above. No proportional calculation, no adjustment for what she was actually worth.

That’s a $1,230 gap per cow. On 35 head, it’s $43,050. AAIS runs the same architecture at a different number — form FL-6 Ed 1.0, Coverage G, pays the smaller of actual cash value, $2,500, or $1,000 for cattle under one year, which puts the gap at $730 a head and $25,550 across the same loss.

The cap is the first of three reductions, not the only one. And the fix is not more limit.

What cleared the 2026 ledger, and what got cut

No federal reporting stream captures dairy animal deaths in barn fires, so The Bullvine built this from fire-service records and news accounts naming the attending department. The search covered the United States only.

Five gates applied at once: calendar 2026, a dairy-cattle or dairy-goat operation, an animal death count recorded in the source, a named responding fire service, and a stated date and location. Three events cleared all five through September 15.

DateLocationOperationAnimals LostResponding Department
Jan. 26Tillamook County, ORDairy goats21 goat kidsTillamook Fire District, Bay City Fire
Jan. 30South Wales, NYOrganic dairy cattleMore than 50 cowsSouth Wales Fire Co.
Feb. 10Jordan Township, PADairy cattle35 cowsIrvona Fire Co.

Recorded total: more than 85 dairy cattle and 21 dairy goats across three fires.

The animal count is the part that gets reported. It is not the part that decides whether an operation comes back. Tillamook crews worked that scene more than eight hours. In Farmington, Wisconsin, the barn that burned on August 28 contained the milking parlor, and 23 departments answered a four-alarm response at one rural address. A herd can be repriced at $3,230 a head. You can’t rebuy housing, parlor capacity, stored feed, or a milking routine in the same week, and the replacement cattle have to arrive somewhere.

Which points at the thing the numbers below cannot reach. The coverage parts in this article are property parts — they insure the animal, not the milk she would have shipped. Every figure here is an asset value, and the $492,000 shortfall on a 400-cow model counts cattle, not the milk check that stops while a parlor is rebuilt. Ask your broker which part of your policy, if any, responds to lost income during a rebuild, and for how long it pays. Don’t assume the barn limit carries the cash flow.

Eight candidate reports failed at least one gate. Six failed on dairy status — Bristol Township, Ohio recorded ten cows with the township department named, and Cherry Township, Pennsylvania recorded four calves with the attending department named in the Butler Eagle in March, but no qualifying source established either property as a commercial dairy.

The most instructive exclusion is a verified dairy. That Farmington barn was declared a total loss, and the Washington County Sheriff’s Office put damage above $1 million under case number 2026-31778, with the fire remaining under investigation and not believed to be suspicious. Every gate clears except one: the release says “several animals had to be euthanized.” It gives no number, and no other qualifying source published one, so the event is excluded rather than estimated.

What does your farm form actually pay for a dead dairy cow?

Bullvine calculation — repricing the recorded cattle loss

Published evidence. USDA NASS, Agricultural Prices, released August 31, 2026. July 2026 average price per head for cattle sold as dairy-herd replacements: Pennsylvania $3,230, New York $3,330, United States $3,260. USD per head, state averages, no range published at state level. Pennsylvania’s April 2026 average was $3,040, so the series moved 6.3% in one quarter.

FireCattle LostState AverageValue at Recorded Floor
South Wales, NYMore than 50$3,330$166,500 or more
Jordan Township, PA35$3,230$113,050
Cattle totalMore than 85$279,550 or more

South Wales calculates at 50 head because that’s the published floor. The recorded loss is higher, so the figure understates.

Bullvine calculation — a 400-cow herd against four published limits

Stated assumptions, not source figures. A 400-cow Pennsylvania milking herd, all mature animals, with an $800,000 limit where a class limit is required. Herd market value at USDA’s July Pennsylvania average: 400 × $3,230 = $1,292,000.

Form language. ISO FP 00 13 04 16 puts the proportional test in Coverage E, scheduled — the least of 120% of the class limit divided by head count, actual cash value, or $2,000 — and counts each head of cattle under one year as half a head in that divisor. Coverage F, unscheduled, has no divisor at all. AAIS FL-6 Ed 1.0 mirrors the structure at $2,500, with the divisor in Coverage F scheduled and the flat limit in Coverage G unscheduled. Form text for FP 00 13 04 16 was obtained from a continuing-education presentation reproducing it with page citations, and the edition filed and in force varies by carrier and state.

Coverage Form & Limit TypeGoverning Cap MechanismPayout on 400 HeadShortfall vs. Market ($1.29M)
ISO Coverage F, unscheduledFlat $2,000/head cap$800,000−$492,000 (−38.1%)
ISO Coverage E, scheduled with $800,000 class limitDivisor yields $2,400; $2,000 cap binds$800,000−$492,000 (−38.1%)
AAIS Coverage G, unscheduledFlat $2,500/head cap$1,000,000−$292,000 (−22.6%)
AAIS Coverage F, scheduled with $800,000 class limitDivisor yields $2,400; binds below $2,500$960,000−$332,000 (−25.7%)

Why buying more blanket limit stops working

On 400 head, the 120% divisor clears $2,000 once the class limit passes $666,667, and clears $2,500 once it passes $833,333. Past those points, the hard dollar ceiling governs, and every additional dollar of class limit adds nothing to what you collect per animal under the special limit.

The one mechanism both forms confirm. ISO and AAIS each exempt animals individually described and specifically covered from the special limit entirely. Itemized individual scheduling is the documented route around the cap, and it is the route that matters for registered, high-genomic-merit or flush-program animals whose defensible value sits well above $2,500.

The question to put to your broker in writing. Whether an agreed-amount or stated-value basis is available on your cattle, and on which form. Neither document reviewed here contains such an endorsement, so treat it as something to ask about rather than something to assume exists on your policy. Get the answer on paper either way.

Layer two — the settlement basis. Both forms settle unscheduled and class livestock at actual cash value as of the time of loss, and FL-6 states outright that actual cash value includes a deduction for depreciation, however caused. USDA’s $3,230 is a replacement price. A depreciated mature cow’s ACV can sit below it before any cap applies, which means the repricing above measures market value, not expected recovery.

Layer three — coinsurance. ISO Coverage F requires a limit equal to at least 80% of the actual cash value of all farm personal property. AAIS Coverage G pays no more than the proportion its limit bears to 80% of ACV. Carry less and a proportional reduction lands on top of the per-head cap.

Methodology note. Published evidence, stated assumptions, and Bullvine math are separated above. No double counting — the $800,000 covers animals only in this model, not barns, parlor, equipment, or feed, each of which sits under its own limit, and it contains no revenue line at all. Units are head and USD throughout. Treat these as two real published structures rather than the structure on your declarations page. No ledger farm’s actual coverage is known or implied. National averages may not reflect your region, herd size, management system, or carrier. If your declarations page shows a different structure or limit than the two forms described here, send it — we’ll report what the spread actually looks like across carriers. Corrections: editor@thebullvine.com.

Nobody publishes a current Pennsylvania replacement-cow benchmark to check any of this against. USDA AMS’s Pennsylvania Weekly Cattle Auction Summary, report 1919, issued September 14, 2026, for the week of September 6–12, reports dairy cattle only in slaughter classes. No springer, fresh, or replacement class appears. The quarterly NASS series is the only dated public authority, and a ceiling set at an earlier renewal is chasing a number that updates four times a year.

Rebuilding means buying into a consolidating market

USDA revised its 2024 Pennsylvania dairy baseline down by 170 herds in its February 20, 2026 Milk Productionrelease, which supersedes the 490-herd figure Bullvine published from the original 2024 vintage. Evaluating same-table data, Pennsylvania lost 320 net licensed dairy herds in 2025 — 6.8% of the state’s count and 30.9% of the national net decline of 1,036.

That figure measures consolidation, not cattle supply. The supply side is a separate dataset, and it points the same direction: USDA NASS’s January 2026 Cattle report counted 3.905 million dairy replacement heifers 500 lbs and over, and the 2026 swap math on a $2,340 cull cow against a $3,500-plus replacement shows what that scarcity does to a buy-sell decision. A Clearfield County producer rebuilding after a fire is buying into both conditions at once — fewer neighbours to buy from, and a national heifer pipeline running below its own ten-year norm.

Does community fundraising close a livestock gap?

South Wales drew the largest public response in the ledger. As of September 15, the campaign displayed $126,993 raised of a $130,000 goal from 947 donations, started by a family member rather than the producer.

Against the $166,500 floor value of 50 replacement cows at New York’s July average, that total covers 76.3% of the livestock line. Against the true recorded loss of more than 50 cows, it covers less.

The ratio is generous and incomplete by design. The campaign describes its purpose broadly — barn repairs, cattle care and day-to-day costs — so the total was never raised as a cattle-replacement fund, and it shouldn’t be read as one. KPTV reported on January 28, 2026, that more than $15,000 had been raised for the Tillamook producer within roughly 24 hours of 21 goat kids dying, which is a fast and real community response and not a barn.

Read these as publicly raised sums. They measure neighbours, not losses, and they say nothing about what any policy paid.

Dairy goats carry no dollar figure in this ledger. USDA publishes no dairy-goat replacement series, and inventing a per-head value to square the table would be fabrication.

Can you get a fire walkthrough before renewal?

Penn State Extension’s Fire Prevention in Barns, updated March 18, 2026 by extension educator Gregory Martin, is specific and costs nothing to act on. Maintain and inspect all wiring, junction boxes, and electrical panels yearly. Remove cobwebs and dust from lights, wiring, and heating sources. Install bulb covers on light fixtures. Cure baled hay outside before bringing it into storage structures, and monitor commodities for abnormal heating. Keep ABC multi-purpose fire extinguishers within 50 feet of any point inside the barn, and train employees annually in using them.

The pre-plan is the cheapest item on this list and the only one that requires nothing but paper. Extension recommends a written plan specific to the facility, including a farm map showing chemical storage, livestock housing, fuel tanks, and water sources available for use by the fire department, plus an emergency contact sheet with the farm name, address, directions, and phone numbers for whoever knows the buildings. Both documents go somewhere secure and known, and both get shared with local first responders. Extension also recommends inviting those departments to tour the farm, and keeping driveways well-marked and maintained for emergency vehicle access.

Farmington’s fire drew 23 departments to one rural address. Access is not a footnote in that arithmetic.

Extension points operations needing sprinklers or additional systems to NFPA 150, Fire and Life Safety in Animal Housing Facilities Code, which covers animal housing including commercial agricultural buildings. The Animal Welfare Institute, an animal-advocacy organization, reported in its Winter 2025 quarterly that the NFPA technical committee held a first draft meeting last fall to open the next revision cycle. Adoption varies by jurisdiction, so treat the code as a design benchmark rather than an automatic obligation on a Pennsylvania barn.

The 90-Day Playbook for Herds Carrying Livestock Under a Farm Form

30 days

  • Pull the declarations page. Find the form number and edition — FP 00 13 04 16, FL-6 Ed 1.0, or whatever your carrier files — then find which coverage part your cattle sit under. Requires the policy itself, not a certificate of insurance. Red-flag trigger: livestock in an unscheduled part with a special limit below your state’s current NASS average moves this to the top of the list this month. Backfire risk: agents quote the class limit, which tells you nothing about the per-head cap.
  • Run the divisor yourself if your cattle are scheduled: class limit ÷ head count × 1.20, then compare against the form’s dollar ceiling and USDA’s July state average. Whichever is smallest is what you collect.
  • Find the settlement basis. If the form says actual cash value, expected recovery on a mature cow sits below USDA’s replacement price before any cap applies. Read the loss-settlement section, not the declarations.
  • Check the coinsurance condition. Both forms tie recovery to carrying 80% of the actual cash value of all farm personal property. Urgent when: you’ve added cattle or equipment since the last renewal without raising the limit.
  • Count heifer calves separately. Both forms cap cattle under one year at $1,000 and count them as half a head in the scheduled divisor.
  • Write the pre-plan and the farm map, then hand a copy to your fire chief. One afternoon and a printer.

90 days

  • Schedule your top animals individually. Both forms exempt animals individually described and specifically covered from the special limit — the documented route past the cap. Requires: current genomic or classification records and sale comparables. Threshold: any animal whose defensible value exceeds the ceiling. Backfire risk:premium rises, and documentation you can’t support at claim time is worse than none. Theft runs the same mechanism as fire, and what happened when Oakfield Corners Dairy lost 17 genotyped Holsteins overnight shows what generic valuation does to a claim on animals you can document.
  • Stop buying class limit past the point it works. On 400 head, above $666,667 you’re in the ISO $2,000 hard cap and above $833,333 you’re in the AAIS $2,500 cap. More limit, same recovery per cow under the special limit.
  • Ask about agreed-amount or stated-value basis in writing, and name the form when you ask. Neither document reviewed here contains such an endorsement, so the answer may be no. If it is no, keep going: ask what else the carrier can write on cattle, whether a separate scheduled livestock policy is available, and whether the account can be marketed to a specialty agricultural or surplus-lines underwriter. Get each answer in writing, and ask on what form and at what valuation basis.
  • Book the annual electrical inspection with panels and junction boxes in scope, and have the lightning protection checked while the electrician is on site. A licensed electrician and about a day of access.

365 days

  • Rebuild from your own pipeline rather than the purchase market. Opportunity signal: USDA Economic Research Service’s Livestock, Dairy, and Poultry Outlook, LDP-M-386 of August 18, 2026, records milk replacement heifers at 3.600 million head as of July 1, 2026, up 100,000 from July 1, 2025, against 9.650 million milk cows. That’s a 37% replacement-to-cow ratio, and ERS notes the ratio averaged about 42% across the past ten mid-year Cattle reports. The January 1 count of 3.905 million is a different reference date on the same semiannual series, not a contradiction — heifer inventories run higher in January. If you want to track your own position against the national picture, run it through the Bullvine Pipeline Index calculator. Rearing capacity added now is capacity you don’t buy at $3,230.
  • Split the coverage review into four: animals, structures, equipment, and lost income. The first three are property questions with limits you can read off a page. The fourth is a different question with a different answer, and it isn’t answered by the per-head limits above. Requires: a broker willing to show the forms and say which one responds to a stopped milk check.
  • Set one recurring annual date for the walkthrough, the electrical inspection, and the schedule reprice. Matters most in any year the state replacement average moves more than 10%.

The replacement heifer pipeline sits roughly five points below its ten-year mid-year ratio while your per-head ceiling sits wherever it sat at the last renewal. Only one of those two numbers is inside your control before your next renewal.

Pull the declarations page and check three lines:

  • Coverage part. Are your milking cows unscheduled, scheduled as a class, or individually described? The middle one still runs into the divisor.
  • The hard cap. Is the special limit per animal $2,000, $2,500, or something else your carrier files?
  • Settlement terms. Does loss settlement say depreciated actual cash value, or replacement cost?

If your form caps a mature cow at $2,000 while Pennsylvania’s July average ran $3,230, more blanket coverage won’t close it — above $666,667 on 400 head the divisor stops helping and the hard ceiling takes over. Itemize your top genetic assets, ask for an agreed-value basis on paper, and find out what your carrier thinks your herd is worth before the trucks pull in.

Dairy Farm Policy Exposure Audit Tool
Check your exposure against standard ISO (FP 00 13) and AAIS (FL-6) blanket livestock caps vs. current market replacement prices.
True Herd Replacement Value: $1,292,000
Maximum Insurer Recovery: $800,000
Effective Recovery per Mature Cow: $2,000
Net Livestock Shortfall: -$492,000 (-38.1%)
Hard Ceiling Reached: At 400 head under ISO Coverage F, recovery stops dead at $2,000 per animal regardless of current sale-barn averages.

Learn More

The Sunday Read Dairy Professionals Don’t Skip.

Every week, thousands of producers, breeders, and industry insiders open Bullvine Weekly for genetics insights, market shifts, and profit strategies they won’t find anywhere else. One email. Five minutes. Smarter decisions all week.
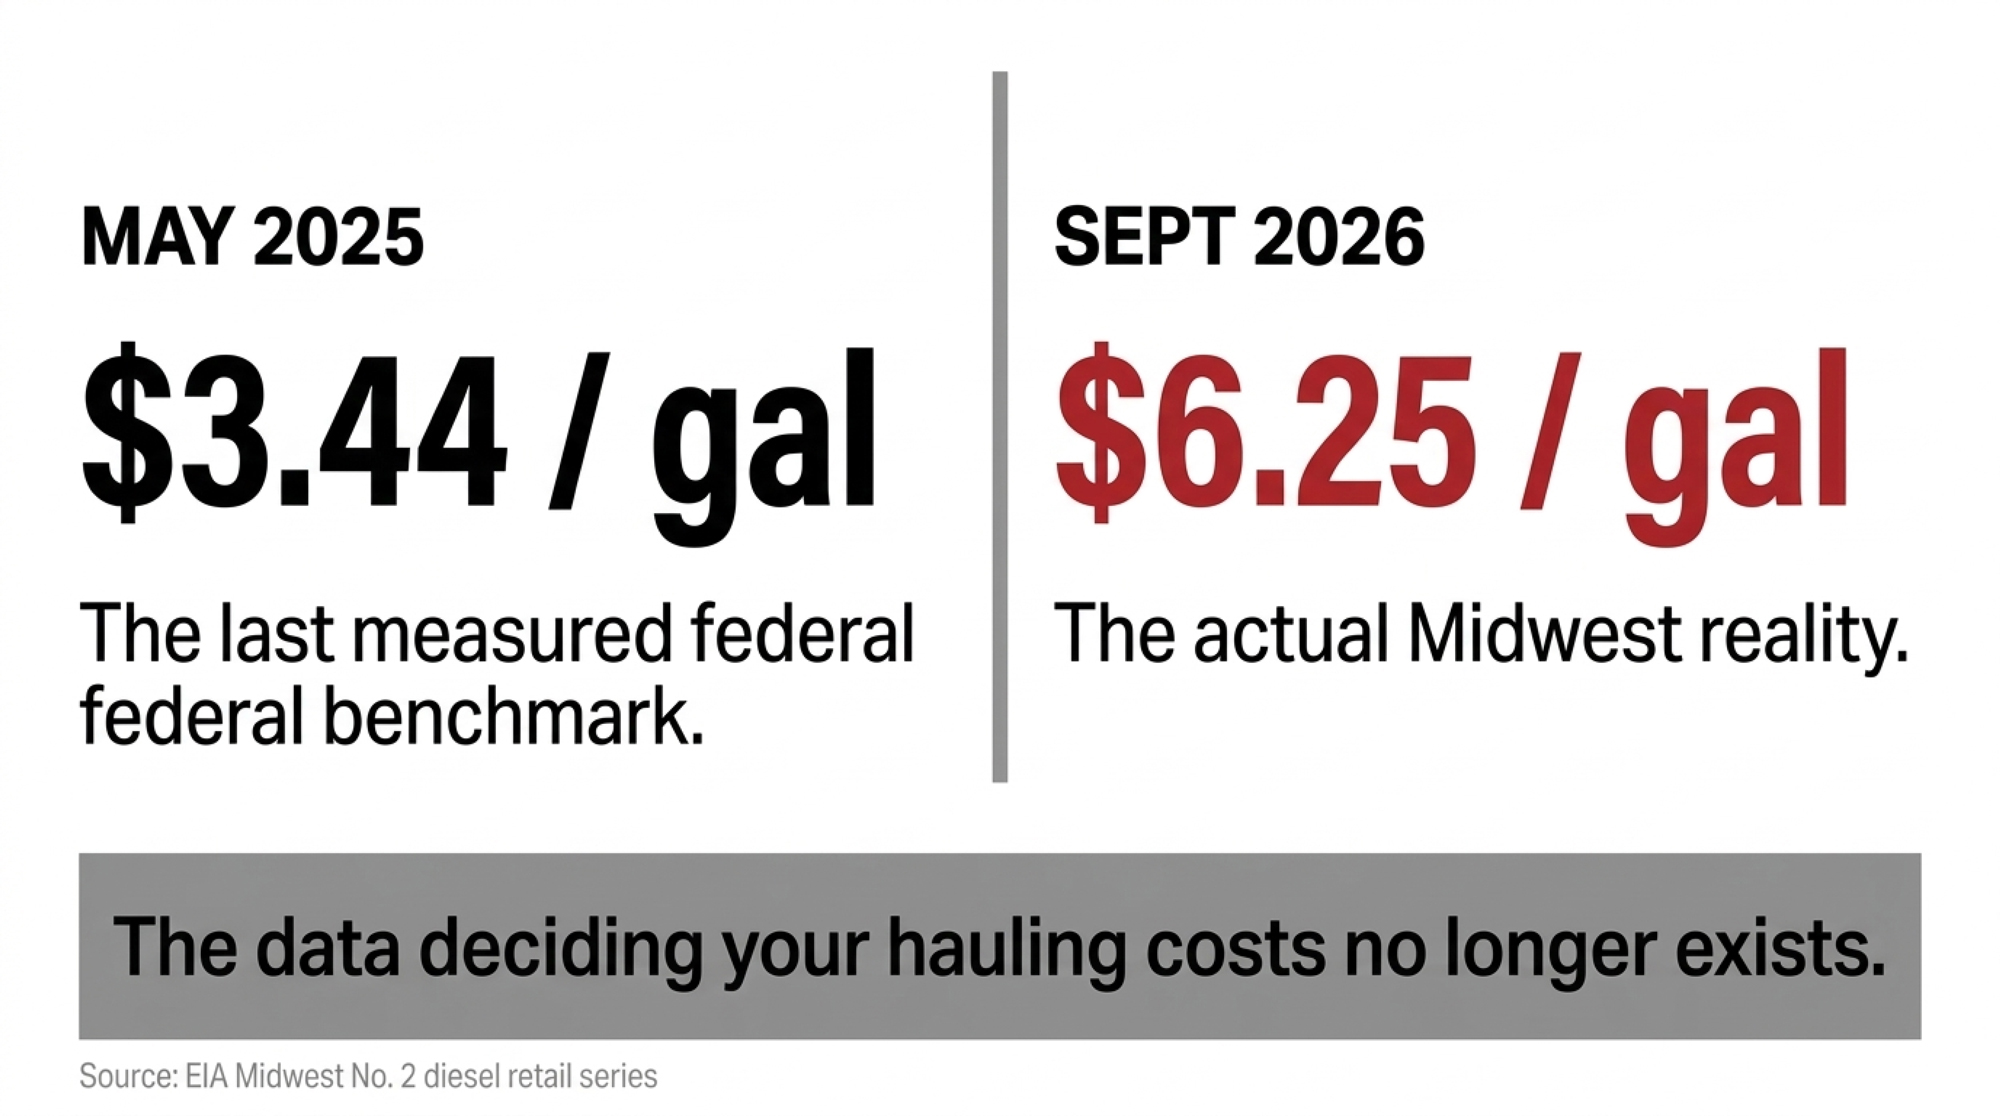
NewsSubscribe
First
Last
Consent

The $128,320 Additive Bill: Why the First Dairy Carbon Credit Wasn’t Bovaer

$128,320 a year on 1,000 cows, and 35 cents a cow a day you don’t get back. The first U.S. dairy methane credit ever sold came off a different product entirely — and the difference is the contract.

Start with the number that belongs on every whiteboard in every barn office. A 2025 economic analysis in the Journal of Dairy Science modeled a 1,000-cow dairy feeding 3-nitrooxypropanol, the methane additive sold as Bovaer and made by DSM-Firmenich. Feeding it cut income over feed costs by roughly $0.35 per cow per day, which on that herd works out to about $128,320 a year the farm has to find somewhere other than the milk check . That’s not a worst case. That’s the modeled outcome.

Now set it beside what happened the first time an American dairy farmer got paid for methane. In January 2024, Texas dairyman Jasper DeVos generated nearly 1,150 metric tons of verified carbon credits, the first sale of its kind in the U.S. livestock market, purchased by Dairy Farmers of America through a marketplace called Athian . Here’s the detail most coverage flattened: DeVos used Athian’s first accepted protocol, built on Rumensin, Elanco’s monensin product, FDA-approved to improve milk production efficiency and cut roughly half a metric ton of CO₂e per cow per year, depending on the herd’s animals and management .

Read those two paragraphs together and you’ve got the hinge of dairy’s next twenty years. The first farmer paid for methane reduction used a tool that improves feed efficiency — it was already earning its keep before the carbon check showed up. The tool the whole industry is now being pitched costs money every day and doesn’t. So the question was never whether you can cut methane. It’s who pays when the cut doesn’t pay for itself, and that’s a contract question headed for your desk.

Why now, in 2026? Because the buyers at the other end of your milk have public deadlines. Nestlé, one of the largest dairy purchasers on the planet, has committed to cutting greenhouse gas emissions 50% by 2030 against a 2018 baseline and reaching net zero by 2050, with roughly 95% of its footprint sitting in Scope 3 . Dairy and livestock ingredients are its single largest Scope 3 source at about 30% of total emissions, and its roadmap targets 21 million tonnes of reductions from that category by 2030 . When a buyer that size sets a public target that depends on farm-level methane cuts, the cost of achieving those cuts becomes a supply-chain question. Producers are part of that chain.

The win nobody outside the barn talks about

Here’s the part that should make you stand up straighter. Between 1971 and 2020, U.S. dairy farms cut greenhouse gas emissions per unit of milk by 42% while milking about 20% fewer cows and producing roughly twice the milk. That isn’t a marketing line. It’s peer-reviewed work from Rotz and colleagues in the Journal of Dairy Science, 2024 .

The rest of that study holds up just as well: fossil energy use per unit of milk down 54%, water-use intensity down 28%, and modeled nitrogen and phosphorus runoff per unit of milk down between 27% and 51%. Cornell’s Northeast analysis lands in the same place, with milk carbon intensity down 42% across the same span and absolute emissions in that region down 24% .

So why does your kid come home from school saying cows are bad for the planet? Because the public conversation never got the memo. Two research teams, one national and one regional, landed within a point of each other on intensity.

Why “per glass” and “in total” are both true

This is the line that won’t fit on a bumper sticker. Total emissions from all U.S. dairy farms still rose about 14% across those five decades, because total production climbed and a good share of it moved west into dry regions that lean hard on irrigation. Per glass, way down. In total, up. Both real.

Why does that matter to you? Because a critic reaches for the 14% and a checkoff ad reaches for the 42%, and if you can’t hold both in one breath you sound like you’re hiding something. You’re not. The footprint of each glass fell while the country drank more of it, which is productivity, not a cover-up. The Northeast figure is your best friend in that argument: in that region, absolute emissions came down 24% while intensity fell 42%. Regional stories differ, and saying so out loud is what makes you credible.

What drove the per-glass gains wasn’t a trick, and it wasn’t hormones. USDA’s Economic Research Service reported in February 2026 that the share of milk sales from farms using bovine somatotropin fell from 35% in 2000 to 2% by 2021 . The progress came from genetics, nutrition, reproduction, and management. More milk out of every cow, every acre, every gallon of diesel, and it paid for itself on the way. That’s exactly what DeVos’s credit was built on: Rumensin improves production efficiency, and the methane reduction rode along with it. The old deal, with a carbon check stapled on. The next round breaks it.

What does feeding 3-NOP actually cost you?

The science isn’t the problem. A meta-analysis in the Journal of Dairy Science found 3-NOP reduced methane production, yield, and intensity by 30.9% to 32.7% at an average dose of 70.5 mg/kg of dry matter . Van Gastelen and colleagues followed Holstein-Friesians over a full lactation and reported 21% lower daily methane, 20% lower methane yield, and 27% lower methane intensity, with a positive effect on production characteristics — Journal of Dairy Science, volume 107, 2024. It works.

The economics are the problem, and two different numbers get confused here. Bovaer’s price has been reported in trade coverage at roughly $0.30–$0.40 per cow per day, or about $93–$105 per cow per year on a lactating-cow basis . Separately, the 2025 JDS analysis found a net income-over-feed-cost decline of about $0.35 per cow per day, driven substantially by reduced feed intake and milk yield in the trials modeled . Similar-looking figures, different metrics. The second one matters because it’s what lands on your bottom line after the production response.

Read that twice before you sign anything. You’re not simply buying a feed additive — you’re absorbing a modeled production effect. Trial results vary, and some studies report no significant yield penalty, which is precisely why you run the number against your own herd instead of against a brochure.

So run it. At the published $0.35 per cow per day net decline, here’s what your operation needs handed to it annually to stand still, applying that figure across herd scale:

Herd sizeBreak-even need at $0.35/cow/day
200 cows~$25,550/yr
500 cows~$63,875/yr
1,000 cows~$128,320/yr

Table note: the 1,000-cow figure is the JDS-modeled annual shortfall, the study’s own number. The 200- and 500-cow rows are Bullvine’s barn math, scaling the published $0.35/cow/day across 365 days, giving $25,550 and $63,875. A straight-line 1,000-cow calculation returns $127,750, fractionally under the study’s $128,320; that difference is in the model, not a typo.

That money comes from a credit, a premium, or a buyer’s check. It isn’t coming from more milk in the tank. USDA AMS put the announced August 2026 Class III price at $16.64/cwt, up $1.12 from July , and Class III opened this year at $14.59 in January before working up through $16.16 in March . There’s no slack in that milk check to quietly absorb 35 cents a cow a day.

On the premium side, the arithmetic is thinner than the pitch. A $0.12/cwt sustainability premium on a 75-lb cow returns only about $33 per cow per year, and Elanco has publicly projected carbon-market returns around $20 per cow per year on top of that — which against a $93–$105 additive bill still leaves a gap of roughly $40–$73 per cow . We’ve walked that contract math clause by clause in the $73-a-cow gap hiding in your 2027 Bovaer contract.

Line itemPer cow / yearPer 1,000-cow herdSource
Bovaer additive cost−$93 to −$105−$93,000 to −$105,000Trade-reported price, $0.30–$0.40/cow/day
$0.12/cwt sustainability premium (75-lb cow)+$33+$33,000Bullvine barn math
Elanco projected carbon-market return+$20+$20,000Elanco public projection
Net gap left on the farm−$40 to −$73−$40,000 to −$73,000Bullvine calculation
Modeled net IOFC decline (separate metric)−$128−$128,320JDS 2025 economic analysis

Who actually keeps the carbon money?

The money is large. It just mostly isn’t yours.

Start with what a digester costs to build, because the regulator publishes its own arithmetic. CARB sets out the cost formulas it uses for dairy manure digesters in Appendix F of its Short-Lived Climate Pollutant Reduction Strategy, and the ICCT’s 2023 California renewable natural gas outlook applied them: capital expense scaling with herd size, operations and maintenance at 6% of capital, pipeline at $200,000 a mile, biogas upgrading at $8 per MCF, and a $2 million interconnection fee on a single-farm project against $5.5 million on a centralized one, plus $250,000 a truck where the gas has to move by road. theicct

Now the per-cow view. UC Davis agricultural economist Aaron Smith, in a 2022 analysis, put a digester at roughly 22.5 MMBTU of biogas per cow per year at a cost of about $636 per cow, operating cost plus capital amortized over ten years, with the gas worth about $112.50 per cow at $5/MMBTU . On the gas alone, you’d never build it.

Then come the credits. Smith calculated that the same cow’s biogas earns approximately $1,834 per cow in California Low Carbon Fuel Standard credits and another $993 per cow in federal Renewable Identification Numbers, about $2,827 per cow in policy-created value . That’s more than four times the value of the gas. Don’t read it as a guaranteed margin on a deal you’re offered today: LCFS and RIN credits are market-set instruments, their value moves with program rules and market conditions, and Smith’s figure is a snapshot of one period rather than a fixed return . What doesn’t move is the underlying dynamic — the regulatory credits, not the methane molecules, drive the cash flow. A 2025 Terrain Ag analysis found the fuel is typically the smallest share of the revenue stream, which is the same finding from the lender’s side of the table .

Project scale tells the same story. Writing in October 2024, Smith reported that data provided to CARB put a typical 2023-built digester on a 2,500-cow dairy at $8.6 million to construct, about $1.2 million a year amortized over a decade, and roughly $1.1 million a year to operate, against gas sales of approximately $230,000 at 2023 city-gate prices. Net operating cost before credits: about $870,000 a year, plus another $500,000 if the gas has to be trucked. Over the first ten years he puts the net cost of building and running a digester at $2,730 to $3,380 per ton of methane abated, and notes that California grants can cover up to half of capital costs. agdatanews.substack

None of that credit stream is hypothetical. LCFS credit generation from manure digester projects has grown roughly 1,000% since 2020 and has produced more than a billion dollars’ worth of credits. California has put about $214 million of state money into 131 dairy digester projects in the San Joaquin Valley alone, and CARB’s own August 2024 dairy sector workshop draws its project data from CDFA’s grant records, EPA AgSTAR, and verified LCFS and cap-and-trade filings. sciencedirect

So the decisive question on any digester deal isn’t whether the project pencils. The question is who holds the credits, and the contracts are written on that point. Guidance published for developers in Biomass Magazine in 2022 advises that the agreement should state the developer owns all rights to the environmental credits, tax credits, and similar benefits arising from the project; lenders and offtakers want clean title in the project entity. Compeer Financial’s 2025 producer guidance puts it plainly: understanding the fine print is crucial . DeVos got a check because his tool earned on performance first, and the carbon was upside. Digester operators sit on top of substantial public subsidy value and mostly don’t hold title to it. The difference isn’t the science. It’s the contract. Our earlier breakdown of a larger covered-lagoon project runs in $1,130 per cow, $128 back.

When does a methane tool actually pencil?

The decision rule is simple even when the answer isn’t. A methane tool pencils only when the outside payment reliably clears the break-even gap and stays cleared after the marketplace or developer takes its share.

LeverRecurring cost to youWho keeps the created valueProven payout to a farmer?Time to effect
Rumensin / monensin (efficiency + credits)None — earns on feed efficiencyFarmer held the creditYes — 1,150 t sold, Jan 2024, DFA via AthianImmediate
3-NOP / Bovaer−$0.35/cow/day net IOFC($128,320 per 1,000 cows)Depends entirely on the premium clauseNo banked U.S. dairy credit to dateImmediate, ~31% methane cut
Manure digester$636/cow/year to build and runDeveloper-side templates assign LCFS, RINs and tax credits to the project entityGas only: ~$112.50/cow vs ~$2,827/cow in creditsMulti-year build, 10-year amortisation
Methane Efficiency genetics (Lactanet)$0 on DHI-enrolled femalesFarmer — it’s in the herdNo credit protocol yet; 23% heritability, >70% reliability5–7 years to herd-level expression
  • For 3-NOP: you need a locked premium above $0.35 per cow per day net, roughly $25,550 a year on 200 cows and $128,320 on 1,000. A $0.12/cwt premium returning $33 a cow doesn’t reach it. A handshake or a one-year pilot price is not a floor.
  • For a digester: ask who holds the LCFS credits and the RINs before you ask anything else, and ask it again about any state grant that covered construction. That clause decides whether the project is your asset or your neighbor’s.
  • For an efficiency tool that also earns credits: a different question entirely. If the product pays its own way on performance, the Rumensin case, carbon revenue is upside rather than justification.
  • For genetics: the one lever with no recurring bill. Lactanet’s Methane Efficiency trait runs 23% heritability with better than 70% reliability on genotyped young animals and costs nothing extra on DHI-enrolled females, though herd-level expression takes five to seven years.

What can you do before the contract hits your desk?

Plenty, and most of it is free. The highest-value move isn’t financial: get the story straight before a reporter, a neighbor, or your kid’s teacher gets it wrong for you. A 2025 Dairy MAX consumer survey found that consumers see farmers as the most trusted source of information on dairy sustainability . Use that standing before somebody else fills the silence.

The second move is to treat every carbon pitch as a contract problem, not a science problem. The science on 3-NOP is settled enough at roughly 31% methane reduction. The open question is who keeps the value when it works. For the genetics side of that answer, see why methane-efficiency breeding beats Bovaer’s $73 gap.

The Producer Playbook: What to Do Before Signing

  • Run 35 cents a cow a day against any additive offer before you sign — $25,550 a year on 200 cows, $128,320 on 1,000. If the premium doesn’t clear that with margin, the answer is no.
  • Check what the premium actually pays. A $0.12/cwt sustainability premium returns about $33 a cow a year, roughly a third of a $93–$105 additive bill. That’s why the gap keeps landing on the farm.
  • On a digester, find the credits clause before you read anything else. The regulatory credits, not the gas, carry the cash flow, and developer-side contract templates assign them to the project entity.
  • Ask what the grant paid for. California grants can cover up to half of digester capital cost, and who took that money shapes who owns the output.
  • Copy the model that actually worked. The only U.S. dairy methane credit ever banked came off Elanco’s Rumensin protocol, not Bovaer: a tool already paying for itself on feed efficiency, with carbon as upside.

DeVos got a check because his tool worked twice, once on efficiency and once on carbon. Most farms won’t get that deal. So where does your operation sit right now: positioned to get paid for the methane you’re being asked to cut, or about to absorb the cost alone?

That splits hard by herd size and region. We’re building the full cost-per-cow model — 3-NOP, digesters, and carbon programs by herd size and region — in next week’s Bullvine Weekly.

Methodology Note: Long-term greenhouse-gas, energy, water, and nutrient figures come from Rotz et al., Journal of Dairy Science (2024), a national U.S. life-cycle assessment comparing 1971 with 2020. These are national averages and will not match every region or operation. Northeast figures are from Cornell CALS reporting on the same body of work. The 3-NOP economics ($0.35/cow/day income-over-feed-cost decline; $128,320/year on a modeled 1,000-cow herd) are from a 2025 JDS economic analysis in which the decline reflected reduced feed intake and milk yield in the trials modeled; individual herd results will differ with feed cost, component values, and dose, and the published figure is a single modeled central value rather than a range. Bovaer’s reported price of $0.30–$0.40/cow/day and $93–$105/cow/year is a separate figure from that net IOFC decline and should not be read as the same number. The 200- and 500-cow rows are Bullvine’s barn math scaling the published per-cow figure across 365 days. Methane-reduction efficacy of 30.9–32.7% at 70.5 mg/kg dry matter is from a JDS meta-analysis; the full-lactation figures of 21%, 20%, and 27% are van Gastelen et al., JDS volume 107 (2024). Jasper DeVos’s January 2024 credit sale used Athian’s first accepted protocol, based on Elanco’s Rumensin (monensin); Bovaer/3-NOP is a DSM-Firmenich product and was not the tool used in that sale. Digester cost formulas are CARB’s own, published in Appendix F of its Short-Lived Climate Pollutant Reduction Strategy and applied in the ICCT’s May 2023 California renewable natural gas outlook. Digester per-cow figures — $636 cost, $112.50 gas value at $5/MMBTU, $1,834 LCFS, and $993 RIN credit value — are Aaron Smith’s 2022 calculations at UC Davis; LCFS and RIN credit values are market-set and move with program rules and market conditions, so those per-cow figures describe one period rather than a current return. Project-scale figures and the $2,730–$3,380 per ton abated range are Smith’s October 2024 analysis, published at the Energy Institute at Haas and Ag Data News, drawing on data provided to the California Air Resources Board; Bullvine has not obtained individual project submissions. LCFS credit growth and cumulative credit value for manure digester projects are from peer-reviewed analysis of CARB program data; the $214 million across 131 San Joaquin Valley projects is CDFA data as cited in peer-reviewed work. CARB’s August 2024 dairy sector workshop presentation identifies its project data sources as CDFA’s Dairy Digester Research and Development Program records, EPA AgSTAR, and verified LCFS and cap-and-trade filings. Contract-structure findings are from 2022 Biomass Magazine developer guidance, a 2025 Terrain Ag/American AgCredit analysis, and Compeer Financial’s 2025 producer guidance. Class III at $16.64/cwt is the USDA AMS announced August 2026 price. Bovine somatotropin figures are from USDA Economic Research Service, February 2026. Methane Efficiency heritability and reliability figures are from Lactanet. Nestlé’s targets are from its published Net Zero Roadmap. Currency pass completed September 14, 2026. Dollar figures are USD. We welcome producer numbers and corrections.

Learn More

The Sunday Read Dairy Professionals Don’t Skip.

Every week, thousands of producers, breeders, and industry insiders open Bullvine Weekly for genetics insights, market shifts, and profit strategies they won’t find anywhere else. One email. Five minutes. Smarter decisions all week.
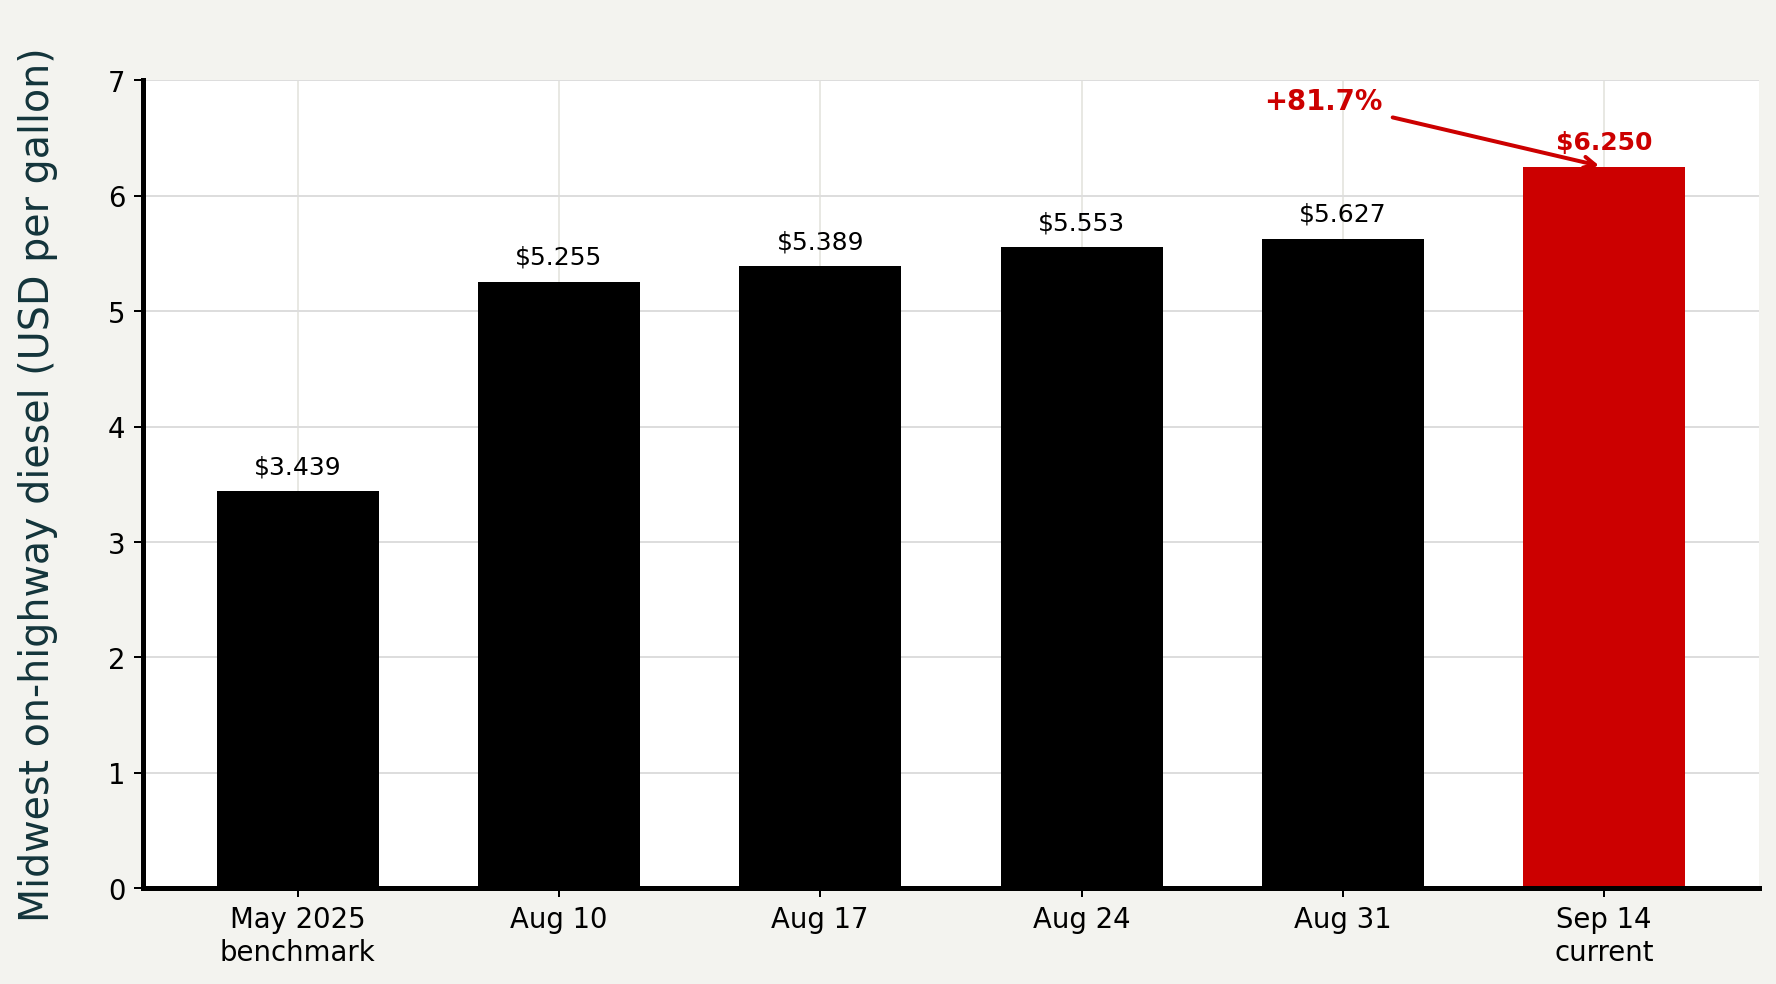
NewsSubscribe
First
Last
Consent

OSHA Proposed $246,609 at Prospect Ranch. Do the Division and It’s at Least 17 Citations.

OSHA proposed $246,609. Divide by the $16,550 serious cap and it’s 17 citations minimum, none willful. Four of the six dead worked for the contractor. Check your monitor’s calibration date.

Executive Summary: Six workers died of hydrogen sulfide exposure at Prospect Ranch LLC in Weld County, Colorado, on August 20, 2025, after a manure-system pipe disconnected. Four of them worked for Fiske Inc., the contractor hired to work on the system, not for the dairy — which puts the exposure on any operation that brings outside crews onto a pit. Release 26-285-DEN classifies the violations against Prospect Ranch and Fiske as serious and names no willful violation. Bullvine divided the three penalty totals by the $16,550 cap: the files hold at least 17 proposed citations, a floor any penalty reduction pushes higher. No outlet has published a count.

 manure gas OSHA penalties

OSHA proposed $246,609 against three companies after six workers died of hydrogen sulfide exposure at Prospect Ranch LLC in Weld County, Colorado, on August 20, 2025. Release 26-285-DEN classifies the violations against Prospect Ranch and Fiske Inc. as serious and names no willful violation, a distinction worth ten times the ceiling per citation — $16,550 against $165,514. Bullvine divided the three penalty totals by the statutory cap: the files hold at least 17 proposed citations. No outlet has published a count. Four of the six dead worked for the contractor, and operations bringing outside crews onto a manure system carry that exposure across two safety programs.

A pipe in the manure management system disconnected, releasing manure water and hydrogen sulfide. A Fiske Inc. employee and a Prospect Ranch employee tried to stop the flow and were overcome. Three more Fiske employees and one more Prospect Ranch employee then entered the pump room. Six workers died of hydrogen sulfide exposure. That is OSHA’s own account.

Under the 2026 schedule a serious violation caps at $16,550. A willful violation caps at $165,514 — ten times as much on identical facts, and willful is the only classification that opens a criminal referral. At least six outlets reported the serious classification the day it landed. Nobody divided the totals by the cap, and for anyone weighing dairy manure gas safety in 2026, that division is where the money sits.

The Chain Reaction: Four Contractors and One Family

Read the employer breakdown inside OSHA’s sequence. Four of the six dead worked for Fiske, whose High Plains Robotics business in Johnstown services dairy equipment. Two worked for the dairy. HD Builders LLC employees were on site and unharmed.

Four of the six were also one family. Alejandro Espinoza Cruz, 50, of Nunn, died alongside his sons Oscar Espinoza Leos, 17, and Carlos Espinoza Prado, 29, of Evans, and his son-in-law Jorge Sanchez Pena of Greeley. Ricardo Gomez Galvan, 40, and Noe Montanez Casanas, 32, both of Keenesburg, also died.

For anyone running a dairy, that split is the part with your name on it. The majority of the dead were not the dairy’s employees.

Serious Versus Willful: A Tenfold Difference in Ceiling

Running the Numbers — Bullvine calculation

Published evidence. Proposed penalties, OSHA release 26-285-DEN, February 24, 2026, U.S., USD: Prospect Ranch LLC $132,406; Fiske Inc. $99,306; HD Builders LLC $14,897. Total $246,609. Statutory maximums, OSHA 2026 annual civil penalty adjustment memo, May 21, 2026: serious $16,550 per violation; willful or repeated $165,514.

Stated assumption. One only: no citation can be assessed above the statutory maximum. That’s a certainty rather than an estimate, so dividing a total by the maximum returns an absolute floor — the fewest citations that could possibly add up to that figure. The release states neither the counts nor whether OSHA grouped any citations.

Bullvine math.

CompanyProposed penaltyCitations implied (proposed), absolute minimum
Prospect Ranch LLC$132,406at least 9
Fiske Inc.$99,306at least 7
HD Builders LLC$14,897at least 1
Total$246,609at least 17

Six dollars decide two of those rows. Eight citations at the $16,550 maximum come to $132,400, six dollars short of what OSHA proposed against Prospect Ranch, so the file holds at least nine. The same gap puts Fiske at seven rather than six.

Read the floor as a floor. OSHA can assess below the maximum, and its 2026 penalty memo describes a size-based reduction available to employers with 20 or fewer employees. Any reduction applied to any citation means more citations were needed to reach the same total. So 9, 7 and 1 are the arithmetic minimum. These are proposed citations; none has been established as a violation.

The ratio needs no assumption at all: $165,514 ÷ $16,550 = 10.0. Bullvine ran the per-worker figure of $41,101.50 in February. What’s new is the ceiling underneath it. Every citation OSHA classified in these files sits inside a category capped at a tenth of the one the release never invokes, and the release doesn’t classify HD Builders’ violations at all. The classification set the ceiling before any arithmetic began.

Status of the Penalties: Why the Public Record Went Dark

Treat $246,609 as an opening figure. OSHA’s release includes a notice that penalty amounts and classifications may not reflect the current or final status of a case, and the companies had 15 working days from receipt to comply, seek an informal conference, or contest before the Occupational Safety and Health Review Commission.

Bullvine searched trade and regional coverage from March through September 2026 and found no report of a contest, a settlement, or a final order. Three states are possible, and no source establishes which. The OSHA status query is outstanding.

What Is Confirmed, What Is Alleged, and Who Owns What

The entity names run close together, and they aren’t interchangeable — and the coverage hasn’t been consistent about them either. OSHA’s release cites Prospect Ranch LLC as the employer, and the Colorado Sun described that company as the dairy’s owner. The Associated Press, reading Weld County tax records in August 2025, put ownership of the property with Prospect Valley Dairy LLC, which lists a Bakersfield, California address for the owners. The Denver Gazette, citing the Colorado Secretary of State in August 2025, reported that Prospect Valley Dairy LLC was formed in January 2012, keeps a registered agent in Centennial, and was in good standing at that time. Arend Bos is identified as the dairy’s registered owner and as owner of Prospect Ranch LLC. Bullvine has not queried the registry directly and cannot reconcile which entity holds which interest today.

On August 19, 2026, the families of four of the six filed a wrongful-death action in Weld County District Court naming Prospect Valley Dairy LLC, Bos, and HD Builders LLC. The filing alleges the dairy operation had no gas monitors, no ventilation, no warning signs, and no rescue procedure or equipment when the pipe ruptured. Bullvine has not obtained the complaint and cannot confirm which defendant each allegation is directed at, or the current stage of the docket. Those are allegations in a filed complaint. Nothing has been ruled on, and no defendant has been found liable.

Arend Bos issued a written statement on behalf of Prospect Ranch in late August 2025: “We at Prospect Ranch and our employees are devastated by the tragic loss of our team members. While the cause is still under investigation, there is no indication that this is anything other than a terrible, isolated accident.” The statement added that “out of respect for the families and our employees, we will refrain from responding to the media at this point.” It predates both the citations and the lawsuit.

The company has stayed with that position through the enforcement action. Prospect Ranch LLC did not respond to requests for comment from the Colorado Sun on February 25, 2026, or Insurance Journal on February 27, 2026, according to both outlets. Bullvine wrote to Prospect Ranch LLC, Fiske Inc., and HD Builders LLC on September 11, 2026, putting the proposed penalties, the serious classification, and the complaint’s specific allegations to each company, and asking whether the citations were contested, settled, or became a final order. We set a deadline of September 18. None had responded by that deadline. We’ll update this article with any reply that arrives.

What Does a Safety Specialist Say Should Have Been Measured?

Dr. David Douphrate, then associate director of the High Plains and Mountain Center for Agricultural Health and Safety at Colorado State University, told CPR News in August 2025 that a manure-management system carries four gases of concern — ammonia, carbon dioxide, methane, and hydrogen sulfide — and that hydrogen sulfide is the one most often associated with manure-related deaths, capable of causing rapid loss of consciousness and death within minutes at high concentration.

“Whenever you have a manure management system like what they have on large dairy operations, you have to account for [H2S],” Douphrate told CPR. “You have to measure for it.”

He continued, in the same interview: “You have to make sure and confirm that it is present, and if it is present at high enough concentrations, then you need to protect workers.”

Douphrate was describing manure systems generally, not this incident. OSHA’s citations six months later included failure to train workers on methods to detect hazardous gases. Bullvine asked Douphrate on September 11 whether his assessment changed after the citations were issued, and had no reply by the September 18 deadline.

Is Ten Meters From the Storage Far Enough on Agitation Day?

In work presented in 2015, Penn State researchers with USDA-ARS colleagues monitored ten Pennsylvania dairies across 19 fall and spring agitation events, placing multi-gas meters around each storage perimeter, ten meters downwind, and on the operator.

Downwind concentrations above 20 ppm at ten meters occurred in eight of the fourteen observations at farms using gypsum bedding. Twenty ppm is OSHA’s ceiling under 29 CFR 1910.1000 Table Z-2, which exposure may never exceed at any time. Four of the 19 operator-exposure observations also exceeded 20 ppm, and three of those four involved someone working over the rim of the storage. The authors concluded that children and animals within ten meters of a storage are at risk.

Now hold that against the geometry at Prospect Ranch. Penn State’s meters sat in open air, where the gas has somewhere to go. The six workers were in an enclosed pump room, where a gas heavier than air pools instead of dispersing. No document Bullvine has obtained establishes the concentration in that room, and this piece won’t estimate it. The comparison establishes direction: if open air at 33 feet broke a never-exceed limit on more than half the gypsum farms measured, an enclosed space at the source is the worst case.

Three limits belong on the Penn State data. These were Pennsylvania farms, not Colorado ones. The work appeared in the 2015 Waste to Worth conference proceedings, which state that the materials included are not refereed publications, so treat it as field measurement that hasn’t been through peer review. Penn State Extension also notes that not all farms using gypsum have safety problems. Extension guidance puts the highest-risk window in the first 30 to 60 minutes of agitation and notes that hydrogen sulfide is heavier than air, settling in pits and near storages, with the rotten-egg odor going undetected at dangerous levels. Whether Prospect Ranch used gypsum bedding isn’t established in any document obtained, and the physics doesn’t require it.

The Legal Trap: When General Industry Trumps the Ag Exemption

29 CFR 1910.146, the permit-required confined spaces standard, states that it “does not apply to agriculture.” CPR reported the practical effect plainly: for agricultural operations, the confined-space provisions function as guidelines rather than enforceable requirements.

Here is the distinction that blindsides dairy owners. Routine dairy farm labor sits inside the agricultural exemption. Contractor maintenance and repair work on your manure system does not — Department of Labor guidance places maintenance, repair, and refurbishing work under general industry, on a farm or anywhere else. That guidance is interpretive. It’s also the reading that best explains why OSHA reached three businesses instead of one. Two of the cited parties are contractors, hired to work on the system, and they hold $114,203 in proposed penalties between them.

Then there’s who OSHA can reach. Colorado is not an OSHA-approved State Plan state and falls under federal OSHA jurisdiction, which covers most private-sector workers. But federal OSHA cannot enforce standards on farms with 10 or fewer employees, under longstanding appropriations restrictions. CPR reported that of more than 300 Colorado dairies, only a few appear to receive planned inspections in a given year.

So exposure splits three ways. At 10 or fewer employees, federal OSHA enforcement largely doesn’t reach you, and your protection comes from contracts and insurance instead of inspections. Above that headcount, the agency has authority. And the moment you bring in an outside crew for pump work, pipe repair, or system commissioning, two employers with two safety programs meet at one hazard — and four of the six who died at Prospect Ranch were the contractor’s people.

The 30/90/365 Playbook Before the Next Agitation

30 days.

  • Find the last calibration and bump-test date on every gas detection device you own. Requires: an hour. Threshold: no dated record inside the manufacturer’s interval means treat the device as absent. Backfire watch: a monitor alarming on a failing sensor teaches crews to ignore alarms.
  • Confirm whether your written hazard communication program names hydrogen sulfide, and which party’s safety program governs contractor work on your manure system. All three cited companies were cited for hazard communication or gas-detection training. Requires: your contractor agreements and your written program. Threshold: any agitation, pump repair, or pipe work scheduled within 30 days. Backfire watch: naming a program you don’t train against creates a dated record of the gap.
  • Set two rules in words the crew repeats back. No atmospheric reading, no entry. And no second person enters after a first goes down without supplied air and retrieval — OSHA’s narrative describes two workers overcome, then four more entering the pump room. Requires: ten minutes at a crew meeting and one person accountable for saying it again. Threshold: before the next agitation, with no exception for a short job. Backfire watch: a rule stated once and never repeated is a rule nobody follows by spring.
  • Penn State Extension recommends a four-gas unit for professional manure haulers. If you contract hauling, ask what the hauler carries.

90 days.

  • Read your contractor agreements for two things before an outside crew touches a pit: who carries indemnification, and who holds stop-work authority on site. Requires: your agreements, and counsel’s time if the language isn’t plain. Threshold: before the next contracted pump or pipe job. Backfire watch: the two questions are separate. One names who pays afterward. The other names who can stop the job before it starts.
  • Write a non-entry rescue procedure with a staged retrieval system and rehearse it once with everyone who works near storage. Requires: equipment and an afternoon with the crew scheduled. Threshold: any pit entered in the last 12 months without a documented reading. Backfire watch: a plan built on a fire department response time nobody has timed.
  • Ask your carrier in writing whether your employer-liability language excludes acts committed with deliberate intent to injure. One illustration of why that question matters, from outside Colorado: in Hoyle v. DTJ Enterprises, decided March 12, 2015, the Supreme Court of Ohio held that such an exclusion precludes coverage for employer intentional torts, because those claims require a finding of intent to injure. That decision does not control in Colorado, and Bullvine has not verified how Colorado courts treat the same clause, which is why the question goes to your carrier in writing. Requires: your policy and a written question. Threshold: now, if outside contractors touch your manure infrastructure. Backfire watch: a verbal assurance from an agent is not a coverage position.

365 days.

  • Treat classification, not penalty size, as the exposure. Requires: a documented record that hazards were identified and abated. Threshold: the moment a known defect goes unrepaired through a second scheduled agitation, documented knowledge starts building. Backfire watch: maintenance logs recording the defect but not the repair build the other side’s file.
  • Opportunity signal: as of June 2026, Colorado State University was running free confined-space safety training for Colorado livestock operations on roughly $190,000 in project funding, aiming to reach 500 workers. Training that also produces a dated training record beats training alone. Requires: enrolment and crew time. Threshold:before your next agitation season. Backfire watch: confirm the program is still enrolling before scheduling around it.

Running the Numbers — what closing the cited gap costs

Published evidence. Penn State Extension recommends farm operators working around gypsum-bedded manure storages wear a single-gas hydrogen sulfide personal monitor, and says these cost under $300 each, are cell-phone sized, and have multi-year battery life. Serious-violation ceiling: $16,550, OSHA 2026 schedule.

Stated assumption. Four monitors cover a 400-cow operation’s crew working near storage during agitation. Scope: 400 cows, one enclosed pump pit, U.S., USD, one-time equipment cost excluding calibration and training hours. This is a reader model. The Keenesburg dairy may run more than 10,000 cows, according to records cited by CPR.

Bullvine math. One monitor at under $300 is under 2% of the $16,550 ceiling on a single serious citation for not training workers to detect the gas. Four monitors run under $1,200, or under 8% of that ceiling. Per cow: under $3.00, one time.

Calibration and training hours sit outside that figure. Add your own.

The Number to Check Before You Agitate

The trade-off here is that classification, not equipment cost, is where the exposure lives — and classification turns on what you can document you knew and when.

Douphrate put the requirement in four words: you have to measure. So find the calibration date on your gas monitor. If there’s no date, or no monitor, you have the same documented condition OSHA cited at Prospect Ranch, and you have it before anything has happened.

Key Takeaways

  • Divide OSHA’s three penalty totals by the $16,550 statutory cap, and the files hold at least 17 proposed citations. Any reduction OSHA applied pushes that count higher.
  • Classification is the exposure, not the penalty size. Serious caps at $16,550 per citation; willful caps at $165,514 and opens a criminal referral. What separates them is what you can document you knew and when.
  • Four of the six who died at Prospect Ranch worked for the contractor. If outside crews touch your manure system, find out today whose safety program governs them, who carries indemnification, and who can stop the work.
  • Federal OSHA can’t enforce standards on farms with 10 or fewer employees. Below that headcount your protection comes from contracts and insurance instead of inspections.

This article is based on OSHA records, court filings, and published reporting available as of September 11, 2026. The current stage of the OSHA enforcement case and of the Weld County District Court docket had not been confirmed at that date. Requests for comment were sent to Prospect Ranch LLC, Fiske Inc., and HD Builders LLC on September 11, 2026, with a deadline of September 18.

Learn More

  • Manure Pit Safety: What Every Dairy Farmer Needs to Know — Arms your crew with immediate atmospheric testing protocols, ventilation run-times, and staged retrieval mechanics before entering any pit or pump room, preventing routine maintenance jobs from turning into multi-victim rescue disasters.
  • Dairy Farm Labor and OSHA: The Regulations You Can’t Afford to Ignore — Breaks down how general industry compliance standards pierce traditional farm liability protections, walking producers through written hazard communication frameworks, inspection trigger thresholds, and contract clauses required to insulate multi-employer operations from five-figure regulatory penalties.
  • Methane Digesters and Dairy Safety: Managing the New Gas Hazards — Exposes how closed-loop biogas systems and automated slurry loops concentrate lethal hydrogen sulfide and methane volumes, showing managers how to integrate continuous gas-monitoring telemetry and automated shut-offs into long-term facility infrastructure design.

The Sunday Read Dairy Professionals Don’t Skip.

Every week, thousands of producers, breeders, and industry insiders open Bullvine Weekly for genetics insights, market shifts, and profit strategies they won’t find anywhere else. One email. Five minutes. Smarter decisions all week.
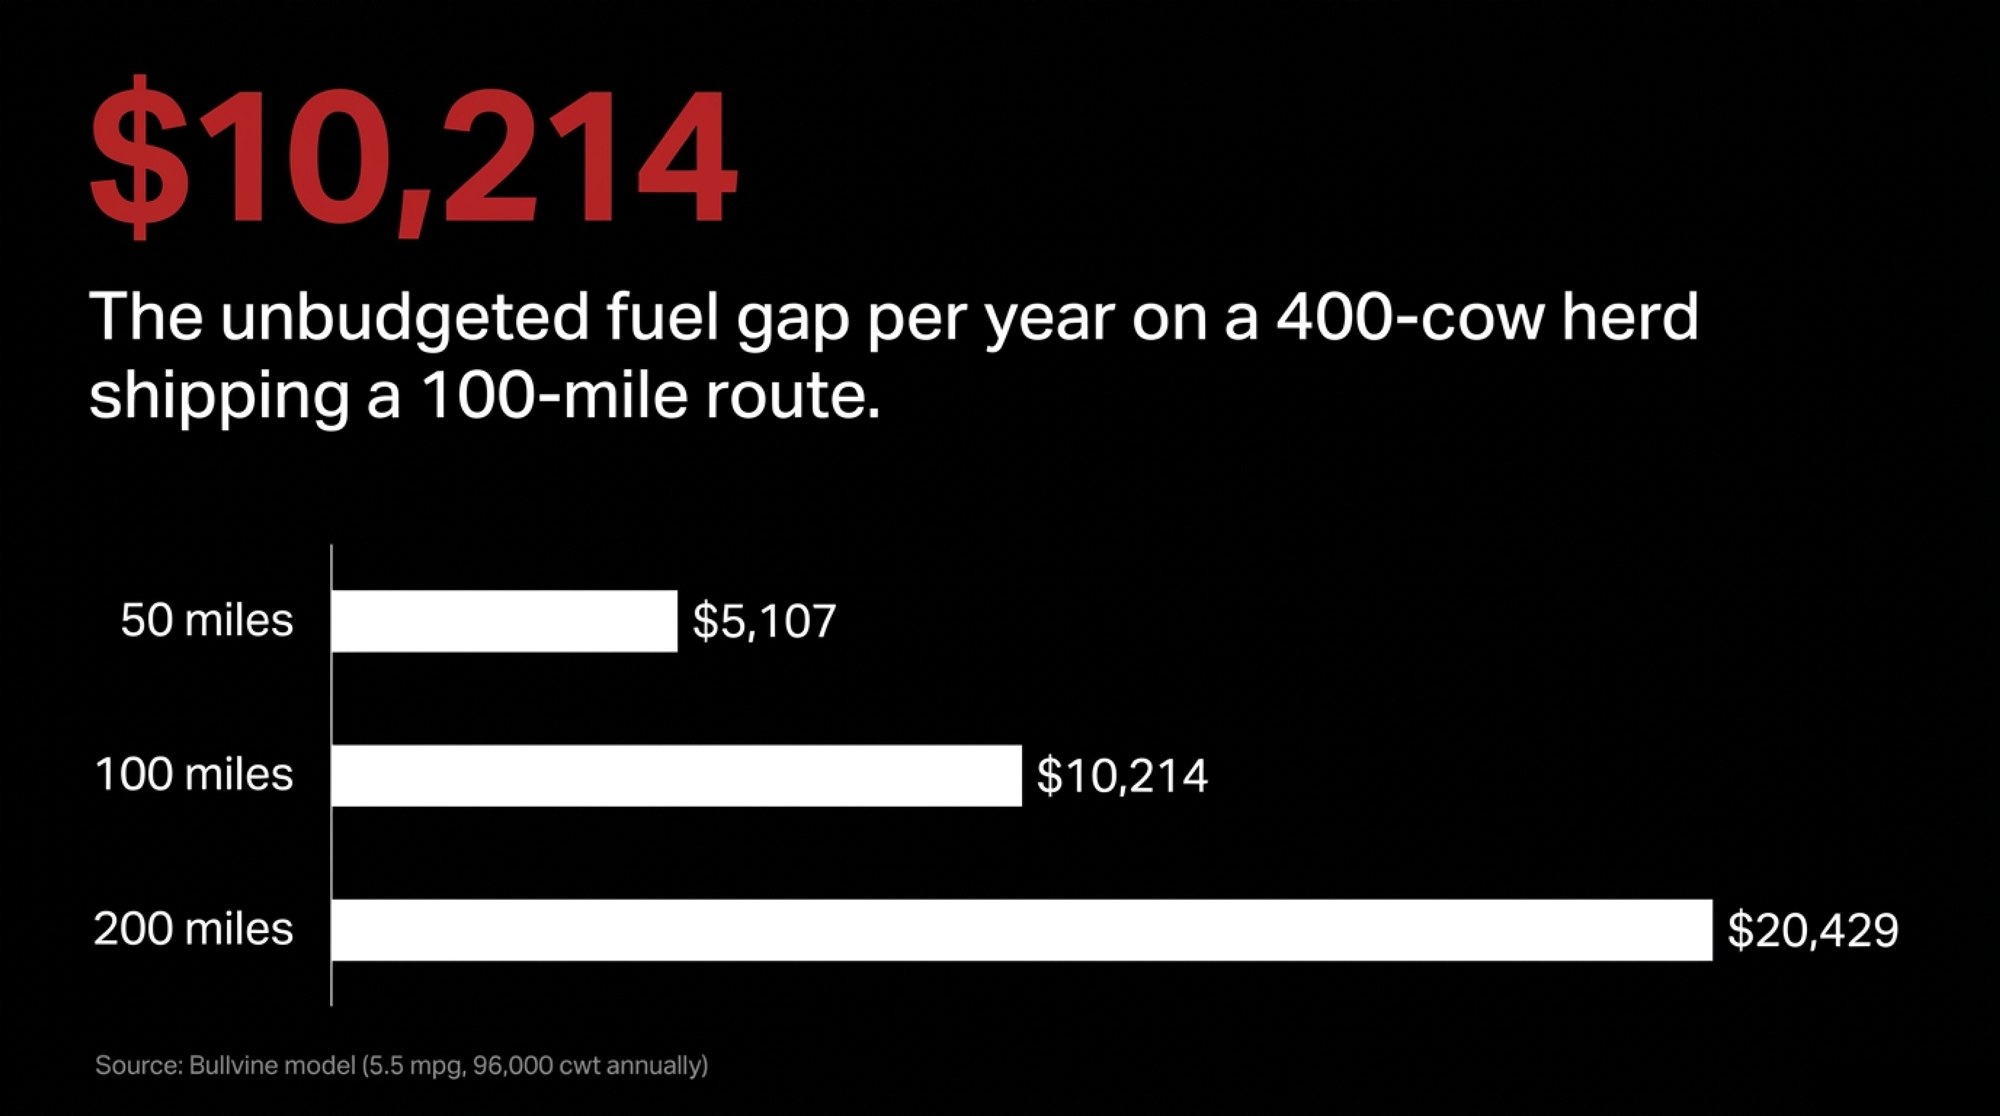
NewsSubscribe
First
Last
Consent

$11,525 Buys One Day Off. $14,263 Is Sitting in Hours Nobody Counts.

Two six-hour relief shifts a week run $11,525 a year. To earn it back on mastitis, you’d stop 60 cases. Nobody stops 60. Teagasc found the money somewhere else entirely.

Two six-hour relief shifts a week, at the U.S. average milker wage of US$18.47 an hour, is 624 hours and US$11,525 a year. To recover that on prevented mastitis at US$192.36 a case, you’d have to stop 60 cases. Nobody stops 60 cases.

So the line item doesn’t pay for itself on disease prevention. We’re saying that first because we’ve argued the softer version of this on this site before, and the arithmetic didn’t hold.

What does pay is the thing almost nobody puts a dollar figure on. Teagasc measured two quartiles of Irish dairy farms running effectively identical herds, 112 cows against 113. The well-organized group worked 51.2 hours a week. The other group worked 70.0 hours a week. Bullvine calculation: priced at U.S. milker wages, that 18.8-hour gap is worth roughly US$14,263 a year. The hours are Teagasc’s. The dollar conversion is ours, and the inputs sit in the Methodology Note.

Before the numbers, one thing worth having in front of you.

Support Resources for Producers and Families

U.S. national — Call or text 988 (Suicide & Crisis Lifeline) · Farm Aid 1-800-FARM-AID

Wisconsin — Farmer Wellness Helpline, 24/7: 888-901-2558 · Wisconsin Farm Center: 800-942-2474

Canada — Crisis Services Canada / Talk Suicide Canada: 1-833-456-4566 · Do More Agriculture: domore.ag

The Counseling Line Item That Isn’t One

Wisconsin’s Farmer Wellness Program, launched with US$200,000 in Governor Tony Evers’ 2019–21 biennial budget through DATCP, provides farmers and farm family members with free in-person and telehealth counseling. The voucher program covers 210 participating providers across 60 Wisconsin counties. Tele-counseling is free, confidential, and unlimited. Ontario’s Farmer Wellness Initiative runs on the same principle.

There is no math to run on that decision. One call to 800-942-2474 and the cost side is zero.

Private rates matter only where no such program exists. In Canada, private therapy commonly runs CA$120 to CA$250 an hour by provider type, with flat-rate virtual options at CA$135 an hour in 2026, and registered psychotherapists and social workers at the lower end.

That’s the correction. The “budget US$400 a month for counseling” figure this site has run before overstates the cost of what it’s arguing for in every state and province where a funded program already exists.

How Much Does a Fatigue-Driven Miss Actually Cost?

Built from the bottom, with sourced unit costs rather than a dramatic total.

A clinical mastitis case runs US$120 to US$337 in direct costs, averaging US$192.36, based on work tracking 37 commercial U.S. dairies published in the Journal of Dairy Science in 2023. Most of that figure is discarded milk rather than drug cost. A left-displaced abomasum runs US$432.48 in first-lactation cows and US$639.51 in later lactations, from a 2016 JDS stochastic cost model. That’s the most current published estimate we could locate, and it’s a decade old, so treat it as a floor. On the cull side, our August 2026 analysis put a cull cow at US$2,340 against a replacement above US$3,500, a net swap near US$1,160. USDA AMS put replacement heifers at US$2,860 in January 2026, down from a record US$3,110 in October 2025.

Stack it all into one week, and you get US$4,000 to US$6,000. That stack combines independently sourced averages for three separate adverse outcomes, not a documented single incident. Subclinical ketosis progressing to DA is a documented pathway. Mastitis runs as a parallel risk rather than a downstream consequence of the same missed cow check. That total is a ceiling. A typical week looks like the first row below.

Line ItemSourced Cost (USD)Annual Exposure (1/mo)Clears US$11,525 Relief Cost?
Clinical mastitis case$192.36 avg (range $120–$337)$2,308No — needs 60 cases/yr
Left displaced abomasum$432.48 (1st lact.) – $639.51 (later)$5,190–$7,674No
Cull-and-replace swap~$1,160 net differential$13,920Only at 12 forced culls/yr — herd crisis, not fatigue
Counseling (WI / ON)$0 — voucher or Initiative$0No cost to clear
Relief labor (the spend)$18.47/hr × 624 hrs$11,525— threshold

Illustrative model. Incident frequencies are assumed for scale, not observed.

Bullvine calculation. A prevented DA at US$639.51 plus one avoided cull-and-replace at US$1,160 gets you to roughly US$1,800 against a US$11,525 spend. It doesn’t pencil at typical relief wages, and anyone selling relief labor on prevented-disease math is overstating the case. Relief labor justifies itself as continuity cover, against the risk that the one person who knows the operation is unavailable for six weeks. That’s a real argument. It belongs in front of a lender as a continuity question, not a herd-health one.

We could find no lender on record treating operator-resilience spending as a factor in a debt-service assessment. That absence is worth reporting rather than filling with a framework nobody has endorsed.

Are Your 70-Hour Weeks Buying Anything?

Teagasc’s June 2025 publication, Becoming the 50-hour farmer, reports a study of Irish dairy farms across a 150-day February-to-June window. A note on the system before the numbers: these are pasture-based, spring-calving herds, where that window is the annual workload peak, and Teagasc measured hours rather than confinement-barn routines. The study isolates work organization, and the specific practices it credits — automatic cluster removers, single-person milking, contracted calf rearing — are equipment and scheduling decisions that exist in year-round confinement barns too. The hour counts won’t transfer to a Wisconsin or Ontario freestall. The question the data poses will.

The top and bottom quartiles on work-organization effectiveness ran 112 cows against 113. The efficient quartile worked 51.2 hours a week, compared with 70.0. Labor input was 17.4 hours per cow against 20.9. Both groups started within thirteen minutes of each other, at 06:47 and 07:00. The efficient group finished at 18:25. The other finished at 19:58. The peer-reviewed treatment is The impact of work organization on the work life of people on Irish dairy farms, published in Animal in 2022.

MeasureTop Work-Organization QuartileBottom QuartileGap / Bullvine Valuation
Herd size112 cows113 cows1 cow — effectively identical
Hours worked per week51.270.018.8 hrs = 977.6 hrs/yr
Labor input per cow17.4 hrs20.9 hrs3.5 hrs/cow = 392 hrs over 150 days
Start time06:4707:0013 minutes
Finish time18:2519:5893 minutes every day
Annual value of the gapUS$14,263 at $14.59/hr · $18,056 at $18.47 · $21,507 at $22

Same cows. Same start time. Ninety-three minutes’ difference at the end of the day, every day.

Bullvine calculation: the value of the gap. 18.8 hours across 52 weeks is 977.6 hours. Priced at U.S. milker wages — an assumption we’re stating rather than sourcing from the Irish data — that’s roughly US$14,263 at $14.59 an hour, US$18,056 at $18.47, and US$21,507 at $22. Run it Teagasc’s other way. The 3.5-hour-per-cow gap across 112 cows over that five-month window is 392 hours, about US$7,240 at $18.47.

The mechanism underneath is narrower than “work less.” Deming and colleagues, Journal of Dairy Science 102(9), 2019, found that contracting out milking cut more hours than any other single change, with only slight effects on profitability, and that the most profitable path paired efficiency gains with herd growth. Separate Teagasc Moorepark case-study work managed a 119-cow herd on under 3,000 hours a year, with the farmer contributing 77% of the labor.

We covered why those hours accumulate in our August 2025 analysis of 70-hour weeks.

Why the Margin Makes This Urgent Now

University of Illinois farmdoc and USDA ERS projections put the U.S. all-milk price near US$18.95/cwt against total economic costs around US$23.66/cwt, a net economic return of roughly negative US$4.71/cwt. Be precise about what that measures. It’s full economic cost including depreciation and the opportunity cost of unpaid family labor and owned land, not cash cost. Most operators’ mental model of “my cost” is cash cost only, and the gap between the two can exceed 40%. A lender assessing your debt service coverage ratio isn’t looking at the full-economic figure. The $4.71 explains why the year feels thin. It won’t decide your loan.

Three structural pressures are landing on the same operator. The 2025 Federal Milk Marketing Order amendments raised manufacturing make allowances effective June 1, 2025, to US$0.2519/lb for cheese, US$0.2272 for butter, and US$0.2393 for nonfat dry milk. In the first three months, the American Farm Bureau Federation calculated Class III down about US$0.92/cwt and Class IV down about US$0.85/cwt from those allowances alone, with roughly US$337 million less in national pool revenue. CoBank flagged a replacement heifer shortfall near 800,000 head through 2026. A National Milk Producers Federation-commissioned 2015 survey estimated immigrants accounted for 51% of U.S. dairy labor, while farms employing immigrant workers produced 79% of U.S. milk. NMPF represents dairy cooperatives and advocates for agricultural labor reform, and that estimate is now more than a decade old. It establishes the exposure, not a current workforce count.

The consolidation figure is current. USDA NASS’s 2022 Census of Agriculture counted 24,094 U.S. farms selling milk. The 2,013 farms with 1,000 or more cows accounted for 66% of all U.S. milk sales, up from 57% in 2017. Price compression drains the cash cushion. A heifer shortfall removes the biological backup, and thin labor removes the human one. All three now sit inside fewer businesses, which is why one owner’s work organization carries more weight than it used to. Size alone doesn’t determine viability — management quality matters more than cow count — but it does concentrate the consequences.

The full per-cwt picture by herd size sits in our Dairy Farm Economics 2026 playbook.

The operator’s own load is documented. University of Guelph epidemiologist Dr. Andria Jones-Bitton surveyed roughly 1,132 Canadian farmers and found stress, anxiety, depression, emotional exhaustion, and suicidal ideation above general-population levels, with ideation at roughly twice the national rate. The National Rural Health Association puts male farmers, ranchers, and agricultural managers at about 43.2 suicides per 100,000 on 2017 occupational data, and farmers’ overall risk at roughly 3.5 times the general population.

Who Actually Gets the Message Through

Numbers don’t move this decision on their own. Delivery does, and Wisconsin has a documented model for it.

Farmer Angel Network currently lists Randy Roecker as running Roecker’s Rolling Acres in Loganville, Wisconsin, a third-generation operation milking 275 cows on 700 acres. He committed to a major expansion in 2006. Two years later, the recession hit, and he told Spectrum News1 in June 2022 that he was concerned he’d lose everything. He fought the depression that followed for seven years before speaking about it publicly, according to our own February 2026 reporting, and he has since discussed farmer mental health on NMPF’s Dairy Defined podcast in January 2023.

Leon Statz died by suicide on October 8, 2018. He was 57, a neighboring dairy farmer, and according to our February 2026 reporting, he had battled depression for more than two decades and had sought help during that time. That detail matters for the argument that follows. In his case, the barrier our coverage documented was not a failure to seek care.

That fall, according to the New York Times in April 2023, monthly meetings began in a Sauk County church hall involving Brenda Statz, Leon’s wife of 34 years. Those meetings became the Farmer Angel Network, co-founded by Brenda Statz, Dorothy Harms, and Roecker, per the organization’s own materials.

Roecker then began training milk haulers, veterinarians, and nutritionists in QPR (Question, Persuade, Refer), a gatekeeper method the network adopted rather than invented. AgriSafe Network delivers a 90-minute agriculture-specific version; contact Tara Haskins. The CDC has published an evaluation of a QPR-based agricultural pilot in which 17 initial gatekeepers went on to train 415 participants, and a 2023 study indexed by NIH examined scaling the approach. Our full account of the hauler training ran in February 2026.

Bullvine archive comparison. We first covered Roecker in August 2020 at a benefit breakfast, again in 2021, in 2023 on immigrant labor, and twice in early 2026. Every one of those ran as human interest. Meanwhile we’ve been publishing hard lender coverage since December 2025 — DSCR stress tests, covenant walkthroughs, debt-to-asset trigger points, five separate pieces through July 2026. Two registers ran in parallel on the same site for eight months. Neither one ever mentioned the other. That’s the gap this piece closes, and it was ours before it was anyone else’s.

What the evidence doesn’t contain, anywhere we could find it, is a documented case of a specific hauler starting a specific conversation that changed a specific outcome. The program-level evidence is real. The case-level evidence is absent, and we’d rather say so than fill it with an anecdote we don’t have.

Dairy Relief Labor Costs the Most. Here Are Four Cheaper Places to Start.

Step 1 — Zero-capital quick win, Day 1 to 30. Exhaust the free programs first. Call Wisconsin DATCP at 800-942-2474 or 888-901-2558, or Ontario’s Farmer Wellness Initiative, before you write a mental-health line into any budget. Where it fails: 210 providers across 60 counties still means travel in thin-provider counties, which is why tele-counseling sits inside the same program.

Step 2 — Operational audit, Day 30 to 60. Reclaim the 18.8-hour gap. Price automatic cluster removers, contracted calf rearing, and a single-person milking routine. This is where Teagasc’s evidence sits and where the US$14,263 sits. Where it fails: shedding the hours where your judgment genuinely is the variable costs more than it saves, and the capital goes out before the hours come back.

Step 3 — Continuity risk, Day 60 to 90. Build the three-person bench. Three names who could take a fresh-cow check or a milking on short notice, with the conversation had while you’re still functional. Lock the bench before you negotiate a rate. Where it fails: reliable relief is scarce, which is exactly why the bench precedes the budget line.

Step 4 — Network training. Get QPR in front of the people already in your yard. Point your bulk-tank hauler, nutritionist, or herd vet at AgriSafe’s 90-minute agriculture-specific course. Enrollment contact is Tara Haskins. Where it fails: the NRHA notes rural provider shortages, so the referral at the end of the chain has to exist locally. In Wisconsin, it does.

Step 5 — Recurring operating cost, only if Steps 1 to 4 leave a gap. Fund relief labor as a continuity shield.About US$11,525 a year at US$18.47 an hour, which is wage expense rather than capital. Take it to your ag lender as a solvency and continuity question. Where it fails: where the owner is the binding constraint on cow performance, buying hours off doesn’t buy equivalent value.

Key Takeaways

  • Relief labor needs 60 prevented mastitis cases to break even at US$11,525. Fund it as continuity cover or don’t fund it.
  • The 18.8-hour gap is worth US$14,263 to US$21,507 a year. Largest recoverable number here.
  • Wisconsin and Ontario counseling is already paid for. Make the call before you budget a dollar.
  • Price your last 90 days at US$192.36 a mastitis case and US$639.51 a DA. If you can’t produce that count, the gap is the finding.
  • Can’t name three people who could milk tomorrow? That’s the 30-day fix, ahead of every budget line.
  • QPR runs 90 minutes. Pick the person already driving into your yard.

Pull your last 90 days of herd records tonight, then check your own finish time against 18:25 and 19:58. Compare what you find against the hours gap rather than against a counseling invoice, because that’s where the recoverable money turned out to be. We’re building the full per-cwt resilience model by herd size, with the continuity-risk walkthrough for lenders, in next week’s Bullvine Weekly.

Try It Yourself · Free Tool

Methodology Note. Mastitis: Ruegg et al., Journal of Dairy Science, 2023, 37 commercial U.S. dairies, USD, mean $192.36 ± $8.90, range $120–$337 per case. DA: JDS stochastic cost model, 2016, U.S., USD, $432.48 primiparous and $639.51 multiparous, the most current published estimate located and treated as a floor. Replacement heifers: USDA AMS Agricultural Prices, January 2026, U.S. national, USD; cull-replace differential from Bullvine analysis, August 2026. Consolidation: USDA NASS 2022 Census of Agriculture, U.S. national. Labor force: National Milk Producers Federation-commissioned survey, 2015, U.S. national, dated and not current; NMPF advocates for agricultural labor reform. Milk price and cost: University of Illinois farmdoc and USDA ERS 2026 projections, U.S. national, USD, full economic cost including depreciation and the opportunity cost of unpaid labor and owned land — not cash cost. Labor hours: Teagasc, Becoming the 50-hour farmer, June 26, 2025, pasture-based spring-calving Irish dairy farms, 150-day February to June window, work-organization quartiles; peer-reviewed treatment: The impact of work organization on the work life of people on Irish dairy farmsAnimal, 2022. The hour figures are specific to seasonal pasture systems and are not measured in year-round confinement. Wages: Indeed U.S. milker average US$18.47/hour, 36 job postings, updated August 21, 2026; range $14.59 to $22, the low end derived from Zippia’s reported $30,339 annual average over 2,080 hours. Applying U.S. wage rates to Irish hour counts is a stated Bullvine assumption, not a finding of either study. Counseling: Wisconsin DATCP Farmer Wellness Program, current as of August 17, 2026; Canadian private rates from GreenShield, 2026, in CA$. Dollar figures are USD unless marked CA$. The 977.6-hour valuation, the 392-hour per-cow calculation, the US$11,525 relief figure, and the break-even case counts are Bullvine calculations on those inputs, with assumed incident frequencies stated rather than observed. The $4,000 to $6,000 stack is a composite of independent averages for three separate outcomes, not a documented single incident. National or regional averages may not reflect your specific region, herd size, management system, or market access. If your experience differs, send us your numbers — we build future coverage from producer data. For factual corrections, reach the editorial team through the contact section at thebullvine.com/about-us.

Learn More

The Sunday Read Dairy Professionals Don’t Skip.

Every week, thousands of producers, breeders, and industry insiders open Bullvine Weekly for genetics insights, market shifts, and profit strategies they won’t find anywhere else. One email. Five minutes. Smarter decisions all week.
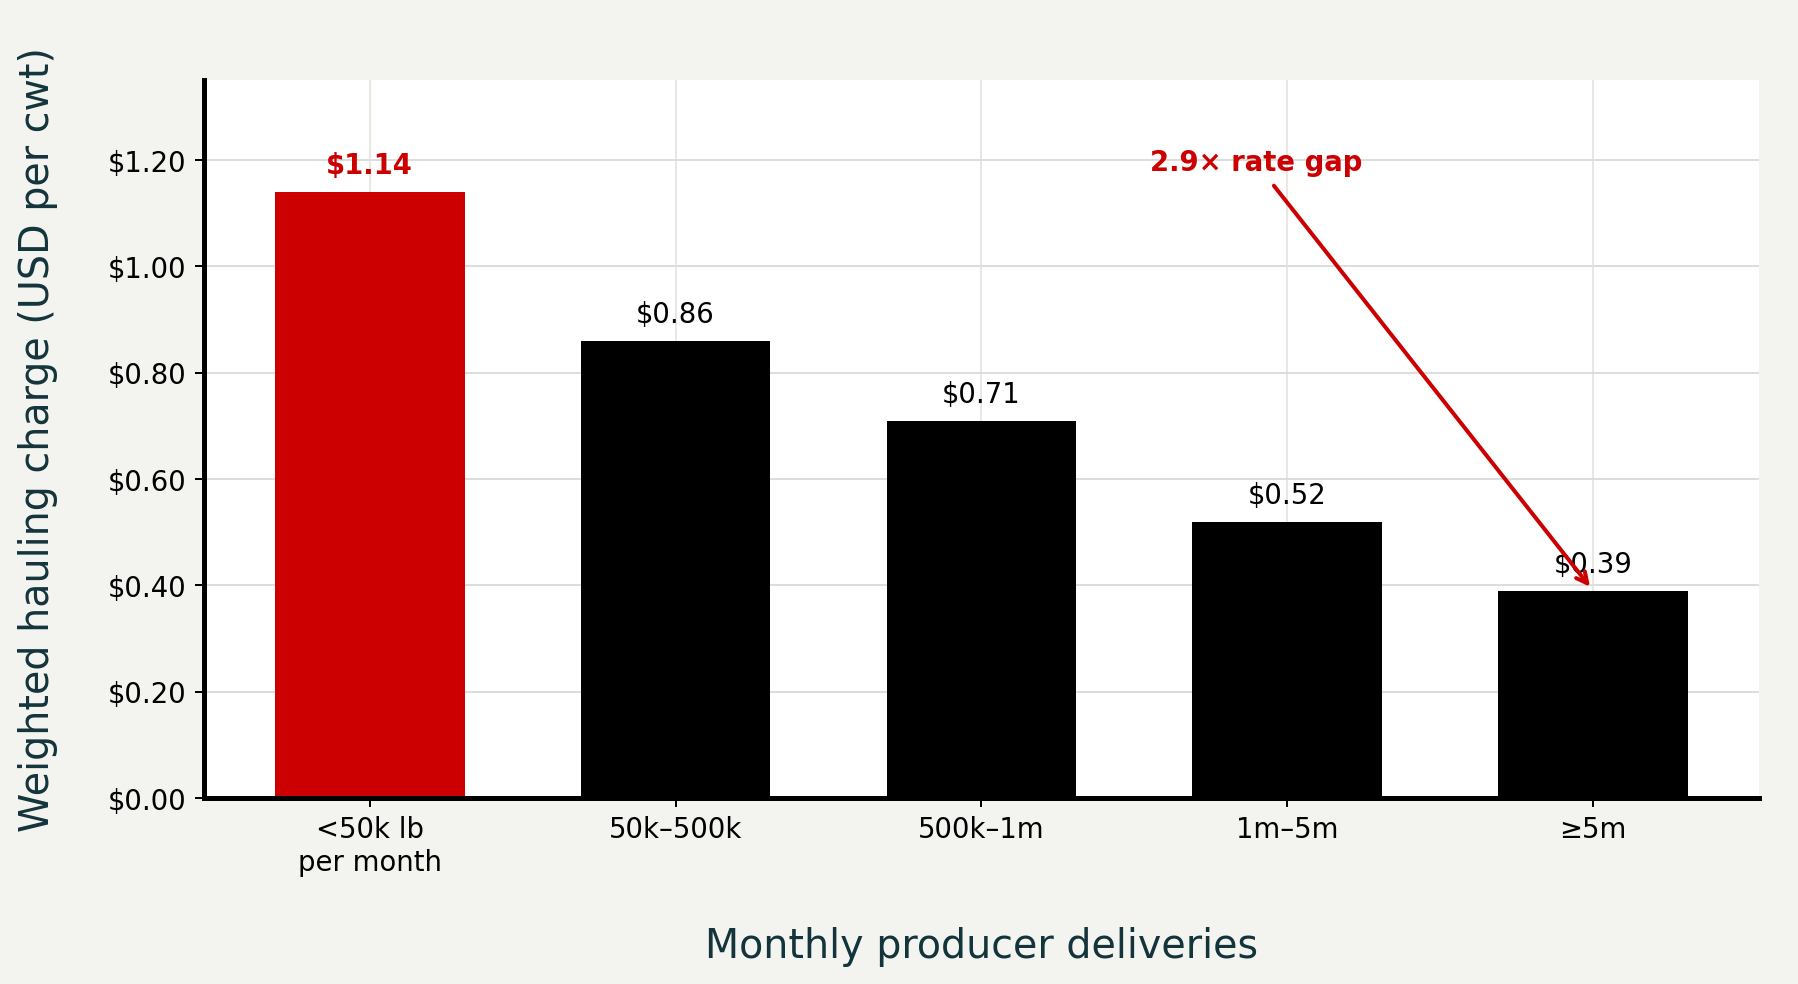
NewsSubscribe
First
Last
Consent

USDA Publishes Two Costs for the Same 200-Cow Herd. S.4906 Prices Milk Off One of Them.

USDA reports two costs for a 200-cow herd: $27.21/cwt on full economic cost, $14.53 on operating costs alone. S.4906 would set price floors from production costs without specifying which — making it either a $402,960 raise or a floor that never binds.

S.4906 milk price floors

USDA publishes two costs of production for a 200-to-499-cow dairy in 2025 — $27.21/cwt on full economic cost, $14.53 on operating cost alone. Sen. Peter Welch’s S.4906, referred to Senate Agriculture on June 24 and unmoved since, would set minimum milk prices partly from that data without saying which measure it means. We ran the ERS size-of-operation workbook against the mechanism: the higher figure sits $7.36 above the current all-milk forecast, worth $402,960 a year on 200 cows. The lower one never binds. ERS also puts mid-size herds $3.59/cwt underwater on full cost while 2,000-plus herds clear $4.25. And the bill would switch off Dairy Margin Coverage while it runs.

USDA publishes a cost of production for your herd size. It publishes two of them, and the gap is $12.68 a hundredweight.

Sen. Peter Welch of Vermont introduced S. 4906 on June 24, 2026, cosponsored by Sen. Bernie Sanders. It was read twice and referred to the Senate Committee on Agriculture, Nutrition, and Forestry the same day, and hasn’t moved since. According to Welch’s own section-by-section summary, Section 3 creates a Dairy Market Stabilization Program by amending the Dairy Production Stabilization Act of 1983.

Here’s why the gap matters. If a rulemaking reads cost of production as full economic cost, a 200-cow herd’s floor lands at $27.21/cwt against an all-milk forecast of $19.85 — a raise of $7.36 on every hundredweight. If it reads the phrase as operating cost, the floor lands at $14.53, never binds, and pays nothing. Same herd, same USDA table, same survey year. Everything below turns on which number wins.

CaseCost BasisFloor ($/cwt)Binds at $19.85?Whole-Herd Uplift
A — Full economic costERS total costs, 200-499 tier, 2025$27.21Yes+$402,960
B — Operating cost onlyERS operating costs, 200-499 tier, 2025$14.53No$0

What the Bill Would Do, on the Record

The mechanism, as described by the sponsor’s summary and independent bill analyses: national and regional dairy boards advising the Secretary, production limits set for each producer, minimum milk prices based partly on production costs, fees charged to producers who exceed their allotment, and those fees redistributed to producers who stay within theirs. Producers may appeal their allotment to the Secretary under the National Board’s advisement.

Two features matter for anyone comparing this to Canada. Allotments “could not be sold, leased, traded, or otherwise monetized,” and the bill limits the buying and selling of production quotas. There’s no asset to build equity in.

Then the provision nobody has costed. Section 3(b)(1) provides that while the Dairy Market Stabilization Program is in effect, the Dairy Margin Coverage program “shall have no force or effect.” Section 3(b)(2) would bar the Federal Crop Insurance Corporation from offering Dairy Revenue Protection or any substantially similar policy. Congress reauthorized DMC through calendar 2031 under the One Big Beautiful Bill Act in July 2025 and raised its Tier 1 threshold at the same time. Eleven months later, this bill would switch it off.

Section 6 would fund dairy training, farmworker ownership assistance, and regional processing infrastructure.

Does S.4906 Mean U.S. Dairy Supply Management in 2026?

It borrows Canada’s cost-of-production logic and breaks from it on the point a lender cares about most: the production right isn’t an asset.

Point of comparisonCanadaS.4906 as described
Is the production right tradable?Yes, through monthly provincial exchangesTransferable between producers, but monetizing, leasing, selling or trading is prohibited
What is it worth?Ontario’s cap is $24,000.00 per kg of butterfat, and quota trades at the cap. Saskatchewan, outside the P5 cap, cleared at $44,144.00 per kg of butterfat in April 2026Nothing. There is no price
EnforcementQuota is required to market milkA fee on production above your allotment
Can you retire on it?Yes — quota is a saleable balance-sheet assetNo. Nothing to sell, nothing to borrow against
Who buys the milkProvincial marketing boardThe Secretary, per the descriptions available

Sources and units: Dairy Farmers of Ontario publishes the Ontario figure as a quota price cap in its Quota Exchange Summary, March 2026, and DFO’s Markets Report records the same $24,000 cap in effect across Prince Edward Island, New Brunswick, Ontario, Nova Scotia and Quebec. SaskMilk publishes its figure as a market clearing price per kilogram of butterfat in its April 2026 newsletterAgriculture and Agri-Food Canada reports provincial averages as dollars per kilogram of butterfat per day. All figures Canadian dollars.

That second row is the whole difference, and the Saskatchewan number shows the scale of it. A Canadian dairy farmer who wants out sells quota — at $24,000 a kilogram in Ontario, or $44,144 where the cap doesn’t apply. A U.S. producer under S.4906 hands an allotment to a neighbor and books nothing.

Ontario also shows what rationing looks like when the asset exists and nobody will part with it: Dairy Farmers of Ontario’s own quota exchange archive records cancellations in February, April, May, July, and August 2026 — five of the first eight months — with the September exchange running. Our breakdown of the May exchange found 1,978 producers bidding against eighteen offering.

The historical parallel is narrower than usually claimed. NMPF published its Foundation for the Future proposal in June 2010, and a version was introduced in the 112th Congress as H.R. 3062, the Dairy Security Act, by House Agriculture Committee Ranking Member Collin Peterson on September 23, 2011. The Agricultural Act of 2014, signed February 7, 2014, included the Margin Protection Program and the Dairy Product Donation Program. The supply-control companion didn’t survive. NMPF’s position at the time, reported by DTN Ag Policy Blog on January 15, 2014, was that House Speaker John Boehner’s opposition “effectively served to kill our proposal within the committee.”

NMPF Answered Through a Trade Outlet, Not a Filing

The National Milk Producers Federation, which represents dairy cooperatives, has one public statement on this bill. Alan Bjerga, NMPF’s executive vice president of communications and industry relations, told Progressive Dairy on September 7, 2026: “Government-mandated supply management has a track record of unintended consequences: It limits farmers’ ability to grow and respond to market signals, it puts producers who have invested in expanding their operations at a disadvantage, and it raises consumer grocery costs.” He added: “Rigid production controls aren’t the right path forward for dairy.”

“Rigid production controls” describes a mechanism the available descriptions don’t support. In the sponsor’s summary and independent analyses, the bill enforces through a fee on over-allotment production, not a prohibition on marketing. That’s a different instrument with a different incentive, and the statement doesn’t engage it — nor does it engage Section 3(b).

The consumer-cost half of the statement is a different matter, and the arithmetic below supports it plainly. A floor set at mid-size full cost of production transfers $7.36 per hundredweight, and somebody pays it.

NMPF issued detailed public praise for Chairman John Boozman’s Senate farm bill draft, naming Dairy Margin Coverage continuation, common cheese name protections, and export promotion funding. The International Dairy Foods Association, which represents dairy processors and manufacturers, endorsed the same draft on June 22. Neither has publicly addressed Section 3(b). We put the question to IDFA the same day we wrote to NMPF.

The bill’s endorsers filed their own record on June 28: the National Family Farm Coalition, Farm Aid, Wisconsin Farmers Union, and the Northeast Organic Dairy Producers Alliance among dozens of farm and food organizations. Wisconsin Farmers Union president Darin Von Ruden, a dairy farmer at Westby, said: “If we want family farms to stay in business, we need a dairy economy that works for the people producing the milk and not one that expects farmers to just work harder.”

NFFC’s own legislative document states the Act “includes a parallel pricing and supply management system for organic farmers.” How that parallel system sets organic floors, and whether organic producers sit inside or outside the main Program, is another question we’ve asked.

What Would Cost-of-Production Pricing Do to a 200-Cow Milk Check?

Running the Numbers — Bullvine calculation

Scope: 200 cows, 12 months, Northeast or Upper Midwest, USD.

The bill would base minimum prices partly on production costs. USDA publishes those costs by herd size, and it publishes two of them.

What Is Cost of Production for a 200-Cow Dairy in 2025?

USDA ERS, Milk Cost of Production Estimates, size-of-operation series, 2025 values, dollars per hundredweight sold:

Herd Size (Cows), 2025Total Full Cost ($/cwt)Operating Cost Only ($/cwt)Milk Sold ($/cwt)Total Gross Value ($/cwt)Net on Full Cost ($/cwt)
Fewer than 50$47.33$16.37$23.45$27.79−$19.54
50–99$37.05$16.77$22.72$26.46−$10.59
100–199$29.56$14.87$21.55$24.61−$4.95
200–499$27.21$14.53$20.94$23.62−$3.59
500–999$23.06$14.33$21.74$24.72+$1.65
1,000–1,999$21.08$13.32$21.04$24.11+$3.03
2,000 or more$18.65$12.69$20.26$22.90+$4.25
All sizes$23.37$13.75$21.00$23.92+$0.55

Read the columns in order, because milk alone doesn’t cover full cost on any tier under 500 cows. Total Gross Value adds cattle sales and other income to the milk check — that’s what ERS nets against total cost, which is why Net isn’t Milk Sold minus Total Full Cost. The All sizes row is ERS’s own aggregate, not our average of the tiers.

The largest single driver on the mid-size row is capital recovery on machinery, housing, and equipment at $7.51/cwt.

Other published inputs:

  • All-milk price, 2026 forecast: $19.85/cwt. USDA ERS, Livestock, Dairy, and Poultry Outlook, August 19, 2026, U.S. national average, revised down 15 cents
  • Class III, August 2026: $16.64/cwt. USDA AMS, U.S. national
  • DMC in 2026: Tier 1 covers the first 6 million lbs of production history, raised from 5 million under the One Big Beautiful Bill Act, which also reauthorized the program through 2031. Coverage $4.00 to $9.50/cwt; $9.50 costs $0.15/cwt plus a $100 annual fee. USDA Farm Service Agency
  • DMC margin below $9.50 in 39 of 84 months, 2019 through 2025, or 46.4%. University of Wisconsin-Madison Division of Extension
  • The margin did not slip below $9.50 until December 2025, per the American Farm Bureau Federation, then triggered again in February 2026 on a margin of $8.46/cwt
  • Output per cow, 200–499 class, 2025: 23,479 lbs. USDA ERS

Stated assumptions, not source figures:

  • 75 lbs/cow/day, 365 days = 27,375 lbs/cow/year = 273.75 cwt. A managed Northeast or Upper Midwest herd, above the ERS class average. Substitute your own DHIA number.
  • The floor operates as a minimum, not a substitute price. A floor below market does nothing.
  • The 200–499 tier is the relevant one for a 200-cow herd if floors are tiered by herd size, as the sponsor’s materials describe.

Bullvine math:

200 cows × 75 lbs × 365 days = 5,475,000 lbs = 54,750 cwt.

The Two Costs, Side by Side

CaseCost basisFloor ($/cwt)Binds at $19.85?Uplift ($/cwt)Whole-HerdPer Cow
A — full economic costERS total costs listed, 200–499, 2025$27.21Yes+$7.36+$402,960+$2,015
B — operating cost onlyERS operating costs, 200–499, 2025$14.53No$0$0$0

Same herd. Same tier. Same dataset. Same year. The only variable is which cost measure a rulemaking adopts. Full economic cost includes imputed returns to owned land and the value of unpaid family labor. Operating cost doesn’t. When a producer says “my cost of production,” they almost always mean the second. When ERS publishes cost of production, it leads with the first.

Read Case A as a per-hundredweight transfer before you read it as a per-cow windfall. A $7.36/cwt uplift is what full-cost pricing actually costs — a 37% lift on the current all-milk forecast, and the strongest available argument against the bill as well as for it. Substitute the ERS class output of 23,479 lbs/cow and the same floor delivers $345,611 whole-herd, or $1,728 a cow.

The Handler Problem, and Why the Bill Reaches for a Single Desk

A tiered floor creates an immediate commercial trap, though not quite the one it first appears to be.

On the 2025 ERS numbers, a full-cost floor prices 200-to-499-cow milk at $27.21/cwt. A 2,000-plus-cow herd’s full cost is $18.65 — below the $19.85 all-milk forecast, so a floor set there never binds and that milk still clears at market. The penalty for sourcing from the smaller herd isn’t the gap between the two floors. It’s $27.21 minus $19.85: $7.36/cwt, the identical figure the mid-size producer gains.

That symmetry is the finding. A transfer has two sides, and both are the same size. No processor buying in a normal market absorbs $7.36 voluntarily, which is why mid-size patrons would be the first contracts under pressure.

The bill appears to see this coming, and its answer is structural rather than financial. On the descriptions available, the Secretary would purchase milk from producers and sell it on to handlers. That removes the choice: a cheese plant can’t drop its small patrons because it wouldn’t have patrons, it would have a supply relationship with a Regional Board.

Which moves the $7.36 rather than erasing it. Somebody still pays the difference between what the Board pays a 200-cow herd and what it charges the plant, and the resale price is the number we can’t find. That’s the question a mid-size operator should want answered before anything else in this bill — not whether the floor is generous, but who sits on the other side of it, and at what price. 

What You’d Be Giving Up

Section 3(b) would settle the other half of the math. DMC would be suspended while the Program runs, and Dairy Revenue Protection couldn’t be offered. Here’s the arithmetic on giving that up.

At $9.50 coverage on 95% of a 200-cow herd’s production history, 52,012.5 cwt at $0.15/cwt is $7,801.88 a year in premium, plus the $100 fee. DMC repays that in any year when indemnities exceed $0.15/cwt of covered production— the premium rate itself. February 2026’s $1.04/cwt shortfall, spread across a twelfth of annual production, is worth $0.0867/cwt on the year, so roughly 1.7 months at February’s depth covers it. Across 2019 through 2025 the margin sat below $9.50 in 46.4% of months, though the record since December 2025 has been sparser.

Methodology Note. Both floor figures are ERS-published 2025 values from the size-of-operation workbook, read directly from the file, not Bullvine constructions; the modeled inputs are yield and DMC election only. “Total Full Cost” is ERS “total costs listed” — operating costs plus allocated overhead, which for the 200–499 row is $14.53 plus $12.68. All uplift figures are calculated against the all-milk forecast as of the August 19, 2026 ERS release; USDA’s release calendar puts the next Livestock, Dairy, and Poultry Outlook on September 16, and it will supersede that figure. Class III appears as market context only; Class III, CME futures, and a legislated floor are three separate things. Per-cwt uplift scales linearly with volume. No double counting: the DMC premium appears once, indemnities once. We do not model any dividend, because its size would depend on how much over-allotment milk the country ships. On how sharply full and cash cost diverge as herds get smaller, see our small herd cost of production breakdown.

One more thing about the data. ERS states that estimates since 2021 “are based on the 2021 USDA, Agricultural Resource Management Survey (ARMS) data from milk producers, with subsequent updates based upon annual price changes.” The 2025 figures above are price-updated from a 2021 structural snapshot. Any floor built on this series inherits that, and the next ARMS re-survey would reset the entire cost ladder.

The 30/90/365 Playbook for Herds Shipping Under 500 Cows

30 days

  • Get two cost numbers from your accountant, not one: cash cost, and full cost with unpaid labor and capital recovery included. Your tier’s 2025 ERS figures are $14.53 and $27.21. Requires one meeting. Threshold: the gap between your two numbers is the range cost-of-production pricing would swing your milk check across. Backfire risk: quoting only cash cost in a comment to USDA argues for the floor that pays you nothing.
  • Pull your 2026 DMC election and divide last year’s indemnities by your covered hundredweight. The Tier 1 threshold moved to 6 million pounds this year, so more of your production may be covered than you think. Threshold: if that number beats $0.15/cwt, DMC has been paying you, and Section 3(b) would take it away. Backfire risk: DMC is a national margin, so yours may have moved differently.
  • Red-flag trigger: if your debt service coverage ratio has been under 1.2 for three consecutive months on your lender’s calculation, losing DMC and Dairy Revenue Protection together is a covenant conversation, not a policy curiosity.

90 days

  • Ask your lender how they underwrite your operating line of credit. DMC indemnities are a documented, program-based cash flow with a published trigger — the kind of line a bank can put in a pro forma and lean on when sizing a winter feed line. Dairy Revenue Protection is the same. If both were suspended, ask specifically: higher cash equity, tighter collateral margins, a lower advance rate, or a covenant change? Requires your loan officer, your last two operating-line renewals, and both cost figures above. Threshold: urgent before your next renewal if either program appears in your credit file. Backfire risk: raising a hypothetical bill can spook a nervous lender — lead with the arithmetic and the fact that nothing is in force.
  • Write down the production figure you’d want as your allotment base and the three years behind it. Requires DHIA or handler records for the past three years. Threshold: if your last twelve months ran more than 5% above your three-year average, how a base gets calculated is worth real money to you.
  • If you’re a co-op delegate, ask your government affairs staff three questions in writing: what happens to your co-op’s base plan if a federal allotment system arrives, what the co-op considers cost of production to mean, and what price handlers would pay a Regional Board. Requires one email. Threshold: immediate if your co-op is preparing a position.

365 days

  • Decide whether your next capital commitment assumes a volume-growth path or a component-and-efficiency path, and run both. Capital recovery is already the largest cost line on your tier at $7.51/cwt. Requires a nutritionist, a breeding plan, and a capital budget. Threshold: any commitment past 2027 with payback built on more hundredweight. Backfire risk: over-rotating to components on a thin premium schedule leaves money on the table if no supply program passes.
  • Opportunity signal: the bill’s described structure redirects allotment toward new entrants and funds farmworker ownership assistance. If a generational transition sits on your five-year horizon, those are the provisions to read when the text is in front of you.

The Committee Vote That Decides Whether Any of This Matters

The Senate Agriculture Committee voted 10-11 against reporting the 2026 Farm Bill out of committee on August 6. Chairman Boozman recessed the committee before the summer break rather than reporting the failed vote, so he could call members back without a lengthy amendment and debate process.

He’s calling them back. Boozman told POLITICO on September 10 that he plans another committee vote next week, without a firm date set: “I really feel like it’s important to continue to have members express where they’re at on this, and so we are going to vote again next week.” He said he’ll call the vote whether or not Sen. Mitch McConnell — hospitalized since June, home for rehab since August, and hoping to attend “if it’s humanly possible” — is well enough to be there. McConnell’s absence, alongside unified Democratic opposition, is what stalled the August markup.

Note what the fight is actually about, because it isn’t dairy. Democrats voted the package down over SNAP spending cuts, and their demand is two extra years for all states before a new requirement that states pay part of SNAP benefits. Boozman’s bill offers a one-year delay, and he told POLITICO that’s his best and final offer. Which means the dairy title’s fate rides on a nutrition-program dispute, and a reopened dairy title is where stabilization language would arrive as an amendment. Advocacy groups backing S.4906 have spent the past week urging exactly that. As of today the bill remains referred, unmarked-up, and unscheduled on its own.

Whether cost-of-production pricing pays you $7.36 a hundredweight or nothing turns on which of USDA’s two cost numbers a rulemaking picks. Get both from your accountant this month — cash and full. Then ask your lender what your operating line looks like if Section 3(b) takes Dairy Margin Coverage off the table.

Key Takeaways

  • USDA publishes two cost figures for a 200-to-499-cow herd in 2025 — $27.21/cwt full economic cost and $14.53 operating cost. S.4906 would price milk off cost of production without saying which. That’s $402,960 a year on 200 cows, or nothing.
  • Section 3(b) would suspend Dairy Margin Coverage and bar Dairy Revenue Protection while the Program runs. DMC at $9.50 costs a 200-cow herd $7,801.88 a year and repays that whenever indemnities clear $0.15/cwt — about 1.7 months at February 2026’s margin.
  • A full-cost floor prices mid-size milk $7.36/cwt above what the market pays for large-herd milk — the same figure the producer gains. The bill’s answer is to make USDA the buyer, which relocates that transfer rather than removing it. Nobody has said what handlers would pay.
  • Senate Agriculture is expected back in markup the week of September 14, on a vote Boozman says he’ll hold regardless of attendance. The blocker is SNAP, not dairy — but a reopened dairy title is the route an amendment would take.
  • Get both cost numbers from your accountant this month, cash and full, before any comment period opens. Then ask your lender what your operating line looks like without DMC.

Run Your Numbers

Dairy Profit Projector — This article gives you USDA’s two cost figures. The Projector gives you yours: drop in your herd size, production, and ration to get your own breakeven milk price and margin per cwt, then move the milk price to see where a floor would actually bind.

Learn More

The Sunday Read Dairy Professionals Don’t Skip.

Every week, thousands of producers, breeders, and industry insiders open Bullvine Weekly for genetics insights, market shifts, and profit strategies they won’t find anywhere else. One email. Five minutes. Smarter decisions all week.
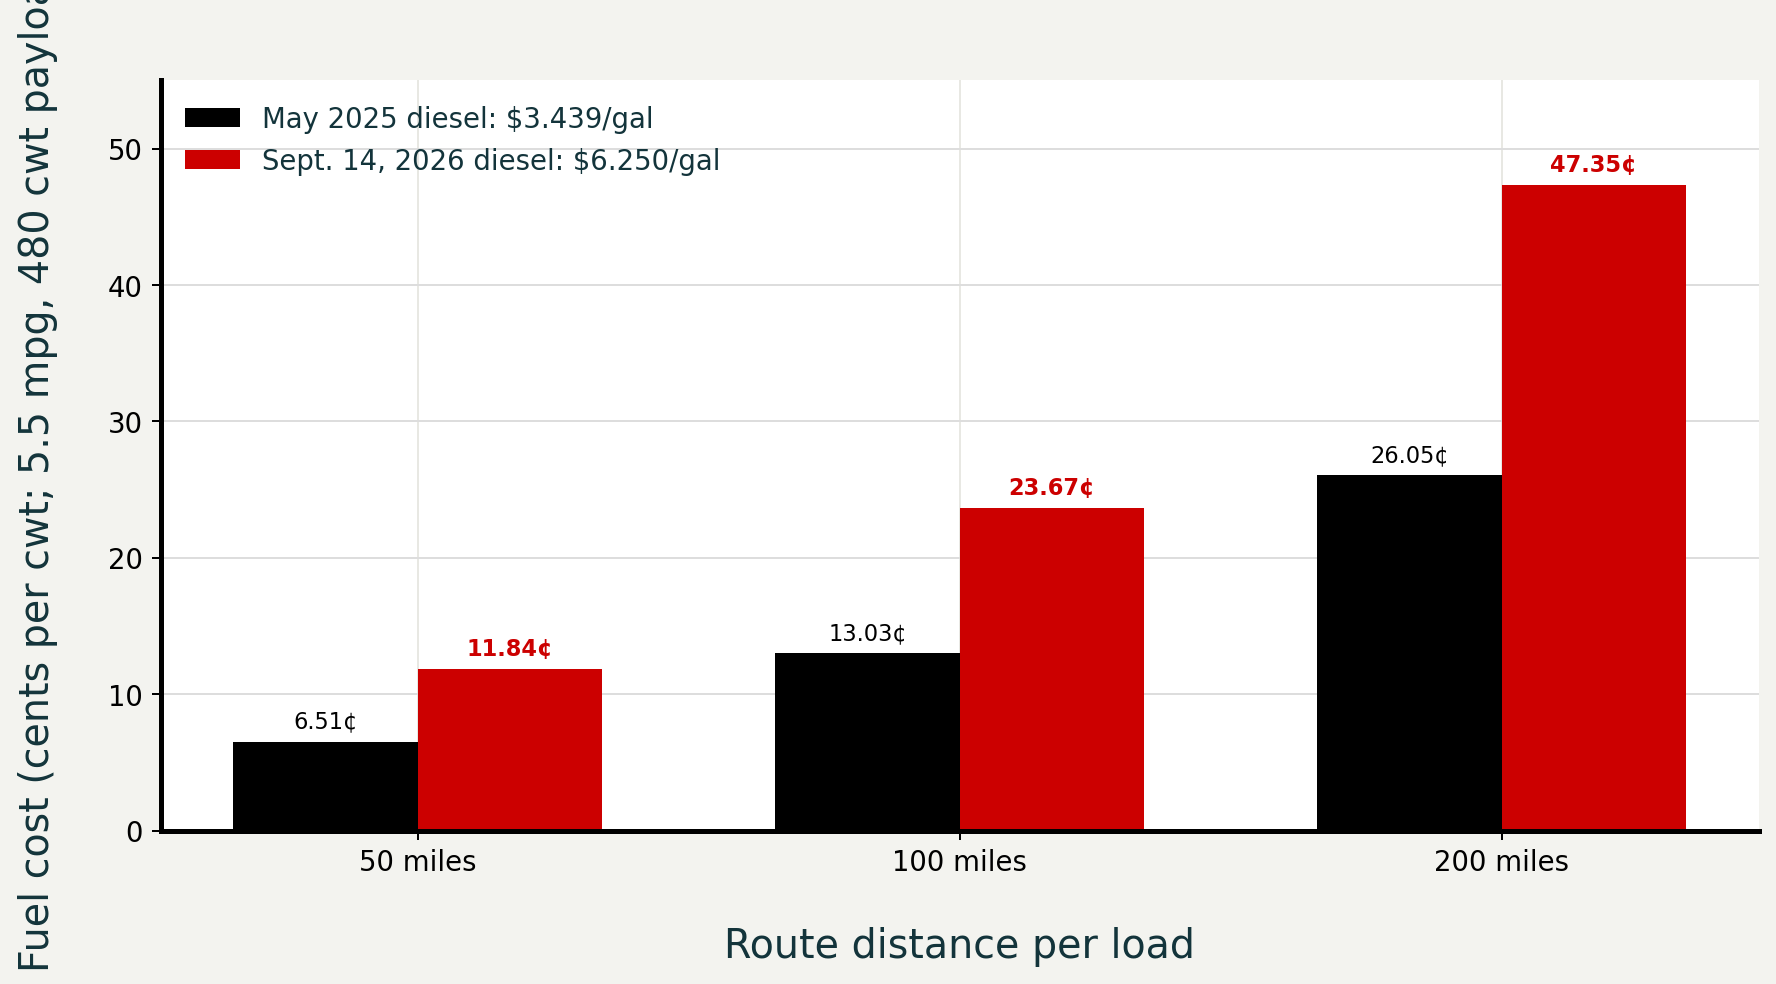
NewsSubscribe
First
Last
Consent

$43,758 for Zero Extra Pounds — and 40 Dry Stalls That Pay Back in Months, Not Years

The lights measured zero. The dry pen didn’t. On a 250-cow herd that’s 41 freshenings a year at $459 each — and one hour in the herd software to find out.

EXECUTIVE SUMMARY

  • The lighting trap. Cornell Cooperative Extension fitted a 1,000-cow western New York dairy with long-day lighting, tracked milk for 14 months against a true control, and measured zero response — turning a $43,758 install into a net loss across all fifteen sensitivity runs.
  • The overlooked pen. University of Florida’s IFAS puts dry cows given cooling and shade at 11 lb/day more milk in the next lactation than cows given shade only. On a 250-cow herd with 60 heat-stress days, that’s 41 affected freshenings and $459 a cow — roughly $18,800 a year against a $4,000–$12,000 install, paying back in under three to eight months. The ranking holds at $17 milk as well as $22.
  • The catches. Cool the entire 60-day dry period: partial cooling rescues yield for about three weeks instead of thirty. And count the feed. On the milking string, a $26,000 fan retrofit runs 16.9 months on gross milk recovery but 69 to 83 months once Kentucky’s net-of-feed figure is applied.
 dry cow cooling payback

Equipment costs retrieved August 31, 2026. Milk price: $19.85 USD/cwt (USDA ERS Livestock, Dairy and Poultry Outlook, August 19, 2026 — the most recent all-milk forecast as of publication). Exchange rate: $1 USD = $1.3825 CAD (Bloomberg, September 10, 2026, 10:16 a.m. EDT). All dollar figures are USD unless marked CAD. Retrofit basis, not new construction.

In September 2012, Libby Eiholzer and Michael Capel started rewiring a dairy barn in western New York.

Eiholzer is a bilingual dairy specialist with Cornell Cooperative Extension’s North West New York Dairy, Livestock and Field Crops Team. Capel is a veterinarian at Perry Veterinary Clinic. On a NYSERDA-funded study, they built something the industry had talked about for thirty years and rarely actually measured on a working farm: a controlled test of long-day lighting, with a real control group, on a 1,000-cow commercial dairy, running fourteen months.

Three barns. LED on a 16-to-18-hour photoperiod. T8 fluorescent on the same photoperiod. And one barn deliberately held below the light threshold as a control. They checked it with a photometer — both treatment barns stayed above 150 lux; the control never cleared 115. Milk came off monthly DHIA tests across roughly 300 days per cow.

Clean design. And to be clear about what they were doing: testing a published hypothesis on a working farm, not going after anybody’s product.

What did the trial actually find?

Nothing. No milk response at all.

From the conclusions of NYSERDA Report 15-11, April 2015: “Despite previous research results, LDPP did not result in an increase in milk yield in this study. There was no statistical difference in milk production detected between the first lactation animals in the LDPP LED and the LDPP T8 treatment groups, nor between the mature cattle in the LDPP LED, the LDPP T8 and the control T8 treatment groups.”

Fitting that LED barn cost $43,758 USD in 2012 dollars. With no milk response and an 80,000-hour fixture life, the partial budget came back at negative $8,400 a year. Then they ran fifteen combinations of fixture lifetime and electricity cost, looking for one that worked. All fifteen came back negative.

The biology isn’t junk. Peters and colleagues reported it in Science in 1978: sixteen hours of light daily at 114 to 207 lux raised milk yield 10 to 15% against cattle on natural photoperiods of 9 to 12 hours at 39 to 93 lux. Dahl, Buchanan and Tucker’s 2000 review in the Journal of Dairy Science confirmed long-day stimulation across numerous studies and pointed to IGF-I as the likely mediator. That’s the foundation under every lighting quote you’ve been handed — including our own coverage of the 8% claim, which this piece corrects.

That same 2000 review flagged something the industry mostly forgot. Relative to long days, short-day treatment during the dry period produced the largest magnitude of milk-yield response in the subsequent lactation. Hold that thought.

But Eiholzer and Capel were straight about why their farm might not have shown the lactating-cow effect. Long-day photoperiod needs six to eight hours of genuinely uninterrupted dark. Milking three times a day, cows kept ending up in the holding pen or the parlor under lights during what was supposed to be their dark window. Two waterers froze in the LED barn over the winter of 2013–14, restricting water for part of the season.

One trial isn’t a verdict. It’s also the only independent commercial trial, and it measured zero.

The pen you drive past on the way to the parlor

Here’s what holds up. And notice where it points — the same place the photoperiod work pointed twenty-six years ago.

The University of Florida program — Geoffrey Dahl, Sha Tao and colleagues — established that cows heat-stressed in late gestation give less milk in their next lactation than herdmates that were cooled. The mechanism is impaired mammary development before she calves, not heat stress while she’s milking. Tao and Dahl published the core work in JDS in 2013, and Fabris and colleagues extended it across the full dry period in 2019.

For the number to plan around, UF’s own extension economics publication is the place to go. IFAS document AN342, updated August 2026, puts it plainly: dry cows given evaporative cooling and shade produced on average 11 lb per day (5 kg) more milk in the next lactation than cows given shade only, citing do Amaral et al. 2009 and Tao et al. 2011 and 2012.

Other sources land higher or lower — University of Maryland Extension cites 9 pounds, and Purina’s summary of the same Florida work says 14 in the first 30 weeks. IFAS’s 11 is the conservative middle, and it comes from the publication written specifically to answer the economics question, so that’s what we use below.

Here’s the condition most people miss. Lactanet’s summary of the Florida work is blunt: cooling for the entire dry period raised milk yield out to 30 weeks into lactation. Cooling only the early or only the late dry period partially rescued yield for just the first three weeks. If you cool the close-up pen and leave the far-off pen in the sun, you’re buying three weeks of benefit, not thirty.

Run the number on your own herd

Say you milk 250 cows, your dry period runs 60 days, and you carry roughly 60 days a year where heat genuinely costs you milk. About 41 of your annual freshenings will have spent their dry period inside that window — 250 × 60 ÷ 365.

Take IFAS’s 11 pounds across the 30-week measurement window:

11 lb × 210 days = 2,310 lb, or 23.1 cwt — about $459 USD a cow.

Multiply by 41 cows, and you’re at roughly $18,800 USD a year. Milking 200? Thirty-three cows fall in that window — about $15,100.

That $459 moves with the milk price, obviously. At $17 — the number your lender is probably modeling — it drops to $393 a cow, or $16,100 across the herd. At $22, it’s $508 and $20,800. The ranking doesn’t change at any of those prices, which is more than you can say for most of what’s below.

One caveat on that 41: it treats partial heat exposure as proportional. Fabris found late-gestation exposure matters most, so a cow stressed for twenty of her sixty dry days may not take exactly a third of the hit. The number could move either way.

Why does it pay so fast? The dry pen is small. Cooling 40 stalls costs a fraction of cooling 250, and the return per cow is bigger and lasts longer. Scaling the University of Wisconsin–Madison Dairyland Initiative’s published figure of $104 USD per cow, fans and soakers over a 40-stall dry pen lands in the $4,000 to $12,000 USD range. Against roughly $600 USD a year to run them, that pays back in under three to eight months — the low end if you’re at the cheap end of that install range, the high end if you’re not.

Two things to know about that cost. It’s scaled from a published per-cow number, not a contractor quote. And the Dairyland figure comes from an 800-cow barn in Green Bay, so scaling down to 40 stalls understates it — electrical service and mobilization don’t shrink proportionally.

Nobody sends a rep out to quote a 40-stall dry pen. That’s most of the story right there.

And this model doesn’t count the upside. Urdaz and colleagues (2006) ran 475 prepartum cows and found adding shade and fans to an existing feed bunk sprinkler system produced a significant lift in 60-day milk production and an economic benefit over the cooling system already in place. Separately, UF extension work reports daughters of heat-stressed dry cows produce 4.9 lb/day less in first lactation and 5.1 lb/day less in second, with effects documented across up to three lactations. Cooling the dry pen buys milk you won’t see for three years.

Does cooling the milking herd actually pay at $19.85 milk?

The Dairyland Initiative publishes two numbers for a natural-ventilation retrofit with fans over the stalls: $104 USD per cow installed, and $20.05 USD per cow per year to run them. Our own first draft only used one of them. On 250 cows that’s $26,000 in and about $5,012 a year in electricity.

Now the part that matters. Fans and soakers mitigate heat stress — they don’t erase it. So the driver isn’t the milk you’re losing. It’s the milk cooling actually gets back, and that’s been measured across several trials.

University of Kentucky extension engineers pulled four sprinkler-and-fan trials into one table. Florida: 39.8 lb up to 44.4, a gain of 4.6 (11.6%). Kentucky: 50.1 to 58.0, a gain of 7.9 (15.8%). Missouri: 51.4 to 55.8, a gain of 4.4 (8.6%). Israel: 72.8 to 78.0, a gain of 5.2 (7.1%). Rectal temperature fell a full degree Fahrenheit in the Kentucky work.

Liu and colleagues, publishing peer-reviewed work in Animals in 2024, ran an automated sprinkler system and found milk yield of 31.3 kg against 29.4 in controls — up 1.9 kg, or 4.2 lb (P = 0.046, nine cows per group). And a 2020 JDSstudy of alternative cooling strategies found no milk difference at all, which the authors attributed to low heat load during the study period.

Milk recovered /cow/daySource trialNet annual gain, 250 cows @ $19.85 USD/cwtSimple payback on $26,000 USD install
0 lb (low heat load year)2020 JDS trial–$5,012 (electricity loss)Never
4.2 lb (1.9 kg)Liu et al. 2024, Animals$7,49441.6 months
4.4 lbMissouri trial$8,08938.6 months
5.2 lbIsrael trial$10,47129.8 months
7.9 lbKentucky trial$18,51016.9 months

Payback reflects gross milk recovery minus $5,012 USD in annual electricity. It doesn’t subtract the additional feed those cows will eat — see below.

Read the column header carefully. It says recovered, not lost.

And here’s the cost that table leaves out, which is exactly the thing we’ve been complaining about. Cooled cows eat more. Rather than estimate the feed line ourselves, look at what Kentucky Extension reports as the bottom line: 25 to 30 cents USD per cow per day in additional net income, after paying for the increased feed, water, and electricity. On 250 cows across 60 days, that’s $3,750 to $4,500 a year — and a payback closer to 69 to 83 months.

That is a different investment than the one in the table. Same equipment, same barn. The gap is feed, and it’s the single largest omission in most cooling proposals — including our own, until we went looking.

BasisMilk recovered/cow/dayAnnual value, 250 cows @ $19.85/cwtPayback on $26,000 install
Gross milk recovery (Kentucky trial)7.9 lb$18,51016.9 months
Net-of-feed, water, electricity (Kentucky Extension)7.9 lb$3,750–$4,50069–83 months
Difference attributable to feed/water/power$14,010–$14,76052–66 months added

Where you farm changes the answer

Gunn and colleagues (2019) projected abatement economics under mid- and late-century climate scenarios and put mean annual net values at –$30 to $190 a cow for High abatement, and –$20 to $590 for Intense. Note the negative floor on both — and that the biggest returns sit late-century rather than today. Reviewing that same paper in 2025, Hutchins and colleagues summarized it bluntly: heat abatement is only cost-effective in the most intense heat.

USDA’s ERS (Key et al., ERR-175) sorted states into four tiers by long-run THI load. The Pacific Northwest and Northeast carry the lightest exposure. The Desert Southwest, Southern Plains, and Southeast have the heaviest. If you’re farming in the top tier, everything in the table above moves toward the bottom row. If you’re in the lightest, it drifts toward the top — and the top row is a loss.

That doesn’t mean you’ve got nothing to spend on. It means the two break-evens further down — five lameness cases, seventeen minutes a day — are where your capital has to earn its keep instead, because neither one depends on how hot your July gets.

How do you know if your barn has a problem worth spending on?

Pull last July’s daily milk weights. Not the monthly test, and not the bulk tank — the per-cow dailies.

The Dairyland Initiative’s own diagnostic is a drop of more than 5 pounds per cow per day in warm weather. That tells you heat is costing you something. What you recover depends on what you install and how you run it. And it’s exactly why monthly testing misses this: heat comes and goes between tests, so a monthly number can look fine while you bled milk for nine straight days.

The management detail matters more than the equipment brochure. Ohio State extension guidance is specific: about 30 seconds of soaking at 0.9 to 1.4 gal/min to wet a cow’s coat through, then four to five minutes of fan-only time to dry her. Air should reach cow height at 8 to 10 ft/sec. Start the system at THI 65 to 68 — roughly 70 to 75°F with moderate humidity — because preventing a rise in body temperature is far easier than pulling one back down.

Flow rate is its own lever. Tresoldi and colleagues, in JDS in 2019, found milk yield roughly 5 kg/day higher in cows soaked at 1.25 and 2.0 L/min than at 0.5 L/min. Same fans, same barn, different nozzle.

For your own local picture, UW–Madison Extension’s Heat Abatement Investment Scouter turns your coordinates into ten years of hourly temperature and humidity and estimates annual hours above THI 68. In Wisconsin, that’s 1,000 to 2,000 hours a year — call it 42 to 83 full-day equivalents. Lactanet, working from a lower THI-60 threshold, reports the Canadian average at 117 days outside the comfort zone.

What Ontario’s incentive program changes

If you farm in Ontario, check the incentives before you price equipment. Everything in this section is in Canadian dollars.

Save on Energy’s Retrofit program lists recirculation ventilation fans as an eligible agriculture measure, and on the schedule effective June 30, 2026, the incentive runs up to $4,820 CAD per high-volume low-speed fan. High-efficiency ventilation exhaust fans draw up to $500 CAD each. Also on the agribusiness list: dairy plate coolers at $1,800 CAD, milk scroll compressors at $1,620 CAD, low-energy livestock waterers at $580 CAD, and solar hot water collectors for dairy at $2,380 CAD.

Two things to watch. The program’s per-cow natural ventilation measure — $56 CAD a cow — is written for tie-stalls, not freestalls, so a freestall dry pen doesn’t qualify. And every figure above is a maximum: IESO states plainly that actual amounts depend on equipment size and eligible cost caps.

Now convert before you compare. The Dairyland figure of $104 USD per cow is roughly $144 CAD at today’s rate, so a 40-stall dry pen at the middle of our range — $7,000 USD — is about $9,700 CAD installed.

Against that:

  • At the HVLS rate, a $4,820 CAD incentive covers roughly half the project. Net cost lands near $4,900 CAD, or about $3,500 USD — a payback around two and a half months.
  • Under the $500 CAD exhaust measure, net cost is about $9,200 CAD, or $6,700 USD — a payback of around four and a half months.
  • If the project fits no prescriptive measure, the Custom stream pays $1,800 CAD/kW or $0.20 CAD/kWh, whichever is higher, up to 50% of eligible project costs — which on a larger cooling retrofit may beat the prescriptive route outright.
Incentive streamMax incentive (CAD)Net install cost (CAD)Net cost (USD)Approx. payback
HVLS fan rate$4,820~$4,900~$3,500~2.5 months
Exhaust fan rate$500~$9,200~$6,700~4.5 months
Custom stream (if no prescriptive fit)50% of eligible costsVaries by projectVariesCase-by-case

One honest limit on those paybacks: the milk revenue behind them uses the USDA all-milk price, because we don’t have a verified Ontario blend price for this analysis. Substitute your own, and the months will move. The cost side of the comparison is sound regardless — halving your install price halves your payback, whatever you’re getting paid for milk.

Either way, it’s the fastest thing in this article, and the difference between those numbers is one phone call: IESO at 1-844-303-5542 or retrofit@ieso.ca. Program terms change, and prescriptive measures require pre-approval and follow one-for-one replacement rules. Confirm eligibility and current amounts before you build a budget on any figure here.

Two upgrades you can settle with a break-even

For these, the cost side is well documented, and the benefit side isn’t. So here’s the break-even instead of a payback — check it against your own records.

Rubber flooring in alleys. Cornell’s NYSCHAP flooring module puts grooved rubber belting at $2.25 to $2.75 USD per square foot installed. Cover 4,000 square feet of transfer alley and holding area, and you’re near $10,000. Vanegas and colleagues (2006) documented reduced claw growth and wear versus bare concrete — a real, peer-reviewed hoof-health benefit.

Lameness cost is documented too. Penn State Extension, updated January 2026, cites Dolecheck and Bewley’s summary at $76 to $533 USD per case, with one study averaging $336.91. Cha and colleagues (2010) broke it out by lesion: $216 for sole ulcer, $133 for digital dermatitis, $121 for foot rot.

So: $10,000 over eight years at 7% needs about $1,675 a year back. At $336.91 a case, you need to prevent five cases a year. At the low end of the published range, twenty-two. Whether rubber prevents five cases in your barn is the number nobody has published. Count last year’s cases and decide.

Automated calf feeders. Iowa State Extension puts stations at $2,000 to $28,000 USD, using $5,500 as a used-equipment default. CalfStar listed new CalfExpert units from $23,250 USD as of August 2026. Two used stations plus a computer runs about $13,500.

Run the break-even in your own currency, because the wage rates differ. In the US, OEWS 2024 puts livestock farmworkers at $18.55 USD an hour — against a $13,500 setup over ten years at 7%, break-even is 17 minutes a day. On the CalfStar figure, 29 minutes. In Ontario, FARMS Ontario’s October 1, 2025 schedule runs $17.60 CAD lower-skilled and $19.06 CAD higher-skilled, with the provincial minimum moving to $17.95 CAD on October 1, 2026 — and that same used setup converts to roughly $18,700 CAD, putting break-even nearer 25 minutes a day.

That US figure comes from OEWS now because USDA’s NASS canceled the Farm Labor Survey on August 28, 2025, and posted the discontinuance to the Federal Register on September 3. The long-running quarterly benchmark for farm wages no longer exists.

Iowa State’s producer survey found farms averaging 2.2 hours a day feeding calves, with some who switched reporting 1.5 hours a day saved — about a 16-month payback at the US wage. But the same survey recorded others saying flatly that no labor was saved at all; the hours just moved from feeding into monitoring. Seventeen minutes is a low bar. Whether you clear it depends on whether you bank the time or spend it watching calves.

UpgradeInstall costAnnualized cost (8yr @ 7% or 10yr @ 7%)Break-even requirement
Rubber alley flooring (4,000 sq ft)~$10,000~$1,675/yr5 prevented lameness cases/yr @ $336.91 avg
Used automated calf feeder (2 stations)~$13,500 USD / ~$18,700 CAD17 min/day saved (US wage) or ~25 min/day (Ontario wage)

Three we won’t put a payback on

These fail for three different reasons — a contested effect, a missing cost, and a null result. Worth knowing which is which, because they don’t all mean the same thing.

Cow brushes — the effect size is contested. The 2.2-pound figure everyone cites traces to one 2009 Cornell study by Schukken and Young at Sprucehaven Farm. Their abstract puts it precisely: installing the brushes produced either no difference in daily milk production in lactation 1 and lactation 3-and-higher, or roughly a 3.5% (1 kg) increase— that increase falling in second lactation. Clinical mastitis dropped by more than 30% in second-and-higher lactation animals. We found the field study on a cow-brush manufacturer’s website. Readers can find the funding and disclosure details in the paper itself.

Two later studies don’t line up with it. Li and colleagues, in Veterinary Sciences in 2024, found the milk response in higher-parity animals — fourth and fifth — with no significant difference in second and third. Griffin’s 2025 Mississippi State thesis found brushes lowered cortisol, but milk didn’t differ statistically: 19.9 versus 22.4 kg/day, P = 0.18. The numerical gap ran the wrong way, with the brush group producing less, which usually means a sample too small to settle it either way.

Three studies, three answers. On Schukken’s number, five brushes pay back in about seven months. On Griffin’s, never. Buy brushes for the welfare case and the mastitis finding — both better supported than the yield claim.

Sand bedding — the cost side doesn’t exist. Where brushes have a disputed benefit, sand has a well-established one and no published price. OMAFRA puts sand at $8–10 per tonne against $40–50 for organic bedding, and the comfort case is solid. What nobody publishes is the retrofit manure-handling cost, and on an existing barn that decides everything. Patz names converting existing barns as a distinct cost. McLanahan notes reclaimed sand offsets 90–95% of purchase. Neither publishes a price for the separation system a barn without one has to add. We checked university, extension, and ministry sources across several passes and found no figure, so we’re not handing you one. Treat sand as a new-build decision until somebody prices that equipment.

Automated feed push-up — the one trial measured nothing. And this one has both a cost and a benefit study. The problem is what the study found. Kary Babb, working through a Vita Plus Dairy Technical Extended Internship in partnership with UW–Platteville, tested a Lely Juno against skid-loader push-up at the university’s Pioneer Farm over four months in an ABA design. Her result: “no significant change in milk production and only a slight change in dry matter intake.” That’s one machine, on one farm, over four months — a result about this trial, not a verdict on the technology.

The detail that lands hardest is Babb’s own explanation. “This farm has been well managed prior to implementing the Lely Juno 100. Feed was pushed up at least six times a day using the skidloader.” They tested the machine where it had almost nothing left to improve.

The labor case is better sourced and still tight. Jack Rodenburg of DairyLogix, working a Progressive Dairy Operators survey of 115 herds from 40 to over 1,000 cows, found the average herd pushing feed 4.27 times a day at 6.07 minutes a go — 158 hours a year, $2,256 in labor at $14.31 an hour. Against a then-quoted $24,675 machine at 5% over 15 years, his read: the average farm comes “about $100 per year short on covering the cost of ownership from the labour saved.” The two farms in that survey that already owned one pushed feed 11 and 18 times a day. Well above average.

That’s your rule — the labor case strengthens the more often you do it by hand, and collapses if you’re already at two. Same discipline we applied to sensors, where precision monitoring ran past a six-year payback on health benefits aloneonce Cornell’s real 2.1-day warning window replaced the five days in the marketing.

The Bullvine action checklist

Audit last July’s per-cow dailies. Not the monthly test, not the bulk tank. A drop over 5 lb/cow/day in warm weather tells you heat is costing you something. Under 3 lb and a $26,000 USD fan retrofit won’t clear its own $5,012 annual electricity bill, let alone the feed.

Price the dry pen before the milking string. Forty stalls at $4,000–12,000 USD return about $459 USD a cow, roughly $18,800 a year on a 250-cow herd, and it holds that ranking from $17 milk to $22. Cover the entire 60-day dry period — cooling one pen and not the other buys about three weeks of the effect instead of thirty.

Check the nozzles before you buy more fans. Tresoldi found roughly a 5 kg/day difference between cows soaked at 1.25–2.0 L/min and those at 0.5 L/min. Same equipment, different flow rate.

Strip two lines out of every quote you’re handed. Electricity at $20.05 USD/cow/year, and the feed those cooled cows will eat. Kentucky’s net-of-everything number is 25–30 cents USD per cow per day — compare any vendor’s milk-response math against that before you sign.

Work the break-even on the contested ones. Rubber flooring needs five prevented lameness cases a year. A used calf feeder needs 17 minutes a day at US wages, or about 25 in Ontario. Both are numbers sitting in your own records right now.

In Ontario, phone IESO before you phone a dealer. Whether your fans draw $4,820 CAD or $500 CAD roughly halves or barely touches your install cost — and that changes the ranking, not just the payback.

What’s your dry pen actually costing you?

Most of us can quote a robot to the dollar and a load of sand to the tonne. Fewer of us have ever put a number on forty stalls of dry cows standing in August heat, because nobody has driven out to the farm and asked us to.

Twenty-six years ago, a review in the Journal of Dairy Science said the largest photoperiod response showed up in the dry period. The industry went and sold lights for the milking string instead. That’s worth sitting with.

So run the hour. Count how many cows went dry between June and August, multiply by $459, and set that against whatever you were about to spend somewhere else. If it surprises you, you’re in good company — it surprised us enough that we threw out our first ranking and rebuilt it. Twice.

The full model goes out to Bullvine Weekly subscribers with the spreadsheet attached: every assumption, the NPV and IRR runs, milk-price sensitivity at $17 and $22, and the interaction math on which upgrades genuinely stack against which ones double-count each other through dry matter intake.

And if you’ve cooled a dry pen, send us the invoice. The weakest number in this article is what that retrofit actually costs, because no university publishes it and we won’t invent it. Reply with a real quote, and we’ll run it in next year’s update with your farm’s name on it.

Run Your Numbers

Dairy Profit Projector — Cooling only pays if the extra milk survives the extra feed. Drop in your herd size, production, milk price and ration cost, and the Projector returns your IOFC per cow per day and breakeven milk price — the two numbers that decide whether a cooling quote’s payback is real or gross.

Learn More

The Sunday Read Dairy Professionals Don’t Skip.

Every week, thousands of producers, breeders, and industry insiders open Bullvine Weekly for genetics insights, market shifts, and profit strategies they won’t find anywhere else. One email. Five minutes. Smarter decisions all week.
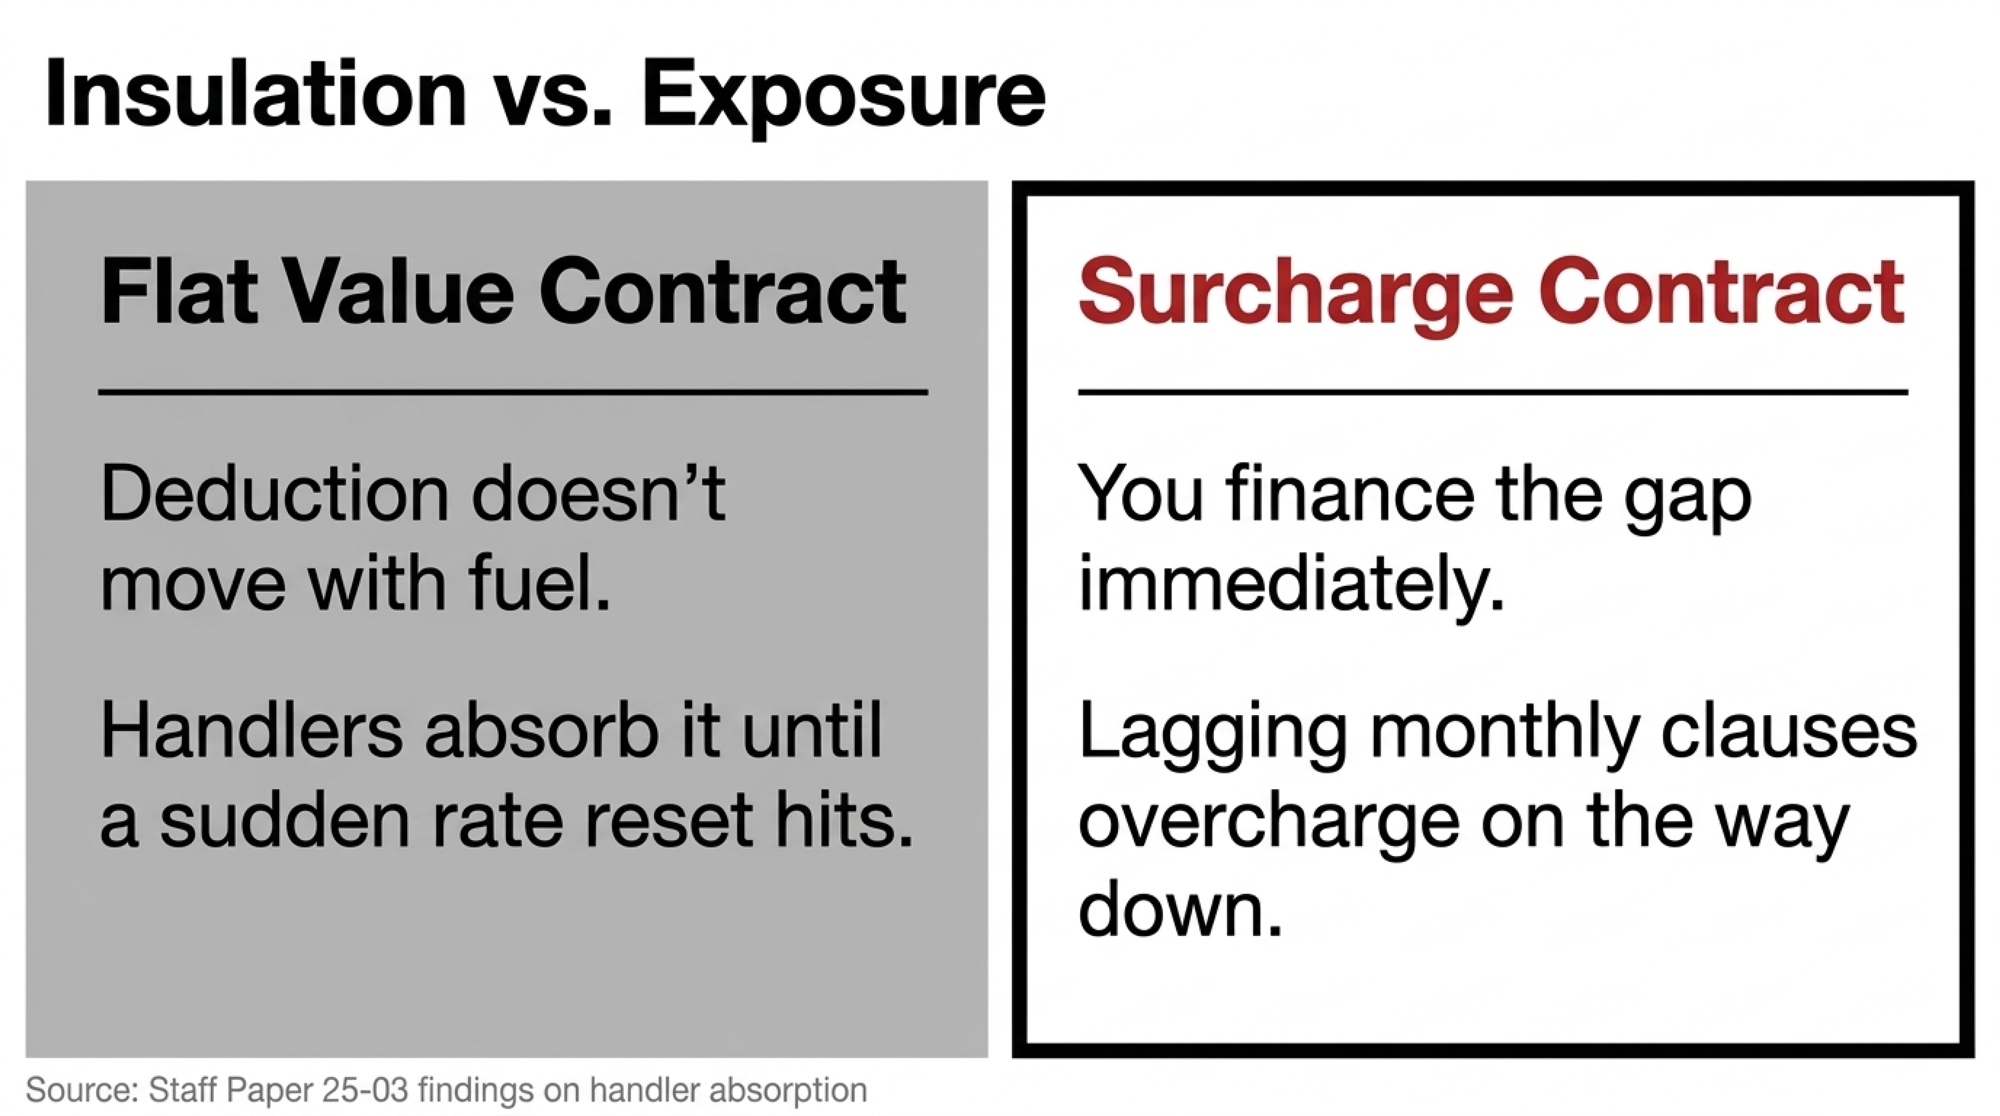
NewsSubscribe
First
Last
Consent

The 22% Starter Made Better Calves – Not Bigger Ones. Here’s the 3-lb Test.

The difference showed up in tissue, not on the scale — and only in calves already eating enough starter to use it. Here’s what to measure first.

When Jennifer Stamey Lanier, James Drackley and their colleagues at the University of Illinois ran Holstein calves on 18% and 22% crude-protein starters, they found something the marketing rarely mentions. Empty body weight gains between the two starter groups weren’t different

Read that again before your next feed conversation. The study most often cited to justify a 22% starter did not produce heavier calves.

What it did show is more interesting, and more useful. The higher-protein starter drove greater visceral tissue gains and cut the fat content of gain during the post-weaning period. Same scale weight, different calf. That distinction is where the 18-versus-22 decision actually lives — and it only matters if calves are eating enough starter to make it real.

What the Illinois Trial Actually Tested

The design matters, because it’s the part that gets flattened in sales conversations.

Stamey Lanier, McKeith, Janovick, Molano, Van Amburgh and Drackley ran calves from birth to 10 weeks across both a conventional and an enhanced milk-replacer program, crossing that with two starter protein levels. The starters were formulated at 18% and 22% CP on an as-fed basis — the numbers you’d read off a tag. Analyzed, they came back at 22% and 26% on a dry-matter basis, equal to 19% and 23% as fed. 

Body weight gain was greater for calves on the high milk-replacer program. It was unaffected by starter protein. Average weekly starter intake didn’t differ between the enhanced treatments either.

Where the higher-protein starter showed up was in composition and organ development — heavier reticulorumen tissue, more total protein in calves on high milk replacer plus high-CP starter, and greater plasma BHB supporting gastrointestinal development.

And here’s a line worth carrying into your next nutritionist meeting. The authors note that the NASEM model suggests 18% CP on a dry-matter basis should be adequate for calves fed enhanced milk replacer. The researchers testing the higher-protein starter said that out loud in their own paper.

Bullvine Bottom Line: The Illinois work supports 22% as a tissue-quality and rumen-development play under a high milk program. It does not support 22% as a weight-gain shortcut, and the researchers themselves flag 18% as potentially adequate.

The Long-Term Numbers Are Real — And Contested

The reason anyone cares about early-life nutrition at all traces back to Cornell.

Fernando Soberon, Michael Van Amburgh and colleagues examined test-day records in a 2012 Journal of Dairy Science study. In the Cornell herd, each additional 1 kg/day of pre-weaning average daily gain was associated with 850 kg more first-lactation milk. In the commercial herd, that figure came in at 1,113 kg. Their 2013 symposium analysis reported 42.9 kg more first-lactation milk per 100 g/day increase in pre-weaning nutrient intake.

Those are associations within study populations, not a promise attached to a feed tag.

The effect size is also genuinely contested. A separate meta-analysis of pre-weaned calf nutrition and growth produced more modest estimates of the same relationship. That disagreement isn’t a reason to ignore early-life nutrition. It’s a reason to stop treating one number as settled and start measuring what happens in your own barn.

The First Question Is Intake, Not Protein

Jim Quigley’s threshold gives you a better starting point than any tag.

His 15 kg cumulative non-fiber carbohydrate benchmark asks whether the calf has eaten enough fermentable carbohydrate for the rumen to carry more of the load once milk drops. For a starter running 50–55% NFC on a dry-matter basis at roughly 90% DM, that works out to about 30–33 kg — 67–73 lb — of cumulative starter as fed.

Daily benchmarks converge from four independent directions. AHDB puts a group ready to wean when calves are routinely consuming 1.5 kg per head per day of high-quality starter — about 3.3 lb as fed. Michigan State Extension puts early-weaned calves at 2–3 lb/head/day and accelerated-program calves at 4–5 lb/head/day. Call 3 lb your working floor.

That MSU split is the number most barns miss. The more milk you feed, the more starter a calf needs to be eating before you take that milk away.

On protein level, the NASEM 2021 guidance is a range rather than a single answer: 18–24% CP for large-breed calves, depending on the ratio of milk replacer to starter intake and your average daily gain goal. Which is another way of saying the tag can’t be evaluated without knowing the rest of the program.

Why Calendar Weaning Creates Trouble

Eight weeks is convenient. It lines up labor, grouping, deliveries, and calf movement. Convenience hides a weak transition when calves are still eating starter inconsistently.

Bullvine reporting on two Wisconsin calf programs, side by side, found the gap opens early: 1.73 lb/day pre-weaning gain on the stronger program against 1.39 lb/day on the weaker one, a 0.34 lb/day spread. The recommendation from that data was to switch the weaning trigger from age alone to starter intake plus age, stepping milk down over 7 to 10 days rather than pulling it.

Measure by pen if individual tracking isn’t practical. Offer a known amount, measure refusals at the same time next morning, divide by head count, write it on the pen board.

That gives your calf team something better than “they’re old enough.” It also tells you whether the protein you’re already paying for is being eaten in enough volume to matter — which is the only reason the cost math below is worth running. If you want the full mechanics, we’ve broken down how starter intake should guide weaning separately.

Is the Premium Worth It on Your Delivered Price?

The gap between 18% and 22% starter moves with supplier, ingredients, freight, medication, and region. There’s no honest national premium to print, so use your own quotes.

ScenarioPremium spread ($/ton)Starter consumed (lb)Added cost per calfShare of a $3,100 heifer
Low-end quote, threshold intake$3568$1.190.04%
Typical spread at the intake gate$4070$1.400.05%
Wide spread, strong intake$5075$1.880.06%
Fed through the post-weaning window$40100$2.000.06%
Common planning error$4055 (assumed, not measured)$1.10 — understates real cost0.04%

Cost per calf = [(22% price per ton − 18% price per ton) ÷ 2,000] × total lb consumed.

Run it at the consumption level your intake gate actually implies. If calves are eating to that 67–73 lb cumulative threshold, a $40/ton delta over 70 lb is $1.40 per calf. A $35/ton delta over 68 lb is $1.19. A $50/ton delta over 75 lb is $1.88. Feed to 100 lb through the post-weaning window at $40/ton and you’re at $2.00.

The cost side stays small across the whole range. The milk side is where honesty matters.

USDA’s August 2026 Livestock, Dairy, and Poultry Outlook revised the all-milk forecast down 15 cents to $19.85/cwtfor 2026, with 2027 at $19.80. National benchmarks — not your mailbox price, component schedule, or basis. Use them as a sensitivity assumption:

Potential gross value per heifer = (milk response in lb ÷ 100) × your milk price per cwt.

The multiplication is easy. Choosing an honest response assumption is the hard part, and the Illinois data won’t hand you one for starter protein alone.

Now put a dollar of starter in context. USDA NASS’s January 1, 2026 Cattle report put milk replacement heifers at 3.90 million head, down again from the previous year and the smallest dairy replacement inventory in 48 years. USDA reporting had springing heifers at $3,010 nationally as of July 2025, with spring 2026 figures near $3,100 and Upper Midwest pens running $3,400–$4,400.

Against a $3,000-plus asset in the tightest replacement market since 1978, a dollar-forty of starter is not where your risk lives. The risk is a heifer that doesn’t arrive in good shape.

How Do You Run the Pen-Board Check This Month?

You don’t need a research station. You need consistent records on two comparable groups.

Day 1–30: Weigh calves at birth and weaning, or apply heart-girth estimates consistently. Track starter offered and refused by pen for at least three weeks around expected weaning. Record the milk step-down date and the actual intake number at that point.

Day 31–90: Audit treatment events through the transition window. Compare delivered feed cost per calf against weaning weights and average pen intake across both groups.

Day 91–365: Measure breeding readiness — stature and weight at 12–13 months — to see whether the earlier gains held. First-lactation milk belongs in that longer analysis, with enough animals per group that you’re not drawing conclusions from three standout heifers and one rough pen.

Don’t change every variable at once. Hold housing, calf-care routine, and weaning procedure steady, and document anything else that shifts. Otherwise you won’t know what moved the result.

Options and Trade-Offs

Stay with 18% and fix the first bottleneck. This fits when intake is inconsistent, calves transition roughly, or nobody’s built a reliable weight record yet. The Illinois authors themselves point to NASEM guidance that 18% CP on a DM basis may be adequate even under enhanced milk feeding. What it requires is unglamorous: clean water, fresh starter, dry bedding, measured intake, readiness-based weaning. The limit is real — as your gain targets climb toward the top of that 18–24% NASEM range, the adequacy assumption gets thinner. Within 30 days: establish baseline pen intake and weaning weights before changing a thing.

Move to 22% inside a defined growth program. This fits when you’re deliberately feeding for stronger early growth and calves already clear the intake gate. Expect what the research actually found — better visceral development and leaner gain composition, not a heavier calf on the scale. The risk is paying a premium while health, housing, or labor consistency does the real damage. It’s worth reading that against the full replacement-heifer cost model before you commit. Within 30 days: run one 18% and one 22% group under the same documented protocol, nothing else different.

Upgrade formulation quality before chasing the protein number. This fits when calves sort feed, leave fines, or eat erratically. Grain processing, protein source, palatability, and batch consistency can matter more than the guarantee on the tag. Premium textured starters use flaked grains and roasted soybeans for bypass protein, with prebiotic and probiotic package in both the 18% and 22% versions — so the comparison runs against your program and delivered cost, not the CP number alone. The trade-off: better physical form lifts acceptance but won’t fix a badly timed weaning. Within 30 days: put two samples side by side with your calf team and score form, fines, intake, refusals, and manure before converting the barn.

Sponsored Post

At a Glance: Matching Starter Protein to Your Program

ADG column shows observed field values from Bullvine program reporting, not recommended targets.

Liquid nutrition levelObserved pre-weaning ADGStarter CP guidanceWeaning intake gate
Conventional1.39 lb/day observed18% CP, lower end of the NASEM 18–24% range≥2–3 lb/day, 3 consecutive days
Enhanced / accelerated1.73 lb/day observed18% may suffice per NASEM; 22% shifts tissue composition, not gain≥4–5 lb/day, 3 consecutive days
Cold-stressedMaintenance demand rises before gain doesPrioritize intake volume over CP percentageHold weaning; add 50 g/day of milk powder for each 5°C below the thermoneutral zone 

Key Takeaways

  • If a rep cites the Illinois study to sell you weight gain, the paper doesn’t support it — empty body weight gains didn’t differ between 18% and 22% starter.
  • If large-breed calves aren’t routinely eating about 1.5 kg — 3.3 lb — per head per day, fix intake before you touch the protein number.
  • If you feed a higher plane of liquid nutrition, your intake gate moves to 4–5 lb/day, not 3.
  • If you want the tissue-composition benefit, you need the high milk program too — the Illinois effects showed up under enhanced nutrition, not on their own.
  • If delivered price decides it, run cost-per-calf at your real consumption level — 70 lb, not 55 — and expect $1.20 to $2.00 at typical spreads.

The decision isn’t whether 18% is dated or 22% is premium. It’s whether the feed in front of the calf matches the program you’re actually running, and whether she’s eating enough of it to care.

That same fit question waits at the grower phase, where early gains either hold through breeding or quietly disappear. Next installment.

Before you pay for another point of protein, walk out to the pen board. What does it say your calves ate yesterday?

Complete references and supporting documentation are available upon request by contacting the editorial team at editor@thebullvine.com.

Learn More

The Sunday Read Dairy Professionals Don’t Skip.

Every week, thousands of producers, breeders, and industry insiders open Bullvine Weekly for genetics insights, market shifts, and profit strategies they won’t find anywhere else. One email. Five minutes. Smarter decisions all week.
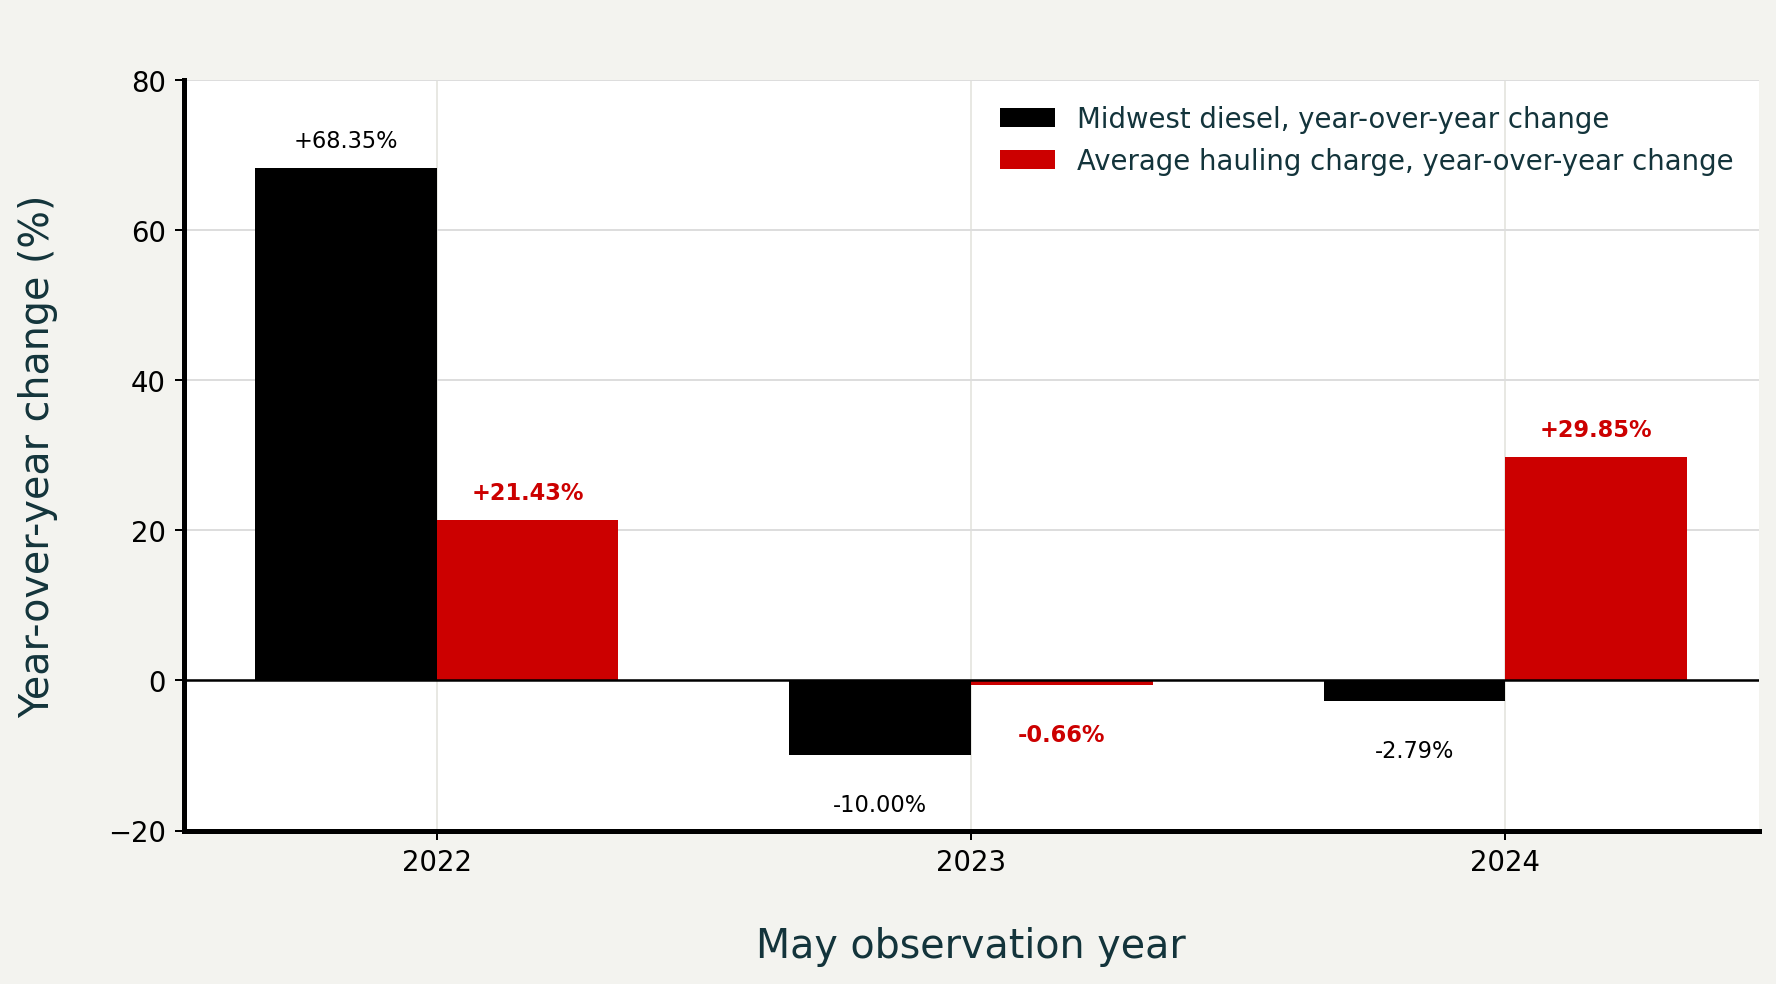
NewsSubscribe
First
Last
Consent

Finding a New Buyer Took Days. The $3.25/cwt They’d Already Lost Took Ten Months.

Every one of Harrisburg’s remaining shippers found a new processor within days. Not one of them got the unpaid milk back.

Executive Summary: Pennsylvania’s Milk Board handed 16 named farms $730,942.29 against $900,070.36 owed — 81 cents on the dollar, or about $3.25/cwt gone on milk already sold. Harrisburg Dairies stopped pickups on October 6, 2025, filed Chapter 11 on February 20, 2026, and sold its Herr Street plant for $4.95 million in April, with roughly $4 million going to secured creditors before producers saw anything. Every one of the bottler’s remaining shippers found a new processor within days, which is the part that should unsettle you: access to a buyer was never the problem; the receivable was. Pennsylvania’s bond is sized to 75% of the highest amount owed across a 40-day window, and when arrears stretch past that window the total owed outgrows the security — two months unpaid on 300 cows at 80 lb/day is 1,440,000 lbs, or roughly $46,700 you never get back at that per-cwt gap. Your state may work nothing like Pennsylvania’s: New York caps claims at the first consecutive 40 days and can void them entirely if you keep shipping after a known default, while Minnesota’s Chapter 27 trust can outrank your buyer’s bank — unless the cooperative carve-out writes you out of it. Two numbers settle your exposure, and one phone call gets both: your handler’s current security and coverage window, against your own days-outstanding right now. If yours runs longer than 40, the protection underneath you is already spent.

milk security bond

Harrisburg Dairies picked up Adam Kopp’s milk on October 5, 2025. The next day, the company told him it was the last time, Lancaster Farming reported.

Kopp is a third-generation dairyman from Middletown who had shipped to that bottler for two decades. By the time the trucks stopped, he told PennLive, Harrisburg hadn’t paid him for his milk in two months. He found another processor. The milk already gone was another matter. Kopp’s account comes from his interviews with Lancaster Farming and PennLive in October 2025; he was not interviewed for this article.

Three names sit on the same page of a Pennsylvania Milk Board order signed November 5, 2025: Merrimart Farms at $165,265.12, Lynncrest Holsteins at $3,482.26, Joel Heisey at $3,211.75. Sixteen producers in total, named in that public order, which lists each farm’s authorized distribution. None was interviewed for this article; no statements or views are attributed to them, and the amounts reflect what the Board authorized from a shared pool rather than any farm’s total loss.

Run the arithmetic in that document, and here’s what you get. Those 16 farms were owed $900,070.36 on 5,209,618 pounds of milk. The state’s security fund and collateral bond together held $730,942.29. Per hundredweight, that’s $14.03 recovered against roughly $17.28 owed — a gap of about $3.25/cwt on milk that had already left the farm and been sold. Eighty-one cents on the dollar, which is genuinely better than producers in most states would have managed. It still took ten months to arrive.

ProducerAuthorized PaymentRecovery RateEstimated Shortfall
Merrimart Farms$165,265.1281%~$38,900 lost
Lynncrest Holsteins$3,482.2681%~$820 lost
Joel Heisey$3,211.7581%~$755 lost
All 16 Farms (Total)$730,942.2981%~$169,128 lost

A Bottler That Lasted More Than Nine Decades

Harrisburg Dairies bottled milk in Pennsylvania’s capital for more than nine decades before financial trouble ended it — 94 years, by Lancaster Farming’s count. Milk Board Chairman Rob Barley told PennLive the company notified its remaining dairy farmers that week it was ceasing its contracts. All five of those farms found other processors, Barley said.

The actual recovery, once the Board finished the arithmetic, came in at 81 percent of what those 16 producers were owed.

Four months later, on February 20, 2026, Harrisburg filed Chapter 11 in the Middle District of Pennsylvania — Case No. 1:26-bk-00474, before Chief Judge Henry W. Van Eck, represented by Robert E. Chernicoff of Cunningham and Chernicoff PC. In April 2026, a federal bankruptcy judge approved the sale of the facility at 2001 Herr Street, along with equipment and the rights to the Harrisburg Dairies name, for $4.95 million. The buyer was Patanjali Dairy USA LLC, a Delaware-registered company that regional business coverage has described as New Jersey-based.

Why read this now, eleven months after the trucks stopped? The file only closed this summer. The Board didn’t finish distributing money to those 16 farms until August 2026; the buyer took over the plant in April, and every producer signing or renewing a contract this fall is making the same call Kopp’s neighbours made — stay or go, with incomplete information.

Now the part that should stop you. Roughly $4 million of that $4.95 million sale price went to secured creditors first. Whatever producers were still owed after the bond payout became an unsecured claim — payable only from what the lenders left behind. So the milk check stood behind the bank. Nobody broke a rule to make that happen. That’s simply where a raw-milk receivable sits in the priority stack, and if you ship to one buyer, you’ve probably never had a reason to find out.

What Two Months of Unpaid Milk Costs on 300 Cows

The Milk Board’s distribution method was mechanical. Divide available funds by total unpaid pounds, then multiply each farm’s unpaid pounds by that rate. All 16 producers signed consent agreements accepting it. Authorized payments ran from $3,211.75 to $165,265.12, averaging about $46,000. None of that spread reflects who deserved more. It tracks pounds shipped and unpaid, and nothing else.

Put Kopp’s timeline on your own herd. Two months unpaid on 300 cows at 80 lb/cow/day is 1,440,000 pounds — 14,400 cwt. At the same $3.25/cwt gap those Pennsylvania farms absorbed, that’s roughly $46,700 that never comes back. Before legal costs. Before hauling. Before interest on whatever you borrowed to cover payroll while you waited.

Twenty years of shipping to the same plant, and the last two months of it went out the door. The 16 producers on the Board’s order eventually recovered 81 cents on the dollar.

The Deductions Nobody Audits — and Why They’re Two Different Problems

A second exposure sits inside your check, and it has nothing to do with the base price. Hauling and promotion assessments come off the top as though they’ve already been paid onward. Whether your handler is actually remitting what it deducts is a question most producers have never put in writing. You have no direct confirmation either way.

Those two line items aren’t the same kind of risk, and it’s worth knowing which one you’re carrying.

Hauling is a service charge — your handler deducts it and, in the ordinary course, owes the hauler. Nothing in the statutes reviewed here gives that deduction any special protected status. If a handler fails, that’s a commercial dispute between the handler and the trucking company, and you may end up in it if the hauler comes looking for payment on milk already moved.

Promotion is a federal assessment, and the mechanics are different. U.S. dairy farmers pay a 15-cents-per-hundredweight assessment on their milk under the Dairy Production Stabilization Act of 1983 and the Dairy Promotion and Research Order, administered by USDA AMS. Importers pay 7.5 cents per hundredweight on dairy products brought into the country. Here’s the part most producers get slightly wrong: the state and regional share isn’t a split — it’s a credit of up to 10 cents against that 15-cent national assessment for contributions to certified Qualified Programs. Producers and handlers of certified organic and 100-percent-organic product can apply for an exemption from the assessment entirely.

Your handler doesn’t own that money. It collects it and remits it — monthly, on USDA form DA-20 — as the responsible party under the Order.

Now the honest limit of what we can tell you. No authority was located resolving whether unremitted checkoff assessments held by a handler in bankruptcy retain any protected or trust character, or fall into the general estate alongside every other liability. That’s a real gap, not a hedge. Minnesota’s Chapter 27 trust attaches to the products and their proceeds — the money owed to you for milk — which is a separate question from assessments a handler collected on your behalf and never passed along. Want an answer specific to your situation? That’s a question for a bankruptcy attorney or USDA’s AMS Dairy Program, and it’s worth asking before you need it.

What you can do this month costs nothing: ask your handler, in writing, for confirmation that hauling and promotion deductions have actually been remitted. Keep the reply. It connects to a broader problem in why some deductions never appear on your statement.

Why a Bond Built for 40 Days Came Up Short

Pennsylvania’s Milk Producers’ Security Act sets a dealer’s bond at a minimum of 75% of the highest aggregate amount owed to producers across a 40-day window in the prior 12 months. Join the state security fund, as Harrisburg had, and the bond drops to a minimum of 30%. On October 7, 2025, Harrisburg’s fund balance stood at $514,942.29, with a $216,000 collateral bond behind it through a Fulton Bank letter of credit.

Forty days. That’s the whole story of the shortfall.

Kopp was two months out — roughly 60 days — and Lancaster Farming reported the company had been behind on payments to farmers for months. Seven Lebanon County farms had already lost their contracts after Whole Foods stopped buying Harrisburg’s milk, Lancaster Farming reported.

Here’s why the window matters. The bond is sized against the highest amount owed to all producers across 40 days. When arrears stretch well past that window, the total owed outgrows the security built to cover it. That’s the gap those 16 farms landed in, and it’s arithmetic rather than anyone’s bad faith.

The Board’s own record shows this wasn’t sudden. Harrisburg Dairies appeared as new business on the Milk Board’s May 7, 2025 Sunshine Meeting agenda under legal docket no. CE-25-004 — regulatory attention on this dealer predated the shutdown by five months. The Board’s November 5 order, Legal Docket No. CB-25-001, then cited the company for failing to timely pay producers for milk received during the 2025–2026 license year, in violation of the Milk Producers’ Security Act and a prior Board order. On October 7, 2025, Harrisburg Dairies executed a consent order, signed by company president Alec J. Dewey, acknowledging the company had failed to pay producers on time and consenting to a claim against the entire fund and bond.

Read that distinction carefully. It’s an admission of failing to pay on time. It isn’t a finding of fraud, and no court has ruled otherwise.

Barley was plain about the ceiling on what the state could do. “We’re just waiting on the process with the bank and the treasury,” he told Lancaster Farming. “We’re hoping (the payments) will be this week.” The full distribution reached farms the following August.

Is Your State’s Protection a Bond, a Fund, or a Trust?

Here’s where geography stops being trivia. Four states, four genuinely different answers — and Pennsylvania’s reputation as one of the better-protected states cuts both ways.

This is reporting on statutory frameworks, not legal advice. Confirm your own coverage with your state agency or your counsel before relying on it.

StatePrimary Protection MechanismCoverage Window / FormulaWho Files & Key Deadlines
PennsylvaniaSecurity fund + collateral bond, PMB-administeredBond ≥75% of highest 40-day aggregate owed; 30% for fund participants (Act 136 of 1984)Board-initiated. Producers did not file individual claims in the Harrisburg distribution (PMB order)
New YorkMilk Producers Security Fund or full alternate security (NYSDAM)Fund assessed $0.012/cwt plus bond ≥12 days’ purchases; alternate security = 40 days of purchasesProducer files. Claims capped at the first consecutive 40-day unpaid period, and shipments continued after a known default risk claim forfeiture under the reasonable-business-judgment test (Ag & Mkts § 258-b)
WisconsinAgricultural Producer Security Fund, DATCP-administered, Wis. Stat. ch. 126Payment due by the 4th and 19th monthly; contractors disqualified from the Fund post ≥75% of highest milk payroll obligationProducer files a default claim with DATCP. Program line: (608) 224-2998
MinnesotaStatutory trust, Minn. Stat. ch. 27Trust on products and proceeds, taking priority over other security interests (MDA)Producer files within 40 days of the due date, with notice to the dealer, MDA, and the Secretary of State. Qualifying co-ops appear excluded from the definition of covered dealer

That table shows a pattern worth naming. Pennsylvania and New York built dairy-specific machinery — a milk board, a milk producers’ security fund — and sized it to what a dairy regulator thinks a dealer’s exposure looks like. Forty days, or twelve days’ purchases. Tidy, bounded, and no bigger than the assumption behind it. Wisconsin and Minnesota folded milk into broader agricultural statutes instead, which means producers there inherit whatever that wider law happens to give.

And there’s a real irony in how that shook out. Pennsylvania built a whole board to look after its dairy farmers, then capped their protection at 40 days. Minnesota never built one — it filed milk in alongside fresh fruit, vegetables, and mushrooms — and gave producers a lien that can outrank the bank.

Minnesota’s Farm Products Dealers Act creates a trust that operates like a lien and takes priority over other security interests, and the statute expressly lists “milk and cream and products manufactured from milk and cream” as covered perishable farm products. A milk plant buying your milk for resale appears to fit the statute’s definition of a farm products dealer — the law even sets a milk-specific due date at 15 days following the plant’s monthly day of accounting. That’s more than PACA does, since PACA’s trust protection has never extended to dairy.

If you’re a Minnesota co-op member, read the exclusions closely before you count on any of it. On its face, the statute writes out any marketing cooperative association where substantially all voting stock is patron-held and at least 75% of business runs through member patrons. Whether your specific buyer falls inside or outside that carve-out is a question for MDA or your own counsel — not an assumption to carry into a crisis.

New York’s cap deserves a second look too. Claims stop at the first 40-day consecutive period of nonpayment, and no claim is allowed on milk sold after a dealer’s known failure to pay if the Commissioner decides your extension of credit “did not constitute a reasonable exercise of business judgment.” Plainly: in New York, continuing to ship to a buyer who’s already missed payments can void your claim on that later milk.

That points the opposite direction from the federal bankruptcy rule, where shipping more unpaid milk actually strengthens your position. Two rules, two directions. And each of these mechanisms has sat in a statute book for years, waiting for someone to look it up. Statutes don’t send you a text when they start to matter.

Finding a New Buyer Wasn’t the Hard Part. So What Was?

All five of Harrisburg’s remaining shippers found another processor, Barley told PennLive. Kopp was among those who did. For the farms still on the route at the end, access to a buyer wasn’t the problem.

The loss was the milk already gone — two months of it in Kopp’s case, and for the 16 producers on the Board’s order, a recovery that arrived ten months later at 81 cents on the dollar. That’s the trap. You can solve the buyer problem quickly. You cannot solve the receivable problem at all once the arrears run past your state’s coverage window.

Switching isn’t free either, and you should price it before you’re forced into it. Work it from the load, not the pool: a tanker carries about 350 cwt, and agricultural trucking runs roughly $4.00 to $5.50 per loaded mile. Add 50 miles to reach a new plant, and that’s 57¢ to 79¢/cwt — somewhere between $50,000 and $68,900 a year on 300 cows at 80 lb/day. Our analysis of what re-routing milk to a new buyer actually costs per cwt after DFA’s St. Albans idle put rerouting at $0.85 to $3.15/cwt depending on destination, so treat those figures as a floor rather than a worst case.

Compare that against $46,700 of unrecoverable milk. A haul premium is an annual cost you can budget and negotiate. Two months of unpaid pickups is a one-time hole you never fill.

What Should You Actually Check Before Friday?

Two numbers, and you can have both by the end of the week. First, your buyer’s current security — the amount and the window it’s built to cover. Second, your current days-outstanding on payment.

Hold them side by side. If your days-outstanding already runs longer than your state’s coverage window — 40 days in Pennsylvania, 40 days under New York’s alternate-security option — the safety net beneath you is functionally spent, and no statute is going to stretch to cover the difference. It takes one phone call and about fifteen minutes.

Options and Trade-Offs

The 30-Day Coverage Audit

  • Action: Call your state milk board or department of agriculture and verify your handler’s current security amount and the coverage window behind it. Wisconsin producers: (608) 224-2998.
  • When it makes sense: Always, and doubly so if one buyer takes all your milk.
  • What it costs you: About 15 minutes.
  • Failure point: It verifies the ceiling, not your handler’s liquidity. Harrisburg was bonded and on the Board’s docket months before it closed.

The Contemporaneous Ledger

  • Action: For every milk check, log the date received, the milk period it covered, days late, and pounds paid.
  • When it makes sense: Starting with the next check, regardless of how healthy your buyer looks.
  • Why it matters: This documentation sustains both a state bond or trust claim and the two federal preference defenses — ordinary course of business and subsequent new value.
  • Failure point: It only pays off if a buyer actually goes down. That’s the point of doing it before one does.

The State Filing Trigger

  • Action: Map your state’s statutory clock now, before nonpayment happens, and confirm you’re actually eligible under it.
  • When it makes sense: If your state requires you to file rather than paying out automatically — Minnesota and Wisconsin both do.
  • Failure point: In Minnesota, missing the 40-day tripartite notice window — dealer, MDA, Secretary of State — destroys statutory trust status regardless of merit. The co-op carve-out may exclude you entirely.

The Preference Demand Protocol

  • Action: Retain shipping records for every load delivered after you received a late or catch-up check.
  • When it makes sense: From the first late payment onward.
  • Why it matters: Payments received in the 90 days before a Chapter 11 filing can be reviewed as preference payments under 11 U.S.C. § 547. The ordinary-course defense turns on whether a payment matched the pattern between you and that buyer, not whether it was prompt. Subsequent new value is arithmetic — milk shipped after a payment and never paid for offsets exposure dollar for dollar.
  • Failure point: Both defenses are fact-intensive, and New York’s business-judgment rule pushes against the new-value logic on state claims. After Dean Foods filed in 2019, roughly 500 former independent suppliers received demand letters from a contingency firm, and those without consistent payment history negotiated from weakness. Get a bankruptcy attorney the day a letter arrives.

Any of this gets harder in a region losing plants. It’s worth knowing where new processing capacity is actually being built before you assume a backup buyer exists within reach.

Key Takeaways

  • If your days-outstanding on payment already exceeds your state’s coverage window, treat the protection as spent and start pricing a second buyer this week.
  • If you can’t state your buyer’s current bond or fund amount from memory, that’s your 15-minute call — the figure is public record.
  • If your state publishes regulatory meeting agendas, read them. Harrisburg was on the Milk Board’s docket five months before the trucks stopped.
  • If your problem feels like “where will my milk go,” reframe it. Harrisburg’s remaining shippers all found new processors. None of them got the unpaid milk back.
  • If you’ve never seen written confirmation that hauling and promotion deductions were remitted, ask for it in writing this month.
  • If you’re claiming less than the full 10-cent Qualified Program credit against your 15-cent checkoff assessment, find out why — that’s a per-cwt line you can verify with your handler.
  • If you’re certified organic, check whether you’ve filed for the assessment exemption. It exists, and it’s producer-initiated.
  • If your state runs a dairy-specific board or fund, expect protection sized to a dairy regulator’s assumptions — bounded, and no bigger than the window behind it.
  • If you’re a Minnesota co-op member, ask MDA directly whether the Chapter 27 trust reaches your buyer before assuming either way.
  • If you ship a private plant in Minnesota and the trust applies, your claim can outrank their bank — but only if you give notice to three parties within 40 days of the due date, which for milk plants runs 15 days after the monthly day of accounting.
  • If you ship in New York and your buyer has already missed a payment, continuing to ship can void your claim on that later milk. The federal rule and the state rule disagree here.
  • If you don’t know what an added 50 miles of haul would cost you, run it at $4.00 to $5.50 per loaded mile across a 350-cwt load before you need a new plant, not after.
  • If a preference demand letter ever lands in your mailbox, your shipping records from the weeks after each payment are the arithmetic that reduces the claim.

Adam Kopp shipped to the same bottler for 20 years and found a new one. What he couldn’t do was reach back and collect two months of milk that had already been sold — and Pennsylvania’s bond formula, sitting in statute since 1984, was never built to let him.

Pull your last twelve milk checks and count the days. You can have that number before this week is out. The harder question is what you’d do Monday morning if it came back longer than 40.

The full 90-day cash-flow map, exposure tables for 300- and 800-cow herds with best, base, and worst recovery scenarios, and the complete processor-risk audit checklist are in the Tier 3 breakdown in Bullvine Weekly — alongside the full creditor timeline and the 90-day clawback window. That’s where the per-cwt modeling by herd size lives.

Complete references and supporting documentation are available upon request by contacting the editorial team at editor@thebullvine.com.

Learn More

The Sunday Read Dairy Professionals Don’t Skip.

Every week, thousands of producers, breeders, and industry insiders open Bullvine Weekly for genetics insights, market shifts, and profit strategies they won’t find anywhere else. One email. Five minutes. Smarter decisions all week.
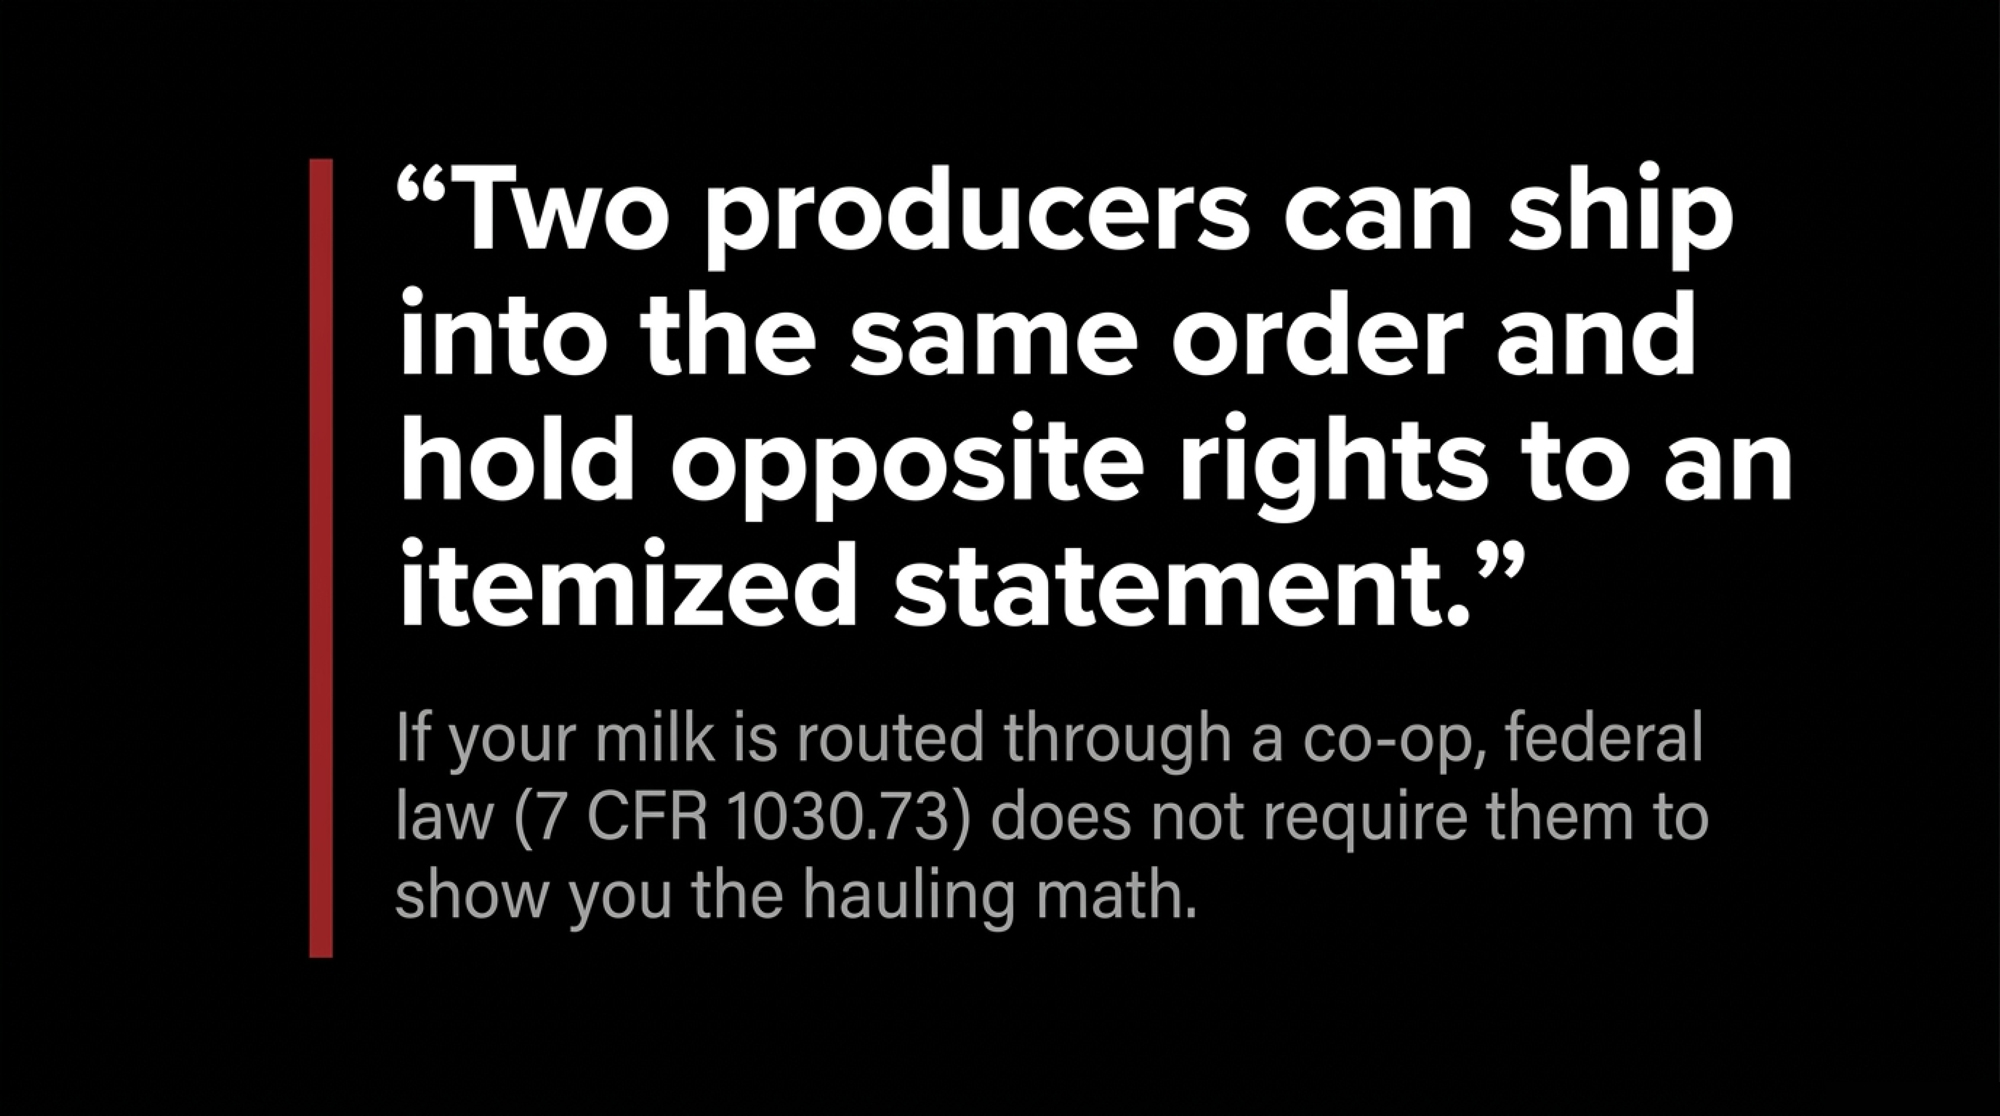
NewsSubscribe
First
Last
Consent

The Biggest Dairies Pay the Highest Wages. Their Labor Costs $1.85/cwt.

ERS puts labor at $1.85/cwt on farms above 2,000 cows and $13.18 on herds under 50 — while the big farms pay the higher wages. Almost none of the gap is pay. And $12.78 of it is you.

Rodney and Dorothy Elliott left a 140-cow farm in Northern Ireland to build Drumgoon Dairy near Lake Norden, South Dakota. Nearly two decades later, they were milking 6,500 cows with 20 robots and more than 50 employees. Some of those people had been with them since the earliest years.

In late May 2025, the Department of Homeland Security audited Drumgoon’s labor records. DHS determined that 38 workers had inaccurate, outdated, or incomplete citizenship or work-authorization documentation, according to South Dakota Searchlight’s October 2025 reporting. Elliott asked them for updated papers. Most couldn’t resolve the issues, and she had to let them go.

The crew went from more than 50 to 16 (South Dakota Searchlight, October 10, 2025; Northeast Radio SD, October 2025). Most of the 38 had worked at Drumgoon for years, the Searchlight reported, and some for nearly two decades — long enough to have had a hand in building the operation they were leaving. Elliott does not know where they went. Federal rules gave them ten business days from the audit finding to resolve their paperwork or be terminated.

Now the part that matters for anyone with a payroll. She didn’t post higher wages and wait for local applicants. She spent more than $110,000 on recruiters and transportation to bring 22 H-2A visa workers up from Mexico.

The Rebuild Nobody Talks About

This was an audit, not a raid. No agents in the yard, no arrests. Drumgoon had gone twenty years without one. Elliott told the Searchlight she reviewed applicants’ documents herself and had turned candidates away repeatedly over the years when the IDs looked questionable.

MetricBefore audit (May 2025)After rebuild (Oct 2025)What it cost
Crew size50+ employees38 workersStill 10–15 short
Immediate post-audit crew16 workers6,500 cows on 16 people
Workforce compositionLocal hires, some 20-year tenure22 H-2A visa, 16 local/tempVisa roles legally restricted
Workers terminated38 (10 business days to cure)Most had years of tenure
Recruitment and transport$0$110,000+Recruiters and travel from Mexico
Wage increase postedNone reportedMoney went to recruiting, not pay
Robot maintenance openingsPostedPostedZero applicants

South Dakota Searchlight, October 10, 2025; Northeast Radio SD, October 2025. Elliott’s account describes recruitment and transportation spending; no wage increase was reported.

Note what the visa route couldn’t do. Those permits restricted which jobs the workers could legally perform, so Drumgoon still had to fill 16 positions locally. And she did all of this in mid-2025 — a full year before USCIS issued the memo that finally wrote down how dairy H-2A petitions get judged. The pathway existed. The clarity didn’t. Even rebuilt to 38, the farm sat short of where it started.

Sixteen people were now covering a 6,500-cow operation. Elliott told the Searchlight her remaining employees were making mistakes from the long hours, or because they were new to farm work — including backing a payloader into the manure pond. Some, she said, were getting only one or two days off in a 15-day period. Nearby farms sent workers over for a couple of days at a time through the summer.

“But what else do you do? Do you just let cows starve or calves die because there’s no one there to take care of them?”

— Dorothy Elliott, co-owner, Drumgoon Dairy, to South Dakota Searchlight, October 2025

Then the detail that should stop you cold. Drumgoon had 20 robots running before any of this happened, and posted maintenance positions aimed at graduates of the Lake Area Technical College program in the same county.

Twenty robots. A technical college down the road. Open skilled positions. And as of the October reporting, nobody had applied.

This wasn’t new either. Back in October 2023, two years before anyone audited anything, Drumgoon told a county zoning process it employed 22 people, 15 of them milkers and stall management operators, and that finding local workers was extremely difficult (Dakota Free Press, October 12, 2023). That’s on the record. The empty applicant pool isn’t a post-audit excuse — it’s a documented pre-existing condition.

Elliott put the question more directly than most operators would:

“We’ve achieved our goals we set out for ourselves: build a dairy, milk cows and grow the dairy industry in South Dakota. Is it a sustainable goal if there’s nobody to work on these dairies?”

Here’s the part that reframes all of it. ERS data says the largest dairies pay the highest wages in dairy — and still carry the lowest labor cost per hundredweight of any herd size class. A sub-50-cow herd shows $13.18/cwt. A 2,000-cow herd shows $1.85. If cheap labor built the big farms, that table should read the other way around.

Your $32 Billion Talking Point Is Older Than Your Replacement Heifers

Three numbers anchor nearly every dairy labor conversation in Washington and at every co-op annual meeting. Immigrant workers make up 51% of hired dairy labor. Farms employing them produce 79% of U.S. milk. Losing that workforce would cost the economy $32.1 billion.

The figureWhere it comes from
51% / 79% / $32.1BAdcock, Anderson & Rosson, Texas A&M AgriLife Center for North American Studies
PublishedSeptember 2015
Data vintageSurvey fielded fall 2014; employment estimates for 2013
FunderCommissioned by the National Milk Producers Federation
Independently replicated?No — and the 2015 report was itself an update to a 2009 study by the same team for the same client

None of it is hidden. NMPF hosts the PDF and discloses the funding. But by 2024 and 2025, those numbers were circulating in trade coverage and House Agriculture Committee documents with no date attached.

Worth being precise about what “51%” actually measures, since this article is about dating your numbers. Researchers estimated 150,418 people worked on U.S. dairy farms in 2013, and that 76,968 of them — 51% — were immigrants. Thirteen-year-old employment data, restated in 2026 as though someone counted last week.

The same 2015 study found immigrant dairy employment rose 35%, nearly 20,000 people, over the six years since the 2009 survey — a number NMPF was still promoting in a December 2018 release. Funded by an industry association with a policy position, so weigh it accordingly. But it points up, not down.

If you cite 51/79 in a memo or at a hearing, attach the year. Costs nothing, and it makes you the most credible person in the room.

Why a Sub-50-Cow Herd Shows $13.18/cwt in Labor and a 2,000-Cow Herd Shows $1.85

USDA’s Economic Research Service breaks out dairy labor costs by herd size. Here’s the full table, including the column almost nobody quotes.

Herd sizeTotal labor/cwtUnpaid familyHiredImputed wage for unpaid labor
10–49 cows$13.18$12.78$0.40$21.74/hr
50–99$8.14$7.53$0.61$22.18/hr
100–199$5.12$3.84$1.28$23.16/hr
200–499$3.53$1.45$2.08$23.71/hr
500–999$2.87$0.69$2.18$25.03/hr
1,000–1,999$2.60$0.30$2.30$25.09/hr
2,000+$1.85$0.10$1.75$25.81/hr

USDA ERS, ERR-274 (MacDonald et al., 2020), Appendix table A2, using ARMS 2016 Dairy Version, national. Hired column derived as total minus unpaid. The imputed-wage column values unpaid family labor at opportunity cost — it is not a hired pay rate.

That last column is the argument. The imputed wage rises steadily with herd size — $21.74 on the smallest farms to $25.81 on the largest. Hired wages do the same. ERR-274 doesn’t publish the hired rate by herd class, but MacDonald reports the same direction of travel: hired wage rates, like imputed ones, run higher on larger farms. That’s the whole point — the biggest dairies pay more per hour and still land at $1.85/cwt.

MacDonald states it flatly: differences in labor costs “do not arise from differences in hourly wage rates,” because wages for both hired and unpaid labor are higher on larger farms.

So the herd that shows $13.18/cwt isn’t paying more per hour. It’s paying $21.74 an hour of opportunity cost for a lot of hours spread across very little milk, and $12.78 of that $13.18 never touches a payroll cheque. It’s your hours and your family’s. Elliott’s 6,500 cows put her in the bottom row of that table. If you’re in the top one, you’re the unpaid labor line.

Look at the hired column too. It climbs to $2.30 at 1,000–1,999 cows and then drops to $1.75 on farms above 2,000 — despite those farms paying the highest wages in the table. That’s not a wage effect. That’s enough milk per worker to bury the cost.

Productivity gap, not wage gap. Which flips the question entirely. The 51/79 framing asks who’s milking the cows. The ERS data asks how many cows one person can milk.

The Expansion Math Was Never About Cheap Wages

We went looking for the counter-argument — that cheap labor was the precondition for building operations like Drumgoon. The expansion literature doesn’t support it.

Hadley, Wolf, and Harsh at Michigan State tracked 20 dairy farms through one-time herd increases of at least 20% between 1988 and 1998, and published their findings in the Journal of Dairy Science in 2002.

MeasurePreexpansionPostexpansion
Herd size296 cows569 cows (+92%)
Milk per full-time equivalent686,656 lb917,980 lb (+34%)
Labor expense$5.14/cwt$3.50/cwt (−32%)
Debt-to-asset ratio31.3%43.4%

Hadley et al., Journal of Dairy Science 85(8), 2002. Debt-to-asset ratio reported for 14 of the 20 farms.

They didn’t get there by paying less. A 34% gain in milk per worker produced a 32% drop in labor cost per hundredweight — the same mechanism the ERS table shows, caught in real time during the buildout decade.

It wasn’t free either. Leverage went from 31.3% to 43.4% across the 14 farms reporting it. Same strategy, different landings.

Bewley, Palmer, and Jackson-Smith surveyed Wisconsin producers who modernized between 1994 and 1998, also in the Journal of Dairy Science, and asked what actually made expansion hard. Labor management ranked high. Wage rates didn’t make the list — and their finding that larger herds relied more on nonfamily labor while finding labor management easier is the whole argument in one sentence.

When the Labor Vanished, Nobody Got a Raise

Drumgoon isn’t the only case. In July 2025, at least nine Texas dairies received Notices of Inspection over a single weekend, Tyne Morgan reported for Dairy Herd Management on July 15. An NOI is a records request, not a finding of wrongdoing.

One farm and a Texas weekend are confirming evidence, not proof. Better to say so than let a handful of cases carry weight they can’t hold.

The stronger evidence sits outside dairy, and it’s causal.

The Bracero termination. The Johnson administration ended the program on December 31, 1964, excluding almost half a million Mexican seasonal farm workers. Clemens, Lewis and Postel studied it in the American Economic Reviewin 2018 and found no meaningful rise in domestic farm wages or employment. Growers mechanized instead — tomato harvesters went from a handful of units to near-universal inside about a year. The finding has a published critic: Kaestner argued in Econ Journal Watch in 2020 that the identification is weaker than claimed. It still stands as the best natural experiment available.

California’s AB 1066. The farmworker overtime phase-in began in January 2019 for employers with 26 or more workers, stepping the weekly threshold down from 55 hours to 40 by 2022. Alexandra Hill at UC Berkeley used National Agricultural Workers Survey data for 2019 and 2020 and found employers cut hours rather than pay premiums. The share working 56–60 hours a week — just under the old threshold — fell by roughly half. The share working 46–50 hours rose by about a third. Workers earned $6 to $9 million less in weekly paychecks across those two years, and the share earning $600–$800 a week dropped by roughly a third, most shifting into the $400–$500 bracket.

Different decades, different crops, different researchers. Both pointing where Drumgoon pointed. When labor gets scarce or expensive, employers reach for visas, machines, or fewer hours before they reach for a raise.

What Would Domestic-Only Labor Actually Cost You Per Hundredweight?

Fair warning on our own math first. The $1.75/cwt hired-labor figure is ARMS 2016, and the production cost is 2021. Two vintages in one equation, against a 2026 price. We just spent a section criticizing undated numbers, so it would be cheap not to date our own.

Here’s the calculation, and you can run the same shape of it on your own payroll in about four minutes. Take hired labor for 2,000-plus cow herds, $1.75/cwt, and apply a wage premium as though you’d replaced that workforce domestically.

Formula: $1.75 × your wage premium = added cost per cwt.

ERS puts 2021 total cost of production at $19.14/cwt for 2,000-plus cow herds. The 2026 all-milk price forecast has been sliding all summer: $20.70 in June, cut 70 cents to $20.00 on July 16, then cut another 15 cents in the August 24 outlook to $19.85/cwt.

Wage premiumAdded cost/cwtTotal costMargin at $19.85
Baseline$19.14+$0.71
+20%$0.35$19.49+$0.36
+40%$0.70$19.84+$0.01
+60%$1.05$20.19−$0.34

USDA ERS, Livestock, Dairy and Poultry Outlook, August 24, 2026. Every margin cell moves one-for-one with the milk price.

Watch what the August revision did. At a 40% wage premium, a 2,000-cow dairy now lands one cent above breakeven — it was sixteen cents in July. Thirty cents of forecast erosion did more damage to that row than a 20-point swing in the wage assumption.

Which is the actual finding. The worst-case labor shock costs a large herd about a dollar per hundredweight. The milk price moved 85 cents in ten weeks without anyone voting on it.

Now set both beside the herd size actually in trouble. ERS has sub-50-cow herds at $42.70/cwt in 2021 — $22.85 underwater against $19.85 milk, before labor enters the conversation at all. That’s the arithmetic closing barns, and it has nothing to do with immigration.

One more limit. We picked 20/40/60% as a sensitivity bracket because no study establishes what premium would actually pull domestic workers into dairy at scale. The model also assumes farms would pay it. Drumgoon, Bracero, and California all say they’d restructure or buy iron first. Elliott’s $110,000 went to recruiters, not a wage sheet.

Your Robot Breakeven Isn’t One Number. Salfer’s Own Range Runs $17.11 to $27.02

Bullvine has published the $27.05/hour breakeven repeatedly — and dated it to 2018 on at least one page. We went back to the source; what we found changes how you should use it.

That number comes from Jim Salfer and colleagues at the University of Minnesota, published in the Journal of Dairy Science in 2017, modeling a 1,500-cow dairy with 25 robots against a double-24 parlor. And it isn’t a single finding. It’s one cell in a sensitivity analysis.

Salfer’s 1,500-cow model, by assumptionBreakeven labor rate
1% wage inflation, robots give up 0.91 kg/d (about 2 lb)$27.02/hour
3% wage inflation, equal production, 30-year horizon$17.11/hour

Salfer et al., Journal of Dairy Science 100(9):7739–7749, 2017.

Read that again. Same researcher, same herd, same model — and the answer swings ten dollars an hour on two assumptions: whether your robots hold production, and what wages do over three decades.

We’ve been quoting only the top of that range. So has most of the industry.

Now the second land-grant number. UW-Madison Extension released its AMS Transition Budgeter on February 5, 2026, and the worked example runs 120 cows, two robots, a 5% milk bump, labor at $20.00/hour, boxes near $200,000 each. Breakeven wage: $14.77/hour. Since that farm already pays $20.00, the transition pencils. The tool’s rule is simple — if your actual labor cost is higher than the breakeven number, it works.

Here’s what nobody has connected. UW’s example is a 120-cow herd. And Salfer’s paper found robots penciling at 120 and 240 cows, while the 1,500-cow parlor beat the robots. Two land-grants, nine years apart, converging on the same range — and both saying scale cuts against automation, not for it.

So the apparent chasm between $14.77 and $27.02 was never a disagreement about robots. It was a disagreement about herd size, and about whether you assume production holds.

Our own Robot ROI Reality Check runs harder numbers than most quotes do:

AssumptionDealer projectionBullvine model
Installed costDealer quote1.4× dealer quote
Production gain10–12%6%
Maintenance$11,500/robot/year
Downtime6.5%

Bullvine modeling assumptions, not published research. Run your own quote through them.

On those inputs, a two-robot install on a 140-cow herd carries roughly an $8,776-a-year cash-flow hole for seven yearsbefore the math turns. Note the herd size — that figure is specific to a 140-cow model, not generic to any two-robot job.

Drumgoon is the sharper lesson anyway, and it isn’t the one in the brochures. Twenty robots didn’t stop that farm from losing 70% of its crew, and the skilled maintenance roles those robots created went unfilled. Automation changes what kind of labor you need — usually toward scarcer, better-paid labor. It doesn’t make you labor-proof.

Where the Evidence Still Runs Thin

Three honest gaps, because you’d spot them anyway.

Hadley’s cohort averaged 569 cows afterward — nowhere near Drumgoon’s 6,500. Whether the same productivity mechanism scales from 600 cows to 6,000 is an extrapolation, not a finding. And the debt-to-asset numbers come from 14 farms, not 20.

Salfer’s robot economics are from 2017, modeled on one 1,500-cow herd. Robot pricing, service contracts, and labor rates have all moved. The sensitivity logic holds; the dollar figures deserve a fresh run.

And nobody has done the direct study. No published work tests whether immigrant labor availability by region predicted where dairies expanded, holding feed cost, land price, and processing capacity constant. That’s the biggest hole in this entire debate, and it’s been sitting open for twenty years.

Options and Trade-Offs for Farmers

Path 1 — Run your own labor cost per hundredweight. Do this within 30 days.

When it makes sense: Any operation, any size; cheapest analysis here, and it tells you whether the rest of this applies to you.

What it requires: Annual payroll and annual hundredweight shipped. Divide one into the other. Work it on your own numbers — a 200-cow herd shipping 26,000 lb per cow moves 52,000 cwt a year, so a payroll of, say, $310,000 lands at $5.96/cwt. That example herd is deliberately labor-heavy. Swap in your two figures and see where you land against the $1.28 ERS reports for 100-to-199-cow herds and the $1.75 for 2,000-plus.

Risks and limits: Decide whether you’re valuing your own hours. ERS imputes $21.74/hour on sub-50-cow herds and $23.16 at 100–199. Skip that step, and you’re understating your real position — to yourself and to your lender.

Path 2 — Audit your I-9 files with counsel, also within 30 days.

The rules changed on March 16, 2026. ICE quietly updated its Form I-9 Inspection fact sheet, moving more than ten error categories from “technical” to “substantive.” Missing date of birth in Section 1. Missing date next to the employee signature. Incomplete List A, B, or C data in Section 2 — even where you kept document copies. Incomplete preparer or translator data. Electronic audit-trail deficiencies. Each now carries an immediate fine of $288 to $2,861 per formwith no cure period.

When it makes sense: Every operation with hired labor. No exceptions, and this is the risk that hasn’t priced in yet.

What it requires: Work with immigration counsel rather than alone. Ballard Spahr’s February 2026 guidance is blunt on the point — internal audits are what demonstrate good-faith compliance if a government audit lands. The statutory good-faith exception has always applied only to technical violations; that hasn’t changed. What changed is which errors count as technical. The ten-business-day cure window still exists for a shorter list: wrong Form I-9 version, missing “other last names used,” missing employee address in Section 1, missing business address in Section 2. Our full breakdown of how a Notice of Inspection unfolds walks through the mechanics step by step.

Risks and limits: You have three business days to produce every I-9 once a Notice of Inspection lands, and you must terminate workers with unresolvable documents within ten business days. Do the arithmetic on your own file count: 40 employees with one substantive error each, at the midpoint of that penalty range, is roughly $63,000 before anyone argues about aggravating factors. Drumgoon had a clean twenty-year record and a co-owner who personally checked IDs, and still lost 38 people. This reduces exposure. It doesn’t eliminate it.

Path 3 — Price your automation breakeven against your own herd size, not the brochure’s.

When it makes sense: Both land-grant models point at the same window. Salfer’s paper found robots penciling at 120 and 240 cows, while the parlor won at 1,500. UW’s worked example is 120 cows with a 5% milk bump and a $14.77 breakeven against $20.00 labor. If you’re between roughly 100 and 500 cows paying above $17/hour loaded, the math is live.

What it requires: A current dealer quote run at 1.4× installed cost, an honest production assumption, and a real budget line for maintenance skill. Drumgoon posted those positions and got nobody.

Risks and limits: The single biggest swing factor is production, not wage rate — that’s what moves Salfer’s breakeven from $17.11 to $27.02. Ask for the production guarantee in writing. And if a scale argument is doing the work in your automation decision, check it against the papers: both models put the economics at 120 to 240 cows, and Salfer’s parlor beat the robots at 1,500.

Path 4 — H-2A got clearer in June. Read what the memo actually says.

When it makes sense: Wider than early coverage suggested. On June 17, 2026, USCIS issued Policy Memorandum PM-602-0200, “Guidance on Temporary or Seasonal Need for H-2A Petitions for Dairying” — nine pages, effective immediately, binding on adjudicators. USDA welcomed it the same day. Per July 6, 2026 analysis, even dairies without a discrete breeding season may qualify by documenting materially different herdsman duties across the year, even though milking itself never stops.

What it requires: Documentation of seasonal duty variation, not of a labor shortage. And more lead time than you’d think — the contract, the certification, and a housing inspection all have to clear before anyone arrives, which puts realistic planning several months out.

Risks and limits: It’s a policy memorandum, not a regulation. It creates no legally enforceable right; any administration can rescind it, and petitions are judged case by case. Your year-round milking crew is still ineligible on its own. Elliott’s experience is the cautionary version: she was working this pathway in 2025, before the standard was written down, with counsel and $110,000 to spend — and it still left her 16 positions short. The Farm Workforce Modernization Act would put a year-round fix in statute, not a memo. It has passed the House twice and stalled in the Senate twice.

Key Takeaways

  • Divide annual payroll by annual hundredweight shipped. Above 500 cows and well north of $1.75/cwt, your gap is labor efficiency, not your wage rate.
  • Under 100 cows, value your own hours at ERS’s $21.74/hour before you call your cost of production finished. Otherwise, you’re the cheapest employee on the place, and nobody’s tracking it.
  • If you audited your I-9 files before March 16, 2026, that audit is stale. Errors that were curable then now carry $288 to $2,861 per form with no correction window.
  • Anyone quoting you one robot breakeven wage is quoting one cell of a sensitivity table. Ask which production assumption it uses. Equal production puts the bar near $17/hour; two pounds a day lost puts it near $27.
  • Above 1,000 cows and weighing robots? Both Salfer and UW put the economics near 120 to 240 cows, and Salfer’s parlor beat the robots at 1,500.
  • Modeling expansion? Track milk per FTE, not wage rate. The Michigan State cohort cut labor cost per cwt by 32% on productivity alone — and carried leverage from 31.3% to 43.4% getting there.
  • Financing this year? Your lender’s labor-shock question has a bounded answer — $0.35 to $1.05/cwt on large herds. The milk price moved 85 cents against you in ten weeks. Know which one you’re actually exposed to.

So where does your labor cost per hundredweight actually sit — and how much of it are you paying versus quietly absorbing? Twenty minutes with your payroll file answers both, and it’s a better twenty minutes spent before an envelope arrives than after.

We’re running the complete scenario model — all seven ERS herd-size tiers, every premium cell, formula, and assumptions on the table — in an upcoming Bullvine deep dive. If you want the full math rather than the headline version, it’ll live there.

This article draws on reporting by South Dakota Searchlight (October 10, 2025), Northeast Radio SD (October 2025), and Dakota Free Press (October 12, 2023); on USDA ERS data and peer-reviewed research as cited; and on federal policy documents current as of September 2026. Drumgoon Dairy was not contacted for this article.

Learn More

  • H-2A Dairy Visa Cost — Arms you with line-by-line guest worker recruitment expense data before signing agency contracts. Reveals true all-in costs averaging $877 per cow, exposing hidden legal overhead, transportation fees, and housing inspection mandates that conventional wage comparisons routinely conceal.
  • Dairy Cost of Production: Small Herds — Dismantles the persistent myth that milk market consolidation is driven purely by feed volatility. Exposes how imputed family labor burdens of $12.78/cwt quietly suffocate sub-50-cow operations long before hired payroll changes impact the balance sheet.
  • Robotic Milking ROI: Cash Flow Valley — Follows the money through a seven-year automated milking conversion to protect working capital. Breaks down why realistic 1.4× capital expenditure multipliers and $11,500 annual maintenance costs create an $8,776 yearly deficit on 140-cow setups despite brochure promises.

The Sunday Read Dairy Professionals Don’t Skip.

Every week, thousands of producers, breeders, and industry insiders open Bullvine Weekly for genetics insights, market shifts, and profit strategies they won’t find anywhere else. One email. Five minutes. Smarter decisions all week.
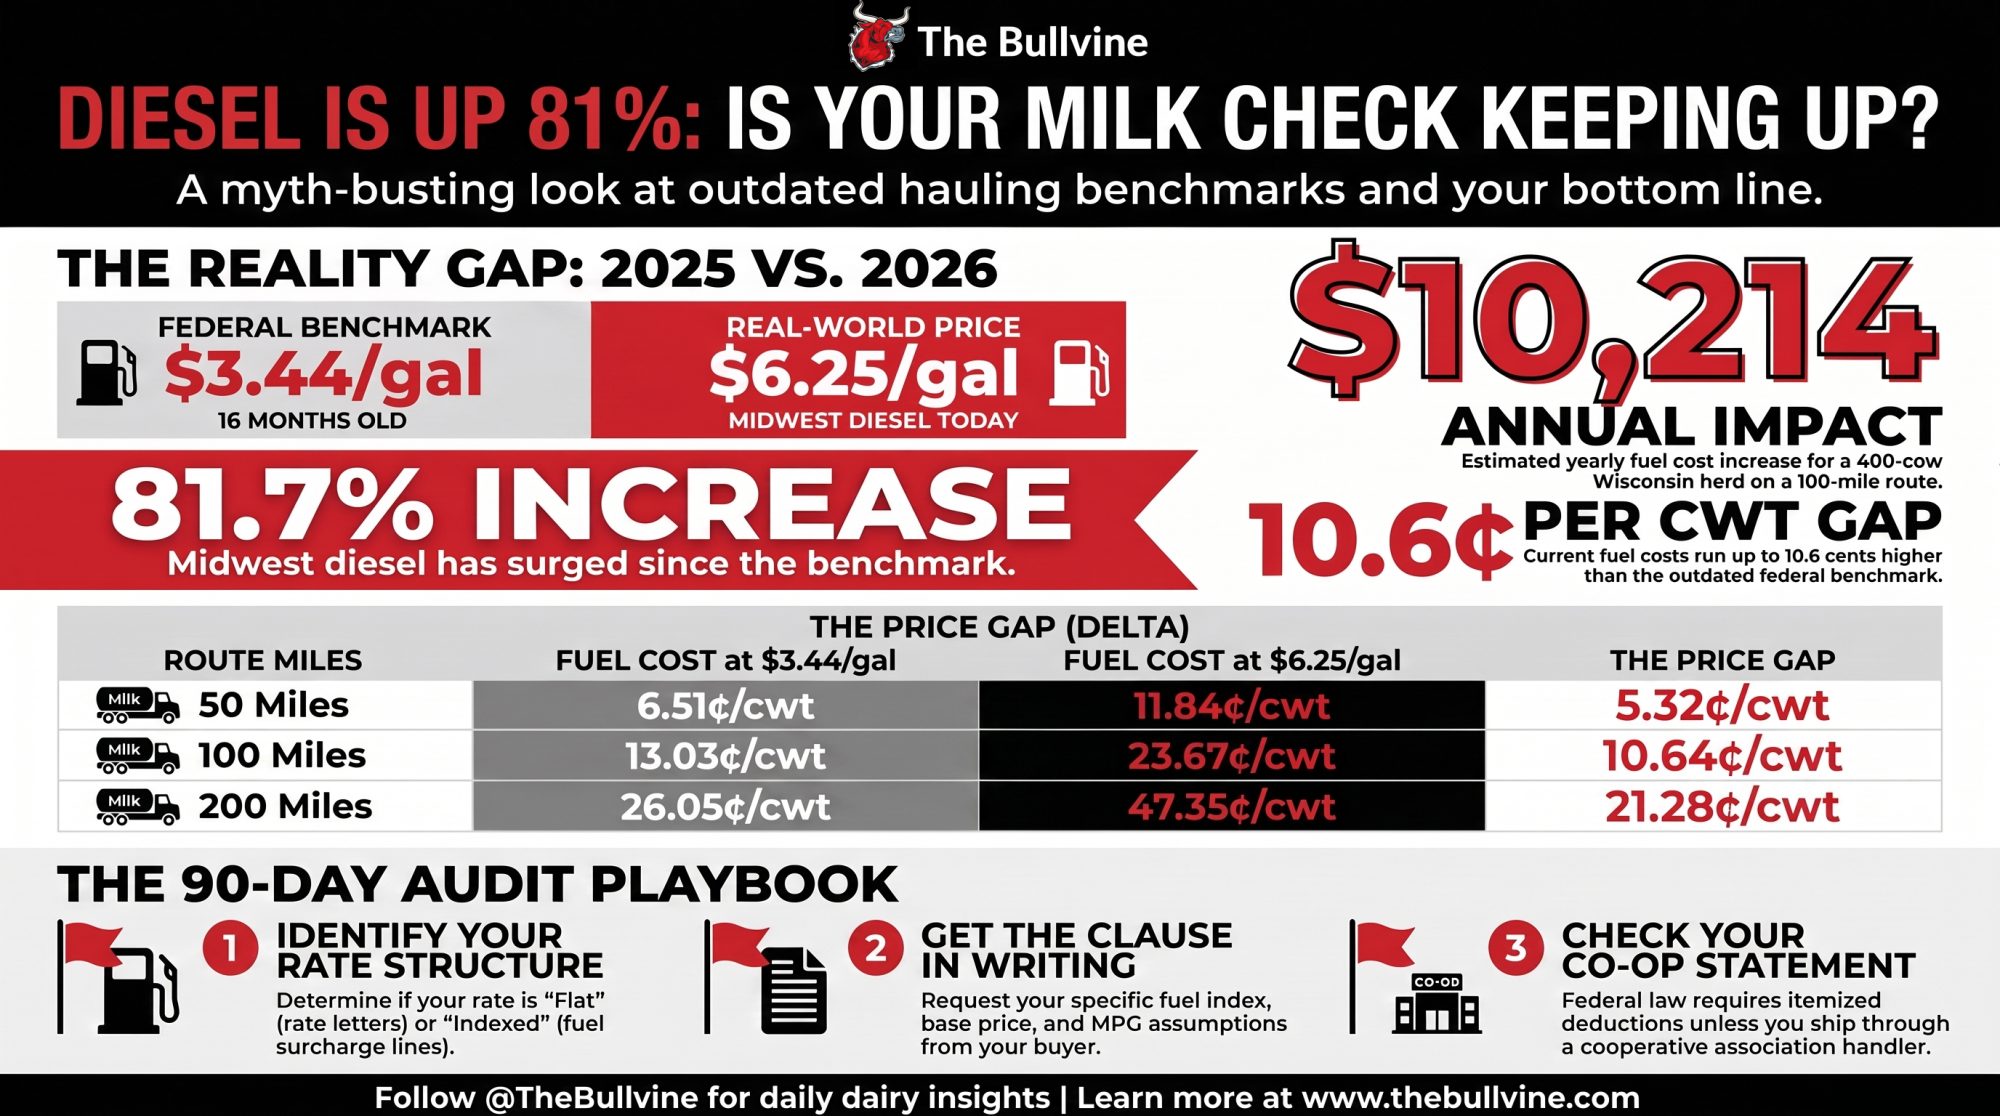
NewsSubscribe
First
Last
Consent

Milcobel’s €8 Clause in 2026: €62,000, or Three Times That?

Four of the world’s ten largest dairy companies are farmer-owned. All four are running the same playbook Lactalis has been running — and the fine print is where members find out what that costs.

EXECUTIVE SUMMARY

  • The €8 clause nobody has defined. Milcobel’s merger proposal pays €8 per 100 kilograms to members who stay three years with FrieslandCampina. Nine months after the deal closed, no public document says whether that lands once or annually — on 760,000 litres, roughly €62,000 versus about €186,000 across the term. It also isn’t clear whether a one-time payment would be calculated on one year’s volume or on cumulative supply, which would close the gap entirely.
  • The macro split. The world’s 20 largest dairy companies turned over USD 267 billion in 2025, up 5.4%. USDA NASS put U.S. producer returns at $21.19/cwt — down 6.1% nominal and 8.5% real. On 400 cows at the national 24,390-lb average, that’s about $133,657 off the top line.
  • Governance moved with the money. FrieslandCampina’s Members’ Council votes one vote per ten million kilos of district milk, and its district count has gone 21 to 14 to 16 since 2009. Milcobel’s merger passed unanimously among 70 delegates; FrieslandCampina’s percentage has never been published. In June, the ICA circulated draft language inserting “normally” into one-member-one-vote.
  • The 14-year capital lag. DFA’s board issued $29.6 million in patronage on September 3, 2026 — 7.5¢/cwt, or roughly $7,317 on that same 400-cow herd. It covered 2012 earnings. If you’re modelling patronage into cash flow, model the delay with it.
dairy cooperative consolidation

€8 per 100 kilograms, for three years, to members who stay. That’s Milcobel’s retention clause, and nine months into the merged cooperative nobody has published whether it pays once or annually. On a 760,000-litre operation, one reading is worth roughly €62,000 and the other nearly three times that. If you ship to DFA, Land O’Lakes, Agropur or any co-op that’s merged in the last decade, the same question sits in your own agreement — and 2025 was the year U.S. producer returns fell 6.1% while the world’s biggest dairy companies grew 5.4%.

A long-standing Milcobel member described that calculation to The Bullvine last December, a week before the vote that folded her Belgian cooperative into Dutch giant FrieslandCampina. A second member, in West Flanders, ran it from the other end.

“They’re offering us €8 per hundred kilos to stay three years,” the first said. “That’s real money. But my nearest plant is on the closure list.”

“The next closest facility is 47 kilometers further,” the second said. “That’s going to add real money to my hauling costs every year.”

There’s the trap. Commit three years to a processing network that may not include your plant, or walk away from the payment. Both members asked not to be named. Both were describing their own operations.

What We Could and Couldn’t Verify: The €8 rate and the three-year condition come from the published merger proposal. Whether the payment is made once or annually is not established in any public document — the whole reason it leads this story — and neither is the volume basis it would be calculated on. We found no documented instance of a Milcobel or FrieslandCampina member facing consequences for speaking publicly, and no published plant-closure list. The cooperative has used the language of network optimization rather than announcing closures. The closure-list characterization is the member’s own reading of her situation. Nestlé’s Top 20 turnover figure is carried by dairy trade press covering the RaboResearch release and isn’t independently cross-confirmed. DFA’s $23.1 billion comes from the Dairy Foods Top 100, a separate North American ranking, not RaboResearch’s own line item. The ICA’s June 2026 draft revision is quoted verbatim below. We haven’t established what prompted the change, and the draft doesn’t mention dairy.

The Divergence in One Table

Metric (2024 → 2025)Top 20 Global Dairy ProcessorsU.S. Producer Farmgate
Topline movement+5.4% — USD 267B combined turnover (RaboResearch, Aug 2026)−3.7% — $48.9B gross cash receipts (USDA NASS, Apr 30, 2026)
Price / return realizationNo group margin published; growth driven by M&A and a stated pivot to protein, functional nutrition and high-value ingredients−6.1% — $21.19/cwt nominal; −8.5% real on BLS CPI-U (313.7 → 321.9)
Output volumeNot reported as a group figure; Arla–DMK–DOC alone carries a pro forma pool of 19.4B kg+2.6% — 232B lbs produced; 24,390 lbs per cow, up 218 lbs

Two things worth naming before the analysis. Revenue growth isn’t profit growth, and a good chunk of that 5.4% comes from mergers stacking two companies’ revenue under one banner rather than anyone selling milk at a better price. And U.S. output rose while returns fell — more milk, less money per hundredweight.

Running the Numbers: Your Herd Against That Table

Every input below is sourced so you can run it against your own statements.

Sourced inputs — USDA NASS, Milk Production, Disposition, and Income 2025 Summary, released April 30, 2026, U.S. national:

  • Producer returns, 2025: $21.19/cwt, 6.1% below 2024 (NASS wording)
  • Implied 2024 figure: roughly $22.56/cwt — a decline of about $1.37/cwt
  • Rate per cow, 2025: 24,390 lbs
  • Deflator: BLS CPI-U annual averages, 313.7 → 321.9, +2.6%
  • Real 2025 return in 2024 dollars: $21.19 ÷ 1.026 = $20.65

Scenario — 400 cows at the NASS national per-cow average:

  • 400 × 24,390 lbs = 9,756,000 lbs
  • ÷ 100 = 97,560 cwt marketed
  • 97,560 cwt × $1.37 = $133,657

Swap in your own cow count, production average, and regional basis, and the figure moves. The direction won’t.

Now put the Belgian arithmetic beside it. The West Flanders member’s 47 kilometres is a permanent cost added to every load, running against a payment that stops after three years even on the most generous reading. Whatever her hauling rate is per kilometre, multiply it by two for the round trip, then by her annual load count, then by three. That’s what the €8 has to beat if the payment recurs annually — and roughly three times what it has to beat if it’s paid once on a single year’s volume. She can’t finish that calculation either, because nobody has published which one it is.

Why Canada’s Farmgate Went the Other Way — And What It Costs to Get In

Not every system moved the same direction in that window. The Canadian Dairy Commission’s National Pricing Formula produced a 2.3255% farmgate increase effective February 1, 2026, following a 0.0237% decrease the prior year. The mechanism is the whole difference: supply management prices milk off a national cost-of-production formula — the CDC calculated 2024 cost of production, indexed to the three months ending August 2025, at $92.82 per hectolitre — rather than off global commodity markets. That insulates Canadian farmgate returns from the swing the table above shows.

It prices entry instead. Ontario quota sits at a policy cap of $24,000 per kilogram of butterfat per day, the same ceiling in force in Quebec, New Brunswick, Nova Scotia and Prince Edward Island. Alberta and Saskatchewan don’t cap at all.

ProvinceMechanismPrice / kg Butterfat / Day
Ontario / P5Policy cap$24,000
AlbertaUncapped market clearing (Oct 2025)$57,115

Sources: Dairy Farmers of Ontario quota exchange summaries; Alberta Milk October 2025 exchange summary.

Watch what happens when you remove the ceiling. Alberta Milk’s October 2025 exchange cleared at $57,115/kg, with 23 successful bids between $58,200 and $60,900 and 30 successful offers between $54,000 and $56,030. That’s roughly 2.4 times Ontario’s capped price for the same asset — the clearest available read on what the cap is holding back.

British Columbia runs a third model worth knowing about, because it’s neither of those. The BC Milk Marketing Board manages a market-clearing price inside a core range of $30,000 to $40,000 per kilogram, with the price permitted to move no more than $1,000 in any month while it sits inside that band — rules that took effect for exchanges from January 1, 2025. Managed drift, not a hard ceiling.

The cap doesn’t make quota cheap; it makes it scarce. Dairy Farmers of Ontario’s March 2026 exchange drew bids from 1,908 producers against 190.60 kg traded, all of it at the ceiling. The November 2025 exchange was cancelled. So was August 2026. Run the ceiling against your own barn and the barrier gets concrete fast: at $24,000/kg, every kilogram of daily butterfat you’d need to add is a $24,000 cheque — assuming an exchange clears at all.

That’s a capital barrier no U.S. or EU producer carries. EU quotas ended in 2015; the U.S. never had them. Canadian farmgate stability is bought, and the purchase price hits the balance sheet instead of the milk cheque.

Our breakdown of why financed Ontario quota at 6% bleeds cash every year runs the servicing math per kilogram — at 6%, every financed kilogram gave back $586 a year.

What Everyone Assumed About Farmer-Owned Processing

Own the plant, control the milk, capture the margin. That’s the founding logic of the cooperative model, and it isn’t wrong — it’s been renegotiated in bylaws while most members were watching milk prices instead.

Here’s the part that breaks the usual framing. That Top 20 list isn’t investor-owned giants circling farmer co-ops. Dairy Farmers of America sits at No. 3 at USD 23.1 billion, just behind Nestlé at USD 23.7 billion. Arla Foods moved to No. 4, passing Danone. FrieslandCampina landed at No. 7 after absorbing Milcobel. Fonterra slipped from 7th to 10th after selling Anchor, Mainland and Kāpiti to Lactalis for NZ$4.22 billion.

Four of the global top ten answer to farmers. And they’re running the same playbook Lactalis has been running — cross-border M&A, exiting commodity categories, and chasing protein and high-value ingredients. RaboResearch’s report frames scale as “a prerequisite for long-term competitiveness,” a line trade coverage attributes to analyst Emma Fuess.

The Arla Number That Doesn’t Say What It Appears To

Worth stopping on Arla, because the calendar complicates the ranking. Arla’s audited 2025 revenue was EUR 15.1 billion, up 9.4% from EUR 13.8 billion in 2024. The merger with Germany’s DMK Group and the Dutch cooperative DOC received unconditional EU Commission approval on May 28, 2026, and took effect June 1, 2026 — after the calendar year the ranking measures. Arla’s own release puts the merged entity at roughly 11,200 farmers, 28,800 employees, local roots in seven countries, and pro forma revenue above EUR 20 billion. In Arla’s H1 2026 results, DMK contributed EUR 409 million — for the single month of June.

So the No. 4 placement rests on a transaction that closed months after the turnover year closed. Pro forma treatment is standard practice, not a methodology complaint. It’s a caution for anyone reading the table as a 2025 snapshot.

The same caution applies to the co-op share of that $267 billion. Publicly available turnover for DFA, Amul, and Fonterra comes to roughly $46 billion — about 17% — and even that floor mixes accounting periods, since the Fonterra component is a 2024-basis figure. Add reasonable proxies for Arla and FrieslandCampina and the share probably sits in the 35–40% range. Probably. Nobody can calculate it precisely without RaboResearch’s full 20-line table on a consistent FX basis, which isn’t public.

What Does Your Co-op Membership Still Buy You?

The economic core hasn’t moved. USDA Rural Development’s framework is blunt: “cooperatives are businesses established for users and do not serve the interests of non-user investors.” Surplus returns as patronage proportional to milk shipped, not shares held. Cooperative earnings get taxed once, not twice.

That machinery still runs. On September 3, 2026, DFA’s board issued $29.6 million in patronage earnings — 7.5 cents per hundredweight — to members who marketed milk through the cooperative in 2012.

Run it on the same 400-cow scenario: 97,560 cwt × $0.075 = $7,317. Hold that beside the $133,657 price swing as a matter of scale, not as a ratio — one is a 2012 earnings allocation, the other a 2024–25 price move, and comparing them as a percentage would flatter neither. It arrives because you shipped milk, not because you bought equity. No investor-owned processor writes that cheque.

Note the lag. A September 2026 allocation covering 2012 earnings. If you’re modelling patronage into cash flow, model fourteen years of delay with it.

Where the Renegotiation Actually Happened

Governance is the piece that changed, and it changed in public. Bylaws, not backrooms.

FrieslandCampina publishes its own formula: members of the Members’ Council “have one vote for every ten million kg of milk that their district supplied to the company during the most recent financial year.” Volume-weighted, at district level. Your influence runs through your district’s aggregate kilos, then through your district’s elected representatives. The Milcobel merger created two new Belgian districts — Milcobel-West (District 15), chaired by Bram Maes, and Milcobel-East (District 16), chaired by Vanessa Tindemans-Van Eynde — each with eight to ten elected farmers.

Watch the district count over time. It tells the story better than any single vote. FrieslandCampina ran 21 districts with ten councillors each as recently as 2009 — a 210-member Members’ Council. A 2021 Members’ Council decision cut districts from 21 to 14, producing a 140-member council. Post-Milcobel, the co-op describes 16 districts with eight councillors each. Fewer, larger districts mean fewer people standing between an individual member and the board.

Fonterra shows the same trajectory over a longer runway, through a New Zealand-specific structure with no direct U.S. equivalent. Trading Among Farmers passed with 66.45% support in June 2012. Flexible Shareholding passed with 85.16% in December 2021, on 82.65% participation, widening the shareholding range from 33% to as much as 400% of the production requirement. The Lactalis brand sale passed with 88.47% in October 2025, on 80.59% participation by milk solids.

Those aren’t close calls. Members voted for this, repeatedly, by wide margins. Any honest reading has to sit with that.

The U.S. Government Accountability Office flagged the mechanism in 2019, six years before either merger closed: as co-ops consolidate, “farmers… can have different expectations,” and voting structures “can create power imbalances based on farm size.”

Turnout is its own variable — when Holstein Canada rewrote its governance, the rewrite passed with 0.8% of members voting.

The Turn: 70 Delegates and One Unpublished Percentage

Here’s the data point that reframes everything above.

Milcobel’s Extraordinary General Meeting approved the merger unanimously — among 70 representative member dairy farmers in attendance. FrieslandCampina’s Members’ Council approved it “by a large majority.” No percentage appears in the joint release, in any subsequent coverage, or anywhere else in the public record. Approval thresholds were reported as two-thirds at FrieslandCampina and three-quarters at Milcobel. The merger took effect January 1, 2026, after EU Commission clearance in October 2025.

Unanimous among 70 delegates isn’t the same measurement as consensus among roughly 16,000 members. No farm-size breakdown of any of these votes is public — not at Fonterra, not at FrieslandCampina — so nobody outside those boardrooms can say which members’ preferences carried the day.

Two members isn’t a pattern, and we’re not calling it one. But it’s a fair question for any co-op to be able to answer:

Can a member raise a costed operational concern under their own name without weighing what it costs them?

Which is why the Fonterra landslides don’t settle anything. An 85% or 88% result measures agreement inside the electorate that earlier votes built. Weight the ballot by kilos and capital, and the room answers to whoever ships and finances the most milk.

Is the Cooperative Principle Itself Being Rewritten?

Here’s what almost nobody in the barn has seen yet. The International Cooperative Alliance’s 1995 Statement on the Cooperative Identity — the document that defines what a cooperative is — sets out Democratic Member Control as the second principle: “In primary co-operatives members have equal voting rights (one member, one vote) and co-operatives at other levels are also organised in a democratic manner.”

Note the escape hatch that’s been in the text since 1995. Federated and secondary cooperatives aren’t held to one-member-one-vote; they need only be “organised in a democratic manner.”

Now look at what the ICA circulated in a revised discussion draft dated June 9, 2026. The second principle becomes: “In primary co-operatives, members normally have equal voting rights (one member, one vote). Cooperatives at other levels and those with discrete classes of members are organised on a suitable democratic basis determined by their members.” (Emphasis added on “normally.”)

One word inserted. One clause added for “those with discrete classes of members.” If adopted, the wording would sit more comfortably alongside the volume-weighted structures FrieslandCampina and Fonterra already run. It’s a discussion draft, not adopted text. Worth watching.

The check still comes by the kilo. What changed is how loud your kilo talks in the room where the next merger gets decided.

Is Your Milk Price Statement Telling You What You Think It Is?

FrieslandCampina publishes a monthly integral milk price, and three consecutive months of 2026 show why any single month tells you very little. June: guaranteed price €41.50/100kg, integral price €45.21. July: guaranteed €41.25, integral €44.96. August: guaranteed €42.50, integral €46.21.

The mechanics matter more than the month. FrieslandCampina calculates monthly payment from the value of protein and fat in a fixed 5:4 ratio, referenced at 3.57% protein and 4.49% fat, excluding VAT. In August, the protein value rose to €593.41 per 100kg from €575.96 in July, and the fat value to €474.73 from €460.77. The integral figure then adds sustainability and quantum surcharges, plus a monthly seasonal bonus or discount set for the calendar year, which is why you can’t simply add a guaranteed price to a headline premium and expect to land on the published number.

Two things to carry to your own statement, whatever co-op you ship to. Separate the guaranteed or base price from the conditional premium. Then subtract the deductions that apply regardless of your score.

And check what you actually earn against the advertised ceiling. FrieslandCampina’s average Foqus planet sustainability premium paid was €2.63/100kg for the 2023 performance year, against a €3.50 maximum at the time — members captured 75% of the ceiling on average in 2023. The maximum has since risen to €4.00. We don’t have a current-year average to compare it to, so we can’t say whether that capture rate has improved or slipped.

Canadian producers are running the same exercise on a reweighting with a date on it. Farm Credit Canada’s 2026 Dairy Outlook puts it plainly: beginning in 2026, in both the P5 in eastern Canada and the Western Milk Pool, a greater dollar amount is placed on protein components. The Western boards have published their ratio — BC Milk, Alberta Milk, SaskMilk and Dairy Farmers of Manitoba move to 70% butterfat, 25% protein and 5% other solids effective April 1, 2026, up from 10% protein. FCC also notes Ontario butterfat composition has risen about 0.9% a year over the last six years. A decade of breeding toward fat, meeting a pool that’s rebalancing toward protein.

Processor network decisions land fast when they land — our reporting on what happened when AMPI’s Paynesville plant went dark is the closest North American parallel to what those two Belgian members described.

The 30/90/365-Day Playbook for Members Facing a Co-op Vote

30 Days — Urgent Checks

Pin Down Whether the Retention Payment Is Annual or One-Time

  • The Trap: €8/100kg for staying three years reads one way to a member and another way on a balance sheet. On 760,000 litres, that’s roughly €62,000 — or about €186,000 if it recurs annually.
  • Action: Written request to member relations asking for the payment clause verbatim. Look for two things: the words “annually” or “one-time,” and the volume basis the calculation runs on.
  • Trigger: You’ve already booked a loyalty or retention payment into a cash-flow projection without seeing that clause in writing.
  • Risk: Verbal confirmation from a field rep isn’t a contract term and won’t survive a dispute. And a one-time payment struck on cumulative three-year supply is a different number again from one struck on a single year.

Calculate Your Voting Weight in Kilograms

  • The Trap: Volume-weighted voting means your influence is arithmetic, not membership.
  • Action: Divide annual kilos shipped by your co-op’s per-vote threshold. FrieslandCampina’s is ten million kg at district level; Fonterra’s Share Standard runs one share per kg of milk solids.
  • Trigger: The threshold isn’t findable in published bylaws — that absence is your first phone call.
  • Risk: Your own figure may look small enough to dismiss. The point isn’t your weight; it’s which farm sizes the structure favours.

Run Your Butterfat-to-Protein Ratio Against the April 1 Reweighting

  • The Trap: If you ship into the Western Milk Pool and your last twelve months of components lean harder on fat than the new 70/25/5 split rewards, the change is a pay cut you can see coming.
  • Action: Pull your component averages from twelve months of statements. Compare your fat and protein percentages against your co-op’s current and post-April-1 weightings.
  • Trigger: Your protein percentage sitting flat or declining while butterfat climbs — the pattern FCC reports at roughly 0.9% a year in Ontario.
  • Risk: One year of data can hide seasonal swing. Use twelve months, not three.

90 Days — Structural Adjustments

Price Hauling Impact Against Plant Consolidation

  • The Trap: A 47-km reroute is a permanent deduction running against a temporary retention bonus.
  • Action: Multiply [round-trip km] × [hauling rate/km] × [loads/year] × 3. That’s the three-year figure the payment has to beat if it’s annual — triple it if the payment is one-time on a single year’s volume.
  • Net it out before you compare offers: Subtract that hauling total from the gross retention payment first. The number left over is what you’re actually being paid to stay — and it’s the only figure worth setting against a competing processor’s bid.
  • Trigger: Co-op communications citing “network optimization” or asset rationalization.
  • Risk: No public FrieslandCampina closure list was located, and co-ops rarely release them early. Model the worst-case distance now and rebuild when something official publishes.

Split Twelve Months of Statements Into Three Buckets

  • The Trap: A single blended milk price hides which portion you actually control.
  • Action: Separate base or guaranteed price, premiums you genuinely earned, and deductions taken regardless of performance. One year of statements, about an hour.
  • Trigger: Realized premium capture below 75% of the advertised maximum — the benchmark FrieslandCampina members hit in 2023.
  • Risk: Premium structures reset annually, so this is a yearly job, not a one-off.

Confirm Your Patronage Lag Before You Bank On It

  • The Trap: Patronage is real money on an unreal timeline.
  • Action: Ask member services when the last allocation was issued and which earnings year it covered.
  • Trigger: DFA’s September 2026 allocation covered 2012. A lag longer than you assumed means patronage doesn’t belong in near-term projections.
  • Risk: Allocation timing is a board decision, not a schedule. Don’t model it as recurring income.

365 Days — Strategic Positioning

Track Where New Capacity Lands Relative to Your Farm

  • The Signal: Announced capacity in your hauling radius, concentrated in a category your components already suit, is leverage in a supply conversation.
  • Action: Map announced projects against your shipping distance. IDFA reports more than $11 billion in U.S. capacity investment across 2025–2028 — cheese leading at $3.2 billion, yogurt and cultured at $2.81 billion, butter and powders at $1.6 billion.
  • Trigger: A new facility inside your current hauling radius serving a category you can hit on components.
  • Risk: Announced isn’t built. Industrial Info Resources counts 499 projects worth over $14.5 billion using a different methodology — don’t stack the two totals. Neither dataset separates co-op from investor-owned from foreign-owned.

Match Your Component Strategy to Where the Pool Is Moving

  • The Signal: The Top 20 is pivoting to protein, functional nutrition, and high-value ingredients. FrieslandCampina’s own formula already prices protein above fat at a fixed 5:4 ratio, and FCC reports both the P5 and the Western Milk Pool putting more dollars on protein beginning in 2026.
  • Action: Take your component averages and your co-op’s published strategy to your genetics conversation. Decide whether your sire selection points where the premium is heading.
  • Trigger: A component pricing ratio change with an effective date, or a public category commitment from your co-op.
  • Risk: Strategies rarely outlast breeding cycles. Build in the possibility of a pivot before you commit a sire lineup to it.

Decide Where You Want to Be Standing When the Farm Count Settles

  • The Signal: Consolidation trajectory and co-op governance math are two halves of the same question about your next decade.
  • Action: Read our projection on who’s still milking by 2035 against your own succession horizon.
  • Trigger: A succession decision, a major capital commitment, or a merger vote inside the next five years.
  • Risk: Projections are projections. Treat the direction as information and the dates as arguable.

What This Means for Your Operation

Four of the world’s ten biggest dairy companies answer to farmers, and scale genuinely strengthened those cooperatives’ balance sheets. S&P upgraded DFA to BBB+ in April 2026. A co-op with capital can build plants instead of stranding member milk behind an undercapitalized one, and that’s not a small thing to hold onto.

You gain that. What you give up is measured in voting weight and in multi-year commitments attached to payments whose structure isn’t publicly documented. Neither side of that trade is illegitimate. But only one side shows up on your milk cheque, and it isn’t the governance side.

Nine months after the merger took effect, no public document clarifies whether the €8 arrives once or three times, or what volume it’s struck on. If your co-op is currently courting a merger partner, don’t wait nine months past the vote to find out what the fine print meant.

So pull your own agreements this week. What do your co-op’s bylaws actually say about your voting weight if a merger doubles the milk pool around you — and does the retention or loyalty payment in your own contract specify “per year,” or just a number?

Key Takeaways

  • Get your retention clause in writing before you model a euro of it. Milcobel’s €8/100kg reads as roughly €62,000 on 760,000 litres — or about €186,000 if it recurs. Nobody’s published which, or what volume it’s struck on.
  • If your co-op weights votes by volume, your influence is arithmetic. FrieslandCampina runs one vote per ten million kilos of district milk, and the district count has gone 21 to 14 to 16 since 2009. Do the division on your own kilos.
  • Producer returns fell to $21.19/cwt while the Top 20 grew 5.4%. On 400 cows at the national 24,390-lb average, that’s about $133,657 — and DFA’s 7.5¢/cwt patronage covered 2012 earnings, so don’t book patronage as near-term cash.
  • Canada bought farmgate stability and pays for it on the balance sheet. Ontario quota caps at $24,000/kg while uncapped Alberta cleared $57,115, and DFO cancelled two exchanges in nine months.
  • Both Canadian pools are putting more money on protein starting in 2026, and the Western boards move to 25% protein weighting on April 1. If you’ve bred toward fat, pull twelve months of components before then.

Complete references and supporting documentation are available upon request by contacting the editorial team at editor@thebullvine.com.

Learn More

The Sunday Read Dairy Professionals Don’t Skip.

Every week, thousands of producers, breeders, and industry insiders open Bullvine Weekly for genetics insights, market shifts, and profit strategies they won’t find anywhere else. One email. Five minutes. Smarter decisions all week.

NewsSubscribe
First
Last
Consent

$1,934,000 for One Missing PTO Guard – and Who Actually Pays It

It’s a Tuesday repair. A guard comes off the PTO shaft, the machine goes back to work, and nobody writes it down. Seven years later that missing line item is worth $1,934,000 — and your comp won’t touch it.

The sand spreader carried the warning on the machine itself. Near the power take-off shaft, the manufacturer had stamped “DANGER, ENTANGLEMENT HAZARD” and “Keep Guards in Place.”

According to the Supreme Court of Ohio’s opinion, Jose Camara was operating that spreader as a farm laborer for Gill Dairy, L.L.C. in Madison County on April 22, 2019. He noticed an oil leak, shut the machine down, couldn’t locate the source, and restarted it to keep looking. Clothing on his left leg caught the unguarded PTO shaft, which pulled him toward the machine and threw him over the shaft — permanent injuries to both legs and his left shoulder, skin grafts, multiple surgeries.

The jury awarded $1,934,000. The award hasn’t been paid out. The Twelfth District Court of Appeals vacated it; the Supreme Court reversed that court on August 12, 2026, and the case now returns to the Twelfth District on two unaddressed assignments of error. But if you employ anyone outside your family, the more consequential ruling here is eleven years older — and it’s about your insurance.

THE SHORT VERSION

On August 12, 2026, the Supreme Court of Ohio reversed an appellate ruling that had tossed a $1,934,000 jury verdict against Gill Dairy, L.L.C., remanding the case to address remaining appeals — and exposing a seven-figure blind spot in farm liability. At August’s $16.64 Class III, that judgment equals roughly 116,200 cwt, a little over two years of gross milk from a 200-cow herd.

The ruling in Camara v. Gill Dairy held that Ohio’s rebuttable presumption of intent attaches on evidence of deliberate guard removal, reachable through circumstantial proof, without the separate non-reattachment finding the Twelfth District had required. Here’s the part that should reach past Ohio: a 2015 decision, Hoyle v. DTJ Enterprises, already established that standard employer-liability language excludes the exact intent such a claim requires proving, so the judgment lands outside your policy — and one carrier stopped writing that coverage in Ohio altogether after Kaminski.

Against BWC dairy base rates of $0.6171 to $0.9296 per $100 of payroll, a farm running fourteen people pays roughly $4,165 to $6,275 a year in premium, meaning that single verdict runs 308 to 464 years of it. The pivot in the record was a 2016 hydraulic pump job by an outside contractor that required pulling the coupling guard, with nothing on file showing it went back on — so if mobile mechanics or short-line dealers touch your guarded equipment, the paper trail that decides your case is being written by someone who doesn’t work for you.

Standards vary sharply by state: Michigan hands the question to a judge as a matter of law, and Pennsylvania’s § 303(a) has no intentional-tort exception. Keep reading if you employ anyone outside your family — the fix is a four-field guard-removal log that costs nothing, and the question for your agent fits in one sentence.

What Camara v. Gill Dairy Actually Decided

Ohio workers’ compensation is built to be your employee’s exclusive remedy. Under R.C. 4123.74, employers who comply with the premium requirements of R.C. 4123.35 aren’t liable in damages at common law for workplace injuries — an immunity backed by Article II, Section 35 of the Ohio Constitution. Ohio also runs a monopolistic state fund: you buy coverage from the Bureau of Workers’ Compensation, not a private carrier, and it’s mandatory from your first employee. No agricultural exemption.

The crack in that wall is R.C. 2745.01, effective April 7, 2005. An employer isn’t liable “unless the plaintiff proves that the employer committed the tortious act with the intent to injure another or with the belief that the injury was substantially certain to occur.” Subsection (B) then defines “substantially certain” as deliberate intent. Read those together, and the two apparent routes to liability collapse into one — there’s no middle ground. A claim is either ordinary, and comp absorbs it, or it’s deliberate, in which case you’re outside comp and, as you’ll see, outside your policy too.

Subsection (C) is the equipment provision. “Deliberate removal by an employer of an equipment safety guard… creates a rebuttable presumption that the removal… was committed with intent to injure another if an injury or an occupational disease or condition occurs as a direct result.”

Gill Dairy’s position, as the Court’s opinion describes it, was that the evidence showed no deliberate removal at all — only guards that may have worked loose during normal use and weren’t replaced. The dairy argued Camara had to prove it both removed the guard and made a considered decision not to reattach it. The Twelfth District accepted that reading and held the dairy should have won on summary judgment. Worth sitting with: an appellate court agreed with them, which is why this arrived at the Supreme Court as a certified conflict rather than a long shot.

The Supreme Court reversed. Its syllabus holds that subsection (C) “creates a rebuttable presumption that attaches when the plaintiff presents evidence that the employer made a considered decision to remove and not reattach an existing equipment safety guard, and no court may add a substantive requirement that is not contained in the text of the statute.” Justice Jennifer Brunner wrote it, joined by Chief Justice Kennedy and Justices DeWine, Deters, Hawkins, and Shanahan, with Justice Fischer joining all but one section. No dissent.

Two Published Analyses Read It Differently

If you’re working from a summary rather than the opinion, which summary you read matters.

Ohio State’s Agricultural & Resource Law Program put it broadly on August 27, in a piece by Senior Research Associate Ellen Essman: “an injured employee must only prove that an employer has knowledge of missing safety equipment, not that the employer deliberately removed them or decided not to replace them.” Writing for Kegler Brown on August 14, Jacob Dobres read it tighter — “The plaintiff still must prove that the employer affirmatively and deliberately removed the guard” — and added that Camara “does not convert ordinary negligence, poor maintenance, or knowledge of a missing guard into an employer intentional tort.”

The gap traces to how the Twelfth District phrased its certified question, which asked what proof is required “in addition to the employer having mere knowledge of a missing safety guard.” Frame the question around knowledge and the answer starts to sound like knowledge is the test.

What the opinion itself shows: the syllabus keeps deliberate removal at the center, Hewitt v. L.E. Myers Co. still stands with its definition of removal as an affirmative act, and the presumption can now be reached on circumstantial evidence. No eyewitness required. Which reading applies to your operation is a question for your own counsel.

The Contractor Problem Nobody Puts in the Work Order

Here’s the detail most commercial dairies will recognize immediately. According to the Court’s opinion, Gill Dairy hired an outside company in April 2016 to replace the spreader’s hydraulic pump — work that required taking the PTO coupling guard off and putting it back on.

That job became evidence. Not the contractor’s problem. The dairy’s.

Read the statute’s trigger again: deliberate removal by an employer. The published opinion doesn’t address whether a third party’s physical act gets attributed to the farm that hired them — that question wasn’t before the Court. What the record shows is more useful anyway. The jury heard that the repair required guard removal, heard that no record showed reinstallation, and saw a still from a video Camara shot in March 2018 — a year before he was hurt — with the coupling guard gone and half the shaft guard missing. Enough to reach a jury on whether the employer made a considered decision.

If you run mobile mechanics, short-line dealers, or a service truck through your yard, that’s your exposure. You won’t be standing next to the shaft when the shield comes off. You won’t know whether it went back on. And the paper trail proving it did gets generated by somebody who doesn’t work for you and has no reason to note it.

The rest of the record ran the same direction, and none of it came from the dairy’s own safety file. Camara testified the machine looked that way from his October 2017 start date onward, and that he raised it with co-owner Frank Van Genugten in 2017 and was told to keep working. An OSHA investigator’s report followed the injury; as the opinion recites Van Genugten’s statements, he didn’t know when the guard had been removed, hadn’t done the repair himself, and couldn’t recall how long ago it happened. The dairy had also obtained a quote in January 2019 for a new PTO shaft assembly, three months before the injury, and the opinion recites a dispute over documents later given to a BWC investigator — the subject of a separate spoliation claim that wasn’t part of this appeal.

A contractor’s invoice. An employee’s phone. A federal investigator. A state investigator. Your operation generates all four categories right now, whether or not anybody’s keeping a file — and the same documentation gap runs through confined-space incidents.

The 2015 Ruling That Decided Who Pays

Hoyle v. DTJ Enterprises, decided March 12, 2015, wasn’t a farm case — Duane Hoyle was a carpenter who fell roughly 14 feet from a ladder-jack scaffold onto a concrete pad in March 2008. His employers had bought exactly the protection you’d want: an endorsement called the Employers Liability Coverage Form—Ohio, purchased from Cincinnati Insurance Company for an additional premium. It covered “substantially certain” intentional torts, and it excluded “liability for acts committed by or at the direction of an insured with the deliberate intent to injure.”

Justice Judith French, writing the lead opinion, closed the loop. Because Ohio law equates substantial certainty with deliberate intent, “whether Hoyle proves that intent with direct evidence under R.C. 2745.01(A) or with an unrebutted presumption under R.C. 2745.01(C), intent to injure is an essential element of his claim.” Therefore: “there is no set of facts under which DTJ and Cavanaugh could be legally liable to Hoyle that falls within the policy’s coverage.”

Justice Judith Lanzinger concurred in judgment only and put the practical effect plainly: “There is now nothing less than deliberate intent.” Justice William O’Neill dissented.

“Now we have insurance agents selling worthless pieces of paper that will never pay a claim to assuage the fears of managers as they, in the name of increased production and reduced labor costs, remove saw guards, disable air-filtration systems, and store time-consuming safety equipment in their offices.”

— Justice William O’Neill, dissenting, Hoyle v. DTJ Enterprises, 2015-Ohio-843

He also asked whether a court can “countenance an insurance company’s assertion that it should be permitted to collect a premium for an event that is never going to happen.” He was writing about intentional-tort endorsements in a construction case, not farm policies generally — but the mechanism he described is the one now sitting behind Camara.

The Hoyle record also reflects that after the Ohio Supreme Court upheld R.C. 2745.01 in Kaminski, Cincinnati Insurance stopped issuing indemnity coverage for employer intentional torts in Ohio and shifted to defense-only coverage. The opinion does not state the company’s reasons. And the Sixth Circuit applied the same reasoning unanimously in Encore Industries v. Travelers Property Casualty Co. of America, No. 25-3076, decided December 8, 2025 — a case arising from an employee’s death, where the court held the insurers owed no duty to indemnify for either the settlement or the judgment.

What Would One Missing Guard Cost You Against Your Premium?

Run your own numbers, because the ratio is the argument.

BWC premium comes to base rate × payroll ÷ 100, then your experience modifier, then any program discounts. Base rates live in Ohio Administrative Code 4123-17-06, Appendix A. In the appendix effective July 1, 2025, the two farm classifications a dairy is most likely to occupy carried base rates of $0.6171 and $0.9296 per $100 of payroll. BWC approved roughly a 1% average reduction for the year beginning July 1, 2026, so your current figure sits a little below those. Confirm your assigned classification with BWC directly — the bureau publishes classification numbers and rates without descriptions, so third-party tables attach their own labels, and those labels disagree.

Annual payrollEstimated annual BWC premium at $0.6171 rateEstimated annual BWC premium at $0.9296 rateYears of premiums to equal $1.934M verdict
$360,000 (~7 workers)$2,222$3,347870 to 578 years
$675,000 (~14 workers)$4,165$6,275464 to 308 years
$1,350,000 (~28 workers)$8,331$12,550232 to 154 years
$1,934,000 verdict benchmark870 premium-years at $2,222/year154 premium-years at $12,550/yearOne incident; one missing guard

Worker counts assume a 2,600-hour year at the $18.55 average hourly wage for livestock farmworkers reported in an American Farm Bureau Federation analysis of federal Occupational Employment and Wage Statistics data published December 5, 2025. Farm Bureau lobbies on farm labor policy, and the figure is a national average, so treat it as a planning benchmark rather than an Ohio wage.

Now put the verdict in milk. USDA announced the August 2026 Class III price at $16.64 per hundredweight, up $1.12 from July and well off January’s $14.59 — the lowest Class III since July 2023. At $16.64, a $1,934,000 judgment equals about 116,200 cwt. A 200-cow herd shipping 75 pounds a day produces roughly 54,750 cwt a year. So one verdict runs a little over two years of that herd’s gross milk revenue at the Class III price, before feed, before labor, before the note. Your mailbox price won’t match Class III exactly, so run it against your own.

One more thing the table leaves out: Appendix A states that base rates exclude the Disabled Workers’ Relief Fund assessment and the additional DWRF assessment, with administrative costs billed separately. Your actual bill runs higher.

Does Your State Work the Same Way as Ohio?

Not remotely, and the spread is wider than most producers assume. Ohio’s presumption route is close to the most plaintiff-accessible standard in the dairy belt.

StateIntentional Tort StandardWho DecidesKey Precedent / Statute
OhioPresumption of intent from guard removal; proven via circumstantial evidenceJury (8 members)R.C. 2745.01(C); Camara (2026)
MichiganSpecific intent to injure, or actual knowledge of certain injury + willful disregardJudge (as a matter of law)MCL 418.131(1); Travis (1996)
New YorkDeliberate act aimed at causing harm to that specific employeeCourt (on the pleadings)WCL § 11; Acevedo
PennsylvaniaNo intentional-tort exception to comp exclusivityN/A (Total Bar)77 P.S. § 481(a); Poyser (1987)
WisconsinStrict exclusivity; extended to loaned/temp workersN/A (Comp Only)Wis. Stat. § 102.03
IndianaDeliberate intent to inflict injury required; “substantially certain” is not enoughCourtInd. Code § 22-3-2-6; Ins. Co. of the West v. High Performance Alloys (7th Cir. 2026)

Michigan is the sharpest procedural contrast. MCL 418.131(1) makes whether an act was an intentional tort “a question of law for the court,” and in Travis v. Dreis & Krump, 453 Mich. 149 (1996), the Michigan Supreme Court called the plaintiff’s burden extremely high. Camara’s case went to an eight-person jury in Madison County, where six concurring votes carry a verdict under Ohio Civ.R. 48. Six people. In Michigan, a judge decides before a jury ever hears it.

Pennsylvania is the sharpest substantive contrast, and it’s genuinely startling. In Poyser v. Newman & Co., 514 Pa. 32 (1987), the Pennsylvania Supreme Court held that § 303(a) barred an employee’s tort action against an employer accused of willful and wanton disregard for employee safety — including fraudulently misrepresenting factory safety conditions to federal safety inspectors. No exception exists in the provision, and the Pennsylvania Supreme Court revisited that framework as recently as April 2023, with Poyser still standing. Same conduct, opposite outcome from Ohio.

Indiana closes the loop from the other direction. In Insurance Company of the West v. High Performance Alloys, Inc., decided August 4, 2026, an employee’s estate alleged the employer knew of dangerous conditions, failed to implement available safety measures, and acted with actual intent to cause injury. The Seventh Circuit held the insurer owed no duty to defend either way: if the injury was accidental, comp exclusivity applied; if it was intentional, the policy’s intentional-acts exclusion applied. Same trap as Ohio, reached by a different route.

The question for your counsel is narrow: does my state allow intent to be presumed from a physical act like guard removal, or must specific intent be proven — and does a judge or a jury decide? Those two answers determine whether your file drawer is a nice-to-have or the entire defense.

Does Your Herd Size Change Your Exposure?

Less than you’d think. Your premium scales with payroll in a straight line. This exposure doesn’t — it attaches to one incident and one machine, so a small operation and a large one face the same order of magnitude from a single unguarded shaft.

What drives it is your shop, not your parlor. The trigger is an affirmative act of removal, so the farms holding most of this risk are the ones pulling guards for their own repairs, or paying somebody else to. A 200-cow dairy doing its own maintenance carries more than a 900-cow operation that sends everything to the dealer.

The exposure isn’t limited to the farm gate either. In February 2026, a Madison County, Illinois jury returned $241 million against Prairie Farms and its subsidiary over a contract courier’s death — $49.5 million compensatory, $191.5 million punitive — landing on a farmer-owned co-op and, through it, on roughly 500 member families. Two Madison Counties, two very different numbers, same question: who carries the risk when a safety protocol goes missing? We’ve walked through the $241M Prairie Farms verdict and what it did to member equity in detail.

Options and Trade-Offs for Farmers

Start a guard-removal log within 30 days, and keep the whole maintenance trail with it. For any operation doing in-house or contracted work on guarded equipment. Dobres spells out the fields: work orders “should identify who removed a guard, why removal was necessary, when it was reattached, and who verified that the machine was safe before returning it to service.” He also flags repair histories, photographs, inspection logs, vendor records, and purchase records as the material that decides whether circumstantial proof reaches a jury — and recommends routing anything you send to OSHA, the BWC, insurers, or counsel through one person so it stays “accurate, consistent, and preserved.” That’s an attorney’s list, not mine. Where it fails: documentation gives you evidence to rebut the presumption, not immunity from it, and a log recording removals you never fixed is worse than no log.

The 4-Field Guard Log

Keep it on the shop wall.

1. Date & Machine — Equipment ID and the specific guard removed. Name it: PTO driveline shield, coupling guard tractor-end, coupling guard implement-end, master shield, gearbox shield. Not “guard.”

2. Reason & Tech — Why removal was necessary, and who performed it. Employee name or dealer/service company.

3. Reinstallation Date — The date the guard went back on and was bolted into place.

4. Safety Verification Sign-Off — Manager or lead operator initials confirming run-readiness before the machine returned to service.

One line per removal. No line means no record, and no record is what turned a 2016 pump repair into evidence a jury heard in 2026.

Take inadequately guarded equipment out of service, and write a return-to-service rule. Today, if you know of a missing guard. Dobres recommends “a written lockout, repair, and return-to-service process” because it cuts accident risk and evidentiary uncertainty at once. Where it gets tricky: recordkeeping cuts both ways, since a dated record of a hazard you left running is itself evidence. Correct first, document the correction second. If an injury has already happened, talk to counsel before you write anything.

Put the coverage question to your agent in writing this month. Ask plainly: If a jury finds a guard was removed and not reattached on this farm, does anything we carry — BWC, farm liability, umbrella, stop-gap — pay a dollar of that judgment? In both Hoyle and the 2025 Sixth Circuit case, the policy language at issue excluded injury the insured deliberately or directly intended, and in both the courts found no duty to indemnify. Whether your policy reads the same way is a question only your policy and your agent can answer. Get it in writing either way.

Confirm your BWC coverage is active and your true-up is filed. Do it every year; it’s the cheapest protection here. R.C. 4123.74 grants immunity only to employers who comply with R.C. 4123.35. Fall out of compliance, and R.C. 4123.77 says private employers “are not entitled to the benefits” of the entire comp chapter during that period — they’re liable for injuries caused by the employer’s “wrongful act, neglect, or default,” and in that action they cannot use the fellow-servant rule, assumption of risk, or contributory negligence as defenses. Under R.C. 4123.75, the employee still collects, and the state comes after you for the money. That’s not a narrow intentional-tort exception. That’s ordinary negligence, undefended. BWC lists August 31 as the payroll true-up deadline for policy year 2026, and missing it disqualifies you from BWC discount and rating programs for the year.

Don’t treat OSHA’s small-farm exemption as liability protection. An appropriations rider dating to 1976 bars OSHA from spending enforcement funds on farming operations with 10 or fewer non-family employees that haven’t kept a temporary labor camp in the prior 12 months. What it doesn’t do: block a post-incident investigation, override the General Duty Clause, or apply once you cross the ten-employee line. An OSHA investigator examined the spreader after Camara’s injury, and that report reached the jury. Ohio’s state plan covers public employees only, so private-sector farms here answer to federal OSHA — and when OSHA does show up after a fatality, the penalties tend to look small next to a civil verdict. In the Colorado manure-pit case we covered in February, it came to $246,609 in proposed fines for six dead workers.

Key Takeaways

In the Shop

  • A guard that came off any machine in the last five years without a dated record showing it went back on is your first file. Start there, not with a policy review.
  • Any machine running with a missing guard right now needs a return-to-service rule, not a note in a file. Take it out of service, fix it, then document the correction.
  • Contractor invoices that don’t record guard removal and reinstallation leave you relying on a mobile mechanic’s memory instead of your own paperwork.
  • Keep the parts quotes. Gill Dairy’s January 2019 shaft-assembly quote became part of the record three months before anyone was hurt.

At the Agent’s Desk

  • If your agent can’t answer the coverage question in writing within two weeks, treat it as unresolved — then ask what specific policy language would have to change for the answer to be yes.
  • Verify whether you actually hold a stop-gap endorsement and read its intentional-act exclusion yourself. At least one major carrier moved to defense-only coverage in Ohio after Kaminski upheld the statute.
  • Lapsed BWC coverage is the bigger hole by far. Under R.C. 4123.77, you lose the benefits of the whole comp chapter and three common-law defenses with them, so ordinary negligence becomes the exposure — not just the narrow intentional-tort exception.

Across State Lines

  • Ohio sends this question to an eight-person jury on circumstantial evidence, where six concurring votes decide it. Michigan hands it to a judge as a matter of law, which means your documentation argues to a different audience entirely.
  • Pennsylvania’s § 303(a) has no intentional-tort exception, and Poyser has stood since 1987. That changes your litigation risk, not your safety obligation.
  • Indiana requires deliberate intent to inflict injury — “substantially certain” doesn’t clear it — and High Performance Alloys confirms the insurance gap sits there too.
  • Above ten non-family employees in the last 12 months? Don’t count on the OSHA rider. And in a state-plan state, it may not apply to you at all.

Where This Leaves You

O’Neill wrote that dissent in 2015 and lost. Eleven years on, a farmworker’s leg went into an unguarded shaft, a jury put a number on it, and the Supreme Court of Ohio declined to narrow the path to that number any further. The dissent nobody adopted turned out to describe the machinery pretty well.

So here’s the question worth answering before your next repair: when somebody on your place takes a guard off a machine this week — your hired man or a dealer’s service tech — who writes it down, and where does that paper live? At $16.64 Class III, you’re not going to milk your way out of a seven-figure judgment.

This article is based on the Supreme Court of Ohio’s published opinion in Camara v. Gill Dairy, L.L.C., 2026-Ohio-3056, released August 12, 2026; the Court’s opinion in Hoyle v. DTJ Enterprises, Inc., 2015-Ohio-843; and Ohio Civ.R. 38(B) and 48 on civil jury composition and majority verdicts. It is journalism, not legal advice. The Camara case remains on remand and is not finally resolved. Ohio court interpretations and BWC classifications change. Consult an attorney licensed in your state before changing your safety program or your coverage.

Learn More

The Sunday Read Dairy Professionals Don’t Skip.

Every week, thousands of producers, breeders, and industry insiders open Bullvine Weekly for genetics insights, market shifts, and profit strategies they won’t find anywhere else. One email. Five minutes. Smarter decisions all week.
NewsSubscribe
First
Last
Consent

Chobani Needs 8.2 Million Pounds a Day. Don’t Pour Concrete Until You See the Paper.

It’s fall. Springing heifers are $3,400–$4,400, Allentown doesn’t take milk until 2027, and Chobani’s CEO just said there’s “still work to do.” What exactly are you borrowing against?

Executive Summary: Chobani’s Allentown plant will need 8.2 million pounds of milk a day at full run — 30.8% of everything Pennsylvania produces, in a state that’s shrunk output five years running to 9.737 billion pounds. The $1.2 billion is real and the Keurig Dr Pepper deal is signed, but no supply contract with any Pennsylvania producer has surfaced publicly, and CEO Hamdi Ulukaya said at a Schnecksville farm on September 1 that “the trust and the confidence is very high, but we still have some work to do.” Production doesn’t start until 2027, while springing heifers are already clearing $3,400 to $4,400 against a replacement inventory at its lowest heifers-per-100-cows ratio since 1991. Meanwhile you’ve already lost $1.16/cwt — the Milk Board deadlocked in June and let the over-order premium and fuel adjuster expire, which on a 300-cow herd at 28.27% Class I utilization runs about $20,800 a year. Freight cuts the same way in either direction: at USDA’s $0.00814 mileage factor, 50 added one-way miles costs a 200-cow herd roughly $17,200 annually, and a plant opening reshuffles routes exactly like the DFA St. Albans closure did. The play for a 150-to-500-cow operation isn’t buying cows against an announcement — it’s pushing true protein on the herd you own and getting freight deductions, component premiums, and destination clauses in writing before anyone signs anything. The article closes with eight questions to send your field rep this week and a decision rule for 150-to-500-cow operations.

Chobani Pennsylvania plant

Chobani just announced a $1.2 billion processing plant in Lehigh County that will eventually pull 3 billion pounds of milk a year. Every general outlet ran the investment total and the governor’s talking points.

What none of them ran is the number that decides whether any of this reaches your barn: 8.2 million pounds of milk a day.

That’s roughly 30.8% of Pennsylvania’s entire annual production landing on a state dairy herd that has contracted for five consecutive years. But before you call your lender or order concrete, write down what sixth-generation Vermont dairyman Harold Howrigan — who also sits on Dairy Farmers of America’s board — told the Boston Globe when DFA moved to idle its St. Albans plant. Higher returns from farther-away plants do get passed back to farmers, he said. But “it’s not all gravy,” because the farmers themselves will have to pay for the increased transportation costs.

Production in Upper Macungie doesn’t start until 2027. The building purchase from Keurig Dr Pepper hasn’t closed. And no direct supply contract with a Pennsylvania producer has surfaced publicly.

You Already Lost $1.16 This Summer

Before any of that, there’s a cut that already landed. Two months before the Chobani announcement, Pennsylvania producers took a hit that got almost no coverage.

The Pennsylvania Milk Board deadlocked and issued no over-order premium order for July through December 2026 — Lancaster Farming reported the deadlock on June 12, and Farmshine confirmed on June 19 that no order had been issued. The premium in force was 50 cents per hundredweight, already the first sub-dollar rate since 2021 under General Order A-1022, plus a 66-cent fuel adjuster. Both expired at midnight on June 30. That’s $1.16/cwt gone, ending a 38-year-old program.

Put it against a 300-cow herd. At Pennsylvania’s average 21,121 pounds per cow, you’re shipping 63,363 cwt a year. Not all of that prices as Class I. Order 1 Class I utilization has run 28.27% year-to-date through April, per USDA AMS — so roughly 17,900 cwt of that milk priced Class I. At $1.16/cwt, that’s about $20,800 a year, gone before anybody said the word Allentown.

That assumes your milk pools at the order-average Class I utilization, which is how blend pricing works for a pooled producer. Your own figure moves with your handler’s mix.

ComponentRate/ValueAnnual Impact (300-cow herd)
Over-order premium (expired June 30)$0.50/cwtIncluded below
Fuel adjuster (expired June 30)$0.66/cwtIncluded below
Combined lost premium$1.16/cwt~$20,800/year
Class I utilization (Order 1, YTD Apr)28.27%~17,900 cwt priced Class I
Program duration before expiration38 yearsEnded with no replacement order

So when you hear about a plant creating new demand, that’s the baseline it’s landing on. Not a neutral one. The full breakdown of that expiration is here.

What Chobani’s CEO Actually Said

Chobani announced the project on September 1, 2026: approximately $1.2 billion over five years for a 1.5-million-square-foot manufacturing and warehouse campus at 7356 Industrial Blvd. in Upper Macungie Township, creating more than 900 jobs. The plant first opened for production in 2021 under Keurig Dr Pepper. KDP will keep some current employees there in corporate functions; the rest are being offered jobs with Chobani.

The next day, Chobani CEO Hamdi Ulukaya stood at Crystal Spring Farm near Schnecksville, a Land O’Lakes member operation, and told reporters he wants the plant to eventually draw 3 billion pounds of milk a year, all of it produced in Pennsylvania. He said he hadn’t previously seen a state commit to helping its farmers increase production the way Pennsylvania is. Then he added the line worth holding onto: “The trust and the confidence is very high, but we still have some work to do.”

Read that as what it is — the buyer saying the supply side isn’t settled. Not a warning, not a retreat. Just an accurate description of where things stand between an announcement and a signed agreement.

Pennsylvania Agriculture Secretary Russell Redding, speaking at the same event, framed the open question directly: “The discussion here has been about ‘how do you keep as many of these 4,300 farms as you can?’ How do you get the co-ops to really work with them to get herd-level improvements and efficiencies? How do you help them get expansions if they want to?”

Those are the right questions. None of them have been answered yet.

The Deal Is Real. The Contract Hasn’t Surfaced.

Keurig Dr Pepper has a definitive agreement to sell its full equity stake in Chobani back to the company for $800 million, plus roughly $125 million for the Allentown facility itself — lease, equipment, and operations included. That piece is locked down in writing.

The $1.2 billion works differently. It’s Chobani’s five-year capital plan, and Allentown is one piece of what the company describes as a broader commitment of more than $4 billion across its U.S. manufacturing network. Chobani is privately held, so there’s no filing behind the Allentown figure and no binding commitment you could show a lender. That’s not a knock on Chobani — that’s how every economic development announcement in America works. It matters because the state stacked $50 million in PA SITES grants and loans on Chobani’s side of the ledger.

ItemStatusDetail
KDP equity buybackConfirmed in writing$800 million definitive agreement
Allentown facility purchaseConfirmed in writing~$125 million, lease/equipment/operations included
PA SITES grants to ChobaniConfirmed in writing$50 million state package
Farmer supply contractNo public agreementZero signed contracts with any PA producer surfaced
$127M farmer loan/grant fundExisting programs, not newDCED says it will “drive out” existing capacity
Production start dateCommitted2027, not before

On the farmer side, Governor Shapiro said the state is providing up to $127 million in loans and grants to help dairy farmers expand herds, buy equipment, and meet the new milk demand. The Department of Community and Economic Development’s own wording is that the Commonwealth will “continue to drive out” that money — existing capacity pointed at a new purpose, not a new Chobani-specific fund with its own eligibility rules. Call the Bureau of Market Development at the Pennsylvania Department of Agriculture and expect the answer to depend on which existing program you land in.

Does the 30% Claim Actually Hold Up?

Yes. And checking it tells you something the announcement didn’t.

Pennsylvania produced 9.737 billion pounds of milk in 2025 from 461,000 cows, averaging 21,121 pounds per cow, according to the Center for Dairy Excellence’s state dairy overview drawing on USDA NASS data. Three billion against 9.737 billion is 30.8%. The state’s number is honest.

But look underneath it. That 9.737 billion was down about 45 million pounds from 2024 — the fifth consecutive year Pennsylvania’s production declined. The state also lost 11.7% of its dairy farms during 2025 alone, which Farmshine’s analysis of USDA data pegged at 41% of all U.S. dairy exits that year. Chobani’s target is measured against today’s output. Today’s output has been shrinking for half a decade.

So the real question isn’t whether Pennsylvania can supply 30%. It’s whether that 30% comes from new cows or from milk already in a tanker headed somewhere else.

The Value Is in the Solids, Not the Tanker

Here’s the distinction that should change what you do next. Chobani says Allentown will produce milk with more protein and less sugar than conventional milk, feeding into products including high-protein shakes. That’s a plant built around one component in particular.

Chobani hasn’t published how it will pay Pennsylvania producers. But under Federal Order pricing, manufactured-class milk is paid on components. So a plant built for high-protein products is a plant whose value runs through what’s dissolved in the tanker, not its raw volume.

That reframes the expansion question. The producer who improves true protein per cow is positioned to capture that value without buying a single head — assuming component premiums are available on your contract, which is worth confirming before you invest in the ration to get there. Meanwhile, the producer who adds 100 cows at industry-average components has taken on debt to deliver more of what the market is least short of. U.S. milk production hit a record 232 billion pounds in 2025, up 2.6% from 2024 per USDA NASS. Nobody is short of volume.

The genetic and ration work behind components is slow — you don’t move a component test in a quarter. But it’s the only response to this announcement that pays off whether Allentown opens on time, opens late, or never buys a pound from your farm. Butterfat still drives your Class III value regardless of who ends up with your milk. Component work isn’t a bet on Chobani. It’s a hedge against everybody.

Ask your nutritionist and your genetics rep the same question this month: where are my components against the herds you work with, and what’s the twelve-month path to moving them?

Will This Volume Reach Your Check, or Just the Pool?

This is the question almost nobody is asking, and it determines whether any of the above matters to you personally.

Northeast milk marketing runs heavily through cooperatives, which market members’ milk collectively and pay out on a blended basis. A new plant buying 3 billion pounds can strengthen the whole pool without a single individual farm seeing a distinct line item for it. That’s not a criticism of how co-ops operate — it’s the structure they operate inside. But it means “Chobani is coming” and “my milk check goes up” are two separate claims, and only the first one has been announced.

So put it to your board delegate directly, in writing: will volume associated with the Allentown plant be blended across the pool, or will there be direct farm-to-plant sourcing premiums for members who ship to it? If the answer is blended, your expansion math shouldn’t assume a farm-specific premium that doesn’t exist. If it’s direct premiums, ask what qualifies a farm — location, volume, components, or all three.

You’re entitled to ask before you borrow, not after.

The Freight Math

Freight is the channel you can measure. USDA’s Agricultural Marketing Service sets the Federal Order 1 mileage rate factor at $0.00814 per hundredweight per mile, effective March 1, 2024, under Final Rule 88 FR 84038. Applied to Pennsylvania’s state-average 21,121 pounds per cow:

Added one-way milesHauling cost per cwtAnnual cost, 200 cowsAnnual cost, 400 cows
24 miles$0.195~$8,250~$16,500
50 miles$0.407~$17,200~$34,400
100 miles$0.814~$34,400~$68,800
180 miles$1.465~$61,900~$123,800

Assumes 42,242 cwt annually at 200 cows and 84,484 cwt at 400 cows, using Pennsylvania’s 2025 state average of 21,121 lbs/cow.

As Vermont Public put it covering the St. Albans fallout, transportation costs show up as a deduction on farmers’ monthly milk checks. That’s where this lands. We ran the mileage math farm by farm after St. Albans closed — the pattern holds in either direction, because a plant opening reshuffles routes the same way a plant closing does.

Your Class III price already carries a second deduction most producers never see broken out. It’s the make allowance — the processing cost USDA subtracts before your milk gets priced. The final rule amending the Federal Milk Marketing Orders, issued January 2025 and effective June 1, 2025, raised all four: cheese from $0.2003 to $0.2519 per pound, butter from $0.1715 to $0.2272, nonfat dry milk from $0.1678 to $0.2393, dry whey from $0.1991 to $0.2668. Butterfat recovery in the Class III formula moved from 90% to 91%. When the allowance goes up, the regulated minimum comes down.

Then there’s what you’re allowed to see. Private handlers must itemize deductions under FMMO rules; cooperatives are exempt from that requirement. That’s a structural difference in what members can see, not a claim about any particular co-op’s practices. If your route changes and your deduction changes with it, ask how the number was built.

What the Math Looks Like on a 300-Cow Farm

This is a constructed scenario, not a real farm. Swap in your own numbers.

Say you’re milking 300 in Berks or Northampton County with barn room to push to 400. A hundred added cows at Pennsylvania’s average 21,121 pounds is 21,121 cwt of new milk a year. At August 2026’s announced Class III price of $16.64/cwt, that’s roughly $351,000 in added gross — before feed, labor, interest, or a single mile of freight.

Now the other side. USDA quarterly estimates put replacement dairy cows at $2,980 per head in January 2026, rising to $3,130 by May. Top-quality springing heifers were clearing $3,400 to $4,400 this spring. Buy 25 head at $3,900 and you’ve spent $97,500 before you pour a foundation.

The supply behind those prices isn’t loosening. USDA’s January 1, 2026 Cattle report counted 3.90 million dairy replacement heifers, and USDA’s own Dairy Outlook notes that heifers per 100 milk cows sat at their lowest percentage since 1991 — with producers expecting 0.3% fewer heifers to calve this year despite a larger national herd. You’d be buying into a tight market to serve a buyer whose CEO just said there’s still work to do.

How Much Does Waiting 30 Days Actually Cost You?

Honestly? Not much. That’s the uncomfortable answer for anyone feeling urgency right now.

The plant isn’t taking milk before 2027. A heifer you buy in October doesn’t freshen and hit peak in time to matter for a 2027 startup anyway. What waiting costs is position in a tight replacement market where prices climbed $150 a head between January and May. That’s the honest trade — the animals get more expensive while you wait, but the buyer stays hypothetical. Where does your breakeven sit if replacements run another 5% higher next spring and there’s still no contract on the table?

Is Your Operation Actually Inside the Milk-Shed?

Being close to Allentown isn’t the same as having access to Allentown. A plant drawing 30 million cwt a year competes hardest inside roughly a 75-to-100-mile radius before freight economics eat what it can offer — which from Upper Macungie Township reaches into Berks, Bucks, Montgomery, Northampton, and Schuylkill counties, and possibly into Warren and Hunterdon counties in New Jersey. That’s a modeled radius built on standard hauling thresholds, not a Chobani sourcing map.

Here’s the threshold worth knowing. USDA’s 2026 all-milk price forecast sits at $19.85/cwt. At that price, about 24 extra one-way miles is where added freight starts eating 1% of your gross. Drop the milk price and the threshold tightens — measured against August’s $16.64 Class III, you hit 1% closer to 20 miles. That percentage holds whether you milk 120 cows or 500.

Do you know your actual haul distance and rate, or roughly? Roughly isn’t good enough when you’re deciding whether a new plant changes your basis.

Options and Trade-Offs

Wait for paper. Hold capital until a written supply agreement exists. Makes sense for nearly any operation without spare borrowing room. Processors building new capacity typically secure a supply base ahead of startup, so ask how early agreements for this plant are expected to be finalized and whether herd size factors into the sequence. Redding’s own question — how do you help farms expand if they want to — hasn’t been answered with a mechanism yet.

Expand only to demand you already have. Add cows to the level your current buyer wants today, and treat Chobani as upside rather than justification. Works if your handler has already signaled it wants more volume. You leave some potential upside on the table. That’s what the certainty costs.

Build components instead of headcount. Covered above, and it’s the path with the widest margin for error. It pays whether or not this plant ever buys from you.

StrategyUpfront CostPayoff If Plant Delays/Falls ThroughPayoff If Plant Delivers
Buy 25 heifers now ($3,900 avg)$97,500Sunk cost, no returnDelayed revenue, uncertain premium
Wait for written supply contract$0No loss, full flexibilitySlightly delayed entry only
Build true protein/component premiumsNutritionist/genetics costStill pays via Class III/component pricingCaptures premium without new debt

Do this within 30 days. Send the checklist below. Not a phone call you’ll half-remember — an email you can file.

Worth knowing where this sits nationally: more than $11 billion has gone into new dairy plants across 19 states, and the map has clear winners and losers. Pennsylvania just landed on the right side of it. That doesn’t automatically mean your farm did.

The Co-Op Director Checklist

Copy these into an email to your co-op director. Send it this week. Keep the reply.

On the contract:

  1. Does a written supply agreement tied to the Allentown plant exist for our region, or is one under negotiation? If yes, what’s the timeline for member offers?
  2. If an agreement is offered, will it specify committed volume, price basis, contract term, and what happens if the plant’s start date moves past 2027?

On the pool:

  • Will volume associated with the Allentown plant be blended across the pool, or will there be direct farm-to-plant sourcing premiums for members who ship to it?
  • If direct premiums exist, what qualifies a farm — location, volume, component levels, or a combination?

On freight:

  • What is my farm’s projected routing for the next twelve months: receiving plant, one-way miles, hauling rate per cwt, and location differential?
  • If my routing changes, how and when will I be notified, and how is the new hauling deduction calculated?

On components:

  • Where do my butterfat and true protein tests sit against the co-op average, and what component premiums are currently available to me?

On the state money:

  • Which specific Pennsylvania loan or grant program would my operation qualify under, and what are the eligibility and repayment terms? (If they can’t answer, call the Bureau of Market Development at the Pennsylvania Department of Agriculture directly.)

Anything you get verbally, ask for in writing. A field rep’s optimism isn’t a commitment, and neither is a governor’s press conference.

The Verdict

Let the operations that can absorb a miss take the risk on $4,400 springing heifers. If you’re running 150 to 500 cows, your play isn’t expansion — it’s efficiency. Push components on the cows you already own, tighten what leaves in the cull pen, and if a regional demand squeeze does materialize as the plant ramps, be positioned to negotiate a better basis from the handler you already ship to. That’s how a mid-sized operation captures value from a plant it doesn’t have a contract with.

A billion-dollar plant down the road doesn’t protect you from a bad milk check. The producers who win when Allentown opens won’t be the ones who gambled their balance sheets on $4,400 heifers. They’ll be the ones who forced their co-ops to put freight deductions, component premiums, and destination clauses in writing today.

So send the email. Then check what your neighbors get back — because if their answers differ from yours, that tells you something about how this pool actually works.

Key Takeaways

  • The $1.16/cwt over-order premium expired June 30 with no replacement order. On a 300-cow herd at Order 1’s 28.27% Class I utilization, that’s about $20,800 a year already gone — recalculate your Class I revenue before you model anything Chobani-related.
  • Allentown doesn’t take milk until 2027, but springing heifers were clearing $3,400 to $4,400 this spring. Buying replacements now against a plant with no public supply contract means carrying that cost through a start date nobody has committed to in writing.
  • Chase protein instead of headcount. A plant built for high-protein products pays through components, and component work holds its value whether or not your milk ever reaches Upper Macungie.
  • Get the routing answer in writing this week: which plant, how many miles, what rate per cwt. At USDA’s $0.00814 mileage factor, 50 added one-way miles costs a 200-cow herd roughly $17,200 a year — and a plant opening moves routes the same way St. Albans closing did.

The full milk-shed derivation, the county-level radius map, and the 300-cow break-even model — including what happens if the 2027 start slips — are coming in Bullvine Weekly. That’s where the numbers behind the decision live.

The Sunday Read Dairy Professionals Don’t Skip.

Every week, thousands of producers, breeders, and industry insiders open Bullvine Weekly for genetics insights, market shifts, and profit strategies they won’t find anywhere else. One email. Five minutes. Smarter decisions all week.
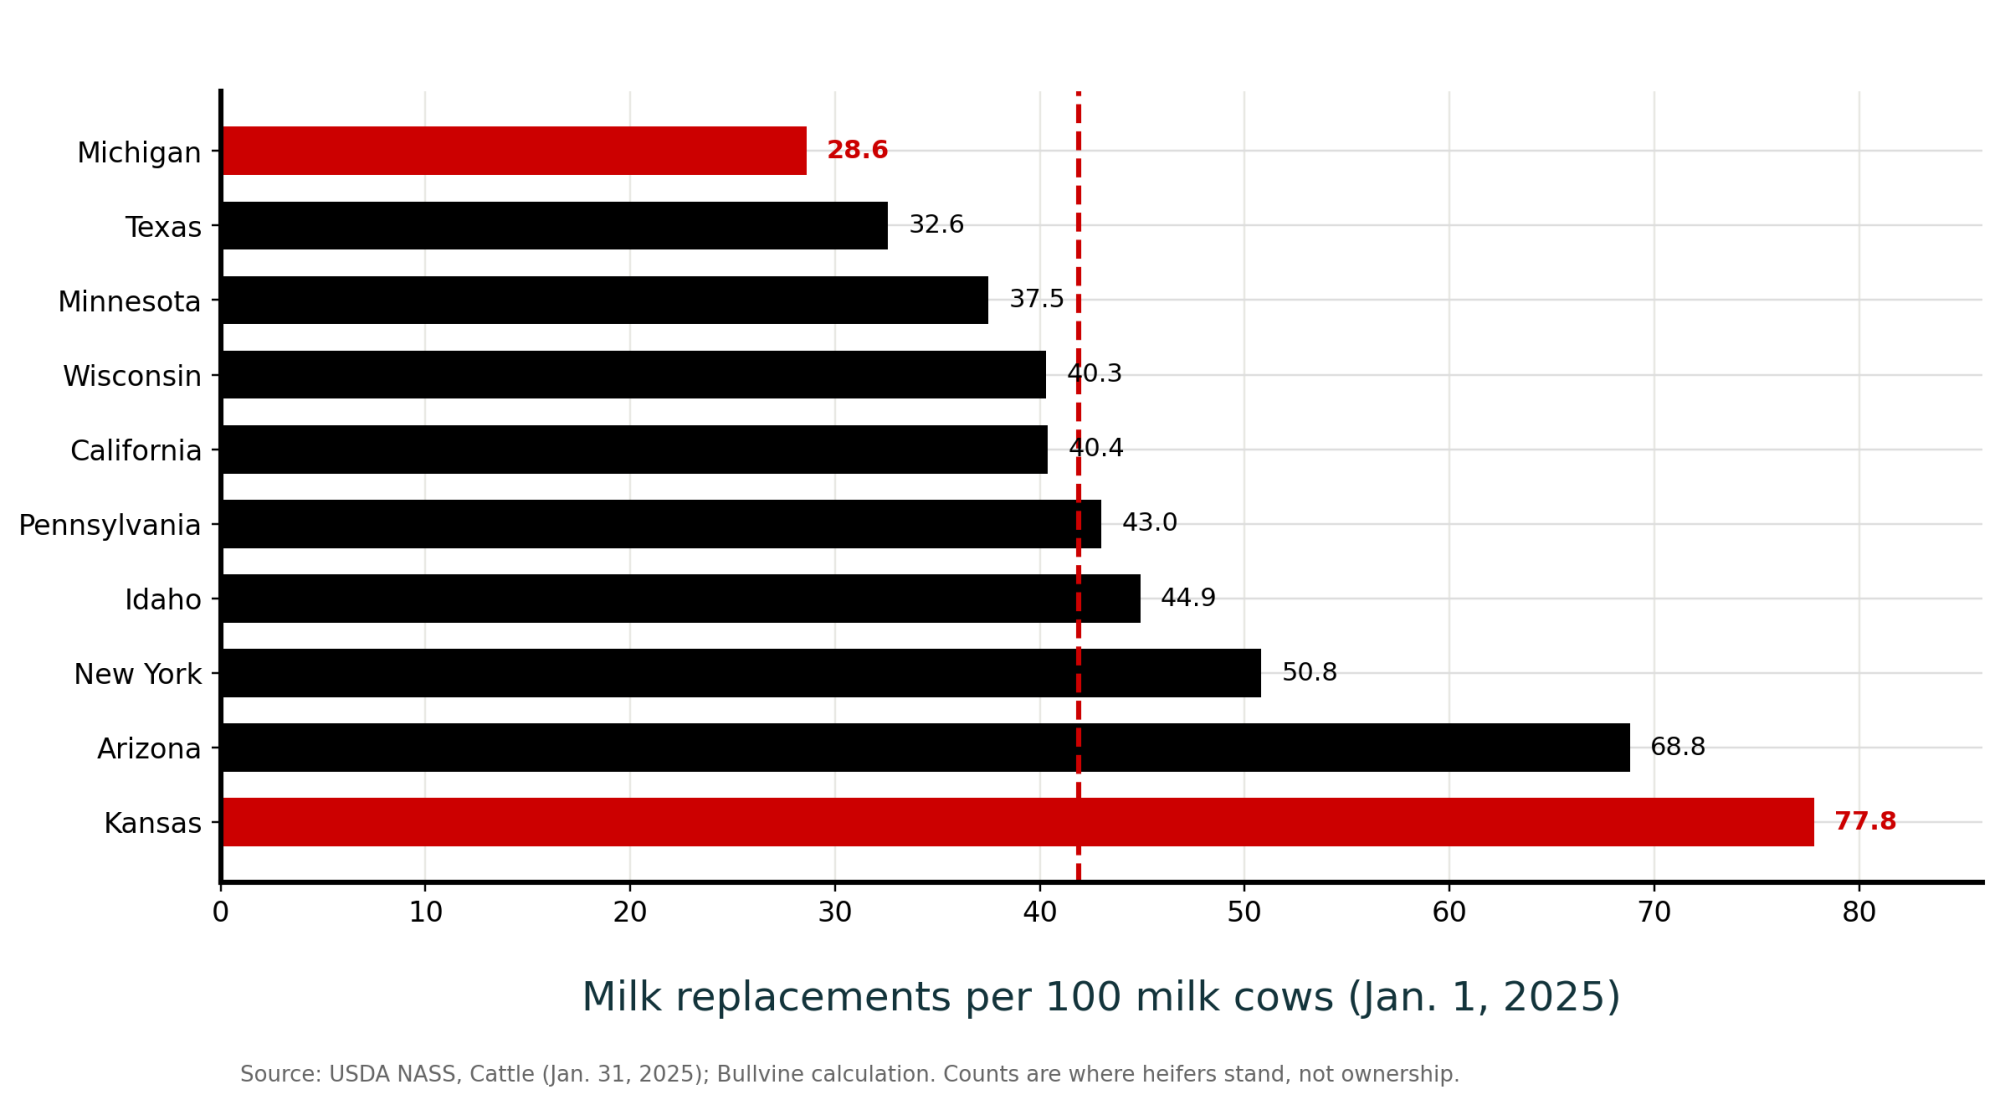
NewsSubscribe
First
Last
Consent

Complete references and supporting documentation are available upon request by contacting the editorial team at editor@thebullvine.com.

Learn More

127 Days on the List, 82 Hours on the Road: The Cull Cow Math Nobody Runs

She went on the list in April at 209 days in milk. It’s September, she’s still milking, and the odds she’s thin have been climbing the whole time. UBC tracked 1,171 cows through exactly this wait. Here’s what it costs.

  • 127 Days — Average time a cow sits on the culling list before leaving the farm 
  • 82 Hours — Average time she then spends in the marketing chain before harvest 
  • 14.7× — Multiplied odds of udder engorgement or inflammation by the time she reaches the abattoir
    Stojkov et al., Journal of Dairy Science, March 2020

An Ontario dairy farmer, describing where responsibility for a cull dairy cow ends, put it about as plainly as anyone has. Identified only as “C2” in a University of Guelph focus-group study published in Frontiers in Veterinary Science in June 2023, he told researchers: “Once it leaves the farm and goes on the truck, it is the trucker’s responsibility, and once it leaves the truck and goes to the sale ring, it is the sale ring’s responsibility. It is, in my mind, whoever has [financial] possession of the animal.”

That’s a coherent position. It’s also the exact belief a British Columbia dataset spent eleven months quietly dismantling — and the dismantling starts earlier than the truck.

The 127-Day Number Nobody Talks About

Jane Stojkov, Marina von Keyserlingk and David Fraser at UBC, with Todd Duffield at Guelph, tracked 1,171 cows off 20 Fraser Valley dairy farms between May 2017 and March 2018. Herd size averaged 311 cows. More than 99% were Holstein. Every animal was scored for body condition, locomotion, and udder condition at four checkpoints: when she went on the culling list, before she left the farm, at auction, and at the abattoir.

Cows were flagged for culling at a mean of 209 days in milk, and left the farm at a mean of 273 DIM. But the span that matters isn’t the gap between those two averages — it’s how long each individual cow actually waited. The paper reports that span as its own figure, with its own standard deviation of 112 days: a mean of 127 days on the listbefore anyone backed up a trailer.

And their condition was already sliding before the trailer showed up. While cows were on the culling list, the odds of being thin or having poor fitness for transport increased. The decision to cull had been made. The shipping decision hadn’t.

The authors offer a straightforward explanation for at least part of it: demand for milk in British Columbia rose through the study’s baseline period, and increased demand appeared to lead to delayed culling — so more compromised cows went to slaughter. Body condition at removal averaged 3.1. By the slaughter plant it was 2.7.

Where Does the Damage Actually Happen?

Then the trailer. Published in the Journal of Dairy Science in March 2020, the study found cows spent a mean of 82 hours — plus or minus 46 — in the marketing system before slaughter. Only 5% were slaughtered within a day of leaving the farm. Forty-three percent took two to three days, 41% took four to five, and 16 cows spent between eight and sixteen days in the system.

Three of those 1,171 cows never made it through in a saleable state. One arrived dead. Two were non-ambulatory on arrival and had to be euthanized on the spot.

Shipping from farm to abattoir raised the odds of a cow being thin by a factor of 5.8 (95% CI 4.2–8.1), of showing udder engorgement or inflammation by 14.7 (10.7–20.2), and of poor fitness for transport by 7.3 (5.7–9.5).

Read “odds” literally. An odds ratio of 14.7 doesn’t mean 14.7 times as many cows arrive with udder problems. It means the statistical odds of that condition being present multiply by roughly fifteen once she’s shipped — a measure of how strongly shipping is associated with the problem, not a headcount.

The mechanism isn’t mysterious. At the livestock markets, cattle in presale pens got no feed and water at all; those in holding pens got water and sometimes low-quality hay. Repeated loading, offloading, and mixing with unfamiliar animals cuts intake and mobilizes body reserves. And the udder finding has a clock on it — research the authors cite shows that even cows producing only 10 to 15 kg a day develop increased udder pressure and elevated stress hormones that peak on day two after milking stops.

Not every cow carries the same risk into that chain. The same paper found a fourth-lactation-or-greater cow had 2.77 times the odds of poor fitness for transport compared with a first-lactation animal, and cows in the first 100 days in milk had 4.48 times the odds of udder engorgement compared with cows past 305 days. The mature cow culled in early lactation is the highest-risk animal you own on every axis the study measured.

And one marginal cow doesn’t only risk herself. Jake Jacobs, market manager at Equity Livestock in Bonduel, Wisconsin, puts it in trailer terms: “When one cow goes down, when you’re going down the highway, it creates a domino effect… you may only have one cow that’s in poor condition, but she goes down, you may have three to four or five other cows piled up over the top of her.”

The Cull Market Is Making This Worse

Cull prices are in record territory. Drovers reported in March 2026 that Southern Plains auction prices for 85% to 90% lean cows had climbed about $3 per cwt to $167 since the start of January, with the cow beef cutout up $19 to roughly $331 per cwt. Mississippi breaker-quality cows hit $175. Yield grade 1 cull bulls broke $200 per cwt in February at Mississippi and Georgia auctions, about $30 higher than the year before. Beef cow slaughter is down more than 20% year over year.

Dairy is pulling the other direction. Dairy cow slaughter is running 7.3% higher than last year, and Drovers expects it to stay ahead of 2025’s pace — the largest dairy cow herd since the early 1990s, meeting sharply lower milk prices. Strong calf prices, especially for beef-on-dairy calves, have helped hold that inventory up by offsetting the milk check.

So the salvage check has never looked better, and the incentive to keep a marginal cow one more week has never been stronger. Stojkov’s 127 days is what that instinct already costs — measured in a year when milk demand was rising rather than milk price falling.

Market or barn figureCurrent levelDirectionWhat it does to the shipping decision
85–90% lean cows, Southern Plains$167/cwt+$3 since JanuarySalvage value rewards holding her
Cow beef cutout~$331/cwt+$19Packer demand is strong
Beef cow slaughterdown >20% y/yBeef side is retaining; dairy is the supply
Dairy cow slaughterup 7.3% y/yLargest dairy herd since the early 1990s meets lower milk prices
Gross on a 1,300 lb cow @ $180/cwt$2,340The number producers actually see
Trial-reported pre-slaughter loss$112.80/cow~4.8% of valueOne JDS feeding trial, August 2024 — not an industry average

The 85% Who Can’t Dry Her Off

Brunt and colleagues, publishing in the Journal of Dairy Science in 2024, found 85% of surveyed Ontario producers did not dry off culled cows before transport. Not because they hadn’t heard the recommendation. Participants named business pressures — production demands and space limitations — as what challenged their ability to dry those cows off. The same paper independently confirmed the C2 pattern: producers disagreed on whether responsibility ended once the cow left the property.

That 85% aren’t cutting corners. Brunt’s respondents described a genuine capacity problem, and a dry-off pen you don’t have isn’t a decision you can make.

But the udder number is the one that punishes the gap hardest. Fourteen-point-seven, and the pain curve peaking on day two, against a system that held better than half these cows longer than three days.

Barn math, assumptions shown

A Journal of Dairy Science feeding trial published in August 2024 reported a $112.80-per-cow economic loss under that specific pre-slaughter feeding protocol — a trial-specific figure, not an industry average. Against a $2,340 gross on a 1,300-pound cow at $180/cwt, that’s about 4.8% of the animal’s value.

Then run the number that’s actually yours. Take your annual culls, multiply by a per-cow loss figure you trust from your own kill sheets, and see what falls out. One feeding trial isn’t your operation, and a percentage isn’t a plan.

One number to handle carefully. The widely circulated $22.4 million industry bruising loss traces to Rosse, 1974, and the researchers who keep citing it say in print that it needs revisiting.

Herman’s Cow, and Why the Trip Beats the Gate

Dr. Julia Herman, the veterinarian on the Beef Quality Assurance team, walked a University of Wisconsin–Madison Division of Extension webinar audience in December 2025 through an illustrative case — her teaching example, not a documented animal. An older cow, lactation three or four. Body condition score 3 on the five-point dairy scale. Slightly lame on a rear leg.

Two hours to a consolidation point. Held overnight, where the lame leg gets a little worse, and she’s introduced to unfamiliar cattle in an unfamiliar pen. She drops a body condition score — about 100 pounds. Another four and a half hours to the plant. Total elapsed: five days, fifteen hours on a trailer, and, because she’s a dairy cow, not milked once.

Her point about destination is sharper than the arithmetic. Across the 2022 audit, the mean final transport leg ran six hours, with a maximum of 24 hours and distances past a thousand miles. Wisconsin producers are luckier than most — a couple of market cow plants sit relatively close, which isn’t true everywhere in the US. But close doesn’t mean guaranteed. From the 2016 audit: a dairy cow sold in California was harvested at a Pennsylvania plant.

Stojkov’s data says the same thing with a map. Roughly 80% of those Fraser Valley cows were slaughtered in the United States, averaging 286 km of transport. Eleven percent went to Alberta — 1,105 km. Nine percent stayed local in BC at 62 km. And during the study, one of the six participating abattoirs stopped slaughtering cattle altogether. The authors’ conclusion is unusually direct for a journal: regions with dense dairy populations need more local facilities for slaughtering cull dairy cows.

DestinationShare of cowsMean transport distanceBarn-level read
United States~80%286 kmBorder crossing is the default, not the exception
Alberta11%1,105 kmLongest route, on the least-fit animals
Within British Columbia9%62 kmThe only option that keeps her under two hours
Capacity change during studyOne of six participating abattoirs stopped slaughtering cattle
US audit comparison (2016)CA sale → PA plantSale location tells you nothing about the trip

Jacobs sits about 25 to 30 miles from what he calls two of the biggest kill cow plants in the US, and he tells his own producers that certain cows should go from the farm straight to the slaughter facility rather than through a sale ring. His reasoning is barn-level: haul her 30 miles the wrong direction into a sale barn, and she stands on cold concrete in a building considerably colder than the milking barn she came out of, eating dry hay instead of TMR, losing energy and condition while she waits for a truck to make the 30-mile trip back to Green Bay.

He described the pattern that gets her there: a cow diagnosed with hoof rot, treated, now under a 30-day withhold. Mid-withhold, she comes up lame on another foot. Another withhold, and her condition keeps deteriorating the whole time. His question is whether day one — diagnosis day — was the day she should have gone on the truck while she was still salvageable.

A note on the language. We’ve argued before that “market cow” is the more accurate term than “cull cow” — she’s an animal with a second career and a real carcass value, and Herman makes the same point when she reminds dairy audiences these cows don’t just become ground beef. The research literature still says “cull.” The barn doesn’t have to.

Why the Sale Ring Lies About Lameness

This finding should change how you interpret anything you see at a sale barn, and it’s the most counterintuitive result in the whole study.

Cows scored better for locomotion at the livestock market than they had on their own farm. The odds of being scored severely lame at auction were 0.37 — a 63% reduction against the on-farm baseline.

They hadn’t improved. The authors offer two explanations, both well grounded in the lameness literature. The novel environment of a sales ring — noise, unfamiliar handlers, individual penning — distracts a cow’s attention away from the pain, which suppresses the gait abnormality you’d otherwise see. And the sawdust flooring in a sales ring is a great deal softer than the concrete she was scored on at home, which improves stride length and gait symmetry.

So if you’re judging fitness for transport by watching cows move through a ring, you’re looking at the most flattering picture that animal will present all week. Score her at home, on your concrete, before anyone loads her.

One Defect Collapsed 87%. The Other Hasn’t Budged.

The audit record is more interesting than “nothing changed,” and more damning.

The 1999 National Market Cow and Bull Beef Quality Audit, published by Roeber and colleagues in 2001, surveyed 5,679 carcasses on the harvest floor. Among cow carcasses, 88.2% carried at least one bruise — which left fewer than 12% clean. By 2016, cow carcass bruising had fallen to 64.1%. The 2022 audit, published in Translational Animal Science in January 2025, recorded 66.7% across 5,762 cow carcasses and 46.4% across 875 bull carcasses — figures its own authors describe as similar to both the 2016 and 2007 results.

So the industry cut cow bruising by roughly 24 percentage points between 1999 and 2016. Then it stopped and has held flat across two audit cycles since.

Two honest caveats. BQA’s own 2022 report notes the audit “stands apart from previous (and future) audits” because collection ran through COVID-era supply chain disruption and processing backlog, which could mask movement either way. And severity matters: in 2016, over half of all bruises on surveyed carcasses were classified as only minor. The 2022 audit shifted the wrong way on that split — more major, less minimal — which Herman ties to condition. Thin cows, she notes, have less coverage to buffer contact.

Now the number that proves this is fixable. Arthritic joints appeared on 10.3% of cow carcasses in the 1999 audit. By 2016, just 1.3% of carcasses showed signs of arthritic joints. That’s a defect cut by roughly 87% between the two audits.

Roeber’s team put a figure on what was sitting on the table in 1999: minimizing quality defects, monitoring condition, and marketing promptly might have recaptured $13.82 for each cow harvested and $27.50 for each bull. Producers went after the arthritic-joint share of that. Herman’s explanation of how is straightforward — when the audits showed how many arthritic joints were arriving, the recommendation went out to cull those animals at an earlier lameness, and the number came down at the packing plant.

Worth noting what that 1999 audit found on lameness itself: only 60.8% of dairy cows showed no evidence of lameness, against 73.4% of beef cows. Roughly two in five dairy cows arrived with something.

One defect got targeted and collapsed. Bruising got the same attention and hasn’t moved in two cycles.

Why Didn’t Telling Farmers Work?

The BC study’s whole second half was an experiment. Ten farms got a one-page decision tool, the study’s own findings on transport duration and arrival condition, auction price data, a free vet consultation line, and an abattoir contact for direct shipping. A 30-minute meeting, delivered by a veterinarian. The other ten got nothing.

Providing that information to farmers did not affect the outcome measures.

Read the rest carefully, because it’s the part that matters. Outcomes did improve between the baseline period and the treatment period — thin cows shipped fell from 9.0% to 4.9%, poor fitness for transport from 25.8% to 15.7%, cows that died from 11.9% to 5.4%, and cows euthanized from 20.5% to 13.3%. The authors attribute that shift to time, not to their intervention. Milk demand had been climbing through the baseline months and then leveled off.

Outcome measureBaseline periodTreatment periodAttributed to
Thin cows shipped9.0%4.9%Not the intervention
Poor fitness for transport25.8%15.7%Not the intervention
Cows that died in the chain11.9%5.4%Not the intervention
Cows euthanized20.5%13.3%Not the intervention
Variable that did track outcomesWhich vet clinic served the farm

But one variable did track with outcomes. The percentage of thin cows sent to auction varied by which veterinary clinic served the farm — and clients of certain clinics shipped fewer cows with poor fitness for transport. Four clinics served those twenty farms, and they did not produce the same results.

Information alone moved nothing. The veterinarian appears to have moved something.

Herman’s advice through the webinar points the same way, and it wasn’t “read more” — it was work with your veterinarian on a customized herd health plan, build treatment and euthanasia protocols, use your resource team. Her position on the culling decision specifically: veterinarians can really support producers in making these euthanasia and culling decisions. She also notes that farms certified under the National Dairy FARM Program are treated as BQA-equivalent.

There’s a harder dimension to the decision moment, too. Our reporting in January 2026 covered research finding farmer stress positively associated with the prevalence of severely lame cows — more operator stress, more severe lameness in the herd. That’s a correlation, not proof of cause, and it could run both ways. But if the person making the call is running on empty, “wait and see one more week” is the path of least resistance, and 127 days is what that looks like on a spreadsheet. Herman’s argument for written protocols lands here: a protocol takes the decision away from the producer and the employees, and makes the euthanasia call easier to make.

The Communication Barrier Jacobs Named

Ask Jacobs where the system breaks on-farm and he doesn’t blame the vet or the trucker. He points at the gap between the person who sees the cow and the person who decides what happens to her.

His words: “I think there’s some miscommunication there. We either… they don’t care or it’s an actual language barrier where, you know, this is my job, this is what I do, and I don’t worry about the next step.”

The cow he’s describing is the one who struggles to get up out of the freestall and is last to the parlor holding area every single time. And the message he wants relayed is blunt: “Hey, you know, this cow, this cow’s got really sore feet. This cow needs to either be treated, hoof trimmer, or sent to slaughter.”

He named two causes, not one. Indifference is the easy diagnosis. A crew working in a second language is the harder and more common one — and Herman landed in the same place from the veterinary side, urging producers to keep protocols and product labels in a language their workers can understand, so they know what they’re giving and where to find more information.

The Hauler Can Say Yes. That Doesn’t Make It Your Answer.

Herman’s guidance on transporters runs both directions, and the second direction is the one worth sitting with. She encourages producers to work with their hauling companies and make sure those companies haul to the welfare standards the farm expects — then challenges haulers to have the same conversation back, because if a driver doesn’t feel comfortable transporting a particular animal, something probably needs improving.

That’s a useful test precisely because it doesn’t depend on liability. A hauler can agree to load her. The plant can still condemn her — as it did for three of those 1,171 cows. And under the C2 logic, a farm that sold her at auction has already been paid and technically owns none of what happens next.

Which is why Herman doesn’t argue the point on economics. Her framing: “All of us need to consider what it means when that animal leaves your farm in that condition. Do you want that to be the billboard for our industry but also your farm?”

The Residue Story Nobody Tells at Meetings

Jacobs worked on drug residues with the FDA during his time with the State of Wisconsin, back before LA200 was pulled for lactating dairy cattle. He described a small farm — 30 cows, an older gentleman who documented every single treatment a cow ever received. One cow was injected for pneumonia with LA200. Eighteen months later, her kidneys and liver came back suspect, with residue found in the liver.

Eighteen months. On a farm with immaculate records. Jacobs believes that case contributed to LA200 coming off the shelf for lactating dairy cattle.

The Wisconsin ending is the good part. Jacobs says the state gets the violator list every week, and right now there’s one farm on it statewide — which he calls very good compared to where it was ten years ago. So when someone tells you residue management can’t improve at scale, that’s the counter-example.

Strategic Action Paths

Path 1 — Put a clock on the culling list. Stojkov’s cows averaged 127 days between the cull decision and the shipping decision, and their condition slid during that window. Set a maximum. Thirty days, sixty, whatever your capacity supports — but a named number, reviewed weekly.

  • Works on any operation that keeps a culling list at all.
  • Costs a recurring calendar entry and someone with authority to act on it.
  • Backfires if the clock forces you to ship into a market or a route you haven’t lined up. Set the number and the destination together.

Path 2 — Set a treatment-attempt ceiling with your herd veterinarian, in writing. Herman gave the number: “If we have a lameness we’re only going to do it twice and then we’re going to really reevaluate and then maybe we ship her instead of just continuing to retreat, retreat, retreat.” Her separate threshold for a down cow — no improvement on medical treatment inside 24 hours means euthanasia — is a welfare line rather than a judgment call.

  • Best where repeat treatment is common and withhold periods run long, which is exactly Jacobs’ hoof rot scenario.
  • Demands a scheduled conversation and a written protocol. Herman argues that the protocol protects the person who’d otherwise make the call alone.
  • Backfires if set so tight it culls recoverable cows. The vet owns the number, not the marketer.

Path 3 — Score her at home, and name the scale. The BC data says a cow looks 63% less lame in a sales ring than she does on your concrete. Score locomotion on-farm, on the surface she actually walks — and write down which scale you’re using. BQA’s transport guidance says don’t ship at a lameness score of 3 or more. AABP’s fitness-to-travel recommendations set the line at 4 or 5. Same country, same year, two industry bodies, two full points apart on the same cow — and that’s before you get to the Canadian Code, the Meat Institute mobility scale and the published research tool. We’ve laid all six out separately.

Path 4 — Thirty-day action: pull your last 20 market cow records and reconstruct the trip. For each cow, write down her BCS at loading, whether she was milked out, how long she sat on the culling list, and where she was actually harvested — not where she was sold. If you can’t fill the last two columns, that’s the finding. Ask your hauler.

What This Means for Your Operation

  • How long has your longest-standing cull been on the list? If you don’t know without checking, that’s the first number to go find. Stojkov’s average was 127 days.
  • Does anyone on your operation own the shipping decision, or does it default to whoever notices the trailer is coming Thursday?
  • With cull prices at record levels and dairy slaughter running 7.3% above last year, what’s your actual reason for holding a marginal cow another week — and would you write it down?
  • Where do you score locomotion? If the answer involves a sale barn or a scale-house alley, the BC data says you’re seeing her best week.
  • Which of your cows are mature and in early lactation right now? On every axis that study measured, those are the ones a long route punishes hardest.
  • Does your veterinarian find out about a cull decision before the trailer leaves, or after? Four clinics served twenty farms in that study and did not get the same results.
  • Do your treatment protocols and product labels exist in the language your parlor crew actually reads?

Key Takeaways

  • Culling is two decisions, not one — the call to cull and the call to ship. Most farm protocols govern the first and leave the second to whoever notices the trailer’s coming.
  • Anything you assess at a sale barn is that animal’s best presentation of the week. The lameness data proves it for gait, and it should make you skeptical of any condition judgment made on someone else’s flooring.
  • The lever isn’t information. Handing twenty farms their own data, a decision tool, a free vet line and an abattoir contact moved nothing measurable. Which clinic served the farm did.

Arthritic joints fell from 10.3% to 1.3% because thousands of producers each started culling a little earlier. Nobody legislated it and no pamphlet did it either — Stojkov tested that directly and moved nothing. The only variable that tracked with better outcomes was which veterinarian a farm happened to use. Canada has since written the udder threshold into law, which is one way to force the conversation. The other way costs a phone call and starts tomorrow. So, in Herman’s framing: the next cow that leaves your yard is going to be somebody’s billboard. Whose?

Run Your Numbers

Health ROI Calculator — Stojkov’s cows sat 127 days on the list because nobody had a number to act on. Plug in your herd size, culling rate, replacement heifer cost and mastitis incidence, and the calculator puts a dollar figure on what earlier, cleaner culling decisions are actually worth.

Complete references and supporting documentation are available upon request by contacting the editorial team at editor@thebullvine.com.

Learn More

The Sunday Read Dairy Professionals Don’t Skip.

Every week, thousands of producers, breeders, and industry insiders open Bullvine Weekly for genetics insights, market shifts, and profit strategies they won’t find anywhere else. One email. Five minutes. Smarter decisions all week.
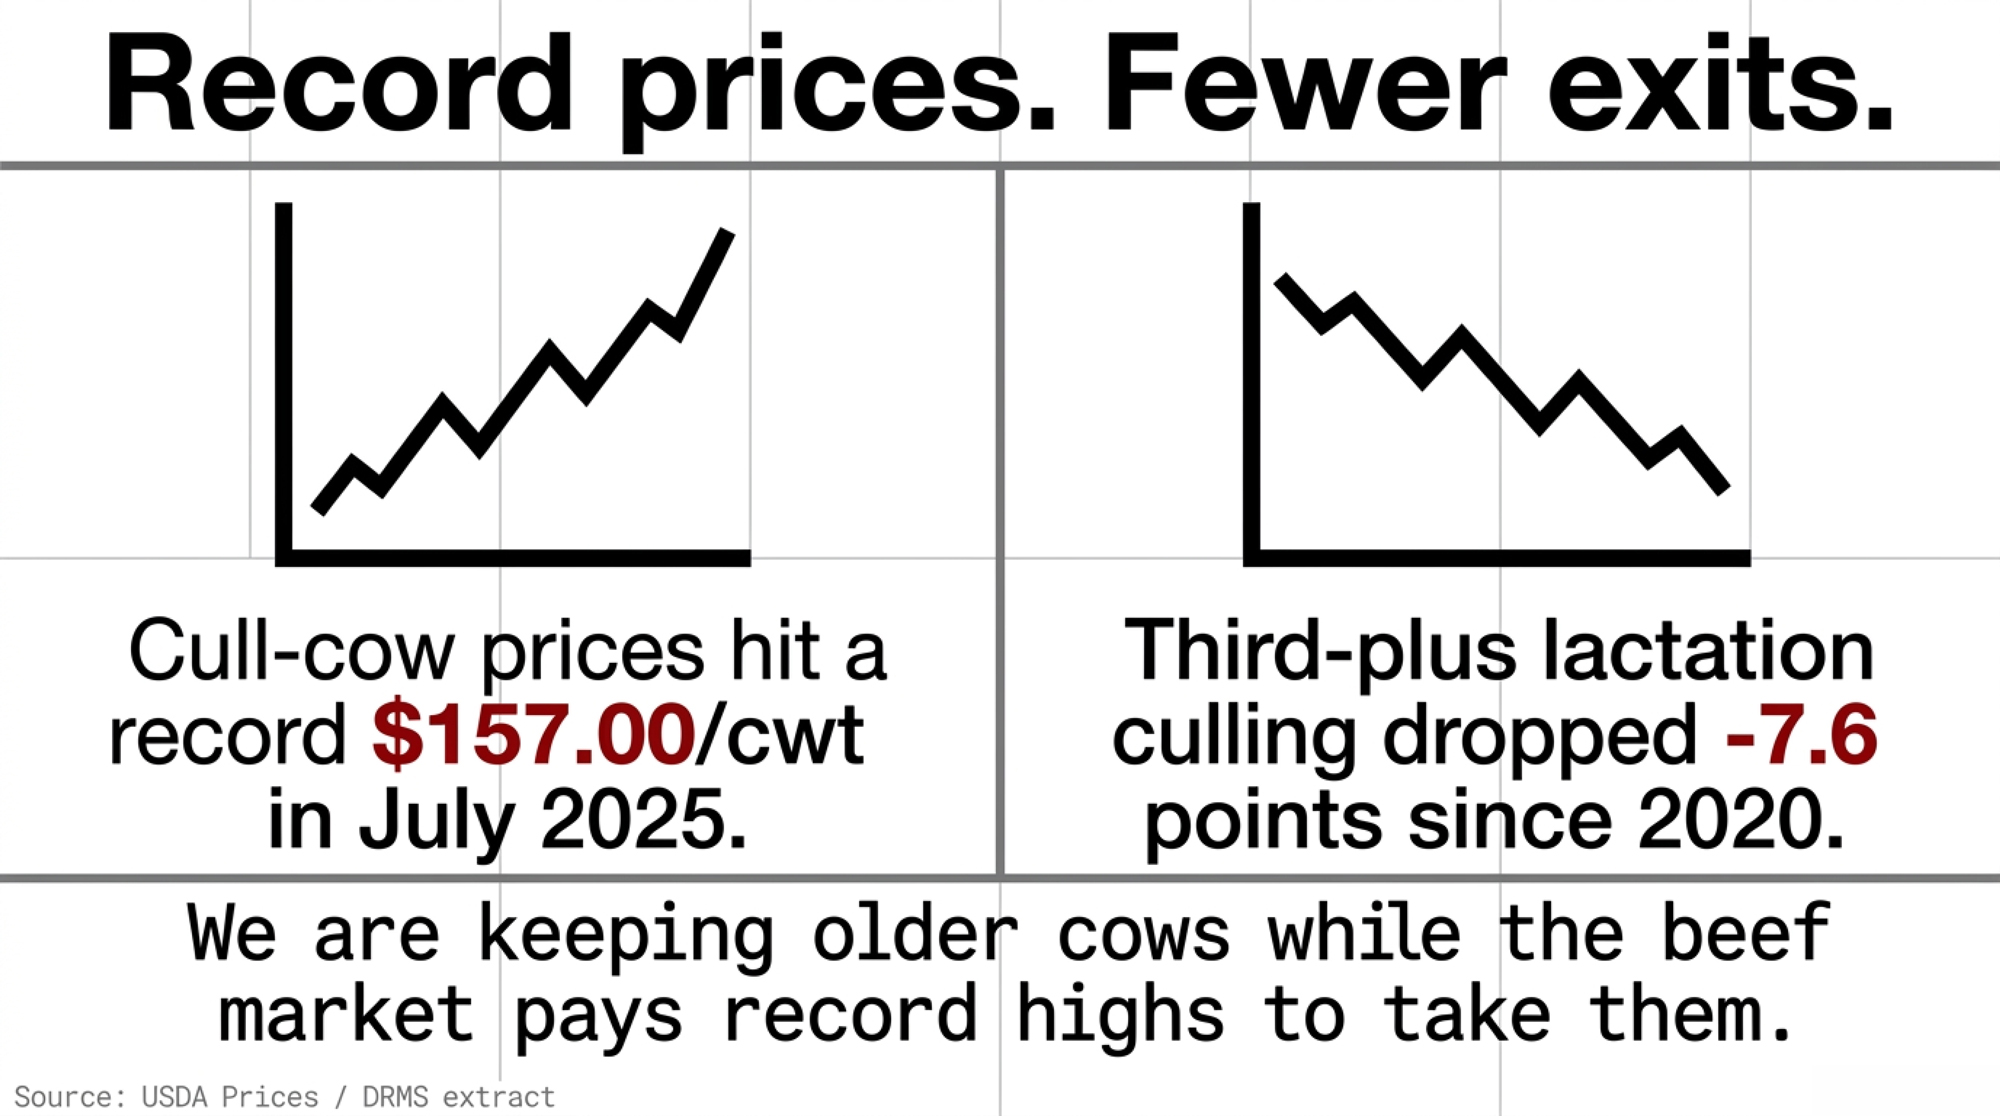
NewsSubscribe
First
Last
Consent

Your Embryo Rep Negotiates the $50 Line. The $217 Line Has No Rep.

Of the $349.48 it took one Wisconsin herd to make a confirmed pregnancy, the embryo was $50. Cows that got one and didn’t conceive were $217.41. Only one of those has a salesperson attached.

embryo transfer cost

A 2,000-cow Jersey dairy in south-central Wisconsin ran two recipient protocols side by side across six months of 2022 — same barn, same embryos, same $400 calf contract. One cleared $1,465 on 100 recipients. The other lost $1,018. The embryo transfer cost per pregnancy came apart by $135.35, which is more than any discount you’ll negotiate this year, and nobody sold them a different embryo. It came down to which two days of the week the transfer window was open.

Natalia Hincapie went in chasing a narrow question about hCG. Working under Paul Fricke at the University of Wisconsin–Madison, her master’s project asked whether 2,500 IU at transfer would lift pregnancy outcomes in lactating Jerseys. It raised progesterone and luteal volume and did nothing for pregnancy per transfer. The farm — unnamed in the published paper, a condition of its participation — was running terminal Angus IVP embryos into those recipients to sell day-old crossbreds, not to build replacements.

Two protocols ran side by side. Protocol A was Double-Ovsynch, every cow transferred on a fixed schedule after synchronized ovulation, no heat watching. Protocol B was synchronized estrus, transferred only once standing heat was observed. Estrus detection in that second arm ran at 74%, which sounds respectable right up until you check what happened to the cows that cycled on the wrong days.

The myth every embryo conversation starts with

Cost lineAmountShare of totalHas a sales rep?
Nonpregnant recipients$217.4162%No
Embryo$50.0014%Yes
Transfer (ET fee + ultrasound)$40.0011%No
Hormonal treatments (incl. hCG $17.97)$28.778%No
Veterinary exams$9.503%No
Unutilized recipients$3.801%No

Ask a producer what an embryo program costs and you’ll get a per-embryo number. Ask a rep and you’ll get a per-embryo number with a volume discount attached. That’s the frame — cost equals price, and price is negotiable.

The frame survives right up until somebody itemizes a real program. Then the negotiation everybody has turns out to be over the fourth-largest line on the invoice, and the largest line turns out not to be on the invoice at all.

Running the Numbers

On a 400-cow herd, enroll 100 cows as recipients. That’s a quarter of the herd, which is workable. On 200 cows it’d be half, which isn’t — scale the enrollment before you scale the conclusion.

Run each protocol at the performance this herd actually recorded: 93% utilization and 31% pregnancies per transfer at day 61 for Double-Ovsynch, 50% and 24% for synchronized estrus. Substitute your own contract price and volume. The structure holds, the dollars won’t.

Metric / Cost ComponentTimed ET (Double-Ovsynch)Synchronized Estrus (Visual Detection)
Recipient utilization93%50%
Pregnancy rate (day 61)31%24%
Transfers per 100 enrolled9350
Confirmed pregnancies2912
Cost per confirmed pregnancy$349.48$484.83
Total enrollment cost (100 cows)$10,134.92$5,817.96
Gross calf revenue ($400/head)$11,600.00$4,800.00
Net program margin+$1,465.08−$1,017.96

Roughly $2,483 apart on the same 100 cows. Read the estrus-detection column carefully before you draw the wrong conclusion from it: that program spent less in total, because half those cows never received an embryo. Fewer transfers, fewer pregnancies, and every fixed cost landing on a smaller base.

What the table actually measures is a denominator. The estrus-detection arm didn’t overpay for a single input — it just had 12 pregnancies to carry costs the timed arm spread across 29. Cost per pregnancy isn’t a price you get quoted. It’s a quotient your calendar sets.

Now price the alternative you were actually considering. Knock 20% off your embryos and you save about $31 a pregnancy. The protocol difference was worth $135.35 — roughly four times the money, and none of it visible on a purchase order.

Where does the money actually go in a $349 pregnancy?

The full Double-Ovsynch stack behind one confirmed pregnancy:

  • Nonpregnant recipients — $217.41, 62%. Cows that received an embryo and didn’t hold.
  • Embryo — $50.00, 14%. The list-price line, and the only one with a rep attached.
  • Transfer — $40.00, 11%. A $35.25 ET fee plus a $4.75 recipient eligibility ultrasound.
  • Hormonal treatments — $28.77, 8%. Of which $17.97 was hCG, against $10.80 for the protocol hormones alone.
  • Veterinary examinations — $9.50, 3%. Pregnancy diagnosis and confirmation work.
  • Unutilized recipients — $3.80, 1%. Cows synchronized but never transferred into.

(Dollar figures are the study’s. Percentages are Bullvine calculations against the $349.48 total and don’t sum to exactly 100 because of rounding.)

That $217.41 deserves a slow read, because it isn’t pure recipient waste. It bundles hormones, transfer fee, the day-33 pregnancy check and the embryo itself for all 103 cows that got one and didn’t conceive.

Count those embryos and your real embryo spend runs about $155 per pregnancy — roughly 44% of the total, not the $50 sitting on its own line. (Bullvine calculation derived from the study’s stated formula. That figure is ours, not the authors’.)

So the embryo isn’t the trivial cost some cost tables make it look like. It just isn’t the biggest lever either. There’s a difference, and the difference is worth $135.35.

Since the hCG didn’t move pregnancy per transfer, a herd skipping it is working from a lower stack than the published figure — call it $331.51 before you compare against your own contract.

Why couldn’t half those cows get an embryo?

Transfers were scheduled Thursdays and Fridays. That was the binding constraint on the entire program.

Cows expressing estrus four, five, six, or seven days after the final prostaglandin — 24% of that group, 44 head out of 180 — couldn’t be transferred into at all. Synchronized, checked, paid for, and then no window. The paper doesn’t say whether the two-day schedule reflected clinic routing, the farm’s own arrangement, or both. Only that cows cycling outside it were unusable.

The estrus-detection arm ran so poorly the farm’s management team wasn’t willing to continue with it. That’s how the partial budget came to exist in the first place.

Be precise about causation, though, because the short version of this story is too simple. The paper names two drivers: the utilization gap and fewer pregnancies per transfer among the estrus-detection cows, 24% against 31%. The narrow window drove the first. Together they built the $135.35 — and neither one is an embryo problem. Repro fundamentals come first, and they’re cheaper than any genetics purchase. The 6-day protocol getting herds to 60% heifer conceptionis the move most herds should try before they buy an embryo.

The Cost Stack in 2026: What Moves When You Leave Wisconsin

Everything above carries a date and a zip code. The cost analysis covers the preliminary experiment only — June through November 2022 — and every line item was priced by Jefferson Veterinary Clinic in Jefferson, Wisconsin, in June 2022. Four years on, two things have moved: the inputs themselves, and what a clinic somewhere else charges for them.

Start with the inputs. A modified Double-Ovsynch study published in the Journal of Dairy Science in January 2026 lists GnRH at $1.53 a dose and PGF2α at $2.34. Read those against Hincapie’s June 2022 budget as dollar figures from the same journal and that’s GnRH up roughly 16%, prostaglandin up 27%. (Bullvine calculation. Neither paper states a conversion, so treat those percentages as direction, not a benchmark.)

Then look at what market does to the same two molecules:

Source / marketGnRH per dosePGF2α per dose
Hincapie budget, Wisconsin, June 2022$1.32$1.84
Modified Double-Ovsynch, JDS, January 2026$1.53$2.34
2025 economic evaluation of Double-OvsynchUSD 2.60USD 2.60
2025 study, large Romanian commercial dairies4 EUR3 EUR

Geography swings harder than four years of inflation did. The Romanian figures come off operations where veterinary services get contracted at scale for 50-plus animals per visit — volume that should push prices down, not up. For the wider protocol-cost picture, two herds solving the same pregnancy-rate problem in opposite directions runs the European comparisons alongside the US numbers.

The transfer line needs its own sanity check. Published commercial ET price lists put a bovine transfer somewhere between $65 and $80 per recipient depending on whether the embryo is fresh, direct-thaw, or vitrified, with IVF embryo production quoted from $55 to $140 an embryo depending on volume. Those are vendor list prices, not independently verified, and every company publishing them sells the service. They also sit well above the $35.25 the Wisconsin veterinarian charged, which may reflect a research-collaboration rate rather than a quote you’d get. Same story on the embryo: those were Angus IVP units carrying a $50 list price from J.R. Simplot Company, priced for volume rather than genetic merit. Nothing like what a dairy embryo selected on index costs.

Canadian readers get less to work with. No published equivalent to the Hincapie breakdown surfaced in a search for this piece, and CETA/ACTE doesn’t publish member pricing. North of the border the cost structure still holds — utilization still drives it — but you’ll need your own clinic’s numbers plus your own read on health-certificate and import requirements.

None of which makes this a boutique practice. AETA reported that in 2021, U.S. transfers of in vitro-produced embryos — 206,584 fresh and 156,261 frozen — ran well ahead of in vivo-derived transfers at 43,588 fresh and 75,720 frozen. Borrow the structure from Wisconsin. Price it yourself.

What the modeling says about paying more

Albert De Vries and Karun Kaniyamattam at the University of Florida put the break-even price for commercial IVP embryo transfer at $89, against their own 2017 base-case assumption of $165. In that scenario, straight AI beat a full embryo program by $185 per cow per year.

Their follow-up work, summarized in Animal Reproduction in 2020, tested 144 price combinations and found the optimal embryo share ranging anywhere from 3% to 100% of breedings. Only 6 of 24 scenarios favored going all-in, each requiring sub-$100 embryos and a premium paid for genetically superior calves. Their read isn’t that embryos never pay. It’s that some use is profitable across a fairly wide band, and the all-in case is narrow.

Nine-year-old modeling assumptions, so read them as direction rather than a current quote — and check them against what’s happening to genetics pricing right now.

Fresh versus frozen: what ships isn’t what performs

One clarification, because it’s easy to assume otherwise: the Wisconsin work wasn’t a heat-stress study. Nobody was testing summer fertility. The flip side is worth knowing though — that cost analysis ran June through November 2022, which means those pregnancy rates were earned partly through a Wisconsin summer. If anything, 31% may be conservative against a year-round program.

The fresh-versus-frozen question still lands on your invoice. Hansen’s 2020 synthesis in the Journal of Animal Scienceput a number on it: across all studies, pregnancy per transfer for cryopreserved embryos ran 7.4 percentage points below fresh. Frozen is what ships, what stores, and what the Wisconsin herd used. If a supplier leads with fertility performance, ask which product the number came from.

The 30/90/365-Day Playbook for Herds Running Recipients

30 days — audit your recipient utilization rate. Pull last year’s records and divide cows enrolled as recipients by cows that actually received an embryo. An afternoon and your repro software, no capital. Trigger: under 75% and you’re funding synchronization on cows that never get a shot at conceiving. Where it backfires: counting mid-protocol culls as scheduling failures will send you after the wrong fix — separate the health exits from the calendar misses before you conclude anything.

30 days — price your calf contract against the stack. Compare what you’re getting for a day-old crossbred against $349.48. Trigger: under roughly $350 and the Wisconsin 2022 cost structure wouldn’t have covered itself, and with hormone prices up double digits since, that line has drifted upward. Where it backfires: the $349.48 excludes on-farm labor for protocol administration, so treat it as a floor rather than a full accounting.

90 days — rebuild the calendar around the transfer window. Book synchronization to match technician availability instead of hoping heats land on the right days. Requires a conversation with your clinic and a willingness to run timed protocols over heat watching. Where it backfires: switching protocols while keeping a one-day-a-week window buys you the hormone cost and none of the gain. Hormone spend barely differed in Wisconsin — $28.77 against $30.15. The savings came entirely from utilization.

365 days — set your embryo share against your own break-even. Four inputs decide it: negotiated embryo price, surplus calf value, whether anyone pays you a genetic premium, and how wide your genetic gap actually runs against active sires — and remember the base change moved everyone’s numbers before you measure that gap. The published modeling puts the answer anywhere from 3% to 100%, and closer to zero more often than the pitch suggests. Opportunity signal: clear 90% utilization with a contract comfortably above $350 and you’re on the profitable side of the Pereira range — that 2024 JDS work modeled Jersey herds swinging from $52.90 to $232.90 per cow per year on embryo cost and beef calf price alone, so there’s real room above the threshold.

365 days — weigh terminal beef against replacement scarcity. Every recipient carrying a terminal beef embryo is a recipient not carrying a replacement dairy calf, and that trade got more expensive. USDA NASS reported 3.90 million dairy replacement heifers on January 1, 2026, with 2.50 million expected to calve against 9.57 million milk cows — a 26.1% ratio. Our read: run the terminal program on the cows you’d never keep a daughter from, and check what a replacement actually costs you now before you widen the share.

Key Takeaways

  • Recipient utilization is the number that decides this, not embryo price. This herd ran 93% one way and 50% the other, and per 100 cows enrolled that split a $1,465 gain from a $1,018 loss.
  • Price negotiation is the smallest lever on this board. Your calendar is the biggest, and no supplier will bring it up because there’s nothing in it for them.
  • Pull the audit inside 30 days: cows you enrolled as recipients divided by cows that actually got an embryo. Under 75% and you’re paying full freight on synchronization for cows that never get a shot.
  • These were $50 terminal Angus embryos sold as day-old crossbreds, priced June 2022, on a $400 contract. Borrow the cost structure, not the dollars — under roughly $350 a calf it didn’t cover itself.

The trade-off nobody prices

You can buy genetic progress faster with embryos, or you can buy crossbred calf revenue with terminal ones. Either way you hand 62% of your cost per pregnancy to whatever your recipient pen does next, and that pen answers to a calendar, not a catalogue.

The Wisconsin herd didn’t fail at genetics. It ran two protocols and one of them lost $1,017.96 per 100 enrolled cows on a scheduling conflict.

So pull the number that describes your barn instead of somebody else’s. What percentage of the cows you enrolled as recipients last year actually received an embryo — and what does that gap cost you against the calf contract you already signed?

Figures here are drawn from published research and public data as cited. This is journalism, not financial or veterinary advice — check your own numbers with your vet and your accountant.

Complete references and supporting documentation are available upon request by contacting the editorial team at editor@thebullvine.com.

Learn More

The Sunday Read Dairy Professionals Don’t Skip.

Every week, thousands of producers, breeders, and industry insiders open Bullvine Weekly for genetics insights, market shifts, and profit strategies they won’t find anywhere else. One email. Five minutes. Smarter decisions all week.
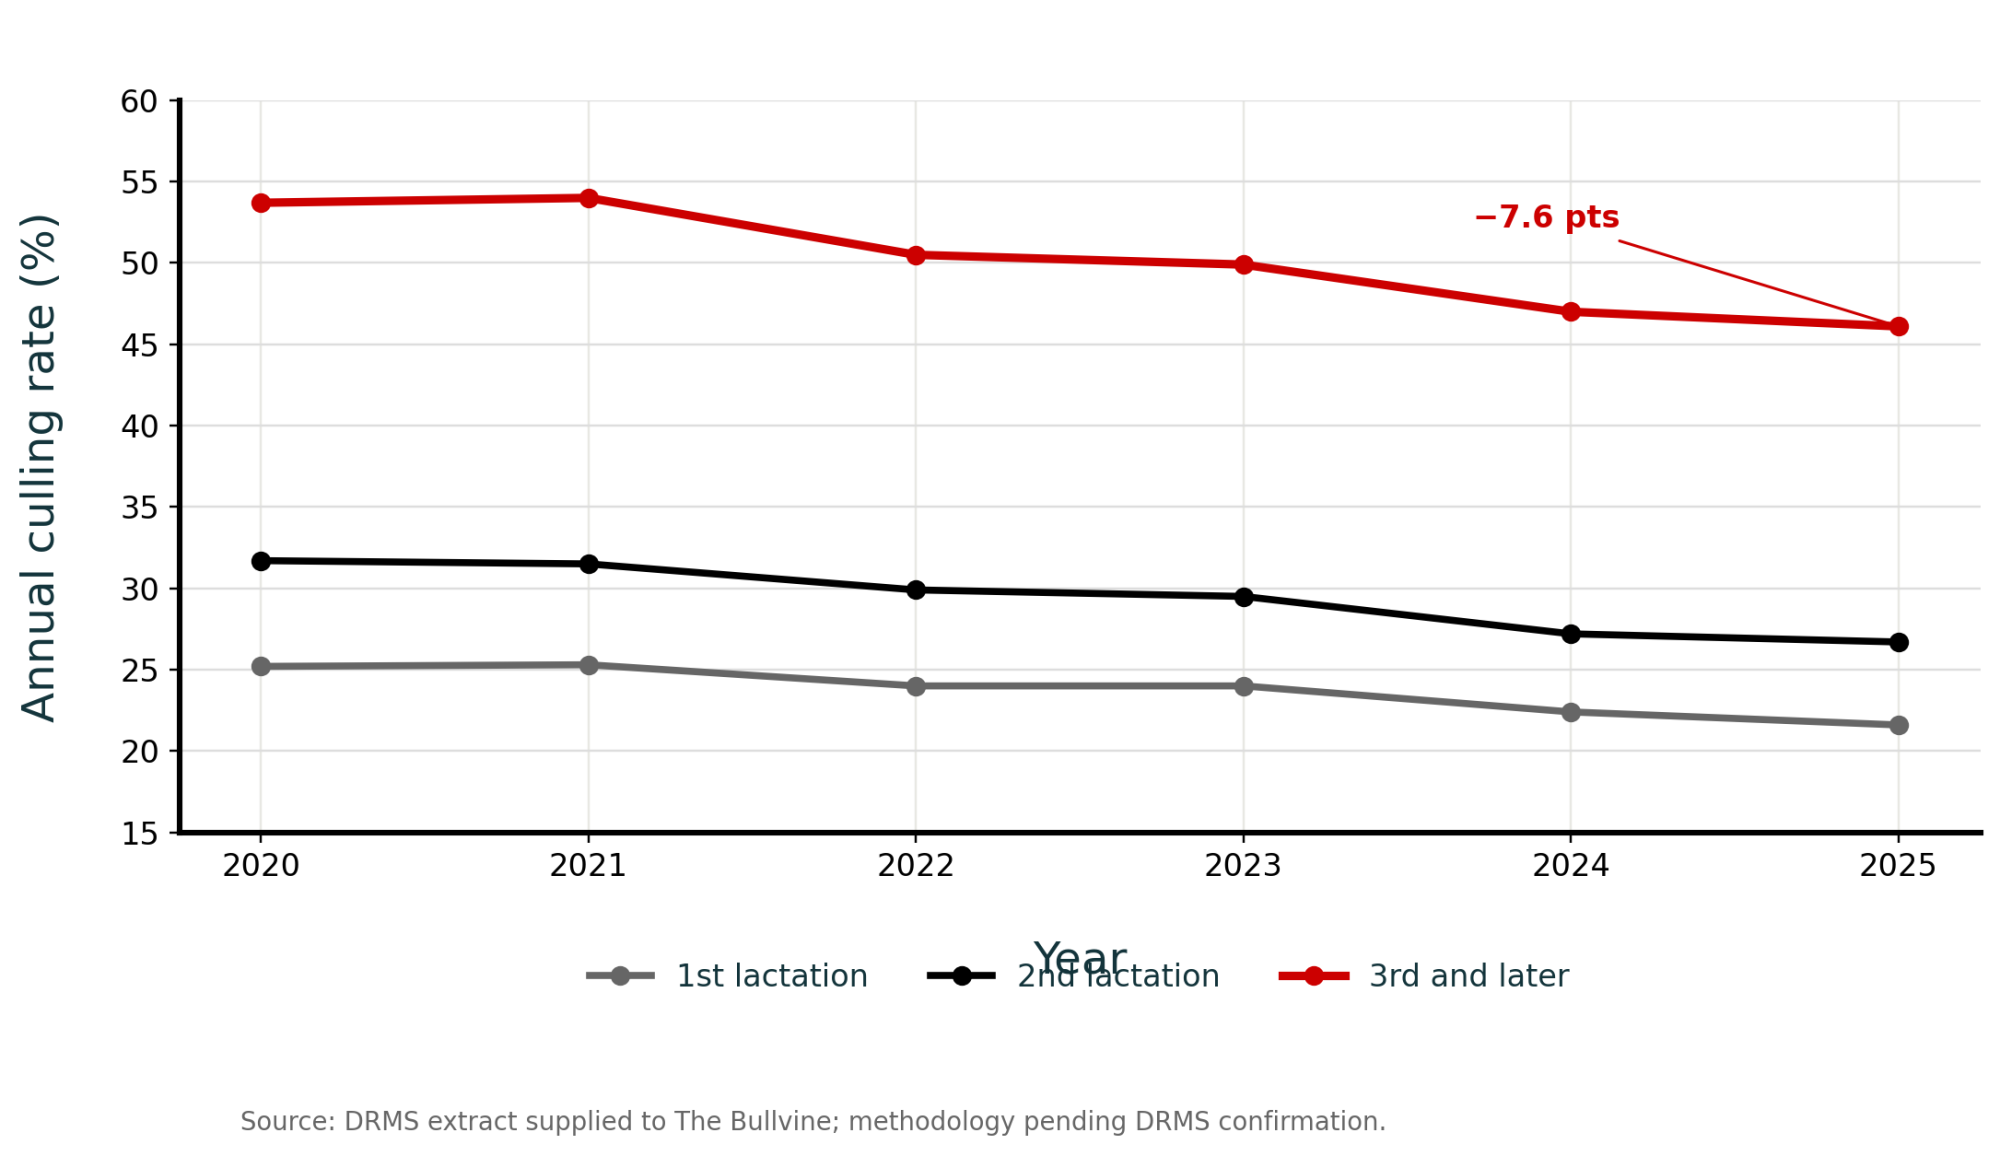
NewsSubscribe
First
Last
Consent

A 2.1 Ratio Now Costs You $2 a Kilogram of Quota. Do You Know Yours?

Ontario’s new formula went live April 1. Below a 2.14 SNF:butterfat ratio, your cheque is already smaller — about $2 per kilogram of quota. Do you know yours?

THE SHORT VERSION

  • Canada: P5 payment policy changed April 1. Holstein producers below a 2.14 SNF:BF ratio are seeing cheques decline — roughly $2 less per kilogram of quota owned for a farm at 2.1. Western Canada’s split moved to 70% butterfat / 25% protein / 5% other solids, from 85/10/5.
  • United States: July protein paid $2.3202/lb against butterfat at $1.6738 — protein’s fourth straight month ahead. But TPI now weights protein at 24 while Net Merit weights it at 13, on the same cow population.
  • The action: Genetics won’t reach your tank until 2029, herd average closer to 2031. Amino acid balancing delivers about 0.07 percentage points of true protein inside the current lactation — roughly $6,669 a year on 150 cows, without touching your forage base.
SNF butterfat ratio

Component prices cited are USDA-announced figures through July 2026. August prices publish September 5.

In Canada, It’s Not a Signal Anymore. It’s the Formula.

While U.S. producers read price tea leaves, eastern Canada rewrote the pay sheet on April 1.

Dairy Farmers of Ontario’s February 2026 Dairynomics bulletin, “Changes in Solids-Non-Fat (SNF) Payment Policy – April 1, 2026,” sets out what the P5 Boards approved for Ontario, Quebec, New Brunswick, Prince Edward Island and Nova Scotia: the SNF-to-butterfat market ratio rises to 2.20, the no-pay ratio to 2.30, and residual other-solids revenue is redistributed 30% to butterfat and 70% to Tier 1 protein. On the cheque, that means Tier 1 protein jumped roughly $2.00 per kilogram while butterfat dropped about $1.80.

MetricCanada (P5 SNF:BF)US/Global (Protein:Fat)
Threshold triggering pay cutsBelow 2.14 (cheque declines)N/A — informational only
New market ratio (Apr 2026)2.200.80 (cheese-yield target)
No-pay / danger ratio2.30Below 0.80 — fortify or skim cream
Current US national averageNot applicable0.77 (down from 0.83 in 2015)
Farm-level example cited2.1 → −$2.00/kg quotaN/A

Note on the math. These are two different ratios and they aren’t interchangeable. Canada’s P5 formula uses solids-non-fat to butterfat — SNF:BF — and the thresholds that matter are 2.14, 2.20 and 2.30. The cheese-yield figure quoted in U.S. and global coverage is true protein to butterfat, where 0.80 is the number cheesemakers want and the U.S. sits at 0.77. Same tank, different denominators. Don’t read one off the other.

Here’s the part with teeth. Holstein producers running below a 2.14 SNF:BF ratio will see their milk cheques decline. A farm sitting at 2.1 that makes no management changes by April 1 receives roughly $2 less per kilogram of quota owned — DFO guidance, as reported by Farmtario in February.

Western Canada moved too. As of April 1, producers in the Western Milk Pool (WMP) are paid 70% on butterfat, 25% on protein and 5% on other solids, down from an 85/10/5 split set in 2017.

Farm Credit Canada’s 2026 Dairy Outlook, published February 4, runs the arithmetic on a western farm testing 4.5% butterfat and 3.4% protein. Push butterfat to 4.7% while holding protein flat and revenue falls 1.2%. Drop butterfat to 4.3% at the same protein and gross revenue rises 1.4%. FCC is a lender, so read its outlook accordingly — but that’s a farm getting paid less for more butterfat, which is the thing U.S. producers keep being told might happen someday.

Canada’s Regulator Said It Out Loud

The genetics side followed the money.

At the February 25, 2026 Open Industry Session, the Canadian Dairy Commission advised the industry to stop further improvement of butterfat content relative to protein. Lactanet reported the directive and added a caution: the adjustment “must be approached carefully to avoid overcorrection, with the objective of achieving a more balanced relationship between fat and protein.”

Six weeks later, Lactanet moved. Effective the April 2026 proof release, the LPI Production subindex shifts Holstein weightings from 60% fat/40% protein to 40F:60P, Jerseys from 50:50 to 33F:67P, and Ayrshires from 60:40 to 50:50. Lactanet’s Hannah Sweett notes the Holstein figure is a reversion — 40F:60P is where the subindex sat in 2015 — and expects “only minor reranking among top animals.”

If you’re milking in Canada, your April proofs re-sorted the bull list you were working from last fall, and your pay formula changed the same month. Worth checking whether your semen order noticed either.

The data behind the change is blunt. Using December 2025 records on registered Canadian females, Lactanet found Holstein genetic merit for Fat Yield reached roughly 56 kg in 2025 against 34 kg for Protein Yield, relative to the 2017–2019 base. Over five years, Holstein fat progress ran 20% ahead of protein. In Jerseys, closer to 40% ahead.

A Decade of Being Told the Opposite

None of this came out of nowhere, and U.S. producers are living the same arithmetic without the formula change.

Butterfat beat protein in 82 of the 128 months from January 2015 through August 2025, and when it did, the average spread ran 93 cents per hundredweight. That’s CoBank’s August 2026 component report — and CoBank is a dairy lender, so weigh its outlook accordingly.

Producers on both sides of the border did exactly what the check told them to do. National U.S. butterfat climbed from 3.75% in 2015 to 4.32% in 2025, per USDA-NASS figures cited in that report.

You can’t unwind ten years of selection in a season. And that’s before you get to the part where the two traits don’t separate cleanly no matter what you do.

Has the Protein Premium Actually Held?

Two things are happening in the U.S. numbers, and only one of them is good news.

The spread held. Protein beat butterfat by 16 cents in February, 65 cents in April, 77 cents in June, and 65 cents again in July.

The absolute price didn’t. Protein hit $2.75 in May, its high point across the months on record here, then slid to $2.46 in June and $2.32 in July. Butterfat fell too, from $1.69 in June to $1.6738 in July — its smallest value since January.

So you’re taking a bigger slice of a shrinking pie. August’s numbers publish by September 5, and the thing to watch isn’t whether protein wins again. It’s whether protein keeps sliding while butterfat steadies, because that closes the gap without a single farm changing a single thing.

The Barn Math on a Tenth

Find your herd size, then find the gap. Both columns assume 75 pounds a day — a Bullvine modeling assumption, so scale it to your own tank. The model holds milk volume constant, so it errs slightly low.

Value of +0.10 percentage point150-cow herd (41,062 cwt/yr)500-cow herd (136,875 cwt/yr)
Protein at July 2026 ($2.3202/lb)$9,527$31,758
Butterfat at July 2026 ($1.6738/lb)$6,873$22,910
Spread, protein over fat+$2,654+$8,848
Protein at April 2026 ($2.5190/lb)$10,344$34,479
Swing, April to July−$817−$2,721

The direction has been stable for four months. The dollar value moved almost three grand on a 500-cow herd in ninety days. Anyone building a five-year breeding plan off one month’s announcement is reading the wrong signal — we ran this same math at March prices back in May, and the tenth was worth less again.

Can You Actually Move Protein Before 2029?

Sixty-four percent, says Lactanet. Eighty percent, says CDCB. Both numbers describe how tightly fat and protein move together, and the two national bodies don’t agree.

Lactanet reports 64% between Fat Yield and Protein Yield in Canadian Holsteins, with heritability of 26% for both. CoBank cites CDCB at 80%. They may be measuring somewhat different things — yield versus composition — and neither has published a reconciliation.

What’s interesting is that Lactanet reads its own number as good news: a 64% correlation, they write, means “we can improve both traits simultaneously,” and “selecting for increased protein will also increase fat.” That’s the reverse of how the correlation gets framed in U.S. coverage, where it’s the reason you can’t fix your ratio. Which reading applies to you depends on whether you’re trying to raise protein or lower fat.

The calendar binds either way. Breed this fall and your heifer calf arrives around mid-2027, freshening at 22 to 24 months, so her first lactation lands in your tank in 2029. Lactanet puts the herd-level figure further out: breeding decisions made today “will not appear in a herd’s bulk tank for roughly 5 years or more, once daughters are born, raised, and enter the milking herd.”

First daughters in 2029. A real shift in your tank average closer to 2031. Which is a problem if your pay formula changed this April.

Four Indexes, Three Directions

If the lag is five years, the index you select on this fall matters more than the semen itself.

IndexOwnerCurrent versionProteinFatPoints toward
TPIHolstein Association USAApril 2026 evaluation24 (was 19)14 (was 19)Protein
Net Merit (NM$)CDCBApril 2025 revision13.0% (was 19.6%)31.8% (was 28.6%)Fat
Cheese Merit (CM$)CDCB2021 AGIL formulation20.9%27.2%Protein, and penalizes milk at −2.2%
Fluid Merit (FM$)CDCBPublished each runZero weightVolume and fat
LPI Production, HolsteinLactanetApril 2026 release60% (was 40%)40% (was 60%)Protein

Read the columns, not across the rows. TPI weights are points within a 100-point scale; Net Merit and Cheese Merit are relative economic emphasis; LPI Production is a within-subindex split. Different units. The CM$ figures come from the 2021 AGIL formulation, the last published side-by-side; current weightings aren’t available in comparable form. Bull-to-bull comparison across TPI, Net Merit, and LPI also requires an Interbull MACE conversion.

One thing the table can’t show you. CDCB’s 2025 revision moved Net Merit toward butterfat. Whether Cheese Merit’s weightings moved with it isn’t published in a form anyone outside CDCB can check — which is its own problem if you ship to a cheddar plant. What the 2021 figures do show is the structural difference: CM$ carries a −2.2% weighting on milk itself, docking carrier volume, where NM$ sits at +0.3%. Protein was 20.9% against 19.6% — a 1.3-point gap, not a transformation. Sort your battery both ways and look at what actually moves before you spend anything.

Holstein Association USA’s board approved its change at the March 26–27, 2026 meeting in Kansas City. No other trait weightings moved, and the Association reports a 0.9978 correlation between the revised and previous formula — a refinement, not an upheaval. CDCB explained its move plainly: “More emphasis on butterfat and less emphasis on protein due to recent price trends.”

Same national cow population, opposite instructions on the same trait pair. We ranked the exposure bull-by-bull before the April proofs dropped, and the reshuffling was real even at that correlation.

The 0.77 That Means Nothing in New Zealand

Here’s where the standard version of this story goes sideways.

The U.S. protein-to-fat ratio fell from 0.83 to 0.77 over the decade, per CoBank. Cheese makers generally want it above 0.80, and below that they’re either buying protein solids to fortify the vat or spinning cream off the front end.

New Zealand sits at 0.77 too. Has for ten years — 0.77 in 2015, 0.77 in 2025, according to DairyNZ and LIC figures cited by CoBank. No one in the New Zealand industry treats it as a problem.

The ratio isn’t the problem by itself. What the milk gets made into is. Only 15% of New Zealand’s whole milk solids go to cheese vats, based on Fonterra data. In the EU it’s 39%. A ratio that wrecks a cheddar plant’s economics is irrelevant to a whole-milk-powder operation.

So What’s the U.S. Number?

Nobody has settled it. CoBank’s report puts 49% of U.S. milk on a total solids basis going to cheese vats, credited to updated calculations by CoBank and dairy consultant Mike McCully. USDA metrics peg it at 42%.

Part of the answer may be that the two count different things. USDA’s Economic Research Service states in its August 2021 Amber Waves methodology that its figures are “based on these components in the final products, not the components used as inputs in the manufacturing process,” because some solids leave in the whey and some are lost in processing. ERS published how it counts; CoBank’s report doesn’t include the methodology behind its own figure.

Seven points apart, no way to reconcile them from outside. Don’t split the difference — an averaged number would be wrong twice.

What the Ration Can Do in One Lactation

Genetics runs on a five-year clock. The bunk runs on a lactation.

The best evidence is a meta-analysis by R.A. Patton in the Journal of Dairy Science, May 2010 — 35 studies, 75 dietary comparisons of rumen-protected methionine. Patton was with Nittany Dairy Nutrition, a private consultancy; the trials tested two commercial products, Mepron and Smartamine.

Adding rumen-protected methionine raised true milk protein by 0.07 percentage points and yield by 27 grams per day. Milk fat percentage went slightly down, dry matter intake dipped slightly, and milk production ticked slightly up. That fat decrease is a second benefit if your ratio is the problem — it nudges both ends the right way at once, which selection can’t do at either correlation figure. Those responses came from adding a supplement to existing diets, not from rebuilding the base ration — no forage or energy-density overhaul required.

Patton also found the protein response wasn’t related to how much product was added, or to the predicted amino acid deficiency of the base diet. More methionine didn’t mean more response. Worth raising with your nutritionist when you price a program.

One caution before you read your own numbers. Milk fat has an annual rhythm — University of Wisconsin–Madison Extension cites Salfer, Dechow and Harvatine (Journal of Dairy Science, 2019) showing national fat yield peaks around January and swings 0.15 to 0.30 percentage points across the year. That’s larger than the tenth this article is built on, which means one month’s test tells you nothing. Read twelve.

Where Your Ration Should Sit

University of Illinois extension guidance from Dr. Phil Cardoso (April 2020) gives workable targets.

DietMethionine (% of MP)Lysine (% of MP)Other
Pre-fresh2.6%8.0%MP not below 1,200 g/day
Fresh2.6%7.0%LYS:MET ratio 2.6:1 to 2.8:1
Patton meta-analysis average2.35%6.33%Below Illinois fresh-cow targets on both

Cardoso is direct that the ratio alone won’t carry a program: “adjusting only for the ratio between LYS:MET will not guarantee the success of your amino acid balancing.”

On cost, there’s no honest per-cow-per-day figure that applies to your ration. It moves with your base diet, your product, and your MP supply. Price the smallest program that hits the targets above.

Options and Trade-Offs for Farmers

Re-rank before you re-breed — your 30-day move. Ask your genetics rep to sort your current bull battery on Cheese Merit as well as Net Merit, and ask your fieldman what your plant’s cheese utilization actually runs. Two phone calls, no cost. Expect a tilt rather than an overhaul — the 2021 figures put the CM$ protein advantage at 1.3 points, with most of the difference in the milk penalty.

Balance amino acids. Ask your nutritionist what the fresh ration delivers for methionine and lysine as a percentage of MP. Under 2.6% and 7.0%? That’s a lever working inside one lactation instead of five years. Expect around seven hundredths of a point — on 150 cows, roughly $6,669 a year at July prices, before program cost.

Shift part of the fall battery. Pull twelve months of statements, divide protein test by fat test, and compare against the same months last year. Under 0.76 on a full-year basis and shipping to a cheese plant? Move a slice of your bull selection toward protein. Not the whole battery — you’d be betting five years on a four-month price pattern, and Lactanet’s own read is that protein selection lifts fat along with it.

Watch the export door. U.S. butterfat exports hit 196 million pounds in the first half of 2026, close to double all of calendar 2024, going mainly to MENA, Mexico, Central America and the Caribbean, and South Korea, per CoBank. That’s a concentrated buyer list. If global butter softens and those flows narrow, surplus fat comes home and farmgate fat value takes the hit — a different problem from the gap between what the pool pays you and what your fat actually sells for, but it lands in the same place on your statement.

Your Checklist, By Herd Type

The 0.80 cheese-yield threshold comes from CoBank. The 4.3% fat test, the 0.76 ratio, and the 25-cent trigger are Bullvine decision rules — useful, but ours, not the industry’s. The Canadian ratios are published P5 policy.

P5 producers — Ontario, Quebec, New Brunswick, PEI, Nova Scotia

  • Find your SNF:BF ratio now. Below 2.14 and your cheque is already declining under the April 1 formula. A farm at 2.1 with no changes gives up about $2 per kilogram of quota owned.
  • 2.20 is the market ratio; 2.30 is where extra protein stops paying. Know which side of that band you’re on.
  • Re-examine your sire lineup under the April 2026 LPI Production formula — 40F:60P for Holsteins, 33F:67P for Jerseys, 50:50 for Ayrshires.

Western Milk Pool producers

  • Your split moved to 70% butterfat, 25% protein, 5% other solids as of April 1. Run FCC’s arithmetic against your own tests before you assume more butterfat is still a win.

Cheese-market shippers, protein-to-fat ratio under 0.76 on a full-year basis

  • Sort the fall sire battery on Cheese Merit and the April 2026 TPI, not just standard Net Merit. Before the semen order, not after.
  • Get the plant’s actual cheese utilization from your fieldman. That single number decides whether the rest applies.
  • Accept the timeline: first daughters in 2029, tank-average shift closer to 2031.

Balanced and high-component U.S. herds, protein-to-fat above 0.80 and fat under 4.3%

  • Hold course. Don’t trade fat yield on a four-month market move.
  • Watch September 5. If protein’s premium falls under 25 cents for two consecutive months, the flip is fading and sitting still was right.

Everyone, within 30 days

  • Screen the fresh ration against Cardoso’s targets: 2.6% methionine, 7.0% lysine of MP, LYS:MET 2.6:1 to 2.8:1.
  • A +0.07 percentage point protein response delivers roughly $6,669 a year on 150 cows at July prices — without changing your forage base.
  • Pull twelve months of component tests, not one. Fat swings 0.15 to 0.30 points seasonally — bigger than the tenth you’re chasing.

Where Does Your Ratio Sit Across a Full Year?

Plenty of producers can recite their fat test from memory and have to go look up their protein. Ten years of the check telling you where to look.

So pull twelve months and do the division — then ask your fieldman the question he may not have fielded lately: what does this plant’s cheese utilization actually run? And if you’re in the P5, ask a harder one. Do you know your SNF:BF ratio, or are you finding out from your April cheque?

Run Your Numbers

Component Value Tracker — Drop in your herd size, bulk tank tests, and your own component prices. It calculates what 0.1 percentage point of butterfat or protein is worth on your farm per year, flags your P:F ratio status, and gives you the nutrition break-even before you commit to a program or a bull list.

Learn More

The Sunday Read Dairy Professionals Don’t Skip.

Every week, thousands of producers, breeders, and industry insiders open Bullvine Weekly for genetics insights, market shifts, and profit strategies they won’t find anywhere else. One email. Five minutes. Smarter decisions all week.
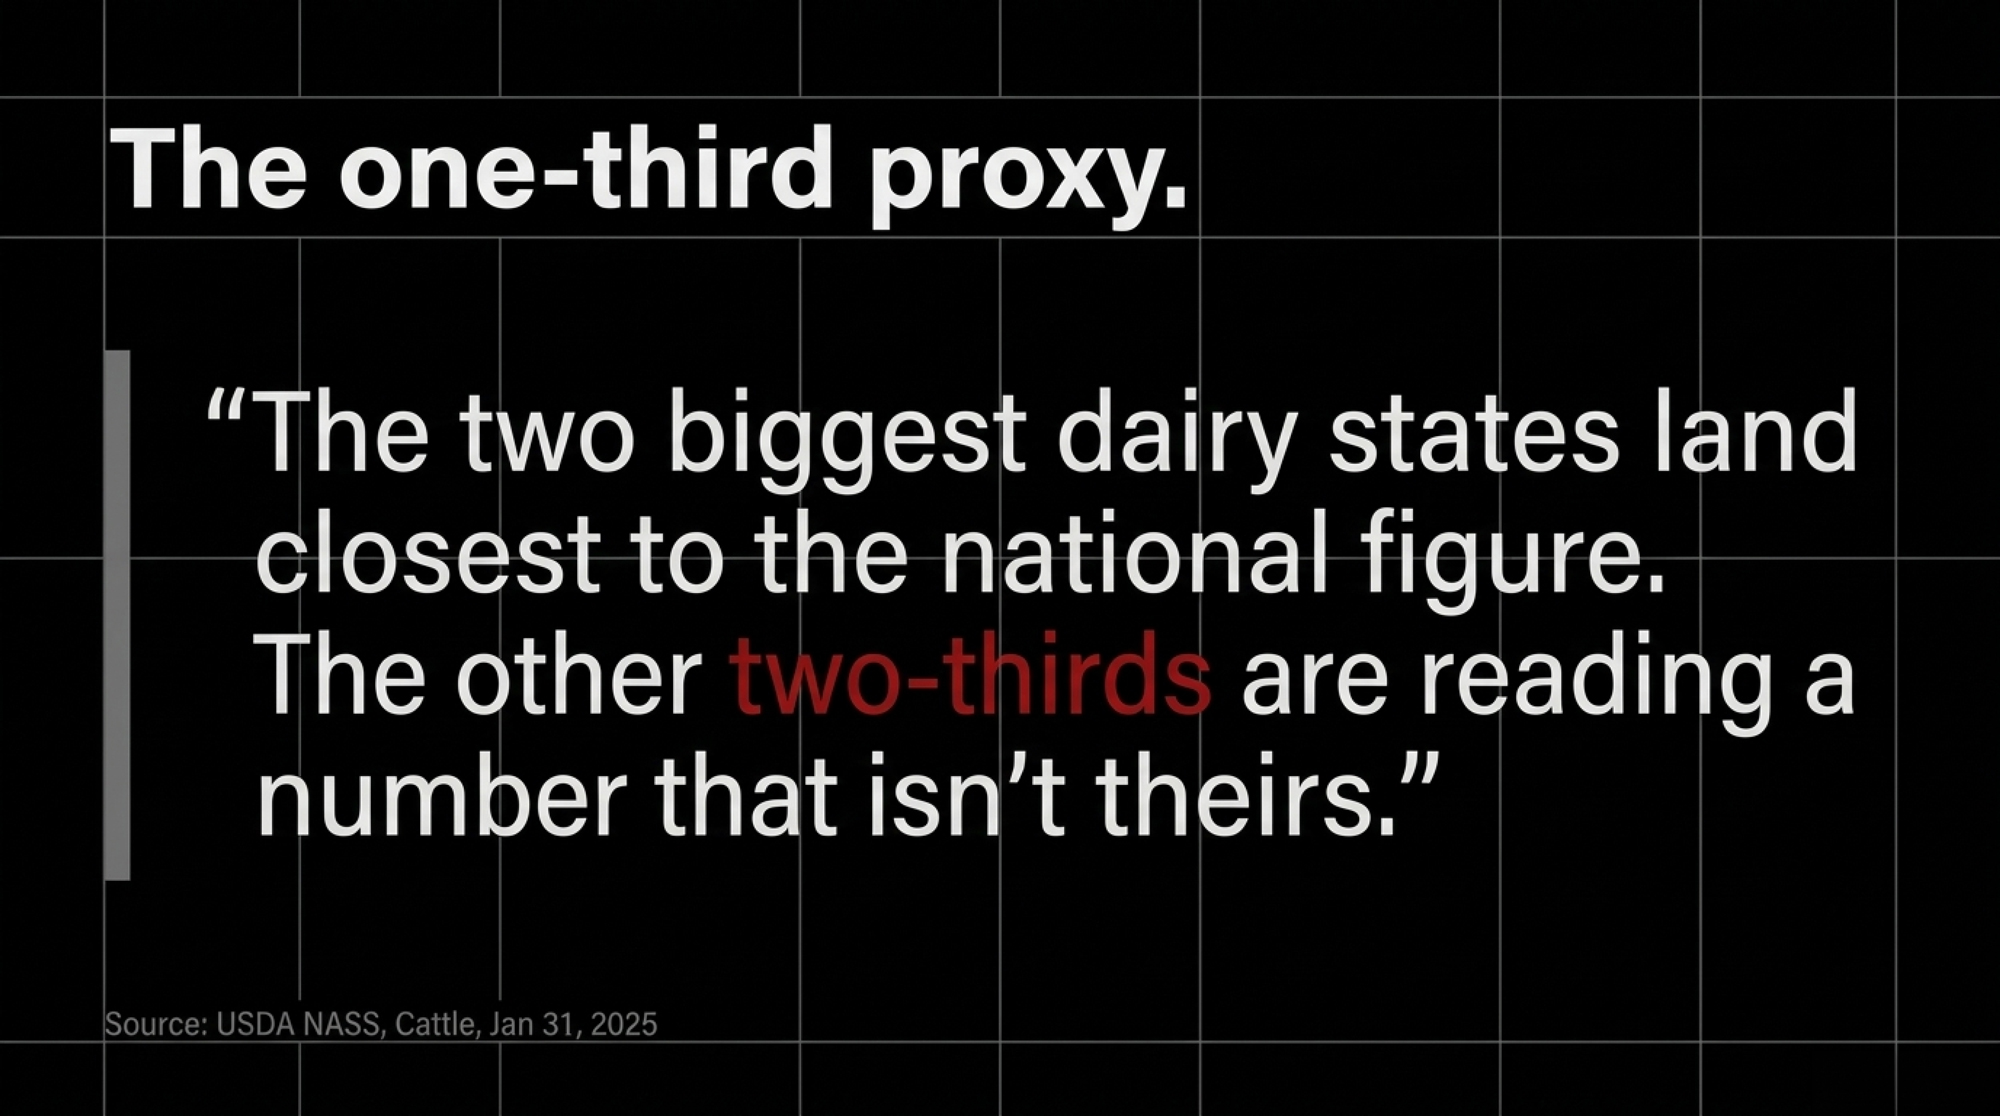
NewsSubscribe
First
Last
Consent

Holding Pen Cooling Lifted This Herd’s Summer Preg Rate Floor Three Points

Two fans at the front of an 80-by-40 pen, 120 cows waiting, and a July preg rate that always slid under 15 percent. Then she staged the controller, and it stopped at 18.

The Problem — A cow’s core temperature climbs 3°F within 20 minutes of walking into an uncooled holding pen, the room where she stands two to six hours a day throwing 4,500 BTU an hour above 80°F.

The Field Result — A +3 point summer 21-day preg rate floor, from under 15% to 18%, at Paul Dotterer and Sons after a 2016 retrofit: six 50-inch fans, drop-down nozzles, one staged controller on a cow-height probe.

The Economic Reality — $2,100 to $4,200 a year on a prorated 90-day heat window, against the misleading $17,000 that full-year coefficient math puts on a quote sheet.

The Limit — Roughly 3 kg (~6.6 lb) ECM per cow per day leaks through gut permeability. Fans recover only about 60% of what heat stress takes.

olding pen cooling

Cows were sluggish. That was the tell at Paul Dotterer and Sons Inc. near Mill Hall, Pennsylvania — not a spreadsheet, not a bulk tank number, but animals dragging through the holding pen and in and out of the parlor through warm, humid Northeastern summers. “You could just tell they were hot in there,” Candice (Dotterer) White told Peggy Coffeen at Progressive Dairyman.

She wasn’t guessing. A couple of fans at the front weren’t moving enough air to cool a group of 120 cows in an 80-by-40-foot pen. So the dairy — 940 cows at the time — put its money where it would touch every animal. “We figured the biggest bang for our buck was the holding area because it affects all of the cows,” White said.

The retrofit went in ahead of the 2016 season. White described the results the following spring: “Normally, our 21-day preg rate drops down below 15 percent in the summertime. This last year, it only dropped down to 18 percent, so we still had the summer drop, but it wasn’t nearly like before.” Her figures, her records, one summer. Same brutal heat, three points higher floor.

Why Does the Worst Room on the Farm Get the Last Fan?

Walk through most freestall barns in August, and you’ll find fans over the stalls, soakers down the feed lane, and a token effort over the holding pen. The physiology says that’s backward. Kansas State’s Harner, Smith, Brouk, and Murphy documented cows standing in the holding pen anywhere from 2 to 6 hours a day depending on parlor throughput, and measured core temperature climbing 3°F within 20 minutes of entering an uncooled pen.

Stocking density is the whole reason. A cow in a barn alley has room to shed heat. A cow packed shoulder-to-shoulder is absorbing radiant load off every animal touching her — and throwing roughly 4,500 BTU an hour above 80°F herself, which Kansas State compares to a 1,500-watt hair dryer running continuously on high. Put 120 of those in a 3,200-square-foot room and do the arithmetic.

That bulletin also quantifies the fix. Overhead spray plus fans dropped body temperature 3.5°Fduring the cows’ time in the pen. Cooled cows gave 1.7 lb (0.77 kg) more milk per day than uncooled pen-mates in one trial, up to 5 lb (2.3 kg) more in another where cows got cooled five times daily for 30 minutes.

One caveat, stated plainly: Kansas State’s MF2468 was published in September 2000. Fan technology has moved on, and today’s high-efficiency models beat what those trials used. Cow physiology hasn’t moved, and the genetic-progress argument cuts against us — a modern high-producing cow throws more metabolic heat than the cow those researchers measured, not less.

What Dotterer Built

Two direct-drive 50-inch fans at the front of the pen, 5 horsepower each, moving air at 32 mph — 2,800 feet per minute — still felt at 5 mph a hundred feet out. Misters affixed to both. Four more 50-inch fans on 1-horsepower motors along the side, pushing fresh air across the waiting group. Eight sets of drop-down nozzles throughout the pen, creating what Coffeen described as a light rain of larger droplets rather than fog.

And the piece that mattered most: one automatic controller operating both fans and water, staged off a temperature probe sitting in the pen where the cows actually stood.

The staging was the design. At 55°F the two front fans came on low, picking up speed as the pen warmed. By 65°F they ran at full speed. At 69°F, the attached misters kicked in with two of the four side fans. At 74°F, the third fan and the sprinklers triggered. By 80°F, everything ran flat out.

White worked with a cow cooling company that designed and installed the system and handled the first seasonal drain and reset. Her own contribution came after. She watched how wet cows were getting and tweaked from there, hunting the balance between spraying enough water to cool and getting them too wet before entering the parlor. Every soaking system needs on-farm calibration — barn geometry, group size, and parlor throughput vary too much for factory defaults to land perfectly anywhere. And wet udders at the unit is a mastitis conversation, not a cooling one.

The February Problem Nobody Predicted

White’s first summer with the system was, in her words, “a really brutal summer” — and she observed less significant drops in performance. Reproduction, specifically, held better.

But the result she flagged as most unexpected had nothing to do with July. “I never thought cows might be experiencing heat stress in February,” she said. On warmer winter days, when temperatures peaked in the 50s or 60s, the pen probe activated the first level of cooling on its own, without anyone deciding it was a hot day.

“I don’t have to run around looking at the thermometer and turning on fans,” White said. “It’s nice to have something looking out for the cows.”

Worth knowing who was making these calls. White managed the dairy side of an operation started by her grandfather, Paul, and carried forward by her father, Larry, and uncle, John. She was third generation, working alongside her sister and two cousins. This wasn’t a consultant’s recommendation imposed on a farm. It was a family reading its own cows — then a manager fine-tuning what got installed.

Run the Numbers — and Watch Where the Math Gets Slippery

Take Kansas State’s conservative figure, 1.7 lb (0.77 kg) per cow per day from holding pen cooling alone. A 400-cow herd × 1.7 lb × 90 heat-stress days = 61,200 lb (27,760 kg).

Now price it, and be careful which price you grab. At the announced August 2026 Class III price of $18.76/cwt, that’s roughly $11,480 in a single season. Price the same volume off the futures curve instead — Class III was trading in the mid-$16s through late 2026 — and you’re closer to $10,050. Neither is your mailbox price. Use your own.

The reproduction side is where the arithmetic gets treacherous, and it’s worth walking through because the mistake is easy and expensive. Lauber and colleagues modeled net return at $3 to $6 per one-percentage-point gain in 21-day pregnancy rate, per cow, per year. Multiply that by three points and 940 cows, and you land near $17,000 — a number that looks great on a quote sheet.

It’s wrong. Lauber’s coefficient prices a sustained, full-year improvement. Dotterer’s gain was a summer-season floor, roughly a 90-day window out of 365. Prorate it honestly — 90 over 365 — and three points across 940 cows sits closer to $2,100 to $4,200 a year, and even that assumes every cow was bred inside the heat window. Smaller number. Still recurring every summer against a one-time capital cost, which is the part that actually matters.

MetricFull-Year (Quote Sheet) MathProrated (90-Day) MathReality Check
Preg rate gain3 points3 pointsSame underlying data
Herd size940 cows940 cowsSame
Coefficient basis$3–$6/point/cow/year, full 365 daysSame coefficient, prorated 90/365Lauber et al. coefficient priced for sustained gain
Annual dollar value$17,000$2,100–$4,200Vendor number overstates gain ~4x
Assumption requiredNone statedEvery cow bred inside heat windowRarely true on a real farm

Reproduction is noisy year to year, and one summer in one herd isn’t a controlled trial. But it moved in the direction the physiology predicts, and it moved the number the farm was worried about. One industry account has put payback on targeted holding pen and parlor upgrades as low as three years — secondhand, without herd size or year attached. If you want to run your own version rather than take anyone’s word for it, our pregnancy-rate economics calculatordoes the cycle-factor weighting for you.

Canadian readers, your math is different. Under Canadian Dairy Commission component pricing effective February 1, 2026 through January 31, 2027, Class 3(d) butterfat runs $11.6208/kg and protein $10.1476/kg. Higher component value per unit than a U.S. Class III conversion — but quota changes the marginal-milk logic entirely. Extra summer milk you can’t ship isn’t revenue. The cooling case in a quota market is about protecting components, reproduction and cow longevity, not chasing volume.

One more caution on that 18 percent figure: two herds can post the same 21-day pregnancy rate for completely opposite reasons, and a manager watching conception rate alone can’t tell which problem he owns. Split heat detection from conception before you spend a dollar on either.

The Ceiling Fans Can’t Break

Here’s where the whole cooling argument hits its limit, and the research is blunt. A Cornell trial in the Journal of Dairy Science ran a pair-fed group — cows kept cool but eating the same reduced diet as the heat-stressed cows. The cool group still out-milked them. Roughly 3 kg (~6.6 lb) of energy-corrected milk per cow per day leaves through gut-wall permeability, independent of intake. No fan reaches that.

Reduced intake explains only 30 to 50% of the total loss. Cooling recovers around 60% of what heat stress takes; the rest leaks through a gut that turns permeable within three days.

Which is why White’s own account is worth reading carefully. She reported less significant drops in performance and a summer preg rate that still fell — “we still had the summer drop, but it wasn’t nearly like before.” The rebuild bought back part of what the farm had been losing on breeding. It didn’t buy immunity, and she never claimed it did.

Farms getting fuller ROI run cooling as one layer: holding pen and feedline work paired with heat-stress ration adjustments — sodium bicarbonate buffers, elevated dietary potassium, honest attention to DCAD. Ohio State and the Iwaniuk/Erdman meta-analysis point to +350 to +400 mEq/kg as the working DCAD target under heat stress. Get the specific potassium and sodium inclusion rates from your own nutritionist against your current ration — the DCAD number is the target, not the recipe. A cooled cow that’s still under-buffered got half a fix.

The Cows Tell You Days Before the Bulk Tank Does

Most producers wait for the tank to talk. By then you’ve been bleeding for a week.

Behavior shifts first. University of Wisconsin Extension flags increased standing and reduced lying time as the earliest visible signs, along with cows bunching at water troughs — evaporative cooling off the water surface pulls them in — and drifting toward whichever end of the barn has better airflow as the afternoon builds. Watch a group migrate between morning and mid-afternoon, and you’ve mapped your airflow problem for free.

Field benchmark — respiration rate. 60 breaths per minute, or one breath per second. When a quarter of the pen hits that rate or faster, those cows are already losing and the bulk tank hasn’t caught up yet. Open-mouth panting with the tongue out and stringy drool is severe, not early.

Frequency matters as much as hardware. Israeli work cited in a 2025 Animals review found multiparous Holsteins cooled eight times daily above THI 68 held respiration at 60.2 breaths per minute, against 73.1 for cows cooled three times daily.

Where the Money Gets Wasted

Installing fans and soakers isn’t the same as installing cooling that works. Ohio State’s extension engineers have cataloged the classic failure modes across commercial barns: fans hung dead-level so air sweeps over cows instead of onto them, undersized supply lines where pressure drops to a dribble at the end of the run, and soaking cycles that either saturate stall bedding into an environmental mastitis nightmare or run too short to penetrate the coat down to the skin.

The benchmark sequence is straightforward: a 30-second soak at 0.9 to 1.4 gal/min (3.4–5.3 L/min), followed by 4 to 5 minutes of fan-only evaporative drying. Soak, then move air. Reverse the sequence or run them continuously without breaks, and you’ve simply added humidity without removing heat.

Holding Pen Engineering Specs

ParameterSpecificationPrimary Reference
Fan density1 fan per 10 cows (150 sq ft / 14 m²) for 30–36 in.; 1 per 20 cows (300 sq ft / 28 m²) for 48 in.Kansas State University
Air volume1,000 cfm (1,700 m³/hr) per cow, based on maximum pen capacityKansas State University
Fan distribution60–70% of fan capacity placed in the half nearest the parlor exitKansas State University
Sprinkler flow0.03 gal/min per sq ft (1.2 L/min per m²); approx. one 360° nozzle per 3 cowsKansas State University
Cycle timing1 min on / 6 min off — distinct from feedline timingKansas State University
Holding time limitUnder 60 min/turn on 2x milking; under 45 min/turn on 3xKansas State University
Group capacityParlor stalls × 4.5Kansas State University
Sidewall openings60% minimum open sidewall; continuous ridge vent at 2 in. per 10 ft (5 cm per 3 m) of building widthKansas State University

Feedline and Freestall Alley Specs

ParameterRecommended SpecificationSource
Soaking cycle30-sec soak at 0.9–1.4 gal/min (3.4–5.3 L/min), then 4–5 min fan-only dryingOhio State Extension
Fan pitch and layoutTilted downward 15–30°, spaced 6–8 ft (1.8–2.4 m) apart in-line; rows 20 ft / 6 m (30–36 in. fans) or 40 ft / 12 m (48 in. fans) apartKansas State University
Feedline spacing48–55 in. panel every 24–30 ft (7–9 m); 72 in. cyclone every 40–60 ft (12–18 m)Ohio State Extension
Airspeed at cow’s back8–10 ft/sec (480–600 ft/min; 2.4–3.0 m/s)Ohio State Extension
Airspeed over stalls200 ft/min minimum (1.0 m/s), 400 ft/min target (2.0 m/s), at 20–30 in. (51–76 cm) above stall baseUW Dairyland Initiative
Building air exchange40–60 full air changes per hour during summer heat stressUW Extension
Soaker activationTrigger at THI 65–68, roughly 70–75°F (21–24°C) ambient depending on humidityUW / Ohio State Extension

Two rules from that Kansas State bulletin are worth more than the whole table. Put sprinklers in a pen without mechanical ventilation, and you’ve built a sauna — the water raises humidity, humidity raises THI, and above 90°F (32°C) with 70% relative humidity, a cow can’t shed heat through breathing at all. You’d have spent the money to make her worse. And run the well capacity before you spec a single nozzle. The system has to hit that flow rate on top of parlor washdown and waterer demand, and many farm distribution systems simply can’t deliver it. Finding that out in July is expensive.

Field benchmark — stall airspeed. 200 ft/min (1.0 m/s) minimum at cow height, 400 ft/min (2.0 m/s) target. A March 2023 report prepared by West Coast Robotics for the BC Dairy Association, covering eight Fraser Valley dairies through the 2021 heat dome, found the four farms hitting target over more than half their stalls lost an average of 1.71% fat-corrected milk. The four managing under 20% of stalls at target lost 7.49%, with the worst two at 9.69% and 9.38%. Same heat event, same province. The variable was whether air reached the lying cow.

Nobody in that study bought new fans to get from 7.49% to 1.71%. They just had air reaching the stalls. If you’re building the barn map that finding implies, start with consistent air speeds at resting height and work outward from the dead zones.

Soakers, Sensors, and the Number You Have to Ask For

A 2019 Journal of Dairy Science trial found milk yield tended to rise 1.5 kg (3.3 lb) per day at higher soaker flow rates — but the authors flagged that their cows stayed relatively cool throughout, which limits how hard you can lean on it. Volume mattered more than spray frequency. “We installed sprinklers” and “we installed effective cooling” are two different sentences.

Sensor-triggered soaking is the current upgrade path, and it finally has independent data behind it. In one 2025 peer-reviewed trial, a smart soaker system delivered cooling effectiveness equal to conventional soakers while cutting water use from 225.3 L (59.5 gal) to 80.6 L (21.3 gal) per cow per day — about 64% less, with no loss of performance. Single study, but a published one, and more conservative than the 75–80% savings Kansas State’s Joe Harner projected in 2017.

Water-savings percentages are the number that gets marketed. Installed cost per cow is the number you have to ask for. Get both from any vendor — installed cost and projected water and pumping savings against your own utility rate — and evaluate the pair rather than the headline figure.

Don’t Stop at the Milking String

Your dry cows are usually the last group to get a fan, and they’re the group where the damage compounds into next lactation. Think about what that heifer already cost you — bred, carried, calved, raised, fed for two years. University of Florida research found daughters of heat-stressed dry cows gave roughly 5 lb (2.3 kg) less milk per day across their first three lactations than heifers from properly cooled dams. You discounted her before she ever walked into the parlor, and you paid full price to raise her.

The barn math backs it up, with one caveat. For a 200-cow herd where 40% of cows dry off above 25 kg (55 lb), fixing dry-cow cooling alone runs about $1,800 a year before counting a drop of daughter milk, and Florida’s model puts payback near five to six years for new construction — faster on a retrofit or in a hotter region. Treat that as an order-of-magnitude figure rather than a quote; the underlying model doesn’t state its currency year. Slower than a holding pen fix, sure. But the holding pen doesn’t reach into next lactation.

Minimum-effective setup: shade, consistent airspeed over feed and lying areas rather than just down the alley, a feedline soaker that wets skin instead of fogging, and automated controls so nobody has to remember.

Your Operational Diagnostic Checklist

Work through these in order. Each one is a decision you can make with numbers you already have or can get in an afternoon.

1. Pull your summer 21-day preg rate against your winter baseline. If the gap runs more than three points, your holding pen is a reproduction problem, not a comfort problem. Price the loss before you price the fans — and prorate the coefficient to your heat window, not the full year, or you’ll overstate the gain by roughly 4×. That prorating step is the one most equipment quotes skip.

2. Watch your cows at the gate. Hesitation going in, dragging coming out. That behavior was the diagnosis at Dotterer before any instrumentation confirmed it, and it costs nothing to read.

3. Find out who your controller is. If it’s a person remembering to flip switches, you’re cooling reactively. A cow-height probe caught heat stress on 50- and 60-degree February days nobody would have flagged by hand.

4. Time your holding pen. Past 45 minutes on 3x milking, fix grouping before you buy hardware. Parlor stalls × 4.5, plus gates or electric fence to subdivide, costs a fraction of a fan bank.

5. Check your parlor hours. Running under 12 hours a day means you can shift milking out of the 1 p.m. to 7 p.m. window — free cooling. Kansas State’s example moves a 2x herd from 5-and-5 to 10-and-10.

6. Count your compliant stalls. Fewer than half hitting 200 ft/min (1.0 m/s) at cow height puts you in the 7 to 9% summer loss range, not the 2% range. That’s what separated eight Fraser Valley farms in a single heat event.

7. Look at your dry pen. No fan there means you’re discounting heifers you haven’t met — 5 lb (2.3 kg) a day across three lactations.

8. If you’re on quota, rerun the whole case on components and longevity. At $11.62/kg butterfat under the current CDC schedule, protecting component yield through a heat wave is the return. Milk you can’t ship isn’t.

9. Audit your existing equipment against the two failure modes that make things actively worse. Sprinklers without mechanical ventilation raise THI instead of lowering it. Fans mounted dead-level move air over cows instead of onto them — target 8 to 10 ft/sec (2.4–3.0 m/s) at her back with 15 to 30 degrees of downward tilt.

10. If you’re still losing 2 to 3 kg (4.4–6.6 lb) ECM per cow per day with fans and soakers running, stop calling it a cooling failure. Cornell’s work points to gut integrity, which lives in the ration, not the ceiling.

The 30-Day Field Test

Two jobs, one afternoon, and you’ll know whether you own an equipment problem or a design problem.

Job one: walk your holding pen with an anemometer during afternoon milking. Take airspeed readings at cow height at ten points across the pen and log them on a sketch of the pen. You’re hunting dead zones, not an average — an acceptable mean can hide a corner where a third of the group stands still.

Job two: check delivery pressure at the last nozzle on your feedline soaker run, not the rated pressure at the pump. If it dribbles at the far end, your nozzle count is irrelevant until you sort the supply line.

The uncomfortable part of this story isn’t the fan spec. It’s how easily a summer number becomes background noise. White’s herd ran below 15 percent every July until sluggish cows in the holding pen pointed at a fixable cause. Every dairy has a number like that, bad long enough that it stopped registering as a problem. What’s yours currently writing off as just July?

Key Takeaways

  • Your holding pen heats cows faster than any other room on the farm — 3°F in twenty minutes uncooled — yet it’s usually the last place fans go. Fix grouping and pen time before you spend on hardware.
  • Sixty breaths a minute in a quarter of the pen means those cows are already losing, days before the tank shows it. That check costs you nothing but a few minutes standing still during afternoon milking.
  • When a vendor prices a summer cooling fix on repro gains, ask whether they prorated the coefficient to your heat window or the full calendar year. Full-year math on a 90-day gain overstates the return roughly fourfold.
  • Cooling only recovers about 60% of what heat stress takes. If you’re still losing 2 to 3 kg (4.4–6.6 lb) ECM per cow per day with fans and soakers running, the rest of that milk is leaking through the gut, and the answer is in the ration.

Reporting on Paul Dotterer and Sons Inc. is drawn from Peggy Coffeen’s reporting for Progressive Dairyman, published March 2017. The Bullvine did not independently interview the Dotterer family for this piece. Equipment specifications, herd size, and reproductive figures reflect the operation as of 2017 and may have changed since. Milk pricing reflects August 2026 announced Class III and CDC component schedules.

Learn More

The Sunday Read Dairy Professionals Don’t Skip.

Every week, thousands of producers, breeders, and industry insiders open Bullvine Weekly for genetics insights, market shifts, and profit strategies they won’t find anywhere else. One email. Five minutes. Smarter decisions all week.
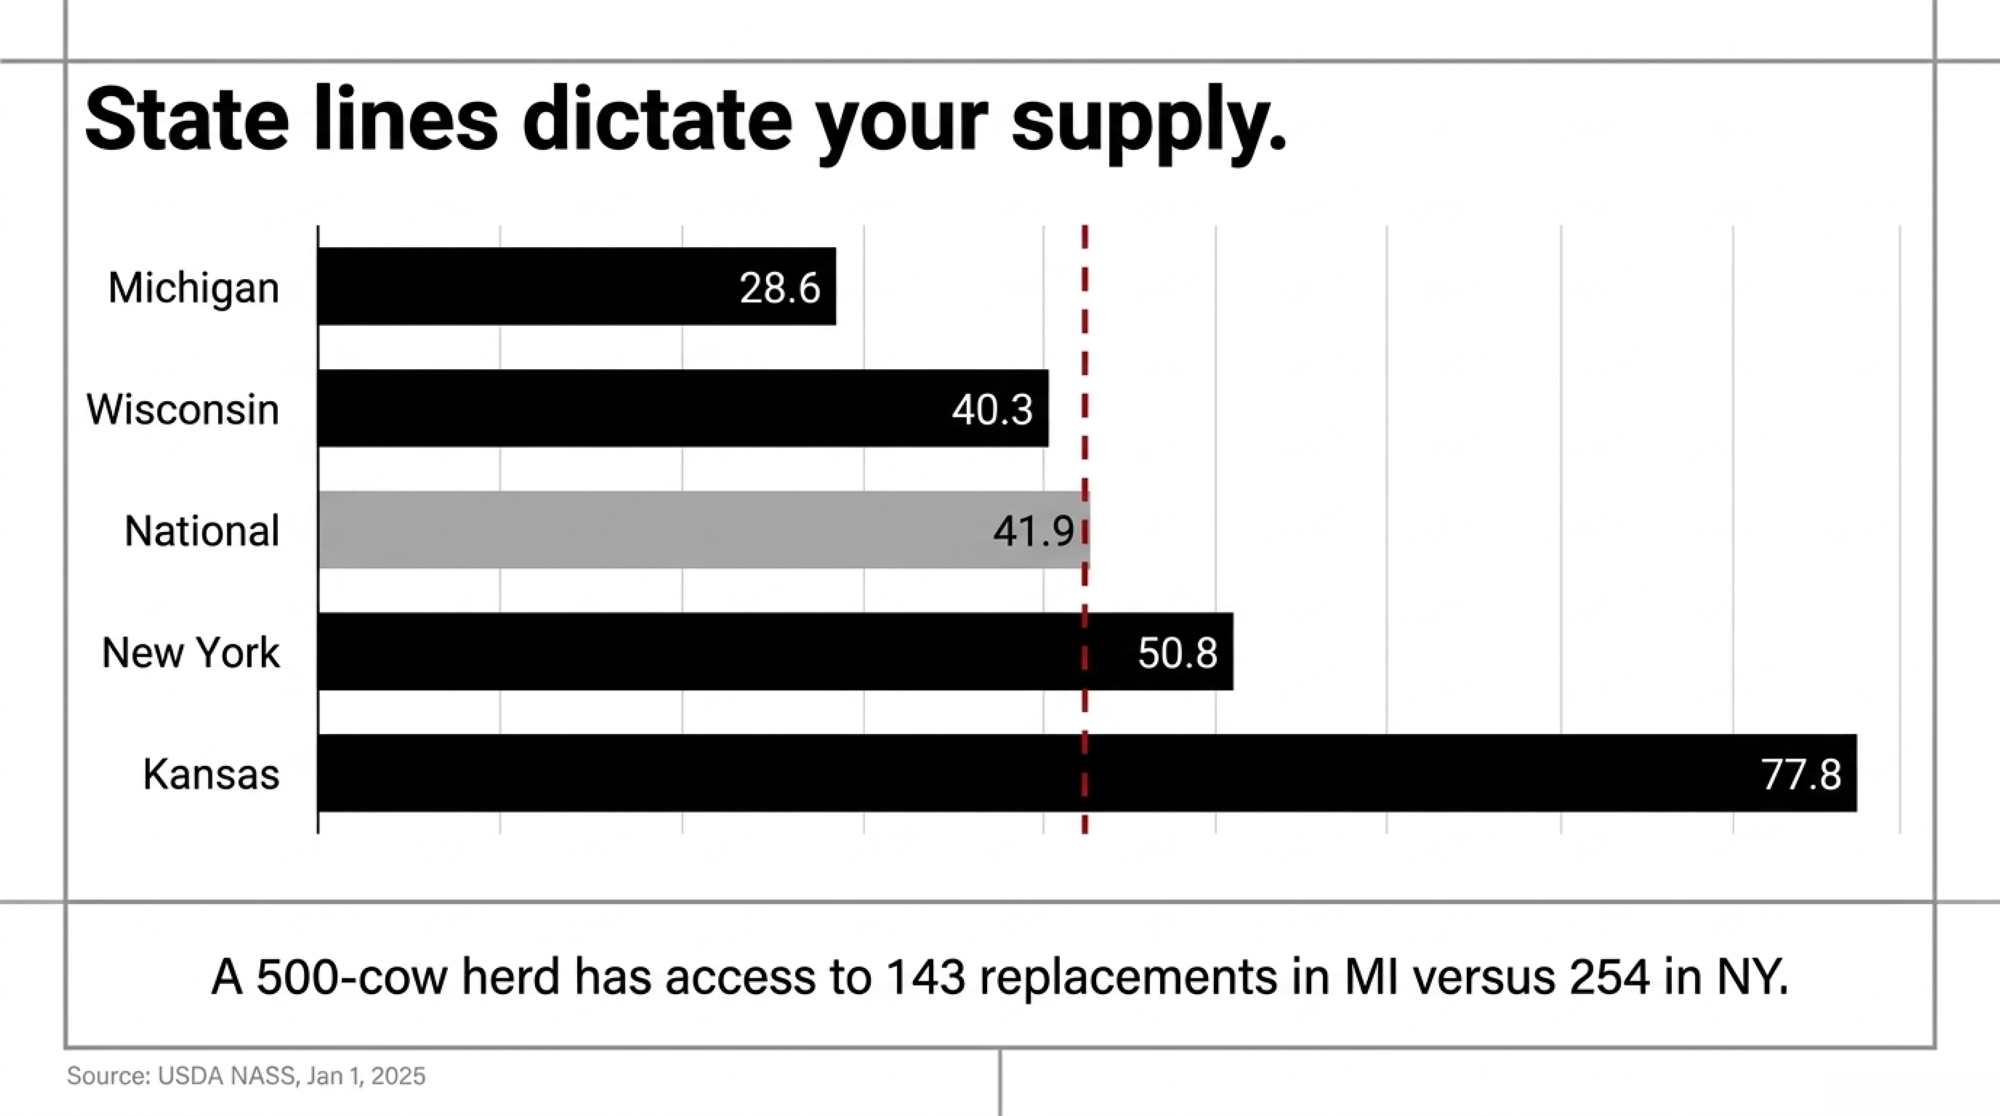
NewsSubscribe
First
Last
Consent

The High Cost of Cheap Dairy Margin Coverage

Same $8.00 margin. Same milk out of the same tank. One paragraph of federal regulation decides whether you pay ten cents a hundredweight or a dollar eighty-one.

EXECUTIVE SUMMARY: At the same $8.00 margin, DMC charges $0.100/cwt in Tier 1 and $1.813/cwt in Tier 2 — eighteen times the price for identical coverage on milk from the same tank. One paragraph of federal regulation, 7 CFR § 1430.407(d), decides which side you land on: elect Tier 1 at $8.00 or below and your Tier 2 pounds lock to that same level automatically, but elect $8.50 or higher and the rule forces you to set Tier 2 separately, which is the only route to the free $4.00 catastrophic floor. Run a modeled 500-cow Upper Midwest herd through 84 months of published FSA margins, and the decoupled election returns $344,669, while locking both tiers at $8.00 loses $417,748 — a $762,417 swing where the winning choice is the more expensive Tier 1 rate. This hits any operation above 6,000,000 lb of production history, roughly 240 cows at 25,000 lb, and the 2026 window already closed February 26. What’s left is Tier 2 coverage at a workable price: DRP ran $0.28/cwt in Q1 2026 against $111,953 for the Tier 2 half of an $8.00 election, and HighGround’s data shows coverage bought three quarters out returned $1.53/cwt while only 19% of producers booked that far ahead. Before the 2027 signup, pull your FSA production history and ask the county office what coverage is currently attached to your Tier 2 pounds — if your Tier 1 sits at $8.00 or under, those numbers should be identical, and you may be paying rates you never picked.

DMC Tier 2 premium

Two Dairy Margin Coverage elections. Same 500-cow Upper Midwest herd, same 2026 program year, same USDA margins. One returns $344,669 across seven years. The other loses $417,748.

The gap is $762,417 — and the election that wins is the more expensive coverage level.

That’s not a typo. It’s written into federal regulation, in a single paragraph of 7 CFR § 1430.407 that decides what your milk above 6,000,000 lb costs to protect. The rule isn’t secret. It’s just not on the form you sign.

The paragraph that decides everything

The Regulatory Rule Every Producer Misses

A dairy operation “may only select one coverage level threshold and only one percentage of coverage applicable to both Tier 1 and Tier 2.”

But an operation electing $8.50, $9.00, or $9.50 in Tier 1 “must choose a different coverage level threshold” — anywhere from $4.00 to $8.00 — for the production history above the tier line.

— 7 CFR § 1430.407(d)

Read it twice, because the logic runs backward from intuition.

Elect Tier 1 at $8.00 or below, and one number covers everything. Your Tier 2 milk gets locked to the same level, at Tier 2 prices. Elect $8.50 or higher, and the regulation requiresyou to set Tier 2 separately — which is the only way to put it at the free $4.00 catastrophic level.

Buying up in Tier 1 is the mechanism that lets you buy down in Tier 2. Jason Hartschuh, Extension Field Specialist in Dairy Management and Precision Livestock at The Ohio State University, flagged the same $8.50 threshold for producers above 6 million pounds when he wrote up 2026 enrollment in Buckeye Dairy News.

So the producer economizing at $7.50 doesn’t save anything. They get pulled into $7.50 Tier 2 pricing on every pound above the line, and Tier 2 pricing is where this program stops being affordable.

What the regulation actually charges

The short version: $0.100 versus $1.813 at the same coverage level. Here’s why the cheaper election is the expensive one.

Table 1 to § 1430.407(e), reproduced in full. These are the statutory rates from the Agricultural Improvement Act of 2018, and USDA’s January 2026 final rule left them unchanged — only the tier threshold moved, from 5 million pounds to 6,000,000 lb.

Coverage LevelTier 1 ($/cwt)Tier 2 ($/cwt)Price Multiple
$4.00 (Catastrophic)NoneNone
$5.50$0.030$0.1003.3x
$6.50$0.070$0.6509.3x
$7.50$0.090$1.41315.7x
$8.00$0.100$1.81318.1x
$9.50 (Max, Tier 2 decoupled)$0.150Free at $4.00

Read the $8.00 row twice. Same margin protection, same milk, same barn — $0.100 in Tier 1 and $1.813 in Tier 2. Eighteen times the price for identical coverage. Compare each tier’s best available option instead, and it’s $0.150 against $1.813, a little over twelve times.

The columns track each other to $5.00. Past that, they fork hard, and by $7.00 Tier 2 costs nearly fourteen times what Tier 1 charges.

Running the Numbers

Model Herd Profile: 500 cows | 25,000 lb/cow | 12.5M lb total | Federal Order 30

Covered history at 95%: 57,000 cwt Tier 1 · 61,750 cwt Tier 2

Monthly exposure: 4,750 cwt Tier 1 · 5,146 cwt Tier 2

Window: July 2025 – June 2026, the most recent twelve months with final FSA margins

Scaling: Every figure below moves with the coverage percentage you elect. At 50% coverage, halve them.

Coverage percentage is set at 95%, the maximum § 1430.407(a)(2) allows, and applied to both tiers as § 1430.407(d) requires. The margin itself is one national calculation, so this premium math holds regardless of your order. What varies by region is the gap between that national margin and your actual mailbox price — which matters later, when we get to DRP.

Worked examples on a modeled herd, not a forecast. Confirm your own election with your county FSA office or a licensed crop insurance agent.

Election A — Tier 1 at $9.50, Tier 2 set separately to $4.00

  • Premium: 57,000 × $0.150 = $8,550, plus the $100 administrative fee
  • Dec 2025, margin $9.42: ($9.50 − $9.42) × 4,750 = $380
  • Jan 2026, margin $7.81: ($9.50 − $7.81) × 4,750 = $8,028
  • Feb 2026, margin $8.46: ($9.50 − $8.46) × 4,750 = $4,940
  • Tier 2 collected nothing. The margin never touched $4.00.
  • Net: +$4,697

Election B — Tier 1 at $8.00, Tier 2 locked to $8.00

  • Premium: (57,000 × $0.100) + (61,750 × $1.813) + $100 = $117,753
  • January was the only month below $8.00, by nineteen cents
  • Both tiers together paid $1,880
  • Net: −$115,873

Election C — Tier 1 at $7.50, Tier 2 locked to $7.50

  • Premium: (57,000 × $0.090) + (61,750 × $1.413) + $100 = $92,483
  • The margin bottomed at $7.81. Neither tier paid a cent.
  • Net: −$92,483

Election A carries the highest Tier 1 rate on the table. It’s the only one that made money.

Scale it to your herd: per 1,000 cwt of production history covered at 95% and $9.50, you paid $142.50 and collected $222 across those three months. Multiply by your own Tier 1 hundredweight.

What if you’re still under 6 million pounds?

Then none of this costs you anything yet, and your election is simple: take $9.50, take the six-year lock-in, and skip the Tier 2 rows entirely.

Watch the line, though. At 25,000 lb per cow, 6,000,000 lb is roughly 240 cows. Every cow past that puts milk into a tier where protection costs eighteen times more — a number most expansion budgets never carry. If you’re within about 500,000 lb of the threshold, run the tier split before you pour the pad.

Does one quiet year prove anything?

Fair challenge, and Hartschuh raised a version of it during the 2026 sign-up.

Writing in Buckeye Dairy News, he pointed out how fast the floor can drop: “In November of 2022, during the DMC program sign-up, the lowest projected milk margin was $8.80, but it fell all the way to $3.52 in July of 2023.” His conclusion — that the collapse demonstrated “the need to use risk management tools even when the risk does not appear to be present.”

He’s right that nobody saw 2023 coming. The margin fell more than five dollars below what the market projected at signup.

So run every year, not just the calm one. Eighty-four months of FSA’s published margin series, same illustrative herd, same three elections.

Election, 2019–2025Premium PaidIndemnitiesNet Position
Tier 1 $9.50 + Tier 2 $4.00$60,550$405,219+$344,669
Tier 1 $7.50, both tiers locked$647,379$313,104−$334,275
Tier 1 $8.00, both tiers locked$824,269$406,521−$417,748

The locked elections collected roughly the same indemnities as the decoupled one. They paid ten to thirteen times more for the privilege.

This comparison is The Bullvine’s own analysis, built from Table 1 to § 1430.407(e), the election rule at § 1430.407(d), and FSA’s published margins. Hartschuh’s guidance in Buckeye Dairy News addresses the general principle for herds above 6 million pounds — that DMC “should be used as a tool to protect your operation from catastrophic losses” — not this specific comparison.

That principle, run through the rate table, points somewhere concrete: elect above $8.00 so the regulation hands you a separate Tier 2 decision.

One cross-check, since the whole argument rests on the margin series. CRS independently reports annual average DMC margins of $9.61 for 2019, $9.45 for 2020, $6.92 for 2021, $10.72 for 2022, and $6.70 for 2023. Averaging FSA’s monthly figures produces 9.61, 9.45, 6.92, 10.72, and 6.70. Two federal sources, same numbers.

Readers who followed the calendar year DMC paid out nothing at all have seen the other side of this. Tier 1 posts losing years too. The seven-year total is what settles it.

What changed for the 2026 program year

The One Big Beautiful Bill Act reauthorized DMC through 2031 and moved the Tier 1 threshold to 6,000,000 lb, a shift we covered when Tier 1 jumped to six million pounds.

Every 2026 enrollee established a new production history. Farms marketing before January 1, 2023 use the highest of their 2021, 2022, or 2023 marketings, documented with milk marketing statements. Later entrants use their first year of monthly marketings.

The lock-in is spelled out at § 1430.404(e)(2): operations making a one-time election during the 2026 period are locked at the same coverage level and percentage from January 1, 2026 through December 31, 2031, at a 25% premium discount — taking the Tier 1 $9.50 rate from $0.150 to about $0.1125/cwt. Locked-in operations still owe the annual administrative fee and still have to file a contract each year certifying they’re producing and marketing milk. Miss that, and you stay liable for the unpaid fees anyway.

One date worth calendaring: premium is due when you submit your election, and no later than September 1 of the coverage year, per § 1430.407(h).

What actually drove the margin swing in the test window was milk, not feed. FSA’s 2026 rate table shows the all-milk price climbing from $17.50/cwt in January to $21.10 in June, while the feed cost component moved only from $9.69 to $10.22. January’s $7.81 margin wasn’t a feed spike. It was a milk price that hadn’t caught up yet.

Enrollment ran January 12 to February 26, 2026. It’s closed. FSA hadn’t posted 2027 dates as of August 31, 2026 — recent cycles opened in mid-January, which is a pattern, not a promise.

Is anyone checking whether producers understand the form?

Not according to the Government Accountability Office, which audited FSA’s outreach in July 2025.

Metric20192024Change
Total DMC-enrolled farms23,48515,686−33%
National participation rate68%63%−5 pts
Small-operation share of participants76%68%−8 pts

Participation is sliding. GAO found 68% of U.S. dairy farms enrolled in 2019 — 23,485 of 34,207. By 2024: 63%, or 15,686 of 24,811. Smaller operations, the ones Tier 1 was designed to serve, fell from 76% of participants to 68%.

Farmer groups told GAO the barriers include “limits on the amount of milk covered, the cost of buy-up coverage… and awareness about the program.” GAO found FSA “has not evaluated its communication efforts.”

FSA’s printed reply: “FSA generally disagrees with the findings in the GAO draft report as it relates to FSA communications and their efficacy.”

Not we’re working on it. Paragraph (d) is a decent example of what that awareness gap looks like in practice — a sentence in the Code of Federal Regulations that swings six figures of premium, sitting nowhere near the paperwork you sign.

The American Farm Bureau Federation reports that in practice, most Tier 2 production is already enrolled at or near the catastrophic $4.00 level. Farm Bureau doesn’t cite the underlying dataset, and FSA doesn’t publish tier-level elections, so read it as an informed industry assessment rather than an audited figure. It lines up with what the arithmetic recommends.

How to protect the Tier 2 milk without paying USDA’s $1.813 rate

Decoupling Tier 2 to $4.00 solves the premium problem and leaves a coverage problem: that milk now carries a catastrophic floor and nothing else. Two federal products fill the gap at a fraction of the Tier 2 rate.

Start with what producers actually paid this year. HighGround Dairy’s review of first-quarter 2026 Dairy Revenue Protection results put average producer-paid premium at $0.28/cwt. On this herd’s 61,750 covered Tier 2 cwt, that’s about $17,290 spread across four quarterly endorsements — against $111,953 for the Tier 2 portion of an $8.00 election. Roughly one-sixth the cost.

Q1 was a strong quarter for anyone holding coverage. HighGround estimated indemnities averaging $1.12/cwt and a net return of +$0.83/cwt after premium, with Class III settling below the 95% coverage level in 93% of the sales days they examined. Read those numbers with three things in mind: RMA hadn’t released Q1 indemnities at publication, so the payout side is estimated from announced class prices and yields; one strong quarter isn’t a run rate; and HighGround Insurance Group is a licensed agency selling this product.

DRP isn’t a fringe tool anymore either. Roughly 16.1 billion pounds of milk carried DRP coverage in Q1 2026 — 27.5% of the U.S. milk supply.

How much does the timing of a DRP purchase actually matter?

More than the premium does, according to HighGround’s Q1 breakdown.

Coverage bought three quarters ahead returned the most: $1.53/cwt net of premium. Four quarters out returned $1.37, five quarters out $1.28. Producers who waited and bought one quarter out saved about $0.20/cwt on premium — and gave up roughly $1.50/cwt in indemnity to do it.

Only 19% of Q1 2026 coverage was booked three to five quarters ahead.

That’s the pattern worth stealing. The cheap premium is usually the expensive decision.

Where DRP can leave you short

DRP settles against an index built from CME futures and state or regional production, not your milk check. Two mechanisms drive the gap.

The first is basis. A herd in Federal Order 30 and one in the Southwest can hold identical coverage and land in different places, because their mailbox-to-index spreads differ. We walked through that in our spring 2026 DRP risk plan.

The second is the Yield Adjustment Factor — your state or pooled region’s actual yield from USDA’s Milk Production report, divided by the expected yield when you bought. Above 1, your indemnity gets cut. Below 1, it gets enhanced. So a quarter where your region milks well and prices fall can pay you less than the price move alone would suggest, regardless of what your own tank did.

Coverage levels run 80% to 95%, with a class pricing option built on Class III and Class IV and a component pricing option using butterfat, protein, and other solids. Subsidies hold at 55% for 80% coverage, 49% at 85%, and 44% at both 90% and 95% — unchanged for the 2027 crop year, per University of Wisconsin–Madison Extension’s August 2026 review. Beginning and veteran farmers receive an additional subsidy.

LGM-Dairy covers the margin between Class III milk and corn and soybean meal futures, with feed quantities set by the producer rather than fixed by formula. Per UW–Madison Extension’s May 2026 summary, deductibles run from $0 to $2.00/cwt in dime increments, with subsidies from 18% to 50%; there’s no minimum hundredweight, and premium comes due at the end of the coverage period.

You gain precision on the feed side. You give up a program your county office can explain in ten minutes.

For readers north of the border

None of this transfers. Canadian farmgate prices are set through the Canadian Dairy Commission’s cost-of-production formula blended with the Consumer Price Index, and production runs on quota rather than open marketing. Because Canadian pricing isn’t benchmarked to CME Class III and Class IV, DMC, DRP, and LGM-Dairy have no Canadian equivalent — there’s no margin index to insure against.

What crosses the border: feed. Corn and soybean meal are globally priced, and input hedging is the one page of this playbook an Ontario or Quebec operation can use directly.

The 30/90/365-Day Playbook for a Herd Sitting on the Tier Line

30 days — urgent checks

  • Pull your FSA production history in pounds. Not your tank average — the number on file, recalculated for 2026 as the highest of your 2021, 2022, or 2023 marketings. Requires one call to the county office. Where it backfires: planning a 2027 election around a split you assumed instead of confirmed.
  • Ask your county office two things: what Tier 1 level you elected for 2026, and what coverage level is currently attached to your Tier 2 history. If your Tier 1 sits at $8.00 or below, those numbers should be identical — and you may be paying Tier 2 rates you never chose. Most expensive item on this list to get wrong.
  • Trigger: if your debt service coverage ratio has sat under 1.2 for three consecutive months on your lender’s calculation, cross CME futures off entirely. Class III trades in 200,000 lb contracts with margin near $1,000 per contract as of the April 2026 specifications, and the exchange resets those periodically. Ten contracts means five figures parked and callable at the worst possible moment.

90 days — structural adjustments

  • Start pricing DRP three to five quarters out, not one. HighGround’s Q1 2026 data puts the net return on three-quarters-out coverage at $1.53/cwt against roughly $0.20/cwt of premium savings for waiting. Requires an agent relationship and a willingness to buy when the quarter still looks fine. Backfires if you commit volume you later sell forward — you’d be insuring milk that’s no longer exposed.
  • Pull twelve months of milk checks and calculate your own mailbox-to-Class III spread. That number tells you whether index-based coverage will actually pay when you’re hurting. If it runs wide or erratic, weight toward LGM-Dairy instead of DRP.
  • Model both DMC elections side by side rather than picking a Tier 1 number in isolation. Run $9.50 with Tier 2 at $4.00 against your preferred lower level with both tiers locked. The gap is usually wider than producers expect, and it usually favors buying up.
  • If you took the six-year lock-in, calendar the annual certification now. The regulation keeps you liable for premiums and fees whether or not you file the paperwork.

365 days — strategic positioning

  • Add one row to your own record every January: what the margin did, what you paid, what you collected. Seven years of that turns an opinion into a table.
  • Opportunity signal: if your realized mailbox-to-Class III spread has held within about a dollar across the last twelve months and your Tier 1 election is above $8.00, index-based DRP is doing roughly what it says on the tin for you, and the Tier 2 substitution is worth pricing seriously. If that spread runs wider, keep the exposure and manage feed instead.
  • Track the 2027 rules, which changed more than most producers noticed. RMA’s package for the 2027 crop year permits concurrent DRP, LRP, and LGM coverage and cancels policies earning no premium for three consecutive years. Earliest practical effect lands around June 2027, when dormant policies cancel ahead of the following year. A lapsed policy you forgot about can disappear quietly.

The trade-off at the center of this

Tier 1 is the cheapest risk management in American dairy, and one paragraph of federal regulation decides whether you get to keep it clean. Elect above $8.00 and § 1430.407(d) hands you a separate Tier 2 decision. Elect $8.00 or less, and it locks your largest block of milk to a rate that hasn’t paid for itself across seven years of USDA data.

Taking the higher Tier 1 number costs nothing real. On the herd modeled above, not knowing why it’s there cost $762,417.

So find your 2026 paperwork. What Tier 1 level did you actually elect — and have you asked your county office what coverage that decision attached to every pound above 6,000,000 lb?

Key Takeaways

  • Elect Tier 1 above $8.00 and the regulation forces you to set Tier 2 separately — that’s the only path to parking it at the free $4.00 level. Elect $8.00 or under and both tiers lock together at Tier 2 prices.
  • At the same $8.00 margin, Tier 1 costs $0.100/cwt and Tier 2 costs $1.813. Eighteen times the price for identical coverage on milk that came out of the same tank.
  • Across 2019–2025, the decoupled election returned $344,669 on this modeled herd. Locking both tiers at $8.00 lost $417,748 — collecting nearly the same indemnities for ten times the premium.
  • Before the 2027 window opens, pull your FSA production history and ask the county office what coverage is currently attached to your Tier 2 pounds. If your Tier 1 sits at $8.00 or below, those numbers should match — and you may be paying rates you never picked.
The Bullvine | Regulatory Investigation

The USDA DMC Tier Trap

Same $8.00 Margin Protection. 18.1x The Premium.

Tier 1 ($9.50 Elect)
$0.150/cwt
Unlocks separate $4.00 catastrophic floor for Tier 2.
7-Yr Net: +$344,669
Tier 2 ($8.00 Lock)
$1.813/cwt
Automatic rate lock on all milk over 6,000,000 lb.
7-Yr Net: -$417,748
The Regulatory Spread on 500 Cows
$762,417
Difference hidden inside 7 CFR § 1430.407(d)
Calculate Your Herd’s Tier Exposure:
Tier 2 Milk (Over 6M lbs): 6,500,000 lbs
Tier 2 Annual Lockout Penalty: $111,953 / yr
Source: 7 CFR § 1430.407 | Analysis by TheBullvine.com

Election rules and premium rates: 7 CFR § 1430.407 (buy-up coverage) and § 1430.404 (registration and annual election), current as retrieved September 1, 2026. Note that the CFR text still references the pre-2026 five-million-pound tier threshold; USDA’s January 2026 final rule raised it to six million pounds under the One Big Beautiful Bill Act, and the rate schedule was unchanged. Margin data and feed cost components: USDA Farm Service Agency, Dairy Margin Coverage Program Updates and Prices, 2019–2026 series. Annual average cross-check: Congressional Research Service. DRP performance data: HighGround Dairy, “DRP Results: Q1 2026” — indemnity figures in that report are estimated, as RMA had not released Q1 settlements at publication; HighGround Insurance Group is a licensed insurance agency. LGM and DRP subsidy terms: University of Wisconsin–Madison Extension, May and August 2026. Canadian pricing context: Canadian Dairy Commission. Net-position figures are The Bullvine’s own calculations applied to the illustrative herd described above — arithmetic, not forecasts. Past margins do not predict future ones. Confirm all program elections with your county FSA office or a licensed crop insurance agent.

Learn More

The Sunday Read Dairy Professionals Don’t Skip.

Every week, thousands of producers, breeders, and industry insiders open Bullvine Weekly for genetics insights, market shifts, and profit strategies they won’t find anywhere else. One email. Five minutes. Smarter decisions all week.
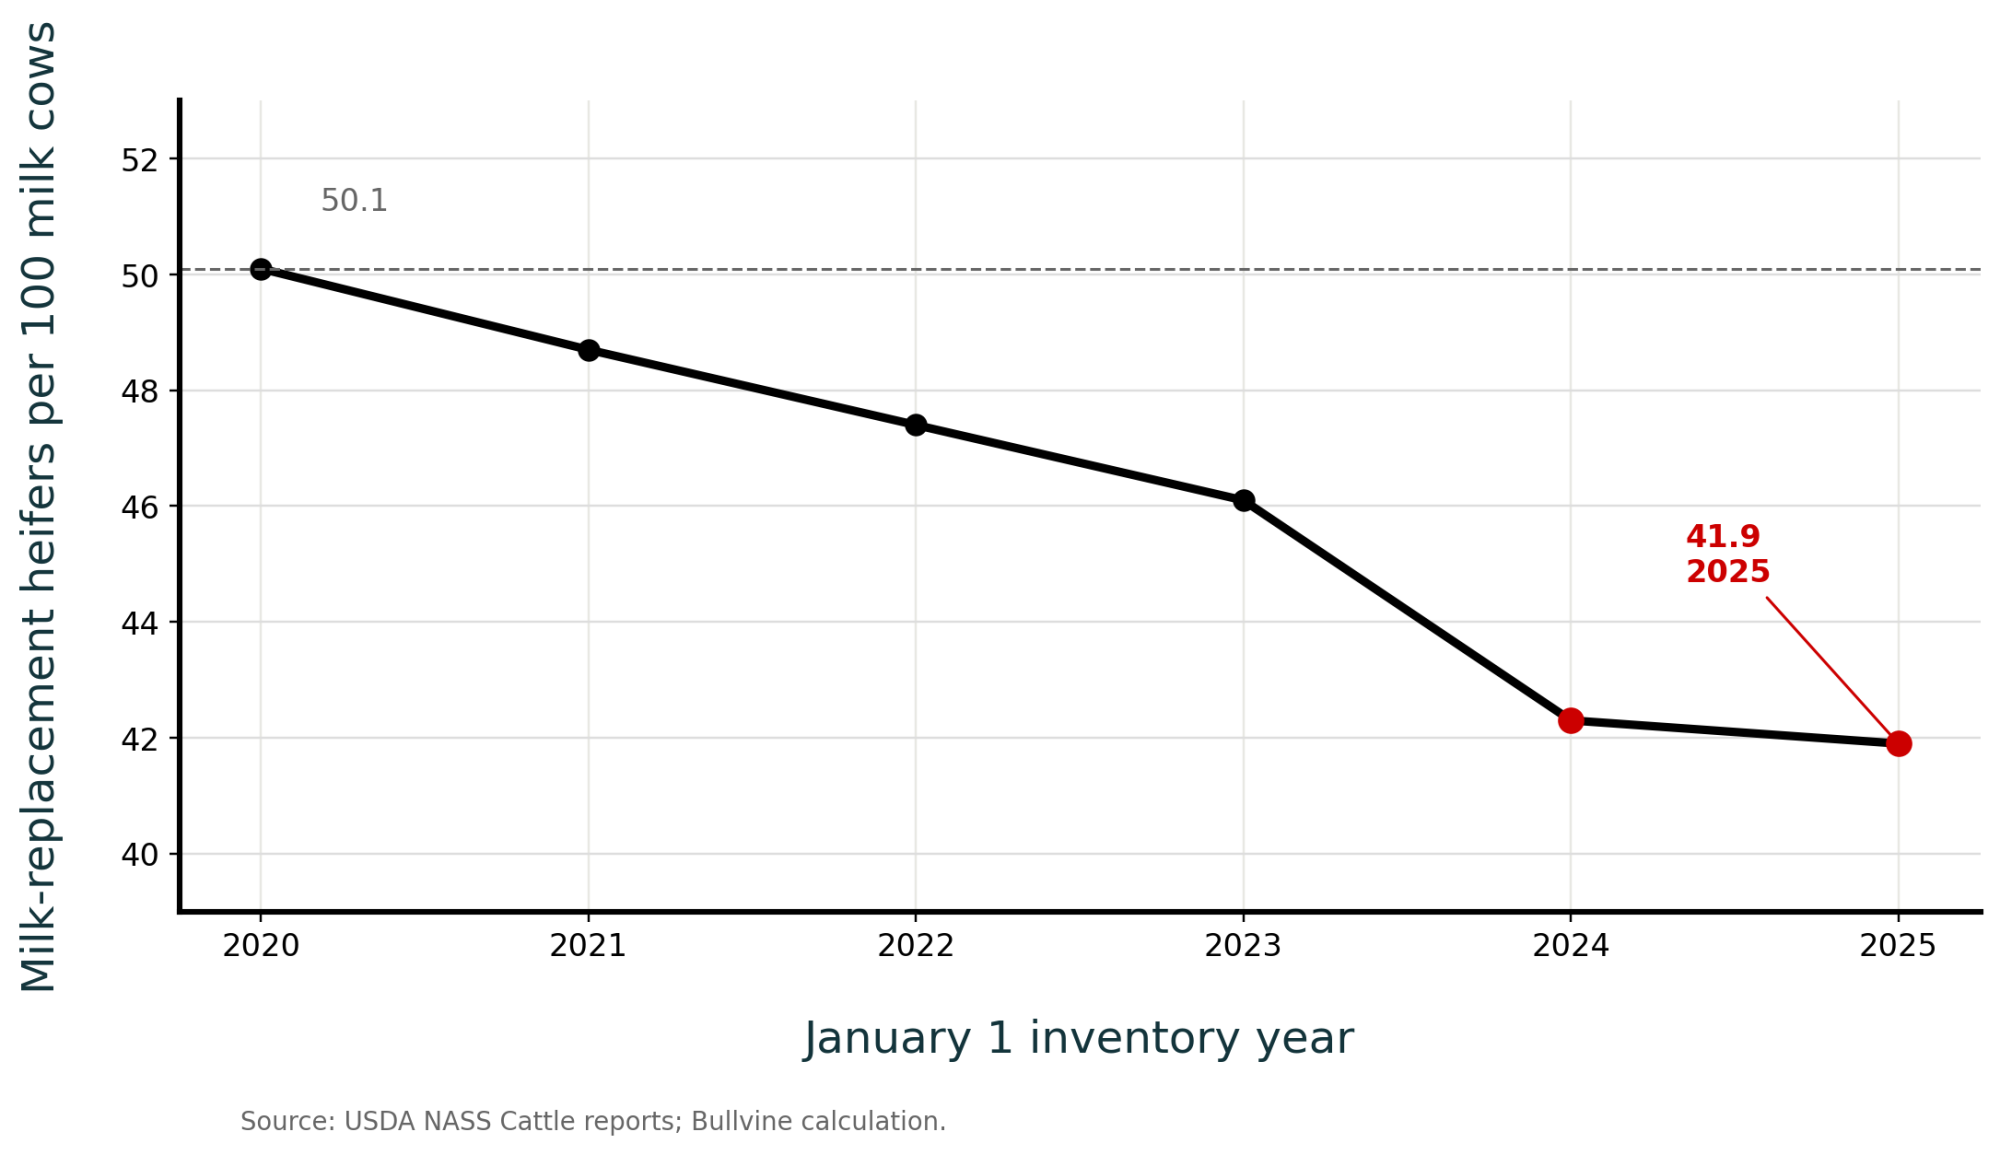
NewsSubscribe
First
Last
Consent

A 12-Month Permit Delay Costs $2.14M. Your Lawyer Costs $96,000.

The remand turned on a missing verification mechanism, not bad geology — and the sixteen-month clock is the part your lender should read.

Executive Summary: On August 24, a Wisconsin administrative law judge sent Ridge Breeze Dairy’s expansion permit back to the DNR — not because the groundwater science was wrong, but because the permit commanded compliance without building in any way to check it. DNR’s own hydrogeologist mapped 279 land-application fields, and the judge upheld that work; the permit still failed on a missing verification mechanism, and it took sixteen months from hearing grant to ruling. Run that delay against your own expansion: 1,000 incremental cows shipping 75 lbs a day is 273,750 cwt a year, and at January’s national DMC margin of $7.81/cwt, twelve months of empty barn leaves $2.14 million on the table against roughly $96,000 in legal fees. Forgone margin, not the lawyer, is what breaks the covenant math — and that ratio holds across every margin USDA published this year, from $7.81 to $11.10/cwt. If you’ve got a permit or nutrient management plan sitting in a DNR inbox, the check is an hour of your time: does the file contain monitoring wells, a testing protocol, or a reporting schedule, or does it only state obligations? Wisconsin has roughly 370 active or pending CAFO permits, and nobody has publicly examined how many share the same gap. The trigger to watch isn’t the eventual ruling — it’s the day DNR grants a contested-case hearing, which in this case showed up sixteen months before anyone knew the outcome.

CAFO permit delay cost

Ridge Breeze Dairy waited sixteen months — from the day Wisconsin’s DNR granted its neighbors a contested-case hearing to the day an administrative law judge sent the expansion permit back.

Here’s what should stop you if you’ve got a CAFO permit or nutrient management plan sitting in a DNR inbox: the judge didn’t say Ridge Breeze’s groundwater science was wrong. She said the opposite. DNR’s own hydrogeologist, Ian Anderson, mapped overburden depth, bedrock depth, and conduits across 279 individual application fields — and the judge upheld that work. The permit failed on something a lot less interesting than geology. Nothing in it verified whether the rules it imposed were actually being followed.

The challenge came from five Pierce County neighbors — Ty Fisher, Larry Brenner, Kay Kashian, Dick Dart, and Gerald Steien — working through GrassRoots Organizing Western Wisconsin. “This victory started when a handful of neighbors sat down together in a garage down the road from Ridge Breeze,” Fisher, a Pierce County farmer, said in a statement released through the group. They filed April 21, 2025. The decision landed August 24, 2026, in Case No. DNR-25-0004.

The Gap Wasn’t in the Science

Administrative Law Judge Angela Chaput Foy, of the Wisconsin Division of Hearings and Appeals, put it in one sentence: “The permit conditions set Ridge Breeze up for anticipated compliance, they also command compliance, but the permit lacks a mechanism to verify compliance.”

Read that twice if you’re mid-application. The permit told the dairy to meet groundwater standards. It just never built in a way to check.

The order itself is narrow, and the narrowness matters. It remands the permit “to incorporate additional conditions or requirements, which may include monitoring, capable of detecting whether the groundwater protection standards of Wis. Admin. Code Chapter NR 140 are being violated.” Chaput Foy didn’t mandate monitoring wells — DNR decides what the mechanism looks like. But the principle underneath travels further than one farm in Pierce County. Obligations and verification aren’t the same thing, and a permit can carry the first without the second.

The geology at Maiden Rock is the kind that makes hydrogeologists slow down. Ridge Breeze sits on Prairie du Chien dolomite — solid rock, but heavily fractured, forming karst. Sinkholes. Conduits that move water fast and unfiltered. Glacial overburden above that bedrock runs 8 to 106 feet thick, averaging 34.7 feet. Depth to bedrock at production-area wells averaged 217 feet, ranging from 23 to 364 feet. Of the 279 land-application fields, DNR’s restriction mapping flagged 4 with direct vertical conduits to groundwater.

Who’s on Each Side

Ridge Breeze operates under Breeze Dairy Group, LLC, an Appleton company formed in 2002 by five Wisconsin dairy families. Gregg Wolf is CEO, and he’s been talking about this expansion publicly for two years. Wisconsin Public Radio reported in March 2026 that Wolf said the project would create 20 jobs and contribute more than $25 million a year to the local economy.

Scale figures vary by source, and the difference is worth knowing. The DNR decision and most coverage describe the expansion as roughly 1,700 to 6,500 cows and heifers. GROWW’s own release puts it at “up to 9,000,” which tracks the animal-unit figure from the April 2025 petition rather than head count. Both are defensible — they’re measuring different things.

Midwest Environmental Advocates represented the neighbors. Senior staff attorney Adam Voskuil told WPR in March 2026: “The DNR assumed groundwater underlying the farm and surrounding fields would be protected from surface contamination and issued the permit without requiring groundwater monitoring.” That’s petitioners’ counsel describing the agency’s approach — he’s not a neutral party. The judge’s ruling turned on a related point: the permit contained no way to verify compliance. If you followed the North Dakota water-permit fight that turned on standing rather than science, this is the same lane from a different angle — there the challenge died on who had the right to bring it; here it succeeded on what the permit left out.

One thing the judge went out of her way to say. She found no evidence linking Ridge Breeze’s permitted activities to existing well contamination, and noted that septic systems and general agriculture are both implicated in Pierce County’s groundwater picture. The county’s 2024 sampling found roughly 14% of tested wells above the 10 mg/L nitrate enforcement standard, scattered county-wide rather than clustered near any one operation. This is a permit case. Not a contamination case.

How Much Does a Permit Delay Actually Cost You?

Run it on a napkin. Take 1,000 incremental cows shipping 75 lbs a day — that’s 273,750 cwt a year. At January 2026’s national Dairy Margin Coverage income-over-feed-cost margin of $7.81/cwt, a barn sitting empty for twelve months leaves roughly $2.14 million in margin on the table.

Now put that beside the legal bill. At $8,000 a month — the low end of the $300 to $500 per hour range Dairy Herd Management documented for environmental counsel in 2022 — twelve months of litigation runs about $96,000. That’s better than twenty-to-one against the lawyer, and it’s the low-fee case. Push counsel costs to $40,000 a month, and the ratio narrows to roughly four-to-one. Forgone margin still wins.

Here’s the full range USDA published this year:

IOFC marginSource month12-month forgone marginLegal fees ($8K–$40K/mo)Total exposure
$7.81/cwtJanuary 2026$2.14M$96K – $480K$2.23M – $2.62M
$9.93/cwtJan–Jun average$2.72M$96K – $480K$2.81M – $3.20M
$11.10/cwtJune 2026$3.04M$96K – $480K$3.13M – $3.52M

Margins come from USDA’s published 2026 DMC series — $7.81/cwt in January, $9.57 in March, $10.54 in April, $10.62 in May, $11.10 in June. That’s a national formula built on standardized corn, soybean meal, and alfalfa prices, so treat it as a benchmark and substitute your own number. Production at 75 lbs/cow/day is a planning assumption, not a survey figure.

Stretch any row to sixteen months — the actual Ridge Breeze wait — and the mid-margin case clears $3.6 million in forgone margin alone.

What the table leaves out matters too. It excludes interest carry on drawn construction debt and construction cost escalation, both real and both potentially large, because the available per-head construction benchmarks come from Canadian survey data that doesn’t transfer cleanly to a U.S. build. Read these totals as a floor. For what a delay does to your cost per hundredweight rather than your total exposure, the $1.56/cwt permit trap runs that math on a 600-stall expansion.

Is Your Permit File Actually Audit-Ready?

Pull your application this week and ask whoever handles your groundwater work one question: does this file contain a documented verification mechanism — monitoring wells, a testing protocol, a reporting schedule — or does it only state compliance obligations?

The Ridge Breeze record shows what holds up under cross-examination. Site-specific data beat county-level extrapolation, consistently. Ian Anderson, DNR’s hydrogeologist program coordinator, relied on well construction reports specific to the production area and field-by-field restriction mapping, grounded in Wisconsin Geological and Natural History Survey data. Petitioners’ expert, Dr. John Jansen — a registered professional geologist with roughly four decades in groundwater investigation — argued from broader county geology. On the geology itself, the site-specific work won.

ElementStatus in Ridge Breeze PermitOutcome
Site-specific well data (279 fields mapped)Present, upheld by judgeSurvived challenge
Overburden/bedrock depth mappingPresent (8–106 ft; 217 ft avg)Survived challenge
Conduit/karst flagging (4 of 279 fields)PresentSurvived challenge
Verification mechanism (monitoring, testing, reporting)MissingPermit remanded

One more thing a knowledgeable reader will look for. A second issue was originally noticed for hearing: whether Section 1.6 of the modified permit and the nutrient management plan were unreasonable if the NMP failed to comply with Wis. Admin. Code § NR 243.14. Petitioners withdrew it by letter on February 24, 2026, and the matter proceeded solely on the groundwater question. Don’t read this ruling as a clean bill of health on the NMP. Read it as a ruling on one specific gap.

The Legal Machinery, in Brief

Three provisions did the work here, and you can hold them in your head:

  • Wis. Stat. § 283.31(4) — DNR must prescribe permit conditions necessary to assure compliance with groundwater protection standards.
  • Wis. Admin. Code § NR 243.13 — those conditions must actually achieve compliance with groundwater quality standards.
  • Wis. Admin. Code § NR 243.15(7) — but whether to require monitoring specifically is DNR’s discretionary call.

That third one is where the case lived. Anderson’s testimony and Jansen’s cross-examination collided over it at the March 3–4 hearing in Eau Claire. Chaput Foy wasn’t writing new law — she found DNR exercised its discretion in a way that left a hole, and petitioners carried their burden of proving that unreasonable by a preponderance of the evidence. Preponderance is a lower bar than “beyond a reasonable doubt,” which is worth knowing before you assume a challenge to your permit is a long shot.

The timing detail lenders should note: DNR granted the contested-case hearing petition on April 28, 2025 — one week after filing — and referred the matter to the Division two days later. That grant date is public, documented, and it showed up roughly sixteen months before anyone knew the outcome.

Options and Trade-Offs for Farmers

Audit your permit file for a verification mechanism — within 30 days. Works for anyone with a pending or recently approved application. It costs you a conversation with your consultant and an hour of your own paperwork. Where it falls short: this is Wisconsin law. If you’re in Iowa, Michigan, or the Dakotas, ask your counsel which statute in your state does the job § 283.31(4) does here, because the holding doesn’t travel automatically.

Commission site-specific hydrogeology during the application phase, not after a challenge. Makes sense if you’re on karst, fractured bedrock, shallow depth-to-bedrock, or sand. Requires real money up front — well construction reports and field-by-field conduit mapping aren’t cheap, and you’re spending it before anyone has objected to anything. But thorough geology alone didn’t save this permit. You need the science and the mechanism, and buying only the first one is how Ridge Breeze ended up here.

Move your financing trigger from permit approval to hearing-grant date. Aimed at lenders, consultants, and anyone phasing construction draws. Requires watching DNR’s contested-case docket, which is public and free. The honest limit: this is The Bullvine’s analysis, not established underwriting practice — we haven’t found a lender willing to say on the record that they price risk this way today.

Defer major steel and equipment orders once a hearing petition is granted. The arithmetic is simple. If twelve months of forgone margin alone runs $2.14 million on a thousand-cow expansion, holding a purchase order 60 to 90 days while the record closes barely registers. The trade-off is real — deferring can cost you a price lock or a contractor slot, and in a tight market that slot may not come back. Comparable fights elsewhere suggest patience is the safer bet: a challenge to the Herberg Dairy permit in North Dakota has been awaiting a ruling since July, and Michigan’s statewide CAFO permit litigation ran more than six years before producing enforcement clarity.

Key Takeaways

  • If your application states compliance obligations but contains no monitoring, testing, or reporting mechanism, that’s the exact gap that got this permit remanded. Check it this month.
  • If you’re siting on karst or fractured bedrock, commission well construction reports and field-by-field conduit mapping before DNR’s final determination — not after somebody files against you.
  • If a contested-case petition against your permit gets granted, treat that as your risk trigger. Not the eventual ruling. The gap between the two ran sixteen months here.
  • Before your next construction draw, run the napkin version: incremental cows × your production × your actual income-over-feed-cost. USDA’s 2026 DMC margins ranged from $7.81 to $11.10/cwt nationally, and your number won’t match either end.
  • If your expansion depends on a permit still inside the contested-case window, price a twelve-month delay into your covenant math now, while you can still negotiate it. Not at renewal, when you can’t.
  • If you’re outside Wisconsin, don’t assume this holding applies. Ask which statute in your state performs the same function before you change anything.

What Would Your File Look Like Under Oath?

No appeal or rehearing petition had been filed as of Monday, August 31. DNR said only that it’s reviewing the decision. Rehearing under Wis. Stat. § 227.49 runs 20 days from August 24; judicial review under § 227.53 runs 30 days. So this can still move. GROWW members were scheduled to gather outside the DNR Service Center in Eau Claire on Monday evening to mark the decision and press for stronger statewide groundwater protections. Nobody has publicly examined whether the same verification gap sits inside other Wisconsin CAFO permits — and with roughly 370 active or pending permits statewide, that’s a question somebody should be asking.

So here’s yours. If a neighbor filed against your permit next Tuesday, would your file stand on its own documentation? Or would you be assembling groundwater evidence after the petition, the way this one went? We’re building the full delay-cost model by herd size — construction carry included once we’ve got defensible U.S. inputs — plus a state-by-state comparison of CAFO permit challenges and how long each took, as a follow-up piece. That’s the one to forward to your lender.

 Learn More

The Sunday Read Dairy Professionals Don’t Skip.

Every week, thousands of producers, breeders, and industry insiders open Bullvine Weekly for genetics insights, market shifts, and profit strategies they won’t find anywhere else. One email. Five minutes. Smarter decisions all week.
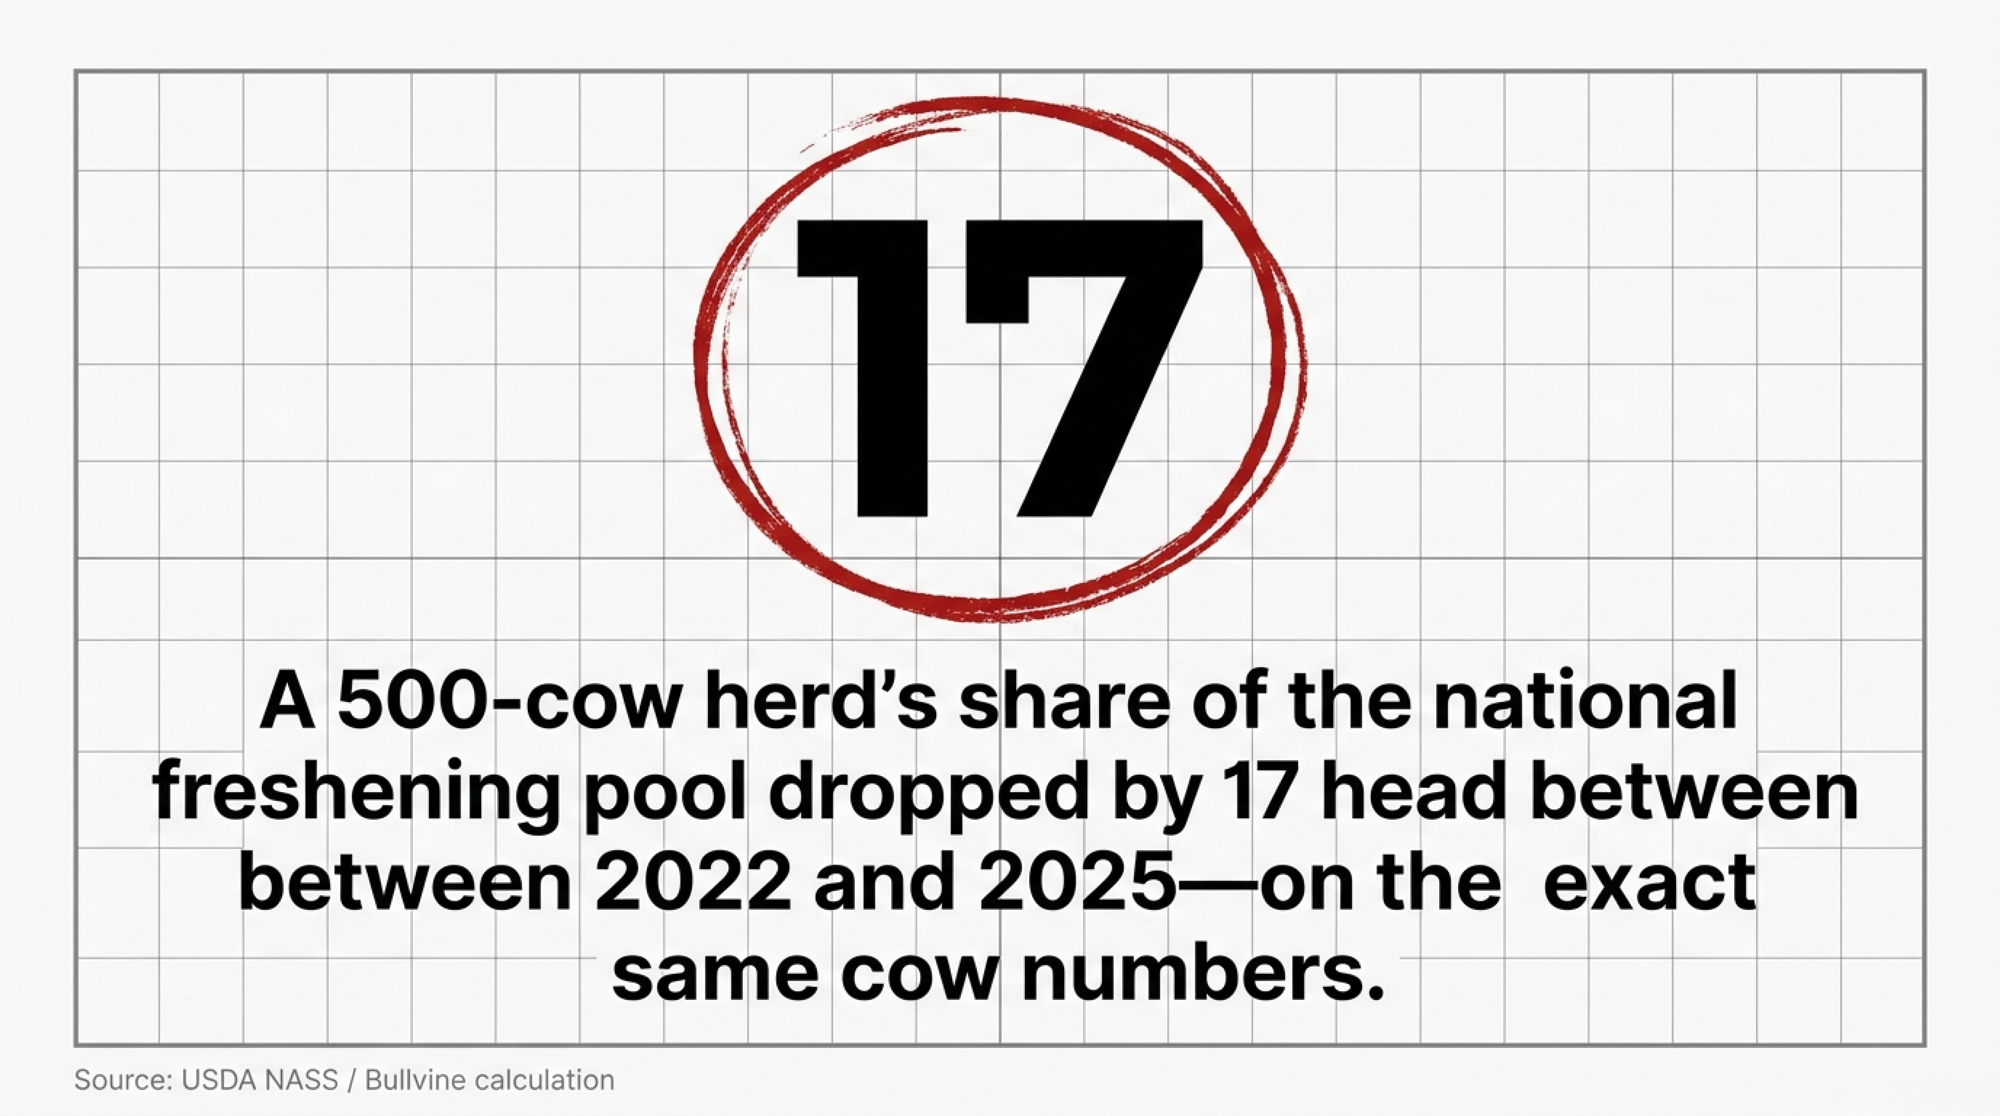
NewsSubscribe
First
Last
Consent

94.3% of Trough Samples Had Coliforms. Your Wellhead Test Won’t Show It

Your last water test was pulled at the wellhead. Researchers swabbed 105 troughs — 94.3% carried coliforms, and biofilm came off two-thirds of the walls. Two bottles and $70 settles it.

You know the sequence. The bulk tank number creeps up and stays up, so you change liners. You retrain the prep routine. You pull the high-SCC cows, culture them, move them into their own group, watch the tank drop for three good weeks, and then climb right back where it started. Somewhere around month four, somebody finally asks when the trough water was last tested for bacteria, and nobody in the room has an answer.

That gap is the story. Dairy water quality gets called a nutrient in every ration textbook and treated like plumbing on every management checklist. And when researchers went looking with swabs and plates, the wellhead usually came back fine — it was everything downstream that didn’t.

The Number That Should End the “Our Water Looks Fine” Conversation

Hayer and colleagues sampled 105 water troughs across 24 dairy farms in Western Germany and published the results in 2022. Coliform bacteria turned up in 94.3% of all water samples. E. coli in 48.6%.

One caveat before that number travels any further: this is Western Germany. Trough materials, ambient temperatures, and management practices differ enough from a typical North American freestall that 94.3% isn’t a North American prevalence figure. What it tells you is that trough contamination is common, easy to miss, and invisible to a source-water test.

Biofilm was collectible from 72 of the 105 troughs — roughly two-thirds. Every single one of those biofilms contained coliforms. And on one farm, the team pulled methicillin-resistant Staphylococcus aureus (MRSA) out of trough biofilm while the water itself tested clean for it. The water sample said one thing. The wall said another.

And Ontario’s guidance says that at 15 to 20 coliforms per 100 mL, adult cows may go off feed entirely — the fresh pen backing away from a trough that looks perfectly clean.

The risk factors that team identified are things you can walk out and check before dinner: high-volume troughs, plastic or cast iron instead of stainless steel, troughs sited close to the parlour, heavy visible soiling, visible biofilm, and high ambient or water temperature. Four of the six cost nothing to change.

Why Does Clear Water Still Fail the Test?

Because the problem isn’t floating in the water, it’s cemented to the wall.

What biofilm is. A colony of bacteria embedded in a self-produced matrix that sticks to trough walls, pipe interiors, and milking equipment alike. Penn State Extension uses the image of a fort — the colony gets established inside it, protected and fed.

Why scrubbing fails. Bacteria living inside a biofilm are shielded from sanitizers that would kill the same organisms swimming free. That’s why a trough can get scrubbed Monday and be a problem again by Thursday.

Why troughs are the worst spot. Every cow that drinks leaves organic matter and bacteria in standing water that hundreds of herdmates share before the day’s out. Warm temperatures plus low flow speed up the whole process.

The same logic in the udder. Penn State Extension, citing Raza et al. (2013) and Veh et al. (2015), notes that biofilm-producing S. aureus isolates have been linked to chronic mastitis, and that strains persisting through the dry period produce more biofilm than strains that don’t. Same survival strategy, different location.

Three Ways Dirty Water Costs You

The first mechanism is well established, and it’s about intake — not infection.

Cows taste the difference and act on it. A Journal of Dairy Science invited review by Jensen (2021), summarizing work by Schultz et al. (2019), reports that lactating cows cut free water intake by 10% when offered only water contaminated with 0.5 mg of fresh manure per gram of water, and by 28% at 1 mg per gram. Given a choice between clean and contaminated, they drank the clean and left the rest.

The second is blunter. Ontario’s OMAFRA guidance puts real numbers on it: above one coliform per 100 mL, calves can scour, and at 15 to 20 coliforms per 100 mL, adult cows may scour and go off feed entirely. That’s not a subtle intake shift — that’s a fresh cow backing away from the trough.

The third is the one being argued in the field, and it deserves an honest label rather than a confident one. The proposed chain runs like this: a cow fighting a constant bacterial challenge from her drinking water has fewer immune resources left for mammary defence, so somatic cell count drifts up. It’s plausible. Practitioners report seeing it.

But the controlled research linking trough water bacteria directly to bulk tank SCC is thinner than the intake evidence — which means the case for buying equipment specifically to lower SCC is weaker than the case for buying it to protect intake. Treat the SCC connection as a working hypothesis, not a proven return.

Metric / FindingData / LevelSource & Context
Trough water coliform prevalence94.3%105 troughs, 24 farms (Hayer et al., 2022)
Trough water E. coli prevalence48.6%105 troughs, 24 farms (Hayer et al., 2022)
Troughs yielding collectible biofilm72 of 105Same survey (Hayer et al., 2022)
Calf scour threshold>1 coliform / 100 mLOMAFRA guidance, Ontario
Adult intake / off-feed threshold15–20 coliforms / 100 mLOMAFRA guidance, Ontario
Intake reduction, mild manure load−10% at 0.5 mg/gSchultz et al., 2019 (via Jensen 2021, JDS)
Intake reduction, heavy manure load−28% at 1.0 mg/gSchultz et al., 2019 (via Jensen 2021, JDS)
Farms with water quality issues26% (none above 75 lb/cow)243 Pennsylvania farms, Penn State (2013)
Milk difference, clean vs. contaminated62 vs. 56 lb/cow/dayPenn State (2013) — correlation only
High vs. low SCC herd yield gap11 lb/cow/day ($0.64/cwt)Zoetis analysis of its own data, 489 herd-years
Lactanet SCC flagging ceiling (Canada)200,000 cells/mLLactanet udder health reporting
Sulfate ceiling, calves vs. adults500 vs. 1,000 mg/L2021 NASEM Nutrient Requirements of Dairy Cattle

What a Trough Swab Actually Involves

Here’s the part that gets skipped, because most producers have never watched one get pulled.

Two samples, not one. Pull the first at the wellhead or pressure tank — that’s your source baseline. Pull the second from the trough serving the group you’re worried about, and take it from the water the cows are actually drinking, not from a fresh fill. The gap between those two numbers is the entire diagnostic. Clean source plus dirty trough means the problem lives in the distribution system and on the trough surface, which is a very different purchase than a source-water problem.

Handling rules that actually matter. Bottles come sterile from the lab. Don’t rinse the bottle. Don’t touch the inside of the cap. Fill it without dunking your hand. Get it cold immediately. Bacterial samples degrade fast, so most labs want them chilled and delivered within 24 hours — a Friday afternoon sample that rides in the truck over a weekend tells you nothing. Lactanet builds that constraint right into its protocol: sample Monday, Tuesday, or Wednesday only, refrigerate immediately, ship same day. Copy that discipline wherever you farm.

  • United States — Penn State. The Agricultural Analytical Services Laboratory prices its WD04 Agriculture/Septic package at $70, covering total coliform, E. coli, pH, total dissolved solids, and nitrate-nitrogen. WD05 Mining runs $80 and picks up sulfate, iron, and manganese. WD08 Extensive is $220. No single mid-priced option covers bacteria and the full mineral panel, so decide what you’re hunting before you order. Lab contact: 814-863-0841.
  • Ontario — Guelph AFL and SGS. Stay domestic, because shipping across the border blows the 24-hour window. The University of Guelph’s Agriculture & Food Laboratory is licensed for microbial drinking water testing under Ontario Regulations 318/319 and 170, covering E. coli, total coliform, and heterotrophic plate count. SGS Agri-Food Laboratories, also in Guelph at 503 Imperial Road North, holds ISO/IEC 17025 accreditation and offers packaged livestock water services. Both quote livestock microbial packages on request.
  • Quebec — Lactanet and a proAction gap. Lactanet runs a water analysis service for Quebec producers. Worth knowing: under proAction, microbial contamination is the only water parameter analyzed routinely. A mineral problem there won’t surface unless somebody goes looking for it.
Region / labPackagePriceTiming constraint
US — Penn State AASLWD04 Agriculture/Septic: total coliform, E. coli, pH, TDS, nitrate-N$70Chilled, delivered within 24 hours — never sample Friday
US — Penn State AASLWD05 Mining: sulfate, iron, manganese$80Mineral panel; no bacteria included
US — Penn State AASLWD08 Extensive$220Order only if you don’t know what you’re hunting
Ontario — Guelph AFL / SGS Agri-FoodE. coli, total coliform, HPC (Reg. 318/319, 170); ISO/IEC 17025 livestock packagesQuoted on requestStay domestic — border shipping blows the 24-hour window
Quebec — Lactanet water analysisMicrobial panelQuoted on requestMon/Tue/Wed only, refrigerate, ship same day. Under proAction, microbial is the only routine parameter

While you’re standing there with a bottle in your hand, run a finger along the inside wall below the waterline. If it’s slick, you’ve got biofilm — and an ATP swab will confirm it for a few dollars before you commit to a lab panel. No lab required for the finger test.

Bacterial Load or Mineral Load? Decide Before You Spend

These are two different problems with two different price tags, and buying the wrong fix is the most common expensive mistake in this whole category.

Diagnostic questionBacterial contaminationMineral load
What the panel showsColiforms or E. coli present; trough count exceeds wellhead countSulfate, TDS, iron or manganese above threshold; bacteria near zero
Where it livesDistribution pipe and trough surfaces — biofilmSource water and the aquifer
What fixes itChlorine dioxide in-line; scrub-and-drain on small herdsReverse osmosis, blending, or peroxide injection
What chlorine dioxide does to itOxidizes itNothing at all
Key actionable thresholdAny coliform above 0 per 100 mL(OMAFRA)Sulfate above 1,000 mg/L adults / 500 mg/L calves (2021 NASEM); TDS above 3,000
Typical capital cost profileIn-line dosing unit — lower fixed cost, ongoing chemicalRO or blending system — higher fixed cost, spread across the whole herd

Buy a bacterial solution for a mineral problem and you’ve spent real money to change nothing. The chemistry simply doesn’t touch it. Keep the full interpretation table open beside your results when they land.

The Payback Math, and Why You Should Distrust It

Two production figures get quoted constantly in this conversation. Both are real. Neither means what a quick sales calculation implies.

2013 Penn State study looked at 243 Pennsylvania dairy farms across 41 counties, with roughly 18,000 cows and 174 samples returned. About 26% had at least one water quality issue. Those problem farms averaged 56 pounds of milk per cow daily, compared with 62 pounds on the clean-water farms.

Two details matter before that six-pound gap goes anywhere:

  1. Those farms opted into free water testing Penn State Extension offered in fall 2012 — a self-selected sample, not a random trial.
  2. Not one farm producing above 75 pounds per cow had a water quality problem, while 32% of farms under 50 pounds did. Water trouble travels with other trouble. Some of that six pounds is water; some of it is everything else those herds were doing differently.

Here’s the arithmetic that gets run on kitchen tables. Six pounds per cow per day on a 200-cow herd is 1,200 pounds — about 12 hundredweight. At the September 2026 Class III settle of $16.42/cwt, that’s just under $200 a day. Almost any treatment system pays back fast against a number like that.

That is exactly why the number deserves a second look — twice over. It’s a correlation across self-selected farms, not a measured response to installing treatment. And the price input isn’t stable either: Class III has swung across roughly a $2 range through 2026, with the curve carrying September at $16.42 and December at $17.20. Build a payback case on a six-pound correlation times a moving price, and you’ve stacked two soft numbers into one confident-looking answer.

So ask for a measured treatment response instead — before-and-after production on comparable herds, with the other variables held still. Controlled on-farm data of that kind is hard to come by, which is exactly why it’s worth asking for.

Use the method, not the multiplier. Get a dated written quote for your own system with capacity in gallons per minute or head served. Measure your own wellhead-to-trough gap. Then price the decision against production you can actually attribute to water.

When This Won’t Pencil

Plenty of herds shouldn’t buy a treatment system, and the honest version of this story says so out loud.

Both counts clean. If bacteria come back near zero at the wellhead and the trough, you don’t have a distribution-system problem and a generator won’t manufacture one worth solving.

SCC is already low. The production you’re buying back is small, and the payback stretches out past the point where the math holds together.

Wrong chemistry for the problem. See the decision table above. This is where the money gets wasted.

Herd too small for the fixed cost. Spread across 60 cows is a different proposition than across 600. A smaller tie-stall herd may capture most of the available benefit from a disciplined weekly scrub-and-drain protocol instead — Penn State Extension notes troughs and watering cups get overlooked in cleaning schedules precisely because the biofilm sits where nobody looks.

Different premium math by border. All pricing here is US Class III. Canadian producers on quota work from a different premium-and-penalty structure, so pull your own processor’s schedule before you build a recovery estimate.

What Actually Kills Biofilm

If testing shows you have a bacterial problem, product choice isn’t a coin flip.

Why not chlorine. It loses effectiveness as pH climbs past 7 and struggles to penetrate an established biofilm matrix.

Why chlorine dioxide. Holds up across roughly pH 4 to 10, isn’t neutralized by organic material the way chlorine is, penetrates biofilm, and is EPA-approved for potable water treatment. It also carries enough oxidizing capacity to deactivate pathogens at lower dose rates than ozone or hydrogen peroxide.

Contact time and concentration. Per UW-Madison guidance last updated in February 2021, the Wisconsin Veterinary Diagnostic Laboratory puts calf feeding equipment sanitation at 25–50 ppm with 2 to 4 minutes of contact time, and facility or calf pen disinfection at 250–500 ppm with 5 to 10 minutes. In-line potable water treatment runs far below either — this is not a one-dose-fits-all chemical.

Dr. Donald Sockett of the Wisconsin Veterinary Diagnostic Laboratory has written that there’s tremendous variability in the actual chlorine dioxide concentration of commercial products. He lays out what to demand, and it turns into four questions you should ask before any money moves:

  1. NSF/ANSI Standard 60 certification — is the product certified for potable water treatment?
  2. Food-grade chemistry — non-food-grade chemicals carry impurities that cut sanitation efficiency.
  3. Strong-acid activation — strong acids are roughly 60% more efficient at converting sodium chlorite into ClO₂, leave no toxic residue, and don’t leave large amounts of unreacted sodium chlorite behind. Unreacted chlorite makes your dosing unpredictable.
  4. Measured on-farm data — do they hold before-and-after production figures from herds like yours?

How fast and how specifically a supplier answers all four tells you most of what you need to know.

Your 30-Day Water Protocol

Week 1 — Sample. Pull two bottles early in the week: one at the wellhead or pressure tank, one from the trough serving your highest-SCC group, taken from water the cows have been drinking. Chill immediately; deliver within 24 hours. Order Penn State’s WD04 at $70, or call Guelph AFL or SGS in Ontario, or go through Lactanet in Quebec.

Week 1 — Walk and feel. Run a finger along the inside trough wall below the waterline on every group. Note trough material, volume, distance from the parlour, visible soiling, and water temperature — five of the six German risk factors, checked for free.

Week 2–3 — Read the gap, not the number. Trough count materially above wellhead count means distribution-system biofilm, and scrubbing alone won’t reach the pipe reseeding it. Any coliform above zero per 100 mL is actionable. Anything in the 15–20 per 100 mL range means stop reading about SCC and deal with intake. Canadian readers: Lactanet flags herds at 200,000 cells/mL, so run your recovery math against that ceiling rather than a US schedule.

Week 2–3 — Route the problem correctly. High bacteria and clean minerals point you toward chlorine dioxide. Sulfate above 1,000 mg/L for the milking herd, or TDS above 3,000, sends you toward reverse osmosis, blending, or peroxide instead. Remember the sulfate split — 500 mg/L is a calf standard and will flag water that’s fine for lactating cows.

Week 4 — Price it honestly, or walk away. If you’re shopping, get a dated written quote with capacity in gallons per minute or head served, and run the four supplier questions. Decide your payback threshold before a quote sets it for you. If both counts came back clean and your SCC is already low, spend the money on the parlour or the pens.

Then book the next one. OMAFRA recommends roughly four tests a year so you build seasonal data on your own aquifer rather than a single snapshot that may have caught a good week.

The Bullvine Bottom Line

Ninety-four percent of those German troughs had coliforms in the water, on farms where nobody had raised a hand about a water problem. Two bottles, a cooler, and roughly $70 will tell you whether you’re one of them — less than one vet call, and OMAFRA thinks you should be doing it four times a year.

The number a salesman will quote you is six pounds per cow per day. The number that should decide your purchase is the gap between your wellhead and your trough. Those are not the same number, and only one of them is yours.

So: do you know your coliform count at the trough, or only at the well — and when did somebody last run a finger along the inside wall of the trough your fresh pen drinks from?

Pricing, milk price, and laboratory fee information current as of August 31, 2026. The Class III figure is the September 2026 CME settlement.

Run Your Numbers

Farm Benchmark Snap Check — Before you commit capital to a water system, the DVI Risk Check benchmarks your margin exposure in dollars per cow and flags whether your hedge, debt load, or feed share is the weaker lever. Three to five numbers. No sales pitch.

Learn More

The Sunday Read Dairy Professionals Don’t Skip.

Every week, thousands of producers, breeders, and industry insiders open Bullvine Weekly for genetics insights, market shifts, and profit strategies they won’t find anywhere else. One email. Five minutes. Smarter decisions all week.
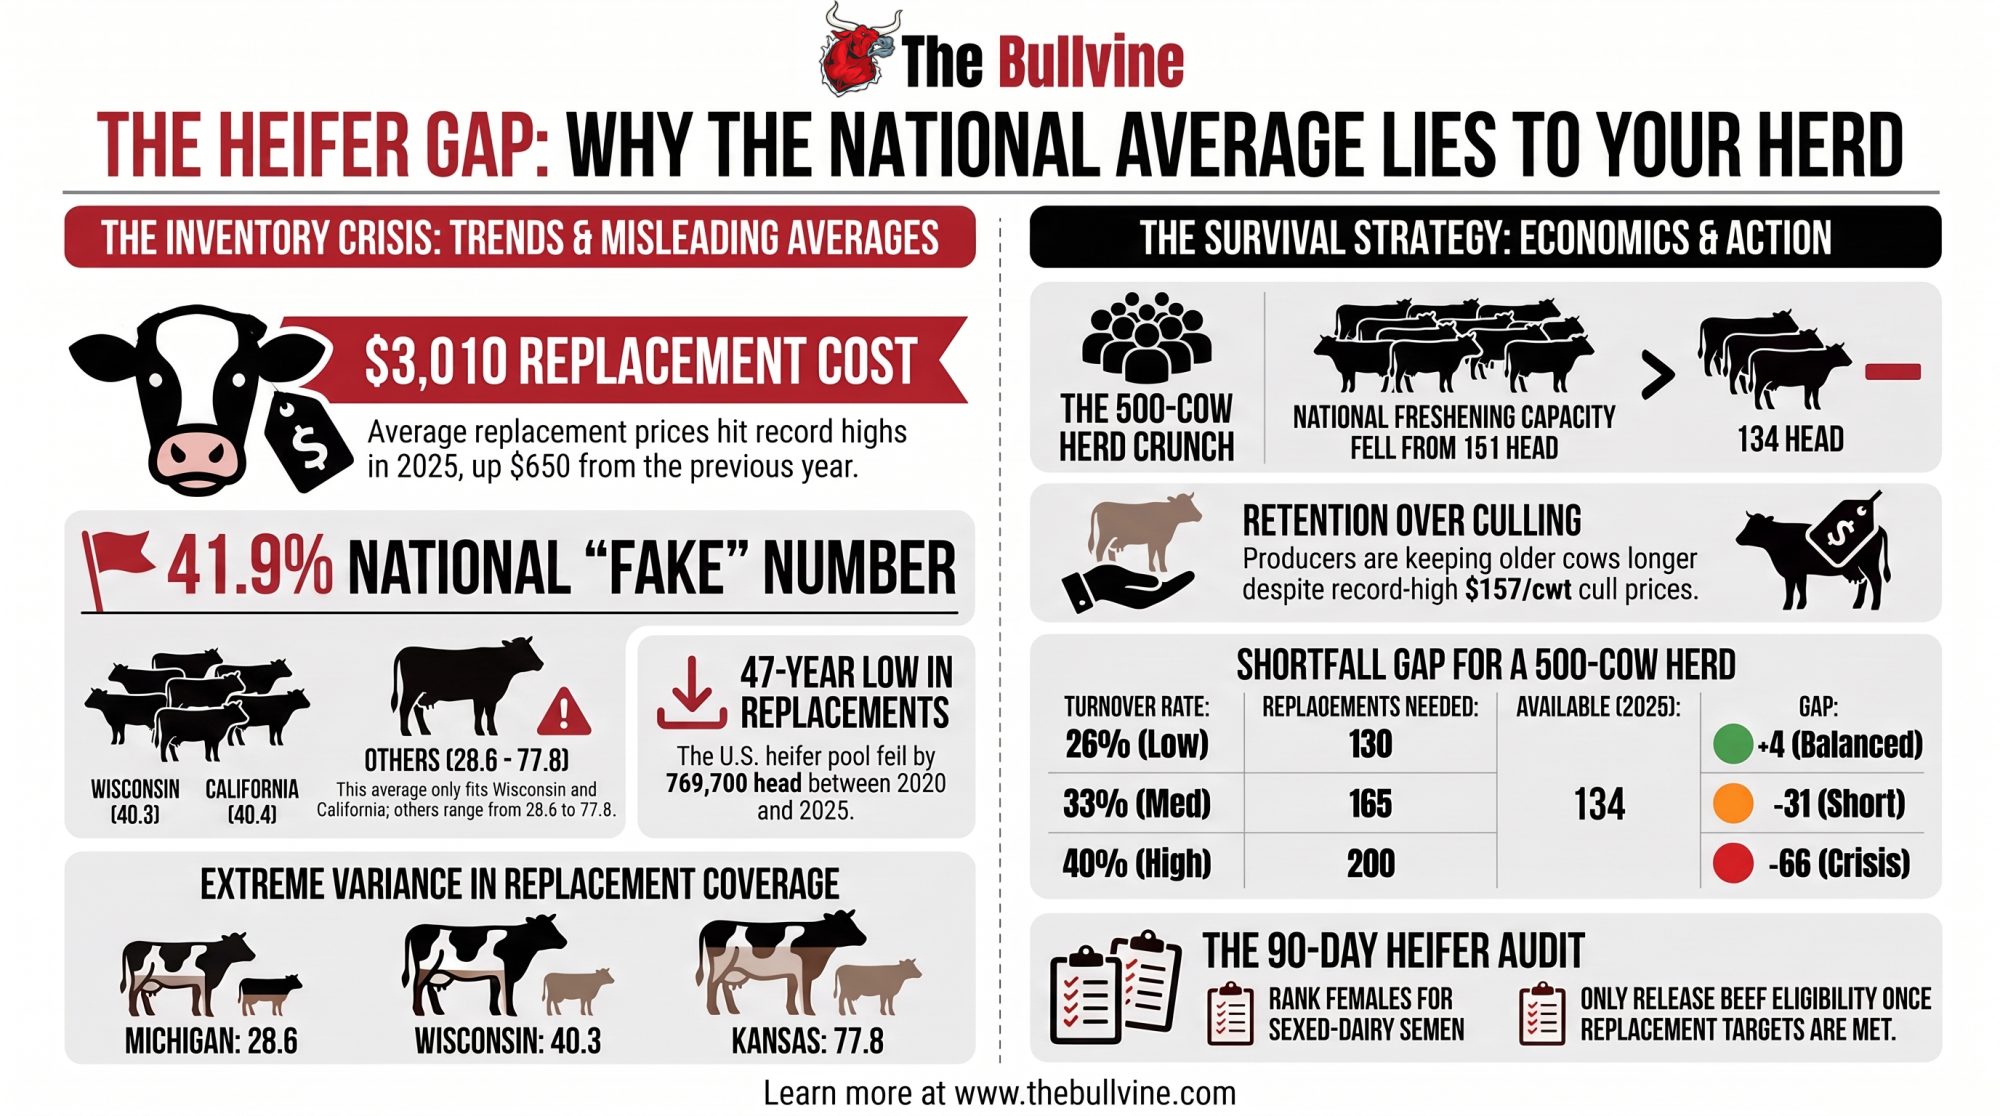
NewsSubscribe
First
Last
Consent

It’s Not a Vet Shortage. The Profession Is Holding — Dairy’s Slice Isn’t.

The profession isn’t shrinking — food-animal practice is. Down 15% in a decade while companion-animal practice grew 22%. Same graduating classes, opposite directions, and your barn is on the losing side.

Executive Summary: An AAVMC workforce study modeling supply through 2032 found the veterinary profession isn’t short overall. So why can’t you get one out to the barn? Because this is a distribution problem, not a supply collapse. With peer-reviewed research ranking the vet’s opinion at 4.0 out of 5.0 on farm management decisions, against 3.0 for nutritionists and peers, your most trusted technical channel is thinning where you need it most. The preparation burden is quietly shifting onto your shoulders.

food-animal veterinarian shortage

Why “Shortage” Is the Wrong Word

AVMA data reported in November 2024 counted roughly 8,100 veterinarians in food-animal or mixed-animal practice across the United States. Over the prior decade, that cohort dropped 15% while companion-animal practice grew 22%.

An AAVMC workforce study modeling supply through 2032 found no basis for calling this a profession-wide shortage. AVMA News summarized the finding plainly in October 2024: the projections “do not justify a conclusion of overall excess capacity or capacity shortage by 2030 or 2035.”

The profession is holding its numbers. The food-animal slice isn’t.

That’s a distributional shift, not a supply collapse — meaning larger graduating classes won’t fix it on their own. The pull runs toward companion-animal practice, and dairy sits on the wrong side of that ledger.

Anyone selling a crisis narrative skips that distinction. The precise version is more useful anyway, because it tells you the problem won’t resolve itself on someone else’s timeline.

What the Research Says About Who You Actually Listen To

The veterinary literature is remarkably consistent: your veterinarian remains the single most influential technical voice on your dairy.

  • Baseline management trust. Gerber and colleagues (2020, Frontiers in Veterinary Science) surveyed Swiss dairy farmers on what drives management decisions. On a five-point scale, the veterinarian landed at a median of 4.0 (interquartile range 4–5) — significantly outranking nutritionists, work colleagues, and family members, who all came in at a median of 3.0 (p < 0.001, Kruskal-Wallis).
  • Biosecurity authority. Brennan and Christley — working from 2013 data, cited by Power and colleagues in the Journal of Dairy Science in 2024 — found 95% of producers would take biosecurity advice from their vet, compared with just 32% who’d take it from their governing body. Rivera-Gomis and colleagues (2025, Preventive Veterinary Medicine) reached the same conclusion: vets are the most frequent, most preferred, and most trusted information source farmers have.
  • The decision limit. That influence isn’t universal. The same Gerber study found that on reducing antimicrobial use specifically, the vet’s opinion barely moved the needle — median 2.5, IQR 1–3. Anyone claiming the vet drives everything hasn’t read past the headline finding.

A necessary limitation: this advisory research draws on Swiss, British, and Canadian operations, and that UK figure is thirteen years old. Four countries pointing in the same direction is real evidence. It still hasn’t been measured on U.S. farms.

StudyCountry/RegionMetricKey FindingLimitation
Gerber et al., 2020 (Frontiers in Vet Science)SwitzerlandMedian trust score (1-5)Vet = 4.0, nutritionists/peers = 3.0Swiss dataset, not US-validated
Brennan & Christley, 2013 (cited in J. Dairy Science 2024)United Kingdom% trusting biosecurity adviceVet = 95%, governing body = 32%Data is 13 years old
Rivera-Gomis et al., 2025 (Prev. Vet. Medicine)Not specified (EU-region)Qualitative rankingVets = most frequent, preferred, trusted sourceConfirms but doesn’t quantify
Gerber et al., 2020 (antimicrobial subset)SwitzerlandMedian trust score (1-5)Vet influence drops to 2.5 on antimicrobial useSame limitation as above

Is Your Region Already Short, or Just Getting Busier? The Zip-Code Lottery

A 15% net decline across food- and mixed-animal practice is a national figure, and national figures rarely distribute evenly. The federal designation system suggests this one doesn’t.

  • The national benchmark. USDA NIFA designates official veterinary shortage situations annually through the Veterinary Medicine Loan Repayment Program (VMLRP), published by state and practice type each nomination cycle. The fact that designations are issued county by county rather than nationally tells you coverage gaps cluster rather than spreading thin everywhere at once.
  • The commercial reality. Merck Animal Health — which sells into this same veterinary channel — cites 500-plus underserved counties across 46 states, alongside a 90% decline in food-animal veterinarians since the 1950s. Vendor-published and not independently verified against the federal list, but the shape of the claim matches how the designation system is built.
  • The leverage factor. A 900-cow operation is a bigger share of any practitioner’s revenue than a 90-cow operation, and that shows up in who gets the Tuesday morning slot when the schedule tightens. If you’re the smaller herd in a designated county, you’re competing for the same hours with less leverage.

Which is exactly the situation where preparation stops being optional. Check your own county against the federal list rather than trusting any aggregate count — including that one.

🔍 Go deeper: What a federal shortage designation actually means for your herd.

The Mechanics: Why the Advisory Vacuum Matters

When the overwhelming majority of animal-health trust routes through a single professional channel, and that channel’s field capacity shrinks, remaining hours carry premium decision weight.

As clinical hours thin out, who fills the technical advisory gap on dairy operations? The commercial supply channel has both the incentive and the field personnel to step in.

McKinsey’s Global Farmer Insights 2024 found input distributors already dominating farmers’ general ag-input and soil-health advice, with integrated distributors ranking as top advisers across Europe and North America. That’s agronomy, not animal-health protocols — but the mechanism travels. It’s not a conspiracy. It’s the predictable shape of a market where demand for technical guidance outlasts the supply of independent people qualified to give it. Nobody has measured how much of that shift has already happened.

Here’s the boundary, stated once: no study cited here measures whether you face more sales pressure per visit than a decade ago, or whether anyone’s advisory independence has been compromised. The structural conditions are documented. Harm isn’t. What matters is how you manage the hours you do have.

How Much Is Your Vet’s Hour Actually Worth to You?

Not the invoice line. The decision value.

Ritter and colleagues (Journal of Dairy Science, 2021) observed that during Canadian herd-health visits, veterinarians initiated 62% of discussions about herd issues, while farmer-initiated discussions turned to herd health in 39% of cases. Those percentages measure different things and don’t sum to a hundred — they’re not two halves of one pie.

Scope it honestly: Canadian herd-health visits, not a universal pattern. But the implication travels. If your practitioner is initiating roughly six of every ten conversations about herd issues, and you see them less often than you did five years ago, the return on your own preparation has climbed whether or not your bill has.

So where does your prep time sit right now — an hour before each visit, or ten minutes in the parlor?

📋 Go deeper: How to structure a herd-health visit that earns its cost.

Options and Trade-Offs for Farmers

Path 1: Walk in with the product question already answered

Pull the independent trial data, label claims, and pricing before the truck pulls in. Then spend your vet’s time on the only question they can answer: does this fit my herd, given what you know about my history? Do this before your next scheduled visit.

  • Trade-off: costs you an hour of prep and a willingness to read a trial abstract. And if a product turns out to have no independent trial data to pull, that’s your answer — delivered early and free.

🔬 Go deeper: How to read a feed-additive trial before your rep does — who funded it, what the control group looked like, and whether the effect size survives your herd’s conditions.

Path 2: Split commercial evaluation from clinical judgment

Send pricing, volume discounts, and distributor comparisons to your sales rep. Send protocol fit, clinical risk, and disease interaction to your vet. Works best where one person is currently doing both jobs — and on a lot of operations, that’s what’s happened by default, not by decision.

  • Trade-off: requires the discipline to say “let me review the clinical fit with my vet first” when a rep is standing in your parlor with a sample case. Where it breaks down: on smaller operations the vet genuinely is the only technical adviser within driving distance, and there’s no second channel to route anything to. If that’s your situation, Path 1 matters more, not less.

Path 3: Move from emergency-only calls to scheduled visits

The AVMA divergence isn’t reversing on a timeline that helps you next spring. It’s reasonable to expect that operations already on a scheduled-visit footing are easier for a stretched practitioner to keep serving than those who only call in a crisis — though no study cited here measures that directly.

  • Trade-off: it competes for capacity rather than creating any, which is worth being clear-eyed about.
PathBest ForTime CostKey Trade-OffRisk If Skipped
1. Answer the product question firstAny herd size~1 hour prep before visitRequires reading trial abstracts yourselfVet time wasted re-explaining basics rep should’ve covered
2. Split commercial vs. clinical adviceLarger operations with rep accessOngoing discipline, low time costMust say “let me check with my vet first” under sales pressureOne person (often the vet) ends up doing both jobs by default
3. Move to scheduled visitsSmaller/underserved-county herdsNo added hours, just reschedulingCompetes for capacity, doesn’t create itEmergency-only calls get bumped when schedules tighten

Before Your Next Herd-Health Visit: The 5-Point Checklist

  • [ ] Ranked question list. Arrive with a prioritized, written agenda — not one improvised while the vet is unpacking the truck.
  • [ ] Trial and source data. Pull independent trial data and funding disclosures on any new product or feed additive under consideration.
  • [ ] Internal performance metrics. Have your recent SCC trend, conception rates, and fresh-cow treatment logs on the table.
  • [ ] Capacity audit. Ask directly: “How many herds are you covering this year compared to three years ago?”
  • [ ] Decision log. Document the agreed protocol and rationale immediately, so the next visit builds on the last rather than restarting.

Key Takeaways

  • If you’ve been waiting for the vet shortage to resolve → stop. A distribution problem doesn’t fix itself on someone else’s timeline.
  • Check your county’s NIFA designation status → if you’re in a designated shortage area, a second technical adviser moves from optional to necessary.
  • If you’re weighing an antimicrobial protocol change → your vet’s opinion carries less weight there than on general management, per the Swiss data. Bring your own numbers.
  • Smaller herds have to out-prepare larger ones → you’re competing for the same hours with less revenue leverage.
  • Don’t outsource trial evaluation to the parlor → do the product homework ahead of time and reserve vet time for clinical validation.
  • If a rep brings you a new product → ask for the trial data and who funded it before your vet’s next visit. No data available? That’s the answer.
  • If you’re seeing your vet less than three years ago → ask them directly what their next twelve months look like.

Your veterinarian remains the most trusted voice on your dairy, and food-animal practice capacity keeps contracting. Both facts are settled. What your operation does about it isn’t.

At your next herd-health visit, ask the question that matters: how many other herds are you covering this year compared to three years ago? The answer tells you how much of the analytical weight is shifting back into your own hands.

(Workforce figures reflect AVMA data reported in November 2024 for the 2023 practice year. Influence research spans 2013–2025.)

Learn More

The Sunday Read Dairy Professionals Don’t Skip.

Every week, thousands of producers, breeders, and industry insiders open Bullvine Weekly for genetics insights, market shifts, and profit strategies they won’t find anywhere else. One email. Five minutes. Smarter decisions all week.
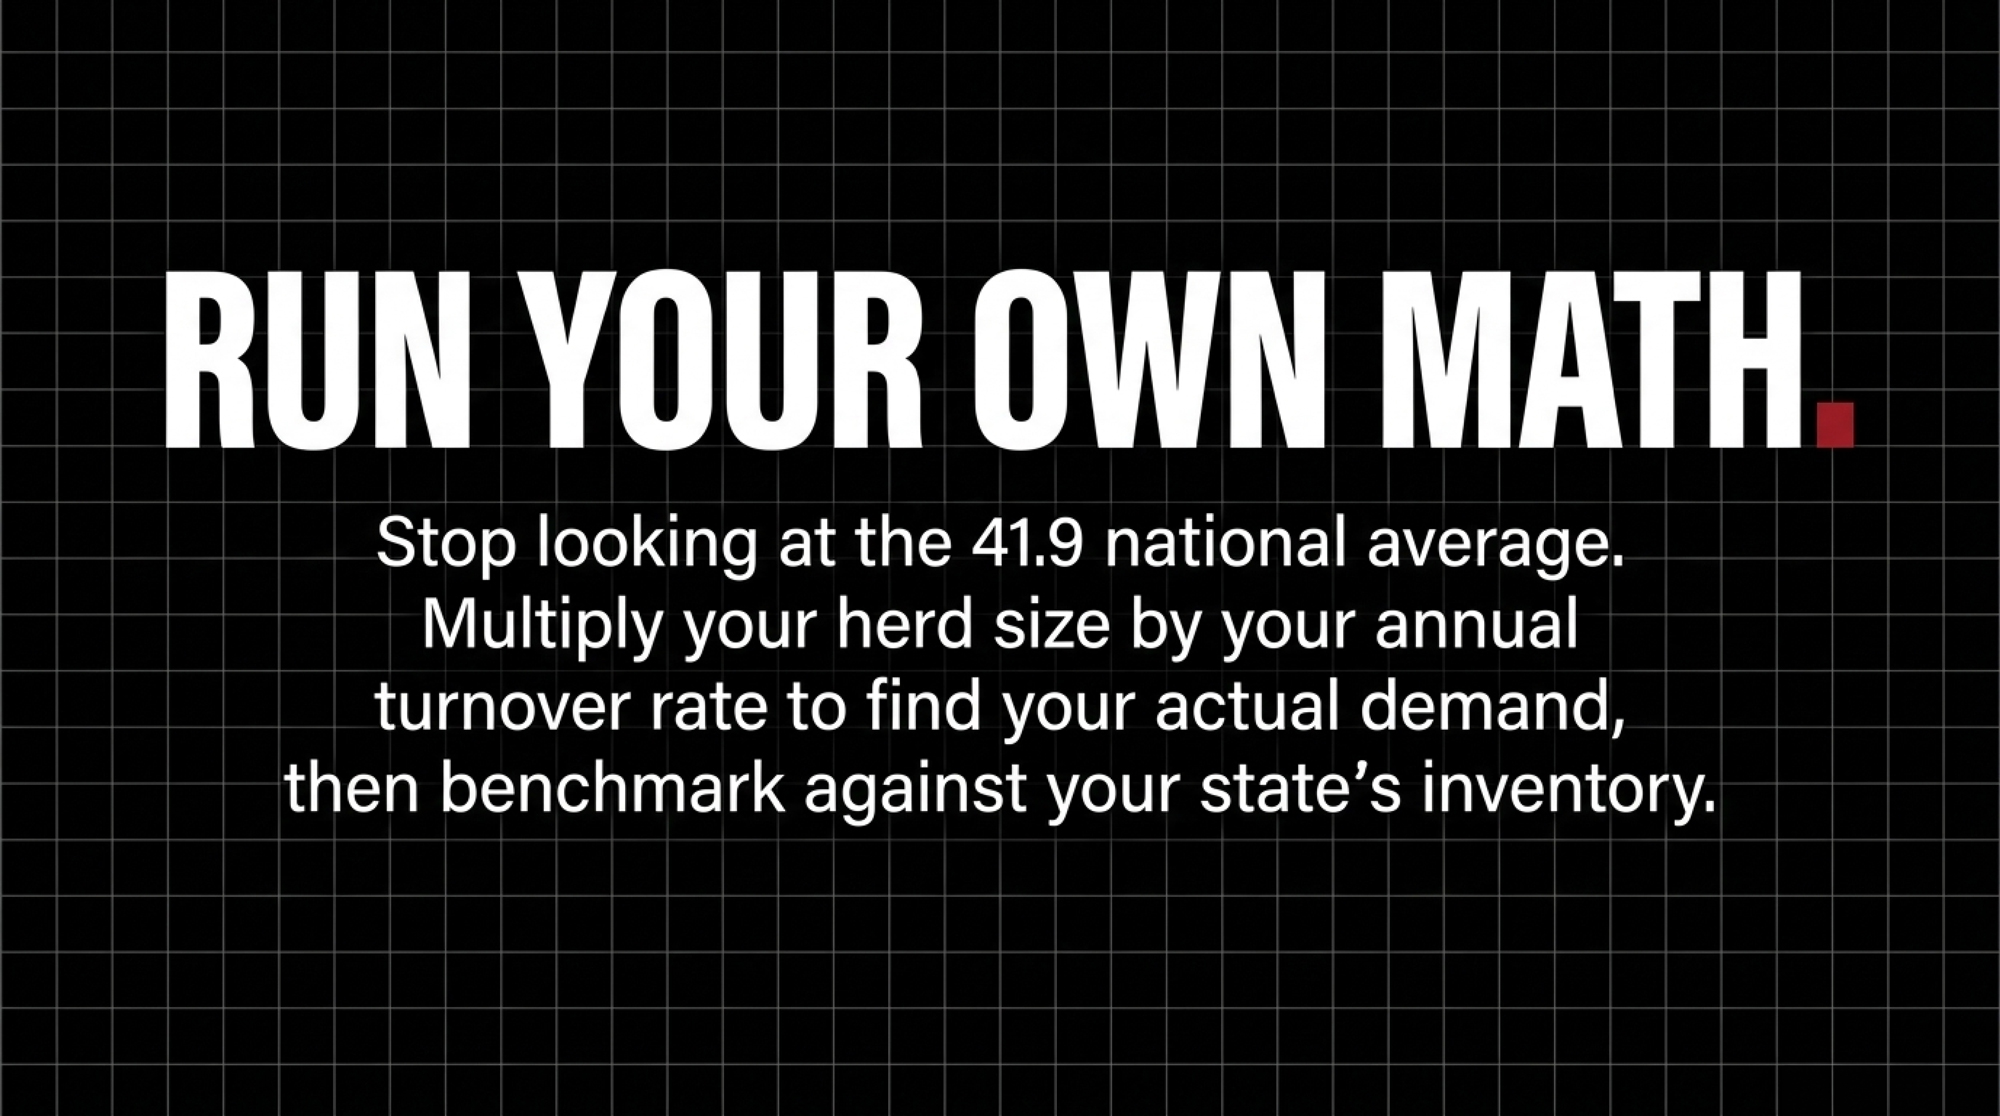
NewsSubscribe
First
Last
Consent

Fat Carried 71% of the Return — Until Western Canada Repriced Protein on April 1

Same trial. Same +0.287 lb fat, +0.176 lb protein. On index weights, fat carries 71% of the return. On Western Canada’s April 1 ratio, protein carries 55%.

EXECUTIVE SUMMARY: The same amino acid trial response is worth 71% fat and 29% protein on genetic index weights — and 45% fat, 55% protein on the Western Milk Pool’s new 70/25/5 ratio, which took effect April 1. That’s a 26-point swing on identical cows eating identical feed, which means the ROI sheet you were handed probably priced one component and charged you for both. WMP shippers running high fat against low protein face up to $900 per cow per year in exposure; P5 producers should be measuring SNF-to-butterfat against 2.20, not 2.14, because every 0.05 up to the market ratio is worth roughly $7.92 per kilogram of quota per month. The nutrition side is real but bounded: balancing rumen nitrogen plus all essential amino acids against metabolizable energy moved 2.9 kg/d of ECM, with fat and protein rising together (+0.13 kg / +0.287 lb fat, +0.08 kg / +0.176 lb protein), worth $1.82 to $2.45 per cow per day against 20¢ of protected product. Three cited trials added protected amino acids and got nothing, and none of it works below 63% 30-hour NDFd — so fix forage before you buy product. Lysine is the trap: it’s already working the fat side, and casein needs methionine, histidine, the branched-chain group, and the proline precursors delivered together. Two things to do this week — ask your feed rep to print the non-essential amino acid line on your current formulation, and re-run every component ROI number on the pool that actually issues your cheque.

component pricing amino acids

If your bulk tank sheet reads the same three test days running — butterfat strong, protein parked and stubborn — while the ration sheet says lysine is at target and the protected-product invoice says you’re paying for it, you’ve got a substrate problem, not a dosing problem. And if you ship in Western Canada, the payment ratio that took effect April 1 just changed which component that problem is costing you.

What follows comes from published feeding trials and model documentation, not one farm’s records. Worth saying plainly, because every number below needs testing against your own pay sheet.

The Fat Side Got Solved. Almost by Accident.

The first fix was subtractive. Cut the polyunsaturated load. A review of milk fat synthesis regulation published in Physiological Genomics summarizes it this way: unsaturated long-chain fatty acids mostly suppress mammary fat synthesis; saturated ones support it. Which is how too much unsaturated fat and linoleic acid quietly capped milkfat across whole regions of the US herd. Dial that back, balance palmitic, stearic, and oleic properly, and fat tests had room to climb.

Genomics stacked on top. Genomic selection cut the sire-of-bull generation interval from roughly 6.8 years to about 2.4 and roughly doubled annual genetic gain for milk, fat, and protein against the progeny-test era. According to CDCB’s published base-change record, the genetic base moved on April 1, 2025, from cows born in 2015 to cows born in 2020. Holsteins led every breed with a 45-pound butterfat rollback — an 87.5% shift from the 24-pound rollback in 2020. Ohio State Extension data puts the longer arc at 3.65% to 4.30% milkfat over 25 years.

That’s the win. Nobody’s giving it back.

But the recent fat responses didn’t come from feeding more fat. They came from amino acids — methionine, lysine, and histidine balanced together against metabolizable energy rather than tuned individually against metabolizable protein. Cell-culture work in bovine mammary epithelial cells, published in the Journal of Agricultural and Food Chemistry, shows lysine amplifying fatty-acid-driven milk fat synthesis through GPRC6A-PI3K-FABP5 signaling. One route by which amino acid supply lifts fat, not only protein.

A 2026 meta-analysis of rumen-protected amino acids in Holsteins split it cleanly: rumen-protected methionine raised milk yield and fat percentage, while rumen-protected lysine primarily raised yield.

Read that split again.

Why Doesn’t Protein Respond the Same Way?

Lysine is feeding the fat side. It isn’t, on its own, building casein.

Casein needs a longer list delivered at once. Leucine, isoleucine, and valine. Proline — which usually means more arginine, since the mammary gland converts arginine and ornithine to proline. Glycine. Then threonine and phenylalanine. Miss one and the pathway stalls, no matter how much lysine sits in the metabolizable protein pool.

Independent research lines converge here. Methionine, lysine, and histidine are the primary limiting amino acids in US dairy diets, with leucine, isoleucine, and threonine as secondary constraints depending on the base ration.

The Cornell Net Carbohydrate and Protein System reference points are worth writing on the wall of the feed office: roughly 1.19 g histidine per Mcal ME, 1.19 g methionine per Mcal ME, and about 3.20 g lysine per Mcal ME — lysine at roughly 2.7 times methionine, as modeled in CNCPS v6.55 and v6.56. Push methionine from 0.86 to 1.19 g/Mcal ME in that work, and ECM rose along with milk fat and true protein content.

That’s the ratio single-product programs miss. Lysine gets fed to target. Methionine and histidine get whatever the software’s default requirement says. And the tables underneath that software were derived for a different cow.

The Non-Essential Amino Acid Your Model Probably Doesn’t Print

Which brings us to the one thing on this list you can act on before lunch — without waiting for another trial, another proof run, or another product.

The science on non-essential amino acid feeding is genuinely emerging. Thin, in places. But auditing what your ration software reports is not a research question. It’s a question you can ask your feed rep today, and the answer tells you whether your program has been formulating casein synthesis with half the substrate list visible.

Start with proline, because it catches people sideways.

It’s classified as non-essential — the cow synthesizes it, mostly from arginine and ornithine. Infusion work published in the Journal of Dairy Science in 1990 found mammary proline uptake running low relative to proline output in milk, with that conversion covering the shortfall. At the casein output levels genomic cows now hit, conversion capacity plausibly becomes the bottleneck.

Straight talk on the evidence: this is thinner than the methionine and lysine work by a wide margin. One 1990 infusion study and an active conversation in casein-composition research circles — not a body of published feeding trials. Treat it as a question worth asking, not settled guidance.

The operational gap, though, is simpler than the biochemistry, and it isn’t waiting on data. “Non-essential” gets read as “don’t worry about it,” so most on-farm ration reviews never print a proline number at all. Ask your nutritionist or feed rep to show you the non-essential amino acid supply line on your current formulation. If the model doesn’t report it, you’re formulating blind on one of casein’s most abundant residues — and you now know that before your next ration change rather than after. Same goes for arginine and glycine: not glamorous, not on the invoice, still load-bearing.

Stop Formulating for Net Requirements

The net-requirement model calculates how much lysine or methionine builds X pounds of casein, full stop. But the enzyme systems running the synthesis carry their own metabolic requirement on top of the net nitrogen cost. Genomics handed cows more synthetic capacity. Feeding programs kept formulating against the older ceiling.

CNCPS has been correcting for it. Versions 6.5 and 6.55 rebuilt amino acid efficiencies on a metabolizable-energy-allowable basis rather than fixed net values, and the formulation goal for digestible methionine as a percentage of MP now sits at 2.6% — roughly 11% above v6.0, and genuinely hard to hit without rumen-protected product. When researchers balanced diets for rumen nitrogen plus all essential amino acids relative to metabolizable energy, ECM rose 2.9 kg/d, fat 0.13 kg/d, and true protein 0.08 kg/d against the negative control.

One working hypothesis — still argued over inside the groups building these models — is that rather than amino acids competing for a fixed pool, the mammary gland prioritizes whichever synthesis route is most energetically efficient at the time. If that holds, lysine, butyrate, acetate, and glucose availability interact instead of behaving as separate silos, and programs built on isolated single-nutrient targets are fighting how the cow actually partitions.

The Forage Baseline Check

This is the part the supplement literature underplays, and the part that protects your money.

Amino acid balancing won’t rescue a weak forage program. The herds running 4.8% fat and 3.5% protein — shipping better than a ton of components annually — get there on three legs: high levels of highly digestible forage, properly balanced dietary fatty acids, and full amino acid balancing. Those are individual high-management herds, not regional averages.

The four numbers that gate everything downstream. Ohio State Extension data defines quality corn silage as 30-hour NDFd above 63%, uNDF240 below 9%, kernel processing above 78%, and 7-hour starch digestion over 70%. Miss those, and protected amino acids are an expensive way to feel productive.

The null results matter as much as the wins. A branched-chain trial at roughly 45.8 g metabolizable leucine, 33.2 g isoleucine, and 31.8 g valine per day found no effect on dry matter intake, milk yield, or milk protein. An N-acetyl-L-methionine study found no change in milk, ECM, or component yields, though feed efficiency improved. A CNCPS analysis across a large dataset found histidine, leucine, tryptophan, threonine, and methionine limiting or co-limiting — while lysine results did not support it as limiting at the inclusion rates tested.

The pitch is almost always simpler than the biology: add the protected amino acid. But three of the trials above added it and got nothing. Find out what’s actually short first.

The Math: Pricing Yield, Not Test Percent

Here’s where most on-farm amino acid arithmetic goes wrong, and it isn’t the multiplication.

The trial reports yield responses — kilos per day of fat and protein — not test percentages. Those are different currencies. A diet that lifts ECM 2.9 kg/d is producing more component pounds partly through concentration and partly through volume, and you can’t split the two without the trial’s baseline yield and baseline tests in front of you. Convert those kg/d figures into percentage points, and the answer swings from about +0.29 to +0.41 points of fat depending on which baseline you assume. That’s not precision. That’s a guess wearing a decimal point.

So price the yield response directly. Both unit systems, because the milk cheques don’t agree on one: +0.13 kg / +0.287 lb of fat and +0.08 kg / +0.176 lb of true protein per cow per day, at a fat-to-protein response ratio of roughly 1.6:1. US Federal Order component prices run in dollars per pound; Canadian Dairy Commission class schedules and provincial pool payments run in dollars per kilogram. Whichever column your pay sheet uses, the response is the same milk — just measured twice.

Now the part most ROI sheets get quietly wrong. The figures below start from genetic index economic values — $5.01/lb fat and $3.33/lb protein — because they’re published and dated. These are not pay prices. An economic value is what an index uses to weight a PTA pound when ranking sires. Your cheque runs on something else: US Federal Order component prices are formula-derived from wholesale product prices minus make allowances, and January 2026 Class III came in at $14.59/cwt. Canadian producers price off Canadian Dairy Commission class schedules — Class 3(d) butterfat at $11.6208/kg and protein at $10.1476/kg effective February 1, 2026, per the Commission’s published component pricing tables.

On the index weights, working in pounds, the same response prices out like this — and if you want the real math on running these numbers against your own operation rather than a trial average, that’s a different exercise:

  • Fat: 0.287 lb × $5.01 = $1.44/cow/day
  • Protein: 0.176 lb × $3.33 = $0.59/cow/day
  • Gross: $2.02/cow/day
  • Less protected methionine and lysine at 20 cents — roughly $7,300/year on 100 cows
  • Net: $1.82/cow/day, about $5,470/month on 100 cows

Treat that as a directional ceiling, not a budget line. It’s one trial on one base ration, and the three trials cited above returned no component response at all.

Same Response, Two Ratios, Opposite Conclusion

Now run the same trial response against the Western Milk Pool’s new ratio and watch what happens to the story.

The WMP boards moved from 85% butterfat / 10% protein / 5% other solids to 70/25/5 effective April 1, 2026, as reported by Farm Tario and confirmed in The Bullvine’s own coverage of the change. At provincial average composition, that’s roughly a 17.6% cut to butterfat’s per-kilogram value and a 150% increase to protein’s. Apply that directional shift to the identical +0.13 kg / +0.287 lb fat and +0.08 kg / +0.176 lb protein:

 Index economic weightsWMP 70/25/5 ratio applied
Fat return$1.44/cow/day$1.18/cow/day
Protein return$0.59/cow/day$1.47/cow/day
Fat’s share of gross71.0%44.6%
Protein’s share29.0%55.4%
Dominant componentFatProtein
Net after 20¢ product$1.82/cow/day$2.45/cow/day

Directional illustration in US dollars per pound. The WMP column applies the published ratio change to index weights to show how the same feed response reprices — it is not a WMP pay-price calculation. Canadian producers should re-run it on their own pool’s per-kilogram component values.

Fat’s share of the return drops 26 percentage points, and protein takes over as the majority earner, reflecting the revenue reallocation the Western boards approved for April 1. Same cows. Same feed. Same trial. Opposite conclusion about which component you just bought.

And the exposure runs the other direction too. High-fat, low-protein herds that don’t adapt to the new ratio could face annual revenue shortfalls of up to $900 per cow — a profile a decade of butterfat selection produced on purpose. Set that beside the $1.82 to $2.45 per cow per day a balanced amino acid program might return, and the arithmetic gets uncomfortable: nutrition can recover a meaningful slice of that gap this year, but it can’t close it alone.

So when someone hands you a nutrition ROI sheet, the first question isn’t about the response size. It’s which system’s values they used — and which unit.

Three Repricings, Two Mechanisms, Four Months

Component pricing moved under the industry’s feet this year, and the changes don’t all work the same way.

SystemChangeEffective DateProducer Impact
Western Milk Pool85/10/5 → 70/25/5 (fat/protein/other solids)April 1, 2026Fat share of ROI drops from 71% to 44.6%; high-fat/low-protein herds face up to $900/cow/year exposure
P5 (Ontario/Quebec etc.)Market ratio raised to 2.20, no-pay ratio to 2.30; SNF residual now 100% to Tier 1 proteinApril 1, 2026Tier 1 protein up ~$2.00/kg; butterfat down ~$1.80/kg; each 0.05 step to 2.20 worth ~$7.92/kg quota/month
Lactanet LPI Production subindexHolstein weighting: 60F:40P → 40F:60PApril 2026Genetic (not milk-cheque) shift — changes sire selection targets, takes 3–5 years to show in the herd

Why the pools moved at all. Canada spent years managing a protein surplus. That situation reversed — Farm Credit Canada’s 2026 dairy outlook describes a sector now “staring down a protein deficit rather than a protein surplus,” driven by significant 2025 growth in higher-protein products like yogurt and cheese. Cottage cheese is the sharpest example: Statistics Canada production data shows a 20% jump between December 2023 and December 2024, with retail demand reportedly up as much as 30% and shortages on shelves through spring 2026. Decades of butterfat-first payment ratios had produced exactly the milk the market no longer wanted most.

Western Canada repriced the cheque. The WMP boards went to 70/25/5 on April 1. Protein didn’t get slightly louder on a Western cheque. It got roughly 2.5 times louder.

P5 repriced it with a gradient, not a switch. Dairy Farmers of Ontario’s P5 payment-policy bulletin sets out the change: the market ratio rises to 2.20, the no-pay ratio to 2.30, both effective April 1, with the residual revenue distribution from other solids shifted so 100% flows to Tier 1 protein instead of splitting 30/70 with butterfat. Net effect: Tier 1 protein up about $2.00/kg, butterfat down about $1.80/kg. Tier 2 protein sits at the 4(a) price plus $3.00/kg.

The P5 gradient is where the money hides. Farm Tario’s analysis of the change puts it plainly: Holstein producers below a 2.14 SNF-to-butterfat ratio will see cheques start to decline — but 2.14 is the floor, not the target. The market ratio is 2.20, and every 0.05 increase in SNF up to 2.20 is worth roughly $7.92 per kilogram of quota owned per month. Above 2.30, extra protein stops being paid. A farm sitting at 2.1 that makes no management changes will receive about $2 less per kilogram of quota owned.

Lactanet repriced the breeding decision. The April 2026 revision to the LPI Production subindex moved Holstein weighting from 60% fat / 40% protein to 40% fat / 60% protein, Jersey to 33F:67P, and Ayrshire to 50F:50P. That one’s a genetic index change — it alters what your sire selection optimizes toward, not what your milk earns this month.

Meanwhile, the US national protein-to-fat ratio has slid to roughly 0.77. What ratio do plants want? Sources disagree — one puts it at 0.80 and up, another at 0.85–0.90 depending on the plant. Either way, 0.77 sits below the floor.

So the herd that won the butterfat race now has a ratio problem, whichever system it ships into. Genetics takes three to five years to correct — heifers bred this fall calve in 2027 and finish a first lactation into 2028. Nutrition is the lever that moves this year.

One caution before you chase SNF. AgProud’s SNF strategy analysis makes the point that in a quota system the old rule still holds: fill quota with butterfat first, optimize SNF second. Sacrificing total kilograms of butterfat shipped to chase SNF, at the expense of filling owned quota, costs more total revenue than the protein premium returns.

LeverWhat It Actually DoesCommon Mistake
LysineAmplifies fatty-acid-driven milkfat synthesis via GPRC6A-PI3K signalingAssuming it builds casein on its own
Methionine + HistidineRaises protein and fat when balanced against ME, not MP aloneFeeding solo methionine and expecting full protein response
Proline, Arginine, GlycineNon-essential, but potentially rate-limiting for high-output casein synthesisIgnored because models omit non-essential lines
ECM-Basis BalancingMatches nutrient partitioning in modern genomic cowsFormulating against outdated fixed net-nitrogen tables
Forage NDFd (>63%)Baseline rumen capacity requirement for AA responseAdding expensive bypass AA to patch poor forage quality

Action Steps for Your Next Ration Review

  • Ask your feed rep to print the non-essential amino acid supply line this week. It’s a report request, not a research project — and if the model doesn’t produce one, that’s your answer about what your program can and can’t see.
  • If an ROI sheet doesn’t say which values it used, send it back. Index economic weights make fat 71% of this response. WMP’s April ratio makes protein 55%. Same trial, 26-point swing.
  • If you’re in P5, calculate your SNF-to-butterfat ratio against 2.20, not 2.14. The floor where cheques start declining is 2.14; the market ratio is 2.20, and each 0.05 step up to it is worth about $7.92 per kg of quota per month.
  • If you’re testing high fat against low protein in the WMP, price the exposure before you price the fix. That profile carries up to $900 per cow per year in revenue shortfall if it doesn’t adapt.
  • If your 30-hour NDFd is below 63%, fix forage before buying a bag of protected amino acid. The 4.8/3.5 herds got there on digestible forage first.
  • If your program balances lysine to target but sets methionine and histidine by default, you’re feeding one leg of a three-legged requirement. CNCPS v6.55 reference points: roughly 3.20 g lysine, 1.19 g methionine, 1.19 g histidine per Mcal ME.
  • If chasing SNF would cost you butterfat kilograms against owned quota, don’t. Fill quota first, optimize SNF second.

Key Takeaways

  • Within the next 30 days: request a full amino acid readout — essential and non-essential — calculated on an energy-corrected milk basis rather than net nitrogen, and get 30-hour NDFd on this year’s forage before committing to any protected product. Both are one phone call.
  • If protein is flat while fat is strong, stop adding lysine. Lysine is working the fat side. The casein constraint sits with methionine, histidine, the branched-chain group, and the proline precursors.
  • Run every component response twice — once on the values you were quoted, once on the values that pay you. The same +0.13 kg / +0.287 lb fat and +0.08 kg / +0.176 lb protein swings from 71% fat-driven to 55% protein-driven depending on the system.
  • Nutrition narrows the gap; it doesn’t close it. A high-fat, low-protein herd faces up to $900 per cow per year of exposure against a nutrition response worth $1.82 to $2.45 per cow per day.
  • Three repricings, two mechanisms, one direction. WMP’s 70/25/5 and P5’s 2.20 market ratio changed what milk earns; Lactanet’s 40F:60P changed what breeding chases. Nutrition is the only one you can act on this month.

Every herd that chased butterfat did what the indexes and the milk cheque asked. Right call at the time, and the gain is banked. The question now is narrower and more awkward: when your nutritionist says the ration is balanced, balanced against what — the tables, or the cheque you actually cash? Ask which year those tables were built. Then ask which pool’s values are in the spreadsheet, and in which unit.

Complete references and supporting documentation are available upon request by contacting the editorial team at editor@thebullvine.com.

Learn More

The Sunday Read Dairy Professionals Don’t Skip.

Every week, thousands of producers, breeders, and industry insiders open Bullvine Weekly for genetics insights, market shifts, and profit strategies they won’t find anywhere else. One email. Five minutes. Smarter decisions all week.
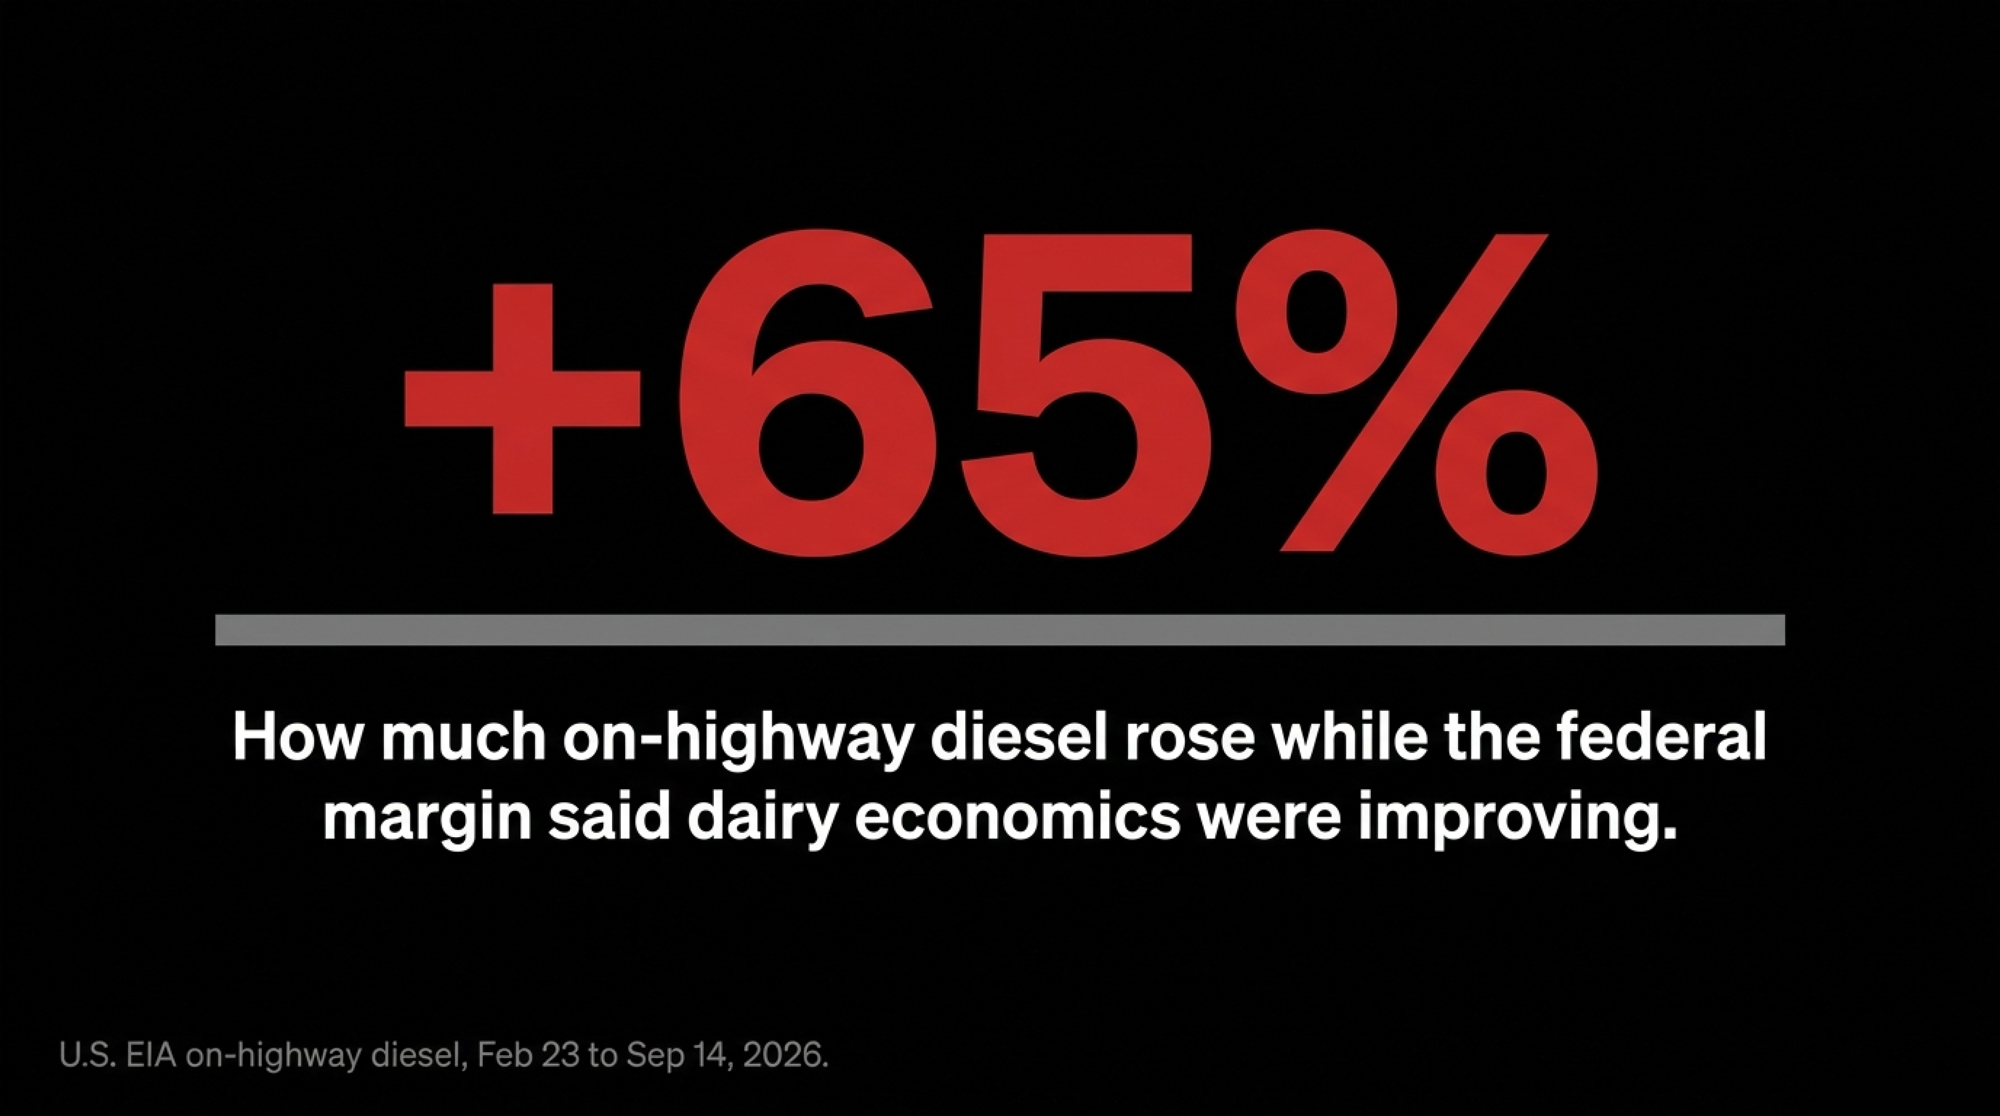
NewsSubscribe
First
Last
Consent

Kansas Milk Growth Slowed to +15.4% While California Shrank

Cull thirty percent of four hundred cows and you’re buying 120 replacements a year. Every $500 the market moves costs you $60,000 — and not one extra cow in the barn.

EXECUTIVE SUMMARY

  • The growth was cows, not cows milking better. Output hit 20.1 billion pounds, up 2.2%, but per-cow output rose three pounds — 93% of the gain walked in on four legs. Kansas is the extreme case at 98% animals, and its growth already decelerated from 18.7% in June to 15.4% in July. California, the largest dairy state in the country, actually shrank 0.8%.
  • The class spread is the money question. Class IV fell to $18.34 in July, down $3.98 from May, leaving a $2.82 gap over Class III’s $15.52. On a 400-cow herd shipping 75 lbs, that’s roughly $26,226 a month of exposure — and which side you’re on is a clause in your co-op agreement, not a market call.
  • Butter’s paradox is a grade problem, not a tonnage problem. Prices kept sliding while the market read tight because 80% butterfat inventories are ample and 82% is where the shortage sits. Most premium structures don’t price that split.
  • Replacements decide whether expansion math still works. Springing heifers run $3,100 nationally and $3,400–$4,400 in Upper Midwest barns. Every $500 move costs a 400-cow herd about $60,000 just to hold size. If you financed stalls against an all-milk forecast instead of an actual Class III print, the next 90 days are a covenant conversation.

Class III milk settled at $15.52/cwt in July 2026 — down $1.40 from May’s peak and the second straight monthly decline. If you financed fresh stalls into that curve, explaining your 2026 margin over feed to your lender just got uncomfortable.

Kansas shipped 494 million pounds in July, up 15.4% year over year on a herd of 245,000 head. Twelve months earlier, that herd stood at 213,000. But Kansas grew 18.7% in June and 15.4% in July, and the state added roughly 1,000 head between those two months after adding 32,000 across the full year. That’s not acceleration. That’s a build winding down.

Nationally, output hit 20.1 billion pounds, up 2.2%, per USDA NASS Milk Production released August 21. The headline reads like productivity. It isn’t.

Which States Actually Shrank in July 2026?

Three did, and one matters enormously. California fell 0.8%. The largest dairy state in the country produced less milk in July 2026 than a year earlier. Washington dropped 2.0%. Ohio slipped 0.4%. Pennsylvania and Vermont came in flat.

A national supply-growth story that skips California’s contraction isn’t describing national supply. It’s describing Kansas and Texas.

That’s the real geography here: growth concentrated in a few expanding states, offset by decline in established ones. National cow numbers held at 9,710,000 head from June to July — unchanged, after twelve months of building.

The 3 Pounds That Rewrite the Report

Production per cow rose from 2,072 to 2,075 pounds nationally. Three pounds. Across the 24 major states, 2,088 to 2,093. The herd, meanwhile, went from 9.511 million head to 9.710 million — up 199,000 cows.

Cow numbers grew 2.09%. Per-cow output grew 0.14%. By The Bullvine’s calculation from those NASS figures, cows account for roughly 93% of the year-over-year growth and per-cow output for about 7%. Those shares describe contribution to the gain, not share of total volume.

Everyone assumed 2.2% meant the national herd got more efficient. It got bigger.

Kansas is the purer case. Per-cow output there went from 2,010 to 2,015 pounds — five pounds, or 0.25%. Cow numbers rose 15.02%. Roughly 98% of Kansas’s growth came from animals, almost none from the cows already standing there.

And before anyone reads July as a turn: NASS revised June’s 24-state figure up by 124 million pounds, or 0.7%. One month is one data point, and this series is routinely rewritten. The next release lands mid-September.

Why Did Class III Fall While Class IV Fell Harder?

The two halves of the pool separated. Federal Order class prices for 2026:

Month (2026)Class III ($/cwt)Class IV ($/cwt)Spread ($/cwt)
January14.5913.55−1.04
February14.9416.291.35
March16.1618.942.78
April16.8220.223.40
May16.9222.325.40
June15.9820.964.98
July15.5218.342.82

Class III and Class IV are USDA AMS-announced Federal Order prices, per Dairy Market News, Vol. 93 Report 34, week of August 17–21, 2026. August prices had not yet been announced at the time of publication. Spread column calculated by The Bullvine.

The full-year series tells a different story than a four-month excerpt would. Class III climbed from January through May, then gave back $1.40 across June and July. Class IV ran harder in both directions — up nearly $9 from January to May, then down $3.98 in two months.

Watch the spread column. In January, Class III sat $1.04 above Class IV. By May, the gap had flipped and widened to $5.40. It’s narrowed in each of the two months since, to $2.82 in July. So the divergence is real, but it’s compressing — Class IV is falling toward Class III rather than the two pulling further apart.

Still $2.82, though. Which side you sit on isn’t a market view. It’s a clause in your co-op agreement.

Running the Numbers: The Class Spread on a 400-Cow Herd

ParameterCalculationExposure
Daily shipped volume400 cows × 75 lbs/day30,000 lbs (300 cwt)
July class spread$18.34 (Class IV) − $15.52 (Class III)$2.82/cwt
Daily margin variance300 cwt × $2.82/cwt$846/day
31-day exposure$846/day × 31 days$26,226/month

That’s the gross gap between milk priced against butter-powder and milk priced against cheese-whey for one month, before producer price differential, hauling, or component adjustment. Your mailbox price won’t match either class cleanly — most producers receive a weighted blend. Read this as the scale of the exposure, not a cheque you lost.

Replacements compound it. Springing heifers ran about $3,100 a head nationally this spring, with Minnesota and Wisconsin barns pushing $3,400 to $4,400, per CoBank and USDA figures. The record monthly average hit $3,110 in October 2025. A 400-cow herd culling 30% needs 120 replacements a year — so every $500 move in heifer price shifts your cost to stand still by $60,000. Same herd. Same tank. Sixty thousand dollars.

Total dairy heifer inventory sits at 3.914 million head, the lowest since 1978. Our deep-dive on the tightest replacement heifer market since 1978 and what it does to beef-on-dairy strategy runs the herd-turnover budget in detail.

Cull values give you a current read from the same week. Conventional cull cows averaged $150.94/cwt at a Pacific Northwest auction reported August 17–21, with the top ten at $187.19/cwt. On a 1,236-lb cow at that average, that’s roughly $1,866 walking out the door against a $3,100 replacement walking in — a gap near $1,234 on every turn, by our arithmetic, before you’ve improved a single thing about the herd.

The Canadian Takeaway

Ontario and Quebec readers: every price in this analysis is a U.S. Federal Milk Marketing Order figure or a CME settlement. None of it sets a Canadian farm-gate price, which runs through supply management and provincial board pricing rather than class utilization.

What transfers is the supply signal. U.S. output at 20.1 billion pounds a month, with cheese exports running at record pace, shapes the world price Canadian processors and exporters watch — and it shapes what imported product costs at the border. The useful takeaway isn’t the $15.52. It’s that U.S. supply growth is coming from animals rather than efficiency, and that the fat side of the U.S. market is softer than the protein side.

The Turn: Butter Splits by Grade, Not by Tonnage

Butter prices kept sliding through August while the market read tight. Dairy Market News explains why the two aren’t contradictory: 80% butterfat inventories remain ample, while 82% butterfat supplies are tighter. Central-region contacts put it the same way — 80 percent butterfat inventories high, 82 percent tight.

Be precise about what’s actually short. DMN reports cream inventories tight with spot availability varying by region, while butter inventories read stable in the West and are actively building in the East ahead of post-Labor Day retail promotions and holiday baking. So the tightness sits in cream and in the higher-fat grade. Commodity-grade butter — the stuff that sets the CME print — is comfortable.

That’s the whole puzzle. The fat surplus isn’t a tonnage story. It’s a grade story.

Butterfat GradeInventory StatusMarket Signal
80% butterfatAmple / high inventoriesPrices sliding — surplus
82% butterfatTight supplyRead as “shortage” but rarely priced separately

CME Grade AA butter closed at $1.4625/lb on August 21, weekly average $1.4510, down 2.45 cents. Blocks closed at $1.5275 against a weekly average of $1.5620; barrels closed at $1.5650. Selected cold storage centers held 66,320 thousand pounds of butter on August 17, down 1% from August 1, while cheese holdings rose 5% to 86,020.

Three years of chasing butterfat on the assumption that fat is fat, and the grade line is where the money actually sits. DMN documents the split qualitatively — high 80% inventories against tight 82% supply — without publishing a price differential between the two grades. If you’re paid on component tests, that absence is itself worth a conversation with your field rep.

There’s a regional wrinkle. DMN reports the Mountain States — Idaho, Utah and Colorado — seeing decreased milk volumes from smoke, haze and high heat, with a noticeable drop in milkfat levels. Northwest plants are bringing in outside cream. Western churns run at full capacity with unsalted butter for export as the priority, because butter produced outside the U.S. trades at a significant premium to domestic product.

What the Futures Curve Says That July Doesn’t

As of the August 20 settlements, CME Class III futures stood at $16.80 for September and $17.13 for October. Class IV sat at $18.86 and $19.10. Nonfat dry milk for September ran 175.200 cents against 159.325 for August.

Every one of those sits above July’s actual print. The market was pricing recovery, not deterioration.

Read the week, though, not just the close. Class III September softened from $17.43 on August 14 to $16.80 by August 20, and October slid from $17.45 to $17.13 across the same five sessions. The curve still says recovery. It was also revising that recovery downward — worth knowing before you treat $16.80 as a floor, and worth re-checking against this week’s settlements before you act.

NDM was the loudest signal in the report. Grade A closed at $1.8000 on August 21, up 5.5 cents on the week, with the CME spot price gaining 11 cents since the prior Thursday. DMN attributes it to building domestic demand plus export interest from Southeast Asia and Mexico, with milk diverted to Class I for the school year leaving less for dryers.

September advanced Class I came in at $17.04, down $1.72, so near-term pressure is real. But if you’re making a twenty-year decision off a single Federal Order print — the most pessimistic number currently on the board — you’re using the wrong input.

Culling says producers are already sorting. Dairy cow slaughter through August 8 totaled 1,651,600 head against 1,581,700 a year earlier, up 4.4%. Herd growing, culling running ahead of last year. That’s a herd being rebuilt, not simply expanded. Whether your co-op’s base year lets that new milk earn blend or base is a separate question, and we broke down how base-year mechanics decide what your expansion milk actually earns this week.

Is the New Capacity Built for the Milk You’re Shipping?

Dairy processors have committed more than $11 billion across 19 states and 50-plus projects between 2025 and early 2028, tied to a projected 15 billion additional pounds of U.S. milk by 2030 — figures IDFA reported and Food Engineering carried in August 2026. New York leads at $2.8 billion, followed by Texas at $1.5 billion, Wisconsin at $1.1 billion, Idaho at $720 million, and Iowa at $701 million. Kansas herd growth clustered where that processing capacity gave the milk a buyer, which is the siting logic you’d expect.

An even path to 15 billion pounds implies roughly 2.5 billion pounds added per year from a 2025 baseline. July’s 2.2% pace on a 236-billion-pound base implies closer to 5 billion if sustained — that’s The Bullvine’s arithmetic on IDFA’s stated target, not an IDFA or USDA projection. The flat June-to-July cow count and Kansas’s deceleration are both real arguments the pace won’t hold.

IDFA’s public materials describe the buildout in aggregate. We couldn’t locate a project-level breakdown showing how much of that $11 billion processes butterfat versus cheese and protein, or which plants run now versus commission in 2027–2028.

Whey economics show where the capital is pointed. Whey protein isolate traded from $14 into the upper $14s in the week ending August 21, with contacts reporting demand outpacing supply. WPC 34% inventories are extremely tight, with manufacturers prioritizing higher-protein products — tight enough that some calf milk replacer makers have substituted nonfat dry milk. That’s the protein side of the buildout showing up in spot markets. Not the fat side.

Call it a collision course and you’re overclaiming. Call it a clean catch-up and you’re ignoring the half nobody’s published.

Kansas Water: Two Clocks, Different Speeds

Sixty percent of Kansas topsoil rated short or very short of moisture in the week ending August 18, per USDA Crop Progress data reported by RFD-TV. Check the current week’s Crop Progress before you treat that as today’s condition — but as a feed-cost signal right now, it’s live.

The longer clock runs independently of any single dry August. Kansas Geological Survey monitoring has documented multi-decade Ogallala decline across western Kansas, with annual rates varying sharply by groundwater management district and by year. A dry August can fix itself with a wet fall. Aquifer drawdown doesn’t reverse on one good year, or two. The input risk belongs to the producers carrying the notes — plants buy milk, they don’t carry the note or the water right — and the drop from 18.7% to 15.4% may be the first sign the build is finishing on its own, before either clock forces the question.

What About Demand?

Cheese exports ran up roughly 24% in the first half of 2026, on pace to top 700,000 metric tons and a third straight record year, according to USDEC and USDA FAS figures reported in trade coverage this month. That’s why the cheese side has somewhere to put additional milk.

Domestic is softer. Natural American cheese use fell to its lowest May level since 2022 on weak foodservice, and June domestic cheese disappearance dropped 1.5% year over year, per HighGround Dairy analysis. DMN adds that U.S. export interest persists but is limited by elevated domestic price points for premium cheeses, pushing offshore business toward lower-priced commodity styles — while European demand stays strong and European milk output declines on summer heat.

Central-region cheese contacts report good demand alongside high inventories from active production schedules. Spot milk moved lower on both ends, from $1.00 under to $3.00 over Class, with some loads trading below Class price on plant downtime.

Export strength is carrying cheese. That’s different durability than strong domestic demand, and it’s worth knowing which one your plant leans on.

The 30/90/365-Day Playbook for Herds Carrying Expansion Debt

Add cows and you buy volume, scale, and leverage with a plant that needs milk. You also lock in feed, labor, facility, and replacement costs that don’t flex when Class III gives back $1.40 in two months. Push components and you buy margin per hundredweight, adjustable inside a feed cycle — but the 80%/82% split shows not all fat gets paid the same, and a premium structure can shift without a single cow changing.

Kansas took the volume bet next to real processing capacity. Defensible. Whether it’s durable depends on inputs nobody controls — and the state’s own growth rate just slowed 3.3 points in a month, which may settle the question before the water does. If you want this math run against a single herd’s replacement pipeline, we worked through the $585-per-service breeding trap on a 500-cow herd.

30-Day Actions

  • Pull your last three milk checks and calculate your actual blend price per cwt, then set it against July’s $15.52 Class III and $18.34 Class IV. Find your real class weighting instead of assuming it. Requires statements and twenty minutes. Backfires if you use one month — pull three.
  • Ask your field rep what share of your milk went to Class III versus Class IV last quarter, and whether your plant pays differently on 80% versus 82% butterfat. One phone call. Watch for utilization shifting month to month, which makes a single quarter less useful than a trend.
  • Red-flag trigger: if your debt service coverage ratio has run under 1.20 for three consecutive months on your lender’s or CPA’s method, treat it as urgent rather than seasonal.

90-Day Actions

  • Re-run your covenant against $15.52 Class III, not the $19.85 all-milk annual forecast. A modeled 5,000-cow High Plains greenfield — $8,000/stall, $40M note, 7% over 20 years, 1.20x DSCR — needed farm-gate milk near $19.07/cwt to clear covenant against Class III near $16.82 in April. Class III has since fallen to $15.52. Those parameters are illustrative and don’t describe any specific operation, but the structure transfers. Requires your amortization schedule and current component data. Backfires if you only stress the downside — run the futures curve too.
  • Price replacements against current local quotes, not last year’s. At $3,100 nationally and $3,400–$4,400 in Upper Midwest barns, a 120-head annual replacement need spans roughly $372,000 to $528,000 depending on where you buy. Requires your actual cull rate and a real local quote. Watch for heifer prices moving faster than your budget cycle.
  • Get component data in front of your nutritionist alongside the grade question. Requires recent tests and a straight answer from your buyer on premium structure. Backfires if you chase specifications your plant doesn’t price differently.

365-Day Moves

  • Decide whether your next increment of milk comes from new cows or cows you already own. Nationally it was 93% animals; in Kansas, roughly 98%. Yours doesn’t have to be. Requires capital planning, facility assessment, honest per-cow benchmarking.
  • If you irrigate in the Ogallala footprint, pull your own groundwater management district’s annual water-level report rather than relying on state or regional averages. District-level rates diverge sharply, and the district you farm in matters more than the state trend. Watch for LEMA allocation changes arriving faster than your cropping plan.
  • Opportunity signal: if September and October Class III settle at or above the $16.80 and $17.13 the curve carried on August 20, and your margin over feed holds, July was the bottom. Confirm against actual settlements, not August’s curve — which softened 63 cents on the September contract in a single week.

So pull your statements. What’s your actual blend price per cwt this month versus 90 days ago, and what share of your milk did your co-op utilize in Class III? If that number isn’t at your fingertips, you don’t yet know whether July’s report was your problem or somebody else’s.

Key Takeaways

  • July’s 2.2% national gain was 93% more cows and 7% better cows. Kansas was 98% cows. Animal-driven growth locks in feed, labor, facility, and heifer costs that don’t flex when Class III gives back $1.40 in two months.
  • The July class spread was $2.82 — $18.34 Class IV against $15.52 Class III. On 400 cows at 75 lbs, that’s roughly $26,226 in a month, and which side you’re on is a clause in your co-op agreement, not a market call. Pull three milk checks and find your real weighting.
  • Butter kept sliding while the market read tight because 80% butterfat inventories are ample and 82% is where the shortage sits. Ask your buyer whether they actually pay differently on grade before you chase fat.
  • Springing heifers at $3,100 nationally and $3,400–$4,400 in Upper Midwest barns mean every $500 move costs a 400-cow herd about $60,000 to hold size. Price replacements locally in the next 30 days, not off last year’s number.

Complete references and supporting documentation are available upon request by contacting the editorial team at editor@thebullvine.com.

Learn More

  • Cull cow replacement cost: $2340 vs $3500 in 2026 — Dismantles the reflex of convenience-culling by exposing the $1,160 cash deficit between a $2,340 slaughter cheque and a $3,500 replacement, arming you with a clear scorecard to keep sound cows earning margin instead of buying expensive replacements.
  • $19.85 milk price forecast 2026: your base year decides — Follows the money on $11 billion in new plant construction to expose how cooperative base-year rules penalize expansion volume into discounted surplus tiers when USDA’s all-milk forecast slips below $20/cwt.
  • Cracking the Code: Behavioral Traits and Feed Efficiency — Delivers a sensor-driven roadmap linking wearable rumination and resting data to residual feed intake, showing how to engineer higher milk efficiency from existing cows rather than purchasing more stalls.

The Sunday Read Dairy Professionals Don’t Skip.

Every week, thousands of producers, breeders, and industry insiders open Bullvine Weekly for genetics insights, market shifts, and profit strategies they won’t find anywhere else. One email. Five minutes. Smarter decisions all week.
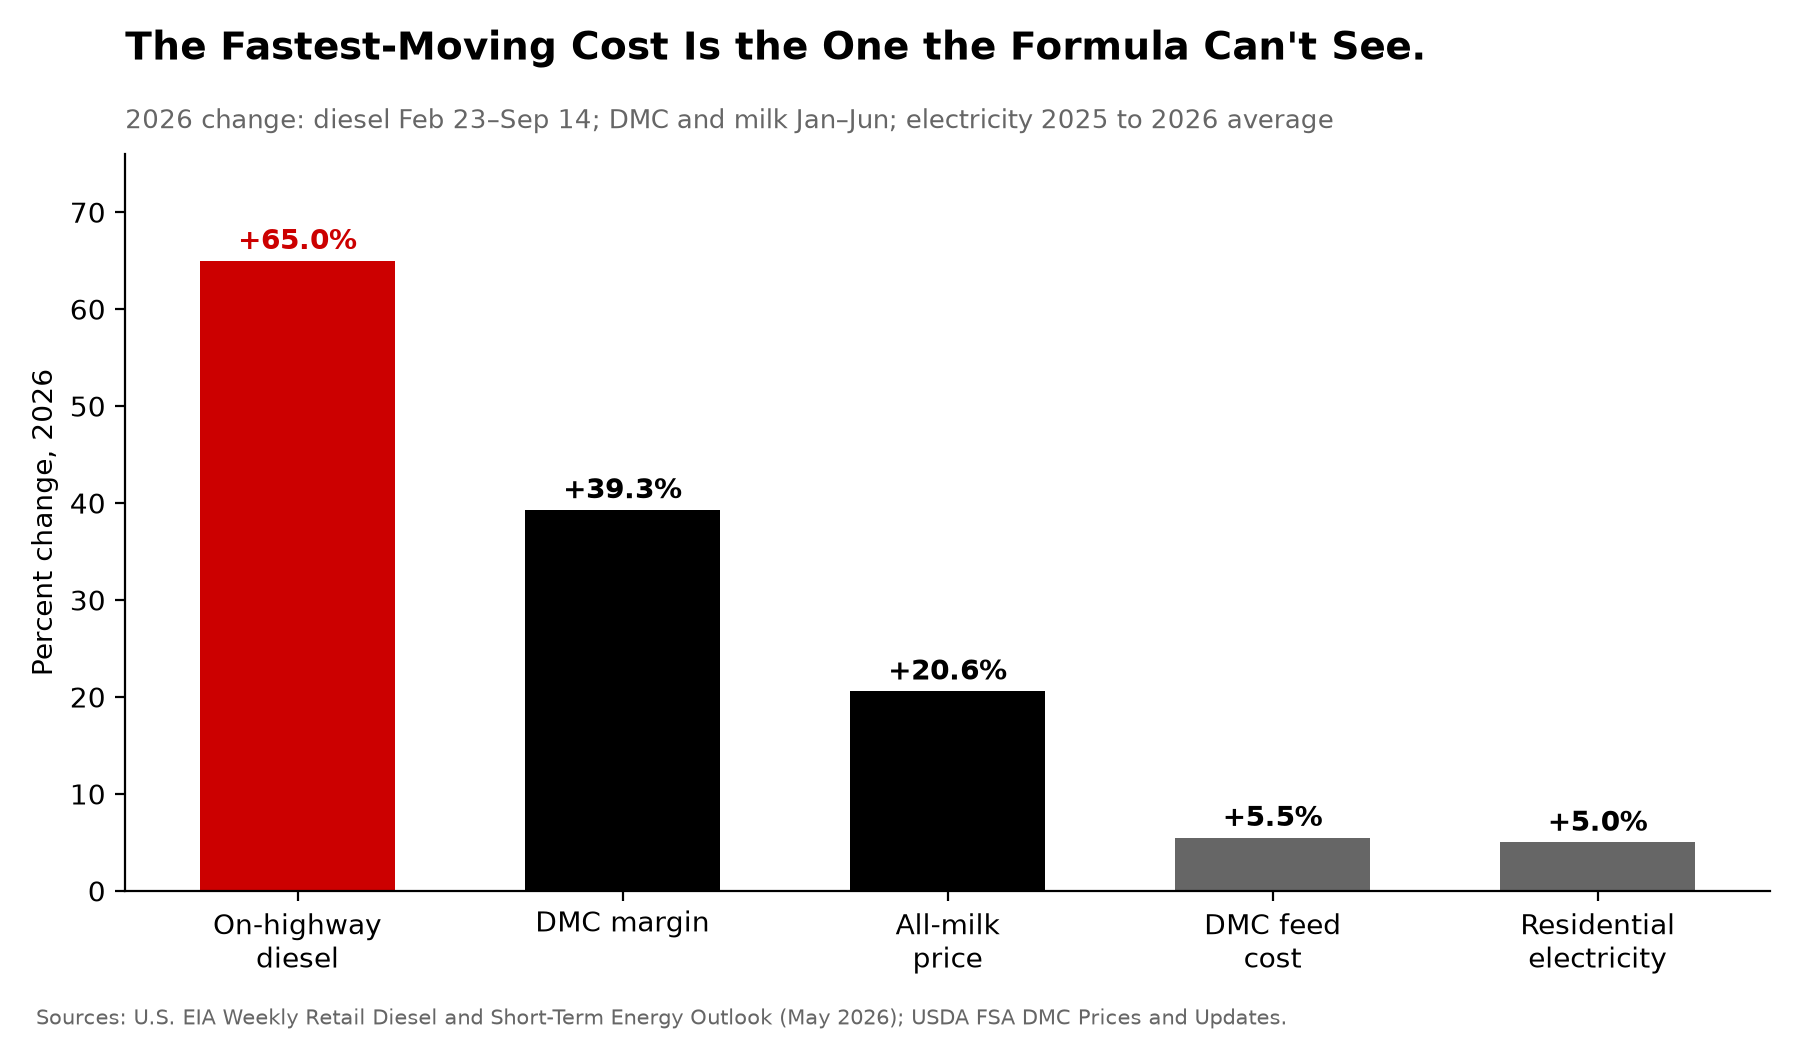
NewsSubscribe
First
Last
Consent

Rumination Drops Five Days Early. The Payback Takes Six Years.

Her rumination was down five days before diagnosis. Lying time didn’t budge till the day before. Catching 30 transition cases a year on 500 cows avoids $12,000 in losses — but on health alone, that $68,000 investment takes over six years to break even.

Wearables sit on cows in 64.2% of surveyed U.S. herds, and they’ll flag a displaced abomasum two days before your best cowman does. Buying them is the easy part. Building a process that turns 40 alerts a week into decisions somebody actually makes is where operations separate.

Somewhere in the Texas Panhandle in March 2024, a set of monitoring dashboards started telling a story that had no precedent in dairy cattle anywhere in the world. Feed intake sliding. Milk dropping off a cliff. Behavior patterns bending in ways that didn’t match a single entry on the fresh-cow differential list. Local practitioners worked through the differentials, running hundreds of tests to rule out other pathogens — and it was their persistence, documented by TVMDL, that kept the investigation moving.

Then Texas A&M’s Veterinary Medical Diagnostic Laboratory in Canyon ran a nasal swab. On March 25, 2024, USDA confirmed highly pathogenic avian influenza H5N1 in dairy cattle — the first confirmation on record anywhere. That week TVMDL tested 138 samples from 12 dairies across Texas, New Mexico, and Kansas. Every farm that submitted samples came back positive.

The sensors didn’t make that diagnosis. Lab work did. But the pattern that kept people testing after the negatives stacked up came off precision dairy monitoring systems that were already watching, and that’s still the sharpest real-world argument anyone has made for this technology. It’s also a warning about what these systems can’t do.

Adoption Isn’t the Argument Anymore

A 2026 Journal of Dairy Science survey of 81 U.S. dairy operations — 48,289 cows across 17 states — found 81.5% had adopted at least one precision dairy technology. Wearables led every category: collars, ear tags, and rumen boluses at a 64.2% adoption rate.

Read that sample before you read it as gospel. Those 81 respondents average roughly 596 cows apiece, which makes this a large-herd dataset rather than a portrait of the whole industry. What it does tell you is that among herds big enough to carry a full-time herd manager, sensors have become standard equipment instead of an experiment.

USDA ERS tracks adoption of precision technologies tied to milking, breeding, and data systems, which has climbed steadily since 2000. In separate ERS work, robotic milking lifted dairy net returns by $3.15 per hundredweight on average relative to non-adopters — a robotics figure, not a wearables figure, and worth keeping straight when somebody quotes it back at you as sensor ROI.

So the interesting question has shifted. Not whether the technology detects anything. Whether your operation has a process for acting on what it detects.

Rumination Is Still the Best Single Signal You Can Buy

If you could only keep one data stream, the research keeps pointing to the same one. Healthy cows ruminate somewhere between seven and nine hours a day, and when that number moves, something is usually wrong before she looks wrong.

Work published in the Journal of Dairy Science on rumination time around dry-off found cows that went on to develop hyperketonemia ruminated 9.83 minutes less per day than unaffected herdmates. Lame cows ruminated 15.00 minutes less. Small numbers on a daily printout. Enormous numbers in a transition pen.

The displaced abomasum data hits harder. In cows that developed a DA early in lactation, rumination time started dropping as early as 12 days before calving compared with cows that stayed healthy. Twelve days isn’t an early warning. That’s a completely different management timeline.

Austrian work published in Theriogenology in 2020 put a clock on the general pattern. Using a commercial 3D-accelerometer system, Gusterer and colleagues found rumination already shorter five days before clinical diagnosis in diseased cows — 401.9 minutes a day against 434.6 in healthy controls. Cows carrying more than one disorder bottomed out at 313.4 minutes the day before diagnosis, against 392.0 for healthy herdmates. That’s a roughly 20% gap at the nadir, and it opened up while nobody was looking.

The activity picture moves on a tighter timeline. High-activity time started shortening three days out, inactive time lengthened three days out, and lying time only diverged one day before diagnosis. Rumination gives you the longest runway of the three.

One caution the sales deck won’t lead with: rumination change tells you something shifted, not what shifted. Extension guidance is blunt about it — changes in rumination pattern can’t diagnose a specific disease, only flag a change in health status or comfort that merits a look. The technology pre-sorts. You still diagnose.

How Good Is the Detection, Really?

The numbers that matter here come from Stangaferro and colleagues at Cornell, published in the Journal of Dairy Science in 2016 and still the reference work a decade on. Running a health index score built from rumination and activity data, the system flagged 98% of displaced abomasum cases (n=41), 91% of ketosis cases (n=54), 89% of indigestion cases (n=9, so treat that one loosely), and 93% of all metabolic and digestive disorders combined(n=104).

Timing is the part producers care about. The tag identified 93% of cows with metabolic disorders an average of 2.1 days ahead of clinical diagnosis — and for DA specifically, detection ran roughly two to three days in advance. That’s the honest number. Not five days, not a week.

Be careful with the specificity claims that circulate in marketing material. A 2024 review of sensor-based health monitoring noted that the Stangaferro data showed overall sensitivity of 59% and specificity of 98% when detecting metabolic disorders, mastitis, and metritis together — because throwing mastitis and metritis into the same bucket drags performance down hard. Precision monitoring is very good at gut and metabolic problems. It’s mediocre at udders.

A 2024 randomized trial made the practical case anyway. Comparing 607 cows managed on automated health alerts against 597 managed on visual observation alone, cows in the alert group were more likely to get a clinical exam and more likely to have clinical health disorders actually diagnosed. The alert thresholds were specific and worth writing down: health index score below 86, daily rumination under 250 minutes, or a milk yield drop greater than 20%.

What Are You Actually Buying When You Buy a Bolus?

Hardware watches different things, and the modality decision matters more than the brand on the invoice.

Sensor ModalityWhat It MeasuresDetection StrengthPrimary Failure Mode
Neck collarRumination via microphone or accelerometer, activity, heatBest-validated for transition disease and estrusCollar loss; interference and wear in headlocks
Ear tagRumination via ear movement, activity, ear temperatureEar temperature adds a fever and hypocalcemia signalTag loss and retention, especially in young stock
Rumen bolusCore temperature, rumen conditions, water intakeReliable temperature drop 24-48 hrs pre-calving; fever spikes in H5N1-positive cowsOne-way install; no visual check that it’s reading
Vision / camerasLocomotion and lameness scoring, body conditionRepeatable, objective scoring over time — front-end and recheckNeeds clean sightlines; newer, thinner validation base

Cameras are where the early adopters are heading, and the reason is practical rather than technical. A camera score creates a documented number that persists — useful the day you catch her, useful again when you need to recheck a blocked foot two or three weeks later.

Boluses earn their place on the calving side. That pre-calving temperature drop is reliable, and in H5N1-positive herds the same device caught fever spikes tied to infection rather than parturition. One sensor, two very different answers, told apart by direction and timing.

Ear temperature deserves more attention than it gets. Ear temperature drops as a cow gets sick — the signal experienced practitioners have been reading by hand for decades, and exactly what you’re reaching for when a fresh cow goes down and the question is whether you’re looking at low calcium or something else. Watching that number trend over hours instead of guessing by hand changes how a fresh-cow protocol runs.

The Labor Savings Are Not Labor Savings

Here’s the part that gets skipped in the pitch.

Every monitoring company builds its own dashboard. Run collars plus a bolus program plus a robot, and you can end up staring at three or four platforms that don’t talk to each other — DHI data in one system, activity alerts in another, milk-component data locked inside the robot’s own software. Somebody has to reconcile who lost a tag, which readers stopped transmitting, and whether last Tuesday’s pen-wide rumination drop meant disease or a feed delivery that ran three hours late.

That reconciliation work isn’t labor savings. It’s a labor shift, and it’s the single biggest reason two herds buy the identical system and get opposite results. A JDS economic evaluation of a commercial rumen sensor system found genuine economic potential — but the return tracked with how consistently alerts were acted on, not with whether the hardware was installed.

False positives compound the problem fast. Wind events, pen moves, hoof trimming, a loose dog running through the barn — any of these throws activity alerts across an entire group at once. Extension guidance puts hoof trimming alone at a 45-minute rumination drop and estrus at 75 minutes. Chase every one and you’ll burn labor faster than the system saves it.

Know this before you sign: independent validation lags well behind commercial release. The peer-reviewed literature covers a small fraction of the systems now on the market — the 2024 review of sensor-based monitoring found published sensitivity figures for only a handful of platforms. Ask any vendor directly whether their algorithm has been validated outside their own trials, and get the citation.

And somebody physically owns the maintenance. Tags fall out. Readers drop offline. Batteries die on their own schedule, not yours. If that job isn’t attached to a name on your labor chart, it defaults to whoever notices last.

The Two-Question Check That Cuts the Noise

Practitioners who run these systems day to day describe the same two-question filter before anyone walks a pen.

Is she off compared with her own baseline? And is she off compared with her pen-mates?

A cow diverging from herself while tracking with her group usually points to something environmental — a ration change, a move, weather. A cow diverging from herself and from everyone around her is the one to put hands on. That distinction is what separates a system that pre-sorts genuinely sick cows from one that generates noise people eventually learn to ignore.

Threshold setting is the other half, and the 2024 trial gives you defensible starting points rather than guesses: health index under 86, rumination under 250 minutes daily, milk drop over 20%. Extension guidance adds a useful individual-cow trigger — investigate a sustained drop of 30 to 50 minutes a day from that cow’s own rolling baseline. Set detection tighter than that and you’ll walk cows that don’t need walking. Set it looser, and you’ll miss the ones that do.

Where the sweet spot lands also depends on your handling system, and this trade-off usually gets settled at purchase without much discussion. A herd that still restrains cows in headlocks gets a second chance at whatever the sensor missed, because eyes and hands are already on every animal at some point in the day. A pure sort-gate operation doesn’t get that second look — which argues for tolerating more false positives, because a missed cow costs more than a walked one.

Does the Precision Monitoring Math Actually Pencil?

This is where most technology conversations go quiet. So let’s do the arithmetic.

Start with what a case costs. A stochastic model of U.S. clinical disease costs published in JDS put left-displaced abomasum at $432.48 per case in primiparous cows and $639.51 in multiparous — the most expensive fresh-cow disorder in the model. Metritis runs roughly $358 per case once you add culling losses within the first 60 DIM ($85), milk loss ($83), reproductive drag ($109), and treatment ($81). Canadian work priced subclinical ketosis at $203 per case, though a systematic review of ten studies found ketosis estimates ranging from €19 to €812 — so use your own vet costs and milk price rather than a borrowed number.

DisorderCost per case (USD)What’s inside the numberConfidence flag
Left-displaced abomasum, multiparous$639.51Most expensive fresh-cow disorder in the JDS stochastic modelModeled, U.S. costs
Left-displaced abomasum, primiparous$432.48Same model, first-lactation cowsModeled, U.S. costs
Metritis$358Culling loss to 60 DIM $85 · milk loss $83 · repro drag $109 · treatment $81Component-built, auditable
Subclinical ketosis$203Canadian per-case estimateSystematic review of 10 studies spans €19 to €812 — use your own numbers
Blended figure used in the 500-cow model~$400Rough midpoint across the sourced per-case figuresEditorial midpoint, not a published value

Now the hardware. Published and vendor-reported figures for wearable monitoring cluster in a narrower band than the marketing noise suggests: roughly $75 to $150 per cow for wearable devices, with annual subscription running around $10 per cow on top. Peer-reviewed economic modeling uses similar inputs — one U.S. analysis modeled activity meters at a $120 tag cost plus $8,000 in base infrastructure and $1,500 annually for maintenance and lost tags, and concluded the system needed to stay functional at least five years to break even, generating up to $13 per cow per year in extra profit at a seven-year service life. European work on activity meters found net returns between €7 and €46 per cow per year depending on breed and scenario.

Run it on a 500-cow herd. At $120 per cow, you’re looking at $60,000 in hardware, plus roughly $8,000 in base infrastructure, plus $5,000 a year in subscription and another $1,500 in maintenance and replacements — call it $68,000 up front and $6,500 annually.

Against that, take 40% transition-disease incidence: 200 cows through the risk window. Blend the sourced per-case figures to a rough $400 midpoint. Catch 30 of those cases early enough to change the outcome, and you’ve avoided about $12,000 a year in disease cost. Add the milk: 30 prevented incidents at roughly 800 lb each, per University of Wisconsin extension figures, is about 24,000 lb staying in the tank — near $4,800 at $20/cwt.

So roughly $16,800 in annual return against $6,500 in annual operating cost leaves about $10,300 a year against a $68,000 entry. That’s a six-to-seven-year payback on disease avoidance alone — which lines up almost exactly with the five-year break-even the peer-reviewed modeling found, and sits well outside the one-to-two-year payback that Penn State Extension notes most companies selling these systems report.

Two things about that 30. It isn’t cases flagged — at a 93% detection rate you’d flag far more than 30 out of 200. It’s cases where earlier intervention actually changed the result, and no study tells you what that conversion rate looks like on your farm. Your treatment records will.

And know what this model leaves out: it counts avoided disease only. Estrus detection carries real published return on top — that $13 per cow per year in the U.S. modeling, €7 to €46 in the European work — which shortens the payback without collapsing it. On the same 500-cow model, adding the published estrus return takes the payback from roughly 6.6 years to about four. Better. Still nothing like eighteen months. That’s the honest case for buying — not the disease math alone, which is thin, but the two streams together.

Where You Farm Changes the Whole Calculation

This is the part most technology coverage flattens, and it matters more than any spec sheet difference.

Non-quota markets — U.S., New Zealand, most of Australia. Every liter you keep in the tank is a liter you get paid for, so prevented disease shows up directly as revenue. That’s why the milk side of the calculation above — 24,000 lb from 30 prevented incidents — belongs in your model. Run the arithmetic on your own milk price and your own fresh-cow disease rate. If you’re chasing volume, the yield-protection argument is the strongest part of the sensor case.

Supply-managed and volume-capped markets — Canada, plus any herd operating under a processor or co-op volume agreement. Extra liters don’t help if you’re already at your cap, so the 24,000 lb line does nothing for you. Your return lives entirely on the cost side: avoided treatment, fewer early culls, less vet time, fewer transition failures pulling animals out of the herd before they’ve paid for themselves. Use the per-case figures — $203 subclinical ketosis, $358 metritis, $432 to $640 for a DA — and count the culling component hardest, because a replacement heifer against a fixed production ceiling is a cost without offsetting revenue.

UK and EU herds sit closer to the non-quota side since the EU milk quota system ended in March 2015, but with a component-weighted milk price and often tighter margins per liter. Weight the yield side by your own butterfat and protein premiums rather than by volume alone, and give the culling-avoidance side more credit than a U.S. herd would.

The peer-reviewed activity-meter work makes this concrete. The European modeling found net returns spanning €7 to €46 per cow per year depending on breed and scenario — a sixfold spread. Read that carefully. Same technology, sixfold difference in return, and not one euro of it explained by which hardware you bought.

Milk-pricing regimeWhere the return comes fromDoes yield protection count?What to weight hardest
Non-quota — U.S., New Zealand, most of AustraliaRevenue plus cost avoidance; every retained pound gets paidYes — 24,000 lb from 30 prevented incidents ≈ $4,800 at $20/cwtYield protection; strongest version of the sensor case
Supply-managed — Canada, or any processor volume capCost side only: treatment, vet time, early culls, transition failuresNo — at your cap the 24,000 lb line is worth $0Culling avoidance; a replacement heifer against a fixed ceiling is cost with no offsetting revenue
UK and EU — post-quota since March 2015Component-weighted revenue plus cost avoidance, on thinner margins per literPartially — weight by your own butterfat and protein premiums, not volumeCulling avoidance gets more credit here than a U.S. herd would give it
Published spread, same technologyEuropean activity-meter modeling, net return per cow per year€7 to €46 — a sixfold spread, none of it hardware

Biosecurity Rewrote the ROI Case in 2026

The H5N1 situation stopped being a 2024 story a long time ago. More than 1,000 herds across 19 states have been confirmed. Texas logged its first dairy-cattle case of 2026 in early June, and 15 dairies across Texas and Idaho came back positive inside a single 30-day window. One Ohio dairy lost $737,500 in 60 days to an outbreak, as we reported in June — a single-farm figure, not an industry average.

Then the ground moved underneath producers. In May 2026, USDA dropped the requirement that lactating cows be tested for H5N1 before crossing state lines for any farm in the 41 states now classed as “unaffected” under the National Milk Testing Strategy. Responsibility for pre-movement testing shifted onto you.

Think about what that means for those same Panhandle herds. In March 2024, they had a federal testing order coming and a diagnostic system that had never seen this virus in cattle. In August 2026, the virus is a known quantity, the lab work is routine — and for most of the country the mandatory testing gate that would have caught an incoming animal is gone.

Bulk-tank PCR remains the best herd-level screen available, and weekly sampling works as a smoke detector. But it catches herds, not individual cows, and it misses early-stage animals not yet milking into the main tank. Cow-level monitoring already watching for unusual mid-lactation milk drops and rumination changes tends to pull the alarm forward by several days — which squares with the two-to-three-day window the Cornell work documented for metabolic disease.

Industry reporting has credited sensor-equipped farms with detecting H5N1 infections five to seven days earlier than visual observation. Treat that as directional. It runs ahead of what the peer-reviewed detection-window research supports, and no published herd count or study geography backs it.

Where the Technology Still Hasn’t Landed

Almost everything commercially mature points at the lactating herd. Calves and growing heifers remain largely open ground, and the results so far are mixed — practitioners report clients who put tags on calves and stuck with them, and clients who pulled them off, usually over retention or over data that never got used rather than over the sensor itself.

Milk-component data is the other frontier. A robotic system captures temperature per quarter per milking, plus several dozen distinct variables per cow per milking depending on the platform. Most of that sits unused. The mastitis connection has proven stubborn — behavioral response varies by pathogen, so a cow with one bug behaves nothing like a cow with another. That’s exactly why the combined sensitivity in the Stangaferro data fell to 59% once mastitis and metritis entered the model.

What This Means for Your Operation

  • Audit your alert-to-action rate. Pull your last 90 days of logs. If fewer than 40% of flagged cows received a hands-on physical exam, halt new hardware purchases until you fix the protocol. That threshold is our judgment, not a published benchmark — but the direction isn’t arguable.
  • Apply validated alert thresholds. Start with a health index below 86, daily rumination under 250 minutes, or a milk yield drop over 20%, rather than default vendor settings. Those came out of a 1,204-cow randomized trial, not a sales deck.
  • Add an individual-baseline trigger alongside the herd threshold. A sustained 30-to-50-minute drop from that cow’s own rolling average is worth a look even when she’s still above the absolute floor.
  • Plan for a two-to-three-day warning window on metabolic disease. Build labor protocols around the 2.1-day average, not around claims of five-to-seven-day advance alerts. Rumination gives you the longest runway of any signal — it moves five days out, where lying time only diverges the day before.
  • Don’t buy wearables to catch mastitis. Broad-spectrum sensitivity drops to 59% once uterine and udder health enter the picture. Buy for metabolic and digestive monitoring, where it hits 93%.
  • Assign hardware maintenance to a named person. Tag reconciliation, offline reader reboots, dead batteries. Put it on the labor schedule with somebody’s name beside it, or it defaults to whoever notices last.
  • Build the business case on both value streams. Disease avoidance alone runs six to seven years. Add the published estrus return, and it drops to roughly four. If you can’t justify it on both, don’t sign.
  • Ask for the validation citation, not the spec sheet. Then ask about tag retention rates and whether somebody answers the phone at 4 a.m. Cows break things. Raccoons chew Cat 5 cable. Lightning finds the same box twice.
  • Set your H5N1 protocol before a neighbor tests positive. Weekly bulk-tank PCR plus cow-level watch on mid-lactation milk drops and rumination. If you’re importing cattle, run your own pre-movement test regardless of what the 41-state rule permits.

Key Takeaways

  • Rumination under 250 minutes plus pen-mate divergence equals a physical today. Not a note for tomorrow’s list.
  • Softening 10 to 12 days pre-calving is a DA and ketosis screen. Treat it as risk stratification, not a data curiosity.
  • Cows carrying multiple disorders bottom out near 313 minutes of rumination the day before diagnosis.Healthy herdmates sit near 392. That gap is your window.
  • A one-to-two-year payback quote needs interrogation. At $120 per cow, avoided disease alone pencils to six or seven years. Add estrus, and it lands near four. Peer-reviewed modeling puts minimum break-even at five.
  • No validation citation means no verified performance. Published sensitivity data exists for only a handful of platforms.
  • Pen-wide alerts point at management, not disease. Hoof trimming costs 45 minutes of rumination; estrus, 75. Check the feed truck log and the calendar before you check the cows.
  • Supply-managed herds count culls, not liters. If you’re already at your cap, the yield-protection argument does nothing for you — the return is entirely on the cost side.
  • Under 40% alert-to-action makes new hardware counterproductive. More sensors on a broken process produces more ignored data.

The herds pulling ahead on health right now aren’t the ones with the most sensors on the most cows. They’re the ones who decided, in advance, what an alert obligates somebody to do — and wrote it down somewhere other than in one person’s head.

Pull your alert log from last month and count how many flagged cows actually got a physical exam. Does that number justify the invoice you’re paying?

Run Your Numbers

Robot ROI Reality Check — This article’s six-year sensor payback is one input away from the bigger question. The tool prices a full sensor suite — activity collars, inline meters, sort gate, health alerts — against a robot quote, and shows five-year net on both. Bring your own milk price and interest rate.

Learn More

The Sunday Read Dairy Professionals Don’t Skip.

Every week, thousands of producers, breeders, and industry insiders open Bullvine Weekly for genetics insights, market shifts, and profit strategies they won’t find anywhere else. One email. Five minutes. Smarter decisions all week.
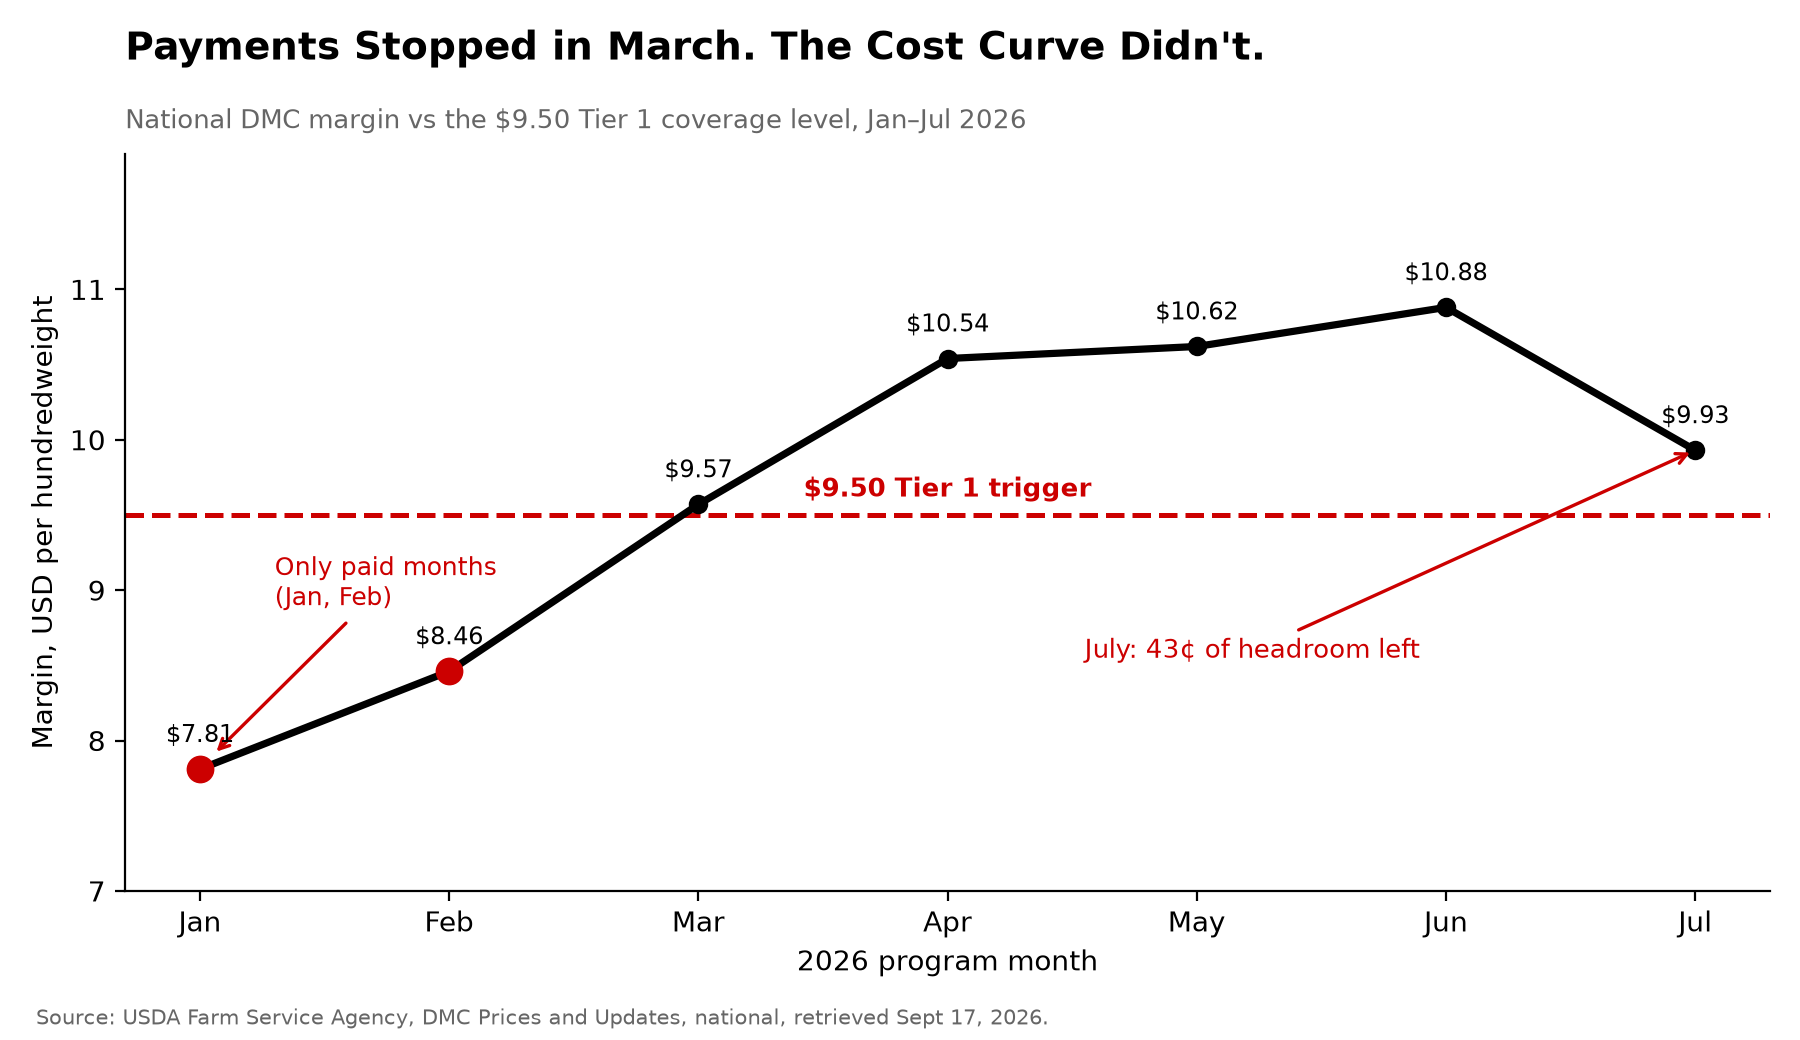
NewsSubscribe
First
Last
Consent

Beef Tariff Waiver 2026: Dairy Has 90 Days to Find Out If Its Best Hedge Still Holds

NMPF flagged 20% of dairy income. The contract your culls actually compete in didn’t move a dollar. Here’s the barn math on a 90-day window nobody has signed yet.

EXECUTIVE SUMMARY: The day Washington waived tariffs on 300,000 tonnes of imported ground beef, the 90% lean trim contract — the one your cull cows actually compete in — held dead flat at $449, while fat trim dropped $8. NMPF put dairy’s exposure at 20% of annual farm income in its August 24 statement, and the $13 billion figure that followed it through the trade press isn’t in that statement; independent reconstruction lands at $10.5 to $12.2 billion. On a 1,000-cow herd, roughly $337,000 to $435,000 of cull and beef-cross calf revenue moves through the 90-day window, with August auction trade running $160/cwt liveweight on culls and $1,200 to $1,975 a head on beef-cross calves. Cattle futures were already sliding well before August 21, so any softening in your cull check needs testing against the WASDE revision and the Tyson plant closures before you blame the waiver. Here’s the part almost nobody flagged: USDA’s Risk Management Agency built LRP coverage types specifically for beef-on-dairy calves and dairy cull cows, and the cull cow product caps at 13 weeks — 91 days against a 90-day waiver. A hedge at a fifth of your revenue isn’t a hedge anymore — it’s a second commodity position, priced by trade policy instead of by cheese.

beef tariff waiver dairy

If beef-cross calves and cull cows make up 20% of your gross revenue, a fifth of your dairy’s income statement was just exposed to a trade policy window you had no say in. On August 21, Washington opened a 90-day tariff waiver on 300,000 metric tonnes of imported ground beef. But before you panic-sell culls or cut beef semen services, look at the actual contract data.

That 20% figure comes from the National Milk Producers Federation’s August 24, 2026 statement, and it’s a national aggregate — your own share is knowable from your settlement sheets and probably isn’t 20%. The same Friday the waiver landed, USDA’s Oklahoma auction report showed slaughter cows selling $5.00 to $7.00 lower than the week before. Whether those two facts are connected is the question this piece exists to answer.

A White House official told reporters an executive order would follow within two weeks. No signed order has appeared in the Federal Register as of this morning, and the White House hasn’t published a supplier list or an enforcement mechanism for its stated commitment that the imported beef will sell 25% below current market prices.

Policy status and market prices reflect publicly available U.S. information as of the morning of August 26, 2026. Prices are U.S. national unless a region is specified.

Two Signed Orders, One That Never Got a Signature

The waiver isn’t the story. The repetition is.

Washington has reached for beef import relief three times since February. A signed presidential proclamation on February 6 raised the 2026 beef tariff-rate quota by 80,000 metric tonnes, allocated entirely to Argentina, restricted to lean beef trimmings by HTS line, released in four quarterly tranches — published in the Federal Register on February 13. In May, the administration prepared a 200-day suspension of beef tariff-rate quotas across all exporting nations; the Wall Street Journal reported on May 10 that the signing was delayed, and The Hill reported on August 20 that the plan was shelved after pushback from the president’s inner circle.

Then August 21.

Northern Ag Network’s August 21 reporting frames the current action as the second executive order aimed at beef prices, because May never produced one.

Why the product scope matters more than the count. February targeted lean beef trimmings specifically, by HTS line. August covers “product for ground beef” — a phrase the White House hasn’t defined. May would have suspended beef TRQs across the board. February hit lean trim directly. August almost certainly does, though the White House hasn’t said so in writing, and lean trim is the product your cull cows compete against in the grind. That’s why this waiver lands differently on a dairy than on a cow-calf operation, and it’s the thread worth pulling if you’ve built beef-on-dairy revenue into your operating budget.

Action DateVolume & ScopeProduct DefinitionLegal Status
Feb 6, 2026+80,000 t TRQ, Argentina only, 4 quarterly tranchesLean beef trimmings, specified by HTS lineSigned proclamation; Federal Register Feb 13
May 2026TRQ suspension, all exporting nations, 200 daysBeef TRQs across the boardSHELVED — never signed
Aug 21, 2026300,000 t waiver, 90 days“Product for ground beef” — undefined by White HouseAnnounced; no EO in Federal Register as of Aug 26
Late Nov 2026Expiry if signed on stated timelineLapse, extend, or become templateUnknown — lands inside fall culling

Running the Numbers: A 1,000-Cow Dairy’s 90-Day Beef Channel

Every figure in the middle column is either sourced or a labeled assumption. Fill the right column with your own, and the answer moves. The model assumes an even calving distribution across the year.

Metric1,000-Cow Baseline ModelYour Herd
Annual cull rate / 90-day culls35% (assumption) / 86 head 
Cull liveweight & farmgate price1,350 lb @ $160/cwt = $2,160/head 
90-day cull salvage gross$185,760 
Beef-semen share / calving rate60% / 85% (both assumptions) 
90-day crossbred calves126 head 
Calf realized value$1,200 – $1,975/head 
90-day calf revenue$151,200 – $248,850 
Total 90-day beef channel gross$336,960 – $434,610 
5–10% compression exposure$16,848 – $43,461 

On 300 cows, the same assumptions run roughly $101,000 to $130,000 through the channel. The percentage exposure is identical; the dollar figure isn’t.

Cull price is the midpoint of current national auction trade: USDA AMS National Daily Feeder and Stocker Summary, August 24, 2026, shows Boning 80-85% at $152.00–162.00 and Lean 85-90% at $143.00–146.00. Oklahoma National Stockyards on August 21 averaged $167.44 on Lean 85-90% and $166.75 on Breaker 75-80%.

Calf values reflect August 2026 beef-cross trade at Ohio auctions reported by Farm and Dairy: beef cross calves $1,200–$1,975/head, with top beef cross at $1,975, against dairy cross at $700–$1,175. Those are per-head prices on baby calves, not per-pound. If you sell by weight, that same report shows crossbreds by weight at $550–$700.

The compression range is a stress test, not a forecast. Nobody has isolated post-waiver farmgate movement from the decline already underway.

The pricing basis that trips up half the coverage. The national cutter cow carcass cutout ran $351.50/cwt on August 22, 2026 (USDA AMS Daily Cattle & Beef Summary). That’s a carcass value — and dairy culls don’t dress anywhere near their live weight. A 2024 Journal of Dairy Science study by Berdusco found direct-cull dairy cows averaged 42.5% dressing percentage, versus 49.1% for cows fed 60 days before slaughter. The broader literature puts dairy cow dressing percentage at 35% to 48% depending on gut fill, pregnancy status, udder weight, and trimmable defects. University of Maine Extension notes dairy cattle dress roughly 3% lower than beef cattle because of heavier bone and lighter muscling.

Run it: 1,350 lb at 42.5% is a 574 lb carcass. At $351.50/cwt, that’s $2,017 — in the neighborhood of the $2,160 liveweight figure, which is the point. Multiply cutout by live weight, and you’d book $4,745 a head. Plenty of coverage does exactly that.

Day-old calves run on a different clock than feeders. The $1,200–$1,975 range above is a per-head price on a wet newborn sold within days of birth. That’s a separate market from the feeder cattle futures dominating cattle headlines, with different buyers and different drivers. Feeder futures fell roughly 17% between May 1 and August 21, but no source has measured what that did to day-old values — so check your own last four settlement sheets against the range rather than assuming a matching decline.

Will Imported Ground Beef Actually Move Your Cull Cow Price?

The arithmetic runs cooler than the headlines, and the answer depends on your denominator.

300,000 metric tonnes converts to 661 million pounds. Against USDA’s 2026 beef production forecast of roughly 25.5 billion pounds, that’s 2.6% of annual U.S. beef production. On paper, a rounding error.

Annual is the wrong frame for a 90-day policy. Set the same volume against roughly one quarter’s production and it’s 10.4%. Against annual U.S. beef imports near 5.5 billion pounds, 12%. Analyst Scott Varilek pegged it at about 44 days of U.S. ground beef consumption, per AgWeb — the narrowest frame, and arguably the most honest, since ground beef is where this volume lands.

Small against all beef. Considerably larger against the 90-day lean-trim segment where your culls get priced. Independent trader Dan Norcini told Reuters on announcement day, “This is just a drop in the bucket. It really does nothing to fix the main issue which is a greatly reduced supply of cattle here in the U.S.”

The Trim Market Didn’t Believe It

Here’s the read almost nobody published, and it’s the most important number in this story.

Per Western Livestock Journal, the 50% lean trim August contract lost $8 over the announcement week to close at $161, with September down $8 to $151. The 90% lean August contract held unchanged at $449. September gained $3.

That second contract is the one that matters to you. Cull cows are a primary source of 90% lean trimmings — the lean side of the grind, blended with fat trim to make ground beef, and the exact product category this waiver targets. Traders had every opportunity to mark it down on Friday. They didn’t move it.

Fat trim took the hit instead. Whatever the market priced on August 21, it wasn’t a lean-trim supply shock.

That’s the strongest evidence available that the alarm is running ahead of the arithmetic. One week of contract data from a single trade source isn’t a verdict — but it’s a direct market read on the specific product category NMPF flagged, and it points the other way.

Everyone Assumed August 21 Tanked the Cattle Market. Check the Dates.

Live cattle futures fell 17.1% and feeders 16.9% from their May 1 highs to the August 21 low, per Barchart technical analysis published August 20 — a technical derivation rather than an exchange settlement figure.

The mid-August leg down had nothing to do with import policy. USDA’s August 12 WASDE cut its 2026 fed steer price forecast by $5.75/cwt. Tyson Foods’ announced closures at Joslin, Illinois, and Eagle Mountain, Utah, along with its stated intent to sell the Pasco, Washington plant, were cited by Andrew Griffith of the University of Tennessee and Tim Petry, livestock marketing specialist at North Dakota State University Extension, as contributing to the decline, per Agriculture.com’s August 17 report.

Announcement day itself is genuinely murky. The honest move is to show the disagreement rather than pick the loudest version. AgWeek reported August live cattle down 30 cents and August feeders down 55 cents. Reuters described futures “tumbling to eight-month lows.” AgWeb said they “gapped lower on the open.” Drovers reported both contracts “clawed back the morning’s losses” by the close — on the same morning USDA’s Cattle on Feed report came in bullish at 11.1 million head, up 2% year over year.

Feeder trade shows where the real pressure sat. Joplin Regional Stockyards sold feeder steers steady to $10 lower that week; Oklahoma National Stockyards saw feeder steers and heifers $5–15 lower and calves $10–20 lower. Those declines run deeper than anything in the cull cow trade — and feeder cattle aren’t what this waiver touches. We covered the broader cattle-market selloff separately; that piece tracks the whole complex, while this one isolates what lands on a dairy’s income statement.

Market SegmentAnnouncement-Week MoveWaiver ExposureWhat Actually Drove It
90% lean trim, Aug contract$0.00 — unchanged at $449Direct — this is the target productMarket declined to price a supply shock
Slaughter / cull cows (OK)−$5.00 to −$7.00/cwtDirect — cull salvage valueUnisolated from pre-existing decline
Feeder steers (OK National)−$5 to −$15/cwt; calves −$10 to −$20None — not a ground beef productAug 12 WASDE −$5.75/cwt; Tyson plant closures
Live cattle & feeder futures−17.1% / −16.9% from May 1 highsIndirect at mostDecline pre-dates Aug 21 by 16 weeks
Day-old beef-cross calvesUnmeasuredIndirect, via feeder boardNo source has quantified the pass-through

How a Percentage Became a $13 Billion Headline

NMPF quantified this exposure in percentages — 20% of farm income, 20% of beef production. No dollar total.

The $13 billion figure that’s followed the story since August 25, including in DairyHerd’s headline, isn’t in that statement. How a percentage becomes a dollar headline matters more than which outlet ran it first: the arithmetic requires a total-dairy-income denominator, and nobody publishing the number has shown one.

Two independent reconstructions get close without landing there. Working from a reported USDA-ERS February 2026 forecast of $42.5 billion in 2026 dairy cash receipts — down $6.2 billion from 2025, which back-solves 2025 milk receipts to roughly $48.7 billion — and treating beef as 20% of total farm income against milk’s 80%, the beef leg lands near $12.2 billion. A second method, applying HighGround Dairy’s estimate of roughly $4.50/cwt of beef income against 2026 milk production, comes out near $10.5 billion. That second figure is single-sourced commercial analysis, and the cull-versus-calf split inside it dates to 2022.

Both are forecasts and estimates, not audited baselines. They establish a range: $10.5 to $12.2 billion. The $13 billion figure sits above it. Not invented — a plausible estimate that rounds up, built on NMPF’s percentage by someone downstream, then repeated as though the trade group said it.

If that number is anywhere in your budget, replace it with your own percentage math.

NMPF represents dairy producers, so its statement is advocacy on their behalf. That’s its job. Worth noting once, since the percentages it cited hold up under independent reconstruction.

Is Your Beef Income Still a Hedge, or a Second Commodity?

Beef-on-dairy got sold as risk mitigation. Cross the bottom of the herd, capture a calf premium, cushion the milk check when Class III goes soft. It worked — calf values climbed from about $200 to more than $1,600 per head over five years, per the Center for Dairy Excellence in April 2026.

The herd grew right alongside it. USDA NASS reported 9.71 million U.S. milk cows in July 2026, up 199,000 head from July 2025, with production in the 24 major states up 2.3% year over year. ERS put 2026 all-milk at $19.85/cwt on August 19, revised down 15 cents. September 2026 Class III futures settled near $16.34 on August 26.

Stack those next to each other, and a loop appears. Beef income helped fund herd retention. That retention added milk. That added milk is part of what’s holding milk prices down — the exact problem beef income was supposed to buffer.

No single source states that chain. It’s the pattern that emerges when separately reported figures sit side by side, and it’s offered here as analysis, not as anyone’s published finding. The implication is still hard to unsee. A hedge that grows to a fifth of revenue isn’t a hedge anymore. It’s a second commodity position — and unlike your milk check, this one gets repriced by trade policy. Most operations built this revenue stream one calf at a time without ever underwriting it as a standalone position.

The 30/90/365-Day Playbook for Herds Carrying 20% Beef Revenue

30-Day: Price RMA Livestock Risk Protection on calves and culls

Action. USDA’s Risk Management Agency built coverage for exactly this exposure. Per RMA Product Management Bulletin PM-25-028, Livestock Risk Protection carries an Unborn Calves type covering beef and beef-on-dairy cross calves sold within two weeks of birth, target weight 60–99 lb, plus a separate Cull Cows type for dairy cull cows with a 13-week coverage limitation. Thirteen weeks is 91 days. The waiver runs 90.

Execution. Call a licensed crop insurance agent with your projected calf and cull volumes and pick a coverage level. Premium subsidies run 35% to 55% depending on level, with additional support for new and beginning producers. Coverage prices derive from CME feeder cattle futures; RMA updates them daily. Trigger: if your beef channel clears 18–20% of gross revenue, this stops being optional.

Risk. Premiums are cash out the door, and if prices hold, you bought coverage you didn’t need. Full dairy calves file under the predominantly-dairy type, not beef-cross — don’t let that get miscoded.

30-Day: Read the pricing clause in your calf contract

Action. Find out whether you’re on a fixed price or a formula tied to feeder cattle futures.

Execution. Pull the actual document, not your memory of it. Formula pricing means you inherited the board’s volatility — and feeders ran $5–15 lower at Oklahoma National the week of the announcement while cull cows moved $5–7.

Risk. A fixed floor gives up upside if the market firms into the fall run.

90-Day: Triage fall culling on welfare and margin, not the political calendar

Action. If the EO gets signed on the stated timeline, 90 days runs to roughly late November — putting expiry inside fall culling season. Sort your cull list by physical condition and production margin rather than by waiver dates.

Execution. Honest herd-health triage, and a hard read on which cows genuinely can’t wait. If a cow is thin enough to grade Lean or Light, the dressing-percentage discount is already working against you — per Oklahoma State Extension guidance, low-dressing cows are discounted $8 to $15/cwt against high-dressing cows, with the widest spreads on the thinnest grades.

Risk. A lame cow doesn’t wait for policy clarity. Holding her costs feed, risk, and eventually carcass value. Don’t turn a marketing call into a welfare problem.

90-Day: Recalculate beef-semen share against replacement cost

Action. Replacement dairy cows averaged $3,130 per head nationally in April 2026, up $270 from January, per USDA price reporting — a spread we broke down in our cull-cow replacement analysis.

Execution. Requires actual heifer inventory, projected cull rate, and a two-year forward view.

Risk. Cutting beef services to build heifers takes two years to show. You’d be making a 2028 herd decision on 2026 information, and the beef premium may well outlast this waiver.

365-Day: Separate salvage accounting from calf revenue

Action. Most operations track beef as one line. They’re two different exposures — imported lean trim hits salvage value directly, while calf values run off feeder futures and feedlot demand. Split them and track the ratio between what a cull brings and what her replacement costs.

Execution. A bookkeeping change and one conversation with whoever builds your financials. At $160/cwt liveweight on a 1,350 lb cull ($2,160/head) against $3,130 replacements, that ratio sits at 0.69. The 0.75 and 0.65 marks below are Bullvine working benchmarks, not industry standards — set your own against your actual replacement cost. Above roughly 0.75, with margin over feed holding, you have room to cull on production rather than defensively. Below 0.65, every cull decision becomes a capital decision.

Risk. The ratio moves on both numerator and denominator. A replacement-price spike can push you under 0.65 without cull prices falling at all — watch both sides.

365-Day: Consider whether feeding culls beats shipping them

Action. The same Berdusco work in the Journal of Dairy Science found 60 days of feeding before slaughter lifted hot carcass weight by 179 pounds and dressing percentage by 6.5 points over direct culls, with better marbling and tenderness.

Execution. Pen space, feed, and 60 days you’re not milking her. Run it against your own feed cost and the current Lean-to-Boning price spread before committing.

Risk. You’re feeding a cull cow at feedlot cost with no milk income against her. The spread has to cover the feed plus the opportunity cost of the stall, and a cow with a chronic problem may not finish.

365-Day: Watch the expiry harder than you watched the announcement

Three attempts in six months, two of them signed, none permanent. The repeat is the risk, not any single window.

What Happens When the 90 Days Run Out?

Three outcomes, and the record doesn’t tell you which. The waiver lapses and lean trim reverts to out-of-quota treatment. It extends, the way February staged tranches across a full year. Or it becomes a template — the tool this administration reaches for whenever retail beef prices make headlines.

That third one is worth pricing. February got signed. May got pulled. August got posted before it was drafted. You can’t forecast that pattern, but you can hedge it — which is why the LRP conversation matters more than the tariff conversation.

Key Takeaways

  • The 90% lean trim contract — where your culls actually get priced — held flat at $449 the day the waiver dropped, while fat trim fell $8. Whatever the market priced on August 21, it wasn’t a lean-trim shock.
  • Skip the $13 billion headline. NMPF said 20% of farm income, not a dollar figure, and independent reconstruction lands at $10.5 to $12.2 billion. Your own share comes off your settlement sheets, not a national average.
  • If your beef channel clears 18–20% of gross revenue, price LRP on both calves and culls this month. The cull cow coverage caps at 13 weeks — 91 days against a 90-day waiver, which is closer to a fit than anything else on offer.
  • Check whether you’re pricing culls off liveweight or somebody’s carcass cutout number. Dairy culls dress around 42.5% direct, so multiplying $351.50 cutout by live weight books roughly twice what she’ll bring.
  • February signed, May pulled, August posted before it was drafted. None permanent, all aimed at lean trim. Watch the late-November expiry harder than you watched the announcement.

The Trade-Off at the Center of This

The 90% lean trim contract didn’t move on announcement day, which tells you the market isn’t pricing this as the shock the headlines described. That’s the case for calm. The case for caution is that this is the third try in six months at the same product, and nothing about the pattern says it stops.

You built the beef line to protect the milk check, and it worked well enough to become a fifth of your revenue and a second exposure — priced by trade policy instead of Class III. You gained margin. You gave up control over where it comes from.

Pull your last four calf settlement sheets and your last cull cow check. Are you pricing culls off liveweight or off somebody’s carcass cutout number — and does your calf contract hand you a floor, or hand you the board?

Complete references and supporting documentation are available upon request by contacting the editorial team at editor@thebullvine.com.

Learn More

The Sunday Read Dairy Professionals Don’t Skip.

Every week, thousands of producers, breeders, and industry insiders open Bullvine Weekly for genetics insights, market shifts, and profit strategies they won’t find anywhere else. One email. Five minutes. Smarter decisions all week.
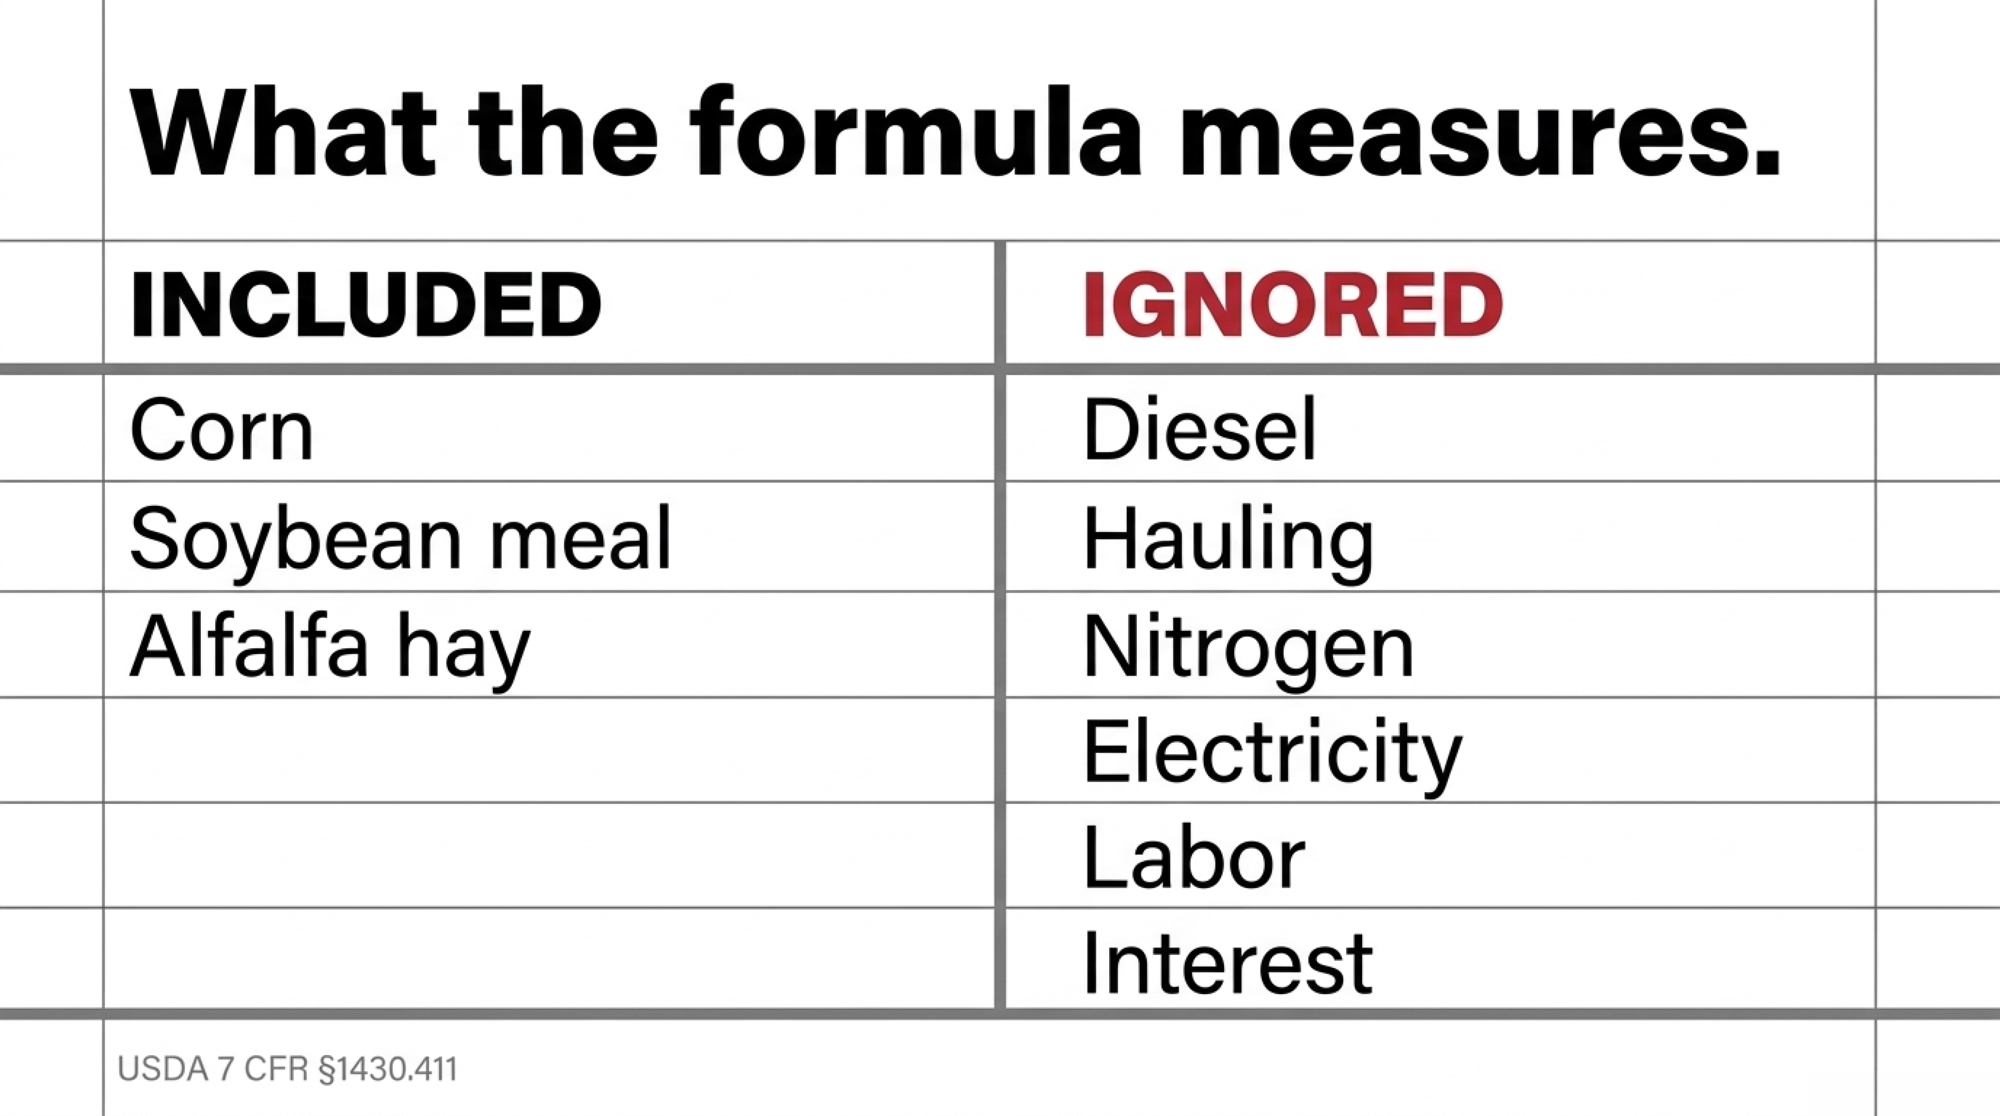
NewsSubscribe
First
Last
Consent

“It’s Not All Gravy”: What a DFA Director Told the Boston Globe About Who Carries the Freight After St. Albans

81 jobs gone, one Vermont plant idled since August 17, and about 24 extra miles before hauling starts eating 1% of your gross.

EXECUTIVE SUMMARY: A DFA board member has now said on the record what most Northeast members suspected: when milk gets rerouted to better-paying plants, farmers pay the added freight themselves. Harold Howrigan — 1,200 Holsteins in Fairfield, Vermont, and a seat on both the DFA and NMPF boards — confirmed to the Boston Globe that the higher returns flow back, minus the freight. DFA idled its St. Albans plant on August 17, cutting 81 jobs per the WARN notice, and is sending that milk to Garelick Farms in Franklin, Massachusetts, and newer western New York capacity. Run USDA’s Federal Order 1 mileage factor of $0.00824/cwt/mile against the August 19 all-milk forecast of $19.85, and the threshold lands at 24 extra one-way miles — that’s where freight eats 1% of gross, and the percentage holds whether you milk 120 cows or 500. At 50 added miles, a 400-cow herd is out $42,106 a year; at 180 miles, you’re handing over 7.5% of gross before feed, labor, or interest. Basis moves too, quietly, because a new receiving plant means a new Order 1 pooling point and a different Class I location adjustment. If your milk moved this summer and nobody has given you the mileage in writing, the table below is where you start.

DFA St. Albans closure

Harold Howrigan’s family operation milks 1,200 Holsteins across four facilities in Fairfield, Vermont, and he sits on the boards of both Dairy Farmers of America and the National Milk Producers Federation. When DFA idled its St. Albans plant this month and began routing that milk to better-paying plants, Howrigan told the Boston Globe the higher returns do flow back to farmers. Then he added the part that lands at the farm gate: it’s “not all gravy,” because farmers pay the increased transportation costs themselves.

StakeholderWhat ChangedNotice GivenDollar/Job Impact
St. Albans plant workersPlant idled Aug 17, 202615 minutes before public announcement81 jobs cut per WARN filing
200-cow Northeast farmMilk rerouted +50 miles to Garelick Farms/western NYNo written mileage notice required$21,053/yr (2.1% of gross)
400-cow Northeast farmMilk rerouted +100 milesNo written mileage notice required$84,213/yr (4.2% of gross)
Teamsters Local 597Filed federal suit alleging retaliationTRO granted, then denied on Aug 20Case moved to arbitration, no ruling yet

That’s a cooperative director describing where the bill goes. Up the road, 81 people lost their jobs at the St. Albans creamery, per the WARN notice DFA filed with Vermont on June 17. If your milk moved through that plant, freight is the line that keeps costing money long after the news trucks leave. Here’s what changed, what it costs, and what you can ask for this month.

What Changed at St. Albans, and When

DFA announced on June 17 that it would idle the St. Albans plant and the adjoining creamery and supply store effective August 17, citing “broader operational and network changes.” The WARN notice filed the same day listed 81 employees at 158 Federal Street. DFA also told VTDigger it was providing affected employees with transition support, including severance pay.

Tom Bellavance, who represents Vermont on the DFA board, gave members a more specific read at a Grand Isle meeting in July: Vermont milk production has been flat for years while American demand shifted toward protein — yogurt, protein powder — and away from what that plant was built to make. St. Albans was a balancing facility, making cream, skim and powder. Balancing plants soak up volume when fluid demand dips, and Bellavance argued that DFA earns more trucking that milk to higher-value fluid plants instead. Where’s it going? He named Garelick Farms in Franklin, Massachusetts, along with DFA’s newer western New York capacity.

Curtis Clough, president of Teamsters Local 597, framed the stakes past the plant gate in an August 20 statement: “Dairy farmers in the St. Albans area are already facing enormous pressure from rising costs, volatile milk prices, and an increasingly concentrated dairy industry. Idling this creamery would only make those challenges worse by disrupting a facility that local farmers, workers, and families have relied on for generations.” Worth noting he didn’t reach for the retaliation argument in June. Clough told Vermont Public at the time it was “possible” DFA was retaliating for the fall strike, but pointed to broader economic forces squeezing Vermont dairy.

What the Court Actually Ordered

Local 597 later sued in federal court alleging the idling was retaliation for a two-week strike in fall 2025, and said it had found an internal memo supporting that claim. According to the complaint, supervisors allegedly told employees the closure “never would have happened if it was not for the Union,” and one described the strike as “disgusting.” DFA calls the memo fake and told reporters any suggestion the closure was retaliatory is “ridiculous and inaccurate.” The company has also said the plant faced financial headwinds for years, a point WCAX reported industry observers echoed. None of these allegations has been tested in arbitration or court.

Judge William K. Sessions III granted a five-day temporary restraining order on August 17 in case 2:26-cv-00281, District of Vermont, ordering DFA to “cease implementation of the St. Albans facility closure” until the court could weigh the evidence on August 20. At that hearing, he declined to extend the order, and the dispute moved to arbitration.

Two details from that hearing matter. DFA’s attorneys told the court operations had already ceased before the restraining order was issued. And the protection against dismantling equipment or selling the building rests on DFA’s assurances in an informal arrangement Sessions brokered — not a standing injunction. The plant could reopen if the arbitrator finds the closure improper.

How This Plays Out on Real Farms

St. Albans isn’t one closure. It’s the fourth in about 18 months in that corner of Vermont. Booth Brothers in Barre, the state’s last commercial fluid bottler, closed in April 2026 after roughly 80 years. Franklin Foods in Enosburgh Falls, a 125-year-old cream cheese maker, closed this summer. Perrigo’s infant formula plant rounds out the four. The cows didn’t leave. The doors did.

PlantProductClosedYears OperatingJobs Affected
Booth Brothers, BarreFluid milk bottlingApril 2026~80 yearsNot disclosed in reporting
Franklin Foods, Enosburgh FallsCream cheeseSummer 2026125 years~100 (down to ~20 under new owner)
Perrigo infant formula plantInfant formula2025–2026 windowN/ANot disclosed in reporting
St. Albans creamery (DFA)Cream, skim, powder (balancing plant)August 17, 2026Decades81 (per WARN notice)

Mary White farms in Corinth and serves as president of the Vermont Farm Bureau. Her worry isn’t the rate — it’s whether the truck comes at all. “If they say, ‘No, you’re too far out there,’ we’re out of business,” she told the Boston Globe. That’s the risk that never shows up on a spreadsheet. In the same reporting, Whitney Hull, a dairy herd management educator with UVM Extension, described the mood plainly: “It’s felt like quite a blow. Dairy farmers are upset, and they’re frustrated, and they’re like, ‘What does this mean for us?'”

So here’s the math that answers her question. USDA’s Agricultural Marketing Service sets a Federal Order 1 mileage rate factor of $0.00824 per hundredweight per mile. Find your herd size and your added distance:

Herd SizeAnnual Volume (cwt)+24 Miles+50 Miles+100 Miles+180 Miles
120 cows30,660$6,063 (1.0%)$12,632 (2.1%)$25,264 (4.2%)$45,475 (7.5%)
200 cows51,100$10,106 (1.0%)$21,053 (2.1%)$42,106 (4.2%)$75,792 (7.5%)
400 cows102,200$20,211 (1.0%)$42,106 (2.1%)$84,213 (4.2%)$151,583 (7.5%)
500 cows127,750$25,264 (1.0%)$52,633 (2.1%)$105,266 (4.2%)$189,479 (7.5%)

Assumes 70 lb/cow/day, 365 days, one-way added miles at USDA’s $0.00824/cwt/mile. Percentages are added freight as a share of gross milk revenue at USDA’s August 19 all-milk forecast of $19.85/cwt. Per-cwt cost: 24 miles = 19.8¢, 50 miles = 41.2¢, 100 miles = 82.4¢, 180 miles = $1.48. That $42,106 shows up twice on purpose — 200 cows at +100 miles and 400 cows at +50 miles land on the same number, because double the volume at half the distance is the same freight bill.

Look down the percentage columns. They don’t move. A 120-cow herd and a 500-cow herd give up the same share of gross at the same added distance — the dollars scale, the pain doesn’t discriminate. And the National Milk Producers Federation pegs real-world hauling higher, around $0.92 to $1.00 per cwt per 100 miles, so treat these as your floor, not your estimate.

Why Did the 24-Mile Line Move In?

Because milk got cheaper, not because freight got dearer. Earlier Bullvine modeling put the 1%-of-gross threshold at 25 to 26 added miles using a $21.07 blend. USDA has since revised its 2026 all-milk forecast down twice — to $20.70 in June, then to $19.85 as of August 19. Same mileage factor, thinner revenue underneath it, so the line pulls in to about 24 miles.

That’s the part worth sitting with. Every dollar off the milk price shortens the distance you can absorb before freight becomes a line item you manage rather than one you ignore. Where does your breakeven sit if hauling jumps 40 to 80 cents a cwt?

The Mechanics Behind the Outcomes

One reroute hits your check twice, and you’ll only see one of them coming. The hauling deduction climbs with every mile and sits right there on the stub. Basis is the quiet one.

Under Federal Order 1, the location of the plant receiving your milk feeds into Class I differentials and your pooling point. When a nearby plant goes idle, your milk gets pooled somewhere else on the map, and that new point carries its own location adjustment. Order 1’s March 2026 schedule lists St. Albans/Swanton at a 4.20 Class I differential with a −0.90 adjustment; Middlebury sits at 4.30 and −0.80. Small numbers that move real money at volume.

Both directions were in play through 2026. The June 2025 FMMO reform lifted Class I location differentials across the Northeast, which helps. Pulling the other way, the new make-allowance provisions trimmed class prices by roughly 85 to 93 cents per cwt nationally in their first three months, pulling an estimated $337 million out of producer pools according to American Farm Bureau analysis. Longer haul, thinner pool.

There’s a structural reason this keeps happening. Laura Ginsburg, Vermont’s dairy strategy manager, put it bluntly to the Globe when describing where processors now build: “They build a plant and the milk is gonna come.” Energy and labor cost less elsewhere. Vermont Agriculture Secretary Anson Tebbetts calls dairy a $5.4 billion industry in the state and says what it needs is more cows. Those two statements sit uneasily together, and that tension is the story of the last 18 months. It’s also the slow version of a trend we’ve mapped before — 

What Can You Actually Demand in Writing?

More than most members do. You can request, in writing, which plant is taking your milk, what the freight and location differential are, and how you’ll be told when the route changes again. That last one is the question almost nobody asks. The first reroute you see coming because it’s in the news. It’s the second and third — quiet, no press release — that catch you behind the math.

Notice how little warning the people closest to the plant got. Clough told VTDigger the decision came “out of the blue,” and that DFA informed workers 15 minutes before its public announcement. A DFA spokesperson confirmed to VTDigger that workers were alerted that Wednesday morning. If the notice window for 81 employees was fifteen minutes, it’s fair to ask what yours looks like for a routing change.

Worth knowing what you won’t automatically get. Federal rules require private handlers to itemize component prices, deductions, and the producer price differential, while cooperatives are exempt as farmer-owned. A University of Wisconsin Extension report found 70% of cooperative pay statements lacked full explanations for deductions over $0.25 per hundredweight. So if a deduction on your statement says “market adjustment” and nothing else, asking for the breakdown is a reasonable request, not an accusation.

Options and Trade-Offs for Farmers

Get your routing in writing. That’s the 30-day move. Sit down with your field rep and ask for a farm-specific routing and hauling profile for the next 12 months: which plant, how many miles, what rate per cwt, what location differential, and how you’ll be notified when it changes. Makes the most sense right now, while arbitration keeps St. Albans in limbo and nobody’s committed to a permanent network. Costs you one meeting and the nerve to ask twice. A co-op can decline to put any of it on paper — and that answer tells you something too.

Price an alternative handler inside your radius. Worth doing if another processor sits within 75 to 100 miles, and it requires running the same math on the new option: basis, premiums, volume commitment, freight. The catch is real. Writing in the Vermont Daily Chronicle on June 22, White argued the Northeast conventional market has effectively closed to new entrants, pointing to cooperatives limiting new memberships. Make the call anyway before you assume the door’s shut.

Look at what John Ovitt did. He spent 37 years working in the Enosburgh Falls cream cheese plant. When Hochland decided to shut its U.S. operations, Ovitt didn’t just stay through the closure — he moved to buy the building himself and reopen it with about 20 workers, down from the nearly 100 it once employed. That’s not a template most farms can copy. But it’s the clearest argument going that nearby processing is worth something beyond the jobs number, and if you’re within reach of a small processor, a school, or a direct market, shaving 10 to 15% of your volume into a shorter, higher-value channel buys room when long-haul costs spike. It won’t replace a big contract. Nobody should pretend otherwise.

Ask the base-program question before it’s asked of you. In October 2019, Agri-Mark told members that milk shipped above each farm’s base would carry a $5/cwt penalty starting that January. DFA says it doesn’t cap member production and hasn’t announced any base program tied to these closures. The Agri-Mark episode isn’t a prediction. It’s evidence that when a region runs short of plants, the rules members live under eventually change.

Key Takeaways

  • Audit your added mileage. If your route lengthened more than 24 miles and your hauling deduction didn’t move to match, ask for the numbers in writing — that’s the 1% of gross line at 70 lb/cow/day against USDA’s August 19 forecast of $19.85, whatever your herd size.
  • Demand a specific plant destination. If your co-op named a state but not a plant, you can’t run freight or basis math. Garelick Farms in Franklin, Massachusetts is a named destination; “New York, Massachusetts, or Maine” isn’t something you can budget against.
  • Calculate your basis swing. If your milk moved to a different Order 1 location, pull both Class I location adjustments and price the difference — basis hides where the freight line doesn’t.
  • Lock down your notification terms. If you don’t have a written 12-month routing-and-notification commitment, that’s the highest-value ask on your table this month. Fifteen minutes was the notice DFA’s own workers got.
  • Pressure-test your over-base exposure. If you ship above base, put the Agri-Mark 2019 precedent in front of your co-op and ask how excess milk gets handled if regional processing keeps tightening.
  • Run your buyer concentration past your lender. If a single buyer takes a large share of your monthly volume, ask where their concentration comfort line sits — and whether your current mix clears it.

An arbitrator will decide whether idling St. Albans was proper, and the plant could reopen if that ruling goes the union’s way. Meanwhile, the milk moves every other day regardless of what’s on the docket. Howrigan already described who carries the transportation cost — so do you know your own number, or will you find it on a stub three months from now?

Find your row in the table above, then pull three milk checks and see whether the deduction matches.

This article is based on court records, WARN filings, and published reporting available as of August 25, 2026. Allegations described in the Teamsters’ complaint have not been tested in arbitration or court.

Complete references and supporting documentation are available upon request by contacting the editorial team at editor@thebullvine.com.

Learn More

The Sunday Read Dairy Professionals Don’t Skip.

Every week, thousands of producers, breeders, and industry insiders open Bullvine Weekly for genetics insights, market shifts, and profit strategies they won’t find anywhere else. One email. Five minutes. Smarter decisions all week.
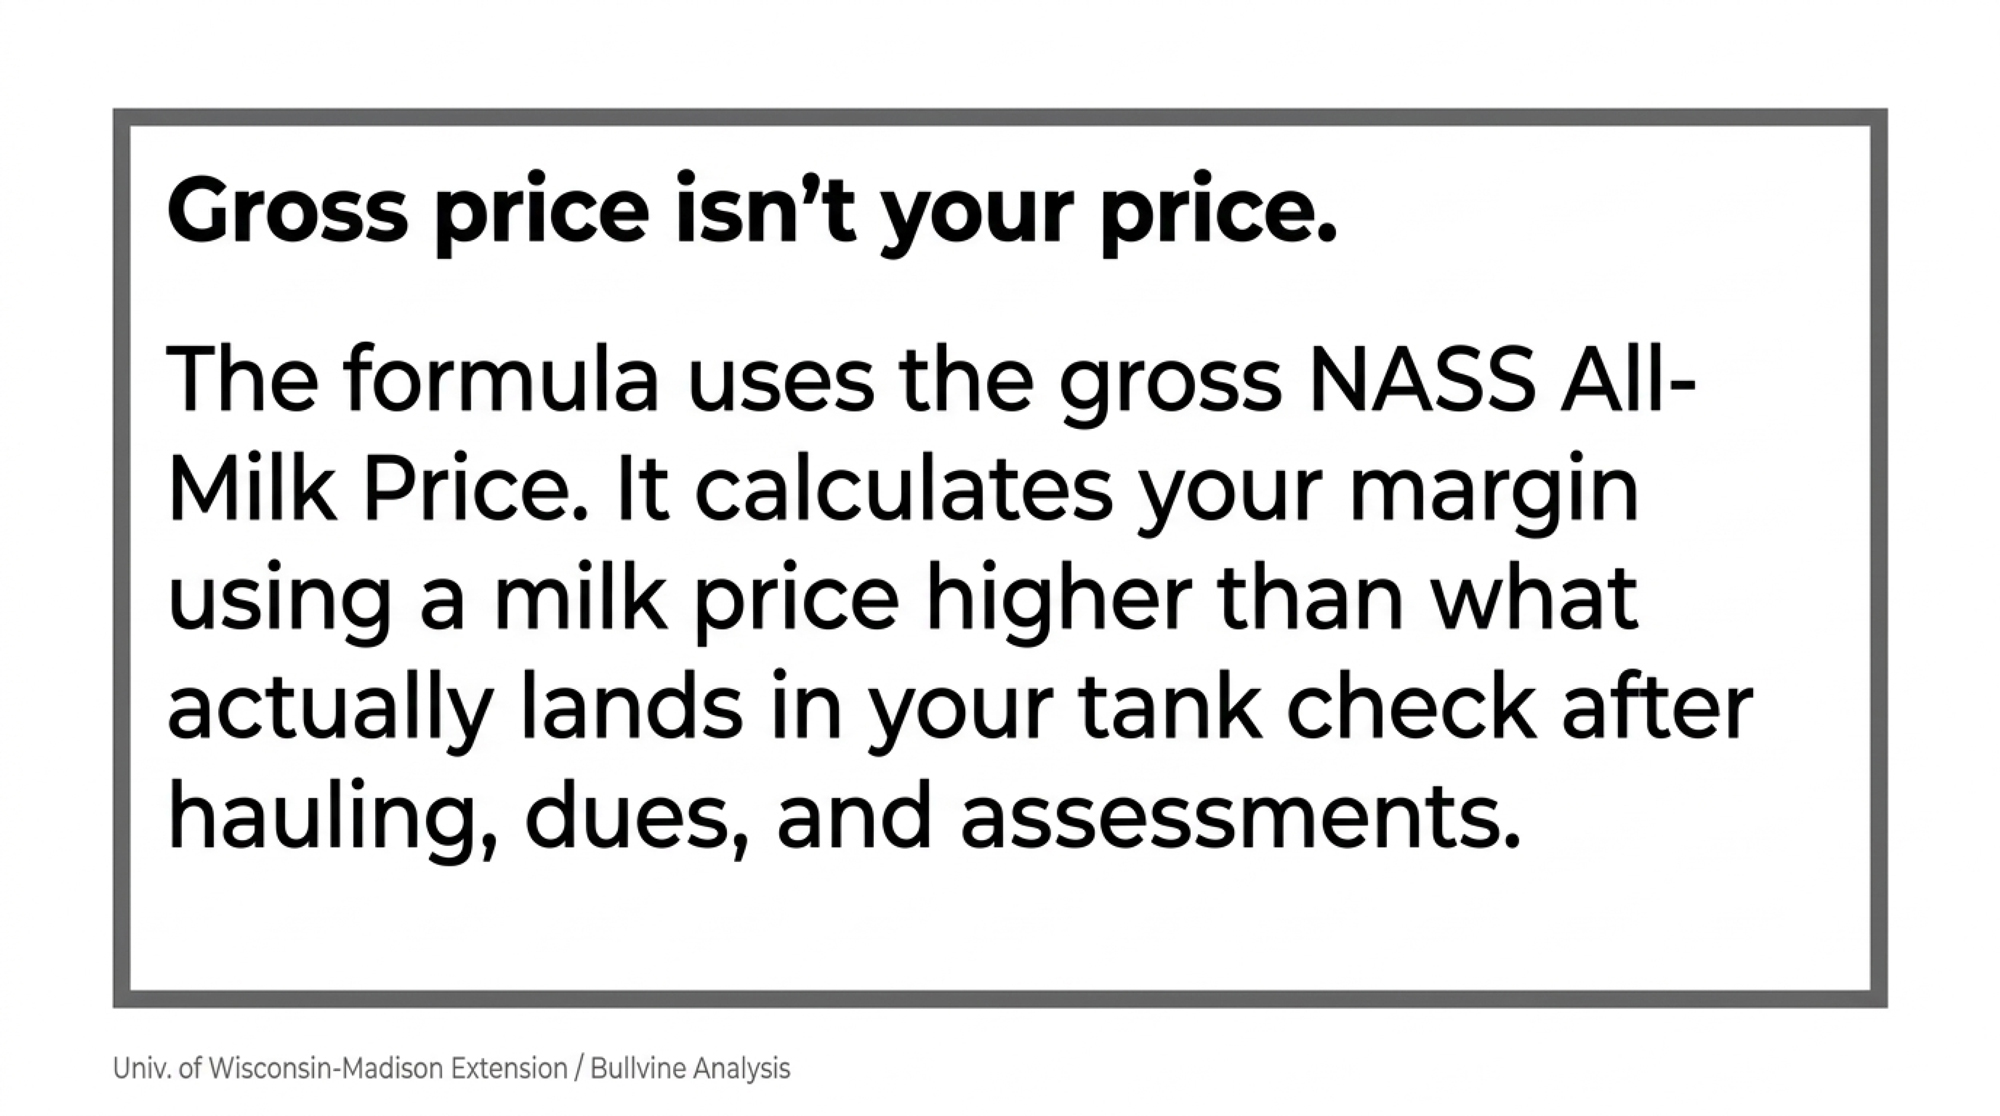
NewsSubscribe
First
Last
Consent

Canada’s Cheese Quota Filled 99% in 2024. Your DFO Exchange Filled Zero.

Three of four DFO exchanges have been cancelled since May. In May, 1,978 producers bid; eighteen had quota to sell. The tariff fight can’t reach your cheque. That can.

Executive Summary: Dairy Farmers of Ontario cancelled the May, July and August 2026 quota exchanges for insufficient quota offered — in May, 1,978 producers bid on 26,153.61 kg of butterfat while eighteen offered 138.39 kg, roughly $628 million in bids against $3.3 million of supply at the $24,000 cap. March cleared 190.60 kg against 25,628 kg bid, a 0.744% buyer success rate, which works out to about a tenth of a kilogram per bidder if it had spread evenly. Meanwhile Canada’s USMCA all-cheeses tariff-rate quota filled to 99% in 2024, so the 50% Section 338 tariff that landed Aug. 22 can’t push more cheese north — the fight is over who holds the import permits, not how much crosses. For P5 quota holders, that permit fight has no documented path to your milk cheque: the National Pricing Formula runs on cost of production and CPI, and cheese import rent isn’t an input, which means the $22.4–$34.4 million in duty that allocation holders skip accrues to processors and distributors, not producers. If expansion quota sits in your 2027 capital plan, that’s a financing-timing conversation with your lender now, not a spring problem. Watch Oct. 1, when Global Affairs Canada publishes the Notice to Importers for the 2027 cheese year — if eligibility still reads processor, further processor, distributor with retailers excluded, the rule rolls forward another year, and U.S. pressure hasn’t moved Ottawa.

DFO quota exchange

If you’re adjusting your 2027 expansion plans around U.S. cheese tariff headlines, you’re watching the wrong border.

Canada’s USMCA all-cheeses tariff-rate quota was filled to 99% in 2024, per Global Affairs Canada data published in USDA Foreign Agricultural Service’s Canada Dairy and Products Annual (Report CA2025-0038, Nov. 21, 2025). The 50% Section 338 tariff that hit Canadian goods at 12:01 a.m. on Aug. 22, 2026 won’t move more cheese north. There’s no room left.

This USMCA cheese quota dispute in dairy 2026 is a fight over import permits, not milk supply. For a P5 quota holder, that means it doesn’t reach your cheque — and it won’t soon.

Here’s what does reach you. Across the four monthly quota exchanges from May through August 2026, Dairy Farmers of Ontario cancelled three for insufficient quota offered for sale. In May, 1,978 producers placed bids on 26,153.61 kg of butterfat per day. Eighteen producers offered 138.39 kg. At the $24,000 cap, that’s roughly $628 million in bids against $3.3 million in available supply.

Three cancellations in four months. That’s your constraint. Not Washington.

What Three Cancelled DFO Exchanges Cost an Expanding Ontario Herd

Ontario and the other P5 provinces — Quebec, New Brunswick, Nova Scotia, PEI — cap quota at CA$24,000 per kilogram of butterfat per day. It is a provincial policy ceiling, not a market-clearing price, and not driven by import competition.

That cap has a history worth knowing. The P5 provinces built a quota pricing mechanism in December 2008 as values climbed. Ontario and Quebec capped at $25,000/kg in 2010, and Quebec cut its ceiling to $24,000 in February 2016 (Library of Parliament, Canada’s Supply Management System). The $24,000 figure now applies across all five P5 provinces, confirmed as current in DFO’s August 2025 markets report and again in Dairynomics, milkproducer.ca, Apr. 27, 2026. British Columbia sits outside the pool at $35,500 — proof the number is a policy choice, not market physics.

The March 19, 2026 exchange cleared, barely. DFO reported 1,908 producers bidding to buy against 18 offering to sell. Of 25,628 kg bid, 190.60 kg actually traded — a 0.744% average buyer success rate, DFO’s own figure, calculated on kilograms cleared rather than producers served. Everything traded at the cap.

Then May was cancelled under policy. June ran. July cancelled. August cancelled.

Running the Numbers

Start with what DFO published across three exchanges and work it two ways.

ExchangeProducers BiddingKg BidKg ClearedBuyer Success Rate
January 20261,82825,266.37250.100.734%
March 20261,90825,628.00190.600.744%
May 20261,97826,153.610 — Cancelled
July 20260 — Cancelled
August 20260 — Cancelled

DFO monthly quota exchange summaries. January figures from DFO’s posted summary dated Jan. 2, 2026; that exchange settled in phases, with 182.60 kg moving through allotment rounds and 2.50 kg through proration at 0.021%.

Run the arithmetic. March: 25,628 kg × $24,000 = $615.1 million in bids, chasing 190.60 kg × $24,000 = $4.57 million in quota. Divide cleared volume by bidders — 190.60 ÷ 1,908 = 0.0999 kg per bidder, if it had spread evenly. It didn’t; DFO allocates by allotment rounds first, then proration.

January was marginally better and still thin: 250.10 ÷ 1,828 = 0.137 kg per bidder.

Scale it to a herd. Ontario’s provincial average butterfat composition ran 4.4655 kg/hL in February 2026 (Dairynomics, Apr. 27, 2026). A herd needing one additional kilogram of butterfat per day faces $24,000 of capital at the cap, before financing. Two consecutive cleared exchanges would have delivered roughly a quarter of that kilogram to the average bidder.

Then May, July, and August delivered nothing at all.

So the practical math for an expanding Ontario operation isn’t a price question. It’s an availability question, and the answer was “no market” in three of those four months. Whatever your 2027 plan assumes about buying quota on the exchange, test it against a market that cleared 250 kg in January, 190 kg in March, and was cancelled three times between May and August.

[VISUAL: bar chart of cleared kilograms by month, January through August 2026, with cancelled months shown as zero bars against a flat line for total kilograms bid.]

Related reading: why new Ontario quota at 6% bleeds cash

Why the 42% Fill Rate Everyone’s Citing Describes the Wrong Quota

Now the trade fight, and why it’s the wrong thing to watch.

The number running through trade press — including The Bullvine’s own earlier coverage — is that Canada’s dairy TRQs sit badly underfilled. Roughly 42% across 14 categories. Something like $200 million in blocked access.

Real number. Also an aggregate, and aggregates bury things.

Trade AgreementAll Cheeses (2024 Fill)Industrial Cheese (2024 Fill)
USMCA (U.S.)99%59%
WTO95%
CETA (EU)95%79%
CPTPP98%1%

Global Affairs Canada data via USDA FAS Report CA2025-0038, Nov. 21, 2025. CPTPP mozzarella and prepared cheese filled 46% in the same year. Al Mussell at the C.D. Howe Institute found roughly 97–99% across all four systems for 2025 in an Aug. 18, 2026 working paper, drawing on the same GAC source.

Industrial cheese feeds further processing. It never hits a retail cooler. The Globe and Mail flagged the pattern on July 14, 2025, reporting 83% of the cheese-of-all-types allotment filled in 2024 — highest of any category.

Two things keep the correction honest. Fill rates were genuinely low in earlier periods — Dairy Farmers of Canada’s own Quarterly Skim put CETA cheese at 43% as of July 31, 2022. And the composite spans categories that behave nothing alike, from CPTPP industrial cheese at 1% to USMCA all-cheeses at 99%. The aggregate measured something true in its year, then traveled into a conversation about retail cheese where it doesn’t apply.

Related reading: the $200M access gap is worth a nickel

What Is the U.S. Actually Asking For in the CUSMA Cheese Quota Dispute?

Eligibility. Not volume.

USMCA allocations go to Canadian processors, further processors, and distributors, awarded on historical market share from the prior Oct. 1–Sept. 30 reference period. The Notice to Importers puts it plainly, as reproduced in the panel record: “Retailers are not eligible for an allocation.”

CETA runs differently. USDA FAS documents a 50/50 split — dairy processors, about 45 companies, on one side; distributors and retailers, about 175 companies, on the other. Within each class, 30% of volume goes to small and medium companies, 20% to large ones.

Read that second class carefully. Distributors and retailers together hold half the CETA all-cheeses quota, and FAS doesn’t separate the two. So the defensible framing is that CETA admits retailers to a class worth half the quota while USMCA bars them outright. How much of that half lands with grocers rather than distributors isn’t in the public data, and the proclamation’s discrimination argument is only as strong as that unpublished number.

That asymmetry is what the July 20, 2026 proclamation is built on.

The most useful voice here belongs to someone already inside the system. Joe Dal Ferro runs Finica Food Specialties in Mississauga and chairs the International Cheese Council of Canada. Finica appears on Global Affairs Canada’s 2026 CETA Cheese of All Types quota holders list, published Jan. 26, 2026 — so he holds quota under a system he’s arguing should admit more competitors. He’s given his reasons publicly and consistently: fairness, consumer variety, and free-market principle.

“This is unfair and goes against the spirit of the trade agreement and free market economics,” Dal Ferro told the Globe and Mail on July 14, 2025, speaking as ICCC chair. Processors holding quota, he said in that same reporting, “are not interested in providing variety to the Canadian consumer.”

Dairy Farmers of Canada reads it differently. As the tariff deadline approached, DFC warned publicly against further concessions on dairy market access, arguing food sovereignty shouldn’t be traded away — reported by CityNews Edmonton on Aug. 6, 2026. Two Canadian industry bodies, opposite conclusions, both on the record.

Dal Ferro walked through the mechanics for Grocery Business on Mar. 20, 2025. “The Canadian government allocates quotas for importers to bring in American cheese. So if an importer is a holder of quotas, there is zero duty on the cheese. It’s only when an importer goes over the quota access or if an importer is not a holder of a quota for cheeses from the US that you then pay the 245% tariff.”

His number checks out, and the schedule is harsher than a single percentage suggests. Canada’s Customs Tariff sets the over-access rate for heading 04.06 at 245.5%, with a per-kilogram floor varying by cheese type — not less than $3.58/kg on grated cheddar, $4.52/kg on fresh cheese, $5.08/kg on Parmesan and Provolone types, $5.33/kg on blue-veined, $5.50/kg on Brie types. Global Affairs Canada’s WTO cheese notice confirms it: ship without a specific import permit, and you’re classified at 245.5% plus the floor.

That floor is why Dal Ferro called over-quota transactions “nearly impossible.” On premium product, the minimum duty alone can run past the cheese’s landed value.

State his position plainly. Dal Ferro chairs an importers’ association. The ICCC filed its submission in the CPTPP cheese TRQ dispute on May 19, 2023, under his name as chair. His members gain from broader access. That doesn’t make him wrong — it makes him a party with an interest, which isn’t the same as a neutral analyst.

Who Actually Has Skin in This Game, If Not the Farm

Exposure sits one layer above the barn, and it’s quantifiable.

Holding a permit is worth money because it lets you skip costs. Import cheese with an allocation and you pay nothing. Import the same cheese without one and you pay 245.5% plus the floor. That gap, multiplied by volume, is the import rent — and it lands on whoever holds the paper.

Two of three inputs are solid. Volume: USMCA all-cheeses access for 2026 is 6,313 tonnes, rising to 7,113 by 2038 (USDA FAS, CA2025-0038). At the 99% fill recorded in 2024, roughly 6,250 tonnes enter duty-free. Rate: 245.5% with those per-kilogram floors.

Landed cost per tonne is the missing term — Statistics Canada and GAC report volume and value at aggregate levels that don’t isolate USMCA-permit cheese.

Bracket it with the floors instead. Grated cheddar carries a minimum over-access duty of $3.58/kg, or $3,580 per tonne before the ad valorem calculation applies at all. Across 6,250 tonnes, that’s about $22.4 million in duty avoided at the low end. On Brie types at $5.50/kg, roughly $34.4 million. Product mix decides where inside that band the real number sits, and the 245.5% component pushes it higher wherever landed value clears the floor.

Floor estimate, not the rent. True rent is larger and unknowable from public sources.

That $22.4–$34.4 million band is what allocation holders collectively don’t pay. It accrues to processors and distributors. Not to producers.

The wider trade at stake is modest. Canadian cheese exports to the U.S. run around US$80 million, Canadian imports of U.S. dairy products around US$400 million, per Mussell’s Aug. 18, 2026 analysis — recent annual figures, no single year specified, and the US$400 million covers dairy broadly rather than cheese alone. The Section 338 dairy proclamation covers 52 HTSUS subheadings representing US$97.2 million of 2024 imports, per White & Case analysis dated July 24, 2026, cited by Peacock Tariff Consulting on Aug. 5, 2026.

The U.S. is already Canada’s second-largest cheese supplier by volume. January through August 2025: 14,196 tonnes, 36.3% of total Canadian cheese imports, up 6.8% year over year. EU-27 held 49.7% at 19,392 tonnes. Total imports: 39,055 tonnes, up 8.7% — Trade Data Monitor figures via USDA FAS.

And the roster of permit holders is about to shift. Lactalis Canada announced a definitive agreement on July 15, 2026, to acquire Agropur Cooperative’s fine cheese division — the OKA, Monsieur Gustav and L’Extra brands, two production facilities at Oka and Saint-Hyacinthe, roughly 400 workers, and Agropur’s fine cheese import activities. CBC reported the division generates roughly $200 million annually. Financial terms weren’t disclosed.

The deal hasn’t closed. Both companies confirmed the transaction remains subject to customary closing conditions and approval by Competition Bureau Canada. Lactalis described it as adding to a portfolio that already includes Galbani, Président, Cracker Barrel, Black Diamond and P’tit Québec, and nothing in the public record links it to the trade action.

What matters either way: if it clears, the companies holding cheese import rights change — and 2027 allocations get calculated on market share from a reference period that includes this transition.

Why the Trade Fight Can’t Reach Your Milk Cheque

Mussell’s answer is no, and the reasoning runs through the pricing formula.

He concludes there’s no direct mechanism for reduced processor margins to lower raw milk prices. USDA FAS documents why the structure blocks it: Canadian milk component prices are set by the National Pricing Formula — “50 percent based on changes in the cost of production and 50 percent on changes in the Consumer Price Index” — determined at year-end and effective Feb. 1.

Cost of production and CPI. Cheese import rent isn’t an input. A processor losing import margin has no channel to push it down.

Not everyone frames access that way. The Canadian Centre for Policy Alternatives estimated on May 25, 2026, that CUSMA represents an annual loss to domestic producers equivalent to 8.4% of milk production — an argument that market access carries real producer cost even where no line-item mechanism exists. Mussell’s point is narrower and mechanical: this particular permit fight has no documented path to your cheque.

Three scenarios, one outcome where it counts:

VariableRetailer Access ShiftStatus Quo HoldsDFO Exchange Freeze
Permit rent ($22.4–$34.4M band)Shifts toward grocersAccrues to processors and distributorsIrrelevant to trade file
Processor marginCompression, unquantifiedStableNo effect
Farm-gate milk priceZero documented mechanismZero documented mechanismZero documented mechanism
P5 quota valueZero documented mechanismZero documented mechanismCapped at $24,000/kg, unmoved
Exchange quota availabilityUnaffectedUnaffectedNone — 3 of 4 months, May–Aug 2026

Read the bottom two rows. Both trade columns are empty where it matters to you, and the third column is the only one with a number attached. Note what that last row does and doesn’t say: the exchange quota was unavailable. Incentive days, component strategy, and productivity gains per cow stayed open the whole time.

Here’s the farm-side calculation, in words, because one input is structurally absent:

(processor margin change from an eligibility shift) × (pass-through rate to the National Pricing Formula) × (quota capitalization multiple) = quota value effect per kg BF

The middle term breaks the chain. The NPF runs on cost of production and CPI, so the pass-through rate is zero and zeroes the product. Any other figure needs an assumption that no published source supports.

There’s no herd-scoped version of this particular calculation, and that absence is the finding rather than a gap in the reporting. Anyone publishing a per-cwt or per-kilogram farm impact from the trade dispute is filling that hole with a guess. The DFO exchange math earlier in this piece is different — that’s real, published, and it’s the number that touches your balance sheet.

Where the permit actually travels

StageUnder USMCAUnder CETA
Import right issuedGlobal Affairs CanadaGlobal Affairs Canada
Allocation basisHistorical market share, Oct. 1–Sept. 3050/50 processor vs. distributor-retailer class
ProcessorEligibleEligible (~45 companies)
Further processorEligibleEligible
DistributorEligibleEligible (~175 companies with retailers)
RetailerBlockedEligible
Retail shelfReached via processor or distributorReached directly or via distributor

That single blocked row is the entire basis of the July 20 proclamation.

The Statutory Problem Two Georgetown Scholars Raised

Section 338 of the Tariff Act of 1930, at 19 U.S.C. § 1338, permits duties up to 50% where the President finds a country “discriminates in fact against the commerce of the United States… in such manner as to place the commerce of the United States at a disadvantage compared with the commerce of any foreign country.”

July 20, 2026 was the first invocation in 96 years, per White & Case’s July 24, 2026 analysis.

Why this matters for the Oct. 1 notice: two tribunals have already ruled, and neither left Ottawa under any treaty obligation to change eligibility.

The treaty record

  • December 2021, USMCA panel — found Canada’s practice of reserving 85–100% of dairy TRQ pools for processors inconsistent with CUSMA. Canada revised.
  • Nov. 10, 2023, second USMCA panel — report issued, public Nov. 24. Split 2-1 on the retailer question specifically.
  • Per USTR’s own release: “Two of the three panelists found that Canada’s measures do not breach any of the USMCA commitments that the United States cited. One panelist, however, agreed with a principal U.S. claim challenging Canada’s narrow definition of eligible applicants.” The dissenter “agreed with the United States that by excluding retailers and others, Canada was breaching its commitment to make its dairy TRQs available to all applicants active in the Canadian food or agriculture sector.”
  • Global Affairs Canada’s record: the panel “ruled in Canada’s favour on all claims,” and Canada “is not required to make any changes.” CUSMA provides no appeal.
  • New Zealand’s CPTPP challenge — per Agriculture and Agri-Food Canada’s question-period note, the panel found against Canada on 2 of 6 claims: Canada violated its obligation to let importers “utilize TRQ quantities fully,” and processor-reserved pools violated the obligation not to “limit access to an allocation to processors.” On retailers, the majority held that “Canada’s exclusion of retailers from TRQ eligibility falls within Canada’s discretion.”
  • Canada’s response to that ruling: it was “very pleased” the panel “recognized that Canada has a margin of discretion in setting its TRQ allocation policies, including determining who is eligible.”

Washington’s claim against that record

One arbitrator of three agreed with the U.S. core complaint. A one-vote margin on the retailer question — and that’s the foundation for invoking a statute untouched since 1930.

The legal vulnerability

Georgetown scholars Peter Harrell and Jennifer Hillman published a critique on Aug. 3, 2026 via the Volokh Conspiracy at Reason. Three arguments, each narrow:

  • The comparative-language problem. Canada applies the processor-and-distributor restriction to every trading partner except the EU. Treatment identical to nearly every other country isn’t discrimination against the United States under the statute’s own wording. “Canada’s dairy practices do not treat American goods differently than those from ‘every foreign country,'” they wrote.
  • The self-negotiation problem. “It is incongruous, to say the least, for the United States to denounce as discriminatory the very terms it agreed to.” The U.S. negotiated those terms. Congress approved them.
  • The procedural gap. No evidence shows the International Trade Commission conducted fact-finding before the proclamations, despite Section 338(g) assigning that duty to the ITC’s predecessor. Peacock Tariff Consulting reported on Aug. 5, 2026, that the Congressional Research Service raised the same point independently.

What it means for your October read

Ottawa won twice, faces no appeal, and holds a documented margin of discretion on eligibility. Nothing in the treaty record compels a change.

Negotiation is the other channel, and it’s live. Talks collapsed Aug. 21, tariffs took effect Aug. 22, and Canadian counter-tariffs land Sept. 8. Eligibility could still move as a bargaining concession regardless of what two tribunals held — so the question isn’t whether litigation forced Ottawa’s hand. It’s whether pressure does what litigation couldn’t. No legal outcome is asserted here; the litigation is live.

The 30/90/365-Day Playbook for P5 Quota Holders

Every outlet will run the retaliation countdown. Canada’s counter-tariffs take effect Sept. 8, 2026, per CBC and ABC7 News reporting from Aug. 21. Real event. Doesn’t touch quota eligibility, and doesn’t touch your exchange.

Cheese TRQs run on the calendar year, separate from the August-start dairy year governing butter and milk powders. Per Global Affairs Canada’s “Key dates and access quantities 2026-2027”:

  • 2027 cheese TRQ application window opens Oct. 1, 2026
  • Application deadline: Nov. 15, 2026
  • Market-share reference period: Oct. 1, 2025 to Sept. 30, 2026 — closes Sept. 30
  • USMCA all-cheeses 2026 access: 6,313 tonnes
  • Unused USMCA cheese quota return deadline: Sept. 1

30-Day Actions

  • Pull the last four DFO exchange summaries and count cleared kilograms, not bids. Requires ten minutes in DFO’s quota exchange archive.
  • Red-flag trigger: if expansion quota sits in your 2027 capital plan and three of the last four exchanges cleared nothing, that’s a financing-timing decision now, not a spring problem. Talk to your lender before the next exchange, not after.
  • Read the Notice to Importers published with the Oct. 1 window. One thing to check: whether eligibility still reads processor, further processor, distributor, retailers excluded.
  • Where it backfires: treating the trade file as a milk-price signal. The National Pricing Formula has no input for it. Don’t reprice your risk off a document that can’t reach your cheque.

90-Day Actions

  • Re-run your expansion model against quota availability rather than quota price. Requires your production data, your lender’s amortization assumptions, and DFO’s cleared-volume history. The $24,000 cap has held since Quebec’s 2016 reduction and applies across all five P5 provinces; the supply behind it doesn’t hold.
  • If you ship to a processor holding USMCA or CETA cheese allocations, ask at the next producer meeting whether import activity is material to plant margin. Requires a direct question and a processor willing to answer.
  • Threshold: if your plant supplies or competes with Agropur’s fine cheese lines, watch the Competition Bureau file. That review determines whether those import activities move to Lactalis and when.
  • Where it backfires: consolidation moves faster than producer meetings, and a pending deal isn’t closed. Don’t restructure anything on an announcement.

365-Day Moves

  • Decide whether your growth plan depends on exchange quota at all. Requires an honest look at incentive days, component strategy, and whether added butterfat per cow beats added kilograms you can’t buy. The P5 boards approved payment policy changes effective April 1, 2026, to increase protein production — that’s a lever that doesn’t require an exchange.
  • Opportunity signal: if DFO exchanges resume clearing volume for three consecutive months while your margin over feed holds, that’s the window to move on quota you’ve been unable to source.
  • Watch whether Canada touches eligibility or only mechanics. Following the July 2025 New Zealand settlement, GAC moved the CPTPP calendar-year return date to May 1, added a chronic-return penalty at returns above 30% of allocation for two consecutive years, and introduced an underfill mechanism switching TRQs below 60% utilization for three straight years from market share to on-demand allocation. Every one of those hit administration. None hit eligibility.

Related reading: nickel versus $3M risk on both sides of the border

Key Takeaways

  • Canada’s USMCA cheese quota filled 99% in 2024, so the 50% tariff can’t push more product north. The fight is over who holds the permits, and under the National Pricing Formula, that fight has no documented path to your milk cheque.
  • Your real constraint is the DFO exchange. May, July, and August 2026 were all cancelled for insufficient quota offered — in May, 1,978 producers bid against 18 sellers, $628 million chasing $3.3 million at the $24,000 cap.
  • March cleared 190.60 kg out of 25,628 kg bid, a 0.744% buyer success rate. If expansion quota sits in your 2027 plan, that’s a lender conversation now, not a spring problem.
  • Watch Oct. 1, when Global Affairs Canada posts the Notice to Importers for the 2027 cheese year. If eligibility still reads processor, further processor, distributor, with retailers excluded, nothing moves, and the rule rolls forward another year.

What’s Actually Constraining Your 2027 Plan

Dal Ferro has made the same argument in a parliamentary committee appearance in March 2023, the ICCC’s CPTPP filing in May 2023, a trade-press interview in March 2025, and the Globe and Mail in July 2025. Four appearances, one position. Dairy Farmers of Canada has spent the same period arguing the opposite. The eligibility rule either changes in the Oct. 1 notice or it doesn’t — and the reference period that decides who gets what closes Sept. 30.

The insulation cuts both ways. Canada’s pricing formula keeps a trade fight from reaching your cheque, which is protection. It also means no upside flows to you if U.S. access tightens and domestic processors capture more of the market. Shielded from the loss, cut out of the gain.

Meanwhile, 1,978 producers bid on quota in May and got a cancellation notice. Same in July. Same in August.

So run the check that matters. Pull your last four DFO exchange summaries and add up the kilograms that actually cleared — not the kilograms bid. If your 2027 expansion plan assumes you can buy quota on that exchange, what does the cleared-volume history say about when, and how much? 

Complete references and supporting documentation are available upon request by contacting the editorial team at editor@thebullvine.com.

Learn More

The Sunday Read Dairy Professionals Don’t Skip.

Every week, thousands of producers, breeders, and industry insiders open Bullvine Weekly for genetics insights, market shifts, and profit strategies they won’t find anywhere else. One email. Five minutes. Smarter decisions all week.
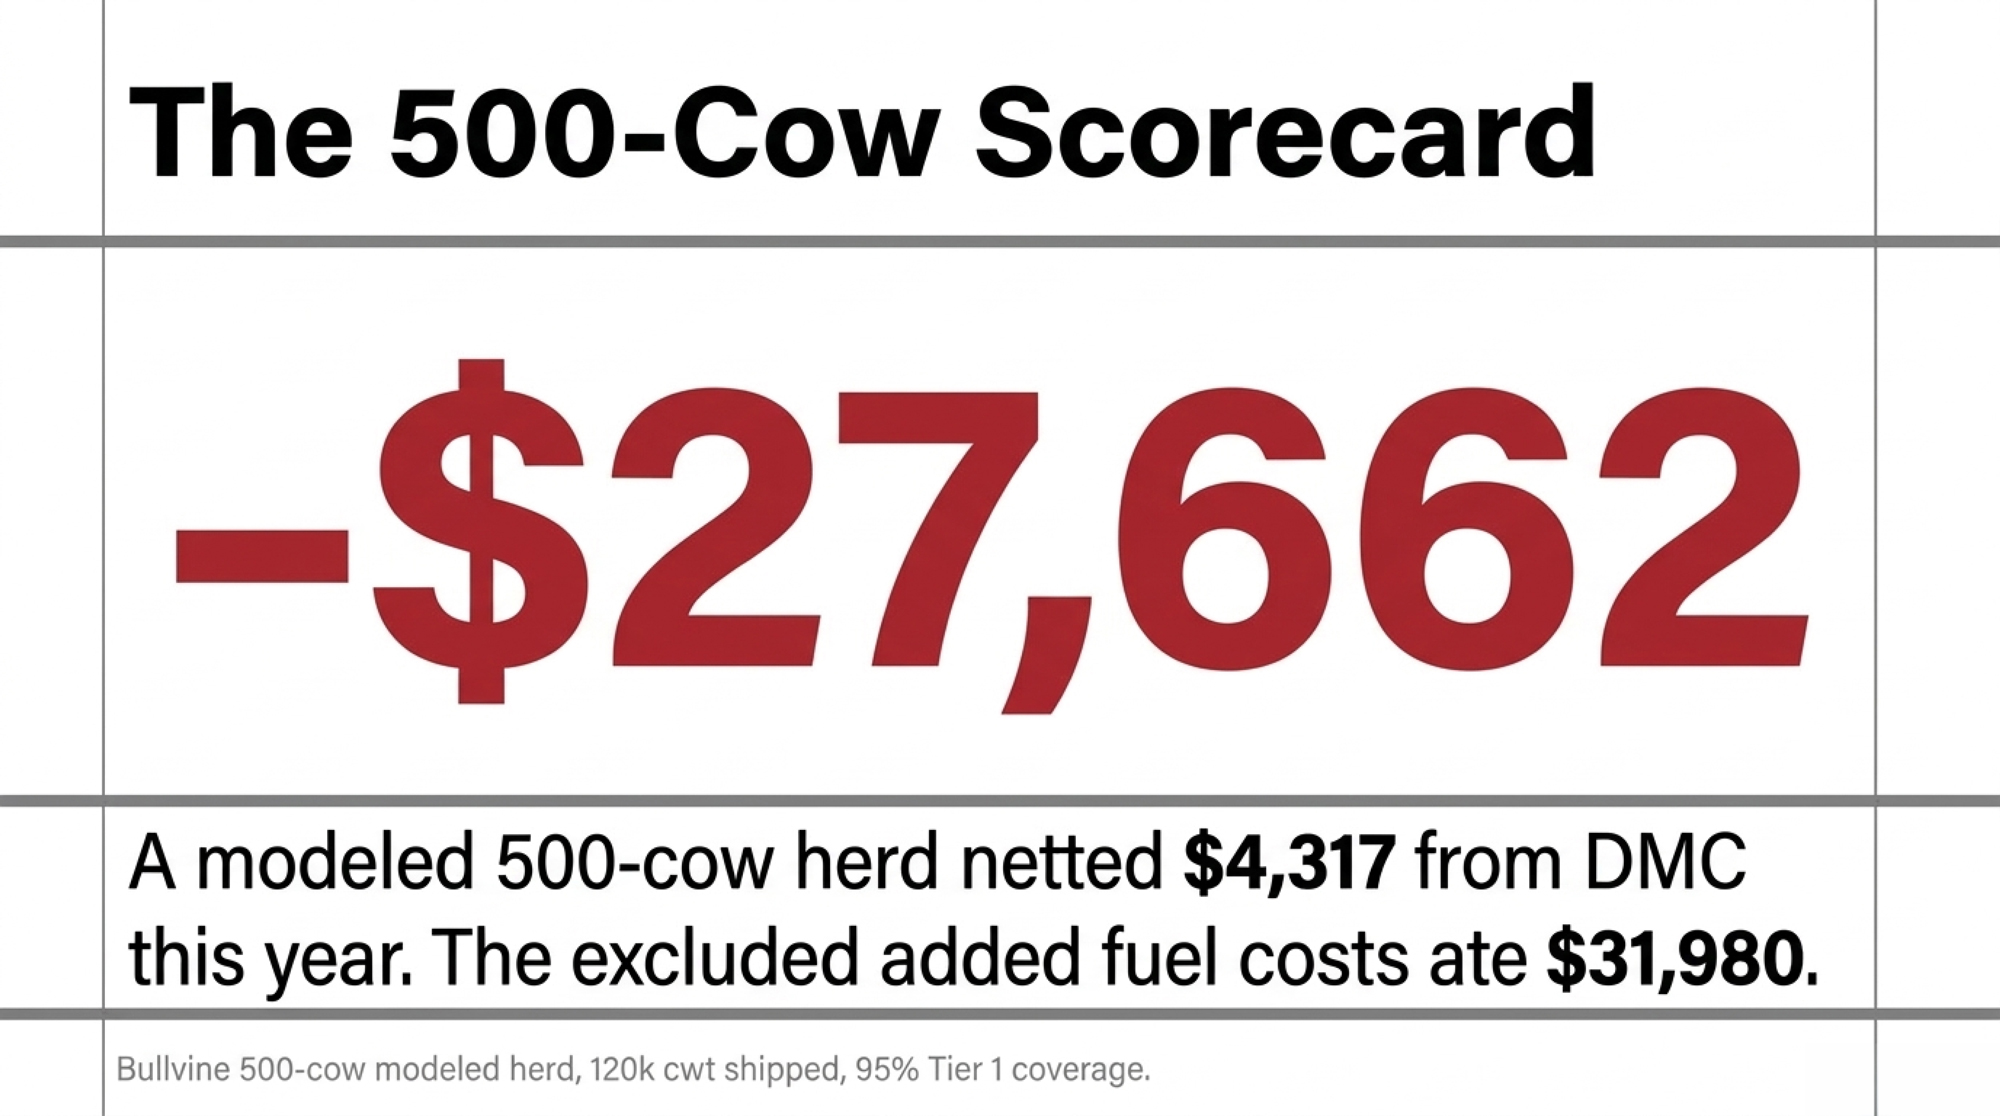
NewsSubscribe
First
Last
Consent

That cull cow brings $2,340. Her replacement costs $3,500.

Thursday morning, the trailer backed up to the door, and she’s sound and bred back. The check is $2,340. Her replacement runs $3,500-plus into a heifer market at a 20-year low.

That $1,160 gap is the whole story of the 2026 dairy cull cow decision — and it runs opposite to twenty years of culling habit. The reflex that used to be free money is now the expensive side of the trade.

More stalls to fill, fewer heifers to fill them with. That’s the arithmetic behind the squeeze: USDA counted 3.90 million dairy replacement heifers on January 1, down slightly year over year and roughly a 20-year low by CoBank’s read, while the milking herd climbed to 9.57 million head.

Third lactation, milking just under herd average. Not a wreck. Not a star. For twenty years she was an obvious load. Now she’s a math problem.

The cull check is real. So is the replacement bill.

Southern Plains cull cow auction prices climbed to almost $180/cwt in late April 2026, up about $15/cwt since January, according to Southern Ag Today. Two caveats before you count that check. Leaner 85–90% cows were running closer to $167/cwt earlier in the year, so check your own grade and basis before assuming the top of the market. And this year’s seasonal increase has been smaller than normal — worth knowing if you’re timing a sale.

On a 1,300-pound cow at the top of that market, the salvage math is simple:

13 cwt x $180/cwt = $2,340

The other side has moved just as hard. USDA reported an average U.S. replacement dairy heifer price of $3,110/head in October 2025 — a record, up $100 (3%) from July 2025 and up $510 (16%) from October 2024. Dairy Star reported replacements running $3,000–$4,000/head through late 2025 as inventories tightened. By mid-2026, USDA’s January report showed the ratio of dairy heifers expected to calve had tightened to a record-low 26.1%, pushing replacement values into territory the industry hasn’t priced before.

CoBank tracked the run-up. Lead dairy economist Corey Geiger put replacement values at $1,140/head in April 2019, $2,660 by January 2025, then a record $3,010 in July 2025 — a 164% climb.¹ The bank’s models show dairy replacement inventories for the milking herd not rebounding until 2027.

So the swap, stated plainly:

  • Salvage check today: $2,340
  • Replacement heifer, current market: $3,500+
  • Purchase-price gap: $1,160

$3,500 – $2,340 =$1,160.00

Call that what it is — a purchase-price gap, not a verdict. It doesn’t yet include the milk she’d have shipped, her feed, her health costs, or her pregnancy status. Those are farm-specific, and they’re where the real answer lives.

What this means for your operation: if the cull candidate is bred, sound, and carrying no chronic health costs, the burden of proof shifts onto the cull decision. You have to show her replacement returns more than the $1,160 gap plus the margin she’d have earned. That’s a higher bar than “she’s below average.”

Why the heifer pipeline got thin

Every cow bred to beef produces a valuable calf and no dairy replacement. During 2023–24 that trade was rational — beef-cross calves paid real money the day they hit the ground, Holstein bull calves didn’t, and milk was weak.

The bill came due three years later. CoBank’s August 2025 analysis, authored by Geiger, put replacement heifer inventories at a 20-year low just as processors were committing to historic plant expansions. As heifer values climbed, the report noted, producers began culling fewer cows to keep milk flowing.

Bullvine’s own reporting on that analysis tracked a structural deficit of 438,844 heifers against the 2026 requirement, locked in by 2023 breeding decisions. Biology’s 30-month timeline means there’s no quick fix — only adaptation. We ran the full pipeline arithmetic when the deficit first showed up, including the forward inventory formula for calculating annual replacement need.

The pain isn’t evenly spread. USDA ERS put 2021 production cost at $42.71/cwt for herds under 50 cows against $19.14/cwt for herds of 2,000-plus. And per USDA ERS Amber Waves (February 2026), the number of licensed U.S. dairy herds fell 63%, from 66,825 in 2004 to 24,811 in 2024. A $3,500 replacement lands differently on a 60-cow dairy than on a 1,500-cow one.

When is a below-average cow still worth keeping?

Penn State Extension puts replacement animals at 15–20% of total milk production cost, ranking them the second- or third-largest production cost on most dairies, behind feed and possibly labor. When that line item roughly doubles, the threshold for shipping a cow moves with it.

Here’s the honest version of the calculation. A cow finishing a 22,000-pound lactation represents real gross milk revenue, but the retained margin depends on your milk price, ration cost, days in milk remaining, health status, and whether she’s settled. There’s no universal number, and anyone who hands you one is guessing. Run it against your own cost of production.

The direction isn’t in question. USDA’s ERS forecast the 2026 all-milk price at $18.25/cwt as of January 2026. Against a $3,500-plus replacement, a settled cow milking modestly below herd average can pencil better than the heifer you’d buy to take her stall — but that depends on your milk price, her remaining days in milk, and her health costs.

This is not a keep-every-cow rule. Chronic mastitis, repeat lameness, long withdrawal periods, genuine reproductive failure, cows eating cash — those still ship, and shipping them into a record cull market is good business. The mistake is treating every below-average cow as a replacement you can buy back cheaply. You can’t right now.

Does the math work the same in Canada?

The biology travels. The market doesn’t.

MetricUnited StatesCanada
Heifer inventory3.90M head — roughly a 20-year lowCattle inventories up year over year, Jan 1 2026
Cost to raise to first calving15–20% of total production cost (Penn State Extension)C$4,822 (Lactanet, 2021) to C$4,870 ± 757 (Canadian Journal of Animal Science)
Milk price exposureOpen market; ERS forecast US$18.25/cwt for 2026Supply-managed; CDC farmgate +2.3255% effective Feb 1 2026
Where to price cowsUSDA AMS regional auction reportsBrussels Livestock (ON); Les Producteurs de bovins du Québec weekly cull report
Current cull tradeSouthern Plains near $180/cwt, late Apr 2026Good Holsteins C$215–$234/cwt; medium C$200–$214/cwt (Brussels, summer 2026)
Heifers expected to calveRecord-low 26.1% ratio (USDA, Jan 2026)Not published on the same basis — verify provincially

Three notes on the Canadian column. The rearing-cost figures come from two separate studies — Lactanet’s 2021 analysis put it at C$4,822 per heifer to first calving, while a Canadian Journal of Animal Science study calculated C$4,870 ± 757 — and both skew toward Quebec herds, so verify against your own province. The February 2026 farmgate increase of 2.3255% came from the National Pricing Formula, which weighs producer cost of production against the consumer price index. And don’t import U.S. auction prices into a supply-managed operation; the quota cushion changes how milk revenue behaves when you hold a cow an extra lactation.

One practical note on Canadian cull values: Ontario’s Brussels Livestock has been reporting good Holstein cows in the $215–$234/cwt range and medium Holsteins at $200–$214/cwt this summer. Springer and fresh-cow pricing moves separately from cull trade, so get a current quote before you budget a replacement purchase.

The transferable part: at roughly C$4,800–C$4,900 to raise a replacement to first calving, a sound settled cow carries more value than her rank in the herd average suggests.

Planning examples: the same decision at two herd sizes

These are planning examples with stated inputs, not case studies from documented farms. Substitute your own numbers.

250-cow herd — five convenience culls this quarter

  • Sound, bred cows shipped mainly for sitting at the bottom of the rolling herd average
  • Replaced at $3,500–$5,000 each
  • Purchase-price gap alone: $5,800 to $13,300
  • Lost production not included
  • The cost surfaces later, when the heifer pen comes up short

60-cow herd — three forced replacement purchases

  • At $3,500 each: $10,500 in gross purchase cash
  • Not a projected loss — a check you write
  • A 1,500-cow dairy absorbs it. A 60-cow dairy feels every dollar

Same decision, same market. The difference is whether your operation has the scale to absorb the cash requirement.

Is your cull list a plan or a habit?

Pull the current list and sort it into two piles: cows that are genuine cash drains, and cows that are merely below average. Those are different animals with different economics, and only one pile belongs on a trailer in this market.

Cow profileCull check @ $180/cwtReplacement costPurchase-price gapVerdict
3rd lactation, confirmed pregnant, 8% below herd average, no health events$2,340 (1,300 lb)$3,500–$1,160KEEP — below average is not a cash drain
5th lactation, open 180+ days, 3 failed breedings, milking herd average$2,610 (1,450 lb)$3,500–$890SHIP — no pregnancy, no next lactation
2nd lactation, third clinical mastitis case, chronic high SCC$2,250 (1,250 lb)$3,500–$1,250SHIP — treatment cost and dumped milk outrun the gap
4th lactation, settled, mild recurring lameness, 12% below herd average$2,520 (1,400 lb)$3,500–$980HOLD & TREAT — decide after hoof work, not at the trailer

Then check whether your pipeline can cover the departures. Divide heifers expected to freshen in the next 12 months by cows expected to leave over the same period. There’s no industry-standard threshold here — the honest test is whether that ratio covers your farm’s projected replacement need, given your cull rate and heifer survival. If it doesn’t, your herd won’t refill itself, and every voluntary cull becomes a purchase decision.

Want the structured version? Lay your heifers out by age band and run them against your cull rate — that walkthrough also pulls in your 12-month 21-day pregnancy rate, which is what determines whether the pipeline holds.

Options and trade-offs

Option 1 — Run the three-gate cull test

Timeline: complete within 30 days

Before any cow goes on the trailer, run her through three gates:

  1. Will she breed back?
  2. Is she a genuine cash drain, or just below herd average?
  3. Can your heifer pipeline absorb losing her stall?

Then reconcile the pipeline:

  • Match cows likely to leave against confirmed heifers due to calving
  • Set the maximum number of voluntary culls your pipeline can actually cover
  • Hold the cull list to that number until the pipeline recovers

Works on: every herd, right now. Requires: honest health and repro records. Fails when: sentiment creeps in and genuine money-losers stay on the list. Open cows and chronic problems still ship.

Option 2 — Cap beef-on-dairy by counting backward

Timeline: before the next breeding cycle

Start from replacement need, not the calf check. Work the steps in order:

  1. Calculate annual replacement need from your cull rate — a 250-cow herd culling at 32% needs roughly 80 replacements a year
  2. Add your own heifer loss rate to get the true springer requirement
  3. Build your calf-to-springer conversion from your own records: sex ratio, calf mortality, heifer mortality, age at first calving, conception losses
  4. Work backward to the number of breedings genuinely free for beef semen
  5. Set the cap — and for herds that ran beef semen well above 40% during the boom, a lower cap is the defensible position until the pipeline recovers

Any single industry conversion factor is a farm-specific assumption, not a constant. Build it from your records.

Works on: herds that pushed hard into beef-cross. Requires: accurate cull and loss rates. Fails when: you surrender calf revenue without a real pipeline deficit to justify it.

Option 3 — Stretch productive cows, not problem cows

Extending herd life on sound, fertile, productive cows avoids replacement purchases at current prices. Bullvine’s estimate of the per-cow annual value of added longevity is a directional calculation built from CoBank replacement-cost figures and University of Wisconsin longevity research — our math, not theirs, and not a guaranteed return.

Works on: short or tight pipelines. Requires: sharper repro and hoof health. Fails when: you hold cows past their useful window and trade a shortage problem for a hospital-pen problem.

Option 4 — Secure heifer supply before you’re forced to buy

Contract growing can price below a spot-market springer when a herd is caught short, particularly in deficit regions like Texas, Kansas, California, and Idaho. Specific contract terms vary by grower, region, and duration — get current quotes in writing rather than working from reported ranges.

Works on: deficit regions with thin local heifer supply. Requires: an honest replacement forecast first. Fails when: you over-contract and end up long on heifers you can’t house.

Key Takeaways

  • If a cow will breed back, isn’t a genuine cash drain, and your pipeline can’t replace her, keep her off the voluntary cull list.
  • If your projected heifer inventory doesn’t cover projected departures, treat every voluntary cull as a purchase decision — because that’s what it is.
  • If beef semen exceeded roughly 40% of your breedings during the boom, rebuild your cap from your own replacement need before the next breeding cycle.
  • If you’re budgeting replacement purchases through 2027, use at least $3,500 per bred heifer and verify against current local auction reports.
  • If you milk under 100 cows, weight the cash requirement harder — three forced purchases is a five-figure check with no scale to absorb it.
  • If you milk in Canada, use Canadian inventory, rearing-cost, and quota economics. The U.S. price column doesn’t transfer.

Replacement availability stays constrained by breeding decisions already locked into the pipeline, and the pace of any rebuild depends on future dairy-semen use, heifer survival, and culling behavior across the industry — not on anyone’s forecast. CoBank’s models don’t show a meaningful recovery before 2027.

So the question isn’t whether heifers stay tight. It’s whether the cows on your list this month are genuinely costing you money, or whether you’re about to sell a productive cow into a record market and buy her replacement into a hotter one. Pull your heifer inventory against projected departures this week and see which pile your cull candidates actually land in. And when you’re ready to put real dollars on a specific cow rather than a market average, the full hold-versus-cull breakeven is where that math lives — replacement cost, longevity value, and the per-cow case for keeping a sound old cow.

Executive Summary: A 1,300-pound cull cow at $180/cwt brings $2,340 right now, and her replacement will run $3,500 or more — a $1,160 purchase-price gap before you count a single day of her lost lactation. USDA’s January 1, 2026 Cattle report put dairy replacement heifers at 3.90 million head, roughly a 20-year low per CoBank, while milk cows climbed 2% to 9.57 million, the largest U.S. herd since 1993. That’s the squeeze: more stalls to fill, fewer heifers to fill them, and USDA’s October 2025 national average already at a record $3,110/head. The pain scales down, not up — a 250-cow herd shipping five convenience culls this quarter is out $5,800 to $13,300 on the swaps alone, and a 60-cow dairy needing three forced buys has to find $10,500 in cash a 1,500-cow operation would barely notice. CoBank’s models don’t show replacements rebounding until 2027, and 2023 breeding decisions locked in the 438,844-head deficit, so there’s no waiting this one out. None of that means keeping every cow — chronic mastitis, repeat lameness, and genuine repro failure still ship, and shipping them into a record cull market is good business. The decision worth 30 minutes this week is sorting your list into cows that actually drain cash versus cows that sit at the bottom of the rolling herd average, then checking whether your heifer pipeline can even cover the departures.

Run Your Numbers

R/C Snapshot — This article tells you to divide heifers freshening by cows leaving. The R/C Snapshot does it in 90 seconds and tells you which band you land in: short, tight, balanced, or long. Under 1.5 and your herd shrinks whether you meant it to or not.

Editor’s note: The barn scenario below is a composite, modeled from multiple Midwest and Northeast operations facing the same cull-versus-replace decision in 2026. The market data is sourced and dated; the producer is a representative planning example, not a documented individual. Dollar figures are in USD unless marked CAD.

¹ On replacement price series: This article uses the USDA/Geiger national-average series — $1,140/head (April 2019) to $3,010/head (July 2025), alongside USDA’s $3,110 October 2025 national average. Some earlier Bullvine coverage cites a $1,720-to-$4,100+ range, which reflects top-end auction clearing prices rather than national averages. Both are defensible; national averages are the conservative basis for budgeting.

Learn More

The Sunday Read Dairy Professionals Don’t Skip.

Every week, thousands of producers, breeders, and industry insiders open Bullvine Weekly for genetics insights, market shifts, and profit strategies they won’t find anywhere else. One email. Five minutes. Smarter decisions all week.
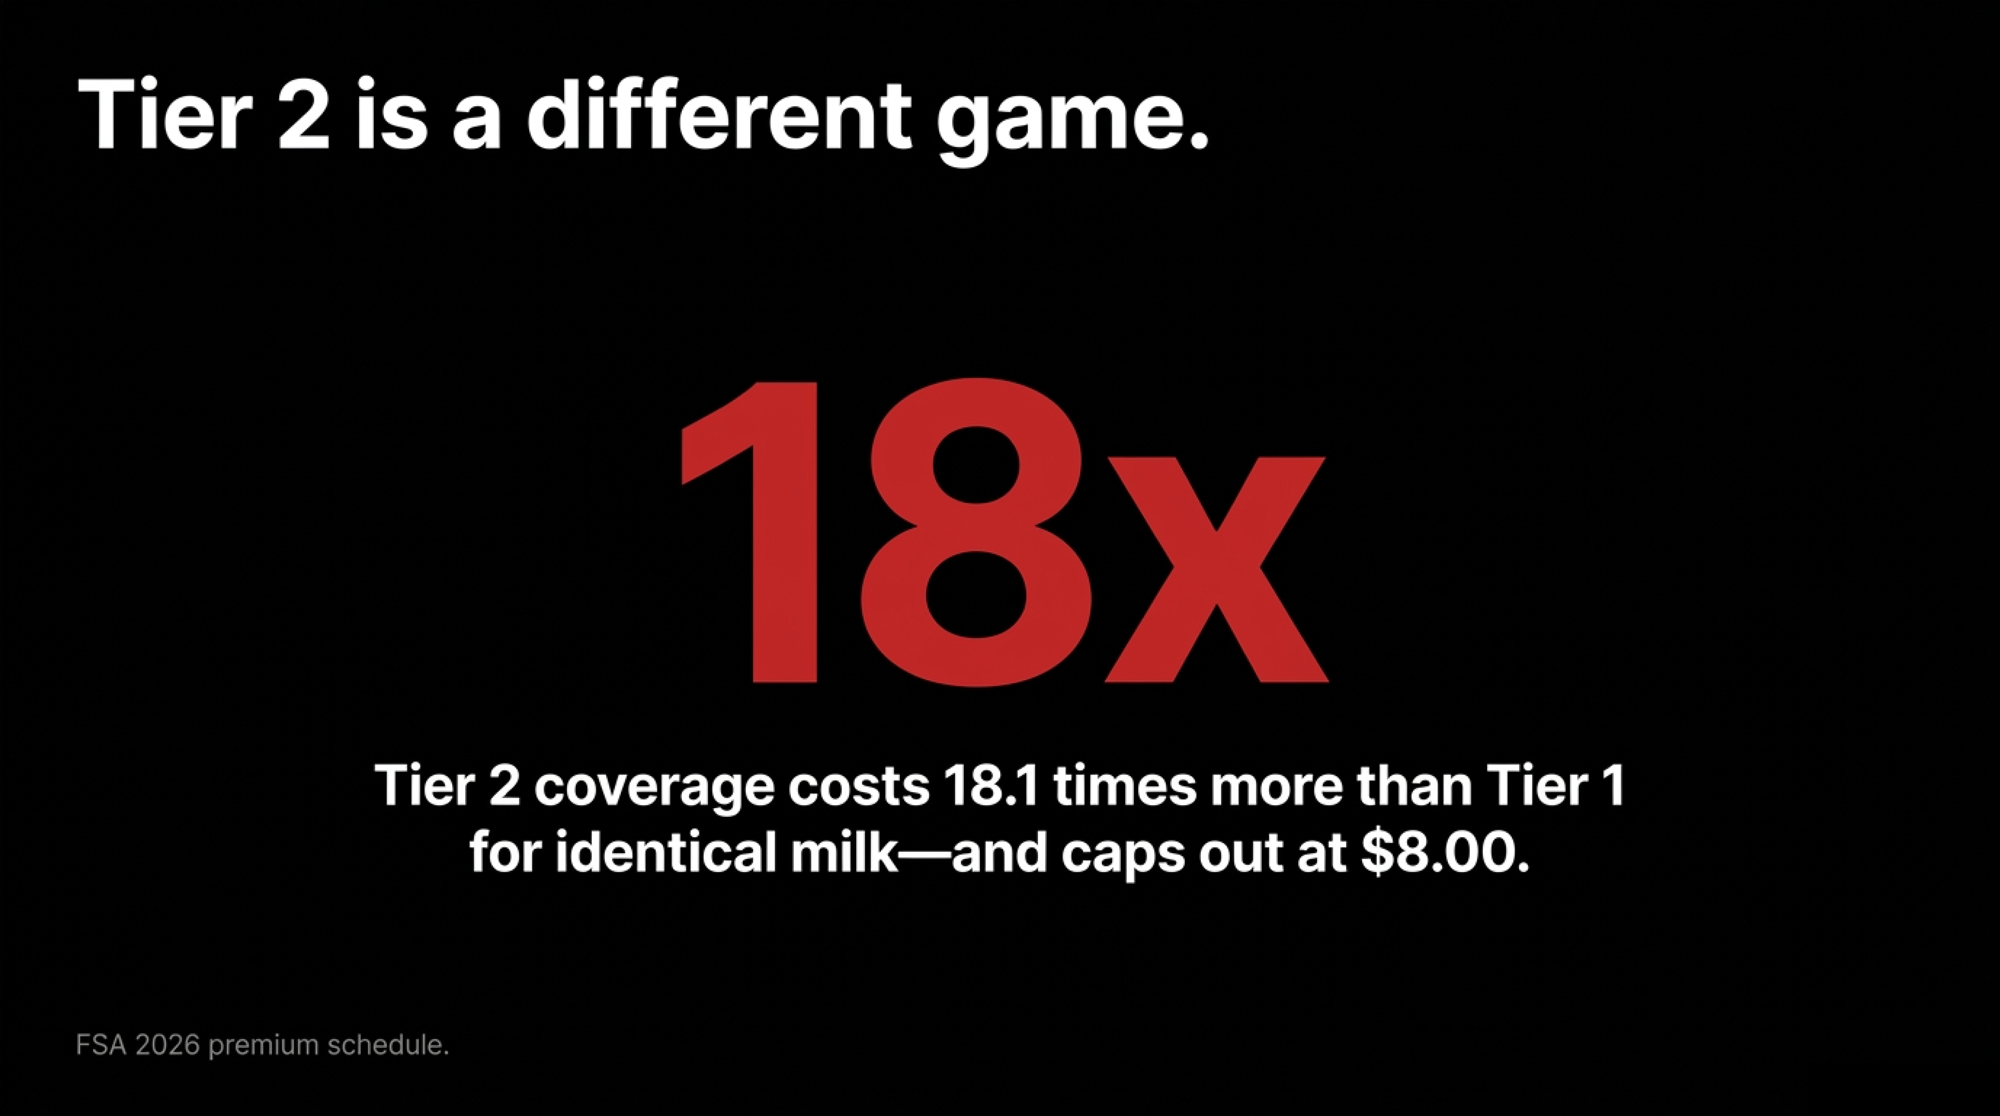
NewsSubscribe
First
Last
Consent

$19.85 Milk: Your Base Year Decides If You Can Grow Into It

Your co-op’s base year was probably set before you thought about expanding — and that decides whether new milk pays base or excess.

EXECUTIVE SUMMARY: USDA cut its 2026 all-milk forecast to $19.85/cwt on August 19 — the same month the dairy sector points to $11 billion in new plant capacity as a green light for growth. But on a 400-cow herd shipping 109,500 cwt, that price swings farm returns from +$49,275 to −$454,425 depending entirely on your full economic cost.

  • The Volume Trap: USDA’s 17.8B lb baseline increase arrives on yield per cow (+5.9%), not herd growth (+1.9%). Processors get their milk without your new barn.
  • The Base Trap: Fixed base programs mean milk from cows you haven’t bought yet settles into discounted excess pools.
  • The Real-Price Drain: Holding nominal milk at $19.85 through 2030 erodes purchasing power to $17.98/cwt in 2026 dollars — a $204,765 annual haircut on 400 cows.
milk price forecast 2026

USDA’s Economic Research Service cut its all-milk forecast to $19.85/cwt for 2026 and $19.80 for 2027 on August 19. Five days ago. That’s the number a 400-cow owner-operator in New York, Idaho, or Wisconsin is being asked to expand into, right as a processor breaks ground nearby and a field rep starts talking about growth room.

Whether that’s a trap depends on two things you can actually check: where your full economic cost sits, and whether your co-op’s base year predates the cows you haven’t bought yet. Get both right, and there’s real room. Get either wrong and a 40¢/cwt gap on 109,500 cwt runs $43,800 a year — on milk you added on purpose.

The plants are real. The International Dairy Foods Association documented more than $11 billion committed across 19 states and more than 50 building projects between 2025 and early 2028 — New York at $2.8 billion, Texas at $1.5 billion, Wisconsin at $1.1 billion, Idaho at $720 million, Iowa at $701 million. IDFA president and CEO Michael Dykes put the reasoning plainly in the association’s October 2, 2025 release: the investment “reflects the confidence dairy companies have in the future of American agriculture and their commitment to meeting growing domestic and global demand for nutritious dairy foods.” That same release states the industry expects U.S. milk production to grow by 15 billion pounds by 2030. Trade coverage in August 2026 has cited the investment total at $13 billion; no primary IDFA statement bridging $11 billion to $13 billion has surfaced, so $11 billion is the figure with a source behind it.

Capacity going up. Price forecast coming down. Same month.

The Trap: Your Base Year Predates Your Decision

Here’s the part that reframes every number above, and it has nothing to do with the price forecast.

Land O’Lakes has run structured base programs since at least 2016, historically offering incremental base to existing members who wanted to grow, and expanded the approach regionally into Eastern states by 2023. Documentation available for this piece runs through 2023 — whether that structure holds unchanged in 2026 is a question for your own field rep, not a settled fact. Not every cooperative works that way. Dairy Farmers of America told The Bullvine in June 2026, in the context of its St. Albans plant closure, that it doesn’t cap how much milk a member can produce and hasn’t announced any base or penalty program tied to those closures.

Two of the largest names in American dairy have publicly described different approaches. That’s the point: there’s no single industry default, which is why the answer for your farm has to come from your own agreement rather than from either co-op’s reputation. Neither cooperative was contacted specifically for this analysis, which relies on published statements and prior reporting.

A structured base program isn’t inherently the bad option. Land O’Lakes documented its base-offer sequencing publicly, which is more transparency than most producers get, and offering incremental base to existing members first cuts in your favor.

The mechanics are well documented even where a specific co-op’s current terms aren’t. American Farm Bureau describes the standard structure: producers establish a base during short-supply months, receive the higher milk price up to that base, and milk above base sells at a discount — the discount exists precisely to remove the incentive to oversupply.

Congressional Research Service documentation of proposed federal versions describes base set either as a three-month rolling average of recent marketings or the same month in the prior year, with excess assessed a penalty redistributed to producers who stayed inside allocation.

Those describe generic structures, not either named co-op’s actual terms. Your own contract is the only document that answers this for your barn.

Read that with a barn addition in mind. Under a fixed-base structure, milk from cows you haven’t bought yet lands in the excess bucket. Even under a rolling base, it sits there until the window catches up. The plant down the road doesn’t change that. Your base formula does.

No public reporting establishes whether any cooperative has tied this specific buildout to written incremental-base offers for existing mid-size members. That’s the most operator-relevant unanswered question in the 2030 story. It’s also the one you can get answered — for your own farm, this week, by asking.

Everyone Assumed New Plants Mean New Room

The logic feels airtight: plants get built, plants need milk, producers ship more of it at a better price. It’s three separate bets wearing one coat, and only one of them is documented.

Bet one is capacity, and it’s solid. Named companies, named states, real concrete.

Bet two is price. USDA’s August 2026 Livestock, Dairy and Poultry Outlook lowered the 2026 Class IV forecast to $18.15/cwt, down a quarter, on weaker butter. AgCountry’s third-quarter 2026 outlook projects second-half Class III averaging $17.25/cwt and Class IV at $18.50 — an analyst forecast, not USDA data, and scoped to half the year rather than the annual average. Two credible reads. Both below where a lot of 2025 expansion math got built.

And the formula has been working against you separately from the market. USDA’s June 2025 Federal Order modernization — per the final rule published January 17, 2025 — raised the butter make allowance from $0.1715/lb to $0.2272/lb, a 32.5% increase, with cheese moving from $0.2003 to $0.2519. Those are subtractions from your component values before any market move. How the make-allowance changes reached your milk check is its own arithmetic, and it compounds everything below.

Bet three is access, and you just read why nobody’s published a number on it.

The Yield Math Says Nobody Needs Your Extra Cows

Run USDA’s baseline and the shape gets uncomfortable. Production climbs from 225.9 billion pounds in 2024 to roughly 243.7 billion by 2030 — a gain of 17.8 billion pounds, which actually overshoots the 15-billion figure the industry has been quoting. Yield per cow does the work: 24,177 pounds to 25,607, up 1,430 pounds. The national herd stays close to flat — about 9.34 million head in 2024, peaking near 9.5 million around 2026, settling near 9.52 million by 2030.

Put the two growth rates side by side and the whole thesis fits in one line: yield up 5.9%, herd up 1.9%.

Multiply the endpoints. 9.52 million × 25,607 = 243.8 billion pounds. The math holds.

So the volume arrives whether or not one new farm exists, and whether or not you buy a single heifer. That’s not a scare line — it’s USDA’s own arithmetic. The buildout is a demand signal for volume, not an invitation to you specifically.

Label this correctly: USDA baseline projections are conditional models built on stated assumptions, not predictions. And a separate USDA-linked summary of the same series published through Ohio State University Extension shows 9.43 million cows at 26,295 pounds for 2030. Different split, same neighborhood on total. Two vintages circulating at once, and coverage rarely names which one it’s quoting.

Where Did “Half the Farms by 2030” Come From?

You’ve seen that phrase attached to this projection. It doesn’t survive the window it’s applied to.

USDA NASS counted 24,600 licensed dairy herds in 2024 and about 23,600 in 2025, with an average herd size of 397 cows. Terrain’s June 2026 analysis projects fewer than 20,000 by decade’s end — a decline of roughly 15 to 19% from today, not 50%.

The halving is real. It’s a two-decade story, and ERS has the exact figure: licensed U.S. dairy herds fell 63%, from 66,825 in 2004 to 24,811 in 2024, per the agency’s February 2026 Amber Waves analysis. Production over that same span rose 32%, from 170.8 billion pounds to 225.9 billion. Pair a twenty-year farm-loss number with a six-year production number in one sentence and the two read as simultaneous. They aren’t. A producer sizing an expansion off that sentence is working from a compressed timeline. Where the farm-count curve actually points — 15,000 to 16,000 herds by 2035, under 10,000 by 2050 — is a slope, not a cliff.

Running the Numbers: What $19.85 Does at Three Cost Structures

Assume 400 cows in milk at 75 lbs/day, 365 days, no dry-period adjustment: 400 × 75 = 30,000 lbs/day, × 365 = 10,950,000 lbs, ÷ 100 = 109,500 cwt/year. If your 400 head includes dry cows at roughly 85% milking, run the table on about 93,000 cwt instead — the per-cwt logic doesn’t change; the dollars do.

Revenue calculated on 400 cows in milk @ 75 lbs/day = 109,500 cwt/year ($2,173,575 total gross).

Scenario / Herd Cost StructureCost/cwtRevenue @ $19.85Annual Net MarginEconomic Status
Low cost / diluted overhead$19.40$2,173,575+$49,275Profitable expansion room
Conservative full cost$20.25$2,173,575−$43,800Negative economic margin
Mid-range 400-cow average$24.00$2,173,575−$454,425Severe capital drain

Sourcing on those inputs: ERS 2021 ARMS data — national averages by herd-size class — puts full economic cost near $20.54/cwt for 500–999-cow herds and $19.14/cwt for 1,000-plus. The $24.00 figure is the mid-range 400-cow full cost our April analysis used, including unpaid family labor valued at $18–22/hour and depreciation at replacement cost. The $19.40 and $20.25 rows are illustrative inputs, not reported figures.

Three cost structures, three completely different decisions off one milk price. That spread is the entire argument for running your own number instead of anyone’s average — and it’s why the headline’s trap is conditional. If you’re the top row, there’s room. If you’re the bottom row, no plant announcement fixes that.

And separately — the real-price erosion. USDA’s $19.85 and $19.80 are nominal. Hold nominal price flat through 2030 and deflate at 2.5% annual general inflation, roughly the Federal Reserve’s long-run target and a stated placeholder rather than a forecast:

  • $19.85 ÷ (1.025)⁴ = $17.98 in 2026 dollars
  • Real decline: $1.87/cwt
  • On 109,500 cwt: $204,765 of annual purchasing power, gone

That figure isn’t a margin — it’s erosion of what the same nominal revenue buys. It stacks on top of whichever row above describes your barn. Change the inflation assumption and the number moves; the direction doesn’t.

Can Your Cost Structure Actually Dilute?

USDA ERS cost-of-production estimates — national averages by herd-size class — put 2,000-plus-cow operations near $19.14/cwt and the smallest herds near $42.70/cwt. Against $19.85 all-milk, the large operation sits roughly at breakeven on full economic cost. The small one isn’t in the conversation.

One caveat that should change how you use those numbers. ERS states its milk cost-of-production estimates from 2021 forward are built on 2021 ARMS survey data, updated only for annual price changes — not re-surveyed. Price-adjusted 2021 cost structures, national scope. Directionally useful. Don’t build a loan application on the decimals.

That spread is the consolidation mechanism in two numbers, alongside labor, succession, and capital access, which the spread doesn’t capture. ERS documents the direction: from 2002 to 2022, farms with fewer than 1,000 cows declined while farms with 1,000 or more grew 60%. It points at the assumption doing all the work in USDA’s 2030 model — cost dilution through scale. If your cost per cwt genuinely falls as you grow, the projection describes you. If it doesn’t, it describes somebody else’s farm.

The 30/90/365-Day Playbook for 400-Cow Herds Facing a Plant Announcement

30-Day Actions

  • Full economic breakeven audit. Calculate non-cash costs: unpaid family labor at a real wage, replacement-cost depreciation, current debt interest, and a return to management.
  • Trigger: if full cost exceeds $19.85/cwt, halt uncommitted expansion plans until your own data says otherwise.
  • Backfire risk: relying on cash-flow breakeven masks long-term equity depletion. You’ll clear a threshold you never cleared.
  • Base contract classification. Request written documentation on whether your cooperative operates a fixed or rolling base year, and what the formula is.
  • Core question for your field rep: “Does milk from added stalls settle into historical base, or excess pricing tiers?”
  • Backfire risk: a verbal “no cap” may be current policy rather than contract. Policy changes. Get the distinction on paper.

90-Day Actions

  • Dual-formula scenario modeling. Model herd returns under both primary base pool pricing and discounted over-base settlement. Requires the formula from your 30-day ask; if the co-op won’t commit it to writing, that silence is the answer.
  • Legal contract review. Review member agreements for volume penalty clauses, mandatory processing deducts, and exit penalties. Requires an hour with your lawyer, not your field rep.
  • Watch for: a clean contract protects you; it doesn’t pay you. Don’t mistake one for a margin.
  • Downside stress-testing. Model the barn addition against $18.15 Class IV and $17.25 Class III rather than optimistic price peaks.
  • Trigger: if the expansion only pencils on the optimistic forecast, it doesn’t pencil.

365-Day Moves

  • Scale dilution vs. margin defense. Expand only if marginal cost per hundredweight demonstrably decreases with added volume. Opportunity signal: full-cost breakeven below $19.40 and incremental base confirmed in writing means you have room the projection was actually built for. What per-cow overhead looks like at each size class is where that comparison starts.
  • Monitor co-op allocation releases. Track written growth-allowance amendments as regional processing plants complete commissioning through early 2028. A written offer is the signal. A groundbreaking photo isn’t.
  • Hold deliberately if the numbers say hold. Real risk, stated honestly: if access tightens and base gets allocated to whoever moved first, waiting carries a cost nobody can quantify right now because the data isn’t public. That’s an unknown, not a reason to move.

What Should a Canadian Producer Take From a US Buildout?

Different system, and the contrast is sharper than most cross-border comparisons.

Metric / MechanismUS Market (FMMO / Private Handlers)Canadian Supply Management (CDC / TPQ)
Pricing baselineMarket-derived; $19.85/cwt nominal forecast for 2026National Pricing Formula; +2.3255% effective Feb 1, 2026, COP + CPI indexed
Inflation protectionNo automatic indexing of the producer price. Nominal stagnation produces roughly $1.87/cwt of real decline by 2030Built-in formulaic cost-of-production and inflation adjustment
Volume allocationPrivate co-op base contracts; fixed or rolling, terms vary by cooperative and frequently aren’t publicStatutory quota via provincial boards. Nova Scotia’s TPQ regulations cap cumulative over-production at 10× daily TPQ
Expansion riskMilk from new barns can fall into excess/discounted pricing tiersVolume capped by quota availability; penalties published in advance

Those first two rows are the whole real-price problem in one frame. A Canadian producer’s price mechanism is designed to track inflation and cost of production. A US producer’s isn’t — FMMO class prices move off product markets, and while make allowances did get adjusted on plant-cost data in 2025, that adjustment cut against producers. Flat nominal all-milk through 2030 quietly becomes a $1.87/cwt real decline; a CDC-priced hectolitre doesn’t erode the same way.

What travels across the border is the allocation discipline. Same underlying question about who controls your volume — very different transparency about the answer. One system publishes its limits in regulation. The other keeps them in a contract you have to request.

Is Your Growth Room Already Allocated?

Not “is a plant coming.” That’s in every trade outlet this month.

The question is whether your cooperative’s base formula treats milk from future cows as base or as excess, and whether anything in writing commits incremental base to existing members. Land O’Lakes put its sequencing on paper in 2016. That proves such commitments can exist in documented form, which means asking for one isn’t unreasonable.

Eleven billion dollars of concrete is going up on Dykes’s stated confidence in long-term demand. USDA’s August revision is a bet that the margin won’t improve. Both can be true at once, and the projection can be internally sound while describing a farm that isn’t yours. You gain volume through scale, but you give up the option to walk away from a base agreement you signed at a different price.

So before the next conversation with your field rep: what does your cooperative’s base formula actually say about milk from cows you haven’t bought yet — and have you read it, or just been told about it?

Key Takeaways

  • If your full economic cost — unpaid labor, replacement-cost depreciation, real interest — lands above $19.85/cwt, treat every expansion conversation as negative-margin until your own numbers say otherwise.
  • Ask your co-op whether your base year is fixed or rolling, and get it in writing. Under a fixed base, milk from cows you haven’t bought yet ships as excess, at a discount.
  • USDA’s own baseline gets to 2030 on yield, not cows — up 5.9% per cow against 1.9% herd growth. The volume shows up whether or not you add a stall.
  • Flat nominal price isn’t flat. Hold $19.85 to 2030 and it’s $17.98 in today’s money — a $1.87/cwt haircut before any input outruns inflation.

Run Your Numbers

Dairy Profit Projector — This article says your full-cost breakeven decides everything. The projector calculates it from your own herd size, production, and ration, then shows margin per cwt against $19.85 milk. The sensitivity table stress-tests milk and corn moves before you commit capital.

Complete references and supporting documentation are available upon request by contacting the editorial team at editor@thebullvine.com.

Learn More

The Sunday Read Dairy Professionals Don’t Skip.

Every week, thousands of producers, breeders, and industry insiders open Bullvine Weekly for genetics insights, market shifts, and profit strategies they won’t find anywhere else. One email. Five minutes. Smarter decisions all week.
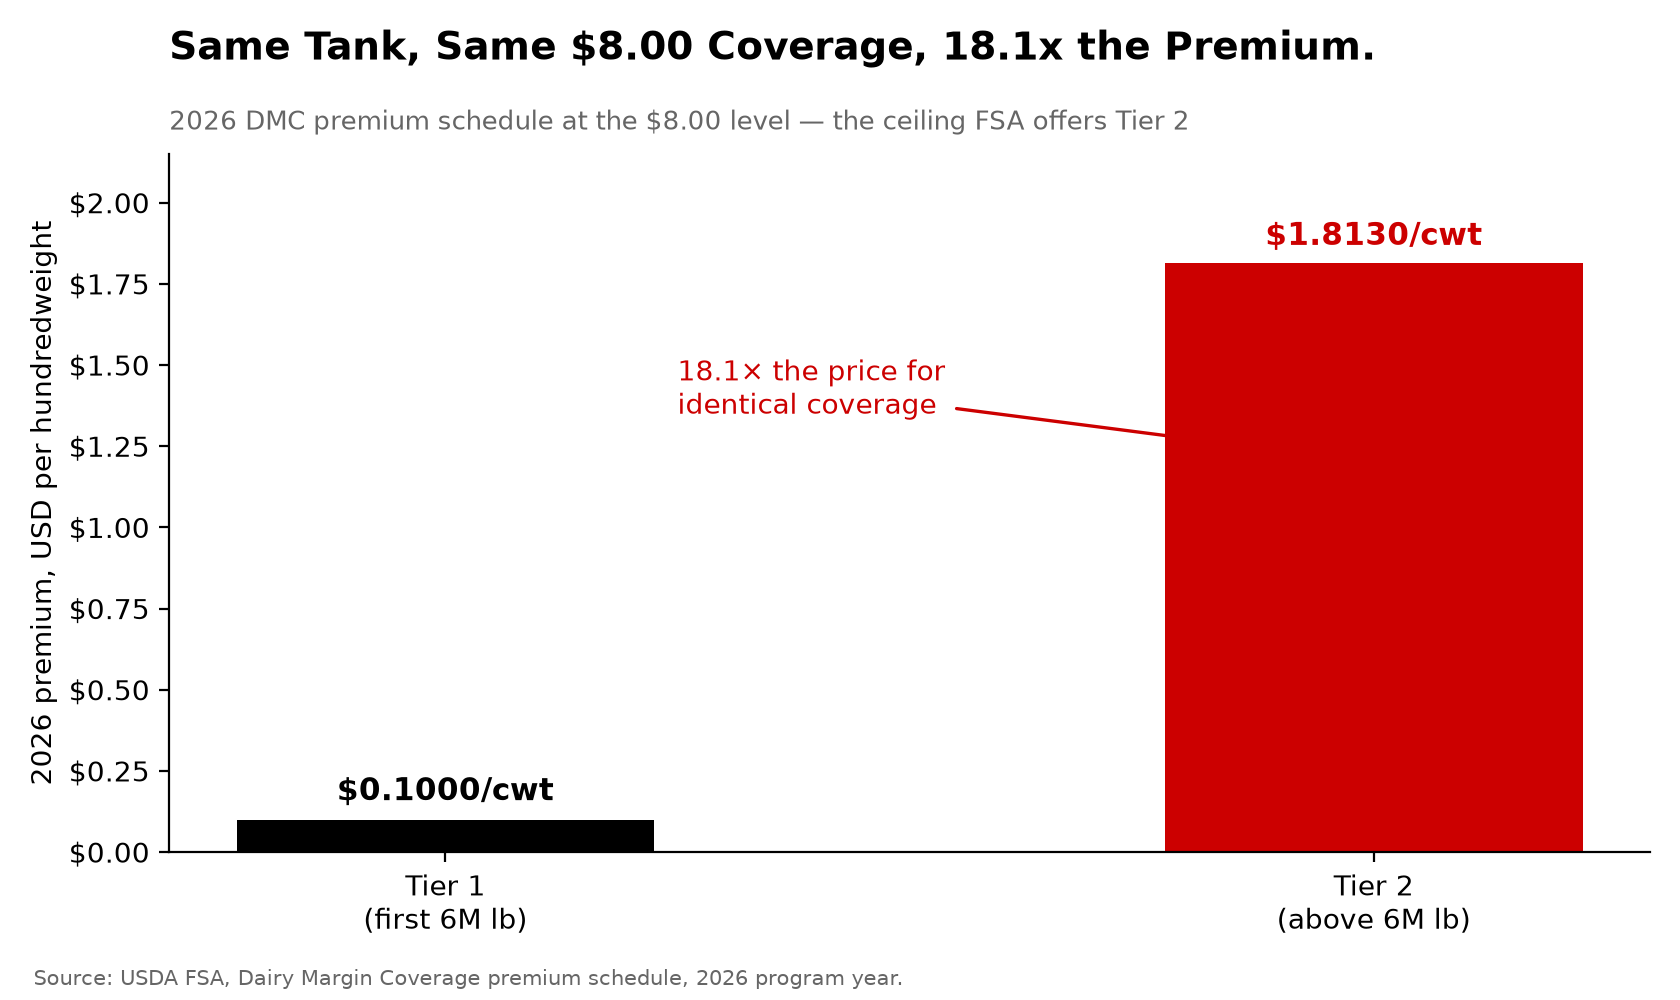
NewsSubscribe
First
Last
Consent

20 ppm at 10 Meters: The Manure-Gas Reading That Isn’t Where You Think

Penn State measured over 20 ppm ten meters back from gypsum-bedded storage during agitation. That’s 33 feet from the opening — and still over OSHA’s ceiling. The pit rim isn’t the edge.

EXECUTIVE SUMMARY: Penn State and USDA-ARS researchers measured hydrogen sulfide above 20 ppm — OSHA’s general-industry ceiling — a full 10 meters back from gypsum-bedded manure storage during agitation, which means the pit rim isn’t the edge of the hazard most of us assume it is. That finding lands the same week families of four workers killed in a Weld County, Colorado pump pit filed a wrongful-death complaint alleging the dairy had no gas monitors, no ventilation, no signage, and no rescue equipment on site; six men died there on August 20, 2025, and OSHA proposed $246,609 across three companies, with the largest single penalty at $132,406. The reason OSHA couldn’t cite the confined-space standard itself sits in one sentence of 29 CFR 1910.146, which has excluded agriculture by name since 1993 — so every decision about testing the air around your pit is a protocol you write, not one you’re handed. Detection runs about $200 for a single-gas personal H₂S meter or $500 to $1,500 for a four-gas unit; on a 400-cow dairy with two below-grade entry points, monitors plus training for the three people who actually go in comes to roughly $2,150 in year one. Watch the retrieval line, though: verified 2026 pricing puts man-rated tripod-and-winch systems at $1,800 to $5,000-plus, and that $300 “confined space tripod” you found is probably a material-handling winch that isn’t rated to lift a person. Purdue counted four livestock-waste incidents nationally in 2025 that killed ten people — six of them in that single Colorado event — and Colorado ranked second in the country for confined-space cases. If you bed with gypsum, know your agitation schedule, work upwind with at least a 10-mph breeze, and ventilate the room for 30 minutes after shutdown before anyone walks in.

manure gas hydrogen sulfide

This article is based on the complaint as reported by the Colorado Sun, Denver7, and AgDaily, and on public records available as of August 21, 2026. The allegations described have not been tested in court.

Jorge Sanchez Peña had just finished changing a flat tire. According to the wrongful-death complaint his family filed in Weld County District Court on Wednesday, August 19, 2026, he and two other men were packing up to leave when, the complaint alleges, the manure-management system was reactivated remotely by phone. A pipe joint let go under pressure. The suit alleges that the joint had been secured with straps rather than repaired, and that the filing includes photographs the plaintiffs say were taken months earlier showing the same arrangement.

Manure water poured into an underground pump pit. Hydrogen sulfide is heavier than air, so in a below-grade space it doesn’t blow off — it settles and builds. Sanchez Peña went in to help close a valve and collapsed, according to the complaint. Alejandro Espinoza, 50, followed him in. Then Espinoza’s two sons, Carlos Espinoza Prado, 29, and Oscar, 17.

Four of those men are named in the lawsuit. Six died that day, August 20, 2025. Among the failures the complaint alleges: no gas monitors, no ventilation, no warning signage, and no rescue procedure or equipment in place at the time. Each allegation remains unproven, and the defendants have not yet filed a response. The Colorado Sun reported that a voicemail left at the number listed for the operation went unreturned.

Three Companies, Three Citations, Same Three Gaps

In February 2026, OSHA proposed $246,609 across three companies. Prospect Ranch LLC took $132,406. Fiske Inc. — doing business as High Plains Robotics, the direct employer of the four men in the suit — took $99,306. HD Builders LLC took $14,897.

Read the violations side by side and the pattern is hard to miss. Failure to protect workers from atmospheric hazards. No written hazard communication program. No training on hazardous-gas detection. Three separate companies. Three separate safety programs. And in OSHA’s account, the same three gaps in each one.

CompanyProposed PenaltyRole in CaseCited Violation Gaps
Prospect Ranch LLC$132,406Named defendant, civil suitNo atmospheric hazard protection, no hazard comm program, no gas-detection training
Fiske Inc. (High Plains Robotics)$99,306Direct employer, not civil defendantSame three gaps as above
HD Builders LLC$14,897OSHA-cited only, not civil defendantSame three gaps as above

All three penalties remain proposed rather than final. Each company kept the right to contest before the Occupational Safety and Health Review Commission, and this article reflects the status OSHA announced in February 2026. Note also that Fiske and HD Builders aren’t defendants in the civil suit; they appear here only because OSHA cited them.

The Weld County Coroner’s Office determined the cause of death was hydrogen sulfide exposure, describing the incident only as an industrial accident in a confined space.

The One Sentence in the Standard That Explains the Rest

OSHA’s permit-required confined spaces standard — 29 CFR 1910.146 — was written for exactly this hazard. It also contains this line: “This section does not apply to agriculture, to construction, or to shipyard employment.”

The standard took effect in 1993. Agriculture was excluded by name from day one. That’s why OSHA had to build the Weld County case on general-duty and hazard-communication provisions instead of confined-space violations. The rule most precisely designed for a manure pit doesn’t reach a manure pit.

This applies whether you milk 80 cows or 8,000. It’s a categorical industry exclusion, not the separate small-farm appropriations rider that’s kept OSHA from enforcing on operations with ten or fewer non-family employees every year since 1976. Two different mechanisms, and worth keeping straight — a defense attorney certainly will.

Here’s what that exclusion means in practice: there’s no federal rulebook telling you how to test the air around your pit. Every decision about when it’s safe to be near that space is a farm-level protocol you write yourself — which makes it worth knowing what the air actually does when manure gets stirred.

Standing Back Isn’t the Safeguard You Think It Is

USDA-ARS and Penn State researchers led by Eileen Fabian-Wheeler measured hydrogen sulfide during agitation at 18 dairy operations. On farms using gypsum bedding, concentrations during agitation exceeded 100 ppm — NIOSH’s IDLH threshold, the point at which the atmosphere is immediately dangerous to life or health.

And on some of those gypsum farms, readings taken 10 meters from the storage still came in above 20 ppm. That’s roughly 33 feet. Away from the opening. Still over OSHA’s general-industry ceiling limit.

Most of us have a mental model where the danger lives inside the pit, and the air gets safe somewhere around the lip. That data says otherwise, at least when high-sulfur manure is being stirred. Farms that combined gypsum bedding with additional manure treatment saw significantly lower H₂S than those without — so the bedding choice isn’t a dead end; it’s a variable you can manage.

Dan Andersen, agricultural engineering specialist with Iowa State University Extension and Outreach, explains why your nose is the wrong instrument for this job: “Hydrogen sulfide gas smells at 1-2 ppm, but levels above that knock out your ability to smell, so our natural detection system goes away.” Then the line that should end every argument about whether a monitor is worth the money: “Once you realize the gas is a problem it’s usually too late.”

Why the Second Person Goes In

NIOSH had this failure mode on paper before 1910.146 was even finalized. A 1990 Fatality Assessment and Control Evaluation report describes five family members dying in one Wisconsin manure pit, entering one after another to help each other. A 2014 FACE report documents a farmer and his employee dying the same way during a rescue attempt.

Across confined-space fatalities generally — all industries, not just agriculture — roughly 60% of the dead are people who went in to help. About 85% of those incidents had a supervisor on scene.

Read that second number again. Supervision wasn’t the missing piece.

What’s missing in every one of these sequences is a moment where the danger becomes visible before someone crosses the threshold. Someone collapses. Someone else goes in. That’s not so much a training failure as a human one — and it’s why the fix has to be a device and a rule, not a reminder to be careful.

What Does the Cheap Version Actually Cost?

SafeguardYear-1 cost (USD)OngoingWhere it fails
Single-gas personal H₂S meter~$200Sensor life 2–3 yrsReads one gas only — no O₂ or methane
Portable 4-gas monitor (H₂S, O₂, CO, CH₄)$500–$1,500~$100–$200/yr bump gas; sensors every 2–3 yrsLeft in the shop drawer; weekly bump test skipped
Man-rated retrieval tripod, winch and harness$1,800–$5,000+Annual inspection/recertificationNobody top-side trained to run the winch
Online confined-space entry training$80–$180/workerRefresher every 1–3 yrsTreated as a checkbox instead of a drill
Written hazard and entry protocol~$0 (4–8 hrs labor)Routine updatesLives in a binder nobody opens under pressure

Andersen is blunt about the cheapest line: “Personal protection meters are a low-cost investment, usually around $200, that will notify you if gas is present. These instruments can be taken anywhere and are always monitoring the air.” Iowa State Extension keeps several models on hand so producers can try before buying — worth a call before you order anything.

Retrieval-system pricing is the line most likely to catch you out. A verified 2026 spot check shows man-rated confined-space kits — tripod, self-retracting lifeline, winch — running from roughly $1,870 for entry-level packages to $4,565 and beyond for full ANSI/OSHA-compliant systems, with individual man-rated winches alone at $3,900 to $4,900. If you find a $300 “confined space tripod,” check whether it’s man-rated or a material-handling winch. Those are different tools and only one of them is legal to hang a person from.

Now run the monitor math on a 400-cow dairy with two below-grade entry points. Two mid-range four-gas monitors at $750 each is $1,500. Train the three people who actually go in at $150 apiece: $450. Bump-test gas, two cylinders a year at $100: $200. That’s roughly $2,150 in year one, before retrieval gear, against the $132,406 OSHA proposed for a single operation in this case. Tight on cash? Two personal H₂S meters at $200 get you detection at both openings for $400.

That comparison isn’t quite the one you’re really making, though. The honest version is a couple thousand dollars a year, indefinitely, against a low-probability event most operations will never see. That’s the hardest kind of risk for anyone to price — it’s why underwriting exists as a profession. But flip it around: of every number on this page, the monitor is the only one you control. Penalty amounts run on statutory ceilings you don’t influence. Damages are contingent and years out. The monitor is this week.

Is This Still Happening, or Is It History?

It’s current, and Colorado is now in the data. Purdue University’s Agricultural Safety and Health Program documented 48 agricultural confined-space cases nationally in 2025 — 22 fatal, 26 non-fatal. That’s down 5.9% from 51 cases in 2024 and below the ten-year average of roughly 60.

But look at the livestock-waste line specifically. Four incidents involving manure pits or lagoons produced ten fatalities in 2025, including six in a single event. That single event is the one in this story. Colorado ranked second nationally for confined-space cases last year with seven, behind Minnesota’s eight.

Purdue’s database now holds 2,477 cases going back to 1962, and grain entrapment dominates it at 58.6%. So manure gas is the smaller category. It’s also the one where a single incident took six men, which tells you something about how these events behave when they go wrong.

One honest gap: nobody has tracked gas-monitor adoption or confined-space training uptake across dairy operations from 1990 to now. So the tempting line — that the industry ignored this for 35 years — isn’t something the data supports. What it does support is three incidents, in 1990, 2014, and 2025, where investigators found or alleged the same missing safeguard. The information was published and findable twice before. The absence of an adoption trend line is its own kind of finding.

Options and Trade-Offs for Farmers

Path 1 — Deploy gas detection and set the entry rule. Do this within 30 days.

  • Cost: $500–$1,500 per four-gas unit, plus roughly $200/year for bump gas and calibration. A single-gas personal H₂S meter runs about $200 if budget is the barrier.
  • Implementation: One monitor per entry point. Set the alarm against a published limit rather than judgment — NIOSH’s recommended 10-minute ceiling is 10 ppm, and OSHA’s general-industry ceiling is 20 ppm, so set it at or below the lower of those and treat any alarm as a stop, not a data point.
  • Fails when: the device stays in the truck instead of being clipped to the lead worker.

Path 2 — Put man-rated retrieval systems at fixed entry points.

  • Cost: $1,800–$5,000+ for an ANSI/OSHA-compliant tripod, self-retracting lifeline, and harness.
  • Implementation: Permanent or quick-mount brackets at pump-station access points.
  • Fails when: the gear is on site, but nobody top-side is trained to operate the winch — or when a material-handling winch gets substituted for a man-rated one.

Path 3 — Write the entry procedure and post it.

  • Cost: four to eight hours a year at your labor rate.
  • Implementation: Written, posted at every identified space, read aloud before entry. Michigan State Extension recommends lock-out tags during agitation and pumping so everyone on the place knows what’s running — the National Pork Board supplies them free to pork producers.
  • Fails when: it becomes paper. Roughly 31% of confined-space fatality sites across all industries had written procedures nobody used.

Path 4 — If you bed with gypsum, treat agitation as its own hazard window.

  • Cost: operational management, plus optional manure treatment additives.
  • Implementation: Know your agitation schedule and work upwind. Andersen’s guidance: agitate only when there’s at least a 10-mile-per-hour breeze, set fans to bring in additional air, and “don’t stand downwind from the barn if at all possible.” Michigan State Extension advises never entering a barn while manure is being agitated below — and if you must go in, shut the agitator down and allow a minimum of thirty minutes for ventilation to clear lingering gases first.
  • Fails when: you assume the pit rim is the edge of the hazard. The Penn State data says it isn’t, and a closed cab is mitigation rather than protection for anyone on foot.

Key Takeaways

  • If anyone on your operation enters a pit, pump station, or below-grade manure structure, price a monitor this week. A four-gas unit runs $500 to $1,500; a personal H₂S meter about $200. Either way, it’s the only line item here you fully control.
  • If you’re relying on smell to tell you the air’s bad, you’re relying on a sense that shuts off above 2 ppm. Andersen’s warning is the whole argument: once you notice, it’s usually too late.
  • If a retrieval kit is quoted under about $1,800, ask whether the winch is man-rated before you buy. Material-handling winches are not rated to lift people.
  • If you bed with gypsum, assume readings above 20 ppm as far as 10 meters from storage during agitation — treat that as a work-zone question, not just an entry question.
  • If you shut down an agitator and walk into that room within thirty minutes, you’re ahead of MSU Extension’s clearance window. Wait it out.
  • If you’re agitating without at least a 10-mph breeze, or you’re set up downwind of the barn, you’ve made the air a variable instead of a controlled condition.
  • If your written hazard-communication program doesn’t exist on paper, you share the exact gap OSHA cited in all three Weld County companies. Fix the document before you buy anything else.
  • If you haven’t asked your local fire department whether they train for confined-space rescue, make the call this month. Many volunteer departments don’t, and finding out during an incident is finding out too late.
  • If your manure system has a repair you’ve been living with — a patch, a strap, a workaround — the hazard isn’t just the repair. It’s the next time something reactivates that line under pressure.
  • If nobody on your place can say the entry rule out loud without checking a binder, you don’t have an entry rule yet.

What Would Your Sequence Look Like?

Walk it through honestly. Somebody goes down in a pit on your operation at four o’clock on a Tuesday afternoon. Who’s the second person on scene, and what stops them from going in after him? If the answer is “their own judgment,” that’s the same answer that was in place in Wisconsin in 1990 and in Weld County in 2025. If the answer is “the monitor at the opening is in alarm and the rule says nobody enters,” you’ve built something different.

Complete references and supporting documentation are available upon request by contacting the editorial team at editor@thebullvine.com.

Learn More

The Sunday Read Dairy Professionals Don’t Skip.

Every week, thousands of producers, breeders, and industry insiders open Bullvine Weekly for genetics insights, market shifts, and profit strategies they won’t find anywhere else. One email. Five minutes. Smarter decisions all week.
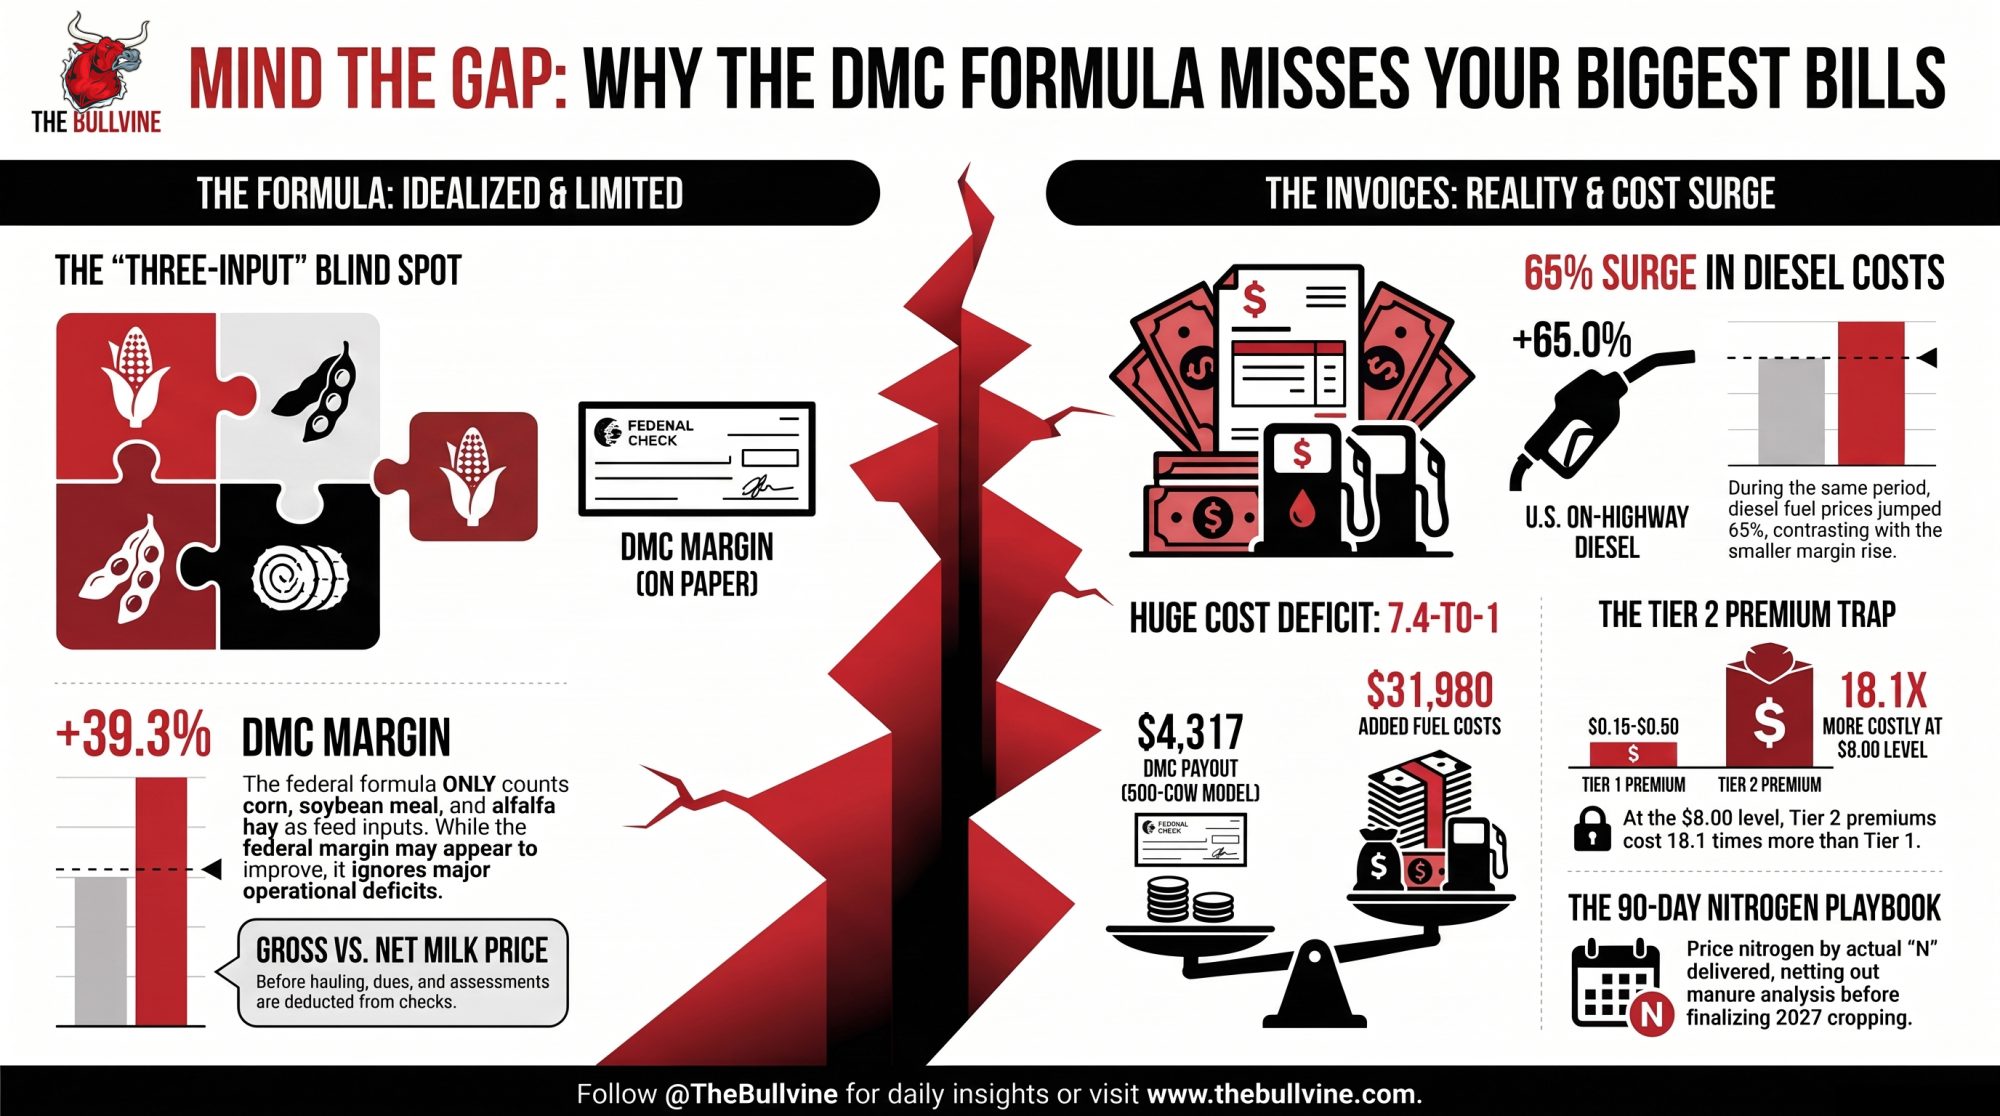
NewsSubscribe
First
Last
Consent

500,000 Gallons a Day: A Ceiling to the City, a Floor to Its Challengers

Wahpeton’s deal allows “up to” 500,000 gallons a day. The petitioners’ attorney calls it a minimum. One number, two meanings — and your supply agreement uses one of those words too.

Executive Summary: North Dakota approved up to 500,000 gallons a day of Wahpeton municipal water for Riverview’s planned 12,500-cow Abercrombie Dairy, and when eight rural landowners challenged it, an administrative law judge threw the case out on July 30, 2026 — on standing, not on the water. Wahpeton holds 2,130 acre-feet a year across two permits and has recently drawn about 919, so the dairy’s 560 acre-feet takes 46% of the headroom between actual use and the ceiling, and that’s Bullvine’s math off the city’s own published figures. Here’s the fight worth watching: Public Works Director Dennis Miranowski told Agweek the deal “allows up to” 500,000 gallons a day, while ELPC attorney Katie Garvey calls it a minimum — same number, one a cap and the other a growth curve, and nobody’s published the use-category breakdown that would settle it. The hydrology’s contested too, with DWR’s 2021 modeling showing 6.7 feet of added drawdown at recent use versus 40.5 at full allocation, against the petitioners’ hydrogeologist documenting 11 feet already lost at one property between 1975 and 2011. If you’re buying utility water instead of drilling, the two numbers to get in writing before you sign are your supplier’s permitted allocation and its recent actual draw — plus which of those two words your contract uses.

 mega dairy water permit

Mary Sahl’s family well went down 70 feet in 1962, and for a while it flowed on its own. No pump. By the mid-1970s, according to the well’s owner, it had stopped flowing altogether. That was five decades before this dairy was proposed, and nobody has suggested the two are connected. But the aquifer under Sahl’s well — the Wahpeton Buried Valley, in southeastern North Dakota — is the same one that will supply Riverview ND, LLP’s planned Abercrombie Dairy in Richland County.

Sahl was one of eight rural landowners whose challenge was dismissed alongside the Dakota Resource Council’s. You may never build within 500 miles of Richland County. The numbers both sides filed are still worth a look, because your own project will have to answer the same three questions this one did.

What Actually Got Decided

North Dakota’s Department of Water Resources approved the arrangement on August 20, 2025. An evidentiary hearing was set for August 12–13, 2026, at the State Capitol. The dismissal canceled it. The Dakota Resource Council and eight members from Richland County, North Dakota, and Wilkin County, Minnesota, filed for reconsideration on August 11, 2026, and that request is still open.

The routing matters more than the headline number. Riverview isn’t pumping from the aquifer under its own permit. Wahpeton draws from the aquifer, pushes water through a new well field and booster station to Southeast Water Users, and Southeast delivers it to the dairy — a chain confirmed by Wahpeton Public Works Director Dennis Miranowski. Two handoffs between the aquifer and the barn. According to the petitioners’ account, the state argued on that basis that Wahpeton bore responsibility for the sale rather than the agency.

And this is a $90 million facility, permitted by the North Dakota Department of Environmental Quality in January 2025, sitting above an aquifer that supplies drinking water to nearly 30 wells, per DTN’s January 2025 reporting. Construction was active as of October 2, 2025, when Inforum reported harvest traffic colliding with dairy construction traffic on rural Richland County roads. No public reporting since then confirms current progress or a commissioning date.

The Allocation Math, Now on the Record

Here’s the part that wasn’t public until a reporter asked for it.

Wahpeton holds 2,130 acre-feet per year across two state permits — roughly 693 million gallons. The city’s recent average use has run about 919 acre-feet. Miranowski says supplying Southeast keeps Wahpeton inside that ceiling: “We have an allocation under two permits. And we get 2,130 acre-feet in a year. So we are within that limit by supplying to the Southeast.”

Now the dairy’s share. At 500,000 gallons a day every day, that’s 182.5 million gallons a year, or about 560 acre-feet. Run the subtraction: Wahpeton’s permit allows 1,211 acre-feet more than the city’s recent average, and the dairy’s 560 would take 46% of that difference. Those are Bullvine’s calculations from the city’s own published figures, and Wahpeton hasn’t characterized the arrangement in those terms.

Per cow, the arithmetic is simple. Penn State Extension and the University of Nebraska both put lactating cow intake at 30 to 50 gallons a day. A Michigan State University Extension summary from 2011 measured on-farm use at 29.9 gallons per cow per day — 23.6 drinking plus 6.3 wash. Older data, and worth treating as a floor rather than a current benchmark.

Divide the permit by the herd: 500,000 ÷ 12,500 = 40.0 gallons per cow per day.

That lands at the upper end of the extension range, which tells you the number almost certainly covers parlor wash-down, cooling, and sanitation on top of drinking water. Nobody has published a use-category breakdown, so that’s a read, not a confirmed fact.

Ceiling or Minimum? Same Number, Opposite Argument

This is the disagreement worth watching, because it decides what the 500,000 figure actually means.

Miranowski told Agweek on August 19, 2026 that the city’s agreement with Southeast Water Users “allows Wahpeton to provide up to 500,000 gallons of water per day.” Up to. A ceiling the dairy may never reach, and one the city says keeps it comfortably inside its state permit.

Katie Garvey, senior attorney at the Environmental Law and Policy Center representing the petitioners, describes the same figure differently: the operation will require a minimum of 500,000 gallons a day. Not a cap — a floor.

One number, two readings, and the gap between them is the whole permitting question. If it’s a ceiling with real slack, Wahpeton’s headroom math holds. If it’s a floor, the dairy’s draw grows from there, and the 46% figure is a starting point, not an outcome. Nobody has published the use-category breakdown that would settle it, and the hearing that could have compelled one got canceled.

Riverview hasn’t addressed the ceiling-versus-floor question directly. Brady Janzen, a Riverview partner, told Inside Climate News in an emailed statement published August 7, 2026: “These projects were subject to extensive environmental and regulatory review, including detailed technical analysis and evaluation by the appropriate agencies. The permits reflect the conclusion of that review that the projects satisfy the standards required by law.” Janzen has also said publicly that the dairies draw on a mix of sources — rooftop rainwater runoff, surface water, and groundwater — rather than groundwater alone. Inside Climate News reported the company did not answer its questions directly, replying with the written statement instead.

How Much Water Is That Against Your Own Barn?

Run it at your scale. A 500-cow herd at 40 gallons per cow per day uses 20,000 gallons daily — about 7.3 million gallons a year, or roughly 22 acre-feet. Abercrombie’s ceiling is 25 times that.

If you think in million gallons rather than acre-feet — and most Eastern and Great Lakes producers do — here’s the same math both ways:

Herd sizeDaily use (40 gal/cow)Annual million gallonsAnnual acre-feet
500 cows20,000 gal7.3 MG~22.4 AF
2,500 cows100,000 gal36.5 MG~112.0 AF
12,500 cows (Abercrombie ceiling)500,000 gal182.5 MG~560.1 AF
Wahpeton total permit cap~1,899,000 gal693.1 MG2,130.0 AF

Conversions at 325,851 gallons per acre-foot. Herd figures assume 40 gal/cow/day every day — a ceiling, not a projection.

Riverview’s own earlier figures for this site ran lower. North Dakota Monitor reported in April 2025 that large dairies need roughly 20 to 30 gallons per cow per day, putting the Richland County site at about 350,000 gallons — with company figures reported in 2024 and 2025 landing in a 300,000 to 350,000 range. So the approved ceiling sits roughly 43% to 67% above the operating estimate. The two don’t quite reconcile, either: 28 to 30 gallons across 12,500 head works out closer to 350,000–375,000 gallons a day, so the 300,000 low end implies a smaller starting herd or a tighter per-cow assumption than the company stated.

SourceGal/cow/day assumedDaily volume (12,500 cows)Status
Penn State/Nebraska Extension range30–50 gal375,000–625,000 galIndustry benchmark
Riverview company figures (2024–2025)~24–28 gal300,000–350,000 galCompany-reported estimate
ND Monitor reported industry range20–30 gal250,000–375,000 galTrade press estimate
Approved Abercrombie ceiling40.0 gal500,000 galState-approved permit

Two Reports, One Aquifer, Different Conclusions

Both technical analyses are public now, which makes this case unusually useful.

The petitioners hired hydrogeologist BJ Bonin of Midwest Geological, whose July 27, 2026 report for the Environmental Law & Policy Center reviewed well records for four properties near Wahpeton and Breckenridge, pulled from ND DWR and the Minnesota Department of Health. Bonin’s findings, as reported: the Wahpeton Buried Valley Aquifer is interconnected with nearby aquifers, so pumping in one affects the broader system; water levels at the Zick property dropped 11 feet between 1975 and 2011; and effects on some wells can’t be quantified because a 2021 pumping test didn’t monitor wells north of the proposed well field. Those are the petitioners’ expert’s conclusions, filed in support of their case.

The agency’s own 2021 recommended decision on Wahpeton’s municipal permits found substantial historical declines — then concluded those declines had flattened and the aquifer was sustainable at then-current development. That same analysis modeled the new well field two ways: at full 2,130 acre-foot use, net drawdown could reach about 40.5 feet; at the city’s recent 919 acre-foot average, roughly 6.7 feet. DWR found the change in diversion points wouldn’t adversely affect other appropriators, and recommended approval.

Both reports agree the water goes down. They fight about how far down is fine, and whether a model built without monitoring the northern wells can tell you. That’s the question an evidentiary hearing exists to settle. This one didn’t get one.

What the Permit Process Already Changed

Residents didn’t wait for litigation to bring in technical help. During the DEQ comment period, David J. Erickson, a principal hydrogeologist with Water and Environmental Technologies, studied the proposal on behalf of area residents and filed public comments. He raised concerns that the 106.7 million gallons of manure the dairy would handle annually could result in spills at the facility and on nearby roads, odors over a large area, and increased flies and insects. Those were predictions submitted during the comment process, not findings. DEQ addressed several of them in its permit decision, and Riverview has said its farms are designed to prevent discharges to surface waters.

DEQ’s response, released January 3, 2025, documents three changes it made after public feedback. The agency reevaluated the permit given the facility’s proximity to a proposed well-head protection area and added new groundwater monitoring well requirements. It revisited the 100-year floodplain analysis and removed three fields from the nutrient management plan while keeping the minimum required acres. It also noted that the three wastewater ponds are designed with synthetic covers to reduce vector concerns.

The agency also put its own groundwater data on the record. DEQ’s 2021 sampling report covered 129 wells across 15 aquifers: pesticides turned up in 8 of them, all below prevention action levels, and the nitrate maximum contaminant level wasn’t exceeded in any well sampled. DEQ also said plainly that it does not continually monitor the Wahpeton aquifer, though it monitors surficial aquifers statewide that carry elevated contamination risk.

That’s a regulator responding to comment on three specifics, and declining jurisdiction over water source and siting. Both halves of that are the story.

What Standing Rule Applied Here?

North Dakota’s water-appropriation statute, N.D.C.C. chapter 61-04, gives a “party of record” who filed written comments 30 days from service of a recommended decision to request an adjudicative proceeding — an appeal under chapter 28-32 — and requires stating “with particularity” how the person would be aggrieved. Separately, North Dakota Administrative Code 89-03-01-01.2 requires an interest in overlying lands to seek a water permit.

The state’s argument, per the petitioners’ account: Wahpeton bore responsibility for the sale rather than DWR, and the petitioners lacked standing as non-residents who hadn’t yet suffered harm. Their counter is that they draw on the same groundwater system as both the city and the dairy. DRC organizer Sam Wagner put the ask plainly: “We’re not asking them to rule in favor of our case, but we are asking them to listen to us. Or have a day in court.”

Why that matters outside North Dakota: a residency-based standing test means the objector risk on your project may depend less on hydrology than on where the property lines fall. Two identical projects on the same aquifer can face very different challenge exposure if one draws from a municipality and the other pumps directly. DWR declined to comment on the case, citing ongoing litigation.

Which Permit Fight Are You Actually Preparing For?

Three Riverview-related matters are active at once, and each turns on a different legal question. Two produced procedural dismissals; the third is still before an appeals court. Read them as one story, and you’ll prepare for the wrong one.

Abercrombie/Wahpeton was dismissed on petitioner standing in a water-appropriation proceeding. The separate Herberg Dairy matter in Traill County — a 25,000-cow permit issued September 24, 2025 — saw an earlier suit dismissed because the agency wasn’t properly served, a service-of-process defect, while the pending appeal concerns Clean Water Act discharge adequacy. West River Dairy near Morris, Minnesota, an 18,855-cow expansion, involves neither: that fight is over environmental review adequacy and greenhouse-gas planning, filed in the Minnesota Court of Appeals on July 22, 2026.

Three doors, three different locks. And note what DEQ said when it permitted Abercrombie: while many issues raised in the comment period were addressed, “certain concerns, such as the facility’s water source and the operation’s location, fall outside the NDDEQ’s jurisdiction and are not subject to review under the permit process.” That jurisdictional line is the one worth noting. Different agency, different question — and if your exposure is environmental-review completeness, better neighbor meetings won’t close it.

ProjectLocationHerd sizeLegal issueOutcome status
Abercrombie Dairy (Riverview/Wahpeton)Richland Co., ND12,500 cowsPetitioner standing, water appropriationDismissed on standing; reconsideration pending
Herberg DairyTraill Co., ND25,000 cowsService of process (dismissed suit); CWA discharge adequacy (pending)Prior suit dismissed; appeal active
West River DairyMorris, MN18,855 cowsEnvironmental review adequacy, GHG planningFiled with MN Court of Appeals, July 22, 2026

Options and Trade-Offs for Farmers

Path 1: End-to-End Water Routing Audit — do this within 30 days

  • Trigger: Buying municipal or rural water utility capacity instead of drilling on-site.
  • Execution: Map every meter, booster, and intermediary entity between the aquifer and the parlor. Abercrombie’s chain runs aquifer → Wahpeton well field and booster → Southeast Water Users → dairy.
  • Cost: One call to your utility, one to your engineer.
  • Core vulnerability: The Abercrombie standing ruling is a single decision with reconsideration pending. A narrow standing bar today isn’t a permanent feature you can plan around, and an intermediary arrangement doesn’t eliminate neighbor opposition — it just changes who gets sued.

Path 2: Allocation vs. Actual Use Calculation

  • Trigger: Pre-lease or pre-purchase due diligence on an expansion site.
  • Execution: Secure both the supplier’s total state-permitted volume and its recent actual draw, in writing. Wahpeton’s 2,130 and 919 are the pair — you need both to see the headroom.
  • Cost: One request; most municipalities have both figures at hand.
  • Core vulnerability: A legal permit cushion doesn’t prevent localized cone-of-depression drawdown. DWR’s own modeling put net drawdown at 40.5 feet if Wahpeton ever used its full 2,130 acre-feet. And get your supply agreement’s language in writing — “up to” and “minimum of” are the difference between a cap and a floor.

Path 3: Pull the Agency’s Modeling, Not Just Its Decision

  • Trigger: Any expansion where a neighbor could plausibly object.
  • Execution: File a written records request with your state water agency — in North Dakota, the Department of Water Resources in Bismarck — asking specifically for the recommended decision and any pumping-test or drawdown modeling tied to your source’s permits, by permit number.
  • Cost: A records request and patience.
  • Core vulnerability: The modeling may not support the comfort you were hoping for. DWR’s 2021 decision held the drawdown estimates, the flattening-decline finding, and the sustainability conclusion — the decision letter was the headline; the analysis underneath is what a challenger reads.

Path 4: Price the Regulatory Delay Before Financing Closes

  • Trigger: Before you sign construction financing.
  • Execution: Add a delay-cost line. The Bullvine’s earlier work on Riverview’s West River expansion put a twelve-month permit delay at roughly $1.56 per hundredweight on a 600-cow expansion. The interest-rate and per-stall assumptions are laid out in that piece — pull them and swap in your own.
  • Cost: Your actual rate and draw schedule.
  • Core vulnerability: Riverview hasn’t disclosed Abercrombie’s financing, so every project-level dollar figure here is an assumption someone owns. Make sure it’s you.

Key Takeaways

  • Audit supplier headroom before you sign. If you’re buying water rather than pumping it, get permitted allocation and recent actual use in writing. Wahpeton’s gap between 919 and 2,130 acre-feet is where the dairy’s 560 fits.
  • Nail down ceiling versus floor. If your agreement says “up to,” you have a cap. If anyone describes your draw as a “minimum,” you have a growth curve. Miranowski and Garvey use the same 500,000 figure to mean opposite things.
  • Treat a thin cushion as a queue position. If the gap between your supplier’s permit and its current use is smaller than your project’s annual draw, you don’t have a water plan yet.
  • Expect modeling scrutiny. If your source has a monitoring gap, assume it surfaces during a challenge. Bonin’s report flagged that the 2021 pumping test skipped wells north of the proposed field.
  • Confirm jurisdiction in writing. Ask each agency which of your project’s questions it will and won’t review. Abercrombie’s DEQ permit added monitoring wells and cut three floodplain fields — and still left water source and siting outside its jurisdiction.
  • Request the analysis, not the letter. If your state agency has issued a recommended decision on your source, pull the underlying modeling.
  • Price regulatory delay. If your financing model has no delay-cost line, add one before closing — the West River frame put twelve months at roughly $1.56/cwt on 600 cows.
  • Match the playbook to the mechanism. Before borrowing another operation’s permit defense, confirm both projects face the same failure mode. Standing, service of process, and environmental review are three different problems.

Closing

The reconsideration request is still pending, which means the standing question isn’t settled — and neither is whether that 500,000 figure is a ceiling or a floor. So here’s the one to take to your own kitchen table: if somebody applied for a large withdrawal on your aquifer next month, could you name your supplier’s permitted allocation, its actual use, and the drawdown your state has already modeled?

Those three numbers sat in Wahpeton’s records the whole time. The reconsideration filing and the reporting that followed are what brought them into the public record. We’re building out the delay-cost model by herd size and a state-by-state comparison of appropriation thresholds and objector-standing rules for Bullvine Weekly — that’s where the carrying-cost math gets laid out, with every assumption shown.

This article is based on public filings, agency records, and published reporting available as of August 21, 2026. The petitioners’ reconsideration request remains pending, and no ruling has been issued on the merits of the withdrawal itself.

Complete references and supporting documentation are available upon request by contacting the editorial team at editor@thebullvine.com.

Learn More

The Sunday Read Dairy Professionals Don’t Skip.

Every week, thousands of producers, breeders, and industry insiders open Bullvine Weekly for genetics insights, market shifts, and profit strategies they won’t find anywhere else. One email. Five minutes. Smarter decisions all week.

NewsSubscribe
First
Last
Consent

Under 20 Cows? $12.00/cwt of Your Cost Is You, Working for Free

Your co-op check says you’re losing $101,000 a year on 20 cows. USDA’s own math says $12.00/cwt of that never left the checkbook.

EXECUTIVE SUMMARY: USDA pegs full production cost at $42.70/cwt for herds under 50 cows against $19.14 at 2,000-plus, which means a 20-cow herd shipping commodity milk into the 2026 all-milk forecast of $20.70 runs about $101,000 in the red, roughly $5,060 a cow. But nearly $12.00/cwt of that small-herd cost is unpaid family labor, priced at what those hours would’ve earned off-farm, so a big share of the “loss” never left the checkbook. It was your hours. Flip the same 15 cows into direct raw sales, farmstead curd, and farm tours and the modeling nets $2,134 to $10,558 per cow, against $359 per cow on a 200-cow commodity benchmark. What decides which side you land on isn’t your cows. It’s your statute book: 15 states allow full retail raw sales at up to $30 a gallon, 19 cap you on-farm nearer $6–15, seven force herd shares, and three ban it outright.

micro-dairy economics

Jacy Vaughn didn’t set out to become a test case. She’s a first-generation farmer near Lamesa, out on the West Texas plains, who wanted to sell raw milk off her roughly 30-cow homestead straight to the families who came looking for it. Texas took her to court over an $800 permit she skipped, and by her own account she’s dumped more than 1,000 gallons of milk since 2025 while the case grinds on. Strip away the courtroom drama and the fight reflects a broader reality: for a small dairy, the battle over direct raw sales is a battle over the only business model that pencils out at that size.

Picture a 20-cow herd anywhere in the country. Cows bred right, barn clean, milk in the tank every morning. The truck comes, the check comes, and at year’s end that farm is down roughly $101,000, about $5,060 per cow. Nobody did anything wrong. At 20 cows, shipping raw commodity milk at today’s price is a losing hand before you walk to the parlor. So if you’re staying small on purpose, how do you keep the cows without an off-farm job quietly subsidizing them?

Why can’t a small herd just cut costs and survive?

Because the cost gap isn’t a management problem; it’s baked into the size.

USDA’s cost-of-production data pegs full production cost at $42.70/cwt for herds under 50 cows, against just $19.14/cwt for herds of 2,000 or more. That’s a $23.56 spread on every hundredweight, and no amount of penny-pinching closes it. You can’t buy feed like a 2,000-cow operation. You can’t spread a parlor’s fixed cost across enough cows to matter. At USDA’s 2026 all-milk forecast of $20.70/cwt, a 42-dollar cost structure doesn’t clear. 

Of every dollar a gallon of milk earns at retail, the farmer keeps about 25 cents.

Every mile between your bulk tank and somebody’s fridge, hauler to processor to store, takes a cut you can’t afford at 20 cows. So the survivors stop giving it away.

Show me the numbers: what actually pencils out?

Run three small farms against a 200-cow commodity herd and the story tells itself. The straight-commodity rows use USDA’s own cost figures directly: $42.70/cwt for the 20-cow herd, $19.14/cwt for the 200-cow benchmark.

One thing to be clear about, because it changes how you read the table. These are full economic costs, not just cash out the door. USDA charges unpaid operator and family hours at what those people could have earned off-farm, roughly $20 to $30 an hour. On herds under 50 cows, that imputed family labor runs about 97% of the total labor bill, and labor alone sits near $12.00/cwt against $2.20/cwt at 2,000-plus cows. So the $101,000 hole isn’t only money leaving the checkbook. A chunk of it is you, working for free.

That cuts both ways on the value-add farms. Their higher per-cwt costs carry processing and agritourism overhead on top, but curd vats and farm tours don’t run themselves. If you’re already counted as working for free in the commodity model, adding a creamery and a tour schedule doesn’t make those hours free. It makes them longer. Treat the value-add net-per-cow ranges below as before-your-own-wage figures, and subtract whatever you’d have to pay someone else to do the processing and host the visitors.

The farmRaw milk soldValue-addRevenue rangeTotal costNet incomeNet per cow
15 cows, all-in — 35% sold raw, farmstead curd/paneer, farm tours14,041 gal3,000 gal$200,323–$326,690$168,315$32,008–$158,375$2,134–$10,558
18 cows, herd-share lean — 20% raw, light value-add9,628 gal1,500 gal$146,156–$232,807$187,778-$41,622–$45,029-$2,312–$2,502
20 cows, straight to the truck00$95,220$196,420-$101,200-$5,060
200 cows, commodity benchmark00$952,200$880,440$71,760$359

Bullvine model. Built from USDA cost-of-production data and published raw-milk price bands; milk priced at USDA’s 2026 all-milk forecast. Assumes roughly 23,000 lb/cow/year and 8.6 lb per gallon. Costs are full economic costs including imputed unpaid labor. Illustrative scenarios, not real operations.

Look at the bottom two rows first. The straight-shipping 20-cow herd is six figures underwater. The 200-cow benchmark, ten times the cows with real scale and real efficiency, clears about $359 per cow. Now the top row. The 15-cow farm that commits to selling direct doesn’t just survive. At the high end, it nets over $10,000 per cow, beating that 200-cow operation many times over.

The 18-cow farm in the middle is the honest one. It swings from a $41,000 loss to a $45,000 gain depending on where its raw milk prices out. That’s the knife’s edge most micro-dairies actually live on. Half-committing to direct sales isn’t a safe middle path. It’s a coin flip.

Run it on your own herd. Take your cows, multiply by ~23,000 lb, divide by 8.6 to get gallons. Co-op farmgate works out to roughly $1.80 a gallon at today’s all-milk price. Move a gallon from that to direct raw at even $10, and you’ve added about $8.20 to the top line, before you subtract hauling, which only widens the gap. On a 15-cow herd, shifting about 35% of production to direct is over 14,000 gallons. North of $100,000 in revenue that never showed up on the co-op check.

Does your state decide this more than your cows do?

Mostly, yes. And that’s the wall Jacy Vaughn ran into in Texas: not a price problem, a permit problem.

Raw milk retails anywhere from $6 to $30 a gallon, and here’s the kicker. That spread has almost nothing to do with quality. It’s your zip code. Live in one of the 15 states that allow full retail sales — California, Pennsylvania, Maine, Nevada, New Mexico, Arizona, Washington, Idaho, Oregon, and now Utah after its 2026 HB 179 — and you can reach that $30 ceiling in a grocery cooler. Cross a line into one of the 19 on-farm or farmers’-market states, and you’re capped closer to $6–15 a gallon, selling out of your own driveway. Same 15 cows, same butterfat, wildly different ceiling.

Category# of StatesPrice CeilingSales ChannelExample States
Full retail-legal15Up to $30/galRetail/groceryCalifornia, Pennsylvania, Utah (2026)
On-farm/farmers’ market19$6–$15/galFarm or market only
Herd-share model7N/A (boarding fee)Member-owned cow shares
Full ban3N/ANone permittedHawaii, New Jersey, Virginia

And the map keeps moving. Oklahoma just yanked its on-farm cap from 100 to 1,500 gallons a month in May 2026 and legalized advertising, though sales still have to happen at the farm, not in stores. Seven states box you into herd shares, where a customer legally owns a piece of the cow and pays you a boarding fee. Only three — Hawaii, New Jersey, and Virginia — ban raw sales in every form, with six more stuck at pet-milk only. Texas technically allows on-farm raw sales, which is exactly why Vaughn’s fight turns on the permit and her private-membership model, not on whether raw milk is legal at all.

That’s the caveat the model farms can’t show you. Direct raw carries liability and regulatory exposure a co-op contract never will. The FDA has linked 143 illness outbreaks to raw milk since 1987, and one event can end a farm-direct brand overnight. Vaughn argued her Private Membership Association kept sales member-to-member and outside the state’s reach; a Travis County judge sided with the state at the injunction stage, in Texas DSHS v. Like Wildflowers Homestead (Cause No. D-1-GN-25-010854). A permit fight alone can mean dumped milk and mounting legal fees before any safety question is even reached. Go in with your eyes open, and call an ag attorney before you call a customer.

Isn’t agritourism just a hobby that eats your Saturdays?

Not on these numbers. For a 20-cow herd, value-add and farm visitors aren’t the garnish. They’re often the meal.

A 2026 peer-reviewed study of five small dairies found on-farm cheese processing shifted the underlying economics, not just the top line. Agritourism reads the same way. The average U.S. farm running tours, stays, or on-farm dining earns about $44,000 a year, though the spread is wide, with top counties averaging $161,000 and only around 1.5% of farms doing it at all. That last number is the opening. Almost nobody’s competing for it. Tours run $15–25 a head, on-farm dining $65–125, and most setups break even inside 12 to 36 months.

Why one dead cow hurts a micro-dairy more than a mega-dairy

Here’s where genetics stops being a big-herd luxury and becomes small-herd survival. When you’ve built a direct-sales brand on 15 cows, every animal is carrying a share of that $200,000-plus revenue line from the table above, not just producing milk but backing the herd shares and the standing orders. Lose one cow early to a bad calving or a lame foot, and you’ve knocked out 6–7% of your milking string in a single week, a hit a 500-cow herd wouldn’t even feel. On a business already living on the coin’s edge, that’s not a bad month. It can be the month the numbers stop working.

That’s why involuntary culling is a financial catastrophe at this scale, and why the genetics of staying matter more than the genetics of peak milk. Longevity is highly polygenic, built from hundreds of small-effect genes rather than one magic marker, so the genomic tools built for big commercial herds still work in a small barn. Canadian Holstein research ties reproduction traits directly to functional longevity: cows that breed back reliably age out on your schedule, not an emergency vet’s. One genetic study put a hard number on soundness. The gap between a “very good” conformation cow and a “poor” one was worth $211 a year and 307 extra days of productive herd life, almost all of it from better locomotion keeping cows out of the cull pen. Extension folks push the same lever from the calf side: aim for first calving around 23 months and pick sires for health and longevity, not just peak milk.

Options and trade-offs

Farm ModelCowsNet Range/CowRegulatory DependencyRisk Level
Straight commodity20-$5,060Low (co-op contract)Low risk, guaranteed loss
Herd-share lean18-$2,312 to $2,502High (7 herd-share states only)Coin-flip / high volatility
Commodity benchmark200$359LowLow risk, thin margin
All-in direct + value-add15$2,134 to $10,558Very high (state statute-dependent)High reward, high compliance risk

Go all-in on direct sales (the 15-cow model)

This is the path that beats a 200-cow herd per cow, but it turns you into a food business as much as a dairy. It makes sense if you’re in a retail-legal or strong herd-share state and you genuinely like customers as much as cows. You’ll need processing space, a permit, and a market you build yourself.

⏱ DO THIS IN THE NEXT 30 DAYS

1. Pull your state’s raw-milk statute. Confirm exactly what you can legally sell before you spend a dollar on infrastructure.

2. Get your insurance answer in writing. Ask your agent one question: does the policy cover raw-milk sales, or does it already exclude them? That exclusion is the trap that turned Jacy Vaughn’s permit skip into a five-figure headache.

Run herd shares and keep it lean (the 18-cow model)

This is the play in the seven herd-share states where retail raw is off the table. Overhead stays lower, but you’re on that coin’s edge. It only clears if you price the boarding fee right and hold onto your members. Lose a few families or misprice the share, and the same model that penciled at a $45,000 gain slides toward a $41,000 loss.

Add agritourism on top of either

This is the lowest-competition lever on the board, and it doesn’t fight your milk for volume. What it needs: land people actually want to visit, real liability coverage, and a tolerance for strangers on the place. Expect break-even somewhere in the one-to-three-year range.

Stay straight-commodity

This one only pencils if the dairy isn’t really the point. The off-farm job is, or the land and the lifestyle are. Nothing wrong with that choice. Just don’t expect 20 cows and a co-op check to pay for themselves.

Where’s this heading?

Direct-to-consumer demand keeps climbing, and more states keep loosening rules. Utah and Oklahoma both expanded access in 2026, with more bills moving in 2026 sessions. But a ruling against a small operator in a top-four milk state like Texas is exactly the enforcement posture regulators next door reach for. The window for early movers in low-competition markets is open now, and how long it stays open depends partly on cases like Vaughn’s.

Which means the decision in front of you isn’t really “should I go direct someday.” It’s whether your state’s rules and your own tolerance for customers make it viable this year, while the field is still thin.

Key takeaways

  • If you’re under ~20 cows shipping straight commodity, you’re subsidizing the cows, full stop. Run your own version of the table before you defend the current model. 
  • If a big share of your “loss” is imputed family labor, know that before you panic. Near $12.00/cwt of small-herd cost is unpaid hours, not cash out the door. 
  • If your state is one of the 15 retail-legal or 7 herd-share states, that’s your single highest-value lever — bigger than any cost cut or genetics tweak you can make.
  • If you’re half-committed to direct sales, you’re on the coin-flip farm. Pick a lane. The middle loses money more often than it makes it.
  • If you’re going direct in a permit state, get the permit and the insurance answer before you sell a jar.Skipping the $800 is exactly what put Jacy Vaughn in a Travis County courtroom.
  • If you’re keeping a tiny herd, treat every early cull as a revenue event, not just an animal loss. A sounder cow is worth ~$211/year and nearly a year of extra herd life, and at 15 cows that margin is your buffer.
  • If agritourism fits your land and temperament, it’s the least-crowded income on the board. Only ~1.5% of farms have claimed it.

So where does your breakeven actually sit right now, and how much of it is really you working for nothing? Pull your milk records and your state’s raw-milk rules this week and run the gallons-times-price math on your own herd. If it comes up short on the co-op check, you already know which lever to pull first.

Run Your Numbers

Dairy Profit Projector — Drop in your herd size, production, and ration to see your own breakeven milk price and margin per cwt. It shows exactly how far your cost structure sits from today’s milk price, so you know what the direct-sales premium has to cover before you build a thing.

Complete references and supporting documentation are available upon request by contacting the editorial team at editor@thebullvine.com.

Learn More

The Sunday Read Dairy Professionals Don’t Skip.

Every week, thousands of producers, breeders, and industry insiders open Bullvine Weekly for genetics insights, market shifts, and profit strategies they won’t find anywhere else. One email. Five minutes. Smarter decisions all week.
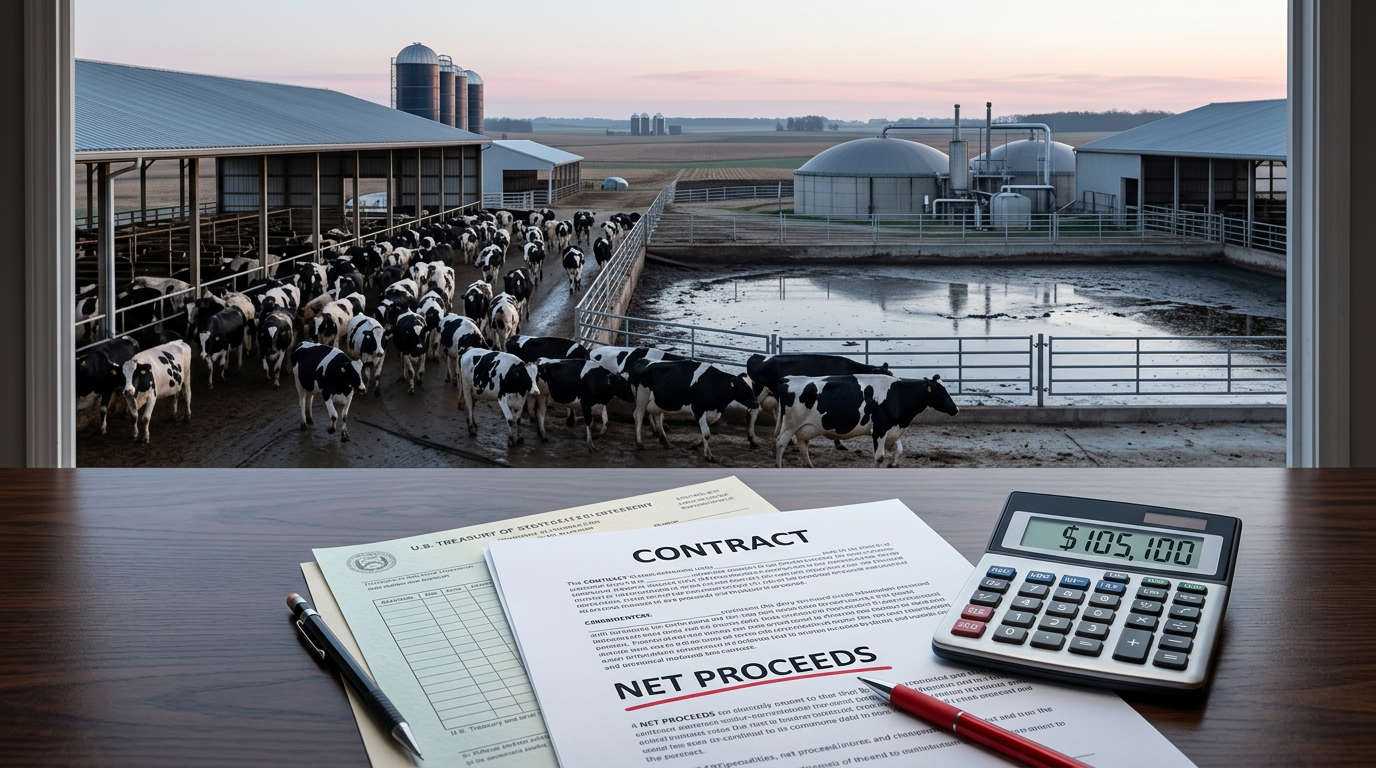
NewsSubscribe
First
Last
Consent

The Colostrum Standard Moved — and 39% of Your “Passed” Calves Are Losing Milk

Reclassified under the four-tier standard, nearly 39% of U.S. heifer calves land in Fair or Poor — and the research suggests that gap follows them into first lactation.

The vet pulls blood from twelve healthy heifer calves, spins it, and runs each sample across a refractometer you already own. Nothing looks wrong. None of these calves are sick. They’re bright, they’re nursing, and they’d pass any eyeball test. Then the numbers come back — and the chart tells a different story than the calves do.

That’s the moment this whole thing turns. For twenty years, the standard said a calf either passed or failed at 10 g/L of serum IgG — and by that math, roughly 90% of calves in the USDA’s National Animal Health Monitoring System (NAHMS) Dairy 2014 study passed. A clean 90%. Sounds like a program that’s working. But it isn’t measuring what pays you back.

The Standard Quietly Changed, and Most Herds Didn’t Notice

In 2020, a group of calf experts led by Jason Lombard published consensus recommendations in the Journal of Dairy Science that retired the old pass/fail line. In its place: four tiers of passive transfer — Excellent, Good, Fair, and Poor — each with serum IgG, total protein, and Brix cut points you can read on-farm (Lombard et al., J. Dairy Sci.103:7611–7624, 2020, U.S. dairy calves).

Transfer categorySerum IgG (g/L)Total protein (g/dL)Brix (%)Herd target (% of calves)
Excellent≥ 25.0≥ 6.2≥ 9.4%> 40%
Good18.0 – 24.95.8 – 6.18.9% – 9.3%≈ 30%
Fair10.0 – 17.95.1 – 5.78.1% – 8.8%≈ 20%
Poor< 10.0< 5.1< 8.1%< 10%

Now run the old NAHMS numbers through the new lens. When the Dairy 2014 data get reclassified into Lombard’s tiers, only about 35.5% of heifer calves land in Excellent, 25.7% in Good, 26.8% in Fair, and 12.0% in Poor (USDA APHIS, NAHMS Dairy 2014 info brief, U.S. national). It’s a decade-plus old, but it’s still the most recent USDA national passive-transfer survey we have. Same calves. Same blood. Nearly 39% of them are sitting in Fair or Poor.

The blood draw didn’t change. The question did. The old test asked, “Is this calf in danger?” The four-tier chart asks something harder: “Is this calf on track to pay back what she cost to raise?”

Why Is a Blood Value Really a Revenue Number?

Three separate studies point at the same target, and none of them are about scours.

Back in 1989, DeNise and colleagues followed roughly 1,000 Holstein heifers and found serum IgG measured shortly after birth was a real source of variation in first-lactation milk — a slope of 8.5 kg of mature-equivalent (ME) milk per 1 g/L of serum IgG (DeNise et al., J. Dairy Sci. 72:552–554, 1989). ME basis means the figure is standardized to a mature cow’s production, not a raw first-lactation tank weight. It’s an association from one cohort, not a guarantee. But it’s held up across the citations since, and it puts a number on a blood value most people file under “health.”

Then there’s growth. Soberon and colleagues reported that each 1 kg of preweaning average daily gain tracked with 850 kg more first-lactation milk in the Cornell herd, and 1,113 kg more in a commercial herd (Soberon et al., J. Dairy Sci.95:5254–5267, 2012). That early growth runs straight through the same colostrum window you’re testing.

And the cost of getting it wrong isn’t hypothetical. Raboisson’s 2016 meta-analysis pegged the mean total cost of a dairy calf with failure of passive transfer at about €60, with a prediction interval running to €109 (Raboisson et al., PLOS ONE, 2016). That’s before you count the milk you never make.

The Barn Math Nobody’s Running

Walk it through on one calf. Take a heifer sitting at 15 g/L — squarely mid-Fair, right where a big share of NAHMS calves live. Compare her to a herdmate at 25 g/L, the floor of Excellent. That’s a 10 g/L gap.

💸 The Leak on the Milk Check

A calf in Fair (15 g/L) instead of Excellent (25 g/L) sits at a 10 g/L deficit.

On DeNise’s 1989 slope, that gap tracks with roughly 85 kg — about 187 lbs — of lost first-lactation milk per calf, mature-equivalent (ME) basis.

Scale it: for every 25 heifers stuck in Fair that could’ve reached Excellent, that’s roughly 4,675 lbs of ME first-lactation milk you’d already paid to raise.

This is an association from one cohort, not a guaranteed yield — but it’s the direction, and it’s real.

That’s the whole tension. The math has existed since 1989. The levers are known. And on most farms it’s still filed next to the scours rate instead of next to pregnancy rate and feed conversion. A leak spread across a quarter of the heifer crop never shows up as a disaster — it shows up as a herd that’s “doing fine.”

How Do You Actually Read the Herd? The 12-Calf Scorecard

Here’s the tool. Have your vet pull serum from at least twelve clinically normal heifer calves at 24 to 48 hours of age — healthy ones, not the sick pen. Read each on a Brix or total-protein refractometer, the same one plenty of herds already use on colostrum. Sort them into the four tiers. Plot the distribution against the 40/30/20/10 target.

TierSerum IgG (g/L)Herd Target (%)Morin BenchmarkAction If Below Target
Excellent≥25.0>40%Protocol is working; maintain
Good18.0–24.9≈30%Combined Excellent+Good should exceed Morin’s 68% medianCheck Brix consistency shift-to-shift
Fair10.0–17.9≈20%Audit first-feeding volume (target ≥2.5 L).
Poor<10.0<10%Trigger: audit volume, Brix, and timing on every calf for a month.

Two things matter here. First, sample the calves that look good, because a sick-calf test only tells you about that calf — a healthy-calf sample tells you what your whole system is producing. Second, do it early, before dehydration or illness muddies the reading. Twelve is a floor, not a ceiling; more calves sharpen the picture.

The first time a herd runs this, the chart usually looks a lot like NAHMS 2014 — about a third Excellent, a quarter Good, the rest stuck in Fair and Poor — unless they’ve already put real work into colostrum. That’s the “oh” moment. And it goes one of two ways.

Sponsored Post

What Separates the Farms That Move From the Ones That File It Away

The difference isn’t knowledge. It’s ownership. And the fixable levers aren’t complicated — they’re things that happen in the first hours after a calf hits the ground.

Morin’s herd-level work in Québec makes the levers concrete. Across 144 herds, the prevalence of adequate transfer of passive immunity ranged from 24% to 100%, with a median of 68% (Morin et al., J. Dairy Sci. 104:1122–1135, 2021). In the final model, only two things stayed significantly tied to a herd hitting adequate transfer: how consistently calves got enough colostrum volume at the first meal, and how consistently they got it fast.

FeatureOld Pass/Fail Standard (pre-2020)Lombard Four-Tier Standard (2020)
Cut pointSingle line at 10 g/L serum IgGFour bands: <10, 10–17.9, 18–24.9, ≥25 g/L
% of NAHMS 2014 calves “adequate”~90% pass61.2% (Excellent + Good)
% flagged as a concern~10% fail38.8% (Fair + Poor)
What it actually predictsDisease risk onlyDisease risk AND first-lactation milk (ME)
Herd target“Pass rate” — no upper tier goal40/30/20/10 distribution across tiers

The companion calf-level study put odds on it. Calves had 2.6 times higher odds of adequate transfer when they got at least 2.5 L at the first feeding, 2.9 times higher odds with colostrum at 24.5% Brix or better, and 1.6 times higher odds when fed within three hours of birth (Morin et al., J. Dairy Sci. 104:4904–4918, 2021, Québec herds). Volume, quality, timing.

A 2025 European study drives home how much herds vary. Across 1,041 calves on 108 farms in six countries, an average of just 35.3% of calves hit Excellent — and only one country, Spain at 47.5%, cleared Lombard’s 40% bar. German herds in the study sat at 21.7% Excellent, French herds at 30.5%. Every extra liter of colostrum raised the odds of Excellent-instead-of-Poor by about 1.5 times (Fernandez-Novo et al., Front. Vet. Sci. 12:1515196, 2025; funded in part by Boehringer Ingelheim Vetmedica; per the paper’s disclosure, the funder was not involved in data analysis or interpretation). Same continent, same standard — a 26-point spread between the best and worst countries. The farms that don’t move tend to spread those levers across shifts and staff, with nobody owning the number.

Building the Dashboard: Owner, Target, Consequence

Pregnancy rate works because it has an owner, a target, and a consequence when it slips. Passive transfer distribution has none of that on most farms yet. You’d have to build it — and the science already hands you every piece.

The owner. The calf manager runs the twelve-calf sampling and the levers. The herd vet reads the chart against Lombard’s targets and connects it to health and growth. The owner owns the money side and decides what a drifting number is worth fixing.

The target. Short-term, beat Morin’s median of 68% adequate transfer, and keep Poor under 10%, Lombard’s herd standard. Medium-term, push the whole distribution toward more than 40% Excellent, around 30% Good, no more than 20% Fair.

The consequence. When Poor climbs past that 10% line, it isn’t just a health flag. Crannell and Abuelo’s retrospective cohort work found calves in the lower passive-immunity categories carried worse morbidity, mortality, and future performance than their better-transferred herdmates (Crannell & Abuelo, J. Dairy Sci. 106:2729–2738, 2023, single dairy herd). That’s your trigger to audit volume, Brix, and timing on every calf for a month.

None of this is new science. It’s a reshuffle — taking numbers that already exist and moving them into the room where the P&L conversation happens, instead of leaving them in the sick pen.

Options and Trade-Offs for Your Operation

Depending on where your herd sits, a few honest paths:

Option 1: Run the 12-Calf Scorecard This Month

  • Best for: Any herd that has only ever tested sick calves.
  • Requirement: One vet visit and about an hour of labor to pull serum from twelve clinically normal heifers at 24–48 hours, then classify each against the Lombard tiers.
  • Risk: None — the only exposure is discovering where the distribution actually sits.

Option 2: Lock Down the Shift-to-Shift Protocols

  • Best for: Herds where calf results swing depending on who worked the night shift.
  • Requirement: Enforcing 2.5–3 L within two to three hours, at 24.5% Brix or better (Morin et al., 2021). No capital — protocol discipline and staff buy-in.
  • Risk: Protocol fatigue if nobody is assigned direct ownership of the data; the chart won’t move and you’ll blame the wrong thing.

Option 3: Integrate Passive Transfer as a Boardroom KPI

  • Best for: Herds already reviewing monthly management dashboards alongside pregnancy rate.
  • Requirement: Percent Excellent-plus-Good and percent Poor on the dashboard, with a re-test schedule and a standing trigger to audit protocols whenever Poor exceeds 10%.
  • Risk: Treating the chart as an interesting report rather than an operational trigger.

What This Means for Your Operation

  • Have you ever tested passive transfer on healthy calves — or only the ones already in trouble?
  • What share of your last twelve heifers would land in Fair or Poor if you plotted them today?
  • Is your Poor category under 10%, and is your combined Excellent-plus-Good above Morin’s 68% median — the line between a working program and a coasting one?
  • Who on your farm actually owns the passive transfer number the way someone owns pregnancy rate?
  • Are your calves reliably getting 2.5–3 L of high-Brix colostrum inside the first two hours — on the night shift, not just the day shift?
  • When was the last time a colostrum decision showed up in a budget conversation instead of a health one?

Key Takeaways

  • If you’ve never sampled healthy calves, run the 12-calf scorecard this month — it’s the only way to see your real distribution instead of your assumed one.
  • If your Poor tier is over 10% or Excellent-plus-Good is under about 68%, treat it as a trigger to audit volume, Brix, and timing — not as a number to file.
  • If you can only fix one thing, fix first-feeding volume and speed: the European data showed each extra liter lifting the odds of Excellent by about 1.5 times.
  • If nobody owns the number, the chart won’t move — assign it to the calf manager, with the vet on interpretation and the owner on the money.

The uncomfortable part isn’t that this is hard. It’s that it’s easy — a couple of levers, a couple of hours, one refractometer — and it still slips through because it’s filed under the wrong heading. So before your next heifer crop hits the ground: if a calf leaves the maternity pen in Fair when she could’ve been Excellent, and it costs you milk two lactations out, whose job was it to catch that — and does that person know it’s their job yet?

Run Your Numbers

Complete references and supporting documentation are available upon request by contacting the editorial team at editor@thebullvine.com.

Learn More

The Sunday Read Dairy Professionals Don’t Skip.

Every week, thousands of producers, breeders, and industry insiders open Bullvine Weekly for genetics insights, market shifts, and profit strategies they won’t find anywhere else. One email. Five minutes. Smarter decisions all week.
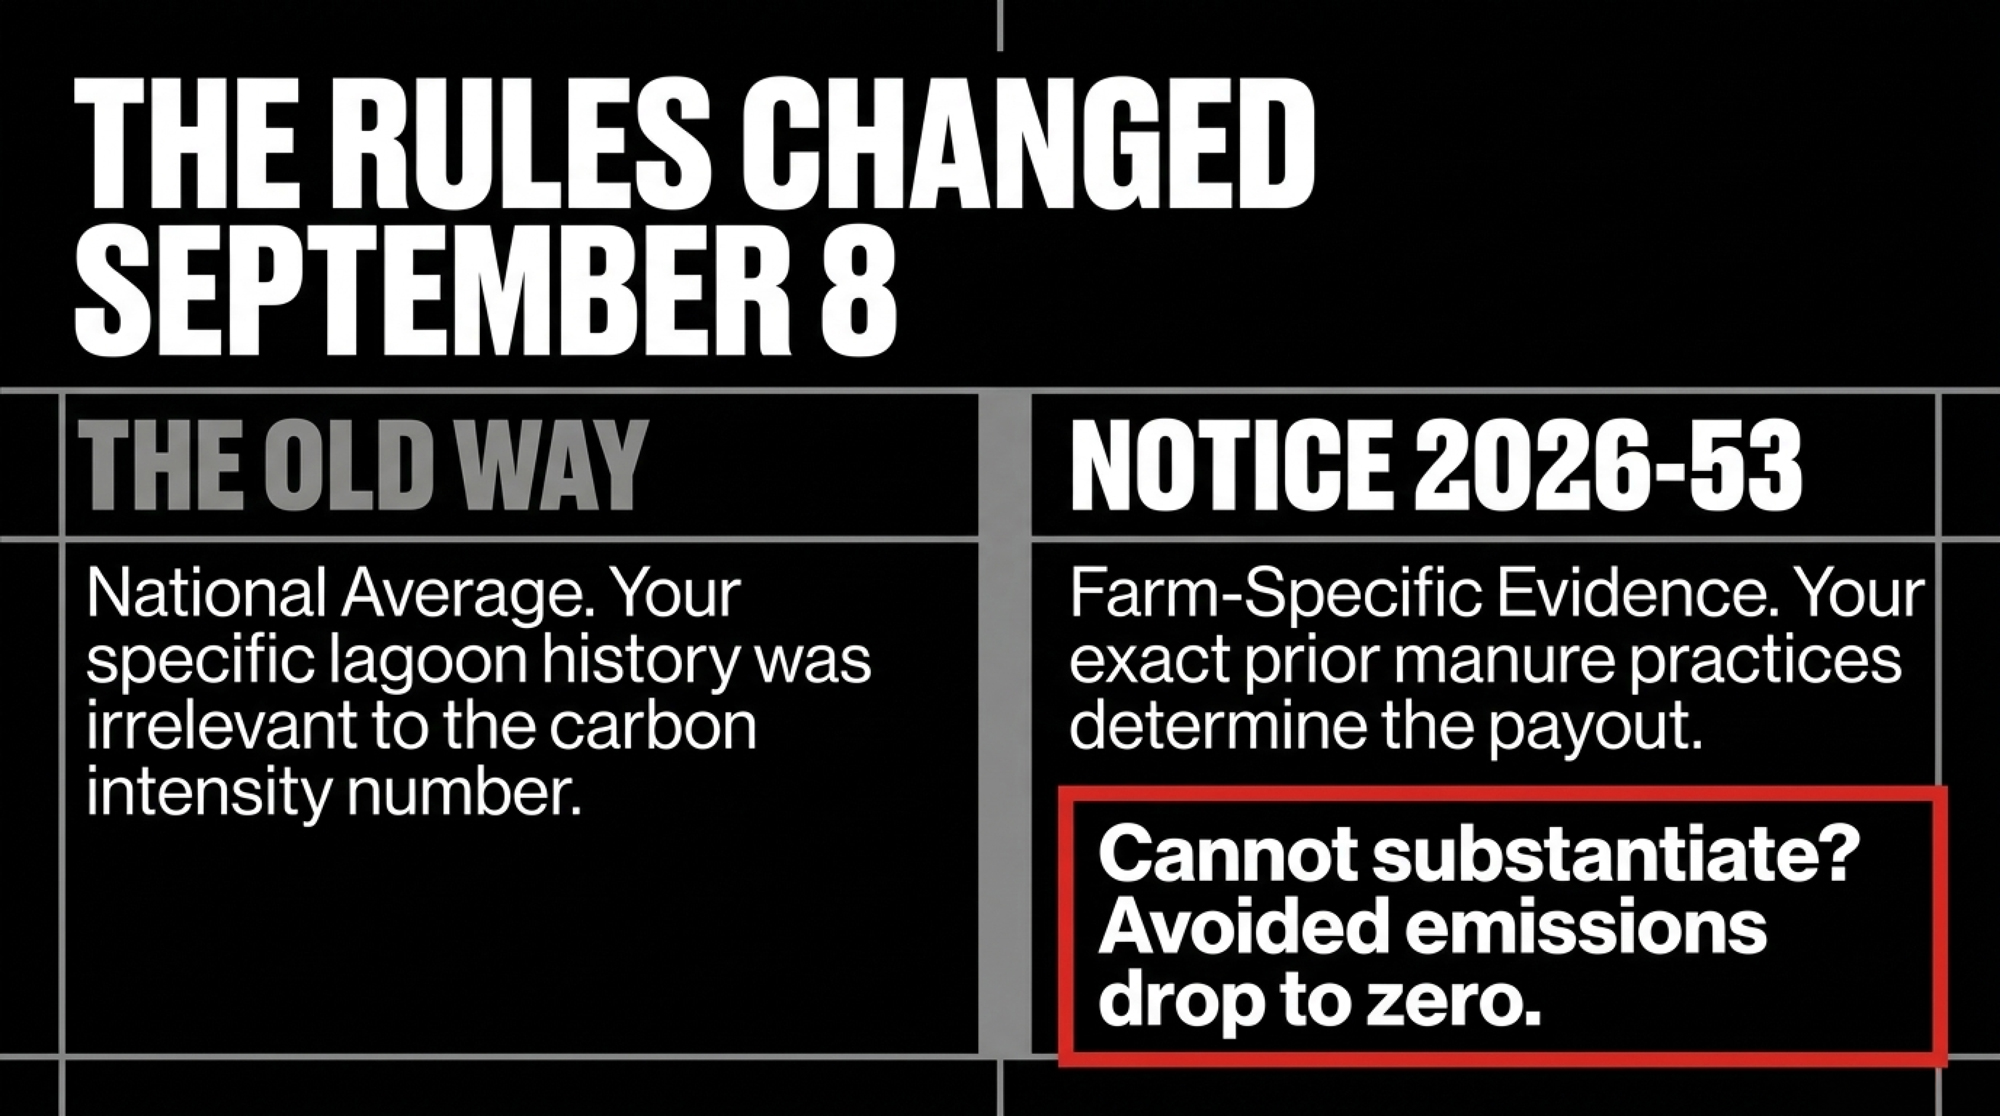
NewsSubscribe
First
Last
Consent

A Plant Closed, the Milk Kept Flowing, and Somebody Paid the Freight. Canterbury’s 204 Suppliers Are Next.

St. Albans went dark today, and the milk still moves — the freight bill just changed hands. Canterbury’s premium is 10 to 30 cents. Nobody has to announce cutting it.

Executive Summary: DFA idled its St. Albans, Vermont plant today after a US$30 million upgrade six years ago, and the milk is still moving — VTDigger reported farmers now cover the freight to Maine, Massachusetts and New York, “an unknown sum” added to hauling fees on a line no federal formula governs. That’s the mechanism worth watching, because The Australian’s DataRoom reported August 15–16 that Fonterra and a2 Milk are exploring a joint take-private of Synlait, and Synlait’s NZX reply denied “discussions” and nothing else. Roughly 204 Canterbury suppliers ship into Dunsandel on a blended NZ$9.90/kgMS against Fonterra’s NZ$9.60–$9.80 draft base — a 10 to 30 cent spread worth NZ$20,700 to NZ$62,100 a year on 500 cows at DairyNZ’s record 414 kgMS. Bright Dairy’s 65.25% stake means no deal clears a shareholder vote without Shanghai, and no published report says Bright’s even been asked. Here’s the part most suppliers haven’t checked: Fonterra hasn’t been required to accept new milk since 1 June 2023, and the duty that replaced open entry only weighs farm viability for farms that supplied Fonterra last season — which a Synlait supplier didn’t. Pull your supply agreement this week, find the premium expiry date and the change-of-control clause, and price the cartage line separately, because a 19c/cwt hauling move like DFA’s 2008 Western adjustment runs US$27,740 a year on 500 cows.

Synlait Fonterra takeover

Editor’s note: The 500-cow Canterbury model below is a composite scenario, not a specific farm. Full methodology at the end of this article.

Kevin Kouri chairs the Vermont Dairy Producers Alliance and works as director of nutrition and sales at Phoenix Feeds & Nutrition, which means he watches processor consolidation from both sides of the fence. When Dairy Farmers of America announced it was idling its St. Albans plant, Kouri didn’t talk about jobs first. He went straight to the money: the closure “will directly increase processing and transportation costs,” he said in the Alliance’s June 19 statement.

That plant goes dark today — August 17 — after six years and a US$30 million upgrade, taking roughly 80 jobs with it. DFA says the milk “will continue to be processed,” rerouting to Maine, Massachusetts and New York. And VTDigger reported in July that Vermont farmers now pay to move that milk out of state, adding “an unknown sum of money to members’ hauling fees.” The plant closed. The milk kept flowing. The freight bill changed hands.

Remember that order, because roughly 11,000 kilometres away, the same mechanism is being set up on a different continent.

On August 15 and 16, 2026, The Australian’s DataRoom column reported that Fonterra and The a2 Milk Company were exploring a joint proposal to take Synlait Milk private. Synlait answered through the NZX the following Monday, confirming it “is not involved in any discussions with The a2 Milk Company or Fonterra regarding the matters referred to in those reports.” No further comment. Fonterra and a2 Milk said nothing at all — both declined to comment on market speculation.

One denial. Two silences. And underneath all three, roughly 204 Canterbury suppliers whose milk cheque depends on a premium that exists only because Fonterra is currently a competitor. We’ll come back to what that Vermont freight shift actually cost, in dollars.

Why Canterbury Was Always the Fight Worth Having

In September 2024, Synlait sent two different offers to two groups of farmers. South Island suppliers were offered a one-off 20 cents per kilogram of milk solids to withdraw their cessation notices — formal notice to stop supplying. North Island suppliers were offered 5 cents. Same company, same crisis, same season — a 15-cent gap in what Synlait would pay to keep two groups from walking.

That gap wasn’t an accident. Synlait had already stopped processing raw milk at Pōkeno in Waikato and handed collection to Open Country Dairy, so North Island suppliers had no retention decision left to buy. Canterbury did. The company closed its 2024 financial year with 274 suppliers total, managing about 4% of the country’s milk supply as New Zealand’s third-largest processor, per BusinessDesk reporting from October 2024. By March 2025, BusinessDesk put the South Island pool at roughly 204 farmers feeding Dunsandel.

And Dunsandel isn’t just a plant. China’s State Administration for Market Regulation approved re-registration of a2 Milk’s 至初® infant formula — stages one, two and three — at that facility in June 2023, running through September 2027. Synlait holds the registration. It’s attached to the Dunsandel site itself, not to a2 Milk, and it doesn’t travel to another plant.

Canterbury held the asset. That’s why it got paid four times what Waikato got.

Who Actually Gets a Vote

Bright Dairy, based in Shanghai, owns 65.25% of Synlait following a NZ$185 million share placement completed in October 2024. A2 Milk holds 19.83%, per the Takeovers Panel New Zealand register. Fonterra — which collected 77.7% of the national milk pool in the 2024/25 season against a long-term internal target of 78%, per BusinessDesk and eDairyNews reporting from July 2025 — is the party reportedly discussing a funding and operating role.

Neither company has said what it would want from Synlait. But Dunsandel’s infant-formula capability and its China registration are assets with obvious strategic value to anyone marketing formula into that market, and Synlait’s distress has been public for two years.

Here’s the structural fact almost nobody has written about. Any transaction requiring a shareholder vote requires Bright Dairy’s vote. That’s not analysis — that’s arithmetic at 65.25%. The exact threshold depends entirely on structure: a Takeovers Code offer, a scheme of arrangement, and a major-transaction approval under NZX rules all set different bars, and nothing public says which structure, if any, is on the table.

ShareholderStake in SynlaitVote Required for Deal?Public Position
Bright Dairy (Shanghai)65.25%Yes — controls outcomeNo published report says it’s been asked
The a2 Milk Company19.83%Yes, but non-controllingDeclined to comment on speculation
Fonterra0% (reported prospective partner)N/A — not a current shareholderDeclined to comment on speculation
Synlait (company itself, via NZX)N/ADenied “discussions”; no further comment

No published report suggests Bright has been approached or consulted, and it hasn’t stated a position. That silence is the biggest single factor in whether anything happens at all. Worth knowing what Bright has done before, though — in October 2025, when Synlait sold its North Island assets to Abbott for roughly NZ$307 million, Bright confirmed its vote in favour ahead of the shareholder meeting. One documented instance of cooperation. Not a prediction.

What a Premium Collapse Would Actually Cost You

Here’s the math on your own vat.

Synlait committed in early 2025 to pay South Island farmers a 10c/kgMS premium for those without a cease notice in place, on top of matching Fonterra’s base price and advance rates, per Rural News Group reporting from February 2025. Its half-year results, filed with the NZX on February 28, 2026, put it plainly: “Forecast base milk price for the 2025/26 season is $9.50 per kg MS with additional premium payments taking the total forecast average milk payment to $9.90 per kg MS.”

Fonterra’s side comes from the Commerce Commission’s draft review dated August 3, 2026: the forecast base milk price is “currently $9.60 – $9.80 per kgMS for the season under review in this draft report, which ended on 31 May 2026.” The Commission’s final report is due by 15 September 2026. Two-thirds difference between those two landings. So here’s both.

DairyNZ’s statistics released in November 2025 put average national production at 414 kg of milksolids per cow — the highest on record.

Production levelSynlait blended (NZ$9.90)Fonterra base (NZ$9.60)Gap at 30¢Fonterra base (NZ$9.80)Gap at 10¢
380 kgMS/cow (190,000 kgMS)$1,881,000$1,824,000$57,000$1,862,000$19,000
414 kgMS/cow (207,000 kgMS)$2,049,300$1,987,200$62,100$2,028,600$20,700
450 kgMS/cow (225,000 kgMS)$2,227,500$2,160,000$67,500$2,205,000$22,500

All figures NZ$.

Find your row, then decide which column you’re planning against. Every extra 10 kgMS/cow adds roughly $1,500 to the 30-cent gap and $500 to the 10-cent gap on 500 cows. Nobody would have to announce a price cut to get there. A premium that only has to lapse at rollover produces the same result on your cheque.

How Much Does Checking Your Contract Actually Cost You?

An afternoon. That’s the honest answer.

Your existing premium commitments run on their own timeline regardless of what any newspaper printed this month. Waiting doesn’t hit your August cheque. What it costs you is knowing your own expiry dates and renegotiation triggers at the exact moment every other supplier in the district starts calling the same field reps with the same questions.

Pull the contract. Find the premium expiry date. Find out whether an ownership-change clause exists. If you can’t find one, that’s information too.

Is Your Region’s Buyer Concentration Already the Real Problem?

Ask the blunt version: if your processor’s terms shifted next season, how many buyers could realistically take your milk?

For many Canterbury operations, the honest answer is one, maybe two. Czapp’s May 2026 analysis puts numbers on it: total national collections peak each October at roughly 250–270 million kgMS, while non-Fonterra volumes peak at around 50–60 million kgMS. Competing processors capture roughly 20–23% of peak-season supply, leaving Fonterra with 77–80%. Czapp notes the drift toward independents has been gradual — incremental gains, not displacement.

Here’s the part that changes the calculus, and it’s easy to miss because the rules changed quietly. Fonterra is no longer required to accept your milk. In Fonterra’s own words on its regulatory disclosure page: “As of the 1 June 2023, the open entry requirements were removed, meaning Fonterra is not required to accept milk from farmers wishing to join Fonterra.” What replaced the obligation is a duty to “have regard to” two things — the effect of the decision on the ongoing viability of the farm if that farm supplied Fonterra in the previous season, and the land-use opportunities available to the applicant.

Read that again. If you’ve been shipping to Synlait, you didn’t supply Fonterra last season — so that protection isn’t yours. Fonterra also amended its constitution in November 2020 to require accepting supply from any farm already supplying Fonterra at the time of application. That one doesn’t reach you either.

Farmer scenarioFonterra obligated to accept?Legal basisPractical status
Supplied Fonterra last season, wants to stayYes2020 constitutional amendmentProtected
Supplied Fonterra last season, moved away, wants back inHave-regard duty only (viability + land use)Post-June 2023 rulesWeak — commercial decision, not a right
Currently supplies Synlait or another processorNoOpen entry removed 1 June 2023Unprotected
New entrant with no prior Fonterra supply historyNoSame removalUnprotected

So acceptance is a commercial decision about vat capacity and cartage economics in your catchment, not an entitlement you already hold.

What Does the Vermont Version Cost, in Dollars?

Kouri’s warning wasn’t abstract, and the Vermont numbers show why. St. Albans was a balancing plant handling over 3 million pounds a day — the facility that absorbs surplus when fluid demand dips. It’s the fourth Vermont plant lost in 2026, and the Vermont Farm Bureau tallied roughly 4 million pounds of daily processing capacity and about 390 jobs gone inside a single year, three of the four in Franklin County.

Watch what happened to the milk from an earlier closure, though, because that’s the tell. When Hood’s Booth Bros. plant in Barre closed April 1 after nearly 80 years, that volume began hauling to Concord, New Hampshire — and per the Vermont Farm Bureau’s July 16 analysis, the added transportation cost landed on farm producers.

Why it travels to Canterbury: the hauling deduct is the one milk-check line with no federal formula behind it. Cooperatives set it, and nobody publishes it. Bullvine’s own reporting has tracked that line moving anywhere from US$0.40 to US$2.50/cwt depending on the market. DFA’s Western Area Council moved its hauling charge from 6 cents to 25 cents per cwt inside a single year in 2008. On a 500-cow Vermont herd shipping roughly 146,000 cwt annually, that 19-cent shift runs US$27,740 a year — same order of magnitude as the Canterbury premium gap, arriving through a line item nobody announced.

Options and Trade-Offs for Farmers

Immediate (0–30 days): Document your contractual rights. Pull your supply agreement. Verify premium expiration dates. Inspect it for change-of-control provisions and ask your rep directly whether one exists in the standard terms. Costs nothing but time and gives you a documented baseline if terms move. Downside is a mildly awkward conversation — worth it.

Near-term: Secure written terms if you’re in the Waikato pool. Suppliers routed through Open Country Dairy need formal written clarity on contract continuity through any restructuring. Your near-term exposure is lower than Canterbury’s because your milk is already collected elsewhere. Where this fails: even Synlait staff may not know more than what’s public, so a polite non-answer is possible. Ask anyway — the request goes on record.

Risk hedging: Benchmark Fonterra entry — verify, don’t assume. Contact local field reps about vat collection capacity and cartage economics in your catchment. Since 1 June 2023, this is a commercial negotiation, not a right, and the “have regard to” duty gives you less protection than a previous-season Fonterra supplier would have. Ask specifically about collection cost, not just acceptance — Vermont says that’s where the money moves.

Policy monitoring: Track the DIRA review. MPI published its terms of reference on 19 May 2026 for the statutory review of the competition provisions regulating Fonterra — including open entry and exit, base milk price settings, and regulated milk supply to other processors. Submissions closed 29 June. Issues paper September 2026, submissions November, draft report February 2027, final report to Parliament 1 June 2027. Open Country Dairy has already warned publicly against “complacency” in the review, per Rural News Group in July 2026. The same review could widen that door again — or close it further.

Key Takeaways

  • If you supply Synlait in Canterbury and can’t state your premium expiry date from memory, pull the contract this week — before an announcement forces the question.
  • If you’re modelling exposure, run both columns: the 30-cent gap only holds if the Commission lands at NZ$9.60, and a NZ$9.80 landing cuts your exposure by roughly two-thirds.
  • If you’ve assumed Fonterra has to accept your milk, check that assumption — open entry was removed 1 June 2023, and the replacement duty is weaker for farms that supplied someone else last season.
  • If your supply agreement contains no change-of-control clause, ask whether one sits in the standard terms — silence isn’t the same as absence.
  • If you’re weighing a processor switch, price the cartage line separately from the milk price. DFA’s 2008 Western adjustment moved 19 cents/cwt, which is US$27,740 a year on 500 cows.
  • If a processor tells you milk “will continue to be processed” through a transition, ask who pays the freight. That’s the question Vermont farmers got answered on the statement, not in the announcement.
  • If the DIRA issues paper lands in September and you supply an independent processor, read it — that document shapes whether you’ll still have a second buyer to threaten your first one with.

Where This Leaves You

Nobody has confirmed a deal. Not Synlait, not Fonterra, not a2 Milk, and not Bright Dairy — which no published report suggests has been asked. What’s confirmed is narrower and more useful: a 65.25% shareholder whose vote any transaction needs, a Canterbury milk pool holding a facility-attached China registration that expires September 2027, and a premium Synlait told the market it built to hold suppliers who could otherwise go to Fonterra.

Kouri’s worry in Vermont ran past any single plant. “We potentially may continue to see an exodus of dairies from the state,” he told VTDigger in July, “and the trickle-down effect that that has not only to local communities… but also the infrastructure and the allied businesses like mine.” So here’s the question for your accountant rather than your Facebook feed. If your milk price dropped 10 to 30 cents next season with no announcement and no negotiation — just a premium that quietly lapsed — where would that leave your debt servicing, and who’s actually obliged to take your milk if you walk? We’re running the full model in Bullvine Weekly, including the Bright Dairy voting mechanics and how long premiums survive an ownership change.

Methodology: The 500-cow Canterbury model in this article is a composite scenario built from Synlait’s published supplier terms, DairyNZ national production benchmarks, and Commerce Commission draft filings. It illustrates regional financial exposure and is not drawn from any specific farm’s balance sheet. Per-cow production of 414 kgMS is DairyNZ’s national average released November 2025; Canterbury operations commonly run above national average, so the 450 kgMS row may fit irrigated systems better. Vermont figures are US dollars; New Zealand figures are NZ dollars. The Bullvine is currently speaking with South Island suppliers on background. All filings and published reports cited are as of August 17, 2026. No party has announced a transaction.

Learn More

The Sunday Read Dairy Professionals Don’t Skip.

Every week, thousands of producers, breeders, and industry insiders open Bullvine Weekly for genetics insights, market shifts, and profit strategies they won’t find anywhere else. One email. Five minutes. Smarter decisions all week.
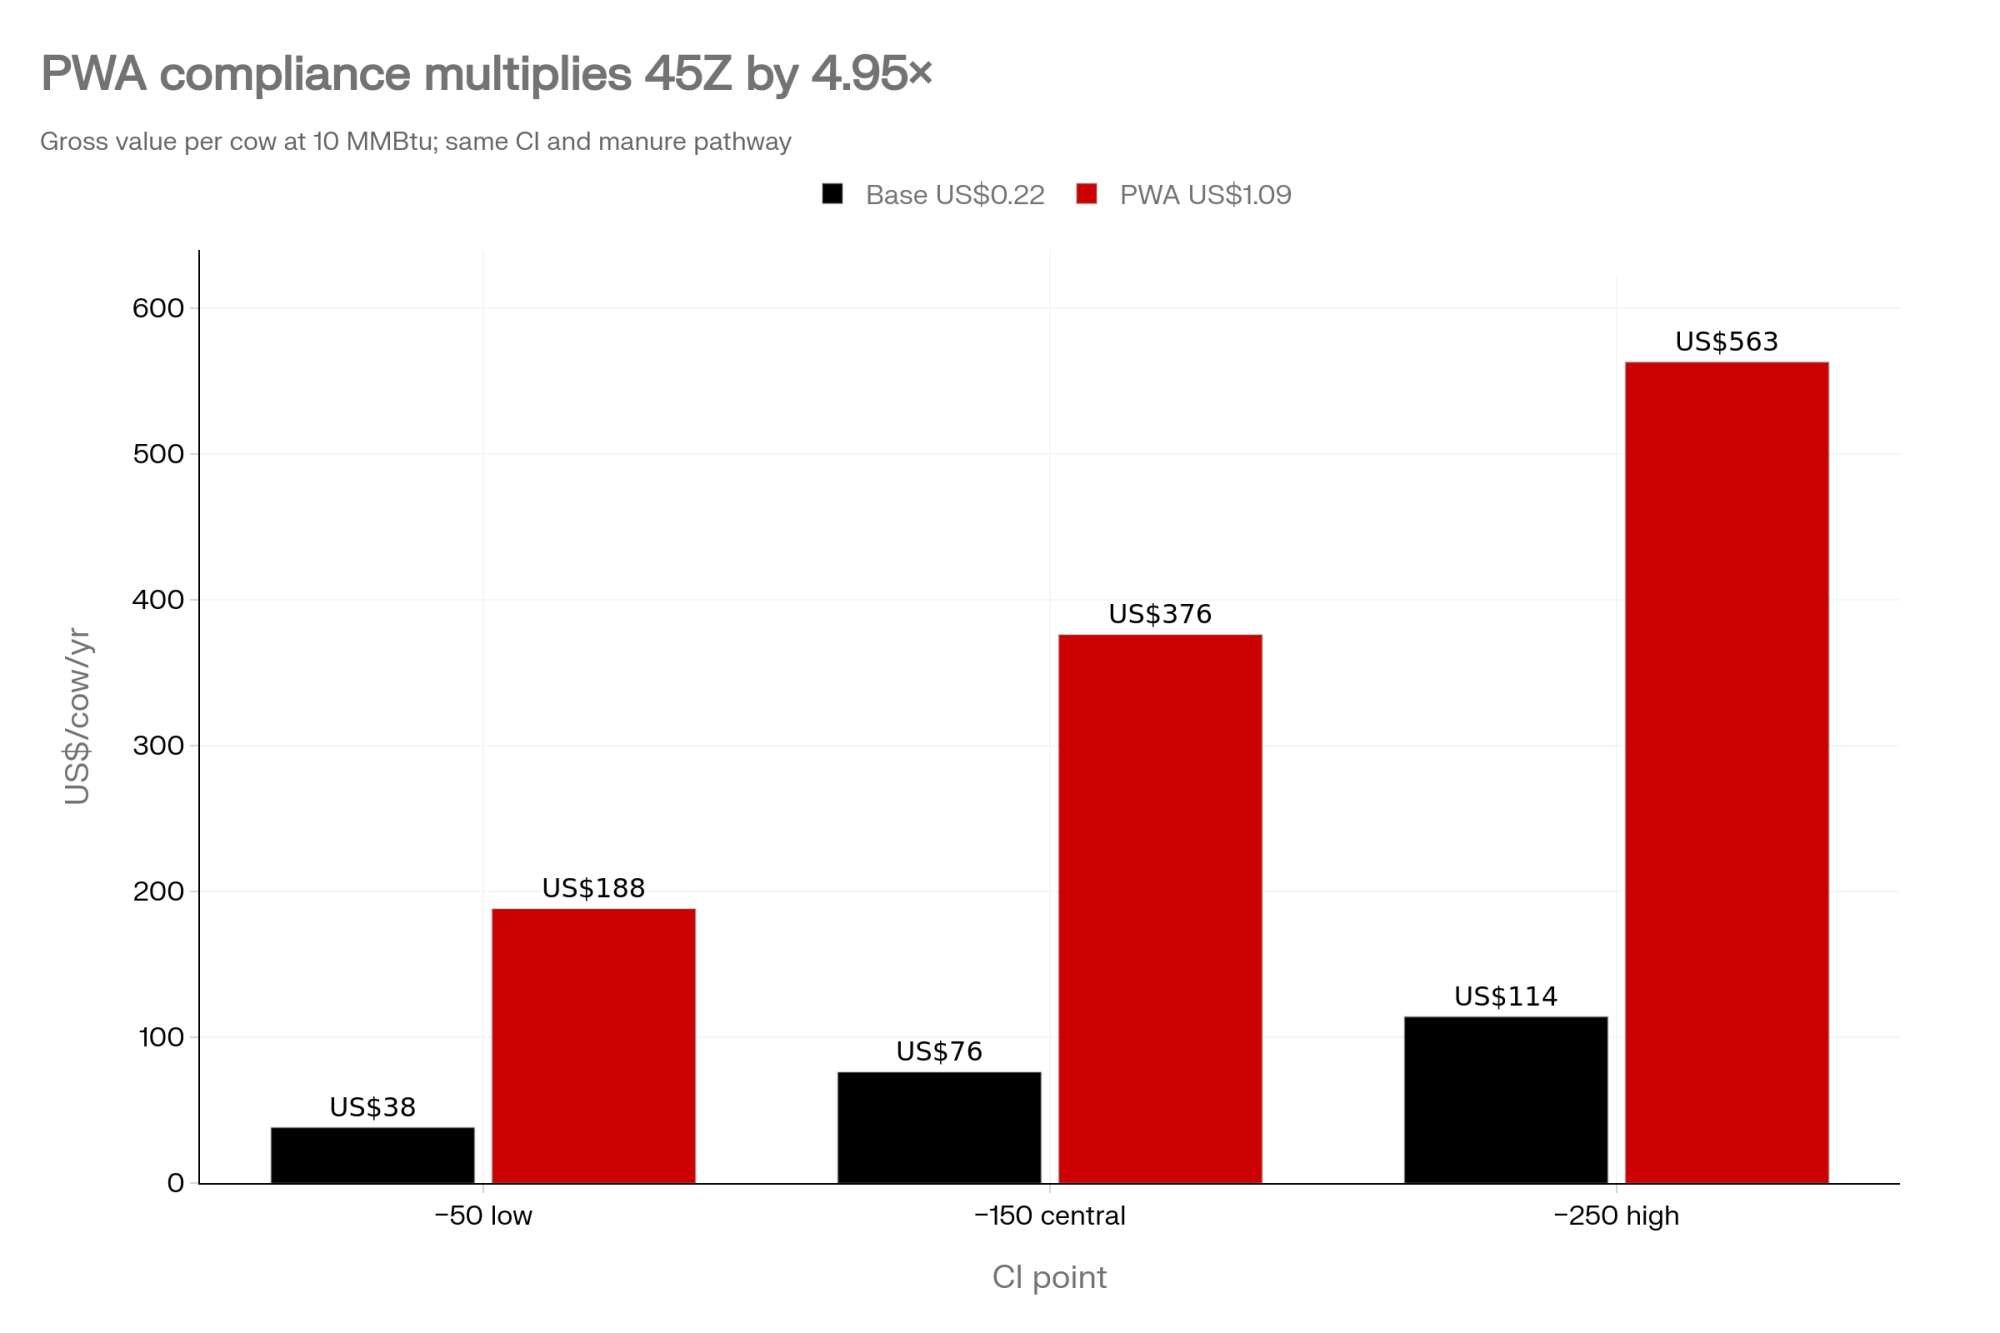
NewsSubscribe
First
Last
Consent
Send this to a friend