Her rumination was down five days before diagnosis. Lying time didn’t budge till the day before. Catching 30 transition cases a year on 500 cows avoids $12,000 in losses — but on health alone, that $68,000 investment takes over six years to break even.
Wearables sit on cows in 64.2% of surveyed U.S. herds, and they’ll flag a displaced abomasum two days before your best cowman does. Buying them is the easy part. Building a process that turns 40 alerts a week into decisions somebody actually makes is where operations separate.
Somewhere in the Texas Panhandle in March 2024, a set of monitoring dashboards started telling a story that had no precedent in dairy cattle anywhere in the world. Feed intake sliding. Milk dropping off a cliff. Behavior patterns bending in ways that didn’t match a single entry on the fresh-cow differential list. Local practitioners worked through the differentials, running hundreds of tests to rule out other pathogens — and it was their persistence, documented by TVMDL, that kept the investigation moving.
Then Texas A&M’s Veterinary Medical Diagnostic Laboratory in Canyon ran a nasal swab. On March 25, 2024, USDA confirmed highly pathogenic avian influenza H5N1 in dairy cattle — the first confirmation on record anywhere. That week TVMDL tested 138 samples from 12 dairies across Texas, New Mexico, and Kansas. Every farm that submitted samples came back positive.
The sensors didn’t make that diagnosis. Lab work did. But the pattern that kept people testing after the negatives stacked up came off precision dairy monitoring systems that were already watching, and that’s still the sharpest real-world argument anyone has made for this technology. It’s also a warning about what these systems can’t do.
Adoption Isn’t the Argument Anymore
A 2026 Journal of Dairy Science survey of 81 U.S. dairy operations — 48,289 cows across 17 states — found 81.5% had adopted at least one precision dairy technology. Wearables led every category: collars, ear tags, and rumen boluses at a 64.2% adoption rate.
Read that sample before you read it as gospel. Those 81 respondents average roughly 596 cows apiece, which makes this a large-herd dataset rather than a portrait of the whole industry. What it does tell you is that among herds big enough to carry a full-time herd manager, sensors have become standard equipment instead of an experiment.
USDA ERS tracks adoption of precision technologies tied to milking, breeding, and data systems, which has climbed steadily since 2000. In separate ERS work, robotic milking lifted dairy net returns by $3.15 per hundredweight on average relative to non-adopters — a robotics figure, not a wearables figure, and worth keeping straight when somebody quotes it back at you as sensor ROI.
So the interesting question has shifted. Not whether the technology detects anything. Whether your operation has a process for acting on what it detects.
Rumination Is Still the Best Single Signal You Can Buy
If you could only keep one data stream, the research keeps pointing to the same one. Healthy cows ruminate somewhere between seven and nine hours a day, and when that number moves, something is usually wrong before she looks wrong.
Work published in the Journal of Dairy Science on rumination time around dry-off found cows that went on to develop hyperketonemia ruminated 9.83 minutes less per day than unaffected herdmates. Lame cows ruminated 15.00 minutes less. Small numbers on a daily printout. Enormous numbers in a transition pen.
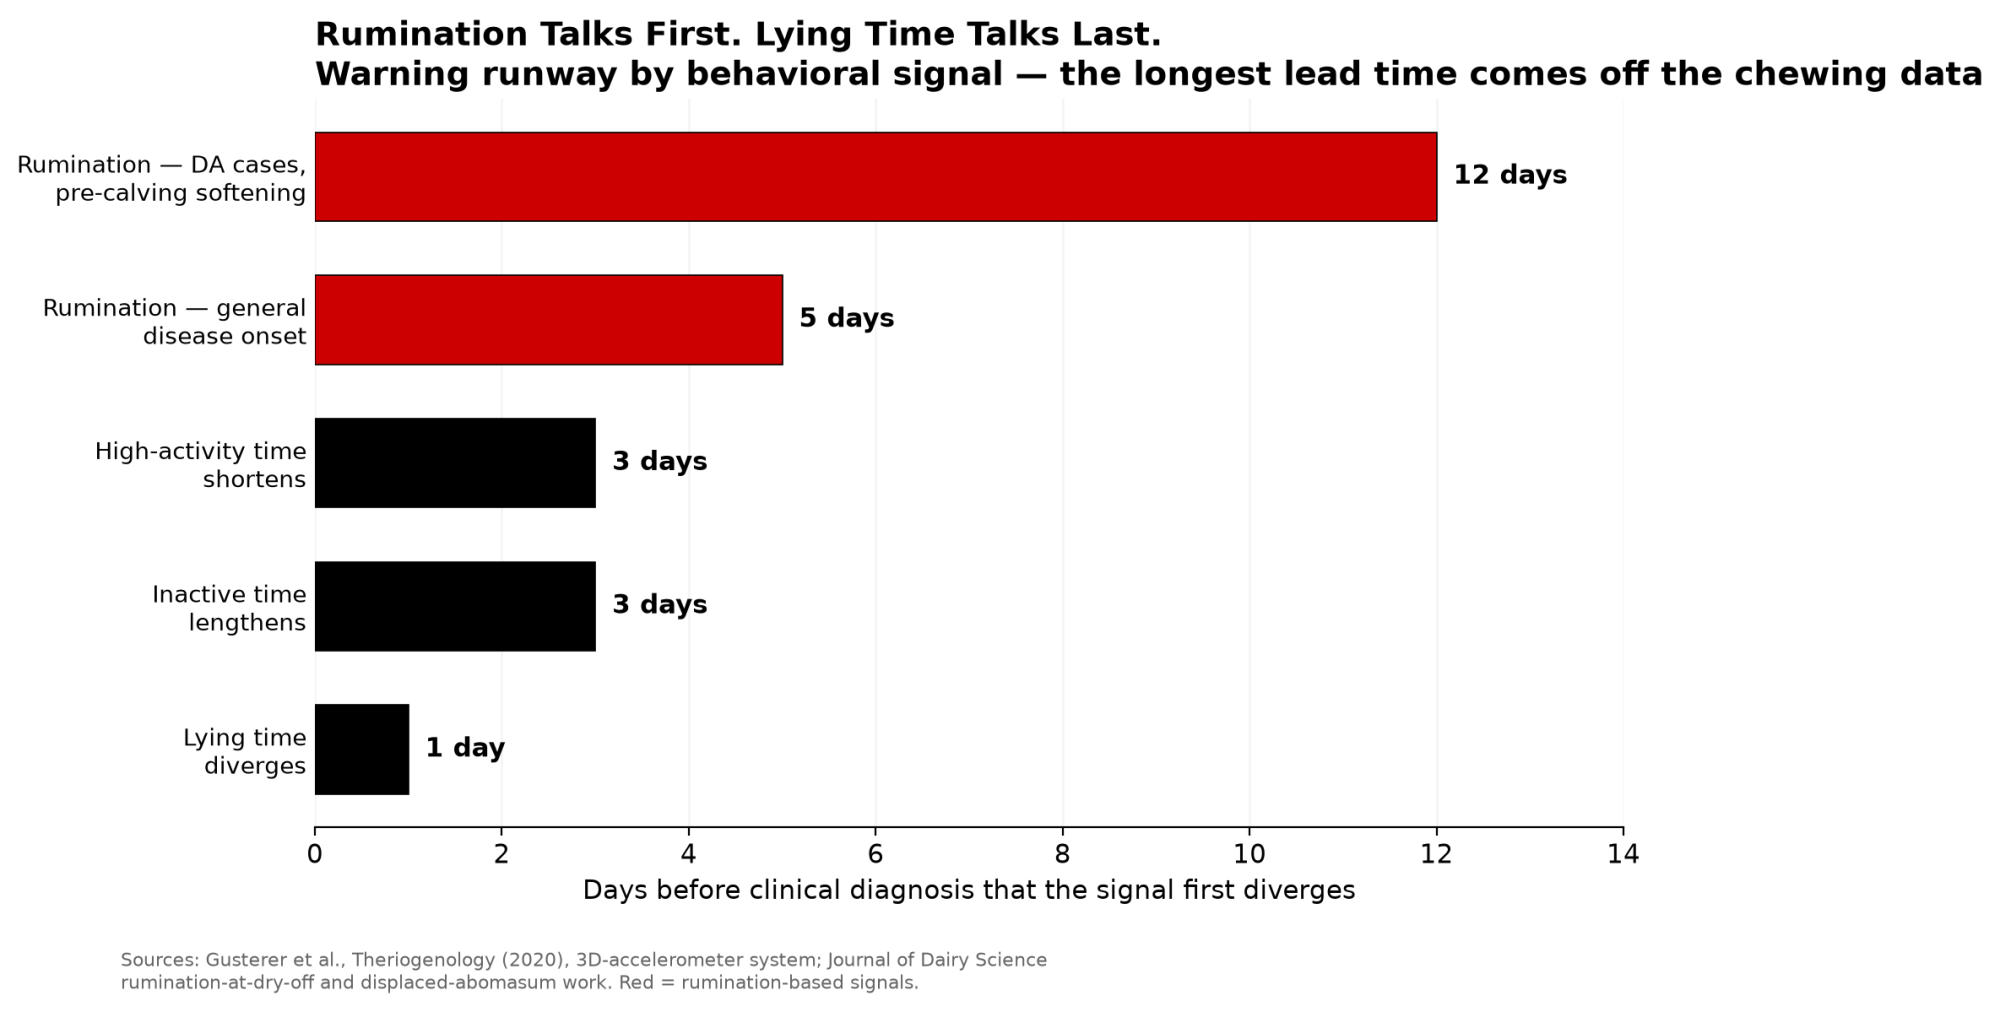
The displaced abomasum data hits harder. In cows that developed a DA early in lactation, rumination time started dropping as early as 12 days before calving compared with cows that stayed healthy. Twelve days isn’t an early warning. That’s a completely different management timeline.
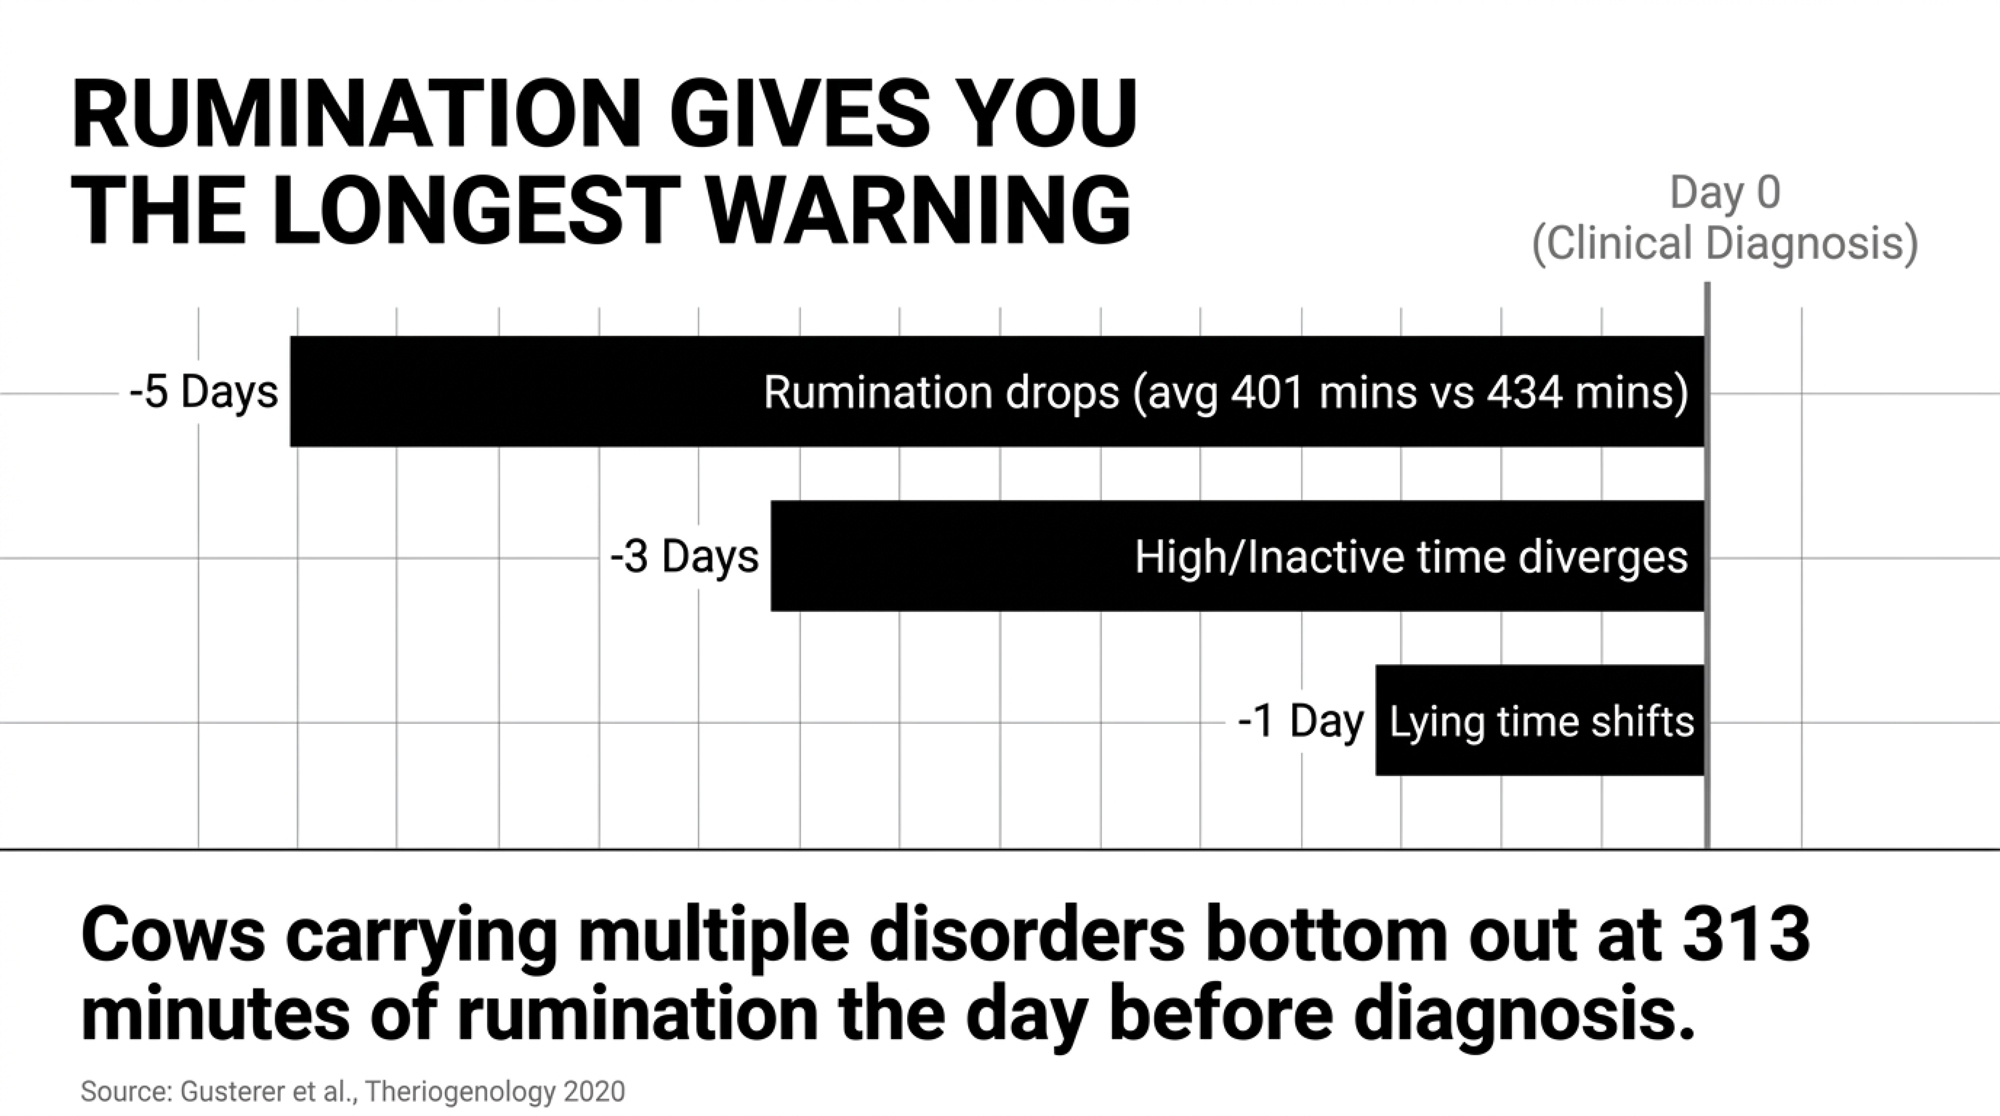
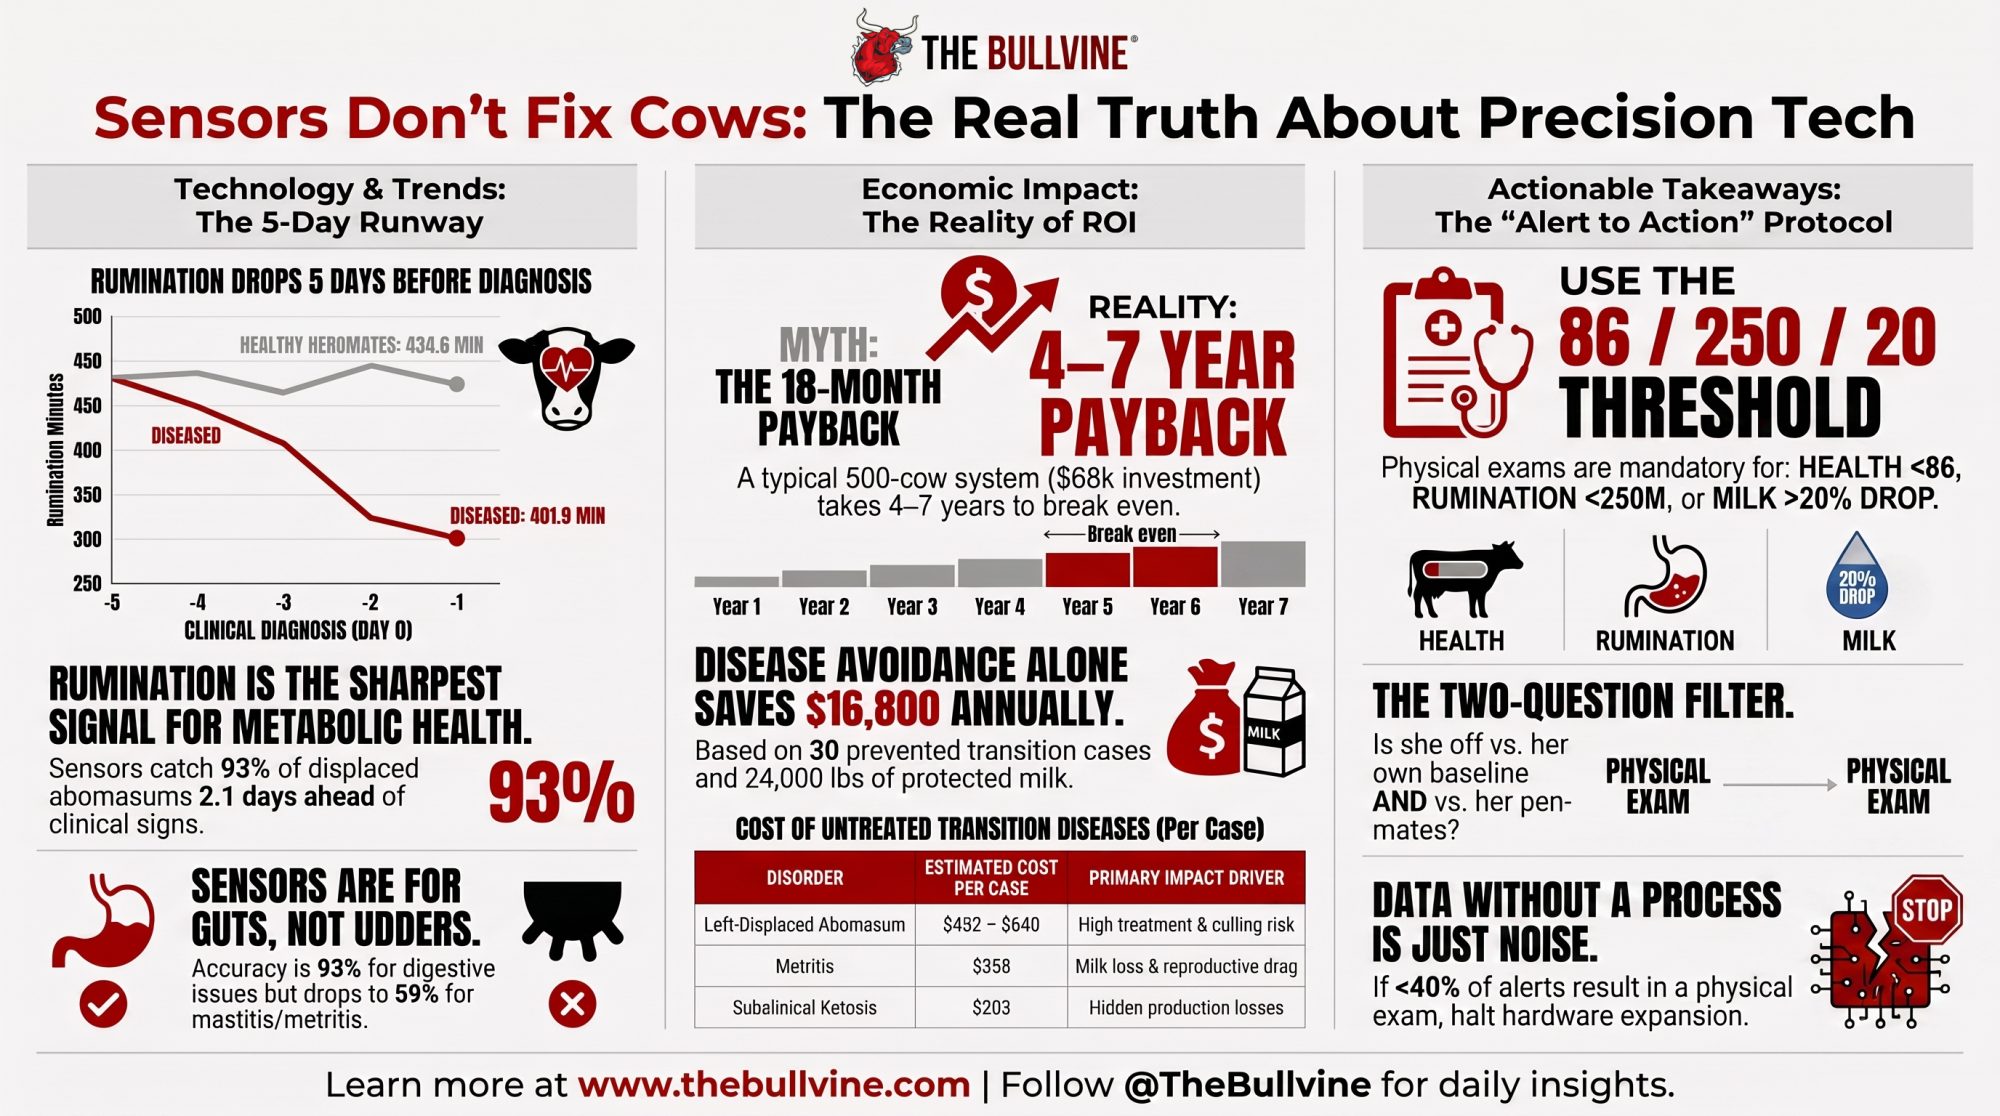
Austrian work published in Theriogenology in 2020 put a clock on the general pattern. Using a commercial 3D-accelerometer system, Gusterer and colleagues found rumination already shorter five days before clinical diagnosis in diseased cows — 401.9 minutes a day against 434.6 in healthy controls. Cows carrying more than one disorder bottomed out at 313.4 minutes the day before diagnosis, against 392.0 for healthy herdmates. That’s a roughly 20% gap at the nadir, and it opened up while nobody was looking.
The activity picture moves on a tighter timeline. High-activity time started shortening three days out, inactive time lengthened three days out, and lying time only diverged one day before diagnosis. Rumination gives you the longest runway of the three.
One caution the sales deck won’t lead with: rumination change tells you something shifted, not what shifted. Extension guidance is blunt about it — changes in rumination pattern can’t diagnose a specific disease, only flag a change in health status or comfort that merits a look. The technology pre-sorts. You still diagnose.
How Good Is the Detection, Really?
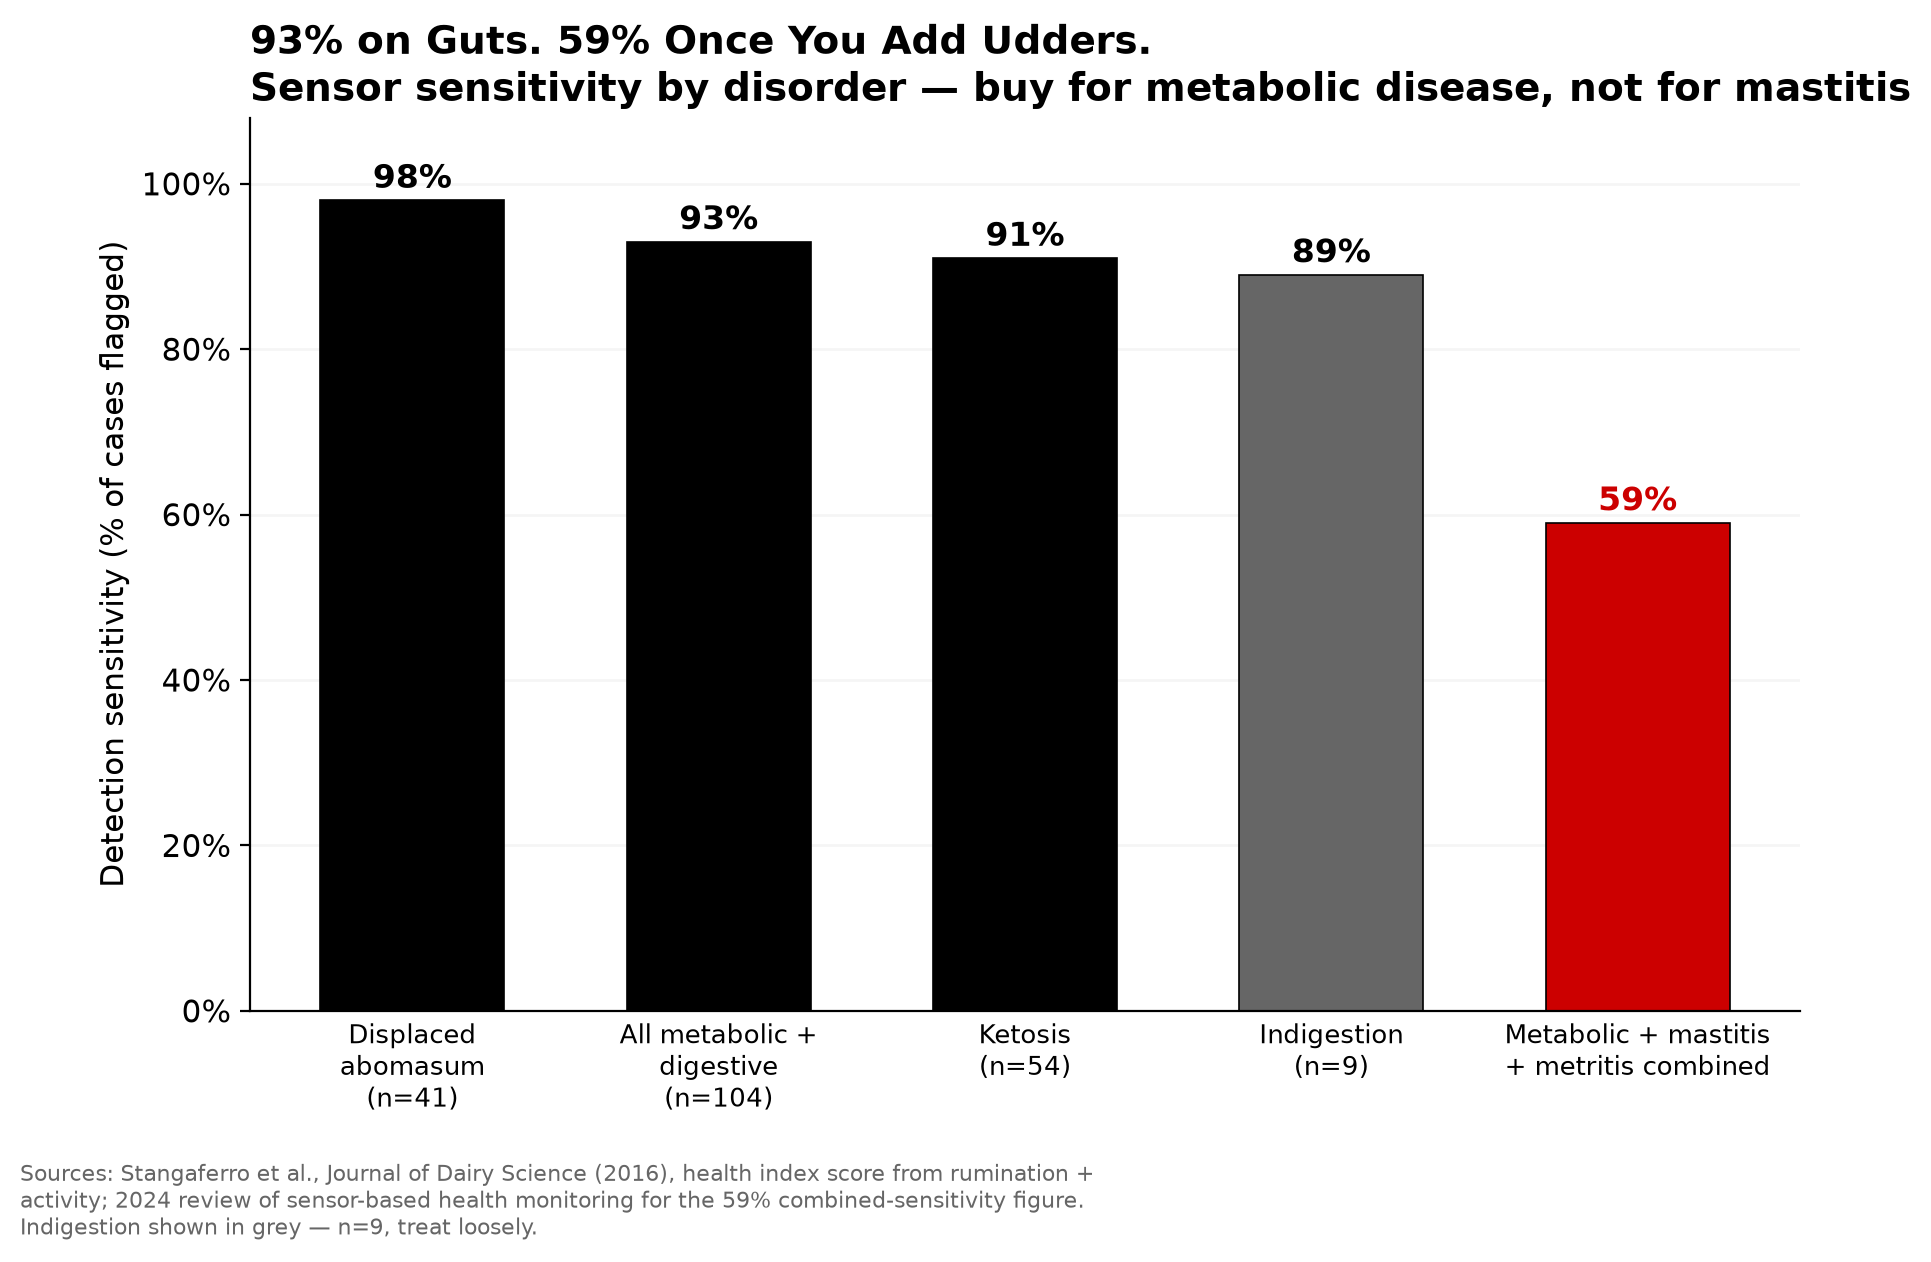
The numbers that matter here come from Stangaferro and colleagues at Cornell, published in the Journal of Dairy Science in 2016 and still the reference work a decade on. Running a health index score built from rumination and activity data, the system flagged 98% of displaced abomasum cases (n=41), 91% of ketosis cases (n=54), 89% of indigestion cases (n=9, so treat that one loosely), and 93% of all metabolic and digestive disorders combined(n=104).
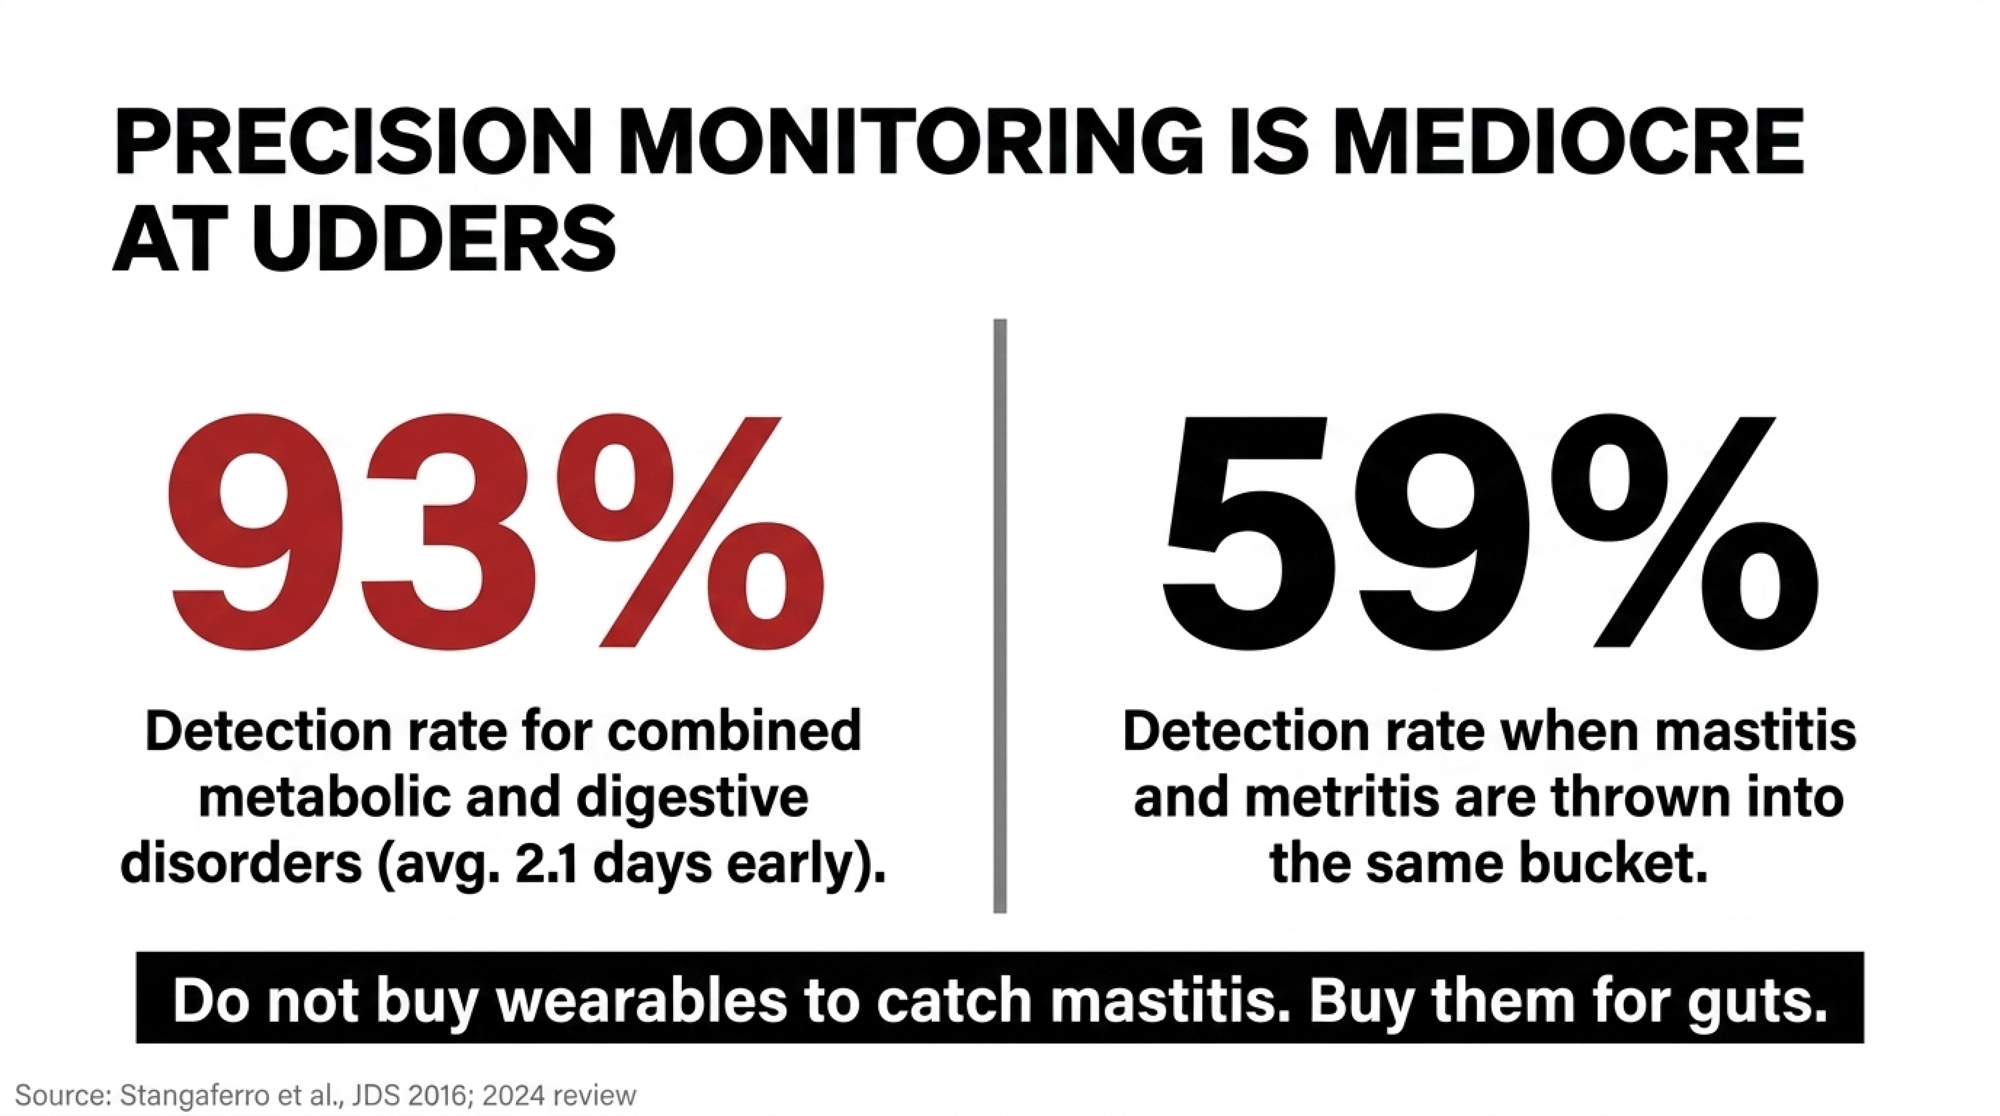
Timing is the part producers care about. The tag identified 93% of cows with metabolic disorders an average of 2.1 days ahead of clinical diagnosis — and for DA specifically, detection ran roughly two to three days in advance. That’s the honest number. Not five days, not a week.
Be careful with the specificity claims that circulate in marketing material. A 2024 review of sensor-based health monitoring noted that the Stangaferro data showed overall sensitivity of 59% and specificity of 98% when detecting metabolic disorders, mastitis, and metritis together — because throwing mastitis and metritis into the same bucket drags performance down hard. Precision monitoring is very good at gut and metabolic problems. It’s mediocre at udders.
A 2024 randomized trial made the practical case anyway. Comparing 607 cows managed on automated health alerts against 597 managed on visual observation alone, cows in the alert group were more likely to get a clinical exam and more likely to have clinical health disorders actually diagnosed. The alert thresholds were specific and worth writing down: health index score below 86, daily rumination under 250 minutes, or a milk yield drop greater than 20%.
What Are You Actually Buying When You Buy a Bolus?
Hardware watches different things, and the modality decision matters more than the brand on the invoice.
| Sensor Modality | What It Measures | Detection Strength | Primary Failure Mode |
| Neck collar | Rumination via microphone or accelerometer, activity, heat | Best-validated for transition disease and estrus | Collar loss; interference and wear in headlocks |
| Ear tag | Rumination via ear movement, activity, ear temperature | Ear temperature adds a fever and hypocalcemia signal | Tag loss and retention, especially in young stock |
| Rumen bolus | Core temperature, rumen conditions, water intake | Reliable temperature drop 24-48 hrs pre-calving; fever spikes in H5N1-positive cows | One-way install; no visual check that it’s reading |
| Vision / cameras | Locomotion and lameness scoring, body condition | Repeatable, objective scoring over time — front-end and recheck | Needs clean sightlines; newer, thinner validation base |
Cameras are where the early adopters are heading, and the reason is practical rather than technical. A camera score creates a documented number that persists — useful the day you catch her, useful again when you need to recheck a blocked foot two or three weeks later.
Boluses earn their place on the calving side. That pre-calving temperature drop is reliable, and in H5N1-positive herds the same device caught fever spikes tied to infection rather than parturition. One sensor, two very different answers, told apart by direction and timing.
Ear temperature deserves more attention than it gets. Ear temperature drops as a cow gets sick — the signal experienced practitioners have been reading by hand for decades, and exactly what you’re reaching for when a fresh cow goes down and the question is whether you’re looking at low calcium or something else. Watching that number trend over hours instead of guessing by hand changes how a fresh-cow protocol runs.
The Labor Savings Are Not Labor Savings
Here’s the part that gets skipped in the pitch.
Every monitoring company builds its own dashboard. Run collars plus a bolus program plus a robot, and you can end up staring at three or four platforms that don’t talk to each other — DHI data in one system, activity alerts in another, milk-component data locked inside the robot’s own software. Somebody has to reconcile who lost a tag, which readers stopped transmitting, and whether last Tuesday’s pen-wide rumination drop meant disease or a feed delivery that ran three hours late.
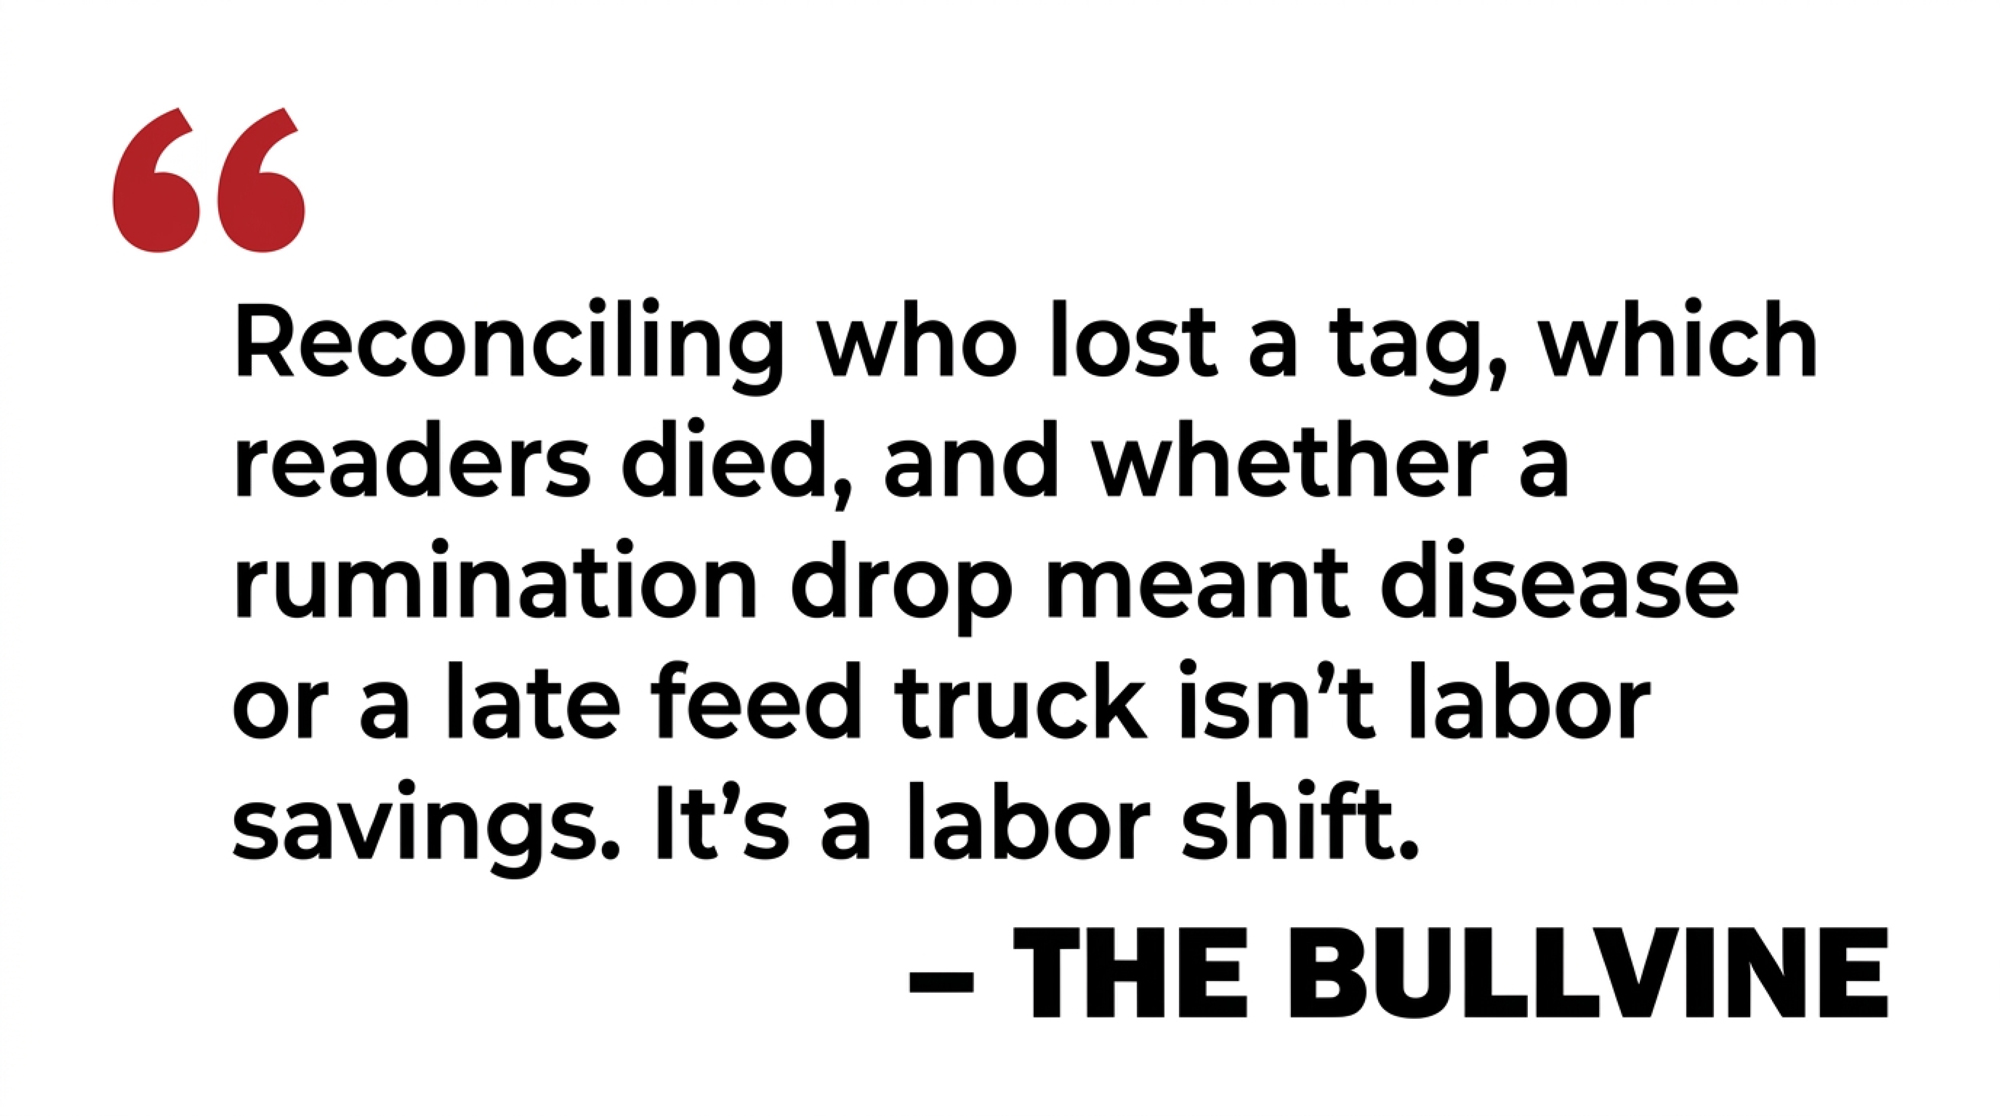
That reconciliation work isn’t labor savings. It’s a labor shift, and it’s the single biggest reason two herds buy the identical system and get opposite results. A JDS economic evaluation of a commercial rumen sensor system found genuine economic potential — but the return tracked with how consistently alerts were acted on, not with whether the hardware was installed.
False positives compound the problem fast. Wind events, pen moves, hoof trimming, a loose dog running through the barn — any of these throws activity alerts across an entire group at once. Extension guidance puts hoof trimming alone at a 45-minute rumination drop and estrus at 75 minutes. Chase every one and you’ll burn labor faster than the system saves it.
Know this before you sign: independent validation lags well behind commercial release. The peer-reviewed literature covers a small fraction of the systems now on the market — the 2024 review of sensor-based monitoring found published sensitivity figures for only a handful of platforms. Ask any vendor directly whether their algorithm has been validated outside their own trials, and get the citation.
And somebody physically owns the maintenance. Tags fall out. Readers drop offline. Batteries die on their own schedule, not yours. If that job isn’t attached to a name on your labor chart, it defaults to whoever notices last.
The Two-Question Check That Cuts the Noise
Practitioners who run these systems day to day describe the same two-question filter before anyone walks a pen.
Is she off compared with her own baseline? And is she off compared with her pen-mates?
A cow diverging from herself while tracking with her group usually points to something environmental — a ration change, a move, weather. A cow diverging from herself and from everyone around her is the one to put hands on. That distinction is what separates a system that pre-sorts genuinely sick cows from one that generates noise people eventually learn to ignore.
Threshold setting is the other half, and the 2024 trial gives you defensible starting points rather than guesses: health index under 86, rumination under 250 minutes daily, milk drop over 20%. Extension guidance adds a useful individual-cow trigger — investigate a sustained drop of 30 to 50 minutes a day from that cow’s own rolling baseline. Set detection tighter than that and you’ll walk cows that don’t need walking. Set it looser, and you’ll miss the ones that do.
Where the sweet spot lands also depends on your handling system, and this trade-off usually gets settled at purchase without much discussion. A herd that still restrains cows in headlocks gets a second chance at whatever the sensor missed, because eyes and hands are already on every animal at some point in the day. A pure sort-gate operation doesn’t get that second look — which argues for tolerating more false positives, because a missed cow costs more than a walked one.
Does the Precision Monitoring Math Actually Pencil?
This is where most technology conversations go quiet. So let’s do the arithmetic.
Start with what a case costs. A stochastic model of U.S. clinical disease costs published in JDS put left-displaced abomasum at $432.48 per case in primiparous cows and $639.51 in multiparous — the most expensive fresh-cow disorder in the model. Metritis runs roughly $358 per case once you add culling losses within the first 60 DIM ($85), milk loss ($83), reproductive drag ($109), and treatment ($81). Canadian work priced subclinical ketosis at $203 per case, though a systematic review of ten studies found ketosis estimates ranging from €19 to €812 — so use your own vet costs and milk price rather than a borrowed number.
| Disorder | Cost per case (USD) | What’s inside the number | Confidence flag |
| Left-displaced abomasum, multiparous | $639.51 | Most expensive fresh-cow disorder in the JDS stochastic model | Modeled, U.S. costs |
| Left-displaced abomasum, primiparous | $432.48 | Same model, first-lactation cows | Modeled, U.S. costs |
| Metritis | $358 | Culling loss to 60 DIM $85 · milk loss $83 · repro drag $109 · treatment $81 | Component-built, auditable |
| Subclinical ketosis | $203 | Canadian per-case estimate | Systematic review of 10 studies spans €19 to €812 — use your own numbers |
| Blended figure used in the 500-cow model | ~$400 | Rough midpoint across the sourced per-case figures | Editorial midpoint, not a published value |
Now the hardware. Published and vendor-reported figures for wearable monitoring cluster in a narrower band than the marketing noise suggests: roughly $75 to $150 per cow for wearable devices, with annual subscription running around $10 per cow on top. Peer-reviewed economic modeling uses similar inputs — one U.S. analysis modeled activity meters at a $120 tag cost plus $8,000 in base infrastructure and $1,500 annually for maintenance and lost tags, and concluded the system needed to stay functional at least five years to break even, generating up to $13 per cow per year in extra profit at a seven-year service life. European work on activity meters found net returns between €7 and €46 per cow per year depending on breed and scenario.
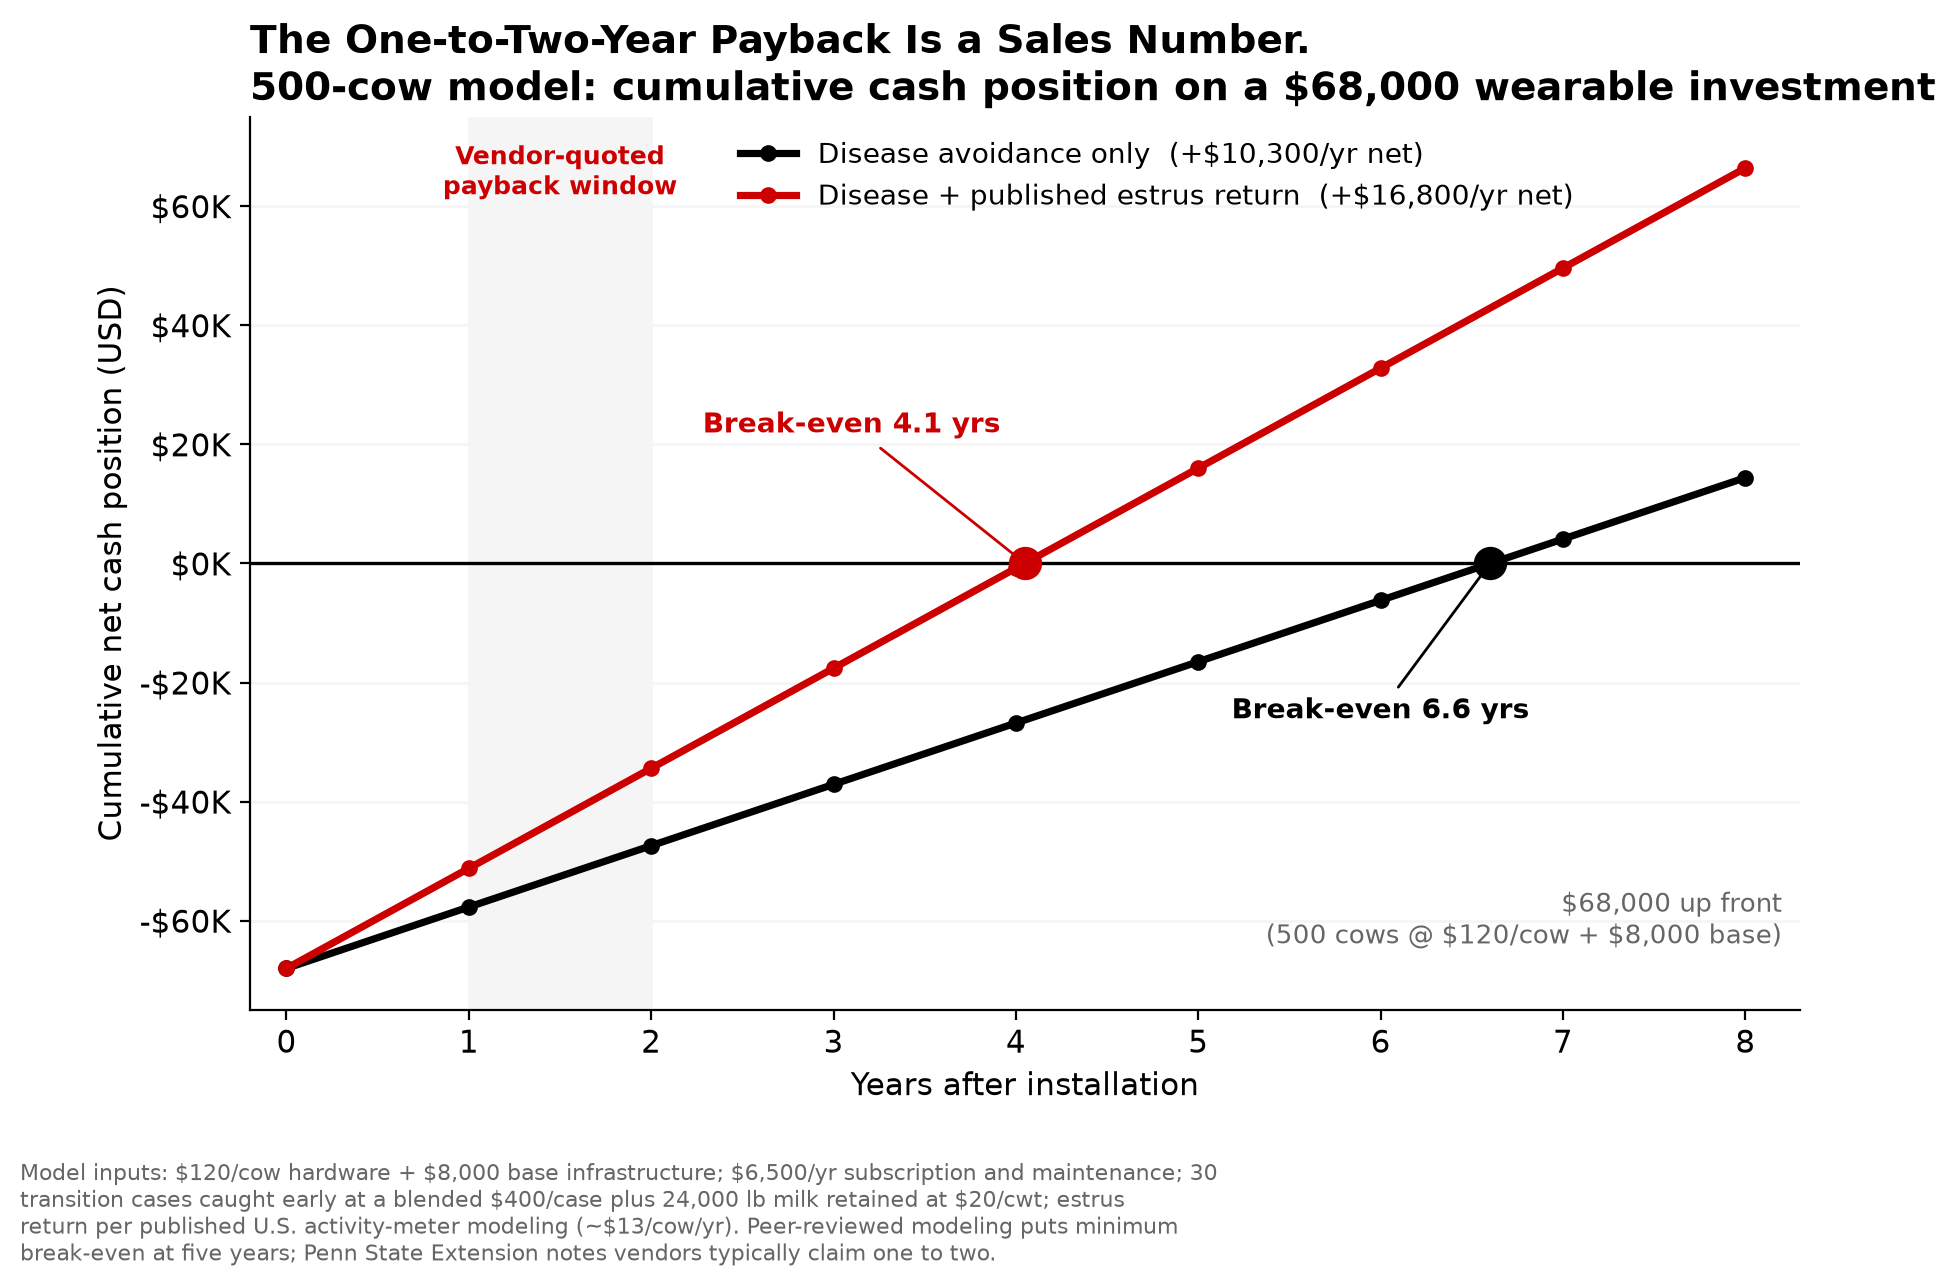
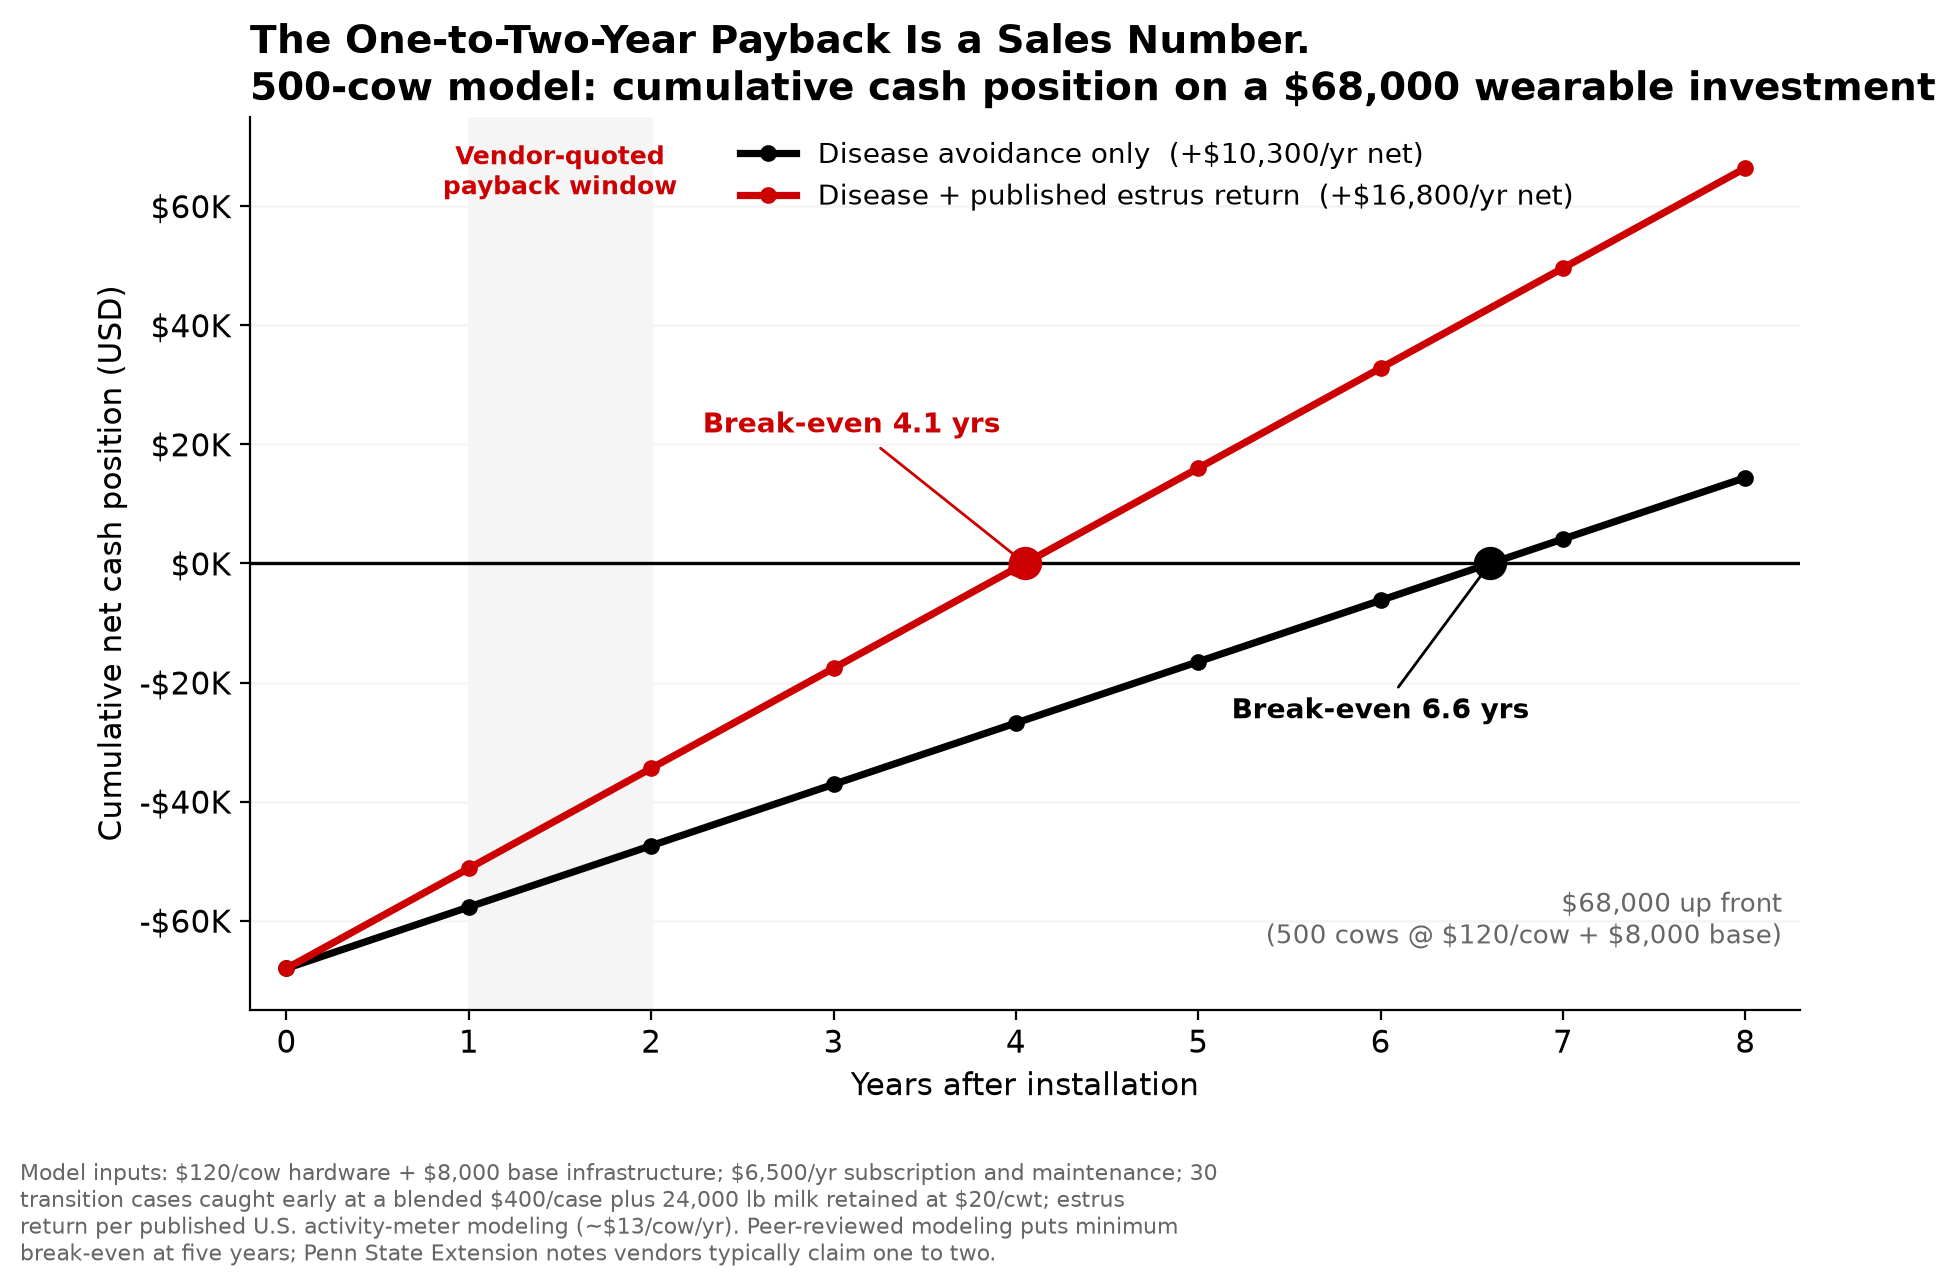
Run it on a 500-cow herd. At $120 per cow, you’re looking at $60,000 in hardware, plus roughly $8,000 in base infrastructure, plus $5,000 a year in subscription and another $1,500 in maintenance and replacements — call it $68,000 up front and $6,500 annually.
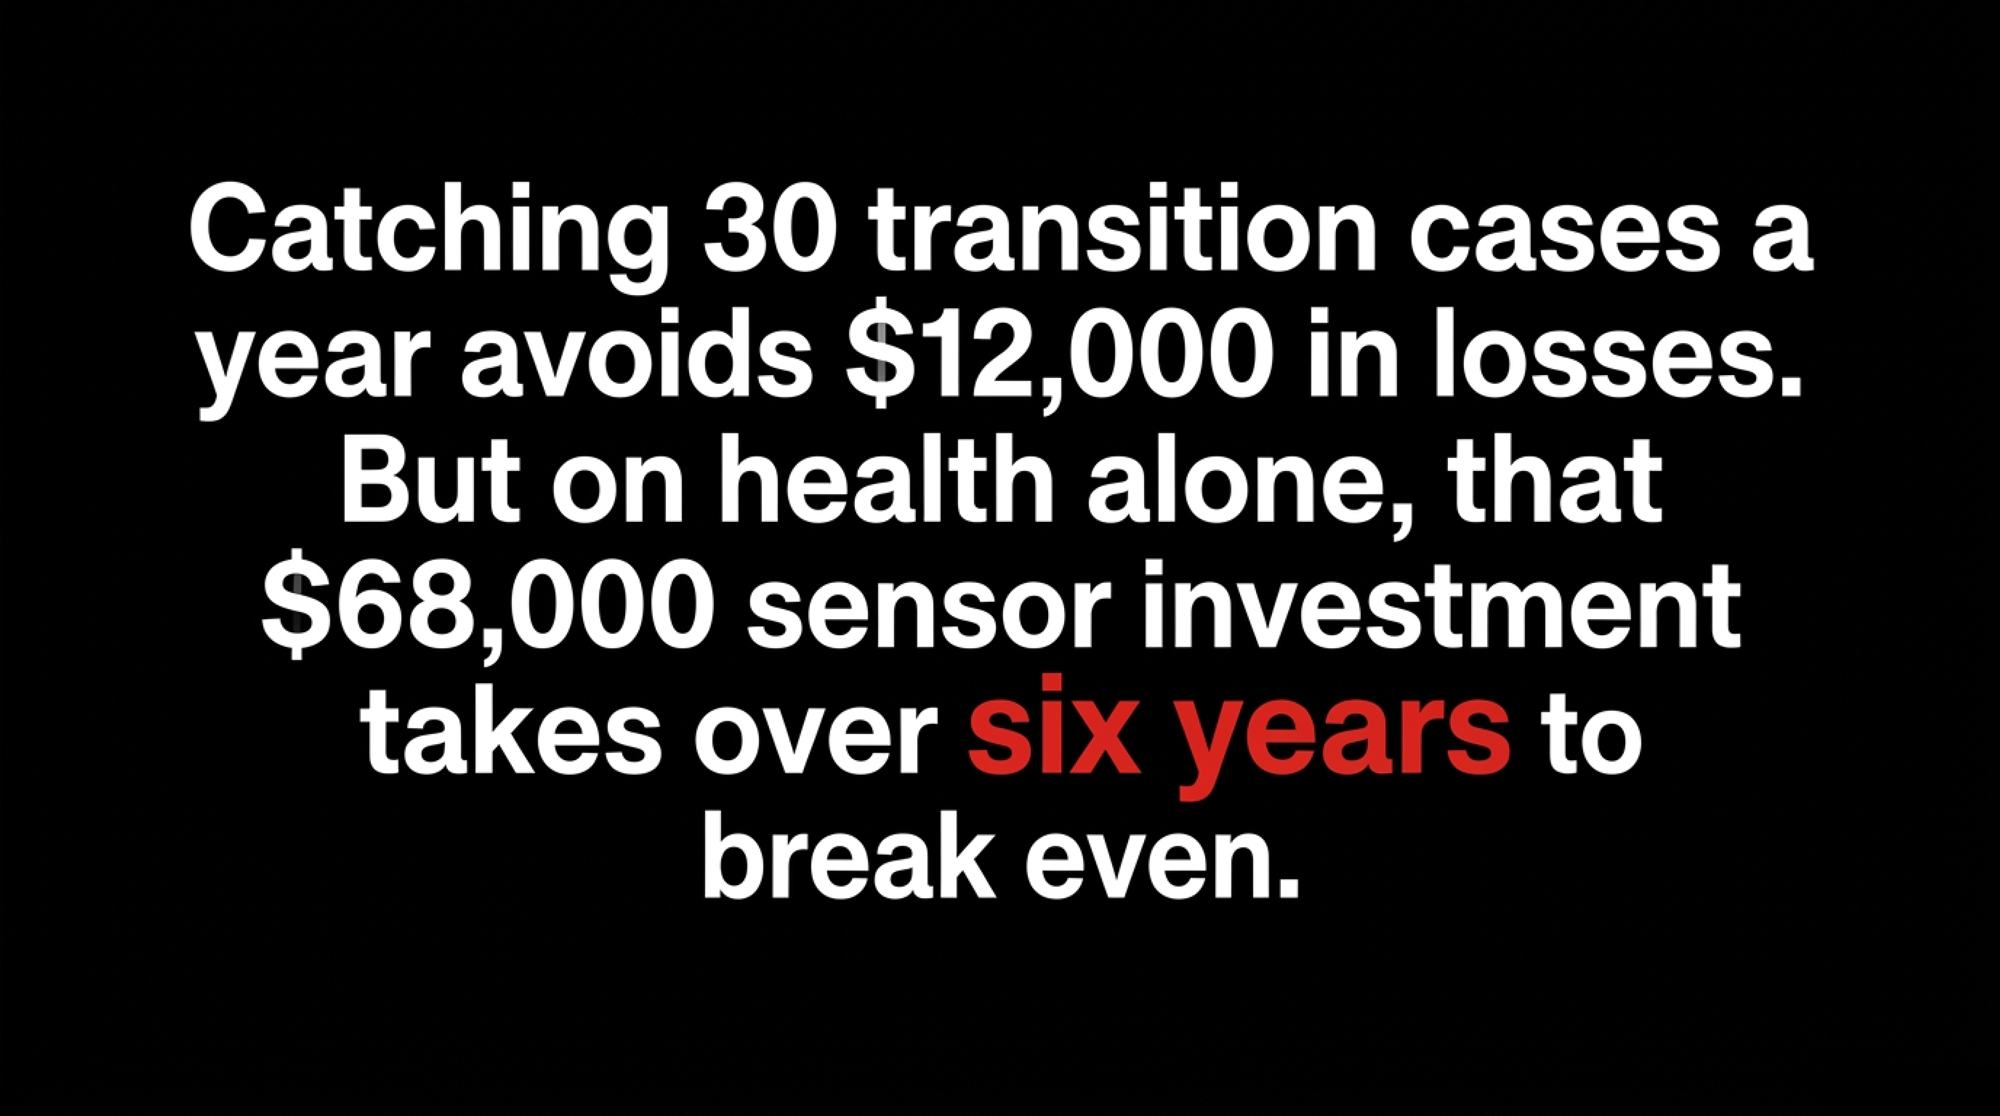
Against that, take 40% transition-disease incidence: 200 cows through the risk window. Blend the sourced per-case figures to a rough $400 midpoint. Catch 30 of those cases early enough to change the outcome, and you’ve avoided about $12,000 a year in disease cost. Add the milk: 30 prevented incidents at roughly 800 lb each, per University of Wisconsin extension figures, is about 24,000 lb staying in the tank — near $4,800 at $20/cwt.
So roughly $16,800 in annual return against $6,500 in annual operating cost leaves about $10,300 a year against a $68,000 entry. That’s a six-to-seven-year payback on disease avoidance alone — which lines up almost exactly with the five-year break-even the peer-reviewed modeling found, and sits well outside the one-to-two-year payback that Penn State Extension notes most companies selling these systems report.
Two things about that 30. It isn’t cases flagged — at a 93% detection rate you’d flag far more than 30 out of 200. It’s cases where earlier intervention actually changed the result, and no study tells you what that conversion rate looks like on your farm. Your treatment records will.
And know what this model leaves out: it counts avoided disease only. Estrus detection carries real published return on top — that $13 per cow per year in the U.S. modeling, €7 to €46 in the European work — which shortens the payback without collapsing it. On the same 500-cow model, adding the published estrus return takes the payback from roughly 6.6 years to about four. Better. Still nothing like eighteen months. That’s the honest case for buying — not the disease math alone, which is thin, but the two streams together.
Where You Farm Changes the Whole Calculation
This is the part most technology coverage flattens, and it matters more than any spec sheet difference.
Non-quota markets — U.S., New Zealand, most of Australia. Every liter you keep in the tank is a liter you get paid for, so prevented disease shows up directly as revenue. That’s why the milk side of the calculation above — 24,000 lb from 30 prevented incidents — belongs in your model. Run the arithmetic on your own milk price and your own fresh-cow disease rate. If you’re chasing volume, the yield-protection argument is the strongest part of the sensor case.
Supply-managed and volume-capped markets — Canada, plus any herd operating under a processor or co-op volume agreement. Extra liters don’t help if you’re already at your cap, so the 24,000 lb line does nothing for you. Your return lives entirely on the cost side: avoided treatment, fewer early culls, less vet time, fewer transition failures pulling animals out of the herd before they’ve paid for themselves. Use the per-case figures — $203 subclinical ketosis, $358 metritis, $432 to $640 for a DA — and count the culling component hardest, because a replacement heifer against a fixed production ceiling is a cost without offsetting revenue.
UK and EU herds sit closer to the non-quota side since the EU milk quota system ended in March 2015, but with a component-weighted milk price and often tighter margins per liter. Weight the yield side by your own butterfat and protein premiums rather than by volume alone, and give the culling-avoidance side more credit than a U.S. herd would.
The peer-reviewed activity-meter work makes this concrete. The European modeling found net returns spanning €7 to €46 per cow per year depending on breed and scenario — a sixfold spread. Read that carefully. Same technology, sixfold difference in return, and not one euro of it explained by which hardware you bought.
| Milk-pricing regime | Where the return comes from | Does yield protection count? | What to weight hardest |
| Non-quota — U.S., New Zealand, most of Australia | Revenue plus cost avoidance; every retained pound gets paid | Yes — 24,000 lb from 30 prevented incidents ≈ $4,800 at $20/cwt | Yield protection; strongest version of the sensor case |
| Supply-managed — Canada, or any processor volume cap | Cost side only: treatment, vet time, early culls, transition failures | No — at your cap the 24,000 lb line is worth $0 | Culling avoidance; a replacement heifer against a fixed ceiling is cost with no offsetting revenue |
| UK and EU — post-quota since March 2015 | Component-weighted revenue plus cost avoidance, on thinner margins per liter | Partially — weight by your own butterfat and protein premiums, not volume | Culling avoidance gets more credit here than a U.S. herd would give it |
| Published spread, same technology | European activity-meter modeling, net return per cow per year | — | €7 to €46 — a sixfold spread, none of it hardware |
Biosecurity Rewrote the ROI Case in 2026
The H5N1 situation stopped being a 2024 story a long time ago. More than 1,000 herds across 19 states have been confirmed. Texas logged its first dairy-cattle case of 2026 in early June, and 15 dairies across Texas and Idaho came back positive inside a single 30-day window. One Ohio dairy lost $737,500 in 60 days to an outbreak, as we reported in June — a single-farm figure, not an industry average.
Then the ground moved underneath producers. In May 2026, USDA dropped the requirement that lactating cows be tested for H5N1 before crossing state lines for any farm in the 41 states now classed as “unaffected” under the National Milk Testing Strategy. Responsibility for pre-movement testing shifted onto you.
Think about what that means for those same Panhandle herds. In March 2024, they had a federal testing order coming and a diagnostic system that had never seen this virus in cattle. In August 2026, the virus is a known quantity, the lab work is routine — and for most of the country the mandatory testing gate that would have caught an incoming animal is gone.
Bulk-tank PCR remains the best herd-level screen available, and weekly sampling works as a smoke detector. But it catches herds, not individual cows, and it misses early-stage animals not yet milking into the main tank. Cow-level monitoring already watching for unusual mid-lactation milk drops and rumination changes tends to pull the alarm forward by several days — which squares with the two-to-three-day window the Cornell work documented for metabolic disease.
Industry reporting has credited sensor-equipped farms with detecting H5N1 infections five to seven days earlier than visual observation. Treat that as directional. It runs ahead of what the peer-reviewed detection-window research supports, and no published herd count or study geography backs it.
Where the Technology Still Hasn’t Landed
Almost everything commercially mature points at the lactating herd. Calves and growing heifers remain largely open ground, and the results so far are mixed — practitioners report clients who put tags on calves and stuck with them, and clients who pulled them off, usually over retention or over data that never got used rather than over the sensor itself.
Milk-component data is the other frontier. A robotic system captures temperature per quarter per milking, plus several dozen distinct variables per cow per milking depending on the platform. Most of that sits unused. The mastitis connection has proven stubborn — behavioral response varies by pathogen, so a cow with one bug behaves nothing like a cow with another. That’s exactly why the combined sensitivity in the Stangaferro data fell to 59% once mastitis and metritis entered the model.
What This Means for Your Operation
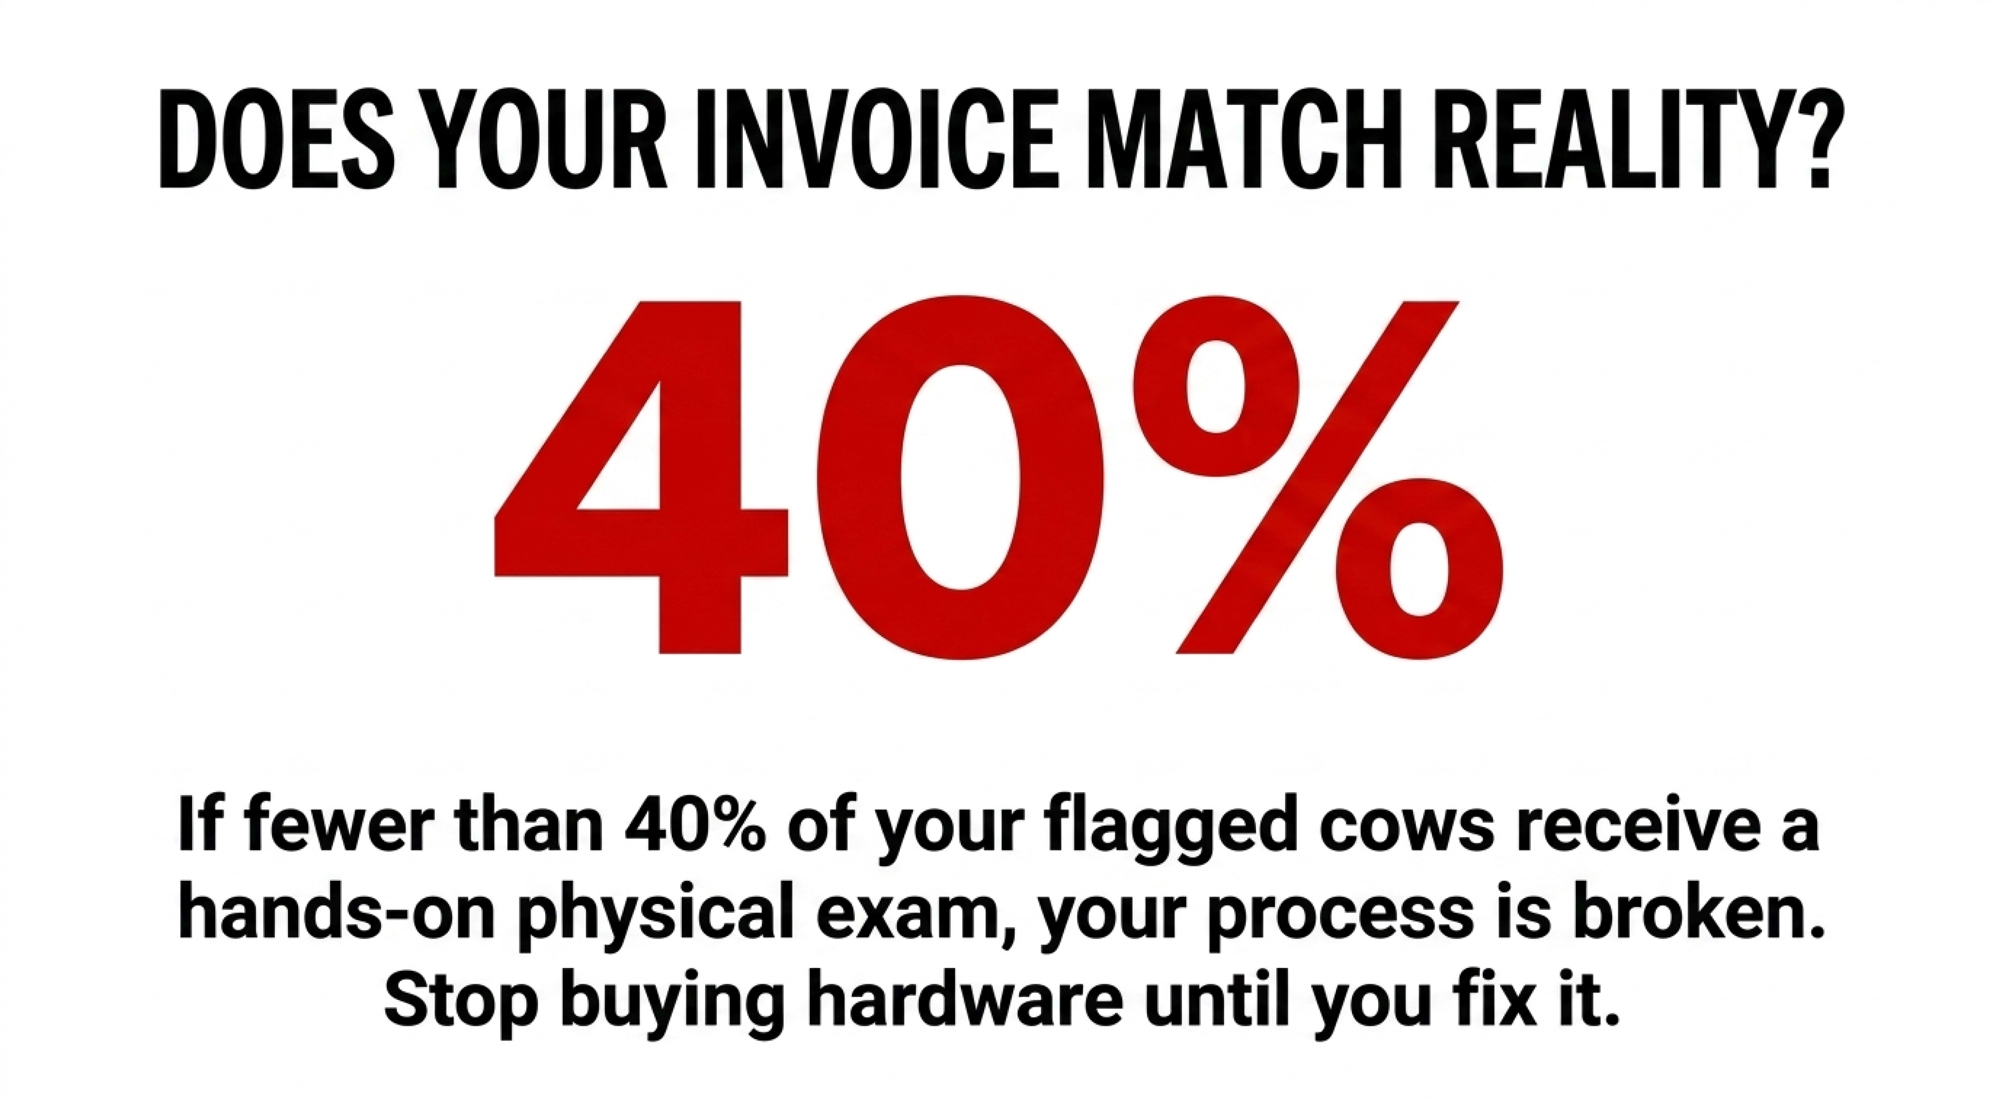
- Audit your alert-to-action rate. Pull your last 90 days of logs. If fewer than 40% of flagged cows received a hands-on physical exam, halt new hardware purchases until you fix the protocol. That threshold is our judgment, not a published benchmark — but the direction isn’t arguable.
- Apply validated alert thresholds. Start with a health index below 86, daily rumination under 250 minutes, or a milk yield drop over 20%, rather than default vendor settings. Those came out of a 1,204-cow randomized trial, not a sales deck.
- Add an individual-baseline trigger alongside the herd threshold. A sustained 30-to-50-minute drop from that cow’s own rolling average is worth a look even when she’s still above the absolute floor.
- Plan for a two-to-three-day warning window on metabolic disease. Build labor protocols around the 2.1-day average, not around claims of five-to-seven-day advance alerts. Rumination gives you the longest runway of any signal — it moves five days out, where lying time only diverges the day before.
- Don’t buy wearables to catch mastitis. Broad-spectrum sensitivity drops to 59% once uterine and udder health enter the picture. Buy for metabolic and digestive monitoring, where it hits 93%.
- Assign hardware maintenance to a named person. Tag reconciliation, offline reader reboots, dead batteries. Put it on the labor schedule with somebody’s name beside it, or it defaults to whoever notices last.
- Build the business case on both value streams. Disease avoidance alone runs six to seven years. Add the published estrus return, and it drops to roughly four. If you can’t justify it on both, don’t sign.
- Ask for the validation citation, not the spec sheet. Then ask about tag retention rates and whether somebody answers the phone at 4 a.m. Cows break things. Raccoons chew Cat 5 cable. Lightning finds the same box twice.
- Set your H5N1 protocol before a neighbor tests positive. Weekly bulk-tank PCR plus cow-level watch on mid-lactation milk drops and rumination. If you’re importing cattle, run your own pre-movement test regardless of what the 41-state rule permits.
Key Takeaways
- Rumination under 250 minutes plus pen-mate divergence equals a physical today. Not a note for tomorrow’s list.
- Softening 10 to 12 days pre-calving is a DA and ketosis screen. Treat it as risk stratification, not a data curiosity.
- Cows carrying multiple disorders bottom out near 313 minutes of rumination the day before diagnosis.Healthy herdmates sit near 392. That gap is your window.
- A one-to-two-year payback quote needs interrogation. At $120 per cow, avoided disease alone pencils to six or seven years. Add estrus, and it lands near four. Peer-reviewed modeling puts minimum break-even at five.
- No validation citation means no verified performance. Published sensitivity data exists for only a handful of platforms.
- Pen-wide alerts point at management, not disease. Hoof trimming costs 45 minutes of rumination; estrus, 75. Check the feed truck log and the calendar before you check the cows.
- Supply-managed herds count culls, not liters. If you’re already at your cap, the yield-protection argument does nothing for you — the return is entirely on the cost side.
- Under 40% alert-to-action makes new hardware counterproductive. More sensors on a broken process produces more ignored data.
The herds pulling ahead on health right now aren’t the ones with the most sensors on the most cows. They’re the ones who decided, in advance, what an alert obligates somebody to do — and wrote it down somewhere other than in one person’s head.
Pull your alert log from last month and count how many flagged cows actually got a physical exam. Does that number justify the invoice you’re paying?
Run Your Numbers
Robot ROI Reality Check — This article’s six-year sensor payback is one input away from the bigger question. The tool prices a full sensor suite — activity collars, inline meters, sort gate, health alerts — against a robot quote, and shows five-year net on both. Bring your own milk price and interest rate.
Learn More
- Ketosis: The Silent Threat to Dairy Herd Success — Arms you with immediate fresh-pen intervention protocols, showing how early oral propylene glycol restores up to 1.5 lb of daily milk loss when rumination alerts flag subclinical ketosis before clinical symptoms surface.
- A Third of Retail Milk Tested Positive. The Map Said Under 0.1%. — Follows the money on herd biosecurity risks, exposing how an undetected H5N1 outbreak cost one commercial dairy $737,500 over 60 days while retail testing outpaced official regulatory maps.
- AI-Powered Multi-Camera System Revolutionizes Dairy Cow Monitoring — Delivers an unvarnished look at wearable-free barn tracking, evaluating how spatial AI systems achieve 90% tracking accuracy without the ongoing hardware loss, ear-tag retention failures, or collar maintenance costs.
 The Sunday Read Dairy Professionals Don’t Skip.
 The Sunday Read Dairy Professionals Don’t Skip.
Every week, thousands of producers, breeders, and industry insiders open Bullvine Weekly for genetics insights, market shifts, and profit strategies they won’t find anywhere else. One email. Five minutes. Smarter decisions all week.