


The state of the dairy industry in 2026 is defined by aggressive policy change, global trade pivots, and a hard turn toward components, carbon, and scale.
For producers, processors, and lenders, the reality is simple: 2025–2026 is the most disruptive policy window since the last quota wars and the original FMMO rollout. The 2025 FMMO modernization, Canada’s Bill C‑282 “fortress” strategy, EU‑Mercosur, Athian and Scope 3 rules, Oregon’s PEACE Act, and the 39% collapse in U.S. dairy farm numbers since 2017 are all hitting at once.
At The Bullvine, we’ve pulled the structural pieces together so you don’t have to. This page walks you through the true state of the dairy industry 2026: the money shifts in FMMOs, the Canadian protein pivot, global trade realignment, consolidation pressure, climate and welfare mandates, and labour plus automation strategies. You’ll see who’s winning, who’s getting squeezed, and where to focus capital and political energy over the next 3–5 years.
KEY TAKEAWAYS
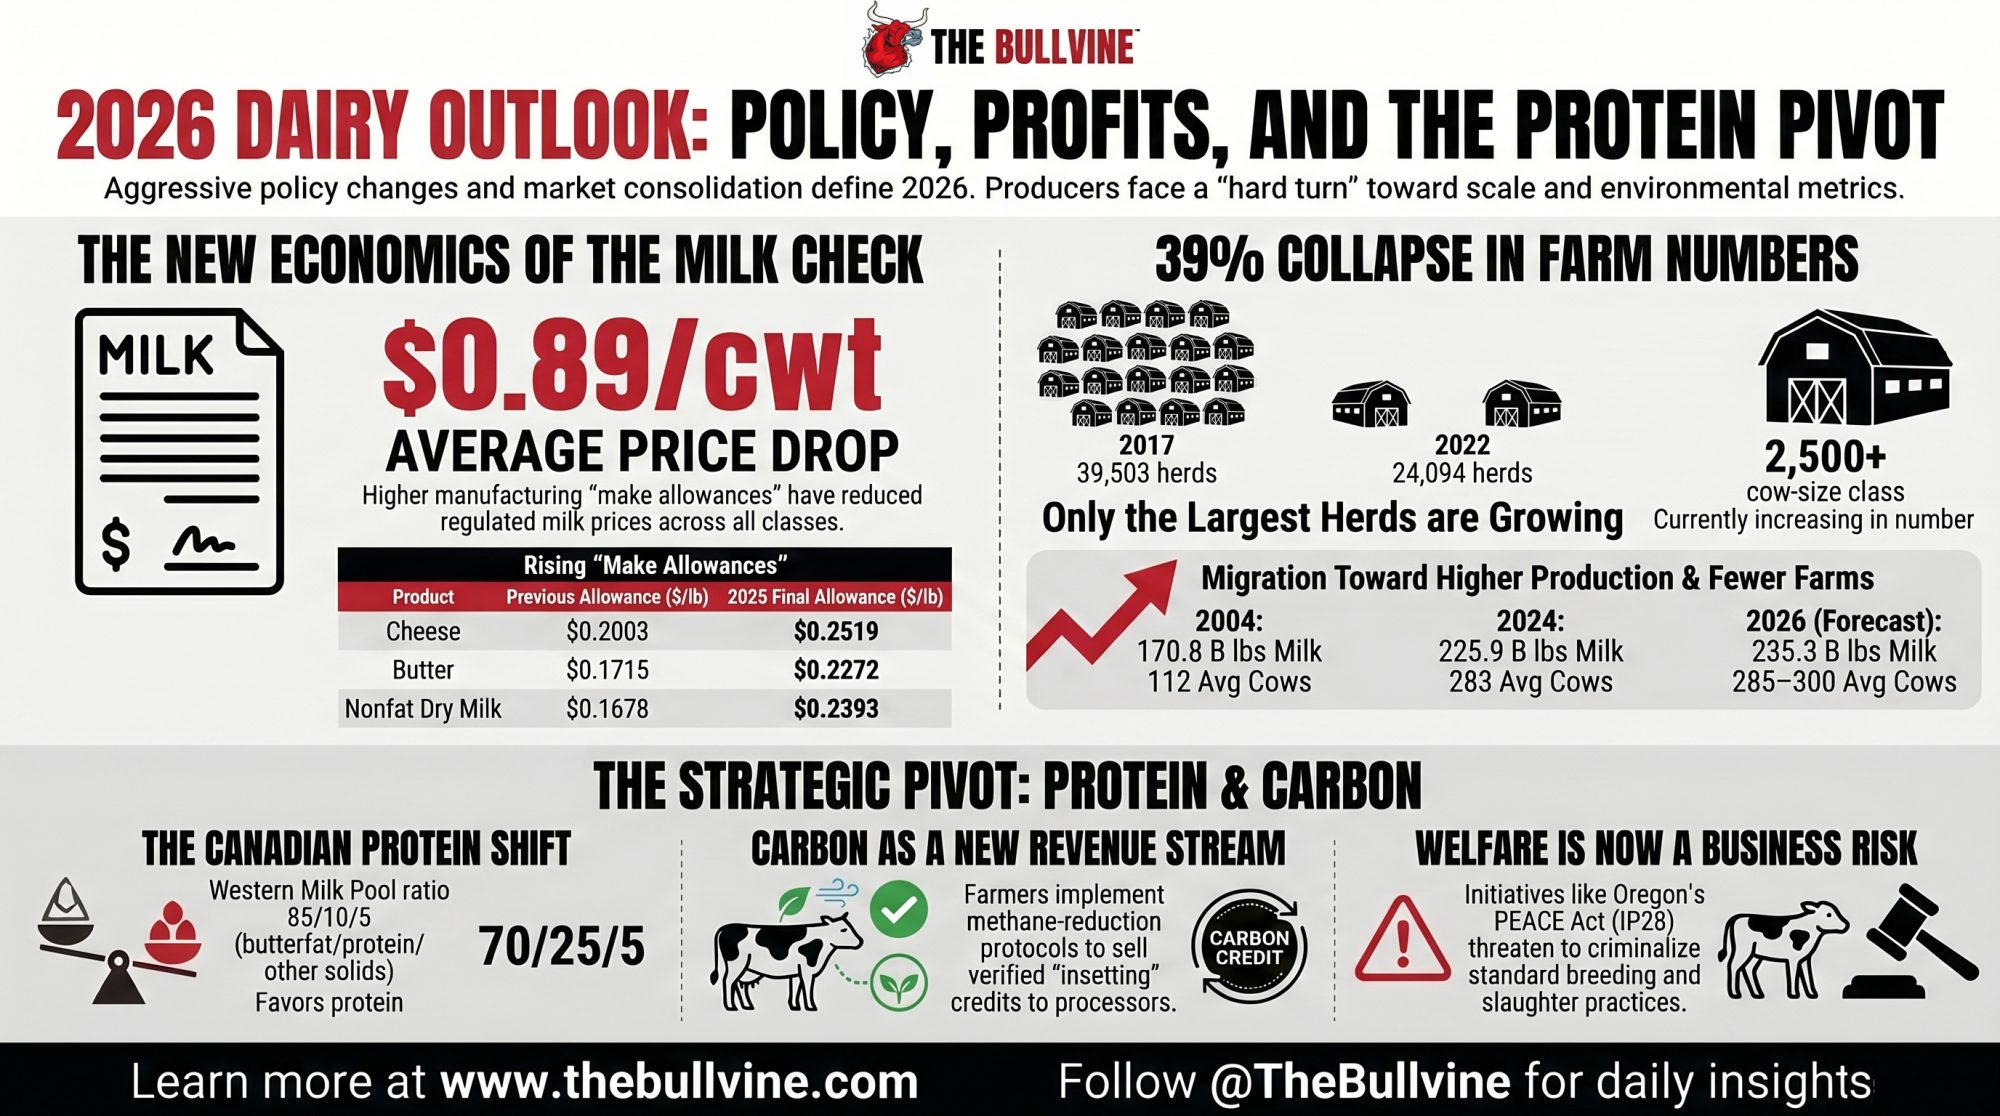
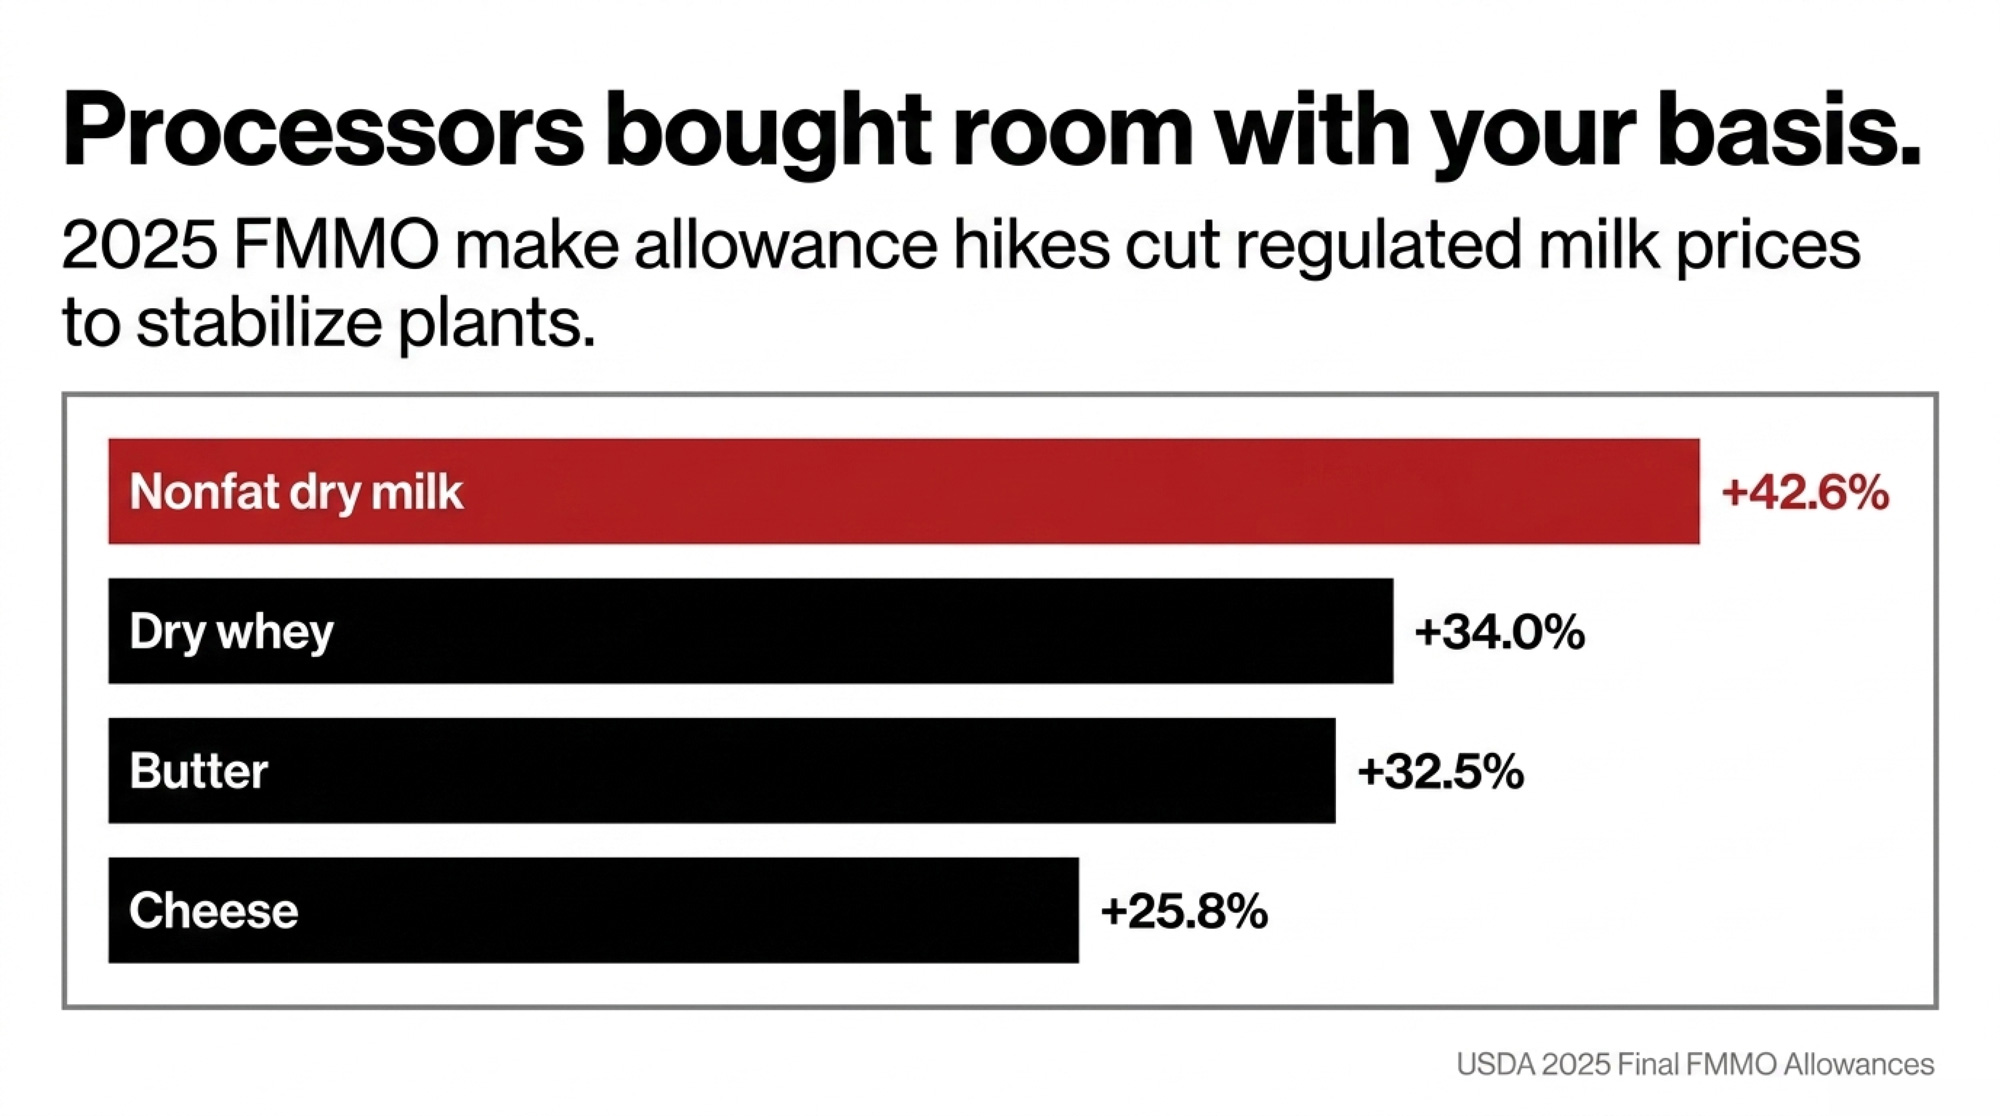
- 2025 FMMO reforms raised make allowances by 26–42%, cut regulated milk prices across all classes, and widened regional winners/losers.
- Canada’s Bill C‑282 and a 2026 protein‑driven pay pivot are reinforcing supply management while raising stakes for the CUSMA review.
- Global trade is shifting: EU‑Mercosur, China’s tariffs on EU dairy, Fonterra’s divestiture, and Lactalis consolidation are redrawing market power.
- U.S. dairy farm numbers fell 39% between 2017 and 2022, with 2,500‑cow‑plus herds the only size class still growing.
- Scope 3 reporting, Athian‑style insetting, and mandatory climate laws are making environmental metrics as important as butterfat and protein.
- Oregon’s PEACE Act (IP28) and evolving proAction/FARM rules show that welfare and social licence are now hard business risks, not just PR.
- Labour shortages are pushing both visa reform (H‑2A, TFWP) and heavy investment in robotics, digital tracking, and “automation offset” strategies.
The Structural Overhaul of U.S. FMMOs
The 2025 modernization of the Federal Milk Marketing Orders is the biggest pricing reset in over twenty years, and 2026 is the first full year you’re living with it. The process started with a 49‑day national hearing in Carmel, Indiana, and ended with a June 1, 2025 go‑live for new make allowances, a return to the higher‑of Class I mover, revised Class I differentials, and a December 1, 2025 update to skim composition factors.
At its core, USDA admitted that pricing formulas had drifted away from reality. Manufacturing allowances hadn’t been updated since 2008, even as labour, energy, and logistics costs climbed. At the same time, the assumed component levels in raw milk no longer matched what modern genetics and nutrition programs were delivering.
Make allowances: stabilising plants, squeezing cheques
The most visible change was the jump in make allowances—the costs deducted from the value of finished products before calculating what you get for components. The new schedule is blunt:
| Product | Previous allowance ($/lb) | 2025 final allowance ($/lb) | Relative increase |
| Cheese | 0.2003 | 0.2519 | 25.8% |
| Butter | 0.1715 | 0.2272 | 32.5% |
| Nonfat dry milk | 0.1678 | 0.2393 | 42.6% |
| Dry whey | 0.1991 | 0.2668 | 34.0% |
USDA framed this as essential to prevent de‑pooling and plant closures, and processors—through IDFA—called it a “much‑needed update”. The trade‑off is obvious: every cent of extra allowance is a cent that doesn’t show up in your milk cheque.
American Farm Bureau and other producer groups flagged exactly that. Just from higher make allowances, early data showed average prices across the first three months of implementation dropped by $0.89/cwt for Class I, $0.85/cwt for Class II, $0.92/cwt for Class III, and $0.85/cwt for Class IV. That’s real money in a thin‑margin year.
Pull quote: “Make allowances bought processors breathing room by selling producers’ basis.”
USDA also updated the butterfat recovery factor to 91%, acknowledging modern plant efficiency, which again shifts how value is carved up between fat and other components.
Higher‑of, ESL, and the composition lag
The good news for fluid regions is the return to the higher‑of Class III or Class IV skim price as the Class I base. Under the 2018 Farm Bill’s “average‑of plus $0.74” formula, producers lost hundreds of millions when cheese and powder markets diverged. Going back to higher‑of closes that gap and is rightly seen as a win for fluid producers.
USDA added a specific adjuster for Extended Shelf Life (ESL) products to smooth volatility for that segment, which has very different logistics and shelf‑life dynamics than conventional fluid.
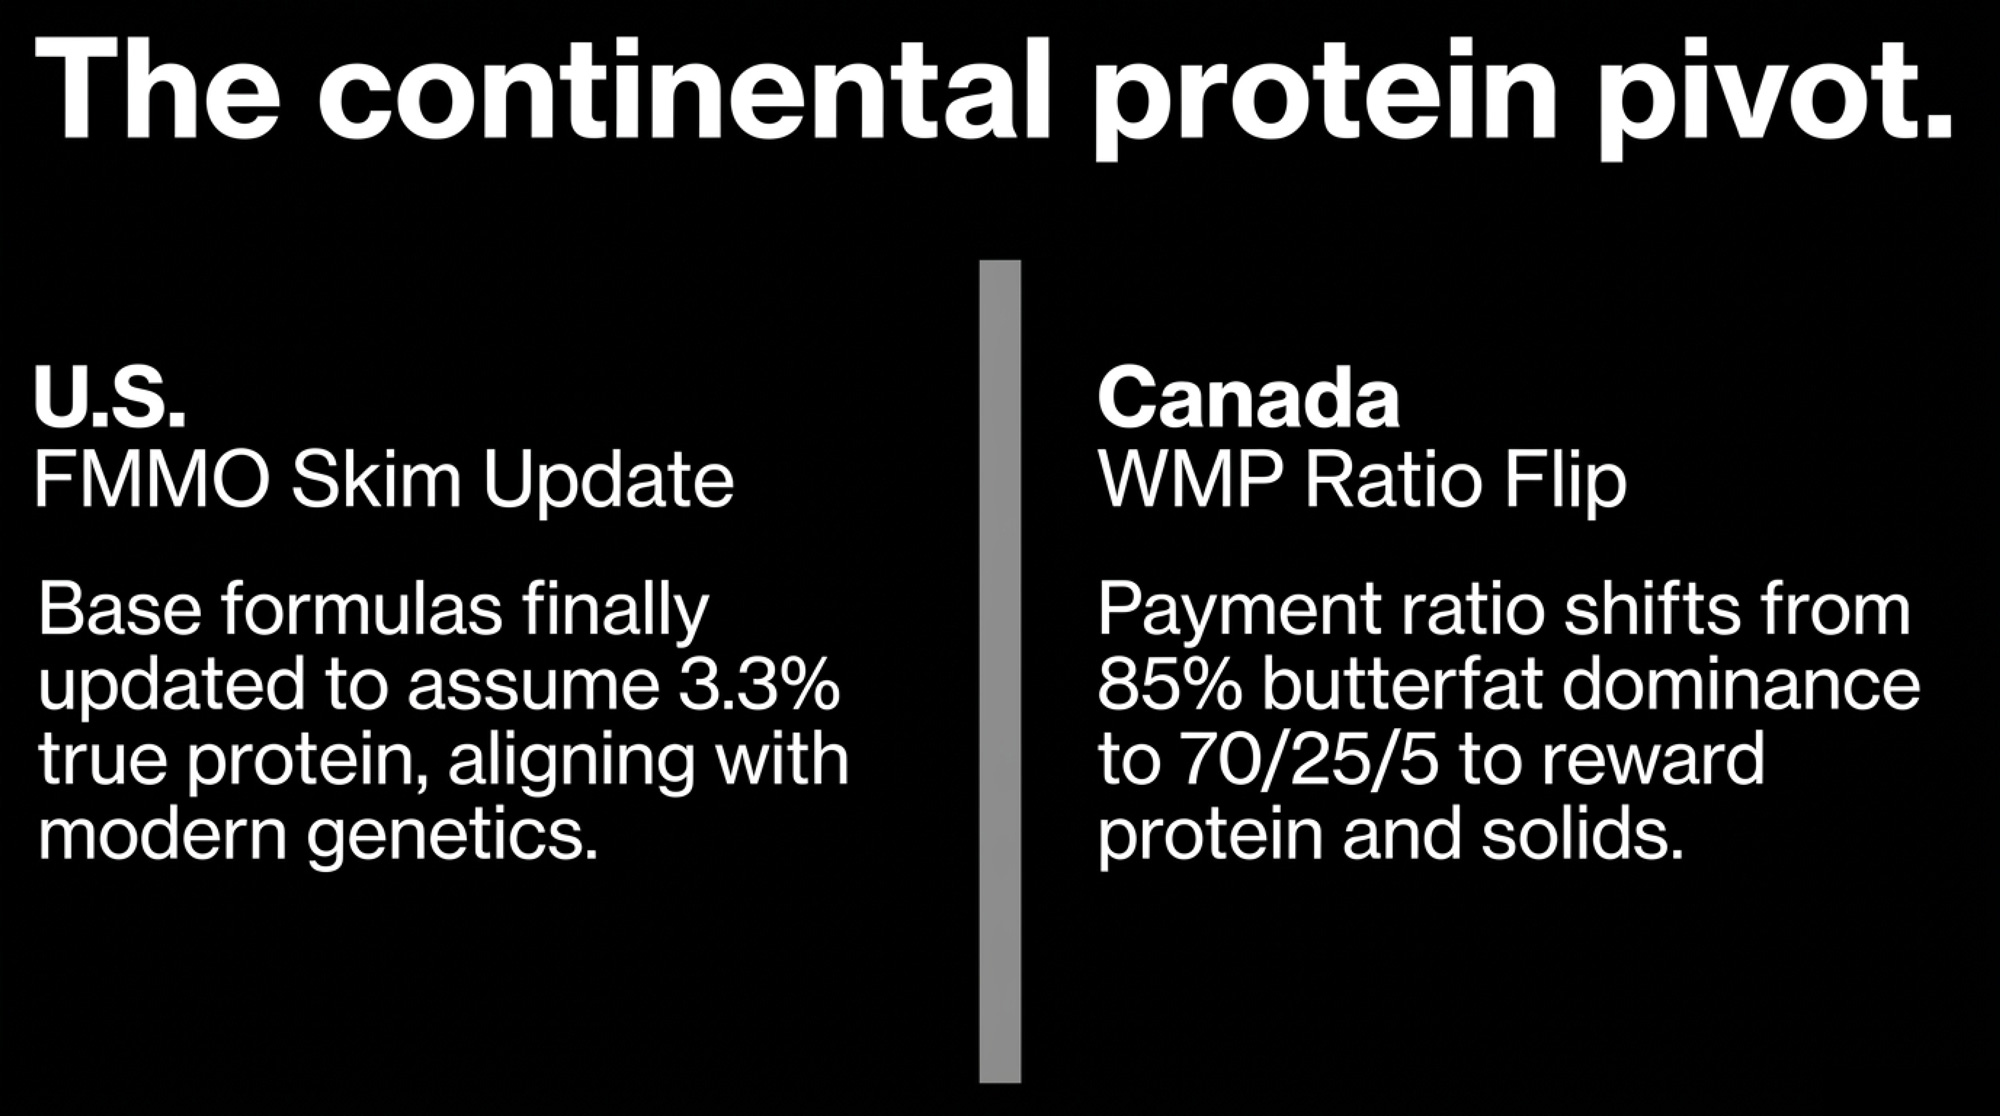
The bad news: USDA staggered the timing. Make allowance increases hit on June 1, 2025, while the more producer‑friendly composition updates waited until December 1, 2025. That six‑month lag cost producers an estimated $100 million in lost revenue. The new factors now assume milk contains 3.3% true protein and 6.0% other solids, finally matching what genetics and feeding have been pushing toward for years.
Regional winners, losers, and utilisation bias
The new FMMO world isn’t flat. It’s heavily shaped by each order’s utilisation profile.
- Upper Midwest (Order 30) and California (Order 51) took heavy hits in the first quarter under the new rules, with pool revenue losses of $64 million and $55 million respectively, driven by their manufacturing‑heavy profiles.
- High‑fluid regions in the Southeast and Northeast saw some of those losses offset by sharply higher Class I differentials, which rose by a national average of $1.24/cwt, with some Southeastern counties seeing increases up to $1.74/cwt and Western counties closer to $0.42/cwt.
In short, the same rulebook plays very differently in Texas vs Vermont.
Table: Early FMMO impact snapshot
| Region / class | Change due to make allowances | Notes |
| Class I average | −$0.89/cwt | Partially offset by higher differentials |
| Class II average | −$0.85/cwt | Impacts cream/soft products |
| Class III average | −$0.92/cwt | Big for cheese belts |
| Class IV average | −$0.85/cwt | Powder/butter plants hit |
| UM Order 30 pool | −$64M Q1 2026 | Manufacturing‑heavy |
| CA Order 51 pool | −$55M Q1 2026 | Manufacturing‑heavy |
| SE Class I diff max | +$1.74/cwt | Fluid tilt |
| National Class I diff | +$1.24/cwt average | Fluid support |
For a typical mid‑size herd shipping to commodity plants, the net is tighter margins and more pressure to chase components and premiums outside the base formula.
Canadian Dairy Supply Management in 2026
Canadian dairy in 2026 looks like a fortress under siege. On one side, there’s Bill C‑282, which legally bars negotiators from trading away more dairy access. On the other, the looming CUSMA review and a wave of TRQ disputes with the U.S. and New Zealand are testing that shield.
At the same time, the pooling system is flipping from a fat‑heavy world to a “protein pivot,” with new component ratios and bonuses that reward higher protein and SNF production.
CUSMA review, TRQs, and CPTPP fallout
CUSMA’s sunset clause requires all three partners to sit down in 2026 and decide whether to continue the agreement. For U.S. dairy, the top complaint is still how Canada administers Tariff‑Rate Quotas.
Washington argues that allocating the vast majority of quota to Canadian processors blocks U.S. exporters from selling directly to Canadian retailers and food‑service customers. Canada lost the first TRQ fight under CUSMA but then won a 2023 panel ruling that its revised market‑share‑based allocation system complies with the deal.
On top of that, Canada settled a CPTPP dispute with New Zealand in July 2025. The settlement promises “commercially meaningful changes,” including earlier return dates and underfill mechanisms on under‑used quotas, which in practice open more space for NZ product.
So while supply management is intact, the armour is getting more joints and access points.
Read more: Canadian TRQ allocation schedules
Bill C‑282: Political shield, trade lightning rod
Bill C‑282 is now law. It prohibits federal negotiators from offering any additional dairy, poultry, or egg market access or tariff cuts in future trade agreements. That’s unprecedented. It effectively silo‑izes the supply‑managed sectors from the rest of trade policy.
For roughly 10,000 Canadian dairy farms, this looks like long‑term certainty on paper. But analysts like Sylvain Charlebois warn it may backfire, alienating other export‑oriented sectors and trading partners who now see dairy as a “no‑go” zone. Retailers and food‑service chains, who carry the cost of supply‑managed pricing, are already pushing back in public debates.
Honestly, it’s a classic Canadian compromise: high short‑term security for producers, higher long‑term diplomatic friction.
The 2026 protein pivot: WMP vs P5
The real money shift inside Canada is happening in the payment grids.
Driven by a 32% surge in demand for protein‑dense products like cottage cheese and a 7% increase for yogurt, both the Western Milk Pool (WMP) and P5 have moved away from butterfat‑dominant ratios.
Table: 2026 Canadian component payment pivots
| Region | Effective date | New BF/PRO/OS ratio or policy | Primary objective |
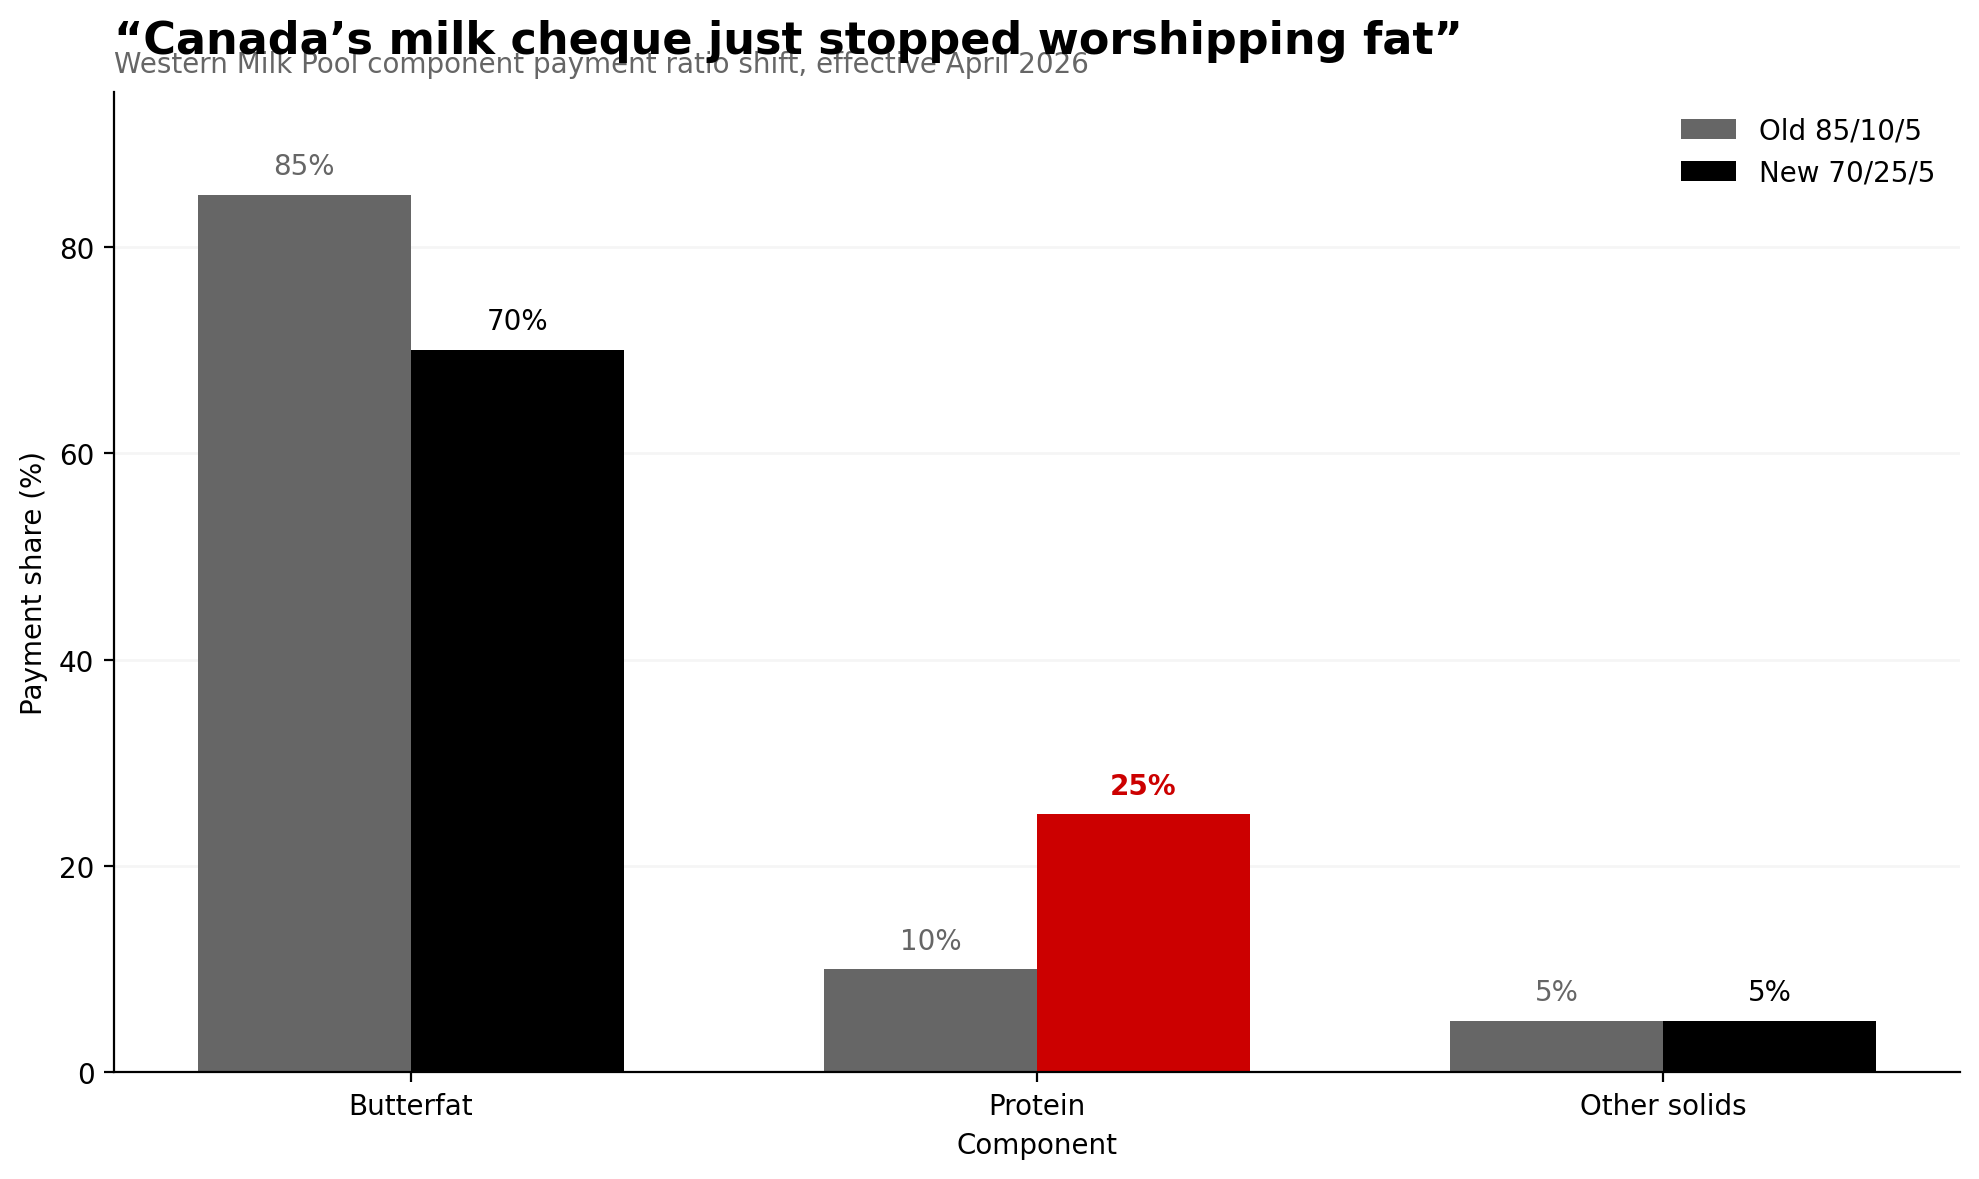
| WMP | Apr 1, 2026 | 70 / 25 / 5 (from 85/10/5) | Boost protein, stabilise BF |
| P5 | Jan 1, 2026 | Tiered protein bonus | Achieve SNF:BF >2.0 |
| P5 tiered bonus | Jan 1, 2026 | $3/kg bonus on Tier 2 protein | Reward higher protein |
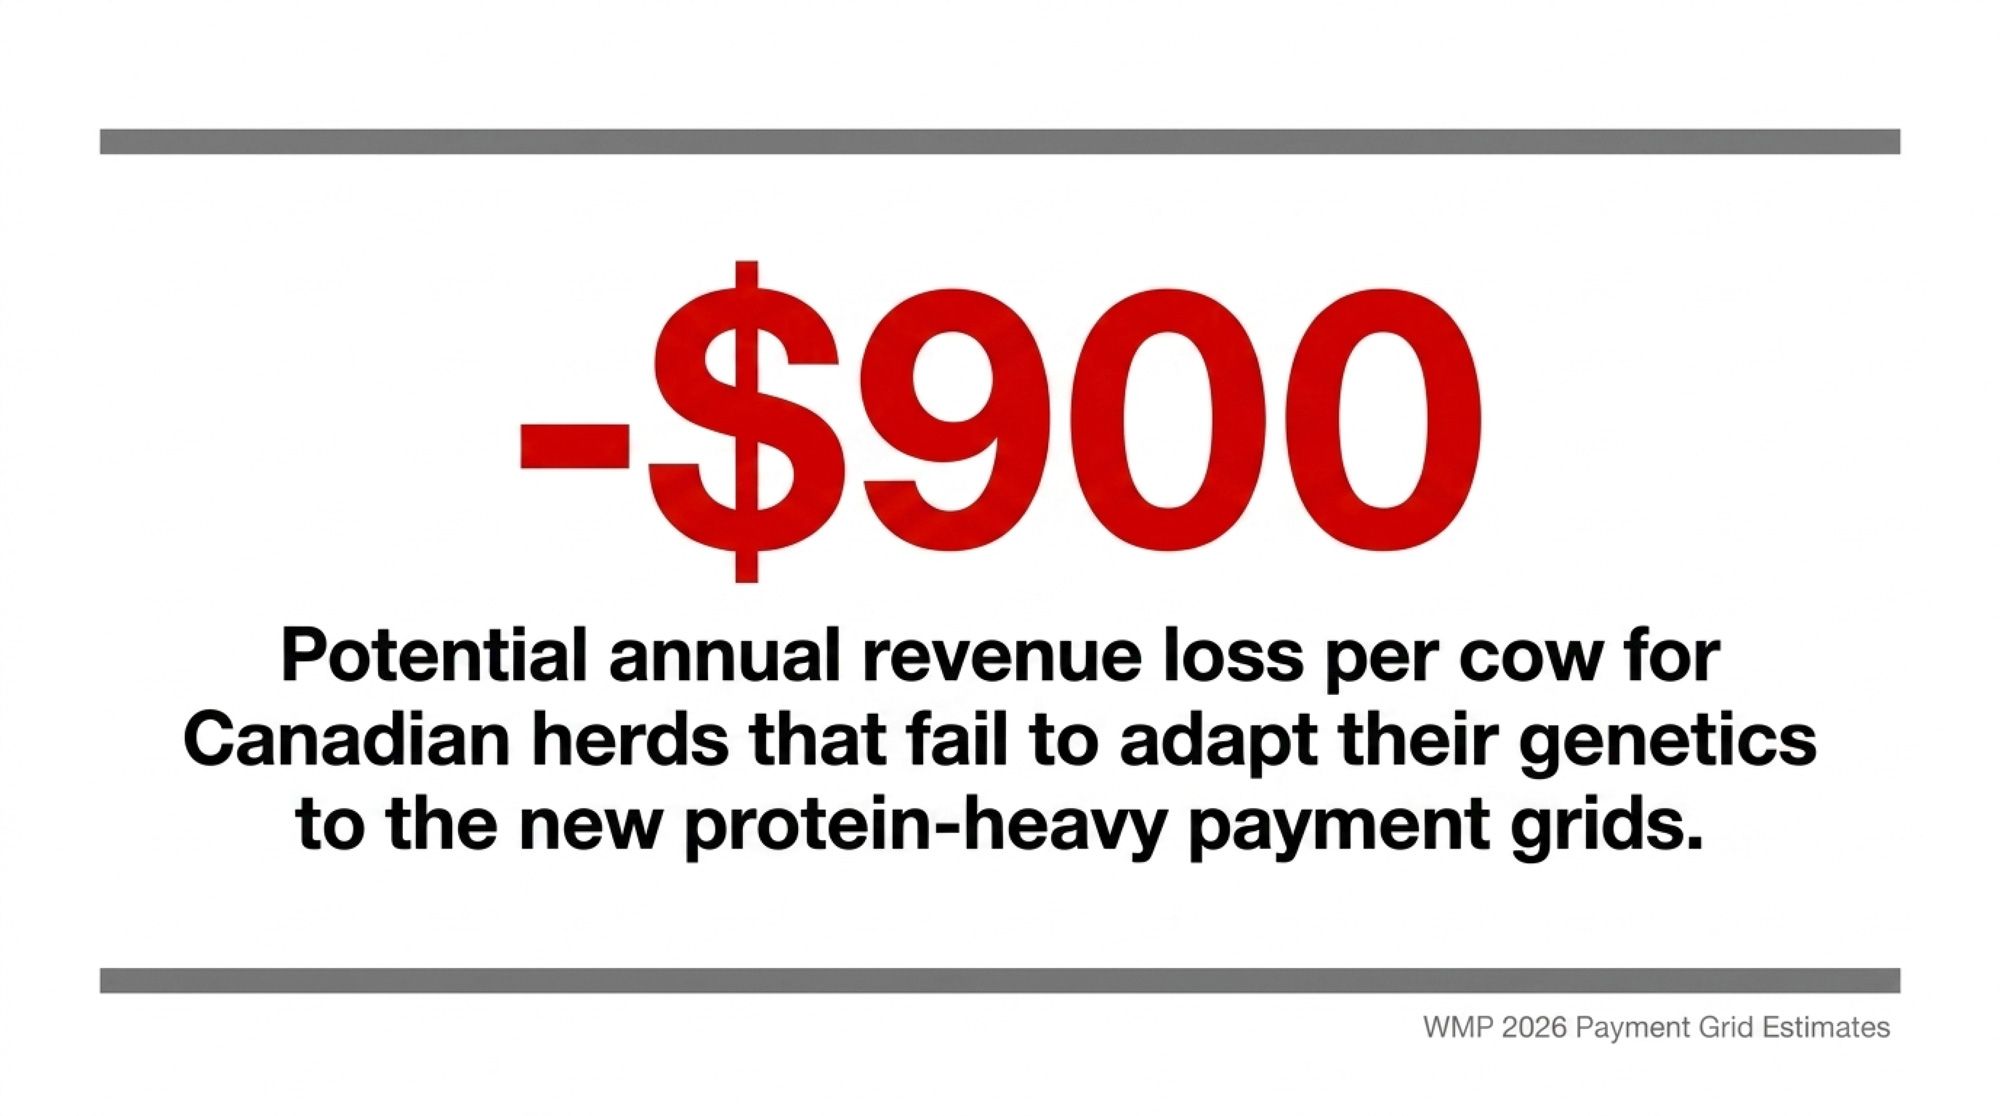
The Western move from 85/10/5 to 70/25/5 is the loudest possible signal that protein and SNF now drive the milk cheque. For high‑fat, low‑protein herds, this is a reckoning: the document estimates potential annual hits of $900 per cow if genetics and nutrition don’t adapt.
In P5, the focus is on pushing the solids‑non‑fat to butterfat ratio above 2.0, again using a $3/kg Tier 2 protein bonus to pull producers in line with market demand.
Fortress vs flexibility: producer perspectives
Producers inside the P5 generally see Bill C‑282 and tight TRQ control as essential to keep processing and farm numbers stable. WMP producers tend to talk more about growth potential and export plays, especially in cheese and powders.
Both sides are now heavily exposed to the protein pivot. Genetics, ration formulation, and barn design decisions made over the last decade are about to show up in line items on the settlement sheet.
Global Dairy Trade and Market Power Shifts
Global dairy in 2026 feels less like a flat world and more like shifting tectonic plates.
The “Big 5” exporters—the U.S., EU, New Zealand, Australia, and Argentina—have collectively grown milk output by 3.7% since April 2025 after a period of contraction. At the same time, bilateral and bloc deals like EU‑Mercosur and targeted tariffs from China are re‑routing where volumes flow.
EU‑Mercosur: tariffs down, politics up
The provisional application of the EU‑Mercosur trade agreement aims to eliminate tariffs as high as 35% on European dairy exports into a 720‑million‑consumer market. For EU cheesemakers and milk‑powder producers, that’s a big door opening.
Eucolait has cheered the deal as a rules‑based trade milestone, even as parts of it face referendum review and legal scrutiny at the Court of Justice. The net result, if it holds, is more European presence in South American dairy markets—putting pressure on U.S. exporters in some segments.
China’s counter‑moves and self‑sufficiency push
China has responded with its own levers. In December 2025, Beijing imposed temporary import tariffs on EU cheese and high‑fat cream under an anti‑subsidy investigation. Given that China previously sourced nearly 25% of its dairy imports from the EU, this matters.
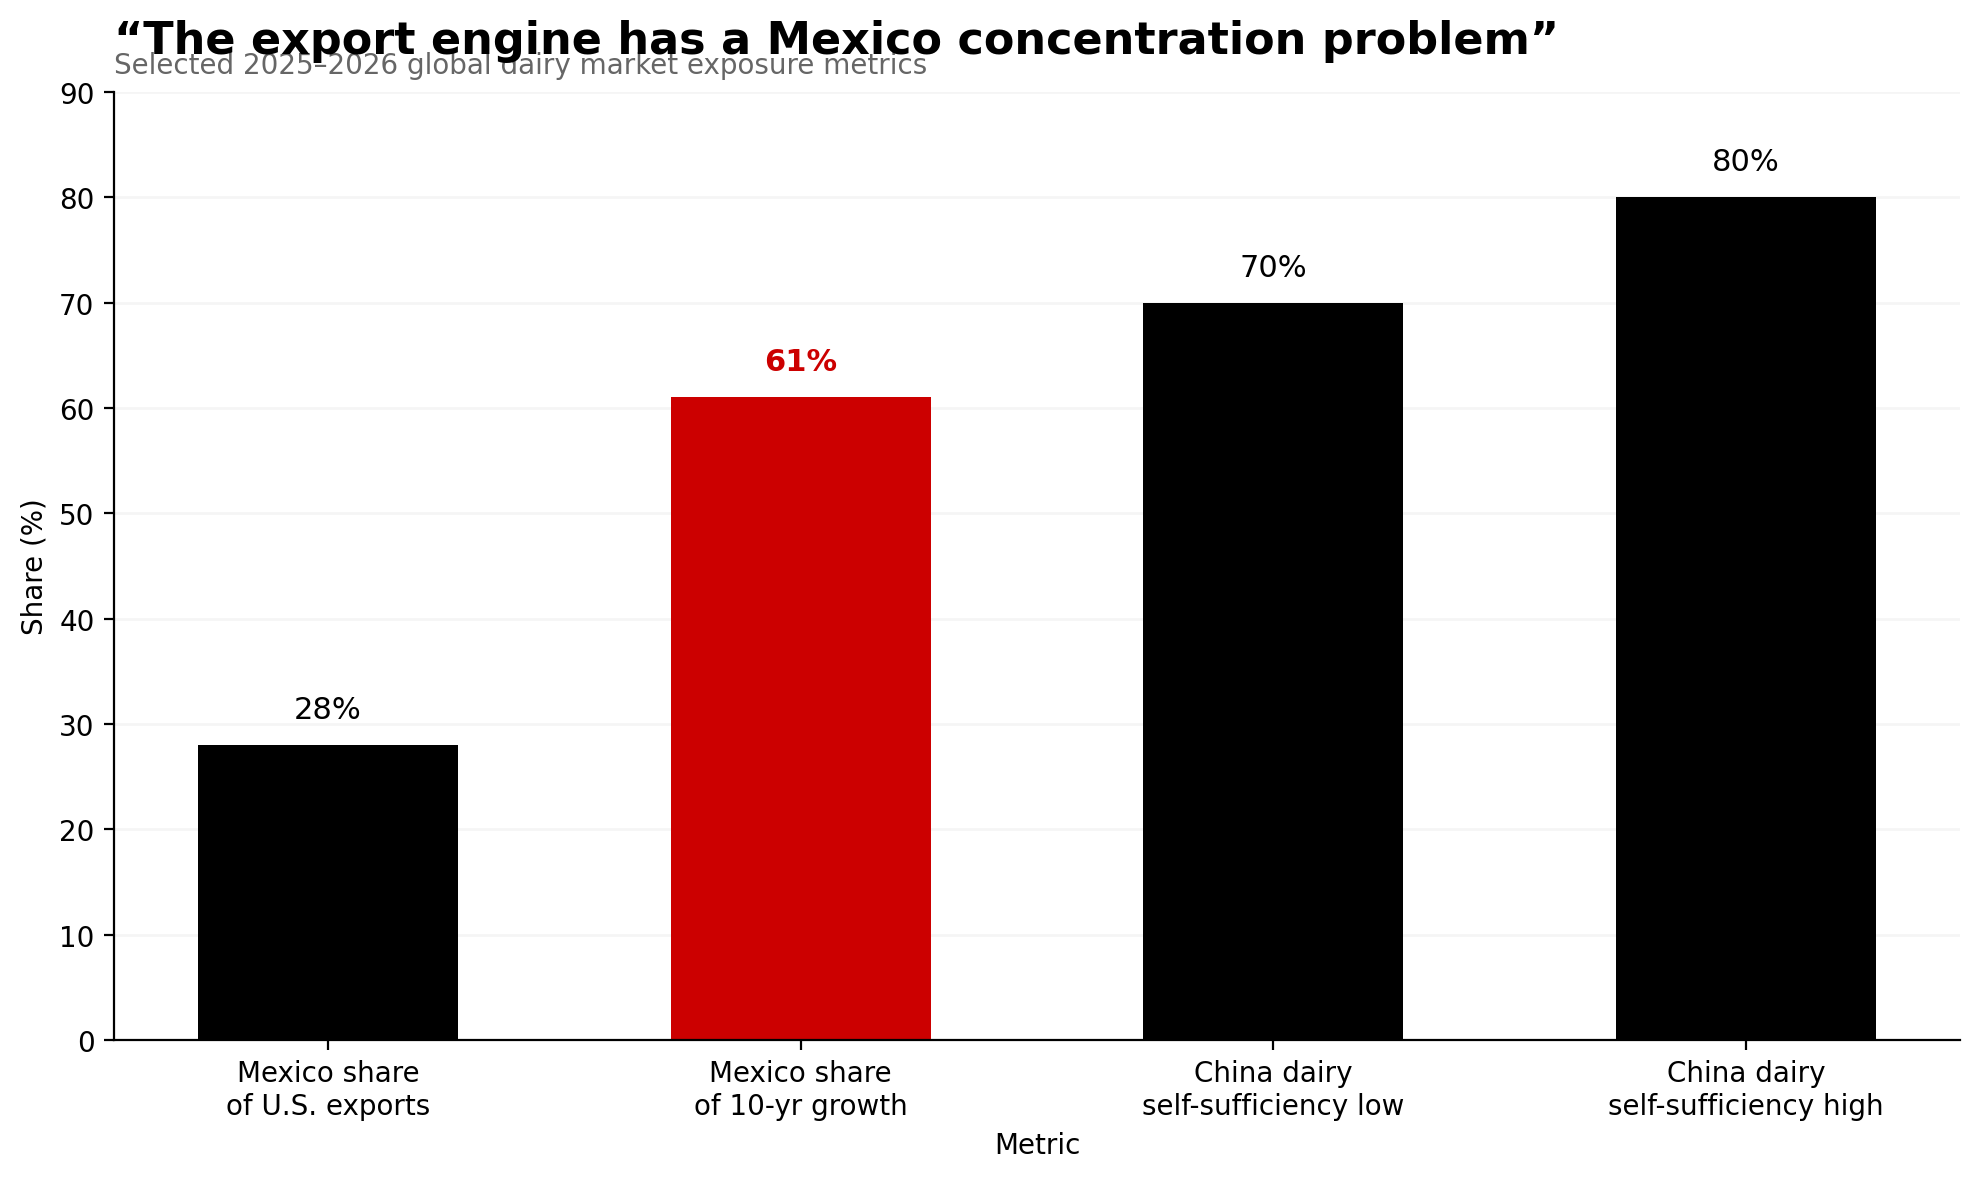
Those tariffs are designed to protect a domestic market where self‑sufficiency has climbed into the 70–80% range and inventories are high after slower economic growth. The flip side: they create a tactical opening for New Zealand and U.S. exporters to claw back share in key categories.
Fonterra’s pivot, Lactalis’ land‑grab
New Zealand’s Fonterra is using this moment to reshape itself. In a NZ$4.22 billion deal—the largest dairy transaction of 2025—Fonterra agreed to sell its consumer and associated businesses in Australia and Oceania to Lactalis. That allows Fonterra to concentrate on B2B ingredients and food‑service, and to return cash to shareholders.
Lactalis, meanwhile, is going on offence. Beyond the Fonterra acquisition, Lactalis USA closed a $2 billion deal for General Mills’ North American yogurt business, including brands like :ratio and Mountain High. By late 2025, it was leveraging these platforms to target the GLP‑1 weight‑loss market with high‑protein yogurts.
Add in the proposed FrieslandCampina–Milcobel merger and a potential Arla–DMK combination in Europe, and you’ve got a handful of mega‑processors consolidating power across continents.
Read more: global dairy trade outlook
Mexico: the indispensable U.S. export outlet
For U.S. dairy, Mexico is the indispensable partner. In 2025, Mexico took 28% of all U.S. dairy exports, and 61% of U.S. export growth over the last decade is tied to Mexico alone. Nearly 590,000 metric tons of product moved south in the first eleven months of 2025.
That corridor is the single most important outlet for U.S. skim and cheese. It’s also the biggest concentration risk in the export portfolio.
Consolidation, Herd Size, and Processing Power
If you feel like neighbours are disappearing, it’s because they are.
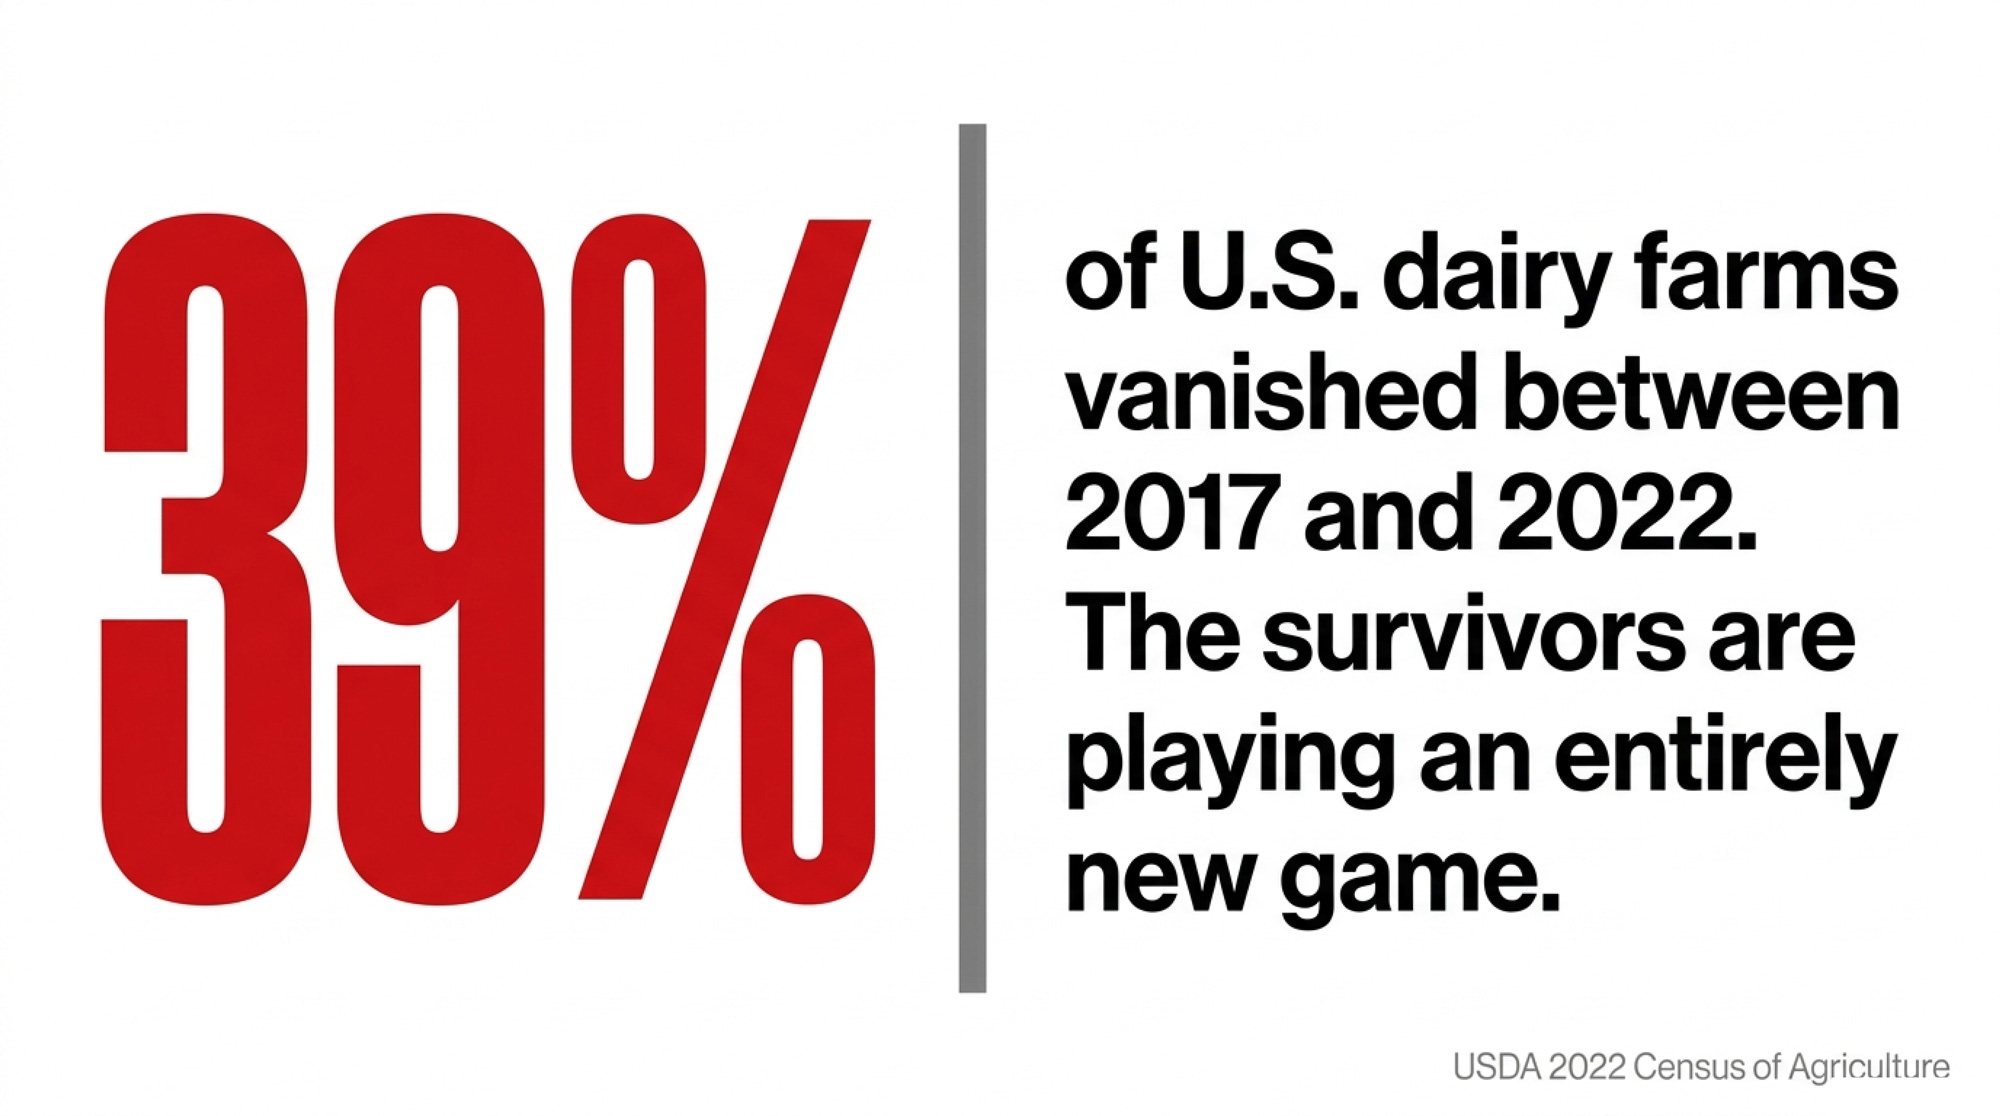
Data from the 2022 Census of Agriculture shows only 24,094 U.S. farms sold milk in 2022—a 39% drop from 39,503 in 2017. That’s the steepest decline between any two census years going back to 1982.
Decadal trends and the “missing middle”
The attrition isn’t even. Smaller herds are bearing the brunt.
- Farms with 20–49 cows saw the biggest percentage declines, followed by those with 50–99 cows.
- The only herd‑size category to grow was farms with 2,500+ cows, which increased from 714 to 834 operations between 2017 and 2022.
At the same time, average cows per farm climbed from 112 in 2004 to 283 in 2022. Total production kept rising, from 170.8 billion lbs in 2004 to 225.9 billion lbs in 2024, with a forecast of 235.3 billion lbs in 2026.
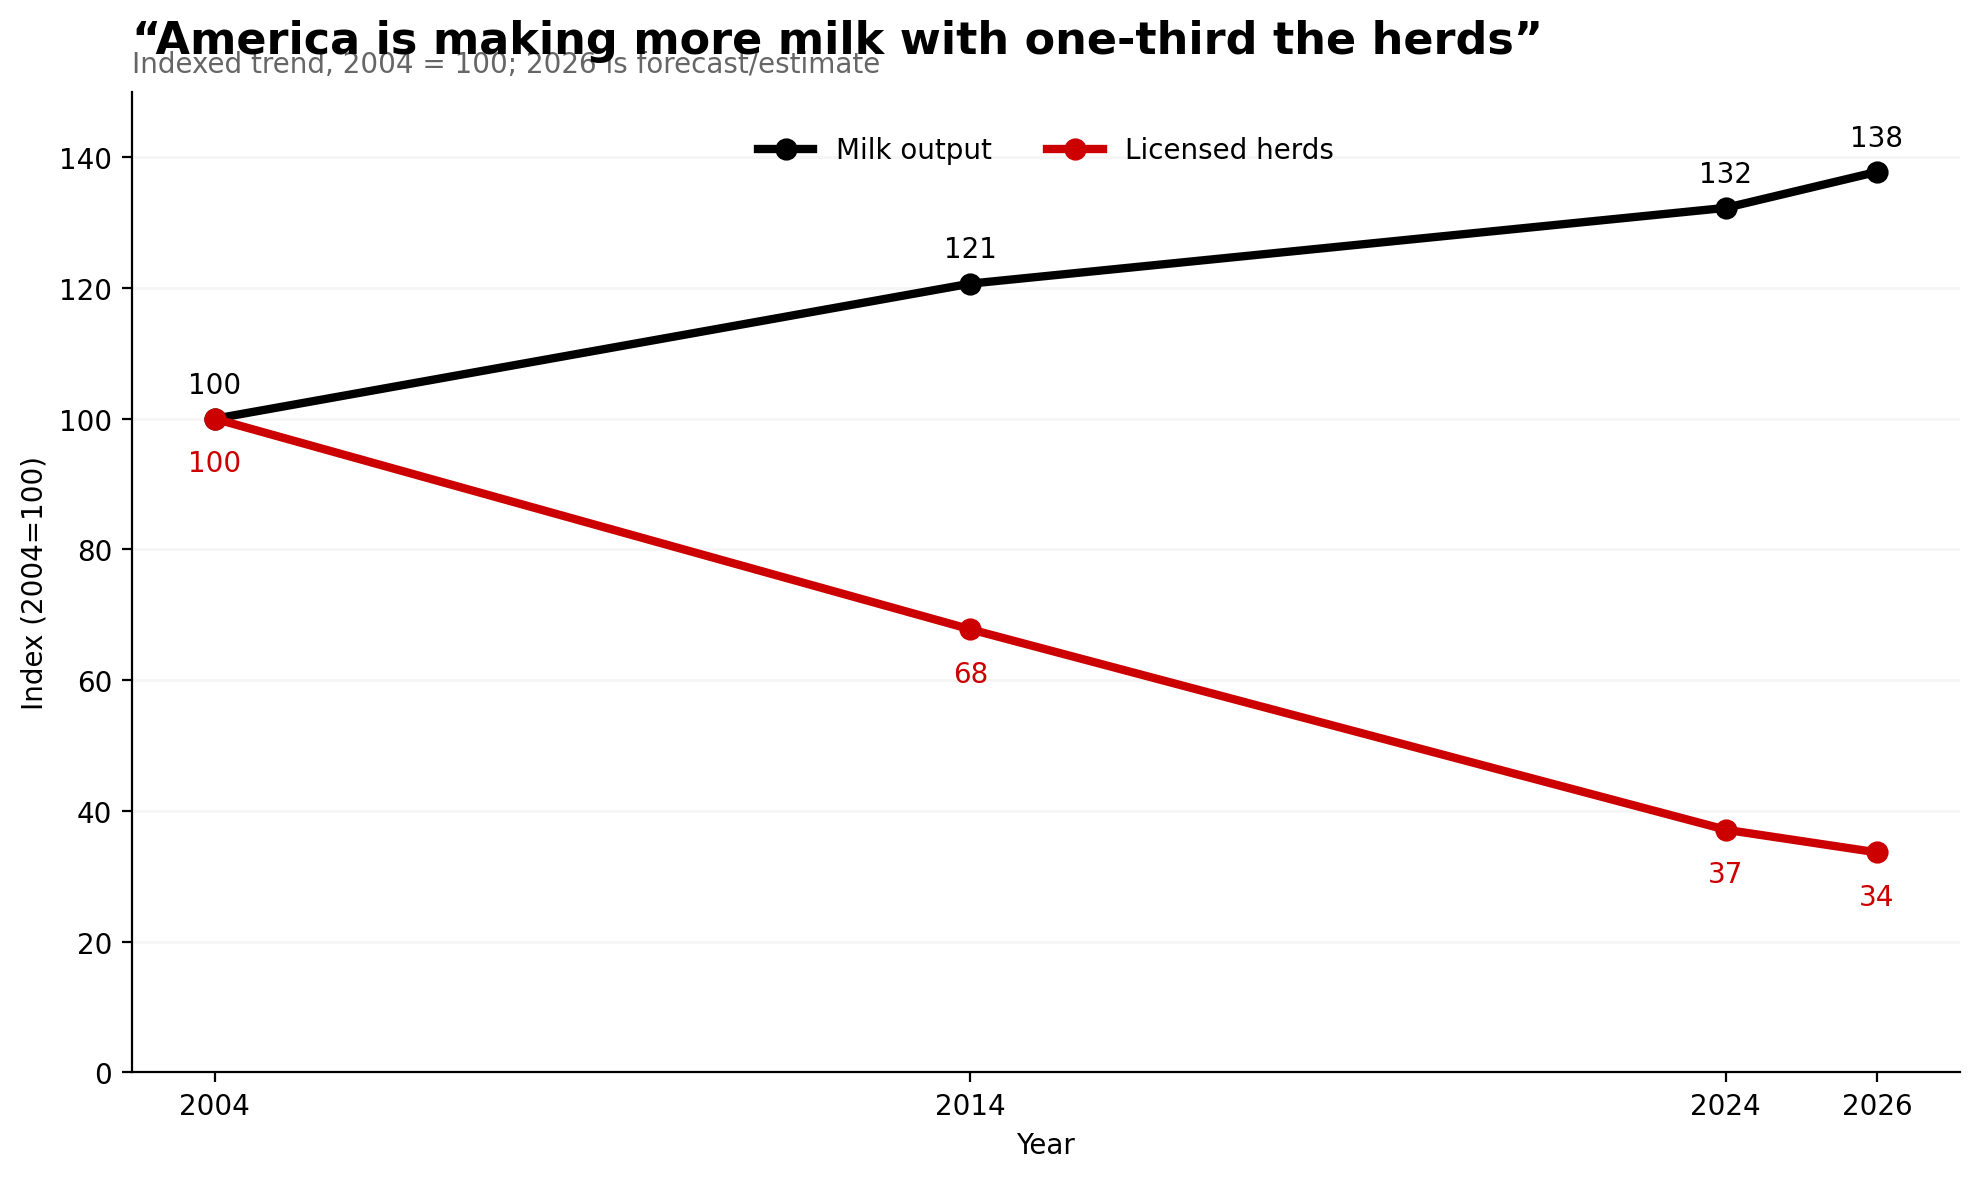
Table: U.S. herd and production migration
| Year | Total milk (B lbs) | Cows (M head) | Lbs/cow | Licensed herds | Avg cows/farm |
| 2004 | 170.8 | 9.0 | 18,960 | 66,825 | 112 |
| 2014* | 206.1* | 9.25* | 22,250* | 45,300* | 180* |
| 2024 | 225.9 | 9.34* | 24,178 | 24,811 | 283 |
| 2026 (F) | 235.3 | 9.61 | 24,485 | 22,500 (est.) | 285–300 |
*Estimates based on ERS/NASS series; all 2026 values are projections from the same datasets.
Economies of size are the driver. USDA data shows the spread in non‑feed costs per cwt between the lowest‑ and highest‑cost herds at roughly $19.59/cwt, with feed cost spread around $2.50/cwt. In a business fighting for 50 cents, that difference is lethal.
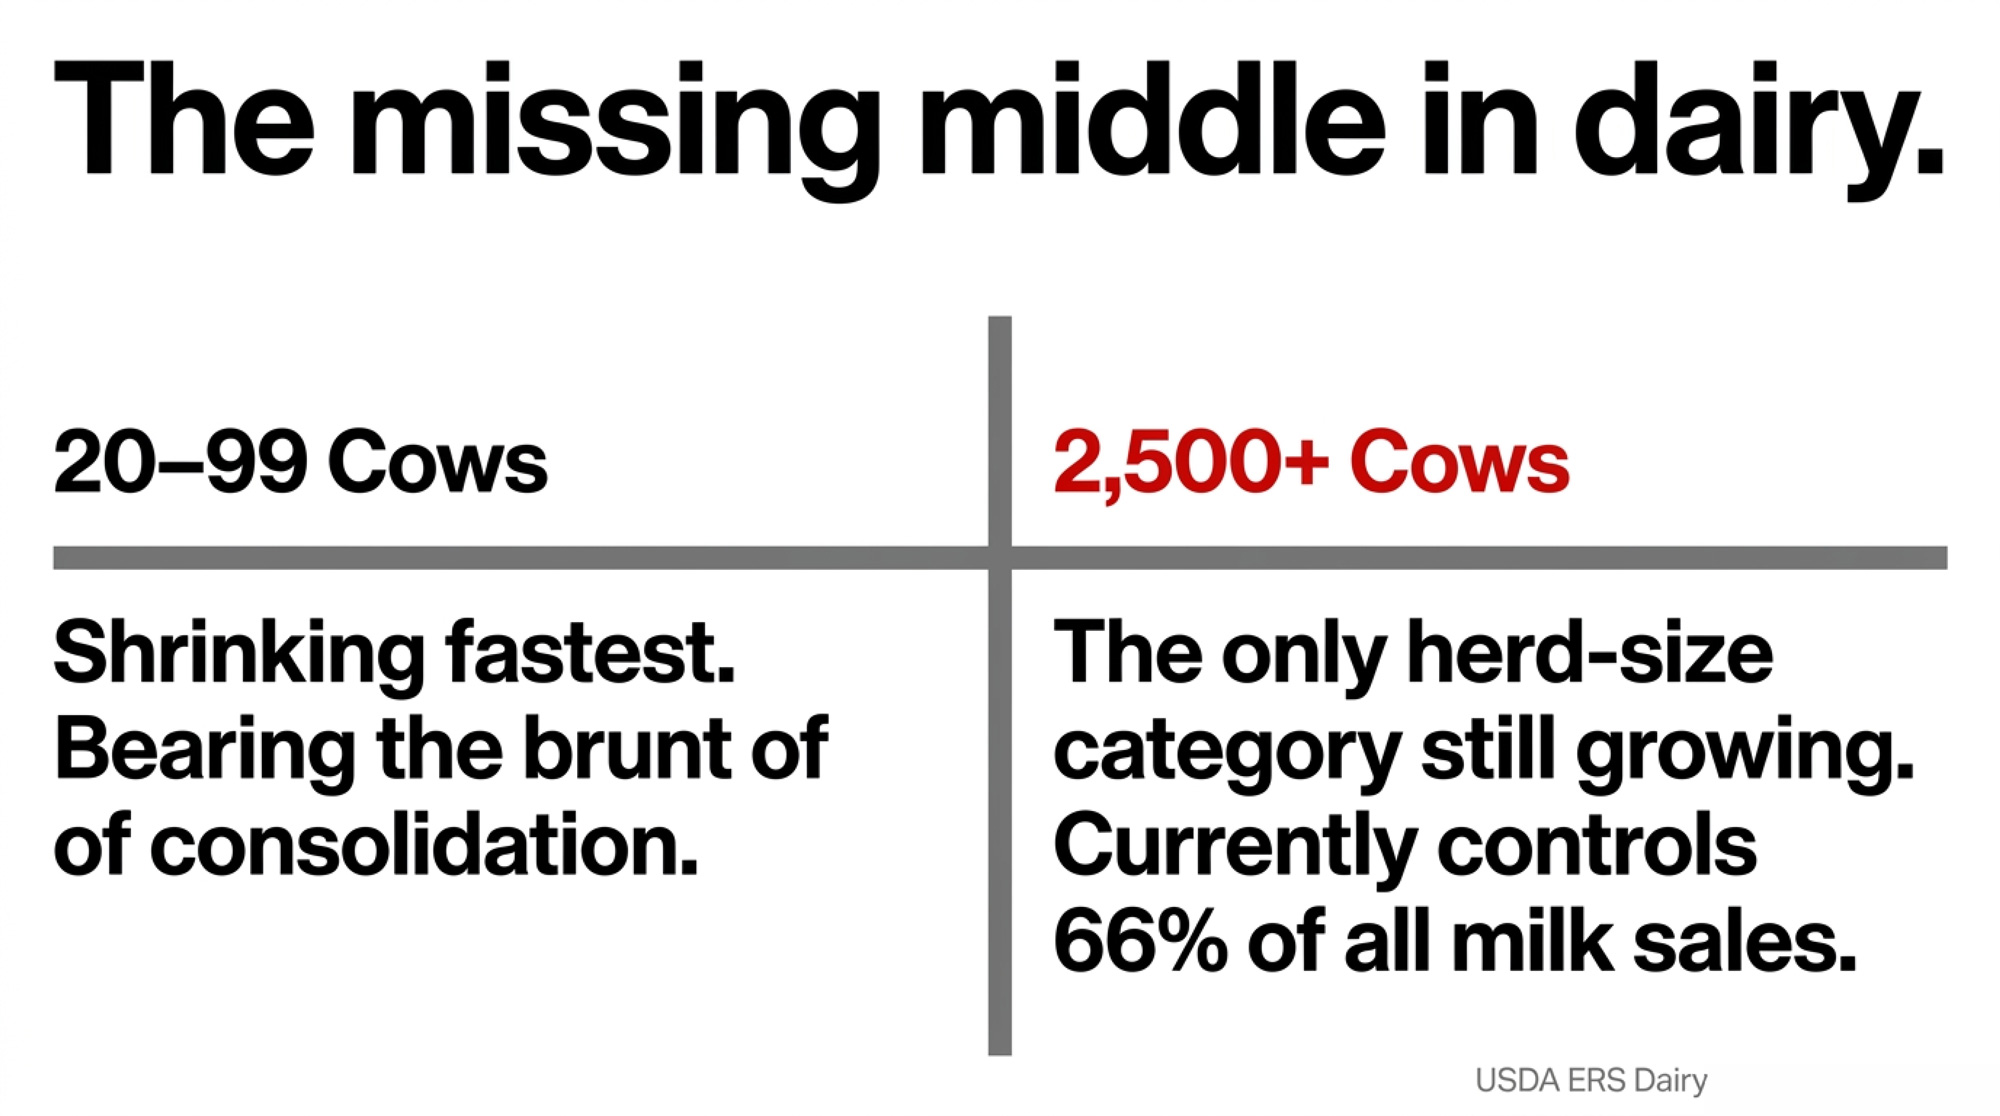
Just 2,013 farms with 1,000+ cows now account for 66% of all U.S. milk sales. The industry isn’t just consolidating. It’s bifurcating into a small group of large, highly capitalised herds and a shrinking tail of small and mid‑size operations.
Co‑ops and processors: scale or get squeezed
The processing side is mirroring this pattern.
- DFA continues to expand, recently acquiring Agropur’s St. Paul facility to boost extended shelf‑life and aseptic capacity.
- FrieslandCampina–Milcobel and the proposed Arla–DMK merger would create multi‑billion‑euro co‑ops with enough scale to go toe‑to‑toe with Lactalis and Danone globally.
In this environment, “co‑op” doesn’t automatically mean “small farmer voice.” Once a co‑op runs multiple plants on multiple continents, its governance and incentives look a lot more like a global processor.
Read more: USDA ERS dairy structure reports
Sustainability, Carbon Markets, and Scope 3 Pressure
By 2026, sustainability isn’t a side project. It’s embedded in law, lender expectations, and processor contracts.
The U.S. Net Zero Initiative (NZI) and Canada’s net‑zero‑by‑2050 commitment are being operationalised through Scope 3 reporting and early carbon markets.
Scope 3, CSRD, and California’s climate acts
For dairy processors, 70–90% of greenhouse gas emissions sit upstream at the farm level as Scope 3. With the EU’s Corporate Sustainability Reporting Directive (CSRD) and California’s Climate Accountability Acts coming fully into force in 2026, large dairy brands must publish standardised emissions reports across their supply chains.
Among the top 100 dairy processors, 25 already have intermediate science‑based targets covering all three scopes, and 10 have adopted specific FLAG (Forestry, Land Use and Agriculture) guidance. Meanwhile, big players like DFA and Tyson have been criticised for a lack of transparent emissions data and are now facing hard deadlines.
On the farm side, that means more data requests, more audits, and more contracts linking premiums to verified practices.
Athian and the rise of carbon insetting
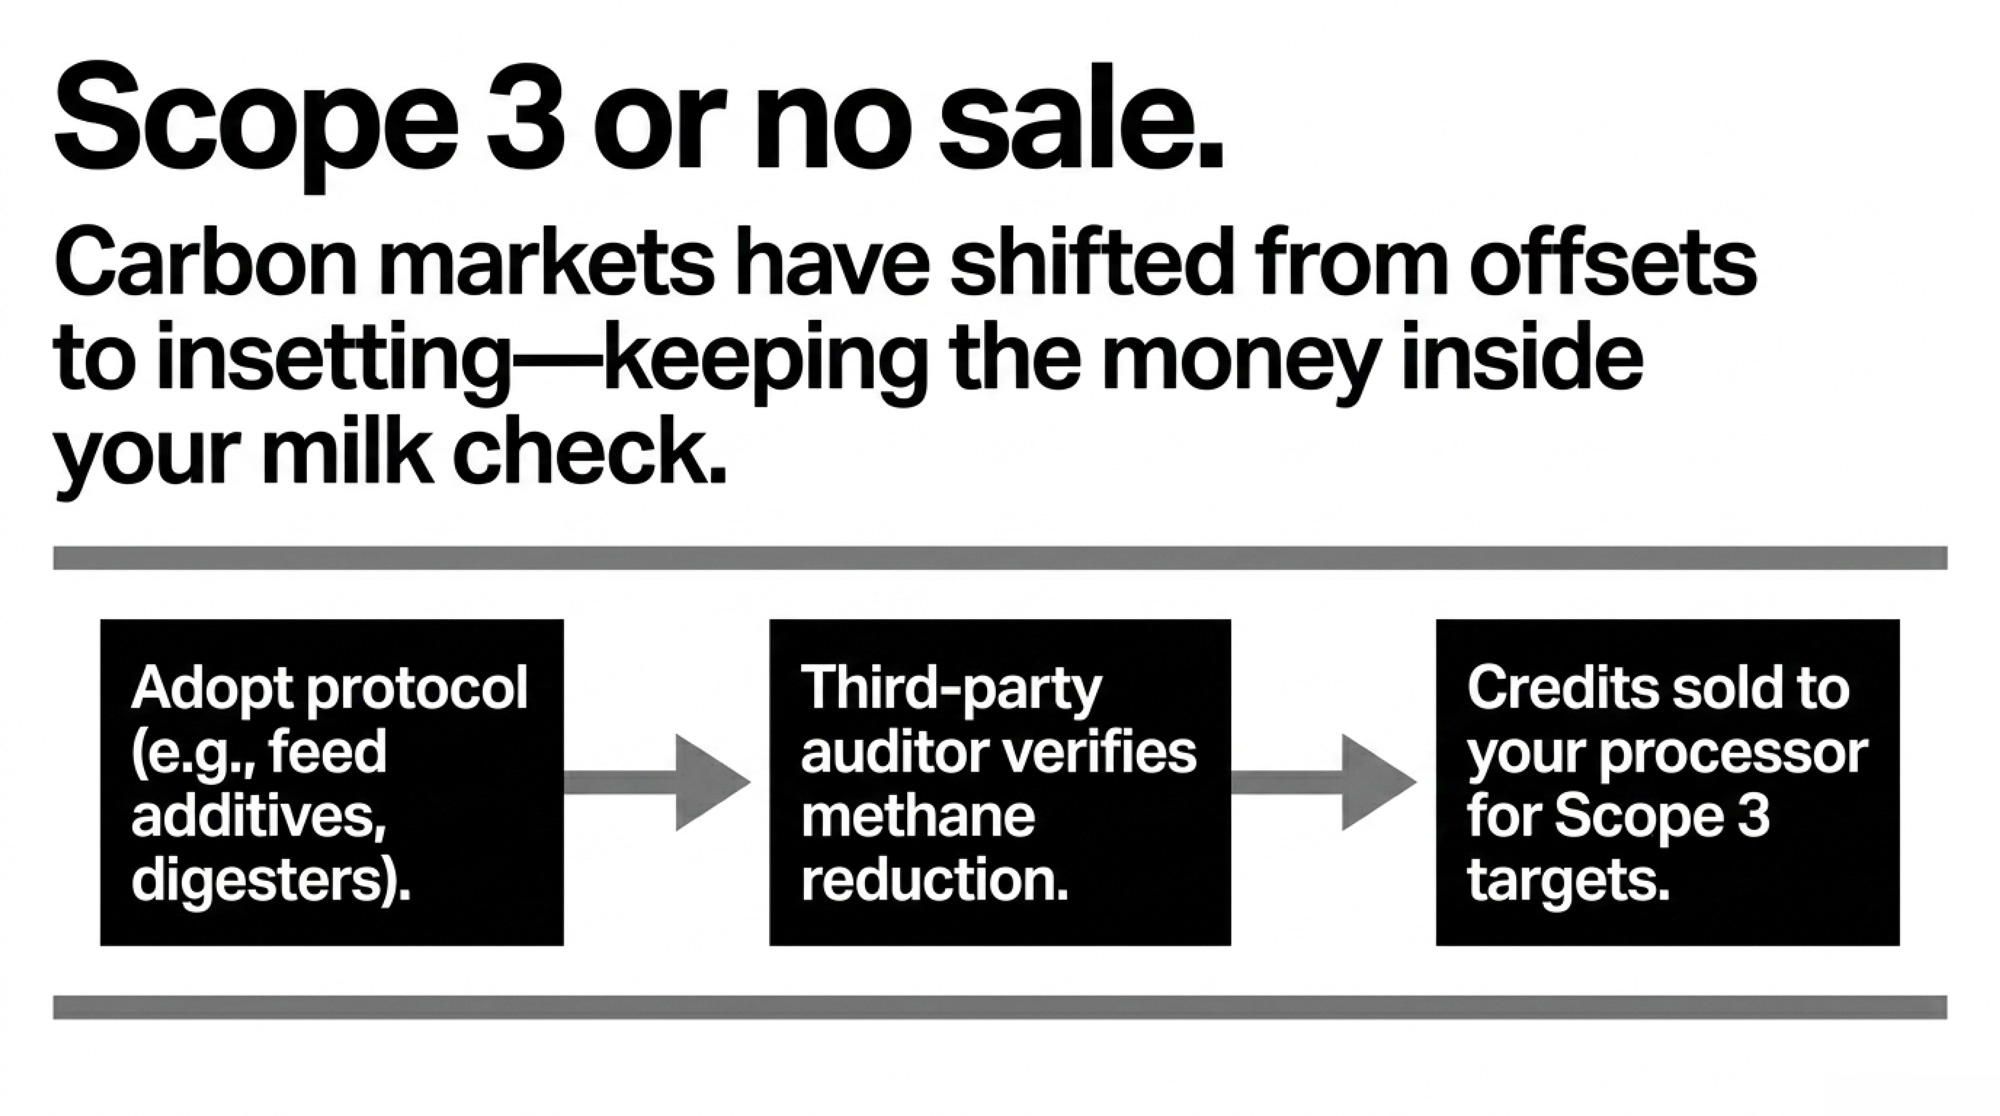
Carbon markets in dairy are shifting from offsets to insetting—where money stays inside the value chain.
Athian has facilitated $18 million in payments to dairy producers for verified practice changes such as methane‑reducing feed additives and anaerobic digesters.
The basic flow looks like this:
- Farmer implements a protocol, such as Elanco’s enteric‑methane reduction product, under a recognised methodology.
- A third‑party auditor verifies reductions.
- Credits are sold to processors or CPG brands in the same supply chain, who apply them against Scope 3 targets.
In 2026, Athian is launching a Carbon Intensity (CI) protocol built with NMPF’s FARM ES program so farms can use data they already collect to generate revenue.
“Scope 3 or no sale—carbon data is becoming part of your shipping number.”
Technical tools: additives, genetics, manure, regen
The mitigation toolbox on farm is expanding:
- Feed additives: Nestlé‑backed Bovaer is already being deployed with documented 20–30% reductions in enteric methane.
- Genetics: breeding for low‑methane cows that convert feed more efficiently is a long‑term lever that aligns with existing genomic selection programs.
- Manure management: Arla and others are investing in biogas projects that turn manure into energy and organic fertiliser, cutting methane and generating new revenue.
- Regenerative practices: cover crops, no‑till, and rotational grazing are being scaled by companies like Danone to meet a 50% Scope 3 reduction target by 2030.
The uncomfortable truth is that these solutions are capital‑intensive. Without careful design, net‑zero pathways will be easiest for 2,000‑cow dairies and hardest for 80‑cow herds.
Animal Welfare, Social Licence, and Ballot Risks
Animal welfare has moved from “soft issue” to legal and market risk.
In 2026 you’re dealing with stricter national programs (FARM v5.0, proAction evolution), rising consumer expectations, and a radical ballot initiative in Oregon that could upend agricultural exemptions entirely.
FARM v5.0 and evolving proAction rules
In the U.S., the National Dairy FARM Program has moved to Version 5.0, raising the bar on euthanasia, fitness for transport, calf care, and stockperson training. Consumer research shows 75% of Americans say they’re less likely to buy from dairies that deny cows daily exercise, and 85% believe certification should require meeting all standards, not just a subset.
In Canada, proAction is mandatory for all 9,000+ farms, and new housing requirements aligned with the Code of Practice for the Care and Handling of Dairy Cattle will apply to validations by April 2027.
Together, these programs effectively set the minimum welfare standard for shipping milk to most major processors.
Oregon’s IP28 “PEACE Act”: existential test case
The sharpest legal threat is Oregon’s Initiative Petition 28, the PEACE Act. It aims to remove agricultural exemptions from animal abuse laws. If passed, it would criminalise standard practices like animal slaughter, natural or artificial breeding, and raising animals for milk, meat, or fibre.
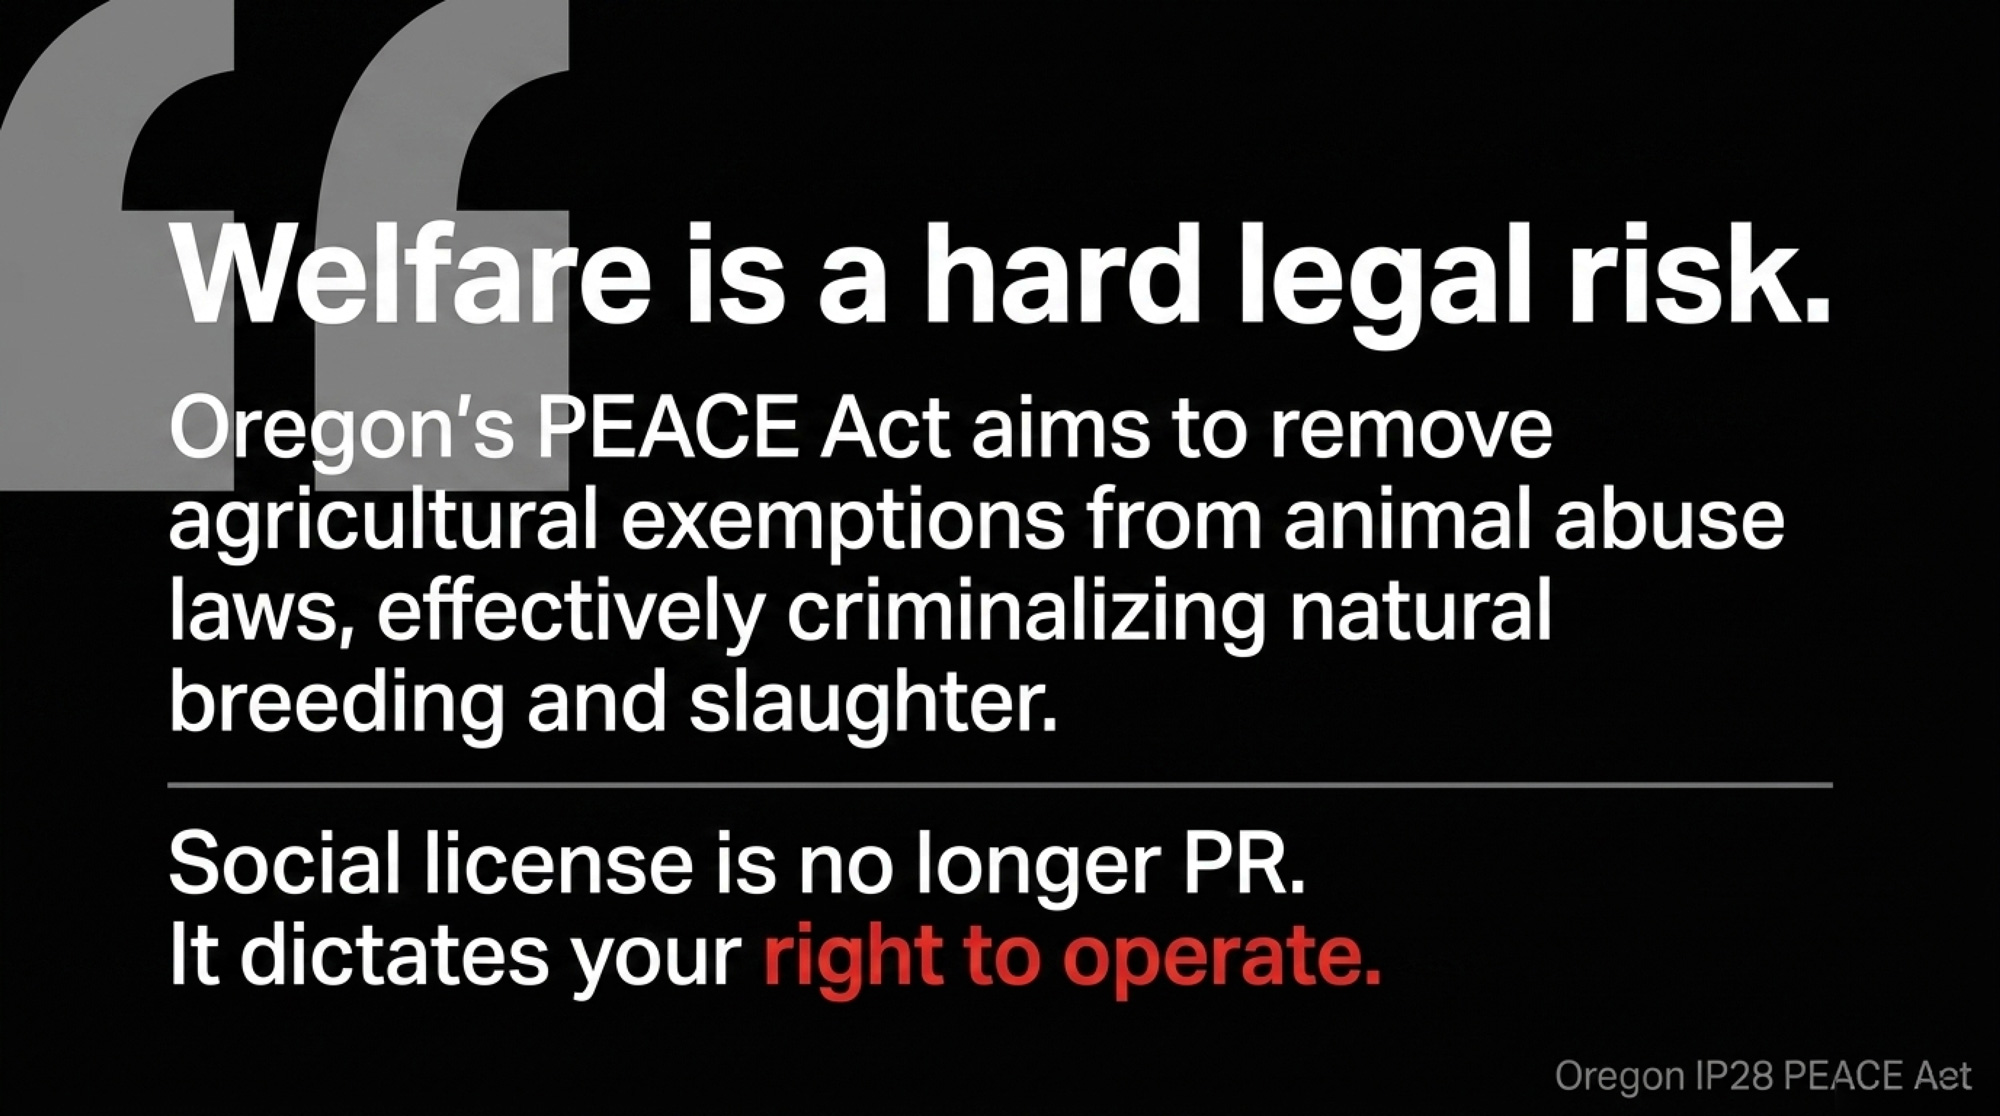
Opposition includes the Oregon Farm Bureau, Oregon Cattlemen’s Association, and a bipartisan legislative caucus, who argue the act could turn a million Oregonians into criminals and bankrupt wildlife management. As of February 2026, backers had collected over 100,000 of the 117,173 signatures needed to put it on the November ballot.
If this makes the ballot and passes, the precedent will ripple far beyond Oregon dairy.
Labour Policy and the Automation Offset
Finally, labour. It’s still one of the most painful bottlenecks on many farms.
Labour represents roughly 25% of operating costs, and both U.S. and Canadian policy are wrestling with how to supply workers for 24/7 operations while addressing wage and housing standards. At the same time, producers are leaning into automation as a hedge.
H‑2A expansion attempts in the U.S.
H‑2A is still technically a seasonal visa program, which doesn’t fit 365‑day dairy. Several legislative efforts—including the Farm Workforce Modernization Act and the DIGNIDAD Act—aim to create a year‑round legal channel, stabilise wage formulas (AEWR), and modernise housing rules for livestock operations.
None of these are slam‑dunks politically, but the direction of travel is clear: more scrutiny, more compliance requirements, and hopefully, more legal certainty for employers and workers.
TFWP tweaks in rural Canada
In Canada, the Temporary Foreign Worker Program remains critical for large dairies, especially in Western provinces and pockets of Ontario/Quebec.
From April 1, 2026 to March 31, 2027, rural employers can use up to 15% of their workforce as low‑wage temporary foreign workers, up from the usual 10% cap. That extra 5% is a real pressure valve for farms outside major census metro areas.
The automation offset strategy
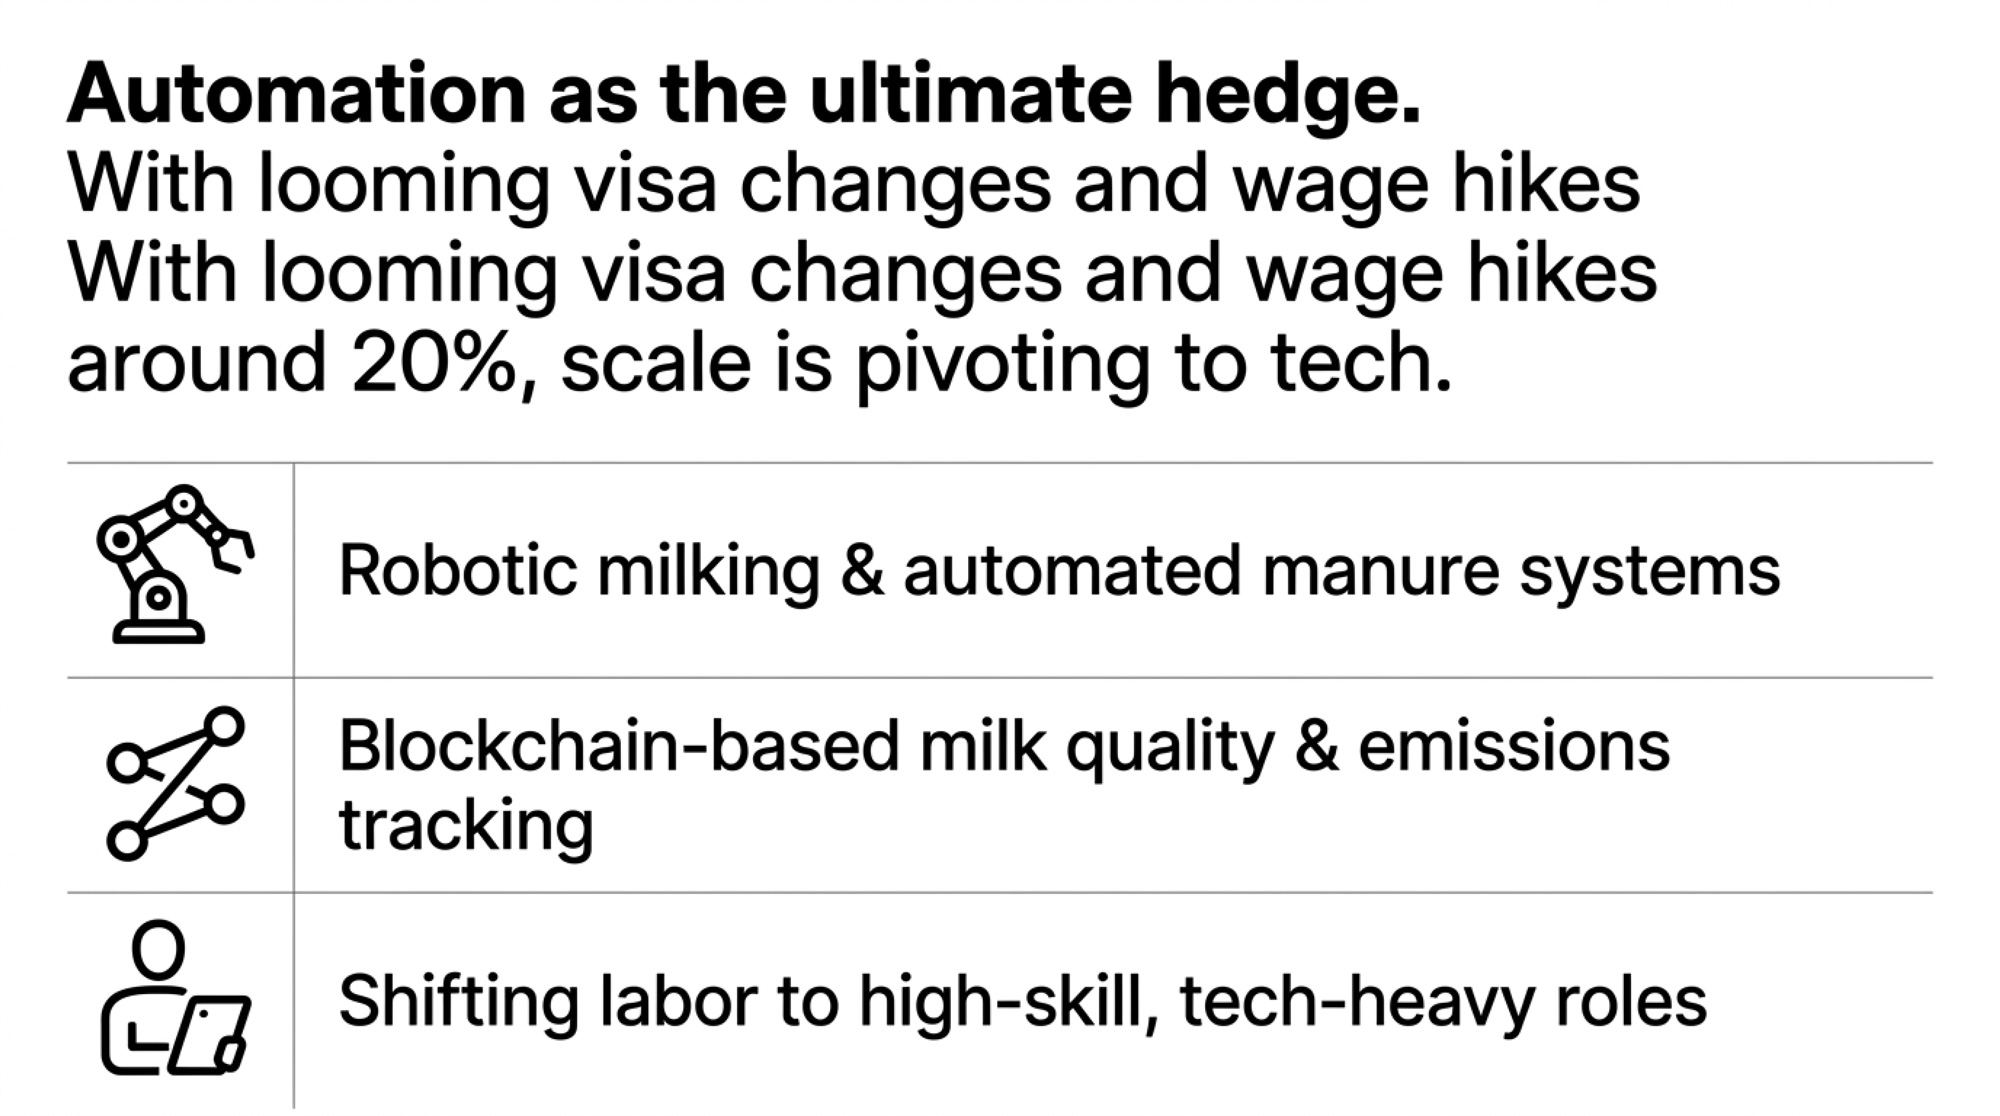
With labour disruptions and regulatory changes threatening to push wages up by around 20%, many mid‑ to large‑scale dairies are betting on automation as their main hedge.
We’re not talking sci‑fi. We’re talking:
- Robotic milking systems
- Computerised feeding and sorting
- Automated manure handling
- Blockchain‑based emissions and milk‑quality tracking, as seen in FrieslandCampina pilots
Research suggests these tools won’t eliminate labour, but will shift it toward higher‑skill, tech‑heavy roles while dampening the financial hit of wage shocks.
Frequently Asked Questions
How did the 2025 FMMO reforms change my milk price?
Estimates in 2026 suggest the 2025 FMMO reforms cut the U.S. all‑milk price by roughly $0.30/cwt initially, mainly through higher make allowances, before December 2025 composition updates clawed some value back for high‑component herds.
What is the new make allowance for cheese under the FMMO update?
The new make allowance for cheddar cheese is $0.2519 per pound, up from $0.2003. That 25.8% increase improves plant cost coverage but directly reduces the regulated component value paid to producers unless premiums or efficiency gains make up the gap.
Is Canadian dairy supply management safe after the 2026 CUSMA review?
Bill C‑282 makes it much harder for Canada to trade away dairy access, and Canada recently won a TRQ allocation dispute. That said, CUSMA’s 2026 review, U.S. pressure on “underfilled” quotas, and CPTPP concessions keep supply management under constant external pressure.
What is the 70/25/5 payment ratio in Western Canada?
Effective April 1, 2026, the Western Milk Pool shifted from an 85/10/5 to a 70/25/5 butterfat/protein/other‑solids ratio. The goal is to reward protein and SNF. High‑fat, low‑protein herds that don’t adapt could see annual revenue shortfalls up to $900 per cow.
How has U.S. dairy farm consolidation changed since 2017?
Between the 2017 and 2022 Censuses of Agriculture, the number of U.S. farms selling milk fell from 39,503 to 24,094, a 39% decline. The only herd‑size category that grew was 2,500+ cows, while small and mid‑size herds exited fastest.
What is carbon insetting, and how does it work for dairy farmers?
Carbon insetting lets processors and brands buy verified emission reductions from farms in their own supply chains. Platforms like Athian pay producers for protocols like feed additives or digesters, then sell the credits to dairy buyers trying to hit Scope 3 targets.
How serious is Oregon’s PEACE Act (IP28) for dairy?
Oregon’s Initiative Petition 28 would remove agricultural exemptions from animal cruelty laws, criminalising standard practices like breeding and slaughter. As of early 2026 it was close to the signature threshold. If it passes, it could reshape farm law nationally via copycat efforts.
Will H‑2A become year‑round for dairy farms?
Several bills aim to extend or adapt H‑2A for year‑round livestock work, recognising dairy’s 365‑day labour needs. None are law yet, but pressure from producers and processors keeps the issue on the agenda heading into the 2026 election cycle.
How are Scope 3 climate rules going to hit my dairy?
Large processors covered by EU CSRD and California climate laws must report full Scope 3 emissions. For you, that likely means more data reporting, third‑party verification, and contracts that tie premiums or access to verified carbon and welfare performance.
What is the primary sustainability goal for Canadian dairy?
Canadian dairy’s primary sustainability goal is net‑zero greenhouse gas emissions by 2050. That target is being implemented through proAction environment modules, housing changes, and emerging carbon programs that reward verified emission reductions at the farm level.
 The Sunday Read Dairy Professionals Don’t Skip.
 The Sunday Read Dairy Professionals Don’t Skip.
Every week, thousands of producers, breeders, and industry insiders open Bullvine Weekly for genetics insights, market shifts, and profit strategies they won’t find anywhere else. One email. Five minutes. Smarter decisions all week.
