


Dairy cow nutrition in 2026 means formulating around NASEM 2021, high‑resolution forage analytics, and real feed efficiency, not just “pounds in, litres out”. If you’re still balancing to NRC 2001 tables, trusting crude NDF, or buying additives on sales pitches, you’re already leaving money on the bunk.

At The Bullvine, we spend a lot of time in parlours, labs, and boardrooms with the people actually pushing the edge on dairy cow nutrition. That includes the researchers behind NASEM 2021, the consultants who live inside AMTS and NDS, and the herds using feed efficiency and methane data to change how they breed and feed.
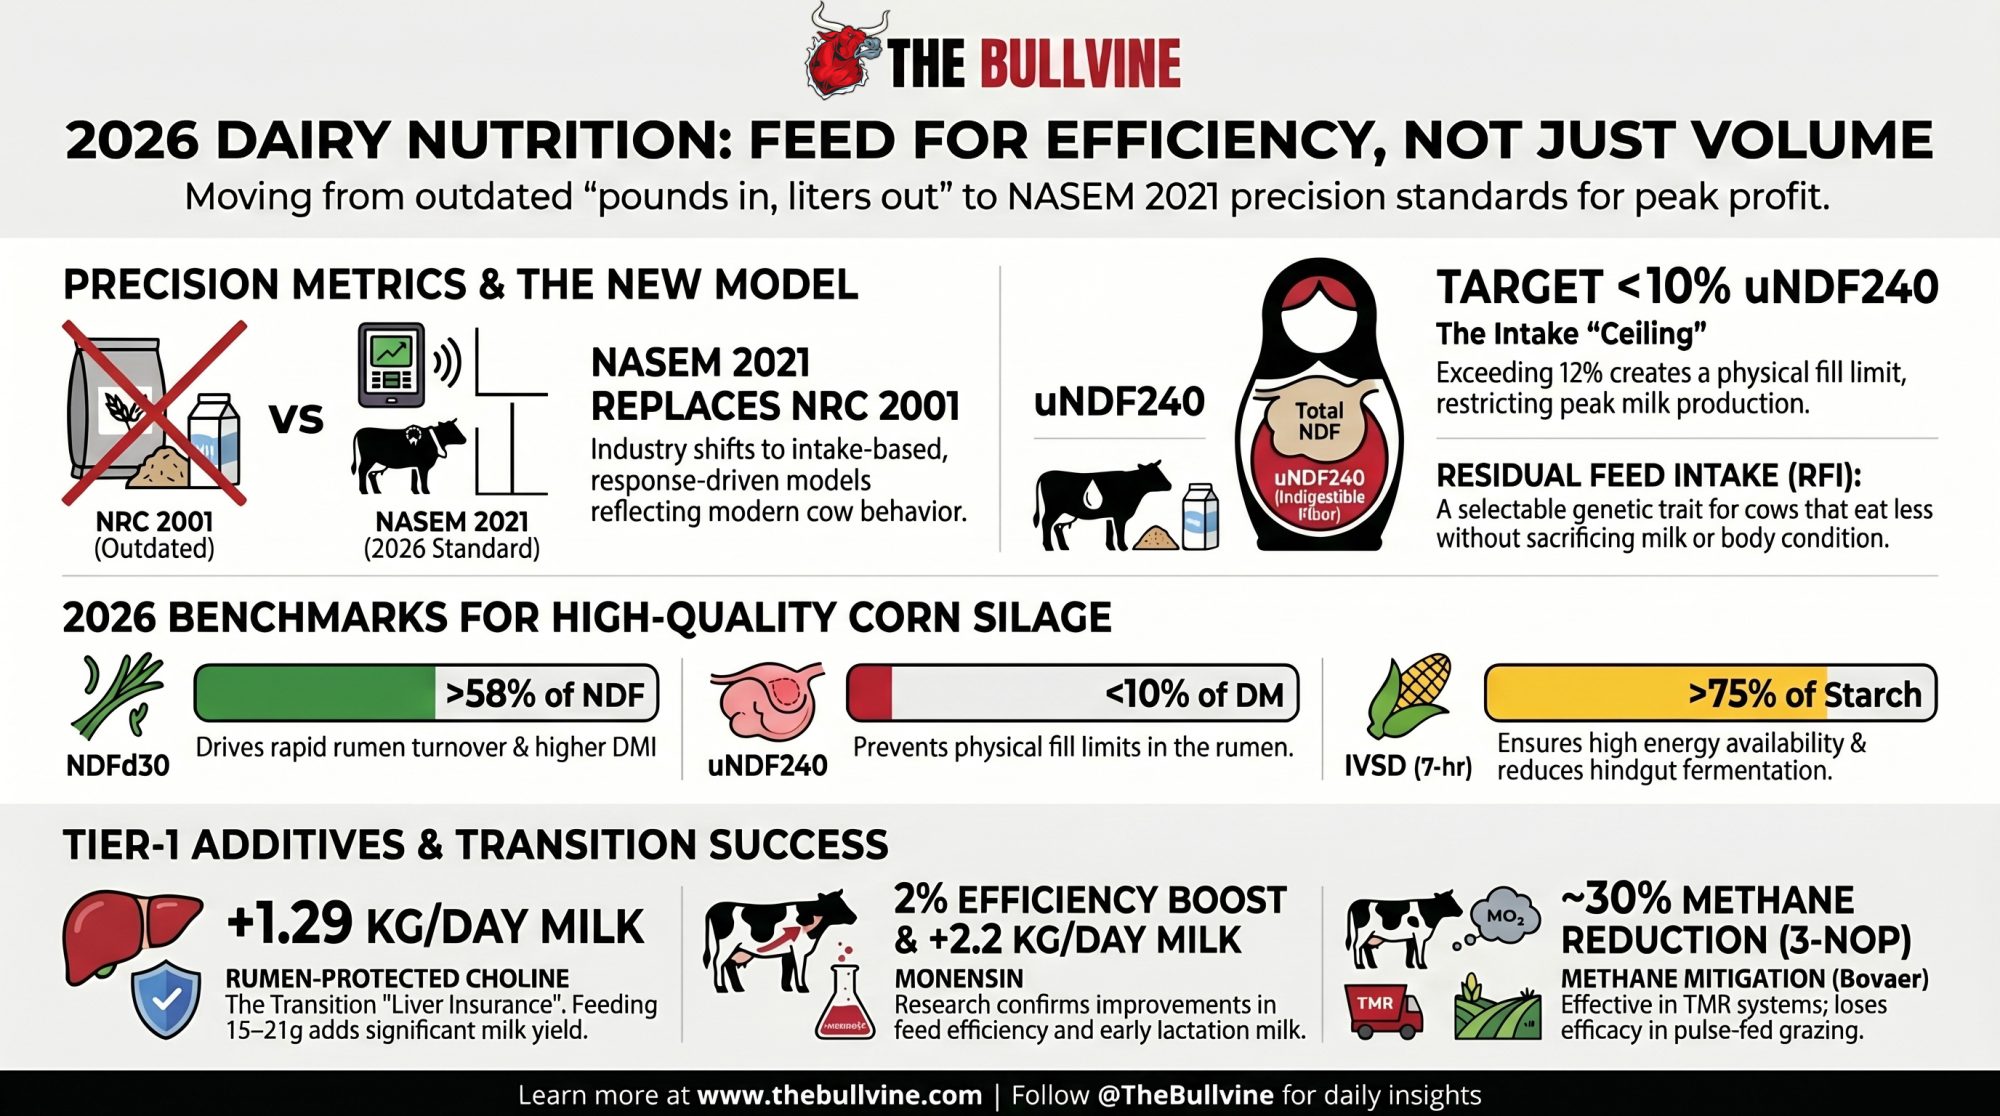
This page pulls that together into one working guide: what changed with NASEM 2021, how ration software really differs, how to read NDFd30, uNDF240 and IVSD, what’s non‑negotiable in transition diets, where Residual Feed Intake fits, and which additives have Tier‑1 evidence versus clever marketing. Think of it as your 2026 reference page for dairy cow nutrition.
Key Takeaways
- NASEM 2021 replaces NRC 2001 with intake‑based, response‑driven models for energy, protein and minerals, and is now the de facto standard in ration software.
- Forage quality in 2026 is built around NDFd30, uNDF240 and IVSD, not just NDF and ADF, because those kinetics actually cap intake and milk.
- Negative DCAD plus rumen‑protected choline and monensin form the core of evidence‑based transition cow nutrition for hypocalcaemia, ketosis and fatty liver risk.
- Residual Feed Intake and Feed Efficiency RBVs are now selectable traits that can permanently lower herd feed costs without sacrificing production.
- 3‑NOP is the Tier‑1 methane additive in TMR systems, but Danish field experience proves you can’t ignore real‑world safety and mixing risk.
- DDGS, canola meal, bakery waste and almond hulls are no longer “junk”; they’re precision tools when you understand their profiles and regional pricing.
NASEM 2021 vs NRC 2001: What Actually Changed
Here’s the blunt truth: if your software and premix are still implicitly tuned to NRC 2001, you’re under‑ or over‑feeding key nutrients relative to how modern cows actually behave. NASEM 2021 doesn’t just move numbers; it changes the underlying biology the model assumes.
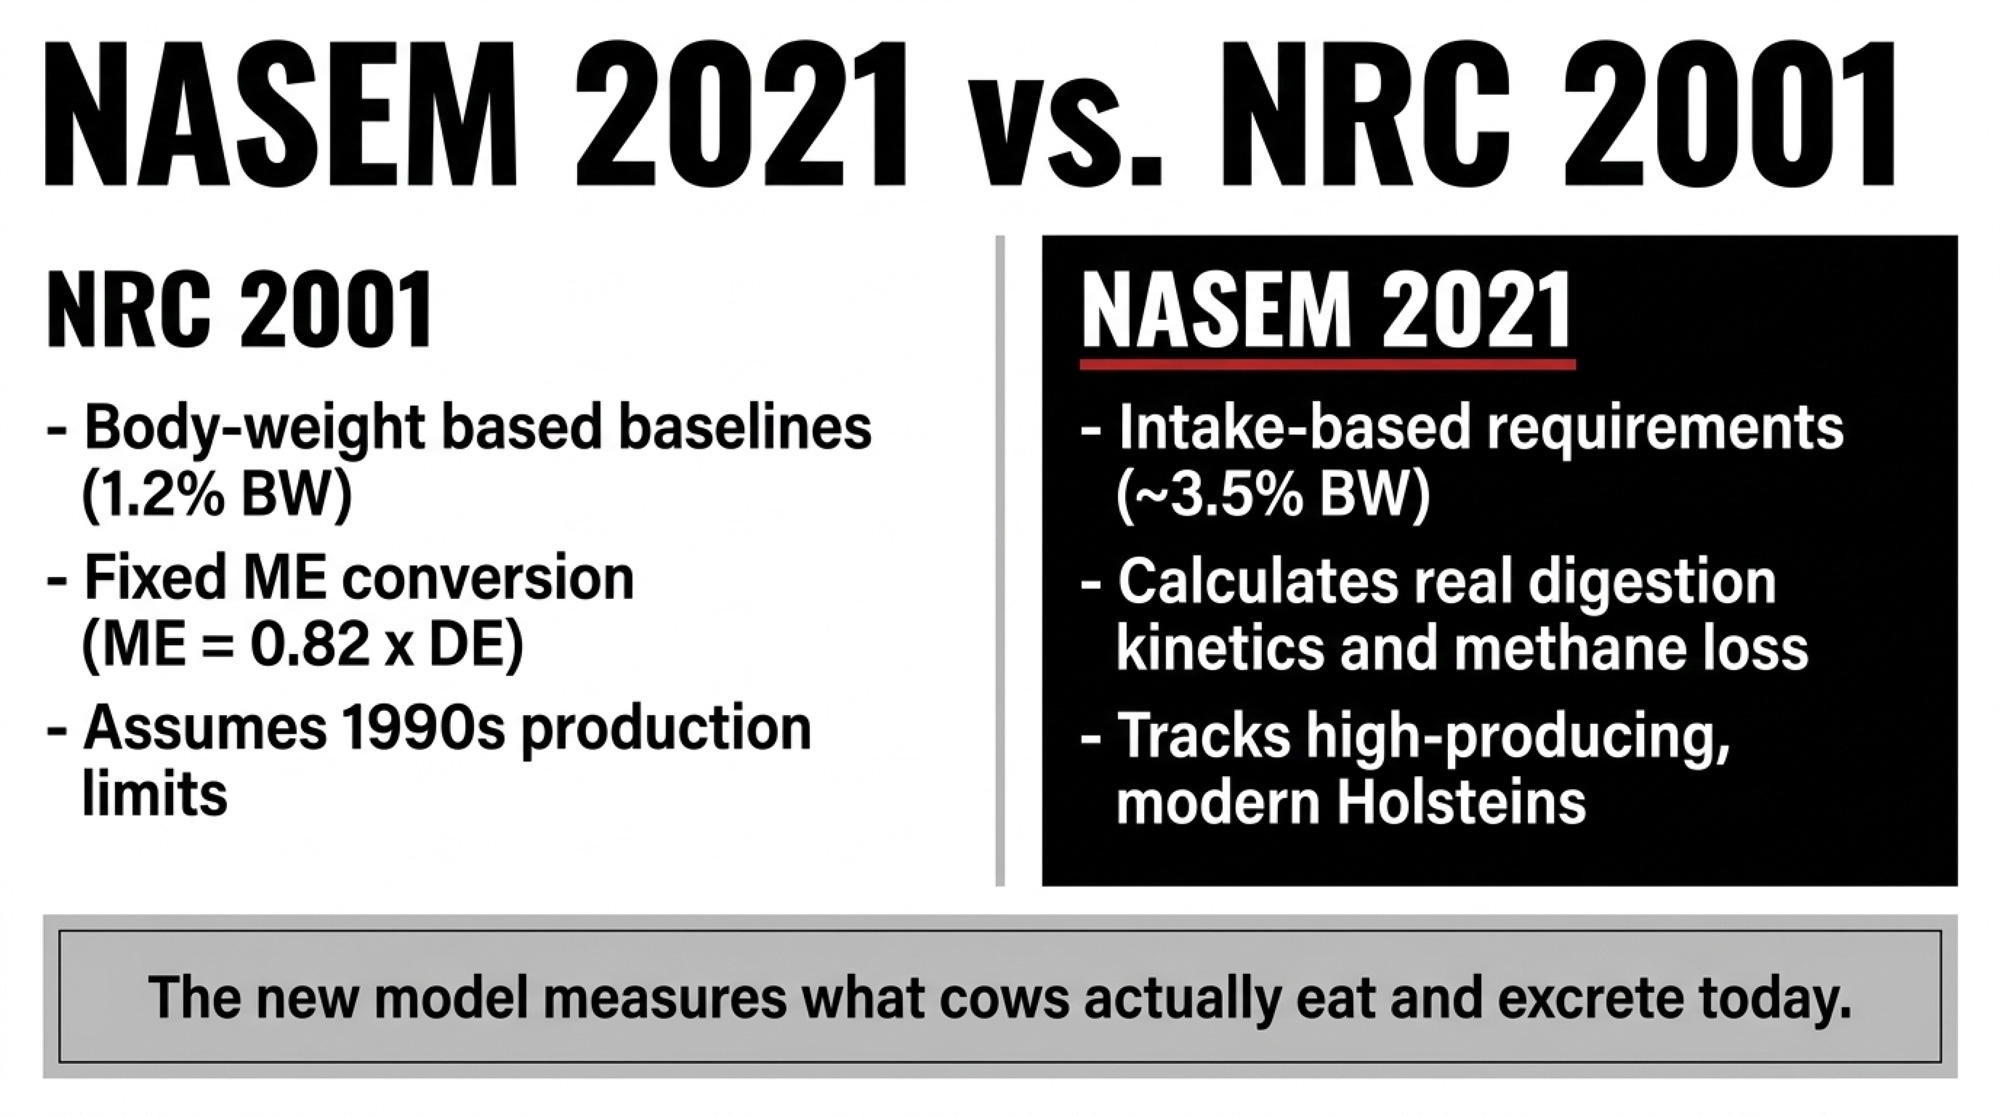
The old NRC system leaned hard on Total Digestible Nutrients (TDN) and maintenance‑level intake baselines around 1.2% of body weight. NASEM 2021 re‑anchors energy around a cow eating roughly 3.5% of body weight with 26% starch in the diet, which is a lot closer to a real high‑producing Holstein. Instead of a fixed “ME = 0.82 × DE” type conversion, methane and urine losses are calculated from DMI, digestible NDF and fatty acids, using equations that recognise how more fat and more digestible fibre suppress methane.
Protein got a similar reality check. The new model stops pretending that “extra protein” is some magical buffer that always adds ME. Once protein goes past requirement and turns into fuel via deamination, NASEM treats its ME value like starch, not like fat. Maintenance protein is now factorial — metabolic faecal protein, urinary endogenous losses and scurf are all explicitly accounted for, not buried in fudge factors.
Minerals might be the single most disruptive shift on the ration sheet. Instead of maintenance being mostly body‑weight‑based, a lot of mineral losses are now tied to dry matter intake, because they move with digesta flow. Sodium maintenance jumps 10–15 g/day for high‑producing cows; magnesium requirements rise, with absorption coefficients explicitly adjusted for high‑K forage; calcium maintenance is now tied to DMI (0.9 × DMI kg), and phosphorus availability is split between organic and inorganic sources. Adequate Intake levels are defined where the data simply aren’t strong enough for precise requirements, especially vitamins and some trace minerals.
“The 2021 model is built around what cows actually eat and excrete now, not what they did in the 1990s. That’s the mental reset nutritionists have to make.” — Bill Weiss, Ohio State
Field reality in 2026? Among professional consultants and larger herds, adoption of NASEM 2021 is effectively universal because AMTS, NDS and CNCPS moved. The lagging edge is small‑herd premix formulations still cloned from old NRC targets, especially on Mg, Mn and the amino‑acid profile.
Quick check: Are you really on NASEM 2021?
- Ask your nutritionist what ME equation and methane loss equation they’re using.
- Look at dry cow Mn targets — if they’re still around 20 mg/kg DM, that’s NRC 2001, not NASEM.
- Ask which amino acids are explicitly balanced and how Lys:Met is being checked.
Dairy Ration Formulation Software in 2026
Honestly, in 2026 the question isn’t “do you use software?” — it’s which engine is quietly driving your dairy cow nutrition decisions every single day. The big players are AMTS.Farm, NDS Professional and, in more academic settings, CNCPS and CPM‑Dairy.
| Software Platform | Engine / Base Model | 2026 Typical Cost (USD) | Operational Sweet Spot | Critical Limitation / Warning |
| AMTS.Farm | CNCPS core | ~$770–$1,000 / year | Power-user consultants, high-detail AA | Steeper learning curve for on-the-fly visual reporting |
| NDS Professional | NASEM-aware CNCPS | Tiered; mid-range | Multi-herd workflow, rapid visual updates | Output is highly dependent on accurate on-farm DM updates |
| CNCPS v6.55 | Research version | Academic / Custom | University trials, research farms | Not built for rapid commercial consulting workflow |
| CPM-Dairy | Older CNCPS build | Free / Low Cost | Training, limited-budget operations | Anchored to outdated NRC 2001 biology assumptions |
AMTS.Farm is the purest expression of the Cornell CNCPS engine. It’s the lab instrument of the consulting world. The base AMTS.Farm.Cattle subscription runs about US$770/year for standard LP optimisation, with non‑linear optimisation and mix optimisation modules taking that toward US$935–1,000/year depending on the bundle. In exchange you get fine‑grained control over degradation rates, passage rates and environmental modifiers, plus excellent amino‑acid balancing tools.
NDS Professional leans into usability and workflow. In 2026 it’s often the day‑to‑day tool for consultants managing lots of herds because the interface makes it much faster to visualise changes and push updates. The “Synchrony” module is genuinely useful — it looks at temporal alignment between fermentable energy and rumen degradable protein to support microbial protein synthesis, not just static averages. NDS was also early in building a NASEM‑aware library that can directly consume NASEM feed fractions, and its tie‑ins to on‑farm apps like FARMEasy make DM updates less of a guessing game.
CNCPS itself (v6.55 in 2026) is still the biological reference model at Cornell and in a lot of extension work. CPM‑Dairy remains a serious teaching and research tool but, at this point, is seen as “academic heavy” for rapid commercial consulting, with a steeper learning curve and less polished reporting.
Dairy ration software snapshot
| Software | Engine / Model | 2026 Typical Cost (USD) | Sweet spot use case |
| AMTS.Farm | CNCPS core | ~770–1,000 / year | High‑detail AA and kinetics, power‑user consultants |
| NDS Professional | NASEM‑aware CNCPS | Tiered; mid‑range | Multi‑herd workflow, visual reporting, synchrony |
| CNCPS (core) | Research version | Academic | University, research farms |
| CPM‑Dairy | older CNCPS build | Free / low cost | Training, limited‑budget work, classroom |
The reality is simple: for advanced herds and independent consultants, the choice is usually AMTS vs NDS. Everything else supports niche or training roles. Your software should match how you actually work — if you’re constantly on the road, NDS’s apps and visuals may save you more time than AMTS’s extra controls. If you’re a numbers‑first IOFC hawk, AMTS’s optimisation tools can be lethal.
Read more: Cornell CNCPS tools
Forage Quality, NDFd30, uNDF240 and Starch Digestibility
If there’s one mindset shift in dairy cow nutrition since 2020, it’s this: forage reports are now about kinetics, not just crude content. NDFd30 and uNDF240 sit at the centre of that.
NDFd30 and uNDF240: rate and ceiling
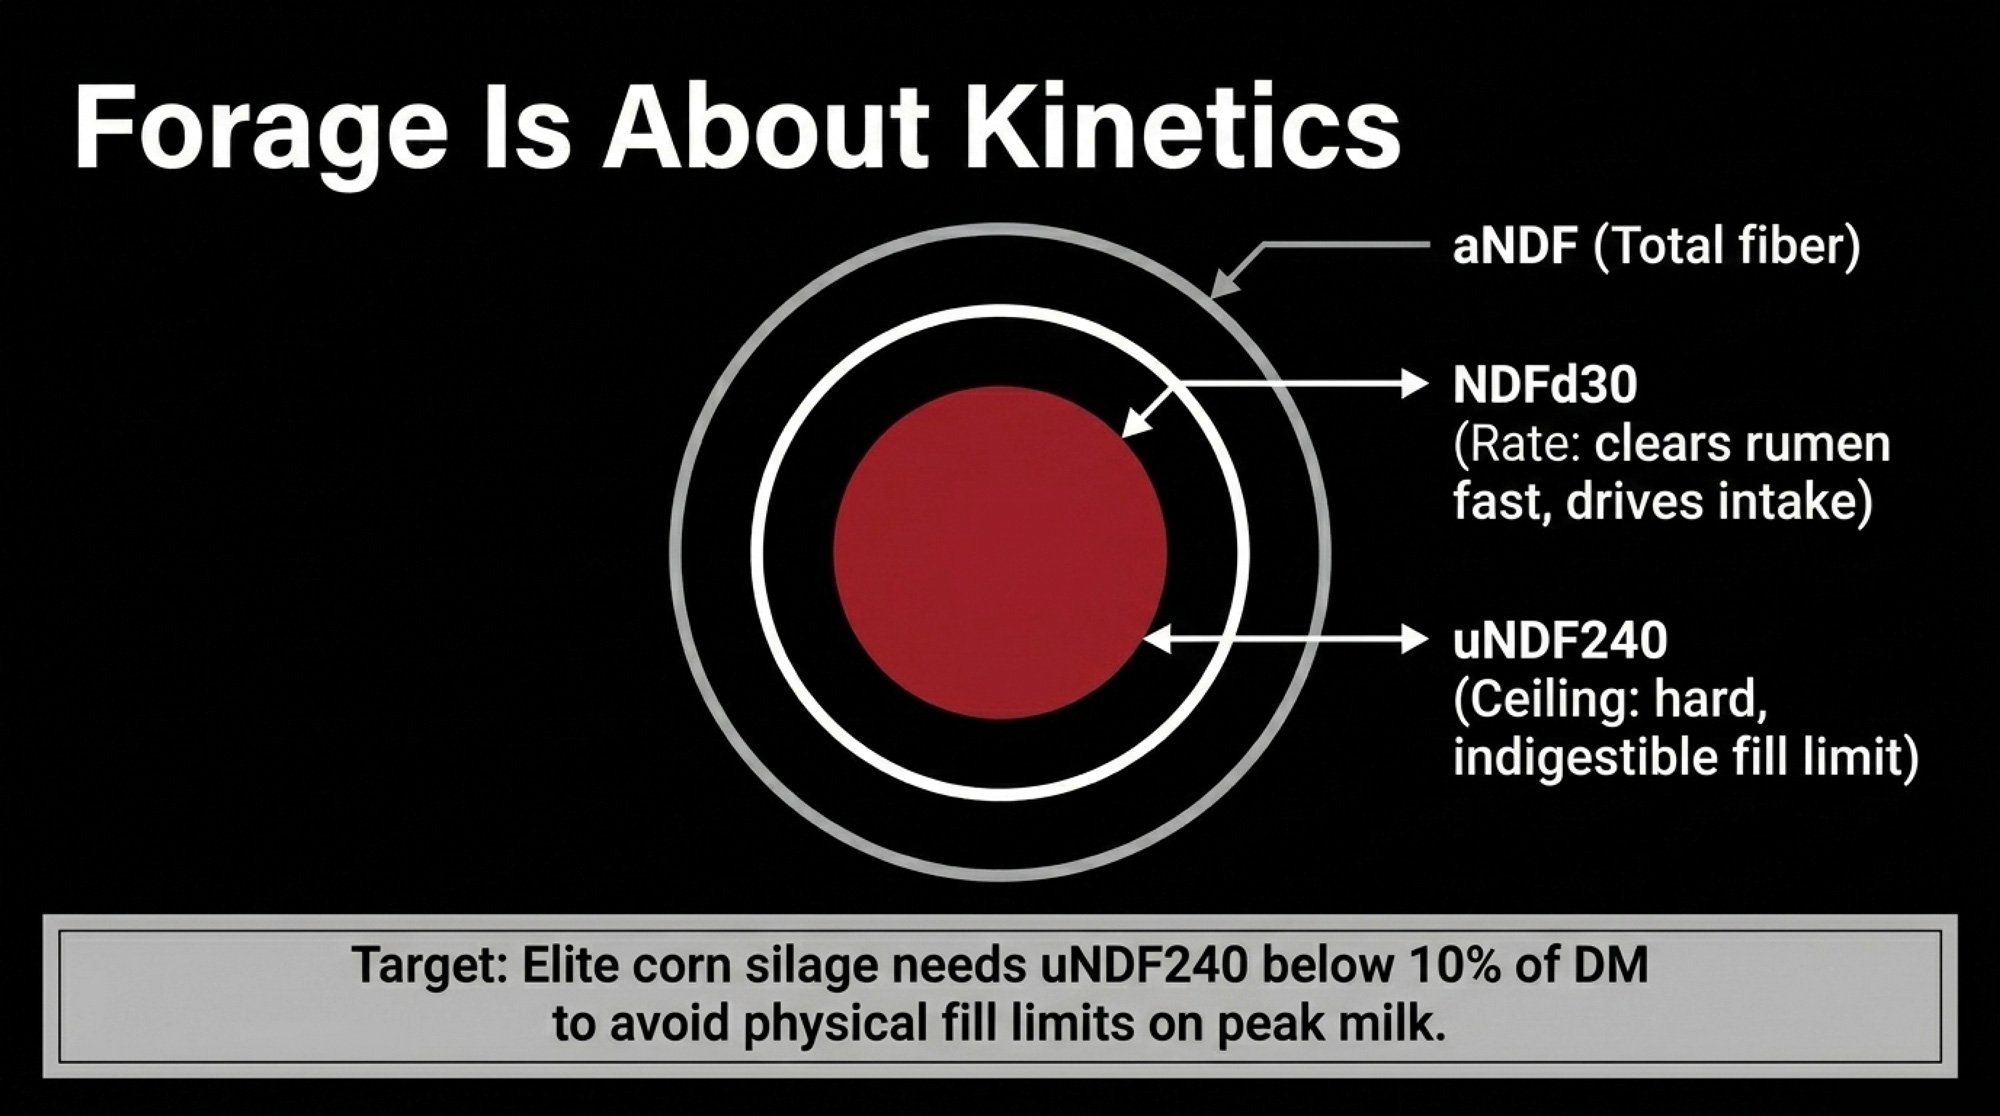
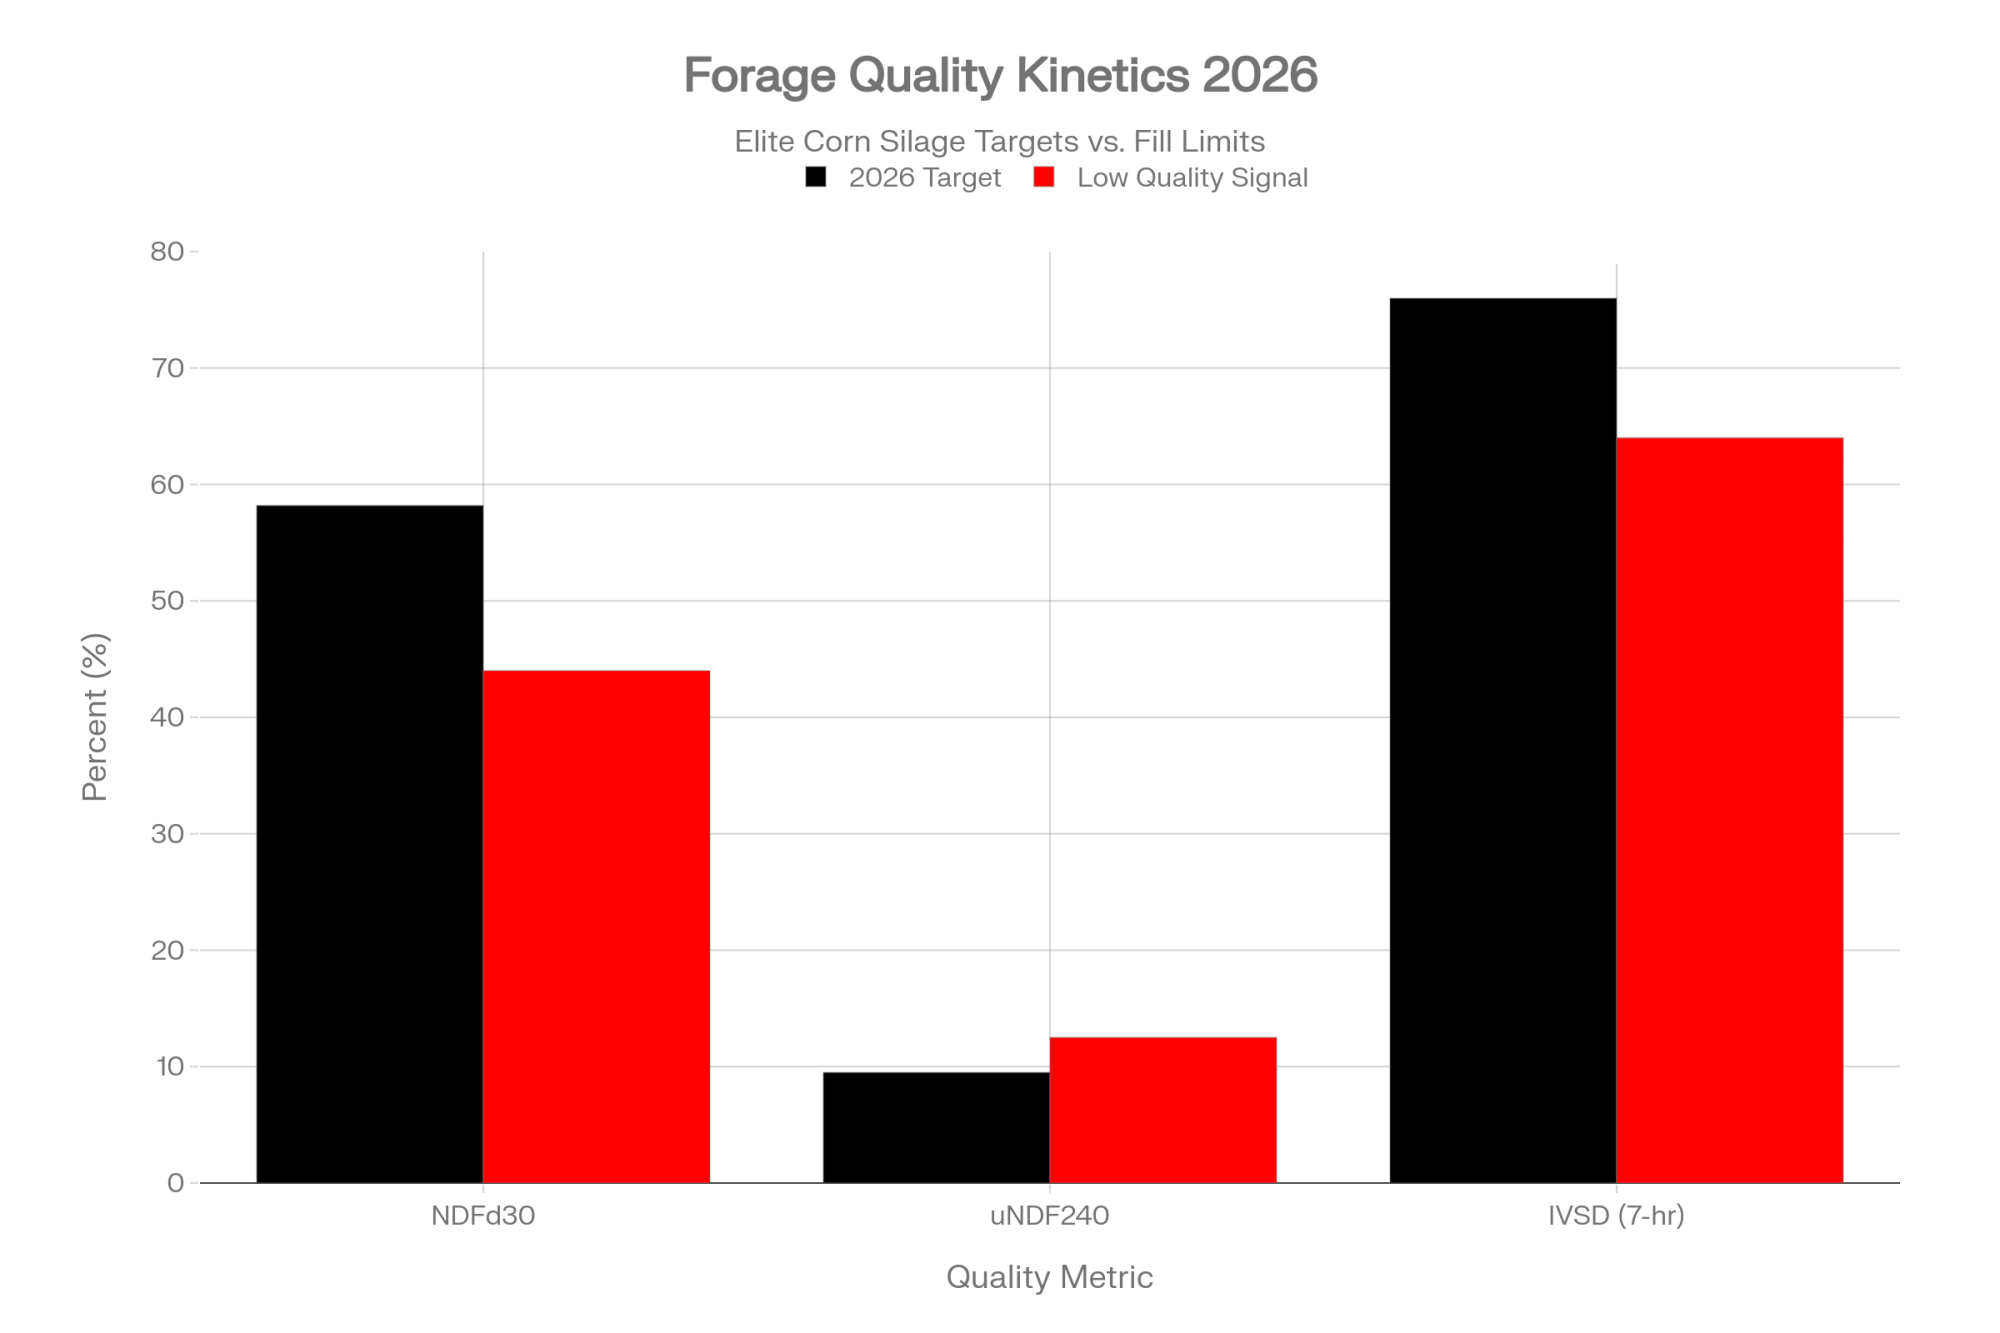
NDFd30 (% of NDF) tells you how quickly fibre clears the rumen. High‑producing cows need rapid clearance to keep DMI up. By 2026, a realistic target for elite corn silage is >55% NDFd30, with some Pennsylvania data sets averaging around 58.2% in top samples. uNDF240 (% of DM) is the opposite side of that coin. It’s the hard, indigestible fibre that will sit there for up to 10 days and physically limit intake. The 2026 target for top‑end corn silage is <10% uNDF240 of DM; once you’re above 11–12%, rumen fill becomes the limiting factor on peak milk, not energy alone.
The “nesting doll” view helps: aNDF contains uNDF240 as the innermost doll. As lignin and maturity climb, uNDF240 grows, and the space left for digestible fibre shrinks. That’s why two forages with the same NDF but different uNDF240 behave totally differently in the bunk.
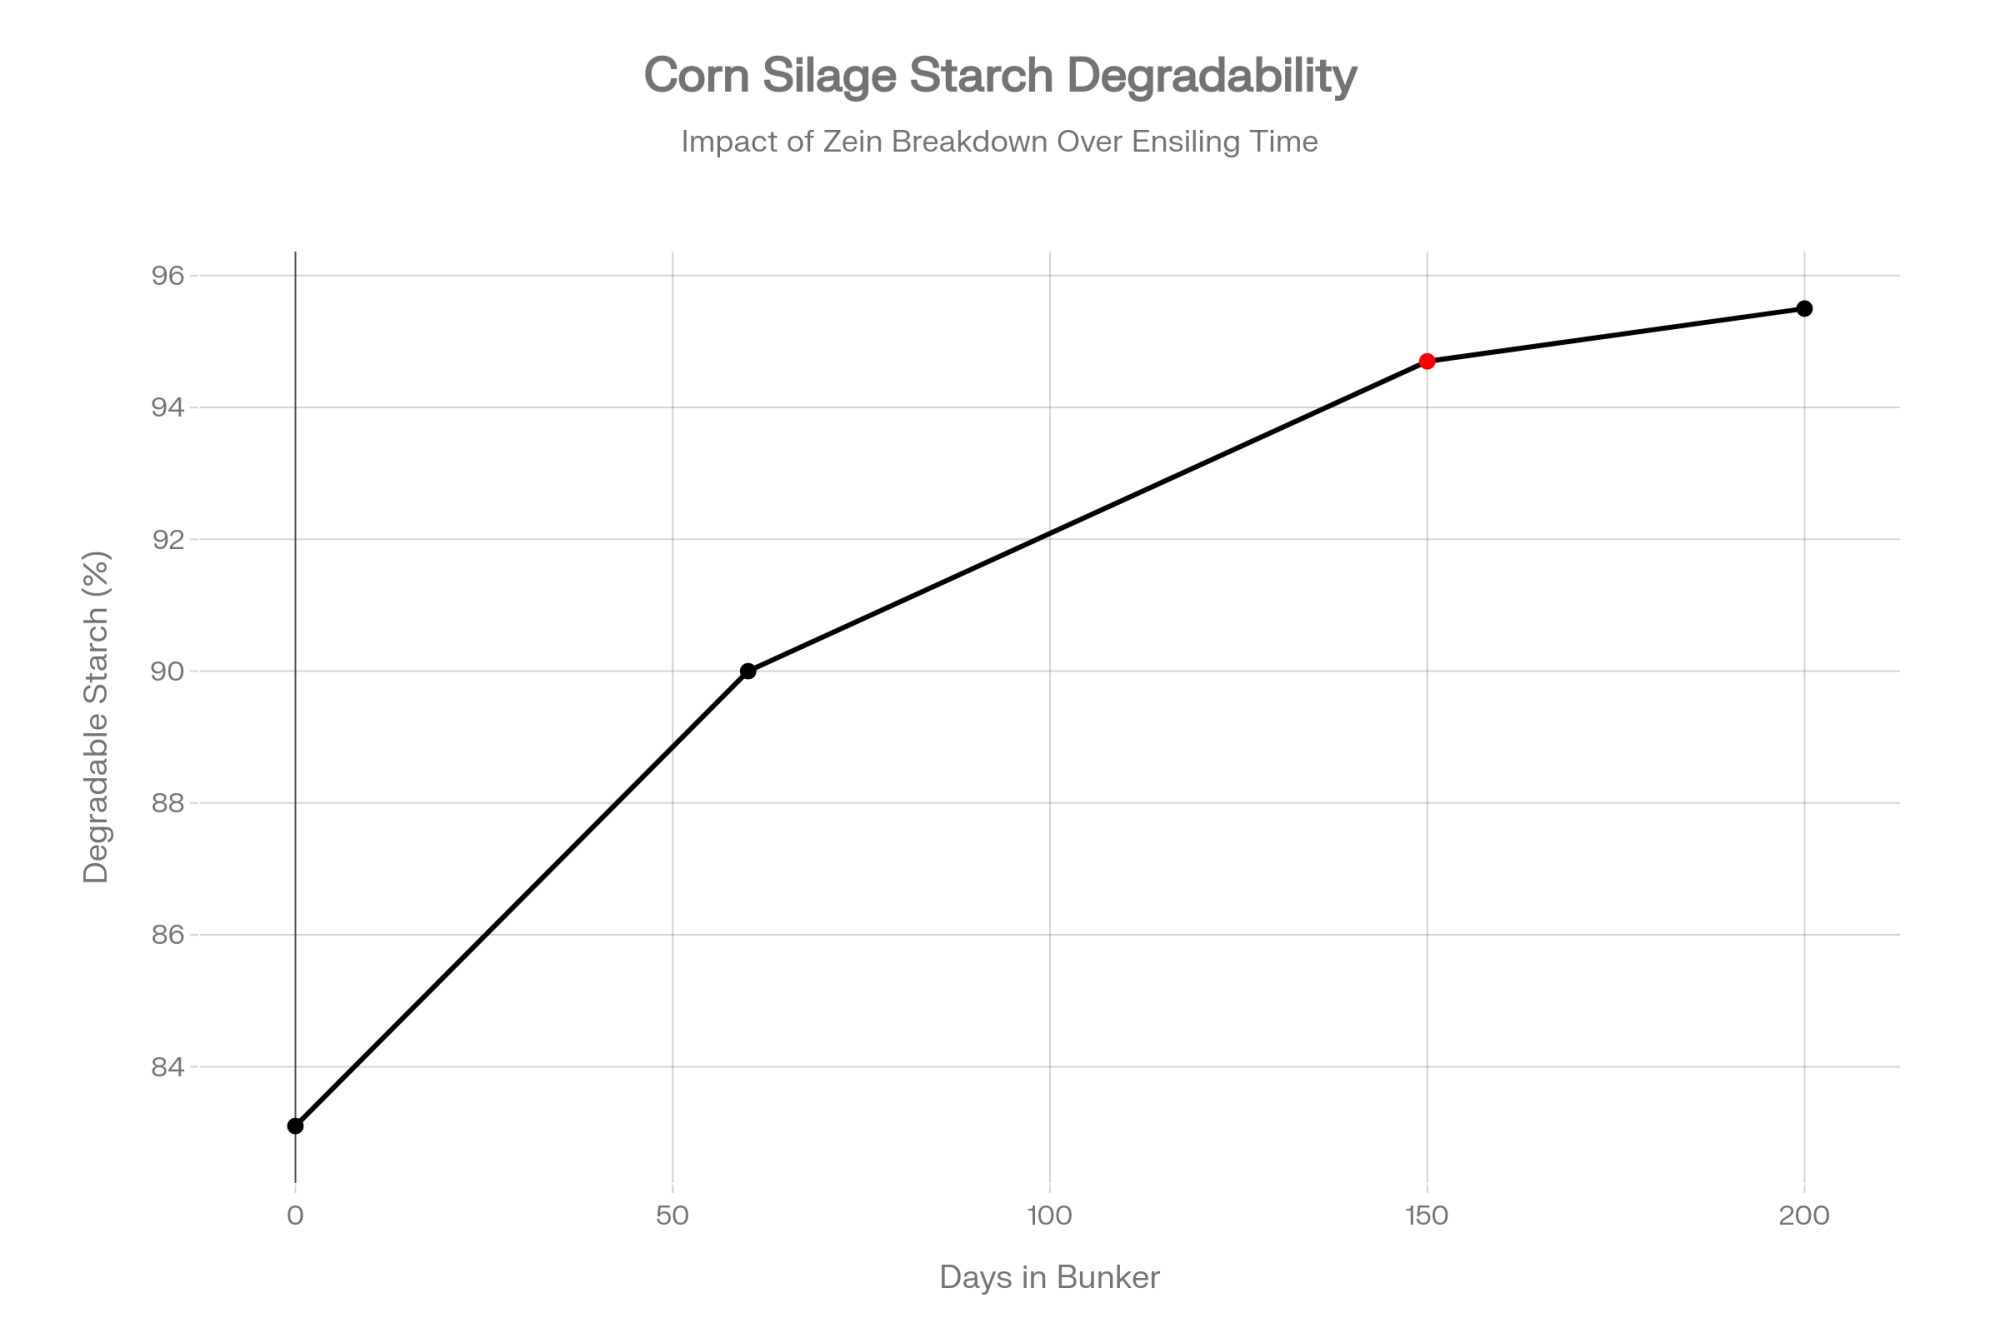
Starch digestibility and the zein effect
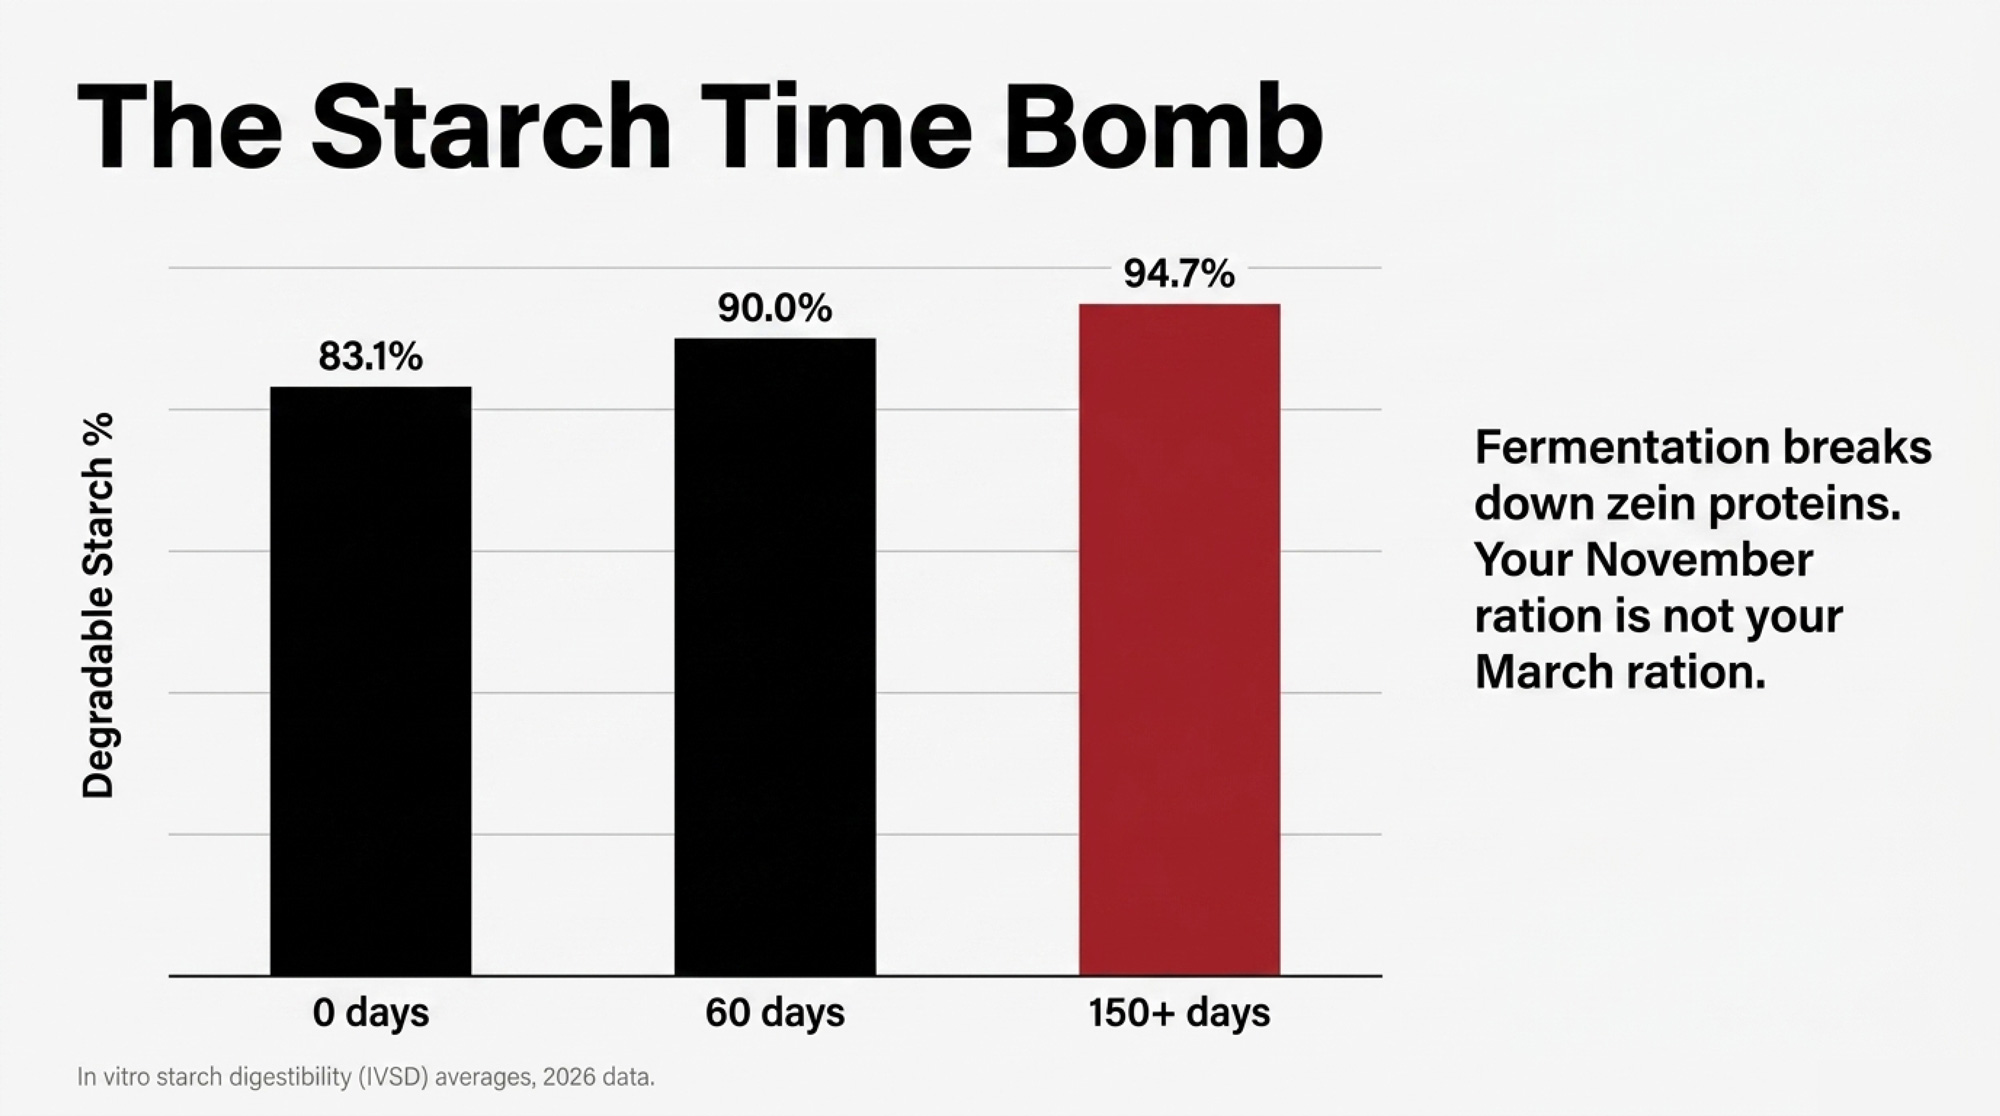
Starch is where a lot of farms quietly lose milk. In situ and in vitro work over the last five years has quantified how ensiling breaks down zein proteins that shield starch granules. Fresh chopped corn silage (0 days) can sit around 83.1% degradable starch, lifting towards ~90% at 60 days and ~94.7% once you’re past 150 days in the bunker. Practically, that means your “same ration” in November and March isn’t actually the same — starch availability has moved, and rumen pH and manure scores will tell you so if you’re watching.
By 2026, the standard is to use 7‑hour in vitro starch digestibility (IVSD) as a monitoring tool, targeting >75% for mature silage. Below ~65%, you’re in low‑energy, high bypass starch territory, which shows up as more hindgut fermentation and inconsistent milk.
Fermentation profile as silage autopsy
A modern forage report should include pH, lactic, acetic, butyric, ethanol and ammonia‑N. Typical 2026 corn silage benchmarks:
- pH 3.8–4.2
- Lactic 5–10% DM
- Acetic 1–3% DM (higher if L. buchneri‑treated, but watch intakes)
- Butyric <0.1% DM; anything above 0.5% is Clostridial territory
- Ammonia‑N <8% of CP; >12% screams excess proteolysis
Ethanol above 3–4% DM is a yeast flag. That’s lost energy and often ties to feedout heating and off‑flavours in milk.
2026 forage‑report interpretation cheatsheet
| Metric | 2026 target | Low‑quality signal | Clinical impact |
| NDFd30 | >58% of NDF | <45% | Slow rumen turnover, reduced DMI |
| uNDF240 | <10% of DM | >12% | Physical fill limit, restricted peak milk |
| IVSD (7‑hr) | >75% of starch | <65% | Low energy, more bypass starch |
| Lactic:Acetic | ~3:1 | <1:1 | Slow pH drop, poor aerobic stability |
| Butyric acid | <0.1% DM | >0.5% | Clostridial fermentation, ketosis risk |
Read more: Penn State forage quality metrics
Transition Cow Nutrition: DCAD, Choline, Monensin and Starch
The transition period is still where you win or lose the lactation. In 2026, the playbook is clearer: negative DCAD, properly supported magnesium and calcium, rumen‑protected choline, monensin, and sane starch ramping.
Negative DCAD basics in 2026
Negative DCAD is standard of care for hypocalcaemia control. Target DCAD is typically −10 to −15 mEq/100 g DM for pre‑fresh cows. You confirm it with urine pH, not vibes: Holsteins should run 6.0–6.5, with Jerseys a tick higher. You also push dietary Mg to 0.40–0.45% DM because Mg is needed for PTH secretion and receptor binding, and you stay away from extreme DCAD values below about −17.5 mEq/100 g to avoid real metabolic acidosis and DMI crash.
Rumen‑protected choline: liver insurance
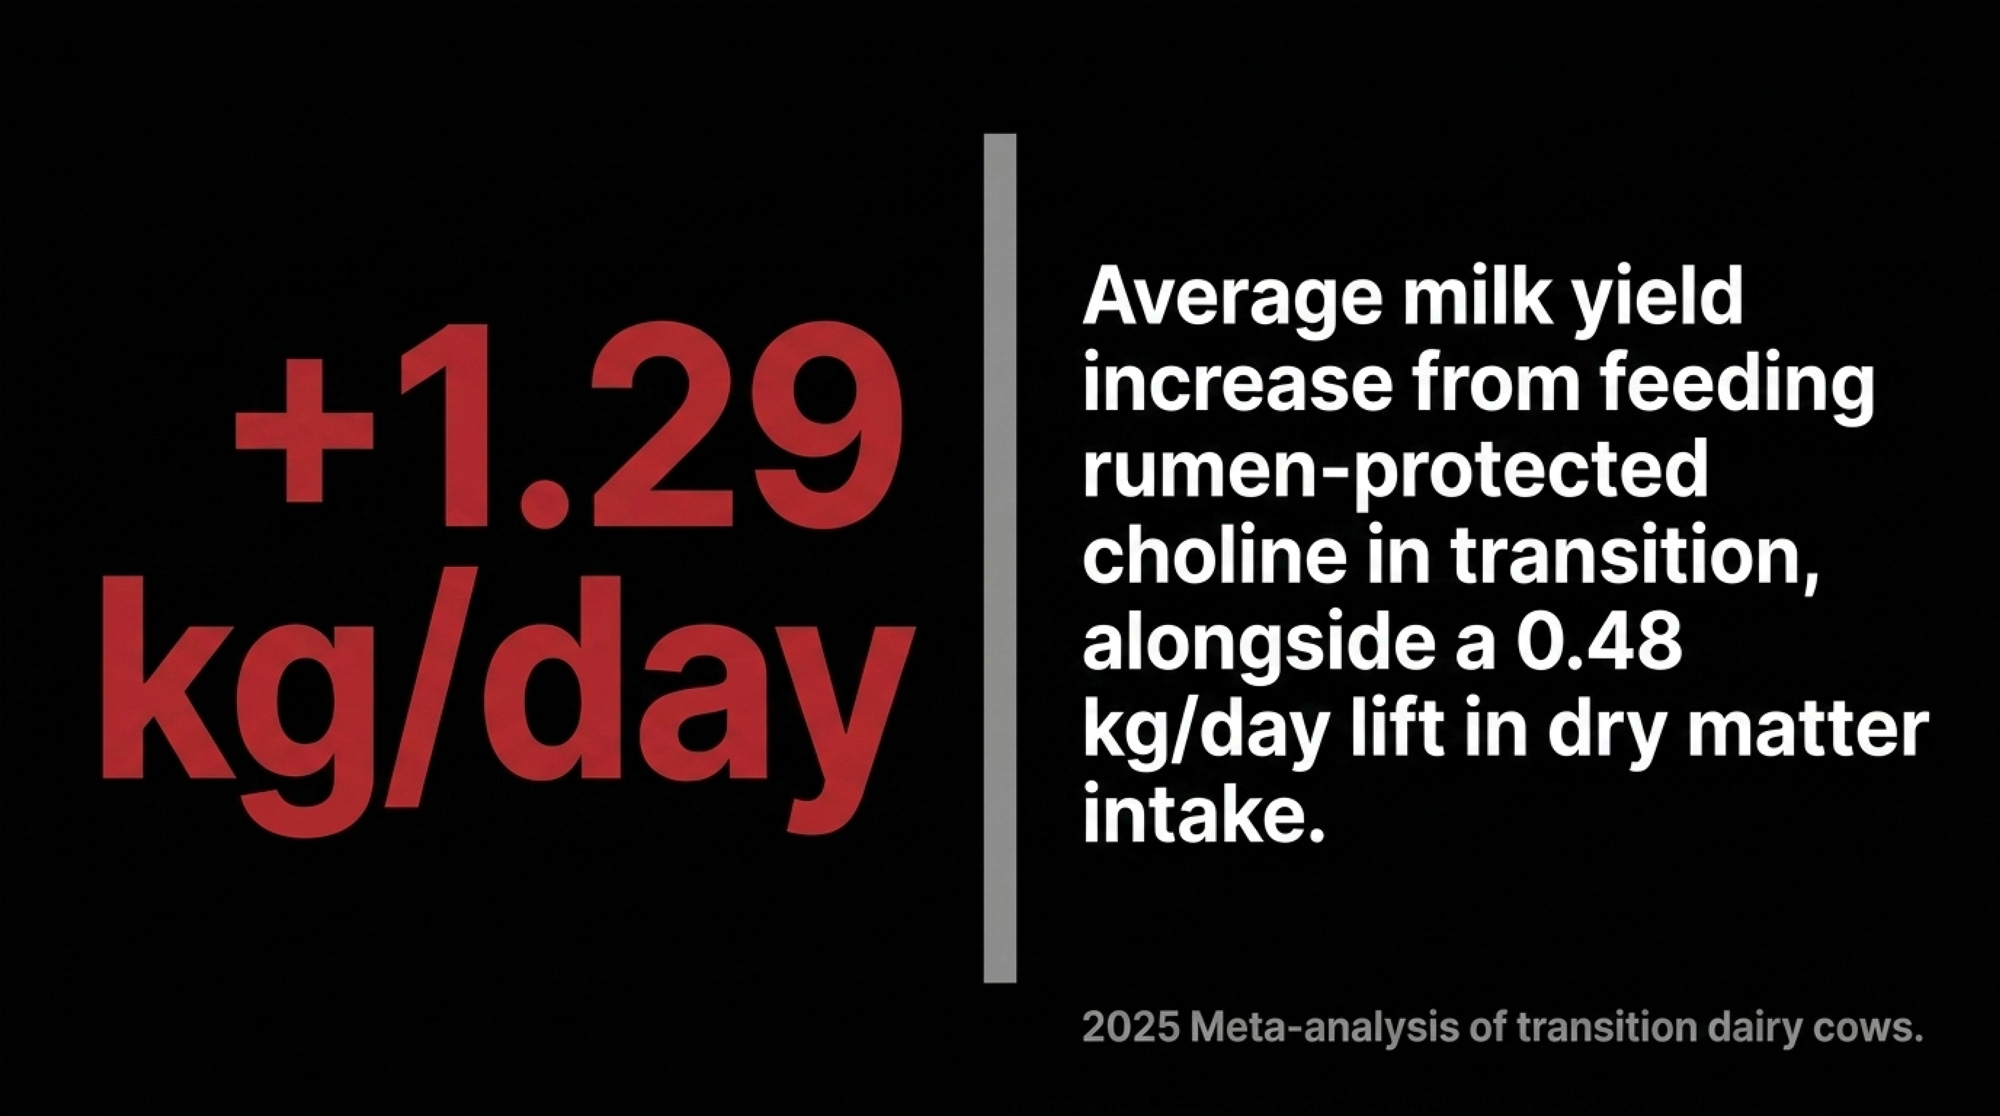
Choline is chewed up in the rumen, so it only works in protected form. Its job in transition is clear: support phosphatidylcholine synthesis so the liver can export triglyceride in VLDL instead of turning into a fat warehouse. A 2025 meta‑analysis showed rumen‑protected choline added 1.29 kg/day of milk on average and lifted DMI by 0.48 kg/day, with recommended doses in 2026 around 15–21 g/day of choline chloride equivalent for high‑risk herds. Responses in 3.5% FCM grew at higher supplementation levels, especially in over‑conditioned multiparous cows.
There’s also a methyl‑donor interplay with methionine. As methionine in MP climbs, the marginal benefit of choline can shrink, which tells you they’re sharing methyl pathways.
Monensin and starch strategy
Monensin is still widely used at ~16 ppm in 2026 to shift rumen fermentation toward propionate and improve feed efficiency. The payoff in transition is better energy balance and lower ketosis risk, with early‑lactation FCM responses around +2.2 kg/day in meta‑analysis.
Starch is tiered more carefully than it used to be:
- Pre‑fresh: 14–16% starch to keep papillae engaged without driving big insulin spikes or extra BCS.
- Post‑fresh: 22–26% starch, stepping toward 28–30% by peak, with enough peNDF to protect fat test and rumen pH.
The trick is not dumping a 28% starch TMR on a rumen that’s been on straw‑heavy dry cow diets and then being surprised by SARA and DA.
Read more: DCAD and milk fever prevention
Feed Efficiency and Residual Feed Intake
Feed efficiency has graduated from a ratio to a genetic and management trait you can actually select for and measure. The move from simple “kg ECM per kg DMI” to Residual Feed Intake is what makes that possible.
RFI in plain language
Residual Feed Intake is the difference between a cow’s actual DMI and her predicted DMI given her metabolic body weight and production. Positive RFI cows eat more than the model expects (less efficient). Negative RFI cows eat less than expected without losing milk or condition (more efficient). The key is that RFI is designed to be independent of production level, so you’re not accidentally selecting for low‑producing “efficient” cows.
On farm, more herds are getting at least pen‑level or group‑level efficiency through automated bunks and integrated milk data. True individual‑cow RFI measurement is still mostly in research or very high‑tech herds, but genomics has changed the game.
Genetics and 2026 benchmarks
In 2026, Lactanet’s Feed Efficiency RBV explicitly targets feed intake after 60 DIM, which avoids rewarding cows that simply starve off condition early. Every 5‑point bump in a sire’s Feed Efficiency RBV is expected to cut daughter DMI by ~80 kg in first lactation and ~120 kg in second. Canadian Pro$ and LPI and US Net Merit all now integrate feed efficiency / Feed Saved components with real economic weighting.
A feed‑efficient daughter isn’t magically cheap to feed; she’s just wasting less feed for the same output. That’s a permanent herd‑level shift in IOFC when you stack it over generations.
Read more: Lactanet Feed Efficiency RBV
Feed Additives and Methane Reduction: Evidence Tiers
Here’s where it’s most tempting to spend money based on slide decks. In 2026, the way to stay sane is simple: Tier‑1 additives have multiple meta‑analyses with consistent results; Tier‑2 has promising but variable data; Tier‑3 is still “interesting” but not ration‑critical.
Methane‑focused additives
- 3‑NOP (Bovaer): Still the gold standard in TMR herds. Meta‑analysis puts methane reduction around 30.6% by inhibiting methyl‑coenzyme M reductase, with rapid metabolism to nitrate and 1,3‑propanediol. ppl-ai-file-upload.s3.amazonaws
- Asparagopsis (red seaweed): Dairy trials show 51–67% methane cuts, sometimes higher in vitro. Field challenges are bromoform stability, cost, and residue concerns.
- Nitrates: Around 16% methane reduction as an alternative hydrogen sink but with a tight toxicity window.
- Essential oils / phytochemicals: Roughly 13.5% methane reduction in some meta‑analyses, but very formulation‑ and diet‑dependent.
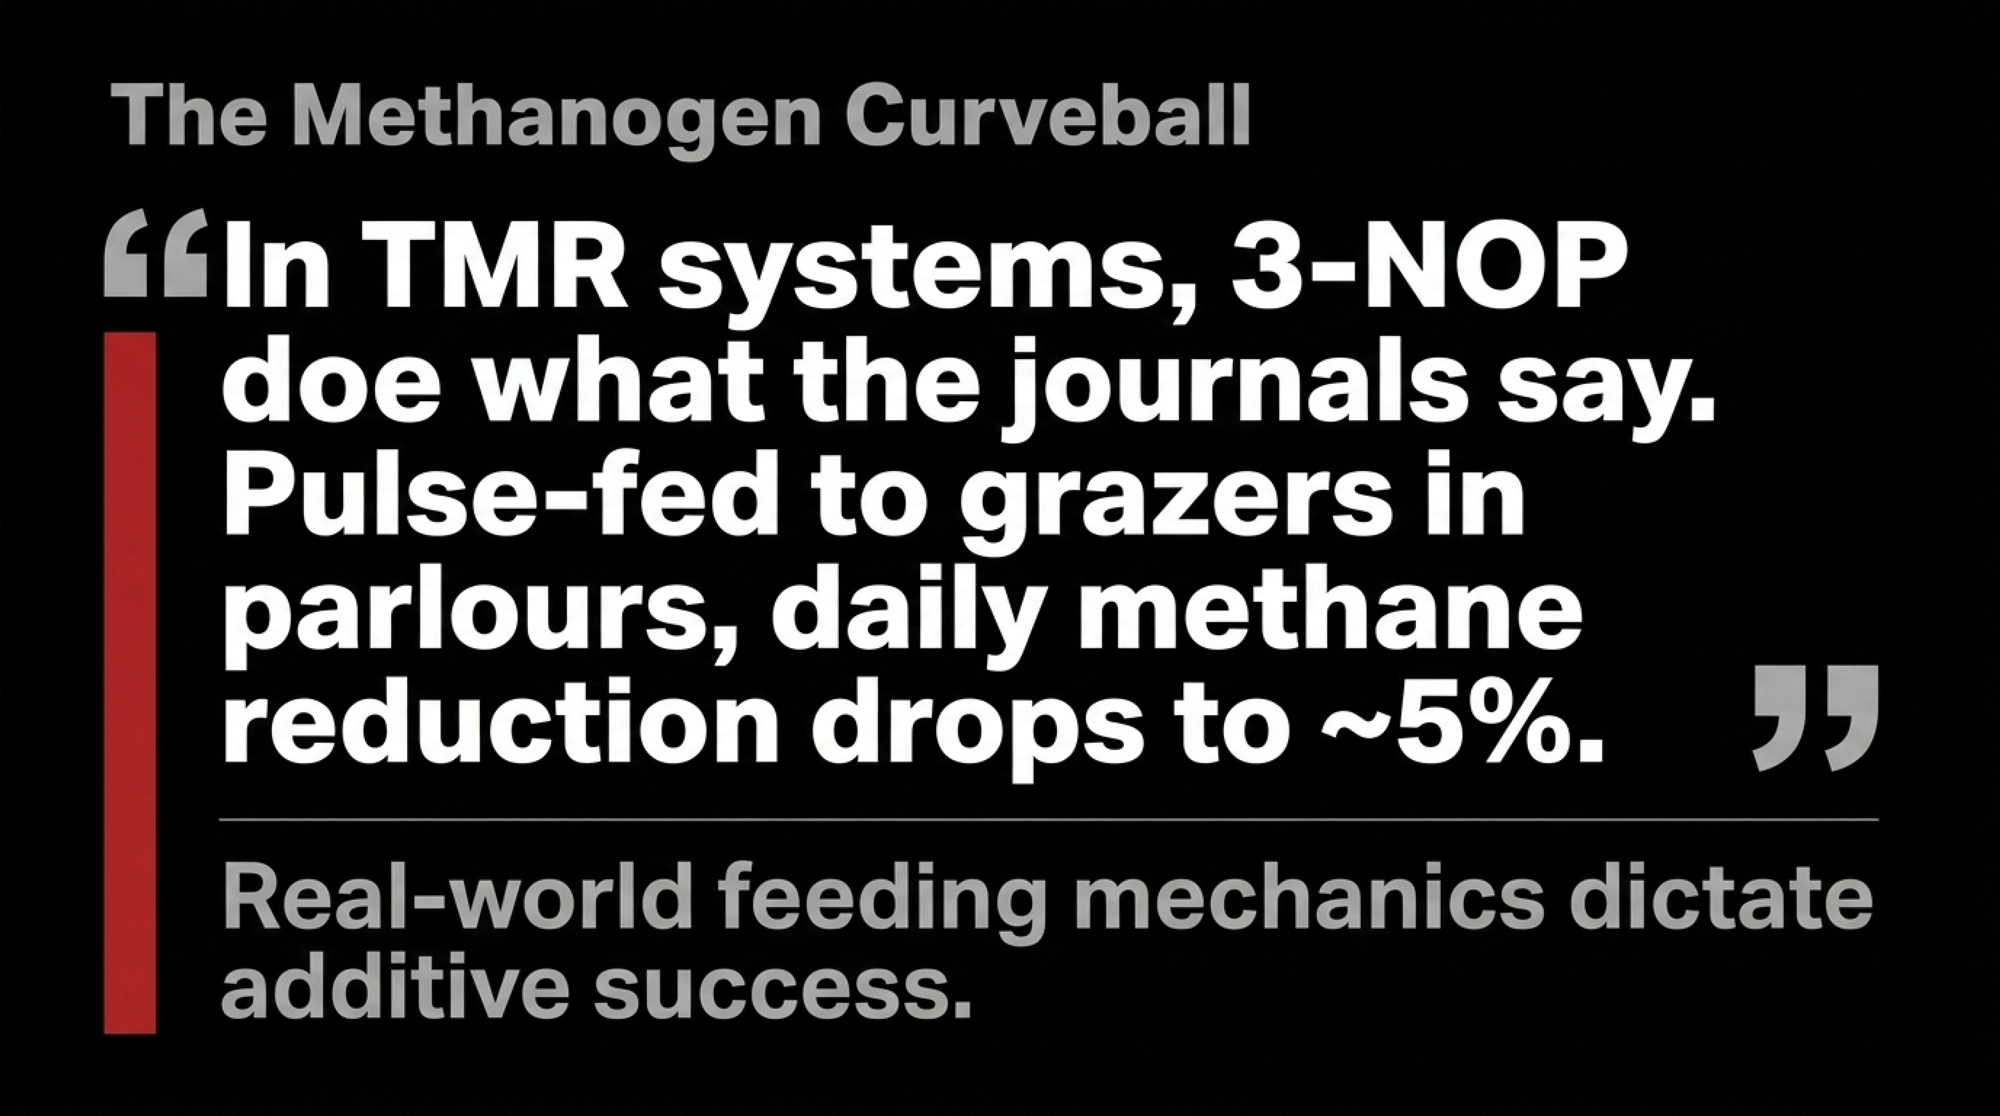
3‑NOP’s mode of action is clean on paper. The curveball is field experience. In TMR systems with stable mixing, it does what the journals say. In more variable environments, especially where it’s pulse‑fed to grazers in parlours, daily methane reduction drops to ~5% because the compound is metabolised in about three hours.
Production additives: who’s Tier‑1 in 2026?
| Additive Category | 2026 Evidence Tier | Primary Production Impact | Expected ROI / Cost Metric | Verdict for 2026 Rations |
| Live Yeast (S. cerevisiae) | Tier 1 | Improved DMI & rumen stability in heat stress | ~$0.05 – $0.08 / cow / day | Core defense for summer and heat-stressed herds |
| Monensin | Tier 1 | +2% feed efficiency, +2.2 kg/day FCM | Consistently high IOFC return | Non-negotiable baseline for early lactation energy |
| Rumen-Protected Choline | Tier 1 | +1.29 kg/day milk, lower fatty liver risk | ~$0.30 – $0.40 during transition | Requires strict 15-21g/day dosing to capture value |
| Essential Oils | Tier 2 | ~13.5% methane cut, modest performance | Highly variable depending on blend | Often oversold; highly dependent on base diet |
| Asparagopsis (Red Seaweed) | Tier 2/3 | 51–67% methane reduction (trials) | Premium cost, limited supply | Bromoform stability and residue risks remain unresolved |
A 2026 evidence matrix stacks up roughly like this:
- Live yeast (S. cerevisiae) — Tier 1: better DMI and milk yield in heat‑stressed cows and improved rumen stability.
- Monensin — Tier 1: +2% feed efficiency, +2.2 kg/day FCM early lactation.
- Rumen‑protected choline — Tier 1: +1.29 kg/day milk, reduced fatty liver markers.
- Direct‑fed microbials — Tier 2: some strains (e.g., certain Lacticaseibacillus) can improve yield by hundreds of litres per lactation, but responses are highly strain‑specific.
- Essential oils — Tier 2: modest methane and performance responses, often oversold in marketing.
“In 2026, the question isn’t ‘does it work in vitro?’ — it’s ‘show me the meta‑analysis and the in‑herd economics’.”
Read more: global methane additive evidence review
Grazing Systems and Byproduct Feeds
North American “pasture” herds and confinement herds using byproducts face different constraints, but the same core physics govern both.
Grazing systems and methane
Pasture‑based herds have a tougher time with 3‑NOP purely for logistics. Because 3‑NOP is metabolised within about three hours, pulse‑feeding it twice a day in the parlour only yields about a 5% daily methane reduction. Red seaweed (Asparagopsis) seems better suited to grazing; some work shows ~24% methane reduction with pulse feeding, likely because bromoform is released more slowly in the rumen. But cost and supply are real barriers.
The nutritional challenge on lush pasture is not getting enough NDF; it’s getting enough effective NDF and not drowning the rumen in sugar and rumen‑rapid protein. That’s where straw, dry hay, beet pulp and judicious concentrate come in.
Byproduct feeds in 2026
Byproducts are now precision tools, not garbage.
- Canola meal: The protein of choice in a lot of Canadian and northern US diets. Replacing soybean meal with canola meal raises milk yield and cuts urinary N. 2026 IngredientHub pricing shows canola meal at about CAD$366.97/MT FOB Winnipeg vs soybean meal at CAD$759/MT FOB Hamilton, which is a big protein cost differential.
- DDGS: Low‑oil DDGS (8–10% fat) is standard. Great protein/energy source, but you have to watch sulphur and milk fat when feeding above ~20% of DMI.
- Almond hulls: Western US NFFS staple. Highly digestible sugar and moderate NDF; nice when forage quality is marginal, but mostly a regional tool given freight.
- Bakery byproducts: Very fermentable starch and variable fat; cost‑effective wheat/corn replacement when you manage inclusion rates and adjust for moisture.
A 2026 IngredientHub snapshot underlines how regional economics drive choices: corn at CAD$230.70/MT FOB Chatham vs CAD$381/MT trucked to Moncton, canola meal at CAD$366.97/MT in Winnipeg vs CAD$510.05/MT delivered to Toronto. Those freight spreads start to matter more than lab values.
Read more: USDA ERS feed price data
FREQUENTLY ASKED QUESTIONS
Does NASEM 2021 completely replace NRC 2001 for dairy cow nutrition?
Yes. NASEM 2021 is the official eighth revised edition and fully supersedes NRC 2001 for dairy cow nutrition requirements. It uses intake‑based equations for energy, protein and minerals rather than static tables, and in 2026 it’s baked into the major ration models most consultants use.
Why did sodium and magnesium requirements increase in the new dairy cow nutrition model?
NASEM 2021 ties sodium and several other minerals to dry matter intake instead of just body weight, reflecting higher metabolic faecal losses in high‑intake cows. Magnesium requirements also rise because the model explicitly accounts for high‑potassium forages interfering with Mg transport across the rumen wall.
What’s the ideal urine pH for dry cows on a negative DCAD diet?
In 2026, the standard target for Holsteins on a negative DCAD program is a urine pH of 6.0 to 6.5. That range indicates enough metabolic acidosis to prime calcium mobilization without depressing dry matter intake. Jerseys often sit slightly higher, but the principle is the same.
How much extra milk can I expect from rumen‑protected choline?
Meta‑analysis work suggests an average response of about 1.29 kg/day more milk and 0.48 kg/day higher DMI when rumen‑protected choline is fed around transition. Responses are larger in high‑risk cows, especially over‑conditioned multiparous cows where fatty liver risk is highest.
Does monensin really improve feed efficiency without hurting milk?
Yes. 2026 reviews still show monensin improving feed efficiency by roughly 2% and adding around 2.2 kg/day of fat‑corrected milk in early lactation. There can be a small drop in milk fat percentage in some diets, but total fat yield often holds or improves, and the energy efficiency gain usually wins.
Is 3‑NOP (Bovaer) safe and effective for methane reduction in dairy cows?
Controlled trials and meta‑analyses show around a 30% methane reduction in dairy cows at label doses, with no consistent negative impact on DMI or milk yield. Field experience, especially mandatory use in some regions, is more complicated, so a cautious, pilot‑based adoption with tight monitoring is smart.
Is uNDF240 more important than ADF when looking at forage quality?
For intake prediction, yes. uNDF240 represents the truly indigestible NDF that sets the physical fill limit in the rumen. ADF still correlates with energy, but uNDF240 is much better at explaining why cows stop eating before they hit their energy requirement on some forages.
Can I really use canola meal as my primary protein source instead of soybean meal?
You can in many rations. Recent research and 2026 field data show canola meal often supports equal or higher milk yield than soybean meal because of its amino‑acid profile, while also reducing urinary nitrogen. With current price spreads in Canada and parts of the US, it’s often the more economical protein.
Why does corn silage starch digestibility go up after six months in the bunker?
Fermentation acids and proteases break down the zein protein matrix that surrounds starch granules over time. That breakdown makes starch more accessible to rumen microbes, so IVSD increases from the low‑80s at harvest toward the mid‑90s after 150+ days of ensiling.
What’s the most practical feed efficiency metric for commercial herds right now?
For most herds, pen‑level or group‑level feed efficiency — energy‑corrected milk per kg DMI — is still the most usable day‑to‑day number. Residual Feed Intake is powerful but needs individual DMI. Genomic Feed Efficiency or Feed Saved indices through Lactanet or CDCB let you still select for efficiency at the sire level.
 The Sunday Read Dairy Professionals Don’t Skip.
 The Sunday Read Dairy Professionals Don’t Skip.
Every week, thousands of producers, breeders, and industry insiders open Bullvine Weekly for genetics insights, market shifts, and profit strategies they won’t find anywhere else. One email. Five minutes. Smarter decisions all week.
