Archive for Nutrition

The $73-a-Cow Gap Hiding in Your 2027 Bovaer Contract

An April 2026 Science paper mapped why methanogen-targeting additives cap near 30% — and why the zero-cost lever is already sitting on a genomic report you paid for.

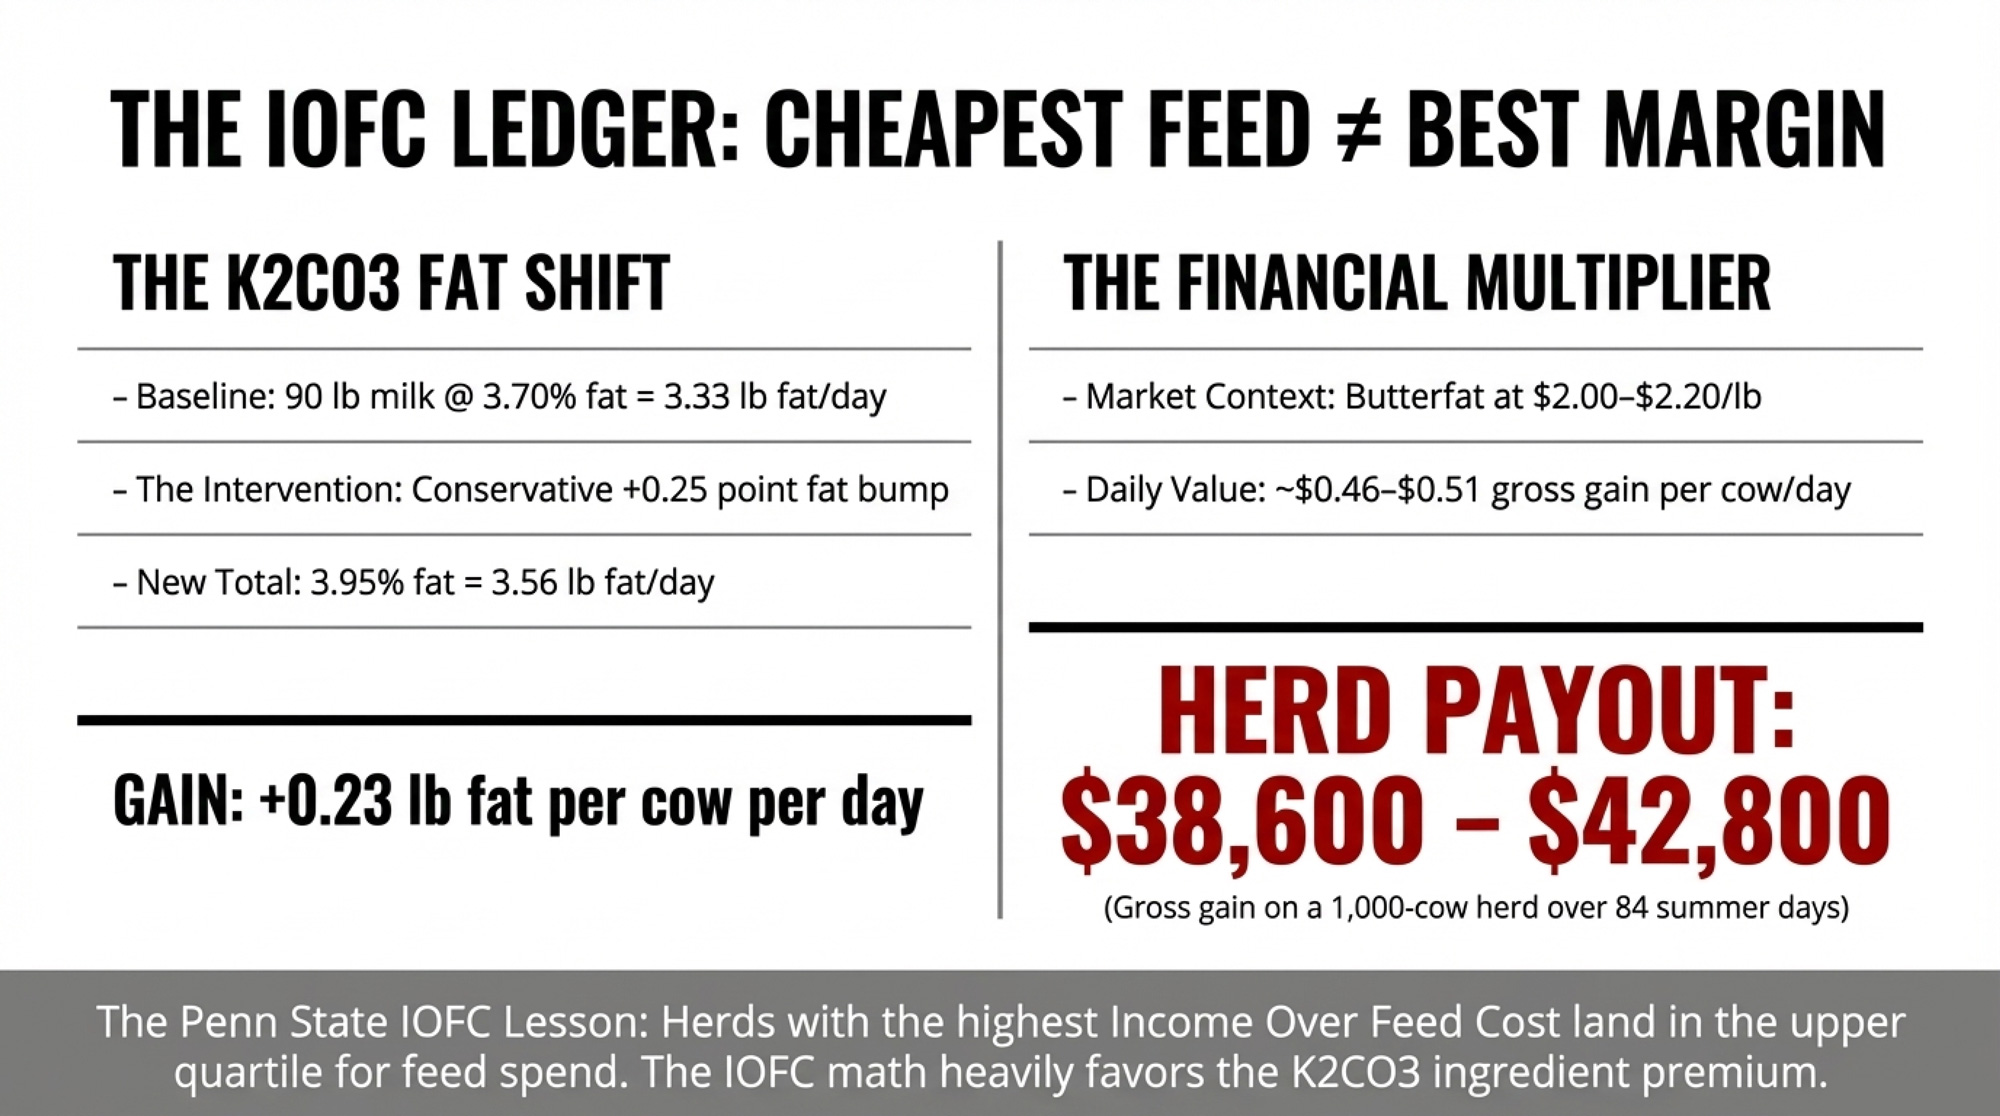
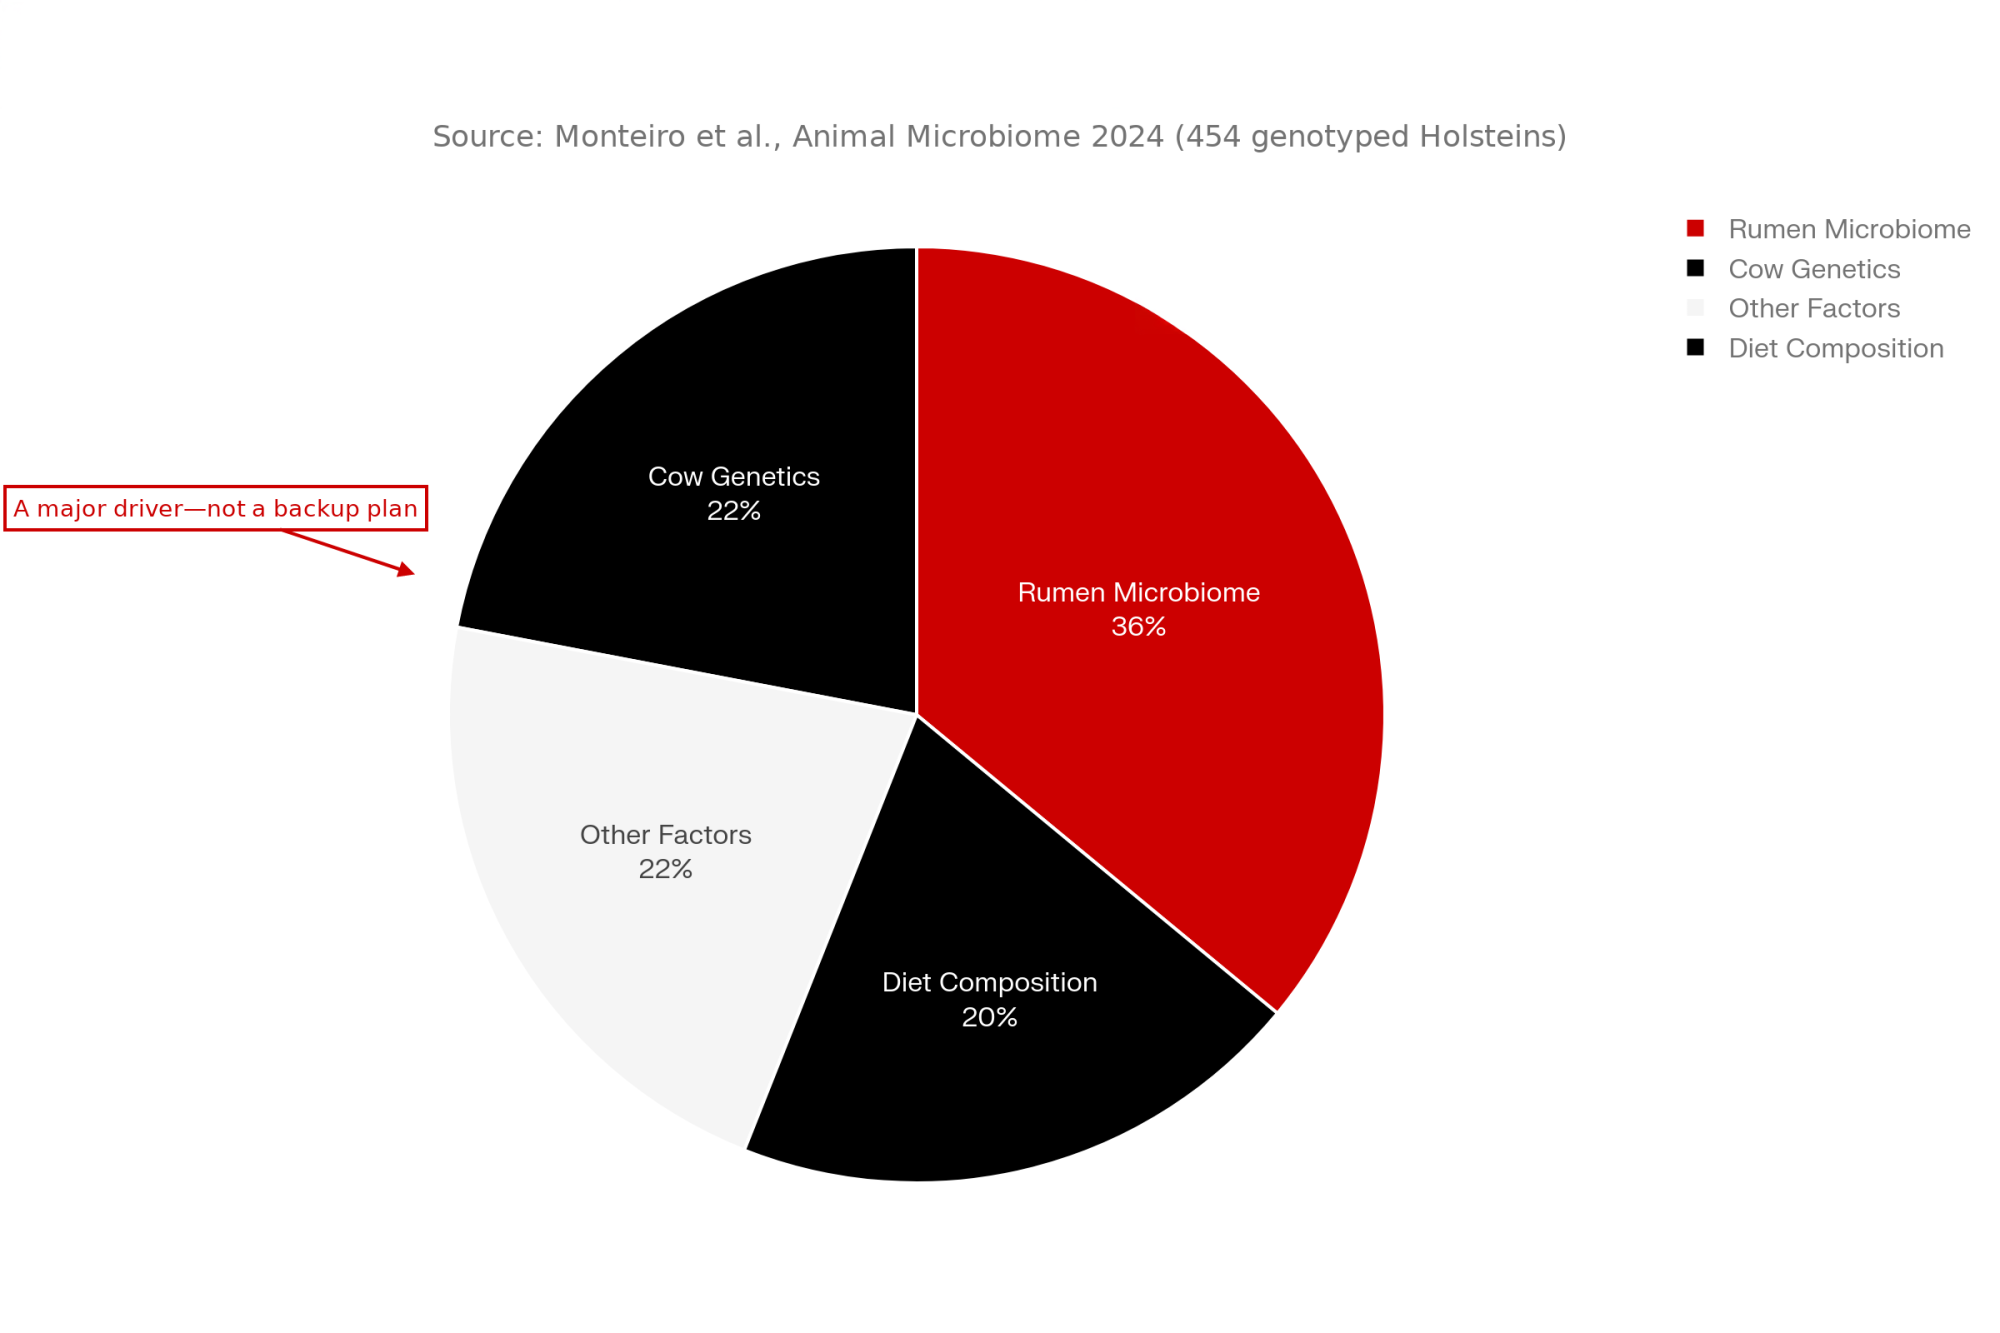
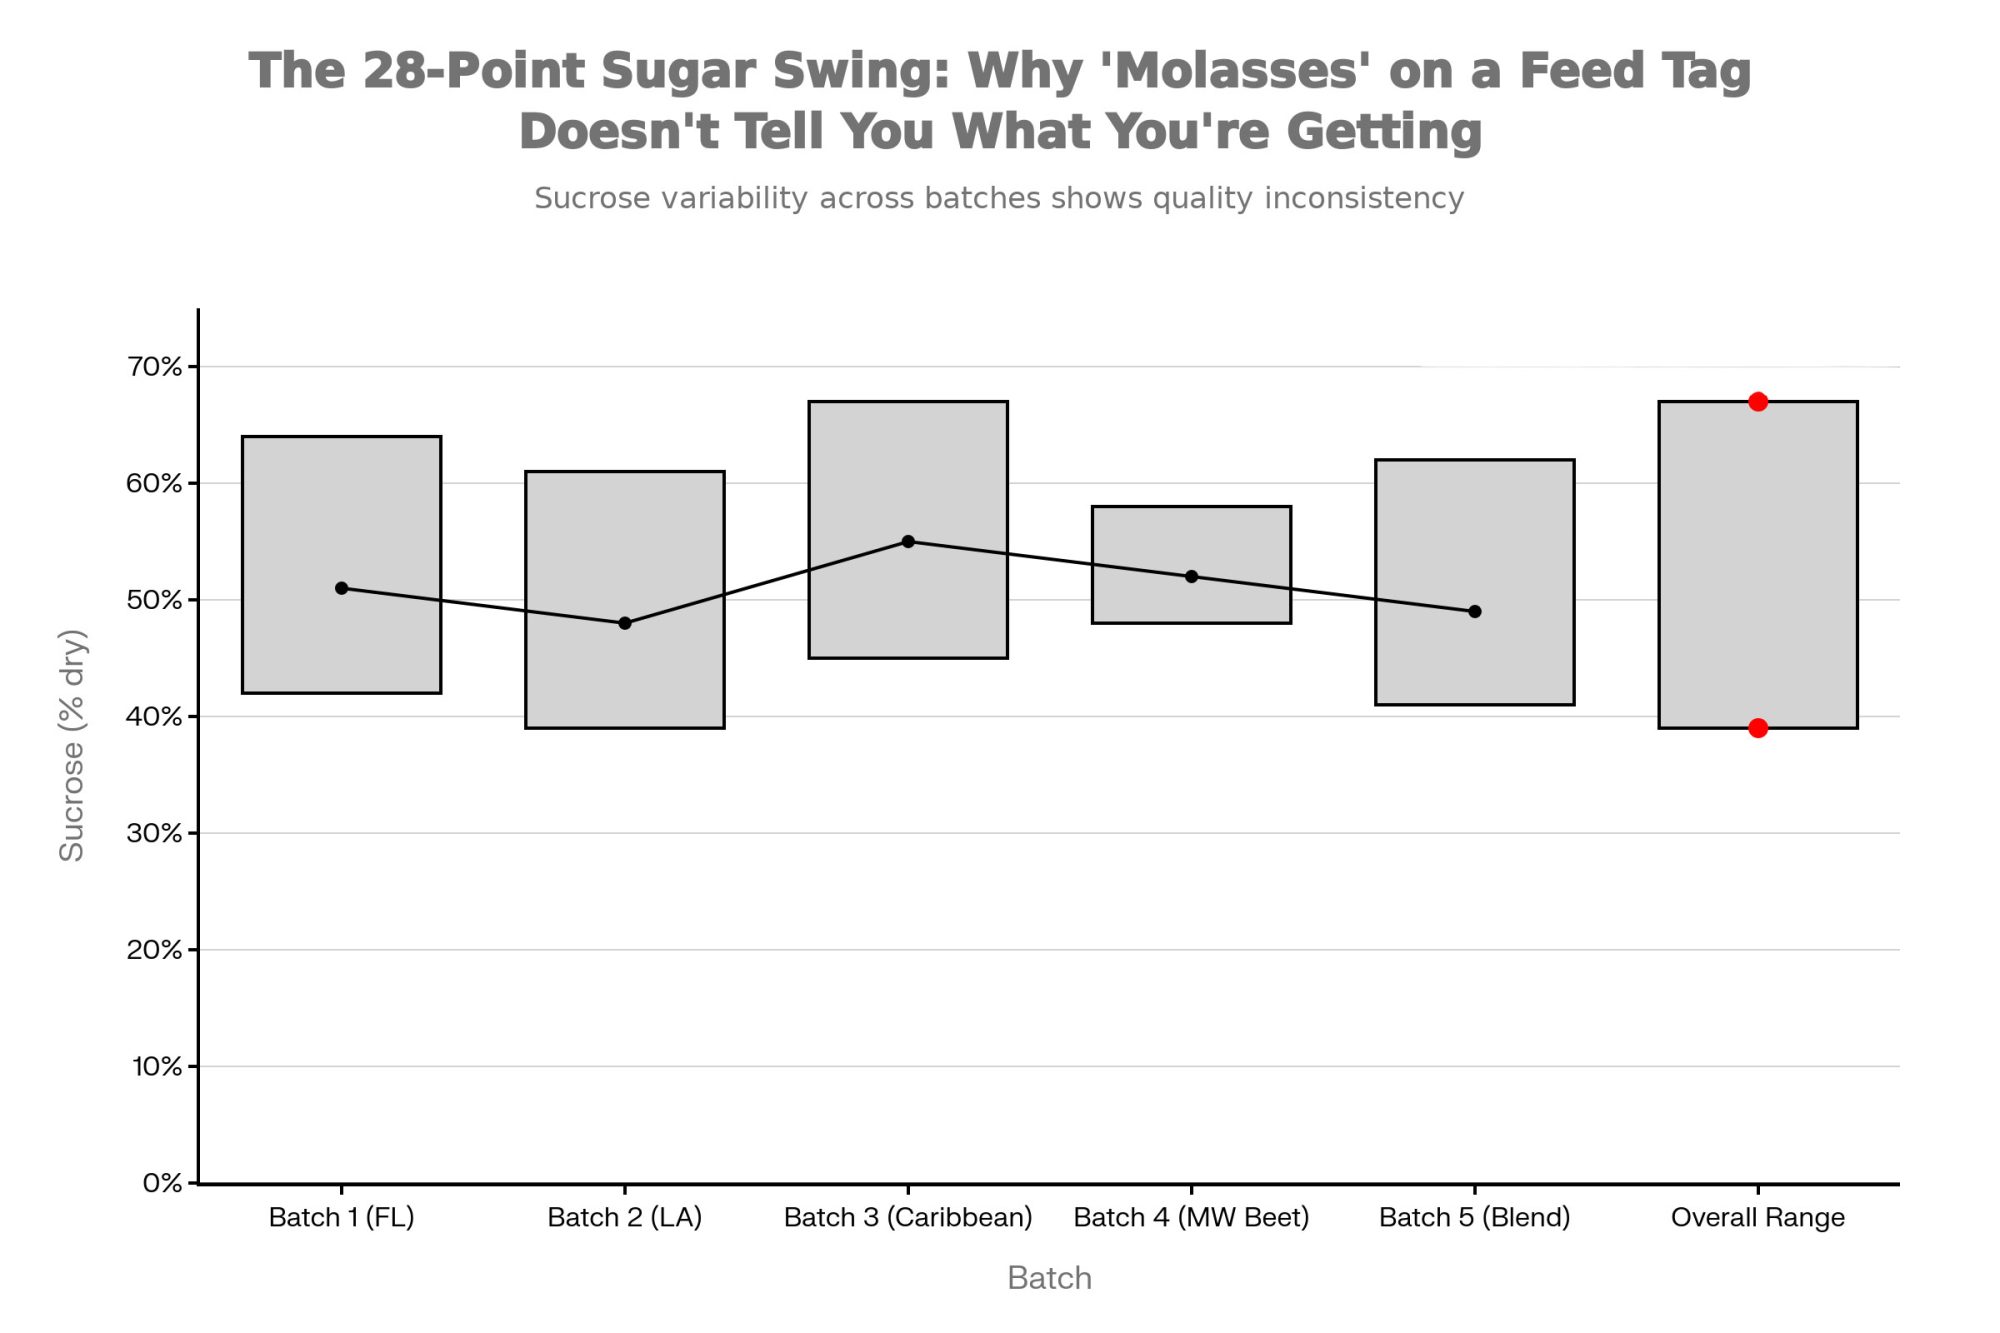
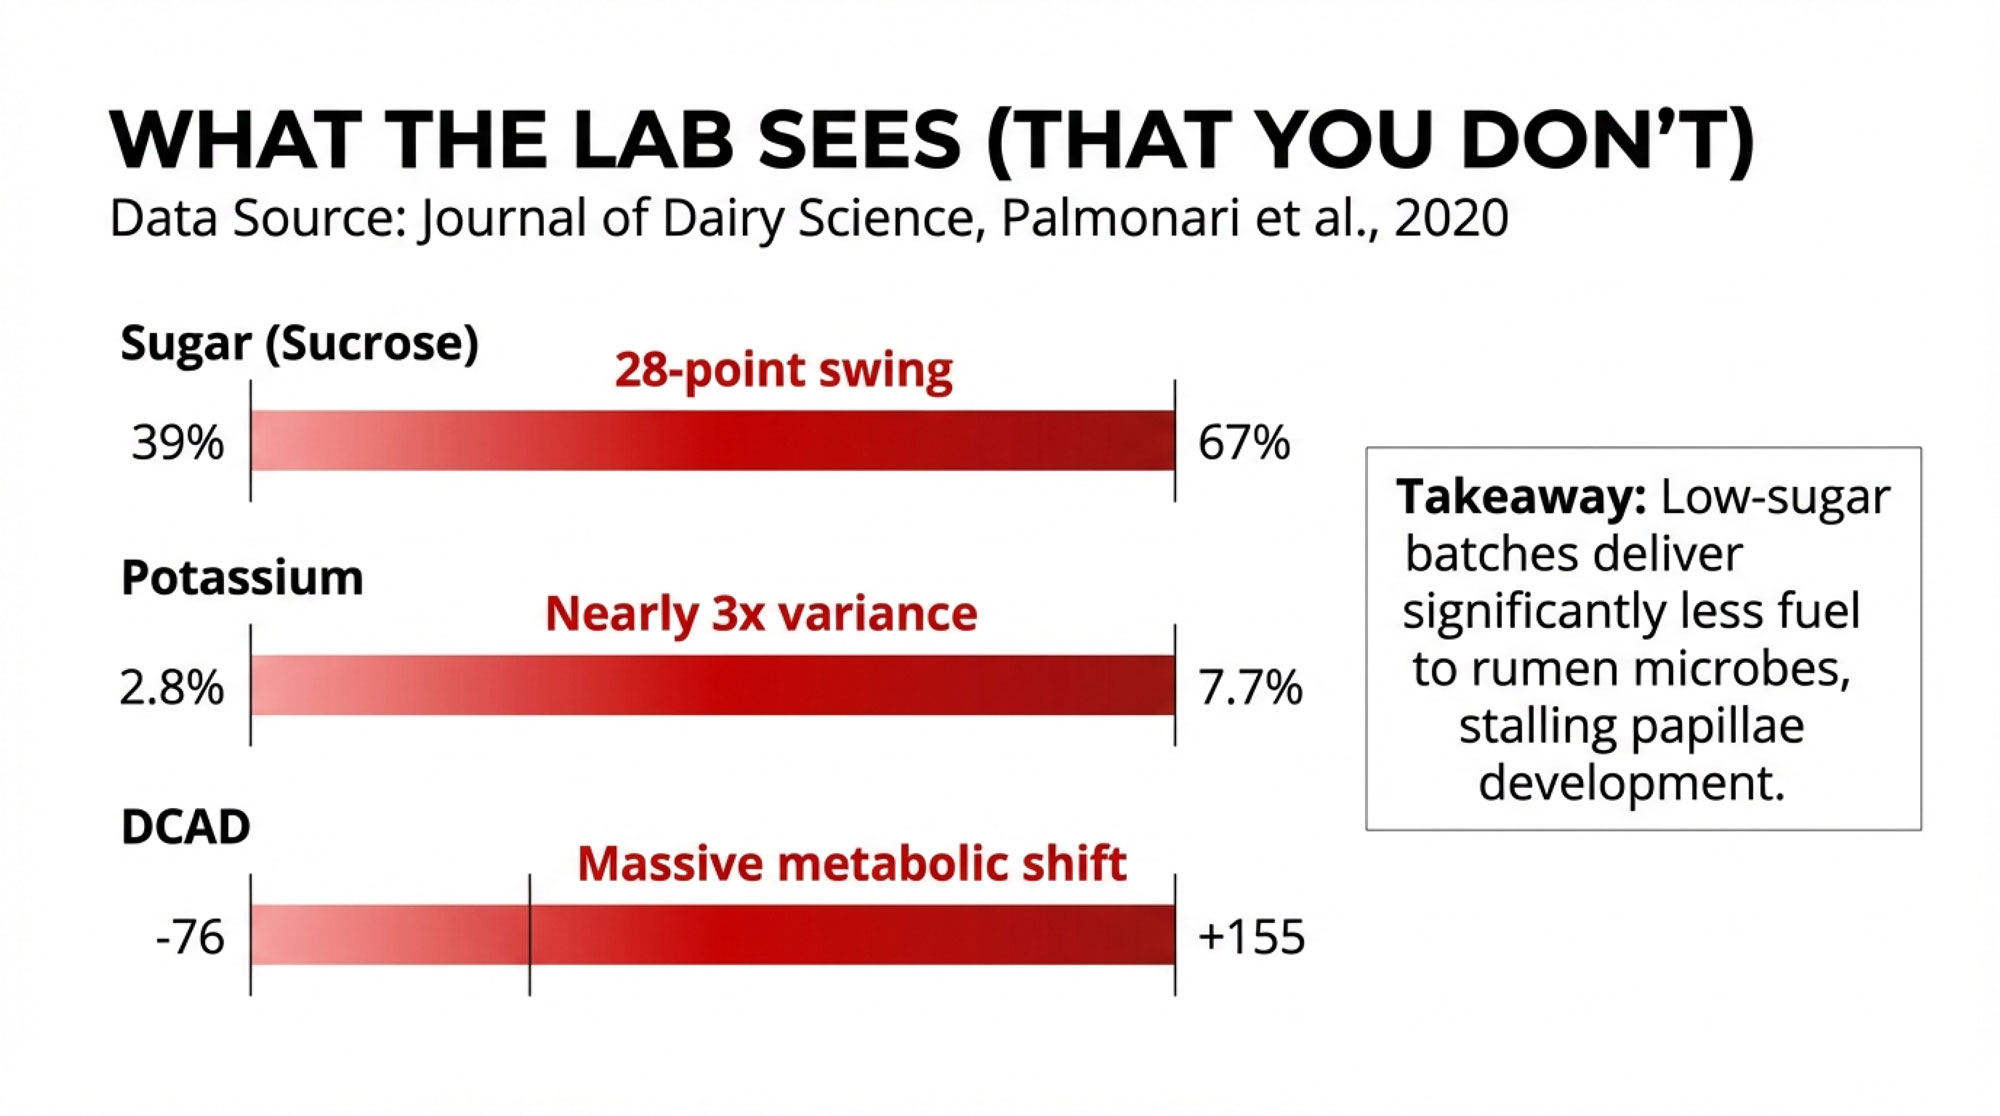
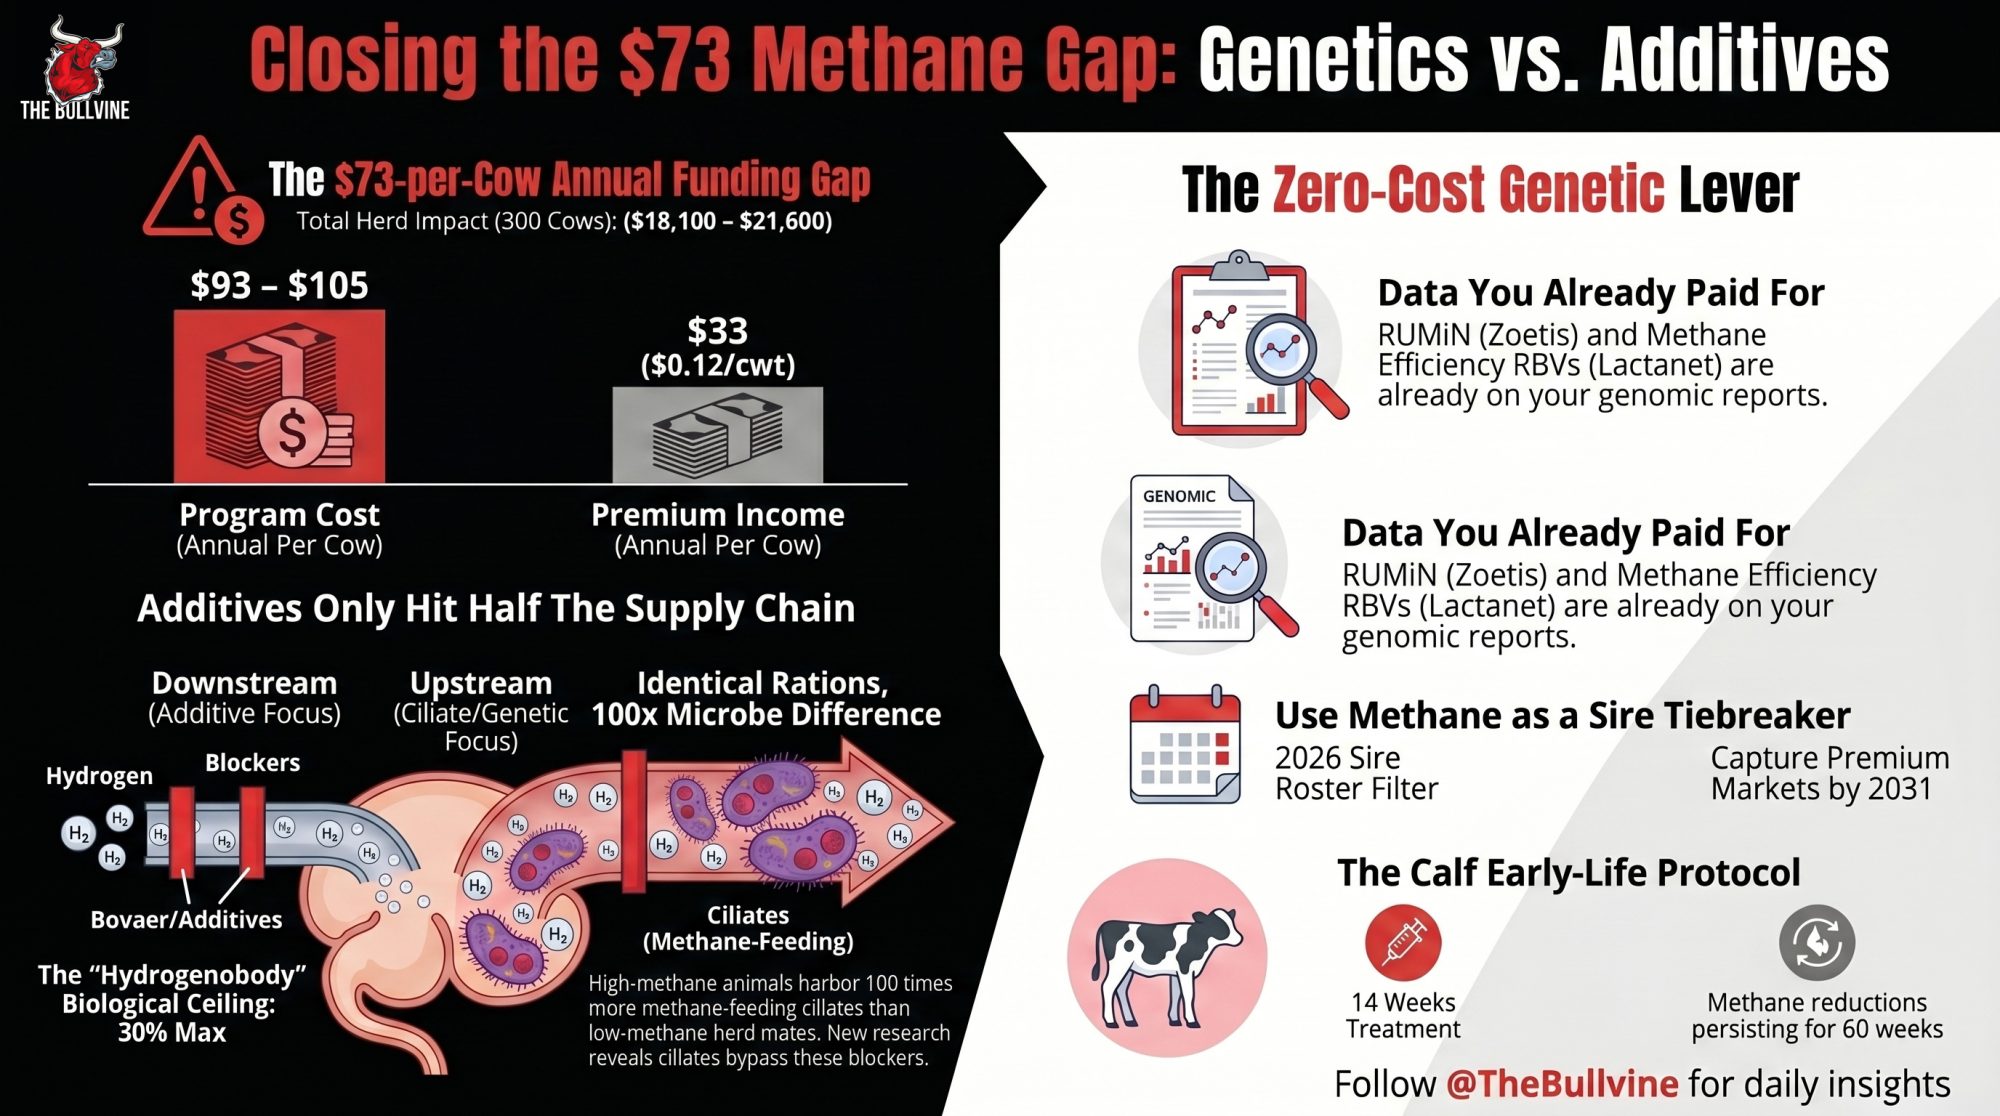
Executive Summary: Bovaer caps near 28–30% methane reduction because the April 30, 2026 Science paper just mapped a second hydrogen supply — the ciliate hydrogenobody — that 3-NOP can’t reach. On a 300-cow herd at 75 lbs/day, Bovaer runs $93–$105 per cow per year while a $0.12/cwt sustainability premium pays back only about $33, leaving a $40–$73 per cow per year gap that carbon credits or insetting have to fill. Sheep on identical rations produced 100 times more Dasytricha ciliates in high-methane animals than low-methane ones — same bunk, same feed, two orders of magnitude apart — which is why adding more additive won’t close the ceiling. The zero-cost lever is already sitting on the genomic reports you paid for: Zoetis dropped RUMiN into the April 2026 DWP$ update, and Lactanet has published Methane Efficiency RBVs on every Holstein female in eDHI since April 2023. Two 30-day moves earn their place before Monday — pull a recent CLARIFIDE Plus or Lactanet report and check whether methane traits ever broke a sire-selection tie, and if Bovaer’s already on farm, talk to your calf manager about adding it to the milk replacer for next-born heifers. Producers who filter sires on methane genetics in 2026 will be selling that genetic trajectory into a premium market by 2031–2032; producers who wait will be buying it back at markup. The full herd-size-tiered math and the two contract questions worth asking before 2027 renewal live in the next Bullvine Weekly.

Bovaer methane reduction

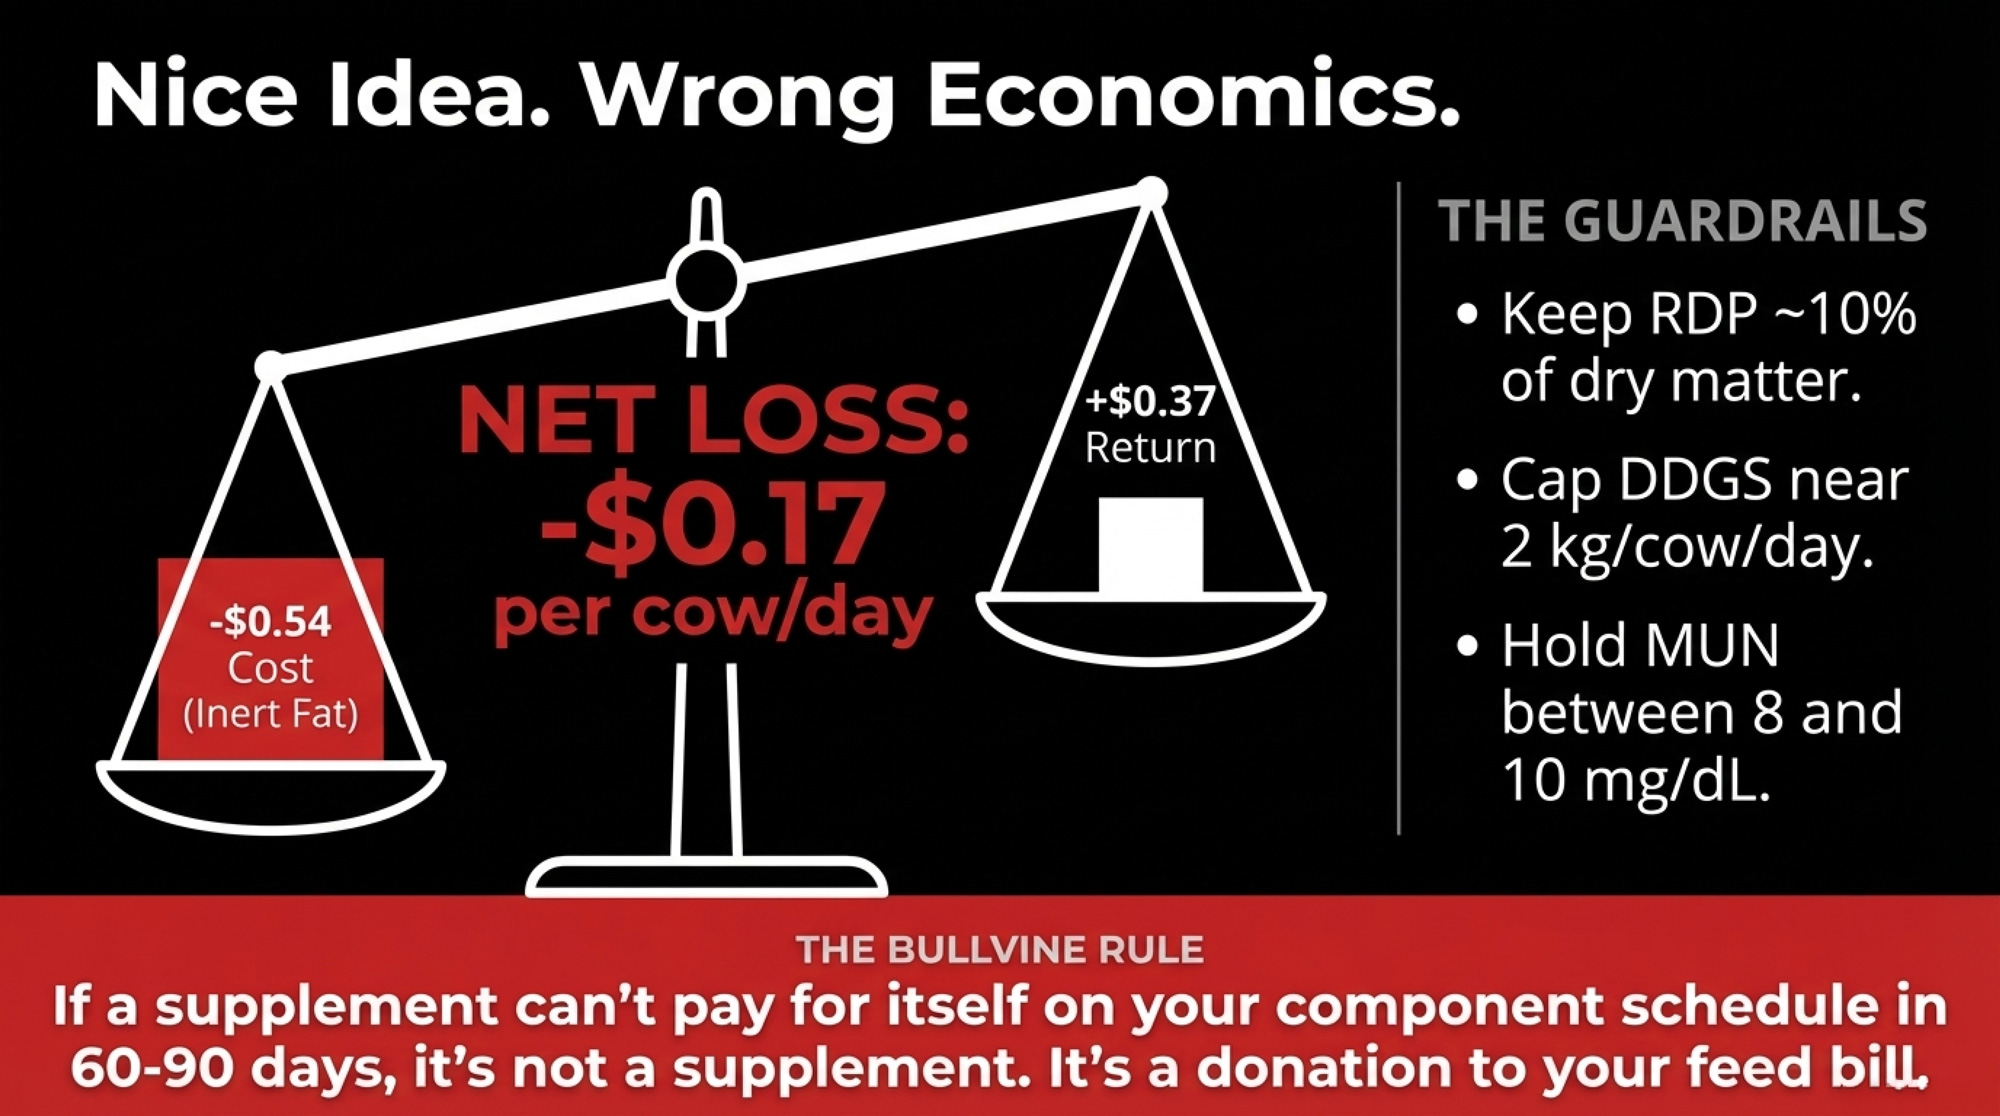
Run the numbers on a typical 300-cow herd shipping to a DFA-member plant at 75 lbs/day, on a contract up for renewal in 2027, collecting a $0.12/cwt sustainability premium. Eighteen months into a Bovaer (3-NOP) program, the methane reduction holds steady at 28%. The additive is doing what the label promised. But Bovaer has been reported in trade coverage at roughly $93–$105 per cow per year, while that $0.12/cwt premium on 75 lbs/day works out to only about $33 per cow per year — and Elanco has publicly projected carbon market returns in the range of $20 per cow per year on top of the premium, which still leaves a gap of $40–$73 per cow per year. The April 30, 2026 paper in Science just explained why closing that gap with more additive isn’t the play.
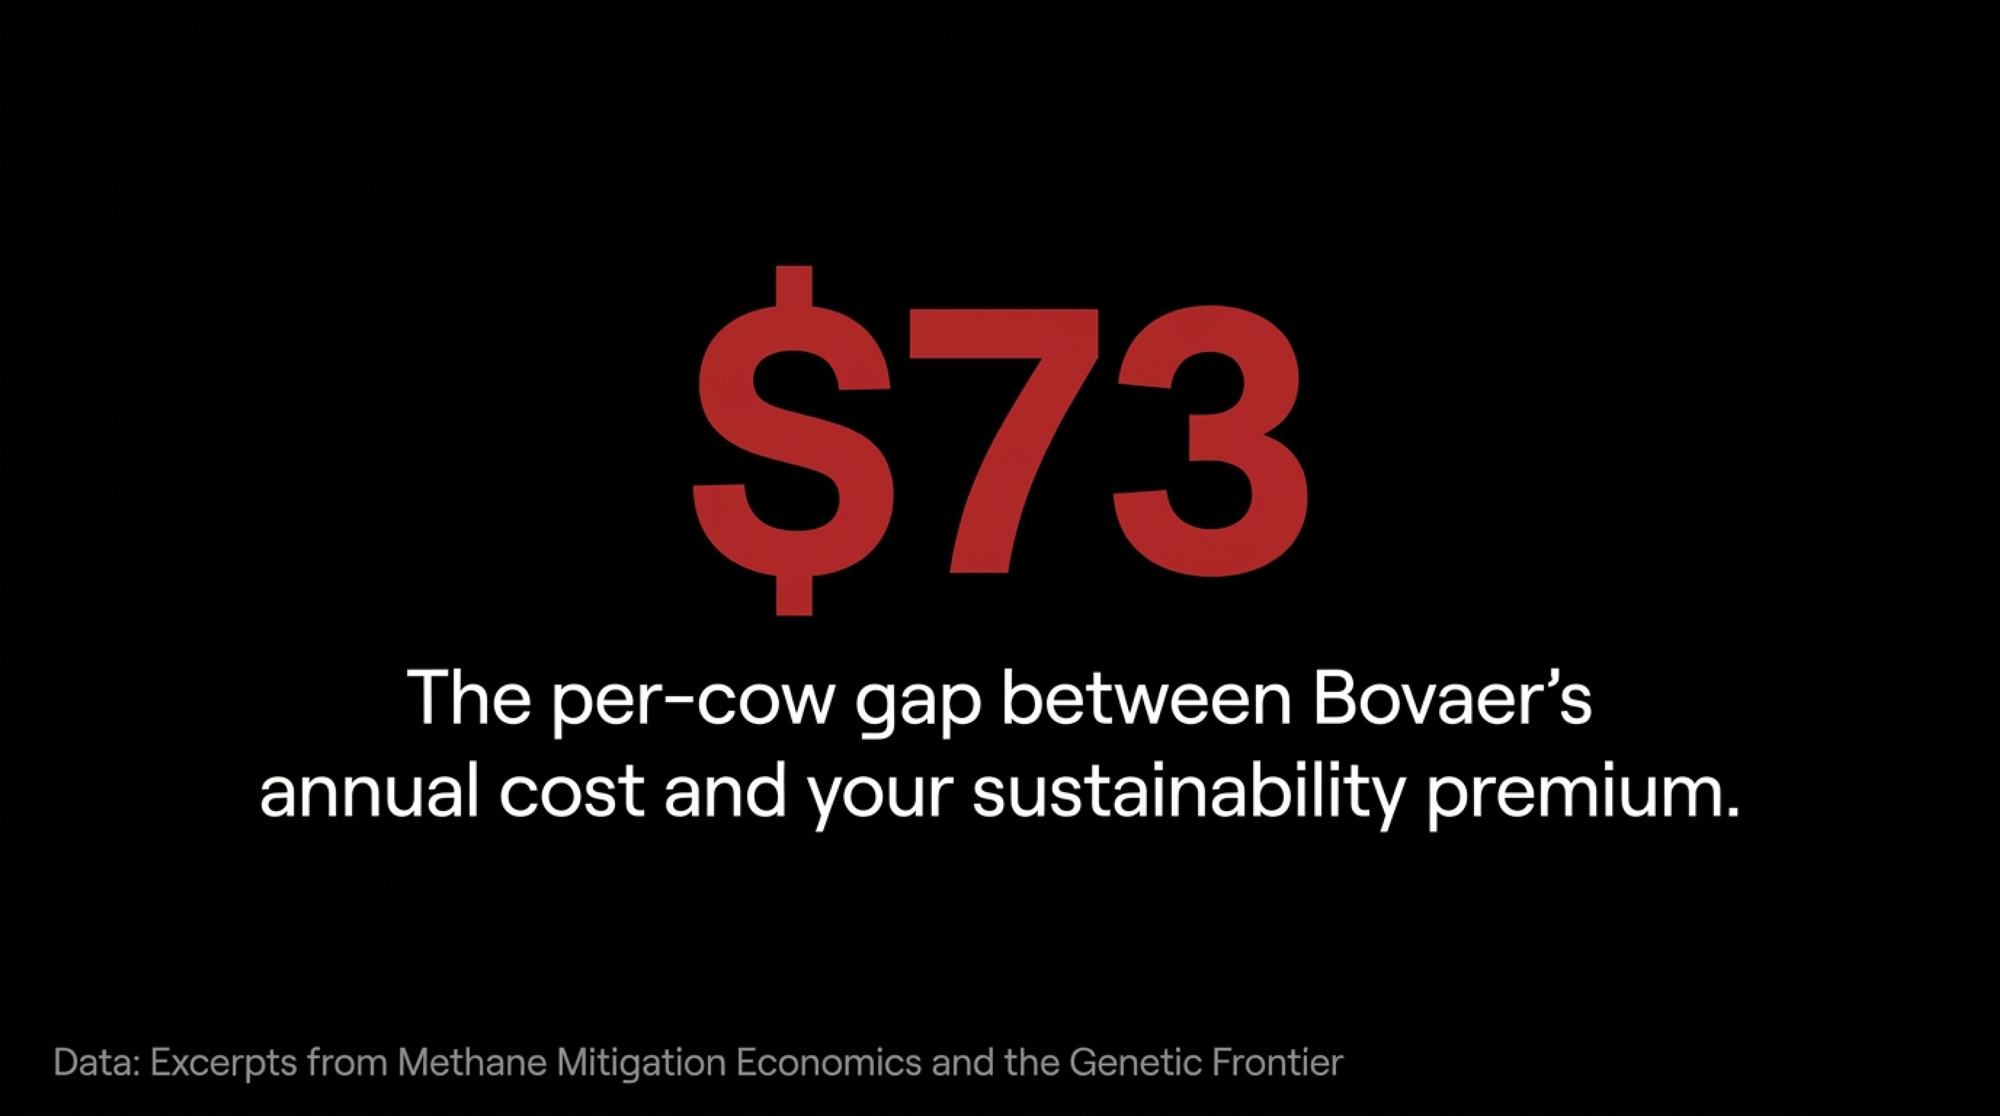
The gap closes fastest where a producer holds insetting access (defined below) or OFCAF cost-share. It widens fastest if carbon market revenue doesn’t materialize at renewal. That’s the variance band every 2027 conversation is running through right now.

The 30% Ceiling: Why the Rumen Resists Methanogen-Only Additives
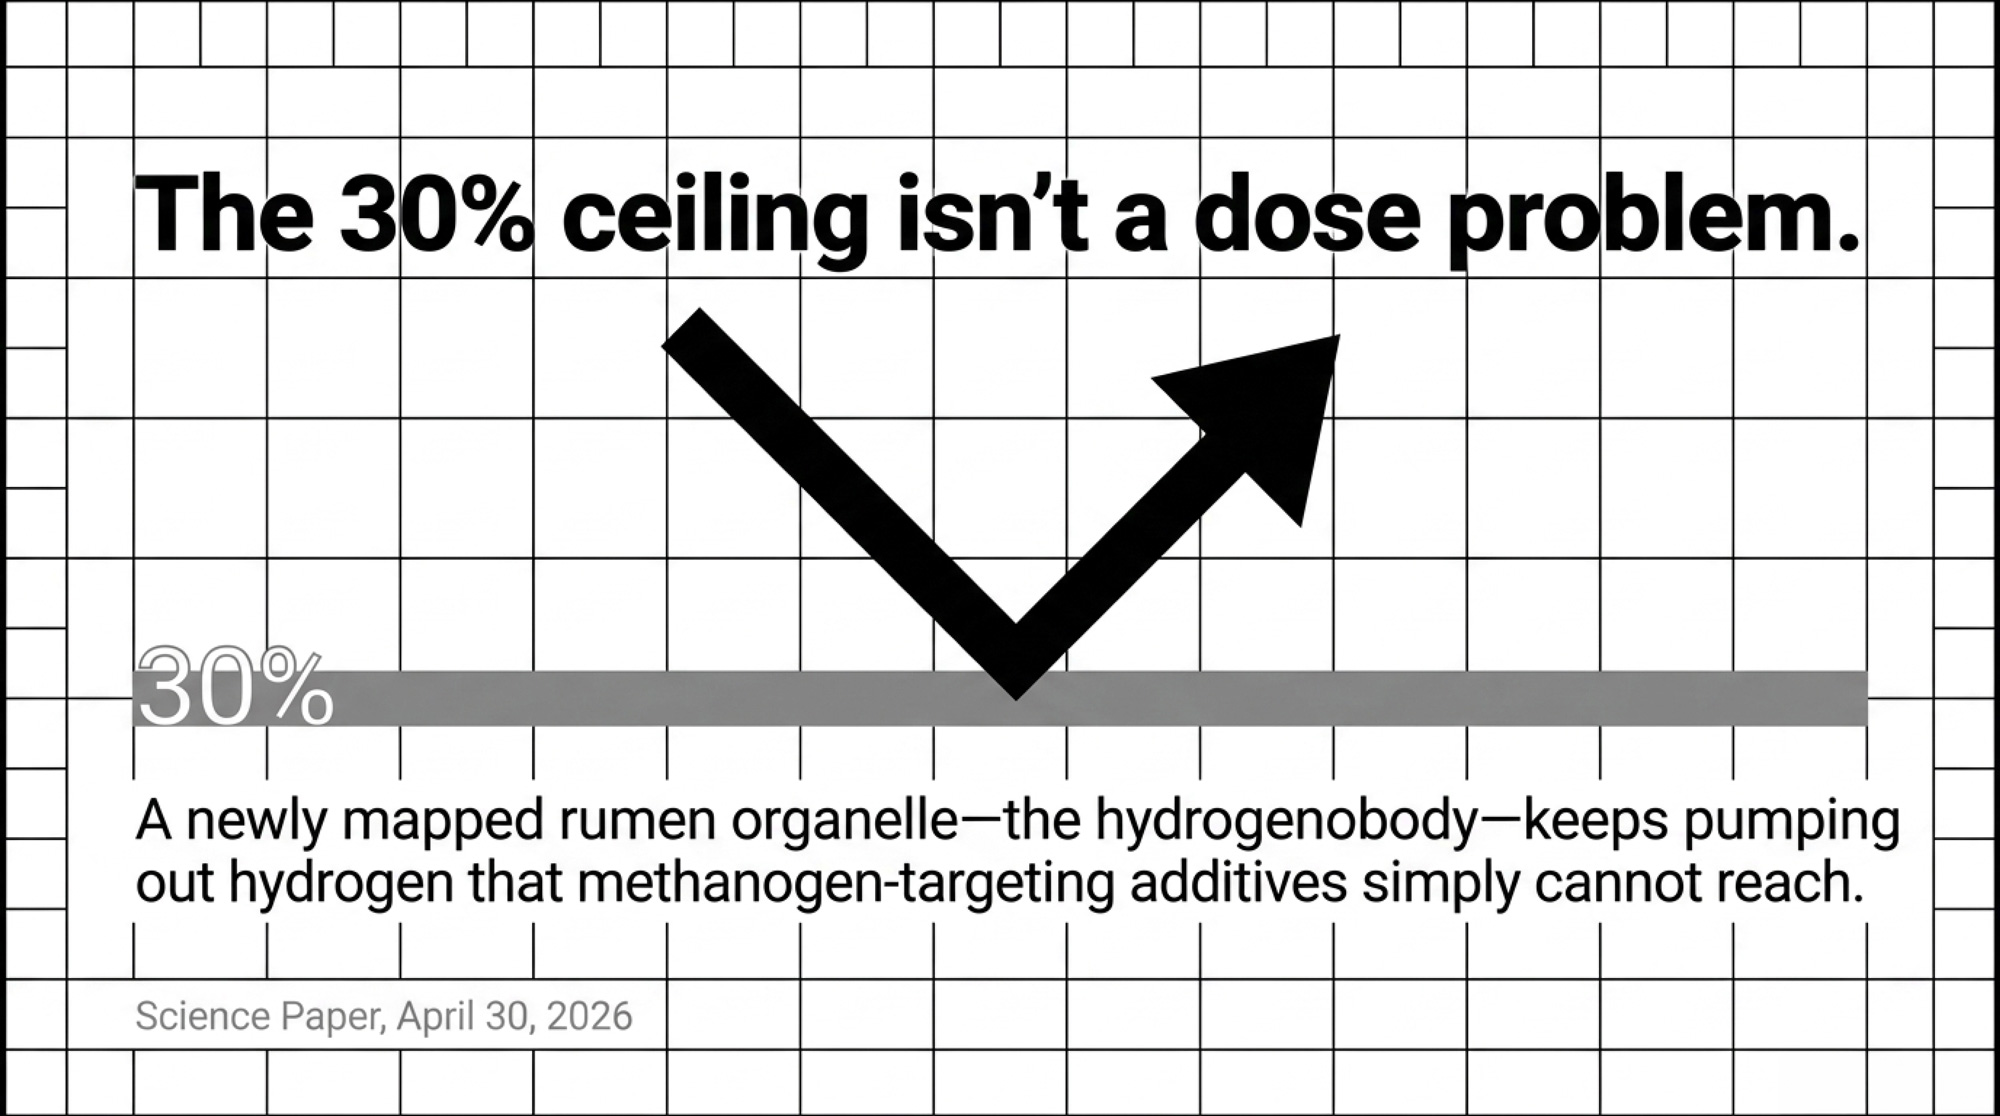
Researchers at the Chinese Academy of Sciences assembled the most comprehensive rumen ciliate genome catalog ever produced — 450 genomes across cattle, sheep, goats, and deer. Inside those single-celled microbes, they found a tiny organelle nobody had described before. They named it the hydrogenobody. It does two jobs: produces hydrogen,

and scrubs oxygen from its immediate environment.

Those two jobs together build a near-perfect environment for the methanogens that convert hydrogen into methane. That’s the causal link the April paper nailed down. Bovaer blocks the downstream methanogens — but the hydrogenobody sitting one step upstream keeps pumping hydrogen the additive can’t reach. Your 28–30% reduction isn’t a dose problem. It’s the practical ceiling of a mechanism targeting only the downstream half of a two-part hydrogen supply chain.

The sheep data is where this lands hard. Animals fed identical rations — same feed, same management — but producing high methane had nearly 100 times more Dasytricha ciliates (a high-hydrogenobody genus) than low-methane sheep. Two animals. Same bunk. Same ration. Two orders of magnitude difference in the microbes most responsible for feeding the methane machine.
How This Shows Up in Real Herds

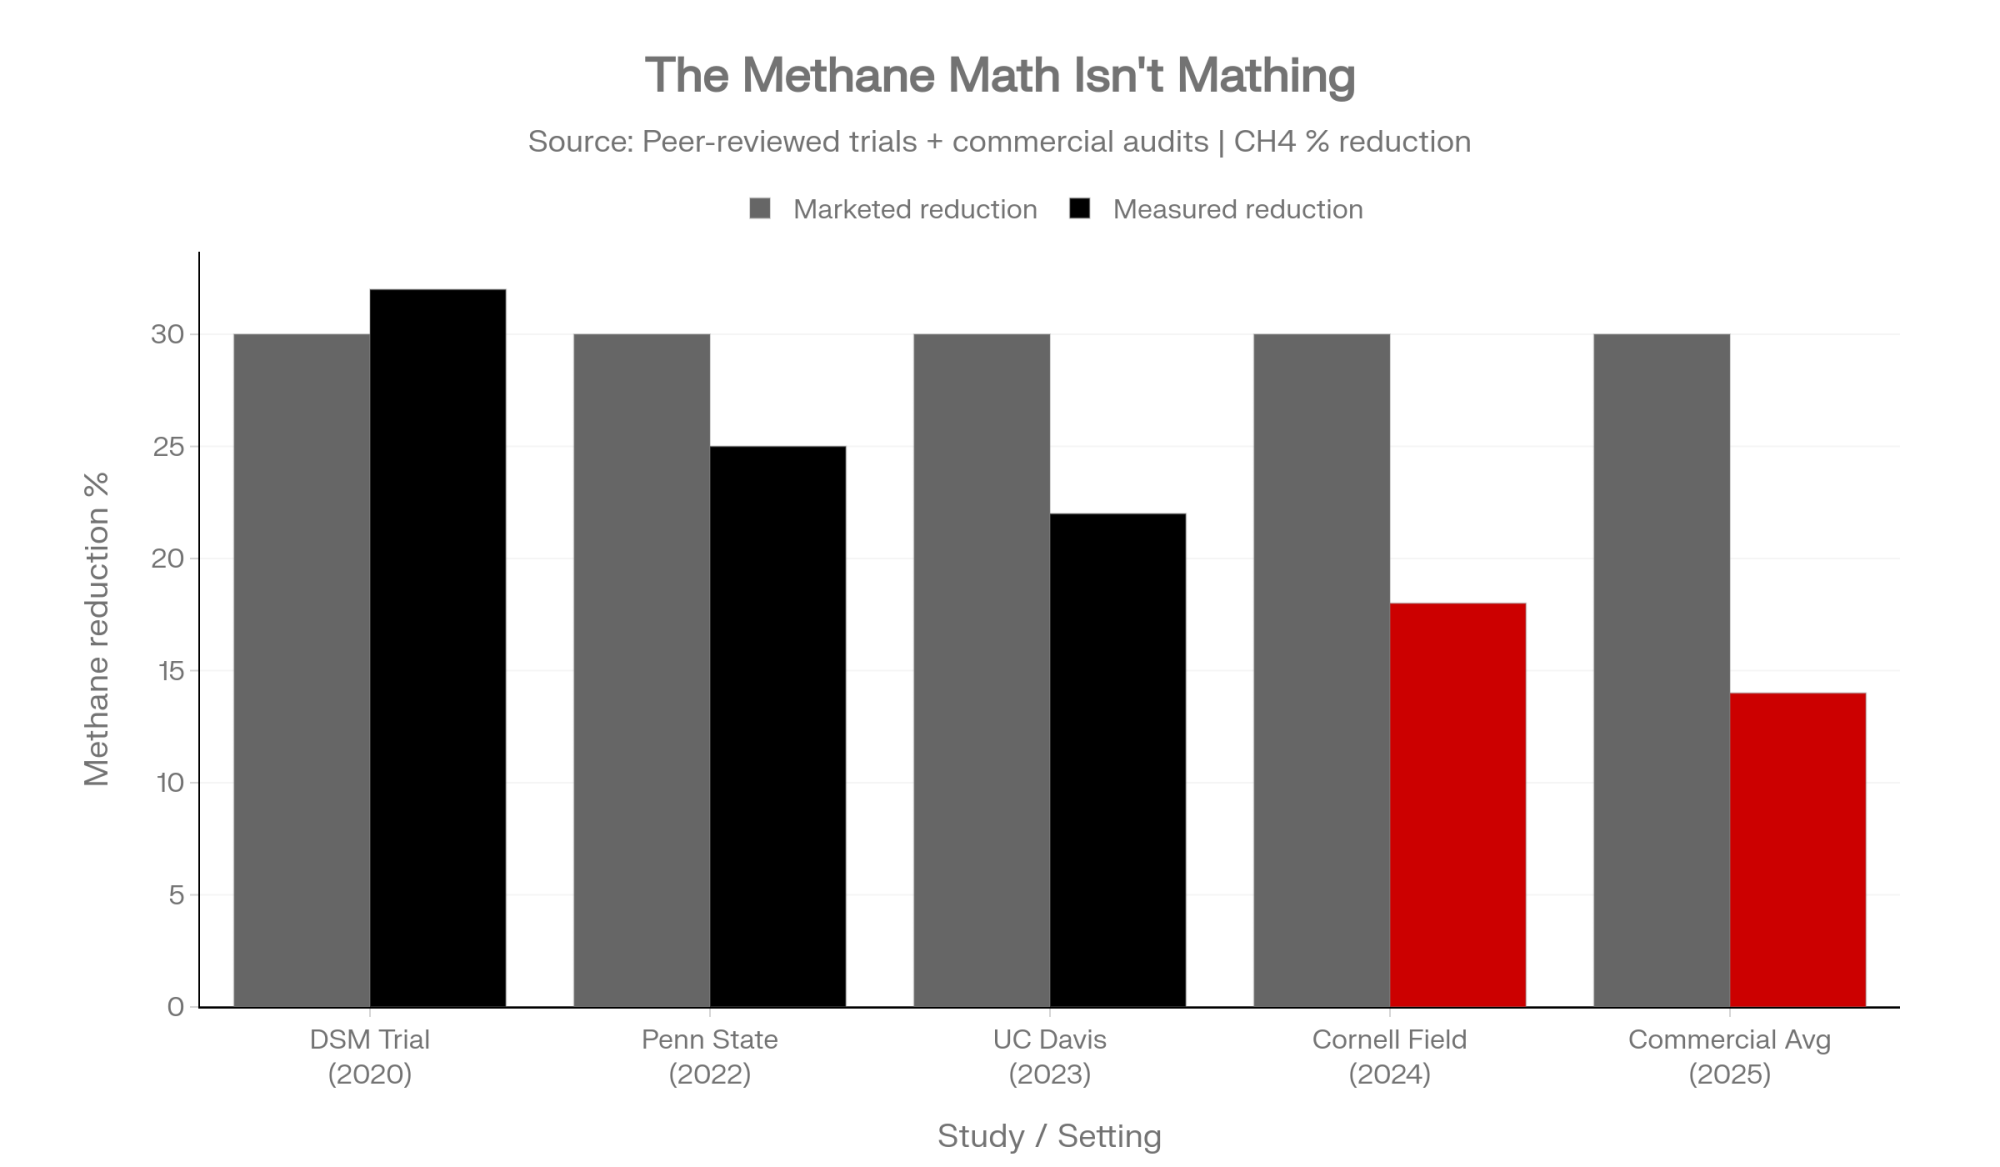
A Canadian producer 18 months into Bovaer watches the methane number hold steady near 28%. A US producer running the same program notices the reduction shrinks when forage composition shifts — consistent with the Dutch year-long trial’s finding that ration changes produced the biggest swings in the number. Both are experiencing the same biology: elevated rumen hydrogen partial pressure from methanogens being partially suppressed, while ciliates keep producing H₂ at the cell surface. Elanco has publicly maintained that Bovaer delivers consistent reductions under commercial conditions across validated trials, and within-mechanism that record is real. What the April paper raises is about the mechanism’s scope, not its integrity.

Penn State measured 3-NOP cutting methane 31% while simultaneously raising free rumen hydrogen from undetectable to 1.33 g/day. The Dutch year-long dairy trial found efficacy of 21–27% across a full lactation. Different herds. Different seasons. Same shape of result.
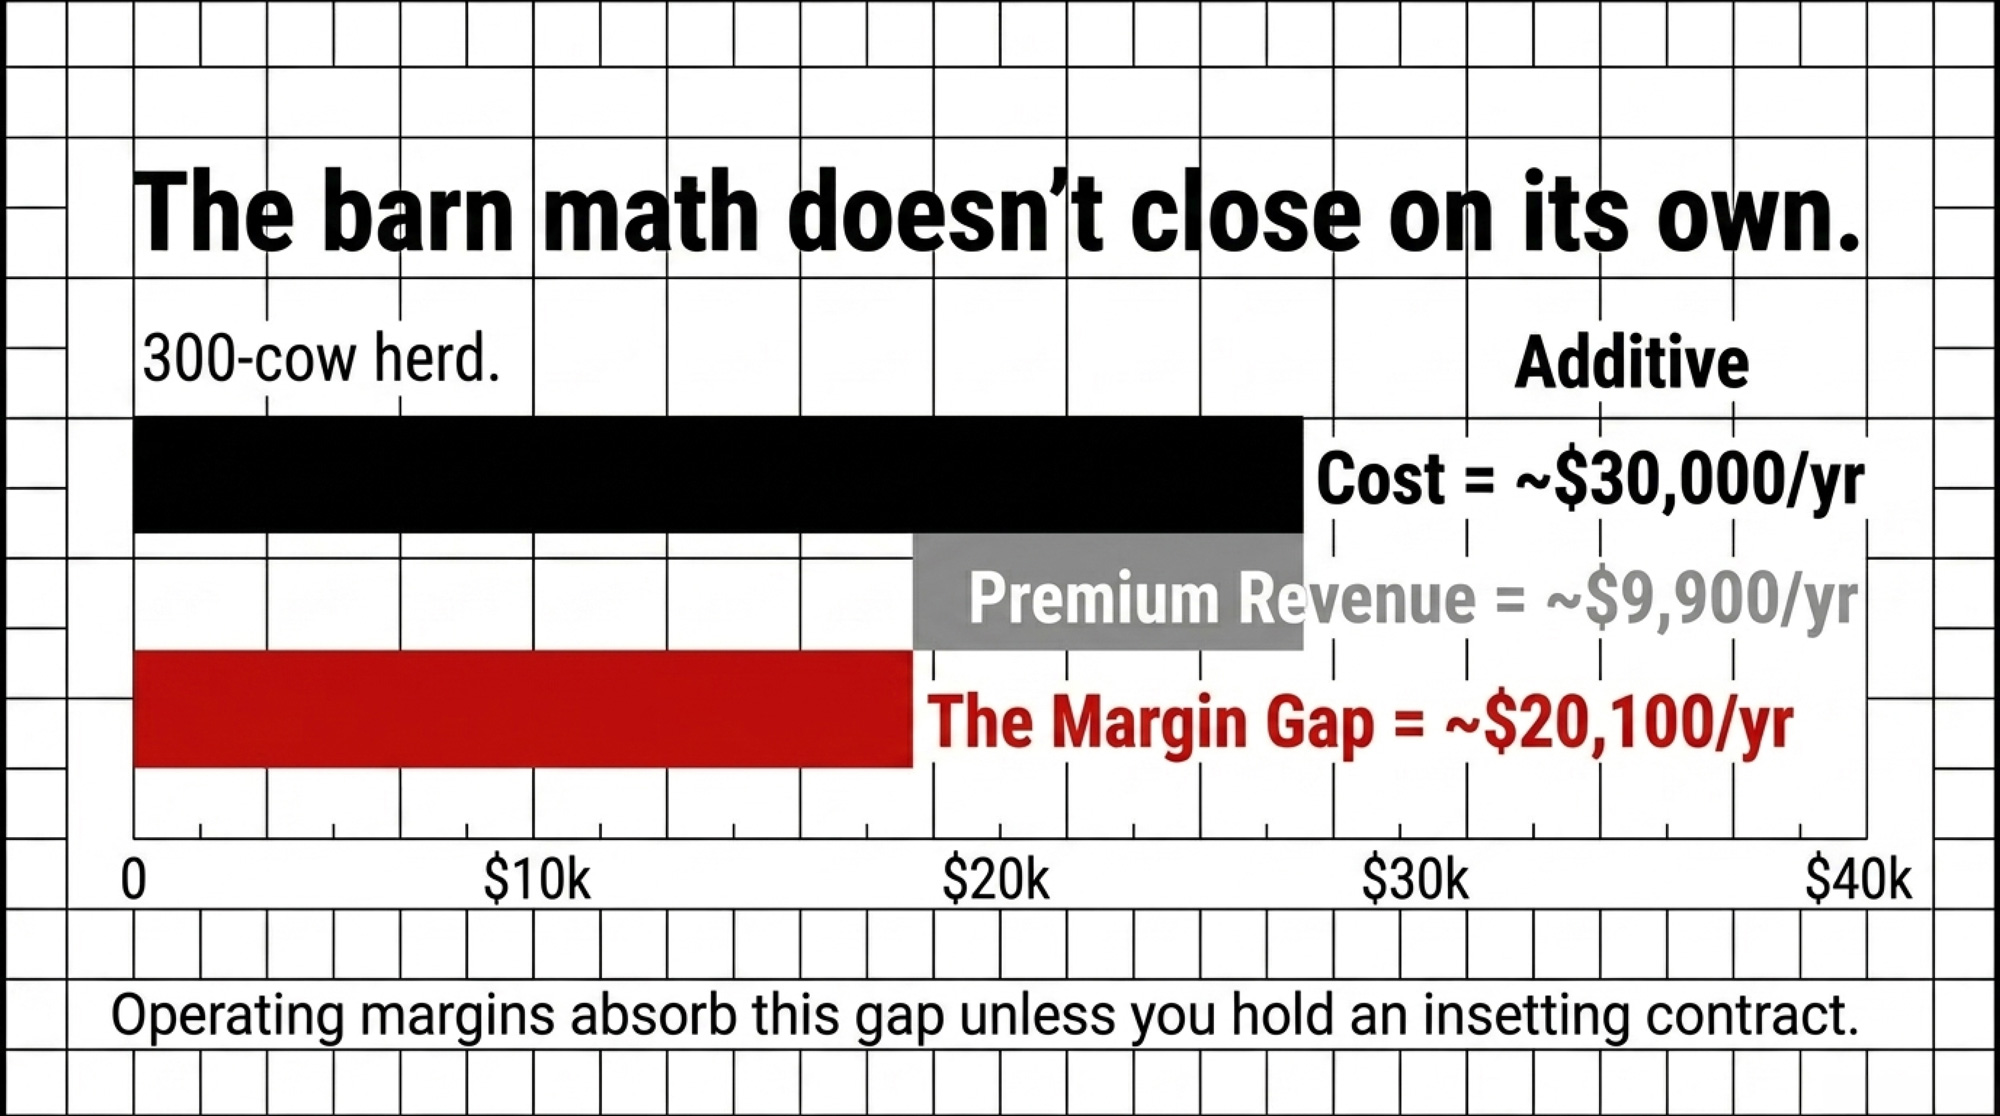
The barn math. On a 300-cow herd, Bovaer costs roughly $28,000–$31,500 per year in additive bills. That same herd earns about $9,900 per year from a $0.12/cwt premium on 75 lbs/day. The gap between cost and current premium revenue lands at $18,000–$21,500 per year that has to come from somewhere. Carbon credits. Cost-share. An insetting arrangement. Or your operating margin absorbing it as audit insurance.

Contract Line ItemMarketed ValueRealized Value (Yr 1)Gap
Sustainability premium$1.25/cwt$0.92/cwt–$0.33
Bovaer feed cost (DSM pricing)“offset by premium”$0.18/cow/day+$65.70/yr
Methane verification feeNot disclosed$12/cow/yr+$12.00
Labor/TMR mixing compliance“minimal”0.4 hr/day/100 cows+$18/cow/yr
Exit penalty (early termination)“standard”24-month clawbackLocked in
Net margin impact+$47/cow–$26/cow–$73/cow

Plug your own numbers in. Your herd size times about per cow per year lands you inside the variance band — closer to the low end if you hold an insetting contract, closer to the high end if you don’t. If that number is larger than you’re comfortable carrying into 2027 renegotiation, the four-lever choice below starts to matter.

Contract ClauseTypical LanguageHidden RiskNegotiation Ask
Premium duration“for the term of agreement”Reviewable annually by processorLock floor at $0.75/cwt for 36 months
Dosing compliance“per manufacturer protocol”Audit failure = full clawbackCap clawback at 6 months
Data ownership“processor retains herd data”Sold to CPG brands without share25% royalty on secondary data use
Methane floor“minimum 25% reduction”Below-threshold = unpaidTiered payment, no zero-out
Termination“24-month notice required”Blocks competing contracts90-day exit with cause

What’s Actually Happening in the Rumen
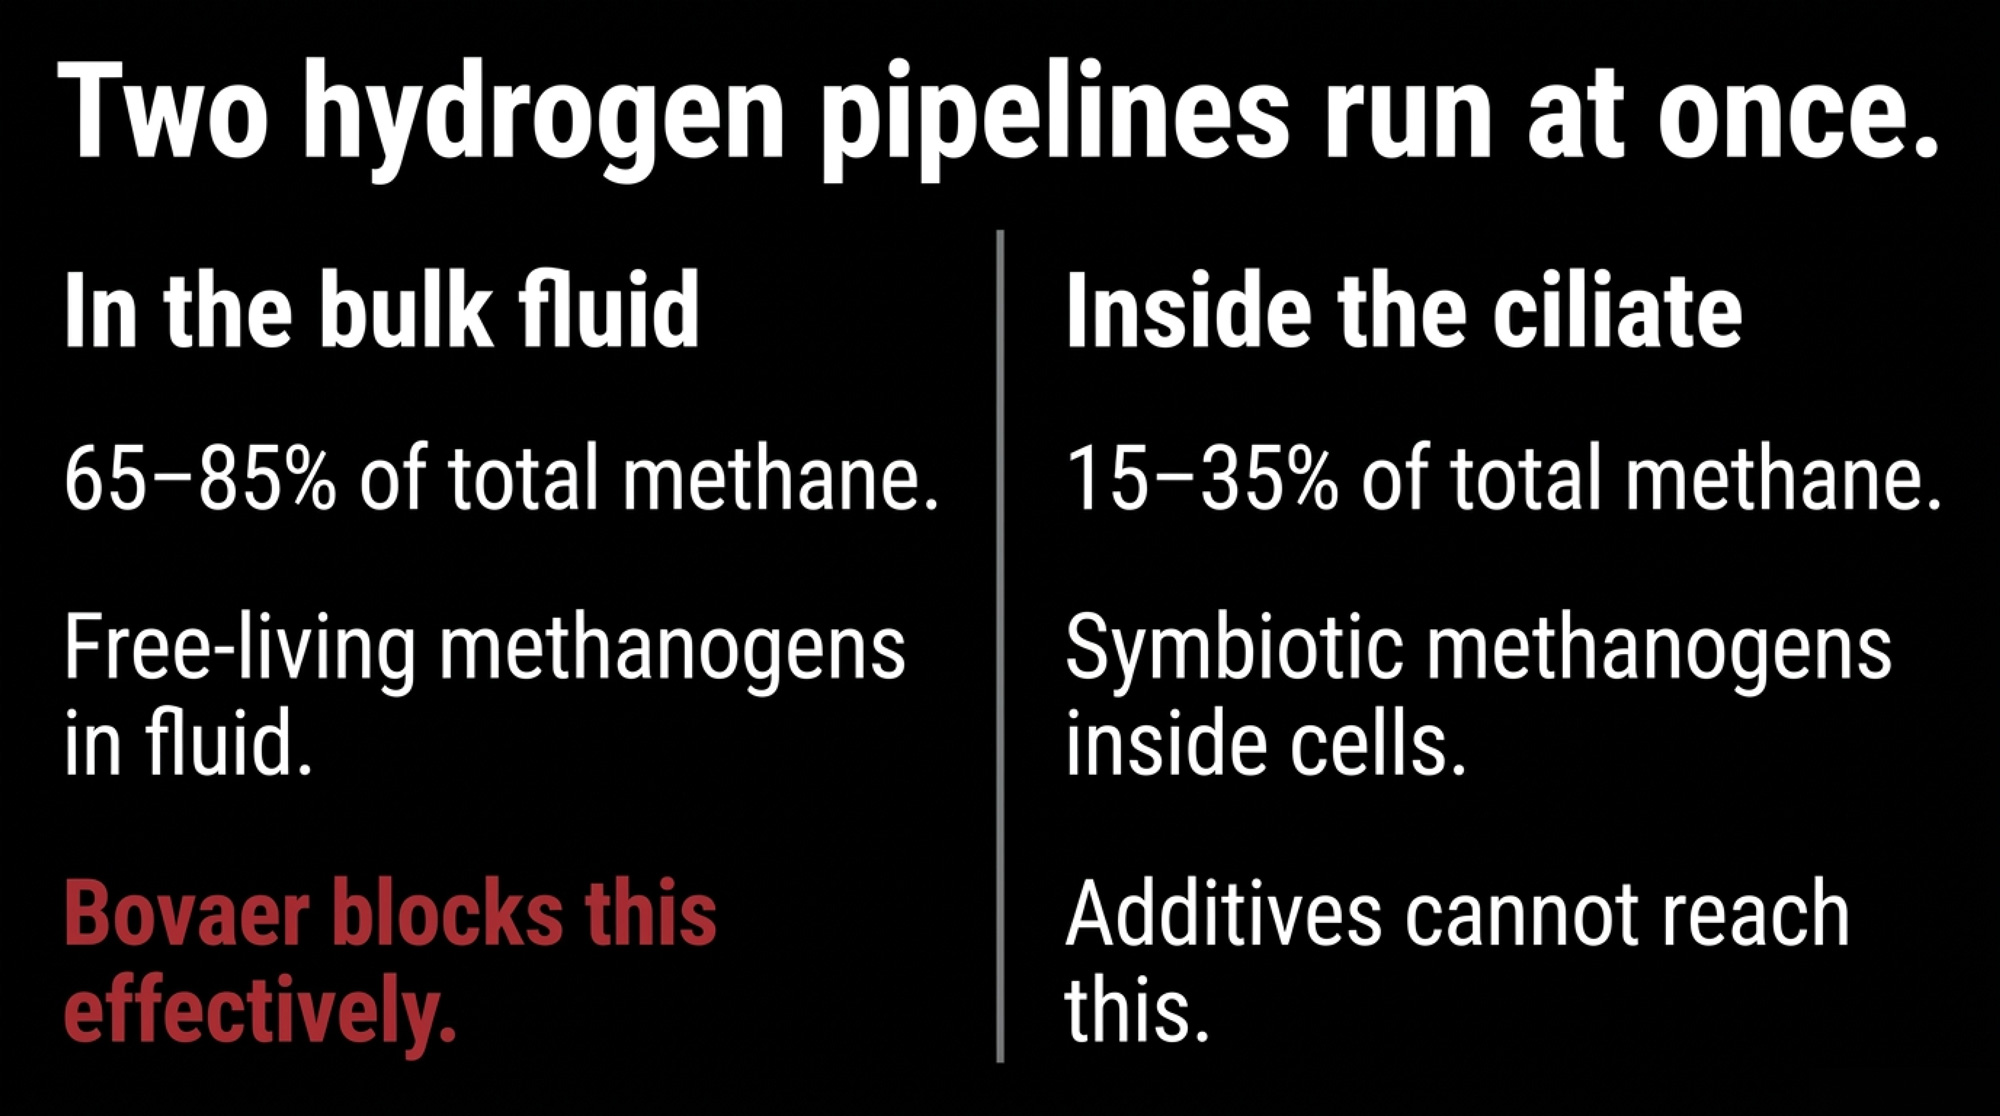
Two hydrogen pipelines run at the same time. Free-living methanogens in the bulk rumen fluid consume roughly 65–85% of total methane production. That’s where Bovaer operates — circulating in fluid, reaching those free-living archaea, blocking the enzyme that makes methane. That’s the real reduction you’re paying for.

But the other 15–35% of methane comes from methanogens that live directly on and inside ciliate cells as symbiotic partners, fed hydrogen at cell-surface proximity by the hydrogenobody organelles. That exchange happens in nanometres, not metres. An additive moving through rumen fluid has a much harder time reaching those methanogens at meaningful concentration — the hydrogen never enters the bulk fluid in the first place.

That upstream gap is why Asparagopsis seaweed routinely hits 80–99% in controlled trials, and why compounds that suppress ciliates directly — certain tannins, saponins, lingonberry-derived extracts — tend to produce more durable results than their mechanism descriptions suggest. They’re hitting the supply, not just the consumer. Worth noting: ambient dietary tannins from alfalfa-heavy rations or byproduct loads don’t reach the therapeutic threshold, so “I already feed high-tannin forage” doesn’t substitute for a targeted blend.

The concerning part for producers 18 months in: recent metagenomics work has documented measurable shifts in the rumen protozoal community under sustained Bovaer dosing, with incomplete reversal after withdrawal. What that work doesn’t answer — and what you should be asking — is whether those community changes affect the size or stability of the methane reduction over time. The long-term efficacy question stays open.

How Much Does Waiting 30 Days Actually Cost?

For the tannin-saponin layer, waiting 30 days costs effectively nothing. The protocols and contract structures aren’t ready to pay for it yet. Verra’s VM0041 methodology — the dominant global protocol for enteric methane feed additive credits — currently covers methanogen inhibition. The ciliate module Viresco Solutions submitted in 2024 was placed on hold December 19, 2024, and the public registry entry does not specify criteria required for it to advance. Stacking a ciliate mechanism onto your current credit path isn’t an option today.

Waiting on the genetic lever costs you a heifer cohort and a breeding cycle. Those compound. Every breeding season you delay adding RUMiN or Methane Efficiency RBV to your sire filter is a generation interval you hand to a competitor who moved first. Danone has publicly stated that genomic testing plays an important role in its global methane reduction strategy. That signals where methane traits may factor into supplier programs over time. Zoetis integrated RUMiN into the April 2026 Dairy Wellness Profit Index update, with company materials indicating that RUMiN-informed sire selection is expected to reduce lifetime methane intensity in daughter cohorts. When methane EBVs get priced into semen premiums — and the trajectory suggests that’s where 2029–2030 is heading — producers who started filtering in 2026 will be the ones selling genetics the late movers pay premium to access.

Value Chain PlayerRevenue/Cow/YrCost/Risk BorneNet Margin/Cow
Dairy farmer$95$88 (feed + labor + risk)$7
Milk processor$142$38 (logistics + admin)$104
CPG brand (Danone, Nestlé)$210$45 (marketing + audit)$165
Carbon credit aggregator$68$14 (verification)$54
Value capture ratioFarmer = 2.4%

Is Your Herd’s Genetic Strategy Already Behind?

Pull a recent Zoetis CLARIFIDE Plus report or a Lactanet genomic summary on any heifer tested in the last six months. If you can’t immediately find the RUMiN value (Zoetis) or the Methane Efficiency RBV (Lactanet, published on every Holstein female in eDHI herds since April 2023), you’re not using data already in your mailbox.

Most selection indexes already weight methane traits implicitly through composites like Feed Efficiency or the Environmental Index inside LPI. That’s a reasonable starting point. When your processor or export buyer shifts toward outcome-based carbon verification in 2028–2030, the herds with a documented genetic trajectory — methane-filtered sires used consistently since 2026, with the genomic records to prove it — walk into that conversation with a structural story competitors can’t replicate on short notice.

Reliability on Lactanet’s methane genomic EBV for young genotyped bulls now exceeds 70%. The genetic correlation between MIR-predicted methane (the kind your eDHI milk sample is already generating) and directly measured methane is 0.85. You’re not selecting on noise. You’re selecting on data flowing through a pipeline that’s already running.

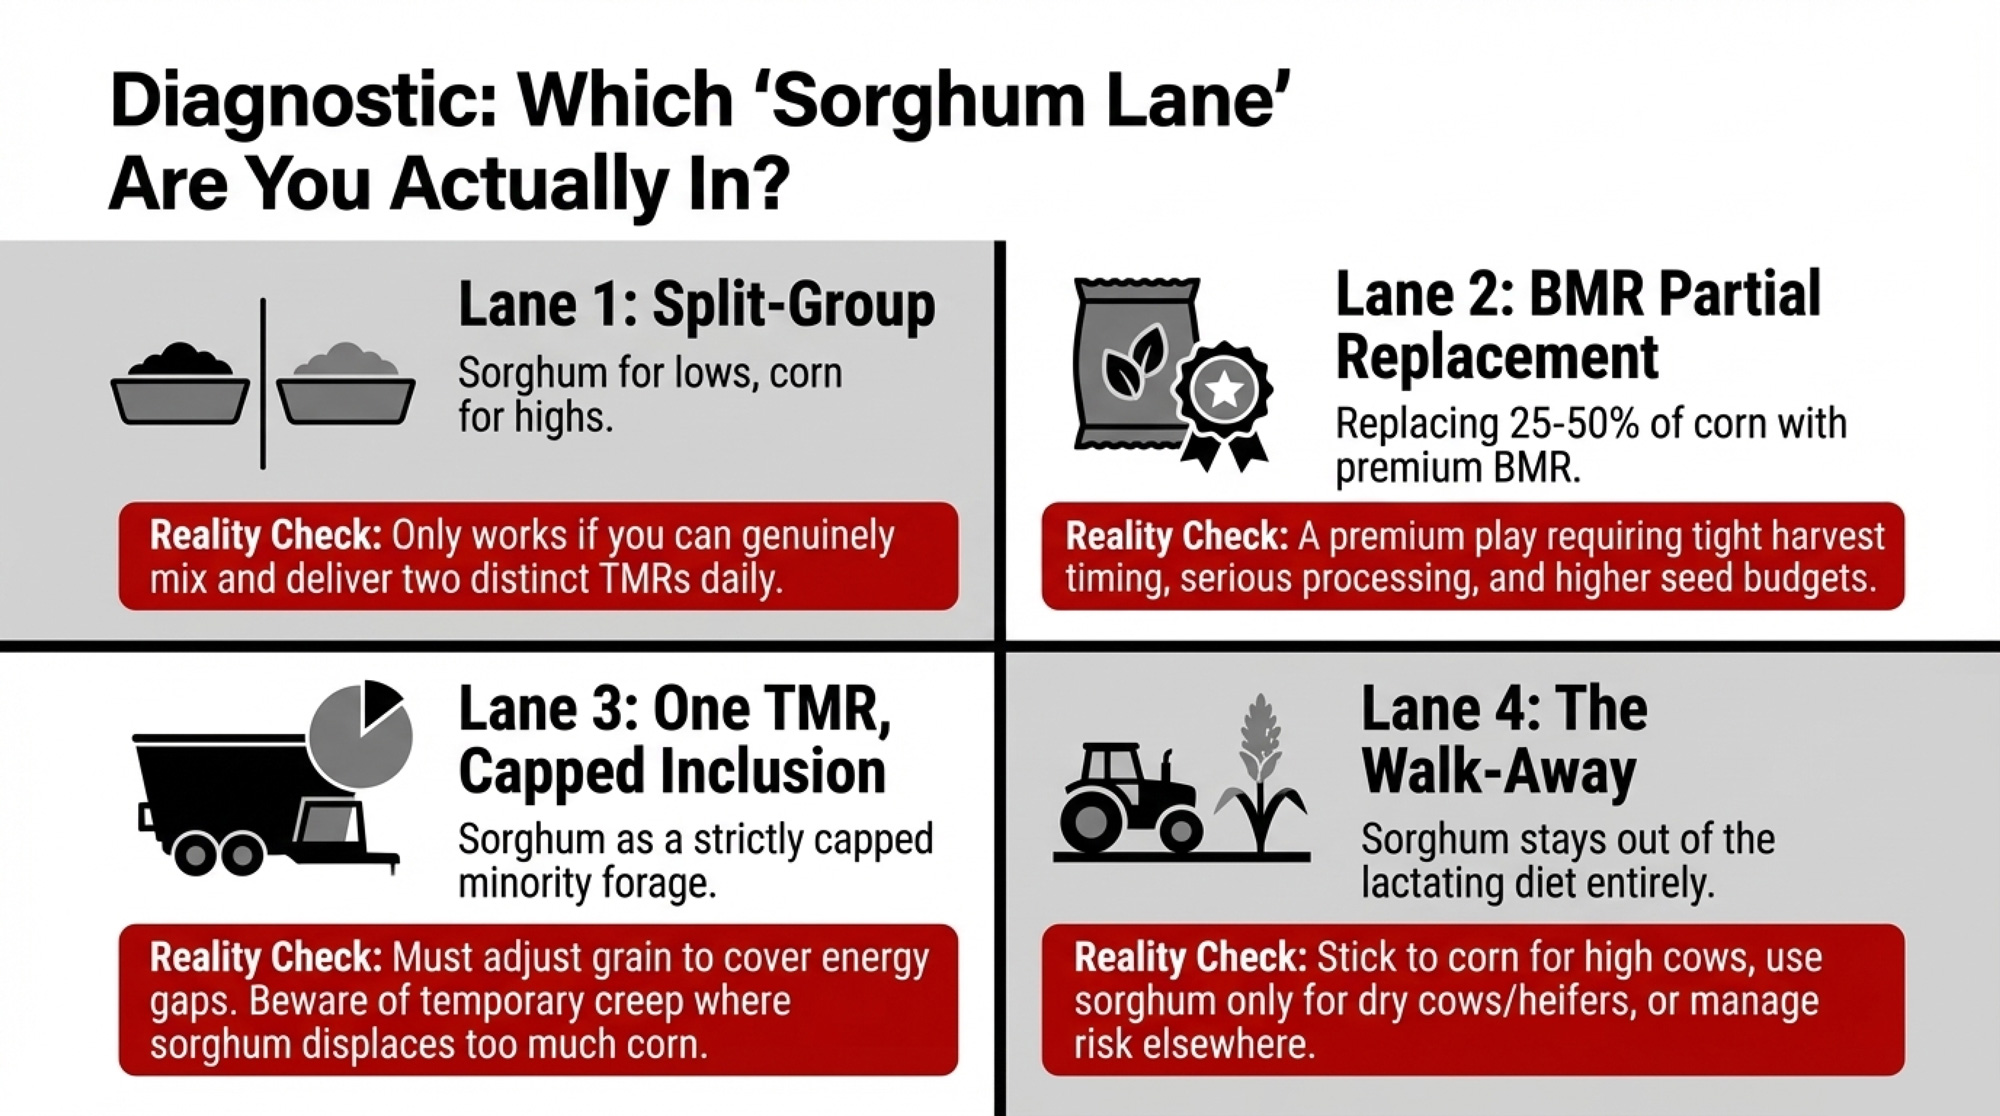
Options and Trade-Offs: The Four-Lever Comparison

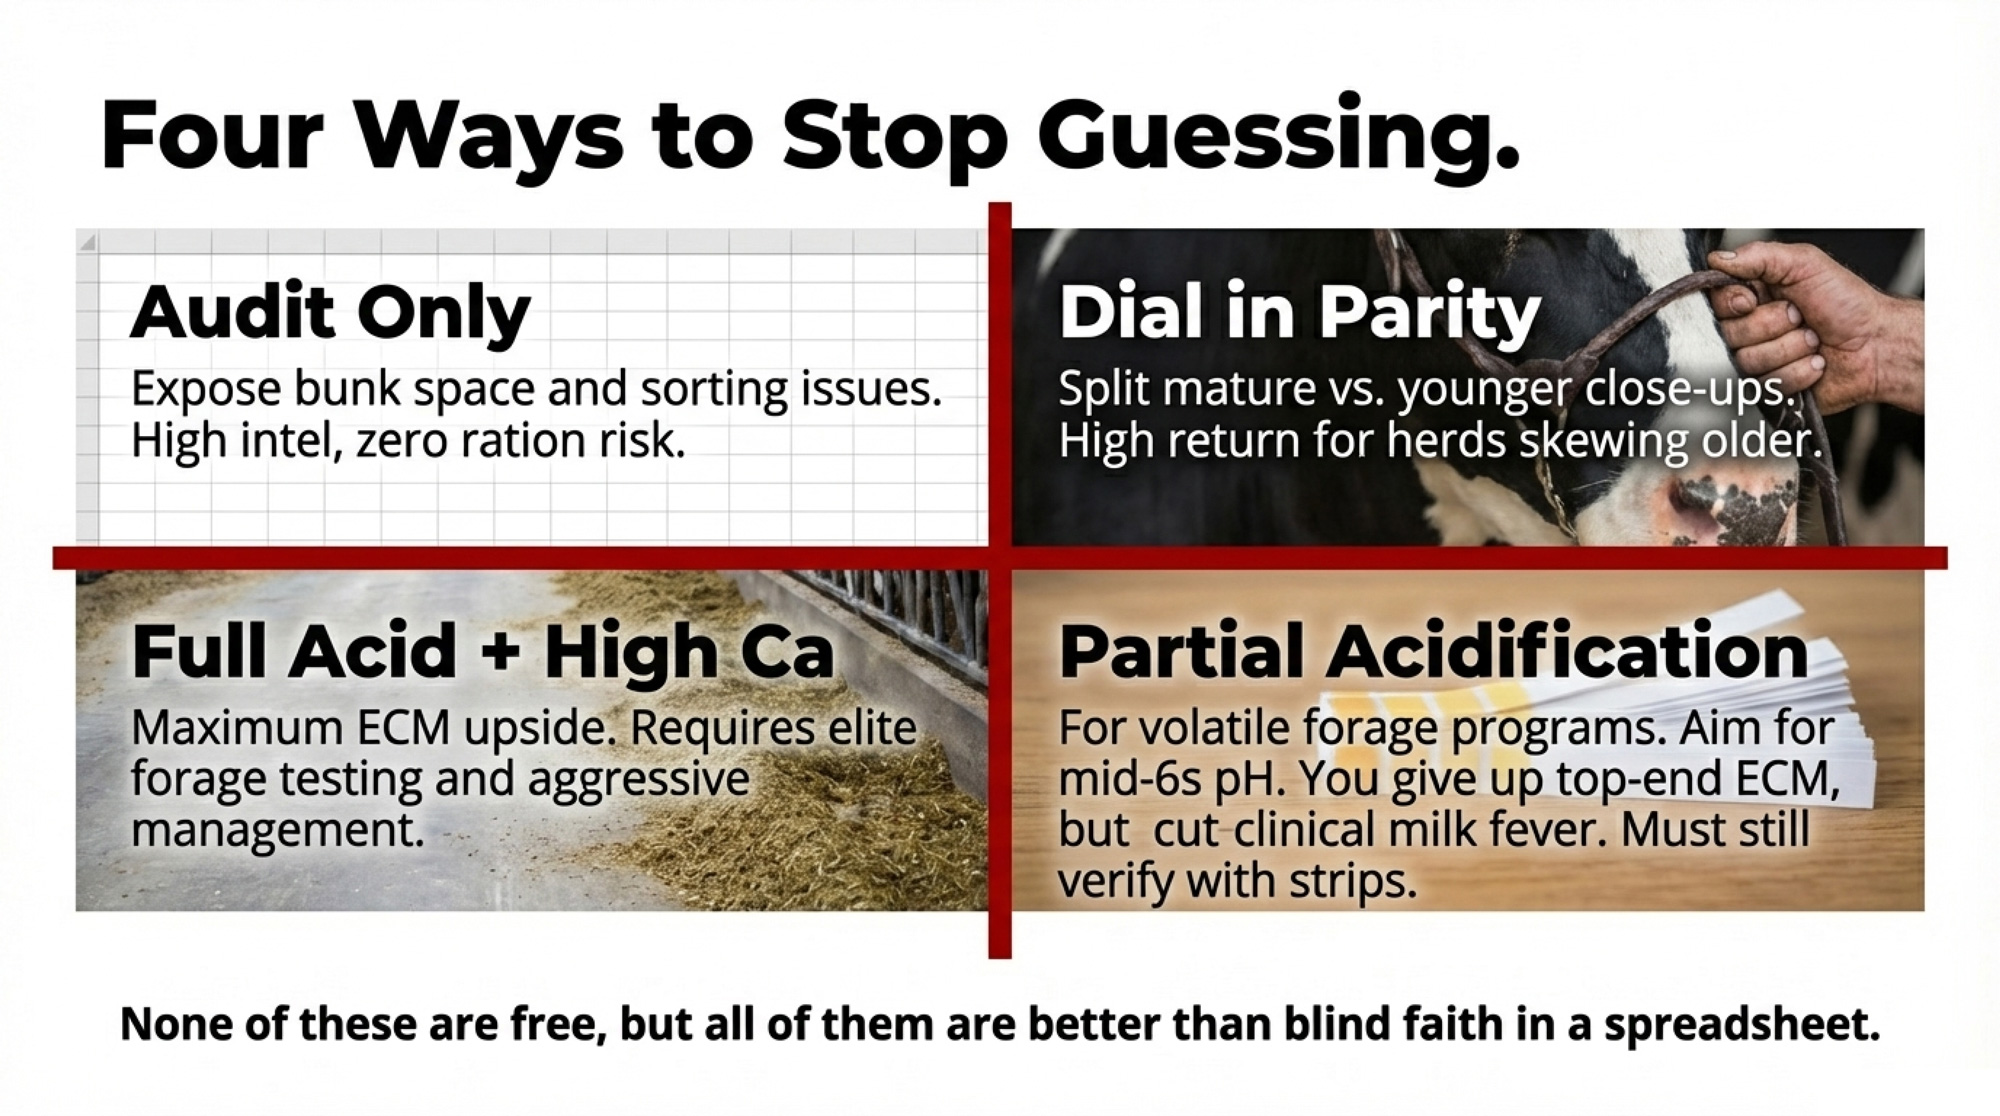
Four levers address different parts of the methane puzzle at different time horizons and cost points. Most producers shouldn’t run all four right now. Pick the combination that matches where your contract and your breeding program sit today.

A quick note on “insetting.” Unlike open-market carbon credits, an insetting arrangement keeps the reduction inside the processor’s own supply chain — it counts toward their Scope 3 footprint rather than being sold to an outside buyer. In an insetting model, your methane numbers feed your processor’s sustainability report. In an open-market model, you can sell the credit independently. The economics of your 2027 contract hinge on which model your processor runs.
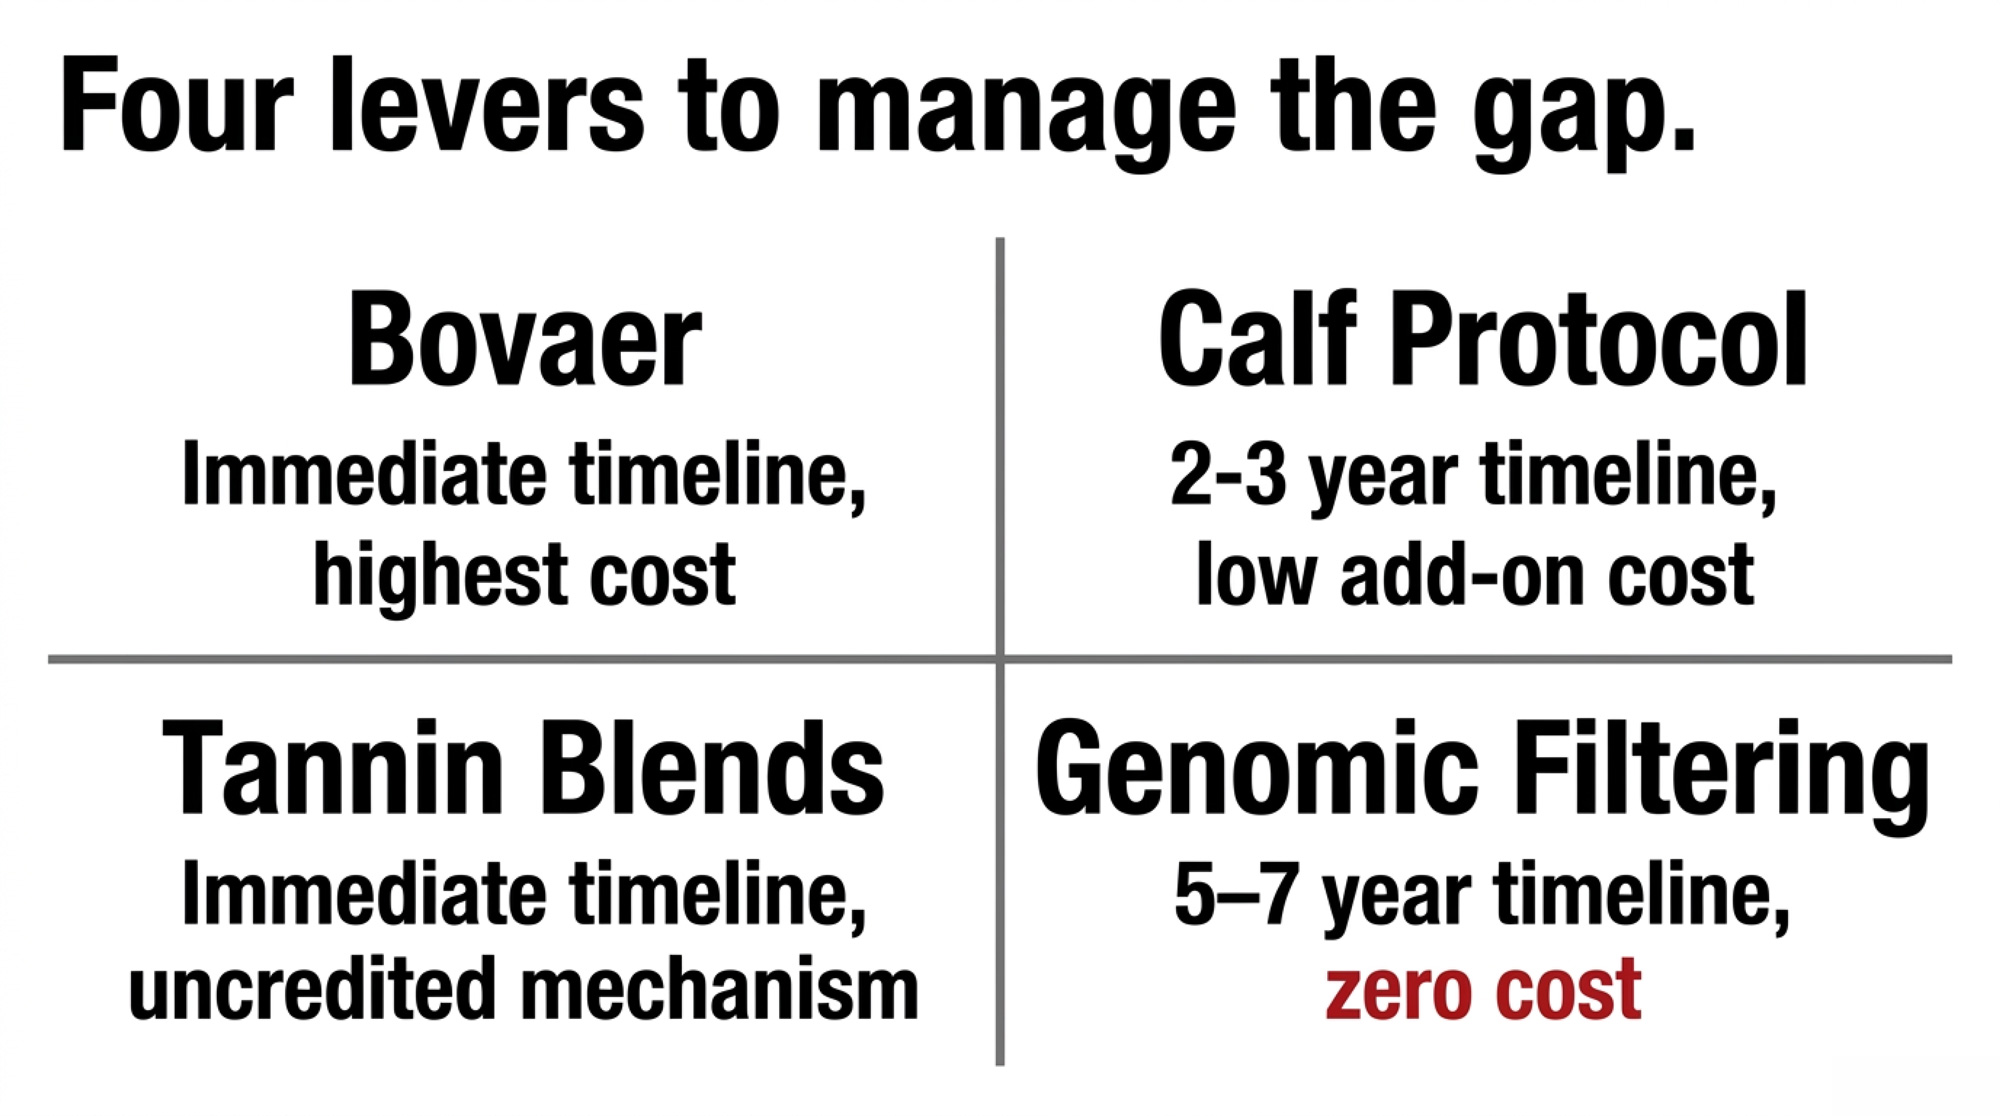
StrategyCost (Est.)Methane ImpactTimelineKey Trigger
Bovaer (3-NOP)$93–$105/cow/year21–31% (practical ceiling)Immediate2027 contract renewal
Calf Early-Life ProtocolLow marginal add if Bovaer already on farmPersistent reduction to 60 weeks of age from 14-week treatment2–3 years to milking stringNext calving season
Tannin/Saponin Blend$0.10–$0.18/cow/daySupplemental (ciliate-targeting, no DMI penalty)Immediate$0.18/cwt dual-mechanism tier, OFCAF access, or VM0041 ciliate module restart
Genomic Sire Filtering$0 incremental if testingCumulative, heritable5–7 years to herd-level expressionThis breeding season

Continue Bovaer. Protocol-compliant under VM0041, registry-creditable today, defensible in a 2027 renegotiation. The net margin is thin at current premium levels, but it isn’t negative if you already hold a sustainability contract. Risk: the 28–30% reduction is the mechanism’s practical ceiling on this lever alone.

Add a tannin-saponin blend — but not yet. The 2025 J. Dairy Science trial on Silvafeed BX confirmed methane reduction without penalty to ECM, fat yield, protein yield, or DMI. The mechanism is real. But the economics don’t close in 2026 — commercial blends scaled from published beef cattle trial pricing land roughly $0.10–$0.18/cow/day on dairy DMI, and current protocols don’t credit the ciliate mechanism separately. Hold this layer until one of three triggers fires.

Start a calf early-life protocol within 30 days. Pre-weaning rumen microbiome colonisation shapes a substantial share of the adult animal’s rumen community, with published estimates clustering in the 60–70% range depending on methodology. A 2021 trial found 3-NOP given to calves in the first 14 weeks produced methane reductions persisting to 60 weeks of age — long after treatment ended. If Bovaer is already on farm, the marginal cost of adding it to the milk replacer program for next-born calves is low. Those calves enter the milking string in 2028–2029, right when outcome-based verification standards are projected to tighten.

Filter your sire roster on methane genetics — zero incremental cost. You’re not buying a new test. Lactanet publishes Methane Efficiency RBVs on every Holstein female in eDHI. Zoetis added RUMiN and Milk Methane Intensity (Z_MI) to every CLARIFIDE Plus report in April 2026. The trade-off: herd-level expression takes 5–7 years. A 2026 sire selection change shows up meaningfully in your herd’s methane number around 2031–2032.
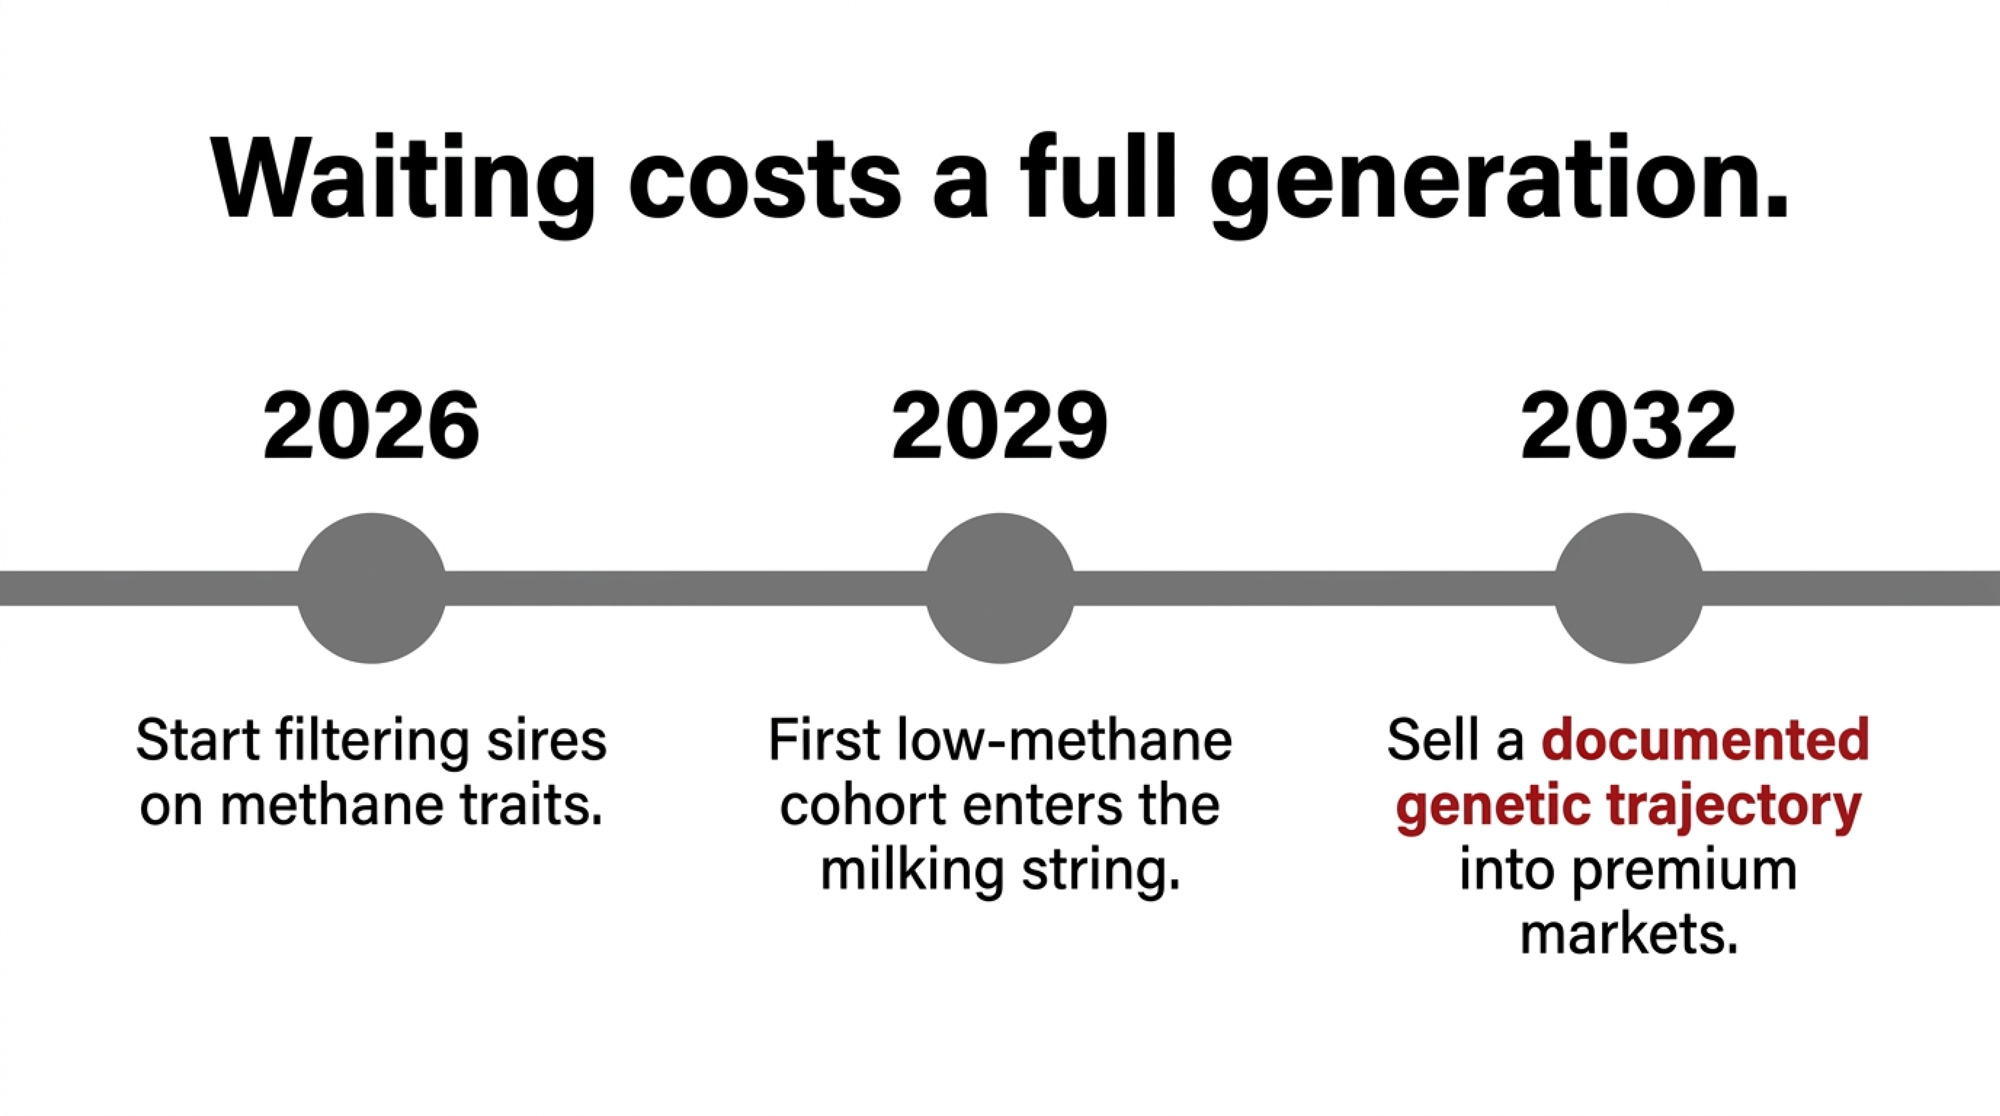
The combination that closes both the near-term audit need and the long-term biological asset without absorbing an extra – per cow per year in negative margin: Bovaer + calf protocol + RUMiN sire filtering. Hold the tannin-saponin layer for the 2028 trigger.
Key Takeaways

  • If your net return on Bovaer is under $20/cow/year after premium, check whether your processor runs an insetting program (DFA, Danone, select others) or whether OFCAF cost-share applies in your region. Ask both questions before the 2027 renewal conversation — that’s where the economics turn positive or don’t.
  • If your Bovaer program has held at 28–30% for 18 months, monitor rumination time and component tests as leading indicators of rumen ecology shifting under sustained dosing. Neither shows up on a methane reduction number until the shift has already compounded.
  • If you’re genomically testing replacement heifers, the RUMiN and Methane Efficiency RBV data is already on the report you paid for. Start using it as a sire tiebreaker within your current economic index this breeding season.
  • If Bovaer is already on farm, talk to your veterinarian and calf manager this month about adding it to the milk replacer protocol for next-born calves. The 2029 heifer cohort is the one that carries this forward.

Where Does Your Operation Actually Sit?

The producers who’ll be selling low-methane genetics into a premium market in 2032 aren’t the ones currently spending the most on additives. They’re the ones who recognized in 2026 that the biology had changed category — from a compliance cost to a heritable asset — and adjusted their sire roster while everyone else was still optimizing additive spend. The April 2026 hydrogenobody paper made that shift explicit. The response window is now, not when methane EBVs get priced into semen premiums.

So where does your operation actually sit on that line? Pull your last genomic report before Monday. Check whether your methane trait values were ever used in a selection decision. If the answer is no, you’ve just identified the highest-leverage, lowest-cost change you can make this month. The full herd-size-tiered math — including the two contract questions worth asking your processor rep before 2027 renewal — runs in the next Bullvine Weekly.

Complete references and supporting documentation are available upon request by contacting the editorial team at editor@thebullvine.com.

Learn More

The Sunday Read Dairy Professionals Don’t Skip.

Every week, thousands of producers, breeders, and industry insiders open Bullvine Weekly for genetics insights, market shifts, and profit strategies they won’t find anywhere else. One email. Five minutes. Smarter decisions all week.
NewsSubscribe
First
Last
Consent

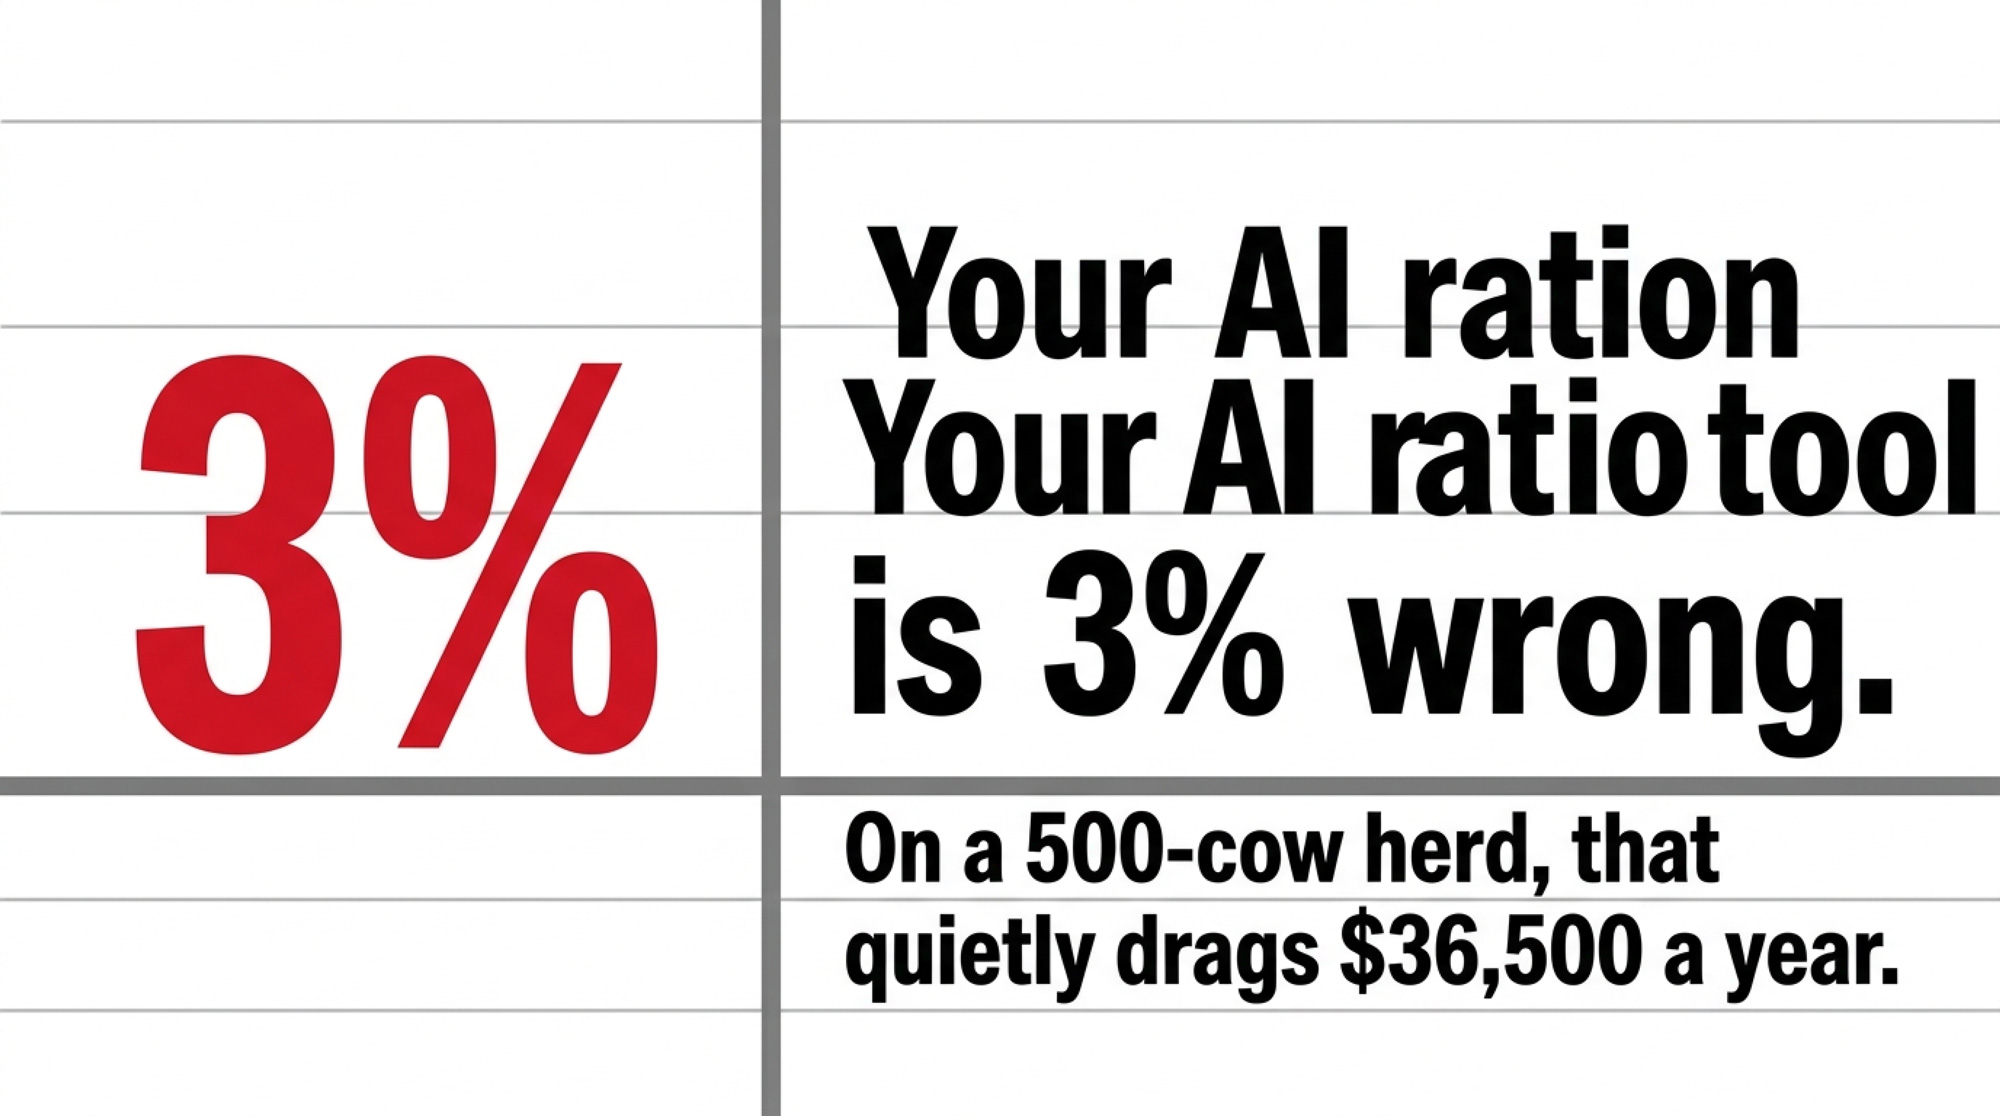
Your AI Ration Tool Is 3% Wrong. On 500 Cows, That’s $36,500 a Year.

A peer‑reviewed 2026 trial on 2,073 cow‑days showed AI rations can lift IOFC — but a 3% intake miss on a 500‑cow high group quietly drags $100/day, about $36,500 a year. Is yours drifting?

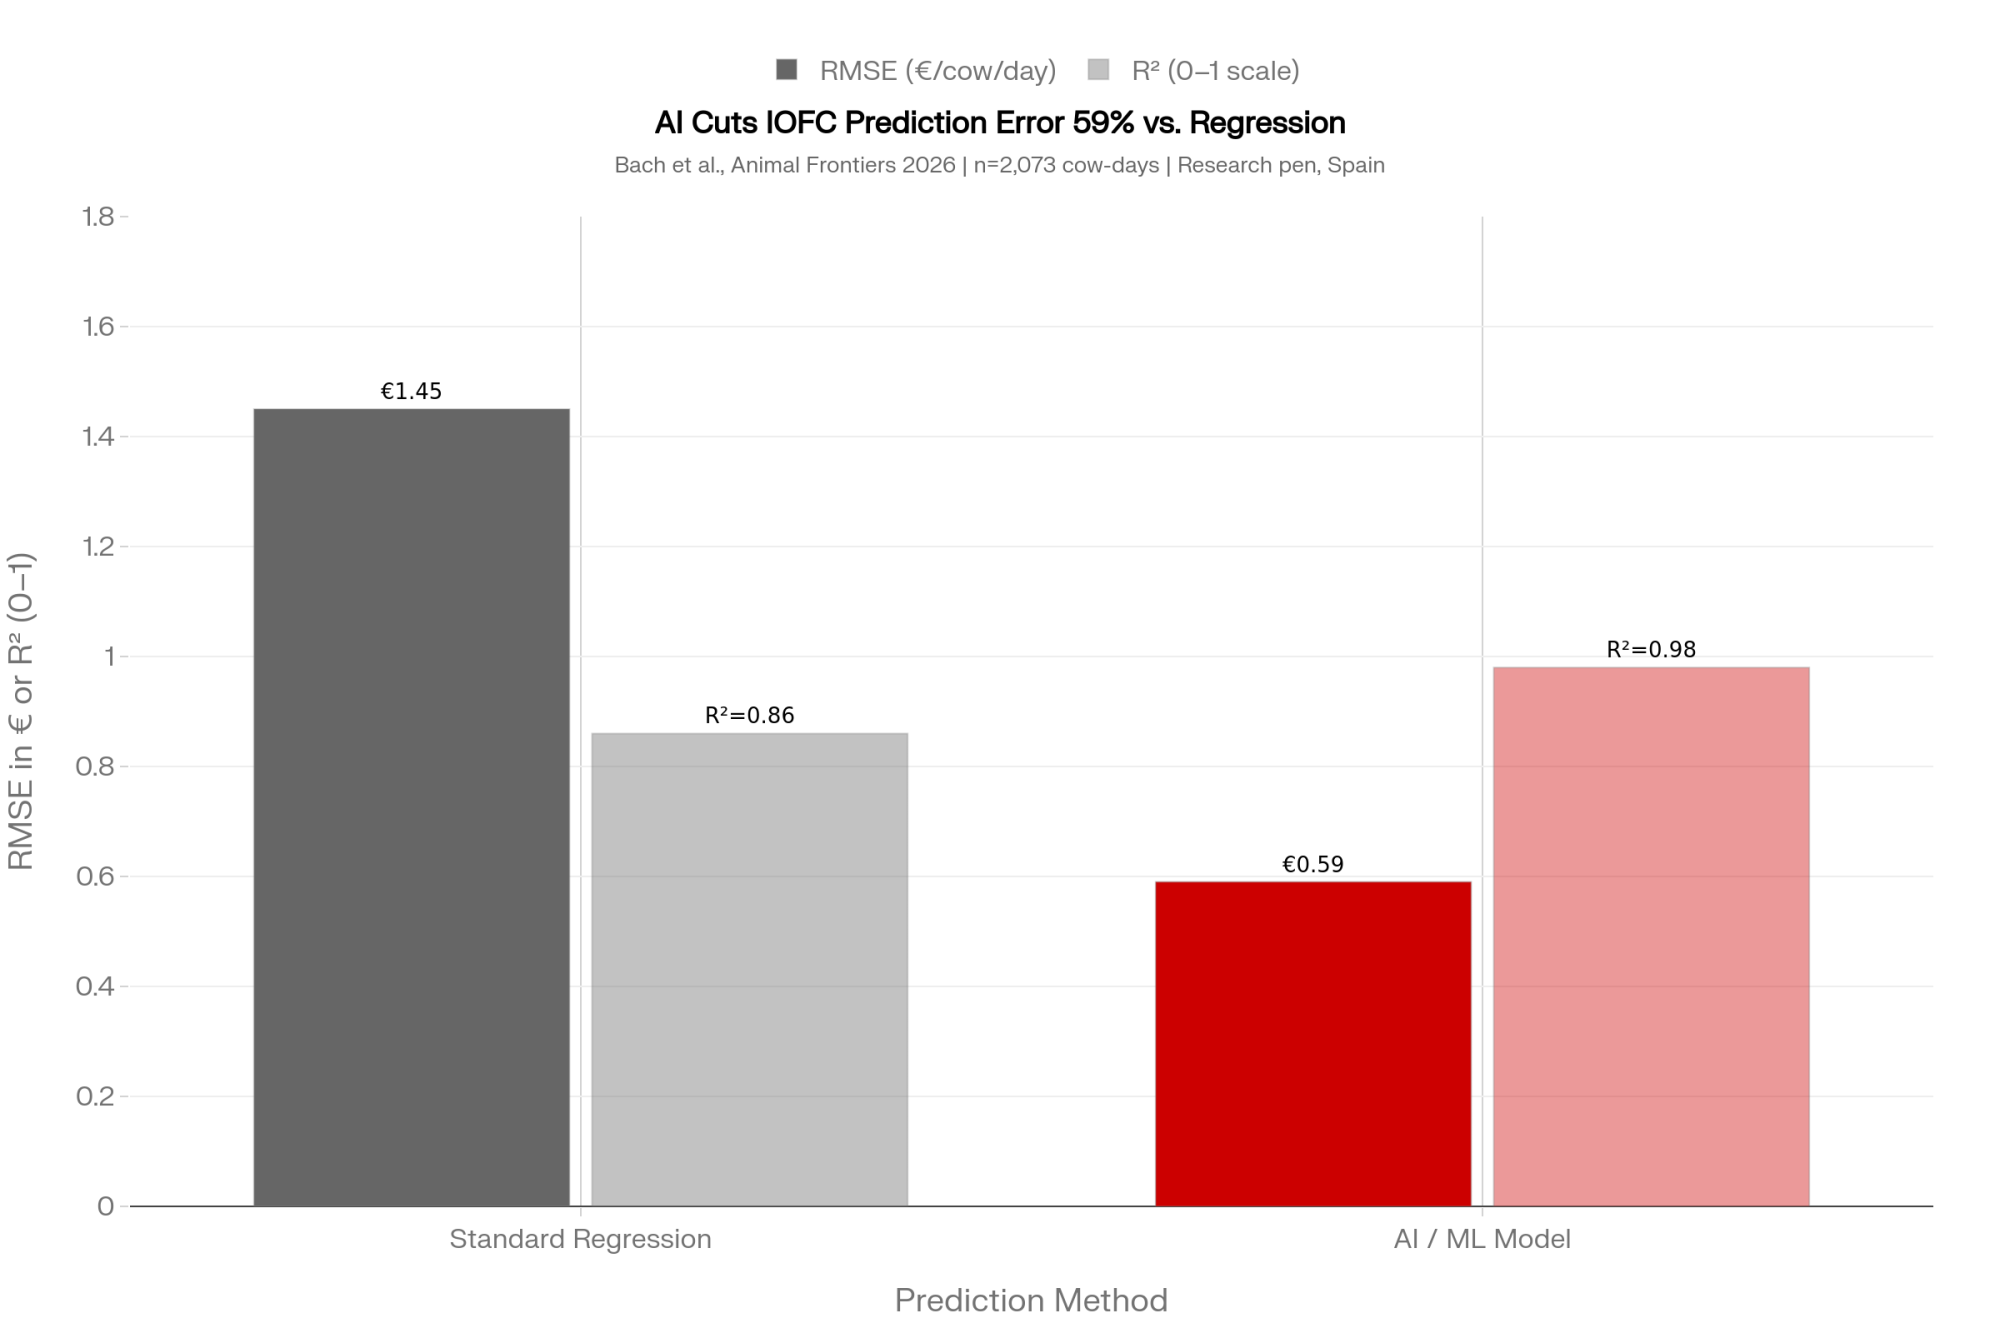
Executive Summary: A peer‑reviewed 2026 Animal Frontiers study from Alex Bach’s group at the University of Lleida trained a machine‑learning model on 2,073 cow‑days and hit R² 0.98 on income over feed cost — roughly 12 percentage points better than standard regression, with RMSE dropping from €1.45 to €0.59 per cow per day. The catch: that accuracy came from a tightly controlled research pen, and on a commercial 500‑cow high group, a 3% intake miss at $0.12/lb DM quietly drags about $100/day, or roughly $36,500 a year. Push the error to 5% and you’re looking at $60,225 — more than what most vendors claim their tools can add in IOFC. Cabrera’s Dairy Brain work and the Barrientos‑Blanco 2020 JDS paper confirm the upside is real (about $31/cow/year in feed cost and 5.5 kg less N excretion), but only when data streams actually line up; a 2022 survey in Animals found 69% of farmers weren’t familiar with data standards and 66% felt they didn’t control their own chain of custody. The practical call is to run a four‑question “AI Ready” audit first, hold any pilot to a 90‑day window with a no‑penalty exit and a 30‑day data‑export clause, and refuse to let the software change your feed sheet until it can shadow‑predict last week’s intake within 3%. For herds with tight DSCR and messy records, “not yet” is a legitimate answer — fixing known feed‑center shrink usually beats chasing a theoretical 20¢/cwt AI gain.

AI dairy rations

You’re sitting in a ration review and the AI tool on the laptop says your high group is fine at 55 pounds of dry matter. If that prediction is off by just 3%, the barn math on a 500‑cow herd works out to roughly ,500 a year at risk — in feed cost or missed milk. That’s the gap Alex Bach’s team exposed when they trained a machine‑learning model on 2,073 cow‑days and showed the “optimal” ration looks very different once the intake numbers are actually right.

The Bach study — published in Animal Frontiers in January 2026 — is one of the strongest recent peer‑reviewed data points showing AI can squeeze real dollars out of a dairy ration when the data underneath it is clean. The uncomfortable part is what happens on your farm, when the data isn’t that clean and the model’s intake guess wanders by a couple of pounds for weeks on end.

What the 2,073‑Cow AI Trial Actually Proved

According to Bach’s 2026 Animal Frontiers paper, the University of Lleida team followed a single pen of around 120 cows and logged far more than milk weights. Ingredient intakes, nutrient profiles, weather, stocking density, bodyweights, days in milk, yields, components, and economic returns — 2,073 daily observations in total, fed into a platform called algoMilk that has been running since 2020.

Two prediction engines were built on top of that dataset. A classic multiple regression — the math that’s quietly run ration software for decades — hit an R² of 0.86 (meaning it explained about 86% of the variation in income over feed cost), with a root mean square error of 1.45 €/cow/day (roughly $1.57/cow/day at an exchange rate near 1.08 USD/EUR in early May 2026). The gradient‑boosting machine‑learning model reached an R² of 0.98 (near‑perfect correlation) and cut RMSE to 0.59 €/cow/day (about $0.64/cow/day) on the same cows.

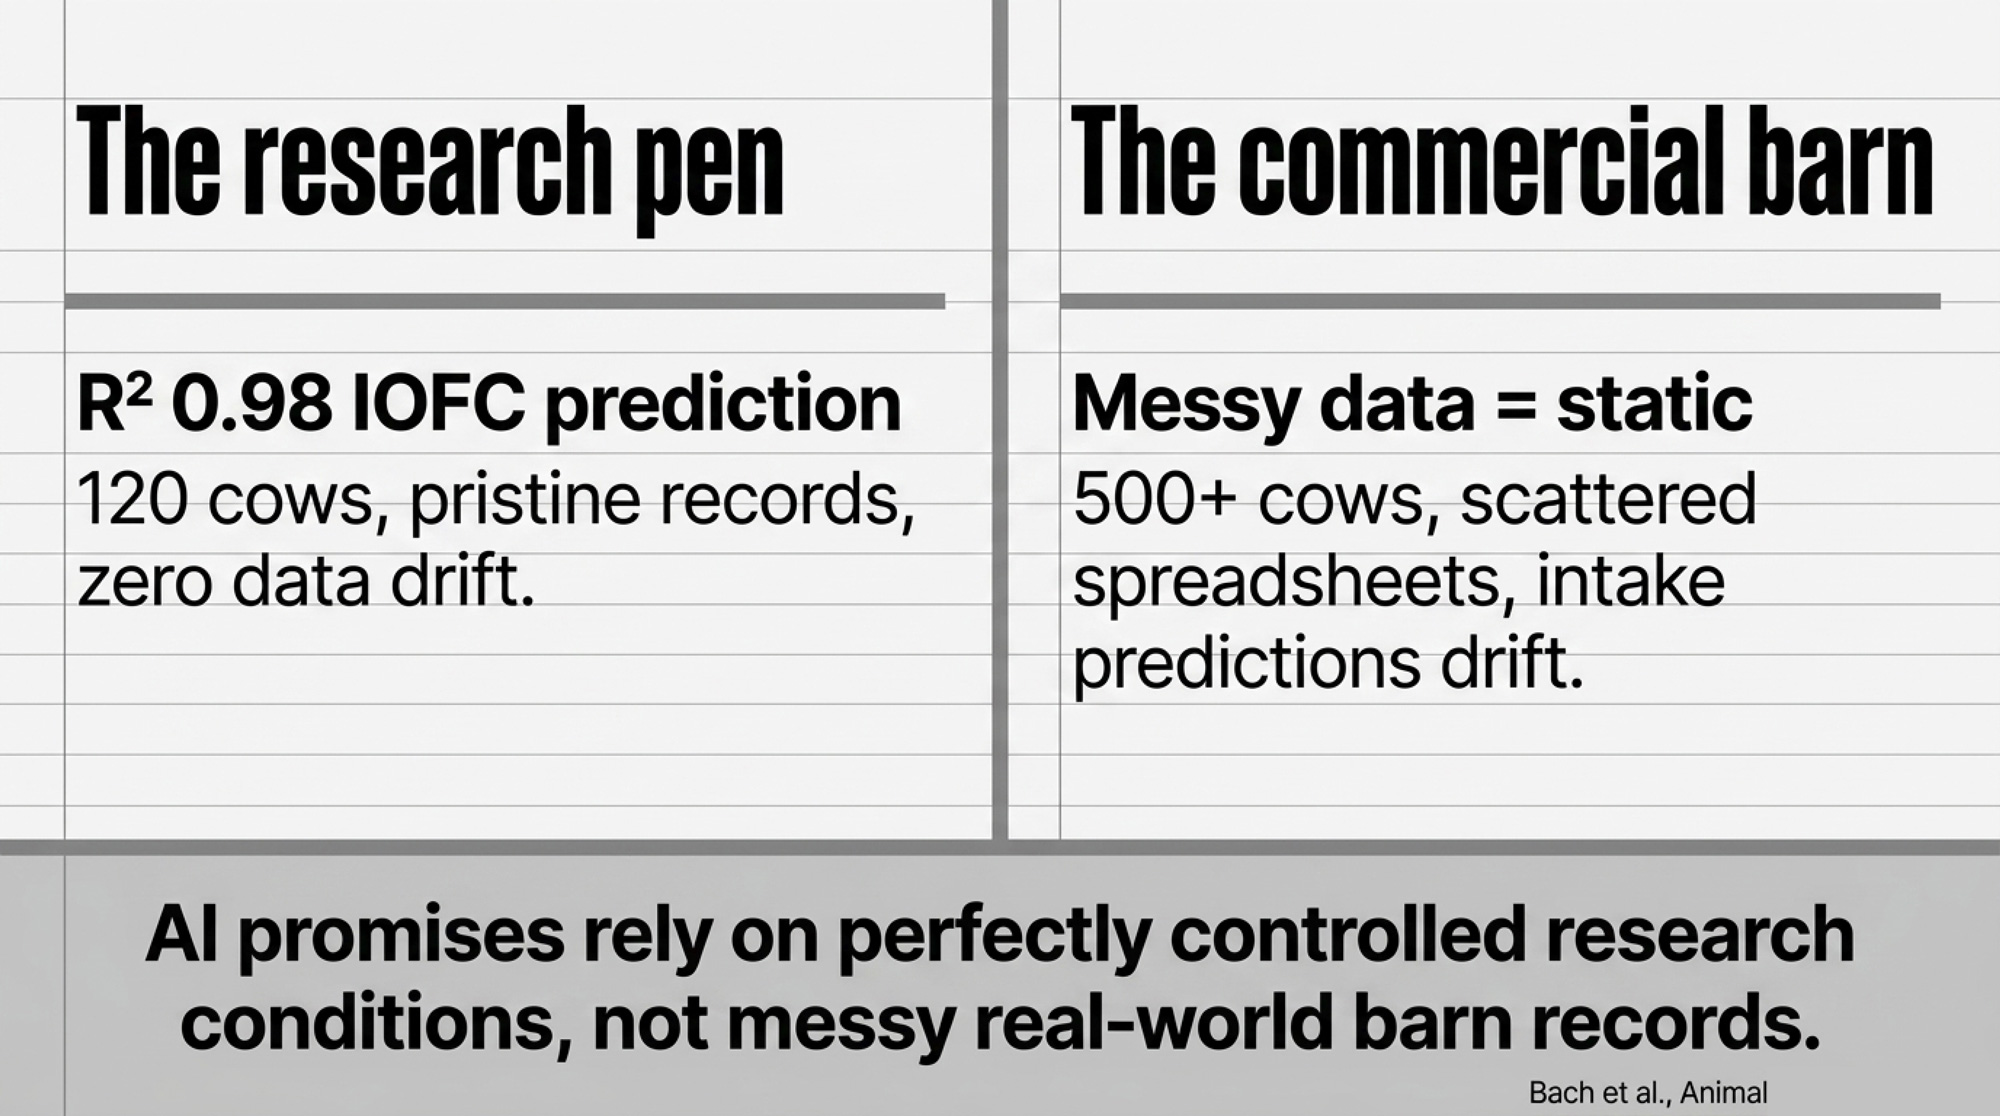
A small reality check before you get carried away: R² 0.98 reflects a tightly controlled research pen in Spain, not a typical commercial herd with messy real‑world records. Bach’s numbers are excellent on his cows, under his conditions — not an out‑of‑the‑box promise for yours.

Then the paper did the part every producer actually cares about. The ML model was plugged into an optimizer and asked to redesign the ration. The AI diet shifted ingredients gently — a bit more corn silage and canola meal, a bit less alfalfa and corn flakes — and lowered predicted dry‑matter intake by 0.2 kg (about 0.44 lb) and milk yield by 0.166 kg (about 0.37 lb) per cow per day. IOFC rose by about 0.015 €/cow/day (roughly $0.016/cow/day). Less milk. Tighter diet. Slightly more profit.

That result bruises a habit the industry has leaned on for a generation. According to the paper, chasing more milk at all costs isn’t always the most profitable move, because feed efficiency flattens and a chunk of cows in any group simply won’t pay you back for a richer ration.

How Dairy Brain Shows the Upside — When Data Is Clean

Bach’s work is one proof point. The bigger system for making AI useful at herd scale is being wired together in Wisconsin.

Victor Cabrera’s Dairy Brain project at UW–Madison has been stitching fragmented dairy data — genetics, milking systems, feed software, DHI, health records — into a single real‑time “brain” since 2016. The team’s 2024 Animal Frontiers paper describes using precision tools, big‑data analytics, and connected sensors to feed integrated models for everything from mastitis risk to culling and feeding decisions. Cabrera’s group publishes with Wisconsin cooperator herds, and the published outcomes line up with what the academic record shows — a pattern worth watching as more U.S. cooperators bring real barn numbers to the table.

An earlier applied study from the Cabrera group, led by Barrientos‑Blanco and published in the Journal of Dairy Science in 2020, put dollars on better diet accuracy. By tightening grouping and fine‑tuning rations with integrated data, they cut feed cost by about per cow per year and dropped nitrogen excretion by 5.5 kg (roughly 12.1 lb) per cow annually. On a 400‑cow herd, that’s roughly ,400 a year — off cows you already own, eating feed you’re already buying.

When data streams line up, AI‑style tools can tighten rations, improve nitrogen efficiency, and bump IOFC without a new ingredient truck ever rolling into the yard. The published work is also clear about the flip side: most herds aren’t close to that level of continuous, integrated data. That’s where the risk creeps in when you plug an AI ration engine into the noise.

Is Your Data Good Enough to Let AI Touch Your Ration?

Here’s where farm reality smashes into the AI sales deck.

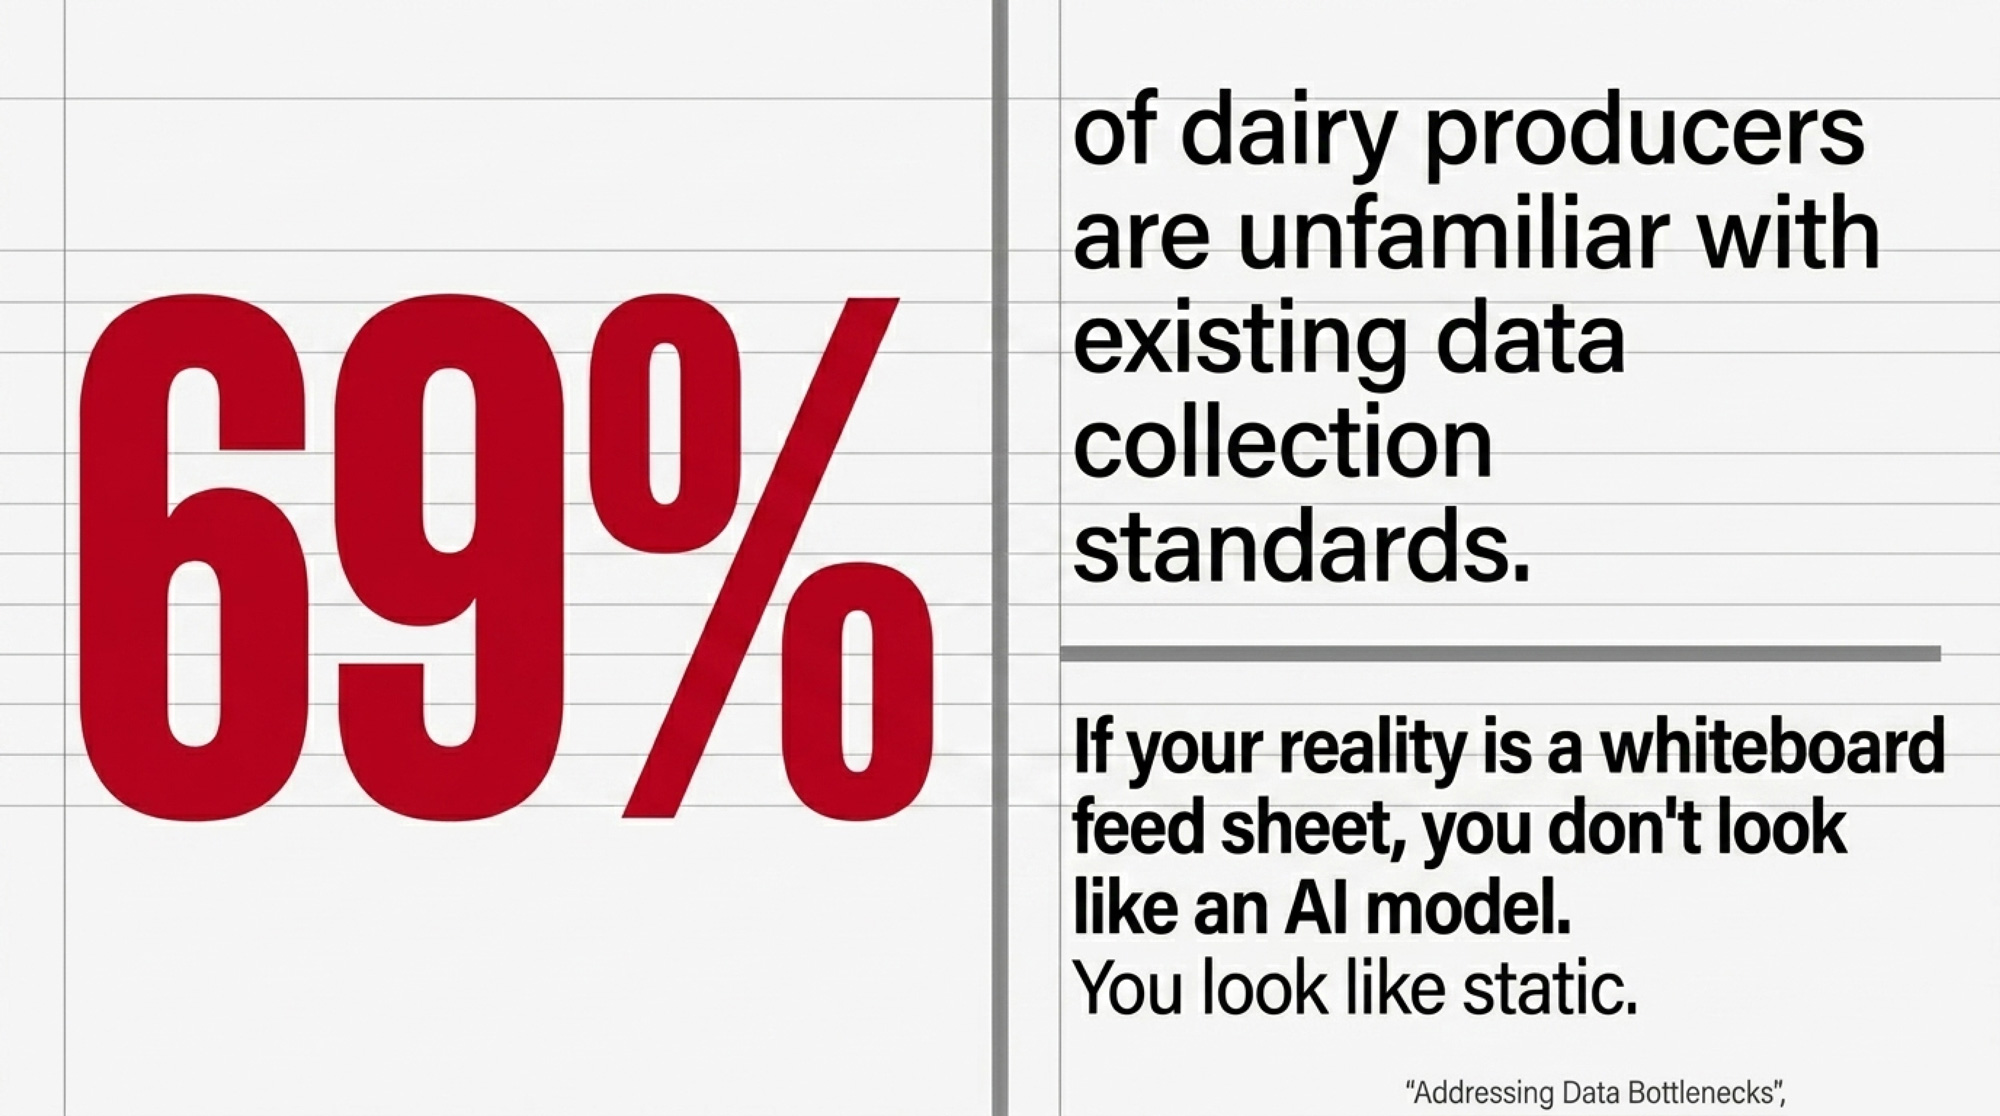
A 2022 paper in Animals called “Addressing Data Bottlenecks in the Dairy Farm Industry” surveyed 73 farmers and 96 non‑farm stakeholders. About 69% said they were unfamiliar with existing data collection standards, and 66% of farmers felt they had no control over the chain of custody for their own data. Only 62% of farms were integrating data from multiple sources at all — and nearly half of those were still doing it manually in spreadsheets.

If your reality is a whiteboard feed sheet, DHIA once a month, and treatment notes scribbled in a spiral notebook, you don’t look like the 120‑cow Spanish research pen to an AI model. You look like static. And static makes intake predictions drift.

Before you download a trial of an “AI dairy nutrition” app, grab your nutritionist and run this readiness check:

The “AI Ready” Audit

  • Pen‑Level DMI: Can you pull 90 days of DM‑adjusted intake by pen?
  • Data Alignment: Do milk and components line up with those same pen‑days?
  • Digital Logs: Are forage DMs and TMR weights logged daily — not on paper?
  • Human Capital: Does someone on your team “own” data quality for at least 2 hours a week?

Zero or one out of four? You’re in good company. At that level, an AI ration tool is far more likely to become an expensive experiment than a profit center. Three or four out of four, and you’re close to the kind of herds where Bach and the Cabrera group have actually shown real gains.

How a 3% Intake Miss Eats $36,500 on a 500‑Cow Herd

Now the arithmetic you can run on the back of a feed tag.

Most high‑producing Holsteins in North America sit in a 52–58 lb dry matter range, depending on bodyweight and stage of lactation. With today’s mix of corn silage, haylage, grain, and by‑products, a realistic blended dry matter cost across many U.S. dairy regions lands in the $0.11–$0.13/lb band.

Say your AI tool claims your high group is eating 55 lbs of DM. In reality they’re closer to 53.35 — or 56.65. That’s about 1.65 lbs off, roughly 3%. Push that gap to 5% and you’re 2.75 lbs off, every cow, every day. Here’s how it lands on a 500‑cow high group at $0.12/lb DM:

Intake ErrorDaily Loss (500 cows)Annual Profit LeakImpact on Cost/cwt
3% miss~$100~$36,500$0.24
5% miss$165$60,225$0.40

Assumes $0.12/lb blended DM cost and cows shipping ~82 lbs/day / 0.82 cwt. Figures rounded; unrounded 3%‑miss values land at about $99/day and $36,135/year.

Herd Size1% Error/Year3% Error/Year5% Error/Year¢/cwt at 3%¢/cwt at 5%
250 cows$1,815$5,456$9,09412¢20¢
500 cows$3,630$10,890$18,15012¢20¢
500 cows (high group only)$3,630$36,500$60,22524¢40¢
1,000 cows$7,260$21,780$36,30012¢20¢
2,000 cows$14,520$43,560$72,60012¢20¢

Assumes $0.12/lb DM, 55 lb/day baseline intake, 82 lb/day milk shipped. High-group row reflects Bach/article scenario. Red = at or above vendor-claimed IOFC gain.

Vendors pitch these tools on IOFC gains in the single‑digit cent‑per‑cwt range. Marketing decks often stretch to 15–25¢/cwt. If the intake prediction the whole thing rides on is drifting 3%, the risk band alone can swallow the promised gain — before you even look at components, health, or labour.

Then the second‑order hits stack up. Butterfat slips a couple of hundredths because the model squeezes forage harder than your cows tolerate. Fresh cows throw a few extra DAs or ketosis cases because energy density moved faster than anybody noticed. Feeders chase bunk calls that don’t match the software. It isn’t scare‑tactic framing — it’s just what the math does when the model’s picture of intake and your actual bunks sit a couple of pounds apart for too long.

What Happens in Your Barn When the Algorithm Misses Intake by 5%?

Push the error band to 5% and you’re in lender‑conversation territory. That $60,225 annual leak sits well past the vet bill — right alongside the squeeze your banker runs DSCR against, like the $18.95 milk / $19.14 cost trap.

At 5%, the operational story gets ugly fast. Bunk calls get noisier because refusals don’t match predicted DMI. Cows swing between too‑full and too‑empty bunks. Health events cluster in patterns you don’t recognize. Feeders start “adjusting around the tool” off the record. If you’re using AI in advisory mode — building shadow rations and comparing — that 5% miss is a discussion point. If you’re letting it write the feed sheet, it’s physical, in front of your cows, every day.

The Bach model hit R² 0.98 on IOFC in that Spanish trial. Nobody has published that kind of accuracy on a typical North American commercial herd with messy real‑world records. The precision‑feeding upside is real. Your data quality decides whether you see Bach‑style gains or a 3–5% error bill.

Options and Trade‑Offs for Farmers

Contract ClauseWhat Farmers NeedTypical Vendor DefaultWho Carries Downside
Pilot duration90 days, hard stopRolling month-to-monthFarmer
Exit penaltyNo-penalty exit at day 90Early-termination feeFarmer
Data exportFull export within 30 daysProprietary lock-inFarmer
Shadow modeDays 1–7 predict only, no feed changesLive optimization from day 1Farmer
Performance threshold<3% intake error before scalingVendor discretionFarmer
IOFC benchmarkMust beat subscription fee in at least 1 pen by day 30No contractual benchmarkFarmer

Red = clause absent in most standard vendor agreements. Based on article’s recommended audit framework.

1. Fix Your Data First — Your 30‑Day Action

When it makes sense: You’re at zero or one on the readiness check. Records are scattered, DMI isn’t tracked by pen, and nobody owns data quality.

What it requires: Treat data like an ingredient for the next 30 days. Check DM on your main forages daily. Log every TMR load with actual weights and which pens it went to. Enter fresh, moved, and sick cows within 24 hours. At month’s end, sit with your nutritionist and pull 90 days of DMI by pen, milk and components by pen or tank, and a simple IOFC‑per‑cwt trend built on your real milk and feed prices.

Risks and limits: You won’t have an AI dashboard at the next meeting. You will have a baseline that tells you whether you’re already leaving money on the table with the software you own today.

2. Run a Small, Hard‑Bound 90‑Day Pilot

When it makes sense: You’re at three or four on readiness. Data’s relatively clean, the team is willing, and your nutritionist isn’t afraid of a spreadsheet.

What it requires: On paper — a written 90‑day pilot, a no‑penalty exit at day 90, and a guaranteed full data export (rations, predictions, actuals) within 30 days if you walk. In the barn — Days 1–7 in shadow mode only, the AI predicts but doesn’t change anything. Days 7–30, one stable pen gets one AI‑driven ration change with clear targets. Days 31–90, expand to a second pen only if pen one shows intake error under ~3% and IOFC improving after subscription fees.

Risks and limits: You’ll spend more time checking predicted versus actual than you’d like. By day 90, you’ll know — in your own dollars per cwt — whether the tool earns more than it costs.

3. Keep AI Advisory — Second Opinion, Not Driver

When it makes sense: You see value in pattern‑spotting but you’re not ready to let software write the feed sheet.

What it requires: Turn off auto‑optimization. Use the AI to generate shadow rations, flag outlier pens, and highlight where intake and milk don’t line up with history. Rule of the house: nothing new goes into the mixer without a human sign‑off.

Risks and limits: You give up some “easy” IOFC gains a fully optimized system might find on pristine data. You gain control, cut the odds of a silent 3–5% intake miss, and still get a second set of eyes.

4. “Not Yet” Is a Valid Answer

When it makes sense: DSCR is tight, you’re behind on higher‑ROI basics, and your data is, frankly, a mess.

What it requires: Sit down with your nutritionist and lender and mark the leaks you already know about. Are you happy with grouping and stocking? Have you tackled obvious feed shrink or mixing‑consistency issues? The Feed Center Revolution work shows many herds leak five figures a year before they ever touch software. Do you have a clear component strategy when the 2026 Class III–IV spread pulls $382,000 off a 500‑cow milk check?

Risks and limits: You might feel sidelined while neighbors talk about AI. You also avoid adding a subscription and one more variable to a cost structure that’s already stressed. Fixing a known six‑figure leak beats chasing a theoretical 20¢/cwt AI gain.

Key Takeaways

  • If an AI ration tool can’t shadow‑predict your last week of intake within roughly 3%, it doesn’t get to change the feed sheet. That gap is about $36,500/year on a 500‑cow herd — enough to erase the whole promised IOFC lift.
  • If you’re at zero or one out of four on the readiness audit, your next 30 days belong to tightening your own numbers before you pay for any AI prediction.
  • If a vendor won’t put a 90‑day pilot, a no‑penalty exit, and a 30‑day data‑export clause in writing, assume you’re carrying effectively all of the downside. Keep any AI tool in advisory mode until the paper and your milk check both say otherwise.
  • If the first 30 days of a pilot don’t show intake error under 3% and IOFC improving after fees in at least one pen, don’t scale it. Pause, diagnose, and make it earn more time.

What to do tomorrow morning: Before milking, pull last month’s feed invoices, your DHIA component report, and your TMR software log. Lay them on the same table. If you can’t line those three up by pen for the last 30 days in under an hour, that’s your AI answer for now — fix the data, then talk to the vendor.

So here’s the real question: if you laid out last year’s IOFC and feed‑cost reports, could you point to a single tool — AI or not — and say, “This clearly adds more than it costs, and here’s the proof in dollars per cwt”? If the answer is still no, any tool that comes next should have to prove itself on your cows, under your conditions, before it earns a seat at your feed table.

Complete references and supporting documentation are available upon request by contacting the editorial team at editor@thebullvine.com.

Learn More

The Sunday Read Dairy Professionals Don’t Skip.

Every week, thousands of producers, breeders, and industry insiders open Bullvine Weekly for genetics insights, market shifts, and profit strategies they won’t find anywhere else. One email. Five minutes. Smarter decisions all week.
NewsSubscribe
First
Last
Consent

The 1.20 FFA Line: Why Guelph Says Call the Vet Before the Tech

Guelph pulled 171,843 Ontario bulk tank tests and found the biggest FFA drivers weren’t your pump. They were your close-up pen, your ration, and three-incentive-day months.

Executive Summary: Guelph researchers Hannah Woodhouse and Dr. David Kelton, working across 171,843 monthly bulk tank observations from every Ontario dairy farm over four years, have reframed the 1.20 mmol FFA sensory threshold as a transition-cow test, not a hygiene test — the significant predictors of an elevated month are lower bulk tank protein, non-parlor milking systems, three-incentive-day months, and higher bacteria counts, not your pump.¹ A companion 293-farm paper (J. Dairy Sci., Feb 2025) attached a 1.17 mmol/100g fat association to the tie-stall + ≥3×/day combination alone, and flagged that no operation in the 109-farm parlor freestall subsample posted a monthly average at or above 1.20.² The FFA penalty side lives almost entirely in the processor-specifications clause of your co-op supply agreement — BC Milk confirms FFA doesn’t affect provincial-pool pay, and no major North American processor posts its $/cwt FFA schedule publicly.³ On a 500-cow US herd producing 11,400 cwt/month at March 2026’s $16.16/cwt Class III, a $0.10–$0.50/cwt hit pencils at $13,680–$68,400/year, and FMMO reform’s 85–93¢/cwt Class-price reductions just tightened the margin in front of that number.⁴ The fastest intervention isn’t a facilities spend: plot FPR alongside FFA for six months, start fresh-cow BHBA testing at ≥1.2 mmol/L cutoff, move dry-off BCS into the 3.0–3.25 window, and layer in rumen-protected choline at the Arshad et al. (2020) dose.⁵ The demographic layer matters too — with US heifer inventories at a 20-year low and CoBank projecting 438,844 fewer dairy heifers in 2026, any parity-shift cull decision runs into $3,000+ replacement costs.⁶ The operator action: pull your last six bulk tank reports and your supply agreement this week, and get your co-op’s FFA penalty math in writing.

In January 2023, Dairy Farmers of Ontario field staff triggered an investigation on a 40-cow Holstein tie-stall that had averaged 1.32 ± 0.50 mmol FFA/100g fat across 752 samples between August 2018 and October 2022 — with more than 54% of samples at or above the 1.20 sensory threshold. The milking equipment tech had already been out. Vacuum fine. Liners fine. Filters changed at every milking, three times a day.

University of Guelph researcher Hannah Woodhouse and Dr. David Kelton walked into that barn and found what the data had been whispering all along: cracked milking unit claws with curdled milk inside, unequal milking intervals as short as three hours, and palm fat fed at 300 g/head/day with the dose pushed higher during fall DFO incentive months.¹ The equipment problems were real. But the ration, the intervals, and the calendar were doing most of the damage — and the equipment tech was never going to solve any of that alone.

That anonymized case farm sits at the clinical end of a bigger story. A body of peer-reviewed Guelph work covering every Ontario dairy farm over four years has reframed the 1.20 mmol bulk tank free fatty acids line as a transition-cow and management test, not a hygiene test.¹,² And the penalty exposure that follows it isn’t on your pay statement — it’s in the “processor specifications” pass-through buried in your co-op supply agreement.

What the 1.20 Bulk Tank Free Fatty Acid Threshold Is Really Measuring

Start with what the 1.20 line does to milk. Above it, trained taste panels pick up rancid notes in butter and cheese, foam stability drops, and cheese-milk coagulation suffers.¹ That’s why processors penalize above threshold. And it’s why the trade spent a decade calling this a hygiene problem — check the pump, audit the vacuum, change the filters.

The Woodhouse et al. JDS Communications work tells a different story. Monthly bulk tank averages across all 3,771 Ontario dairy farms, August 2018 through December 2022, totaled 171,843 observations. Roughly 7% of those monthly averages sat at or above 1.20, and the significant predictors of an elevated month weren’t hardware — they were lower bulk tank milk protein, non-parlor milking systems, three-incentive-day months, and higher bulk tank bacteria counts.⁷

Protein drift in a bulk tank isn’t a plumbing signal. It’s a metabolic signal — cows in negative energy balance, mobilizing body fat, driving NEFA and lipase activity into milk that’s already biochemically compromised before it touches a single piece of stainless. The 1.20 line isn’t testing your milking system. It’s testing your transition cow program.

Writing for AgProud in September 2024, Woodhouse put it in producer-ready terms: dairy producers can manage individual cows, ration quality, milking frequency, and milk filter changes to reduce FFA levels.⁸ Cows and ration come first on her own list. Filters last. The paper’s predictor ranking points squarely in the same direction.⁷

DimensionOld industry assumptionGuelph 2024-2025 evidenceOperator action
Primary causePump/vacuum/liner wearTransition-cow energy deficit (low BT protein)Call vet first
Key predictorEquipment ageTie-stall + ≥3×/day (β=1.17)Audit housing × milking freq
Filter protocolReplace more oftenFilter <2×/day adds only β=0.27Keep, don’t over-weight
Seasonality driverSummer heat on equipment3-incentive-day monthsMap incentives to FFA peaks
Parlor freestall herds ≥1.20Common0 of 109 farmsBenchmark target

Is This a Metabolic Problem or an Equipment Problem?

The Woodhouse et al. farm-factors paper (J. Dairy Sci., February 2025) put direct measurements on that question. It’s a cross-sectional study of 293 Canadian dairy farms — 238 in Ontario, 55 in British Columbia, split across 71 tie-stall, 109 parlor freestall, and 113 AMS freestall operations. Mean bulk tank FFA: 0.84 mmol/100g fat, SD 0.40, range 0.26–3.67. Ten percent of herds sat at or above 1.20.²

The final multivariable model is where the argument lands. Not in round numbers —in published beta coefficients:

  • Tie-stall barns milking ≥3×/day: β = 1.17 mmol/100g fat (95% CI 0.76–1.59)
  • AMS herds milking ≥3×/day: β = 0.27 (95% CI 0.12–0.41)
  • Not changing the milk filter at least 2×/day on ≥3×/d farms: β = 0.27 (95% CI 0.10–0.44)
  • No pre-cooling: β = 0.16 (95% CI 0.02–0.30)

And this one matters: **in the 109-farm parlor freestall subsample, no operation posted a monthly FFA average at or above 1.20 during the study window.**² That’s a snapshot, not a universal law. But it’s a loud snapshot.

The adjusted R² on the model was 29%, which is an honest way of saying hardware and routine only explain about a third of the variation — the rest sits in cows, rations, and calendars.² Ontario’s broader surveillance closes the loop: FFA lowest in May, highest in July and September, every year.⁷ Equipment doesn’t know what month it is. Transition cows do.

What’s the FFA Penalty Actually Worth on Your Herd?

Here’s where most coverage of this paper waves a dollar figure around and hopes you don’t check the schedule behind it. We’re not going to do that.

The Canadian disclosure landscape is thinner than it looks. DFO reports FFA back to every Ontario producer on every bulk tank load.¹ BC Milk has reported FFA back to producers since August 1, 2019 — but the BC Milk Marketing Board’s own Component & Quality Testing page explicitly states that FFA “does not factor into producer’s component or quality results and has no impact to a producer pay” at the provincial-pool level.³,⁹ That doesn’t mean there’s no penalty. It means the penalty, if any, flows through the processor-specifications clause of the individual producer agreement — which is not public.

On the US side, FMMO pooling doesn’t set FFA penalties at all. Those live entirely in co-op supply agreements and processor contracts, and we could not locate a single publicly posted $/cwt FFA penalty schedule from a major North American processor or co-op at publication. What is public is the penalty mechanism: above threshold, the plant either discounts the load, downgrades it out of cheese milk, or diverts it to a lower-value class. The dollar hit depends on your co-op, your plant, and your class mix.

So the barn-math in this piece is a worked example with reader-supplied inputs, not a documented exposure. Here’s the frame for a 500-cow US herd:

  • 500 cows × 75 lb/cow/day × 30.4 days ÷ 100 = 11,400 cwt/month.
  • At the USDA AMS-announced March 2026 Class III price of $16.16/cwt, gross milk value ≈ $184,224/month.¹⁰
  • Multiply 11,400 cwt by your own co-op’s FFA forfeiture ($/cwt) to size your exposure.
Illustrative $/cwt ForfeiturevAnnual Cost% of Annual Gross
$0.10/cwt$1,140$13,6800.6%
$0.25/cwt$2,850$34,2001.5%
$0.50/cwt$5,700$68,4003.1%

Halve the herd to 250 cows at the same production and price and the middle line pencils at about $17,100/year. Whatever your co-op’s number is, it’s not a rounding error — and the only way you’ll know it is to pull the agreement. That’s the point of the contract-audit step in the next section.

Did FMMO Reform Make the US FFA Penalty Sharper?

Federal milk marketing order reform took effect June 1, 2025. The USDA AMS final rule, issued January 15, 2025, after a 49-day national hearing and producer referenda across all 11 orders, reshaped component pricing formulas and raised processor make allowances:¹¹

ProductNew Make Allowance (per lb)
Cheese$0.2519
Butter$0.2272
Nonfat Dry Milk$0.2393
Dry Whey$0.2668

The butterfat recovery factor was adjusted to 91% (from 90%), and the composition factor upgrade — updating skim milk to 3.3% true protein, 6.0% other solids, 9.3% nonfat solids to reflect modern milk — was held back six months and took effect December 1, 2025.¹¹

AFBF economist Daniel Munch put hard numbers on the gap in his September 22, 2025, Market Intel piece. Higher make allowances pulled $337 million from pool revenues in the first three months alone, with Class price reductions of 85–93¢/cwt, and the six-month composition-factor delay cost farmers roughly $100 million in compensationagainst what full reform would have delivered on the original timeline.¹²

Margin pressure pushes operators harder toward co-op production incentive signals. The Ontario analysis flagged three-incentive-day months as a significant predictor of elevated FFA.⁷ Fat supplements rise. Marginal cows get pushed. The quality penalty — whatever your agreement says it is — then bites exactly the milk you overproduced. Neither side of that loop appears as a line item on the pay statement.

The Fastest Intervention That Doesn’t Cost $50,000

Before spending a dollar on facilities, run the JDS finding backward. Pull three bulk tank reports. Calculate fat-to-protein ratio. Penn State Extension flags a herd-level FPR above 1.4 as an energy-deficit and subclinical-ketosis signal when more than about 40% of the measured group exceeds it.¹³ A validation study refined the individual-cow cut-off to >1.42 (sensitivity 92%, specificity 65%) for subclinical ketosis.¹⁴ Twenty-minute diagnostic. Zero dollars.

Then the protocol. Do these now, not next quarter:

  • This week: Pull your last six bulk tank FFA reports from your co-op quality lab and plot FPR on the same months. If FPR leads FFA by 4–6 weeks, that’s your metabolic signal.
  • This week: Pull your co-op supply agreement. Find the “processor specifications” or “quality” clause and the line that references FFA. Then email your quality manager and ask, in writing, for (a) the exact $/cwt or class-downgrade math the plant applies above 1.20, and (b) what share of your last six quality adjustments was attributable to FFA. Save both answers. This is the barn-math input only you can get.
  • This month: Score every cow going dry. Anything above BCS 3.5 goes into a limit-fed pre-dry pen; dry-off BCS in the 3.0–3.25 range minimizes post-calving NEFA mobilization.¹⁵ Costs labor, not capital. Tank effect lags 6–8 weeks.
  • This month: Start fresh-cow BHBA testing. Blood BHBA ≥1.2 mmol/L is the widely used subclinical-ketosis cutoff with balanced sensitivity and specificity in hand-meter field work; Oetzel’s ≥1.4 mmol/L threshold marks the jump in DA and clinical ketosis risk.¹⁶ Test days 3–5 and 10–14. At ~40 calvings a month and roughly $1.00/test, that’s about $80/month. 
  • Within 60 days: Work rumen-protected choline into the close-up ration at the Arshad et al. (2020) meta-analysis dose of 60 g/cow/day at 25% active, from 21 days pre-calving through at least 28 days postpartum.⁵ That meta-analysis of 21 trials reported an average milk response of ~2.3 kg/day and ~0.08 kg/day fat, with substantial between-trial and between-herd variation.⁵ Balchem’s published summary of pooled ReaShure trials puts the sustained response at roughly 700 kg more milk over a standard 305-day lactation — real, but not uniform across herds.¹⁷ Ask your nutritionist for a per-cow-per-day cost based on current feed contracts; it will move with commodity markets and isn’t a single published number.

And the longer horizon:

  • 90 days: Six months of FFA + FPR plotted; at least two fresh-cow BHBA cohorts logged; your co-op’s FFA penalty math on file in writing; a decision on which of the three paths below you’re actually taking.
  • 365 days: Re-plot your fall FFA peak year-over-year against parity distribution and incentive-day calendar. Decide whether you can document a structural shift worth bringing to a co-op board meeting.

Filter changes still matter. The Woodhouse TTR follow-up paper (J. Dairy Sci., February 2026) found “milk too cold” alarms associated with an average FFA of 1.31 mmol/100g fat — the only alarm type with a significant increase over baseline — and more than 15% of alarm-associated samples already sat at or above 1.20.¹⁸ Real. Measurable. Worth doing. But changing the filter without fixing the transition cow problem is putting a new battery in the smoke alarm while the fire burns.

When Does an FFA Problem Become a Culling Decision?

Some FFA problems aren’t managerial. They’re demographic.

When the fall peak climbs year over year and herd average parity sits above 3.2, protocol upgrades blunt the problem but don’t solve it. Older multiparous cows carry more metabolically active visceral fat, mobilize NEFA faster, and compound ketosis risk at every subsequent calving. The Woodhouse/Kelton case farm added another wrinkle: late-lactation cows carry higher LPL activity, so extending lactation to fill quota can amplify lipolysis risk.¹

A working operator rule — Bullvine editorial rule-of-thumb, not a published threshold — if more than 30% of your parity 4+ cows test BHBA >1.4 mmol/L across two consecutive calvings, that cohort belongs on the voluntary cull list before the next dry-off. The cull market makes the call easier than it was two years ago: RFD-TV reported Southern Plains lean-cow (85–90%) auction prices at roughly $167/cwt in early March 2026, with bulls north of $200/cwt in parts of the South on tight supplies and strong grinding demand.¹⁹ A 1,400-lb parity 4+ Holstein at $167/cwt returns about $2,338 — real cash that partially funds her replacement.

But the replacement side is brutal. CoBank’s August 2025 Knowledge Exchange outlook put US dairy heifer inventories at a 20-year low, with a predictive model showing 438,844 fewer dairy heifers in 2026 versus 2025 — driven largely by ~398,925 more beef-on-dairy calves — and total replacement inventories expected to shrink by roughly 800,000 head before rebounding in 2027, with heifer prices potentially above $3,000/head.²⁰

Walking herd average parity from 3.2 to 2.8 in that market isn’t cheap or fast. Typical structural FFA correction through parity shift runs 18–24 months under normal replacement supply, closer to 24–30 months under today’s conditions — a Bullvine analytical projection based on typical parity-turnover mechanics, not a sourced forecast. But running RPC forever on a metabolic age that keeps escalating is more expensive, slower, and quieter.

Options and Trade-Offs for Your Operation

PathBest-fit triggerCore spend / year (500-cow)Payback windowBackfire risk
30/60/90 protocol onlySeasonal pattern, parity ≤3.2, no YoY escalationRPC ~60 g/cow/day + BHBA testing (~$960/yr)6–9 monthsMisdiagnosed demographic problem
Protocol + parity 4+ cullingParity >3.2, YoY peak climb >0.15 mmolAbove + ~$3,000/head replacement cost18–24 monthsHeifer market ($3,000+/head, 438,844 shortfall)
Add contract auditAny herd, any patternOperator time onlyImmediateCo-op refusal = your new baseline
Status quo“Filters and hope”$13,680–$68,400/yr penalty exposureNeverCompounding margin loss under FMMO reform (85–93¢/cwt)

Three paths, depending on what your six months of data say:

  • Run the 30/60/90-day protocol only. Works when the pattern is managerial — seasonal, spring-recovering, no year-over-year escalation. RPC plus BHBA testing is the core spend. Backfires if you’ve misdiagnosed a demographic problem and your fall peak climbs again next October.
  • Run the protocol plus targeted culling of parity 4+ repeat-ketosis cows. Works when herd average parity tops 3.2 and year-over-year peaks escalate more than 0.15 mmol/100g fat. Pays out over 18–24 months. Backfires if you can’t source replacements at workable economics at CoBank’s projected heifer prices.²⁰
  • Run the contract audit alongside either path. Even a clean-FFA herd benefits from knowing exactly what the FFA threshold in its supply agreement says and what share of quality adjustments the co-op will attribute to FFA in writing. The answer — or the refusal — is your baseline for every future conversation.

DFO publishes the mechanics of its FFA reporting to every Ontario producer.¹ BC Milk publishes the framework while clarifying that FFA does not affect provincial-pool pay — any producer-level penalty flows through the processor-specifications clause of the individual agreement.³ Most US co-op supply agreements reference a processor-level FFA threshold but don’t publish the penalty math. That absence isn’t universal bad faith — some co-ops share full component and quality schedules with members on request. It’s the absence of a public, standardized FFA penalty framework across North America that makes this a contract-audit problem, not a headline problem. 

What This Means for Your Operation

  • When FFA climbs, your first call is your transition-cow vet. The equipment tech is the second call. That’s the core reframe the Guelph data demands.⁷,²
  • If April readings stay above 1.10 after a winter-stress recovery window, you’re not looking at a seasonal problem. You’re looking at a structural one — a parity question, not a filter question.
  • If FPR leads FFA by 4–6 weeks in your own six-month data, your tank is broadcasting the metabolic signal before the sensory threshold catches it. Act on the FPR.
  • If more than 30% of your parity 4+ cows throw BHBA >1.4 mmol/L across two consecutive calvings, that cohort is carrying your fall FFA peak — and at $167/cwt lean-cow prices, the market is paying to move them.¹⁹
  • If your co-op’s incentive-day calendar sits 3–5 weeks ahead of every FFA elevation on your statement, you’ve documented exactly the mechanism the Ontario data flagged.⁷ That’s a specific conversation to have with your quality manager, in writing.
  • If your co-op can’t — or won’t — put the FFA portion of your last six quality adjustments in writing, that silence is your baseline. Everything you do next sits against it.
  • If the 30-day protocol pencils at low four figures a month and your contract-audit reveals a meaningful $/cwt FFA hit, the expensive fix is cheaper than the invisible one.

Key Takeaways

  • If bulk tank milk protein is drifting down, the odds of elevated FFA climb sharply in the Ontario data — call your vet before the equipment tech.⁷
  • If your herd is tie-stall and milking ≥3×/day, the Woodhouse farm-factors paper attaches a 1.17 mmol/100g fat association to that single combination — the single biggest lever in the model.²
  • If herd average parity is above 3.2 and fall FFA peaks are escalating year over year, you’re looking at a demographic problem the 30-day protocol alone won’t solve, in a heifer market projected to shrink by 800,000 head before rebounding in 2027.²⁰
  • If you don’t know your co-op’s FFA penalty math in writing, you don’t know your exposure. Period.
  • If you execute the 24-month plan and document the before/after, you’ve earned a governance argument, not just a management win.

The Question You’ll Face Next October

The Woodhouse/Kelton case farm ran 1.32 mmol FFA on average over four years, with 54% of samples elevated.¹ That’s not an outlier. It’s a data point with a mailing address. The research doesn’t cull the parity 4+ cow for you. It doesn’t pull your supply agreement. It doesn’t translate the processor-specifications clause the pay statement leaves out.

What it does — through exact betas, seasonal patterns, and 171,843 monthly bulk tank observations across every Ontario dairy farm — is prove that the margin test hiding inside every bulk tank FFA reading is measurable, attributable, and fixable on a timeline shorter than the opacity of the system suggests.

Here’s the harder question. An operator who fixes their FFA and says nothing lets the current arrangement continue as designed — program worked, producer responded, questions about disclosure never get asked. An operator who fixes their FFA and walks a documented before/after into a co-op board meeting — with their own supply agreement in one hand and AFBF’s $337 million pool-revenue analysis in the other — is doing something different. So what are you going to bring to your co-op board next October — your FFA numbers, or your silence?

Editor’s note: This article contains editorial analysis and opinion by The Bullvine. It describes general industry patterns and does not refer to any specific named co-operative, processor, or producer other than those expressly attributed. Specific contract terms, quality schedules, and regulatory frameworks vary by co-op and jurisdiction; producers should consult their own agreements and advisors.

Complete references and supporting documentation are available upon request by contacting the editorial team at editor@thebullvine.com.

Learn More

The Sunday Read Dairy Professionals Don’t Skip.

Every week, thousands of producers, breeders, and industry insiders open Bullvine Weekly for genetics insights, market shifts, and profit strategies they won’t find anywhere else. One email. Five minutes. Smarter decisions all week.
NewsSubscribe
First
Last
Consent

Your Cow’s Breath Knows When SARA Starts. A $3,500 Rumen pH Bolus Trial Proves It.

24 heifers, same 60% concentrate ration, same barn—three totally different SARA profiles. The only way anyone saw it was by watching a rumen pH bolus every 15 minutes.

Executive Summary: Continuous pH boluses are already catching SARA patterns that exhalomics can only explain in the lab, and the gap between the two is costing real money. Islam’s JDS work showed breath acetate tracks rumen acetate at r = 0.84, but there’s no affordable barn sensor that can reliably separate a burp from a breath. Meanwhile, Hartinger’s 2024 study bolused 24 first‑lactation cows on the same 60% concentrate ration and found three very different SARA severity clusters, with one extra week on close‑up feed cutting severe SARA odds by 34.5%. Using Stone’s $1.12/cow/day estimate and published prevalence, a 450‑cow herd quietly carries $18,400–$47,800 a year in SARA exposure while relying on four rumen taps and component trends. In contrast, a real 350‑cow UK herd saved £14,647 in 90 days by tweaking the ration twice based on continuous pH curves, with no drop in milk or components. Bolus hardware and data for a 40‑cow trial run about $3,500–$4,000 in year one, and pH sensors last 12–18 months, so the real decision is whether that subscription buys more than another DA surgery and a few lame cows. If you’re serious about collars, feeding tweaks, or future breath sensors, this piece walks through how pH curves can calibrate the tech you already own and show you what four needles a year are missing.

Rumen pH boluses

Picture a 450-cow freestall on a Tuesday afternoon. High-starch TMR. Collars on most cows. Ration hasn’t changed on paper. Cows chewing, tank on target, manure acceptable. Everything looks fine from the alley.

Now picture this: a set of rumen pH boluses in the fresh pen indicates that a quarter of those cows spent more than four hours below pH 5.8 yesterday. Nobody walking through the barn caught it. Published surveys report SARA prevalence at 19–26% in early-to-mid lactation U.S. Holstein herds (Garrett et al. 1997), with European data from Kleen et al. (2013) confirming similar rates across German dairies. Ohio State Extension puts it bluntly: up to 33% of dairy cattle experience SARA during lactation, and up to 40% of pasture cattle have a pH below 5.8. Ontario’s Ministry of Agriculture says if more than 30% of sampled cows sit at or below pH 5.5, consider the whole feeding group at risk. Your four rumenocentesis visits a year aren’t seeing this — and a lab in Zurich has proven it can read those fermentation signals from a field called exhalomics: the metabolic fingerprint in a cow’s exhaled breath.

The science works. The barn sensor doesn’t exist yet. And every progressive operation faces the same question: wait for the perfect tool, or start building your data infrastructure now with what you can actually buy?

What the Breath Data Actually Shows

Islam et al. published a Journal of Dairy Science paper in 2024 measuring volatile organic compounds in cow breath using high-resolution mass spectrometry. They fed cows two distinct starch levels — 16.2% versus 6.3% dry matter — and compared what showed up in exhaled air against what was happening in rumen fluid. The correlations landed hard:

  • Breath acetate tracked rumen acetate at r = 0.84–0.85
  • Breath propionate tracked at r = 0.74
  • The acetate-to-propionate ratio in breath tracked rumen A:P at r = 0.80

The analytical platforms driving this — SESI-MS and PTR-MS — detect compounds at parts-per-trillion levels. Think of an electronic nose that could pick out a single molecule of vinegar in an Olympic pool. These instruments identified over 1,298 unique chemical features in the bovine exhalome, capturing volatile fatty acids, ketone bodies, and metabolites that reflect both rumen fermentation and whole-animal metabolism simultaneously.

The Ketosis Signal Worth Watching

Work by Dobbelaar et al. (1996, Veterinary Quarterly) demonstrated that breath acetone correlates with blood BHB with r = 0.81 in dairy cows. More recent temporal evidence points to a 24-to-48-hour head start on intervention compared to conventional testing — breath acetone levels rise faster than changes detectable in milk ketone composition. If this holds up across herds and seasons, your fresh cow protocol could shift from catching clinical ketosis to intercepting it before signs ever appear.

The data on cross-herd reproducibility is thin. But the biological logic is solid: acetone is the most volatile ketone body and crosses the alveolar membrane freely. The question isn’t whether the signal exists. It’s about whether anyone can reliably capture it in a barn.

Why You Can’t Buy This Yet

Here’s where the exhalomics story gets honest.

SESI-MS and PTR-MS setups run into six figures once you add the mass spectrometer, ionization source, installation, and ongoing support. GreenFeed units, used in many exhalomics trials to capture eructation events and methane, cost tens of thousands per unit. Even if you wrote those cheques, VOC stability tests on collection bags show that some compounds degrade or climb as they interact with bag material. The ETH Zurich team calls out sample degradation as a key limitation — proximity to the lab is critical.

Walking samples down the hall in Zurich is one thing. Shipping them across Ontario, Wisconsin, or Alberta is another.

But the commercial gap isn’t just about price and logistics. There’s a harder technical problem that the correlation coefficients don’t warn you about.

What Happens When a Burp Corrupts Your Breath Data?

Not all cow “breath” is created equal. This is the detail that separates the lab results from what a barn sensor would actually face.

Eructation brings rumen headspace gas — VFA-rich, methane-heavy, straight from the fermentation vat. Normal nasal breathing carries lung air with systemic biomarkers but a much lighter rumen fingerprint. Barrientos Blanco et al. (2025) measured the difference: eructation-dominated samples had 20.9% higher acetate, 27.4% higher propionate, and 32.7% higher butyrate concentrations than respiratory breath samples.

On a real cow, those two streams mix at the muzzle. The lab solution is elegant: use GreenFeed or custom hoods to capture eructation events, then monitor methane in real time as a gate signal. When methane spikes, you’re in an eructation window. When it drops, you’re sampling respiratory breath. That works in a controlled setting with a dedicated unit and an analyst watching the screen. In a 400-cow freestall with high humidity, parlor traffic, and nobody spare? Different story.

Until a commercial system can tell the difference between a burp and a breath under barn conditions, the correlations from Zurich don’t transfer cleanly to your operation. That’s not a reason to ignore the science. It’s a reason to build your baseline with a tool that goes straight to the source.

The $3,500 Bridge You Can Deploy This Month

If the rumen is the organ you’re trying to monitor, a bolus sitting in the reticulum is about as direct as it gets. And unlike a breath sensor, boluses are commercially available now — smaXtec launched its latest dedicated pH bolus in September 2025, and the company is actively pushing into North American herds from its U.S. base in Madison, Wisconsin.

Rumen pH boluses record pH every 10–15 minutes, giving you up to 96 data points per day per cow. Over a 60-day trial on one pen, that’s roughly 5,760 readings per cow. Compare that to four rumenocentesis visits a year.

Here’s what makes this uncomfortable. Hartinger et al. (2024) bolused 24 first-lactation Holsteins at the VetFarm research station in Pottenstein, Austria — every heifer on the same 60% concentrate lactation ration. When they clustered the pH data, they didn’t find two groups. They found three. Six cows experienced minimal SARA, exceeding the pH 5.8 threshold for more than 330 minutes on just 7% of experimental days. Nine cows hit that threshold on 20–87% of days. Same feed. Same barn. Wildly different rumens. And one extra week of close-up feeding reduced the odds of severe SARA by 34.5%.

Snapshot rumenocentesis couldn’t have caught that. Neither your collars nor manure scoring alone. Only continuous monitoring revealed the individual variation hiding inside a group that, from the alley, looked like one herd on one ration.

Kučerová et al. (2024) added another layer, finding that subclinical acidosis cows showed an 18.8% lower reticulorumen pH, an 11.88% lower fat-to-protein ratio, a 6.59% shorter rumination time, and a 57.19% higher activity compared to healthy herd mates. Your collars might already be flagging some of these cows. But without rumen truth underneath, you’re reading signals without a reference point.

The Trade-Offs Nobody Puts on the Brochure

Boluses aren’t magic either. Aidan Connolly, president of AgriTech Capital in Wilmington, N.C., told Farm Progressthat pH sensors in the rumen typically burn out after 12 to 18 months as acid exposure degrades the sensor — compared to 6–7 years for movement-only boluses that track activity and temperature. That means pH monitoring is functionally a subscription to sensor replacement, not a one-time install.

They also need vet insertion. Your barn needs adequate repeater or antenna coverage for continuous data transmission. And pH alone is only one dimension of a complex disorder — it doesn’t directly capture shifts in VFA profiles or microbial population changes. It’s a strong early signal. Not the whole picture.

But weighed against the quiet accumulation of undetected SARA — hoof problems, DAs, sluggish repro, chronically soft components — the question isn’t whether boluses are perfect. It’s whether four rumen taps a year are enough to catch a problem that never stops moving.

How Much Is Undetected SARA Costing Your Herd?

The math isn’t complicated, and it isn’t kind.

Stone (1999) estimated SARA losses at $1.12 USD per affected cow per day — a figure still cited in Ontario’s current SARA factsheet and widely referenced across the literature. It has never been formally updated. On a 450-cow herd, using the published prevalence range:

MetricUndetected SARA LossesBolus Monitoring (Year 1)
Annual exposure$18,400 – $47,800~$3,500–$4,000 (40 cows)
Per cow/month (herd avg.)~$3.41 – $8.85 in hidden loss~$4.00 investment
Data quality4 snapshots / year96 readings / day per cow
Detection speedDays to weeks after damageHours

Low end: 450 × 10% × $1.12 × 365 = $18,396. High end: 450 × 26% × $1.12 × 365 = $47,830. For the boluses: 40 units at approximately $39 each plus $3.90/cow/month in subscriptions (user-reported pricing, AgTalk May 2025). Total year-one hardware and data: roughly $3,500–$4,000. That’s using a 27-year-old cost estimate that almost certainly understates the real impact.

Those aren’t hypothetical numbers. When eCow ran a commercial pH bolus trial across eight dairy farms in South West England, six of the eight farms changed feeding management based on what the bolus data showed. Farm B — a 350-cow, 12,500 kg/year TMR herd — adjusted its ration twice in three months using pH curves as the guide. Each change cut feed cost while keeping cows out of the acidosis risk zone. Total savings: £14,647.50 in 90 days, with no decline in milk production or components. J. Hamilton of Three Counties Feeds, who advised on the trial, called the data “really useful to build up a picture of normal daily pH fluctuations on commercial farms” and noted it “highlighted the nutritional impact of management changes which force cows into unnatural daily routines”.

That UK trial was from 2013. The technology has improved since. At the 2025 Canadian Dairy XPO in Stratford, Ontario, both smaXtec and Guelph-based Cattlescan were promoting bolus-based monitoring to Canadian operators — Cattlescan backed by validation work at the University of Guelph and the University of Wisconsin. The infrastructure is here. The question is whether your herd is collecting data before your neighbor’s is.

How This Calibrates the Tech You Already Own

One of the most valuable things continuous pH data does isn’t replace your collars and parlor system — it calibrates them.

Herds layering bolus pH curves over collar activity, rumination data, and milk components are building what amounts to a green/yellow/red rumen map for their specific conditions. Not a textbook threshold. Not a vendor’s default alert. A picture of what subclinical acidosis actually looks like on their ration, in their barn, with their cows.

If subclinical acidosis cows show 57% higher activity and nearly 7% shorter rumination, do your collar thresholds reflect that? Are your rumination alerts catching the cows that are restless around feeding and short on cud time — or tuned for clinical-level problems that show up weeks later?

When precision tech vendors pitch “real-time metabolic monitoring,” the herd with six months of pH curves and correlated collar data isn’t taking the marketing at face value. They’re evaluating it against data they already own. That’s a fundamentally different buying position than hoping the next sensor works as advertised.

What This Means for Your Operation

Do the SARA math first. Plug your herd size into the prevalence range and the $1.12/day figure. As stale as that estimate is, the number will be uncomfortable. If you’ve never run this calculation, that’s the first problem to solve — before you buy anything.

Start with one pen, not the whole herd. Pick 30–50 cows in your highest-risk group — fresh pen or your hottest starch group. At roughly $39 per bolus and ~$4/cow/month, an 8–12-week trial might run $2,000–$3,000, depending on volume. Compare that to one DA surgery.

Benchmark your collars against rumen truth. Pull your lameness, DA, and chronic low-fat cows from the last six months. If subclinical acidosis cows show 57% higher activity and 7% shorter rumination in published data, are your alerts catching those patterns — or tuned for something else entirely?

Budget for sensor replacement, not just purchase. pH sensors degrade in the rumen after 12–18 months. That’s fundamentally different from an activity collar you buy once. Factor in per-cow annual sensor costs when you run your ROI analysis, not just the upfront hardware.

Get trial-ready before the sensors ship. If a university or sensor company came looking for a test herd tomorrow, could you hand over clean pH data, stable feeding records, and a team comfortable with continuous monitoring? The herds with that infrastructure will shape what “validated” means for breath-based tools. The ones without it will buy whatever ships first and hope.

In the next 30 days: Pick one pen. Talk to your vet about bolus logistics. Get a quote from your smaXtec dealer or regional bolus supplier. Plan one ration adjustment you’ll track with pH curves and collar data together — not just milk and manure.

In the next 90 days: Evaluate whether the bolus data reveals patterns your current monitoring misses. If it does, decide whether to expand bolus coverage or recalibrate your collar alerts based on what the pH curves are teaching you about what subclinical acidosis actually looks like on your farm.

Key Takeaways

  • The VFA correlations are real. The barn sensor isn’t. Islam et al. (2024, JDS) showed breath acetate tracking rumen acetate at r = 0.84. Serious science — but the eructation separation problem, six-figure instruments, and sample degradation mean no commercial barn sensor is imminent.
  • Same ration doesn’t mean same rumen. Hartinger et al. (2024) demonstrated that 24 first-lactation Holsteins on identical diets were divided into three SARA severity clusters. If continuous bolus monitoring can reveal that kind of hidden variation, what’s lurking in your fresh pen right now?
  • Continuous pH turns SARA from a quarterly hunch into a daily decision. Four snapshots a year versus 96 data points per day. One UK herd saved £14,647 in 90 days from two bolus-guided ration adjustments alone.
  • Your collars are already capturing part of this story — they need a reference point. Bolus pH curves don’t replace your existing tech. They tell you whether your existing tech is calibrated against what’s actually happening in the rumen.

The next time your nutritionist schedules rumenocentesis, ask what would change if you already had 60 days of pH and collar data for that group. If the answer is “nothing,” you might be right. But if the answer is “I don’t know,” that’s the gap worth closing before the breath sensor ever ships.

Complete references and supporting documentation are available upon request by contacting the editorial team at editor@thebullvine.com.

Learn More

The Sunday Read Dairy Professionals Don’t Skip.

Every week, thousands of producers, breeders, and industry insiders open Bullvine Weekly for genetics insights, market shifts, and profit strategies they won’t find anywhere else. One email. Five minutes. Smarter decisions all week.
NewsSubscribe
First
Last
Consent

Preston Farms Swapped Bypass Fat for High‑Oleic Soybeans and Found $0.60–$1.00/Cow/Day – Could Your Dairy Do the Same?

Brian Preston’s feed bill dropped, and his components went up — at the same time. Three herds, three states, and the barn math that explains why it’s not a fluke.

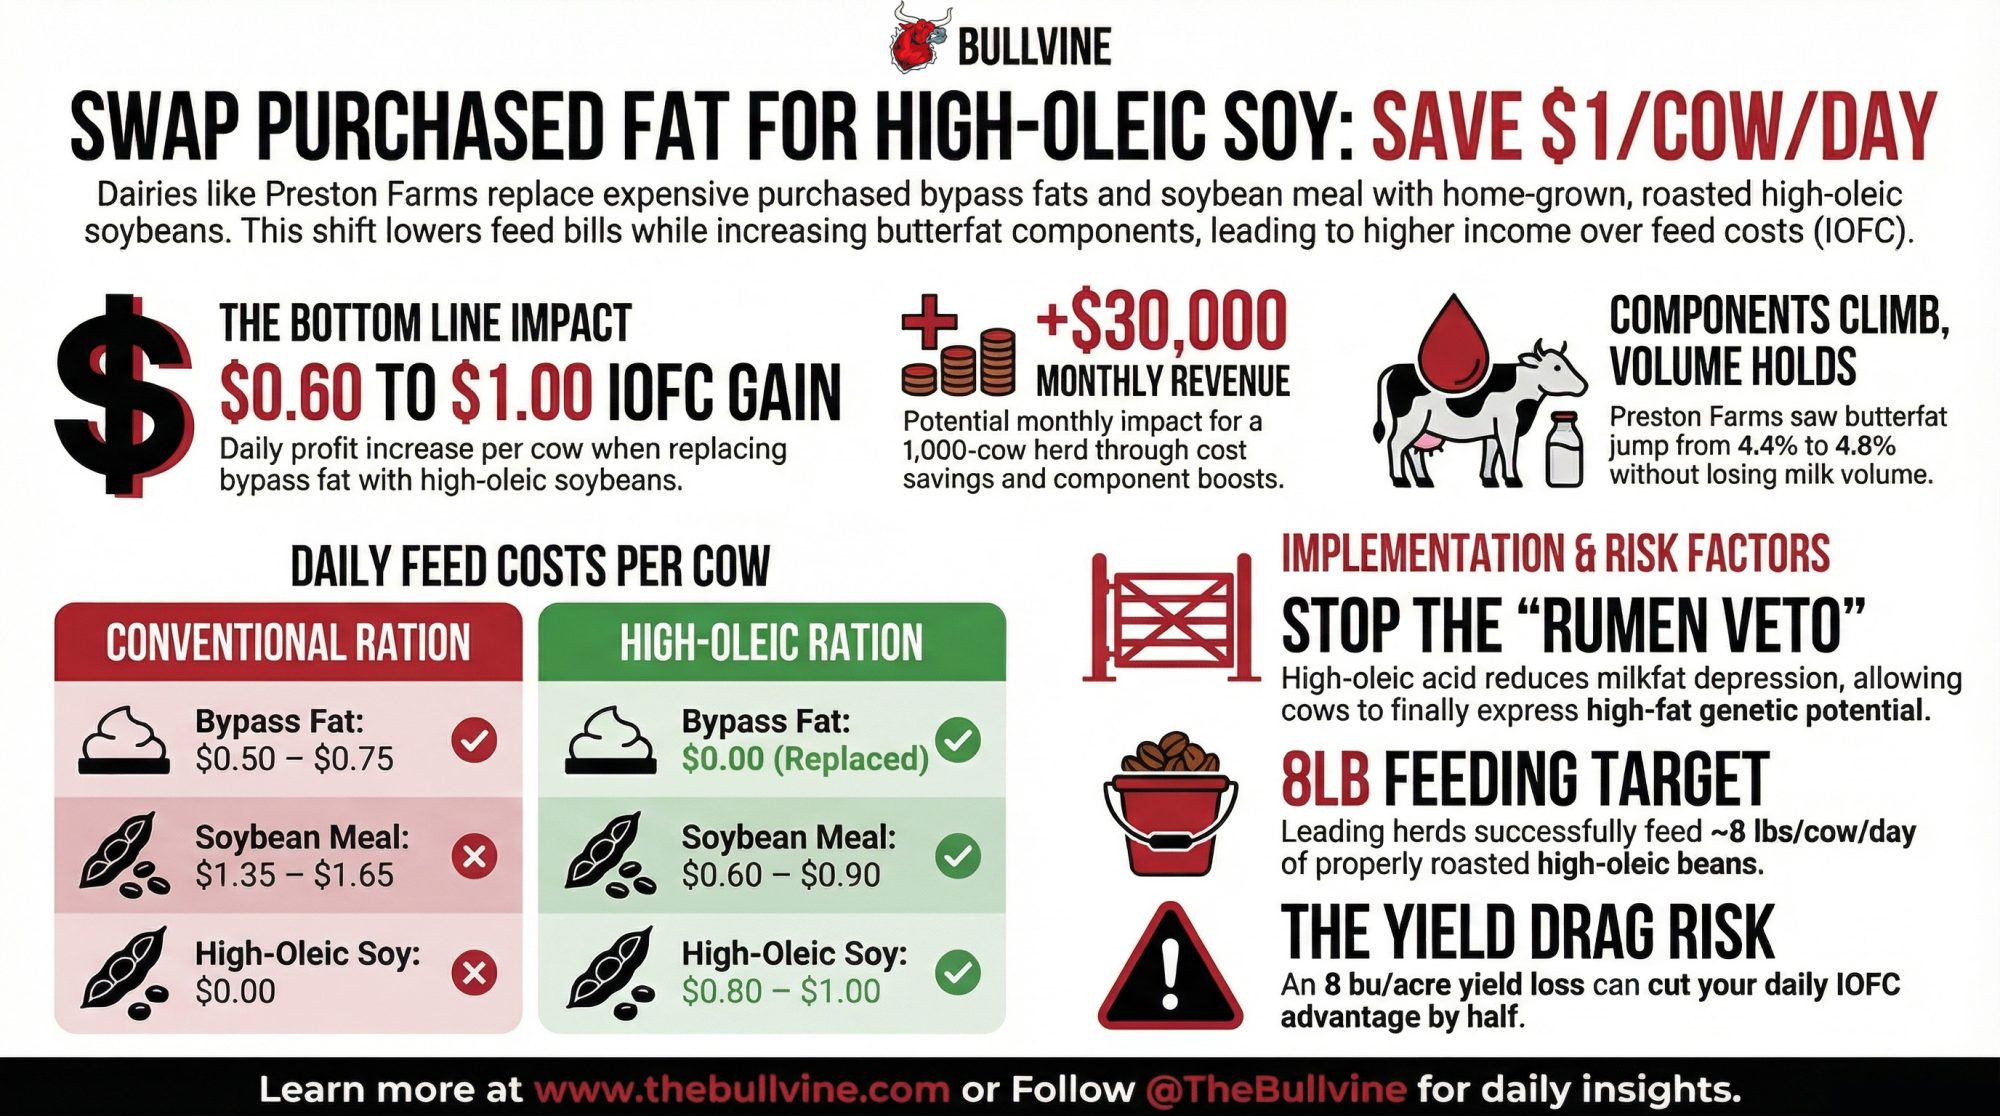
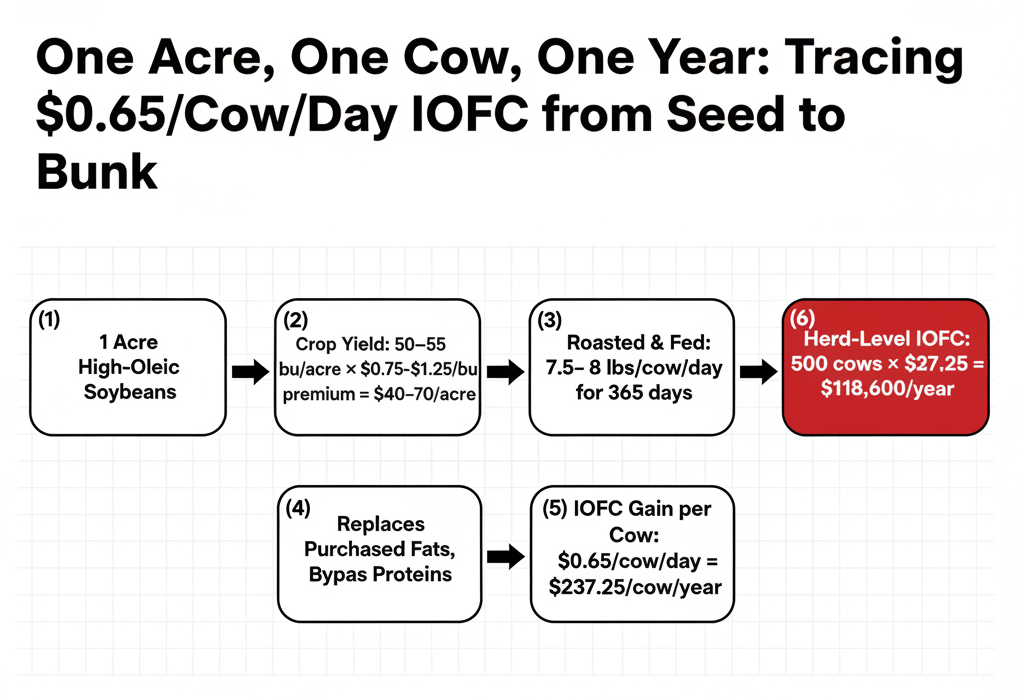
Executive Summary: Preston Farms in Michigan pulled bypass fat out of a 1,000‑cow ration, fed 8 lb/cow/day of home‑grown high‑oleic soybeans, and still gained about $0.60–$1.00/cow/day in IOFC. Three very different herds — Holsteins in Michigan, Brown Swiss in Iowa, Holsteins in New York — all used high‑oleic beans to replace part of their purchased fat and meal without giving up milk or components. The upside shows up when you’re spending real money on bypass fat and soybean meal and can grow decent‑yielding soybeans; that’s where the ration shift starts to pencil as $18,000–$30,000/month on 1,000 cows instead of a neat research slide. The risk is yield and agronomy: an 8 bu/acre yield drag or a weed‑control misfit can quietly turn a “/cow/day” win into a marginal quarter. The article walks through a simple green‑light/red‑light test — seed access, acres, current fat spend, and advisor experience — so you can see if high‑oleic belongs in your 2027 crop plan or on your watch list. If you’ve been buying high‑fat genetics and still shipping “flat” butterfat, it also shows how a high‑oleic‑friendly ration can stop the rumen from vetoing the proofs you’ve already paid for.

High-oleic soybeans dairy

In November 2024, Brian Preston loaded the first batch of roasted high‑oleic soybeans into the TMR on his family’s farm in Quincy, Michigan. Within days, butterfat climbed from 4.4% to 4.8%, and the milk volume didn’t flinch. Six months later, even after component prices softened, Preston was still netting about 60–70 cents per cow per day, and Michigan State University summarized his early peak as “more than per cow per day in income over feed cost.”

“We got both,” he told Farm Progress — lower costs and better components — “which rarely ever happens.”

That line has echoed across MSU, Farm Progress, and the broader U.S. soy world ever since. But between seed access, weed pressure, roasting logistics, and changing butterfat markets, copying Preston’s move is not as simple as swapping one ingredient line for another. The operators who treat this like a full‑system decision — not just a shiny new feed ingredient — are the ones most likely to keep the dollars Preston and others are now banking.

The Day Preston Flipped His Ration

Preston Farms is a fourth‑generation dairy in southern Michigan. Brian works with his dad, Keith, uncle Glenn, and cousin Adam on roughly 1,600 acres near the Indiana line, milking about 1,000 Holsteins, raising contract hogs, and growing corn, soybeans, and alfalfa. Before high‑oleic, their model was simple: grow grain corn, buy soybean meal, and buy bypass fat.

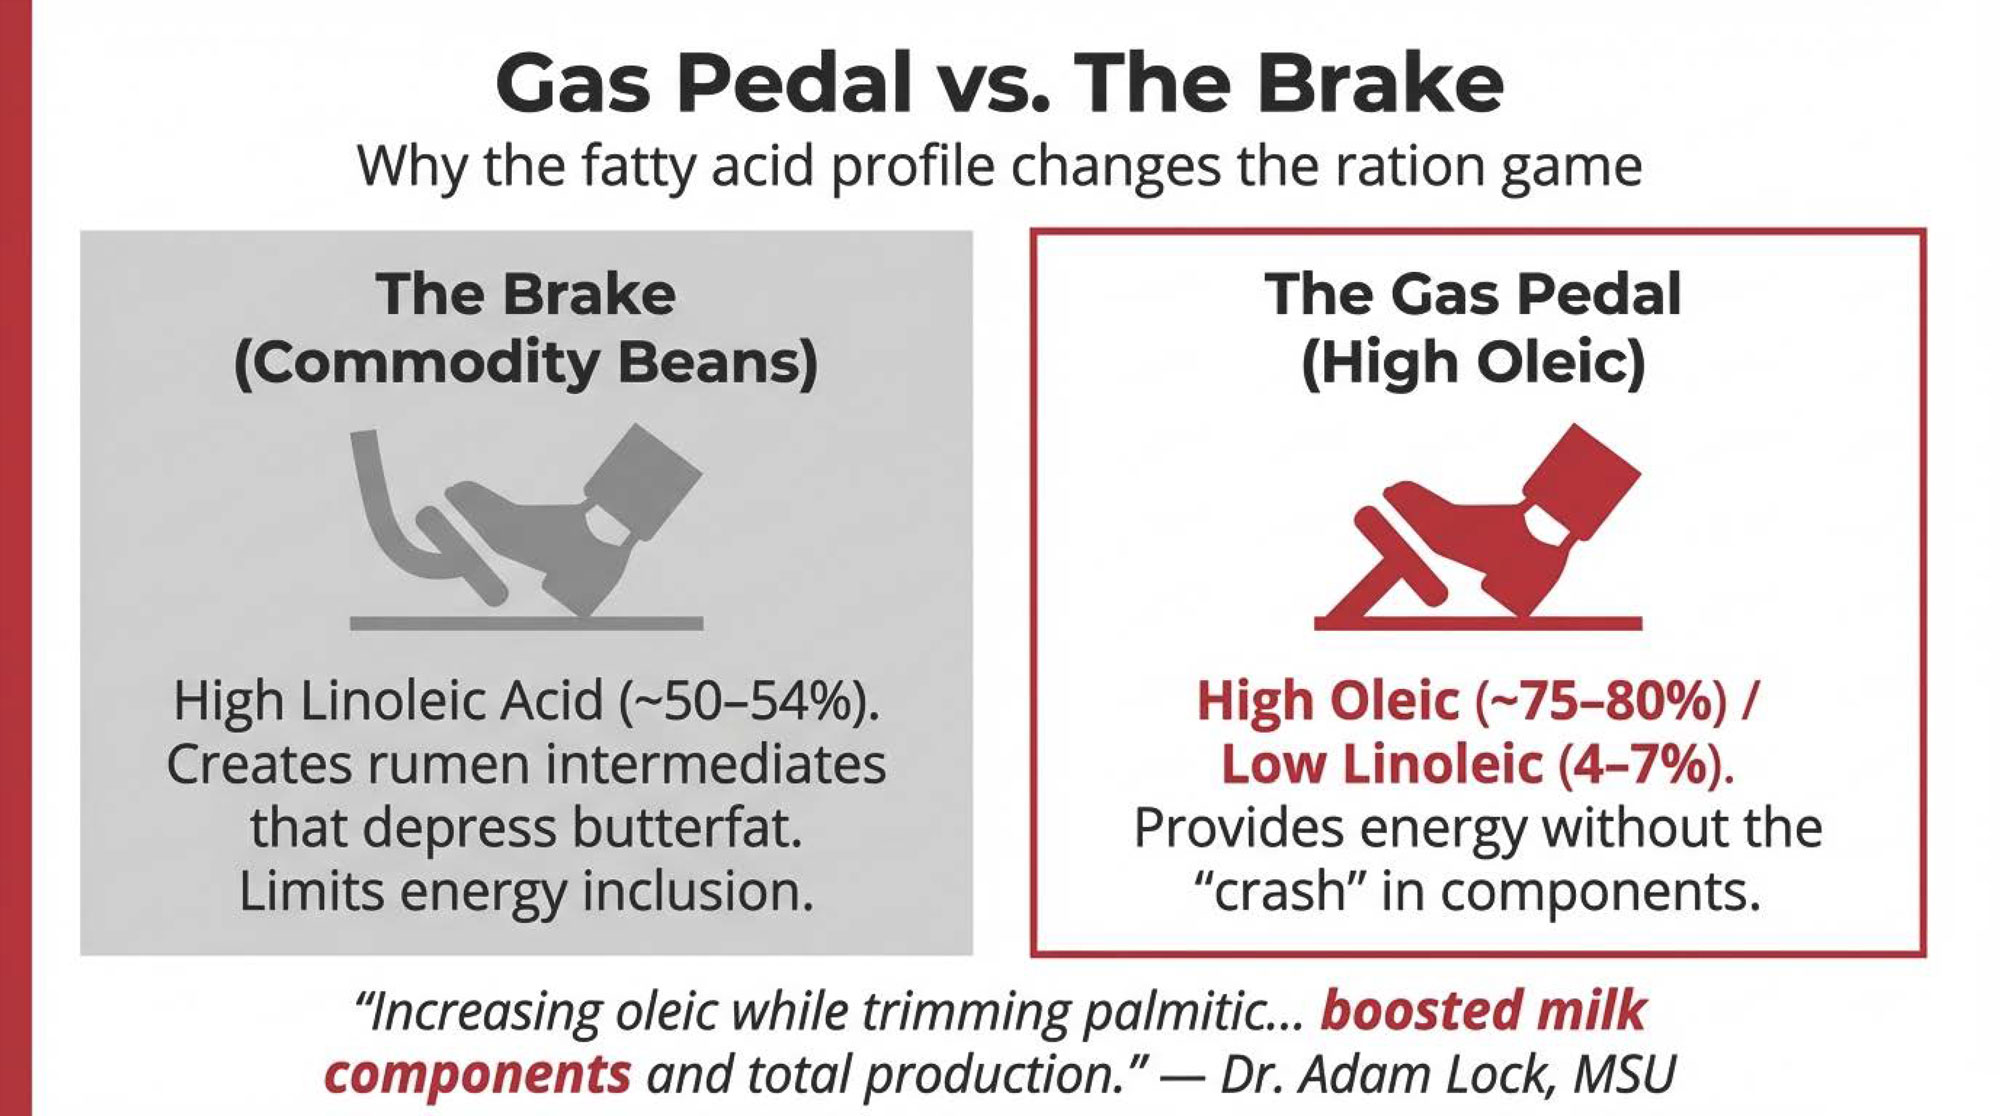
MSU’s Adam Lock had been in their barn more than once with a bold pitch. His group had identified high‑oleic soybean lines with more oleic acid and less linoleic acid than conventional soy, and they were seeing a very different impact on milkfat when those beans were properly roasted and fed. The theory was straightforward: if you could push more oleic and less linoleic acid to the small intestine, you could feed more fat, pull expensive calcium salts and palm‑based fats out of the ration, and still gain on butterfat without crashing the rumen.

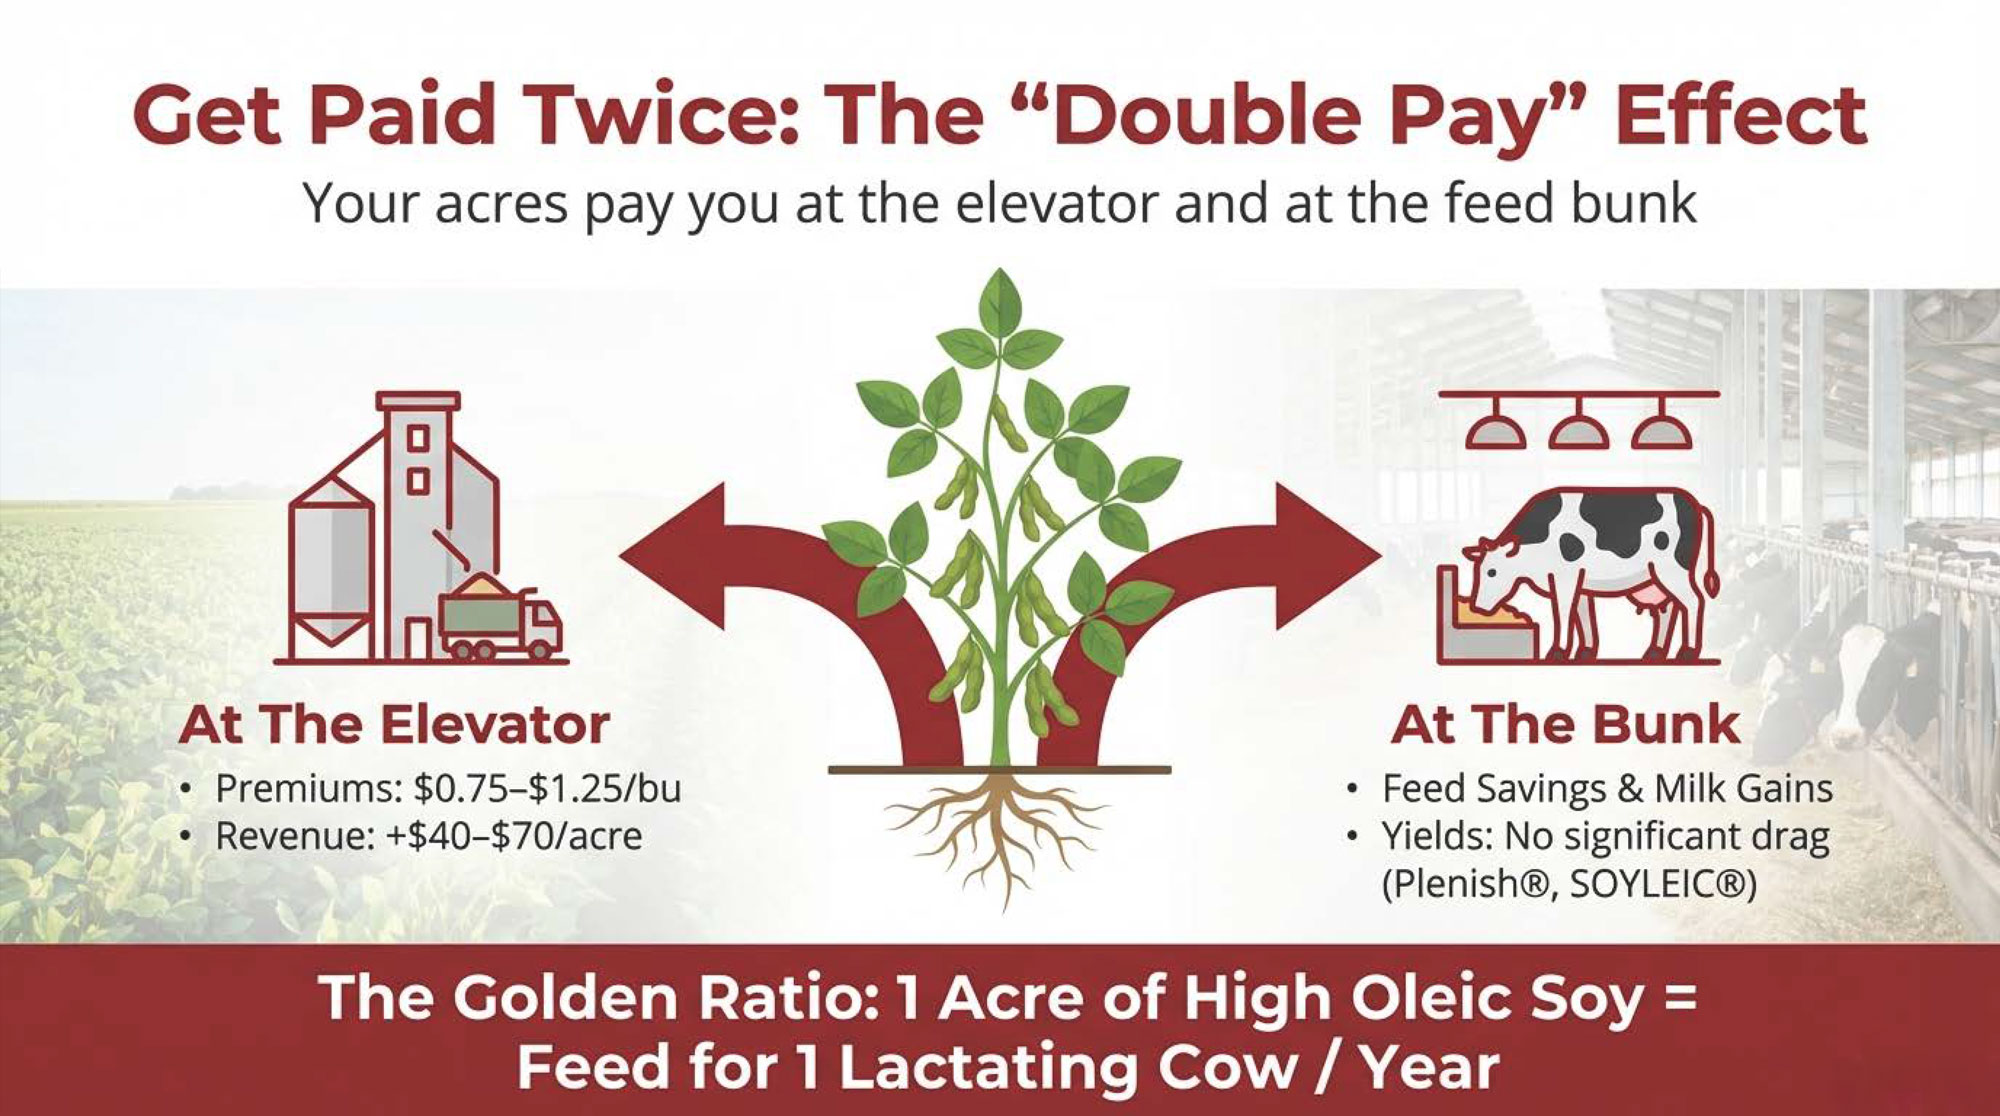
In 2024, the Prestons put that theory to the test. They seeded about 300 acres of high‑oleic soybeans on their own land and lined up another block of beans from neighbors to cover their needs — roughly 400 acres total when you add contracted ground. They installed an electric soybean roaster, worked with MSU on roasting targets, and by November started feeding around 8 lb/cow/day of roasted high‑oleic soybeans in the lactating ration.

“What was different with high‑oleic beans,” Preston told Farm Progress, “we were able to cut out the calcium salts and some of the palm fats for a significant feed savings with higher butterfat and the same pounds of milk.” MSU’s Michigan Alliance for Animal Agriculture report put it bluntly: the shift “allowed one southwest Michigan dairy farm to add more than $1 per cow per day in income over feed cost.” As butterfat and protein prices eased off the 2024 highs, that advantage settled into the $0.60–0.70 per cow per day lane — still worth roughly $18,000–21,000 a month on 1,000 cows.

Preston also used high‑oleic soybeans to rebalance his cropping rotation. After years of corn‑on‑corn, adding triticale and high‑oleic soybeans let them harvest three crops off the same acres over two years — triticale, corn silage, then high‑oleic soybeans — without sacrificing feed quality. It wasn’t just a ration tweak. It was a whole‑farm adjustment.

How Much Is Your Bypass Fat Really Costing You?

If you’re still buying bypass fat like it’s 2015 without checking what your own acres could do, you’re almost certainly leaving money on the table. And if your current ration is already leaking margin through purchased fat and protein, that problem won’t fix itself.

Take a common “before” scenario on a high‑producing herd:

  • Bypassing fat add up fast. Many herds are feeding roughly 0.5–0.75 lb/cow/day of rumen‑protected palm fat. At recent price bands of about $1,700–2,000/ton, that often lands in the neighborhood of $0.50–0.75/cow/day, and higher where feeding rates or prices sit above those mid‑range examples.
  • Soybean meal quietly stacks the bill. Feeding around 6 lb/cow/day of soybean meal, at $450–550/ton, easily tacks on about $1.35–1.65/cow/day.
  • Together, fat + meal often clears $2.00/cow/day. For a lot of herds, those two lines alone sit in the ~$2.00/cow/day or more range.

Now picture the Preston‑style “after” where you let high‑oleic beans do more of the work:

  • Home‑grown HOS takes over both fat and part of the protein. Feeding 7.5–8 lb/cow/day of roasted high‑oleic soybeans grown on your own acres, at an all‑in cost of roughly $450–520/ton, works out around $0.80–1.00/cow/day.
  • Soybean‑meal dependence drops. With beans carrying more of the protein load, soybean meal spend might drop into the $0.60–0.90/cow/day band instead of $1.35–1.65. That’s ration‑specific, but it’s the pattern Preston, Hilltop, and Half Full have followed. 
  • Bypass fat can legitimately become a zero line. When roasted high‑oleic beans carry the energy and fat load, bypass fat has a clear path to $0.00/cow/day

Put side‑by‑side, it looks like this:

InputConventional Ration (Approx. Cost)High‑Oleic Ration (Approx. Cost)
Bypass fat$0.50–0.75/cow/day$0.00/cow/day (replaced)
Protein (soybean meal)$1.35–1.65/cow/day$0.60–0.90/cow/day (partial replacement)
High‑oleic soybeans$0.00/cow/day$0.80–1.00/cow/day (home‑grown, roasted)
Estimated IOFC gainBaseline+$0.60 to +$1.00/cow/day

That table is why Preston’s numbers — and MSU/UW‑Madison modeling — land in that $0.60–1.00/cow/day IOFC gain range. On ingredient cost alone, you’re largely swapping one expense for another. The extra money shows up when butterfat and protein go up, and milk volume doesn’t drop.

What Happens When the Crop Doesn’t Cooperate?

None of that works if the beans don’t yield. And an agronomic miss on your feed crop feels a lot like discovering your “fine” ration has been burning cash.

  • High‑oleic can yield like your normal beans — if you treat them like it. USB and the Iowa Soybean Association both point out that high‑oleic soybeans have performed on par with comparable conventional varieties when they’re matched correctly to soil type and weed‑control programs. 
  • A yield drag hits your IOFC faster than most vendors admit. Say your soybean COP sits around $650–700/acre and you expect 60 bu/acre — that puts you roughly in the $11–11.50/bu zone. Drop eight bushels because you put the wrong variety on the wrong field, or your weed program wasn’t tight enough, and the same cost per acre jumps to about $12.70–13.00/bu. At 7.5–8 lb/cow/day, that adds roughly $0.22–0.23/cow/day to your bean cost.
  • A “dollar a cow” can quietly become “a quarter a cow.” If your IOFC gain at strong butterfat prices was $0.60/cow/day, that kind of yield drag can cut your advantage by roughly a third to a half, depending on your other ingredient prices.

The early misses all rhyme:

  • Putting high‑oleic beans on your worst weed‑pressure acres. Treating HOS as a place to dump risk fields is a reliable way to guarantee yield penalties as resistant weeds get a free run.
  • Choosing a high‑oleic variety that doesn’t match your herbicide program. If the trait stack doesn’t fit your existing weed tools, you either pay to adopt new chemistry or accept more weeds. Neither is free. 
  • Relaxing fungicide and plant‑population decisions because “it’s just feed.” High‑oleic soybeans don’t get a pass on agronomy just because they don’t go straight to a food‑grade contract. 

The trait isn’t the problem. The field choices are.

Can Your Seed Rep Actually Get You the Right Variety?

High‑oleic soybeans have quietly moved from niche curiosity to real acreage.

  • Farmers in 16 states grew high‑oleic soybeans on roughly 800,000 acres in 2024. USB and Brownfield reporting put the footprint there, with the heaviest concentrations in states like Indiana and Ohio, where crushers and food markets are already lined up. 
  • Seed choice isn’t just “yes/no,” it’s traits and maturity. USB and partner seed companies list 21 high‑oleic varieties for recent seasons, with maturity groups from roughly 1.9 to 4.8 and trait stacks ranging from Plenish high‑oleic Enlist E3 to SOYLEIC lines with other herbicide packages. 
  • Feed isn’t the first destination — yet. USB data suggest about 35% of high‑oleic soybeans currently go into dairy rations, about 60% into food uses, and around 5% into industrial markets. 

Your practical test is simple:

  • If your rep can name a specific high‑oleic variety in your maturity group, with the herbicide traits your weed pressure actually needs, and commit to delivering enough units, you’re in the game. That doesn’t guarantee success, but it means the supply‑side friction is manageable. 
  • If the answer is “we’ll see what we can find,” you’re watching the first wave, not riding it. That’s a signal to keep pushing your suppliers and watching the data — not to build your 2027 feed strategy on a hypothetical seed supply. 

Who’s Actually Running This Play Today?

Preston isn’t the only operator betting real money on high‑oleic. He’s just one of the easiest to find on a map.

Hilltop Acres Farm, Iowa — Brown Swiss on beans. In northeast Iowa, Dennis Mashek runs Hilltop Acres, an eight‑generation Brown Swiss herd near Calmar. About four years ago, his nutritionist suggested feeding his own high‑oleic soybeans. “My nutritionist told me high oleic soybeans could raise butterfat by a point to a point and a half, so I thought I’d give it a try, and it did,” Mashek told the Iowa Soybean Association. Today, he feeds six pounds of ration containing high‑oleic soybeans per head per day, roasts beans on‑farm at about 280–310°F, and has eliminated Novameal from the ration. His Brown Swiss herd is running roughly 4.9 fat and 3.7 protein, and he plans to keep high‑oleic soybeans in the rotation.

Half Full Dairy, New York — chasing ROI when palm fat spiked. In Warners, New York, Half Full Dairy started feeding high‑oleic soybeans in 2020 as palm‑fat prices spiked and supply got choppy. Owner AJ Wormuth worked with Dairy One nutritionist Brian Rapp to source high‑oleic beans, dial in roasting and grinding, and rework the ration. They replaced bypass fat and some soybean meal with high‑oleic soybeans and saw about $0.37/cow/day in savings, with components holding.

The whole‑system view in Iowa. The Iowa Soybean Association and Iowa State University are now running HOS from ISU field plots through the feed mill into the ISU dairy herd, explicitly to understand how growing, processing, and feeding high‑oleic all fit together for dairies like Mashek’s.

Different states, different breeds, different cooperatives. Same pattern: acres, a nutritionist willing to do more than “tweak,” and a farm family prepared to live with the result if the experiment doesn’t pay.

Are Your High‑Fat Genetics Hitting a Rumen Wall?

High‑oleic soybeans aren’t just a feed‑cost story; they’re a quiet genetics story too.

If you’ve spent years stacking bulls for higher fat and component kilos, but your ration leans hard on rumen‑active unsaturated fats from “cheap” sources, you’ve probably watched proofs that say “components up” turn into milk cheques that say “fat flat.” The rumen is vetoing the genetics.

By pushing more oleic and less linoleic acid to the small intestine when beans are properly roasted, high‑oleic soybeans reduce the risk of diet‑induced milkfat depression that often comes with feeding more unsaturated fat. That’s the kind of environment where high‑index cows are more likely to show the fat yield their proofs predict, instead of hitting a rumen wall. If you’re already using genomic proofs to chase higher fat and component kilos, a high‑oleic‑friendly ration is one of the few realistic tools that helps those numbers show up consistently on your butterfat line rather than staying hypothetical.

Worth thinking about: you’ve already paid for those genes. What’s your ration doing to let them express?

Does This Still Pencil When Butterfat Prices Slide?

You don’t need a Ph.D. to ask the obvious question: what happens when butterfat isn’t paying as it did in 2022–24?

In a 2024 Journal of Dairy Science paper and a companion UW‑Madison Dairy Innovation Hub seminar, Nicholson and colleagues pulled data from five feeding trials, modeled high‑oleic soybeans at 5% of diet DM, and ran the economics across butterfat prices from 2014 to 2020. Even at lower butterfat prices, high‑oleic diets delivered higher milk income less feed cost than conventional soybean diets in their model. Higher butterfat prices make the math prettier, but they’re not the only thing holding it together: in strong fat markets, the “more pounds of fat shipped” side of the ledger does a lot of work; as prices move back toward “normal,” more of your win comes from turning bypass‑fat and meal spend into home‑grown beans with a solid yield.

Preston’s own numbers track that curve. When markets were strong, he was over $1.00/cow/day ahead; as prices cooled, he settled into the $0.60–0.70/cow/day band. The math doesn’t evaporate when fat prices come off their highs. It just leans harder on your cropping and roasting discipline. And the protein side of this equation deserves its own audit in a future piece.

Green Light / Red Light: Are You Ready for High‑Oleic in 2027?

🟢 Green Light Signals

  • You already grow soybeans in a high‑oleic geography. You’ve got soybean acres in a region where high‑oleic seed is actually available in your maturity group — not just “somewhere in the state.” 
  • Your seed rep can be specific, not vague. When you ask, “Which high‑oleic variety in my maturity group, with the traits my weed pressure needs, can you actually deliver for 2027?”, your rep can name the variety, the trait package, and a realistic unit count. 
  • You’re spending real money on bypass fat and soybean meal. Your current ration uses at least 0.5 lb/cow/day of bypass fat and a healthy dose of purchased protein, so there’s legitimate room for cost replacement.
  • Your nutritionist is up for more than a paper exercise. They’re willing to design a ration with 5–8 lb/cow/day of roasted beans, understand roasting targets, and commit to watching fat, protein, MUNs, and body condition for at least 60–90 days instead of assuming everything will be fine on day one.
  • You can commit 40–80 acres without jeopardizing your whole crop plan. You’ve got enough acres to run a meaningful pilot, but not so many that a yield miss takes down your feed budget. 

🔴 Red Light Signals (Wait 2–3 Years)

  • Seed supply is a shrug, not a plan. Your rep can’t guarantee a specific high‑oleic variety in your maturity group, with the trait stack your weed history requires, for 2027. That’s a supply‑chain issue, not a personal failure — and a sign to hold fire this cycle. 
  • Your weed program is already hanging on by its fingernails. You’re leaning hard on trait stacks and herbicides to stay ahead of waterhemp, ragweed, or Palmer, and the available high‑oleic options would be a step backward on weed control. 
  • You don’t buy much bypass fat now. If your ration uses little to no bypass fat and your components are already strong, your upside is smaller and might not justify the agronomy and roasting learning curve in 2027.
  • No one on your advisory bench has actually done this. If your nutritionist, seed dealer, co‑op nutrition team, and local extension all only know high‑oleic from a brochure, you’d be testing a new crop, a new feed ingredient, and a new advisory model all at once. 
FactorGreen‑Light HerdRed‑Light Herd
Seed supplyNamed high‑oleic variety, 40–80 acres secured“We’ll see what we can find” for 2027 units
Bypass‑fat use≥0.5 lb/cow/day, fat+meal ≥2.00 $/cow/day<0.25 lb/cow/day, fat+meal ≤1.50 $/cow/day
Soy acres & riskCan pilot 40–80 acres without stressing feed planHigh‑oleic would tie up >50% of soybean acres
Weed controlSolid herbicide program that matches HOS trait stackProgram already “hanging on by fingernails” vs. waterhemp
Advisory benchNutritionist + seed rep have at least one HOS caseNo one on team has fed or grown HOS yet
Monitoring disciplinePlan to track butterfat, protein, MUNs 60–90 daysNo time or systems to watch ration response

Whatever column you’re in, write an exit plan before you plant.

If you’re contracting high‑oleic for food or industrial markets, know where beans you don’t feed will go and at what basis. If you’re planting strictly as a feed crop, talk to your elevator now about whether they’ll treat those beans like commodity soy, discount them, or refuse them. High‑oleic beans are still soybeans. But they’re not automatically just “beans” in every local market.

What This Means for Your Operation

  • Audit your last 90 days of feed invoices for fat and protein spend. Add your bypass‑fat and soybean‑meal lines and divide by cows. If that combined number is under roughly $1.50/cow/day, high‑oleic is a second‑wave decision, not a 2027 emergency.
  • In the next 30 days, put your seed rep on the spot. Ask: “What specific high‑oleic variety in my maturity group, with the herbicide traits my weed pressure requires, can you actually deliver for 2027?” If they can’t answer cleanly, that’s your answer for this cycle. 
  • Run a simple stress test with your nutritionist instead of guessing. Model high‑oleic at three butterfat prices (today, a stronger case, and a stressed scenario) and two yield levels (your five‑year soybean average and minus 8 bu/acre). If the only line that works is “high fat price + no yield drag,” you know this is a gamble, not a plan.
  • Start small and intentionally if you go ahead. Treat 40–80 acres as a deliberate pilot for agronomy, roasting, and ration performance — not as proof of a sales pitch. 
  • Add a genetics lens to your feed decisions. If you’re already stacking bulls for fat and components, look at whether your current fat sources are helping those high‑index cows show up on the milk cheque or quietly capping them with diet‑induced fat depression. A high‑oleic‑friendly ration is one of the few tools that pushes the rumen in the same direction your proofs are pushing the cow.
  • Write your abort criteria now. Something as simple as “If we don’t have seed with the right trait stack in hand by [date], or if butterfat stays below [target price] for six months, we pause this plan” will save you from talking yourself into a marginal bet later. 

Key Takeaways

  • If you’re not already feeding at least 0.5 lb/cow/day of bypass fat, high‑oleic soybeans are probably a “watch and plan” tool for 2027, not the first place you throw capital.
  • If your seed rep can’t name and secure a specific high‑oleic variety in your maturity group with the herbicide traits your weed pressure demands, you’re early in the curve; your smartest move is to push for better options and watch the next two years of data, not to force a half‑supplied experiment. 
  • If you can grow and roast your own high‑oleic soybeans and you’re currently writing big cheques for bypass fat and soybean meal, the most durable play is treating high‑oleic as a cost‑replacement crop, not a bolt‑on fat booster — you’re trying to grow a big slice of the fat and protein you currently buy. 
  • And if you’ve already spent years investing in high‑fat, high‑component genetics, a high‑oleic‑friendly ration may be one of the few realistic ways to stop leaving that genomic potential in the pipeline and start seeing it show up, consistently, on your butterfat line. 

The Prestons in Michigan, Mashek in Iowa, and Wormuth in New York didn’t wait for everyone in the industry to agree this was safe; they had enough of the pieces in place to try something new, with an exit plan if it didn’t deliver. The question for your farm is simple: over the next crop cycle, are you going to keep treating bypass fat and soybean meal as fixed costs — or are you ready to see whether your acres, your cows, and your numbers can turn high‑oleic soybeans into your own $0.60–$1.00 per cow per day?

Complete references and supporting documentation are available upon request by contacting the editorial team at editor@thebullvine.com.

Learn More

The Sunday Read Dairy Professionals Don’t Skip.

Every week, thousands of producers, breeders, and industry insiders open Bullvine Weekly for genetics insights, market shifts, and profit strategies they won’t find anywhere else. One email. Five minutes. Smarter decisions all week.
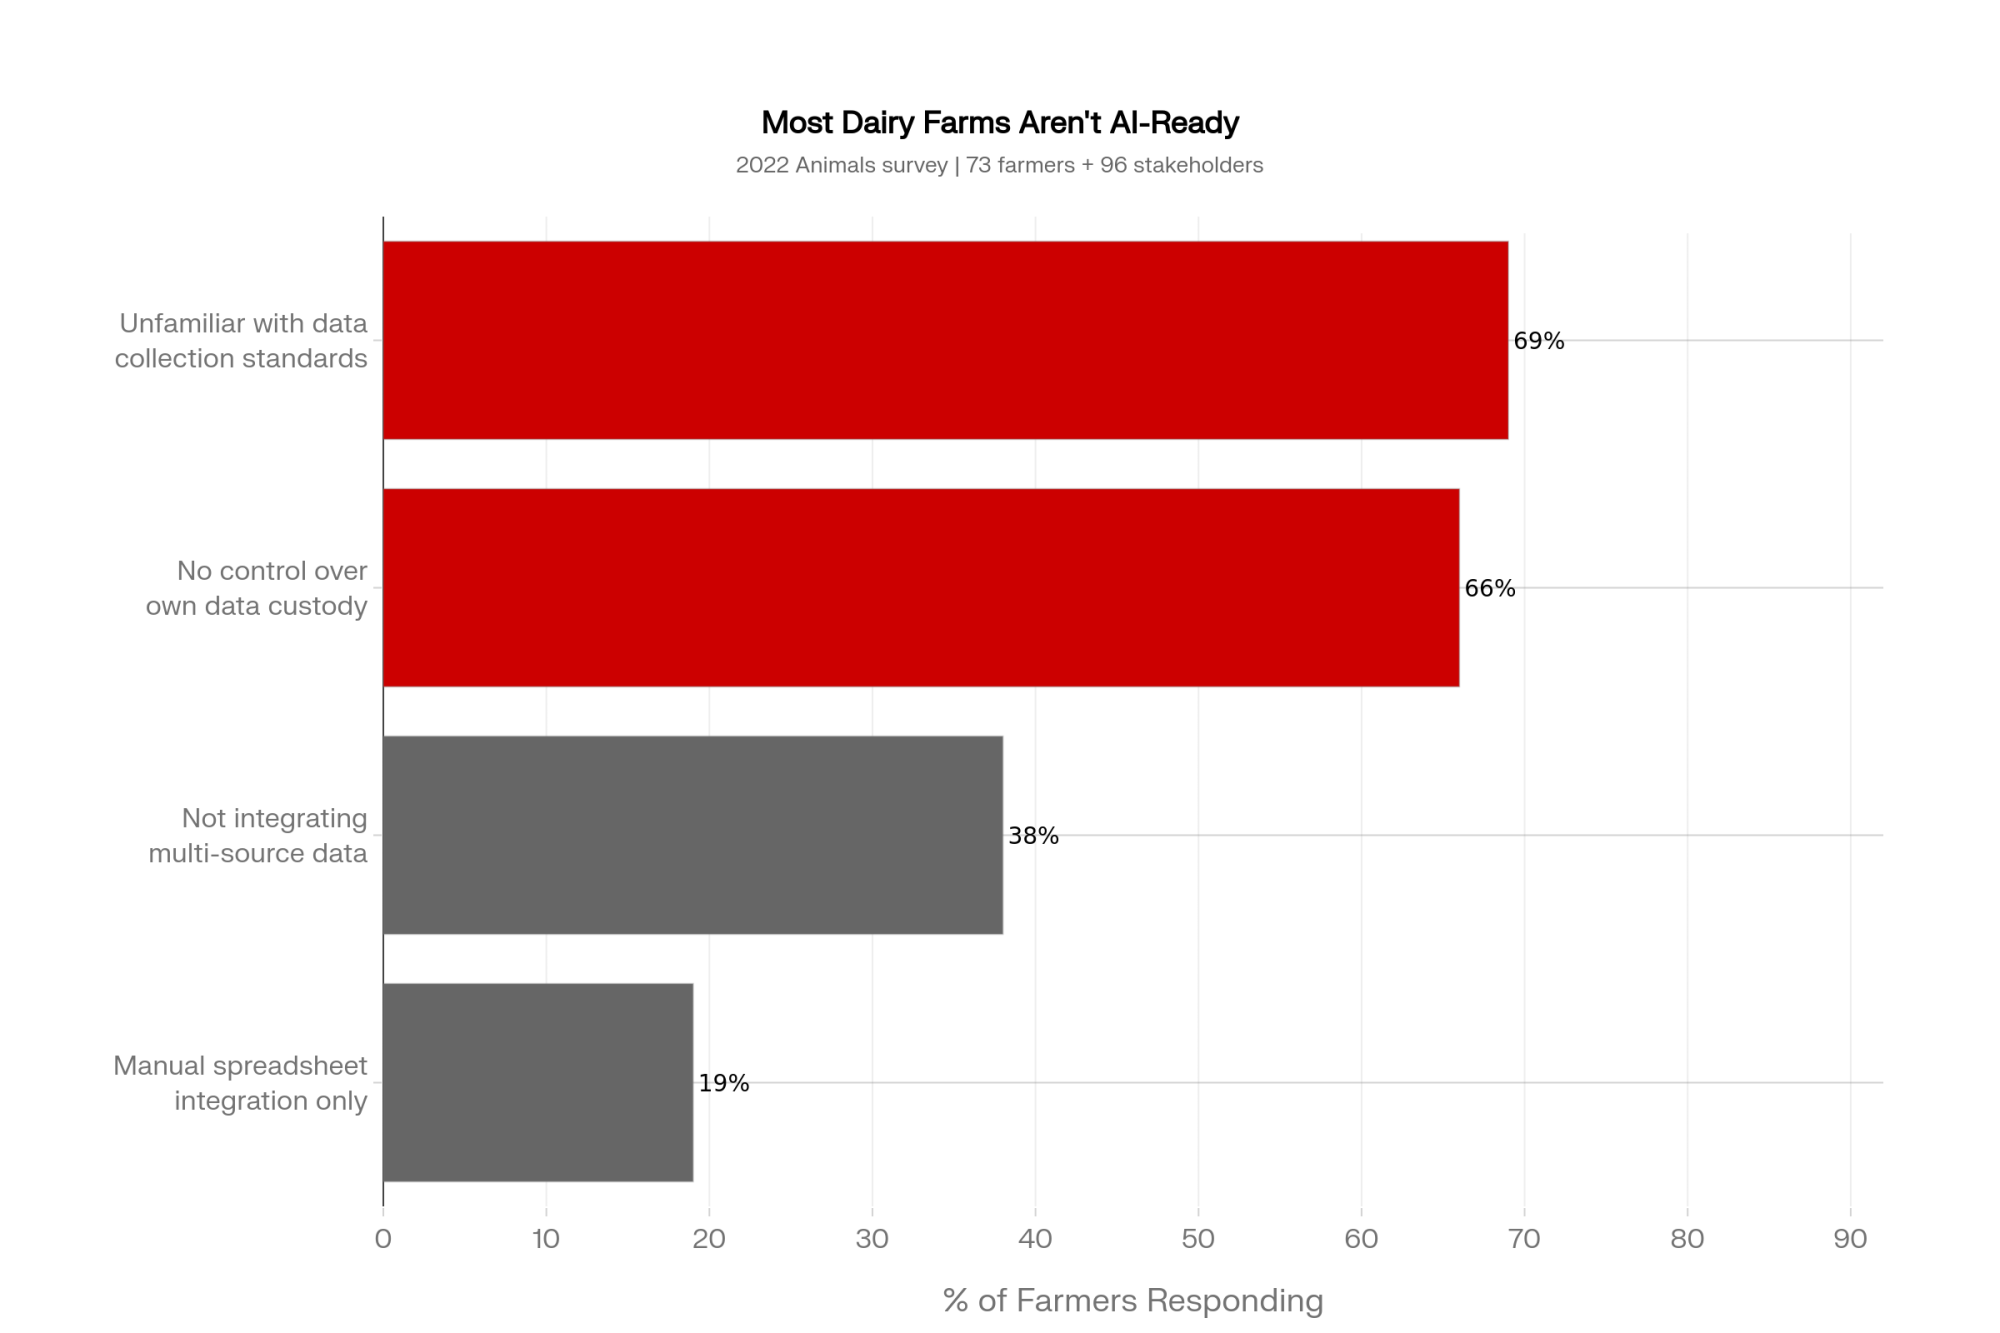
NewsSubscribe
First
Last
Consent

Triângulo Mineiro Dairy’s Sorghum Silage Trap: The 360‑Liter‑a‑Day Reality Check

A 200-cow dairy outside Uberlândia ran the numbers on swapping corn silage for sorghum. The gap: 360 liters a day — and that was before they opened the bunker.

Executive Summary: A 200‑cow dairy in Brazil’s Triângulo Mineiro nearly gave up 360 liters of milk per day by treating “cheap” sorghum silage as a 1:1 swap for corn. The article walks through current Brazilian and international research showing conventional forage sorghum typically runs at roughly 80–85% of corn silage’s energy and can drop milk by about 1.6–1.8 kg/cow/day if you don’t rebuild the ration. It breaks sorghum into grain, forage, sweet, biomass, and BMR types and shows where each actually fits — including why biomass sorghum’s high lignin makes it a tonnage tool, not feed for 40-liter cows. BMR sorghum can hang with corn on milk in well‑managed diets, but brings a 12–15% yield penalty and a higher seed bill, so it only pencils out as a premium forage, not “cheap corn.” The piece also lays out harvest and fermentation rules specific to sorghum — soft dough at ~28–30% DM, serious processing, and roughly 56 days in the bunker — so you’re not throwing starch out the back end. Finally, it offers four “sorghum lanes” (split‑group, BMR partial replacement, one‑TMR moderate inclusion, or walk‑away) and a 30‑day assignment: pull 12 months of records, calculate feed cost per liter, and see which lane your herd can actually manage on paper.

Sorghum vs corn silage

When a small dairy outside Uberlândia decided to lean harder on sorghum silage a couple of seasons ago, the move felt pretty logical. Sorghum would fill the bunkers when second‑crop corn missed rain, cut the seed bill, and keep corn reserved for the high group.

Then the family sat down with their nutritionist and ran the barn math. Swapping conventional forage sorghum straight in for corn, 1:1 in the main lactating ration, would cost them roughly 360 liters of milk every day on a 200‑cow herd — about 1.8 kg less milk per cow per day than a comparable corn‑silage diet. That 1.8‑kg gap lines up with a 2019 Journal of Dairy Science meta‑analysis that compared conventional sorghum, brown‑midrib (BMR) sorghum, and corn silages at the same dry matter intake.

They never made that full swap. But that number stuck. And it’s exactly why “cheap” sorghum silage is suddenly a hot, uncomfortable topic in a lot of Brazilian‑style climates.

What’s Really at Stake with Sorghum Silage in Brazil?

Brazil isn’t dabbling in sorghum anymore. According to recent CONAB‑aligned and USDA/FAS analyses, sorghum planted area climbed to around 1.5 million hectares in 2024/25, up about 6.5% from the previous season, with production projected near 5 million tons, roughly 12% more than 2023/24. Growth has been driven hard by the Cerrado and other water‑stressed regions where double‑crop corn is increasingly a weather gamble instead of a sure bet.

From the agronomy side, Embrapa’s national sorghum program and Brazilian economic studies all circle the same points. Sorghum:

  • Handles heat and drought better than corn.
  • Tolerates lower fertility and marginal soils.
  • Often needs less fertilizer and crop protection to stay viable.

Work under restricted irrigation shows sorghum maintaining biomass production where corn yields drop sharply, with some trials reporting sorghum sustaining comparable biomass while using considerably less water, depending on hybrid and soil.

But your bank doesn’t cash tonnes. It cashes liters.

Feeding trials and meta‑analyses give a consistent story when both crops are harvested and ensiled properly:

  • Whole‑plant forage sorghum silage usually sits at about 80–85% of corn silage’s energy density on a dry matter basis.
  • Across multiple experiments, cows on conventional sorghum silage diets produced roughly 1.6–1.8 kg less milk per day than cows on corn‑silage diets at similar dry matter intake.

Do that math on a 200‑cow herd, and you’re staring at something very close to 360 liters of milk per day if you treat conventional forage sorghum like a one‑for‑one corn replacement and don’t rebuild the ration.

The Triângulo family didn’t fully go there. They kept corn silage anchored in the high‑group ration and parked sorghum with low cows and heifers. That’s the only reason the 360-liter number stayed on paper and not in their milk sheets.

That’s the heart of the sorghum silage story right now. It’s not “good vs bad.” It’s whether you’re measuring it in tonnes per hectare or feed cost per liter of milk.

Are You Growing the Right Sorghum for the Right Cows?

One of the quickest ways to get burned is talking about “sorghum” like it’s one crop. Embrapa doesn’t even do that. Their breeding work splits sorghum into at least five main types:

  • Grain sorghum — shorter plants, high grain proportion, lower whole‑plant yield, high energy density.
  • Forage sorghum — taller plants, strong fresh‑matter yields, more fiber, less starch than grain sorghum or corn.
  • Sweet sorghum — juicy, high‑sugar stems often used for juice or biofuels.
  • Biomass sorghum — very tall bioenergy types bred for fiber and tonnage.
  • Broom sorghum — niche type for panicles.

On Brazilian dairy farms, the ones that really show up in bunkers are forage sorghum and some dual‑purpose grain sorghum. Grain sorghum silage gives up tonnage but packs more energy per kilogram of dry matter thanks to the head. Forage sorghum is the workhorse compromise: big tonnes, middling energy, flexible enough for low cows, heifers, and beef.

Biomass sorghum is a different animal. Embrapa and recent genotype work under tropical conditions show that, compared with forage sorghum, biomass types tend to bring:

  • Very high fresh‑matter yields from very tall plants.
  • Very high NDFlow crude protein, and higher lignin.

That lignified fiber doesn’t just look impressive across the field. It sits in the rumen, slows passage, and caps how much energy a 40-liter cow can eat. High lignin drags down fiber digestibility; more of that massive biomass passes through the cow without doing much work.

From the road, biomass sorghum looks brilliant — towering stands, heavy wagons, deep bunkers. At the bunk, it can feel more like a trap when intakes slide, and you see stem fiber coming out the back end.

Brazilian researchers are straightforward about this. Right now, biomass sorghum is best treated as:

  • tonnage tool for low‑demand cattle or bioenergy, or
  • secondary forage that you use carefully in dairy rations when you’re ready to pay for extra grain.

The dairies that are genuinely happy with sorghum tend to do one simple thing: match the sorghum type to the job.

Can BMR Sorghum Really Get Close to Corn Silage?

The brown‑midrib (BMR) trait is where sorghum stops being just “cheap tonnage” and starts looking like a serious dairy forage.

BMR sorghum has a mutation that reduces lignin in the plant. Less lignin usually means more digestible fiber, which can support higher intakes and more milk. In 2019, Sanchez‑Duarte and colleagues published a meta‑analysis of nine experiments looking at cows fed:

  • Conventional sorghum silage (CSS)
  • Conventional corn silage (CCS)
  • BMR sorghum silage (BMRSS)

They found:

  • Cows on BMR sorghum silage produced similar milk yield to cows on corn silage when diets were properly balanced for energy and nutrients.
  • Compared with BMR diets, cows on conventional sorghum silage produced about 1.64 kg/day less milk and had 0.09 percentage points lower milk‑fat concentration, with lower fat yield.
  • BMR sorghum diets tended to lift milk fat percentage slightly and drop protein percentage slightly compared with corn silage diets, but total milk and component yields were in the same neighborhood.

U.S. university work says roughly the same thing. Trials from the Upper Midwest and the South report that diets based on BMR forage sorghum silage can deliver similar DMI and milk yield to corn‑silage diets when maturity, kernel processing, and ration starch are managed well.

So yes, under the right management, BMR forage sorghum can get very close to corn silage on milk — and in plenty of trials, essentially match it. But there’s fine print that matters in Brazilian‑type systems:

  • A 2025 meta‑analysis on BMR sorghum reports about a 12–15% reduction in dry matter yield for BMR lines compared with non‑BMR sorghums across trials.
  • BMR seed usually carries a premium price over conventional forage sorghum.
  • Embrapa emphasizes that BMR breeding is active, but commercial hybrid availability and adaptation still vary by region and seed supplier.

Put that together, and your cost per tonne of BMR sorghum silage can land similar to or higher than corn silage, depending on yield and seed deals. For a high‑output herd dealing with drought or input costs, that can still be a smart trade if BMR sorghum helps protect liters when corn fails. But it only makes sense if you treat BMR as a premium forage tool, not a shortcut to “cheap corn.”

Are You Letting Corn Protocols Ruin Your Sorghum Silage?

The next failure point isn’t genetics. It’s harvest and fermentation.

With corn, pushing toward ⅔–¾ milkline usually buys more starch, and a decent kernel processor will bust open even hard kernels. Harvesting around 32–35% dry matter fits the crop and the bunker.

Sorghum doesn’t behave the same. If you chase more starch past soft dough into hard dough without serious processing horsepower, total starch might tick up on the lab sheet, but starch digestibility heads the wrong way. Sorghum berries are smaller and harder than corn kernels. If a processor doesn’t crack them, they come out the back end as expensive bird feed — exactly what a lot of people see in manure behind poorly harvested forage sorghum.

Brazilian and U.S. work on sorghum maturity and silage quality points to a different target.

  • A Brazilian study on sorghum BRS‑610 found that ensiling between the milky/dough and dough stages gave very good fermentation and nutritive value.
  • Forage sorghum trials in Texas and other hot regions show soft‑dough harvest balances yield with lower NDF and better energy.
  • That typically lines up with whole‑plant dry matter in the high‑20s to around 30%, rather than pushing to 35% and beyond.

On fermentation time, a 2022 study following sorghum stalk silage from Day 0 to Day 56 found that pH reached its lowest point by Day 7 and fermentation parameters stayed stable from about Day 28 through Day 56, with good preservation and low dry matter losses. A 2021 study on whole‑plant sorghum silage reported improved aerobic stability and heterofermentative co‑fermentation at 56 days when inoculated with Lactobacillus plantarum and L. buchneri. A 2018 trial with sorghum silages showed that adding L. buchneri reduced yeast populations and increased aerobic stability, confirming the role of heterofermentative inoculants.

Taken together, they all point to the same practical window: aim to harvest at soft dough around 28–30% DM, then give sorghum silage about two months in the silo before you really lean on it.

If you’re already committed to sorghum, the protocol that protects your investment looks like this:

  • Aim for soft dough at about 28–30% dry matter. Earlier and wetter than a lot of corn programs, but where berries are still crackable, and starch is usable.
  • Crank up processing and shorten chop length. Tighten roll gaps and chop finer so more berries are actually opened. If you don’t have a processor, chop shorter to improve exposure and packing.
  • Give it time in the bunker. Plan on at least 56 days of fermentation before heavy feed‑out; multiple studies around 56–60 days show stable sorghum silages with strong fermentation profiles and better aerobic stability when inoculated.
  • Use the right inoculant on sweet or high‑sugar types. Research on whole‑plant sorghum and sweet sorghum silages shows that heterofermentative lactic acid bacteria, especially strains containing L. buchneri, increase acetic acid, suppress yeasts, and extend aerobic stability.

No harvest protocol will turn conventional forage sorghum into BMR or corn. But a sloppy harvest can easily give away another chunk of value between the field and the face.

Where Sorghum Actually Fits: Triângulo, Mato Grosso, the South, and Cariri

The Triângulo family that did the 360-liter math isn’t the only one treating sorghum as “insurance.” A 2024 characterization of corn silage from dairy farms in the Triângulo Mineiro region found that many herds were already leaving performance on the table because of silage quality issues and recommended more targeted technical assistance and better forage management. In that context, using sorghum to guarantee bunker volume and control per‑hectare costs while keeping corn silage concentrated in high‑producing groups is a pattern that lines up with how nutritionists describe their strategies in similar Brazilian climates.

In Mato Grosso and other parts of the Cerrado, sorghum has a natural lane in integrated crop‑livestock systems and as a second‑crop option behind soybeans. A 2022 longitudinal study of Brazilian food production shows cropping systems in the Midwest shifting toward more resilient, lower‑input species as heat and water stress trends intensify. Climate‑impact modeling on corn/soy double‑cropping indicates that future drought scenarios hit second‑crop corn yields especially hard in these regions. When late corn hits flowering and grain fill under high temperatures and erratic rain, its yield potential drops off fast — while sorghum’s physiology gives it more room to cope.

In parts of southern Brazil, agronomists like Dr. Arthur Behling Neto have seen a different picture. He notes that in the south of Brazil, sorghum “does not work properly,” while it performs much better in drier eastern regions like north of Minas Gerais and south of Bahia, where rainfall is more limiting. The lesson isn’t “never plant sorghum in the south.” It’s “don’t assume a Cerrado or Cariri playbook will work the same way in a completely different climate without local data.”

In Cariri, Paraíba, sorghum isn’t a nice‑to‑have option; it’s the backbone. A 2014 survey of 100 dairy farms in Caturité and Boqueirão found 88% cultivated sorghum as silage forage for feeding dairy cows, making sorghum forage the most commonly used silage type there. Under that kind of rainfall pattern and soil, “just grow more corn” isn’t realistic. Those producers still have to respect sorghum’s fiber and energy limits like anyone else — they don’t have many second chances if they bet wrong.

Across those regions, the common thread is simple. Sorghum works when it reduces drought and input risk without wrecking your feed cost per liter of milk. It fails when you buy it in tonnes and feed it like corn.

Which Sorghum Lane Are You Actually In?

Listen to enough producers and nutritionists talk through their forage programs, and four clear “sorghum lanes” show up. It’s worth being honest with yourself about which one your farm actually lives in — not which one you recite when the seed rep pulls in.

Lane 1: Split‑Group — Sorghum for Lows, Corn for Highs

This is the lane many Triângulo‑type dairies aim for.

  • Corn silage stays anchored in the high‑group ration.
  • Conventional forage sorghum feeds low producers, late‑lactation cows, heifers, and dry cows.

It only really works if:

  • You truly feed two distinct TMRs every day.
  • Your pen layout actually keeps high and low cows separate.
  • Your nutritionist actively rebuilds both rations when silage inventories shift.

On an 80–120‑cow herd with two pens and disciplined feeding, that’s achievable. On a “one TMR and hope the lows eat less” operation, it’s fiction. If you can’t reliably run two rations, you’re not in this lane — even if your whiteboard says so.

Lane 2: BMR Sorghum as Partial Corn Replacement

Here, you’re using BMR forage sorghum to replace maybe 25–50% of corn silage in the high‑group ration.

The 2019 meta‑analysis and newer BMR work say this can hold milk production at corn‑silage levels when diets are handled properly. But BMR sorghum:

  • Brings roughly a 12–15% yield penalty in dry matter vs conventional sorghum lines across trials.
  • Costs more in seed.
  • Needs tight harvest timing and serious processing to cash in on its fiber digestibility.

This lane fits if you’re fighting drought and forage cost:

  • You can consistently source BMR hybrids adapted to your region.
  • You have processing capacity for small, hard berries.
  • You’re ready to manage cutting dates and fermentation like a hawk.

It’s a premium play. Treat it like one.

Lane 3: One TMR, Some Sorghum, No Drama

Plenty of mid‑size herds land here, whether they admit it or not.

They run one main lactating TMR and use sorghum as a minority forage, with corn or other high‑energy options still anchoring the ration. They cap sorghum inclusion rates and tweak concentrates as inventory changes.

This lane works if:

  • You’re honest that you’re a one‑TMR outfit because of labor or barn design.
  • You set a realistic max sorghum percentage in the lactating ration and stick to it.
  • You and your nutritionist actually adjust grain and other forages when sorghum replaces corn in the pile.

The main risk is “temporary” creep: sorghum quietly displaces more corn than planned “just for this month,” and the ration never gets rebuilt. Your bulk tank tells the story later.

Lane 4: Walk‑Away — Sorghum Stays Out of the High Group

The last lane is the walk‑away: sorghum doesn’t go near high‑cow diets.

That’s a perfectly valid decision when:

  • You’re in a region where corn silage consistently performs and drought risk is manageable.
  • Your current silage program already hits your feed cost per liter targets.
  • You’re not under pressure to plant sorghum just because it’s on the flyer.

Even in this lane, sorghum might still earn a spot with dry cows, heifers, or beef animals. But you’re clear that, in your climate and infrastructure, corn is the better dairy forage bet — and you’ll manage weather and cost risk with other tools.

In the next 30 days, the most useful move you can make is simple:

  • Pull the last 12 months of milk and feed records.
  • With your nutritionist or advisor, calculate feed cost per liter of milk for your current setup.
  • Then ask one direct question:

“If we brought sorghum into this system — in a lane that actually fits our pens and labor — what would feed cost per liter look like with the ration you’d really build?”

If nobody can answer that clearly on paper, you’re not ready to plant sorghum for your dairy cows yet.

LaneWho It Actually FitsCore Requirement⚠️ Red FlagFeed Cost/Litre Risk
Lane 1: Split-Group80–120-cow herds with 2 real pens and daily TMR disciplineTrue two-ration feeding every dayIf you run “one TMR and hope lows eat less” — you’re not in this laneLow, if executed; HIGH if pen separation fails
Lane 2: BMR Partial ReplacementHigh-output herds fighting drought or input costs; strong processing equipmentBMR-adapted hybrid available locally; tight harvest timing and fermentation12–15% DM yield penalty + premium seed = cost/tonne often equals cornNeutral to low — only if BMR protects litres corn cannot
Lane 3: One-TMR Moderate InclusionMid-size herds with labor or barn constraints; honest single-ration operationsHard cap on sorghum % in ration; active ration rebuilding as inventory changes“Temporary” creep — sorghum quietly displaces more corn than planned, ration never rebuiltMedium-HIGH if inclusion drifts; Low if cap is respected
Lane 4: Walk-AwayRegions where corn silage consistently performs; current feed cost/litre already on targetNothing — sorghum stays out of the high group entirelyPlanting sorghum because it’s “on the flyer” — not because the numbers say soLowest risk — manage weather/cost with other tools

What This Means for Your Operation

  • Judge sorghum on feed cost per liter, not R$/tonne. Before you chase “cheap” tonnage, work with your nutritionist to run at least one real ration scenario in which sorghum replaces part of your corn silage, and see what happens to liters and feed cost per liter on paper.
  • Be brutally honest about how many TMRs you can actually run. If barn layout and labor effectively give you a single lactating ration, forget complex split‑group sorghum strategies. You’re either in the moderate‑sorghum single‑TMR lane or the walk‑away lane.
  • Know exactly which sorghum you’re planting. Before you buy seed, confirm whether the hybrid is grain, forage, sweet, biomass, or BMR. For high‑producing cows, forage and BMR sorghums are your main options; biomass types are usually tonnage tools for low‑demand cattle or bioenergy, not a primary silage for 40-liter cows.
  • Match harvest and fermentation to sorghum, not corn habits. If your crew is going to wait until hard dough, as we do with corn, and your processor isn’t dialed in, you should expect more undigested berries and lower starch digestibility. Target soft dough around 28–30% dry matter, and plan on about two months of fermentationbefore you feed sorghum heavily.
  • Treat BMR sorghum as a premium tool, not a shortcut. BMR forage sorghum can come very close to corn silage on milk in well‑managed diets, but the 12–15% yield penalty and higher seed cost mean your cost per tonne often climbs. It makes sense when it protects litres you can’t afford to lose, not when it’s sold as “cheap corn.”
  • Use this month for barn math, not brochure math. In the next 30 days, actually sit down with your numbers and run at least one sorghum scenario in each lane that could realistically fit your herd. If the answer on feed cost per litre or expected milk change feels fuzzy, you’ve got more homework before you drop a sorghum planter in the ground.

Key Takeaways

If you don’t know your current feed cost per litre, adding sorghum to your system is a blind bet — that’s the first report you should pull before you plant a hectare.

If your barn and labor setup only support one main lactating TMR, either cap sorghum inclusion in that ration at a level your nutritionist is comfortable putting on paper, or keep sorghum out of the high group entirely and use it for lows, dry cows, and beef animals.

If the hybrid on the quote sheet is a biomass sorghum, assume it’s a tonnage‑first forage for low‑demand animals, not a primary silage for your top group, unless you’re willing to buy a lot more grain to cover its fiber load.

If you have access to BMR forage sorghum hybrids adapted to your region, treat them as a premium: they can get very close to corn-on-the-ear in milk under the right management, but they won’t be cheap, and they won’t rescue a ration that’s already short on energy.

Next time someone offers you a screaming deal on sorghum seed, don’t just ask, “How many tonnes can I get?” Ask: “Where, exactly, in my herd can this forage live without costing me liters?” If you can’t answer that on one sheet of paper, it might not be such a bargain.

Learn More

A Wisconsin Herd’s DCAD Said −120. A 50‑Cent Urine Strip Said Otherwise.

When a Wisconsin dairy finally tested urine pH, their “negative” ration was doing exactly nothing — and the latest research says they’re far from alone.

Executive Summary: One herd in a published six-farm investigation was feeding negative DCAD at −100 to −160 mEq/kg DM and still averaged a urine pH of 7.2 — functionally alkaline — because 15.2 inches of bunk space caused enough sorting to gut the diet entirely. Goff’s 2025 meta-analysis (660 multiparous Holsteins across 9 studies) now provides parity-specific targets: 5.5–6.0 for 2nd–3rd lactation, 6.2–6.8 for 4th-plus cows, where dropping below 5.75 actually harms calcium status. The safety case for full acidification is stronger than the industry’s been acting — Graef’s trial put fully acidified cows at just 3.5 mmol/L urinary ammonium with blood pH steady at 7.39–7.41. SCH runs $125 to $226.46 per affected cow, depending on the model, and at 45–80% multiparous incidence, a 130-multiparous-cow herd faces $6,500 to $11,777 per year in avoidable drag. With the CDC’s 2.3% farmgate increase tightening input scrutiny in 2026, a 50-cent urine strip and 10 close-up cows will tell you whether your DCAD dollars are working in the cow or just living on the ration sheet.

Negative DCAD monitoring

You’re probably paying for a DCAD program you aren’t actually getting. In Wisconsin, the Schaefer family thought their −120 mEq/kg close‑up ration was bulletproof. The “Animate” bill was paid, the spreadsheet looked perfect, and the cows looked fine.

Then they finally dipped a 50‑cent urine strip. The average pH in their close‑up pen was 7.5. Their “negative” DCAD was doing exactly nothing. When they and their nutritionist rebuilt the ration actually to hit a 5.5–6.0 urine pH, their fresh‑cow list quietly shrank — fewer slow starts, fewer mild ketotics, and less time babysitting older cows in the first week fresh.

They’re not alone. In a published field investigation across six herds all feeding correctly formulated negative‑DCAD TMRs, one farm averaged a urine pH of 7.2 — not because the ration was wrong on paper, but because 15.2 inches of bunk space per cow caused enough sorting to neutralize the acidogenic diet entirely. The ration analyzed fine. The cows weren’t eating it the way the model assumed.

Here’s the twist the latest research adds: in fully acidified cows, the average urinary ammonium is just 3.5 mmol/L. That low ammonium number shows that low urine pH by itself does not equal acidosis danger. The real warning isn’t “don’t go too low.” It’s “stop being too timid” — because staying alkaline is what keeps subclinical hypocalcemia quietly chewing through your margins. With the CDC’s 2.3% farmgate price increase effective February 2026, pushing input scrutiny higher than ever, you can’t afford to keep writing checks for a program that isn’t actually working in the cow.

Why That 3.5 mmol/L Number Really Matters

In a recent trial led by Graef, Holsteins on a fully acidogenic pre‑fresh ration landed at a mean urine pH of 5.57 — squarely in the full‑acidification zone. The eye‑opener was their urinary ammonium.

Those cows averaged only 3.5 mmol/L of ammonium, far below the levels associated with systemic over‑acidification. Constable’s work on net acid excretion suggests two guideposts worth knowing:

  • At around 10 mmol/L, urinary ammonium is a reliable indicator of systemic acidification.
  • Once ammonium climbs above roughly 20 mmol/L, blood pH tends to drop by about 0.02 units — that’s where acid‑base safety becomes a real concern.

In the Graef work, cows never got close to either line at a urine pH most of us would call “aggressive.” Blood pH stayed in the 7.39–7.41 range, and serum bicarbonate sat at or near the lower edge of the typical 22–30 mmol/L window in related negative‑DCAD studies.

When your ration is properly balanced, full acidification (urine pH 5.5–6.0) operates safely within the cow’s compensation system. The danger zone isn’t “anything below 6.5.” It’s keeping cows alkaline because you’re afraid of numbers that the research says are actually safe.

How Low Is Too Low — And For Which Cows?

A 2025 meta‑analysis led by Jim Goff pulled together data from 660 multiparous Holsteins across nine studies to answer the question that really matters in the barn: which pre‑fresh urine pH ranges line up with better blood calcium after calving?

The answer changes with parity:

  • For 2nd‑ and 3rd‑lactation cows, the big step is just getting them out of the alkaline zone. Cows with prepartum urine pH below 7.75 had significantly better calcium status than those above that threshold, and driving pH lower within the acidified band didn’t provide much additional benefit.
  • For 4th‑lactation and older cows, the sweet spot is narrower. Cows with urine pH between 6.26 and 6.75 had the highest blood calcium nadirs, while cows above 7.25 or below 5.75 showed poorer calcium outcomes.

That moves you from a one‑size‑fits‑all DCAD target to a parity‑specific playbook.

Urine pH Targets by Parity

Cow GroupTarget Urine pHBlood Calcium OutcomeKey ThresholdRisk if Outside Range
2nd–3rd Lactation5.5–6.0Best Ca status; strong fluxpH must drop below 7.75Staying alkaline (>7.75) impairs Ca
4th Lactation+6.2–6.8Peak Ca nadir in this bandSweet spot is narrower<5.75 harms Ca status
4th Lactation+>7.25Poor blood calcium nadirSame group, high endAlkaline = no DCAD benefit
Any parity — Danger<5.5Ca status trends wrongVery low DCAD (~−220)Uncompensated metabolic acidosis

If you’ve watched a mixed‑parity close‑up pen, you’ve likely seen this play out already. Second‑ and third‑calvers usually cruise on a hot close‑up ration. It’s the 4th‑ and 5th‑lactation cows that look duller, lose more condition, or keep showing up on the fresh‑cow problem list when the diet is pushed as hard as the youngsters’.

What Does “Safe” Full Acidification Actually Look Like?

Pull the DCAD research together, and the safety story is clearer than the coffee‑shop debates.

From recent trials and reviews:

  • Fully acidogenic diets drop urine pH into the 5.5–6.0 band, but blood pH hangs around 7.39–7.41, well above the 7.30 “start to worry” threshold for systemic acidosis.
  • In a 2022 JDS study, very low DCAD treatments reduced serum bicarbonate by about 8–9%, landing near the lower edge of the 22–30 mmol/L reference range; more moderate negative DCAD diets kept bicarbonate comfortably within normal limits.
  • In a Florida trial by Zimpel and colleagues, cows on a strong fully acidogenic program had urine pH around 5.4, but still carried ≈25 mmol/L bicarbonate — squarely normal.
  • The real trouble shows up in extremely negative DCAD experiments. A “very low DCAD” diet around −220 mEq/kg DM pushed cows into uncompensated metabolic acidosis with lower blood pH, depressed intakes, and clear metabolic strain. In a separate herd case, dry cows on a diet near −143 mEq/kg DM had urine pH in the 5.2–5.8 range; when the diet was adjusted to about −53 mEq/kg DM, postpartum blood calcium didn’t change — only the acid load and metabolic strain improved.

In practice, negative DCAD diets in roughly the −100 to −150 mEq/kg DM range, paired with adequate fiber and minerals, tend to put cows in a compensated metabolic acidosis zone — enough to prime calcium metabolism without pushing blood pH into dangerous territory.

The real‑world risk for most herds isn’t “too low” DCAD. It’s never getting low enough in the right cows, or pushing the oldest cows too far, because nobody ever checks a strip.

BiomarkerNormal Reference RangeGraef Trial (Urine pH 5.57)Systemic Acidosis ThresholdStatus
Blood pH7.35–7.457.39–7.41<7.30✅ Normal
Serum bicarbonate (HCO₃)22–30 mmol/L~22–24 mmol/L (low-normal)<18 mmol/L✅ Within range
Urinary ammonium (NH₄)3.5 mmol/L>10 mmol/L (systemic marker)✅ Far below threshold
Urinary ammonium (NH₄)3.5 mmol/L>20 mmol/L (blood pH drops)✅ Far below threshold
Urine pH5.57Not a direct danger indicator✅ Target achieved

How Much Is Subclinical Hypocalcemia Really Costing You?

You see the classic downer cows. The quieter hit comes from subclinical hypocalcemiacows that stay standing but run with low blood calcium for a day or two after calving.

Reviews and field surveys suggest SCH often hits 25–40% of first‑calvers and 45–80% of multiparous cows in high‑producing herds. That means roughly half or more of your older cows may be affected. Those are the ones that calve “fine,” then quietly drag around mild ketosis, metritis, DAs, and a few extra weeks open.

On the economics side:

  • Progressive Dairy / University of Minnesota model built around a 1,000‑cow herd estimated SCH‑related losses — added disease, culling, and lost milk — at $67,938, or $226.46 per affected cow.
  • Prince Agri/Progressive analysis uses a more conservative $125 per SCH case and roughly $300 per milk fever case, while still accounting for both health and production impacts.
  • A 2022 study from North‑West Ethiopia estimated SCH losses at 3,026.25 ETB per cow per lactation, which the authors converted to about US$69.6 for their conditions.

Taken together, a realistic SCH cost range is around US$60 to US$ 226 per cow, depending on milk price, herd health, and how broadly you count ripple effects.

Micro barn math: what that looks like on your farm

Come back to a 200‑cow herd like the Schaefers, with 130 multiparous cows. Even if 40% of those multiparous cows are subclinically hypocalcemic — a conservative number given that 45–80% range — that’s 52 SCH cows in a year.

At the $125 per‑case estimate:

  • 52 cows × $125 ≈ $6,500 per year in SCH‑linked losses.

At the $226.46 per‑case estimate:

  • 52 cows × $226.46 ≈ $11,777 per year.

If your “negative DCAD” program isn’t actually lowering that SCH burden — either because it’s not acidifying cows or it’s hammering the wrong cows — you’re spending money on the right idea and the wrong execution.

How Much Milk Are You Leaving on the Table?

The cost of SCH isn’t just in vet work and displaced abomasums. It’s also milk that never hits your bulk tank.

A series of trials looked at fully acidogenic pre‑fresh diets combined with higher dietary calcium — roughly 1.5–2.0% of diet DM — and followed cows through the first two months postpartum. Across those studies:

  • Cows on negative DCAD plus higher calcium showed stronger calcium flux around calving, maintained or improved pre‑fresh DMI, and had higher postpartum DMI than cows on low‑calcium acidogenic diets.
  • Those same cows produced more energy‑corrected milk (ECM) in early lactation than cows on positive DCAD or low‑calcium fully acidogenic diets.

Keep the barn math conservative. Say that program buys you 1 kg/day of ECM for the first 60 DIM in your multiparous cows. In that 200‑cow herd with 130 multiparous cows, that’s:

  • 130 cows × 1 kg/day × 60 days = 7,800 kg of extra ECM.

Use the Ontario blend value of about $0.85/kg — based on DFO’s June 2025 average net of $87.96/hL after deductions — and you get:

  • 7,800 kg × $0.85 ≈ $6,630 in extra milk revenue in the first two months of lactation.

(Note: these calculations use $0.85/kg based on Ontario’s June 2025 net blend; adjust to your local mailbox price. With the CDC’s 2.3% farmgate increase effective February 2026, your local number may now be slightly higher.)

Even if the real bump on your place is half that, you’re still talking several thousand dollars a year on top of avoided SCH‑linked disease. But you can’t tap any of that upside if the cows in front of you never actually reach the acidification zone you think you’re feeding for.

Is Your DCAD Program Actually Hitting Its pH Target?

The economic question underneath all of this is simple: Is your DCAD program working in the cows, or just on paper?

That published field investigation across six herds shows just how common the gap is. All six farms delivered TMRs that analyzed at a DCAD of −100 to −160 mEq/kg DM — right where they should be. All used the same commercial anionic product. But when urine pH was systematically collected from randomly selected multiparous cows over three days, not all farms met the 5.5–6.0 target. Farm 2 averaged 7.2 — functionally alkaline despite a correctly formulated ration. The culprit: 15.2 inches of bunk space per cow, which caused enough sorting and DMI disruption to neutralize the diet. Farm 4 had a similar miss tied to forage particle size and TMR mixing issues.

The lesson: DCAD value is a formulation number. Urine pH is what the cow is actually experiencing.

A practical monitoring protocol from Goff and others:

  • Sample at least 10 cows, or about 10% of the close‑up group, whichever is bigger.
  • Make sure they’ve been on the pre‑fresh ration for at least 48 hours, ideally 3–21 days before calving.
  • Catch urine 2–4 hours after cows get access to that ration, when pH is at its lowest and results are tightest.
  • Aim for around 80% of sampled cows to land in your target pH band.

Using the parity‑specific data:

  • 2nd‑ and 3rd‑lactation cows: target urine pH 5.5–6.0 — full acidification, with safe blood pH and bicarbonate profiles supported by multiple trials.
  • 4th‑lactation and older cows: target urine pH around 6.2–6.8, where Goff’s meta‑analysis saw the best calcium outcomes and a clear calcium decline below 5.75.

If your first audit comes back with an average of 7.2 — like Farm 2 in that field study — you don’t have “moderate DCAD.” You have a ration that isn’t acidifying those cows at all.

And if you see a string of older cows under 5.5, especially alongside intake or condition concerns, you’ve probably pushed anions too hard relative to fiber, magnesium, or overall palatability. That’s the edge where the very low DCAD work — down near −220 mEq/kg DM — tipped cows into uncompensated acidosis.

You can’t manage what you won’t measure. But you can buy a box of urine strips for less than a DA surgery — and a lot less than a weekend tied up in the hospital pen.

Are You Feeding Enough Calcium With Your Anions?

Old transition‑cow dogma said “never feed high calcium pre‑fresh.” Newer DCAD and mineral work says that, under a properly negative DCAD, high calcium plus anions is often where the payback is.

Across recent studies:

  • Cows on negative DCAD diets with 1.5–2.0% Ca in diet DM had stronger calcium flux, better postpartum DMI, and higher ECM than cows on low‑calcium fully acidogenic diets.
  • High‑calcium fully acidogenic diets did a better job of holding DMI than low‑calcium FAS diets, which showed bigger intake dips.

The chemistry catch is that calcium is alkalizing. When you bump dietary calcium — especially as carbonate — you usually have to adjust anion supply to hold the same urine pH. If you crank anions every time you bump Ca, and never check what cows are actually peeing, you’re back to guessing.

Too little anion with high Ca and high‑K forages, and you recreate the old “high‑potassium hay + high‑calcium close‑up” milk fever trap. Too much anion, especially in pens heavy with older cows, and you risk dragging that group below 5.5 pH, where Goff’s meta‑analysis saw calcium status trending the wrong way.

The sweet spot isn’t a single DCAD target on paper. It’s the balance between DCAD, calcium level, and who’s actually standing in your close‑up group.

Options and Trade‑Offs for Farmers

You’ve got four real ways to play this — none of them free, but all of them better than guessing.

StrategyBest Fit ForWhat You GainWhat You Give UpKey Risk
30-Day Urine pH AuditAny herd — starting pointActual data on whether DCAD is working30 min + cost of stripsFinding out your program is doing nothing
Parity-Specific TargetsHerds >30% 4th+ lactation cowsTighter Ca support for oldest cowsPen complexity, management timeOver-acidifying older cows below pH 5.75
Full Acidification + High CaStable forage, strong advisory teamMaximum ECM gains, lowest SCHRequires accurate, frequent forage testingPushing anions without checking urine pH
Partial Acidification (Proven)Variable forage K, no parity sortingLower milk fever risk vs. no DCADWon’t capture full SCH/ECM benefitCosmetic program at pH 7.8 = money wasted

1. 30‑Day Action: Audit Your DCAD in the Cows, Not on Paper

This is the low‑risk, high‑information starting point — the same move that exposed the problem in the Schaefer example and that documented field investigation.

  • Within 30 days, run a urine pH profile on your close‑up pen: at least 10 cows, or 10% of the group, 2–4 hours after feeding, on the ration for at least 48 hours.
  • Mark strips by parity (“P2–3” vs “P4+”) so you can see whether older cows live in a different pH band.
  • Sit down with your nutritionist and vet and compare those numbers to your calculated DCAD and your latest forage K analyses.

Patterns you’re likely to find:

  • Rations that look fully acidogenic on paper but leave cows at pH 7.0–7.8 because forage potassium came back higher than assumed — or, like Farm 2, because bunk space or mixing issues prevent cows from eating what you think they’re eating.
  • Older cows sit at 5.2–5.4, while younger cows hover near 5.8–6.0, and those same older cows are turning up too often on your “problem fresh” list.

This doesn’t fix the ration. It just tells you whether your main problem is being too timid overall, too aggressive with certain cows, or something as simple as bunk management.

2. Dial in Parity‑Specific Targets

If about a third or more of your close‑up pen is 4th lactation or older, Goff’s parity‑specific data says you shouldn’t chase the same pH for them as for your 2nd‑calvers.

In practice, that can look like:

  • Grouping by parity when barn design allows: a “mature‑cow close‑up” and a “younger‑cow close‑up.”
  • Running a parity‑specific mineral strategy: same base forage, slightly different DCAD and Ca levels by pen.
  • Re‑checking urine pH and, if you’re keen, spot blood calcium by group a couple of times a year.

You gain tighter support for the cows most likely to crash. You give up some simplicity and pen flexibility.

3. Strengthen Full Acidification + High Calcium Where It Fits

For herds with stable forage programs and a strong advisory team, leaning into full acidification plus higher calciumcan be a high‑return move.

Best fit when:

  • You’re already getting reliable mineral analyses back from your forage lab.
  • You’re willing to watch DMI, manure, and fresh‑cow health closely during any ration changes.
  • Your vet and nutritionist are aligned on DCAD targets and SCH benchmarks.

It demands:

  • Accurate DCAD math using up‑to‑date Na, K, Cl, and S lab numbers.
  • Dietary Ca in the 1.5–2.0% DM range.
  • Adequate magnesium and effective fiber to keep cows on feed.

Risks:

  • Over‑pushing anions to “fix” what’s really a forage‑testing problem, edging toward uncompensated acidosis.
  • Raising calcium without enough anion, which blunts the very calcium‑mobilizing system DCAD is designed to prime.

4. Stick With Partial Acidification — But Prove It

Some barns aren’t good candidates for full acidification: volatile forage potassium, no room to sort by parity, and limited labor.

In those systems, aiming for more moderate urine pH — often in the mid‑6s instead of around 8.0 — can still cut clinical milk fever risk compared with no DCAD program at all, even if you never push pH into the 5.5–6.0 band.

The key is honesty:

  • You likely won’t get the full SCH and ECM benefits seen in FAS + high‑calcium research.
  • You still have to test. A ration “designed” for pH 6.5 that yields pH 7.8 in the pen is cosmetic, not partially acidified.

As ingredient costs keep climbing, cosmetic programs are going to be harder to justify than well‑measured ones.

Key Takeaways

  • If you’re not pulling urine pH strips on your close‑up cows at least a few times a year, you don’t have a DCAD program — you have a DCAD expense. Start with a 10‑cow, 2–4‑hour post‑feeding sample and see if your cows are anywhere near your target pH.
  • If roughly a third or more of your close‑up group is 4th lactation or older, don’t chase 5.5 pH for everyone. Aim those cows around 6.2–6.8 and reserve the 5.5–6.0 band for 2nd‑ and 3rd‑calvers, where full acidification is both safe and effective.
  • If your SCH prevalence in multiparous cows is north of about 30% and you’re already paying for anionic salts, assume a verification gap before you decide “DCAD doesn’t work here.” Use the US$60–$226 per‑case range to ballpark what SCH might be costing you and whether a DCAD tune‑up pencils out.
  • If your ration DCAD is printed at −180 mEq/kg DM and your older cows are peeing at 5.2, you’ve probably gone past the point of diminishing returns. Back off anions until those cows’ urine pH and calcium status are closer to 6.5, then re‑check urine pH and calcium status instead of assuming “hotter” must be better.

The Bottom Line

You’re already writing checks for anionic salts and pre‑fresh minerals. It’s worth knowing whether those dollars are actually buying fewer SCH cows, more milk, and calmer fresh pens — or just living on a ration sheet. Start with that 30‑day urine pH audit. From there, you’ll know whether your next move should be more anion, more calcium, smarter grouping, or tighter forage testing.

If you want the deeper math — SCH calculators, DCAD formulation walkthroughs, or parity‑specific transition strategies — watch for the follow‑up playbooks and Bullvine Weekly breakdowns. Once you’ve seen your own pH strips, you won’t look at that “−120 mEq/kg” printout the same way again.

Complete references and supporting documentation are available upon request by contacting the editorial team at editor@thebullvine.com.

Learn More

The Sunday Read Dairy Professionals Don’t Skip.

Every week, thousands of producers, breeders, and industry insiders open Bullvine Weekly for genetics insights, market shifts, and profit strategies they won’t find anywhere else. One email. Five minutes. Smarter decisions all week.

NewsSubscribe
First
Last
Consent

Cornell Found the 3 kg/Day Heat Stress Leak Your Fans Were Never Going to Fix.

A 46‑cow chamber trial proved heat‑stressed Holsteins are losing milk through the gut wall — not just from reduced intake. Here’s the barn math at $18.95/cwt.

Executive Summary: Cornell’s McFadden group proved that heat-stressed Holsteins lose about 3 kg of energy-corrected milk per cow per day through gut-wall failure — independent of reduced feed intake. In their 46-cow chamber trial, a pair-fed group kept cool but eating the same reduced diet still out-milked the heat-stressed cows, which means a real chunk of your summer leak is coming from somewhere fans and soakers can’t reach. What’s actually happening: endotoxins slip through a compromised intestinal barrier, and the immune system burns glucose that should’ve gone to milk — Kvidera’s work showed over 1 kg of glucose torched in just 12 hours. A microencapsulated organic acid/botanical blend restored gut permeability and cut inflammation in the trial, though a follow-up calf study found no growth response, so the strongest case is in lactating cows under sustained THI above 74. At $18.95/cwt, a conservative 2 kg/day recovery on 500 cows over 120 heat-stress days is worth roughly $50,100 in gross milk value — before you subtract product cost. The longer invoice is worse: Laporta’s 10-year Florida data showed daughters of heat-stressed dry cows lost 4.9 months of productive life, with a national cost estimated at 5 million/year.

heat stress milk loss

It’s July. Fans screaming at 100%, soakers drenching the holding pen, and your bulk tank still bleeding out. You’ve done everything the heat stress playbook says — but a Cornell research team reported heat‑stressed Holsteins losing about 3 kg of energy‑corrected milk per cow per day from a place your fans can’t reach: the gut wall.

We’ve all been raised on the same summer script: keep cows cool, keep them eating, hang on to the milk. Joseph McFadden’s group at Cornell put that theory to the test in a chamber and showed it’s only half the story. They took 46 multiparous Holsteins, split them into four groups, and proved that even when feed intake is matched, heat stress still punches holes in the intestine and lights up the immune system — stealing glucose that was supposed to end up in your milk cheque (Fontoura et al. 2022, JDS 105:7842–7860).

The Part of Heat Stress Your Fans Can’t Touch

It only took three days of 74+ THI for the gut wall to start failing.

McFadden’s team ran four treatments:

  • Thermoneutral controls at THI 68.
  • Heat‑stressed controls cycling between THI 74 and 82.
  • A pair‑fed group kept cool but was restricted to the same intake as the hot cows.
  • Heat‑stressed cows on a microencapsulated organic acid/pure botanical (OA/PB) blend.

That pair‑fed pen is the smoking gun. Same reduced intake as the hot group, but kept cool — and they still out‑milked the heat‑stressed cows. In other words, a chunk of your summer loss is happening independent of dry matter intake. Fans and sprinklers fix body temperature. They don’t fix a leaky gut.

What’s actually happening? Heat stress loosens the tight junction proteins that zip intestinal cells together. Bacterial endotoxins slip through, hit immune receptors, and your cow’s immune system goes to war. Iowa State’s Sara Kvidera showed an acutely activated immune system in a lactating Holstein that burns more than 1 kg of glucose in just 12 hours. That’s several kilograms of milk sacrificed to immune cells instead of the parlour.

Cornell’s team summed it up: heat stress reduces production through “important mechanisms … independent of changes in DMI.” That’s the part your heat abatement system can’t touch.

What Cornell Actually Fed — And Why the Coating Matters

This wasn’t a random “gut health” sprinkle. On a dry‑matter basis, the OA/PB blend in the Cornell trial was:

  • 25.0% citric acid
  • 16.7% sorbic acid
  • 1.7% thymol
  • 1.0% vanillin
  • 55.6% triglyceride (the lipid shell)

The cows got it twice daily as a top‑dress; controls got the same amount of plain triglyceride carrier, so every pen was handled the same way. That triglyceride coating is the whole play. In vitro work showed minimal release in rumen‑like fluid and targeted release under intestinal conditions once lipases crack the fat layer open. Without that fat shell, most organic acids and botanicals get chewed up or absorbed upstream before they ever see the small intestine.

In the chamber, the coated OA/PB did three big things for the heat‑stressed group:

  • Pulled total‑tract gut permeability back toward thermoneutral values.
  • Lowered systemic inflammation markers like LBP and serum amyloid A.
  • Improved energy‑corrected milk and DMI vs. unsupplemented heat‑stressed controls.

Mechanistically, once the shell opens in the gut, the organic acids and botanicals act at three levels: they create pores in undesirable bacterial membranes, dampen mucosal inflammation, and upregulate tight junction proteins to help reseal the barrier.

But it’s not magic. A follow‑up calf study from the same group (Fontoura et al. 2023, JDS 106:2904–2918) showed the OA/PB improved gut‑integrity markers under heat stress but was not able to improve growth performance in heat‑stressed calves — the authors concluded reductions in DMI alone accounted for production losses in that class of stock. The strongest evidence of performance lies in heat‑stressed lactating cows, gut‑barrier endpoints, and milk energy. Not every animal responds the same way.

Disclosure: author E. Grilli is affiliated with Vetagro, the manufacturer of the OA/PB product used in the trial. The work is still a peer‑reviewed Journal of Dairy Science paper, with full affiliation spelled out — standard practice for industry/university collaborations.

Can Gut Integrity Really Pay at $18.95 Milk?

Cornell fed 75 mg/kg of body weight — that’s about 49 g/cow/day on a 650 kg Holstein. Real inclusion, not fairy dust.

The USDA’s February 2026 outlook puts the all‑milk price at $18.95/cwt, down from a revised $21.17/cwt in 2025. So any gut‑integrity program has to pay in a margin year, not just when milk is rich.

Here’s the barn math that matters.

500‑Cow Herd — Conservative (2 kg/cow/day recovery)

Assume you’ll only claw back 2 kg ECM per cow per day instead of Cornell’s ~3:

  • 2 kg × 500 cows × 120 heat‑stress days = 120,000 kg
  • 120,000 kg × 2.205 lb/kg = 264,600 lb = 2,646 cwt
  • Gross milk value: 2,646 cwt × $18.95 ≈ $50,100

750‑Cow Herd — Full Cornell Response (3 kg/cow/day)

If you assume the full ~3 kg ECM/cow/day that Cornell reported under chamber conditions:

  • 3 kg × 750 cows × 120 days = 270,000 kg
  • 270,000 kg × 2.205 = 595,350 lb = 5,953.5 cwt
  • Gross milk value: 5,953.5 cwt × $18.95 ≈ $112,800
Herd SizeRecovery Scenariokg ECM Recoveredlbs RecoveredcwtGross Milk ValueNotes
250 cows2 kg/day (conservative)60,000 kg132,300 lb1,323 cwt$25,071Get a real product quote to net
250 cows3 kg/day (Cornell)90,000 kg198,450 lb1,984 cwt$37,597Chamber result; on-farm ~70% likely
500 cows2 kg/day (conservative)120,000 kg264,600 lb2,646 cwt$50,142Article baseline scenario
500 cows3 kg/day (Cornell)180,000 kg396,900 lb3,969 cwt$75,213
750 cows2 kg/day (conservative)180,000 kg396,900 lb3,969 cwt$75,213
750 cows3 kg/day (Cornell)270,000 kg595,350 lb5,954 cwt$112,817Article full-response scenario
1,000 cows2 kg/day (conservative)240,000 kg529,200 lb5,292 cwt$100,283
1,000 cows3 kg/day (Cornell)360,000 kg793,800 lb7,938 cwt$150,425

Those are gross numbers — the milk value recovered before you subtract product cost. Pricing for microencapsulated OA/PB blends varies by supplier, dose, and contract. Get your real quote, multiply it by your cows and your heat‑stress days, and subtract it from the gross. If the leftover is fat enough, the product earns a season in the ration. If it’s thin or negative, it doesn’t.

One caveat: if your barn rarely sees THI above 72, or your cooling system is genuinely keeping rectal temperatures and respirations tight, gut permeability may not be your biggest leak. This lever matters most for herds that sit in the mid‑70s THI or higher for weeks at a time.

For Canadian readers, the Canadian Dairy Commission approved a 2.3255% farmgate increase effective February 1, 2026, under its pricing formula for butterfat used in dairy products. Different currency, same math — every kilogram you leak in July still lands on your milk cheque.

The Ghost of Heat Stress Past: What It Does to Daughters and Granddaughters

The milk dip hurts in August. The real damage hits you in 2028.

Heat‑stressed breeding seasons are a fertility tax. Peer‑reviewed field work and reviews show summer pregnancy rates routinely dropping from roughly 32–40% in cooler months down to 10–20% in severe heat, depending on region and THI. That’s not just semen baking in a hot AI kit. It’s inflammation, oxidative stress, and early embryos that never stand a chance. If you want to dig deeper into how those THI lines move conception rates, we’ve walked through it before.

The longer invoice comes from the dry pen. Laporta et al. (2020, JDS 103:7555–7568) followed daughters of heat‑stressed dry cows (n=198) against daughters of cooled dry cows (n=196) over 10 years of Florida Holstein data — dams cooled or not cooled during the last 46 days of gestation. A hot, dry cow today is a cull candidate’s mother.

Daughters of heat‑stressed dams:

  • Lost 4.9 months of productive life.
  • Lost 11.7 months of total lifespan.
  • Were culled more often before first calving.

The same paper reported granddaughters of heat‑stressed dams produced 1.3 fewer kg of milk per day in their first lactation than granddaughters of cooled dams. A University of Florida IFAS factsheet estimated that, on a national basis, late‑gestation heat stress in dairy cows costs about $595 million/year once extra heifer‑rearing, reduced longevity, and lost milk yield are added together.

If you’ve ever wondered whether there’s a genetic time bomb hiding in your fresh pen, this is one of the fuses.

You don’t see that bill on your August statement. You see it in a replacement pipeline that’s thinner and more expensive than it should’ve been.

If a gut‑integrity program can take even part of the inflammatory load off those cows — and Cornell’s permeability and inflammation data say it can, at least in mid‑lactation Holsteins — then it belongs in the same planning meeting as shade, soakers, and fan upgrades.

Not Every “Gut Health” Product Is Aimed at the Same Target

Here’s where this gets real in the nutrition office.

A lot of products sold under the “gut health” banner actually have their best published data in the rumen — pH stabilization, fibre digestibility, and components. That work has value. It’s just a different job than sealing an intestinal wall under heat stress.

The yeast and buffer literature is overwhelmingly rumen‑centric. Many of those companies are careful about what they claim — they market for rumen performance, and that’s what their trials measure. Loose organic acids mostly get fermented or absorbed in the upper tract before they ever see the small intestine.

Right now, the peer‑reviewed trials that specifically measure gut permeability, tight‑junction expression, and systemic inflammatory markers in heat‑stressed lactating Holsteins are centred on microencapsulated OA/PB blends like Cornell’s. Comparable published data for yeast, buffers, or unprotected acids at those exact endpoints aren’t readily available in the literature.

That doesn’t make what you’re already feeding bad. It just means different tools belong in different categories:

Product CategoryPrimary Site of ActionRumen-Bypass EvidenceGut Permeability TrialsHeat-Stress (THI ≥74) DataRecommended Use Window
Yeasts & BuffersRumen✗ Not required✗ Limited/none in peer review✗ Not testedYear-round rumen stabilization
Loose Organic AcidsUpper GI tract✗ Minimal✗ Absorbed upstream✗ Not tested at these endpointsFeed hygiene; silage preservation
Unprotected BotanicalsRumen / upper GI✗ Variable✗ Inconsistent✗ Data gapsTMR palatability; mild microbial control
Microencapsulated OA/PBSmall intestine✅ In vitro lipase-release data✅ Tight-junction & LBP data (Fontoura 2022)✅ Lactating Holsteins, THI 74–82Heat stress windows; high-inflammation periods
General ProbioticsHindgut / rumen✗ Species-dependent✗ Minimal heat-stress data✗ Not consistently testedTransition; post-antibiotic recovery
  • Yeast and buffers → rumen stabilizers.
  • Loose organic acids → feed hygiene and upper‑tract support.
  • Microencapsulated OA/botanicals → intestinal‑wall tools for heat stress and other high‑inflammation windows.

🔍 The “Gut Health” Buyer’s Filter

Before you write the next cheque, run every product through three questions:

1. BYPASS — Is there real rumen‑bypass data showing limited release in rumen fluid and targeted release in the intestine? Not a brochure line — actual in vitro or in vivo work.

2. ENDPOINTS — Do the trials measure gut permeability, tight‑junction proteins, or inflammatory markers under heat stress? Or just milk and DMI under thermoneutral conditions?

3. CONDITIONS — Were the key trials run in lactating Holsteins at THI in the mid‑70s or higher? Or in calves, dry cows, or another species entirely?

If your rep can’t clear all three bars, it doesn’t mean the product is junk — it means it wasn’t designed or tested for this specific job. Your expectations (and your spend) should match what the evidence actually supports.

What Would This Look Like on Your Farm?

Say you’re running 650 Holsteins in a THI‑75+ region and your high pen reliably drops 2.5–3.0 kg/cow/day every summer once night‑time THI stays over 70 for more than a week. Cooling is maxed. You can’t justify more concrete and steel. Here’s one way to put the Cornell data to work instead of just reading about it.

Pick a 240‑cow high pen with solid records and leave a matching pen on the base ration. Layer in a microencapsulated OA/PB product at ~49 g/cow/day, delivered as a top‑dress with the PM feeding to match Cornell’s dose. Start two weeks before THI historically climbs, and run the program for three straight calendar months. Track daily ECM, pen‑level DMI, and pregnancy rate on breedings that happen during the heat window.

What should you be looking for? By weeks four to six of real heat, you want to see at least 1.5–2.0 kg ECM/cow/day better than your historic pattern, and summer fertility at least holding where it used to tank. If those numbers aren’t showing up at your product cost and your barn conditions, this lever doesn’t earn its spot. A 3 kg response like Cornell’s is a chamber result. On‑farm, 1.5–2.0 kg is a realistic bar to clear.

Every herd’s noise floor is different. This isn’t academic hand‑waving — it’s how you separate signal from marketing.

Where the Signal Gets Buried

Your barn isn’t Cornell. There are four places where a genuine 1–2 kg response can disappear:

  • Overcrowding at 130%+: Timid cows never see the bunk long enough. You can fix their gut, but if they’re not eating, you won’t see milk.
  • Background inflammation: Lameness, mastitis, metritis, or sloppy transition management already soaking the system in cytokines will drown out incremental gut improvements.
  • Forage swings: Summer forage quality bouncing from load to load can swamp any additive’s signal.
  • Trial too short: Cornell measured gut permeability at day 3 and followed cows through the full heat‑stress exposure. A two‑week “trial” over one hot spell tells you almost nothing.

If your numbers look flat, it doesn’t automatically mean the product is snake oil. It might mean your barn’s noise floor is too high to hear the signal.

What This Means for Your Operation

  • If your summer milk curve reliably drops 2–3 kg/cow/day once THI sits in the 70s, and your only tools so far are fans and sprinklers, you’ve got a quantified gut‑wall lever you haven’t tested. Cornell gives you both a dose and endpoints to benchmark against.
  • In the next 30 days, pull your last two summers of weekly bulk-tank or pen‑level milk data and overlay them against local THI. How many kg/cow/day did you actually lose, and for how many weeks? That’s the size of the hole any gut program has to fill on your farm.
  • Sit down with your nutritionist and ask: “Which products in this ration have peer‑reviewed data on gut permeability in heat‑stressed lactating Holsteins?” If the answer is “none,” there’s a gap between the tag’s gut‑health language and what the research has actually measured.
  • Compare your June–August pregnancy rates with January–March for the last two years. If you’re consistently 10–20 points lower in summer, that’s not bad luck. That’s heat‑driven inflammation and oxidative stress showing up in your repro numbers.
  • Walk your dry cow pens when THI is ugly. Laporta’s data — 4.9 months off productive life, 11.7 months off total lifespan, and roughly $595 million/year in multi‑generation losses across the US — deserves to be in the same budget meeting as shade structures and close‑up soakers.
  • When a rep pitches gut health, run their product through the bypass–endpoint–condition filter before you talk price. If the trials don’t deal with gut permeability and inflammation in heat‑stressed Holsteins, it’s not a gut‑wall tool — and shouldn’t be priced like one.

Key Takeaways

  • If THI routinely sits in the 70s and your summer drop is 2–3 kg ECM/cow/day, don’t stop at cooling. Fans fix body temperature. The Cornell work shows gut permeability is a separate problem with its own price tag.
  • At $18.95/cwt, a 2 kg ECM/cow/day recovery on 500 cows over 120 heat‑stress days is worth roughly $50,100 in gross milk value. Your net depends on product cost and the real response on your farm — not on anyone’s slide deck.
  • Products with rumen‑bypass data, gut‑barrier endpoints, and heat‑stress trials in lactating Holsteins are in a different evidence class from general “gut health” additives whose data stop at rumen pH or thermoneutrality in milk. Both can be useful — just not for the same jobs.
  • The consequences of heat stress don’t end when the weather breaks. They walk through your calving interval, your replacement pipeline, and your cull list for years, and the research team behind Laporta’s work has already put a national dollar figure on it.

The Bottom Line

Your bulk tank already knows how much heat stress is costing you. The real question is whether this is the year you keep calling it “just heat” — or the year you finally find out how much of that 3 kg leak is coming through the gut wall.

Complete references and supporting documentation are available upon request by contacting the editorial team at editor@thebullvine.com.

Learn More

The Sunday Read Dairy Professionals Don’t Skip.

Every week, thousands of producers, breeders, and industry insiders open Bullvine Weekly for genetics insights, market shifts, and profit strategies they won’t find anywhere else. One email. Five minutes. Smarter decisions all week.
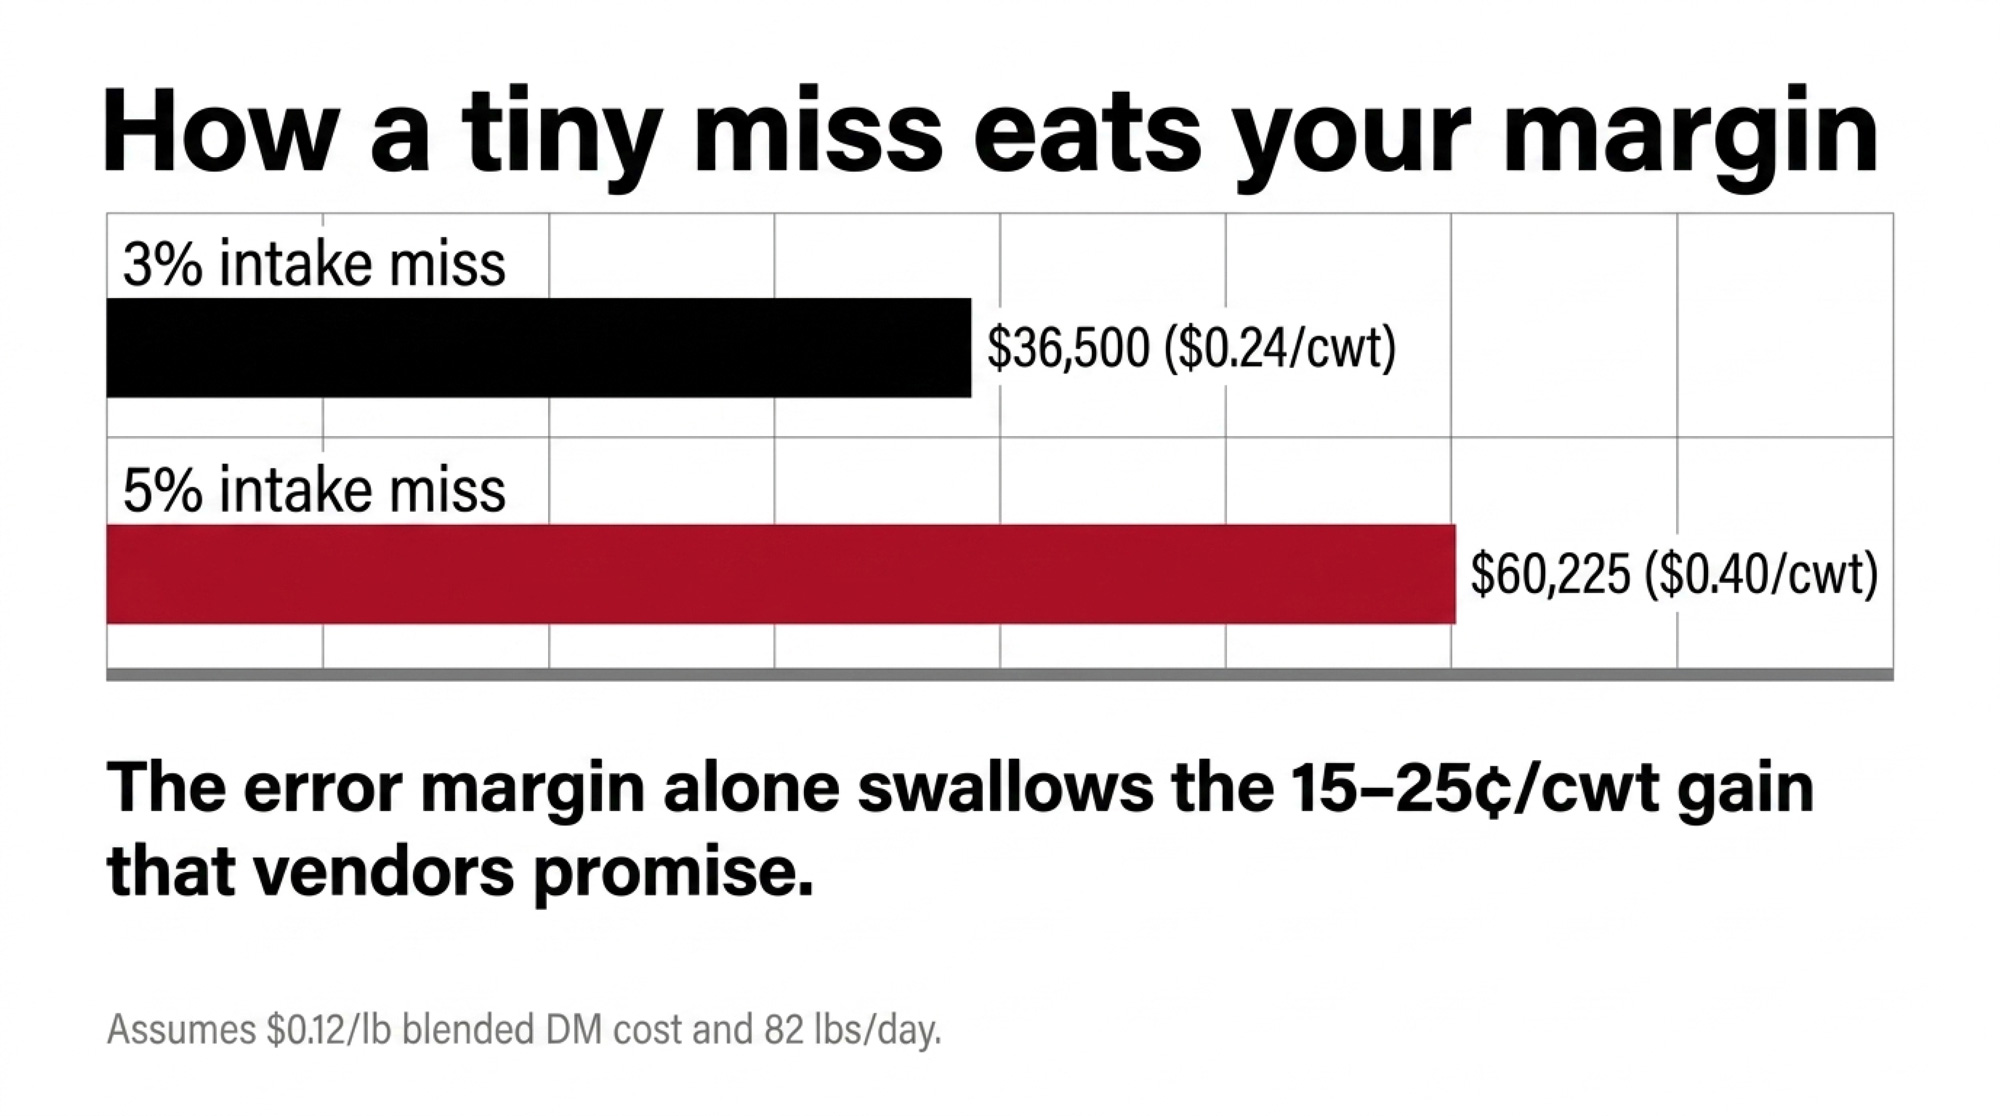
NewsSubscribe
First
Last
Consent

Stuck at 1.3 Feed Efficiency: How One Midwest Dairy’s “Fine” Ration Burned $64,000 in Feed

December 2025’s DMC margin hit $9.42/cwt — the only payment all year. One nutritionist pulled the feed tickets. The leak wasn’t price. It was efficiency.

Executive Summary: At 1.3 feed efficiency, a 300‑cow high group feeding a $0.33/kg DM ration is burning roughly $64,000 a year on dry matter it doesn’t need to hold current milk. This article walks through a composite Midwest herd that looked “fine” at 32 kg 3.5% FCM until December 2025, when the DMC margin of $9.42/cwt on $9.58/cwt feed costs exposed how little protection there was in the safety net. Using the updated NASEM 2021 model, the same ration that NRC 2001 would run at higher DMI shows it can support that milk on about 1.8 kg less DMI per cow per day, if bunk management, starch/NDF balance, and cow flow line up. The piece then tackles additives and shows how a common inert fat example — $0.54/cow/day in for $0.37/cow/day back — turns some “supplements” into straight donations to your feed bill. It also hits the mineral blind spot: water with elevated iron, manganese, or sulfate can quietly block copper and zinc and drag down intake even when your premix looks perfect. You’ll come away with specific thresholds (high group FE, RDP %, MUN range, fat and DDGS caps) and a 30‑day plan to calculate FE by pen, re‑run your ration through NASEM 2021, and order a full water test. If your high group is anywhere near 1.3 FE right now, this is a 10‑minute read that could easily be worth $0.50–$0.60 per cow per day in recovered margin.

Feed Efficiency Trap

On a 300‑cow Holstein dairy in the U.S. Midwest, the high group looked fine. Cows were at the bunk, manure looked decent, and the tank was holding around 32 kg of 3.5% fat‑corrected milk per cow. Fine. But when feed costs climbed to roughly $0.33 per kilogram of dry matter — with corn in the $7–$7.60 per bushel range and soybean meal around $440 per ton in recent U.S. examples — “fine” stopped lining up with the milk cheque.

Then the December 2025 Dairy Margin Coverage (DMC) report landed: a national margin of .42 per hundredweight on a .58 per hundredweight feed‑cost component, the first and only DMC payment of the year. When the farm’s nutritionist pulled a week of feed tickets and ran the high‑group ration through the 2021 National Academies (NASEM) dairy model, the alley view and the spreadsheet didn’t match. The high group everyone called “fine” was quietly stuck at 1.3 feed efficiency — and the barn math said that number had a $64,000 price tag.

This isn’t one farm’s story — it’s a composite built from NASEM 2021 data, widely used feed‑efficiency benchmarks, USDA DMC numbers, and common bunk‑side patterns. The math is real. The herd is illustrative.

The $64,000 Feed Efficiency Leak

The nutritionist didn’t start with a software update. They started with a calculator.

Across extension and industry resources, feed efficiency for lactating cows is defined as energy‑ or fat‑corrected milk divided by dry matter intake — for example, 3.5% fat‑corrected milk (FCM) ÷ DMI. On this Midwest dairy, the high‑group numbers looked like this:

  • 32 kg of 3.5% fat‑corrected milk.
  • 24.5 kg of dry matter intake.
  • FE = 32 ÷ 24.5 ≈ 1.3

Using a dry‑matter cost of about $0.33 per kg, a very simple barn‑math exercise shows what a move from 1.3 to 1.4 feed efficiency would look like at the same milk:

  • At 1.3 FE, cows eat 24.5 kg of dry matter per day.
  • At 1.4 FE, they’d eat 22.7 kg to produce that same 32 kg of FCM.
  • That’s 1.8 kg less DMI per cow per day.
  • 1.8 kg × $0.33/kg ≈ = $0.59 per cow per day in feed cost. 

On 300 cows, that’s roughly $64,000 per year in dry matter to support the exact same milk. In a year where DMC only paid once — December 2025, with that $9.58/cwt feed‑cost component and $9.42/cwt margin — that extra 1.8 kg of DMI per cow per day starts to look less like “cow comfort” and more like an overdraft.

In plain language, the high group was eating as much as the low group. The bank account didn’t care how “fine” it looked at the bunk.

Is Your High-Group Eating Like a Low-Group?

Recent extension and technical pieces report typical feed‑efficiency ranges for dairy cows of 1.3-1.8, depending on stage of lactation and grouping. Benchmarks commonly used on commercial Holstein herds look roughly like this:

  • High‑group, mature cows: about 1.7–1.8 FE.
  • High‑group, first‑lactation cows: around 1.6 FE.
  • Low group: 1.2–1.3 FE.
  • One‑group TMR herd: about 1.5 FE.
  • Whole herd below 1.3 FE is generally a “look‑out” level — something in the system is dragging.

Tables from university and industry sources that relate milk yield to feed efficiency show the same pattern: as milk moves from the mid‑20s into the 30s and 40s (kg), FE typically rises into the mid‑1.4s and beyond. So a high group giving 32 kg at 1.3 FE is behaving more like a low group, at least on paper.

That’s where our composite Midwest dairy found itself: buying an extra 1.8 kg of dry matter per cow per day for milk that the ration should have been able to support without it.

The first 30‑day job on that farm was straightforward and a bit uncomfortable:

  • Pull a week of pen‑level milk and convert to 3.5% FCM.
  • Weigh actual DMI, refusals included.
  • Write the feed‑efficiency number on the whiteboard in every pen.
  • Stop calling “fine” good if the high group started with 1.3.

If you did the same thing on your farm this week, what number would you be staring at?

The NASEM Shift: Why Feeding to 2001 Costs You in 2026

Plenty of solid rations in North America were built around NRC 2001 assumptions and then tuned over time. In late 2021, the National Academies released the updated “Nutrient Requirements of Dairy Cattle” — often referred to as NASEM 2021 — with new equations for intakes, energy, protein, and minerals.

The new volume runs 482 pages and introduces an updated model that many nutritionists now use to compare rations with current research. The ingredients in this Midwest ration didn’t change. The math underneath them did.

On dry matter intake for a 680‑kg Holstein, the 2021 model makes three big changes relative to the old 2001 book:

  • Predicted DMI for high‑producing cows is about 2 kg lower.
  • Predicted DMI for low‑producing cows is about 1 kg higher.
  • The reduced DMI “penalty” in early lactation shrinks from roughly 90 days to 31 days

Example guideline tables for a 680‑kg Holstein show how the targets move:

Stage2001 DMI (kg)2021 DMI (kg)2001 Milk (kg)2021 Milk (kg)
Far‑off dry14.013.9
Close‑up dry10.012.3
Fresh (≈21 d)15.020.83533
Early lactation30.028.05555
Mid lactation24.027.43543
Late lactation20.020.02525

When a typical high‑cow ration (corn silage, haylage, shelled corn, cottonseed, soybean meal, by‑products) is run through both models for a 700‑kg Holstein, the comparison often looks something like this:

ItemNRC 2001NASEM 2021
DMI (kg)30.028.5
Net energy (Mcal/kg)1.661.81
Energy‑allowed milk (kg)48.554.8

The newer model doesn’t create energy out of thin air — it changes how it discounts the energy you already bought.

In particular, the 2021 equations:

  • Discount energy based on percent of body weight, not just multiples of maintenance.
  • Explicitly subtract energy lost as methane, calculated from digestible NDF.
  • Include the energy cost of excreting excess nitrogen, at about 14.3 Kcal per gram of nitrogen

For our composite Midwest dairy, plugging the existing ration into the 2021 model was a wake‑up call. The model said the energy density was there to support the current milk on slightly lower DMI. Their high group was still eating 24.5 kg and stuck at 1.3 FE. In other words, they weren’t just feeding cows. They were feeding the gap between 2001 and 2021.

Bunk Management: Where Energy Walks Out the Back of the Cow

When the numbers don’t match, you don’t start with a new product. You start at the bunk.

The 2021 model treats starch as a separate nutrient and assumes a default digestibility of around 91%, replacing older NFC groupings with residual organic matter (ROM). That matters when you look at how your corn is processed, not just what the lab sheet says.

Example comparisons of shelled corn forms show the impact on digestible energy:

Feed ingredientDigestible energy (Mcal/kg)Starch (%)
Shelled corn, coarse grind3.0170.4
Shelled corn, medium grind3.4670.4
Shelled corn, fine grind3.5570.4
High‑moisture corn (28% DM)3.7070.9

Same starch. More usable energy. A kilo of fine‑ground corn carries roughly 18% more digestible energy than coarse‑ground, with high‑moisture corn a bit higher again.

On this composite farm, the bunk and manure told a familiar story:

  • Half- and whole-kernel seeds are sitting in the top pan of the shaker box.
  • Shiny, intact corn pieces in manure.
  • Extra forage pushed into the ration when corn got expensive, in the name of “protecting the rumen.” 

To stop guessing, they set their numbers against a commonly used forage‑NDF/starch guide for high‑producing Holsteins:

Minimum forage NDF (%)Minimum total NDF (%)Maximum starch (%)
192530
182728
172926
163124
153322

Drop forage NDF because drought hammered corn silage or hay is pricey, and you can’t keep starch high without flirting with sub‑acute rumen acidosis. Practical levers many nutritionists use:

  • If forage NDF has to come down, either add by‑product NDF (soy hulls, corn gluten feed, citrus pulp, beet pulp) or pull starch back.
  • If chop length is shorter and starch is “fast,” raise your forage‑NDF minimum.
  • Buffers and higher DMI give some room to lower forage NDF, but not limitless room to do so.
  • If cows slug‑feed in robots or parlours, or you’re overcrowded at the bunk, you need more forage NDF, not less. 

On this composite Midwest dairy, the bunk‑side to‑do list looked like this:

  • Tighten corn processing so the energy you’re paying for doesn’t show up in the lagoon.
  • Bring in targeted by‑product NDF to support rumen fill and chewing.
  • Trim ration starch a couple of points once corn is actually disappearing, not decorating manure.
  • Fix overcrowding so cows aren’t slug‑feeding and sorting.

The aim was simple: move feed efficiency from 1.3 toward 1.4+ without exploding lameness, cows off feed, or vet bills.

Are You Buying Supplements — or Making Donations?

Once starch and NDF were under control, the next question was what all those fat and amino‑acid products were actually doing.

Modern ration models, including NASEM 2021, track fatty acids in more detail and group lipids into multiple categories with different digestibilities; basal oils from feeds like corn and corn silage are often modeled at around 70–75% digestibility. The model also reflects what recent research has shown: fat doesn’t generate methane, and polyunsaturated fatty acids (PUFAs) can reduce methane from other nutrients. And unlike older approaches, added fat isn’t automatically hit with a DMI penalty in the equations, especially in early lactation.

On paper, that makes it tempting to think rumen‑protected fats and amino acids are always a good buy. The economics don’t always cooperate.

A typical on‑farm example for inert fat looks like this:

  • 0.30 kg of an inert fat product costs about $0.54 per cow per day.
  • The milk and milk‑fat response brings back about $0.37 per cow per day.
  • Net: roughly −$0.17 per cow per day.

Working guidelines used in many high‑cow programs:

  • Raw or extruded soybeans: up to 1 kg/cow/day.
  • Roasted/cracked soybeans: up to 2 kg/cow/day.
  • Fuzzy cottonseed: up to 2 kg/cow/day.
  • Distillers grains: about 2 kg/cow/day.
  • Keep PUFAs under about 500 g/cow/day and RUFAs around 700 g/cow/day

On the protein side, the 2021 model predicts milk protein from a set of key amino acids and generally points toward RDP around 10% of dry matter as an efficient target, with caution about going much past 12%. Fresh‑cow programs aiming at around 17.5% crude protein with roughly 10% RDP and 7.5% RUP, while holding milk urea nitrogen (MUN) between 8 and 10 mg/dL, are common in both research and field practice.

For our composite Midwest herd, that turned into a very blunt filter:

  • Rumen‑protected methionine or lysine stayed in only if the model clearly showed those amino acids as limiting, and the milk cheque actually rewarded more protein.
  • DDGS were capped near 2 kg/cow/day to stay inside fat and amino‑acid guardrails.
  • Inert fat for fresh cows was judged by its impact on feed efficiency, ketosis, and pregnancy, not just by model output or fat test results.

If a product costs $0.54 and your numbers say it only brings back $0.37, it’s not acting like a supplement — it’s a donation to your input costs. If it can’t pay for itself on your component schedule within 60–90 days, it probably belongs in the “nice idea, wrong economics” pile.

Supplement TypeTypical Cost/Cow/DayTypical Return/Cow/DayNet ROIVerdict
Inert bypass fat (0.30 kg)$0.54$0.37$-0.17❌ Donation
Rumen-protected Met (justified by model)$0.18–$0.22$0.25–$0.40+$0.05 to +$0.18✅ Keep if model confirms limitation
Raw/extruded soybeans (≤1 kg/d)$0.15–$0.22$0.20–$0.30+$0.05 to +$0.10✅ Efficient fat + protein source
DDGS (>2 kg/d cap exceeded)$0.10–$0.14Diminishing return above cap$0.00 to -$0.08⚠️ Cap at 2 kg; beyond that, fat/AA guardrails break
Fuzzy cottonseed (≤2 kg/d)$0.18–$0.25$0.22–$0.32+$0.04 to +$0.08✅ When fat budget allows
Buffer/NDF support (soy hulls, beet pulp)$0.08–$0.12Indirect: fewer health events, steadier DMIPositive when FE improves ≥0.05✅ Structural, not optional

The Blind Spot: Water, Minerals, and What the Model Can’t See

Water ContaminantSafe LevelWatch Level⚠️ Action LevelDairy Impact
Iron (Fe)<0.3 mg/L0.3–1.0 mg/L>1.0 mg/LBlocks copper & zinc absorption; off-taste reduces intake
Manganese (Mn)<0.05 mg/L0.05–0.2 mg/L>0.2 mg/LDepresses intake; competes with copper
Sulfate (SO₄)<500 mg/L500–1,000 mg/L>1,000 mg/LReduces milk fat; elevates Se/Vit E/Cu requirements
Molybdenum (Mo)<0.5 mg/L0.5–2.0 mg/L>2.0 mg/LSeverely blocks copper; can cause scours in high-forage herds
Total Dissolved Solids<1,000 mg/L1,000–3,000 mg/L>3,000 mg/LReduced palatability; lower voluntary water intake
Nitrate-N<10 mg/L10–20 mg/L>20 mg/LInterferes with oxygen transport; heat stress magnifies risk

The last place this farm looked was the one even the best ration model can’t see: water.

NASEM 2021 updates macro‑minerals by basing them on absorbed amounts, using absorption coefficients for most elements except sulfur, iodine, and a few others. Common guideline tables for lactating Holsteins look like this:

MineralNASEM 2021 (%)NRC 2001 (%)Extension guideline (%)
Calcium0.640.600.70
Phosphorus0.390.380.38
Magnesium0.180.210.30
Sodium0.230.220.40
Potassium1.101.071.20
Chloride0.200.290.30
Sulfur0.200.200.25

Because the model doesn’t set explicit DCAD targets for heat stress, many field programs push heat‑stress rations toward about 1.6% potassium and 0.5% sodium of dry matter for high‑producing cows.

Trace‑mineral recommendations for lactating cows typically include: cobalt 0.2 ppm, copper 10 ppm, iodine 0.4–0.5 ppm, iron 20–25 ppm, manganese 30–35 ppm, selenium 0.30 ppm (regulatory cap), and zinc 60–70 ppm. But the model has big blind spots:

  • It doesn’t account for antagonists such as ironsulfur, or molybdenum from water.
  • It doesn’t assign absorption advantages to organic trace minerals.
  • It doesn’t address chromium directly, even though research suggests potential milk and health benefits in some situations.

That’s where water quality steps in. Penn State Extension’s 2024 guidance flags iron and manganese as the most common water‑related culprits for reduced intake and milk production in Pennsylvania herds, with iron levels above 0.3 mg/L and manganese above 0.05 mg/L enough to create off‑tastes that cut intake and production. Elevated sulfatelevels (over 500–1,000 mg/L) have been linked to reduced milk fat and increased requirements for selenium, vitamin E, and copper.

For our composite Midwest dairy, that turned into one more lab report on the kitchen table: a full water test, not just a quick strip check. With actual iron, sulfur, manganese, and molybdenum numbers in hand, they could decide whether to push trace‑mineral levels, change mineral forms, treat water, or leave a program that’s working alone.

If you’ve never put your water report beside your mineral tag and ration printout, you’re asking a model to solve a problem it literally can’t see.

What This Means for Your Operation

  • In the next 30 days, calculate feed efficiency by pen. Pull a week of data, convert milk to 3.5% FCM, weigh actual DMI (refusals included), and divide. If your mature‑cow high group is under about 1.7 FE, your first‑lactation high group under 1.6, or your one‑group herd under 1.5, you’re likely feeding into the same 1.3‑level leak this composite herd showed — especially when the only DMC payment in 2025 came at a margin of $9.42/cwt on $9.58/cwt feed costs. 
  • Within 90 days, sit down with your nutritionist and run your current ration through NASEM 2021. Keep your cow weights and ingredients the same, and compare the old vs. 2021 assumptions for predicted DMI, energy density, and energy‑allowed milk. If the newer model says your ration should carry the same milk on less DMI, that gap is the target for bunk management, grouping, and NDF/starch corrections — not an excuse to pour on more grain. 
  • Audit starch and forage NDF at the bunk, not just in the lab report. Use a shaker box and manure checks to see how much corn you’re dragging through cows. Then line your forage NDF, total NDF, and starch up against a forage‑NDF/starch reference, and adjust with chop length, by‑product NDF, buffers, feeding frequency, and bunk space so you’re not “protecting” cows into low‑group feed efficiency. 
  • Run every fat and amino‑acid product through a simple ROI screen using your own milk cheque. Take the inert fat example — $0.54/cow/day in vs $0.37/cow/day back out, net −$0.17 — as a template. Check that RDP is around 10% of dry matterMUN sits between 8 and 10 mg/dL, and the model shows a genuine amino‑acid limitation before you let those products live in your fresh‑cow ration. 
  • Order a full water test and put it beside your mineral program. If you don’t know your ironmanganese,sulfate, and molybdenum levels, you’re flying blind on trace‑mineral absorption. Compare that report to the ranges in your ration and premix; decide if the bottleneck is actually in the trough, not in the bag. 
  • Over the next year, make feed efficiency part of how you judge every “safety net.” The 1.3→1.4 example — 1.8 kg DMI saved, about $0.59/cow/day, or $64,000/year for 300 cows — shows how much margin sits inside your own feed pad before any government program cuts a cheque. When you look at Dairy Margin Coverage or similar tools, treat feed efficiency as the lever that decides how much of that national margin actually ends up in your bank account. 

Key Takeaways

  • If your high group sits around 1.3 feed efficiency at roughly 30–32 kg of 3.5% fat‑corrected milk, you’re almost certainly feeding about 1.8 kg of dry matter per cow per day that isn’t needed to hold that milk, worth around $0.50–$0.60 per cow per day at a $0.33/kg DM cost. 
  • If your ration is still mentally anchored to 2001‑era assumptions, the updated NASEM 2021 model suggests you may be able to hold or increase milk on less DMI by tightening energy density, fixing corn processing, and getting forage NDF and starch back into a safe but efficient zone — instead of throwing more dry matter and hoping the bunk cleans up. 
  • If your market doesn’t pay rich protein premiums, you still need about 10% RDPMUN between 8 and 10 mg/dL, and DDGS capped near 2 kg per cow per day, but you don’t have to assume every rumen‑protected amino acid or inert fat is money in the bank just because a model tags an amino acid as “limiting.” 
  • If you’ve never set a current water analysis beside your mineral tag and ration printout, you’re leaving a big blind spot in an otherwise tight mineral plan — high iron or sulfate in water can quietly undo a lot of careful copper, zinc, and selenium work and quietly drag down intake and milk. 

The Bottom Line

This Midwest dairy composite isn’t a fairy tale or a horror story. It’s what happens when a “fine” 1.3‑FE ration gets forced through 2021‑era math, December 2025’s DMC margin and a couple of blunt bunk‑side conversations. When you run your own feed‑efficiency, starch, NDF, protein, and water numbers over the next month, do they say you’re getting paid for the dry matter you’re buying — or that your high group is quietly eating like a low group?

Complete references and supporting documentation are available upon request by contacting the editorial team at editor@thebullvine.com.

Learn More

The Sunday Read Dairy Professionals Don’t Skip.

Every week, thousands of producers, breeders, and industry insiders open Bullvine Weekly for genetics insights, market shifts, and profit strategies they won’t find anywhere else. One email. Five minutes. Smarter decisions all week.
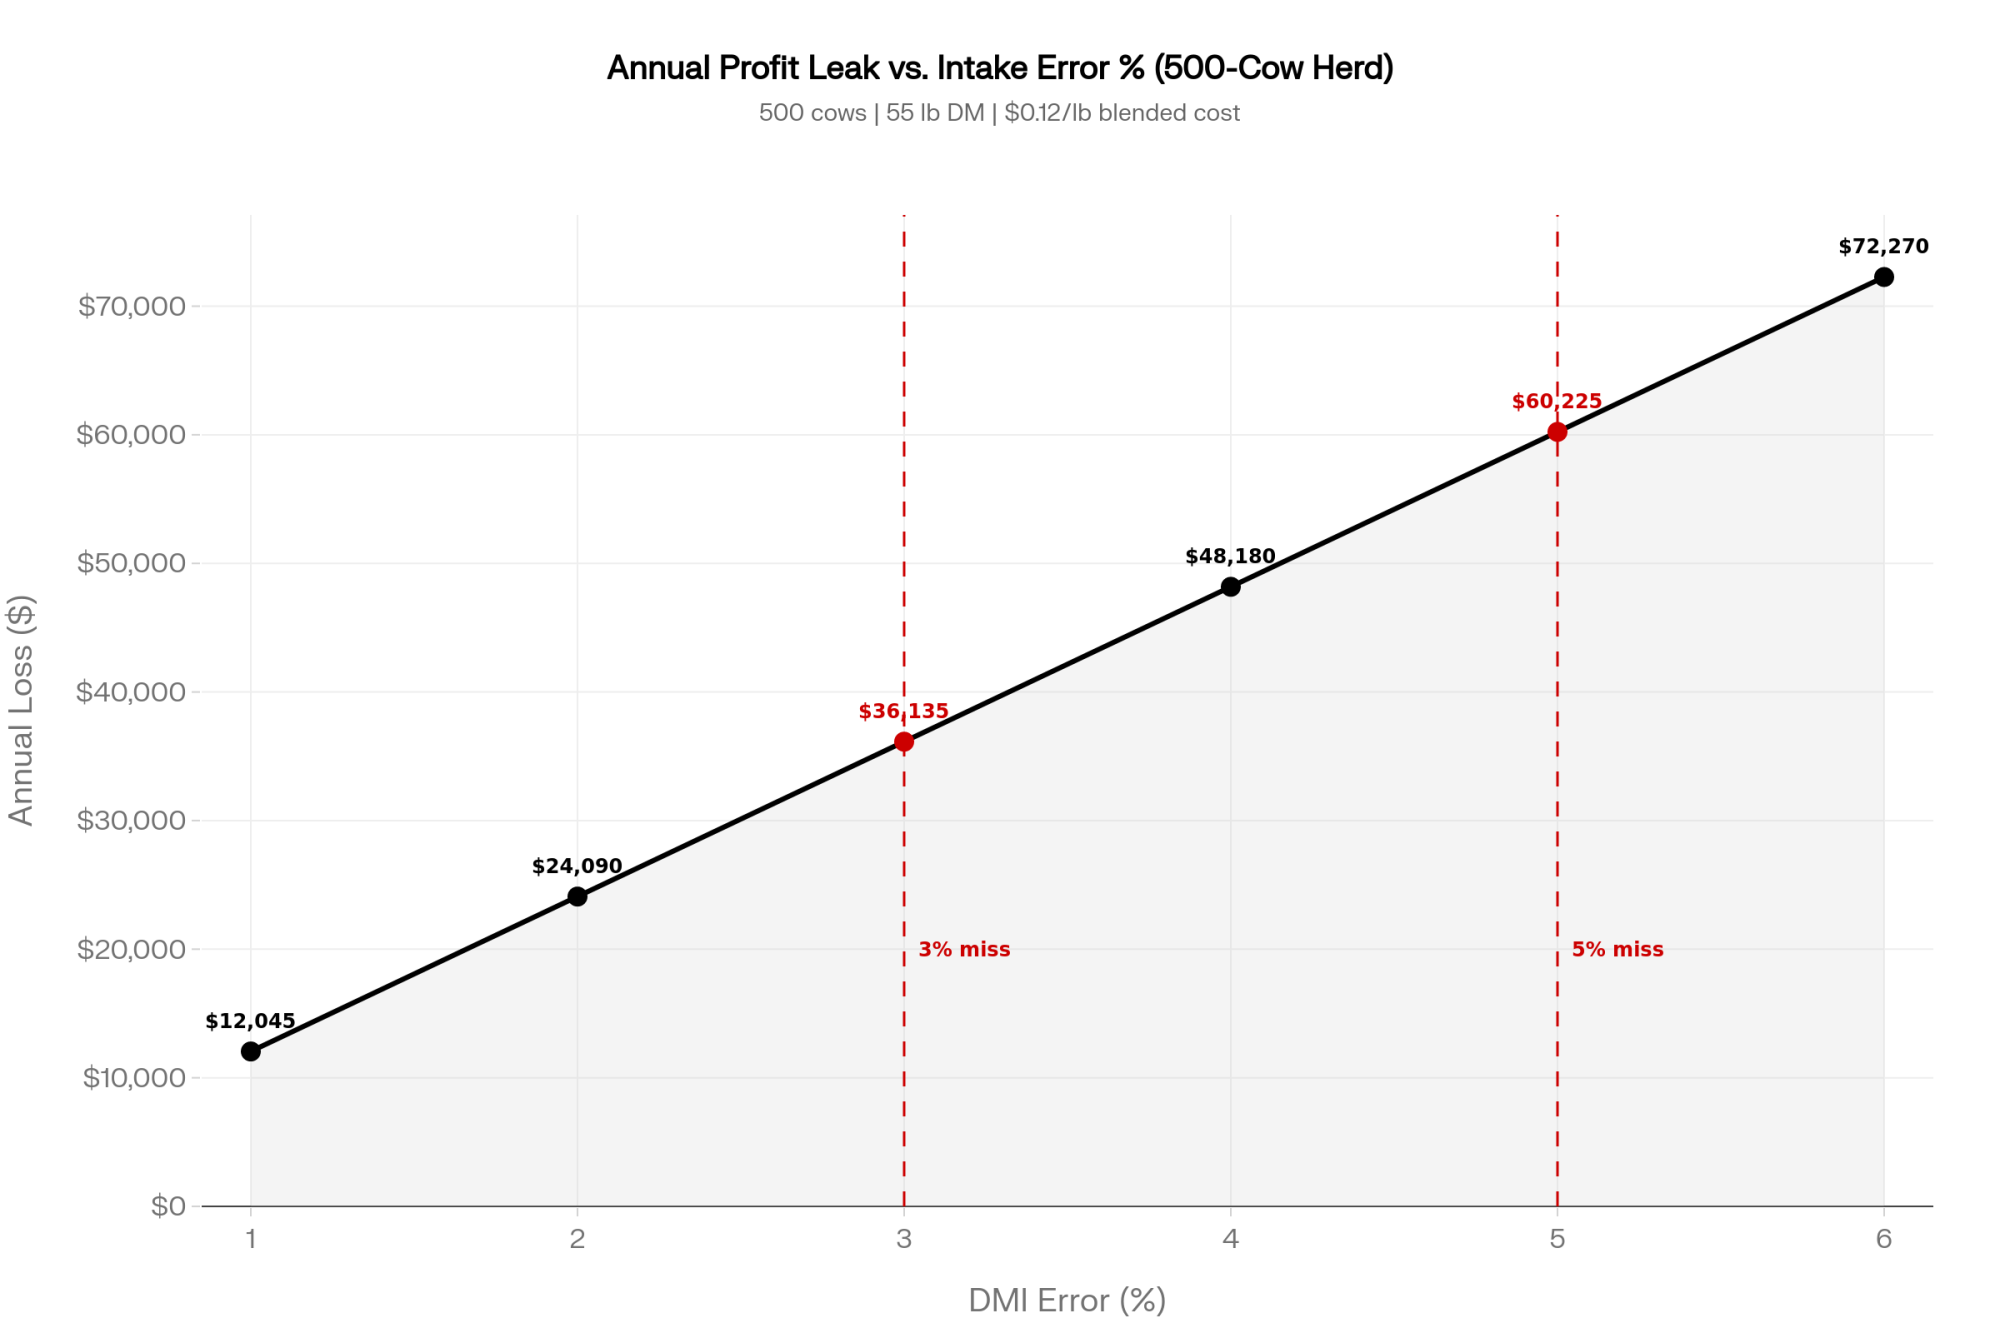
NewsSubscribe
First
Last
Consent

The 89¢ Per Cow Per Day Leak at a Southwest Dairy Found in Its Feed Center

An 8,500‑cow Southwest dairy installed a batching system and suddenly found $225 a day in feed they’d been “feeding” to thin air. Sure, your numbers wouldn’t say the same?

Executive Summary:  A Southwest dairy milking 8,500 cows was sure its feed program was “good enough” until an automated batching system exposed an 89¢ per cow per day leak in the feed center. Tightening micro‑ingredient delivery with MWI’s system and Pro‑Control Plus didn’t change the ration on paper, but it cut $225.34/day in feed cost and saved 54 minutes/day of batching time across 27 loads. Hutjens’ benchmarks and simple barn math show why that matters: whole‑herd feed efficiency below 1.3 and total shrink in the 6.5–8.5% range quietly turn feed into a six‑figure annual drain. The article lays out exactly how those numbers play out — from the 89¢/cow/day FE ladder to the $233,600/year lost at 8% shrink on a 1,000‑cow herd — and why cutting the ration usually makes IOFC worse, not better. It then turns the Southwest dairy’s wake‑up call into a playbook any herd can use: run a 3‑day shrink audit, write down four key numbers (DM cost, feed cost per cwt, FE, shrink), price feeds by nutrient value, and treat NDF digestibility like a trait you get paid for before next harvest. Readers finish with concrete thresholds and 30‑day actions to decide whether their own “good enough” feed program is quietly starving their profits.

Dairy feed efficiency

The feed center at a Southwest dairy wakes up before the sun. Loaders arc in and out of commodity bays. A mixer hums. A feeder jokes with the trucker while the first TMR drops into the bunk. On paper, this 8,500‑cow herd was doing everything right on feed.

Then they put a number on what was actually going into the mixer.

When the dairy installed an automated micro‑ingredient batching system built around MWI Animal Health’s Micro Ingredient Delivery System and Pro‑Control Plus Feed Batching platform, they didn’t change cows, facilities, or even the ration on paper. They just stopped guessing. Within weeks, they could point to $225.34 per day in feed savings and 54 minutes of batching time saved across 27 loads per day, based on their own cost structure and time studies. With the manager’s fully loaded labour and equipment rate of $500/hour, that 54 minutes of saved time was worth about $450/day on its own.

They hadn’t discovered a magic ingredient. They’d discovered how much their “good enough” program was actually costing them.

“We Thought We Were Tight”: When the Ledger Tells a Different Story

This Southwest dairy isn’t a shoestring outfit. It’s a big, modern operation with experienced people and plenty of steel. The manager genuinely believed the feed program was in good shape. The numbers seemed to back that up.

Then 2025 happened.

The USDA’s Dairy Margin Coverage index slid to $9.42/cwt in December 2025, triggering the first and only Tier I indemnity payment of the year — a total of $0.08/cwt. Illinois Farm Business Farm Management data, summarized by economist Bradley Zwilling, showed that while cash returns finally clawed their way back into the black in 2024 and were projected to stay barely positive in 2025, total economic costs were still above total returns on many herds.

That’s the kind of math that keeps managers awake at 2 a.m.

Feed has always been the big line item. Hutjens’ benchmarks put feed at about 60% of total costs on many Midwestern dairies. You can’t move the mailbox price or the DMC formula. You can move what you shovel into the mixer.

Like a lot of operations, the Southwest dairy’s first instinct was to “tighten up” feed. But before they started pulling ingredients, they decided to find out how much feed they were actually buying, batching, and feeding to cows. That decision turned out to be more important than any single tweak to the ration.

The Day They Stopped Guessing in the Feed Center

Before automation, micro‑ingredients at this dairy were classic “good enough.” The feeder was careful and experienced, but micro bins and totes were still handled by eye and habit. Scoop sizes and bucket loads varied a little from batch to batch. Over the course of 27 TMR loads a day, those “little” variations turned into real money.

With the MWI system in place, every micro-ingredient was delivered to the mixer via a controlled delivery line rather than a bucket. The Pro‑Control Plus batching platform logged target and actual weights, as well as time per batch. The manager suddenly had hard data instead of a gut feel.

It didn’t take long to see the pattern:

  • Micro‑ingredients were routinely overshot “to be safe.”
  • Loads weren’t identical; they were “close enough.”
  • The crew was working hard, but the system made it hard for them to be precise.

Once the batching system took over micro‑delivery and locked in targets, the averaged numbers told the story:

  • $225.34/day in feed cost reduction, with the same ration specs and milk targets.
  • 54 minutes less batching time per day, across 27 loads.
  • Less “hero work” and rushing in the feed center; more consistency from batch to batch.

For this Southwest dairy, that was the first big wake‑up: they didn’t have a ration problem. They had a delivery problem.

How Much Is “Good Enough” Feed Efficiency Costing You?

Zoom out from that one farm and look at the math the way Hutjens does in his feed‑cost talks.

Take a mid‑range ration that costs $5.76/cow/day for a lactating Holstein in a Midwestern TMR system. That buys you about 49 lb of dry matter at an average ingredient cost of just under 12¢/lb DM. On a herd averaging 80 lb of milk, that works out to a feed cost of about $7.20/cwt and an income over feed cost (IOFC) around $10.80/cwt at an $18 milk price.

Now imagine your herd slides down to 70 lb of milk because you cut ingredients to save money — but you don’t actually reduce intake much. If feed cost stays at $5.76, your feed cost per hundredweight jumps to $8.23, IOFC slips under $10/cwt, and feed efficiency drops from 1.63 to 1.43.

You didn’t save the feed. You made each pound of milk more expensive.

Milk Yield (lb/cow/day)Feed Cost/Cow/DayFeed Cost ($/cwt)IOFC ($/cwt)Feed Efficiency
80$5.76$7.20$10.801.63
75$5.76$7.68$10.321.53
70$5.76$8.23$9.771.43
65$5.76$8.86$9.141.33
60$5.76$9.60$8.401.20

Feed efficiency — pounds of 3.5% fat‑corrected milk per pound of dry matter — gives you a quick, hard‑number check. Hutjens’ guidelines are simple:

  • High group, mature cows: >1.7.
  • One‑group TMR herds: >1.5.
  • Whole herd: <1.3 is a concern value.

Now run the same 70‑lb herd through those FE numbers:

  • At FE 1.3, cows need about 54 lb DM. Feed cost at 12¢/lb DM: $6.48/cow/day.
  • At FE 1.4, cows need 50 lb DM. Feed cost: $6.00/cow/day.
  • At FE 1.5, cows need about 46.7 lb DM. Feed cost: ≈$5.60/cow/day.

That’s roughly:

  • 48¢/cow/day saved going from 1.3 to 1.4.
  • 40¢/cow/day from 1.4 to 1.5.
  • About 89¢/cow/day from 1.3 all the way up to 1.5 — with the same 70 lb of milk.

On a 250‑cow string, that’s around $222/day. On 1,000 cows, it’s close to $890/day. On 2,500 cows, you’re over $2,200/day.

You don’t need to be an 8,500‑cow operation to feel that.

Dutch dairy farmer and CRV consultant Niels Achten sees exactly that spread in Europe. Working with his own ~280‑cow herd and clients through consultancy firm Liba, he’s watched operations with similar genetics and facilities post very different feed efficiencies purely on management and cow comfort. “Many dairy farmers still have opportunities to increase the feed efficiency on their farms,” he says.

The uncomfortable truth: most of those opportunities aren’t in the nutrition program on paper. They’re in what actually lands in the bunk.

Where 6.5–8.5% of Your Feed Disappears Before Any Cow Sees It

The MWI case study put real numbers on batching losses. Progressive Dairy has done the same with shrink.

Ingredient CategoryTypical Shrink RangeHigh-Risk ThresholdAnnual Loss on 1,000 Cows ($8/day)
Wet byproducts12–40%>20%$35,000–$116,800
Corn silage5–17%>10%$14,600–$49,600
Dry meals & minerals2–10%>6%$5,800–$29,200
Hay/dry forages3–12%>7%$8,760–$35,040
Total feed (all classes)6.5–8.5%>7%$189,800–$248,200

In a 2022 article, they pulled together research and field data and landed on a typical 6.5–8.5% feed shrink across all ingredients at many North American dairies. The range by ingredient is sobering:

  • Wet byproducts: 12–40%.
  • Corn silage: 5–17%.
  • Dry meals and minerals: 2–10%.

Their target: keep total shrink under 5%.

Now plug that into a herd that spends $8/cow/day on feed across all classes. At 8% shrink, you’re losing 64¢/cow/dayyou paid for but never fed. On a 1,000‑cow herd, that’s about $233,600/year that disappears in the feed center, bunker, and bunk.

At 5%, you’re still losing money, but the annual cost drops to roughly $146,000. That’s an $87,600/year gap between “pretty typical” and “tight.”

The Southwest dairy didn’t fix shrinkage everywhere overnight. But by tightening batching and making ingredients hit the mixer consistently, they plugged one of the worst leaks first — the part they could measure fastest.

And that’s a key pattern. You don’t have to solve everything at once. You have to pick the spots where you can actually see what’s going on.

How Forage Quality Quietly Turns Into Milk Cheques

Feed efficiency and shrink live in the feed center. Forage quality lives in your fields and bunkers — but it shows up in the same ledger.

Oba and Allen’s 1999 meta‑analysis in the Journal of Dairy Science is still the go‑to reference on NDF digestibility:

  • For every 1‑point increase in NDFD, dry matter intake goes up about 0.17 kg/day, and 4% fat‑corrected milk goes up about 0.25 kg/day.

On a 1,000‑cow herd, that 0.25 kg (about 0.55 lb) of extra FCM per cow is roughly 5.5 cwt/day. At an $18/cwt milk price, that’s about $99/day of extra milk revenue.

Those cows will eat a bit more to get there, around 0.17 kg (0.37 lb) of extra DM per cow per day. At 12¢/lb DM, that’s roughly $45/day more feed across the herd.

Net result: a 1‑point NDFD bump is worth about $54/day, or roughly $1,600/month, on that 1,000‑cow herd after you pay for the extra feed.

Hutjens and the 2021 NASEM dairy update both push toward the same practical targets:

  • 30‑hour NDFD:
    • Legumes and cool‑season grasses: ≥50%.
    • Corn silage: ≥60%.
    • Low‑lignin corn silage hybrids: ≥65%.
  • uNDF240:
    • Around 5.0–5.3 lb/day of forage uNDF for a 1,400‑lb Holstein — enough to keep the rumen working without choking intake.

Lab summaries from places like Dairyland Labs show a wide spread. Many alfalfa samples peak at around 45% NDFD— shy of the 50% mark. Corn silage, especially low‑lignin hybrids harvested right and stored tight, often sits in the 60–70% NDFD range. Small-grain and grass silages can be anywhere from corn‑like to straw‑like.

Two bunkers can both say “NDF 40%.” If one is 45% NDFD and the other is 60%, those aren’t the same feed at all.

For a herd like the Southwest dairy, that’s the difference between a ration that looks okay on paper and a feed program that actually hits the milk tank the way the nutritionist expects.

The Feed Bunk: Where You Can See If It’s Working

Hutjens calls feed bunk management one of the places producers have the most control — and the least patience.

The guidelines aren’t complicated:

  • Bunk space: About 75 cm (30 inches) per Holstein or Brown Swiss cow.
  • Refusals:
    • Fresh cows: 2–5%.
    • High groups: 1–5%, depending on sorting.
    • Late‑lactation: 0.5–3%.
  • Timing:
    • Drop fresh feed at a consistent time, ideally as cows return from milking.
    • Push up roughly an hour before milking and every 2–4 hours after, depending on cow behavior.
  • Clean‑up:
    • Pull refusals at least daily; more often if you can.

On the Southwest dairy, the new batching system made it obvious when feed was late or uneven. Overhead cameras made it even more obvious. Pictures of bunks taken at regular intervals showed:

  • Red zones with little or no feed where cows were standing.
  • Times when the feed was supposed to be delivered but wasn’t.
  • Spots where cows sorted hard, leaving long particles and rejected bits.

On a 60‑cow freestall, you might not need cameras. A flashlight and your nose work fine.

A simple test: scrape your fingers along the concrete under where the feed sits. If you come up with gunk, slime, or something that makes you wince, your cows noticed it long before you did. Sealed surfaces, epoxy, or tile clean out better than raw concrete and don’t hold that film.

The Southwest dairy team didn’t love what they saw in the first week of bunk photos. But once they could see it, they could fix it — morning feed times, push‑up schedules, bunk‑cleaning routines. None of that required a new wagon. It required a new level of stubbornness.

“We Didn’t Change the Cows. We Changed Our Expectations.”

Feed additives, DCAD, precision grouping — all of that matters. But on a lot of farms, those tools get thrown at problems that start in the feed center and bunk.

Hutjens’ own “needs list” of additives for high‑producing herds is respectably short:

  • Rumen buffers.
  • Yeast cultures or yeast‑based products.
  • Monensin (where legal).
  • Proven silage inoculants.
  • Biotin.
  • Organic trace minerals.
  • Rumen‑protected choline and anionic salts for close‑up and fresh cows.

The Southwest dairy already had a lot of those boxes ticked. What they didn’t have was the discipline to demand a certain level of feed efficiency and shrink — and the tools to see where they were falling short.

That’s the line their manager kept coming back to after they saw the first month of data.

“We didn’t change the cows. We changed our expectations.”

They stopped accepting “good enough” for batching and bunks. They started writing down their own feed efficiency, shrink, and IOFC numbers. They stopped using milk price as an all‑purpose excuse and started looking for dollars they could actually reach.

That’s the part any operation reading this can copy — with or without an automated batching system.

What This Means for Your Operation

You don’t need 8,500 cows or a brand‑new micro‑ingredient setup to get the same kind of reality check. You need to stop guessing and write down a few numbers.

1. In the next 7 days, get your shrink out of the dark.
Pick three consecutive days. For each ingredient, record what should go into the mixer and what actually goes in. Track spoiled feed, wind losses, and what piles up in corners. If your total shrink comes in above 6–7%, that’s not “normal.” It’s a big, fixable cost center.

2. Within 30 days, write down four numbers.

  • Feed cost per pound of dry matter.
  • Feed cost per hundredweight of milk.
  • Whole‑herd feed efficiency (3.5% FCM ÷ DMI).
  • Best estimate of total feed shrink.

If you can’t put all four numbers on a single sheet of paper for your own herd, you’re flying blind.

3. Within 30 days, sit down with your nutritionist and price ingredients by nutrient, not habit.
Use a tool like Ohio State’s SESAME or your own spreadsheets to rank feeds by cost per unit of energy and protein at today’s prices. Corn silage, decent byproducts, and good forages often pencil out better than they look at first glance. Some “cheap” ingredients don’t.

4. Before your next harvest, treat NDFD like you would a proof.
Pull last year’s forage analyses. If your corn silage NDFD is stuck under 55% or your alfalfa under 50%, talk now about hybrid choice, planting decisions, and cutting stage. A 1‑point NDFD bump is worth roughly $1,600/month on a 1,000‑cow herd after extra feed is paid for. That’s as real as any proof change.

5. Any time you feel tempted to cut the ration, force yourself to run the 80‑lb vs 70‑lb math.
On a scratch pad, calculate feed cost per cwt and IOFC at both levels. If cutting ingredients pushes your feed cost per cwt up and IOFC down, your “savings” are just another shrink line — this time in the milk tank.

Key Takeaways

  • If your whole‑herd feed efficiency is under 1.3 for more than a month, treat it as a breakdown signal, not a ration‑cutting excuse. First, fix shrink, forage quality, and bunk behavior.
  • If you’ve never actually measured shrink by ingredient, your easiest money probably isn’t in the ration — it’s in the feed center and bunk. A three‑day audit will show you whether you’re closer to 5% or 8.5% shrink. The difference between those two is too big to ignore.
  • If your first response to a bad DMC margin is to cheapen feed, you’re probably deepening the hole instead of climbing out. The Southwest dairy only started winning when they stopped trying to save their way into profit and started demanding more milk and margin per pound of dry matter.
  • If your forages haven’t been tested for NDFD in the last year, you don’t actually know what you’re feeding. Until you do, you’re building rations on hope, not on what’s really in the bunk.

The Bottom Line

The Southwest dairy didn’t become a different farm when they installed that batching system. They just gave themselves nowhere to hide from their own numbers. If you pulled the last three months of your feed and milk data and wrote those four key numbers on a scrap of paper this week, would you like what you see?

Complete references and supporting documentation are available upon request by contacting the editorial team at editor@thebullvine.com.

Learn More

The Sunday Read Dairy Professionals Don’t Skip.

Every week, thousands of producers, breeders, and industry insiders open Bullvine Weekly for genetics insights, market shifts, and profit strategies they won’t find anywhere else. One email. Five minutes. Smarter decisions all week.
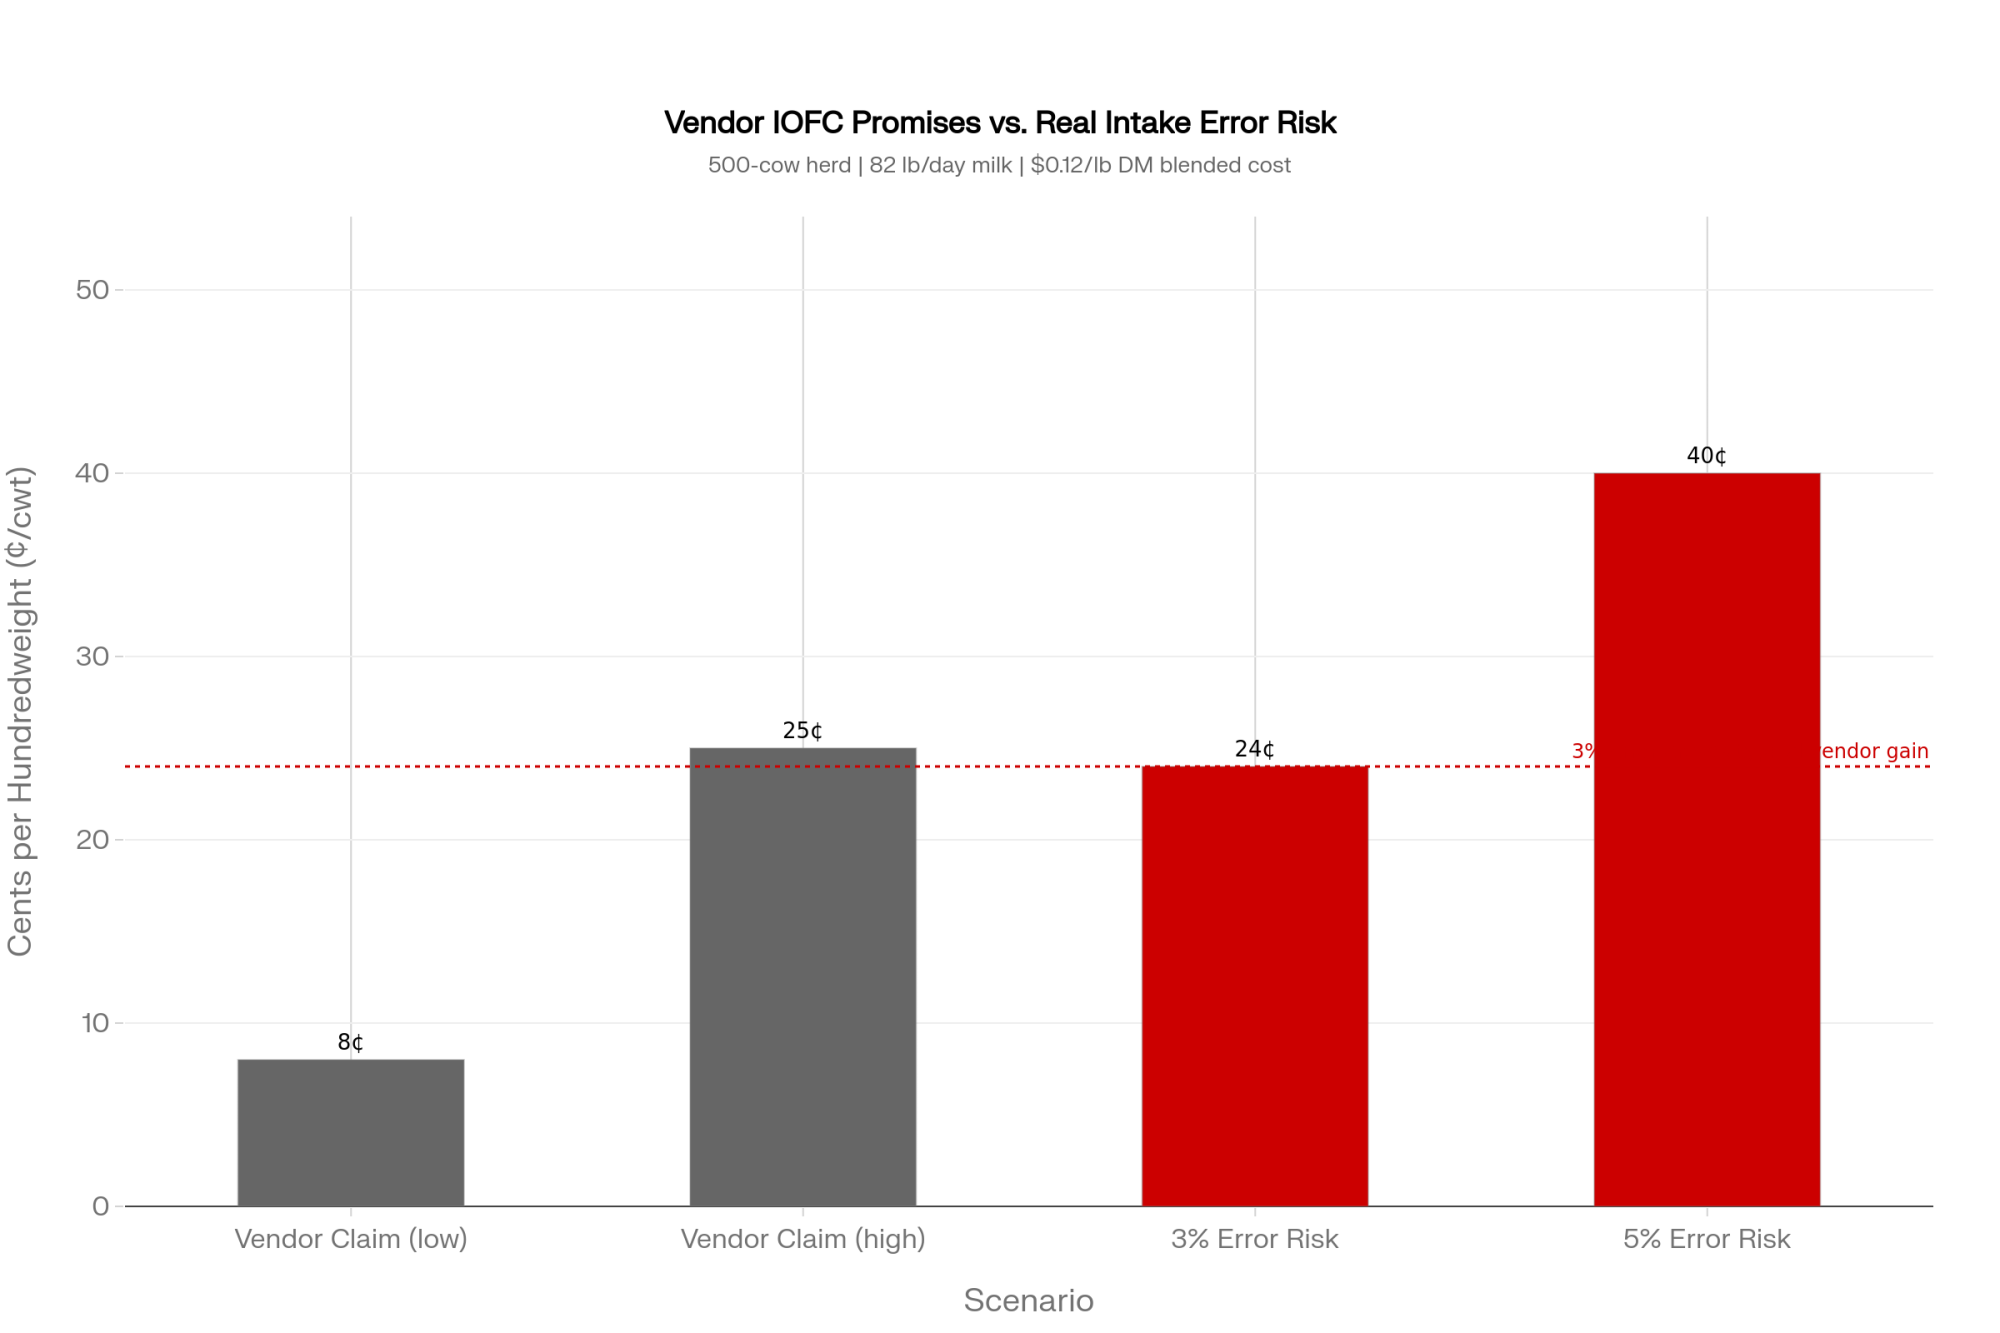
NewsSubscribe
First
Last
Consent

Nigel Cook’s $74 Heat Stress Number Was Never Wrong. It Was Never Finished.

Fertility collapse, feed efficiency erosion, and the wrong potassium source are where heat stress quietly empties the tank — and none of it shows up in that number.

Executive Summary: Nigel Cook’s $74-per-cow heat stress number was never wrong — it only priced the milk, not the pregnancies, culls, and lost efficiency that push his own updated estimate for Wisconsin closer to $120 per cow. New work on THI shows conception rate damage starting around 60, while most barns still wait until 68–72 to flip fans on, so herds are quietly losing pregnancies while cows look “fine.” On the nutrition side, meta-analyses and field trials now point to summer DCAD targets in the +350 to +400 mEq/kg DM range, with roughly 0.5% sodium and 1.8% potassium if you actually want to protect components rather than change a premix tag. Those same trials make it pretty clear that potassium carbonate and potassium chloride aren’t interchangeable: carbonate drives DCAD and milk fat response, and chloride mostly keeps the spreadsheet and the ingredient bill happy. Put together, the 2026 heat stress question isn’t “Is it costing me $74 or $120?” — it’s whether your real summer ration and cooling triggers are set for THI 60 and +350 DCAD, or still stuck on spring settings.

dairy heat stress economics

His milk-loss figure was never meant to capture the full extent of the damage. Fertility collapse, feed efficiency erosion, and the wrong potassium source are where heat stress quietly empties the tank.

Nigel Cook’s heat-stress research at UW–Madison gave the dairy industry one of its most-quoted figures: $74 per cow per year in lost milk production. Clean. Quotable. Easy to multiply by herd size, subtract the cost of fans, and feel like you’ve done the math. But Cook always framed that figure as a milk production estimate — not the total economic hit.

Across the industry, though, $74 quietly became the ceiling on what summer heat was “worth” fixing. Cook himself has since suggested that for the Madison, Wisconsin, climate — roughly 77 days above 20°C, a pattern that looks a lot like southern Ontario — the number is closer to $120 per cow per year. And even that doesn’t touch fertility, lameness, culling, or metabolic costs. Jeff Dahl and colleagues at the University of Florida have estimated total U.S. dairy heat-stress losses at over $1.5 billion annually, once reproduction and long-term effects are factored in. USDA modeling has pegged average per-farm production losses at roughly 183,000 lb of milk in some heat-affected regions.

The $74 was never wrong. It was always scoped to milk loss alone. The problem starts when that number becomes your entire summer budget.

Fertility Starts Sliding Before the Fans Turn On

Most barns flip fans and soakers on around THI 68–72. For visible panting and milk drops, that threshold holds up. Fertility is a different animal.

A 2024 Dutch study published in the Journal of Dairy Science matched reproduction records for hundreds of thousands of first-parity Holsteins against daily THI. The calving-to-first-insemination interval and the overall calving interval began to stretch at THI 50. Conception rate and first-to-last-insemination interval started to slide at THI 60 — a full 8 to 22 points before most cooling systems respond.

At THI 60, the barn looks fine. No panting. Cows lying down. But inside the cow, the damage is already stacking up. Peter Hansen’s work at the University of Florida explains why: heat disrupts hormonal signaling during follicular growth, damages developing oocytes at the DNA level, and reduces the proportion of embryos that reach the blastocyst stage — the point where implantation becomes possible. In many of Hansen’s experiments, the oocyte still got fertilized. It just couldn’t develop properly afterward.

Hansen and Aréchiga reported that summer pregnancy rates per insemination can drop to 10–20%, roughly half to a third of those in cool weather. And oocyte damage persisted for about 105 days after the heat event ended — a full follicular cycle.

Your July heat isn’t just a July problem. It’s why September pregnancy rates sag, fall synch costs climb, and replacement numbers look thin the following spring. None of that shows up in $74.

The Feed Efficiency Staircase

On the production side, deterioration under heat stress is predictable and stepwise. NRC-based modeling, echoed in extension presentations and on-farm data, maps what you’ll see from the parlor:

Barn TemperatureMaintenance EnergyDMI NeededDMI ConsumedMilk (kg)Feed Efficiency
20°C (68°F)100%18.2 kg18.2 kg27.31.50
25°C (77°F)111%19.1 kg16.8 kg23.21.38
30°C (86°F)120%19.5 kg16.4 kg18.21.11

Between 20°C and 25°C — a shift you can get in a single afternoon — the cow drops about 4 kg of milk while eating 1.4 kg less dry matter. She needs more energy, not less, because maintenance jumped 11% just to run her cooling systems. By 30°C, feed efficiency has cratered from 1.50 to 1.11. That’s a completely different economic animal.

But a lower intake only accounts for part of the milk loss. Heat-stressed cows actively repartition nutrients — more glucose gets diverted to survival and heat dissipation, less reaches the udder. You’re fighting on two fronts at once: holding DMI and persuading the cow to send those nutrients back to the bulk tank. Throwing more grain and fat on top of a spring mineral program can raise the feed bill without recovering the milk.

Is Your Summer DCAD Still Running on Spring Settings?

If there’s one number to check before the heat arrives, it’s DCAD.

Most lactating rations sit around +200 to +250 mEq/kg DM. Fine in cool weather. Under heat stress — when cows lose sodium, potassium, and bicarbonate through sweat and faster respiration — that margin gets tight fast.

The 2015 Iwaniuk and Erdman meta-analysis in the Journal of Dairy Science found that milk fat yield and concentration continue to increase as DCAD rises, reaching 400–500 mEq/kg DM. DMI and milk yield plateau between 200 and 300. A 2025 review by Kirby Krogstad at Ohio State, summarized in the Buckeye Dairy News, recommends ≥300 mEq/kg DM for milk fat production, with practical heat-stress targets pushing into the mid-300s to 400 mEq/kg DM range.

Summer mineral targets for high cows, drawn from extension guidelines and applied nutritionist recommendations:

  • Sodium: 0.4–0.5% of DM, primarily from sodium bicarbonate
  • Potassium: 1.5–1.8% of DM, ideally from potassium carbonate
  • Magnesium: 0.30–0.35% of DM, with K: Mg close to 5:1
  • DCAD: >+350 mEq/kg DM, with some research pointing to a “sweet spot” near 400

Getting from a +220 DCAD spring ration to the +350–+400 band with those mineral levels puts you in the zone the research actually supports. Pull real summer rations across dairy farms, and a lot of them are still April diets with a bit more buffer and whatever potassium was cheapest.

The Potassium Source Question: Does KCl Actually Move Your DCAD?

This is the part of the summer ration that gets the least scrutiny and probably costs the most in unrealized response.

MineralCool-Season BaselineHeat-Stress TargetNotes
Sodium0.18–0.22% DM0.40–0.50% DMPrimarily from NaHCO₃
Potassium1.0–1.2% DM1.5–1.8% DMPrefer K₂CO₃ as primary lever
Magnesium0.20–0.25% DM0.30–0.35% DMK:Mg ratio target ~5:1
DCAD+200–+250 mEq/kg+350–+400 mEq/kg<span style=”color:red”>Gap = where fat pounds disappear</span>
ChlorideManaged for DCAD balanceKeep low in lactatingKCl adds Cl without DCAD benefit

Potassium chloride is familiar and cheaper per unit of K. It checks the box on the ration printout. But chloride salts make no net contribution to positive DCAD — the chloride anion essentially offsets the potassium cation on a milliequivalent basis. You add potassium. Chloride takes it right back. Potassium carbonate, by contrast, delivers roughly 20% more DCAD per kilogram than sodium bicarbonate, and the carbonate anion provides direct rumen buffering.

Classic Clemson work, referenced in several extension programs, demonstrated that KCl doesn’t have the same impact on heat-stressed cattle as K₂CO₃. Tom Jenkins at Clemson tested this directly — first in vitro, then in live cows.

A 2014 Journal of Dairy Science continuous-culture study increased potassium from about 1.2% to 2.0% of DM using K₂CO₃ and tracked rumen biohydrogenation. The shift was clear: more stearic acid and cis-9, trans-11 CLA, fewer trans-10 intermediates — the fatty acid profile associated with higher milk fat.

Then came the cow trial. Jenkins and colleagues (2017, JDS) fed 35 early-lactation Holsteins one of five diets: a high-concentrate control (DCAD ~65 mEq/kg), K₂CO₃ (DCAD ~326), KHCO₃ (DCAD ~324), KCl (DCAD ~64), or Na₂CO₃ (DCAD ~322). Results:

  • Milk fat concentration: K₂CO₃ pushed fat to 4.03% versus 3.26% for the control — a 0.77 percentage point lift.
  • Total fat yield: Did not significantly improve, partly because milk volume tended to decrease with K₂CO₃ compared to KCl under that extreme diet.
  • Biohydrogenation pathway: Trans-10 18:1 was higher with Na₂CO₃ than with K₂CO₃, indicating K₂CO₃ specifically favored the pathway associated with normal milk fat.

Two honest caveats. This trial used a very high-concentrate diet (47% NFC) designed to stress milk fat, and the DCAD jump — from 65 to 326 — is much larger than the jump from a spring ration to a summer formulation. The decrease in milk volume with K₂CO₃ likely reflects those extreme conditions. In a more typical TMR, expect a more moderate response.

The piece that actually matters on-farm: when the same potassium level came from KCl, DCAD remained stuck at ~64 mEq/kg, and the favorable fat shifts didn’t appear. Chloride blunted the effect.

One thing worth being clear about: KCl is still the right product for close-up dry cow programs targeting a negative DCAD, and it can meet potassium requirements in rations where DCAD is already on target from other buffering sources. The problem is specific — using KCl as the primary lever to push DCAD higher in a heat-stress lactating ration.

FeatureKClK₂CO₃
Net DCAD impactMostly neutral — Cl⁻ offsets K⁺Strongly positive — ~20% more DCAD/kg than NaHCO₃
Rumen bufferingNoneDirect buffering effect
Fat concentration (Jenkins 2017)No improvement; DCAD stayed at ~64 mEq/kg+0.77 points vs. control (4.03% vs. 3.26%)
Cost per unit KLowerHigher
Best useClose-up dry cows (negative DCAD); meeting K when DCAD already on targetSummer DCAD push + fat support under heat stress

Why Potassium Reaches the Udder — Not Just the Rumen

This isn’t just a rumen story. It reaches the mammary gland, and that’s why a heat-stressed cow losing potassium through sweat isn’t just depleting a mineral. She’s losing her ability to make milk.

Every cell runs a sodium-potassium pump (Na⁺/K⁺-ATPase) that maintains the electrochemical gradient the cell needs to function. Foundational work by Linzell and Peaker in the 1970s identified this pump on mammary epithelial cell membranes and measured intracellular potassium in mammary tissue at approximately 115 mEq/L in guinea pigs, with similar values later confirmed in ruminant models.

Potassium is the primary cation in bovine sweat. Losses spike in hot weather. As circulating K drops, the Na/K pump can’t hold its gradient as effectively. That matters because glucose is the primary precursor for lactose — the sugar that acts as the udder’s osmotic engine, drawing in water and essentially setting milk volume. Mammary cells take up glucose through GLUT1 transporters and convert it to lactose. That whole chain depends on the Na/K pump keeping the cell environment intact.

Every individual link here is well established in dairy physiology. The full end-to-end pathway — heat depletes K, depleted K weakens the mammary pump, weakened pump reduces glucose uptake and lactose synthesis, lower lactose means less milk — hasn’t been demonstrated in a single published study. But the pieces are solid. And they explain why the form of potassium matters: supplying K as chloride in a heat-stress ration may satisfy the K requirement on paper while doing nothing for DCAD, nothing for rumen buffering, and leaving the cow’s acid-base balance to sort itself out.

How Much Extra Butterfat Can K₂CO₃ and DCAD Actually Buy You?

Take a high group averaging 90 lb of milk at 3.70% fat. That’s about 3.33 lb of fat per cow per day. A K₂CO₃-based DCAD shift that conservatively bumps fat to 3.95% — a 0.25-point lift, well under the 0.77-point trial result in Jenkins’ extreme diet — puts you at roughly 3.56 lb of fat. Extra: 0.23 lb per capra al giorno.

U.S. butterfat pricing context as of early 2026: USDA AMS data showed butterfat around $1.45/lb in January, recovering to $1.78/lb in February, with CME futures pointing to summer 2026 (June–August) butterfat in the $2.29–$2.35/lb range. For barn math heading into the heat season, $2.00–$2.20/lb tracks with where summer futures sit.

At $2.00–$2.20/lb, that extra 0.23 lb is worth roughly $0.46–$0.51 per cow per day in gross component value.

On a 1,000-cow herd over 84 summer days, the gross butterfat gain lands around $38,600–$42,800. Scale that to a 300-cow herd and you’re still looking at roughly $11,600–$12,800 — real money, not rounding error.

The K₂CO₃ ingredient premium is real. Industrial potassium carbonate runs roughly $1,600–$1,800/MT versus $300–$500/MT for feed-grade KCl. Your per-cow-per-day cost depends on inclusion rate and your premix supplier’s margin — get a current quote before you commit. But even after netting out that ingredient premium, the IOFC math favors K₂CO₃ at summer 2026 U.S. butterfat futures. If butter drops back toward January’s $1.45 floor, the math tightens. One more reason to track component pricing alongside the ration cost, not in isolation.

Cheapest Feed ≠ Best Margin: The IOFC Lesson

The potassium decision fits a bigger pattern that keeps showing up in herd economics.

A 2014 Journal of Dairy Science study from Penn State examined IOFC records from 95 Pennsylvania herds between 2009 and 2012. The mean IOFC was about $7.71 per cow per day at that era’s prices. The herds with the highest IOFC weren’t the ones spending the least on feed. They landed in the upper quartile for feed cost — $6.27 or more per cow per day at those 2009–2012 price levels.

In plain terms, the herds that spent more on the right inputs made more money. Squeezing purchased feed cost didn’t maximize margin then, and there’s no reason to think the principle has changed.

Judge potassium on cost per ton, and chloride wins every time. Judge it on IOFC per cow per day under heat stress — factoring in butterfat, rumen function, and the actual DCAD shift — and K₂CO₃ starts looking like the investment the ration model alone won’t show you.

You Still Can’t Out-Ration a Hot Barn

All the DCAD and potassium math assumes the infrastructure basics are covered first.

Kansas State’s heat abatement priority list stays simple and right-side-up: shade first to cut solar load, then water on cows via soakers, then air movement from fans, then air cooling (foggers or misters) where humidity is low enough.

Jeff Dahl at the University of Florida has documented a well-managed Gainesville setup: sand-bedded freestalls, fans over stalls, soakers over the feedline. Fans come on at 21.1°C. Soakers cycle 1.5 minutes on, 3.5 minutes off, starting at 22°C. Both activation points are deliberately set before visible cow distress.

Given the Dutch fertility data showing damage at THI 50–60, “early” cooling likely refers to earlier than most operations currently practiced. If the holding pen bakes through the afternoon and fans don’t start until cows are already panting, even a technically perfect ration is bailing water out of a boat with no hull.

What This Means for Your Operation

In the next 30 days, pull your actual summer ration and check the DCAD.

Not the model on a laptop — the formulation that matches what’s going on in the mixer come July. Is DCAD at +350 or higher, or still sitting in the +200–+280 band? Is potassium coming from K₂CO₃ or KCl? Are sodium (0.4–0.5%), potassium (1.5–1.8%), and magnesium (0.30–0.35%) in heat-stress ranges, with K: Mg close to 5:1? If those numbers look like April while the barn feels like July, you’ve found a concrete place to move.

Over 60–90 days, run a controlled pen comparison this summer.

If you have the pen structure, take one group — fresh or high-cow — and swap part or all of the KCl for K₂CO₃ while keeping the total potassium similar. Track components and IOFC per cow per day for a full 60–90 days. No signal? You’ve bought clarity relatively cheaply. Signal shows up? Now you’ve built your own response curve instead of relying on trial averages. You’ll need pen-level component data from your plant. If that’s not available, start with the 30-day DCAD audit.

Over the next year, tie your fall reproduction back to summer.

Pull the pregnancy rate by month and the lameness treatments for the past two years. Lay them alongside local THI data, and when your cooling is actually activated. If September and October sag every year, you’re probably looking at the delayed invoice for summer heat — not a run of bad luck.

Revisit your cooling trigger points.

Given the Dutch data showing fertility damage around THI 60, ask whether fans and soakers should kick on well before cows show visible distress. Dropping the activation trigger from THI 72 into the low 60s costs electricity. Losing pregnancies costs a lot more.

Pick the right benchmark when you price heat investments.

When you’re quoting fans, soakers, shade, or a mineral shift, are you measuring the return against $74, $120, or the full picture? Cook’s figures are milk-loss anchors — regional and conservative. Dahl’s UF estimate accounts for reproduction and long-term effects at the national scale. Whatever number you use to say “too expensive” should match what the research actually says heat stress costs you.

Key Takeaways

  • If your summer DCAD sits below +300 mEq/kg and your potassium comes from chloride, your ration likely isn’t delivering the DCAD shift the research supports. The Iwaniuk/Erdman meta-analysis and current Ohio State recommendations both point to +350–+400 as the working target under heat stress.
  • If your cooling system activates at THI 68–72, the Dutch fertility data on hundreds of thousands of cows suggest you’re missing 8–22 THI points of damage every summer. The conception rate began declining at a THI of 60. That gap is where pregnancies quietly disappear.
  • If you’re selecting a potassium source based on price per ton, you may be optimizing the wrong line on the ration sheet. KCl doesn’t move DCAD, doesn’t buffer the rumen, and doesn’t produce the fat concentration response that K₂CO₃ did in Jenkins’ Clemson work. A conservative 0.25-point fat bump on 1,000 cows over 84 summer days is worth roughly $38,600–$42,800 gross at current U.S. butterfat futures — but only if the ingredient actually shifts DCAD.
  • If your heat-stress budget is still anchored to a milk-loss-only estimate, you’re accounting for the visible hit but ignoring the rest. Cook’s own updated $120/cow/year for Wisconsin doesn’t include fertility, lameness, or culling. Dahl’s UF group puts the national figure above $1.5 billion. The real number for your operation depends on which costs you’re willing to count.

The Bottom Line

Heat stress isn’t a summer problem. It’s a 12-month accounting problem with a 60- to 90-day lag. The cows you breed in August carry that oocyte damage into October pregnancy checks. The DCAD you run in July shows up in the August components. And the potassium source you chose in April — because it was cheaper per ton — quietly costs you fat pounds all summer long. Before the heat arrives, pull the real ration, check the real DCAD, and ask the one question that actually matters: is your potassium moving the number, or just checking the box?

Complete references and supporting documentation are available upon request by contacting the editorial team at editor@thebullvine.com.

Learn More

The Sunday Read Dairy Professionals Don’t Skip.

Every week, thousands of producers, breeders, and industry insiders open Bullvine Weekly for genetics insights, market shifts, and profit strategies they won’t find anywhere else. One email. Five minutes. Smarter decisions all week.
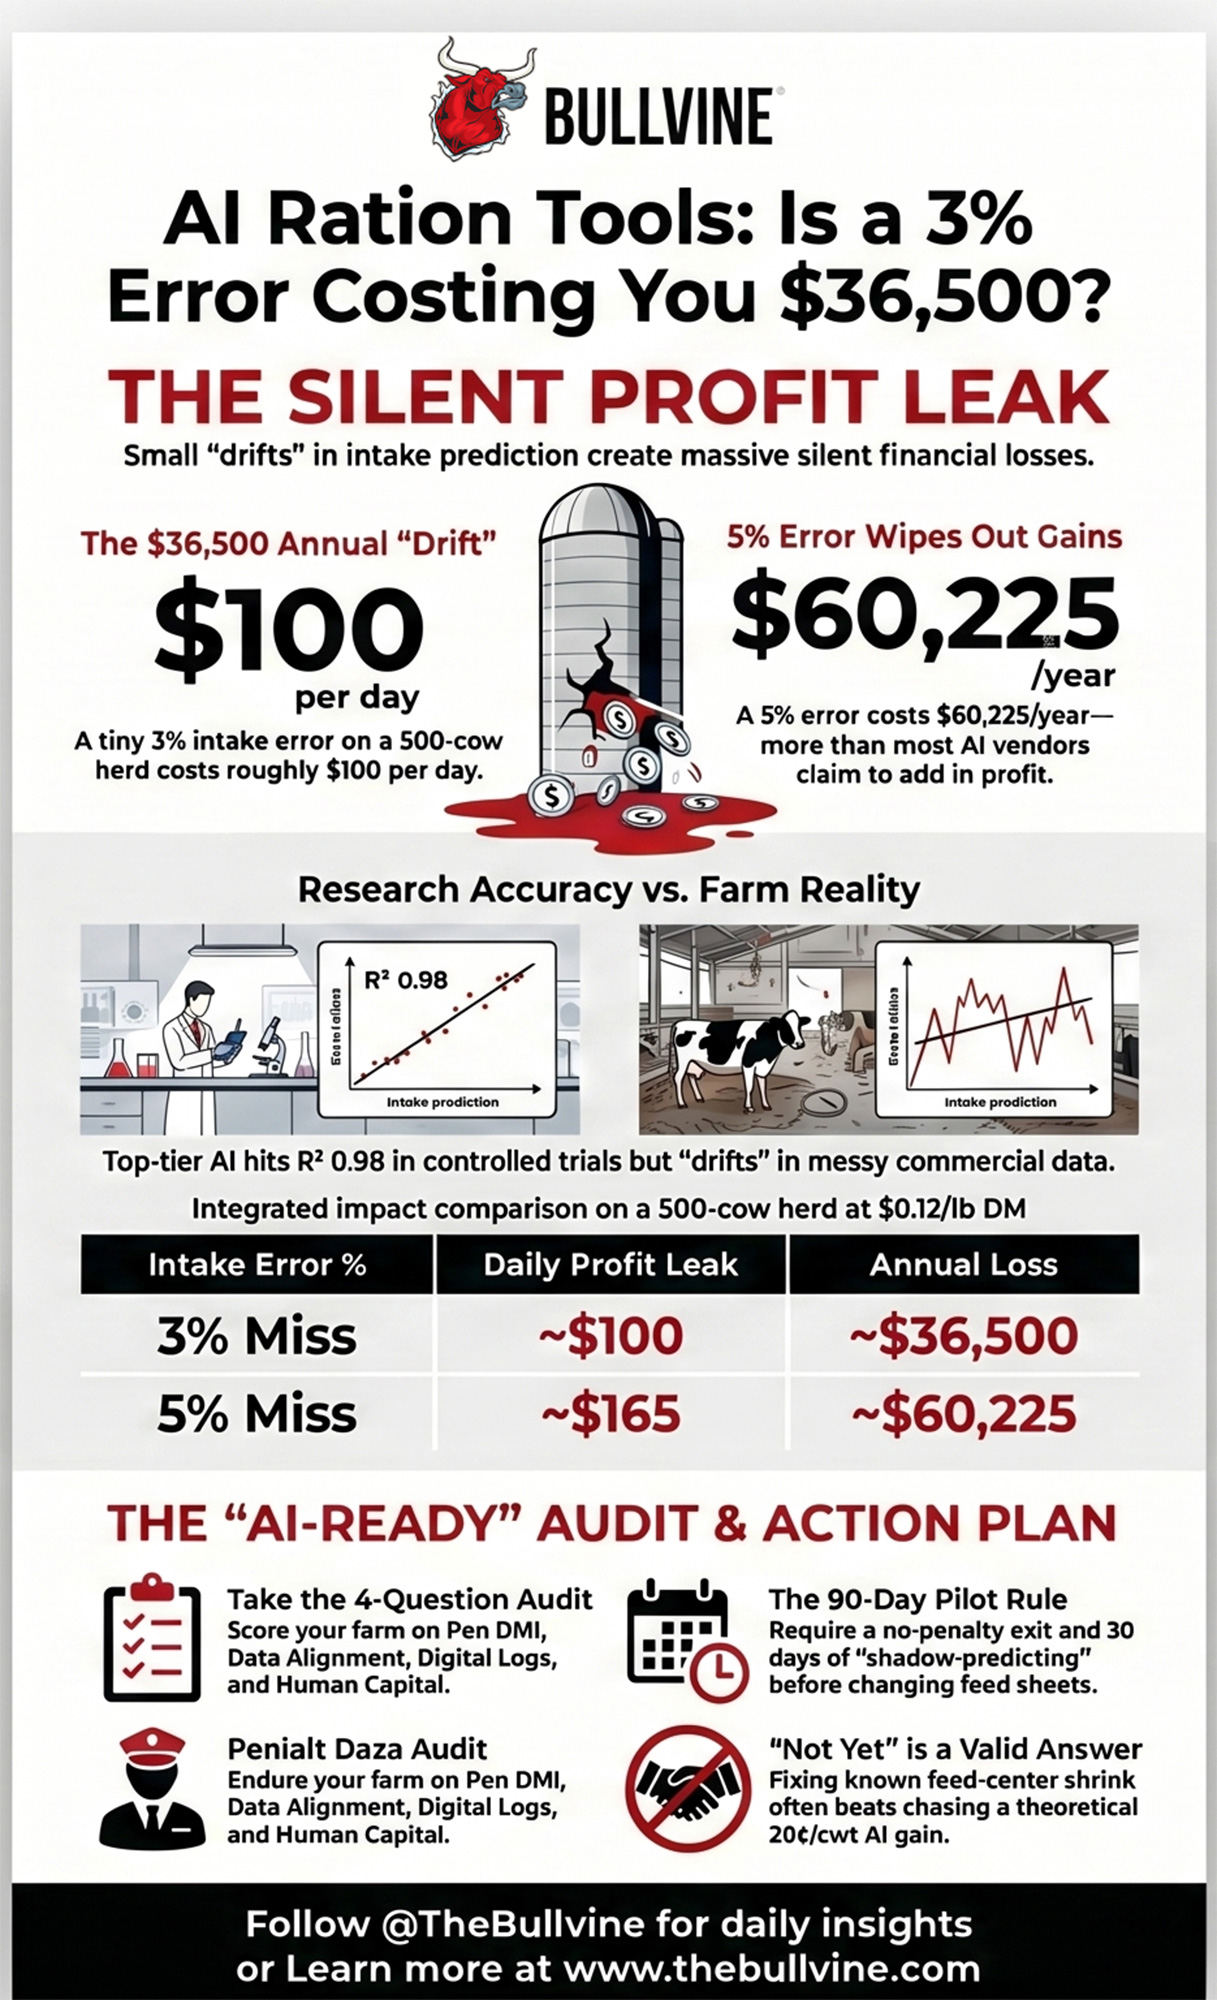
NewsSubscribe
First
Last
Consent

6% or 24%? The RUFAL Audit That Turned a $40,000 Lameness Bill Into a Ration Problem.

Your herd doesn’t have to be a train wreck to bleed money. ‘Average’ lameness is a $40,000 ration problem in a lot of freestall barns.

Executive Summary: Many freestall herds guess lameness at 5–7%, but proper scoring often lands closer to 20–25%, turning “normal” into a roughly $40,000‑a‑year problem at about $337 per case. Using the Robcis 2023 cost model and recent lameness research, this article walks through a composite 500‑cow herd in which one RUFAL audit traced that hidden bill back to the ration rather than just the trim chute. A high RUFAL (over about 3.5% of DM) quietly drives more subclinical acidosis, thinner digital cushions, and extra claw horn lesions — especially when low‑BCS dry cows and TMR sorting pile on. By pulling RUFAL down, enforcing a BCS 3.0 floor at calving, and tightening sorting with the Penn State shaker box, that herd cut lameness from 24 to under 18 cases per 100 cows and avoided roughly ,000 a year in lameness cost. The 30‑Day Lameness Audit and “Paying Twice” Calculator give you a simple way to put your buffer bill, lameness bill, and ration risk on one page. If your own math shows lameness costs bigger than your buffer spend, it’s a strong signal your ration and dry‑cow program — not your hoof trimmer — are the first place to go to work.

dairy lameness costs

Nearly one in four dairy cows in freestall herds worldwide is lame right now — and most owners think their number is under 7%. A 2025 Journal of Dairy Science meta-analysis by Wessels et al. estimates a median lameness prevalence of 29.5% across studies. A 2023 Journal of Dairy Science bioeconomic model by Robcis et al. puts the average cost at €307.50 ($336.91 USD) per case, with digital dermatitis cases roughly $92 more expensive and an extra $13.26 tacked on for every additional week a cow stays lame.

Those two numbers collided on a 500-cow North American freestall operation when the owner put the annual trim-chute costs and the sodium bicarbonate invoice on the same spreadsheet for the first time. What he found: the herd was spending over $40,000 a year on lame cows and another $25,000–35,000 buffering a ration that kept breaking hooves. He wasn’t running a bad dairy. He was running an average one. And the average was expensive.

What follows is a composite management case built from 2023–2025 lameness research and field data. No single farm is named — but the numbers, the patterns, and the ration problems are real.

“We Thought We Were at 6%.”

If you’ve ever guessed your herd’s lameness prevalence before a welfare audit, you already know this part. Someone says five percent. Maybe six. You picture the obvious head-bobbers and move on.

That’s what happened here. The owner and herd manager settled on “six or seven percent.” Then they brought in locomotion scoring — the three-point system (1 = sound, 3 = arched back with shorter stride and head bob, 5 = clearly favoring one or more hooves). Over two sessions, an outside vet scored every cow in the herd. The number wasn’t 6%. It was just under 24%.

The perception gap isn’t unique to this farm. A 2019 review in Animals (Salgado et al., doi:10.3390/ani9050270) found that farmers consistently underestimate lameness prevalence compared to trained scorers — often by a factor of two to four. Put that gap beside the Robcis cost model, and “six percent” starts to look like an expensive myth.

Two hard questions came out of that scoring session: What in our system is actually creating lame cows? And how much are we spending to manage the damage rather than prevent it?

The ration sheet had the first answer.

What Is RUFAL — and Why Is 3.5% the Line?

The cows were milking well. Components looked good. Total dietary fat didn’t seem extreme. But when the herd nutritionist ran the numbers through AMTS — one of the ration-balancing platforms that calculates RUFAL (NDS and CPM Dairy do too, though display units may differ between grams per day and percent of DM) — the story shifted.

RUFAL — Rumen Unsaturated Fatty Acid Load — totals the unsaturated C18:1, C18:2, and C18:3 fatty acids entering the rumen from all ingredients: corn silage, high-moisture corn, DDGS, whole or extruded soybeans, vegetable oils — not just the “fat supplement” line. Dr. Tom Jenkins at Clemson University developed the concept. On this herd, the number came back at about 3.8% of the ration DM.

As Jenkins summarized in a 2013 presentation and later with Harvatine in 2014, values below about 3.5% of DM are viewed as lower-risk fat intakes, while those above 3.5% indicate fatty acid loads that “may be at risk of being too high.” That’s not a hard clinical cutoff — it’s a red-flag level at which rumen fat load warrants closer scrutiny.

Above 3.5% RUFAL, fiber-digesting bacteria take the hit first. Forage doesn’t break down as it should. Rumen pH slides toward subclinical acidosis more often, especially when cows sort and slug-feed. And it changes the mix of volatile fatty acids and endotoxins hitting the bloodstream — some of which are linked to vascular changes and inflammation inside the hoof.

RUFAL Cheat Sheet: What Pushes It Up and What Doesn’t

IngredientRUFAL ImpactApprox. C18 UFA (% EE)Risk Level at Typical Inclusion
Soybean oil / corn oil (free liquid)Very High~85–90%🔴 High — small additions move RUFAL sharply
Corn DDGS (full fat, 10–12% EE)High~60–65%🔴 High — linoleic acid rapidly rumen-available
Whole / extruded soybeansHigh~55–60%🔴 High — extrusion makes oil fully rumen-active
Corn silage (high-oil hybrids)Moderate-High~45–55%🟡 Moderate — adds up fast at 55–65% ration DM
High-moisture cornModerate~40–50%🟡 Moderate — germ oil more available than dry corn
Grass / legume foragesLow-Moderate~35–45%🟢 Lower — fat mostly intact in cell structure
Calcium salts of palm FA (e.g., Megalac)Low~5–10% C18🟢 Low — bypass rumen; mostly saturated
Hydrogenated tallow / prilled fatVery Low~2–5% C18🟢 Very Low — saturated, rumen-inert
C16:0 palmitic acid supplementsNone0% (C16, not C18)🟢 None — not counted in RUFAL calculation

When the Buffer Bill and the Lameness Bill Look the Same

The herd nutritionist stared at the RUFAL printout. Then she pulled up the annual bicarb and monensin invoices.

Buffer + ionophore spend (illustrative field math):

  • 24 kg DM/cow/day × 0.75% sodium bicarbonate = 180 g bicarb per cow per day. 
  • At $0.60–0.80/kg feed-grade bicarb: roughly $0.11–0.14 per cow per day.
  • 500 cows × 365 days: approximately $20,000–26,000/year on bicarb.
  • Monensin at $0.03–0.05/cow/day adds roughly $5,500–9,100/year.
  • Combined: roughly $25,000–35,000 annually.

Lameness bill:

  • 120 cases/year (24 per 100 cows) × $336.91 per case = approximately $40,429 on the Robcis model. 

They weren’t wrong to use buffers and monensin. But here’s the decision frame that changed the conversation: If your RUFAL is below 3.5% and you’re still seeing subclinical acidosis, the buffer is doing its job. If RUFAL is above 3.5%, the buffer is a bandage — fix the ration first.

This herd was paying twice. Once to keep a high-RUFAL ration from falling over, and again when the system still generated enough lame cows to cost $40,000 a year.

📊 The “Paying Twice” Calculator

Cost A — Annual Buffer + Ionophore Spend
(Bicarb kg/cow/day × price/kg × 365 × herd size) + (monensin cost/cow/day × 365 × herd size)

Cost B — Annual Lameness Bill
(Total lameness cases in 12 months) × $337

If Cost B > Cost A, your ration may be working against you despite the additives propping it up.

This herd: Cost A ≈ $30,000. Cost B ≈ $40,429. Gap: over $10,000.

What Were the Thin Dry Cows Telling Them?

The next uncomfortable meeting wasn’t at the mixer. It was in the dry-cow pen.

When they pulled BCS scores, a pattern jumped out: too many cows were drying off below BCS 3.0, and first-lactation heifers were often closer to 2.5–2.75. Those same animals kept reappearing in the trim chute after freshening.

Coverage of a £1 million SRUC/RVC/Liverpool digital cushion study in Dairy Global reported that cows with greater digital cushion thickness had decreased odds of sole lesions (odds ratio about 0.74 for the typical ulcer site). That soft-tissue pad under the sole is thickest late in lactation and thinnest in early lactation — exactly when cows face the most metabolic stress and the most concrete. Earlier work from Tarlton and colleagues showed that hormonal changes around calving loosen the suspensory apparatus inside the claw, allowing the pedal bone to shift downward when cushion thickness is already at its lowest.

More recent work from the University of Nottingham, covered in The Bullvine’s December 2025 JDS roundup, found structural differences in the digital cushions of cows with lifetime histories of hoof horn lesions — including changes in collagen composition that may reduce shock absorption.

If you send a cow into that calving period at BCS 2.5, you’re not just flirting with ketosis. You’re thinning the shock absorber between bone and sole when she’s about to spend more time on concrete and eat a hotter ration. For a deeper look at how prepartum BCS affects DMI and energy balance, The Bullvine’s breakdown of the University of Florida BCS research lays out the numbers by BCS category.

The herd drew a line: mature cows at BCS 3.0–3.25 at dry-off, first-lactation heifers at about 3.25–3.5, and any animal below those targets in the last 60 days of lactation flagged as a “rebuild” cow.

Can RUFAL and Dry-Off BCS Really Change Your Lameness Bill?

Over the next 90 days, the owner, nutritionist, and hoof trimmer agreed on three moves.

1. Pull RUFAL out of the danger zone.

They pulled back on DDGS and free vegetable oil, replaced some of that energy with better forage and starch sources, and shifted a portion of supplemental fat to a rumen-inert calcium salt product. The revised ration landed at about 3.2% RUFAL, down from 3.8%.

On cost: projected DDG prices for late 2025 and early 2026 are in the $145–155/ton range at $4.00 corn and $325 soybean meal, with a realistic band of $125–170/ton depending on corn and soybean meal swings. In many regions, that still makes DDGS a relatively cheap protein-energy source. Pulling it back to lower RUFAL may add $0.10–0.30 per cow per day in feed costs, depending on what replaces it. The question is whether the lameness savings outrun that ingredient cost — and on this herd’s numbers, they did.

2. Build a “rebuild” lane for thin cows.

They flagged cows and heifers under target BCS in the last 60 days of lactation, moved them into a smaller group with better bunk access and a ration targeting roughly 0.25–0.5 BCS gain before dry-off, and enforced a hard floor: no cow calves under BCS 3.0 unless there’s a clear health reason.

This requires pen space and labor. Not every barn layout can support a separate group; if you can’t build one, at minimum, flag thin cows at dry-off and adjust their close-up ration accordingly. For more on why that BCS window matters for fresh-cow outcomes, The Bullvine’s 90-day transition fix shows how calving most Holsteins at BCS 3.0–3.25 supports both fertility and health.

3. Stop letting sorting rewrite the ration.

Running the Penn State particle separator at 0, 6, 12, and 18 hours told the real story. Penn State Extension guidelines flag a change of more than about 3–5 percentage units in any sieve over several hours as meaningful sorting. By 12 hours post-feeding, this herd’s top screen had swung past that. Cows were picking out grain and fines early and leaving a stemmy mess for the last shift.

Countermeasures: forage length cut under about 25 mm, a couple of kilograms of water added at mixing, and more frequent feeding and pushups. For a full walkthrough of the Penn State separator as a weekly tool — including tying it to fecal starch testing — see The Bullvine’s particle separator feature.

Did the Ration Changes Actually Reduce Lameness?

Nobody expected lameness to disappear. It didn’t. But over the next 12 months, lameness dropped from 24 cases per 100 cows to just under 18 per 100 — about 90 cases instead of 120.

That 30-case drop: 30 × $336.91$10,107 in direct lameness cost avoided on the Robcis model. Beyond the spreadsheet, the hoof trimmer saw fewer repeat claw horn disruption lesions in the same claws, slightly better reproductive performance in fresh cows, and a trim list that felt more manageable.

Sodium bicarbonate stayed at 0.75% of DM. Monensin rates held. They didn’t need to crank either one up. Those tools were now supporting a ration that protected hooves rather than propping up one that kept breaking them.

When Is It the Barn — and When Is It the Ration?

All of this played out in a freestall barn that wasn’t perfect but wasn’t a horror show. Stalls were reasonably sized, bedding adequate, alleys scraped regularly, and parlor routines kept cows out of the pen less than four hours a day.

On this herd, the numbers said the environment wasn’t the primary driver. The big step-change came from RUFAL and BCS, backed by sorting control — not a barn redesign. For herds where the barn is the bottleneck, The Bullvine’s deep dive on time out of the pen shows how stall design, stocking density, and holding-pen time drive lameness and lost production. And for a broader look at what most “non-lame” cows are hiding under their feet, The Bullvine’s hoof lesions feature a breakdown of the scale of subclinical damage.

If your herd is sitting on worn concrete, narrow stalls, or overstocked pens, your math will look different. This isn’t a hall pass for ignoring the barn. It’s a reminder that for some freestall operations, the cheapest place to start is in the ration and the dry-off lane.

Your 30-Day Lameness Audit

You’re not running this exact herd. But you can steal a lot from how they put the pieces together.

Week 1: Get Your Three Numbers on One Page

  • RUFAL (% of DM): Run your current ration through AMTS, NDS, or CPM Dairy — or ask your nutritionist to pull it. Flag if it’s above 3.5%. 
  • Lameness cases per 100 cows per year: Pull your trim and treatment records for the last 12 months. If you don’t have them, that’s finding number one.
  • BCS at dry-off: Score every cow entering the dry pen this week. What percentage is below 3.0?

Week 2: Score, Sort, and Stare at the Bunk

  • Locomotion-score the entire milking herd using a 1-3-5 system. Compare your number to what you thought it was. If the gap is more than 2×, you’ve got a detection problem. 
  • Run the Penn State particle separator on fresh TMR, then again at 6 and 12 hours. Any box shifting more than 3–5 percentage units? You’ve got a sorting problem. 
  • Walk the bunk at 18+ hours. If it looks like corn cobs and stems, cows sorted the good stuff out hours ago. 

Week 3: Do the “Paying Twice” Math

  • Calculate your annual buffer + ionophore spend using the calculator above.
  • Calculate your annual lameness cost: (cases/year) × $337.
  • Put them side by side. If your lameness cost exceeds your buffer spend, your ration may be working against you.

Week 4: Decide and Assign

  • If RUFAL is above 3.5%, work with your nutritionist on an ingredient swap plan. Target getting below 3.5% within two ration changes.
  • If more than 15% of dry-off cows are below BCS 3.0, build a rebuild lane or, at a minimum, flag thin cows and adjust their close-up ration.
  • If sorting is confirmed, pick at least two countermeasures: shorter chop, added water, more frequent feeding/pushups, or a wet ingredient.
  • Assign one person to own the connection between RUFAL, dry-off BCS, and the trim-chute report. Nothing changed on this herd until the nutritionist, hoof trimmer, and owner were looking at the same numbers.
InputThis Herd (500 cows)Your Herd (fill in)
Bicarb inclusion (% DM)0.75%________
Bicarb cost ($/kg)$0.70________
Bicarb cost/cow/day~$0.12________
Annual bicarb spend~$23,000________
Monensin cost/cow/day~$0.04________
Annual monensin spend~$7,300________
Total Cost A (Buffer + Ionophore)~$30,300________
Lameness cases per 100 cows/yr24________
Cases per year (total herd)120________
Cost per case (Robcis 2023)$336.91$336.91
Total Cost B (Annual Lameness Bill)$40,429________
Gap (Cost B minus Cost A)$10,129 🔴________

What This Means for Your Ration and Your Trim Bill

If your RUFAL lives north of about 3.5% of DM and you’re seeing more than 30 lameness cases per 100 cows per year, you probably don’t have a “trim faster” problem — you have a ration and dry-cow problem showing up in the hoof.

Bringing RUFAL under 3.5% and enforcing a BCS floor of about 3.0 at calving are two of the cheapest moves you can make to change your lameness math — even before you touch the barn. Pulling RUFAL down may cost you on the ingredient line, especially if DDGS is your cheapest energy source. But if your lameness savings outrun that extra $0.10–0.30 per cow per day in feed cost, the math is still in your favor.

At 90 days, re-score the entire herd for locomotion. Compare your new per-100-cow lameness rate to the baseline you established in Week 1.

At 12 months, run the Paying Twice Calculator again with real post-change data. If your lameness cost dropped more than your ration-change cost, the RUFAL fix paid for itself.

The next time your nutritionist and hoof trimmer are at the same table, don’t just ask how to treat lame cows faster. Ask where your lameness bill really starts — and how long you’re willing to keep paying twice.

Key Takeaways:

  • When proper scoring puts lameness closer to 20–25% than the 5–7% you’d guess, you’re likely staring at a $40,000‑a‑year problem at about $337 per case.
  • Treat 3.5% of DM RUFAL as a warning line: above that, your ration is a major lameness risk, even if the barn and trimmer look good.
  • Don’t calve cows under BCS 3.0; thin cows bring softer digital cushions into the riskiest weeks and show up more often with claw horn lesions.
  • Pulling RUFAL under 3.5%, holding a BCS 3.0 floor, and fixing TMR sorting can realistically drop lameness from the mid‑20s to the high‑teens per 100 cows and keep roughly $10,000 a year in your pocket.
  • Any time your lameness bill is bigger than your buffer and ionophore spend, it’s your ration and dry‑cow program — not your hoof trimmer — that should move to the top of the to‑fix list.

Complete references and supporting documentation are available upon request by contacting the editorial team at editor@thebullvine.com.

Learn More

The Sunday Read Dairy Professionals Don’t Skip.

Every week, thousands of producers, breeders, and industry insiders open Bullvine Weekly for genetics insights, market shifts, and profit strategies they won’t find anywhere else. One email. Five minutes. Smarter decisions all week.
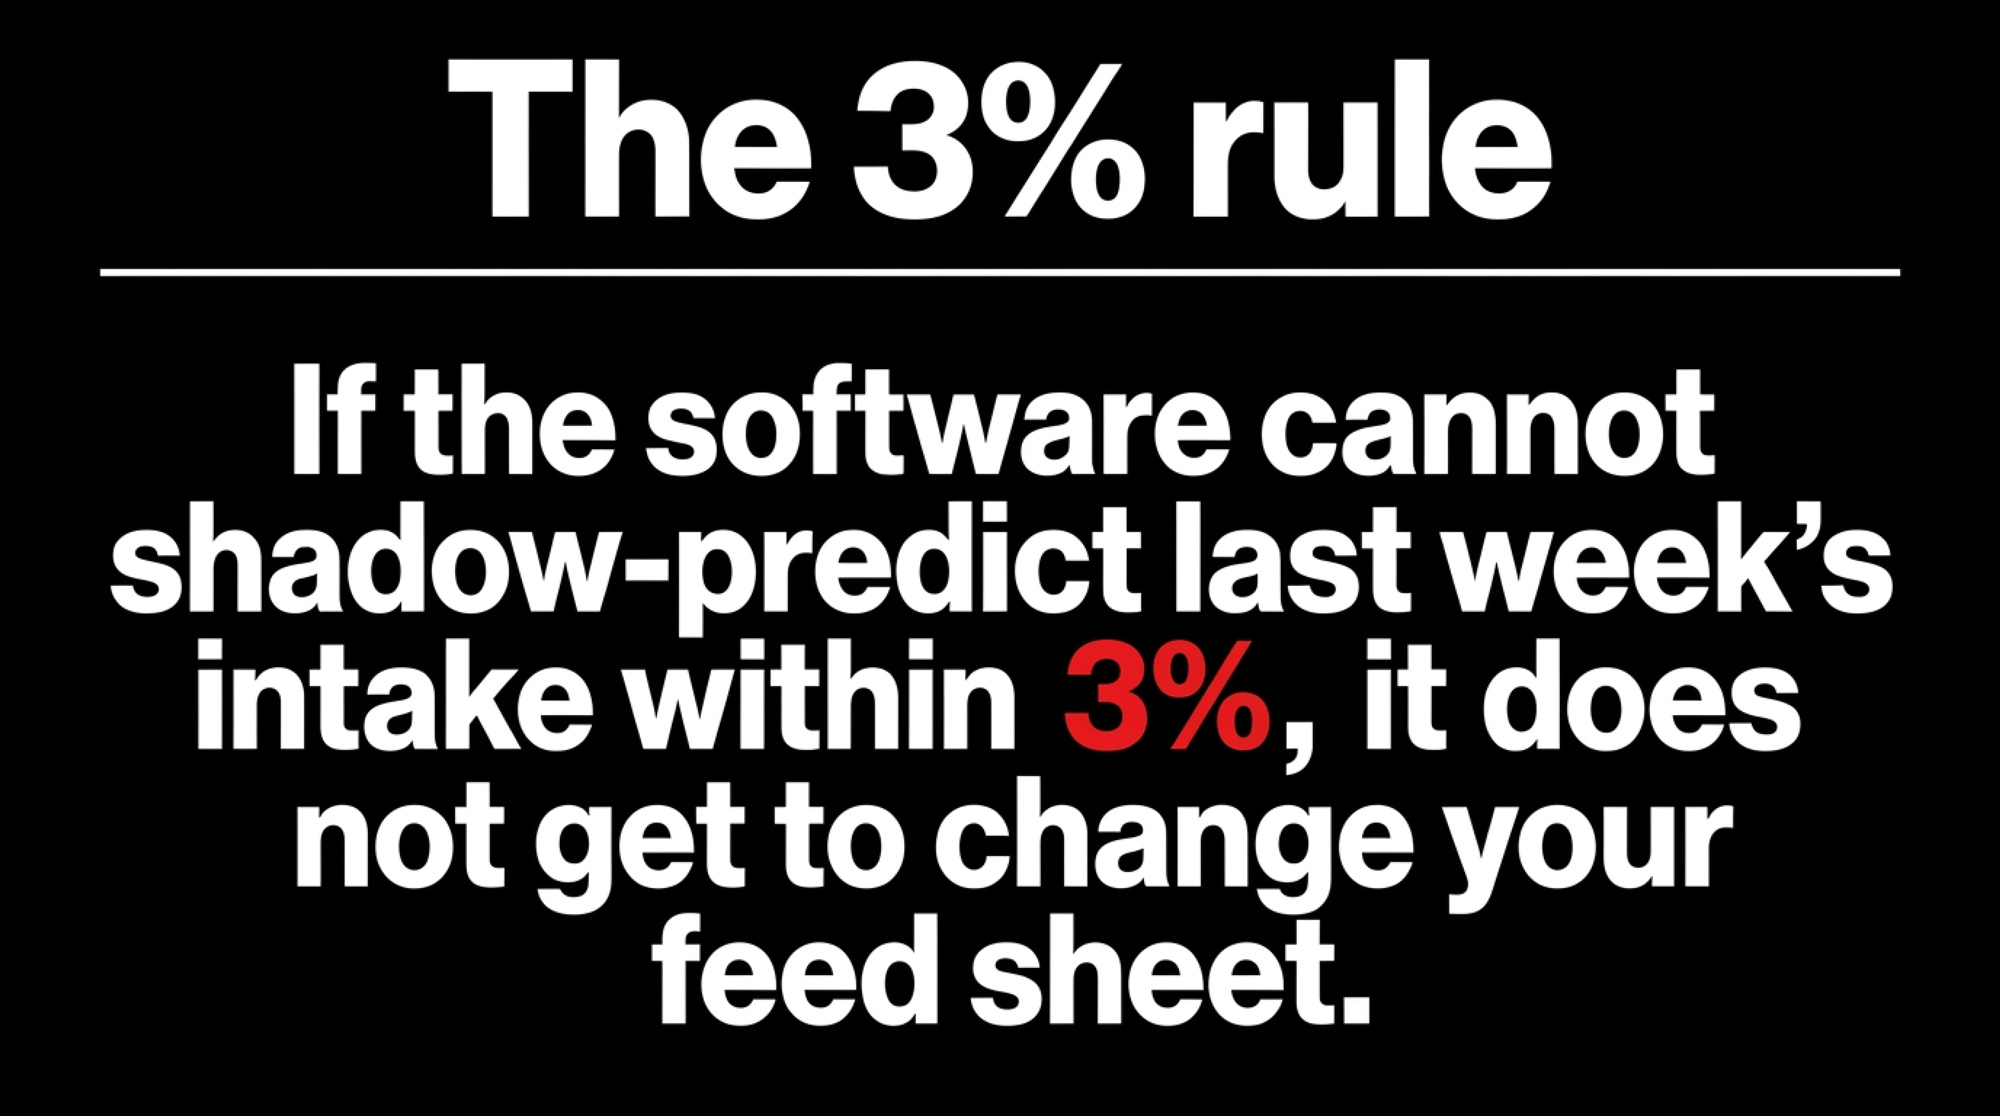
NewsSubscribe
First
Last
Consent

The $52,000 Protein Leak: How 16% Holstein Rations Waste Protein Efficiency

“Safe” 16% rations are bleeding $52,000/year in soybean meal your cows never needed. Two lines of barn math prove it.

Executive Summary: This feature argues that many Holstein herds are leaking profit on protein because they stick with “safe” 16% crude protein rations instead of managing for protein efficiency. Using a composite 500‑cow herd, it shows that dropping from 16% to 14% CP at 22 kg DMI can save about ,000/year in soybean meal at current futures, while Michigan State modelling ranks feed waste reduction and modest CP cuts as the biggest efficiency movers. Extension data from Wisconsin and Vermont are used to set guardrails, with MUN around 10–11 mg/dL, normal Holstein protein: fat ratios near 0.80, and higher fresh‑cow MP needs defining how far you can push CP without hurting milk or components. The article highlights the rumen as the cheapest protein factory on the farm — microbes can cover most amino acid needs when rumen carbs are 38–40% of DM — and shows where rumen‑protected amino acids actually pay once high groups are over 36 kg/day. It closes with a concrete playbook for the next month: calculate your protein efficiency once, average recent MUN scores, run your own 16% vs 14% barn math with current ingredient prices, check your protein: fat ratio, and treat any amino acid program as a defined IOFC trial rather than a permanent add‑on.

Dairy Protein Efficiency

The whiteboard in the office was full.

Dry matter intake, ECM, starch, NDF, and bunk scores from last week’s walk. All the usual suspects that decide whether the month ends in black ink or red.

Then someone asked a question that stopped the room:
“Do we even know our protein efficiency?”

Silence. Lots of numbers on the board. None answering that one. So they grabbed a calculator, pulled the ration sheet and the last milk statement, and did the math. The number that came back was 27.3% protein efficiency — almost exactly where extension work says many U.S. Holstein herds sit today.

That single number changed the whole conversation.

The Protein Efficiency Metric Hiding Beside Feed Efficiency

Feed efficiency has been living on dairy whiteboards for years. Kilograms of ECM per kilogram of dry matter. Milk solids per kilogram of dry matter.

Protein efficiency sits right beside it, but rarely gets tracked:

Protein efficiency (%) = (kg milk protein shipped ÷ kg crude protein fed) × 100

Extension examples use three simple scenarios from a typical Midwest Holstein herd to show how fast that number can move:

Scenario 1Scenario 2Scenario 3
DMI, kg/day222222
Crude protein, %161414
CP fed, kg/day3.523.083.08
Milk, kg/day303033
Milk protein, %3.23.23.3
Milk protein, kg/day0.960.961.09
Protein efficiency27.3%31.2%35.4%

Same cows. Same 22 kg of dry matter.

  • Dropping from 16% to 14% crude protein, while still meeting metabolizable protein and amino acid needs, bumps PE from 27.3% to 31.2%.
  • Pushing milk from 30 to 33 kg and nudging protein from 3.2% to 3.3% on that same 14% diet takes PE to 35.4%.

Modelling work from Cornell and Michigan State suggests rations approaching 40% PE are possible on paper. The reality in most barns is still high‑20s. That’s the gap this story is about.

Is Feed Waste Really a Bigger Lever Than Protein Products?

Here’s the part the product sheets don’t lead with.

Michigan State University modelled how different management changes affect whole‑farm energy and protein efficiency, starting from a base of 28%. For protein, the gains looked like this:

Management leverProtein efficiency gain (points)
Reduce feed waste 10%+3.1
Reduce diet CP by 2 percentage points+1.3
One more lactation per cow+0.5
Increase milk 10%+0.4
Shorten calving interval by 1 month+0.4
Drop age at first calving by 2 months+0.3

Feed waste sits right at the top.

That’s not a new bag or a new additive. That’s the 9 p.m. bunk check. It’s the inches of refusals you tolerate in front of your high group. It’s how often feed gets pushed up on the night shift.

Put another way:

Feed waste reduction (+3.1) and a 2‑point CP trim (+1.3) together deliver more than 4.4 PE points before you buy a single new supplement.

From a 28% baseline, that gets you into the low‑30s. Add better longevity and reproductive timing, and mid‑30s becomes realistic — without touching your semen tank or buying into the latest “protein booster.”

The Barn Math That Starts Arguments

Let’s go back to that composite 500‑cow Holstein herd.

They were feeding 16% CP on a 22 kg DMI. That’s 3.52 kg of crude protein per cow per day. Dropping to 14% CPat the same intake brings that down to 3.08 kg. The difference is:

  • 0.44 kg of crude protein per cow per day

If that protein is coming from standard 48% soybean meal (around 47.5% CP as fed), you’re looking at roughly:

  • 0.44 ÷ 0.475 ≈ 0.93 kg soybean meal per cow per day

Soybean meal futures for mid‑2026 are trading in the low‑$300s per ton. Recent quotes put mid‑2026 contracts around $308–$312/ton, with continuous front‑month near $322/ton. Using a conservative $310/ton (~$0.31/kg) for barn math:

  • 0.93 kg × $0.31/kg ≈ $0.29 per cow per day
  • $0.29 × 500 cows × 365 days ≈ $52,000 per year

That’s the $52,000 protein leak in the headline. It’s straight multiplication off your ration sheet and the current meal board.

When this extension material was first presented, U.S. soybean meal was priced at around $460/ton. Run the same math:

  • 0.93 kg × $0.46/kg ≈ $0.43 per cow per day
  • Roughly $77,000 a year on 500 cows

Feed markets have moved since then, and they’ll move again. The underlying point doesn’t change: 16% isn’t “safe” by default. It’s an unpriced insurance policy that can quietly carry a five‑figure annual premium.

And in your own ration, that entire 0.44 kg CP won’t all come from soybean meal. But once you plug in your actual protein sources and prices, the direction of travel will look very similar.

What Your MUN Is Really Telling You About Protein Efficiency

Here’s the good news: you already have a real‑time nitrogen report card sitting on every milk statement.

Milk urea nitrogen (MUN) is routinely reported for U.S. herds and widely used in extension work. The guidance bands often look like this:

MUN (mg/dL)StatusWhat it tells you
0–8⚠️ LowRumen microbes may be short on nitrogen; may need more rumen‑degradable protein.
8–12✅ TargetBest balance between nitrogen efficiency and milk protein yield.
12–16🟠 Above targetNitrogen use is less efficient; more loss as urine and milk urea.
16–24🔴 HighHigher risk for fertility impacts, nitrogen loss, and environmental load.

A University of Wisconsin model, combined with work by Nousiainen et al. (2004), plotted:

  • The percentage of intake nitrogen captured in milk, and
  • Total milk protein yield

against MUN.

As MUN rises:

  • The share of intake nitrogen showing up in milk drops.
  • Milk protein yield increases with MUN up to about 20–25 mg/dL, then levels off.

The interesting part is where the two curves cross. That crossover — where you keep good milk protein yield without throwing nitrogen away — sits right around 10–11 mg/dL MUN.

So if your rolling MUN average lives in the mid‑teens, you’re paying to move nitrogen through the cow and into the lagoon instead of into the bulk tank.

Why Rumen Bugs Can Replace Expensive Protein

If you’re going to cut crude protein, you need to know something else is doing the heavy lifting on amino acids.

That “something” is your rumen.

A Vermont project compared model‑predicted allowable milk from metabolizable protein with actual milk shipped. The relationship was almost perfectly linear, with an R² of about 72%. In plain terms, metabolizable protein explained roughly three‑quarters of the variation in milk yield.

The source of that metabolizable protein matters. University tables comparing amino acid profiles show this:

Feed sourceLysine (% of MP)Methionine (% of MP)
🏆 Rumen bacteria7.92.6
NRC target7.22.5
Milk requirement7.62.7
Corn silage2.51.5
Corn grain2.82.1
Soybean meal6.31.4
Blood meal9.01.2

Rumen bacteria land almost exactly on the NRC target for 7.2% lysine and 2.5% methionine. When the rumen is firing, it can cover 60–70% of a high‑producing cow’s amino acid needs.

Corn silage and corn grain don’t come close on their own. Heavy corn‑based diets common in the Midwest and Northeast need help — either from high‑lysine ingredients like soybean meal or from rumen‑protected amino acids in the right pens.

The key to unlocking microbial protein isn’t throwing more crude protein at the cow. It’s giving the rumen bugs the right fuel:

Target roughly 38–40% of diet dry matter as “rumen carbs”: starch + sugar + soluble fiber.

That’s what lets microbes grab ammonia and turn it into near‑perfect protein instead of letting it blow off as urea.

How Do You Know If You’ve Cut Protein Too Far?

The big fear with any CP cut is simple: “What if the tank drops?”

That fear is valid. The fix is to put hard guardrails around the change.

The extension material points to some clear red flags:

  • MUN consistently < 8 mg/dL
    Nitrogen is tight for the rumen bugs. You may have over‑cut RDP or shifted too much toward bypass protein.
  • Protein: fat ratio < 0.75
    DHI averages for U.S. Holsteins are 3.81% fat and 3.04% true protein, a ratio of about 0.80. Drop below 0.75, and you’re likely short on amino acids — either from microbial protein or from RUP quality.
  • Fresh cow protein below 3.0% in the first 40 days
    North Carolina DHIA data from 2009–2017 (herds from 19,000 to 30,000 lb RHA across three lactations) showed early‑lactation true protein values consistently under 3.0%, highlighted in red in the original tables. NRC (2001) sets the fresh Holstein MP requirement at 13.8% of DM, while DMI is only about 15 kg/day. There’s almost no cushion.
  • Peak milk softens in the 4–8 week group.
    If peak shifts down after a CP cut, you didn’t improve efficiency — you just shrank the curve.
  • Dry matter intake slides
    According to the same extension talk, protein is a driver of DMI. Lower intake means lower total nutrient delivery, even if PE looks better on paper.

The safest place to start trimming crude protein is not the fresh pen. It’s mid‑ and late‑lactation groups where:

  • MUN is running high
  • Protein tests have headroom
  • Cows are past peak, and intakes are stable

In practice, that means agreeing ahead of time on your floors for milk yield, protein %, and MUN — and booking a 30‑day check‑in before you change anything.

If the cows don’t hold those lines, crude protein goes back up. No drama. No sunk‑cost pride.

When Amino Acid Balancing Is Actually Worth the Money

Once the simple levers — feed waste, crude protein, rumen carbs — are under control, the next question is usually about rumen‑protected amino acids.

Do they pay, or is it just one more shiny bag?

An Ohio State University trial, summarized in the extension slides, offers a clean comparison:

ParameterControlBalanced AA
Crude protein, %16.916.9
Milk, kg/day42.946.6
Protein, %2.993.09
MUN, mg/dL14.313.5
IOFC, $/cow/day$8.74$9.90

Same crude protein. Different amino acid profile.

  • Milk jumped 3.7 kg per cow per day.
  • Protein test nudged up 0.10 percentage unit.
  • MUN dropped slightly while staying in a sensible range.
  • Income over feed cost improved by $1.16/cow/day, including the cost of the amino acid product.

Scaled up to 500 cows for a full year, that’s roughly $212,000 more IOFC — at the feed prices and milk value that applied when the trial was run. Real herds won’t reproduce university results perfectly, but it shows what’s on the table when crude protein is already optimized.

The wider research summarized in the same presentation puts the range of field response roughly here:

  • Milk yield: 0 to 2.3 kg/cow/day
  • Protein test: +0.1 to +0.2 percentage units, often within days
  • Where it works: mostly in early lactation, when cows are setting their curve, and RUP lysine/methionine can be limiting

One rule of thumb from that extension work:

When your high group is consistently over 36 kg/day and shipping about 1.2 kg of milk protein per cow per day, amino acid modelling and RP methionine are much more likely to pay.

Below that line, the big wins usually still come from management.

The key with any amino acid program is to treat it like a trial, not a belief system:

  • Benchmark milk, components, MUN, and IOFC before you start.
  • Run the product for a set period.
  • Decide up front what success looks like.
  • If the numbers don’t show up in 60 days, pull it.

What This Means for Your Operation

  • Within the next 30 days, calculate protein efficiency at least once.
    Use your current ration: estimate kilograms of crude protein fed per cow per day from DMI and CP%. Use your milk shipper statement to get kilograms of milk protein per cow per day. Divide. If that number starts with a 2instead of a 3, you’ve just sized a real opportunity.
  • Pull your last 6–10 MUN results and average them.
    If you’re living between 8 and 12 mg/dL, you’re near the efficiency–yield crossover that the Wisconsin model points to. If you’re consistently in the 13–16 range, some of your protein is walking right past the mammary gland and out through urine.
  • Sit down with your nutritionist and run your own 16% vs 14% barn math.
    Plug in your DMI, your CP %, your actual protein ingredients, and your current delivered meal price. The example here — $0.29/cow/day and $52,000/year at $310/ton soybean meal — is a template, not a budget. Decide which pens, if any, can move toward 14% CP, and set clear guardrails before making any changes.
  • Check your protein: fat ratio this week.
    Take your Holstein herd average. Divide true protein % by butterfat %, and the data says the “normal” is about 0.80. If you’re well above 0.90, chase milk fat depression and rumen health first. If you’re below 0.75, look hard at amino acid supply — especially MP, microbial protein support, and RUP quality.
  • If your high group exceeds 36 kg/day, treat amino acids as a real trial.
    Use a modelling tool to balance lysine and methionine. Pick a rumen‑protected methionine product with published data. Track IOFC, not just milk volume. Set a kill date if the economics don’t show up.

Key Takeaways

  • If your protein efficiency starts with a “2,” management fixes are your first step.
    Reducing feed waste by 10% and trimming diet CP by 2 points can add more than 4 PE points on their own, based on MSU modelling.
  • MUN is a free, powerful nitrogen dashboard you’re probably under‑using.
    Aim for 8–12 mg/dL, with the efficiency–yield sweet spot right around 10–11. Averages in the mid‑teens point to nitrogen — and money — going out in urine.
  • Rumen microbes are the cheapest protein on your farm.
    They can supply 60–70% of a high‑producing cow’s amino acids when rumen carbs sit around 38–40% of DM,and CP is balanced for MP and amino acid profile.
  • Amino acid products pay best when combined with good management, not instead of it.
    The Ohio State trial shows what’s possible at 16.9% CP, but field herds will only see that kind of return once DMI, CP, MUN, and feed waste are under control.

The Bottom Line

None of this requires you to reinvent your feeding program overnight.

It does mean that at your next ration meeting, alongside ECM/DMI and feed cost per cow per day, there probably needs to be one more line on the whiteboard:

Protein efficiency =?

Once that number is up there, what you do with it is where the real management starts.

Complete references and supporting documentation are available upon request by contacting the editorial team at editor@thebullvine.com.

Learn More

The Sunday Read Dairy Professionals Don’t Skip.

Every week, thousands of producers, breeders, and industry insiders open Bullvine Weekly for genetics insights, market shifts, and profit strategies they won’t find anywhere else. One email. Five minutes. Smarter decisions all week.
NewsSubscribe
First
Last
Consent

Life After BMR: The $103,000 Corn Silage Decision Behind 4 Pounds of Milk per Cow

If BMR disappeared tomorrow, would you lose 4 lb of milk per cow and $103,000 a year — or nothing at all? Your corn silage NDFD holds the answer.

Executive Summary: Corteva is phasing BMR corn silage out of its seed lineup by 2030, and that’s a big deal if you’ve been using bm3 to buy extra fiber digestibility. For a herd of around 1,800 cows, the article shows that losing just 2 points of ration NDFD can mean roughly 4 lb less milk per cow and about $103,000 a year in lost milk revenue at current Class III prices. It breaks down how much of BMR’s edge came from fiber versus starch, then shows how top-end conventional silage hybrids, chop height, plant population, and kernel processing can claw back a surprising amount of that energy. Short-stature corn and biologicals get a reality check — worth trialing, but nowhere near proven enough to build your whole feeding program around. You’ll finish with a 30-day punch list, including which forage tests to pull and what questions to run past your nutritionist and seed rep, so you can see exactly where your own corn silage stands before BMR disappears.

BMR corn silage phase-out

In March 2025, Corteva confirmed that its brown midrib (BMR) corn silage program would be phased out of Pioneer, Brevant, and Dairyland Seed lineups by the end of this decade. For large dairies that built their high-group rations around BMR’s fiber digestibility advantage, the announcement forced an immediate question: Where does that energy come from now?

Duane Ducat, a partner in Deer Run Dairy in Kewaunee County, Wisconsin, put the stakes plainly in a Brownfield Ag News interview that spring. “We had good conventional digestibility at anywhere from the 63 to 68 NDF30,” Ducat told Brownfield. “With BMR, we’re looking probably eight points higher in digestibility.”

Eight points isn’t a rounding error. It’s milk. “I would say that we’re looking at probably four pounds of milk before energy corrected, so it’s been feeding very well for us, the BMR,” he said. Deer Run milks about 1,800 cows and manages 3,200 crop acres, according to a February 2025 Dairy Business Association profile.

All Ducat quotes in this article are drawn from his March 2025 Brownfield Ag News interview and public remarks. Deer Run Dairy’s herd and acreage figures come from the farm’s February 2025 Dairy Business Association profile.

When a Seed Company Moves Your Goalposts

If BMR feeds that well, why would a major seed company walk away from it?

Corteva says BMR hybrid sales trailed their top conventional silage hybrids, which the company says deliver more tonnage and comparable feed quality. Stacking modern traits — insect protection, herbicide tolerance — onto a BMR background has been harder and more expensive than building them into full-lignin silage lines. And non-BMR silage hybrids have kept marching ahead on yield and agronomics, widening the tonnage gap even when BMR wins on digestibility.

The most widely used BMR gene, bm3, knocks down the activity of a key lignin-pathway enzyme (COMT), which cuts lignin and boosts cell wall digestibility. But peer-reviewed work has tied that same mutation to weaker stay-green, more lodging, and greater disease susceptibility — because lignin is part of the plant’s structural and defense system. Breeders have clawed back a lot of agronomic strength in bm3 backgrounds over the years, but pushing yield, standability, and trait stacks has still been easier in conventional programs that keep full lignin.

The phase-out won’t yank BMR out of your planter tomorrow. Corteva confirmed the timeline runs through no later than the 2030 growing season across its U.S. and Canadian brands. But it puts a clock on any system that’s been leaning on bm3 to buy a few extra points of fiber digestibility quietly.

What BMR Actually Did in Herds Like Deer Run

BMR earned its place in high-production rations because it reliably pushed fiber digestibility and intake — and that showed up on the milk sheet.

The mutation reduces lignin in the plant cell wall, giving rumen microbes a better shot at breaking down neutral detergent fiber. A five-year U.S. study showed in vitro NDFD30 about 7 percentage units higher than conventional hybrids, with the gap ranging up to 10 units historically. BMR silage also comes in with lower uNDF240 — the undigested fiber pool that drives gut fill and caps intake. In a review of BMR feeding trials, 100% of the long-term studies showed higher milk production. Controlled trials have often found bm3 delivering roughly 4–6 lb more milk per cow per day versus isogenic normal corn silage.

“It’s hard to compete with that from a production performance perspective,” said Luiz Ferraretto, ruminant nutrition extension specialist at the University of Wisconsin–Madison, at the February 2026 Midwest Forage Association Symposium.

The flip side shows up just as clearly. Extension and on-farm data keep landing in the same place:

  • Lower yields — often 10–15% less tonnage than strong conventional silage hybrids, especially in older bm3 lines.
  • Lower starch concentration, because bm3 plants shift more biomass into digestible stalk and leaf relative to grain.
  • More agronomic risk, particularly when BMR hybrids don’t carry the latest insect traits.

“Long story short, BMR is a great tool to improve fiber digestibility and increase intake and performance, but you need to be able to afford having less starch and lower yield,” Ferraretto said.

That’s why many herds have targeted BMR at fresh and high-producing pens rather than planting it wall-to-wall. One lever in a system, not a whole-farm crutch.

The Barn Math: What One NDFD Point Is Really Worth

Before you decide how hard to chase BMR-level digestibility, you need to know what each point is actually worth in your barn.

UW–Madison Extension has put a number on it: a one-percentage-unit increase in ration NDFD30 boosts milk production by an estimated 0.55 lb per cow per day. That’s at the ration level, not per ingredient — an important distinction. If corn silage makes up around 40% of total dry matter, a 5-point drop in corn silage NDFD30 translates to roughly a 2-point drop in ration NDFD30 once you blend in haylage, grain, and by-products.

Here’s what that math looks like at a herd Deer Run’s size, using publicly reported figures and the UW response curve against current milk markets:

  • Assumed ration NDFD drop without BMR: 2 points (from losing ~5 points of corn silage NDFD30).
  • Milk impact per cow per day: 2 × 0.55 = 1.1 lb.
  • Herd size (milking): ~1,800 cows, per the DBA profile.
  • Days in milk used for math: 305.
  • Annual milk loss: 1.1 × 1,800 × 305 ≈ 603,900 lb.
  • 2026 Class III forecast: USDA’s March 2026 WASDE projects $17.05/cwt; January 2026 actual was $14.59, and CME futures for the balance of the year trade $15.38–$18.00. Using $17/cwt as a mid-range estimate.

That puts about 3,000/year of gross milk revenue on the line if ration NDFD slips 2 points and you don’t fix it somewhere else. Your acres, yields, and milk price will differ, but the principle holds: each point of ration NDFD is a five-figure decision on most 1,000-plus cow dairies. Scale your own herd into that math, and the number should get your attention even at 500 cows.

Fiber vs. Starch: Two Knobs, Not One

Most conversation around BMR focuses on fiber. But the energy your cows get out of corn silage isn’t just about NDFD — it’s also about starch content and how much of that starch actually gets digested.

bM3 BMR silage comes in with higher NDFD but lower starch concentration than non-BMR counterparts. In some comparisons, high-yielding non-BMR silage hybrids produced more digestible NDF per acre and more starch per acre because their extra tonnage and grain compensated for slightly lower NDFD per ton.

Conventional silage hybrids today also tend to carry higher starch and more vitreous endosperm, which can hold back rumen starch digestibility if you miss on harvest maturity, kernel processing, or storage time. That’s pushed plant breeders to select for more floury endosperm in silage lines — starch that behaves more like a finisher corn than a flint.

Amylase-enabled hybrids like Enogen take a different route, building an alpha-amylase trait directly into the grain. In a Penn State feeding study where corn silage made up 40% of the diet dry matter, cows fed Enogen silage produced about 4.4 lb more milk per day with better feed efficiency at similar intakes. The seed premium varies by dealer and volume — get a quote and run it against your expected milk response before penciling the advantage.

That gives you two knobs when replacing BMR’s energy contribution:

  • Fiber knob: Pick silage-specific conventional hybrids toward the top of the NDFD30 and TTNDFD range and pair them with plant populations and chop heights that protect digestibility.
  • Starch knob: Favour hybrids with strong starch content and kernel texture that fits your system, and where the premium pencils, consider amylase-enabled genetics to pull more energy out of each ton.

The goal isn’t to clone bm3. It’s to get back to “more energy per acre” through a different genetic package.

Can Conventional Hybrids Really Close the Gap?

John Goeser, who works with large dairies through Progressive Dairy Solutions, has been blunt. “BMR corn silage sits in its own class for fiber digestibility,” he said, as reported by Dairy Herd Management in March 2026. “No current conventional hybrid matches it in the same way.”

The nuance lives in those last four words. UW–Madison’s hybrid data show conventional hybrids ranging roughly 47–67% NDFD30 and BMR hybrids roughly 54–74% NDFD30, depending on hybrid, environment, and location. There’s overlap — and Ducat’s own numbers hint at where. His conventional silage was already running 63 to 68 NDF30before BMR. That puts Deer Run’s conventional base squarely in the top tier of UW’s range. And it means Ducat’s telling Brownfield he sees BMR as worth the yield penalty specifically because it stacks on top of an already strong conventional program — not because his conventional base was weak.

MetricBMR (bm3 focus)High-Management Conventional
NDFD30 range~68–72% in good environments~60–64% for top silage-specific lines
Starch (% of DM)~28–32%~34–38%
TonnageFrequently lowerFrequently higher
Agronomic riskHigherLower
Milk per tonHigher (when fiber is limiting factor)Competitive (when starch + NDFD balanced)

Not every operation starts from Deer Run’s baseline. If your conventional silage has been running in the mid-50s, the gap to fill is a lot wider. But a top-end conventional hybrid that consistently tests in the 60–65% NDFD30 band can hang with an average BMR on predicted milk per ton once you account for its higher starch, lower uNDF, and yield advantage.

Chad Staudinger, agronomist with Dairyland Seed, has spoken publicly about that trade-off in the context of their conventional “high DF” silage line. “Our customers and our clientele, I think we’re not going to skip a beat,” he told Brownfield. “We’re going to move right into high DF and other products that show the benefits we need to feed our cattle and make milk and meat.”

On pure fiber digestibility curves, conventional won’t fully replace BMR. On milk per ton and milk per acre in a well-managed system, some of these hybrids get closer than the headlines suggest.

Does Raising the Chopper Bar — or Dropping the Seeding Rate — Really Pay?

Two of the biggest levers you can pull without changing seed are chop height and plant population. Both work by the same principle: diluting the lignified lower stalk that drags down digestibility.

“When we increase chop height, all we are leaving in the field is extra stalk — maybe we are leaving one leaf,” Ferraretto explained at the 2026 MFA Symposium. “We are diluting the undigestible material and consequently have more fiber digestibility in the silage.” A 2018 meta-analysis from his Wisconsin team (Ferraretto et al., averaging seven studies) found that for each centimeter you raise cutting height, corn silage gains 0.08 units of starch and 0.08 units of NDFD — but you lose 0.05 Mg/ha of dry matter yield.

Penn State Extension pulled together 11 university and on-farm trials showing that raising chop height by about 12 inches cut DM yield roughly 7% while boosting starch and NDFD by 2–4 units, trimming predicted milk per acre only about 2%. In one high-yield year, high-cut silage actually produced more milk per acre and per ton.

Cutting Height (inches)NDFD30 Gain (pts)DM Yield Loss (%)
6 (baseline)00%
9+1.0–2.5%
12+2.0–5.0%
15+3.0–7.5%
18+4.0–10.0%

But when Penn State put high-cut silage in front of cows, milk fat slipped from about 3.7% to 3.4% — likely because the ration’s effective fiber dropped when the forage got more energy-dense. The fix: when they reduced grain inclusion by 3 percentage units, holding ration energy constant, there were no differences in milk yield, fat, or protein. Treat high-cut silage like a more energy-dense forage and pull some purchased grain out. That’s how you keep milk steady and trade field biomass for a lower grain bill.

“I’m not trying to convince you that raising the chop height is not a good thing. I think it’s quite good, but it’s not BMR,” Ferraretto told the MFA crowd. “It’s different, and farmers have to realize that.”

On population, UW–Madison works with the Midwest Forage Association, which found that 30,000 plants per acre produced significantly higher NDFD than 35,000 or 40,000. Barry Visser, a nutritionist with Vita Plus, wrote in Dairy Star in November 2025 that “several farms have found success in improving the fiber digestibility of their conventional corn silage by controlling the planting population” — though quality responses “may not be consistent across different hybrids.”

Goeser reinforced the principle during a 2025 Hoard’s Dairyman webinar: “The more leafy tissue we have — the less midrib and the less stover we have — the greater fiber digestibility.” He also noted that while higher populations can boost yields, “this may negatively affect feed value.” Pioneer’s multi-year analysis using UW corn silage trial data found milk per acre peaked at about 41,000 plants, with NDFD only slipping about a point across the range. A one-point swing from population is a much smaller deal than a five-point swing from hybrid choice or harvest timing.

For a place like Deer Run, managing 3,200 crop acres, there’s room to run different populations on different fields — dialing back on the best ground to chase quality, pushing harder on marginal acres where tonnage matters more. Stop treating seeding rate as a single farm-wide number.

Ferraretto’s team has built a Corn Silage Cutting Height Calculator that lets you plug in your own yields, nutrient analyses, and proposed chop heights to estimate the impact on nutritive value, DM yield, and production cost per ton. The tool is based on a meta-analysis by Cole Diepersloot, Randy Shaver, and Ferraretto (presented at the XX International Silage Conference, Florida, 2025) and includes both imperial and metric tabs. Worth running those scenarios before a wet fall forces a seat-of-the-pants call at the edge of the field.

Why the Management Margin Just Got Thinner

When BMR was doing half the digestibility work, you could get away with “pretty good” on the rest of the silage decisions. That buffer is going away.

“Everything we can do to change fiber digestibility in corn silage reduces biomass that you bring to the silo,” Ferraretto said. “There is nothing out there that can increase fiber digestibility and keep — or increase — biomass.”

That pushes more weight onto levers that don’t require leaving tons in the field:

  • Harvest timing: Hitting the right whole-plant dry matter and kernel milkline remains the biggest single driver of both NDFD and starch capture.
  • Kernel processing: Across multiple UW and field studies, the kernel damage score shows up as the biggest factor in starch availability, regardless of hybrid. A wrench on the processor is cheaper than another load of corn.
  • Packing and fermentation: Air pockets, poor face management, and visible spoilage will erase the NDFD and starch advantage you paid for with seed, fuel, and time.

More herds have started tracking TTNDFD — total-tract NDF digestibility — alongside NDFD30 because it ties better to intake and performance across the whole cow. Losing BMR nudges you from chasing one number on the forage report to managing TTNDFD plus starch digestibility as a package.

UW’s “Beyond BMR” factsheet also flags that BMR hybrids without modern insect traits may need heavier fungicide and insecticide programs to manage ear disease and mycotoxins — adding to the yield penalty you’re already absorbing. None of that is new science. What’s changed is the room for sloppiness. Without BMR as a backstop, those 2–3-point swings in NDFD30 from timing, processing, or bunk management start looking like real money — the kind of money in the barn math above. For mid-size operations already navigating tighter strategic margins, losing the BMR crutch means every other management lever has to work harder.

Is Short Corn the Next BMR?

When a silver bullet gets taken off the table, everybody hunts for the next one. Short-statured corn is the loudest candidate right now — and two Wisconsin operations are already testing the idea from different angles.

UW–Madison agronomist Harkirat Kaur’s early work suggests short-statured corn can post higher NDFD than standard-height hybrids while maintaining similar grain yield, largely because the plant carries less lignified lower stalk per ton. Iowa State’s 2024 report adds practical reasons for the buzz: short hybrids decrease lodging risk, improve standability, and let you run full-season ground rigs without worrying about tassel damage.

Andy DeVries, a silage farmer from Rosendale, Wisconsin, got an early look through Bayer’s Ground Breakers program. “Preceon delivered yields comparable to BMR, but with exceptionally high starch and similar digestibility,” DeVries shared during a January 2026 Ground Breakers session, as recounted by Bayer senior VP Elzandi Oosthuizen. “Watching Preceon silage go into the wagon made it easy to understand where that starch is coming from.” That field-level observation lines up with what Michigan State’s VandeHaar lab found when they put br2 short corn head-to-head against BMR — the br2 silage shipped 2.5 lb more ECM per cow per day than BMR in mid-lactation Holsteins, even though BMR still owned the NDFD column in the lab.

Ferraretto and Italian collaborators (Catellani et al., published in the Journal of Dairy Science, February 2026) compared short-statured silage to conventional in rations where corn silage sat at about 40% of dry matter. Nutrient analyses showed NDF digestibility and starch slightly higher for short corn — numbers that resembled BMR analyses, Ferraretto said. But the cow data told a different story.

“The question is, are cow responses similar to BMR? The answer is no,” he asserted at the MFA Symposium. Total milk production still improved, but there was no statistical difference in feed intake — suggesting a different biological mechanism. Here’s the catch: the conventional corn was planted at 32,500 seeds per acre, while the short corn was planted at 54,600.

“It’s very promising, but we have a lot to learn about it,” Ferraretto stated.

Biologicals — seed treatments, inoculants, foliar products — are the other hot category. UW’s “Beyond BMR” factsheet describes that market as “vast and relatively unregulated,” stressing that independent testing will be crucial. There’s nothing wrong with testing short corn or a biological in your own plots. The risk is treating either one like a guaranteed BMR replacement before you’ve seen multi-year, replicated data in your region.

What This Means for Your Operation

You don’t have to milk 1,800 cows to be in the same boat as Deer Run. If BMR has been part of how you buy room for higher forage rates and strong components, the clock is ticking.

In the next 30 days:

  • Pull your last two years of forage tests. Circle every corn silage sample with NDFD30 at or above 60% and strong TTNDFD. Those results are your proof that non-BMR acres can carry a bigger share of the ration’s digestibility load.
  • Sit down with your nutritionist and seed advisor. For every conventional or short-corn hybrid on the table, ask for multi-year local trial data — NDFD30, TTNDFD if available, starch, yield, and trait package. If a hybrid can’t consistently reach the high-50s to low-60s for NDFD30 in your environment, it doesn’t belong in your high-group bunk.

Before you plant:

  • Decide which fields can trade a little tonnage for quality. On those acres, consider pulling plant population back toward 30,000–32,000 plants/acre and pairing that with higher chop height in a normal-or-better crop year.
  • For each field, sketch a Plan A and Plan B chop height — one setting for when inventories and grain prices let you leave stalk, another for when you need every ton. Run both through UW’s cutting-height calculator so the decision is math, not a guess.

At harvest and feedout:

  • Check kernel processing score early in the run, then again when crews are tired. Slowing the chopper or tightening a processor is cheaper than hauling more corn because starch is locked in whole kernels.
  • Match your highest-quality lots to the groups where digestibility pays hardest. Let late-lactation cows and heifers eat the “nice but not great” silage.
  • If you raise chop height, make sure your nutritionist adjusts for effective fiber — don’t trade butterfat for a few extra pounds of milk.

Over the next 12 months:

  • Compare milk per ton, milk per acre, TTNDFD, and purchased feed costs from your first non-BMR crop against your last season with BMR.
  • Where there’s still a shortfall, pin down exactly where it lives. Intake on the hottest days? Butterfat when you raised the chop height? Milk from fresh cows? Specific answers drive next year’s hybrid, population, and ration decisions — vague disappointment doesn’t.
TimelineAction ItemWhy It Matters
Next 30 DaysPull last 2 years of forage tests; circle every corn silage sample with NDFD30 ≥60% and strong TTNDFD.Proves your non-BMR acres can carry more digestibility load. If you don’t have samples above 60%, your gap to BMR is wider than Deer Run’s.
Next 30 DaysSit with nutritionist and seed advisor; demand multi-year local trial data (NDFD30, TTNDFD, starch, yield, traits) for every hybrid on the table.If a hybrid can’t consistently hit high-50s to low-60s NDFD30 in your environment, it doesn’t belong in your high-group bunk.
Next 30 DaysRun UW’s Corn Silage Cutting Height Calculator for your fields (link in article).Model Plan A and Plan B chop heights before fall—turn a cab decision into math.
Before PlantingDecide which fields trade tonnage for quality; pull population to 30k–32k plants/acre on those acres.Dilutes lignified stalk, boosts NDFD ~1–2 points. Don’t treat seeding rate as farm-wide—vary by field goals.
Before PlantingSketch Plan A (high-cut) and Plan B (standard-cut) chop heights by field; cost both scenarios in the calculator.Wet fall or tight inventories kill high-cut plans. Have the math done ahead so you’re not guessing at harvest.
At HarvestCheck kernel processing score early in the run, then again when crews are tired.A wrench on the processor is cheaper than hauling more corn because starch is locked in whole kernels.
At Harvest/FeedoutIf you raise chop height, flag it for your nutritionist—don’t trade butterfat for milk.Penn State saw milk fat slip from 3.7% to 3.4% on high-cut silage until they pulled 3 points of grain to rebalance effective fiber.
At FeedoutMatch highest-quality silage lots to high-producing and fresh pens; let late-lactation and heifers eat “nice but not great” silage.Digestibility pays hardest in groups where intake and milk yield are highest. Stop feeding one-size-fits-all TMR.
Over Next 12 MonthsCompare milk/ton, milk/acre, TTNDFD, and purchased feed costs from first non-BMR crop vs. last BMR season.Shows you exactly where the shortfall lives—intake on hot days? Butterfat? Fresh-cow milk? Specific answers drive next year’s seed plan.
Over Next 12 MonthsTrack forage test results monthly; flag any NDFD30 or TTNDFD drift below your baseline.Early warning system. If quality slips mid-year, you can adjust ration or pull different silage lots before milk checks show the damage.
OngoingTrial short-statured corn or biologicals on 10–20 acres—but don’t build your program around them yet.Promising, but multi-year replicated data doesn’t exist. Test them; don’t bet the farm on them.
OngoingAsk your nutritionist to calculate ration-level NDFD30, not just forage-level—that’s what drives milk response.UW’s 0.55 lb milk per NDFD point is at the ration level. If corn silage is 40% of DMI, a 5-pt drop in silage = ~2-pt drop in ration NDFD.

Key Takeaways

  • Price your fiber insurance now. Using UW’s 0.55 lb/cow/day per ration NDFD point, a 2-point ration NDFD drop on a 1,800-cow herd works out to roughly $103,000/year at USDA’s 2026 Class III forecast of $17.05/cwt — scale for your own herd size and milk price.
  • Your conventional baseline is the whole story. Ducat’s own program ran 63–68 NDFD30 before he added BMR — that’s the neighborhood you need to be in. Top silage-specific conventionals in the 60–65% NDFD30 range with strong starch and trait packages can compete with average bm3 on milk per ton and per acre. If your conventional sits in the mid-50s, the gap is wider and the urgency is higher.
  • Treat chop height and plant population as ration levers, not just chopper settings. A ~12-inch bump in cutting height tends to shave ~7% off DM yield, boost starch and NDFD by 2–4 units, and trim milk per acre only ~2% — but the win only sticks if you rebalance for effective fiber or pull back on grain.
  • Demand more than a plot tour from short corn and biologicals. DeVries saw promising starch and digestibility from Preceon, and VandeHaar’s lab found br2 shipped 2.5 lb more ECM than BMR — but Ferraretto’s own cow data didn’t match BMR-level responses, and multi-year replicated data across regions doesn’t exist yet. Trial them. Don’t build your feeding program around them.

The Bottom Line

Ducat’s 63-to-68 conventional baseline and 8-point BMR bump aren’t just Deer Run numbers — they’re a measuring stick. If you know where your conventional silage sits on that scale right now, you already know how much work you’ve got ahead of you. The tools to close most of that gap are already in your hands. What matters is whether you pick them up before Corteva’s timeline picks for you.

Learn More

br2 Short Corn Beat BMR: 2.5 lb More ECM on Mid‑Lactation Cows

BMR won the NDFD test. br2 short corn still shipped 2.5 lb more ECM per cow. Ready to see why the cows disagreed?

Executive Summary: Michigan State’s first short‑stature br2 feeding trial put three br2 hybrids head‑to‑head with a tall conventional and a Pioneer BMR — and the br2 silage shipped 2.5 lb more ECM per cow per day than BMR in mid‑lactation Holsteins. On paper, BMR still owned the NDFD column, but cows on br2 ate about 2 kg more dry matter and pulled more energy out of organic matter, starch, and protein, so total‑tract digestibility and milk moved their way. Fat test slipped roughly 0.13 points versus BMR while fat pounds stayed similar, which looks a lot less scary once you know CoBank is already warning about butterfat oversupply and cheesemakers chasing a tighter protein‑to‑fat ratio. When you turn it into barn math, that ~2.5 lb ECM bump pencils out to roughly $36,500 a year on 200 cows (and north of $90,000 on 500) at a $20/cwt pay price, against about $50/acre more in seed cost from higher-priced bags and higher plant populations. br2 also brings standability and optionality BMR can’t — similar or better DM yield than tall corn, less lodging risk in storms, and the option to shell it for grain if the milk‑to‑corn ratio flips, instead of being stuck chopping every acre. The fine print: feed efficiency was lower on br2, BMR still has the best data in very early lactation, and we’re talking about one Michigan trial plus an Italian study that only tested brachytic against tall corn, so this is strong first evidence, not a universal law yet. For 2026, the smart move is to trial br2 on a slice of your silage acres, budget the seed premium up front, and sit down with your nutritionist so higher forage intake actually replaces purchased energy instead of just giving you a bigger feed bill for the same milk.

br2 corn silage vs BMR

When Bayer’s Ground Breakers program offered Andy DeVries a chance to test Preceon short-stature corn on his Rosendale, Wisconsin, silage acres, the pitch was standability. What he found went further.

“Preceon delivered yields comparable to BMR, but with exceptionally high starch and similar digestibility,” DeVries shared during a January 2026 Ground Breakers session, as recounted by Bayer senior VP Elzandi Oosthuizen. “Watching Preceon silage go into the wagon made it easy to understand where that starch is coming from.”

Then, Michigan State University published the numbers, turning his field observation into a peer-reviewed challenge to a long-standing industry assumption.

For twenty years, 30-hour NDF digestibility has been the number on every seed brochure. Higher NDFD, more milk. Simple, intuitive, and — according to the first published feeding trial of br2 corn silage — incomplete.

Mid-lactation Holsteins fed short-stature br2 corn silage produced 1.1 kg more energy-corrected milk per day than cows on BMR (37.6 vs. 36.5 kg/d, P = 0.01), even though BMR had a 3- to 6-point NDFD advantage in the lab. The hybrid bred specifically for fiber digestibility lost to the one that wasn’t, because the cow measures everything, not just fiber.

Measurebr2 (avg of 3)BMRDifferenceP-valueWinner
DMI (kg/d)26.524.5+2.0< 0.01br2
Milk (kg/d)33.232.0+1.2< 0.01br2
ECM (kg/d)37.636.5+1.10.01br2
Fat (%)4.324.45−0.13< 0.01BMR
Fat (kg/d)1.431.40+0.030.14—*
Protein (kg/d)1.151.10+0.05< 0.01br2
ECM/DMI1.431.51−0.08< 0.01BMR

One caveat up front: br2’s ECM advantage over tall conventional corn was not statistically significant in this trial (P = 0.11). The bulletproof comparison is br2 vs. BMR. That distinction matters when you’re deciding which fields to switch.

Nobody Bred This Corn for Your TMR

The brachytic2 mutation shortens internodes — the stem segments between leaf nodes — while preserving leaf area, ear size, and grain fill. It cuts plant height by roughly a third. Same engine, lower chassis.

Bayer picked up the trait for grain standability, not silage quality. The 2020 Midwest derecho drove the investment. Bayer’s own research (Barten et al., 2022, published in Crop Science) documented that short-stature plots in the derecho’s path suffered only 10–15% damage from 50–75 mph winds, while tall corn in adjacent fields was, in some cases, “completely unharvestable.”

Shawn McDonald, a Bayer agronomist, told Brownfield Ag News in September 2024 that Preceon is “only about 7 feet tall with 24-to-28-inch ear heights,” and that it “has significant reductions in green snap risk.” The dairy feeding angle came later. But when VandeHaar’s lab fed br2 silage to lactating Holsteins, the cows rewrote the priority list.

40 Cows, Five Hybrids, One Question

Sarmikasoglou et al. published in JDS Communications (2025; 6(6):776–780). Here’s what they set up:

  • 40 Holstein cows (20 primiparous, 20 multiparous), 150 ± 42 DIM, averaging 35 ± 6.4 kg milk/d at enrollment
  • Incomplete Latin square with three 21-day periods, balanced for carryover effects
  • Five silage hybrids: one tall conventional (DKC59-07RIB, Dekalb/Bayer), one BMR (P0956AMX, Pioneer), and three short-stature br2 hybrids (Bayer)
  • All diets formulated to 18% CP, ~24% forage NDF, and ~26% starch on a DM basis
  • Preplanned contrasts: Tall vs. Short (average of three br2 hybrids) and BMR vs. Short
  • Silage planted May 15, 2023, at the MSU Dairy Cattle Teaching and Research Center; chopped September 21–22 at 34% DM; feeding trial ran January–April 2024

One cow was removed for clinical mastitis; her data were excluded. Funding came from Bayer Crop Science, and co-authors D. Hammer and T. Dietz are Bayer employees — standard practice for industry-university trials. The study was peer-reviewed and published in JDS Communications.

What the Cows Actually Said

Here’s the statistically significant comparison — br2 vs. BMR:

Measurebr2 (avg of 3)BMRDifferenceP-value
DMI (kg/d)26.524.5+2.0< 0.01
Milk (kg/d)33.232.0+1.2< 0.01
ECM (kg/d)37.636.5+1.10.01
Fat (%)4.324.45−0.13< 0.01
Fat (kg/d)1.431.40+0.030.14
Protein (kg/d)1.151.10+0.05< 0.01
ECM/DMI1.431.51−0.08< 0.01

Against tall conventional, br2 bumped milk yield (33.2 vs. 32.5 kg/d, P = 0.02) but the ECM gap — 37.6 vs. 37.0 — wasn’t significant (P = 0.11). Fat yield was nearly identical (P = 0.39). Don’t project revenue off that comparison.

br2 beat BMR on production at the cost of lower feed efficiency and a lower fat test. If your market pays hard on fat percentage, that 0.13-point drop versus BMR isn’t a footnote — it’s a spreadsheet conversation.

A note on scope: The trial tested one Pioneer BMR hybrid (P0956AMX). BMR performance varies across genetics and growing conditions — this result speaks to one hybrid in one Michigan field in one year, not BMR technology broadly.

Why Did Mid-Range NDFD Win at the Feedbunk?

Line up the 30-hour in vitro NDF digestibility and BMR wins on paper: Tall 53%, short hybrids 57–60%, BMR 63%. If you’ve spent a decade picking hybrids off that NDFD column, the choice looks obvious.

The cows disagreed.

Total-tract digestibility told a different story:

NutrientBMRShort (avg of 3)P-value
Organic matter52.2%~59.9%< 0.01
Starch98.1%~99.3%< 0.01
Crude protein67.2%~71.1%< 0.01
NDF45.4%~45.2%0.88

BMR’s fiber was more digestible in the test tube. But in the cow — where OM, starch, and protein digestibility all contribute to energy supply — br2 captured more total nutrients. And the cows ate 2.0 kg/d more of it than BMR.

More intake multiplied by better total-tract digestibility equals more ECM shipped. That’s a story about NDFD’s limits as a sole selection metric, not NDFD’s irrelevance. The in vitro number accurately measured one thing. The cow measured everything.

The Caveats MSU Disclosed

The MSU team was candid. Diets ran higher NDF (~29% DM) and lower starch (~26% DM) than what’s typically optimal for mid-lactation cows. They noted the 2023 Michigan drought could have affected BMR silage quality, and mycotoxin levels weren’t tested.

They also acknowledged that mid-lactation cows may respond differently to BMR than early-lactation cows, where fill limitation is the main intake constraint. Honest limits from the researchers themselves.

BMR Is a Commitment. br2 Is Optionality.

Here’s something the NDFD column on a seed brochure can’t tell you: BMR is a commitment. Once it’s in the ground, you’re chopping it. Period. BMR’s lower DM yield and poorer standability make it a poor candidate for leaving in the field past optimal chop timing, and its grain yield doesn’t justify combining.

Every BMR acre is a silage-only acre. br2 is optionality.

In the MSU trial, br2’s DM yields ran comparable to — or better than — tall conventional. One short-stature hybrid hit 21 t/ha, compared with 19 for tall and just 17 for BMR. That yield drag on BMR is well-documented: the MSU paper cites Sattler et al. (2010) and Wallau et al. (2022), noting that “bm3 corn typically has lower DM yields and poorer standability compared with conventional corn.”

Think about what that means in practice. You plant 200 acres of br2 for silage, but milk prices soften mid-summer while corn basis strengthens. You redirect acres to grain without taking a yield hit. Try that with BMR, and you’re looking at lower grain yields from a hybrid that wasn’t bred for it — if it’s still standing. That’s the kind of per-acre economics that separates surviving operations from the ones that don’t make it.

CharacteristicBMRbr2Advantage
DM yield vs. tallLower (−2 t/ha in MSU trial)Similar or betterbr2
StandabilityPoorer (lodging risk)Better (low green snap)br2
Harvest flexibilitySilage only (poor grain yield)Can pivot to grainbr2
NDFD (in vitro)Highest (63%)Mid-range (57–60%)BMR
Total-tract OM digestibility52.2%59.9%br2
Total-tract starch digestibility98.1%99.3%br2
ECM (mid-lactation cows)36.5 kg/d37.6 kg/dbr2
Feed efficiency (ECM/DMI)1.511.43BMR
Market optionalityNone (committed to silage)High (silage or grain)br2

In a volatile corn market, the question isn’t just “which hybrid makes the most milk?” It’s “which hybrid gives me the most options if the market moves?”

Are You Shipping Fat or Shipping Energy?

br2 silage dropped fat percentage versus both tall and BMR — 4.32% vs. 4.43% tall and 4.45% BMR (P < 0.01 for both). Fat yield in kg/d wasn’t significantly different from tall (P = 0.39) or from BMR (P = 0.14).

The percentage drop matters in markets that pay on component test. Before you react, look at how ECM is actually calculated.

The widely used Tyrrell and Reid formula adjusts milk to 3.5% fat and 3.2% protein:

ECM (lb)=(0.327×milk lb)+(12.95×fat lb)+(7.65×protein lb)

BMR cow producing 71 lb of milk at 4.45% fat (3.1 lb fat) and 3.46% protein (2.4 lb protein) ships roughly 82 lb ECM.

br2 cow producing 73 lb of milk at 4.32% fat (3.2 lb fat) and 3.47% protein (2.5 lb protein) ships roughly 84 lb ECM.

Two more pounds per day despite the lower fat test — because the volume gain and protein bump more than offset the fat-percentage drop. The fat coefficient (12.95) is heavy, but it multiplies pounds of fat, not percentage.

(The MSU paper used NASEM 2021’s NEL-based ECM equation, which weights fat, protein, and lactose somewhat differently. The illustration above uses the simpler Tyrrell and Reid formula common in extension materials. Both point in the same direction.)

Where the Component Markets Are Heading

CoBank’s Corey Geiger laid out the butterfat oversupply case in a September 24, 2025, Knowledge Exchange report titled “Soaring demand for dairy foods fueled a US butterfat boom, but cheesemakers need milk protein levels to catch up.”

“For 10 years, the market couldn’t supply enough of it, and now there’s an oversupply — it’s almost too much of a good thing,” Geiger wrote. Cheesemakers, he noted, “strive for a protein-to-fat ratio near 0.80.”

By January 2026, he was telling Brownfield that 2026 could be tough for dairy producers, with butterfat production running 5–6% above year-ago and spot butter already down nearly $0.70 from its August high. If you’re watching where component markets are heading, br2’s lower fat test may actually align with the shift.

But if your FMMO class puts steep weight on fat test, run the math both ways with your own component differential before committing acres.

Does Italy Confirm the Pattern?

A separate trial in the Journal of Dairy Science (Catellani et al., published online February 25, 2026; Università Cattolica del Sacro Cuore with UW-Madison’s Ferraretto) pointed in the same direction from a different angle.

Their brachytic hybrid was fed to 24 Holsteins (SSC group at 82 ± 31 DIM, TSC group at 85 ± 34 DIM), which produced 1.8 kg more milk per day (44.7 vs. 42.9 kg/d) with higher energy density but on lower DMI (25.0 vs. 26.8 kg/d). More milk from less feed. The opposite intake mechanism from MSU.

Two trials, same production direction, two different pathways. Catellani’s trial only compared brachytic to tall — no BMR head-to-head. Treat them as converging evidence, not interchangeable results.

The MSU paper referenced an earlier, unpublished version of Catellani’s work (cited as a personal communication) that “found no effects on DMI, ECM, or BW.” The published version told a different story — a reminder of why peer-reviewed data matters more than conference-corridor results.

The Revenue Math — and What It Costs to Get There

Our August 2025 coverage cited a +5 lb ECM figure based on preliminary, pre-publication data. The peer-reviewed numbers came back lower. Here’s what the published data actually support, using the statistically significant br2-vs-BMR comparison:

Herd SizeDaily ECM Gain (~2.5 lb)Annual Added Revenue (@ $20/cwt)
200 cows500 lb/d~$36,500
500 cows1,250 lb/d~$91,250
1,000 cows2,500 lb/d~$182,500

Assumptions disclosed: +2.5 lb ECM/cow/day (1.1 kg/d, P = 0.01, from Sarmikasoglou et al.), full-year feeding, $20/cwt blended pay price. Your real-world response depends on hybrid, growing conditions, lactation stage, and ration design.

The Seed-Cost Compounding Effect

Seed premiums for br2 run roughly 15–25% higher per bag, and the per-acre gap widens because Preceon growers plant at significantly higher populations. Bayer’s February 2026 press release reported Ground Breakers planted Preceon at an average of approximately 41,600 plants per acre, compared to roughly 34,500 for traditional corn.

MSU Extension’s Jonathan LaPorte published “Seed Selection: Beyond Yield and Disease Resistance (Corn Edition)” on July 10, 2025, with a cost-comparison tool showing how bag-price differences narrow or widen dramatically depending on seeding rate. When both bag price and seeding rate climb simultaneously — as they do with Preceon — the per-acre premium compounds.

VariableConventionalbr2 (Preceon)Premium
Seeding rate (plants/acre)34,50041,600+20%
Seed cost per bag~$280~$335+20%
Cost per acre$110–120$160–175~$50
Total premium (200 acres)$10,000
Annual revenue gain (200 cows)$36,500
Annual revenue gain (500 cows)$91,250
ROI multiple (200 cows)3.5:1
ROI multiple (500 cows)9.1:1

At a conventional seed cost of roughly $110–120/acre (a typical 80,000-kernel bag at ~$280 and 32,000–34,500 seeds/acre), a 20% seed premium plus a 20% increase in population pushes br2 toward $160–175/acre. That’s roughly $50/acre more.

On 200 silage acres, that’s about $10,000 in extra seed. Set against a 200-cow herd’s projected $36,500 annual ECM advantage, the math pencils to roughly 3.5:1. A 500-cow herd on the same acreage? Closer to 9:1.

Then there’s the equipment question. All silage respondents in Bayer’s 2025 post-season survey reported “achieving target moisture at harvest” with “comparable packing and processing characteristics relative to traditional corn,” according to Bayer’s February 2026 press release. Header modifications for short corn may carry a meaningful cost — our August 2025 coverage cited estimates of $15,000–22,000 per machine based on conversations with Midwest equipment dealers, though no independently verified figure has emerged from the 2025 Ground Breakers feedback. Newer machines appear to adapt better, but expect setup changes and a learning curve in year one. Talk to someone who’s actually chopped it at your latitude before you assume your setup works as-is.

What Your Nutritionist Needs to Hear Before Planting

br2’s advantage over BMR in this trial ran through intake — cows ate 2.0 kg/d more on br2. If nobody adjusts the ration to let that extra forage intake substitute for purchased energy — corn, bypass fat, commodity supplements — you’re feeding more total DM without optimizing the economic return.

The cow produces more milk, but your feed costs rise alongside it. That’s the difference between a management strategy and a feed bill problem.

To get this right, you need to move past the “wait and see” approach.

The 2-Minute Nutritionist Drill

Don’t let your nutritionist treat br2 like “shorter tall corn.” If you do, you’re leaving money on the table. Ask these three questions before the seed hits the soil:

  1. The Displacement Question: “If these cows eat 2.0 kg more forage, which purchased energy source are we dropping first to keep the ration cost-neutral?”
  2. The Component Pivot: “Our fat test might dip 0.13 points. Does the volume gain at 3.5% ECM still beat our current BMR margin at today’s component prices?”
  3. The Starch Strategy: “Since br2 has higher total-tract starch digestibility (99.3%), can we pull back on ground corn without losing peak milk?”

By forcing these questions early, you ensure that the extra 2.5 lb of Energy Corrected Milk isn’t “eaten up” by an unadjusted feed bill. You aren’t just looking for a nutritionist who can balance a ration; you’re looking for one who can balance a budget.

That’s not a nutrition question. It’s a feed-cost question.

Where the Data Gets Thin

No trial result transfers perfectly. Be skeptical in these spots:

Early lactation, high-starch rations. The MSU trial tested mid-lactation cows (150 DIM) on higher-NDF, lower-starch diets. Whether br2’s advantage holds in early lactation on aggressive starch levels is an open question.

The paper cited Oba and Allen (2000), which documented BMR’s advantage with fill-limited, early-lactation cows. Separately, Utah State researchers (Holt et al., 2013) fed BMR vs. conventional corn silage from calving through 180 DIM to 28 multiparous Holsteins and found a 2 lb ECM/cow/day advantage for BMR. That’s the feeding window where BMR still has the strongest evidence.

Feed-efficiency-constrained operations. Feed efficiency (ECM/DMI) was significantly lower on br2 than BMR — 1.43 vs. 1.51 (P < 0.01). If you’re purchasing most of your forage, that efficiency gap costs real money per ton DM.

Regions without adapted hybrids. Bayer’s Preceon portfolio is expanding to 16 hybrids for 2026, including five new additions in the 100–118 day relative maturity range, with geographic expansion into the Northeast. It’s still available only through the Ground Breakers program, with a minimum commitment of 40 acres.

“The roadmap is deliberate,” said Lindsey Battle, Preceon Strategy and Launch Lead, in Bayer’s February 2026 press release. “We are scaling in phases — validating performance across more acres, more environments, and more management systems as we move to full commercial launch.” Bayer’s Ader told Hoosier Ag Today in December 2025 that the biotech version of the short-stature trait “should start launching in 2027 and will continue scaling from that area.”

One trial, one year, one drought-stressed Michigan field. The MSU team planted all five hybrids on 2.19-hectare (5.4-acre) plots on Marlette fine sandy loam, used Vita Plus Titanium inoculant, and sent samples to Cumberland Valley Analytical Services.

They wrote: “Further studies in other growing environmental conditions seem warranted.” VandeHaar presented the same data at a Balchem webinar on November 4, 2025. His lab is part of a USDA-funded multi-university effort, with related trials underway at the University of Maryland under Dr. Fabiana Cardoso. But multi-site, multi-year data doesn’t exist yet.

What br2 Means for Your 2026 Silage Acres

  • Frame your hybrid decision around br2 vs. BMR, not br2 vs. tall. That’s where the ECM data are statistically significant (P = 0.01). If you’re switching acres, switch BMR acres first — especially on fields where standability has cost you.
  • Run the fat-test math with your own component differential. Fat percentage dropped 0.13 points on br2 vs. BMR, but fat pounds per day were not significantly different (P = 0.14). Use the ECM formula with your herd’s actual numbers. CoBank’s Geiger flagged in September 2025 that butterfat oversupply is already compressing prices. If that trend continues, the fat-test trade-off shrinks.
  • Budget ~$50/acre extra for seed. Ground Breakers in 2025 averaged 41,600 plants/acre vs. 34,500 for traditional corn. The premium comes from both a higher bag price and higher planting rates.
  • Think about the insurance policy. In a volatile corn market, br2 gives you a harvest pivot that BMR never will. Every br2 acre can go to grain if the milk-to-corn ratio shifts.
  • If your fat premium is steep and stable, br2’s 0.13-point fat-test drop versus BMR could narrow the margin. But fat pounds per day were statistically identical (P = 0.14). Model both sides.
  • If seed cost is the concern, roughly $10,000 extra (about $50/acre) on 200 acres against a projected $36,500 ECM gain (200 cows) or $91,250 (500 cows) yields a 3.5:1 to 9:1 return — assuming the trial response holds at full or even half strength.
  • If you’re feeding early-lactation cows on high-starch rations, BMR still has the stronger evidence base — both from Oba and Allen (2000) and Holt et al. (2013). Target br2 to mid-lactation pens or fields where standability and dual-purpose optionality matter most.
  • 30-day action: Sit down with your nutritionist and agree on the ration adjustment plan before seed goes in the ground. The MSU data show br2 cows eat 2.0 kg/d more than BMR cows. How does that extra intake flow through your ration economics — and what purchased feed does it replace?
  • 90-day action: After chopping, run a separate silage analysis on your br2 versus your conventional or BMR storage. Get NDFD, starch, and OM digestibility from Cumberland Valley or equivalent — so you have your own total-tract comparison by fall.
  • 365-day action: Compare ECM per acre across hybrids at year-end. Not ECM per cow — ECM per acre planted. That’s the number that captures yield, quality, and optionality together.
  • If you can get into the Ground Breakers program, trial br2 on 10–20% of your silage acres this spring. Bayer is expanding to 16 hybrids across the 100–118 day RM range for 2026. Target your most wind-exposed fields or BMR ground that hasn’t clearly outearned conventional on ECM per acre. Map those acres for separate harvest and dedicated storage to keep your feeding comparison clean.

Key Takeaways

  • If you’re feeding mid‑lactation cows off BMR today, MSU’s first br2 trial says short‑stature corn can ship about 2.5 lb more ECM per cow per day, even when BMR wins on NDFD in the lab. ​
  • If your milk cheque still rewards volume plus protein more than fat test, a ~0.13‑point fat‑% drop on br2 looks a lot smaller next to higher ECM and CoBank’s warning that butterfat is already drifting into oversupply.
  • If you can afford roughly $50/acre extra in seed, the projected ECM gain pencils out to about $36,500/year on 200 cows and $90,000+ on 500, which more than covers the seed premium as long as your ration allows extra forage intake to replace purchased energy.
  • If standability and flexibility matter on your acres, br2 gives you similar or better DM yield than tall corn, less lodging risk, and the option to shell for grain — something BMR’s lower yield and standability don’t offer. ​
  • If you’re thinking about going all‑in, remember the fine print: lower feed efficiency than BMR, better data for BMR in early‑lactation high‑starch diets, and only one Michigan plus one Italian trial so far — this is a “trial 10–20% of your acres and watch the ECM per acre” move, not a flip‑the‑whole‑farm overnight move.

The Bottom Line

DeVries tested Preceon for standability and found a feeding advantage. VandeHaar’s lab gave it a P-value. The question now isn’t whether br2 can outproduce BMR — one peer-reviewed trial says it did. The question is whether it will do the same on your ground, in your growing year, fed to your cows.

Pull your field-by-field yield records from 2025. Convert to tons DM per acre. Multiply by your nutritionist’s milk-per-ton estimate for each silage. Which hybrid actually won on ECM per acre — and does it match the one you’re about to put in the planter?

Complete references and supporting documentation are available upon request by contacting the editorial team at editor@thebullvine.com.

Learn More

The Sunday Read Dairy Professionals Don’t Skip.

Every week, thousands of producers, breeders, and industry insiders open Bullvine Weekly for genetics insights, market shifts, and profit strategies they won’t find anywhere else. One email. Five minutes. Smarter decisions all week.
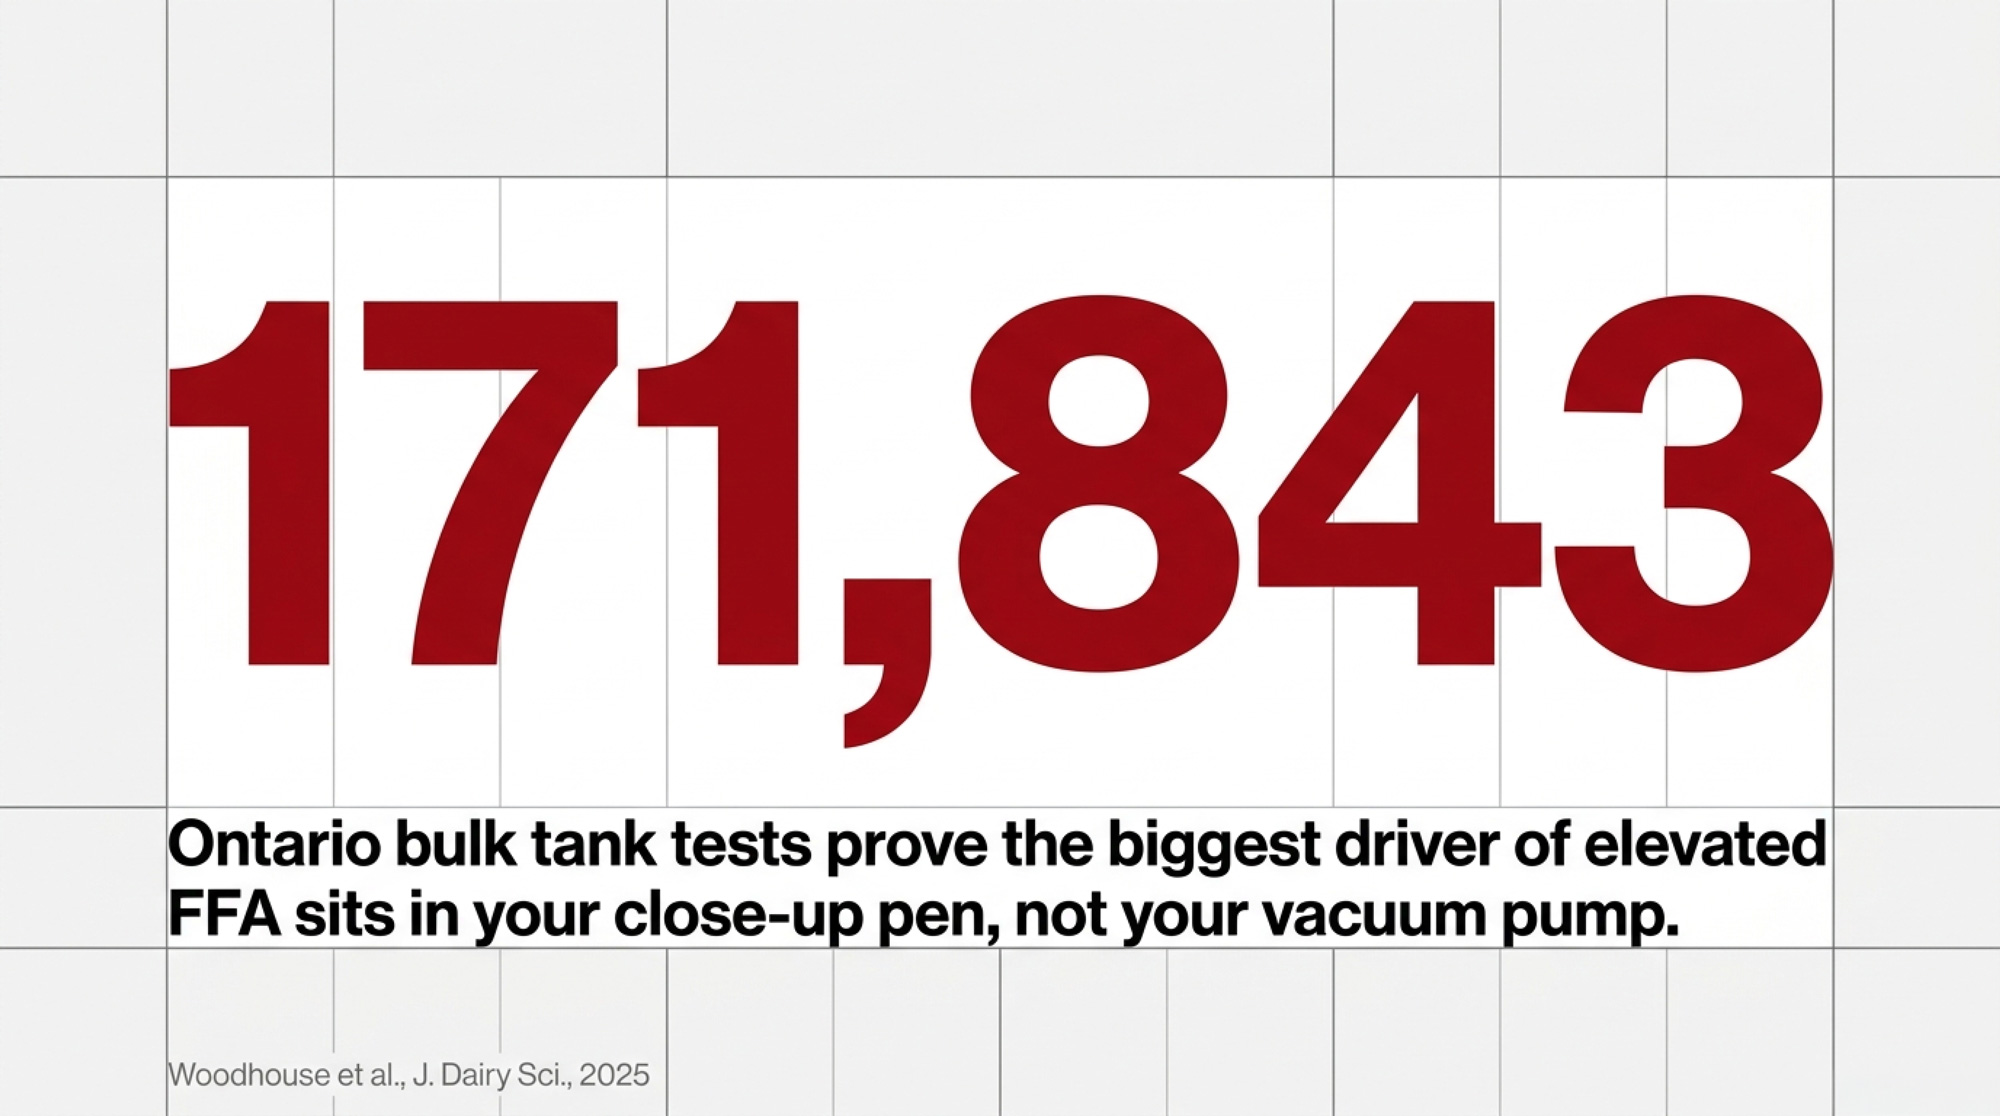
NewsSubscribe
First
Last
Consent

Calf Weaning by Starter Intake: Jim Quigley’s 15 kg NFC Threshold

Drop the afternoon milk, and you’ve just cut a calf’s ME by 50%. Jim Quigley says that’s an energy crash, not a weaning strategy.

Executive Summary: Most dairies still wean calves by age, but Jim Quigley’s work shows the rumen isn’t truly ready until a calf has consumed about 15 kg of NFC from the starter — roughly 33 pounds of fermentable carbohydrate. Many 8‑week weaning programs, especially on higher milk intakes, never reach that mark, which helps explain the post‑weaning growth checks and treatment spikes producers see. Research from Quigley, NASEM 2021, and Jim Drackley’s 2025 weaning review all point in the same direction: later, intake‑based weaning with a gradual step‑down beats abrupt, calendar‑driven protocols on biological and performance outcomes. Wagner Farms in Wisconsin built their calf program around intake targets and a 28‑day weaning step‑down and recorded zero calf losses in the year. Free tools like CalfSim and NASCalf let you model when your own calves will reach the 15 kg NFC threshold and how different feeding plans affect intake, growth, and cost. The extra 7–14 days on milk might add $30–40 per calf, but the article walks through how smoother weaning, better growth, and higher first‑lactation yield can repay that investment — and gives a 30/90/365‑day plan to test it in your own calf barn.

intake-based weaning

Only 21.5% of U.S. dairy farms wean calves based on starter intake rather than a fixed age. That’s the most recent national figure — USDA NAHMS Dairy 2014, now 12 years old and still the best we have. (The next NAHMS dairy study is anticipated in 2026, and anecdotal evidence suggests intake-based weaning has gained traction, but no national update exists yet.) What it means: roughly four out of five operations are pulling milk on a calendar. Jim Quigley thinks the calendar is broken.

Walk into a calf barn on weaning day, and you know the result. Bawling calves, scattered starter, a handful of 8-week-olds that clearly aren’t ready. Starter intake drops. A few get pulled for treatment. Growth flatlines, then slowly recovers.

Weaning ProtocolTypical Cumulative Starter Intake at Day 56Cumulative NFC ConsumedQuigley’s Readiness Threshold
Industry Standard (8 weeks, 6L milk/day)25–28 kg11.5–13 kg NFCSHORT by 1.5–3.5 kg
Accelerated Milk (8 weeks, 10L milk/day)18–22 kg8.3–10.1 kg NFCSHORT by 4.9–6.7 kg
Extended Intake-Based (9–10 weeks, 10L milk/day)31–34 kg14.3–15.7 kg NFC✓ Threshold met
Quigley’s Biological Threshold31 kg (55% NFC starter)15 kg NFCRumen functionally ready

The calf nutrition researcher behind Calf Notes (calfnotes.com) has spent years arguing that weaning by intake is the only approach that lines up with what’s actually happening inside the rumen. His benchmark is specific: roughly 15 kg of cumulative non-fiber carbohydrates from the starter. That’s about 33 pounds. And on a lot of North American dairies running accelerated milk programs, his modeling suggests calves don’t cross that line until week 9 or 10.

If you’re pulling milk at week 8, you’re asking the rumen to do a job it can’t yet handle. One Wisconsin operation already proved what happens when you stop asking.

Zero Calves Lost: What Wagner Farms Proved

Wagner Farms in Oconto Falls, Wisconsin, doesn’t wean by the calendar. Profiled in Hoard’s Dairyman in 2020, the operation feeds whole milk with a milk balancer, uses paired calf housing, and weans calves based on starter intake. Laura Raatz, the farm’s calf manager, shared the approach at the Purina Leading Dairy Producers Conference.

Protocol ElementIndustry Standard (Most U.S. Dairies)Wagner Farms (Intake-Based)
Weaning TriggerFixed age (8 weeks)Starter intake threshold: 8 lbs/day (summer), 10 lbs/day (winter)
Step-Down Duration5–7 days28 days
ME Reduction per Step~50% (drop afternoon milk)<25% per step
Cumulative NFC at Weaning8–13 kg (typically SHORT)≥15 kg (threshold met)
Post-Weaning Treatment Rate10–15% (typical)Not disclosed; zero calves lost (profile year)
Calf Losses (Profile Year)5–8% (U.S. average, USDA NAHMS)0%

Their step-down stretches for a full 28 days — dramatically longer than the 5–7-day transitions common on most North American dairies. The targets are concrete: at least 8 pounds of starter per head per day in summer and 10 pounds in winter before calves finish weaning. “The more consistent the solids stay, the happier your calves will be,” Raatz told Hoard’s.

Their result for the profile year: zero calves lost.

That’s not just a health number. It’s a management statement. Wagner Farms wrapped nutrition, housing, social environment, and weaning timing into one coherent system — one where protocol-level changes empty hospital pensrather than fill them. Intake-based weaning didn’t work in isolation. It worked because the entire front end of the program was designed to get calves to eat grain early and consistently.

So what does biological readiness actually look like in numbers? That’s where Quigley’s research and Drackley’s review converge on a specific answer.

Why Higher Milk Programs Broke the 8-Week Rule

Here’s the paradox nobody planned for. Over the past decade, the industry moved hard toward feeding more milk — 8, 10, even 12 liters per day — because the data linking higher pre-weaning growth to first-lactation performance are strong. Soberon and Van Amburgh’s 2012 Journal of Dairy Science work at Cornell showed that for every 1 kg of preweaning ADG, heifers produced 850 kg more milk during first lactation in the university herd (1,244 animals) and 1,113 kg more in a commercial herd. Preweaning ADG accounted for 22% of the variation in first-lactation milk yield.

That was the right move. But higher milk intake suppresses early starter consumption.

The NASEM 2021 dairy nutrient requirements model confirms it: the more liquid energy a calf gets, the slower she ramps onto grain. Quigley sees the same thing in the field. When he looks at herds feeding 8–10 L/day and still weaning at 8 weeks, his verdict is blunt: more milk means less grain, so the rumen simply isn’t ready when the calendar says it’s time to quit milk.

The “glide path” to weaning has to be longer, or you drive calves into negative energy balance and ruminal acidosis during the transition — what he calls the “dark side” of feeding more milk. So we upgraded the front half of the feeding program without adjusting the back half.

James Drackley’s invited review in Applied Animal Science (Volume 41, Issue 3, June 2025) — “The Weaning Transition in Dairy Calves—Why So Traumatic?” — and Quigley in his ongoing Calf Notes work both point to this mismatch as the root of most post-weaning problems on well-managed dairies.

The Post-Weaning Slump You’re Probably Not Costing Out

NASEM 2021’s analysis of 64 studies found that solid-feed intake for weaned 8-week-old calves ranged from 2.16% to 4.45% of body weight — a wide range at the same age. Some of those calves are functioning as small ruminants. Others are essentially pre-ruminants with an underdeveloped fermentation vat.

When calves in that second group lose their milk, the energy math falls apart. Drackley’s review documents increased disease risk and depressed growth when weaning is too early or too abrupt, noting that “ruminal acidosis is likely more common than has been recognized and causes decreased intake, decreased growth, and diarrhea, especially in calves soon after weaning.”

Eckert et al. (2015, Journal of Dairy Science) showed this clearly: Holstein calves on an elevated plane of nutrition weaned at 8 weeks achieved 50% higher daily gains during the weaning transition than those weaned at 6 weeks. By three months of age, the later-weaned calves were 9 kg heavier and held that advantage through 150 days.

The 50% Energy Cut Nobody Talks About

Here’s a detail that doesn’t get enough attention. A lot of farms “step down” by simply cutting the afternoon milk feeding the week before weaning. Do the math on that. You just slashed ME intake by roughly 50% overnight.

Quigley’s take is direct — a reduction greater than about 25% of ME intake is probably excessive. He’s upfront that hard numbers on that threshold don’t exist in the published literature, but the biology lines up. At a 50% ME cut, the calf may be barely above maintenance. You can’t expect an animal to keep growing under that kind of energy shock.

Think about it from the calf’s perspective: in nature, the cow’s milk production tapers gradually along her lactation curve. Calves don’t just quit drinking on a Tuesday afternoon. Wagner Farms’ 28-day step-down mimics that natural taper. Most 5–7 day transitions don’t even come close.

The pattern holds across a much larger evidence base. Welk, Neave, and Jensen at Aarhus University reviewed 44 studies in a 2024 Journal of Dairy Science systematic review (Volume 107, Issue 8, pages 5237–5258) and found “consensus for positive effects (or at least no negative effects) on overall growth of calves weaned at later ages, over longer durations, based on starter intake.” They also found that “weaning based on starter intake had superior growth and feed intakes compared with calves weaned at a fixed earlier age.”

Wagner Farms’ 28-day step-down isn’t radical. It’s just what the science — and basic biology — supports when you actually follow it.

How Much Starter Before Dairy Calf Weaning? Quigley Put a Number on It

Quigley’s team went looking for the threshold in digestibility data. His 2019 Journal of Dairy Science symposium review compiled results from 83 calves and 24 pens across three published studies and back-calculated how much metabolizable energy calves actually extracted from the starter at different ages. Early in life, the real energy yield was well below what the NRC tables predicted. The rumen’s microbial community and papillae simply weren’t mature enough.

The tipping point: when calves consumed at least 15 kg of NFC, “ME calculated from digestibility measurements was similar to the ME calculated using NRC equations”—the rumen was finally “online.” Below it, your ration software is quietly overstating how much energy that grain is actually delivering.

When Quigley first shared that 15 kg cumulative NFC number, the research community’s reaction was basically, “Yes, biologically that makes sense.” The pushback wasn’t about the biology. It was the practical question every producer would ask next: how the heck do we know when a calf actually hits 15 kg?

For a typical calf starter at 55% NFC on a dry matter basis, that 15 kg of NFC works out to roughly 31 kg of total starter consumed as-fed. With a lower-NFC starter (50%), you’re looking at closer to 34 kg. The exact target depends on your starter’s composition.

Drackley’s daily intake gates pair with Quigley’s cumulative threshold. His Applied Animal Science review concluded that “calves should not be weaned until they are consuming an adequate amount of starter to allow the discontinuation of milk intake and should be weaned gradually rather than abruptly.” The Hoard’s Dairyman summary of his work raised the bar above the old rule of thumb: ≥1.5 kg/day starter DM for large-breed calves and ≥1.0 kg/day for small breeds, each for 3 consecutive days.

The old “1 kg/day for 3 days” isn’t enough for Holsteins. At that intake, NASEM modeling shows calves barely cover maintenance once milk disappears. Stack both gates — cumulative NFC near 15 kg and daily intake at the breed-appropriate threshold — and you’ve got a weaning signal grounded in physiology, not the calendar.

What Do CalfSim and NASCalf Tell You About Your Weaning Date?

You don’t have to run this math on a whiteboard. Joao Costa’s group at the University of Vermont built CalfSim — a free, web-based decision-support tool that runs your feeding program using NASEM 2021 equations. Plug in breed, birth weight, milk program, starter composition, and environment. It gives you predicted daily and cumulative starter intake, NFC accumulation, ADG, bodyweight, and rearing costs.

Costa et al. (2025, JDS Communications) tested CalfSim against 27 studies covering 1,585 calves and 76 treatment groups. Bodyweight predictions hit an R² of 0.91 with an RMSE of 8.56 kg — meaning predictions can be off by about 19 lbs per calf.

Quigley’s own consulting work pushed the next step. Under Calf Notes Consulting, he launched NASCalf (tools.calfnotes.com), a more detailed intake and growth modeling tool built from the same biological logic. NASCalf goes deeper than CalfSim with a feed library, knowledge base, and more granular prediction of when calves accumulate enough NFC to support weaning.

A word of honest caution on both tools — and Quigley himself is the first to say it: don’t overpromise and underdeliver. CalfSim and NASCalf are models. They predict average performance. Your individual calves will scatter around that average, and farm-specific curveballs — a scours outbreak, a cold snap, poor-ventilation stress, a high-pathogen housing environment — can throw off even the best prediction. Think of the output as directional, not diagnostic. It tells you roughly when your program should get calves to the NFC threshold. It doesn’t tell you that calf #47 in hutch row B is ready today.

That said, directional beats are blind. Run your 6 L/day and 10 L/day programs side by side in either tool. You’ll see the high-milk calves reach the 15 kg cumulative NFC and 1.5 kg/day starter gates days or even weeks later. That gap is invisible until you model it.

What It Actually Costs — and What You Get Back

Let’s not pretend this is free. If calves need an extra 7–14 days on liquid feed, that’s real money. With U.S. Class III at just $14.59/cwt in January 2026 (USDA AMS, February 4, 2026) — and USDA’s own cost-of-production estimate showing expenses at $19.14/cwt against an $18.95 all-milk price — every input dollar has to earn its way back.

Cost or Return CategoryPer-Calf Impact150-Calf Herd (Annual)
Added Liquid Feed Cost (10 extra days @ $2/day)+$20+$3,000
Added Bedding & Labor+$10–20+$1,500–3,000
Total Added Rearing Cost per Calf+$30–40+$4,500–6,000
Reduced Treatment Costs (6% fewer treatments @ $25/treatment)+$1.50 (savings)+$225 (savings)
Faster Growth (15 kg heavier at 6 months)Value: ~$45 (3% lower age at first calving)+$6,750
First-Lactation Milk Gain (+850 kg @ $0.35/kg)+$297.50+$44,625
Net ROI per Calf (24-month payback)+$257.50–267.50+$38,625–40,125
Break-Even TimelineFirst lactation (month 24–26)First lactation cohort

Here’s the rough math on a 300-cow dairy raising 150 replacements per year. Extending weaning by 10 days, at roughly $2/day in added liquid feed costs, adds an extra $20 per head on the milk side alone. Factor in slower hutch turnover, additional bedding, and labor for intake monitoring, and the total added cost per head likely runs $3,0–40, depending on your system. On a tight-facility dairy, that 10-day extension could also require a temporary overflow solution or staggered starts for hutch turnover. Across 150 calves, that’s roughly $4,500–6,000 in added rearing expense.

A University of Wisconsin-Extension survey of 26 farms (published 2018) found autofeeder calves ran $6.35/day total vs. $5.84/day for individually housed, with liquid feed higher ($2.08 vs $1.60/day) but labor lower ($1.01 vs $1.39/day). Those costs have risen since, but the relative structure holds.

Against that, Soberon and Van Amburgh’s 2012 data showed 850–1,113 kg more first-lactation milk per 1 kg/day of preweaning ADG. Van Amburgh’s 2013 Journal of Animal Science meta-regression estimated roughly 1,551 kg of first-lactation milk per 1 kg/day of preweaning ADG. Even a conservative reading — say half the growth advantage holds — puts the first-lactation payback well ahead of the calf-barn cost.

But those returns arrive 24+ months later. That’s the tension: the expense hits now, the payoff compounds later. And the payoff only comes home if you’re keeping the heifer. If you’re raising beef-on-dairy calves headed for sale or feedlot, the NFC threshold still matters for health — but there’s no first-lactation payback. Run those numbers separately. 

Three Phases to Testing It in Your Barn

Nobody’s asking you to overhaul your calf program overnight. Quigley summed it up neatly: farms need simplicity and consistency, or the best protocol on paper will die in the barn. Variation is hard to manage. Intake-based weaning only works if your team can repeat it.

Phase 1 — 30-Day Baseline. Pick 15–20 calves approaching weaning. Measure starter intake with pre-weighed buckets and weigh-backs, even 2–3 times per week. Weigh calves before and after weaning. Run your current program through CalfSim or NASCalf. At the end of 30 days, answer one question: are your calves hitting the intake thresholds by the age you’re pulling milk?

Phase 2 — 90-Day Intake Gate Trial. Set a new rule: calves wean within an 8–10 week window, but only when they meet the daily starter gate. Stretch the step-down to 10–14 days minimum—and keep the ME reduction at any single step under 25%. Use CalfSim/NASCalf to predict when those gates should be reached, then compare that to what you see at the bunk. Track ADG and health events against your baseline.

Phase 3 — 365-Day Comparison. Run two cohorts for a full year — one on your old calendar, one on intake-based weaning informed by CalfSim or NASCalf. Track growth to 6 months, age at breeding, treatment costs, and first-lactation milk as records come in. This is where you build your own ROI case and decide how much complexity your crew can realistically manage every day.

Performance MetricAge-Based Weaning (8 weeks, calendar-driven)Intake-Based Weaning (9–10 weeks, gradual step-down)
Post-Weaning Treatment Rate (%)12–15%6–8%
ADG Post-Weaning (kg/day, weeks 9–12)0.52–0.680.75–0.88
Body Weight at 6 Months (kg)178–185193–201
Age at First Breeding (days)420–435405–415
First-Lactation Milk Yield (kg, 305d)10,200–10,80011,050–11,650 (estimated +850 kg)
Calf Losses (%)5–8% (U.S. average)2–4% (improved health)
Added Rearing Cost per CalfBaseline+$30–40 (extra milk days)

What This Means for Your Operation

If you’re feeding 4–6 L/day and weaning at 6–7 weeks, You likely need both more milk and a later weaning target. CalfSim or NASCalf can show which change moves the needle more.

If you’re feeding 8–10 L/day and weaning at 8 weeks: Your calves may be 1–2 weeks short of the NFC threshold. Run CalfSim or NASCalf with your actual starter analysis. If cumulative NFC at day 56 falls well below 15 kg, that’s your gap. And if your step-down protocol is “drop the afternoon feeding,” you’re probably cutting ME by 50% in one shot. That’s too much. Spread it out.

If you’re already weaning at 9–10 weeks with a gradual step-down, you may be closer than you think. A 30-day baseline will confirm it—and if your calves show no post-weaning ADG dip, don’t fix what’s working.

If you’re running an automated calf feeder that already tracks individual intake, you’ve solved the hardest part. Your feeder data tells you cumulative consumption. Map that to the NFC threshold using your starter’s NFC%, and you have an individualized weaning signal without any additional labor.

If you’re running a smaller herd raising 15–25 calves per year: Individual observation replaces modeling. You already know your calves. The value of CalfSim/NASCalf indicates whether your instincts align with the NFC math.

As a rough benchmark: if your current 8-week calves maintain an ADG above 0.75 kg/day for 2 weeks after weaning and your post-weaning treatment rate stays under 10%, you may not need to change anything. These aren’t published thresholds—they’re practical guideposts. Track your own data and let it tell you.

Quick NFC check for any program: Total starter consumed (kg as-fed) × 0.89 (DM factor) × your starter’s NFC%. For a 52% NFC starter, that’s roughly: total kg starter × 0.46. When that running total hits 15, you’re in the zone.

Key Takeaways

  • 15 kg cumulative NFC (roughly 31–34 kg starter as-fed depending on NFC content) is Quigley’s research-based threshold for rumen readiness at weaning (Quigley et al., 2019, JDS).
  • Daily intake gates: ≥1.5 kg/day for large-breed calves, ≥1.0 kg/day for small breeds, for at least 3 consecutive days before finishing weaning (Drackley, Applied Animal Science, Vol. 41, Issue 3, June 2025).
  • Don’t cut ME by more than 25% at any single step-down. Dropping the afternoon feeding slashes ME intake by roughly 50% — that’s a maintenance-level energy shock, not a weaning transition. Taper gradually, like the cow’s own lactation curve would.
  • Wagner Farms weans by intake with a 28-day step-down. The year Hoard’s profiled them, they lost zero calves. The calendar didn’t earn that result.
  • CalfSim and NASCalf are directional, not diagnostic. They predict average performance — your individual calves will scatter around that average, and farm-level curveballs will shift the timeline. But directional beats blind, and both tools finally answer the question producers have been asking: when should my calves be ready?
  • The extra milk days aren’t free — but the post-weaning slump isn’t free either, and only one of those costs shows up on your feed invoice.

The Bottom Line

Laura Raatz doesn’t check the calendar to decide when milk stops at Wagner Farms. She checks the bucket. And the science — from Quigley’s NFC threshold to Drackley’s Applied Animal Science review to Welk’s 44-study systematic review — says the bucket is right.

Pull your CalfSim or NASCalf report. Does cumulative NFC at your current weaning age hit 15 kg — or are you weaning calves that aren’t ready?

Learn More

The Sunday Read Dairy Professionals Don’t Skip.

Every week, thousands of producers, breeders, and industry insiders open Bullvine Weekly for genetics insights, market shifts, and profit strategies they won’t find anywhere else. One email. Five minutes. Smarter decisions all week.
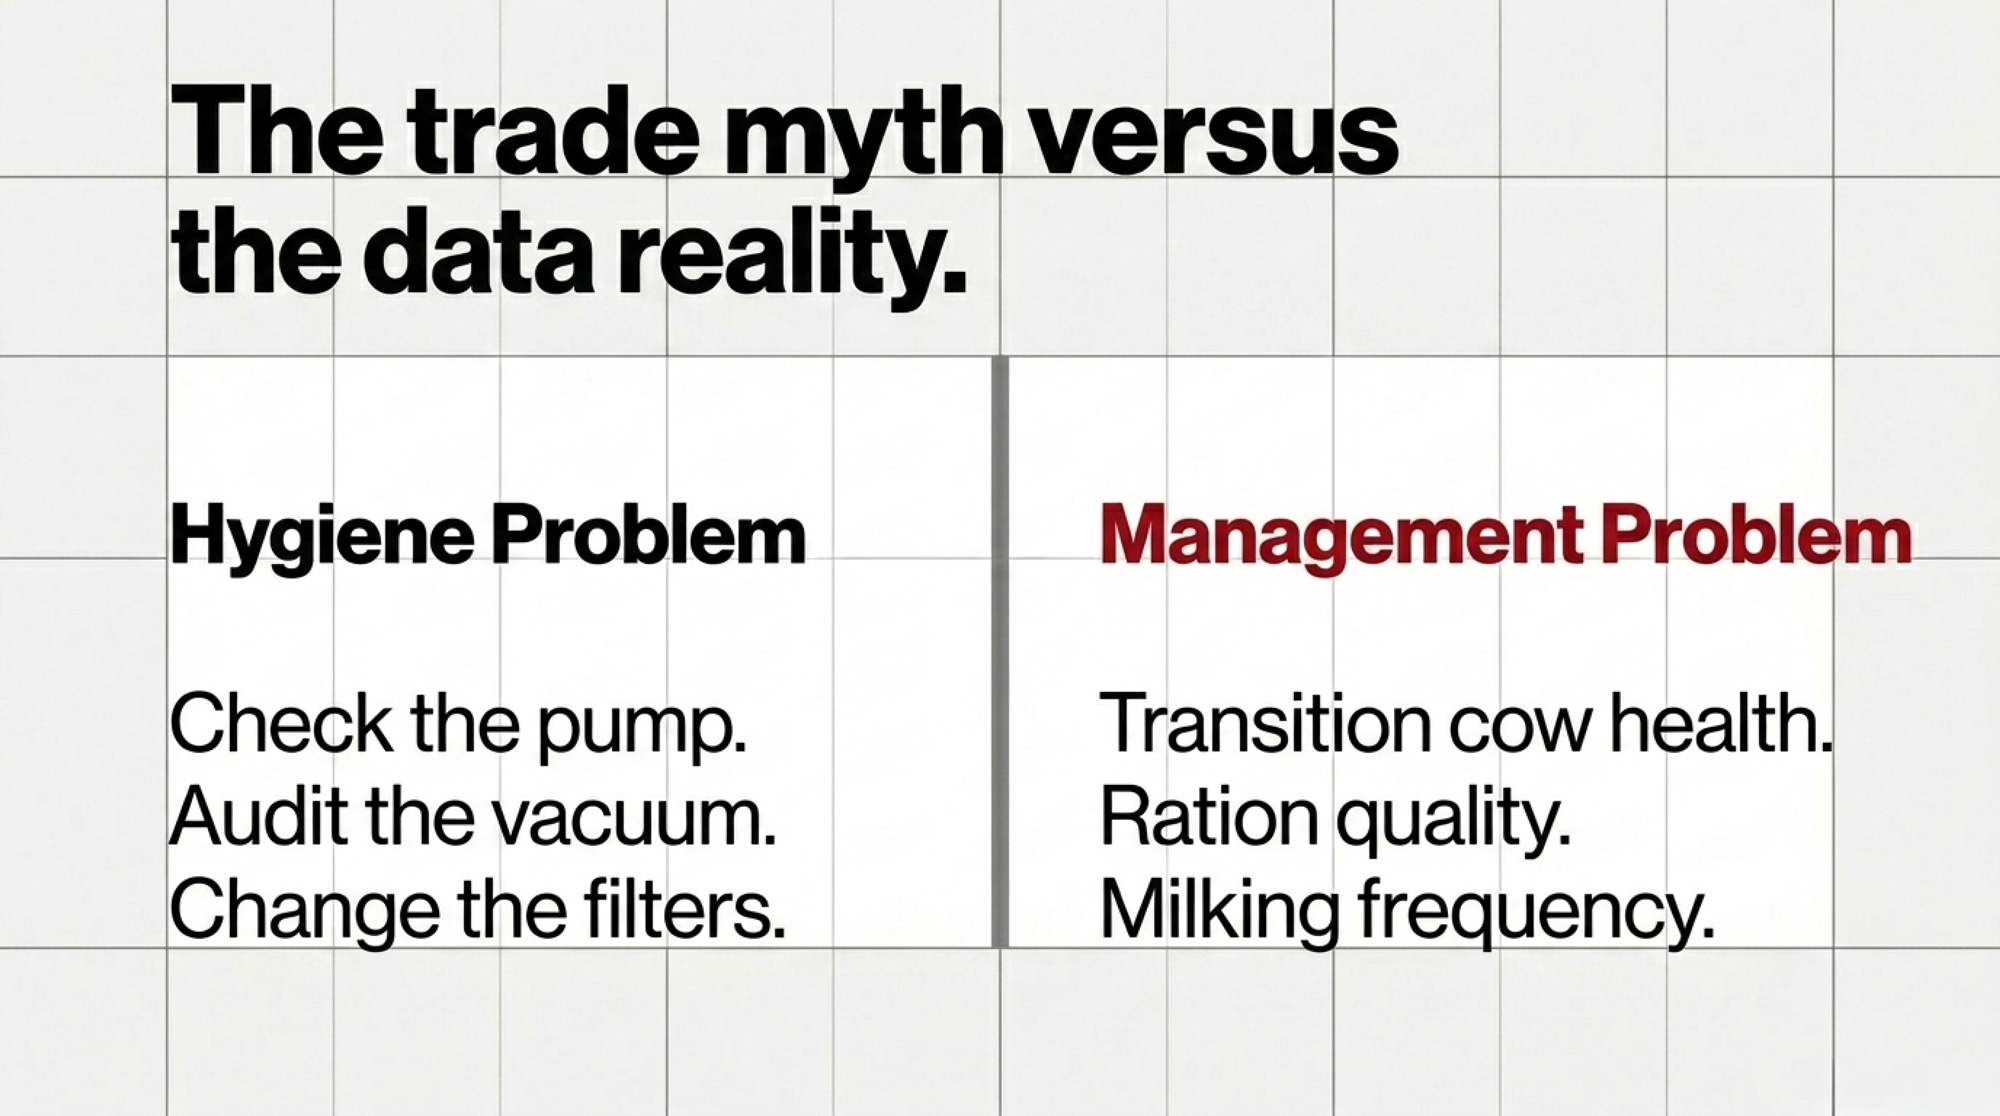
NewsSubscribe
First
Last
Consent

The 1,113 kg Question: Does Dairy Calf Starter Consistency Really Affect Lifetime Production?

One kilogram of preweaning gain. 1,113 kilograms more milk. The real question is what your calf starter is doing with that opportunity.

Here’s a number that stopped me cold when I first came across it: 1,113 kilograms of additional milk in first lactation for every single kilogram of preweaning average daily gain. And no, that’s not a typo. It comes from Cornell University work led by Fernando Soberon and Dr. Mike Van Amburgh, published in the Journal of Dairy Science back in 2012—and you know what? It’s held up remarkably well as more data have come in over the years.

I recently spoke with a Wisconsin producer who’d seen this research presented at a nutrition conference. His reaction was similar to mine: “I’ve been buying dairy calf starter feed the same way for twenty years. Maybe it’s time to ask some different questions.”

For most of my time covering this industry, dairy calf starter occupied that comfortable category of “necessary but unremarkable.” You bought it primarily for price, made sure it met the tag minimums, and moved on to the next item on your list. That thinking is starting to shift on a meaningful number of operations, and the reasons why are worth exploring.

A meta-analysis published this year in the Journal of Dairy Science combined 18 studies and confirmed what the Cornell team found over a decade ago—calves that grow faster before weaning consistently produce more milk in their first lactation. The exact response varies somewhat by study and herd, but the positive relationship appears again and again.

But here’s the question that’s really driving the current conversation: If early nutrition matters this much, does the consistency of that nutrition matter too?

Why Your Rumen Bugs Care About Consistency

Let me walk through the science here, because it’s genuinely fascinating once you dig into it—and it has real practical implications for how we think about calf feeding programs.

We’ve known for decades that the calf’s rumen microbiome undergoes rapid colonization during those first weeks of life. What’s newer, and what’s really caught my attention, is our understanding of just how diet-dependent that colonization process is.

The microbial foundation you establish in those hutches appears to influence how well these animals perform in the years ahead.

Think about what that means for your operation. The bugs establishing themselves in your calves’ rumens right now are being shaped by what those calves eat—and that foundation may well stick around through first calving and beyond.

It’s a bit like laying concrete: what you do in those early days sets up the structure for everything that follows.

Dr. Mike Van Amburgh over at Cornell—he’s a Professor of Animal Science there and leads the development of the Cornell Net Carbohydrate and Protein System (which, as many of you probably know, is used to formulate diets for roughly 70 percent of dairy cows in North America)—has been studying this connection for over two decades. Cornell’s calf nutrition program emphasizes a straightforward goal: double birth weight by weaning through adequate and consistent milk replacer and starter intake.

Why is this significant? The long-term numbers tell the story.

Industry technical summaries based on the Cornell data show just how much this matters over a cow’s productive life. In one commercial herd tracked by researchers, cows that made it to three lactations produced about 1,287 kilograms more milk across those lactations for every extra kilogram of preweaning gain. The Cornell research herd showed even larger responses.

LactationIf Benefit Stopped After L1Commercial Herd ActualResearch Herd (High Response)
L11,1131,1131,113
L21,1131,2001,350
L31,1131,2871,500

The early nutrition effect doesn’t just show up once and disappear—it builds on itself over time.

It’s worth noting that genetics also play a role here. Operations heavily focused on genomic selection for feed efficiency are seeing these early nutrition effects interact with genetic potential—calves with strong genetic merit for production seem to respond particularly well to optimized early nutrition. Nutrition and genetics work together rather than independently.

So what happens when feed formulations shift on your calves? The rumen microbiota need time to adapt to new feed ingredients. Research on rumen microbial dynamics, including work by Schären and colleagues published in Frontiers in Microbiology, shows that meaningful adaptation can take anywhere from a day or two to three weeks or more when diets change substantially.

During those adaptation periods, feed efficiency typically drops, and the risk of digestive upset increases. And when formulation changes occur frequently—as can happen with feeds optimized first for ingredient prices rather than consistency—the rumen may never fully stabilize.

That’s the biological argument. But biology, as we all know, is only part of the decision.

What the Treatment Data Actually Show

The USDA’s National Animal Health Monitoring System (NAHMS) provides solid benchmarks here. Their Dairy 2014 study collected data from 104 operations across 13 states, which is about as representative as you’re going to find for this kind of work.

Here’s what they found: about 33.8 percent of preweaned heifers experienced at least one bout of illness, with digestive problems accounting for just over half of those cases—50.9 percent to be exact. Mortality stood at 5.0 percent overall.

Now, context matters here. These numbers actually represent real improvement from earlier surveys. NAHMS reported mortality rates of 8.4 percent back in 1992 and 7.8 percent in 2007. So the industry has improved significantly in keeping calves alive and healthy over the past few decades. That’s encouraging, and it reflects genuine progress in housing, colostrum management, and overall calf care protocols.

But the current numbers also suggest room for continued progress. The NAHMS study compared those results to Dairy Calf and Heifer Association (DCHA) targets at the time—25 percent morbidity and 5 percent mortality. It’s worth noting that the current DCHA Gold Standards are actually more stringent: scours incidence below 10 percent preweaning, pneumonia below 15 percent preweaning, and survival rates of at least 97 percent from 24 hours through 60 days of age. High-performing operations across the country are hitting these numbers. Some are doing even better.

Health MetricUSDA NAHMS National Avg (2014)DCHA Gold Standard TargetHigh-Performing OperationsEst. Cost Gap ($/calf)
Preweaning Scours Rate17.2% ⚠️<10%6–8%$8–12
Preweaning Pneumonia Rate16.2% ⚠️<15%8–10%$15–20
Preweaning Mortality5.0% ⚠️<3% (≥97% survival)2–2.5%$45–60
Overall Morbidity33.8% ⚠️<25%15–18%$25–35

I spoke with a calf manager at a large California operation last spring who’d brought her scours rate down to around 6 percent—well under that DCHA target. When I asked what changed, she walked me through several factors, but consistent nutrition was near the top of her list. “We stopped chasing the cheapest option every delivery,” she told me. “Once we did that, we could actually see what else was going on.”

What I found particularly telling was her approach to tracking the change. She started measuring weaning weight coefficient of variation alongside her treatment records—something she hadn’t done systematically before. Within about four months, her CV had dropped from around 14 percent to just under 9 percent. “That’s when I knew the consistency piece was real,” she said. “The calves weren’t just healthier on average—they were more uniform. And uniform is easier to manage.”

That observation—about finally being able to see the other variables—comes up repeatedly in conversations with producers who’ve improved their numbers. Eliminating feed variability actually allowed them to troubleshoot the other factors. When feed was no longer confounding their analysis, they could isolate issues with housing, or ventilation, or colostrum protocols.

I should be honest with you here, though: controlled comparisons in the published literature remain limited. The evidence connecting feed consistency specifically to improved outcomes is suggestive rather than definitive at this point. Much of what we know comes from producer experience and biological reasoning. That’s valuable information, but it’s different from randomized trial data.

Quick Reference: Key Benchmarks

  • 1,113 kg additional first-lactation milk per 1 kg preweaning ADG (Soberon & Van Amburgh, Journal of Dairy Science, 2012)
  • ~1,287 kg additional milk across three lactations per 1 kg preweaning ADG in one tracked commercial herd (Cornell research technical summaries)
  • 33.8% average preweaned heifer morbidity (USDA NAHMS Dairy 2014)
  • <10% scours, <15% pneumonia, ≥97% survival current DCHA Gold Standards targets
  • Days to 3+ weeks, typical rumen microbiome adaptation period to diet changes (Schären et al., Frontiers in Microbiology, 2017)

Sponsored Post

The Economics: Running Your Own Numbers

The financial case for feed consistency depends heavily on individual operation parameters, which is why I get a little skeptical when I see generic ROI claims floating around. Your math isn’t my math, nor is it your neighbor’s math.

But the framework for calculating it is straightforward, and the research coefficients are reasonably solid at this point.

What the research tells us: the 2025 meta-analysis confirms that for meaningful increases in preweaning ADG, you’re looking at real gains in first-lactation milk yield—the positive relationship holds across diverse management systems and keeps showing up study after study. And as the Cornell data show, those effects appear to persist across multiple lactations, not just the first one.

The NAHMS data suggest that reducing morbidity from the 33.8 percent average toward those tighter DCHA Gold Standard targets would reduce treatment costs in ways that add up. When you factor in drugs, labor, and lost performance, the total cost of a treated calf can run into the tens of dollars per case—sometimes considerably more depending on your vet costs and how much growth gets set back. Across a calf crop, which accumulates quickly.

The Basic Math: A 400-Calf Operation

FactorEstimate
Annual starter usage~60 tons
Premium for fixed-formulation$20–40/ton
Additional annual feed cost$1,200–$2,400
  
Potential return per calf 
Plausible weaning weight improvement+5 kg average
First-lactation milk gain (using Cornell relationship as a guide)typically on the order of ~100–200 kg/head, depending on how much of that 5 kg reflects true ADG improvement and your current baseline
Multi-lactation compounding effectAdditional gains in L2, L3 are likely when those early gains carry through
Reduced treatment costsVariable by operation

The question isn’t whether the research is real—it is. The question is whether your specific operation’s baseline makes the investment worthwhile.

What this means for your operation depends explicitly on your current baseline. If you’re already achieving tight weaning weight distributions and low morbidity, the marginal benefit from changing feeds may be modest. If you’re seeing high variability and treatment rates above industry benchmarks, the potential benefits of a stronger nutrition and management program are considerably larger.

On the cost side: from conversations with nutritionists and producers across several regions, many report that fixed-formulation dairy calf starters often cost somewhere in the ballpark of $20–40 per ton more than strictly least-cost options. Some regions see higher premiums where supplier choices are limited. Because prices vary so much by company and freight, you’ll want to confirm this with your own quotes.

Run your own calculation. Pull your weaning weight data from the last three cohorts. Calculate your coefficient of variation—that’s your standard deviation divided by your mean, expressed as a percentage—as a measure of how much variability you’re seeing. Look at your treatment records. The math will tell you whether the potential upside justifies the definite cost increase—and that answer genuinely varies by operation.

Knowing When to Prioritize Other Investments First

I’d be doing you a disservice if I presented this as a simple “switch feeds immediately” recommendation. Every operation has competing priorities, and feed consistency is one variable among many affecting calf performance.

On some farms, the bigger wins might come first from tightening up colostrum delivery, improving housing and ventilation, or addressing transition-cow bottlenecks before focusing on feed formulation details for calves. On others, especially where calf programs are already fairly sound, but weaning weights and health records still look noisy, dialing in nutrition consistency can be the logical next move.

One nutritionist I spoke with—who asked me not to use his name because he consults for suppliers using different formulation approaches—put it this way: “The right feeding strategy depends on the operation’s specific goals, constraints, and current performance baseline. What works exceptionally well for one farm might not be the highest-priority investment for another.”

That strikes me as exactly right. The consistency question isn’t about whether variable-formulation feeds meet regulatory requirements—they do. It’s about whether feed consistency represents the best next investment for your operation, given where you are today and where you want to go.

Evaluating Supplier Approaches

If you decide feed consistency is worth investigating for your operation, how do you actually figure out whether a supplier delivers it? I’ve found that a few direct questions reveal a lot—and most suppliers will give you straight answers if you ask clearly.

Questions that tend to cut through the marketing:

“Can you provide batch records showing our specific product’s formulation over the past year?” A supplier with consistency systems will generally have this readily available—it’s just how they operate. A supplier using a more flexible formulation will show ingredient variation that tracks commodity prices. Neither response is inherently wrong. What matters is that it tells you what you’re actually buying.

“What percentage of your ingredient sourcing uses fixed-supplier relationships versus spot-market commodity purchasing?” This gets at their underlying business model. There’s no single “right” answer—but you should know what you’re getting.

“Do you conduct incoming ingredient testing beyond supplier certifications?” Operations with NIR spectroscopy or proximate analysis on incoming loads can verify what they’re receiving. Those relying solely on supplier certificates are trusting their ingredient sources. Reputable companies in the marketplace use both approaches.

FactorFixed-Formulation ApproachVariable (Least-Cost) FormulationHidden Cost of Variability
Ingredient SourcingLong-term supplier contracts, consistent sourcesSpot-market purchasing, ingredients change batch-to-batchRumen adaptation stress every 2–4 weeks
Feed Price$20–40/ton premium over least-costLowest price per ton at time of purchaseFalse economy if growth/health suffer
Rumen Microbiome StabilityConsistent substrate = stable microbial communityFrequent substrate changes = constant re-adaptation3–21 days adaptation per change = chronic inefficiency
Weaning Weight CVTypically 8–10% (tighter distribution)Typically 12–16% (wider distribution)Harder to manage, delayed breeding, culling pressure
Treatment Rate PatternsConsistent baseline, easier to troubleshootMay spike after formulation changesDifficult to isolate non-feed variables
DocumentationBatch records, formulation history availableLimited transparency, formulas are “black box”Can’t analyze trends or root-cause issues
Best Use CaseOperations targeting DCHA Gold Standards, tight protocolsOperations prioritizing low upfront cost, high risk toleranceDepends on baseline performance and goals

What the responses typically reveal:

  • Detailed documentation with specific dates and formulations → you’re likely dealing with a consistency-focused supplier
  • General assurances about quality control without specific records → approach is unclear, and it’s worth following up
  • Acknowledgment that formulations adjust based on ingredient prices → that’s a more flexible formulation model, and there’s nothing inherently problematic about that if it fits your goals

The key is understanding which model you’re buying and whether it aligns with what you’re trying to accomplish.

The Transition Timeline: Setting Realistic Expectations

Operations that switch to a more consistent, fixed-formulation feeding program typically experience a transition period before realizing the anticipated benefits. Based on producer conversations and the biological literature on rumen adaptation, here’s roughly what to expect:

Weeks 1–3: Initial adjustment. Some producers report slight changes in fecal consistency as the rumen microbiome adapts to the new substrate—even though that substrate will now remain consistent. This is the period of highest uncertainty, and it’s easy to second-guess your decision. Stick with it unless you’re seeing serious problems.

Weeks 3–6: Early signals start to emerge. Starter intake patterns should smooth out. Fecal scores stabilize. Treatment incidence may begin declining in new calves entering the program—though calves already through the highest-risk period won’t show dramatic changes.

Weeks 6–8, around weaning: First measurable outcomes appear. Weaning weight distribution should tighten—look for your standard deviation narrowing—and cohort uniformity generally improves. This is when you can start to see whether the change is actually delivering for you.

Months 3–6: The pattern becomes clear. By this point, enough cohorts have moved through the system to distinguish signal from noise. If consistency delivers value on your operation, you should see it by now.

PhaseDurationKey Milestones
Weeks 1-3: Initial AdjustmentWeek 0-3Rumen microbiome adapting; possible fecal consistency changes; highest uncertainty
Weeks 3-6: Early SignalsWeek 3-6Starter intake patterns smooth out; fecal scores stabilize; treatment incidence begins declining in new calves
Weeks 6-8: First OutcomesWeek 6-8Weaning weight standard deviation narrows; cohort uniformity improves; first measurable confirmation
Months 3-6: Pattern ClearWeek 12-24Multiple cohorts processed; signal distinguished from noise; definitive performance data available

The timeline matters for setting expectations. Feed changes don’t produce overnight results. Operations that switch, see some initial variability during the adaptation window, and immediately switch back may never realize any potential benefit. Give it time to work—or not work—before drawing conclusions.

A Practical Assessment Framework

For producers considering whether feed consistency deserves attention alongside other calf management priorities—colostrum protocols, housing ventilation, transition feeding, fresh cow management—here’s a straightforward framework:

Step 1: Benchmark your current performance

  • Calculate the weaning weight coefficient of variation for your last three cohorts. If you’re already below 10 percent, you’re doing well.
  • Document treatment incidence rates against the NAHMS benchmarks and DCHA Gold Standards.
  • Note any patterns in timing—do problems tend to cluster after feed deliveries or lot changes?

Step 2: Understand your current supplier’s model

  • Ask the questions outlined above.
  • Request documentation if they claim consistency.
  • Pay attention to whether the answers satisfy you or leave you with more questions.

Step 3: Calculate your specific economics

  • Use your operation’s numbers, not industry averages.
  • Include both direct costs (treatment, mortality) and opportunity costs (production potential).
  • Factor in realistic switching costs and the transition period.

Step 4: Prioritize against other investments

  • How does this compare to other calf program improvements you could make?
  • Where’s your biggest current gap—nutrition, housing, health protocols, colostrum management?
  • Would the money deliver better returns somewhere else in your operation?

Step 5: Make a data-informed decision

  • Current performance is strong, and your supplier can demonstrate consistency? You may be well-positioned already.
  • Unexplained variability in weaning weights or treatment rates? The consistency question is worth investigating.
  • Economics don’t pencil out clearly? A pilot approach—one cohort on a new feed while maintaining your current program—can give you operation-specific data.

What It All Adds Up To

The research connection is real. Preweaning nutrition has measurable, long-term effects on lifetime milk production. The work from Cornell and the 2025 meta-analysis show consistent associations between early growth and first-lactation performance. This isn’t speculation—it’s well-documented science that keeps getting confirmed.

The consistency question is more nuanced. While the biological case for nutritional consistency is plausible—stable rumen microbiome, reduced adaptation stress, better feed efficiency—the controlled research comparing consistent versus variable formulations remains limited. Much of the evidence comes from producer experience and biological reasoning rather than randomized trials. I think being honest about that is important.

The economics are genuinely operation-specific. A 400-calf operation with high current variability might find substantial opportunity here. A smaller operation with already strong performance might find limited benefit. Run your own numbers rather than relying on anyone else’s projections—mine included.

Supplier models vary legitimately. Different formulation strategies correspond to distinct business approaches with distinct trade-offs. Understanding which model your supplier uses—and whether it aligns with your priorities—matters more than assuming one approach is universally superior.

Context always matters. Feed consistency is one of many variables affecting calf performance. Operations with excellent colostrum programs, well-designed calf housing, and strong health protocols may see less marginal benefit from feed consistency improvements than operations with gaps in those areas. Consider where your biggest opportunities actually lie.

The conversation around feed consistency reflects a broader shift in how progressive operations are thinking about calf-raising these days: as a foundational investment in lifetime productivity rather than a cost center to minimize. Whether that perspective applies to your operation depends on your specific circumstances—but it’s a question worth asking.

Key Takeaways

  • Early-life growth pays: Cornell work links each extra kilogram of preweaning gain to roughly 1,113 kg more milk in the first lactation, with multi-lactation benefits on top.
  • Consistent calf starter helps the rumen microbiome settle, reduces stress when calves hit diet changes, and can make weaning weights and health records a lot less “noisy.”
  • National data (NAHMS, DCHA) show calf health has improved, but many herds still sit above target levels for scours, pneumonia, or death loss—leaving money on the table.
  • For a 400-calf operation, paying about $20–40/ton more for a fixed-formulation starter means roughly $1,200–$2,400 extra feed cost per year, which can pencil out if it boosts growth and trims treatments.
  • There’s no one-size-fits-all answer; the article gives a simple checklist and supplier questions so each farm can decide whether calf starter consistency is the right next lever to pull.

Executive Summary: 

This article looks at a simple but powerful question: could the consistency of your dairy calf starter be quietly influencing lifetime milk production? Cornell research links each extra kilogram of preweaning gain to about 1,113 kilograms more milk in first lactation, with follow-up work and industry summaries showing those gains can carry into later lactations. It pairs that science with USDA NAHMS data and current DCHA Gold Standards to show where calf health has improved and where there’s still room to tighten things up. From there, the piece walks through how inconsistent formulations can disrupt rumen development and drive avoidable health bumps, while also being upfront that direct, controlled research on feed consistency itself is still limited. A practical “400-calf” example lays out the likely cost premium for more consistent starter versus the potential milk and health returns, then offers a step-by-step framework to run the numbers with your own data. Producers also get concrete questions to ask feed suppliers, a realistic transition timeline if they switch feeds, and guidance on when other investments—such as colostrum, housing, or fresh cow management—might warrant priority. The aim is to give dairy producers a clear, research-grounded context so they can decide whether dialing in calf starter consistency is the right next move for their own operation, not to sell a one-size-fits-all solution.

Complete references and supporting documentation are available upon request by contacting the editorial team at editor@thebullvine.com.

Learn More

The Sunday Read Dairy Professionals Don’t Skip.

Every week, thousands of producers, breeders, and industry insiders open Bullvine Weekly for genetics insights, market shifts, and profit strategies they won’t find anywhere else. One email. Five minutes. Smarter decisions all week.
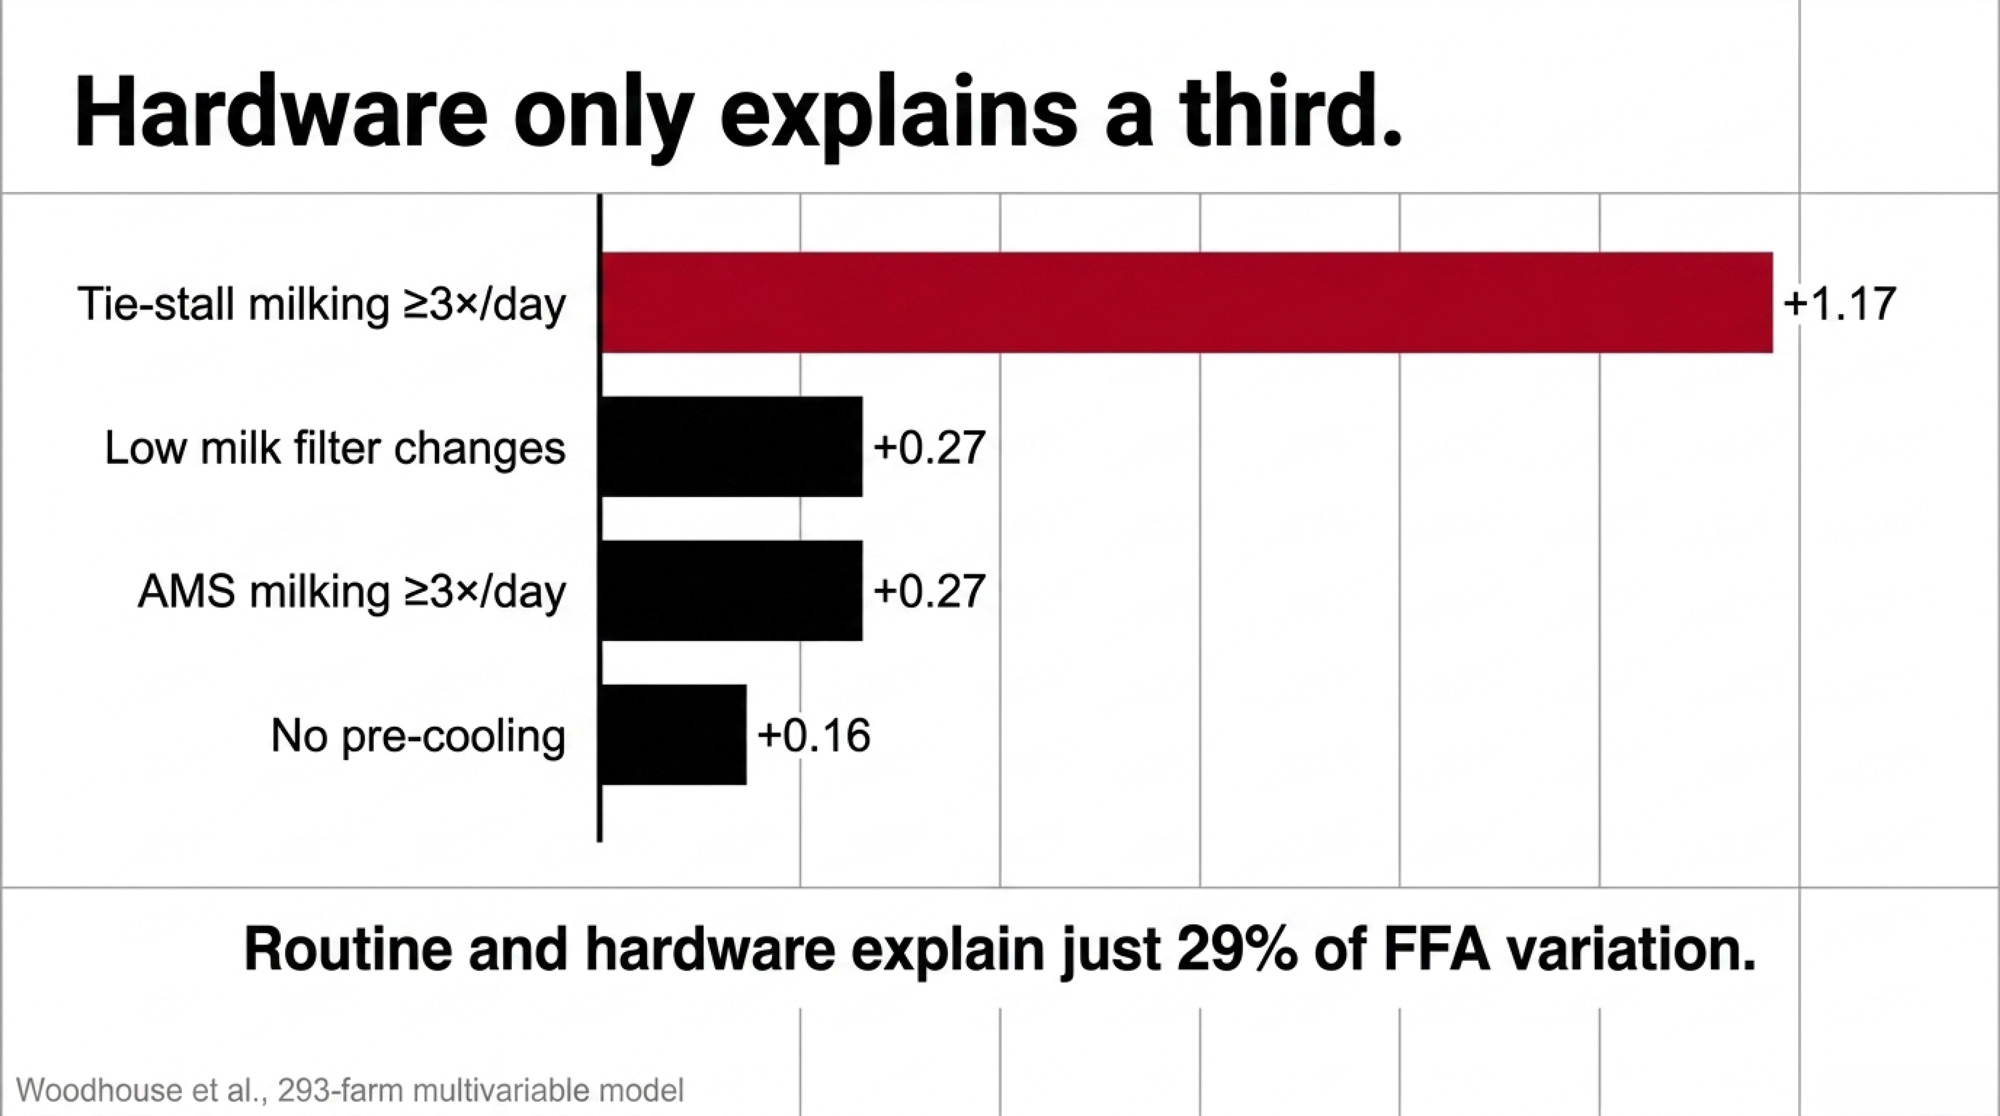
NewsSubscribe
First
Last
Consent

€2.2 Billion, 4 Companies, 1 Feed Bunk: CVC Just Carved Up Your Premix Supply Chain with dsm-firmenich Deal

CVC Capital Partners just bought one of the biggest names in your feed supply chain. Here’s the math on what changes, what might actually improve, and the four moves you should make before the deal closes.

EXECUTIVE SUMMARY: CVC Capital Partners bought dsm-firmenich’s entire Animal Nutrition & Health division on February 9, 2026, for €2.2 billion — carving one of the world’s largest dairy nutrition suppliers into four separate companies by year-end. For a 300-cow Midwest U.S. dairy carrying $73,000–$83,000 a year in mineral, vitamin, and premix exposure through this supply chain, the ownership change is anything but abstract. CVC brings genuine dairy experience through Urus and a proven digital-transformation playbook, but also brings PE margin discipline that typically hits input pricing within the first 24 months. Three structural risks matter most: vitamin allocation now runs through commercial negotiations rather than internal management, over 73% of global vitamin production is concentrated in China, and quarterly return targets can incentivise quiet reformulations that take weeks to show up in your bulk tank. Producers have roughly 10 months before closing to document current formulations, audit feed mill sourcing, trial a second premix supplier, and lock contract terms with substitution-notice and change-of-control protections. That playbook starts with one phone call to your nutritionist — this month.

On February 9, 2026, dsm-firmenich sold its entire Animal Nutrition & Health division to private equity firm CVC Capital Partners for approximately €2.2 billion, including an earnout of up to €0.5 billion. Combined with last year’s €1.5 billion sale of its feed enzymes stake to Novonesis, the total ANH divestiture reaches €3.7 billion — implying a 10x EV/Adjusted EBITDA multiple on the combined value. That’s ANH’s entire €3.5 billion-a-year operation and roughly 8,000 employees changing hands. 

Those are the corporate numbers. Here’s the farm-level number: a 300-cow dairy spends roughly $73,000 to $83,000 a year on the minerals, vitamins, and premix that flow through this supply chain, based on the University of Missouri Extension’s 2025 confinement dairy planning budget at $840/ton and 577–656 lbs per cow (a Midwest U.S. estimate — your region’s numbers will differ, but the exposure ratio holds). Minerals and vitamins? Bigger line item than you’d guess. And the companies supplying them just changed hands. 

One Division Becomes Four Companies

The nutrition supply chain that used to run through a single integrated ANH division is being carved across four separate businesses — all effective by the end of 2026: 

EntityWhat They SupplyOwnerHQ
Solutions CompanyPremix, performance products, precision servicesCVC Capital PartnersKaiseraugst, Switzerland 
Essential Products CompanyVitamins, carotenoids, aroma ingredientsCVC Capital PartnersKaiseraugst, Switzerland 
NovonesisFeed enzymes (phytase, xylanase, protease)NovonesisDenmark  
dsm-firmenich (retained)Bovaer, Veramarisdsm-firmenichKaiseraugst, Switzerland 

dsm-firmenich retains a 20% equity stake in both CVC-owned entities but holds no operational control. Feed enzymes went to Novonesis in a deal completed in June 2025, representing approximately €300 million in annual net sales. Novonesis will continue a long-term commercial relationship with ANH for re-sale of its feed enzymes through the premix network. 

So that “single supplier” relationship many producers had? It’s now four commercial relationships with four distinct P&Ls. Four separate sets of incentives deciding what goes into your premix, what it costs, and who picks up the phone when something goes wrong. This is part of a broader consolidation wave reshaping the dairy sector — and it’s accelerating. 

Company NameWhat They Supply to DairyOwnerYour RiskRevenue (Annual)
Solutions CompanyPremix, performance products, precision servicesCVC Capital PartnersThird in vitamin allocation queue~€2.0–2.5 billion
Essential Products CompanyVitamins, carotenoids, aroma ingredientsCVC Capital Partners73%+ China concentration; spot market priority~€1.0–1.5 billion
NovonesisFeed enzymes (phytase, xylanase, protease)Novonesis (independent)Re-sale through premix network only~€300 million
dsm-firmenich (retained)Bovaer (methane), Veramaris (omega-3)dsm-firmenichCost-benefit gap; unclear processor co-funding~€100–200 million

The PE Playbook: What Actually Changes on Your Farm

Let’s be honest — “private equity buys a feed company” usually makes producers nervous. Sometimes that’s warranted. Sometimes it isn’t. Here’s how to think about it clearly.

CVC isn’t a nutrition company. They manage roughly €201 billion in assets across 150+ companies with combined annual sales over €165 billion. But here’s the thing that matters for dairy: CVC already owns Urus, which they describe as “a global leader dedicated to serving dairy and beef cattle producers around the world with cutting-edge genetics and customised reproductive services”. They’re not walking into animal agriculture blind. And this isn’t even their first deal with dsm-firmenich — CVC held a majority stake in the ChemicaInvest joint venture with DSM back in 2015. 

The return math, simplified: CVC paid roughly 7x normalised EBITDA for ANH. Their recent PE exits have averaged 3.3x invested capital at a 27% gross IRR. If historical patterns hold, a €2.2 billion acquisition needs to grow toward €6–7 billion over a five-to-seven-year hold. That’s the number shaping every pricing, staffing, and product-line decision going forward. 

What does that mean in plain language? PE ownership follows a predictable sequence:

  • Phase 1 (Years 1–2): Margin improvement — operational efficiencies, overhead reduction, portfolio rationalisation. This is the phase most likely to touch your feed bill.
  • Phase 2 (Years 2–5): Bolt-on acquisitions to build scale and market share.
  • Phase 3 (Years 5–7): Position for premium-multiple exit or IPO.

The Private Equity Stakeholder Project tracked 129 PE deals in U.S. agriculture between January 2018 and December 2023 using Pitchbook data — outcomes ranged widely, from genuine platform growth to Prima Wawona, where Paine Schwartz Partners merged two profitable stone fruit growers into a single entity that entered Chapter 11. CVC’s track record looks materially different. But the underlying dynamic — new owners optimising for return metrics on a fixed timeline — applies across every PE-owned supplier. 

Where PE Ownership Could Actually Help

Here’s where I’ll push back on the doom narrative. PE ownership isn’t all margin pressure and cost-cutting. CVC has been aggressive about deploying AI and digital transformation across its 120+ portfolio companies, classifying each by AI readiness and prioritising where technology can unlock measurable value. ANH already built precision livestock tools — Sustell for farm-level sustainability measurement, Verax for animal health monitoring, and FarmTell for data-driven herd management. Under a PE owner with CVC’s tech orientation, investment in those platforms could accelerate. 

Steven Buyse, CVC’s Managing Partner, said in the announcement: “The Solutions Company will continue to drive innovation and efficiency in animal farming, delivering tailored solutions with high proximity to its global customer base. The Essential Products Company will be built as a resilient global leader in essential feed, food, and fragrance ingredients”. 

Translation: CVC sees two distinct value-creation stories. The Solutions Company gets the precision services and innovation mandate. The Essential Products Company gets built for supply reliability and cost efficiency. If CVC executes well, producers could see better digital tools, more professionalised logistics, and sharper supply-chain management. That’s a real potential upside.

The catch? Those digital tools and precision services tend to come bundled with longer-term contracts and proprietary data ecosystems. More on that in a minute.

Three Structural Risks That Still Deserve Your Attention

You Might Be Third in the Vitamin Supply Queue

When ANH was one division, vitamin production and premix blending shared a single management team. During the 2023 vitamin price crash — Chinese oversupply drove ANH’s adjusted EBITDA down 91% year-on-year in Q3, with a vitamin price effect of about €120 million  — the integrated structure absorbed the hit. When BASF’s Ludwigshafen plant fire in July 2024 sent Vitamin A prices surging from roughly $21/kg to $72/kg — a 243% spike — internal allocation kept the premix business supplied. 

Post-split, those allocation decisions become commercial negotiations. The Essential Products Company now serves three customer types:

  1. dsm-firmenich — contractually guaranteed volumes under a long-term supply agreement, backstopped by a €450 million loan facility and up to €115 million in additional liquidity support from dsm-firmenich 
  2. Spot buyers — willing to pay premium prices during supply squeezes
  3. The Solutions Company — a customer relationship, not a guaranteed supply line

During a disruption, dairy premix customers could find themselves third in that queue. In November 2022, DSM announced a temporary halt to Rovimix Vitamin A production at its Sisseln, Switzerland, plant for at least 2 months, along with significant reductions in Rovimix Vitamin E-50. DSM stated it would “honour existing contractual commitments” while activating allocation procedures. That kind of allocation triage gets harder when the vitamin producer and the premix blender sit on separate balance sheets — and it’s exactly the type of supply chain vulnerability that dairy producers have been caught flat-footed by before.

The China Concentration Risk Underneath Everything

The vitamin CVC market the company is stepping into is arguably the most geopolitically exposed input market in agriculture. AFIA president Constance Cullman told the 2025 NAFB Convention that over 73% of vitamins originate in China. The European Feed Manufacturers’ Federation (FEFAC) puts the concentration even higher for specific vitamins: 

  • Vitamin D3: ~93% China-sourced 
  • Vitamin B1: ~97% China-sourced 
  • Folic acid: nearly 100% China-sourced 

“We believe this is a national security issue.” — Constance Cullman, AFIA president, 2025 NAFB Convention 

China imposed provisional anti-subsidy tariffs of 21.9% to 42.7% on certain EU dairy products in late 2025. If that escalation touches vitamin exports — or if China simply prioritises domestic supply during a disruption — ANH’s European vitamin capacity becomes CVC’s most strategically valuable asset. And CVC will price it accordingly. On the flip side, CVC has both the capital and the incentive to invest in non-Chinese vitamin capacity — that’s exactly the kind of strategic asset-building that could justify a premium multiple at exit. 

Biology Doesn’t Run on Quarterly Reporting

Trevor DeVries at the University of Guelph presented research at the 2019 Western Canadian Dairy Seminar, establishing that “dairy cow health, production, and efficiency are optimized when cows consume consistent rations, both within the day and across days”. More variability between delivered and formulated rations increases the chance that cows won’t perform to expectations. 

Here’s the problem: when a margin-driven reformulation — swapping chelated zinc for zinc oxide, trimming vitamin inclusion from above-NRC to minimum-NRC — saves a few dollars per tonne of premix, the production effects may not show in the tank for six to eight weeks. By then, the cost saving has been booked to the current quarter’s EBITDA. The component drift? That’s your problem to diagnose.

This isn’t unique to PE ownership. Any supplier under margin pressure can make these moves. But PE’s quarterly discipline and fixed-horizon exit timeline sharpen the incentive.

Four Moves to Make Before the Deal Closes

The transaction is expected to close by the end of 2026. That gives you roughly 10 months. Use them. 

1. Get your formulation on paper. Call your nutritionist and request the complete premix specification for every product you’re running — full ingredient list, inclusion rates, source identifications (not just “zinc” but zinc methionine vs. zinc sulfate vs. zinc oxide), and guaranteed analysis. Dated and signed. This costs nothing, takes one conversation, and enables every other protective move. Without a baseline, you can’t detect reformulations, comparison-shop credibly, or hold anyone accountable.

2. Audit your feed mill’s sourcing. If you’re a 200–400 cow dairy, your premix likely comes through a feed mill, not directly from ANH. Ask three questions: Where do they source vitamins? How many suppliers? What’s the contingency if the primary goes on allocation or raises prices 20%? If your mill single-sources from the Essential Products pipeline, their vulnerability is yours.

3. Test a second supplier on part of your herd. Running 10–15% of volume through an alternative creates a tested backup and real negotiating leverage. Here’s a rough threshold: if your total premix spend exceeds $20,000 a year and you currently single-source, that trial is manageable. The premix market offers genuine options: Trouw Nutrition, Adisseo, Evonik, and regional specialists such as Animine, Devenish Nutrition, and Novus International. The ADM-Alltech joint venture, announced in September 2025, combines Alltech’s 33 feed mills (18 U.S., 15 Canada) with ADM’s 11 U.S. feed mills into a 44-mill network — another competitor entering the space. The trade-off: your nutritionist needs time to validate formulation equivalence, and rumen adaptation matters. Transition gradually. 

4. Lock contract terms while there’s an incentive to deal. Before closing, both sides want a smooth handover. Use that to formalise: 30-day written notice before any ingredient substitution; service-level commitments; pricing escalation caps indexed to verifiable benchmarks; and a change-of-control clause allowing renegotiation if either entity is subsequently sold. But remember — long-term contracts cut both ways. When vitamin prices crashed in 2023, locked-in terms would have left you paying above-market rates. Indexed pricing structures beat fixed rates in a volatile input market. 

Action ItemTimeline / DeadlineCost to ExecuteRisk If You Don’tWho to Call First
1. Document current premix formulationThis month (Feb 2026)$0 (one phone call)No baseline to detect reformulations or hold suppliers accountableYour nutritionist
2. Audit feed mill’s vitamin sourcingBefore April 2026$0 (3 questions)Feed mill’s single-source vulnerability becomes your cash flow crisisYour feed mill rep
3. Test second premix supplier on 10–15% of herdMay–Aug 2026$1,500–$3,000 trial costZero negotiating leverage; no tested backup during allocation squeezeIndependent nutritionist or alt supplier
4. Lock contract terms with substitution protectionsBefore Oct 2026 (deal close)Legal review: $500–$1,500Eat reformulations and price increases with no recourse or exit clauseFeed supplier + lawyer (change-of-control clause)

The Bovaer Split: Who Pays for Methane?

dsm-firmenich kept Bovaer and Veramaris while selling everything else. That means the company promoting methane reduction on your farm is no longer the company managing your daily nutrition. 

Elanco estimates a potential annual return of “$20 or more per lactating dairy cow” through voluntary carbon markets and government incentives — but that figure reflects projected potential, not observed farm-level returns. Greg Hocking, Mars Snacking’s global VP of R&D for New Innovation Territories, was direct in a December 2025 interview: “Consumers will benefit from these efforts, but we don’t expect them to pay extra for sustainability”. Denmark is moving toward subsidised adoption and may mandate methane-reducing additives. If that regulatory model spreads, processor co-funding could follow. 

But the gap between the additive cost and the documented on-farm returns means the economics of voluntary methane programs are still tight. Evaluate any value-chain program carefully — we dug into the details in Bovaer Unleashed: The Controversial Additive Changing Dairy Forever

What This Means for Your Operation

  • Your mineral and vitamin line item is more exposed than it looks. At $242–$275 per cow per year for a Midwest U.S. confinement dairy (University of Missouri Extension, 2025 ), a 10% cost increase means $7,000–$8,000 on a 300-cow operation. Your region’s absolute numbers will differ—benchmark your feed costs against strategic alternatives with your nutritionist. 
  • The financial incentives behind your supplier just changed — but that’s not automatically bad. PE ownership optimises for 5–7 year return cycles, not 20-year relationships. That could mean tighter margins andbetter digital tools. Verify rather than assume. Watch what actually happens to service levels and product specs.
  • Your feed mill is the invisible middleman. If they single-source vitamins from ANH’s Essential Products pipeline, a pricing or allocation squeeze hits you even if your name isn’t on the contract. Ask the question this week.
  • Precision services come with strings. If CVC invests in Sustell, Verax, or FarmTell — dsm-firmenich’s existing data platforms  — those tools could genuinely improve your herd management. Just understand what data you’re handing over and which contract terms come with it. 
  • Collective purchasing deserves a conversation. If you sell through a cooperative, ask whether group nutrition procurement is on the board’s agenda. Volume leverage is the strongest counter to supplier concentration — and building financial firewalls against supplier disruption starts with knowing where the risk sits. 

Key Takeaways

  • Get your complete premix formulation documented this month — dated, signed, with source identifications for every active ingredient. One phone call, zero cost, foundation for everything else.
  • Test an alternative premix supplier on 10–15% of your herd before the deal closes. A credible alternative is the only pricing leverage that consistently works in concentrated markets.
  • Evaluate whether your nutritionist works for the company selling you premix. If so, get a second opinion from an independent consultant.
  • Run the stress test: if premix costs rose 10% while milk prices dropped $2/cwt simultaneously, what does your cash flow look like? Run that number now, not after closing.
  • Don’t dismiss PE upside. CVC’s digital investment track record and its existing dairy exposure through Urus mean this could bring genuine improvements in supply-chain efficiency and precision tools. Stay skeptical, but stay open. 
  • Watch for CVC-branded communications in your feed mill or nutritionist’s feed after closing — that’s the signal the margin-optimisation phase has started.
Herd SizeCurrent Annual Premix CostAfter 10% IncreaseAnnual Cost ImpactImpact as % of Milk Revenue
100 cows$24,200–$27,500$26,620–$30,250$2,420–$2,7500.5–0.6%
300 cows$72,600–$82,500$79,860–$90,750$7,260–$8,2500.5–0.6%
500 cows$121,000–$137,500$133,100–$151,250$12,100–$13,7500.5–0.6%
750 cows$181,500–$206,250$199,650–$226,875$18,150–$20,6250.5–0.6%
1,000 cows$242,000–$275,000$266,200–$302,500$24,200–$27,5000.5–0.6%

The Bottom Line

The ownership of your dairy’s nutrition supplier changed on February 9, 2026. Your formulation, your service levels, and your contract terms haven’t changed yet. That gap is your window—and it closes when this deal does at year-end. How are you planning to use it? 

Complete references and supporting documentation are available upon request by contacting the editorial team at editor@thebullvine.com.

Learn More

The Sunday Read Dairy Professionals Don’t Skip.

Every week, thousands of producers, breeders, and industry insiders open Bullvine Weekly for genetics insights, market shifts, and profit strategies they won’t find anywhere else. One email. Five minutes. Smarter decisions all week.
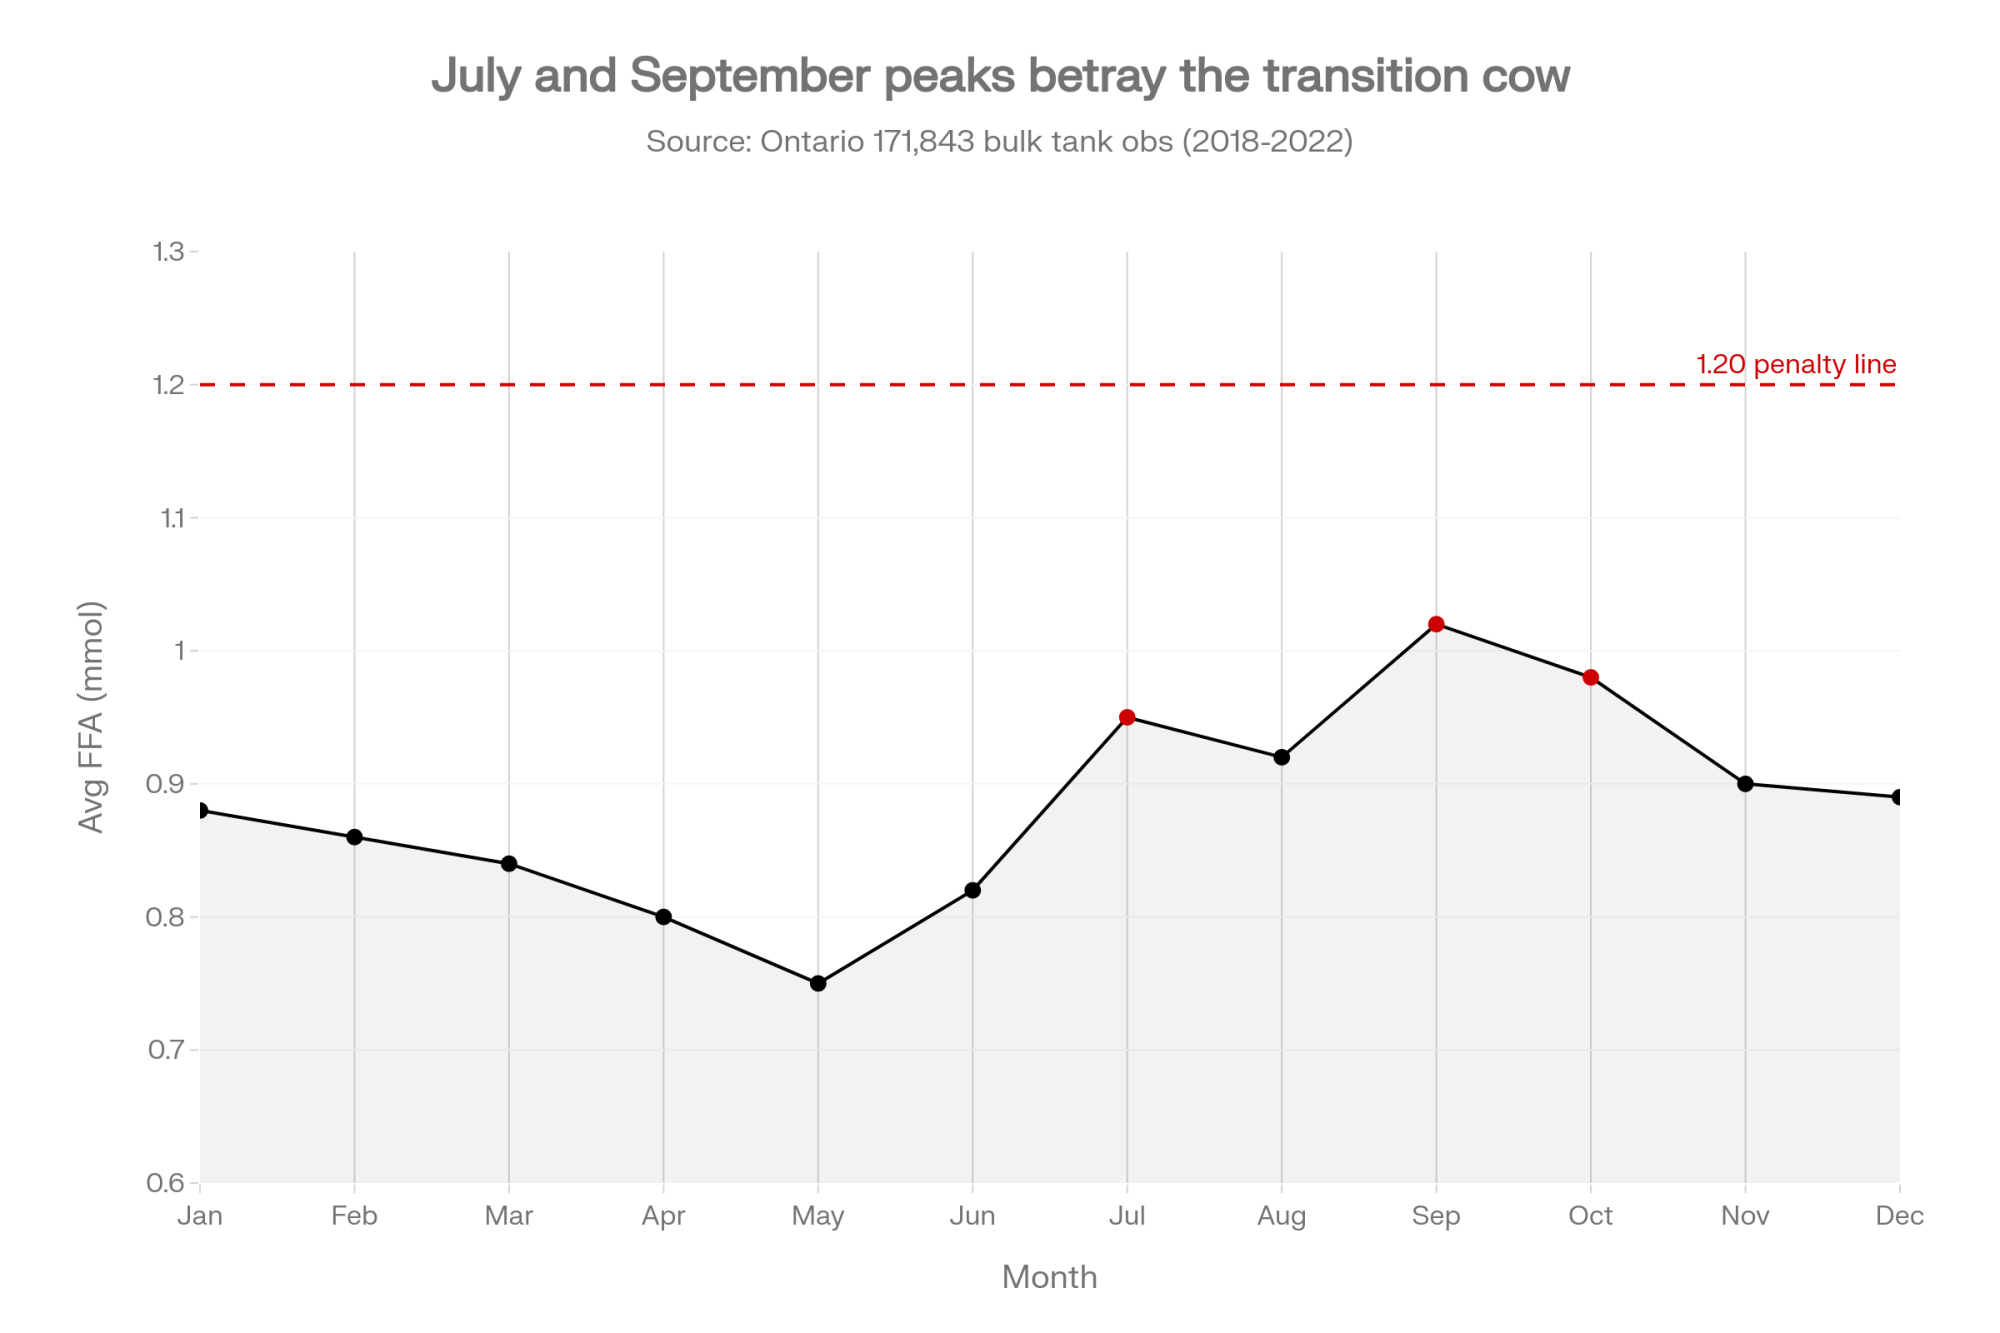
NewsSubscribe
First
Last
Consent

Dairy Calf Nutrition for Healthier, Higher‑Producing Cows

“Reminder: every extra pound of pre‑weaning gain can mean 1,000+ lbs more milk later. Are your calves leaving money on the table?

You know that frustration when calves look fine one week and then crash the next? Weaning dip stretches into three weeks of depressed intake, respiratory disease clusters right around that vulnerable transition window, and it happens no matter what you try. Most of us have been there—whether you’re running 200 cows in Vermont or 2,000 in the Central Valley. It’s one of those persistent challengesc in calf nutrition and heifer development that never quite seems to get solved.

For decades, we’ve treated this as just the cost of doing business. Calves are fragile. Weaning is stressful. Budget for the treatments and move on.

But here’s what’s interesting—a growing body of research and a smaller group of producers willing to rethink their protocols suggest something different. The weaning dip may be less about inevitable stress and more about accumulated decisions made weeks earlier. And the solutions aren’t necessarily expensive or complicated. They’re just… different from how most of us learned to do things.

I want to walk through what the research actually shows, what some operations are finding when they apply it, and—just as importantly—why this approach doesn’t work for everyone.

The Economics Nobody Wants to Talk About

Let’s start with the numbers, because that’s ultimately what drives decisions.

Dr. Michael Steele’s research group at the University of Guelph has been tracking the long-term consequences of early-life calf health for years. Their work, combined with Swedish research by Svensson and Hultgren, which has been widely cited in the Journal of Dairy Science, documents something that should give us pause: calves experiencing diarrhea in their first month of life produce roughly 340-350 kg (748 – 770 lbs) less milk in their first lactation than healthy calves.

That’s not a typo. We’re talking about nearly 350 kg (770 lbs) of milk—gone—because of a bout of scours in week two.

Dr. Alex Bach, an ICREA research professor working with IRTA in Spain, has been equally direct about respiratory disease. His research shows that heifers treated for bovine respiratory disease before weaning have significantly higher odds of dying or being culled before first calving—with survival rates often running 10-20 percentage points lower than healthy cohorts. The immune insult doesn’t resolve simply because the calf clinically recovers. It reverberates through her productive life.

This connection between early-life health and lifetime performance continues to be reinforced by ongoing research. A 2025 study by Leal and colleagues in the Journal of Dairy Science demonstrated that suboptimal preweaning nutrition creates measurable metabolic differences that persist through first lactation—effects visible in glucose metabolism and overall metabolic profiles well into the heifer’s productive life.

Now, here’s where I think our industry gets stuck. These are long-term consequences. The treatment costs are visible today—you see them on this month’s vet bill. The first-lactation milk penalty won’t appear for 2 years. Most operations—understandably—optimize for what they can see and measure right now.

The challenge, as multiple dairy economists have noted, is convincing producers to invest today for returns they won’t see until that heifer’s second lactation. It’s fundamentally different from evaluating the price of a bag of milk replacer.

And it’s worth sitting with that tension for a moment, because it explains why adoption of these practices has been slower than the research might predict.

What’s Actually Happening in the Calf’s Gut

To understand why certain interventions work, you need to understand what’s developing inside the calf during those first critical weeks. The science here has advanced dramatically in the past decade—and it’s reshaping how progressive operations think about their calf programs.

The Small Intestine Window

Before the rumen becomes functional—roughly weeks one through five—the calf is essentially a monogastric animal. The small intestine handles the heavy lifting for nutrient absorption, and it’s susceptible to early nutrition choices.

Research published in peer-reviewed nutrition journals has mapped digestive enzyme development in young calves, and what these studies have found matters for anyone making decisions about milk replacer formulation: pancreatic proteases operate at only a fraction of adult capacity at birth, gradually maturing over the first three to four weeks.

Why does this matter practically? The calf’s enzyme systems evolved to digest milk proteins, including casein and whey. When you substitute milk proteins by plant proteins like soybean meal or wheat gluten (often done to reduce costs), you’re asking an immature digestive system to handle substrates it’s not fully equipped to handle.

Work published in the Journal of Dairy Science by Ansia and colleagues compared nitrogen digestibility between all-milk protein replacers and those supplemented with enzyme-treated soybean meal. The pattern was clear: all-milk formulas showed notably better digestibility by week three compared to plant-supplemented formulas. That gap represents protein that isn’t nourishing the calf—it’s passing through to the hindgut, where it can feed the wrong bacteria.

Research presented at the 2024 Healthy Calf Conference in Ontario reinforced this point: early-life nutrition—specifically the first 60 days—affects digestive function throughout the animal’s productive life. That framing helps explain why the details matter so much during this critical window.

The Rumen Transition

As starter intake increases around weeks five through eight, something remarkable happens. The rumen transforms from a collapsed, non-functional organ into the calf’s primary fermentation chamber. This transition depends entirely on establishing stable populations of beneficial bacteria—and this is where substrate consistency becomes critical.

Dr. Phil Cardoso’s lab at the University of Illinois has done elegant work tracking how rumen microbial communities develop. Here’s the part that surprised me when I first dug into this literature: rumen bacteria are extraordinarily substrate-specific.

Different bacterial species have evolved enzymatic machinery optimized for specific fermentation substrates. When feed composition shifts—different molasses sources, varying grain suppliers, new protein ingredients—the microbial community has to reorganize around the new substrate profile.

A 2024 study published in Frontiers in Microbiology, which tracked fecal microbiota development in Holstein and Jersey heifer calves, found that the gut microbiome changes rapidly during early life. Instability during colonization leaves the microbial community vulnerable to dysbiosis, where pathogenic species can outcompete beneficial microbes, leading to suppressed immune function and inflammation.

The time required for microbial reorganization varies considerably depending on what you’re measuring and how dramatic the diet change is. Some studies suggest bacterial communities can shift within a week or two. Others indicate that full functional stabilization can take considerably longer, sometimes several weeks or more.

The practical takeaway? During that reorganization period, volatile fatty acid production becomes erratic. And VFAs—particularly butyrate—are what drive rumen papillae development. Inconsistent VFA production means inconsistent rumen development.

Sponsored Post

The Substrate Consistency Question

This is where things get practical, and also where opinions start to diverge among nutritionists.

Several nutritionists I’ve spoken with point to ingredient consistency as the single most overlooked variable in calf programs. The logic is straightforward: if rumen bacteria need stable substrates to establish and function, then constantly changing feed ingredients creates perpetual instability.

Research from the University of Minnesota and other institutions has documented this pattern: calves on fixed formulations show much more consistent day-to-day starter consumption than calves on least-cost programs where ingredients shift with commodity prices. The intake variability isn’t dramatic on any given day, but it compounds over the critical period of rumen development.

Industry estimates suggest the cost premium for specification-guaranteed, consistent-source ingredients is approximately 2-4%—typically $8-12 per calf over a 12-week rearing period. That number varies by region and current commodity markets, but it gives you a ballpark for planning purposes.

The Other Perspective

Now, I want to be fair here, because this isn’t settled science. Not every nutritionist is convinced that ingredient consistency matters as much as some of the research suggests.

“Look, rumen bacteria are adaptable,” argues one dairy nutritionist who asked not to be named because he works with several least-cost formulation systems. “They’ve evolved to handle dietary variation. A healthy calf can adjust to different molasses sources reasonably quickly.”

He has a point about adaptability—cattle wouldn’t have survived as a species without metabolic flexibility. And the research on substrate consistency, specifically in pre-weaned calves (as opposed to mature cattle), is still developing. Most of the microbial stabilization studies were conducted in older animals.

What we can say with confidence is that operations running fixed formulations generally report lower variability in calf performance. Whether that’s causation or correlation with other management factors—like the kind of attention to detail that leads someone to specify ingredients in the first place—is harder to untangle.

Stage-Matched Microbial Support

The growing interest in probiotic supplementation for calves has created what I’d call an implementation gap. Most operations using probiotics deploy the same blend in both milk replacer and starter feed, assuming gut health support works the same way throughout development.

The research suggests otherwise—and this is where things get interesting.

Different Ecosystems, Different Needs

The small intestine during liquid feeding operates in a microaerobic environment—there’s oxygen present. Effective probiotics for this phase include facultative anaerobes like Bacillus subtilisLactobacillus, and Bifidobacterium species that can survive stomach acid and establish quickly.

A 2024 study in ASM Spectrum demonstrated that compound probiotics containing multiple Lactobacillus and Bacillusstrains accelerated both immune function development and the establishment of a healthy gut microbiome in newborn Holstein calves—reducing the abundance of harmful bacteria while promoting beneficial populations.

Research published in Scientific Reports and the Journal of Animal Science has shown how certain Bacillus species secrete compounds that promote intestinal epithelial cell differentiation and help inhibit pathogenic biofilm formation. There’s good evidence for measurable improvements in gut barrier function when appropriate strains are delivered during the liquid feeding phase.

The developing rumen is a completely different environment—strictly anaerobic. Oxygen is toxic to the bacteria that should dominate there. Effective rumen probiotics include obligate anaerobes such as Megasphaera elsdenii and Butyrivibrio species, which would die immediately if exposed to the oxygen-rich environment of the small intestine.

“Using the same probiotic blend in milk and starter is like planting the same crops in two completely different climates,” explains Dr. Mike Flythe, a microbiologist with the USDA Agricultural Research Service in Lexington, Kentucky. “You might get something to grow, but you’re not optimizing for either environment.”

Gut EnvironmentOxygen LevelEffective Probiotic SpeciesPrimary MechanismWhat Happens If Mismatched
Small Intestine (liquid feeding phase)Microaerobic (oxygen present)Bacillus subtilis, Lactobacillus, BifidobacteriumEpithelial cell differentiation; pathogen inhibition; gut barrier functionAnaerobic rumen species die immediately upon exposure
Developing Rumen (starter feeding phase)Strictly anaerobic (no oxygen)Megasphaera elsdenii, Butyrivibrio speciesVFA production optimization; pH stabilization; fiber digestionOxygen toxic to obligate anaerobes
Industry Standard (single-blend approach)Both environments, same formulationMixed facultative speciesCompromise formulation attempting dual-useSuboptimal colonization in both environments
Stage-Matched ApproachEnvironment-specific formulationsOxygen-matched species for each developmental phaseOptimized for gut compartment and maturity stageMaximizes colonization success and functional support

That analogy stuck with me—it’s a useful way to think about what we’re trying to accomplish.

What the Market Offers

Several feed companies have developed stage-matched probiotic programs. Kalmbach Feeds’ LifeGuard and Opti-Ferm XL technologies represent one approach—different formulations designed for the liquid and solid feeding phases, respectively. Other companies offer similar stage-specific options, and the market continues to evolve as the research develops.

Stage-matched programs do represent a greater investment than basic single-probiotic approaches, though the actual cost differential varies considerably by program design, feeding rates, and supplier. For operations weighing this decision, it’s worth getting specific quotes based on your calf numbers and current protocols—the investment can range from modest to meaningful depending on how programs are structured.

Whether that investment makes sense depends heavily on your baseline performance. Operations already running tight calf programs with low disease incidence will see smaller marginal returns than operations struggling with persistent scours or respiratory challenges. This isn’t a universal solution—it’s a tool that works better in some contexts than others.

The Stress Calendar: Potentially Free Improvement

Here’s something that costs nothing but requires real management discipline—and it might be the most overlooked opportunity in calf management.

Research on weaning stress—particularly work from Dr. Jeff Carroll and colleagues at the USDA-ARS Livestock Issues Research Unit—shows that cortisol elevation from weaning alone is acute but manageable. Elevated for 3-5 days, then returning toward baseline as the calf adapts.

But when weaning coincides with vaccination, dehorning, regrouping, or housing changes, cortisol can remain elevated for 2 weeks or longer, resulting in sustained immune suppression. The calf never gets a chance to recover before the next challenge hits.

The mechanism isn’t additive—it’s multiplicative. Each stressor independently activates the hypothalamic-pituitary-adrenal axis. When stressors overlap, you’re compounding the immune suppression rather than just extending it.

What this means practically: the common approach of “we have the crew here anyway, let’s do everything at once” may be one of the most costly management decisions we make. It’s efficient from a labor standpoint. It’s terrible from a calf physiology standpoint.

Building a Stress Calendar

Operations that separate stressors generally report meaningful improvements. The specific timing depends on your operation, but here’s a general framework:

  • Disbudding/dehorning: Position 4-5 weeks before weaning, allowing full recovery before weaning stress begins
  • Weaning: Gradual over 5-7 days (the most recommended weaning is step down process for 10 – 14 days, even if it is not the most used), treated as a standalone event with no concurrent stressors
  • Vaccination: 7-14 days post-weaning, after acute stress resolves
  • Regrouping/housing changes: 2+ weeks post-weaning when possible

Research presented at the 2024 Healthy Calf Conference emphasized that gradual weaning has become non-negotiable for operations feeding today’s higher milk volumes. When calves consume eight to twelve liters of milk per day, abrupt weaning creates severe physiological stress. Comparing five-day versus ten-day weaning programs, longer-weaned calves performed better in both gain and grain intake, with fewer health issues during the transition.

I’ve spoken with producers in Wisconsin and across the Upper Midwest who’ve tried separating procedures, and the feedback has been generally positive—many report noticeable reductions in post-weaning respiratory cases. A producer in central Minnesota told me his post-weaning BRD treatments dropped by about a third after implementing a stress calendar. That’s anecdotal, but it’s consistent with the research’s predictions.

That said, I’ve also heard from smaller operations—particularly in the Northeast, where labor is especially tight—where this approach is genuinely impractical. The separated stress calendar requires scheduling flexibility that not every operation has.

And that’s okay. Not every intervention works for every farm.

What Implementation Actually Looks Like

The operations I’ve spoken with that have successfully adopted systems-based approaches share a common thread: they didn’t try to change everything at once. That seems to be the critical success factor.

A Phased Approach

Months 1-2: Establish measurement baseline and address substrate

  • Lock in ingredient specifications with your feed supplier
  • Begin rigorous daily measurement—fecal scores, intake tracking, treatment records
  • Expected outcome: Modest improvement in consistency; proof of concept that builds confidence for next steps

Months 3-4: Optimize milk program

  • Transition to all-milk protein if appropriate for your operation and budget
  • Evaluate milk allowance; the research increasingly favors higher volumes in early life
  • Expected outcome: Improved pre-weaning growth and intake stability

Months 5-6: Implement stress calendar

  • Separate management procedures where labor and facilities allow
  • This is the “free” intervention—no additional cost, just scheduling discipline
  • Expected outcome: Reduced weaning dip severity and faster recovery

Months 7+: Layer in stage-matched probiotics

  • Add appropriate formulations to milk replacer and starter
  • Expected outcome: Further optimization of gut development and immune function

Research consistently shows that sequencing matters when implementing these changes. Layering probiotics onto an unstable nutritional foundation often produces disappointing results. The operations seeing the best outcomes start by stabilizing their feed program, then build additional interventions on that foundation.

That’s advice worth taking seriously. The producers who struggle with this approach are usually the ones who tried to implement everything simultaneously and couldn’t tell what was working.

Honest Talk About Economics

Let me lay out the math as clearly as I can, with the caveat that these figures will vary based on your specific situation, region, and current market conditions.

Investment Breakdown (Per Calf Estimates)

ComponentEstimated RangeNotes
Substrate consistency premium (Calf Starter with fixed formulation)$8-12Quality-controlled, specification-guaranteed ingredients
Milk program optimization$5-12All-milk protein and/or increased volume
Stage-matched probioticsVaries by programIntestine-phase and rumen-phase formulations; get specific quotes based on your feeding rates
Stress calendar implementation$0Labor reallocation only
Total InvestmentVariesDepends on baseline program and scope of changes
Potential Long-term Return+350 kg first-lactation milkPer heifer kept healthy through weaning (Svensson & Hultgren research)

What the Research Suggests You Might Get Back

  • Reduced treatment costs: Often in the $15-25 per calf for operations with high baseline disease incidence
  • Labor savings from fewer sick calves: Variable but meaningful for operations currently spending significant time on treatments
  • Improved growth trajectory affecting age at first calving (AFC): This is the big variable, and honestly, the hardest to pin down precisely

The age-at-first-calving benefit is where the math gets compelling—or speculative, depending on your perspective. If improved early-life health allows you to gain 30 -60 days on AFC and you’re spending $2.50-3.00 per day to raise a heifer (a reasonable estimate for many operations), you’re looking at meaningful savings per animal.

The timing challenge: You invest in month one. You might see reduced treatments by month two. But the AFC benefit doesn’t materialize for 18-24 months. That requires patience and cash flow that not every operation has, especially in tight milk price environments.

As dairy economists frequently point out, the ROI is real, but the payback period tests most producers’ patience and cash flow.

Who This Works For—And Who It Doesn’t

Let me be direct about something the advocates for systems-based calf programs don’t always acknowledge: this approach isn’t right for every operation. Understanding that might save you time and money.

It likely makes sense if:

  • You’re experiencing persistent calf health challenges—say, diarrhea incidence above 25% or respiratory disease above 15%
  • You have the management bandwidth for more rigorous protocols and measurement
  • Your cash flow can absorb increased upfront costs for 6-12 months without strain
  • You’re tracking lifetime performance and can actually measure long-term returns
  • You’re raising your own replacements and capturing the downstream value

It may not make sense if:

  • Your current calf program is already performing reasonably well (if it ain’t broke…)
  • Labor constraints make separated stress events genuinely impractical
  • You’re operating on thin margins that can’t absorb any additional costs right now
  • You’re selling calves rather than raising replacements—someone else captures the long-term value

Paul Rapnicki, DVM, who has extensive experience consulting with dairies across the Midwest, puts it this way: “I’ve seen operations transform their calf programs with this approach. I’ve also seen operations spend money on premium ingredients and probiotics while ignoring basic management—clean water, dry bedding, adequate ventilation. The fancy stuff doesn’t fix the fundamentals.”

That’s worth remembering. Before you invest in stage-matched probiotics and specification-guaranteed molasses, make sure your calves have clean, dry housing and fresh water available at all times. Get the basics right first.

Practical Takeaways

For producers considering a more systematic approach to calf gut health, here’s what seems to matter most:

Start with measurement. You can’t improve what you don’t track. Daily fecal scoring, intake monitoring, and treatment records create the baseline you need to evaluate any intervention. Without data, you’re just guessing—and guessing gets expensive.

Fix one thing at a time. The phased implementation approach isn’t just about budget management—it lets you identify what’s actually working. Change everything at once, and you’ll never know what made the difference. You’ll also have nowhere to go if something doesn’t work.

Respect the stress calendar. Of all the interventions discussed here, separating management stressors has clear research support and zero additional cost. If you do nothing else, consider this. It’s the closest thing to a free lunch in calf management.

Be realistic about timelines. The full benefit of optimized early-life nutrition takes 18-24 months to materialize. Plan accordingly and ensure your operation can sustain the approach long enough to see results. Starting and stopping is worse than not starting at all.

Talk to your nutritionist. The research on substrate consistency and stage-matched probiotics is interesting, but the application depends on your specific operation. A good nutritionist can help evaluate whether changes make sense for your situation—and which changes to prioritize given your current performance and constraints.

The Bottom Line

Your calves don’t care about tradition, and they don’t care about how busy you are. They only reflect the system you build for them.

Stop treating the weaning dip as a mystery and start treating it as a management decision. The research is clear: early-life gut health programs and lifetime performance. The tools exist. The question is whether you’re willing to invest in month one for returns that show up in year two.

For some operations, the answer is yes—and they’re seeing the results. For others, the timing isn’t right, and that’s a legitimate business decision too.

But don’t let inertia make the choice for you. Run the numbers for your operation. Talk to your nutritionist. Look at your treatment records from last year.

Then decide deliberately.

KEY TAKEAWAYS

  • One week of scours = 350 kg less milk in first lactation — The cost is invisible for two years, but the research is clear: early-life gut health programs lifetime productivity
  • The weaning dip is a management decision, not inevitable — Outcomes trace back to nutrition and timing choices made weeks before weaning begins
  • Ingredient consistency may matter more than ingredient cost — Rumen bacteria are substrate-specific; least-cost formulations that shift with commodity markets create ongoing microbial disruption
  • Separate your stressors—it’s free — Spacing dehorning, weaning, and vaccination prevents compounding immune suppression; it’s the closest thing to a free lunch in calf management
  • This approach isn’t right for every operation — If your current program performs well or you’re selling calves rather than raising replacements, the investment may not pay back for your situation

EXECUTIVE SUMMARY

The weaning dip isn’t bad luck—it’s a management decision. Research confirms that calves experiencing diarrhea or respiratory disease in their first month lose 340-350 kg of milk production in the first lactation, a penalty that stays hidden for two years but compounds across your herd. This feature examines why some operations are rethinking calf nutrition entirely: stabilizing feed ingredients to support rumen microbial development, matching probiotic strategies to different gut environments, and separating management stressors from weaning. One intervention—the stress calendar—costs nothing beyond scheduling discipline, and producers report meaningful reductions in post-weaning respiratory disease. The full approach requires patience; ROI takes 18-24 months to materialize and depends on your baseline performance. For operations already running successful calf programs, the investment may not pencil out. But for those watching the same health patterns repeat season after season, this research offers something more valuable than another treatment protocol: a different set of decisions to make.

Complete references and supporting documentation are available upon request by contacting the editorial team at editor@thebullvine.com.

Learn More

The Sunday Read Dairy Professionals Don’t Skip.

Every week, thousands of producers, breeders, and industry insiders open Bullvine Weekly for genetics insights, market shifts, and profit strategies they won’t find anywhere else. One email. Five minutes. Smarter decisions all week.
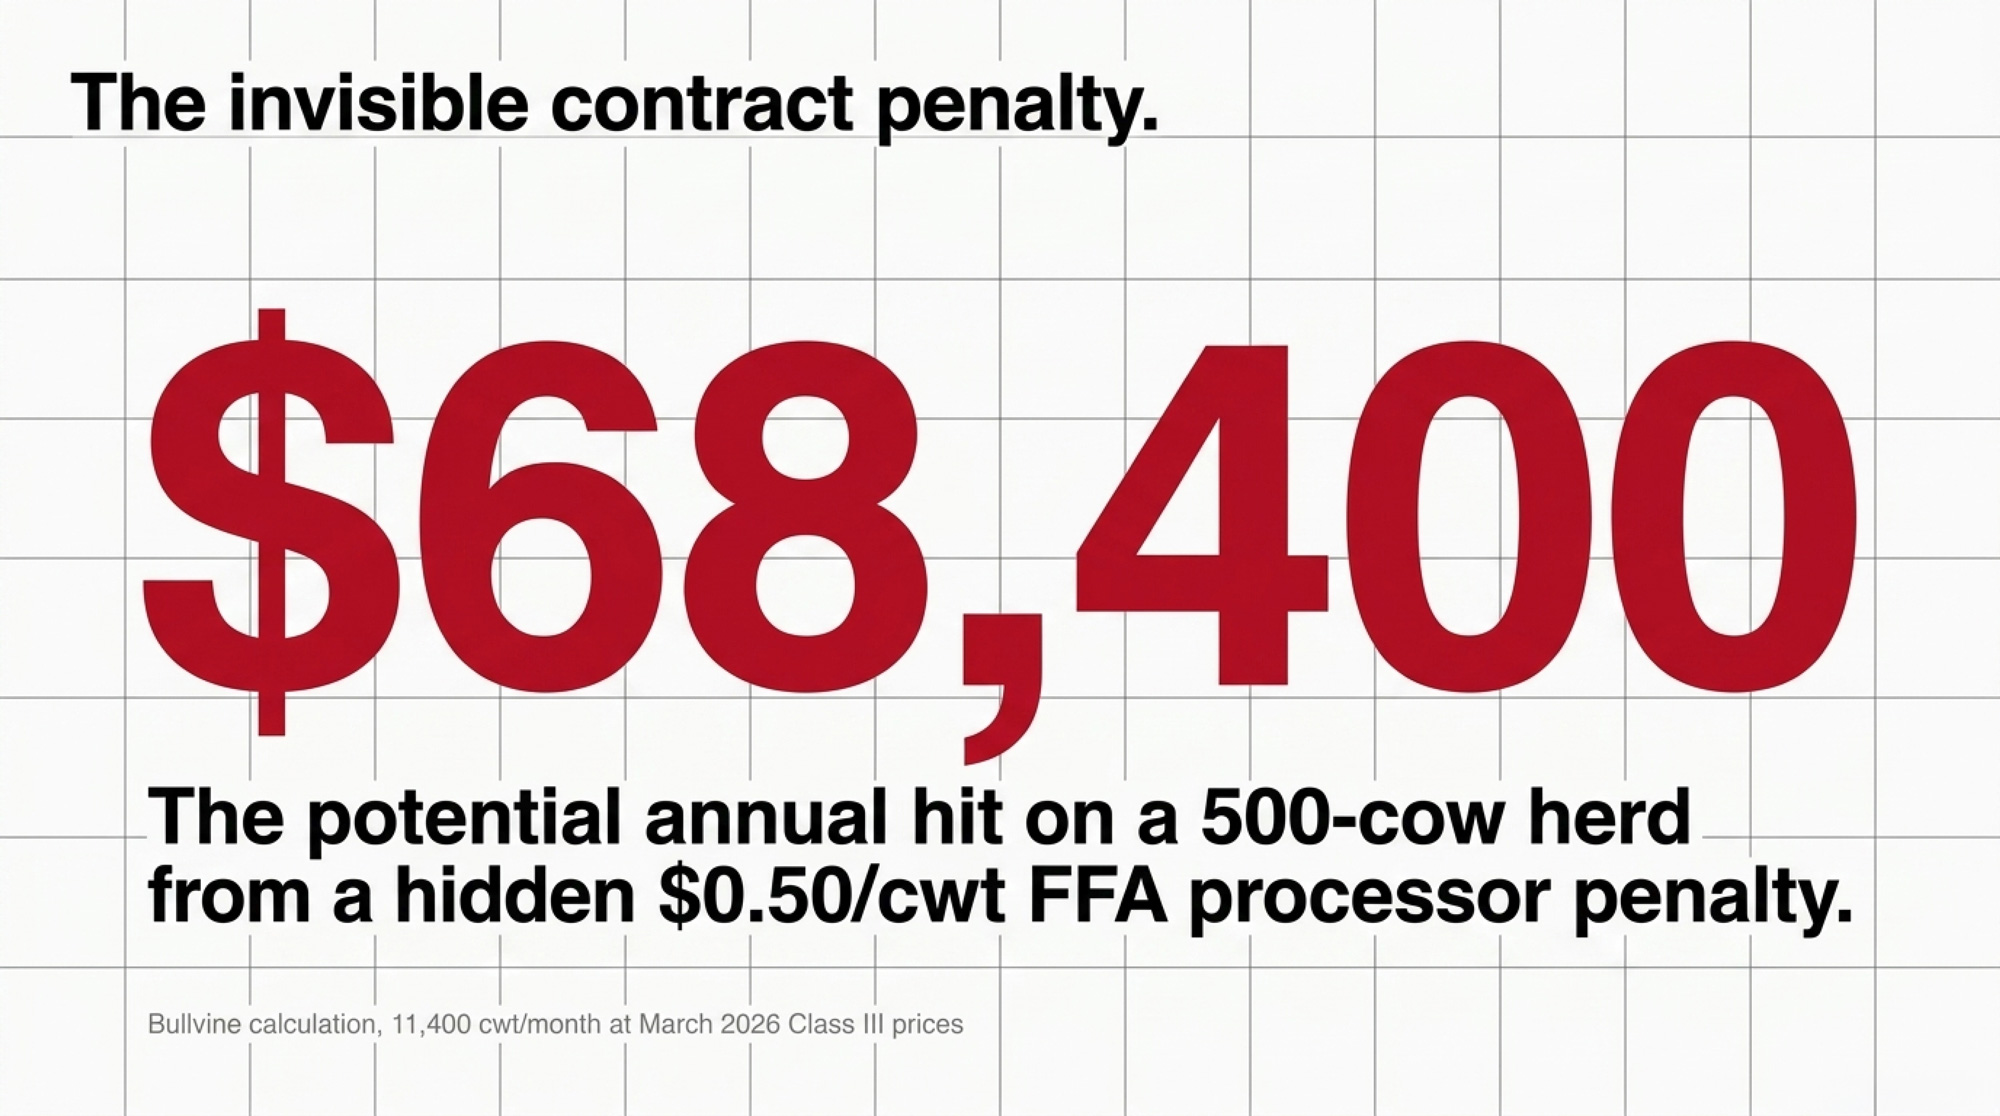
NewsSubscribe
First
Last
Consent

One Acre, One Cow, $0.65 a Day: MSU’s High‑Oleic Soybean Playbook for 5‑ to 6‑Figure Dairy Margin Gains in 2026

$18 milk in 2026. T&H Dairy hit $0.65/cow/day with high-oleic soy—$118K/year on 500 cows. One acre feeds one cow. How does your fat spend compare?

Executive Summary: USDA’s January 2026 outlook drops the U.S. all‑milk price forecast to about $18.25/cwt, which makes every extra $0.30–$0.60/cow/day in margin a survival number, not a bonus. New Michigan State University research shows high‑oleic soybeans can deliver that kind of lift, with modeled IOFC gains of $0.27/cow/day when purchased roasted and about $0.65/cow/day when farms grow and roast their own beans, and roughly one acre of high‑oleic soy feeding one lactating cow for a year. T&H Dairy in Michigan is already seeing 4–5 pounds more fat‑corrected milk, 0.15–0.20 points more butterfat, and about $0.65/cow/day in IOFC at 7.5–8 pounds of roasted beans, which works out to around $118,600 a year on 500 cows and well into six figures on larger herds. United Soybean Board data adds crop‑side upside, with high‑oleic contracts across 16 states paying $0.75–$1.25/bu (and in some cases around $2.20/bu) over commodity beans—roughly $40–70/acre extra at typical yields before those beans ever hit the bunk. The article makes the case that high‑oleic soybeans are a serious 2026 fat tool—not a magic bullet—and walks owners and managers through a three‑path playbook (move now, plan a pilot, or watch and wait) plus a simple checklist to decide whether their acres, bins, and fat bill justify turning high‑oleic into part of their long‑term margin strategy.

Here’s what’s really going on. USDA’s January 2026 Livestock, Dairy, and Poultry Outlook pegs the 2026 U.S. all‑milk price at about $18.25 per hundredweight, down from a forecast of over $21 for 2025.  At the same time, Class III futures are sitting down in the mid‑$16s, which is exactly the gap The Bullvine flagged earlier this month as a $150,000‑plus budgeting problem for a 300‑cow herd if you bet on the wrong number. 

On paper, that 2026 downgrade doesn’t look dramatic. In the real world—spread across 200, 500, or 1,500 cows—it’s the difference between sleeping at night and explaining to your lender why your cash flow projections missed by six figures.

What’s interesting right now is that Michigan State University’s work with high‑oleic soybeans says farms that grow and roast their own beans are seeing about $0.65 per cow per day in extra income over feed cost, while farms buying roasted beans are still picking up around $0.27 per cow per day.  At the feeding rates MSU is using, one acre of high‑oleic soybeans can cover one lactating cow’s needs for a full year, which suddenly makes your soybean acres feel a lot closer to your milk cheque than they did five years ago. 

The real question isn’t “Are high‑oleic soybeans magic?” It’s whether your acres, your ration, and your infrastructure give you a realistic shot at turning this into repeatable dollars instead of one more “great idea” that never quite pencils out on your farm.

Looking at This Trend: What’s Actually Different in the Fat?

Let’s start where your nutritionist will start: the fat profile.

According to Michigan State University Extension’s 2025 “High‑oleic, high reward” analysis, typical commodity soybean oil is about 23% oleic acid and 50–54% linoleic acid.  That big linoleic fraction is exactly why most nutritionists start putting on the brakes when they see a lot of whole beans show up in the diet—linoleic is more prone to producing rumen biohydrogenation intermediates that can chip away at butterfat performance when you push too hard. 

Fatty Acid ComponentCommodity Soybeans (%)Plenish® High-Oleic (%)SOYLEIC® Non-GMO (%)
Oleic Acid2375–8078–84
Linoleic Acid50–544–76–8
Crude Fat (approx.)~20~21~20–21
Crude Protein (approx.)~38~38–39~38–39

High‑oleic soybeans flip that around. MSU Extension reports that Plenish® high‑oleic soybeans usually test about 75–80% oleic acid and only 4–7% linoleic acid, while non‑GMO SOYLEIC® lines often run 78–84% oleic and 6–8% linoleic.  The crude fat and protein values still look like soybean values. What’s changed is the fatty acid mix. 

That shift matters because it changes how the cow sees the ration. With more oleic and less linoleic in the diet, you can bring more energy in through soybeans without taking the same butterfat punch you’d expect from piling on commodity beans or other high‑linoleic fats—if you actually rebalance starch and fiber instead of just “adding a little more.”

Dr. Adam Lock, professor of dairy nutrition at MSU and head of the Dairy Lipids Nutrition Program, has spent much of his career looking at how different fatty acids—palmitic, oleic, and others—shift milk yield, component percentages, body condition, and income over feed cost.  A 2025 summary of his high‑oleic work noted that increasing oleic while trimming palmitic in fat supplements boosted milk components and total production, especially in high‑producing cows, when the rest of the ration was in good shape. 

Penn State research led by Dr. Alexander Hristov found that feeding Plenish high‑oleic soybeans and extruded high‑oleic soybean meal increased milk fat percentage by about 0.2 points with minimal change in milk volume or dry matter intake.  MSU’s more recent trials with roasted high‑oleic soybeans, highlighted by Extension in 2025, saw milk yield climb at inclusion rates around 16% of ration dry matter while holding milk fat steady—as long as starch and fiber were managed sensibly. 

From a fresh cow and whole‑herd ration standpoint, that’s a very different lever than just writing another cheque for bypass fat and hoping your butterfat hangs on.

Inside MSU’s New Dairy: Where the Big Questions Are Being Tested

Looking at this trend from the research side, MSU didn’t just tweak a few diets on a small research herd and call it a day. They built a full‑scale commercial‑style test dairy to figure out what happens when you really lean into high‑oleic and related changes.

The new MSU Dairy Cattle Teaching and Research Center is a roughly $70 million facility, with about 40% of that funding provided by the State of Michigan.  The barn is set up to house about 680–688 cows—more than triple the old MSU dairy—and uses tunnel‑ventilated freestall housing that looks a lot like the modern freestall and dry lot systems you see across the Upper Midwest. 

Dr. Barry Bradford, Chair of Dairy Management at MSU, has been pretty blunt about the main question they’re chasing: if more of your diet’s energy comes from high‑oleic soybeans and other targeted fats, what does that do to the “right” level of starch that many herds locked in 15–20 years ago in the corn‑silage‑plus‑commodity‑co‑products era?  In a January 2026 Brownfield interview, he talked about going back to first principles on starch levels instead of assuming yesterday’s numbers automatically fit tomorrow’s fatty acid profiles. 

To do that, MSU invested about $1 million in individual robotic feeding stations that record dry matter intake cow‑by‑cow, rather than relying on pen averages.  The new dairy and its connected greenhouse complex are expected to host around 10,000 visitors a year—students, industry, and consumers—so people can see what a data‑heavy, commercially styled research herd actually looks like. 

Producers tend to trust research more when the barn in the photos looks like theirs. In this case, we’re not talking about 40 cows in tie‑stalls; we’re talking hundreds of cows in group housing on rations that wouldn’t look out of place on a 500‑ or 1,500‑cow operation. That makes MSU’s high‑oleic work a lot easier to take seriously when you’re sitting down with your own feed sheets.

What Producers Are Actually Seeing: From “Trial” to “System” on a Michigan Dairy

Research is great. Cash flow is better. Let’s talk about what’s happening on the ground.

T&H Dairy: Turning Beans into Butterfat and IOFC

T&H Dairy, run by Mike Halfman and his family near Fowler, Michigan, milks roughly 1,600 cows and farms about 4,400 acres of corn, alfalfa, wheat, and soybeans.  For a long time, soybeans were just another cash crop disappearing into the commodity stream. 

In 2024, they changed gears. T&H planted about 900 acres of high‑oleic soybeans and contracted another 300 acreswith a neighbour, with the specific goal of roasting the beans and feeding them to their high‑producing cows.  According to MSU Extension’s 2025 profile, they started cautiously at around 3 pounds of roasted high‑oleic soybeans per cow per day. At that level, they saw 2–3 pounds more milk per cow per day, but butterfat percentage stayed pretty flat. 

Once they installed on‑farm roasting and pushed inclusion to roughly 7.5–8 pounds of roasted high‑oleic soybeans per cow per day in their top groups, the response shifted. Halfman reports that fat‑corrected milk jumped by more than 4–5 pounds per cow per day, and butterfat percentage improved by around 0.15–0.20 points.  That lines up almost exactly with the 0.2‑point milk fat increase Hristov documented at Penn State with high‑oleic diets. 

On the economics, MSU’s modeling across several case farms—including operations like T&H—found that dairies producing and roasting their own high‑oleic soybeans saw an average income‑over‑feed‑cost (IOFC) advantage of about $0.65 per cow per day.  Farms that didn’t grow beans but bought roasted high‑oleic product still saw modeled IOFC advantages around $0.27 per cow per day

The Michigan Alliance for Animal Agriculture (M‑AAA), which is co‑funding this work, points to a southwest Michigan dairy that pulled out expensive bypass fats and proteins as they ramped up high‑oleic beans and ended up north of $1.00–1.20 per cow per day in IOFC improvement.  One of the owners told MSU that they normally celebrate 5–6 cents per cow per day, so they called this “a once‑in‑a‑generation change.” 

Let’s be honest: not every herd is going to hit $1.20. But when multiple well‑documented farms consistently land in the $0.27–$0.65 range—and a few blow past that when they really redesign the ration—that’s not just coffee‑shop talk anymore.

Where the Acres and Premiums Actually Are

All that IOFC talk falls apart if the crop piece doesn’t hold.

The United Soybean Board’s May 2025 high‑oleic briefing reports that farmers in 16 U.S. states planted more than 1.1 million acres of high‑oleic soybeans in 2023 and around 800,000 acres in 2024.  That 2024 drop wasn’t because crushers lost interest; USB and MSU both point to seed availability and contracting capacity as the main bottlenecks. 

USB notes that in 2024, growers had access to 21 high‑oleic varieties across the Plenish® and SOYLEIC® programs, covering maturity groups 1.9-4.8.  That covers a big chunk of the traditional soybean belt, with new maturities being developed for shorter‑season northern regions. 

On pricing, USB says high‑oleic growers typically earn premiums of $0.75–1.25 per bushel over commodity beans, depending on contract and delivery terms.  Brownfield Ag News and USB farmer‑leaders have highlighted cases like Indiana farmer Kevin Wilson, a USB director, who’s reported cash premiums around $2.20 per bushel on his high‑oleic contracts with ADM for recent crops. 

If you match those premiums with USDA‑reported average U.S. soybean yields around 50–55 bushels per acre, you’re realistically talking about $40–70 per acre in extra crop revenue before you feed anything.  Then, if those beans roll through your roaster and displace purchased fats and proteins in the ration at a profit, that same acre is effectively getting paid twice: once at the elevator and once at the bunk. 

Brownfield’s 2025 coverage quoted USB treasurer Matt Gast saying roughly 35% of high‑oleic beans are now heading into dairy rations, about 60% into food, and the remaining 5% into industrial uses.  So dairy isn’t an afterthought in this market. We’re a major end user. 

Agronomics and Defensive Traits: Are You Sacrificing Yield?

Whenever somebody says “specialty crop,” most growers quietly translate that to “yield drag” unless they see evidence otherwise.

USB and partner organizations have been clear that high‑oleic traits are being stacked on elite yield and defensive backgrounds, not on leftover genetics.  Corteva’s Plenish® beans, for example, commonly carry soybean cyst nematode resistance, Phytophthora tolerance, and the Enlist E3 herbicide trait, giving you access to modern weed control and disease packages you’d expect from top‑end commercial beans.  On the non‑GMO side, SOYLEIC® varieties developed by Missouri Soybeans and programs in states like Georgia are being stacked with resistance to SCN, root‑knot nematode, and frogeye leaf spot. 

MSU Extension points out that from an agronomy standpoint, the day‑to‑day management of high‑oleic beans looks a whole lot like conventional soybeans, aside from the identity‑preserved handling and any herbicide restrictions tied to specific trait packages.  You still have to match maturity, disease package, and herbicide system to your fields—the same homework you should already be doing with commodity beans. 

From yield reports and field experience shared through USB and state soybean groups, high‑oleic beans can run with strong commodity lines when you put them on appropriate ground and treat them like serious production varieties rather than side projects.  Are there weak performers out there? Of course. But “high‑oleic” does not automatically mean “yield anchor”

The Catch: Identity Preservation and the Work Between the Drill and the Roaster

Here’s the part that looks great on slides and then blows up in the yard if you’re not careful: identity preservation.

High‑oleic beans are almost always grown under identity‑preserved (IP) contracts, because crushers and end users have to know they’re actually getting the fatty acid profile they’re paying for, not a blend of whatever fell into the bin.  That makes your planting, harvesting, hauling, and storage plan part of the value chain, not an afterthought. 

USSEC’s High Oleic Sourcing Guide lays out the basics: clean planters, combines, grain carts, augers, and bins thoroughly when you switch between commodity and high‑oleic beans; keep high‑oleic lots segregated; and track beans from field to bin to delivery.  Soy Canada’s identity preservation resources add the same themes—clear bin labeling, separate handling lines, and documented flows—based on decades of non‑GMO and food‑grade experience. 

Wisconsin Extension adds a very practical farm‑gate layer: mark high‑oleic fields clearly, make sure custom operators know which fields are IP and what herbicide system they’re in, and don’t send a combine into those fields with commodity beans still in the hopper from yesterday’s job. 

If your plan is to “sprinkle on a few beans” and call it good, you’re not going to see MSU‑level responses. If nobody on your team owns the IP details—bins, augers, cleaning, record‑keeping—high‑oleic will be a headache long before it becomes a margin tool.

On the flip side, if you’re already handling non‑GMO or food‑grade grain streams, most of this will feel like structured discipline you already understand, with a different premium and trait stack attached. Even if your primary goal is feeding your own cows, commingling still matters. If your nutritionist is formulating around high‑oleic fatty acid profiles but the bin is half commodity beans, you can’t expect butterfat performance or IOFC to match the research.

The High‑Oleic Math: From Acres to Cows to IOFC

Now for the part you can actually plug into your budget.

MSU’s 2025 Extension work, supported by the Michigan Alliance for Animal Agriculture, modeled two main scenarios using real farm performance data and realistic feed costs: 

  • Farms producing and roasting their own high‑oleic soybeans saw an average IOFC advantage of about $0.65 per cow per day.
  • Farms purchasing roasted high‑oleic soybeans saw an average IOFC advantage of about $0.27 per cow per day.

At the inclusion rates and yields MSU is working with, one acre of high‑oleic soybeans can supply enough beans to feed one lactating cow for a full year, assuming on‑farm roasting and feeding patterns similar to the case farms. 

Here’s how that IOFC advantage plays out across different herd sizes:

Herd sizeIOFC +$0.27/cow/dayIOFC +$0.65/cow/day
200 cows≈ $19,700/year≈ $47,500/year
500 cows≈ $49,300/year≈ $118,600/year
1,500 cows≈ $147,900/year≈ $355,900/year

Those are straight annualizations of MSU’s IOFC averages, not “best barn at the meeting” numbers. 

On the crop side, USB’s premium range of $0.75–1.25 per bushel, combined with 50–55 bushel per acre yields, points to around $40–70 per acre extra crop revenue before you feed anything.  In some contracts, like the ADM deals highlighted by Brownfield and USB farmer‑leaders, premiums up near $2.20 per bushel have been reported, which pushes those crop‑side gains higher when conditions line up. 

What producers are finding is that the biggest wins show up when:

  • High‑oleic acres are reasonably close to the dairy, keeping transport sane.
  • The ration has a meaningful purchased fat and “fancy ingredient” line item that you can actually replace.
  • There are enough cows to spread roasting and IP overhead, so it doesn’t feel like a science fair project.

If your purchased fat and specialty ingredient line is already north of about $0.40 per cow per day, and you can realistically commit 0.5–1 acre of soybeans per cow into high‑oleic over the next couple of years, you’re in the zone where this deserves serious, numbers‑on‑paper attention. 

Three Paths: Move Now, Plan a Pilot, or Watch and Wait

Decision FactorMove Now FarmsPlan & Pilot FarmsWatch & Wait Farms
Herd Size300+ cows, or 200+ with flexibility200–400 cows, moderate flexibility<200 cows, or grazing-dominant systems
Soybean Acreage & Fat SpendGrow soybeans; >$0.40/cow/day purchased fat spendSome soybean acres; modest fat spendLittle to no soybean acres; minimal purchased fat
InfrastructureBins, augers for IP handling; access to roasterBins/augers with planning; may need upgradesNo grain infrastructure or not scalable for IP
2026 ActionSit with nutritionist on IOFC scenarios; contract high-oleic; pilot 90 daysCommit 0.3–0.5 acres/cow to pilot; run “what-if” scenarios; track pilot resultsMonitor university work, regional Extension updates, co-op messaging; revisit in 2027–2028
Expected IOFC Gain$0.27–$0.65/cow/day (basis: buy vs. produce)$0.15–$0.50/cow/day (conservative, pilot-stage)Deferred; focus on other margin levers now
Next StepSchedule call with nutritionist + elevator; list candidate fats to displaceDesign a small-group pilot on fresh pen or high group; define tracking metricsAssess forage, fresh cow transition, SCC; revisit high-oleic in 2027

Looking at this trend with both optimism and a bit of healthy skepticism, most herds fall into one of three buckets.

1. “Move in the Next 12 Months” Farms

You’re probably in this group if:

  • You milk 300+ cows and already grow soybeans, or could easily partner to hit 0.5–1 acre per cow in high‑oleic.
  • Your ration includes purchased bypass fat, palm fat, or other high‑priced energy sources you’d love to cut back on.
  • You have—or could add—storage and handling to keep an identity‑preserved stream separate.
  • You either have reliable access to a custom roaster or can justify investing in on‑farm roasting equipment.

For you, the next moves aren’t “order some seed and see what happens.” They’re:

  • Sit down with your nutritionist and list exactly which fats and supplements you’d pull at 3–4 pounds and then at 7–8 pounds of roasted high‑oleic soybeans per cow per day.
  • Have them show you IOFC projections on paper using MSU’s $0.27 and $0.65 per cow per day ranges as bookends, plugged into your component prices and ingredient costs. 
  • Call your elevators or processors and get specific: which high‑oleic contracts exist, their maturities, premiums, delivery windows, and the penalties if loads miss specs. 
  • Walk your grain system and decide which bins and augers will actually carry the high‑oleic stream, who cleans them, and who signs off.

If your nutritionist can’t show you, in numbers, how high‑oleic beans would displace existing fats and supplements in a way that adds up, you’re not ready to shift acres. If they can, you’re a strong candidate for a 90‑day high‑oleic feeding trial as soon as beans and roasting are lined up.

2. “Plan and Pilot” Farms

You’re in this lane if:

  • You milk 200–400 cows and have some soybean acres, but you don’t have endless flexibility.
  • Your ration uses some supplemental fat, but you’re not chasing 100‑lb tanks.
  • You have bins and handling that could manage an IP stream, but only with planning and maybe a couple of modest upgrades.

For you, 2026–2027 probably looks like:

  • Committing a modest amount of high‑oleic acres—say 0.3–0.5 acres per cow—aimed at a specific high group or fresh pen, rather than the whole herd.
  • Using MSU’s IOFC estimates as realistic boundaries: $0.27 per cow per day if you’re buying roasted product, $0.65 if you end up producing and roasting your own. 
  • Running “what‑if” scenarios with your advisor: what happens if butterfat price softens from today’s levels? What if you only capture half the modeled IOFC bump, or if premiums slide toward the low end of USB’s range? 
  • Treating year one as a structured pilot with defined rations, groups, and tracking, not a casual “we tried some beans one month and didn’t see anything dramatic.”

Your goal isn’t to redesign your entire feed system overnight. It’s to get your own data—on your cows, your acres, and your premiums—so if margins tighten more, you’re making decisions with real numbers instead of guesses.

3. “Watch and Wait” Farms

You’re probably here if:

  • You run a grazing‑dominant or seasonal system with relatively low concentrate feeding.
  • You don’t grow soybeans and don’t have bins or grain handling set up for IP crops.
  • Your current ration uses little to no purchased fat, so there’s not much displacement value to capture.

For you, the smartest move may be to stay informed rather than jump in. That can look like:

  • Keeping an eye on MSU and other university work on fatty acids and high‑oleic, plus your regional Extension updates on feed costs and butterfat premiums. 
  • Hammering out lower‑cost wins closer to home—fresh cow transitions, forage quality, milking routine, SCC—before you commit to a specialty ingredient with IP requirements.
  • Watching how your co‑op or processors evolve component pricing and whether they start hinting at “diet‑friendly” fat programs or call out high‑oleic in their own messaging. 
  • Re‑evaluating high‑oleic in a couple of years, when seed availability, contract options, and case studies will all be deeper.

You don’t lose ground by waiting thoughtfully if your system doesn’t have the acres, bins, or fat spend to make this pay right now.

A Quick “What This Means for Your Operation” Checklist

Before you sign anything—or blow it off—run through this with your team:

  • Crops: How many acres can we realistically move into high‑oleic without starving our corn silage and forage program?
  • Fat spend: What did we actually spend last year on bypass fats, palm products, and other specialty energy sources on a $/cow/day basis?
  • Contracts: What specific high‑oleic contracts exist in our trucking radius—premiums, maturities, delivery windows, quality specs, and penalties if we miss them? 
  • Infrastructure: Do we have bins and augers that can be dedicated to an identity‑preserved stream, and what would it cost—in time and money—to properly clean and separate? 
  • Ownership: Who on our team is going to “own” the high‑oleic/IP system day‑to‑day so it doesn’t become everybody’s job and therefore nobody’s job?

If you can’t answer those questions yet, that’s your next step. Not ordering seed. Not pricing roasters. Clarity.

Stepping Back: A New Fat Tool in a Tough 2026 World

Stepping back from all the charts and quotes, high‑oleic soybeans are best viewed as a new fat tool, not a magic button. They give you a way to bring more energy—and a more butterfat‑friendly fatty acid profile—into the ration from your own acres, especially if you’re already cutting big cheques for purchased fats.

The combination of:

  • USDA’s 2026 price outlook is pointing to tighter margins, 
  • MSU’s full‑scale dairy research with individual intake data, 
  • USB’s long‑term investment in high‑oleic traits and premiums, 
  • And real‑farm experience from herds like T&H and other Michigan dairies, 

means this is not just a shiny idea in a conference slide deck.

At the same time, the IP discipline, seed and contract access, storage needs, and scale realities mean high‑oleic beans won’t be the right play for every operation in 2026. Canadian quota and butterfat pool rules, EU Green Deal pressures, and pasture‑based systems in places like New Zealand all shape different price signals and contract structures, even if the underlying IOFC and fatty acid logic stay the same. 

So what should you actually do with this?

  • First, pull last year’s fat and supplement bills and run the IOFC scenarios—$0.27 and $0.65 per cow per day—on your actual herd size. 
  • Second, ask your nutritionist to design a 90‑day high‑oleic trial that truly replaces purchased fats and proteins, not just sprinkles beans on top of an unchanged ration. 
  • Third, talk to your elevator or processor about real, not hypothetical, high‑oleic contracts—what’s on offer, what they expect, and how they fit with your harvest and storage realities. 

You don’t have to chase every new trait or every new feed idea that shows up in a slide deck. But if your acres, ration, and fat bill line up with what MSU and USB are seeing, ignoring high‑oleic soybeans completely could mean leaving serious five‑ or even six‑figure money on the table every year. In a world where USDA is talking $18‑milk, and some regional Class III projections are hovering near $16, that’s not a side note.  That’s a strategic decision. 

Key Takeaways

  • 2026 margins leave no room for fluff. USDA’s $18.25/cwt all-milk forecast means a $0.30–$0.65/cow/day IOFC gain isn’t a bonus—it’s survival math.
  • One acre of high-oleic soy feeds one cow for a year. MSU’s modeling shows $0.65/cow/day IOFC gains for farms that grow and roast their own beans—roughly $118,600/year on 500 cows.
  • T&H Dairy in Michigan is already banking results: 4–5 lbs more fat-corrected milk and 0.15–0.20 points higher butterfat at 7.5–8 lbs of roasted high-oleic beans per cow per day. ​
  • Your soybean acres can pay you twice. High-oleic contracts add $0.75–$1.25/bu over commodity beans ($40–70/acre extra at typical yields)—then those same beans boost IOFC in the bunk.
  • High-oleic is a system, not a sprinkle. It only works with IP handling, dedicated bins, roasting, and real ration changes. The article’s three-path playbook (move now, plan a pilot, or watch and wait) helps you decide if your farm is ready.

Complete references and supporting documentation are available upon request by contacting the editorial team at editor@thebullvine.com.

Learn More

The Sunday Read Dairy Professionals Don’t Skip.

Every week, thousands of producers, breeders, and industry insiders open Bullvine Weekly for genetics insights, market shifts, and profit strategies they won’t find anywhere else. One email. Five minutes. Smarter decisions all week.
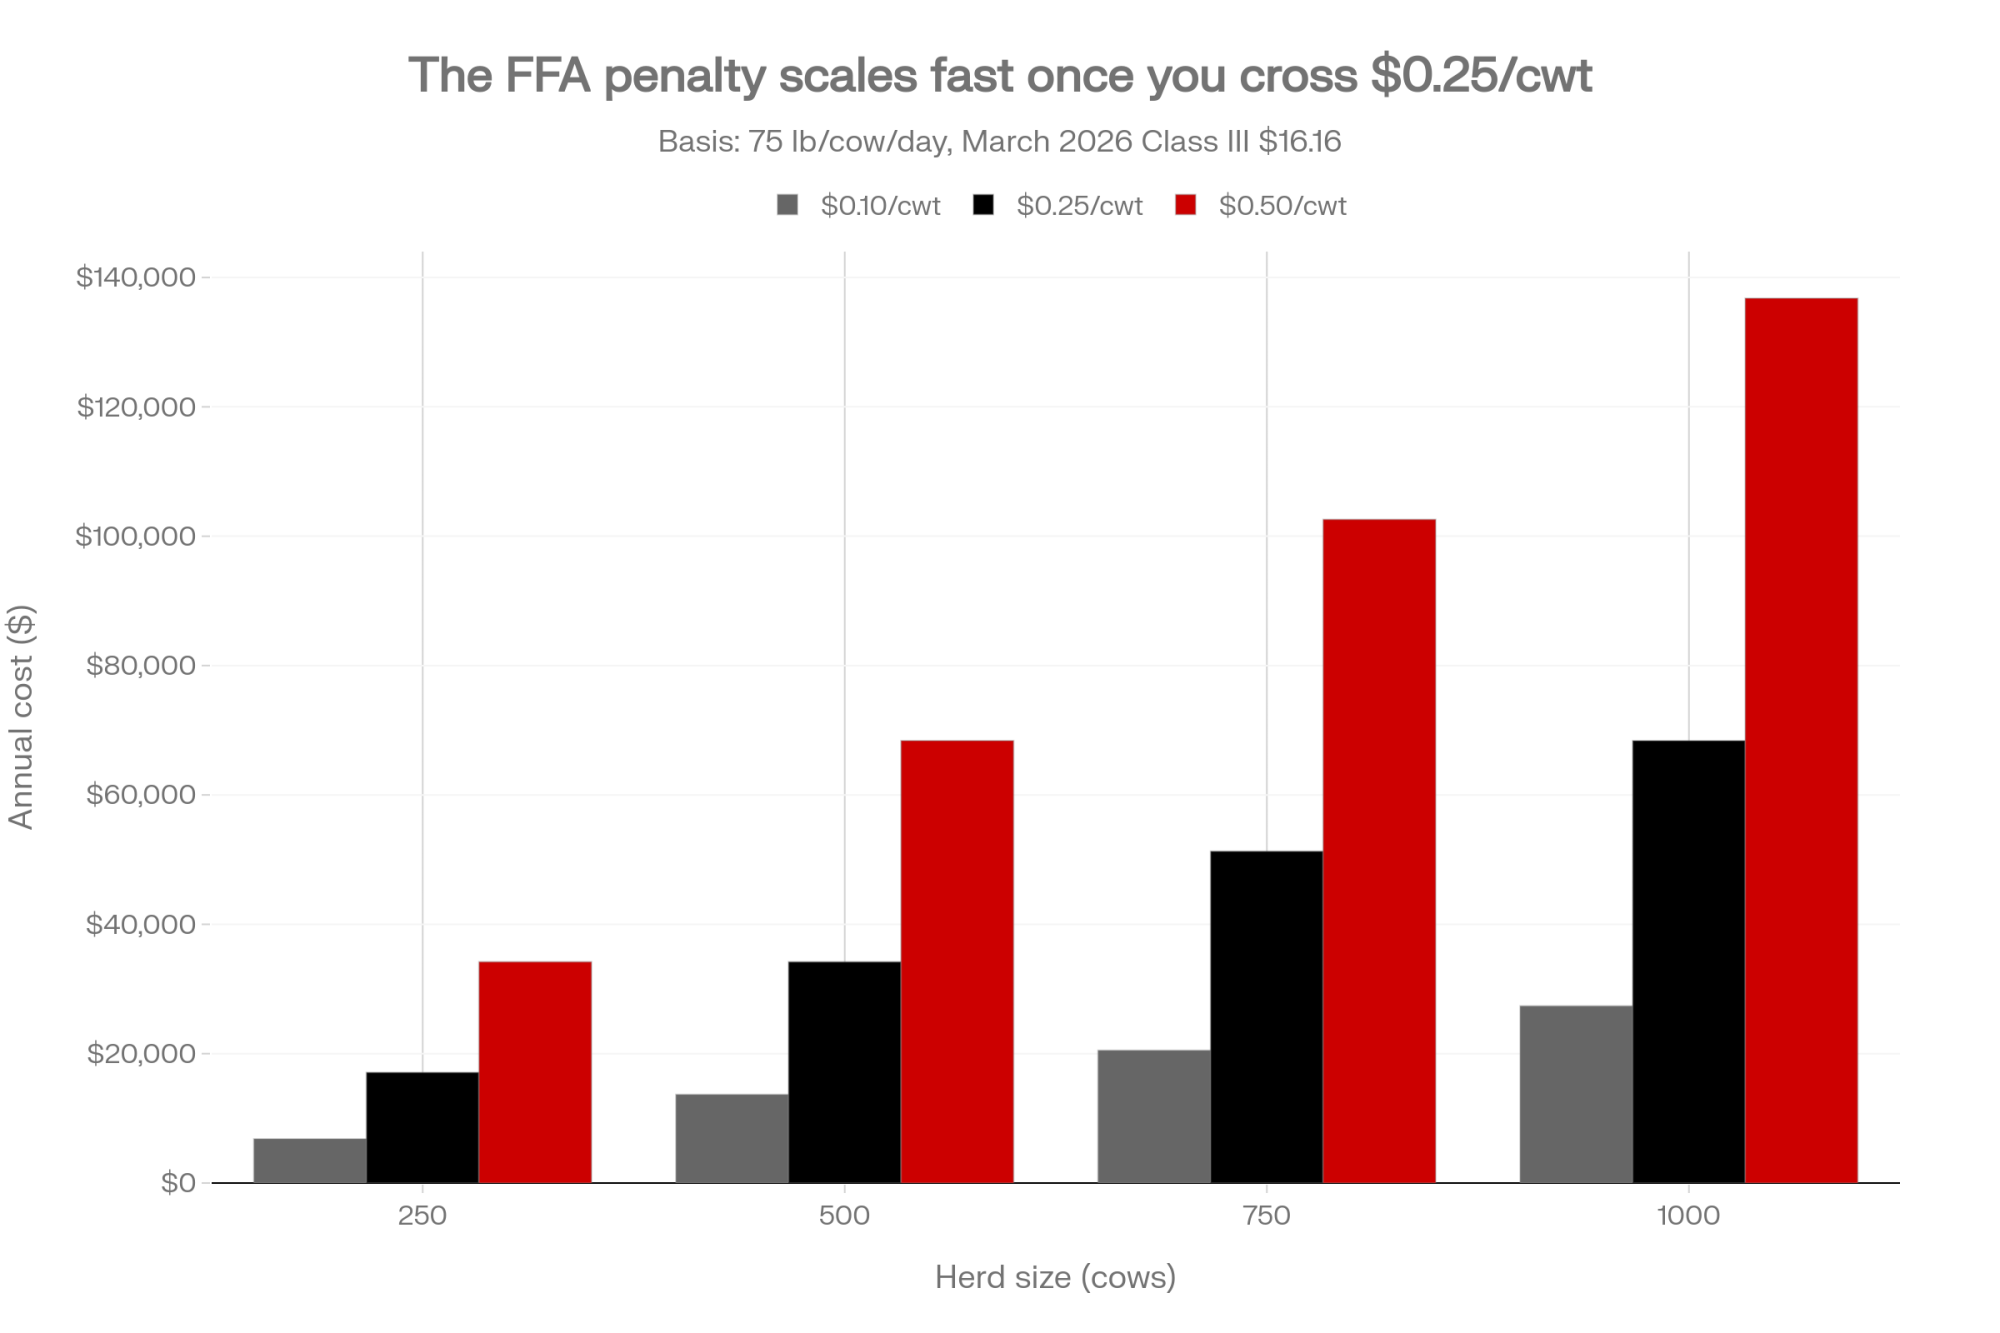
NewsSubscribe
First
Last
Consent

Unlock $700 Per Cow: The Rumen Microbiome Strategy That Fixes Hidden Feed Efficiency Losses.

$700/cow is hiding in your bunk. Weekend feed drift, DM swings, and sorting are quietly stealing it. Here’s the four-phase fix.

Sit at enough kitchen tables across dairy country, and you start hearing the same line in different accents.

“We’ve got good cows. The ration looks right on paper. But the milk just isn’t where it should be.”

You know that feeling. The ration balances, butterfat performance ought to be stronger, you’ve invested in genetics and decent forage… and the bulk tank still isn’t telling the story you’d expect.

What’s interesting here is that, in the last few years, some very solid research has started to put a name and a number on part of that gap: the rumen microbiome, and how stable—or unstable—we make it with day‑to‑day management, not just with what we put in the mixer.

A 2024 paper in Animal Microbiome, led by H.F. Monteiro at the University of California, Davis, used an AI‑based ensemble model on 454 genotyped Holsteins from commercial herds in the U.S. and Canada and found that the rumen microbiome alone accounted for about 36% of the variation in residual feed intake (RFI), even after diet composition and cow traits were accounted for. The authors described the microbiome as a “major driver” of feed efficiency, sitting alongside ration and genetics rather than behind them. That lines up with other work showing that when you follow Holstein cows across a full lactation, the composition of the rumen and lower‑gut microbiomes tracks closely with feed efficiency and production traits, and the prediction of efficient versus inefficient cows improves when microbiome data is added to diet and genetic information. 

On top of that, newer host–microbiome projects—such as the 2024 “host genome–microbiome networks” study on mid‑lactation Holsteins—are showing that parts of the core rumen microbiome are heritable and linked to both feed efficiency and methane output. In other words, the cow’s genome and her microbial passengers are working together to shape how she uses feed and what comes out the front of the tank and out the back as gas. 

So we’re not throwing out ration formulation or genetics. But the data suggests the microbiome is a third leg of the stool. And, as many of us have seen in the barn, those bugs are very sensitive to how consistent their world is. 

Looking at This Trend: What the Bugs Are Quietly Telling Us

What I’ve found, looking at this research alongside what producers are seeing on their own farms, is that microbiome‑first thinking mostly backs up what good cow people have been saying for years. It just gives those instincts a clearer scientific backbone. 

You probably know this already, but the rumen community isn’t one thing. Reviews of how the rumen microbiota shifts from the dry period into early lactation show a fairly consistent pattern: bacteria that specialize in rapidly fermentable carbohydrates tend to increase as starch and sugars rise, while classic fibrolytic species such as Fibrobacter and Ruminococcus are more sensitive to drops in rumen pH and rough dietary changes. When the feeding environment is steady—similar ration, predictable feeding and push‑up times, consistent dry matter—those different groups can settle into a balance that supports both butterfat performance and feed efficiency. When we keep changing the rules on them, the fast opportunists win more often, and the slower fiber‑digesters get pushed back. 

And as many of us have seen, that can show up as:

  • Butterfat levels are bouncing more than the diet changes would suggest
  • Fresh cows in the transition period that don’t ramp up on dry matter intake the way we’d expect based on the ration
  • More days where rumination, manure consistency, and overall cow behavior feel “off,” even though nothing obvious changed on paper

It’s worth noting that when you line up the science with on‑farm experience, three everyday management areas keep coming up as the main microbiome disrupters: feed timing and access, TMR dry matter, and particle size/sorting

Let’s walk through each one, because that’s where a lot of the opportunity is hiding.

Feed Timing and Access: The “Saturday Morning” Problem

Looking at this trend on real farms, feed timing and access are usually the first places where the microbiome story becomes very concrete.

In many Wisconsin freestall herds—and plenty of Ontario, New York, and Pennsylvania barns too—the weekday schedule on paper looks quite good. Feed at 6 a.m., push up several times in the next few hours, second feeding mid‑afternoon, a couple more push‑ups before night. Then Saturday and Sunday arrive. That 6 a.m. feeding quietly becomes 6:30 or 7:00, the early‑morning routine gets “flexible,” and late‑night push‑ups happen only if there’s time. I’ve noticed that pattern over and over, sitting in farm kitchens from the Midwest to the Northeast.

On larger Western dairies in California or Idaho, the pattern can be different, but the result is similar. You might have multiple feeding crews, and one crew is very tight on timing while another is a bit looser. To the cows—and to their microbes—that still feels like an irregular routine. 

Penn State’s “Benefits of Timely Feed Delivery and Push Ups,” written by extension educator Dr. Virginia Ishler and colleagues, brings together several studies that quantify what many of you have already felt. In their summary of work by Collings et al. and Matzke & Grant, cows that were restricted from feed for about ten hours—typically overnight—ate 3.5 pounds less dry matter per day and produced 7.9 pounds less milk per day than cows that had feed available throughout the night. A Dairy Herd article by Penn State educator Michal Lunak echoes those numbers and adds that herds routinely pushing feed up produced, on average, over eight pounds more milk than herds that didn’t. 

When feeding and push‑up practices were adjusted so that feed remained available from midnight to early morning and was pushed up more consistently, dry matter intake and milk yield increased, and cows spent more time both lying and eating. Penn State also highlights that bunk empty time should be kept under about three hours; beyond that, cows’ motivation to eat rises sharply, and they’re more prone to slug‑feeding when feed returns. 

From the microbial side, what’s happening is intuitive once you think about it. When cows go through long stretches with an empty bunk, they’re more likely to slug‑feed when the TMR finally arrives—packing in a big meal quickly. That dumps a heavy load of fermentable carbohydrate into the rumen all at once, causing rumen pH to drop more sharply and the slower fiber‑digesting microbes to get stressed or washed out. In herds that have taken the time to log feed delivery and push‑up times (some have done this with simple charts or camera snapshots), those longer gaps—especially on weekends—often match up with the days when butterfat drops and fat: protein ratios point toward subacute acidosis. 

There’s also a broader transition‑cow angle. Work on transition cow nutrition in North American herds has shown that more consistent routines around the dry and fresh periods—fewer abrupt diet changes, grouping, and environmental shocks—are associated with better metabolic profiles and stronger early lactation performance. Feeding schedule is one of the major “time cues” the cow’s system responds to. The microbes, even though they don’t have watches, are reacting to the same pattern. 

So one of the first microbiome‑friendly questions to ask is very simple: “How long are my cows actually going without feed they can reach?” Penn State emphasizes that bunks should not be empty for more than about three hours, and that more frequent push‑ups in the first hours after feeding are strongly associated with higher DMI and milk yield. The microbiome is one more good reason to take that seriously. 

TMR Dry Matter: The Quiet Thief in the Bunker

The second lever, TMR dry matter, is one of those things that quietly steals profit when no one’s looking.

Penn State’s “Total Mixed Rations for Dairy Cows,” by Dr. Virginia Ishler and the dairy nutrition team, spells out how changes in TMR dry matter affect what cows actually eat. When a TMR gets wetter but batch weights don’t change, cows fill up on volume but take in fewer kilograms of dry matter than the ration assumes they will. The bulletin shows farms where actual DMI drifts away from predicted intake as TMR moisture changes, and notes that herds that keep actual DMI within about 5% of expected intakes—and pay close attention to TMR accuracy—consistently achieve higher milk and more stable components than herds where DMI and TMR DM are rarely checked. 

Industry pieces on TMR moisture, including extension articles and dairy nutrition case reports, have shown that when TMR moisture comes in higher than expected, and no one adjusts, early‑lactation cows can lose several percent of their DMI and a few kilograms of milk per day until someone finally tests dry matter and corrects the ration. Many of you have lived that scenario: “Nothing changed… except we opened a new corner of the bunker or switched bags and didn’t test.” 

From the microbiome’s point of view, those moisture swings do two things at once:

  • On wetter days, cows reach rumen fill sooner and don’t get the expected dry matter. Passage rate increases, long fiber particles spend less time in the rumen, and fiber‑digesting bacteria have less chance to colonize and break them down. 
  • On drier days, the same volume of TMR carries more dry matter and more fermentable energy, so the fermentation runs “hotter” and rumen pH can dip more sharply, again putting pressure on the fiber‑digesting community. 

What farmers are finding is that you don’t have to nail TMR dry matter at one exact number. But you do want to keep day‑to‑day changes in a reasonable band and adjust batch weights when moisture moves outside that band. Many Midwest and Northeast herds now do at least one or two TMR dry matter checks a week, more often when they start a new section of bunker or change forage sources, and they treat it as part of routine bunk and fresh cow management rather than just troubleshooting. 

The evidence suggests that habit alone can prevent many “mystery” weeks in which milk and components slip for reasons nobody can quite explain until someone dusts off the Koster tester. 

Particle Size and Sorting: Three Rations in One Bunk

The third piece is particle size and sorting—the classic “three rations in one bunk” problem that shows up on farms of all sizes.

After feeding a TMR, it’s common to walk the bunk an hour later and see a line of longer stems pushed out of the way while the finer material has been cleaned up. By early afternoon, cows are picking over what’s left, and what’s left doesn’t look much like the ration the nutritionist balanced. I’ve noticed that on everything from 80‑cow tiestalls to 4,000‑cow freestall barns.

The Penn State Particle Separator (PSPS) has become a standard tool for seeing what’s really happening. For many corn‑silage‑based rations, Penn State guidance suggests that only about 2–8% of the TMR should remain on the top sieve, roughly 30–50% on the next sieve, 10–20% on the 4 mm sieve, and no more than 30–40% in the bottom pan for high‑producing cows. Hoard’s articles on ration particle size have highlighted research showing that diets with overly long particles and high undigested NDF reduced DMI by 5–6 pounds per day, and that finer chopping and better PSPS distributions restored DMI and milk yield. 

When a TMR has too much long material on that top sieve, cows can sort around it. They end up eating a diet richer in starch and poorer in effective fiber than intended. Industry articles and extension pieces have repeatedly called out that gap between the “paper ration” and the “eaten ration” as a major driver of inconsistent butterfat performance and subacute rumen acidosis, even when the formulation itself looks sound. 

From a microbiome perspective, heavy sorting means you’re constantly pushing the rumen community toward the organisms that thrive on rapidly fermentable carbohydrates, while making life harder for the slower, fiber‑digesting bacteria that underpin fiber utilization and rumen health. 

What’s encouraging is that producers in very different environments—freestall barns in Ontario, tiestalls in Quebec, and dry lot systems in hot regions—have all reported improvements after making particle size checks and bunk observations a regular habit. Running the separator weekly for a period, adjusting chop length and mixing time, and watching what’s left at the bunk an hour after feeding are simple, practical tools that align very well with what the bugs seem to be asking for. 

Management GapWhat HappensMilk Loss per Cow/DayButterfat ImpactAnnual Cost per 1,000 Cows
10-Hour Overnight Feed RestrictionCows slug-feed; rumen pH crashes; fiber-digesting microbes washed out−7.9 lbs−0.4% (subacute acidosis)$1,153,600
TMR Dry Matter Drift (+2–3 points)Cows fill on volume but get fewer kg DM; passage rate increases; fiber digestion drops−3.5 to −5 lbs−0.2–0.3%$510,500–$728,750
Excessive Sorting (Long particles, fine refusal)Cows select around fiber, eating richer diet; slow fiber-digesters starved out−5 to −6 lbs−0.5–0.7% (fat:protein inversion)$728,750–$876,900
All Three Combined (Common State)Microbes destabilized; rumen environment chaotic; fresh cows struggle to ramp intake−14 to −16 lbs−1.0–1.5%$2,044,000–$2,332,000

What Farmers Are Finding: A Four‑Phase Plan That Fits Real Herds

So with all that on the table, the natural question is: how do you actually use this microbiome‑first lens on your own farm?

What I’ve noticed, talking with producers from Wisconsin, Ontario, the Northeast, and the West, is that the herds getting the most from this approach tend to move through four broad phases. They don’t always call them phases, but the progression shows up again and again, and it lines up nicely with what extension and research folks are seeing. 

Phase 1: Tighten Timing and Feed Access

Phase 1 is about getting honest about feed access.

A straightforward starting point looks like this:

  • For two weeks, write down when feed really hits each group and when it’s last pushed up at night. Don’t rely on memory. Include weekends and holidays. 
  • Look for recurring long gaps—especially overnight—where cows don’t have feed in front of them or can’t reach it.
  • Given your labor and layout, decide what’s realistic in terms of extra push‑ups, an automatic feed pusher, or improved hand‑offs between shifts to shorten those gaps.

Penn State’s work and related industry articles have shown that when cows move from long overnight feed restrictions to continuous access, dry matter intake and milk yield increase in ways that match the 3.5 lb DMI and 7.9 lb milk responses measured when feed is restricted versus available overnight. In a microbiome‑first mindset, you’re reducing the size and frequency of the shocks the microbial community has to deal with each day. 

Phase 2: Tune Up the Physical Ration

Once cows can depend on there being feed in front of them most of the time, Phase 2 is about what that feed looks like physically.

On farms where this has really moved the needle, Phase 2 typically includes:

  • Running the Penn State Particle Separator on the TMR weekly for a period and working with the nutritionist and forage team to adjust chop length, kernel processing, and mixing until the ration consistently falls into the recommended PSPS distributions for your forage mix.
  • Spending time at the bunk 45–60 minutes after feeding, especially in fresh and high pens, to see how much sorting is actually happening and what is left in front of the cows. 
  • Watching kernel processing scores for corn silage and keeping an eye on haylage or straw length to avoid overloading the top sieve and inviting sorting. 

The goal is a ration that’s chewable but not easily sorted. Research and field experience both show that when you hit that sweet spot, you see more consistent chewing, better saliva production, smoother manure, and more stable butterfat performance. 

Phase 3: Make Dry Matter Checking Routine

By the time herds get to Phase 3, many notice they’re not seeing as many “mystery” swings in milk and components. Phase 3 is about turning TMR dry matter checks into a standard part of bunk management.

In practical terms, that often means:

  • Testing TMR dry matter at set times each week—often early and late in the week. 
  • Logging those numbers so you and your nutritionist can track when moisture shifts as you move along the bunker or between forage sources.
  • Agreeing on a simple trigger—such as a two‑point or greater difference between actual and assumed TMR dry matter—that prompts ration adjustments rather than “wait and see.”

Penn State’s TMR bulletin and related herd‑level analyses suggest that farms with tighter control over TMR dry matter and loading accuracy see higher milk yield and more consistent components than those where dry matter is rarely checked. For the microbiome, this kind of consistency means fewer sudden jumps in fermentable load and a more predictable environment in which to work. 

Phase 4: Use Additives to Fine‑Tune, Not Patch

Only after those three pieces feel reasonably solid does it make sense to lean into live yeast, buffers, and other additives.

The research on live Saccharomyces cerevisiae in dairy cows brings several themes together:

  • In transition‑cow trials, such as those led by Marinho and colleagues, supplementing live yeast around calving improved postpartum dry matter intake and rumination, led to milder inflammatory and liver stress markers, and increased milk yield compared with unsupplemented cows on the same base ration. 
  • Reviews and industry summaries that pool results from multiple mid‑lactation trials often report milk yield gains in the range of 1–2 kilograms per day and more stable rumen pH when live yeast is added, particularly in herds with solid basic management. 
  • Under heat-stress conditions, especially in hot, dry regions, live yeast has been shown to help stabilize rumen pH and support production when combined with effective cooling and feeding strategies. 

At the same time, extension and university reviews are clear that additives cannot overcome fundamental problems such as poor forage quality, erratic feeding schedules, or severe overcrowding. In many commercial herds, responses to yeast and buffers are variable, and benefits tend to be largest where the basics are already in decent shape. 

In a microbiome‑aware framework, that means treating additives as a way to fine‑tune a system that’s already working reasonably well, rather than as a band‑aid for underlying management issues.

Putting Numbers to the Four Phases: The Economics on a 1,000‑Cow Herd

So why is all this significant? Economics plays a big part in the story.

Imagine a 1,000‑cow freestall herd with:

  • Average production is around 38–39 kilograms (about 85 pounds) of milk
  • Butterfat at roughly 3.2% and protein just over 3.1%
  • Dry matter intake near 25 kilograms (55 pounds) per cow per day
  • Milk price is around $0.40 per kilogram, and feed cost is roughly $0.20 per kilogram of dry matter

Those numbers won’t fit every farm, but they’re realistic for many North American herds right now based on recent Hoard’s Dairyman economic analyses and regional milk price reports. 

If Phase 1—tightening feeding times and improving access—helps you realistically recover around 0.75–0.8 kilograms of milk per cow per day by eliminating long overnight feed gaps (a conservative figure compared to the 7.9 lb milk response Penn State reports when cows move from restricted to continuous night access), that’s roughly $0.30–0.35 per cow per day. Over a year and 1,000 cows, you’re looking at about $110,000–120,000 in additional milk revenue. 

If Phase 2—getting particle size and sorting under control—adds another 1.3–1.4 kilograms of milk per cow per day and nudges butterfat up a bit, that can easily translate into a couple of hundred thousand dollars a year in combined volume and component pay, depending on your milk pricing and how much room there was for improvement. That’s consistent with the kind of DMI and milk yield recoveries seen when rations shift from “too long and sorted” toward better PSPS targets and reduced excessively long particles. 

Phase 3—keeping TMR dry matter in line with regular checks and adjustments—might reasonably prevent a 0.5–0.6 kilogram per cow per day loss during those weeks when moisture shifts used to drag DMI and milk down quietly. Extension examples and field data show that even modest, unnoticed drops in DMI from dry matter changes can add up to tens of thousands of dollars per year on larger herds. 

Then, in Phase 4, if a well‑designed live yeast program on top of this more stable foundation adds another 0.7–0.8 kilograms of milk per cow per day in the pens you target—figures that fall within the 1–2 kg/day range often reported when live yeast is used in well‑managed herds—then after covering product cost you might realistically net on the order of $50,000 per year. 

Put those pieces together, and it’s not hard to model a total improvement on the order of $500,000–700,000 per year for a 1,000‑cow herd. On a per‑cow basis, that’s about $500–700. Early indications from extension economic estimates and field experience suggest that those kinds of gains are achievable in herds with significant room to tighten timing, dry matter control, and sorting—provided they treat this as a stepwise management project rather than a quick fix. 

Even if you only capture half of that modeled upside, you’re still talking about a six‑figure swing in annual income on a 1,000‑cow unit. That’s the kind of math that justifies taking a hard look at your feeding routine, DM checks, and PSPS readings.

Of course, if your feeding program is already very tight, your upside may be smaller. And if other bottlenecks like lameness, poor ventilation, water limitations, or chronic fresh cow problems are holding cows back, those will cap how much any microbiome‑focused approach can deliver until they’re addressed. 

Looking a bit further ahead, this development suggests that herds that get serious about microbiome‑aware management now may also be better positioned for future shifts in breeding goals and processor expectations—especially as more emphasis is placed on feed efficiency and methane in proofs, and as sustainability programs look more closely at emissions and feed conversion. 

How This Plays Out on Different Types of Farms

It’s also important to note that microbiome‑aware management doesn’t look the same in every system. The principles are the same; the levers change.

Smaller Family Herds

On a 120‑cow tie‑stall in Quebec or a 200‑cow freestall in Wisconsin, the total dollar amount won’t be as large as on a 1,000‑cow dairy, but the per‑cow impact can look very similar. Many of these farms have a key advantage: the people making decisions are the ones feeding cows and walking the alley every day, so they notice subtle changes quickly. 

The constraint is usually time. One person may be handling feeding, milking, fresh cow management, and fieldwork. On these operations, the most successful microbiome‑aware changes are often:

  • Keeping feed times reasonably consistent every day, including weekends
  • Adding a simple weekly TMR or key forage dry matter check, rather than trying to test constantly
  • Using the particle separator at least occasionally to see whether sorting might be part of why butterfat performance is more variable than expected

Additives like live yeast or buffers are often targeted at small groups—such as fresh cows during the transition period or high‑risk pens—where the return is easiest to see and monitor. 

Grazing and Seasonal Systems

In grazing and seasonal systems—such as many in Atlantic Canada, parts of the Northeast, Ireland, and New Zealand—the basic microbial principles remain the same, but the feeding context differs.

Instead of asking, “When does the TMR arrive?” the questions sound more like:

  • “How consistent are turnout times onto fresh pasture?”
  • “Are parlor concentrates or supplementary TMR fed at predictable times and rates?”
  • “Are we giving fresh cows enough time to adapt when moving from a winter ration to lush spring grass?”

Pasture‑based management guides and research reviews emphasize that consistent grazing rotations, careful pasture dry matter measurement, and smooth transitions between conserved feed and pasture are critical for avoiding digestive upsets and performance drops. In these systems, a microbiome‑aware approach often leads to more deliberate use of fiber sources or buffers alongside high‑sugar grass, and particular attention to fresh cow management so the rumen isn’t shocked by abrupt diet changes. 

Hot, Dry Regions and Dry Lot Systems

In hot, dry regions—such as parts of California, Arizona, and Texas—dry lot systems under high temperature‑humidity index conditions add heat stress to the rumen‑stability conversation. Research and field observations show that heat stress depresses intake, alters rumen fermentation (more acid load, lower pH), and can reduce fiber digestibility, making the rumen more fragile. 

On those dairies, producers who are thinking in microbiome terms often work on three fronts at once:

  • Feeding more of the ration during cooler times of day so cows actually feel like eating
  • Making sure shade, fans, and soakers are set up and managed so cows can stay comfortable enough to use the feed that’s in front of them
  • Using live yeast and buffers strategically, once cooling and feeding basics are in place, to help stabilize rumen pH and fermentation under heat stress

Industry sources have reported that, under those conditions, live yeast can provide a positive return when it’s part of a broader heat‑stress management package, not a stand‑alone solution. 

Farm TypeHerd SizeKey Implementation FocusPrimary Labor BarrierRealistic Annual Gain per CowTotal Herd Annual Gain
Tie-Stall Family120–200 cowsConsistent daily feeding times; weekly DM test; occasional PSPSSingle operator doing feeding + milking + fieldwork; weekends are tight$250–350 per cow$30,000–$70,000
Smaller Freestall300–500 cows2–3 week DM checks; PSPS quarterly; better push-up routine with existing crewHand-offs between shifts; weekend consistency$350–450 per cow$105,000–$225,000
Mid-Size Freestall800–1,200 cowsFull four-phase playbook; weekly DM; PSPS monthly; automatic feed pusher ROI positiveCrew discipline on timing; shift management$450–550 per cow$360,000–$660,000
Dry Lot & Hot Climate2,000–8,000 cowsPhase 1 (timing) + heat-stress additives; cooler-hour feeding; aggressive yeast useCooling infrastructure consistency; feed crew schedule discipline$300–400 per cow (capped by heat stress)$600,000–$3,200,000
Grazing/Seasonal80–300 cows (milk + calf)Pasture turnout timing consistency; transition management (winter→spring); forage DM variabilitySeasonal labor shifts; pasture readiness unpredictability$180–280 per cow$14,400–$84,000

Where Microbiome‑First Efforts Can Go Off Track

As promising as this way of thinking is, it’s not a magic wand. There are a few common ways it can go sideways.

One is partial implementation. If a herd tightens up feeding times but leaves a very sortable ration unchanged, cows may simply eat more of the fast‑fermenting portion of the diet more consistently. In the short term, that can actually increase the risk of rumen acidosis rather than reduce it, which aligns with PSPS‑based research and field reports showing that excessively long particles encourage sorting. 

Another is overestimating labor capacity. On many family farms, it’s simply not realistic to add frequent night push‑ups and multiple TMR dry matter tests per week. Extension advisers often recommend starting with one or two high‑impact changes—like a weekly DM check and better weekend feeding consistency—that everyone believes can be sustained. 

A third is expecting additives to solve structural issues. In herds where forage quality is poor, dry cow and fresh cow housing are limiting, or stocking density is excessive, yeast and buffers might help at the margins, but they won’t turn the situation around on their own. Reviews of direct‑fed microbials and buffers emphasize that these tools complement, but cannot replace, sound ration formulation, forage management, and cow comfort. 

So while the microbiome lens is very useful, it’s healthiest to treat it as a way to prioritize and sharpen management decisions, not as a replacement for the fundamentals.

A Practical Starting Checklist

If we were wrapping this up over coffee in your farm office, here’s the simple checklist I’d leave on the table:

  • Log what really happens. For two weeks, write down actual feed delivery and push‑up times by group, including weekends and holidays. Let those numbers—not memory—show where the biggest gaps are. 
  • Watch the bunk after feeding. Stand at the bunk 45–60 minutes after a TMR delivery. What are cows doing? What’s left on the bunk? If you can borrow or buy a particle separator, run both fresh TMR and refusals at least once to see how much the ration changes between wagon and cow. 
  • Add one dry matter check to your week. Pick a day each week to test TMR dry matter and compare it to the value in your ration program. Talk with your nutritionist about adjusting when the difference becomes large enough to matter for DMI. 
  • Use pen‑level data as an early warning. Look at fat: protein ratios, rumination indices (if you have monitors), and manure scores by group. Treat changes there as early hints that the rumen—and the bugs—may not be as stable as you’d like. 
  • Put additives in their proper place. Once timing, TMR structure, and dry matter are under reasonable control, then sit down with your nutritionist to design a focused, time‑limited trial with yeast or buffers in specific pens, rather than making a blanket change and hoping for the best. 

The Bottom Line

At the end of the day, we’re not just feeding cows. We’re managing microbial ecosystems that live inside those cows and turn this season’s feed bill into next month’s milk cheque. 

What’s encouraging is that many of the things those microbes seem to like—steady routines, consistent dry matter, well‑structured rations, thoughtful fresh cow management—line up closely with what good producers have been working toward for a long time. The microbiome‑first perspective doesn’t throw any of that out. It simply connects the “why” and the “how much” in a way that helps you decide where your next management tweak should be, whether you’re milking 80 cows in a tie stall or 8,000 cows in a dry lot system. 

KEY TAKEAWAYS

  • The rumen microbiome drives 36% of feed efficiency—manage it or lose it. A 2024 AI study on 454 Holsteins found microbiome composition rivals genetics and diet in determining which cows convert feed to milk efficiently.
  • Three bunk-management gaps are quietly draining your tank. Weekend feed-time drift, unnoticed TMR dry matter shifts, and sortable rations cost pounds of DMI and milk every single day—often without any obvious ration change.
  • A 10-hour feed gap costs 3.5 lb DMI and 7.9 lb milk per cow per day. Penn State data shows that fixing overnight access alone can recover much of that loss. Bunks should never sit empty for more than three hours.
  • Additives can’t fix bad timing or a sortable ration. Follow the four-phase playbook: tighten feed delivery and push-ups first, tune particle size with the PSPS, make weekly DM checks routine, then use live yeast to fine-tune—not to patch.
  • The math: $500–700 per cow per year. Stack those four phases on a 1,000-cow herd, and you’re looking at $500,000–700,000 in recoverable margin. Even capturing half changes your year.

Executive Summary: 

If your ration looks right but the bulk tank keeps coming up short, this article explains why the missing piece may be your cows’ rumen microbiome—and how you manage the bunk around it. It starts with new AI‑based research showing the rumen microbiome accounts for roughly 36% of residual feed intake variation in Holsteins, then ties that directly to three daily levers you control: feed timing and access, TMR dry matter, and particle size/sorting. Using Penn State data, it quantifies how 10‑hour overnight feed gaps, unnoticed TMR moisture shifts, and highly sortable rations can quietly cost 3.5 lb of DMI and 7–8 lb of milk per cow per day—even in herds that think they’re “feeding well.” From there, it lays out a four‑phase, microbiome‑aware playbook: tighten feeding schedules and push‑ups, get the physical ration right with the PSPS, make routine DM checks part of bunk management, then use live yeast and buffers as fine‑tuning tools instead of expensive band‑aids. A realistic 1,000‑cow example shows how stacking those phases can unlock about $500–700 per cow per year—$500,000–700,000 across the herd—if you’re starting from the “common” level of drift in timing, DM, and sorting. Finally, the article shows how this approach scales from 80‑cow tiestalls to 8,000‑cow dry lot systems, with a simple checklist you can use to pick your first one or two changes and start turning microbiome theory into extra dollars on your milk cheque. ​

Complete references and supporting documentation are available upon request by contacting the editorial team at editor@thebullvine.com.

Learn More

The Sunday Read Dairy Professionals Don’t Skip.

Every week, thousands of producers, breeders, and industry insiders open Bullvine Weekly for genetics insights, market shifts, and profit strategies they won’t find anywhere else. One email. Five minutes. Smarter decisions all week.
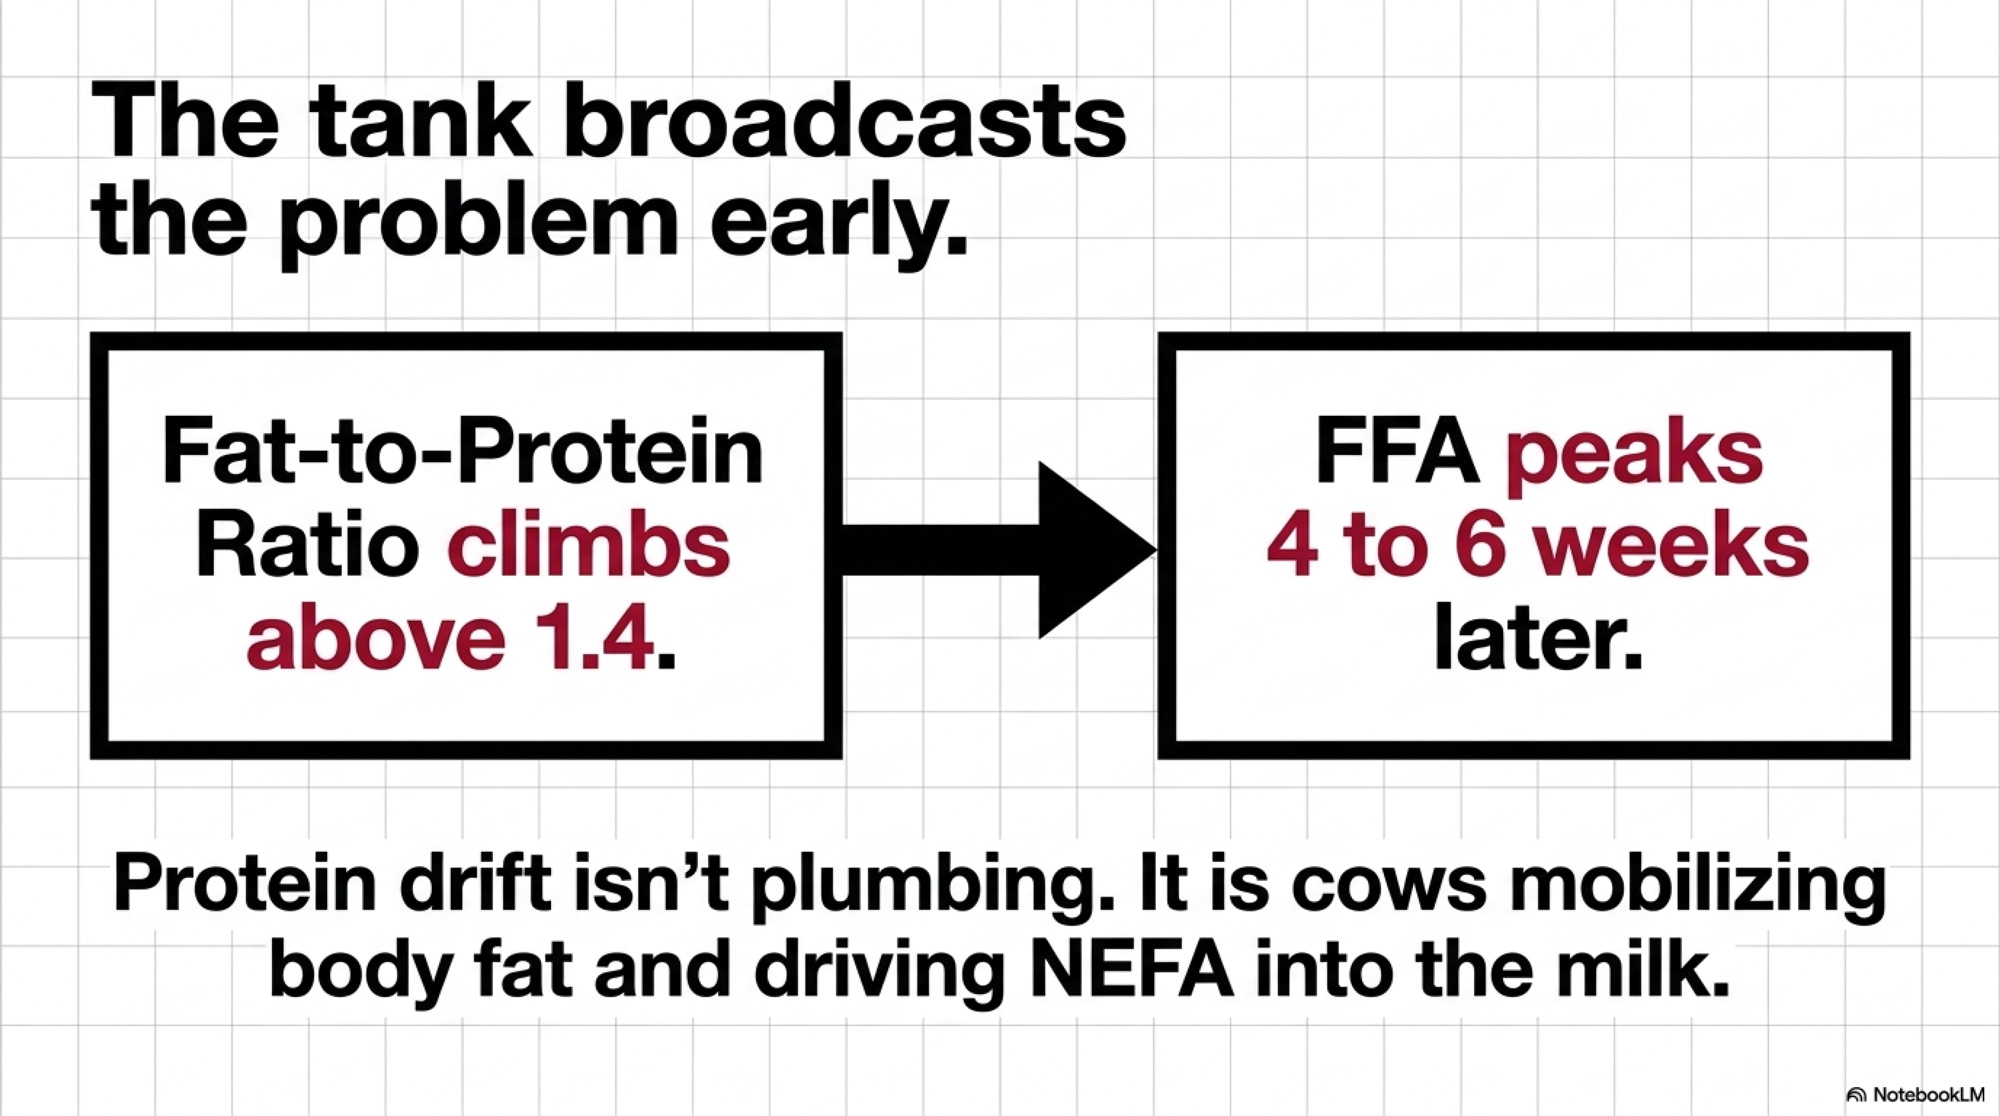
NewsSubscribe
First
Last
Consent

Same Tag, Different Feed: The Molasses Problem Your Calves Can’t Tell You About

What the 28-point sugar swing in molasses means for your calf program—and the five questions your supplier should be able to answer.

You know how it is when you’re standing at the feed store or reviewing a quote from your supplier, trying to make sense of what you’re actually buying? Most of us zero in on the guaranteed analysis—crude protein, minimum fat, maximum fiber. Those numbers feel solid. They seem like they’re telling the whole story.

But here’s what I’ve been thinking about lately. A growing body of research, combined with what calf managers are observing from Wisconsin to California to the Northeast, suggests that one of the most common ingredients on that tag may be affecting heifer development in ways the guaranteed analysis simply doesn’t capture.

That ingredient is molasses.

What appears as a single, standardized commodity actually represents one of the most variable ingredients in animal nutrition. A 2020 study published in the Journal of Dairy Science by Palmonari and colleagues documented sucrose content in cane molasses ranging from 39% to 67% on a dry-matter basis. That’s not a minor fluctuation—we’re talking about a swing that can meaningfully alter energy delivery, fermentation patterns, and rumen development in young calves.

Researchers studying early-life nutrition have noted that, while this variability is well documented in the scientific literature, its practical implications for calf programs are often overlooked at the farm level. When you’re looking at a 28-percentage-point swing in sugar content, you’re essentially dealing with different ingredients showing up under the same name on that feed tag.

For operations investing significant resources in replacement heifer programs—and that’s most of us these days, given heifer values—understanding this variable is becoming increasingly important for achieving consistent results.

What the Research Actually Shows

The assumption that “molasses is molasses” doesn’t hold up once you start digging into laboratory data. The Palmonari study systematically characterized molasses samples from suppliers around the world, and honestly, the compositional differences they documented were more dramatic than I expected when I first came across this work.

Here’s what stood out:

  • Sucrose content in cane molasses averaged about 49% but ranged from 39% to 67% on a dry matter basis
  • Crude protein differed dramatically between sources—beet molasses averaged 13.5% while cane molasses averaged just 6.7%
  • Potassium levels in cane molasses ranged from roughly 2.8% to 7.7%, nearly a threefold variance
  • Dietary Cation-Anion Difference (DCAD) in cane molasses showed a range from -76 to +155 meq/100g DM

Why does this matter for your calf barn? Molasses serves a dual biological function in calf starters. Beyond driving palatability and encouraging early dry matter intake (which we all know is critical for rumen development), molasses provides the rapidly fermentable sugars that fuel rumen microbial populations. These microbes produce volatile fatty acids—particularly butyrate—which directly stimulates the growth of rumen papillae. Those finger-like projections are what allow the calf to absorb nutrients efficiently throughout her productive life.

When molasses quality fluctuates, so does this entire digestive process. A batch of starter containing low-sugar molasses delivers less fermentable substrate to rumen microbes, potentially slowing butyrate production during the critical pre-weaning window.

Industry reviews and technical reports indicate that many feed manufacturers source molasses from multiple suppliers throughout the year. That’s just the nature of commodity markets—and it’s not necessarily a criticism. But it does mean batch-to-batch variability can creep into your calf program without anyone specifically tracking it.

Cane Versus Beet: Two Different Ingredients

The differences between cane and beet molasses go well beyond their plant origins. These are functionally different ingredients that affect calf metabolism differently—yet feed tags rarely specify which type is being used.

ParameterCane MolassesBeet MolassesClinical Significance
Crude Protein6.7% avg (range: 2.2–9.3%)13.5% avg (range: 10.7–15.6%)Beet provides 2× more protein; impacts amino acid balance in starter
Sugar ProfileSucrose + glucose + fructose (mixed)Almost exclusively sucroseCane ferments faster; beet requires enzymatic breakdown first
Potassium (K)Highly variable: 2.8–7.7%Consistently high (~4.5–5.5%)Wide cane variability can stress DCAD balance; beet more predictable
DCAD Range–76 to +155 meq/100g DMMore consistent: +66 avg meqCane swings create acid-base stress; beet better for budding system maturity
Regional AvailabilitySouth (FL, LA, TX), Caribbean, S. AmericaMidwest (MN, ND, MI, ID)Geography determines typical molasses type by region
Consistency (Year-Round)Batch-to-batch variability commonMore consistent sourcingBeet easier to specify; cane requires active supplier vetting

Data Source: Palmonari et al., Journal of Dairy Science, 2020

I’ve looked at dozens of calf starter tags over the years, and almost universally, they just say “molasses” or “molasses products.” That’s perfectly legal, but it doesn’t tell you much about what you’re actually getting.

ParameterCane MolassesBeet Molasses
Crude Protein6.7% average (range: 2.2–9.3%)13.5% average (range: 10.7–15.6%)
Sugar ProfileSucrose + glucose + fructoseAlmost exclusively sucrose
PotassiumVariable (2.8–7.7%)Consistently high
DCADHighly variable (-76 to +155 meq)More consistently positive (+66 avg)

Data from Palmonari et al., Journal of Dairy Science, 2020

The sugar profile difference is worth understanding, though in practice, molasses typically accounts for only 5–7% of the starter’s dry matter. Cane molasses contains appreciable free glucose and fructose—monosaccharides that rumen microbes can ferment immediately. Beet molasses is almost exclusively sucrose, which must be enzymatically broken down before fermentation proceeds.

Since both sugar sources are ultimately fermented and molasses inclusion is relatively modest, dramatic shifts in calf performance from source switching alone would be unusual in well-formulated starters. However, the cumulative effect of multiple ingredient variables—including molasses quality—can influence consistency, particularly in operations monitoring intake and growth patterns closely.

What matters more, from a practical standpoint, is consistency within a given source type. Whether a mill uses cane or beet molasses is less important than whether it uses the same type with a similar composition batch after batch.

A note on regional sourcing: Geography plays a meaningful role here. Cane molasses is produced primarily in the South—Florida, Louisiana, Texas—or imported from the Caribbean and South America. Beet molasses comes from processing plants in Minnesota, North Dakota, Michigan, Idaho, and other northern regions. If you’re a producer in Wisconsin or Minnesota, the locally available molasses is almost certainly beet. Operations in the Southeast have easier access to cane. This doesn’t mean one is inherently better, but “standard molasses” means different things in different regions—and switching suppliers can inadvertently switch your source type.

The Mineral Balance Question: When Consistency Matters

One of the more significant findings from the research involves DCAD and mineral variability. The 200+ milliequivalent swing in DCAD between molasses batches represents meaningful compositional variation, though the practical impact depends heavily on overall diet formulation and molasses inclusion rate.

In typical calf starter formulations where molasses represents 5–7% of dry matter, mineral imbalances severe enough to cause clinical problems are relatively uncommon. However, what producers may observe is more subtle: slight variations in intake consistency, minor changes in manure character, or small differences in how calves transition through weaning.

Here’s what’s worth watching for:

“The calves look fine, but performance isn’t quite as consistent as it was last quarter.”

This pattern—where nothing is dramatically wrong but consistency has declined—is where ingredient variability often shows up first. It’s not necessarily pathogenic scours or clinical acidosis. It’s the kind of variability that makes it harder to predict which calves will hit weaning targets on schedule.

Here’s a reference I’ve found useful for distinguishing between different types of digestive upset:

Clinical SignNutritional VariabilityPathogenic Scours
Calf demeanorGenerally normal, eatingDull, depressed, off-feed
Outbreak patternSubtle, affects consistency metricsProgressive, spreads calf-to-calf
TemperatureNormal (<103°F)Often elevated (>103°F)
Manure characterVariable consistency, not severeOften contains mucus or blood
Response to managementImproves with consistent feedRequires treatment protocol

What’s encouraging is that the industry has made real progress on calf survival over the years. USDA NAHMS data from the Dairy 2014 study found preweaning heifer mortality at about 5.0%, with digestive disorders accounting for roughly 32% of known causes of death. Earlier NAHMS studies from the 1990s and 2007 reported somewhat higher mortality rates—around 7.8–8.4%—with scours historically accounting for a larger share of the total.

So we’re moving in the right direction as an industry. But as mortality rates have improved, attention is increasingly shifting to consistency and performance optimization—the difference between calves that simply survive and calves that thrive.

Making Sense of DCAD

Dietary Cation-Anion Difference represents the balance of key minerals and influences acid-base status. If you’ve worked with close-up dry cows (and most of us have spent plenty of time thinking about transition period management), you know DCAD for milk fever prevention. But its impact on calves receives far less attention.

Think of DCAD like pH balance in a swimming pool. There’s an ideal range where everything works. Push too far in either direction and problems emerge.

For calves, those problems manifest as metabolic stress that diverts energy away from growth.

The challenge is that cane molasses DCAD can swing by more than 200 milliequivalents between batches. When a strongly anionic load arrives, it nudges the calf toward metabolic acidosis. When a highly cationic batch follows, the system has to readjust in the opposite direction.

Why does this matter more in calves than in mature cows? Adult cattle produce 50-plus gallons of saliva daily—essentially a massive buffer tank of bicarbonate that helps neutralize pH swings. Pre-weaned calves produce very little saliva and lack this buffering capacity. Their kidneys are also still maturing, which limits their ability to excrete excess minerals efficiently.

The observable result is often erratic feed intake. Calves experiencing metabolic stress from DCAD fluctuations frequently self-regulate by reducing consumption—a biological brake that protects against further imbalance but at the expense of growth.

If you’re seeing unexplained intake variability that doesn’t match weather patterns or management changes, ingredient consistency might be worth examining.

Thinking Through the Economics

For operations raising replacement heifers, the economic impact of ingredient variability can compound across multiple factors. I want to be upfront here—these aren’t hard universal numbers. They’re illustrative scenarios based on reasonable assumptions and published biological relationships. Your specific situation will depend on your herd, management, and many other variables.

For every 1 kilogram of additional preweaning ADG, first-lactation milk yield increased by roughly 850–1,100 kilograms—about 1,870 to 2,425 pounds of milk.

— Soberon and Van Amburgh, Cornell University, 2012–2013

Cost ComponentLow Impact ($)Typical ($)High Impact ($)
Growth lag (1 week delay at $5.50/day)3538.5042
Additional monitoring & treatment101825
Subtotal: Direct variability costs4556.5067
First-lactation milk (per lactation per calf)
Assumed growth lag recovery gap in FL milk200 lbs milk × $18/cwt360 lbs milk × $18/cwt500 lbs milk × $18/cwt
Value recovery potential$36$65$90
Net cost after recovery (or risk exposure)$9–$8.50–$23

Potential hidden costs of variability per calf:

  • Growth lag: If inconsistent nutrition adds even a week to reaching weaning targets, at typical pre-weaning costs of $5–6/day, that’s $35–40 per calf
  • Treatment costs: Additional monitoring, electrolytes, and labor when performance becomes unpredictable—perhaps $15–25 per affected calf
  • Future milk: When inconsistent nutrition suppresses early growth, that milk production difference follows those heifers into first lactation and beyond

The investment side:

Nutritionists working with multiple mills often note that starters made with tightly specified, tested ingredients tend to command a noticeable per-ton premium compared with least-cost commodity formulations. The exact spread depends heavily on region, ingredient markets, and additive packages—somewhere between $30 and $70 per ton, based on conversations I’ve had.

When you consider extra days on feed, management complexity, and potential milk yield differences, it becomes easier to see how relatively small per-calf investments in ingredient consistency might deliver meaningful returns.

What some producers are observing:

On several dairies in the Upper Midwest, calf managers working closely with their nutritionists have noticed a pattern worth sharing. Every six to eight weeks, starter intake would become slightly less predictable, and a small percentage of older hutch calves—the 5–7 week olds who should be past the high-risk window for most pathogens—would show softer manure than usual.

When these herds began tracking feed deliveries against calf performance, the timing often correlated with new starter batches. In some cases, further investigation revealed that ingredient sourcing was changing based on market prices—sometimes cane, sometimes beet, sometimes blends—without the farm being specifically informed.

After switching to starters with fixed formulations and specified ingredient sourcing, those same operations commonly reported smoother intake curves and more predictable weaning outcomes.

Are these controlled trials? No—and I want to be clear about that distinction. But the observations align logically with the compositional variability documented in the research.

Early Indicators: What to Watch in the First 90 Days

You don’t have to wait two years for first-lactation data to assess whether your starter program is delivering consistent results. Several indicators become visible within the first 90 days—if you know what to look for.

Monitoring FocusDays 1–14Days 15–35Days 36–60Days 61–90
Intake PatternsEstablish baselineWatch for daily consistency; compare delivery datesIdentify correlation between new feed batches and intake dipsConfirm steady upward curve or flag variability
Manure (older calves)Monitor for pathogenic scours5+ week olds should be past acute phaseWatch for unexplained soft manure (suggests metabolic drift)Should be firm; loose manure = performance concern
Coat QualityRough coats normal (early)Gradual improvement expectedShould be noticeably slick and shinyDull or rough coat = potential absorption issue
Body Condition vs. FrameAssess baseline body/frame ratioMonitor for pot belly without frame growthPot belly pattern = slow fermentation signalStrong frame growth, minimal fill = good metabolic health
Post-Weaning MomentumN/AN/APrepare for transitionCalves should maintain growth through weaning, not plateau

A 90-Day Monitoring Approach:

  1. Intake patterns: Is daily starter consumption following a steady upward curve, or does it fluctuate after new feed deliveries? Tracking this for a few weeks can reveal patterns that correlate with delivery dates.
  2. Manure in older calves: Are 5–7 week old calves experiencing loose manure episodes that don’t respond to typical treatment? These older calves should be past the high-risk window for most pathogens.
  3. Coat quality at 60 days: Calves should display a slick, shiny hair coat approaching weaning. Rough, dull coats can suggest metabolic stress or absorption issues.
  4. Body condition vs. fill: Are calves developing “pot bellies” without corresponding frame growth? This pattern can indicate slow fermentation and inefficient nutrient conversion.
  5. Post-weaning momentum: Do calves maintain growth through weaning, or do they plateau for 7–10 days when milk is removed? A well-developed rumen should carry them through this transition more smoothly.

Patterns of inconsistent intake, unexplained digestive changes in older calves, and post-weaning growth stalls might suggest the starter program is delivering variable nutrition even while meeting tag guarantees.

Why the Supply Chain Makes Consistency Challenging

Why does ingredient variability persist? The supply chain itself creates structural barriers that even well-intentioned manufacturers face.

Most molasses travels through multiple stages: sugar mills produce it as a byproduct of varying quality, brokers purchase from multiple sources across regions and seasons, and central terminals often commingle batches in shared storage. By the time a tanker reaches a feed mill, the contents may be a blend of uncertain composition.

For manufacturers seeking consistency, maintaining separate storage for specified sources requires significant capital investment. Shipping cane molasses from Florida to Upper Midwest mills costs considerably more than sourcing local beet molasses. Most mills also lack dedicated quarantine capacity to test incoming loads before production.

This explains why some manufacturers invest in “Fixed-Process Assurance”—defined specifications, testing every load, and maintaining formulations regardless of commodity prices—while others follow standard procurement practices. Both approaches have their logic; they just produce different outcomes for ingredient consistency.

It’s worth noting that commodity suppliers aren’t cutting corners maliciously. The system evolved for volume and efficiency, which serves many applications well. It just wasn’t designed for the tight specifications that performance-focused calf nutrition may require.

Questions for Your Supplier

Producers evaluating calf starter programs can learn a lot by asking specific questions about ingredient sourcing and quality control. The goal isn’t confrontation—it’s building an informed partnership. Most feed representatives genuinely want to help, but they may not volunteer technical details unless you ask directly.

Five questions that reveal quality commitment:

Question to AskStrong AnswerWorth Following Up
“Does this starter use a fixed formula, or does it adjust based on commodity prices?”Fixed formula—ingredients don’t change batch to batch“We use the least-cost formulation,” or “It adjusts based on markets.”
“Is the molasses cane, beet, or a blend? Does that stay consistent year-round?”Specific source named, consistent throughout the year“Standard blend” or “Whatever’s available.”
“What’s your minimum specification for sugar content in incoming molasses?”Specific number cited (e.g., “43% TSI minimum”)“Industry standard” or “We trust our suppliers.”
“Do you test every incoming molasses load, or rely on supplier certificates?”In-house testing on each delivery before production“We rely on supplier documentation.”
“How do you monitor mineral balance for calf feeds specifically?”Active monitoring with defined limits for calf productsFocus only on meeting guaranteed analysis minimums

Suppliers committed to quality typically welcome these questions and provide specific, confident answers. The conversation itself often reveals how much thought has gone into ingredient consistency. If you’re getting vague responses or a lot of “industry standard” language, that tells you something, too.

A Practical Approach

For producers who want to explore whether ingredient variability might be affecting results, here’s a measured approach that minimizes risk while gathering useful information.

Step 1: Document current performance. Track starter intake patterns, digestive consistency, and weaning weights for your current calf group. Even a simple notebook log gives you concrete information for conversations with your nutritionist.

Step 2: Start a conversation. Approach your nutritionist or feed representative with curiosity: “I’m seeing some variability in my calf performance that I can’t fully explain with management factors. Can we look at the ingredient specifications in my starter?”

Step 3: Consider a comparison. Rather than switching everything at once, test a fixed-process starter on one group of calves while maintaining the current program for another. Compare intake consistency, health events, and weaning outcomes over 60–90 days.

Step 4: Evaluate total cost. When assessing results, account for management time, predictability, and growth outcomes—not just the per-ton price. The lowest-cost bag isn’t always the lowest-cost option when you factor in the complete picture.

Sponsored Post

Key Takeaways

What the research indicates:

  • Molasses composition varies more than feed tags reveal, with sugar content ranging from 39% to 67% and DCAD differing by over 200 milliequivalents between batches
  • Cane and beet molasses have different compositional profiles, though practical impacts depend on inclusion rates and overall formulation
  • Ingredient variability can manifest as subtle inconsistencies in intake patterns and growth performance

What producers are finding:

  • The guaranteed analysis represents a legal minimum, not a guarantee of batch-to-batch consistency
  • Performance indicators are often visible within 90 days—well before first-lactation data arrives
  • The economics can favor investing in consistency, though specific returns vary by operation

Practical next steps:

  • Ask specific questions about ingredient sourcing, testing protocols, and specifications
  • Document calf performance patterns to identify potential variability effects
  • Evaluate feed programs based on total cost and predictability, not just initial price

The broader lesson here is that consistency may be among the most underappreciated attributes in calf nutrition. A calf’s developing rumen needs steady, predictable substrate to build the biological foundation for a productive cow. What progressive producers are recognizing is that this consistency doesn’t necessarily arrive automatically with every delivery—it often needs to be specified, tested, and verified through intentional quality management.

The feed tag tells you what should be in the bag. The question worth exploring is whether anyone has verified that’s what you’re consistently getting.

Executive Summary: 

The feed tag says “molasses.” It doesn’t tell you whether this batch has 39% sugar or 67%—a swing documented in the Journal of Dairy Science that represents one of the widest compositional ranges in animal nutrition. At typical inclusion rates of 5-7% of starter dry matter, this variability won’t cause dramatic clinical problems. But it does contribute to the subtle inconsistencies producers notice: unpredictable intake curves, variable manure in older hutch calves, uneven weaning performance. Dairies that track feed deliveries against calf metrics often discover that performance dips align with new starter batches—sometimes because molasses sources changed without anyone mentioning it. The takeaway isn’t about cane versus beet or switching suppliers. It’s about asking specific questions: fixed formula or least-cost? In-house testing or supplier certificates? For operations spending $5-6 per calf per day on replacement heifers, ingredient consistency may be the difference between calves that survive and calves that thrive.

Complete references and supporting documentation are available upon request by contacting the editorial team at editor@thebullvine.com.

Learn More

The Sunday Read Dairy Professionals Don’t Skip.

Every week, thousands of producers, breeders, and industry insiders open Bullvine Weekly for genetics insights, market shifts, and profit strategies they won’t find anywhere else. One email. Five minutes. Smarter decisions all week.
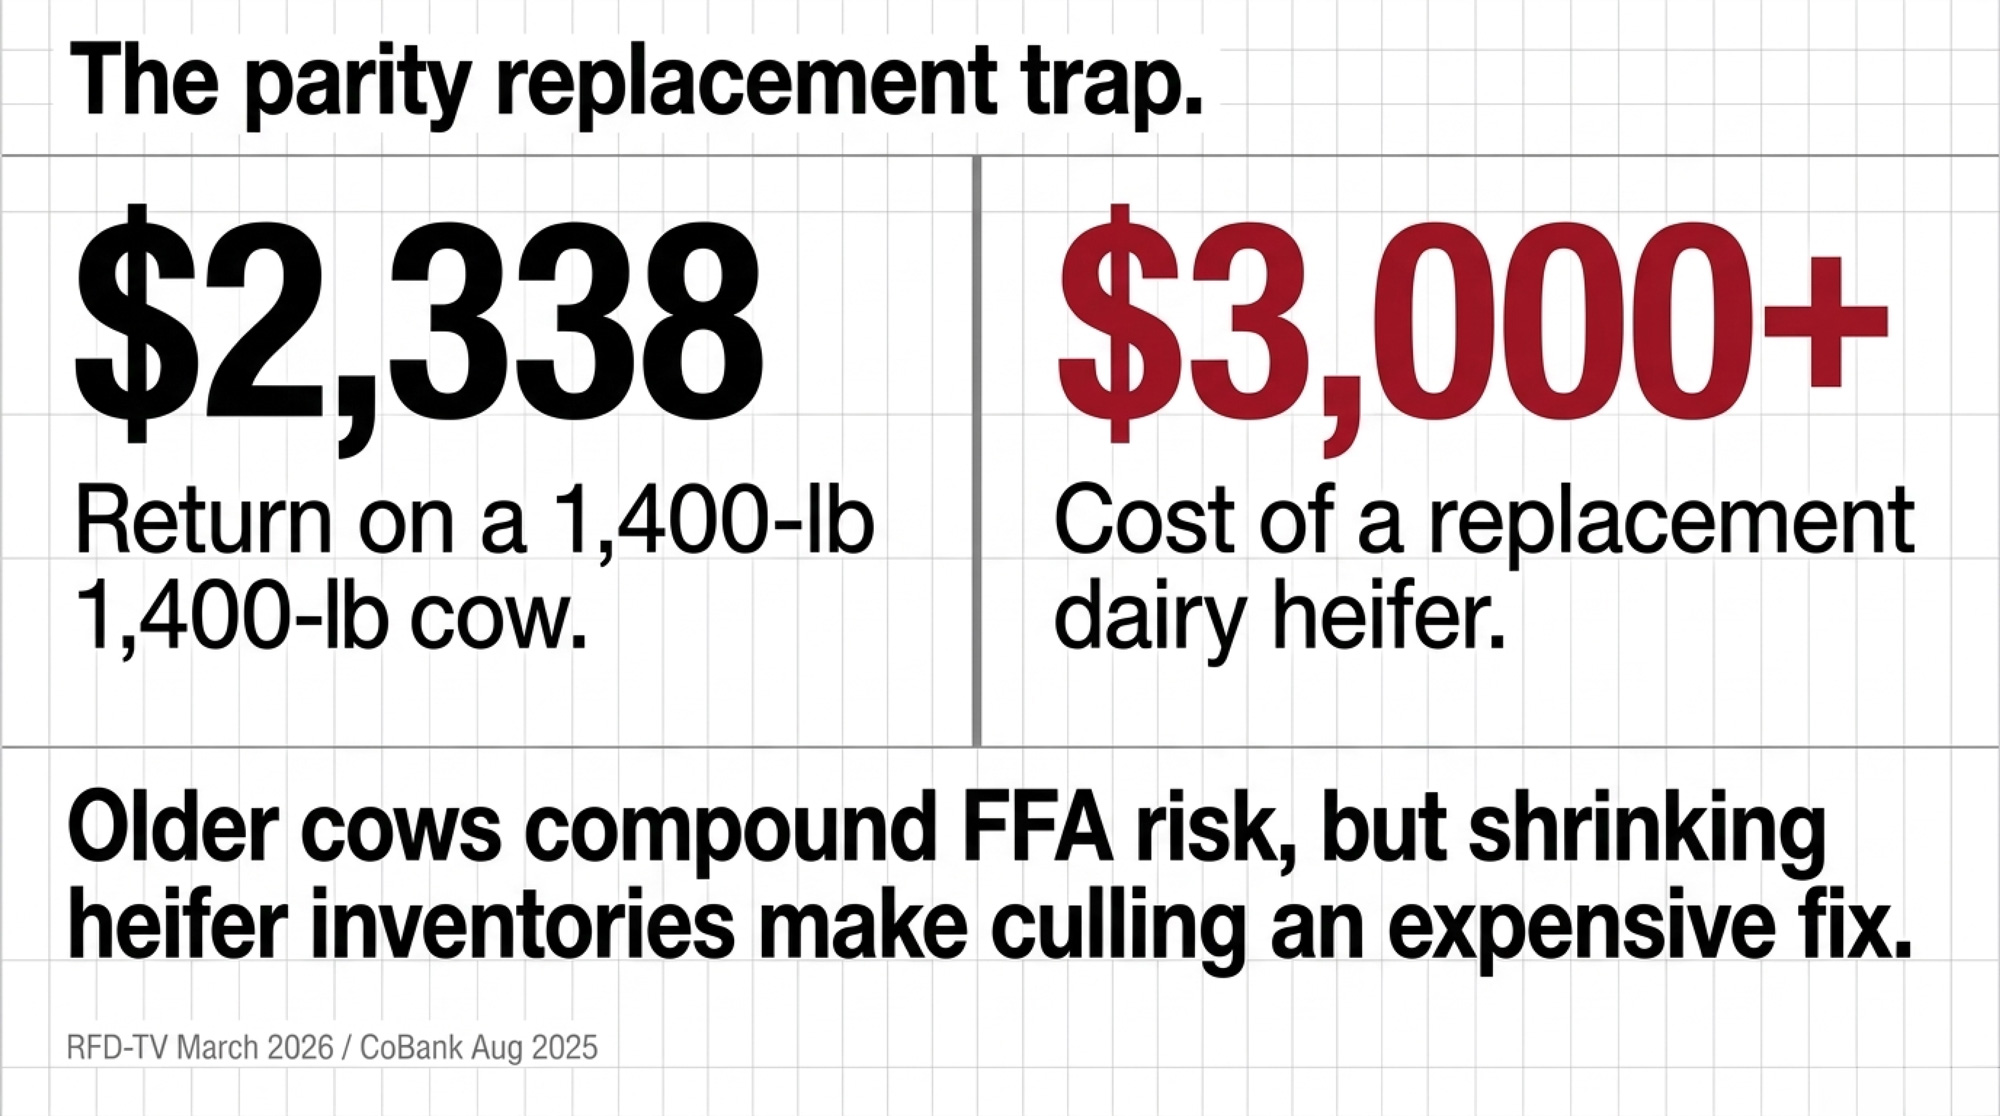
NewsSubscribe
First
Last
Consent

The 2% Protein Mistake: How One Feed Change Is Saving Dairies $40,000 a Year

The diagnostic protocol and implementation timeline that’s turning wasted nitrogen into profit

Executive Summary: That extra 2% crude protein in your ration isn’t insurance—it’s a $40,000 annual drain on a 300-cow dairy. Research from Penn State, Cornell, and USDA confirms that properly balanced 15-16.5% protein diets match production while eliminating wasted nitrogen that hits your feed bill and your conception rates. Stack protein optimization with zero-cost heifer separation and proper silage timing, and the combined opportunity reaches $130,000-$160,000 per year. The risk: cutting protein without proper diagnostics can trigger intake depression and lost milk. This guide delivers the 4-step diagnostic protocol that’s working on progressive operations—plus an 18-month implementation timeline, fresh cow exceptions, and clear guidance on when to hold back. The goal isn’t minimum protein. It’s the maximum profit per cow.

What if I told you that 2% of your crude protein is actually a $40,000 hidden tax on your 300-cow herd? That’s the conversation I keep having with producers across North America, and it’s worth exploring carefully.

The central issue comes down to protein. Specifically, the long-standing practice of feeding more than cows can efficiently utilize.

When Applied Animal Science published a survey of U.S. dairy nutritionists in 2021, the findings confirmed what most of us suspected—the majority still formulate lactating cow rations at 17-18% crude protein. There are solid historical reasons for that approach. Protein has always been viewed as insurance against production losses.

But here’s where the conversation gets interesting. Foundational research from scientists like Glen Broderick at USDA’s Agricultural Research Service has consistently demonstrated that well-formulated diets in the 15-16.5% crude protein range can deliver equivalent performance—when amino acid nutrition is properly addressed. That qualifier matters.

The economics become clearer once you work through the numbers. Protein remains one of the most expensive components of the ration. When cows receive more than their metabolism can utilize, the liver converts that surplus nitrogen to urea—an energy-intensive process that diverts calories away from productive purposes. That urea shows up in three places: elevated Milk Urea Nitrogen readings, increased nitrogen loading in the manure lagoon, and higher numbers on the feed bill.

Understanding the Financial Picture

For a 300-cow operation—and I’ve worked through these calculations with producers in several regions—the potential impact deserves attention. Current feed prices vary considerably by geography, but overfeeding crude protein by two percentage points typically costs $0.30-0.45 per cow per day in direct feed expenses.

Annually, that represents roughly $33,000 to $49,000 in potential savings from optimization alone. Whether those savings are fully achievable depends on your specific situation, which is why working with a qualified nutritionist matters so much.

And that’s before considering the reproductive implications.

Research from Cornell University and the University of Wisconsin has established connections between elevated MUN levels and reduced fertility. Studies published in Animal Reproduction Science found that cows with MUN concentrations above 16 mg/dL showed notably lower pregnancy rates—approximately 14% reduction in some trials. That’s meaningful when you’re working to maintain reproductive efficiency.

The biology here is reasonably well understood. Elevated circulating ammonia and urea can alter the uterine environment, compromising embryo development. Penn State’s extension service recommends targeting MUN in the 10-14 mg/dL range, and research suggests approximately a 10% reduction in conception odds for each 1 mg/dL increase above that target.

What does that mean practically? A 300-cow operation seeing even modest conception rate improvements—say 5-6 percentage points—could realize $15,000-$25,000 annually in reduced days open, lower breeding costs, and fewer replacement purchases. The exact figures depend heavily on your replacement costs and current reproductive performance.

Why the Transition Takes Careful Thought

Given the potential economics, it’s fair to ask why more operations haven’t pursued protein optimization. The nutritionists I’ve spoken with offer thoughtful perspectives.

The Applied Animal Science survey identified “fear of decreased dry matter intake” as the primary concern when formulating lower-protein diets. And honestly, that concern has merit.

Dr. Alex Hristov’s research group at Penn State has done extensive work in this area, and their findings confirm there’s a real threshold below which performance suffers. In long-term trials, diets containing approximately 14% or less crude protein resulted in decreased intake, even when amino acid balance was addressed. At the 2024 Florida Ruminant Nutrition Symposium, their work highlighted that supplementation with rumen-protected histidine improved performance on low-protein diets—underscoring the amino acid’s critical role.

I recently spoke with an Ontario nutritionist who put it this way: “I’ve seen operations run successfully at 15% crude protein, and I’ve also seen farms struggle at 16% because their forage base couldn’t support it. The tipping point varies by herd.”

That variability is exactly why blanket recommendations can be problematic. Every operation has different forages, different genetics, and different management systems.

There’s another consideration worth acknowledging. Dr. Chuck Schwab, Professor Emeritus at the University of New Hampshire and a leading voice on amino acid nutrition, has been appropriately cautious about some rumen-protected amino acid products. Not all have been rigorously evaluated for bioavailability using in vivo methods, which means nutritionists sometimes formulate without complete confidence in how much amino acid is actually being absorbed. That uncertainty makes some advisors understandably careful.

A Measured Approach That’s Working

The operations successfully navigating this aren’t making dramatic overnight changes. They’re following methodical processes that identify their specific herd’s optimal range before making adjustments that could affect production.

What does that look like in practice? I walked through the process recently with a California producer running 400 cows who’s been fine-tuning his approach over the past 18 months.

  • Establish your baseline first. Before any dietary changes, examine individual MUN records from DHI testing. Cornell’s PRO-DAIRY program suggests that 75% or more of cows should fall within ±4 mg/dL of the herd average. Wide variation—some cows at 8 mg/dL while others hit 22 mg/dL on the same ration—usually indicates mixing or sorting issues to address first. “We discovered our TMR wasn’t as consistent as we thought,” that California producer told me. “Had to fix that before anything else made sense.”
  • Move gradually. Reduce dietary crude protein by 0.5 percentage points while maintaining amino acid levels. Monitor manure consistency and milk protein percentage carefully. Slightly firmer manure often indicates less nitrogen waste. But if the milk protein percentage drops by more than 0.05% in the first week, you may have reduced rumen-degradable protein too aggressively.
  • Address amino acid nutrition simultaneously. When dropping crude protein further, consider introducing or increasing rumen-protected methionine and lysine. Published research suggests targeting a ratio of approximately  for Lysine to Methionine, with roughly 7.2% lysine and 2.4-3.2% methionine as a percentage of metabolizable protein. Your nutritionist can help fine-tune these targets.
  • Find your floor carefully. Continue modest reductions—perhaps 0.25% increments every three weeks—while watching fresh cow peak milk as a key indicator. Fresh cows have the highest amino acid requirements. When peaks plateau or decline, you’ve found your floor. Add back half a percentage point immediately.
Diet TypeCrude Protein (%)Risk ProfileAnnual Cost (300-cow herd)
Traditional Industry Standard17-18%Low risk, high nitrogen wasteBaseline + $40,000
Aggressive Low (Risky)14% or lessHigh risk—intake depression likelyMay lose production
Optimized Target Range15-16.5%Balanced—when amino acids addressedSaves $33,000-$49,000
Fresh Cow Exception19%Supports metabolic transitionWorth the premium

Most operations following this approach discover their sustainable range is 1.5 to 2.0 percentage points below their starting point. But the key word is “sustainable”—the goal isn’t to reach the lowest possible number; it’s to find where your specific herd performs optimally.

Fresh Cows Require Different Thinking

Here’s where the conversation takes an important turn. While mid-lactation cows may thrive on optimized protein levels, transition cows appear to benefit from more generous protein nutrition.

Recent research found that fresh cows receiving approximately 19% crude protein increased fat-corrected milk substantially—from 31.4 to 34.9 kg/day in one study. Those same animals showed reduced body condition loss and improved metabolic markers (lower NEFA and BHB concentrations), suggesting better adaptation to the demands of early lactation.

Dr. Masahito Oba’s work at the University of Alberta supports this general pattern, though he notes that research on rumen-protected amino acid supplementation during transition has yielded inconsistent results. The physiology of transition cows is complex, and we’re still learning how best to support them nutritionally.

So how do you capture efficiency gains on the main herd while protecting vulnerable fresh cows?

Many operations are finding success with a Partial Mixed Ration approach. Rather than preparing completely separate batches—which creates logistical headaches and often exceeds mixer capacity for small fresh pen loads—they feed the entire lactating herd a base ration at the optimized protein level. Fresh cows then receive a high-protein top-dress at the bunk.

This captures most of the potential savings (since 80-90% of cows consume the efficient ration) while providing transition animals the metabolic support they need.

The economics suggest that somewhere around 120 lactating cows represents a rough threshold where the management complexity pays for itself. Smaller operations may find the labor hard to justify. Larger herds—150 cows and above—that remain on a single high-protein ration may be leaving meaningful money on the table.

A High-Return Strategy That Requires No Ration Changes

One finding that consistently surprises producers: one of the most impactful changes doesn’t involve the feed sheet at all.

Separating first-lactation animals into their own group—even on identical nutrition—regularly delivers measurable production improvements. Research from multiple university programs, including work highlighted in Hoard’s Dairyman, has confirmed that first-lactation heifers housed apart from mature cows show reduced competitive stress and improved feeding patterns.

European researchers documented that heifers housed separately for just one month after calving increased milk yield by 506 pounds across the lactation. Classic studies suggest farms may sacrifice close to 10% of potential production when parities are commingled—a substantial penalty for something that costs nothing to address.

The mechanism is behavioral, and as many of us have seen watching bunk activity, first-lactation animals naturally prefer smaller, more frequent meals. Mature cows tend toward larger, less frequent consumption. When housed together, dominant animals control access to the bunk during the critical period after fresh feed delivery. Younger cows respond by eating faster (which destabilizes rumen pH) and resting less (which reduces rumination time).

For a 300-cow dairy with roughly 110 first-lactation animals, even a 6% production improvement translates to approximately $32,500 in additional annual revenue at $18 milk. No equipment investment, no ration reformulation—just a management decision about pen assignments.

Management SystemLactation Yield ImpactAnnual Value (300-cow herd)Additional Cost
Mixed Parity HousingBaseline (100%)$0None
Heifers Separated (1 month)+506 lbs/lactation$16,000-$20,000Zero
Heifers Separated (Full lactation)+800-1,000 lbs/lactation (est)$25,000-$32,500Zero
European Research Average+506 lbs/lactation$16,000-$20,000Zero

A Wisconsin producer I spoke with made this change two years ago. “We were skeptical at first,” he told me. “Same feed, same barn, just different pens. But we saw results in the bulk tank within six weeks. The heifers settled into a better routine once they weren’t competing with older cows.”

I’ve heard similar stories from Northeast operations and California dairies. The specifics vary, but the pattern holds.

The Annual Decision That Creates Outsized Impact

While protein optimization and grouping strategies operate throughout the year, one seasonal decision carries disproportionate financial weight: corn silage harvest timing.

The Bottom Line on Harvest Timing: “Losing 11 points of NDF digestibility from delayed harvest costs more than $52,000 annually for a 300-cow dairy. That’s money lost in a few autumn days that you can never recover.”

Research published in Translational Animal Science quantified what many producers have observed. As harvest gets pushed from 37% to 43% dry matter, NDF digestibility declined from 64.4% to 53.4%. That’s roughly 11 percentage points of fiber digestibility compromised by delayed harvest.

Why does that matter so much? Work from Michigan State—specifically, Drs. Mike Oba and Mike Allen—established that each percentage point of NDF digestibility improvement corresponds to about 0.40 pounds more daily dry matter intake and 0.55 pounds more 4% fat-corrected milk. When you’re losing 11 points of digestibility, the math gets uncomfortable quickly.

The challenge is practical. Corn typically dries at 0.5-0.75% per day during fall conditions (though weather obviously affects this). An operation with 10 days of chopping capacity that waits for an ideal 35% dry matter may finish well above 40%.

For a 300-cow dairy feeding late-harvest silage, the consequences compound:

  • Additional corn grain needed to replace lost energy: roughly $17,500 annually
  • Higher shrink losses from compromised packing and aerobic stability: approximately $15,000 annually
  • Unrecoverable milk from reduced intake: around $19,700 annually

That’s more than $52,000 in annual impact from decisions made in a few autumn days. This is one area where even experienced operations sometimes get caught by weather or competing priorities.

When Caution Is Warranted

Any honest discussion of these strategies must acknowledge situations in which aggressive implementation can backfire.

  • Variable forage quality presents real challenges. Operations dealing with inconsistent harvest conditions, limited storage infrastructure, or purchased feeds with uncertain history face genuine risk when tightening protein margins. The traditional safety cushion exists for good reason.
  • Existing rumen health issues complicate the picture. Herds already managing subclinical acidosis have compromised rumen function. Reducing protein on top of SARA often makes things worse. Address rumen health first.
  • Monitoring limitations matter. Operations relying primarily on bulk tank MUN and monthly DHI tests may not detect problems quickly enough. More frequent observation—at minimum, close attention to milk protein percentage and manure consistency—becomes essential when operating near the efficiency frontier.
  • Regional and system differences affect optimal approaches. Southwest operations managing heat stress face different metabolic pressures than those in the Upper Midwest. Farms built around byproduct feeds have different amino acid profiles than corn silage-alfalfa operations. And for pasture-based systems—whether in Ireland, New Zealand, or parts of Australia—these TMR-focused strategies require significant adaptation for grazing contexts where lush pasture protein creates entirely different management challenges.

And some nutritionists raise reasonable questions about whether current amino acid models are precise enough to support aggressive protein reduction across all scenarios. “The science is clearly trending this direction,” one told me, “but I’m not convinced we have the precision yet for every situation.” That perspective deserves respect.

How the Strategies Work Together

What makes these approaches compelling is how they interact. Operations implementing multiple strategies often see returns exceeding the simple sum of individual improvements.

StrategyPer Cow Annual Value ($)300-Cow Herd Impact ($)
Protein Optimization$110-165$33,000-49,000
Reproductive Improvement (Lower MUN)$50-85$15,000-25,000
Parity Grouping (Zero-Cost)$108$32,500
Optimal Harvest Timing$174$52,000
Total Annual Opportunity$442-532$130,000-$160,000

Quality forage creates a safety margin for lower-protein diets—rumen microbes need readily available energy to utilize limited nitrogen efficiently. Reduced social stress from proper grouping improves nutrient utilization. Better body condition from appropriate MUN levels supports reproduction, gradually improving herd structure over time.

Here’s how the numbers add up when you put these pieces together for a 300-cow operation:

StrategyEst. Annual Value (Per Cow)Primary Driver
Protein Optimization$110-165Reduced nitrogen waste & feed cost
Reproductive Improvement$50-85Lower MUN / higher pregnancy rates
Parity Grouping$108Reduced social stress in heifers
Harvest Timing$174Improved NDF digestibility
Combined Potential$442-532Combined management impact

That suggests an annual improvement potential of $130,000 to $160,000 for a 300-cow dairy. Your specific numbers will shift based on milk price, regional feed costs, current practices, and implementation success—but the general magnitude tends to hold. You can adjust these figures for your own milk price and feed costs to get a better sense of what applies to your operation.

Your 30-Day Quick Start

  1. Pull DHI MUN records—check variation across your herd
  2. Separate first-lactation heifers into their own group (zero cost, immediate impact)
  3. Schedule a nutritionist review for the amino acid balancing feasibility
  4. Mark the corn silage target harvest date on the calendar now

The Component Pricing Connection

One additional factor worth considering: current component pricing structures can amplify or dampen the returns from these strategies, depending on your market.

In regions where protein premiums remain strong relative to butterfat, the milk protein percentage improvements from proper amino acid balancing deliver direct check impact beyond feed savings. Conversely, in markets where butterfat premiums dominate (as they have in many U.S. Federal Orders through 2024-2025), the reproductive and efficiency gains matter more than component shifts.

The point is that these strategies aren’t one-size-fits-all economically any more than they are nutritionally. Understanding your specific market’s component structure helps prioritize which elements to implement first.

Realistic Expectations for the Timeline

Operations considering this path should understand what a realistic timeline looks like.

TimelineWhat’s Actually HappeningMonthly Cash Impact
Month 1Feed cost reduction appears immediately+$1,500-$2,000
Months 2-3Amino acid costs peak, milk check looks same—patience required+$500-$1,000
Months 4-6Heifer grouping benefits measurable, component premiums visible+$2,500-$3,500
Month 6+New crop forage (optimal harvest) creates largest single cash gain+$4,500-$6,000
Months 12-18Full reproductive cycle improvement compounds into herd demographics+$10,000-$13,000

What’s Coming Next

Looking ahead, several developments may make precision protein feeding more accessible and reliable.

Real-time MUN monitoring through inline milk analyzers is becoming more practical, potentially allowing daily or even milking-by-milking adjustments rather than waiting for monthly DHI results. Precision feeding systems that deliver individualized rations based on production stage, body condition, and metabolic status are moving from research herds to commercial application. And genomic selection for feed efficiency traits—still in early stages—may eventually allow producers to select animals that convert feed more efficiently at the genetic level.

These technologies won’t replace good nutritional management, but they may provide better tools for finding and maintaining optimal protein levels for individual animals rather than group averages. Worth watching as these systems mature.

Practical Guidance by Operation Size

  • For herds with fewer than 100 cows, the management complexity of multi-group feeding may not justify the labor investment. Focus on forage quality and gradual protein optimization first. The diagnostic approach still applies—just proceed more slowly and acknowledge real constraints on management time.
  • For herds of 120-300 cows: The economic case for fresh cow differentiation and heifer separation becomes quite compelling. Consider starting with parity grouping (requiring no ration changes) to build confidence in nutritional optimization. This range represents something of a sweet spot for these strategies.
  • For herds with more than 300 cows, full implementation represents a substantial annual opportunity. The 18-month timeline means changes initiated now affect profitability through 2027 and beyond. At this scale, the question shifts from “whether” to “how well and how quickly.”
  • For all operations: Perhaps the most common mistake is confusing high feed efficiency numbers with genuinely profitable efficiency. A cow showing 1.8 pounds of milk per pound of dry matter intake while losing body condition isn’t efficient—she’s depleting reserves that will be repaid through reproductive failure, health challenges, or premature culling. Sustainable efficiency means strong production supported by adequate intake and stable body condition.

Your Next 3 Moves

  1. Review the last 6 months of DHI MUN data—calculate your herd’s variation and identify outliers
  2. Walk your fresh pen and first-lactation group this week—observe feeding behavior during and after TMR delivery
  3. Block 30 minutes with your nutritionist—discuss amino acid balancing feasibility for your specific forage base

The Bottom Line

The opportunity exists for many operations. Whether to pursue it—and how aggressively—depends on management capacity, forage infrastructure, current practices, and appropriate risk tolerance. But the underlying economics, for those positioned to capture them, continue to look favorable.

Key Takeaways:

  • Cut 2% protein, bank $40,000: Balanced 15-16.5% CP diets match 17-18% production—saving $33,000-$49,000/year on a 300-cow herd
  • Fix MUN, fix fertility: Every 1 mg/dL above 14 costs ~10% conception odds. Target 10-14 mg/dL for $15,000-$25,000 in annual reproductive savings
  • Separate heifers today—it costs nothing: First-lactation cows in their own pen gain 506 lbs/lactation. That’s $32,500/year at zero feed cost
  • Miss harvest timing, lose $52,000: Late-chopped silage drops NDF digestibility 11 points. That milk loss can’t be bought back
  • Stack all four for $130K-$160K/year: But first—pull MUN records. Variation over ±4 mg/dL means TMR problems to fix before touching protein

Complete references and supporting documentation are available upon request by contacting the editorial team at editor@thebullvine.com.

Learn More

The Sunday Read Dairy Professionals Don’t Skip.

Every week, thousands of producers, breeders, and industry insiders open Bullvine Weekly for genetics insights, market shifts, and profit strategies they won’t find anywhere else. One email. Five minutes. Smarter decisions all week.
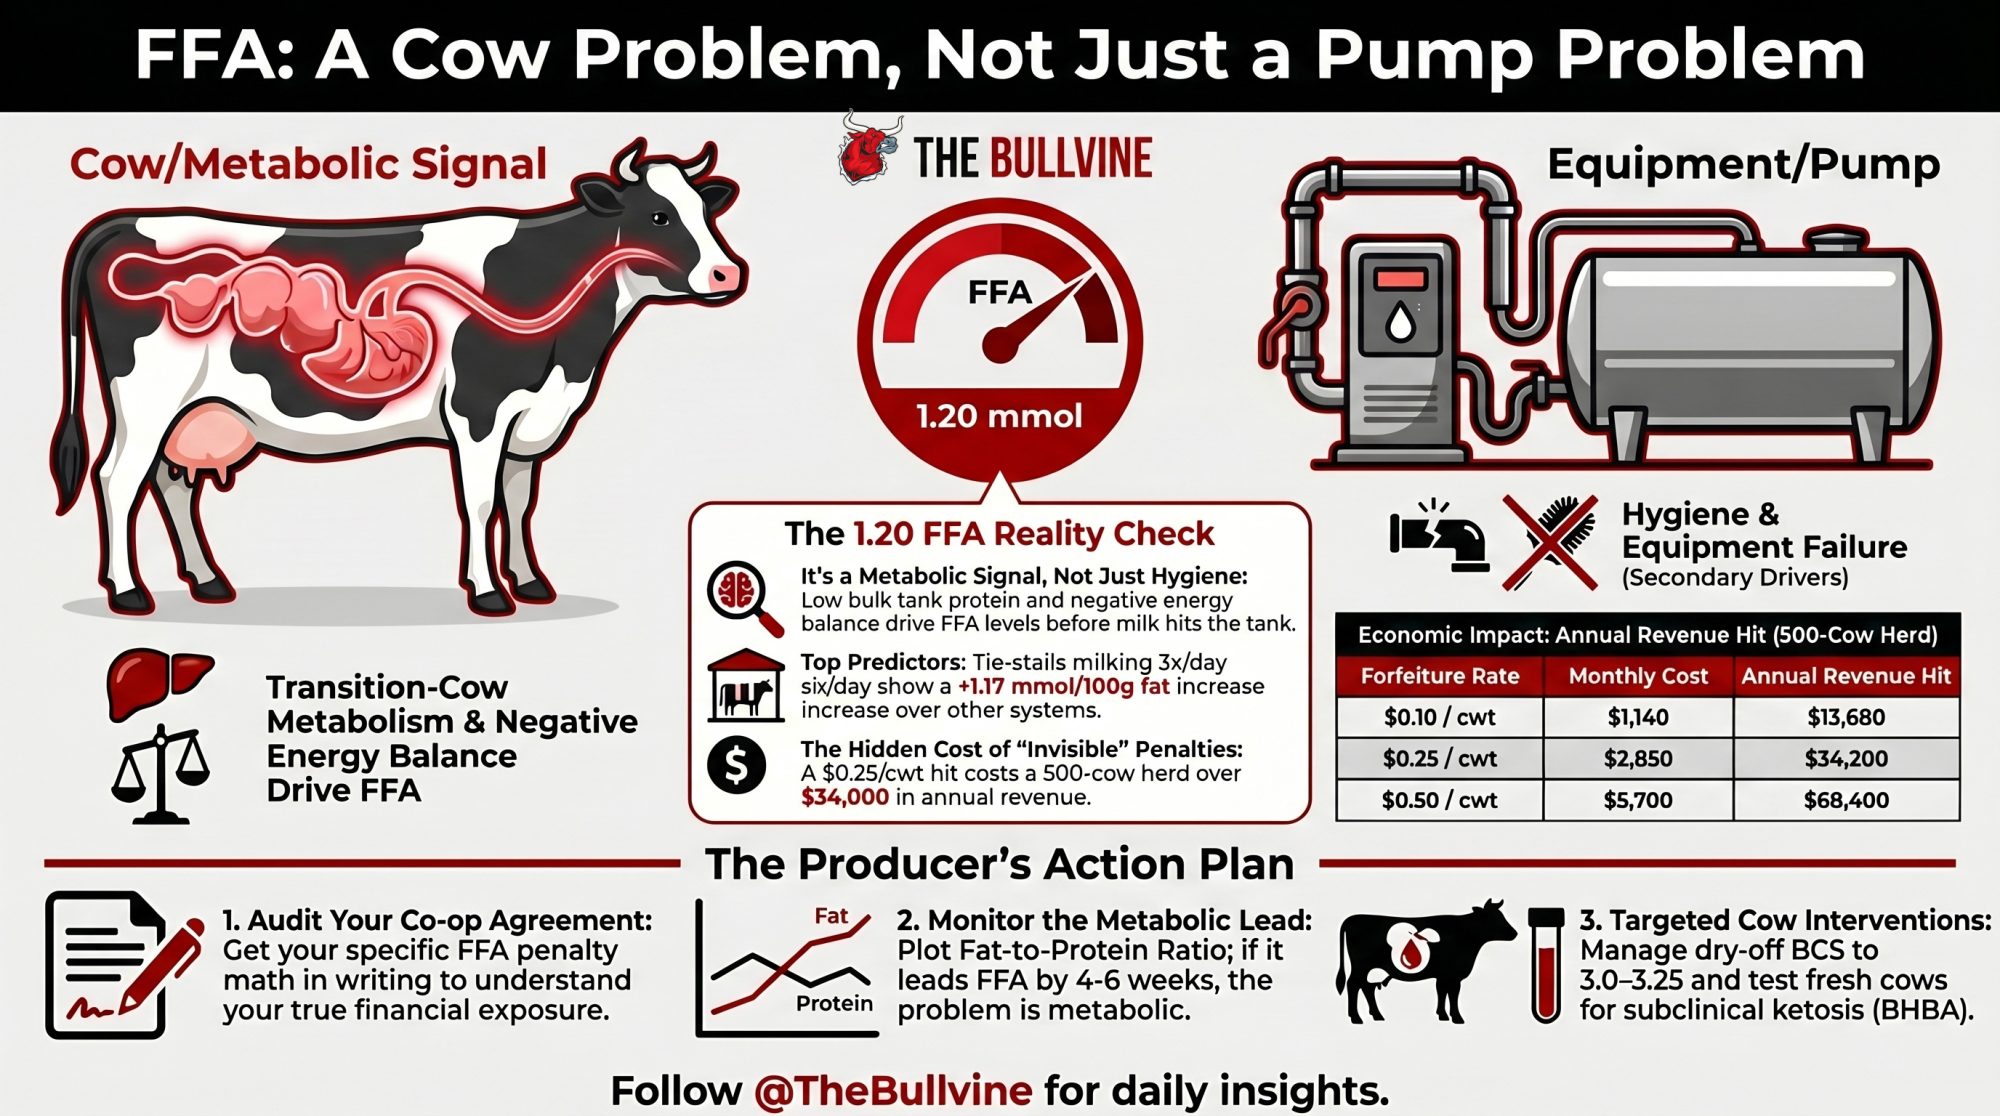
NewsSubscribe
First
Last
Consent

Wisconsin Proves It: Processed Alfalfa Adds $30K/Year – But Execution Is Everything

$30K/year from processed alfalfa. Wisconsin proved it. This tech rewards discipline—and punishes wishful thinking.

EXECUTIVE SUMMARY: Wisconsin researchers just proved what skeptics doubted: mechanically processed alfalfa silage can add $30,000/year to a 100-cow operation. But here’s what separates farms that profit from farms that waste money. The September 2024 Journal of Dairy Science study documented 1.5 kg/day more energy-corrected milk and 5.8% better feed efficiency—that’s $29,000-30,000 in milk revenue plus $8,600 in feed savings annually. The catch is straightforward but unforgiving: this only works on quality forage under 45% NDF. Process weather-damaged hay over 50% and you’re burning cash, not saving it. This technology rewards disciplined managers and punishes wishful thinking—farms already hitting quality targets see full returns, while those struggling with harvest timing need to solve that problem first. No technology rescues poor execution. Start with custom processing at $3/ton, book your operator by March, and let your own numbers make the final call.

Here’s what’s interesting: New research from Wisconsin shows mechanically processed alfalfa silage can boost energy-corrected milk by 1.5 kg per day and improve feed efficiency by nearly 6%. But the real story? It only works if your operation can handle the logistics.

At a Glance:

  • Milk production gain: 1.5 kg ECM/day per cow
  • Annual revenue increase: $29,000-30,000 (100 cows)
  • Processing cost: $3/ton custom hire or $50-75K equipment
  • Feed efficiency improvement: 5.8% less DMI for the same production
  • Break-even: Immediate with custom hire; 3.5 years with ownership
  • Quality threshold: Process only if NDF < 45%
Wisconsin nailed it: Mechanically processed alfalfa blows past traditional in every metric—if you nail the forage quality. That 12-point NDF digestibility jump and 1.5 kg ECM day? That’s real, documented by UW research.

You know, we’ve been making alfalfa silage the same way for generations—cut it, wilt it, chop it, pack it. Works fine, right? But what I’ve been following closely is this fascinating work coming out of the University of Wisconsin-Madison that might actually change how we think about forage processing.

The researchers up at the Dairy Forage Research Center in Prairie du Sac tracked 36 mid-lactation Holsteins over six weeks, and what they found in this September’s Journal of Dairy Science really caught my attention. They’re showing that mechanically processed alfalfa silage improved neutral detergent fiber digestibility from about 40% to nearly 52%. That’s almost a 12-point jump—and you don’t see that kind of improvement very often in forage research.

Here’s what’s really encouraging: The milk fat content went from 3.81% to 3.93%, and feed efficiency—that’s your energy-corrected milk per kilogram of dry matter intake—climbed by nearly 6%.

Matt Pintens, who led the research team, put it perfectly when he said they were “seeing cows do more with less.” The processing level index—that’s basically how much the cell walls get ruptured—jumped from about 38% with our conventional chopping up to 74% with mechanical processing. That’s a huge difference in how accessible that fiber becomes to the rumen bugs.

For a typical 100-cow operation here in the Upper Midwest, we’re talking about an additional $29,000 to $30,000 in annual milk revenue, based on what USDA’s reporting for current Class III prices around $19-20 per hundredweight. But here’s the thing—and this is where it gets interesting for those of us actually farming—it only works if you can execute the logistics properly.

How This Processing Actually Changes Things

Let me walk you through what’s happening at the cellular level, because it helps explain why this matters so much. When we chop alfalfa the traditional way, those cell walls stay mostly intact. You’ve got your cellulose, hemicellulose, and lignin all locked up tight, and even the best rumen microbes struggle to break through. The folks at Michigan State Extension have been documenting this for years—up to half the structural fiber in conventional silage can pass right through the cow undigested.

What mechanical processing does—and specifically, we’re talking about using a screenless hammermill after the alfalfa’s wilted in the field—is physically rupture those cell walls. The hammers essentially shred and fiberize the stems, creating way more surface area.

Dave Combs, the emeritus professor down at Madison, has this great way of explaining it: “Think of it like trying to dissolve a sugar cube versus granulated sugar—same material, but one dissolves immediately because of surface area.” That’s exactly what we’re doing for those rumen microbes.

The Wisconsin research documented faster fermentation, higher volatile fatty acid production—especially acetate, which you know is crucial for butterfat—and just more efficient energy extraction from the same amount of feed.

What really surprised me in their behavioral data was this: Cows fed the processed silage spent 49 more minutes lying down every day. They went from 751 minutes to 800 minutes of lying time. And their eating time? Dropped from 282 to 253 minutes daily. They’re eating more frequent but shorter meals—about 9.6 meals a day, averaging 27 minutes, compared to about nine meals averaging 32 minutes on conventional silage.

The Economics: When It Pencils Out (And When It Doesn’t)

Boost herd revenue by $30k with mechanical alfalfa processing. Wisconsin research reveals the NDF thresholds and logistics required for 5.8% better efficiency.

Tom Harrison, a nutritionist who’s been working with farms up in Vermont on this technology. Shares that “The economics are compelling, but only if you can execute the logistics.”

Quick Math for a 100-Cow Herd

Here’s what the Wisconsin study is showing:

  • Energy-corrected milk increase: 1.5 kg/day per cow
  • Annual production gain: 54,750 kg ECM for the whole herd
  • Butterfat yield increase: 2,920 kg annually

Based on what we’re seeing for component pricing this November, you’re looking at:

  • Conservative scenario ($19/cwt Class III): $29,233/year
  • Moderate scenario ($19.50/cwt with butterfat strength): $29,842/year
  • Optimistic scenario ($20/cwt with Class IV premium): $30,450/year

Custom Hire vs. Ownership: Breaking It Down

Processing OptionInitial InvestmentAnnual CostNet Benefit (100 cows)Break-Even Point
Custom Hire$0$600 (200 tons @ $3/ton)$28,600-29,850/yearImmediate profit
Equipment Ownership$50,000-75,000$7,750 (depreciation + maintenance)$21,450-22,700/year3.5-3.7 years
Co-op (3 farms)$17,000-25,000 per farm$2,600 per farm$26,600-27,850/year1.5-2 years

The Wisconsin Custom Rate Guide released this year shows custom processing at about $3 per ton. Now, in Wisconsin and Minnesota, you’ll find maybe 5-7 custom operators total. Eastern states typically have 1-2, while California’s Central Valley has 3-4, mostly concentrated near the major dairy regions. Beyond these regional operators, your state’s custom harvester association often maintains updated lists—definitely worth checking before harvest season.

I talked with John Martinez, who’s milking 120 cows near Tulare. He went the ownership route last year. “We figured with our harvest schedule and doing 300 tons of alfalfa annually, ownership made sense,” he told me. “But honestly, if I was doing less than 200 tons, I’d stick with custom hire.”

What often gets overlooked—and this is important—is the feed efficiency bonus. The Wisconsin study documented that 5.8% improvement in efficiency. For a herd eating 2,730 kg of dry matter daily, that’s 57,794 kg less dry matter consumed annually for the same production. With what the USDA’s Hay Market Report is showing for alfalfa values around $150 per ton dry matter, that’s another $8,669 in annual savings. That’s real money.

Quality Matters: Where Processing Shines and Where It Doesn’t

This is crucial, and the Wisconsin researchers were very clear about it: processing benefits vary dramatically depending on your starting forage quality.

You know, I’ve noticed farmers sometimes think processing can save a poor cutting. It can’t. Here’s what the data from Wisconsin and Extension research is showing:

How Different Quality Levels Respond

Premium first-cut (38% NDF, 72% NDF digestibility): This is your sweet spot. Processing takes digestibility from 72% up to around 81%—that’s the full benefit shown in the research, worth $30,000+ annually for a 100-cow herd.

Good first-cut (40% NDF, 68% NDF digestibility): Still excellent. You’re looking at digestibility jumping to 76%, with returns of $28,000 to $29,000 annually.

Marginal quality (42-45% NDF, 58-64% NDF digestibility): This is where many of us end up when rain delays harvest by a week. Processing still helps—digestibility improves to around 64-72%, generating $20,000 to $24,000 in value. It’s viable, but you’ve got to watch your costs.

Poor quality (50%+ NDF, less than 45% NDF digestibility): Here’s where processing hits a wall. You might see digestibility improve from 45% to maybe 49%, but that’s only worth $8,000 to $12,000 annually. Often not worth the processing cost.

As Dan Undersander, the forage specialist emeritus at Wisconsin, explains it: “The lignin content is the limiting factor. Once lignin hits 7-8% of dry matter—which happens in overmature or weather-damaged alfalfa—mechanical processing can’t overcome that biochemical barrier.”

Sarah Chen, who runs 200 cows over in Idaho, learned this the hard way. “We tried processing some rain-damaged first cut that tested at 52% NDF,” she told me. “Complete waste of money. Now we only process cuts under 45% NDF, and we segregate anything over that for the dry cows.”

Implementation: What’s Actually Working on Farms

After talking with extension specialists and farmers who’ve tried this technology, I’ve identified three make-or-break decisions:

Decision 1: How Will You Access Processing?

The biggest mistake I see? Farmers are waiting until June to start looking for a custom operator for the July harvest. By then, everyone’s booked solid.

Mark Olson at Minnesota Extension puts it bluntly: “If you want custom processing, you need to lock in an operator by March, period. Most regions only have one or two operators within 50 miles.”

Progressive Forage’s survey this year confirmed that custom operators in the Upper Midwest are typically booked 4-6 weeks in advance during peak season. And here’s something to consider—weather delays affect everyone at the same time. When your harvest is pushed back by rain, so is everyone else’s.

Decision 2: What Will You Actually Process?

Not everything needs processing. This surprised me when I first looked at the economics, but it makes perfect sense.

For a typical 100-cow operation producing maybe 200 tons of alfalfa silage annually:

  • First-cut at optimal quality (40-42% NDF): Process 80-100 tons
  • Second-cut (typically 35% NDF already): Skip it—it’s already high quality
  • Weather-delayed or poor cuts: Segregate for dry cows, don’t process

Jim Walsh, who milks 85 cows in Pennsylvania, has this figured out: “We only process our best first-cut, maybe 60 tons out of 180 total. Second and third cuts are already leafy enough. And anything that gets rained on? That goes to the heifers.”

Decision 3: How Will You Feed It?

This is where many farms stumble. You can’t just dump processed silage in with everything else and expect magic to happen.

The farms seeing the best results are those that can segregate. Lisa Thompson in New York dedicates her processed silage to her 25-head fresh cow group. “They’re the ones that need the highest quality feed, and they’re easiest to track for milk response,” she explains. “Within two weeks of starting on processed silage, our fresh group’s milk fat test jumped from 3.75% to 3.91%.”

Your Practical Timeline

Based on what’s worked for successful adopters I’ve interviewed, here’s a realistic timeline:

December-January (Right Now):

Start making those calls. Contact your current forage chopper about processing capabilities. Call your Extension office—they often know who’s running hammermills in your area. Here are the numbers if you need them:

  • Wisconsin: UW-Madison Forage Team at (608) 263-2890
  • Minnesota: University of Minnesota Forage Program at (612) 625-8700
  • Pennsylvania: Penn State Forage Specialist at (814) 863-0941
  • New York: Cornell PRO-DAIRY at (607) 255-4478
  • Other states: Check www.foragenetwork.org/state-contacts

Pull your harvest records from the last couple of years. When did you actually cut? What quality did you achieve? Be realistic about your typical harvest windows.

February-March:

Lock in your custom operator. Get the rate in writing—the Wisconsin Custom Rate Guide shows $2.50 to $3.50 per ton is typical. Specify your target processing level—you want a PLI of 70+ for this to work right.

Tom Harrison advises: “Don’t just say ‘process my alfalfa.’ Specify moisture targets, processing intensity, and get a commitment on timing.”

April-May (Pre-Harvest):

Get baseline measurements. Pull forage tests on your current conventional silage. Document current milk fat percentages and component levels. You need this data to prove whether processing works on your farm.

Plan your storage. Where will processed silage go? Can you keep it separate? Even just using a different bag or dedicating one section of your bunker makes tracking easier.

Being Honest About What We Don’t Know Yet

I think it’s important to be transparent here. The Wisconsin study, while rigorous, was a single trial, conducted at a single location, with 36 cows over six weeks. That’s solid science, but it’s not the whole story.

Dave Combs acknowledges this: “We need multi-year, multi-location data. We need to see how this performs in different climates, with different alfalfa varieties, especially the new reduced-lignin genetics.”

What we don’t know yet:

  • How processing performs with low-lignin varieties like HarvXtra or Nexgrow
  • Long-term effects beyond the six-week study period
  • Performance in large freestall operations with 500+ cows
  • How results vary between spring versus fall cuttings

As Harrison puts it, “I’d love to see data from California’s Central Valley versus Wisconsin versus the Maritime provinces. Different climates, different harvest patterns—will the results hold?”

Making the Decision: Who Should Jump In?

After reviewing all the research and talking with farmers who’ve tried this, here’s my take:

You should seriously consider processing this season if:

  • You consistently harvest first-cut alfalfa at 40-45% NDF or better
  • You have a reliable custom operator available (or 200+ tons annually to justify ownership)
  • You can segregate processed silage in storage
  • You track milk components and feed quality regularly
  • Current butterfat premiums in your market exceed $0.30/cwt

You should probably wait if:

  • Your typical first-cut runs 48%+ NDF due to weather delays
  • You can’t segregate storage or feeding groups
  • You’re switching forage contractors frequently
  • You don’t have systems to measure milk component response

Rick, who farms 150 cows in Minnesota, put it well: “This technology is like buying a better corn planter. It only helps if you can plant on time and manage the crop properly. Same with processing—it amplifies good management but can’t fix poor execution.”

What’s interesting is that farms already doing a good job with forage quality see the biggest absolute benefit. If you’re hitting 40% NDF consistently, processing can take you to the next level. If you’re struggling to get below 48% NDF, you’ve got bigger problems to solve first.

The research from Wisconsin is compelling, and the early farm adoptions I’m seeing suggest the benefits are real. But like any technology, success depends more on implementation than innovation. Start small, measure everything, and let your own data guide your decisions.

As one Extension specialist told me—and I think this really nails it—”The best farms aren’t the ones with the most technology. They’re the ones that can execute the technology they have.”

For those ready to take the next step, mechanical processing of alfalfa silage represents a genuine opportunity to improve feed efficiency and milk components. Just make sure you’re ready to execute the logistics before you commit to the technology.

For more information on mechanical processing research and custom operator listings, contact your state Extension forage specialist or visit the U.S. Dairy Forage Research Center website at www.ars.usda.gov/midwest-area/madison-wi/us-dairy-forage-research-center/

KEY TAKEAWAYS

  • $30K/year is verified science: Wisconsin’s September 2024 Journal of Dairy Science study documented a 1.5 kg/day increase in ECM and 5.8% better feed efficiency. For 100 cows, that’s $29,000-30,000 annually—plus $8,600 in feed savings.
  • Only quality forage pays off: Processing boosts digestibility 12 points on premium first-cut (40% NDF). Above 50% NDF? Save your money—lignin wins, and you lose.
  • Custom hire beats ownership for most: $600/year custom vs. $7,750/year ownership. Same result, zero equipment risk. Only consider buying at 200+ tons annually.
  • This rewards good managers, not bad ones: Farms already hitting 40% NDF get the full benefit. Still struggling past 48%? Fix your harvest timing before buying technology.
  • March deadline—call this week: Most regions have 1-2 custom operators who book solid 4-6 weeks ahead. Contact your Extension office now, or you’re sitting out 2026.

Complete references and supporting documentation are available upon request by contacting the editorial team at editor@thebullvine.com.

Learn More:

The Sunday Read Dairy Professionals Don’t Skip.

Every week, thousands of producers, breeders, and industry insiders open Bullvine Weekly for genetics insights, market shifts, and profit strategies they won’t find anywhere else. One email. Five minutes. Smarter decisions all week.
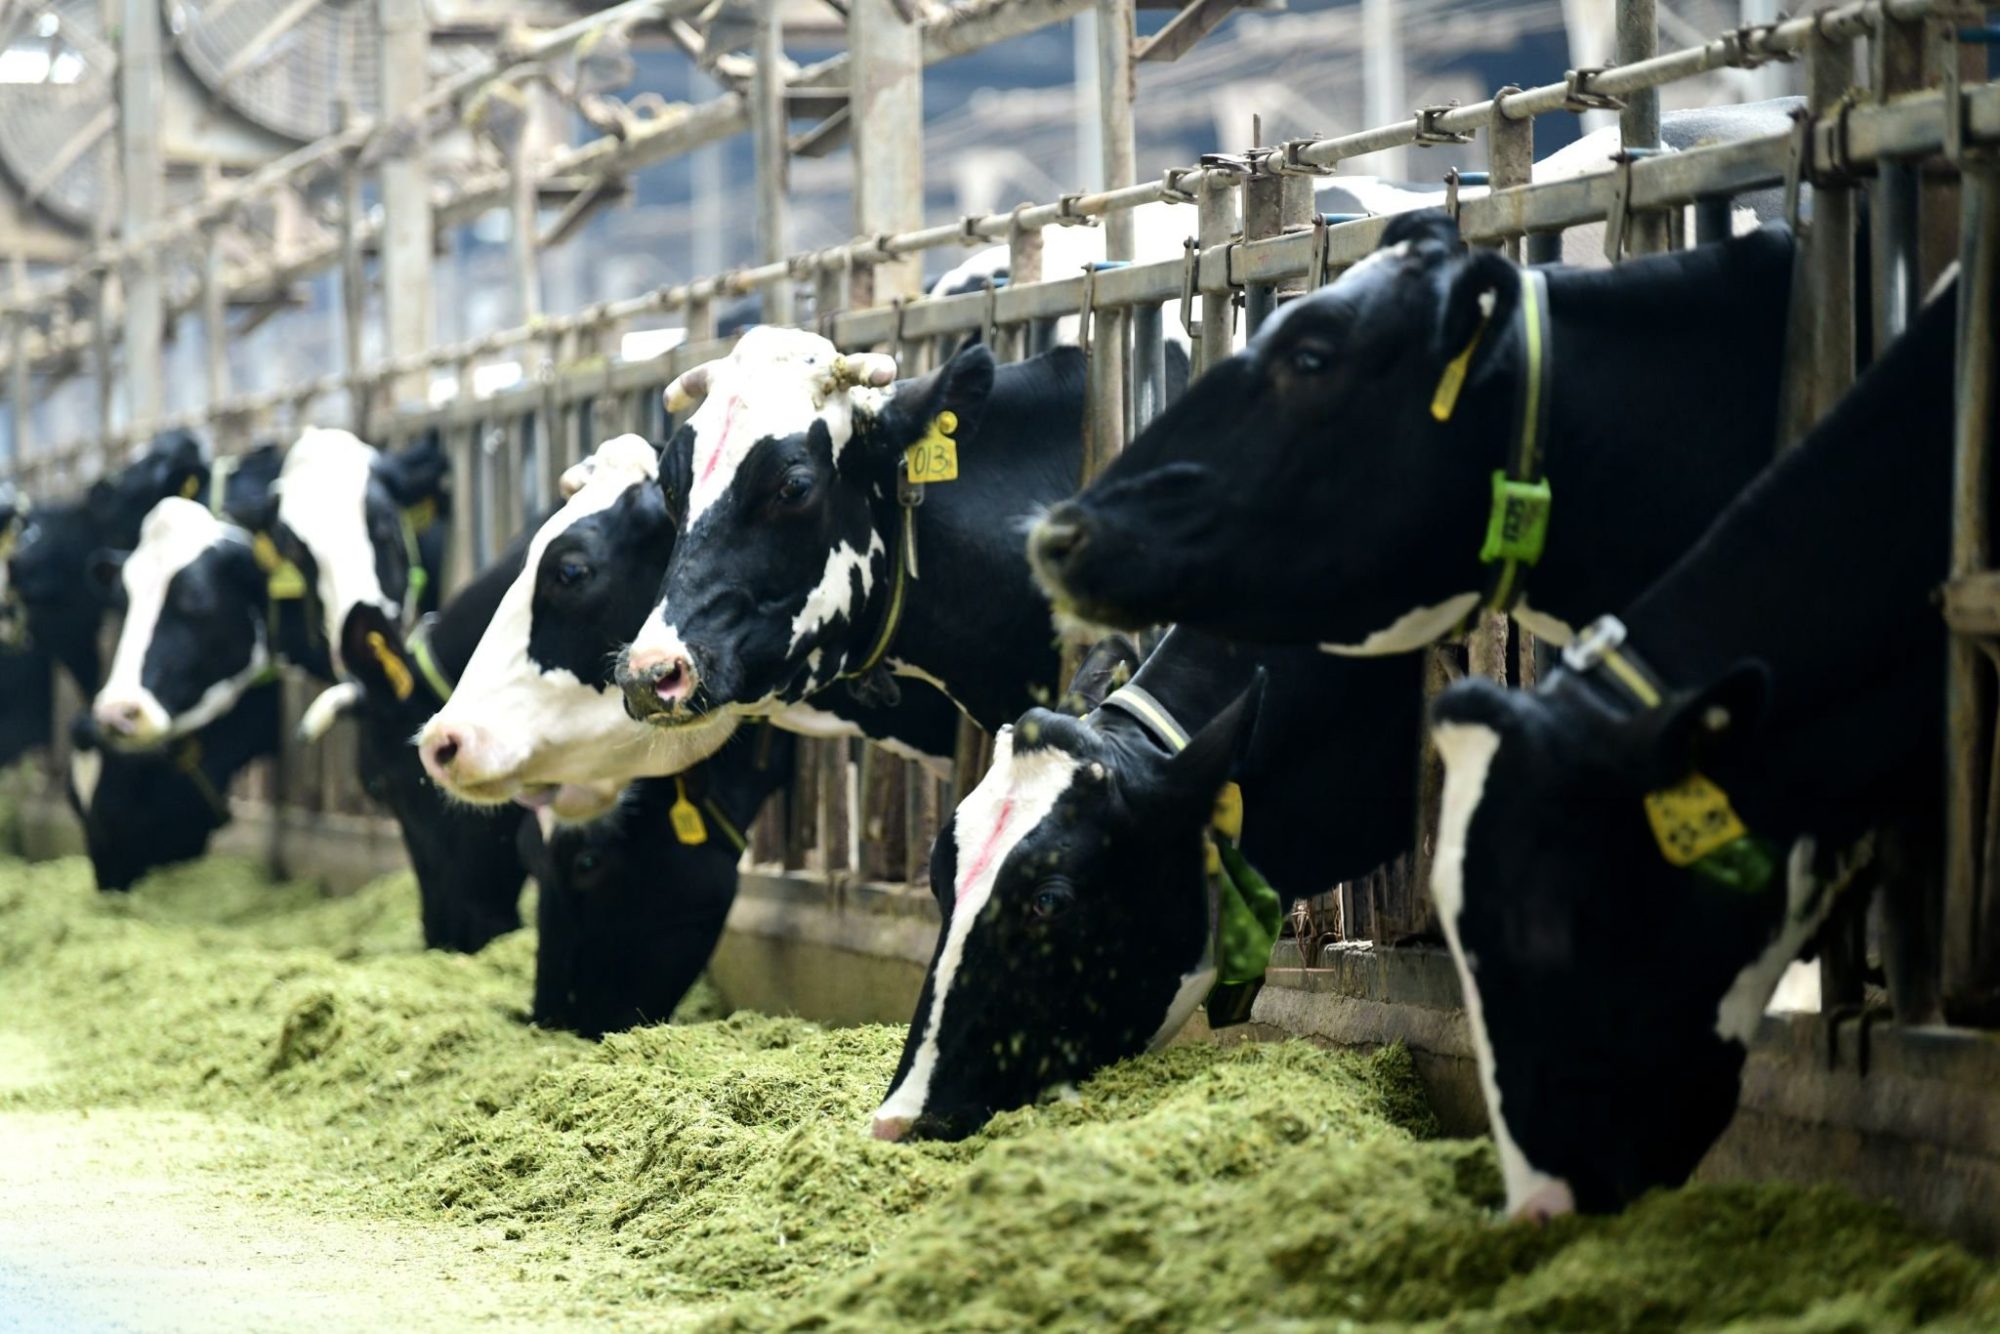
NewsSubscribe
First
Last
Consent

Feed as Science: How the Penn State Particle Separator Turns TMR Consistency into Butterfat and Profit

Feed as Science: How the Penn State Box Turns TMR Consistency into Butterfat and Profit

I was in a feed room on a Wisconsin dairy not long ago when I noticed something familiar—a brand-new Penn State Particle Separator, still in the box and tucked behind a stack of feed samples. The herd manager laughed when he saw me notice it. “We bought it last winter,” he admitted, “but we’ve been too busy to get into the routine.”

You know, that exchange says a lot about where we are as an industry. We’ve got tools that can unlock thousands of dollars in performance, but in the rush of day-to-day dairy life, the simplest ones often get sidelined. What’s interesting here is that this little plastic box—the Penn State Separator—is turning out to be one of the best pay-per-minute management tools we have.

Why Particle Size Still Deserves Attention

In recent years, research from Penn State Extension and the University of Wisconsin–Madison Department of Dairy Science has made one thing clear: physical feed structure drives both nutrition and profit. When TMR particle size drifts off target—either too fine or too coarse—milk output routinely dips 3–8 pounds (1.4–3.6 kg) per cow per day. Butterfat often falls 0.3–0.6 percentage points, especially when rumen function gets disrupted.

Those numbers add up quickly. For a 600-cow herd, that could easily amount to five figures in monthly component revenue left on the table.

Dr. Mike Hutjens, Professor Emeritus at the University of Illinois, puts it plainly: “Feed uniformity is your daily quality control system. Without it, you’re guessing.” And that’s the truth—consistency isn’t a luxury metric; it’s how high-performing dairies stay profitable year-round.

The Science Inside the Box

If you’ve handled a Penn State Particle Separator, you know it’s simple: four sieve trays stacked by particle size that literally show what cows are eating—not just what’s printed on the ration sheet.

For most lactating cows, Penn State guidelines suggest:

  • 2–8% retained on the top (>19 mm) sieve
  • 30–50% on the next (8–19 mm)
  • 20–30% on the third (4–8 mm)
  • Under 20% in the bottom pan (<4 mm)

What’s really fascinating is how this simple distribution tells us everything about the efficiency of rumen function. Too much fine material, and pH typically plummets below 5.8, kicking off subacute ruminal acidosis (SARA) (Krause & Oetzel, J. Dairy Sci., 2006). Too much long material, and cows start sorting, which restricts intake and upsets the delicate microbial balance that drives butterfat production.

Essentially, the Separator is a truth serum for TMR management—turning impressions into data.

When Feed Gets Too Fine – The Hidden Efficiency Leak

Overmixing is easy, especially in winter when forages dry out and mixing times stretch. The problem is subtle: rations start looking “fluffy,” but excessive blending breaks down fiber particles that cows need for natural buffering.

Mixing Time: The Goldilocks Zone for Particle Size – Seven to nine minutes hits the sweet spot for most operations: enough to blend thoroughly, not enough to pulverize fiber. Beyond 11 minutes, physically effective NDF drops below 60%, and fine particles spike—setting up acidosis risk. 

Research from Penn State (2023) and Dairyland Laboratories (2024) shows a consistent relationship—each 1% increase in fecal starch above 3% equals roughly 0.7 pounds (0.3 kg) of lost milk per cow per day. That drop traces directly back to reduced particle size and faster rumen passage.

Fecal Starch: The 3% Rule That Costs Real Money – Every 1% above 3% fecal starch equals 0.7 lbs lost milk per cow daily. At 5%, a 600-cow herd loses $30,660 annually.

Once the feed texture is corrected, cows respond fast. Intake climbs within a few days, and butterfat tends to normalize within 10–14 days. That’s the rumen re-establishing equilibrium, and it happens predictably if consistency holds.

It’s worth noting that recovery isn’t instant because microbial populations need a full cycle—about three weeks—to rebuild. But when farms stick with the plan, the results speak for themselves.

When Feed Gets Too Long – Why “More Fiber” Can Backfire

Across the Midwest, it’s common to see the opposite: rations that are too coarse. Sometimes it’s due to harvest conditions, sometimes prolonged knife wear, or wet forages. But even 10–15% material on the top sieve can drop dry matter intake by 3.3–4.4 pounds (1.5–2 kg) per cow per day, according to Cornell Cooperative Extension (2023)and Kononoff et al. (J. Dairy Sci., 2003).

It’s easy to spot. Bunks show long refusals, feed sorting increases, and milk solids vary from cow to cow. That imbalance also stresses the fresh cow group, where consistent energy delivery is critical during the transition period.

The fix is often small—a sharper chop or added moisture—but the payoff is large. One Northeast producer told me, “We didn’t change the ration at all, just the chop setting—and our intakes stabilized in a week.”

Connecting Particle Size and Fecal Starch

Here’s where modern precision feeding really shines. When farms combine physical evaluation (via the separator) with digestion analytics (via fecal starch testing), they close the loop on total feed efficiency.

Research at the University of Guelph (2024) found that herds maintaining a balanced TMR structure consistently achieved fecal starch levels below 3%, aligning with about 96% total-tract starch digestibility. Anything over 5% points to feed passing too quickly—often because TMR is too fine, not because kernels are underprocessed.

Or, as Hutjens says in his workshops, “If the rumen can’t hold feed long enough, microbes can’t finish their job.” That line always sticks because it’s a simple truth: the rumen’s efficiency relies on physical structure first, chemistry second.

What Improvement Looks Like – The 21-Day Timeline

Now, many producers ask: once we fix it, how quickly do the cows show results? Based on consistent findings from Penn State, UW–Madison, and the Miner Institute, here’s what usually happens:

  • Days 1–2: Feed sorting drops; bunk refusals even out.
  • Days 3–5: DMI increases 2–4 pounds (0.9–1.8 kg) per cow.
  • Days 5–7: Milk production rises 3–5 pounds (1.4–2.3 kg) per cow.
  • Days 10–14: Butterfat lifts 0.2–0.3 points.
  • By Day 21: Rumen and microbial stability return to optimal levels.

What’s interesting here is just how predictable the recovery is when particle size and feeding routine stay on target. Results don’t happen overnight—but give it three weeks, and the cows will show you why it’s worth sticking to the plan.

21-Day Recovery: From Feed Fix to Full Profit – Cows respond predictably when particle size is corrected. Milk rises within a week, butterfat follows by week two, and rumen stability locks in by day 21. 

Turning the Separator into a Habit

Producers who’ve made this work treat the Separator as part of weekly herd management, not a special task. I like to call it “Feed Quality Friday”—a fifteen-minute ritual where the feeder runs one test, records the numbers, and shares them with the nutritionist.

The payback for that small amount of time is remarkable. Field results from Penn State Extension (2024) show that farms that regularly monitor particle size reduced component volatility by nearly 30% across seasons, saving $50,000–$60,000 annually on a 500-cow herd.

But more importantly, it changes culture. Feeders begin catching drift before it shows up in milk tests. They start asking better questions about forage moisture, mixing time, and loading sequences. And that’s how farms shift from reactive to proactive management.

Building a Culture of Consistency

What’s encouraging is that this approach works everywhere—from 120-cow tiestalls in Ontario to 2,000-cow dry lot systems in California. The herds that succeed treat feed measurement with the same precision as fresh cow management or breeding records.

Across operations big and small, I’ve noticed that testing isn’t just about data—it builds accountability. Posting results weekly in the feed room, laminating target charts next to the mixer, or even color-coding sieves can transform an abstract concept into a visible, shared goal.

As Hutjens likes to emphasize, “Technology gives you options, but discipline delivers results.” That sentiment captures the heart of this discussion.

The Takeaway

Here’s what it all comes down to: the Penn State Separator isn’t flashy, and it doesn’t plug into an app—but it represents precision in its purest form. Measure, monitor, adjust, repeat. That process costs almost nothing and protects everything that matters: milk yield, butterfat performance, and cow health.

So if your separator is sitting in a corner, unopened, dust it off this week. Shake out one sample. It might just be the five most profitable minutes you’ll spend all month.

This feature draws on research and field data from Penn State Extension, University of Wisconsin–Madison, University of Guelph, Cornell Cooperative Extension, Dairyland Laboratories, and the William H. Miner Agricultural Research Institute, with expert perspective from Dr. Mike Hutjens, University of Illinois Professor Emeritus.

Key Takeaways:

  • The Penn State Particle Separator turns feed analysis into a five‑minute habit that can unlock five‑figure profits.
  • A simple metric—fecal starch over 3%—signals lost milk and missed feed efficiency worth hundreds daily.
  • “Feed Quality Fridays” pay off: just 15 minutes a week can protect up to $60,000 a year in butterfat returns.
  • Within 21 days of adjusting the feed structure, rumen health steadies, and milk fat rebounds naturally.
  • Across every region and herd size, the best dairies win on one thing: disciplined consistency—not fancy tools.

Executive Summary

Ask any successful dairy manager, and they’ll tell you—precision starts with the basics. This article reveals how the humble Penn State Particle Separator has become one of the most cost-effective tools for improving butterfat and overall feed efficiency. Backed by university and field research, it shows how something as simple as a five-minute TMR check can prevent $50,000 or more in yearly losses from feed inconsistency and poor fiber balance. Each 1% rise in fecal starch above 3% translates directly to milk left on the table, and yet, herds that make testing routine see full recovery in yield and butterfat within just 21 days. What’s interesting here is that the wins don’t come from expensive equipment—they come from habit, focus, and follow-through. It’s proof that on the best dairies, measurement has become a mindset, not just a task.

Complete references and supporting documentation are available upon request by contacting the editorial team at editor@thebullvine.com.

Learn More:

The Sunday Read Dairy Professionals Don’t Skip.

Every week, thousands of producers, breeders, and industry insiders open Bullvine Weekly for genetics insights, market shifts, and profit strategies they won’t find anywhere else. One email. Five minutes. Smarter decisions all week.
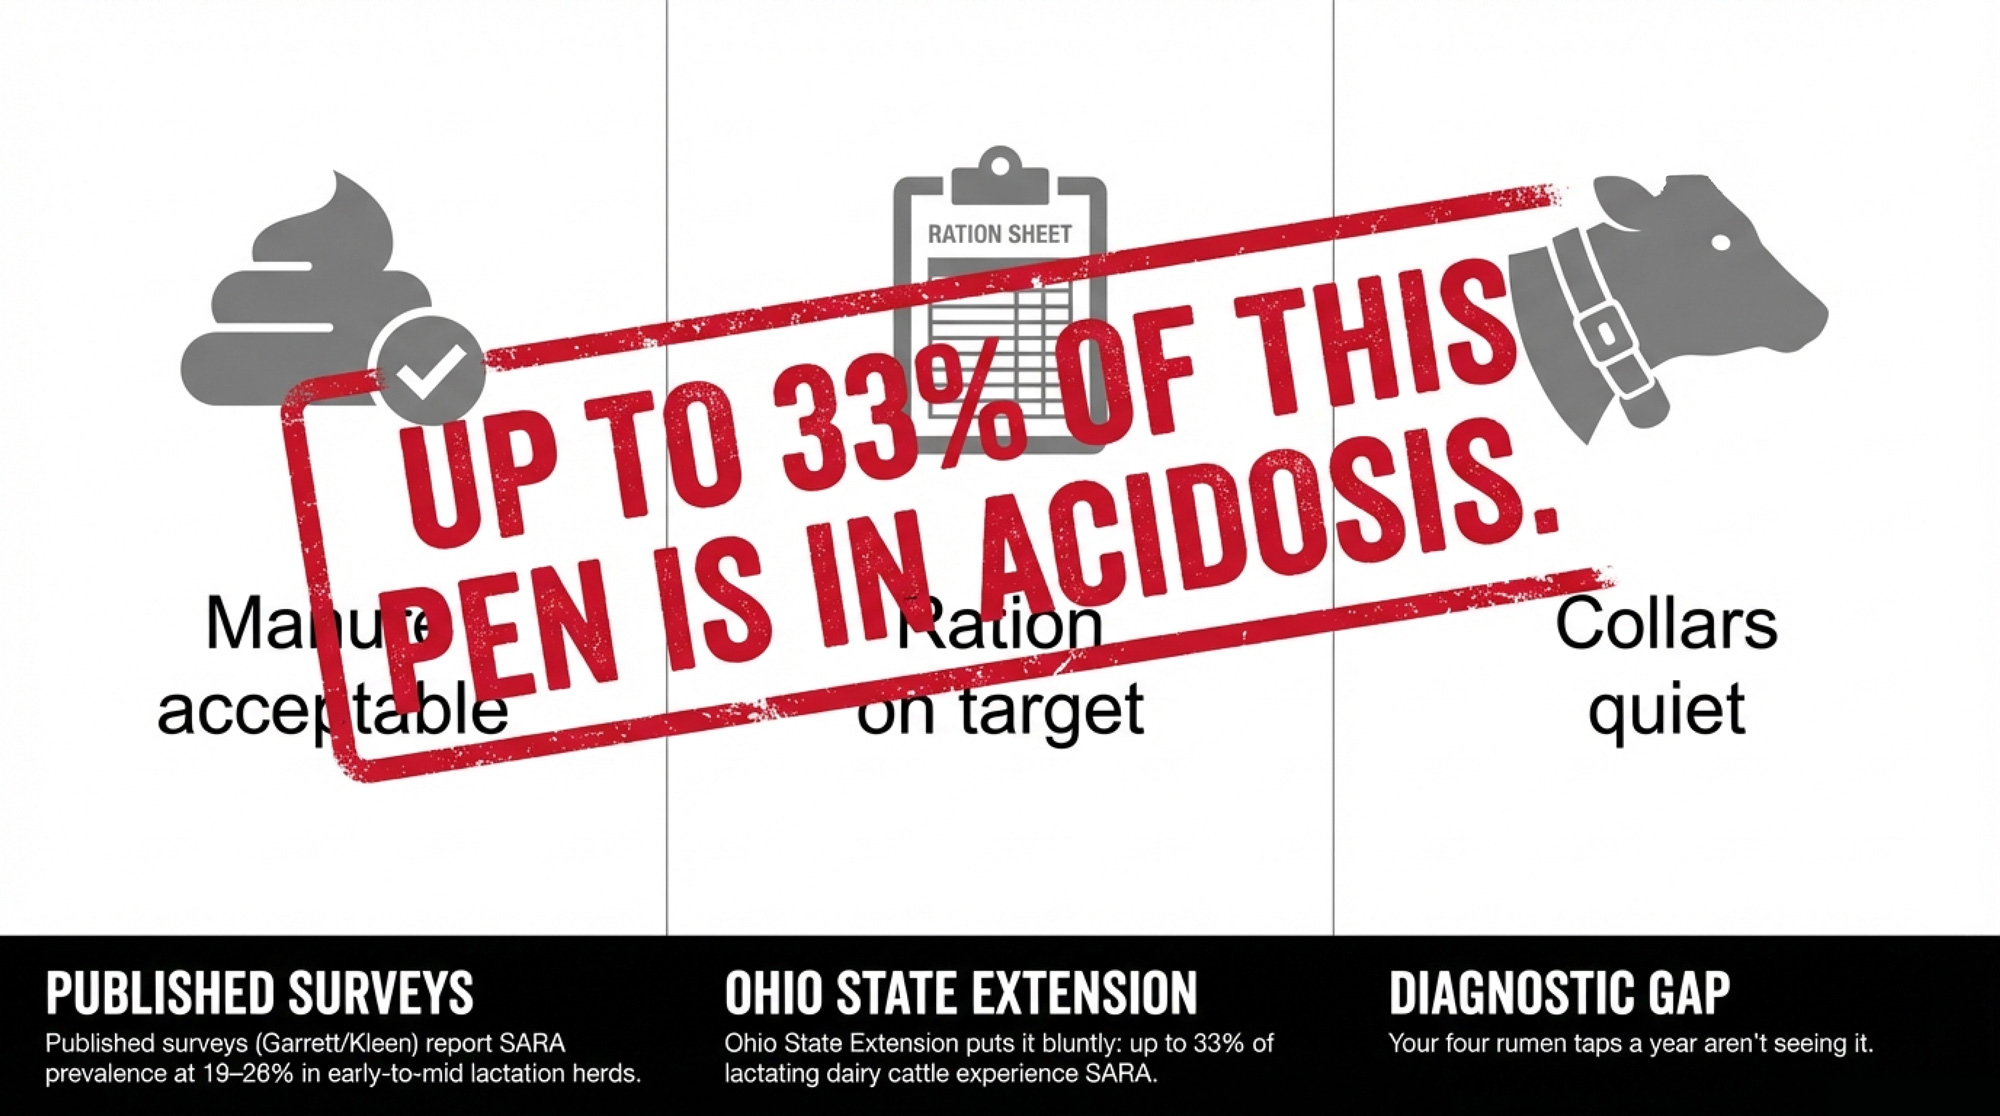
NewsSubscribe
First
Last
Consent

Matching the Feed to the Calf: Birth to 120 Days – Practical Science for Dairy-Beef Calves

Consistency isn’t a suggestion—it’s biology. Same time, same temp, same quality = 2.6 lb ADG and $100+ more per calf.

Good calf growth starts with steady habits—consistent feeding, clean water, and careful observation. From birth through 120 days, the calf’s diet and environment change rapidly, and how those changes are managed determines strength, health, and efficiency later on. Success comes from small, repeated actions done right every day.

Philosophy in Practice

Calves grow on consistency. Steady feeding times, clean water, dry air, and no sudden ration changes are the foundation of every good calf program.

Consistency Drives Growth

  • Feed at the same times every day
  • Keep milk solids and milk temperature consistent
  • Replace the starter daily so it smells clean and fresh
  • Make ration changes gradually over 4–7 days

Quick Start Essentials: 

□ Buy Brix refractometer ($30) 
□ Buy digital thermometer ($12) 
□ Set feeding times and stick to them 
□ Test first colostrum batch today 
□ Check milk temperature at next feeding

Birth to Day 3 — Immunity and Metabolic Activation

A newborn calf is born without immune protection in its bloodstream. All early protection comes from colostrum, which provides antibodies (IgG) and energy for warmth and early growth. If the calf doesn’t receive enough high-quality colostrum quickly, long-term health and gain are compromised.

What must happen in the first 24 hours:

  • Feed at least 4 quarts of clean, high-quality colostrum (Brix 24 or higher) within 2 hours of birth or 8.5%-10% of body weight
  • Provide another 2 quarts in the next 8–12 hours
  • Aim for 200+ grams of IgG total. A quick check is a Brix reading of 24% or higher
  • Dip the navel and provide deep, dry bedding
  • Offer warm water between liquid feedings
  • Keep calf temperature above 100°F

Research confirms that colostrum quality varies significantly between cows, with IgG concentrations ranging from less than 50 g/L to over 150 g/L. Using a Brix refractometer to test colostrum is now standard practice; readings of 22% or higher indicate good quality, and readings below 18% suggest the colostrum should not be used as the first meal. The 2024 National Animal Health Monitoring System (NAHMS) dairy study found that 29% of colostrum samples tested below minimum quality thresholds, while producers estimated only 8% was of poor quality.

Why Water Matters

  • Water and milk are not the same in the calf’s gut
  • Free-choice water helps rumen microbes begin developing early
  • No water equals weak fermentation, which equals slow rumen growth
  • Dump, clean, and refill water buckets daily

Water consumption is critical even in the first days of life. Unlike milk, which bypasses the rumen through the esophageal groove, drinking water enters the rumen directly and supports bacterial establishment and fermentation.

Days 3–21 — Rumen Initiation and Microbial Establishment

By day 3, the rumen is waking up. A good calf starter stimulates chewing and microbial activity. When microbes ferment starch, they produce volatile fatty acids (VFAs), especially butyrate, which signals the rumen lining to grow papillae—the structures that absorb energy later in life.

Feeding goals for this stage:

  • Feed milk replacer (20–24% CP, 20–22% fat) twice daily at consistent solids and temperature
  • Introduce textured starter by day 5 and keep it fresh
  • Starter formulation: 20–23% CP, 3–5% fat, 6–8% fiber
  • Provide clean, room-temperature water at all times
  • Maintain dry bedding and good airflow

Research demonstrates that VFA production, particularly butyrate and propionate, drives papillae development in young calves. Calves fed corn-based starters show improved rumen development compared to those fed barley or oats, with corn providing superior energy density and fermentability. Dr. Jud Heinrichs from Penn State, who’s been studying calf nutrition for 4 decades, emphasizes that these early days set the stage for lifelong digestive capacity.

Temperature consistency matters more than most realize. Research from Virginia Tech shows that milk temperature variations from 88 to 122°F within a single facility cause 40-65% more nutritional scours and 0.25-0.33 pounds of slower daily growth.

Temperature Consistency Drives Lifetime Value: Temperature swings from 88-122°F reduce ADG by 27% and cost $100+ per calf

Days 21–49 — Transition, Frame Growth, and Stable Fermentation

By week 3, calves transition from monogastric to ruminant digestion. Microbes multiply rapidly, and fermentation patterns shift toward propionate and butyrate production. These VFAs fuel lean growth and the development of rumen papillae.

Targets for this stage:

  • Starter intake: 1.5–3.0 lbs/day by week 6
  • Starter formulation: 18–23% CP, 3–5% fat, 6–8% fiber
  • Maintain uniform texture to prevent sorting
  • Watch manure consistency for early feedback on rumen health

Studies show that calves consuming adequate starter during this period develop larger, more functional rumens with greater papillae surface area. The relationship between starter intake and rumen pH becomes more pronounced as calves increase dry feed consumption, though young calves appear more tolerant of lower pH than adult cattle.

Sponsored Post

Days 49–70 — The Weaning Window

Wean by intake, not age. Calves are ready for weaning when they consistently eat 3 lb of starter per day for three consecutive days and drink water freely. A premature milk pull can cause growth slumps that can take weeks to recover from.

Best practices for weaning:

  • Taper milk gradually over 5–7 days
  • Keep the same starter ration during taper and for 10–14 days after full wean
  • Ensure dry housing, strong airflow, and adequate bunk space
  • Calves should be at least 8 weeks old before weaning is completed

Research consistently shows that weaning based on starter intake (minimum 3 lbs for three consecutive days) rather than age alone reduces stress and maintains growth momentum. Dr. Emily Miller-Cushon at Florida found that calves weaned before adequate intake show 180-280% increases in muscle breakdown markers, literally catabolizing their own tissue to survive the energy deficit.

Days 70–120 — Early Grower Phase for Dairy-Beef Calves

Three Biological Windows Programming Lifetime Value: Each missed critical period creates permanent deficits that cascade through production

Once fully weaned, calves function as true ruminants. The goal now is frame and muscle growth without digestive upset. A balanced grower with moderate starch, digestible fiber, and proper minerals supports this phase.

Key management points:

  • Target ADG of 2.4–2.6 lbs/day
  • Maintain 12–15% NDF from digestible fiber
  • Keep feed fresh and bunks clean
  • Manage heat with shade and airflow

Research on dairy-beef crossbred calves shows they can achieve exceptional growth rates when appropriately managed, with some studies reporting ADG exceeding 5.5 lbs/day on high-energy diets post-weaning. The optimal NDF level for starter diets appears to be in the range of 12-20%, with higher levels (above 27%) potentially reducing intake and growth.

This period is critical for marbling development. Research from South Dakota State shows that marbling adipocytes—the cells that determine quality grade—primarily form between days 70 and 120. Miss this window with inadequate nutrition, and those cells simply don’t form, costing 16.2 percentage points in Choice grading at harvest.

Common Mistakes and How to Avoid Them

  • Weaning by age instead of intake
  • Changing feed and pulling milk in the same week
  • Letting water get dirty—calves notice first
  • Feeding dusty or inconsistent starter
  • Overcrowding pens and limiting bunk space

Feeding Benchmarks by Stage

StageMilk Replacer (lb./day) 13.5% SolidsCalf Starter (lb/day)Water (qt/day)Target ADG (lb/day)
Birth–3 days1.12 – 1.682–40.8–1.0
3–21 days1.68 (6 quarts)0.25–1.04–61.2–1.6
21–49 days1.68 (6 quarts)1.5–3.06–81.6–2.0
49–70 days (wean)5.0–6.08–102.0–2.4
70–120 days6.0–8.0 (grower)8–122.4–2.6

Use these benchmarks as general guides. If calves fall below expectations, check water, environment, and feed freshness before adjusting the ration.

Nutritional Specifications by Stage

StageCP (%)Fat (%)NDF (%)Notes
Birth–3 daysColostrum quality (Brix ≥24%), warmth, hydration
3–21 days20–2318–20<5Starter + water drive rumen start-up
21–49 days18–203–56–8Uniform texture; watch manure form
49–70 days16–183–48–10Wean by intake; avoid new feeds during taper
70–120 days15–173–412–15Manage heat, bunk space, and cleanliness

The Economic Impact

Morbidity Collapse: Precision Feeding Reduces Pre-weaning Disease by 60%

While high milk replacer programs promise rapid early gains, the economics tell a different story. Operations using this starter-focused, consistency-based approach typically see:

  • 22% to 9% reduction in pre-weaning morbidity
  • 26 kg heavier weaning weights
  • 20 percentage point improvement in Choice grading
  • $100+ per calf additional value at harvest

The investment? A $30 Brix refractometer for colostrum testing, a $12 thermometer for milk temperature, and attention to daily details. These simple tools prevent the cascading failures that cost producers thousands in lost performance.


Economic Cascade: How Precision Practices Build $100+ Value Per Calf

Regional Considerations

Northeast operations dealing with harsh winters need insulated transport containers and pre-warmed feeding equipment when temperatures drop below zero.

Southwest producers face the opposite challenge—preventing milk from overheating when ambient temperatures exceed 100°F. Cooling systems and shaded feeding areas become essential.

Southeast operations must manage humidity’s impact on both heat stress and feed stability, requiring more frequent starter replacement and enhanced ventilation.

Putting It All Together

Healthy calves grow on predictability. If intakes or gains stall, start by checking basics: water, air, bedding, and space. When these fundamentals are right, calves stay on feed, develop strong rumens, and finish efficiently later in life.

The transition from colostrum-dependent newborn to functional ruminant represents one of the most critical developmental periods in a calf’s life. Research consistently demonstrates that calves receiving optimal early nutrition—including timely, high-quality colostrum, gradual increases in starter intake, and consistent access to clean water—show improved first-lactation milk production, reduced morbidity, and enhanced lifetime productivity.

For dairy-beef crossbred calves specifically, proper early management becomes even more critical as these animals represent an increasingly important segment of beef production. USDA data shows the dairy-beef sector expanded approximately 23% from 2021 to 2024. When managed with attention to the physiological transitions outlined here, dairy-beef calves can achieve growth rates and feed efficiencies that rival or exceed those of traditional beef calves while producing high-quality carcasses.

The key is consistency—the same times, same temperatures, same quality, every single day. Biology operates on its own schedule. Our job is to support that schedule with predictable, quality nutrition and management. Miss these critical windows in the first 120 days, and no feeding program can fully recover what’s been lost.

KEY TAKEAWAYS: 

  • Consistency Drives Everything: Feed same time, same temp (102-105°F), same quality daily—variation of just 14°F causes 60% more scours and 0.3 lb/day slower growth
  • Three Windows Program Forever: Immunity (0-3 days), rumen development (3-21 days), marbling formation (70-120 days)—miss any window and lose 16% Choice grade permanently
  • Water From Day 3 Changes the Game: Clean, fresh water drives rumen microbes; no water = weak fermentation = compromised lifetime efficiency
  • Wean by Intake, Not Calendar: 3 lbs starter/day for three consecutive days signals readiness—force it at 8 weeks and watch calves cannibalize their own muscle
  • $42 Tools Prevent $100 Losses: Brix refractometer ($30) catches bad colostrum that looks good; thermometer ($12) prevents temperature swings killing performance

EXECUTIVE SUMMARY: The first 120 days determine everything—calves grow on consistency, not complexity —and missing critical windows creates permanent deficits that no feeding program can fix. From birth through weaning, success requires unwavering precision: colostrum within 2 hours (Brix ≥24%), milk at 102-105°F (not the 88-122°F range common on farms), clean water from day 3, and weaning based on intake (3 lbs/day), not calendar. Three biological windows program lifetime performance: immunity (days 0-3), rumen development (days 3-21), and marbling formation (days 70-120)—miss any one and lose 16% Choice grade, 500 kg lifetime milk equivalent, or worse. This guide provides exact feeding benchmarks and nutritional specifications for each stage, showing how to achieve 2.4-2.6 lb daily gains while reducing morbidity by 60%. The tools are simple ($30 refractometer, $12 thermometer), the schedule is specific, and the payoff is clear: $100+ more per calf through better health, heavier weights, and superior carcass quality.

Complete references and supporting documentation are available upon request by contacting the editorial team at editor@thebullvine.com.

Learn More:

The Sunday Read Dairy Professionals Don’t Skip.

Every week, thousands of producers, breeders, and industry insiders open Bullvine Weekly for genetics insights, market shifts, and profit strategies they won’t find anywhere else. One email. Five minutes. Smarter decisions all week.
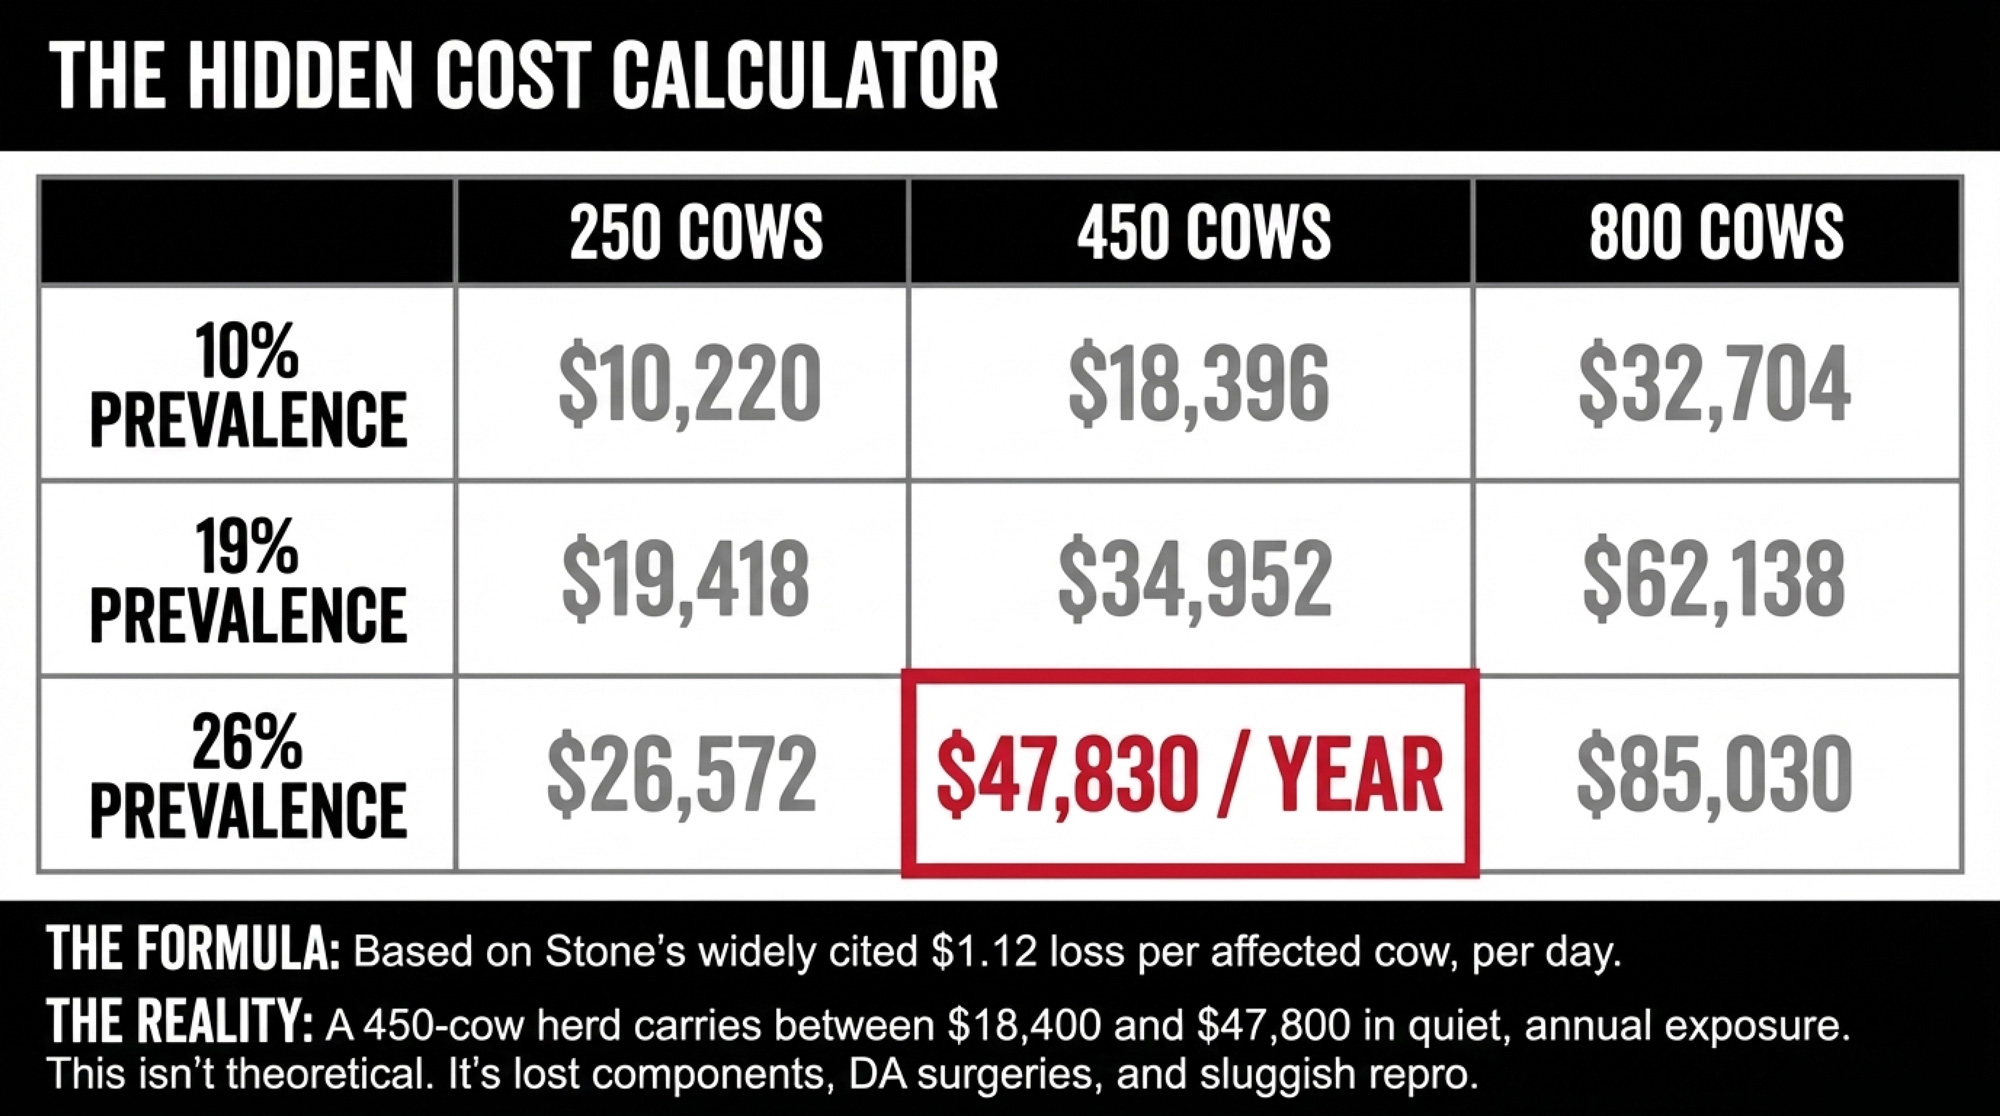
NewsSubscribe
First
Last
Consent

The $20,000 Fresh Cow Feeding Mistake Most Dairies Make (And How Michigan State’s Research Can Fix It)

Your nutritionist has you feeding three fat sources to fresh cows? Michigan State just proved that one works identically. Same 5-6 kg ECM boost. Same health. $20,000 less cost. The biology is eye-opening.

Executive Summary: You’re probably feeding multiple fat sources to fresh cows and wasting thousands each year—Michigan State just proved that one source works just as well. Dr. Adam Lock’s research shows that single-source supplementation at 3% dietary fat produces the same 5-6 kg ECM boost as expensive 4.5% combinations, but costs $0.42 less per cow per day. Why? Fresh cows have biological ceilings on fat processing—their intestines, rumens, and livers can only handle so much, making extra supplementation literally worthless. Choose whole cottonseed for high-starch rations or calcium salts for strong forage programs, but stop combining them—you’re throwing $20,000 yearly (500-cow herd) into the manure lagoon. The ROI difference is staggering: 228% for single-source versus 118% for combinations. Bottom line: More fat doesn’t mean more milk—it just means more cost.

dairy fat supplementation

So I was having coffee with a producer outside Madison last week, and he said something that really stuck with me. “Twenty years ago,” he told me, “my nutritionist had me feeding one fat source. Today? I’m feeding three different ones and honestly can’t tell you if they’re all necessary.”

You know, that resonates across the industry right now. Walk through most feed centers these days and you’ll find whole cottonseed, palmitic acid supplements, maybe some bypass fats… it’s basically a nutritional insurance policy that’s getting more expensive every year. And here’s what’s interesting—we’re all wondering whether this approach is actually delivering returns or just adding complexity.

Michigan State proved the controversial truth: single-source at 3% dietary fat produces identical milk as expensive 4.5% combinations—same 5-6 kg ECM boost, $20K less cost

Recent work from Dr. Adam Lock’s team up at Michigan State offers some compelling insights that might reshape how we think about all this. Their research, published in the Journal of Dairy Science in 2023 (Volume 106, pages 8667-8680), found something that really challenges what we’ve been doing. Turns out, cows fed a single fat source at 3% total dietary fatty acids produced 5-6 kg more energy-corrected milk daily compared to controls. But here’s the kicker—that’s exactly what cows receiving those expensive combination approaches at 4.5% total fat achieved too. Same results, but we’re paying for 50% more fat supplementation.

ROI comparison reveals single-source fat supplementation delivers 228% return versus just 118% for expensive combinations—nearly double the profitability for identical milk production

Understanding the Biological Framework

You know how the traditional thinking goes—fresh cows face massive energy deficits, fat provides concentrated energy, so more fat sources should help bridge that gap. Makes sense, right? It’s driven our supplementation strategies for decades.

But Dr. Lock, who’s spent over a decade investigating fatty acid metabolism at Michigan State’s Department of Animal Science, suggests we might be looking at this all wrong. “What we’re seeing,” he explains, “is that fresh cows aren’t simply energy-deficient—they’re processing-limited. Their intestinal absorption, rumen fermentation, and liver metabolism create biological ceilings that we can’t simply override with more inputs.”

This builds on what many of us have observed in the field for years. We’ve watched producers add supplemental fat sources, maintain stable production, yet see feed costs steadily climb. The cows appear healthy, milk flows well, but margin pressure… well, it quietly intensifies.

The Three Processing Bottlenecks

Here’s what the research identifies: three critical constraints that help explain why additional supplementation doesn’t necessarily translate into better performance.

So first, consider intestinal absorption capacity. Work from multiple research groups—including foundational studies by Doreau and Chilliard back in 1997, as well as more recent confirmations by Lock and Bauman—demonstrates that fatty acid digestibility follows a predictable pattern. At moderate intake levels, we’re seeing 80-85% digestibility. But push total dietary fat above 5-6% of dry matter, and that drops to 65-75%.

Intestinal capacity limits hit hard above 5% dietary fat—digestibility plummets from 82.5% to 70%, wasting 30% of expensive supplements in the manure lagoon

Why does this matter? Well, the small intestine requires bile salts and lysolecithin to form micelles—think of them as molecular structures that transport fatty acids across the intestinal wall. There’s a finite capacity here. And when we exceed it? Those expensive supplements we’re feeding end up contributing more to manure nutrient value than milk production.

The second constraint involves our rumen microbial populations. Research published in Animal Feed Science and Technology demonstrates that excessive unsaturated fatty acid loads force bacteria to shift their metabolism. Instead of following normal trans-11 biohydrogenation pathways, they switch to trans-10 pathways that produce compounds that actively suppress milk fat synthesis. It’s actually counterproductive.

And then there’s the third bottleneck at the liver. Fresh cow hepatic metabolism is already under tremendous strain. Drackley’s work from 1999, along with more recent studies by Ospina and colleagues in 2010, shows plasma NEFA concentrations spiking to 0.8-1.0 mEq/L in early lactation—that’s a four- to five-fold increase from the pre-calving baseline. When you add substantial dietary fat loads on top of endogenous mobilization, you’re asking the liver to exceed its metabolic capacity.

Quick Decision Guide: Cottonseed vs. Calcium Salts

Decision FactorChoose Whole Cottonseed When:Choose Calcium Salts When:
Base Ration StarchExceeds 26-28% of dry matterControlled below 26% of dry matter
Forage QualityLimited access to quality foragesExcellent forage program (peNDF >22%)
Heat StressTHI is regularly above 72Moderate climate conditions
Storage InfrastructureAdequate commodity handling is availableLimited storage capabilities
Milk PricingComponent pricing is moderateButterfat premiums >$2.50/lb over base
Fiber NeedsNeed additional effective fiberBase ration of fiber is already adequate
Primary GoalStabilize rumen functionMaximize milk fat synthesis

Economic Realities in Today’s Market

Let’s translate this biology into economics. Current market conditions—and I’m looking at USDA Agricultural Marketing Service data from October 2025—show whole cottonseed trading at around $220-250 per ton, though prices vary considerably by region and quality. California producers might see the lower end, while operations in the Northeast often face the higher range due to transportation costs.

Calcium salts of palmitic and oleic acids… that’s a different investment level entirely. We’re typically looking at $1,800-2,200 per ton, depending on volume and supplier relationships. Some operations negotiate better rates, but these figures represent what most producers encounter.

The Michigan State research suggests that the combination approach costs approximately $0.42 more per cow per day than single-source supplementation, with no production advantage. So for different herd sizes, the annual implications become pretty substantial:

You’ve got a 100-cow operation? That’s roughly $4,000 in additional cost. Scale that to 300 cows, and we’re discussing $12,000. For 500-cow dairies—which are increasingly common as consolidation continues—that’s $20,000. And larger operations feeding 1,000 cows or more? They could be looking at $40,000 annually.

Annual savings scale with herd size: 500-cow operations save $20,000 yearly by ditching combination feeding for strategic single-source supplementation

What’s particularly striking in the data is how return on investment shifts. Single-source strategies in the Michigan State trials delivered 228-231% ROI. The combination approach? Just 118%, despite requiring greater investment.

“What surprised us was discovering our combination feeding approach was actually driving higher NEFA concentrations. We thought more energy supplementation would reduce body fat mobilization, but we were creating metabolic stress instead.” – Central Valley dairy producer implementing monitoring protocols

Strategic Selection: Matching Supplement to System

Here’s the thing—the choice between whole cottonseed and calcium salt supplements isn’t about which is inherently superior. It’s about matching the tool to your specific situation.

When Cottonseed Fits Best

I spoke recently with a producer near Green Bay who made an important observation. His operation was pushing starch levels near 30% of dry matter, trying to maximize energy density. “Adding calcium salts to that situation,” he explained, “was like adding fuel to a fire that was already burning too hot. Cottonseed gave us energy but also brought fiber that helped stabilize the whole system.”

And this aligns with the biological understanding. Operations running higher starch levels—approaching 28-30% of dry matter—often benefit from cottonseed’s dual contribution. The intact seed coat provides a time-release mechanism, delivering oil gradually over 12-24 hours rather than flooding the system. Plus, that effective fiber component helps maintain rumen mat integrity and supports more stable fermentation.

Heat stress considerations matter significantly, too. Research from Lock’s group indicates that whole cottonseed maintains feed intake more effectively during heat-stress periods because its lower fermentation rate generates less metabolic heat. For operations in Arizona, New Mexico, or even during increasingly hot summers in traditional dairy regions, this becomes critical when the temperature-humidity index regularly exceeds 72.

And you can’t overlook storage infrastructure either. Cottonseed requires proper commodity storage—covered, well-ventilated, with moisture control. Operations lacking these facilities might find the handling challenges outweigh potential benefits.

When Calcium Salts Excel

On the flip side, operations with strong forage programs often maximize returns from calcium salt supplementation. If you’re maintaining physically effective fiber above 22% with quality alfalfa or grass hay, you don’t need cottonseed’s fiber contribution—you need concentrated, targeted energy delivery.

The fatty acid profile matters here. Most commercial calcium salt products feature a 60:30 palmitic-to-oleic ratio, which Lock’s recent research suggests offers specific advantages. Palmitic acid directly drives milk fat synthesis, while oleic acid helps maintain insulin sensitivity and moderates body condition loss during early lactation.

Component pricing drives this decision, too. With the Federal Milk Marketing Order adjustments that went into effect June 1st, 2025, we’re seeing shifts in how components are valued. When processors pay strong butterfat premiums—and some regions are seeing $2.50-3.50 per pound over base—the enhanced milk fat response from palmitic acid supplementation can justify the investment. Provided you’re operating within biological capacity limits, that is.

Monitoring What Matters

Making the transition from combination to single-source supplementation requires systematic monitoring to validate outcomes. And progressive operations are tracking several key metrics.

Body condition score change remains fundamental. You want to target less than 0.5 units of loss from calving through day 21. Ospina’s research showed cows exceeding this threshold face 61% higher hyperketonemia risk, while Shin documented five-fold increases in pregnancy loss rates. If your supplementation strategy drives excessive mobilization, you’re creating cascading problems throughout lactation.

The milk fat-to-protein ratio at the first test provides valuable insight, too. Ratios exceeding 1.5-1.6 suggest a severe negative energy balance was occurring 10-14 days prior, according to University of Wisconsin Extension guidelines. Now, this lag means you’re always looking backward, but patterns across fresh pen groups reveal systemic issues versus individual cow problems.

Blood NEFA testing at days 3-6 postpartum offers an early warning system. Cornell University’s Animal Health Diagnostic Center has long recommended targeting below 0.6 mEq/L, with concern rising when more than 10% of sampled cows exceed 0.7 mEq/L.

Blood NEFA levels reveal metabolic stress: fresh cows spike 4-5x above baseline, and exceeding 0.7 mEq/L triggers 61% higher ketosis risk—combination feeding often makes this worse

A Central Valley producer I work with implemented these monitoring protocols last year. “What surprised us,” she noted, “was discovering our combination feeding approach was actually driving higher NEFA concentrations. We thought more energy supplementation would reduce body fat mobilization, but we were creating metabolic stress instead.”

Broader Industry Context

You know, this research emerges at a particularly relevant time. Milk price volatility combined with elevated feed costs—just look at the latest USDA Economic Research Service reports from October 2025—means efficiency increasingly determines profitability rather than pure production volume.

Dr. Lock frames it well: “We’ve moved past the era where simply adding expensive ingredients guarantees returns. Biology has limits, and understanding those limits separates thriving operations from those merely surviving.”

The science continues evolving, too. Michigan State’s work with high-oleic soybeans offers intriguing possibilities for operations growing their own feedstuffs. These varieties contain 75-80% oleic acid, compared with conventional soybeans’ 50% linoleic acid profile, potentially providing homegrown solutions for optimizing fatty acid supplementation.

Looking forward, precision feeding technologies will enable even more targeted supplementation. Several research institutions are field-testing sensors measuring milk fatty acid profiles at each milking, with automatic supplementation adjustments based on individual cow needs. Sure, it sounds futuristic, but remember—robotic milking seemed equally far-fetched just two decades ago.

International Perspectives Worth Considering

What’s fascinating is seeing how different production systems worldwide approach fat supplementation through various lenses. Pasture-based systems, in particular, have discovered that timing often matters more than source selection. They’re using milk fatty acid profiling to guide supplementation decisions during transitions between grazing and stored feeds—insights that are applicable to any operation managing seasonal feed changes.

European operations, particularly in regions with strict nutrient management regulations, have focused intensively on efficiency rather than maximization. Their experience suggests single-source supplementation matched to specific production phases often delivers superior economic and environmental outcomes.

Key Takeaways for Implementation

So several principles emerge from both research and field experience:

First, respect biological processing limits. The Michigan State data clearly indicates that pushing beyond 3% total dietary fat often means paying for supplements that deliver no additional benefit. This isn’t about feeding less—it’s about feeding smarter.

Second, match your strategy to your system. Either cottonseed or calcium salts can deliver excellent returns when properly implemented. The combination approach appears to waste resources while producing identical results. Base your choice on ration composition, infrastructure capabilities, and component pricing rather than following generic recommendations.

Third, consider timing carefully. Lock’s team has shown that delaying high-palmitic supplementation until after day 21-28 postpartum can prevent excessive body condition loss while still capturing milk fat benefits. Fresh cow nutrition isn’t just about what to feed, but when to feed it.

Fourth, invest in monitoring. Don’t wait for monthly test days to reveal problems. Systematic tracking of body condition, metabolic markers, and milk components catches issues while there’s time for correction. The testing investment pays dividends through prevented metabolic crises.

And finally, evaluate true economics. Look beyond ingredient cost per ton to assess income over feed cost, factoring in component premiums, health outcomes, and reproductive impacts. That “expensive” single-source strategy might actually reduce total cost when all factors are considered.

The Path Ahead

What’s encouraging is that the Michigan State research provides clarity in an area often clouded by conflicting advice. Strategic single-source fat supplementation respects the biology of the fresh cow while delivering strong economic returns.

For a typical 500-cow dairy, transitioning from a combination to a single-source supplementation system could yield $20,000 in annual savings without sacrificing production. As margins continue tightening industry-wide, these are opportunities worth serious consideration.

And here’s what I find particularly encouraging—implementation doesn’t require new technology or infrastructure investment. It’s about understanding biological constraints and making more informed decisions with familiar ingredients.

The operations that’ll thrive in 2026 and beyond are those that embrace evidence-based nutrition strategies. The kitchen-sink approach served its purpose when we understood less about the metabolism of fresh cow milk. But now that we know better, we can do better.

The fundamental question has evolved, you know? It’s no longer whether to supplement fat to fresh cows—that value is established. The question now is which source, at what inclusion rate, during which timeframe, and within what biological constraints. Answer those questions correctly, and you’re not just feeding cows… you’re optimizing a complex biological system for maximum efficiency and profitability while respecting the fundamental limits that govern metabolic function.

This represents a more sophisticated approach to dairy nutrition—one that acknowledges that more isn’t always better, that biology has boundaries, and that respecting those boundaries often leads to superior outcomes both economically and metabolically.

Key Takeaways:

  • One fat source = Same milk, less cost: Single-source supplementation (3% dietary fat) matches combination results (4.5%) while saving $20,000/year per 500 cows
  • Biology has limits—respect them: Fresh cows max out fat processing at intestines (digestibility drops 85%→65%), rumen (bacteria shift to harmful pathways), and liver (NEFA overload)
  • Choose based on your ration: Cottonseed for high-starch operations needing fiber; calcium salts for strong forage programs chasing butterfat premiums—but never both
  • ROI tells the story: Single-source delivers 228% return vs. 118% for combinations—that’s nearly double the profitability for identical production

Complete references and supporting documentation are available upon request by contacting the editorial team at editor@thebullvine.com.

Learn More:

The Sunday Read Dairy Professionals Don’t Skip.

Every week, thousands of producers, breeders, and industry insiders open Bullvine Weekly for genetics insights, market shifts, and profit strategies they won’t find anywhere else. One email. Five minutes. Smarter decisions all week.
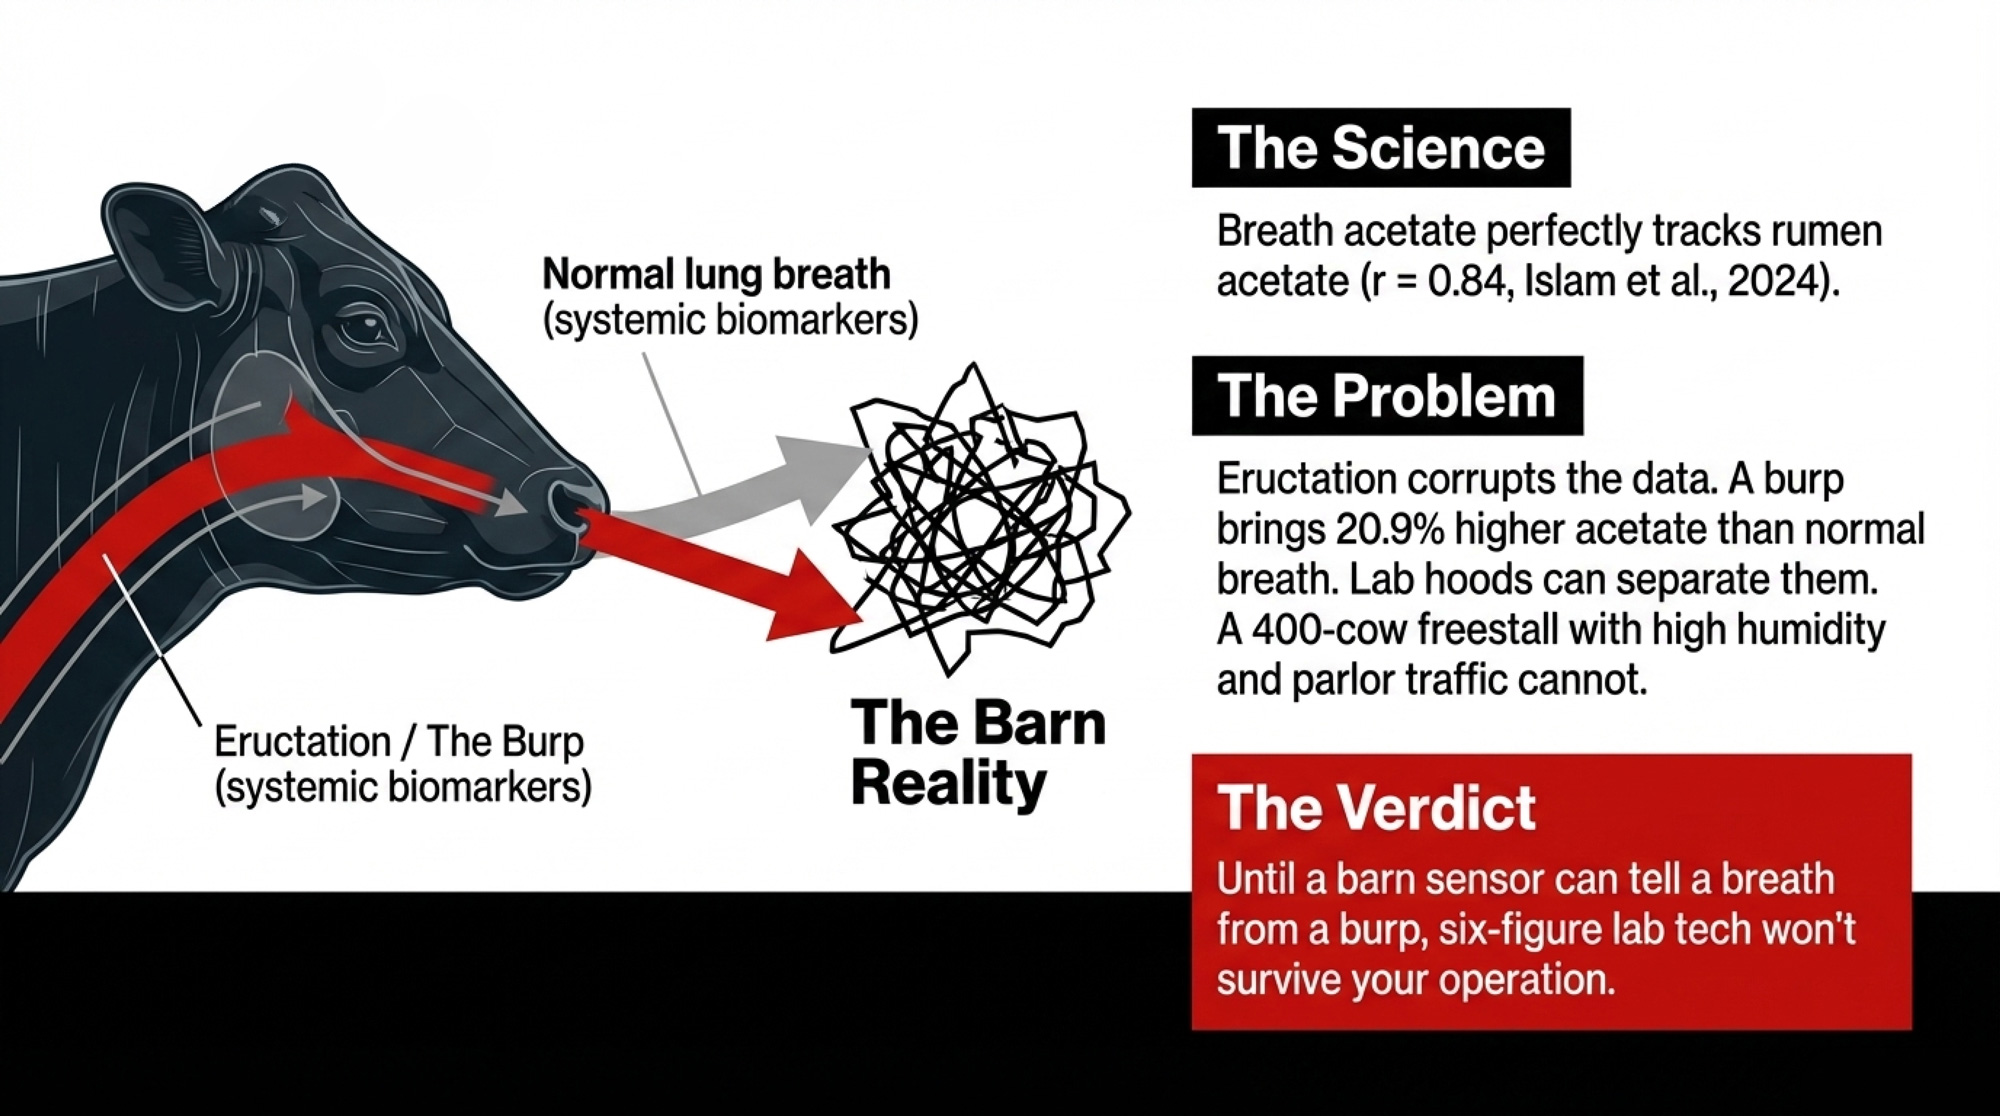
NewsSubscribe
First
Last
Consent

The DDGS Discovery That’s Changing How Smart Producers Think About Transition Feeding

That $145/ton DDGS you’re feeding? Contains the same compounds as $20K/ton supplements. Your cows knew. Now you do too.

EXECUTIVE SUMMARY: That pile of DDGS you’re feeding at $145/ton contains the same immune-boosting compounds as supplements costing $20,000/ton—you just didn’t know it. University research reveals that distillers grains carry billions of heat-killed yeast cells packed with beta-glucans, potentially improving transition cow health and colostrum quality. Producers already report fewer metabolic issues and stronger calves when feeding DDGS, though they’ve been crediting the protein content. For a 500-cow dairy, these hidden benefits could be worth $42,900 annually. The catch: we can’t reliably test for these compounds yet, and every ethanol plant produces different levels. Until standardization develops over the next 3-5 years, you’re essentially feeding a lottery ticket—valuable, but unpredictably so.

I was having coffee with a group of nutritionists last month when someone brought up something interesting. “We’ve been feeding distillers grains for twenty years,” one of them said. “But are we really understanding what’s in them?”

You know, that question has been rattling around in my head ever since. Because what we’re starting to discover about DDGS might change how we think about this everyday feed ingredient—and maybe even how we evaluate feed efficiency in general.

The Research That’s Getting Everyone Talking

This year, new university-led research and field studies have begun examining how dried distillers grains affect the health of transition cows and calves. While early results suggest possible improvements in colostrum and calf immunity, producers should remember that more peer-reviewed research is needed before making major feeding changes.

Here’s what’s interesting: it might not just be about the protein and energy we usually focus on.

You probably know the basics of how DDGS are made—corn is fermented with yeast, the alcohol is removed as ethanol, and what’s left is dried and sold to us as feed. What I hadn’t really thought about until recently is that all those yeast cells used in fermentation? They’re still in there. Heat-killed from the drying process, sure, but their cell walls are intact.

And those cell walls… well, according to feed chemistry research from places like Cornell and Wisconsin, they contain compounds like beta-glucans and mannanoligosaccharides. If those sound familiar, it’s because they’re the same things that companies have been selling us in premium yeast supplements for years. The difference is, in DDGS, they just come along as part of the package.

Looking at the Numbers

What I’ve found particularly thought-provoking is when feed scientists analyze DDGS for these yeast components. Preliminary industry and university analyses estimate that the beta-glucan content in DDGS may range from 3 to 6 percent, though results vary widely by plant and region.

DDGS protein has become more consistent and fat content has declined over 15 years. 2021 DDGS delivers more reliable nutrition, but variability remains a challenge

Now, think about this for a minute. Many of us are spending around $20 to $25 per cow on various transition supplements—that’s based on current extension budgets from Penn State and Wisconsin. Between anionic salts, yeast cultures, protected choline, trace minerals… it adds up. I was talking with a producer from northeast Wisconsin recently who calculated he’s at about $22 per cow through the transition period. Pretty typical for folks who are serious about fresh cow management.

Meanwhile, we’re feeding DDGS at maybe 10 to 15 percent of the dry cow ration, chosen mainly because they’re economical when soybean meal gets pricey. But what if those distillers grains are doing more than we realize?

Some university field trials and producer observations suggest there might be something to this, though—and I want to be clear here—we’re still in the early stages of understanding exactly what’s happening. The mechanisms aren’t fully worked out yet. But anecdotally, producers and some university field trials have noted possible improvements in colostrum quality or calf health when DDGS are used, though comprehensive published research is still underway.

What Producers Are Noticing

This is where it gets really interesting. I’ve been making a point of asking producers about their experiences with DDGS in transition diets, and I keep hearing similar themes.

A friend who runs about 400 cows in southwestern Minnesota told me, “Our fresh cows just seem to handle the transition better when DDGS are consistent in the closeup ration. Fewer DAs, better appetites coming out of calving.” He’d always figured it was the extra energy or maybe the bypass protein.

The science is black and red: Maximum immunity for calves comes at 15% DDGS in dry cow rations. Take your passive transfer strategies to the next level and leave doubt in the dust.

I heard something similar from a larger operation in California’s Central Valley, and even a grazing dairy in Vermont mentioned that its calves seem more vigorous when DDGS are higher during the dry period. Up in the Northeast, where they’re dealing with different forage bases than we see in the Midwest, producers are still noticing these patterns.

A producer near Syracuse, New York, who’s been tracking this closely, mentioned something interesting: “We started monitoring colostrum quality more carefully last year. The weeks when DDGS inclusion was higher, our Brix readings seemed better. Could be a coincidence, but it’s got me thinking.”

Now, these are just observations—not controlled research. Every farm has so many variables at play, and we can’t draw firm conclusions from field observations. But when you hear the same things from different types of operations in different parts of the country… it makes you wonder, doesn’t it?

The Economics of It All

Let’s talk dollars and cents, because that’s what matters at the end of the day.

With current Midwest pricing from USDA reports—and you know how this changes—DDGS are running somewhere around $145 to $165 per ton, depending on your contracts and location. Soybean meal? We’re looking at $420 to $450,based on recent DTN spot prices. The economics of protein are pretty clear, which is why so many of us use these ethanol coproducts.

IngredientPrice ($/ton)Rate (%DM)Protein (%DM)Annual Cost ($)
DDGS$15512.0%30%$33,480
Soybean Meal$4308.0%48%$75,400
DDGS+Premium$23012.0%30%$49,700
Yeast Supplement$20,0000.05%50%$42,000

But here’s a thought: what if there’s additional value we haven’t been accounting for in our feed efficiency calculations?

I was working through some numbers with a nutritionist colleague, and even if—and this is purely hypothetical—standardized DDGS with guaranteed bioactive content commanded a $75 per ton premium, the math could still work when you consider potential reductions in other supplements.

Of course, that market doesn’t exist yet. And honestly, it might never fully develop given all the challenges involved.

Why This Isn’t Going to Be Simple

Before anyone gets too excited and starts changing their rations, we need to talk about the real-world challenges here.

The biggest issue? Variability. That estimated 3-6% range in beta-glucan content I mentioned? That’s a problem if you’re trying to formulate consistent rations.

And it’s well documented by groups like the U.S. Grains Council that different ethanol plants use different corn, different yeast strains, and different drying temperatures. All of that affects what ends up in your feed bunk. I was talking with a producer in Illinois who sources from three different ethanol plants depending on pricing and availability. He said the physical characteristics alone vary noticeably—color, smell, texture. If the basics vary that much, imagine the variation in these bioactive compounds we’re talking about.

Testing is another bottleneck. While there are methods to measure these compounds, they’re not something you can get from your regular feed testing lab. Most commercial labs still focus on crude protein and fiber analysis. I’ve checked with several major labs, and while they’re aware of the interest, they haven’t seen enough demand yet to add these bioactive analyses. Maybe that’ll change, but we’re not there yet.

And then there’s the regulatory side. According to the FDA Center for Veterinary Medicine and AAFCO guidelines for animal feed, companies must be very careful about health claims. An ethanol plant can’t just start marketing their DDGS as “immune-supporting” without crossing into regulated territory. They’re limited to talking about composition, not function.

What This Means for Your Operation Today

So, where does this leave us as dairy producers?

Well, first off, you can’t call up your feed dealer today and order “high-beta-glucan DDGS.” That’s not a thing yet. But understanding that DDGS might be delivering benefits beyond just protein and energy—that’s worth considering in your dairy nutrition strategy.

Here’s what I’ve been telling folks who ask about this:

Don’t change everything based on preliminary research. DDGS are still a good deal based on their traditional nutritional value alone. That hasn’t changed.

But maybe start paying closer attention. Track what happens when DDGS inclusion changes in your rations. Watch your colostrum Brix readings. Keep an eye on fresh cow health events. You might already be seeing patterns you haven’t connected.

If you can, try to source from consistent suppliers. While you can’t specify bioactive content, ethanol plants with good process control probably have more consistent products overall. A large dairy I know in Nebraska has been doing this for years—not for these functional properties we’re discussing, but just for ration consistency. Makes sense either way.

And think about where in your feeding program DDGS might offer the most value. If these functional benefits are real, transition cows would be the logical place to focus. That’s where immune support and colostrum quality matter most for long-term herd health.

Most importantly, work with your nutritionist on this. Any changes to your feeding program need to fit into your overall strategy, not work against it.

The Bigger Picture Here

What fascinates me about all this is what it says about how we evaluate feeds in general.

For decades, we’ve focused on the measurable nutrients—protein, energy, fiber, minerals. Our formulation software is really good at modeling these. But what if there’s a whole category of bioactive compounds that influence health and productivity through different pathways? Compounds we’re not routinely measuring or accounting for?

Think about it—forages have polyphenols, fermented feeds have metabolites from bacterial activity. Even regular corn silage might have functional compounds we don’t consider.

Someone made an interesting comparison at a conference recently: we might be where we were with vitamins a century ago—knowing something important is there, but not having all the tools yet to understand or use it fully.

Looking Down the Road

The dairy industry has always moved forward through careful observation, good science, and practical application. This emerging understanding about DDGS fits right into that pattern.

Will this completely change how we feed cows? Probably not. But it might add another layer to our decision-making, especially for specific times like the transition period, where these functional benefits could really matter.

We definitely need more research. Those early university findings need to be replicated and expanded. We need better, practical, affordable testing methods. And ultimately, we need larger field trials to see if these effects hold up on commercial farms.

The good news is, this work is happening. Universities have projects underway. Feed testing labs are exploring new methods as demand develops. Even some ethanol producers are starting to think differently about their product.

And it’s worth noting—this isn’t just a U.S. conversation. International markets from Mexico to Southeast Asia import substantial amounts of American DDGS. If functional properties become a selling point, that could reshape global trade patterns. European feed companies are already exploring bioactive feed ingredients more aggressively than we are in some cases.

What’s the timeline for all this? Hard to say exactly, but based on how these things typically unfold in our industry, I’d guess we’re looking at 3 to 5 years before we see meaningful market changes—if they happen at all. That’s about how long it takes for research to build up, testing infrastructure to develop, and markets to adjust.

What’s encouraging to me is that we’re not talking about adding expensive new ingredients. We’re talking about potentially getting more value from something we’re already feeding. In an industry where margins are always tight, finding hidden value in what we’re already doing… that could make a real difference.

The Bottom Line

You know, the cows probably figured this out before we did. They usually do, don’t they? They’ve been getting whatever benefits DDGS offer while we focused on the protein and energy values.

Maybe that’s the real lesson here. Sometimes the best discoveries aren’t about finding something new—they’re about better understanding what’s been right in front of us. And in this case, it’s been sitting in feed bunks across North America for the better part of twenty years.

It makes you wonder what else we might be missing, doesn’t it? But then again, that’s what keeps this industry interesting. Just when you think you’ve got it all figured out, you learn something new that makes you look at things differently.

For now, keep feeding DDGS when they make economic sense. Pay attention to how your cows respond. Stay informed as this research develops. And always remember—the best feeding decisions are the ones that work for your specific operation, with your cows, in your situation.

Because at the end of the day, that’s what really matters. Not what might be in the feed, but how your cows perform with it. And if they’re doing well with DDGS at current prices? Well, any additional benefits we discover are just icing on the cake.

The next time you’re looking at that pile of DDGS getting mixed into the TMR, maybe take a second to think about what else might be in there. We might not fully understand it yet, but your cows seem to appreciate it either way.

KEY TAKEAWAYS:

  • DDGS at $145/ton contain the same beta-glucans as $20,000/ton yeast supplements—you’ve been feeding premium immune support without knowing it
  • Producers seeing fewer fresh cow problems with DDGS now have an explanation: 3-6% yeast-derived compounds supporting immunity and colostrum quality
  • The math is compelling: $42,900 potential annual value for a 500-cow dairy, just from benefits you’re likely already getting
  • Today’s move: Track colostrum Brix and transition health against DDGS inclusion—you might already see patterns worth thousands
  • The catch: Without testing (3-5 years out) or standardization, you’re feeding a lottery ticket—valuable but unpredictable

Complete references and supporting documentation are available upon request by contacting the editorial team at editor@thebullvine.com.

Learn More:

The Sunday Read Dairy Professionals Don’t Skip.

Every week, thousands of producers, breeders, and industry insiders open Bullvine Weekly for genetics insights, market shifts, and profit strategies they won’t find anywhere else. One email. Five minutes. Smarter decisions all week.
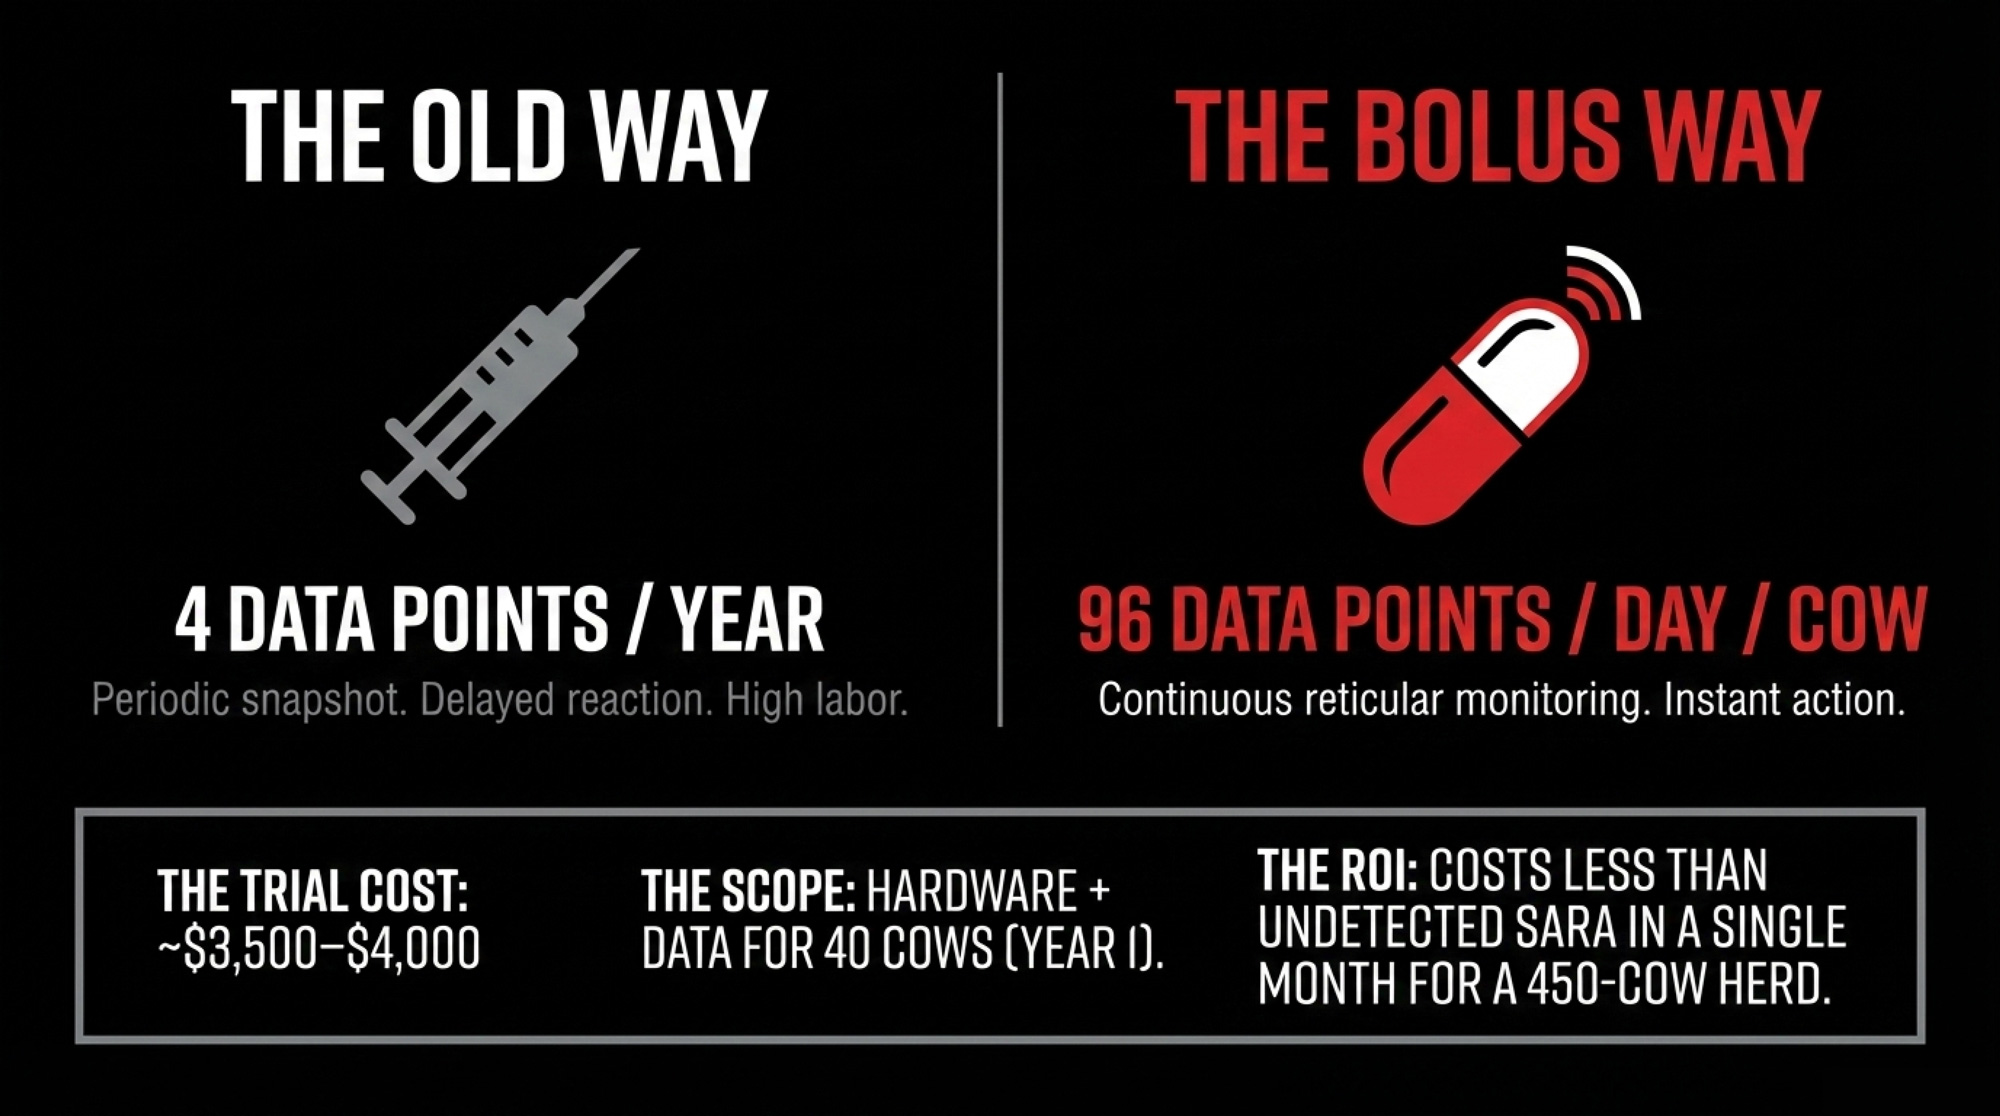
NewsSubscribe
First
Last
Consent

Rethinking Dairy Feed: Michigan Farmers Turn High Oleic Soybeans into High Butterfat Profits.

“We saw butterfat jump in three days.” How Michigan farmers and MSU science turned soybeans into dairy profits.

EXECUTIVE SUMMARY: A simple feed change in Michigan is making big waves across the U.S. dairy industry. At Preston Farms, feeding high oleic soybeans—developed with support from Michigan State University (MSU)—boosted butterfat from 4.4% to 4.8% in under a week, while replacing costly palm fats and protein meals with a locally grown crop. The shift, based on extensive research by Dr. Adam Lock, saved the farm hundreds of thousands in inputs and lifted overall profits to more than $1 million per year. Early adopters are proving that this innovation doesn’t just add points of fat—it builds feed independence and sustainability into dairy rations. And as universities and producers nationwide study the results, one thing is clear: sometimes the next big leap for dairy is just a smarter way to feed the cows.

High Oleic Dairy Feed

Sometimes the biggest dairy innovations don’t come from a lab or a boardroom—they start right in the feed bunk. That’s what’s happening at Preston Farms in Quincy, Michigan, where a simple change to the ration is improving butterfat performance, cutting feed costs, and rewriting the farm’s milk check.

Brian Preston didn’t set out to pioneer something revolutionary. But his decision to feed high-oleic soybeans, a crop once bred for frying oil rather than feed, has become one of the most quietly disruptive stories in dairying today.

From University Research to On-Farm Success

This breakthrough isn’t luck. It’s the product of years of research at Michigan State University (MSU) led by Dr. Adam Lock, Professor of Dairy Nutrition, whose focus has long been on how different fats affect rumen function and milk composition.

“We didn’t increase the fat level in the ration,” Lock explains. “We changed the kind of fat—and that changed everything.”

It’s Not Magic—It’s Biochemistry: Conventional soybeans trigger a biochemical cascade that blocks milk fat synthesis through trans-10 CLA formation. High oleic soybeans bypass the problem entirely—oleic acid moves straight through the rumen to the mammary gland. Same fat amount, completely different metabolic pathway.

Traditional soybeans are loaded with linoleic acid, a polyunsaturated fat known to interfere with rumen microbes and cause milk fat depression. High oleic soybeans, however, reverse that chemical balance. They contain 75–80% oleic acid and under 10% linoleic acid, according to USDA and Pioneer® data (2024). That single change stabilizes rumen fermentation and boosts acetate, an essential precursor to milk fat synthesis.

The Chemistry That Changes Everything: High oleic soybeans flip the fatty acid profile from 63% problematic linoleic acid to 75% beneficial oleic acid—a complete reversal that protects rumen function and boosts butterfat. This isn’t incremental improvement; it’s biochemical transformation.

The result? Cows can handle higher inclusion without the digestive disruption that once scared off nutritionists from pushing soy-based feeds too hard.

For Lock, the findings weren’t theoretical—they were replicated across multiple MSU feeding trials, later published in the Journal of Dairy Science (2023). And in Preston’s case, it worked exactly as the data suggested.

How Fast Did It Work? Try 72 Hours

In 2024, Preston planted 400 acres of Pioneer® Plenish® high oleic soybeans and began feeding them roasted—about 8 pounds per cow per day—in place of purchased soybean meal, canola meal, and expensive palm-based fats.

Within three days, milk tests came back with an unexpected jump: butterfat up from 4.4% to 4.8%, with milk protein slightly higher too.

Faster Than You Think: Butterfat jumped from 4.4% to 4.8% in just 72 hours—so fast Preston thought the lab made a mistake. The response stays consistent because oleic acid bypasses rumen hydrogenation. No lag time. No adaptation period. Just immediate biochemical efficiency.

“I honestly thought there was a lab error,” Preston laughs. “But it happened again the next week. The cows handled it so well, we kept it in full-time.”

Lock says that kind of immediate response makes sense because oleic acid bypasses much of the rumen’s hydrogenation process, entering the bloodstream faster as an energy source for milk synthesis. Cows use it directly—no lag time, no rumen stress.

That faster conversion means farms see the payoff quickly. As any producer knows, immediate improvements in component yield help confidence spread far faster than any spreadsheet could.

The Economics: Turning Fat into Feed Efficiency

When you quantify it, the economic implications are eye-opening.

Every 0.1 increase in butterfat adds roughly $0.20 per cwt when butterfat sells near $3.23/lb (USDA Agricultural Marketing Service, October 2025). Preston’s 0.4-point jump produced about $1 per cow per day, adding roughly $380,000 annually in butterfat premiums across his 1,000-cow herd.

Then came the ingredient savings.

Tack on feed savings—achieved by replacing high-cost supplements like palm-derived fats and purchased proteinswith roasted soybeans grown right on the farm—and the total improvement exceeded $1 million annually.

The Math That Matters: Preston Farms turned 400 acres of high oleic soybeans into over $1 million in annual gains—$380K from higher butterfat, $320K in feed cost savings, and $300K from improved efficiency. It’s rare to find a ration change that pays on both ends. This one does.

“It’s rare to find a single ration change that pays on both ends,” Preston says. “Usually you’re spending to gain production, or cutting cost and losing quality. This time, the cows—and the feed bill—both lined up.”

The Economics Work for Every Herd Size

Size Doesn’t Matter—Consistency Does: The economics scale perfectly from $36,500 for a 100-cow herd to $730,000 for 2,000 cows. Every single cow adds $365/year. No economies of scale required, no threshold to cross—just consistent, predictable, bankable per-head gains.

Why Michigan Is Ahead of the Curve

Michigan’s adoption of this feeding system stems largely from timing and teamwork.

Dr. Lock’s program at MSU, supported by the Michigan Alliance for Animal Agriculture (M-AAA), has spent over a decade translating lipid metabolism science into field-tested protocols. That partnership between the university and producer accelerated on-farm implementation and helped local nutritionists understand how to balance rations for these new soybeans.

“Michigan farmers had years of data before they took the plunge,” Lock says. “That’s what builds trust.”

In contrast, neighboring Wisconsin—the second-largest milk producer in the U.S.—has moved more cautiously. Nutritionists there often wait for validation from the University of Wisconsin-Madison Dairy Science Department, which is currently planning its first high oleic feeding trials for 2026.

It’s understandable. As Lock puts it, “Dairy nutritionists are trained to be risk-averse. When you’ve got millions of pounds of milk at stake, you confirm every feed trend before you move.”

The GMO Conversation: What Farmers Should Know

One of the first questions producers ask is whether the GMO status of these soybeans affects milk markets. The short answer: no.

Under the USDA’s National Bioengineered Food Disclosure Standard (2016), milk or meat from animals fed genetically modified feed is not considered genetically modified because the feed’s DNA does not transfer into milk or meat. After almost a decade of data, no studies—including those conducted by the FDA—have found detectable transference from feed to product.

For non-GMO or organic dairies, the alternative is the Soyleic® variety, developed at the University of Missouri, which achieves nearly identical oleic acid levels through conventional plant breeding. Those beans have done particularly well in identity-preserved markets, though they yield about 5–10% less per acre.

Long-term, both versions show strong potential for dairies seeking greater feed self-sufficiency.

How Many Farms Are Doing This?

METRICCURRENT STATUSOPPORTUNITY/NEEDEDTHE GAP
Dairy Cows on HOS Diet<1% (75,000 cows)20% (1.8M cows)1.725M cow opportunity
Nutritionists Recommending20% (160/800)80% for mass adoption480 nutritionists needed
Roasting Infrastructure~75 units1,500+ units1,425+ units required

Nationally, adoption remains low — about 70,000 to 80,000 cows on high oleic soybean diets, according to MSU Extension estimates (2025). That’s less than 1% of the total U.S. dairy herd.

The bottleneck isn’t supply — seed production can easily scale — but rather processing. On-farm roasting is still critical for unlocking feed value, and each roaster typically serves about 1,000 cows daily. Expanding adoption to even 20% of U.S. cows would require more than 1,500 new roasting units.

Some co-ops, especially across the Midwest, are exploring shared roasting programs in which individual farms deliver beans for contract processing.

There’s also a knowledge gap. Only about 20% of the nation’s 800 dairy nutritionists actively recommend high oleic soybean feeding programs (Great Lakes Dairy Nutrition Conference Survey, 2025). Many say they’re waiting for state-level replication trials before updating formulations.

It’s the same cycle seen with bypass proteins in the 1990s—slow at first, then exponential once the local data confirms early wins.

What Cows and Numbers Are Saying So Far

After a full year of feeding high-oleic soybeans, Preston’s herd metrics are stable. Milk yield remains consistent. Reproductive performance—often the first red flag for new fats—has held steady.

Lock’s ongoing work at MSU mirrors those findings, showing no significant difference in ketosis, displaced abomasum, or other metabolic measures compared with control groups. The focus now shifts to multi-year monitoring.

“We’re confident in the short-term biology,” Lock says. “Now it’s about proving sustainability year after year.”

For producers, that’s comforting. As most know, herd-level consistency decides whether an innovation stays or fades.

Practical Starting Points

For producers curious about testing the concept, the learning curve is short and management-friendly:

  • Start small: Try 50–100 acres and dedicate one group of cows for trial feeding.
  • Roast right: Keep roasting temps between 280–300°F for optimal protein availability.
  • Track diligently: Monitor butterfat, dry matter intake, and conception rates over multiple months.
  • Work closely with nutritionists: Fine-tune diets to prevent unbalanced fat inclusion.
  • Run the ROI: Compare component-based milk revenue with any feed cost shifts.

Early adopters like Preston insist on treating the transition as a management system, not a silver bullet. “We made sure every change was measurable,” he says. “Then we let the data drive whether we stayed with it.”

What’s Interesting About This Development

Three things stand out. First, it highlights how small biological improvements can have huge economic consequenceswhen component pricing drives profitability. Second, it reconnects modern dairying with something age-old: growing and processing one’s own feed to reduce dependency on volatile markets. And third, it demonstrates how collaboration between land-grant universities and farmers creates innovation grounded in real-world application, not lab theory.

“We’ve had feed additives come and go,” Preston says. “This one is different—it’s ours to grow, feed, and control.”

The Bottom Line

For all the advanced technology shaping the dairy world today, sometimes innovation looks as familiar as a roasted soybean.

High oleic feeding strategies may not transform the industry overnight, but evidence from Michigan’s early adopters shows real, sustained improvements in butterfat performance, feed efficiency, and economic stability. The concept works because it fits seamlessly into existing farm systems—it’s scalable, measurable, and backed by solid science.

If the next several years of data across Wisconsin, New York, and beyond confirm what MSU has already seen, this may very well be the next “quiet revolution” in feed efficiency.

As one producer joked after hearing Preston’s story: “The cows might be the best university research partners we’ve ever had.”

Key Takeaways

  • A quiet revolution in cow nutrition is underway: high oleic soybeans are raising butterfat and replacing expensive palm fats in dairy rations.
  • Preston Farms and MSU researchers demonstrated the impact—a 0.4-point increase in fat and more than $1 million in annual gains from feed efficiency and component premiums.
  • Dr. Adam Lock’s studies confirm that oleic-rich fats improve rumen stability and milk components more quickly than traditional rations.
  • Nationwide growth depends on expanding roasting infrastructure, education, and replicable regional trials.
  • For forward-thinking producers, this strategy offers a real-world, on-farm route to feed self-sufficiency, profitability, and sustainable dairy progress.

Complete references and supporting documentation are available upon request by contacting the editorial team at editor@thebullvine.com.

Learn More:

The Sunday Read Dairy Professionals Don’t Skip.

Every week, thousands of producers, breeders, and industry insiders open Bullvine Weekly for genetics insights, market shifts, and profit strategies they won’t find anywhere else. One email. Five minutes. Smarter decisions all week.
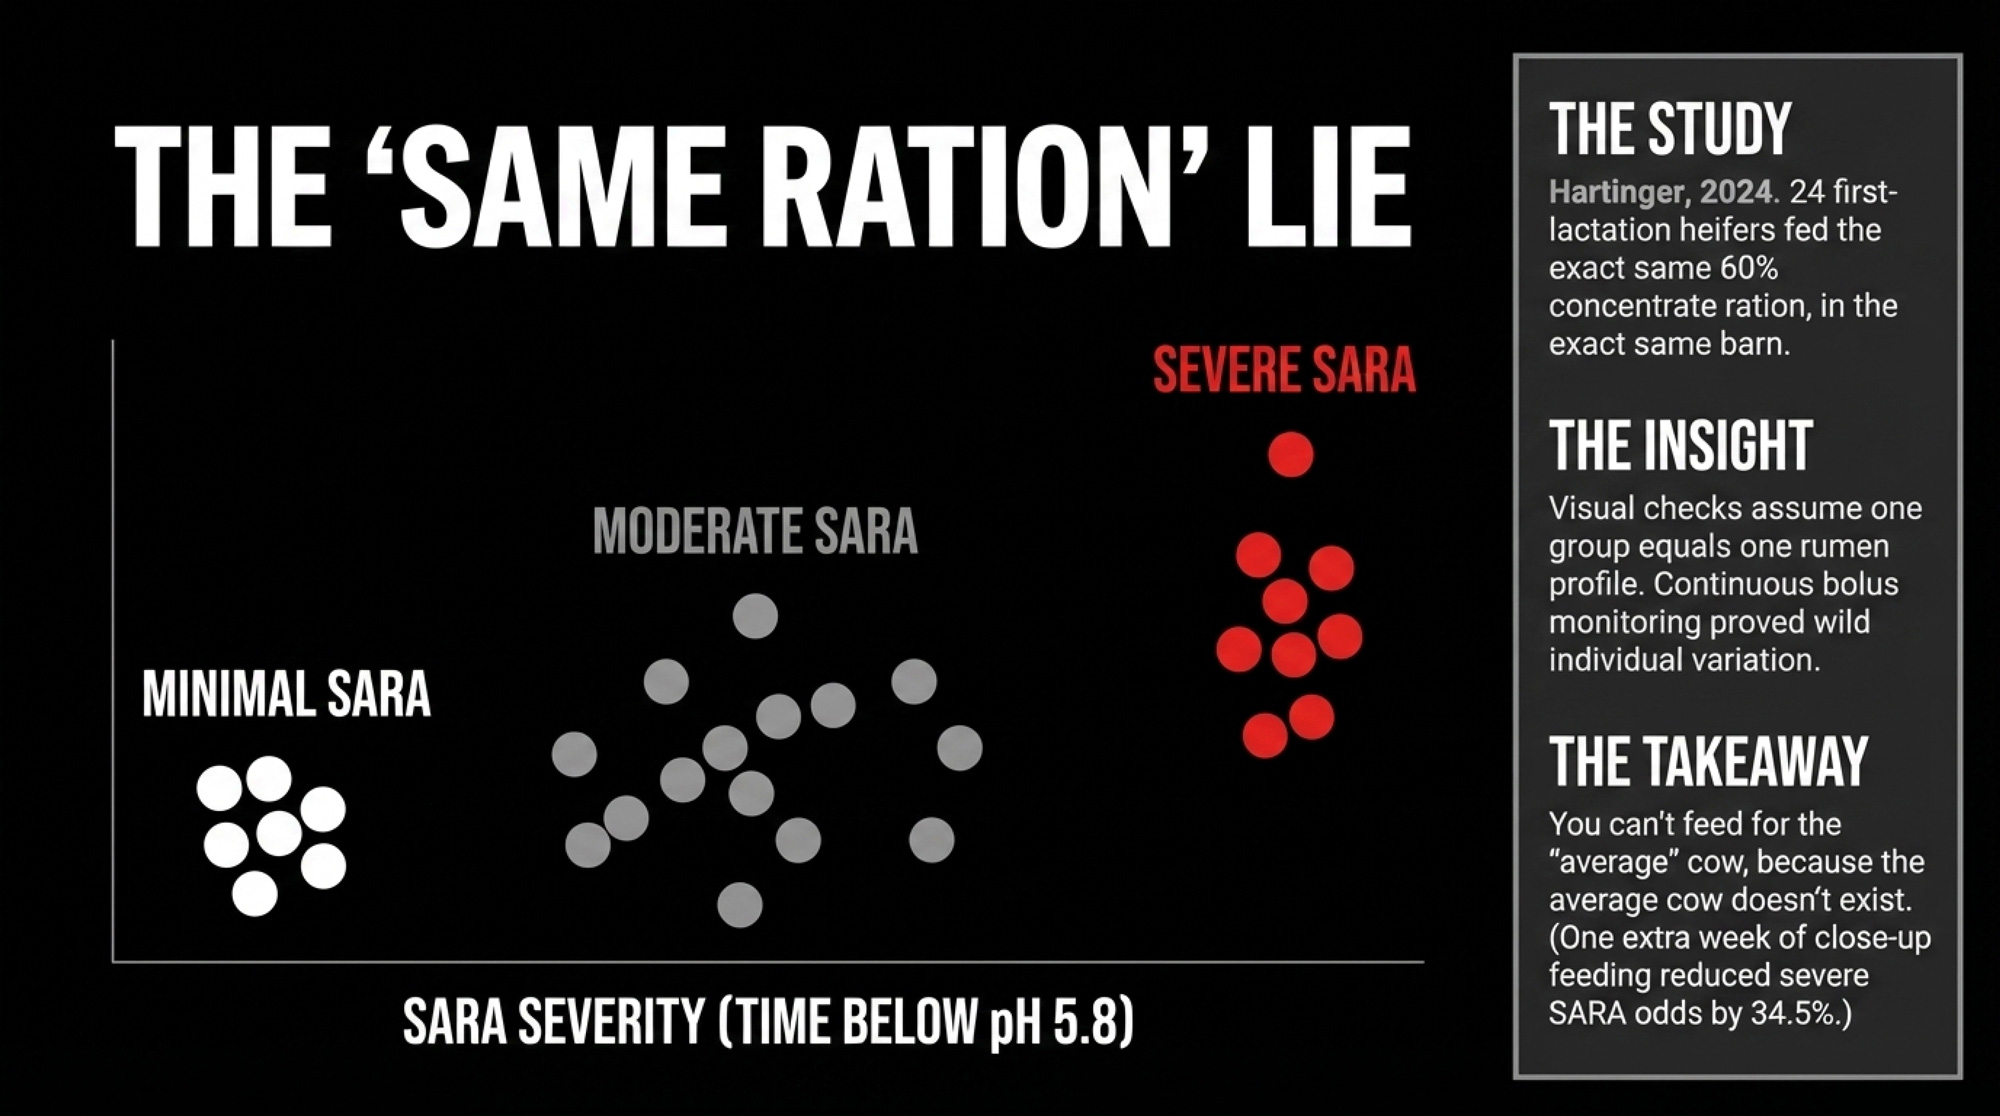
NewsSubscribe
First
Last
Consent

The Proven Strains Behind Smarter Probiotics and  Stronger Herds

Proof, not promises. That’s what modern dairies expect from probiotics—and why the right strains deliver results you can measure.

Executive Summary: You know, it’s clear we’ve turned a corner with probiotics in dairy. What once felt like trial‑and‑error is now precision management—backed by data, field proof, and measurable ROI. Proven strains like Actisaf®, Levucell®, and CLOSTAT® are helping producers improve feed intake, stabilize butterfat, and ease transition stress —where most fresh‑cow challenges begin. Research from universities and extension programs shows results that speak volumes—stronger cows, healthier calves, and up to 20:1 returns. The dairies getting ahead are the ones matching microbial strategies to their region and feeding consistently. And with affordable DNA sequencing now unlocking deeper herd insights, the future of dairy health is becoming clearer than ever—because managing microbes is quickly becoming as important as managing genetics.

Probiotic strain selection

You know, it’s interesting how some dairy ideas come full circle. Probiotics are one of those. Years ago, we treated them like a shot in the dark – something you tried if you had a problem cow or a slugging tank. Today, the conversation sounds very different. Research, farm data, and extension trials all show the same thing: when probiotics are used the right way – with the right strain – they can consistently improve cow health, stabilize production, and boost profitability.

What’s especially exciting is that this isn’t about reinventing nutrition programs. It’s about managing what’s already in the cow—the hundreds of microbial species driving rumen efficiency, feed conversion, and fresh cow resilience. Once you support those microbes correctly, they pay you back every day they stay in balance.

Looking at the Transition Period: The Biggest Opportunity

If you’ve milked cows or managed fresh cows, you already know—the transition period is where you win or lose the year. Energy drops, feed intake declines, and health risks peak. University of Guelph and Cornell data confirm that over 70 percent of dairy herd health challenges occur within the first 30 days after calving. And they’re expensive. Cornell’s PRO‑DAIRY economic models estimate the average case of ketosis costs around $290 per cow, while a displaced abomasum often adds another $500 to $600 in lost production and treatment cost.

The encouraging news is that probiotics have now proven their place in this stage. Multiple studies published in the Journal of Dairy Science and verified by EFSA research show that the yeast strain Saccharomyces cerevisiae CNCM I‑4407—marketed as Actisaf®—increases average intake by around 1 kg/cow/dayand raises milk yield by approximately 3 kg/day during early lactation.

What’s happening is basic microbial biology. Actisaf helps rumen microbes stabilize pH, reduces lactic acid buildup, and supports acetate production for butterfat synthesis. In extension-monitored herds across Wisconsin and Ontario, producers report fewer off-feed cows and more consistent butterfat.

As one nutritionist for UW Extension puts it, “When rumen microbes are healthy, cows don’t crash.” That simplicity—keeping cows eating and fermenting evenly through transition—is what drives both milk gains and health paybacks.

Breaking Down What Works: The Proven Strains

DNA sequencing dropped from $3,000 to under $100 per sample—a 97% cost collapse that’s pushing microbiome management from research labs to feed bunks, with Cornell predicting commercial tools within 5 years

Let’s get clear about something important: not all probiotics perform equally. Think of them like sire lines—each strain has its own genetic potential and specialty. Here are the top three strains with consistent dairy‑specific validation:

Probiotic StrainBrand ExampleKey Function in Dairy Cows
S. cerevisiae CNCM I‑4407Actisaf®Improves feed intake, stabilizes rumen pH, supports butterfat production.
S. cerevisiae CNCM I‑1077Levucell® SCEnhances fiber digestion and fermentation for high‑forage diets.
Bacillus subtilis PB6CLOSTAT®Stabilizes feed intake, reduces inflammation, and improves performance under heat or metabolic stress.

What’s worth noting is how the environment or management influences effectiveness. In cooler climates—say, Minnesota or Ontario—yeast-based products like Actisaf perform consistently during the transition window. In the dry‑lot systems of California or Arizona, spore-forming Bacillus strains like CLOSTAT have an advantage because they survive high feed temperatures and long storage times.

As UW–Madison field specialists like to remind producers, “If the strain ID isn’t on the bag, it’s not a guarantee—it’s a gamble.” Verified strain research is what separates proven tools from placebo feeds.

Calf Health: The Race to Colonize Early

What’s fascinating about current research is how probiotics can change the trajectory of youngstock performance. The gut of a newborn calf is almost sterile at birth, so timing matters. The first microbes to colonize will shape that calf’s immunity and digestion for weeks to come.

Studies from the University of Alberta (2023) showed that giving Lactobacillus reuteri in colostrum cut the rate of E. coli K99 binding—linked to scours—by more than 80 percent and halved diarrhea cases. Meanwhile, research at Iowa State (2024) demonstrated that a multi‑strain blend of Bifidobacterium animalis and L. johnsonii increased weaning weights by about 4 kg and shortened scours duration by roughly a day.

Spending $4.50 per calf on probiotics prevents $250 in scours treatment costs—a 55:1 payback that’s backed by University of Alberta and Iowa State research showing 80% E. coli reduction and 50% fewer diarrhea cases

For those watching costs, scours prevention is one of the easiest wins. Wisconsin Extension values one case of calf scours at $250 per calf, once you include treatments and growth setbacks. Preventing even one in ten calves from scouring with a $4–5 probiotic investment per head adds up fast.

But the timing window’s short. Probiotics need to be in the first colostrum or milk feeding and continue through 10‑14 days. Wait longer, and the pathogens win the race to colonize.

Let’s Talk ROI: The Real Math Behind the Microbes

Transition cows deliver the highest immediate payback at 19:1 ROI—proof that precision nutrition during the critical 3-week window transforms both health and profitability

Herd data from the University of Wisconsin and Penn State Extension show remarkably consistent returns for well‑managed probiotic protocols:

Herd CategoryProgram Cost (100 Cows)Average ROIObserved Benefit
Calves $300 – $350 1:10 – 1:12 Stronger starts, fewer scours
Transition Cows ~$500 1:18 – 1:20 Better intake, smoother health curves
Lactating Herd ~$2,600 1:4 – 1:6 More consistent butterfat, feed efficiency

Transition cows deliver the most immediate payback, with returns up to 1:20, justifying the high ROI figures in the title. This happens because the improvements occur within the same lactation cycle. Calves show longer-term returns—lower morbidity and better feed conversion once they join the milking herd. Meanwhile, full-lactation programs amplify ration efficiency and component stability, particularly during summer heat or ration changes.

The common factor? Consistency. Herds that feed verified probiotic strains daily and track DMI, health events, and butterfat see repeatable, predictable returns.

When transition diseases can cost $289 to $550 per case and hit over 70% of fresh cows, the $5 probiotic investment looks less like a feed additive and more like production insurance

Regional Fit: Matching Microbes to Management

Probiotic performance depends on regional and environmental conditions, which is why “copy‑paste” programs rarely hold up across the country. In humid regions like the Great Lakes and Northeast, yeast strains that buffer rumen pH help offset silage variability and maintain component levels as forages shift in moisture content.

In contrast, herds in California’s San Joaquin Valley or Idaho’s Snake River region often rely on spore-forming Bacillusstrains for one key reason—they remain viable in feed that can exceed 100 °F in mixers or holding bins. Field studies presented at the California Animal Nutrition Conference confirm that these spores retain live-cell counts, unlike yeasts, which lose them.

Smaller herds often rely on pelleted mineral inclusion for simplicity, while large freestall or dry‑lot dairies integrate inoculants through automated micro-systems. The principle’s the same either way: healthy rumen bacteria need consistent delivery, regardless of herd size or region.

The Next Wave: Precision Microbiome Management

Here’s what’s encouraging. DNA sequencing that once cost thousands per sample now runs under $100. Cornell and Wageningen University researchers have shown that rumen microbiome profiles can now predict feed efficiency and methane output with about 85 percent accuracy.

European dairy herds are already testing tailored microbial feeding models in pilot programs, pairing sequencing data with ration adjustments. Cornell’s Dairy Innovation Group expects commercial applications in the United States within the next five years.

This development suggests that herd microbiome management is shifting from reactive to predictive. Soon, we’ll be adjusting feed programs not just for dry matter and energy—but for microbial populations that signal rumen resilience or stress. It’s technology catching up to the biology farmers have been managing intuitively for decades.

Practical Takeaways: From Research to Routine

Across the board, the dairies seeing the most consistent ROI from probiotics share three traits:

  1. They feed daily. Skipping doses resets microbial populations.
  2. They use verified strains. Each product lists strain number, live count, and dairy trial data.
  3. They track outcomes. DMI, components, and health metrics are logged every month.

When those three habits become routine, probiotics stop being “add‑ons” and start behaving like feed insurance. An Ontario field project reported at the 2024 Southwestern Dairy Conference found that herds running continuous Actisaf and CLOSTAT protocols saw 20 percent fewer ketosis cases after six months.

And as Université Laval microbiologist Dr. Marie Auger reminded producers during that same conference, “A dairy cow is the most advanced fermentation system you’ll ever manage.” She’s right. Once you view the cow’s gut microbes as vital production partners—not just digestive passengers—the economics, consistency, and herd health all speak for themselves.

Because at the end of the day, what the science and the field work both say is simple: better microbes make better cows. And better cows make better margins.

Key Takeaways:

  • Verified probiotics—Actisaf®, Levucell®, and CLOSTAT®—have moved past the marketing stage, delivering consistent 20:1 returns by keeping rumens stable and cows milking strong.
  • The transition period remains the biggest opportunity; feeding proven strains from 21 days pre‑calving through fresh boosts both intake and butterfat.
  • Calves benefit most when probiotics start at birth—giving them a microbial head start that reduces scours and strengthens lifetime performance.
  • Results depend on fit: pick yeast for humid forage‑heavy herds, Bacillus spores for hot, dry‑lot conditions, and always feed daily for consistency.
  • With affordable DNA testing on the horizon, farmers will soon manage rumen microbes as precisely as genetics—making the microbiome a true management tool.

Complete references and supporting documentation are available upon request by contacting the editorial team at editor@thebullvine.com.

Learn More:

The Sunday Read Dairy Professionals Don’t Skip.

Every week, thousands of producers, breeders, and industry insiders open Bullvine Weekly for genetics insights, market shifts, and profit strategies they won’t find anywhere else. One email. Five minutes. Smarter decisions all week.

NewsSubscribe
First
Last
Consent

Why 90% of Midwest Farms Will Dump $20,000 of Milk by 2030 – And how $63/Cow Prevents It

What farmers are discovering about climate-driven contamination: Prevention protocols cost $63 per cow annually, but crisis response wipes out six months of profit margins at $128 per cow in just one week

EXECUTIVE SUMMARY: What farmers are discovering across the Midwest is that aflatoxin contamination—long considered a southern problem—is heading north faster than most operations are preparing for it. Michigan State’s climate research shows nearly 90% of corn-growing counties will experience increased contamination by the 2030s, putting thousands of dairy farms at risk of dumping milk worth $20,000 or more per incident. Here’s what’s particularly concerning: processors are already segmenting their supplier base into premium and commodity tiers based on contamination control protocols, with a $2-4 per hundredweight difference that could mean $30,000-50,000 annually for a mid-sized operation. The math on prevention is surprisingly straightforward—at $63 per cow annually (approximately $9,475 for a 150-cow herd)—implementing testing and mycotoxin binders costs less than half what a single seven-day contamination event would. Research from land-grant universities suggests these binders often pay for themselves through improved butterfat tests and reduced fresh cow problems, even without contamination events. Looking ahead, farms that establish laboratory relationships and testing histories now will have market access when processors implement mandatory requirements… while those waiting until 2029 face the prospect of losing premium markets before they can even get test results. The choice is becoming clearer every month: invest in prevention on your timeline, or scramble for solutions when your processor gives you 72 hours to prove control.

Dairy Aflatoxin Prevention

You know, I was at a nutrition conference in Madison last month, and I heard the same thing from just about every producer there—”aflatoxin is a southern problem, we don’t deal with that here.”

That confidence? It could become an expensive lesson for thousands of us.

What really caught my attention recently was news from international dairy markets, where contamination events have been hitting major processors—companies with all the quality systems one’d expect. They’re finding aflatoxin M1 in products that passed multiple checkpoints. Every sample exceeds what Europe allows.

And it’s reaching consumers anyway.

What’s worth understanding is the research Dr. Felicia Wu’s team published in Environmental Research Letters in May 2022. They used 16 different climate models to project aflatoxin expansion, and here’s what they found—nearly 90% of corn-growing counties across the Midwest are going to see increased contamination by the 2030s. We’re not talking about a few hot spots here and there. This represents a complete geographic shift northward into regions where most of us have never even tested for the stuff—from Wisconsin to Michigan, Ohio to Pennsylvania, Minnesota to Iowa.

And for those of you milking in New York or Vermont? The eastern dairy regions are seeing similar projections according to the same climate models. Vermont’s roughly 600 dairy operations could face similar challenges to those being addressed in the Midwest. Michigan’s concentrated dairy areas around Allegan and Ottawa counties? They’re right in the expansion zone, too.

The Market Split That’s Already Happening

I’ve been closely watching processor requirements for the past few years, and something interesting is emerging that most people haven’t yet caught on to. The milk market’s basically splitting in two, and the gap’s getting wider every month.

If you pull up the supplier handbooks from any of the big players—Organic Valley, Horizon, even some regional co-ops—you’ll see what I mean. Farms shipping to export programs or premium organic brands? They’re playing by one set of rules. Everyone else? Completely different game.

Here’s what the premium side looks like these days, based on processor documentation:

  • Monthly bulk tank testing for aflatoxin M1
  • Feed protocols that get audited every year
  • Can’t go above 50 parts per billion—that’s matching EU Regulation 165/2010
  • Mycotoxin programs with third-party verification
  • Getting paid $2 to $4 more per hundredweight, according to recent USDA Agricultural Marketing Service data

And then there’s the commodity side:

  • No required testing at the farm level per FDA Compliance Policy Guide 527.400
  • Feed documentation is optional
  • FDA’s action level sits at 500 parts per billion—ten times higher
  • No mycotoxin requirements
  • Base pricing, and you’re first to get cut when there’s too much milk

A quality manager at one of the Wisconsin cooperatives—speaking on condition of anonymity—told me they started segmenting their suppliers about three years ago. “The farms with testing history they get first dibs on premium programs. Everyone else is commodity-only, and it’s getting really hard to move up once you’re in that category.”

What’s interesting is that this mirrors what Italian researchers documented in the journal Toxins back in February 2023. They analyzed almost 96,000 milk samples between 2013 and 2021, achieving 98.6% compliance with EU standards. But here’s the thing—they only got there by testing everything and taking immediate action when problems showed up. The farms that couldn’t keep up lost their export access for good.

I’ve noticed even smaller regional processors are getting on board. Several cheese plants in the Midwest are starting enhanced testing requirements in 2026, according to their published supplier notifications.

Now, for those of you running organic operations—here’s something you might not realize. Many organic certifications require testing for aflatoxin B1 in feed, but not necessarily M1 in milk at EU levels. Worth checking your specific certification requirements because processors are starting to look beyond just the organic label.

Why This Isn’t Like Other Feed Problems

You know, I’ve watched producers handle feed issues for decades, and most of us treat aflatoxin like we’d handle moldy silage or wet hay—something to manage when it shows up. But after talking with nutritionists across the region, that’s really the wrong way to think about it.

Consider how we normally handle feed problems. Moldy silage? We decide how much to feed and may add some yeast culture. Bad hay from that late cutting? We supplement around it. Wet corn from a rainy harvest? We monitor the heating process and may add some propionic acid. These are all decisions we control. Our cows, our management, our call.

Aflatoxin’s completely different. The moment your processor finds contamination above their limit—and according to National Milk Producers Federation data from 2024, they’re testing more frequently now—you’re done shipping milk. Not slowed down. Done.

A dairy nutritionist working with farms across Wisconsin, Minnesota, and Iowa—who requested anonymity due to client relationships—shared a recent case. “We had a farm with 15 years of perfect quality records, hit 75 ppb AFM1. That’s below FDA limits but above EU standards. Lost their premium market instantly. Took over a year to qualify again. For a 200-cow operation, that’s easily $45,000 gone.”

And here’s what makes it particularly tricky—USDA Grain Inspection, Packers, and Stockyards Administration’s 2024 annual report shows that black light screening at grain delivery catches roughly half of the contaminated loads—though this varies quite a bit depending on the contamination levels and who’s conducting the inspection. The other half gets through because contamination concentrates in specific areas, or hot spots. Research from Iowa State University Extension on grain quality confirms that just five contaminated kernels per million can push a load over FDA action levels.

For those of you with pasture-based operations, thinking you’re safe—drought-stressed pastures can develop aflatoxin-producing molds too. Nobody’s immune from this.

What This Actually Costs (I Did the Math)

Let me break down real numbers based on what we’re seeing right now with recent Class III pricing averaging around $18.40 per hundredweight. I’ve cross-referenced these against current supplier catalogs and the actual payments producers are making.

The economics are stark: $63 per cow annually for prevention versus $128 per cow for just one week of crisis response—and that’s before counting lost premium market access worth $30,000-50,000 annually

For a typical 150-cow herd producing 65 pounds per cow daily:

Annual prevention costs:

  • Monthly bulk tank testing (12 samples at $50 based on Marshfield Labs pricing): $600
  • Rapid test strips for grain (about 200 tests at current Charm Sciences rates): $1,400
  • Mycotoxin binders all year (using standard 100g/head/day inclusion): $5,475
  • Annual audit from an ISO-certified lab: $2,000
  • Total: $9,475 (that’s $63 per cow annually)

One contamination event based on current milk pricing:

  • Seven days of dumped milk (9,750 lbs/day × 7 × $18.40/cwt): $12,558
  • Emergency feed replacement at typical 30% drought premiums: $3,200
  • Rush laboratory testing (HPLC confirmation from accredited lab): $1,500
  • Consultant support for crisis response: $2,000
  • Total: $19,258 (that’s $128 per cow for just one week)

But here’s what’s really interesting—research published in the Journal of Dairy Science has shown mycotoxin binders can improve milk production during low-level contamination periods. Multiple studies report increases of 3-7 pounds per day. At current prices, that production boost often covers much of the binder cost.

Here’s what most nutritionists won’t tell you upfront: mycotoxin binders typically pay for themselves through improved production and butterfat—before you even count contamination prevention, turning a $5,475 cost into an $8,924 benefit

The bigger operations—those 500-cow dairies you see around Wisconsin and Ohio—they get even better economics. Prevention costs drop to around $45 per cow through bulk buying agreements, but crisis costs remain at $125 to $ 140 per cow. You’re still dumping the same percentage of your milk.

Dairy nutrition researchers at land-grant universities have consistently found that mycotoxin binders offer benefits beyond just contamination control. According to the University of Wisconsin Extension’s 2024 dairy nutrition guidelines, “We often see better butterfat tests, usually up a tenth or two, and fewer fresh cow metabolic problems. The prevention often pays for itself even without contamination events.”

When This Hits Your Region

Michigan State’s climate research used the same models NOAA relies on to map out where contamination’s heading. And based on their projections published in 2022, it’s coming faster than most of us realize.

Michigan State’s climate models show aflatoxin contamination expanding from occasional southern droughts to routine problems across 89.5% of Midwest corn counties by 2034—transforming a regional issue into an industry-wide crisis

Currently, through 2027, Southern Illinois and Indiana experience problems during drought years—we saw this in 2023. Most operations north of I-70 haven’t experienced it yet. Although extension agents in southern Ohio report that they’re starting to see occasional positives during extremely dry periods.

2028-2030: The problem shifts north. Southern Wisconsin—the Monroe and Janesville areas—plus most of Iowa and northern Illinois, start seeing contamination every few years. University of Minnesota Extension modeling from their 2024 climate adaptation report suggests that what used to occur once in 20 years now happens once in three.

2031-2033: This is when the models indicate real expansion. Central Wisconsin’s dairy country, Minnesota’s concentrated production areas, Michigan’s agricultural zones, Ohio’s dairy regions—they’ll see contamination approaching what Kentucky experiences today.

2034 and beyond: It becomes routine across nearly 90% of Midwest corn counties, according to the Michigan State projections. Processors won’t have a choice—they’ll require testing because they can’t absorb the liability of contaminated milk.

Kansas State University agricultural economists have calculated that significant economic impacts are coming. Their recent outlook estimates regional losses could increase 5- to 8-fold by the mid-2030s based on contamination modeling.

The USDA Economic Research Service documented over $1 billion in agricultural losses from the 2012 drought, with mycotoxin contamination representing a significant component according to their published analysis. That event was supposed to be once in 20 years. Current climate patterns suggest it could become an every-other-year occurrence in some regions by 2030.

As for insurance, from what insurance professionals are telling us, most standard dairy policies exclude mycotoxin contamination unless you purchase specific riders. And those premiums? They’re reflecting the increasing risk.

What Recent Contamination Events Teach Us

Recent international contamination events offer important lessons. Even operations with comprehensive quality systems—such as ISO certifications, laboratory access, and corporate protocols—have had contaminated products reach consumers.

In one recent case, inspectors found no critical violations during routine facility audits. The contamination was only detected through targeted product testing. Multiple batches of children’s products failed EU standards despite passing earlier checkpoints.

What went wrong? Industry analysts suggest that the same issue threatening Midwest operations—reliance on spot checks instead of systematic monitoring —also applies. Each checkpoint appeared fine because continuous aflatoxin testing was not a standard protocol.

Now imagine that scenario across hundreds of Midwest farms during a drought summer in, say, 2031. Processors can’t handle dozens of simultaneous contamination cases. Based on how processors handled the 2012 drought surge—according to those who lived through it, their experiences reveal a great deal—they’ll likely implement rapid decision protocols. Prove you’ve got control within 72 hours or face suspension.

Getting Started Based on Your Size

Different-sized operations need different approaches, but everyone needs to start building infrastructure before contamination becomes routine.

Under 150 cows:

Keep it simple at first. Rapid test kits from established suppliers, such as Charm Sciences or Neogen, typically cost around $200 for starter kits. Test your next five corn deliveries—it takes about five minutes per test. If everything’s clean, you’ve spent less than your monthly DHIA bill, confirming you’re okay. If something tests positive, you’ve potentially saved yourself months of lost income.

Consider teaming up with neighboring farms. State dairy organizations in Wisconsin (Professional Dairy Producers), Minnesota (Milk Producers Association), and Pennsylvania (Center for Dairy Excellence) have been facilitating group purchasing agreements for testing supplies and consultant services since 2024. Several producer groups report successful cost-sharing arrangements for testing equipment.

150 to 400 cows:

This is actually a sweet spot for implementing full prevention protocols. You’re big enough to justify dedicated equipment but nimble enough to change quickly.

Start monthly bulk tank testing immediately. Regional laboratories, such as Marshfield Labs in Wisconsin, MVTL in Minnesota, or the Pennsylvania Animal Diagnostic Laboratory, can provide this service. You need that testing history before processors start requiring it. Add mycotoxin binders to your standard ration—commercial mycotoxin surveys suggest the production response typically covers 70-80% of the cost, even without contamination events.

Over 500 cows:

Larger operations have significant advantages here. Prevention represents less than 1.5% of your typical feed budget according to the University of Wisconsin’s 2024 annual farm financial summary. The real risk isn’t the cost—it’s being the last major operation in your milkshed to implement protocols.

Consider becoming a regional leader in contamination control. Several larger Wisconsin and Ohio operations have successfully piloted testing programs with their processors, positioning themselves as preferred suppliers for premium programs. Some are even helping smaller neighboring farms implement protocols through equipment sharing or group purchasing.

The 72-Hour Rule That Changes Everything

Here’s what most producers don’t understand about processor decision-making during contamination events. When it involves one or two isolated cases, processors typically work with the affected farms for weeks to identify and correct the problems. The major cooperatives all have similar protocols for isolated incidents.

But when contamination becomes widespread? Everything changes.

A procurement manager at a major Midwest cooperative—speaking about their experience during the 2012 drought—explained: “We had 15 farms test positive in 10 days. Our quality team couldn’t handle individual investigations. We implemented a 72-hour rule based on that 2012 experience—provide documented corrective action and clean test results within three days or face suspension.”

This is where preparation becomes critical. Farms with established laboratory relationships—those that send monthly samples, maintain accounts, and know the staff—can often achieve a 24-hour turnaround, even during surge periods. New customers? According to the American Association of Veterinary Laboratory Diagnosticians’ 2024 capacity survey, they face delays of two to three weeks when demand spikes.

The math simply doesn’t work. Processor demands results in 72 hours. Laboratory says 14 days for new accounts. You lose premium market access before test results even arrive.

Where to Invest First

Based on what successful early adopters have shared, here’s a practical implementation sequence:

This month ($2,000-3,000):

  • Order rapid test strips from established suppliers
  • Set up accounts with accredited laboratories now
  • Begin baseline bulk tank testing to establish your clean history
  • Start documenting feed deliveries—even smartphone photos with timestamps help

Next 3-6 months ($5,000-8,000):

  • Implement systematic feed testing protocols
  • Add mycotoxin binders, working with your nutritionist on inclusion rates
  • Expand laboratory testing frequency
  • Schedule conversations with your processor about future requirements

By year’s end ($8,000-12,000):

  • Complete third-party audit from an ISO-certified provider (you can find auditors through the American National Standards Institute directory or your state’s quality certification programs)
  • Upgrade documentation systems for better traceability
  • Establish crisis response fund (minimum $20,000 recommended)
  • Build relationships with alternative market outlets

Total investment over 12 months: $15,000-23,000

Compare that to one contamination event, at a minimum of $19,000, plus the potential loss of premium market access worth $30,000-$50,000 annually for a mid-sized operation.

Questions for Your Processor This Week

Most producers don’t know what to ask until it’s too late. Here are the critical questions:

What are your current AFM1 testing requirements for premium programs? How much advance notice will we receive before requirements change? What documentation do you need for contamination control verification? Which laboratories do you accept for official testing? What’s your specific protocol and timeline if contamination is detected?

Get these answers in writing. Email your field representative today—seriously, this conversation can’t wait.

The Seasonal Pattern Worth Understanding

Dairy nutrition specialists consistently point out that aflatoxin risk peaks during late summer through fall harvest, especially following drought stress. From September to November, corn typically shows the highest contamination risk, according to multi-year USDA grain inspection data.

Smart operations adjust their testing frequency seasonally—doubling tests during high-risk months, then scaling back in winter and spring. It makes economic sense to focus prevention resources when risk is highest.

Several states, including Illinois and Iowa, are developing aflatoxin monitoring programs through their extension services, though funding remains limited so far.

Making Your Decision

Considering everything—recent international contamination events, Michigan State’s peer-reviewed climate projections, and processor requirements already being implemented—the path forward is becoming clearer.

If you’re skeptical about climate projections, that’s understandable. But processors aren’t skeptical. They’re implementing testing requirements now based on risk assessments. Even if your specific farm never sees contamination, lacking documented protocols will exclude you from premium markets.

If you’re concerned about costs, run your own numbers. Seven days of production multiplied by current milk prices equals your minimum crisis cost. Add lost premium access, and you’re looking at months of profit margins eliminated. Prevention—at $9,475 annually for a 150-cow herd—costs less than half what a single contamination event would.

If you think there’s time to wait, consider that laboratory relationships take months to establish. Testing histories require 12-24 months to build. Premium programs often have waiting lists. Starting in 2029, when contamination becomes routine, means you’re already years behind.

If you’re ready to move forward, start this week. Order test strips from reputable suppliers. Contact three laboratories about their services. Schedule that processor meeting. Small steps compound into comprehensive protection.

The producer who told me aflatoxin’s “a southern problem”? He’s right about today. But Michigan State’s research—16 climate models all pointing in the same direction—shows that by 2030, southern problems become Midwest realities. Whether you’re milking in Wisconsin, Iowa, Ohio, Pennsylvania, Michigan, New York, Vermont, or anywhere between.

What is the difference between operations that thrive through this transition and those that struggle? About $63 per cow annually for prevention—yes, that’s $9,475 for a 150-cow operation, but spread across your annual production, it’s manageable.

That’s less than treating one displaced abomasum. It’s a fraction of your monthly fuel costs. And it’s minimal compared to the market access you’re protecting.

Climate patterns are shifting whether we’re ready or not. Processors won’t wait for stragglers. That 89.5% probability across Midwest counties isn’t a maybe—it’s a timeline that’s already in motion.

The only real question is whether you’ll build your prevention system on your schedule over the next 18 months, with time to optimize and establish relationships, or on your processor’s timeline in 72 hours while your milk truck’s being turned away.

One approach costs $63 per cow annually, with time to implement it properly. The other costs $128 per cow in just one week while you’re dumping milk and scrambling for solutions.

The math’s straightforward. The choice should be too. But from what I’m seeing across the industry, most operations are choosing to wait.

That could become an expensive lesson.

KEY TAKEAWAYS

  • Prevention delivers 3:1 return on investment: Annual prevention costs of $63/cow protect against weekly crisis costs of $128/cow, plus mycotoxin binders typically improve milk production by 3-7 pounds daily and boost butterfat tests by 0.1-0.15 points
  • Start testing protocols immediately for smaller operations: Farms under 150 cows can begin with $200 rapid test kits from Charm Sciences or Neogen, testing five corn deliveries monthly—costing less than your DHIA bill while establishing the clean history processors will require
  • Premium market access depends on documentation starting now: Processors are already paying $2-4/cwt more for farms with established testing histories, and building the required 12-24 month documentation takes time you can’t make up during a crisis
  • Regional timing varies, but preparation doesn’t: Southern Wisconsin and Iowa see contamination by 2028-2030, while Michigan and Ohio follow by 2031-2033—but laboratory relationships and prevention protocols need 18 months to establish, regardless of location
  • The 72-hour processor rule changes everything: During widespread contamination events (like the 2012 drought), processors demand clean test results within three days while new laboratory customers face 14-day waits—making advance preparation the difference between keeping and losing market access

Complete references and supporting documentation are available upon request by contacting the editorial team at editor@thebullvine.com.

Learn More:

The Sunday Read Dairy Professionals Don’t Skip.

Every week, thousands of producers, breeders, and industry insiders open Bullvine Weekly for genetics insights, market shifts, and profit strategies they won’t find anywhere else. One email. Five minutes. Smarter decisions all week.
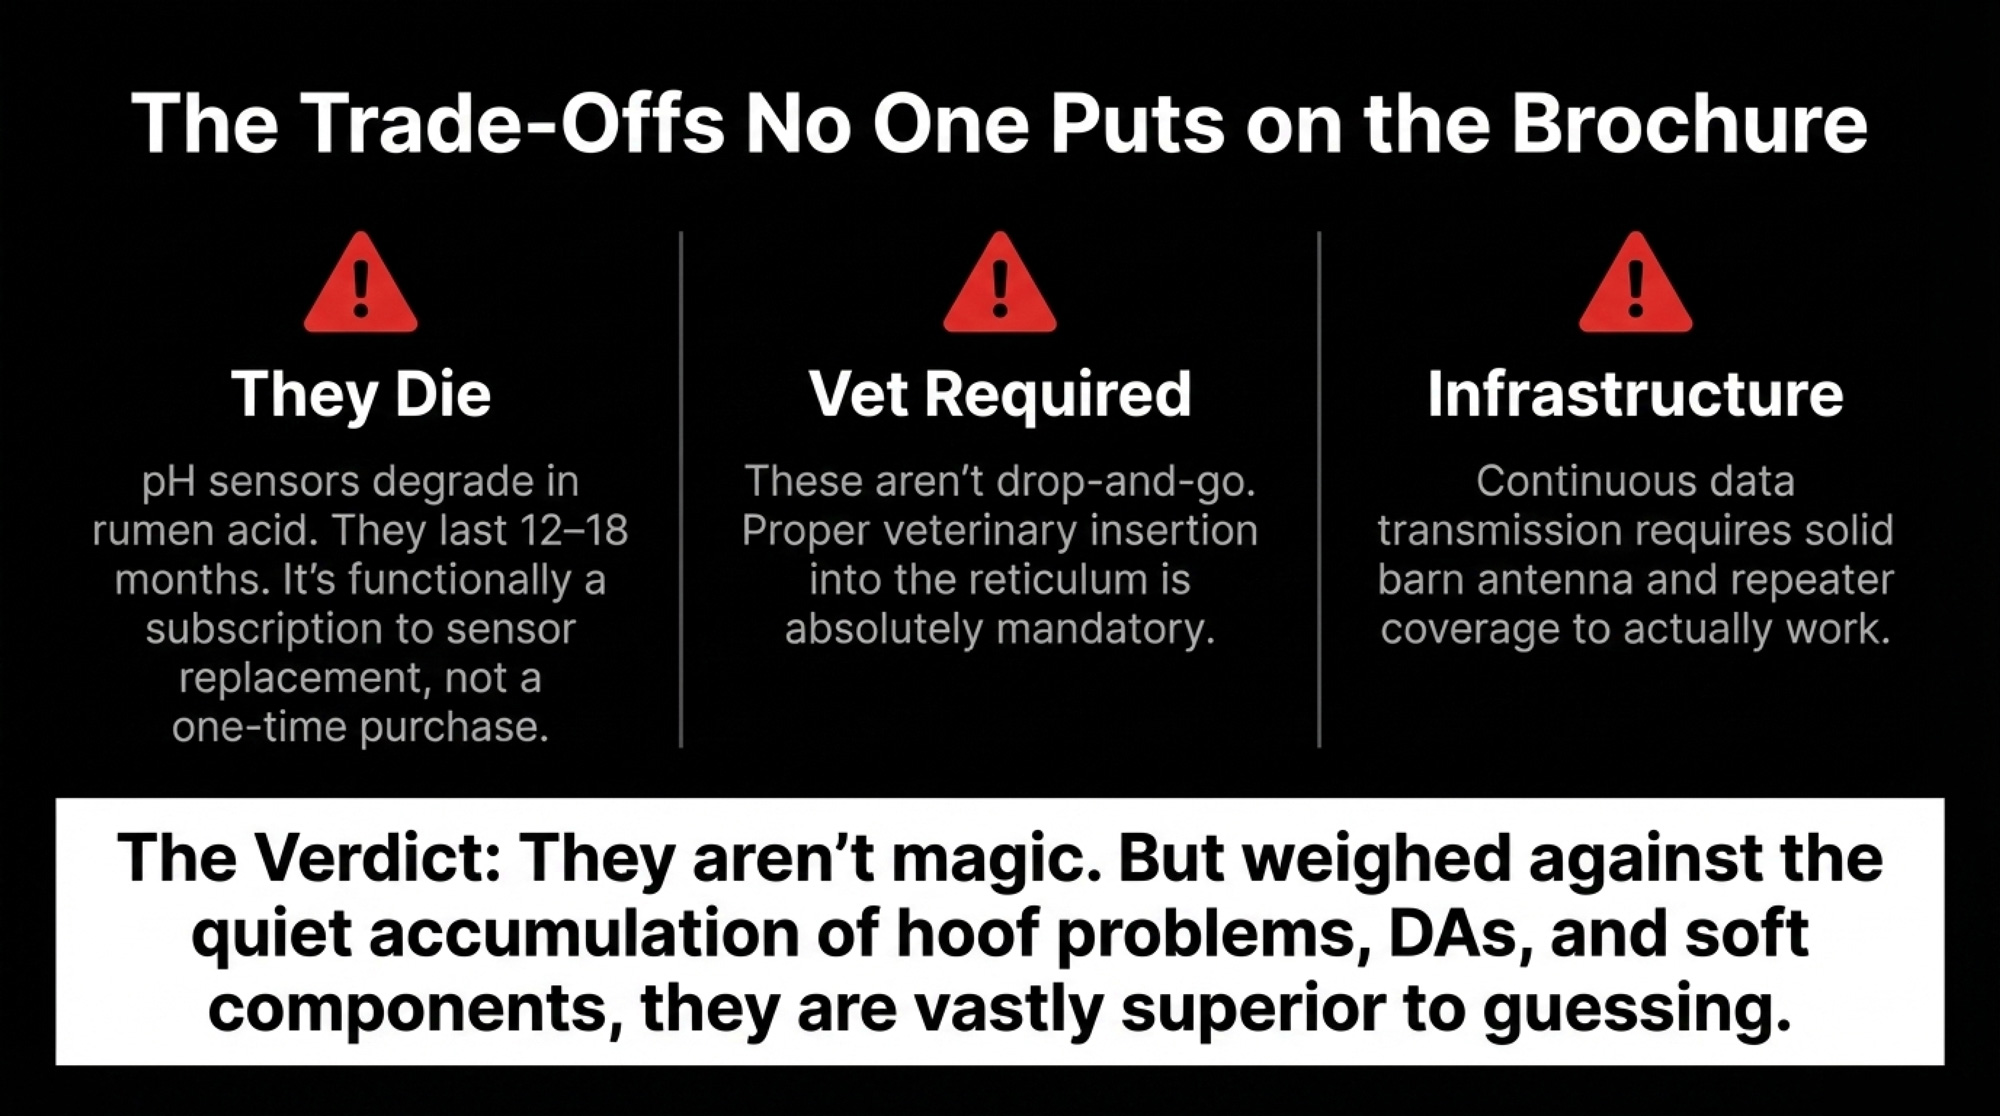
NewsSubscribe
First
Last
Consent

Why Smart Dairies Are Spending MORE on Feed at $4.20 Corn (And Banking $100K Extra)

Feed costs dropped 30% but farms lose more money—the 35% cost share shift changes everything

EXECUTIVE SUMMARY: What farmers are discovering right now challenges everything we thought we knew about feed economics—operations spending more strategically on feed at $4.20 corn are generating $100,000 to $110,000 in additional annual revenue per 100 cows, according to Wisconsin Extension’s 2025 profitability analysis. The math has fundamentally shifted: feed now represents just 35-40% of total production costs (down from the historical 50%), while labor costs have jumped 15-20% since 2020, and replacement heifers have doubled to $3,000-4,000 per head based on USDA market data. Cornell PRO-DAIRY’s benchmarking reveals that farms tracking Return on Feed Cost rather than minimizing feed expense are capturing an extra $3 for every additional 50 cents invested in quality nutrition. Geographic disparities are widening, too—Midwest operations maintain positive margins while California and Northeast dairies face $45-60 per hundredweight structural disadvantages from freight, water, and regulatory costs. Penn State Extension research shows another opportunity most miss: reducing feed shrink from 15-18% to 8-10% through systematic inventory management returns $150-200 per cow annually. The path forward isn’t about spending less on feed—it’s about investing strategically in nutrition, measurement, and multi-layered risk protection that positions your operation for the new economic reality.

Dairy Profitability Strategy

Feed costs dropped 30%, yet most dairy operations are bleeding cash harder than when corn hit $7. Here’s what’s really happening—and what the profitable few are doing differently.

There’s an interesting disconnect this October. Corn futures on the Chicago Board of Trade sit at $4.13 a bushel—down from over $6 last year. USDA’s Agricultural Marketing Service reports soybean meal in the $270s. Dairy Margin Coverage formulas suggest margins above $11 per hundredweight.

By all traditional measures, this should be a boom time.

Yet producers from Wisconsin to California report rising operating loans and shrinking working capital. They’re asking why lower feed costs aren’t boosting profitability the way they used to.

Understanding the New Cost Structure

Looking at this trend, it’s clear that feed no longer dominates expenses. Wisconsin Extension’s 2025 analysis shows feed now accounts for just 35–40% of total production costs, down from the historical 50% benchmark.

That shift has big implications:

  • Labor Costs have jumped 15–20% since 2020, with Midwest wages near $19.50/hour (USDA NASS).
  • Replacement Heifers now run $3,000–4,000 apiece, more than double past norms (USDA AMS).
  • Machinery Costs are up 25% over three years (Association of Equipment Manufacturers).
  • Insurance Premiums climbed 18–25% with shrinking coverage (Farm Bureau data).

When feed is only a third of your costs and these other expenses are escalating, grain-price relief alone can’t solve profitability challenges.

The 35% Cost Share Shift: Feed costs dropped 30% but now represent just 37.5% of total expenses (down from 50%), while labor jumped to 18% and replacement heifers doubled to 14% of costs. This fundamental restructuring explains why lower corn prices haven’t translated to farm profitability

A Different Way to Measure Success

The 50-Cent Decision Worth $100,000: Cornell PRO-DAIRY benchmarking reveals farms tracking Return on Feed Cost capture an extra $3 for every additional 50 cents invested in quality nutrition. Operation B spends just 50¢ more per cow daily but generates $100,000 additional annual revenue per 100 cows—proving strategic feeding beats cheap feeding

What I’ve found is that top-performing dairies track Return on Feed Cost (ROFC) rather than just feed cost per cow. Extension case studies from the Midwest illustrate this:

MetricOperation AOperation B
Feed cost per cow daily$5.40$5.90
Milk production per cow62 lbs73 lbs
Income per feed dollar$14.00$16–17
Annual difference (100 cows)Baseline+$100,000

That extra 50 cents spent can return nearly $3—a powerful insight backed by Cornell PRO-DAIRY’s 2025 benchmarking.

Rethinking Protein Sourcing

While everyone watches corn, a quieter opportunity lies in protein markets. Research from the University of Saskatchewan shows that canola meal delivers digestible protein on par with soybean meal (18.2% vs. 18.6%) and a superior amino-acid profile.

UC Davis Extension reports larger herds blending canola meal with distillers grains, saving $10,000–15,000 monthlyand often gaining 1.5–2 lbs of milk per cow daily after the transition period.

  • Lysine, histidine, and threonine availability increases by 20g, 13g, and 24g, respectively (Canadian Journal of Animal Science).
  • Canada supplies 75% of U.S. canola meal, so price volatility is possible (USDA FAS).
  • Southern Extension data shows small-herd cooperatives saving $8–12 per ton by pooling purchases.

It’s worth noting that smaller dairies without bulk-buying power can still capture these gains by teaming up locally.

The Hidden Drain on Profitability

Here’s something that might surprise you: feed shrink. Penn State Extension’s 2024 research indicates farms lose 15–18% of purchased feed to spoilage, storage losses, mixing errors, and waste.

Implementing:

  • Weekly dry matter tests
  • Monthly inventory reconciliations
  • Quarterly mixer-wagon audits

can cut shrink to 8–10%, saving $150–200 per cow annually on a 200-cow operation after investing $3,000–4,000 in equipment and labor (Michigan State Extension).

Regional Realities and Their Impact

Geography’s structural cost differences are widening, according to USDA ERS and state Extension studies:

  • Midwest operations maintain margins of $1–2 per cwt
  • California dairies often lose $50–60 per cwt
  • Northeast farms typically lose $45–55 per cwt

Key drivers include:

  • Freight addons of $0.60–0.75/bu for Midwest corn (USDA).
  • Water costs of $1.00–1.50/cwt in California (UC Cooperative Extension).
  • Hay priced $90–100/ton above Midwest markets (USDA).
  • Labor regulations adding 20–25% to payroll (state employment data).

Yet some operations adapt—organic premiums of $8–10/cwt and grass-fed verification adding $5–6/cwt can offset structural disadvantages.

The Evolving Industry Structure

The 2022 Census of Agriculture shows a clear trend:

  • 39% of dairy farms closed between 2017 and 2022 (USDA Census).
  • Milk production rose 4% despite fewer farms.
  • 66% of production now comes from operations with 1,000+ cows, up from 57%.

Farm Credit Mid-America’s 2024–25 analysis finds dairies investing $25,000–40,000 annually in professional services—nutrition consulting, risk management, quality control—often generate $150,000–250,000 in additional value.

Evaluating Nutrition Advisory Services

Nutrition advice bundled with feed purchases often seems “free,” but Ohio State research warns of structural conflicts when advisors represent feed companies.

Extension analyses estimate 200-cow operations face $60,000–90,000 in annual opportunity costs from:

  • Limited ingredient options
  • Protein over-feeding
  • Missed contracting windows
  • Lack of ROFC tracking

Independent consulting costs $10,000–15,000/year yet often returns 4–6 times that through optimized rations (Professional Dairy Producers benchmarking).

Building Comprehensive Risk Protection

Recent volatility shows one layer of protection isn’t enough. University of Illinois farmdoc analysis and Risk Management Agency data recommend:

Layer 1: DMC at $9.50 coverage (~$0.15/cwt)
Layer 2: Dairy Revenue Protection covering 40–60% (cost $0.30–0.40/cwt)
Layer 3: Forward Feed Contracts for 60–70% of needs (saves $0.20–0.40/bu corn, $15–25/ton protein)
Layer 4: CME Micro-Futures (investment $8,000–10,000 quarterly protects $30,000–50,000)
Layer 5: Cash Reserves to cover 60–90 days of feed

Total cost: $60,000–80,000 annually for 300–500 cows, with protected value reaching $200,000–250,000 in volatile years.

Five Common Patterns Among Profitable Operations

What producers are discovering is that successful dairies consistently:

  • Prioritize ROFC over raw cost cutting—worth $50–80 per cow.
  • Measure everything—weekly tests, monthly inventories, and daily refusals yield $60,000–130,000 returns.
  • Invest in expertise—$10,000–15,000 consulting generating 4–6x returns.
  • Layer protection—diversified risk tools guard $200,000+ in potential losses.
  • Act decisively—delays in contracting or enrollment can cost $20,000–30,000 annually.

These aren’t secrets—they’re documented best practices. The challenge is moving from knowledge to action.

Your 90-Day Action Plan

Opportunities are time-sensitive. Over the next 90 days:

☐ Lock Feed Contracts (Nov–Dec 2025) at $4.05–4.20/bu for Q1–Q2 2026 (grain quotes vary by region).
☐ Enroll in Dairy Revenue Protection (Jan 2026) for Q2–Q3 coverage.
☐ Finalize Planting Decisions (Feb 2026) to lock forage costs through fall 2027.

Each month’s delay can cost $5,000–7,000 in missed optimization. Three months equals $15,000–21,000 plus $20,000–30,000 in lost harvest pricing.

Moving Forward

This isn’t a temporary market glitch. It reflects structural shifts in dairy economics:

  • Feed’s cost share has shrunk.
  • Labor, equipment, and regulatory expenses have soared.
  • Geography drives growing cost disparities.
  • Professional management is essential.

The tools and expertise to succeed exist—forward contracts, risk programs, independent advisors, and measurement systems. Success today isn’t about working harder—it’s about working differently.

What I’ve found is that the most resilient operations out-think challenges instead of simply out-working them. The path forward exists. The question is whether we’ll take it.

KEY TAKEAWAYS

  • Shift focus to Return on Feed Cost (ROFC): Operations generating $16-17 in milk revenue per feed dollar versus $14 are banking an extra $100,000 annually per 100 cows—that 50-cent strategic investment in better nutrition returns nearly $3, making quality more profitable than cheap
  • Attack the 15-18% feed shrink hiding in plain sight: Weekly dry matter testing, monthly inventory reconciliations, and quarterly mixer audits can cut losses to 8-10%, saving $150-200 per cow annually with just $3,000-4,000 invested in measurement systems
  • Build five-layer risk protection now: Combine DMC foundation coverage, Dairy Revenue Protection for 40-60% of production, forward contracts locking 60-70% of feed needs, CME micro-futures, and 60-90 days cash reserves—total cost of $60,000-80,000 protects against $200,000+ in potential losses
  • Act on the 90-day window: Lock November-December feed contracts at $4.05-4.20 before March’s typical $4.45+ pricing, enroll in January’s DRP for Q2-Q3 coverage, and finalize February planting decisions that lock forage costs through fall 2027
  • Recognize regional realities and adapt accordingly: If you’re facing California’s $50-60/cwt disadvantage or the Northeast’s $45-55/cwt structural costs, consider organic premiums ($8-10/cwt), grass-fed verification ($5-6/cwt), or value-added processing to offset geography’s impact on profitability

Complete references and supporting documentation are available upon request by contacting the editorial team at editor@thebullvine.com.

Learn More:

The Sunday Read Dairy Professionals Don’t Skip.

Every week, thousands of producers, breeders, and industry insiders open Bullvine Weekly for genetics insights, market shifts, and profit strategies they won’t find anywhere else. One email. Five minutes. Smarter decisions all week.
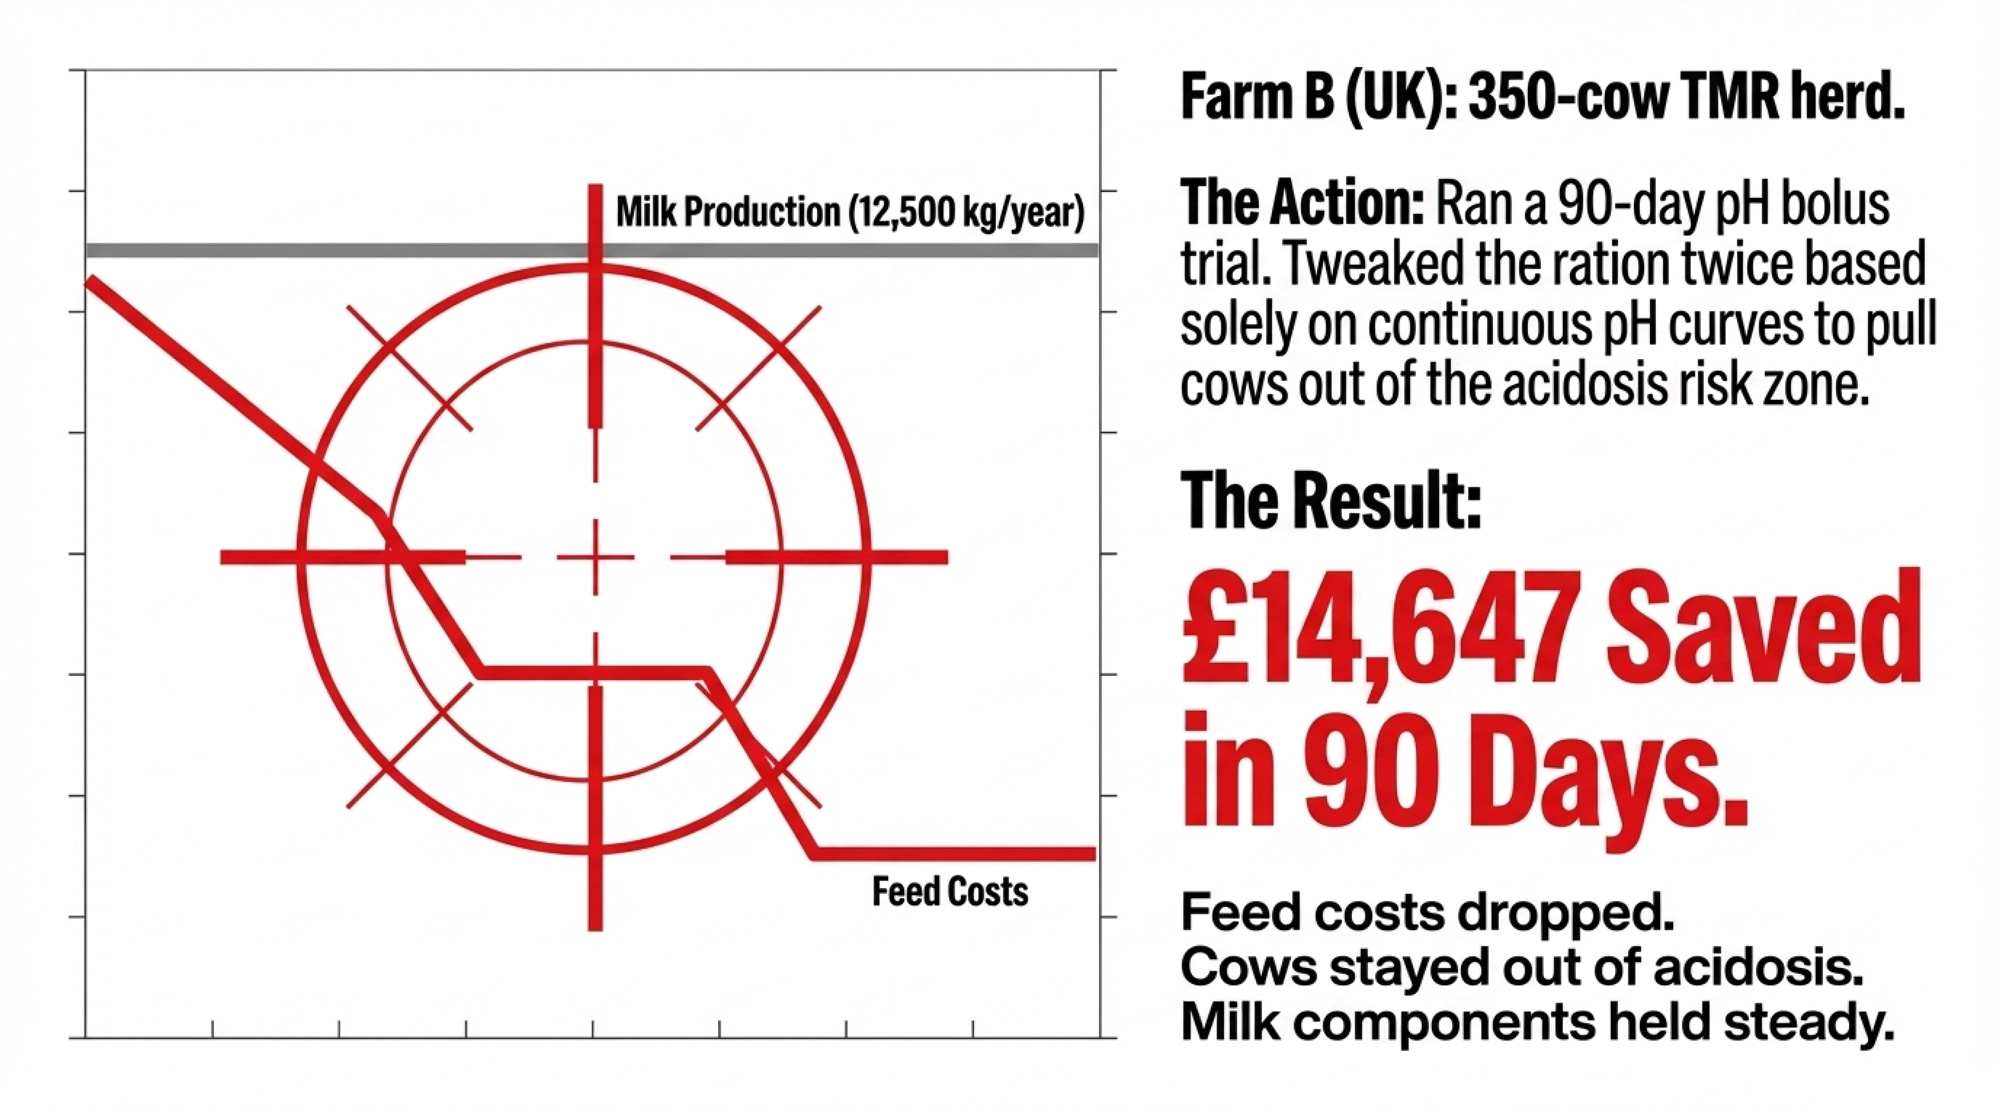
NewsSubscribe
First
Last
Consent

Your Silage Is Lying to You: The $180,000 Annual Loss Most Farms Never Calculate

Your bunker’s hiding a $15K monthly bleed—and the fix costs less than your next vet call 

EXECUTIVE SUMMARY: What farmers are discovering through painful experience this season is that feed variability isn’t just another management challenge—it’s become a $15,000 monthly profit drain that compounds invisibly across their operations. Cornell’s dairy research team documented that weather-damaged forages force cows to consume 2.67 extra pounds of feed daily just to maintain production, while Wisconsin Extension’s October data show that this translates to over $5,000 monthly in direct waste alone for a typical 377-cow dairy. However, what’s truly compelling is that Jake, an organic producer near Middlebury, Vermont, transformed his bottom-third performance into nearly $90,000 in recovered profitability with just $1,100 in strategic investments—primarily a $340 moisture tester and joining Cornell PRO-DAIRY’s discussion group. Dr. Chris Wolf’s economic analysis at Cornell’s Dyson School reveals that farms adapting now with 18-24 month forage inventories experience 30-40% less income volatility during weather events, with some actually turning market disruptions into premium selling opportunities. The convergence of climate unpredictability, tightening margins, and consolidation pressure means farms have roughly 18-24 months to implement these proven strategies before compounding losses create structural challenges. The good news? Every farm we studied that took action—from 285-cow organic operations to 5,000-head Western dairies—recovered their investment within weeks and positioned themselves to thrive rather than just survive.

feed variability cost

So I’m watching Carlos, grab a handful of corn silage during morning feeding last week. Eighteen years of experience, right? He just shakes his head and says quietly, “Feels different.”

You know what’s interesting? That simple observation—when caught early—can save anywhere from $20,000 to $30,000, based on our current industry observations. Problem is, most of us miss these signals for months.

The 2025 growing season has been brutal, hasn’t it? We’ve got drought from Michigan through Ohio. Flooding across Iowa and southern Wisconsin. And what’s sitting in our bunkers isn’t just variable feed anymore—it’s become this profit drain that many farms haven’t fully calculated yet. Industry-wide, we’re talking billions in hidden losses that compound year after year.

Here’s what’s fascinating, though. While some operations are bleeding thousands monthly—we’re talking $5,000, $10,000, sometimes even $15,000—others have actually turned this volatility into a competitive advantage. The difference? Well, it’s not what you’d expect.

At a Glance: What You Need to Know

  • Feed variability costs: Typically $5,000-15,000+ monthly for mid-sized dairies
  • Simple fix: Weekly moisture testing prevents about 80% of losses
  • Best ROI: Discussion groups often deliver 300%+ returns for just $200-600 annually
  • Critical window: You’ve got 18-24 months to adapt before losses start compounding
  • Industry impact: Estimated $2.4 billion annually across U.S. dairy operations

Where Your Money’s Actually Going

Let me walk you through where these losses hide in a typical 377-cow operation, because once you see the full picture, the opportunities become pretty obvious.

When feed efficiency drops just 5% from weather-damaged forages—and Cornell’s dairy folks have been documenting this extensively—your cows need about 2.67 extra pounds of feed daily to maintain that 80-pound production average. We’re talking over 1,000 pounds of wasted feed. Every single day.

At current Midwest feed prices—Wisconsin Extension’s October report has them around eighteen cents per pound dry matter—you’re looking at $5,000-plus monthly just from excess consumption alone.

But here’s where it gets really interesting.

Dr. Randy Shaver from Wisconsin’s dairy science department shared something with me that really resonates: “Most nutritionists formulate assuming 35% dry matter in corn silage. When that silage actually tests at 36% DM due to face exposure, farms systematically overfeed without realizing it.”

Do the math with me here. One percentage point drift equals 580 pounds of annual overfeeding per cow. For 377 cows? That’s several thousand more walking out the door, based on typical silage running anywhere from $45 to $55 per ton these days.

The Cost Cascade Most Farms Don’t See

Loss CategoryMonthly ImpactAnnual Total
Direct feed waste$5,000$60,000
Moisture drift$2,000$24,000
Production loss$4,500$54,000
Health issues$3,500$42,000
Total Impact$15,000+$180,000+

Look at those numbers carefully—what hits you first? It’s the direct feed waste and production losses, right? They account for nearly two-thirds of the total impact. Most farms I visit focus on the health issues, but the silent killers are those daily inefficiencies that just compound month after month.

Penn State’s feed management team found something else worth noting—TMR particle size variation. Most farms operate with an 8% variation without even realizing it. Each percentage point costs somewhere between 0.2 and 0.4 pounds of milk per cow. We’re talking about another 900 pounds of lost production daily, or $4,000 to $5,000 per month, at October’s Class III prices of around $16.80.

Dr. Mike Hutjens from Illinois—he’s been tracking these patterns for decades—puts it pretty bluntly: “Research shows metabolic disorders can increase 15 to 20 percent when feed consistency varies. Add in reproduction hits from energy imbalance, and what seems like a manageable $5,000 problem becomes $15,000 or more in total monthly impact.”

Thing is, these losses don’t show up as “Feed Variability Loss” on your P&L. They hide in slightly higher vet bills, components that drift lower, feed costs that creep up…

Corn Silage Moisture Management: Your First Line of Defense

The Meeting That Changed Everything—let me tell you about something remarkable at a Pennsylvania dairy last spring.

Tom—not his real name, privacy matters—runs 420 cows, and he’d assembled this unusual group around his beat-up office table. His veterinarian is Dr. Sarah Chen. Nutritionist Mike Rodriguez with fifteen years of experience working in Pennsylvania dairies. Jennifer Hayes from Penn State Extension. And Carlos Martinez, his herd manager, who’d never been invited to a meeting like this before.

Tom’s problem? Income-over-feed-cost running $2.80 below his benchmark group. On 420 cows, we’re talking over $400,000 annually, he couldn’t explain. Painful doesn’t even begin to describe it.

Jennifer—she’s facilitated dozens of these through Penn State’s Dairy Excellence program—started with an unusual rule: “Let’s observe this data for fifteen minutes. No talking. No solutions. Just observe.”

The silence was uncomfortable, I must admit. But patterns started emerging.

Mike noticed that milk was holding at 79 pounds, while the butterfat dropped from 3.8% to 3.6%. Dr. Chen spotted MUNs trending from 14.2 to 16.8—that’s classic protein imbalance according to Cornell’s guidelines. The December ration showed 16.5% crude protein. Overfeeding shouldn’t be happening.

Then Carlos, hesitant about speaking up, mentioned: “The corn silage has been feeding different lately. Drier. The cows are sorting more, leaving stems.”

Mike’s response was immediate: “When did you last test moisture, Tom?”

The pause said everything. “September. At harvest.”

This was March.

Mike’s calculator came out. If silage had drifted from 35% to 37% dry matter—and that’s completely normal with an exposed face—they were overfeeding 1.1 pounds DM per cow daily. That’s 462 pounds of daily waste across 420 cows.

“We’re looking at 84 tons annually at $50 per ton—over $4,000 just from corn silage overfeeding,” Mike explained. “Plus, you’re diluting the entire nutrient profile, so Tom’s compensating with extra grain.”

Tom nodded slowly. “Yeah, I added about a pound of high-moisture corn per cow in January when body conditions started slipping.”

The room went quiet as everyone calculated. Extra grain: $12,000-plus annually. Elevated ketosis, Dr. Chen had been treating: another $4,000 to $5,000. Total identified loss from moisture drift alone: over $20,000 annually.

Jennifer’s observation still sticks with me: “Everyone in this room had important pieces, but nobody had the complete picture. This is why collaboration matters.”

“Cows tolerate slightly sub-optimal nutrition better than frequent changes. A ration that’s 95% correct but consistent outperforms theoretical perfection with weekly modifications.” – Dr. Heather Dann, Miner Institute

Success Story Snapshot: Jake’s Transformation Timeline

Month 0 (January): IOFC at $9.80 vs. $11.20 goal | 62 pounds production 
Month 1: Joined Cornell PRO-DAIRY discussion group ($300) 
Month 2: Discovered moisture drift issue, purchased Koster tester ($800) 
Month 3:Implemented weekly moisture testing protocol 
Month 4: Adjusted rations based on actual dry matter 
Month 5:Production recovering to 60 pounds 
Month 6: Production at 61 pounds | IOFC at $10.90 | Ketosis cases: 18→6 
Annual benefit: Nearly $90,000 | 
Total investment: $1,100 | ROI: Over 8,000%

Small Farms Finding Big Solutions Through Smart Collaboration

What’s really encouraging—and I’ll admit, kind of surprising—is how smaller operations are pioneering sophisticated approaches without massive investment.

Take Jake—another name I’ve changed for privacy—organic dairy near Middlebury, Vermont. Third generation, 285 cows. His numbers were unflattering: IOFC dropped from $11.20 to $9.80 per cow per day. Milk slipped from 62 to 58 pounds. You’d think he’s too small for sophisticated management, right?

Wrong. Instead of buying technology, Jake joined Cornell PRO-DAIRY’s discussion group. Cost? Three hundred bucks annually. Jason Karszes, who runs the program as Cornell’s Farm Management Specialist, tells me they have dozens of groups across New York now, with hundreds of farms participating.

“That first benchmarking meeting was humbling,” Jake told me over coffee recently. “We were $2.20 below the group average on IOFC. Do the math—that’s over $200,000 in unrealized annual revenue. I wanted to crawl under the table.”

But here’s where it gets good. Through the group, Jake learned that a neighboring farm had identified moisture drift as the cause of systematic overfeeding. He tested immediately with a Koster tester. Same problem—moisture had shifted from 32% to 35% dry matter.

Six months later? Production recovered to 61 pounds. IOFC hit $10.90. Fresh cow ketosis cases dropped from 18 to 6. Jake’s meticulous records indicate that annual benefits are approaching $90,000, based on a total investment of approximately $1,100.

“We stopped operating in isolation,” Jake explains simply. “Eight farms sharing real numbers, genuine problems, proven solutions. For $300 annually, I basically gained a management team.”

Dairy Feed Efficiency Monitoring: Making Sense of Starch Digestibility

Now, Jake’s success story leads us to another piece of the puzzle—one that gets a bit technical but really matters for your bottom line. Remember that corn silage Carlos noticed was “feeling different”? There’s hard science behind why that observation matters so much.

Dr. Luiz Ferraretto, from the dairy science department at the University of Wisconsin, has been researching this topic for years. Fresh corn silage typically has a starch digestibility of 60-65% when tested using the 7-hour in vitro method. After 240 days of fermentation? That can hit 85 to 90 percent.

“This isn’t minor variation—it’s fundamentally different feed,” as Dr. Ferraretto explained at last year’s Four-State conference in Dubuque.

Research published this year in the Journal of Dairy Science from Wisconsin confirms that this evolution follows predictable patterns. Starch digestibility generally increases by about 2% per month during peak fermentation—that’s between days 21 and 90.

Dr. Bill Weiss from Ohio State, who’s been at this for three decades, shared his framework with me:

“Silage under 21 days old? Avoid it unless you’re desperate—that starch is basically locked up. Days 21 to 90? Test bi-weekly with NIR analysis and adjust when digestibility increases by four percentage points or more. After 90 days? Monthly testing, quarterly adjustments usually work fine. Beyond 180 days? You’re just monitoring for stability at that point.”

What surprises many folks—surprised me too, honestly—is that sometimes patience beats immediate adjustment.

“When silage is 30 to 60 days old and climbing 2% monthly in digestibility, adjusting now means you’re readjusting in two weeks,” explains Dr. Heather Dann from the Miner Institute up in northern New York. “Better to wait until that 90-day plateau for one comprehensive adjustment.”

Fecal starch analysis provides validation; Wisconsin’s feed lab processes thousands of these samples monthly. Above 5% indicates that you have undigested energy walking out the back end. But if that silage is only 60 days old, Dr. Dann suggests patience while fermentation completes its job.

When Your Advisors Won’t Work Together

This might be uncomfortable to discuss, but after numerous conversations this year, it needs to be addressed.

I know a Wisconsin nutritionist—let’s call him Rick—serving 40 dairies. He told his client Mark: “Team meetings produce more talk than action. After 20 years, I understand nutrition, your vet understands health. That’s efficient specialization.”

Three months later? Mark’s IOFC had declined another 40 cents per cow daily despite following Rick’s recommendations precisely.

Dr. Sarah Roche at Guelph has been researching advisor-farmer relationships, and she’s identified some predictable resistance patterns: “Professional identity plays a huge role—collaboration can feel threatening. Business models optimized for volume rather than depth create challenges. Past territorial conflicts teach advisors to maintain boundaries.”

How do you assess whether resistance is fixable? Try this approach:

Ask your advisor: “I’ve been learning about quarterly collaborative meetings between vets and nutritionists. What’s been your experience?”

A constructive response sounds like: “Some work well with proper structure, others lose focus. What outcomes are you seeking?”

A closed response: “Complete waste of time. Never effective.”

Mark ultimately switched nutritionists. His new advisor embraces collaboration, telling me, “Every joint meeting teaches me something valuable. Professional growth requires acknowledging that nutrition expertise, while important, isn’t the only expertise that matters.”

Building for Whatever Comes Next: The 18-24 Month Adaptation Window

Examining operations positioned for long-term success reveals consistent patterns that extend beyond technology.

Dr. Chris Wolf, the agricultural economist at Cornell’s Dyson School, has documented how farms maintaining 18 to 24 month forage inventories experience 30 to 40 percent less income volatility during weather events.

“When drought creates spot market spikes—and we’ve seen regional prices exceed $250 per ton in some areas—farms with deep inventory continue feeding from reserves. Some strategically sell excess at premium prices, turning crisis into opportunity,” his research shows.

They’re also diversifying before they have to. During my recent visit to Dr. Tom Overton’s Cornell research plots, the impacts of PRO-DAIRY’s forage diversity were really evident. Farms reducing corn silage from 60-70% down to 40-50% of forage dry matter while adding small grains, sorghum, and cover crop silages show remarkable stability.

“Multiple crop failures become unlikely when you’ve diversified appropriately. It’s basically portfolio management applied to forage,” Dr. Overton explains.

What’s particularly interesting—counterintuitive even—is deliberate production moderation. These operations target a weight of 85 to 88 pounds, rather than aiming for 95.

Dr. Mike Van Amburgh at Cornell quantified it for me: “Lower peaks, sure, but when forage quality varies 5%, these herds barely notice. Result: $1.50 to $2.00 improved income-over-feed-cost despite producing 7 to 10 pounds less milk daily.”

Different Regions, Different Challenges

While I’ve been emphasizing Pennsylvania and Vermont examples, this challenge looks different depending on where you farm.

Dr. Jennifer Heguy, UC Extension’s Central Valley dairy advisor, deals with completely different issues: “We’re not fighting moisture drift—we’re managing extreme heat impacts on fiber digestibility. Alfalfa that tests 42% NDF in June can reach 48% by September after heat stress.”

Dr. Jim Salfer from Minnesota Extension describes their unique situation: “Transition timing creates our challenge. Switching from old to new crop silage in December coincides with the onset of cold stress. Perfect storm for metabolic issues.”

Dr. Rick Norell at Idaho Extension makes an interesting observation: “Large dairies assume size provides protection, but when you’re feeding 5,000 cows, a 2% efficiency loss becomes massive. Precision becomes more critical as you grow, not less.”

And Dr. Ellen Jordan from Texas A&M AgriLife adds another dimension entirely: “Aflatoxin risk in drought-stressed corn can halt milk shipments immediately. That’s a whole different variability challenge.”

Your Action Plan—Starting This Week

Ready to tackle feed variability? Here’s your prioritized approach based on what’s actually working out there:

This Week

Calculate your actual IOFC using Penn State’s online tools or Wisconsin’s DairyComp app. Compare to regional benchmarks. Dr. Kevin Harvatine at Penn State tells me that simply understanding your position often catalyzes change all by itself.

Within Two Weeks

Invest in moisture testing. The AgraTronix MT-PRO costs approximately $340, the Delmhorst F-2000 is around $395, and the Koster units range from $280 to $ 320. They typically pay for themselves within weeks. Iowa State Extension research confirms weekly moisture testing prevents most variability losses before they compound.

Within 30 Days

Schedule a collaborative meeting with your veterinarian and nutritionist. Dr. Jessica McArt from Cornell’s veterinary college has documented that farms conducting even annual joint advisory meetings show significantly improved problem resolution.

Within 90 Days

Join a peer discussion group. Extension programs operate nationwide, including PRO-DAIRY in New York, UW Dairy Management in Wisconsin, and the Center for Dairy Excellence in Pennsylvania. Annual costs typically range from $200 to $ 600, with documented returns often exceeding 300%.

Quick Wins for Under $500

For immediate impact with minimal investment:

  • Moisture tester ($340): Weekly testing prevents thousands in losses
  • Fecal starch analysis ($15-20/sample): Monthly validation of ration effectiveness
  • Discussion group ($200-600): Immediate access to peer experience
  • Employee training: Teaching feeders to recognize changes costs nothing but prevents everything

The Clock’s Ticking

Dr. Normand St-Pierre, Professor Emeritus at Ohio State, shared something pretty sobering with me recently: “The window for addressing these challenges isn’t infinite. We’re looking at maybe 18 to 24 months before compounding losses create structural challenges.”

Think about it—delaying doesn’t defer costs. It compounds them. A 350-cow dairy losing $5,000 monthly faces more than $60,000 in annual losses. By year three? You’re looking at over $200,000 accumulated, plus deferred maintenance, reduced genetic progress, and good employees leaving for better-managed operations.

USDA Economic Research Service data from their 2024 farm financial report shows that most closures follow years of declining indicators. These operations attended conferences, understood best practices, yet never actually started implementing changes.

The 2025 growing season wasn’t an anomaly, you know. NOAA’s Climate Prediction Center October outlook shows this variability is becoming our new baseline. The question isn’t whether you’ll face feed variability—that’s certain. It’s whether you’ll manage it proactively or just react to it.

That Vermont producer I mentioned? He transformed bottom-third performance into nearly $90,000 in recovered profitability through about $1,100 in strategic investment. The Pennsylvania operation identified over $20,000 in losses during one collaborative meeting. Their success wasn’t extraordinary—they just took action.

The knowledge exists. Extension support operates nationwide. Research validates the economics. The only missing element? Implementation.

Twenty years ago, we could wait for normal to return. Five years from now, based on USDA National Agricultural Statistics Service consolidation trends, only adaptive operations will remain.

The industry isn’t failing—it’s evolving. The divide forms between operations that accept excellence and require different approaches in 2025 and those that are still resisting change.

Your corn silage keeps evolving. Costs keep accumulating. Competitors keep adapting.

So what’s your first step going to be?

KEY TAKEAWAYS:

  • Weekly moisture testing prevents 80% of feed losses: A $340 investment in an AgraTronix MT-PRO or similar tester pays for itself within 2-3 weeks by catching drift before it compounds into thousands in monthly overfeeding—Wisconsin’s feed lab data shows fecal starch above 5% means you’re literally watching profits walk out the back end
  • Discussion groups deliver 300%+ ROI for $200-600 annually: Cornell PRO-DAIRY’s Jason Karszes reports dozens of groups where farms like Jake’s recover $200,000+ in unrealized revenue simply by benchmarking with peers and sharing what’s actually working in their specific regions
  • The 18-24 month adaptation window is real: USDA Economic Research Service’s 2024 data shows farms that delay implementation face compounding losses exceeding $200,000 by year three, plus talent migration to better-managed operations—but those acting now are turning $1,100 investments into $90,000 annual gains
  • Regional challenges require regional solutions: From California’s heat-stressed alfalfa jumping from 42% to 48% NDF to Minnesota’s December silage transitions during cold stress, successful farms are adapting strategies to their specific climate realities rather than following one-size-fits-all approaches
  • Deliberate production moderation beats pushing for peaks: Dr. Mike Van Amburgh’s Cornell research proves farms targeting 85-88 pounds instead of 95 gain $1.50-2.00 better IOFC despite lower production—when forage quality varies 5%, these herds barely notice while high-pushers hemorrhage profits

Complete references and supporting documentation are available upon request by contacting the editorial team at editor@thebullvine.com.

Learn More

The Sunday Read Dairy Professionals Don’t Skip.

Every week, thousands of producers, breeders, and industry insiders open Bullvine Weekly for genetics insights, market shifts, and profit strategies they won’t find anywhere else. One email. Five minutes. Smarter decisions all week.
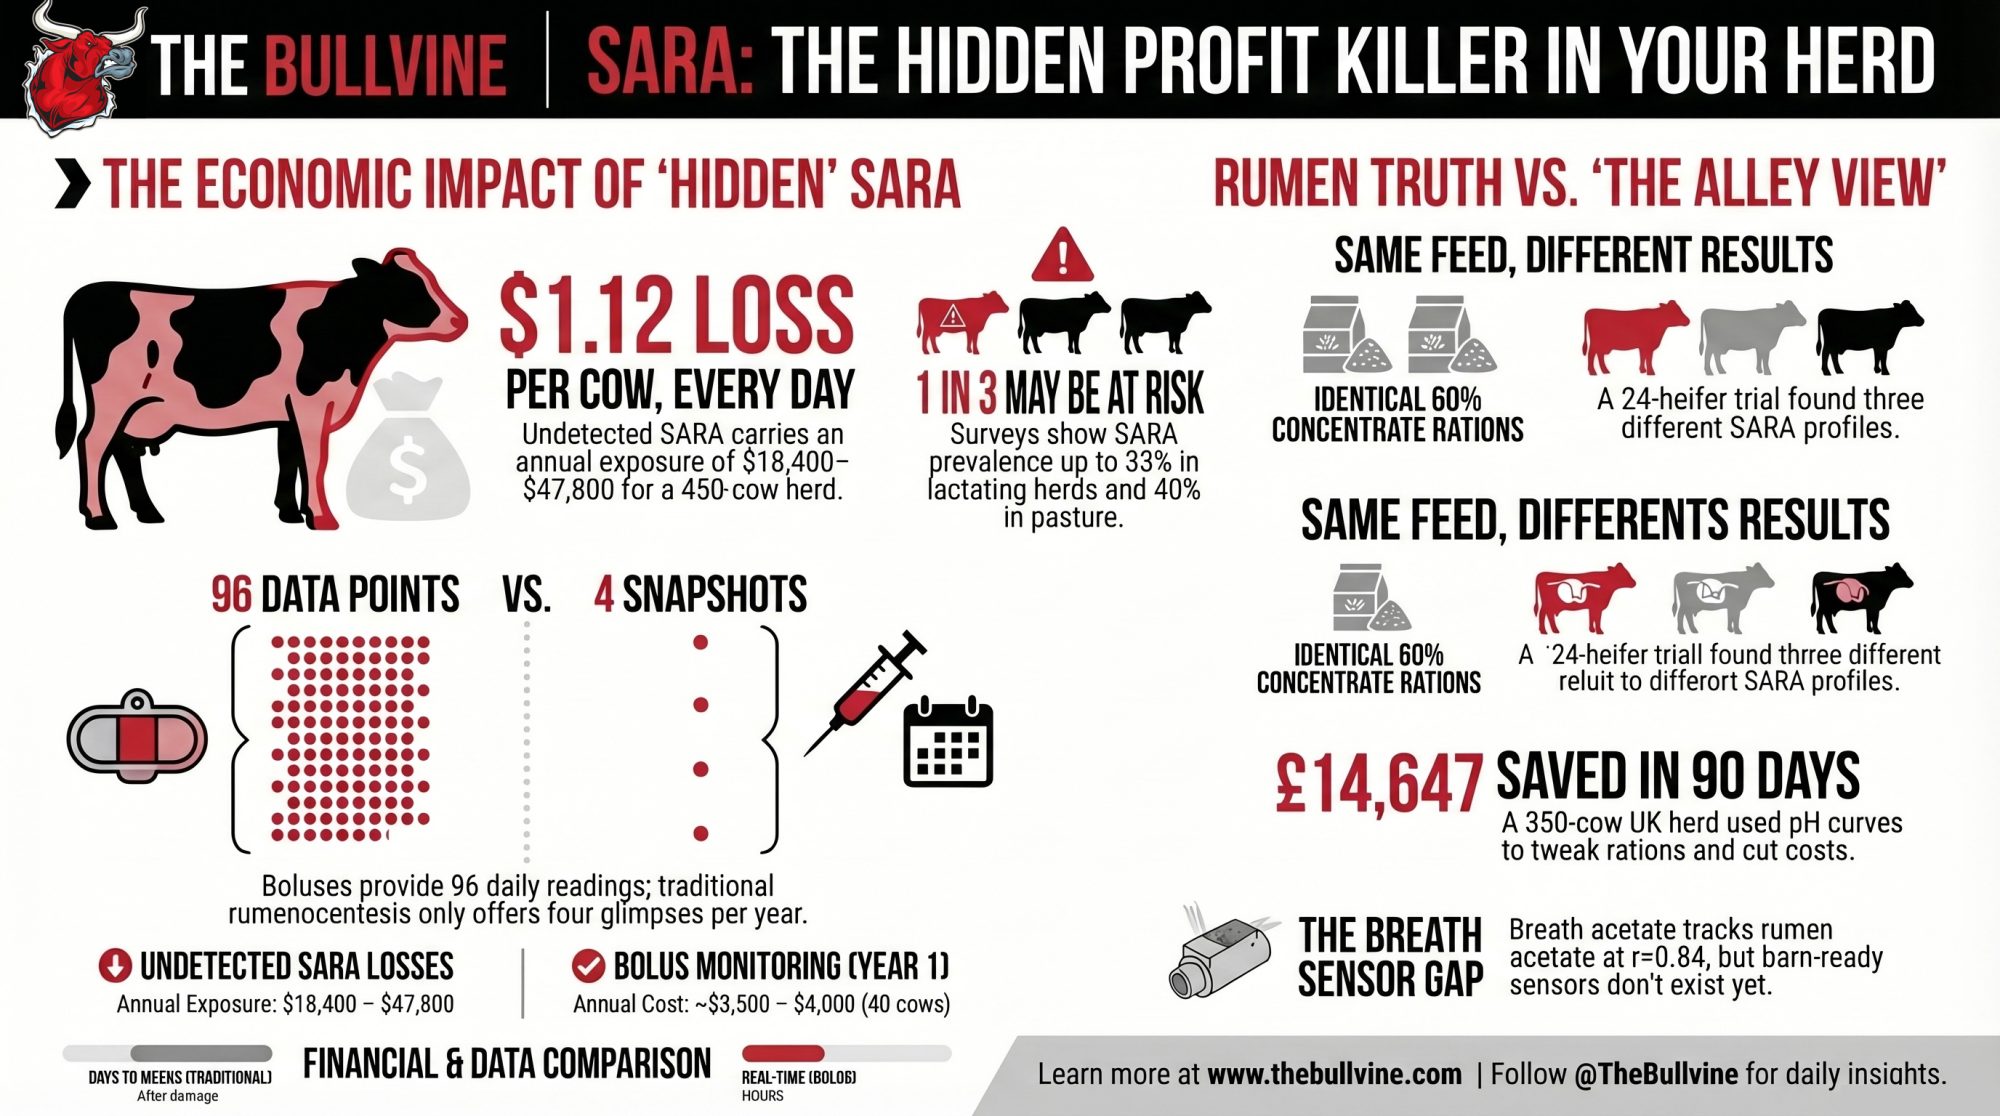
NewsSubscribe
First
Last
Consent

The $40 Weaning Question: Why Some Farms Skip Binders and Get Better Results

Is spending $10 on binders smarter than waiting 2 weeks to wean?

EXECUTIVE SUMMARY: What farmers are discovering about calf weaning might surprise you—the most successful operations aren’t necessarily the ones buying the most supplements. According to 2024 extension data, farms using gradual weaning protocols based on starter intake (2.75 pounds daily for three days) rather than calendar dates are seeing treatment costs drop by 20-30% while maintaining or improving growth rates. Dr. Michael Steele’s research at Guelph shows that managing ruminal pH during transition prevents the bacterial die-offs that release endotoxins in the first place, potentially eliminating the need for those $6-10 per calf binders many of us have accepted as necessary. Regional variations matter too—southern operations extending weaning during heat stress and northern farms using pair housing during winter are both finding better results by adapting to their specific conditions rather than following rigid protocols. Here’s what this means for your operation: whether you’re milking 50 cows or 5,000, the principle remains the same—healthy transitions based on biological readiness lead to healthier heifers and better lifetime production. The tools and knowledge are available through your extension service, and the potential returns make this worth examining carefully for any operation looking to improve both calf health and economics.

profitable calf weaning

You know how weaning season always gets us thinking about what we’re spending versus what we’re getting? I’ve been talking with producers across the dairy belt lately, and here’s what’s interesting—we’re all looking at those endotoxin binder bills (running $6 to $10 per calf annually according to 2024-25 feed supplier pricing) and wondering if there might be a smarter approach to this whole transition period.

What I’ve found digging through extension publications and chatting with nutritionists is that we might be looking at this from angles we haven’t fully considered. Not that supplements don’t have their place—sometimes they’re exactly what we need—but maybe there are management pieces that could make a real difference.

What’s Actually Happening During Weaning

When we transition calves from milk to starter, most operations do this around 6-8 weeks, according to the USDA’s National Animal Health Monitoring System data—their digestive system essentially has to reinvent itself. The rumen begins producing volatile fatty acids as fermentation commences, and that’s where things can become complicated.

Dr. Michael Steele, Professor of Ruminant Nutrition at the University of Guelph, and his team have been studying this for years, publishing their findings in the Journal of Dairy Science. Their research shows how these bacterial population changes during weaning can really affect gut function. What happens is that the ruminal pH can drop significantly during this transition—sometimes to a level that causes substantial bacterial die-off.

And when those gram-negative bacteria die? They release endotoxins—technically called lipopolysaccharides—that can trigger inflammatory responses. That’s why the feed industry developed these binders we’re all familiar with. According to 2024 feed industry surveys, lots of operations have found them helpful, especially during challenging periods.

However, it’s worth noting that extension services and university research programs are increasingly interested in whether we can prevent some of these issues through effective management before they even develop.

Learning from Different Approaches

What I find fascinating is how different operations handle weaning, and they’re all getting results worth considering. Some individuals are extending milk feeding to 10-12 weeks instead of the traditional 6-8 weeks. Others are focusing on really gradual transitions—taking two or three weeks to reduce milk rather than doing it quickly.

Research from land-grant universities supports this idea that gradual transitions might help keep the rumen more stable during weaning. Makes sense when you think about it…we already do this everywhere else in dairy management. When we change rations for the milking herd, we take our time. Dry cow transitions are carefully managed. So why rush weaning?

I was talking with a dairy nutritionist from Iowa last month who put it perfectly: “We spend all this time balancing transition cow rations to the gram, then we expect baby calves to handle abrupt diet changes like it’s nothing.”

What’s encouraging is that there’s no single “right” answer here. Different operations face different realities—labor constraints, facility limitations, disease pressures—and what works needs to fit those circumstances.

The Money Side of Things

Weaning Economics: Traditional vs. Extended Approaches

Traditional Protocol (6-8 weeks):

  • Milk/replacer costs: Baseline standard
  • Endotoxin binders: $6-10 per calf annually (2024-25 pricing)
  • Treatment costs: $15-30 per affected calf (regional averages)
  • Typical treatment rate: 20-30% of calves

Extended Protocol (10-12 weeks):

  • Additional milk costs: $25-40 per calf (varies by region)
  • Binder use: Often reduced or eliminated
  • Treatment costs: Lower incidence reported
  • Labor: May vary depending on the system

Penn State Extension has been consistent in its recommendations, which can be found in their calf management bulletins, updated in 2024. They suggest waiting until calves are eating approximately 2.75 pounds of textured starter daily for three consecutive days before starting to cut milk. It’s about biological readiness, not what the calendar says.

Now, if you’re running a larger operation—say, 200-plus calves—you might be looking at those automated monitoring systems. Based on 2024 manufacturer quotes, the cost ranges from $85,000 to $110,000 installed for systems handling 150 or more calves. Some operations report they help with labor and catching health issues earlier, though results vary by management. For smaller farms? Careful observation and basic intake monitoring often work just as well. There’s definitely no one-size-fits-all solution here.

How Location Changes Everything

Climate makes a huge difference in how we approach this. Southern producers dealing with heat stress face completely different challenges than what we see up north. Texas A&M Extension recommends extending weaning timelines during those brutal summer months (when the temperature-humidity index exceeds 72) because calves handle the transition better when they’re not fighting heat stress as well.

Meanwhile, in Wisconsin and Minnesota, winter housing creates its own set of challenges. University of Minnesota research, published in 2024, suggests that different housing strategies—such as pair housing during cold months—might help reduce weaning stress behaviors by providing social support during the transition.

Out in California’s Central Valley, I’ve heard from extension dairy advisors about operations experimenting with three-stage weaning programs. They’re gradually shifting calves through different housing and feeding setups. It takes some logistics to figure out, but according to the 2024 regional dairy reports, several farms have seen their post-weaning treatment costs drop after implementing these systems.

Making Changes That Actually Work

Practical Weaning Readiness Checklist

✓ Starter Intake: Consistently eating 2.75+ pounds daily
✓ Rumination: Active cud chewing (3-5 hours daily by 8 weeks)
✓ Body Condition: Maintaining or gaining during milk reduction
✓ Behavior: Normal activity, minimal vocalization
✓ Growth: Meeting breed-appropriate weight gains

Here’s what I find really practical—you don’t need to revolutionize everything overnight. Start with better starter intake monitoring. Weighing refusals daily and keeping track can tell you a lot about when calves are actually ready to be weaned.

One thing that research from Cornell Pro-Dairy suggests helps is spacing out stressful events. If you’re vaccinating, consider waiting until after weaning. Their 2024 calf health guidelines indicate that separating these events by 10-14 days can improve how calves respond to both the vaccine and the weaning transition.

And staff training…that’s crucial. When your calf feeders understand why they’re doing something—not just following a protocol but actually getting the biology behind it—everything works better. Wisconsin Extension’s 2024 dairy workforce development data show that operations spending even just four hours training their calf feeders results in measurable improvements in protocol compliance.

Finding What Works for Your Farm

Looking at the broader picture, endotoxin binders aren’t the enemy. They serve real purposes, especially if you’re dealing with unavoidable management constraints or specific disease challenges. The American Association of Bovine Practitioners’ position papers acknowledge that both management-focused and supplement-supported approaches have merit depending on your situation.

Some operations combine strategies really successfully. They use gradual weaning as their standard practice, but keep binders on hand for high-stress periods—like those brutal summer months or when they’re training new staff. They track everything to see what’s actually working.

According to economic analyses from Iowa State Extension (2024), it is essential to consider the entire picture over several months, rather than just weaning costs. Operations that track total cost per pound of gain through approximately four months of age often make different decisions than those that only consider weaning expenses.

Where Things Are Heading

Extension services continue to develop better resources to help us figure this out. Most land-grant universities have updated their cattle management guidelines in the past two years, and there are webinars and decision-support tools available to help. You can find many of these through your state’s extension dairy website.

What’s particularly interesting is how nutritionists, veterinarians, and producers are collaborating more closely to develop farm-specific protocols. Instead of generic recommendations, we’re seeing more customization tailored to what individual farms can actually achieve. According to 2024 field reports from extension dairy specialists across the Midwest, this approach appears to be working better across the board.

Your calves are constantly communicating with you through their behavior. A calf that’s eating well, spending hours chewing cud, maintaining body condition during transition—that’s telling you your management is on track. Sometimes we just need to pay better attention to those signals.

Making Smart Decisions for Your Operation

Whether it’s October or any other time of year, it’s worth taking a hard look at your weaning protocols. Track what’s actually happening, not what you think is happening. Monitor starter intakes. Document how long transitions really take. Keep track of health events, particularly during weaning.

Most of us already have a fairly good sense of when calves are ready to be weaned. They’re aggressive at the starter bunk, they’re ruminating well, and they look vigorous and healthy. Sometimes we just need to trust those observations more than the calendar.

Where to Find More Information:

  • Your state’s extension dairy programs (most updated 2024-25)
  • Penn State Extension’s calf management resources
  • Cornell Pro-Dairy calf health publications
  • University of Wisconsin’s Dairyland Initiative
  • Regional dairy conferences and workshops

The economics will vary by operation—your milk costs, labor situation, and facilities all factor in. But the principle stays consistent: healthy transitions lead to healthy heifers. And healthy heifers become profitable cows.

Every calf you wean has the potential to become a high producer in two years. Getting this transition right now—whether through traditional methods, alternative approaches, or a combination of both—that’s an investment that pays dividends down the road. The research is available, the tools are accessible through extension services, and the potential returns make it worthwhile to take a careful look at what might work better for your specific operation.

After all, in this business, we’re always looking for that edge—that one percent improvement here, two percent there. Sometimes it’s not about adding something new. Sometimes it’s about doing what we’re already doing just a little bit smarter.

KEY TAKEAWAYS:

  • Save $30-50 per calf by extending milk feeding 2-3 weeks while monitoring starter intake—the additional milk costs ($25-40) are offset by reduced treatment expenses and eliminated binder costs
  • Track biological readiness, not calendar dates: Wait for consistent 2.75-pound daily starter consumption, active rumination (3-5 hours daily), and maintained body condition before reducing milk
  • Adapt protocols to your region: Southern operations benefit from extending timelines during summer heat stress, while northern farms see improvements with pair housing during winter months
  • Space management stressors by 10-14 days: Separating vaccinations from weaning improves antibody response and reduces transition stress—a no-cost change that Cornell Pro-Dairy research shows makes a measurable difference
  • Both approaches have merit: Endotoxin binders serve valuable purposes during unavoidable management constraints—the smartest operations combine gradual weaning as standard practice with strategic supplement use during high-stress periods

Complete references and supporting documentation are available upon request by contacting the editorial team at editor@thebullvine.com.

Learn More:

The Sunday Read Dairy Professionals Don’t Skip.

Every week, thousands of producers, breeders, and industry insiders open Bullvine Weekly for genetics insights, market shifts, and profit strategies they won’t find anywhere else. One email. Five minutes. Smarter decisions all week.

NewsSubscribe
First
Last
Consent

155 Pounds More Milk Per Heifer: The Calf Feeding Discovery That’s Changing Everything

Your calves are hungry for a reason—nature designed them to eat 8-12 times daily, not twice.

EXECUTIVE SUMMARY: Cornell’s groundbreaking research reveals that for every tenth of a pound increase in preweaning daily gain, heifers produce 155 pounds more milk in their first lactation—a discovery that’s prompting dairy farmers to reconsider fundamental calf-feeding practices. Wisconsin studies now show that calves fed three times daily gain 10.4 pounds more by 42 days and achieve a feed efficiency of 0.61, compared to 0.52 for twice-daily feeding. According to Trouw Nutrition’s 2024 analysis, automated systems are reducing labor by 90%. With 36.5% of British Columbia dairy farms already implementing social housing ahead of Canada’s 2031 requirements, and the Smart Calf Rearing Conference coming to Madison this September for the first time, the industry is witnessing a shift toward biology-based management that respects both traditional wisdom and emerging science. The economics are becoming clearer too: Wisconsin Extension data show that autofeeder systems cost $6.35 per calf daily, versus $5.84 for individual housing. Although the extra milk investment ($140.50 vs. $111.95) often pays back through lifetime production gains. Whether you’re managing 50 cows or 5,000, understanding these biological principles—while acknowledging that excellent producers succeed with various approaches—can help you evaluate which changes, if any, make sense for your operation and market conditions.

I was standing in a calf barn last week, watching a Holstein heifer drain her bottle in about 60 seconds flat. An hour later, she was bawling again. The producer next to me shook his head and said, “They’re always hungry at this age.” But you know what? I’m starting to wonder if that hunger is actually biology trying to tell us something important about how these animals are meant to develop.

Like many of you, I grew up washing bottles twice a day, trudging through snow to check hutches before school. It’s what we did. What our parents did. However, the research emerging lately—and especially what’s being discussed ahead of the Smart Calf Rearing Conference, which is coming to Madison this September—is prompting many of us to reconsider some fundamental assumptions about raising calves.

The 155-Pound Discovery That’s Making Us All Think Twice

Here’s what really got my attention at the last extension meeting. In 2013, Soberon and Van Amburgh at Cornell published a meta-analysis in the Journal of Animal Science, which compiled data from studies spanning several years. What they found has stuck with me: for every kilogram of preweaning average daily gain, heifers produced about 1,550 kilograms more milk in their first lactation.

Let me put that in terms we think about at 5 a.m. during milking—a tenth of a pound increase in daily gain before weaning translates to roughly 155 pounds more milk when that heifer freshens. That’s actual milk in the bulk tank, based on thousands of real calves across multiple studies.

Every tenth of a pound matters: Cornell’s meta-analysis proves what progressive producers suspected—we’ve been leaving thousands of pounds of milk on the table by underfeeding calves. The red zone shows where ROI peaks before diminishing returns kick in.

What Van Amburgh’s team has been piecing together is the why behind these numbers. During those first 60 days of life, the mammary gland grows much faster than the rest of the body. That parenchymal tissue, the actual milk-producing machinery, expands rapidly when nutrition supports it properly.

Now, I’ve been hearing from producers across the Midwest who’ve improved their calf programs. Some are seeing these effects as those animals come into the milking string. Although, to be honest, not everyone sees dramatic changes—management matters tremendously.

While you’re washing bottles, these calves are building their milk-making machinery at 3.5x the rate of their body growth. Miss this window, and no amount of later feeding recovers that lost potential.

Why Our Twice-Daily Routine Might Be Working Against Us

This is where things get uncomfortable. When a calf guzzles down those 2-3 quarts in 90 seconds, we’re creating two connected problems that research is helping us understand better.

First, there’s the physical issue. Research from the University of Guelph suggests that rapid milk consumption can lead to esophageal groove dysfunction, causing milk to be directed to the rumen instead of the abomasum, where it is intended to be. Now you’ve got milk fermenting in the wrong stomach compartment.

Wisconsin data doesn’t lie: that extra trip to the calf barn pays for itself in weeks, not years. Yet 73% of farms still stick with twice-daily feeding. Are you leaving money in the hutch?

This directly contributes to the stress problem. Those digestive issues, combined with genuine hunger between feedings, create elevated stress indicators. Here in Wisconsin, where we’re already managing January cold stress, we’re layering nutritional stress on top. The combination impacts immune function, growth rates, and ultimately, lifetime productivity.

But—and this is really important—I know plenty of excellent producers who raise healthy calves on twice-daily feeding. If that’s you, you’ve obviously figured out the management details that work for you.

“I’ve seen more farms fail from poor management of fancy systems than from sticking with simple twice-daily feeding done right.” – Wisconsin dairy nutritionist

That’s worth considering, too.

Learning from Nature (and Recent Research)

MetricNatural Nursing (Beef Calves)Traditional 2x Daily3x Daily (Wisconsin Study)Automated/Ad Lib
Feeding Frequency (times/day)8-12236-10
Meal Size (quarts)0.5-1.02-32-2.50.8-1.5
Total Daily Intake (quarts)8-104-66-7.58-12
Stress Hormone LevelsBaseline+45-60%+20-30%+5-10%
Immune Response Score95-10070-7580-8590-95
Average Daily Gain (lbs)2.2-2.61.2-1.51.6-1.92.0-2.4
Feed Efficiency (gain/DMI)0.68-0.720.50-0.540.59-0.630.64-0.68
Esophageal Groove FunctionOptimalCompromised 25-30%Improved 10-15%Near Optimal
Disease Incidence (%)3-5%15-20%10-12%5-8%
First Lactation Milk (lbs)N/ABaseline+18.7%+25-30%
Labor Hours/Calf/Day00.5-0.750.75-1.00.08-0.15
Feed Cost/DayN/A$5.84$6.10$6.35

Research confirms that beef calves nurse 4-9 times in the first few days, often 8-12 times daily in the first week. Small meals, frequent intake, no stress peaks.

A recent University of Wisconsin study, presented by Donald Sockett, suggests that three-times-daily feeding could become the standard. Calves fed three times gained 65.7 pounds from birth to 42 days, compared to 55.34 pounds for twice-fed calves. Feed efficiency improved too—0.61 gain per dry matter intake versus 0.52.

Wisconsin research proves what progressive farmers suspected: three-times-daily feeding delivers 18% better weight gain and 17% improved feed efficiency. That third feeding might be the easiest money you’ll make this year – if you can manage the extra labor.

I’m hearing from more producers experimenting. Some add that noon feeding is allowed when labor permits. Others try acidified milk systems. Förster-Technik and Urban Calf Tech systems typically cost $2,000-$ 4,000 for basic setups, although results vary by operation.

Nature designed calves to eat 8-12 times daily, but we feed them twice – this biological mismatch creates stress peaks that impact immune function, growth, and lifetime productivity. The red zones show when your calves are genuinely hungry, not just ‘being calves.

When Technology Actually Makes Biological Sense

Automated calf feeders enable calves to eat multiple times daily, providing valuable management data. Jorgensen and colleagues at the University of Minnesota tracked management on 26 farms using these systems, publishing their findings in the 2017 Journal of Dairy Science.

What’s particularly interesting from the 2024 research is that Trouw Nutrition found that automated systems can reduce labor by approximately 90% compared to manual feeding. Many producers tell me they’re catching pneumonia or scours 2-3 days earlier.

The investment? A 2018 Wisconsin Extension study found that autofeeder systems cost about $6.35 per calf per day, compared to $5.84 for individual housing—but that included $140.50 in liquid feed costs for autofeeder calves, compared to $111.95 for individually housed calves. The extra milk has driven up costs, but many view it as an investment in the future.

The Social Housing Debate Gets Real Data

Research from Emily Miller-Cushon at Florida shows social housing affects learning and stress response in ways that persist. The Canadian industry now requires pair or group housing by 2031.

What’s interesting is new data from British Columbia. A 2025 survey by Elizabeth Russell at UBC found 36.5% of farms already using social housing, with another 11.1% combining approaches. These are regular commercial operations, figuring it out.

I’m still hearing mixed reports. One producer who tried group housing told me, “The disease pressure in our area made it unworkable. Maybe with different facilities, but not for us now.”

Making Economic Sense When Numbers Keep Changing

Let’s be real about costs. The British Columbia survey found 52.4% of farms monitor calf growth, but only 31.7% have target growth rates. We’re measuring more, but not always sure what to do with it.

Questions to Consider:

  • What’s your current mortality rate and treatment cost?
  • How many hours daily on calf care?
  • Can small changes be made before major investments?
  • What disease pressures are specific to your region?
  • Are you tracking growth against targets?

Where This Leaves You

I don’t have all the answers. Nobody does, really. But our understanding of calf biology is evolving faster than it has in decades.

If you’re successfully raising healthy calves with traditional methods, you’re not doing anything wrong. Your experience matters more than any research paper. However, if you’re experiencing issues—such as high mortality, poor growth, or rough weaning transitions—these insights may point toward potential solutions.

The calves are telling us what they need. Our job is figuring out how to listen while keeping the lights on.

What’s one small change you’ve made to your calf program that’s had a big impact? Maybe it was adding a third feeding, switching to teat feeders, or simply increasing milk allowance. Share what worked (or didn’t) at The Bullvine—your experience could be exactly what another producer needs to hear.

KEY TAKEAWAYS:

  • 155-pound milk increase per lactation for every 0.1 lb improvement in preweaning daily gain (Cornell meta-analysis, 2013)—that’s roughly $31 extra revenue per heifer at current milk prices, achieved through better early nutrition management tailored to your system
  • Three-times-daily feeding shows measurable benefits: 65.7 lbs weight at 42 days versus 55.3 lbs for twice-daily (Wisconsin research), with 17% better feed efficiency—consider adding that noon feeding if labor allows, or explore acidified milk systems ($2,000-4,000 investment) that let calves self-feed
  • Automated feeders reduce labor by 90% while catching illness 2-3 days earlier through intake monitoring (Trouw Nutrition, 2024), though investment ranges from $15,000-30,000—evaluate whether labor savings and health benefits justify costs for your herd size
  • Social housing becoming industry standard: Canadian requirement by 2031, with 36.5% of BC farms already implementing—start small with pair housing in existing hutches to test disease management before major facility changes
  • Biology-based weaning using BHB testing (95% accuracy per Guelph research) identifies individual readiness from 7-10 weeks versus calendar weaning—particularly valuable for high-genetic-merit heifers where maximizing lifetime production justifies extra management attention

Complete references and supporting documentation are available upon request by contacting the editorial team at editor@thebullvine.com.

Learn More:

The Sunday Read Dairy Professionals Don’t Skip.

Every week, thousands of producers, breeders, and industry insiders open Bullvine Weekly for genetics insights, market shifts, and profit strategies they won’t find anywhere else. One email. Five minutes. Smarter decisions all week.
NewsSubscribe
First
Last
Consent

The Feed Tag Fine Print: 7 Nutrients That Actually Drive Calf Health

Research shows 7 nutrients can cut calf treatment costs up to 20% when fed in bioavailable forms versus cheap alternatives

Hey folks! Ever stood in the feed store staring at two calf starters with identical 18% protein on the bag, wondering why one keeps your calves thriving while the other has you calling the vet? I’ve been there, scratching my head over why some calves just don’t take off right. Here’s what I’ve learned: the real story’s hiding in the fine print.

Red Flags That Cost Real Money

Weeks 2-4 are when $400 in vet bills get made or saved. This immunity gap is why timing your nutrition strategy matters more than your neighbors realize—and why smart producers are investing in targeted supplementation during this critical window.

Before we dive into solutions, let’s talk about what you might already be seeing in your own herd. Watch your records for these warning signs:

  • More than 15% of calves are getting scours treatments (according to USDA NAHMS data)
  • Pneumonia clusters, especially in vaccinated groups
  • Post-weaning growth drops right after transition.
  • Dull, rough-coated calves that look “off” without obvious illness.
  • Slow recovery from illness, even with proper treatment

If any of these sound familiar, you could be facing hidden nutritional gaps that are draining your time and profits. A sick calf costs real money—not just vet bills but lost growth potential that never comes back.

Every Region Has Its Mineral Curveballs

Here’s the thing—soil and water conditions vary drastically from region to region, and these differences can make or break your calf nutrition program. Some areas battle selenium-poor soils, others deal with iron-rich dirt that contaminates silage during harvest. Then you’ve got sulfur showing up in well water, or molybdenum in forages that ties up the copper your calves desperately need.

One producer I know put it perfectly: “I used to wonder why my neighbor’s calves always looked healthier. Turns out it wasn’t about protein—it was about getting minerals that could actually work with our local soil and water conditions.”

Those pale rings around a calf’s eyes that make them look like they’re wearing glasses? This can be related to a copper deficiency, which is far more common than most of us realize, as copper deficiency is a widespread problem in many areas of the United States and Canada (NASEM, 2016).

The Seven Game-Changers That Actually Matter

The absorption gap is staggering—organic selenium delivers 3x better uptake than cheap alternatives. When treatment costs average $85 per sick calf, spending an extra $30 on bioavailable minerals becomes the smartest investment you’ll make this year.

Forget chasing protein numbers alone. Research from Penn State, the University of Wisconsin, and extension services nationwide shows these seven nutrients make the real difference between calves that thrive and those that just survive:

Vitamin E: Your Antioxidant Shield

This is your calf’s protection against oxidative stress, especially during periods of stress, such as cold weather or transport. Research shows calves need 220-440 IU per kg of starter feed for real immune benefits—way above basic requirements.

Here’s the catch: Look for natural vitamin E (d-alpha-tocopherol), not the synthetic, cheaper version. Your calf’s body literally can’t use most of the synthetic forms.

Selenium: The Missing Piece

Many regions have selenium-poor soils, so you want feeds hitting the legal 0.3 ppm limit using a reliable source of selenium. Beware the cheap alternative: Inorganic selenium, such as sodium selenite, doesn’t build tissue stores and is instead flushed out. Organic selenium builds reserves that get mobilized during stress—that’s the difference between calves that crash and those that power through challenges.

Zinc: Your Gut Guardian

Strong gut integrity means fewer pathogens getting through. The new NASEM suggests using 75-100 ppm of zinc for stressed calves. Prefer to use more available sources, such as chelated or hydroxy minerals. Red flag alert: Avoid feeds listing zinc oxide—it’s cheap and poorly absorbed. Producers who switch to more bioavailable zinc sources often report improvement on animal performance.

Copper: Easy to Lose, Expensive to Replace

If your water runs high in sulfur or your forages contain high levels of molybdenum, you’re fighting an uphill battle. You need 10-15 ppm copper from chelated or hydroxy copper to overcome the antagonistic effects of these high sulfur/molybdenum minerals. Major warning: Copper oxide is essentially biologically unavailable and worthless—its presence on a feed tag is a major red flag.

Manganese: The Quiet Builder

Critical for bone development in growing heifers. Target 40 ppm from organic or hydroxy sources, especially since iron contamination in feeds can block uptake. High iron levels compete directly with manganese for absorption sites, so bioavailable organic/hydroxy forms help overcome this interference.

Glutamine: The Stress-Buster

This amino acid fuels gut lining cells during transport or weaning stress. Around 1-2% of dry matter intake as rumen-protected glutamine helps calves cope. Form matters: Free glutamine gets degraded in the rumen, so it must be rumen-protected to reach the small intestine where it’s needed.

Arginine: The Circulation Enhancer

Helps immune cells reach infection sites through better blood flow. Supplement at 0.25-0.5% dry matter with rumen-protected forms. Like glutamine, it needs protection from rumen microbes to be effective.

Sponsored Post

Your Feed Tag Cheat Sheet

What to Look For:

  • Protein: 18-22% is fine, but don’t obsess
  • Vitamin E: 220+ IU/kg from natural sources
  • Trace Minerals: Hydroxy or chelated minerals —avoid “oxide”
  • Gut Health Boosters: Probiotics, yeast culture, prebiotics.

Questions That Matter:

  • “Which specific forms of trace minerals do you use?”
  • “How do you account for regional mineral antagonists?”
  • “What’s your pellet durability score?”
  • “Got any performance data from farms in my area?”
Premium minerals cost $30 more per calf but save $140 in total expenses—that’s a 467% ROI that compounds across your entire calf crop. The math isn’t even close when you factor in treatment costs and lost growth potential.

The Bottom Line: Your Wallet Will Thank You

University extension analyses suggest significant returns from proper mineral supplementation, with benefits varying by operation and local conditions14.

Real example: One producer switched to a starter with organic minerals and higher vitamin E. Two years later, he reported his healthiest heifer crop yet—fewer vet calls and better weaning weights.

Impact AreaImprovement with Organic MineralsEconomic Value (per calf)Research Source
Treatment Cost Reduction20% reduction in scours treatments$25-40 savedMultiple university studies
Improved Pregnancy Rates3-5% increase in conception rates$150-250 valueCargill, NAHMS data
Weaning Weight Gains15-25 lbs additional weaning weight$30-50 additional revenueMultiple feeding trials
Reduced Mortality2-3% reduction in calf mortality$400-600 loss preventionUSDA mortality statistics
Feed Efficiency5-8% improvement in FCR$20-35 feed savingsFeed conversion studies
Mineral Supplement Cost$0.15/day per calf additional cost$11 annual cost increaseCommercial pricing
Net Economic Benefit$75-150 per calf net return$75-150 net profitCombined analysis

Your Action Plan

This Week:

  1. Pull your treatment records and look for patterns.
  2. Check your current feed tags for mineral sources.
  3. Call your nutritionist with the questions above.

This Month:

4. Test your water and soil for problematic minerals

5. Track starter intake and growth rates closely

6. Consider upgrading to feeds with proven hydroxy or chelated mineral packages

7. Track Results: Monitor intake, average daily gain, treatment rates, and weaning transitions. The numbers will tell the story.

The Hard Truth

No matter where you farm, calves face stress from weaning, weather changes, and the challenges of modern dairy production. Give them the nutritional tools they need—in forms they can actually use—and your bottom line will show the difference.

Don’t let hidden deficiencies steal your profits. Those seven nutrients, properly sourced and formulated for your local conditions, aren’t just nice-to-haves—they’re your competitive edge.

KEY TAKEAWAYS:

  • Bioavailability beats quantity: Organic forms of zinc (proteinate), selenium (yeast), and copper (amino acid complex) deliver 15-30% better absorption than cheaper sulfate or oxide forms, especially when antagonists like iron or sulfur are present in local water or forages.
  • Regional customization pays: Producers in high-sulfur water areas or iron-rich soil regions who switch to organic copper sources often see 20% reductions in scours treatments, as organic minerals bypass common antagonistic interactions that block absorption.
  • Target the immunity gap strategically: Calves face peak vulnerability between 2-3 weeks of age when maternal antibodies decline, but active immunity isn’t fully developed—optimal levels of vitamin E (220-440 IU/kg) and selenium (0.3 ppm from yeast) during this period strengthen immune response and vaccination effectiveness.
  • Form matters more than inclusion rates: Natural vitamin E shows 2-3x greater bioactivity than synthetic forms due to the body’s preferential transport proteins, making it worth the premium cost for operations focused on reducing treatment costs and improving weaning success rates.

EXECUTIVE SUMMARY:

What farmers are discovering is that traditional calf nutrition strategies, which focus on meeting minimum requirements, are leaving money on the table during the most critical growth period. Recent research from leading agricultural universities identifies seven nutrients—vitamin E, selenium, zinc, organic copper, manganese, glutamine, and arginine—that, when delivered in bioavailable forms, can significantly reduce treatment costs and improve weaning performance. The key finding revolves around bioavailability: organic, chelated forms of these nutrients consistently outperform cheaper inorganic alternatives by 15-30% in absorption rates, particularly when dietary antagonists like iron, sulfur, or molybdenum are present. Studies demonstrate that calves receiving optimal levels of these nutrients in bioavailable forms show 20% fewer scours treatments and smoother weaning transitions with less post-weaning growth slumps. Here’s what this means for your operation: by investing in scientifically formulated starters that prioritize nutrient form over just inclusion rates, producers can bridge the critical “immunity gap” between maternal protection and active immunity development. The future of calf nutrition lies in understanding the complex nutrient interactions and antagonisms that vary by region, creating opportunities for producers to tailor their approach to local soil and water conditions.

Complete references and supporting documentation are available upon request by contacting the editorial team at editor@thebullvine.com.

Sponsored Post

Learn More:

The Sunday Read Dairy Professionals Don’t Skip.

Every week, thousands of producers, breeders, and industry insiders open Bullvine Weekly for genetics insights, market shifts, and profit strategies they won’t find anywhere else. One email. Five minutes. Smarter decisions all week.
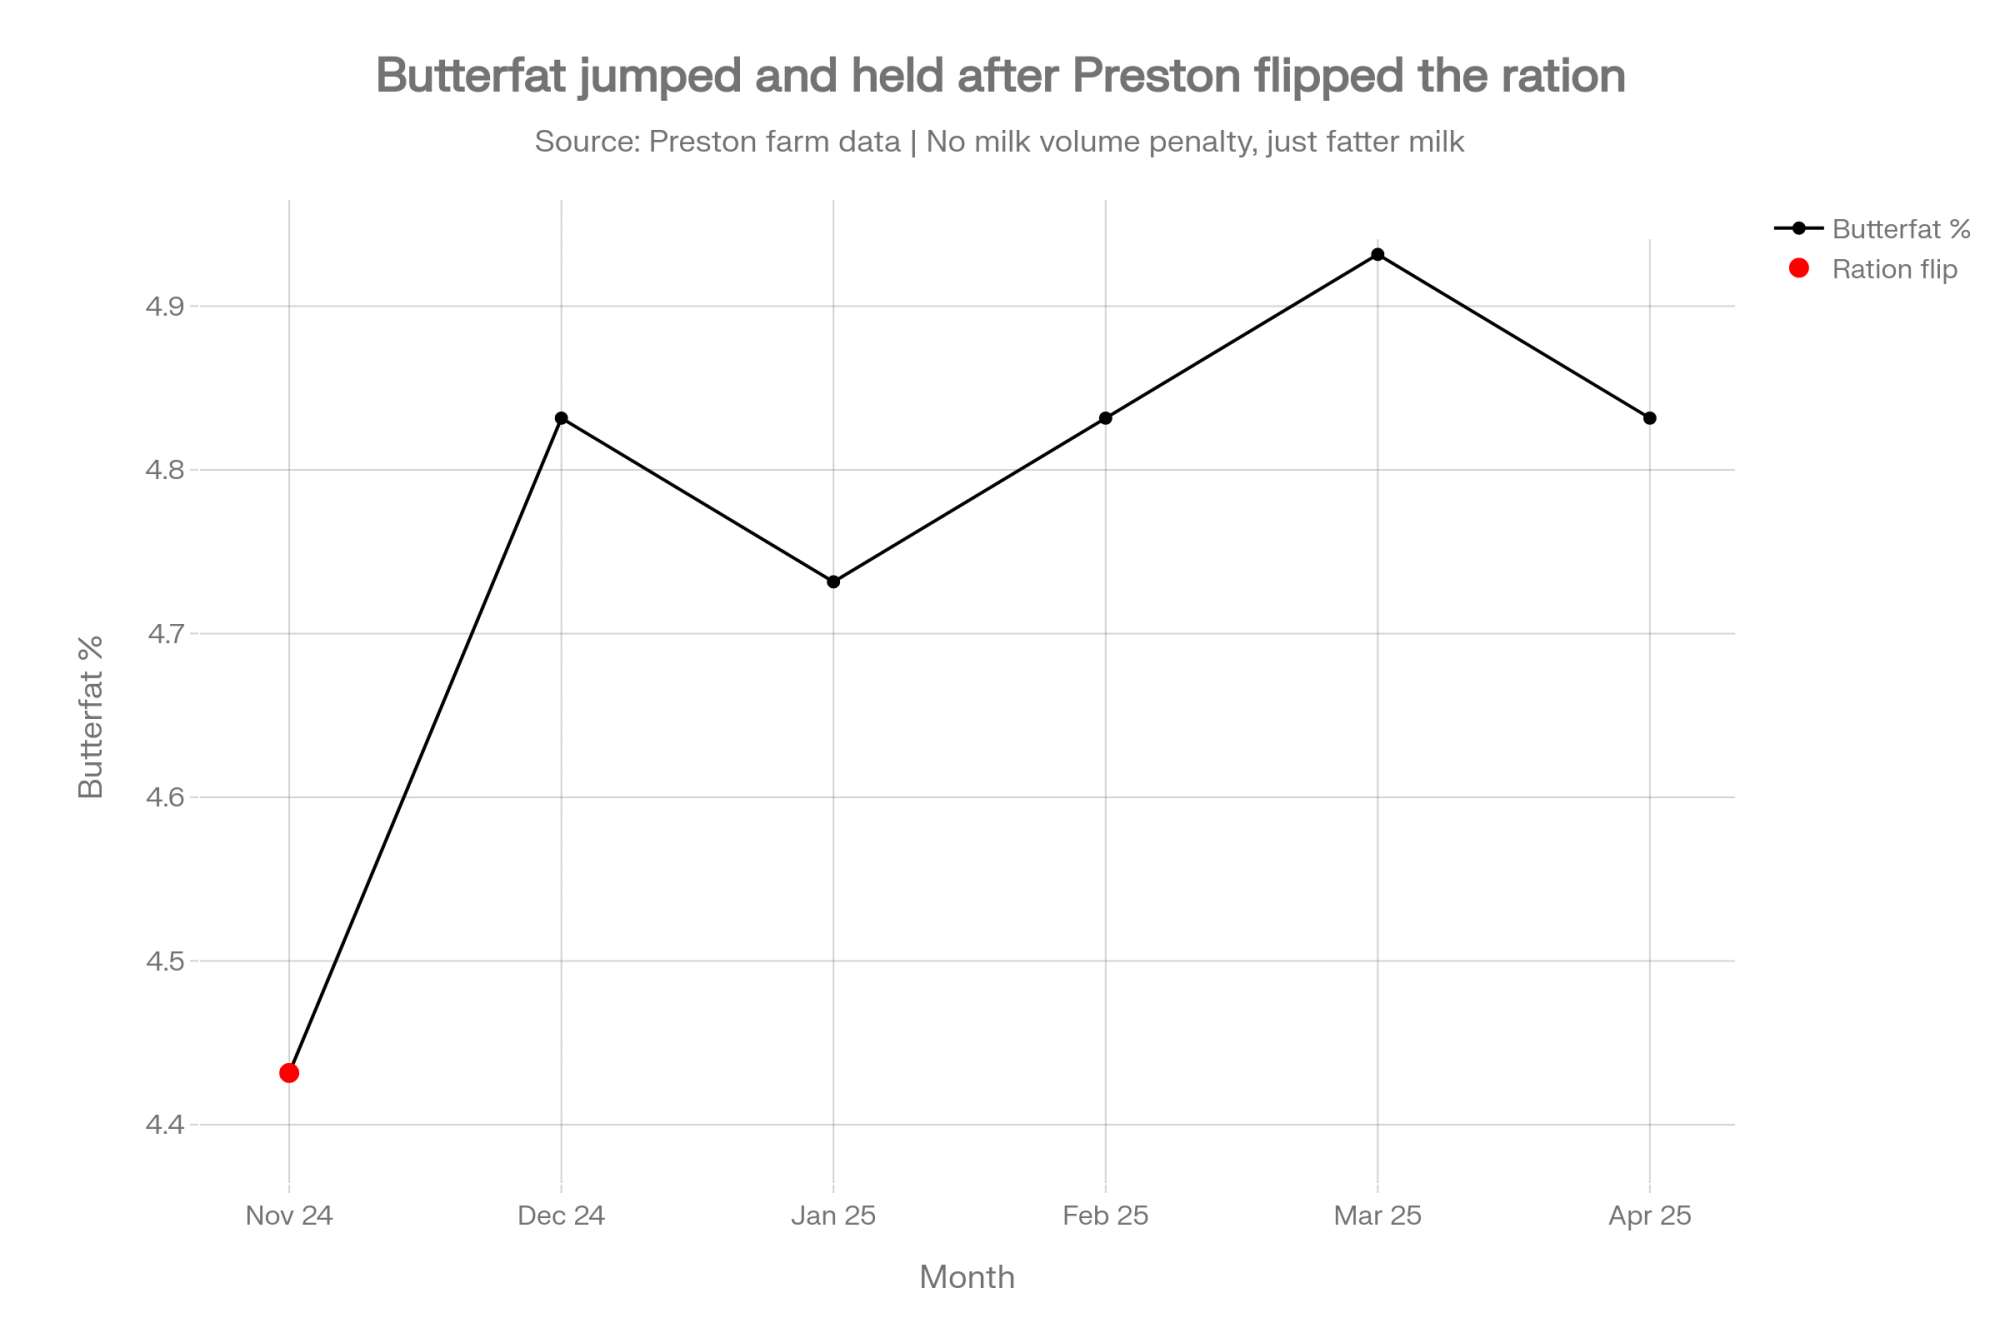
NewsSubscribe
First
Last
Consent

Your Feed Room’s Hidden $58,400 Leak – And How Smart Dairy Farms Are Plugging It

Smart farms aren’t just switching to digital feed management—they’re discovering money they never knew they were losing.

EXECUTIVE SUMMARY: Recent University of Minnesota research reveals that 100-cow dairies can save $58,400 annually by reducing feed shrink through precision tracking—losses that traditional paper logs simply can’t detect. What’s particularly noteworthy is how mobile feed management systems aren’t just improving efficiency; they’re uncovering waste patterns that experienced operators never saw coming, with some operations discovering 3-8% shrinkage they’d been accepting as normal. With feed costs representing 20-45% of gross income according to agricultural financial consultants, even modest improvements in accuracy can determine yearly profitability. The precision dairy technology market is expanding 9-15% annually as mid-size operations realize they can’t afford to operate blind on their largest expense. Beyond immediate cost savings, these systems are reshaping the relationships between nutritionists and farms, enabling real-time adjustments instead of reactive monthly reviews, and positioning farms for environmental compliance programs that increasingly require detailed documentation. Current feed price volatility makes this visibility particularly valuable—when corn and soy swing dramatically, knowing exactly where every ingredient goes becomes a competitive advantage rather than a luxury.

dairy farm management, dairy profitability, feed efficiency, farm operational optimization, mobile feed management, precision agriculture, dairy technology

You know, I’ve been following the shift toward mobile feed management for a few years now, and what strikes me is how many farms are discovering money they never knew they were losing.

Here’s what’s interesting—Dr. Jim Salfer from the University of Minnesota Extension puts a number on it that really gets your attention: a 100-cow dairy can save $58,400 in one year just by reducing feed shrink from high to low levels. That’s real money walking out the barn door every day… and most operations using paper logs simply can’t see where that shrink is happening.

Hidden Feed Waste: The Money You Never See – Feed waste costs scale dramatically with operation size, but the proportional impact on smaller farms can be devastating. Most operations using paper logs can’t track these losses, making every cow count when margins are tight.

What I’ve found is that this technology isn’t just improving efficiency—it’s revealing losses that were always there but impossible to track. Gary Sipiorski, who does agricultural financial consulting, points out that feed costs range from 20% to 45% of gross income, and if you’re purchasing all your feed, it pushes toward 50% of your milk check. With numbers like that, even small improvements in accuracy can determine whether you’re profitable this year.

This development suggests something important about where our industry is heading. The precision dairy technology market is projected to reach $5.59 billion by 2025, expanding at 9-15% annually, but what’s driving that growth isn’t just bigger farms going high-tech. Mid-sized operations are realizing they can’t afford not to know where their feed dollars are going.

When the Old System Finally Shows Its Cracks

Now, I should mention that I’ve seen some excellent operations that stick with paper and clipboards and do just fine. Usually, these are smaller farms with one consistent mixer operator who’s been doing it for years—someone who knows every ingredient by feel and rarely makes mistakes. There’s something to be said for that kind of experience and consistency.

But there’s usually a specific moment when traditional systems fail spectacularly… and that’s what forces change. As many of us have seen, busy weeks when communication breaks down between shifts can create expensive problems. Ingredients get mixed into the wrong pens, quantities get miscalculated during hectic mornings, and suddenly you’re looking at thousands in losses trying to figure out what went wrong through handwritten notes.

Dr. Mike Hutjens from the University of Illinois—who’s probably forgotten more about dairy nutrition than most of us will ever know—puts it this way: “The problem with paper is you don’t know you have a problem until it’s too late.” And here’s the thing—with feed representing half of total farm expenses according to recent industry data, these mistakes add up fast.

What’s encouraging is that farms making the switch to real-time tracking often discover patterns of inefficiency they’d been accepting as “normal” for years. I’ve noticed that the operations pushing toward digital aren’t necessarily the most tech-savvy farms. They’re often the ones that got tired of losing money on preventable mistakes and decided the investment was worth trying.

What Digital Systems Actually Reveal

Management AspectPaper-Based SystemsDigital Systems
Waste TrackingLimited visibilityReal-time alerts
Cost per Cow/Year$0$15-40
ROI TimelineN/A6-12 months
Labor EfficiencyHigh manual effortAutomated reporting
Data AccuracyHuman error pronePrecise measurements
Integration CapabilityNoneFull herd management
Environmental ComplianceManual documentationAutomated records

Modern mobile feed management captures information that paper logs simply can’t match. When your mixer operator scans a barcode, the system pulls up target ingredients and pen assignments instantly. As each component hits the scale, you’re seeing actual versus target weights with tolerance indicators, live deviation tracking, and alerts if someone’s about to feed the wrong group.

But here’s where it gets really valuable—those post-mix report cards that generate automatically after each batch. They show exact weights, deviations, and final nutrient profiles, then get stored digitally with timestamps. No more hunting through clipboards trying to reconstruct what happened three days ago when butterfat performance started dropping.

Why is this significant? The economics tell the story. Recent work published in Hoard’s Dairyman showed that farms using precision feeding see feed efficiency improvements from 1.55 to 1.75. On a 2,500-cow operation, that translates to $470 per cow annually—roughly $1.2 million to the bottom line. For smaller operations, the proportional impact is often even greater.

Looking at this trend across different regions, I’m seeing some interesting patterns. Up in Wisconsin and Minnesota, where you’re dealing with corn silage that changes dramatically from October through March, that real-time adjustment capability becomes crucial for maintaining consistent milk components. However, I’ve also spoken with California producers who claim that their consistent TMR quality yields different benefits—mainly increased labor efficiency and improved documentation for their sustainability programs.

And if you’re running robotic milking systems—which seems to be happening in a lot of new barns these days—this precision becomes even more critical. Work from the University of Saskatchewan shows that individually targeted diets can boost milk yield by 3.3 kg per cow while maintaining the same dry matter intake. That’s improved efficiency without higher feed costs, which is exactly what we need with current market conditions.

Getting Your Team on Board

You probably know this already, but transitioning experienced operators from intuitive mixing to screen-guided precision takes some finesse. The key is positioning technology as backup support rather than skill replacement—because good feed operators have pride in their accuracy, and rightfully so.

What I’ve found works best is hands-on training where operators mix real rations alongside tech support. When veteran mixers discover their “feel” weights are actually off by pounds of grain, skepticism usually turns to curiosity pretty quickly. Dr. Marcia Endres at the University of Minnesota has studied this transition across 52 farms in Minnesota and Wisconsin, noting that successful adoption almost always involves a gradual process of trust building.

This builds on what we’ve seen with other farm technologies… you can’t just flip the switch overnight. Many operations run mobile apps alongside paper logs for a couple of weeks, letting operators maintain familiar routines while building confidence. Generally, by week three or so, paper becomes obsolete—not because management mandated it, but because operators prefer the precision and immediate feedback.

What’s worth noting is that resistance often comes from operators who’ve built their reputation on mixing accuracy. They see screens as questioning their skills rather than validating them—so you’ve got to frame it right from the start. Make it about helping them be even better at what they’re already good at.

How This Changes Your Nutritionist Relationship

Here’s something that’s caught my attention… real-time feed data is fundamentally changing how nutritionists work with farms. Monthly reviews are evolving from historical post-mortems to continuous collaborative management.

What’s particularly noteworthy is how this is reshaping the role of a nutritionist entirely. Instead of spending half their time driving farm to farm, many consultants are analyzing data patterns across multiple operations. Rather than waiting for lab results to tell them what happened last week, they can access live dashboards showing daily nutrient drift, automated alerts for unusual events, and historical overlays connecting mix deviations to milk components 24 hours later.

This shift requires some service agreements to be restructured. Rather than flat monthly fees, some nutritionists are moving toward more flexible arrangements—base dashboard access for ongoing monitoring, performance incentives tied to income over feed cost improvements, and consultation blocks for real-time scenario testing.

Based on producer discussions and industry reports, nutritionist costs might tick up slightly with these new arrangements—maybe 10-15% in many cases—but the precision enables more profitable recommendations that typically pay for the additional investment several times over. It’s one of those situations where spending a bit more actually saves you money, assuming you’re working with the right consultant.

What’s interesting here is how this technology is creating opportunities for smaller operations to access higher-level nutrition expertise. A consultant can monitor multiple farms remotely and provide more frequent guidance than the old once-a-month visit model allowed.

The Technical Side That Nobody Talks About

And here’s something that often catches many operations off guard: connecting feed management systems with herd management systems can create unexpected challenges. The issue isn’t data compatibility but timing mismatches.

Herd systems typically update pen movements on their own schedule while feed apps track in real time, which can create situations where you’re trying to mix rations for pens that have changed composition since morning. It’s like trying to hit a moving target—particularly during busy periods with lots of fresh cow management or pen moves.

From what I understand, the better systems have found ways to smooth this out—they’ll coordinate data updates and make sure both systems agree before any mix starts. But it’s worth knowing going in that you’ll probably need some patience while everything learns to talk to each other.

Multiple producers report that integration typically takes longer than vendors initially estimate—sometimes several weeks longer than promised—but once it’s working properly, it eliminates a significant amount of the manual pen count adjustments that used to consume time every morning. The key is having realistic expectations and good vendor support during the setup process.

When you’re evaluating systems, ask specifically about:

  • How they handle real-time data synchronization with your existing herd management software
  • What happens when systems go offline or lose connectivity (because it will happen)
  • How long does integration typically take for operations similar to yours
  • What level of ongoing tech support is included versus additional cost
  • Whether you can export your data if you decide to switch systems later
  • How they handle system updates and whether those might disrupt daily operations

I’ve noticed that the farms with the smoothest rollouts are usually the ones that budget extra time for integration and have clear backup plans for when technology hiccups occur.

What the Numbers Really Show

Research on feed efficiency continues to become more compelling. Recent studies show that highly efficient cows produce less methane than low-efficiency cows, even at the same milk yield. A 20-point gain in feed efficiency can reduce methane emissions by approximately 22 tons per year on a 2,500-cow dairy—which matters as environmental programs become more common across different regions.

This aligns with work from Viking Genetics showing that breeding for better feed efficiency can save up to 200kg of dry matter per lactation without compromising production, health, or reproduction. But technology provides immediate improvements while genetic gains accumulate over generations—which is why smart producers are pursuing both strategies.

The environmental piece is becoming more important, too, especially for operations in areas with stricter regulations or those participating in carbon credit programs. Better feed efficiency directly impacts sustainability metrics, and it’s nice when doing the right thing for your bottom line also helps with regulatory compliance and potentially generates additional revenue.

Looking at this from a broader perspective, feed efficiency improvements of just 0.1 units—say from 1.5 to 1.6—typically translate to $60-80 per cow annually in reduced feed costs, depending on your local feed prices and ration complexity. That might not sound like much, but on a 500-cow operation, that’s $30,000-40,000 annually. Real money.

Regional Differences Worth Considering

What I’ve noticed is that results vary quite a bit by region and operation size. In the upper Midwest, where seasonal forage quality changes can be dramatic, the real-time adjustment capability becomes particularly valuable for maintaining consistent butterfat performance through challenging periods.

During Vermont’s recent drought, several farms reported that mobile feed management systems helped them track forage inventory more accurately and adjust rations quickly as feed quality deteriorated. That kind of agility can mean the difference between maintaining production and facing a costly feed crisis.

But operations with more consistent feed ingredients—like some California dairies with year-round access to similar quality forages, or operations in the Southeast with more stable growing conditions—may see different benefits. For them, it’s mainly labor efficiency, better documentation for sustainability programs, and tighter cost control during volatile feed markets.

For extensive grazing operations—and I’m thinking of some of the farms I’ve visited in Missouri, Kentucky, and other regions with significant pasture-based systems—the core benefits remain, but they may find basic tracking sufficient rather than full integration platforms. The late Dr. Robert James from Virginia Tech, who passed away this past August after decades of studying automated feeding systems across multiple production systems, always emphasized that successful implementation depends more on management protocols than technology sophistication.

Current feed price volatility seems to be accelerating adoption in many areas. With corn, soybean meal, and other inputs swinging like they have been this year, several vendors report that real-time ingredient cost tracking alone is justifying investments for many producers who want better visibility into their largest expense category.

Making Sense of the Investment

So what’s this actually going to cost you? Based on vendor discussions and industry reports, basic mobile feed management systems typically run somewhere in the range of $3,000 to $8,000 annually for a mid-size operation, though this varies considerably depending on features, herd size, and integration complexity.

To put that in perspective, let’s do some quick math. If you’re running 200 cows and spending $250,000 annually on purchased feed (which isn’t unusual these days), and the system helps you reduce waste by even 2%, you’re looking at $5,000 in annual savings. That more than pays for most basic systems.

Most farms report seeing payback relatively quickly—often within six to twelve months—though this varies significantly based on current feed waste levels, number of operators, and existing management practices. The operations with the fastest payback are usually those dealing with multiple operators or frequent mixing errors.

Here’s a simple calculation you can do to estimate your potential return: Track your current feed waste percentage (if you don’t know it, industry estimates suggest 3-8% is typical). Multiply your annual feed cost by your estimated waste percentage. If that number is larger than the system cost, you’ve probably got a business case.

The key seems to be matching technology sophistication to your specific operational needs. Basic systems that track batching accuracy and delivery times can provide immediate value for smaller operations or those just getting started. Larger farms or those with complex ration management often benefit from full integration with herd management systems and advanced analytics.

But look, I’m not saying every operation needs to rush into this tomorrow. The question becomes whether the investment makes sense for your specific situation, current pain points, and long-term goals.

Decision Framework for Your Operation

When does mobile feed management make sense? Generally, when specific pain points create measurable losses or inefficiencies. These typically include frequent mixing errors, inventory surprises, communication gaps between shifts, difficulty tracking the source of nutritional problems, or simply wanting better visibility into your largest cost center.

If you’re evaluating this technology, here’s what I’d consider:

  • Operations with documented feed waste above 3%, frequent butterfat or protein swings, or multiple mixer operators usually see the biggest immediate benefits and fastest payback
  • Farms with stable performance seeking efficiency gains or environmental compliance improvements might find it worthwhile for the long-term advantages, even if payback takes longer
  • Very small operations (under 100 cows) with single operators and stable performance metrics might want to wait and see how costs develop, unless they’re planning expansion or facing specific challenges

What’s your current feed waste level? Do you have consistent mixing between different operators? How often do you deal with ingredient shortages or quality issues that require ration adjustments? Are you participating in any environmental programs that require detailed documentation? These questions can help determine whether you’re likely to see quick returns on investment.

When you’re talking to vendors, don’t just focus on features—ask about their track record with farms similar to yours, what ongoing support looks like, and whether you can talk to other producers who’ve been using their system for at least a year. Get references from operations in your region if possible, because local conditions matter.

Implementation Reality Check

Let me be honest with you… I’ve talked to some operations that struggled with these systems initially. Usually, it comes down to not having realistic expectations about the learning curve, trying to implement too much too fast, or not getting adequate vendor support during rollout.

One producer in Pennsylvania told me they had to dial back their expectations during the first few months. “We thought it would solve all our feed management problems immediately,” he said. “What we found is that it gave us better information to make decisions, but we still had to make the decisions and adjust our management.”

Common first-year challenges include adapting to new workflows, occasional connectivity issues, learning to interpret data effectively, and coordinating system updates with daily operations. Most of these are temporary, but knowing they’re coming helps set realistic expectations.

The successful implementations I’ve seen typically involve starting with basic features and gradually adding complexity as the team gets comfortable. Don’t try to revolutionize your entire feed management system in the first month.

The Bottom Line

What’s happening in feed management really reflects a fundamental shift from reactive to proactive farm management. The farms making this transition first—and doing it well—are positioning themselves not just for today’s challenges, but for whatever comes next in terms of market conditions, environmental regulations, and labor availability.

And based on what I’m seeing across different regions and operation sizes, that practical advantage is becoming harder to ignore. As input costs stay volatile and margins remain tight, farms embracing data-driven precision are gaining advantages that build on themselves over time.

The question isn’t really whether digital feed management will become standard—it’s whether individual operations can afford to wait while others capture these efficiency gains. Because when you’re looking at potential savings of tens of thousands of dollars annually, plus better positioning for future challenges… well, that math becomes pretty hard to ignore.

But remember, technology is just a tool. It won’t address poor management practices or resolve fundamental nutritional issues. What it will do is help good managers be even better at what they’re already doing—and in today’s competitive environment, that edge might be exactly what you need.

KEY TAKEAWAYS

  • Quantified waste reduction: Operations typically discover 3-8% feed shrink they weren’t tracking, translating to $30,000-80,000 annual savings for mid-size dairies when systems cost $3,000-8,000 annually
  • Integration advantages: Farms connecting feed and herd management systems eliminate manual pen count adjustments while enabling nutritionists to provide remote monitoring and real-time ration adjustments during volatile markets
  • Regional adaptation strategies: Wisconsin and Minnesota operations find real-time adjustments crucial for seasonal forage quality changes, while California dairies focus on labor efficiency and sustainability documentation requirements
  • Implementation realities: Most successful rollouts involve 2-3 week parallel operation periods, gradual feature adoption, and realistic expectations about 6-12 month learning curves with vendor support
  • Decision framework: Operations with multiple operators, documented feed waste above 3%, or frequent component swings see the fastest payback, while smaller farms with consistent single operators may benefit from waiting as technology costs decline

Complete references and supporting documentation are available upon request by contacting the editorial team at editor@thebullvine.com.

Learn More:

  • The Numbers That Actually Tell the Story – This article moves beyond feed management to show how data-driven decisions in genetics and nutrition can boost butterfat and protein. It provides a strategic view on how component premiums and risk management are becoming more valuable than volume, offering a holistic approach to profitability.
  • June Milk Numbers Tell a Story Markets Don’t Want to Hear – This piece provides a critical economic perspective on market shifts. It analyzes how factors like regional production growth and feed costs are influencing milk prices, revealing why locking in feed prices and focusing on agility are essential strategies for navigating volatility and protecting your bottom line.
  • Danone vs. Lifeway: How a $307M Standoff Proves Grit is the New Milk Check – While not about feed, this article provides a powerful lesson in innovation and speed. It demonstrates how nimble companies are outperforming corporate giants, inspiring producers to rethink their own operations and embrace rapid decision-making to survive and thrive in a fast-changing industry.

The Sunday Read Dairy Professionals Don’t Skip.

Every week, thousands of producers, breeders, and industry insiders open Bullvine Weekly for genetics insights, market shifts, and profit strategies they won’t find anywhere else. One email. Five minutes. Smarter decisions all week.
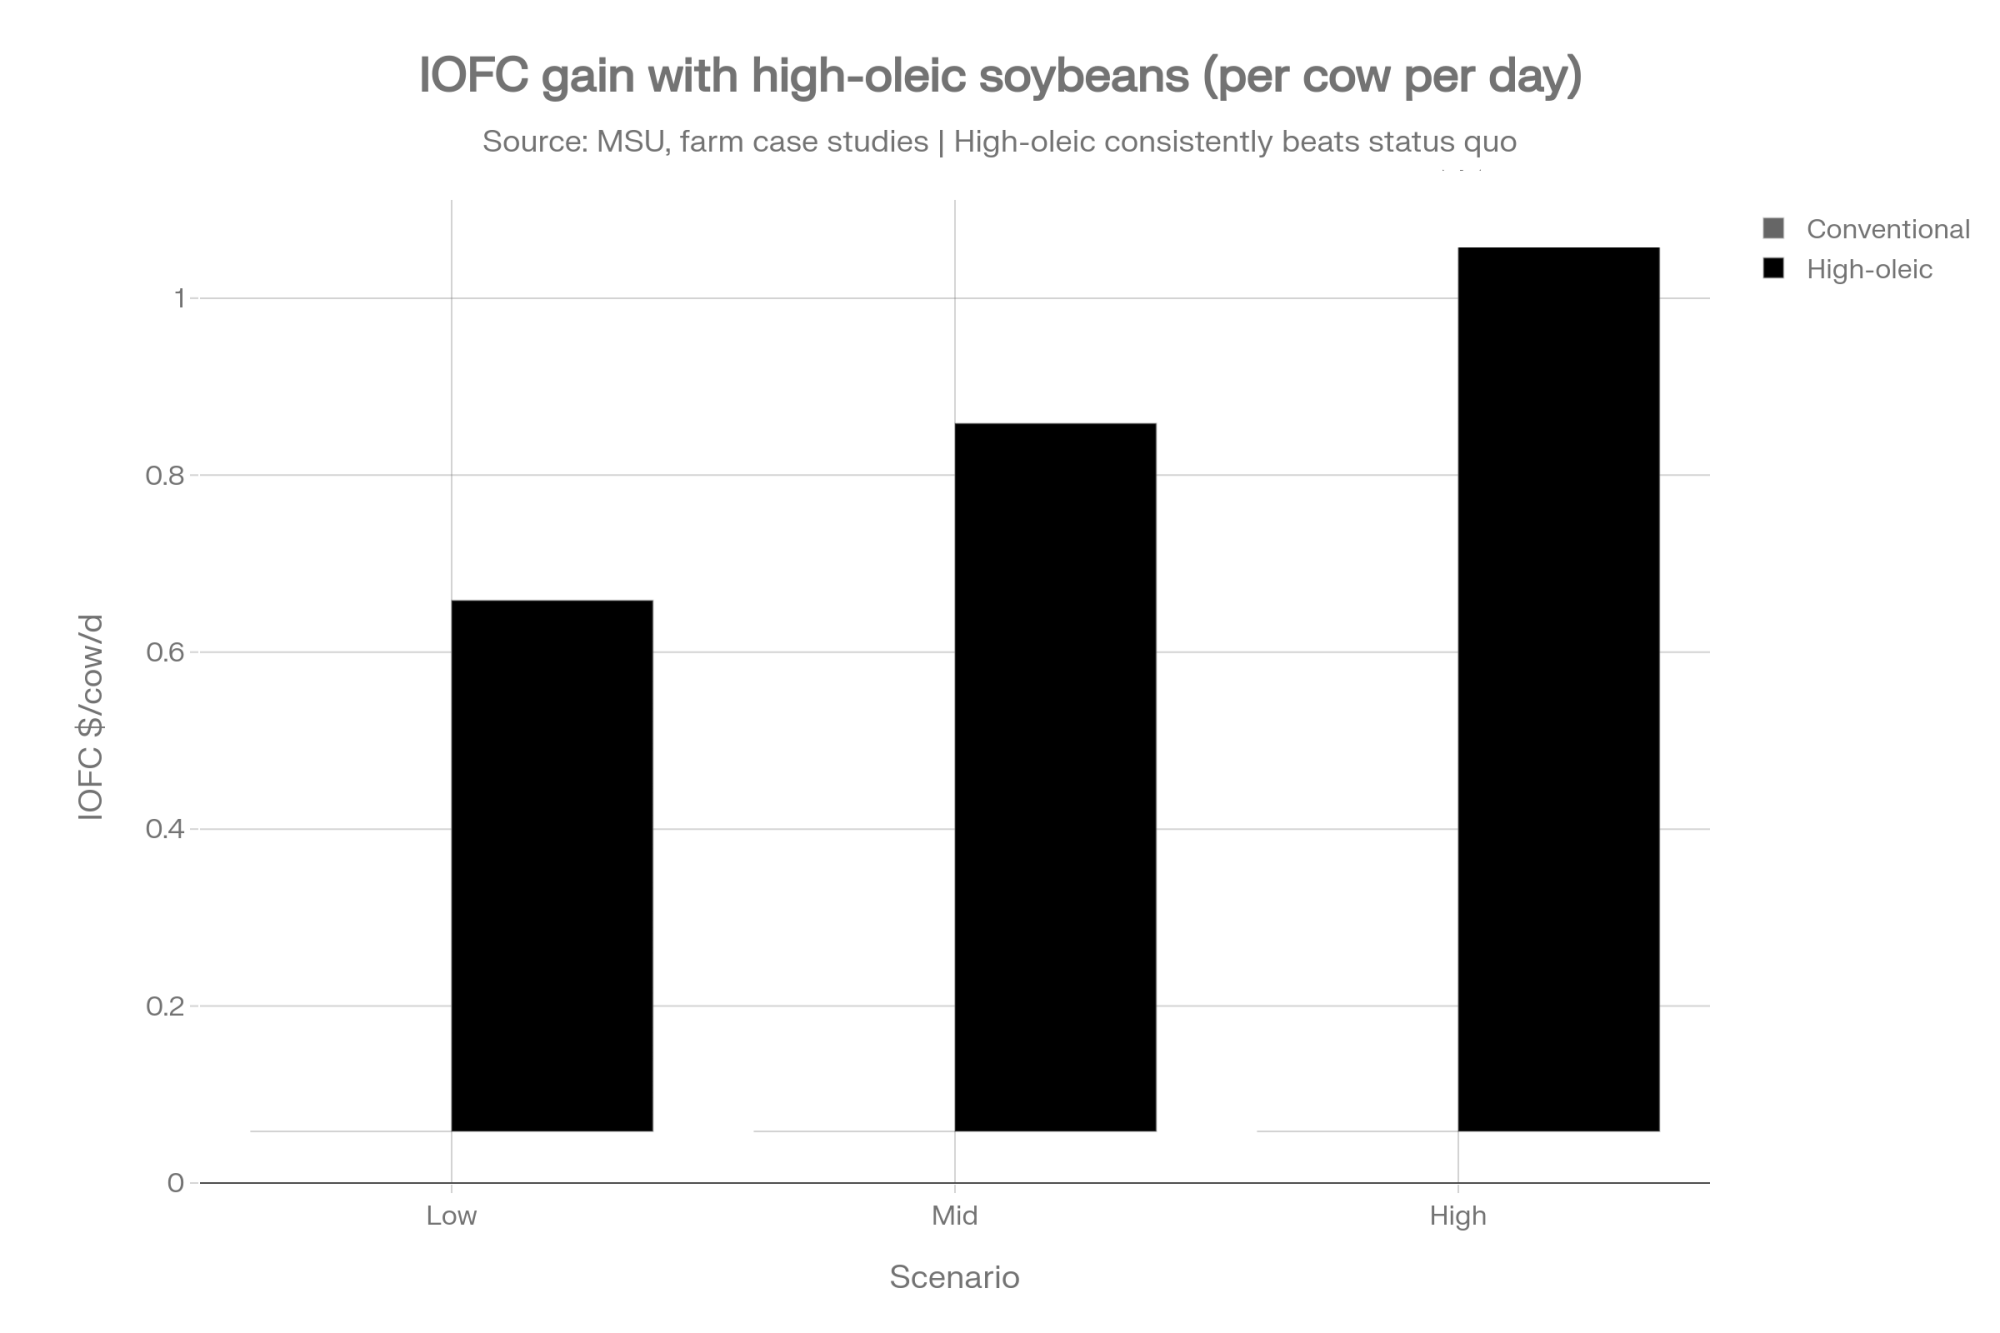
NewsSubscribe
First
Last
Consent

The $342K Feed Cost Blind Spot Corporate Ag Doesn’t Want You Tracking

Shocking: 40% of dairy feed costs hide beyond commodities—time to uncover where your money’s really going

EXECUTIVE SUMMARY: Big dairies know what most don’t: 40% of feed costs slip right under the radar—beyond the commodities you watch. USDA reports reveal trucking costs jumped 28% last year, while many farms still buy spot. University research says precision feeding can save up to $300 per cow—but tech gaps leave many hanging. Regionally, Vermont producers pay 40¢ more per bushel than Wisconsin, while California’s drought pushes alfalfa above $300 per ton. The hidden cost bleed threatens family dairies; act before the feed price locking policy expires September 30. This investigation arms farmers with real talk—how to fight back, thrive, and outsmart the system.

KEY TAKEAWAYS:

  • Save up to 40% by tracking hidden feed costs beyond commodity prices, like freight and losses.
  • Lock in 60–70% of feed needs before Sept 30 to manage volatility with USDA’s program.
  • Adopt precision feeding tech carefully, considering connectivity and support requirements.
  • Understand regional cost differences to optimize sourcing and control margins.
  • Build buying groups and assign tech-focused staff to protect profit margins.
feed cost reduction, dairy farm profitability, herd management, farm efficiency, precision feeding

So here’s the deal… and I’m gonna be straight with you because somebody needs to be. You know how everyone’s got their eyes glued to corn futures like those ticker numbers tell the whole story about feed costs? Well, honestly? That’s maybe 60% of what’s actually hitting your books. The rest just sneaks right out the back door while you’re checking butterfat numbers and worrying about your fresh cow protocols.

This infographic illustrates the critical insight that 40% of feed costs remain hidden beyond commodity tracking, highlights the September 30th USDA deadline, and shows regional cost disparities affecting dairy profitability.

Last spring, I was chatting with multiple producers across Iowa and Wisconsin—good operators running 1,000 to 1,500 head—and when they finally cracked open their detailed feed expenses beyond just corn and soy prices… well, let’s just say what they found was eye-opening. We’re talking freight bills, storage losses, mixing inefficiencies, and feed waste at the bunk. One guy told me it was like finding a black hole in his operation.

And look, this isn’t just some anecdotal stuff. The USDA’s Agricultural Marketing Service has been documenting this in their grain transportation reports—trucking costs jumped 28% year-over-year according to their 2024-2025 data. You talk to any producer from Michigan down to Ohio, they’ll tell you the same thing. Trucks getting delayed, rail lines backing up, ports all snarled… it’s feeding chaos right down the supply chain.

Trucking costs have accelerated dramatically from 12% in 2023 to 28% in 2025, representing a major hidden cost driver that most dairy operations don’t adequately track or budget for.

But here’s what really gets me fired up: most dairy operations are still buying feed week by week on the spot market, rolling the dice every time, while the big corporate dairies? They’re locking in substantial portions of their feed supply months ahead of time using forward contracting strategies.

The USDA’s Dairy Forward Pricing program expires September 30th—that’s next week, folks—and it’s wild how many family farms either don’t know this program exists or their cash flow won’t let them use it effectively.

The Tech Promise That’s… Well, It’s Complicated

Everyone’s buzzing about precision feeding these days. Save $200, maybe $300 per cow annually—Cornell University research backs those numbers when everything works right, and Wisconsin studies show similar results under optimal conditions. But here’s what they don’t mention at those slick equipment demos…

The FCC’s own broadband accessibility data from 2024 indicates that roughly 40% of rural dairy operations still lack reliable high-speed internet. Try running precision algorithms over satellite internet during a thunderstorm and see how that works for you.

I was talking with a Holstein producer from Wisconsin recently—I can’t use his name, but he’s representative of what I’m hearing—who dropped about $180K on robotic feeding equipment. Worked beautifully for eight months. Then sensors started glitching during morning feed, and tech support? Kids reading manuals from corporate headquarters who’d never been within 50 miles of a transition cow.

But that’s the reality on family farms versus what gets promised in the sales brochures.

Geography’s Your Silent Profit Killer

What really strikes me is how much location’s becoming a wealth tax on dairy operations. At the dairy conference last month, producers from Vermont were talking about paying premiums of 30-40 cents per bushel over Wisconsin operations just because of transportation costs—and over a year, that’s serious money.

California’s drought has pushed alfalfa costs above $320 per ton, according to UC Davis Cooperative Extension reports, while Canadian operations deal with border delays and rail strikes that can double transportation costs overnight.

Meanwhile, Midwest farms sit in what I call the “feed fortress”—cheap ingredients, solid infrastructure, multiple delivery options.

What Industry Consolidation Data Won’t Tell You

Here’s my take on where this is heading, and I don’t think I’m being alarmist…

Small operations with fewer than 300 cows are facing systematic elimination due to cost disadvantages they can’t control. Industry data shows increasing consolidation pressure on smaller farms who can’t absorb these hidden cost multipliers.

Mid-sized farms are at this crossroads where they either get smart about strategic procurement and selective technology adoption, or they become acquisition targets for operations that understand the cost game better.

The biggest players? They’re already three moves ahead—using scale advantages, bulk purchasing power, and forward contracting to build competitive moats that independent farms struggle to replicate.

What You Need to Do Before October 15th

Look, when we’re standing around after evening milking, talking about this stuff, here’s what actually matters right now:

Track every penny flowing into feed—and I mean everything. Freight charges, storage fees, waste at the bunk, mixing labor, and shrink losses. Most of us are only measuring commodity costs while the real wealth extraction happens in categories we don’t even monitor.

Lock in 60-70% of your major feed ingredients before September 30th—that USDA program deadline isn’t a suggestion. The big dairies already have their 2026 feed secured at today’s prices, while independent farmers stay exposed to market volatility.

Start small with technology adoption—maybe feed intake monitoring on your highest-producing groups before going full robotic. Learn what works in your barn with your internet, your labor situation, and your operational reality.

Form regional purchasing alliances—five farms buying together negotiate better terms than any individual operation. It’s basic math, but most of us haven’t organized to use it.

Get someone on your crew who can champion the procurement side—train them, and bonus them based on feed efficiency improvements. That person’s worth every dollar you invest in their development.

Watch weather patterns and market volatility daily—this year’s been anything but normal, and volatility’s probably here to stay.

The Intelligence Corporate Agricultural Media Won’t Share

Here’s what really fires me up about all this: while corporate ag publications keep you focused on commodity price movements, the real wealth extraction happens in costs they’ve trained us to accept as “operational necessities.”

Transportation companies extracting surge pricing during tight capacity. Storage facilities are adding handling fees that didn’t exist when our dads were farming. Technology vendors are selling systems designed for corporate operations, while family farms become beta testers for equipment that fails under real-world conditions.

It’s systematic, it’s accelerating, and most of the industry press won’t call it what it is because they’re funded by the same companies profiting from this extraction.

So yeah, I’m not here to scare you—just sharing what I’m seeing from Wisconsin truckers to Iowa feed dealers, from USDA transportation analysts to university extension specialists who understand what’s really driving feed cost inflation beyond just commodity prices.

Because if you’re not moving strategically on this stuff, you’re gonna find yourself on the wrong side of an industry realignment that’s happening whether we acknowledge it or not.

And when butterfat’s tanking and fresh cow problems crop up—which they will—you sure don’t want hidden feed cost bleeding, making everything worse.

Complete references and supporting documentation are available upon request by contacting the editorial team at editor@thebullvine.com.

Learn More:

  • Everything Dairy Farmers Need to Know About Residual Feed Intake – This article provides practical, actionable strategies to improve feed efficiency by focusing on factors you can control right now, like optimizing your feed mix, managing feeding times, and ensuring cow comfort. It reveals how simple operational changes can lead to significant cost savings.
  • The Dairy Industry’s Big Problem with Productivity and How to Fix It – Go beyond the daily grind and learn about the structural economic shifts impacting dairy. This piece analyzes key market trends, from per-cow productivity gains to shifts in global demand, and outlines long-term strategic actions to future-proof your operation against market volatility.
  • Cracking the Code: Behavioral Traits and Feed Efficiency – Discover how cutting-edge technology can uncover hidden efficiencies. This article demonstrates how using wearable sensors to monitor cow behavior, like rumination and lying time, can provide a low-cost, innovative way to identify your most efficient animals and improve herd genetics.

The Sunday Read Dairy Professionals Don’t Skip.

Every week, thousands of producers, breeders, and industry insiders open Bullvine Weekly for genetics insights, market shifts, and profit strategies they won’t find anywhere else. One email. Five minutes. Smarter decisions all week.
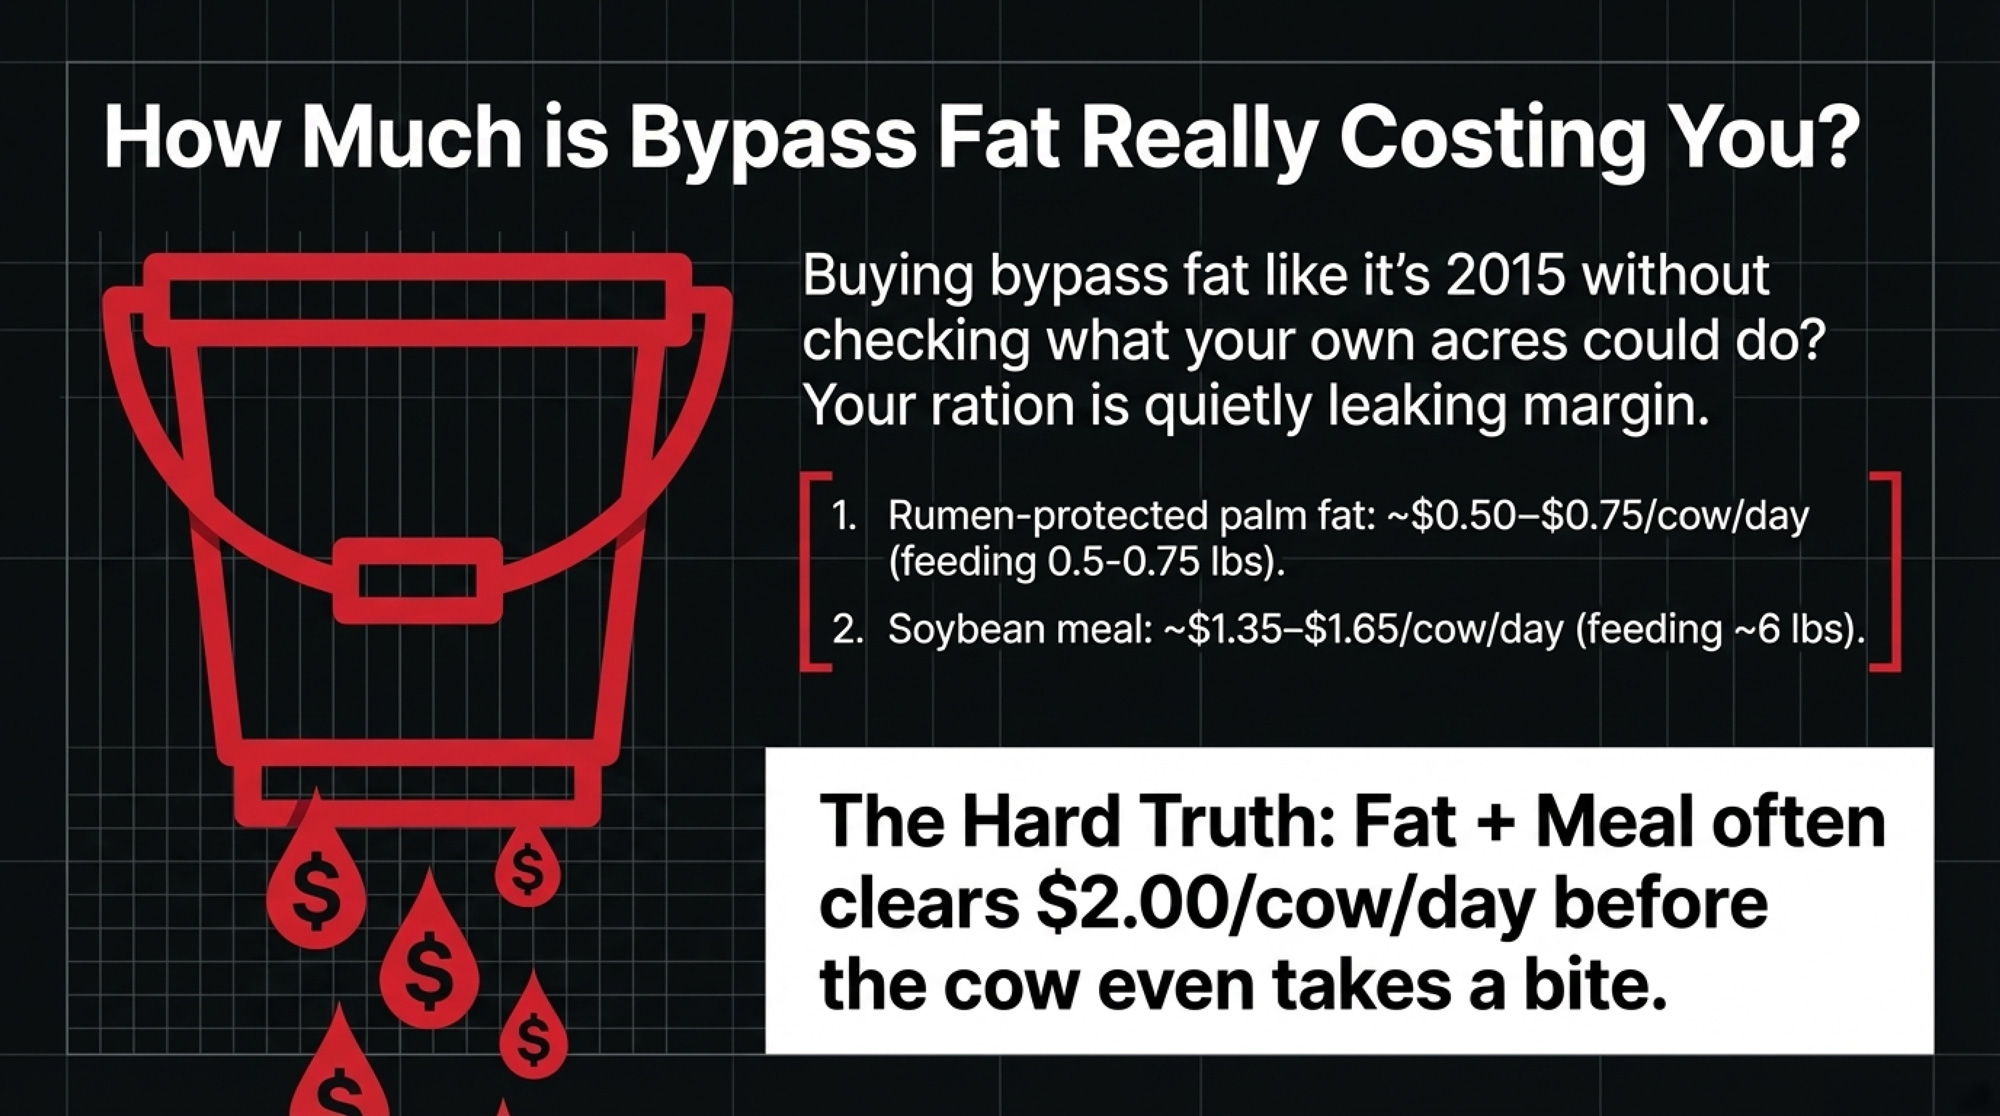
NewsSubscribe
First
Last
Consent

The Mycotoxin Challenge: What Dairy Producers Are Quietly Paying For

66% of feed samples contain multiple mycotoxins—quietly costing dairy operations $300-900 per cow annually

EXECUTIVE SUMMARY: Recent global research reveals that mycotoxin contamination has evolved into a complex challenge affecting two-thirds of dairy feed samples worldwide, with multiple toxins working together to multiply their damage beyond what individual toxins could achieve alone. Moderate mycotoxin exposure reduces milk production by 3-5 pounds per cow per day, while also dropping conception rates by up to 25%, resulting in annual losses of $300-900 per cow that many producers attribute to other factors. The traditional reliance on clay binders and rumen protection is proving inadequate against these multi-toxin combinations, particularly in high-producing cows, where faster feed passage rates reduce natural detoxification capacity. Blood biomarker testing is revealing that up to 80% of actual mycotoxin exposure goes undetected by conventional feed testing, while comprehensive management programs combining advanced binding, enzymatic degradation, and immune support demonstrate ROI figures exceeding 200%. Climate change is intensifying these challenges as warmer, wetter conditions expand mycotoxin risks into regions previously considered low-risk, making proactive management increasingly critical. Progressive producers implementing multi-modal approaches focused on transition cows and high-producers are documenting significant improvements in production, reproduction, and profitability within months.

KEY TAKEAWAYS:

  • Comprehensive mycotoxin management programs deliver 225-330% ROI by preventing $300-900 annual losses per cow through improved production, reproduction, and health outcomes
  • Blood biomarker testing reveals up to 80% more mycotoxin exposure than feed testing alone, enabling targeted protection for transition cows and high-producers where investment generates the highest returns
  • Multi-modal defense strategies combining advanced binding, enzymatic degradation, and immune support outperform traditional clay binders, which show only 3-6% effectiveness in real feed conditions
  • Climate change is expanding mycotoxin risks northward and intensifying contamination patterns, making proactive monitoring and protection essential for maintaining a competitive advantage
  • Focusing initial implementation on vulnerable populations—transition cows and peak lactation animals—provides the most cost-effective entry point for comprehensive mycotoxin management programs
mycotoxin management, dairy profitability, herd health, feed efficiency, milk production loss

What if a silent thief is stealing from your bottom line, costing you $300 to $900 per cow every year? You see it in the data: milk production that falls short, a stubborn conception rate, and animals that just don’t seem to hit their peak. You’ve checked the feed, you’ve optimized the genetics, and you’ve managed the herd carefully. Yet, something is quietly costing you. For a growing number of dairy producers, that unseen culprit is a complex mix of mycotoxins in the feed—a challenge that has become far more widespread and damaging than most realize.

What’s interesting here is that many of us are running into this same puzzle. What’s quietly stealing from the bottom line isn’t always obvious—and increasingly, mycotoxins seem to be part of the story. Research around the world, including a comprehensive review from Selko in 2024, shows that about two-thirds of feed samples now contain multiple mycotoxins together. These aren’t just your run-of-the-mill toxins but blends of things like DON, zearalenone, and fumonisins showing up regularly in the mix.

Unpacking the Impact

Multiple mycotoxin contamination is prevalent across all major U.S. dairy regions, with the Midwest showing the highest rates due to climate conditions favoring fusarium growth. Insert after the paragraph discussing regional variations in contamination patterns

Take a step back and think about what this means. Research has shown that moderate levels of mycotoxins can drag a cow’s milk yield down by 3 to 5 pounds a day. In Wisconsin, where producers are pushing high production, losing that amount really adds up fast. It might explain why some herds aren’t hitting their predicted yields despite solid management.

But it’s not just about volume. I remember chatting with a producer in Vermont who noticed his somatic cell counts creeping up—impacting his quality premiums—and strangely, the milk was behaving differently at the cheese plant, with altered protein and coagulation performance. It turns out, mycotoxins mess with more than just milk secretion—they degrade milk protein quality too.

And from the reproductive side, zearalenone is a culprit we can’t ignore. Studies tell us conception rates can slip by a quarter when these toxins are present. You can see these effects in farm records when pregnancies don’t stick, and open days creep up beyond expectations.

When Mycotoxins Team Up

Co-contamination with multiple mycotoxins creates exponentially worse production and reproductive losses compared to single toxin exposure, emphasizing why traditional single-solution approaches fail. 

Here’s what’s particularly noteworthy: DON and zearalenone aren’t just causing separate problems—they’re interacting in ways that multiply their damage. That Pennsylvania producer I mentioned saw fertility issues worse than what single toxin data would suggest. This aligns with broader findings from global studies, which show that these toxins often co-occur and synergize to have a more severe impact on production and fertility than either could have alone.

Rethinking the Old Assumptions

Many producers have leaned on the idea that the rumen microbes act like a natural filter for mycotoxins. But that’s proving less true than we thought. High-producing cows gobble up feed quickly, so these microbes don’t have as much time to break down toxins. And when cows face subacute ruminal acidosis—as a good portion experience during the fresh cow period—those microbes are weakened, leaving the animals more vulnerable.

Even more to chew on: zearalenone can actually convert into a more potent toxin after ruminal metabolism. That’s a twist many of us didn’t appreciate fully until recently.

Why Don’t We Hear More About This?

The mycotoxin effects are often subtle, looking like general health or fertility issues, so many producers chalk problems up to other causes. And the old staple solution—clay binders—only captures part of the problem. It’s like fighting a multifaceted battle with a single arrow.

New Testing Insights

What I’ve found is that more herds using blood biomarker testing get a clearer picture of what’s actually passing into cows’ systems. Unlike feed-only tests, blood tests can show cumulative exposure and toxins missed by traditional methods. While the cost and access can be barriers, they’re often worthwhile for herds with unexplained production issues.

Beyond Clay: New Defense Strategies

Clay binders still have a role, but progressive farmers I talk with combine them with enzymatic detoxifiers and supplements that support gut and liver health. This layered approach is where the research shows real promise, often yielding return on investment figures exceeding 200 percent.

Real-World Examples

A friend running a 200-cow dairy in Vermont saw significant milk production and reproductive improvements within months after adopting a multi-stage mycotoxin management program focused on his fresh cows.

Whether you’re running a hundred cows or a thousand, prioritizing the most vulnerable groups first makes the most sense financially and operationally.

Climate Change and Emerging Tech

One thing we’re all watching closely is how climate variability is making mycotoxin issues more erratic. Wetter springs in the Midwest are raising fusarium risks, while the Northeast sees more aflatoxin creeping upward. Producers report new challenges in storage and feed quality that didn’t exist a decade ago.

The good news? Technology is responding. AI is emerging as a valuable tool for forecasting fungal growth and toxin risk well in advance of harvest. Rapid on-farm testing is becoming quicker and more comprehensive, detecting multiple toxins in minutes. Enzymatic detoxifiers, with increasing efficacy, promise to break down toxins rather than merely bind them.

What Can You Do Right Now?

Here’s what I’d recommend: start integrating mycotoxin testing beyond just your feed—look at biomarkers in your cows to get the full picture.

Focus protection on your transition and highest-producing animals. Use multi-modal mitigation strategies rather than relying on clay binders alone.

Work closely with your nutritionist and vet to tailor your strategy to your farm, considering local climate, forage sources, and herd health.

Start early and stay consistent to avoid surprises during critical production times.

Final Takeaways

Mycotoxins aren’t new, but the scale and complexity of the problem are growing. They quietly erode our herds’ health and our farms’ profitability if unaddressed.

What’s encouraging is that we’re getting better at spotting and fighting these hidden threats. The key is awareness and proactive management, aided by solid data and collaboration.

The dairy farmers who embrace this evolving knowledge and adapt thoughtfully will be the ones turning these challenges into competitive advantages.

Let’s keep the conversation going and continue sharing what’s working out there on the farms. Together, we’ll keep our dairies thriving through these invisible storms.

Complete references and supporting documentation are available upon request by contacting the editorial team at editor@thebullvine.com.

Learn More:

The Sunday Read Dairy Professionals Don’t Skip.

Every week, thousands of producers, breeders, and industry insiders open Bullvine Weekly for genetics insights, market shifts, and profit strategies they won’t find anywhere else. One email. Five minutes. Smarter decisions all week.
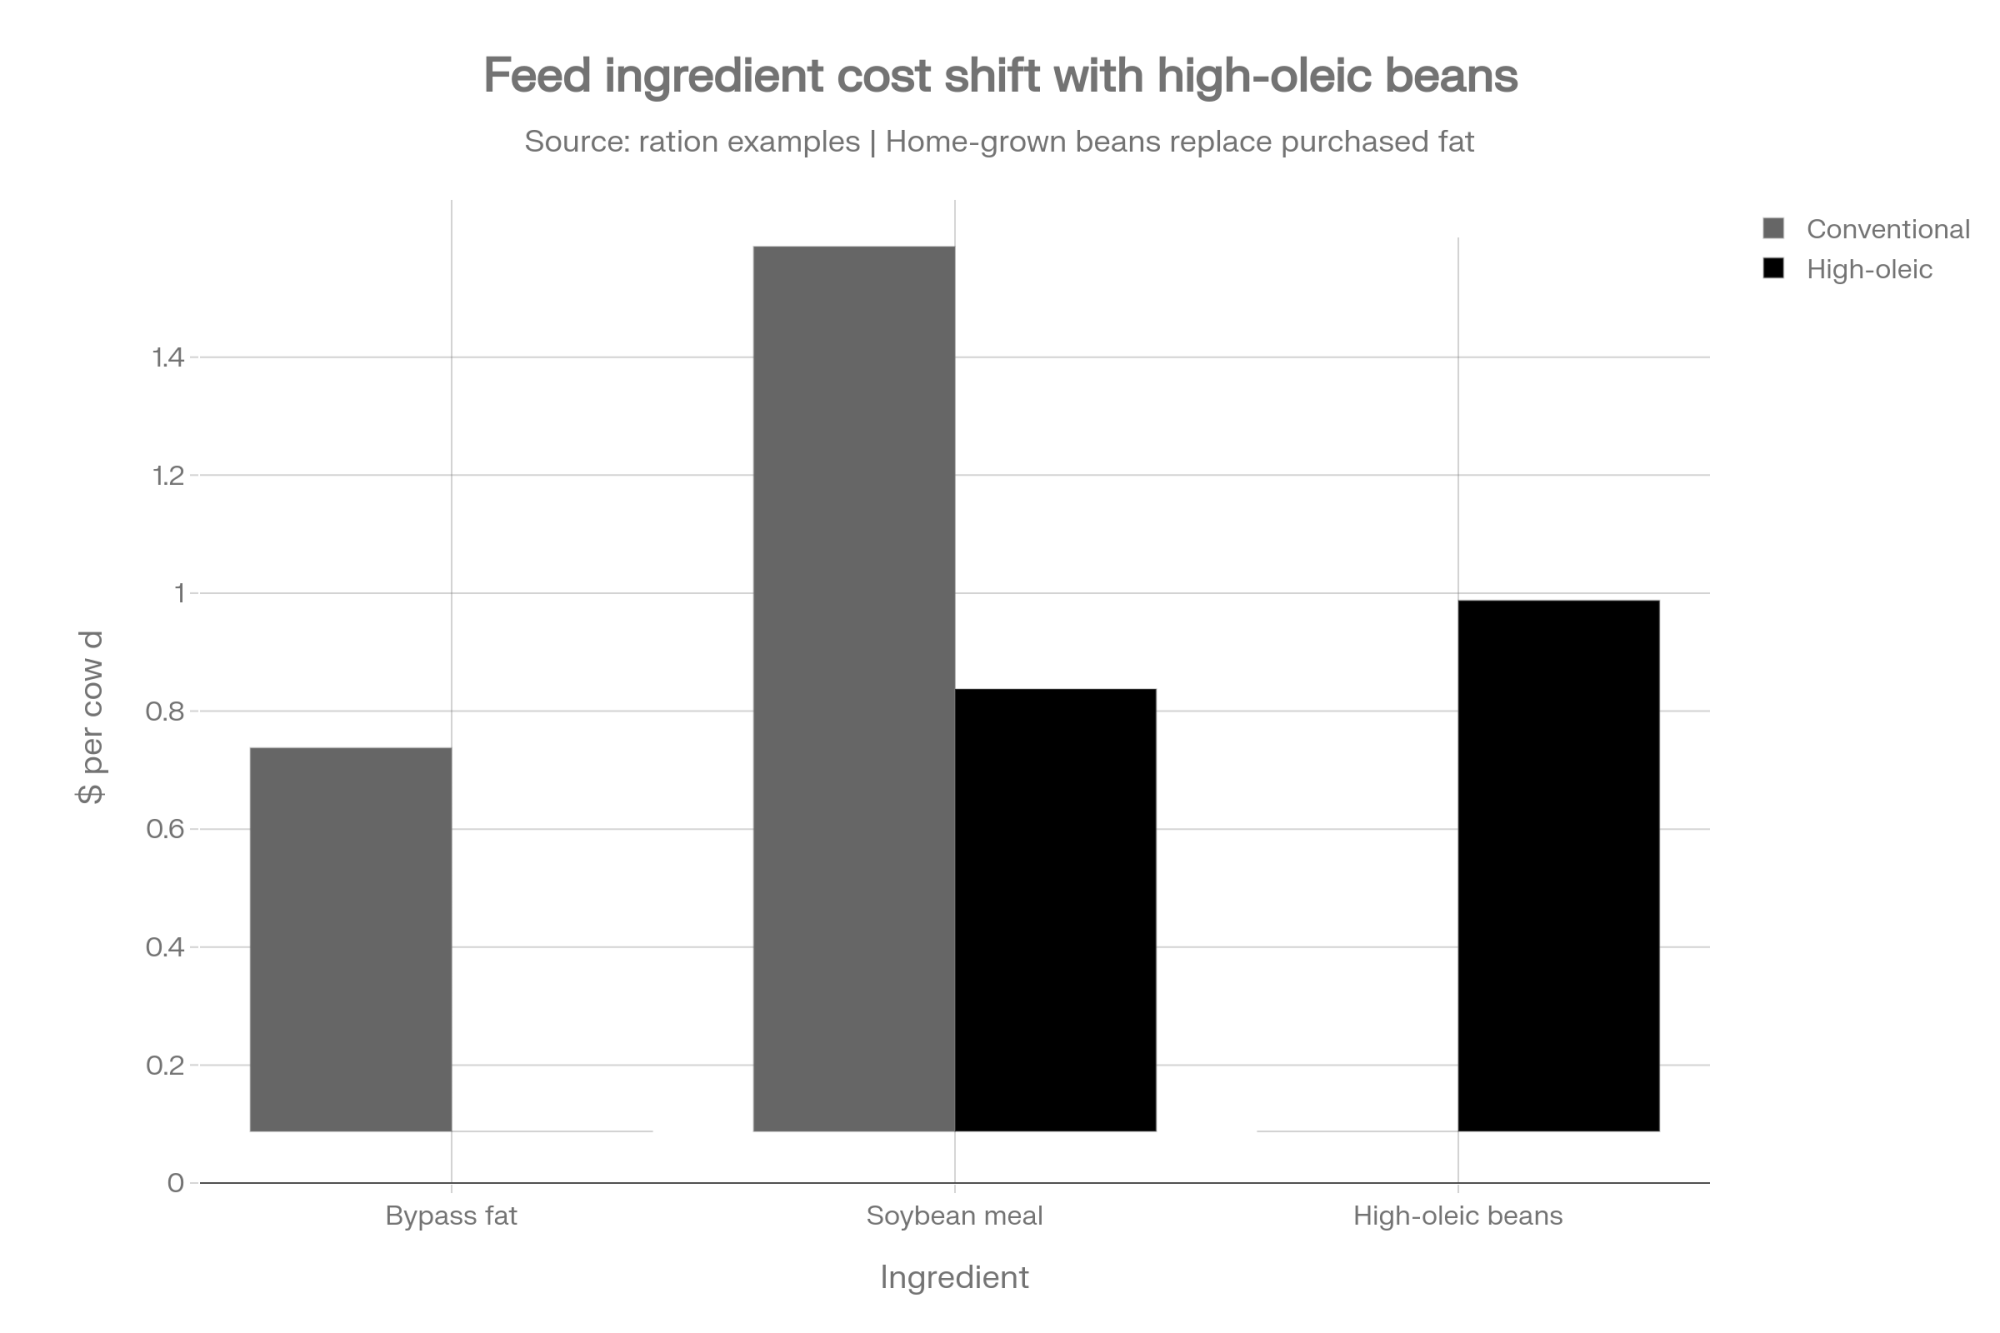
NewsSubscribe
First
Last
Consent

The Feed Room Decision That Defines a Heifer’s Lifetime Value

A textured calf starter can boost your calf’s growth by up to 35% — are you still grinding your feed?

You know that moment when the feed truck rolls up and you’re staring at invoices, wondering if that premium for textured calf starter is really worth it? Well, here’s something that might change how you look at those feed bills forever.

Across dairy farms of all sizes and regions, the message is consistent: the physical form of the starter feed isn’t just about convenience anymore. It’s about setting up heifers that will become profitable foundations of the herd.

Numbers That Get Your Attention

Here’s what caught my eye in the research: Cornell’s solid work (Soberon et al., 2012) found every extra pound of pre-weaning gain means 850 to 1,113 kilograms (1,875 to 2,450 pounds) more milk in first lactation alone. For example, even with milk prices in the $17-19/cwt range, that’s an extra $200 to $300 in your pocket — just in year one.

This chart visualizes how strategic investments in calf nutrition, particularly a premium starter, offer a substantial return. The data shows that while there is an initial added cost per calf (red bars), the net economic benefit (blue bars) from improved health, faster growth, and enhanced lifetime production significantly outweighs the investment.

But here’s the thing: it’s not about dumping more grain on calves. It’s about recognizing a newborn’s rumen as a construction site — and us, the contractors.

Building Something That Lasts

The calf comes equipped with stomach plumbing but only runs on one cylinder at first. Those tiny papillae inside her rumen start smaller than a pinky nail but can grow big — like enough to cover a pool table — by 70 days with the right feed.

Performance MetricTextured Starter AdvantageResearch SourceEconomic Impact
Dry Matter Intake (% increase)15-25%Jafari et al. 2018Higher feed conversion
Average Daily Gain (% increase)20-35%Multiple studiesFaster growth = earlier breeding
Rumination Time (% increase)140%Jafari et al. 2018Better rumen development
Days Earlier Weaning5-7 daysIndustry reportsReduced milk feeding costs
Feed Digestibility Improvement (%)7-13%Porter et al. 2007More efficient nutrient use
Rumen pH (textured vs pelleted)5.43 vs 5.03Porter et al. 2007Healthier rumen environment
Time to First Rumination (weeks)3.7 vs 6.0Porter et al. 2007Earlier functional rumen
VFA Absorption Improvement (%)15-20%Gelsinger et al. 2020Better long-term performance
Starter Intake at 5-8 weeks (% higher)19%Gelsinger et al. 2020Improved weaning transition
Body Weight Advantage at 17 weeks (lbs)72 lbsGelsinger et al. 2020Higher market weights

Research from Coverdale et al. (2004) was pivotal in demonstrating how textured starters increase dry matter intake and promote superior rumen development compared to other feed forms. Their work showed that physical feed characteristics aren’t just about palatability — they’re fundamental to proper digestive development.

Visual evidence of superior rumen development. Images (a) and (c) show the rumen lining of calves fed only milk (M), with smaller papillae and thinner epithelial layers. In contrast, images (b) and (d) display significantly longer, more numerous papillae and a more mature rumen epithelium in calves fed milk plus a starter diet (M+S), highlighting the critical role of solid feed in early rumen development.

I found biology fascinating: volatile fatty acids, especially butyrate, act as molecular messengers signaling the rumen lining to grow while reducing cell death. Texture matters because coarse particles make calves chew more and ruminate more — that ramps up saliva flow, and saliva brings bicarbonate that keeps rumen pH around 6.2 to 6.8, avoiding acid damage as the rumen builds its engine.

As Dr. Sarah Mills, a ruminant nutritionist at Midwestern University, says, “You only get one chance to build that rumen. Butyrate in a textured starter signals the rumen lining to grow and mature, setting the calf up for a lifetime of production. It’s a biological investment with compounding returns.”

This aligns with what veterinarians and nutritionists observe on farms: fewer digestive issues when calves consume textured starter.

Textured vs Pelleted: The Research Data

The facts are clear, and recent studies like Jafari et al. (2018) confirm what progressive producers have been seeing on-farm:

  • Calves on textured starters eat 15-25% more
  • They achieve 20-35% higher average daily gain
  • They spend over 140% more time ruminating
  • They wean about a week earlier
  • They digest feed 7-13% better
A side-by-side comparison of key performance metrics, demonstrating the measurable advantages of a textured starter. The data highlights significant gains in starter intake, average daily gain (ADG), rumination time, and overall digestibility, all of which contribute to a more robust and profitable calf.

That rumination difference — 20% for textured vs. 9% for pelleted — is big. Jafari’s work specifically linked this to more stable rumen pH and better overall digestion, which sets calves up for healthier transitions throughout their development.

Checking the Local Pulse

Premiums for textured starters vary widely by region and market conditions, typically ranging from $40 to $85 per ton, based on a compilation of regional feed market reports from the past year. However, producers should always check local pricing to understand their investment.

In Wisconsin and other traditional dairy regions, adoption is increasing because growers recognize the value, especially during tough winters. In newer dairy regions, progress is slower — a natural consequence of such a significant change.

Payback? Most farms see it in 6 to 8 months, thanks to better health and growth.

Sponsored Post

Making It Work on Your Farm

Here’s what successful farmers do:

  • Get colostrum fed on time
  • Start textured starter early — even just a taste
  • Keep water clean and free
  • Maintain robust milk feeding while pushing starter intake
  • Keep feed fresh — no stale piles
  • Look for rumination starting around 3-4 weeks
  • Push past 3 pounds of starter by 4-8 weeks
  • Add small, quality forage portions after that
  • Wean gradually, based on feed intake, not calendar

Dealing with Practical Stuff

Yes, textured feeding takes some attention:

  • Store feed in climate-controlled bins
  • Control dust when humid
  • Use a twice-daily feeding schedule

But the payback is real.

This graph illustrates the long-term financial impact of strategic heifer rearing. The lines show profitability over a heifer’s lifetime, demonstrating the initial cost of raising the animal (the negative curve) followed by the eventual positive return. The investment in superior early nutrition helps the heifer reach profitability sooner (as early as 38 months), demonstrating the long-term financial payoff of building a strong foundation. (Source: Lactanet)

Bottom Line

The window for building optimal rumen capacity closes between 8 and 10 weeks of age. Miss it, and you’re managing the consequences for that cow’s entire productive life. Get it right, and you’ve built yourself a money-maker.

KEY TAKEAWAYS:

  • Textured starters spark up to 25% higher intake — calves eat more willingly, grow stronger, and develop better digestive foundations from week one
  • Pre-weaning growth boosts up to 35% translate into hundreds of extra pounds of milk per cow over her lifetime — that’s real money in your pocket, not just better-looking calves
  • Coarser feed textures promote natural chewing and rumination, boosting saliva flow that buffers rumen pH to a healthy 6.2-6.8 range — preventing costly acidosis and digestive upsets
  • Farmers worldwide report smoother weaning transitions and healthier calves with textured feeds — especially crucial in today’s tight economic conditions, where every animal needs to perform
  • Research from Cornell, Purdue, and European universities backs this strategy with hard data linking texture-focused feeding to superior rumen development and lifetime productivity gains

EXECUTIVE SUMMARY:

At The Bullvine, we’re seeing that the old “grind-everything” approach to calf starters is quietly holding back performance across dairy operations. Textured starters improve intake by up to 25% and growth by up to 35%, delivering concrete ROI with long-term economic impact — including an extra $200-$300 per heifer in first-lactation earnings from better pre-weaning development. This isn’t just about feeding more grain; it’s about nurturing a robust rumen foundation from day one that pays dividends for years. Around the globe, progressive dairies from New Zealand to Europe are already making this switch, focusing on digestion quality that pairs perfectly with farm economics. With university studies from Cornell to Europe confirming these benefits — improved rumen health, more stable fermentation, and healthier calves with fewer digestive issues — the path forward is clear. It’s time to challenge assumptions and make textured starters a cornerstone of your 2025 calf program.

Complete references and supporting documentation are available upon request by contacting the editorial team at editor@thebullvine.com.

Learn More:

The Sunday Read Dairy Professionals Don’t Skip.

Every week, thousands of producers, breeders, and industry insiders open Bullvine Weekly for genetics insights, market shifts, and profit strategies they won’t find anywhere else. One email. Five minutes. Smarter decisions all week.
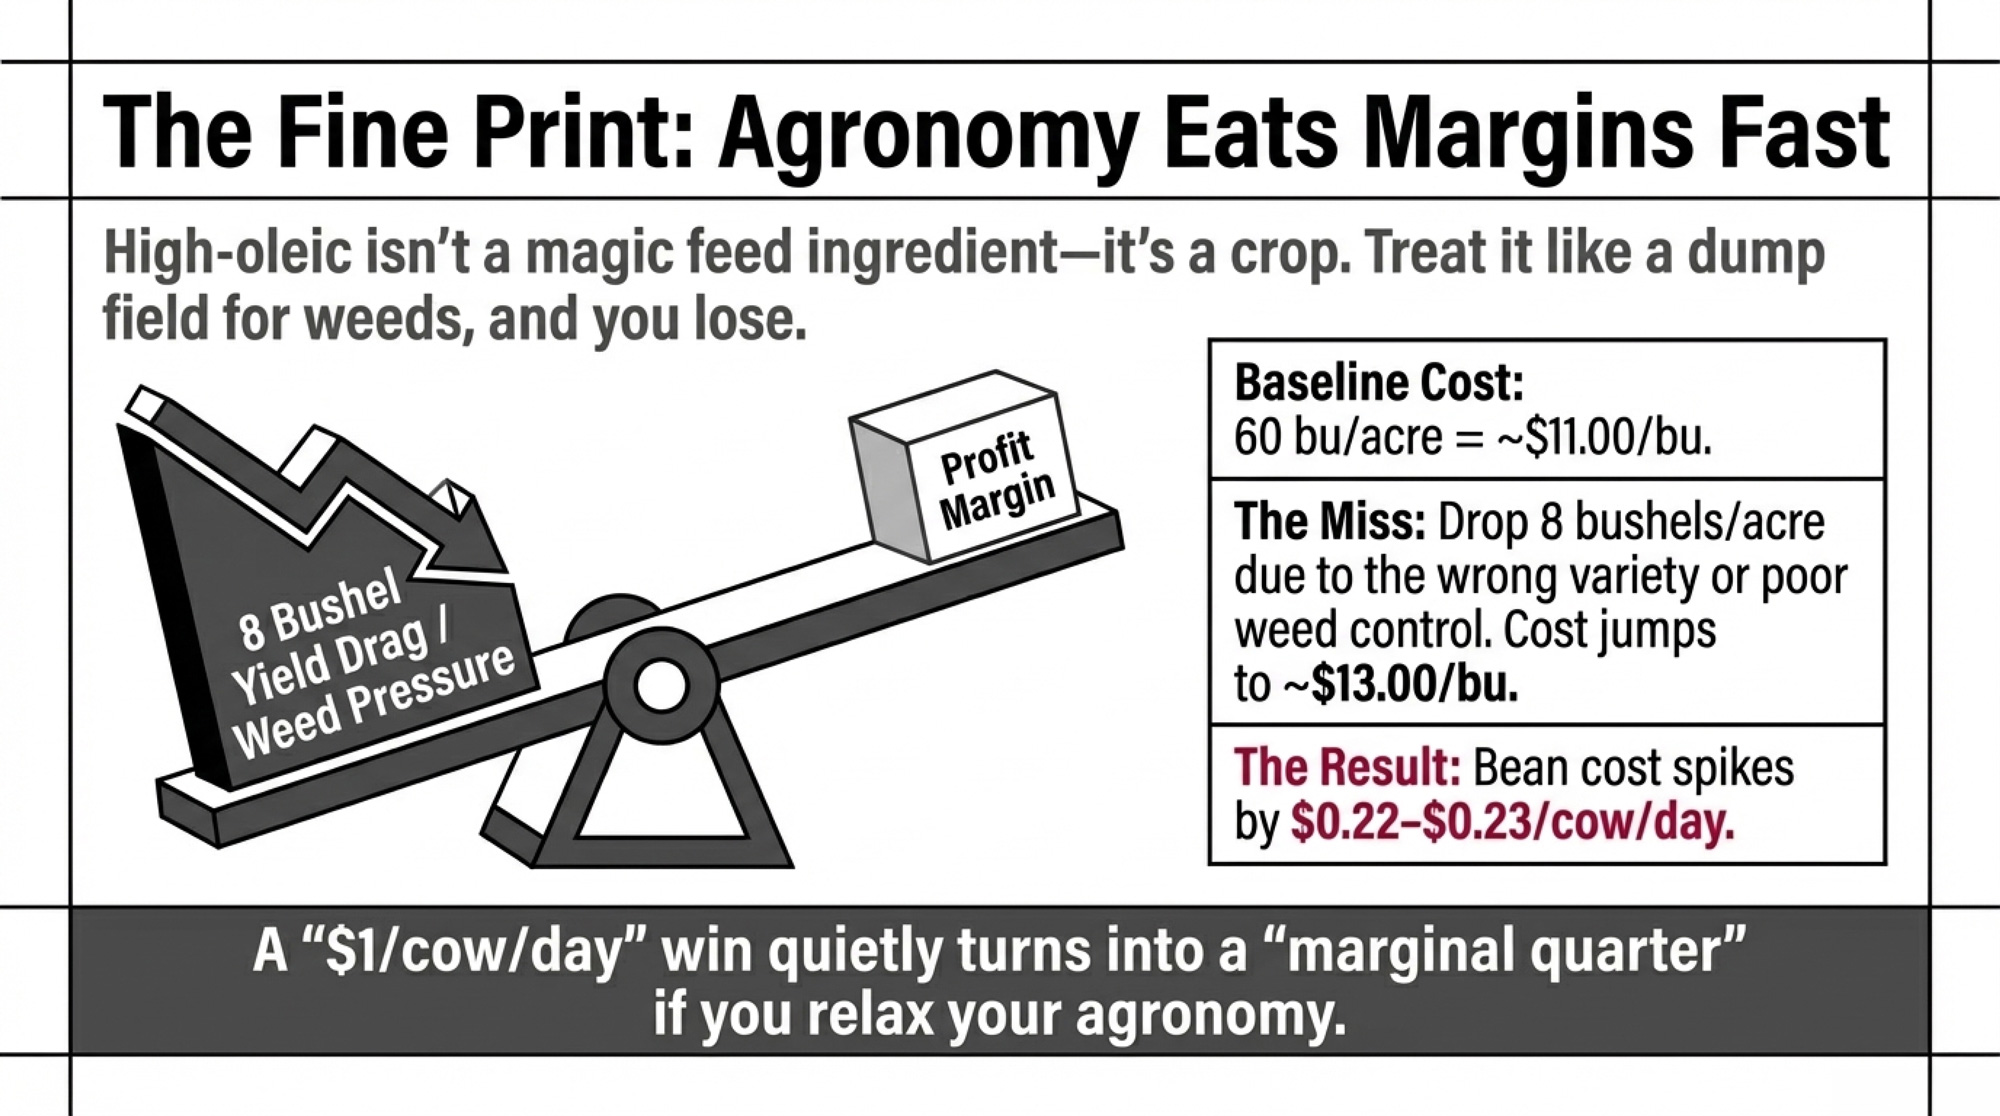
NewsSubscribe
First
Last
Consent
Send this to a friend