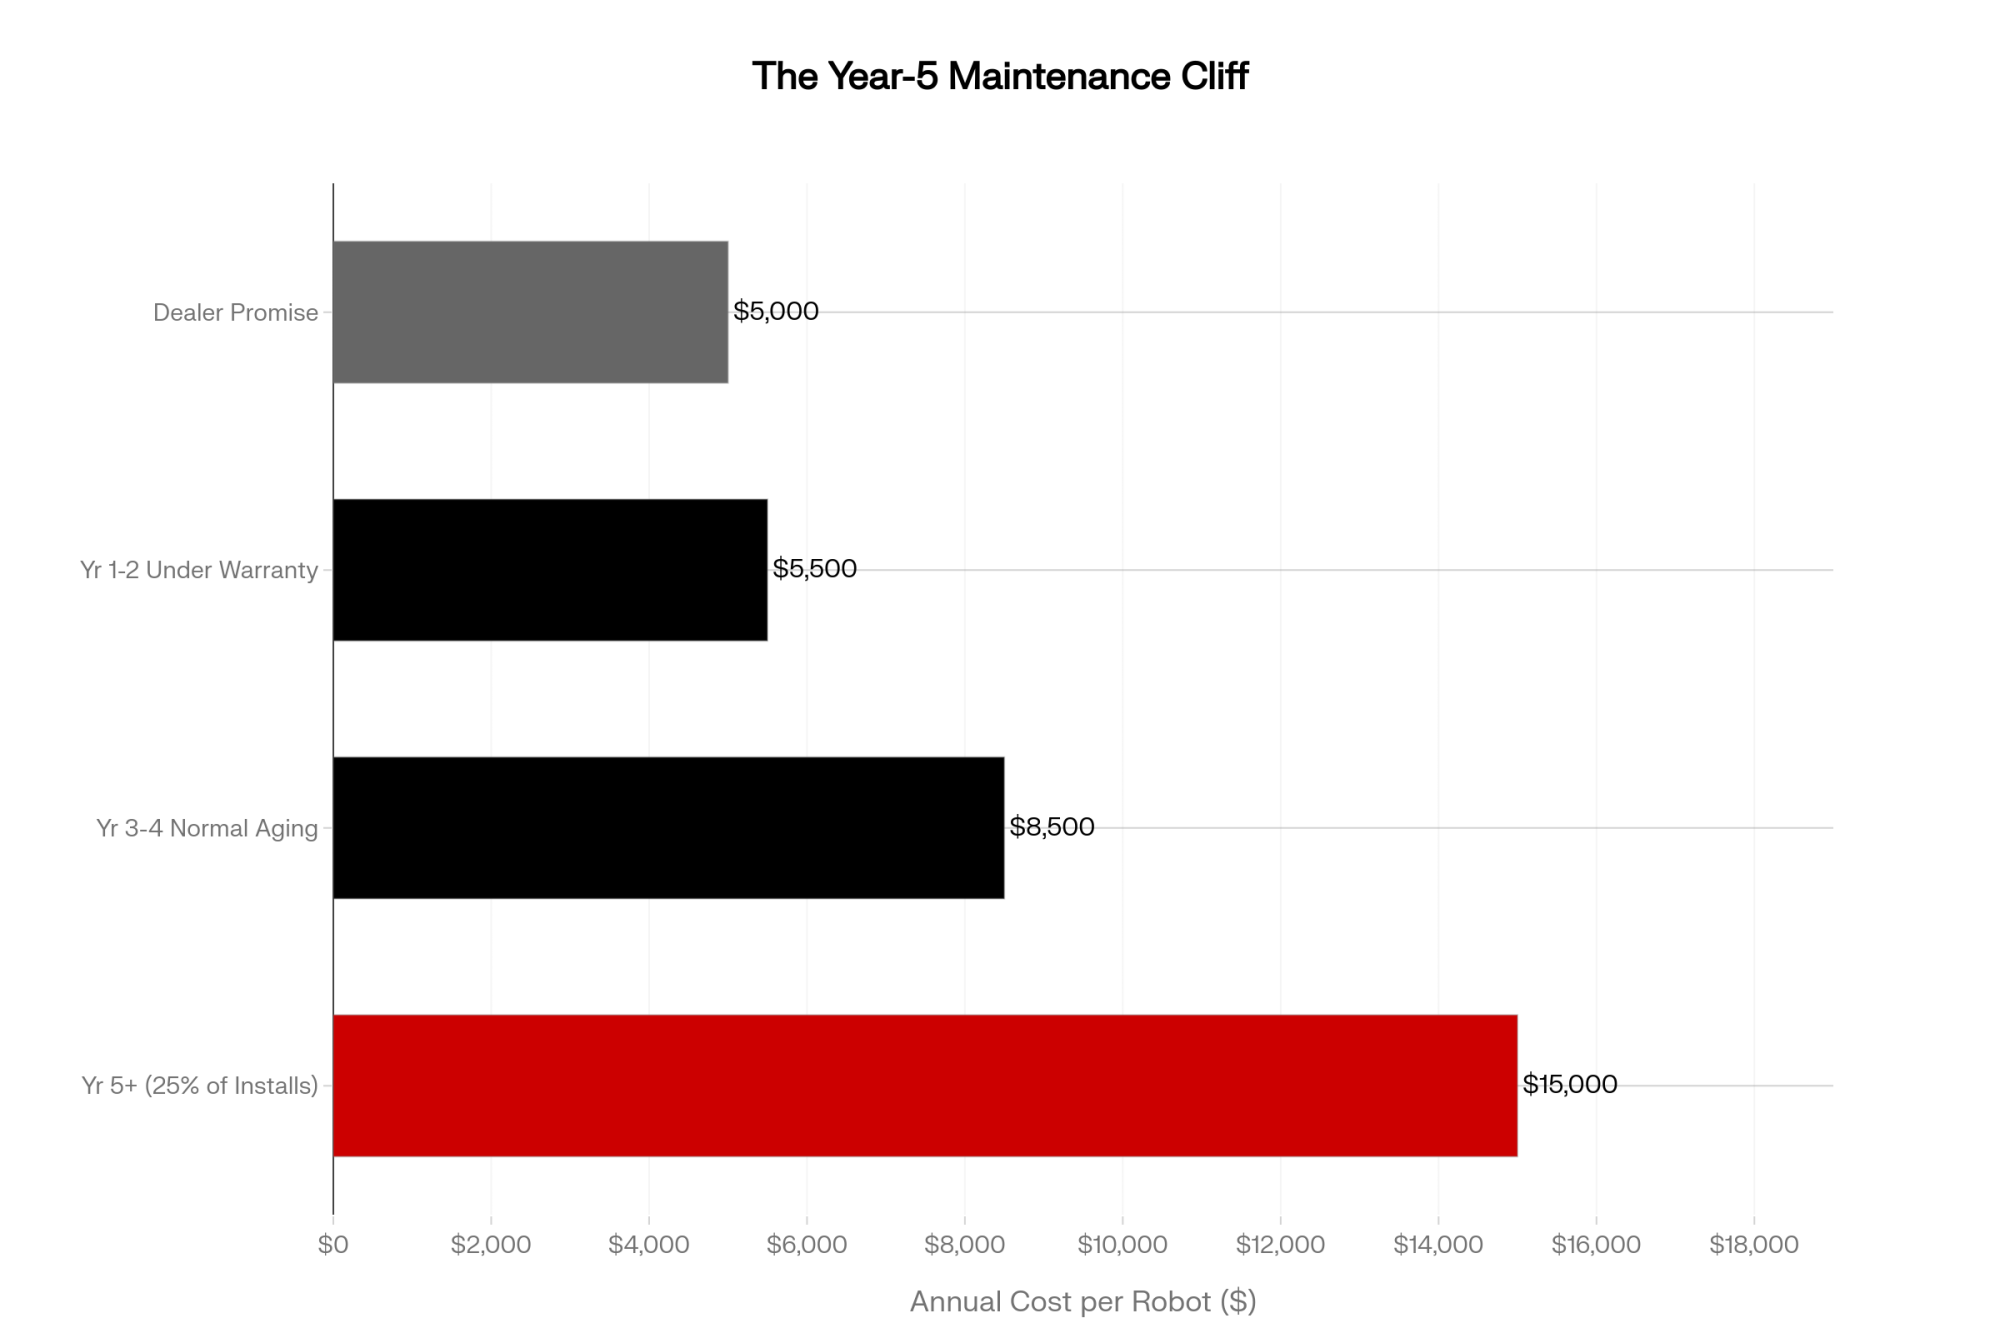
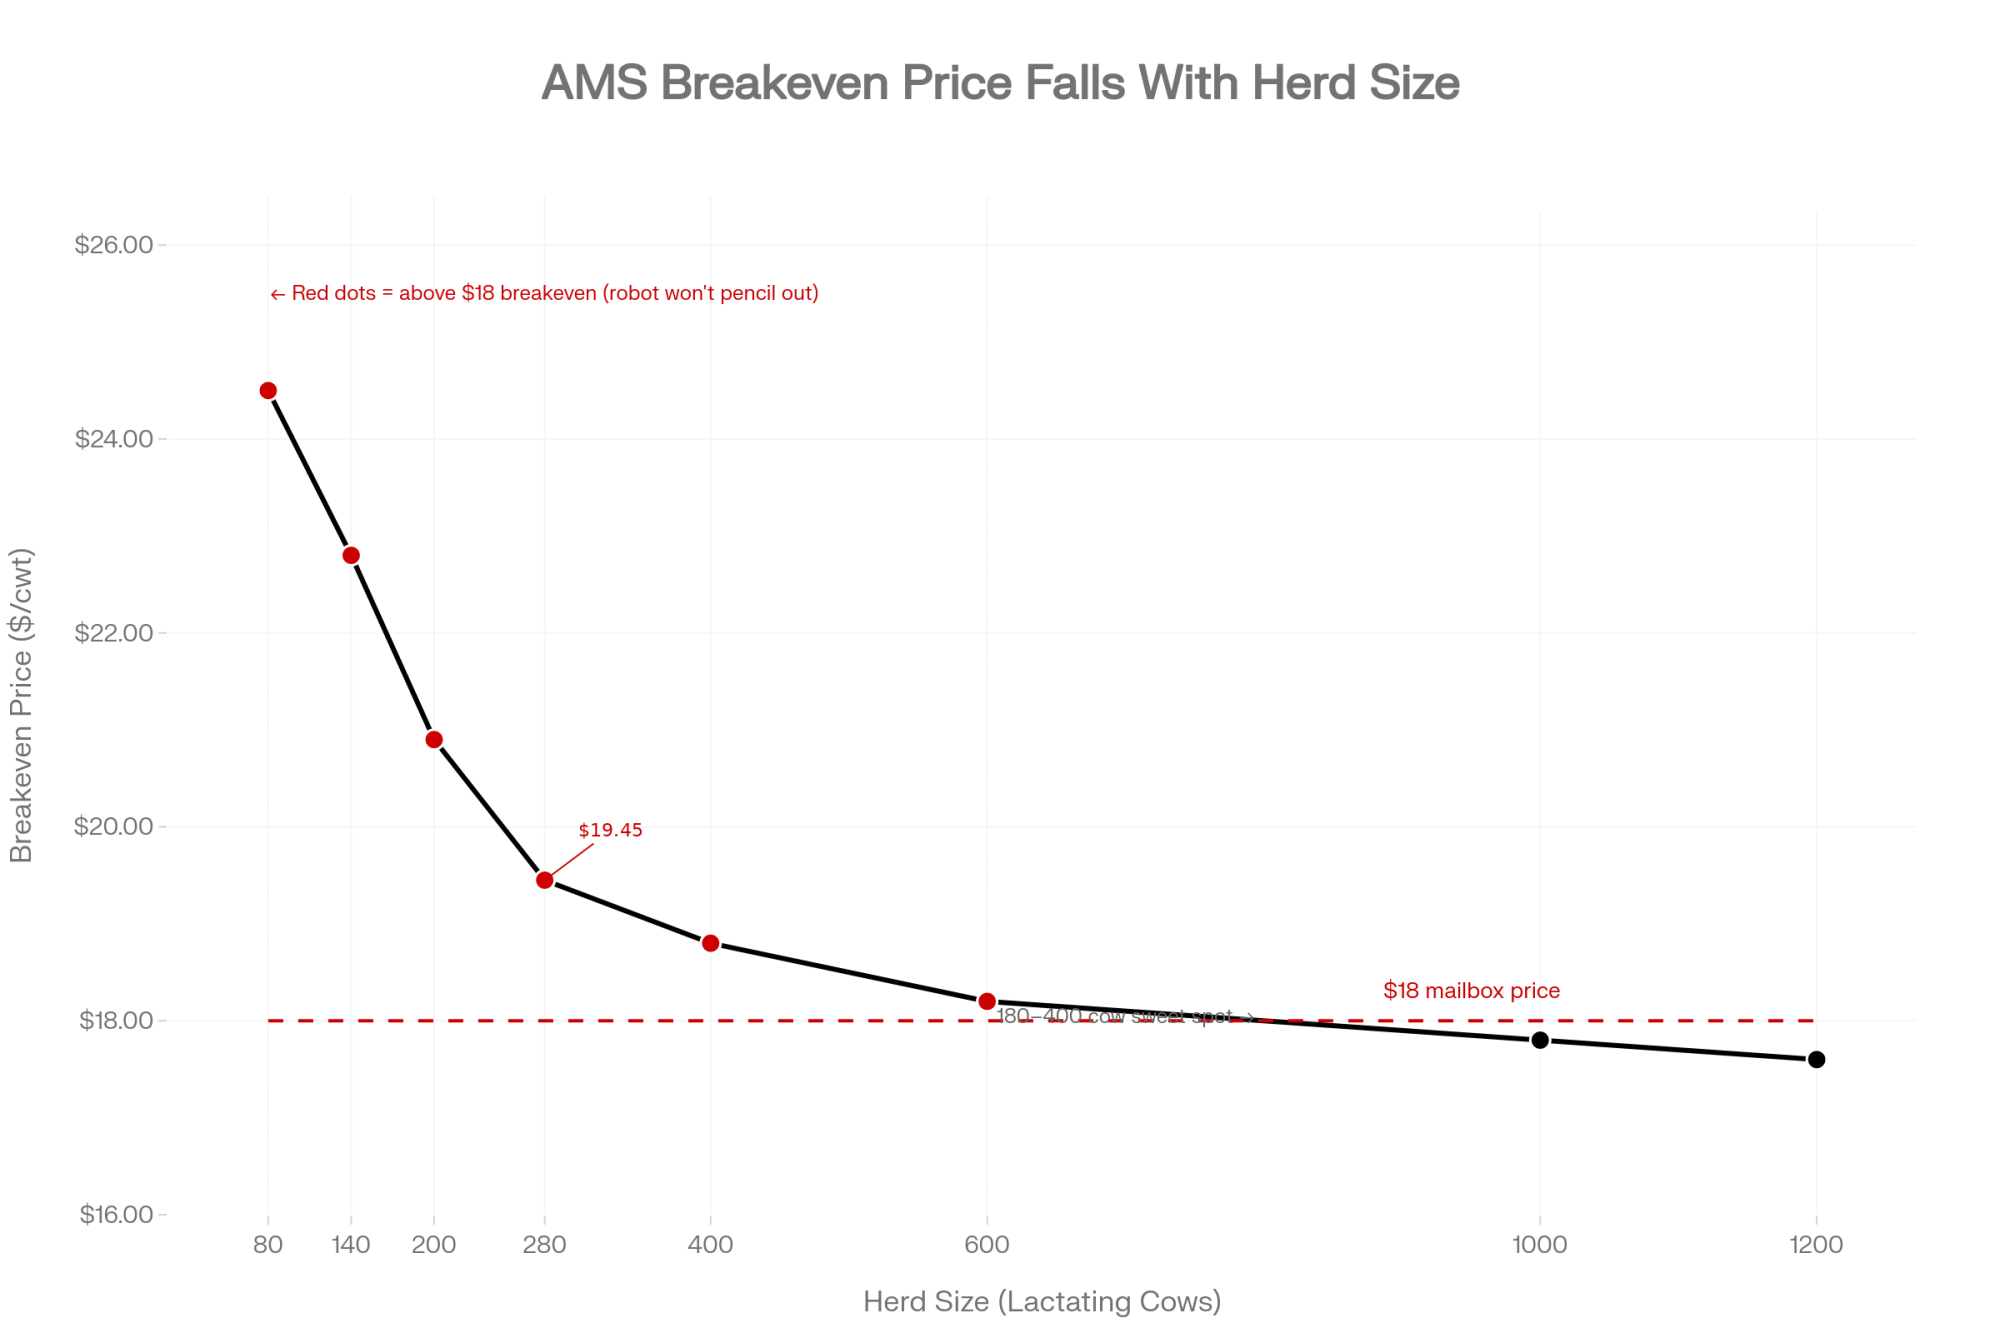
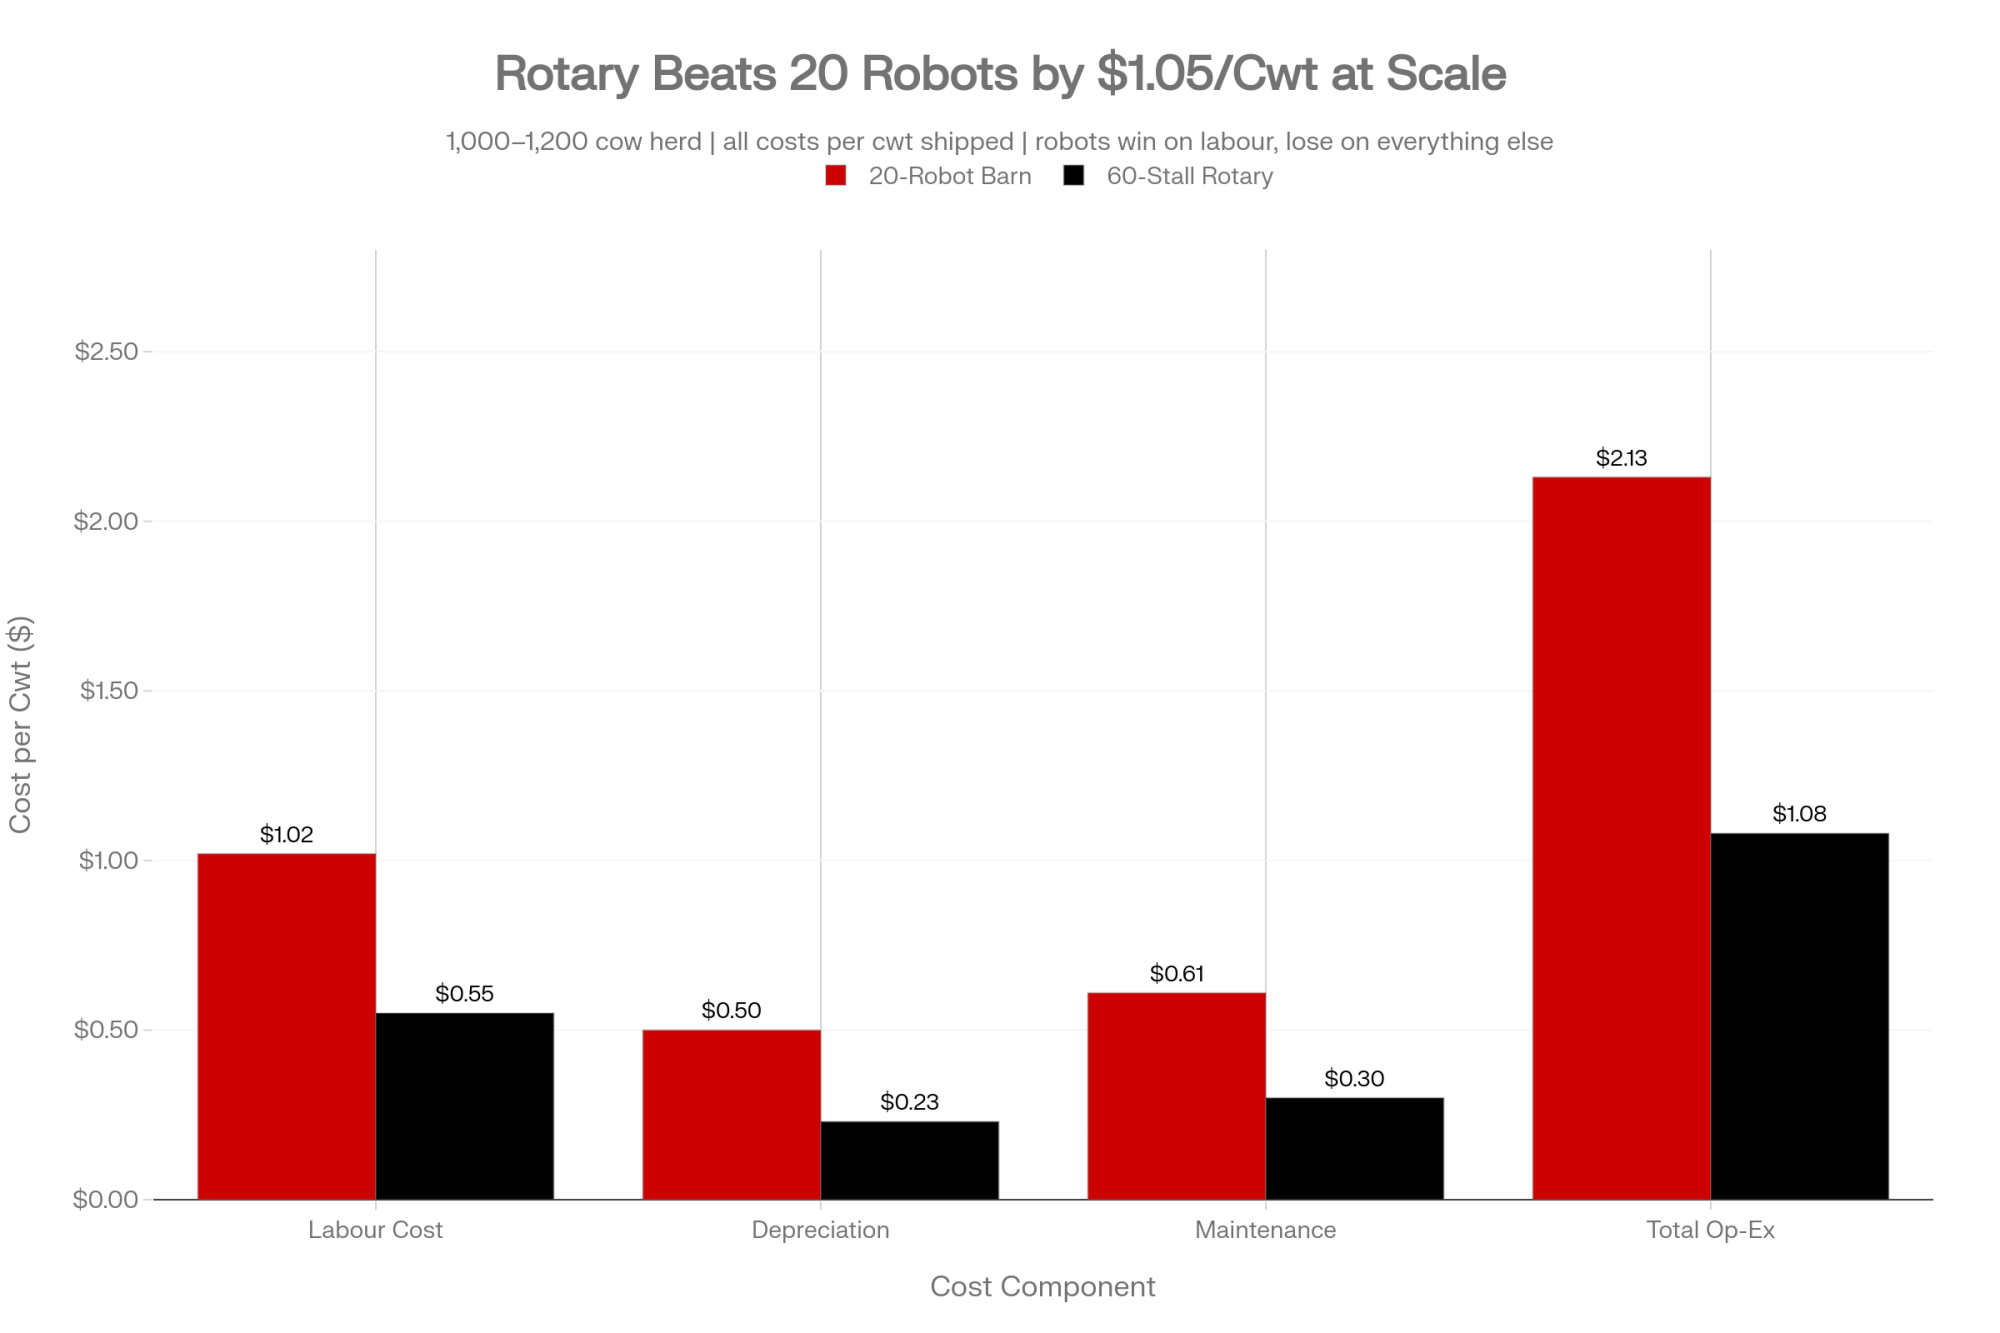
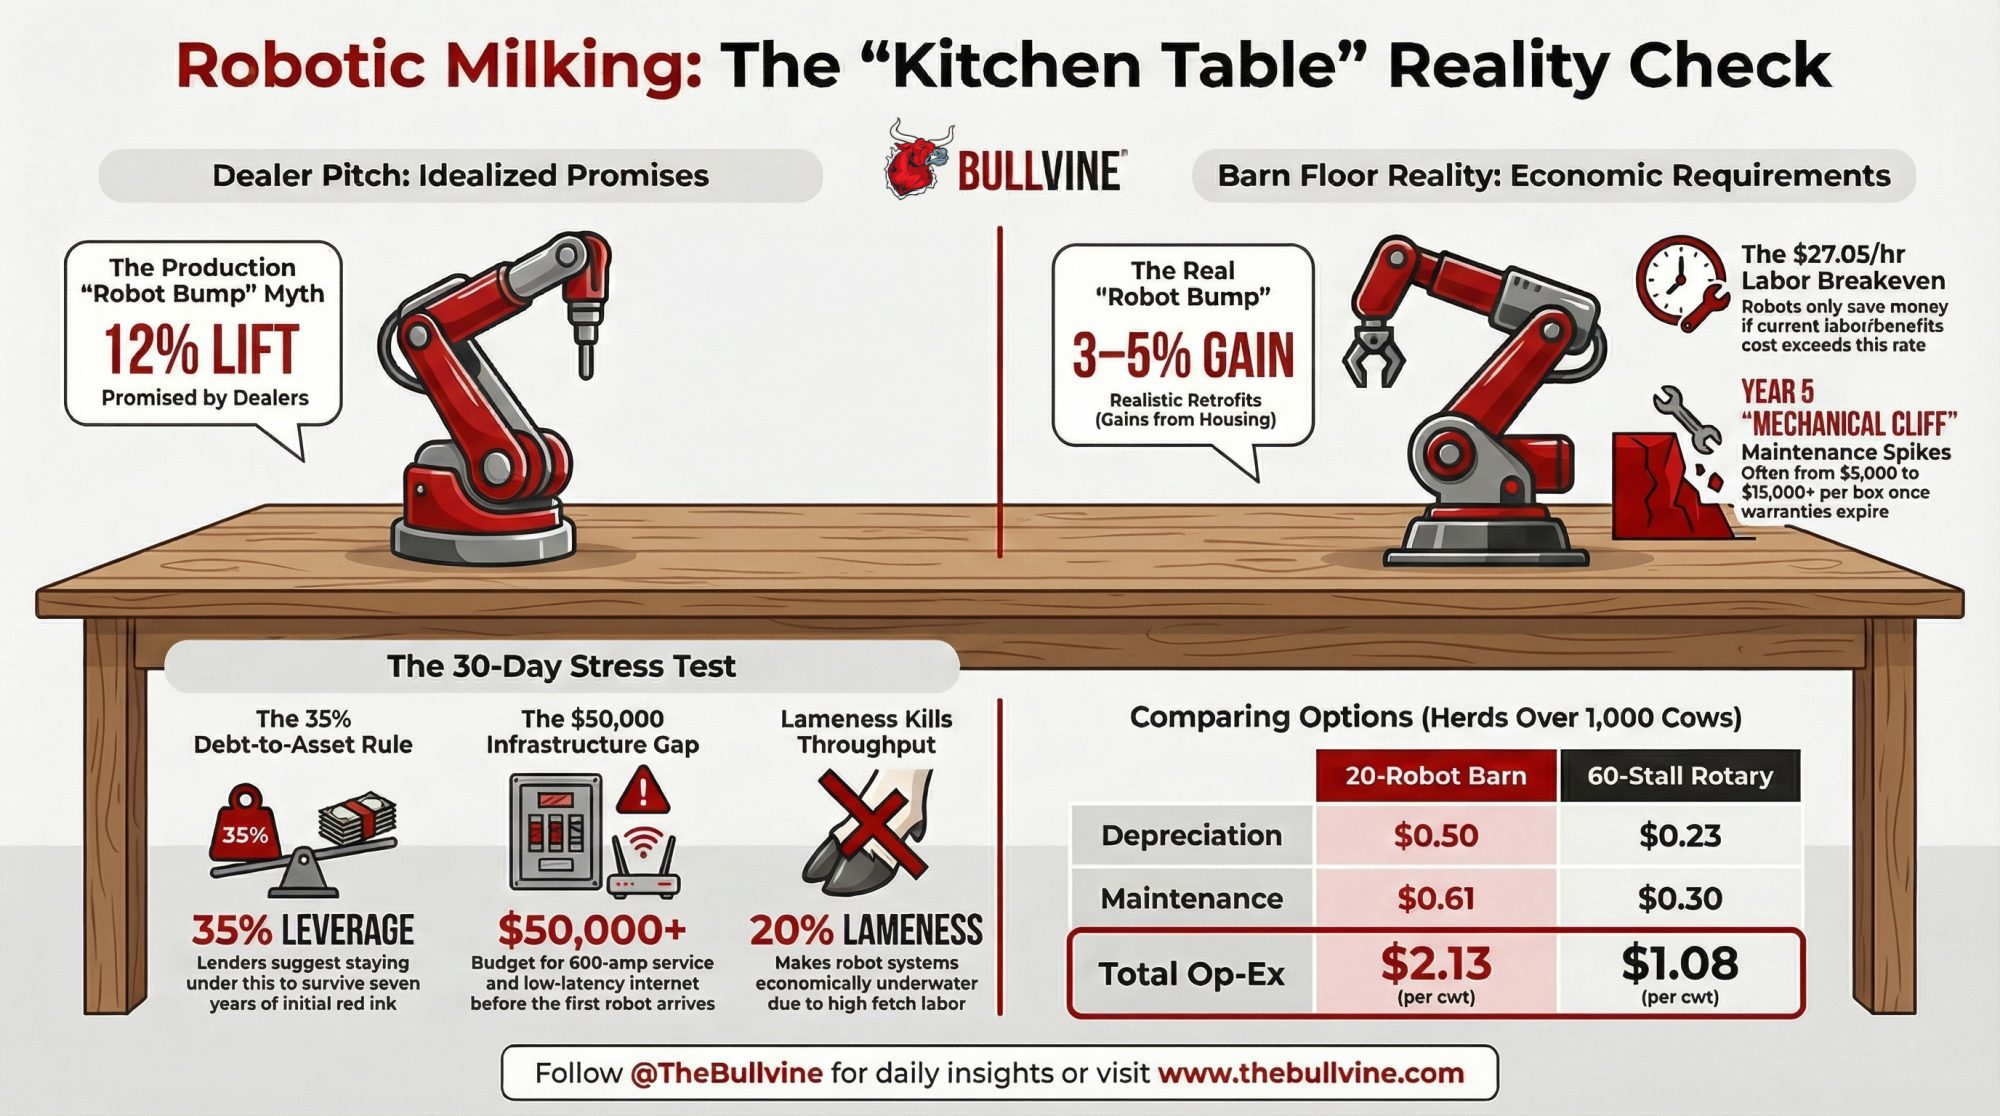
Archive for Management

The Hidden Labor Bill That Makes “Ethical Robot Dairies” Pencil — And Who’s Quietly Paying It

Two robots, 100 cows, a calm barn — and a milk cheque that only balances because mom, the kid who “helps out,” and the farmer at hour fourteen all work for free.

Scroll through the parenting and ethics corners of Reddit, and you’ll keep hitting the same question: is more humane, ethical dairy even possible? Every so often an actual dairy farmer wanders in to answer it, describing a cow‑health‑first operation milking around 100 cows on a pair of robots — cows coming and going as they please, nobody setting a 4 a.m. alarm. It’s the dream a lot of tired producers and ethics‑minded consumers want to believe in. And honestly, parts of it are real.

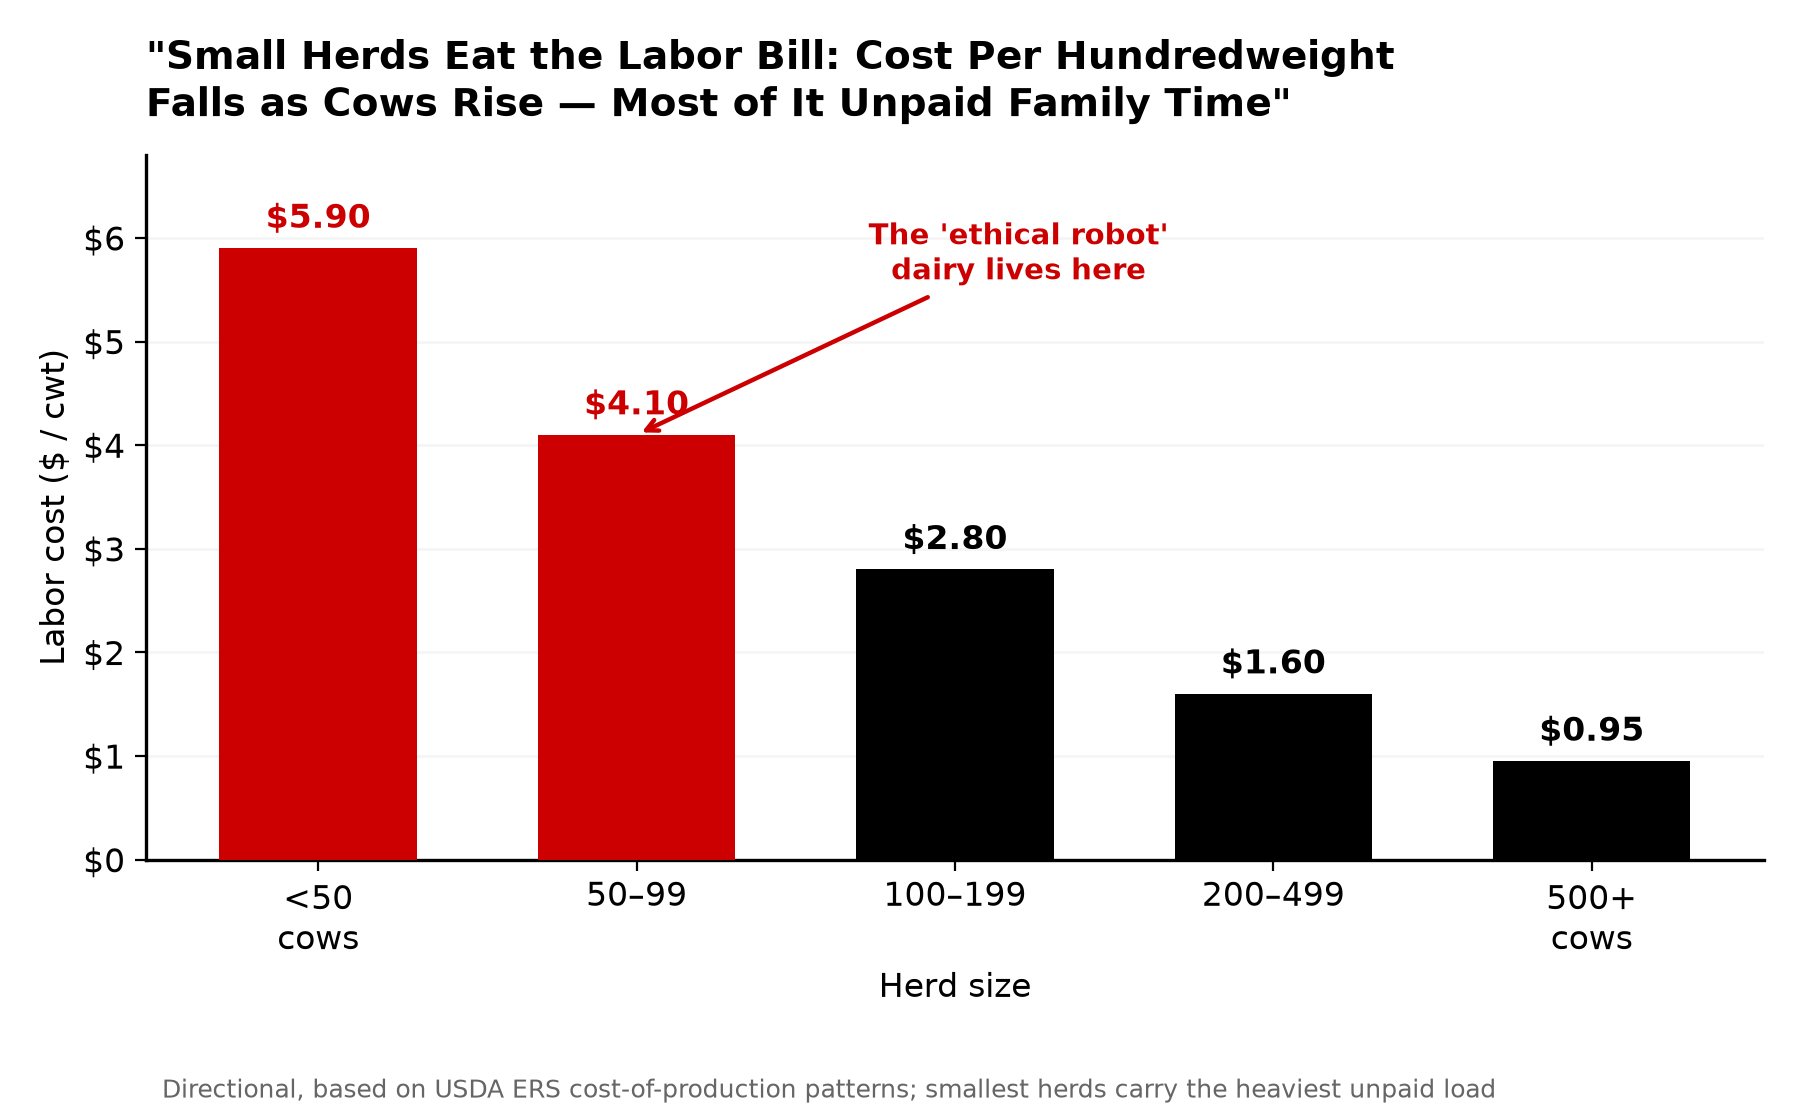
Here’s the part those threads never price. At 100 cows on commodity milk, that “ethical robot dairy” usually only balances because somebody’s labor is valued at zero. USDA’s Economic Research Service shows small herds carry far more labor cost per hundredweight than big ones — and on the smallest operations, most of it is the imputed value of unpaid family hours that never hit a payroll line. Robots don’t erase that line. They make it easier to pretend the time is free. Who’s actually paying for the “ethical” part is the question this whole story turns on.

What’s Changing and Why

Robotic milking has stopped being exotic. USDA’s ERS reports box robots milked about 6% of U.S. milk by 2021, with the fastest uptake on 150‑to‑499‑cow farms. And the headline finding everyone repeats holds up: in ERS’s June 2026 analysis, robotic milking raised dairy net returns by $3.15/cwt on average, relative to non‑adopters.

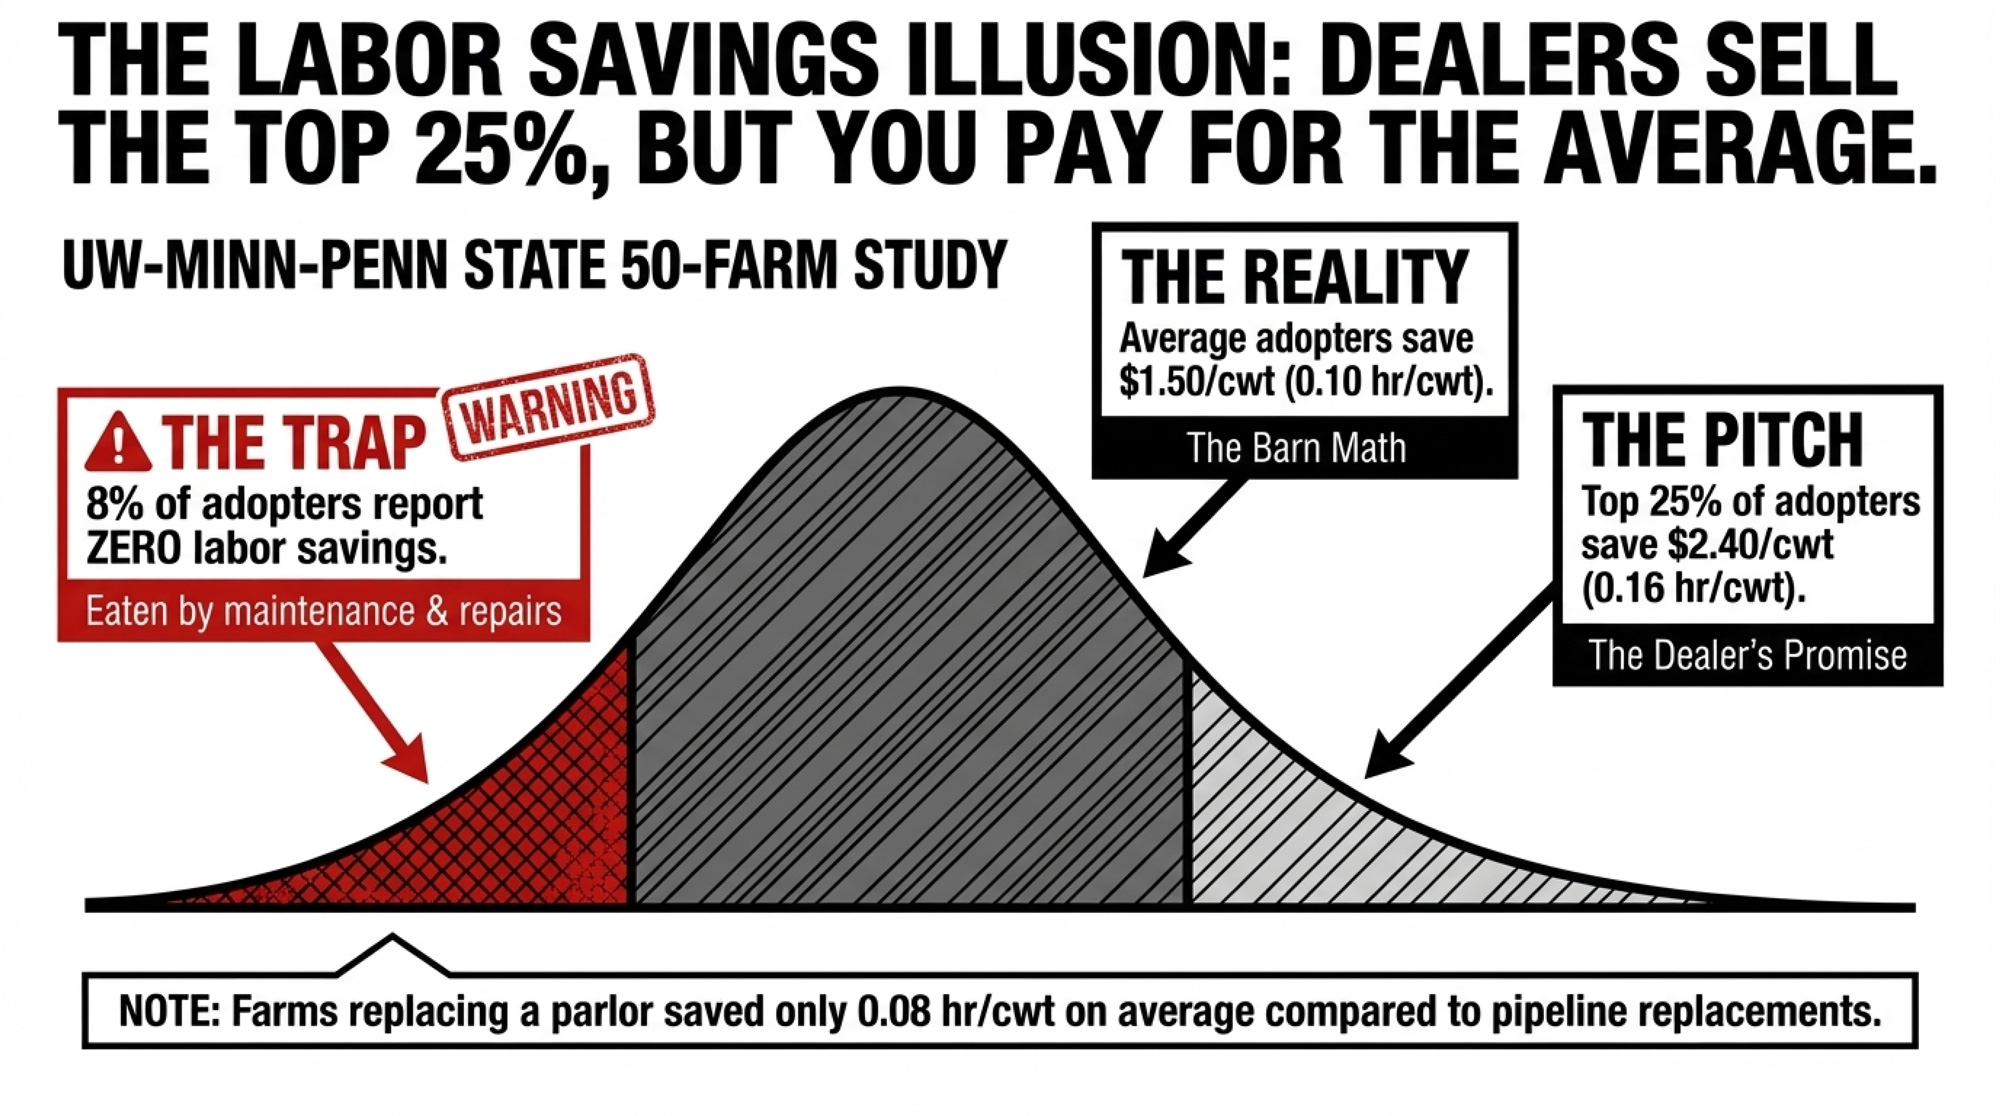
That number’s real. It’s just shown at the wrong resolution. ERS measures it as an average across adopters — and the strongest returns lean toward larger, well‑utilized herds, not the 80‑to‑120‑cow place. The “ethical robot” dairy that keeps getting shared online sits on commodity milk, often with no premium channel at all. That average wasn’t built on farms like that one.

So the farms most exposed to the gap are exactly the ones the humane‑dairy story celebrates — small, family‑run, welfare‑forward, betting on robots to make the lifestyle last. They’re not wrong that robots improve daily life. They’re wrong if they assume the average return shows up on their balance sheet just because they bought the box.

How This Plays Out on Real Farms

Iowa State extension economist Larry Tranel has run AMS cash flow for years, and his models tell the part the dealer’s payback chart skips.

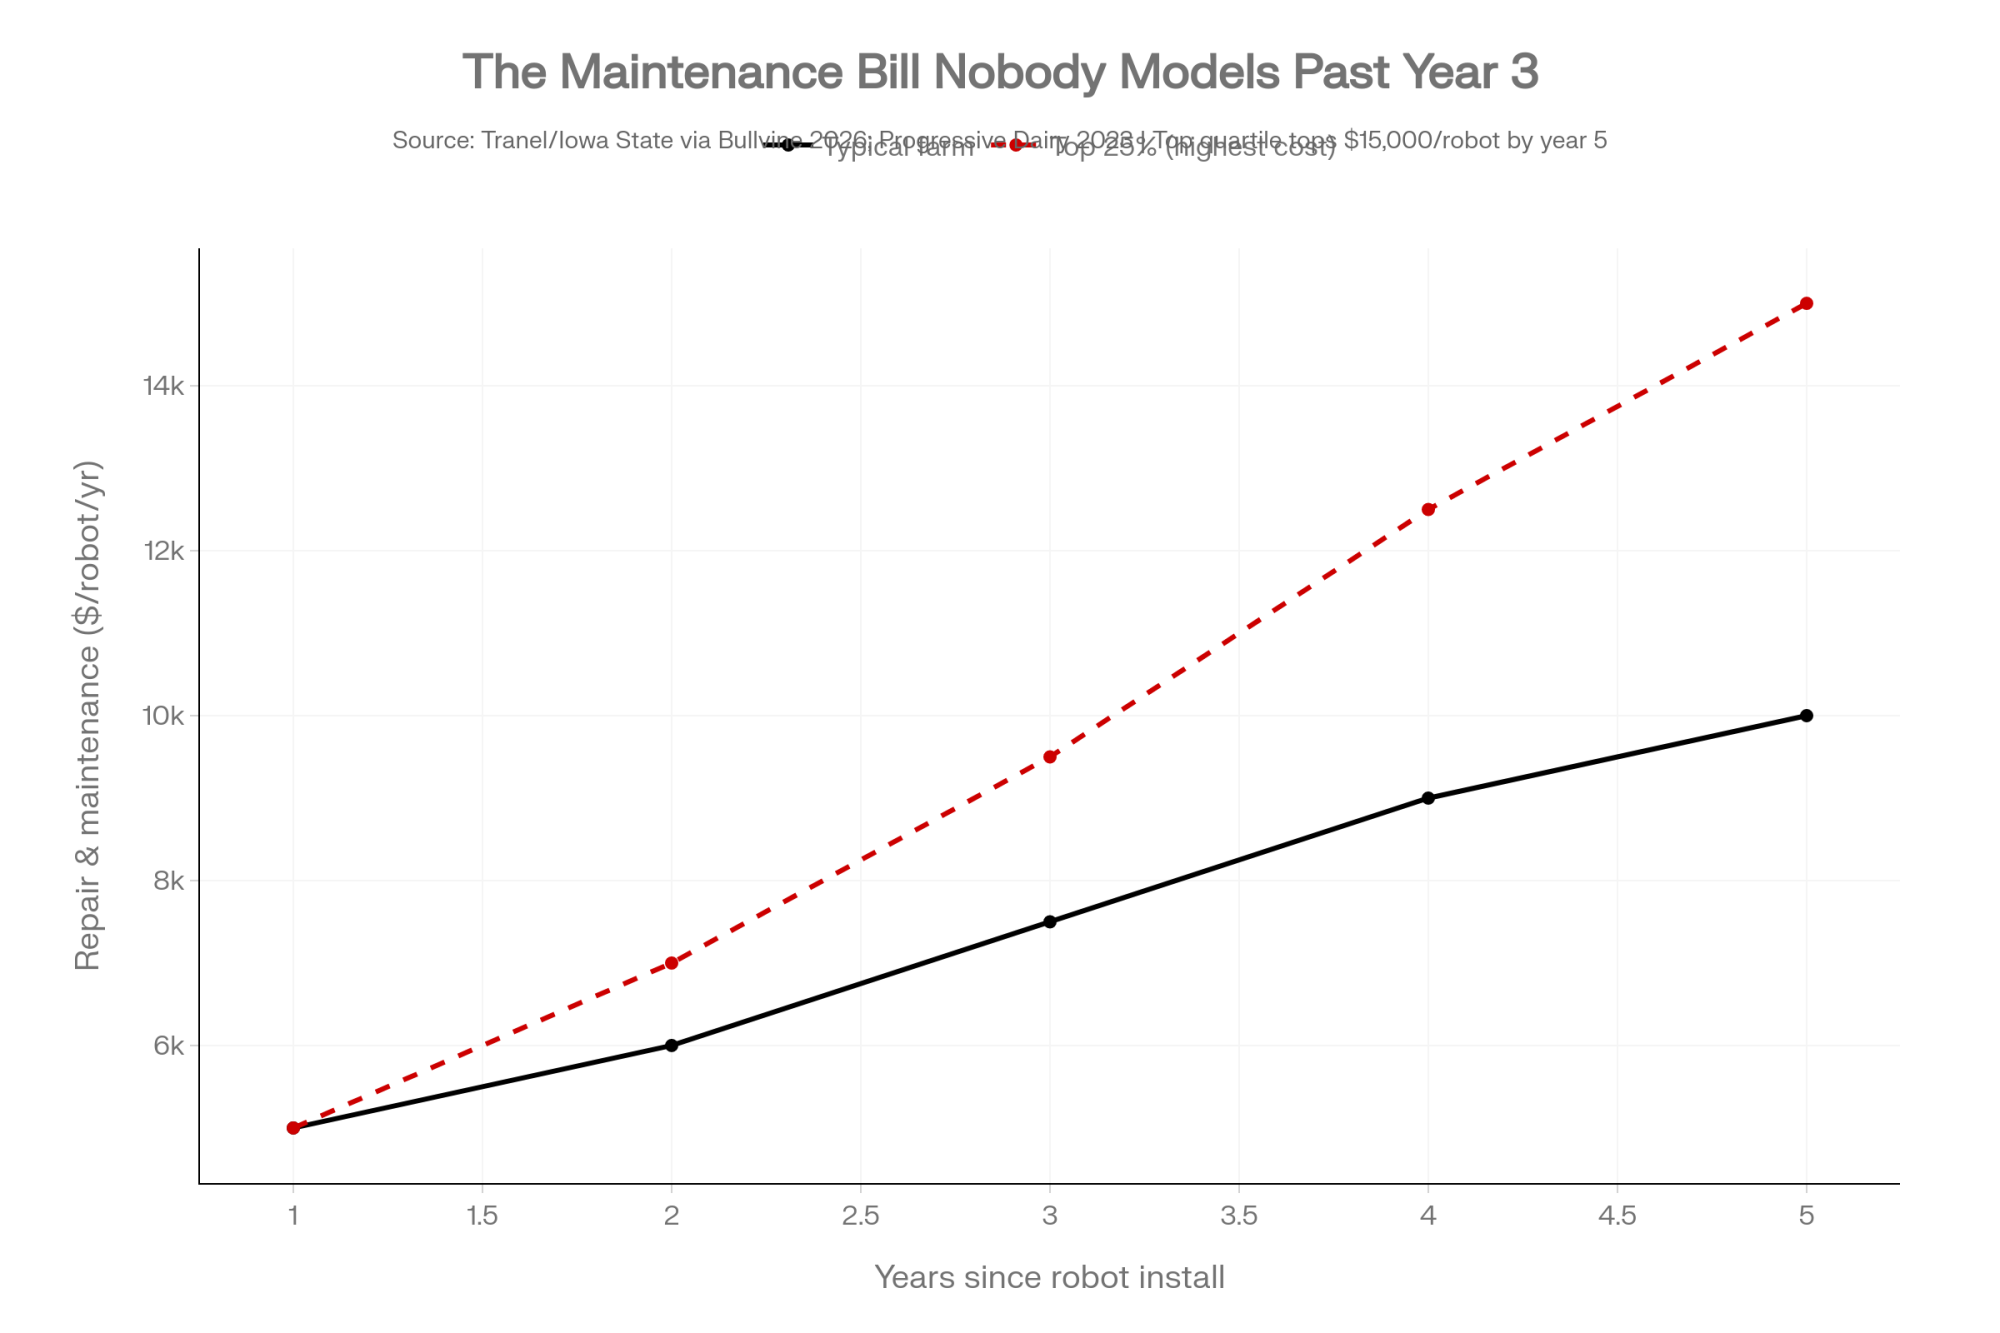
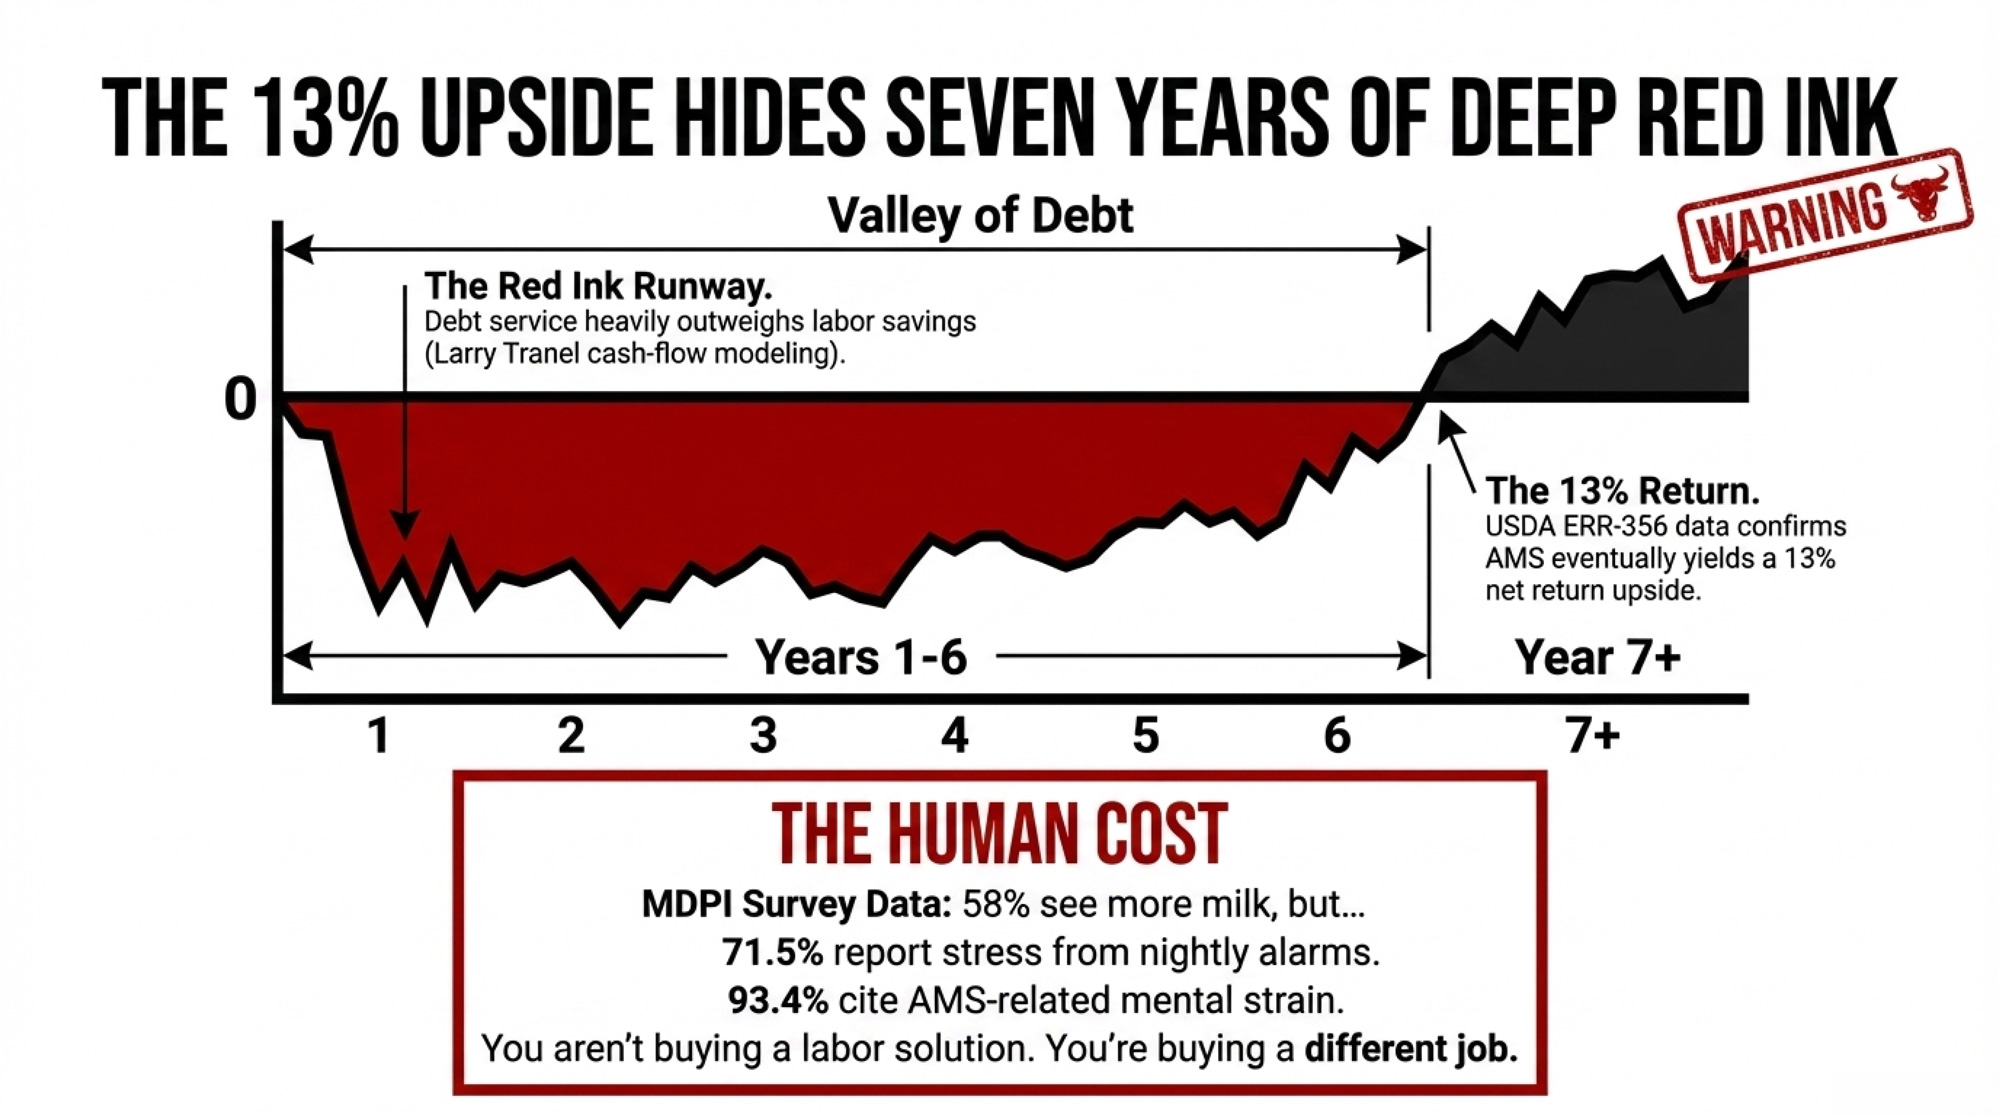
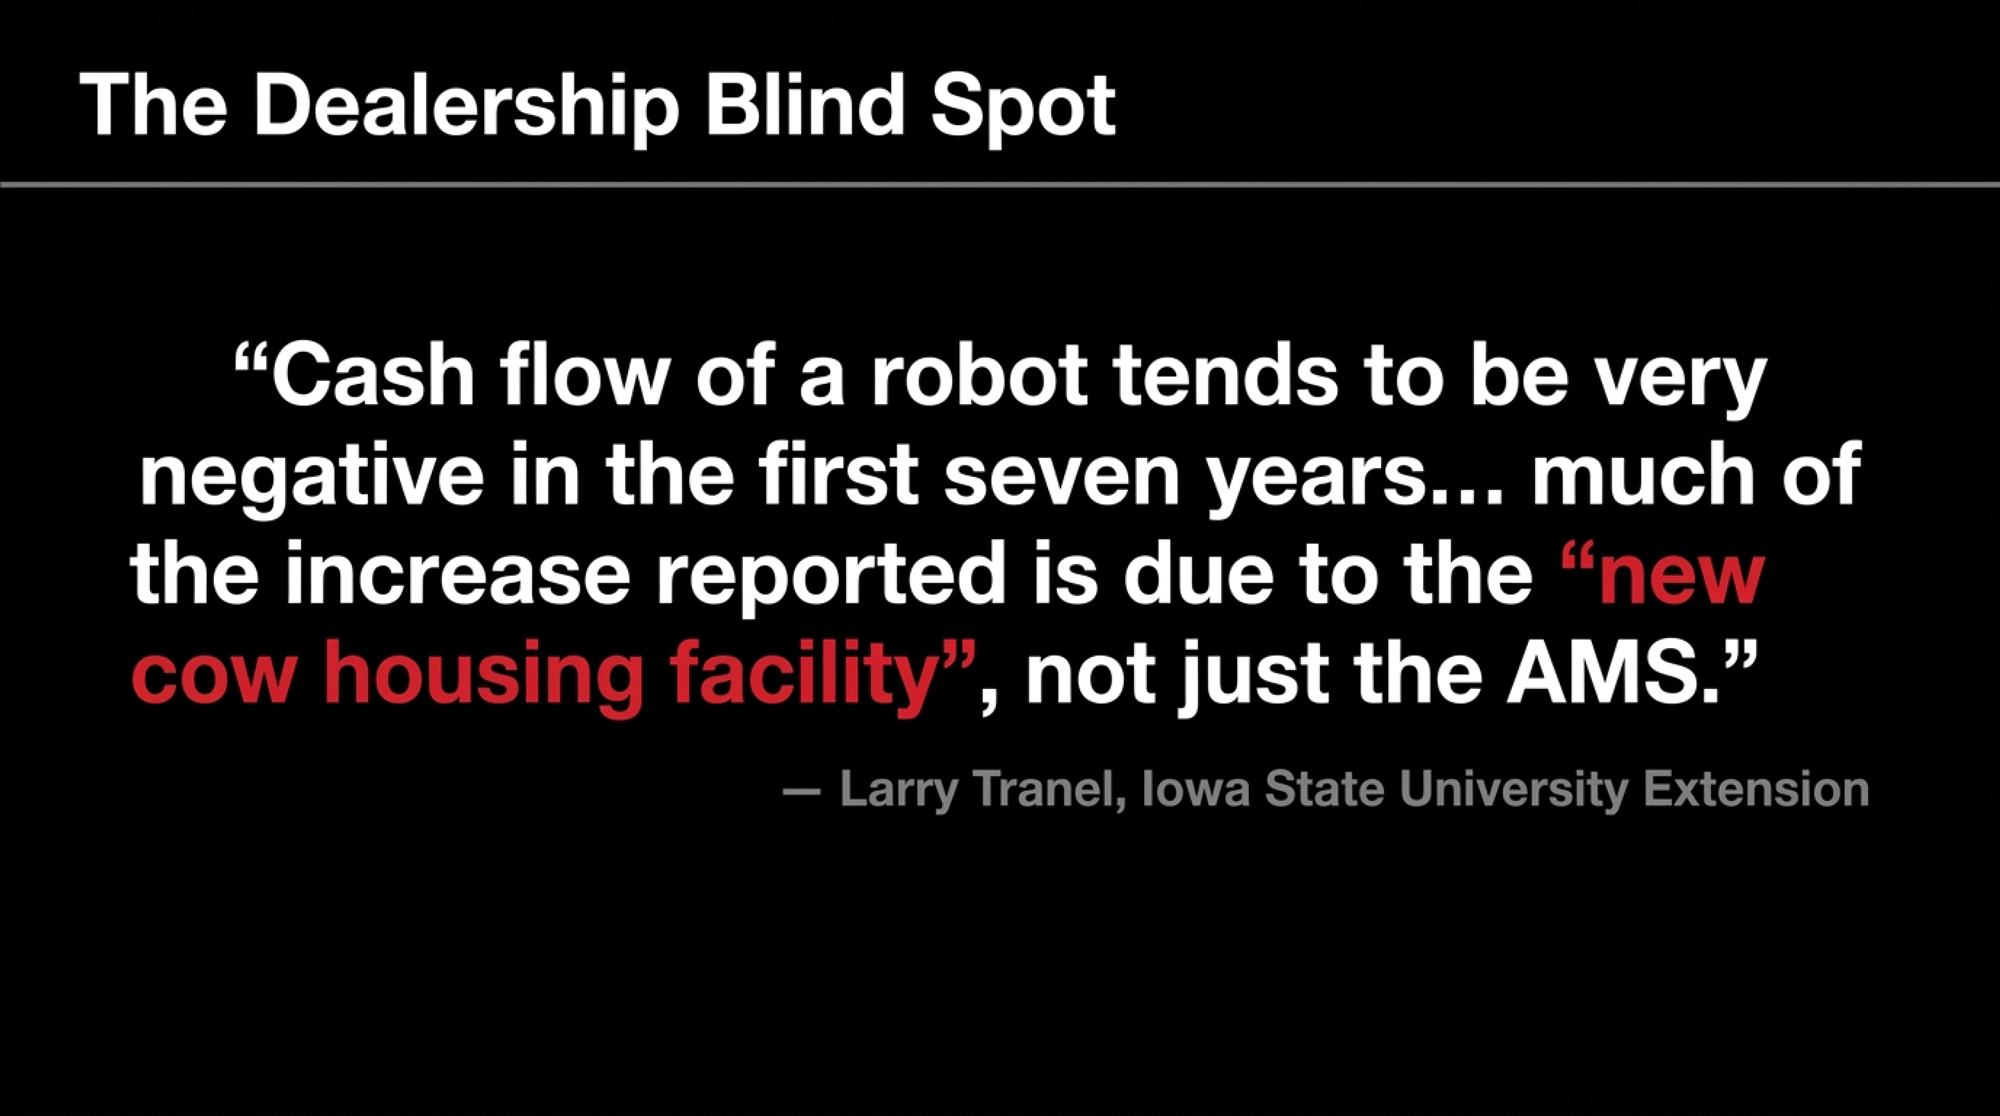
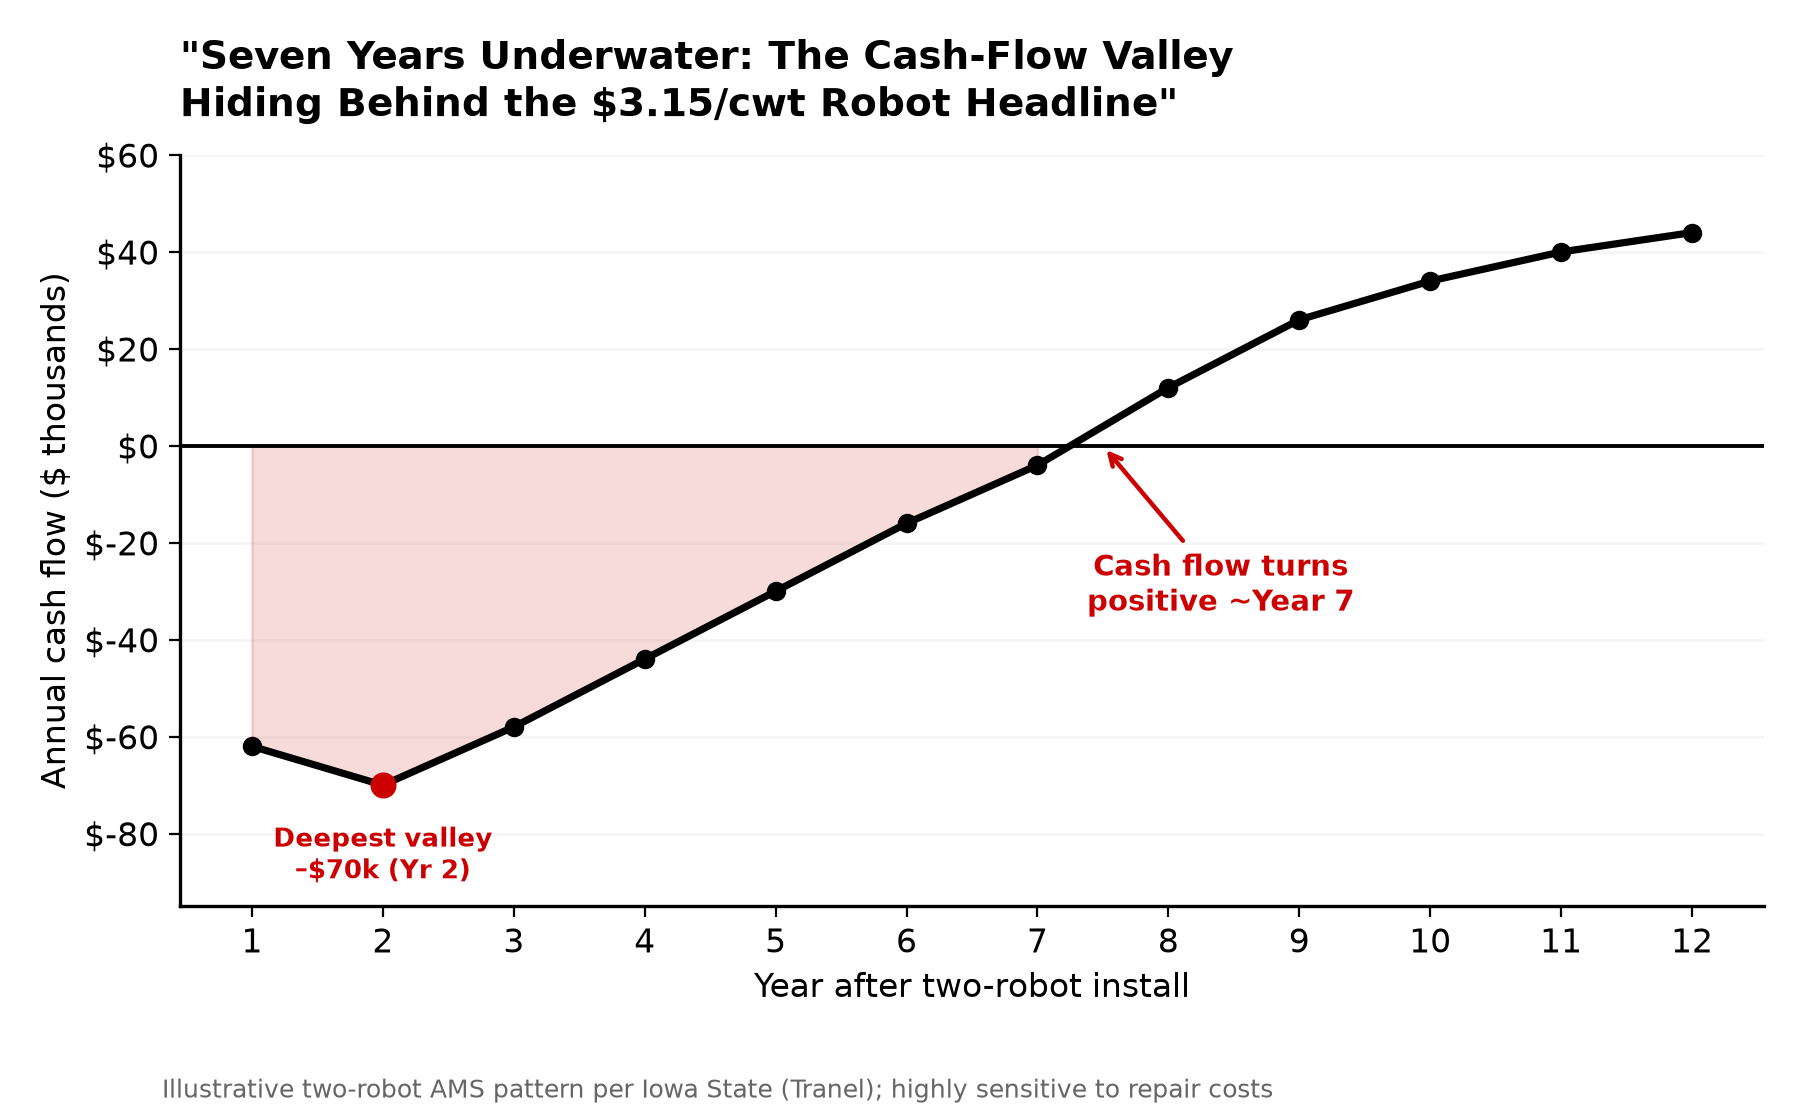
“Cash flow of a robot tends to be very negative in the first seven years, then pretty positive for the rest of the life of the AMS — but that is dependent on many variables, especially repair costs across the whole life of the robot.” — Larry Tranel, Iowa State University Extension.

Two robots plus barn work routinely lands a family $400,000 to $550,000 in new or refinanced debt. And there’s a trap hiding inside the production bump. Tranel warns that “much of the increase reported on AMS is due to the new cow housing facility, not just the AMS, as new facilities often increase production 6 to 8 percent over old, worn‑out facilities.” In plain terms: families credit the robot for gains the new barn delivered, then build their projections on repeating them.

Smaller robot stories can work — but rarely on the dairy alone. The ones that hold together almost always have a second income stream quietly carrying the cash‑flow valley. Marcus and Paige Dueck of Four Oak Farms near Kleefeld, Manitoba are the cleanest example you’ll find. When Western Canada’s first rail‑mounted Robomax milker rolled into their old tie‑stall barn in July 2020, it wasn’t a freedom play — it was a math problem. “My parents were looking to slow down their involvement in the barn, we had a new baby, and we had to make a decision,” Marcus told Farm Forum. “Expanding just wasn’t a financially feasible option.”

Notice what they didn’t do. They didn’t scale up to chase the robot’s economics — they kept a herd of about 50 cows and changed almost everything else. They swapped Holsteins for Brown Swiss, betting on temperament and component premiums over volume. “You don’t need more cows,” Marcus says. “You just need the right cows — ones that make milk that pays better.” Production per cow climbed roughly 40% over five years, driven by a shift to three‑times‑a‑day milking and cow‑level data — not more animals.

The dairy alone still wouldn’t carry it, and the Duecks are blunt about that. Half their roughly 900 acres goes to a high‑value hay business aimed at performance‑horse owners across Canada and the U.S., built around a German composite baler nobody else in their market runs. The other half is cash crop. On top of that sits Four Oak Ag Solutions, a manure‑and‑nutrient consulting firm Marcus grew from helping one neighbor with a manure plan. “In dairy, you can’t have all your eggs, or your milk, in one basket anymore,” he says. That diversification — not the robot — is what makes a 50‑cow operation work. It earned them Manitoba’s 2024 Outstanding Young Farmers title and a philosophy worth stealing: “We see a lot of farms chasing size, not sanity,” Paige says. “You can scale without losing peace.” Their model is the exception that proves the rule — robots fit inside a diversified business; they don’t rescue a bare commodity dairy.

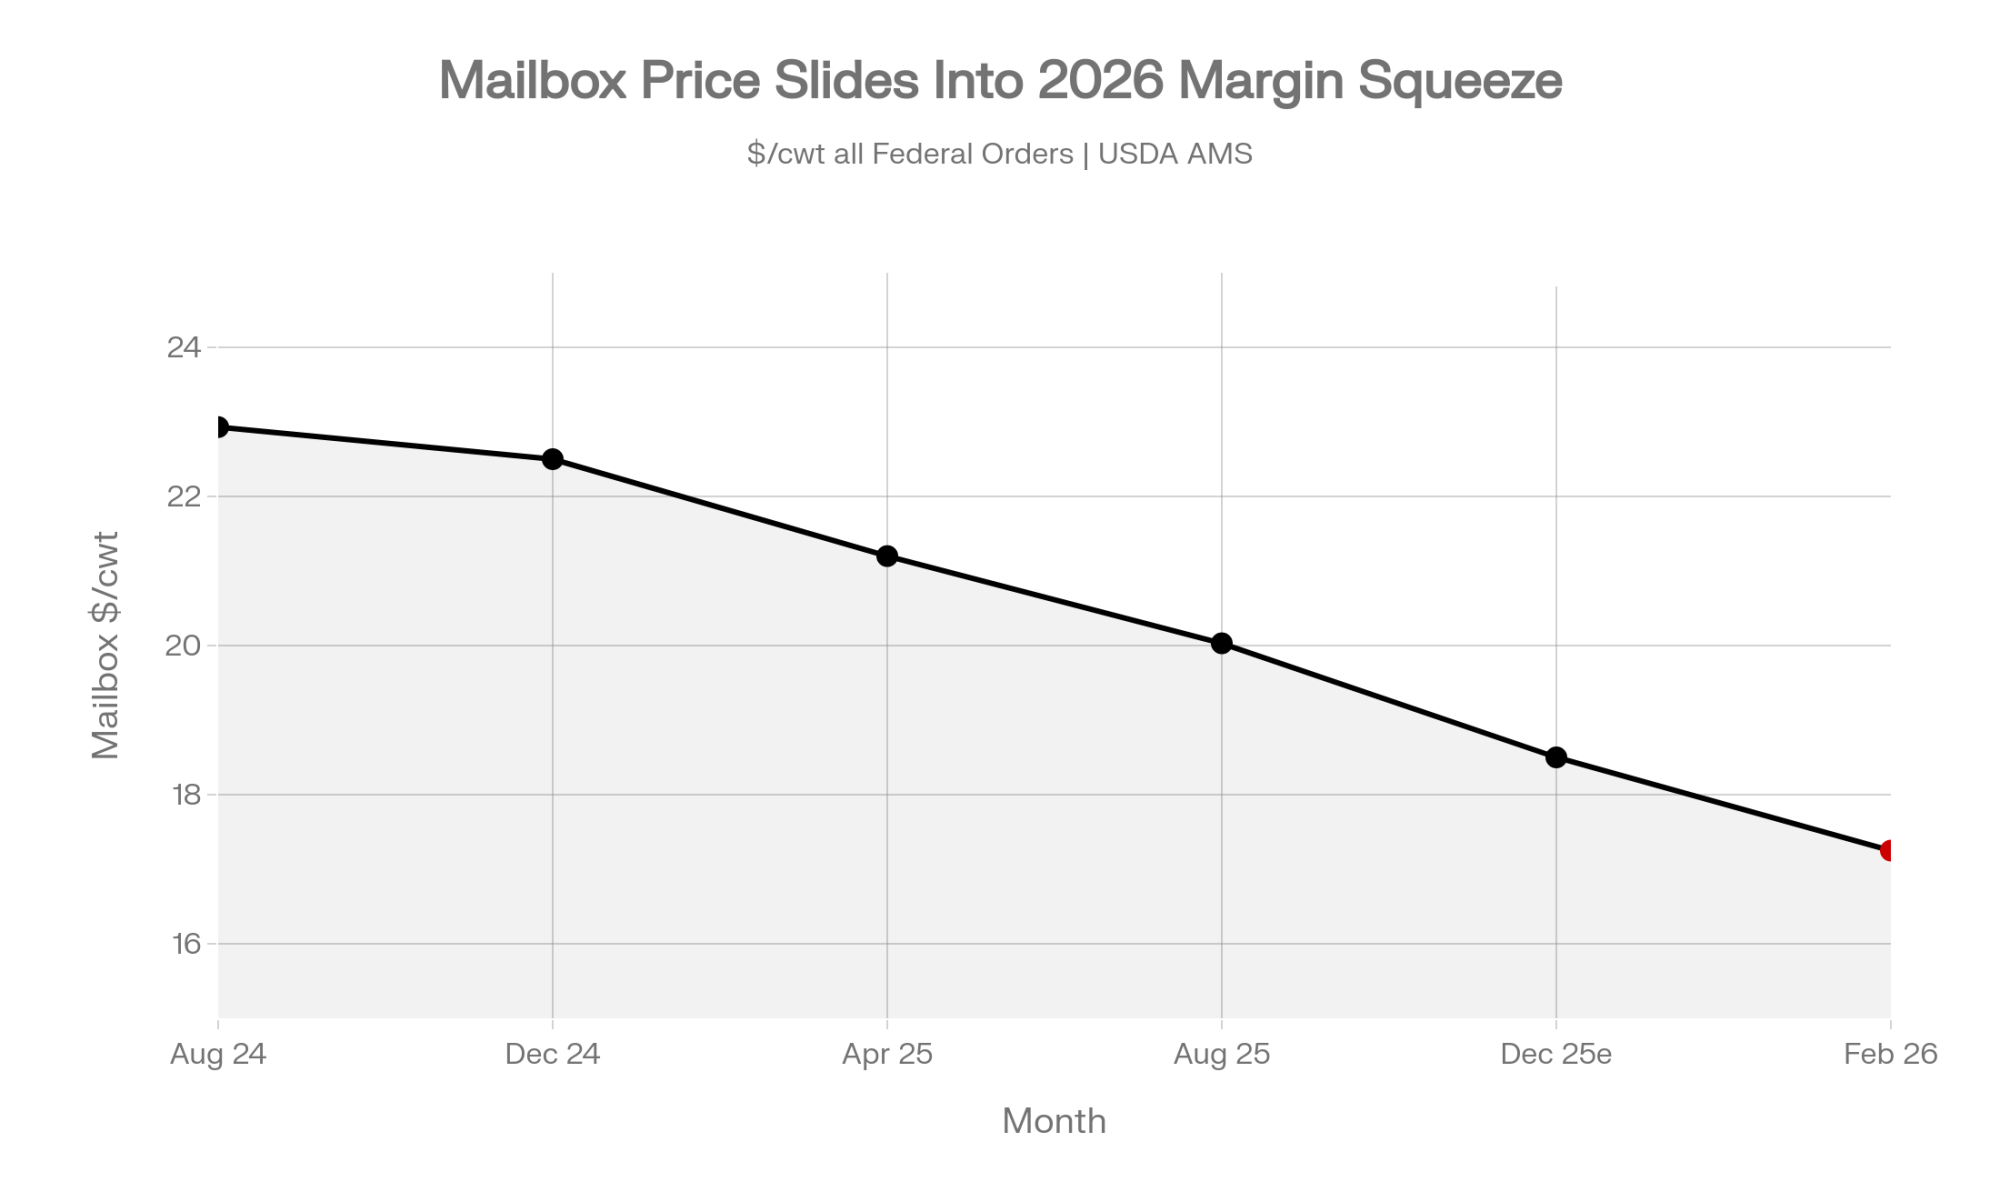
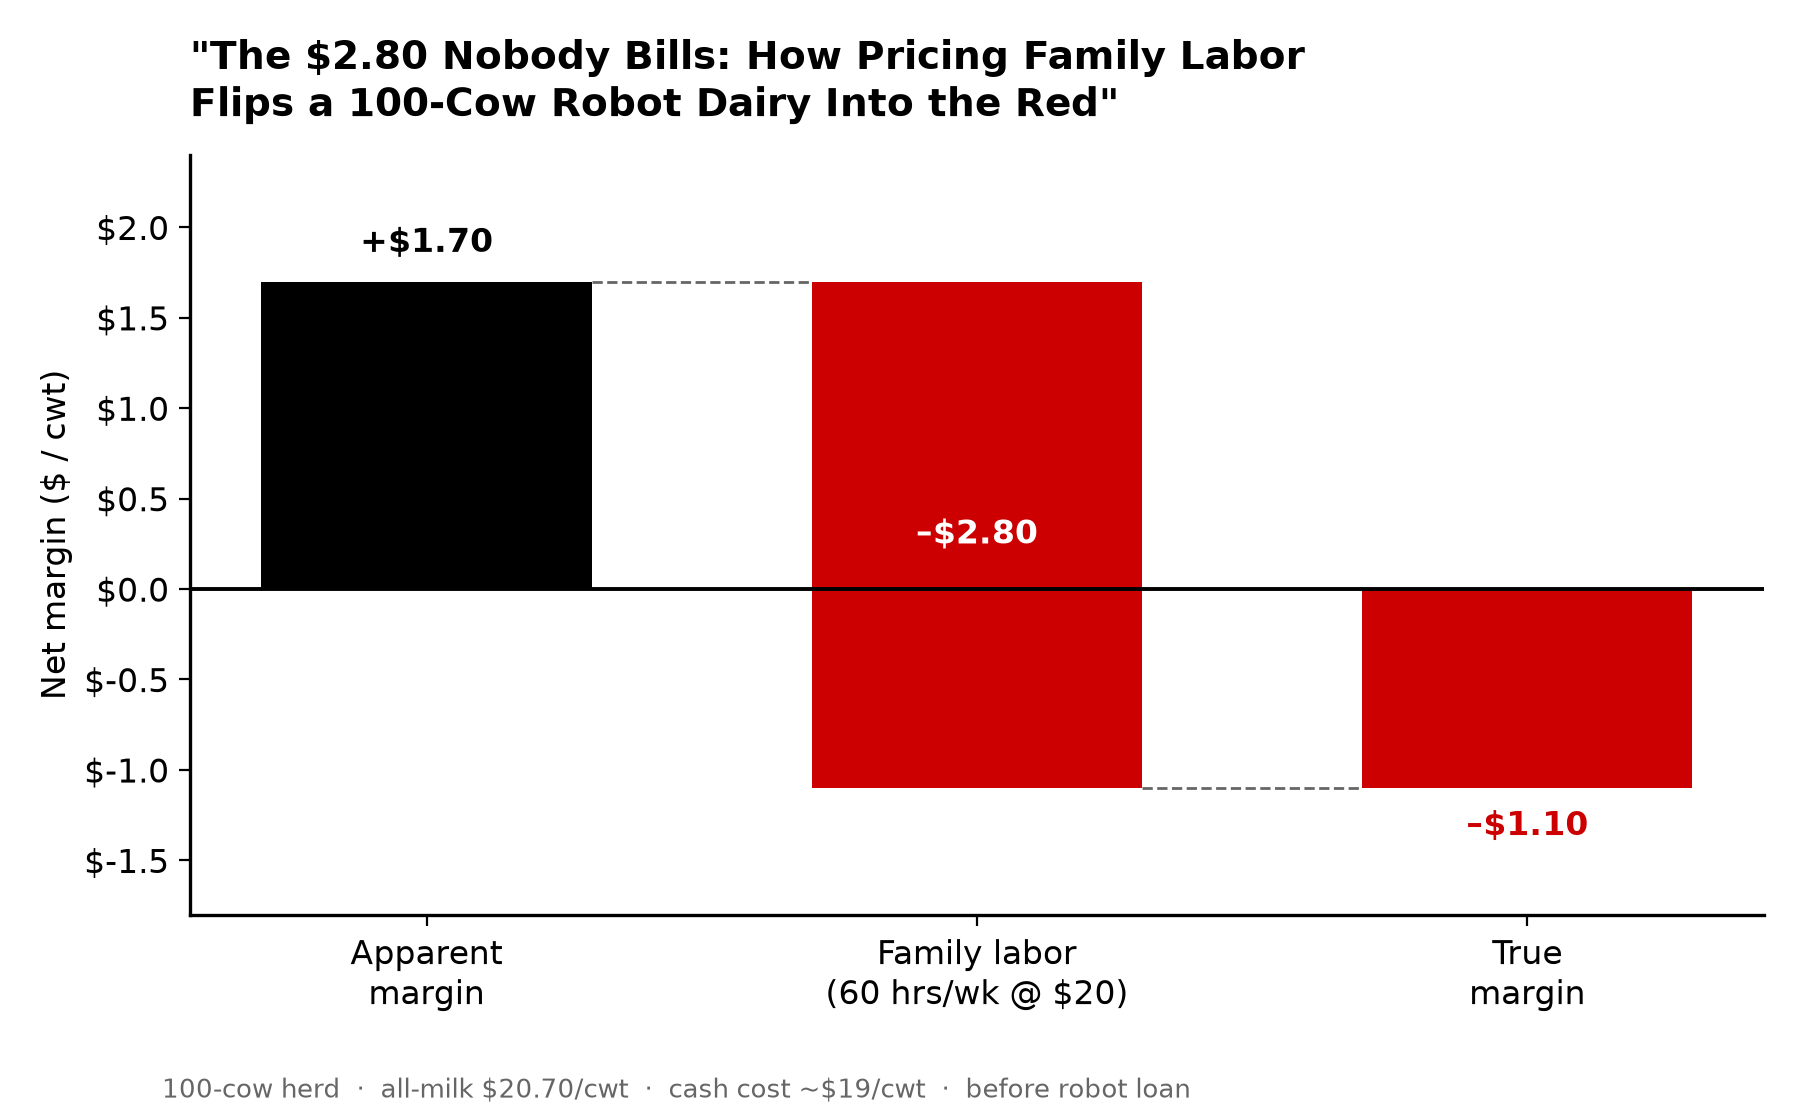
Now the micro barn‑math that should stop the room cold. USDA lowered its 2026 all‑milk forecast by 55 cents in June to $20.70/cwt, and the market’s still drifting. Say your 100‑cow place runs cash costs near $19/cwt and looks like it’s clearing a couple of dollars. Then you price the family hours honestly.

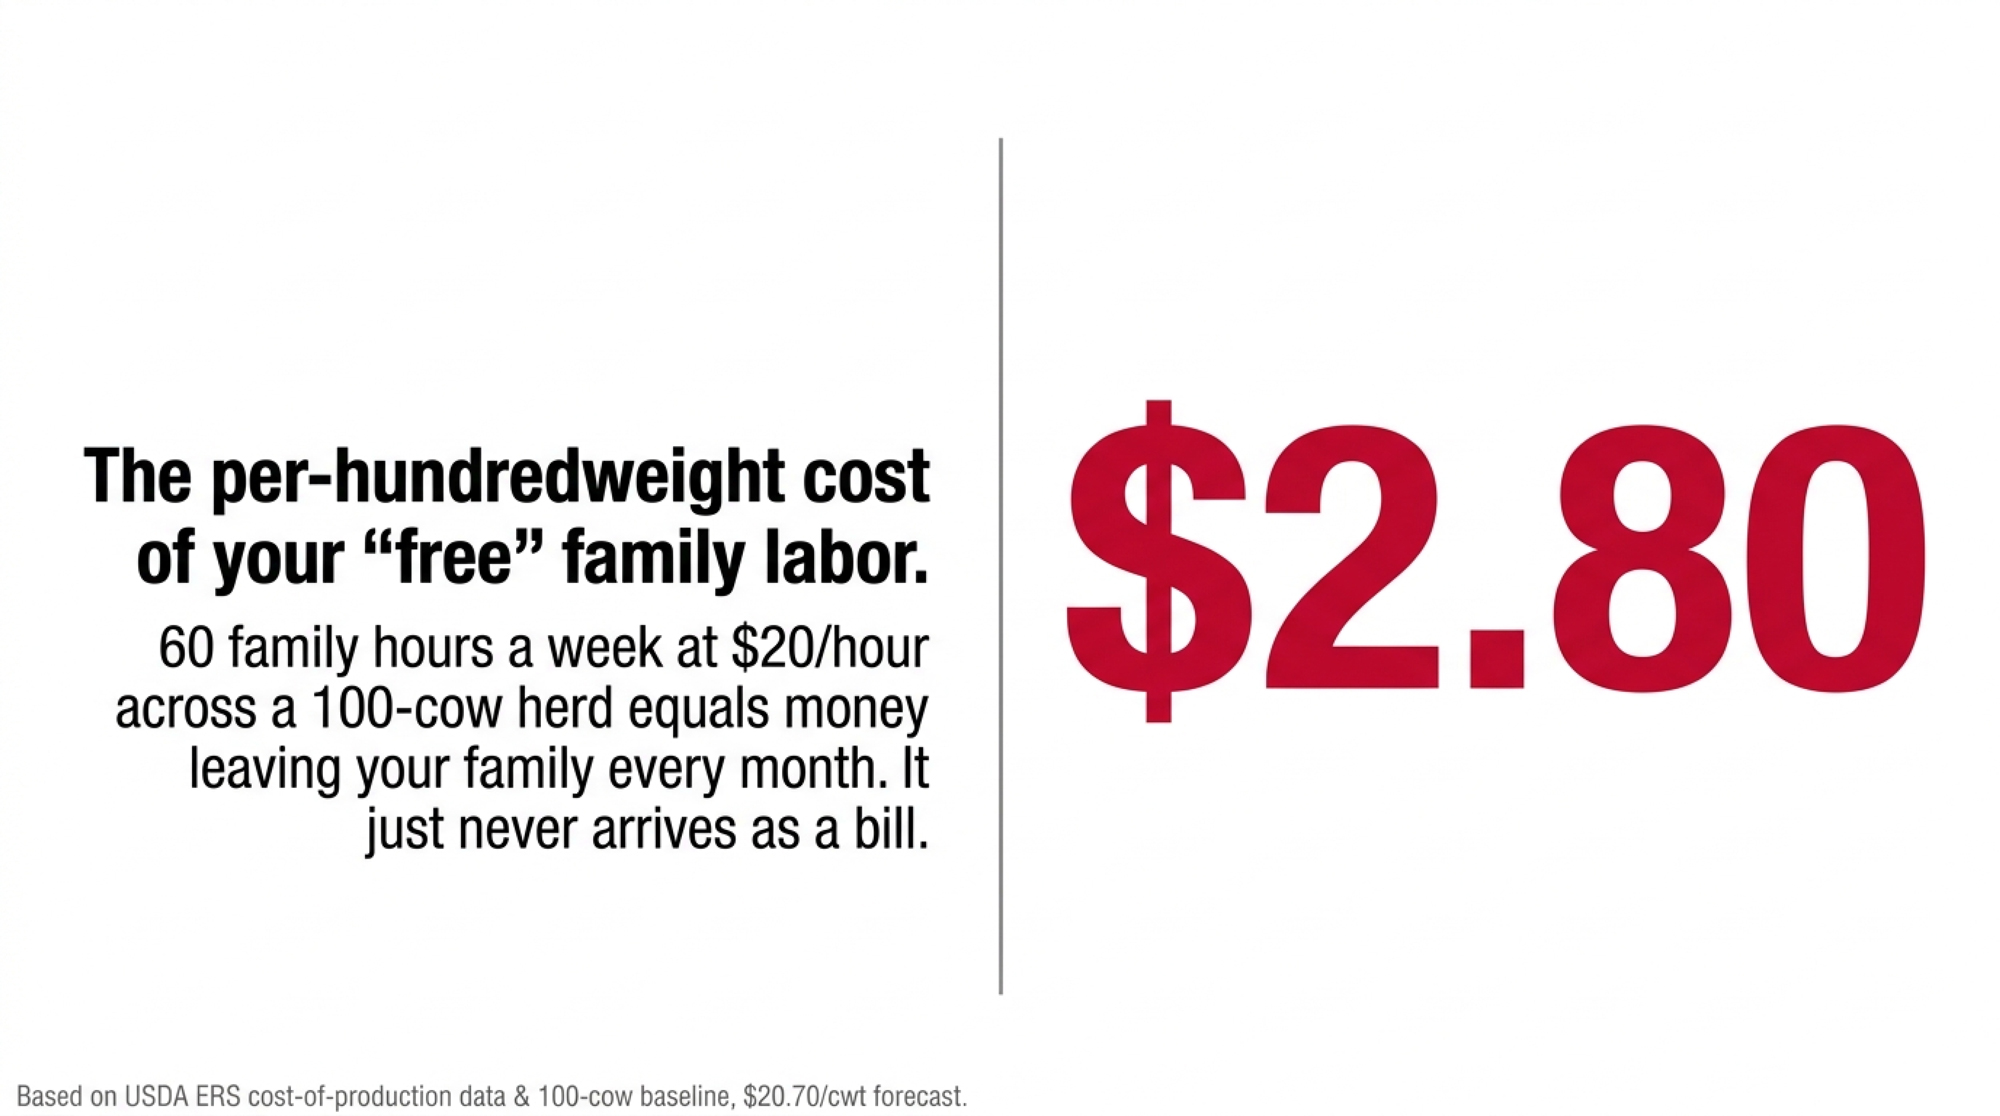
Run your own version: 60 family hours a week at $20/hour is about $62,400 a year — spread across roughly 2.2 million lbs of milk, that’s near $2.80/cwt you’re absorbing before you’ve paid a robot loan. ERS’s own cost‑of‑production work shows the smallest herds carry the heaviest labor load per hundredweight, much of it unpaid family time. Add that real labor bill back, and a comfortable‑looking margin can flip negative in a hurry. On 100 cows, that’s money leaving the family every month. It just never arrives as a bill.

The Mechanics Behind the Outcomes

Three hidden subsidies make the ethical robot story pencil on paper. None of them show up in the brochure, and all of them are load‑bearing.

Hidden SubsidyWho Pays ItWhat The Data Says
Unpaid family laborMom, the kid, the farmer at hour 14Robots cut milking labor 21%+, but U. of Minnesota found robot herds less profitable per cow — the edge only appears per full-time worker
Paid-off land / off-farm incomeThe second business or the mortgage-free balance sheetFour Oak Farms carries the cash-flow valley on hay + consulting income — not the robot
Welfare premium that never arrivesThe farmer’s conviction, priced at commodity70% say they’ll pay more; only 14% trust the label; 60% think brands are “just pretending”
  • Unpaid family labor. Robots cut hands‑on milking sharply — adopters in one multi‑box study reported labor‑cost cuts of over 21% — but they shift the rest of the work from physical to managerial and on‑call: the 2 a.m. alarm, the software, the fetch cows. University of Minnesota work found robot herds were actually less profitable per cow than conventional herds; the advantage only showed up once profit got measured per full‑time worker. Robots make your people more productive. They don’t make the labor free. They make it invisible.
  • Paid‑off land or off‑farm income. The small robot farms that genuinely work tend to own their ground outright or run a second paycheck that quietly absorbs the cash‑flow valley. The Duecks’ hay and consulting income is exactly this — and they’ll tell you so. That’s an exception worth naming honestly, not a model to bolt onto a leveraged start‑up.
  • The welfare premium that never reaches the milk cheque. A November 2025 study in the Journal of Dairy Research found 70% of consumers say they’ll pay more for animal‑welfare‑certified dairy. But only 14% of U.S. consumers fully trust sustainability claims on labels, and 60% figure companies are “just pretending.” The farmer carries the cost and the conviction of high‑welfare care while the market prices it at commodity. The handful who capture real premiums — Jasper Hill, Maple Hill, Alexandre Family Farm — do it through certification and brand, not by owning a robot.
MetricFigureWhat It Means For The Cheque
Consumers who say they’ll pay more for welfare-certified dairy70%Stated intent — the brochure number
Consumers who fully trust sustainability label claims14%Intent evaporates without a trusted third party
Consumers who think brands are “just pretending”60%Baseline skepticism working against you
Consumers emphasizing third-party certification (American Humane, 2024)67%No independent label = no reliable premium

How Much Does Your “Ethical” Story Cost Once You Price the Labor?

Run the reality check this month. Three questions, three numbers, and you’ll know more than most operators who’ve already signed.

What’s your true cost per cwt at your actual cows‑per‑robot utilization — not the dealer’s glossy target? How many unpaid family hours are propping up the story, and what are they worth at your local wage? And what premium per cwt would a processor or direct customer need to pay before the welfare narrative covers its own freight? If you can’t answer all three, you don’t yet know whether you own a business or a very expensive family project. Where does your breakeven actually sit right now?

Want to go deeper on that first number? See why small herds carry the heaviest labor cost per hundredweight.

Is the Robot the Reason Your Kids Stay — Or the Reason They Can’t Leave?

The succession pitch is powerful, and it’s not cynical: your kids won’t have to milk at 4 a.m. There’s real signal behind it. Bullvine’s own reporting has tied a tech‑savvy, balanced approach to a sharp rise in next‑generation interest — one figure put it as high as a 340% jump, though that stat traces to a single source and is best treated as directional, not gospel. Robots can genuinely make dairy a life a young person chooses instead of endures.

But technology doesn’t fix succession — economics and planning do. Only a small fraction of family operations survive to the third generation, and a robot doesn’t change those odds. When a heavily leveraged robot barn becomes the reason the next generation signs on, the “freedom” can quietly turn into a golden handcuff. They didn’t inherit cows and choice. They inherited $400,000‑plus in tech debt and an obligation to make it pay. The robot keeps them on the farm. It doesn’t necessarily keep the farm viable past their watch.

Options and Trade-Offs for Farmers

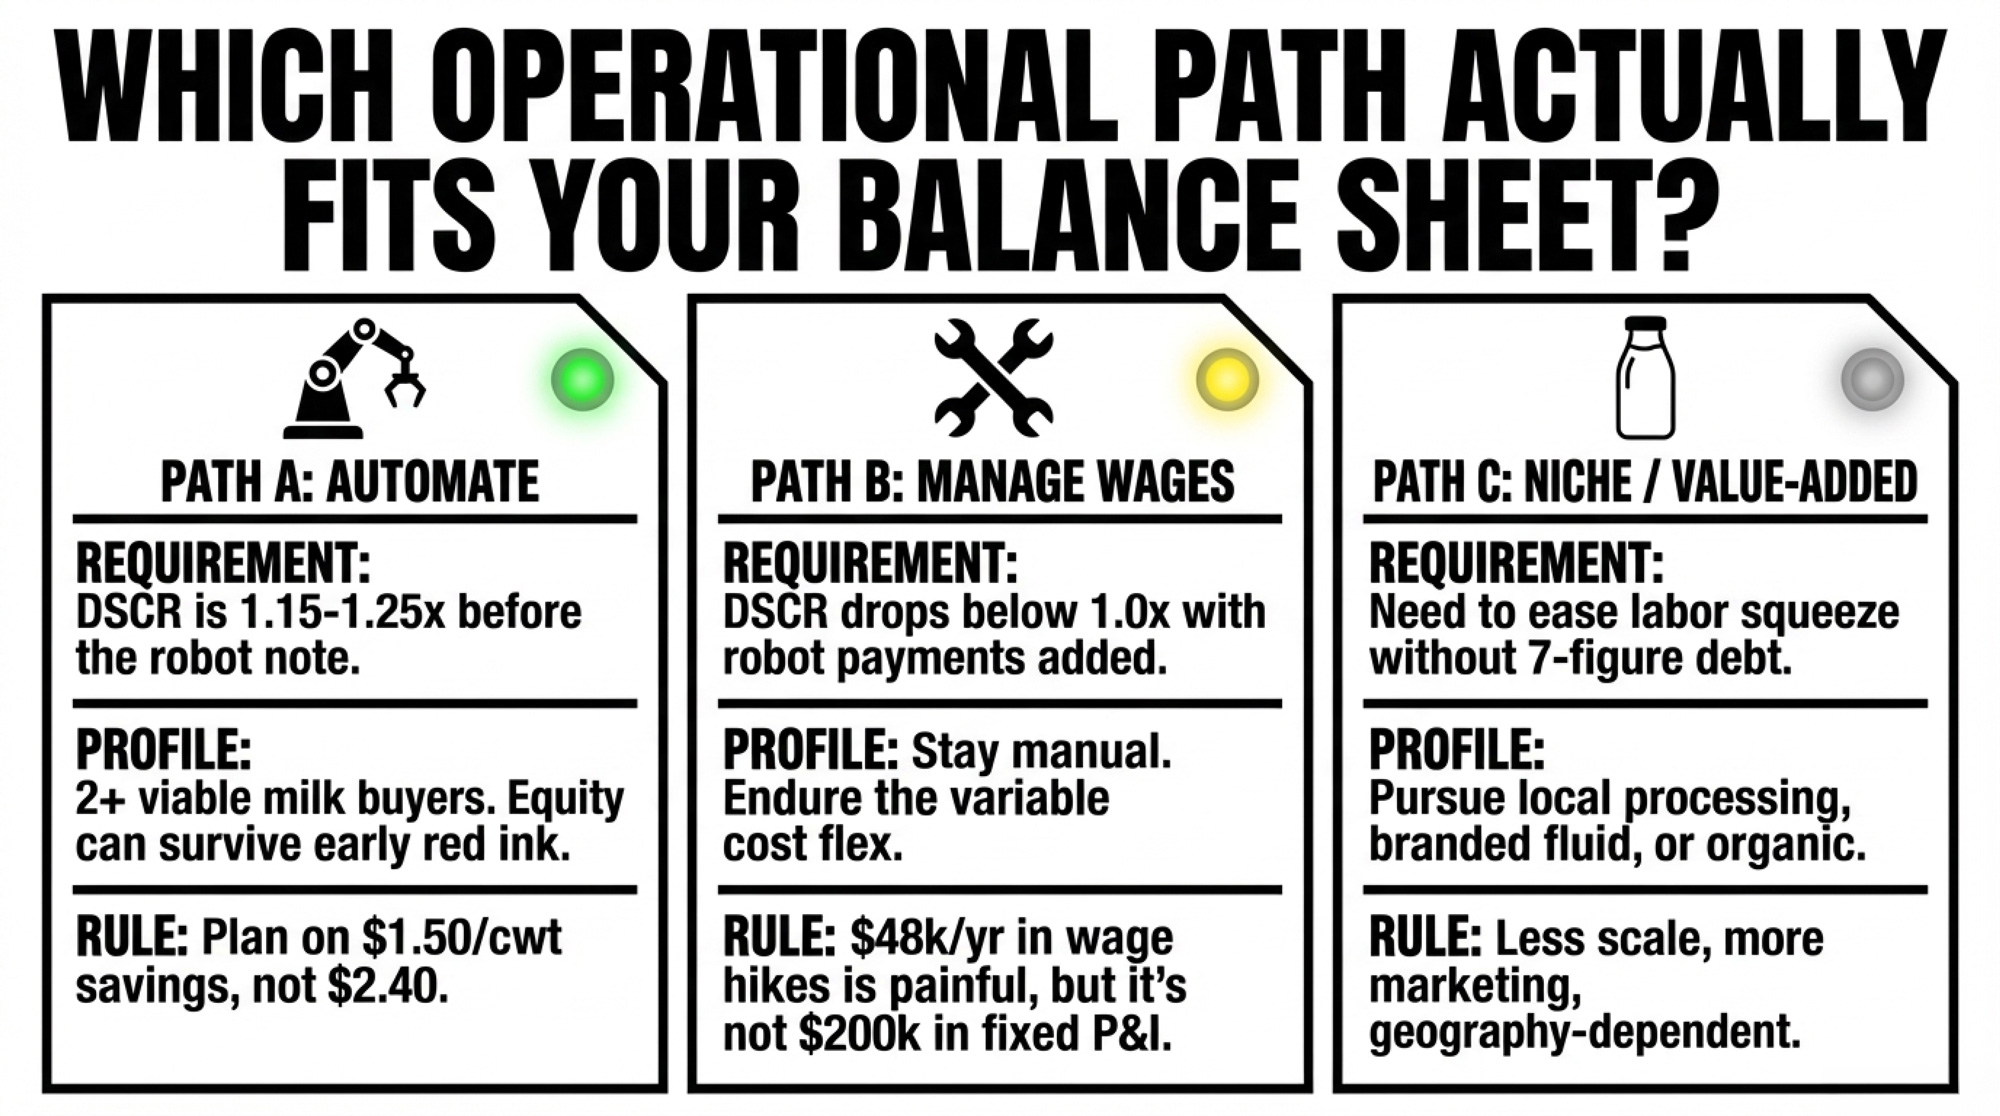
There’s no single right answer here. There are three honest paths, and your own math points to the one that fits.

PathWorks WhenRequired ConditionThe Risk
1 — Scaled, cost-competitiveClimbing toward larger, well-utilized herds~55 cows/robot utilization; labor valued at $27.05/hr breakevenBelow ~140 cows on commodity milk, the math rarely closes
2 — Robot + 2nd income / real premiumYou have a genuine second business or a paying market channelThe Four Oak model: diversified revenue + component-premium breedWTP collapses at checkout — 67% demand third-party certification
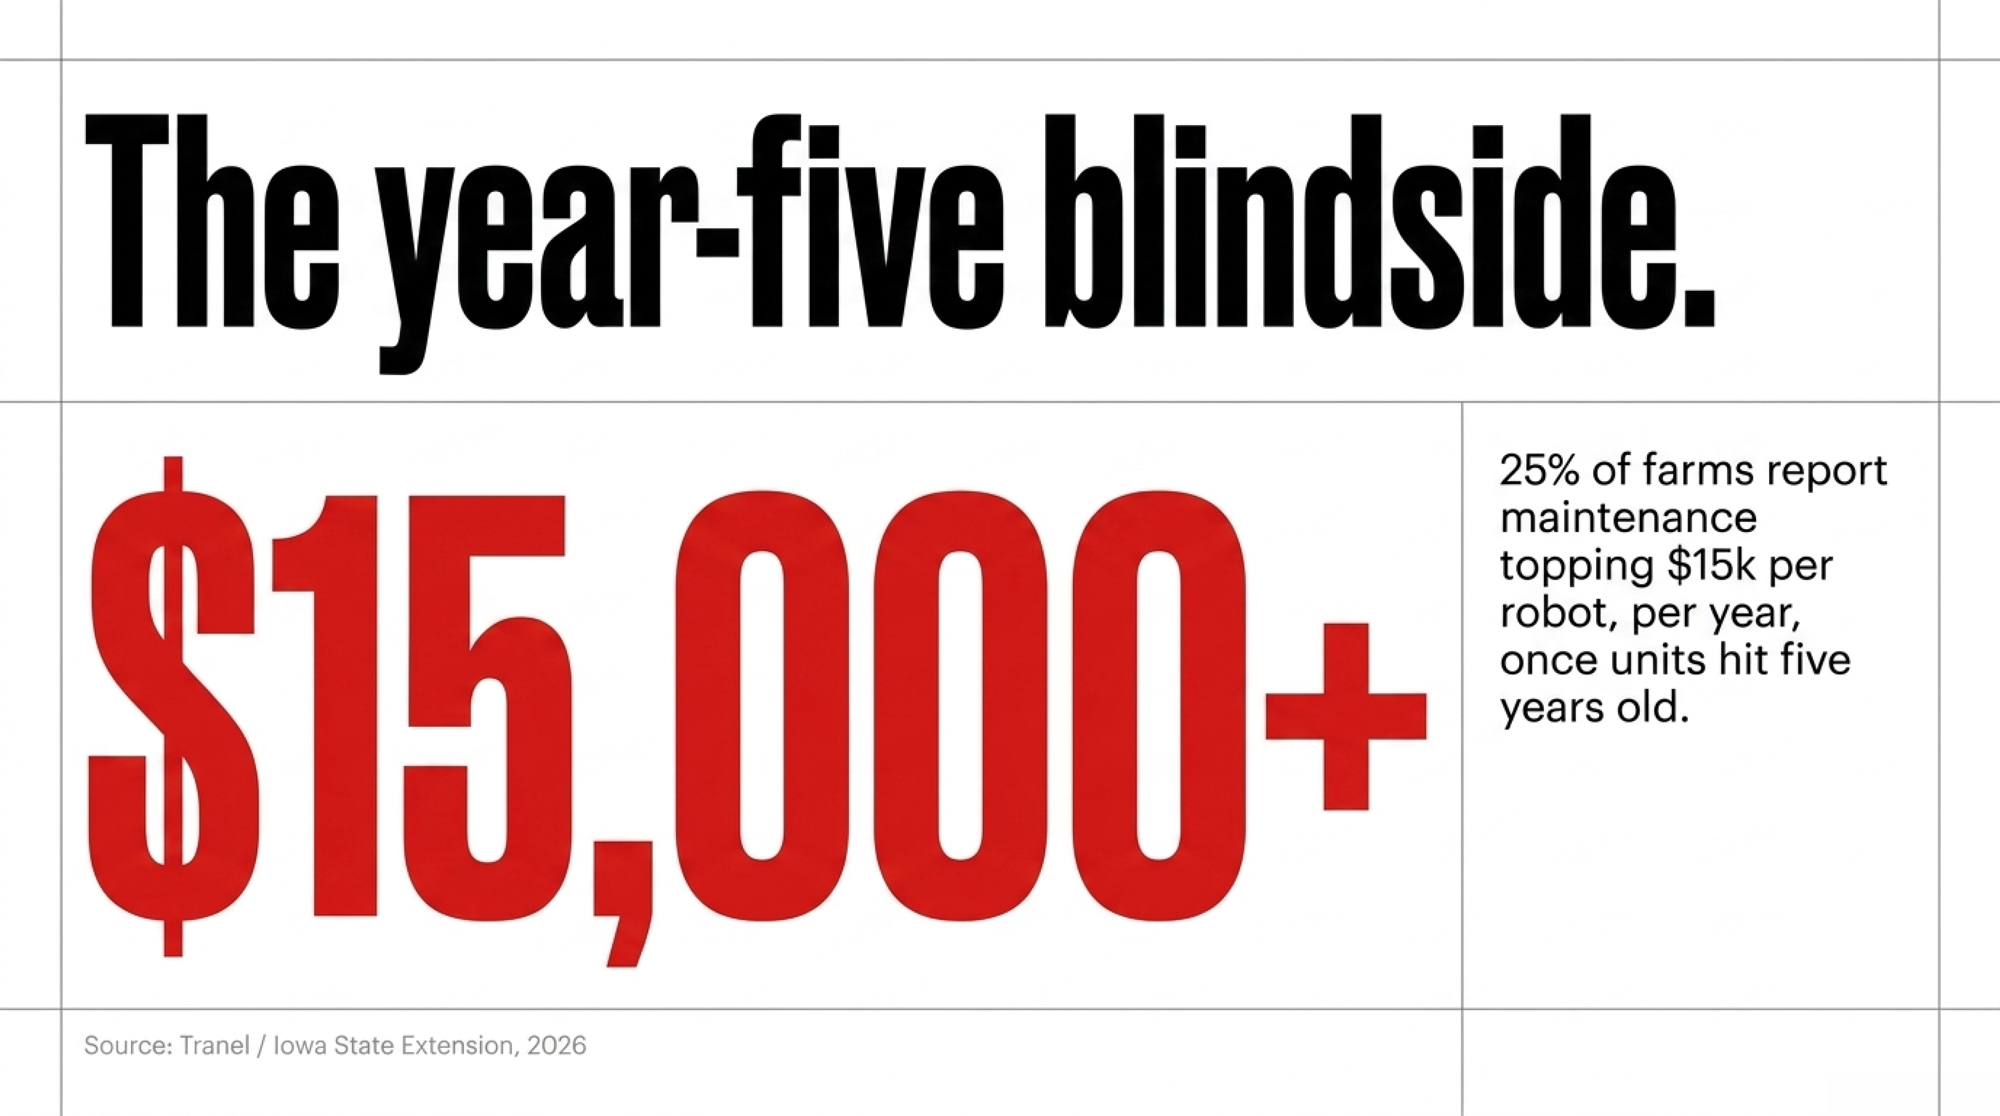
3 — Stop pretending robots fix itStructurally negative 100-cow operationRun true cost/cwt with family hours priced inWaiting 18 months too long burns ~$575,000 in equity
  • Path 1 — Robots as a scaled, cost‑competitive system. Makes sense if you’re climbing toward the larger, well‑utilized herd size where ERS sees the strongest returns, with utilization near the 55 cows per robot extension benchmarks favor. Requires ruthless cost tracking and labor valued at market — University of Minnesota pegs the breakeven labor cost around $27.05/hour. The risk: below roughly 140 cows on commodity milk, the math rarely closes.
  • Path 2 — Robots plus a second income or a real premium. This is the Four Oak Farms model — a robot paired with diversified off‑farm revenue (the Duecks’ hay business and Four Oak Ag Solutions consulting) and a breed strategy built on butterfat and protein premiums rather than volume. Requires either a genuine second business or a market channel paying a measurable $/cwt over commodity. The risk: stated willingness‑to‑pay collapses at the checkout without a trusted third‑party label — 67% of consumers in American Humane’s 2024 survey specifically emphasized third‑party certification.
  • Path 3 — Stop pretending robots fix an unprofitable commodity dairy. Sometimes the honest move within the next 30 days is to run your true cost per cwt — family hours priced in — and accept that a structurally negative 100‑cow operation needs a different decision than more debt. Bullvine’s exit‑math work shows waiting 18 months too long on a negative position can quietly burn around $575,000 in equity; a planned transition preserved $765,000 versus $255,000 in a forced liquidation. No robot out‑runs that gap.

We’re building the full seven‑year cash‑flow valley behind that $3.15/cwt return — laid out year by year by herd size — as a follow‑up; watch for it in the coming weeks.

Key Takeaways

  • If your robot herd “breaks even” on paper, rerun it with every family hour priced at your local wage. If that move pushes you into the red, you’re subsidizing the operation, not running it.
  • If you’re below ~140 cows on commodity milk with no premium channel, treat the $3.15/cwt average net return as somebody else’s number until your own utilization and labor math say different.
  • If you’re banking on a welfare premium, get the contract or certification in writing first — 70% say they’ll pay, only 14% trust the label, and your co‑op rarely converts welfare compliance into $/cwt.
  • If you’re going to make a small robot herd work, copy the Duecks before you copy the brochure: a second income stream and a component‑premium breed strategy did the heavy lifting, not the robot.
  • If your operation’s been structurally negative for 18 months or more, run the exit‑versus‑reinvest math before you sign robot debt. The equity gap between a planned and a forced transition runs into six figures.
  • If robots are the reason your kids are staying, separate the lifestyle promise from the balance sheet. Make sure they’re choosing a viable business, not inheriting an obligation.

The Question to Take to the Kitchen Table

That farmer answering the “is ethical dairy even possible” question isn’t wrong to want a calmer barn and cows that get to be cows. The question that decides whether the dream survives contact with the milk cheque is the one nobody in the showroom asks: at your herd size, your milk price, and your real labor bill, who’s quietly paying for the “ethical” part — the market, or your own family?

Run those three numbers this week. Then take them to your lender and your kids before you take them to the equipment rep. And if you want to see how a robot, Brown Swiss, hay, and consulting actually came together on one real Manitoba farm, read how the robots hum and the cows stay calm at Four Oak Farms.

Complete references and supporting documentation are available upon request by contacting the editorial team at editor@thebullvine.com.

Learn More

The Sunday Read Dairy Professionals Don’t Skip.

Every week, thousands of producers, breeders, and industry insiders open Bullvine Weekly for genetics insights, market shifts, and profit strategies they won’t find anywhere else. One email. Five minutes. Smarter decisions all week.
NewsSubscribe
First
Last
Consent

A Nickel vs. $170K: The Two USMCA Dairy Fights, Priced Out

Two USMCA dairy fights are on the table this month. One’s worth about a nickel a cwt. The other swings $170K on a 600-cow herd — and nobody at the table is naming it.

Executive Summary: On July 1, USTR declined to renew USMCA in its current form, reopening the dairy file — and both governments are loudly fighting over the wrong number. Washington wants the $200 million in annual access Canada allegedly never delivered (TRQ fill sits near 42%, with 9 of 14 categories under 50%), but spread across US milk production that’s worth about a nickel a cwt — roughly $1,800 a year on a 150-cow dairy. The fight that actually moves your milk check is the quiet one: Canada’s structural protein surplus moving into the US under uncapped codes like HTS 1901.90, leaning on Class IV. On a 600-cow herd, a $1/cwt Class IV swing is $170,000 a year — and even on a 150-cow herd it’s about $42,000, still an order of magnitude past the TRQ nickel. US Class IV shippers should read the cap annex language, not the fill-rate headlines, when the July round drops; Canadian producers sitting on ~CA$2.5M in quota equity behind Bill C-202 should watch the CDC’s fall price signal. The number to watch isn’t 42% — it’s whether the new text counts protein by what it does, not what the label says.

On February 12, 2026, Ted Vander Schaaf sat in front of the U.S. Senate Finance Committee and made the case that Canada isn’t delivering the dairy market access it promised under USMCA. Vander Schaaf milks about 1,250 Holsteins in Idaho and is a member-owner of Northwest Dairy Association, the co-op behind Darigold — so the outcome hits his own milk check. USMCA promised American dairy roughly US$200 million a year in new tariff-free access into Canada. Six years in, most of that access sits unused. That’s the fight you’ll see in every headline about the July review.

Here’s the part nobody puts on the podium. Divide that full $200 million across the 231.7 billion pounds of milk the U.S. produced in 2025, and you get about 8.6 cents a hundredweight — and that’s the gross headline figure, the whole tariff benefit if every dollar of it reached the farm. It doesn’t. That $200 million is processor-and-exporter margin at the border; the slice that flows back to producer milk checks, after processing, freight, and the fact that barely 42% of the quota even fills, realistically lands near a nickel a cwt — roughly $1,800 a year on a 150-cow dairy. It’s real money. It’s just not the money that decides whether your barn pencils out. The fight that actually moves your milk price is quieter, buried in a tariff code, and almost nobody’s naming it (Federal Milk Marketing Order data).

What’s Changing and Why

On July 1, 2026, USMCA hit its first mandatory joint review — and the U.S. Trade Representative confirmed Washington “did not agree to renew the USMCA in its current form,” though the agreement stays in force while talks continue. Within hours, U.S. dairy groups accused Canada of ignoring its commitments, Canada said it’s holding up its end, and another negotiating round got scheduled for this month. The flashpoint is Canada’s tariff-rate quotas — the TRQs. USMCA handed U.S. dairy 14 separate TRQ categories, each a set tonnage of milk, cream, cheese, or powder that can cross the border duty-free.

The catch is that those quotas barely get used. U.S. exporters have filled about 42% of their allocated Canadian dairy quotas since the deal took effect, with 9 of the 14 categories sitting under 50%. The U.S. argument: Canada hands most of the import licenses to its own processors, who’ve got no reason to bring in competing American product. Canada’s counter is that trade is growing fine — total U.S. dairy exports to Canada climbed to US$1.31 billion in 2025, up 78% since 2020. Keep those two numbers apart, because the debate constantly blurs them: the $1.31 billion is total two-way sales, most of it flowing through channels that never existed in the TRQ fight; the $200 million is the new, negotiated access USMCA was supposed to open on top of it. Trade grew. The specific quotas Americans bargained for still don’t fill.

So the U.S. did what you do when you think a deal’s been broken. It went to dispute settlement — twice. It won the first panel in January 2022, which found Canada had breached the agreement by reserving TRQ pools exclusively for processors. Canada rewrote its rules. A second panel in November 2023 ruled 2-1 that the rewrite didn’t violate USMCA, with one panelist dissenting that Canada’s narrow eligibility rules still shut out importers who’d bring retail-ready American product to Canadian shelves. Two rounds of litigation. One win each. And the fill rate barely moved. As UC Davis economists put it, the dispute is “mainly the result of politics, and the economic benefits at issue are relatively small” (International Trade Insights).

How This Plays Out on Real Farms

Now the quiet fight — the one with real dollars behind it.

Canada’s supply management sets milk production to match domestic butterfat demand. Produce milk for its fat, though, and you generate a pile of leftover protein and skim solids. A U.S. International Trade Commission report released in late May 2026 said it plainly: Canada’s quota system creates “a domestic structural surplus of nonfat milk solids components,” and its pricing “unlinks its relatively high farmgate price of milk from the price that processors pay for milk components” through regulated “price discrimination”. In plain terms, Canadian processors can buy that surplus protein at prices below the regulated farmgate value and move it into export channels (U.S. Dairy Export Council).

USMCA was built to cap exactly this. It limits Canada’s skim milk powder and milk protein concentrate exports to 35,000 tonnes, with a C$0.54/kg surcharge above that line. But the caps only bite on some product codes. A growing share of that surplus is exported as blended dairy products and protein isolates — classified under Harmonized Tariff Schedule (HTS) code 1901.90 and similar headings that USMCA’s disciplines don’t cover. Those classifications are lawful and long-standing under Canadian customs rules; whether USMCA should cover them is exactly what the U.S. wants renegotiated. Bullvine estimates roughly 147,000 tonnes of total milk solids moved into the U.S. under these broad blended-product codes in 2024 — up from an estimated 77,000 tonnes before USMCA — based on Canadian export data. That’s the wide bucket. Inside it, the USITC clocked one narrow protein-isolate line jumping from 76 tonnes in 2013–2015 to over 32,000 tonnes by 2022–2024 — a single HTS heading, not the whole flow, which is how you get two figures at very different scales in the same story (The Bullvine).

Here’s the barn math that flips the story. That extra low-priced protein leans directly on U.S. Class IV — and because Class IV pricing is driven heavily by nonfat dry milk and skim powder values, cheap imported protein pulls the whole class down with it. On a 600-cow herd shipping about 170,000 cwt a year — a high-output Western operation running well above the 2025 U.S. average of 24,390 lbs/cow — a $1.00/cwt swing in your milk price is worth roughly $170,000 a year; even a half-dollar move runs about $85,000. And this isn’t a big-herd trick: run that same $1/cwt swing on the 150-cow dairy from the TRQ example and it’s still about $42,000 a year — versus the $1,800 that fight is worth. Same barn, same year, two fights. One’s worth a nickel. The other moves a full dollar — and it’s the one nobody’s negotiating.

The Mechanics Behind the Outcomes

Why does the loud fight get all the airtime while the expensive one hides in a customs table? Because TRQs come with a clean headline and a clear villain: “Canada promised $200 million and delivered 42%.” That fits on a bumper sticker. The protein story needs you to sit through structural surplus, regulated pricing, and Chapter 19 tariff classification — none of which trend on anybody’s feed (U.S. Dairy Export Council).

The classification piece is the whole game. Classic skim milk powder sits under Chapter 04 dairy headings, the ones USMCA disciplines with caps and surcharges. But Canada’s border agency has long allowed that a product with added ingredients — a “preparation predominantly based on” dairy — can be classified under Chapter 19 instead. A U.S. customs ruling shows the kind of product in play: a blend of 56% skim milk powder and 44% milk fat, treated as a food preparation rather than a dairy product. Same solids. Different code. Outside the fence. Legal — and, from the U.S. side, exactly the point (Canada Border Services Agency).

AttributeChapter 04 (Classic Dairy)Chapter 19 (Food Preparations — HTS 1901.90)
Typical productsSkim milk powder, MPC, butter, cheeseBlended dairy powders, protein isolates with added ingredients, food prep bases
Example composition>97% milk solids, no added non-dairy ingredients56% skim milk powder + 44% milk fat with permitted additions
USMCA cap applies?✅ Yes — 35,000-tonne cap + CA$0.54/kg surcharge above threshold❌ No — sits outside USMCA Chapter 3 dairy disciplines
Canadian export volume trend (est.)Regulated; constrained by cap~147,000 tonnes into US (2024 est., up from ~77,000 pre-USMCA)
U.S. legal challenge statusSettled; two dispute panels completedUSITC Section 332 probe opened July 2025 — allegation, not finding
Price impact channelLimited — capped volume constrains floor pressureDirect — uncapped volume leans on US NDPSR and Class IV price
What renegotiation would doAlready covered; tighten fill enforcementExtend cap language to cover “protein by function” — the real ask

The U.S. isn’t leaving that argument to trade lawyers. In July 2025, the USITC opened a Section 332 probe into whether Canadian exporters are evading the caps by blending or relabeling surplus proteins — an allegation Canada disputes and the panel record so far hasn’t upheld. New Zealand and Australian dairy groups joined U.S. groups in a January 2025 joint call, arguing that Canadian processors’ access to structurally cheap surplus protein “is distorting its export of a range of dairy products”. Dairy Farmers of Canada, for its part, has publicly held that the current terms are sufficient and that Canada is meeting its USMCA obligations. When three exporting nations point at the same door, it’s not a rounding error — but it’s a policy fight over what the rules should cover, not a finding that anyone broke them. If you want the full walk-through of how the two panels changed the rulebook without changing the trucks, that’s its own story.

For the deeper backstory on how Canada’s system holds the line, see our supply management coverage hub — clean legal wins, messy farm realities.

How Much Does Chasing the Loud Fight Actually Cost You?

Run the honest calculation. If your operation spends real attention — advisor hours, association dues, mental bandwidth — tracking every TRQ headline, you’re chasing a nickel. Even a best-case doubling of enforcement takes that 150-cow herd from $1,800 to maybe $5,400 a year. UC Davis economists went further, concluding that fixing TRQ allocation would likely “do little to nothing” for the makeup of Canadian dairy imports, because U.S. product still loses on price and logistics against Canada’s own processors (The Bullvine).

That doesn’t make the TRQ fight pointless. Precedent matters, and a deal you can’t enforce isn’t a deal. But if you’re a producer deciding where to point your worry this month, don’t confuse the fight that fills press releases with the one that fills your milk check. Where does your breakeven actually sit right now — and which of these two numbers would move it?

FightThe Mechanism150-cow Value/yr600-cow Value/yrWho Controls the OutcomeWhat to Watch
TRQ Fill Rate14 quota categories; ~42% average fill; US argues Canada reserves licenses for domestic processors~$1,800~$7,200USTR / Global Affairs Canada negotiatorsFill rate improving past 50% in new allocation rules
Protein Reclassification (Class IV)Surplus Canadian protein moving as HTS 1901.90 blends, outside USMCA caps; leaning on Class IV NDPSR~$42,000 (red flag)~$170,000 (red flag)USMCA annex language in July roundWhether “isolate” or “protein by function” appears in new cap text
DRP Hedge (US)Dairy Revenue Protection; Q1 2026 indemnities avg $1.12/cwt vs $0.28/cwt premiumNet ~$14,280 valueNet ~$57,120 valueFarm-level decisionQ2 2026 premium resets
Canadian Quota CarryCA$24K–$27K/kg butterfat; 6% commercial rate; milk margin ~CA$854/kg — negative net carry~–CA$586/kg held~–CA$586/kg heldFCC rates + CDC price signalFall 2026 CDC farmgate announcement
US Dairy Exports to Canada (total)Two-way flow growing; US$1.31B in 2025, up 78% since 2020 — but not the negotiated TRQ accessDiffuse / indirectDiffuse / indirectBroader trade environmentSeparate from TRQ dispute

Is Canada Actually Getting What It Paid For?

Not quite — and that’s the part neither government says out loud. Canada bought stability with supply management: administered prices, no wild swings, and no reliance on the direct subsidies U.S. farmers lean on. That stability isn’t abstract. Farm Credit Canada’s 2026 reporting pegs mid-size quota holdings near CA$2.5 million, at CA$24,000 to CA$27,000 per kilogram of butterfat — an 85-cow Quebec herd carrying multi-million-dollar quota equity before you count a single cow or barn. Daniel Gobeil, who milks in Quebec and heads Les Producteurs de lait du Québec, put the mood plainly at his group’s 2025 annual meeting: “There is very strong consensus in Quebec on the importance of keeping supply management intact and protecting our sector” (Les Producteurs de lait du Québec).

That’s not abstract politics to a producer sitting on that balance sheet. When Bill C-202 passed, Dairy Farmers of Canada welcomed “any effort aimed at ensuring no further supply managed concessions are made in trade negotiations”. And in April 2026, with the review bearing down, Gobeil delivered a line — in French, roughly translated — that should tell every producer where the pressure sits: on the government’s promise to hold firm, “we’ll judge them on the results”. Translation from the kitchen table — don’t let anyone bargain away the asset I’ve mortgaged my farm to buy (Les Producteurs de lait du Québec / Newswire).

But the same global cost shocks hitting Idaho are hitting Quebec. Feed, labour, and debt service don’t care which pricing system you’re under. Rabobank’s analysts have been projecting 7–9% annual farm exits across North America through 2027 — on a base of roughly 39,000 U.S. operations, that’s somewhere between 2,700 and 3,500 farms closing in a single year, driven by margin compression, not border tonnage. That’s why Parliament passed Bill C-202 — locking supply management out of the negotiation entirely — and it received Royal Assent on June 26, 2025, before the review talks even opened. When you’re sitting on CA$2.5 million in quota, a law that stops anyone from writing down the asset reads less like protectionism and more like a seatbelt (Parliament of Canada, LEGISinfo).

Options and Trade-Offs for Farmers

You can’t negotiate the treaty. You can read the signals coming out of the review and position for them. Here’s what producers on both sides are watching and doing.

U.S. Class IV shippers — read the cap language, not the fill data (do this within 30 days)

  • The signal: Whether USTR and Global Affairs Canada rewrite the protein disciplines to count all high-protein dairy — blends and isolates included — against the cap (National Milk Producers Federation).
  • When the July round drops documents: Read the annexes, not the press release.
  • Works when: You’re Class IV-heavy.
  • Requires: Someone reading trade text.
  • Risk: The language stays vague — which tells you the coverage gap isn’t closing, and that’s worth knowing too.

U.S. producers — hedge the volatility no treaty will fix

  • The signal: HighGround Dairy’s Q1 2026 Dairy Revenue Protection results reported estimated indemnities averaging $1.12/cwt against premium costs of $0.28/cwt.
  • Works when: Your breakeven’s tight.
  • Risk: Premiums are a real cost, and DRP smooths volatility rather than erasing it.

Canadian producers — stress-test the quota-heavy balance sheet

  • The signal: Take the CA$24,000/kg quota cap and finance it at a 6% commercial rate — that’s CA$1,440/kg a year in interest alone. Net the roughly CA$854/kg that kilo of butterfat earns in blended milk margin against it, and you’re carrying about –$586/kg a year in negative carry on newly financed quota until the milk pays it back. (Farm Credit Canada quota values; Ontario/DFO margin basis — see FCC dairy sector updates.)
  • Works when: You’re weighing any expansion or succession move.
  • Risk: A system that wins legal arguments can still leave you exposed to input costs no trade law touches.

Everyone — treat the CDC’s fall price announcement as a pressure gauge

  • The signal: For Feb. 1, 2026, the Canadian Dairy Commission raised farmgate prices 2.3255% through its National Pricing Formula. Watch this fall’s number for Feb. 2027 (Canadian Dairy Commission).
  • How to read it: A formula-consistent bump says Canada feels its system’s intact; a below-inflation move hints the trade pressure is starting to bite.

To pressure-test your own position, run a DSCR on your quota before the next expansion decision.

Key Takeaways

  • If you’re Class IV-exposed, judge the July review by one thing: whether the cap language starts counting protein by what it does, not by what the label says (NMPF).
  • If you ship in the U.S., run your DRP math this month — Q1 2026 indemnities averaged $1.12/cwt against $0.28/cwt premiums, and volatility won’t wait for a trade deal.
  • If you farm under supply management, price quota equity into every succession and expansion decision. At CA$24,000/kg and 6%, newly financed quota nets about –$586/kg a year before it earns a dime of political protection (FCC).
  • Put the CDC’s fall announcement on your calendar. A below-formula move is the clearest tell that Canada feels the trade squeeze (Canadian Dairy Commission).
  • Before the next TRQ headline pulls your attention, ask whether you’re tracking a nickel or a dollar. The math isn’t close.

The July round will generate a stack of statements calling itself a win. The real test is whether the annex language behind those statements ever mentions the word “isolate” — because that’s the sentence that decides whether you should start modeling Class IV upside or file another press release with better formatting. Gobeil said he’ll judge Ottawa on the results; you should judge the whole review the same way. So pull your last twelve milk checks and ask which of these two fights actually shows up in the numbers.

We’re breaking down the full protein-reclassification mechanism and a Class IV sensitivity model by herd size in next week’s Bullvine Weekly — that’s where the barn-level numbers live. For the groundwork now, here’s the full margin and DRP playbook.

Run Your Numbers

Dairy Profit Projector — This article says a $1/cwt Class IV swing is worth $170K on 600 cows and $42K on 150. The Dairy Profit Projector turns that into your number: drop in your herd, milk price, and ration to see 12-month margin, breakeven, and margin per cwt or hL — US or Canadian.

Editor’s note: The farm operations sized in the barn-math examples — a 150-cow reference dairy, an 85-cow Quebec herd, and a 600-cow Class IV shipper — are modeled composites used for illustration. Named individuals (Ted Vander Schaaf, Daniel Gobeil) and all dollar figures are sourced as cited. The nickel/cwt realized figure is a Bullvine estimate haircutting the gross 8.6¢/cwt tariff benefit for farmgate pass-through and the ~42% fill rate; the –$586/kg net-carry figure is a Bullvine calculation from Farm Credit Canada quota values and an Ontario milk-margin basis; the 147,000- and 77,000-tonne reclassified-solids figures are Bullvine estimates from Canadian export data, with the USITC’s 32,000-tonne figure being one narrow HTS line inside that broader bucket. The tariff classifications described are lawful under current Canadian customs rules; the U.S. reclassification-evasion claim is an allegation under USITC investigation, not an established finding, and the underlying dispute is over what USMCA should cover, not whether any party has broken the law.

Complete references and supporting documentation are available upon request by contacting the editorial team at editor@thebullvine.com.

Learn More

The Sunday Read Dairy Professionals Don’t Skip.

Every week, thousands of producers, breeders, and industry insiders open Bullvine Weekly for genetics insights, market shifts, and profit strategies they won’t find anywhere else. One email. Five minutes. Smarter decisions all week.
NewsSubscribe
First
Last
Consent

−$8,776 a Year for Seven Years: The Real Cash-Flow Curve Behind Your Dairy’s Robot Note

On a 140-cow herd, that −$8,776/year robot valley isn’t theory — it’s seven milk checks’ worth of red ink before the dealer’s “payback” ever shows up.

Editor’s note: The farmer and his daughter described below are a composite scenario modeled from typical 120–160-cow Midwest and Ontario family operations, not a single real individual. All farm cases drawn from named, published sources are identified as such.

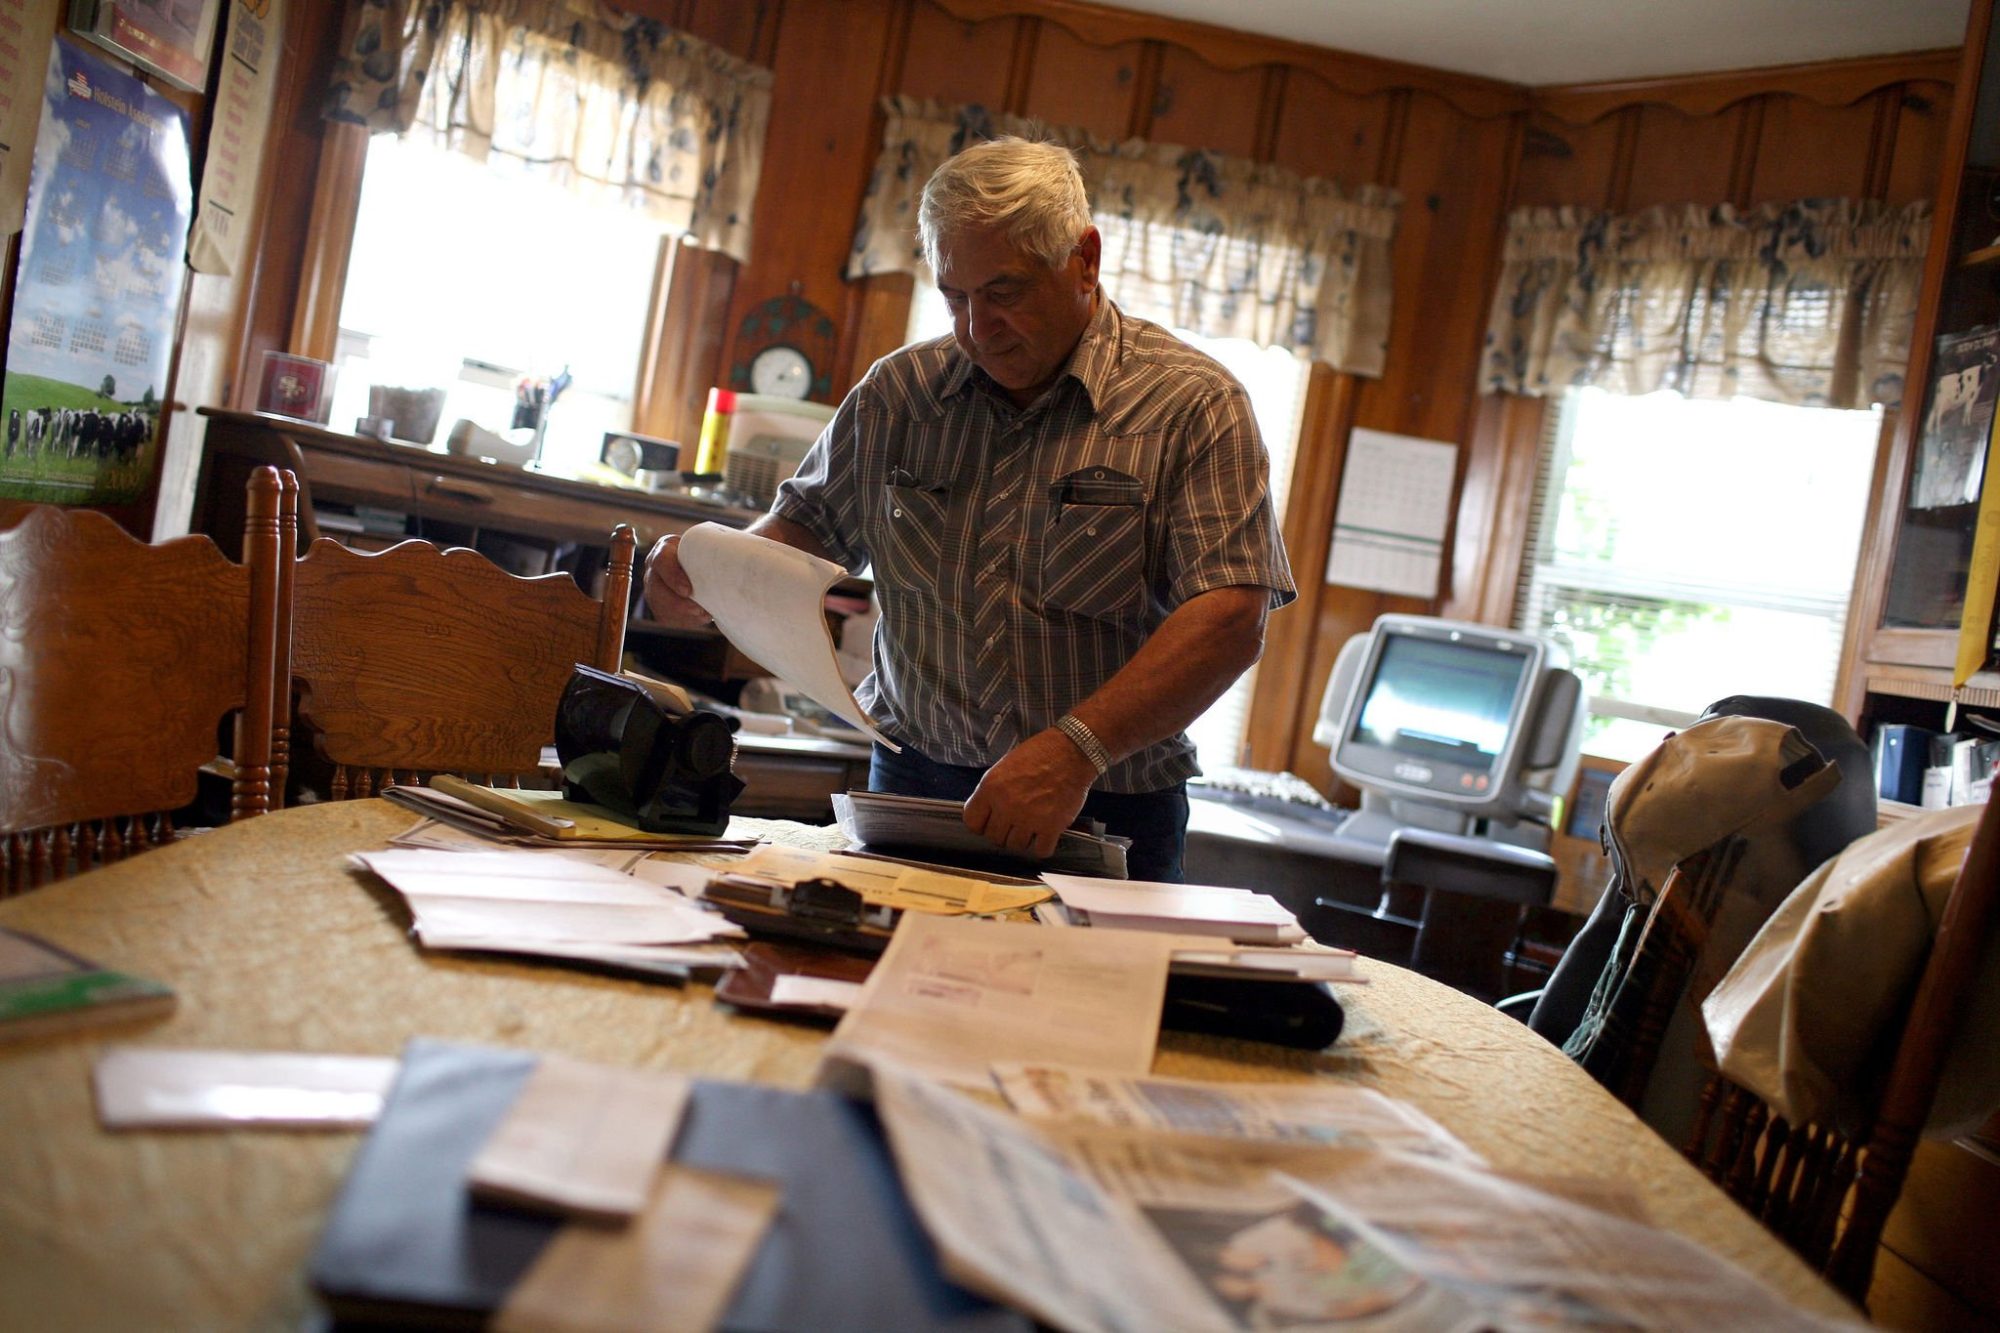
Picture a 58-year-old farmer at the kitchen table on a 140-cow operation, a robot dealer’s proposal sitting between the coffee cups. Two boxes, a tidy three-year payback, and that line everybody’s heard: “the labor savings pay the payment.” His daughter’s leaning in the doorway, half-deciding whether there’s a future here worth coming home to. That’s where robotic milking actually gets decided. Not in a spreadsheet — at a table, with a payment book on one side and a balance sheet on the other.

Here’s the number that should be sitting there too. Across Iowa State surveys and Bullvine’s own analysis, 86% of robot owners are satisfied — but only 28% find it profitable. That gap is the reason you can love your robot and still be patching cash-flow with off-farm income.

What’s Changing — and Why the Gap Is So Wide

Robotic milking has gone mainstream fast, and the appeal is real: fewer 4 a.m. shifts, more flexibility, a barn that runs while you sleep. A 2021 University of Guelph study of 28 Ontario robotic-milking farms, published in Animal Welfare, found that farmers who paired robots with automated feeding reported lower stress, anxiety, and depression — and that better farmer well-being tracked with healthier, less-lame cows. That’s the kind of thing the 86% satisfaction number is really capturing. Quality of life. And on that score, robots usually deliver exactly what they promised.

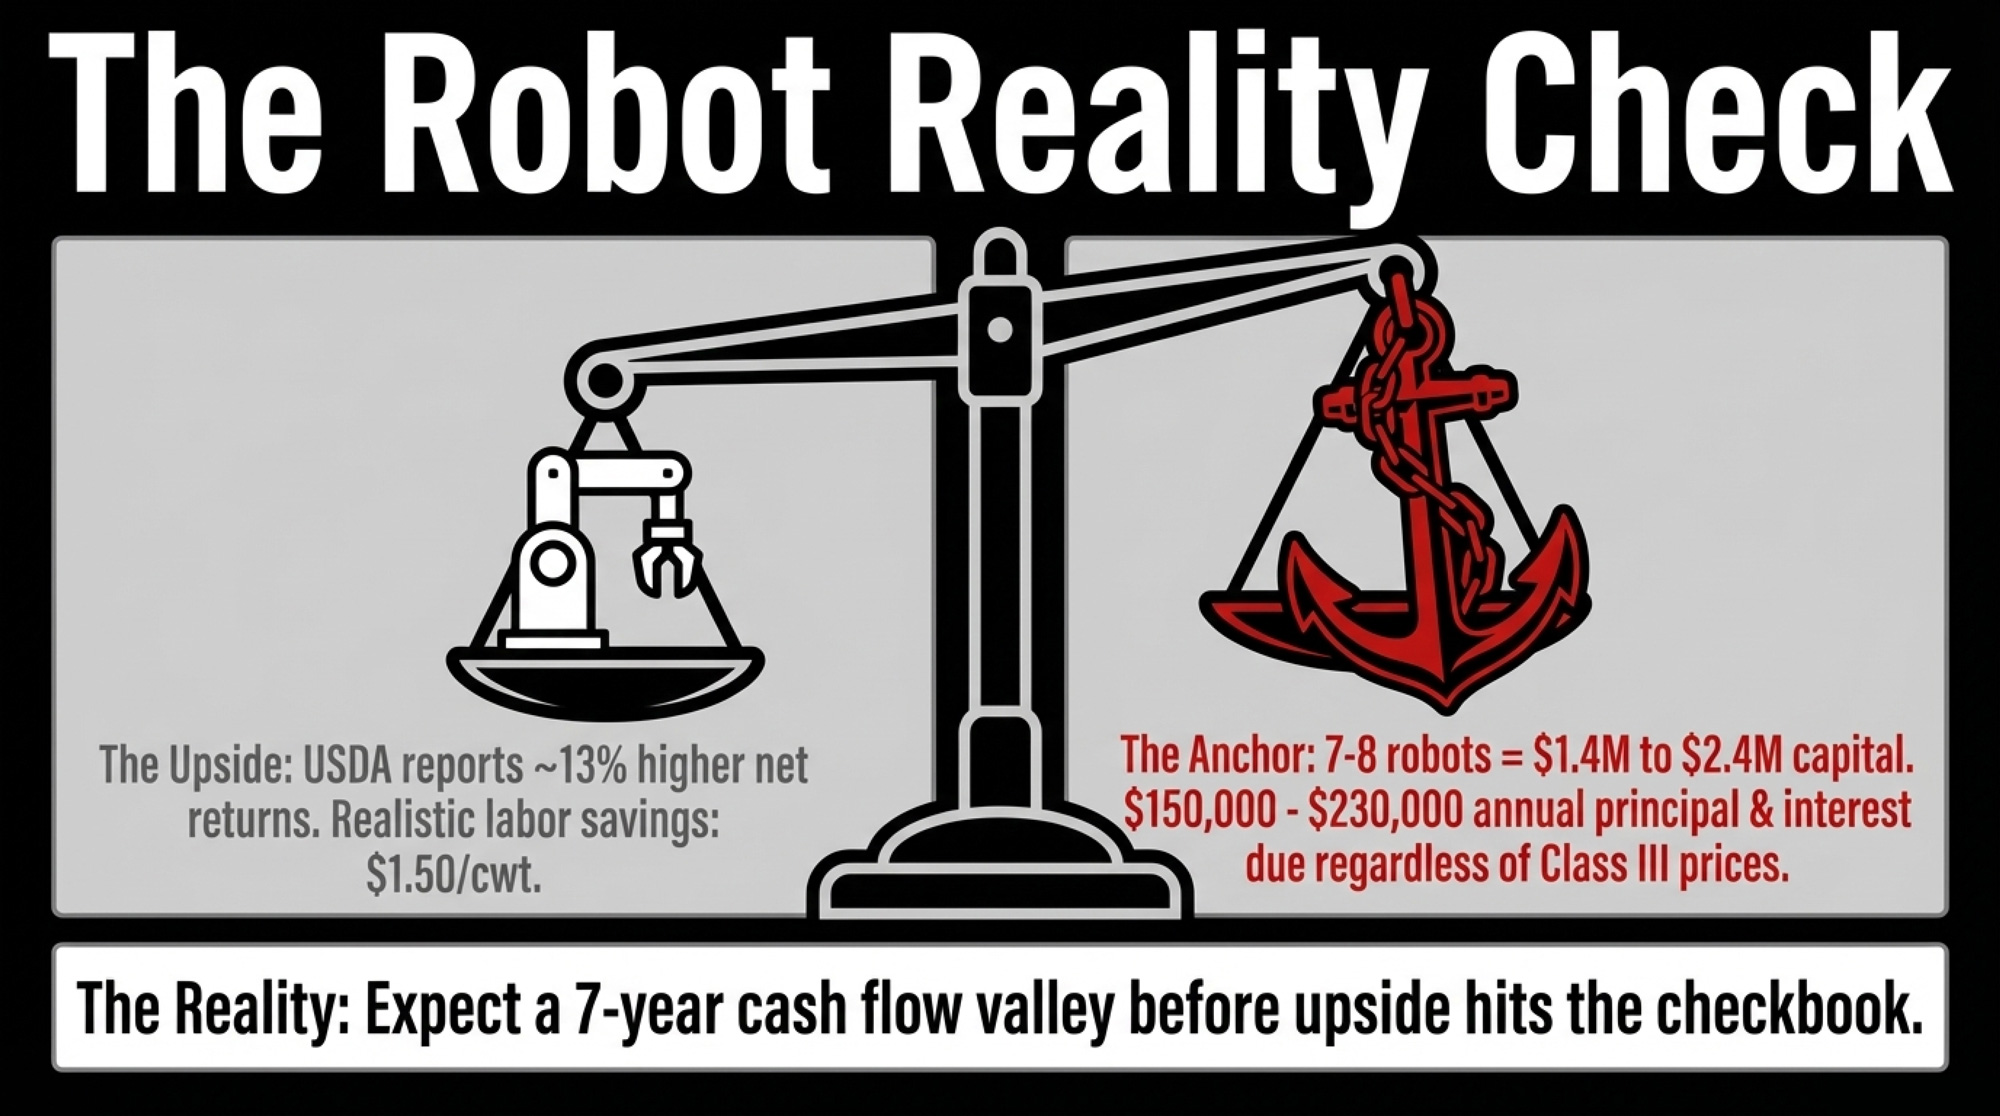
Profitability is a different ledger. In January 2026, USDA’s Economic Research Service published ERR-356 — the first nationally representative study of its kind — and found that box robots increase dairy net returns by 13% — about $3.15 per cwt — relative to nonadopters. But that’s an average built on average assumptions. What your farm actually sees rides on your herd size, your capital cost, and how well you run the barn.

One number is about your life — your sleep schedule and who’s in the barn at 4 a.m. The other is about your loan — the payment book on the fridge. You need to be clear which ledger you’re really buying in before you sign.

How This Plays Out on Real Farms

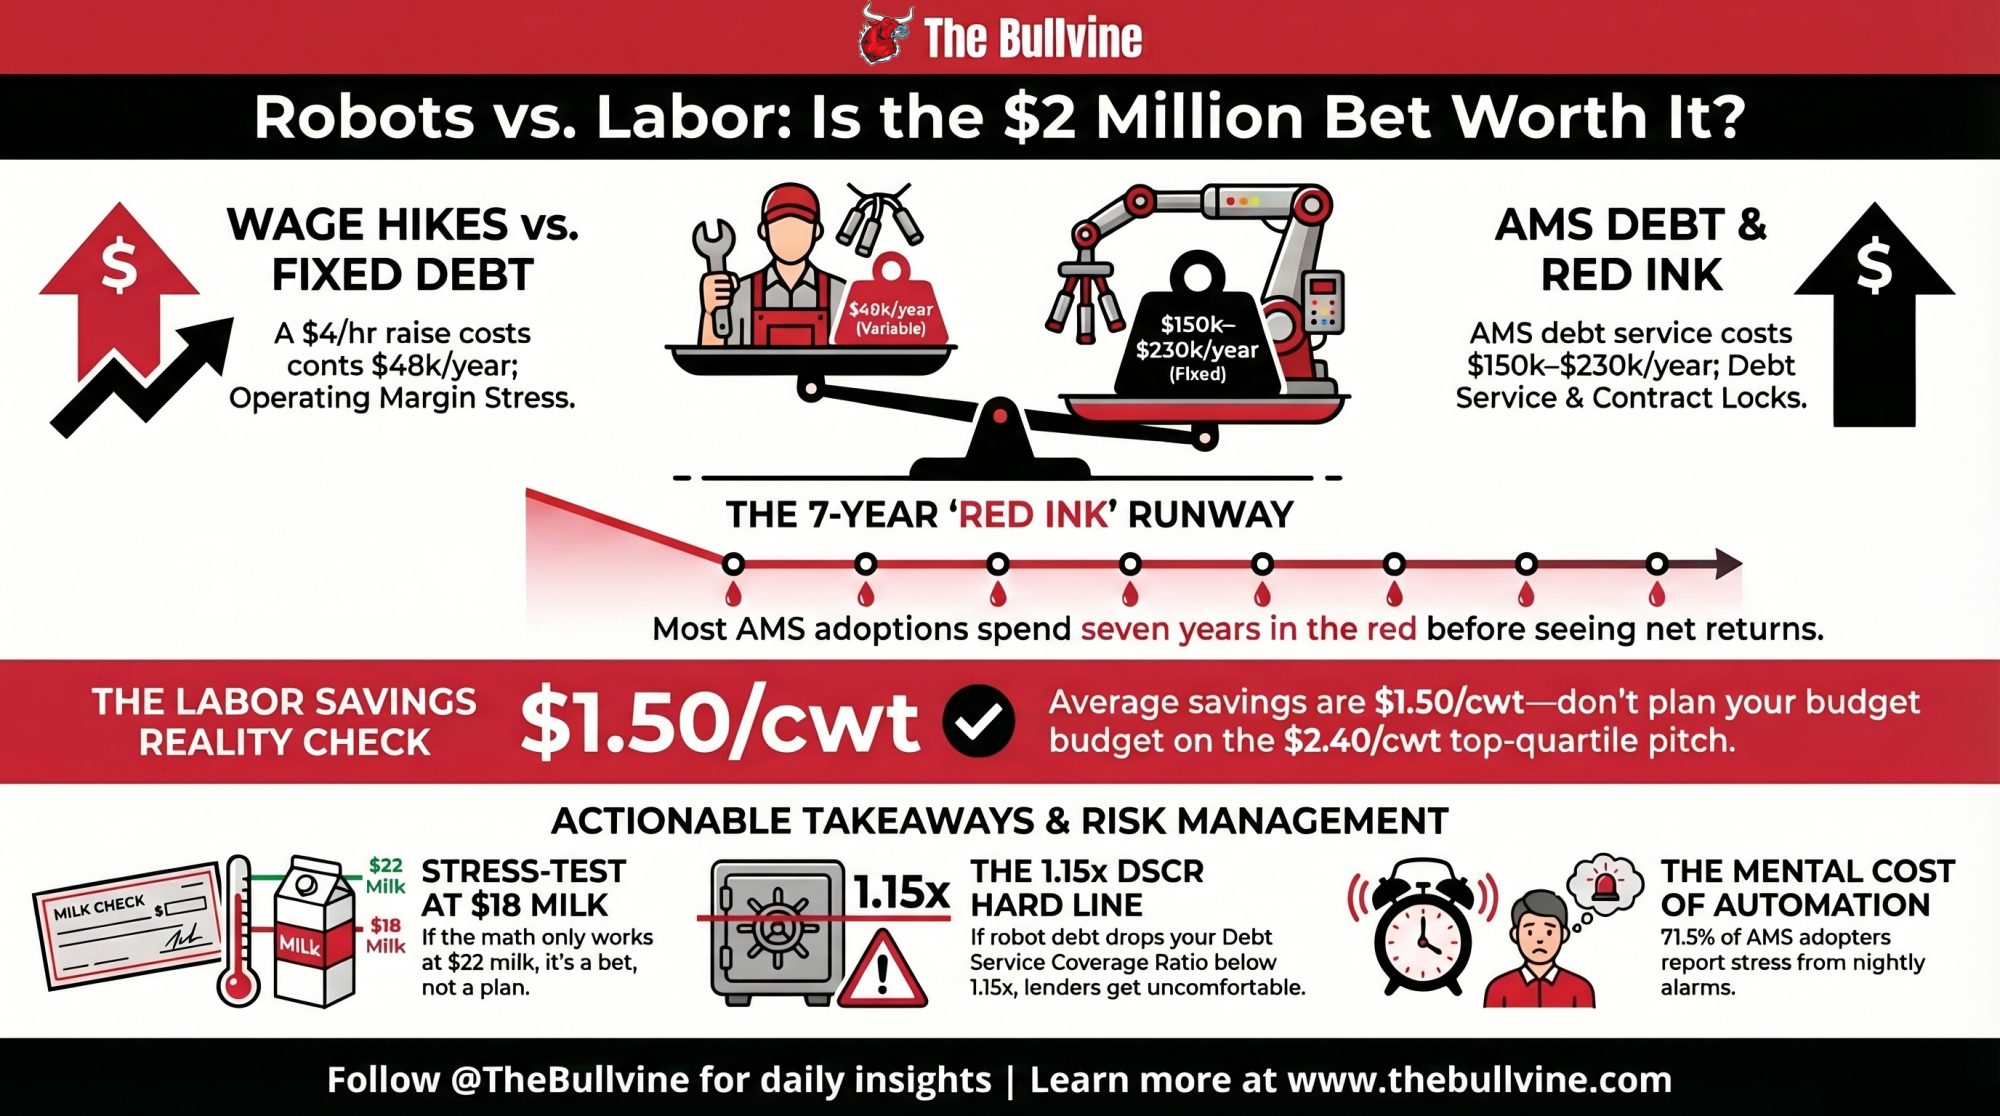
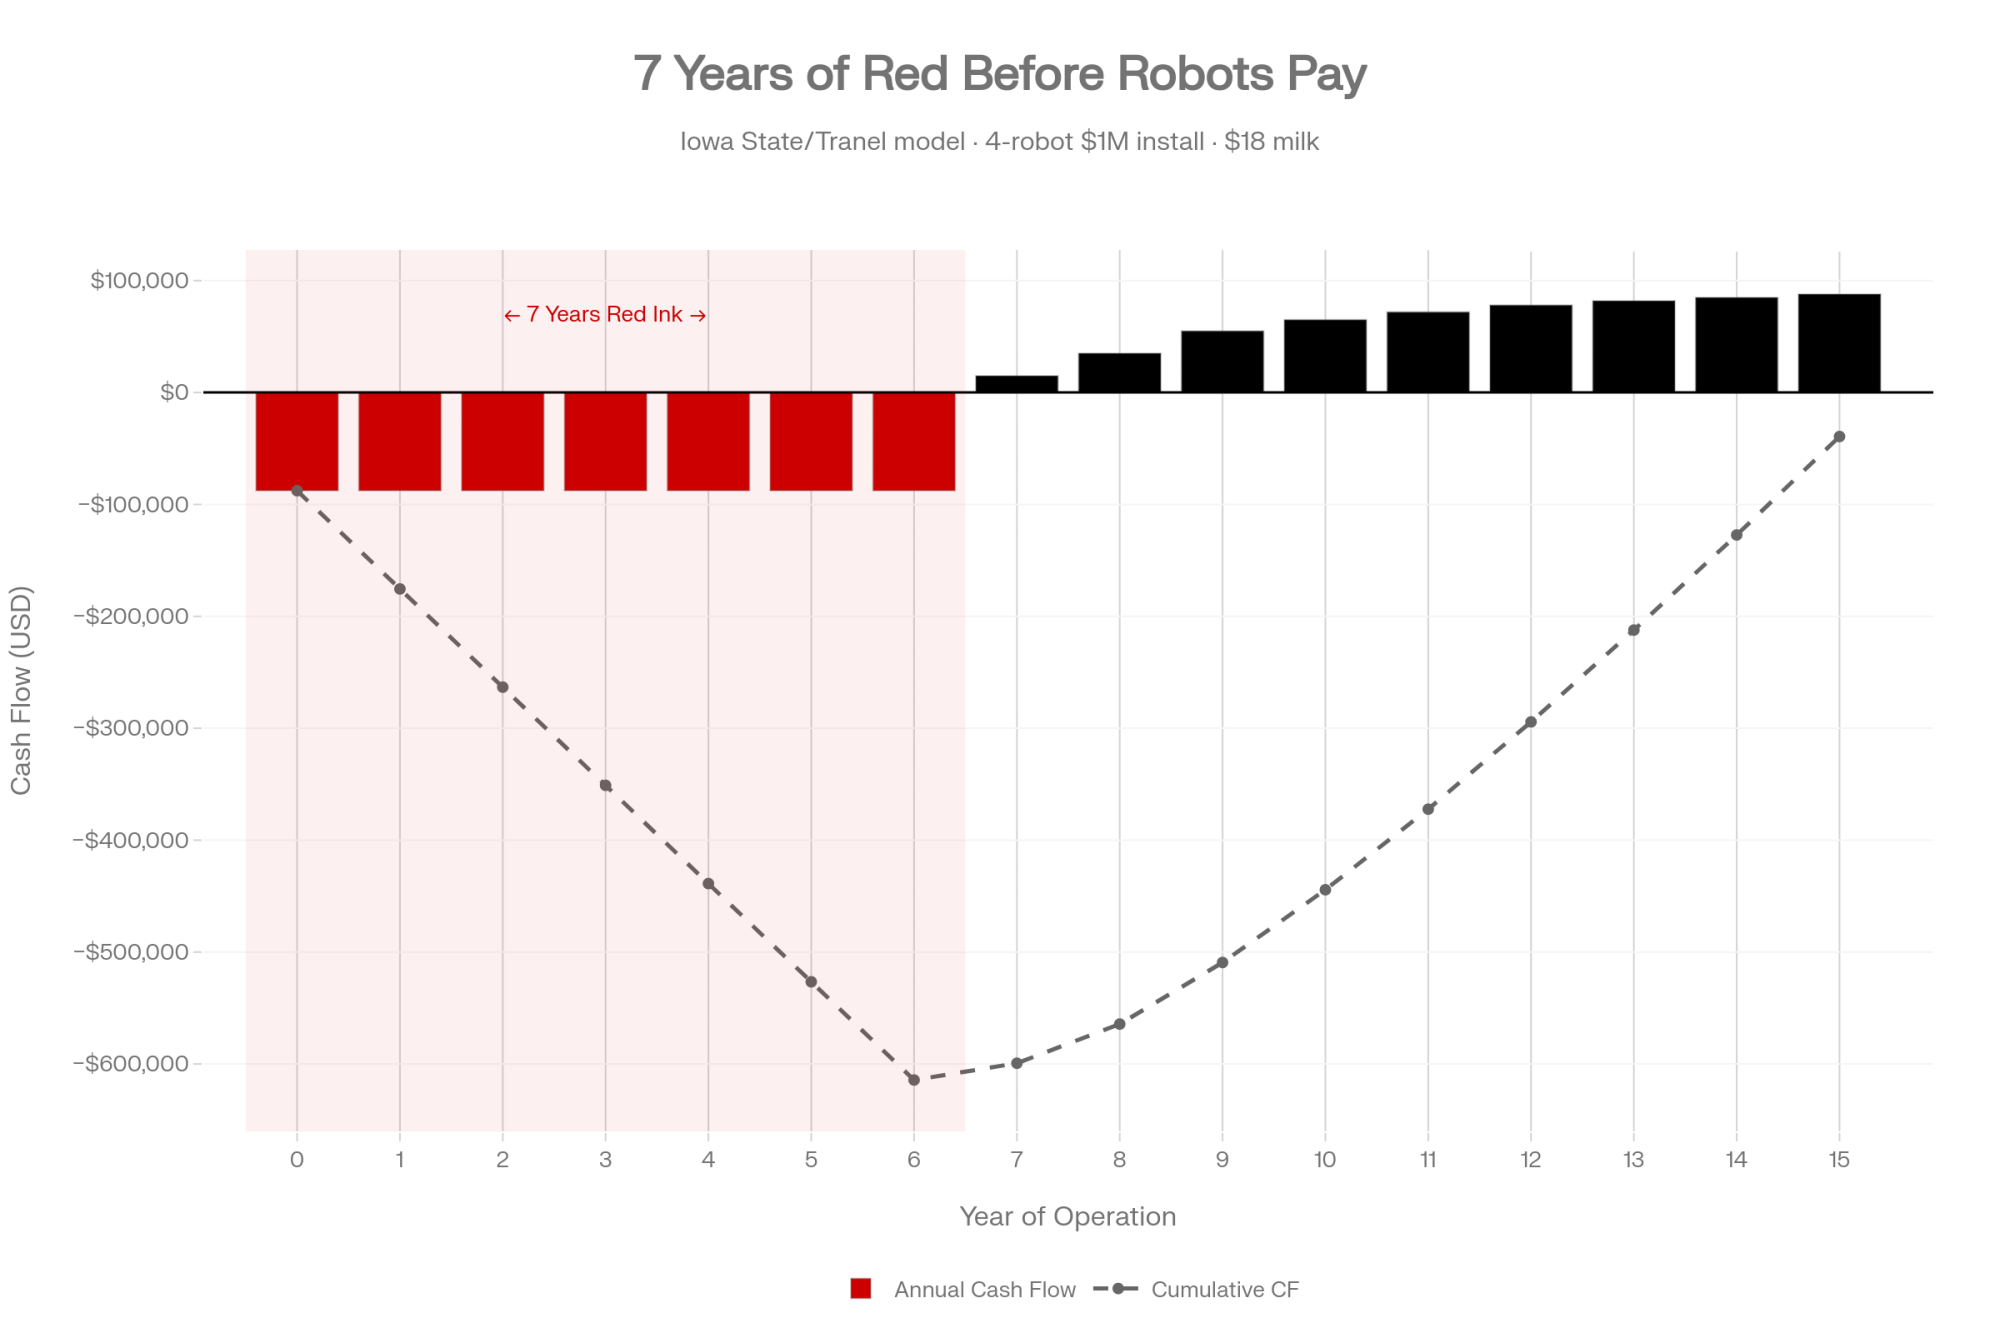
Iowa State dairy economist Larry Tranel has been running AMS economics for years, and his cash-flow model tells the part of the story the payback chart skips. A typical two-robot install — about $400,000 all-in — carries roughly $62,000 a year in ownership costs plus $69,000 in loan payments, against only a slim net financial benefit in those early years: about $1,391 a year in the partial-budget run this article follows, and $1,472 in Iowa State’s published 2018 example, depending on herd size and inputs. Run Tranel’s full model — ownership, payments, labor savings, and production gains all netted together — and you land on a cash-flow gap of about $8,776 a year for seven years before the math turns positive. That $8,776 isn’t payments minus benefit; it’s the net annual shortfall after every offset is counted.

Stack it up and that $8,776 hole runs to roughly $60,000 before the valley ends. You don’t need a consultant to tell you what that would feel like on your own balance sheet. Tranel’s modeling shows robot cash flow running sharply negative for roughly the first seven years before turning positive, and he’s clear that the swing depends heavily on lifetime repair costs across the whole life of the machine.

Run it on your own herd. Average AMS labor savings come in around $1.50/cwt across surveyed herds — but debt service on the robots runs $2.60 to $3.99/cwt. On a 140-cow herd shipping roughly 8 million pounds a year, that $1.50/cwt of labor savings is about $120,000. Real money. But if your robot debt service lands at $3.00/cwt, that’s $240,000 going the other way. The production bump and the management value have to cover the difference. Sometimes they do. Often they don’t.

The Dealer Pitch vs. Extension Reality

Put the brochure side by side with the university numbers and the gap stops being abstract. Here’s where the two stories diverge on the figures that actually drive your payment book:

Financial MetricDealer Proposal PitchUniversity Extension Reality
Projected payback3 years7 years — the cash-flow valley
Milk yield bump5% to 10% increase3% to 5%; near zero if you’re already milking 3x
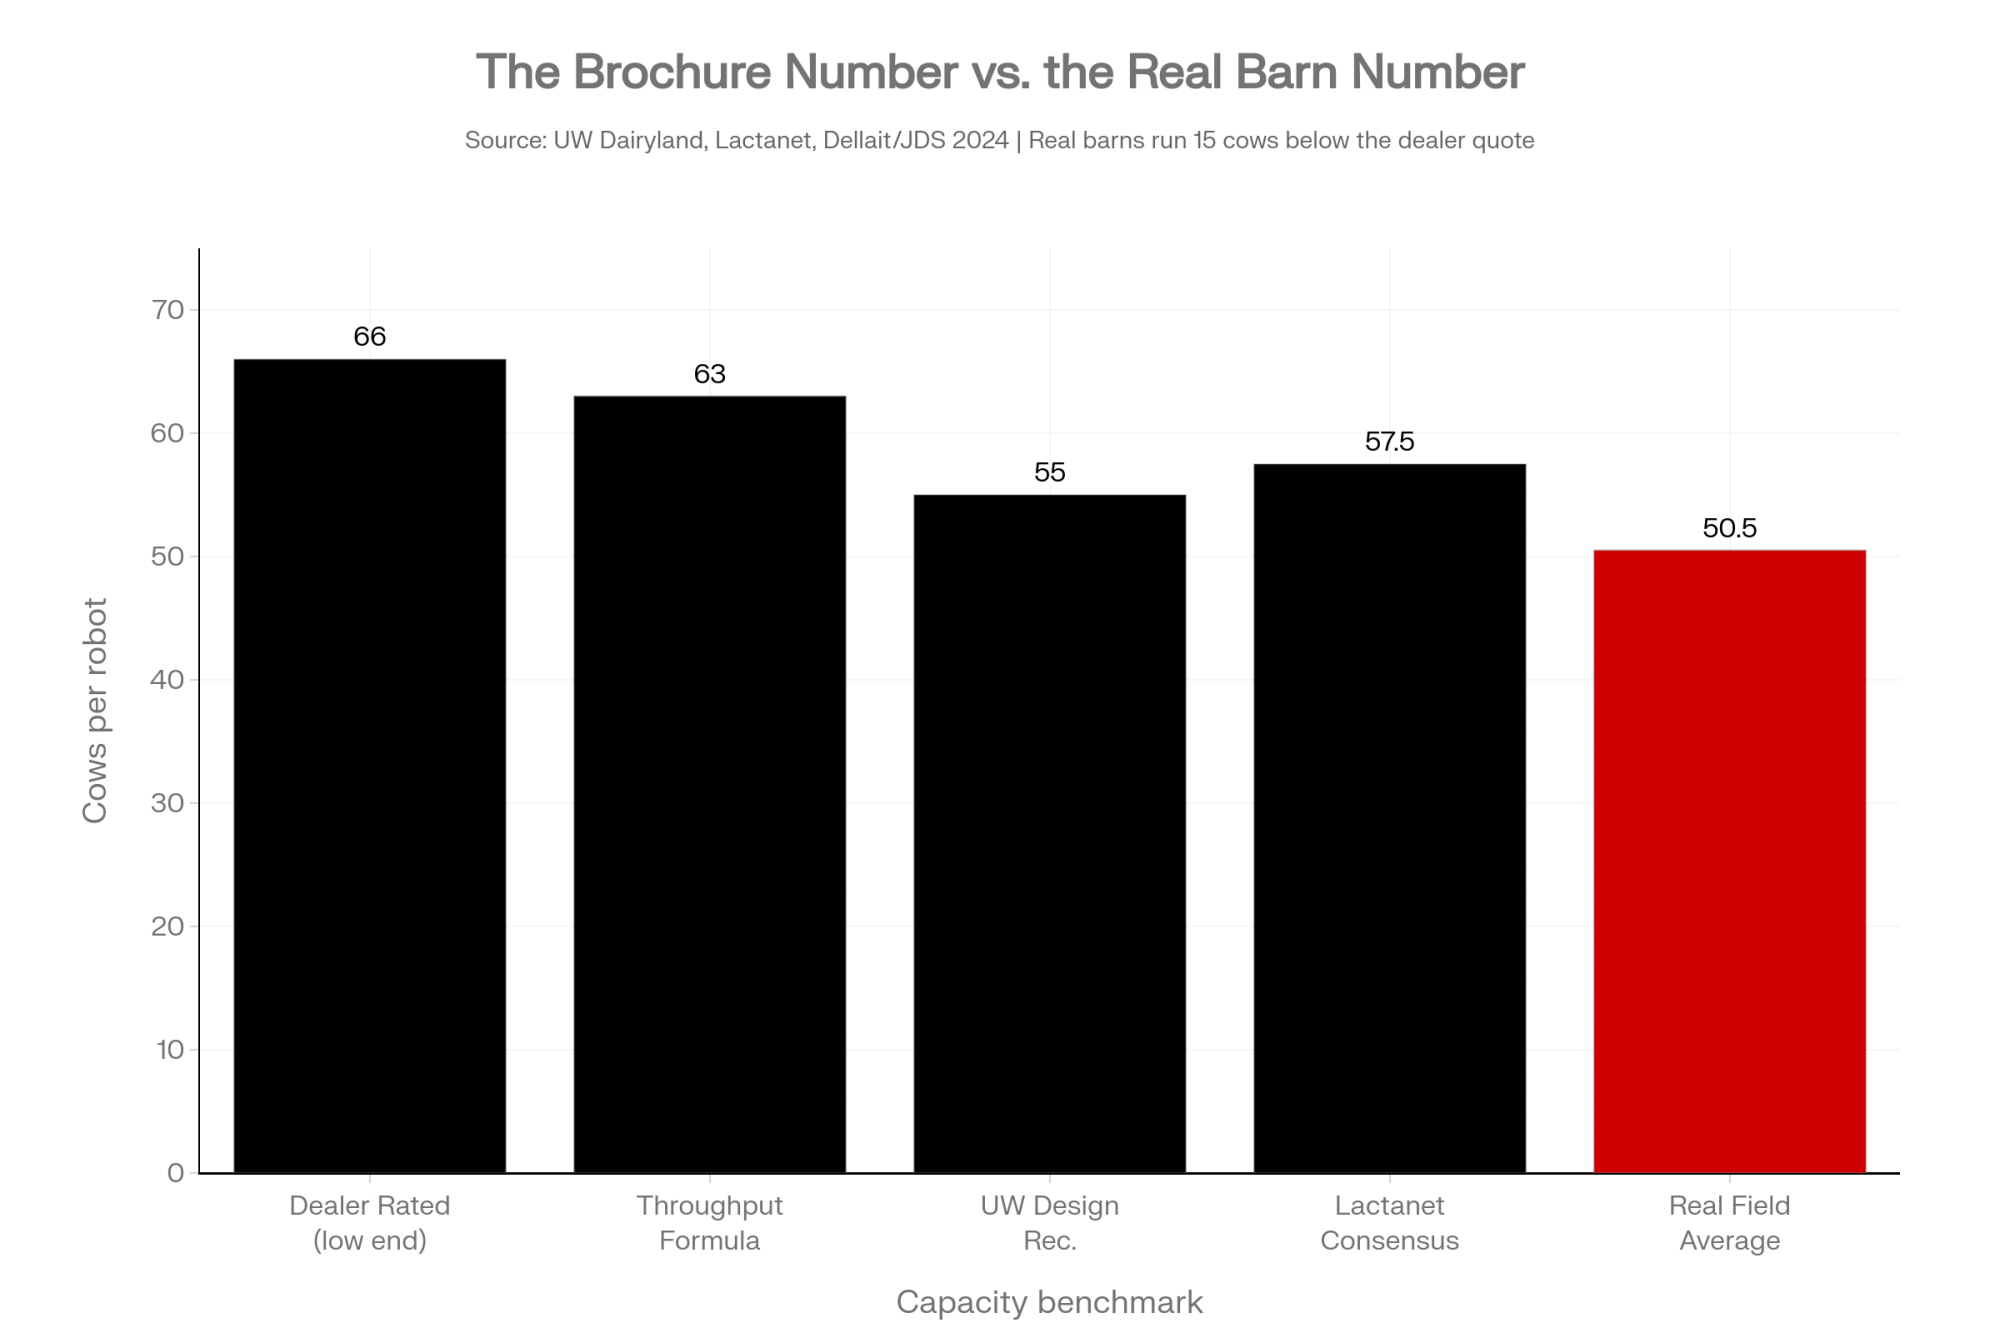
Cows per robot boxUp to 70 cows55 to 60 high-producing cows
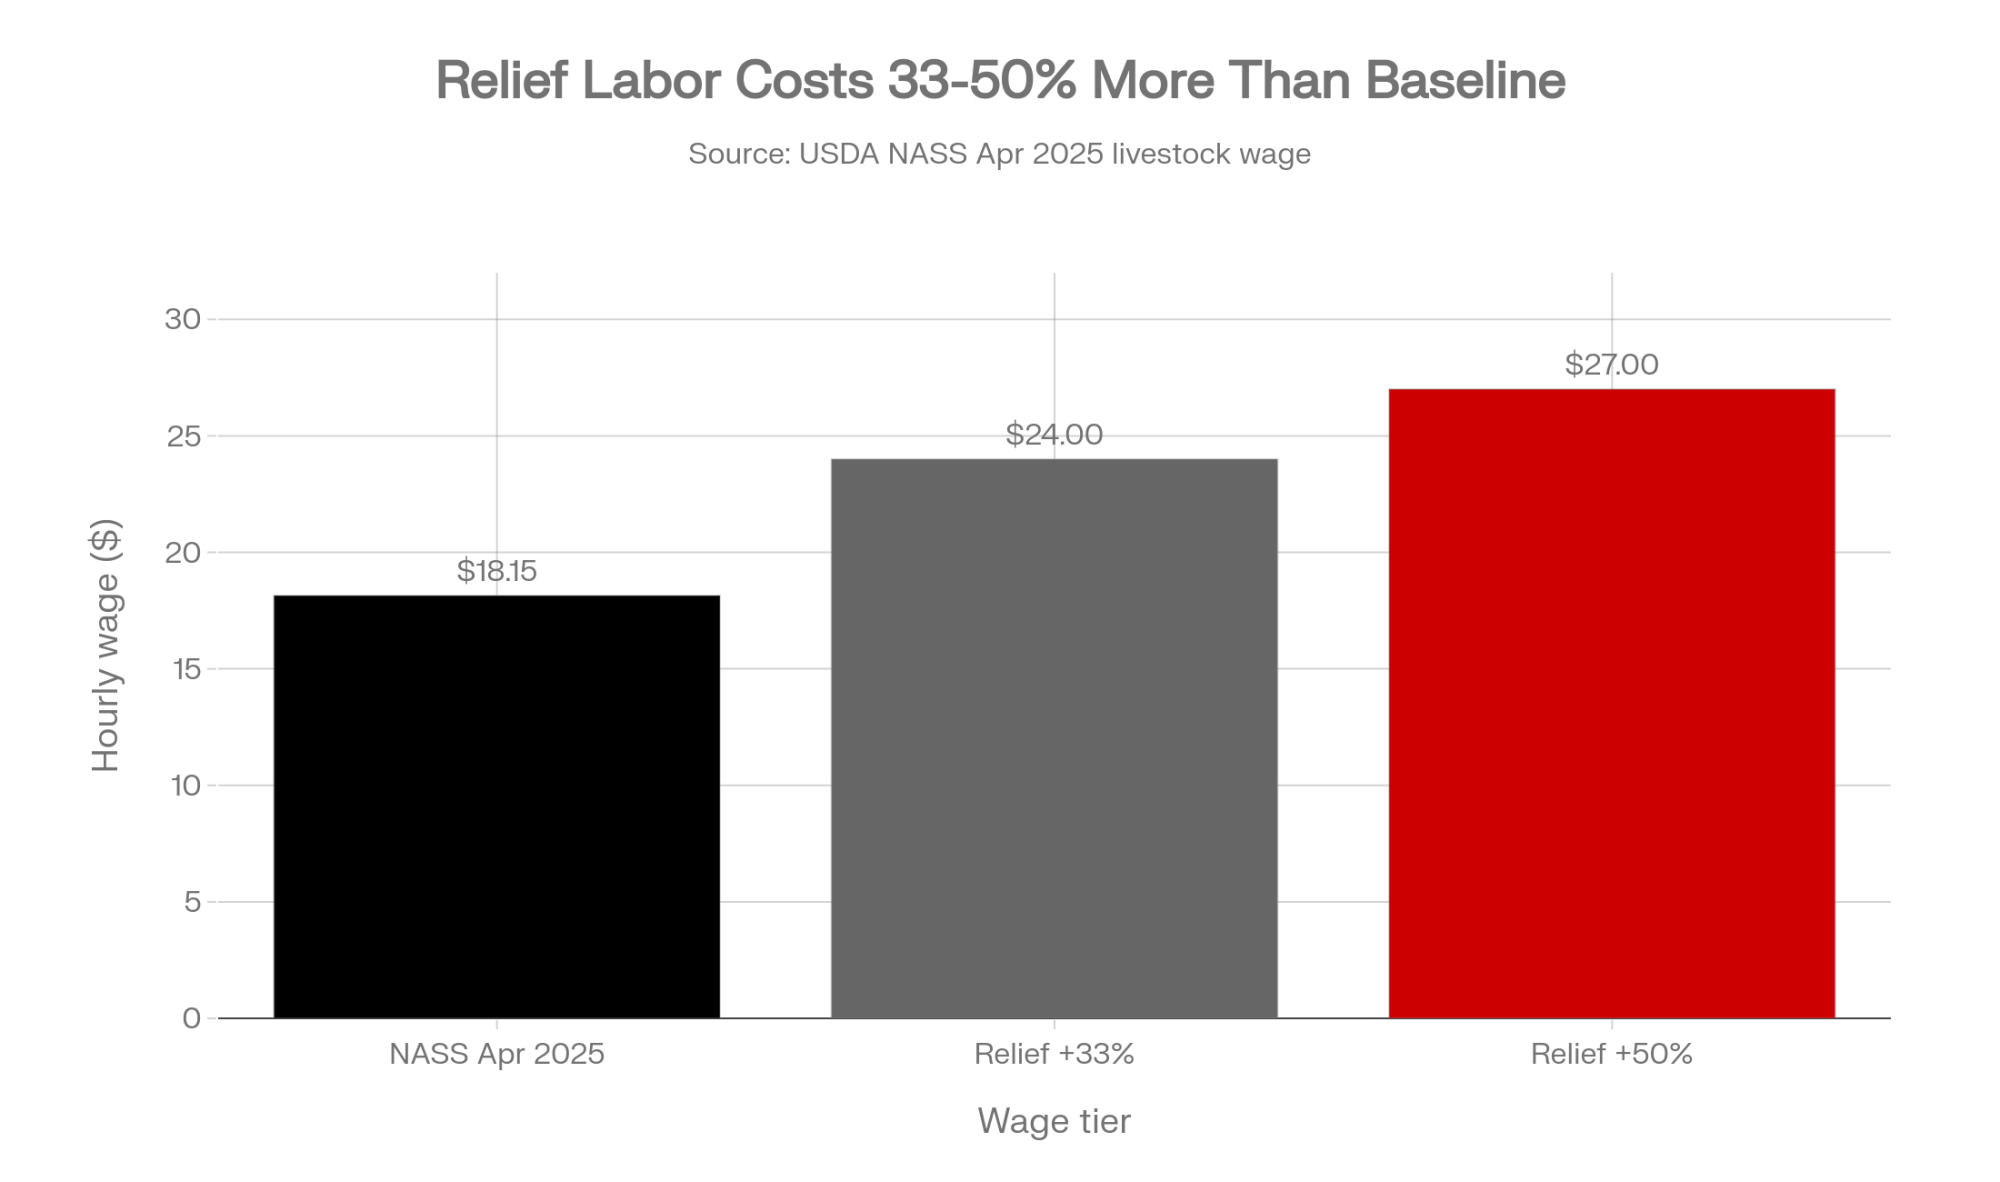
Break-even labor wage“Pays for itself”Only balances if current labor costs $27.05/hr
Net early annual returnHighly positive$1,391 to $1,472/year net cash flow

None of the dealer’s numbers are lies, exactly. They’re best-case inputs presented as expected ones. The extension column is what the same machine does in an average barn with average cows and an average loan — which is the barn most of us actually farm.

What Does a Robot Actually Cost Per Cwt — and What Does It Really Save?

This is where the dealer math and the extension math part ways. Iowa State pegs the AMS milking cost at about $1.80/cwt, with a realistic range of $1.36 to $2.00 once you account for a leased two-robot setup at roughly $32,819 per unit per year. The labor savings that are supposed to offset it? Iowa State puts those at $1.06 to $1.36/cwt on a 120-cow herd — real, but thinner than the pitch implies. Line those bars up against debt service and the early-year squeeze stops being abstract.

Look at the gap and the lesson lands without anybody having to spell it out. The cost of running the robot plus the cost of financing it sits well above what you claw back in labor on most family-scale herds. That’s not an argument against robots. It’s an argument for knowing exactly where your own numbers fall inside those ranges before you treat the dealer’s single tidy figure as gospel. Pull your real labor hours and your real quoted payment, drop them onto this chart, and see whether your bars cross.

📖 Go deeper: Want the cash-flow valley walked through one year at a time? See our companion breakdown, Robotic Milking Pays 13% More — After 7 Years of Red Ink.

The Mechanics Behind the Outcomes

The most fragile number on a typical robot ROI proposal is the assumed milk-yield bump. Proposals routinely pencil in a 5 to 10% production increase. Tranel and the extension data put the realistic gain at 3 to 5% for herds coming off twice-daily milking — and for herds already on 3x, that per-cow response can run lower still. If you’re milking 3x in a good parlor today, that gap can shrink toward zero. And every other line on the spreadsheet is riding on it.

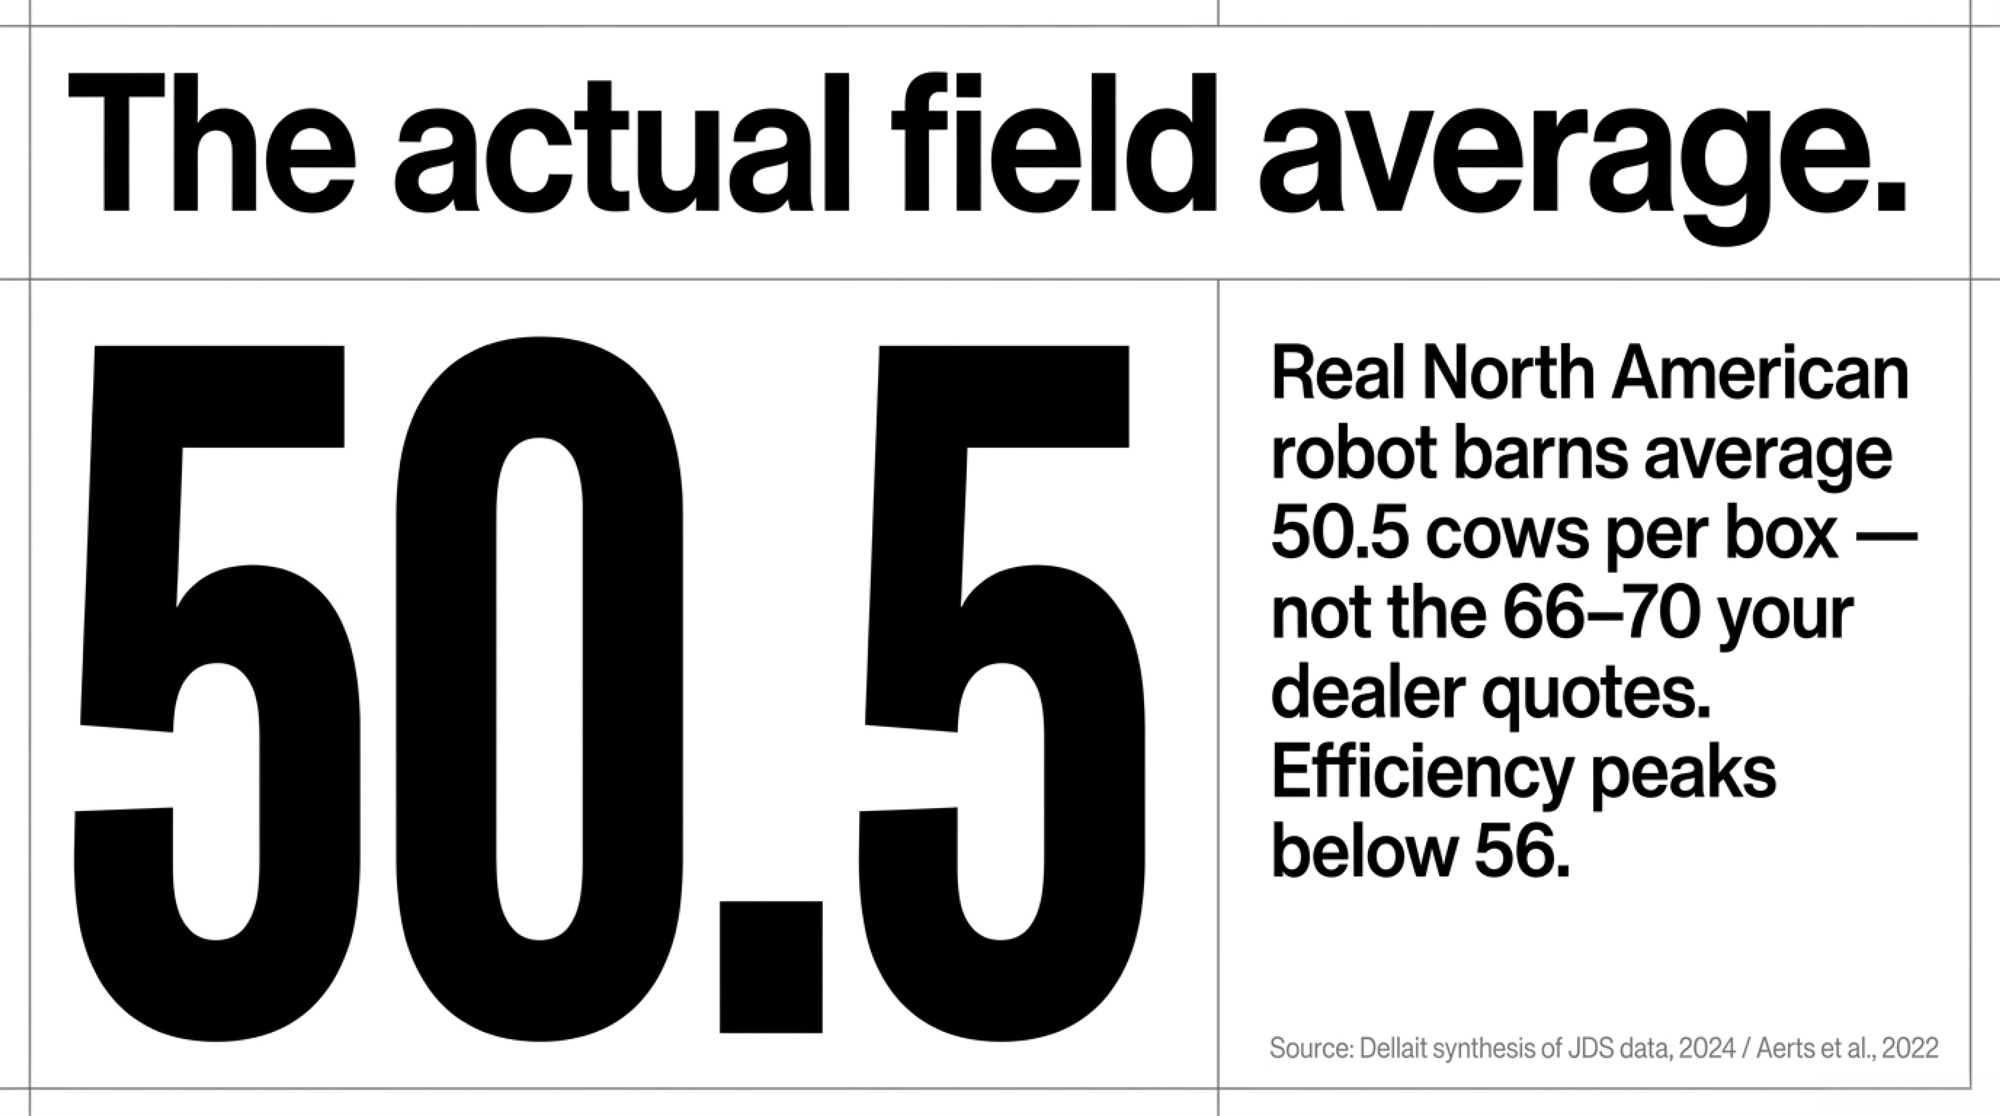
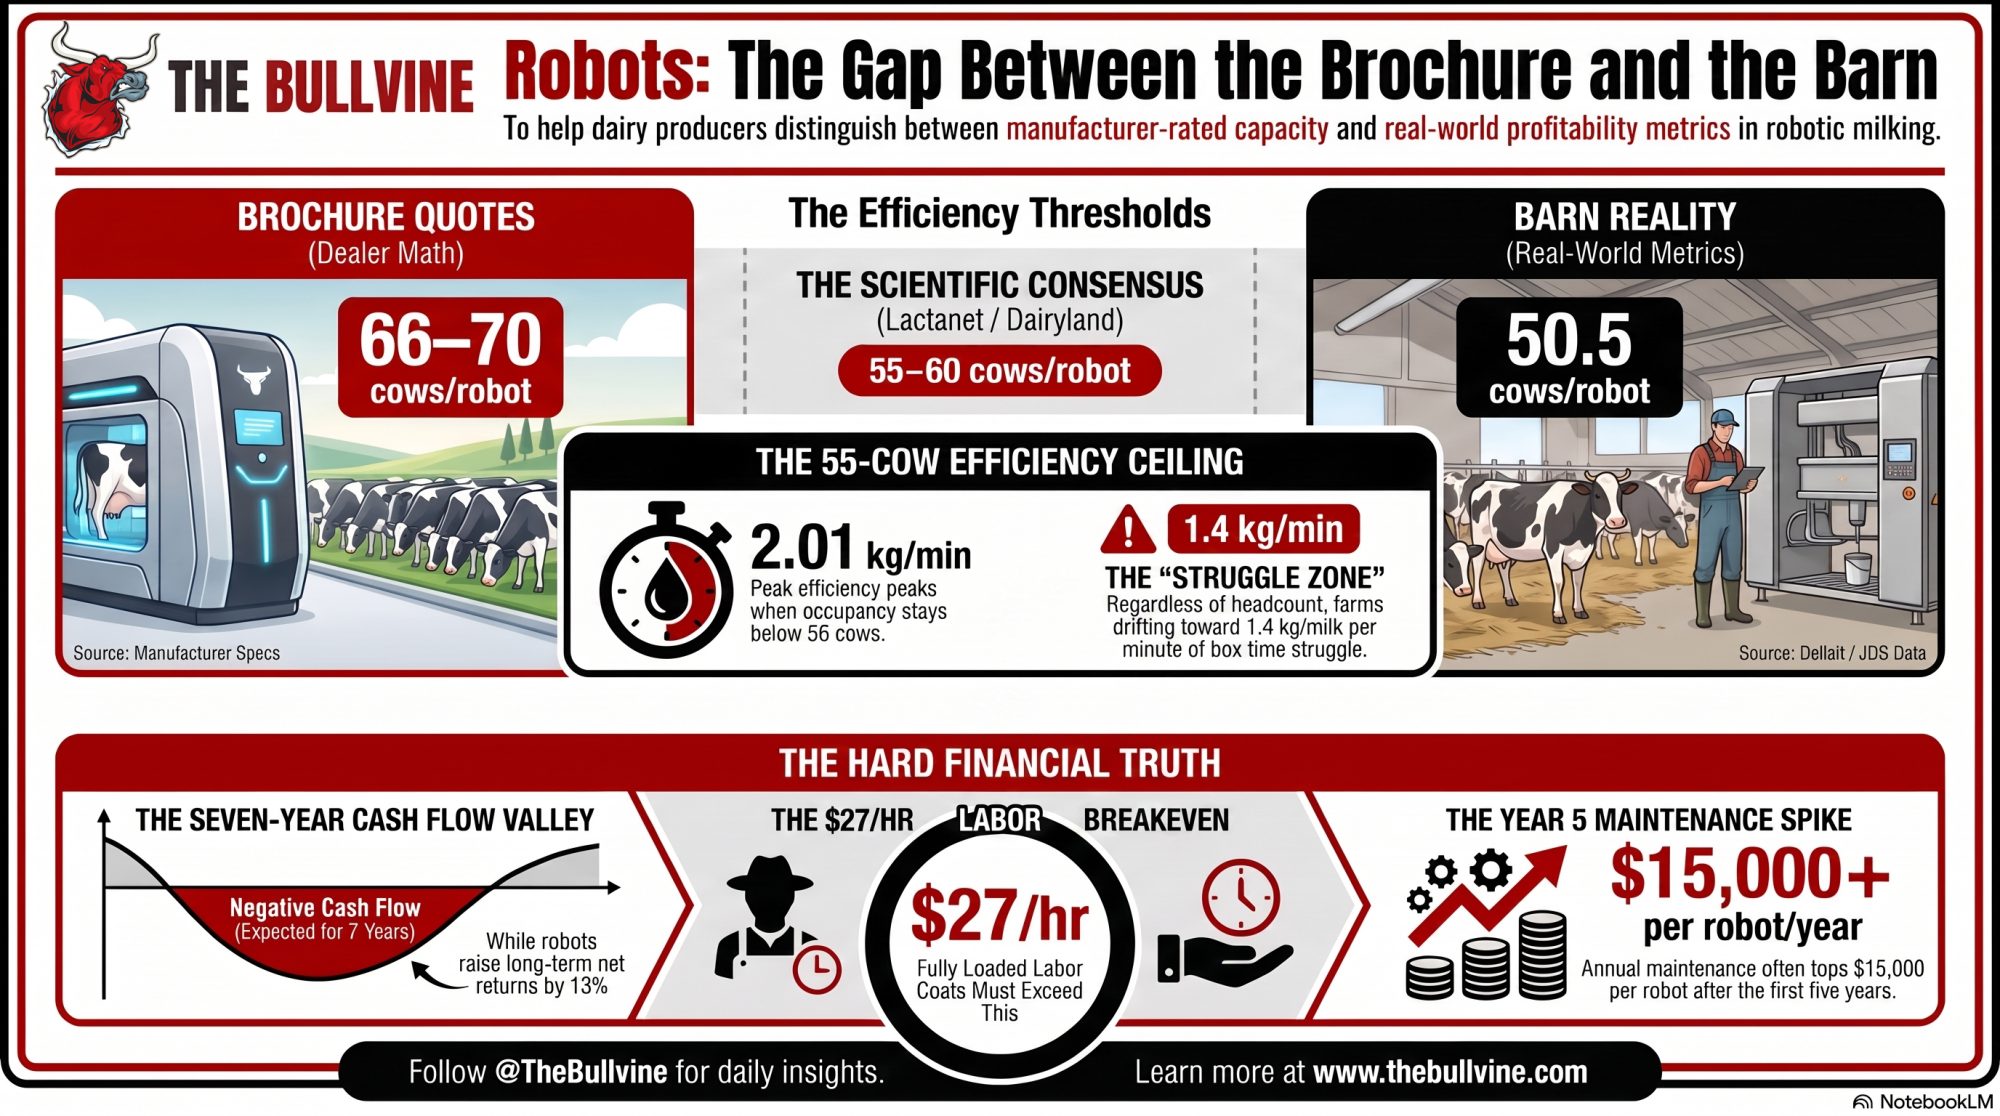
Tranel points to a cleaner predictor anyway: milk per robot box, not milk per cow. He’s blunt that milk per AMS unit is “very highly correlated” with profitability, more so than per-cow yield. Dealers rate the boxes for up to 70 cows. Extension guidance from Iowa State, Wisconsin, and Lactanet pegs the realistic profit sweet spot closer to 55 to 60 high-producing cows per robot. Push past that to make the numbers sing, and box time climbs, fetch lists grow, and the system quietly bleeds.

Then there’s the labor assumption holding the whole thing up. University of Minnesota Extension’s Jim Salfer found robots and a well-run parlor only break even when you’re paying milkers $27.05 an hour — or gaining about 3 pounds per cow per day more milk than your current 3x system. For you, if you’re not paying $27 an hour for milking labor, robots are first a lifestyle call. That’s a fair reason to buy one. It’s just not the same as a profit upgrade, and it’s worth being honest with yourself about which one you’re signing for.

Does the Math Change North of the Border?

It does, and not in the direction most people assume. Under Canada’s quota system, the constraint isn’t selling more milk — it’s making more fat per kilogram of quota you already own. That flips the robot equation from “milk more cows” to “push more fat through each box.” A Lactanet-profiled farm in Lambton County, Ontario, shows what that looks like in practice: they grew from 90 cows producing 130 kg of fat a day to 120 cows on 175 kg of quota, lifting output per robot from 65 to 87 kg of fat a day. Same hardware, far better economics — because they optimized fat per box, not headcount.

But quota cuts the other way on the debt side. Lactanet has warned that with $20,000 of debt per kilogram of quota, a 2% interest-rate bump can add $225 per kilogram per year, and for a 100-cow farm with 113 kg of quota that’s an extra $2,000 to $3,500 a month before you’ve bought a single robot. Stack a $400,000 AMS loan on top of an already quota-leveraged balance sheet and the seven-year valley gets steeper, not shallower. If you farm under quota, you need to run the robot decision as a fat-per-box question and a debt-stacking question at the same time — not as the volume play the US extension models describe.

Options and Trade-Offs for Your Operation

There’s no single right answer here. There’s a right answer for your barn, your labor market, and your balance sheet. Four paths producers are actually walking:

PathWhen It FitsCapital / PaybackThe Risk (flagged)
Buy the robotsLabor scarce, wages mid-$20s, purpose-built barn~$400,000, 2 boxesRetrofit + cheap labor = financing the problem
Go hybrid (parlor + tech)Herds under 180 cowsMonitors: 7–14 mo paybackManages a shortage; doesn’t solve a true one
Fix the herd firstLameness or poor cow flowNear-zero (audit only)Skip it and the 7-yr valley gets deeper, fast
Wait & stress-testTight financesModel at $18 milk$18 milk pushed one pitch from $2.03 to $4.07/cwt
  • Buy the robots — when labor is scarce and expensive. Makes sense when you genuinely can’t hire or keep milkers, wages are pushing into the mid-$20s, and you’ve got a purpose-built barn with good cow flow and low lameness. Needs a strong start: a manager who likes living in the data, sand-bedded freestalls, tight box utilization. The risk — in a retrofit barn with cheap labor, you’re financing your problems, not fixing them.
  • Go hybrid — parlor plus targeted tech. For herds under the 180-cow threshold where activity monitors and precision feeding consistently out-return robots, you can capture much of the benefit at a fraction of the capital. The Bullvine’s 2025 tech-ROI analysis puts the automation sweet spot squarely between 180 and 400 cows — below it, monitors with a 7- to 14-month payback usually win. The risk — it manages around a labor shortage; it doesn’t solve a true one.
  • Fix the herd first — and start this month. Before you sign anything, run a real milking-routine and lameness check. Tranel’s seven-year valley gets deeper fast if cows won’t walk to the box. This is the cheapest move on the list, and it tells you whether your throughput problem is a robot problem or a management problem.
  • Wait and stress-test. If your finances are tight, model the proposal at $18 milk before you commit. A 240-cow Upper Midwest family ran their dealer’s four-robot pitch at $18 instead of the dealer’s $22 and watched the projected milking cost jump from $2.03 to $4.07/cwt. The risk cuts both ways — waiting costs you too if your labor situation is actively falling apart.

📖 Go deeper: If you’re milking under 500 cows and weighing robots against hired help, read Robots Won’t Save Your Dairy If You’re Alone: 5 Hard Truths About Labor and Robotic Milking ROI Under 500 Cows.

How Much Does That Seven-Year Valley Actually Cost a Family?

Year three is where it gets real. The robot has kept its promise on lifestyle — the early mornings are gone, the data’s slick, the barn looks modern enough that the neighbors slow down to look. But the bank’s promise on profitability is still on layaway. The monthly reality is $8,000-plus in annual red ink getting patched with off-farm income, a deferred repair, or a quiet draw on equity that nobody mentions at supper.

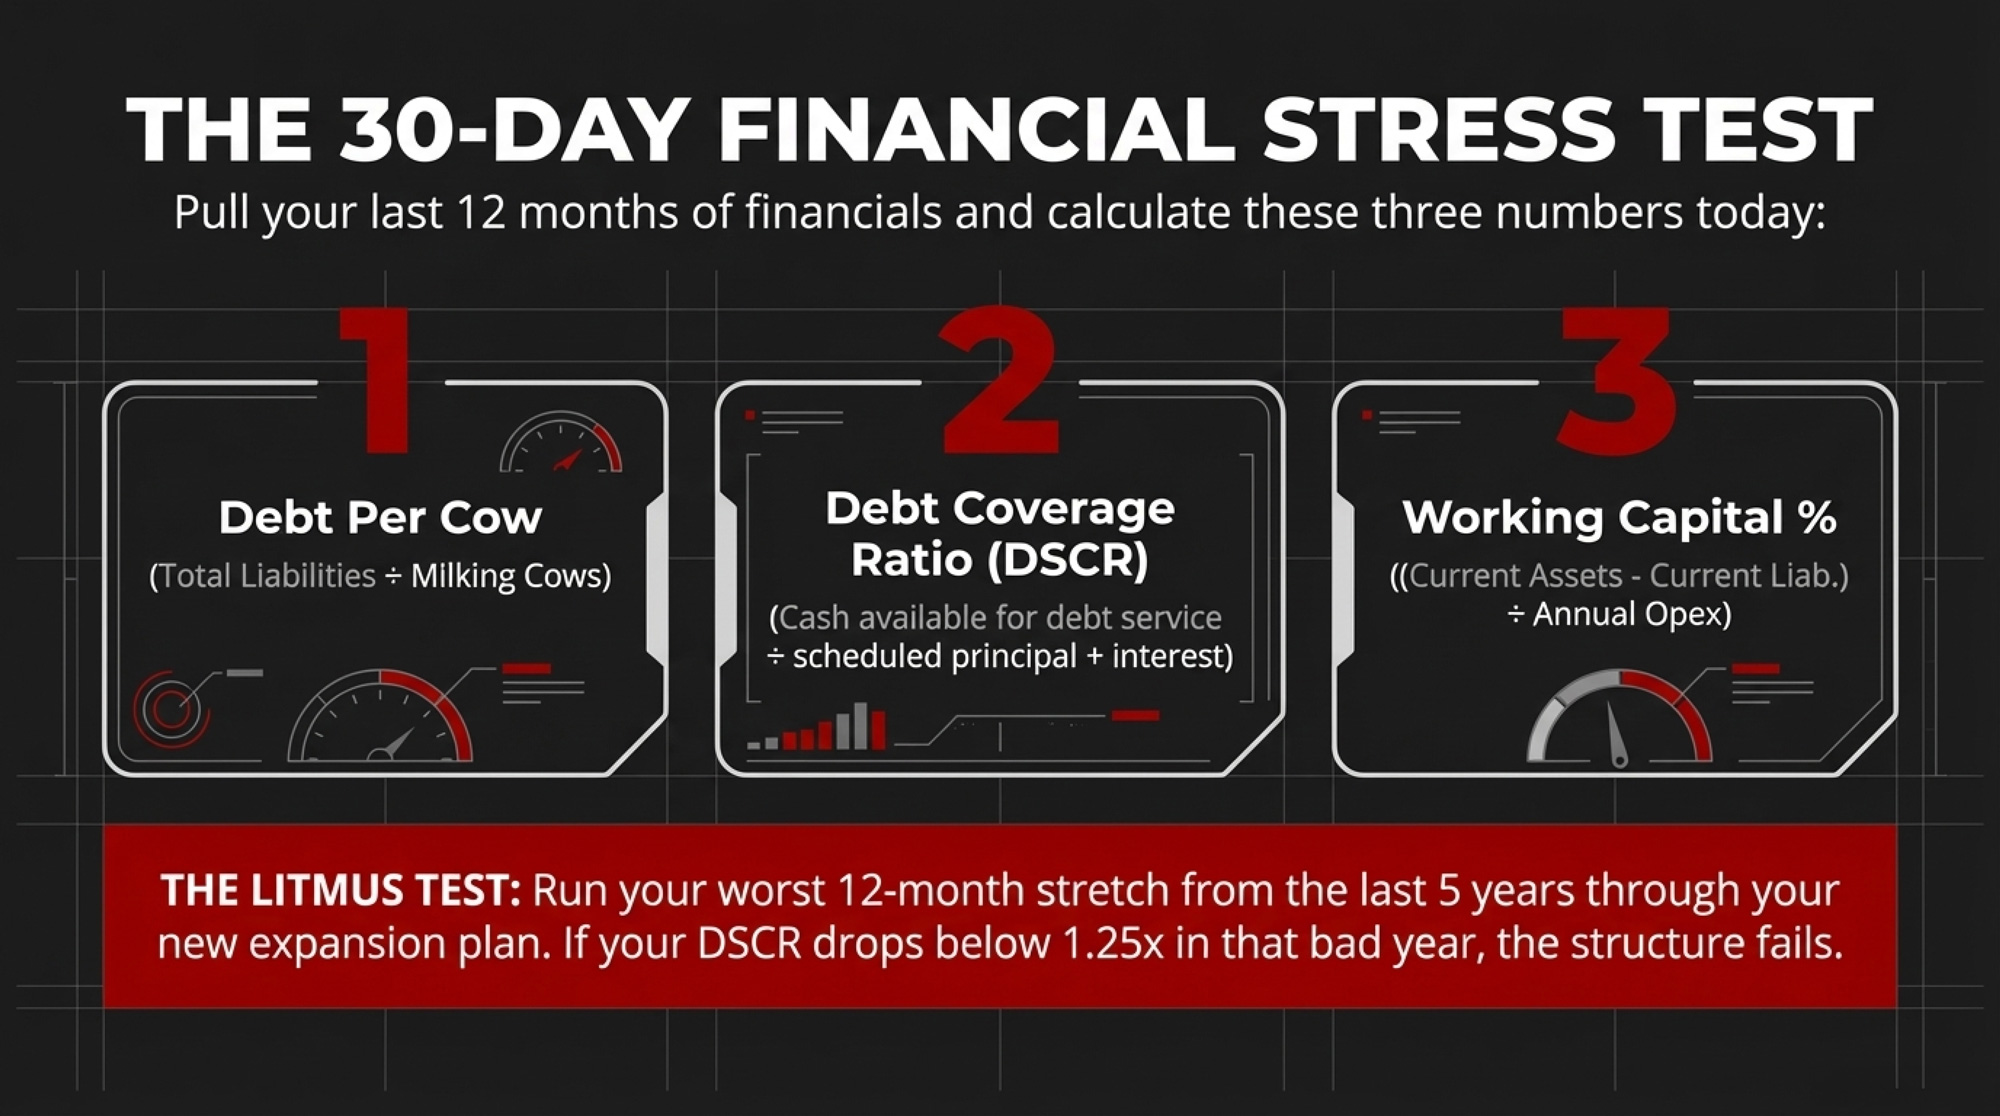
Try the debt-service coverage check your lender actually runs. DSCR is just your net farm income available for debt service divided by your total annual payments. Say you’ve got $260,000 available and $200,000 in existing payments — that’s a 1.30x ratio, comfortable. Add, say, an $80,000 robot payment and the same income now covers $280,000 of debt, dropping your DSCR to roughly 0.93x. Below 1.0x means the farm isn’t generating enough to cover its own payments, and that’s when a lender turns cautious. The University of Waterloo’s dairy-robotics case study put it bluntly: adopting AMS “may require a transition period of up to four years to achieve profitability.” That’s a polite description of the same valley.

Is Your Barn Already Telling You the Answer?

You can spot the fit before the decision’s even made — no hindsight required. The farm that should buy robots has high, hard-to-fill labor, a DSCR comfortably above 1.25x, sand-bedded stalls, clean feet, and cows already hitting strong milk per box. The infrastructure was doing the hard work. Robots just monetize it. Walk that barn and the cows are calm, the alleys flow, the fetch list is short.

The farm that shouldn’t is the tie-stall retrofit with cheap labor, a debt-service ratio already flirting with 1.0x, lameness in every alley, and a fetch list that’d make a robot tech wince. There’s a hard infrastructure truth underneath this, too: Bullvine’s 2025 tech-ROI work found 62% of automated-milking difficulties trace back to inadequate electrical and connectivity setup, not the purchase decision. Robots won’t fix lameness or a weak service panel. They’ll just put interest on it. Here’s what the glossy proposal tends to underplay: the robot is an amplifier, not a cure. Watch a milking, walk the alleys, look at the feet — your barn usually answers the question before the dealer does.

What About the Next Generation Standing in the Doorway?

Now put the daughter back in the picture. Only about 16.5% of dairy farms make it to the third generation — the other 83.5% don’t, and it’s usually planning and debt structure that sink them, not markets. Lenders generally want debt-to-EBITDA under 4:1 and term-debt coverage of at least 1.25x before they’ll bless new debt. So the question across that table isn’t really “robots or no robots.”

It’s whether you want to hand her a business with room to breathe — or a high-tech barn strapped to a payment schedule she’ll spend her thirties servicing. A clean balance sheet with good cows is a bigger inheritance than a laser arm. Robots can absolutely be part of a strong handoff. But only when they’re turning a real labor crisis into durable margin in a barn that already works — not when they’re bolting cutting-edge debt onto a structure that was already wobbling.

📖 Go deeper: Before you add a dime of debt, walk through Why 83% of Dairy Farms Will Disappear: How to Beat the Succession Odds Before It’s Too Late.

📋 The Kitchen-Table Checklist

Financial Guardrails

  • The DSCR target: If your debt-service coverage ratio sits below 1.15x before adding robot debt, treat it as a flashing yellow light — model the new payment against your income before you fall for the technology.
  • The stress test: Run the proposal at $18 milk, not $22 — then add one $10,000-to-$15,000 maintenance spike. If it still covers payments and family living, proceed. If it only works at $22, you’ve found your real answer.
  • The yield assumption: Make the dealer put the milk bump in writing. If it’s above 3 to 5% and you’re already milking 3x, demand retrofit-specific data before you sign.

Operational Realities

  • The break-even wage: Check your actual milking-labor wage. If you’re paying well under $27/hour, you’re buying a lifestyle upgrade, not a profit margin — fine, as long as you decide with that clear.
  • Box efficiency: Keep plans capped at 55 to 60 high-producing cows per box. Push past that and your fetch lists spike while box utilization tanks.
  • The quota flip (Canada): Judge the system on fat per box, not head count. Follow the Lambton County model — they hit 87 kg of fat per robot per day by optimizing that, not headcount.

Before You Sign

  • Infrastructure first: Have an electrician audit your service panel and connectivity. 62% of automated-milking failures trace back to poor electrical/connectivity setup, not the purchase.
  • The free option: Book a comprehensive milking-routine and lameness audit this month. If cows won’t walk to the box voluntarily, your cash-flow valley gets deep, fast — and it’s the cheapest check on this list.

The One Question to Put on the Table

So if you could ask just one thing across that kitchen table, make it this: If I plug my own last 12 months of milk checks, my real labor cost, and my actual barn into Tranel’s cash-flow model and Salfer’s breakeven wage, does this robot still make money — or am I just financing a lifestyle upgrade? It’s a fair question. It just forces the dealer’s averages to collide with your numbers — which is exactly the collision a glossy proposal is built to avoid.

So where does your breakeven really sit? Before you sign a $400,000 note, run your own numbers against the ones the brochure left out, and have that conversation with your lender and your kid in the same week. We’ve built the full cost-per-cwt model by herd size — plus the $18-milk stress test and the quota-side fat-per-box math — in this week’s Bullvine Weekly breakdown. That’s where the real numbers live, and it’s worth an evening before the dealer’s truck comes back down the lane.

Key Takeaways

  • If your DSCR is under roughly 1.15x before the robot note, treat that as a yellow light and run the $18 milk stress test before you sign.
  • Robots make the most sense where labor is truly scarce and expensive, cows are sound, and you can keep box use in the 55–60 high-producing cows range.
  • If you’re paying well under $27/hour for milking labor, be honest that you’re mostly financing lifestyle, not margin, and decide with that clear.
  • Before any AMS contract, do the cheap work first: a full milking-routine, lameness, and infrastructure audit in the next 30 days to see if you’re fixing management or just buying hardware.

Run Your Numbers

Before you accept any dealer’s three-year payback, drop your own installed cost, labor wage, milk price, interest rate, and downtime into the Robot ROI Reality Check. It turns the dealer’s averages into your breakeven and shows whether the seven-year valley is real on your balance sheet.

Learn More

The Sunday Read Dairy Professionals Don’t Skip.

Every week, thousands of producers, breeders, and industry insiders open Bullvine Weekly for genetics insights, market shifts, and profit strategies they won’t find anywhere else. One email. Five minutes. Smarter decisions all week.
NewsSubscribe
First
Last
Consent

The $73-a-Cow Gap Hiding in Your 2027 Bovaer Contract

An April 2026 Science paper mapped why methanogen-targeting additives cap near 30% — and why the zero-cost lever is already sitting on a genomic report you paid for.

Executive Summary: Bovaer caps near 28–30% methane reduction because the April 30, 2026 Science paper just mapped a second hydrogen supply — the ciliate hydrogenobody — that 3-NOP can’t reach. On a 300-cow herd at 75 lbs/day, Bovaer runs $93–$105 per cow per year while a $0.12/cwt sustainability premium pays back only about $33, leaving a $40–$73 per cow per year gap that carbon credits or insetting have to fill. Sheep on identical rations produced 100 times more Dasytricha ciliates in high-methane animals than low-methane ones — same bunk, same feed, two orders of magnitude apart — which is why adding more additive won’t close the ceiling. The zero-cost lever is already sitting on the genomic reports you paid for: Zoetis dropped RUMiN into the April 2026 DWP$ update, and Lactanet has published Methane Efficiency RBVs on every Holstein female in eDHI since April 2023. Two 30-day moves earn their place before Monday — pull a recent CLARIFIDE Plus or Lactanet report and check whether methane traits ever broke a sire-selection tie, and if Bovaer’s already on farm, talk to your calf manager about adding it to the milk replacer for next-born heifers. Producers who filter sires on methane genetics in 2026 will be selling that genetic trajectory into a premium market by 2031–2032; producers who wait will be buying it back at markup. The full herd-size-tiered math and the two contract questions worth asking before 2027 renewal live in the next Bullvine Weekly.

Bovaer methane reduction

Run the numbers on a typical 300-cow herd shipping to a DFA-member plant at 75 lbs/day, on a contract up for renewal in 2027, collecting a $0.12/cwt sustainability premium. Eighteen months into a Bovaer (3-NOP) program, the methane reduction holds steady at 28%. The additive is doing what the label promised. But Bovaer has been reported in trade coverage at roughly $93–$105 per cow per year, while that $0.12/cwt premium on 75 lbs/day works out to only about $33 per cow per year — and Elanco has publicly projected carbon market returns in the range of $20 per cow per year on top of the premium, which still leaves a gap of $40–$73 per cow per year. The April 30, 2026 paper in Science just explained why closing that gap with more additive isn’t the play.

The gap closes fastest where a producer holds insetting access (defined below) or OFCAF cost-share. It widens fastest if carbon market revenue doesn’t materialize at renewal. That’s the variance band every 2027 conversation is running through right now.

The 30% Ceiling: Why the Rumen Resists Methanogen-Only Additives

Researchers at the Chinese Academy of Sciences assembled the most comprehensive rumen ciliate genome catalog ever produced — 450 genomes across cattle, sheep, goats, and deer. Inside those single-celled microbes, they found a tiny organelle nobody had described before. They named it the hydrogenobody. It does two jobs: produces hydrogen,

and scrubs oxygen from its immediate environment.

Those two jobs together build a near-perfect environment for the methanogens that convert hydrogen into methane. That’s the causal link the April paper nailed down. Bovaer blocks the downstream methanogens — but the hydrogenobody sitting one step upstream keeps pumping hydrogen the additive can’t reach. Your 28–30% reduction isn’t a dose problem. It’s the practical ceiling of a mechanism targeting only the downstream half of a two-part hydrogen supply chain.

The sheep data is where this lands hard. Animals fed identical rations — same feed, same management — but producing high methane had nearly 100 times more Dasytricha ciliates (a high-hydrogenobody genus) than low-methane sheep. Two animals. Same bunk. Same ration. Two orders of magnitude difference in the microbes most responsible for feeding the methane machine.

How This Shows Up in Real Herds

A Canadian producer 18 months into Bovaer watches the methane number hold steady near 28%. A US producer running the same program notices the reduction shrinks when forage composition shifts — consistent with the Dutch year-long trial’s finding that ration changes produced the biggest swings in the number. Both are experiencing the same biology: elevated rumen hydrogen partial pressure from methanogens being partially suppressed, while ciliates keep producing H₂ at the cell surface. Elanco has publicly maintained that Bovaer delivers consistent reductions under commercial conditions across validated trials, and within-mechanism that record is real. What the April paper raises is about the mechanism’s scope, not its integrity.

Penn State measured 3-NOP cutting methane 31% while simultaneously raising free rumen hydrogen from undetectable to 1.33 g/day. The Dutch year-long dairy trial found efficacy of 21–27% across a full lactation. Different herds. Different seasons. Same shape of result.

The barn math. On a 300-cow herd, Bovaer costs roughly $28,000–$31,500 per year in additive bills. That same herd earns about $9,900 per year from a $0.12/cwt premium on 75 lbs/day. The gap between cost and current premium revenue lands at $18,000–$21,500 per year that has to come from somewhere. Carbon credits. Cost-share. An insetting arrangement. Or your operating margin absorbing it as audit insurance.

Contract Line ItemMarketed ValueRealized Value (Yr 1)Gap
Sustainability premium$1.25/cwt$0.92/cwt–$0.33
Bovaer feed cost (DSM pricing)“offset by premium”$0.18/cow/day+$65.70/yr
Methane verification feeNot disclosed$12/cow/yr+$12.00
Labor/TMR mixing compliance“minimal”0.4 hr/day/100 cows+$18/cow/yr
Exit penalty (early termination)“standard”24-month clawbackLocked in
Net margin impact+$47/cow–$26/cow–$73/cow

Plug your own numbers in. Your herd size times about per cow per year lands you inside the variance band — closer to the low end if you hold an insetting contract, closer to the high end if you don’t. If that number is larger than you’re comfortable carrying into 2027 renegotiation, the four-lever choice below starts to matter.

Contract ClauseTypical LanguageHidden RiskNegotiation Ask
Premium duration“for the term of agreement”Reviewable annually by processorLock floor at $0.75/cwt for 36 months
Dosing compliance“per manufacturer protocol”Audit failure = full clawbackCap clawback at 6 months
Data ownership“processor retains herd data”Sold to CPG brands without share25% royalty on secondary data use
Methane floor“minimum 25% reduction”Below-threshold = unpaidTiered payment, no zero-out
Termination“24-month notice required”Blocks competing contracts90-day exit with cause

What’s Actually Happening in the Rumen

Two hydrogen pipelines run at the same time. Free-living methanogens in the bulk rumen fluid consume roughly 65–85% of total methane production. That’s where Bovaer operates — circulating in fluid, reaching those free-living archaea, blocking the enzyme that makes methane. That’s the real reduction you’re paying for.

But the other 15–35% of methane comes from methanogens that live directly on and inside ciliate cells as symbiotic partners, fed hydrogen at cell-surface proximity by the hydrogenobody organelles. That exchange happens in nanometres, not metres. An additive moving through rumen fluid has a much harder time reaching those methanogens at meaningful concentration — the hydrogen never enters the bulk fluid in the first place.

That upstream gap is why Asparagopsis seaweed routinely hits 80–99% in controlled trials, and why compounds that suppress ciliates directly — certain tannins, saponins, lingonberry-derived extracts — tend to produce more durable results than their mechanism descriptions suggest. They’re hitting the supply, not just the consumer. Worth noting: ambient dietary tannins from alfalfa-heavy rations or byproduct loads don’t reach the therapeutic threshold, so “I already feed high-tannin forage” doesn’t substitute for a targeted blend.

The concerning part for producers 18 months in: recent metagenomics work has documented measurable shifts in the rumen protozoal community under sustained Bovaer dosing, with incomplete reversal after withdrawal. What that work doesn’t answer — and what you should be asking — is whether those community changes affect the size or stability of the methane reduction over time. The long-term efficacy question stays open.

How Much Does Waiting 30 Days Actually Cost?

For the tannin-saponin layer, waiting 30 days costs effectively nothing. The protocols and contract structures aren’t ready to pay for it yet. Verra’s VM0041 methodology — the dominant global protocol for enteric methane feed additive credits — currently covers methanogen inhibition. The ciliate module Viresco Solutions submitted in 2024 was placed on hold December 19, 2024, and the public registry entry does not specify criteria required for it to advance. Stacking a ciliate mechanism onto your current credit path isn’t an option today.

Waiting on the genetic lever costs you a heifer cohort and a breeding cycle. Those compound. Every breeding season you delay adding RUMiN or Methane Efficiency RBV to your sire filter is a generation interval you hand to a competitor who moved first. Danone has publicly stated that genomic testing plays an important role in its global methane reduction strategy. That signals where methane traits may factor into supplier programs over time. Zoetis integrated RUMiN into the April 2026 Dairy Wellness Profit Index update, with company materials indicating that RUMiN-informed sire selection is expected to reduce lifetime methane intensity in daughter cohorts. When methane EBVs get priced into semen premiums — and the trajectory suggests that’s where 2029–2030 is heading — producers who started filtering in 2026 will be the ones selling genetics the late movers pay premium to access.

Value Chain PlayerRevenue/Cow/YrCost/Risk BorneNet Margin/Cow
Dairy farmer$95$88 (feed + labor + risk)$7
Milk processor$142$38 (logistics + admin)$104
CPG brand (Danone, Nestlé)$210$45 (marketing + audit)$165
Carbon credit aggregator$68$14 (verification)$54
Value capture ratioFarmer = 2.4%

Is Your Herd’s Genetic Strategy Already Behind?

Pull a recent Zoetis CLARIFIDE Plus report or a Lactanet genomic summary on any heifer tested in the last six months. If you can’t immediately find the RUMiN value (Zoetis) or the Methane Efficiency RBV (Lactanet, published on every Holstein female in eDHI herds since April 2023), you’re not using data already in your mailbox.

Most selection indexes already weight methane traits implicitly through composites like Feed Efficiency or the Environmental Index inside LPI. That’s a reasonable starting point. When your processor or export buyer shifts toward outcome-based carbon verification in 2028–2030, the herds with a documented genetic trajectory — methane-filtered sires used consistently since 2026, with the genomic records to prove it — walk into that conversation with a structural story competitors can’t replicate on short notice.

Reliability on Lactanet’s methane genomic EBV for young genotyped bulls now exceeds 70%. The genetic correlation between MIR-predicted methane (the kind your eDHI milk sample is already generating) and directly measured methane is 0.85. You’re not selecting on noise. You’re selecting on data flowing through a pipeline that’s already running.

Options and Trade-Offs: The Four-Lever Comparison

Four levers address different parts of the methane puzzle at different time horizons and cost points. Most producers shouldn’t run all four right now. Pick the combination that matches where your contract and your breeding program sit today.

A quick note on “insetting.” Unlike open-market carbon credits, an insetting arrangement keeps the reduction inside the processor’s own supply chain — it counts toward their Scope 3 footprint rather than being sold to an outside buyer. In an insetting model, your methane numbers feed your processor’s sustainability report. In an open-market model, you can sell the credit independently. The economics of your 2027 contract hinge on which model your processor runs.

StrategyCost (Est.)Methane ImpactTimelineKey Trigger
Bovaer (3-NOP)$93–$105/cow/year21–31% (practical ceiling)Immediate2027 contract renewal
Calf Early-Life ProtocolLow marginal add if Bovaer already on farmPersistent reduction to 60 weeks of age from 14-week treatment2–3 years to milking stringNext calving season
Tannin/Saponin Blend$0.10–$0.18/cow/daySupplemental (ciliate-targeting, no DMI penalty)Immediate$0.18/cwt dual-mechanism tier, OFCAF access, or VM0041 ciliate module restart
Genomic Sire Filtering$0 incremental if testingCumulative, heritable5–7 years to herd-level expressionThis breeding season

Continue Bovaer. Protocol-compliant under VM0041, registry-creditable today, defensible in a 2027 renegotiation. The net margin is thin at current premium levels, but it isn’t negative if you already hold a sustainability contract. Risk: the 28–30% reduction is the mechanism’s practical ceiling on this lever alone.

Add a tannin-saponin blend — but not yet. The 2025 J. Dairy Science trial on Silvafeed BX confirmed methane reduction without penalty to ECM, fat yield, protein yield, or DMI. The mechanism is real. But the economics don’t close in 2026 — commercial blends scaled from published beef cattle trial pricing land roughly $0.10–$0.18/cow/day on dairy DMI, and current protocols don’t credit the ciliate mechanism separately. Hold this layer until one of three triggers fires.

Start a calf early-life protocol within 30 days. Pre-weaning rumen microbiome colonisation shapes a substantial share of the adult animal’s rumen community, with published estimates clustering in the 60–70% range depending on methodology. A 2021 trial found 3-NOP given to calves in the first 14 weeks produced methane reductions persisting to 60 weeks of age — long after treatment ended. If Bovaer is already on farm, the marginal cost of adding it to the milk replacer program for next-born calves is low. Those calves enter the milking string in 2028–2029, right when outcome-based verification standards are projected to tighten.

Filter your sire roster on methane genetics — zero incremental cost. You’re not buying a new test. Lactanet publishes Methane Efficiency RBVs on every Holstein female in eDHI. Zoetis added RUMiN and Milk Methane Intensity (Z_MI) to every CLARIFIDE Plus report in April 2026. The trade-off: herd-level expression takes 5–7 years. A 2026 sire selection change shows up meaningfully in your herd’s methane number around 2031–2032.

The combination that closes both the near-term audit need and the long-term biological asset without absorbing an extra – per cow per year in negative margin: Bovaer + calf protocol + RUMiN sire filtering. Hold the tannin-saponin layer for the 2028 trigger.

Key Takeaways

  • If your net return on Bovaer is under $20/cow/year after premium, check whether your processor runs an insetting program (DFA, Danone, select others) or whether OFCAF cost-share applies in your region. Ask both questions before the 2027 renewal conversation — that’s where the economics turn positive or don’t.
  • If your Bovaer program has held at 28–30% for 18 months, monitor rumination time and component tests as leading indicators of rumen ecology shifting under sustained dosing. Neither shows up on a methane reduction number until the shift has already compounded.
  • If you’re genomically testing replacement heifers, the RUMiN and Methane Efficiency RBV data is already on the report you paid for. Start using it as a sire tiebreaker within your current economic index this breeding season.
  • If Bovaer is already on farm, talk to your veterinarian and calf manager this month about adding it to the milk replacer protocol for next-born calves. The 2029 heifer cohort is the one that carries this forward.

Where Does Your Operation Actually Sit?

The producers who’ll be selling low-methane genetics into a premium market in 2032 aren’t the ones currently spending the most on additives. They’re the ones who recognized in 2026 that the biology had changed category — from a compliance cost to a heritable asset — and adjusted their sire roster while everyone else was still optimizing additive spend. The April 2026 hydrogenobody paper made that shift explicit. The response window is now, not when methane EBVs get priced into semen premiums.

So where does your operation actually sit on that line? Pull your last genomic report before Monday. Check whether your methane trait values were ever used in a selection decision. If the answer is no, you’ve just identified the highest-leverage, lowest-cost change you can make this month. The full herd-size-tiered math — including the two contract questions worth asking your processor rep before 2027 renewal — runs in the next Bullvine Weekly.

Complete references and supporting documentation are available upon request by contacting the editorial team at editor@thebullvine.com.

Learn More

The Sunday Read Dairy Professionals Don’t Skip.

Every week, thousands of producers, breeders, and industry insiders open Bullvine Weekly for genetics insights, market shifts, and profit strategies they won’t find anywhere else. One email. Five minutes. Smarter decisions all week.
NewsSubscribe
First
Last
Consent

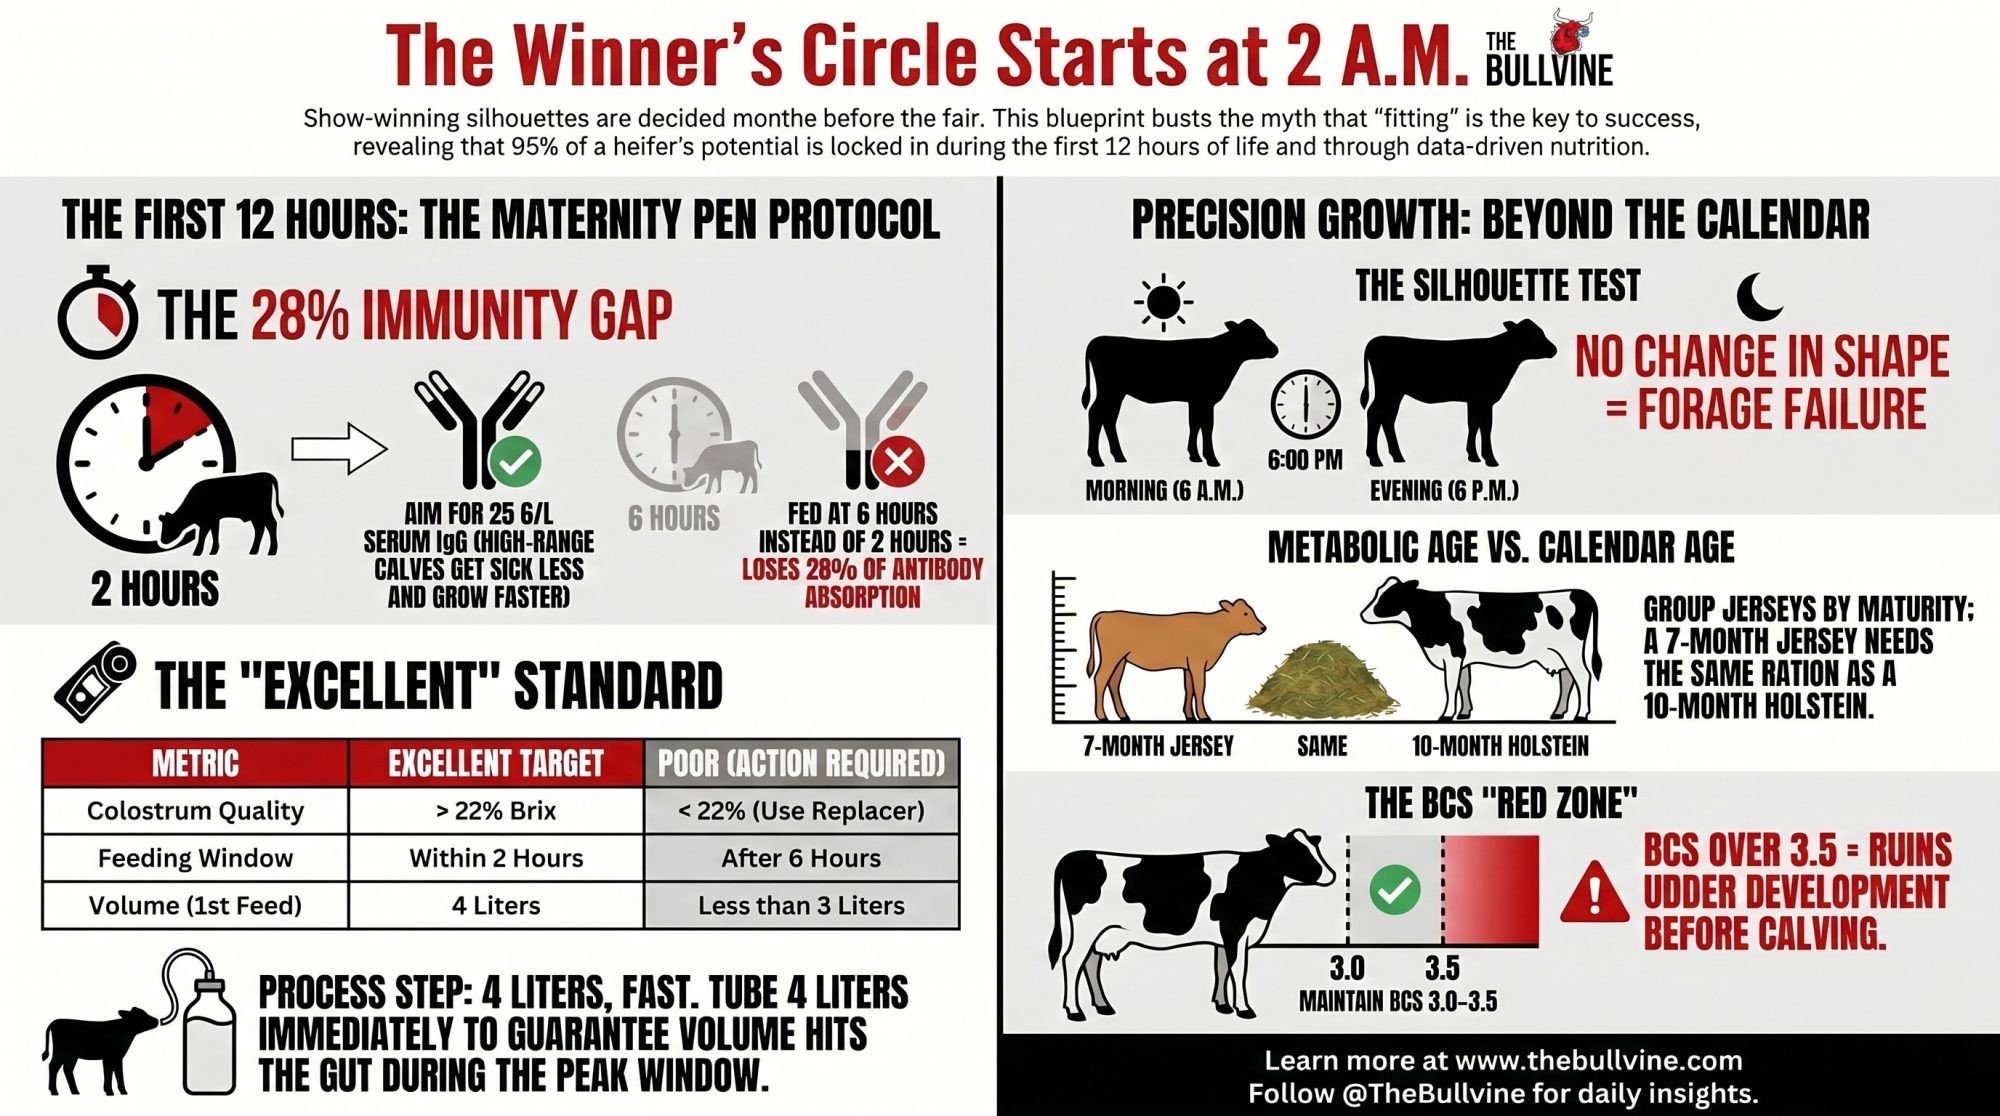
Why Your Show Heifer Development Program Starts in the Maternity Pen, Not the Fitting Chute: The 28% IgG Gap That Decides the Class

The judge’s first glance in September is shaped by decisions you made eight months earlier at 2 a.m. — and the research on why that’s true keeps getting harder to argue with.

Picture the walk-in at your county show next September. The judge takes three seconds per heifer on that first pass — silhouette, topline, the way she moves off the halter. By the time the ribbons get handed out, the class was basically decided long before anyone touched a clipper. It was decided in a maternity pen at 2 a.m. the previous January, when somebody either got up to catch that calf or didn’t.

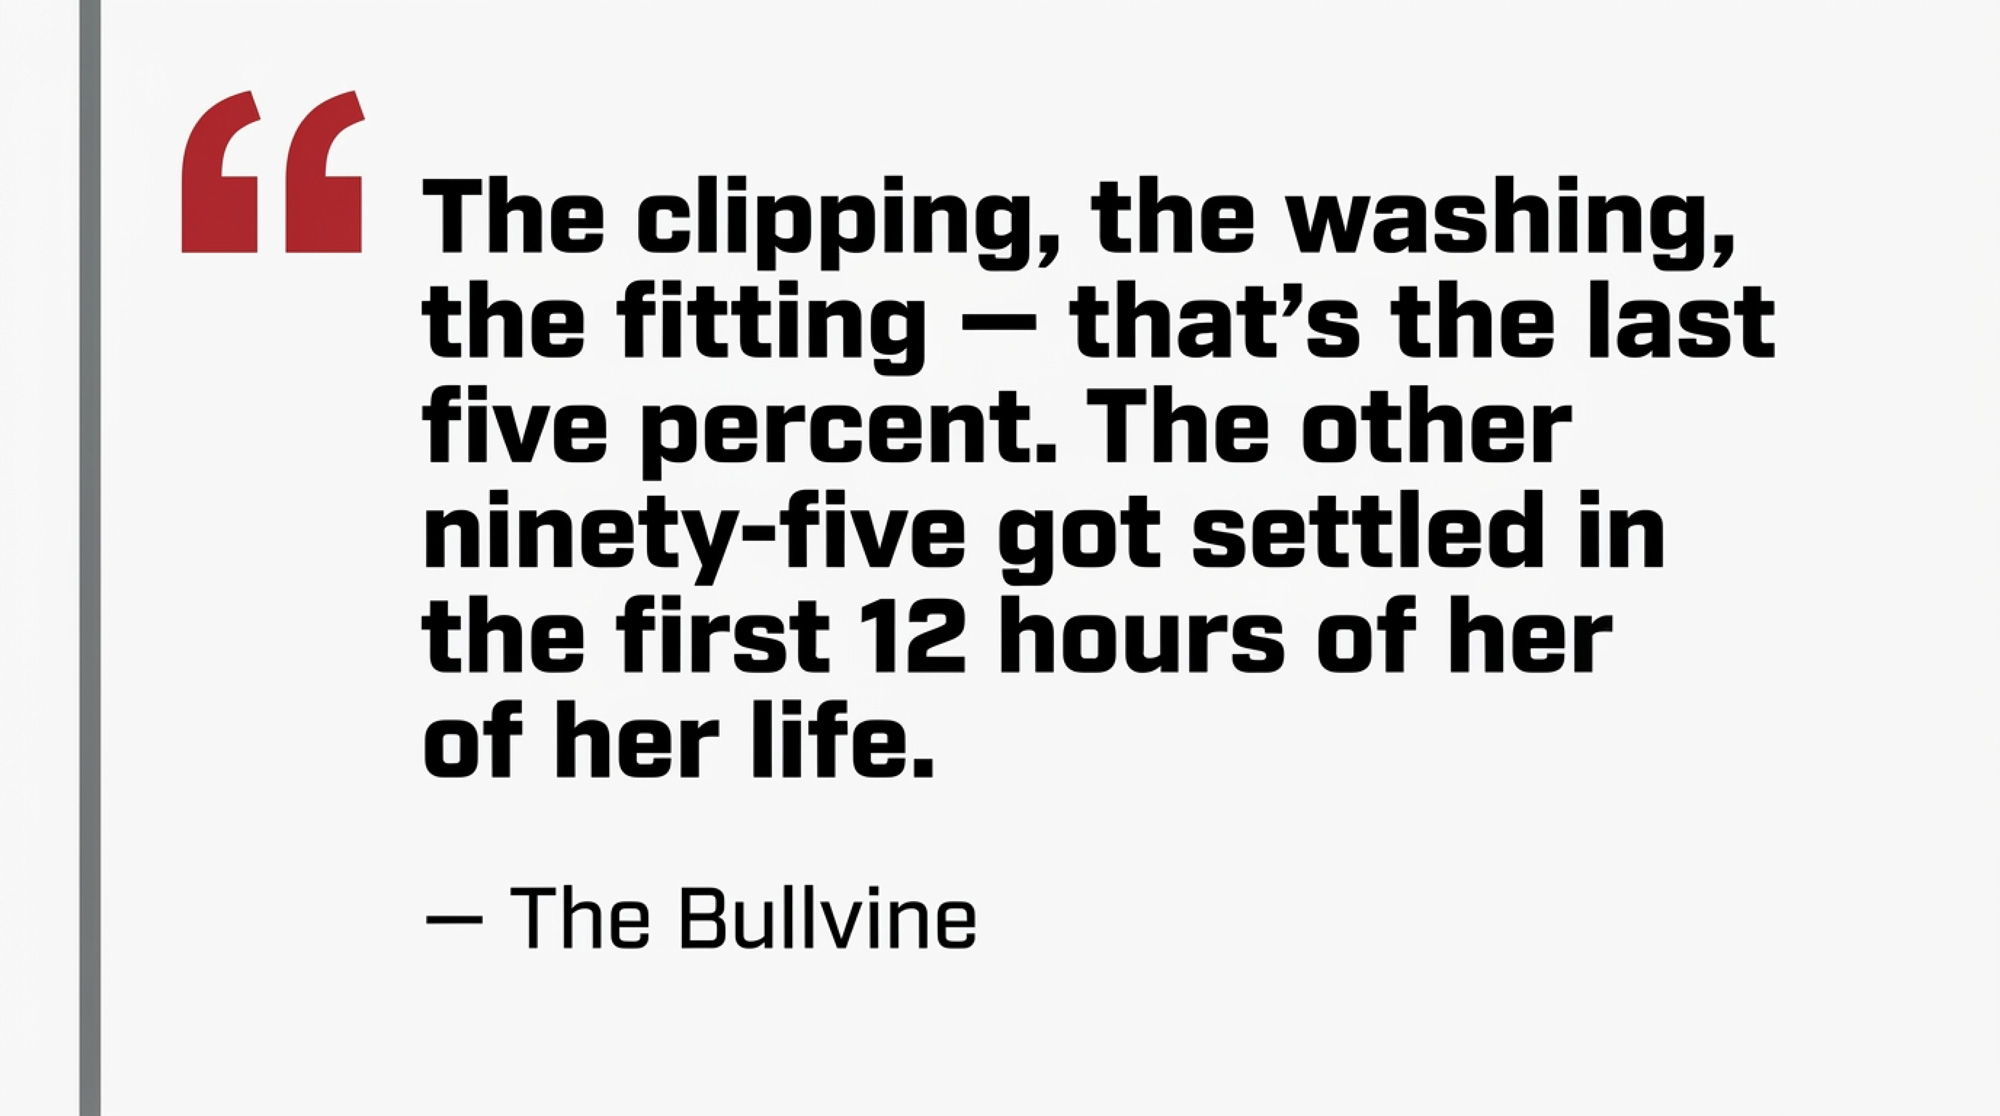
That’s the part nobody puts on a show poster. The clipping, the washing, the fitting — that’s the last five percent. The other ninety-five got settled in the first 12 hours of her life. Most show people know this is true. Running a real show heifer development program like you actually believe it is a whole different thing.

What’s Really at Stake Here

A show heifer is an athlete. Like any athlete, her ceiling gets set early. Miss a step in the first few weeks and you don’t just fall a little behind — you cap how good she can ever be. By the time she walks into the ring as a yearling, the work you did before she was a week old is what the judge is actually grading.

The people winning consistently on the 2026 circuit aren’t doing anything magical. They’re running a Brix refractometer on their colostrum. They’re weighing and measuring their heifers every month against a written target. They’re paying attention to what genomic tests say about how much feed each calf actually needs. They treat the whole thing — maternity pen through show day — as one connected system. Not a string of tricks they pull out the week before fair.

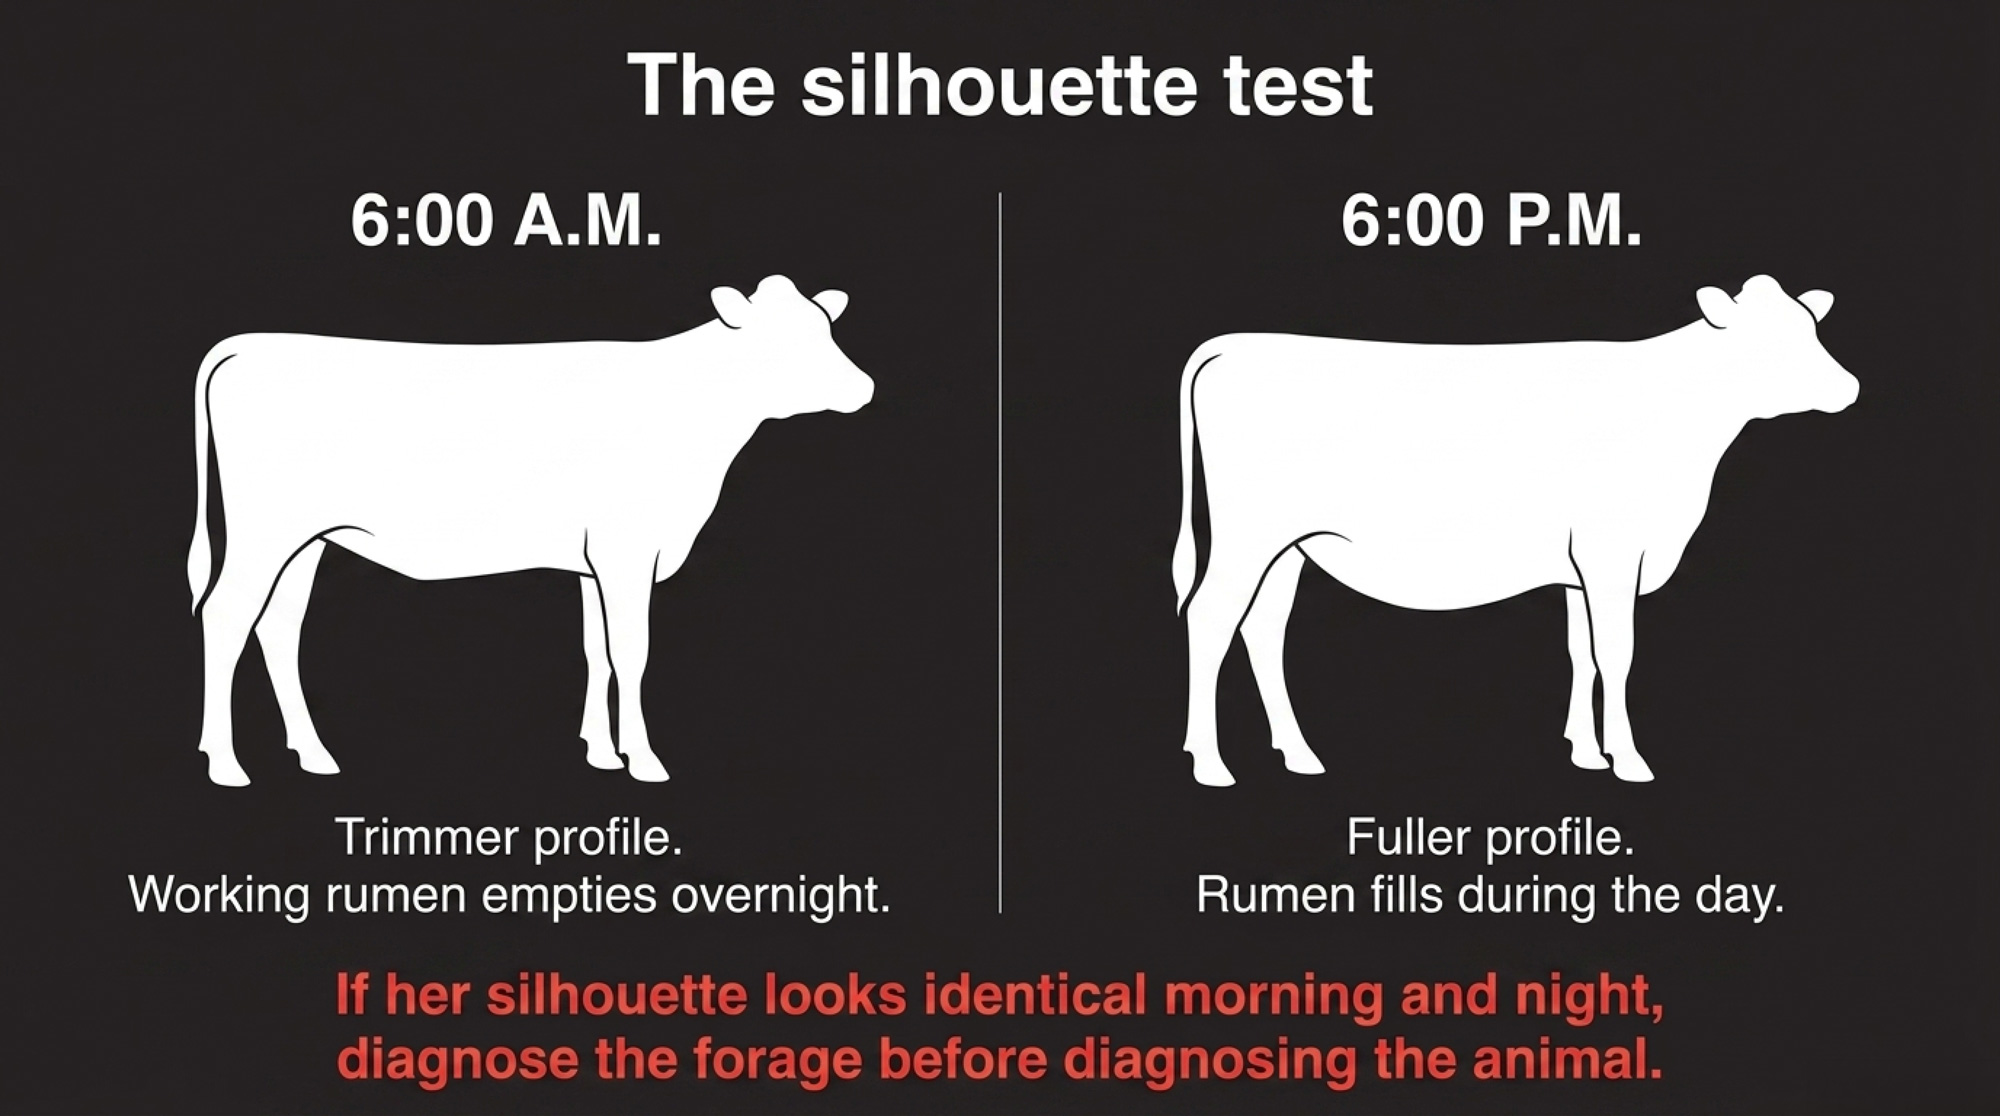
One simple trick before we go further: walk your heifers in the morning before they’ve eaten, then walk them again that evening after full feed. That silhouette should change. If it doesn’t, something’s off. We’ll come back to why.

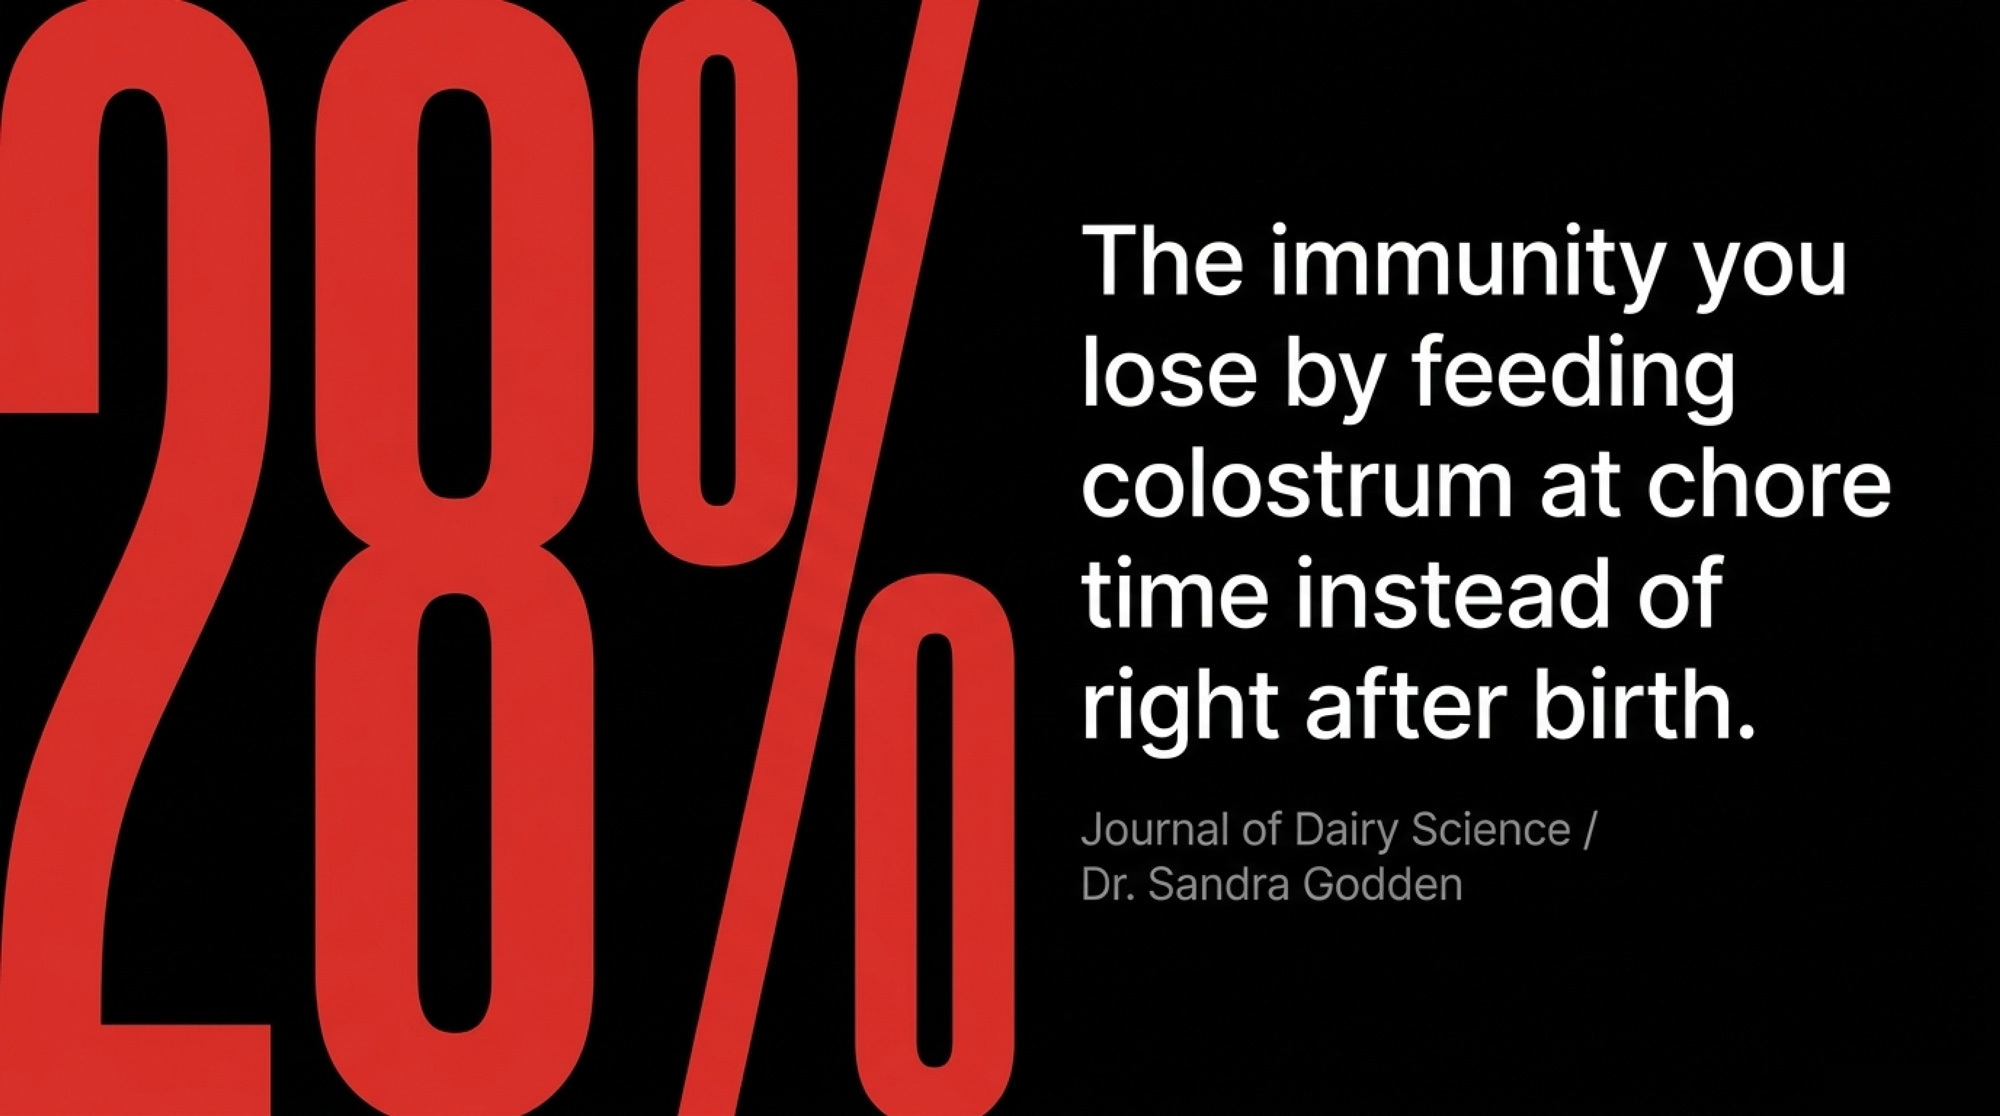
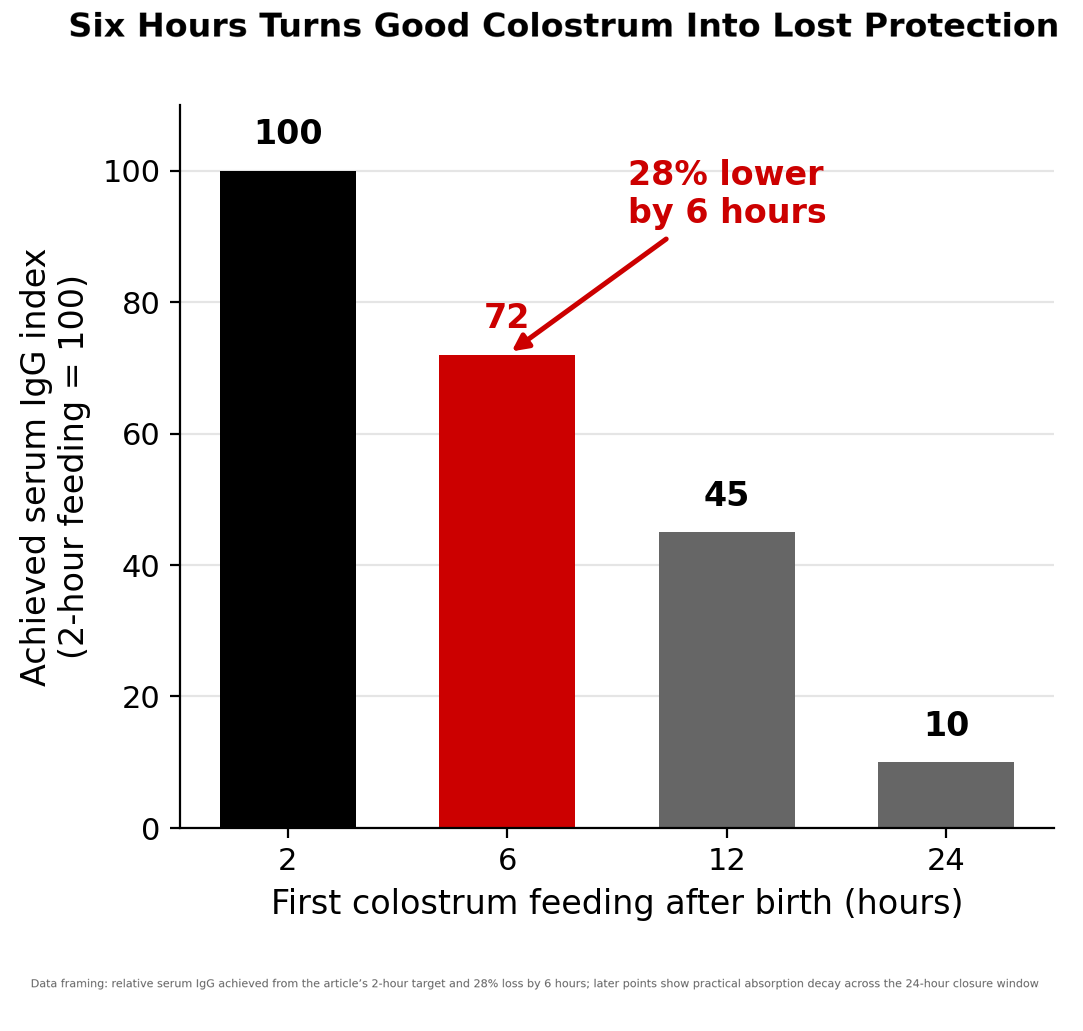
Why Does Waiting Six Hours Cost You 28% of Her Immunity?

Here’s the single most important thing a young showman can learn about calf care. Colostrum isn’t just “the first milk.” It’s a time-sensitive protection package — and the decay clock isn’t about the colostrum itself going bad in the bottle. The colostrum in the pitcher stays full of antibodies all morning. What collapses is her ability to absorb them.

That’s worth reading twice. The 28% loss is an absorption efficiency loss, not a quality loss. The calf is born with specialized cells in her small intestine that pull whole IgG antibodies out of colostrum and ship them into her bloodstream intact. Those cells close — gradually at first, then fast — over the first 24 hours of life. Feed her at two hours and those gates are wide open. Feed her at six hours and they’re already partly shut. Same colostrum, same volume, different destination. The antibodies that don’t make it into her blood don’t protect her.

Research from Dr. Sandra Godden at the University of Minnesota and colleagues, synthesized in the Journal of Dairy Science colostrum management literature and echoed in Morrill’s published calf nutrition work, shows that missing the early window cuts achieved serum IgG by roughly a quarter to a third. Not cuts colostrum quality. Cuts what ends up in her blood, which is the only thing that actually matters for protecting her.

Think about that. A quarter of her disease protection — gone. Not because you fed bad colostrum. Because you fed it at chore time instead of right after she calved.

The target has moved, too. The old benchmark was 10 mg/mL of IgG in her blood — the minimum to keep her from getting sick. The current standard, set by the 2020 Lombard consensus paper in Journal of Dairy Science and adopted by the Dairy Calf and Heifer Association, pushes way higher: you want at least 40% of your calves hitting 25 g/L or better, and fewer than 10% coming in below 10 g/L. Calves in that top “excellent” range get sick less and die less than calves in the merely “okay” range. For a show heifer, getting sick as a baby means growth stalls you can never get back. You build frame once, or you don’t.

The Colostrum Decision Table

Metric“Excellent” Target“Fair / Poor” — Action Required
Colostrum quality (Brix)> 22% (roughly ≥ 50 g/L IgG)< 22% — pull from freezer bank or use replacer
Serum IgG (calf blood, 24–48 hrs old)> 25 g/L< 10 g/L — failure of passive transfer
Feeding window from birthWithin 2 hoursAfter 6 hours — roughly 28% lower serum IgG achieved
Volume at first feeding4 L (or 10% of body weight)Less than 3 L — under-dosed
Second feeding2 L by 12 hoursSkipped — missed top-up absorption

Pro tip — Tube vs. bottle, and why it’s not close. A slow bottle feeder can burn an hour of your peak absorption window. Research summarized by the DCHA and university extension guidance consistently shows that tubing 4 liters immediately is often superior to waiting for a “slow starter” to nurse it, because tubing guarantees the volume hits the gut during the 0–2 hour peak absorption window. You can always bottle-feed her the next meal once she’s built protection. You can’t re-open the absorption gates once they’ve closed.

Want the full protocol? The Bullvine’s 4 golden rules of colostrum feeding goes deeper on the full protocol if you want to nerd out on it.

The Hay Belly Problem Nobody Explains Right

If you’ve ever heard a judge or a fitter complain that a heifer has “hay belly,” you’ve heard about a problem that starts with feed, not with looks. And it’s more interesting than most people realize.

Her rumen — that big first stomach — has to grow in two ways at once. Picture the inside wall covered in thousands of tiny fingers called papillae, each one reaching into the rumen fluid to grab volatile fatty acids and pull them into her bloodstream. Grain fermentation produces butyrate, and butyrate is what makes those fingers grow longer and thicker. Think of it as building shag carpet on the inside of the rumen — more surface area, more nutrient uptake. On a calf fed almost no grain, that wall stays smooth and pale, like bathroom tile. Lots of room for feed. Almost no ability to absorb it.

Meanwhile, the rumen also needs muscular wall and volume, and that comes from forage stretching it out. So grain builds the absorption surface. Forage builds the container. Neither one alone gets you there.

Here’s the trap. Cheap, mature, stemmy hay has a lot of what we call uNDF240 — indigestible fiber that just sits in the rumen for up to ten days without breaking down. It fills her up without feeding her. She stops eating grain because she’s already full. No grain means no butyrate means no papillae. Now you’ve got a heifer with a smooth-walled, oversized container hanging forward off her barrel instead of tucking up like a dairy cow should.

The Silhouette Test: Chronic Fill vs. Real Growth

A real working rumen fills during the day and empties overnight. Morning: trimmer. Evening: fuller. Same animal, different silhouette. If your 6-month-old looks identical at 6 a.m. and 6 p.m., she’s got chronic fill, and the forage is the suspect.

Get a forage test, look at NDFD30 and uNDF240, and if the uNDF is high, find better hay. The silhouette test costs nothing and runs itself — if it’s failing, your grain program doesn’t stand a chance until you fix the forage. The Bullvine’s NASEM 2021 dairy nutrition guide has the full breakdown.

Why Do Jerseys Get Fat on Holstein Rations?

If you run both breeds, you already know Jerseys are easier keepers. The why goes deeper than most people think, and it changes how you feed them.

Holsteins hit early lactation with a much deeper tissue energy deficit than Jerseys — roughly double at nadir on a body-reserve-mobilization basis, per the Journal of Dairy Science comparative metabolism literature — because they’re pulling milk out of their body reserves. So a Holstein heifer needs to come into calving with some condition to draw on. A Jersey at the same body condition score is already over-conditioned for what she’s actually going to need. She got there on less feed, because she converts feed to milk solids more efficiently than a Holstein does on an ECM/DMI basis.

In a commercial herd, that efficiency is a win. In a show heifer program, it’s a trap. Feed your Jersey yearling the same ration as your Holstein yearling of the same age, and your Jersey gets fat while your Holstein stays right. Fat Jerseys mean mushy udders at freshening. Mushy udders at freshening mean a mammary score that kills her in the ring at two years old.

Breed-Specific Management Cheat Sheet

FactorHolsteinJersey
Feed conversion efficiency (ECM/DMI)LowerHigher — gets same job done on less
Early-lactation tissue energy deficitDeeper (roughly 2× at nadir)Shallower
Over-conditioning risk on a shared rationLowerHigher — gets fat first
Clinical hypocalcemia rateLowerMeasurably higher per JDS breed comparisons
Pre-calving anionic salt strategyStandard DCADMore aggressive DCAD, per Penn State / Wisconsin extension
Grouping ruleBy metabolic age, not calendar ageBy metabolic age — a 7-mo Jersey ≈ a 10-mo Holstein

Jerseys also handle calcium differently at calving. They show measurably higher clinical hypocalcemia rates than Holsteins across multiple Journal of Dairy Science breed-comparison studies — a pattern attributed in part to differences in intestinal vitamin D receptor density — and you have to be more aggressive with anionic salts pre-calving than you would for a Holstein, per current Penn State and University of Wisconsin extension guidance.

The fix is simple once you see it. Don’t group Jerseys and Holsteins by calendar age. Group them by where they are in their growth. A 7-month-old Jersey and a 10-month-old Holstein sit at about the same spot on their growth curve. Put those two in the same pen on the same ration and you’re actually feeding them right. Calendar age is a trap with mixed breeds.

Why the Yearling Stretch Is Where Most Programs Leak

The ration that was right at 6 months is wrong at 12 months if nothing changes. NASEM 2021’s protein math shifts as she approaches mature size, because crude protein requirements for lean tissue accretion drop relative to her body weight as her growth curve flattens.

In plain English: the same ration that was building frame and muscle at 8 months starts laying down fat at 12 months. You didn’t change anything. She did.

Fat at 12 months means a yearling whose fore udder is getting laid down wrong, before she’s ever seen a milker. And the mammary system still carries the biggest single weighting on the PDCA unified scorecard. That one weighting is why an over-conditioned yearling costs you more ring points than any other single management miss.

The Ferrari Problem: What Feed Efficiency Actually Means in Your Barn

Lactanet’s Canadian Holstein evaluation publishes Feed Efficiency as a relative breeding value, and this is where genomic testing starts paying dividends beyond sire selection.

Here’s the practical framing. A heifer with a high Feed Efficiency breeding value is a Ferrari that runs on regular gas. Give her premium volume and she’s going to store it as fat faster than her pen mates — she’s literally bred to make more out of less. That’s a gift in the tank. It’s a liability in the show ring, where a BCS over 3.5 means she’s over-conditioned and her udder is getting laid down wrong.

The low-FE heifer in the same pen has the opposite problem. She needs the calories to hold condition. Feed them both the same ration and one ends up fat while the other ends up thin.

This is why genomic data shouldn’t end at sire selection. Pull Feed Efficiency RBVs on your replacement heifers. The high-FE tier needs less volume, lower energy density, or both. The low-FE tier needs what you’d consider a “normal” ration. Segmenting pays off fastest on bigger operations — small groups can’t justify the separate pens — but even a two-pen split on FE tier will save feed and protect udder development on your show prospects.

Lactanet Feed Efficiency RBV explainer breaks down how the index is built and how to read it.

Write It Down or You’re Guessing

Here’s the part nobody tells 4-H kids often enough: if you don’t write it down, you don’t actually know.

Monthly weights. Monthly BCS. Monthly height measurements against the breed standard. Forage tests. Dates of every health event and every treatment. Not because the fair committee asked for it — because you literally cannot improve a program you aren’t measuring. Which heifers hit their target weights? Which ones drifted and when? Which batch of hay lined up with the hay belly problem in that pen? Which bull’s daughters are growing differently than the others?

The 2026 Breed Benchmarks: Target show heights for all major dairy breeds from birth to 24 months. Use these curves to ensure your heifer is hitting her frame potential without over-conditioning. or check out our NEW Show Heifer Growth Check Tool

Every season without records starts from zero. Every season with records builds on the last one. The compounding that matters most isn’t just about the cow — it’s about you getting smarter every year.

What You Can Actually Do

Run the maternity pen like a hospital. Refractometer on every batch. Four liters in the first two hours, tubed if she won’t nurse it. Two more liters at 12 hours. About $200 in gear and fifteen minutes of labor per calf gets you most of the way there. The one thing that can blow it all up: dirty equipment. Bacterial contamination undoes the whole protocol in one feeding, so wash and dry your gear every single time.

Use the genomic data you already paid for. If you’re genomic-testing, pull the Feed Efficiency values and segment your rations where group size supports it. Feed the Ferraris less. Feed the work trucks normal.

BCS your heifers every month. Same person. Same target: 3.0 to 3.5. Pre-commit to what you’ll do if she’s over — usually pull grain or switch pens. Here’s the part that’s hard: don’t break the rule because she’s your favorite or because the fair is in three weeks. Get somebody outside your family to eye her, too. Phones and photos help you see what you can’t see when you’re in the barn with her every day.

Have a written re-entry plan for show animals. Isolate returning animals for 7 to 14 days and watch them, consistent with AABP and university extension biosecurity guidance. A September show heifer who came home with a respiratory bug can set back your whole yearling pen through October if you don’t catch it.

What This Means for Your Operation

  • Are you actually testing your colostrum, or just hoping it’s good? If you’re not Brix-testing at harvest, you don’t actually know what you’re feeding.
  • Pull a forage test on your growing-heifer hay and check NDFD30 and uNDF240. High uNDF240 creates hay belly even when intake looks reasonable.
  • When did you last BCS your yearlings against a written target, with a non-family reviewer’s input? If the answer is “never” or “I don’t remember,” the emotional filter is running your program.
  • Are your Jerseys in the same pen as Holsteins of the same calendar age? If yes, your Jerseys are getting fat. Match them by metabolic age instead.
  • Walk them at 6 a.m. and again at 6 p.m. Does the silhouette change? If not, diagnose the forage before diagnosing the animal.
  • Do you know your heifers’ Feed Efficiency values? A high-FE daughter on the same ration as a low-FE pen mate is going to get fat first.
  • What’s your plan when a show animal comes home? If it’s informal, it’s a disease event waiting to happen.

Key Takeaways

  • If a calf isn’t fed colostrum within 2 hours of birth, her achieved serum IgG is already roughly 28% lower than it should be — and the rest of the program is working uphill from there.
  • If your heifers show the same silhouette at 6 a.m. and 6 p.m., your forage is failing before your grain program has a chance to succeed.
  • If you’re running one ration across Holsteins and Jerseys of the same calendar age, you’re over-conditioning one breed and under-fueling the other.
  • If your genomic data ends at sire selection and doesn’t inform ration design, your high-FE heifers are quietly getting fat on the ration that’s keeping your low-FE heifers right.
  • If BCS scores over 3.5 don’t trigger a pre-committed, automatic ration change, emotional bias is deciding your program — not the data.

📌 Your 30-Day Move

In the next month, sit down with your herd vet and set up a serum total protein check on the next 30 calves born on your place. That number tells you exactly how well your colostrum program is actually working — not how well you hope it’s working. You can’t fix what you aren’t measuring, and this is the highest-leverage window in the whole show heifer program. Full stop.

The 90-Day and 365-Day Plays

Next 90 days: Get a forage test on your growing-heifer hay and pull a BCS on every animal in the yearling pen. Put the numbers in writing. Buy the $200 refractometer if you don’t own one. Walk the morning-versus-evening silhouette check once a week.

Next 365 days: Pull your heifers’ genomic Feed Efficiency values if you’re testing. Start segmenting rations by FE tier if your group size supports it. Build a written post-show re-entry protocol, sign-off and all. And by the time this cycle closes, you should have month-over-month growth and BCS data on every single replacement — not a feeling, not a memory, a spreadsheet.

The Question That Decides the Class

The walk doesn’t lie. You can fit a mediocre heifer to look impressive standing still. You can’t fit her to move like a champion. That effortless, ground-covering stride is what comes out when everything was done right from day one. You either earn that walk in the maternity pen, or you don’t get it at all.

So here’s the one worth sitting with tonight. Of the calls you’re making this month — whether to get up for that 2 a.m. calving, whether to switch hay loads, whether to pull the grain on that heifer who’s looking a little thick — which one will you see in the ring next September? And which one are you going to wish you’d made differently?

The class gets decided a long time before the shavings go down. The only real question is whether your program runs like you know that.

Is She Big Enough?

Monitor whether your show heifers are on track to hit critical weight and height targets at each development stage using industry-validated benchmarks. This tool compares your heifer’s current measurements against breed-specific growth curves and mature body weight percentages, flagging whether she’s running ahead, on pace, or falling behind where she needs to be for optimal development and show ring readiness. Access the Show Heifer Growth Check

Learn More

The Sunday Read Dairy Professionals Don’t Skip.

Every week, thousands of producers, breeders, and industry insiders open Bullvine Weekly for genetics insights, market shifts, and profit strategies they won’t find anywhere else. One email. Five minutes. Smarter decisions all week.
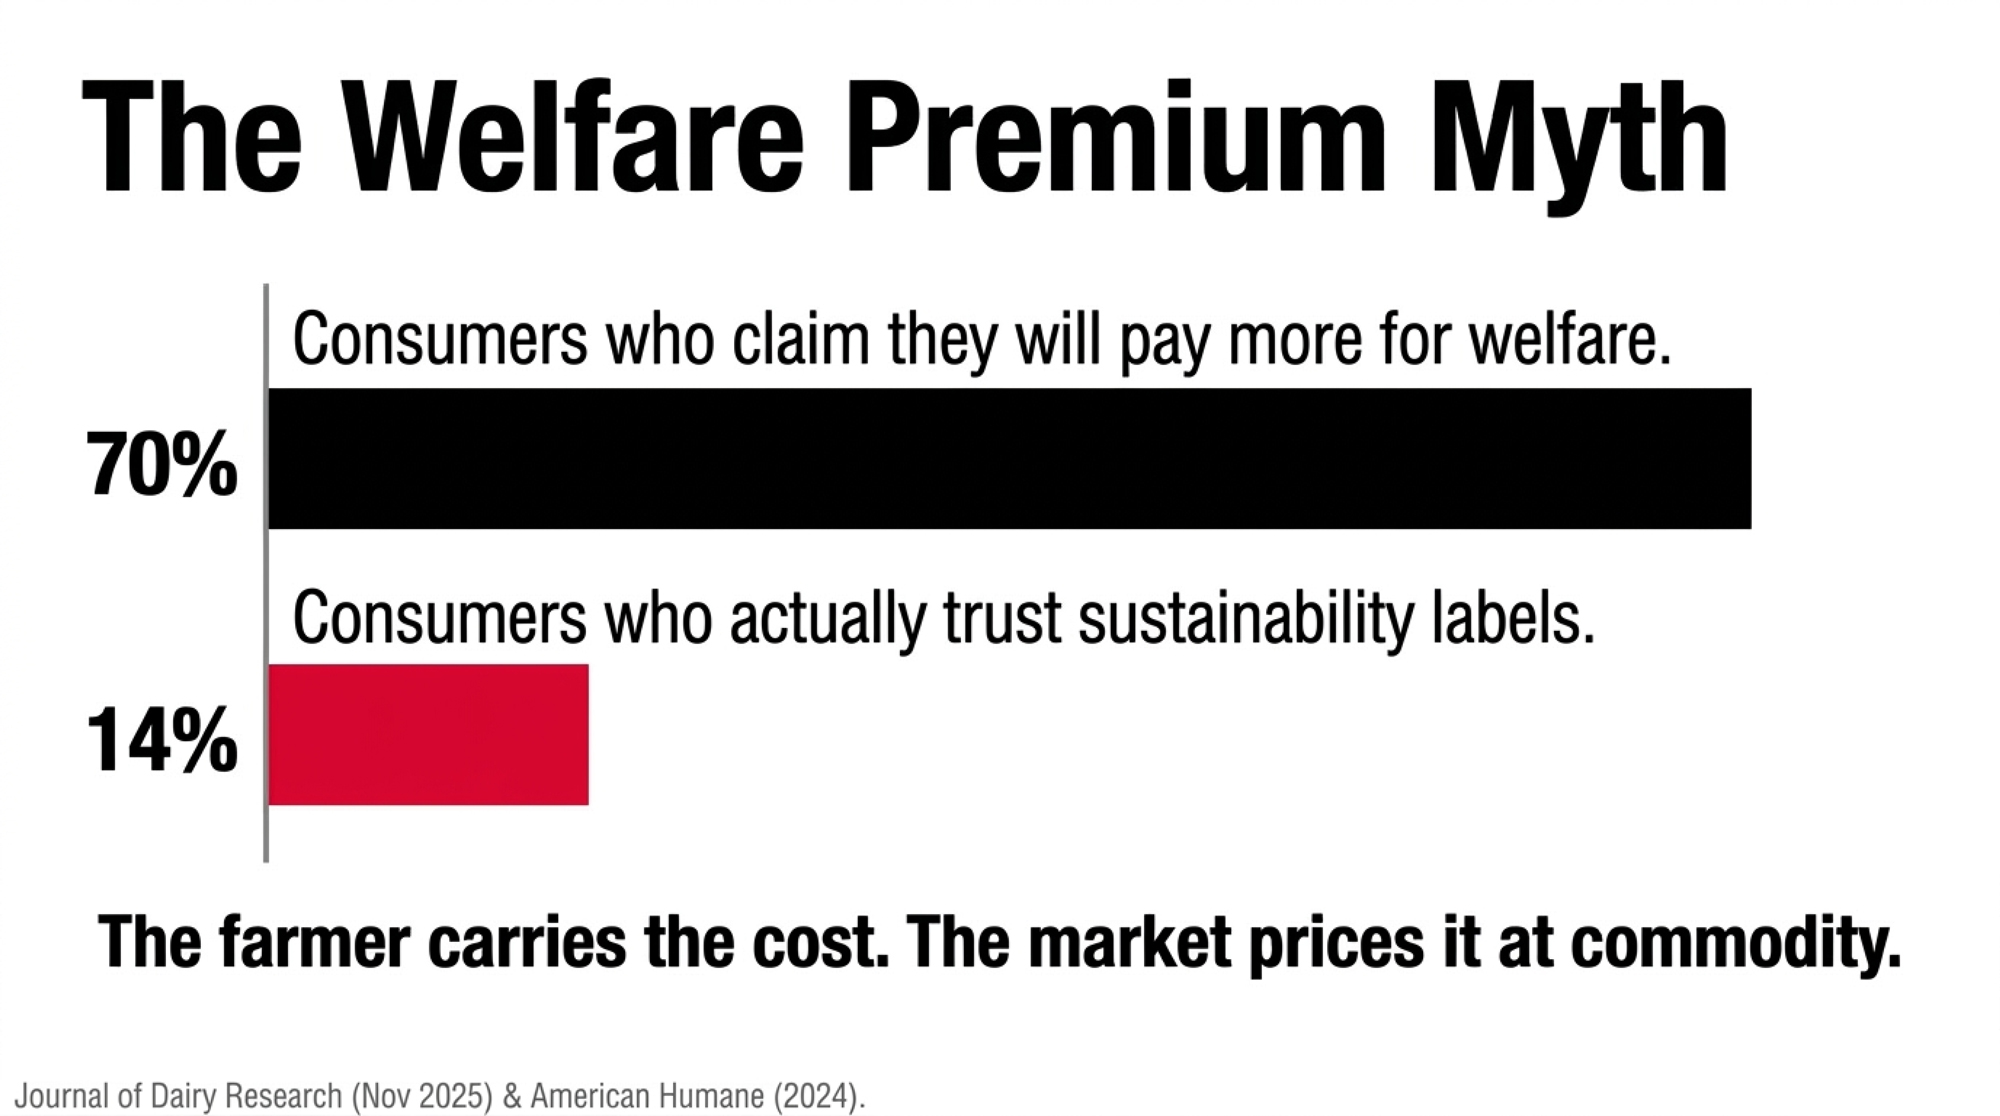
NewsSubscribe
First
Last
Consent

The $152,820 “BLV Tax” Hiding in a 1,200‑Cow Herd

Run Michigan State’s 40‑cow BLV test on a 1,200‑cow herd at 45% prevalence and the math lands on $152,820–$205,200 a year — quietly, in milk, early culls, and condemned carcasses.

Executive Summary: Run Michigan State’s 40‑cow BLV profile on a 1,200‑cow herd at 45% prevalence and the annual loss lands at $152,820–$205,200 — roughly $283–$380 per infected cow in lost milk, early culls, and condemned carcasses. BLV now sits in 88.6–94.2% of U.S. dairy herds, and MSU’s 2015–2016 study of 103 herds across 11 states pegs animal‑level prevalence at 46.5%, up from 40.8% in 1996. Bartlett et al. (J. Dairy Sci. 96:1591–1597, 2013) found ELISA‑positive cows are about 23% more likely to leave the herd, and every 10‑point jump in prevalence costs roughly 209 lb of milk per cow per year. The real leverage isn’t blanket culling — in one herd, 11% of positives drove 64% of new infections, and in another, two cows carried 26% of the total proviral load. Fix the usual leaks (single‑use needles and sleeves, pasteurized or frozen colostrum, qPCR on older positives to tag the top 10–15% super‑spreaders) and a realistic 25–30% recovery is worth about $38,000–$62,000 a year on that same 1,200‑cow herd. If your 40‑cow profile comes back at or above 30–40%, BLV belongs on your P&L as a structural cost, not a footnote. The full piece walks through the Tax Table, the 30/90/365‑day playbook, and where this lands in The Silent Tax series.

BLV tax

Most of the data here comes from Michigan State University’s BLV research program (Bartlett, Erskine, Norby, Coussens, Kendrick, Durst and colleagues) and Dr. Tasia Kendrick’s March 2026 interview on The Dairy Health Blackbelt Podcast (Episode 38). No individual dairies are profiled by name; the “typical 1,200‑cow herd” example is a representative case built from published BLV research and MSU field descriptions. Cross‑reference any numbers here with your own herd’s test results and your vet’s recommendation before acting.

Picture the kind of 1,200‑cow Southeast freestall the Michigan State University BLV team has worked with repeatedly: solid rolling herd average, decent components, nothing on the monthly reports that screams crisis. According to MSU’s BLV research program, many of these herds don’t engage on BLV until their vet pushes for a baseline test, usually because the same older cows keep showing up on hospital lists.

When one of those herds runs MSU’s 40‑cow bovine leukemia virus (BLV) profile and comes back at roughly 45% infected, the cost range the BLV research points to — $283–$380 per infected cow per year — translates to about $152,820–$205,200 a year in lost milk, early culls, and condemned carcasses on a 1,200‑cow herd. That’s not a prediction. It’s money those herds are already paying out, quietly, every year.

“BLV is often present long before it becomes an issue. So if you’re not looking for it on the farm, chances are it’s there.” — Dr. Tasia Kendrick, Associate Professor, MSU Department of Animal Science, on The Dairy Health Blackbelt Podcast (Episode 38, March 2026)

The Silent Margin Leak in 9 Out of 10 U.S. Herds

For years, BLV lived in the “slaughterhouse surprise” category — the disease you only thought about when a carcass came back condemned for lymphoma. That story doesn’t fit anymore.

National work summarized by MSU’s BLV program shows 88.6–94.2% of U.S. dairy herds now have at least one BLV‑positive cow, with typical within‑herd prevalence in the 40–50% range. Animal‑level infection climbed from about 10% in the 1960s to 40.8% in a 1996 USDA study and around 46.5% in a 2015–2016 MSU national study of 103 herds across 11 states — the most recent national anchor point published by the team. In some high‑pressure regions, individual herds sit close to 100% positive.

Several European countries hit BLV early with coordinated test‑and‑cull programs and wiped it out while herd prevalence was still under 5%. The U.S., Canada, Japan, Argentina, and others largely did not, and the virus took the room it was given.

Kendrick, who works with the MSU BLV research team, put it plainly on The Dairy Health Blackbelt Podcast: infected cows “have lower milk production, decreased longevity” and a weaker immune system, even when they look normal in the pen.

Economic modeling using U.S. data from the mid‑1990s through the 2010s estimates that at around 50% prevalence, BLV costs roughly ,400 per 100 milking cows per year in unrealized milk, shortened productive life, and lost salvage value. On a national scale, MSU reports BLV losses of about $525 million in 1996, with more recent figures suggesting an annual deficit of up to $2.7 billion.

You’ll never see “BLV” on your milk cheque. You feel it as 200–300 lb less milk from certain cows, more mastitis and respiratory cases that never quite clear, older cows dying instead of shipping, and condemnation slips that turn a lifetime of investment into zero salvage at the plant.

What BLV Is Quietly Doing Inside Your Cows

BLV is a deltaretrovirus, closely related to human T‑cell leukemia virus, that targets B‑lymphocytes — especially those expressing CD5 and CD21 markers. It integrates its DNA (the provirus) into those cells and turns them into long‑term virus factories. Your cows’ immune systems still work, but they work with a constant handicap.

Researchers and field programs see three big knock‑on effects:

  • Weaker vaccine response. BLV‑infected cows often mount a reduced antibody response, so the vaccines you buy don’t deliver full protection.
  • Higher disease burden. Positive animals show higher rates of mastitis, respiratory issues, and lameness, especially as they get older.
  • Chronic inflammation. Studies in BLV‑positive heifers, particularly during transition, have found elevated haptoglobin and fibrinogen — markers of ongoing inflammation that quietly drain energy and resilience.

Clinically, about 70% of infected cows are aleukemic carriers with no obvious signs, around 30% develop persistent lymphocytosis, and fewer than 5% go on to full enzootic bovine leukosis with visible tumors. From a business point of view, that 70% matters more than the 5%, because those “normal‑looking” cows still cost you milk and lifetime production.

MSU work led by Bartlett, Erskine and colleagues links every 10‑point increase in BLV prevalence to about 209 lb less milk per cow per year, with a corresponding hit to the rolling herd average. A follow‑up MSU survival analysis tracking 3,849 animals across 112 herds for roughly 19 months found ELISA‑positive cows were about 23% more likely to leave the herd through culling or death, with the effect growing as antibody levels rose (Bartlett et al., Journal of Dairy Science 96:1591–1597, 2013). BLV‑related lymphoma is now the number one reason for U.S. dairy cow carcass condemnation, accounting for 26.9% of dairy condemnations and 13.5% in beef cows, per USDA FSIS data summarized in the MSU materials.

Worst of all, those extra deaths and condemnations cluster in older cows, right when they should be printing margin — peak lactations plus a final salvage cheque. BLV quietly “prunes” those cows out of your herd early. Less lifetime milk. Less salvage. Less room for mistakes elsewhere.

What a BLV Herd Looks Like on Paper

The typical pattern MSU and other BLV teams describe in 40–50% prevalence herds is a year of records that never quite add up — nothing that screams BLV, but a persistent background of repeat mastitis cases, hard‑to‑resolve respiratory episodes, and non‑calving deaths in 3rd‑plus lactation cows.

Per 100 milking cows, a herd at that prevalence often shows a pattern like this in the records (illustrative numbers stitched from MSU research and field observations, not a single farm’s dataset): around 32 clinical mastitis cases, with a handful of older cows making repeat appearances; roughly 9 respiratory or “fever of unknown origin” episodes; about 14 lameness events outside the normal trim schedule; and just under 6.5 non‑calving deaths or euthanasias, many in 3rd‑plus lactation cows. Rolling herd average? Respectable. BLV? Never discussed at the monthly meeting.

Find Your Herd on the BLV Tax Table

Using MSU’s modeled $283–$380 per infected cow per year at a typical 45% within‑herd prevalence, estimated annual losses scale with herd size. Actual losses on a given operation will vary with milk price, cull value, and management:

Herd SizePrevalenceInfected CowsAnnual “BLV Tax” (Est.)
500 cows45%225$63,675 – $85,500
1,000 cows45%450$127,350 – $171,000
1,200 cows45%540$152,820 – $205,200
2,000 cows45%900$254,700 – $342,000

Once those numbers hit the kitchen table, BLV stops being a “we should look at that someday” topic and becomes a six‑figure line item you either accept or start clawing back.

The 4 A.M. Reality: Where Your SOPs Are Failing

If you’re going to fight something, you need to know how it travels. BLV moves with infected lymphocytes — mostly in blood, but also in colostrum and milk. On the ground, that turns into a few familiar trouble spots.

MSU’s BLV program and Dr. Kendrick’s work point to these high‑risk routes:

  • Needles and syringes. Reusing needles, or leaving one “barn needle” stuck in a multi‑dose bottle all day, is a very efficient way to share infected blood.
  • Palpation sleeves. Even when a rectal sleeve looks clean, micro‑tears in the rectal mucosa can carry blood from one cow to the next.
  • Surgical and hoof‑trimming tools. Gouge‑type dehorners, tattoo pliers, and hoof‑trimming equipment that aren’t disinfected between animals become mechanical BLV buses.
  • Biting flies. Flies act like dirty syringes, picking up infected blood on their mouthparts and injecting it into the next cow they bite.

Vertical and calf routes matter as well. BLV can cross the placenta in roughly 4–18% of pregnancies. More damaging for your future herd is what happens in the calf barn: in some herds, about 12% of young stock are already BLV‑positive before they ever enter the parlor, mainly through raw colostrum or waste milk from infected dams. If BLV‑positive milk is feeding your replacements, you’re essentially seeding your future herd with the virus.

The good news: colostrum is one area where you can win big with straightforward management. Pasteurizing colostrum at 60°C for 60 minutes or freezing and thawing it correctly will inactivate BLV while preserving the antibodies calves need. That’s one of the fastest ways to stop loading new animals into the BLV column.

Go deeper: the colostrum protocols that actually protect replacements — our Tier 2 calf‑management pillar.

How Much Is Your Herd Really Paying to Wait?

If you haven’t tested for BLV in years — or ever — it’s easy to assume your herd is “probably average.” Michigan State’s 40‑cow protocol exists to replace that guess with an actual number.

Here’s the method:

  • Test 40 cows — 10 in each of four lactation groups: 1st, 2nd, 3rd, and 4th‑plus.
  • Choose the most recent fresh cows in each group, making sure they’re at least 3 days in milk.
  • Don’t cherry‑pick “good” or “bad” animals — take them in order.

Once you know that prevalence number, your BLV tax math is two steps:

  1. Milking cows × prevalence = number of infected cows.
  2. Infected cows × $283–$380 ≈ annual BLV tax range.

On a 1,200‑cow herd at 45% prevalence, that formula gives 540 infected cows and the $152,820–$205,200 range in the table above. It’s not perfect to the dollar, but it’s good enough to answer two questions. First, are you willing to keep paying that BLV tax? Second, if not, how much of it do you realistically want back over the next few years?

Even a conservative 25–30% recovery — by tightening the obvious leaks and dealing with the highest‑risk cows — can put roughly $38,000–$62,000 a year back into a 1,200‑cow herd at that prevalence. That’s not lottery money. It’s the difference between replacing equipment on schedule and nursing it through one more breakdown season.

The Super‑Spreader Problem: Why 11% of Cows Drive 64% of New Infections

Once you’ve seen your number, the uncomfortable part is looking in the mirror. Where is BLV still hitching rides in your routines? When herds run the 40‑cow test, make changes, then re‑test 12–18 months later, the BLV teams keep finding the same pattern. BLV prevalence drops a little, then stalls. When you dig into why, the answers usually fall into three buckets.

1. The “paper SOP vs. 4 a.m. reality” gap. BLV researchers describe a common pattern across many farms: a single needle left in a multi‑dose bottle for half the day, or a used syringe grabbed in a rush when someone is catching up. The same thing can happen in the repro line when a sleeve gets rinsed and reused “just this once.” Your protocol binder may say “new needle for every cow,” but those shortcuts are exactly the gaps BLV uses to move.

2. Super‑spreaders still living in high‑traffic pens. BLV doesn’t spread evenly across positives. In one 199‑cow herd summarized in MSU’s research, 11% of ELISA‑positive cows were responsible for about 64% of new infections. In another herd, just two cows carried 26% of the total proviral load (PVL). If those highest‑PVL cows are still in the fresh group, still donating colostrum, and still getting “one more chance” when they crash, you’re trying to drain the pool while the fire hose is still wide open.

Pro‑Tip: ELISA tells you who’s infected. qPCR tells you who’s dangerous. A standard ELISA test gives you a yes/no on exposure — good for herd‑level prevalence, but it treats every positive cow the same. Quantitative PCR (qPCR) goes further: it measures each cow’s proviral load (PVL) and reports a cycle threshold (Ct) value. The lower the Ct, the more virus in that cow’s blood, and the more likely she’s a super‑spreader. That’s how you move from “half my herd is positive” (which feels hopeless) to “these 10–15% of cows are driving most of my new infections” (which is a management plan).

3. A calf program that keeps re‑loading the virus. If your heifers are getting raw colostrum or waste milk from BLV‑positive or unknown cows, that ≈12% infected youngstock figure from MSU research is probably happening in your pipeline. The fix that works on real farms is blunt but manageable: colour‑code colostrum jugs (green for BLV‑negative, yellow for cows whose colostrum must be pasteurized, red for high‑PVL or unknown cows whose colostrum never goes to calves), keep a dedicated “calf‑approved” fridge, and make it a hard rule that calf feeders don’t grab anything else.

DimensionELISA (antibody test)qPCR (proviral load test)
What it measuresAntibody presence (yes/no exposure)Quantitative virus copies per cell (Ct value)
Best use caseHerd-level prevalence baseline, MSU 40-cow profileIdentifying the top 10–15% super-spreaders
Resolution on riskTreats every positive cow the sameSeparates low-risk carriers from high-PVL spreaders
Management output“Half my herd is positive” (feels hopeless)“These 10–15% of cows drive most new infections”
Typical cost tierLower per sampleHigher per sample, targeted subset
Action it unlocksPrevalence tracking, trend monitoringTerminal-cull list, colostrum colour-coding, beef-semen assignment

None of that’s glamorous. It’s sleeves, needles, tools, flies, and colostrum. But that’s where BLV actually moves — and where you can actually stop it.

Go deeper: why your best cows keep leaving too early — a closer look at BLV’s quiet effect on longevity.

Options and Trade‑Offs for Farmers

30‑Day Action: Run the 40‑Cow Test and Audit the Obvious

When it makes sense: You haven’t profiled BLV in the last few years, or have never tied BLV status to real dollars.

Your 30‑day checklist:

  • ✅ Book the MSU 40‑cow BLV profile through your vet or lab.
  • ✅ Pull the right cows: 10 most recent fresh animals in each lactation group, all at least 3 days in milk.
  • ✅ Spend one week spot‑checking how injections, preg checks, dehorning, hoof trimming, fly control, and colostrum actually happen — not how they’re written down.
  • ✅ Walk your crew through the BLV Tax Table using your own herd size and a realistic prevalence range.

Risks and limits: You may not like the prevalence number. You may also find your real‑world routines don’t match your SOPs. But staying blind is usually more expensive than finding out.

90‑Day Action: Protect Calves and Tag the Super‑Spreaders

When it makes sense: Your 40‑cow profile comes back at or above roughly 30–40% prevalence, and you expect to be milking in five years.

What it requires: Put a colour‑coded colostrum system in place and commit to pasteurizing or freezing any colostrum from BLV‑positive or unknown cows before it goes to heifers. Work with your vet to run qPCR on a subset of ELISA‑positive cows — usually older, high‑antibody animals — to identify the highest‑PVL individuals. Mark those cows in your herd software and in the parlor as terminal BLV cows: they get beef semen only, their colostrum never goes to replacements, you don’t spend on heroics when they crash, and they go to the top of the cull list as soon as they’re saleable.

Risks and limits: You’ll discard some colostrum and lean harder on frozen stores. You may ship a few older, good‑milking cows earlier than you’d prefer. You’re trading a bit of short‑term milk from a small group for lower infection pressure and healthier replacements over the long term.

Forward‑looking signal: As research into BoLA‑DRB3 alleles and BLV resilience matures, expect to see sires marketed not just for components or fertility but for keeping daughters at lower PVL even when infected. That’ll be another lever — but it won’t replace sleeves, needles, and colostrum work.

365‑Day Check: Re‑Test, Re‑Score, and Decide How Hard to Push

When it makes sense: You’ve made changes and want proof they’re working.

HorizonTrigger to actCore actionRequired investmentCost of skipping
30 daysHaven’t profiled BLV in years, or never tied status to dollarsMSU 40-cow ELISA profile + one-week SOP audit (needles, sleeves, colostrum, flies)Lab fees for 40 tests; 1 week of walkaround timeContinuing to pay $152,820–$205,200/yr blind on a 1,200-cow herd
90 daysProfile returns ≥30–40% prevalenceColour-coded colostrum system + qPCR on older high-antibody cows + terminal-cull list for top 10–15% PVLPasteurizer/freezer capacity; qPCR subset; beef semen on flagged cows~12% of heifers entering parlor already BLV-positive via raw colostrum
365 days12 months post-interventionRe-run 40-cow profile, compare hospital pen, non-calving deaths, drug spend, cull ageSecond round of ELISA tests; vet/nutritionist/bookkeeper review meetingNo evidence trail — can’t defend the investment or tune the plan
OngoingPrevalence stuck at ~same level after 12 monthsDiagnose the leak: super-spreaders in fresh pens, slipped single-use needle rule, red-tag colostrum reaching calf fridgeManagement attention, not capital2–3 point drift feels like “progress” while BLV tax keeps compounding

What it requires: Re‑run the MSU 40‑cow BLV profile 12 months after your first test, using the same selection rules. Sit down with your vet, nutritionist, and bookkeeper and compare BLV prevalence then vs now, mastitis and respiratory cases per 100 cows, non‑calving deaths, drug spend, and cull patterns — especially in older cows. If prevalence has moved down meaningfully — say, in the range of 5–10 points, alongside a cleaner hospital pen and fewer old‑cow deaths — you have real evidence you’re clawing back part of the BLV tax.

Risks and limits: If prevalence only moves 2–3 points, it’s not a failure — it’s feedback. It’s your cue to look harder at where BLV is still moving: are super‑spreaders still parked in fresh pens, did single‑use needles quietly slide back, are red‑tag colostrum jugs sneaking into the calf fridge at 2 a.m.? BLV control is a multi‑year project, not a one‑and‑done shot.

Key Takeaways

  • If your 40‑cow profile comes back at or above roughly 30–40% BLV prevalence, treat BLV as a structural cost on your P&L, not just a lab result to file away.
  • If you can’t honestly say every cow gets a new needle and a new rectal sleeve every time, assume BLV is still catching rides and fix that before you spend big on extra testing or culling.
  • If your non‑calving deaths and chronic mastitis cases cluster in older BLV‑positive cows, talk with your vet about high‑PVL qPCR testing and a terminal culling rule for roughly the worst 10–15% of positives — the small group most likely to behave like super‑spreaders in your herd.
  • If raw colostrum or waste milk from BLV‑positive or unknown cows is feeding your heifers, treat that as your fastest leak to plug: move to pasteurized or frozen colostrum from BLV‑negative or low‑risk cows and keep “red‑flag” jugs out of the calf room.
  • If you decide to invest in BLV control, put a 12‑month re‑test date on the calendar now and commit to measuring change in black and white instead of guessing.

You already know the “mystery” cows in your barn — the ones that eat up time in the hospital pen, come back on the list a month later, or die right when you expect one last lactation and a salvage cheque. The hidden question is whether BLV is quietly pulling more of those strings than you’d like to admit.

If you ran your own herd through the BLV Tax Table above, where would your number land — $63,000, $150,000, $300,000‑plus a year? And if you saw that figure in black and white, what would it take for you to cut a third of it over the next three years?

In our next segment of The Silent Tax series, we’ll dive into the specific ROI of high‑PVL culling — exactly how fast a herd can expect to see a return on its testing investment, and how the cost curve shifts at 30%, 45%, and 60% prevalence. For now, the first move is simple: run the 40‑cow test, watch your own barn for a week, and decide how much longer you’re willing to pay the BLV tax without a plan.

Complete references and supporting documentation are available upon request by contacting the editorial team at editor@thebullvine.com.

Learn More

The Sunday Read Dairy Professionals Don’t Skip.

Every week, thousands of producers, breeders, and industry insiders open Bullvine Weekly for genetics insights, market shifts, and profit strategies they won’t find anywhere else. One email. Five minutes. Smarter decisions all week.
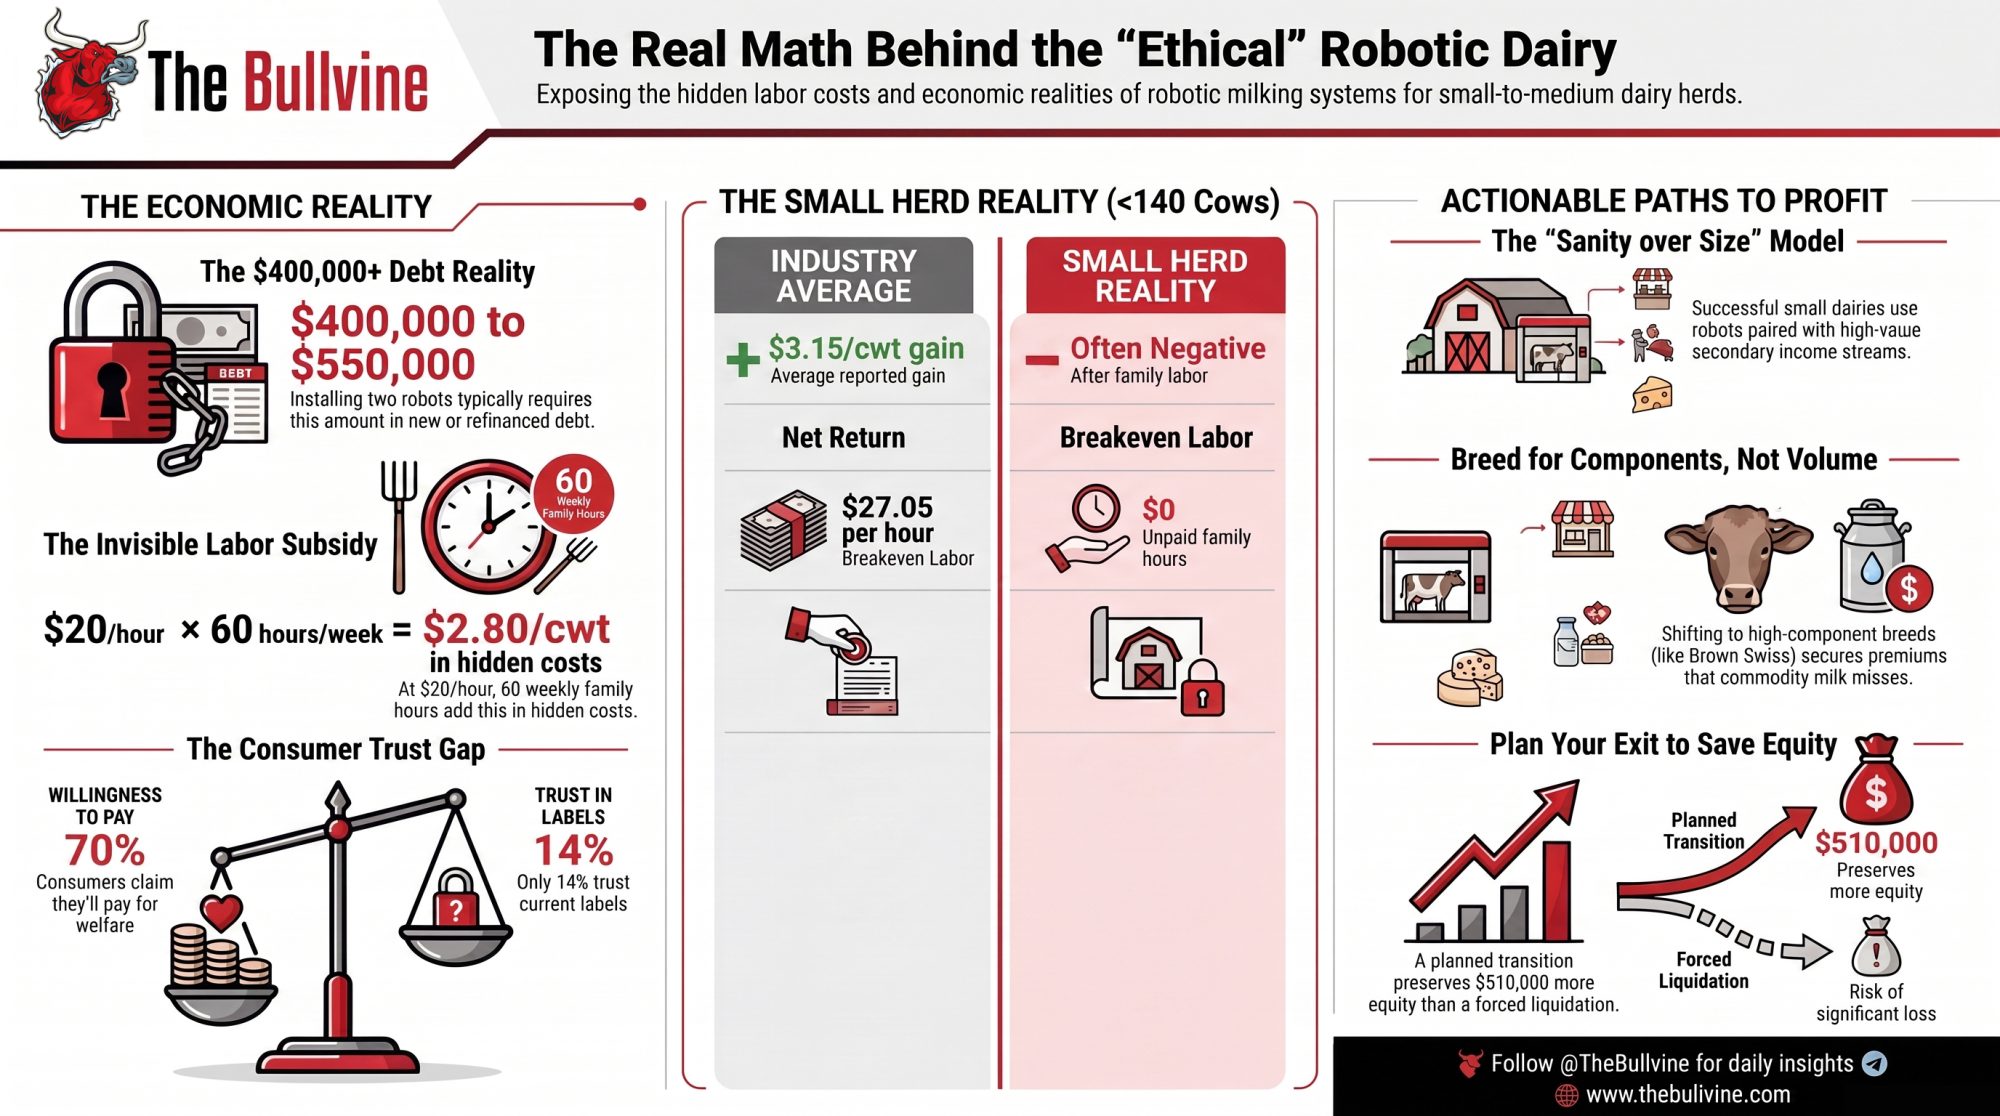
NewsSubscribe
First
Last
Consent

Your AI Ration Tool Is 3% Wrong. On 500 Cows, That’s $36,500 a Year.

A peer‑reviewed 2026 trial on 2,073 cow‑days showed AI rations can lift IOFC — but a 3% intake miss on a 500‑cow high group quietly drags $100/day, about $36,500 a year. Is yours drifting?

Executive Summary: A peer‑reviewed 2026 Animal Frontiers study from Alex Bach’s group at the University of Lleida trained a machine‑learning model on 2,073 cow‑days and hit R² 0.98 on income over feed cost — roughly 12 percentage points better than standard regression, with RMSE dropping from €1.45 to €0.59 per cow per day. The catch: that accuracy came from a tightly controlled research pen, and on a commercial 500‑cow high group, a 3% intake miss at $0.12/lb DM quietly drags about $100/day, or roughly $36,500 a year. Push the error to 5% and you’re looking at $60,225 — more than what most vendors claim their tools can add in IOFC. Cabrera’s Dairy Brain work and the Barrientos‑Blanco 2020 JDS paper confirm the upside is real (about $31/cow/year in feed cost and 5.5 kg less N excretion), but only when data streams actually line up; a 2022 survey in Animals found 69% of farmers weren’t familiar with data standards and 66% felt they didn’t control their own chain of custody. The practical call is to run a four‑question “AI Ready” audit first, hold any pilot to a 90‑day window with a no‑penalty exit and a 30‑day data‑export clause, and refuse to let the software change your feed sheet until it can shadow‑predict last week’s intake within 3%. For herds with tight DSCR and messy records, “not yet” is a legitimate answer — fixing known feed‑center shrink usually beats chasing a theoretical 20¢/cwt AI gain.

AI dairy rations

You’re sitting in a ration review and the AI tool on the laptop says your high group is fine at 55 pounds of dry matter. If that prediction is off by just 3%, the barn math on a 500‑cow herd works out to roughly ,500 a year at risk — in feed cost or missed milk. That’s the gap Alex Bach’s team exposed when they trained a machine‑learning model on 2,073 cow‑days and showed the “optimal” ration looks very different once the intake numbers are actually right.

The Bach study — published in Animal Frontiers in January 2026 — is one of the strongest recent peer‑reviewed data points showing AI can squeeze real dollars out of a dairy ration when the data underneath it is clean. The uncomfortable part is what happens on your farm, when the data isn’t that clean and the model’s intake guess wanders by a couple of pounds for weeks on end.

What the 2,073‑Cow AI Trial Actually Proved

According to Bach’s 2026 Animal Frontiers paper, the University of Lleida team followed a single pen of around 120 cows and logged far more than milk weights. Ingredient intakes, nutrient profiles, weather, stocking density, bodyweights, days in milk, yields, components, and economic returns — 2,073 daily observations in total, fed into a platform called algoMilk that has been running since 2020.

Two prediction engines were built on top of that dataset. A classic multiple regression — the math that’s quietly run ration software for decades — hit an R² of 0.86 (meaning it explained about 86% of the variation in income over feed cost), with a root mean square error of 1.45 €/cow/day (roughly $1.57/cow/day at an exchange rate near 1.08 USD/EUR in early May 2026). The gradient‑boosting machine‑learning model reached an R² of 0.98 (near‑perfect correlation) and cut RMSE to 0.59 €/cow/day (about $0.64/cow/day) on the same cows.

A small reality check before you get carried away: R² 0.98 reflects a tightly controlled research pen in Spain, not a typical commercial herd with messy real‑world records. Bach’s numbers are excellent on his cows, under his conditions — not an out‑of‑the‑box promise for yours.

Then the paper did the part every producer actually cares about. The ML model was plugged into an optimizer and asked to redesign the ration. The AI diet shifted ingredients gently — a bit more corn silage and canola meal, a bit less alfalfa and corn flakes — and lowered predicted dry‑matter intake by 0.2 kg (about 0.44 lb) and milk yield by 0.166 kg (about 0.37 lb) per cow per day. IOFC rose by about 0.015 €/cow/day (roughly $0.016/cow/day). Less milk. Tighter diet. Slightly more profit.

That result bruises a habit the industry has leaned on for a generation. According to the paper, chasing more milk at all costs isn’t always the most profitable move, because feed efficiency flattens and a chunk of cows in any group simply won’t pay you back for a richer ration.

How Dairy Brain Shows the Upside — When Data Is Clean

Bach’s work is one proof point. The bigger system for making AI useful at herd scale is being wired together in Wisconsin.

Victor Cabrera’s Dairy Brain project at UW–Madison has been stitching fragmented dairy data — genetics, milking systems, feed software, DHI, health records — into a single real‑time “brain” since 2016. The team’s 2024 Animal Frontiers paper describes using precision tools, big‑data analytics, and connected sensors to feed integrated models for everything from mastitis risk to culling and feeding decisions. Cabrera’s group publishes with Wisconsin cooperator herds, and the published outcomes line up with what the academic record shows — a pattern worth watching as more U.S. cooperators bring real barn numbers to the table.

An earlier applied study from the Cabrera group, led by Barrientos‑Blanco and published in the Journal of Dairy Science in 2020, put dollars on better diet accuracy. By tightening grouping and fine‑tuning rations with integrated data, they cut feed cost by about per cow per year and dropped nitrogen excretion by 5.5 kg (roughly 12.1 lb) per cow annually. On a 400‑cow herd, that’s roughly ,400 a year — off cows you already own, eating feed you’re already buying.

When data streams line up, AI‑style tools can tighten rations, improve nitrogen efficiency, and bump IOFC without a new ingredient truck ever rolling into the yard. The published work is also clear about the flip side: most herds aren’t close to that level of continuous, integrated data. That’s where the risk creeps in when you plug an AI ration engine into the noise.

Is Your Data Good Enough to Let AI Touch Your Ration?

Here’s where farm reality smashes into the AI sales deck.

A 2022 paper in Animals called “Addressing Data Bottlenecks in the Dairy Farm Industry” surveyed 73 farmers and 96 non‑farm stakeholders. About 69% said they were unfamiliar with existing data collection standards, and 66% of farmers felt they had no control over the chain of custody for their own data. Only 62% of farms were integrating data from multiple sources at all — and nearly half of those were still doing it manually in spreadsheets.

If your reality is a whiteboard feed sheet, DHIA once a month, and treatment notes scribbled in a spiral notebook, you don’t look like the 120‑cow Spanish research pen to an AI model. You look like static. And static makes intake predictions drift.

Before you download a trial of an “AI dairy nutrition” app, grab your nutritionist and run this readiness check:

The “AI Ready” Audit

  • Pen‑Level DMI: Can you pull 90 days of DM‑adjusted intake by pen?
  • Data Alignment: Do milk and components line up with those same pen‑days?
  • Digital Logs: Are forage DMs and TMR weights logged daily — not on paper?
  • Human Capital: Does someone on your team “own” data quality for at least 2 hours a week?

Zero or one out of four? You’re in good company. At that level, an AI ration tool is far more likely to become an expensive experiment than a profit center. Three or four out of four, and you’re close to the kind of herds where Bach and the Cabrera group have actually shown real gains.

How a 3% Intake Miss Eats $36,500 on a 500‑Cow Herd

Now the arithmetic you can run on the back of a feed tag.

Most high‑producing Holsteins in North America sit in a 52–58 lb dry matter range, depending on bodyweight and stage of lactation. With today’s mix of corn silage, haylage, grain, and by‑products, a realistic blended dry matter cost across many U.S. dairy regions lands in the $0.11–$0.13/lb band.

Say your AI tool claims your high group is eating 55 lbs of DM. In reality they’re closer to 53.35 — or 56.65. That’s about 1.65 lbs off, roughly 3%. Push that gap to 5% and you’re 2.75 lbs off, every cow, every day. Here’s how it lands on a 500‑cow high group at $0.12/lb DM:

Intake ErrorDaily Loss (500 cows)Annual Profit LeakImpact on Cost/cwt
3% miss~$100~$36,500$0.24
5% miss$165$60,225$0.40

Assumes $0.12/lb blended DM cost and cows shipping ~82 lbs/day / 0.82 cwt. Figures rounded; unrounded 3%‑miss values land at about $99/day and $36,135/year.

Herd Size1% Error/Year3% Error/Year5% Error/Year¢/cwt at 3%¢/cwt at 5%
250 cows$1,815$5,456$9,09412¢20¢
500 cows$3,630$10,890$18,15012¢20¢
500 cows (high group only)$3,630$36,500$60,22524¢40¢
1,000 cows$7,260$21,780$36,30012¢20¢
2,000 cows$14,520$43,560$72,60012¢20¢

Assumes $0.12/lb DM, 55 lb/day baseline intake, 82 lb/day milk shipped. High-group row reflects Bach/article scenario. Red = at or above vendor-claimed IOFC gain.

Vendors pitch these tools on IOFC gains in the single‑digit cent‑per‑cwt range. Marketing decks often stretch to 15–25¢/cwt. If the intake prediction the whole thing rides on is drifting 3%, the risk band alone can swallow the promised gain — before you even look at components, health, or labour.

Then the second‑order hits stack up. Butterfat slips a couple of hundredths because the model squeezes forage harder than your cows tolerate. Fresh cows throw a few extra DAs or ketosis cases because energy density moved faster than anybody noticed. Feeders chase bunk calls that don’t match the software. It isn’t scare‑tactic framing — it’s just what the math does when the model’s picture of intake and your actual bunks sit a couple of pounds apart for too long.

What Happens in Your Barn When the Algorithm Misses Intake by 5%?

Push the error band to 5% and you’re in lender‑conversation territory. That $60,225 annual leak sits well past the vet bill — right alongside the squeeze your banker runs DSCR against, like the $18.95 milk / $19.14 cost trap.

At 5%, the operational story gets ugly fast. Bunk calls get noisier because refusals don’t match predicted DMI. Cows swing between too‑full and too‑empty bunks. Health events cluster in patterns you don’t recognize. Feeders start “adjusting around the tool” off the record. If you’re using AI in advisory mode — building shadow rations and comparing — that 5% miss is a discussion point. If you’re letting it write the feed sheet, it’s physical, in front of your cows, every day.

The Bach model hit R² 0.98 on IOFC in that Spanish trial. Nobody has published that kind of accuracy on a typical North American commercial herd with messy real‑world records. The precision‑feeding upside is real. Your data quality decides whether you see Bach‑style gains or a 3–5% error bill.

Options and Trade‑Offs for Farmers

Contract ClauseWhat Farmers NeedTypical Vendor DefaultWho Carries Downside
Pilot duration90 days, hard stopRolling month-to-monthFarmer
Exit penaltyNo-penalty exit at day 90Early-termination feeFarmer
Data exportFull export within 30 daysProprietary lock-inFarmer
Shadow modeDays 1–7 predict only, no feed changesLive optimization from day 1Farmer
Performance threshold<3% intake error before scalingVendor discretionFarmer
IOFC benchmarkMust beat subscription fee in at least 1 pen by day 30No contractual benchmarkFarmer

Red = clause absent in most standard vendor agreements. Based on article’s recommended audit framework.

1. Fix Your Data First — Your 30‑Day Action

When it makes sense: You’re at zero or one on the readiness check. Records are scattered, DMI isn’t tracked by pen, and nobody owns data quality.

What it requires: Treat data like an ingredient for the next 30 days. Check DM on your main forages daily. Log every TMR load with actual weights and which pens it went to. Enter fresh, moved, and sick cows within 24 hours. At month’s end, sit with your nutritionist and pull 90 days of DMI by pen, milk and components by pen or tank, and a simple IOFC‑per‑cwt trend built on your real milk and feed prices.

Risks and limits: You won’t have an AI dashboard at the next meeting. You will have a baseline that tells you whether you’re already leaving money on the table with the software you own today.

2. Run a Small, Hard‑Bound 90‑Day Pilot

When it makes sense: You’re at three or four on readiness. Data’s relatively clean, the team is willing, and your nutritionist isn’t afraid of a spreadsheet.

What it requires: On paper — a written 90‑day pilot, a no‑penalty exit at day 90, and a guaranteed full data export (rations, predictions, actuals) within 30 days if you walk. In the barn — Days 1–7 in shadow mode only, the AI predicts but doesn’t change anything. Days 7–30, one stable pen gets one AI‑driven ration change with clear targets. Days 31–90, expand to a second pen only if pen one shows intake error under ~3% and IOFC improving after subscription fees.

Risks and limits: You’ll spend more time checking predicted versus actual than you’d like. By day 90, you’ll know — in your own dollars per cwt — whether the tool earns more than it costs.

3. Keep AI Advisory — Second Opinion, Not Driver

When it makes sense: You see value in pattern‑spotting but you’re not ready to let software write the feed sheet.

What it requires: Turn off auto‑optimization. Use the AI to generate shadow rations, flag outlier pens, and highlight where intake and milk don’t line up with history. Rule of the house: nothing new goes into the mixer without a human sign‑off.

Risks and limits: You give up some “easy” IOFC gains a fully optimized system might find on pristine data. You gain control, cut the odds of a silent 3–5% intake miss, and still get a second set of eyes.

4. “Not Yet” Is a Valid Answer

When it makes sense: DSCR is tight, you’re behind on higher‑ROI basics, and your data is, frankly, a mess.

What it requires: Sit down with your nutritionist and lender and mark the leaks you already know about. Are you happy with grouping and stocking? Have you tackled obvious feed shrink or mixing‑consistency issues? The Feed Center Revolution work shows many herds leak five figures a year before they ever touch software. Do you have a clear component strategy when the 2026 Class III–IV spread pulls $382,000 off a 500‑cow milk check?

Risks and limits: You might feel sidelined while neighbors talk about AI. You also avoid adding a subscription and one more variable to a cost structure that’s already stressed. Fixing a known six‑figure leak beats chasing a theoretical 20¢/cwt AI gain.

Key Takeaways

  • If an AI ration tool can’t shadow‑predict your last week of intake within roughly 3%, it doesn’t get to change the feed sheet. That gap is about $36,500/year on a 500‑cow herd — enough to erase the whole promised IOFC lift.
  • If you’re at zero or one out of four on the readiness audit, your next 30 days belong to tightening your own numbers before you pay for any AI prediction.
  • If a vendor won’t put a 90‑day pilot, a no‑penalty exit, and a 30‑day data‑export clause in writing, assume you’re carrying effectively all of the downside. Keep any AI tool in advisory mode until the paper and your milk check both say otherwise.
  • If the first 30 days of a pilot don’t show intake error under 3% and IOFC improving after fees in at least one pen, don’t scale it. Pause, diagnose, and make it earn more time.

What to do tomorrow morning: Before milking, pull last month’s feed invoices, your DHIA component report, and your TMR software log. Lay them on the same table. If you can’t line those three up by pen for the last 30 days in under an hour, that’s your AI answer for now — fix the data, then talk to the vendor.

So here’s the real question: if you laid out last year’s IOFC and feed‑cost reports, could you point to a single tool — AI or not — and say, “This clearly adds more than it costs, and here’s the proof in dollars per cwt”? If the answer is still no, any tool that comes next should have to prove itself on your cows, under your conditions, before it earns a seat at your feed table.

Complete references and supporting documentation are available upon request by contacting the editorial team at editor@thebullvine.com.

Learn More

The Sunday Read Dairy Professionals Don’t Skip.

Every week, thousands of producers, breeders, and industry insiders open Bullvine Weekly for genetics insights, market shifts, and profit strategies they won’t find anywhere else. One email. Five minutes. Smarter decisions all week.

NewsSubscribe
First
Last
Consent

$48,500 a Month: The “Audit Tax” Behind the Texas Dairy Labor Crisis

Nine Texas dairies got the envelope in one July weekend. H-2A takes 120 days to deliver a worker. At $14.59 Class III, the contract-crew premium runs $48,540 a month on 1,500 cows — straight off your operating line.

Executive Summary: On June 4, 2025, federal agents arrested 11 workers at Outlook Dairy near Lovington, NM, and 35 of roughly 55 employees were absent the next morning; a month later, at least nine Texas dairies got Notices of Inspection over a single weekend. On a modeled 1,500-cow Panhandle operation, replacing 12 FTE with a crisis contract crew costs roughly ,540 a month above direct-hire baseline — drawn straight off your operating line at .59 Class III. Drumgoon Dairy in South Dakota spent more than $110,000 rebuilding after a DHS I-9 audit pulled 38 of 50 workers; H-2A takes 75 to 120 days to land the first replacement on your parlor floor, and ICE gives you three business days to produce records. The March 16, 2026 ICE Fact Sheet reclassified more than ten I-9 error categories as substantive violations with no cure window, at $288 to $2,861 per form and $716 to $28,619 per worker for knowing-hire. The real failure mode isn’t compliance — it’s liquidity: by Day 90, you’re simultaneously drawing on the operating line and fielding SCC calls from your co-op, and your lender is asking questions you weren’t ready to answer. If your I-9 files haven’t been reviewed by counsel in three years, your SOPs live in your herdsman’s head, and your 72-hour playbook doesn’t exist on paper, those are the three jobs for the next 30 days.

dairy I-9 audit

On June 4, 2025, federal agents executed a search warrant at Outlook Dairy near Lovington, New Mexico, and arrested 11 workers at the site, according to nm.news and KOB New Mexico. Thirty-five of Outlook’s roughly fifty-five workers were absent the following morning. Owner Isaak Bos told reporters, “It takes 100% of the labor force, so no day is off right now,” and that the raid left his operation “barely able to keep going” (Ruidoso News, June 18, 2025). Neither Outlook Dairy nor Bos has been publicly charged with any employer-level violation on the public record reviewed for this article as of press time.

A month later, at least nine Texas dairies two states east received Notices of Inspection over a single weekend — according to Darren Turley, executive director of the Texas Association of Dairymen. The arithmetic that followed — what one worker’s absence costs, what thirty-five absences cost, what three business days to produce I-9 records means when your next H-2A worker is 75 to 120 days away — is the arithmetic every Southwest dairyman has been running since.

You’ve been hearing about this for eleven months. You’ve probably bought something — a compliance platform, a legal retainer, E-Verify enrollment. That’s fine. But the conversation the industry is actually having is solving the wrong problem, and the operators who’ve been through one of these events already know it.

What’s Changed in the Rules

The enforcement picture changed fast and in a specific direction. ICE I-9 audit activity escalated sharply through late 2025 and early 2026. April 2026 client alerts from Holland & Knight, Morgan Lewis, and Fisher Phillips all characterized the current enforcement pace as materially higher than 2024 and the audit stakes as meaningfully raised. Compliance-tracking firm I-9 Intelligence published an August 2025 analysis describing ICE field operations as moving to quarterly worksite inspection quotas with agriculture designated as a priority sector. ICE has not publicly confirmed the quota structure. Nine dairies in one Texas weekend is the scale the industry is now planning around.

The New Reality — I-9 Enforcement, March 2026

What Used to Be TrueWhat’s True Now
Ten-business-day cure window for technical I-9 errors (1997 Virtue Memorandum).More than ten error categories reclassified as substantive violations. No cure window.
Most paperwork mistakes treated as correctable.Immediate fines of 8 to ,861 per Form I-9 (January 2025 DHS inflation adjustment, current 2026 schedule).
Employer posture: fix on discovery.Employer posture: fix before discovery, or pay on discovery.
Knowing-hire fines largely theoretical for audit-only cases.6 to ,619 per worker, scaling with offense number.
E-Verify treated as near-sufficient by many operations.Independent evaluations of E-Verify have documented meaningful false-negative rates when workers present fraudulent documents; no standalone DHS effectiveness study has superseded the earlier Westat work.

Sources: Morgan Lewis, “ICE Rewrites the Rules on Form I-9 Violations” (April 13, 2026); Holland & Knight, “Quiet Change, Serious Consequences” (April 13, 2026); Fisher Phillips, “ICE Changes I-9 Enforcement Standards” (April 19, 2026). Holland & Knight advised clients to “act promptly to review existing Forms I-9, address deficiencies, and update internal compliance practices before ICE inspections potentially expose them to avoidable penalties.”

These ranges apply to I-9 audits generally, not to any operation named in this article. No public record reviewed here indicates that Outlook Dairy, Drumgoon Dairy, or the nine unnamed Texas dairies received knowing-hire findings. The ranges matter because every operation facing an audit deserves to know what’s at stake financially, regardless of its compliance posture.

How This Plays Out Across the Industry

Drumgoon Dairy in Lake Norden, South Dakota — owned by Rodney and Dorothy Elliott — saw 38 of roughly 50 workers depart following a DHS I-9 audit in late May 2025. Their workforce dropped from over 50 to 16 within days (Bullvine, February 9, 2026; Dairy Herd Management, January 20, 2026). Public reporting has not identified any formal enforcement findings against the farm. Dorothy Elliott told South Dakota Searchlight in October 2025 that the alternative to rebuilding fast was letting cows go unmilked and calves go uncared-for. The Bullvine reached out to Drumgoon Dairy for comment; the operation had not responded at press time. The Elliotts spent more than $110,000 on recruiters and transportation to bring in 22 H-2A workers from Mexico — and still needed 12 local hires, with another 10 to 15 positions open.

That $110,000 figure is the most specific public data point on actual workforce-replacement cost following an I-9 audit. It’s not hypothetical. It’s what one mid-size dairy spent to get back to roughly full staffing — and it doesn’t include the ongoing hourly premium, the production variance from transitioning crews, or the owner-hours absorbed by recruiting instead of managing.

Metric (12 FTE, 60 hrs/wk)Baseline (Direct Hire)Crisis Mode (Contract Crew)The “Audit Tax” (Delta)
Hourly Rate (all-in)$16.93$32.50+$15.57/hr
Weekly Labor Cost$12,190$23,400+$11,210/wk
Monthly Labor Cost$52,780$101,320+$48,540/mo
90-Day Liquidity Hit$158,340$303,960+$145,620 total

The Audit Tax — 1,500-Cow Texas Panhandle Modeled Scenario

Modeled scenario using verified cost inputs — not a single reported dairy. Inputs: 12 FTE replaced, 60-hour weeks (720 worker-hours/week), 4.33 weeks/month.

MetricBaseline (Direct Hire)Crisis Mode (Contract Crew)Delta (The “Audit Tax”)
Hourly rate (all-in)$16.93$32.50 (midpoint of $31–$34)+$15.57/hr
Weekly labor cost, 12 FTE × 60 hrs$12,190$23,400+$11,210/wk
Monthly labor cost~$52,780~$101,320+$48,540/mo

Milk price input: .59/cwt (January 2026 first-announced FMMO Class III, down .27 from December and the lowest since July 2023. Texas direct-hire wage: $16.93/hour (ZipRecruiter, Q2 2025). Contract crew range: $31 to $34/hour all-in, rough industry range for crisis-replacement crews.

At $14.59 milk on a 1,500-cow herd, that premium doesn’t compress your margin. It eliminates it. You’re into your operating line by the end of Month 1. None of the public accounts of the Drumgoon and Outlook events describe a written contingency plan in place before the audit. They describe good operators making hard decisions fast.

Why 120 Days Is the Number That Matters

Here’s the structural trap nobody puts on a conference slide.

H-2A takes 75 to 120 days minimum from first filing to first worker on your parlor floor, per the Department of Labor’s own application flowchart. That’s the State Workforce Agency job order, the DOL application, the domestic recruitment window, USCIS processing, the consulate appointment, and travel — all chaining cleanly in sequence. An I-9 Notice of Inspection gives you three business days to produce your records.

This isn’t a gap. It’s a canyon — and most dairies are currently trying to jump it in a skid steer.

Two Timelines That Never Touch

TimelineDay 1Day 3Day 30Day 75–120
ICE enforcementNotice of Inspection served.Records due. Substantive violations fine immediately.Workforce disruption visible in production.Penalty determinations finalized.
H-2A replacementJob order filed with State Workforce Agency.Domestic recruitment window opens.DOL certification pending; USCIS not yet filed.First worker arrives on parlor floor (earliest case).

The lines don’t cross. They run parallel across the canyon. Every operator who’s lived it describes the same 60-to-90-day window where the audit clock has already expired and the H-2A clock hasn’t yet delivered anything.

For most Texas Panhandle dairies, H-2A doesn’t even close it. The program only covers seasonal or temporary work — and dairy isn’t either. The Farm Workforce Modernization Act (H.R. 3227) was reintroduced in the 119th Congress on May 15, 2025 by Reps. Zoe Lofgren (D-CA), Dan Newhouse (R-WA), Mike Simpson (R-ID), Jim Costa (D-CA), David Valadao (R-CA), and Adam Gray (D-CA) — the bipartisan coalition that has shepherded the bill through two prior House passes that never cleared the Senate (lofgren.house.gov, May 15, 2025; Citrus Industry, May 14, 2025). The 2025 version currently sits in committee. USDA Secretary Brooke Rollins told the House Agriculture Committee in June 2025 that “significant reform needs to happen” on H-2A and that there’s “a major gap in the labor market for our dairy farmers” (Hoosier Ag Today, June 11, 2025). She’s since called dairy’s H-2A exclusion “particularly broken”. Acknowledging the problem and fixing it are different calendars.

Layer in the October 2, 2025 Interim Final Rule that revised AEWR methodology — projected by the Economic Policy Institute to cut H-2A wage floors to roughly .70/hour for the 92% of workers reclassified as “unskilled,” against a prior average minimum of .43/hour (CalMatters, March 19, 2026; Agroinformacion, April 20, 2026) — and the picture gets more complicated. That rule is currently under challenge in United Farm Workers v. Chavez-DeRemer, Case No. 1:25-cv-01432-JLT-SAB, before Judge Kirk Sherriff in the Eastern District of California, with oral arguments concluded March 18, 2026 and a written ruling expected imminently. On April 26, 2026, the Supreme Court granted review in the parallel DOL case questioning whether Labor Department administrative law judges have constitutional authority to levy H-2A fines at all — a direct extension of SEC v. Jarkesy (Bloomberg Tax, April 26, 2026). Any operator building a 2026 labor budget on the $13.70 figure is budgeting against a number that could reset twice before the first H-2A worker steps off a bus. That’s not an argument against H-2A planning — it’s an argument for building a buffer into the math.

How Much Does Waiting 30 Days Actually Cost?

If you get a Notice of Inspection on a Thursday and don’t have a playbook, here’s how the next 90 days typically go.

Weeks 1 through 3, the margin structure cracks first. You’re burning roughly $48,000 in incremental labor cost on a 1,500-cow herd, drawn straight from your operating line. This is invisible from the outside — your lender doesn’t know unless you told them. Weeks 3 through 6, milk quality starts drifting. Contract crews running unfamiliar protocols often produce longer milking times and inconsistent teat prep. SCC drift during the transition is a pattern operators commonly report during prolonged crew turnover — rarely across penalty thresholds immediately, but the monthly DHIA pull shows a trend your fieldman will notice and your co-op will flag.

Weeks 6 through 10, the two conversations collide. You’re simultaneously drawing on your operating line and fielding quality calls from your co-op. Neither one alone is fatal. Together, from the outside, they look like an operation losing control. By Day 90 — which falls inside the standard review window on most ag operating lines — your lender is asking questions you weren’t ready to answer. And the ones you already had weren’t the ones that mattered most.

The difference with a written playbook isn’t that the dollars stop moving. They move the same either way. The difference is what the conversations sound like.

Is This a Compliance Problem or a Liquidity Problem?

Here’s the reframe that separates the operators who come through the next 24 months from the ones who don’t.

Compliance failure isn’t what kills a dairy operation. Liquidity failure is. The path from an I-9 audit to a liquidity event is shorter and more automatic than most operators have mapped. Every conversation in the industry right now is organized around documentation — I-9 files, E-Verify enrollment, legal retainers. That’s correct as far as it goes. But the probability of experiencing some form of workforce event in the next 24 months is no longer low enough to plan around avoidance alone.

Published evaluations of E-Verify have consistently documented that the system misses a meaningful share of unauthorized workers who present fraudulent documents. No standalone effectiveness study has replaced the earlier DHS-commissioned Westat work, and USCIS monitoring reports have since provided periodic updates without a comprehensive successor evaluation. The practical read for operators is that E-Verify is necessary but not sufficient.

The honest read of the current moment isn’t “I might get audited.” It’s “I’ll probably face something — the question is whether I’ve built for it.” A large Panhandle operation that spoke with The Bullvine on background in July 2025 described spending approximately $18,000 on a compliance platform in the prior year, and said the investment paid for itself by surfacing form-level documentation errors during internal review. That’s one data point, not a guarantee. Good enough to take seriously.

Options and Trade-Offs for Farmers

Path 1: File H-2A for eligible positions anyway. This works for crop-integrated activities, silage, and feed production — not your parlor workforce under current law. It requires housing compliance infrastructure, a legal retainer, and a four-month planning horizon minimum. The trade-off: you get audit-proof documentation on the workers who arrive through the program, but you can’t legally route milkers through H-2A until H.R. 3227 or a similar reform clears the Senate. And with the Fresno ruling pending on the IFR wage floor and the SCOTUS cert grant on DOL H-2A fines authority, you may need to rebuild your cost model mid-cycle. Plan for it; don’t bet the operating line on it.

Path 2: Internal I-9 audit with immigration counsel this quarter. This is the highest-ROI move available to any operation that hasn’t done one in three years — and post–March 2026 ICE guidance makes it more urgent, not less, because the window to self-correct on more than ten error classes has narrowed. The trade-off: some historical errors can no longer be fully rehabilitated through internal correction per the March 2026 Fact Sheet. Finding them early still puts you in a materially better position than finding them during an ICE inspection.

Path 3: Build a written 72-hour playbook. Do this within 30 days. See the Playbook Essentials sidebar below. This costs owner-hours, not capital. Two or three days of concentrated work. The uncomfortable part isn’t the drafting — it’s admitting on paper what happens if you’re not the one answering the phone. The operators who’ve come through recent workforce disruptions describe building these documents afterward. The ones who build before sleep better.

Path 4: Pre-vet a contract labor firm before you need them. Get their I-9 compliance documentation. Get their rate sheet and lead times for 5, 10, and 20 workers. Build the relationship when you’re not in crisis. When you are in crisis, every dairy in your region is calling the same firm on the same Tuesday morning — and availability isn’t guaranteed. The trade-off is modest: some relationship maintenance cost for coverage you hope you never activate.

🔧 Playbook Essentials — What the 72-Hour Binder Contains

Six documents. One three-ring binder in the farm office. Copies laminated and posted in the parlor.

  • Workforce vulnerability map: roles by shift, cross-training depth, single-points-of-failure flagged by name.
  • First-call contact list: immigration counsel, ag lender loan officer, co-op fieldman, contract labor firm, veterinarian. Names and cell numbers, not generic switchboards.
  • Laminated parlor SOP: prep, attach, post-dip, wash-up — written so someone who has never milked on your farm could execute at 4 a.m.
  • Production triage decision tree: which pens first, which cows dry off early, which heifers ship, what the once-a-day-milking threshold looks like.
  • Pre-written lender notification script: what you call about, what numbers you bring, what draw capacity you’re confirming.
  • Pre-written fieldman notification script: quality expectations during the transition window and what you’re doing about SCC drift.

The 30/90/365 At-a-Glance

  • 30 days: Write the 72-hour playbook. Call your ag lender. Confirm every current parlor worker is on E-Verify.
  • 90 days: Internal I-9 review with immigration counsel. Pre-vet a contract labor firm with rate sheet and lead times for 5, 10, and 20 workers.
  • 365 days: File H-2A on the eligible positions you have. Paper-ize every parlor SOP that currently lives in your herdsman’s head.

Key Takeaways

  • If your I-9 files haven’t been reviewed by immigration counsel in the last three years, move that review into this quarter. The March 16, 2026 ICE Fact Sheet revision means more than ten error categories that used to be correctable now carry immediate penalty exposure. The review costs less than one fine.
  • If you don’t have a written 72-hour playbook — first-call contacts, laminated parlor SOP, pre-written lender script — put it on paper within 30 days. This costs hours, not dollars. It’s the highest-leverage action available to any operation right now regardless of herd size.
  • If you’re building a 2026 H-2A budget on the $13.70/hour IFR floor, carry a contingency in the $5,000 to $10,000 per worker range against pre-IFR rates being restored mid-cycle. The low end reflects a roughly $3–$4/hr delta between the IFR floor and prior AEWR averages, conservatively rounded, over 2,080 annual hours; the high end loads in housing, transportation, and legal adjustments. Both the Fresno ruling and the SCOTUS cert grant on DOL fines authority are pending.
  • If your operating line assumes normal labor costs, stress-test it against a 90-day scenario in the $240,000 to $255,000 range for a 12-FTE gap — three months of ~$48,500/month contract-crew premium plus an upfront rebuild cost in the $95K–$110K range, consistent with Drumgoon Dairy’s reported $110,000 expenditure. Know your draw capacity before you need it.
  • If you haven’t talked to your ag lender about workforce risk in the last six months, schedule that call now.Lenders who hear it from you first respond categorically differently than lenders who read about it elsewhere.
  • If your parlor SOPs live in your herdsman’s muscle memory and nowhere on paper, that’s a single point of failure with a friendly face. Write them down. Hand them to someone who’s never milked on your farm and ask if they could follow them at 4 a.m. If the answer is no, they’re not complete.
  • If you’ve enrolled in E-Verify and assumed that closes your compliance gap, confirm that your full current parlor workforce is actually on the platform — not just the workers you hired most recently.

The Question Worth Asking This Week

The operators making it through 2026 aren’t the ones waiting for the regulatory environment to stabilize. They’re the ones who decided it’s the weather, not the forecast — and built their operation to produce milk through whatever comes. The compliance platform doesn’t substitute for the liquidity architecture. You need both, and the sequencing matters: the playbook has to exist before the envelope arrives, not after.

So the question isn’t whether you’ve bought the subscription. It’s where your 72-hour plan actually lives right now — in a document anyone on your team could execute, or in your own head on a day you might not be available. Walk out to the farm office after chores tonight. Pull the binder off the shelf. If there isn’t one, that’s the job for the next 30 days.

Next week’s Bullvine Weekly runs the three-scenario H-2A wage model, the contract-crew stress test at different herd sizes, and the compliance ROI math broken out by operation scale. If tonight’s walk to the office turns up a thin binder, that’s where the next layer of numbers is.

Legal note: This article is journalism, not legal advice. I-9 and H-2A rules are changing week by week in 2026. Before acting on any compliance strategy, internal audit, or H-2A filing discussed here, consult qualified immigration counsel and your own ag lender. Figures cited are modeled or drawn from public reporting as noted; your operation’s numbers will differ.

Learn More

The Sunday Read Dairy Professionals Don’t Skip.

Every week, thousands of producers, breeders, and industry insiders open Bullvine Weekly for genetics insights, market shifts, and profit strategies they won’t find anywhere else. One email. Five minutes. Smarter decisions all week.
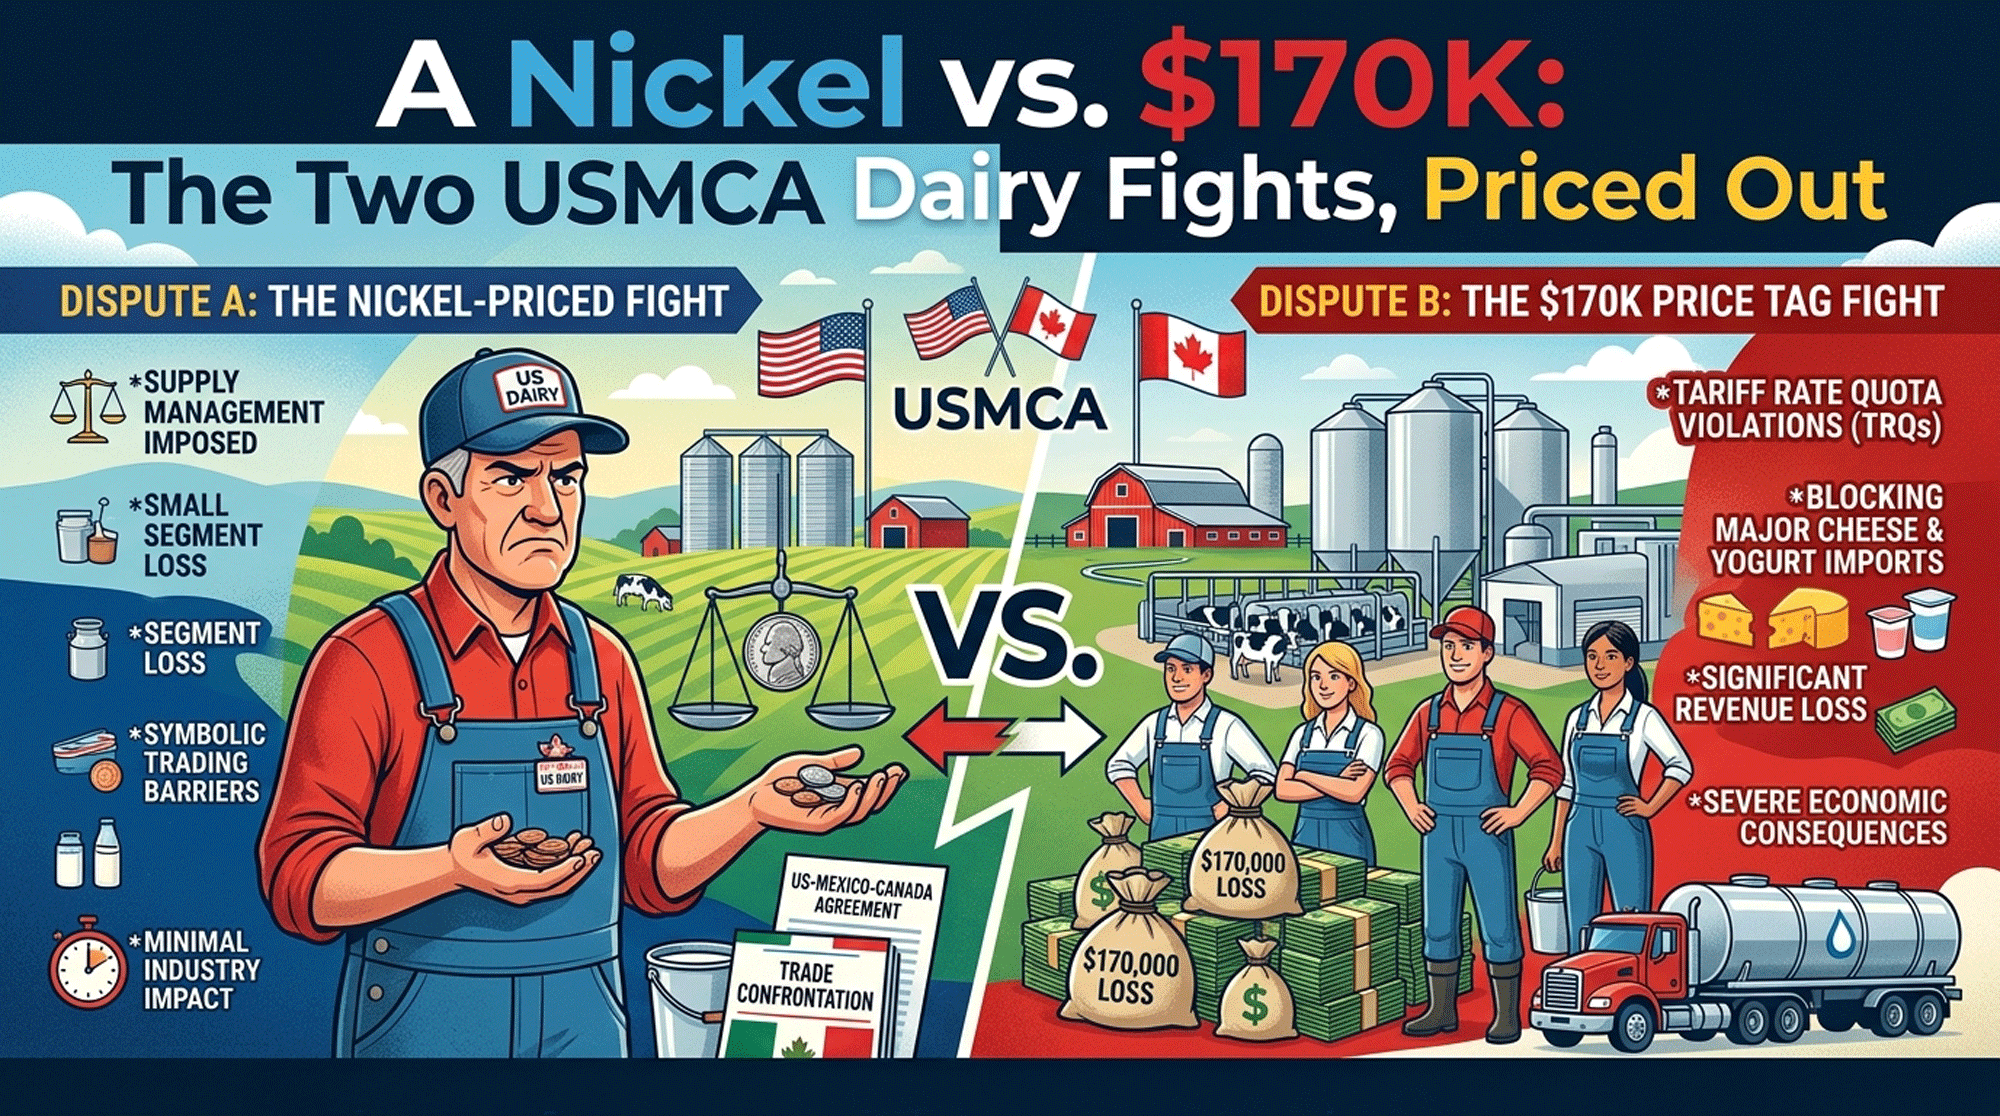
NewsSubscribe
First
Last
Consent

The $6,600 6‑Week Weaning ‘Savings’ Trap: Why It Can Mean an $11,000 BRD and Calving Bill on a 300‑Cow Dairy

On a 300‑cow Wisconsin dairy, the milk‑replacer invoice said: “smart.” The heifer ledger quietly said the opposite.

Dave runs 300 Holsteins in central Wisconsin. For nearly a decade, he weaned every calf at 42 days and figured he was saving about $55 per head on milk replacer compared with an 8‑week program — roughly $6,600 a year across 120 heifers.

On the milk‑replacer invoice, that math looked good. When his vet put a $260 price tag on each pneumonia case, and they walked through what that did to age at first calving, the ledger flipped. The “cheap” 6‑week program looked a lot more like an $11,000 drag on the heifer enterprise.

Where Dave’s $6,600 Weaning “Savings” Actually Came From

Start with what Dave was paying for liquid feed.

He was on a 20/20 all‑milk replacer. His contracted price sat around $1.80 per pound — right in the middle of what many dairies are seeing, with 50‑lb bags often running from the mid‑$60s to the $120 range depending on formulation and brand.

His 6‑week program looked like this:

  • 1.25 lb/day of milk replacer powder
  • 42 days on milk
  • 1.25 × 42 = 52.5 lb of powder per calf

At $1.80/lb:

  • 52.5 lb × $1.80 = $94.50, call it $94 per calf

An 8‑week scenario at a slightly higher feeding rate:

  • 1.5 lb/day of powder
  • 56 days on milk
  • 1.5 × 56 = 84 lb of powder

At the same $1.80/lb:

  • 84 lb × $1.80 = $151.20, call it $151 per calf

On paper:

  • 6‑week: ≈ $94/head
  • 8‑week: ≈ $151/head

That’s a $55/head difference. Across 120 heifers a year:

  • 120 × $55 ≈ $6,600 per year

If you stop the spreadsheet at day 42 or 56 and never look past the bottle, you’d call that a win.

The trouble is, the costs don’t stop at the day you pull the nipple.

The BRD Ledger, the Milk Invoice, Never Shows

Dave’s vet didn’t start with rumen theory. He started with the sick sheet.

“How many calves are you actually treating for pneumonia after weaning?” he asked.

Over the previous couple of years, Dave’s records showed roughly 20% of his heifers — about one in five — were treated for BRD in the 30 days after weaning. Not every respiratory case hits right after the last bottle, but that’s where the spike was.

Like most producers, Dave guessed those cases cost him forty or fifty bucks each. A couple of drugs, a vet call, and some extra labor.

A 2020 paper in Animal Health Research Reviews priced it differently. Overton and colleagues looked at 104,100 U.S. dairy replacement heifers and compared animals with and without a BRD history in the first 120 days of life. They reported:

  • 36.6% of heifers had at least one BRD case in that early‑life window.
  • The estimated cost per incident BRD case was about $252 or $282 per heifer, depending on whether anticipated future milk differences were included. 

That cost rolled in:

  • Treatment drugs and vet time
  • Lost growth and delayed breeding
  • Higher culling risk as heifer and cow
  • Lower first‑lactation milk in affected animals

So the drugs are the cheapest part of the bill.

To keep the math grounded, Dave and his vet agreed on $260 per BRD case as a working number — basically the midpoint of the $252–282 range.

On 120 heifers a year, with a 20% post‑weaning BRD rate:

  • 20% of 120 = 24 cases
  • 24 × $260 = $6,240 per year in BRD cost

Compare that to the milk line:

  • Milk‑replacer “savings”: $6,600/year
  • BRD cost: $6,240/year

On Dave’s books, the money he “saved” on milk replacer was almost entirely eaten by pneumonia, before they even put a number on delayed calving.

Rumen Biology Doesn’t Care About Your Calendar

The next question was simple: “Why are so many calves getting sick after weaning?”

Dave’s nutritionist pulled out rumen‑development work from Jim Quigley and the latest weaning review from Aarhus University.

Quigley, through Calf Notes and a 2019 Journal of Dairy Science review, has pushed a specific biological threshold: a calf needs roughly 15 kg of cumulative non‑fiber carbohydrates (NFC) from starter — about 33 lb of fermentable carbohydrate — before the rumen is truly ready to take over.

The Bullvine walked through his math earlier this year:

  • On a typical 8‑week program with 6 L of milk per day, many calves only get to around 11.5–13 kg of cumulative NFC from the starter by day 56 — 1.5–3.5 kg short of the 15 kg target. 
  • On higher‑milk programs, calves often don’t hit that 15 kg NFC mark until week 9 or 10, because liquid keeps them full and slows grain intake. 

That tracks with what you see in real barns: big, shiny 6‑week‑old calves that still hardly touch the starter bucket.

A 2024 systematic review in the Journal of Dairy Science by Welk, Neave, and Jensen compiled 44 studies on weaning practices. Their conclusions matched the barn experience:

  • Calves weaned later, over longer durationsbased on starter intake, or using step‑down milk removal, were more likely to show positive growth and intake responses
  • Weaning based on starter intake produced superior growth and feed intake compared with fixed‑age, earlier weaning.
  • When pre‑weaning milk allowances were adequate (over about 6 L/day), weaning after 8 weeks supported superior weight gain

At 42 days, when Dave pulled the last bottle, most of his calves were barely at a pound of starter a day. Some less. Nowhere near the 2+ lb/day that corresponds to Quigley’s 15 kg NFC target over time.

The milk disappeared anyway.

Extension recommendations from Penn State, Cornell, and the Canadian Dairy Code of Practice all push in the same direction: don’t fully wean Holstein‑size calves until they’re consistently eating roughly 2–3 lb of starter per day for several consecutive days. That’s just a practical way of making sure biology has caught up.

When you wean on a calendar date instead of an intake gate, you’re betting that rumen development is done just because the chart says “day 42.”

How a Rough Weaning Turns Into a 25‑Month Calving Problem

The pneumonia cases were obvious. The weaning slump was there too: calves coughing, sulking, backing off the starter for a week or ten days, then slowly coming around.

What wasn’t obvious was how those ten days of weaning showed up in the heifer yard.

The Welk review and several individual trials report that calves weaned later and more gradually not only eat more starter but also gain more weight per day around weaning and carry a bodyweight advantage through the post‑weaning period, especially when milk is generous pre‑weaning. Those gaps don’t magically close.

Now put heifer economics on top of that biology.

Iowa State University’s 2024 “What’s it Cost to Raise Your Dairy Best Heifer?” budget for a conventional 26,000‑lb herd shows:

  • Total cost to raise a heifer to 24 months: about $2,651
  • Daily heifer cost: roughly $2.65/head/day when you underload labor, up to about $3.15/head/day when labor is fully charged

The same ISU sheet runs the economics of tightening that up:

  • Cutting the heifer‑raising period from 24 to 23 months saves about $93 per heifer

Work it the other way:

  • Take a midpoint of $2.75 per day
  • One extra month ≈ 30 × $2.75 = $82.50 per heifer

When Dave’s team pulled his calving records, plenty of heifers were freshening closer to 25 months than 24. Many of those files carried simple notes like “small, waited.”

If half of his 120 heifers — 60 head — were calving just one month later than they needed to because they never quite caught up post‑weaning, that’s:

  • 60 × $82.50 ≈ $4,950 per year in extra heifer costs

Stack that on top of the BRD bill:

  • BRD: $6,240/year
  • Extra heifer month: $4,950/year
  • Total downstream cost: $11,190/year

Compare that to the weaning savings:

  • Milk‑replacer “savings”: $6,600/year
  • BRD + AFC cost: $11,190/year

On Dave’s farm, the 6‑week calendar program wasn’t saving money. It was quietly burning about ,600 a year once the heifer and health costs were on the same page.

Cost Line6‑Week ‘Savings’ Program7–8 Week Intake‑Based Program
Milk replacer per year$11,280$18,120
BRD cost per year$6,240$1,560
Extra AFC/heifer‑day cost$4,950$1,500
Total annual heifer program cost$22,470$21,180

The Before‑and‑After Ledger on a 300‑Cow Herd

Once all three lines — milk replacer, BRD, and age at first calving — were in front of him, Dave could finally see what the weaning program was really doing.

Here’s how his example pencils out.

Assumptions (Dave’s Numbers)

  • Herd: 300 Holstein cows
  • Heifers raised/year: 120
  • Milk replacer price: $1.80/lb (contract)
  • BRD cost per case: $260, midpoint of the published $252–282 per case range. 
  • Post‑weaning BRD incidence (first 30 days):
    • Old 6‑week program: 20% (24 heifers)
    • New intake‑based program: 5% (6 heifers)
  • AFC drift:
    • Old: 60 heifers calving ~1 month late
    • New: 30 heifers calving ~10 days late on average

Old 6‑Week Calendar Program

Milk replacer:

  • 52.5 lb/calf × $1.80 ≈ $94.50 → $94 per calf
  • 120 × $94 ≈ $11,280 per year

BRD cost:

  • 20% of 120 = 24 BRD cases
  • 24 × $260 = $6,240 per year

AFC drift cost:

  • 60 heifers × $82.50 ≈ $4,950 per year

Total:

  • $11,280 + $6,240 + $4,950 ≈ $22,470 per year

New Intake‑Based 7–8‑Week Program

Milk replacer:

  • 84 lb/calf × $1.80 ≈ $151.20 → $151 per calf
  • 120 × $151 ≈ $18,120 per year

BRD cost:

  • 5% of 120 = 6 BRD cases
  • 6 × $260 = $1,560 per year

AFC drift cost:

  • 30 heifers drifting ~10 days: 10 × $2.75 ≈ $27.50/hd
  • 30 × $27.50 ≈ $825 per year
  • For simplicity, Dave’s team rounded this up to about $1,500 per year to stay close to ISU’s $93 per heifer‑month and acknowledge some extra variation. 

Total:

  • $18,120 + $1,560 + ~$1,500 ≈ $21,180 per year

Even with conservative rounding, the intake‑based 7–8‑week program came out roughly $1,300/year cheaper than the old 6‑week system on Dave’s farm.

Change the incidence rates or costs, and the gap will move. In some herds with very low BRD and tight AFC, 6‑week weaning might still hold its own on a full ledger.

The point is: until you put your own numbers into a similar layout, you’re guessing.

Why Those Dollars Matter More at $3,000 Heifer Values

If replacements were cheap and plentiful, you might treat this like a nice‑to‑have improvement.

That’s not the market you’re in.

USDA’s Agricultural Prices reports and Ag Proud coverage show U.S. replacement cow prices averaging about $3,110 per head in October 2025, up roughly 3% from July and 16% from October 2024. By early 2026, averages had eased to around $2,860, but they were still high compared with prior years.

BRD Impact Line ItemConservative Cost per CaseCapital Context at ,000 Heifers
Drugs + vet timeSmall part of total loss
Lost early growth + delayed heat–0Pushes AFC toward 24.5–25+ months
Higher culling/poor first lact.0–0Lost future milk and genetics
Total economic hit per case≈2–28–9% of a ,000 heifer’s value

A Bullvine analysis across multiple datasets pegged average replacement heifers at about $3,010 per head in early 2026, with U.S. heifer inventories likely to tighten further before any meaningful rebuild around 2027.

At those values, every replacement in your place quietly carries a $2,800–$3,100 asset tag.

A BRD case that knocks a heifer out of your pipeline or drags down her first‑lactation performance is not just a sick‑calf problem. It’s an equity decision.

The same goes for age at first calving. If your heifers are freshening closer to 25 months than 22–24, you’re not just feeding a little extra grain. You’re tying up capital in animals that aren’t milking yet.

So the real question stops being, “How can I save $55 per calf on milk replacer?”

It becomes:

“At $3,000 per heifer, how much BRD and delayed calving am I willing to buy for a milk‑replacer ‘savings’ that only shows up if I ignore biology and time?”

What Changed in Dave’s Barn: From Calendar to Intake

Dave didn’t flip his program because somebody told him 6‑week weaning was “wrong.” He changed because his own numbers — and a few published ones — said the calendar was costing him.

The decision they made was simple:

  • The calendar no longer decides when a calf is weaned.
  • The calf’s starter intake does.

Three practical changes were made that are real.

1. Intake Became a Gate, Not a Guess

They added one line to the calf card:

“3 days at ~2 lb starter before full wean? Y/N”

Then they did a five‑minute exercise:

  • Weighed a full scoop of their calf starter and wrote on the wall: “1 scoop ≈ X lb.”

From that point forward:

  • No calf was fully weaned until she had eaten roughly 2 lb of starter per day for three consecutive days — verified with the scoop.
  • If she wasn’t there at day 42, she kept her last feeding until she hit that gate.

This lines up with Quigley’s 15 kg NFC concept — calves need to accumulate around 31–34 kg of starter at typical NFC levels to reach that threshold — and with Drackley’s extension‑level recommendation of ≥1.5 kg/day (3.3 lb) of starter dry matter for several days before full weaning.

It also mirrors what Penn State, Cornell, and the Canadian Code of Practice have been saying in plainer language: use starter intake as your weaning trigger, not age alone.

2. They Stretched Weaning Into a Planned 10–14‑Day Step‑Down

Under the old program, the milk schedule went from “full” to “none” at 6 weeks. No ramp.

Expense Category6-Week “Savings” Program8-Week “Intake” ProgramImpact of Change
Milk Replacer$11,280$18,120+$6,840 (Cost)
BRD/Pneumonia$6,240 (20% rate)$1,560 (5% rate)-$4,680 (Saving)
Delayed Calving (AFC)$4,950 (60 head late)$1,500 (30 head late)-$3,450 (Saving)
TOTAL ANNUAL COST$22,470$21,180-$1,290 (Net Gain)

Under the revised program, they:

  • Cut milk volume by about 50%, roughly two weeks before the earliest possible weaning window.
  • Held that reduced feeding while watching starter intake.
  • Pulled the last feeding only after the intake gate was met.

In practice, that meant:

  • Step‑down starting somewhere in week 6
  • Full weaning happens in week 7 or 8 for most calves, depending on their starter intake

That’s exactly the pattern the 2024 Welk review found supported smoother growth: calves weaned later, over longer durations, and based on intake had better performance through the transition, particularly when pre‑weaning milk allowances were higher.

For Dave, the visible payoff was fewer calves crashing when milk disappeared and fewer heifers falling behind by the time they hit breeding pens.

3. They Changed the Starter to Pay for the Program

The last piece was feed, not philosophy.

Dave and his nutritionist swapped out a fine, dusty pellet for a textured starter with visible grain and enough fermentable starch to actually drive rumen development. If you want calves to hit 2 lb/day before weaning, the starter has to be something they want to eat.

They also moved to a starter that included a Saccharomyces cerevisiae fermentation product (SCFP). A 2022 Journal of Dairy Science trial found that calves fed SCFP had better post‑weaning growth and feed efficiency and required fewer respiratory treatments through four months of age, even though pre‑weaning gains were similar between groups. A 2024 review on SCFP as a postbiotic outlined how these products may support immune and rumen function in calves and cows.

Weaning Feature6‑Week Calendar ProgramIntake‑Based 7–8 Week Program
Weaning triggerFixed age (42 days)Starter intake (~2 lb/day × 3 days)
Weaning durationAbrupt, <3 days step‑downPlanned 10–14 day step‑down
Post‑weaning BRD in first 30 days20% of heifers (24/120)5% of heifers (6/120)
Typical starter intake at full weanOften <1 lb/day2–3 lb/day
Heifers calving ≥1 month late (per yr)60 head30 head (about 10 days late)
Annual extra AFC + BRD cost≈$11,190≈$3,060

You can waste a lot of money on additives that don’t pay. In this case, the economics looked reasonable:

  • If better palatability and SCFP‑supported gut health pull starter intake forward and trim just a handful of $252–282 BRD cases per year.
  • The extra cost of a higher‑end starter becomes cheap insurance relative to $3,000 heifers.

Three Economic Paths for Your Weaning Program

Not every herd is Dave’s herd. Your BRD rates, milk replacer price, labor, and heifer inventory pressure will look different.

But the decision paths are similar.

Path 1: Defend 6‑Week Weaning With Your Own Data

Early weaning can still make economic sense in some herds.

When this path works:

  • Your post‑weaning BRD incidence in the first 30 days is consistently in the single digits.
  • Calves are reliably eating 2+ lb of starter per day by day 40–42.
  • Your heifers are calving around 22–24 months without a pattern of “small, waited” notes.

What it demands:

  • At least 12–24 months of calf treatment and AFC records you actually trust.
  • A simple intake check to avoid assuming calves are at 2+ lb when they aren’t.

If those numbers look good, your 6‑week program may genuinely be a savings strategy rather than a hidden cost.

If you don’t have the records, you’re not defending 6‑week weaning. You’re just hoping it’s fine.

Path 2: Triage High‑Risk Calves Into 7–8‑Week Intake‑Based Weaning

You don’t have to flip the whole calf barn at once.

Triage play:

  • Keep the 6‑week target as your default on paper.
  • Any calf that hasn’t hit your 2 lb/day intake gate by day 40–42 gets pushed into a 10–14‑day step‑down and weaned later, once she meets the gate.
  • Track BRD and 90‑day weights for this group separately.

Economics:

  • You spend more milk replacer only on calves that are biologically behind the curve.
  • These are often the same calves driving your post‑weaning BRD and extra heifer months, so improvements here have outsized ROI.

This path works well for herds that have:

  • Reasonable calf labor and discipline.
  • Chronic trouble with a specific band of high‑risk calves.

Path 3: Redesign Weaning Around Heifer ROI and $3,000 Replacements

If your post‑weaning BRD rate is in the teens or higher and your average AFC is drifting toward 24.5–25+ months, it may be time for a full reset.

What a redesign includes:

  • A standard intake gate (for example, “3 days at ~2 lb starter before full wean”).
  • A built‑in 10–14‑day step‑down that fits your chore rhythm.
  • A starter that calves actually consume, with formulation aimed at hitting Quigley’s 15 kg NFC before milk disappears.
  • Routine pricing of BRD and heifer days off your own numbers — not generic assumptions — at least once a year.

When this path pays fastest:

  • You’re raising your own replacements in a high heifer‑value environment ($2,800–3,100/head).
  • You have a clear pattern of post‑weaning disease and delayed calving.
  • You’re thinking about heifers as capital investments, not just “the young stock.”

What This Means for Your Operation

  • If your post‑weaning BRD incidence is above roughly 15–20% and you’re weaning at 6 weeks, assume your weaning program is a financial risk, not an efficiency. Once each case is priced around $252–282, and you add the cost of extra heifer days, the milk‑replacer “savings” look a lot like Dave’s — quickly eaten up by disease and delayed calving. 
  • If your average age at first calving is north of 24 months, treat that as a calf‑program red flag, not just a breeding issue. ISU’s 2024 budget puts the cost of an extra heifer month around $80–100, depending on labor. Until you understand why your heifers are late, your biggest heifer‑cost lever is probably in the calf barn. 
  • If you don’t have a simple starter‑intake gate built into your weaning protocol, you’re making a capital decision with no biological checkpoint. A weighed scoop and a “3 days at ~2 lb starter? Y/N” checkbox turn that into a gate you can manage and adjust.
  • If you’re valuing or buying heifers at $2,800–3,100 and still treating BRD as a $40 problem, you’re underpricing your own risk. Using the $252–282 per‑case economics for heifer BRD puts you in the right ballpark for capital‑level decisions, not just vet‑bill conversations. 
  • If you want a 30‑day move that doesn’t blow up your chores, start with a BRD + AFC audit. In the next month, pull 12–24 months of calf/heifer records, count your BRD cases in the first 120 days (especially the 30 days post‑weaning), calculate your own BRD cost (cases × ~$260), measure how much later BRD heifers calved, and put that next to your milk‑replacer “savings.” That one piece of paper will tell you whether your current weaning program is defensible or overdue for a redesign.

Key Takeaways

  • If your post‑weaning BRD rate is roughly 15–20% and you’re relying on a 6‑week calendar, the odds are high that you’re not actually saving money on milk replacer once you factor in BRD and delayed calving.The $6,600 that looks like savings in the calf‑feed column can be more than offset by $11,000‑plus in disease and extra heifer days on a 300‑cow herd. 
  • If your average age at first calving is over 24 months, each additional month quietly costs you about $80–100 per heifer. Until that distribution is under control, your fastest heifer‑cost improvement usually sits in intake‑based weaning and grower management, not just semen choice or breeding targets. 
  • If you’re not using starter intake as a weaning gate, your weaning program is a guess, not a strategy.Adding a simple intake trigger and a 10–14‑day step‑down is one of the cheapest, cleanest risk‑management moves you can make in the heifer enterprise.
  • If you’re handling $3,000 heifers in a tight inventory market, treating pneumonia and late calving as “normal noise” is an equity decision. The question isn’t just “Can we live with it?” It’s “Is this the risk position we want to own at today’s heifer values?”

The Bottom Line

Dave didn’t walk away from the 6‑week weaning because someone told him it was outdated. He walked away because, once he stacked his milk‑replacer spend, post‑weaning BRD cases, and ages at first calving on the same ledger, the numbers said the calendar was quietly burning cash.

If you pulled the same reports for your herd and laid them out side by side, would your weaning program look like a savings strategy — or like a risk position you haven’t really priced yet?

The numbers above are built on a 300-cow Wisconsin example with one contractor milk-replacer price and two BRD incidence scenarios. Your herd runs on different inputs — and the answer changes fast when you swap in your own BRD rate, your own replacer cost, and your own AFC. Use the calculator below to run the same ledger with your numbers.

Learn More

The Sunday Read Dairy Professionals Don’t Skip.

Every week, thousands of producers, breeders, and industry insiders open Bullvine Weekly for genetics insights, market shifts, and profit strategies they won’t find anywhere else. One email. Five minutes. Smarter decisions all week.
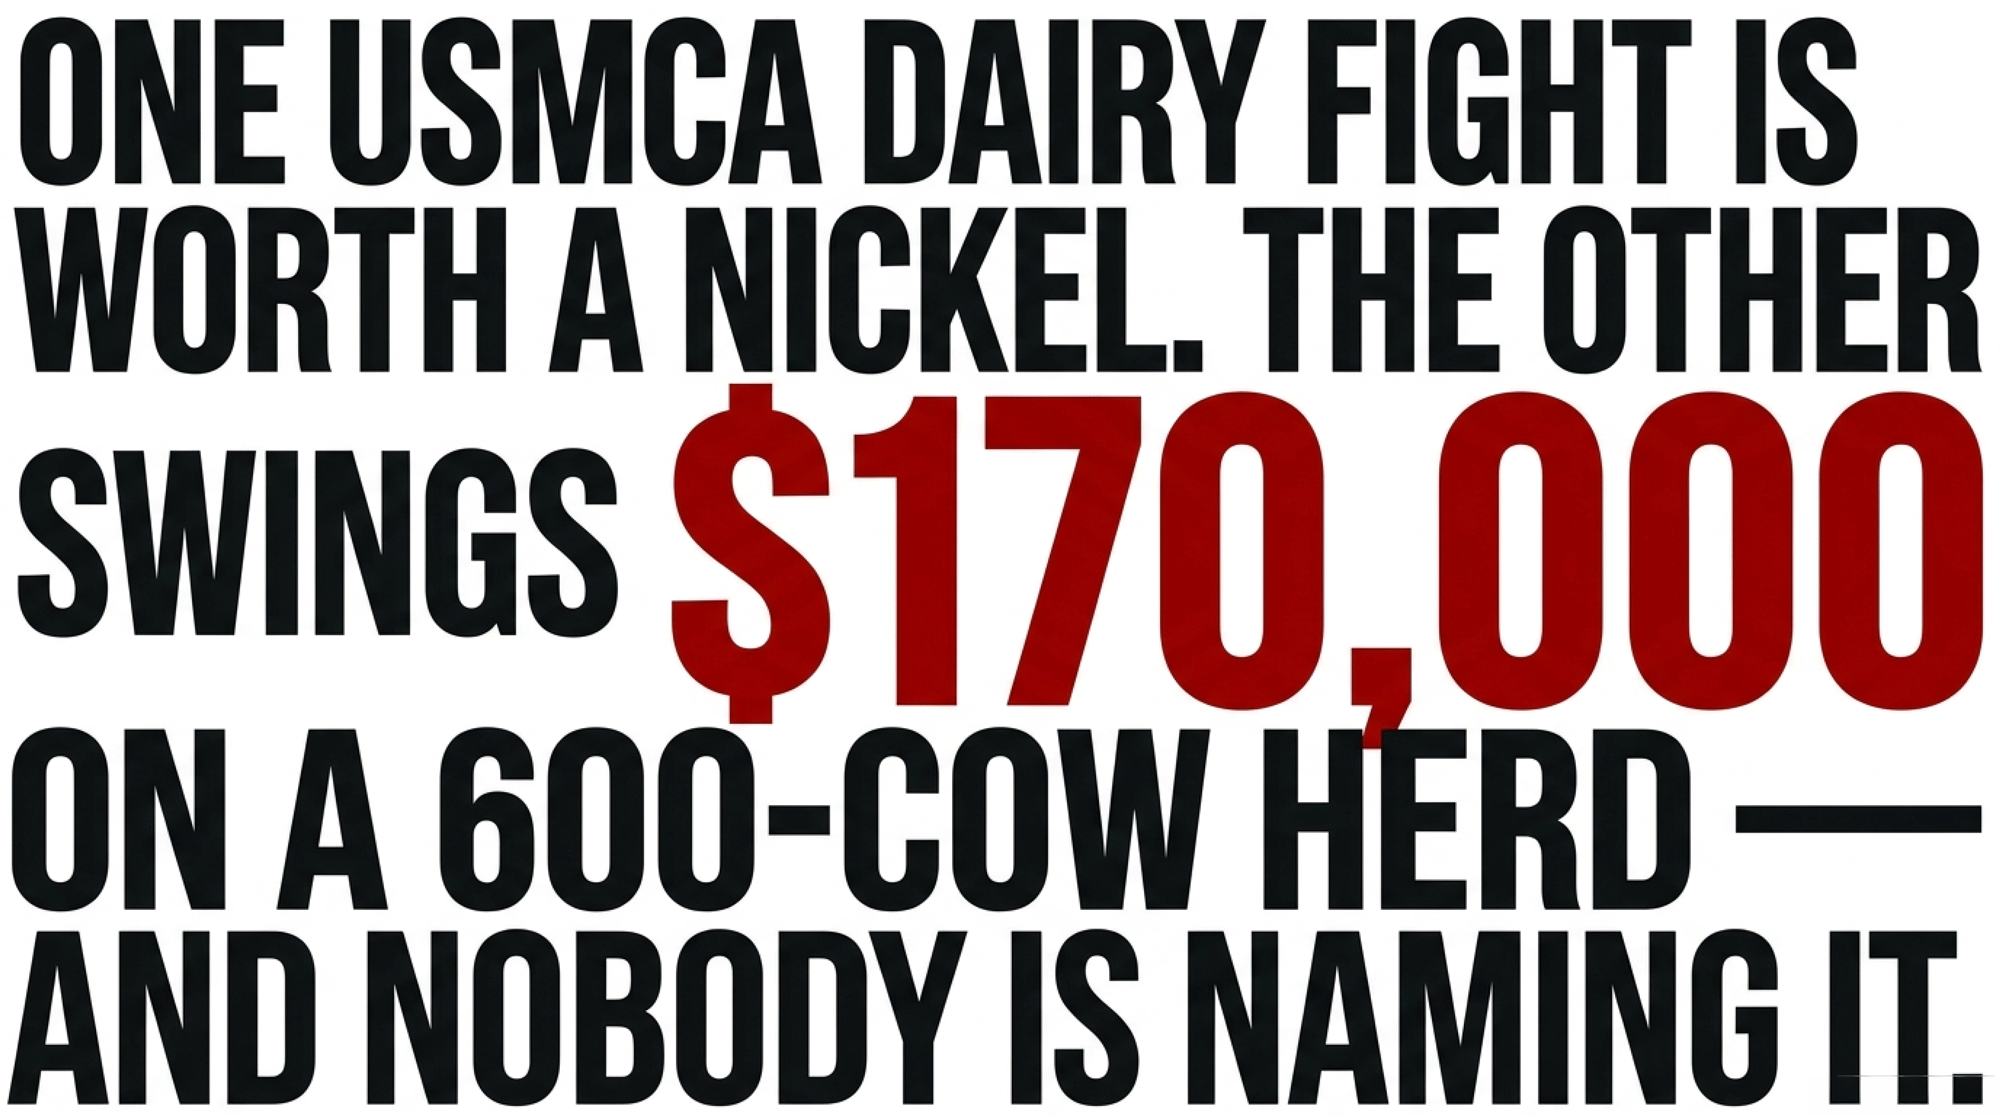
NewsSubscribe
First
Last
Consent

Your Nutritionist’s PDF vs. August 12: The SDRP Deadline Worth $80,000 to a Wisconsin Dairy

On a Wisconsin 800‑cow dairy, the gap between a forgotten hay test PDF and filing SDRP by August 12 isn’t theory — it’s roughly $80,000 and the difference between a $90K stack and $200K.

Executive Summary: A Wisconsin 800‑cow dairy’s 2026 government payment stack ranges from about $90,000 to $200,000, and the difference isn’t herd work — it’s paperwork. SDRP Stage 2 is the one live lever: filing by August 12 with actual hay test RFV records can turn roughly $385,000 of alfalfa value into $76,000–$130,000 of drought‑quality payments, while relying on the county fallback leaves you stuck near $51,500. The same farm’s FBA check is about $35,278 and DMC January–February at the 6M lb Tier 1 cap adds $13,650, but those programs are already baked in; SDRP is where a forgotten PDF from your nutritionist still moves the needle by about $80,000 mid‑case. That’s the gap between a $90,077 “Loser” stack and a $200,928 “Winner” stack built on the same cows, acres, and milk shipped. If your operating line is over 80% drawn, your DSCR is under 1.1, or your non‑feed costs are above the AFBF $13.34/cwt benchmark, this isn’t “nice to know” — it’s whether your lender sees a receivable on the table or just another wish list.

sdrp stage 2 deadline

USDA’s February 2026 WASDE forecast pegs the 2026 all‑milk price at .95/cwt, subject to monthly revision. AFBF’s March 1, 2026 Market Intel paper, drawing on USDA ERS cost‑of‑production data, puts total cost of production for large herds at .14/cwt and fixes 2024 farm‑level net return at negative .05/cwt. For a Wisconsin 800‑cow dairy — call it the Dane County profile, an explicitly composite operation modeled on University of Wisconsin Center for Farm Financial Management benchmarks — the margin over feed dairy 2026 math is underwater on a full‑cost basis before the first truck leaves the yard.

Cameron Castillo, the AFBF economist credited as author of the April 22, 2026 Farmer Bridge Assistance tracker, logged $9.6 billion disbursed on about 500,000 approved applications. The dairy share on a comparable Wisconsin land base calculates to roughly $35,278. A grain‑focused neighbor on the same acres receives materially more than the dairy’s share under the same program. The headline gap isn’t the story. The gap hiding inside the dairy’s own 2026 payment stack — FBA, DMC, SDRP Stage 2, ARC/PLC — is. It closes with two phone calls and one FSA office visit before a deadline most 2026 dairy coverage has treated as row‑crop news: August 12, 2026.

Sandy Chalmers, the 11‑Day Window, and the Two‑Letter Code

Per Brownfield Ag News coverage from February through April 2026, Sandy Chalmers, Wisconsin’s FSA State Executive Director, has focused her public comments on application processing, approvals, and disbursement timing. Her role is operational. The structural question — how FBA was designed, and for which commodities — sits at the policy level, not the state FSA level.

The FBA rule published December 8, 2025. Acreage certification on FSA‑578 closed December 19, 2025. Eleven days.

Every fall, Wisconsin dairy operators assign a use code to corn acreage: GR for grain or SL for silage. Based on FSA’s published FBA per‑acre rate schedule and consistent with AFBF tracker totals, corn reported as GR paid approximately $44.36/acre. Corn reported as SL paid zero. Producers filing in 2026 should confirm current per‑acre rates with their county FSA office for the latest schedule.

Same corn. Same field. Same cow it ultimately fed.

A dairy that filed 350 corn acres as SL in September 2025 — the accurate declaration for an operation feeding that corn as silage — made an honest call that calculates to roughly ,526 in forgone FBA. Not negligence. Not error. Accuracy.

Related: The 2024 Drought Season That Reshaped One Wisconsin Dairy Family

What Does the August 12, 2026 SDRP Deadline Actually Pay an 800‑Cow Dairy?

The biggest dairy‑relevant program in 2026 isn’t FBA. It’s a drought‑relief track with dairy paperwork hiding inside it.

USDA announced April 24, 2026 that the Supplemental Disaster Relief Program Stage 2 deadline moved from April 30 to August 12, 2026, with the payment factor doubled from 35% to 70%. Stage 2 covers forage quality losses — alfalfa and corn silage with documented RFV or TDN reduction during qualifying 2023 or 2024 weather events. Most 2026 dairy coverage of the April 24 extension has treated it as row‑crop news. Dairy‑specific follow‑through has been light.

The FSA Forage Quality Fact Sheet publishes the national calculation framework. For alfalfa, the county high RFV benchmark is 151 and the county low is 75. Quality loss percentage equals (151 − your tested RFV) ÷ 76. Multiply by production value. Multiply by the 70% payment factor. That’s the form.

Without lab records, FSA calculates on county‑average RFV with a penalty applied to the loss percentage, per the Stage 2 guidance. Bring the exact fallback calculation your county office applies into any cash‑flow projection; the penalty factor can vary by program year and county conditions.

Accepting the County Average Is a $40,000+ Donation Back to the Treasury

Here’s the assumption that costs Wisconsin dairies the most money before August 12, 2026: that the county fallback is “good enough.” It isn’t. On the Dane County composite’s 550 alfalfa acres, records‑backed filing computes to a post‑cap range of $76,000–$130,000. The fallback computes near $51,500. Mid‑case gap: north of $40,000.

WindowActionTrigger / DocumentStake
30 days (before Aug 12)Pull 2023–2024 alfalfa & corn silage RFV PDFs from Rock River, Dairyland, or Cumberland Valley portalsLab PDF with harvest date, cutting #, RFV lineK–0K SDRP post-cap
30 daysBook FSA appointment; file CCC-963 Stage 2 applicationOperating line drawn >80% for 3+ months → top of listSame farm, same drought, +K vs fallback
30 daysVerify 2025 FSA-578 corn use codes (GR vs SL); confirm DMC at OBBBA 6M lb Tier 1 capSame FSA visit, two extra check-boxesUp to ,526 FBA recovery + ,900/10K cwt at January DMC rate
90 days (before Q3 lender renewal)Build three-scenario DSCR model (best/mid/worst SDRP) with FSA case # attachedQ3 operating line meetingReceivable vs projection — different lender conversation
90 daysReconcile DMC production history against 6M lb ceiling; request written confirmation of any OBBBA adjustmentDMC enrollment record,900/month per 10K cwt at January 2026 indemnity rate
365 days (2027 Farm Bill)Document non-feed cost/cwt vs AFBF .34 benchmarkTrack Farmdoc & NFU multiplier proposalsPositions farm for any mid-herd reform that lands

Accepting the county average is a $40,000+ donation back to the Treasury. Don’t be a donor.

Every commercial dairy nutritionist working Wisconsin for the past decade has pushed quality testing. Which means the records exist. They’re in a Rock River Labs portal, a Dairyland Labs PDF, an email folder somebody’s nutritionist sent in 2024 that nobody has opened since. Nobody connected them to a government payment form because nobody called it a dairy program.

What This Means for Your Operation

You’re sitting on a payment stack with a high‑five‑figure variance between best and worst administrative capture, and the variance has nothing to do with herd management. It’s about which FSA forms you’ve filed, whether your corn use codes match your feed plan, and whether your hay test PDFs can be attached to a CCC‑963 before August 12, 2026. The operators who capture the full stack aren’t better farmers. They’re better paperwork clients of their county FSA office.

All payment figures below are estimates based on public program rates as of April 28, 2026. Individual producer payments depend on FSA‑established yields, production history, payment caps, and county‑level data. Verify with your county FSA office before relying on any figure here.

Dane County 800‑Cow Composite — Winner vs. Loser

Two operations. Same herd size. Same acres. Same milk output. One checked the boxes. One didn’t.

Line ItemLoser (worst case)Winner (best case)
FBA payment on corn (SL vs GR filing)*$19,752$35,278
DMC Jan 2026 (history under 6M cap vs at cap)$4,225$8,450
DMC Feb 2026 (history under 6M cap vs at cap)$2,600$5,200
SDRP Stage 2 (county fallback vs lab records)$51,500$130,000
ARC/PLC Oct 2026$12,000$22,000
Stack total$90,077$200,928
Gap vs Loser+$110,851

*Loser assumes eligible grain acres coded as SL; Winner assumes those acres coded as GR.

The move from Loser to Winner isn’t herd management. It’s four FSA documents:

  • an amended FSA‑578 corn use code,
  • a verified DMC production history at OBBBA’s 6M lb Tier 1 cap,
  • a CCC‑963 filed with lab‑documented RFV,
  • an ARC/PLC election confirmed in October.

Mid‑case capture (lab records on SDRP, DMC at cap, ARC/PLC mid) lands at $168,928 — a $78,851 gap vs the Loser. That’s the $80,000 in the headline.

Running the Numbers: The Dane County 800‑Cow Stack

Composite modeled on University of Wisconsin Center for Farm Financial Management dairy benchmark reports and USDA NASS Wisconsin production norms. Individual farms vary. Replace every input below with your operation’s FSA‑established yields, production history, and lab documentation.

  • 800 cows, 24M lbs annual production (30,000 lbs/cow) — a realistic high‑output Wisconsin benchmark. Monthly production ≈ 20,000 cwt.
  • 1,900 total acres: 550 alfalfa, 480 corn silage, 350 corn grain, 220 soybeans, 120 oats, 80 wheat, 100 pasture/misc.
  • Enrolled at DMC Tier 1, $9.50 coverage, at OBBBA’s 6M lb ceiling.

FBA (received Feb/March 2026):

  • 350 corn grain × $44.36 = $15,526
  • 220 soybeans × $30.88 = $6,794
  • 120 oats × $81.75 = $9,810
  • 80 wheat × $39.35 = $3,148
  • Subtotal: $35,278
  • 550 alfalfa + 480 corn silage + 100 pasture/misc. = 59.5% of the land base, paid $0.

DMC January 2026 indemnity (confirm against the USDA DMC Decision Tool for your operation’s actual production history):

  • Reported January 2026 margin $7.81/cwt ($9.50 − $7.81 = $1.69/cwt)
  • DMC Tier 1 ceiling 6M lbs annual = 60,000 cwt/year = 5,000 cwt/month
  • 5,000 cwt × $1.69 = $8,450/month at the 6M cap

DMC February 2026 indemnity:

  • Reported February 2026 margin $8.46/cwt ($9.50 − $8.46 = $1.04/cwt)
  • 5,000 cwt × $1.04 = $5,200

Jan + Feb DMC at Tier 1 cap: $13,650. Every 10,000 cwt of additional production history brought under cover equals $16,900 at January’s indemnity rate before tier‑factor adjustments.

SDRP Stage 2 (open, August 12, 2026 deadline):

  • 550 alfalfa acres × tons/acre × price/ton = production value basis. Illustrative inputs of 4.0 tons/acre and $175/ton give $385,000. Substitute your FSA‑established county yield and the USDA NASS Wisconsin 2023–2024 price your county office will actually run.
  • Tested RFV 100 records: (151 − 100) ÷ 76 = 0.6711 = 67.11% quality loss
  • $385,000 × 0.6711 × 0.70 = $180,832 pre‑cap computed ceiling
  • County fallback (no lab records, penalty applied to county‑average RFV): about $51,500 computed

Caveat: $180,832 is the pre‑cap computed ceiling. FSA cross‑checks every Stage 2 application against established county yields, county prices, and payment limits. Realistic post‑cap payment for a 550‑acre alfalfa base with documented drought‑year quality losses lands in the ,000–0,000 band. The records‑vs‑no‑records gap holds under either figure.

ARC/PLC October 2026 signup:

  • 770 row‑crop base acres. Estimated range from recent PLC history: $12,000–$22,000.

Scale it: a 400‑cow operation with 275 alfalfa acres halves the SDRP ceiling. A 1,500‑cow operation with 1,000 alfalfa acres roughly doubles it before payment‑limitation review.

The AFBF Framing: What the April 24 Extension Actually Opened

AFBF’s published framing of FBA — reflected in the April 22 tracker co‑authored by Faith Parum, Ph.D. — roots the program in CCC emergency authority targeting a documented grain‑commodity dislocation, not dairy’s chronic cost‑price inversion. That framing defines what the April 24 SDRP extension is — and isn’t.

It isn’t a dairy program. It’s the one window in 2026 where dairy‑eligible paperwork fits inside a dairy‑sized deadline at a dairy‑relevant payment rate. Stage 2 forage quality applies directly to alfalfa and corn silage. The 70% factor — doubled April 24 — applies in full to new applications and adds a 35% top‑up for producers who filed under Stage 1.

The assumption has been that “general farming wins” from FBA trickle through to dairy. The April 22 tracker and the April 24 extension say the opposite. Dairy’s 2026 program path runs through drought relief, not commodity support. That’s architecture, not rollout timing. For your dairy, that means the only 2026 program still moving meaningful new cash is SDRP, not FBA.

The June Lender Meeting: $90,000 Stack vs $200,000 Stack

Walk in with a receivable, not a wish list. Lenders in 2026 are looking for operators who manage their FSA files as tightly as their somatic cell counts.

Chicago Fed AgLetter reporting through late 2025 pointed to rising non‑real‑estate farm loan demand across the Seventh District. A lender reading a $200,000 government payment projection in June 2026 knows the difference between deposits and optimism.

Here’s the framing that works.

FBA and DMC January are deposits — bring the FSA confirmation. DMC February is in processing, near‑certain, treat as received. SDRP Stage 2 is a filed receivable if you have the case number, filing date, and lab documentation attached. Some ag lenders with FSA program experience may advance against documented filings; the specific rate should come from your lender’s ag desk, not a published assumption.

ARC/PLC is Q4 paydown, not Q2 liquidity. Leading with October ARC/PLC in a June operating‑line conversation signals you’re conflating timing with availability. That closes doors. Separating it explicitly — “this is our Q4 line paydown mechanism” — earns the benefit of the doubt.

On the Dane County composite, annual debt service at current interest rates on roughly $2.8M–$3.5M total debt runs $280,000–$350,000 as a general Midwest benchmark; your amortization schedule will vary. FBA plus DMC received‑to‑date covers 15–20% of that. Add documented SDRP Stage 2 at the mid‑range and program‑income coverage reaches 50–60%. Two scenarios. Both documented. That’s the DSCR conversation.

Why Does a 500‑Cow Dairy Get Hit Hardest by DMC’s Blind Spot in 2026?

If you feel like the program is rigged against the mid‑sized Midwest herd, you aren’t being paranoid — you’re reading the data correctly.

DMC measures one thing. A national all‑milk price minus a standardized feed‑cost stack — corn, soybean meal, premium alfalfa hay. When that formula margin falls below your coverage level, the program pays. Feed cost. That’s the whole program.

Farmdoc’s February 2024 analysis of USDA ERS cost‑of‑production data by herd size makes the structural point: non‑feed costs exceed feed costs for herds under 1,000 cows. Above 2,000 cows, feed dominates. The crossover sits right at the 1,000‑cow line.

That crossover is the blind spot.

Farmdoc’s ERS‑derived ranges show non‑feed costs spanning from roughly $27.96/cwt at the smallest operations to $8.37/cwt at 2,000+ cow operations — a $19.59/cwt spread driven by overhead, labor, and capital recovery. Feed cost varies across the same herd‑size spectrum by about $2.50/cwt. DMC captures the $2.50. It doesn’t see the $19.59.

AFBF’s March 1, 2026 paper laid the 2024 numbers out cleanly: DMC formula margin .98/cwt, non‑feed costs .34/cwt, TCOP .65/cwt, actual net return negative .05/cwt. The formula said the sector was fine. Every milk check in the 300–900 cow band said it wasn’t.

DMC captures the $2.50. It doesn’t see the $19.59.

Regional spread sharpens the picture. The same AFBF paper reports 2024 non‑feed costs at $8.97/cwt in California and $20.21/cwt in the Northeast (Pennsylvania and New York). AFBF’s 2024 regional breakout covers West and Northeast explicitly; Wisconsin and the broader Midwest aren’t separately published in that dataset, so Northeast figures shouldn’t be generalized to Wisconsin operators.

On this analysis, DMC isn’t the dairy safety net. It’s the feed‑margin safety net — and for mid‑size operations where non‑feed cost is the dominant driver, that’s a different program wearing a dairy label. If your non‑feed cost is north of roughly $13/cwt, DMC’s formula is never going to “see” the pressure your lender is staring at.

Related: OBBBA’s Tier 1 Reset: What the 6M lb Ceiling Actually Changes for Your DMC Enrollment

Why Hasn’t the Formula Reform Conversation Happened?

NMPF’s published farm bill priorities emphasize maintaining DMC, expanding production history coverage, and adjusting payment limits — all access improvements. OBBBA (the Overcoming Barriers to Better Business Act) delivered on access: it raised the DMC Tier 1 production‑history ceiling from 5M lbs to 6M lbs — meaning an operation can now cover an extra 1M lbs of annual production at the highest indemnity rate — and extended DMC authorization through 2031. The margin formula itself wasn’t touched.

RegionNon-Feed Cost ($/cwt, 2024)TCOP vs DMC Formula MarginWhat DMC “Sees”
West (California)$8.97Below national TCOP — feed-dominated cost structureMost of the picture
National benchmark (large herds)$13.34TCOP $19.14 vs DMC margin $11.98 — net return –$1.05~50% of pressure
Midwest / WisconsinNot separately published in AFBF 2024Inferred mid-range; verify against UW CFFM benchmarksUnknown — caution applying NE figures
Northeast (PA, NY)$20.21$6.87/cwt above national non-feed averageRoughly 1/3 of pressure

The coalition math is straightforward. Formula reform creates winners and losers within dairy. Operations with higher non‑feed cost structures — the 300–900 cow band, the Northeast, older facilities — benefit more. Efficient 2,000+ cow Western operations benefit less. Expanding the pie builds coalitions. Redistributing slices fractures them. NMPF’s published rationale: access‑first avoids fracturing the coalition that keeps DMC authorized at all.

The National Farmers Union’s March 2026 Special Order of Business broke that pattern, calling for dairy‑program reforms structured to cover producers’ actual costs of production. Farmdoc’s 2024 policy paper proposed three mechanisms: scaling DMC payments by the ratio of non‑feed to feed costs at a given herd size, creating a parallel non‑feed cost index program, or a flat per‑cow payment targeting the 300–900 cow band. None of the three has moved in the current Congress. Coalition choice, not analytical gap. Until something like that makes it into statute, your non‑feed cost problem is a local management conversation, not a DMC fix.

Related: $16,600 DMC Farm Bill Win vs a 0.9x DSCR: The Gap Policy Won’t Close

The 30/90/365‑Day Playbook for Herds Like the Dane County Composite

Related: Alfalfa RFV Testing Protocol for Dairy Nutritionists and Herd Managers

30‑Day Actions (Before August 12, 2026)

  • Pull your 2023 and 2024 alfalfa and corn silage test records today. Rock River Laboratory, Dairyland Laboratories, Cumberland Valley Analytical. Ask for PDFs with harvest date, cutting number, and RFV line.
  • Compare your tested RFV to FSA’s national alfalfa high of 151. Below RFV 120 is a strong claim. RFV 100 calculates to 67.1% quality loss before the 70% factor. RFV above 135 makes the records chase marginal — county‑average fallback may be close to equivalent on small acreage.
  • Call your FSA county office. Find yours at farmers.gov/contact/fsa‑service‑centers. Ask for a SDRP Stage 2 appointment before August 12, 2026. The form is CCC‑963. Say: “I want to file a Stage 2 application for forage quality losses on alfalfa acres in 2023–2024. I have lab documentation.”
  • Red‑flag trigger: If your operating line has been drawn above 80% of approved limit for three consecutive months heading into June, SDRP Stage 2 moves to the top of this list. On the Dane County composite, mid‑range SDRP payment equals roughly 30% of annual debt service.
  • Same appointment, two additional checks: confirm your 2025 corn use codes on FSA‑578 and ask whether any amendment path applies if eligible grain acres were filed as SL. Verify 2026 DMC enrollment reflects Tier 1 under OBBBA’s 6M lb ceiling and that production history is at that ceiling.
  • Where it backfires: Some FSA offices are still processing OBBBA production‑history updates. Ask for written confirmation of adjustments — don’t rely on verbal.

90‑Day Actions (Before Q3 Lender Renewal)

  • Build a three‑scenario DSCR model for the June lender meeting. Best (SDRP filed with records, high post‑cap). Mid (records filed, mid‑range). Worst (county fallback). Show debt service coverage under each. Bring actual FSA deposit records for FBA and DMC. Separate ARC/PLC explicitly as Q4 paydown.
  • What it requires: Two hours at the FSA office, three years of milk marketing records from your CPA, your lender’s DSCR worksheet, your SDRP filing confirmation with case number.
  • Reconcile DMC production history against OBBBA’s 6M lb Tier 1 ceiling. If your history was set under the 5M lb ceiling and current output runs above 6M lbs, confirm whether your history was recalculated to the new cap. Every 10,000 cwt captured at $1.69/cwt is $16,900 in January alone.
  • Where it backfires: Rushing a lender meeting without the SDRP case number converts a documented receivable back into a projection. Different conversation.

365‑Day Moves (2027 Farm Bill Positioning)

  • Document your operation’s non‑feed cost per cwt against the AFBF 2024 national benchmark of $13.34/cwt, with regional variance from $8.97/cwt West to $20.21/cwt Northeast. If you’re above the national number, you’re in the DMC blind spot.
  • Opportunity signal: If your non‑feed cost lands between $12 and $16/cwt and your DSCR holds above 1.1 without government payments, you’re positioned to benefit from any Farmdoc‑ or NFU‑style DMC multiplier aimed at mid‑size herds. Track 2027 Farm Bill markup for non‑feed cost‑floor language.
  • Where it backfires: If non‑feed cost exceeds $16/cwt at 800‑cow scale, no formula reform under discussion closes that gap. That’s a structural cost conversation with a dairy financial consultant, not a legislative fix.

The Trade‑Off at the Center of This

The trade‑off isn’t whether to file. It’s whether to spend 90 minutes retrieving lab records for roughly $80,000 in mid‑case SDRP post‑cap payment vs accepting the county fallback at about 40% of the records‑backed figure and calling it even. On 550 alfalfa acres with documented drought‑year quality losses, that 90 minutes outranks any other paperwork you’ll do this week.

The 2026 DMC paid the Dane County composite $8,450 in January and $5,200 in February at the 6M lb Tier 1 cap. FBA paid $35,278 for the year. SDRP Stage 2, filed before August 12, 2026 with lab records, computes between $76,000 and $130,000 in realistic post‑cap payment. The full stack, captured cleanly, lands in the $170K–$200K band. Captured badly, near $90K. Mid‑case gap: $78,851. Best‑vs‑worst: $110,851.

It’s not strategy. It’s administration nobody sent you an email reminder about — because FBA was a row‑crop program, SDRP was filed under a drought‑relief banner, and DMC’s production history and Tier 1 ceiling reset under OBBBA inside a window most operators didn’t treat as a dairy deadline.

Pull your milk check. Pull your last hay test PDF. Pull your fall 2025 FSA‑578. If corn reads SL and you’ve never asked your county office whether any amendment path applies, if the hay test is in a portal you haven’t opened since second cut 2024, if DMC production history still shows the old 5M lb ceiling — what does your fall 2025 FSA‑578 actually say, and what is your county FSA office’s position on SDRP Stage 2 appointments and corn‑code amendments before August 12, 2026?

CALL TO ACTION: Make These Three Calls This Week

StepContactWhat to Ask For
1. Pull your hay recordsRock River Laboratory (Watertown, WI — see rockriverlab.com for current contact)2023–2024 alfalfa and corn silage test PDFs with harvest date, cutting, and RFV line
2. Pull your hay recordsDairyland Laboratories (Arcadia, WI — see dairylandlabs.com for current contact)Same as above
3. Pull your hay recordsCumberland Valley Analytical Services(Waynesboro, PA — see foragelab.com for current contact)Same as above
4. Book your FSA appointmentYour county FSA office — farmers.gov/contact/fsa‑service‑centersSDRP Stage 2 appointment before August 12, 2026; corn‑code amendment check on FSA‑578; DMC history confirmed at OBBBA 6M cap

Key Takeaways

  • SDRP Stage 2 is where 2026 money still moves for dairy. Filing before August 12 with actual hay test RFV records turns a $51,500 county‑fallback payment into a $76,000–$130,000 post‑cap range on 550 alfalfa acres — same drought, same farm, different paperwork.
  • Your 2023–2024 RFV PDFs are probably already in a Rock River, Dairyland, or Cumberland Valley portal. Pull them, book an FSA appointment, file on CCC‑963. That’s the $80,000 mid‑case decision — 90 minutes of work, not a strategy project.
  • Check two other boxes in the same visit: confirm 2025 FSA‑578 corn codes (GR vs SL on grain acres) and that your DMC production history is sitting at OBBBA’s 6M lb Tier 1 cap. Every 10,000 cwt left uncovered cost $16,900 in January alone.
  • Walk into the June lender meeting with a filed SDRP case number as a documented receivable, not a projection — especially if your line’s been drawn above 80% for three straight months or non‑feed costs are running above the AFBF $13.34/cwt benchmark.

Complete references and supporting documentation are available upon request by contacting the editorial team at editor@thebullvine.com.

Learn More

The Sunday Read Dairy Professionals Don’t Skip.

Every week, thousands of producers, breeders, and industry insiders open Bullvine Weekly for genetics insights, market shifts, and profit strategies they won’t find anywhere else. One email. Five minutes. Smarter decisions all week.
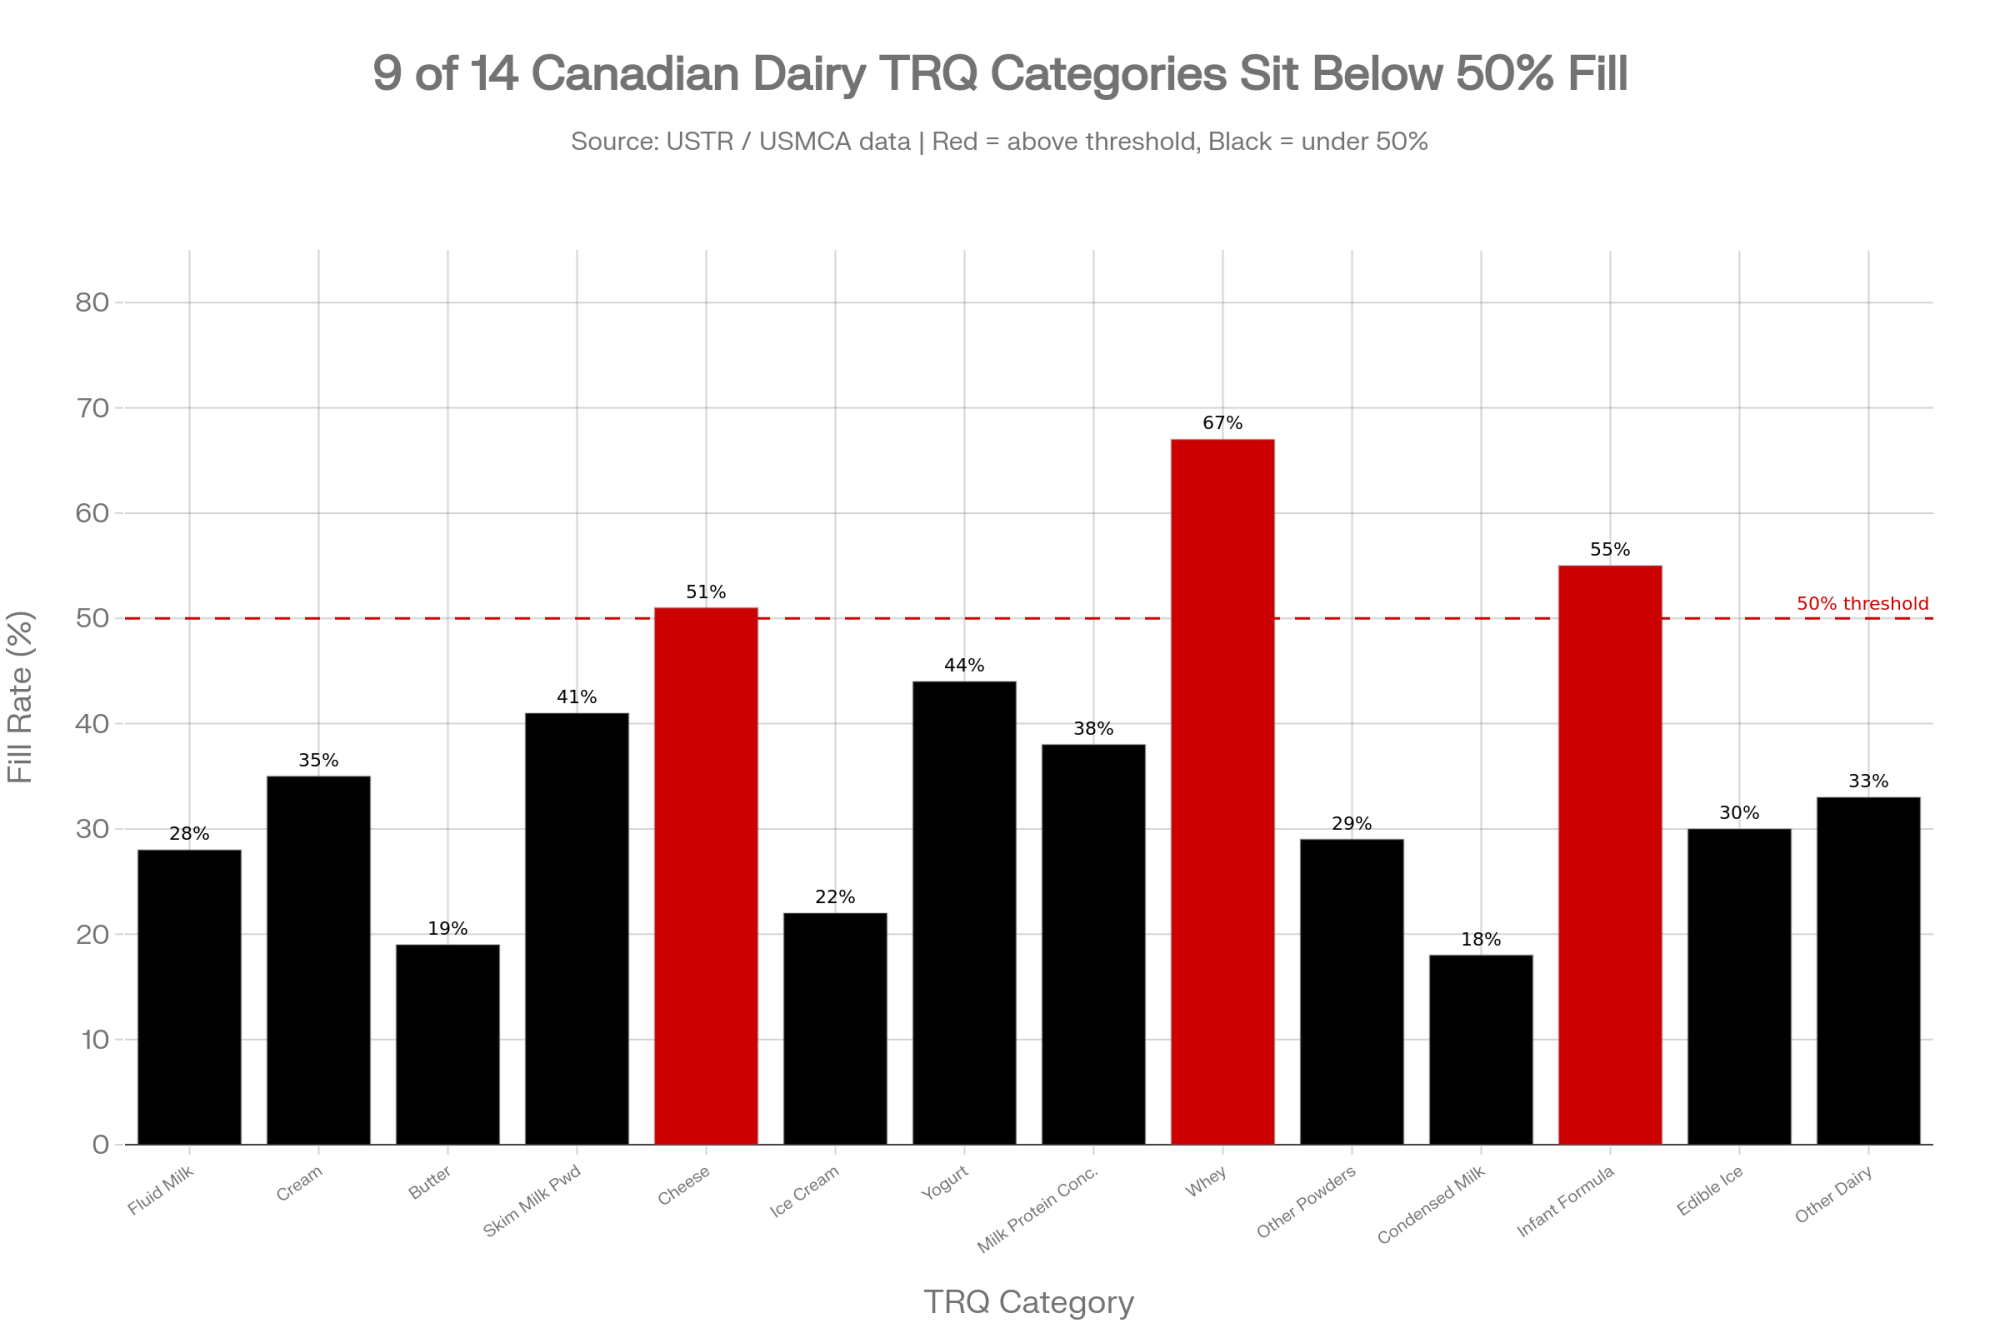
NewsSubscribe
First
Last
Consent

45 Pounds, 500 Cows, “Within Guidelines”: The Wisconsin Stray Voltage Case Every Mid‑Size Dairy Should Read

500 cows, 45 lbs on 3x, calf losses past 50%, and every utility test came back “within guidelines.” The Den Hoeds brought in ~2,000 heifers before an independent consultant found 2–7 volts in the dirt.

Executive Summary: On 500 cows, 40 lb below baseline at a $20/cwt working benchmark is a $1.46M annual bleed — and the Den Hoeds of Burnett County, Wisconsin say that’s the math they’ve been living since their 2014 freestall build, while every utility test came back “within guidelines.” Jayce Den Hoed told Dairy Star the family fell to 45 lb on 3x milking, calf losses past 50%, and they brought in roughly 2,000 replacement heifers before an independent consultant measured 2–7 volts of ground current moving between two substations 13 miles apart. The pivot point producers need to see: Wisconsin PSC’s own Phase II database — roughly 3,500 investigations — puts average cow-contact resistance at 192 ohms, while the standard utility test uses a 500-ohm resistor, meaning the protocol tests a “model cow” that pulls about 2.6x less current than the field average. Three affirmed Upper Midwest verdicts (Halderson, Vagts, Norman) now total more than $18M, and the Vagts case turned on DC stray voltage from a pipeline’s cathodic protection — a signal standard AC-only utility equipment cannot see. The operator implication scales: a 5-lb drag on 500 cows runs ~$182,500/year; on 200 cows, ~$73,000 — margin-eraser territory that compounds into lender-covenant territory by year five if the cause is never named. The 30-day move is cheap — a 72-hour continuous voltage log at the main waterer, matched to DHIA weights — but Jayce also describes a 10-day certified termination letter from their milk cooperative after they pushed the regulatory complaint, so pull your milk marketing agreement before you file anything. If your herd has sat on an unexplained plateau for more than a year with normal ration, genetics, and health metrics, this is the piece to read before the next consultant retainer clears.

For the Den Hoed family of Frederic, Wisconsin, the crisis didn’t arrive as a storm. It arrived as a slow, 40-pound-per-cow drain that no nutritionist and no vet could explain.

Based on Dairy Star reporting published in August 2025, by the time the family went public their 500-cow herd had fallen to 45 pounds per cow on three-times-a-day milking — down from a pre-crisis baseline of 85. Calf losses, per the same account, had climbed past 50%. Every test the electric utility ran came back “within guidelines.”

“In the midst of it, you feel like a failure,” Jayce Den Hoed told Dairy Star.

According to the family’s account, they weren’t failing. What they describe is stray voltage — 2 to 7 volts they say an independent consultant measured in the ground between two substations roughly 13 miles apart. The 500-ohm testing resistor built into the standard utility protocol, they argue, was quietly guaranteeing the problem stayed invisible. The Den Hoeds are one of three Upper Midwest families whose cases have, per primary court records, produced more than million in combined jury verdicts and affirmed awards against utilities and a pipeline operator — Halderson v. Xcel/Northern States Power (Trempealeau County, Wisconsin, $4.5M jury verdict August 2017, with a willful-and-wanton finding that opened the door to treble damages up to $13.5M); Vagts v. Northern Natural Gas Company (Fayette County, Iowa, $4.75M jury verdict January 2023, upheld by the Iowa Supreme Court on June 21, 2024); and Norman v. Crow Wing Cooperative Power & Light (Minnesota, $4.86M economic and $1.5M nuisance jury verdict October 2014, affirmed by the Minnesota Court of Appeals, eventually approximately $9M with interest and fees).

The testing standard producers say misses the worst cases

Wisconsin’s Public Service Commission runs one of the largest stray voltage databases in the country, covering roughly 3,500 farm investigations under its Phase II protocol. The average source resistance measured at cow contact points in that database is 192 ohms, per the PSC Staff Report on the Phase II Stray Voltage Testing Protocol. The standard testing resistor used by utilities is 500 ohms — the reference level the PSC’s Phase II documentation identifies for evaluating cow contact current and voltage.

That’s not a rounding issue. The protocol tests a “model cow,” not your cow. At any given source voltage, a real cow circuit at 192 ohms pulls about 2.6 times the current the 500-ohm model assumes (500 ÷ 192 ≈ 2.6). The field average sits well below the test assumption. The Wisconsin PSC was contacted for comment on that framing.

USDA Agriculture Handbook 696 — the federal reference on stray voltage, published in 1991 and not substantially updated since — estimated that a meaningful share of U.S. dairy operations encounter stray voltage at some level. Wisconsin had 5,661 licensed dairy herds as of January 2024 per DATCP records, and the count has continued to fall. Even a conservative prevalence read puts hundreds of Wisconsin dairies somewhere on the spectrum — most sub-clinical, an unknown subset operationally significant.

CaseDefendant & StateSource IdentifiedVerdict / Affirmed Award
Halderson (Aug 2017)Xcel / Northern States Power — Trempealeau Co., WIAC ground current; willful-and-wanton finding$4.5M jury; up to $13.5M (treble)
Vagts (Jan 2023, aff’d June 2024)Northern Natural Gas Company — Fayette Co., IADC stray voltage from pipeline cathodic protection — invisible to AC-only testing$4.75M, affirmed Iowa Supreme Court
Norman (Oct 2014, aff’d)Crow Wing Cooperative Power & Light — MNAC ground current / nuisance$4.86M economic + $1.5M nuisance; ~$9M w/ interest & fees
Den Hoed (active, per Dairy Star Aug 2025)Utility(ies) not yet named publicly — Burnett Co., WI2–7 V ground current between two substations 13 mi apart (per independent consultant)Pending; 11-yr fight per family account

Sources: Trempealeau Co. WI court records (Halderson); Iowa Supreme Court opinion 21-1899 (Vagts, June 21, 2024); Minnesota Court of Appeals (Norman); Dairy Star, Aug 2025 (Den Hoed). The Bullvine has not independently verified the Den Hoed cooperative-side timeline.

Risk concentrates in specific farm profiles, as described in UW Extension stray voltage resources and borne out in the case record of the three affirmed verdicts. Operations sitting between two substations. Barns built on aging grounding infrastructure. Dairies within a mile of recent substation or pipeline construction — as in Vagts, where a Northern Natural Gas cathodic-protection system was identified as the source. The Den Hoeds describe checking the substation and freestall-expansion boxes. Their acute crisis, per the Dairy Star account, tracked with the 2014 freestall build.

When the data said they were fine and the cows said otherwise

The family bought their Burnett County land and moved the operation from Washington’s Yakima Valley in 2010. By 2014 they’d built the new freestall. Then, according to the Dairy Star account, the herd started coming apart in ways nothing on the books could explain.

Production fell to 45 pounds per cow. Calf losses climbed past 50%. Across what the family describes as the crisis window, they brought in roughly 2,000 replacement heifers trying to hold herd size together.

Here’s the math they were living inside. On 500 cows, 40 pounds per cow per day below baseline at a /cwt working benchmark — a defensible midpoint across the 2014–2022 Class III range reported by USDA ERS, which swung from the low teens to the mid-s:

  • Daily loss: $4,000 in milk that never shipped
  • Annual loss: $1.46 million in revenue, before a dollar goes to replacement heifer capital
  • Replacement capital drain: roughly 2,000 heifers cycled through the herd during the crisis window, per the family’s account to Dairy Star
  • Equity strategy: buying nearby land at $2,000 an acre, improving it with wells, carrying it on the books at closer to $6,000 to keep the operating line alive.

“We were buying land,” Jayce told Dairy Star, “so we could keep borrowing.” That’s not growth. That’s a financing strategy to survive.

The 10-day letter, as the family describes it

When the family pushed their electric cooperative into a formal regulatory process, the consultant they’d hired warned them what might come next. Jayce’s account to Dairy Star:

“He told us that they all borrow their money from the same place. We thought he was nuts for a while, but sure enough there started being discrepancies in our milk tests and we got a certified letter stating we had 10 days to find a new home for our milk.”

The Bullvine has not independently verified the milk-test sequence or the termination timeline described in that quote. The cooperatives involved are not identified in the Dairy Star account or elsewhere in the public record, and have not been reached for comment. If any party identified in subsequent reporting wishes to respond, this piece will be updated.

What is verifiable: milk marketing cooperatives and rural electric cooperatives in the Upper Midwest often draw on overlapping federal financing sources, including USDA Rural Utilities Service, CoBank, and Farm Credit. How those shared financing relationships shape — or don’t shape — the handling of member disputes is a question the Den Hoed account raises. Not one the public record currently resolves.

⚠️ PRODUCER WARNING: Read before you file

The risk below is drawn from Jayce Den Hoed’s published Dairy Star interview; The Bullvine has not independently verified the cooperative-side timeline.

If you’re planning to file a PSC stray voltage complaint or commission an independent audit that could contradict your utility’s findings, the Den Hoed account describes a risk you need to price in before you act.

According to Jayce’s Dairy Star interview, the family received a certified letter giving them 10 days to find a new home for their milk after pushing the complaint process forward. The Bullvine has not independently verified that timeline, and the cooperatives involved are not public. But the precedent described in a published, attributed account is one a prudent operator cannot ignore.

Before you file or audit:

  • Pull your milk marketing agreement and read the termination-notice clause.
  • Identify at least one alternative processor inside your hauling radius.
  • Get a written quote for a temporary hauling contingency.
  • Talk to your lender before — not after — initiating the process.

Do this in the weeks before you act. Not the ten days after.

The breakthrough no one was looking for

Standard utility testing under the Wisconsin PSC Phase II protocol measures voltage at cow contact points inside the parlor, evaluates both primary and secondary sources, runs a 24-hour motor-start transient recording in most complaint cases, and reports against a 1-milliamp / 2-volt level-of-concern threshold at the cow. None of that architecture, the Den Hoed consultant concluded, was going to find what was happening on their farm.

According to the family’s account, when an independent stray voltage specialist finally ran the farm, readings showed 2 to 7 volts in the dirt itself — not at the waterers, not at the feed alley, not in the parlor. They say the voltage persisted even after the farm’s own power lines were fully disconnected, and that ground current was traveling between two substations 13 miles apart.

“If you place your manure pit wrong on your farm, in relation to the transformer, your well and distribution boxes,” Jayce put it, “you can sink your farm.”

The Den Hoeds argue the utility’s “within guidelines” reports were technically accurate against the protocol the utility was using. And that the protocol was looking in the wrong place.

A fix that paid back in months — if you can find the problem

Compare the Den Hoed trajectory to a Minnesota operation that eventually got to the other side. As reported in Bovine Veterinarian (September 2022) and Bullvine’s November 2025 stray voltage coverage, Olmar Farms — Jill and Brian Nelson’s registered Holstein operation near Sleepy Eye — went through roughly eight years of standard utility testing by Brown County Rural Electrical Association before an independent specialist identified the source. The Nelsons paid almost $100,000 out of pocket to install three-phase electric service and an isolated transformer. Production gained nearly 20 pounds per cow per day once the isolated transformer was in. In summer 2017, when most Upper Midwest herds are trying to hold ground through heat stress, not add it.

On 400-plus cows at prevailing 2017 milk prices, Bovine Veterinarian reported the capital outlay paid back inside a few months on recovered milk alone. The gap between the Den Hoed eleven-year fight and the Olmar eight-year fight isn’t the fix. It’s how long the standard testing protocol stayed between each family and the answer.

Why did standard utility testing miss what the Den Hoeds say was there?

Standard protocols evolved around secondary-system faults: a bad neutral, a grounding failure inside a farm’s own distribution. Those show up at cow contact points within a short testing window, and the 500-ohm resistor assumption works well enough to catch them. Ground current between distant substations — or from a pipeline cathodic-protection system, as in Vagts — is a different animal.

It’s a primary-transmission or external-source problem. And it can run on DC. That matters, because cathodic protection systems on buried pipelines work by injecting low-voltage direct current into the ground to prevent steel pipe from corroding — and standard AC-only utility test equipment cannot see DC signals at all. That’s the blind spot Lawrence Neubauer exposed on the Vagts farm near West Union, Iowa in September 2020, finding DC stray voltage at cow-contact points that AC-only testing had been ruling out for years. The problem may also only spike during specific load conditions. At night. During irrigation season. When a neighbor’s large motor cycles on. A 48-hour spot test at the wrong time of week can catch nothing.

An independent audit with AC and DC capable, millisecond-resolution equipment — Fluke or Dranetz class instruments, run continuously for 72 hours or longer — is what UW Extension stray voltage specialists and the consultants in the Vagts, Norman, and Halderson cases generally used to find what the utility testing missed. AC-only equipment, by design, would have missed the cathodic-protection source that won the Vagts verdict. For the full technical breakdown, see our Is Stray Voltage Stealing 20 Pounds Per Cow from Your Dairy?

That’s the diagnostic gap the Den Hoed account surfaces. It’s also the connective thread across the three Upper Midwest verdicts producers have so far won against utilities and pipelines. The full pattern across those named cases — Vagts, Normans, Haldersons — is broken out in our $18 Million in Stray Voltage Verdicts and a $3,000 Test No One Told Them About. If you read one companion piece before calling a consultant, that’s it.

How much does an unexplained production gap actually cost your operation?

Before you budget another consultant retainer, run the math on what the gap is already costing you. A 5-pound-per-cow-per-day drag on a 500-cow herd at a $20/cwt working benchmark (USDA ERS Class III ranged roughly $14–$25 across 2014–2022) works out to roughly $182,500 in annual lost revenue. On a 200-cow herd at the same 5-lb drag, it’s about $73,000 a year. Not a farm-ender in year one. A margin-eraser.

By year three, with compounding debt service, working capital tightens. By year five, on standard leverage ratios, the equity position for a mid-size Wisconsin operation can cross from “restructure” to “exit” without anyone ever naming the actual cause — the same lender-covenant threshold mapped in our The $287,500 Equity Decision Facing Mid-Size Wisconsin Dairies.

The severe case is the $1.46 million annual bleed before replacement heifer capital. Add the multi-year heifer drain the Den Hoeds describe and you’re into fourth-generation-scale damage — the same pattern that shows up in our 490 PA Dairies Gone in 2025. Two Spent $40,500 to Not Be Next.

Is the pattern showing up on your farm, and how would you know?

The symptom pattern, consistent across UW Extension stray voltage resources and the Vagts, Norman, Halderson, and Olmar case records, is specific enough to use as a screening tool. Production plateau despite optimized nutrition. Cows hesitating or lapping at waterers rather than drinking deep, or avoiding one wet metal spot. Breeding failure at normal investment levels — a bull works in the pen but AI doesn’t hold. Calf mortality that won’t map to a consistent pathogen. Elevated culls without a clean reason.

And critically: symptoms that get worse in winter, when frozen ground intensifies current conduction, and ease in summer. If three or more of those fit your last two years, the cheapest test you haven’t run is a 72-hour continuous voltage recording at the main waterer. Not a utility spot-check. A continuous log. Done before the next consultant retainer gets cut.

Options and trade-offs

Do this within 30 days — install a continuous monitor. A 72-hour continuous voltage recorder at the main waterer, logged against daily milk weights for the same window, typically runs a few hundred dollars in rental from UW Extension or a stray voltage consultant. A fraction of a single reproductive workup on a mid-size herd. Matched against DHIA records from the same dates, it either exonerates the electrical system or gives you the first piece of hard evidence you’ve ever had. The limit: you still need a qualified specialist to interpret anomalies and rule a DC ground-current source in or out. But you’re no longer testing blind.

Commission an independent electrical audit (90-day path). A stray voltage specialist running AC and DC capable millisecond-resolution equipment typically charges in the low four figures for a full protocol — cheaper than one round of reproductive workups on a mid-size herd, and roughly a week of the milk an affected herd is already losing on a 5-lb-per-cow drag. Ask the consultant directly for a current quote and scope. Trade-off: results that contradict a utility’s testing trigger a regulatory process you’ll need to be ready to run. Don’t commission this test unless you’re prepared for what you might find — and you’ve read the Producer Warning above.

File a PSC complaint with your documentation package already built (365-day path). Wisconsin’s DATCP Rural Electric Power Services program and the PSC’s three-phase investigation process give producers a real lever. The Den Hoeds describe a multi-year process through those channels. Trade-off: the 10-day termination precedent in their account isn’t something a prudent operator can ignore. Secure an alternative processor in your hauling radius before filing anything.

Remediate after diagnosis — isolated transformer or bonding fix. The Olmar Farms remediation ran about 0,000 and paid back inside a few months on production recovery, per Bovine Veterinarian. The specific cost and structure of the Den Hoed remediation are not public. Trade-off: remediation without litigation is faster but forfeits recovery of years of losses. Remediation with litigation recovers losses but runs two to five years in parallel. With three affirmed Upper Midwest verdicts totaling more than million across 2014–2024, early documentation materially changes what a producer can recover.

Key takeaways

  • If your herd has run more than 90 days below DHIA-projected baseline with no confirmed diagnosis, and your ration, genetics, and health metrics are normal — budget for an independent electrical audit before the next consultant engagement.
  • If your farm sits between two substations, built a new freestall in the last decade, or is within a mile of recent substation or pipeline construction — install the continuous monitor as baseline documentation, regardless of current symptoms.
  • Pull every utility test report you’ve ever received. Matched against DHIA production records from the same dates, those documents are the strongest evidence any future case will have.
  • If your utility’s standard test doesn’t include DC capability, outdoor ground contact points, and a minimum 48-hour continuous recording window — you don’t have a stray voltage test result. You have a partial snapshot.
  • Before filing any regulatory complaint — secure an alternative processor inside your hauling radius and review your milk marketing agreement’s termination-notice clause.
  • If symptoms intensify November through March and ease in summer — document the seasonal pattern before August. Spot-checks run in summer will miss a textbook signature.

The four-test question. When was the last time an unexplained production gap on your farm was evaluated against the right standard, with the right equipment, at the right contact points, for the right duration? If you can’t answer yes to all four, the next conversation with your nutritionist probably isn’t going to close it.

According to the August 2025 Dairy Star feature, the Den Hoeds are running at 80 pounds per cow today. Five pounds below their pre-crisis baseline of 85. The 24/7 voltage meter is still on the wall. “What damage has been done to the DNA that they’ll pass on to future generations?” Jayce asked. “Will it ever truly go away?”

Nobody has answered that question for the Den Hoeds yet. The full barn-math model — cost-per-cwt impact by herd size, the replacement-heifer capital drain, and the lender-covenant thresholds that move an operation from restructure to exit — is coming in next week’s Bullvine Weekly. If your production plateau has been unexplained for more than a year, that’s the piece to read before the next vet visit.

📋 Am I at risk? A 5-point screening checklist (screenshot this)

Risk SignalWhy It Points to Stray VoltageSeverity WeightScore
Grid geography — between two substations or within 1 mile of recent substation/pipeline buildSource of every named verdict (Halderson, Vagts, Norman); ground current travels miles between substationsHigh1 pt
Unexplained production plateau — ≥5 lb/cow below DHIA projection for 90+ days, normal ration & geneticsSub-clinical current depresses milk letdown; nutrition/genetics workups will not close the gapHigh1 pt
Calf and repro signature — calf mortality with no consistent pathogen; AI fails where bull settlesStray current disrupts implantation and immune development; bull-vs-AI gap is a textbook tellMedium1 pt
Waterer behavior — cows hesitate, lap, or avoid one wet metal spot rather than drinking deepCows feel current at the wet metal contact point before any meter doesMedium1 pt
Seasonal pattern — symptoms intensify Nov–Mar, ease by midsummerFrozen ground intensifies conduction; spot-checks run in summer will miss the signatureHigh (diagnostic)1 pt
Total Score30-Day Move90-Day Move
0–2Document baselines; pull every utility test report you’ve received and match to DHIA recordsRe-screen quarterly
372-hr continuous voltage log at main waterer before next consultant retainer clearsEngage independent specialist if anomalies appear
4–572-hr log + commission AC/DC-capable independent auditRead Producer Warning; secure alternate processor BEFORE filing PSC complaint

Symptom set drawn from UW Extension stray voltage resources and the Vagts, Norman, Halderson, and Olmar Farms case records.

Score one point for each statement that applies to your operation over the last 24 months.

  1. Grid geography. Your farm sits between two substations, or within one mile of recent substation, transmission, or buried pipeline construction.
  2. Unexplained production plateau. Your herd has held 5 or more pounds per cow per day below DHIA-projected baseline for 90+ days despite normal ration, genetics, and health metrics.
  3. Calf and repro signatures. Calf mortality that won’t map to a consistent pathogen, or AI conception that won’t hold on cows a bull will settle in-pen.
  4. Waterer behavior. Cows hesitating, lapping, or avoiding one wet metal spot rather than drinking deep at the main waterer.
  5. Seasonal pattern. Symptoms intensify November through March when the ground freezes, and ease measurably by midsummer.

3 or more: budget a 72-hour continuous voltage log at the main waterer before your next consultant retainer clears. 4 or more: commission an independent AC/DC audit, and read the Producer Warning above before you file anything.

Complete references and supporting documentation are available upon request by contacting the editorial team at editor@thebullvine.com.

Learn More

The Sunday Read Dairy Professionals Don’t Skip.

Every week, thousands of producers, breeders, and industry insiders open Bullvine Weekly for genetics insights, market shifts, and profit strategies they won’t find anywhere else. One email. Five minutes. Smarter decisions all week.
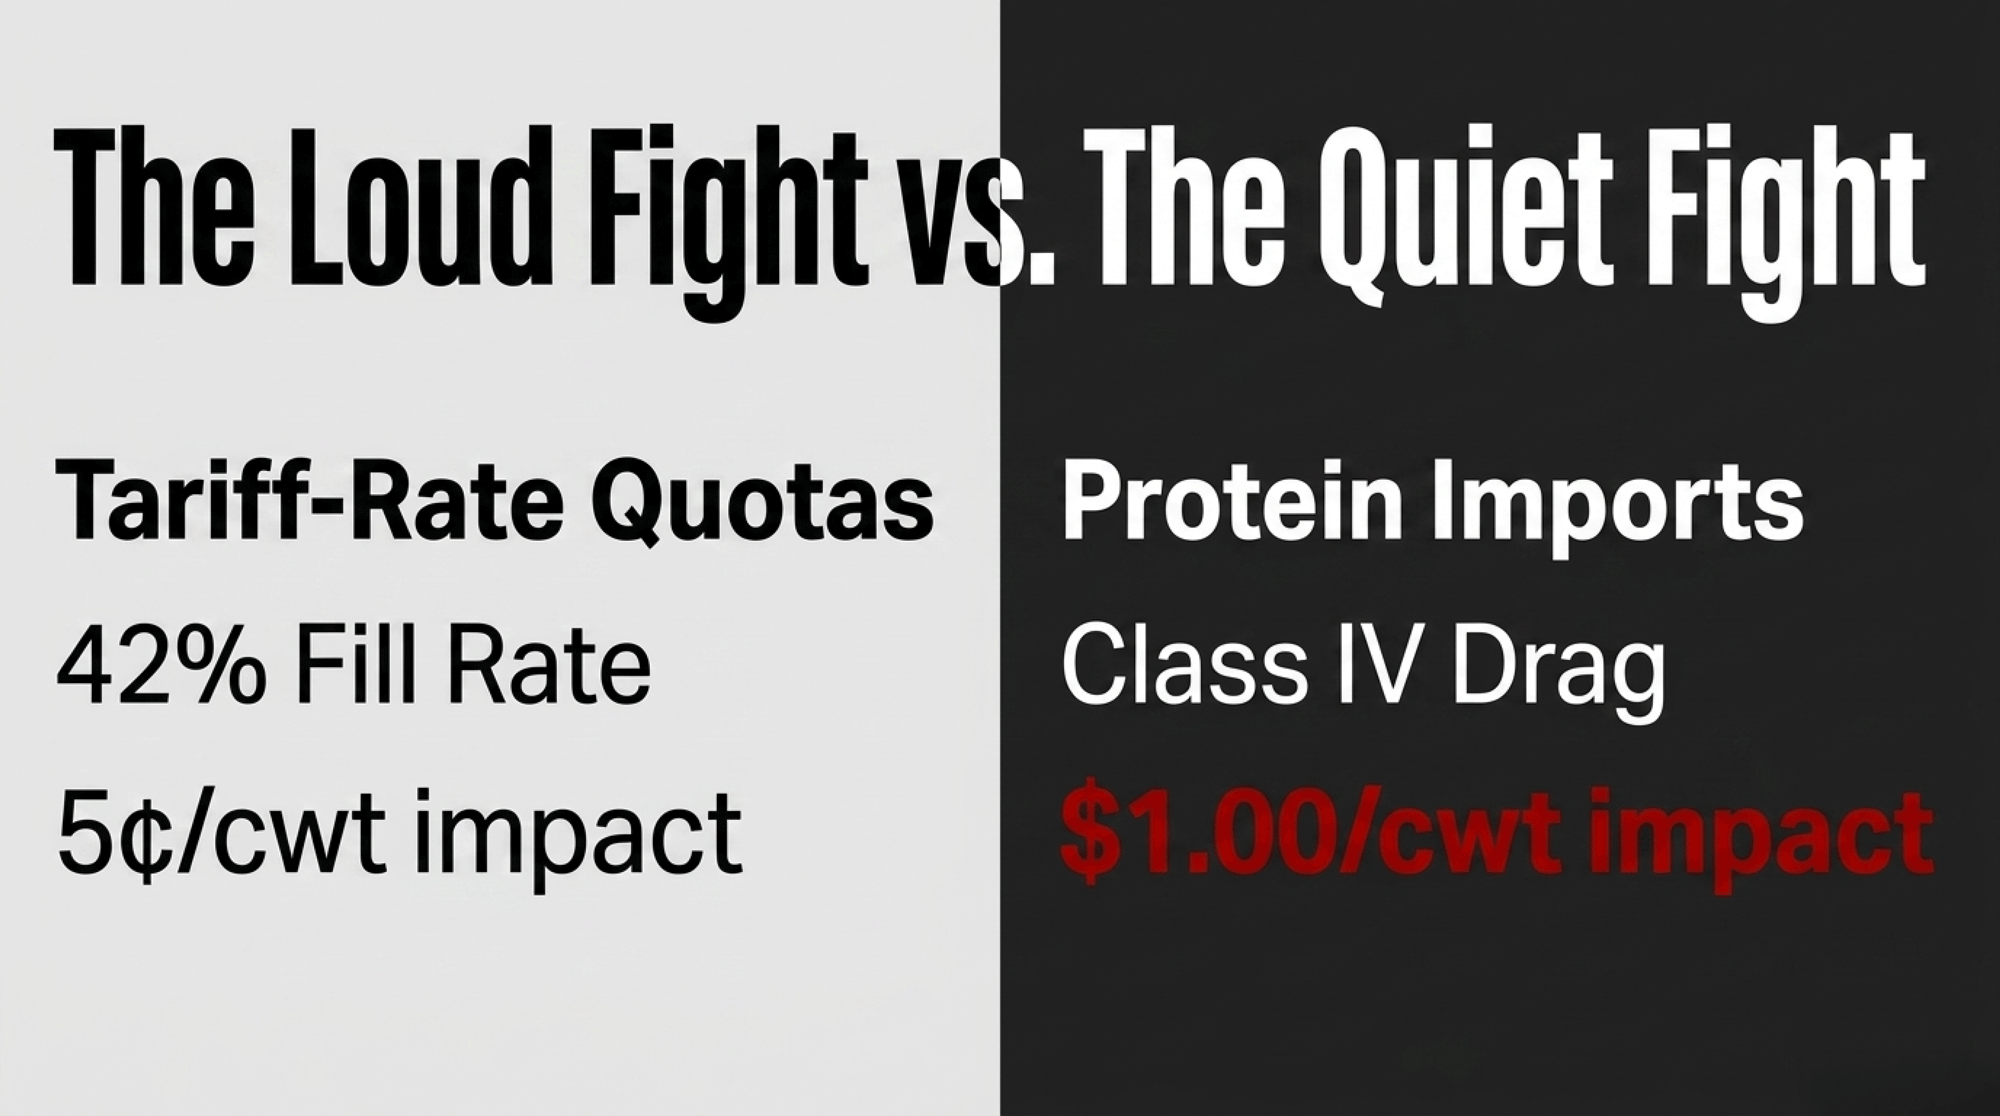
NewsSubscribe
First
Last
Consent

490 PA Dairies Gone in 2025. Two Spent $40,500 to Not Be Next.

Rylee Fuller and Kristina Quinn each logged 3,000 paid hours as PA’s first Dairy Herd Manager apprentices. $40,500 over 18 months. One resignation costs a 150-cow dairy $24,750 in 90 days.

Executive Summary: Pennsylvania just graduated its first two Dairy Herd Manager Registered Apprentices — Rylee Fuller at Laurel Grove Farm (Perry County) and Kristina Quinn at Zahncroft Dairy (Berks County) — for a total labor investment of $40,500 over 18 months across 3,000 paid hours stepping from $11 to $16/hour plus 216 hours of technical instruction. That matters because PA lost 490 dairies in 2025, roughly 41% of all U.S. exits, and 28% of producers weighing their own exit cited no available successor. The ghost invoice nobody runs: one sudden herd manager departure costs a 150-cow PA dairy about $24,750 in the first 90 days — $11,250 of that is owner time pulled back into the barn, plus repro slippage, days open at $3.63/day, fresh cow detection misses, and onboarding friction, all hitting harder at the Q1 2026 PA all-milk price of $19.40/cwt. Two failed cold hires in 18 months can run $132,000–$221,000 all-in on MSU Extension’s turnover benchmarks, especially with Northeast management-track turnover at 41% per the 2024 FARM Workforce Year-in-Review. If you’ve cycled through a herd-level employee more than once in the last five years, the ,500 apprenticeship isn’t sentimental — it’s cheaper than your next resignation. Farms that can’t name a daily trainer other than the owner, or can’t block 90 minutes a week for review, aren’t ready to host — fix that first, then enroll.

Dairy Herd Manager Apprenticeship

Rylee Fuller logged her 3,000th paid hour at Laurel Grove Farm in Perry County. Kristina Quinn logged hers at Zahncroft Dairy in Berks County, the Sattazahn family’s Holstein and Brown Swiss operation that’s been milking in Womelsdorf since the 1930s. They’re the first two people in Pennsylvania to complete the Dairy Herd Manager Registered Apprenticeship, a credential the Center for Dairy Excellence is spotlighting during National Apprenticeship Week starting April 26. And the number behind their 18 months? Roughly ,000 — what the next sudden herd manager departure will cost a 150-cow Pennsylvania dairy in the first 90 days, with the line-by-line math below landing closer to ,750. Which invoice is your farm writing?

Why Pennsylvania Just Lost 490 Farms — And Why Two Dairies Bet Differently

Pennsylvania lost 490 dairy farms in 2025, accounting for roughly 41% of all U.S. dairy exits that year, according to figures tracked through USDA and Pennsylvania Department of Agriculture reporting. The 2025 Pennsylvania Dairy Producer Survey found 27% of producers planning a generational transition within three to five years. And 28% of the farms weighing an exit cited no available successor. That’s not just a labor shortage. It’s a succession collapse with a labor shortage stacked on top.

Two completers is a small sample. But the cost math doesn’t need a cohort to hold — it needs one resignation you didn’t see coming, on a Tuesday, with nobody trained up behind the door.

The Center for Dairy Excellence built the apprenticeship to address both at once. Eighteen months. 3,000 paid hours of on-the-job training. 216 hours of technical instruction. A wage that steps from $11/hour to $16 over the program. Host farms commit to exposing the apprentice to the four competency areas — reproduction, calf care, herd health, and records — with monthly review visits from Workforce Development Manager Michelle Shearer.

Laurel Grove and Zahncroft bet first because their owners did the math most farms don’t run until after somebody walks. Cindy Comp’s Laurel Grove operation hosted Fuller through the full 3,000 hours. Katie Sattazahn’s Zahncroft carried Quinn through hers. Two farms. One question worth answering for every mid-size operation watching: did they just buy stability cheaper than everyone else?

The 90-Day Cost Clock When Your Herd Manager Walks

Picture a 150-cow Pennsylvania dairy rolling 26,000 pounds per cow, milk priced at .40/cwt — the Q1 2026 Pennsylvania all-milk average per USDA NASS. Your herd manager gives two weeks’ notice on a Monday. Or doesn’t show up at all.

The job ad is the cheapest line item. Here’s the 90-day invoice, built from published extension and peer-reviewed data. Actual numbers vary based on herd structure, processor schedule, and replacement timing. This is a midpoint scenario, not a prediction.

Expense CategoryImpact Detail90-Day Cost (150 Cows)
Owner Opportunity Cost2.5 hrs/day @ $50/hr$11,250
Reproduction Slippage3-pt pregnancy rate drop$2,200
Days Open1,075 days @ $3.63/day$3,900
Health Detection7–8 extra clinical cases$1,600
Onboarding FrictionRecruitment & training$5,800
TOTAL INVOICE $24,750

Sources: University of Georgia Extension Circular 1254, “Economic Impact of Days Open” (2023), for the $3.63/day midpoint. Owner-time opportunity cost and onboarding friction built from Cornell PRO-DAIRY onboarding-labor benchmarks. The reproduction and health-detection figures apply standard extension per-cow economics to a 90-day window and a 150-cow herd.

A separate line the table doesn’t show: milk-quality slippage. A 20,000-cell SCC creep on roughly 9,600 cwt across 90 days, at a $0.05/cwt premium, adds about $480. At the $19.40/cwt Q1 2026 milk price, any production drop from detection misses hits harder than it did a year ago. The ghost invoice in 2026 is meaner than the one in 2024.

Conservative 90-day total: about $24,750. Before a single replacement cow. Before the first extra vet call. Before the SCC climbs past the 20K drift.

Now line it up against the apprenticeship. Eighteen months of wages progressing linearly from $11 to $16 across 3,000 paid hours works out to a $13.50/hour blended rate. That’s $40,500 — total. One sudden departure pays more than 60% of the entire program. Two failed cold hires in 18 months — realistic in a Northeast dairy environment where management-track turnover hit 41% per the 2024 FARM Workforce Year-in-Review — runs $132,000 to $221,000 all-in. That range applies Michigan State Extension’s hourly turnover benchmark of 100–150% replacement cost on the low end (roughly $132,000 across two cycles) and its management-tier benchmark of 200–250% on the high end (roughly $221,000 if the role carries salary-grade compensation), drawn from MSU Extension’s “Employee Turnover Costs on Dairy Farms” bulletin by Stan Moore (2019, updated 2023).

Running 400 cows instead of 150? The variable costs — repro slippage, fresh cow misses — scale close to linearly. Owner time and recruitment friction don’t. Plan on roughly 1.8–2.2x the 150-cow numbers, not 2.67x cow count.

Why Trained-In-House Beats Experienced-Cold

The reason the math works isn’t sentimental. It’s structural.

A manager trained on your farm, in your protocols, under monthly review, doesn’t arrive carrying habits from another operation. “Management factors associated with milk quality on high-performing dairies,” published in Journal of Dairy Science 108:1422–1435, found that managers who invested more than average time in animal monitoring posted measurably lower somatic cell counts and better overall performance outcomes. Protocol consistency shows up in the tank, the repro report, and the calf barn. It doesn’t show up on a resume line.

The apprenticeship is structured so completers take on defined competency areas — reproduction checks, calf-barn protocols, herd-health records — that previously pulled the owner or a senior employee out of whatever else was in front of them. That’s the mechanic. Free owner hours. Tighter protocol ownership. A person whose competency was built on your system, not grafted onto it.

“The biggest shift wasn’t the hours; it was moving from ‘doing tasks’ to ‘owning outcomes,'” said Michelle Shearer, the Center for Dairy Excellence’s Workforce Development Manager who runs the monthly review visits. “In an apprenticeship, you aren’t just milking; you’re monitoring the heartbeat of the business.”

Cold hiring runs into a failure mode extension specialists call protocol substitution — experienced workers pattern-match your system to one they already know and fill in the gaps with prior habits. Penn State Extension and Michigan State’s dairy veterinary-school onboarding materials flag the same pattern. A 2025 Progressive Dairy analysis by Matt Lange, “When ‘Yes’ Actually Means ‘No’: Why Experienced Hires Drift From Your Protocols” (September 2025), walks through it on real farms. The fix is harder than unwinding a trainee’s drift, because confident habits are more durable than new ones.

And there’s the retention piece. Registered Apprenticeship programs broadly show a 92% post-program employment retention rate and 2.5–3x longer tenure than traditional hires, per the Jobs for the Future Policy Blueprint “Apprenticeship as Workforce Infrastructure” (April 2025), drawing on U.S. Department of Labor completion data. The apprentice chose your farm. Developed on your farm. Earned the credential on your farm. When someone offers them a dollar more across the county line, the switching cost is real.

How Much Does One Sudden Departure Actually Cost You?

The $11,250 owner-time line item is the one owners consistently underprice, because it’s time they’re already used to giving. On a 150-cow Pennsylvania dairy, that alone is bigger than most farms’ annual training budget. The other four line items add another $13,500 on top — repro slippage, fresh cow misses, days open, and onboarding friction — bringing the 90-day total to $24,750.

Those costs compofund if the first replacement doesn’t stick. Two failed cold hires in 18 months can run $132,000–$221,000 all-in. Worth writing on the whiteboard next to your current labor budget. If you’ve cycled through a herd-level employee more than once in the last five years, the math’s already been run on your operation. The invoice just didn’t land in your inbox.

Is Your Farm Actually a Teaching Operation — Or Just a Host With Paperwork?

That distinction matters. A teaching operation has four things in place before day one: written SOPs for reproduction, calf care, herd health, and records; a designated daily trainer who isn’t the owner; one carved-out management domain assigned to the apprentice within the first three to six months; and a protected 60–90 minute weekly review block that doesn’t get eaten by whatever’s on fire. The weekly review and phased domain assignment follow the CDE Host Farm Guide’s program expectations for sponsors; the specific review length and domain timeline reflect common practice among apprenticeship host farms rather than a rigid CDE mandate.

Farms that skip the weekly review and still pay the wages don’t get a slower version of the same outcome. They get protocol drift — the apprentice practicing a version of your system that’s 80% right and 20% quietly wrong, reinforced through 12 months of repetition. The correction cost at month 18 is higher than at month three.

Cornell PRO-DAIRY’s onboarding framework lands in the same place as Penn State Extension and the dairy vet-school guidance: written SOPs plus scheduled feedback prevent drift. Nothing else does.

Readiness TestReady Farm StandardNot-Ready WarningWhy It Matters
Written SOPsSOPs exist for reproduction, calf care, herd health, and recordsOnly verbal instructions or “ask the owner”Without written standards, the apprentice learns a moving target
Daily trainerNamed trainer other than the ownerOwner is the only person qualified to teachThe program collapses into shadowing, not management development
Weekly review blockProtected 60–90 minutes every weekReview happens only when something goes wrongFeedback after drift is correction; feedback before drift is training
Early ownership domainApprentice owns one competency area within 3–6 monthsApprentice stays in task mode for the full programRetention comes from responsibility, not just hours
Protocol monitoringRecords, repro, health events, and calf outcomes are checked regularly“We’ll know if something’s off”By the time the tank or preg-check report shows the problem, the habit is already baked in

Options and Trade-Offs for Farmers

PathBest FitUpfront Cash ExposureManagement RequirementBiggest Risk
Registered apprenticeFarm has a trainable employee or candidate and can commit weekly review time$40,500 over 18 monthsWritten SOPs, daily trainer, monthly review, real domain ownershipCompletion risk; national registered apprenticeship completion runs around 59%
Informal internal developmentFarm has a trusted employee but wants less paperwork$30,000–$45,000 in wages/training timeSame SOP and feedback discipline, minus outside accountabilityProtocol drift hides until repro, SCC, or calf outcomes slip
Cold hireFarm has strong management depth and can absorb a failed transition$66,000–$110,000 per failed management-tier hireHeavy onboarding, protocol correction, owner supervisionExperienced habits override farm protocols
Do nothingOwner keeps absorbing the gap$11,250 owner-time hit in first 90 days aloneOwner becomes the default trainer, manager, and firefighterThe labor problem becomes succession risk

Path 1 — Host a registered apprentice

When it makes sense: You already have a strong employee or family member who could develop into a management role, or you’re one resignation away from being back in the barn full-time.

What it requires: Written SOPs in the four competency areas. A daily trainer who isn’t the owner. Ninety minutes of protected review time each week. Willingness to hand the apprentice a real management domain within the first few months.

Risks and limits: National Registered Apprenticeship completion rate runs around 59%. Dairy-specific completion data doesn’t exist yet — Pennsylvania’s program has two completers as of April 2026. Selection and farm readiness matter more than the credential itself.

Path 2 — Develop an existing employee informally

When it makes sense: You’ve got a person on staff, limited bandwidth for formal program paperwork, and a relationship that already works.

What it requires: Everything the apprenticeship requires — SOPs, scheduled review time, progressive responsibility — minus the external accountability of monthly CDE visits. That external piece matters more than it sounds.

Risks and limits: No credential at the end, so retention leverage is weaker. Without an outside set of eyes on a schedule, protocol drift is easier to miss until it surfaces in the tank or the repro report.

Path 3 — Keep cold-hiring and absorb the turnover tax

When it makes sense: You’ve got real management depth already — a son, daughter, partner, or senior employee who’s bulletproof and isn’t going anywhere.

What it requires: Acceptance that each cycle costs what it costs, and a financial cushion to ride out the 90-day transition windows.

Risks and limits: The math above is the risk. One failed management-tier hire on a 150-cow operation can clip roughly $66,000–$110,000 on MSU’s 150–250% turnover benchmark alone, applied to an assumed $44,000 annual management salary. Layer in the 90-day cost clock, and total exposure lands closer to $90,000–$135,000 before broader production losses.

The 30-day action — regardless of path

Name one person, on your payroll or in your known network, who could develop into a herd management role over 18 months. Run the replacement-cost math for your current situation: take your key person’s rough annual cost, apply 150–200%, compare it to ,500. That one calculation usually answers the question.

By day 90: one SOP drafted in one of the four competency areas, with the designated daily trainer identified by name. By day 365: the apprentice (or internal trainee) should own one full competency area end-to-end, with documented owner hours reclaimed per week.

Key Takeaways

  • If you’ve cycled through a herd-level employee more than once in the last five years, run the $40,500 apprenticeship cost against your realistic replacement exposure before the next resignation. One failed management-tier hire typically costs more than the entire 18-month program.
  • If you can block 90 minutes a week for apprentice review AND you already have two or more written SOPs in the competency areas, the formal apprenticeship ROI outperforms informal training. If either condition fails, spend 90 days building SOPs before enrolling.
  • If no one on your farm besides the owner can function as daily trainer, the apprenticeship is likely to collapse into “follow me around and hope.” Fix that first.
  • If you’re treating the apprenticeship as a succession solution, build the equity entry pathway before the candidate starts — not at year four. Non-family succession, where it works, typically requires five or more years of senior management experience plus a deliberately designed ownership-transfer structure, per Land For Good’s “Farm Succession and Transfer: A Guide for Non-Family Transitions” (2023) and Penn State Extension’s Farm Transition Planning program.
  • If your owner-time-in-the-barn has been creeping up for two quarters straight, that’s the leading indicator your current labor situation is already costing you. The invoice just hasn’t arrived yet.

The Question Pennsylvania’s First Two Apprentices Already Answered

Fuller and Quinn chose dairy careers in a year when 490 Pennsylvania farms chose to exit. Two farms figured out something worth figuring out: the apprenticeship isn’t an upgrade decision for a stable operation. It’s an insurance decision for an unstable one. Every owner reading this already knows which category their operation falls into. They just haven’t said it out loud yet.

What would it take for yours to be the one that attracts — and keeps — the next apprentice looking for a real career in this industry?

Complete references and supporting documentation are available upon request by contacting the editorial team at editor@thebullvine.com.

Learn More

The Sunday Read Dairy Professionals Don’t Skip.

Every week, thousands of producers, breeders, and industry insiders open Bullvine Weekly for genetics insights, market shifts, and profit strategies they won’t find anywhere else. One email. Five minutes. Smarter decisions all week.
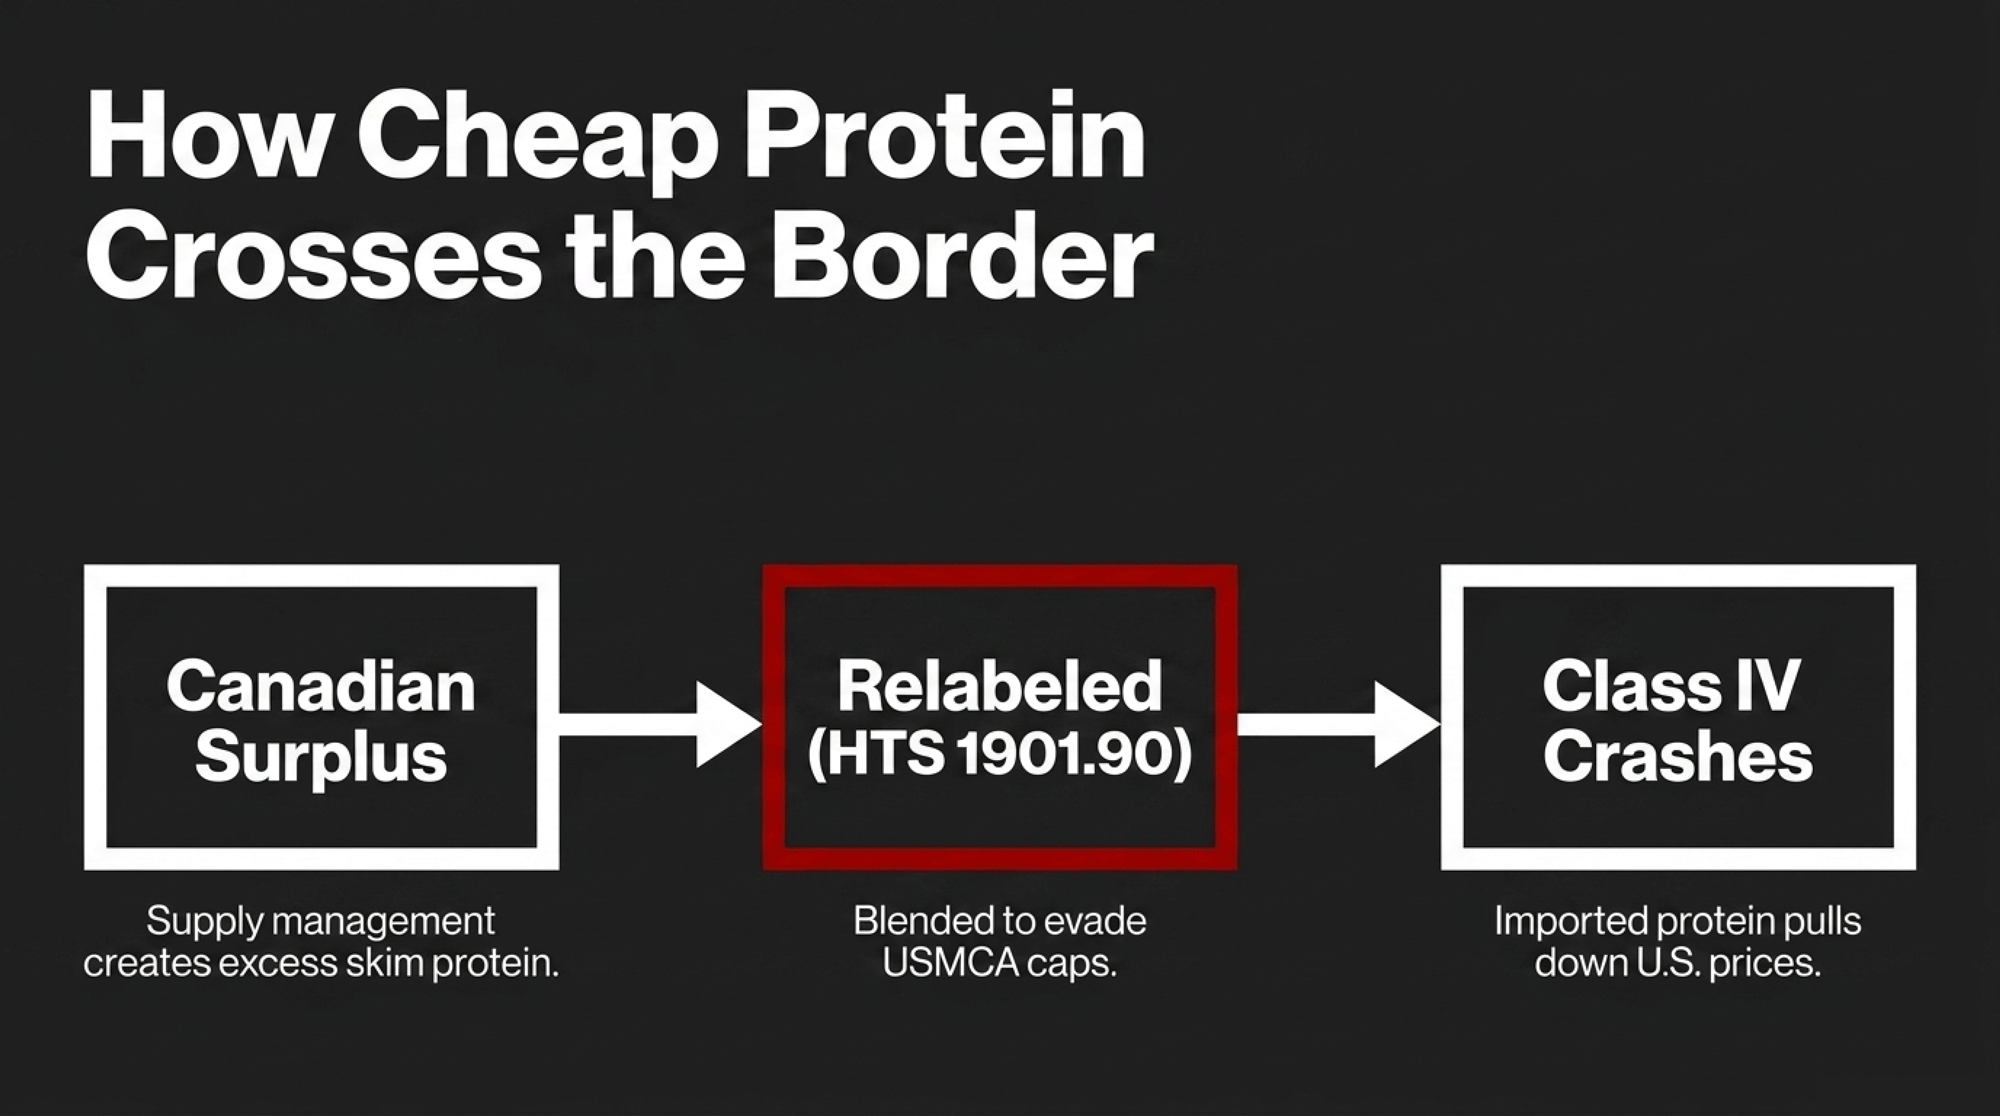
NewsSubscribe
First
Last
Consent

The Economic Reality of Pellet-Free Robotic Milking. A Retrofit Barn Could Lose $71K Trying.

At Double Creek in Merced, eight DeLaval V300s milk 500 cows and reportedly save $171K a year pellet-free. Run the same play in a 240-cow free-flow retrofit and the first-year math looks very different.

At Double Creek Dairy in Merced, California, eight DeLaval VMS V300s milk roughly 500 cows. In a DeLaval-produced promotional video, operator Matt Strickland reports annual savings of about $171,000 from going nearly pellet-free — only seven of his cows still get any pellet at all. That figure comes from manufacturer marketing material, not an independently audited result, and it reflects the economics of his barn and his transition. Spread across the full herd, it works out to roughly $342 per milking cow per year, based on Bullvine arithmetic, not a figure Strickland or DeLaval has published.

None of what follows is a claim that Strickland’s number is wrong for his operation. The composite scenario later in this piece is a separate illustration of what the same move can cost in a very different barn. That distinction matters because his number is moving fast at spring 2026 dealer meetings, and the barn-design context that makes it work isn’t always moving with it. If your barn doesn’t look anything like Double Creek — and most AMS retrofits don’t — pulling pellets can quietly stack into a mid-five-figure hole inside the first year, before any savings show up on the P&L. The Barn Math Table below shows how.

The AMS Pitch Shifted. The Barns Didn’t.

Three years ago, pellet-free robotic milking was a niche conversation. Now it’s the “next evolution” line in a lot of proposals, backed by a handful of flagship farms and some genuinely useful research. The science is real. What’s getting glossed over is the structural condition that makes it work.

University of Wisconsin Extension says it plainly: in free-flow barns, the primary reason cows voluntarily visit the robot is the pellet dispensed there. Jack Rodenburg’s widely cited traffic data — still the figure most carried through the AMS literature — pegs average fetch rates at roughly 16% of the herd per day in free-flow versus about 8.5% in guided-flow. European AMS research in guided-flow systems has consistently reported lower rates of unproductive visits than free-flow comparisons, though specific figures vary by study.

None of those traffic numbers show up on a typical AMS proposal’s ROI sheet. All of them decide whether a pellet-free move survives contact with your barn. The operators most exposed are mid-size and large producers running existing free-flow retrofit barns — long alleys, one robot at the end of a pen, no selection gate between rest and feed. Industry benchmarks have long placed the majority of U.S. AMS installations in the retrofit free-flow category, and the pitch at spring 2026 dealer meetings is aimed squarely at that population.

Colby, Wisconsin: What a Barn Built for This Looks Like

The Heeg family’s robotic facility near Colby, Wisconsin, came online in late 2023. Eight DeLaval units, tunnel ventilation, guided-flow from day one, no pellets at startup or since. Early-morning return traffic cycles cleanly through the selection gate, and the fetch list sits where you’d hope.

What the Heeg build illustrates is the pattern extension specialists keep describing on guided-flow startups: cows coming out of existing parlors carry habituated behavior that takes weeks to unlearn, while fresh cows and heifers introduced directly into a robot barn adapt faster and hold production better. In the documented guided-flow new-builds, it wasn’t the feed table that made pellet-free possible. It was the concrete, the gates, and a cohort of cows that had no old routine to fall back on.

Now sit the new-build story against a more typical one. A 240-cow herd — a composite scenario built from extension field observations, not a single named operation — in an existing free-flow freestall installs two robots, runs pellets for two years, then decides to go pellet-free after hearing the Strickland number at a spring meeting. Bullvine modeling, drawing on extension observations of retrofit transitions, puts the typical adjustment curve at a 10–15% milk drop in the first two weeks, then weeks three through ten running 9–12% below baseline. Picture it at 4 p.m. on a Tuesday in week six: the fetch list is longer than anyone wants to admit, a third-lactation cow who used to walk herself through is parked in a stall, the gate has cycled through an empty approach twice, and the nutritionist’s phone is ringing again.

Barn Math Table

240-cow composite herd, 80 lbs/cow/day baseline. Milk price assumed at $22/cwt (U.S. Class III reference band, spring 2026); if current Class III is running higher, every dollar in the left column moves against you. Skilled farm labor at $22/hour. All figures are Bullvine-composed estimates in USD, not audited operator outcomes.

MetricLow-End ImpactHigh-End ImpactSource / Assumption
Transition milk loss$26,600$35,50010-week window, 9–12% drop below baseline, 240 cows at 80 lbs, $22/cwt
Annual fetch labor$10,278$20,50016% fetch rate, 2 vs 4 min per cow at $22/hr, 365 days
Early cull costs$8,000$15,000Low: 4 culls × $2,000/head. High: 8 culls × $1,875/head. Replacement cost band reflects Bullvine editorial estimate based on current regional springing heifer markets.
Total first-year drag$44,878$71,000Bullvine composite

The annual fetch labor line runs over a full 12 months. The bottom row reflects compound drag across the first full year, not six months. The low end assumes a barn close to guided-flow functionality and a well-managed transition. The high end assumes a long-alley retrofit, no selection gate, and a nutritionist who wasn’t fully looped in. Most free-flow retrofits sit closer to the right-hand column than the left.

Why Do Pellets Work in Some Barns and Not Others?

The mechanics are less about feed formulation and more about concrete. In a free-flow barn, the pellet isn’t “feed” — it’s a bribe. Pull the bribe without changing the gates, and the only cows you’ll see at the robot are the ones who got lost on the way to the water trough. That’s not a management problem you can nutrition your way out of. It’s a traffic problem poured into the foundation.

Three strands of research converge on the same conclusion. Gregory Penner’s work at the University of Saskatchewan (Western Canadian Dairy Seminar, 2019) and Alex Bach’s 2007 Journal of Dairy Science paper both found that varying pellet allocations in controlled conditions had little to no effect on milk yield, with Bach reporting cow substitution of partial mixed ration for robot feed at ratios between 0.62 and 1.58 kg of PMR per kg of pellet. Commercial data pushes the same direction: a Vita Plus Upper Midwest AMS herd survey reported that robot pellet cost showed a negative relationship with income over feed cost across the sample, and visit frequency itself had no measurable effect on IOFC. Stack those three together and pellets start to look less like a feed input and more like the cost of running a barn that can’t move cows without them.

But the science supports pellet reduction only where both the barn and the forage can carry the load. The working principle in published guidance from the Penner lab at Saskatchewan and the DeVries lab at Guelph is straightforward: if your undigested neutral detergent fiber at 240 hours is too high, the PMR isn’t palatable enough to drive the barn on its own, and pulling the pellet pulls the only reason a cow had to walk. Specific uNDF240 thresholds depend on your forage program and herd; the most current figures should come from your nutritionist or the published work of those labs, not from a dealer’s rule of thumb. Published AMS barn-design guidance also shows barns with more than 15 stalls between resting area and the first crossover, or dead-end return alleys, produce measurably less milk per robot regardless of ration.

How Do You Know If Your Barn Is Free-Flow or Guided-Flow?

Walk it. Count the stalls between a cow’s resting area and the nearest crossover alley. Trace her route to the feed bunk — does it force her past the robot, or can she reach feed and water without going near it? Watch what happens to a timid cow at the approach gate when a dominant animal is standing there.

If she can get to feed and water without ever passing a milking decision point, you have a free-flow barn. The published evidence for pellet-free success in that layout, without structural changes, is thin. That’s not an argument against pellet-free milking. It’s an argument for doing it with your eyes open — priced, modeled, and stress-tested against your own operation’s numbers, not on the strength of a $171,000 figure from a different barn in a different state.

How Much Does Waiting Until Year-End Actually Cost?

Here’s the numeric version of procrastination. That same 240-cow composite, four months in, milk still running 8–10% below baseline instead of recovering. Fetch labor up noticeably at current wages. Do nothing for the rest of the year and the compound drag — lost milk, extra fetch labor, early culling — can stack into the $44,000–$71,000 range before you have the hard conversation. That’s before you touch working capital or debt service.

Sustained pressure on debt service coverage triggers lender conversations well before the operating line runs out. Published AMS lending guidance from the major U.S. and Canadian farm lenders gets more specific on the numbers, and your own lender’s current thresholds should be the ones you plan against. USDA’s Economic Research Report 356, released January 2026, pegs robotic milking at higher net return on average than conventional parlor systems — on the other side of a multi-year payback curve.

A pellet-free retrofit that isn’t working stacks a second valley on top of the first.

Options and Trade-Offs for Farmers

There’s no universal right answer. The right path depends on your barn’s bones, your balance sheet, and how long you plan to milk cows in that building.

Path 1 — Stay on pellets, but cut cost per ton. The Vita Plus Upper Midwest AMS survey found pellet costs ranging from $132 to $500 per ton across its herds on functionally similar rations. That spread is real, and it’s worth a hard conversation with your nutritionist before you commit to any structural change. The Bullvine’s earlier look at the true labor math behind robot debt digs into why the cost stack is bigger than a feed-only conversation captures. When it makes sense: free-flow retrofit with limited capital for barn work. Risk: you’re financing the barn-design problem through pellet costs rather than solving it.

Path 2 — Partial reduction by group. Keep pellets for fresh cows, heifers, and the chronic fetch list. Pull them from mature, mid-lactation animals in the pens closest to the robot. Done well with a nutritionist who can build and monitor differential feed tables, you bank most of the available savings without the structural exposure. Done poorly, you’ve added a spreadsheet problem on top of a barn problem. When it makes sense: partially functional barn layout, strong nutritionist relationship, a service tech who isn’t already at capacity on calls. Risk: management complexity and the temptation to expand the pellet-free group faster than the data supports.

Path 3 — Structural changes before pulling pellets. Selection gate between stalls and feed, mid-barn crossover, commitment pen, shorter return lanes. This means tearing out concrete, rerouting lanes, and absorbing real production downtime. Not a weekend project, and the economics vary sharply by barn geometry and regional contractor rates. The Bullvine’s $17,000-per-cow retrofit reality is the companion read here — price any structural path against a current quote before you commit. When it makes sense: five or more years of robot life ahead, equity to invest, a lender who can model the long game. Risk: some retrofit barns won’t accept the gates cleanly, and not all the concrete math works out.

Path 4 — Do this within 30 days if you’re already stuck. If you’ve been pellet-free for four months or more and milk hasn’t returned to within roughly 3% of baseline (an editorial benchmark, not a published standard), stop waiting. Check your own numbers against these red flags — any one should trigger the meeting, and two or more should trigger it this week. These are editorial thresholds drawn from the Rodenburg 16% fetch baseline and common herd-management practice, not published standards:

  • Fetch list consistently above 20% of the herd. That’s well north of the free-flow baseline and deep into labor-burn territory.
  • Bulk tank variance above 5% week-over-week. Pellet-free herds trying to find their footing often shake the tank before the fetch list tells you why.
  • Somatic cell count spikes with no clear infection pattern. Irregular milking intervals from missed robot visits show up in SCC before they show up in the fetch log.
  • Operating line quietly absorbing monthly shortfalls. If you’re moving money from operating to cover feed and labor, you don’t have a feed problem. You have a cash problem dressed up as one.

If any of those are live, get three people in a room this month: your nutritionist, your AMS service specialist, and your lender or farm financial adviser. Bring the last 120 days of production data, fetch logs, SCC reports, and cash flow. Decide which path above you’re actually on, or put pellets back in the highest-need groups while you reset the timeline. Then set two checkpoints: day 90 (production recovered or structural path committed) and day 365 (full pellet-free vs. pellets-restored P&L review). Risk of not doing this: another two or three months of drag lands on the operating line before an adviser forces the conversation at a less favorable moment.

Key Takeaways

  • If your barn is free-flow with one robot at the end of a long pen and no selection gate, treat any pellet-free pitch as a capital decision, not a feed decision — you’re being asked to accept permanently higher fetch labor or to fund a structural reconfiguration.
  • If herd size × current lbs/cow × 9–12% drop × milk price × 10 weeks of transition, plus a full year of elevated fetch labor, exceeds your comfortable draw on your operating line, you don’t have the financial headroom to run the experiment.
  • If your fetch list sits above 20%, bulk tank variance runs above 5% week-over-week, or SCC is spiking with no infection source, schedule the joint nutritionist–service–lender meeting inside 30 days.
  • If your current pellet cost per ton is anywhere near the high end of the Vita Plus $132–$500 range, you may capture most of the available savings without touching the feed table at all.
  • If a proposal you’re reviewing doesn’t include a transition milk-loss line in dollars, a chronic fetch labor line at or above 15% fetch rates, and a value for stranded pellet infrastructure, ask for those lines before you sign. Proposals that leave them out understate the true cost picture.
  • If your barn has more than 15 stalls between the resting area and the first crossover, address the geometry before you address the ration. Your nutritionist should be setting the uNDF240 target, not your dealer.
  • If sustained pressure on debt service coverage is already forcing the operating line to absorb shortfalls, the course correction is overdue — not early.
  • If your forage program is soft on NDF digestibility or TMR moisture consistency, fix that before the feed table.

The Question Worth Taking Into the Barn

Strickland’s $171,000 is real to him and to Double Creek. The Heegs’ barn in Colby is real too — guided-flow, no pellets, and a different kind of decision about how cows move through the building. Neither of those outcomes happened in a retrofit free-flow barn, and neither started with a dealer ROI calculator. So when you’re standing at your own robot tomorrow morning watching who’s on the fetch list, the question isn’t “should I go pellet-free?” It’s “does my concrete, my gates, my forage program, and my working capital look anything like the farms showing up in marketing materials right now?”

If even one of those answers is soft, what you’re looking at isn’t an evolution. It’s an experiment you pay for twice — once in the transition, once more in the barn you should have reconfigured first. For the full economic model — cost-per-cwt by herd size, the five-question lender sidebar, and a side-by-side retrofit vs. new-build cash flow walkthrough — keep an eye on Bullvine Weekly, where the barn-by-barn math runs.

Sources: USDA Economic Research Report 356 (January 2026); University of Wisconsin–Madison Extension AMS publications; Bach, A. et al., Journal of Dairy Science (2007); Penner, G., Western Canadian Dairy Seminar proceedings (2019); DeVries lab, University of Guelph; Vita Plus Upper Midwest AMS herd survey; Rodenburg, J., AMS barn-design and traffic research; published AMS financing guidance from major U.S. and Canadian farm lenders; and publicly available operator materials including a DeLaval-produced promotional video featuring Matt Strickland. Dollar figures are USD unless otherwise noted.

The Sunday Read Dairy Professionals Don’t Skip.

Every week, thousands of producers, breeders, and industry insiders open Bullvine Weekly for genetics insights, market shifts, and profit strategies they won’t find anywhere else. One email. Five minutes. Smarter decisions all week.
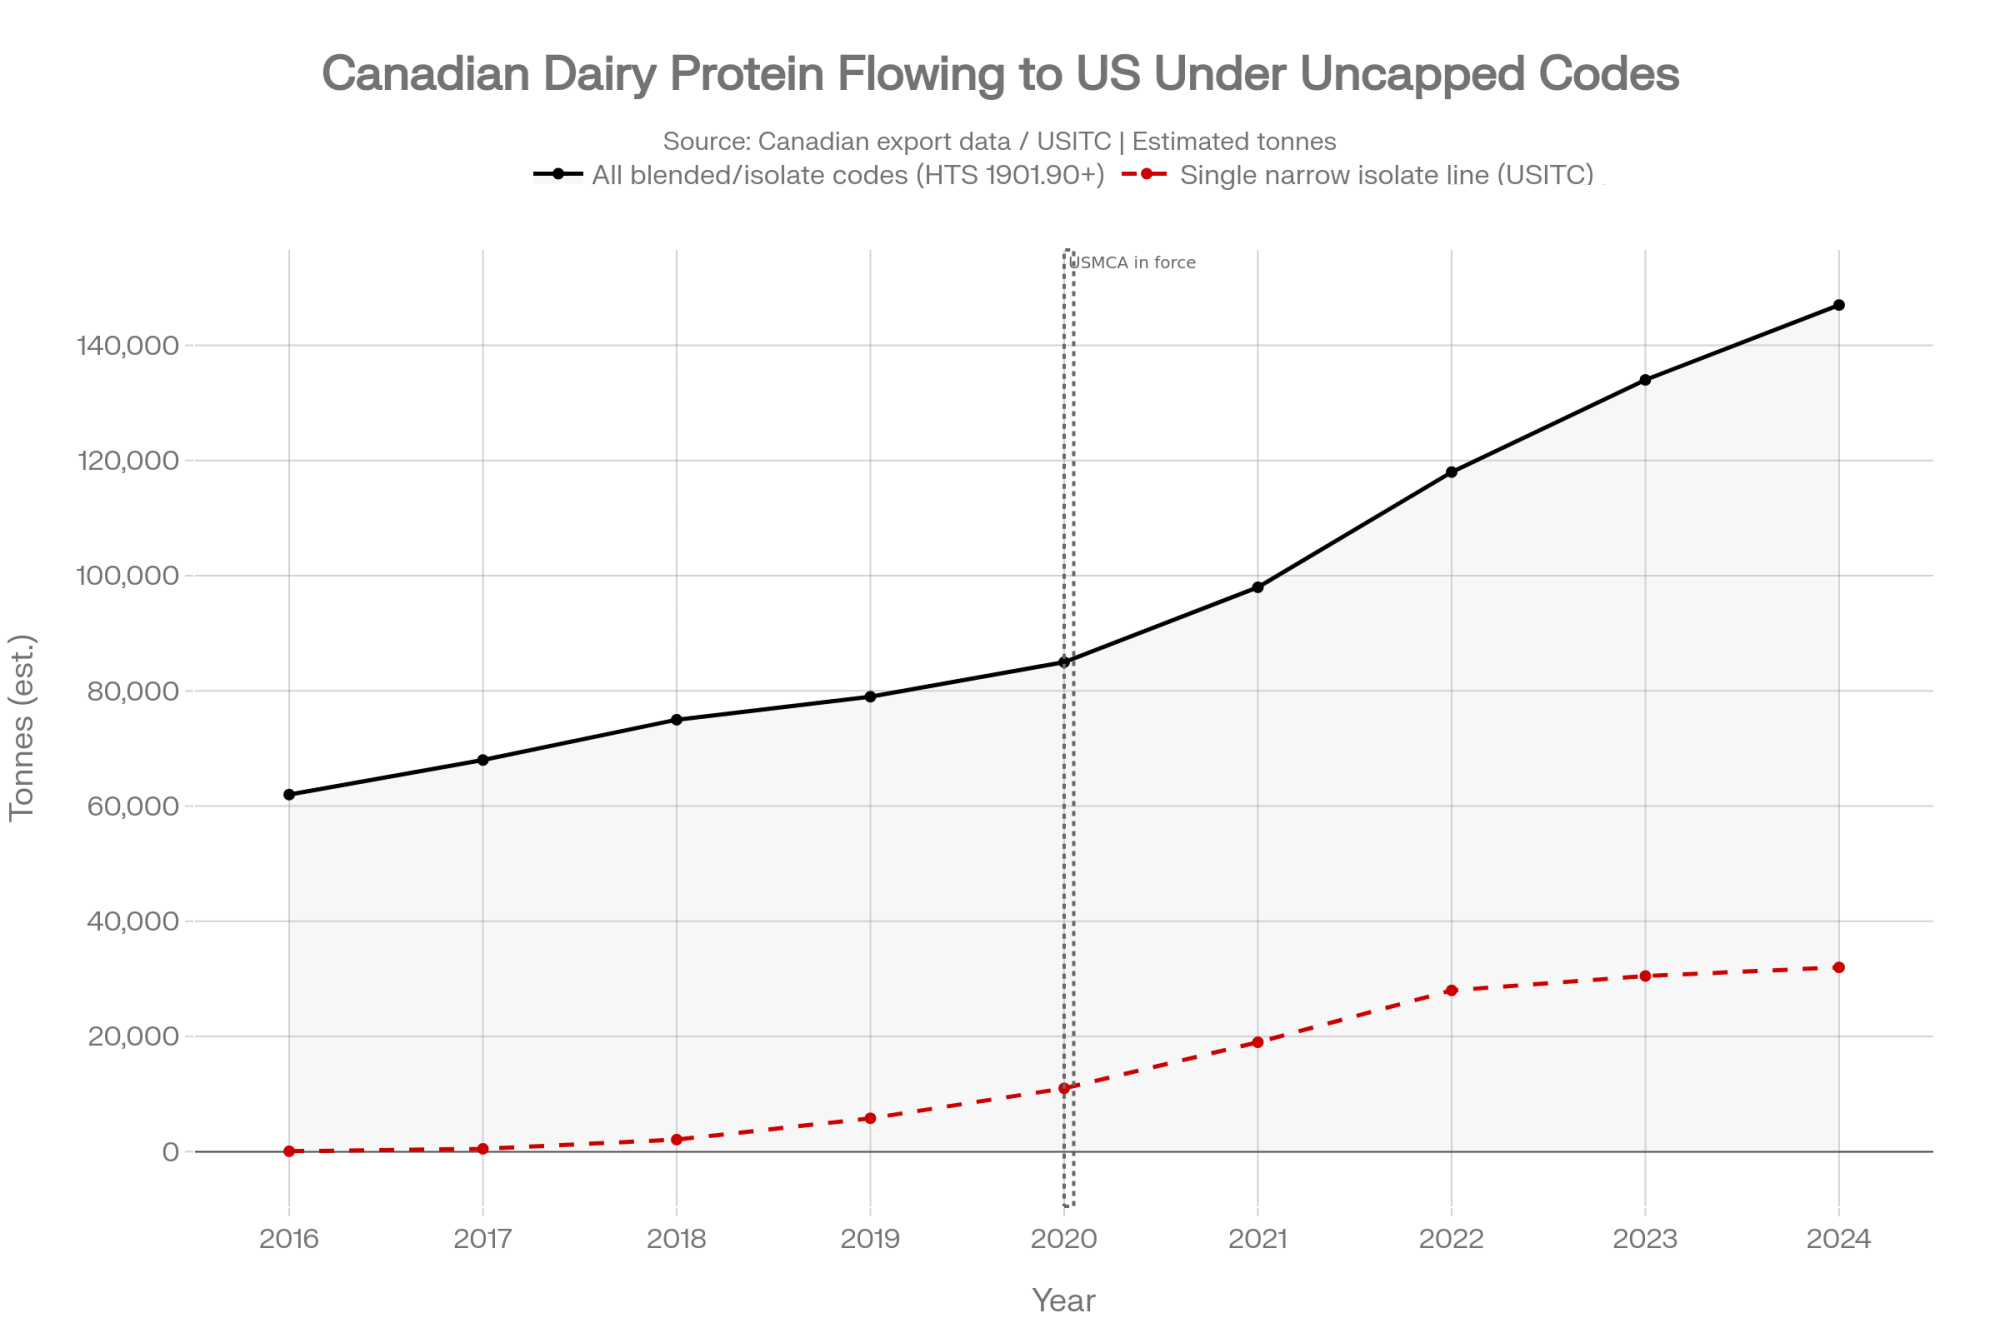
NewsSubscribe
First
Last
Consent

Alberto Dairy’s $640K Worm Bet: Who Actually Gets Paid on a BioFiltro Deal?

At 1,000 cows, the 10-year gap between fixing your lagoons and hosting BioFiltro runs near $640K. The term sheet says the vendor keeps the carbon. What does yours say?

Executive Summary: The 10-year cost gap at 1,000 cows runs near $640K, and the crossover where vermifiltration starts to pencil is a lagoon-upgrade quote around $950K. Alberto Dairy near Hickman is hosting one of California’s largest vermi installs — six beds on roughly eight acres, handling up to 1.7 million gallons of manure water a day. Here’s the catch most pitches don’t lead with: BioFiltro’s publicly filed 2022 investor summary describes the vendor and its equity partners as holding the climate attributes on WAS systems, so the farm avoids the capex and the vendor captures the carbon economics. The 2026 Central Valley nitrogen order will grade you on whole-farm N balance, not lagoon cleanliness — which means without a signed compost-export contract, vermifiltration cuts your on-farm N loading by just ~4%; with 50% of solids moving off-farm, it drops ~38%. Add 8–12 operator hours a week and a Sleep Deprivation Tax of roughly $10–18K/yr, and the realistic vermi-vs-lagoon gap at 1,000 cows climbs closer to $780K over a decade. For 800–1,200 cow operators: fix the lagoons, run the worm deal, go solo-digester, or right-size — but decide against your engineer’s written quote and your term sheet, not the vendor’s model.

dairy vermifiltration cost

That 0K gap is the defining number in California dairy manure management 2026. It’s the premium an operator pays to hand lagoon capex risk to a vendor and buy regulatory peace on the way into the new Central Valley nitrogen order. Alberto Dairy near Hickman in Stanislaus County, a third-generation family operation reported as founded in 1981 in Dairy Herd Management’s 2024 California coverage, is hosting the BioFiltro install: six vermifiltration beds on roughly eight acres, handling up to 1.7 million gallons of manure water per day. BioFiltro has described the installation as among California’s largest dairy vermifiltration systems.

Here’s the structural question most readers miss. BioFiltro’s publicly filed 2022 investor summary describes the vendor and its equity partners as holders of the climate attributes on its “Wastewater as a Service” systems. Under that described structure, dairies pay a service fee and receive treated effluent; farms hosting WAS systems wouldn’t directly receive the associated carbon or water credits unless individual contracts provide otherwise. The Bullvine requested confirmation from BioFiltro on whether the 2022 structure remains current in 2026 WAS contracts. As of publication, no response had been received, and current contract terms aren’t independently verified.

Bullvine editorial analysis: That’s not a scandal. It’s a term sheet.

Stress-test that term sheet against your own lagoon exposure before the 2026 Central Valley nitrogen order takes effect. Alberto’s confirmed cow count, exact WAS fee, grant stack, and contract term aren’t public. The model below uses 1,000 cows because it roughly matches the reported scale — and because it’s the size band where the decision actually matters.

Why Did California Dairy Manure Management 2026 Just Get More Expensive?

The State Water Board’s October 2024 directive told the Central Valley Regional Board to align its dairy orders with the 10 mg/L drinking water nitrate standard and move dairies toward whole-farm nitrogen accounting. Central Valley Regional Board staff analysis attributes roughly 94% of nitrogen reaching affected aquifers to land application of manure, not lagoon leakage.

Read that twice. The order won’t grade you primarily on how clean your ponds are. It’ll grade you on pounds of nitrogen per acre, sustained across a ten-year whole-farm balance.

Stanislaus County sits in the Modesto Subbasin — a medium-priority SGMA basin under DWR’s 2024 prioritization, with a groundwater sustainability plan already adopted. Stack that on California’s 40% dairy and livestock methane reduction target under SB 1383, the AMMP and Dairy Plus grant cycles, and Nestlé’s dairy sustainability program. “Do nothing” stopped being an option a couple of years ago. The question is which path costs the least — and who captures any upside along the way.

A Central Valley ag lender, asked informally what’s driving 2025–2026 capex conversations with mid-size dairy clients, put it plainly to The Bullvine: lagoon reline quotes have gotten uglier, not prettier, and the quote is now the conversation starter. The per-client range isn’t for publication. The direction of travel isn’t in dispute. Readers with a better number from their own engineer are invited to send it in for the “Lagoon Inflation” tracker described at the end of this piece.

What the Worm System Actually Does (and Doesn’t)

Vermifiltration routes liquid manure across beds of wood chips and red wiggler worms. Worms and the associated microbial community break down organic load, strip nitrogen from the liquid stream, and immobilize nutrients in the bed media. Per Dairy Herd Management’s 2024 reporting and BioFiltro’s public site documentation, the Alberto system runs six beds on roughly eight acres with approximately four-hour retention. Treated water cycles back to barn flush and parlor cleaning. Bed media is eventually harvested as vermicompost.

The California Dairy Research Foundation cites 40–80% nitrogen removal from the liquid fraction in dairy vermifiltration systems, depending on design and operating conditions. LPELC and Washington State University extension research confirm the range at the concentration level. BioFiltro has reported 97–98% methane reduction compared with conventional lagoon storage, based on pilot data from Fanelli Dairy in Tulare County.

Those are real, repeatable numbers in the liquid stream. What they don’t change is total nitrogen excretion from the herd. And they don’t change the whole-farm accounting the 2026 order will apply.

Running the Numbers: Three Lanes for a 1,000-Cow Central Valley Dairy

Inputs: 1,000 milking cows, 600 acres for manure application (~1.67 cows/acre, typical for a mid-size Central Valley dairy), 10-year horizon, 7% cost of capital (capital recovery factor ≈ 0.1424). Benchmarks drawn from Newtrient and NRCS capex ranges, UCCE dairy lagoon cost studies, BioFiltro’s publicly reported Fanelli WAS figure, and standard Central Valley operating data. Scope: California Central Valley, 2026–2035 planning window. Illustrative — not an accounting of any specific operation’s books.

Crossover Threshold (Read This First)

At 1,000 cows with the modeled inputs, vermifiltration under WAS starts penciling when your engineer’s lagoon-upgrade capex quote hits roughly $950,000–$1.0M. Below that, fixing lagoons is less expensive. Above it, vermi starts winning — before grant stack, carbon carve-outs, or labor adjustments.

That one number is the most actionable data point in this article. If your engineer’s memo lands below $950K, Lane 2 probably isn’t your path, regardless of how the pitch reads.

Lane 1 — Lagoon Upgrade Path

InputValue
Capex (mid-range reline/expansion, Newtrient/NRCS benchmarks)~$500,000
Annualized at 7% over 10 yrs (× 0.1424)~$71,200/yr
Lagoon OPEX (UCCE benchmark, inclusive of baseline labor)~$75/cow/yr × 1,000 = $75,000/yr
Total annual cost~$146,200/yr
10-year total~$1.46 million (~$146/cow/yr)

Lane 2 — Vermifiltration Under BioFiltro WAS

InputValue
WAS service fee (Fanelli benchmark near $162/cow/yr per vendor disclosure; modeled at $180/cow/yr for conservatism)$180,000/yr
Residual lagoon OPEX$30/cow/yr × 1,000 = $30,000/yr
Total annual cost$210,000/yr
10-year total$2.10 million ($210/cow/yr)

Lane 3 — Solo Covered-Lagoon Digester

InputValue
Post-grant capex (1,000-cow solo project, directional; CDFA DDRDP and Newtrient benchmarks — solo capex varies widely by site and grant stack)~$4,000,000
Annualized at 7% over 10 yrs~$569,600/yr
Added OPEX (digester + residual lagoon)~$110/cow/yr × 1,000 = $110,000/yr
Total annual cost~$679,600/yr
10-year total~$6.80 million (~$680/cow/yr)

The Lane 2 vs Lane 1 gap at these inputs: ~$638,000 over 10 years — the “~$640K” in the headline.

One labor-symmetry note: the $75/cow/yr Lane 1 OPEX benchmark already rolls in baseline conventional lagoon management labor. The 8–12 additional operator hours per week associated with vermifiltration are incremental to that baseline, not a replacement for it.

Plug Your Operation In (Phone-in-the-Barn Version)

Define your variables: C = your milking cow count F = your vendor’s WAS fee, in $/cow/year (ask for it in writing) R= residual lagoon OPEX, modeled at $30/cow/year L = your current lagoon OPEX, modeled at $75/cow/year K = your engineer’s lagoon-upgrade capex quote, in whole dollars A = 0.1424 (annualization factor: 7% cost of capital, 10-year horizon)

Your annual vermi cost = (C × F) + (C × R) Your annual lagoon cost = (K × A) + (C × L)

Worked at C=500, F=$180, R=$30, L=$75, K=$300,000: Lane 2 = (500 × $180) + (500 × $30) = $90K + $15K = $105K/yr (~$1.05M over 10 years) Lane 1 = ($300,000 × 0.1424) + (500 × $75) = $42.7K + $37.5K = $80.2K/yr(~$802K over 10 years) Lane 2 premium at 500 cows: ~$24.8K/yr × 10 = ~$248K over a decade.

If your vendor’s WAS quote (F) lands materially above or below $180/cow/year, Lane 2 narrows or widens accordingly. Get that number in writing before you model anything.

What the Alberto Dairy Case Actually Shows Mid-Size Operators

Dairy Herd Management’s 2024 reporting places Alberto Dairy in its third generation, founded in 1981. Per Ag Alert’s California coverage, the operation is among the California sites BioFiltro features when presenting the WAS model to prospective dairy operators. The system is installed and operating under the WAS structure. The 2026 Central Valley order will apply regardless of when the installation decision was made.

The harder question for any third-generation California family dairy isn’t whether vermifiltration works technically. Published data show it does. It’s whether entering a long-term service contract for vendor-owned treatment infrastructure is the right structural choice for an independent family operation, given current credit-ownership terms and the coming regulatory framework.

As an industry pattern for dairies in this size band, WAS installations can function as a defensive capital decision — hedging a large near-term lagoon capex against a long-term service fee. The Bullvine isn’t characterizing the specific financial reasoning at Alberto Dairy, which isn’t public. Whether that’s the calculus at any given farm is a question only the operator can answer.

For readers weighing the same decision right now, the operator’s question isn’t “is this the future of dairy?” It’s “which lane does my actual operation survive?” That’s the lens this piece is written in.

The Nitrogen Trap Most Sustainability Stories Don’t Tell

The common assumption was that 40–80% nitrogen removal in treated effluent would translate directly into smaller regulatory exposure under the 2026 order. It mostly doesn’t — because the order is built around whole-farm nitrogen balance, not lagoon concentration readings.

🔑 Key Takeaway — The 4% vs. 38% Rule

Without a compost export contract, vermifiltration cuts your whole-farm nitrogen loading by just ~4%. With 50% of solids moving off-farm, loading drops ~38%.

To survive the 2026 order, vermi without an export contract is a capital expense without a compliance outcome. The compost buyer is the compliance strategy — not the worms.

A 1,000-cow Central Valley dairy excretes roughly 140,000 lb N/year at the 140 lb N/cow benchmark from UC Davis nutrient-balance work. Milk and animal exports carry off around 25%, the midpoint of the 20–30% band in published California herd studies, leaving ~105,000 lb N on the farm to manage. On 600 acres, three scenarios.

Nitrogen per acre, three management approaches (1,000 cows / 600 acres, illustrative)

ScenarioTotal N on farm (lb/yr)Per-acre N (lb/acre/yr)
Conventional lagoon, all N applied on-farm105,000175
Vermifiltration WAS, all solids applied on-farm100,590168
Vermifiltration WAS, 50% of solids exported off-farm64,995108

Assumptions: 70/30 liquid/solids split under conventional; 60% N removal from liquid (mid-range of the published 40–80% band) under vermi; 90% of removed N immobilized in bed media, 10% lost via gaseous pathways; half the vermi solids exported represents ~900 dry tons/year ≈ 1,800 as-is tons at 50% moisture, at 2% N dry basis.

One honest caveat on that 10% gaseous loss line. Volatilization is a double-edged sword: it reduces N on the balance sheet, but ammonia and nitrous oxide are increasingly tracked under California air-quality mandates and under SB 1383. Treat gaseous loss as a temporary regulatory loophole — one that closes the moment air-side accounting catches up with water-side accounting.

Compost-buyer relationships at the 900 dry tons/year scale aren’t a given for individual dairies at this size. This step, not the worms themselves, is where the model earns its premium or doesn’t.

Moving that volume off-farm isn’t a passive win. It’s a logistics program — reliable buyer, consistent hauling, pricing that doesn’t turn a nitrogen strategy into a cost center. Using regional rates consistent with CalRecycle and UCCE compost pricing work (sale near $15/ton, trucking near $10/ton), best-case compost revenue on 1,800 as-is tons lands near +$9,000/year net after haul. For conservatism, the Lane 2 model above holds that revenue out; netted in, Lane 2 would move to ~$201K/yr and ~$2.01M over a decade. The value isn’t the check. It’s the acres you don’t rent and the cows you don’t cull to stay under the N cap.

Who Actually Gets the Carbon Money on California Dairy Projects?

Project / funding laneCredit or funding pathwayRealistic value signalWho likely captures upsideFarm-level question before signing
Vermifiltration WASVoluntary carbon / climate attributesLower than LCFS; contract-dependentVendor/equity partners under described 2022 WAS structureDoes the current term sheet assign climate attributes to the farm or vendor?
Covered-lagoon digesterLCFS / RNG economics$91–$548/cow/year gross range in published project economicsSplit varies by operator/developer contractWhat is the farm’s written gross and net revenue share?
AMMP / Dairy Plus supportCalifornia grant stackCan reduce upfront project burden materiallyFarm benefit depends on grant pass-through and fee structureDoes the grant lower the service fee, or only improve vendor economics?
Compost exportVermicompost sales and N-balance reliefAbout +$9K/year net in modeled best caseFarm, if buyer/haul terms are realIs there a signed buyer for 800–1,000 dry tons/year, not just a handshake?

In the pitch deck, the California climate premium flows back to dairies. For covered-lagoon digesters participating in the Low Carbon Fuel Standard, there is real revenue — published analyses of California dairy consolidation and LCFS economics covering the 2020–2024 window place LCFS value in the range of $91–$548 per cow per year gross on qualifying projects, with material variance driven by LCFS credit price and project vintage.

Revenue-share arrangements between dairies and third-party digester operators vary widely. Published contract analyses have reported farm share sometimes running a minority of gross. Individual contracts vary. Request your split in writing before assuming a number.

Vermifiltration sits in the voluntary carbon market, which has historically paid less per ton than LCFS. BioFiltro’s publicly filed 2022 investor summary states that the vendor and its equity partners hold the climate attributes generated under its WAS structure. Unless individual contracts provide otherwise, farms hosting WAS systems under that described structure wouldn’t directly receive carbon credit revenue.

AMMP, Dairy Plus, CPG climate funding, and the vendor’s own credit revenue are the three pillars the pitch stands on. The farm avoids capex and gains regulatory cover. The vendor captures the climate economics over the life of the contract.

Bullvine editorial analysis: That arrangement can be rational. Operators entering WAS agreements expecting direct carbon revenue should request the current credit-ownership clause in writing before assuming otherwise.

Can Your Family Actually Run a Small Wastewater Plant?

Dairy Conservation Navigator is direct: vermifiltration requires trained operators, daily and weekly inspections, and media replacement every 18–24 months. For an 8-acre system at the scale of the Alberto install, realistic routine labor runs roughly 8–12 additional operator hours per week above conventional lagoon management — about 416–624 additional hours per year. Priced at working-manager rates around $25–$30/hr, that’s roughly $10,000–$18,000/yearin implicit labor cost, or $100,000–$180,000 over the decade. Add the midpoint (~$14K/yr) to Lane 2 and the vermi-vs-lagoon gap for a 1,000-cow modeled operation moves toward ~$780K over ten years.

Call that line what it actually is: the Sleep Deprivation Tax. For operations that rely on owner-operator labor to backfill when a relief manager calls in sick, walking the worm beds at 2:00 AM burns the most expensive labor on the farm at roughly /hr — while the cows and the parlor crew still need that same owner sharp at 4:00 AM. Those hours come out of the one manager already watching pregnancy rates, feed shrink, and parlor labor. If that attention slips, the indirect hit to production can exceed the explicit labor line several times over. Decide which person absorbs those hours before you sign a long-term contract.

Royal Dairy in Washington has been publicly associated with BioFiltro for years through trade press and vendor case-study material. Fanelli has published pilot case-study data. Both are specific operations with specific management bandwidth — not proof the model travels automatically.

Does California Vermifiltration Pencil? Four Honest Lanes

For an 800–1,200 cow Central Valley operator facing the 2026 order, four paths. Each with when it makes sense and where it breaks down.

LaneBest-fit operation10-year modeled costDecision triggerWhere it breaks
Lagoon upgrade800–1,200 cows with workable acres and disciplined NMP records$1.46M at 1,000 cowsEngineer quote below $950KIf added storage/reline climbs toward $1.0M–$1.5M, the advantage narrows fast
Vermifiltration WASMid-size dairy with ugly lagoon exposure, grant eligibility, and compost outlet$2.10M before labor; $2.24M with midpoint laborEngineer quote near or above $950KNo compost export contract means only ~4% N-loading reduction
Solo covered-lagoon digesterLarger or cluster-scale operation with deep grant/LCFS stack$6.80M at 1,000 cowsStrong gas volume, grants, and revenue-share termsSmall solo projects rarely carry debt service without outside economics
Right-size or structured exitTight acres, weak DSCR, unclear succession, high basin pressureVariable, but avoids forced capex spiralDSCR below 1.2 for repeated quartersWaiting too long lets the buyer or lender set the terms

Lane 1 — Fix the lagoons, tighten nitrogen management. Makes sense when your engineer’s 10-year compliance estimate is in the $400–700K range, your acres-per-cow ratio is workable, and your NMP execution is disciplined. Requires a current lagoon integrity assessment against Central Valley Regional Board seepage standards, added storage planning, and honest per-acre N accounting. Risk: if the 2026 order requires partial covers or significant added storage, a $500K estimate can climb toward $1.0–1.5M, and this lane narrows against Lane 2.

Lane 2 — Vermifiltration under a vendor-owned WAS deal. Makes sense when expected lagoon capex is heading toward $950K+, you’re a competitive AMMP/Dairy Plus candidate in the current cycle, you have a real outlet for 800–1,000 dry tons of compost per year, and your management team has bandwidth for roughly 8–12 additional operator hours per week. Risk: under structures like the one BioFiltro’s 2022 investor summary describes, you don’t capture carbon revenue, you’re locked into a long-term service contract, you still carry residual lagoon OPEX, and your compliance story depends on keeping compost moving off-farm.

Lane 3 — Covered-lagoon digester, solo project. At 1,000 cows, the 10-year model runs near $6.8M. Requires deep grant and LCFS revenue to pencil, and typically makes sense only at consolidated or cluster scale. Smaller solo projects rarely generate enough biogas volume to cover debt service without a co-digestion partner.

Lane 4 — Right-size or plan a structured exit. Makes sense when basin math is ugly, acres-per-cow is already tight, succession is unclear, and any capex path above would strain what your lender will refinance. Risk: waiting too long lets a forced sale set the terms. Requires an advisor without a sales agenda and a willingness to look at the numbers without attachment to headcount.

The 30/90/365-Day Playbook for Herds Facing This Decision

Print this section. Take it to your lender.

30-Day Actions — Pull These Before Any Vendor Meeting

  • Get a written, independent lagoon assessment. Commission a current lagoon integrity and storage-capacity review from your ag engineer, referenced to Central Valley Regional Board seepage standards. Use an engineer with no commercial relationship to the system vendor. Red-flag trigger: if the 10-year compliance estimate comes back above $950K in today’s dollars, Lane 2 becomes a legitimate conversation. Where it backfires: a vendor-funded assessment isn’t the same thing.
  • Check your AMMP/Dairy Plus eligibility. Ask your NRCS technical service provider for an updated eligibility review before the next grant cycle opens. Red-flag trigger: if you don’t qualify for either program as currently structured, the WAS economics don’t work without CPG or third-party funding.
  • Test the compost market. Call the nearest bulk compost buyer and request a price and volume quote for 500–1,000 tons/year of dairy vermicompost, plus a haul estimate for your location. Red-flag trigger: if no buyer within 50 miles quotes you a price, Lane 2’s nitrogen benefit disappears.

90-Day Actions — Structural Decisions That Need Planning

  • Run the three-lane model for your actual operation. Use your real cow count, real acres, and your lender’s honest 10-year debt service view. Requires your CPA, your lender, and one independent ag engineer — not the vendor’s financial model. Red-flag trigger: if your DSCR has been below 1.2 for three or more consecutive quarters under your lender’s method, any capital-intensive path is secondary to fixing cash position.
  • Get a written WAS term sheet. Request a written quote including per-gallon or per-cow fee, carbon credit ownership clause, contract term and exit conditions, and what happens if you sell or right-size. Red-flag trigger: any clause that bars decommissioning if the system fails to meet your agronomic or regulatory targets.
  • Run your actual per-acre N balance. Pull the last three years of NMP records and calculate real lb N/acre/year by field. Red-flag trigger: if you’re already above 175 lb/acre on a meaningful portion of your acreage, you have a nitrogen problem vermi alone won’t solve without a parallel export strategy.

365-Day Moves — Strategic Positioning for the Rule You’re Going to Get

  • Make a binary lane decision. Indecision has a cost. Each lane is defensible with clear eyes; none is defensible as a permanent maybe. Opportunity signal: if AMMP and Dairy Plus together can cover 60%+ of a verified vermi project AND your lagoon bullet is at the $950K+ end, Lane 2 may pencil. Document the analysis and take it to your lender before the order finalizes.
  • Lock in your compost export relationship in writing. Treat the compost outlet like a feed contract. An informal agreement isn’t a nitrogen compliance strategy. Requires a signed annual purchase agreement with a buyer who can absorb consistent volume, plus a backup if that buyer exits.
  • Position for the rule as written, not as hoped. Whole-farm N accounting is coming to the Central Valley whether or not you own worms. Operators with the most flexibility in 2027 and 2028 will be the ones who ran the N balance honestly this year and made a structural decision — more acres, verified export, precision feeding, or a lane choice above.

What This Means for Your Operation

Vermifiltration is a legitimate survival tool for a narrow band of California dairies where the lagoon bullet is genuinely ugly, the grant stack is real, the compost outlet exists, and management has bandwidth to run a small wastewater plant alongside a large dairy. For that specific combination, Lane 2 is a rational hedge against regulatory and capital risk. For everyone else, the math still favors fixing your lagoons, running your N balance honestly, and making a hard call about whether your acreage and cost structure survive what the 2026 order is about to demand.

The trade-off at the heart of this case isn’t worms versus lagoons. It’s whether paying a premium to host infrastructure that generates climate revenue for the vendor — in exchange for regulatory goodwill and avoided lagoon capex — is worth it for your balance sheet, your management bandwidth, and your basin’s specific water pressure.

What does your engineer’s most recent lagoon memo actually say your 10-year compliance path costs — and does any clause in your current processor sustainability agreement change which lane you’re really in?

Are you seeing lagoon upgrade quotes in the $1M range in your basin? Drop a comment or email us — we’re tracking the “Lagoon Inflation” across the Central Valley and will publish an aggregated quote range in a follow-up within 60 days.

Key Takeaways

  • The deciding number isn’t $640K — it’s your engineer’s lagoon-upgrade quote. Below roughly $950K at 1,000 cows, fixing lagoons still wins; above it, a BioFiltro deal starts to pencil before labor and carbon carve-outs.
  • Under the 2022 WAS structure, the vendor holds the climate attributes. Before you sign, get the current credit-ownership clause in writing — don’t assume carbon revenue flows back to the farm.
  • Worms don’t solve a whole-farm N balance. Without a signed compost-export contract moving 50% of solids off-farm, your on-farm loading drops only ~4%; with that contract, it drops ~38%.
  • Four honest lanes: fix lagoons, sign a WAS deal, build a solo digester, or right-size. Pick one against your actual engineer’s memo, your NMP records, and your lender’s DSCR view — not the vendor’s financial model.

Methodology & Sourcing Note

This piece analyzes publicly reported information about Alberto Dairy and BioFiltro. Contract descriptions reflect BioFiltro’s publicly filed 2022 investor summary and may not match specific Alberto Dairy contract provisions, which aren’t public. All barn math is modeled and illustrative — not an accounting of any specific operation’s actual books. Regulatory references include the State Water Board’s October 2024 directive to the Central Valley Regional Board and the Central Valley Regional Board’s staff analysis of nitrogen pathways to affected aquifers. Trade-media references include Dairy Herd Management’s 2024 Alberto Dairy feature and Ag Alert’s California coverage. The lender characterization reflects an informal, off-the-record industry conversation and is included as directional context only; no client-specific numbers are attributed. Financial modeling inputs are drawn from Newtrient, NRCS, UCCE dairy cost studies, the California Dairy Research Foundation, LPELC, Washington State University Extension, CalRecycle, CDFA’s Dairy Digester Research & Development Program, and BioFiltro public disclosures. Lane cost ranges reflect a 2026–2035 planning window at 7% cost of capital; individual operations should model their own inputs with their CPA, lender, and an independent ag engineer.

Learn More

The Sunday Read Dairy Professionals Don’t Skip.

Every week, thousands of producers, breeders, and industry insiders open Bullvine Weekly for genetics insights, market shifts, and profit strategies they won’t find anywhere else. One email. Five minutes. Smarter decisions all week.
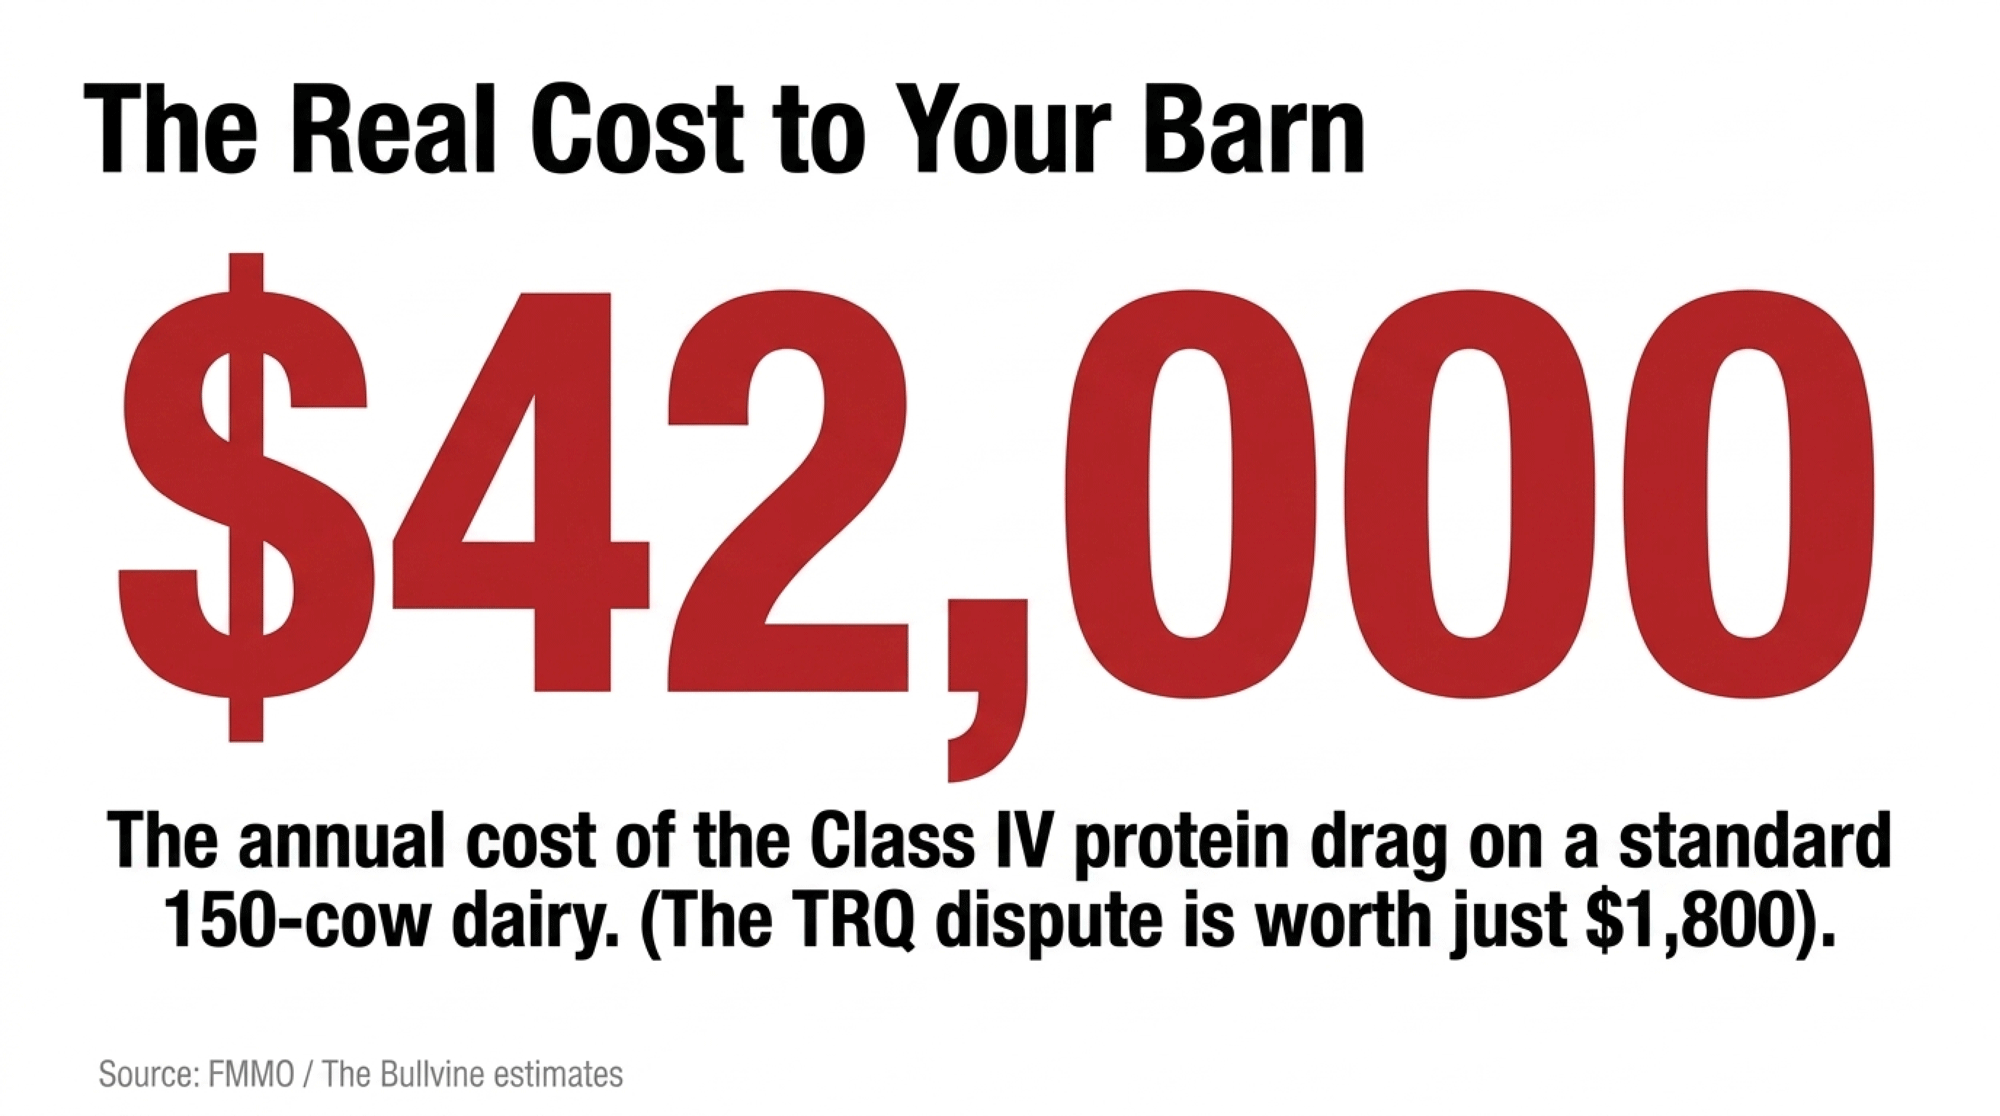
NewsSubscribe
First
Last
Consent

Cornell Hit 93%. Your 400-Cow Retrofit Won’t: The McLanahan SMS12 Payback That’s Really 4.5 Years, Not 2.5

Cornell’s Teaching Dairy and SwissLane’s Oesch family built their sand-separator success inside facilities designed around the system. For a 400-cow retrofit, the same $85K quote carries a very different set of risks — including one Klebsiella cow you can’t afford to lose.

Executive Summary: The McLanahan SMS12 quote says 2.5-year payback on $85K — the honest math on a 400-cow retrofit says 4.5, once you put depreciation back in and haircut recovery from 90% to 78%. Cornell’s Teaching Dairy hits 93% separation because the facility was built around the system; SwissLane’s Oesch family hits 90% because they’ve got the scale and internal labor to run it right. Your retrofit, with a shared-duty feeder running behind by 7 a.m., isn’t either of those. A 20,000 cells/mL SCC drift on commissioning costs a 400-cow herd roughly $25,550/year in lost quality premium — larger than the stressed-case net savings — and one preventable Klebsiella cull on a pedigree cow in Month 3 erases a full year of separator savings before her daughters are counted. In the Midwest at $12–15/ton contract sand this is an ROI play; in the Northeast at $18+/ton with single-supplier exposure, it’s an insurance play against a trajectory that SARE already documented rising 70% in real dollars between 2003 and 2013. Read the full piece if you’re re-bedding this year, staring at a dealer quote, or if your 400-cow herd carries any pedigree value you can’t afford to lose in commissioning.

McLanahan SMS12 payback

It’s mid-April. Coffee going cold on the kitchen table, an iPad open beside a paper dealer quote, the parlor pump cycling steady in the background. The producer staring at the McLanahan SMS12 quote could be in Lancaster County, Clinton County, or Addison County — this decision is on 400-cow kitchen tables across three regions right now — and the quote says 2.5-year payback in base-case spreadsheet optimism.

McLanahan engineered the SMS12 for dairies with 500 or fewer cows. Using the company’s own published 500-cow example — 50 lbs of sand per cow per day, $12/ton delivered, electricity at $0.07/kWhr — the pre-separator sand bill runs $54,750, and the system claims to cut roughly $40,000 a year off that bill while recovering more than 90% of the bedding. Base-case projections are standard practice across dairy capital equipment, from robotic milkers to heat recovery. The question isn’t whether the base case is optimistic. It’s how it holds up against your barn, your labor, and the cow in stall 47.

Figures in this article are illustrative, drawn from published case studies and model inputs. Actual costs, savings, and payback periods depend on herd size, regional sand pricing, barn design, labor, and site conditions.

What Cornell’s Teaching Barn Actually Proved — and What It Didn’t

Cornell University’s Teaching Dairy Barn in Ithaca, New York — a 150-cow facility built around best-practice demonstration — installed the SMS12 and published its results through McLanahan’s February 2025 case study. Their stated goal was 90% sand separation. The long-term average has come in at roughly 93%. Weeks hitting 97% or better happen regularly.

“One of the nice surprises we’ve had is how well it does the sand separation for us,” Jennette, the Teaching Dairy’s manager, said in McLanahan’s published Cornell case study. Before installation, the Teaching Dairy was trucking in about 30 tons of new sand every week. Today they buy a few tons at a time.

That’s a legitimate success story. But it’s a ceiling, not a benchmark. The Teaching Dairy Barn was purpose-built around the system, staffed by people whose primary job is to manage and document it. Institutional backing. No shared-duty labor problem. A 400-cow retrofit with two hired hands and a feeder who’s already running behind by 7 a.m. is a different animal entirely.

Scale up and the same tension shows up in a different form.

SwissLane Dairy in Alto, Michigan — a 2,000-cow, fourth-generation operation under the Oesch family — ran headlong into the real-world version of that gap before McLanahan solved it mechanically for them. Per McLanahan’s SwissLane case study, switching to sand bedding added roughly 8 lbs/cow/day to the herd average, and SwissLane cows now produce around 90 lbs/cow. Sand-laden manure was wrecking equipment, compacting fields, and stacking maintenance bills. Their McLanahan Sand-Manure Separation System now recovers up to 90% of the sand depending on sand size and water quality. “We are recycling up to 90 percent of the sand, which cuts back on our need for new sand,” Matt Oesch, the fourth-generation financial controller, said in that same case study. “Also, there is much less wear and tear on our equipment.”

Both systems work, but for different reasons. Cornell’s works because it was purpose-designed. SwissLane’s works because the Oesches have the scale and internal infrastructure to run it properly. That variable is missing from the base-case model — and it’s exactly the variable a 400-cow retrofit is most exposed to.

System / Herd TypeDesign & Labor RealityRisk if Copied to 400‑Cow Retrofit
Cornell Teaching Dairy150 cows; barn purpose-built around SMS12; dedicated staff tracking sand daily93% recovery becomes 75–80% when shared-duty labor replaces dedicated ops
SwissLane (2,000+ cows)Large-herd scale; in-house maintenance; strong internal infrastructureAssumes capital, infrastructure, and uptime most 400‑cow barns don’t have
400‑Cow Retrofit (spec)Existing barn geometry; limited fall; 2–3 hired hands with full chore listsDesign constraints and labor load push recovery below spec by 10–15 points
400‑Cow Retrofit (drift)Shared-duty “separator manager”; protocols erode after 90 days; reactive maintenanceKlebsiella or SCC drift can erase a full year of savings in Month 3

What a Klebsiella Event Actually Costs You on a Pedigree Cow

The payback math assumes a commissioning SCC event is a one-time quality-premium hit. It isn’t — not in a Bullvine reader’s barn.

Rowbotham and Ruegg’s 2016 Journal of Dairy Science study (“Bacterial counts on teat skin and in new sand, recycled sand, and recycled manure solids used as bedding in freestalls”) documented that primiparous Holsteins bedded on new sand had longer survival times to first culture-positive subclinical mastitis case than cows on recycled sand. Read “survival time” as what it actually is on a breeder’s herd: the difference between a second-lactation EX classification and a cull tag at Day 95.

Commissioning drift on a recycled-sand system opens the door specifically to environmental coliforms — Klebsiella, E. coli, Enterobacter — the organisms Leite et al. tied in a 2023 Pathogens study to higher clinical mastitis incidence when bedding moisture and coliform counts climbed. A Klebsiella mastitis case on a high-genomic or deep-pedigree cow isn’t a $250 treatment bill. It’s a cow you lose.

On a 400-cow herd carrying even a small nucleus of breeder-value animals, the 4.5-year payback math flips the moment one of those cows goes down in Month 3. A $10,000-class cow lost to a preventable bedding event erases a year of net separator savings on its own — before you count what her daughters were supposed to contribute. The separator doesn’t know which cow is in stall 47. You do.

Can a 400-Cow Retrofit Hit Spec When Cornell and SwissLane Were Purpose-Built for It?

Run the barn math honestly. A 400-cow herd at 50 lbs of sand per cow per day burns through about 3,650 tons of sand a year. At $15/ton delivered — a reasonable 2025 Midwest contract band, though regional pricing varies by supplier — that’s $54,750 in new sand, or roughly $137 per cow per year in bedding alone.

Run the design-spec math honestly. Makeup sand at 10% of 3,650 tons ($5,475), O&M at $15,000, and straight-line depreciation on $85,000 of capital over 15 years ($5,667/yr) totals about $26,000 all-in. That’s $65/cow. Gross cash savings against the all-new baseline — new sand avoided minus O&M — come to $34,275. That’s the number the dealer spreadsheet divides into $85,000 to get its 2.5-year payback. Put depreciation back into the denominator, and simple payback stretches to roughly 3 years even at design spec. Add interest on the loan ($3,000–$5,000/year, depending on term), and the headline number softens more.

Now haircut it. Recovery drifts from 90% to 78%. Makeup sand climbs toward 22% of pre-separator volume — about $12,000. O&M runs $4,000 over projection, a routine Year-1 variance on any new dairy capital equipment. Tack on one Year-1 commissioning SCC event ($3,000–$5,000) and one mid-range mechanical intervention ($7,500), amortized into Year 1 rather than buried. Net savings compress to roughly $17,000. Simple payback stretches to roughly 4.5 years. Still positive. Just no longer a runaway case.

Base Case vs. 80% Performance — 400-Cow Herd, $15/Ton Sand

MetricBase Case (100%)Real World (80% + Year-1 Adders)
Sand Recovery90%78%
Annual New Sand Cost (makeup)~$5,500~$12,000
Annual O&M$15,000$19,000
Net Annual Savings~$28,600~$17,000
Simple Payback2.5 yrs (3.0 with depreciation)4.5 yrs

The Year-1 column amortizes one commissioning SCC event ($3,000–$5,000) and one mid-range mechanical intervention ($7,500) into the first operating year; recurring O&M is shown separately.

On a 400-cow operation with working capital and a stable milk-quality baseline, a 4.5-year payback is manageable. On a 250-cow operation at $12/ton sand — the number McLanahan itself runs for the SMS12 — it’s tighter. The fixed-cost burden doesn’t scale down the way gross savings do. That’s why McLanahan positions the SMS12 “for dairies with 500 cows or less” but emphasizes site design requirements right alongside herd size.

The $85K Lie: What the Dealer Quote Actually Leaves Off

The $85,000 capital figure is the illustrative anchor for a 400-cow-class SMS12 installation. On most retrofits, it’s also the number that dies first.

Separator quotes cover the unit and often the dewatering screen. They frequently don’t cover the things that let the unit actually run. On a 400-cow retrofit, the soft costs that show up between “signed quote” and “commissioning day” routinely include:

  • Three-phase power at the manure stack. Single-phase service at that end of the yard means either a rotary phase converter or a utility line extension. Realistic band: $5,000–$15,000, site-dependent. 
  • Covered sand storage. The 12% moisture target McLanahan specs after the dewatering screen doesn’t hold if the stockpile sits under an open sky through a wet October. A roof and pad for recovered sand storage runs roughly $15,000–$40,000 depending on footprint and whether an existing commodity bay can be repurposed.
  • Alley fall and gravity conveyance modifications. Systems designed around four feet of fall need exactly that. Retrofits into flatter barns may require a reception pit, transfer pump, or plumbing rework.
  • Water supply for the sand-lane flush cycle. On farms already running at well capacity in August, this is a real engineering conversation, not a line item.
  • Electrical panel upgrade. A dewatering screen, transfer pumps, and the separator can push an older service past rated capacity.
  • Permits, engineering, and nutrient management plan updates. State rules vary. A separator changes manure-solids chemistry, which can trigger plan revisions before it triggers anything in the bulk tank.

A realistic “all-in” anchor for a 400-cow retrofit isn’t $85,000. It’s $85,000 plus whatever your site needs to actually run the equipment. Anchor your lender model to a live, anonymized vendor quote that prices electrical, storage, and civil work separately. If any of those lines come back as “TBD,” treat “TBD” as the upper end of the ranges above until proven otherwise.

Should You Switch From New Sand to Recycled Sand on a 400-Cow Herd?

Rowbotham and Ruegg’s 2016 work also documented that new sand generally carries fewer Gram-negative bacteria than recycled sand, and that clinical mastitis incidence rates across bedding types didn’t differ significantly — at least when management held steady.

That “when management held steady” clause is doing a lot of work.

What “In Spec” Actually Looks Like vs. What “Drifted” Looks Like

McLanahan’s own dewatering screen specifications give you a concrete measuring stick.

ParameterRaw Recycled Sand (Pre-Screen)In-Spec After Dewatering ScreenDrifted / Red-Flag
Moisture content~20%~12%>15%
Organic matter contentElevated<1%>1.5%
Visible characterDamp, darker, organic finesGranular, lighter, sand-likePack-y, stains the hand, sour smell
Stall behaviorCompacts, holds moistureGrooms like new sandCows bed short, rear legs stay wet

The in-spec column is what the equipment can deliver. The drifted column is what shared-duty labor often delivers three months in. The middle column isn’t automatic. It’s the output of someone owning the process.

A 2021 Wisconsin microbiota study in Animals (“Assessing the microbiota of recycled bedding sand on a Wisconsin dairy farm”) found bacterial community composition in recycled sand shifts significantly with both season and recycling stage. Leite et al. tied bedding moisture to clinical mastitis incidence and coliform counts to subclinical mastitis prevalence.

When moisture rises and organic content climbs, the bacterial envelope in the stall shifts with it. The separator’s still working. The auger still turns, sand still comes out. Working and working correctly are not the same thing — and a 400-cow operation running shared-duty labor is the most exposed to the gap between them.

What a 20,000 Cells/mL SCC Drift Actually Costs You

The Day 90 commissioning check specifies bulk-tank SCC staying within about 20,000 cells/mL of the pre-commissioning baseline. That sounds small. On a 400-cow herd, it isn’t.

Working with round but honest inputs: 400 cows averaging roughly 87.5 lbs/day ships 35,000 lbs (350 cwt) of milk per day. If an SCC drift costs that herd a $0.20/cwt quality premium step on a processor’s tiered schedule — a common band in published mailbox premium — the arithmetic is direct:

That’s $25,550 of premium lost, every year the drift persists — against a stressed-case net savings of roughly $17,000. The lost premium alone is larger than the Year-2 net savings. It doesn’t just stretch the payback period. It inverts it.

And that’s before a single Klebsiella cow goes down, before a single treatment cost, before a single withheld-milk day.

Plug in your own $/cwt step when you run this for your operation. The arithmetic doesn’t change. What changes is how quickly the separator stops being an asset on your balance sheet.

Is This an ROI Play — or an Insurance Play?

That’s the framing shift Northeast producers have to make before they run the same math a Midwest operation does.

In the Midwest, the SMS12 is usually an ROI play: a capital investment that pays back through reduced new-sand purchases, evaluated against a relatively stable regional sand market. In the Northeast, it’s increasingly an insurance play: capital that hedges a structural supply problem, evaluated against a rising input price trajectory. Same equipment. Different thesis. Different lender conversation.

The 2017 SARE-funded bedding study by Smith, Simms, and Aber (“Case Study: Animal bedding cost and somatic cell count across New England dairy farms”) surveyed 129 producers and documented a 70% real-dollar increase in bedding costs between 2003 and 2013 — conventional dairy costs rose from /cow/year to 4/cow/year, and organic operations from to 5. That trajectory hasn’t reversed. Quarry consolidation, construction demand, and 30×50 silica sand specifications keep pinching supply.

Some Northeast producers find themselves dependent on a single quarry relationship, and a closure or disruption pushes them quickly into the spot band.

Against a conservative 4% annual sand-price inflation from $18/ton — and the SARE numbers are anything but alarmist by that standard — the separator’s Year 10 economics shift sharply in its favor. That case has to be made explicitly to the lender. A base-case payback model isn’t built to carry a 15-year rising-input assumption. If you can’t justify the SMS12 as an ROI play at today’s contract prices, you may still be able to justify it as an insurance play against the next decade of them.

THE HARD TRUTH

If your morning feeder is also your “Separator Manager,” your recovery rate is 75%, not 93%. The machine is automated. The consistency isn’t. If you don’t have someone on the payroll who treats sand dryness like a religion, stay with new sand.

The 30/90/365 Commissioning Playbook

Every separator investment should come with three audit dates baked into the loan conversation before commissioning day. Not after.

Day 30 — Is the Machine Working?

Three cheap measurements. None requiring a consultant.

  • Dry matter of recovered sand: target 35–40%
  • Organic matter content: target below 1.5%; McLanahan’s spec with a dewatering screen is below 1%
  • Sand recovery rate: target 90–95%, per NRCS Practice Standard 632

Day 90 — Is the System Working?

This is where commissioning drift shows up in the data.

  • Bacterial counts on fresh recovered sand and on used bedding from the back third of occupied stalls. Extension management guidance and Cornell field research point to a 300,000 cfu/g target and a 1,000,000 cfu/g red-flag line. 
  • Testing cost (2025 Cornell AHDC): BEDID1 environmental bacterial quantification at $48 per sample plus an $8 accession fee — roughly $50–$75 per sample all-in.
  • Bulk tank SCC check: within about 20,000 cells/mL of the pre-commissioning baseline. Drift beyond that at Day 90 is a management or mechanical signal, not a commissioning artifact — and on a 400-cow herd, it’s the $25,550/year problem from the section above until you fix it.

Day 365 — Is the Investment Working?

This is the conversation you want with your lender — not a surprise at refinancing.

  • Reconcile actual new sand purchased, actual O&M costs, and actual milk quality premium capture against the loan application projections.
  • Within 15% of projection: healthy; stay the course.
  • Shortfall of 25% or more: systematic problem requiring management intervention, not an assumption that Year 2 will be better on its own.

Operations that only run Day 30 informally tend to miss the drift that shows up between months three and six. That’s where the gap between projection and reality opens up. Cornell’s long-term performance came out of a facility where the system was the dedicated focus of staff. On a shared-duty operation, that focus erodes in inches.

Four Paths and What They Each Actually Cost You

Path / StrategyWhen It Actually WorksTypical Bedding Cost Band ($/cow/yr)Red-Flag Situation (Don’t Do This)
New sand, optimize what you haveDelivered sand under ~$12/ton; barn not designed for recycling; tight labor~80–110Installing SMS12 just to “keep up with neighbors”
Recycled sand, purpose-designed system400+ cows; $16+/ton sand; dedicated separator operator and good ventilation~65–90Retrofits with <4 ft fall or no covered storage
Recycled sand as supply hedgeNortheast herds at $18–24/ton with single quarry dependence~90–120Treating it as a 2.5‑year ROI play instead of insurance
Wait, stay on new sand until renovationCurrent barn geometry wrong; renovation or expansion already on the horizon~100–140Sinking capex into separator before fixing the barn design

Path 1: New sand, optimize what you have. Works when delivered sand is under $12/ton, the barn lacks adequate fall or ventilation for recycling, or the labor structure can’t absorb a dedicated daily protocol. If you’re already under $100/cow in bedding, separator capex probably doesn’t survive honest stress-testing.

Path 2: Recycled sand, purpose-designed integration. Works when sand is $16+/ton, herd size is 400+, and you can assign dedicated operator time — not bolt it onto someone’s morning route. Requires written daily protocols, monthly bacterial testing at Cornell AHDC 2025 rates, and a backup supplier relationship locked in before commissioning day. Where it backfires: retrofits into barns with under four feet of fall, curtain-sided structures with weak summer ventilation, and indoor covered sand storage that traps moisture in the pile.

Path 3: Recycled sand as a supply hedge, not a cost savings play. The Northeast case. At $18–24/ton with single-supplier risk, evaluate the separator as a 15-year input supply investment, with the math running against a rising price trajectory rather than today’s contract price.

Path 4: Keep buying new sand until the barn catches up. Works when current infrastructure isn’t suited to recycling but a renovation or expansion is already on the horizon. Cornell’s 93% came from a facility designed around the system, not retrofitted into one. Waiting, doing the renovation right, and then buying the separator isn’t a failure of ambition. Sometimes it’s the sharper capital sequence.

Your Next 30 Days

Pull your sand delivery invoices for the last 24 months and calculate your actual per-cow bedding cost. Compare it to the $110–$137 band typical at $12–15/ton delivered. Then pull your last two bulk-tank SCC reports and your last DHI cull reason summary, and mark the cows in stalls 1–10 that you cannot afford to lose to a bedding event. That single hour tells you which of the four paths is yours before a dealer sets foot on the place.

What This Means for Your Operation

  • Before you call a dealer: if this system runs at 80% of projected performance for two years, can your operation absorb that financially and still say yes? If the answer makes you flinch, the more defensible decision is to stay with new sand and harden your supplier relationships.
  • Run your actual delivered sand price against the threshold bands: under $10/ton, almost certainly no; $10–14/ton, only with dedicated labor and a strong milk quality premium structure; $16+/ton, the economics work if the barn supports it.
  • Audit three fixed barn factors before any other conversation: alley fall, ventilation design, and covered storage location. These predetermine the bacterial envelope your recycled sand lives inside before the operator ever touches it.
  • Price the soft costs separately: three-phase power, covered storage, alley fall modifications, permits, panel capacity. If any sit on “TBD,” assume the upper end of published ranges in your lender model.
  • Price the genetic exposure separately: a single Klebsiella cull on a high-pedigree cow in Month 3 can cost more than the first year of net separator savings. Account for it in your stressed case, not your base case.
  • Build the lender conversation around a stressed-case cash flow model — 78% recovery, one commissioning SCC event, $4,000 O&M overage — not the base case. Post-2020 agricultural lending practice has tightened DSCR floors and rate-sensitivity assumptions; confirm specifics with your Farm Credit branch or equivalent before signing.
  • If separator management will be an “added duty” rather than a primary assignment, haircut your projected net savings by 20% before comparing payback. 

Key Takeaways

  • If delivered sand is under $12/ton and your barn wasn’t designed for recycling, the separator probably doesn’t pencil honestly — regardless of what the base case says.
  • If you’re in the Northeast at $18+/ton with single-supplier risk, evaluate the SMS12 as an insurance play, not an ROI play. The SARE 2003–2013 data already showed a 70% real-dollar cost increase. Nothing about the last decade suggests that direction has changed.
  • If your barn has under four feet of fall, curtain-sided summer ventilation, or indoor covered sand storage, fix the barn first. Cornell’s 93% and SwissLane’s 90% both came from facilities designed to support the system. No operator skill compensates for the wrong infrastructure.
  • If separator operation will be an added duty on top of an existing workload, haircut projected savings by 20% in your own model. It’s not pessimism — it’s what the commissioning record shows.
  • If your 400-cow herd carries a pedigree nucleus, one preventable Klebsiella cull in commissioning can erase a full year of separator savings — and the genetic progress behind the cow you just put on the trailer.
  • If you can’t answer the 80% question with a clear yes, keep the $85,000 and buy three years of new sand instead. Sometimes that’s the sharper capital decision.

The spreadsheet on your kitchen table shows the base case. Cornell’s team didn’t just run the base case — they built the system, staffed it, measured it at 30 days, 90 days, and every week for years. That’s why their long-term average is 93%. The question for your operation isn’t whether McLanahan builds a system that performs. They do. The question is whether your barn, your labor, and your balance sheet are set up to capture that performance — and what happens to your milk cheque, and the cow in stall 47, in Year 1 if they aren’t. Does your current payback model have a cell for that answer?

This article draws on McLanahan’s published Cornell and SwissLane case studies, the cited peer-reviewed research, and public technical material. McLanahan, Cornell Teaching Dairy Barn, and SwissLane Dairy were not interviewed directly for this piece.

Learn More

  • What Type of Bedding is Best for Cows? — Evaluate the microbial thresholds and cost-per-cow shifts that signal it is time to pivot your bedding strategy. Arms you with the benchmarks to decide if sand still pencils against rising regional commodity prices.
  • Why Cow Comfort is a Competitive Advantage — Position your dairy for the next decade by leveraging stall environment as a strategic production asset. Exposes how superior comfort secures cow longevity and maximizes the genetic potential of your elite herd.
  • How to Make Sand Bedding Work in Your Robotic Dairy — Bridge the gap between sand comfort and robotic milking hardware without risking machine downtime. Delivers the technical blueprints for managing silica’s abrasive wear while maintaining the gold standard in cow cleanliness.

The Sunday Read Dairy Professionals Don’t Skip.

Every week, thousands of producers, breeders, and industry insiders open Bullvine Weekly for genetics insights, market shifts, and profit strategies they won’t find anywhere else. One email. Five minutes. Smarter decisions all week.
NewsSubscribe
First
Last
Consent

Dairy Labor’s $48,000 Tuesday: Why Every U.S. Producer Needs a 72‑Hour Plan

On April 21, 2025, CBP arrested eight workers at Vermont’s largest dairy before the morning milking finished. The cows still had to be milked. Does your barn have a plan for that Tuesday?

Executive Summary: On April 21, 2025, CBP arrested eight workers at Pleasant Valley Farms in Berkshire, Vermont — the state’s largest dairy, 3,000 cows across 10,000 acres — and every U.S. producer who leans on immigrant labor should treat it as a dress rehearsal. Vermont detentions ran close to tenfold their prior baseline in 2025, roughly 900 people through state facilities, per Migrant Justice intake data cited by The Guardian. On an 800‑cow herd at ~$20/cwt (USDA AMS, Aug 2025), a 30% crew loss driving a worst‑case 10 lb/cow drop leaks about $48,000 in 30 days before a single SCC penalty or covenant call; a milder 3–5 lb drop still bleeds $14,000–$24,000. Relief labor runs a one‑third to one‑half premium over the USDA NASS April 2025 livestock wage of $18.15/hr — budget $24–$27/hr when the call comes. Your lender and co‑op field rep are already watching workforce stability as a cash‑flow risk; February 2026 outlook has mailbox prices running $2.50–$3.00/cwt below 2025 on top of it. The 30‑day move isn’t waiting on the Farm Workforce Modernization Act — it’s booking a real I‑9 self‑audit with an employment attorney and writing a one‑page 72‑hour staffing plan with names, not roles. If your answer to “who milks Tuesday if three people don’t show up” is a shrug, that’s the first number to fix.

Dairy labor risk

On April 21, 2025, U.S. Customs and Border Protection agents arrested eight migrant workers at Pleasant Valley Farmsin Berkshire, Vermont, according to reporting by VTDigger and Vermont Public. The St. Pierre family operation is the state’s largest dairy, milking roughly 3,000 cows across about 10,000 acres in Vermont and New Hampshire. The cows, of course, still had to be milked.

The workers — not the farm — were the subject of the federal proceedings. The Bullvine contacted Pleasant Valley Farms for comment; but has received no response received.

That’s the part the policy press usually doesn’t cover. If you run a dairy that leans on immigrant labor, the Pleasant Valley enforcement story isn’t a “Vermont thing.” It’s a preview of what dairy labor enforcement can look like when it lands close to your yard. We had charts. We had quotes from Washington. We had a draft sitting in our CMS that week explaining, yet again, why the Farm Workforce Modernization Act might — someday — open a legal path for year‑round dairy workers. What we didn’t have was a single article that helped a producer survive the first 72 hours after a crew disappears.

That’s the blind spot this piece is about. Not because Vermont is special. Because the policy‑first frame we were using applies to almost every U.S. dairy that runs on immigrant labor — and in a crisis, that frame is useless in the parlor.

Why Your Lender Might Be Thinking About This Before You Are

Let’s start with the part that’ll keep you up at night — and it’s not CBP. It’s your next renewal conversation.

Quietly, ag lenders and co‑op field staff have started asking harder questions about workforce stability. Not to police your hiring — because a 30% crew loss hits cash flow faster than almost any commodity price move, and it shows up in the places they already watch: milk quality penalties, herd health costs, production slippage and covenant ratios. February 2026 dairy outlook flagged margin compression for 2026. Layer workforce disruption on top of that and you’ve got the kind of compound cash‑flow risk any ag lender watches closely.

Across several operator conversations in late 2025, the same question surfaced in different words: not another article about the Farm Workforce Modernization Act, but what their lender would actually accept as workforce continuity documentation if federal enforcement action ever affected their own payroll, regardless of what they believed about their crew’s status. No single conversation said it that cleanly. But the sentiment showed up often enough to stop being an outlier.

Operational coverage — I‑9 audit explainers, enforcement‑response protocols, emergency staffing templates — was getting forwarded to operators by their own attorneys and co‑op reps. Ours wasn’t. That’s the moment a policy‑first frame stopped being defensible.

Where Our Coverage Missed The Barn

For eighteen months, The Bullvine covered dairy labor like it was a Capitol Hill story. Federal reform bills. Association statements. USDA labor surveys. Tidy quotes from Congressional co‑sponsors. Most of that reporting was factually accurate.

In July 2025, we ran “Here’s the Hard Truth About Labor Reform: Why the Farm Workforce Modernization Act Could Finally Fix Dairy’s Biggest Crisis.” The credibility anchor was a Congressional co‑sponsor. The call to action was legislative preparation. A month earlier, “How Dairy’s Worker Shortage Will Reshape Your Farm by 2030” treated labor as a long‑arc automation and demographics story.

Both pieces were solid reporting. Both pointed the reader toward Washington. And neither of them helped you decide who covers Tuesday morning.

The Guardian‘s April 16, 2026 investigation — “‘I don’t go out’: Vermont’s undocumented dairy workers live in fear after immigration raids” — made the gap obvious. A Vermont dairy of recognized size was the site of a federal enforcement action, and the immediate operational questions that followed — who milks tomorrow, who pays bond, what does the lender say — were not ones our Capitol‑focused coverage had prepared any reader to answer. VTDigger reported in May 2025 that one of the Pleasant Valley workers was ordered released on a $10,000 bond, and another on the $1,500 statutory minimum.

What’s Actually At Risk For Your Herd

Step outside Vermont for a minute. This story isn’t really about one state.

A Texas A&M AgriLife Center for North American Studies / NMPF survey of 973 dairies across 18 states (Adcock, Anderson and Rosson, fieldwork 2014, published 2015) found that immigrant labor accounts for 51% of all U.S. dairy labor, and that dairies employing immigrant labor produce roughly 79% of the nation’s milk supply. A 2018 NMPF follow‑up concluded that a complete loss of immigrant labor could cost the U.S. economy $32.1 billion and eliminate one‑in‑six dairy farms. Across much of the Midwest, Northeast and West, immigrant workers — both documented and undocumented — make up a substantial share of parlor crews on mid‑ and large‑herd dairies.

When enforcement ticks up, you don’t feel it as a shift in the Federal Register. You feel it as a hole in Tuesday’s schedule. A milker who worked Saturday and Sunday but didn’t show up Monday. A cousin who left the state overnight after seeing a neighbor’s farm on the news.

That’s the version of labor risk we hadn’t been writing into. So here’s the math we should have been running all along.

What Does A 30% Crew Loss Actually Cost On An 800‑Cow Herd?

Take an 800‑cow herd shipping 65–70 lb/cow/day — mid‑to‑upper range for a commercial Northeast herd. USDA’s August 2025 mailbox milk price across all Federal Orders averaged $20.03/cwt, down $2.90 from August 2024. February 2026 dairy snapshot projects 2026 mailbox prices running $2.50–$3.00/cwt lower than 2025. Call it a ~$20/cwt working number for a Northeast herd. That’s about $11,200 a day in milk revenue coming off the pad.

Now assume a neighboring farm sees an enforcement action and 30% of your crew either doesn’t show up or gives notice within a week. Parlor prep gets rushed. Shifts stretch. The cow that should have been culled three months ago is suddenly a long‑term employee.

The Cost of a “Tuesday Morning” Crisis

Based on an 800‑cow herd at ~$20.00/cwt

MetricStandard Operation30% Crew Loss (First 30 Days)
Daily milk revenue$11,200$9,600 (worst‑case 10 lb/cow drop)
Monthly revenue leak$0−$48,000
Labor cost$18.15/hr (USDA NASS, Apr 2025 livestock workers)$24–$27/hr (1/3–1/2 premium range)
Milk qualityStable SCC, standard protocolMastitis spikes, rushed prep, missed detections
Long‑term riskNormal cull/replace rhythmCull errors, lender flags, co‑op quality penalties

That $48,000 is the worst‑case first‑30‑day figure. A milder shock — say a 3–5 lb/cow drop because you triaged fast and kept fresh‑cow protocols intact — produces monthly revenue leaks in the $14,000–$24,000 range on the same herd. Either way, run these numbers with your own herd size, shipping average, and mailbox price before your next bank meeting. The point isn’t the $48K. The point is knowing what it costs you to buy back one week of rushed milking.

Push the same scenario onto a 400‑cow herd losing two key employees and the daily number gets smaller, but the percentage hit to your margin often gets worse. You have fewer people to absorb the shock.

That math is what we left out of our labor coverage for eighteen months. Not because we didn’t have it. Because we were reporting upward, toward the Capitol, instead of sideways, toward the parlor. 

The Mechanics Behind The Shock

Three structural realities explain why a single enforcement event lurches the way this one did in Vermont, and why your exposure may be bigger than your books suggest.

Structural dependence with no legal backfill. Dairy tilted hard toward immigrant labor over two decades. Non‑ag wage expectations rose, H‑2A and H‑2B visas were written for seasonal crops rather than cows that calve on Christmas, and consolidation put more hired positions on fewer farms. Vermont has lost 49% of its dairy farms since 2013 while cows per farm have jumped 69% (Vermont Dairy Delivers, 2024). A single enforcement event doesn’t bounce. It lands.

Enforcement is lumpy, not linear. VTDigger characterized the Pleasant Valley arrests as the largest Vermont immigration enforcement action targeting migrant workers in recent memory, and roughly 900 immigrants were detained in Vermont facilities in 2025 — close to a tenfold increase over the prior baseline, according to Migrant Justice intake data cited in The Guardian‘s April 2026 investigation. From your side of the fence, it looks like random bad luck. It isn’t.

Your buyers and lenders are paying attention. Brand‑sensitive processors and retailers don’t want to be on the six o’clock news next to an enforcement story. Quality problems and covenant breaches make lenders flinch. Public enforcement events can accelerate both.

Every U.S. dairy operates inside that reality, whatever your own workforce composition.

72‑Hour Survival Checklist

Print this. Put it in the milk house. You won’t have time to Google it when the call comes.

Editorial guidance only — not legal advice. Consult your own employment attorney for jurisdiction‑specific guidance on I‑9, enforcement‑response protocol, and lender communications. 

Protocol ElementUnprepared OperationLender-Ready OperationWhy It Matters
Tuesday 2 a.m. crew backup“We’ll figure it out”Named list, not rolesShifts fill in < 6 hours
I-9 audit statusDrawer checkAttorney-led self-auditReduces paper-trail risk
Emergency wage rateNegotiated in crisisPre-agreed at $24–$27/hrNo resentment at 3 a.m.
Lender notificationAfter covenant flagBefore the callPreserves refinancing optionality
Documentation of impactVerbal, laterWritten, within 24 hrsAttorney + lender both want it

Hour 1–6: Triage

  • Confirm who’s missing. Call or text every crew member. Don’t assume — verify.
  • Lock down the milking schedule. Who’s covering the next shift? Write names on the whiteboard, not roles.
  • Call your herd manager. If they’re affected, you need to know now, not at 4 p.m.
  • Do not discuss immigration status with anyone on your crew, any agent, or any reporter. Call your attorney first.

Hour 6–24: Stabilize

  • Activate your emergency contact list. Relief milkers, retired employees, neighbors with parlor experience, family members.
  • Notify your veterinarian. Short‑staffed milking means rushed prep means higher mastitis risk. Get ahead of it.
  • Call your co‑op field rep and explain the situation. Quality penalties are easier to manage with advance notice than with a surprise SCC spike.
  • Document everything. Hours worked, temps called, protocols skipped. Your lender and your attorney will both want this.

Hour 24–72: Shore Up

  • Contact your ag lender. Brief them before the covenant math does it for you. Bring a written estimate of the revenue and cost impact.
  • Set emergency pay rates for overtime and relief workers and communicate them clearly. Ambiguity breeds resentment when everyone’s exhausted.
  • Identify which tasks to cut vs. which to protect. Fresh‑cow checks, milking prep, and feeding can’t slip. Cosmetic barn work can wait.
  • Begin recruiting. Expect relief labor to cost a one‑third to one‑half premium over the USDA NASS April 2025 livestock worker average of $18.15/hr — roughly $24–$27/hr based on what Northeast operators and co‑op field staff are quoting in 2025–2026. Budget for it.

What Would You Actually Do On A Tuesday?

Here’s the honest question. If your phone buzzed at 5 a.m. with news that a neighbor’s farm had seen an enforcement action, and by 7 a.m. three of your best parlor people hadn’t shown up — what would the next 72 hours look like?

If you can answer in specifics — names, shifts, call list, pay rate, feed routine — you’re in better shape than most. If you can’t, that’s your homework for the month. Pull the list of who’s on your 2 a.m. crew. Ask yourself which two names you’d replace first, and with whom.

Options And Trade‑Offs

You’re not going to solve federal immigration policy from the milk house. You do have choices about how you prepare for the next 72‑hour shock. Four are worth running.

1. Treat I‑9 and documentation like biosecurity. When it makes sense: any herd with hired labor, and any operation in a region where neighbors have already been affected. What it requires: a real I‑9 self‑audit with an employment attorney or HR pro — not a drawer check — plus written onboarding and document‑handling procedures, and a clear plan for what you’ll say if federal agents arrive, with or without a warrant. Risks and limits: you can’t audit your way into a fully legal crew if no legal pipeline exists for year‑round workers. Sloppy internal audits can create paper trails that hurt you later. 30‑day action: book that I‑9 consult this month, even if you’re sure you’re fine.

2. Write a 72‑hour staffing protocol. When it makes sense: herds over 400 cows, where losing two parlor employees blows up the schedule. What it requires: a named list (not roles — names) of who covers milking, feeding and fresh cows in a short‑staffed week. A pre‑agreed wage premium or bonus framework for emergency coverage. A written “bare minimum operations” plan that protects milk quality and cow welfare when you can’t run the normal playbook. Risks and limits: emergency labor is expensive. USDA NASS reported the April 2025 livestock worker wage at $18.15/hour, up 4% year over year. Paying a one‑third to one‑half premium over that baseline adds up fast, and family labor patches can hide burnout until it breaks.

3. Decide how far you’ll go on automation. When it makes sense: herds already flirting with a third parlor shift, and operations with balance sheets and lenders that can absorb long‑payback capital. What it requires: honest ROI math that accounts for robots plus maintenance, software and financing — not just “robots replace X workers.” A realistic view of how much human oversight automated systems still need. Risks and limits: automation doesn’t end your enforcement exposure if you still rely on immigrant workers in maternity, youngstock and feeding. Over‑leveraging for robots during a labor panic traps you if milk slips or rates stay sticky. [INTERNAL LINK: Clark Farms / 143‑hour‑week ROI piece] → Suggested anchor text: “how one operation did the hard math on time, capital and labor” → pillar page / Tier 3 economics.

4. Talk to your lender before they talk to you. When it makes sense: any operation refinancing in the next 18–24 months, or any herd where more than half of hired positions are filled by immigrants. What it requires: a candid conversation about how many roles would be hard to refill within 30 days, a short written workforce continuity plan, and willingness to hear uncomfortable questions now instead of at renewal. Risks and limits: some lenders aren’t ready for this conversation. Some will default to box‑checking. Better that than a surprise at the covenant review.

Key Takeaways

  • If your crew is foreign‑born, book an I‑9 self‑audit with an employment attorney within the next 30 days. Not a drawer check. A real one.
  • If two missing milkers would break your schedule, write a one‑page 72‑hour staffing plan with names — not just roles — on the page.
  • If you’re refinancing soon, ask your loan officer what workforce continuity documentation they’d actually find useful before they ask you for it.
  • If you haven’t run a 30% crew‑loss barn‑math scenario for your own herd size and milk price, do it before your next bank meeting. The number will either reassure you or rearrange your calendar.
  • If SCC penalties crept up while you’ve been short‑staffed, treat that as a labor‑risk warning light, not just a milk quality issue.
  • If you’re eyeing automation because of labor fear, run the ROI math twice — once with wage savings, once with a realistic headcount for all the jobs robots won’t touch.

Don’t Get Caught Without A Plan

The next enforcement story will land somewhere. Maybe not your county, maybe not your co‑op, maybe not this season. It will land on someone’s crew, someone’s lender call and someone’s quality report.

The question isn’t whether federal policy is fair. It’s whether your operation can stay upright when a meaningful share of your crew can’t show up on a Tuesday and nobody in Washington picks up the phone.

Complete references and supporting documentation are available upon request by contacting the editorial team at editor@thebullvine.com.

Learn More

The Sunday Read Dairy Professionals Don’t Skip.

Every week, thousands of producers, breeders, and industry insiders open Bullvine Weekly for genetics insights, market shifts, and profit strategies they won’t find anywhere else. One email. Five minutes. Smarter decisions all week.
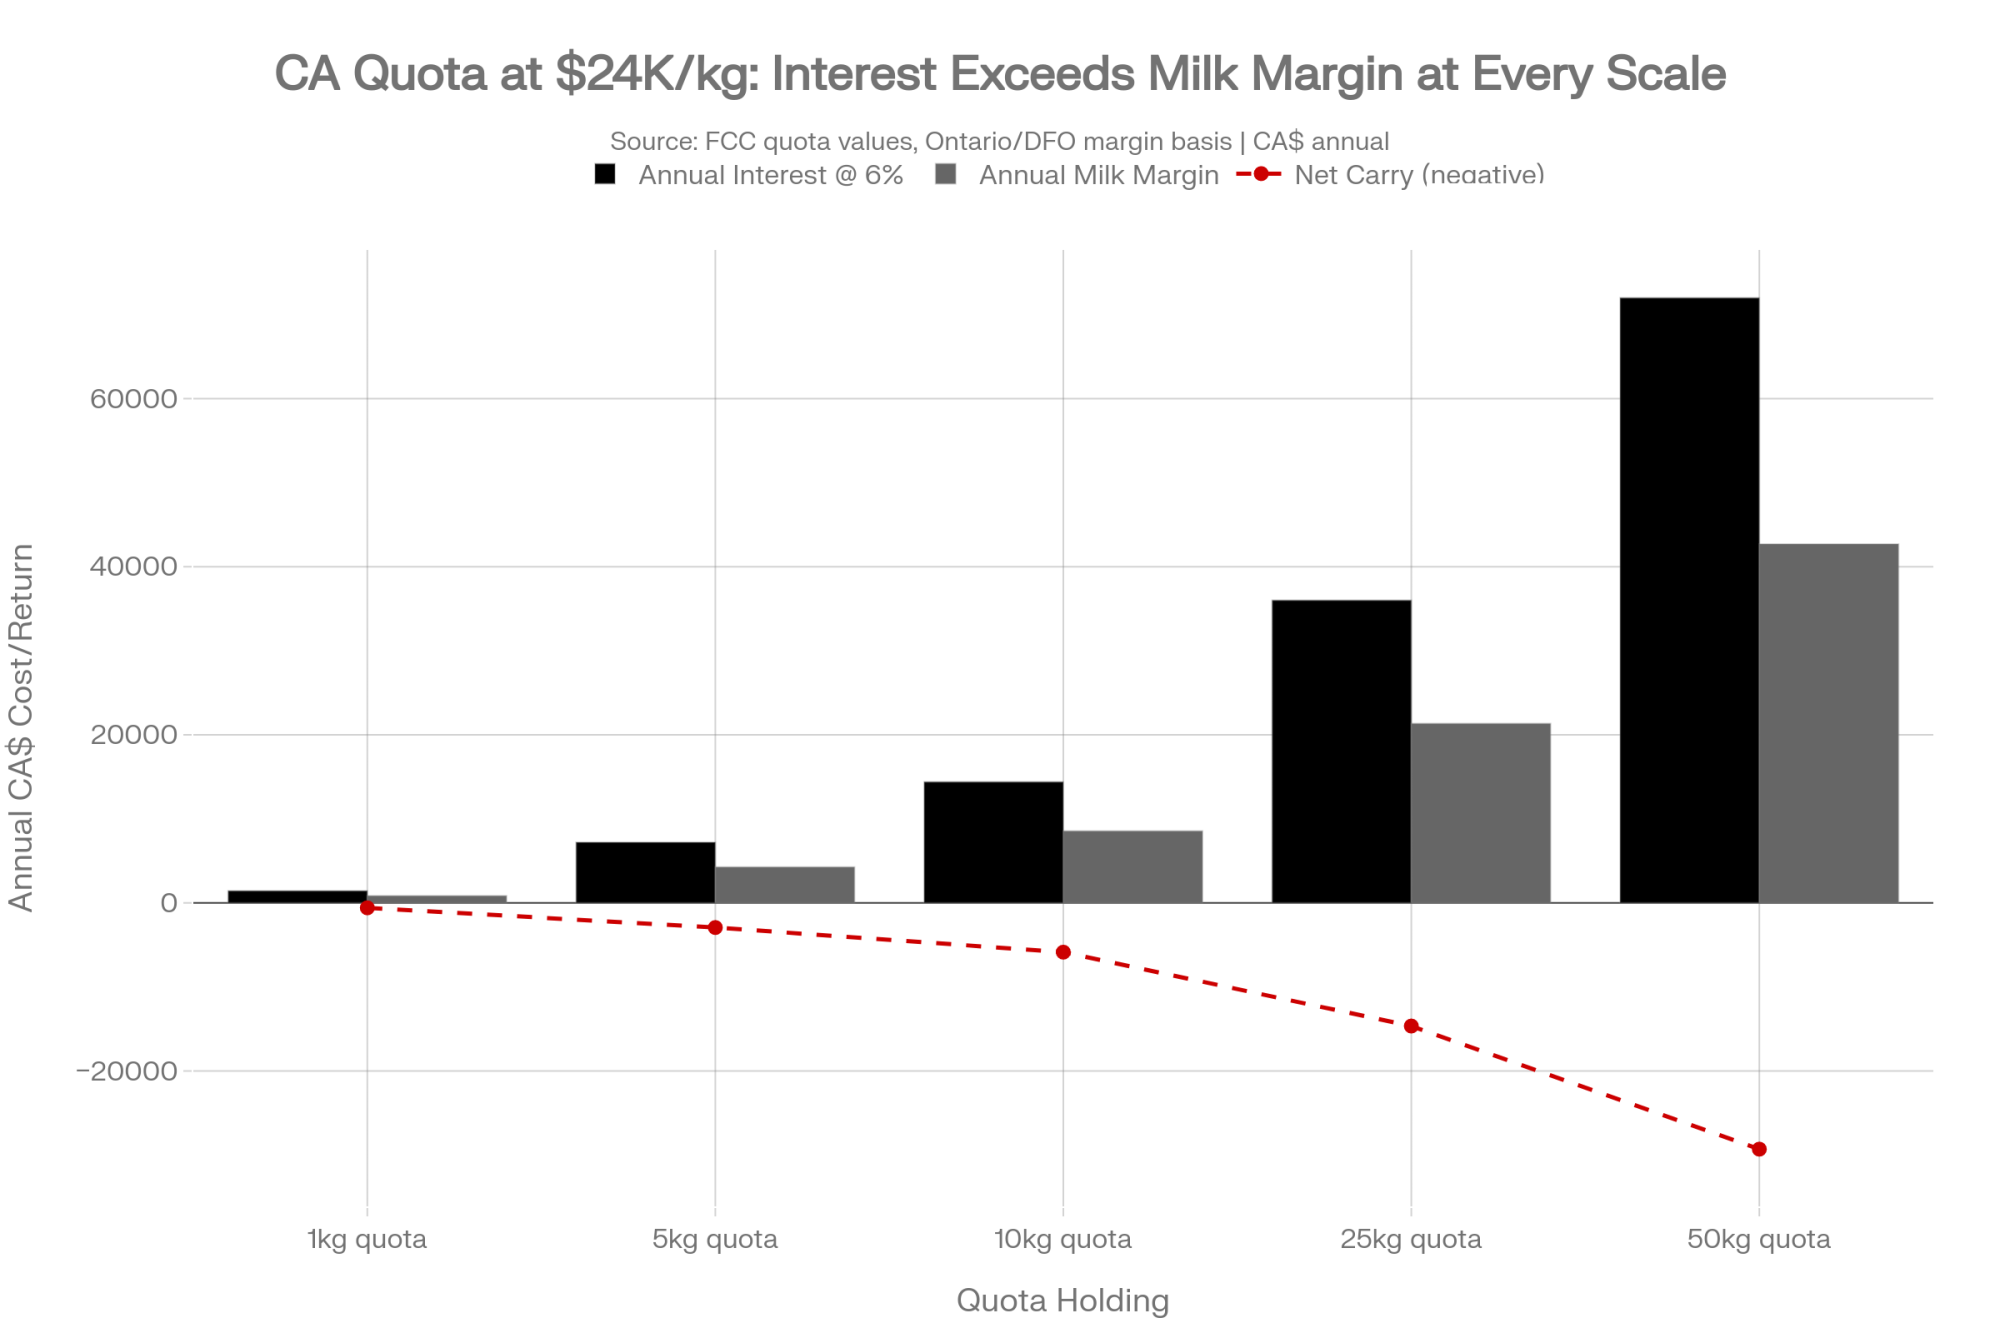
NewsSubscribe
First
Last
Consent

The 1.20 FFA Line: Why Guelph Says Call the Vet Before the Tech

Guelph pulled 171,843 Ontario bulk tank tests and found the biggest FFA drivers weren’t your pump. They were your close-up pen, your ration, and three-incentive-day months.

Executive Summary: Guelph researchers Hannah Woodhouse and Dr. David Kelton, working across 171,843 monthly bulk tank observations from every Ontario dairy farm over four years, have reframed the 1.20 mmol FFA sensory threshold as a transition-cow test, not a hygiene test — the significant predictors of an elevated month are lower bulk tank protein, non-parlor milking systems, three-incentive-day months, and higher bacteria counts, not your pump.¹ A companion 293-farm paper (J. Dairy Sci., Feb 2025) attached a 1.17 mmol/100g fat association to the tie-stall + ≥3×/day combination alone, and flagged that no operation in the 109-farm parlor freestall subsample posted a monthly average at or above 1.20.² The FFA penalty side lives almost entirely in the processor-specifications clause of your co-op supply agreement — BC Milk confirms FFA doesn’t affect provincial-pool pay, and no major North American processor posts its $/cwt FFA schedule publicly.³ On a 500-cow US herd producing 11,400 cwt/month at March 2026’s $16.16/cwt Class III, a $0.10–$0.50/cwt hit pencils at $13,680–$68,400/year, and FMMO reform’s 85–93¢/cwt Class-price reductions just tightened the margin in front of that number.⁴ The fastest intervention isn’t a facilities spend: plot FPR alongside FFA for six months, start fresh-cow BHBA testing at ≥1.2 mmol/L cutoff, move dry-off BCS into the 3.0–3.25 window, and layer in rumen-protected choline at the Arshad et al. (2020) dose.⁵ The demographic layer matters too — with US heifer inventories at a 20-year low and CoBank projecting 438,844 fewer dairy heifers in 2026, any parity-shift cull decision runs into $3,000+ replacement costs.⁶ The operator action: pull your last six bulk tank reports and your supply agreement this week, and get your co-op’s FFA penalty math in writing.

In January 2023, Dairy Farmers of Ontario field staff triggered an investigation on a 40-cow Holstein tie-stall that had averaged 1.32 ± 0.50 mmol FFA/100g fat across 752 samples between August 2018 and October 2022 — with more than 54% of samples at or above the 1.20 sensory threshold. The milking equipment tech had already been out. Vacuum fine. Liners fine. Filters changed at every milking, three times a day.

University of Guelph researcher Hannah Woodhouse and Dr. David Kelton walked into that barn and found what the data had been whispering all along: cracked milking unit claws with curdled milk inside, unequal milking intervals as short as three hours, and palm fat fed at 300 g/head/day with the dose pushed higher during fall DFO incentive months.¹ The equipment problems were real. But the ration, the intervals, and the calendar were doing most of the damage — and the equipment tech was never going to solve any of that alone.

That anonymized case farm sits at the clinical end of a bigger story. A body of peer-reviewed Guelph work covering every Ontario dairy farm over four years has reframed the 1.20 mmol bulk tank free fatty acids line as a transition-cow and management test, not a hygiene test.¹,² And the penalty exposure that follows it isn’t on your pay statement — it’s in the “processor specifications” pass-through buried in your co-op supply agreement.

What the 1.20 Bulk Tank Free Fatty Acid Threshold Is Really Measuring

Start with what the 1.20 line does to milk. Above it, trained taste panels pick up rancid notes in butter and cheese, foam stability drops, and cheese-milk coagulation suffers.¹ That’s why processors penalize above threshold. And it’s why the trade spent a decade calling this a hygiene problem — check the pump, audit the vacuum, change the filters.

The Woodhouse et al. JDS Communications work tells a different story. Monthly bulk tank averages across all 3,771 Ontario dairy farms, August 2018 through December 2022, totaled 171,843 observations. Roughly 7% of those monthly averages sat at or above 1.20, and the significant predictors of an elevated month weren’t hardware — they were lower bulk tank milk protein, non-parlor milking systems, three-incentive-day months, and higher bulk tank bacteria counts.⁷

Protein drift in a bulk tank isn’t a plumbing signal. It’s a metabolic signal — cows in negative energy balance, mobilizing body fat, driving NEFA and lipase activity into milk that’s already biochemically compromised before it touches a single piece of stainless. The 1.20 line isn’t testing your milking system. It’s testing your transition cow program.

Writing for AgProud in September 2024, Woodhouse put it in producer-ready terms: dairy producers can manage individual cows, ration quality, milking frequency, and milk filter changes to reduce FFA levels.⁸ Cows and ration come first on her own list. Filters last. The paper’s predictor ranking points squarely in the same direction.⁷

DimensionOld industry assumptionGuelph 2024-2025 evidenceOperator action
Primary causePump/vacuum/liner wearTransition-cow energy deficit (low BT protein)Call vet first
Key predictorEquipment ageTie-stall + ≥3×/day (β=1.17)Audit housing × milking freq
Filter protocolReplace more oftenFilter <2×/day adds only β=0.27Keep, don’t over-weight
Seasonality driverSummer heat on equipment3-incentive-day monthsMap incentives to FFA peaks
Parlor freestall herds ≥1.20Common0 of 109 farmsBenchmark target

Is This a Metabolic Problem or an Equipment Problem?

The Woodhouse et al. farm-factors paper (J. Dairy Sci., February 2025) put direct measurements on that question. It’s a cross-sectional study of 293 Canadian dairy farms — 238 in Ontario, 55 in British Columbia, split across 71 tie-stall, 109 parlor freestall, and 113 AMS freestall operations. Mean bulk tank FFA: 0.84 mmol/100g fat, SD 0.40, range 0.26–3.67. Ten percent of herds sat at or above 1.20.²

The final multivariable model is where the argument lands. Not in round numbers —in published beta coefficients:

  • Tie-stall barns milking ≥3×/day: β = 1.17 mmol/100g fat (95% CI 0.76–1.59)
  • AMS herds milking ≥3×/day: β = 0.27 (95% CI 0.12–0.41)
  • Not changing the milk filter at least 2×/day on ≥3×/d farms: β = 0.27 (95% CI 0.10–0.44)
  • No pre-cooling: β = 0.16 (95% CI 0.02–0.30)

And this one matters: **in the 109-farm parlor freestall subsample, no operation posted a monthly FFA average at or above 1.20 during the study window.**² That’s a snapshot, not a universal law. But it’s a loud snapshot.

The adjusted R² on the model was 29%, which is an honest way of saying hardware and routine only explain about a third of the variation — the rest sits in cows, rations, and calendars.² Ontario’s broader surveillance closes the loop: FFA lowest in May, highest in July and September, every year.⁷ Equipment doesn’t know what month it is. Transition cows do.

What’s the FFA Penalty Actually Worth on Your Herd?

Here’s where most coverage of this paper waves a dollar figure around and hopes you don’t check the schedule behind it. We’re not going to do that.

The Canadian disclosure landscape is thinner than it looks. DFO reports FFA back to every Ontario producer on every bulk tank load.¹ BC Milk has reported FFA back to producers since August 1, 2019 — but the BC Milk Marketing Board’s own Component & Quality Testing page explicitly states that FFA “does not factor into producer’s component or quality results and has no impact to a producer pay” at the provincial-pool level.³,⁹ That doesn’t mean there’s no penalty. It means the penalty, if any, flows through the processor-specifications clause of the individual producer agreement — which is not public.

On the US side, FMMO pooling doesn’t set FFA penalties at all. Those live entirely in co-op supply agreements and processor contracts, and we could not locate a single publicly posted $/cwt FFA penalty schedule from a major North American processor or co-op at publication. What is public is the penalty mechanism: above threshold, the plant either discounts the load, downgrades it out of cheese milk, or diverts it to a lower-value class. The dollar hit depends on your co-op, your plant, and your class mix.

So the barn-math in this piece is a worked example with reader-supplied inputs, not a documented exposure. Here’s the frame for a 500-cow US herd:

  • 500 cows × 75 lb/cow/day × 30.4 days ÷ 100 = 11,400 cwt/month.
  • At the USDA AMS-announced March 2026 Class III price of $16.16/cwt, gross milk value ≈ $184,224/month.¹⁰
  • Multiply 11,400 cwt by your own co-op’s FFA forfeiture ($/cwt) to size your exposure.
Illustrative $/cwt ForfeiturevAnnual Cost% of Annual Gross
$0.10/cwt$1,140$13,6800.6%
$0.25/cwt$2,850$34,2001.5%
$0.50/cwt$5,700$68,4003.1%

Halve the herd to 250 cows at the same production and price and the middle line pencils at about $17,100/year. Whatever your co-op’s number is, it’s not a rounding error — and the only way you’ll know it is to pull the agreement. That’s the point of the contract-audit step in the next section.

Did FMMO Reform Make the US FFA Penalty Sharper?

Federal milk marketing order reform took effect June 1, 2025. The USDA AMS final rule, issued January 15, 2025, after a 49-day national hearing and producer referenda across all 11 orders, reshaped component pricing formulas and raised processor make allowances:¹¹

ProductNew Make Allowance (per lb)
Cheese$0.2519
Butter$0.2272
Nonfat Dry Milk$0.2393
Dry Whey$0.2668

The butterfat recovery factor was adjusted to 91% (from 90%), and the composition factor upgrade — updating skim milk to 3.3% true protein, 6.0% other solids, 9.3% nonfat solids to reflect modern milk — was held back six months and took effect December 1, 2025.¹¹

AFBF economist Daniel Munch put hard numbers on the gap in his September 22, 2025, Market Intel piece. Higher make allowances pulled $337 million from pool revenues in the first three months alone, with Class price reductions of 85–93¢/cwt, and the six-month composition-factor delay cost farmers roughly $100 million in compensationagainst what full reform would have delivered on the original timeline.¹²

Margin pressure pushes operators harder toward co-op production incentive signals. The Ontario analysis flagged three-incentive-day months as a significant predictor of elevated FFA.⁷ Fat supplements rise. Marginal cows get pushed. The quality penalty — whatever your agreement says it is — then bites exactly the milk you overproduced. Neither side of that loop appears as a line item on the pay statement.

The Fastest Intervention That Doesn’t Cost $50,000

Before spending a dollar on facilities, run the JDS finding backward. Pull three bulk tank reports. Calculate fat-to-protein ratio. Penn State Extension flags a herd-level FPR above 1.4 as an energy-deficit and subclinical-ketosis signal when more than about 40% of the measured group exceeds it.¹³ A validation study refined the individual-cow cut-off to >1.42 (sensitivity 92%, specificity 65%) for subclinical ketosis.¹⁴ Twenty-minute diagnostic. Zero dollars.

Then the protocol. Do these now, not next quarter:

  • This week: Pull your last six bulk tank FFA reports from your co-op quality lab and plot FPR on the same months. If FPR leads FFA by 4–6 weeks, that’s your metabolic signal.
  • This week: Pull your co-op supply agreement. Find the “processor specifications” or “quality” clause and the line that references FFA. Then email your quality manager and ask, in writing, for (a) the exact $/cwt or class-downgrade math the plant applies above 1.20, and (b) what share of your last six quality adjustments was attributable to FFA. Save both answers. This is the barn-math input only you can get.
  • This month: Score every cow going dry. Anything above BCS 3.5 goes into a limit-fed pre-dry pen; dry-off BCS in the 3.0–3.25 range minimizes post-calving NEFA mobilization.¹⁵ Costs labor, not capital. Tank effect lags 6–8 weeks.
  • This month: Start fresh-cow BHBA testing. Blood BHBA ≥1.2 mmol/L is the widely used subclinical-ketosis cutoff with balanced sensitivity and specificity in hand-meter field work; Oetzel’s ≥1.4 mmol/L threshold marks the jump in DA and clinical ketosis risk.¹⁶ Test days 3–5 and 10–14. At ~40 calvings a month and roughly $1.00/test, that’s about $80/month. 
  • Within 60 days: Work rumen-protected choline into the close-up ration at the Arshad et al. (2020) meta-analysis dose of 60 g/cow/day at 25% active, from 21 days pre-calving through at least 28 days postpartum.⁵ That meta-analysis of 21 trials reported an average milk response of ~2.3 kg/day and ~0.08 kg/day fat, with substantial between-trial and between-herd variation.⁵ Balchem’s published summary of pooled ReaShure trials puts the sustained response at roughly 700 kg more milk over a standard 305-day lactation — real, but not uniform across herds.¹⁷ Ask your nutritionist for a per-cow-per-day cost based on current feed contracts; it will move with commodity markets and isn’t a single published number.

And the longer horizon:

  • 90 days: Six months of FFA + FPR plotted; at least two fresh-cow BHBA cohorts logged; your co-op’s FFA penalty math on file in writing; a decision on which of the three paths below you’re actually taking.
  • 365 days: Re-plot your fall FFA peak year-over-year against parity distribution and incentive-day calendar. Decide whether you can document a structural shift worth bringing to a co-op board meeting.

Filter changes still matter. The Woodhouse TTR follow-up paper (J. Dairy Sci., February 2026) found “milk too cold” alarms associated with an average FFA of 1.31 mmol/100g fat — the only alarm type with a significant increase over baseline — and more than 15% of alarm-associated samples already sat at or above 1.20.¹⁸ Real. Measurable. Worth doing. But changing the filter without fixing the transition cow problem is putting a new battery in the smoke alarm while the fire burns.

When Does an FFA Problem Become a Culling Decision?

Some FFA problems aren’t managerial. They’re demographic.

When the fall peak climbs year over year and herd average parity sits above 3.2, protocol upgrades blunt the problem but don’t solve it. Older multiparous cows carry more metabolically active visceral fat, mobilize NEFA faster, and compound ketosis risk at every subsequent calving. The Woodhouse/Kelton case farm added another wrinkle: late-lactation cows carry higher LPL activity, so extending lactation to fill quota can amplify lipolysis risk.¹

A working operator rule — Bullvine editorial rule-of-thumb, not a published threshold — if more than 30% of your parity 4+ cows test BHBA >1.4 mmol/L across two consecutive calvings, that cohort belongs on the voluntary cull list before the next dry-off. The cull market makes the call easier than it was two years ago: RFD-TV reported Southern Plains lean-cow (85–90%) auction prices at roughly $167/cwt in early March 2026, with bulls north of $200/cwt in parts of the South on tight supplies and strong grinding demand.¹⁹ A 1,400-lb parity 4+ Holstein at $167/cwt returns about $2,338 — real cash that partially funds her replacement.

But the replacement side is brutal. CoBank’s August 2025 Knowledge Exchange outlook put US dairy heifer inventories at a 20-year low, with a predictive model showing 438,844 fewer dairy heifers in 2026 versus 2025 — driven largely by ~398,925 more beef-on-dairy calves — and total replacement inventories expected to shrink by roughly 800,000 head before rebounding in 2027, with heifer prices potentially above $3,000/head.²⁰

Walking herd average parity from 3.2 to 2.8 in that market isn’t cheap or fast. Typical structural FFA correction through parity shift runs 18–24 months under normal replacement supply, closer to 24–30 months under today’s conditions — a Bullvine analytical projection based on typical parity-turnover mechanics, not a sourced forecast. But running RPC forever on a metabolic age that keeps escalating is more expensive, slower, and quieter.

Options and Trade-Offs for Your Operation

PathBest-fit triggerCore spend / year (500-cow)Payback windowBackfire risk
30/60/90 protocol onlySeasonal pattern, parity ≤3.2, no YoY escalationRPC ~60 g/cow/day + BHBA testing (~$960/yr)6–9 monthsMisdiagnosed demographic problem
Protocol + parity 4+ cullingParity >3.2, YoY peak climb >0.15 mmolAbove + ~$3,000/head replacement cost18–24 monthsHeifer market ($3,000+/head, 438,844 shortfall)
Add contract auditAny herd, any patternOperator time onlyImmediateCo-op refusal = your new baseline
Status quo“Filters and hope”$13,680–$68,400/yr penalty exposureNeverCompounding margin loss under FMMO reform (85–93¢/cwt)

Three paths, depending on what your six months of data say:

  • Run the 30/60/90-day protocol only. Works when the pattern is managerial — seasonal, spring-recovering, no year-over-year escalation. RPC plus BHBA testing is the core spend. Backfires if you’ve misdiagnosed a demographic problem and your fall peak climbs again next October.
  • Run the protocol plus targeted culling of parity 4+ repeat-ketosis cows. Works when herd average parity tops 3.2 and year-over-year peaks escalate more than 0.15 mmol/100g fat. Pays out over 18–24 months. Backfires if you can’t source replacements at workable economics at CoBank’s projected heifer prices.²⁰
  • Run the contract audit alongside either path. Even a clean-FFA herd benefits from knowing exactly what the FFA threshold in its supply agreement says and what share of quality adjustments the co-op will attribute to FFA in writing. The answer — or the refusal — is your baseline for every future conversation.

DFO publishes the mechanics of its FFA reporting to every Ontario producer.¹ BC Milk publishes the framework while clarifying that FFA does not affect provincial-pool pay — any producer-level penalty flows through the processor-specifications clause of the individual agreement.³ Most US co-op supply agreements reference a processor-level FFA threshold but don’t publish the penalty math. That absence isn’t universal bad faith — some co-ops share full component and quality schedules with members on request. It’s the absence of a public, standardized FFA penalty framework across North America that makes this a contract-audit problem, not a headline problem. 

What This Means for Your Operation

  • When FFA climbs, your first call is your transition-cow vet. The equipment tech is the second call. That’s the core reframe the Guelph data demands.⁷,²
  • If April readings stay above 1.10 after a winter-stress recovery window, you’re not looking at a seasonal problem. You’re looking at a structural one — a parity question, not a filter question.
  • If FPR leads FFA by 4–6 weeks in your own six-month data, your tank is broadcasting the metabolic signal before the sensory threshold catches it. Act on the FPR.
  • If more than 30% of your parity 4+ cows throw BHBA >1.4 mmol/L across two consecutive calvings, that cohort is carrying your fall FFA peak — and at $167/cwt lean-cow prices, the market is paying to move them.¹⁹
  • If your co-op’s incentive-day calendar sits 3–5 weeks ahead of every FFA elevation on your statement, you’ve documented exactly the mechanism the Ontario data flagged.⁷ That’s a specific conversation to have with your quality manager, in writing.
  • If your co-op can’t — or won’t — put the FFA portion of your last six quality adjustments in writing, that silence is your baseline. Everything you do next sits against it.
  • If the 30-day protocol pencils at low four figures a month and your contract-audit reveals a meaningful $/cwt FFA hit, the expensive fix is cheaper than the invisible one.

Key Takeaways

  • If bulk tank milk protein is drifting down, the odds of elevated FFA climb sharply in the Ontario data — call your vet before the equipment tech.⁷
  • If your herd is tie-stall and milking ≥3×/day, the Woodhouse farm-factors paper attaches a 1.17 mmol/100g fat association to that single combination — the single biggest lever in the model.²
  • If herd average parity is above 3.2 and fall FFA peaks are escalating year over year, you’re looking at a demographic problem the 30-day protocol alone won’t solve, in a heifer market projected to shrink by 800,000 head before rebounding in 2027.²⁰
  • If you don’t know your co-op’s FFA penalty math in writing, you don’t know your exposure. Period.
  • If you execute the 24-month plan and document the before/after, you’ve earned a governance argument, not just a management win.

The Question You’ll Face Next October

The Woodhouse/Kelton case farm ran 1.32 mmol FFA on average over four years, with 54% of samples elevated.¹ That’s not an outlier. It’s a data point with a mailing address. The research doesn’t cull the parity 4+ cow for you. It doesn’t pull your supply agreement. It doesn’t translate the processor-specifications clause the pay statement leaves out.

What it does — through exact betas, seasonal patterns, and 171,843 monthly bulk tank observations across every Ontario dairy farm — is prove that the margin test hiding inside every bulk tank FFA reading is measurable, attributable, and fixable on a timeline shorter than the opacity of the system suggests.

Here’s the harder question. An operator who fixes their FFA and says nothing lets the current arrangement continue as designed — program worked, producer responded, questions about disclosure never get asked. An operator who fixes their FFA and walks a documented before/after into a co-op board meeting — with their own supply agreement in one hand and AFBF’s $337 million pool-revenue analysis in the other — is doing something different. So what are you going to bring to your co-op board next October — your FFA numbers, or your silence?

Editor’s note: This article contains editorial analysis and opinion by The Bullvine. It describes general industry patterns and does not refer to any specific named co-operative, processor, or producer other than those expressly attributed. Specific contract terms, quality schedules, and regulatory frameworks vary by co-op and jurisdiction; producers should consult their own agreements and advisors.

Complete references and supporting documentation are available upon request by contacting the editorial team at editor@thebullvine.com.

Learn More

The Sunday Read Dairy Professionals Don’t Skip.

Every week, thousands of producers, breeders, and industry insiders open Bullvine Weekly for genetics insights, market shifts, and profit strategies they won’t find anywhere else. One email. Five minutes. Smarter decisions all week.
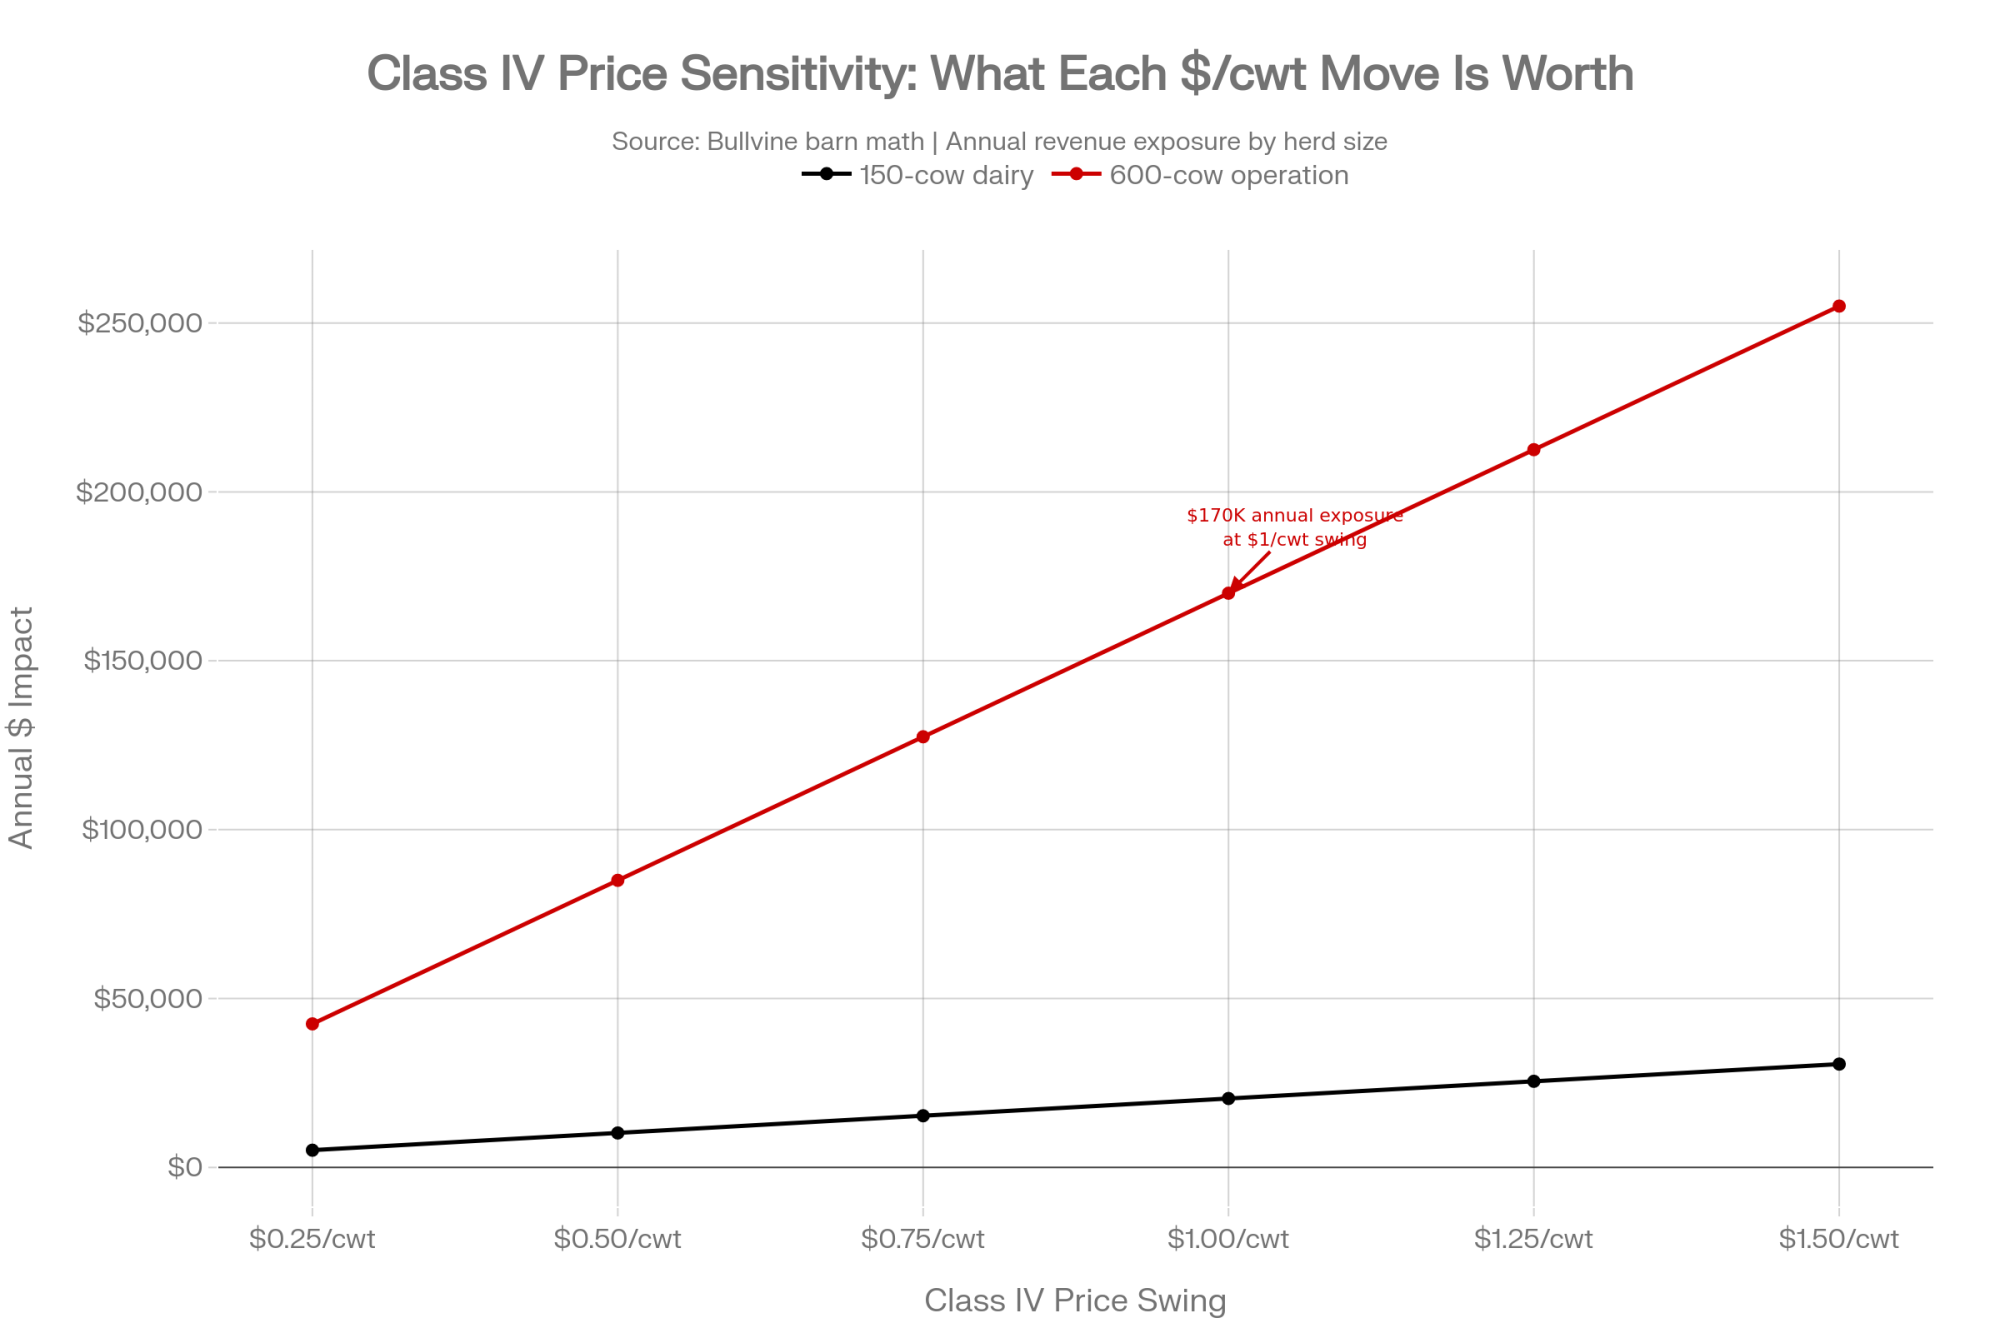
NewsSubscribe
First
Last
Consent

Fenwick Got the Cows Back. The $519,000 Insurance Gap Is Still There.

Your neighbors will bring casseroles and cattle trailers for the first 48 hours. They won’t write a $519,000 check in month 13. Only a correctly written policy does – and most mid-size dairies don’t carry one.

Executive Summary: An EF-1 tornado leveled Hull’s Dairy in Fenwick, Michigan at 10:58 PM on April 14, scattering 210 cows across Montcalm County — and exposing a six-figure coverage hole sitting in most mid-size dairy policies. Default farm policies run 12-month business interruption periods, but industry ag claims guidance — including from Sedgwick — puts complex dairy rebuilds at 18–24 months, leaving roughly $519,000 in uninsured gross milk revenue on a 210-cow herd at March 2026’s $16.16/cwt Class III. Construction costs make it worse: BLS PPI put 2025 materials inflation at 6.2%, and Lactanet’s 2023 survey pegs insulated dairy barns at $18,160 per head all-in, $7,100 per cow in equipment alone. Your LIP payment isn’t a recovery mechanism either — $1,681.88 per adult cow pays about 42 cents on the dollar against a $4,000+ springer, and as little as 12 cents on a VG-88 with real genetic merit. Blanket livestock coverage doesn’t distinguish a +2800 GTPI two-year-old from a GP-83 off a truck. The community brought cattle trailers for the Hulls within hours; they won’t cover month 13 of a rebuild. The 30-day move: call your agent, confirm Replacement Cost (not ACV) coverage, and price a 24-month MIP before renewal.

dairy farm insurance

Janet Hull was in her basement at 10:58 PM on April 14, 2026, when the EF-1 hit her family’s farm in Fenwick, Michigan. She told Fox 17 it sounded like a train coming through the barns above her. By morning, the freestall that housed 80 of her cows was gone, two head were confirmed dead, and more than 200 animals were scattered across miles of dark Montcalm County countryside.

The community response was the kind dairy country still does better than anywhere else. Noah Heckman pulled in at sunrise with a cattle trailer, per Fox 17. Stephanie Schafer of Jem-Lot Dairy — a Michigan Farm Bureau District 5 director — drove her own truck over, per McClatchy wire reporting. Lane Grieser with Farm Bureau was on the phone. By Wednesday night, nearly the entire 210-cow herd had been recovered and relocated to a neighbor farm in North Ionia.

Every local outlet ran that story. None of them ran the math.

Here’s what they missed — and it’s not about Hull’s specific policy, which isn’t public. It’s about the default farm insurance structure a typical 200-cow family dairy carries. That structure likely sits on roughly $519,000 in uninsured gross revenue exposure between what a 12-month business interruption policy pays and what a complex rebuild costs when it runs to the midpoint of an 18–24 month range. No claim here about the Hulls’ individual coverage. This is about what the default structure does to a farm at that scale — and where the real risk hides in most dairy farm tornado damage recovery scenarios.

What’s Changed — and Why Your Policy Hasn’t Kept Up

Three things have shifted in the last few years that quietly made most farm insurance policies inadequate. Most producers didn’t notice. Carriers don’t send a letter when the math stops working.

Construction costs are the first. Construction material prices rose 6.2% across 2025 — the largest single-year increase since the post-Covid spike in 2021 — according to Bureau of Labor Statistics Producer Price Index data reported by ConstructConnect. Steel bars, plates, and structural shapes climbed 12.1%. Aluminum mill shapes jumped more than 30% on tariff pressure. The Dairy Challenge 2022 benchmark pegged a basic freestall at roughly $3,500–$7,000 per milking stall depending on parlor and equipment build-out. Lactanet’s 2023 survey of 29 insulated dairy barns in Quebec put median costs at $101 per square foot total, $60.10 per square foot building only, $18,160 per head all-in, and $7,100 per cow in equipment alone. Layer the 2025 materials escalation onto that 2022–2023 baseline and rebuild numbers are running well above what most policies were priced to cover.

The replacement heifer market is the second. CoBank’s Knowledge Exchange reported in August 2025 that U.S. dairy heifer inventories have already hit a 20-year low and will shrink by an estimated 800,000 head over the next two years before any rebound in 2027. CoBank’s Corey Geiger flagged that heifer prices had already reached record highs and “could climb well above $3,000 per head.” Trade-media reporting through spring 2025 puts peak-market Holstein springer prices at $4,000–$4,200. If you have to replace cows fast after a disaster, “average” isn’t the number you pay. The market is. And the market is expensive.

The third shift is the quiet one. Farm policies don’t automatically update to either of those realities. Per-building replacement values are set at underwriting and only move when you proactively ask for a reappraisal. Some policies carry inflation-guard or auto-adjust endorsements, but most standard farm packages don’t include them by default — which is why the audit call matters. Maximum indemnity periods on business interruption coverage default to 12 months, a number calibrated back when a standard dairy rebuild fit inside that window. The gap shows up when the adjuster does.

How This Plays Out on Real Farms

Run the numbers on a 210-cow herd. A well-managed Holstein herd producing at 85 lbs/day puts roughly 17,850 pounds of milk in the tank daily — a pace above USDA NASS’s national average of about 65 lbs/cow/day across all breeds, which is why we’re calling it well-managed, not average. At USDA AMS’s March 2026 Class III price of $16.16/cwt, that’s $2,885 in daily gross milk revenue. Weekly, call it $20,200. Monthly, about $86,500. April 2026 Class III futures were trading around $16.84 as of mid-April; the USDA final print follows at month-end.

Now layer in the disruption math. Standard farm BI kicks in after a 48–72 hour waiting period and runs for a 12-month maximum indemnity period on most policies. In Sedgwick’s February 2024 publication “Maximum Indemnity Period: Is 12 months long enough?”, the firm’s major loss specialists make the case explicitly: policyholders “should work on the assumption of a total loss” and factor in a full recovery period, because rebuilding the physical asset is only phase one — winning back revenue or customers is phase two, and the phases compound. Farmers Weekly’s Business Clinic makes the dairy-specific version of the same point bluntly: “For larger, more complex dairy units 24 months may be needed to rebuild and re-establish a herd.” Those extensions have to be proactively bought. Unless you raise it, many policies renew at the default 12-month MIP out of habit.

What Your Policy Probably Says vs. What the Rebuild Actually Costs

Coverage elementDefault policy assumption2026 realityGap
Freestall replacement (80-stall unit)Indexed to pre-2023 build figuresPer Lactanet 2023: median $18,160/head all-in on insulated barns; equipment alone at $7,100/cowScales with cumulative 2023–2026 escalation
Construction input escalationLocked at last appraisal6.2% materials increase in 2025 alone per BLS PPITens of thousands to six figures depending on appraisal age
Business interruption period12 months MIP18–24 months per Sedgwick and Farmers Weekly guidance for complex dairies6–12 months uncovered
Livestock indemnity per adult cow$1,681.88 via USDA FSA LIP (2025 schedule)$3,000+ per head per CoBank; $4,000–$4,200 peak spring 2025~$1,300–$2,500+ per head
Gross milk revenue at risk, months 13–18Not covered~$519,000 on a 210-cow herd~$519,000 ← The Kill Zone

If a rebuild runs past the 12-month mark, the missing months 13 through 18 represent roughly $519,000 in uninsured gross milk revenue on a herd this size. One caveat worth naming up front: BI policies typically pay gross revenue minus saved expenses, so the actual out-of-pocket shortfall moves with feed, labor, and repair savings during the disruption. The $519,000 is the top-line revenue hole, not the net gap. Even so, the net still lands in six figures on a herd this size. Call it the kill zone: the window where no program, no neighbor, and no GoFundMe covers the difference. Only a correctly written policy does.

And this math scales. A 500-cow operation running the same 85 lbs/day at $16.16/cwt is putting about $206,000 in monthly gross revenue through the parlor — double the exposure per month the default MIP leaves uncovered. Scale doesn’t protect you here. It widens the gap.

What LIP Doesn’t Cover: The Genetic Premium Your Policy Ignores

Now the second gap — and this one hits Bullvine readers harder than most. The USDA Livestock Indemnity Program pays $1,681.88 per adult dairy cow lost to a qualifying disaster under the 2025 rate schedule. The 2026 table hadn’t been released as of publication; historically, LIP rates update mid-year based on prior-year fair market values.

That $1,681.88 is calculated on an industry-average market value for a generic adult dairy cow. It doesn’t distinguish between a GP-83 first-calver you bought off a truck and a VG-88 two-year-old carrying a +2800 GTPI that you’ve spent three generations building toward. If you lose that animal in a tornado, LIP pays $1,681.88. Period. The pedigree, the classification score, the genomic premium, the flush potential — none of it exists in the indemnity formula.

Market replacement springers are running $4,000–$4,200 for average genetics at peak, per spring 2025 trade-media reporting. But if you’re rebuilding a herd with above-average genetic merit, the replacement cost per head isn’t $4,000. For genomic-tested, classified cows — the kind many Bullvine readers are building — market replacement routinely runs two to four times the commodity springer price, and for the top end of the market, much higher. The Amplify 2026 sale averaged $8,652 across 124 lots — roughly double commodity springer pricing. Move up one tier and the 2024 World Classic Holstein Sale at World Dairy Expo averaged $30,245 across 55 lots, with a $205,000 IVF session topping the board. Best of Triple-T & Friends in May 2025 hit $78,500 on Ms Milksource Sunday-ET, an All-American class winner Tattoo daughter. That makes LIP not a recovery mechanism but roughly 42 cents on the dollar at commodity replacement, and materially less — potentially 12–21 cents on the dollar — for a genetically invested herd. For every cow lost and replaced, the farm eats the rest.

Standard farm insurance livestock coverage doesn’t typically distinguish by genetic merit either — not unless you’ve specifically scheduled individual high-value animals, which most 200-cow operations haven’t done. If you’ve never asked your agent whether your livestock coverage is blanket or scheduled, and whether it pays market value or a flat sublimit, this is the week to find out.

The Mechanics Behind the Outcomes

It’s not random. It’s how the system was built.

Farm insurance is priced against historical average losses. Reinsurance models, per-building sublimits, and MIP caps were calibrated against a decade of claims data from an era when construction costs were flatter and ag contractors more available. Those assumptions haven’t updated at the pace the underlying economics have. The policy you signed three years ago is protecting a farm that no longer exists at those numbers.

Federal disaster programs, meanwhile, run in isolation. LIP, FSA Emergency Loans, SBA EIDL, and crop insurance — four different agencies, four different timelines, four different sets of eligibility rules, and no coordinated intake. USDA’s One Farmer, One File initiative launched at 2026 Commodity Classic is working to streamline digital services across FSA, NRCS, and RMA, but completion is targeted for 2028. A producer in active recovery today still has to navigate all four programs independently while managing a displaced herd, a construction project, and a cash-flow hole. The system rewards sophistication at exactly the moment operators have the least capacity for it.

And there’s a piece nobody talks about at the Farm Bureau meeting: your lender isn’t your friend when the barn is flat. They’re a risk manager. Ag lenders use internal risk classification systems, and a disaster-recovery loan can quietly move to a watch list or “Special Assets” classification. Disclosure timing varies by lender. Borrowers who ask directly typically get straightforward answers. Borrowers who don’t ask often don’t find out until their loan terms change underneath them — interest rate, reporting requirements, and collateral scrutiny can all shift once the file moves to a different desk. The bridge-financing conversation that could’ve happened easily in month 2 gets noticeably harder in month 10.

None of this is rocket science. It’s just the work nobody does until the wind hits.

How Much Does the 20-Minute Phone Call Actually Save?

Depends where your current coverage sits relative to your real exposure. But the order of magnitude is consistent across most mid-size dairies that haven’t reviewed their policies in three or more years.

On the structure side, a construction cost gap against a $300,000 barn scales directly with the cumulative escalation since your last appraisal — likely in the tens of thousands on a barn that size, potentially six figures if the appraisal is five-plus years old. BLS PPI put 2025 materials inflation at 6.2%. On the MIP side, stretching from 12 to 24 months on a 210-cow operation protects roughly the same six-figure range as the $519,000 gap walked through earlier — the back half of a slow rebuild where the default policy has already tapped out. Combined, the phone call plus a modest premium adjustment closes a six-figure exposure currently sitting on your balance sheet as unacknowledged risk. That’s a better ROI than most decisions you’ll make this quarter.

Is Your Mutual-Aid Network Real, or Is It a Hope?

Every producer in tornado country has a mental list of neighbors they’d call. Fewer have actually confirmed those neighbors have the capacity, the facility space, and the willingness to absorb 50–100 head on 12 hours’ notice. Fewer still have had the conversation explicitly enough that the neighbor knows to pick up the phone at 11 PM on a Tuesday.

Per public reporting, the Hulls had Noah Heckman, Stephanie Schafer, Lane Grieser, and a neighbor in North Ionia who could house the entire 210-cow herd. Real network. It showed up. For most producers, the answer to “who boards my herd for 6 months if the barn’s gone tomorrow” is a name, not an agreement. Those aren’t the same thing. Write down the agreement. Exchange numbers. Document the capacity. After the siren, you can’t build the relationship fast enough.

Element“I Have a Name”A Real Agreement
Contact confirmed?Maybe — you assume they’d answerCell number in your phone, verified in last 6 months
Capacity confirmed?Assumed based on farm sizeExplicit: “I can take 50 head in the freestall for up to 90 days”
Timing confirmed?“They’d come if I called”Explicitly agreed: picks up at 11 PM on a Tuesday
Herd biosecurity discussed?❌ Never✅ Health status, vaccination protocols exchanged
Feed/labor cost arrangement?Assumed informalWritten: cost-sharing or reciprocal commitment documented
Lender/insurance notified?❌ Unknown✅ Listed as contingency in your insurance file
Michigan AgMediation contact?❌ Unknown📞 800-616-7863 on file

Options and Trade-Offs for Farmers

Four practical paths for producers who want to close these gaps before they turn into active problems.

Path 1 — The 20-minute coverage audit (do this within 30 days). Call your ag insurance agent this week and ask three specific questions: (1) What is the replacement cost per building on my policy, and when was it last updated? (2) What is my maximum indemnity period for business interruption? (3) What does a livestock loss claim actually pay on cows that are unrecovered versus confirmed dead?

Pro Tip: Ask your agent one more question: “If I have a total loss today, do I have a Replacement Cost or Actual Cash Value policy?” If they say ACV, start shopping. An ACV policy insures depreciated value — the farm as it existed in 2018, not the farm you’d have to rebuild in 2026. That single distinction can be the difference between a six-figure gap and a manageable rebuild. Replacement Cost coverage pays what it actually costs to rebuild at today’s prices. ACV pays what your barn was worth minus years of wear. You don’t want to find out which one you have after the adjuster shows up.

Path 2 — Request a replacement cost appraisal. If your last appraisal is more than three years old, construction escalation has likely opened a meaningful gap between insured value and rebuild cost. BLS PPI data — via ConstructConnect — puts 2025 construction materials inflation at 6.2%, the fastest single-year rise since 2021, with specific items like steel and aluminum running well higher. Makes sense for any farm with meaningful capital infrastructure. Requires a formal appraisal request and possibly a premium adjustment. The limit: ask for the quote before committing. Premium increases may be modest or meaningful depending on how much coverage you actually need to expand.

Path 3 — Extend your MIP to 24 months. Sedgwick’s major loss team and Farmers Weekly’s Business Clinic both make the case that 18–24 months is the realistic indemnity window for complex dairy rebuilds. Makes sense for any farm with specialized ventilation, robotic or parallel milking systems, or multi-structure exposure. Requires a proactive ask at renewal. The premium increase is usually modest. The coverage difference can run into six figures.

Path 4 — Document your mutual-aid network in writing. Identify two neighbor farms willing to take 50–100 head on 12 hours’ notice. Get their cell numbers in your phone. Exchange basic herd inventories so confirmations move fast. Makes sense for every farm in tornado, flood, or fire country. Requires a real conversation, not an assumption. The limit: goodwill and capacity aren’t the same thing — confirm both. Michigan producers can also loop in the state’s Agricultural Mediation Program (800-616-7863) for any disaster-related lender or neighbor-aid dispute that can’t be resolved at the kitchen table.

Key Takeaways

  • If your policy’s per-building replacement value hasn’t been updated in three years, assume a meaningful construction gap and request a reappraisal this month. BLS PPI alone put 2025 materials inflation at 6.2%.
  • If your business interruption MIP is still 12 months, get a quote on 24. Sedgwick and Farmers Weekly both point to 18–24 months as the realistic rebuild window for complex dairies.
  • If you don’t know whether you carry Replacement Cost or Actual Cash Value coverage, find out before your next renewal. ACV protects a depreciated barn, not the one you’d have to build.
  • If your livestock coverage is blanket rather than scheduled, high-value genetics typically aren’t protected — a VG-88 cow and a GP-83 cow often pay out the same under standard farm policies. Confirm with your agent before assuming your genetic investment is covered.
  • If you don’t know that LIP pays $1,681.88 per adult dairy cow, you can’t model the out-of-pocket gap against CoBank’s $3,000+ heifer forecast — let alone replacement for an Amplify 2026-tier lineup averaging $8,652 or a World Classic-tier lineup averaging $30,245.
  • If your mutual-aid network is a list of names rather than a set of confirmed agreements, treat it as a hope, not a plan.
  • If you haven’t asked your commercial lender how your loan classification changes in a disaster-recovery scenario, you’re flying blind on a conversation that happens quietly around month 8.
  • If you can’t name an operator in your region who has completed a full post-disaster dairy rebuild, find one through Farm Bureau or your co-op before you need them. Their pattern recognition is worth more than any program brochure.

The community that showed up for Janet Hull on April 15 was extraordinary. But here’s the part nobody says out loud: your neighbors will bring casseroles and cattle trailers for the first 48 hours. They aren’t writing a $519,000 check in month 13. Only you — and a correctly written policy — can do that. Find out your number before your neighbor finds out theirs.

Next week in Bullvine Weekly: the full replacement cost audit framework by herd size and structure type — the exact questions to bring to your agent, the documents to request, and the thresholds that tell you whether your policy is keeping pace with 2026 construction costs. That’s where the real numbers live.

Sourcing note: This article is based on public reporting from Fox 17, WKAR, WWMT, and the McClatchy wire (Kansas City Star). Class III price per USDA AMS Announcement of Class and Component Prices (March 2026). LIP rate per USDA FSA 2025 Livestock Indemnity Program fact sheet. Construction cost data per Bureau of Labor Statistics Producer Price Index (2025) as reported by ConstructConnect (February 2026). Dairy barn construction cost benchmarks per Lactanet 2023 survey of 29 insulated Quebec dairy barns and Dairy Challenge 2022 building cost estimates. Heifer market data per CoBank Knowledge Exchange, “Dairy Heifer Inventories to Shrink Further Before Rebounding in 2027” (August 27, 2025). Business interruption guidance per Sedgwick, “Maximum Indemnity Period: Is 12 months long enough?” (February 11, 2024) and Farmers Weekly Business Clinic (March 28, 2022). Sale averages per Amplify 2026 (February 27, 2026), 2024 World Classic Holstein Sale at World Dairy Expo, and The Best of Triple-T & Friends 2025. Milk production context per USDA NASS. The Bullvine has not spoken directly with the Hull family. If Janet, Bryan, Ryan, or Drew would like to share their perspective for follow-up coverage — or request a correction on anything in this piece — we welcome the conversation.

Learn More

The Sunday Read Dairy Professionals Don’t Skip.

Every week, thousands of producers, breeders, and industry insiders open Bullvine Weekly for genetics insights, market shifts, and profit strategies they won’t find anywhere else. One email. Five minutes. Smarter decisions all week.
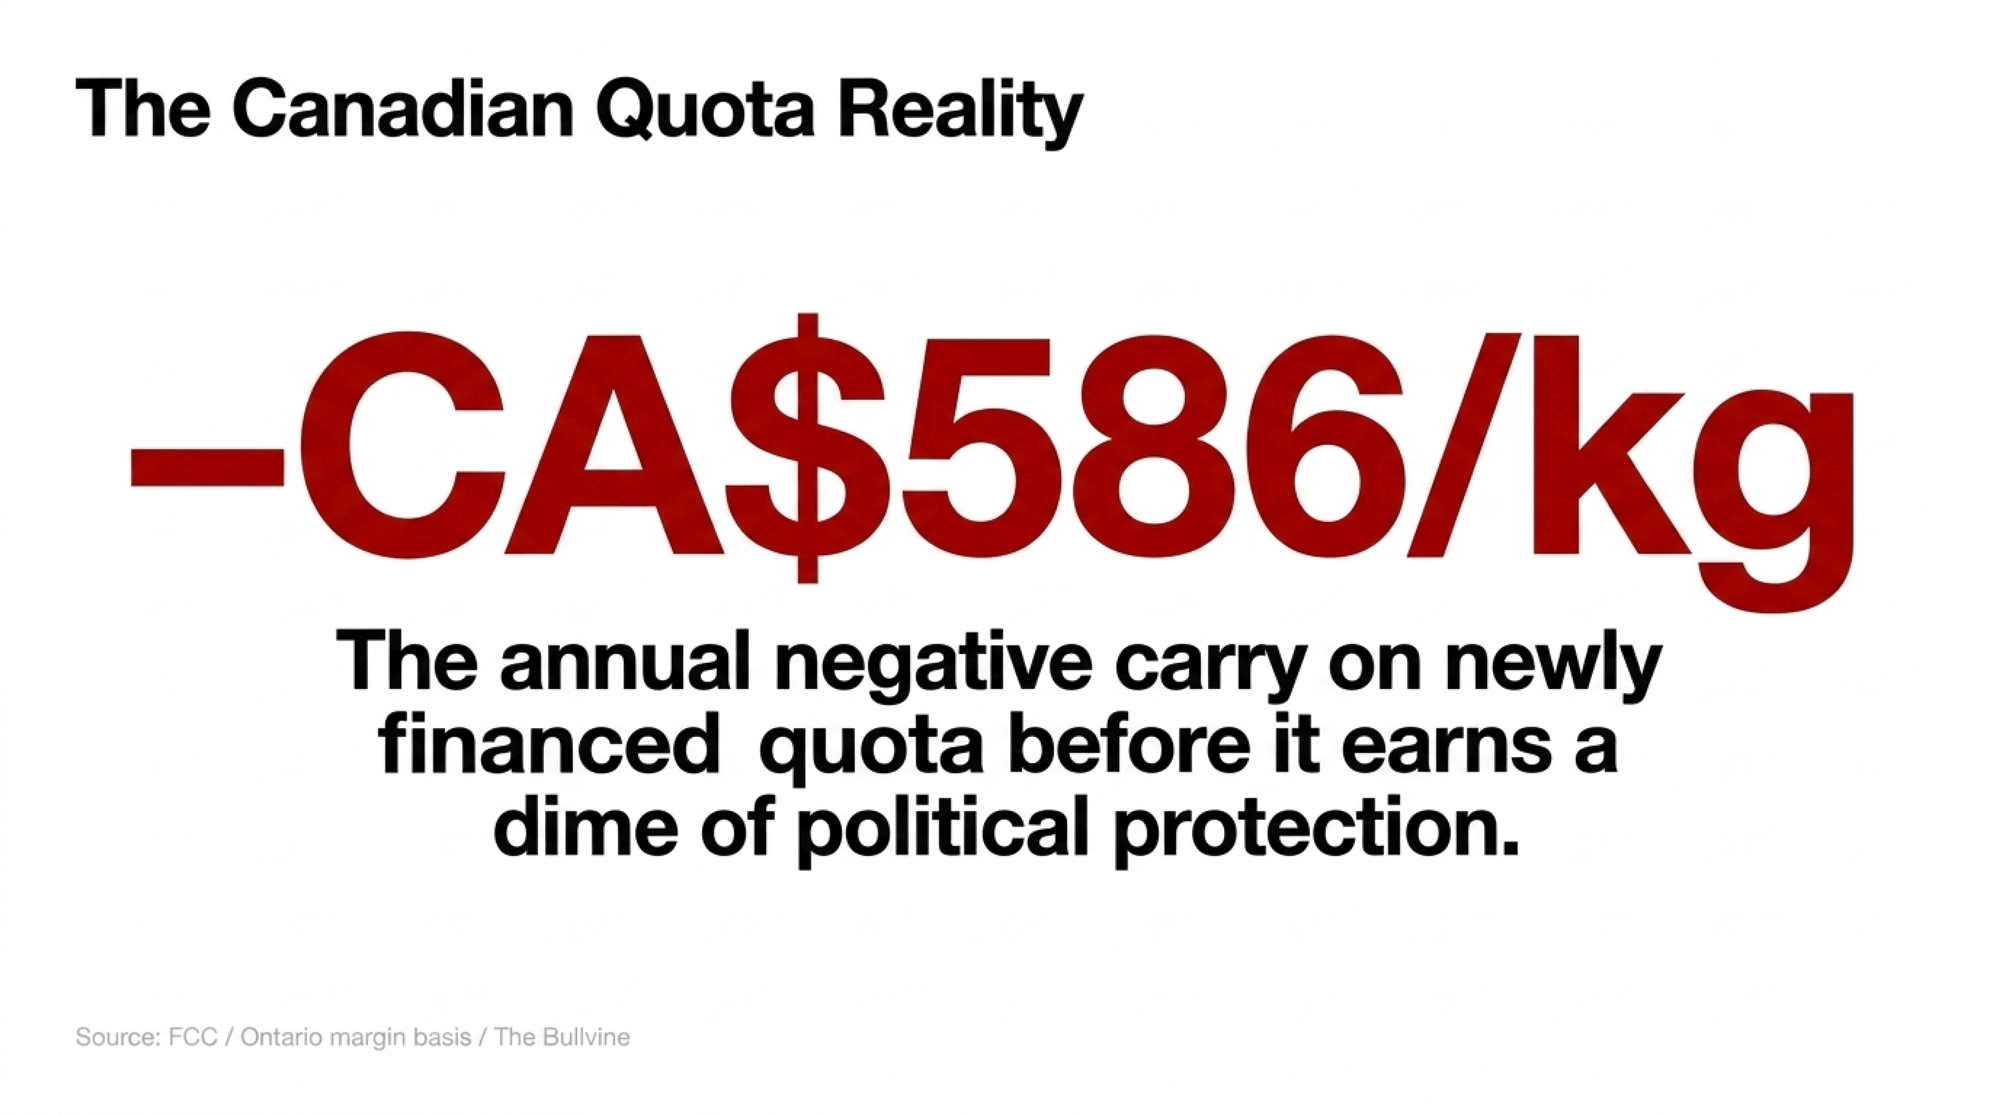
NewsSubscribe
First
Last
Consent

Your Handshake Succession Plan Is Worth $31,700. Ask the Metskes.

A trial judge valued six years of working the Metske family dairy at $405,000. The Ontario Court of Appeal cut it to $31,700. The $373,300 gap is what a handshake is worth in court.

All facts about the Metske family in this article are drawn from the public Court of Appeal decision Metske v. Metske (2025 ONCA 418) and publicly available legal commentary on that decision from Lerners LLP, Hull & Hull LLP, Weilers LLP, Blaney McMurtry LLP, the Ontario Bar Association, and Law360 Canada. The Bullvine has not contacted the Metske family; the analysis and editorial views are The Bullvine’s alone.

Tim Metske didn’t lose his family’s 152‑acre Ontario dairy because he misread the milk market. According to the published Court of Appeal decision in Metske v. Metske, 2025 ONCA 418, the key expectations about the barn, the quota, and the land were never reduced to enforceable written terms. The decision records that in spring 2018, after six years of work on his parents’ farm, his mother, Roseanne, notified him and his wife, Amanda, that they had to vacate the property by the end of May.

The court record shows they shipped 96 head through a catalog sale at OLEX — Ontario Livestock Exchange — and moved off‑farm during that transition. A trial judge valued their succession claim at $405,000. The Ontario Court of Appeal reduced that to $31,700 — the net value of $33,700 in concrete and equipment upgrades left behind, minus $2,000 in farmhouse damage. That $373,300 gap is what the court determined informal assurances were worth once enforceable property rights were tested.

If your own dairy farm succession plan mostly lives in people’s heads, the same legal trap sits closer to your parlor than it feels. The core problem: legal structure almost always lags behind the kitchen‑table understanding.

A note on scope: Metske was decided in Ontario, but proprietary estoppel — the legal doctrine at the heart of this case — is a cornerstone of Common Law systems across the U.S., Canada, the U.K., and Australia. The handshake trap doesn’t stop at the border. Probate fees, estate tax thresholds, and Medicaid/long‑term care rules vary by state and province. The probate and Medicaid math below uses Wisconsin as a reference point. Your numbers will differ. The lesson won’t.

Why the Stakes Are Higher in 2025–2026

The legal doctrines behind Metske aren’t new. The economics around them are. USDA NASS 2025 data put Wisconsin farm real estate at about $6,420 per acre and cropland around $7,250 per acre, with most dairy regions across the U.S. and Canada seeing steady or rising land values heading into 2026. A 300‑cow dairy with 400 acres of usable cropland, buildings, equipment, and herd can easily land in the –6 million range on a full balance sheet at those numbers.

The farm count keeps dropping, too. USDA NASS reported 23,609 licensed U.S. dairies on average in 2025 — a loss of 1,202 operations from 2024, a 4.6% national decline in a single year. Pennsylvania alone accounted for 490 of those exits, an 11.7% single‑year hit (Farmshine, February 2026). Milk price and input costs drive plenty of those exits. But ag lawyers and lenders keep flagging a different pattern: estate disputes, probate delays, and succession breakdowns are turning otherwise viable operations into dispersal catalogs.

Here’s the tension. Your lender won’t advance a $500,000 operating line without a signed note. Your processor won’t pick up milk without a contract. And yet the biggest financial transfer your family will ever attempt — moving a multi‑million‑dollar dairy to the next generation — still runs on handshakes and “we all know how this ends” on a lot of farms. Metske shows exactly how little that holds up before a judge.

How the Metske Arrangement Unfolded on Paper

The arrangement described in the court decision follows a pattern common to many family dairy transitions. According to the reasons for judgment, Tim and Amanda bought about 60 cows for roughly $90,000 using a bank loan co‑signed by his father, Martin. They leased the quota, barn, and house from Martin and Roseanne, with the expectation that they would eventually buy 44 kg of quota and, later, the barn and land on terms the trial judge described as “favorable but undefined.”

The business plan filed with the bank assumed fair market value for those purchases. No written discount, no sweat‑equity formula, no fixed price per acre. When Tim sought financing for dairy quota in 2013, the bank required a 10‑year amortization that the projected cash flow couldn’t support. The Court of Appeal found Tim and Amanda’s own bank documents — showing they expected to buy at fair market value — directly contradicted any claim of a guaranteed below‑market transfer.

From 2013 to 2017, the court record shows that Tim and Amanda continued to operate as if a transfer would eventually occur. Martin had twice mentioned a $2 million buyout price in conversation, but nothing was ever written down. They took on barn and building repairs on the understanding that these expenses would fall to the incoming operators. They grew the herd from roughly 60 to 96 head.

In April 2018, Roseanne notified Tim and Amanda that they had to vacate by the end of May. They sent the 96 cows through OLEX and received roughly the same amount for the full herd that they had paid for their original 60 head six years earlier.

From a farm‑family perspective, those years looked like a time of building equity. Legally, the court treated the arrangement as a lease and service relationship — not a transfer of ownership rights.

📌 Go Deeper: We’ve already run the milk cheque math on what delayed succession costs a 400‑cow Wisconsin dairy in “The $2.30/cwt Succession Trap.” That piece covers the per‑cwt bleed. This one covers the legal trap that makes the bleed permanent. Read them together.

Why the Court Said “No Enforceable Promise”

Legally, Tim and Amanda relied on proprietary estoppel — the doctrine that if someone encourages you to believe you’ll get an interest in their land, and you reasonably act on that promise to your detriment, a court can enforce it or compensate you. The core logic is the same whether you’re in Ontario, Wisconsin, or Queensland, even if the labels differ.

The Court of Appeal concluded the test wasn’t met. The judges looked for three things and found gaps in all of them:

  • A clear promise or assurance about who would own what, on what terms.
  • Reasonable reliance — that it made sense for Tim and Amanda to act as if that promise were real.
  • Detriment linked to that promise.

On the promise, the court required a “clear and unambiguous assurance” — not vague encouragement, not general family goodwill, not a willingness to negotiate someday. Twice‑mentioned buyout figures and “favorable but undefined” terms didn’t clear that bar. The Court of Appeal characterized the arrangement as an “agreement to agree,” which Ontario law does not enforce as a property right.

On reliance, the Court of Appeal found that the bank’s cash‑flow concern and the fair‑market‑value assumption in the filed business plan undercut the estoppel argument. The court concluded that continued reliance on a “favourable” transfer — while operating under loan documents that assumed full market value — was not reasonable.

On detriment, the court treated low wages, hard work, and routine herd costs as the ordinary risks of operating a business, rather than losses tied to a broken promise. The only detriment the appeal court quantified was improvements left behind: $33,700 in concrete and equipment upgrades, minus $2,000 for farmhouse damage, leaving $31,700.

Six years. Ninety‑six cows. And, according to the Court of Appeal, the claimed equity resolved to the value of some leftover farm improvements. The decision didn’t turn on character or motive. It turned on a straightforward rule: if you want succession rights, you need a binding agreement, not hope that “we’ll work it out.”

How Much Does Probate Really Eat on a $5 Million Dairy?

That’s the “founder is still alive” side of the trap. The “when Dad dies” side is probate.

If a founder dies with land, buildings, cows, and accounts in their personal name — no trust, no entities — everything falls into the probate estate. For a $5 million operation in Wisconsin, based on published fee ranges from Wisconsin probate practitioners, a realistic probate bill looks more like a feed contract than a rounding error:

Expense categoryLow estimate (USD)High estimate (USD)
Court & filing fees (~0.2%)$10,000$10,000
Personal representative fee (~2%)$100,000$100,000
Attorney fees (~3% of estate)$150,000$150,000
Accounting, tax prep & valuations$35,000$100,000
Bond premiums & misc. court costs$10,000$30,000
Total cost of dying without a plan$305,000$390,000
Cost of a professional succession plan$10,000$25,000

These figures bracket what Wisconsin probate practitioners typically quote for contested farm estates, though every case varies.

Read those last two rows again. Nobody writes a $20,000 legal cheque cheerfully. It still beats letting the state perform a $390,000 autopsy on your life’s work.

That’s roughly 6–8% of farm value consumed by process over 12–36 months, before anyone touches land transfer tax or income tax. Here’s the barn math you can run right now on your own numbers: take your total estate value, multiply by 0.065 to 0.08, and set it next to a planning fee. If the gap doesn’t make you reach for the phone, read it again.

What Happens to Your Parlor When the Estate Is Frozen?

When an owner dies, the law’s job is to preserve estate value for creditors and heirs — not to keep your parlor on a 10‑minute rotation. Your vet still needs to be paid. Your hauler still backs in before 5 a.m. The probate court doesn’t care.

If Dad dies with everything in his name, here’s what can unfold on a dairy:

  • Bank accounts in his sole name may be frozen or restricted until the court appoints a personal representative and issues letters, a process that can take weeks.
  • The milk cheque that used to say “John Smith” now belongs to “Estate of John Smith.” The processor might keep paying, but legally, only the court‑appointed rep is supposed to endorse cheques or open new accounts.
  • Cows, feed, and equipment in Dad’s name become estate assets. Selling culls, signing feed contracts, or taking on new loans falls to the personal representative — not the widow, not the on‑farm kid — and only after the court signs off.

In real barns, families do whatever it takes to keep cows fed. But if a sibling or creditor later questions those decisions — “Why did you sell those cows?” — the person who stepped up can end up defending every move in front of a judge.

A revocable living trust sidesteps most of that. When the trust owns the land and business interests and names a successor trustee, the hand‑off at death or incapacity occurs under the trust document rather than before a probate judge. Milk cheques keep getting signed. Feed trucks keep backing in. Your parlor doesn’t care who just died.

Only about 12% of family dairy farms make it to the third generation — a number we’ve documented in our coverage of the generational cliff — and how succession choices drive it.

How a 5‑Year Medicaid Look‑Back Turns a “Family Deal” Into a 66‑Month Penalty

Here’s the quiet trap that collides with succession planning as founders age.

Consider an illustrative scenario: a 68‑year‑old owner transfers 150 acres to his son for $500,000 when an appraisal would peg the fair market value at $1.2 million. On paper, it’s a sale. Around the kitchen table, it feels like a family deal. Four years later, he has a stroke and moves into a nursing home. The family applies for Medicaid long-term care.

Medicaid doesn’t just look at what you own the day you apply. It looks back 60 months to find what you gave away or sold below fair market value.

Medicaid sees that land transfer inside the window. It compares $500,000 to the $1.2 million appraised value and treats the $700,000 difference as a divestment — a gift. Wisconsin’s divestment divisor is $352.06 per day, per Wisconsin DHS Operations Memo 25‑20, effective for applications filed on or after January 1, 2026.

The penalty math:

  • $700,000 ÷ $352.06 ≈ 1,988 days
  • 1,988 days ÷ 30 ≈ 66 months

Medicaid’s answer: “You’re otherwise eligible, but we’re not covering your nursing‑home bill for roughly 66 months.” At Wisconsin’s monthly average private‑pay nursing home rate of $10,708.49 (same memo), the family faces roughly $707,000 out of pocket before coverage kicks in.

The “discount” you thought you were giving the next generation can boomerang as a long‑term care penalty when it falls inside the five‑year window. Mitigation options exist — partial return of assets, narrow hardship waivers — but they’re complicated and fact‑specific. The cleanest path is timing: if you’re going to use irrevocable trusts or deep discounts, do it well outside the look‑back period. This example uses Wisconsin’s 2026 Medicaid rules; specifics vary by state and province.

If any founder in your family is north of 65 and the plan is “we’ll start the transfer after the next project,” you’re not just playing chicken with milk price. You’re playing chicken with that clock.

✅ The Seven Legal Pieces That Keep You Out of a Metske‑Style Trap

Save this. Print it. Tape it to the office wall next to the milk cheque.

Lawyers love making this sound like wizardry. It isn’t. The farm plans that actually hold up — in court and on the balance sheet — share the same seven pieces. Miss even one, and there’s a gap a judge or a Medicaid caseworker can drive a truck through.

☐ 1. CLEAN DEEDS THAT MATCH YOUR STORY. Every parcel needs to be titled in the name of the person or entity your plan assumes. If everyone talks like “the LLC owns the land,” but the county recorder still shows Dad on the title, the judge and the bank go with the deed, not the family story. Your 30‑day action: pull every deed from the county recorder’s office and check whose name is actually on it.

☐ 2. AN LLC OR PARTNERSHIP OPERATING AGREEMENT THAT SAYS WHO OWNS WHAT.Percentages, voting rights, profit splits, exit rules — this is where they live. Many dairies now hold land in one entity and cows and equipment in another so that the operating business can transition separately from the dirt. If you don’t have one, you don’t have a business. You have a handshake with a tax ID number.

☐ 3. A BUY–SELL AGREEMENT. The absence of a written buy–sell arrangement is a significant reason the Metskecourt found no enforceable succession rights. A buy–sell spells out who buys if someone dies, divorces, or wants out; how the price is calculated; and how the payments happen. Without one, you’re back to an “agreement to agree,” and Metske shows exactly how courts treat that.

☐ 4. A REVOCABLE LIVING TRUST FOR FOUNDERS. The trust owns the land and entity units. Founders act as trustees while they’re capable. When they die or can’t act, the successor trustee takes over without forcing a full probate on every acre. This is the single document that keeps the probate table above from becoming your family’s reality.

☐ 5. DURABLE FINANCIAL POWER OF ATTORNEY. Gives someone authority to sign cheques, refinance loans, and enter into contracts if the owner is alive but incapacitated. On a dairy, it’s the difference between a stroke triggering an emergency guardianship fight and the on‑farm kid keeping the milk truck rolling.

☐ 6. HEALTHCARE DIRECTIVE AND HEALTHCARE POA. Keeps ugly medical fights from bleeding into succession decisions. When everyone already knows who makes the call on end‑of‑life care, nobody has to use the farm as leverage in those conversations.

☐ 7. A MEDICAID‑SAVVY TRANSFER PLAN FOR ANYONE OVER 65. This is where the five‑year look‑back gets built into the timeline. Maybe it’s an irrevocable trust funded well before any likely nursing‑home stay. It could be a sale at fair market value with installment notes instead of big gifts. The key is that your ag attorney and your elder‑law advisor need to be looking at the same balance sheet.

On a 200–600 cow dairy, getting all seven pieces right typically runs $10,000–$25,000 in professional fees [NEEDS: source — published ag‑law firm fee range or UW Extension farm transfer publication; Menn Law Firm and Ruder Ware LLSC have published fee guidance consistent with this range]. Nobody pretends that’s nothing. Line it up against a $305,000–$390,000 probate bill or a roughly $707,000 Medicaid penalty, and it starts looking like the cheapest insurance policy on the farm.

Are Your “Family Discounts” Worth Anything on Paper?

This is the part nobody wants to talk about at the kitchen table.

Maybe you’ve charged below‑market rent for years because “the kids are taking over anyway.” Maybe you’ve been paying yourself less than a hired manager would cost because you see it as “building equity.” Maybe the on‑farm kid uses equipment at a rate no neighbor could ever negotiate.

Metske illustrates a hard legal reality: unless those breaks live in formal documents — a buy–sell formula, a unit‑ownership schedule, a written discount on an appraised price — a court may not treat them as the next generation’s equity.

The Court of Appeal recognized only $31,700 of net improvements as Tim and Amanda’s recoverable interest. Six years of reduced wages, reinvested labor, and herd‑building didn’t translate into equity because the court found no clear and unambiguous assurance the farm would transfer on favorable terms — and the bank documents pointing to fair market value undercut any claim it would.

Same principle in non‑quota systems. If your on‑farm heir rents 400 acres well under market rate, that discount is real money. But unless it’s baked into an ownership formula or a buy–sell agreement, it won’t automatically convert to equity before a judge. It’s worth understanding how marriage, divorce, and ownership structure can quietly shift who actually owns your dairy — because those dynamics compound the same risk.

Options and Trade‑Offs for Farmers

You don’t have to turn your family into a boardroom. But you do have to choose a path on purpose.

Path 1: Treat the farm plan like a bank loan. When it makes sense: clear on‑farm successor, serious land value, at least one off‑farm heir. What it requires: over the next 90 days, sit everyone down and answer three questions — who gets the operating business, who gets the land, and what “fair” looks like for non‑farm heirs. Take those answers to an ag‑savvy attorney and build or update the LLC agreement, buy–sell, trust, and POAs. Risks: you’ll surface hard feelings now instead of letting them detonate at the funeral. Someone may hear “no” for the first time. That conversation is hard. Probate is harder.

Path 2: Use insurance to level the table — and keep it fresh. When it makes sense: the farm can’t cash‑flow a full‑value buyout of off‑farm heirs, but you can afford premiums. What it requires: a realistic valuation of land, cows, and buildings every 5–10 years, with life insurance sized to roughly cover what off‑farm heirs won’t get in dirt or cows. Risks: policies that made sense when the farm was $1.5M can be wildly undersized at $5M. Skip the updates, and you’re handing your off‑farm kids a lawyer’s phone number instead of a cheque.

Path 3: Admit it’s a business sale, not a gift. When it makes sense: the next generation can’t stroke a cheque for fair market value today but can run a profitable operation over time. What it requires: a clear valuation formula — appraisal with a defined sweat‑equity discount — long‑term amortization, and often a “farm pension” where founders live off land rent or entity distributions. Risks: successors have to run lean enough to service the buyout. Founders may need to accept that the final transfer step happens at death to get the tax result everyone wants. If any founder is nearing long‑term care, this path has to be coordinated with elder‑law counsel to stay outside the 60‑month window.

Path 4 — Your 30‑Day Move: Stop pretending the handshake is a plan. When it makes sense: if you’ve read this far, it’s you. What to do this month:

  • Pull every deed, will, LLC/partnership document, and life insurance policy tied to the farm.
  • Make two lists: who thinks they’re getting the farm, and whose names are actually on those documents.
  • If those lists don’t match, book an agricultural attorney within 60 days. Bring both lists and your latest balance sheet.

Risks: You may discover the story you’ve been telling around the kitchen table never had a legal backbone. That’s a lousy Monday morning. But it beats finding out at the funeral — or in a courtroom, as the published Metske decision makes painfully clear.

Key Takeaways

  • If your succession plan only exists in conversations, assume a court could treat your on‑farm heir as a tenant, not a future owner. Don’t shake hands on another season — book an attorney meeting before your next herd check.
  • If any founder in your family is over 65 and you’re planning a deep “family discount” on land or quota, assume Medicaid will count the gap as a divestment if nursing‑home care arrives within five years. Build the transfer outside the 60‑month window or reframe it as a documented sale at fair market value.
  • If your total asset value exceeds your state’s small‑estate threshold (for example, $50,000 in Wisconsin under Wis. Stat. §867.03), treat a revocable living trust as mandatory — not optional. The probate math on a $5M dairy puts the break‑even against planning fees inside the first death in the family.
  • If the names on the deed, the LLC units, the life insurance beneficiary form, and the will don’t all point to the same successor, fix the mismatch this quarter. That gap is exactly what fuels the next Metske‑style dispute.
  • If you’re counting on sweat equity or a family discount to reduce your buyout price, require it in writing before you invest another year of labor. Courts won’t back‑fill a formula just because “everyone knew what we meant.”

You don’t have to draft contracts at the kitchen table. But you do have to accept that courts, banks, Medicaid offices, and title companies all speak one language — and it isn’t “you know what we mean.”

Ask yourself this week: if a judge looked only at your paperwork tomorrow — no stories, no memories, no handshake promises — who would they say owns your dairy? How much would they say it’s worth? And who would they say has the right to run it? If that answer doesn’t match what you thought, now’s the time to fix it. For the deeper milk‑cheque math on how delayed succession quietly bleeds dollars per cwt off your operation, we unpacked that in “The $2.30/cwt Succession Trap.” That’s where the spreadsheets live. This piece is your nudge to pick up the phone before your own handshake becomes Exhibit A.

Complete references and supporting documentation are available upon request by contacting the editorial team at editor@thebullvine.com.

Learn More

The Sunday Read Dairy Professionals Don’t Skip.

Every week, thousands of producers, breeders, and industry insiders open Bullvine Weekly for genetics insights, market shifts, and profit strategies they won’t find anywhere else. One email. Five minutes. Smarter decisions all week.
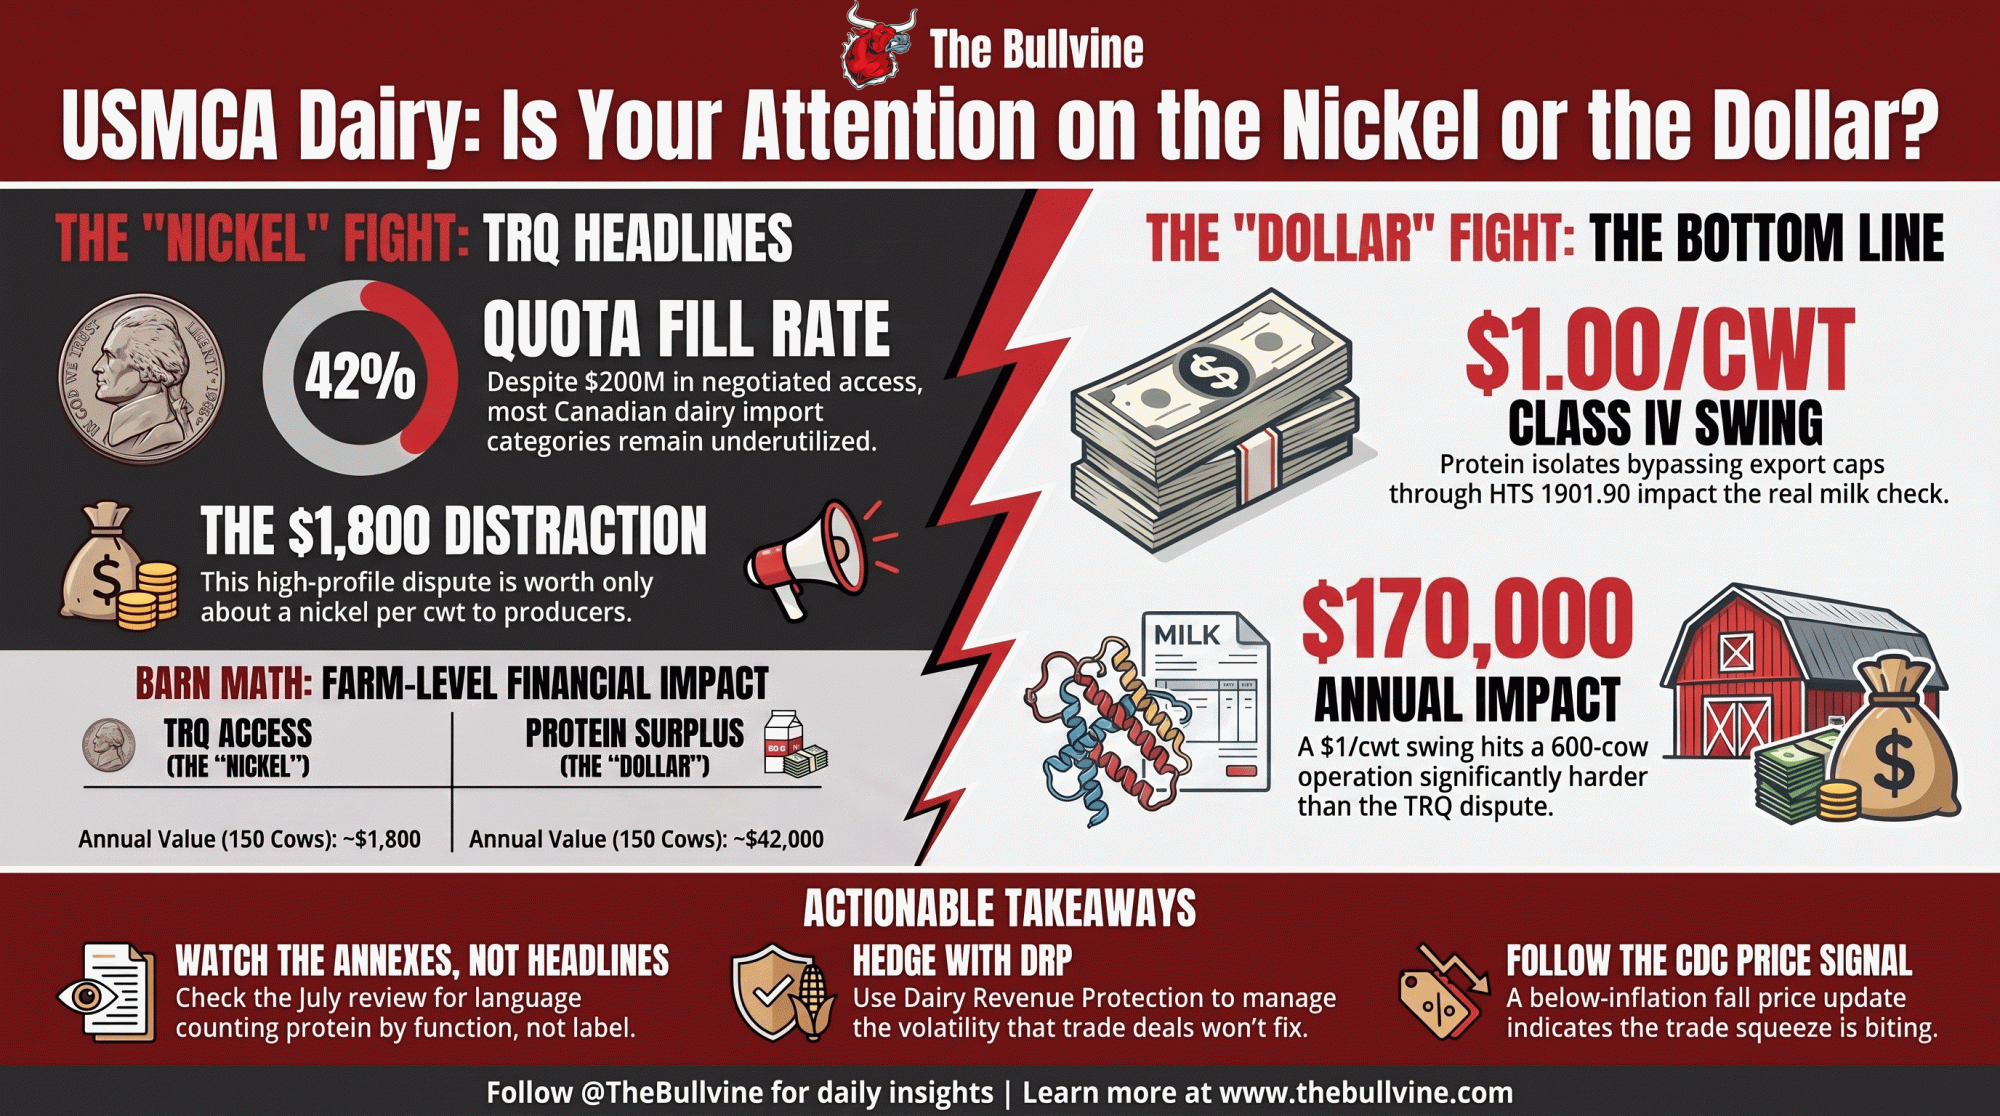
NewsSubscribe
First
Last
Consent

Fat Alone Shuts Down Immunity: The $150/Cow NEFA Trap You’re Building in the Dry Pen.

A 2026 Canadian lipid infusion trial shows that elevated NEFA — without calving or infection — suppresses lymphocyte function within 3 hours. Here’s the barn math, and the four dry-period levers that actually fix it.

Executive Summary: A 2026 lipid-infusion trial at Agriculture and Agri-Food Canada’s Sherbrooke center proves that elevated NEFA — without calving, infection, or hormonal change — suppresses lymphocyte proliferation and neutrophil killing capacity within three hours. Pierre Lacasse’s team infused dry, non-pregnant Holsteins with fat and watched haptoglobin spike 40-fold and immune cell function crater at NEFA concentrations (1.39 mM) you’d see on any freestall with overconditioned fresh cows. That shifts NEFA from “useful transition marker” to direct immune lever with per-cow costs attached. Our barn math, built on Ospina (2010) disease-risk data and Liang (2017) per-case costs, puts the direct damage at roughly 9–2 per high-NEFA cow — and closer to 0–0 once you factor milk loss, compromised oocytes, and early culling. In a 250-cow herd where a third of fresh cows clear 0.7 mEq/L, that’s an estimated ,000+ in avoidable disease costs annually. Ontario benchmarking shows about 40% of dry cows are already overconditioned before close-up, which means the problem is being built in the late-lactation pen months before you see the vet bill. The article walks through the full cost table, the immunology behind it, four management levers that address the root cause, and a 30-day checklist you can run against your own herd records this month.

Eleven days fresh, milking well, and lame by Tuesday. The DA surgery cost ranged from $432 to $640—that’s the U.S. cost estimate, depending on parity (Liang et al., 2017). By the time the manager on a 260-cow freestall in eastern Ontario tallied dumped milk, the metritis treatment that followed, and the lost peak yield, that single cow had burned through close to $1,200 before her first test day.

Bad luck — until the herd vet pulled NEFA on twelve more fresh cows. Five came back above 0.7 mEq/L. Same threshold. Same immune-compromise pattern. Different animals. The damage across the fresh group worked out to an estimated $150–$300 per high-NEFA cow, with about a third of calvings landing in that band. Those losses weren’t random. They were upstream, predictable, and largely built into the operation’s own dry-cow program.

How Much Does Excessive NEFA Cost per 100 Calvings?

You don’t pay bills with cytokines. So, before the science, here’s the bill.

Across 2,758 cows on 100 northeastern U.S. freestall herds, Ospina et al. (2010) found that cows with postpartum NEFA at or above 0.57 mEq/L had a risk ratio of 9.7 (95% CI 4.2–22.4) for displaced abomasum, with all risk ratios for DA, clinical ketosis, metritis, and retained placenta exceeding 1.8. That 0.57 mEq/L threshold is the ROC-optimized cutpoint for predicting clinical disease within 30 DIM. The widely used herd-alarm threshold of 0.7 mEq/L sits well above it — meaning cows that clear 0.7 carry even greater risk.

Take 100 calvings on a herd where roughly one-third of fresh cows land above 0.7 mEq/L. Here’s a conservative estimate of the additional disease cost in that high-NEFA subset:

DiseaseEst. Extra Cases / 100 CalvingsCost per CaseTotal Cost
Metritis+5$511 (Pérez-Báez et al., 2021) $2,555
Subclinical Ketosis+4$117 component cost (McArt et al., 2015) $468
Clinical Ketosis+1$181 multiparous (Liang et al., 2017; primiparous: $77) $181
LDA+1~$536 midpoint (Liang et al., 2017; $432 prim. / $640 mult.) $536
Early Mastitis (first 60 DIM)+3~$375 midpoint (Liang et al., 2017; $325 prim. / $426 mult.) $1,125
Total Extra Direct Cost$4,865

Note: Per-case costs are from U.S.-based studies. A 2010 Canadian estimate put subclinical ketosis alone at ~$203 CDN per case — higher than the U.S. figure used here.

Spread across 30–35 high-NEFA cows, that’s approximately $139–$162 per cow in direct disease cost. Factor in harder-to-capture losses — milk production drops, NEFA-damaged oocytes reducing conception rates, premature culling — and $150–$300 per high-NEFA cow is a defensible working range. The upper end carries more uncertainty, but even the conservative floor adds up fast.

For a 250-cow herd calving about 200 per year, with a third in the high-NEFA band, the direct disease cost is roughly $10,000, based on the table above. Include indirect losses, and you’re potentially looking at $15,000–$18,000 annually — though the upper figure depends on repro and culling assumptions that vary by herd.

Plug in your own disease counts from DairyComp or your herd records. If your numbers run higher than this example, your cost per high-NEFA cow will be higher, too.

Can NEFA Alone Suppress a Cow’s Immune System?

For years, the industry treated high NEFA as a useful marker — a symptom of the broader transition mess. Calving stress, hormonal surges, DMI crashes, and social disruption. Under that logic, managing NEFA feels optional. A wellness upgrade, not a survival lever.

Pierre Lacasse’s team at Agriculture and Agri-Food Canada’s Sherbrooke Research and Development Center just broke that assumption. Published in the Journal of Dairy Science (2026, In Press), they used six dry, non-pregnant Holsteinsin a 3 × 3 double Latin square. Each cow cycled through three treatments: saline control, intravenous Intralipid 20% at 1 mL/kg body weight per hour for 6 hours, and the same lipid infusion plus glutathione. No calving. No uterine contamination. No ration change. Just controlled fat in the bloodstream.

Plasma NEFA jumped from 0.06 to 1.39 mM — well within the range you’d see in overconditioned early-lactation cows on Ontario or U.S. freestalls. And then the immune system started misfiring.

The False Alarm: How Fat Tricks Your Cow’s Immune System

Think of what happened in those cows as the immune system hitting the gas and the brake at the same time.

Haptoglobin — typically undetectable in healthy cattle — spiked roughly 40-fold. Serum amyloid A rose 20-fold, peaking at 18 hours post-infusion. Both are acute-phase proteins that the liver cranks out when it perceives a systemic threat. In Lacasse’s cows, the only threat was their own circulating fat.

IL-6 (pro-inflammatory) climbed — that’s the gas pedal, launching the acute-phase response. But IL-10 (anti-inflammatory) went up simultaneously — the brake, the body trying to rein in the inflammation it just triggered. When both spike together without a pathogen present, you’re looking at an immune system burning resources on a false alarm while losing the capacity to fight the real thing.

Lymphocyte proliferation — the ability of T and B cells to divide and mount a defense — dropped within three hoursof starting the infusion. Neutrophils still showed up and swallowed bacteria, but their oxidative burst was significantly compromised. The cells reported for work. Their weaponry didn’t.

Here’s why. Saturated fatty acids — palmitic and stearic, the dominant players in bovine NEFA — bind directly to TLR4, the same innate immune receptor that recognizes gram-negative bacterial endotoxin. Once TLR4 fires, the inflammatory machinery kicks on — IL-6, TNF-α, the full alarm suite. TNF-α then feeds back to drive more lipolysis and suppress appetite, deepening negative energy balance in a vicious loop. Zhou et al. (2018) confirmed that NEFAs strongly upregulate the TLR2/4–NF-κB pathway in ketotic cows, and that this inflammatory over-activation closely tracks circulating NEFA levels.

BHB piles on. At concentrations of 2.5–5.0 mM, it inhibits both basal glycolysis and glycolytic capacity in neutrophils — cutting the fuel supply to the cells that need it most.

Not every cow that crosses the 0.7 line gets clinically sick. Many don’t. But the Lacasse data shows those cows are operating with measurably weakened immune defenses during the exact window when pathogen exposure is highest — and the ones that do get sick cost you real money.

Where the NEFA Spike Actually Starts

Most people troubleshoot NEFA in the fresh pen. On the eastern Ontario herd that triggered this story, nearly half the cows that later tested above 0.7 mEq/L had been dried off at BCS 3.5 or higher. The NEFA spike didn’t originate in the close-up pen. It started months earlier, in the late-lactation group.

Ontario benchmarking data says that’s not unusual. A 2022 project across 31 Ontario herds (average 192 cows) found a mean dry-cow BCS of 3.23 ± 0.32, with roughly 40% of dry cows overconditioned, exceeding the target range of 2.75–3.25. Four out of ten. And that’s the average herd in the study.

Those overconditioned cows carry adipose tissue that’s already inflamed before calving — larger adipocytes, more macrophage infiltration, upregulated TNF-α and IL-6 expression inside the fat depot itself. That tissue is insulin-resistant and primed to dump NEFA the moment energy balance tips negative. And crash-dieting them during the dry period makes it worse — cows that lose BCS prepartum actually run higher NEFA and face more metabolic disease.

The Ontario government’s recommendation: BCS 3.0–3.25 at dry-off and calving. Ohio State’s March 2026 guidance: 3.0–3.5 at dry-off, maintaining — not gaining — through the dry period.

Is Your Close-Up Pen Creating High-NEFA Cows?

LeBlanc et al. (2005) studied 1,044 cows across 20 Ontario herds and found that cows with NEFA at or above 0.5 mEq/L in the last week prepartum were 3.6 times more likely to develop a DA after calving. Even with BCS nailed, the close-up pen can induce early lipolysis in cows.

A monthly pre-fresh NEFA panel — 10–12 close-up cows sampled 2–14 days before calving — turns guesswork into a scorecard. If more than 15–20% clear the 0.3 mEq/L prepartum line, your close-up environment is generating avoidable fat mobilization.

What to look at first:

  • Overcrowding above ~80–85% of headlocks in the close-up pen.
  • Feed access gaps — late delivery, weak push-ups, heat stress, pulling cows off the bunk.
  • Abrupt ration switches between far-off and close-up diets that crash intakes.
  • Carried-over overconditioning — the 3.75 BCS cow tips into NEB earlier than her 3.0 penmate on the same feed.

Four Levers to Break the NEFA Cycle

You won’t eliminate negative energy balance. You can decide how many cows go deep into the red zone.

Lever / OptionPrimary target metricTypical cost per cow (US$)Expected impact on high-NEFA cowsNotes
Cap BCS at 180 DIM% cows ≥3.5 BCS at 150–180 DIM0–5 (management time)↓ 10–20%high-NEFA cowsRe-penning and feed adjustments prevent overconditioning upstream.
Tune close-up pen (≤80–85% stocking, intake)NEFA ≥0.3 prepartum; close-up DMI5–15 (space/feed changes)↓ 5–15% high-NEFA cowsSpace and feed access cut lipolysis before calving.
Monthly NEFA/BHB panels (pre- and postpartum)% cows ≥0.3 pre; ≥0.7 post; 0–30 DIM disease counts15–25 lab + handlingIndirect – flags problems earlyData KPI; pays when paired with actual changes, not as a stand-alone.
Rumen-protected choline as main “solution” onlyNEFA/BHB on supplemented cows25–40 per transitionSmall unless BCS/pen already fixedRisk of expensive window dressing if cows are still dried off fat.

1. Cap late-lactation BCS. Score at 150–180 DIM and again 6–8 weeks before dry-off. Anything trending above 3.5loses access to extra grain and moves to your lowest-energy lactating group. Trade-off: You need a system that also protects thin cows — this isn’t “take feed away from everyone.”

2. Tune the close-up pen for actual intake. Target ≤80% stocking on headlocks. Build a controlled-energy, high-forage diet. Stage concentrate increases; don’t hit fresh cows with a big day-one jump. Trade-off: Pen space is the bottleneck on many operations. If you can’t regroup, lean harder on ration design and feed-push timing.

3. Make NEFA/BHB a standing monthly KPI. Sample 10–12 close-up and 10–12 fresh cows. Alarm thresholds: fewer than 15–20% above 0.3 mEq/L prepartum; fewer than 15–20% above 0.7 mEq/L postpartum. Trade-off: A few hundred dollars a month in lab costs. Only worth it if you’ve already decided what you’ll change when results run hot.

4. Deploy rumen-protected choline as a margin tool, not a silver bullet. RPC supports hepatic triglyceride export and can lower NEFA/BHB — when BCS is under control and intake is solid. Trade-off: Expensive window dressing if you’re still drying off fat cows and jamming 120% stocking into the close-up pen.

The manager on that eastern Ontario herd didn’t reach for a new supplement first. After the NEFA panels exposed the pattern, the initial move was to score BCS at 180 DIM and pull grain on everything trending above 3.5. The vet adjusted the close-up ration and pushed to get stocking below 85%.

What This Means for Your Operation

  • Pull NEFA on 10–12 fresh cows (3–14 DIM) this month. If more than 20% come back at or above 0.7 mEq/L, you’ve got a lipolysis problem with real dollar consequences — not just a metabolic footnote.
  • Score BCS on your late-lactation cows (150–180 DIM) this week. If they’re routinely hitting 3.5+ before the dry period, the NEFA problem is baked in before your close-up program even starts. Ontario benchmarking says ~40% of dry cows are overconditioned. Know your number. 
  • Run your own version of the barn math above. Plug in your actual case counts per 100 calvings. Multiply by the per-case costs in the table. The number will either reassure you or get your attention fast.
  • Count headlocks and count cows in your close-up pen. Above 85%? Intake is being compromised regardless of what’s printed on the ration sheet.
  • If you’re spending $25–$40/cow on metabolic support products but haven’t audited BCS at dry-off in the past 6 months, you’re treating a symptom downstream of the cause.
  • Set up rolling 90-day tracking. NEFA percentage above threshold bundled with 0–30 DIM disease incidence per 100 calvings. If NEFA improves and the disease doesn’t within the first 90 days, hold the course — immune function recovery lags metabolic improvement by roughly one calving cycle. If both improve, you’ve found your lever.
  • Three consecutive monthly panels above 20%? That’s your signal to change late-lactation BCS management or to close up stocking — not just treat more sick cows.
Transition Cow NEFA

Key Takeaways

  • Lacasse’s 2026 lipid-infusion trial proves NEFA alone suppresses lymphocyte proliferation and neutrophil killing at concentrations common in early-lactation cows — independent of calving, infection, or hormonal change. NEFA management is a direct immune lever, not an optional wellness metric. 
  • Postpartum NEFA at or above 0.57 mEq/L carries a risk ratio of 9.7 for DA and a significantly elevated risk of metritis and clinical ketosis within 30 DIM (Ospina et al., 2010). Each high-NEFA fresh cow likely carries 9–2 in direct disease cost, with the full economic impact potentially reaching 0–0. 
  • Ontario benchmarking shows ~40% of dry cows are overconditioned  — and overconditioned adipose tissue is already inflamed and insulin-resistant before calving even begins. 
  • The highest-ROI move for many herds in 2026 may not come in a jug. It may come from a BCS ceiling at 180 DIM and a quieter, better-fed close-up pen.

If you don’t know how many of your last 20 fresh cows cleared the 0.7 mEq/L line, that’s your first report to run this month. Lacasse’s work — done right here in Canada — says those aren’t just cows having a rough first week. They’re cows whose immune defenses were significantly compromised by the fat they were allowed to carry. That’s a management decision with a dollar sign attached.

Complete references and supporting documentation are available upon request by contacting the editorial team at editor@thebullvine.com.

Learn More

The Sunday Read Dairy Professionals Don’t Skip.

Every week, thousands of producers, breeders, and industry insiders open Bullvine Weekly for genetics insights, market shifts, and profit strategies they won’t find anywhere else. One email. Five minutes. Smarter decisions all week.
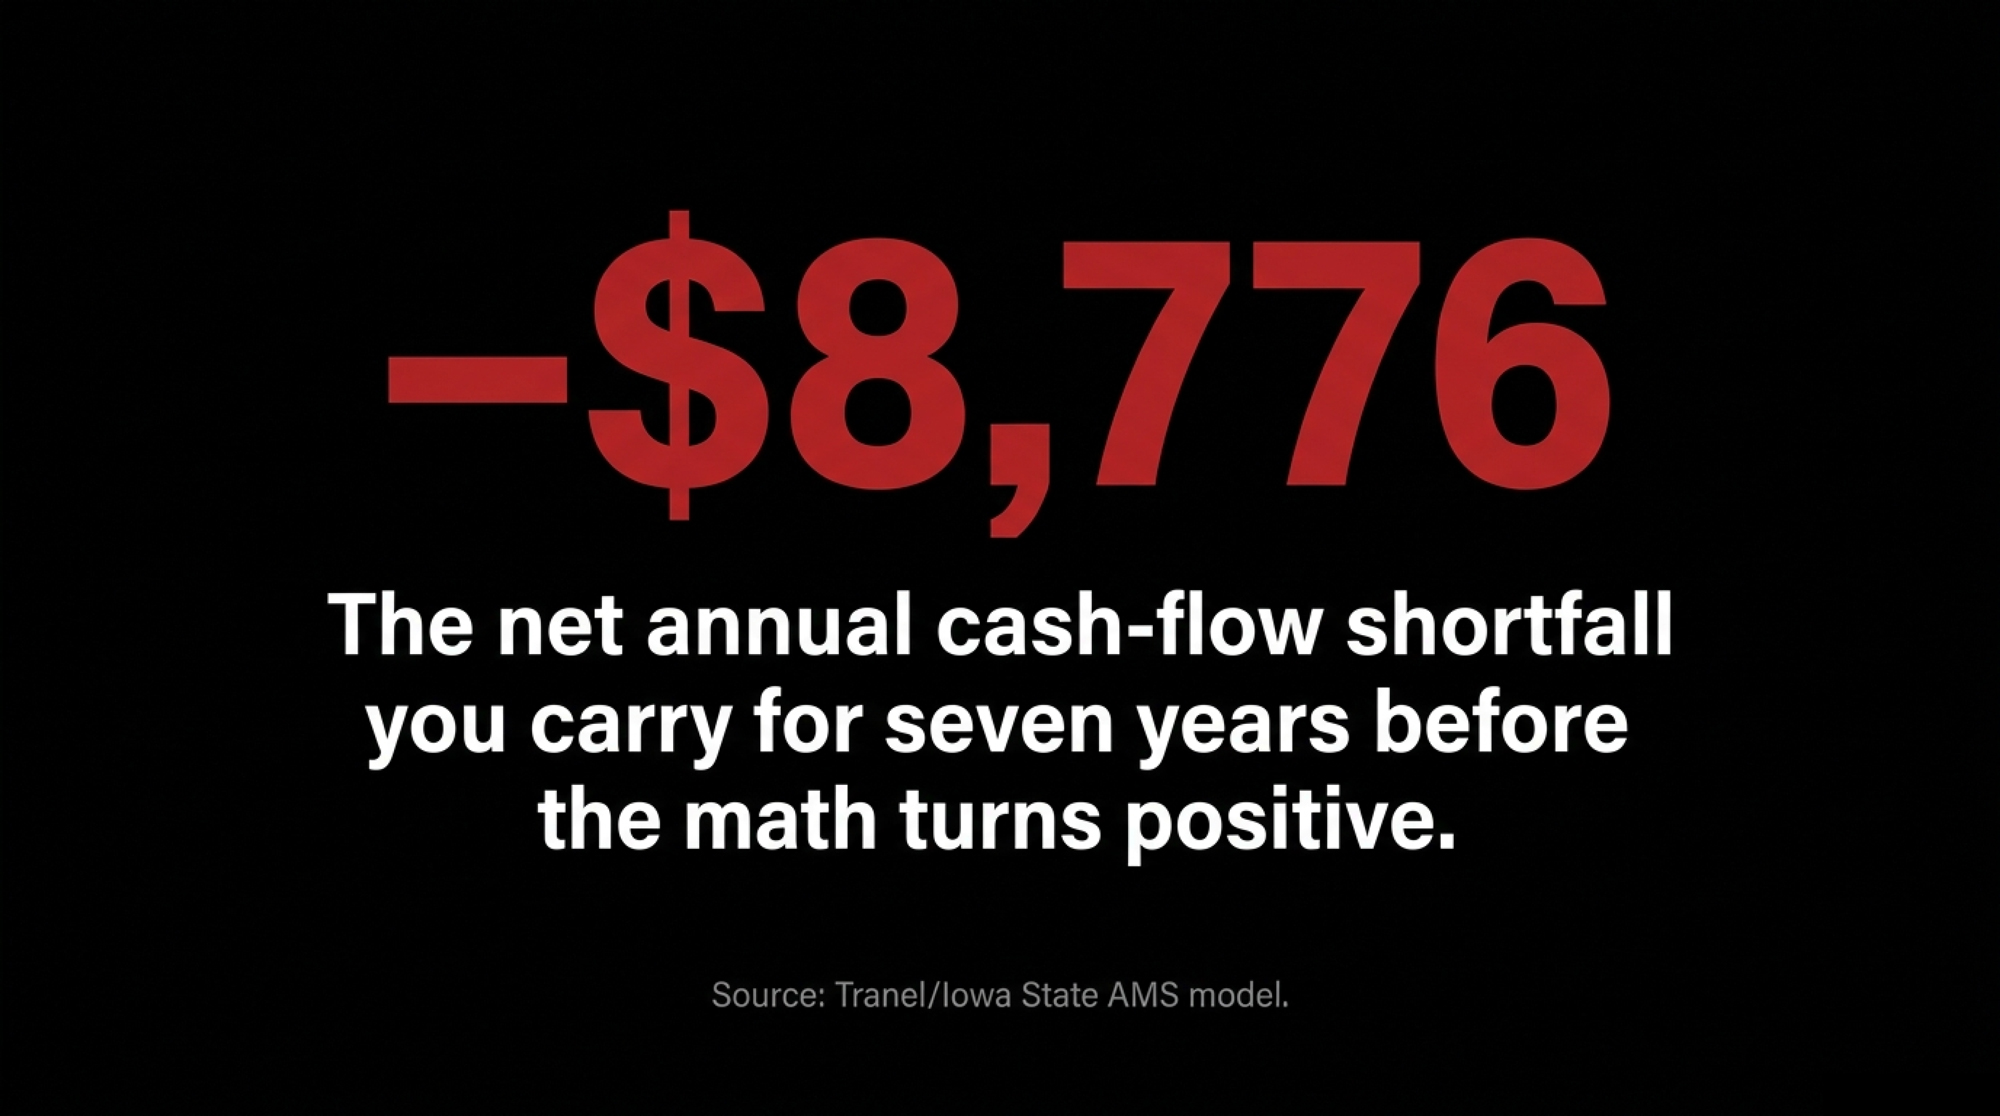
NewsSubscribe
First
Last
Consent

$368 Insurance, −$1,830 from Farming: What Actually Keeps One Iowa Dairy Alive

When enhanced ACA subsidies expired at the end of 2025, one Iowa dairy family’s monthly insurance cost nearly doubled — and exposed the financial arithmetic most dairy households already live but rarely put on paper.

Executive Summary: USDA’s 2024 data says the median U.S. farm household lost ,830 farming and earned ,900 off the farm — and when enhanced ACA subsidies expired in December 2025, families like Meghan Palmer’s in northeastern Iowa watched their monthly health insurance bill nearly double to 8.18, exposing exactly how much of a dairy’s real margin comes from the spouse’s W-2. On a 200-cow herd shipping 75 lbs/day at USDA’s current .50/cwt all-milk forecast, gross revenue runs about .12 million — but with average total production costs near .56/cwt, net margin is razor-thin or negative before you account for insurance, equipment, or anything else. Factor in that more than 40% of dairy farmers lack health insurance entirely, and that 27% of the ag workforce buys coverage on the individual marketplace at four times the national rate, and you’ve got a structural vulnerability most operations have never formally addressed. A spouse’s ,000 salary plus employer health benefits and retirement match adds up to ,000–,000 in total compensation — yet that income stream rarely appears on the farm‘s loan documents, succession plan, or cash-flow projections. This piece walks through the barn math, the governance gap, and four decision paths — including a 30-day action any operator can take with last year’s tax return and a W-2. If the off-farm number is bigger than the Schedule F net, the conversation about who really funds the dairy needs to happen now.

Meghan Palmer is 43, a registered nurse, and runs a dairy farm in northeastern Iowa with her husband, John. Their family’s monthly health insurance cost nearly doubled at the start of 2026 — climbing more than 90%, to $368.18 — after enhanced ACA premium subsidies expired. At $368 a month, that’s roughly $4,400 a year in premiums alone, nearly twice what they paid before the subsidies lapsed. Their total deductible for 2026: $7,200, as reported by KFF Health News in January 2026.

Palmer picks up nursing shifts as needed, giving her flexibility to prioritize the farm. But she’s now searching for a job with employer-sponsored health benefits — and she told KFF Health News she worries a job that doesn’t let her keep up with farm work will create a bigger burden for John.

“John is working exhausted most of the time,” she said. “That’s when mistakes get made, and you end up in the ER.”

Their situation isn’t unusual. It’s just more visible than most.

The Number Nobody Puts on the Whiteboard

USDA’s Economic Research Service tracks what farm households actually earn — not what they earn from farming, but what they earn total. The 2024 figures tell a story that anyone married to a dairy farmer already knows.

Median household income from farming in 2024: negative $1,830. Median off-farm income: $86,900. Total median farm household income: $102,748, according to ERS’s Farm Household Income Estimates. The typical American farm household lost money farming and made its living off the farm.

Dairy-specialized households do better than that all-farm median. ERS’s commodity-specialization data show dairy households earned a median of $100,493 from farming, with a total median household income of $146,964 (2023 reference year, from the December 2024 chart—the most recent dairy-specific breakdown available at publication). That’s real money from the cows. But even in dairy, off-farm income closes the gap between getting by and getting ahead — and for smaller operations, it’s often the gap between staying and leaving.

The point isn’t that farming doesn’t pay. For commercial-scale dairies, it often does. The point is that on a huge share of operations, the spouse with the town job isn’t “helping out.” She’s the financial backbone — and nobody’s accounting for it that way.

What Does the Town Job Actually Cover?

Here’s where most farm families undercount what the off-farm job is worth.

A $55,000 nursing or accounting salary doesn’t just bring home $55,000. It carries employer-paid health insurance — and that piece alone is bigger than most people realize. KFF’s 2024 Employer Health Benefits Survey puts the average employer contribution at about $7,500 a year for single coverage and nearly $19,300 for a family plan. Then there’s a 3%–6% salary match. Social Security credits that self-employment income alone often can’t match. Disability and life coverage are usually bundled at no extra cost.

Add the employer’s premium share and the retirement match to that $55,000, and you’re looking at $65,000 to $77,000 in total compensation — depending on whether you’re on single or family coverage. Now stack that against the milk check.

On a 200-cow herd shipping 75 lbs/day at USDA’s April 2026 forecast of .50/cwt all-milk price, gross milk revenue runs roughly .12 million a year. But your net? After feed, labor, depreciation, debt service, and the rest — USDA’s own full-economic-cost estimates run above $19/cwt for the largest operations, and a Bullvine analysis of 2024 data put average total production costs at about $23.56/cwt — the net might pencil out in the low single digits in a decent year. For mid-size and smaller herds, it runs at a loss.

That $65,000–$77,000 in total off-farm compensation doesn’t look like “extra income” when you run those numbers. It looks like the operating margin.

Is the Spouse’s Off-Farm Income in Your Farm’s Business Plan?

This is the governance question that the forces pushing mid-size operations to restructure or exit make unavoidable. If the town job is propping up the farm financially, is the person earning it actually part of the farm’s financial structure?

In many operations, the answer is no. The spouse with the W-2 isn’t on the operating loan. It isn’t on the farm’s bank accounts. It isn’t named in the succession plan. Isn’t at the table when the lender comes for the annual review.

That’s a big governance gap. You’ve built a dairy that depends on a single off-farm income stream, and the person generating it has no formal role in the business it supports. If that person gets hurt, burns out, or quits, there’s no Plan B — because nobody wrote Plan A down.

Your lender already factors this in. They’re looking at your whole household, not just your cows — total household cash flow, not just milk revenue — when they assess repayment capacity. The town job is already part of your credit picture. It should be part of your management picture too.

What Happens When the Insurance Math Changes?

The Palmer family’s 90% premium spike isn’t an outlier. KFF projected that ACA marketplace premium payments for subsidized enrollees would more than double once enhanced subsidies expired — from an average of $888 in 2025 to $1,904 in 2026, a 114% increase. That subsidy loss landed on top of underlying insurer premium increases — a median of about 18% nationally, per KFF’s analysis of 312 insurer filings, with the average closer to 20%. For farm families with incomes that fluctuate above and below subsidy thresholds from year to year, the whiplash is sharper still.

And it’s not just dairy. James Davis, 55, who grows cotton, soybeans, and corn in northern Louisiana, told KFF Health News that his family’s insurance premium quadrupled for 2026, to about $2,700 a month. That’s $32,400 a year in premiums alone, before a single deductible dollar kicks in. “You can’t afford it,” Davis said. “Bottom line. There’s nothing to discuss. You can’t afford it without the subsidies.”

More than a quarter of the agricultural workforce — 27% — purchases health insurance through the individual marketplace, per KFF. That’s more than four times the 6% rate for U.S. adults overall. And among dairy farmers specifically, more than 40% lack health insurance entirely — one of the highest uninsured rates across all agricultural sectors, according to KFF Health News.

Now layer the milk-price outlook on top. USDA’s February 2026 forecast projected dairy cash receipts would fall by $6.2 billion to $42.5 billion in 2026 — a 12.8% decline from 2025. Subsequent WASDE updates have lifted the all-milk forecast to $20.50/cwt as of April, which may narrow that gap. But on that same 200-cow herd, even $20.50 pencils out to about $1.12 million gross — and when average total production costs ran $23.56/cwt in 2024, you’re operating on tight margins before you think about insurance, machinery, or your kid’s braces.

In that environment, the off-farm paycheck isn’t a cushion. It’s the floor.

The Town Job vs. the Milk Check

Here’s how the math stacks up side by side for a typical dual-income dairy household:

DimensionTown Job (W-2 + Benefits)Milk Check (200-cow net)
Base Cash Income~$55,000 salaryVariable; near $0 to negative in tight years
Health Insurance Value$7,500–$19,300/yr employer share (KFF 2024)$0 unless self-purchased
Retirement ContributionEmployer match 3–6% (~$1,650–$3,300/yr)Self-funded or none
Total Comp Value$65,000–$77,000Razor-thin at $20.50/cwt vs. $23.56/cwt cost
Payment PredictabilityBiweekly, guaranteedMonthly, highly volatile
2026 Insurance ExposureEmployer-covered<span style=”color:red”>40%+ of dairy farmers fully uninsured</span>
Appears in Farm P&L?❌ No✅ Yes
Risk if LostHousehold loses insurance, retirement, stabilityHousehold loses equity and identity

Neither column is dispensable. But only one shows up in your farm’s P&L.

Options and Trade-Offs for Dairy Families

Path 1: Protect and formalize the town job — your 30-day action. If the off-farm W-2 plus benefits exceed one-third of total household income — and, for most dairy households, they do — treat it like any other critical business input. Put the earning spouse on the farm’s bank accounts and loan documents. Include off-farm income explicitly in cash-flow projections. Build the succession plan around two incomes, not one.

Here’s the 30-day move: pull your most recent tax return and your spouse’s latest W-2. Add the salary, the employer insurance contribution, and the retirement match. Compare that total to your net farm income on the Schedule F. If the off-farm number is larger — and don’t be surprised when it is — you’ve got a concentration-risk problem worth addressing this month, with your spouse, your lender, and your accountant.

Palmer herself faces exactly this calculus. She told KFF Health News that farmers “can be reluctant to acknowledge that they rely on government-subsidized insurance.” And she added: “We’re not handout-takers.” But the math doesn’t care about pride.

Path 2: Reduce dependence on a single W-2. If the town job disappears — layoff, injury, burnout — what happens to your operation? Diversifying off-farm sources (a second part-time income, custom work, or rental income) or building on-farm revenue reduces risk. But the real math of on-farm diversification is worth studying before you commit. Every diversification path costs time, and time is the scarcest input on a dairy. You gain resilience, but stretch management thinner.

Path 3: Restructure the dairy so it stands on its own. Some operations can realistically reach a cost structure where the milk check covers the bills without off-farm support. That usually means significant scale, premium marketing channels (organic, A2, processor quality bonuses), or radical cost reduction — low debt, paid-for facilities, minimal hired labor. This is the multi-year play, and it only works if you’re honest about your breakeven. Average total production costs ran about $23.56/cwt in 2024, per USDA data analyzed by The Bullvine. Even at the improved .50/cwt all-milk price, that gap doesn’t close in 12 months through genetic progress or feed tweaks alone.

Path 4: Plan the exit with eyes open. If the off-farm income is clearly the household’s real earning power, and the dairy is consuming equity rather than building it, an intentional transition — renting the land, selling quota (in Canada), shifting to beef, or exiting production — may be the strongest financial move. The hardest part isn’t the math. It’s the identity. But when financial stress piles up, management decisions suffer first, and the cost of delayed exits compounds every month. (If financial stress is affecting you or someone on your operation, the 988 Suicide & Crisis Lifeline and the Farm Aid hotline — 1-800-FARM-AID — are free, confidential resources.)

Key Takeaways

  • If your spouse’s W-2 plus employer benefits exceed your net farm income, the town job is your primary business — treat it accordingly in governance, lending conversations, and succession planning.
  • If a single off-farm income accounts for more than one-third of household cash flow, that’s a concentration risk. Assess it the same way you’d assess dependence on a single milk buyer.
  • Pull your 2024 tax return and your spouse’s W-2 this month. Add salary + employer health premium + retirement match. If that total is larger than your Schedule F net, the conversation about the farm’s real financial structure needs to happen now — not next year.
  • If your all-in production cost sits above $20.50/cwt — and with 2024 averages near $23.56/cwt for many operations, it likely does — your milk check still isn’t covering the full cost of producing it. The off-farm income isn’t supplemental. It’s subsidizing the operation.

Meghan Palmer’s $368 insurance bill isn’t really about insurance. It’s about what happens when the financial structure holding a dairy together takes a 90% jolt — and nobody had written down how much of the load that structure was carrying.

You know what your milk price is. You probably know your feed cost per cow. But do you actually know — down to the dollar — what your spouse’s off-farm job is worth to your operation? Not just the paycheck. The insurance. The retirement. The stability.

Pull the numbers. Then have the conversation.

Complete references and supporting documentation are available upon request by contacting the editorial team at editor@thebullvine.com.

Learn More

The Sunday Read Dairy Professionals Don’t Skip.

Every week, thousands of producers, breeders, and industry insiders open Bullvine Weekly for genetics insights, market shifts, and profit strategies they won’t find anywhere else. One email. Five minutes. Smarter decisions all week.
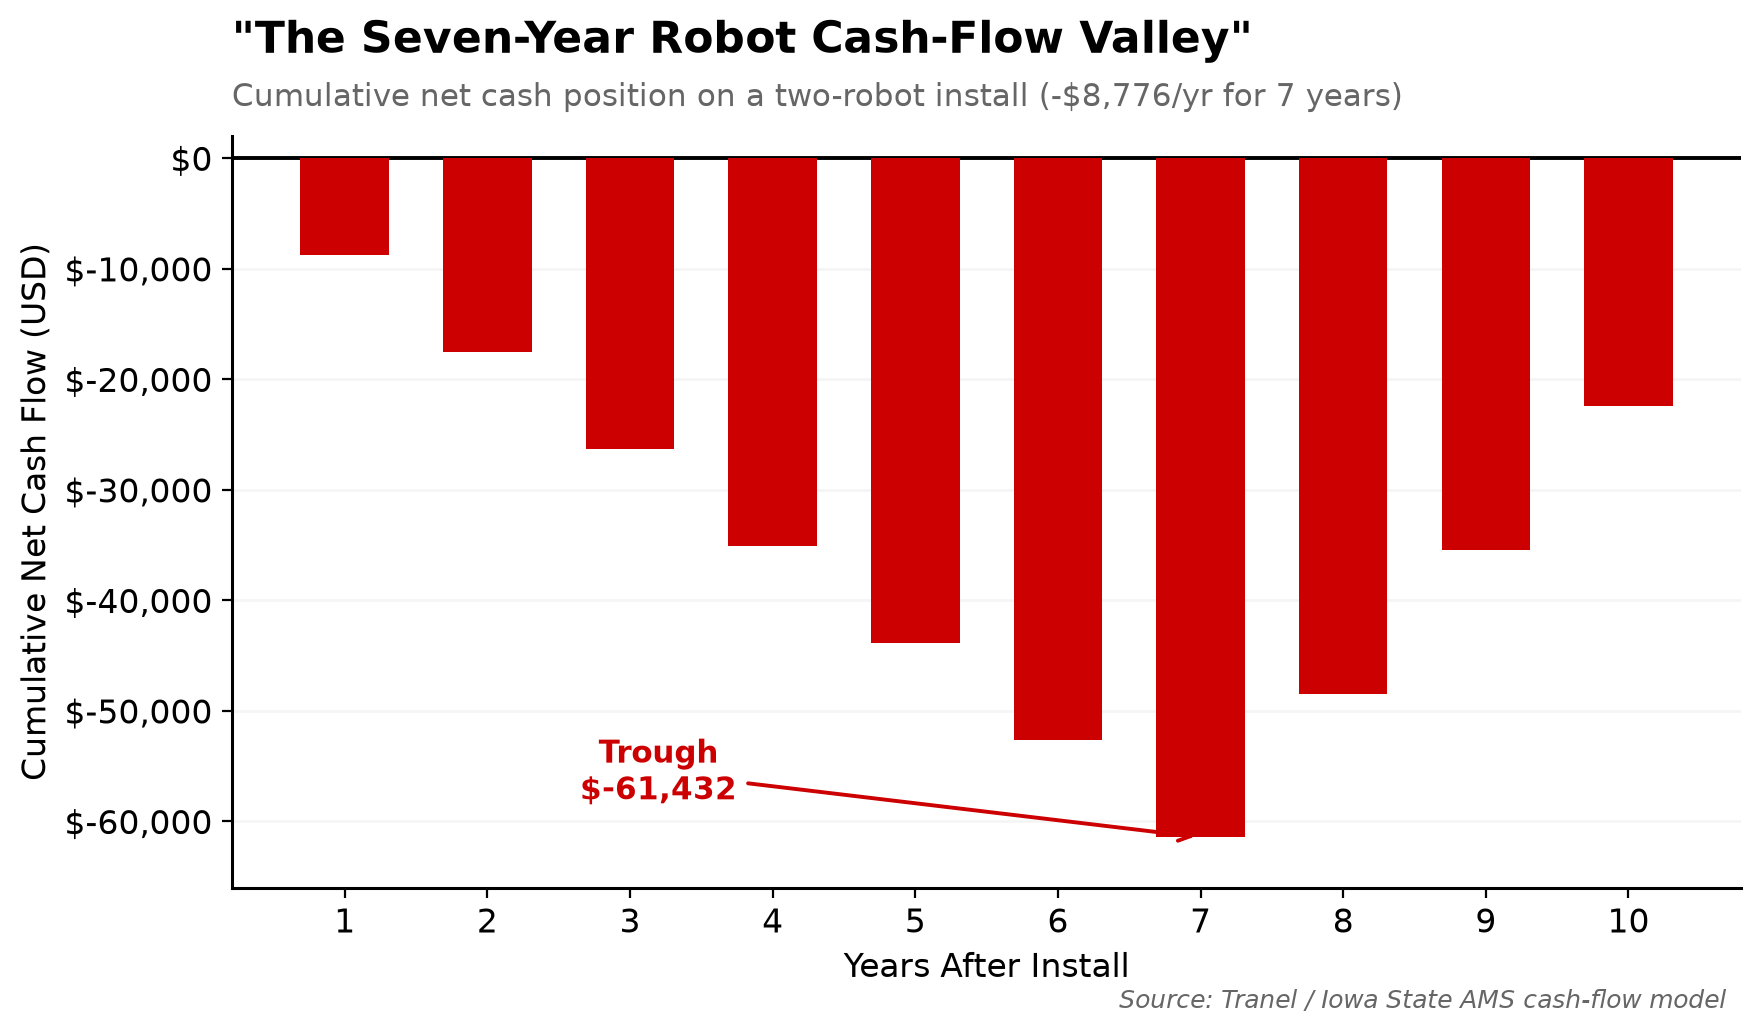
NewsSubscribe
First
Last
Consent

The 40‑Hour Cliff: How a $48,000 Overtime Bill Is Forcing Dairy Farms to Choose Between People, Robots, and Fewer Cows

New overtime thresholds in Washington, California, Oregon, and New York are handing mid‑size dairies a cost nobody budgeted for — and every option for absorbing it carries a price the regulators never modeled.

Executive Summary: New overtime laws in WA, CA, OR, and NY are adding roughly 12% to dairy payroll, which works out to about $48,000 a year, or 36–37¢/cwt, for a 480‑cow herd with a $400,000 labor bill. That pushes you into a three‑way choice: pay overtime to keep your best milkers, take on $1.4–$2.4 million in robot debt, or cut cow numbers and labor together, and each option carries risks regulators never modeled. OSU and UMN data show that if your all‑in labor cost is over $4.00/cwt, the problem is structural, but if you can hold it under $3.50/cwt, paying overtime to hang onto an A‑team can pencil better than a rushed robot install. At the same time, Zoetis/Compeer and MSU work make it clear that chopping hours and constantly retraining new milkers is a fast way to wreck SCC and give up $0.64/cwt in net income plus premium dollars you can’t afford in a tight year. The article walks through barn‑floor math on all four paths — overtime, robots, downsizing, and shift redesign — so you can plug in your own herd size, labor bill, and milk price to see which version of your operation actually survives a milk drop and one key milker walking away.

dairy farm overtime laws

On January 25, 2024, about 300 farmworkers packed the steps of the Washington state Capitol in Olympia. They weren’t chanting for overtime pay. They were protesting what the new law was doing to their paychecks.

Washington’s agricultural overtime threshold had just finished phasing down to 40 hours per week after a two‑year rollout sparked by the Martinez‑Cuevas court decision. Workers who once counted on 60‑ or 70‑hour weeks during peak season were now getting scheduled for closer to 36–40 hours, because farms were hiring more people and spreading hours around to avoid time‑and‑a‑half. “It’s not giving enough money to send to his family in Mexico,” one H‑2A dairy worker told Northwest Public Broadcasting reporter Johanna Bejarano about his new schedule.

Down in Chehalis, Washington, Sun‑Ton Farms has been milking cows for three generations. In local interviews, the Schilter family has made it clear that new labor rules are right up there with milk prices and feed costs as the challenges that decide whether their legacy continues. For operations like theirs, the dairy farm overtime laws 2026 don’t read like a policy debate. They read like a $48,000 problem they didn’t ask for. For many family herds, these dairy farm overtime laws 2026 are less about politics and more about whether the barn math still works.

The Deadlines You’re Actually On

The ag overtime exemption that let dairy crews work 55–70 hours at straight time for decades is disappearing, state by state. The practical scoreboard looks like this:

StateOT Threshold NowEffectiveWhere It’s Headed
Washington40 hrs/weekJan 1, 2024 Fully phased in
California40 hrs/week or 8 hrs/dayJan 1, 2025 final phase‑in for ≤25 employees Larger employers already there
Oregon48 hrs/weekJan 1, 2025 (HB 4002) Steps down to 40 hrs on Jan 1, 2027
New York52 hrs/weekJan 1, 2026 Drops 4 hrs every 2 yrs → 40 hrs by 2032

Washington is your preview. Analysis of real payroll records and interviews with both workers and employers show that farms aren’t simply paying overtime. They’re restructuring around it — adding more bodies, capping hours below 40, and compressing schedules.

California’s numbers tell a similar story. USDA Farm Labor Survey data, analyzed by Cornell’s Agricultural Workforce Development group, shows California’s directly hired farmworkers averaged 2.7 more hours per week than all U.S. farmworkers in 2016; by 2023, they averaged about one hour less. The overtime law didn’t automatically boost total paychecks. Hours shrank. Weekly earnings often went the wrong way.

For dairy, which already ran some of the longest workweeks on the farm, those trends hit harder than in most crops.

The Barn Math Behind the $48,000 Shock

Oregon State economists Tim Delbridge and Jeff Reimer pulled anonymized payroll records from five Oregon farms — three dairies, three nurseries, and two cherry orchards — and modeled what happens at different overtime thresholds. Dairy was the most exposed because its employees were already working the longest weeks.

Their estimates:

  • At a 48‑hour threshold, dairy payroll jumped around 7%
  • At 40 hours, the increase was about 12%.

Now put that into your barn.

You’re running 480 cows, shipping 75 lb/cow/day. That means:

  • 480 cows × 75 lb/day = 36,000 lb/day
  • Over 365 days: 36,000 × 365 = 13,140,000 lb/year
  • Divide by 100 → 131,400 cwt/year

Your all‑in payroll for parlor and cow care — wages, payroll taxes, basic benefits — is around $400,000. usda

Twelve percent of $400,000 is $48,000. Spread across 131,400 cwt:

  • $48,000 ÷ 131,400 ≈ $0.37/cwt

Call it roughly 36–37 cents per cwt of the new cost you didn’t have last year. That’s the “just pay it” option.

But the Oregon analysis and follow‑up coverage also show what farms actually did in response: opb

  • Cut back individual hours so fewer workers exceeded 40 hours.
  • Hired more workers part‑time to cover the same work.
  • Reshuffled tasks to squeeze milking and cow care into tighter windows.

Workers ended up with higher hourly rates and lower weekly pay. Farms ended up managing more people for the same output. And that’s where the hidden costs start.

How Much Overtime Can Your Operation Actually Carry?

USDA ERS estimates hired labor accounts for roughly 13–15% of total dairy cash expenses on average. A University of Minnesota analysis used by Choices magazine shows that a 10% increase in labor costs can shave about 15% off net income on an average dairy.

The number that really matters isn’t wage per hour. It’s labor cost per hundredweight shipped — and how many pounds each full‑timer helps move out the driveway. A farm paying $18/hour with 1.5 million pounds sold per full‑time equivalent can be in better shape than a neighbor paying $16/hour and moving only 900,000 pounds per worker.

Once you calculate your true all‑in labor cost per cwt — wages, overtime, payroll taxes, benefits, plus a realistic estimate for turnover and any quality losses tied to labor — chances are you land somewhere on this spectrum:

Labor $/cwtZoneWhat It Really Means
Under ~$3.00🟢 EfficientYou’ve got room. Overtime by itself won’t kill you. The real risk is losing your best people.
$3.00–$3.50🟡 TightWorkable, but one bad milk‑price quarter erases margin.
$3.50–$4.00🟠 EdgeYou’re one bad break from a structural problem. Time for a stress‑test.
Above ~$4.00 after a serious cleanup🔴 StructuralThis isn’t a bad year. It’s a business‑model issue that needs a redesign.

Those zones align with MSU and UMN benchmarks and USDA’s own cost‑of‑production work.

One question cuts through the noise:

If milk drops $2/cwt and you lose one key milker in the next 12 months, does your current setup still keep the farm alive?

If the honest answer is yes, then paying overtime to hold a strong crew together might be the cheapest risk management you’ve got.

If the answer is no, overtime is a bridge — not a plan.

What Happens to Your SCC When You Chop Your Milker’s Shifts at 40 Hours?

Your cows don’t read the labor code. They care about one thing: the same person doing the same thing the same way, every milking.

An 11‑year analysis by Zoetis and Compeer Financial found herds in the top third for bulk tank SCC — averaging around 125,000 cells/mL — shipped about 11 lb/cow/day more milk and made $0.64/cwt more net income than herds in the bottom third, which averaged about 269,000 cells/mL. Genetics helps, but that spread is mostly routines and people.

Work from Pamela Ruegg and others has put hard numbers on milking routine: standardized prep and unit attachment generated a 5.5% increase in lactational milk yield compared to inconsistent prep and timing. A separate study across 68 dairy herds found that milker behavior and management explained up to 40% of the variability in bulk-tank SCC among herds.

Michigan State University’s parlor evaluation team gives one example that should make you sit up: a herd with bulk tank SCC in the 80,000–85,000 range was still running 44% bimodal milking events, a sign that cows weren’t letting down properly even though the tank looked great. The parlor looked fine on paper. The milk curves told a different story.

Now overlay overtime.

When you slice shifts to dodge OT, you:

  • Add more people to cover the same parlor hours.
  • Give each person fewer full milking cycles to master.
  • Rely on yesterday’s hire to train today’s.

Rodriguez’s training study, which The Bullvine covered earlier, looked at 112 milkers on 16 farms. A single focused, bilingual on‑farm training session:

  • Moved milker knowledge scores from 49.3% to 67.6%.
  • Cut inadequate teat prep from 69% to 48%.
  • Trimmed milking time by 25–43 seconds per cow.

And yet herds that had SOPs written down for milking but no training showed bulk tank SCC 21,600 cells/mL higherthan herds with no SOPs at all. A three‑ring binder doesn’t milk cows. People do.

Dairy One and processor premium sheets translate that into real dollars: slipping from a premium SCC tier into a penalty/no‑premium band in a 400–500‑cow herd can quietly drain five figures a year from your milk check. The overtime law doesn’t itemize that. Your settlement sheet does.

The Mid‑Size Squeeze

The operations caught in the worst squeeze are in the 200–800 cow range. Too big to cover everything with family and one hired hand. Too small to spread robot installation costs over 2,000–3,000 cows.

Bre Elsey, director of governmental affairs at the Washington Farm Bureau, told Cascade PBS that “agriculture is the second largest industry in the state, and we’re losing them, one by one.” She was talking about family operations — the six‑ to twelve‑employee outfits that can’t casually absorb a $48,000 annual payroll shock without rethinking everything.

On the robot side, the temptation is real. USDA’s January 2026 report, ERR‑356, suggests farms using automatic milking systems (AMS) can see about 13% higher net returns over time. But Iowa State’s Larry Tranel, whose AMS cash‑flow work underpins a lot of extension talks, shows a typical install running roughly seven years of negative or flat cash flow before that upside shows up in the checkbook.

Scale that to a 480‑cow parlor:

  • You’re looking at 7–8 robots.
  • At $200,000–$300,000 installed per box, that’s $1.4–$2.4 million in capital. 
  • Annual principal and interest on that kind of note can land roughly in the $150,000–$230,000 range at typical 10–15 year terms and current rates. 

Those payments don’t care what Class III does next winter. But for some, the $230,000/year debt is a “reliability tax” they are willing to pay just to stop checking their phone for “I can’t make my shift” texts.

One Bullvine case study laid out what happens when the milk price in the dealer’s spreadsheet doesn’t match reality. A 240‑cow family ran their dealer’s four‑robot proposal at $18 milk instead of $22 and watched the projected milking cost jump from $2.03 to $4.07/cwt. The robots did what they promised. The economics didn’t.

The Cost Nobody Logs Under “Labor”

Here’s the thread that runs through every path you’re considering.

U.S. dairies using hired labor are reporting turnover rates of 30–40% per year. The National Dairy FARM Workforce Development survey reported an average of 38.8%. Extension and HR estimates peg the real cost of replacing a single hourly dairy employee — recruiting, hiring, onboarding, on‑the‑job training, early mistakes, and lost production — at 100–150% of that person’s annual wage.

If three milkers leave in a year at $35,000 base pay, you’re effectively burning:

  • 3 × $35,000 × 100% = $105,000 on the low end.
  • 3 × $35,000 × 150% = $157,500 on the high end.

Round it, and you’re somewhere around $105,000–$158,000 in real cost churned through just because you had to refill the same three positions.

Now layer overtime on top.

If your crew was working 55 hours a week at straight time pre‑law and you now cut them to 38 hours at straight time to avoid time‑and‑a‑half, their straight‑time hours just dropped by 31%. That’s roughly a 30% pay cut if the hourly rate doesn’t change. You’ve just handed a good milker a powerful reason to find a steadier income.

So the choice isn’t really “overtime vs robots.” It’s: pay a known premium to keep your best people, or design your system so it quietly pushes them out the door.

ScenarioAnnual Payroll ImpactSCC RiskTraining DisruptionNet Income Hit
Pay overtime, keep A-team (480 cows)+$48,000 (+37¢/cwt)Low — consistent crewMinimal–$48k vs. baseline
Cap hours, trigger turnover (3 exits/yr @ $35k wage)+$105k–$158k replacement costHigh — rotating pitConstant retraining–$105k–$158k + SCC penalty
SCC slip (top → bottom third, 480 cows)$0 added labor cost–$84,096 net income premiumRoutine breakdown–$84k/yr disappears from milk check
Robot install + ramp (Yr 1–5 deficit years)–$100k to –$35k/yr net vs. debtLow once stableHigh during transition–$100k–$200k/yr until Yr 6+

How Much Overtime Can Your Operation Carry? (Economic Question)

If you’re sitting at $2.80/cwt in all‑in labor cost and you’ve got a stable crew, overtime can look like tuition — money you pay to keep the people who make your cows more productive and your SCC more predictable.

If you’re at $3.20/cwt, you’re tight, but you’ve got options. You can absorb some overtime, trim obvious waste, and buy yourself a year or two to decide whether robots or a parlor redesign make sense.

If you run the real numbers and you’re at $3.80–$4.20/cwt even after cleanup, then you’re not dealing with a bad year. You’re looking at a system problem.

The takeaway: don’t guess. Pull your last quarter’s labor spend, include payroll taxes and benefits, divide by cwt sold, and see exactly where you sit on that spectrum. Then look at that number next to your milk price, your interest rate, and your tolerance for a 15% swing in net income.

What Happens to Your SCC When You Chop Your Milker’s Shifts at 40 Hours? (Operational Question)

You’ve seen it in your own tank. When the same three or four people milk every day and follow the routine, SCC trends one way. When you’re swapping new faces into the pit every month, it trends another.

Research from Wisconsin and elsewhere consistently links predictable, low‑stress cow handling with better oxytocin release and more complete milk letdown. MSU’s parlor performance team talks about watching bimodal milking curves — a sign that cows aren’t letting down properly — as closely as you watch vacuum settings.

When you redesign shifts purely around a 40‑hour line, you risk turning your parlor into a revolving‑door training program. The overtime line on your payroll might look cleaner. Your SCC report probably won’t.

Options and Trade‑Offs for Farmers

You’ve really got four paths. None is painless. Each one has a breaking point.

PathBest Fit (Labor $/cwt)Core RequirementAnnual Cost/InvestmentBreak Point
Absorb Overtime< $3.50/cwtStable A-team crew+$48,000/yr (37¢/cwt)$2 milk drop + 1 key milker lost
Automate (Robots)> $4.00/cwt structuralBarn redesign + data discipline$1.4M–$2.4M capital; $150k–$230k/yr P&I7–10 yrs negative cash flow; $16 milk
Downsize HerdAny, if labor not cutRemove ≥ 1 FTE with cows soldCow sale offset; lower productionSpread fixed costs over fewer cwt → $/cwt spikes
Shift Redesign$3.50–$4.00/cwtIdentify A-team + run real training30-day effort; low cash costReverts if not tracked quarterly

Path 1: Absorb Overtime and Stabilize

When it makes sense: Your all‑in labor cost comes in under about $3.50/cwt after a realistic cleanup. Your SCC trends are solid. You’ve got a core group of milkers you trust, and your banker is not excited about you taking on another million‑plus of debt.

What it requires:

  • Treat overtime on your best milkers as a planned investment, not a mistake.
  • Trim obvious time‑waste — double work, jobs that creep into the milking window — instead of cutting the A‑team.
  • Track labor $/cwt quarterly so you see creep before it bites you.

Risks and limits: If milk falls $2/cwt, that extra 36–37 cents of labor burns more of what little margin you’ve got. If your A‑team leaves anyway, you’re paying overtime to a less‑skilled crew and getting worse results.

Path 2: Automate

When it makes sense: Even after cleanup, your labor cost sits above roughly $4.00/cwt, and it’s not a one‑year fluke. Your facilities work for robot traffic. Your balance sheet and stomach can handle 7–10 years of tighter cash flow.

What it requires:

  • Treat robots as a full‑farm system change. Genetics, grouping, fetch strategy, and data use all have to move with it. 
  • Use realistic labor‑savings numbers. The USDA report and large‑herd AMS perception studies both suggest many farms land around $1.50/cwt in real labor savings — not the $3–4/cwt you sometimes see in sales decks. 
  • Stress‑test your payment at a few milk prices and interest rates. Don’t model only your best year.

Risks and limits: Fixed payments in the $150,000–$230,000/year neighborhood for a 480‑cow install — every year, whether Class III is $22 or $16. Tranel’s work suggests roughly seven years before the net‑return upside shows up in the checkbook. You don’t unwind that bet easily.

Path 3: Downsize the Herd

When it makes sense: You can sell 10–20% of your cows and actually remove at least 0.5–1.0 full‑time positionswithout making the remaining crew’s lives impossible. Your barns aren’t so oversized that fewer cows send your fixed cost per cwt through the roof.

Barn‑floor math: Say you go from 480 cows at 75 lb/day to 400 cows at 80 lb/day.

  • 400 × 80 = 32,000 lb/day
  • Over a year: 32,000 × 365 = 11,680,000 lb = 116,800 cwt

If you cut labor $0.25–$0.75/cwt by removing one position and tightening everything up, you free up $29,200–$87,600/year in cash flow. At the same time, a well‑planned right‑sizing move can keep total margin surprisingly close to where it was.

Risks and limits: If you sell cows but don’t cut labor, you just spread the same barn costs over fewer pounds — your labor $/cwt goes up, not down. And if reproduction or health slips while you’re shrinking, you take a double hit: fewer cows and fewer pounds per cow.

Path 4: Redesign Shifts and Roles — Your 30‑Day Move

When it makes sense: Your biggest problem is chaos, not headcount. Shifts bleed into each other, nobody really owns training, and you’re not confident about where the time is going.

Do this in the next 30 days:

  • Identify your A‑team. These are the two to four milkers whose shifts consistently show better parlor numbers. Don’t just look at speed. Look at SCC trends on their pens, the consistency of their milking curves, and how cows behave around them. Calm, predictable handling boosts oxytocin release and milk letdown; rough or inconsistent handling has the opposite effect. 
  • Run one real milking routine training. Not a laminated sheet. An actual session where someone with credibility watches prep and attachment, corrects in real time, and follows up. Rodriguez showed that one focused session moved knowledge, prep quality, and milking time across 112 milkers. 
  • Audit time‑waste. Walk a few full shifts with a notebook. Where are people waiting? Where do cows get hung up? What jobs are happening in the pit that could happen somewhere else?

Over the next 90 days, track four numbers:

  1. All‑in labor $ per cwt.
  2. Rolling 3‑month SCC.
  3. Milk per cow per day.
  4. Turnover (who leaves, who stays).

If all four move in the right direction and stay there, you’ve changed the system. If they snap back the second you stop watching, you had a good month — not a fix.

Oregon drops from 48 to 40 hours in 2027. New York ratchets down its cap every two years until it hits 40 in 2032. You want to hit those dates with your labor $/cwt and your people in a place where you’re choosing your next move, not having one forced on you.

Key Takeaways

  • If your all‑in labor cost stays above about $4.00/cwt after a serious cleanup, treat that as a structural problem, not a bad year. University of Minnesota modeling suggests a 10% labor increase can slice roughly 15% off net income. At that level, “wait and see” is usually the riskiest strategy. 
  • If you can get that number under about $3.50/cwt and keep it there for 90 days, paying overtime to keep your A‑team together is a defensible choice. You’re buying consistency in your parlor instead of rolling the dice on constant turnover. 
  • If you’re between $3.50 and $4.00/cwt, you’re in the danger zone. You should be running the survival question — $2 milk drop, one key milker gone, 12 months — do we make it? — before doing anything else.
  • If robots are on the table, don’t sign until you’ve modeled 7–10 years of cash flow at realistic labor savings and current interest rates. The 13% net‑return bump in the USDA report is real for many farms. So is the 7‑year cash‑flow valley Tranel’s numbers show. 
  • If you haven’t done a real milking routine training in the past year, that’s your cheapest 30‑day move. It’s a lot less expensive than signing a million‑dollar note or losing two of your best milkers because their hours got chopped. 

The overtime laws aren’t going away. Oregon’s own economists are telling lawmakers dairy payroll will rise about 12%, and the state is moving ahead anyway. California is already at 40 hours across the board. New York has started its slow walk toward 40 by 2032. Washington’s workers went to Olympia to say the law cut their pay, and family farms like Sun‑Ton are still trying to make it work on their side of the fence.

So the real question for your farm isn’t whether any of this is fair.

Pull your last quarter’s timesheets. Calculate your true labor cost per cwt. Then ask yourself this — which version of your operation survives a $2 milk swing, a 40‑hour cap, and one key milker walking out the door?

That answer is your strategy. Everything else is just noise.

And if you want to see exactly how the robot‑versus‑labor numbers shake out at different herd sizes and milk prices — including why one 240‑cow family’s four‑robot proposal doubled their milking cost at $18 milk — we opened the full spreadsheet up for you here:

➡️ The Robot vs. Labor Spreadsheet: When $200,000 in Debt Beats $1 in Overtime — and When It Doesn’t

Complete references and supporting documentation are available upon request by contacting the editorial team at editor@thebullvine.com.

Learn More

The Sunday Read Dairy Professionals Don’t Skip.

Every week, thousands of producers, breeders, and industry insiders open Bullvine Weekly for genetics insights, market shifts, and profit strategies they won’t find anywhere else. One email. Five minutes. Smarter decisions all week.
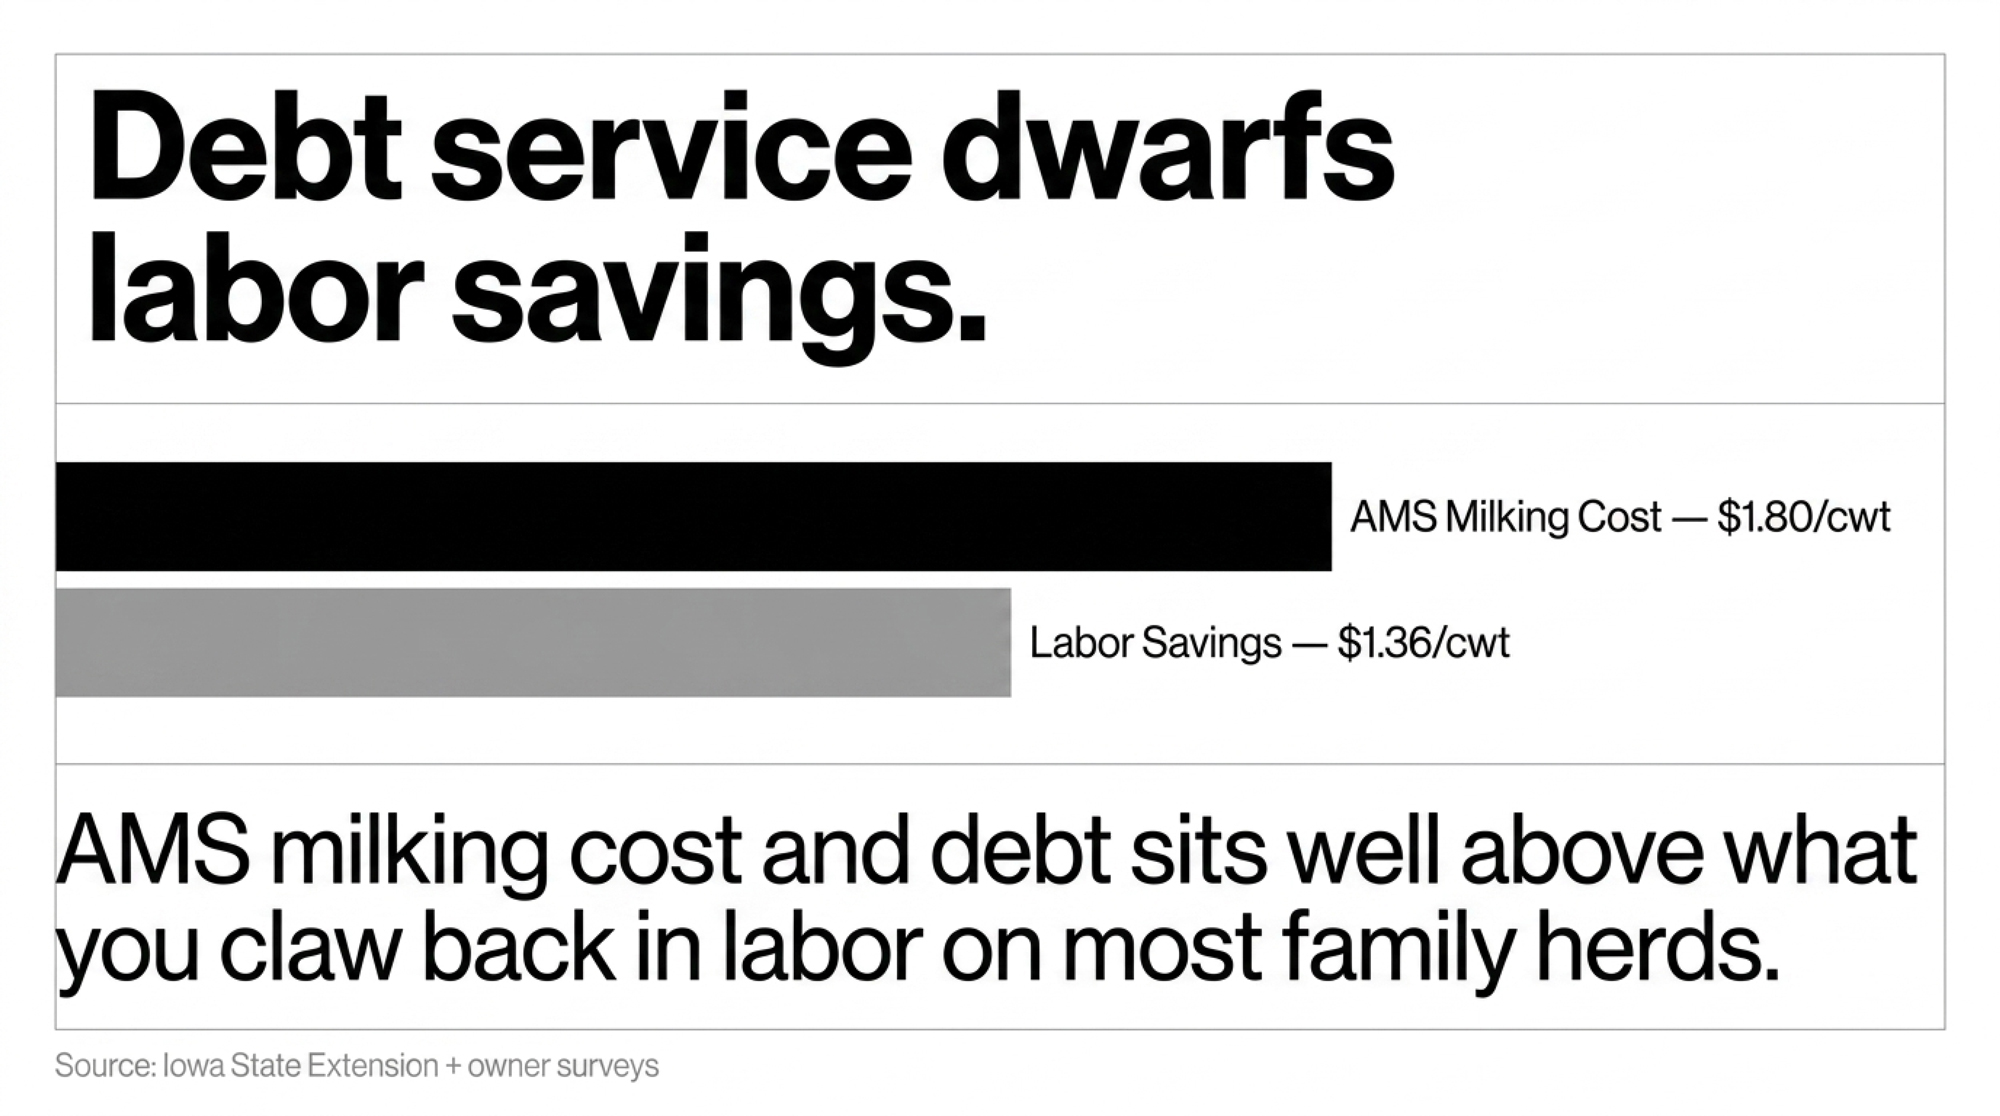
NewsSubscribe
First
Last
Consent

How a $286 Milk Replacer Shortcut Cost One 600‑Cow Herd $30,000 in Future Milk

When a 600‑cow Wisconsin herd tried to save $286 per calf on milk replacer, it looked like smart cost‑cutting. Three years later, the heifer records told a different story.

In early 2023, the team at a 600‑cow Holstein herd in central Wisconsin sat down with their nutritionist and lender to “trim the fat” out of their youngstock program. Feed and labor had pushed their heifer‑raising cost toward the $2,300–$2,600 per head range Iowa State budgets were warning about for herds of their size. They moved from a premium all‑milk replacer to a cheaper 20/20 blend, cutting about $286 per heifer out of the total preweaning milk program when you include both bag price and the way they fed it — roughly $30,000 – $35,000 ‘saved’ over four heifer crops on 120 replacements a year.

At the time, that felt like a win. When they ran first‑lactation records three years later and lined those heifers up against their previous all‑milk program, the pattern — exactly what Cornell’s calf data has been screaming for a decade — was hard to ignore. The calves raised on the cheaper program were behind on first‑lactation milk, behind on age at first calving, and more likely to leave early. When you added it up, the realistic value gap sat around $260–$310 per heifer, stacked against that $286 “saving” on replacer. You weren’t just cutting a feed bill. You were detuning a $2,500 capital asset.

MetricBudget 20/20 (plant protein)Premium all‑milk program
Preweaning ADG (kg/day)0.650.85
Replacer cost per heifer (USD)Base – 286Base
Lifetime milk value per heifer (3 lactations, USD)Base+ 218.88
Days to first calvingBase–21 days (~52.50 saved)
Net impact per heifer (before survival, USD)+ 286 “saved” feed–14.62 vs budget

What’s Really Changing in Those First 56 Days

If you’ve followed calf work over the last 10–15 years, you’ve watched the question flip. We used to ask, “How little milk can we get away with?” Now the serious conversation is, “What does early growth really do to lifetime production?”

Felipe Soberon and Mike Van Amburgh at Cornell pushed that shift hard in their 2012 Journal of Dairy Science study. They tracked 1,244 heifers in the Cornell research herd and 624 heifers on a commercial dairy, tying their preweaning average daily gain (ADG) back to first‑lactation milk. For every 1.0 kg/day of preweaning ADG, they saw about 850 kg more milk in first lactation at Cornell and 1,113 kg more in the commercial herd. Later datasets pushed that first‑lactation response up to around 1,550 kg per 1 kg/day of preweaning ADG in some datasets.

Even if you stick with the conservative end of that range, you’re looking at roughly 1,100 kg of milk tied to how a calf grew while she was on replacer. At the 2024 All Federal Order mailbox average of about $21.80/cwt — roughly $0.48/kg — that’s around $528 per heifer in first‑lactation milk value that lives or dies on those preweaning gains. Cornell’s longer‑term modeling says that in cows that make it through three lactations, each extra 1 kg/day of preweaning ADG can be worth about 2,280 kg more milk over three lactations — another $1,090 or so per heifer at that same milk price.

ADG bump (kg/day)Extra milk 3 lactations (kg)Lifetime value (USD, $0.48/kg)
0.0000
0.10228109
0.15342164
0.20456219
0.25570274
0.30684329

Meanwhile, the cost to get a heifer from the hutch to the parlor keeps climbing. Iowa State’s 2024 budgets put the total cost to raise a heifer to calving between about $2,258 (pasture‑based, 18,000‑lb herd) and $2,651 (confinement, 26,000‑lb herd). Back that into a per‑head, per‑day cost, and you’re looking at roughly $2.50–$3.00 once you include feed, bedding, facilities, and labor. You already treat each replacement like a $2,300–$2,700 capital asset before she ever hits the parlor.

Preweaning is the most expensive phase per day in the heifer program. It’s also the one with the cleanest, most measured link between what you feed and what that genetic investment actually does in the tank.

How This Math Shows Up in a Real Herd

Back to that 600‑cow Wisconsin herd. On paper, the change looked harmless. The monthly feed report even looked better.

On the budget replacer program, they switched into:

  • 20/20 milk replacer with plant protein listed in the top half of the tag.
  • Feeding rate around 0.7 kg of powder per day.
  • Preweaning ADG averaged about 0.65 kg/day across Holstein heifers in hutches.

On their earlier all‑milk program:

  • Higher‑cost replacer using only milk‑derived proteins.
  • Feeding rate closer to 0.9 kg/day, split into two or three feedings.
  • Preweaning ADG averaged about 0.85 kg/day under similar genetics and housing conditions.

That’s a 0.20 kg/day ADG advantage for the all‑milk program across a roughly 56‑day preweaning window. Here’s the barn math — the same math they walked through when they finally put numbers to it.

0.20 kg/day × 56 days = 11.2 kg more gain to weaning. Call it about 24–25 lb of extra bodyweight when you pull the nipples. Now plug that into the Cornell relationships:

  • 0.20 × 850 = 170 kg more milk in first lactation (Cornell herd).
  • 0.20 × 1,113 = 223 kg more milk in first lactation (commercial herd).

Split the difference, and you’re looking at roughly 180–200 kg extra milk in first lactation from that 0.20 kg/day ADG gap. At $0.48/kg, that’s about $86–$96 more milk per heifer in her first trip through the parlor.

Over the longer run, Cornell reported that cows reaching three lactations could produce about 2,280 kg more milk per 1 kg/day increase in preweaning ADG. On that same 0.20 kg/day bump:

  • 0.20 × 2,280 = 456 kg more milk over three lactations.
  • 456 × $0.48 ≈ $219 lifetime milk value per heifer.

Here’s how that stacks up for this herd, using the conservative Cornell numbers and Iowa State’s cost ranges:

MetricBudget Program (Plant)Premium Program (All‑Milk)Difference (All‑Milk vs Budget)
Preweaning ADG0.65 kg/day0.85 kg/day+0.20 kg/day
Lifetime Milk (3 lactations)Base+456 kg+$218.88
Approx. AFC (days to calving)Base−21 days+$52.50 (at $2.50/day)
Direct Replacer Cost−$286Base−$286.00
Net (milk + AFC, before survival) −$14.62 per heifer

So before you even talk about survival, the higher‑nutrition, all‑milk program is essentially breaking even on this conservative model, down roughly $15 per heifer once you net lifetime milk, earlier calving, and replacer cost. That’s not exciting on its own. The story changes when you look at which heifers actually stick around to use that extra capacity.

On this herd, the calves from the all‑milk program reached breeding weight sooner and freshened several weeks earlier on average, resulting in fewer non‑productive days and burning $2.50–$3.00/day in feed and yardage. Stack that across 120 heifers a year and add in even modest improvements in early survival, and the decision to “save” $286 per calf added up to more than $30,000 in lost potential over a few heifer crops — right in line with the research linking rough starts to higher culling and lower lifetime performance.

What Is That $286 “Saving” Really Doing to Your Herd?

If you’re trying to decide whether your “cheap” replacer is actually saving you money, you have to stack three pieces together:

LeverKey stat (red in design)Take‑home message
Lifetime milk~$219 per heifer from 0.20 kg/day ADG bumpExtra early gain keeps paying for three lactations.
Days to first calving~$40–$90 saved per heifer15–30 fewer non‑productive days at $2.50–$3.00/day.
Survival risk+5.1% culling risk per extra month; 5.52× risk after 30 mo calvingLate, slow‑grown heifers are the riskiest “investments”.

1. Lifetime Milk: Around $200–$220 per Heifer

A 0.20 kg/day ADG difference across preweaning realistically buys you about 456 kg more milk over three lactationsin the cows that stay in the herd. At $0.48/kg, that’s right around $219 per heifer in lifetime milk value.

Even if your herd only captures half of that response because of other bottlenecks, you’re still in the $100+ per heiferrange tied directly to preweaning gain.

2. Days to First Calving: Roughly $40–$90 per Heifer

Better‑grown calves hit breeding weight sooner and freshen earlier. They don’t spend extra months standing around eating your money while you wait for the scale to catch up.

On‑farm work in the UK, looking at 11 herds, found restricted‑milk calves running well under 0.6 kg/day, while higher‑intake calves in the same systems were closer to 0.7 kg/day or better in the first month. Those early gaps don’t just disappear; they follow heifers right up to breeding targets.

Research on age at first calving (AFC) and survival shows that the sweet spot for first‑lactation milk and lifetime performance is around 22–24 months, with performance dropping off when you push heifers much later than the mid‑20s. When you feed calves so they reach breeding size sooner instead of dragging them through extra months on low gain, you’re realistically shaving a couple of weeks to a month off the calendar for a lot of heifers.

Even a 15–30 day shift at a daily maintenance cost of $2.50–$3.00 per head — in line with recent heifer‑raising and housing cost work — is worth roughly $38–$90 per heifer in feed, bedding, and overhead you don’t have to burn.

3. Survival and Longevity: Real Money, Even if the Exact Number Varies

The third piece is messier but important. Slow‑grown, disease‑hit heifers are more likely to leave early and less likely ever to pay back what you put into them.

Fodor and colleagues followed 35,128 Holstein heifers across 33 herds and found that each additional month of age at conception increased culling risk by 5.1%, and heifers calving after 30 months were 5.52 times more likely to be culled within the first 50 days in milk compared with heifers calving before 22 months. In plain language: the later and rougher you bring her in, the more likely she is to leave before she’s repaid her replacement cost.

Putting a single dollar figure on “improved survival” across all herds isn’t honest. The value depends on your replacement cost, culling patterns, and the number of cows that actually reach second and third lactation. What the Fodor data do say clearly is that the late, slow‑grown heifer is a much higher‑risk investment than the one that grew well and calved on time. For most herds, even a slight drop in early culling tied to better early growth adds real money on top of the 9 in milk and – in earlier calving.

So even if you ignore survival completely and stack the ~$219 in lifetime milk with a conservative $40–$90 from shaving non‑productive days, you’re looking at roughly $260–$310 of value per heifer against a $286 replacer gap. Add any survival benefit on top, and the “cheap” program stops looking cheap.

On a 600‑cow herd raising 120 heifers a year, that per‑head swing quickly adds up to tens of thousands of dollars in capital performance — one way or the other.

Why Protein Source in Week 1–3 Matters So Much

If those 1,100–1,550 kg of milk per 1 kg/day of preweaning ADG still feel too large, it helps to look under the hood. In those first weeks, you’re not just putting on frame. You’re building the factory, wiring the control system, and deciding how often it breaks.

You’re building a mammary factory. Trials comparing restricted and enhanced preweaning feeding show calves on higher planes of nutrition develop substantially more mammary parenchyma — the secretory tissue — by eight weeks of age. More parenchyma now means more secretory cells later. That’s literal milk‑making capacity you either build or you don’t.

You’re resetting the growth hormone axis. Calves fed higher planes of milk nutrition show higher circulating IGF‑1 and insulin, and mammary gene expression patterns that favor development. One regression, Soberon and Van Amburgh reported — roughly milk yield = −106 + 1,551 × ADG in one model — isn’t magic; it’s what happens when better early nutrition rewires how that calf allocates nutrients and grows.

You’re wiring immunity and gut health — and protein source is a big part of it. Back in the late 1980s, researchers showed that replacing milk protein with isolated soy protein reduces the ileal digestibility of indispensable amino acids from about 82% to around 62% in neonatal calves. CalfCare.ca and similar extension programs are blunt: calves under three weeks of age should be on an all‑milk protein milk replacer, because their abomasal enzymes aren’t built to handle soy or wheat proteins efficiently yet.

When you push plant protein too early, you’re not just wasting protein. You’re buying more loose stools, depressed intake, and a gut barrier under stress right when the immune system is still spooling up. Add in research tying preweaning disease events to poorer fertility and lower first‑lactation milk later on, and it’s not surprising that preweaning ADG explained about 20–22% of the variation in first‑lactation milk yield in the Cornell models.

How Much Is Your Calf Milk Replacer Really Costing You?

Here’s the Cornell‑style math in a version you can actually drop your own numbers into.

Say your calves are averaging 0.7 kg/day preweaning ADG right now. You’re looking at a move to an all‑milk, higher‑plane program that you expect will push that to 0.8–0.9 kg/day. Trials and field data put a 0.1–0.2 kg/day improvement well within reach when you upgrade both protein quality and feeding rate and keep housing and health decent.

Take the conservative end: a 0.1 kg/day bump in ADG.

Using Soberon’s 850–1,113 kg/kg ADG range:

  • 0.1 × 850 = 85 kg more milk in the first lactation.
  • 0.1 × 1,113 = 111 kg more milk in the first lactation.

At $0.48/kg, that’s around $41–$53 extra milk per heifer in first lactation. Over three lactations, that same 0.1 kg/day bump scales to:

  • 0.1 × 2,280 = 228 kg more milk over three lactations.
  • 228 × $0.48 ≈ $109 lifetime milk value per heifer.

Now compare that to your replacer cost. If your all‑milk program runs roughly $200–$286 more per calf than a budget plant‑protein 20/20 replacer, and even that conservative 0.1 kg/day improvement is worth roughly $41–$53 in first‑lactation milk and around $109 over three lactations, you’re at $150–$162 of milk value before you even think about days to first calving or survival.

In herds where a full 0.2 kg/day improvement is realistic, the lifetime milk advantage roughly doubles. That’s how you land in the ~$219 milk value range you saw in the Wisconsin herd’s model. So if your replacer choice is “saving” $286up front, but even a cautious reading of the data says you’re giving up $219–$300 in lifetime value before you add survival, that bag isn’t cheap. It’s a capital trade‑off.

Sponsored Post

Is Your Calf Barn Measuring the Right Number?

Most calf barns can answer two questions without opening a laptop: “Did she live?” and “What did she weigh at weaning?” Helpful, but not enough.

If you want to know whether your replacer program is building the cows your genetic plan paid for, the number you need to start treating as non‑negotiable is preweaning ADG.

Here’s a 30‑day action that doesn’t require a new feeder or building:

  1. Weigh or tape every heifer calf at birth and at weaning. Use a platform scale if you have it, or a consistent heart‑girth tape on dry calves if you don’t.
  2. Calculate ADG for each calf and each birth month. (Weaning weight − birth weight) ÷ days on milk. Write it somewhere you’ll actually look — a whiteboard in the calf barn beats a forgotten tab in the herd software.
  3. Write the replacer product and lot number at the top of each month’s record. When a group suddenly averages 0.6 kg/day and treatments spike, you’re not guessing whether a formulation change or batch issue was involved.
  4. Cross‑check ADG against your genomic rankings. Are your highest‑index calves actually outgrowing the lower‑index calves preweaning? If not, the bottleneck isn’t genetics. It’s what’s in the bucket.
MetricSolid target (black text)Red‑flag zone (red text in design)
Preweaning ADG (kg/day)0.8–0.9 kg/day when housing and health are decent. <0.7 kg/day = nutrition/housing bottleneck.
Cost per kg of gain (preweaning)Lower on all‑milk, higher‑plane programs because calves grow faster and stay healthier. “Cheap” program shows higher cost per kg of gain than premium.
Age at first calving22–24 months sweet spot for milk and lifetime performance. Regularly calving >26–27 months.
Heifer investment lensView each heifer as a $2,300–$2,700 capital asset.Decisions driven only by bag price, not lifetime ROI.

Holstein herds using higher‑plane milk programs in trials and field reports commonly hit 0.8–0.9 kg/day preweaning when housing and health are decent. If your 30‑day snapshot says you’re living under about 0.7 kg/day, something in your replacer, feeding rate, housing, or health is capping the genetic engine you paid for.

Options and Trade-Offs for Farmers

How Much Is Your $286 “Saving” Really Costing?

When it makes sense: Any time your feed supplier or spreadsheet says, “We can save you $X per calf on milk replacer.”

What it requires:

  • A realistic estimate of preweaning ADG on your current program and on the program you’re considering — even a month of tape weights is better than guessing.
  • A simple ADG‑to‑milk conversion using the Cornell ranges: 850–1,113 kg per 1 kg/day ADG in first lactation, about 2,280 kg over three lactations for survivors.
  • One milk‑price assumption used consistently across your math (for now, $0.48/kg based on 2024 mailbox).

Risks/limits: Your first pass won’t be perfect. But it’s better than letting the bag price decide for you.

Make Preweaning ADG a Non‑Negotiable KPI (30‑Day Action)

When it makes sense: Any herd raising replacements — whether you’re milking 80 cows or 1,800.

What it requires:

  • Birth and weaning weights (or tape equivalents) for every heifer calf over the next month.
  • One simple tracking sheet: calf ID, birth date, birth weight, weaning date, weaning weight, replacer, lot.
  • A starting target: work toward 0.8–0.9 kg/day preweaning. Treat anything consistently under 0.7 kg/day as a red flag, not a detail.

Risks/limits: It’s one more habit to build. Once it’s in place, it becomes one of the most useful numbers in your heifer program.

Why it matters: Once ADG is on your dashboard, replacer changes, seasonality, housing tweaks, and staff shifts all show up in hard numbers. You stop arguing “calves look good” and start asking “Are they growing fast enough to justify the genetics we paid for?”

Shift From Least‑Cost to Fixed‑Formulation, All‑Milk Protein Replacer

When it makes sense: When you’ve seen calf performance bounce around with no obvious changes in housing, staff, or weather — or when you’re pretty sure your replacer is being sold on price first and formulation second.

What it requires:

  • A direct question to your supplier: “Is this replacer least‑cost formulated, or are the ingredient sources fixed?”
  • Confirmation that protein sources are all milk‑derived — whey, whey protein concentrate, skim — especially in the first three weeks.
  • A habit of tying replacer lot numbers to calf ADG and health in your own records.

Risks/limits: Bag price will almost always go up compared with aggressive, least‑cost options. And some mills aren’t eager to talk about how often they swap ingredient sources under a least‑cost model.

Why it matters: Least‑cost formulation is built to swap ingredients as commodity markets move while keeping the 20/20 tag on paper. On some herds, those quiet shifts show up as an invisible “volatility tax” on calf performance when ingredient changes affect how calves respond. Fixed‑formulation, all‑milk replacers don’t make calves bulletproof, but they remove one of the biggest hidden variables in your heifer program.

Compare Programs by Cost per Pound of Gain, Not Cost per Bag

When it makes sense: Anytime you’re comparing a “cheap” replacer against a higher‑priced option — especially if someone is trying to sell you on bag price alone.

What it requires:

For at least two recent calf groups:

  • Total preweaning cost per calf: replacer, starter, meds, plus a realistic estimate for labor and bedding.
  • Total gain: weaning weight − birth weight.
  • The simple metric:
  • Cost per lb (or kg) of gain = Total preweaning cost per calf ÷ Total gain.

Economic modeling of preweaning programs shows that while higher‑nutrition, all‑milk programs increase total preweaning cost per calf, they often lower cost per kg of gain because calves grow faster and stay healthier. In one 2019 analysis, preweaning costs ranged from about $258.56 to $582.98 per calf across different feeding strategies, but the higher‑milk programs produced more gain per dollar invested.

Risks/limits: You need enough calves in each group to avoid chasing noise. And pulling real cost numbers takes a bit of time.

Why it matters: If your cost per pound of gain is higher on the “cheap” program, that saving isn’t real. You’re paying more for slower, riskier gain.

Reframe the Lender Conversation as Heifer ROI

When it makes sense: When your lender or business partner tells you calf costs need to come down this year.

What it requires:

  • A one‑page summary that shows, for your herd:
    • Current preweaning cost per heifer (from your cost‑per‑gain work).
    • Projected extra spend per heifer on an improved replacer program (for example, around +$200–$286).
    • A conservative payback story, grounded in the research: roughly $150–$300 in lifetime milk and fewer non‑productive days per heifer from even a 0.1–0.2 kg/day ADG bump, plus the survival risk differences Fodor documented for late‑calving heifers.

Risks/limits: Some lenders think in 12‑month cycles, not three‑lactation ROI. You may have to walk them through replacements as capital assets, not just an expense line.

Why it matters: When you can say, “We’re asking to invest an extra $286 in each heifer to realistically capture more than that in lifetime value and reduce early culling risk,” it changes the tone of the meeting. You’re not defending “expensive powder.” You’re explaining a capital decision on an asset your lender already helped finance.

Partner Perspective: Consistency as the Antidote to Volatility

Consistency is the antidote to the batch‑to‑batch volatility problem you’ve probably felt in your calf barn. Industry partners like Kalmbach Feeds have leaned into that with their Generations™ All Milk 20/20 and 22/20 Milk Replacers, using milk‑derived proteins in a fixed formulation and including LifeGuard® immune support, as described in Kalmbach’s product literature. The idea is simple: keep ingredient sources consistent from batch to batch so you’re not chasing unexplained intake or performance dips tied to formulation changes when you’re making a capital decision on a $2,300–$2,700 animal. Knowing what’s actually in the bag matters.

Key Takeaways

  • If your preweaning ADG is consistently under about 0.7 kg/day, don’t start by chasing a cheaper bag. Start by asking why your calf barn is putting a governor on the genetics you’re paying for.
  • If your highest‑index calves aren’t outgrowing your lower‑index calves preweaning, genetics aren’t the weak link — your nutrition program is. That’s a bottleneck you can actually fix.
  • If your “cheap” replacer program has a higher cost per pound of gain than an all‑milk or higher‑plane program, that saving isn’t real. You’re paying more for slower, riskier gain.
  • If scours and treatment rates swing when replacer lots change, treat that as a sign that the least‑cost formulation is adding volatility you never agreed to pay for.
  • If you’re walking into a lender meeting under pressure to cut calf costs, go in with a three‑part story — milk, days to first calving, and survival risk — instead of a single bag price. Let the math make the case for you.

You don’t need to turn your calf barn into a research station. You do need to know whether the milk replacer in your mixer is building the cows your genetic plan is paying for — or quietly turning that investment into scrap value.

So here’s the challenge. Over the next 30 days, weigh a run of calves at birth and weaning. Calculate ADG. Tie it to replacer lots and genomic rankings. Then ask yourself, with your own numbers in front of you: is that 6 “saving” actually putting money in your pocket — or is it the most expensive cut you make all year?

Run Your Own Milk Replacer Math

Learn More

The Sunday Read Dairy Professionals Don’t Skip.

Every week, thousands of producers, breeders, and industry insiders open Bullvine Weekly for genetics insights, market shifts, and profit strategies they won’t find anywhere else. One email. Five minutes. Smarter decisions all week.
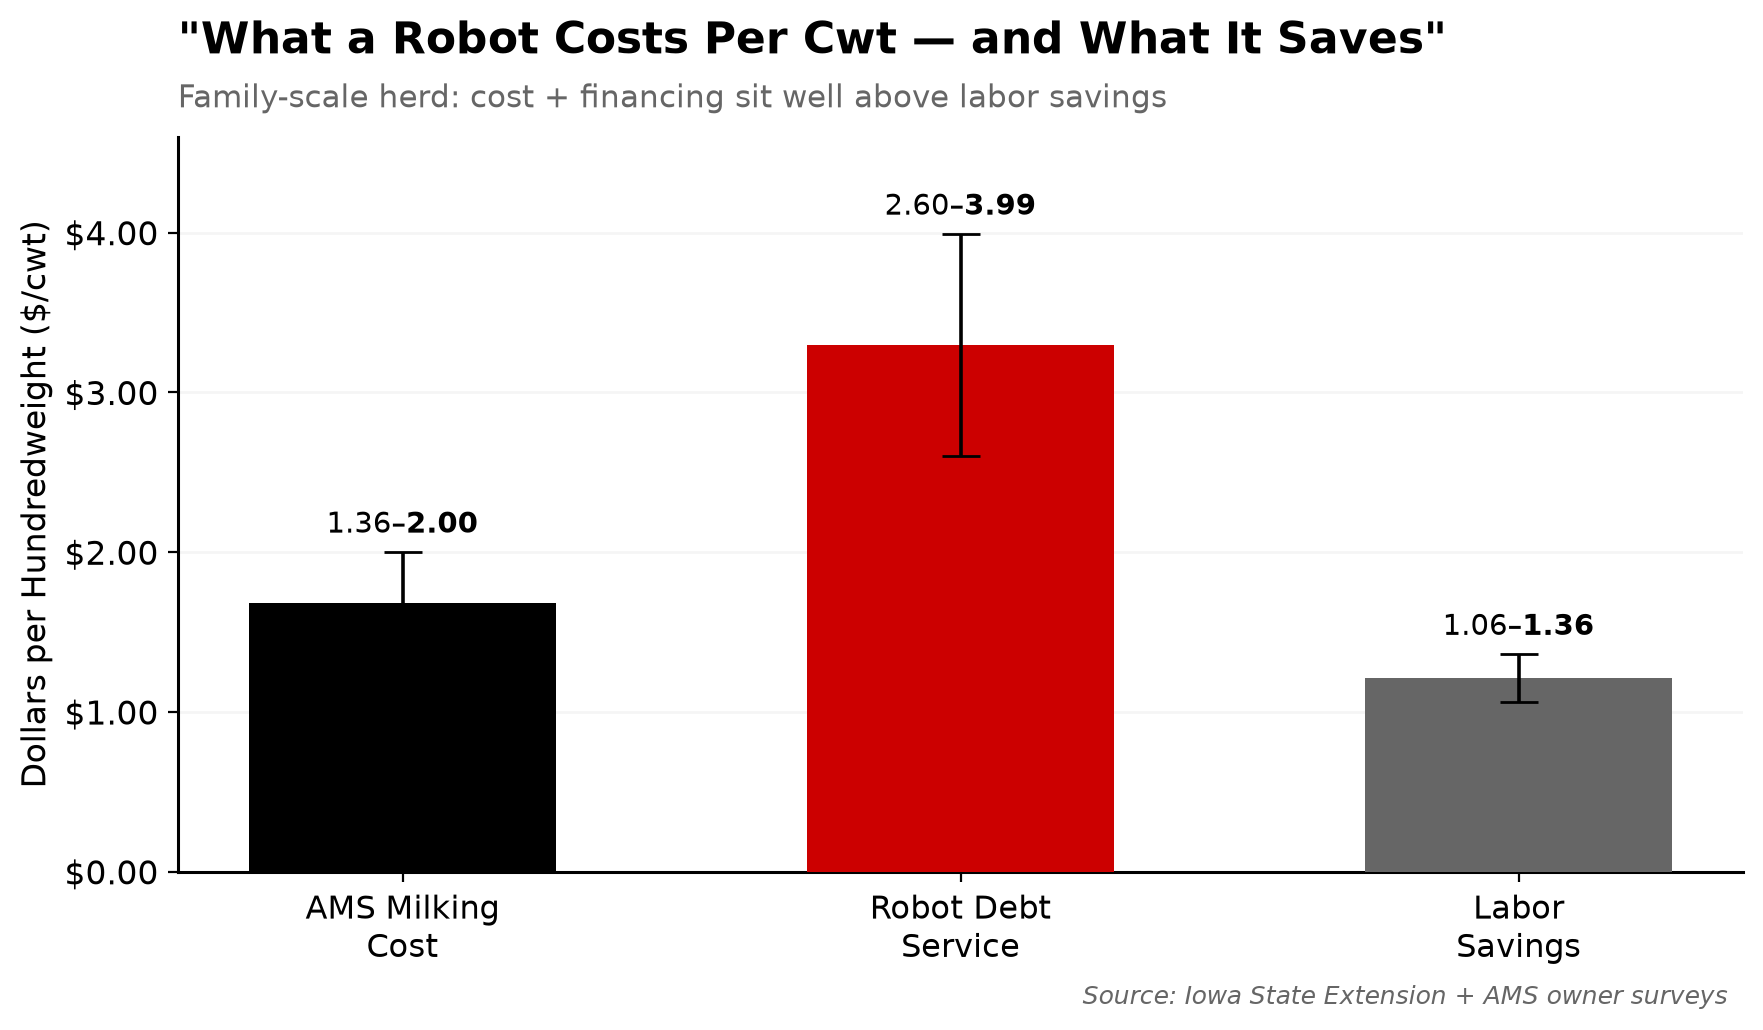
NewsSubscribe
First
Last
Consent

Outlook Dairy Lost 35 Workers Before Milking. The 30‑Day Barn Math Your Lender Can’t Ignore.

35 of 55 workers gone before afternoon milking. If that happened in your parlor tomorrow, how many days of profit would your 400 cows burn through?

Executive Summary: Outlook Dairy in New Mexico lost 35 of 55 workers before afternoon milking in a single enforcement action, and milk production “effectively ceased” overnight. The article shows how that kind of hit translates into a 30‑day loss of roughly ,620 in milk from a 10 lb/cow/day drop on 400 cows, plus another ~,000 in quality penalties, emergency wages, and repro/vet lag. It explains why 51% of U.S. hired dairy labor and 79% of the milk now depend on immigrant workers, with states like Wisconsin at ~70% undocumented labor and parts of Idaho near 90%. You’ll see why H‑2A still doesn’t fit year‑round dairying, what happens when enforcement touches your county (including the “chilling effect” on neighboring farms), and why robots are a long‑payback strategy, not an emergency exit. Then it walks you through a simple 30‑day “Table of Doom” you can run on your own herd and a 72‑hour backup‑crew checklist that forces you to answer who actually shows up if three key people don’t. If you’ve never put hard numbers on a labor shock for your own cows — or asked your lender to stress‑test one — this is worth ten minutes and a notepad.

dairy labor risk management

Biosecurity signs don’t stop rifles.

Masked Homeland Security agents armed with rifles swept onto Outlook Dairy in Lovington, New Mexico, on the morning of June 4, 2025, brushing past biosecurity signs — posted for H5 bird flu, asking all visitors to check in — without stopping. By the time they left, 11 workers were in custody, and owner Isaak Bos had been ordered to fire 24 more after federal agents conducted an employment document review, according to AP reporting — 35 of his 55 employees gone before the afternoon milking.

“It takes 100% of the labor force, so no day is off right now,” Bos told reporters as his wife, relatives, and local high‑school kids scrambled into the parlor. “It’s detrimental for our cattle. We’re barely able to keep going.”

“You can’t turn off cows. They need to be milked twice a day, fed twice a day.”
— Beverly Idsinga, Dairy Producers of New Mexico

As of January 2026, Outlook Dairy was still working to rebuild and get back to something resembling normal, months after that June morning tore the operation apart.

If you think your I‑9 binder is a bulletproof vest, you’re already bleeding.

When Two-Thirds of Your Crew Disappears Before Lunch

Outlook runs roughly 5000 Holsteins. At a typical Holstein average of around 70 lb/cow/day and the 2025 U.S. all‑milk price forecast of $21.35/cwt, daily gross milk revenue sat near $7,470 before the raid. Losing 35 workers didn’t trim that number. It broke the system.

Within hours, milking intervals that should’ve been 10–12 hours stretched to 14, then 16. Bulk tank SCC starts climbing almost immediately when intervals get that far apart — from a well‑managed 150,000 cells/mL toward the 300,000–400,000 range where quality bonuses vanish, and deductions kick in at most co‑ops. Fresh cows that need twice‑daily monitoring for metritis and ketosis? Those checks got skipped or rushed.

You know how that story ends. Cows you miss in the fresh pen don’t just hit you with a vet bill. They take peak milk you never see.

The community around Lovington responded. Teenagers showed up. Neighbors climbed into the parlor. Family members who hadn’t worked a shift in years were back on the line. But good intentions don’t replace the guy who’s been reading that holding pen for a decade. Bos himself confirmed that milk production at Outlook “had effectively ceased.”

If you think that’s “a New Mexico problem,” you’re exactly who this piece is for.

The Math Behind 79% of Your Milk

Outlook made the news for the rifles. It matters for the arithmetic.

A Texas A&M AgriLife Center for North American Studies survey, conducted for the National Milk Producers Federation, collected data from 973 dairy farms of all sizes and regions in fall 2014. The results: immigrant workers account for 51% of all hired dairy labor, and the farms employing them produce 79% of the nation’s milk supply.

NMPF’s modeling went one step further. It estimated that a sudden loss of immigrant labor would eliminate over 7,000 dairies, cut 48.4 billion pounds of milk, and nearly double retail prices. That’s a national barn‑burn, not an isolated fire.

The dependency hasn’t shrunk since 2015. A 2023 UW–Madison School for Workers survey estimated that more than 10,000 undocumented workers perform about 70% of Wisconsin’s dairy labor, and the authors warned that without them, the state’s dairy industry “would collapse overnight.” In parts of Idaho, the University of Idaho’s McClure Center has documented dairies where roughly 9 out of 10 workers are foreign‑born.

Here’s the structural mismatch you live with every day: the H‑2A visa program — the main legal guest‑worker channel for agriculture — is limited to temporary or seasonal employment, up to 10 months per year. Your cows don’t take seasons off. The Trump administration and multiple agricultural groups have pushed Congress to expand H‑2A to year‑round positions, but that change still needs a congressional vote that hasn’t come. A House Homeland Security appropriations rider would allow year‑round dairy, and the Economic Policy Institute projects that, combined with wage cuts, the program could hit 900,000 workers by 2034.

Right now, that’s theory, not help. As of spring 2026, you’re still dealing with processing delays and uncertainty in H‑2A access, not a smooth year‑round dairy program.

Then the USDA pulled one more rug. On August 29, 2025, the USDA announced it was discontinuing the Farm Labor Survey effective immediately. That’s the main tool Washington used to track farm wages. So, at the exact moment dairy’s labor dependence is under political and economic pressure, the official wage data just went dark.

You’re flying with less information in more turbulence.

How Much Does a 30-Day Labor Shock Really Cost a 400-Cow Herd?

Talking about raids in another state is easy. The only way this gets real is if you run the numbers on your own herd.

Take a 400‑cow herd shipping a typical 70 lb/cow/day at the 2025 all‑milk price of $21.35/cwt. That’s 28,000 lb/day — roughly $5,978 in daily gross milk. Over 30 days, you’re looking at $179,340 in gross milk revenue.

Now imagine a disruption like Outlook’s. It doesn’t have to be ICE. Two experienced milkers get into a car accident.. A family emergency in a three‑person crew. Or enforcement activity one county over that sends half your workforce home to pack a bag.

Here’s the snapshot you should be staring at on your phone in the parlor.

The 30-Day Table of Doom: 400-Cow Herd at $21.35/cwt

Loss CategoryDaily Impact30‑Day Total
Milk Production (10 lb drop)‑$854.00‑$25,620
Quality Bonus/SCC Penalty‑[$120.00]‑[$3,600]
Emergency Wage Premium‑[$180.00]‑[$5,400]
Estimated Reproductive/Vet Lag‑[$8,500+]
TOTAL MARGIN ERODED‑$43,120+

Brackets on the last three lines mean this is illustrative, not a quote from your co‑op or your vet. The first line isn’t up for debate: 10 lb/cow/day × 400 cows × 30 days = 120,000 lb. At $21.35/cwt, that’s $25,620 in gross revenue gone.

You know what SCC penalties look like on your milk cheque. You know what you’d have to pay to get neighbors, teenagers, and extended family in for an emergency month of milking. You know what happens to repro when fresh cows get missed. Plug your own numbers into those second and third lines. You won’t hit exactly $43,120. You’ll land unpleasantly close.

This isn’t just about gross revenue; it’s about the fact that your fixed costs — debt service, insurance, taxes — don’t care that your parlor is half‑empty. Your break‑even just climbed while you were looking for a milker.

USDA’s January 2026 ERS report (ERR‑356) using 20 years of ARMS data confirmed what you see in the fresh pen every day: milking frequency and consistency are key drivers of net returns. Lose people, lose consistency. Lose consistency, lose margin.

Run that 30‑day cascade with your own herd size and pay price. If the answer makes your stomach drop, that’s not fear‑mongering. That’s your exposure in black and white.

Can Robots Actually Close the Gap When Workers Disappear?

When you hear the Outlook story, the instinct is obvious: “This is why we need robots.” Honestly, that reaction makes sense. It just doesn’t close the gap the way the sales pitch says it will.

Bullvine readers already know the headline numbers: 86% of robotic milking adopters say they’re satisfied, but only 28% say their systems are profitable. A January 2026 USDA Economic Research Service report (ERR‑356) put harder national numbers behind it — robotic milking increases U.S. dairy net returns by about 13% on average, based on five waves of ARMS data from 2000 through 2021. That’s not fluff. That’s the actual margin.

But Iowa State dairy economist Larry Tranel’s cash‑flow work tells the other half of the story. A typical two‑robot installation on surveyed Iowa herds has a payback in the 6.1 to 7.2‑year range, depending on useful‑life assumptions. You get labor relief and management flexibility, but you tie up a lot of capital for a long time.

And robots only touch one slice of your labor picture. AMS units can pull many hours out of the parlor. They don’t push feed, mix colostrum, walk calf pens, fix a frozen waterer, or catch a fresh cow going off feed.

A labor crisis is the worst time to transition to robots. When your barn is in chaos, you’re in no shape to onboard an AMS. Automation is a strategy, not an emergency exit.

If Outlook had been a robot barn, those agents still would’ve walked out the people who feed, scrape, and watch cows. You’d be left with a line of shiny stainless steel and a crew that doesn’t yet know the software, the fetching patterns, or the exceptions. That’s not a hedge. That’s a new failure mode.

If you’re pricing automation as a labor hedge, the sharper question isn’t “should I buy robots?” It’s “which specific jobs on my farm can a machine realistically take over, and what’s the payback on that task?” For many 300–500 cow herds, the first automation dollar probably belongs on a feed pusher, calf feeder, or alley scraper — not on the most expensive box in the catalog.

Could This Happen at Your Place? Look at the Map

Lovington is a small town in the New Mexico oil patch near the Texas border. It’s easy to shrug and say, “That’s down there. We’re fine up here.”

Then you look at Vermont.

On April 21, 2025, U.S. Customs and Border Protection agents arrested eight migrant workers at Pleasant Valley Farms in Berkshire, Vermont’s largest dairy, a roughly 10,000‑acre operation running more than 3,000 cows, owned by Mark and Amanda St. Pierre. The farm itself was not the target of the operation, and the St. Pierres weren’t accused of wrongdoing. Agents said they were responding to a citizen report of “two individuals carrying backpacks exiting a wooded area” near the Canadian border, and the eight workers were detained during the search that followed. State officials and Migrant Justice called it the largest migrant worker enforcement action in Vermont in recent memory.

Same year, different coast. In California’s Central Valley, ICE and other federal agents were reported near fields and packinghouses in Tulare, Kern, Fresno, and Ventura counties, with workers fleeing fields when agents appeared. Farm bureau leaders for Tulare, Kern, and Fresno counties told reporters they couldn’t confirm specific raids on member farms. But the fear alone was enough to blow holes in crews — workers staying home, skipping shifts, turning off their phones.

By April 2026, a Whatcom County, Washington producer told local TV that federal activity in the area was leaving critical gaps during planting season. He wouldn’t allow his name to be used for fear of making things worse for his workers.

New Mexico. Vermont. California. Washington. The enforcement corridor isn’t one state. It’s a moving target across multiple regions and milk sheds.

And here’s the part you’ll never see in any official statistic: when one farm in a county gets hit, workers on every other farm in that county hear about it before the next milking. Some don’t show up. Not because anyone told them not to — because they’re afraid they’ll be next. Reports from southeastern New Mexico described a chilling effect across dairies after the Outlook raid — Idsinga among those saying labor was disappearing not just from the raided farm but from neighbors’ farms, too.

That “community contagion” isn’t on any spreadsheet in Washington. It absolutely shows up on your bulk tank.

How Should You Price a 72-Hour Labor Shock?

This is where the kitchen‑table math meets your actual risk tolerance.

You don’t need a consultant to start. You need an honest look at what 72 hours without your core crew would really cost — and what you’d do about it.

First question: on your farm, which jobs break things the fastest if they don’t get done for 24–72 hours? Milking is obvious. Fresh‑cow checks, calvings, and feed delivery aren’t far behind. Scraping, bedding, and breeding probably slot in after that.

Now ask yourself: do you know exactly who you’d call and what they’d do if three key people didn’t walk in at 4:30 a.m.?

If that question makes your stomach flip, that’s the point.

Are You Counting on Robots or People When Things Go Sideways?

When you start plugging your own herd into the Table of Doom, it’s tempting to jump straight to capital solutions. “If I had robots, this wouldn’t be as bad.”

Sometimes that’s true. A well‑run, dialed‑in robot herd with strong management can absolutely ride out a milker loss better than a parlor operation. The ERS data shows real return. So do many farm case studies.

But look at your own barn honestly. Ask: if your current crew disappeared and a truck delivered robots tomorrow, would your operation smoothly transition to a totally different management system while you’re also scrambling to hire, train, and keep cows healthy?

A farm in chaos is the worst possible candidate for a major technology transition. You need your best management IQ for those first six to twelve months on AMS. You need time to learn exceptions, software quirks, and how specific cows behave on robots. You need your best people focused on onboarding, not plugging holes.

So yes, robots can be part of a labor strategy. They’re not an emergency exit. They don’t remove the need for a 72‑hour plan, cross‑training, or hard conversations with your lender and your lawyer.

Options and Trade-Offs for Farmers

You can’t control when or where the next enforcement action happens. You can absolutely control how exposed your operation is when it does.

Path 1: Run Your Own 30-Day Cascade — This Month

This is your 30‑day action.

Sit down with your milk cheque and a notepad. Write down three things: herd size, lb/cow/day, and current pay price. Model a 10 lb/cow/day drop for 30 days. Then add:

  • A realistic estimate for lost quality bonuses or SCC penalties.
  • A bump in wages for emergency help.
  • A number for extra vet and repro costs if fresh cows get missed.

You’re not building a thesis. You’re answering one question: how many months of profit would that 30‑day shock erase for your operation?

If the answer is more than two, your risk isn’t “some policy debate in Washington.” It’s a very specific amount of money on your own P&L.

Path 2: Build a 72-Hour Crew on Paper

Picture 4:30 tomorrow morning. Your three most experienced workers don’t walk in. Any reason.

Grab a piece of paper and make this checklist real:

  • [ ] Name the 4–6 people who show up if you call.
  • [ ] Make sure they have the gate codes.
  • [ ] Make sure they know where the oxytocin is kept.
  • [ ] Make sure they can start the backup generator and keep it running.
  • [ ] Assign each one specific strings, pens, or tasks for those 72 hours.
CategoryPrepared FarmAverage FarmExposed Farm
Backup crew identified4–6 named, trained contacts2–3 people “who might help”No list exists
Cross-training status2nd-tier staff trained on milking + fresh cowsSome informal exposureSingle-person dependencies
Gate codes / accessAll backups have codes + keysOwner holds all access“I’ll let them in when they call”
Critical supply locationsDocumented: oxytocin, colostrum, generatorKnown to 1–2 peopleOwner’s head only
Milking interval riskMaintains 10–12 hr intervals for 72 hrsStretches to 14–16 hrs within 24 hrsMisses milkings within 12 hrs
Fresh cow monitoringAssigned to specific backup person“Somebody will check”Skipped entirely
Estimated 72-hr milk loss< 3 lb/cow/day5–8 lb/cow/day10+ lb/cow/day
SCC impactStays under 200K cells/mLClimbs toward 300K+Blows past 400K — penalties hit

If you can’t fill in those blanks without guessing, you don’t have a backup plan. You have a schedule.

Path 3: Rank Jobs by Consequence, Not Comfort

Not all jobs fail at the same speed.

Your most trusted, best‑documented, hardest‑to‑replace workers should sit where a missed shift hurts fastest — milking and fresh cows. Cross‑train your second tier in feeding, scraping, and calf chores so they can step in when someone is out.

Then look at automation through that same lens: where does a missed job hurt fastest, and which of those jobs can a machine actually cover? That might mean a feed pusher, calf feeder, or manure scraper long before it means AMS.

Path 4: Talk to an Immigration Attorney Before a Letter Shows Up

You probably already know where your workforce realities sit. Hoping your paperwork never gets tested isn’t a plan.

An ag‑focused immigration attorney can help you answer three uncomfortable but critical questions:

  • What would a real internal I‑9 audit show?
  • Which workers have strong documentation, and which don’t?
  • What kind of timeline and exposure would you face if enforcement turned your way?

Uncomfortable conversation. A lot less uncomfortable than having it for the first time in your driveway with a government vehicle idling.

And if Congress finally does open H‑2A year‑round for dairy, the farms with attorneys already in their corner will be first in line to file. If it doesn’t, you’ll still know where you stand — and what your realistic options are.

Key Takeaways

  • If your 30‑day cascade shows a 10 lb/cow/day drop that would erase more than two months of profit, your margin of safety is thinner than your balance sheet suggests. That’s your cue to either build a buffer or rethink exposure.
  • If you can’t name a 72‑hour backup crew and match each person to specific jobs, what you’ve got is a schedule, not a contingency plan. The Outlook raid showed how fast “we’ll figure it out” turns into “we’ve effectively ceased milking.”
  • If your labor strategy is “we’ll add robots when it gets bad,” you’re betting on a technology transition at the exact moment your barn is least able to handle one. Robots can add margin over time — they don’t magic away a crisis.
  • If your lender has never stress‑tested your operation for a labor disruption, that risk isn’t priced into your financing. You don’t need their permission to run the Table of Doom with your own numbers — but you should bring it to the next meeting.

You can look at Lovington, Berkshire, Tulare, or Whatcom County and tell yourself the map is somebody else’s problem. Different state. Different politics. Different co‑op.

Your cows don’t care about state lines. Neither do your vet bills, your wage premiums, or the peak milk that never hits your bulk tank.

So here’s the only question that really matters right now: if three people in your barn didn’t show up at 4:30 tomorrow morning, would you have a plan — or just a hope that it works out?

Complete references and supporting documentation are available upon request by contacting the editorial team at editor@thebullvine.com.

Learn More

The Sunday Read Dairy Professionals Don’t Skip.

Every week, thousands of producers, breeders, and industry insiders open Bullvine Weekly for genetics insights, market shifts, and profit strategies they won’t find anywhere else. One email. Five minutes. Smarter decisions all week.
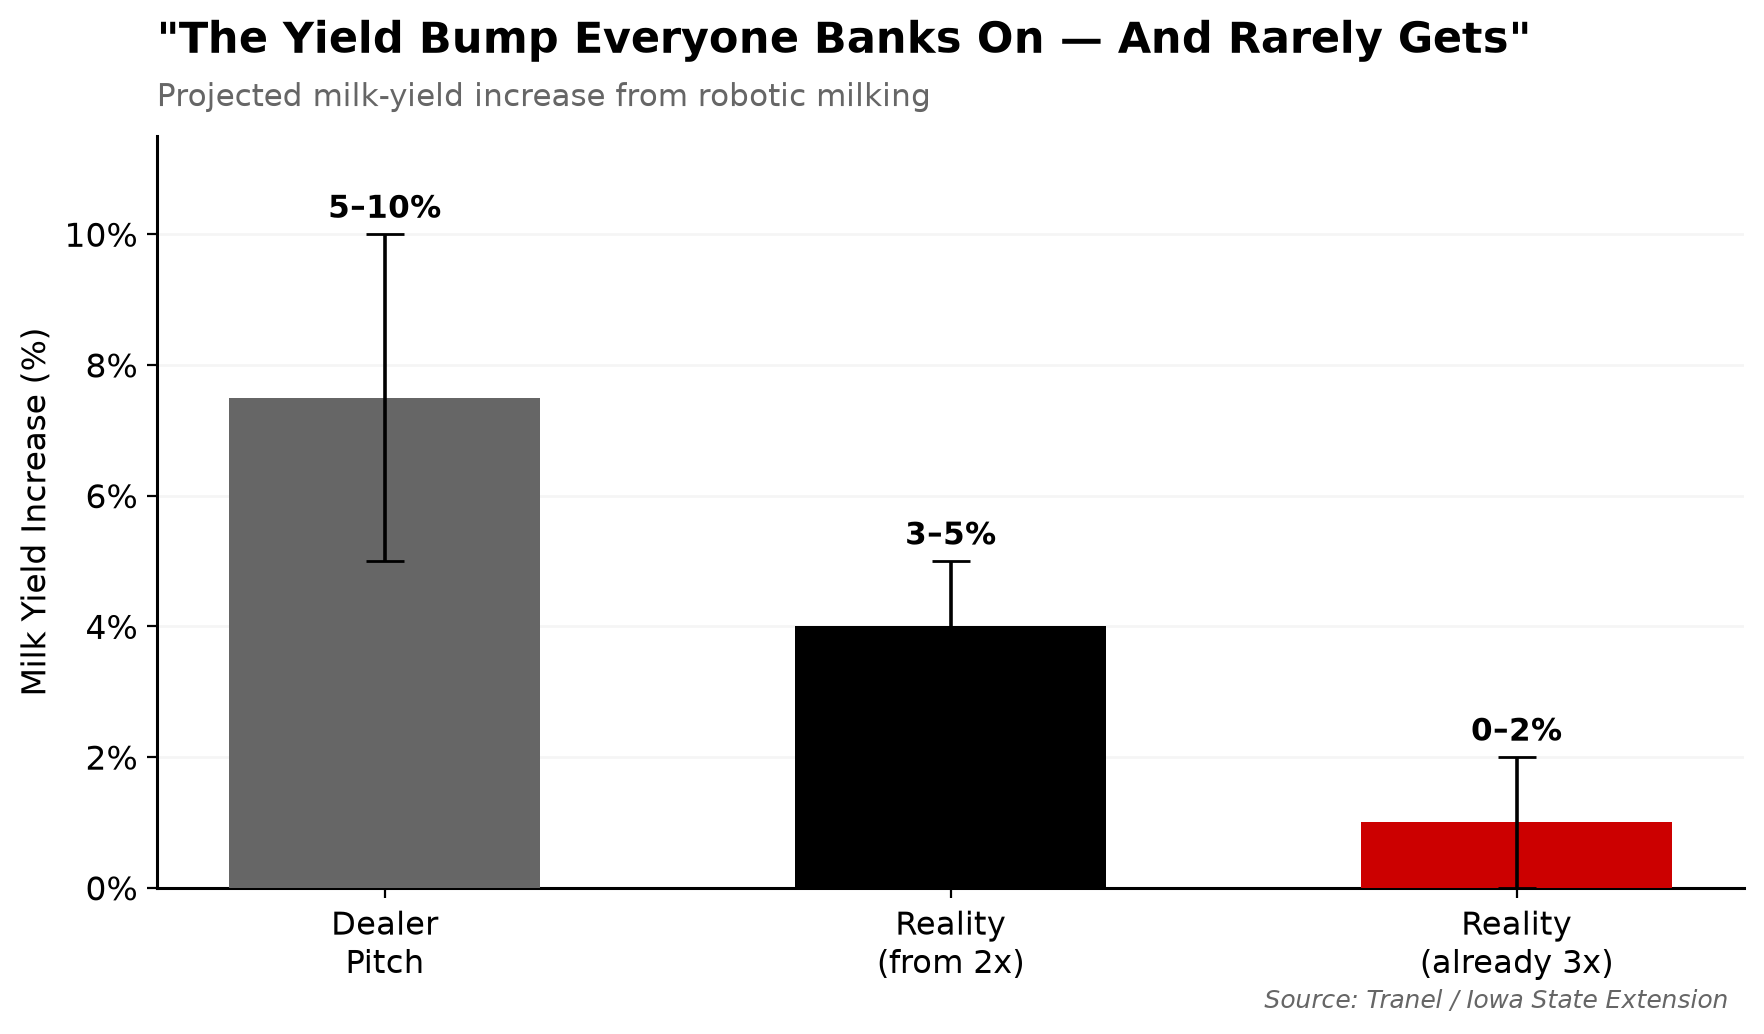
NewsSubscribe
First
Last
Consent

Your Cow’s Breath Knows When SARA Starts. A $3,500 Rumen pH Bolus Trial Proves It.

24 heifers, same 60% concentrate ration, same barn—three totally different SARA profiles. The only way anyone saw it was by watching a rumen pH bolus every 15 minutes.

Executive Summary: Continuous pH boluses are already catching SARA patterns that exhalomics can only explain in the lab, and the gap between the two is costing real money. Islam’s JDS work showed breath acetate tracks rumen acetate at r = 0.84, but there’s no affordable barn sensor that can reliably separate a burp from a breath. Meanwhile, Hartinger’s 2024 study bolused 24 first‑lactation cows on the same 60% concentrate ration and found three very different SARA severity clusters, with one extra week on close‑up feed cutting severe SARA odds by 34.5%. Using Stone’s $1.12/cow/day estimate and published prevalence, a 450‑cow herd quietly carries $18,400–$47,800 a year in SARA exposure while relying on four rumen taps and component trends. In contrast, a real 350‑cow UK herd saved £14,647 in 90 days by tweaking the ration twice based on continuous pH curves, with no drop in milk or components. Bolus hardware and data for a 40‑cow trial run about $3,500–$4,000 in year one, and pH sensors last 12–18 months, so the real decision is whether that subscription buys more than another DA surgery and a few lame cows. If you’re serious about collars, feeding tweaks, or future breath sensors, this piece walks through how pH curves can calibrate the tech you already own and show you what four needles a year are missing.

Rumen pH boluses

Picture a 450-cow freestall on a Tuesday afternoon. High-starch TMR. Collars on most cows. Ration hasn’t changed on paper. Cows chewing, tank on target, manure acceptable. Everything looks fine from the alley.

Now picture this: a set of rumen pH boluses in the fresh pen indicates that a quarter of those cows spent more than four hours below pH 5.8 yesterday. Nobody walking through the barn caught it. Published surveys report SARA prevalence at 19–26% in early-to-mid lactation U.S. Holstein herds (Garrett et al. 1997), with European data from Kleen et al. (2013) confirming similar rates across German dairies. Ohio State Extension puts it bluntly: up to 33% of dairy cattle experience SARA during lactation, and up to 40% of pasture cattle have a pH below 5.8. Ontario’s Ministry of Agriculture says if more than 30% of sampled cows sit at or below pH 5.5, consider the whole feeding group at risk. Your four rumenocentesis visits a year aren’t seeing this — and a lab in Zurich has proven it can read those fermentation signals from a field called exhalomics: the metabolic fingerprint in a cow’s exhaled breath.

The science works. The barn sensor doesn’t exist yet. And every progressive operation faces the same question: wait for the perfect tool, or start building your data infrastructure now with what you can actually buy?

What the Breath Data Actually Shows

Islam et al. published a Journal of Dairy Science paper in 2024 measuring volatile organic compounds in cow breath using high-resolution mass spectrometry. They fed cows two distinct starch levels — 16.2% versus 6.3% dry matter — and compared what showed up in exhaled air against what was happening in rumen fluid. The correlations landed hard:

  • Breath acetate tracked rumen acetate at r = 0.84–0.85
  • Breath propionate tracked at r = 0.74
  • The acetate-to-propionate ratio in breath tracked rumen A:P at r = 0.80

The analytical platforms driving this — SESI-MS and PTR-MS — detect compounds at parts-per-trillion levels. Think of an electronic nose that could pick out a single molecule of vinegar in an Olympic pool. These instruments identified over 1,298 unique chemical features in the bovine exhalome, capturing volatile fatty acids, ketone bodies, and metabolites that reflect both rumen fermentation and whole-animal metabolism simultaneously.

The Ketosis Signal Worth Watching

Work by Dobbelaar et al. (1996, Veterinary Quarterly) demonstrated that breath acetone correlates with blood BHB with r = 0.81 in dairy cows. More recent temporal evidence points to a 24-to-48-hour head start on intervention compared to conventional testing — breath acetone levels rise faster than changes detectable in milk ketone composition. If this holds up across herds and seasons, your fresh cow protocol could shift from catching clinical ketosis to intercepting it before signs ever appear.

The data on cross-herd reproducibility is thin. But the biological logic is solid: acetone is the most volatile ketone body and crosses the alveolar membrane freely. The question isn’t whether the signal exists. It’s about whether anyone can reliably capture it in a barn.

Why You Can’t Buy This Yet

Here’s where the exhalomics story gets honest.

SESI-MS and PTR-MS setups run into six figures once you add the mass spectrometer, ionization source, installation, and ongoing support. GreenFeed units, used in many exhalomics trials to capture eructation events and methane, cost tens of thousands per unit. Even if you wrote those cheques, VOC stability tests on collection bags show that some compounds degrade or climb as they interact with bag material. The ETH Zurich team calls out sample degradation as a key limitation — proximity to the lab is critical.

Walking samples down the hall in Zurich is one thing. Shipping them across Ontario, Wisconsin, or Alberta is another.

But the commercial gap isn’t just about price and logistics. There’s a harder technical problem that the correlation coefficients don’t warn you about.

What Happens When a Burp Corrupts Your Breath Data?

Not all cow “breath” is created equal. This is the detail that separates the lab results from what a barn sensor would actually face.

Eructation brings rumen headspace gas — VFA-rich, methane-heavy, straight from the fermentation vat. Normal nasal breathing carries lung air with systemic biomarkers but a much lighter rumen fingerprint. Barrientos Blanco et al. (2025) measured the difference: eructation-dominated samples had 20.9% higher acetate, 27.4% higher propionate, and 32.7% higher butyrate concentrations than respiratory breath samples.

On a real cow, those two streams mix at the muzzle. The lab solution is elegant: use GreenFeed or custom hoods to capture eructation events, then monitor methane in real time as a gate signal. When methane spikes, you’re in an eructation window. When it drops, you’re sampling respiratory breath. That works in a controlled setting with a dedicated unit and an analyst watching the screen. In a 400-cow freestall with high humidity, parlor traffic, and nobody spare? Different story.

Until a commercial system can tell the difference between a burp and a breath under barn conditions, the correlations from Zurich don’t transfer cleanly to your operation. That’s not a reason to ignore the science. It’s a reason to build your baseline with a tool that goes straight to the source.

The $3,500 Bridge You Can Deploy This Month

If the rumen is the organ you’re trying to monitor, a bolus sitting in the reticulum is about as direct as it gets. And unlike a breath sensor, boluses are commercially available now — smaXtec launched its latest dedicated pH bolus in September 2025, and the company is actively pushing into North American herds from its U.S. base in Madison, Wisconsin.

Rumen pH boluses record pH every 10–15 minutes, giving you up to 96 data points per day per cow. Over a 60-day trial on one pen, that’s roughly 5,760 readings per cow. Compare that to four rumenocentesis visits a year.

Here’s what makes this uncomfortable. Hartinger et al. (2024) bolused 24 first-lactation Holsteins at the VetFarm research station in Pottenstein, Austria — every heifer on the same 60% concentrate lactation ration. When they clustered the pH data, they didn’t find two groups. They found three. Six cows experienced minimal SARA, exceeding the pH 5.8 threshold for more than 330 minutes on just 7% of experimental days. Nine cows hit that threshold on 20–87% of days. Same feed. Same barn. Wildly different rumens. And one extra week of close-up feeding reduced the odds of severe SARA by 34.5%.

Snapshot rumenocentesis couldn’t have caught that. Neither your collars nor manure scoring alone. Only continuous monitoring revealed the individual variation hiding inside a group that, from the alley, looked like one herd on one ration.

Kučerová et al. (2024) added another layer, finding that subclinical acidosis cows showed an 18.8% lower reticulorumen pH, an 11.88% lower fat-to-protein ratio, a 6.59% shorter rumination time, and a 57.19% higher activity compared to healthy herd mates. Your collars might already be flagging some of these cows. But without rumen truth underneath, you’re reading signals without a reference point.

The Trade-Offs Nobody Puts on the Brochure

Boluses aren’t magic either. Aidan Connolly, president of AgriTech Capital in Wilmington, N.C., told Farm Progressthat pH sensors in the rumen typically burn out after 12 to 18 months as acid exposure degrades the sensor — compared to 6–7 years for movement-only boluses that track activity and temperature. That means pH monitoring is functionally a subscription to sensor replacement, not a one-time install.

They also need vet insertion. Your barn needs adequate repeater or antenna coverage for continuous data transmission. And pH alone is only one dimension of a complex disorder — it doesn’t directly capture shifts in VFA profiles or microbial population changes. It’s a strong early signal. Not the whole picture.

But weighed against the quiet accumulation of undetected SARA — hoof problems, DAs, sluggish repro, chronically soft components — the question isn’t whether boluses are perfect. It’s whether four rumen taps a year are enough to catch a problem that never stops moving.

How Much Is Undetected SARA Costing Your Herd?

The math isn’t complicated, and it isn’t kind.

Stone (1999) estimated SARA losses at $1.12 USD per affected cow per day — a figure still cited in Ontario’s current SARA factsheet and widely referenced across the literature. It has never been formally updated. On a 450-cow herd, using the published prevalence range:

MetricUndetected SARA LossesBolus Monitoring (Year 1)
Annual exposure$18,400 – $47,800~$3,500–$4,000 (40 cows)
Per cow/month (herd avg.)~$3.41 – $8.85 in hidden loss~$4.00 investment
Data quality4 snapshots / year96 readings / day per cow
Detection speedDays to weeks after damageHours

Low end: 450 × 10% × $1.12 × 365 = $18,396. High end: 450 × 26% × $1.12 × 365 = $47,830. For the boluses: 40 units at approximately $39 each plus $3.90/cow/month in subscriptions (user-reported pricing, AgTalk May 2025). Total year-one hardware and data: roughly $3,500–$4,000. That’s using a 27-year-old cost estimate that almost certainly understates the real impact.

Those aren’t hypothetical numbers. When eCow ran a commercial pH bolus trial across eight dairy farms in South West England, six of the eight farms changed feeding management based on what the bolus data showed. Farm B — a 350-cow, 12,500 kg/year TMR herd — adjusted its ration twice in three months using pH curves as the guide. Each change cut feed cost while keeping cows out of the acidosis risk zone. Total savings: £14,647.50 in 90 days, with no decline in milk production or components. J. Hamilton of Three Counties Feeds, who advised on the trial, called the data “really useful to build up a picture of normal daily pH fluctuations on commercial farms” and noted it “highlighted the nutritional impact of management changes which force cows into unnatural daily routines”.

That UK trial was from 2013. The technology has improved since. At the 2025 Canadian Dairy XPO in Stratford, Ontario, both smaXtec and Guelph-based Cattlescan were promoting bolus-based monitoring to Canadian operators — Cattlescan backed by validation work at the University of Guelph and the University of Wisconsin. The infrastructure is here. The question is whether your herd is collecting data before your neighbor’s is.

How This Calibrates the Tech You Already Own

One of the most valuable things continuous pH data does isn’t replace your collars and parlor system — it calibrates them.

Herds layering bolus pH curves over collar activity, rumination data, and milk components are building what amounts to a green/yellow/red rumen map for their specific conditions. Not a textbook threshold. Not a vendor’s default alert. A picture of what subclinical acidosis actually looks like on their ration, in their barn, with their cows.

If subclinical acidosis cows show 57% higher activity and nearly 7% shorter rumination, do your collar thresholds reflect that? Are your rumination alerts catching the cows that are restless around feeding and short on cud time — or tuned for clinical-level problems that show up weeks later?

When precision tech vendors pitch “real-time metabolic monitoring,” the herd with six months of pH curves and correlated collar data isn’t taking the marketing at face value. They’re evaluating it against data they already own. That’s a fundamentally different buying position than hoping the next sensor works as advertised.

What This Means for Your Operation

Do the SARA math first. Plug your herd size into the prevalence range and the $1.12/day figure. As stale as that estimate is, the number will be uncomfortable. If you’ve never run this calculation, that’s the first problem to solve — before you buy anything.

Start with one pen, not the whole herd. Pick 30–50 cows in your highest-risk group — fresh pen or your hottest starch group. At roughly $39 per bolus and ~$4/cow/month, an 8–12-week trial might run $2,000–$3,000, depending on volume. Compare that to one DA surgery.

Benchmark your collars against rumen truth. Pull your lameness, DA, and chronic low-fat cows from the last six months. If subclinical acidosis cows show 57% higher activity and 7% shorter rumination in published data, are your alerts catching those patterns — or tuned for something else entirely?

Budget for sensor replacement, not just purchase. pH sensors degrade in the rumen after 12–18 months. That’s fundamentally different from an activity collar you buy once. Factor in per-cow annual sensor costs when you run your ROI analysis, not just the upfront hardware.

Get trial-ready before the sensors ship. If a university or sensor company came looking for a test herd tomorrow, could you hand over clean pH data, stable feeding records, and a team comfortable with continuous monitoring? The herds with that infrastructure will shape what “validated” means for breath-based tools. The ones without it will buy whatever ships first and hope.

In the next 30 days: Pick one pen. Talk to your vet about bolus logistics. Get a quote from your smaXtec dealer or regional bolus supplier. Plan one ration adjustment you’ll track with pH curves and collar data together — not just milk and manure.

In the next 90 days: Evaluate whether the bolus data reveals patterns your current monitoring misses. If it does, decide whether to expand bolus coverage or recalibrate your collar alerts based on what the pH curves are teaching you about what subclinical acidosis actually looks like on your farm.

Key Takeaways

  • The VFA correlations are real. The barn sensor isn’t. Islam et al. (2024, JDS) showed breath acetate tracking rumen acetate at r = 0.84. Serious science — but the eructation separation problem, six-figure instruments, and sample degradation mean no commercial barn sensor is imminent.
  • Same ration doesn’t mean same rumen. Hartinger et al. (2024) demonstrated that 24 first-lactation Holsteins on identical diets were divided into three SARA severity clusters. If continuous bolus monitoring can reveal that kind of hidden variation, what’s lurking in your fresh pen right now?
  • Continuous pH turns SARA from a quarterly hunch into a daily decision. Four snapshots a year versus 96 data points per day. One UK herd saved £14,647 in 90 days from two bolus-guided ration adjustments alone.
  • Your collars are already capturing part of this story — they need a reference point. Bolus pH curves don’t replace your existing tech. They tell you whether your existing tech is calibrated against what’s actually happening in the rumen.

The next time your nutritionist schedules rumenocentesis, ask what would change if you already had 60 days of pH and collar data for that group. If the answer is “nothing,” you might be right. But if the answer is “I don’t know,” that’s the gap worth closing before the breath sensor ever ships.

Complete references and supporting documentation are available upon request by contacting the editorial team at editor@thebullvine.com.

Learn More

The Sunday Read Dairy Professionals Don’t Skip.

Every week, thousands of producers, breeders, and industry insiders open Bullvine Weekly for genetics insights, market shifts, and profit strategies they won’t find anywhere else. One email. Five minutes. Smarter decisions all week.
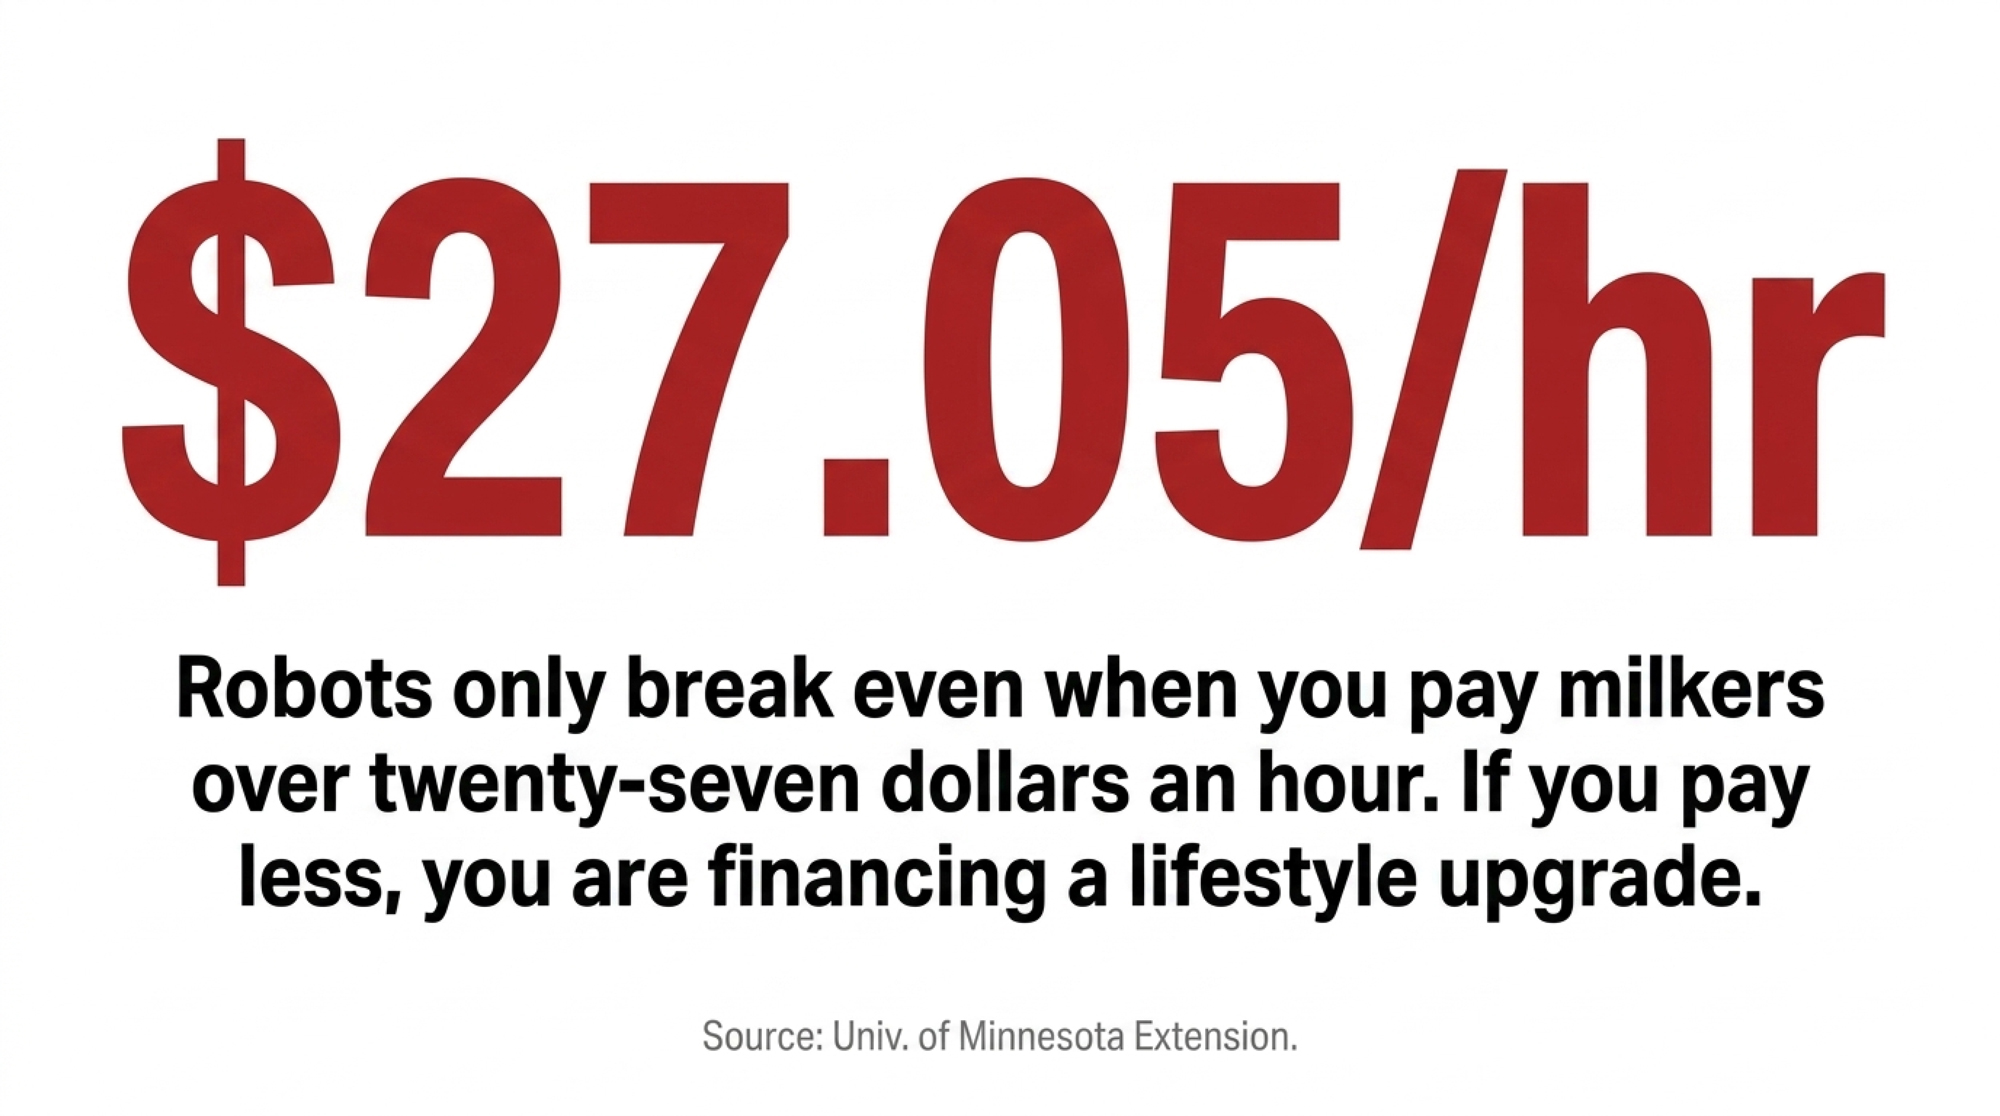
NewsSubscribe
First
Last
Consent

$1 Labor or $200,000 Debt? The Robotic Milking Bet That Could Make or Break Your Dairy

A $4/hour raise costs this 480‑cow family $48,000 a year. The robots their dealer pitched added $200,000 in payments. Which one are you actually signing up for?

Executive Summary: A $4/hour wage bump on a 480‑cow dairy costs $48,000 a year — painful but variable. The AMS alternative runs $150,000–$230,000 in annual debt service on $1.5–$2.0 million in robot capital, and that number doesn’t flex when milk hits $18. UW–Minnesota–Penn State data show average AMS labor savings of $1.50/cwt, but roughly 8% of adopters saved nothing, and USDA’s ERR‑356 confirms that the 13% net‑return upside emerges only after about seven years of red ink. Layer on a direct‑supply contract with three‑to‑seven‑year terms and six‑month termination windows — structures attorney Todd Janzen has compared to broiler grower agreements — and you’ve converted a labor problem into a fixed‑debt‑plus‑captive‑buyer problem. If your DSCR drops below 1.15× with robot payments added, your lender’s comfort disappears before your labor savings arrive. This piece walks through the full barn math, the contract hooks, the risk transfer nobody’s putting in the dealer proposal, and a 30/90/365‑day playbook for stress‑testing the decision on your own numbers.

A Wisconsin family milking 480 Holsteins burned through six hired milkers in two years. They’re not unusual. Finding and keeping parlor labor at competitive wages has become one of the hardest operational problems on mid‑size U.S. dairies, and every time this family bumped pay to stop the bleeding, it showed up on the milk check. A $4‑per‑hour raise across roughly 12,000 milking‑related labor hours adds $48,000 a year — that’s $0.83/cwt on a herd shipping 57,600 cwt annually.

So when a robot dealer walked in with an AMS proposal, the pitch was simple: trade variable labor headaches for fixed payments on machines that never quit. But the math behind that pitch deserves a harder look than most families give it.

This example pulls together numbers and decisions from several real mid‑size herds The Bullvine has followed, written as a single composite family so you can see the whole decision in one place.

Six Milkers in Two Years — and the Wage Math Nobody Wants to Run

Here’s the core tension. Matching local blue‑collar wages can push milking labor toward $1.00/cwt for herds in the 300–600‑cow band. On a 480‑cow dairy shipping 120 cwt per cow per year, that’s 57,600 cwt. If your all‑in labor cost for milking sits at $1.00/cwt, you’re writing a check for $57,600 a year to keep the parlor staffed — and that’s before benefits, turnover costs, and the nights you’re filling in yourself.

Drop to 300 cows at the same per‑cwt cost, and it’s still $36,000 a year. That’s real money. But it’s variable money. You can cut hours, adjust shifts, or restructure if milk prices tank. That flexibility matters more than most robot proposals acknowledge.

The question isn’t whether $1.00/cwt labor is painful. It is. The question is whether the alternative — a seven‑figure capital commitment — actually fixes the problem or converts it into a different kind of pain.

Is AMS Really Cheaper Than Labor on a 480‑Cow Dairy?

Let’s run it.

A joint survey by the Universities of Wisconsin, Minnesota, and Penn State — covering 50 U.S. dairy operations that adopted AMS — found an average labor saving of 0.10 hr/cwt, which works out to roughly $1.50/cwt at a $15/hour wage. On average, those herds cut milking time by 38% per cow and 43% per hundredweight. The top quartile — 25% of respondents — saved 0.16 hr/cwt or better, translating to $2.40/cwt at the same wage rate.

But here’s the spread that matters: roughly 8% of AMS adopters reported zero labor savings. Maintenance and repair ate the hours right back. And farms replacing a parlor (not a pipeline) saved less on average — 0.08 hr/cwt versus 0.16 hr/cwt for pipeline replacements.

Now price the robots. Each AMS box handles 50–70 cows. A 480‑cow herd needs 7–8 boxes, depending on how hard you push cows per unit. Installed cost ranges from $200,000 to $300,000 per box in the current U.S. market. That puts total AMS capital at roughly $1.4 million to $2.4 million.

 Scenario A: Raise WagesScenario B: Install AMS
Annual cost$48,000 ($4/hr raise on 12,000 hrs)$150,000–$230,000 P&I (on $1.5–$2.0M, 10–15 yr, post‑2023 rates)
$/cwt impact$0.83/cwt$2.60–$3.99/cwt in debt service alone
Labor savingsNone (still paying people)$86,400–$138,240/yr ($1.50–$2.40/cwt × 57,600 cwt)
Net annual gapDebt service exceeds labor savings by $12,000–$144,000/yr in early years
Risk typeVariable — adjustable if prices dropFixed — payments don’t flex with milk price

The labor savings are real. But in the early years, debt service on the robots often exceeds the labor dollars you save— sometimes by a wide margin. That’s not a reason to never automate. It is a reason to stress‑test the deal at $18 milk, not just $22.

The 13% That Hides Seven Years of Red Ink

USDA’s Economic Research Service published ERR‑356 in January 2026 — the first nationally representative study of AMS profitability using multi‑year ARMS data (2000–2021). The headline finding: robotic milking and precision dairy technologies increase U.S. dairy net returns by about 13% on average, after controlling for the fact that stronger managers tend to adopt first.

That 13% is an adjusted treatment effect, and it’s the strongest national evidence yet that AMS can pay. But Iowa State economist Larry Tranel’s cash‑flow modeling tells the rest of the story: a typical two‑robot install often spends roughly seven years in the red before that upside appears. One 240‑cow Iowa family profiled by The Bullvine ran their numbers through Tranel’s model and saw exactly that arc — years of negative cash flow before the math finally turned.

The MDPI perception study of large U.S. AMS dairies (those running seven or more robots) backs up both sides: 54% of respondents would recommend AMS to other farms. But 38% said, “consider more aspects before deciding.”Among adopters, 58% reported increased milk production, and 32% reported higher component levels. At the same time, 71.5% reported stress from nightly alarms, and 93.4% cited at least one AMS‑related mental strain.

You’re not buying a labor solution. You’re buying a different job — and a different risk profile.

When the “Labor Fix” Comes With a Contract Hook

Here’s the turn most AMS proposals don’t mention. A seven‑figure capital investment often changes your relationship with your milk buyer.

Attorney Todd Janzen — general counsel to the Indiana Dairy Producers — reviewed direct‑supply contract trends in a 2018 analysis and flagged structural shifts that matter even more now. Direct‑buy contracts typically run three to seven years, compared to 30‑day termination windows at most cooperatives. The termination notice can stretch to six months, and in most cases, as Janzen reviewed, the contract language gave buyers more lenient exit terms than producers.

Janzen compared the “Cost+” direct‑supply model specifically to broiler and swine grower contracts — arrangements where the producer carries the capital and the buyer controls the terms. His conclusion was blunt: these contracts would “hasten the demise of small farms” and could be “the nail in the coffin for many small dairies.” As he put it: “If you’re a big buyer of milk, it’s much easier to sign up 10 2,000‑cow dairy farms than 100 200‑cow dairy farms.”

Regulators elsewhere have started to act. In Australia, the ACCC fined Lactalis AU$950,000 in July 2023 for breaching the Dairy Code during the 2020/21 season — the Code’s first enforcement action. The ACCC alleged contract clauses made non‑exclusive supply “inefficient and commercially unviable,” effectively locking producers in. In the UK, new Fair Dealing Obligations took effect for new milk contracts in July 2024, with existing contracts required to comply by July 2025.

The U.S. has no equivalent code. If you’re carrying $1.5 million in robot debt and your processor is your only realistic buyer, your negotiating leverage looks a lot different than it did when you ran a parlor with a 30‑day co‑op agreement.

Contract FeatureTraditional Co-opDirect-Supply / Cost+
Typical term lengthMonth-to-month or annual3–7 years
Termination notice30 days (standard)Up to 6 months
Exit symmetryGenerally equal both sidesBuyer often has more lenient exit (Janzen, 2018)
Price mechanismPool price + premiumsCost+ formula set by buyer
ExclusivityNon-exclusive (can ship elsewhere)Often exclusive or “commercially unviable” to split
Capital alignmentFarm chooses own equipmentAMS investment may tie you to buyer’s specs
Regulatory protection (U.S.)Capper-Volstead cooperative protectionsNo equivalent code — contrast with AU Dairy Code (ACCC, 2023) and UK Fair Dealing Obligations (2024)
Janzen’s comparisonTraditional dairy relationship“Broiler and swine grower contracts”
Risk profileVariable but flexibleFixed debt + captive buyer

When Does “Modernization” Become Risk Transfer?

In practice, a lot of this modernization tends to shift more day‑to‑day risk and control onto the farm, while processors and lenders benefit from more predictable supply and better data.

Your AMS and herd‑management software now stream production, quality, and cow‑health data in real time. In some programs, processors and lenders can access that feed directly. And in some arrangements, they may use it to model things like herd performance and potential margins much more precisely than in the past. That’s not inherently bad — better data can mean better lending terms and more responsive supply chains. But it also means your buyer and your banker may know your numbers as well as you do, and they’re using that transparency to manage their risk, not yours.

The labor risk that once showed up as processor shutdowns and trucking chaos now often lands back on the farm. Either solve it with capex, pay more, or eventually scale down or exit. When you add a multi‑year exclusive supply contract on top of robot debt, you’ve layered two fixed commitments that don’t flex when milk drops to $18.

Which Path Fits Your Balance Sheet?

There isn’t one right answer. But there are three honest paths, and each comes with real trade‑offs.

Path A: AutomatePath B: Stay ManualPath C: Niche / Value-Added
Capital required$1.4M–$2.4M$0$50K–$300K (processing, branding)
Annual fixed cost$150K–$230K debt service$0 new fixedVaries by channel
Annual variable costMaintenance + reduced labor$48K–$58K milking laborMarketing + labor
DSCR impactDrops 0.2–0.4xNo changeNeutral to positive
Milk price sensitivityHIGH — payments don’t flexLOW — hours adjustableMODERATE — margin-dependent
Buyer leverageOften locked to 1 processor30-day co-op termsMultiple small buyers
Break-even timeline~7 years (Tranel model)Immediate (no new debt)2–4 years
Best fitDSCR ≥1.15x pre-robot, 2+ buyers, strong equityDSCR < 1.15x, or single-buyer marketGeography supports premium, operator wants scale control
Biggest risk7 years of red ink + captive contractChronic turnover, burnoutSmall market, limited scale

Path A — Automate. This works best when your debt‑service coverage ratio (DSCR) sits comfortably in the 1.15–1.25× range or higher before the robot note, you have at least two viable milk buyers, and you can survive the early red‑ink years on existing equity. Plan using $1.50/cwt in labor savings, not the $2.40 top‑quartile figure — only 25% of adopters hit that.

Path B — Stay manual, manage wages. Variable labor costs hurt, but they flex. If your DSCR would drop below 1.0×with robot payments layered on, you’re in the stress zone. A $4/hr raise costs this composite herd $48,000 a year. That’s painful — but it’s not $150,000–$230,000 in fixed P&I.

Path C — Pursue niche or value‑added channels. Smaller, higher‑margin markets — local processing, branded fluid, organic, specialty — can ease the labor‑cost squeeze without a seven‑figure capital bet. Trade‑off: less scale, more marketing effort, and not every geography supports it.

What This Means for Your Operation

  • Run your milking labor $/cwt this month. Pull 12 months of milking‑related labor costs and divide by cwt shipped. If you’re approaching $1.00/cwt, you’re in the band where AMS proposals start to feel urgent — but that doesn’t mean they’re right.
  • Stress‑test any AMS proposal at $18 milk, not $22. Ask the dealer and your lender to model robot payments at the bottom of a realistic price range. If the deal only works at high milk, it’s a bet, not a plan.
  • Check your DSCR before and after. If adding robot debt pushes your ratio below 1.15×, you’re entering the band where lenders get uncomfortable. Below 1.0×, and you can’t cover debt obligations from farm income alone.
  • Read your supply contract like it’s a second mortgage. Check termination notice periods, exclusivity clauses, and whether the contract gives the buyer more lenient exit terms than you get. If you have only one viable buyer, treat it as a risk signal.
  • Audit your data flows. Know exactly what production, quality, and herd data your systems share with processors and lenders — and whether you’ve consented to that sharing explicitly.
  • Ask your lender one direct question: “If milk drops to $18 for 18 months, does our AMS note plus our operating line still pencil at a DSCR your credit committee would approve today?”

Key Takeaways

  • If your DSCR sits below 1.15× before adding robot debt, you’re already in the caution band. Layering $150,000–$230,000 a year in fixed payments on top of that is a high‑risk move regardless of labor savings.
  • The average AMS labor saving is $1.50/cwt, not $2.40. Planning on top‑quartile performance when only 25% of adopters achieve it is how you end up in year four with negative cash flow and no exit.
  • AMS can pay — eventually. USDA’s ERR‑356 shows a 13% net‑return advantage on average. But Tranel’s cash‑flow work shows roughly seven years of red ink first. If your equity can’t carry that runway, the 13% upside is academic.
  • Your robot decision is also a contract decision. A seven‑figure capital commitment often ties you to a single buyer on terms that increasingly resemble grower agreements in poultry and pork — not the cooperative relationships most dairy families grew up with.

The dealer’s pitch is always clean: swap variable labor for fixed automation. But the spreadsheet that actually matters is yours — and the number that decides whether this works isn’t labor saved per cwt. It’s the gap between your total debt service and your income in the worst milk‑price year you can realistically model. What does that gap look like on your operation right now?

Complete references and supporting documentation are available upon request by contacting the editorial team at editor@thebullvine.com.

Learn More

The Sunday Read Dairy Professionals Don’t Skip.

Every week, thousands of producers, breeders, and industry insiders open Bullvine Weekly for genetics insights, market shifts, and profit strategies they won’t find anywhere else. One email. Five minutes. Smarter decisions all week.
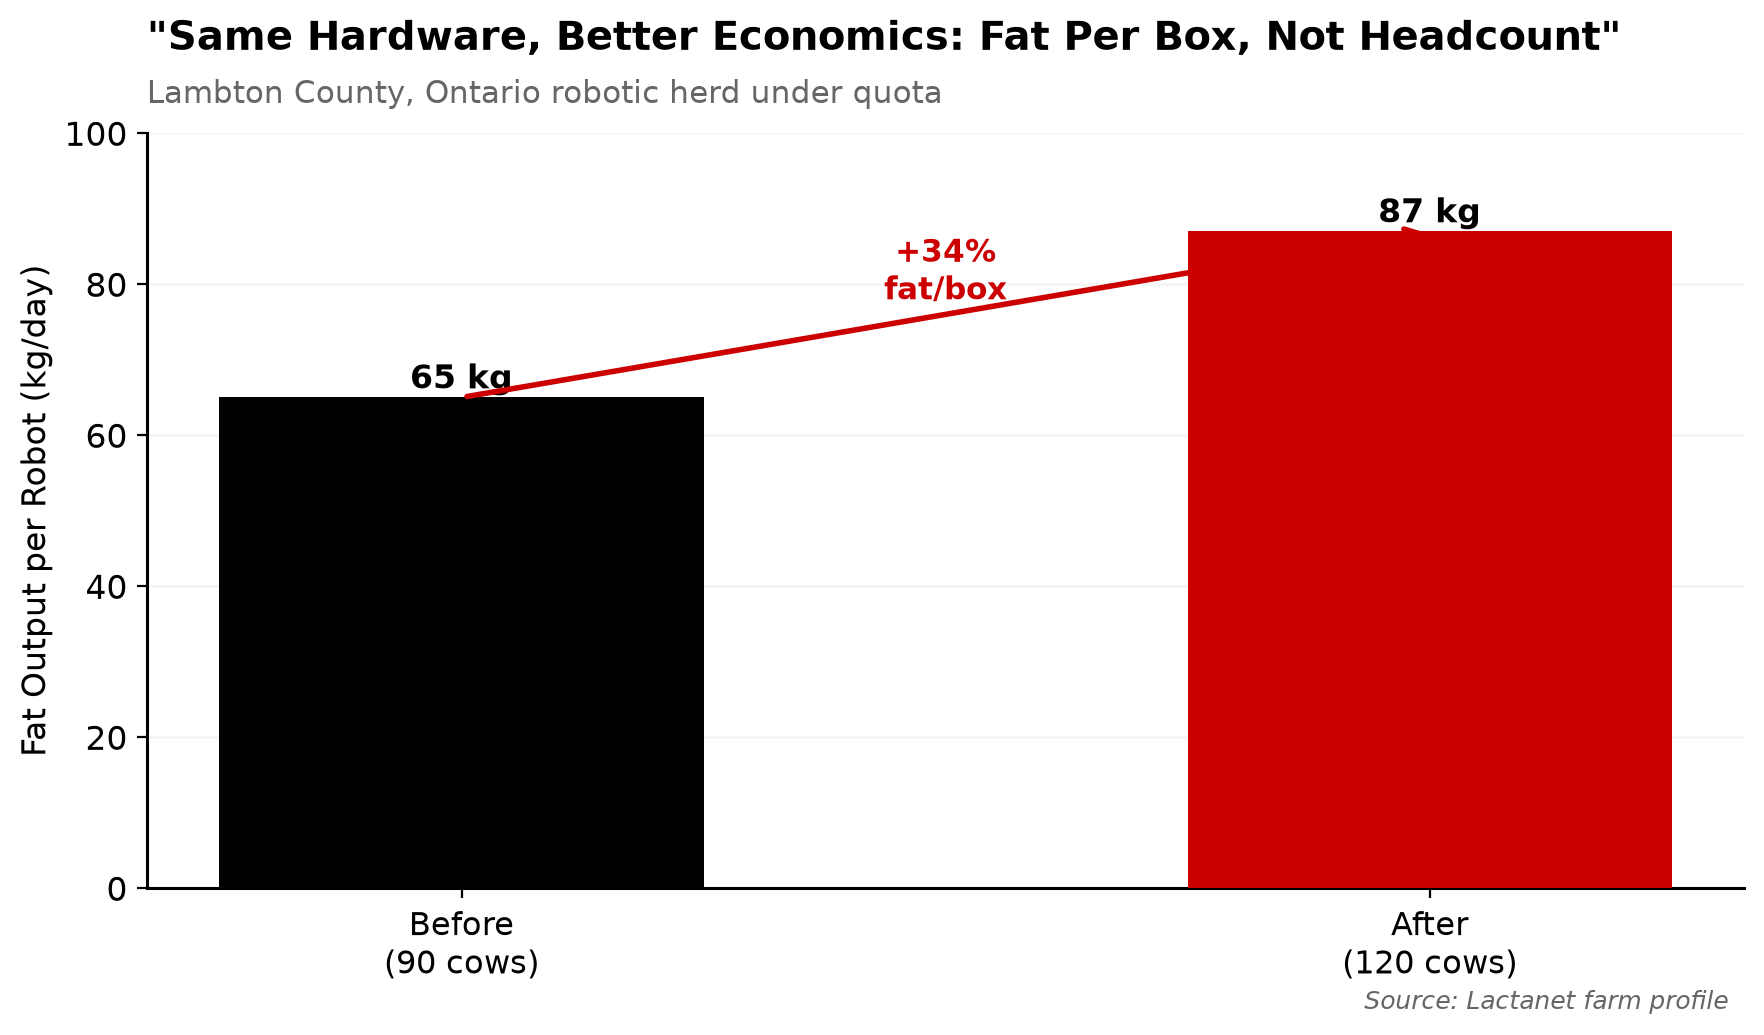
NewsSubscribe
First
Last
Consent

$1,130 Per Cow, $128 Back: Where the Rest of Your RNG Money Really Goes

A 400‑cow herd can be $584,000 in the hole even after “sustainability” premiums. The math isn’t a scare tactic — it’s what happens when credits don’t hit your milk check.

Executive Summary: A UC Davis analysis shows that a typical dairy digester costs about $1,130 per cow per year,while the gas is worth only $128 per cow, so nearly $1,000 has to come from credits, incentives, and premiums. Standard RNG contracts and lender requirements usually assign those LCFS credits, RINs, tax breaks, and Scope 3 “wins” to the project and processor, not the farm, which means the climate value created in your lagoon often lands on someone else’s balance sheet first. Using 2022 Illinois cost data and a modeled 400‑cow herd shipping 100,000 cwt, the article walks through how a farm already losing $5.49/cwt on full cost can end up $5.84/cwt in the hole — $584,000/year — even after a $1.00/cwt sustainability premium. It shows how 10‑ to 20‑year manure deals can behave like an encumbrance on your land and succession plan, tying you to minimum volumes and lender‑friendly terms long after the RNG hype cycle or policy incentives shift. For herds in the 300–1,200‑cow band looking at digesters, feed additives, or “climate‑smart” bundles, the risk is quietly self‑funding someone else’s ESG story out of your equity if the premium per cwt never catches up to the true sustainability bill. The piece gives you a 30/90/365‑day playbook to calculate your own sustainability gap, read the fine print on environmental credit ownership, and push for a milk price floor plus a defined share of the credit stack before you sign. 

Dairy digester economics

When a 1,000‑cow producer in Virginia, we’ll call Ben Smith, finally sat down with the numbers on his new digester, one line item stopped him cold. Independent 2023 work by UC Davis economist Aaron Smith estimated that a dairy digester on a 2,500‑cow covered‑lagoon project costs about $1,130 per cow per year, while the gas itself is worth only about $128 per cow per year. Everything in between — almost $1,000 per cow — has to come from somewhere other than the gas. 

A 2025 Terrain Ag/American AgCredit analysis of digester economics confirmed the same thing in plain language: “The value of the fuel is typically the smallest share of the revenue stream.” The real money sits in LCFS credits, RIN credits, and tax incentives. And standard RNG contracts are designed to keep most of that value on the developer’s side of the ledger. 

Ben Smith is a composite of several 800–1,200‑cow dairies we’ve spoken with over the past 18 months. His name isn’t real. The math and the contract patterns are. 

The Price Gap Before Sustainability Even Enters the Room

Ben’s herd operates in the same economic band that 2022 Illinois data spelled out: full economic costs around $26.49 per cwt, average net price at $25.36 per cwt, a gap of about $1.13 per cwt in economic losses for the average herd in that dataset. 

Set that against USDA’s expectation of a roughly $20.00 per cwt national all‑milk price for 2024, and you see the backdrop when an RNG developer pulls into your yard with a slick deck. 

They roll through slides about “new revenue streams,” “monetizing waste,” and “partnering for climate wins.” You picture a stronger milk check. On the other side of the table, the pitch is built around 20‑year asset cashflows, LCFS credit strips, and tax incentives layered on top. 

If you aren’t at the table for the LCFS credit discussion, you’re not really a partner in how that value gets split.

How RNG Contracts Turn Your Manure Into Someone Else’s Climate Asset

The standard story is that sustainability programs are here to help you transition. In practice, these deals also turn your manure and management into tradable climate value — and that value is usually booked somewhere other than your milk check. 

Your digester makes methane a measurable commodity. Protocols like the Climate Action Reserve’s U.S. Livestock standard treat the difference between your old lagoon and your new digester as avoided methane emissions. Those avoided tonnes of CO₂e become: 

  • LCFS credits are awarded when RNG with very low or negative carbon intensity hits a California pipeline. 
  • D3 RINs under the federal Renewable Fuel Standard. 
  • In some cases, additional voluntary carbon credits are layered on top. 
ScenarioEnvironmental credit ownershipContract term & volume obligationsImpact on milk check per cwt
Typical developer templateDeveloper owns LCFS, RINs, tax credits <span style=”color:#FF0000;”>(farmer: 0%)</span>10–20 years, strict minimum manure volume <span style=”color:#FF0000;”>locked in</span>Small fixed payment, no defined share of credit value
Producer assumes “50/50 partnership”Shared in theory, but no explicit credit split in contractLong term, volumes loosely defined, lender rights unclearRevenue share only after costs recovered; payout highly variable
Contract with defined credit‑share clauseDeveloper holds title; farmer guaranteed <span style=”color:#FF0000;”>10–30%</span> of LCFS/RIN revenue10–15 years, minimum volumes tied to realistic herd sizePer‑cwt formula ties credit value directly to milk check
Producer‑led negotiation with floorJointly structured entity or royalty on all climate valueTerm aligned with lender horizon; flexible volumes on downsizingMilk price floor plus per‑cwt climate bonus; downside risk reduced

Nothing about the manure changed physically. But once the system is metered and verified, its climate impact becomes quantified, certified, and tradable. 

Standard RNG contracts push that value upstream. Guidance written for developers is blunt about who’s supposed to own those credits. A 2022 Biomass Magazine article on manure‑supply agreements advises developers that the contract should “clearly state that the developer owns all rights to the environmental credits, tax credits, and similar benefits arising from the project.” 

Lenders and offtakers want the project entity to have a clean title to LCFS credits, RINs, and tax incentives — not shared or ambiguous ownership. Compeer Financial’s 2025 guidance to producers echoed the same concern from the farmer’s side: “Understanding the fine print is crucial to ensure a successful and sustainable partnership.” 

In many of the digester and RNG project templates and legal guides The Bullvine has reviewed, the pattern looks like this:

  • You sign a 10‑ to 20‑year manure‑supply agreement with minimum daily volumes keyed to your current herd size. 
  • They — the project company and its financiers — own the LCFS credits, RINs, and tax incentives. 
  • Your processor or brand counts the resulting emissions reduction toward its Scope 3 targets. 

The climate asset your farm creates doesn’t vanish. Under most current contract and policy setups, it’s usually recognized first on the developer’s or buyer’s balance sheet, not on your milk check. 

Processors book Scope 3 wins off your barn. Under the Greenhouse Gas Protocol, processors report supply‑chain emissions from purchased milk under Scope 3 Category 1. If they can show that milk from farms like yours carries less embedded CO₂e — because of digesters, feed additives, or manure practices — they can claim progress toward net‑zero targets and market “lower‑carbon milk” to retailers. 

Those wins are real. But they don’t automatically show up in your mailbox price unless the contract forces them to. 

The Premiums Are Real — But Thin

Brands and co‑ops are right to say they’re not asking for all this for free. There are real premiums out there, especially in Europe and New Zealand. 

  • ING’s 2024 work on dairy companies’ path to net zero notes that a “couple of cents per liter” is the sort of sustainability premium discussed in parts of Western Europe — and that dairy companies struggle to pass even that level on to end customers. 
  • Fonterra’s 2025/26 incentives include a new Emissions Excellence payment of 1–5 cents per kgMS, plus an Emissions Incentive of 10–25 cents/kgMS for the roughly 300–350 farms (out of ~10,000 suppliers) with the very lowest emissions intensity. A separate Fonterra–Nestlé partnership adds 1–2 cents/kgMS for farmers hitting certain sustainability levels. 

Convert those kgMS figures into U.S. units, and you’re usually in the sub‑$1 to low‑$2 per cwt range for top‑performing farms, depending on solids and exchange rates. Real dollars. But not unlimited — and not guaranteed across every herd. 

Region or programPremium per cwt (USD, est.)Added sustainability cost per cwt (USD, est.)Net effect on margin per cwt
Western Europe “couple of cents/liter”~1.50–2.001.00–2.50 (manure, feed, verification)Often near zero; can slip negative in high‑cost years
Fonterra top‑tier incentives (NZ)~1.00–2.000.75–1.75 (emissions, auditing, practice changes)Small positive spread for elite low‑emission herds
USDA climate‑smart pilots (U.S.)0.25–0.750.75–1.50 (cover crops, data, management time)Many farms underwater on true full cost
Modeled 400‑cow herd in article example1.001.35 (digester, cover crops, grazing shifts)–0.35 per cwt; $35,000/year gap

In North America, published premium examples are thinner. USDA’s climate‑smart commodities projects describe incentives in modest terms, not major price shifts. And while the developer’s PowerPoint always looks clean, nobody’s putting the 2:00 a.m. frozen‑pump repair on a slide. 

What Does $21 Milk Plus RNG Costs Mean for a 400‑Cow Herd?

Here’s where it stops being theory and becomes barn math you can run on a legal pad. These numbers are a modeled example — not a specific farm — so you can plug in your own herd size and cost structure. 

Take a 400‑cow conventional herd shipping roughly 10 million pounds of milk per year — about 100,000 cwt.

Step 1: Your base gap before sustainability.
Say your average milk check over the last year sat around $21 per cwt. Stack that against a full‑cost level like the Illinois benchmark at $26.49 per cwt

  • Gap: $5.49 per cwt.
  • On 100,000 cwt: $549,000 per year

If your full cost beats your price, you’re already plugging a hole with deferred repairs, restructured loans, or unpaid family labor. This is the hole many “sustainability” deals are quietly being asked to fill.

Step 2: Add a reasonable sustainability bundle.
Working from digester economics and extension budgets:

  • Digesters: ~$0.75–$1.25 per cwt in net required margin after gas revenue, based on the $1,130/$128 per‑cow gap scaled to a mid‑sized herd.
  • Cover crops: ~$0.15–$0.30 per cwt
  • Grazing/forage shifts: ~$0.10–$0.25 per cwt in early years. 

Pick mid‑points: $1.00 + $0.20 + $0.15 = $1.35 per cwt, or $135,000 per year

Step 3: Add a strong sustainability premium.
Assume a relatively generous $ 1.00-per-cwt premium on all your milk, above what many North American programs currently pay. 

  • Extra revenue: $100,000.
  • Sustainability costs: $135,000.
  • Net sustainability gap: $35,000 per year, or $0.35 per cwt.

Whole‑farm picture:

  • Base economic gap: $5.49 per cwt.
  • Plus net sustainability gap: $0.35 per cwt.
  • Effective economic shortfall: about $5.84 per cwt, or $584,000 per year.

Here’s the breakeven rule of thumb: if your sustainability premium per cwt is lower than your added sustainability costs per cwt over a 5‑ to 10‑year horizon, you’re self‑funding the program out of equity.

Remember — this is a modeled 400‑cow herd, not a specific farm. Your numbers will shift depending on the cost structure and premiums you can actually lock in. 

The Turn: When Ben Read His Own Contract

For Ben, the moment things clicked wasn’t a bad milk check. It was a Scope 3 slide deck. 

His main buyer laid out how it planned to cut Scope 3 supply‑chain emissions by about 30% by 2030 using “value‑chain interventions” — digesters, feed additives, manure upgrades — on farms that supply it. Ben sat there looking at the tonnes of CO₂e on the screen and thinking about the $1,130/$128 per‑cow math and his own cost per cwt. 

Then he re‑read his manure supply agreement. The developer had a long‑term commitment (10–20 years), minimum-volume obligations, environmental and tax-credit ownership, and lender protections upon termination. Ben had a promise of revenue sharing once costs were recovered — payments tied to project performance and policy, not a hard floor. 

His wife asked the question that changed the conversation: What happens to this contract if we want to sell or if the kids want to downsize? The answer wasn’t simple. Legal and project guidance on RNG deals makes clear that lenders want long terms and enforceable feedstock commitments. A 10‑ or 20‑year manure obligation can function like an encumbrance — something a bank, buyer, or lawyer must clear before a sale, retirement, or transition. 

A May 2025 Brownfield Ag News report underlined the policy risk: one dairy analyst noted that “the future of dairy digester projects is contingent on federal and state incentive programs continuing” and that “a larger portion of profitability hinges on RIN credits as the value of California’s carbon credit weakens.” 

Ben’s takeaway is blunt: “Sustainability wasn’t just about practices anymore. It felt like a financial product. And from where I sat, I was the only one who didn’t have a clearly defined share written into the deal.” 

That’s the assumption this piece pushes on. Not that digesters or climate‑smart programs are automatically bad — but that they’re structured financial assets, and as a producer, you need to negotiate like you’re part of that asset, not just a convenient source of manure and data.

Your 30 / 90 / 365‑Day RNG & Sustainability Playbook

You can’t control the LCFS market or your buyer’s ESG strategy. You can control how you show up in the next conversation. 

Next 30 days: put real numbers on your own sheet.

  • Run a full‑cost per cwt check, not just margin over feed. Pull your last 12 months of books — feed, labor at a realistic rate, vet/med, fuel, repairs, insurance, interest, depreciation, overheads — and divide by cwt shipped. 
  • Compare that to a benchmark like $26.49 per cwt from Illinois, and your actual average milk price is around $20–$21 per cwt. If your price falls below your full cost, any unfunded sustainability obligation will come out of your equity. 
  • List every sustainability ask on the table — from co‑ops, developers, and lenders — and mark whether each one has a firm per‑cwt premium, a duration, and capital support. 
  • Use your own quotes and the ranges above to calculate your sustainability gap per cwt. If that number is positive, you’re paying to make someone else’s emissions profile look better. 

Next 90 days: change the conversation with your co‑op and developers.

  • Take your numbers to the next co‑op or processor meeting. Frame it: “This bundle costs us $X per cwt. Your sustainability premium is $Y per cwt. Who’s funding the X–Y gap?”
  • Ask for a written explanation of how they value emissions reductions from your farm, how those reductions are monetized (credits, brand claims, Scope 3 targets), and how that value gets back to producers in predictable per‑cwt terms. 
  • Before signing or renewing any RNG contract, push for:
    • clear formula for your share of total project revenue, including LCFS, RIN, and carbon credit value — not just gas sales. 
    • minimum annual payment per cow or per cwt, indexed over time, so your return doesn’t disappear if credit prices sag. 
    • Either partial ownership of environmental credits or a defined share of the revenue they generate, spelled out in dollars. 
    • Exit and assignment terms that define what happens if you sell or retire before the term ends, including who pays what to unwind the obligations. 

If the contract instead says “developer owns all environmental and tax credits” and only describes “revenue sharing” in broad terms, it’s very likely that most of the formal credit ownership — and the leverage over how it’s used — sits with the project entity, not your farm. 

Next 365 days: build leverage instead of just compliance.

  • Turn your existing management into a documented sustainability asset. Many mid‑size dairies already use rotations, grazing, and manure cycling that soil and climate researchers describe as resilient. Write it down: rotations, grazing plans, soil tests, input changes. 
  • Add someone to your advisory circle for protocols and policy: LCFS/RFS updates, Scope 3 guidance, Farm Bill debates. Their job is simple — translate each change into dollars per cwt on your farm. 
  • Build a bloc inside your co‑op. A group of producers who’ve done their own sustainability‑gap math and are asking for a contractual price floor plus a share of the credit stack is harder to ignore than one lone voice. 

What This Means for Your Operation

  • Calculate your sustainability gap per cwt in the next 30 days. Use your own quotes for digesters, cover crops, and grazing shifts, plus the ranges above, to calculate added costs per cwt; subtract firm premiums and project payments. If the result is positive, you’re self‑funding someone else’s climate target. 
  • Read your contracts for where the climate value sits. Look for language that assigns all environmental and tax credits to the project entity and locks in long-term commitments with minimum volumes and lender rights. Bring those clauses to your advisor or lawyer before you sign. 
  • Tie your “yes” to a floor and a formula. Before agreeing to any new sustainability requirement or label, ask for a written milk price floor for participating farms and a simple per‑cwt formula showing your share of any climate‑related value — credits, premiums, or brand payments. 
  • Factor manure contracts into your succession plan. If you’re planning a transition in the next 10–20 years, treat long‑term manure and RNG deals like major debt instruments. Your lender, lawyer, and kids need to understand what their limits are before anyone signs. 
  • Watch RIN and LCFS credit prices, not just milk futures. Brownfield’s coverage and energy‑market analysis make it clear that more digester profitability is tied to RINs as LCFS weakens. If incentives shift, your developer’s ability — and willingness — to share revenue shifts too. 
  • Ask one blunt question in every sustainability pitch. “Over the life of this deal, in dollars per cwt, how much of the climate value created on my farm comes back to my milk check, and how much stays on your balance sheet?” If nobody answers plainly, you’re not looking at a partnership yet. 

Key Takeaways

  • Standard RNG contracts assign LCFS credits, RINs, tax incentives, and Scope 3 reductions to developers and processors, not farms — by design, to satisfy lenders and offtakers.
  • Aaron Smith’s analysis puts digester costs at ~$1,130/cow/year and gas value at ~$128/cow/year, a gap backed up by the 2025 Terrain Ag report’s finding that fuel is “the smallest share of the revenue stream.”
  • If your sustainability premium per cwt doesn’t match your added sustainability costs per cwt over a realistic timeframe, you’re financing climate goals out of equity — and the $584,000 modeled gap on a 400‑cow herd shows how fast that adds up.
  • Policy risk is real: with LCFS values weakening and more profitability tied to RINs and federal incentives, any long‑term manure contract that assumes today’s credit value is exposing you to someone else’s policy bet.
  • Your best defense is to treat sustainability as a financial product and negotiate for a contractual milk price floor, a defined share of the climate value stack in dollars per cwt, and exit terms that don’t trap the next generation.

Before you sign the next “climate‑smart” agreement, pull your last year of milk checks and your cost‑of‑production worksheet. What’s your actual full cost per cwt — and how many dollars per cwt of the climate value created on your farm are guaranteed to come back to you in writing?

That spread is the only sustainability metric that really decides what happens to your operation.

Complete references and supporting documentation are available upon request by contacting the editorial team at editor@thebullvine.com.

Learn More

The Sunday Read Dairy Professionals Don’t Skip.

Every week, thousands of producers, breeders, and industry insiders open Bullvine Weekly for genetics insights, market shifts, and profit strategies they won’t find anywhere else. One email. Five minutes. Smarter decisions all week.
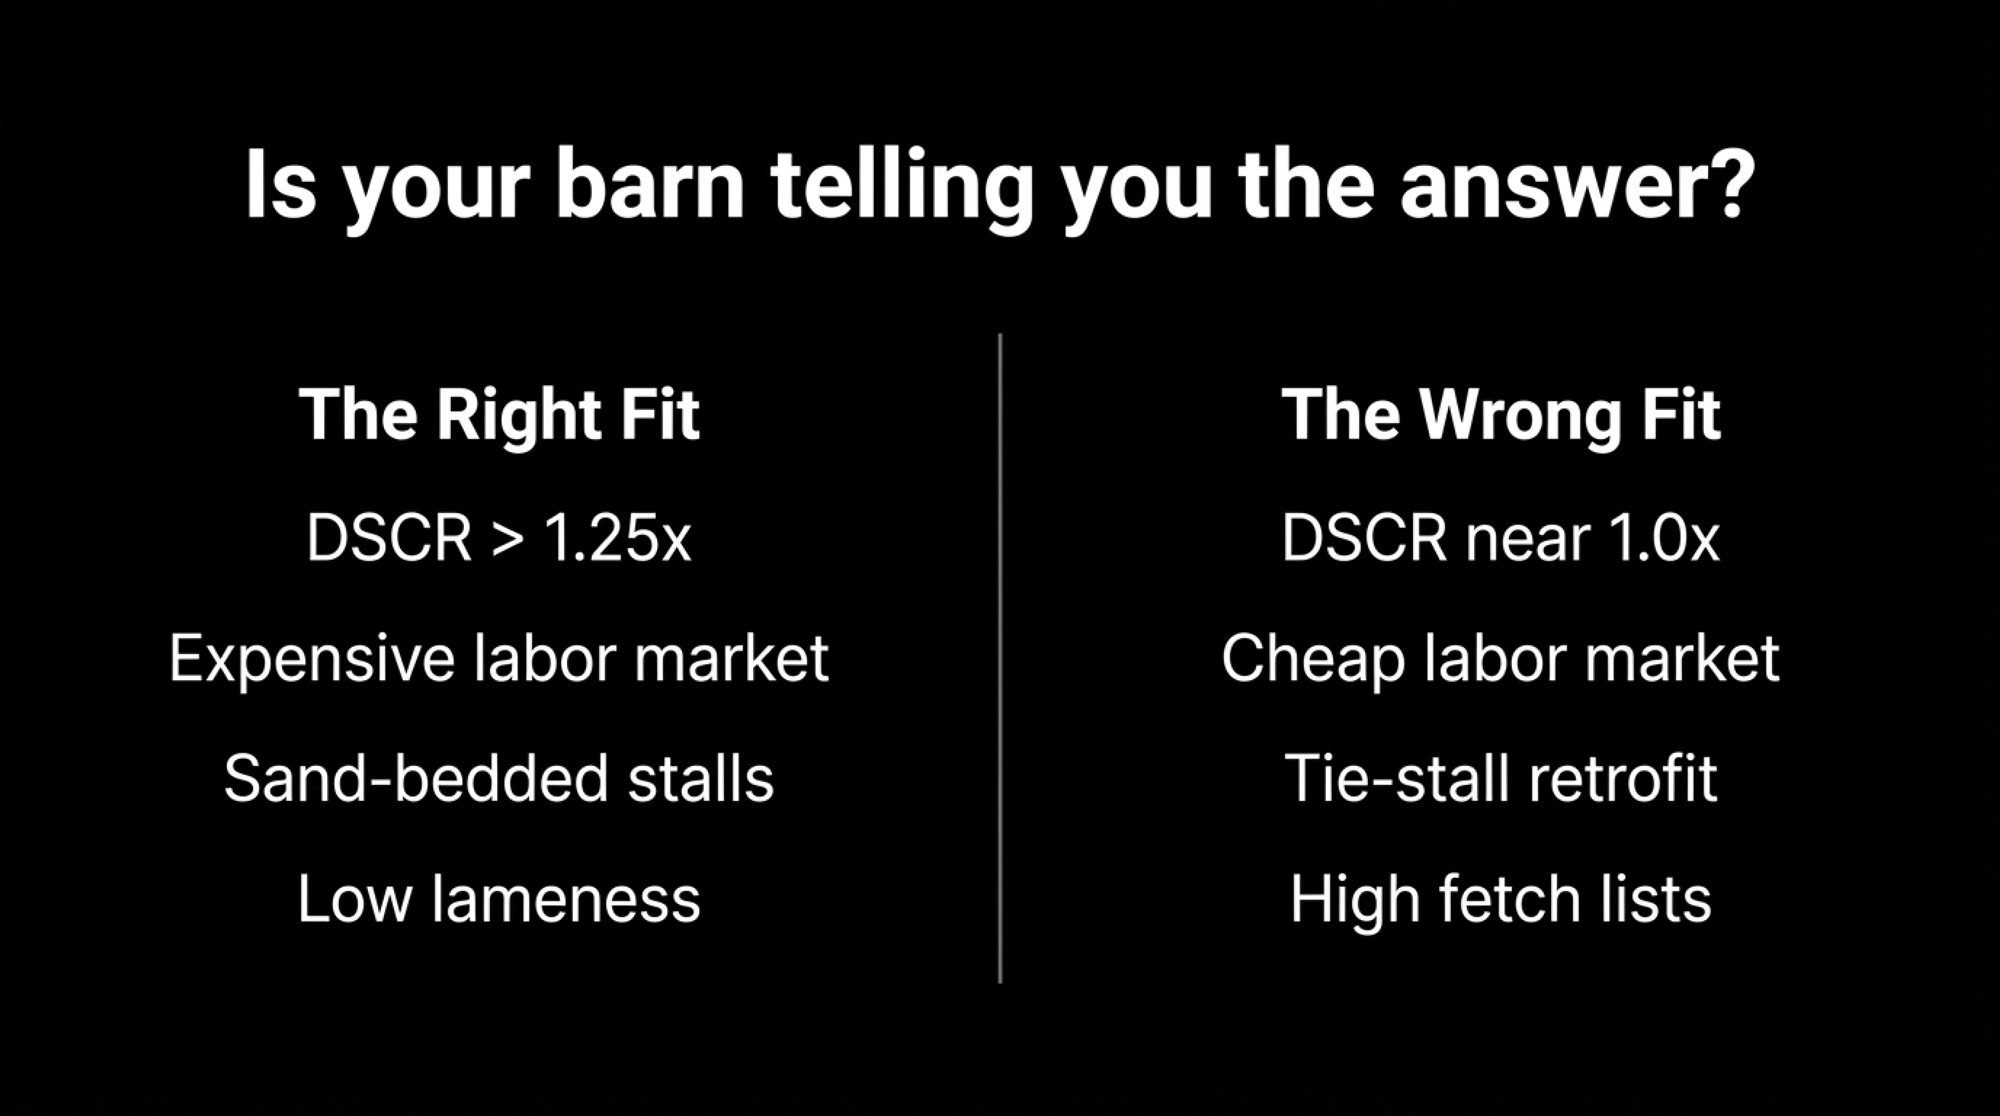
NewsSubscribe
First
Last
Consent

The $12,700 Mistake Hiding in Your Dairy’s Cover Crop Plan

Your agronomist and nutritionist both wrote good plans. The problem is nobody checked if they match.

Executive Summary: On a 500-acre Midwest dairy running cover crops and fall manure, the disconnect between the agronomist’s fertility plan and the nutritionist’s forage targets costs at least $12,700 a year — and almost nobody’s budgeting for it. The core problem isn’t the manure or the rye; it’s that no one’s deciding field by field whether the cover crop is there for water protection or for feed. Those two jobs demand different nitrogen strategies: UW-Madison data shows that once rye biomass tops 1,000 lb DM/acre at termination, you need to subtract 35 lb N/acre from your manure credit and bridge it with starter — roughly $25.55/acre at spring 2026 urea prices. On harvested double-crop acres, the math gets worse: every ton of rye silage strips about $76 in P and K off the field, and if that’s not a separate replacement line in the corn plan, you’re mining soil fertility and booking it as feed margin. The difference between a double-crop system netting $230/acre and one quietly bleeding $7,600/year in unreplaced nutrients is one column on your field map — purpose — and one meeting your agronomist and nutritionist should’ve had last February.

Dairy cover crop economics

Picture a kitchen table in February on a Midwest dairy running cover crops and fall manure. Feed program printouts are stacked on one side, coffee rings and all. The agronomist’s nutrient-management binder sits on the other side. A field map is thumbtacked to the wall behind the pot. On a 500‑acre family dairy, those two stacks of paper rarely end up in the same conversation.

The agronomist built a corn silage fertility plan assuming a certain manure nitrogen credit. The nutritionist designed a ration around forage quality targets. Both plans are solid on their own — but if nobody connects them through the cover crop, the field‑level economics quietly fall apart. And the cover crop ties those two plans together? It often got planted because someone recommended it, without anyone deciding what it was actually there to do. That gap costs $10,000 to $20,000 a year on an operation this size — and the verified floor, once you run the math with spring 2026 fertilizer prices, is $12,700.

The fix doesn’t require new iron or a bigger pit. It starts with a question nobody’s asking, field by field: What is this cover crop actually here to do?

Is That Cover Crop Insurance – or Feed?

On most dairies using cover crops, those acres are quietly serving two completely different jobs. Sometimes across the operation. Sometimes on the same field. Rarely with that job written down.

Insurance covers are biological filters. They intercept nitrate before it hits tile lines or surface water. A 41‑article global meta‑analysis found cover crops reduced nitrate leaching by an average of 69% compared to fallow ground, mostly in temperate row‑crop systems (Thapa et al., Global Change Biology, 2022). In Minnesota, a spring‑terminated cereal rye cover at the Waseca Southern Research and Outreach Center cut nitrate concentration and flow‑adjusted loss in tile drainage by about 70% in 2017, with smaller reductions (roughly 20–30%) in years when fall establishment was weaker. 

Feed covers do something completely different. They convert fall‑applied fertility into saleable dry matter — tonnage you can put in front of cows. UMass double‑cropping work from 2014–2018 documented 2 to 4 extra tons DM per acre in spring while capturing 60+ lb N per acre. At Ohio State’s North Central Research Station in Fremont, Jason Hartschuh’s 2024–2025 nitrogen‑rate trial showed that boot‑stage rye yield jumped when spring N exceeded fall rates — and that 60 lb/acre of spring N was needed to maximize crude protein regardless of what went on in the fall(Buckeye Dairy News, March 2026). 

Hartschuh’s team also ran the feed economics. High‑quality rye harvested at flag leaf emergence returned $9.80/cwt of milk in income over feed cost. Average rye at late boot slipped to $9.20/cwt. Headed‑out rye fell to $8.50/cwt — a $1.30/cwt spread from harvest timing alone (OSU analysis, 2019). 

Neither job is wrong. The problem is when every acre is managed the same way.

Bullvine Benchmark: If your rye hits boot stage after May 20, you’re not growing feed — you’re growing a corn yield penalty.

Where Does the Money Actually Leak?

Think about a typical fall‑manure system. Manure goes on in September or October. Nitrogen starts transforming in the soil. Winter arrives. Then spring — often wet, tile lines running. The following corn crop won’t meaningfully use that nitrogen until late May or June. Long exposure window.

A living cover crop changes the equation by pulling nitrate as it forms, converting soluble nitrogen into plant tissue that water can’t carry away. But here’s the trade‑off nobody should sugarcoat: the cover crop isn’t scavenging leftovers; it’s locking up the groceries meant for the corn.

At roughly 1,000 lb of rye dry matter per acre, UW‑Madison work shows the cover can trap up to 25 lb of potentially leachable N. Push biomass past 2,000 lb, and the nitrogen tied up in plant tissue climbs toward 40 lb or more. Terminate late or grow heavy, and that N won’t be sitting there in the soil when corn needs it most. 

Hartschuh put it bluntly in March 2026 Buckeye Dairy News“When spring and fall total nitrogen applied is less than 100 lb/acre, our research showed that the forage removed more nitrogen than was applied.” The forage ate more than the field was fed. That’s the nutrient removal side of the ledger that disappears when nobody declares which job the field is doing. 

The Nitrogen Credit Table You Should Print

Here’s where you turn that concept into a simple rule you can actually use.

UW‑Madison’s A4178 Extension guide (updated March 2026) lays out a biomass‑based framework for adjusting manure N credits behind rye. At the same time, DTN’s March 2026 retail summary put urea over $600/ton, which works out to about $0.73/lb of actual N

Put those together, and you get a very printable table:

Rye Biomass at TerminationN Credit AdjustmentAction RequiredCost at $0.73/lb N
Below 1,000 lb DM/acreNoneNo adjustment to manure N credit$0/acre
1,000–2,000 lb DM/acreSubtract 35 lb N/acre from manure creditStarter N in 2×2 placement~$25.55/acre
Above 2,000 lb DM/acre(approaching flag leaf)Subtract 40–80 lb N/acre depending on manure rateStructural N input — starter alone may not bridge the gap$29–$58/acre

You’re not adding a second full fertility program. You’re admitting that the cover crop sequestered some of the nitrogen the manure was supposed to deliver — and budgeting to make up the difference. Planned in February, that’s just another line in the fertilizer column. Discovered in May, it’s a scramble.

Across 200 “insurance” acres sitting in the 1,000–2,000 lb DM bracket:
35 lb N × $0.73 × 200 acres = $5,110.

That’s the first chunk of the $12,700.

Why Manure Alone Won’t Replace What the Rye Removed

Now look at the P and K, those double‑crop acres are hauling away.

OSCIA’s Crop Advances trials in Ontario (2014–2015) measured boot‑stage rye fertilized with 60 lb N, removing 26.5 lb P₂O₅ and 126.3 lb K₂O per acre. DTN’s February 2026 retail prices pegged DAP at $851/ton and potash at $487/ton. On a nutrient basis, that’s about $0.93/lb of P₂O₅ and $0.41/lb of K₂O. Multiply by the OSCIA removal rates, and you land at roughly $76/acre in P and K, leaving the field in the feed wagon. 

Here’s the catch: manure is a package deal. You don’t get to order N, P, and K separately.

UMass Extension puts liquid dairy manure around 28 lb N, 13 lb P₂O₅, and 25 lb K₂O per 1,000 gallons. Apply enough to hit your N target, and you’re stuck with whatever P and K ratio the cows produce. On many long‑term manured fields, soil test P is already high enough that you’re bumping into regulatory limits. 

Manitoba’s nutrient management rules, for example, cap manure P application at 2× crop removal when Olsen P is between 60 and 120 ppm, at 1× removal between 120 and 180 ppm, and prohibit P application above 180 ppm. Ontario and several Midwest states have similar P‑based caps on high‑testing fields. In those situations, more manure isn’t on the table. To replace what the rye forage removed, you’re buying potash and sometimes DAP. 

Across 100 double‑crop acres at $76 each: $7,600.

Add that to the $5,110 starter N line, and you’ve hit $12,710, which we’ll call the $12,700 ghost-cost floor. That’s before you factor in nitrogen slipping through tiles on low‑risk ground that never needed fall manure in the first place.

Bullvine Benchmark: If your double‑crop fields and your straight‑corn fields have the same fertility plan, someone’s getting robbed. Check which one.

When Does Double‑Cropping Rye Silage Actually Pay?

Same farm. Same 100‑acre block. Three different management stories.

Version 1: The Winner — $230/acre net

Rye yields 2.2 tons DM per acre. It’s seeded on time and catches fall moisture. Harvest hits the boot stage by about May 10–15. Corn goes in by May 18. P and K removal gets fully replaced in the corn fertility plan.

  • Revenue: 2.2 t DM × $180/t × 100 acres = $39,600 (adjust $180 to your local feed market; that’s the sensitivity lever).
  • Costs: seed $25/acre + harvest/chop/pack $65 + P&K replacement $76 = $166/acre × 100 = $16,600.
  • Net: $230/acre.

Cornell partial budgets for similar systems (2015 inputs) put cover crop forage production costs at $94–$118 per ton DM — a floor that’s higher now but still a useful benchmark. In this version, double‑cropping is clearly paying its way.

Version 2: The Tight Margin — Breakeven to loss

Now cut that rye yield to 1.5 tons DM/acre. Cold fall. Late seeding. So‑so stand. You throw 75 lb of spring N at it to try to rescue tonnage. Harvest slides to late May. Corn doesn’t go in until May 28.

UW‑Madison planting date work (Joe Lauer’s long‑term trials) pins corn grain yield loss at about 0.3% per day in early May, rising to roughly 1% per day after mid‑May. Extension agronomists commonly use a similar curve for silage tonnage. Even if you cut that in half to stay conservative, a 10‑day delay on an 8 t DM/acre silage field still costs: 

8 t × 0.5% × 10 days = 0.4 t DM/acre.

At $165/t for corn silage, that’s 0.4 × 165 × 100 acres = $6,600 in corn penalty.

Once you add that to the rye economics, this version at best breaks even and at worst runs red. The farm harvested forage. The pencil says it barely mattered.

Version 3: The Hidden Cost — $7,600/year walking off the field

Same 100 acres. Rye yields 1.8 t DM/acre. Corn is planted around May 25. The P and K removed by the forage — that $76/acre — never gets replaced. Those fields get the same corn fertility plan as the terminated‑cover fields across the road.

On paper, the double‑crop looks profitable. The P and K line in the budget doesn’t move. But $7,600 in fertility value is leaving the field every year. By year three, soil test P starts slipping on ground that was comfortably high a decade ago. OSCIA’s Crop Advances team warned about exactly this: when you harvest rye as forage, you have to treat nutrient replacement as part of the economic calculation, not an afterthought. 

The gap between Winner and Hidden Cost isn’t an agronomy skill. It’s whether anybody ran the nutrient removal numbers before they locked in the corn fertility plan.

Which Fields Should You Stop Trying to Harvest?

When rye looks good, it’s tempting to turn every acre into feed. That’s rarely the smartest play.

Realistically, on most dairies, maybe a third to two‑fifths of cover crop acres can reliably carry a double‑crop program without squeezing corn planting date or compaction risk too hard. The rest are better off in the insurance column — especially high‑risk fields for runoff or leaching.

Here’s a simple filter:

  • Can this field reliably deliver 1.5+ t DM/acre without pushing corn planting past May 20? If not, it belongs in the insurance column.
  • Heavy, tile‑drained clays that are slow to dry in spring? Those are prime insurance acres.
  • Fields with slopes above 3% or close to tile outlets or surface water? Insurance — non‑negotiable.
  • Land that always ends up last in the silage harvest queue or where covers don’t get seeded until October? Insurance. Weak establishment won’t support reliable feed tonnage.

The only thing you’re adding to the map your agronomist already has is one more column: Purpose.

Dimension🛡️ Insurance Acres🌾 Feed / Double-Crop Acres
Primary goalN interception, water protectionSaleable dry matter tonnage
Biomass target<1,000 lb DM/acre1,500–2,500+ lb DM/acre
Seeding rateNormal fall rateHigher rate for stand density
Spring NPre-budgeted starter (35 lb N/ac)60+ lb N/ac for CP and yield
TerminationEarly spring kill before bootBoot-to-flag-leaf harvest window
Corn plantingOn schedule, no delayMust be in by May 20 or field reverts
Fertility planStandard corn silage planSeparate plan with P&K replacement ($76/ac)
Risk profileTile-drained clays, slopes >3%, near waterWell-drained, flat, early-drying fields
If it failsN still captured; low downsideCorn delay penalty + unreplaced nutrients

Insurance fields get normal fall seeding rates, earlier spring termination, and a pre‑budgeted starter N line behind heavier biomass. Feed fields get higher seeding rates, intentional fall fertility, a May harvest window circled on the calendar, and a separate corn silage fertility plan that replaces every pound of P and K the forage pulled off.

Same species. Same drill. Same manure tanker. Different marching orders for different dirt.

Can Spring Manure Shrink the Risk Window — Without Wrecking the Soil?

Spring manure makes agronomic sense on more acres than most pits and schedules allow. Nitrogen availability at or near the incorporation site can approach 100%, compared with 60–70% for unincorporated fall-surface applications. On flat, well‑drained ground with low leaching risk, there’s not a strong agronomic argument for fall. 

But the constraint isn’t just calendar. It’s compaction.

A loaded 7,500‑gallon tanker easily tops 70,000 lb. Even with duals, you’re well above the 5‑ton‑per‑wheel thresholdthat Matthias Stettler of Bern University of Applied Sciences flags as the line where subsoil compaction starts — damage below 12 inches that “can be felt for decades” because frost doesn’t reach that deep. A 2022 global assessment in PNAS (Keller et al.) pegs long‑term productivity losses from soil compaction at 10–20% for major crops in mechanized systems. On an 8 t DM/acre corn silage field, even a 10% drag is 0.8 t/acre — every year. 

The realistic spring application window in the upper Midwest and Ontario is maybe 10–21 workable days between thaw and “too late for heavy iron.” Those same weeks, you’re eyeing the rye harvest and trying to start corn. Add manure to that window, and you don’t just create a scheduling headache; you set up a three‑way fight between the pit, the chopper, and the planter. When storage pressure wins, manure goes on too wet, on the wrong day, on the wrong soils. 

The practical answer for most herds isn’t “flip everything to spring.” It’s picking three to five low‑risk fields you canhold back — even without more storage — and deliberately running those on spring timing for better N efficiency. That’s a realistic one‑year adjustment. A full-time switch is a multi‑year infrastructure and logistics project.

Bullvine Benchmark: Every spring tanker pass on wet soil is a bet against future yield. If you can’t wait for the field to carry the weight, it’s cheaper to wait for fall.

What This Means for Your Operation

  • Can you name the purpose of every cover crop field right now? If you can’t quickly label a field “insurance” or “feed,” that’s the first leak to plug.
  • Does your farm have one corn silage fertility program or two? If double‑crop and terminated‑cover fields follow the same corn fertility plan, you’re not replacing that $76/acre in P and K removal — you’re quietly mining soil tests.
  • Are you budgeting starter N behind heavier rye biomass, or reacting in May? UW’s 35 lb/acre adjustment behind 1,000–2,000 lb biomass isn’t optional — it’s the cost of asking rye to protect N all winter and still feed the corn. 
  • When did you last compare soil tests on double‑crop vs straight‑corn fields? If the P and K gap is opening, the shortfall isn’t in the pit; it’s in the plan.
  • Are you trying to force-feed production on fields that should be insured? If a field rarely hits 1.5 t DM/acre before May 20, you’re probably running Version 2 or 3, not the Winner.
  • When was the last time your agronomist and nutritionist were in the same room with your field map? It’s not that either one is doing bad work — it’s that nobody’s paid to knit their plans together. If the answer is “never,” that’s the single most valuable meeting you can schedule before fall.

Key Takeaways

  • If your rye biomass is over 1,000 lb DM/acre, starter N is a planned cost — not a surprise. For 1,000-2,000 lb of biomass, UW‑Madison data suggest subtracting 35 lb N/acre from your manure credit and bridging it with starter. Above 2,000 lb, that adjustment climbs to 40–80 lb N/acre. 
  • Every ton of rye silage is pulling about $76 in P and K out of the field at current prices. OSCIA’s 26.5 lb P₂O₅ and 126.3 lb K₂O removal at boot stage, multiplied by February 2026 fertilizer prices, is your base math. If there’s no replacement line in the corn plan for double‑crop acres, you’re cashing in soil fertility as profit. 
  • Double‑cropping doesn’t automatically pay. The Winner scenario nets ~$230/acre. The Tight Margin version barely breaks even after the corn delay penalty. The Hidden Cost version looks profitable on paper, while fertility quietly walks out the driveway.

First Step Monday Morning

This week

  • Print your field map. Add one column: Purpose (Insurance or Feed). Assign every cover crop field — no “we’ll see” blanks.
  • Pull last fall’s biomass notes, drone images, or just your best visual estimate, and mark which fields usually run below or above that 1,000 lb DM threshold at termination.

Within 14 days

  • Pull the last two years of soil tests on your double‑crop fields and line them up next to your straight‑corn fields. Look specifically at P and K. If you see a downward trend only on the double‑crop ground, you’ve just found your $7,600.
  • Print the nitrogen credit adjustment table and sit down with your agronomist. Agree on which biomass bracket most of your rye lands fall under and what that means for starter N on those acres.

Within 30 days

  • Book the advisor meeting: agronomist, nutritionist, field map, and your best estimate of rye yields and harvest dates. The goal isn’t a perfect plan — it’s to get both people telling the same story about which acres are insured and which are feed.
  • For each field in the Feed column, verify that the corn silage fertility plan includes a separate P and K replacement line if it doesn’t, add one before you decide where to put the fall manure.

Somewhere next February, there’s a kitchen‑table conversation waiting to happen. An agronomist, a nutritionist, and a field map spread between coffee cups. Two separate plans are finally becoming one. The only question is whether you pull those chairs together while the money’s still on the table — or after you’ve already watched it wash away.

Complete references and supporting documentation are available upon request by contacting the editorial team at editor@thebullvine.com.

Learn More

The Sunday Read Dairy Professionals Don’t Skip.

Every week, thousands of producers, breeders, and industry insiders open Bullvine Weekly for genetics insights, market shifts, and profit strategies they won’t find anywhere else. One email. Five minutes. Smarter decisions all week.
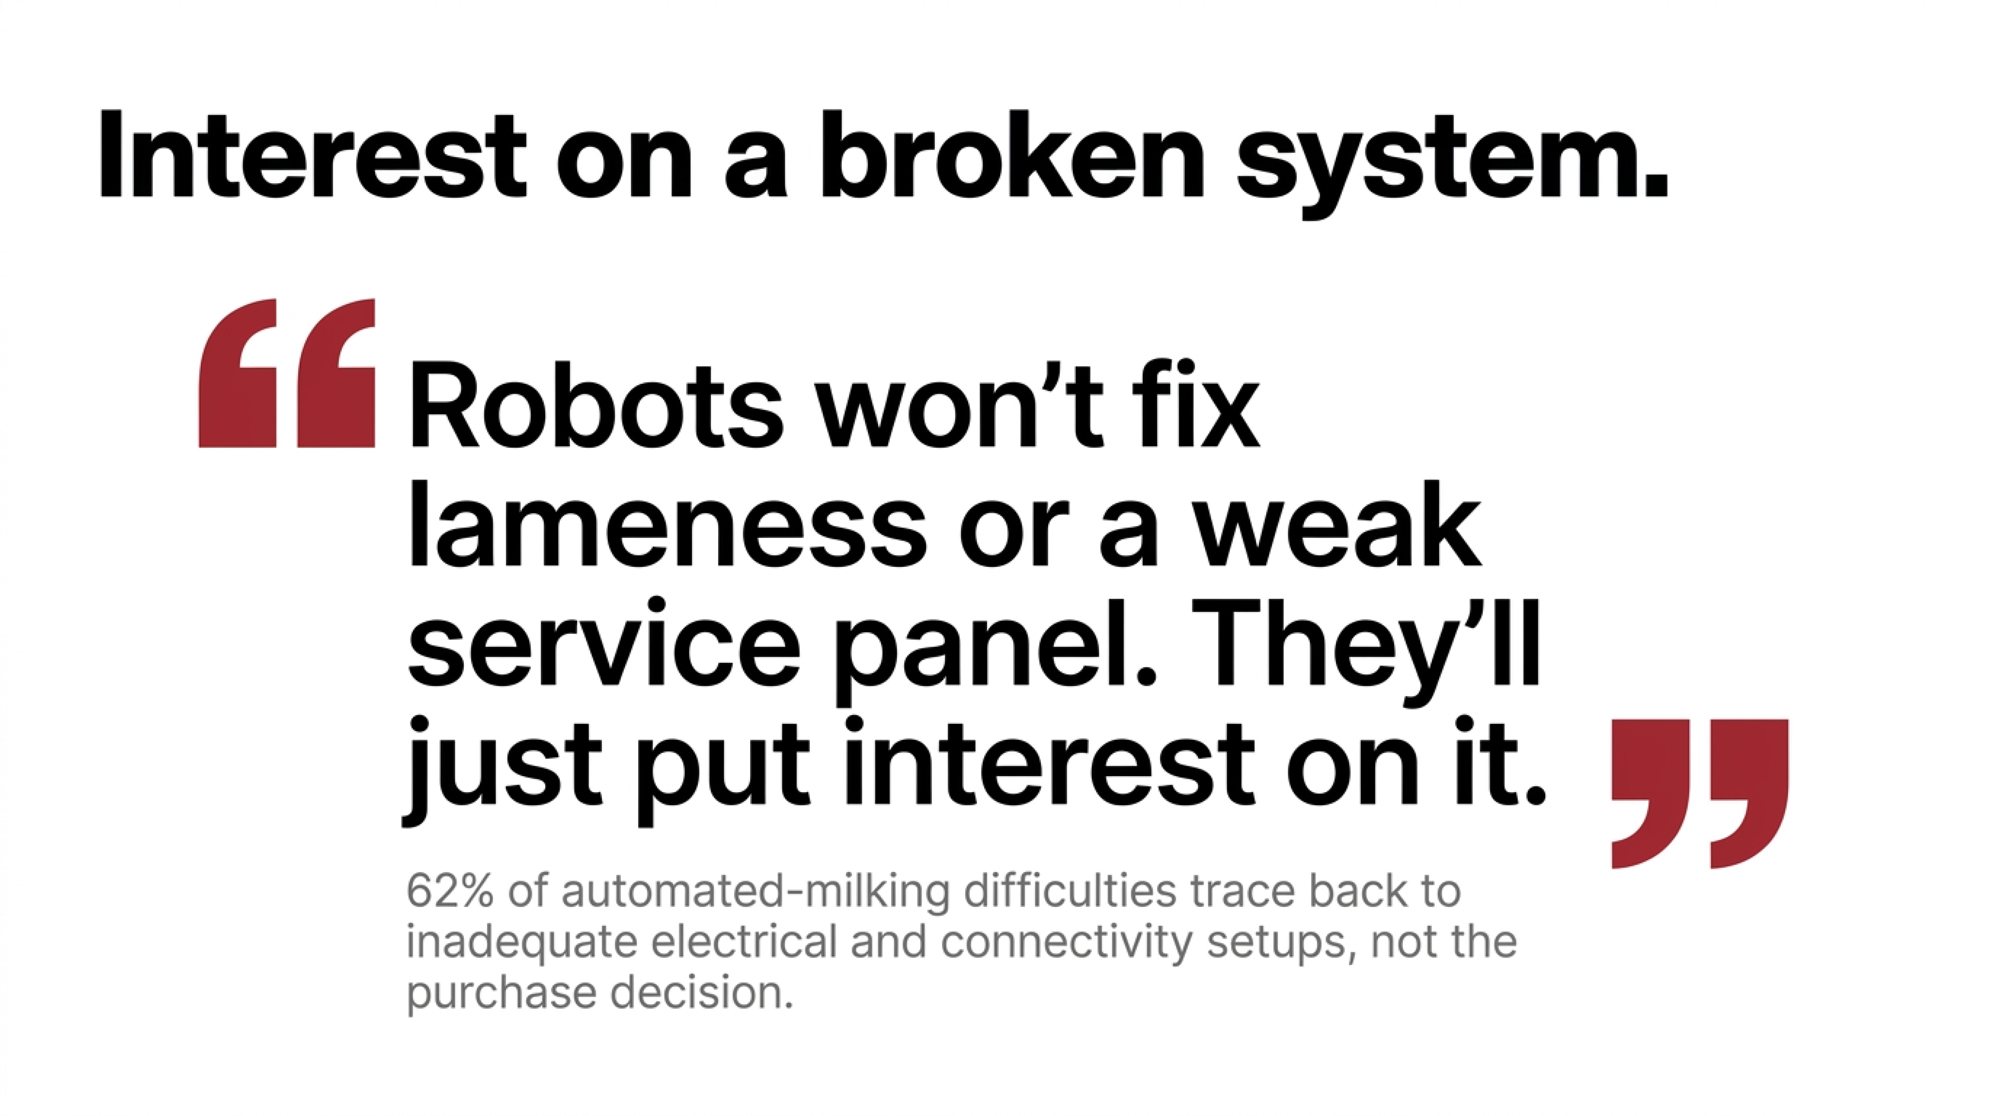
NewsSubscribe
First
Last
Consent

Vagts, Normans, Haldersons: $18 Million in Stray Voltage Verdicts. And a $3,000 Test No One Told Them Existed.

Three dairy families fought utilities for decades over unexplained herd losses. The testing blind spot and insurance trap they exposed threatens every operation milking on concrete.

Executive Summary: Three Upper Midwest dairies have already won more than $18 million in stray‑voltage verdicts, and the barn‑math says a hidden 4 lb/cow/day loss on a 500‑cow herd can quietly burn about $185,000/year off your milk check. The article walks through what happened to the Vagts (Iowa), Normans (Minnesota), and Haldersons (Wisconsin) when DC current from utility and pipeline systems ran through concrete barns while standard AC‑only tests kept saying “you’re fine.” It shows how insurance language like “death by electrocution” and “necessary suspension of operations” often pays for dead cows and wiring, but not years of lost milk if you keep milking through the problem. You’ll see exactly when to suspect voltage — cows avoiding one wet metal spot, 2–4 lb/cow/day unexplained loss, and no clear biological cause — and why a low‑thousands‑of‑dollars AC+DC test is basically eight days’ worth of the milk you’re probably already losing. There’s a clear 30‑day plan: schedule an independent DC‑capable test if you see those red flags, email your agent a 4–7 lb/cow/day scenario and ask what actually pays, and start logging production, behavior, and utility work like a future plaintiff. If you’re milking a few hundred cows or more on concrete, especially on older rural lines, this is the kind of “invisible loss” story you read once and then immediately go check your own numbers.

dairy stray voltage

Editor’s note: These cases are centered in the Upper Midwest United States, but the technical blind spots in stray‑voltage testing and the “Catch‑22” in farm insurance language are risks any modern dairy on concrete can face, regardless of region.

Lawrence Neubauer walked onto the Vagts dairy near West Union, Iowa, in September 2020 and quickly found DC stray voltage at cow‑contact points. He spent three more days documenting it. By then, Mark, Joan, and Andrew Vagts had already burned through about seven years of vet calls, nutrition consults, and equipment checks trying to explain why cows that looked “fine” on paper were sick, nervous, and underperforming.

Their troubles started after 2013, when a nearby Northern Natural Gas pipeline’s cathodic protection system began leaking current into their ground. A Fayette County jury later awarded the Vagts $4.75 million — $3 million in economic damages, $1.25 million for personal inconvenience and distress, and $500,000 for loss of use and enjoyment of their property. The Iowa Supreme Court upheld every dollar on June 21, 2024.

That’s one family. Across Iowa, Minnesota, and Wisconsin, stray‑voltage verdicts now total well over $18 million, even if you use conservative numbers. The real total is closer to $20–30 million once you add interest, fees, and multiple trials. Farm legal expert Roger McEowen, a professor at Washburn University School of Law whose March 2026 analysis was published through Kansas State’s AgManager, put it bluntly: if this happened on your farm tomorrow, your insurance probably wouldn’t cover the part that hurts the most.

What’s Changing — and Why These Verdicts Matter Now

Stray voltage used to be a weird problem from the 1980s that only showed up in old extension bulletins. Four recent cases have turned it into a very current, very expensive risk.

In Minnesota, Randy and Peggy Norman ran a dairy near Pine River and did a lot of things right. Minnesota Lawyer reports that in 1994, they were 27 percent above the state average in milk production, and by 2012, they were 20 percent below. Over those years, their cows’ health would wax and wane without a good diagnosis that would fix the issue, their attorney Jeremy Stevens told the paper. “The cow would be culled or die.” After repeated accusations that they were mismanaging the herd, the Normans’ lender issued an ultimatum in 2012: sell the cows and quit milking. They did.

A Cass County jury trial in October 2014 produced the largest stray‑voltage jury award in Minnesota history: $4,861,478 in economic loss and $1.5 million in nuisance damages. With interest and fees, the total climbed to roughly $6.3 million. The Minnesota Court of Appeals affirmed it, and trial‑law publications later highlighted the case as a landmark.

Near Galesville, Wisconsin, Paul and Lyn Halderson operate a nearly 1,000‑cow dairy. Their lawsuit alleged that Northern States Power (an Xcel Energy subsidiary) had found “excessive voltage” in one of their barns starting in 1996 and never told them. Over the next 15 years, the Haldersons watched cows struggle with health and production while enduring accusations that they were substandard farmers. In 2011, they hired their own consultant, who traced the high electricity levels to the utility’s distribution system. Court records show the family claimed $5.8 million in lost profits between 2004 and 2011. A Trempealeau County jury found Xcel’s conduct “willful, wanton or reckless” and awarded just under $4.5 million — an amount that, under Wisconsin statute, can be tripled to $13.5 million when a utility violates certain safety laws. Appeals and post‑trial motions will determine the final number.

In Wright County, Minnesota, a jury initially awarded Harlan and Jennifer Poppler and Roy Marschall more than $750,000 in a stray‑voltage case against Wright‑Hennepin Cooperative Electric Association. After the Minnesota Court of Appeals ordered a new trial on damages, a second Wright County jury in 2015 returned a verdict of nearly $2.5 million. Minnesota’s appellate courts later upheld that award.

Taken together, these cases show a pattern where farm families spent years battling unexplained herd problems and litigating with utilities before juries and judges ultimately ruled in their favor. The cases didn’t just move money; they pulled back the curtain on how testing protocols, infrastructure, and insurance language actually behave when current starts leaking through concrete.

And in every single case, the big money didn’t come from insurance.

How This Actually Shows Up in Your Barn

The Vagts didn’t sit on their hands. They did what you’d probably do.

They called the vet. They adjusted rations with their nutritionist. They had the milking system serviced. They checked ventilation, bedding, and cow flow. For years, every professional who walked through that barn worked through the same checklist you and your advisors would use: bloodwork, cultures, necropsies, ration audits, cow comfort reviews. Nobody found a single “smoking gun.”

Here’s the hard truth buried in Wisconsin’s own stray‑voltage program documents: ” Stray voltage “is an electrical issue and can only be identified through standardized electrical testing protocols. There’s no blood test for it. No milk culture. No special SCC code on your DHI sheet.

Your vet can see the effects — chronic mastitis, odd behavior, production that doesn’t match the ration — but her toolkit is built to rule out disease, metabolic issues, and management mistakes. Voltage at the cow’s feet doesn’t show up in her lab work. It’s not in your nutritionist’s software. It’s not in your repro logs.

So how much did all that troubleshooting cost the Vagts before Neubauer showed up with the right meter?

You don’t have a published survey that nails down that figure. But on a 400–500 cow herd chasing an unresolved “mystery problem,” it doesn’t take long for extra vet calls, nutrition visits, milking‑equipment service, and outside consultants to add up to a noticeable line item. Over several years, that easily climbs into the five‑figure range — money that, in hindsight, would have covered a comprehensive independent electrical test many times over.

Then layer on what the Vagts eventually proved in court: about $3 million in lost production.

The Three Blind Spots That Let Stray Voltage Hide

Stray voltage becomes expensive because three systems you rely on — testing, utilities, and insurance — are built with blind spots.

Blind Spot 1: The Testing Protocol

Wisconsin’s PSC Phase II protocol — the standard many utilities use and point to — explicitly measures only AC, 60 Hz, RMS, steady‑state animal‑contact voltages at cow contact points. That’s the right test if your problem is classic 60‑cycle current leaking off the utility neutral. It’s almost useless if the source is DC stray voltage from a pipeline rectifier, like on the Vagts farm, or if the current rides in on frequencies outside the 60 Hz band.

When utilities test under that protocol, they’re essentially using a thermometer that only reads one scale. If the problem is DC, the meter can sit close to zero, even while cows are still getting enough current through their legs to change behavior and milk.

Pro tip: A standard utility stray‑voltage test is tuned for AC at 60 Hz. If your problem is DC from something like a pipeline cathodic protection system, that DC current can slip right past that setup — which is exactly what happened before Neubauer showed up with a DC‑capable meter on the Vagts farm.

Blind Spot 2: Who Runs the Test

When your power company tests your farm, they’re evaluating their own system for potential legal exposure. They pick the test points, the timing, and the load conditions. They write the report. In states like Wisconsin, they follow PSC rules that set thresholds and protocols, which is better than nothing. But it’s still the entity whose system is being evaluated.

The Halderson case shows how that can go wrong. According to court documents and farm‑media coverage, Northern States Power measured excessive voltage in one of the Halderson barns starting in 1996 and recorded it internally. The Haldersons say nobody told them. They kept milking. They spent years battling health problems and production shortfalls. It wasn’t until 2011 — fifteen years later — that they paid for their own independent testing and finally had numbers they could use in court.

Blind Spot 3: The Insurance Fine Print

Standard farm packages were built for sudden events: fires, storms, and building collapses. Stray voltage is a slow‑motion wreck that doesn’t fit neatly into that box. The Mengel Dairy Farms case is the clearest lesson here.

Hastings Mutual insured Mengel, and its own investigation confirmed stray voltage as a cause of damage. The company paid for dead cows and electrical work. Then it denied coverage for years of reduced milk production, arguing two key policy clauses never kicked in:

  • Livestock coverage: “death of livestock by electrocution.”
  • Business income coverage: loss of income due to the necessary suspension of your operations caused by a covered cause of loss

Mengel cut back cow numbers but kept milking. The cows didn’t die instantly from a visible shock. That, Hastings said, meant no business‑income coverage. A federal district court agreed, and the Sixth Circuit Court of Appeals affirmed in July 2021. As McEowen put it in his March 2026 article, it’s “a Catch‑22 for many farmers: if you keep working to save your business, you may disqualify yourself from insurance payouts for lost income.”

What Does Undetected Stray Voltage Actually Cost Per Cow Per Year?

Let’s do the barn math in plain numbers you can plug into your own herd.

Take a 500‑cow operation. Suppose stray voltage quietly knocks 4 lb/cow/day off production — conservative compared to what families like the Vagts and Haldersons documented in court, and close to but below the nearly 20 lb/cow/dayproduction gain Jill Nelson at Olmar Farms in Sleepy Eye, Minnesota, saw after installing an isolated transformer and investing almost $100,000 to separate her farm from utility infrastructure.

Use a mid‑range milk price of $18.00/cwt — you can swap in your own number.

Barn Math at a Glance (500 cows)

Impact CategoryEstimated Loss (Per 500 Cows)Per Cow/Year
Milk revenue (4 lb loss @ $18/cwt)$131,400$262.80
Extra culling (5 more culls per 100 cows)$45,000$90.00
Mastitis treatment (1 extra case per 10 cows)$8,750$17.50
TOTAL ANNUAL LOSS$185,150$370.30

How it pencils out:

  • Daily lost milk: 500 cows × 4 lb = 2,000 lb = 20 cwt
  • Daily lost revenue: 20 cwt × $18.00 = $360
  • Annual: $360 × 365 = $131,400
  • Extra culls: 25 cows × $1,800 = $45,000
  • Extra mastitis: 50 cases × $175 = $8,750

Rounded, that’s about $370 per cow per year on a 500‑cow herd.

And that’s using a modest 4 lb/cow/day loss. Nelson’s experience — nearly 20 lb/cow/day more milk after an isolated transformer and major electrical upgrade — shows how quickly these numbers get ugly when you’re on the wrong side of the current for years.

A comprehensive independent electrical assessment that measures both AC and DC at cow‑contact points often lands in the low‑thousands of dollars for a mid‑size dairy — for many 400–700 cow herds, that means writing a check in the low‑thousands range once you factor in travel and time on farm. At $360/day in milk‑only losses, a $3,000 test is equal to about eight days of the production loss it’s designed to catch. Even if your numbers are half that, the math doesn’t take long to pencil out.

Does Your Farm Insurance Actually Cover Stray Voltage Damage?

Short version: your farm policy likely covers a sliver of the damage — dead cows and maybe some electrical repairs — but not years of lost milk.

McEowen’s stray‑voltage insurance piece walks through the Mengel case in detail. The key lessons match what shows up over and over in real farm policies and public farm‑insurance endorsements:

  • Electrocution means “instant death,” not chronic decline.
    The livestock section in many policies uses language like “death of livestock by electrocution.” In Mengel, the court interpreted “electrocution” broadly enough to cover cows that didn’t die instantly — good news for direct animal‑loss claims. But that clause only applied to dead animals, not reduced milk flow.
  • Business income often requires “necessary suspension of operations.”
    The business‑income section typically says something like “we will pay for the actual loss of business income you sustain due to the necessary suspension of your operations caused by a covered cause of loss.” Mengel reduced cow numbers but kept milking. Because the farm didn’t fully shut down, the court held that the business‑income coverage never kicked in. Hastings Mutual didn’t have to pay for the years of reduced production.
  • Off‑premises utility language can leave a gap.
    Many standard farm policies include wording that limits coverage for problems with utility service before power reaches your meter. If the source of your stray voltage is a grid problem or a pipeline cathodic protection system, that language may mean your insurer has no obligation to cover the loss under the current wording.

That’s why you see big verdicts but small insurance checks. The utilities and pipeline companies are paying because juries found them liable. The insurers, in cases like Mengel, have covered direct physical losses, while courts have held that policy wording doesn’t extend to long‑term production loss.

How Do You Close That Gap Before a Problem Hits?

You’re not going to find a clean “Stray Voltage Rider” in your agent’s menu. But you can use the tools that do exist to close most of the hole.

Ask for business‑income coverage that doesn’t require a full shutdown.
Sit down with your agent and walk through this specific scenario: “If stray voltage or another electrical issue reduces our production by 4–7 lb/cow/day for three years while we keep milking, what does this policy actually pay?” Ask about:

  • A farm business‑income or “loss of farm income” endorsement that covers partial production loss, not just total shutdown.
  • Whether “necessary suspension” can include a partial interruption or whether you truly have to stop milking to trigger coverage.

Don’t accept a hand‑wave answer. Ask them to put their explanation in an email.

Add utility service interruption coverage that reaches past your meter.
Standard property coverage often excludes damage caused by off‑premises utility failures. You want:

  • A utility service interruption endorsement that covers losses if a problem on the grid or pipeline causes damage at your farm.
  • Wording that explicitly includes overhead lines, distribution equipment, and, where possible, third‑party systems like pipelines if they’re feeding current into your ground.

On many mid‑size Upper Midwest dairies carrying full farm property, liability, auto, and umbrella, total annual premiums often end up in a five‑figure range. Endorsements like business‑income and utility‑service interruption usually add only a small percentage on top of that, not a second premium. In real terms, you’re talking about something in the ballpark of one smaller load of milk a year to close a six‑figure coverage gap.

And again, get it in writing. A clean email that says “here’s exactly how your policy would respond if stray voltage quietly took 4 lb/cow/day off your production for three years” is gold if you ever have to argue with a claims adjuster.

When Is It Time to Pay for a Stray Voltage Test?

You don’t wait until your vet says, “I have no more ideas,” and your milk check has been light for three years. You pick up the phone when three things show up together.

  • Cows consistently avoid one specific wet, metal contact point.
    They balk, dance, or drink less at one waterer, stall row, or parlor lane — but use others without hesitation. Shadows, footing, and boss cows can cause some avoidance. But when it’s pinned to one specific piece of wet metal over time, you should get suspicious.
  • You’ve got a subtle but persistent production miss.
    One group or the whole herd is running 2–4 lb/cow/day under what your ration, genetics, and facilities should deliver, and minor tweaks never quite close the gap. You’ve got a sense your numbers “should be better than this,” even if you can’t prove it on paper.
  • Your vet and nutritionist can’t find a clear biological or management cause.
    You’ve worked through the checklist — fresh cow protocols, mastitis patterns, rumen health, feed quality, ventilation, milking routine — and you keep hearing some version of: “Honestly, this herd should be milking better than this. I don’t see a smoking gun.”
SignalTypical dairy explanationStray‑voltage interpretation
Cow behaviorAvoiding one trough is “cow politics”High‑risk: one wet metal point consistently avoided
Production numbers2–4 lb/cow/day miss blamed on geneticsHigh‑risk: ration and housing say you should be higher
Vet & nutrition work“Nothing obvious, herd should milk better”High‑risk: biology ruled out, electrical not tested yet
Recommended actionTweak feed or stall setup againHigh‑risk: book independent AC+DC test within 30 days

When those three line up, that’s your signal. You treat a low‑thousands‑of‑dollars independent AC+DC electrical assessment as cheap insurance, not a luxury.

What the “Cow Model” Actually Means

When consultants or PSC documents talk about a “500‑ohm cow model,” they’re just describing how easily a cow completes a circuit through her body — from a front foot in one wet spot to a back foot or nose touching another. The meter stands in for the cow, using about 500 ohms of resistance (roughly what a cow’s body presents), and measures how much voltage really exists from hoof to hoof or nose to ground. That’s why proper testing clamps onto actual cow‑contact points in wet conditions instead of just poking around in the panel.

And you start with someone who doesn’t have skin in the utility game. In Wisconsin, you can absolutely call your power provider and request a PSC‑compliant test, and you should. But remember: their protocol measures only AC, 60 Hz, RMS, steady‑state voltage. If your problem is DC from a pipeline or mixed‑frequency noise from aging infrastructure, that test literally can’t see it.

An independent dairy‑focused electrical consultant will:

  • Measure both AC and DC at cow‑contact points with a realistic “cow model” (usually around 500 ohms).
  • Log data over time, not just take snapshots.
  • Look at your farm wiring and the grid as a system, not in isolation.
  • Put findings in a written report of your own.

A simple, quick screen you can do yourself today: set a basic digital multimeter to low‑range AC volts, and check between the water in a suspect trough and a good ground reference. If you consistently see a few tenths of a volt or more — especially if it jumps when motors kick on — you’ve got enough reason to book a proper test. It’s not definitive, but it’s a useful filter between “cow politics” and “electrical problem.”

Why Do These Cases Keep Coming From Wisconsin, Minnesota, and Iowa?

It’s not that stray voltage only happens in the Upper Midwest. It’s that the conditions for big, provable cases cluster there. And those conditions are showing up in more regions every year.

First, the grid. Some Minnesota farm and energy advocates have described parts of the state’s rural electrical infrastructure as “crumbling.” Long rural feeders, multiple splices, and heavy livestock loads on circuits that were never designed for today’s 500–2,000 cow herds push a lot of current through a lot of grounded metal. Add in big barns built with concrete and steel — great for cow comfort, great for stray‑voltage pathways — and you’ve got more opportunities for dangerous “cow contact voltage” per mile of line than in smaller, pasture‑heavy regions.

Second, Wisconsin’s stray‑voltage program changed the game. Since the late 1980s, the PSC and DATCP have run a structured program with:

  • Standardized Phase I and Phase II testing protocols.
  • A defined “level of concern” threshold at about 2 milliamps (roughly 1 volt at a 500‑ohm cow model) at cow contact.
  • A hard rule that utilities must keep their own contribution under 1 milliamp.

That framework created a paper trail. When a utility knows it measured above those thresholds and didn’t fix it, a jury has something concrete to latch onto. That’s exactly what happened with NSP and the Haldersons.

Third, once a few big verdicts land, the flywheel spins. Law firms and consultants build expertise. Producers talk. Neighbors recognize similar patterns of herd problems when they hear the story. The infrastructure for proving stray‑voltage cases — technical, legal, and cultural — exists in Wisconsin, Minnesota, and Iowa in a way it doesn’t yet in many other dairy regions.

That doesn’t mean other states are safe. It likely means they have under‑measured, under‑documented problems, which is exactly why this kind of piece belongs in your reading stack even if you live a thousand miles from the Upper Midwest.

Options and Trade-Offs for Farmers

You’ve got a few realistic paths here. None involves crossing your fingers and hoping.

Path 1: Treat a comprehensive electrical test as routine maintenance (30‑day action).
In the next month, schedule a full AC+DC stray‑voltage assessment if:

  • Your cows avoid specific wet metal areas,
  • Your herd is quietly a few pounds under where it should be, and
  • Your advisors can’t find a good reason.

Think of it like a major parlor service or a feed audit. On a 500‑cow Upper Midwest dairy, a low‑thousands‑of‑dollars test is a line item. The risk of not knowing — $185,150 per year in quiet damage, plus the legal mess if you end up in a dispute — is not.

Path 2: Audit your insurance with stray voltage in mind.
Within the next 30 days, pull your farm policy and send your agent a simple email:

“If stray voltage or another electrical issue reduces our production by 4–7 lb/cow/day for three years while we keep milking, what parts of this policy actually pay, and what doesn’t?”

Ask them to walk through:

  • The definition of “electrocution” in livestock coverage.
  • Whether business‑income coverage requires “necessary suspension of operations.”
  • Whether off‑premises utility issues (grid or pipeline) are excluded.
  • Whether you can add business‑income and utility‑service endorsements that respond to partial production loss.

Get the answers in writing. Then decide whether that small percentage bump in premium is worth closing a six‑figure coverage gap.

Path 3: Start documenting like a future plaintiff, even if you never plan to be one.
If you’re not ready to spend on a test or endorsements this month, at least start a simple log:

  • Daily or weekly milk by group.
  • SCC trends.
  • Culling reasons and dates.
  • Behavior notes at waterers, stalls, and parlor lanes.
  • Dates and descriptions of any electrical, utility, or pipeline work near your farm.

If you ever do end up in a fight — with a utility or an insurer — that notebook will be the single most important asset you own that isn’t a cow.

Path 4: Use your utility’s free test — but don’t stop there.
If you’re in Wisconsin, you can and should request a PSC‑standard stray‑voltage investigation. It’s a no‑cost way to establish a baseline. Just understand what it can’t see: DC, non‑60 Hz problems, and anything outside the narrow test setup. Treat it as a starting point, not a verdict.

Key Takeaways

  • If your herd is consistently 2–4 lb/cow/day below where your ration, genetics, and facilities say it should be — and your vet and nutritionist can’t find a clear biological cause — you should treat a low‑thousands‑of‑dollars electrical test as a reasonable next step, not a last resort.
  • If cows are avoiding one specific wet metal area (a waterer, stall row, or parlor lane) and not others, and minor changes don’t fix it, that’s your cue to suspect voltage before you accept “cow behavior” as the explanation.
  • If your business‑income coverage requires “necessary suspension of operations,” assume it won’t pay for years of reduced milk unless you literally shut down — and talk to your agent about endorsements that cover partial production loss.
  • If your policy limits coverage for utility problems before power reaches your meter, assume damage caused by the grid or a pipeline could fall in that gap until an agent puts in writing that it’s covered.
  • If you’re milking 400–1,000 cows on concrete on older rural lines in the Upper Midwest, your risk profile looks uncomfortably close to the Vagts, Normans, Haldersons, and Popplers — and a low‑thousands‑of‑dollars test is about eight days’ worth of the loss it’s designed to catch.

The Normans spent more than twenty years fighting unexplained herd problems before a jury finally vindicated them. The Vagts dug through seven years of vet bills and underperformance before someone ran the right test. The Haldersons milked through at least fifteen years of documented voltage problems while their utility sat on a 1996 measurement that never made it back to the barn.

Cases like these are why families who’ve been through similar battles often say they wish they’d pushed for answers sooner.

Your vet can’t see voltage on a lab report. Your nutritionist can’t taste it in a TMR. Your utility will generally follow the testing protocol it has in place, which focuses on a narrow slice of possible electrical problems. And your insurer — if the Mengel case is any indication — can pay for dead cows and wiring fixes while denying years of reduced‑production claims because the policy language never contemplated a slow, stray‑voltage wreck.

So the real question isn’t whether stray voltage could be happening somewhere in your county. It’s whether you’re willing to spend one bad week’s worth of milk money this year to find out if it’s happening on your concrete.

We’re building a full insurance audit checklist, a 5‑question script you can use with your agent, and an independent testing directory for Upper Midwest dairies — with copy‑and‑paste email templates — in an upcoming Bullvine Weekly. That’s where we’ll get into the deeper contract language and dollar‑by‑dollar model that didn’t fit here.

If you had to pick one to do this month — schedule a DC‑capable stray‑voltage test or send that 4–7 lb/cow/day email to your agent — which one would you actually do first?

Complete references and supporting documentation are available upon request by contacting the editorial team at editor@thebullvine.com.

Learn More

The Sunday Read Dairy Professionals Don’t Skip.

Every week, thousands of producers, breeders, and industry insiders open Bullvine Weekly for genetics insights, market shifts, and profit strategies they won’t find anywhere else. One email. Five minutes. Smarter decisions all week.
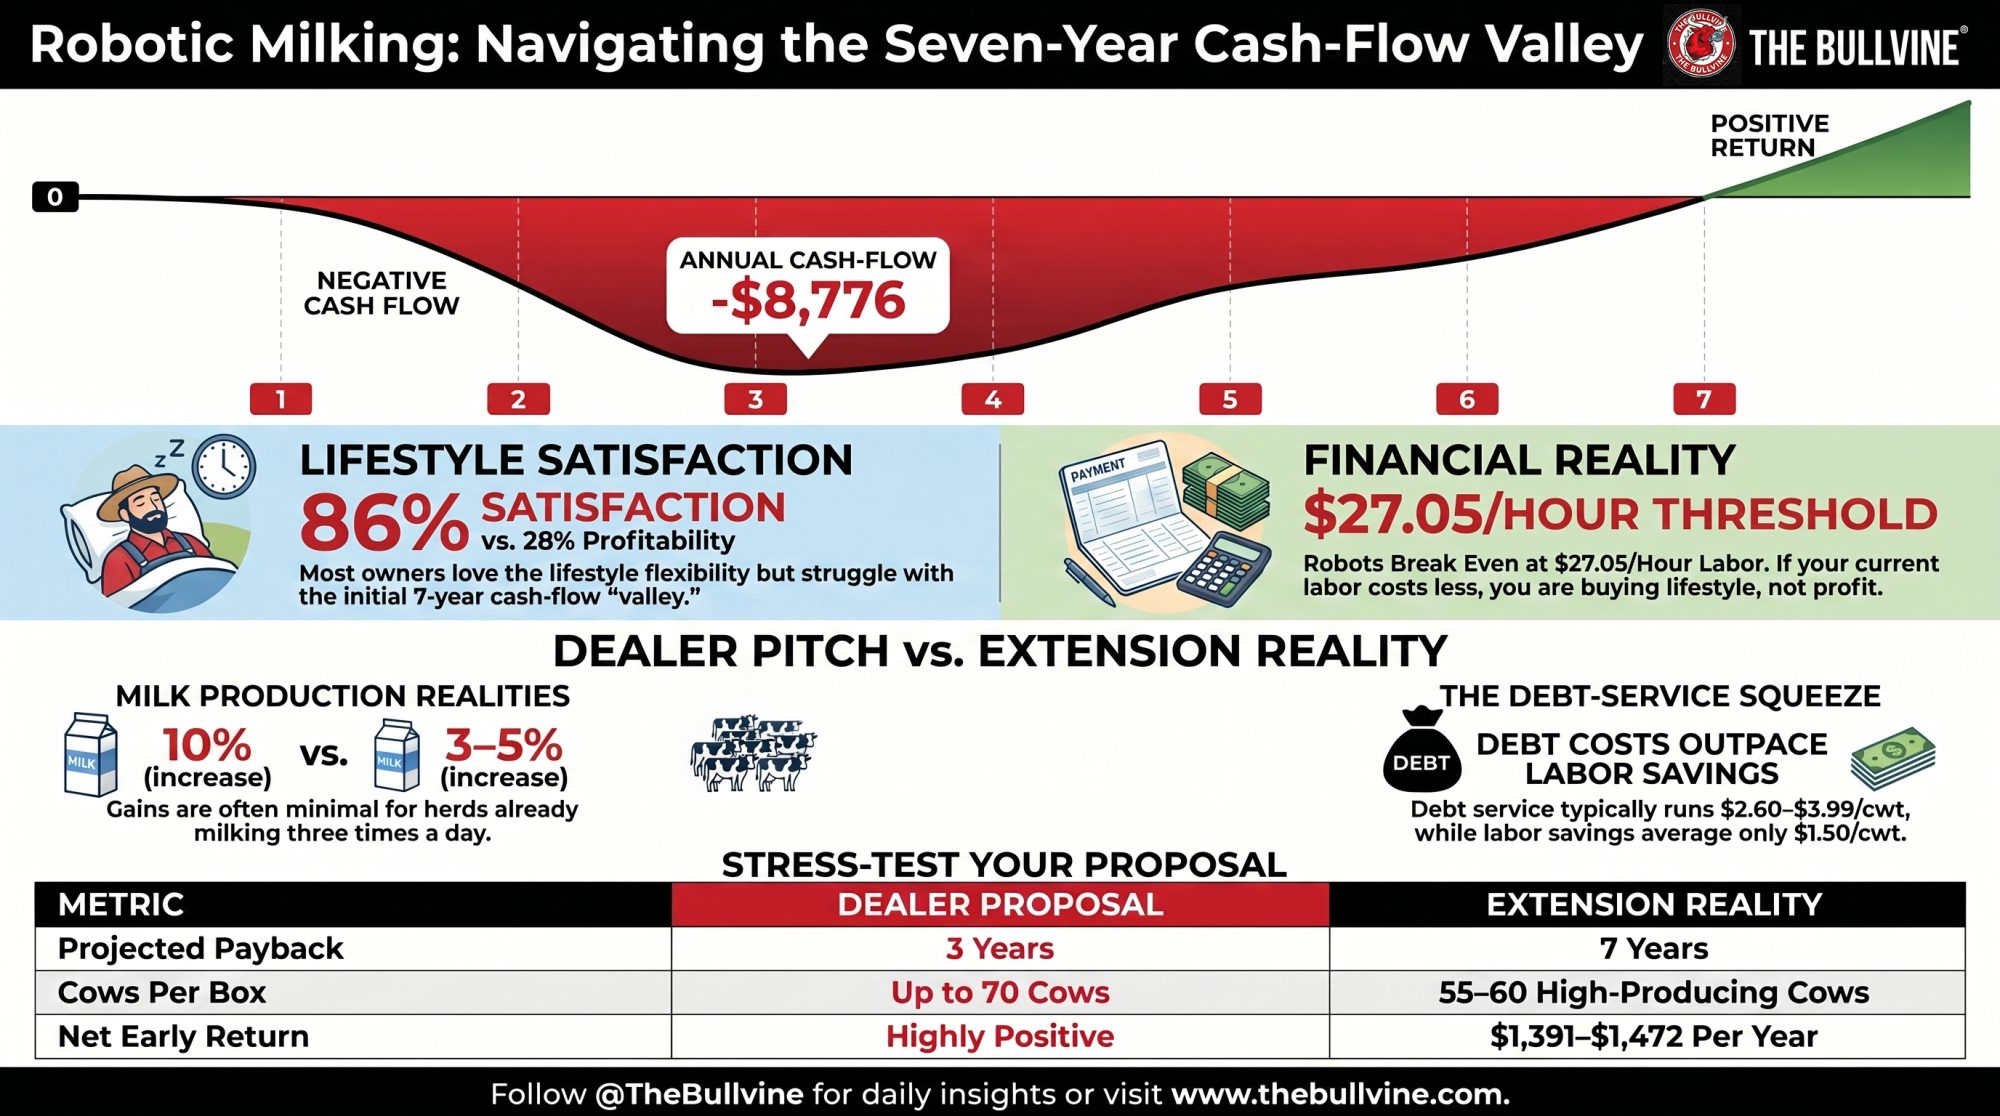
NewsSubscribe
First
Last
Consent

Preston Farms Swapped Bypass Fat for High‑Oleic Soybeans and Found $0.60–$1.00/Cow/Day – Could Your Dairy Do the Same?

Brian Preston’s feed bill dropped, and his components went up — at the same time. Three herds, three states, and the barn math that explains why it’s not a fluke.

Executive Summary: Preston Farms in Michigan pulled bypass fat out of a 1,000‑cow ration, fed 8 lb/cow/day of home‑grown high‑oleic soybeans, and still gained about $0.60–$1.00/cow/day in IOFC. Three very different herds — Holsteins in Michigan, Brown Swiss in Iowa, Holsteins in New York — all used high‑oleic beans to replace part of their purchased fat and meal without giving up milk or components. The upside shows up when you’re spending real money on bypass fat and soybean meal and can grow decent‑yielding soybeans; that’s where the ration shift starts to pencil as $18,000–$30,000/month on 1,000 cows instead of a neat research slide. The risk is yield and agronomy: an 8 bu/acre yield drag or a weed‑control misfit can quietly turn a “/cow/day” win into a marginal quarter. The article walks through a simple green‑light/red‑light test — seed access, acres, current fat spend, and advisor experience — so you can see if high‑oleic belongs in your 2027 crop plan or on your watch list. If you’ve been buying high‑fat genetics and still shipping “flat” butterfat, it also shows how a high‑oleic‑friendly ration can stop the rumen from vetoing the proofs you’ve already paid for.

High-oleic soybeans dairy

In November 2024, Brian Preston loaded the first batch of roasted high‑oleic soybeans into the TMR on his family’s farm in Quincy, Michigan. Within days, butterfat climbed from 4.4% to 4.8%, and the milk volume didn’t flinch. Six months later, even after component prices softened, Preston was still netting about 60–70 cents per cow per day, and Michigan State University summarized his early peak as “more than per cow per day in income over feed cost.”

“We got both,” he told Farm Progress — lower costs and better components — “which rarely ever happens.”

That line has echoed across MSU, Farm Progress, and the broader U.S. soy world ever since. But between seed access, weed pressure, roasting logistics, and changing butterfat markets, copying Preston’s move is not as simple as swapping one ingredient line for another. The operators who treat this like a full‑system decision — not just a shiny new feed ingredient — are the ones most likely to keep the dollars Preston and others are now banking.

The Day Preston Flipped His Ration

Preston Farms is a fourth‑generation dairy in southern Michigan. Brian works with his dad, Keith, uncle Glenn, and cousin Adam on roughly 1,600 acres near the Indiana line, milking about 1,000 Holsteins, raising contract hogs, and growing corn, soybeans, and alfalfa. Before high‑oleic, their model was simple: grow grain corn, buy soybean meal, and buy bypass fat.

MSU’s Adam Lock had been in their barn more than once with a bold pitch. His group had identified high‑oleic soybean lines with more oleic acid and less linoleic acid than conventional soy, and they were seeing a very different impact on milkfat when those beans were properly roasted and fed. The theory was straightforward: if you could push more oleic and less linoleic acid to the small intestine, you could feed more fat, pull expensive calcium salts and palm‑based fats out of the ration, and still gain on butterfat without crashing the rumen.

In 2024, the Prestons put that theory to the test. They seeded about 300 acres of high‑oleic soybeans on their own land and lined up another block of beans from neighbors to cover their needs — roughly 400 acres total when you add contracted ground. They installed an electric soybean roaster, worked with MSU on roasting targets, and by November started feeding around 8 lb/cow/day of roasted high‑oleic soybeans in the lactating ration.

“What was different with high‑oleic beans,” Preston told Farm Progress, “we were able to cut out the calcium salts and some of the palm fats for a significant feed savings with higher butterfat and the same pounds of milk.” MSU’s Michigan Alliance for Animal Agriculture report put it bluntly: the shift “allowed one southwest Michigan dairy farm to add more than $1 per cow per day in income over feed cost.” As butterfat and protein prices eased off the 2024 highs, that advantage settled into the $0.60–0.70 per cow per day lane — still worth roughly $18,000–21,000 a month on 1,000 cows.

Preston also used high‑oleic soybeans to rebalance his cropping rotation. After years of corn‑on‑corn, adding triticale and high‑oleic soybeans let them harvest three crops off the same acres over two years — triticale, corn silage, then high‑oleic soybeans — without sacrificing feed quality. It wasn’t just a ration tweak. It was a whole‑farm adjustment.

How Much Is Your Bypass Fat Really Costing You?

If you’re still buying bypass fat like it’s 2015 without checking what your own acres could do, you’re almost certainly leaving money on the table. And if your current ration is already leaking margin through purchased fat and protein, that problem won’t fix itself.

Take a common “before” scenario on a high‑producing herd:

  • Bypassing fat add up fast. Many herds are feeding roughly 0.5–0.75 lb/cow/day of rumen‑protected palm fat. At recent price bands of about $1,700–2,000/ton, that often lands in the neighborhood of $0.50–0.75/cow/day, and higher where feeding rates or prices sit above those mid‑range examples.
  • Soybean meal quietly stacks the bill. Feeding around 6 lb/cow/day of soybean meal, at $450–550/ton, easily tacks on about $1.35–1.65/cow/day.
  • Together, fat + meal often clears $2.00/cow/day. For a lot of herds, those two lines alone sit in the ~$2.00/cow/day or more range.

Now picture the Preston‑style “after” where you let high‑oleic beans do more of the work:

  • Home‑grown HOS takes over both fat and part of the protein. Feeding 7.5–8 lb/cow/day of roasted high‑oleic soybeans grown on your own acres, at an all‑in cost of roughly $450–520/ton, works out around $0.80–1.00/cow/day.
  • Soybean‑meal dependence drops. With beans carrying more of the protein load, soybean meal spend might drop into the $0.60–0.90/cow/day band instead of $1.35–1.65. That’s ration‑specific, but it’s the pattern Preston, Hilltop, and Half Full have followed. 
  • Bypass fat can legitimately become a zero line. When roasted high‑oleic beans carry the energy and fat load, bypass fat has a clear path to $0.00/cow/day

Put side‑by‑side, it looks like this:

InputConventional Ration (Approx. Cost)High‑Oleic Ration (Approx. Cost)
Bypass fat$0.50–0.75/cow/day$0.00/cow/day (replaced)
Protein (soybean meal)$1.35–1.65/cow/day$0.60–0.90/cow/day (partial replacement)
High‑oleic soybeans$0.00/cow/day$0.80–1.00/cow/day (home‑grown, roasted)
Estimated IOFC gainBaseline+$0.60 to +$1.00/cow/day

That table is why Preston’s numbers — and MSU/UW‑Madison modeling — land in that $0.60–1.00/cow/day IOFC gain range. On ingredient cost alone, you’re largely swapping one expense for another. The extra money shows up when butterfat and protein go up, and milk volume doesn’t drop.

What Happens When the Crop Doesn’t Cooperate?

None of that works if the beans don’t yield. And an agronomic miss on your feed crop feels a lot like discovering your “fine” ration has been burning cash.

  • High‑oleic can yield like your normal beans — if you treat them like it. USB and the Iowa Soybean Association both point out that high‑oleic soybeans have performed on par with comparable conventional varieties when they’re matched correctly to soil type and weed‑control programs. 
  • A yield drag hits your IOFC faster than most vendors admit. Say your soybean COP sits around $650–700/acre and you expect 60 bu/acre — that puts you roughly in the $11–11.50/bu zone. Drop eight bushels because you put the wrong variety on the wrong field, or your weed program wasn’t tight enough, and the same cost per acre jumps to about $12.70–13.00/bu. At 7.5–8 lb/cow/day, that adds roughly $0.22–0.23/cow/day to your bean cost.
  • A “dollar a cow” can quietly become “a quarter a cow.” If your IOFC gain at strong butterfat prices was $0.60/cow/day, that kind of yield drag can cut your advantage by roughly a third to a half, depending on your other ingredient prices.

The early misses all rhyme:

  • Putting high‑oleic beans on your worst weed‑pressure acres. Treating HOS as a place to dump risk fields is a reliable way to guarantee yield penalties as resistant weeds get a free run.
  • Choosing a high‑oleic variety that doesn’t match your herbicide program. If the trait stack doesn’t fit your existing weed tools, you either pay to adopt new chemistry or accept more weeds. Neither is free. 
  • Relaxing fungicide and plant‑population decisions because “it’s just feed.” High‑oleic soybeans don’t get a pass on agronomy just because they don’t go straight to a food‑grade contract. 

The trait isn’t the problem. The field choices are.

Can Your Seed Rep Actually Get You the Right Variety?

High‑oleic soybeans have quietly moved from niche curiosity to real acreage.

  • Farmers in 16 states grew high‑oleic soybeans on roughly 800,000 acres in 2024. USB and Brownfield reporting put the footprint there, with the heaviest concentrations in states like Indiana and Ohio, where crushers and food markets are already lined up. 
  • Seed choice isn’t just “yes/no,” it’s traits and maturity. USB and partner seed companies list 21 high‑oleic varieties for recent seasons, with maturity groups from roughly 1.9 to 4.8 and trait stacks ranging from Plenish high‑oleic Enlist E3 to SOYLEIC lines with other herbicide packages. 
  • Feed isn’t the first destination — yet. USB data suggest about 35% of high‑oleic soybeans currently go into dairy rations, about 60% into food uses, and around 5% into industrial markets. 

Your practical test is simple:

  • If your rep can name a specific high‑oleic variety in your maturity group, with the herbicide traits your weed pressure actually needs, and commit to delivering enough units, you’re in the game. That doesn’t guarantee success, but it means the supply‑side friction is manageable. 
  • If the answer is “we’ll see what we can find,” you’re watching the first wave, not riding it. That’s a signal to keep pushing your suppliers and watching the data — not to build your 2027 feed strategy on a hypothetical seed supply. 

Who’s Actually Running This Play Today?

Preston isn’t the only operator betting real money on high‑oleic. He’s just one of the easiest to find on a map.

Hilltop Acres Farm, Iowa — Brown Swiss on beans. In northeast Iowa, Dennis Mashek runs Hilltop Acres, an eight‑generation Brown Swiss herd near Calmar. About four years ago, his nutritionist suggested feeding his own high‑oleic soybeans. “My nutritionist told me high oleic soybeans could raise butterfat by a point to a point and a half, so I thought I’d give it a try, and it did,” Mashek told the Iowa Soybean Association. Today, he feeds six pounds of ration containing high‑oleic soybeans per head per day, roasts beans on‑farm at about 280–310°F, and has eliminated Novameal from the ration. His Brown Swiss herd is running roughly 4.9 fat and 3.7 protein, and he plans to keep high‑oleic soybeans in the rotation.

Half Full Dairy, New York — chasing ROI when palm fat spiked. In Warners, New York, Half Full Dairy started feeding high‑oleic soybeans in 2020 as palm‑fat prices spiked and supply got choppy. Owner AJ Wormuth worked with Dairy One nutritionist Brian Rapp to source high‑oleic beans, dial in roasting and grinding, and rework the ration. They replaced bypass fat and some soybean meal with high‑oleic soybeans and saw about $0.37/cow/day in savings, with components holding.

The whole‑system view in Iowa. The Iowa Soybean Association and Iowa State University are now running HOS from ISU field plots through the feed mill into the ISU dairy herd, explicitly to understand how growing, processing, and feeding high‑oleic all fit together for dairies like Mashek’s.

Different states, different breeds, different cooperatives. Same pattern: acres, a nutritionist willing to do more than “tweak,” and a farm family prepared to live with the result if the experiment doesn’t pay.

Are Your High‑Fat Genetics Hitting a Rumen Wall?

High‑oleic soybeans aren’t just a feed‑cost story; they’re a quiet genetics story too.

If you’ve spent years stacking bulls for higher fat and component kilos, but your ration leans hard on rumen‑active unsaturated fats from “cheap” sources, you’ve probably watched proofs that say “components up” turn into milk cheques that say “fat flat.” The rumen is vetoing the genetics.

By pushing more oleic and less linoleic acid to the small intestine when beans are properly roasted, high‑oleic soybeans reduce the risk of diet‑induced milkfat depression that often comes with feeding more unsaturated fat. That’s the kind of environment where high‑index cows are more likely to show the fat yield their proofs predict, instead of hitting a rumen wall. If you’re already using genomic proofs to chase higher fat and component kilos, a high‑oleic‑friendly ration is one of the few realistic tools that helps those numbers show up consistently on your butterfat line rather than staying hypothetical.

Worth thinking about: you’ve already paid for those genes. What’s your ration doing to let them express?

Does This Still Pencil When Butterfat Prices Slide?

You don’t need a Ph.D. to ask the obvious question: what happens when butterfat isn’t paying as it did in 2022–24?

In a 2024 Journal of Dairy Science paper and a companion UW‑Madison Dairy Innovation Hub seminar, Nicholson and colleagues pulled data from five feeding trials, modeled high‑oleic soybeans at 5% of diet DM, and ran the economics across butterfat prices from 2014 to 2020. Even at lower butterfat prices, high‑oleic diets delivered higher milk income less feed cost than conventional soybean diets in their model. Higher butterfat prices make the math prettier, but they’re not the only thing holding it together: in strong fat markets, the “more pounds of fat shipped” side of the ledger does a lot of work; as prices move back toward “normal,” more of your win comes from turning bypass‑fat and meal spend into home‑grown beans with a solid yield.

Preston’s own numbers track that curve. When markets were strong, he was over $1.00/cow/day ahead; as prices cooled, he settled into the $0.60–0.70/cow/day band. The math doesn’t evaporate when fat prices come off their highs. It just leans harder on your cropping and roasting discipline. And the protein side of this equation deserves its own audit in a future piece.

Green Light / Red Light: Are You Ready for High‑Oleic in 2027?

🟢 Green Light Signals

  • You already grow soybeans in a high‑oleic geography. You’ve got soybean acres in a region where high‑oleic seed is actually available in your maturity group — not just “somewhere in the state.” 
  • Your seed rep can be specific, not vague. When you ask, “Which high‑oleic variety in my maturity group, with the traits my weed pressure needs, can you actually deliver for 2027?”, your rep can name the variety, the trait package, and a realistic unit count. 
  • You’re spending real money on bypass fat and soybean meal. Your current ration uses at least 0.5 lb/cow/day of bypass fat and a healthy dose of purchased protein, so there’s legitimate room for cost replacement.
  • Your nutritionist is up for more than a paper exercise. They’re willing to design a ration with 5–8 lb/cow/day of roasted beans, understand roasting targets, and commit to watching fat, protein, MUNs, and body condition for at least 60–90 days instead of assuming everything will be fine on day one.
  • You can commit 40–80 acres without jeopardizing your whole crop plan. You’ve got enough acres to run a meaningful pilot, but not so many that a yield miss takes down your feed budget. 

🔴 Red Light Signals (Wait 2–3 Years)

  • Seed supply is a shrug, not a plan. Your rep can’t guarantee a specific high‑oleic variety in your maturity group, with the trait stack your weed history requires, for 2027. That’s a supply‑chain issue, not a personal failure — and a sign to hold fire this cycle. 
  • Your weed program is already hanging on by its fingernails. You’re leaning hard on trait stacks and herbicides to stay ahead of waterhemp, ragweed, or Palmer, and the available high‑oleic options would be a step backward on weed control. 
  • You don’t buy much bypass fat now. If your ration uses little to no bypass fat and your components are already strong, your upside is smaller and might not justify the agronomy and roasting learning curve in 2027.
  • No one on your advisory bench has actually done this. If your nutritionist, seed dealer, co‑op nutrition team, and local extension all only know high‑oleic from a brochure, you’d be testing a new crop, a new feed ingredient, and a new advisory model all at once. 
FactorGreen‑Light HerdRed‑Light Herd
Seed supplyNamed high‑oleic variety, 40–80 acres secured“We’ll see what we can find” for 2027 units
Bypass‑fat use≥0.5 lb/cow/day, fat+meal ≥2.00 $/cow/day<0.25 lb/cow/day, fat+meal ≤1.50 $/cow/day
Soy acres & riskCan pilot 40–80 acres without stressing feed planHigh‑oleic would tie up >50% of soybean acres
Weed controlSolid herbicide program that matches HOS trait stackProgram already “hanging on by fingernails” vs. waterhemp
Advisory benchNutritionist + seed rep have at least one HOS caseNo one on team has fed or grown HOS yet
Monitoring disciplinePlan to track butterfat, protein, MUNs 60–90 daysNo time or systems to watch ration response

Whatever column you’re in, write an exit plan before you plant.

If you’re contracting high‑oleic for food or industrial markets, know where beans you don’t feed will go and at what basis. If you’re planting strictly as a feed crop, talk to your elevator now about whether they’ll treat those beans like commodity soy, discount them, or refuse them. High‑oleic beans are still soybeans. But they’re not automatically just “beans” in every local market.

What This Means for Your Operation

  • Audit your last 90 days of feed invoices for fat and protein spend. Add your bypass‑fat and soybean‑meal lines and divide by cows. If that combined number is under roughly $1.50/cow/day, high‑oleic is a second‑wave decision, not a 2027 emergency.
  • In the next 30 days, put your seed rep on the spot. Ask: “What specific high‑oleic variety in my maturity group, with the herbicide traits my weed pressure requires, can you actually deliver for 2027?” If they can’t answer cleanly, that’s your answer for this cycle. 
  • Run a simple stress test with your nutritionist instead of guessing. Model high‑oleic at three butterfat prices (today, a stronger case, and a stressed scenario) and two yield levels (your five‑year soybean average and minus 8 bu/acre). If the only line that works is “high fat price + no yield drag,” you know this is a gamble, not a plan.
  • Start small and intentionally if you go ahead. Treat 40–80 acres as a deliberate pilot for agronomy, roasting, and ration performance — not as proof of a sales pitch. 
  • Add a genetics lens to your feed decisions. If you’re already stacking bulls for fat and components, look at whether your current fat sources are helping those high‑index cows show up on the milk cheque or quietly capping them with diet‑induced fat depression. A high‑oleic‑friendly ration is one of the few tools that pushes the rumen in the same direction your proofs are pushing the cow.
  • Write your abort criteria now. Something as simple as “If we don’t have seed with the right trait stack in hand by [date], or if butterfat stays below [target price] for six months, we pause this plan” will save you from talking yourself into a marginal bet later. 

Key Takeaways

  • If you’re not already feeding at least 0.5 lb/cow/day of bypass fat, high‑oleic soybeans are probably a “watch and plan” tool for 2027, not the first place you throw capital.
  • If your seed rep can’t name and secure a specific high‑oleic variety in your maturity group with the herbicide traits your weed pressure demands, you’re early in the curve; your smartest move is to push for better options and watch the next two years of data, not to force a half‑supplied experiment. 
  • If you can grow and roast your own high‑oleic soybeans and you’re currently writing big cheques for bypass fat and soybean meal, the most durable play is treating high‑oleic as a cost‑replacement crop, not a bolt‑on fat booster — you’re trying to grow a big slice of the fat and protein you currently buy. 
  • And if you’ve already spent years investing in high‑fat, high‑component genetics, a high‑oleic‑friendly ration may be one of the few realistic ways to stop leaving that genomic potential in the pipeline and start seeing it show up, consistently, on your butterfat line. 

The Prestons in Michigan, Mashek in Iowa, and Wormuth in New York didn’t wait for everyone in the industry to agree this was safe; they had enough of the pieces in place to try something new, with an exit plan if it didn’t deliver. The question for your farm is simple: over the next crop cycle, are you going to keep treating bypass fat and soybean meal as fixed costs — or are you ready to see whether your acres, your cows, and your numbers can turn high‑oleic soybeans into your own $0.60–$1.00 per cow per day?

Complete references and supporting documentation are available upon request by contacting the editorial team at editor@thebullvine.com.

Learn More

The Sunday Read Dairy Professionals Don’t Skip.

Every week, thousands of producers, breeders, and industry insiders open Bullvine Weekly for genetics insights, market shifts, and profit strategies they won’t find anywhere else. One email. Five minutes. Smarter decisions all week.
NewsSubscribe
First
Last
Consent

Your 30‑kg Dry‑Off Cows Are Wrecking Colostrum Six Weeks Before Calving

23% of quarters still had open teat canals after six dry weeks. Your 30‑kg dry‑off cows are the ones keeping that number ugly.

Executive Summary: Your 30‑kg dry‑off cows are quietly wrecking colostrum six weeks before calving by keeping udders leaking when they should be sealed and rebuilding. Research on high‑yield Holsteins shows cows drying off above ~21 kg have more open teat canals, more new IMI, and, when they leak pre‑calving, lower Brix colostrum. Other studies tie short or rushed dry periods and heat‑stressed dry cows to reduced colostrum yield, weaker bioactive profiles, and daughters that give 2.2–6.5 kg/day less milk across three lactations. For a 200‑cow herd with 40% of cows drying off above 25 kg, UF’s barn math says fixing dry‑cow cooling alone is worth about $1,800/year before you count daughter milk. This piece reframes colostrum failure as a structural clash between high‑yield genetics, abrupt dry‑off, and mammary physiology — not something you can fix with another replacer or a better Brix gun. You’ll see clear thresholds for dry‑off yield, dry‑period length, and heat‑stress, plus barn‑tested options like tiered dry‑off and minimum‑effective cooling. If you’re already hitting 22–25% Brix but still buying too many scour treatments, this is the six‑week window you need to audit next.

Fresh calved cows and older cows are kept in the pen bedded with woodchips. PICTURE: Chris McCullough

The invoice in the calf barn doesn’t lie. Electrolytes, scour treatments, respiratory drugs, colostrum replacer — those line items keep creeping up for a lot of high‑yield herds. On paper, the colostrum program looks tight. Brix numbers are solid. Calves get fed on time. But the real problem often started six weeks earlier, in the dry pen, when a cow walked out of the parlor still pushing 30‑plus kilograms and was told to stop — today.

If you’re breeding for 45‑kg peaks and drying off cows like it’s 1985, colostrogenesis is where that conflict shows up first.

What’s Really Happening in Those Six Weeks?

The mammary gland doesn’t sit idle between dry‑off and calving. It runs through three different jobs, and colostrum depends on each one finishing on time.

First is active involution, roughly the first two to three weeks after dry‑off. Milk stasis and intramammary pressure shut secretion down, old cells are cleared out, and the teat canal closes as a keratin plug forms. It’s the most vulnerable stretch for new intramammary infections (IMI), and the risk rises as milk yield at dry‑off goes up.

Next is steady‑state involution. This is the stretch a lot of herds treat as “dead time.” The cow isn’t milking, but the gland isn’t off. Tissue is regenerating, and the udder’s defenses against mastitis are at their highest.

Finally, about 15–20 days before calving, colostrogenesis kicks in. The mammary gland switches back into production mode — not for milk yet, but for colostrum. IgG starts moving from blood into secretions, and the gland begins synthesizing fat, protein, and a stack of bioactive compounds that shape the calf’s gut and immune system. In one Holstein study that followed cows through the dry period, IgG started building in pre‑partum secretions several weeks before calving in many cows, and those that accumulated IgG earlier and more gradually ended up with higher IgG at first milking.

So that six‑week window you’ve been treating as a holding pattern is actually colostrum’s entire production run.

How 30‑kg Dry‑Off Cows Blow Up the Timeline

Walk through a dry pen three weeks after dry‑off. Some cows look exactly how you want — udders soft, teats sealed, nothing leaking. Then there are the others: three weeks dry, udders still tight, milk beads at the teat ends or streaks down the back legs.

Those are the cows the dry‑off research keeps circling back to.

A landmark Holstein trial on drying‑off found that higher milk yield at dry‑off significantly increased the odds of new IMI during the dry period and delayed teat‑canal closure. After about six dry weeks, around 23% of quarters still had open teat canals, and cows with higher yields at dry‑off were more likely to be in that group. Cows producing more than 21 kg/day at dry‑off had a lower probability of teat‑canal closure and a higher risk of new IMI than cows drying off under 15 kg.

A 2024 study looking at milk leakage and udder pressure reported the same pattern: cows that leaked milk after dry‑off, and cows with higher udder pressure, were more likely to develop new IMI. The leaking cows were also the ones that had higher yields at dry‑off.

On the colostrum side, a multi‑herd study found that cows with ante‑partum leakage produced colostrum with significantly lower Brix readings than cows that stayed dry, and that dry‑period length, calving season, and herd size all influenced Brix values. Leakage wasn’t just a management annoyance — it showed up in colostrum quality data.

Now think about your own herd software. It’ll happily print “dry‑off today” beside a cow still giving 30 kg. That report doesn’t show you that you’ve just set that cow up for a rough involution, a leaky udder, and a higher chance of compromised colostrum.

The biology is simple and ugly: too much milk at dry‑off stretches active involution, keeps mammary tissue “busy” when it should be resting, leaves teat canals open longer, and makes it harder for that gland to flip into a clean colostrum‑synthesis state at the right time.

What Your Brix Gun Can’t See

Brix refractometers have cleaned up a lot of colostrum programs. If you pull a sample at first milking and see 22–25% Brix, you can be reasonably confident you’re somewhere around 50 g/L IgG, often enough to hit the classic 10 g/L serum IgG target if you feed enough volume within two hours.

But Brix doesn’t tell you the whole story.

Brix is a total dissolved solids number. It was always meant to be an IgG proxy. It says almost nothing about the other pieces colostrum is supposed to deliver:

  • Growth factors like IGF‑I, EGF, and TGF‑β drive intestinal villus growth and enzyme activity in the small intestine.
  • Cytokines and immune modulators that tune how the calf’s immune system reacts to future bugs.
  • Oligosaccharides that feed beneficial bacteria and help keep pathogens from sticking to the gut wall.
  • Fat and fat‑soluble vitamins — the calf’s first big energy dose and a key support for early immune function.

Several studies report strong correlation between Brix and colostrum IgG, with Brix readings of 19, 22, 25, and 30%as rough stand‑ins for 25, 50, 75, and 100 g/L IgG. That’s useful. But two samples can land at 23% Brix, carry similar IgG, and still be different animals when it comes to fat and bioactive profiles, depending on how the cow’s dry period went.

So yes, your colostrum can test 23% Brix and still be thinner on fat or certain bioactives if the cow spent the far‑off period leaking, heat‑stressed, or rushed through involution. Brix tells you you’ve probably cleared the IgG bar. It doesn’t tell you if the calf got the full biological blueprint or just the rough sketch.

Until there’s a practical field test for those bioactives, the upstream story is your best proxy: dry‑off yield, dry‑period length, far‑off pen stocking, heat‑stress exposure, and leakage.

Are Your Dry Periods Short‑Changing Colostrum and Longevity?

The same genetic pressure that pushed Holsteins into 45‑kg peaks also pushed dry‑off yields into the 25–30 kg band unless you actively manage the tail of lactation.

Colostrum traits themselves have real genetic variation. Recent work in Holsteins reported heritabilities around 0.21–0.23 for colostrum IgG and total Ig concentration, roughly double the heritability of colostrum yield (about 0.10). Genetic correlations between colostrum yield and IgG are low to moderate and can even be negative, and the links between colostrum traits and standard milk‑yield indexes aren’t strong. So breeding for higher milk doesn’t automatically protect colostrum; you’re dealing with different traits that need their own attention.

On the management side, a study in automatic‑milking herds found that dry‑period lengths under 40 days and over 70 days were linked with higher odds of culling in the first 60 days of lactation, compared to cows dried off in the 50–60 day band. Cows with very short or very long dry periods also had more fertility problems, while dry periods in the 40–70 day range delivered the best combination of early‑lactation production and udder‑health outcomes.

Shorter dry periods can improve postpartum energy status and, in some models, cash flow or emission numbers. But they also give the gland less time to involute and complete colostrogenesis fully. Several trials have reported reduced colostrum yields and compositional shifts in cows with short dry periods.

That’s the trade‑off in front of a lot of high‑yield herds right now: shaving the dry period to keep milk in the tank, versus protecting colostrum and early‑lactation stability. There isn’t a one‑size answer. The key is to stop treating the dry‑off date as something that happens when the close‑up pen is full.

The Economics You Don’t See on the Milk Cheque

Dry‑off and dry‑cow cooling tend to get framed as “soft” decisions. The UF/IFAS group has done the barn math on why they’re not.

In a modeled scenario with 96 annual heat‑stress days and standard U.S. milk price and construction costs, the Economic Feasibility of Cooling Dry Cows analysis showed that cooling dry cows in a new barn returned a net present value of about $22.50 per cow per year, with a benefit–cost ratio of 1.45 and a payback period around 5.67 years. Under those conditions, the authors concluded it’d be profitable to cool dry cows for roughly 89% of U.S. cows.

A related paper on cooling dry cows suggested that failing to cool them could knock next‑lactation yields down by about 5 kg/day in some situations. Meanwhile, a pooled Florida dataset showed that daughters of heat‑stressed dry cows produced 2.2 kg/day less milk in first lactation, 2.3 kg/day less in second, and 6.5 kg/day less in third than daughters of cooled cows, and those daughters also had shorter productive lives.

Now pull that into your own barn.

Take a 200‑cow herd where 40% of cows dry off above 25 kg. That’s 80 higher‑risk dry‑off cows a year. Multiply that by $22.50 per cow per year from the UF dry‑cow cooling model, and you’re looking at roughly $1,800 per year tied just to improved dry‑cow performance and cooling, before you even count the milk those daughters don’t leave on the table in second and third lactation.

Cost/Benefit CategoryStatus Quo (No Cooling, High Dry-Off Yield)Progressive Protocol (Cooled, Tiered Dry-Off)
Dry-cow cooling NPV/cow/year$0$22.50 (UF/IFAS model)
Est. annual gain, 200-cow herd (40% at risk)$0~$1,800
Daughter milk loss, 1st lactation−2.2 kg/day~0 kg/day
Daughter milk loss, 2nd lactation−2.3 kg/day~0 kg/day
Daughter milk loss, 3rd lactation−6.5 kg/day~0 kg/day
New IMI risk during dry periodHigher (open canals >21 kg yield)Lower (<15 kg target at last milking)
Colostrum BrixMay pass IgG test; fat/bioactives depletedHigher probability of full bioactive profile
Dry-cow cooling payback periodN/A~5.67 years (new barn); faster for retrofits
Benefit–cost ratio (UF model)1.01.45

That’s not a made‑up “you could be losing…” headline. Those are the UF numbers. You can plug in your herd size and local cost/price structure and get your own version of the same math.

3 Ways to Stop Treating the Dry Period Like a Parking Lot

You’re not going to rebuild your dry‑off system in one shot. You don’t have to. But if the 30‑kg trap feels uncomfortably familiar, here are three places progressive herds are actually moving the needle.

1. Tier Dry‑Off by Yield Instead of DIM

When it fits: Holstein herds where a quick 60–90 day report shows more than 20–30% of cows drying off above 25–30 kg.

How it works:

  • Pull a 60–90 day dry‑off yield report by cow.
  • Any cow projected to be over 25–30 kg at 10–14 days before dry‑off gets flagged for 5–7 days of once‑a‑day milking and, where possible, a lower‑energy ration or separate group.
  • Aim for <15 kg at the last milking before dry‑off treatment and moving to the far‑off pen, in line with data showing mastitis risk climbs as dry‑off yield rises above about 10–15 kg.

What it costs: Some complexity in the parlor and pens, especially if staffing is tight or grouping options are limited.

Where it can backfire: If communication is sloppy and flagged cows don’t actually get OAD or ration changes, you’ve added disruption without real yield reduction.

2. Treat 50–60 Days Dry as a Non‑Negotiable Band

When it fits: Herds where dry periods regularly slide under 40–45 days because transition housing is tight or the milk price is pushing you to keep cows milking.

How to check it:

  • Audit the last 12 months of dry periods and flag everything under 40–45 days.
  • Push to keep most cows in the 50–60 day band that AMS data linked with lower early‑culling odds and better fertility.
  • Keep the vast majority of cows within 40–70 days dry, where early‑lactation production and udder‑health outcomes were best.

What it costs: Discipline in repro and pen planning so cows actually make it to target dry‑off dates. In some cases, short‑term milk sales may feel like they’re taking a hit.

Where it can backfire: In herds already overstocked in transition, pushing every cow to 50–60 days without adding space or changing traffic can swap one bottleneck for another.

3. Cool Dry Cows Before You Buy Another Gadget for the Calf Barn

When it fits: Any herd where colostrum quality and next‑lactation milk clearly drop in summer, or where heat‑stress days are a regular feature.

What a minimum‑effective cooling setup looks like:

  • Shade and strong, consistent airspeed over feed and lying areas, not just down the alleys.
  • A feedline soaker system that actually wets the cow’s skin (not fog), on a thermostat and timer.
  • Automated controls so fans and soakers kick in when the barn is hot, without someone remembering to flip switches.

UF’s model says cooling dry cows can pay for itself in about five to six years for a new barn and faster for retrofits or hotter regions. Florida data say those decisions ripple through multiple lactations in daughters and granddaughters: 2.2 kg/day less in first lactation, 2.3 kg/day less in second, and 6.5 kg/day less in third for daughters of heat‑stressed dry cows compared with daughters of cooled cows.

Where it can backfire: If soakers are poorly placed or controls are wrong, you can make cows wet without truly cooling them and even push humidity up.

Old Rules vs Progressive Targets at Dry‑Off

FactorThe Old StandardProgressive TargetWhat Goes Wrong Without the Shift
Dry-off yield“Whatever she’s giving”<15 kg at last milkingOpen teat canals, more new IMI, lower-Brix colostrum
Dry period length“~45 days, give or take”50–60 days (core band)Higher culling odds in first 60 DIM; fertility problems
Dry period floorNo hard minimum≥40 days absolute minimumIncomplete involution; colostrum yield and composition compromised
Heat stress management“She’s not milking anyway”Feedline soakers + high-speed fans−2.2 to −6.5 kg/day in daughters across three lactations
Colostrum quality goal22% Brix / high volumeIgG + fat + full bioactive profileCalves clear IgG bar but lack growth factors, cytokines, oligosaccharides
Dry-off methodAbrupt / calendar-drivenTiered by yield (OAD + ration change)High-yield cows don’t hit <15 kg target; all downstream risks follow
Heritability of colostrum traitsIgnored / assumed milk-linkedSelected independently (h² ~0.21–0.23 for IgG)Milk-yield breeding doesn’t protect colostrum; different traits need different attention
Far-off pen investmentLow priorityCooling and stocking rate budget itemsEvery heat-stress dollar NOT spent there costs 3+ lactations of daughter milk

Your exact numbers will vary. The shift is what matters: stop treating the dry pen like a parking lot, and start treating it like the six‑week factory run for colostrum and the next lactation.

What This Means for Your Operation

  • If more than a third of your cows are drying off above 25–30 kg, treat abrupt dry‑off as a colostrum‑risk protocol, not just “how we do it here.” Pull a 60–90 day report and count how many cows hit that band.
  • If your dry periods are regularly under 40–45 days, recognize that you’re selling short your colostrum program and early‑lactation stability to keep milk in the tank this month. The AMS data say 50–60 days dry is where culling risk and fertility look better.
  • If you’re spending serious money on colostrum replacer and calf treatments but haven’t invested in cooling the far‑off pen, you’re fighting a problem the dry cows are still creating. UF/IFAS and Florida data show dry‑cow cooling pays in next‑lactation milk and in the daughters’ three lactations deep.
  • If your Brix gun says you’re “good enough” but calves still feel fragile, read your colostrum in the context of dry‑off yield, dry‑period length, leakage, and heat stress before blaming the colostrum bucket. Brix can’t see fat or bioactives.
  • Within 30 days, pull your last 3 months of dry‑offs, sort by yield at last milking, and draw a line at 25–30 kg. If the list above that line is longer than you’d like, that’s your first project list.

Key Takeaways

  • If your dry‑off report shows more than ~30% of cows leaving the parlor above 25–30 kg, start tiering your dry‑off protocol around yield, with OAD and ration changes to get those cows under 15 kg before you stop milking.
  • If your typical dry period keeps slipping under 40–45 days, treat 50–60 days dry as a non‑negotiable target band instead of a nice‑to‑have, and plan reproduction and pen moves around that.
  • If you haven’t cooled the far‑off pen yet, do the math on UF/IFAS’s $22.50/cow/year NPV and the 2.2–6.5 kg/day milk losses in daughters of heat‑stressed dry cows — then ask whether another calf‑barn gadget really solves the root problem.
  • If your Brix numbers look fine but calf performance doesn’t, start treating the dry period as the real colostrum program and use leakage, dry‑off yield, and dry‑period length as early‑warning signs.

The next time you walk the dry pen, forget DIM for a minute and look at udders and numbers instead. How many cows are three weeks dry and still look like they could walk back into the parlor? That’s your 30‑kg time bomb — and you’re the only one who can defuse it.

Complete references and supporting documentation are available upon request by contacting the editorial team at editor@thebullvine.com.

Learn More

The Sunday Read Dairy Professionals Don’t Skip.

Every week, thousands of producers, breeders, and industry insiders open Bullvine Weekly for genetics insights, market shifts, and profit strategies they won’t find anywhere else. One email. Five minutes. Smarter decisions all week.
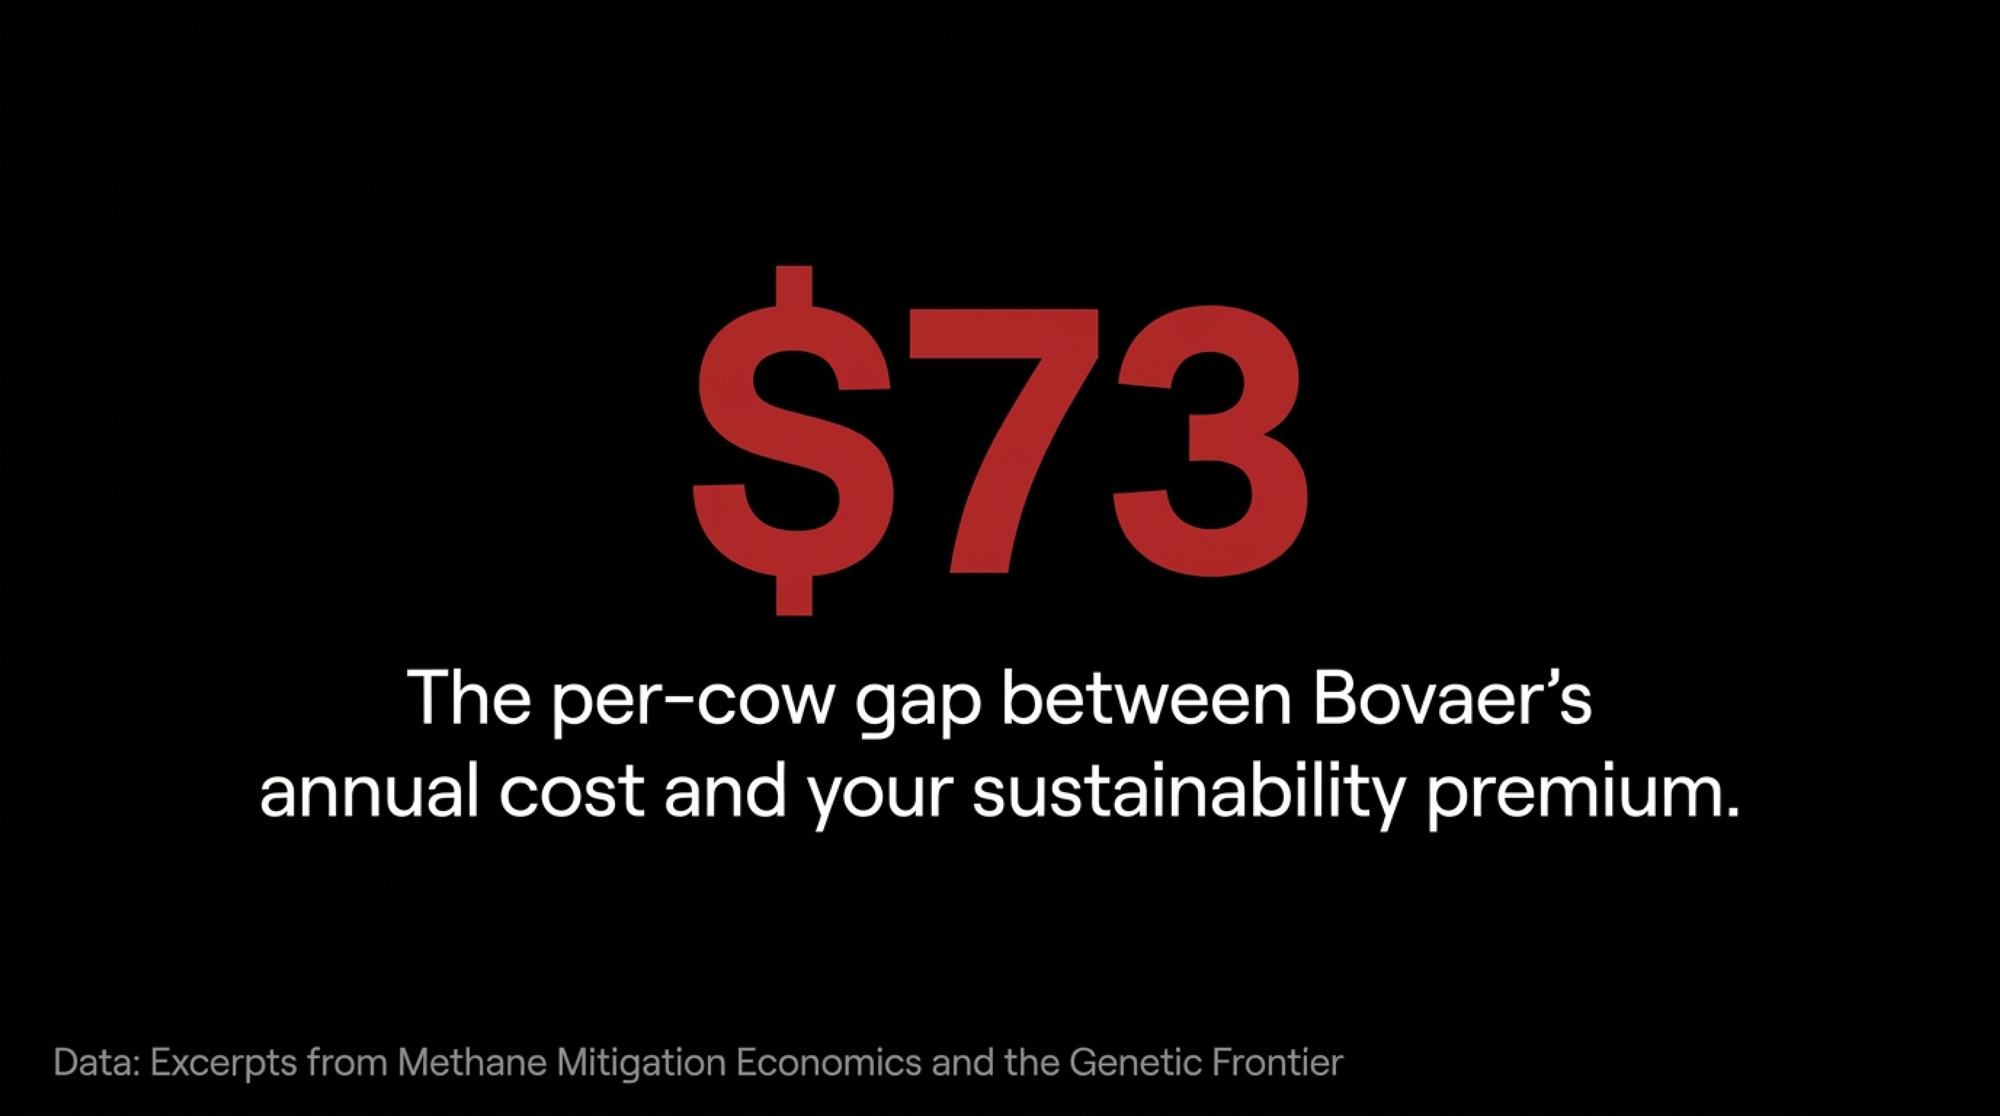
NewsSubscribe
First
Last
Consent

548 Pounds of Milk Lost in a Crowded Dry Pen – Inside a 400‑Cow Holstein Herd’s Metabolic Prep Fix

Oetzel’s data: 80% stocking vs. 120% stocking. A 548‑lb milk gap over 85 DIM. Same ration. Same cows. Different pen.

Executive Summary: A single overcrowded dry pen cost this 400‑cow Holstein herd 548 lb of milk per fresh heifer over 85 DIM — same ration, just too many bodies at the bunk. The article walks through how one “fresh‑pen ER” herd realized the real problem wasn’t their close‑up mix or additives, but a homeorhetic biology that keeps driving cows into lactation whether facilities and BCS are ready or not. Using Oetzel’s stocking data, Dahl’s short‑day photoperiod work, and Cornell NEFA/BHBA thresholds, it shows how density, lighting, and mid‑lactation BCS quietly set up — or sabotage — transition health and milk yield. You’ll see four concrete changes this herd made: locking in 3.0–3.25 BCS at dry‑off, keeping close‑up under ~85% of stalls, putting the dry pen on a true 8/16 light program, and using NEFA/BHBA as management triggers instead of lab trivia. A simple 50‑calving notebook test then tells you, in your own herd, how many fresh cows actually “needed help” in the first 21 DIM. If that number dropped by even a quarter, what would move first on your place — sick‑pen traffic, repro, or your milk cheque?

Transition cow management

She was a fat third‑calver in a 400‑cow Holstein herd — the kind of cow who kept following the same ugly script. Crowded dry pen. Rough start fresh. Ketosis. A brush with a DA. A long, expensive slog back to “okay.” The owner had seen it enough times that it felt like weather. Just something that happens.

It wasn’t the weather. It was transition cow management — or more accurately, a dry‑cow program that didn’t understand what it was actually managing. The ration balanced fine. The close‑up group had a decent DCAD, the right minerals, and the expected additives. And yet the fresh pen felt more like triage than anyone was comfortable with. The Holstein metabolic health picture looked right on the whiteboard but wrong in the sick pen.

MetricOvercrowded (>120% SD)Optimized (≤80–100% SD)Change
Stall stocking density130–145%80–100%▼ 30–45%
Bunk space/cow<24 in30+ in▲ 25%+
Daily lying time~11 hrs~13 hrs▲ 2 hrs
Daily milk loss/cow6.4–8.0 lbs0✅ Recovered
74-day lactation milk loss473–592 lbs0✅ Recovered
Ketosis risk (subclinical)ElevatedBaseline
LDA riskElevatedBaseline
Est. metabolic disease cost/cow$300–$639$80–$120▼ $200–$500
Recommended DCAD (close-up)Often ignoredNeg. DCAD, urine pH 6–7✅ In spec

That fat third‑calver? Repeat customer.

Here’s the uncomfortable biology behind what was really going on — and why dry cow bunk space, lighting, and body condition matter more than your close‑up ration.

Homeostasis vs. Homeorhesis: The Switch Nobody Votes On

Every dairy producer understands homeostasis intuitively. Blood sugar drifts too high, insulin brings it down. Drops too low, counter‑regulatory hormones bring it back up. Tight range. Quick corrections. Negative feedback loops keep the cow in balance.

Homeorhesis is different. Dale Bauman and W.B. Currie defined it in their landmark 1980 Journal of Dairy Sciencepaper as the “orchestrated or coordinated changes in metabolism of body tissues necessary to support a dominant physiological state” — in this case, lactation. It’s not a thermostat. It’s a one‑way program. The cow’s biology doesn’t ask permission before redirecting nutrients toward the udder and the calf. It just does it.

During late pregnancy and early lactation, that homeorhetic program drives a cascade that looks alarming if you measure it the wrong way.

Peripheral tissues become more insulin‑resistant — on purpose — so glucose gets shunted to the mammary gland. Circulating lipids spike as the cow mobilizes body fat to fuel a mammary system ramping up faster than her feed intake can cover. The liver gets hit with a NEFA surge that, in a well‑prepared cow, it handles. In an over‑conditioned, overcrowded, stressed cow? That’s where ketosis, fatty liver, and DAs start.

None of this is pathology. It’s physiology. The question is whether the cow’s environment and body reserves were ready for it.

The Genetic Amplification Problem

Here’s where it gets uncomfortable for anyone who breeds Holsteins.

Decades of selection for higher milk yield haven’t invented a new metabolic pathway. They’ve turned the volume up on the one that already existed. High‑merit Holsteins don’t ease into lactation; their biology punches the gas and trusts that management will keep the tank from running dry.

A beef cow runs this same homeorhetic program at low volume — enough to feed a calf, which is what evolution intended. A modern Holstein runs it at full blast, producing 40‑plus kg of milk per day within weeks of calving, mobilizing body reserves at a rate that would alarm a physician if a human patient did it.

The European Food Safety Authority has reported that high milk yield is associated with increased risk of metabolic and reproductive disorders in dairy cows. That’s not a design flaw in the cow. It’s a design flaw in how the industry manages the gap between genetic capacity and physical infrastructure.

On this 400‑cow herd, the “gas” was fully pressed. The “tank” — BCS, liver health, dry cow bunk space, lighting environment — wasn’t ready. So the biology did what it was built to do, and the fresh pen paid the price.

One Dry‑Pen Walk That Changed Everything

The fix didn’t start with a product. It started with a two‑hour walk.

The owner, vet, and nutritionist spent a morning looking at nothing but preparation. No laptop. No ration software. They walked in order: mid‑lactation pens (where the body condition story actually starts), far‑off dry, close‑up, maternity, and fresh pen. They counted headlocks and cows. They watched a feed delivery to see who got knocked off the bunk. They timed how long cows rested and how often they were disturbed.

What they saw wasn’t dramatic. It was worse than that — it was normal.

Mid‑lactation cows were quietly drifting above 3.25 BCS before dry‑off. Far‑off dry cows sat on a diet that was more “polite” than truly controlled‑energy. Close‑up pens were routinely overstocked whenever calvings bunched. The dry barn had no short‑day photoperiod — just whatever daylight leaked in and a few yard lights that stayed on all night.

The advisor’s comment that stuck: “The ration isn’t the issue. The cows just never got a fair shot at using it.”

That comment lines up with what a 72‑farm prospective cohort study led by Kerwin, Overton, and colleagues at Cornell found: across all those northeastern U.S. Holstein herds, there was no evidence that transition cow nutritional strategies alone were associated with milk yield outcomes. Controlled‑energy far‑off, high‑forage NDF close‑up, high‑starch fresh — the diets mattered for metabolic health markers and disorder incidence, but they didn’t move the needle on milk when examined in isolation from everything else happening on those farms (Animals 13(17):2701, 2023).

The ration is one lever. It’s not the whole machine.

Can You Really Fix Anything After She Calves?

Fair pushback. You’ve got cows calving tomorrow.

You still have tools — they can’t undo months of missed preparation.

What works post‑calving: IV and oral calcium save cows and prevent some DAs and retained placentas. Targeted propylene glycol in the first week can bring BHBA down, bump appetite, and head off some DAs and metritis. Aggressive treatment of metritis, mastitis, calving trauma, and lameness keeps cows eating — every extra kilo of DMI is less NEFA the liver has to mop up.

Where you’re mostly paying for your own lack of prep: Blanket “transition cocktails” for every fresh cow, whether she needs them or not. Pulling NEFA and BHBA to document how bad things are without ever touching BCS, density, or dry‑pen management. Pouring multiple rounds of treatment into clearly wrecked livers because no one wants to have the harder conversation about what happened upstream.

With feed costs still a major line on the P&L, every litre of early‑lactation milk matters more than it used to. A couple fewer DAs and chronic ketotics per 50 calvings moves the milk cheque more than a lot of herds want to admit.

Triage is damage control. Necessary. Sometimes life‑saving. But it can’t buy back the mammary capacity, liver health, and early‑lactation curve that mid‑lactation BCS and dry‑pen conditions have already decided.

The Four Moves That Turned This Herd Around

Here’s what changed once this team committed to treating transition as metabolic prep, not disease control.

Move 1: Get Honest About BCS — Starting in Mid‑Lactation

They made 3.0–3.25 BCS at dry‑off non‑negotiable.

Instead of trying to crash‑diet cows during the dry period, they adjusted mid‑lactation diets and grouping so cows stopped quietly creeping past that range. Research consistently shows that over‑conditioned cows face a higher risk of fatty liver, ketosis, and reproductive failure after calving. Every 0.25‑unit increase in BCS above 3.25 at dry‑off compounds the NEFA surge her liver will face when the homeorhetic program kicks in.

They stopped shrugging and drying off obviously, 3.75 cows “just this time.”

Trade‑off: Uncomfortable conversations about overfeeding “nice” cows in mid‑lactation. More sorting work. But it stopped sending already over‑fat livers into a metabolic marathon they weren’t trained for.

Move 2: Treat Dry‑Cow Bunk Space Like High‑Value Real Estate

Crowded close‑up cows used to be normal. Now, comfortable stocking is the target, not a suggestion.

Gary Oetzel’s data from the University of Wisconsin showed that first‑lactation animals stocked at 80% of stalls pre‑fresh produced 6.5 lb more milk per day over the first 80 days of lactation compared with those stocked at 120% — a 548‑lb cumulative deficit over 85 DIM from nothing but pen crowding. Nordlund and Cook argued in their transition cow facility design papers that the critical nutritional issue isn’t just how much cows eat, but how much their DMI drops around calving, which is heavily influenced by stocking density and pen moves.

A 2024 Journal of Dairy Science study by Cook, Pepler, Viora, and Hill reinforced this across 2,780 cows in two UK herds: the odds of disease in the first 30 DIM increased with prepartum stocking density, and stocking density at 8 to 2 days before calving showed a direct relationship with both early‑lactation and 305‑day milk production in multiparous cows (JDS 107(12):11381–11397). The social disruption of pen‑filling events mattered too.

When calvings bunched on this herd, they started flexing other groups, not the close‑up pen. (For a deeper dive on what the best transition operations do differently, see Your Fresh Cow Problems Started 6 Weeks Ago.)

Trade‑off: Cow‑flow got inconvenient some weeks. But the fresh‑pen drama dropped enough that nobody wanted to go back.

Move 3: Put the Dry Barn on a Real Short‑Day Lighting Program

Instead of “whatever daylight and yard lights we get,” the dry barn got timers and a genuine dark period.

Geoffrey Dahl’s research at the University of Florida established that cows exposed to a short‑day photoperiod (8 hours of light, 16 hours of dark) during the dry period produce significantly more milk in the next lactation. In a controlled study with a 42‑day dry period, multiparous Holsteins on SDPP produced 40.4 kg/day through 120 DIM compared with 36.8 kg/day for cows on long‑day lighting — a 3.6 kg/day advantage. The mechanism works through prolactin signaling: short days during the dry period decrease circulating prolactin but upregulate prolactin receptor expression in the mammary gland, priming the tissue to respond more aggressively once lactation begins.

Staff routines adjusted so they weren’t flicking on bright lights for every nighttime check. The test: if you can comfortably read a newspaper in the dry‑pen alley after hours, you don’t have a short‑day photoperiod, no matter what your SOP says.

(For more on how lighting programs affect both lactating and dry cows, see How to Increase Milk Production and Herd Health with Better Lighting.)

Trade‑off: A bit of fuss with wiring and habits. But the herd saw smoother early‑lactation curves and fewer immune train wrecks in the first 10 DIM.

Move 4: Treat NEFA and BHBA as Control Dials, Not Trivia

Instead of pulling blood “because the vet wanted data,” they used metabolite monitoring as a management trigger.

Ospina, Nydam, and colleagues at Cornell established the critical thresholds in a 100‑herd prospective study: prepartum NEFA at or above 0.29 mEq/L and postpartum NEFA at or above 0.57 mEq/L predicted DA, clinical ketosis, metritis, and retained placenta. The postpartum BHBA threshold of 10 mg/dL (~1.0 mmol/L) predicted the same diseases, with risk ratios above 2.3 for all outcomes and as high as 9.7 for DA when postpartum NEFA was the predictor.

At the herd level, the same Cornell group found that when more than 15% of sampled transition cows exceeded these thresholds, consequences were measurable: a 3.6% increase in DA and clinical ketosis incidence, a 1.2% decrease in pregnancy rate, and a 282 kg decrease in average 305‑day ME milk for herds above the prepartum NEFA alarm level.

This herd’s protocol: sample a small group of close‑up cows for NEFA about a week before calving and fresh cows for BHBA between 3 and 10 DIM. If too many cows cross the lines, change one upstream factor — BCS management, density, or dry‑cow environment — not just pour more propylene glycol. (For more on putting BHBA to work, see 46% Subclinical Ketosis in “Good” Herds — Are Your Transition Cows Any Different?)

Trade‑off: Added lab cost and a firm commitment — no collecting numbers unless you’re prepared to act on them.

Can 50 Calvings Tell You If Your Dry Cow Program Works?

This herd didn’t build a fancy spreadsheet. They grabbed a notebook and looked at the last 50 calvings. For each cow, one question: did she need any significant intervention in the first 21 days in milk?

The first tally was uncomfortable. Too many names on the list.

After they committed to treating the dry period as metabolic prep — tightening BCS in mid‑lactation, dropping density in close‑up, installing real short‑day lighting, and acting on NEFA/BHBA data — that same notebook started looking different. Fewer fresh cows on the “needed help” list, week after week.

Your 30‑day action: Pull the last 50 calvings. Count how many of those cows had any significant intervention in the first 21 DIM — ketosis, DA, retained placenta, metritis, or milk fever needing more than one treatment. Write that number down. Then ask yourself: if that number dropped by even a quarter, what would you notice first — less time in the sick pen, a calmer fresh group, or a cleaner repro chart?

Milk Price ($/cwt)% Cows Affected (transition)Lbs Lost/Affected CowCows Affected (400-herd)Annual Revenue Lost
$18.0020%548 lbs80 cows$7,891
$20.0020%548 lbs80 cows$8,768
$22.0020%548 lbs80 cows$9,645
$18.0030%548 lbs120 cows$11,837
$20.0030%548 lbs120 cows$13,152
$22.0030%548 lbs120 cows$14,467

What This Means for Your Operation

  • Are your cows actually hitting dry‑off at 3.0–3.25 BCS, or are you hoping to crash‑diet them in the last 21 days? If you’re routinely drying off 3.75 cows and then blaming “transition disorders,” the problem started months before calving.
  • Do you know how crowded your close‑up pen really gets at peak calving weeks? Count headlocks and cows. Don’t guess from the yard gate. Oetzel’s Wisconsin data showed first‑lactation animals lost 548 lb of milk over 85 DIM just from being overstocked pre‑fresh — no ration change required to create that loss. Cook et al.’s 2024 data from two UK herds confirmed prepartum stocking density increased disease odds across 2,780 cows.
  • When was the last time you walked your dry barn after dark? If you can read a newspaper by the lights left on, you don’t have a short‑day photoperiod.
  • If you pulled NEFA and BHBA on a small group next month and didn’t like the numbers, what’s the first upstream change you’d be willing to make? If the only answer is “treat more cows,” you’re not really using those tests.
  • Who owns transition results on your farm — not just the ration, or the shots, or the repro chart, but the whole package? The Kerwin et al. Cornell study across 72 northeastern U.S. farms found that nutrition strategy alone didn’t predict milk yield. It’s everything around the ration that makes or breaks the outcome.

Key Takeaways

  • If your close‑up pen routinely runs over 85% stocking, expect to give away milk. Oetzel’s data and Cook’s 2024 work show that crowding alone can cost hundreds of pounds per cow in early lactation, even with a good ration.
  • If more than 15% of sampled cows beat NEFA or BHBA alarm thresholds, change management, not just treatments. Use those numbers as dials on density, BCS, and dry‑cow environment, not just as lab curiosities.
  • Suppose cows are drying off above 3.25 BCS, fix mid‑lactation, not the last 21 days. Crash‑dieting fat cows in the dry pen is trying to undo months of overfeeding while their biology is already ramping up for lactation.
  • If your dry barn never really goes dark, you’re leaving 3–4 kg/day of milk on the table. A true short‑day photoperiod is one of the few management levers with a controlled 3.6 kg/day advantage behind it.

The Bottom Line

Walk your dry pens this week. Not the fresh pen. The dry pen. That’s where your next month of fresh‑cow outcomes is being written right now.

Complete references and supporting documentation are available upon request by contacting the editorial team at editor@thebullvine.com.

Learn More

The Sunday Read Dairy Professionals Don’t Skip.

Every week, thousands of producers, breeders, and industry insiders open Bullvine Weekly for genetics insights, market shifts, and profit strategies they won’t find anywhere else. One email. Five minutes. Smarter decisions all week.
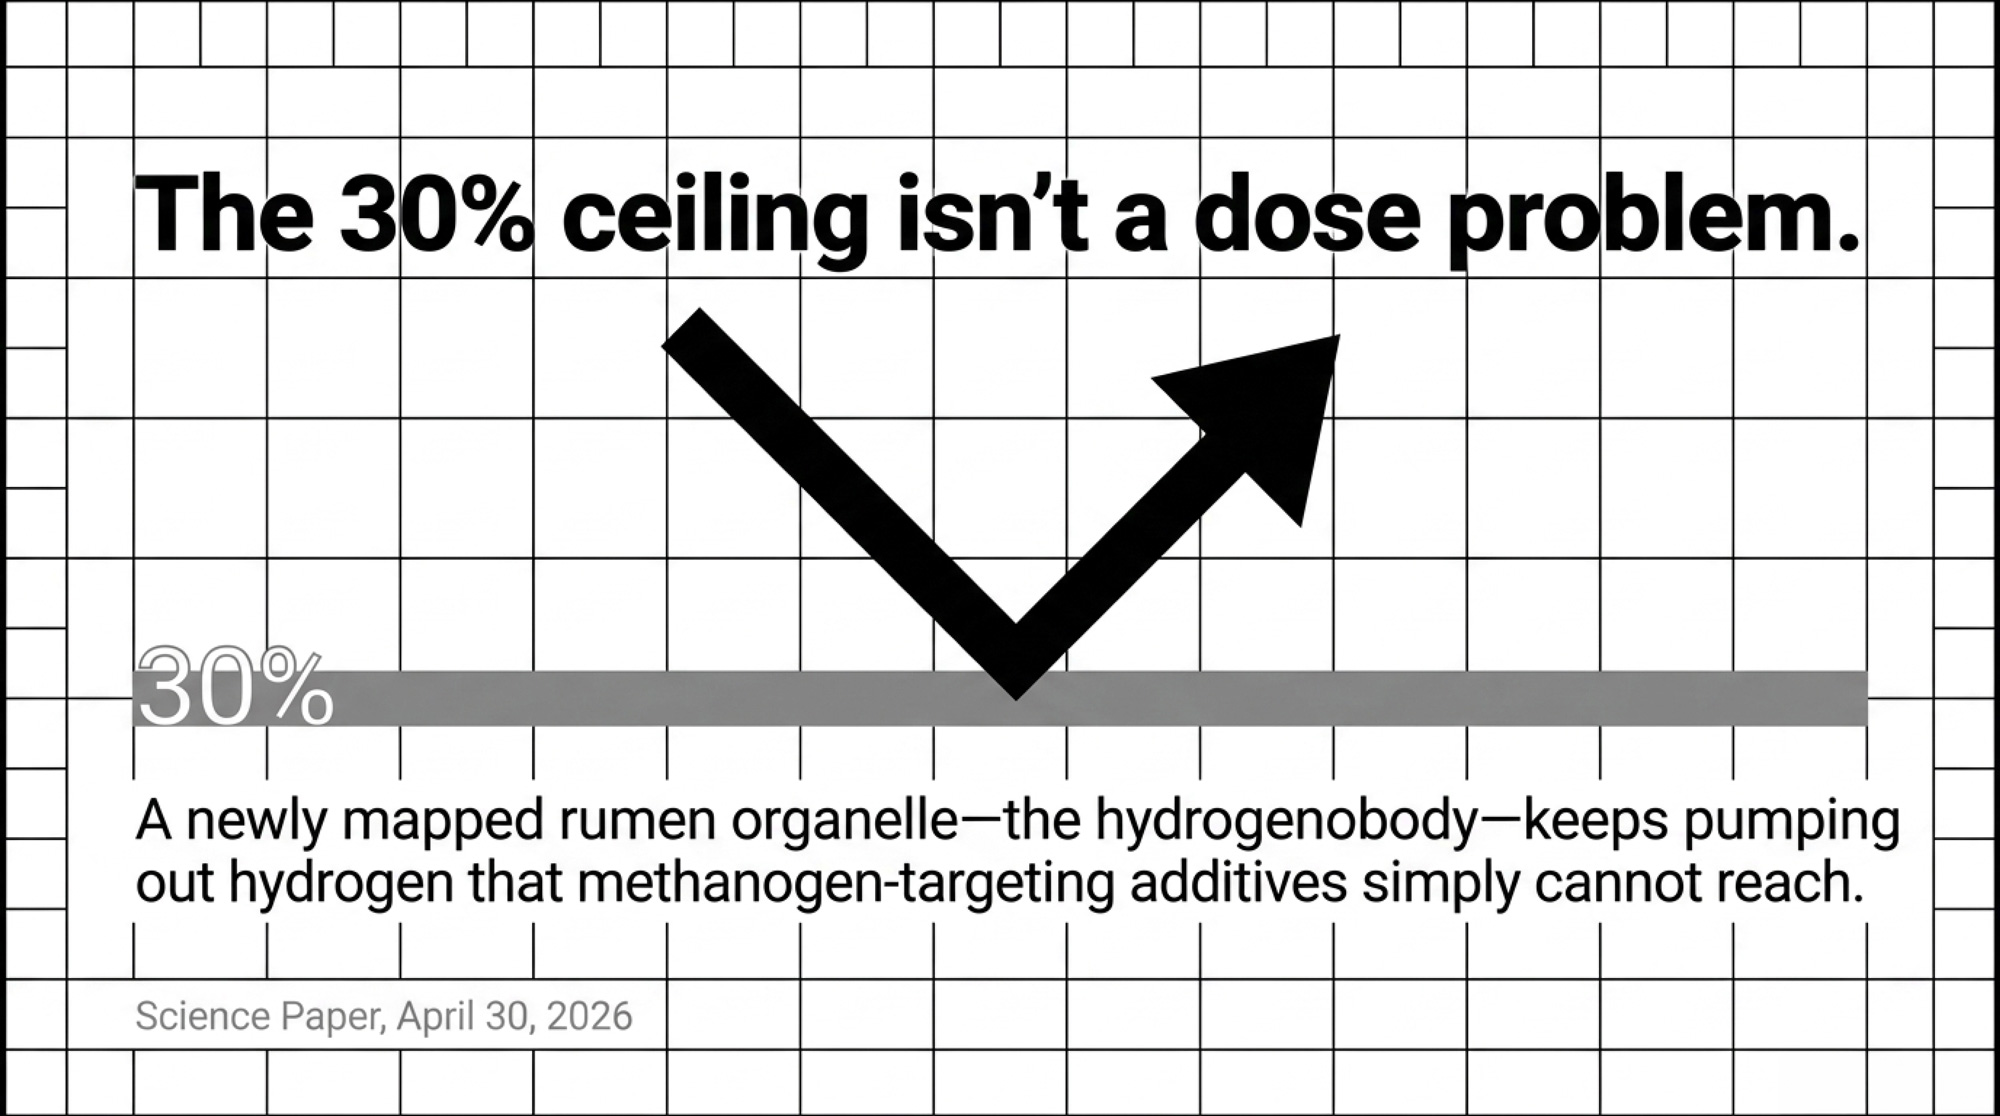
NewsSubscribe
First
Last
Consent

40 Years of Breeding. One Müller Letter. Six Figures Gone.

Neil Taylor’s Puddle Hill herd went through the ring after 12 months’ notice. Now up to 100 more UK farms just got the same letter — and your milk contract’s fine print decides whether you lose $260,000 or $78,000.

Executive Summary: On a 200-cow herd, the difference between a 12-month and a 90-day termination notice is roughly $260,000 in equity — about 2–3 years of profit gone on timing alone. Müller just proved it again: on March 30, 2026, the processor issued 12-month notices to an estimated 50–100 UK farms in North Wales and Scotland, two years after Neil Taylor’s four-generation Derbyshire herd went through the ring as commercial dispersal cattle under the same kind of letter. This isn’t only a UK pattern — Horizon Organic and Maple Hill dropped 135 Northeast organic farms in 2021–22, and most had even less warning than Taylor got. The expansion trap is equally ugly: at Müller’s current 34.5ppl, adding volume to hit a processor’s target means losing 4.5–7.5ppl on every extra liter before you touch a loan payment. And real auction data shows the gap between a forced dispersal and a well-timed pedigree sale runs £800–£1,300 a head — so how you exit matters almost as much as whether you have to. Pull your contract, run your herd-equity gap against a year of net income, and talk to your lender this month — that checklist applies whether you’re shipping to Müller, a US co-op, or anyone in between.

Neil Taylor is the fourth generation to milk cows at Puddle Hill Farm near Matlock in Derbyshire. He told BBC Farming Today: “I’ve bought them, reared them, I can remember their mums, their grandmas.” Then Müller sent a letter: hit a new production target by the following year, or the contract ends in 12 months. (BBC, July 2024Farmers Guide, July 2024)

“When I asked how far I’d got to get, they said probably double to what you’re sending now next year,” Taylor told BBC Farming Today. “I couldn’t do it.” Müller has not publicly disclosed the specific volume targets it set for individual farms.

Taylor saw the gap between what Müller was paying and what expansion would actually cost. He sent his cows to market. He and his wife, Bev, have since bought six dairy cows back and plan to raise them for beef. But the dairy herd — the cow families, the genetic equity, four generations of selection — went through the ring as commercial dispersal cattle.

“It’s absolutely devastating,” Taylor told the BBC. “I’ve had 40 years of breeding cows and just to have it taken away from you, it’s a bitter pill to swallow.”

Not Just One Farm: Müller’s Letters Keep Landing

Taylor’s story hit the news in July 2024, but he was just the first to speak up. He told BBC Farming Today he was one of “over a dozen” smaller family farms facing termination. Müller described those affected as “a very small number” of suppliers not meeting its sustainability, welfare, or volume standards, and said all received a full 12-month notice period.

Then on 30 March 2026, a bigger wave landed. Farmers Weekly reported that Müller issued 12-month termination notices to producers in North Wales and Scotland, with the last milk collections set for 31 March 2027. Industry sources told Farmers Weekly the number is likely between 50 and 100 producers, with more than half offered the option to move to a lower-value ingredients-only contract instead. Grant Hartman, chairman of dairy producer organization MMG Dairy Farmers, confirmed the scope: “There are a number of our members who have unfortunately been served the full 12 months’ notice.” (Farmers Weekly, March 31, 2026)

The NFU confirmed Müller’s cuts affect roughly 1% of its current milk volumes — a small share of the supply base, but a very large share of the affected farms’ futures. (NFU, March 31, 2026)

Müller’s agricultural director, Richard Collins, wrote to affected producers: “To ensure we manage our supply of raw milk responsibly and maintain a sustainable balance between milk intake and processing demand, we have no choice but to make adjustments to our supply base.” At the same time, Müller’s Advantage price for March 2026 sits at 34.5ppl— a 1ppl cut from February. For smaller herds already operating on thin margins, those two envelopes arrived in the same period. (IPMS/FarmingUK, January 2026)

When 135 Northeast Dairy Farms Got the Same Kind of Letter

FactorMüller (UK, 2024–2026)Horizon/Maple Hill (US Northeast, 2021–22)
Farms affectedEst. 50–100 (2026 wave) + prior cases135 farms (89 Horizon + 46 Maple Hill)
Notice given12 months (full legal minimum)Horizon: ~12 months; Maple Hill: shorter
Regulatory backstopUK Fair Dealing Regs 2024 (new)None — private contract terms only
Processor rationale“Balance intake and processing demand”Organic market oversupply
Price at termination34.5ppl (Müller Advantage, Mar 2026)Organic premium shrinking vs. conventional
Alternative found?Some offered ingredients-only contractOrganic Valley absorbed ~90 of 135 farms
Farms that exited anywayNeil Taylor + unknown numberSome sold herds, left organic, or quit entirely
Farmer quote“40 years of breeding…a bitter pill” — Taylor“I could see this coming…not this quick” — Conant
Key lessonNotice ≠ rescue. Time helps, not guarantees.Alternative buyer ≠ guaranteed. Speed kills equity.

If you’re reading this from North America and thinking, “That’s a UK problem,” it isn’t.

In August 2021, Danone’s Horizon Organic sent termination letters to 89 organic dairy farms across the Northeast — including 28 in Vermont14 in Maine17 in Washington County, New York, and the balance in New Hampshire and other New York counties — with contracts ending August 31, 2022. Vermont Agriculture Secretary Anson Tebbetts told VTDigger the terminations were “a significant problem because these farmers have few choices on where to sell their milk.” Dean Conant, who’d been selling milk to Horizon for 14 years from his farm in Randolph, Vermont, began reaching out to other buyers when he received the letter. Nobody had room. (VTDigger, August 2021)

“I could see this coming,” Conant told VTDigger. “I didn’t think it was gonna be this quick.”

Then Maple Hill terminated contracts with an additional 46 organic farmers in eastern New York. That’s 135 farm families in one region, inside of a year, told their buyer was done with them. Organic Valley eventually offered to pick up as many as 90 of those farms — but by the time the offer came, some had already sold herds, exited organic, or quit entirely. (VTDigger, March 2022)

Abbie Corse, an organic dairy farmer on the board of the Northeast Organic Farming Association of Vermont, put it plainly: “These aren’t just jobs. These aren’t just pieces of the economy. These are entire lives that are tied up in a farm.” If you want a closer look at what happens when the truck stops showing up with zero warning, AMPI’s Paynesville plant shutdown is a case study in how fast stranded milk turns into stranded equity.

The Rulebook Helped on Paper — Not in the Parlor

Part of the backdrop here is the UK’s new Fair Dealing Obligations (Milk) Regulations 2024. Those rules require processors to give at least 12 months’ notice to terminate a milk-supply contract, offer farmers at least 21 days to consider new contracts, and spell out transparent pricing mechanisms instead of one-sided “take it or leave it” terms.

On those measures, Müller complied. Taylor and the 2026 wave of affected farms all received the full year’s notice. The NFU confirmed this: “Where producers receive no less than 12 months’ notice of any no-fault termination, milk buyers are likely to be complying with that aspect of the regulations.” But the NFU also urged affected producers to seek independent legal advice and contact the Supply Chain Adjudicator if anything seemed off.

Notice PeriodJurisdiction ExampleHerd Recovery RateEquity Lost (200-cow/$780k)Risk Level
30 daysUS — some private contracts~60–65%$273,000–$312,000🔴 CRITICAL
60 daysUS — some state minimums~65–68%$250,000–$273,000🔴 HIGH
90 daysPennsylvania (state rule)~68–72%$218,000–$250,000🔴 HIGH
6 monthsSome UK pre-2024 contracts~75–80%$156,000–$195,000🟡 ELEVATED
12 monthsUK Fair Dealing Regs 2024~82–88%$94,000–$140,000🟡 MANAGEABLE
18+ monthsBest-practice co-op bylaws~90–95%$39,000–$78,000🟢 LOW

The trouble is, the regulations protect the process of being dropped more than the equity you’ve built. They can’t turn an uneconomic expansion into a good bet. And they don’t guarantee you’ll have the time or market conditions to sell decades of breeding as anything more than commercial dairy cows.

On this side of the Atlantic, even that level of protection often doesn’t exist. Federal Milk Marketing Orders deal with minimum price formulas, not private contract terms or notice periods. In Pennsylvania, the state Milk Marketing Board pushed a change from the old 28-day minimum to a 90-day notice for contracts covered by state rules, after some farmers received short-notice terminations and struggled to find new buyers. In many other regions, your “notice period” is whatever your co-op bylaws or individual milk contract says — and for some, that’s still 30 or 60 days, or nothing in writing at all.

How Does Expansion at 34.5ppl Actually Pencil?

Taylor’s supposed option was simple on paper: expand enough to meet Müller’s volume expectations, and the truck keeps coming. But the economics behind that “option” aren’t theoretical.

Cost-of-production estimates vary widely by farm, region, and method. Albert Goodman’s 2025 farming profitability review noted that the AHDB average farmgate price topped 46.56ppl in October 2025 and that “many dairy farms making healthy profits well over £1,000 per cow” — but also warned that with global oversupply pushing prices down, “there is already talk of it going below 30 pence per litre, which is below current breakeven price for many dairy farmers.” Kite Consulting’s climate-resilience work, based on data from over 850 UK dairies, adds another 2.4ppl over ten years for the average farm to cover slurry storage, silage capacity, and land improvements — roughly £472,539 per farm over that period, based on an average herd of 236 cows. (Albert Goodman, February 2026)

Run a quick barn-math check on the kind of expansion someone in Taylor’s position would face. Say you add 250,000–350,000 liters a year to hit a new target. At 34.5ppl, that extra milk brings in about £86,250–£120,750. If your true cost of production — even at the lower end of current estimates, say around 39–42ppl once you include resilience investments — those same liters cost somewhere in the range of £97,500–£147,000 to produce. You’re losing roughly 4.5–7.5ppl on every extra liter. That’s somewhere between £11,250 and £26,250 a year in the red — before you make a single loan payment on the new capacity.

Now layer on the capital. For a smaller operation looking at a more modest step — buying 30–50 cows at £1,800–£2,500 a head plus the housing, slurry, and parlor upgrades those extra cows need — you’re easily into a £150,000–£250,000 capital project. Farm borrowing costs have risen significantly from the ultra-low levels of recent years, and HCR Law noted in February 2026 that “the longer-term ‘floor’ for rates appears higher than before.” At current farm lending rates, that kind of project adds roughly £13,000–£22,000 a year in repayments. (HCR Law, February 2026)

Taylor told the BBC he “couldn’t do it.” Under those prices and costs, doubling output doesn’t save the farm. It deepens the hole. Grant Hartman’s advice to the 2026 cohort echoes that: don’t make “knee-jerk reactions,” but “take stock, assess the position.”

How Much Does Losing 60 Days of Notice Actually Cost Per Cow?

Notice periods look like lawyer talk until you hang them on a real herd. Take a 200-cow US dairy with about 80 replacements and peg the going-concern value off USDA-tracked replacement prices. Those have climbed steeply — from about $2,140 per head in April 2024 to $2,660 in January 2025 and a record $3,110 in October 2025, according to USDA NASS quarterly estimates. By January 2026, the average eased back to $2,860 per head. For a deeper look at what those per-head numbers mean for your culling and replacement decisions, the $3,110 heifer trap is worth your time.

Using recent prices, a reasonable working herd value for 200 cows plus 80 replacements sits in the neighborhood of $700,000–$870,000.

With a genuine 12-month notice period and a plan, you can often recover something like 80–90% of going-concern value. That means time to market cows privately, structure a going-concern sale, and time to cull and heifer sales into stronger points in the price cycle.

On a 90-day clock, it changes fast. You’re trying to do in one quarter what usually takes a year or more. In many dispersal situations, recovery drops toward two-thirds of the going-concern value. On a herd valued at roughly $780,000 (midpoint of our range), that gap works out to around $260,000 in equity wiped out — compared to maybe $78,000–$156,000 left on the table with a full year’s notice. Tighten that to 30 days, the kind of window some producers saw in past contract terminations, and you may only see 60–65% of going-concern value.

Here’s the barn math in plain language. If that 200-cow herd generates somewhere in the range of $80,000–$120,000 a year in net income — a figure that swings enormously by region, debt load, and management — a $260,000 equity hit from a 90-day forced dispersal represents roughly 2–3 years of profit gone because of how much time your notice clause gave you. The UK’s 12-month rule didn’t save Taylor’s herd. But it gave him time to organize the dispersal and protect more value than many North American producers could on 60 or 90 days’ notice.

Options and Trade-Offs for Farmers

Stack those numbers up — Taylor’s four-generation herd, 50–100 more UK farms on the clock, 135 Northeast organics dropped in a single year — and the pattern is obvious. Processors will continue reshaping their supply bases. You can’t control that. You can control how exposed your equity is when they do.

Path 1: Harden to stay with your current buyer

When it makes sense: You’ve got a successor, a clear 10- to 15-year plan, and enough appetite to reinvest if the margin is there. You want to be one of the suppliers they fight to keep.

What it requires:

  • Knowing your true cost of production — and using tools like Dairy Margin Coverage or DRP only when they actually protect margin at your volumes, not because they sound smart. If you’ve never looked at who really controls the cheque in consolidated markets, that context matters here.
  • Breeding so little of your future lives only in the bulk tank: more sexed dairy on the top 30–40% of the herd, more beef-on-dairy in the bottom end, and at least a pocket of genetics that holds value outside your processor’s cheque.
  • Being ruthless on capex that only makes sense if this exact relationship stays perfect — those extra stalls, parlor extensions, or robots that don’t improve your flexibility or exit options.
  • Quietly building secondary outlets. A standing conversation with another plant in your hauling radius. A limited on-farm product line. Even just being a known quantity to another co-op, so you’re not a total stranger if you ever need to call.

Risks and limits: You may give up expansion speed. You might watch a neighbor add 150 cows while you spend money on slurry storage and debt structure. But if the truck stops coming, you’re the one with a safer notice clause, a clear equity number, and a lender who already knows you’ve thought about this.

Path 2: Stage an exit on your terms, not in 90 days

When it makes sense: You don’t see a clear successor. You’re not keen to start another long debt cycle in your 50s or 60s. When you look at the barn math on a forced sale, the equity you stand to lose is more than a year or two of net profit.

What it requires:

  • Using today’s strong cull and beef markets to reduce numbers at your speed, not under a deadline. The USDA reported 2024 annual average cull cow prices at $127/cwt — the highest on record —, and while December 2024 eased to $121/cwt, the market remains historically strong. Albert Goodman’s UK review noted beef prices “continued to increase” with liveweight cattle around £4/kg and supply down 1% year-over-year. Conditions like these won’t last forever.
  • Identifying your top 10–20 cow families and selling them differently — private treaty or consignment sales with time to promote, rather than letting them blend into a commercial ring. Taylor’s herd went through dispersal as commercial cattle. To see what that gap looks like in practice: at the July 2025 WB Winder & Co dispersal at Crooklands (J36), Holstein Friesians topped at £2,350 for a second-calver, with most of the herd selling £1,800–£2,200. Compare that to pedigree dairy cattle at York Auction Centre the same period clearing 3,000gns (roughly £3,150) for a fresh-calved cow. The gap between a dispersal and a well-marketed pedigree sale can run £800–£1,300 a head — and it multiplies across an entire herd. (North West Auctions, July 2025York Auction Centre, October 2025)
  • Sitting down with your lender to map a “glide path” where debt comes down as cows leave, so one bad letter doesn’t trip loan covenants or force a land sale.

Risks and limits: Emotionally, this is the hardest path. Shrinking or planning to wind down can feel like failure. The reality is the opposite: it’s protecting what decades of work have built, rather than gambling it on someone else’s procurement strategy.

Forward-looking signal for both paths: If you see your buyer trimming price while issuing termination notices to “non-aligned” suppliers — as Müller has done in both 2024 and 2026 — move this from “someday” to “now.” If organic plants or speciality processors in your region are consolidating, as Horizon and Maple Hill did across the Northeast, don’t assume your contract is immune. Those are your early-warning lights.

Path 3 (30-Day Action): Know your clause and your gap

Even if you’re not sure which camp you’re in, there’s one path that fits almost every operation — and you can do it within the next 30 days.

  • Pull your processor or co-op contract — or call and get a copy — and mark the termination and notice sections. If you’ve never actually read the termination clause in your milk contract, this is the week to find it. The NFU’s advice to UK farmers applies everywhere: seek independent legal advice if anything about the notice terms is unclear.
  • Run a simple herd-equity gap: use a realistic replacement value per head in your region (USDA’s latest quarterly estimates have ranged from $2,860–$3,110 over the past two quarters), subtract a realistic cull value ($121/cwt was the US average in December 2024 per USDA), multiply by your total cows and heifers, and compare that number to your average annual net profit. If the gap is bigger than a year of profit, you’re carrying serious processor risk. For a deeper look at how that replacement-vs-cull math works at the cow level, the $3,000 Heifer Hangover breaks it down.
  • Book a short meeting with your lender and lead with, “We’re not in trouble, but we want to understand how exposed our herd equity is if our buyer changes terms or drops us.” That one conversation often decides whether you have options if something shifts — or whether you feel boxed in.

Key Takeaways

  • If the herd equity you’d lose in a forced exit is bigger than a year of net profit, you’re not fine — you’re exposed. That’s your threshold to either harden your position or start staging an exit instead of hoping your contract always renews.
  • If your contract gives you less than 90 days’ notice, time is your most valuable asset. You might not fix the clause tomorrow, but you can make sure you have a cull plan, a lender plan, and at least one potential alternative outlet lined up before you ever need them.
  • If most of your future is priced as anonymous bulk milk, shift some of it into value that survives a processor change. Beef-on-dairy calves, a pocket of genetics that sell on their own merit, a modest direct-sale channel — none of these replace the milk cheque, but they give you more landing spots when buyers move.
  • If your next big capex project only pencils with this buyer and this route, hit pause and rerun the numbers with your equity gap on the table. Grant Hartman’s advice to the latest wave of Müller farmers — don’t make “knee-jerk reactions,” but “take stock” — applies to expansion decisions too.

The Bottom Line

Asked whether he’ll ever retire, Taylor told BBC Farming Today he hopes to be fit enough to keep farming for “another 20 odd years.” He isn’t leaving farming. He’s leaving a contract that didn’t pencil — and starting over with six cows and a beef plan.

The question for you isn’t whether Müller treated him fairly under the law. It’s whether you’re running your numbers as if your processor could give you 90 days — or as if they’ll always need your milk the way they do today. If you want the deeper math on how to calculate your own processor-dependency ratio and which contract clauses move the needle most, keep an eye on the Bullvine newsletter and the upcoming playbook on processor risk. And if you want a gut-check on how fast milk can become unmarketable when trucks or buyers disappear, the Henschels’ story is the case study you don’t forget.

Complete references and supporting documentation are available upon request by contacting the editorial team at editor@thebullvine.com.

Learn More

The Sunday Read Dairy Professionals Don’t Skip.

Every week, thousands of producers, breeders, and industry insiders open Bullvine Weekly for genetics insights, market shifts, and profit strategies they won’t find anywhere else. One email. Five minutes. Smarter decisions all week.
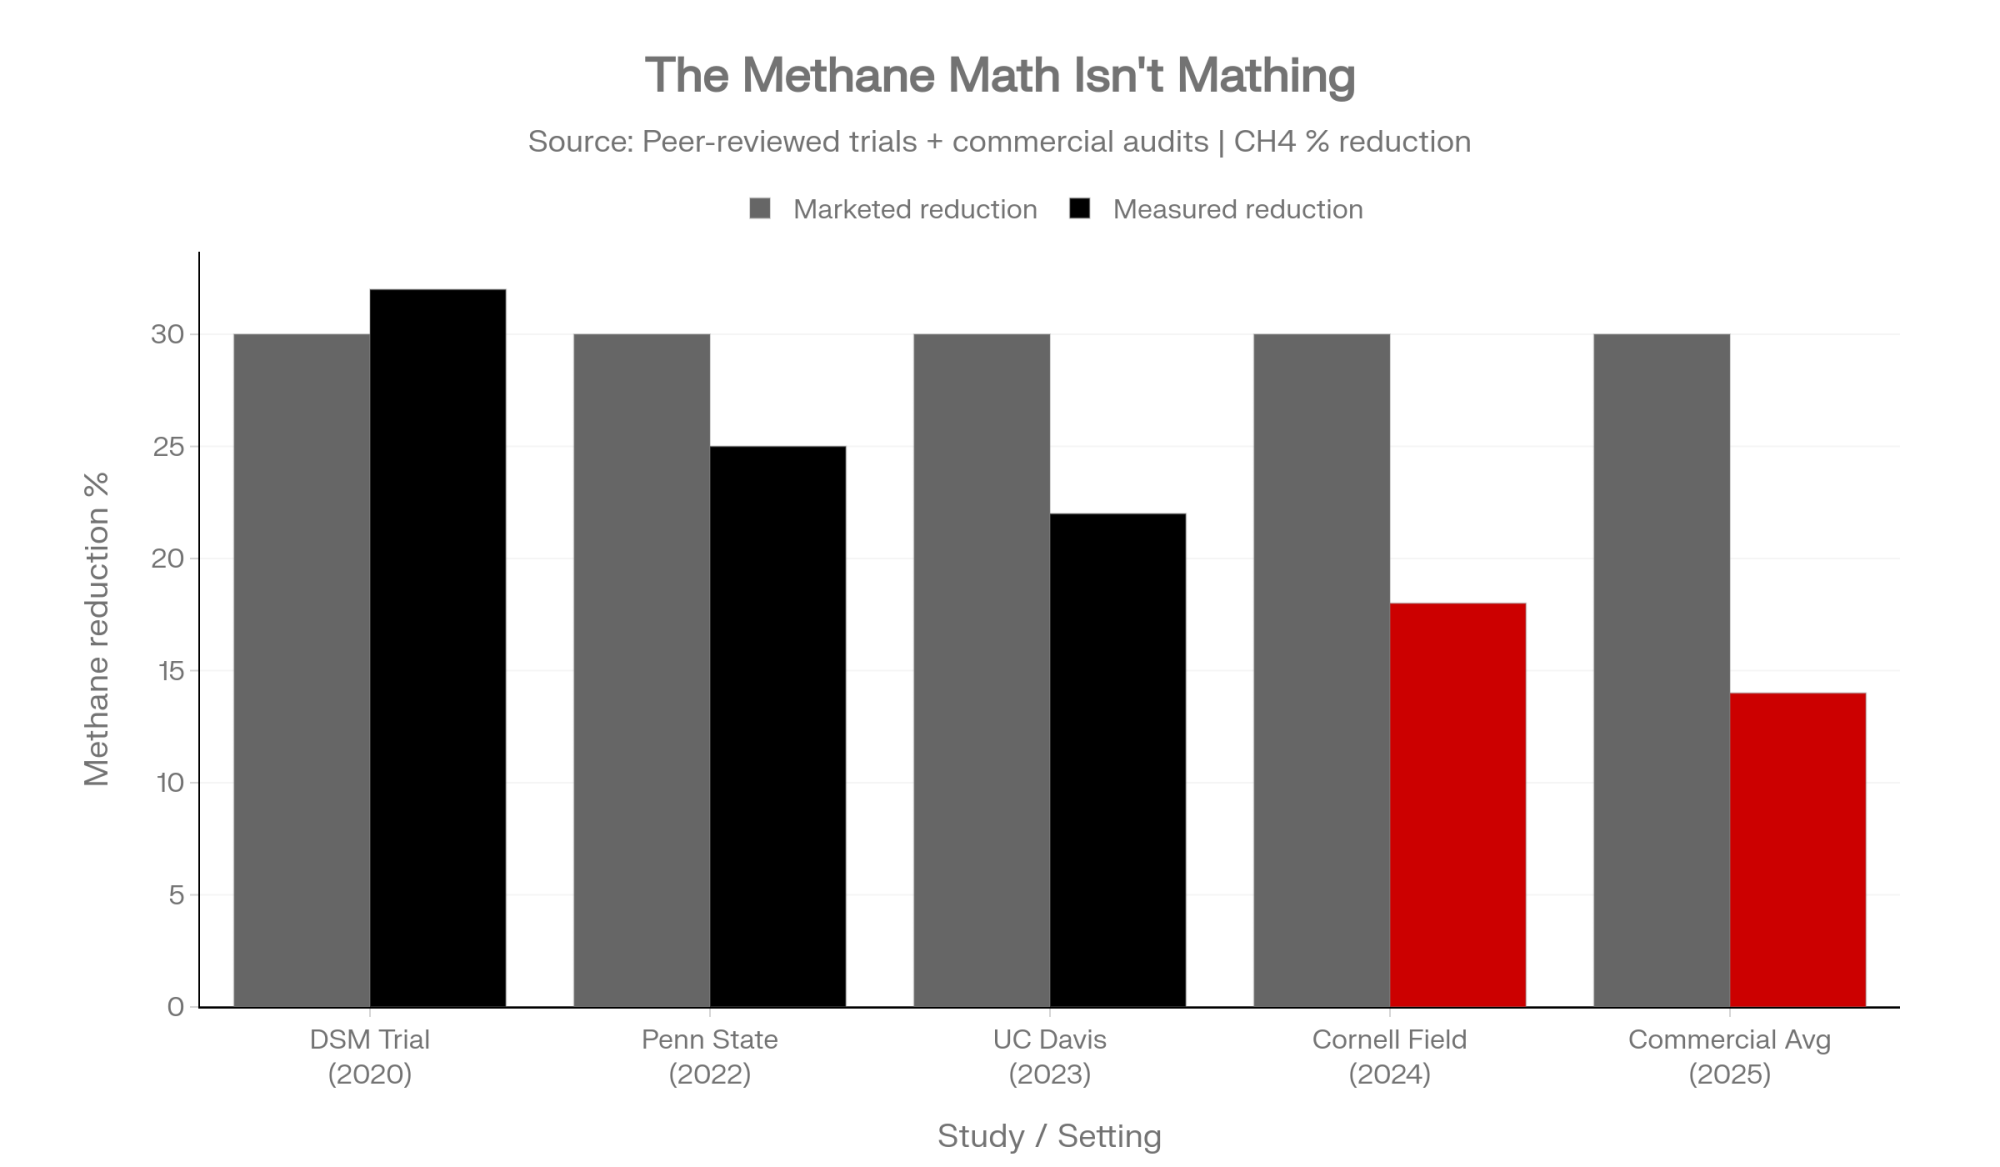
NewsSubscribe
First
Last
Consent

Triângulo Mineiro Dairy’s Sorghum Silage Trap: The 360‑Liter‑a‑Day Reality Check

A 200-cow dairy outside Uberlândia ran the numbers on swapping corn silage for sorghum. The gap: 360 liters a day — and that was before they opened the bunker.

Executive Summary: A 200‑cow dairy in Brazil’s Triângulo Mineiro nearly gave up 360 liters of milk per day by treating “cheap” sorghum silage as a 1:1 swap for corn. The article walks through current Brazilian and international research showing conventional forage sorghum typically runs at roughly 80–85% of corn silage’s energy and can drop milk by about 1.6–1.8 kg/cow/day if you don’t rebuild the ration. It breaks sorghum into grain, forage, sweet, biomass, and BMR types and shows where each actually fits — including why biomass sorghum’s high lignin makes it a tonnage tool, not feed for 40-liter cows. BMR sorghum can hang with corn on milk in well‑managed diets, but brings a 12–15% yield penalty and a higher seed bill, so it only pencils out as a premium forage, not “cheap corn.” The piece also lays out harvest and fermentation rules specific to sorghum — soft dough at ~28–30% DM, serious processing, and roughly 56 days in the bunker — so you’re not throwing starch out the back end. Finally, it offers four “sorghum lanes” (split‑group, BMR partial replacement, one‑TMR moderate inclusion, or walk‑away) and a 30‑day assignment: pull 12 months of records, calculate feed cost per liter, and see which lane your herd can actually manage on paper.

Sorghum vs corn silage

When a small dairy outside Uberlândia decided to lean harder on sorghum silage a couple of seasons ago, the move felt pretty logical. Sorghum would fill the bunkers when second‑crop corn missed rain, cut the seed bill, and keep corn reserved for the high group.

Then the family sat down with their nutritionist and ran the barn math. Swapping conventional forage sorghum straight in for corn, 1:1 in the main lactating ration, would cost them roughly 360 liters of milk every day on a 200‑cow herd — about 1.8 kg less milk per cow per day than a comparable corn‑silage diet. That 1.8‑kg gap lines up with a 2019 Journal of Dairy Science meta‑analysis that compared conventional sorghum, brown‑midrib (BMR) sorghum, and corn silages at the same dry matter intake.

They never made that full swap. But that number stuck. And it’s exactly why “cheap” sorghum silage is suddenly a hot, uncomfortable topic in a lot of Brazilian‑style climates.

What’s Really at Stake with Sorghum Silage in Brazil?

Brazil isn’t dabbling in sorghum anymore. According to recent CONAB‑aligned and USDA/FAS analyses, sorghum planted area climbed to around 1.5 million hectares in 2024/25, up about 6.5% from the previous season, with production projected near 5 million tons, roughly 12% more than 2023/24. Growth has been driven hard by the Cerrado and other water‑stressed regions where double‑crop corn is increasingly a weather gamble instead of a sure bet.

From the agronomy side, Embrapa’s national sorghum program and Brazilian economic studies all circle the same points. Sorghum:

  • Handles heat and drought better than corn.
  • Tolerates lower fertility and marginal soils.
  • Often needs less fertilizer and crop protection to stay viable.

Work under restricted irrigation shows sorghum maintaining biomass production where corn yields drop sharply, with some trials reporting sorghum sustaining comparable biomass while using considerably less water, depending on hybrid and soil.

But your bank doesn’t cash tonnes. It cashes liters.

Feeding trials and meta‑analyses give a consistent story when both crops are harvested and ensiled properly:

  • Whole‑plant forage sorghum silage usually sits at about 80–85% of corn silage’s energy density on a dry matter basis.
  • Across multiple experiments, cows on conventional sorghum silage diets produced roughly 1.6–1.8 kg less milk per day than cows on corn‑silage diets at similar dry matter intake.

Do that math on a 200‑cow herd, and you’re staring at something very close to 360 liters of milk per day if you treat conventional forage sorghum like a one‑for‑one corn replacement and don’t rebuild the ration.

The Triângulo family didn’t fully go there. They kept corn silage anchored in the high‑group ration and parked sorghum with low cows and heifers. That’s the only reason the 360-liter number stayed on paper and not in their milk sheets.

That’s the heart of the sorghum silage story right now. It’s not “good vs bad.” It’s whether you’re measuring it in tonnes per hectare or feed cost per liter of milk.

Are You Growing the Right Sorghum for the Right Cows?

One of the quickest ways to get burned is talking about “sorghum” like it’s one crop. Embrapa doesn’t even do that. Their breeding work splits sorghum into at least five main types:

  • Grain sorghum — shorter plants, high grain proportion, lower whole‑plant yield, high energy density.
  • Forage sorghum — taller plants, strong fresh‑matter yields, more fiber, less starch than grain sorghum or corn.
  • Sweet sorghum — juicy, high‑sugar stems often used for juice or biofuels.
  • Biomass sorghum — very tall bioenergy types bred for fiber and tonnage.
  • Broom sorghum — niche type for panicles.

On Brazilian dairy farms, the ones that really show up in bunkers are forage sorghum and some dual‑purpose grain sorghum. Grain sorghum silage gives up tonnage but packs more energy per kilogram of dry matter thanks to the head. Forage sorghum is the workhorse compromise: big tonnes, middling energy, flexible enough for low cows, heifers, and beef.

Biomass sorghum is a different animal. Embrapa and recent genotype work under tropical conditions show that, compared with forage sorghum, biomass types tend to bring:

  • Very high fresh‑matter yields from very tall plants.
  • Very high NDFlow crude protein, and higher lignin.

That lignified fiber doesn’t just look impressive across the field. It sits in the rumen, slows passage, and caps how much energy a 40-liter cow can eat. High lignin drags down fiber digestibility; more of that massive biomass passes through the cow without doing much work.

From the road, biomass sorghum looks brilliant — towering stands, heavy wagons, deep bunkers. At the bunk, it can feel more like a trap when intakes slide, and you see stem fiber coming out the back end.

Brazilian researchers are straightforward about this. Right now, biomass sorghum is best treated as:

  • tonnage tool for low‑demand cattle or bioenergy, or
  • secondary forage that you use carefully in dairy rations when you’re ready to pay for extra grain.

The dairies that are genuinely happy with sorghum tend to do one simple thing: match the sorghum type to the job.

Can BMR Sorghum Really Get Close to Corn Silage?

The brown‑midrib (BMR) trait is where sorghum stops being just “cheap tonnage” and starts looking like a serious dairy forage.

BMR sorghum has a mutation that reduces lignin in the plant. Less lignin usually means more digestible fiber, which can support higher intakes and more milk. In 2019, Sanchez‑Duarte and colleagues published a meta‑analysis of nine experiments looking at cows fed:

  • Conventional sorghum silage (CSS)
  • Conventional corn silage (CCS)
  • BMR sorghum silage (BMRSS)

They found:

  • Cows on BMR sorghum silage produced similar milk yield to cows on corn silage when diets were properly balanced for energy and nutrients.
  • Compared with BMR diets, cows on conventional sorghum silage produced about 1.64 kg/day less milk and had 0.09 percentage points lower milk‑fat concentration, with lower fat yield.
  • BMR sorghum diets tended to lift milk fat percentage slightly and drop protein percentage slightly compared with corn silage diets, but total milk and component yields were in the same neighborhood.

U.S. university work says roughly the same thing. Trials from the Upper Midwest and the South report that diets based on BMR forage sorghum silage can deliver similar DMI and milk yield to corn‑silage diets when maturity, kernel processing, and ration starch are managed well.

So yes, under the right management, BMR forage sorghum can get very close to corn silage on milk — and in plenty of trials, essentially match it. But there’s fine print that matters in Brazilian‑type systems:

  • A 2025 meta‑analysis on BMR sorghum reports about a 12–15% reduction in dry matter yield for BMR lines compared with non‑BMR sorghums across trials.
  • BMR seed usually carries a premium price over conventional forage sorghum.
  • Embrapa emphasizes that BMR breeding is active, but commercial hybrid availability and adaptation still vary by region and seed supplier.

Put that together, and your cost per tonne of BMR sorghum silage can land similar to or higher than corn silage, depending on yield and seed deals. For a high‑output herd dealing with drought or input costs, that can still be a smart trade if BMR sorghum helps protect liters when corn fails. But it only makes sense if you treat BMR as a premium forage tool, not a shortcut to “cheap corn.”

Are You Letting Corn Protocols Ruin Your Sorghum Silage?

The next failure point isn’t genetics. It’s harvest and fermentation.

With corn, pushing toward ⅔–¾ milkline usually buys more starch, and a decent kernel processor will bust open even hard kernels. Harvesting around 32–35% dry matter fits the crop and the bunker.

Sorghum doesn’t behave the same. If you chase more starch past soft dough into hard dough without serious processing horsepower, total starch might tick up on the lab sheet, but starch digestibility heads the wrong way. Sorghum berries are smaller and harder than corn kernels. If a processor doesn’t crack them, they come out the back end as expensive bird feed — exactly what a lot of people see in manure behind poorly harvested forage sorghum.

Brazilian and U.S. work on sorghum maturity and silage quality points to a different target.

  • A Brazilian study on sorghum BRS‑610 found that ensiling between the milky/dough and dough stages gave very good fermentation and nutritive value.
  • Forage sorghum trials in Texas and other hot regions show soft‑dough harvest balances yield with lower NDF and better energy.
  • That typically lines up with whole‑plant dry matter in the high‑20s to around 30%, rather than pushing to 35% and beyond.

On fermentation time, a 2022 study following sorghum stalk silage from Day 0 to Day 56 found that pH reached its lowest point by Day 7 and fermentation parameters stayed stable from about Day 28 through Day 56, with good preservation and low dry matter losses. A 2021 study on whole‑plant sorghum silage reported improved aerobic stability and heterofermentative co‑fermentation at 56 days when inoculated with Lactobacillus plantarum and L. buchneri. A 2018 trial with sorghum silages showed that adding L. buchneri reduced yeast populations and increased aerobic stability, confirming the role of heterofermentative inoculants.

Taken together, they all point to the same practical window: aim to harvest at soft dough around 28–30% DM, then give sorghum silage about two months in the silo before you really lean on it.

If you’re already committed to sorghum, the protocol that protects your investment looks like this:

  • Aim for soft dough at about 28–30% dry matter. Earlier and wetter than a lot of corn programs, but where berries are still crackable, and starch is usable.
  • Crank up processing and shorten chop length. Tighten roll gaps and chop finer so more berries are actually opened. If you don’t have a processor, chop shorter to improve exposure and packing.
  • Give it time in the bunker. Plan on at least 56 days of fermentation before heavy feed‑out; multiple studies around 56–60 days show stable sorghum silages with strong fermentation profiles and better aerobic stability when inoculated.
  • Use the right inoculant on sweet or high‑sugar types. Research on whole‑plant sorghum and sweet sorghum silages shows that heterofermentative lactic acid bacteria, especially strains containing L. buchneri, increase acetic acid, suppress yeasts, and extend aerobic stability.

No harvest protocol will turn conventional forage sorghum into BMR or corn. But a sloppy harvest can easily give away another chunk of value between the field and the face.

Where Sorghum Actually Fits: Triângulo, Mato Grosso, the South, and Cariri

The Triângulo family that did the 360-liter math isn’t the only one treating sorghum as “insurance.” A 2024 characterization of corn silage from dairy farms in the Triângulo Mineiro region found that many herds were already leaving performance on the table because of silage quality issues and recommended more targeted technical assistance and better forage management. In that context, using sorghum to guarantee bunker volume and control per‑hectare costs while keeping corn silage concentrated in high‑producing groups is a pattern that lines up with how nutritionists describe their strategies in similar Brazilian climates.

In Mato Grosso and other parts of the Cerrado, sorghum has a natural lane in integrated crop‑livestock systems and as a second‑crop option behind soybeans. A 2022 longitudinal study of Brazilian food production shows cropping systems in the Midwest shifting toward more resilient, lower‑input species as heat and water stress trends intensify. Climate‑impact modeling on corn/soy double‑cropping indicates that future drought scenarios hit second‑crop corn yields especially hard in these regions. When late corn hits flowering and grain fill under high temperatures and erratic rain, its yield potential drops off fast — while sorghum’s physiology gives it more room to cope.

In parts of southern Brazil, agronomists like Dr. Arthur Behling Neto have seen a different picture. He notes that in the south of Brazil, sorghum “does not work properly,” while it performs much better in drier eastern regions like north of Minas Gerais and south of Bahia, where rainfall is more limiting. The lesson isn’t “never plant sorghum in the south.” It’s “don’t assume a Cerrado or Cariri playbook will work the same way in a completely different climate without local data.”

In Cariri, Paraíba, sorghum isn’t a nice‑to‑have option; it’s the backbone. A 2014 survey of 100 dairy farms in Caturité and Boqueirão found 88% cultivated sorghum as silage forage for feeding dairy cows, making sorghum forage the most commonly used silage type there. Under that kind of rainfall pattern and soil, “just grow more corn” isn’t realistic. Those producers still have to respect sorghum’s fiber and energy limits like anyone else — they don’t have many second chances if they bet wrong.

Across those regions, the common thread is simple. Sorghum works when it reduces drought and input risk without wrecking your feed cost per liter of milk. It fails when you buy it in tonnes and feed it like corn.

Which Sorghum Lane Are You Actually In?

Listen to enough producers and nutritionists talk through their forage programs, and four clear “sorghum lanes” show up. It’s worth being honest with yourself about which one your farm actually lives in — not which one you recite when the seed rep pulls in.

Lane 1: Split‑Group — Sorghum for Lows, Corn for Highs

This is the lane many Triângulo‑type dairies aim for.

  • Corn silage stays anchored in the high‑group ration.
  • Conventional forage sorghum feeds low producers, late‑lactation cows, heifers, and dry cows.

It only really works if:

  • You truly feed two distinct TMRs every day.
  • Your pen layout actually keeps high and low cows separate.
  • Your nutritionist actively rebuilds both rations when silage inventories shift.

On an 80–120‑cow herd with two pens and disciplined feeding, that’s achievable. On a “one TMR and hope the lows eat less” operation, it’s fiction. If you can’t reliably run two rations, you’re not in this lane — even if your whiteboard says so.

Lane 2: BMR Sorghum as Partial Corn Replacement

Here, you’re using BMR forage sorghum to replace maybe 25–50% of corn silage in the high‑group ration.

The 2019 meta‑analysis and newer BMR work say this can hold milk production at corn‑silage levels when diets are handled properly. But BMR sorghum:

  • Brings roughly a 12–15% yield penalty in dry matter vs conventional sorghum lines across trials.
  • Costs more in seed.
  • Needs tight harvest timing and serious processing to cash in on its fiber digestibility.

This lane fits if you’re fighting drought and forage cost:

  • You can consistently source BMR hybrids adapted to your region.
  • You have processing capacity for small, hard berries.
  • You’re ready to manage cutting dates and fermentation like a hawk.

It’s a premium play. Treat it like one.

Lane 3: One TMR, Some Sorghum, No Drama

Plenty of mid‑size herds land here, whether they admit it or not.

They run one main lactating TMR and use sorghum as a minority forage, with corn or other high‑energy options still anchoring the ration. They cap sorghum inclusion rates and tweak concentrates as inventory changes.

This lane works if:

  • You’re honest that you’re a one‑TMR outfit because of labor or barn design.
  • You set a realistic max sorghum percentage in the lactating ration and stick to it.
  • You and your nutritionist actually adjust grain and other forages when sorghum replaces corn in the pile.

The main risk is “temporary” creep: sorghum quietly displaces more corn than planned “just for this month,” and the ration never gets rebuilt. Your bulk tank tells the story later.

Lane 4: Walk‑Away — Sorghum Stays Out of the High Group

The last lane is the walk‑away: sorghum doesn’t go near high‑cow diets.

That’s a perfectly valid decision when:

  • You’re in a region where corn silage consistently performs and drought risk is manageable.
  • Your current silage program already hits your feed cost per liter targets.
  • You’re not under pressure to plant sorghum just because it’s on the flyer.

Even in this lane, sorghum might still earn a spot with dry cows, heifers, or beef animals. But you’re clear that, in your climate and infrastructure, corn is the better dairy forage bet — and you’ll manage weather and cost risk with other tools.

In the next 30 days, the most useful move you can make is simple:

  • Pull the last 12 months of milk and feed records.
  • With your nutritionist or advisor, calculate feed cost per liter of milk for your current setup.
  • Then ask one direct question:

“If we brought sorghum into this system — in a lane that actually fits our pens and labor — what would feed cost per liter look like with the ration you’d really build?”

If nobody can answer that clearly on paper, you’re not ready to plant sorghum for your dairy cows yet.

LaneWho It Actually FitsCore Requirement⚠️ Red FlagFeed Cost/Litre Risk
Lane 1: Split-Group80–120-cow herds with 2 real pens and daily TMR disciplineTrue two-ration feeding every dayIf you run “one TMR and hope lows eat less” — you’re not in this laneLow, if executed; HIGH if pen separation fails
Lane 2: BMR Partial ReplacementHigh-output herds fighting drought or input costs; strong processing equipmentBMR-adapted hybrid available locally; tight harvest timing and fermentation12–15% DM yield penalty + premium seed = cost/tonne often equals cornNeutral to low — only if BMR protects litres corn cannot
Lane 3: One-TMR Moderate InclusionMid-size herds with labor or barn constraints; honest single-ration operationsHard cap on sorghum % in ration; active ration rebuilding as inventory changes“Temporary” creep — sorghum quietly displaces more corn than planned, ration never rebuiltMedium-HIGH if inclusion drifts; Low if cap is respected
Lane 4: Walk-AwayRegions where corn silage consistently performs; current feed cost/litre already on targetNothing — sorghum stays out of the high group entirelyPlanting sorghum because it’s “on the flyer” — not because the numbers say soLowest risk — manage weather/cost with other tools

What This Means for Your Operation

  • Judge sorghum on feed cost per liter, not R$/tonne. Before you chase “cheap” tonnage, work with your nutritionist to run at least one real ration scenario in which sorghum replaces part of your corn silage, and see what happens to liters and feed cost per liter on paper.
  • Be brutally honest about how many TMRs you can actually run. If barn layout and labor effectively give you a single lactating ration, forget complex split‑group sorghum strategies. You’re either in the moderate‑sorghum single‑TMR lane or the walk‑away lane.
  • Know exactly which sorghum you’re planting. Before you buy seed, confirm whether the hybrid is grain, forage, sweet, biomass, or BMR. For high‑producing cows, forage and BMR sorghums are your main options; biomass types are usually tonnage tools for low‑demand cattle or bioenergy, not a primary silage for 40-liter cows.
  • Match harvest and fermentation to sorghum, not corn habits. If your crew is going to wait until hard dough, as we do with corn, and your processor isn’t dialed in, you should expect more undigested berries and lower starch digestibility. Target soft dough around 28–30% dry matter, and plan on about two months of fermentationbefore you feed sorghum heavily.
  • Treat BMR sorghum as a premium tool, not a shortcut. BMR forage sorghum can come very close to corn silage on milk in well‑managed diets, but the 12–15% yield penalty and higher seed cost mean your cost per tonne often climbs. It makes sense when it protects litres you can’t afford to lose, not when it’s sold as “cheap corn.”
  • Use this month for barn math, not brochure math. In the next 30 days, actually sit down with your numbers and run at least one sorghum scenario in each lane that could realistically fit your herd. If the answer on feed cost per litre or expected milk change feels fuzzy, you’ve got more homework before you drop a sorghum planter in the ground.

Key Takeaways

If you don’t know your current feed cost per litre, adding sorghum to your system is a blind bet — that’s the first report you should pull before you plant a hectare.

If your barn and labor setup only support one main lactating TMR, either cap sorghum inclusion in that ration at a level your nutritionist is comfortable putting on paper, or keep sorghum out of the high group entirely and use it for lows, dry cows, and beef animals.

If the hybrid on the quote sheet is a biomass sorghum, assume it’s a tonnage‑first forage for low‑demand animals, not a primary silage for your top group, unless you’re willing to buy a lot more grain to cover its fiber load.

If you have access to BMR forage sorghum hybrids adapted to your region, treat them as a premium: they can get very close to corn-on-the-ear in milk under the right management, but they won’t be cheap, and they won’t rescue a ration that’s already short on energy.

Next time someone offers you a screaming deal on sorghum seed, don’t just ask, “How many tonnes can I get?” Ask: “Where, exactly, in my herd can this forage live without costing me liters?” If you can’t answer that on one sheet of paper, it might not be such a bargain.

Learn More

The $1.56/cwt Permit Trap Hiding in Your Next Dairy Expansion: Riverview’s 18,855‑Cow Minnesota Fight

A one‑year permit delay on 600 new stalls quietly adds about $1.56/cwt to that milk you haven’t shipped yet. The Stevens County fight shows exactly how that math catches up to you.

Executive Summary: A one‑year delay on a 600‑cow expansion can quietly add about US$1.56/cwt in interest alone to every cwt those new stalls should be producing. In Stevens County, Minnesota, Riverview’s proposed 18,855‑cow West River Dairy expansion triggered that exact risk profile: a 226‑million‑gallon water permit request, an MPCA EAW under fire, and a room full of neighbors who don’t trust the math. The same company just agreed to an US millionArizona settlement over groundwater in Sulphur Springs Valley, which opponents now point to as Exhibit A in their fight against more cows on the same aquifer system as Morris. The article walks through the barn math on time‑risk (capital × interest ÷ cwt), shows how a 7.5% rate and US$3 million in debt turn into that US$1.56/cwt drag, and then lays out why regulatory compliance no longer guarantees community approval. If you’re planning to add cows in the next 12–24 months, this is a playbook for pricing in permit delays, pressure‑testing your DSCR with your lender, and doing the neighbor and board work before your name shows up in the legal notices.

Dairy permit risk

The number that froze the room in western Minnesota wasn’t the cow count. It was 226 million gallons of water per year — the volume Riverview LLP’s proposed West River Dairy expansion near Alberta would be allowed to pull from an off‑site well under a Minnesota DNR appropriation request, according to MPCA filings and a March 2026 public notice.

For nearby grain farmer Joe Stromen, who lives a few miles from the proposed site, that Minnesota dairy expansion permit isn’t an engineering abstraction; coverage from Land Stewardship Project (LSP) and Sentient Media has him clearly in the “opposed” column. It’s his well, his gravel road, his property value tied to a project that, until the public comment period opened, he had no formal say in. And for any dairy operator planning growth in 2026, Stevens County is a case study in the cost nobody budgets: the price of a permit fight you didn’t see coming, measured in months of lost revenue and interest you’re still paying on barns that aren’t milking cows.

When a Minnesota Dairy Permit Becomes the Biggest Risk in the Room

The West River Dairy proposal didn’t start with protesters. It started with paperwork.

Riverview LLP — the Fehr family‑founded dairy and beef company headquartered near Morris since 1939 and widely identified as Minnesota’s largest dairy producer — filed with the MPCA to expand West River Dairy from 7,855 to 18,855 dairy cattle, which equates to 26,397 animal units under Minnesota’s feedlot formula. LSP’s analysis calls it the largest dairy CAFO ever proposed in Minnesota by animal units.

On the engineering side, Riverview’s plan tracks with Minnesota feedlot rules on paper. LSP and MPCA summaries note that the expansion would add a new 11,000‑cow freestall site and increase covered, clay‑lined liquid manure basins from around 102 million gallons to roughly 250 million gallons, with about 13,200 acres of cropland identified for manure application. The DNR water permit would authorize pumping up to 226 million gallons per year, at no more than 1,000 gallons per minute, from an off‑site well near the dairy. The City of Morris — population just over 5,000 — is currently permitted to withdraw up to 300 million gallons per year from its municipal wells in the same aquifer system.

Opponents like Stromen, Carroll, and Matthew Sheets read those numbers differently than Riverview’s engineers.

LSP organizer Sean Carroll, who has tracked CAFO permitting across western Minnesota for years, and residents like Stromen and Sheets point to three numbers in particular: LSP’s reading of state permits says a single dairy expansion is applying to draw roughly 75% of Morris’s annual permitted groundwater volume; the site lies in a landscape dotted with waterfowl production areas and wildlife refuges; and Sentient Media’s review of Minnesota water‑use records estimates Riverview’s existing Minnesota hog and dairy operations already use at least 570 million gallons per year, with West River adding another 226 million if approved.

Carroll’s line, documented in LSP materials and comment letters, is that this isn’t “anti‑dairy,” it’s about cumulative risk: how much animal density and water a single landscape can absorb — and whether the review process is equipped to answer that question at Riverview’s current scale.

Did Riverview File First and Engage Later — and Is That Why They’re Fighting?

From Riverview’s side, the logic is familiar to anyone who has expanded a dairy. Partner and spokesperson Brady Janzen has been quoted in prior coverage saying Riverview grows where cheese demand and processor capacity pull them, and the I‑29 corridor, with billions in new cheese and processing investment, is pulling hard. That’s the same dynamic The Bullvine highlighted in earlier consolidation and plant‑investment work: processors build stainless, and cows, heifers, and capital follow the pipe.

The internal assumption behind West River is one that a lot of growth‑minded herds still share:

  • Hire respected engineers.
  • Model manure, storage, and acres to state specs.
  • Keep water pulls under the modeled aquifer capacity.
  • Deliver a tight nutrient management plan.

If the paperwork is clean, the permit might get noisy — but it eventually lands.

Stevens County is the reality check on that “clean paperwork = smooth permit” assumption. Twice.

First, history. In 2014, the Minnesota Pollution Control Agency’s Citizens’ Board — a now‑abolished citizen oversight panel — ordered a full environmental impact statement (EIS) for a proposed Riverview dairy on essentially the same Stevens County site, citing cumulative concerns about groundwater and downstream impacts. That project did not proceed in its original form. In 2015, after intense political and industry pushback, the legislature eliminated the Citizens’ Board, a move widely linked in state reporting to the Riverview decision and other controversial feedlot calls. When a new, larger West River plan emerged a decade later with only an environmental assessment worksheet (EAW) instead of a full EIS, LSP, and the Institute for Agriculture and Trade Policy (IATP) framed it as a system that had lost a layer of scrutiny, not one that had learned from 2014.

Second, track record. In January 2026, Arizona Attorney General Kris Mayes announced a US$11 million settlementwith Riverview related to concerns about declining groundwater levels in the Sulphur Springs Valley. Under the agreement, Riverview agreed to provide US$11 million to fund replacement wells, emergency and interim water supplies, and community water systems for affected residents, while continuing water‑conservation efforts; the company did not admit legal wrongdoing. LSP and Food & Water Watch have used that case, and that dollar figure, as part of their argument that West River deserves closer scrutiny.

On the one hand, Riverview can cite its MPCA and DNR filings and argue that its West River proposal fits within Minnesota’s current feedlot and water‑permit framework. On the other hand, groups like LSP and IATP argue that Riverview’s current scale — and high‑profile groundwater disputes like the Arizona case — justify tougher questions about cumulative water draw and enforcement. However, that argument plays out legally, the operator who absorbs the financial cost of any delay, conditions, or litigation is Riverview — and in the next county, with the next big barn, that operator could be you.

How Much Does a Dairy Expansion Permit Delay Actually Cost?

Here’s the math almost nobody runs before filing. You don’t need 18,855 cows for this to hurt — the arithmetic hits just as hard at 400, 800, or 1,500 new stalls.

When a permit stalls, you’re carrying:

  • Interest on expansion‑tied capital you’ve already drawn or committed — land, barns, storage, parlor, rolling stock.
  • Fixed costs — insurance, taxes, maintenance, utilities — on infrastructure that isn’t yet shipping milk.
  • Professional fees — engineering, legal, consulting — that tick up with every hearing, comment extension, or requested study.

And you’re missing:

  • Milk revenue from cows that should already be shipping.
  • Component premiums and incentives are baked into the original pro‑forma.
  • Manure nutrient credits you expected to offset the purchased fertilizer on your acres.

Most people budget for construction risk — overruns, weather, and contractors. Very few explicitly budget time‑risk. In a county watching West River and reading about Arizona, that line item is getting more real.

How Much Can a Minnesota Dairy Expansion Permit Delay Actually Cost?

Here’s why that Stevens County fight matters even if you’re “only” adding 600 cows two states away. Walk through this once with transparent numbers. Then swap in your own.

Assume:

  • You’re adding 600 cows to your current herd.
  • You’ve drawn about US$3.0 million in expansion‑tied capital — a midpoint in the US$2.5–3.5 million range seen in some Upper Midwest freestall/parlor plus manure‑infrastructure budgets for 500–700 cows.
  • Your blended interest rate on that capital is 7.5%, consistent with recent Kansas City Fed data showing average interest rates on farm real‑estate loans around 7.49% in early 2025 — near the long‑term average but still high enough to make every month of delay expensive.

Here’s the time‑risk cost profile:

  • Annual interest = capital × interest rate
    • 3,000,000 × 0.075 = US$225,000 per year in interest directly tied to the expansion.
  • Monthly burn = 225,000 ÷ 12 ≈ US$18,750 per month in interest — before you count depreciation, taxes, insurance, or legal fees.
  • A 12‑month permit delay at that rate = US$225,000 in interest alone, with no milk from those 600 cows.

Now convert that into something you actually feel in the milk check.

USDA and related summaries put average US milk production per cow in the low‑ to mid‑20,000‑pound range annually; using 24,000 pounds (240 cwt) per cow per year is a reasonable example for a Holstein herd in recent years.

  • 600 cows × 240 cwt/cow/year = 144,000 cwt of milk per year. Those new stalls should produce once they’re filled.

Time‑risk penalty per cwt in this example:

  • 225,000 ÷ 144,000 cwt ≈ US$1.56/cwt.

That’s just the interest — no feed, no labor, no margin‑over‑feed math. In a 600‑cow example at current rates and infrastructure costs, a one‑year permitting delay quietly adds around a dollar and a half per cwt to the effective cost of that new production. If your build is larger, rates are higher, or production runs lower, the penalty climbs.

Run your own version:

  • Expansion capital drawn × interest rate ÷ 12 = monthly time‑risk cost.
  • Monthly time‑risk cost × months of delay = total time‑risk hit.
  • Total time‑risk hit ÷ annual cwt from new cows = your hidden US$/cwt drag.
Expansion SizeCapital DrawnMonthly Interest Burn$/cwt Drag @ 6-Mo Delay$/cwt Drag @ 12-Mo Delay
400 cows$2,000,000$12,500$0.78$1.56
600 cows$3,000,000$18,750$0.78$1.56
800 cows$4,000,000$25,000$0.78$1.56
1,000 cows$5,000,000$31,250$0.78$1.56
1,500 cows$7,500,000$46,875$0.78$1.56

Where in your spreadsheet did you plan for that line?

What Stevens County Teaches Every Dairy Farmer to Grow

Here’s the myth this fight quietly kills: “Big guys get what they want. My smaller expansion won’t draw this kind of heat.”

Riverview did what any seasoned operator is told to do. Tight nutrient numbers. Engineered storage. A water permit request, DNR staff say, can be managed within the aquifer’s capacity on paper. Yet they still walked into a hearing room where opponents had binders of state records, an Arizona AG press release, and a decade‑old EIS fight on the same site to point at.

That dynamic doesn’t stay confined to a 26,397‑animal‑unit project. It shows up when:

  • You grow from 300 to 600 cows on the edge of town.
  • You site a deep pit or lagoon along a gravel road that a newer subdivision uses every day.
  • You move from one barn to a multi‑barn complex in a township that has never seen that density.

Your nutrient management plan might be airtight. The question is whether you’ve done any work to translate those numbers into the lived reality of dust, headlights, and truck counts that your neighbors care about.

Stevens County also exposes a second busted assumption for any operator: “Once regulators sign off, the science argument is over.”

In their formal and media comments, LSP and IATP argue that cumulative nitrate and water‑use risks in the Pomme de Terre watershed aren’t fully captured by current modeling for a project of West River’s size. That’s a technical argument, not just a vibes‑based objection. Whether you buy their analysis or not, once that level of distrust fills a boardroom, another engineering cross‑section or appendix letter from MPCA doesn’t move the room by itself.

In 2026, regulatory approval is the floor for community trust, not the ceiling. If an expansion strategy stops at “the state says yes,” the operator is effectively handing the public narrative about their farm to critics — and doing it while the interest meter ticks and heifers keep aging.

Those months of drift also collide with other structural constraints. Work on the heifer shortage has shown how tight replacement supply and higher heifer values already squeeze expansion timelines and flexibility; every extra month of permit limbo shifts when those heifers calve in, and how you manage culling and breeding. A year‑long permitting detour doesn’t just cost you interest; it can throw your replacement, breeding, and culling plans out of sync.

Risk DimensionWest River (Proposed)Typical 500–1,200 Cow MN Expansion
Herd size (animal units)26,397 AU (18,855 cattle)700–1,700 AU
Water permit request226M gal/yr (75% of Morris municipal)5–25M gal/yr
Manure storage~250M gal liquid basin2–8M gal
Cropland for application~13,200 acres800–3,000 acres
Prior EIS/EAW history on siteYes — 2014 fight, project abandonedTypically none
AZ groundwater settlement (same operator)$11M (Jan 2026)N/A
Community opposition on recordLSP, IATP, local residents, formal commentsOccasional neighbor objections
Permit pathwayEAW only (no full EIS)Standard MPCA feedlot permit

The 30/90/365‑Day Expansion Playbook: What to Do Before You File

You don’t control aquifers, activist groups, or statehouse politics. You do control how exposed you are before your farm’s name shows up in a public notice that opposition groups can organize around.

TimeframeActionOwnerRisk if Skipped
30 daysRun time-risk math (capital × rate ÷ cwt)Operator + lenderFlying blind on $/cwt drag
30 daysAttend 2 township/county meetingsOperatorCan’t name likely opponents before filing
30 daysDSCR stress-test at 6 and 12-mo delayLender conversationCovenant breach risk not modeled
30 daysAudit own regulatory/neighbor historyOperator + attorneyOpposition brings it up first
90 daysThird-party “skeptic’s review” of operationEnvironmental engineerGaps handed to critics at hearing
90 daysTranslate NMP into plain-language neighbor summaryAgronomist + operatorNutrient narrative controlled by opponents
90 daysPre-negotiate haul routes with county road authorityOperatorTruck traffic becomes hearing flashpoint
365 daysBuild advisory circle (neighbors + local officials)OperatorNo trusted voices in the room when it counts
365 daysAnnual stewardship snapshot (public-facing)Operator“Distant operator” framing sticks unopposed
365 daysVisible local investment (FFA, fire dept, road cleanup)Operator.56/cwt permit fight that was avoidable

In the Next 30 Days

  • Show up where decisions are already being made. Attend at least two county or township meetings you’d normally skip. Sit in the back and listen. Note who always comments, which commissioners lean in on ag issues, and what topics stall the room. If you can’t name the three people most likely to speak against your expansion today, you’re filing blind.
  • Run your time‑risk math now, not after you’ve broken ground.
    • Pull your expansion‑tied capital and real blended interest rate.
    • Use your own rolling‑12‑month production to estimate annual cwt from the new cows.
    • Plug into the formulas above to calculate your monthly burn and US$/cwt penalty for a 6‑ and 12‑month delay.
  • Test your coverage with your lender. Take that time‑risk number to your lender and ask, “How many months of zero new revenue from this expansion can we absorb before my debt‑service coverage ratio drops below about 1.2?” Many ag lenders use around 1.2 as a common minimum DSCR covenant on term debt; you need your actual threshold and how close you are to it in writing, not as a guess from memory.
  • Audit your own regulatory and neighbor history. Pull five to ten years of your own interactions with environmental regulators: spill reports, notices of violation, odor complaints, anything formally logged. Make a second list of serious neighbor disputes. Assume every item on those lists will be mentioned in a hearing, and start thinking now about what you’d say in response.

Over the Next 90 Days

  • Commission your own “skeptic’s review” of your current operation. Hire a third‑party environmental or engineering firm — not just the engineer who’ll file your permit — to look at nutrient loading vs acres, seasonal odor, and truck traffic by season and time of day. Ask them explicitly, “Where would a critic reasonably push on this?”
  • Translate your nutrient management plan into a neighbor’s language. Before your name shows up in the legal notices, pull your immediate neighbors into a conversation or mailer that says, in plain numbers:
    • How many acres get manure, roughly how many gallons per acre, and how many times per year?
    • Most of those nutrients replace purchased N, P, and K on those fields, based on your lab results and agronomist recommendations.
    • The specific steps you take on timing, injection/surface‑application, setbacks, and slope to keep nutrients and odors as controlled as possible.
  • Pre‑negotiate haul routes and timing with your county. Sit down with the county or township road authority now and lay out your anticipated truck trips at full build‑out, including peaks for silage, feed, and manure. If you can walk into a hearing with a signed or draft road‑use understanding — or at least a memo showing you’ve offered to contribute to maintenance — it changes the tone of that part of the debate.

Over the Next 365 Days

  • Build a small advisory circle that outlasts the permit fight. That might be two neighbors, one local official, and a representative from the school or fire department. Meet once or twice a year to share high‑level plans and ask for blunt feedback. The goal isn’t consensus; it’s a pattern of engagement that commissioners can point to when they’re under pressure.
  • Create an annual stewardship snapshot you’d be comfortable seeing on Facebook. One page on manure handled, acres receiving it, major changes you’ve made to reduce risk or nuisance, and what you’re doing on water use and emergency preparedness. Post it online and drop a printed copy with immediate neighbors.
  • Invest visibly before you ask for a big yes. Target local support where your trucks and impact already show up: fire department, FFA, local EMS, and road cleanups. You’re not buying votes, you’re demonstrating that you see your operation as part of the community, not above it. That matters a lot when a commissioner is weighing two stacks of testimony.

By the time your permit hits the agenda, you want key people in that room thinking, “We know them. They show up, and they fix things.” That doesn’t eliminate organized opposition. It makes it harder to frame you the way critics have portrayed Riverview in their campaigns — as a distant, growth‑driven operator the community never really got to vet.

What This Means for Your Operation

  • Price the year you didn’t plan for. Use your own capital and rate to calculate your monthly time‑risk cost, then stress‑test a 6‑ and 12‑month delay. If that scenario would shove your working‑capital buffer below roughly a month of operating expenses, re‑phase or downsize the project before you file.
  • Stop assuming a clean permit file equals a smooth community process. Build a basic communication and neighbor‑engagement plan the same way you build a nutrient plan — with names, dates, and specific risks you’re trying to manage.
  • Clear your own skeletons off the table first. Make a realistic list of past notices, complaints, and disputes, then decide what you can fix or visibly improve this year so they’re not the only stories in the room when your name comes up.
  • Treat Stevens County as tuition, not spectacle. Watch what happens with the West River Dairy permit — the timelines, the conditions, and the political fallout — and then identify where your own expansion looks similar on scale, water draw, or proximity to town. That’s your risk stripe.
  • Do one concrete thing in the next 30 days. Either show up to a local board or planning meeting to listen, or book a meeting with your lender to walk through your time‑risk math and DSCR headroom. Put the date and the name on your calendar now, not “sometime this summer.”

Key Takeaways

  • If your expansion pro‑forma only works when everything stays on schedule, you don’t have a plan — you have a best‑case scenario. The West River fight shows how fast a technically compliant, well‑engineered project can still get bogged down when history, water, and community trust are in play.
  • Regulatory approval is the starting line in 2026, not the finish. The barns that get built without an extra year of legal and political drag usually belong to operators who did the communication and relationship work before their permit hit the agenda, not after.
  • Your most expensive opponent may not be the loudest person at the hearing — it’s the monthly interest and lost margin you never modeled when the permit timeline slipped. In a realistic 600‑cow example at current rate and cost assumptions, that delay can quietly add around US$1.50 per cwt to the effective cost of that new milk; larger builds carry even more time‑risk.

The Bottom Line

Stevens County’s mega‑dairy fight will keep showing up in headlines and legal filings. Your version will show up in a local boardroom with 30 people, a sign‑up sheet, and a clock.

Before you sign the next construction contract, pull two things: your monthly expansion‑related interest burn, and the name of the first neighbor or local official you’d call before your permit goes public. If either one is blank, that’s your real permitting problem.

Complete references and supporting documentation are available upon request by contacting the editorial team at editor@thebullvine.com.

Learn More

The Sunday Read Dairy Professionals Don’t Skip.

Every week, thousands of producers, breeders, and industry insiders open Bullvine Weekly for genetics insights, market shifts, and profit strategies they won’t find anywhere else. One email. Five minutes. Smarter decisions all week.
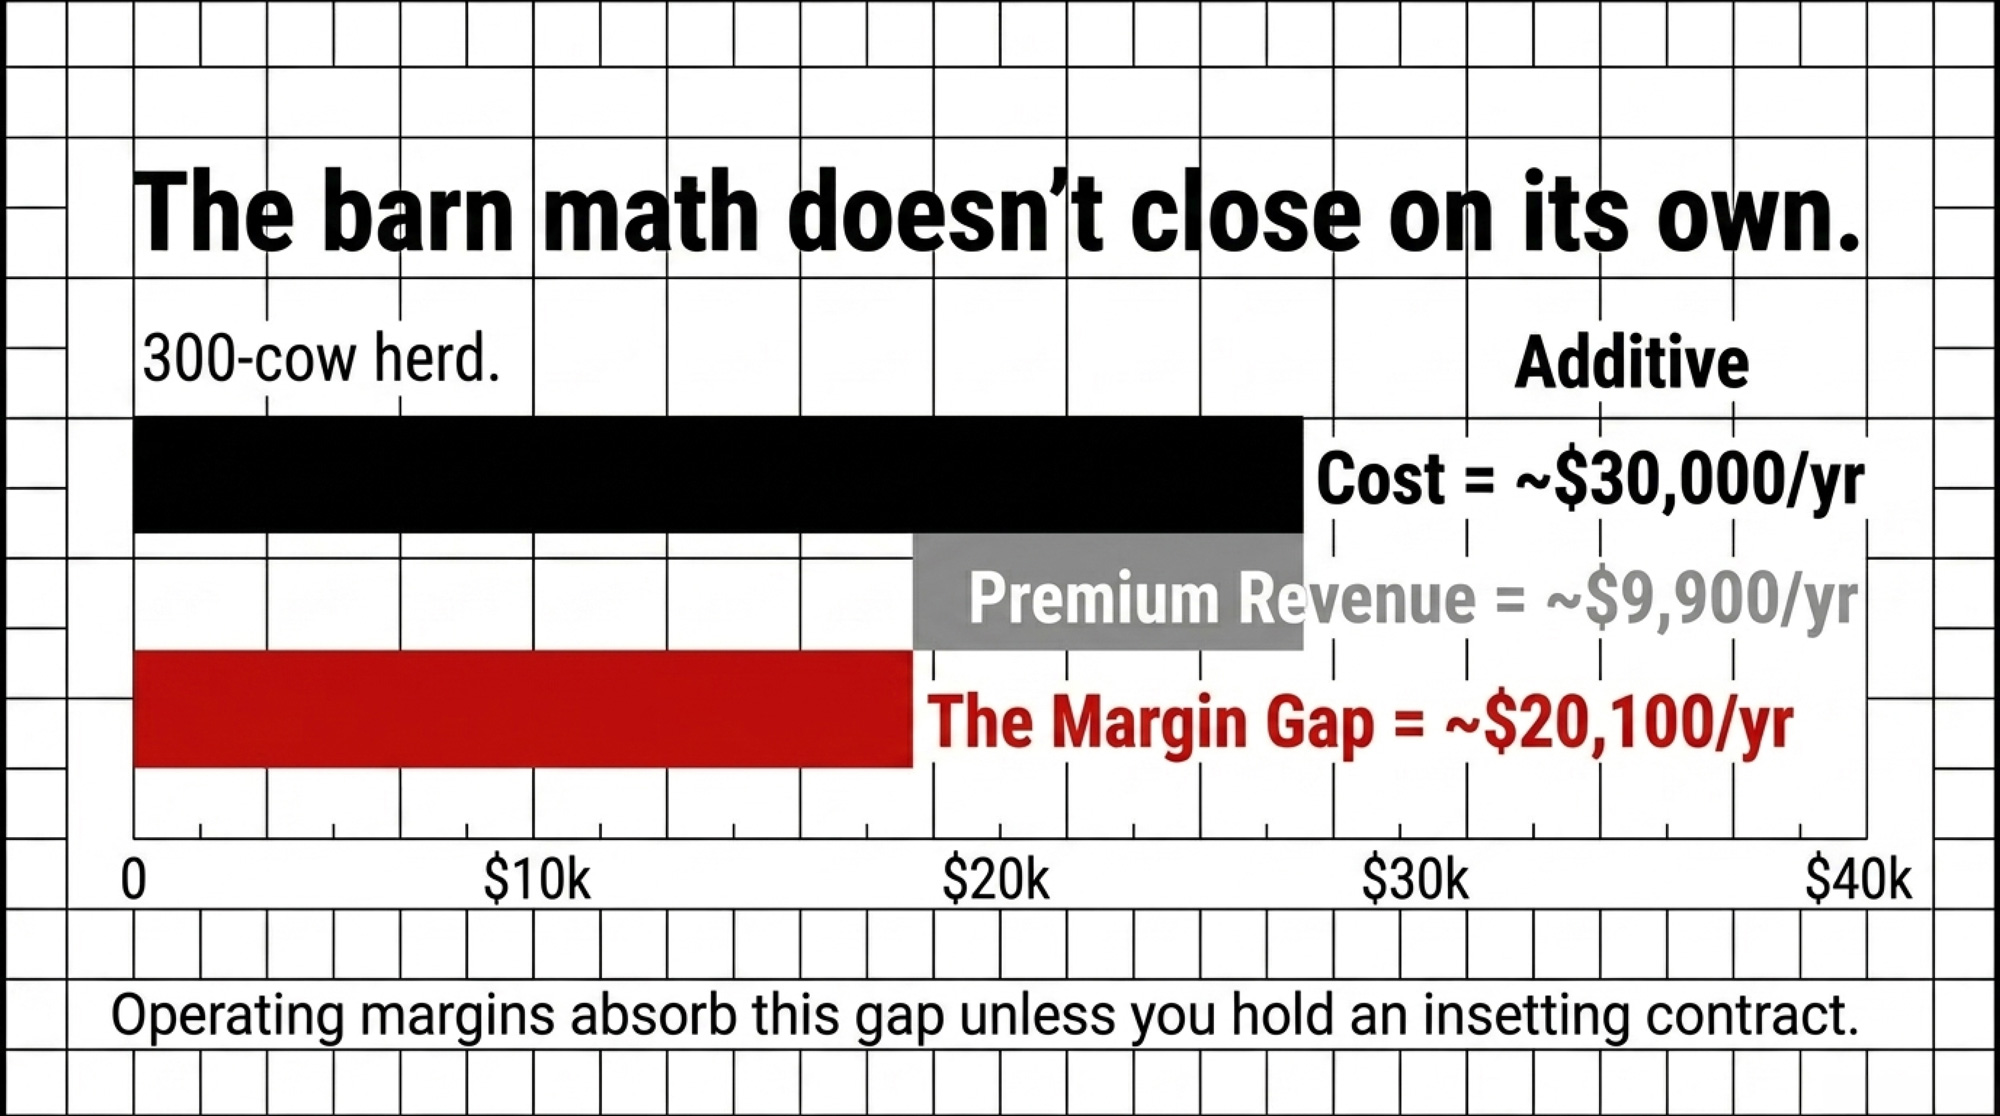
NewsSubscribe
First
Last
Consent

$4.07 Per Cwt: The Kitchen‑Table Math That Killed a Million‑Dollar Robot Deal

USDA says robots boost net returns 13% — after seven years of red ink. Here’s the barn math the dealer brochure leaves out.

EXECUTIVE SUMMARY: A 240‑cow Upper Midwest family sat down with a million‑dollar robot proposal and ran the numbers at $18 milk instead of the dealer’s $22 — and watched their milking cost jump from $2.03 to $4.07 per cwt, with a breakeven at $19.45. USDA’s January 2026 ERR‑356 confirms robots boost net returns 13% on average, but Iowa State economist Larry Tranel’s cash‑flow modelling shows seven years of red ink before that payoff starts — and only if maintenance doesn’t blow past $15,000 per box by year five. The deal died at the kitchen table because the family’s debt‑to‑asset ratio couldn’t absorb seven lean years, and their hired‑hand wage of $18–20/hr sat well below the $27.05/hr breakeven where robot labour savings actually pencil out. For herds above 1,000 cows, a 60‑stall rotary runs roughly $1.05/cwt cheaper on total operating cost than a 20‑robot barn — unless you literally can’t staff a parlour at any price. If you’re sitting on a robot quote right now, the full article walks through the barn math by herd size, the lameness and pellet traps that silently kill box throughput, and a 30‑day stress‑test checklist you can run with your lender before you sign anything.

The laminated spreadsheet was still warm from the dealer’s truck when it hit the kitchen table. Four robotic milking units for a 240‑cow Upper Midwest family herd, ,000,000 all‑in, paying for itself in five years. The dealer’s math assumed a steady $22 all‑milk price, a 12% production lift, and a 75% cut to milking labour.

But the family’s mailbox price had already slid toward $18, the lender was circling “debt‑to‑revenue” on the cash‑flow projection, and the oldest son asked the question nobody wanted to say out loud: “Can this place really carry that note if $18 sticks around?”

That question sits at the center of robot economics in 2026. A January 2026 USDA Economic Research Service report (ERR‑356) confirmed that automatic milking systems (AMS) boost U.S. dairy net returns by 13% on average — the strongest national evidence yet that robot profitability is real. Iowa State dairy economist Larry Tranel, who’s been running AMS economics since before most dealers had a demo unit, doesn’t disagree. He adds the part that rarely makes it into the sales brochure: “Cash flow of a robot tends to be very negative in the first seven years, then pretty positive for the rest of the life of the AMS, but that is dependent on many variables, especially repair costs across the whole life of the robot.”

Both things are true. The gap between them is where this family’s decision — and your next capital bet — lives.

The Dealer Spreadsheet vs. the Barn Floor

On paper, the pitch looked bulletproof. Four robots at roughly $200,000 apiece plus $200,000 in retrofit and infrastructure — a tidy $1,000,000 for a “future‑proof” barn. In the dealer’s world, that Upper Midwest herd jumps from 6.5 million to over 7.2 million pounds shipped per year, labour drops by three‑quarters, and maintenance stays at a nice round $5,000 per box. The kind of math that makes everybody feel just brave enough to sign.

When the family asked their lender to run the same scenario at $18 milk using extension data instead of brochure numbers, the picture changed fast. The realistic retrofitted lift landed closer to 5% — 6.5 million pounds to 6.825 million. Tranel’s work backs that up: production gains of 3–5% are realistic for herds switching from twice‑daily milking, and much of any larger “robot bump” comes from new facilities — better ventilation, sand‑bedded stalls, cleaner lanes — not the box itself. The labour “savings” looked more like a 35–40% shift into higher‑paid tech hours, not a 75% disappearance.

Then came the line that mattered most at that table: the milking cost going from $2.03 per cwt in their existing 2x parlour to $4.07 per cwt once the robot debt and year‑five maintenance were fully baked in. The banker didn’t give a motivational speech. They just pushed the spreadsheet back and let the numbers talk.

MetricDealer Sales PitchRealistic Scenario ($18–20 Milk)Gap
Milk response lift10–12%3.5–5.0% (retrofits)-7 points
Labour hours saved75% gross reduction35–40% net shift to specialised-35 points
Annual maintenance / box$5,000 flat$7,000 early → $15,000+ yr 53× by yr 5
Payback period3–5 years7–15 years+2–10 years
Breakeven labour wageNot specified$27.05/hr (fully loaded)Dealer ignores entirely
Milking cost / cwt~$2.03 (implied)$4.07 at $18 milk+$2.04/cwt
Breakeven milk price~$17–18 (implied)$19.45/cwtBelow current mailbox risk
Capital req. vs. alternatives$1,000,000 AMS330 replacement heifers @ $3,000Opportunity cost ignored

Do Robot Barns Actually Pay at $18 Milk?

Once you strip away the laminated brochure math, three realities stare you down.

Production lift usually comes from the barn, not the box. That 10% “robot bump” you see in marketing material is often really a new barn bump — superior air, better stalls, more bunk space. Tranel doesn’t sugarcoat it: “Often, much of the increase reported on AMS is due to the new cow housing facility, not just the AMS, as new facilities often increase production 6 to 8 percent over old, worn-out facilities.” Drop robots into tired housing and the realistic gain is 3–5% from more frequent milkings, and only if box utilisation is dialled in. Already milking 3x in an efficient parlour? His data says you may actually lose ground if box throughput isn’t perfect.

Labour doesn’t vanish — it changes shape. On this farm, twelve hours of parlour shifts turned into 3–4 hours of higher‑stakes work: robot maintenance, fetch cows, fresh‑cow checks, and screen time with AMS software. The hours dropped. The wage didn’t. Keeping competent people on call for 2:00 a.m. alarms meant $28–35 per hour fully loaded, not $18.

Tranel’s partial budget work puts the breakeven labour rate at $27.05 per hour — wage plus benefits, housing, and taxes. Unless you’re paying at least that for milking labour, the robot note can’t be justified on labour savings alone. For an Ontario operator facing a .60 minimum wage or a Wisconsin farmer paying –20 for hired hands, that’s a big gap. At those rates, the robot is a lifestyle choice rather than a pure economic one.

Year five is the mechanical cliff. The first couple of years live under warranty. After that, lasers, liners, boards, and hoses all start aging at the same time. A joint survey by extension educators at UW‑Madison, the University of Minnesota, and Penn State found maintenance climbing from $5,000–7,000 per robot to more than $15,000 per boxfor about a quarter of installations after five years. Among those producers, some “made it clear that adaptation to AMS didn’t go well for them and that they were transitioning back to conventional milking systems or exiting the dairy sector.”

One in four older installs hitting that cost wall isn’t a tail risk. It’s a quartile. For this 260‑cow scenario, that maintenance spike translated into roughly $0.35 per cwt of extra cost on the milk passing through each robot. Scale that across a 300‑cow herd, and you’re suddenly staring at an $80,000‑plus annual hit — basically a robot payment disappearing into the cost column.

Where the Breakeven Actually Sits at $18 Milk

At $22 milk, the extra 325,000 pounds of production in this scenario pencil out at about $71,500, and labour savings of roughly $40,000 help narrow the gap. At $18, that same milk is only $58,500. Debt service alone burns 12.7% of total revenue, and the breakeven milk price for this specific 260‑cow scenario sits at $19.45 per cwt.

Below that number, you’re not “riding out a rough patch.” You’re quietly selling down equity to keep the robots running.

And $18 milk isn’t a one‑off bad year. Bullvine’s analysis of the .6 billion processor migration to Texas and Kansas — and the fact that 76% of Wisconsin’s dairy farms have disappeared since the mid‑2010s — shows it’s part of the structural gravity reshaping where and how milk gets produced across North America.

The opportunity cost of that $1,000,000 told the same story at the family table. In a high‑interest environment, that capital could buy roughly 330 high‑quality replacement heifers at $3,000 each, potentially increasing total milk volume more than the robot lift ever could. Or fund the stalls, ventilation, and cow‑flow fixes that lift everything you already own.

The 180–400 Cow Sweet Spot — and Its Catch

The banker didn’t tell this Upper Midwest family that robots never work. When they pulled more data together, a pattern emerged.

Below about 140 cows, the fixed cost of a robot is spread over too few animals. Even with sharp management, each cow carries too much capital per pound shipped.

For herds in the 180–400 cow range, the math looks very different. Three to four robots allow high box utilisation, meaningful labour displacement, and a system that doesn’t drown in complexity. This is also the window where equity positions are often still strong enough to absorb the ugly early years. Iowa State extension modelling for robot startups predicts roughly seven years of red ink before the system settles into the black — and Tranel’s own partial budget model for a two‑robot install estimates an $8,776 per year cash flow gap in those early years.

To survive that, this lender wanted to see a debt‑to‑asset ratio under about 35% going in. Once the balance sheet climbs north of 50%, the $1,000,000 note stops being “the next step” and starts looking like the handcuff that might block future parlour upgrades, stall renovations, or a successor buy‑in.

Brad Guse, Senior Vice President of Agriculture at BMO Harris Bank, frames the question the way your banker will: “Given the significant capital outlay for robotic dairy equipment, how are you going to repay the debt?” He warns specifically against balloon payments — you’re deferring principal at exactly the point maintenance costs start climbing. And Tranel adds a horizon check most dealers don’t mention: if you’ll be farming another 13–17 years, robots make more sense; if you’re planning only seven, they probably don’t.

At that kitchen table, the conversation shifted from “Are robots good or bad?” to “Does this specific herd actually sit in that sweet spot?” On size and management, they were close. On leverage, they weren’t.

When Does a Rotary Beat 20 Robots?

If growth is the real plan, the next question is whether to go bigger or more expensive. The same modelling compared a 1,000–1,200 cow operation choosing between a 20‑robot barn and a 60‑stall rotary parlour.

Metric20‑Robot Barn60‑Stall Rotary
Total capital outlay$4,500,000$2,800,000
Labour hours/cow/year18.226.5
Depreciation per cwt$0.50$0.23
Maintenance per cwt$0.61$0.30
Total op‑ex per cwt$2.13$1.08

Robots clearly win on the labour line. But once depreciation and maintenance are added, the rotary comes out roughly $1.05 per cwt cheaper on total operating expense.

At $18 milk, that spread isn’t a rounding error. It’s the whole game.

The only scenario where the 20‑robot barn comes out ahead is the one where more and more large herds are already living in: a labour market so tight that adding another parlour shift isn’t possible at any wage. Large herds that win with robots do so by driving throughput — pushing each box to milk 65–70 cows, despite vendor warnings about behavioural bottlenecks. The breakeven milk price where robots become superior to a well‑run rotary at this scale is often above $23, unless labour availability is essentially non‑existent at any price.

The 15.8% Who Walked Away

The family’s lender had seen enough robot barns to know the modelling wasn’t just theory. Real‑world adoption data backs that up.

Dr. Nicolas Lyons, dairy technology leader at NSW Department of Primary Industries and a key researcher on Australia’s FutureDairy project, tracked that country’s entire AMS adoption history: “Of the 57 farms that commissioned robots since 2001, now there were only 48 operating. We had nine cease — some went back to a conventional dairy, and some left the industry entirely.”

Nine of 57. A 15.8% discontinuation rate — not among tire‑kickers, but among farms that installed robots, ran them, and then walked away. Lyons doesn’t dodge the reasons: “It basically comes down to things like expectations weren’t met; some couldn’t make it work; some didn’t have a good relationship with the equipment provider; and some didn’t achieve what they had hoped.”

And among the U.S. operations that stuck with it? A 2024 study of large AMS farms — herds running seven or more boxes, median around 940 lactating cows — found 54% would recommend AMS, another 38% said do your homework first, and just 8% were neutral or wouldn’t recommend. Perhaps most telling for anyone about to pour concrete: 68% wished they’d planned their barn differently — the one thing you absolutely cannot fix without a jackhammer.

Lameness: The Invisible Capacity Killer

The deeper this family dug, the clearer it became that the real robot game wasn’t about list price and payments. It was about how many cows would quietly wreck the system from the inside.

In a robot barn, the cow has to choose to be milked. Lame cows are about 2.2 times more likely to need fetching, which chews up the very labour you thought you were saving. A cow visiting the robot 2.1 times a day instead of 2.8 isn’t just giving less milk — she’s occupying a slot a sound cow could use. At a 20% lameness rate, the modelling treats the robot barn as functionally underwater at milk — the system can’t hit the throughput it needs to pay its own way.

The fixes aren’t glamorous. They are non‑negotiable:

  • Frequent footbaths — 1–2 times weekly in a dedicated lane.
  • Professional trimming every ~150 days.
  • Layouts that avoid tight 90‑degree turns at robot entry and exit.
  • At least 20 feet of clearance in front of the robots for low‑stress cow traffic.

Those are exactly the details that get shaved off in cheap retrofits, and they show up later as a steady flow of white‑line lesions and lost box capacity.

Tranel puts an even finer point on it: milk per AMS unit is “very highly correlated” to AMS profitability — more so than milk per cow. One 2019 extension survey showed milk per visit ranging from 21.4 to 39 lb, and that spread is where all the money lives. The gap isn’t about the brand of robot. It’s cow flow, stall comfort, feed management, and lameness protocols.

The Pellet Tax and the $50,000 You Forgot to Budget.

At $18 milk, the cost of 4–8 pounds of high‑energy robot pellet per cow per day becomes a serious lever. In this family’s modelling, their nutritionist’s quiet “pellet creep” — bumping pellet quality to fix visit problems caused by poor stalls or inconsistent feed push‑up — added $0.15–0.20 per cow per day. Across a full year and full herd, that leaked tens of thousands straight out of the margin.

What surprised them was how aggressively some farms have gone the other way. Heeg Brothers Dairy near Colby, Wisconsin, milks roughly 450 cows in a robot barn that’s run completely pellet‑free since day one, using a guided‑flow design. They’re shipping about 98 lb per cow per day in the robot herd versus around 94 lb in their parlour herd, with butterfat running near 4.5%. As The Bullvine’s pellet‑free analysis breaks down, guided‑flow barns like Heeg’s can often save tens of thousands per year while improving components, and a 2024 Michigan State trial found that free‑flow barns needed about 3.2 times more pellets to maintain visits.

Then there’s the infrastructure nobody wants to talk about. A $200,000 robot plugged into a $20 internet router is a $220,000 mistake. Roughly 62% of robot difficulties trace back to bad power or bad connectivity, not finicky cows or fussy software.

Smooth AMS life requires at least 600 amps of dedicated power, solid surge protection, and internet latency under 50 milliseconds, so alerts hit your phone in real time. Positive‑pressure ventilation in the robot room keeps corrosive barn air off circuit boards. On a barn that went up before smartphones were a thing, that adds about $50,000 to make the place robot‑ready.

The 2:00 a.m. Phone Problem

The shift from a defined 4:00 a.m.–noon parlour crew to a 24/7 “robot manager” changes more than the clock. A 2014 survey of 228 Finnish AMS farmers — published in 2016 by Karttunen, Rautiainen, and Lunner‑Kolstrup in Frontiers in Public Health — found 71.5% reported mental stress from nightly AMS alarms and 51.7% experienced stress from the 24/7 standby. Overall, 93.4% mentioned at least one AMS‑related issue causing mental strain.

Christina Lunner Kolstrup of the Swedish University of Agricultural Sciences, a co‑author on that study, put it bluntly: “Previously, with conventional milking, the working day had a clear and natural ‘start’ and ‘end’, but with the AMS, there are no specific working hours.”

Alarm management tech has improved since 2014. The underlying reality hasn’t changed — a robot never clocks out. One Wisconsin producer in the UW–UMN–Penn State extension survey nailed it: “AMS is not stress-free. Physically, it is easier. Mentally stressful.”

At that Upper Midwest kitchen table, this became a hard, personal question. Nobody in the next generation really wanted to be the person whose phone never shuts up. If you can’t staff a management team that genuinely likes living inside data and alerts, staying with a well‑run parlour and investing in people and protocols is the better economic move. [INTERNAL LINK: $234,000 Gone: The Gap Between Dairy Tech Promises and Farm-Gate Reality — Tier 2 tech ROI piece]

What This Means for Your Operation

Farm Factor🔴 Don’t Sign (High Risk)🟡 Borderline — Do the Math⚫ Green Light (Best Case)
Herd size< 140 cows140–179 cows180–400 cows
Debt-to-asset ratio> 50%36–49%< 35%
Current labour wage$17–20/hr$22–26/hr$27+/hr (or can’t staff)
Farming horizon< 7 years remaining7–12 years13+ years
Current lameness rate> 20%12–19%< 10%
Milking systemEfficient 3x parlourStandard 2xStruggling to staff any shifts
Electrical/internet< 400 amp, poor internet400–599 amp, adequate600–800 amp, sub-50ms latency
Likely breakeven milk price> $21/cwt$19.50–21.00/cwt$18.00–19.45/cwt

For a 200–400 cow family herd sitting on a robot quote right now, this isn’t about robots being “good” or “bad.” It’s about whether they genuinely work for your numbers and your people. In the next 30 days, before you sign anything:

  • Stress test your current parlour at $18 milk with your lender. If your operation can’t survive 12 months at $18 on your existing system, a $1,000,000 robot note doesn’t fix the math — it magnifies it. Have your banker show you what your breakeven price does if milking cost jumps from $2.03 to $4.07 per cwt.
  • Check your debt‑to‑asset ratio before you fall in love with the idea. At or above 50%, think very hard before tying up another million in steel. Tranel’s modelling and Iowa State extension data both assume you’ll need room for seven lean years of red ink before the cash flow turns.
  • Audit your labour reality against the $27.05/hr breakeven. Well below that number and still able to staff your parlour? Robots become a lifestyle choice, not an ROI play. Consistently above it and still struggling to fill shifts? Robots might be a legitimate labour hedge — but only if you can also hit box‑throughput and fetch‑rate targets.
  • Measure your box potential honestly, not aspirationally. Could you realistically push each robot toward 5,500 lb per day and keep the fetch rate under 10% with your current genetics, stall design, and hoof‑care program? Tranel’s data shows milk per visit ranging from 21.4 to 39 lb — that spread is where all the money lives.
  • Price the hybrid path instead of jumping from parlour to full AMS. Activity monitors, automated sort gates, and a feed pusher can deliver roughly 60% of the labour savings at about 10% of the capital cost.
  • Audit the electrical and internet infrastructure now, not after the quote. No 600–800 amp service and high‑speed connectivity? Add $50,000 to the dealer’s quote before you compare their “payback period” to anything.
  • Look at your lameness report before you look at robot brochures. If your lame‑cow rate is flirting with 20%, you’re setting yourself up to spend robot dollars on fetch cows instead of margin. Fix stalls and hoof health before you pour the robot room concrete.

For 1,000+ cow herds, you’re choosing between management models, not between buckets and boxes. A well‑run rotary parlour running roughly $1.05/cwt cheaper is usually a smarter place to park capital in an $18 milk world — unless labour is your absolute binding constraint and your team genuinely wants to live inside AMS reports.

For herds already running robots: if your fetch rate sits above 10% and box throughput below 4,500 lb per day, stop blaming the machines. Look at stalls, hoof health, cow flow, and pellet creep. And pull your genetic index — shift selection toward milking speed and teat placement. A slow‑milking cow isn’t just annoying; she’s a capital‑inefficient cow that drags down ROI on every dollar you’ve put into the system.

Key Takeaways

  • If your robot ROI depends on a 10–12% milk lift and a 75% labour cut, you’re working off dealer fiction, not barn math. Plan around 3–5% lifts in retrofits and 35–43% net labour savings if you want your numbers to survive real life.
  • If your lameness rate is at or above 20%, a robot barn will quietly bleed you at $18 milk. Fix hoof health, cow flow, and stall design before you let anyone cut a hole in your wall for a robot.
  • If your barn can’t support 600–800 amps of clean power and low‑latency internet, add at least $50,000 to the robot quote — or accept that you’re wiring a Ferrari to a garden hose.
  • If you sit in the 180–400 cow range with debt‑to‑asset under 35%, robots can work — but you need to budget for $15,000 per robot in maintenance by year five and be honest about whether you have 13–17 years of farming left to harvest the 13% net‑return upside Tranel and USDA are seeing.

The Bottom Line

Robots aren’t the villain in this story. They’re amplifiers. On the right farm — with the right labour pressure, equity position, cow flow, and hoof health — they’re a powerful tool that can deliver that 13% net return over the long haul. On the wrong farm, they quietly turn one tough $18 year into a structural problem you can’t grow your way out of.

That Upper Midwest family walked away from the four‑robot proposal and put their first million into stalls, ventilation, and hybrid tech instead. No ribbon. No show‑ring photo. But ten years from now, that decision might be the reason their grandkids still have a barn to argue about.

When you look at your own numbers — and you should look this month, not next quarter — are you buying into seven years of hard math with a genuine payoff on the other side, or financing a dealer’s best‑case scenario with your family’s equity?

Complete references and supporting documentation are available upon request by contacting the editorial team at editor@thebullvine.com.

Learn More

The Sunday Read Dairy Professionals Don’t Skip.

Every week, thousands of producers, breeders, and industry insiders open Bullvine Weekly for genetics insights, market shifts, and profit strategies they won’t find anywhere else. One email. Five minutes. Smarter decisions all week.
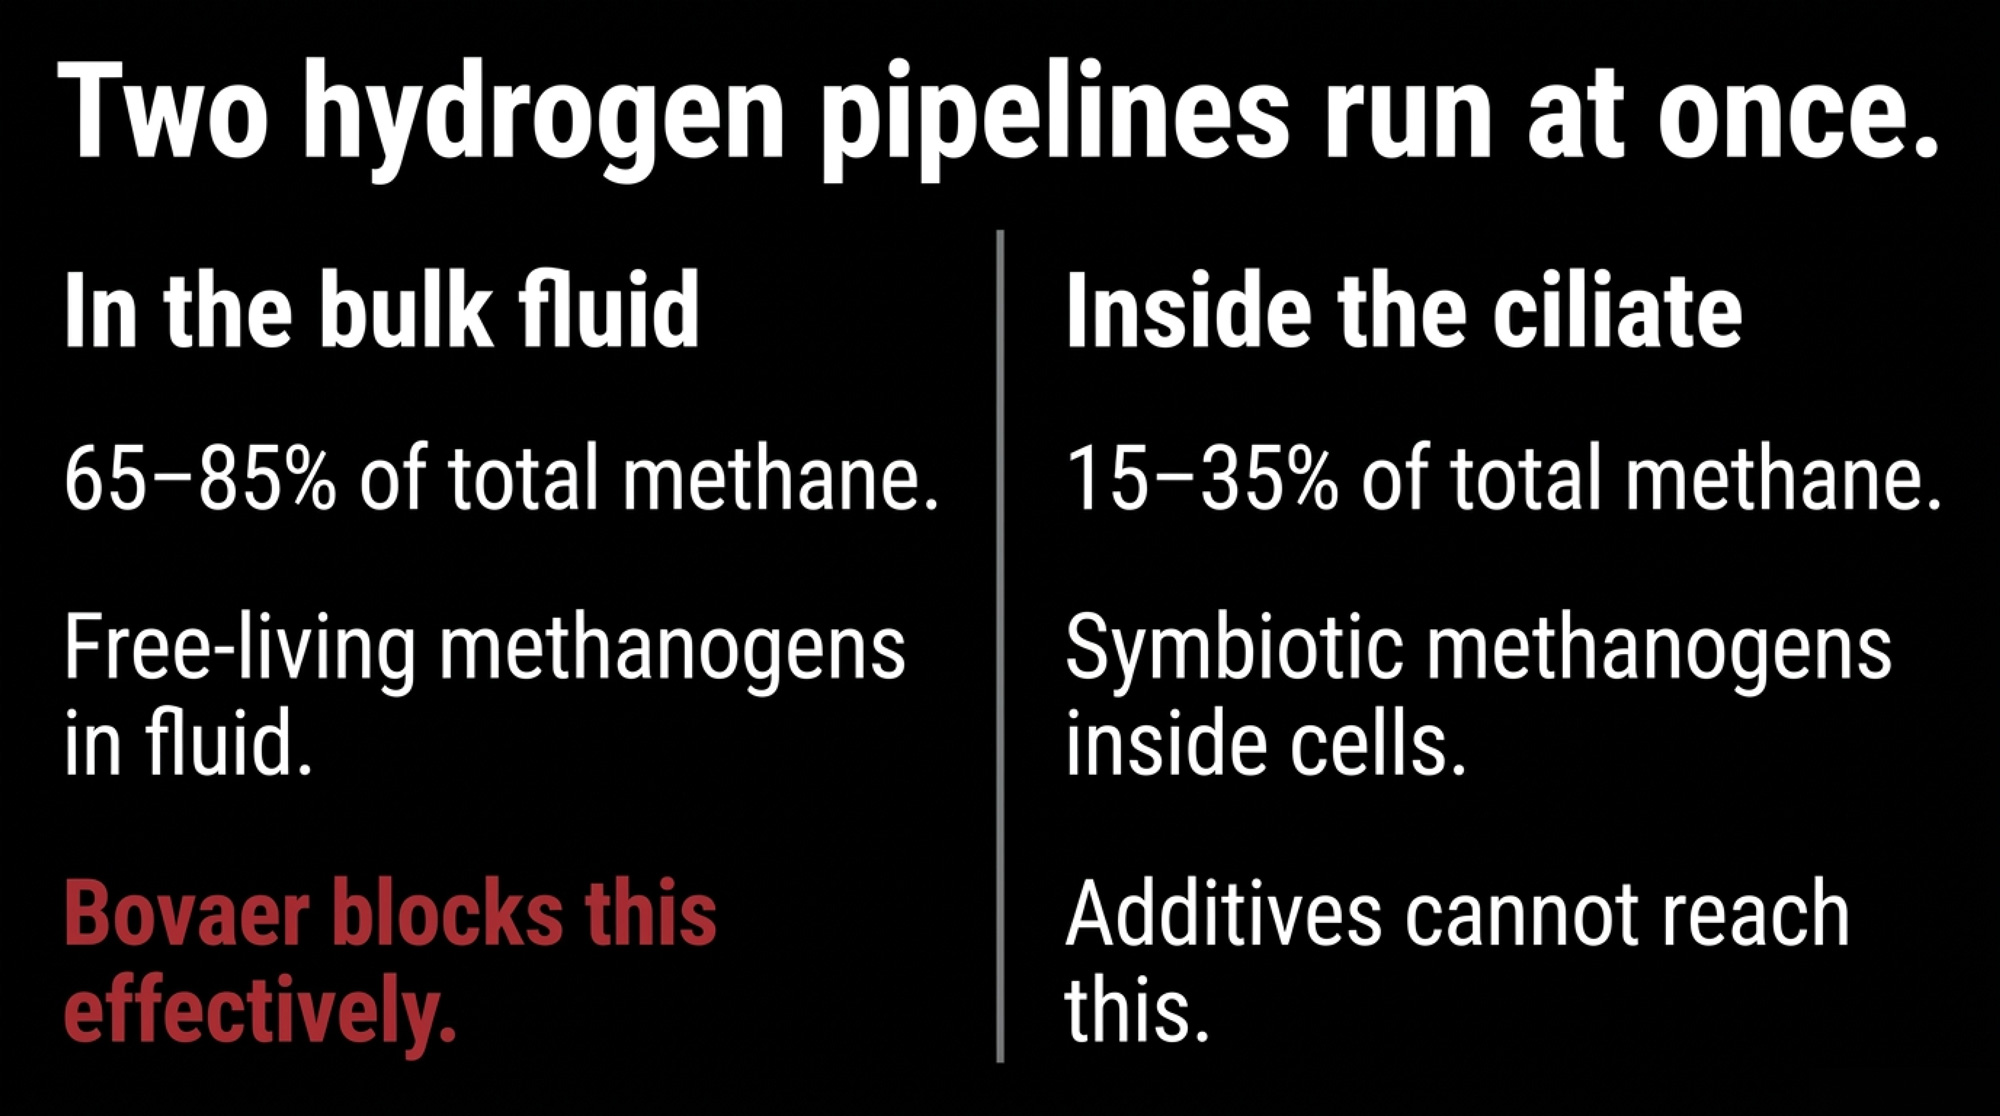
NewsSubscribe
First
Last
Consent

Ishler vs. Ferreira: The Feed‑Cost Trap Hiding $547,500 in Your IOFC

$3.75/cow/day. That’s the IOFC gap between Ishler and Ferreira — and it adds up to $547,500 on 400 cows. The question isn’t if it’s real. It’s where it’s hiding.

Executive Summary: A $3.75/cow/day gap in income over feed cost between Penn State’s Ishler benchmark and Virginia Tech’s Ferreira example adds up to $547,500/year on a 400‑cow herd. The article shows how 2026 feed and milk outlooks — corn around $4.10, soymeal near $300/ton, and milk in the high‑$19s — can swing IOFC from roughly $9.15 to $3.75/cow/day depending on whether you’re in a “soft feed,” “margin squeeze,” or “forage short” scenario. You’ll see the full barn math on a $0.75/cwt feed‑cost move (about $98,550/year at 400 cows) and how it interacts with Penn State’s $7.41/cow/day IOFC breakeven. The piece then walks through three research‑backed levers — trimming excess protein, grouping by IOFC instead of just volume, and chasing NDFD instead of tons — with per‑cow and per‑herd IOFC impacts. Finally, it gives you a 30‑minute IOFC calculation you can run with your own milk check and feed bills, plus thresholds to decide when a ration change or feed contract is actually worth at least $0.50/cow/day in IOFC.

Dairy IOFC Management

Virginia Ishler’s team at Penn State Extension runs one of the cleanest income‑over‑feed‑cost benchmarks in dairy economics: a herd averaging 80 lb/day, milk at $19.59/cwt, and feed cost at $5.90/cow/day. IOFC: $9.77 per cow per day. Down in Blacksburg, Virginia Tech’s Gonzalo Ferreira published a very different reality: 76.4 lb/day, milk at .00/cwt, and feed cost at .73/cow/day in a controlled feeding study — IOFC: .02.

That .75/cow/day gap is what a lot of mid‑size herds are actually living with — they just haven’t run the math. On a 400‑cow herd, it’s roughly $547,500/year (3.75 × 400 × 365). This isn’t about a 10¢ tweak in the corn market. It’s three variables — milk price, production, and feed cost — compounding in opposite directions while most operations only watch one number on the ration sheet.

The $7.50 Illusion

Your ration sheet says $7.50/cow/day. Maybe $7.75. Looks disciplined.

Run the full IOFC, not just the feed line. A 78‑lb cow at $18.00/cwt generates $14.04 in milk income per day (78 ÷ 100 × 18). Subtract $7.50 feed cost, and IOFC is $6.54/cow/day. Not the $8–$9 a lot of people carry around in their heads. A miss of .50–.50/cow/day is 9–5/cow/year — five‑figure money for a 400‑cow herd hiding in the gap between “what it feels like” and “what the math says.”

Ishler, Goodling, and Beck hammered on this in a 2014 Journal of Dairy Science paper built from 75 Pennsylvania dairy rations over four years. The contrarian result: the highest IOFC came from the highest total feed‑cost quartile— herds spending $6.27 or more/cow/day. Cheap rations ranked worst on IOFC.

But it wasn’t a simple “spend more” story. Milk yield and IOFC didn’t correlate with purchased feed cost alone. The herds that won on IOFC lived in the intermediate forage‑cost band — about $1.45–$1.97/cow/day for forage. Not the absolute cheapest, not the most expensive. The money came from where they spent feed dollars, not just how many dollars they spent.

Milk Price ($/cwt)Production (lb/day)Feed Cost ($/cow/day)Actual IOFC ($/cow/day)Annualized on 400 Cows
$19.5980$5.90$9.77$1,424,620
$18.0078$7.50$6.54$955,260
$18.0076.4$7.73$6.02$878,920
$17.0078$9.50$3.76$549,040
$17.0078$11.25$2.01$293,460

What Does a $0.75/cwt Feed Jump Do to a 400‑Cow Herd?

The February 2026 WASDE pegs 2025/26 U.S. corn ending stocks at 2.127 billion bushels and the season‑average corn price at .10/bu. USDA’s soymeal forecast for 2025/26 sits around $295/short ton, with subsequent March commentary and market coverage pointing toward a $300/ton season‑average as futures firm. Nearby soybean meal futures have been trading in the low-$320/ton range on the CME in late March. On the milk side, USDA’s 2026 outlook has the all‑milk price in the high‑$19s, roughly $0.75/cwt higher than earlier 2025 projections, depending on region and class mix.

On a spreadsheet, $0.75/cwt doesn’t look dramatic. On your cash flow, it’s a capital decision. A 400‑cow herd averaging 90 lb/day ships about 131,400 cwt/year (90 ÷ 100 × 400 × 365). A $0.75/cwt change in feed cost is roughly $98,550/year. That’s your robot payment. That’s the difference between building equity and explaining to your lender why principal just got tight.

Penn State’s IOFC guidance (updated 2023) frames it plainly: lactating‑cow feed cost often runs 30–70% of milk income, and IOFC is what’s left to pay heifers, dry cows, overhead, debt, and family living. When IOFC compresses $1/cow/day, your whole plan for the year shifts.

So the real question isn’t “Is $7.50/cow/day reasonable?” It’s: “Where does my IOFC sit now — and what happens if feed jumps $0.75/cwt?”

Three IOFC Scenarios You Should Run Before Summer

Let’s stay with a very normal profile: 400 cows, Holstein, 90 lb/day, U.S. basis. The TMR costs below are modeled off WASDE corn and soymeal projections applied to a standard 55%‑forage ration. Your numbers will float ±$0.50–$1.50/cow/day depending on basis, forage program, and shrink. The point is the magnitude, not arguing over pennies.

ScenarioCorn ($/bu)Soymeal ($/ton)Milk ($/cwt)Est. TMR $/cow/dayIOFC $/cow/dayAnnual IOFC (400 cows)
A – “Soft feed” window~4.00~27518.50~7.509.15≈$1,335,900
B – “Margin squeeze”~5.75~45017.00~11.254.05≈$591,300
C – “Forage short” year~4.80~34017.50~12.003.75≈$547,500

Scenario A — “Soft feed” window. Corn near $4.00, soymeal around $275, and milk at $18.50. IOFC is $9.15/cow/day, or about $1.34 million/year for 400 cows. This is when grouping, forage upgrades, and IOFC‑positive ration tweaks pay for themselves fastest. You’ve got room to move.

Scenario B — “Margin squeeze.” Corn pushes toward $5.75, soymeal into the mid‑$400s/ton range, similar to 2023 levels when Argentina’s worst drought in decades crimped soybean output and kept meal values elevated above prior‑year averages. Milk is stuck at $17.00. IOFC drops to $4.05/cow/day, or about $591,300/year on 400 cows. The gap between Scenario A and B is roughly $744,600/year.

That’s not “a tighter year.” That’s a different business model.

Scenario C — “Forage short” year. A local weather hit takes out a chunk of your corn silage. Forage that usually pencils at $80–$100/ton on‑farm now has to be bought at $200–$250/ton. TMR lands closer to $12.00/cow/day. At $17.50 milk, IOFC is about $3.75/cow/day — roughly $547,500/year on 400 cows. The difference between Scenario A and C is about $788,400.

How many herds have actually run all three scenarios on their own IOFC and feed contracts, instead of just asking “What’s corn today?” and hoping for a soft year?

It Looks Like a Feed Problem. It’s Actually a Measurement Problem.

Look at those scenario gaps — $744,600–$788,400 between good and bad years. It feels like a feed‑cost problem.

It’s mostly a measurement problem. And a pricing problem.

The Ishler vs. Ferreira contrast isn’t “Penn State feeds cheap, and Virginia Tech doesn’t.” Ishler’s benchmark herd has higher production (80 vs. 76.4 lb/day), a higher milk price ($19.59 vs. $18.00), and lower feed cost ($5.90 vs. $7.73). Any one of those variables can swing six figures at 400 cows. Most herds are watching just one.

Elliot Block, writing in Progressive Dairy, walked through a ration change where a herd pulled a proven ingredient and shaved $0.35/cow/day off feed cost. Milk and components dropped. IOFC fell $0.76/cow/day. Net, the “savings” cost $0.41/cow/day in lost margin — about $59,860/year on 400 cows. Cheaper ration. Worse economics.

Penn State’s case‑farm breakeven IOFC is about $7.41/cow/day. Below that line, the cash‑flow plan stops working without more debt or less family living. That’s the number worth taping above the feed desk.

A practical house rule in 2026: no ration change gets implemented unless it shows at least +$0.50/cow/day in IOFC on paper. On 400 cows, $0.50/cow/day is roughly $73,000/year. Below that threshold, the disruption is rarely worth it.

Move 1: Stop Paying Cows to Excrete Protein

Jonker and Kohn looked at 1,156 dairy farms in the Chesapeake Bay watershed for a 2001 paper in The Scientific World Journal and found the average farm fed 6.6% more nitrogen than NRC recommendations, boosting urinary N excretion 16%. That’s protein you’re buying, not getting paid for, and hauling out in the spreader.

Dutch agricultural accounting firm Countus benchmarked herds at 160 g vs. 180 g crude protein per kg dry matterand reported about €0.60/cow/day in extra feed cost at the higher protein level. That’s roughly €219/cow/year. On 400 cows, you’re looking at around €87,600/year in protein cost with no milk check upside if those grams never show up as higher components.

Five‑figure money sitting in the manure pit. Literally.

Here’s the simple, data‑backed check:

  • Pull your last three DHI milk urea nitrogen (MUN) reports.
  • If a group is consistently over about 14 mg/dL for 2–3 tests, you’re most likely feeding more protein than the rumen — and the milk check — need.

The first move isn’t an additive. It’s a call to your nutritionist about trimming crude protein toward roughly 160 g/kg DM while watching MUN, milk, and components for 2–3 test cycles. Cutting protein too hard without watching data, and you’ll give back what you saved. Cut with a MUN target, and you start closing a recurring IOFC leak.

Move 2: Let IOFC — Not Volume — Decide Who Eats What

Alex Bach’s 2023 Journal of Dairy Science study tracked 1,960 cows across three herds and 2,142 pen moves. Cows moved from high‑nutrient to lower‑nutrient diets and lost some milk. The economics flipped it: IOFC was positive in every case except two pen moves on two farms when diet cost savings were included.

Vita Plus dairy specialist Paulina Letelier, Ph.D., took that work into a 750‑cow dairy, reporting in Hoard’s Dairymanin August 2024. Cows moved to a low‑production diet dropped 12.2 lb/day, but ration cost dropped more, and IOFC improved when feed prices were high relative to milk.

Run that math on a slice of your herd:

  • High group: 150 late‑lactation cows on a ration costing $9.50/cow/day, averaging 70 lb/day at $18 milk.
    IOFC = 70 ÷ 100 × 18 − 9.50 = $3.10/cow/day.
  • Low group: move them to a ration at $7.50/cow/day that supports 68 lb/day.
    IOFC = 68 ÷ 100 × 18 − 7.50 = $4.74/cow/day.

That’s +$1.64/cow/day from a pen move. Across 150 cows for a full year, it’s about $89,790/year.

You gain margin. You give up some flexibility, and you have to manage pen dynamics. Push timid cows into a bad group or move cows too often, and you’ll pay in lameness and reproduction. This isn’t a “just group more” slogan. It’s a reminder that, with 2026 feed prices, IOFC should be deciding who eats what — not just “we’ve always had one high group.”

Move 3: Turn NDF Digestibility into IOFC, Not Just Tons

Three points of NDF digestibility are a harvest‑timing choice, not a product.

Oba and Allen’s 1999 meta‑analysis in Journal of Dairy Science pulled together in vitro NDF digestibility (NDFD) work on corn silage and found that for each 1‑point increase in NDFD, cows ate about 0.37 lb more dry matter and produced roughly 0.55 lb more 4% fat‑corrected milk. Michigan State University Extension built that into forage recommendations in 2018–2022 as climate pressure forced more attention to forage quality.

Take a 3‑point NDFD bump:

  • Extra milk: 3 × 0.55 ≈ 1.65 lb FCM/cow/day.
  • At $18/cwt, that’s 1.65 ÷ 100 × 18 ≈ $0.30/cow/day in revenue.

On 400 cows over 365 days, that’s about $43,800/year in milk income tied directly to forage quality — not more purchased grain.

If your 30‑hour ivNDFD numbers are under about 50%, milk and IOFC are sitting in the field. But chasing tonnage by letting corn get too mature can cost you those digestibility points. You gain tons. You give up IOFC. That trade‑off gets made with hybrid selection, kernel processing, and chop timing — long before you argue about $0.10/bu corn.

How to Calculate Your Own Income Over Feed Cost This Weekend

Before you change anything, you need one number: your current IOFC per cow per day.

Grab three pieces of paper from last month:

  • Your milk is shipped, and the number of milking cows, so that you can get lb/cow/day.
  • Your milk check to get your actual blend price in $/cwt (or producer blend price under Canadian supply management).
  • Your feeding records or invoices to get lactating‑cow feed cost per cow per day, including a realistic value for homegrown forage.

Then run the formula:

IOFC = (milk price × lb milk ÷ 100) − feed cost/cow/day

Penn State’s DairyCents tool is one way to cross‑check your IOFC against market‑based numbers in your region; Penn State Extension has used it for years to monitor IOFC against their own herd and benchmark herds. It’s not a substitute for your invoices, but it’ll tell you whether your numbers move with the broader market.

Now shock it. Add $0.75/cwt to your feed cost.

At 85 lb/day, a $0.75/cwt feed increase is about $0.64/cow/day more in feed cost (0.75 × 0.85). Subtract that from your IOFC.

  • If your current IOFC is under about $8.00/cow/day and the $0.75 shock pushes you below $7.00, you’re operating close to or under the $7.41 Penn State case‑farm breakeven. That’s thin ice heading into any feed shock. 
  • If your IOFC holds above $9.00 after the shock, you’ve got room. That’s the window where grouping, protein cuts, and forage work pay back quickest — before feed risk moves you toward Scenario B or C.

This is half an hour at the kitchen table with a calculator. Then you walk into your next nutritionist meeting, and your next lender review with a number more honest than “feed is about $7.50.”

Forward Signals: What to Watch in the Next 90 Days

You can’t control South American weather. You can control when you re‑run IOFC and how you react to changing risk.

Three signal sets matter most in 2026:

  • Acreage and yield expectations. USDA’s Prospective Plantings (late March) and June Acreage reports are the first clear reads on intended corn and soybean area. If corn acres come in light or soy acres tighten, you’re moving toward Scenario B. If 2026/27 corn ending‑stock projections in WASDE trend toward or below 1.5 billion bushels, your long‑feed view gets tighter. 
  • Your own forage inventory and quality. A local drought or wet fall that trims silage tonnage or knocks NDFD down is how Scenario C shows up first — in your bunk, not on CME. Watch ivNDFD and inventory spreadsheets with the same discipline you watch futures. 

Component pricing and premiums. CoBank’s Corey Geiger has noted that well over 90% of U.S. farm milk is now marketed on multiple components. DFA and other co‑ops report component values, adding roughly $1–$3/cwt to checks for some producers. If you’re still feeding for volume under a component system, you’re working against your milk check — and your IOFC.

What This Means for Your Operation

Change TypeTypical $/cow/day ShiftProjected IOFC ImpactAnnual Impact (400 cows)Threshold Met?
Protein trim to ~160 g/kg DM (from >180 g)-$0.60 feed cost+$0.60 IOFC+$87,600✅ Yes
Pen regroup — move coasting late-lact. cows-$2.00 ration cost+$1.64 IOFC+$89,790✅ Yes
Forage NDFD +3 pts (harvest timing)$0 direct cost+$0.30 IOFC+$43,800⚠️ Borderline
Single ingredient swap, 10¢ cheaper-$0.10 feed cost-$0.06 IOFC net*-$8,760❌ No
Add-on supplement, no ration restructure+$0.20–$0.40/dayNeeds verificationVaries❓ Needs IOFC proof
Lock forward feed contract at $4.10 cornStable vs. scenario BDefends vs. -$7.10/day+$744k vs. Scenario B✅ Strategic
  • This weekend: Calculate your IOFC per cow per day with current milk and feed prices. Write the number down. Then run the $0.75/cwt feed shock. If the shock drops you under $7.00, you’re operating below the Penn State breakeven band; you need to tighten that IOFC conversation before your banker does it for you. 
  • At your next nutritionist visit: Take your IOFC and shock numbers and make them the first agenda item. Any ration change that doesn’t show at least +$0.50/cow/day projected IOFC — about $73,000/year on 400 cows — doesn’t get implemented.
  • On protein: If MUN is consistently >14 mg/dL in a group, treat that as a specific IOFC leak. Use the 160 g/kg DM crude‑protein target and Countus’s €0.60/cow/day overfeed cost as the guardrails for your next formulation round. 
  • On grouping: If you’re feeding one high group where a third of cows are coasting, run the Bach/Letelier math on those coasters. If a pen change can add $1–$1.50/cow/day in IOFC for 100–150 cows, that’s a cleaner lever than chasing more cows or more steel. 
  • On forage: If your 30‑hour ivNDFD is under 50%, mark this year’s harvest window in red. Hybrid choice, kernel processing, chop height, and timing will show up as IOFC next year. Treat that NDFD report like a second milk check. 
  • Within 90 days: Before you lock in major feed or forage contracts for the 2026–27 season, re‑run IOFC under your own version of Scenarios A, B, and C with your contracts and your forage numbers. Print those three IOFC outcomes and take them to your lender. It changes the conversation from “we hope feed stays reasonable” to “here’s how we’ve stress‑tested our cash flow.” 

Key Takeaways

  • If you don’t have your IOFC per cow per day written down with 2026 numbers, you don’t actually know whether your ration is earning its keep. The Penn State vs. Virginia Tech benchmarks show that what feels like “reasonable feed cost” can be a $3.75/cow/day gap — about $547,500/year at 400 cows. 
  • A $0.75/cwt change in feed cost is a six‑figure event, not background noise. On a 400‑cow, 90‑lb herd, it’s about $98,550/year. Treat feed‑price moves like capital decisions. 
  • Most of the margin you’re hunting is already in your TMR and pen map. Overfeeding protein, keeping coasting cows on high‑octane rations, and ignoring NDFD are all documented IOFC leaks with fixable barn‑math behind them — not mysteries that require new tech or more cows. 
  • A house rule that fits 2026: No ration change gets implemented without a written IOFC projection, and anything under +$0.50/cow/day doesn’t make the cut. That’s roughly $73,000/year on 400 cows; below that, the churn probably isn’t worth it.

The Bottom Line

Pull your milk check. Pull your feed invoice. Run the IOFC math with a pen. Then look at your next feed contract and ask one blunt question before you sign: Does this deal defend your income over feed cost when feed jumps $0.75/cwt — or does it just make your $/cow/day ration line look cheaper on paper?

Complete references and supporting documentation are available upon request by contacting the editorial team at editor@thebullvine.com.

Learn More

The Sunday Read Dairy Professionals Don’t Skip.

Every week, thousands of producers, breeders, and industry insiders open Bullvine Weekly for genetics insights, market shifts, and profit strategies they won’t find anywhere else. One email. Five minutes. Smarter decisions all week.
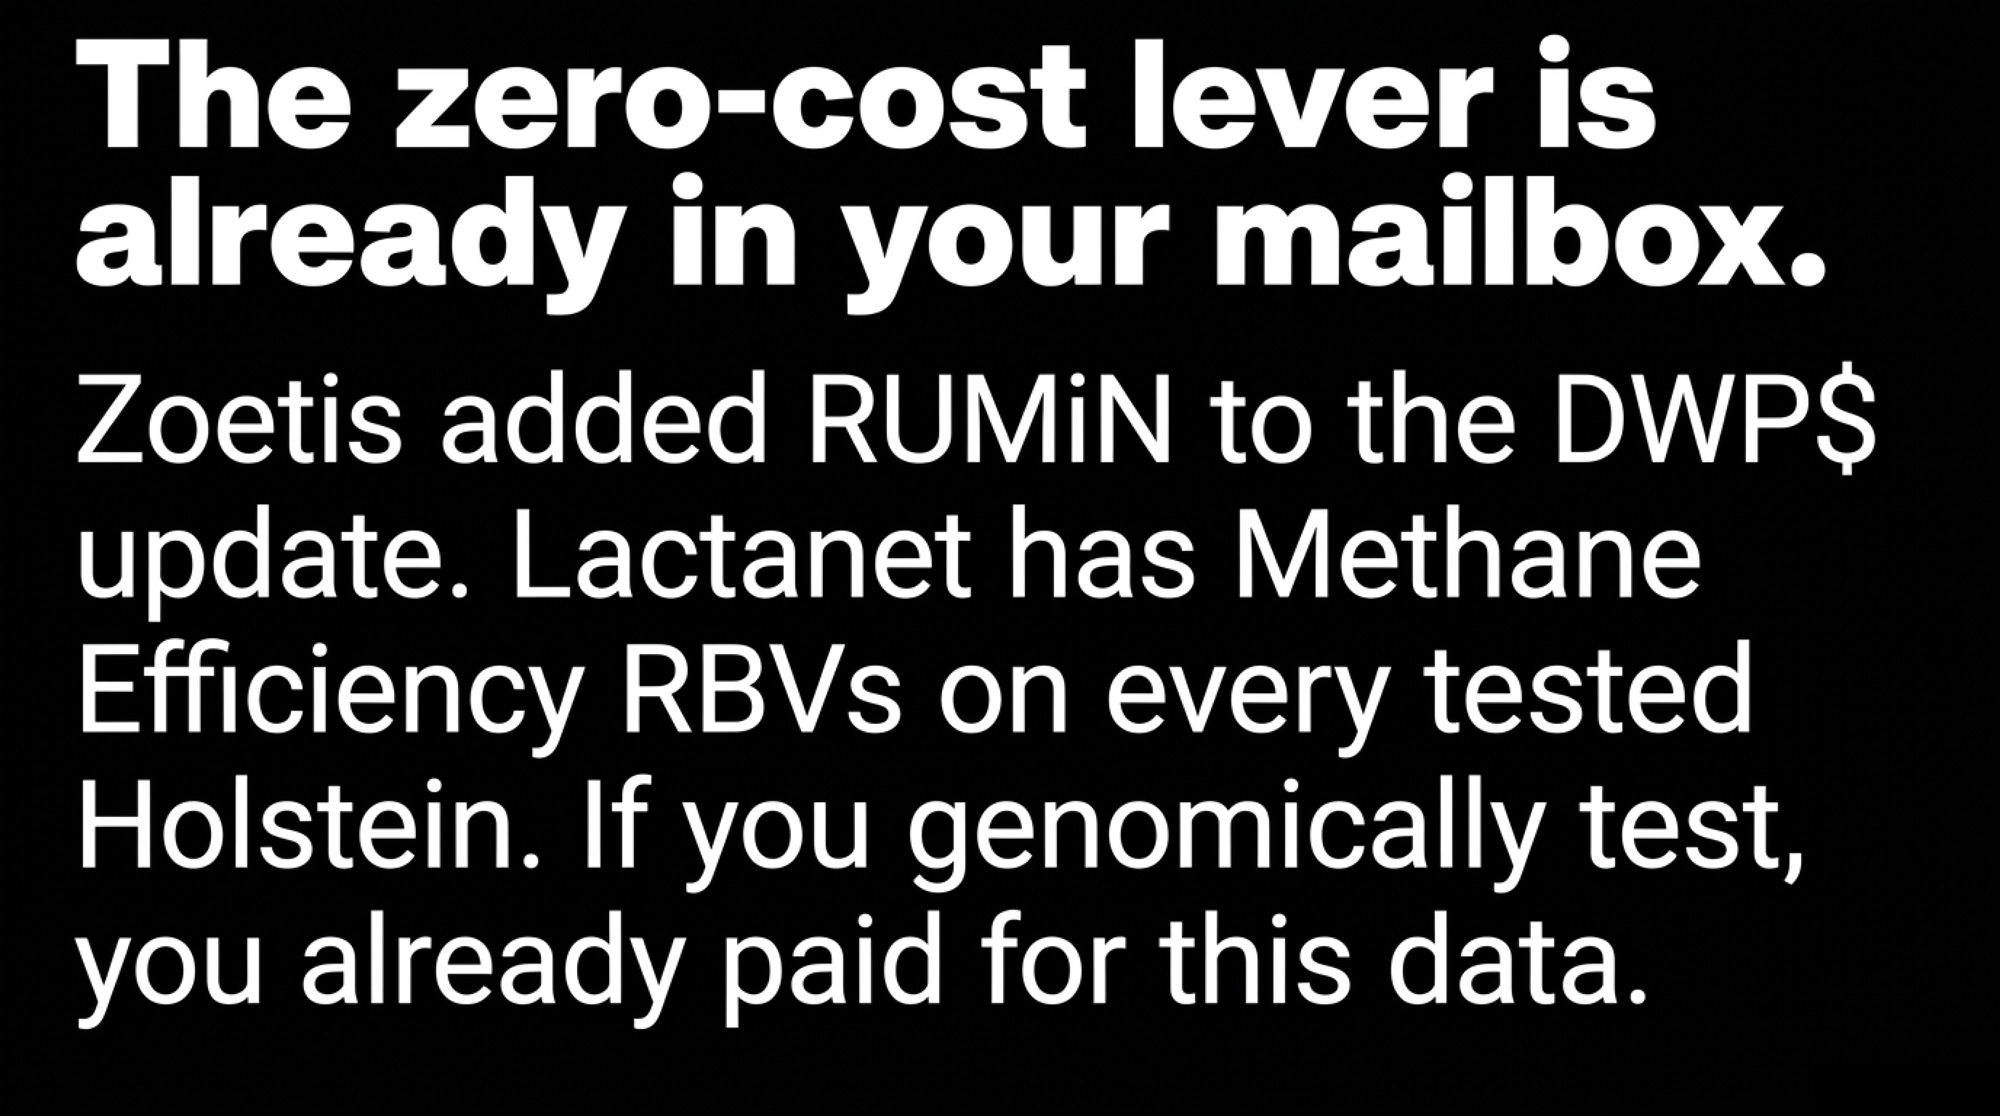
NewsSubscribe
First
Last
Consent

Why Greg Bethard Passed on Private Equity — and the $6,638‑Per‑Cow Debt Line Behind That Call

Greg Bethard told a roomful of dairy operators he doesn’t want investors — he wants partners who know what a bad milk year smells like.

“We are looking for partners, not investors.”

That’s how Greg Bethard opened his talk at the 2025 MILK Business Conference. He’s the CEO and managing partner of High Plains Ponderosa Dairy near Plains, Kansas — a rotary‑parlor operation that ships milk to the Hilmar Cheese Co. plant in Dodge City and earned the 2025 Kansas Distinguished Dairy Award. Bethard has expanded without private equity, choosing people who already understand cows and volatility over funds that want out in five to seven years. Sitting beside him on the panel were TJ Tuls, a fourth‑generation Nebraska dairy farmer, and Hank Hafliger of Cedar Ridge Dairy in Filer, Idaho. Different herds, different structures, same basic bet: keep the timeline with the cows and the family, not the fund clock.

Nearly 4 in 10 U.S. dairy farms with off‑farm milk sales disappeared between 2017 and 2022. Cow numbers barely moved — still around 9.3–9.4 million head — but milk shifted hard into fewer, bigger herds. Those herds now face a blunt question: do you take fast capital and more leverage, or do you find slower money that lets you sleep at night?

The Fork Every Growing Dairy Hits

Any serious expansion now runs into the same wall: your own balance sheet.

USDA’s 2022 Census of Agriculture shows the number of dairy operations with off‑farm milk sales fell from 39,303 in 2017 to 24,082 in 2022 — almost 12,000 farms gone, roughly a 39% decline. Over that stretch, total cow numbers held near 9.3–9.4 million while milk volume climbed about 5%. Just over 2,000 herds with 1,000‑plus cows now produce about two‑thirds of the country’s milk by value, according to Census analysis and Rabobank estimates. PE funds look at that curve and see a defensive thesis. People still buy food in a downturn.

You know the other side of it. A heifer you raise this year won’t really pay back until her second or third lactation. You invest for years before you know whether genetics and cow‑care decisions actually worked. When you finance that biology with a five‑ to seven‑year buy‑grow‑flip model, something gives — either the cows, the capital, or your control.

Three Families, Three Very Different Paths

What made the MILK Business panel worth paying attention to wasn’t just that Bethard, Tuls, and Hafliger all said no to PE. It’s that each built a completely different alternative — and accepted the trade‑offs that came with it.

OperatorCapital ModelStructureGeographic AnchorCore Trade-OffExit Timeline
Greg Bethard— High Plains Ponderosa Dairy, KSPatient ag-industry partners; no PEPrivate partnershipPlains, KS → Hilmar Cheese, Dodge CitySlower growth; full cow-level decision controlNone — family timeline
TJ Tuls — Nebraska, DARI ProcessingBank + infrastructure lenders for $165M greenfield plantFamily + lendersSeward Rail Campus, NEConcentration risk; construction/ramp-up execution riskNone — generational build
Hank Hafliger— Cedar Ridge Dairy, IDFamily equity + bank debt; no outside shareholdersMulti-site family unified businessFiler, ID (moved from CA)High people/alignment demands across kids and in-lawsNone — family-controlled
PE-Backed Generic ModelPrivate equity fund; limited partnersFund-controlled; DSCR covenantsProcessor clusters; “packageable” geography5–7 yr hold period; drag-along exit rights; covenant restrictions5–7 years (fund clock)

TJ Tuls went vertical. His family is building DARI Processing at Nebraska’s Seward Rail Campus — reported in mid‑2025 coverage as the state’s first major greenfield dairy plant in more than six decades. Trade and state sources peg the project at about $165 million, designed to handle roughly 1.8 million pounds of milk per day, with groundbreaking in 2025 and start‑up targeted around 2027. When asked where he’d build a new dairy, Tuls didn’t hesitate: “Close to a milk plant.” His family decided to be the milk plant. Their capital partners are lenders and infrastructure‑focused entities, not limited partners, grading them on quarterly IRR.

The trade‑off is concentration. If DARI hits a rough patch — construction overruns, a slower ramp‑up, margin squeeze — every part of the family’s operation feels it. You swap processor dependency for execution risk. Not every family wants that exposure.

Hank Hafliger went structural. Cedar Ridge Dairy started in California before the family moved the operation to Filer, Idaho. Today, Hank owns it with three of his children and their spouses, running multiple dairy sites as a single unified business. No PE fund. No outside equity. Bank debt, retained earnings, and a family agreement that everything lands in one bucket. “By running them as one, we don’t have that ‘my dairy is doing better than yours’ conflict,” Hafliger told the crowd. “It’s about maturity, learning to relax and let things happen rather than trying to force them.”

That model asks a lot of people, not just paper. Not every family can operate three sites as one business without it fracturing. When it works, you get alignment across kids, in‑laws, and locations. When it doesn’t, the damage runs deeper than dollars.

Bethard went for patient partners with ag scars. High Plains Ponderosa has grown by bringing in people who already know what a bad milk year feels like — not financial sponsors planning a sale before the heifers from this year ever calve. He’s honest about the early expansion learning curve. “We have our 10,000 hours of experience now,” he said, borrowing Malcolm Gladwell’s mastery concept. “We’re going to screw stuff up. There are going to be bad days… But we keep going at it, and we’ll get it figured out.”

You don’t get to 10,000 hours if the business plan has a Year 6 expiration date.

What Does $6,638 of Debt Per Cow Actually Look Like?

Here’s where this stops being theoretical and starts hitting your spreadsheet.

Cornell’s July 2025 bulletin “Comparing New York dairy farm characteristics, costs, and returns by profitability, 2024” (PD‑2025‑08‑01) sorted 129 New York dairy farms into earnings quartiles. The patterns are stark. More profitable herds consistently carried less debt per cow, held stronger debt coverage ratios, and produced milk at a substantially lower cost per cwt than the least profitable group. In that dataset, the highest‑earning quartile averaged about $2,997 of debt per cow with a debt coverage ratio north of — roughly five dollars of cash flow for every dollar of scheduled principal and interest. The lowest‑earning quartile? About $6,638 per cow, with coverage under . Cash flow couldn’t cover the payments. And this was during a year when average net farm income per cow jumped sharply.

Even in one of the best income years in recent memory, the most leveraged herds couldn’t comfortably service their debt.

The cost‑of‑production gap runs parallel. Cornell’s public DFBS tables show top‑quartile farms producing milk several dollars per cwt cheaper than the bottom group — a function of better feed efficiency, labor productivity, and fixed‑cost absorption. Using a spread of roughly $6.53/cwt between the top and bottom quartiles, run that through a real herd: 2,000 cows shipping 280 cwt per cow per year gives you 560,000 cwt. Multiply by $6.53, and you’re looking at approximately $3.66 million per year in operating‑cost difference. Same milk prices. Same feed markets. Very different bank statements.

That’s New York data, not a national average — your region’s numbers will look different. But the pattern between top and bottom tends to hold across state farm‑business summaries. When any capital source — PE or otherwise — pushes you toward that $6,600‑per‑cow neighborhood before your earnings and cost structure say you belong there, the term sheet isn’t your biggest problem. The math is.

Is the Deal Built to Pencil — or Built to Sell?

This is the economic question you actually live with: can you still hit your numbers when things go sideways?

Highly leveraged structures — PE‑backed or just aggressive debt — usually come with tighter covenants than a traditional bank expansion. DSCR floors, restrictions on new borrowing, caps on capex, and sometimes approval requirements on major operational changes. None of that bites when milk is good, and feed is reasonable. It bites when you need breathing room.

You’ve probably had that year already. Health wreck, feed quality issue you chase for months, or a long run of heat that drags component tests. Your instinct says: slow expansion, keep youngstock, invest in a dry‑cow barn or fans, buy time to reset. Tight covenants can push in the opposite direction: freeze spending, delay maintenance, and more milk per stall. That’s the structural conflict Bethard described on the panel — not that PE is evil, but that the contract can force you to make the opposite call from what your gut and cows are telling you.

Then there’s drag‑along language. Many PE shareholder agreements give the fund the right to force a sale of the whole business when they exit. In corporate settings, that’s standard. On a family place, depending on how it’s written, it can short‑circuit a slow‑build succession plan. Cross‑industry family‑business research consistently reports that only about 30% of family businesses transition to the second generation, and fewer than 12–13% make it to the third. Contract provisions that accelerate a sale timeline don’t improve those odds.

Before you stare at the check size, it’s fair to ask: Is this structure built to pencil through your worst 12‑month stretch, or is it built to be easy to sell?

Can You Still Make Cow‑Level Decisions When Covenants Control the Budget?

This is the operational version of the same question.

Ask anyone who’s lived under tight covenants. The day‑to‑day pressure doesn’t feel like “capital structure.” It feels like arguing with your own spreadsheet about things you’d normally just do..

Do you need a lender sign‑off to build that fresh‑pen addition you know would take stress off transition cows? Does a board have to agree before you hang more fans, add a hoof‑trimming visit, or keep more heifers this year instead of selling? On paper, those are capital‑allocation decisions. In the barn, they’re cow‑care decisions that directly change milk, longevity, and cull rates.

Bethard was blunt on this point. When you pick partners, you’re also picking who sits at the table when there’s a tough quarter. He wants people who understand that holding onto extra heifers in a bad year can be the best long‑term move, even if it drags DSCR in the short run.

If a deal puts you in a position where every down‑cycle adjustment needs outside permission, you haven’t just sold equity. You’ve sold a chunk of how you manage cows.

Is Your Expansion Built to Stay — or Built to Flip?

Location exposes what you really believe about your time horizon.

Bethard told the audience that if he were siting a new dairy today, he’d look for “low environmental risk and a place without a lot of people.” Fewer neighbors, less legal risk, more room to run. Tuls’ answer was short: “Close to a milk plant.” For him, that means DARI — because that’s the anchor his family is building generations around.

Investors running a shorter‑term play often think about geography differently. They like production clusters that can be packaged with processing capacity and sold together: multiple herds within hauling distance of a plant, good roads, a neat story for the next buyer. That doesn’t automatically make a site wrong for a 40‑year plan. But it means you need to double‑check the long‑term water, permitting, and community story — not just the current land price.

Bethard noted you need a contract before you can even build now. That reality has pushed new capacity toward regions like western Kansas and the I‑29 corridor, where processors like Hilmar and Valley Queen are pulling milk into existence rather than chasing existing herds. If you’re choosing a spot for your grandkids to renew contracts in 2045, that’s a completely different filter than picking the easiest site to sell in 2032.

Options and Trade‑Offs for Farmers

You don’t need a PE term sheet on your desk for this to matter. Any expansion that stretches your balance sheet forces you to pick a path.

PathTypical Debt/CowDSCR in Bad YearCow-Level Decision ControlExit PressureBest ForYellow / Red Flag
1. Traditional Debt + Patient Bank~$2,997–$4,500>1.25× if sized rightFull — no outside approvalNoneSolid profitability, clean financials, moderate growth🔴 Red if debt pushed past ~$5,500/cow
2. Strategic Partners (No Fund Clock)$3,500–$5,500>1.0× if structured correctlyHigh — per operating agreementMinimal if agreements are written rightExpansion beyond bank capacity; multigenerational family🟡 Yellow if partners want short-term return hurdles
3. Private Equity / PE-Style Equity$4,500–$6,638+May drop below 1.0× under covenantsReduced — capex/hiring may require board approvalHigh — 5–7 yr hold, drag-along rightsRapid roll-up, processing integration, very large facilities🔴 Red if DSCR <1.0× in bad-year scenario
4. Slow-Build / Do Less, Better<$3,500Typically >1.5×Full — sole-prop or tight familyNoneOperations with sub-optimal cost structure needing reset🟡 Yellow if facility is fundamentally inefficient

Path 1: Traditional Debt + Patient Partners

When it makes sense: You’ve got solid profitability, reasonable leverage, and a lender who understands your history. Your debt per cow sits closer to that top‑quartile DFBS band than the most leveraged group, and your coverage ratio stays above roughly 1.25× even when you run a bad‑year scenario.

What it requires: Clean financials, believable projections, and genuine working capital. In Cornell’s 2024 DFBS, the most profitable quartile held substantially more working capital relative to operating expenses than the least profitable group. You don’t need to match any specific benchmark exactly, but you need real cushion — not wishful thinking.

Risks and limits: You’re still exposed to milk price and interest‑rate swings. Size the project too aggressively relative to your earnings, and the “traditional” deal lands you in bottom‑quartile debt territory without a PE fund anywhere in the picture.

30‑day action: Pull your last 12 months of financials this month and calculate three numbers:

  • Debt per cow (total liabilities ÷ milking cows)
  • Debt coverage ratio (cash available for debt service ÷ scheduled principal + interest)
  • Working capital % ((current assets − current liabilities) ÷ annual operating expenses)

Then run your worst 12‑month stretch from the last five years through your next‑step plan. If this structure keeps DSCR above ~1.25× in that bad year, it stays on the table. If it drops below 1.0×, the red flag goes up.

Path 2: Strategic Partners Without a Fund Clock

When it makes sense: You need more capital than your bank will supply alone, but you want partners who’ll stay through cycles — family members, neighbors, or agribusiness investors who aren’t running a 5‑ to 7‑year fund. This is the space Bethard lives in, and it’s what Hafliger built with his kids and spouses across multiple Idaho sites.

What it requires: Hard conversations about control. Operating agreements that spell out who decides what: capex thresholds, hiring and firing senior managers, land purchases, and dividend policy. A common understanding that you’re building for 20–40 years, not dressing the place up for a sale.

Risks and limits: People risk. These deals fall apart when expectations around distributions, lifestyle, or succession were never put on paper. Even without PE, your partners may still want tighter covenants than a simple family sole‑prop structure.

Signals to watch: If a potential partner insists on sale or IPO timelines, short‑term return hurdles, or aggressive drag‑along rights, you’re drifting back into fund‑clock land. That’s not automatically wrong — but call it what it is.

Path 3: Private Equity or PE‑Style Outside Equity

When it makes sense: You’re chasing a very specific play: rapid multi‑site roll‑up, vertical integration into processing, or a large‑scale facility where the check size isn’t realistic any other way. Teams like Tuls’ on the processing side live near this territory, even if their specific capital stack isn’t classic PE.

What it requires: Exceptional cost of production, real management depth, and a story that sells in a boardroom as well as it does in the parlor. You need a cold‑eyed lawyer walking you through every clause: covenants, drag‑along, tag‑along, non‑competes, and reserved matters.

Risks and limits: The fund’s holding period is usually 5–7 years. That’s a heifer and a half. If milk prices and interest rates don’t cooperate, pressure to hit IRR targets can show up as stalled maintenance, pushed cows, or delayed people investments. At the family level, drag‑along language can force a sale on a timeline that doesn’t match the next generation’s readiness.

Forward‑looking signals: Where are interest rates headed over the next 3–5 years? How tight are current milk‑supply contracts in your region, and how long are they written for? Are lenders and investors pricing in environmental and labor risk — or assuming they’ll be gone by the time it matters?

Path 4: Slow‑Build or “Do Less, Better”

When it makes sense: Your numbers don’t justify aggressive leverage, you don’t like the idea of outside veto power, and there’s still a path to solid profitability by tightening the cost of production and modestly growing components instead of cow numbers.

What it requires: Patience. Relentless work on cost per cwt instead of headline herd size — feed efficiency, cow longevity, reproduction, labor efficiency. In DFBS data, the most profitable, lower‑debt farms didn’t just borrow less; they also produced milk several dollars per cwt cheaper. That combination is what gives them room to breathe.

Risks and limits: You may age out of opportunities if processors shift or neighbors move faster. And if your current facility is fundamentally inefficient, no amount of small tweaks fully fixes that.

Forward‑looking signals: Watch how processors tweak premiums in your area, what they say about components, and whether they start writing water‑ or sustainability‑linked clauses into contracts. That tells you how far a “do less, better” strategy can carry you where you sit.

Key Takeaways

  • If your expansion plan pushes debt past the mid‑$6,000s per cow, treat that as a hard yellow light.Cornell’s 2024 DFBS shows the lowest‑earning New York quartile at about $6,638 per cow with debt coverage under 1×, even in a strong income year. Top earners sat near $2,997 with coverage above 5×. 
  • If one capital structure survives your worst recent 12‑month stretch and another fails the DSCR test, believe the math. Run both through your ugliest year. The structure that keeps coverage above roughly 1.25× when everything goes wrong is the one you can build on.
  • If you can’t approve cow‑comfort or youngstock spending in a down year without outside sign‑off, someone else is making your cow‑level calls. Any deal that pulls basic barn decisions into board or lender approval changes how you manage stress years. 
  • If there’s drag‑along language, understand what it can force — and when. Cross‑industry benchmarks say only about 30% of family businesses survive to the second generation and fewer than 13% reach the third.  You don’t want contract terms cutting those odds even further. 

The Bottom Line

Hafliger’s grandkids are already counting cows. Bethard talks about 10,000 hours of expansion scars. Tuls is backing a $165 million plant with no exit date in the plan.

None of them got there quickly. All of them got there on terms they chose.

So here’s the question worth sitting with: five years from now, do you want to be explaining your decisions to a board — or to your kids?

We’re building the full debt‑per‑cow stress‑test model now — covenant math, leverage thresholds by herd size, and a PE‑vs‑partner calculator you can drop your own numbers into. Watch for it in The Bullvine Weekly and our follow‑up economics deep dive.

Source note: Quotes and panel insights are drawn from MILK Business Conference coverage in Dairy Herd Management. Financial patterns are based on Cornell’s 2024 Dairy Farm Business Summary bulletin, “Comparing New York dairy farm characteristics, costs, and returns by profitability, 2024” (PD‑2025‑08‑01).

Learn More

The Sunday Read Dairy Professionals Don’t Skip.

Every week, thousands of producers, breeders, and industry insiders open Bullvine Weekly for genetics insights, market shifts, and profit strategies they won’t find anywhere else. One email. Five minutes. Smarter decisions all week.
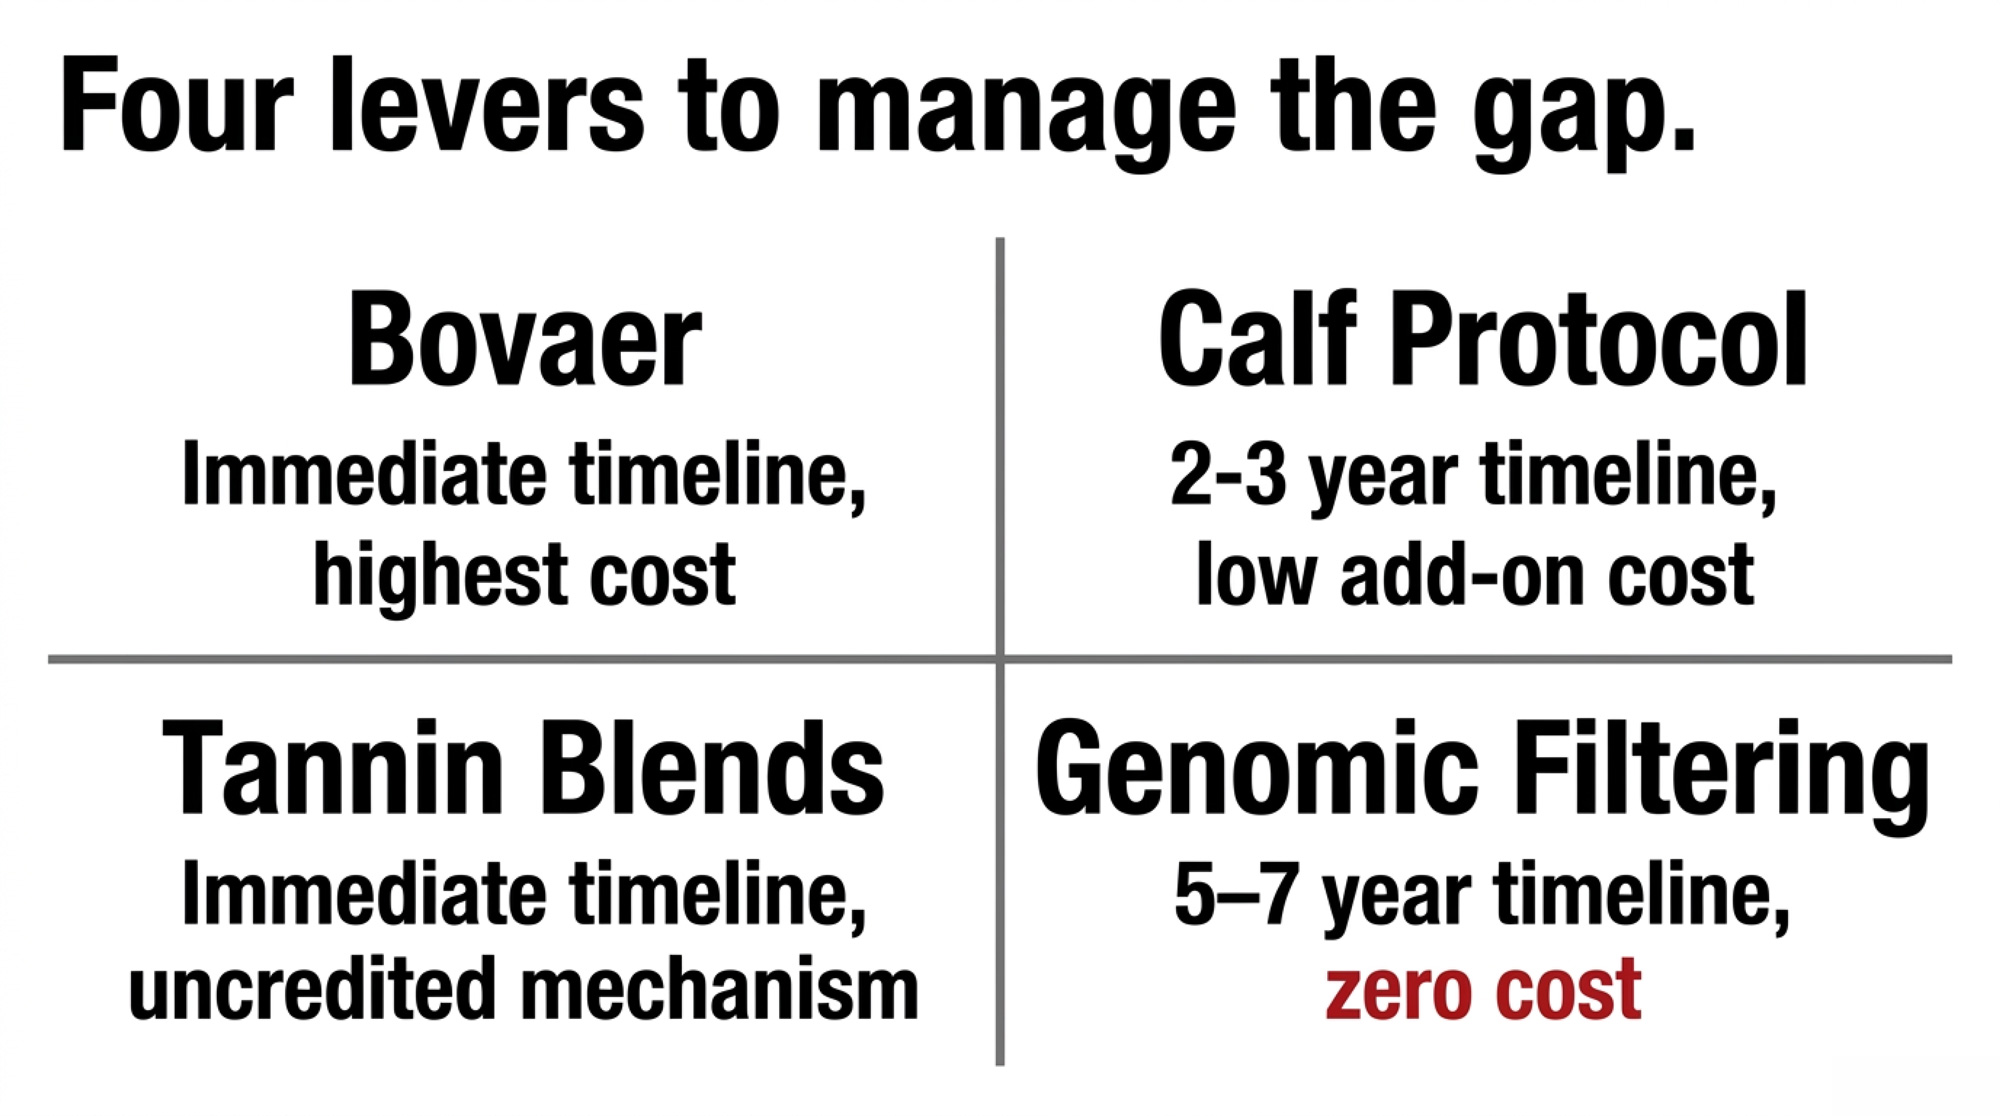
NewsSubscribe
First
Last
Consent

A Wisconsin Herd’s DCAD Said −120. A 50‑Cent Urine Strip Said Otherwise.

When a Wisconsin dairy finally tested urine pH, their “negative” ration was doing exactly nothing — and the latest research says they’re far from alone.

Executive Summary: One herd in a published six-farm investigation was feeding negative DCAD at −100 to −160 mEq/kg DM and still averaged a urine pH of 7.2 — functionally alkaline — because 15.2 inches of bunk space caused enough sorting to gut the diet entirely. Goff’s 2025 meta-analysis (660 multiparous Holsteins across 9 studies) now provides parity-specific targets: 5.5–6.0 for 2nd–3rd lactation, 6.2–6.8 for 4th-plus cows, where dropping below 5.75 actually harms calcium status. The safety case for full acidification is stronger than the industry’s been acting — Graef’s trial put fully acidified cows at just 3.5 mmol/L urinary ammonium with blood pH steady at 7.39–7.41. SCH runs $125 to $226.46 per affected cow, depending on the model, and at 45–80% multiparous incidence, a 130-multiparous-cow herd faces $6,500 to $11,777 per year in avoidable drag. With the CDC’s 2.3% farmgate increase tightening input scrutiny in 2026, a 50-cent urine strip and 10 close-up cows will tell you whether your DCAD dollars are working in the cow or just living on the ration sheet.

Negative DCAD monitoring

You’re probably paying for a DCAD program you aren’t actually getting. In Wisconsin, the Schaefer family thought their −120 mEq/kg close‑up ration was bulletproof. The “Animate” bill was paid, the spreadsheet looked perfect, and the cows looked fine.

Then they finally dipped a 50‑cent urine strip. The average pH in their close‑up pen was 7.5. Their “negative” DCAD was doing exactly nothing. When they and their nutritionist rebuilt the ration actually to hit a 5.5–6.0 urine pH, their fresh‑cow list quietly shrank — fewer slow starts, fewer mild ketotics, and less time babysitting older cows in the first week fresh.

They’re not alone. In a published field investigation across six herds all feeding correctly formulated negative‑DCAD TMRs, one farm averaged a urine pH of 7.2 — not because the ration was wrong on paper, but because 15.2 inches of bunk space per cow caused enough sorting to neutralize the acidogenic diet entirely. The ration analyzed fine. The cows weren’t eating it the way the model assumed.

Here’s the twist the latest research adds: in fully acidified cows, the average urinary ammonium is just 3.5 mmol/L. That low ammonium number shows that low urine pH by itself does not equal acidosis danger. The real warning isn’t “don’t go too low.” It’s “stop being too timid” — because staying alkaline is what keeps subclinical hypocalcemia quietly chewing through your margins. With the CDC’s 2.3% farmgate price increase effective February 2026, pushing input scrutiny higher than ever, you can’t afford to keep writing checks for a program that isn’t actually working in the cow.

Why That 3.5 mmol/L Number Really Matters

In a recent trial led by Graef, Holsteins on a fully acidogenic pre‑fresh ration landed at a mean urine pH of 5.57 — squarely in the full‑acidification zone. The eye‑opener was their urinary ammonium.

Those cows averaged only 3.5 mmol/L of ammonium, far below the levels associated with systemic over‑acidification. Constable’s work on net acid excretion suggests two guideposts worth knowing:

  • At around 10 mmol/L, urinary ammonium is a reliable indicator of systemic acidification.
  • Once ammonium climbs above roughly 20 mmol/L, blood pH tends to drop by about 0.02 units — that’s where acid‑base safety becomes a real concern.

In the Graef work, cows never got close to either line at a urine pH most of us would call “aggressive.” Blood pH stayed in the 7.39–7.41 range, and serum bicarbonate sat at or near the lower edge of the typical 22–30 mmol/L window in related negative‑DCAD studies.

When your ration is properly balanced, full acidification (urine pH 5.5–6.0) operates safely within the cow’s compensation system. The danger zone isn’t “anything below 6.5.” It’s keeping cows alkaline because you’re afraid of numbers that the research says are actually safe.

How Low Is Too Low — And For Which Cows?

A 2025 meta‑analysis led by Jim Goff pulled together data from 660 multiparous Holsteins across nine studies to answer the question that really matters in the barn: which pre‑fresh urine pH ranges line up with better blood calcium after calving?

The answer changes with parity:

  • For 2nd‑ and 3rd‑lactation cows, the big step is just getting them out of the alkaline zone. Cows with prepartum urine pH below 7.75 had significantly better calcium status than those above that threshold, and driving pH lower within the acidified band didn’t provide much additional benefit.
  • For 4th‑lactation and older cows, the sweet spot is narrower. Cows with urine pH between 6.26 and 6.75 had the highest blood calcium nadirs, while cows above 7.25 or below 5.75 showed poorer calcium outcomes.

That moves you from a one‑size‑fits‑all DCAD target to a parity‑specific playbook.

Urine pH Targets by Parity

Cow GroupTarget Urine pHBlood Calcium OutcomeKey ThresholdRisk if Outside Range
2nd–3rd Lactation5.5–6.0Best Ca status; strong fluxpH must drop below 7.75Staying alkaline (>7.75) impairs Ca
4th Lactation+6.2–6.8Peak Ca nadir in this bandSweet spot is narrower<5.75 harms Ca status
4th Lactation+>7.25Poor blood calcium nadirSame group, high endAlkaline = no DCAD benefit
Any parity — Danger<5.5Ca status trends wrongVery low DCAD (~−220)Uncompensated metabolic acidosis

If you’ve watched a mixed‑parity close‑up pen, you’ve likely seen this play out already. Second‑ and third‑calvers usually cruise on a hot close‑up ration. It’s the 4th‑ and 5th‑lactation cows that look duller, lose more condition, or keep showing up on the fresh‑cow problem list when the diet is pushed as hard as the youngsters’.

What Does “Safe” Full Acidification Actually Look Like?

Pull the DCAD research together, and the safety story is clearer than the coffee‑shop debates.

From recent trials and reviews:

  • Fully acidogenic diets drop urine pH into the 5.5–6.0 band, but blood pH hangs around 7.39–7.41, well above the 7.30 “start to worry” threshold for systemic acidosis.
  • In a 2022 JDS study, very low DCAD treatments reduced serum bicarbonate by about 8–9%, landing near the lower edge of the 22–30 mmol/L reference range; more moderate negative DCAD diets kept bicarbonate comfortably within normal limits.
  • In a Florida trial by Zimpel and colleagues, cows on a strong fully acidogenic program had urine pH around 5.4, but still carried ≈25 mmol/L bicarbonate — squarely normal.
  • The real trouble shows up in extremely negative DCAD experiments. A “very low DCAD” diet around −220 mEq/kg DM pushed cows into uncompensated metabolic acidosis with lower blood pH, depressed intakes, and clear metabolic strain. In a separate herd case, dry cows on a diet near −143 mEq/kg DM had urine pH in the 5.2–5.8 range; when the diet was adjusted to about −53 mEq/kg DM, postpartum blood calcium didn’t change — only the acid load and metabolic strain improved.

In practice, negative DCAD diets in roughly the −100 to −150 mEq/kg DM range, paired with adequate fiber and minerals, tend to put cows in a compensated metabolic acidosis zone — enough to prime calcium metabolism without pushing blood pH into dangerous territory.

The real‑world risk for most herds isn’t “too low” DCAD. It’s never getting low enough in the right cows, or pushing the oldest cows too far, because nobody ever checks a strip.

BiomarkerNormal Reference RangeGraef Trial (Urine pH 5.57)Systemic Acidosis ThresholdStatus
Blood pH7.35–7.457.39–7.41<7.30✅ Normal
Serum bicarbonate (HCO₃)22–30 mmol/L~22–24 mmol/L (low-normal)<18 mmol/L✅ Within range
Urinary ammonium (NH₄)3.5 mmol/L>10 mmol/L (systemic marker)✅ Far below threshold
Urinary ammonium (NH₄)3.5 mmol/L>20 mmol/L (blood pH drops)✅ Far below threshold
Urine pH5.57Not a direct danger indicator✅ Target achieved

How Much Is Subclinical Hypocalcemia Really Costing You?

You see the classic downer cows. The quieter hit comes from subclinical hypocalcemiacows that stay standing but run with low blood calcium for a day or two after calving.

Reviews and field surveys suggest SCH often hits 25–40% of first‑calvers and 45–80% of multiparous cows in high‑producing herds. That means roughly half or more of your older cows may be affected. Those are the ones that calve “fine,” then quietly drag around mild ketosis, metritis, DAs, and a few extra weeks open.

On the economics side:

  • Progressive Dairy / University of Minnesota model built around a 1,000‑cow herd estimated SCH‑related losses — added disease, culling, and lost milk — at $67,938, or $226.46 per affected cow.
  • Prince Agri/Progressive analysis uses a more conservative $125 per SCH case and roughly $300 per milk fever case, while still accounting for both health and production impacts.
  • A 2022 study from North‑West Ethiopia estimated SCH losses at 3,026.25 ETB per cow per lactation, which the authors converted to about US$69.6 for their conditions.

Taken together, a realistic SCH cost range is around US$60 to US$ 226 per cow, depending on milk price, herd health, and how broadly you count ripple effects.

Micro barn math: what that looks like on your farm

Come back to a 200‑cow herd like the Schaefers, with 130 multiparous cows. Even if 40% of those multiparous cows are subclinically hypocalcemic — a conservative number given that 45–80% range — that’s 52 SCH cows in a year.

At the $125 per‑case estimate:

  • 52 cows × $125 ≈ $6,500 per year in SCH‑linked losses.

At the $226.46 per‑case estimate:

  • 52 cows × $226.46 ≈ $11,777 per year.

If your “negative DCAD” program isn’t actually lowering that SCH burden — either because it’s not acidifying cows or it’s hammering the wrong cows — you’re spending money on the right idea and the wrong execution.

How Much Milk Are You Leaving on the Table?

The cost of SCH isn’t just in vet work and displaced abomasums. It’s also milk that never hits your bulk tank.

A series of trials looked at fully acidogenic pre‑fresh diets combined with higher dietary calcium — roughly 1.5–2.0% of diet DM — and followed cows through the first two months postpartum. Across those studies:

  • Cows on negative DCAD plus higher calcium showed stronger calcium flux around calving, maintained or improved pre‑fresh DMI, and had higher postpartum DMI than cows on low‑calcium acidogenic diets.
  • Those same cows produced more energy‑corrected milk (ECM) in early lactation than cows on positive DCAD or low‑calcium fully acidogenic diets.

Keep the barn math conservative. Say that program buys you 1 kg/day of ECM for the first 60 DIM in your multiparous cows. In that 200‑cow herd with 130 multiparous cows, that’s:

  • 130 cows × 1 kg/day × 60 days = 7,800 kg of extra ECM.

Use the Ontario blend value of about $0.85/kg — based on DFO’s June 2025 average net of $87.96/hL after deductions — and you get:

  • 7,800 kg × $0.85 ≈ $6,630 in extra milk revenue in the first two months of lactation.

(Note: these calculations use $0.85/kg based on Ontario’s June 2025 net blend; adjust to your local mailbox price. With the CDC’s 2.3% farmgate increase effective February 2026, your local number may now be slightly higher.)

Even if the real bump on your place is half that, you’re still talking several thousand dollars a year on top of avoided SCH‑linked disease. But you can’t tap any of that upside if the cows in front of you never actually reach the acidification zone you think you’re feeding for.

Is Your DCAD Program Actually Hitting Its pH Target?

The economic question underneath all of this is simple: Is your DCAD program working in the cows, or just on paper?

That published field investigation across six herds shows just how common the gap is. All six farms delivered TMRs that analyzed at a DCAD of −100 to −160 mEq/kg DM — right where they should be. All used the same commercial anionic product. But when urine pH was systematically collected from randomly selected multiparous cows over three days, not all farms met the 5.5–6.0 target. Farm 2 averaged 7.2 — functionally alkaline despite a correctly formulated ration. The culprit: 15.2 inches of bunk space per cow, which caused enough sorting and DMI disruption to neutralize the diet. Farm 4 had a similar miss tied to forage particle size and TMR mixing issues.

The lesson: DCAD value is a formulation number. Urine pH is what the cow is actually experiencing.

A practical monitoring protocol from Goff and others:

  • Sample at least 10 cows, or about 10% of the close‑up group, whichever is bigger.
  • Make sure they’ve been on the pre‑fresh ration for at least 48 hours, ideally 3–21 days before calving.
  • Catch urine 2–4 hours after cows get access to that ration, when pH is at its lowest and results are tightest.
  • Aim for around 80% of sampled cows to land in your target pH band.

Using the parity‑specific data:

  • 2nd‑ and 3rd‑lactation cows: target urine pH 5.5–6.0 — full acidification, with safe blood pH and bicarbonate profiles supported by multiple trials.
  • 4th‑lactation and older cows: target urine pH around 6.2–6.8, where Goff’s meta‑analysis saw the best calcium outcomes and a clear calcium decline below 5.75.

If your first audit comes back with an average of 7.2 — like Farm 2 in that field study — you don’t have “moderate DCAD.” You have a ration that isn’t acidifying those cows at all.

And if you see a string of older cows under 5.5, especially alongside intake or condition concerns, you’ve probably pushed anions too hard relative to fiber, magnesium, or overall palatability. That’s the edge where the very low DCAD work — down near −220 mEq/kg DM — tipped cows into uncompensated acidosis.

You can’t manage what you won’t measure. But you can buy a box of urine strips for less than a DA surgery — and a lot less than a weekend tied up in the hospital pen.

Are You Feeding Enough Calcium With Your Anions?

Old transition‑cow dogma said “never feed high calcium pre‑fresh.” Newer DCAD and mineral work says that, under a properly negative DCAD, high calcium plus anions is often where the payback is.

Across recent studies:

  • Cows on negative DCAD diets with 1.5–2.0% Ca in diet DM had stronger calcium flux, better postpartum DMI, and higher ECM than cows on low‑calcium fully acidogenic diets.
  • High‑calcium fully acidogenic diets did a better job of holding DMI than low‑calcium FAS diets, which showed bigger intake dips.

The chemistry catch is that calcium is alkalizing. When you bump dietary calcium — especially as carbonate — you usually have to adjust anion supply to hold the same urine pH. If you crank anions every time you bump Ca, and never check what cows are actually peeing, you’re back to guessing.

Too little anion with high Ca and high‑K forages, and you recreate the old “high‑potassium hay + high‑calcium close‑up” milk fever trap. Too much anion, especially in pens heavy with older cows, and you risk dragging that group below 5.5 pH, where Goff’s meta‑analysis saw calcium status trending the wrong way.

The sweet spot isn’t a single DCAD target on paper. It’s the balance between DCAD, calcium level, and who’s actually standing in your close‑up group.

Options and Trade‑Offs for Farmers

You’ve got four real ways to play this — none of them free, but all of them better than guessing.

StrategyBest Fit ForWhat You GainWhat You Give UpKey Risk
30-Day Urine pH AuditAny herd — starting pointActual data on whether DCAD is working30 min + cost of stripsFinding out your program is doing nothing
Parity-Specific TargetsHerds >30% 4th+ lactation cowsTighter Ca support for oldest cowsPen complexity, management timeOver-acidifying older cows below pH 5.75
Full Acidification + High CaStable forage, strong advisory teamMaximum ECM gains, lowest SCHRequires accurate, frequent forage testingPushing anions without checking urine pH
Partial Acidification (Proven)Variable forage K, no parity sortingLower milk fever risk vs. no DCADWon’t capture full SCH/ECM benefitCosmetic program at pH 7.8 = money wasted

1. 30‑Day Action: Audit Your DCAD in the Cows, Not on Paper

This is the low‑risk, high‑information starting point — the same move that exposed the problem in the Schaefer example and that documented field investigation.

  • Within 30 days, run a urine pH profile on your close‑up pen: at least 10 cows, or 10% of the group, 2–4 hours after feeding, on the ration for at least 48 hours.
  • Mark strips by parity (“P2–3” vs “P4+”) so you can see whether older cows live in a different pH band.
  • Sit down with your nutritionist and vet and compare those numbers to your calculated DCAD and your latest forage K analyses.

Patterns you’re likely to find:

  • Rations that look fully acidogenic on paper but leave cows at pH 7.0–7.8 because forage potassium came back higher than assumed — or, like Farm 2, because bunk space or mixing issues prevent cows from eating what you think they’re eating.
  • Older cows sit at 5.2–5.4, while younger cows hover near 5.8–6.0, and those same older cows are turning up too often on your “problem fresh” list.

This doesn’t fix the ration. It just tells you whether your main problem is being too timid overall, too aggressive with certain cows, or something as simple as bunk management.

2. Dial in Parity‑Specific Targets

If about a third or more of your close‑up pen is 4th lactation or older, Goff’s parity‑specific data says you shouldn’t chase the same pH for them as for your 2nd‑calvers.

In practice, that can look like:

  • Grouping by parity when barn design allows: a “mature‑cow close‑up” and a “younger‑cow close‑up.”
  • Running a parity‑specific mineral strategy: same base forage, slightly different DCAD and Ca levels by pen.
  • Re‑checking urine pH and, if you’re keen, spot blood calcium by group a couple of times a year.

You gain tighter support for the cows most likely to crash. You give up some simplicity and pen flexibility.

3. Strengthen Full Acidification + High Calcium Where It Fits

For herds with stable forage programs and a strong advisory team, leaning into full acidification plus higher calciumcan be a high‑return move.

Best fit when:

  • You’re already getting reliable mineral analyses back from your forage lab.
  • You’re willing to watch DMI, manure, and fresh‑cow health closely during any ration changes.
  • Your vet and nutritionist are aligned on DCAD targets and SCH benchmarks.

It demands:

  • Accurate DCAD math using up‑to‑date Na, K, Cl, and S lab numbers.
  • Dietary Ca in the 1.5–2.0% DM range.
  • Adequate magnesium and effective fiber to keep cows on feed.

Risks:

  • Over‑pushing anions to “fix” what’s really a forage‑testing problem, edging toward uncompensated acidosis.
  • Raising calcium without enough anion, which blunts the very calcium‑mobilizing system DCAD is designed to prime.

4. Stick With Partial Acidification — But Prove It

Some barns aren’t good candidates for full acidification: volatile forage potassium, no room to sort by parity, and limited labor.

In those systems, aiming for more moderate urine pH — often in the mid‑6s instead of around 8.0 — can still cut clinical milk fever risk compared with no DCAD program at all, even if you never push pH into the 5.5–6.0 band.

The key is honesty:

  • You likely won’t get the full SCH and ECM benefits seen in FAS + high‑calcium research.
  • You still have to test. A ration “designed” for pH 6.5 that yields pH 7.8 in the pen is cosmetic, not partially acidified.

As ingredient costs keep climbing, cosmetic programs are going to be harder to justify than well‑measured ones.

Key Takeaways

  • If you’re not pulling urine pH strips on your close‑up cows at least a few times a year, you don’t have a DCAD program — you have a DCAD expense. Start with a 10‑cow, 2–4‑hour post‑feeding sample and see if your cows are anywhere near your target pH.
  • If roughly a third or more of your close‑up group is 4th lactation or older, don’t chase 5.5 pH for everyone. Aim those cows around 6.2–6.8 and reserve the 5.5–6.0 band for 2nd‑ and 3rd‑calvers, where full acidification is both safe and effective.
  • If your SCH prevalence in multiparous cows is north of about 30% and you’re already paying for anionic salts, assume a verification gap before you decide “DCAD doesn’t work here.” Use the US$60–$226 per‑case range to ballpark what SCH might be costing you and whether a DCAD tune‑up pencils out.
  • If your ration DCAD is printed at −180 mEq/kg DM and your older cows are peeing at 5.2, you’ve probably gone past the point of diminishing returns. Back off anions until those cows’ urine pH and calcium status are closer to 6.5, then re‑check urine pH and calcium status instead of assuming “hotter” must be better.

The Bottom Line

You’re already writing checks for anionic salts and pre‑fresh minerals. It’s worth knowing whether those dollars are actually buying fewer SCH cows, more milk, and calmer fresh pens — or just living on a ration sheet. Start with that 30‑day urine pH audit. From there, you’ll know whether your next move should be more anion, more calcium, smarter grouping, or tighter forage testing.

If you want the deeper math — SCH calculators, DCAD formulation walkthroughs, or parity‑specific transition strategies — watch for the follow‑up playbooks and Bullvine Weekly breakdowns. Once you’ve seen your own pH strips, you won’t look at that “−120 mEq/kg” printout the same way again.

Complete references and supporting documentation are available upon request by contacting the editorial team at editor@thebullvine.com.

Learn More

The Sunday Read Dairy Professionals Don’t Skip.

Every week, thousands of producers, breeders, and industry insiders open Bullvine Weekly for genetics insights, market shifts, and profit strategies they won’t find anywhere else. One email. Five minutes. Smarter decisions all week.
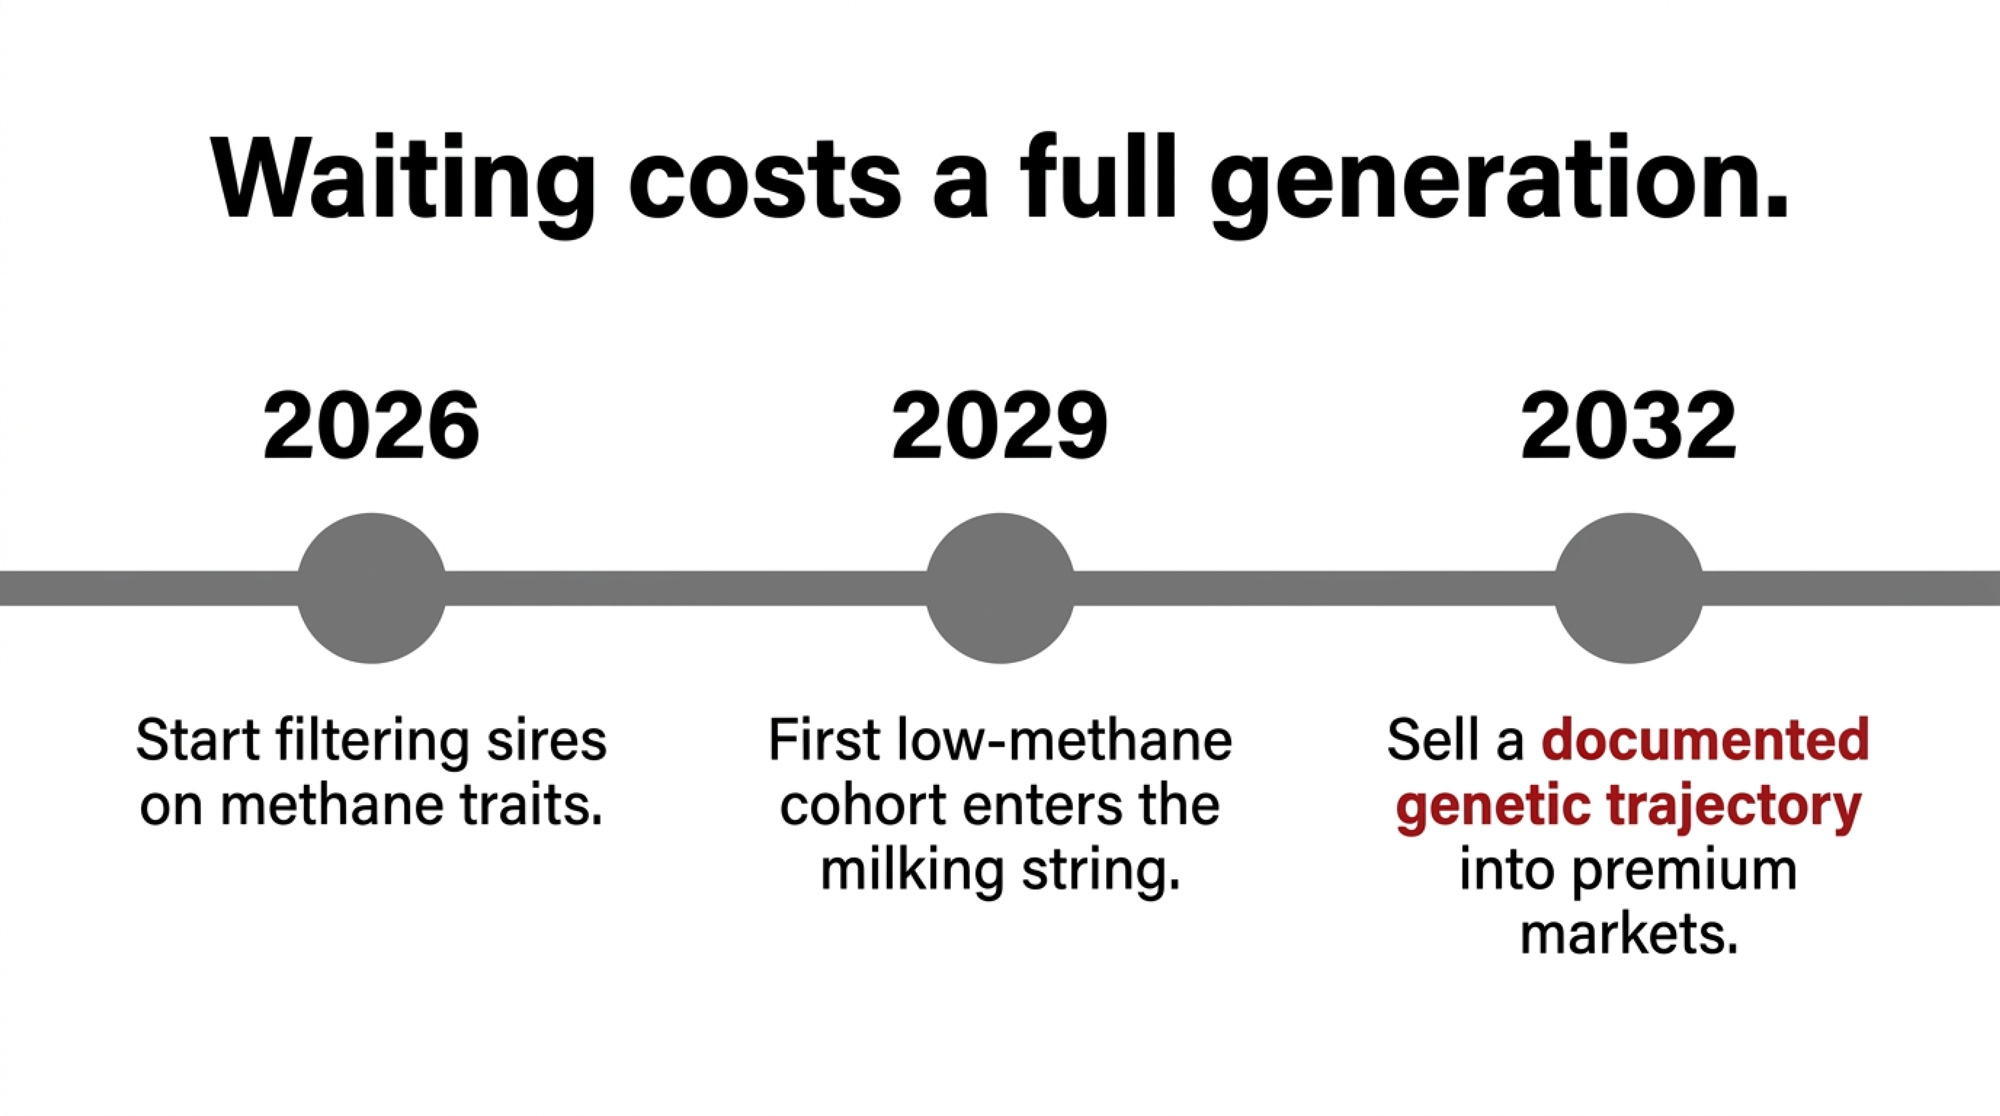
NewsSubscribe
First
Last
Consent

The Henschels Dumped $38,664 of Milk After a Blizzard. The Federal Safety Net Paid $0.

The Henschel family milked through 5‑to‑15‑foot drifts near Manawa — then dumped a full day’s milk because the truck couldn’t come, and no federal program covers the milk you lose.

On the Sunday morning of the March 14–16 blizzard, the Henschel dairy near Manawa, Wisconsin, was buried in snow. Drifts on the lane were higher than the skid steer. The milk truck that usually shows up like clockwork couldn’t reach them. Roads were closed, plows were pulled, and for about 36 hours, they were essentially on their own with cows still milking and a bulk tank running out of room.

Chris Henschel told US Farm Report that they were dealing with “whiteout conditions with snow drifts anywhere from 5 to 15 feet high” around the farm, and that the roads were “impassable for about 36 hours.” Keeping feed in front of cows and milk moving out of the parlor didn’t change one hard fact: the tank only holds so much. In the end, Henschel said they dumped “basically almost a day’s worth of milk because nobody could get to the farm.”

They did the work. They hit every milking. They had no way to ship it. Lay the program rules and the barn math beside that picture, and it’s hard not to see your own risk sitting there too.

When the crew couldn’t reach the barn and the backup was plowing snow, the backup to the backup crew rolled in — the Henschel boys muscling a cart of milk for calves on that blizzard day.

What the March 14–16 Blizzard Really Did to Dairy Roads

This wasn’t a normal March snow that blows through overnight and melts by the weekend. The National Weather Service called it a “historic, record-setting winter storm” — a potent Colorado low that deepened as it tracked from the central Plains toward Chicago and Lake Huron, pulling Gulf moisture into cold air and hammering the Upper Midwest for more than 48 hours.

NWS Green Bay reported a widespread 1 to 2 feet across northeast Wisconsin, with localized amounts exceeding 30 inches from Wausau to Marinette and Door County. Green Bay itself recorded 26.6 inches — its second-largest snowstorm on record. Waupaca County, where the Henschel dairy sits near Manawa, saw 25 to 30.5 inches, with nearby Shawano County reporting up to 33 inches. Snowfall rates hit 4 inches per hour at times, with thundersnow and lightning.

To the west, NWS La Crosse confirmed 25 inches at Kellogg, Minnesota, with similar totals across Trempealeau and Clark Counties in Wisconsin — Independence and Strum both hit 25 inches, Granton 25 inches, and Mondovi 26.6 inches. Peak wind gusts reached 59 mph at Green Bay Airport and 60 mph in De Pere, with 40–55 mph gusts common across the region. NWS La Crosse noted reports of 3‑to‑5‑foot drifts were common; NWS Green Bay documented a 10‑foot drift in Ephraim.

The timing was brutal. Storm onset hit Saturday evening, March 14. Peak winds and whiteouts ran late Saturday into Sunday. Interstates 35, 80, and 94 were all closed for a period on Sunday and Sunday night. NWS Twin Cities confirmed that vehicles became stranded on I‑94 between Eau Claire and Osseo during blizzard conditions, and WisDOT posted “No Travel Advised” across the northern half of the state for an extended period. The worst transport window lasted roughly 24–36 hours, during which rural routes were effectively shut down. If your usual truck hits the yard Saturday night or Sunday morning, a 36‑hour shutdown doesn’t just mean “late pickup.” Depending on your tank size and flow, it can mean “no pickup” before you run out of storage.

US Farm Report and Dairy Herd both described the Henschels’ situation as a “rare milk dump” triggered by this storm, noting that towering drifts blocked every path to the farm. On farms across the region, that translated into township and county plows leaving some dairy roads for last, haulers making the call to stay parked rather than risk drivers in whiteouts, and milk plants adjusting schedules or pausing loads until they knew trucks could actually move.

You can’t change the weather. You can be honest about what it costs — and why all the programs that show up after storms like this barely touch the milk itself.

“Milk Can’t Wait”: The Aid That Showed Up — and What It Missed

Within days, USDA’s Farm Service Agency in both Wisconsin and Minnesota was pushing reminders about disaster programs. Sandy Chalmers, FSA State Executive Director in Wisconsin, put it bluntly: “Milk can’t wait. When trucks can’t reach farms or processors on time, producers face costly delays and, in some cases, must dispose of milk that can’t be stored.” She urged producers to report “crop, livestock, and infrastructure-related losses” and to contact their county offices.

Here’s what was actually on the table for a storm like this:

  • Livestock Indemnity Program (LIP) — Authorized under the 2014 Farm Bill and administered by FSA, LIP pays 75% of the fair market value for livestock deaths above normal mortality due to eligible adverse weather events like blizzards and extreme cold.  It can also cover animals sold at a discount after storm-related injuries. Notice of Loss must be filed within 30 calendar days of when the loss becomes apparent. 
  • Emergency Assistance for Livestock, Honeybees, and Farm‑raised Fish (ELAP) — Provides emergency relief for above‑normal feed costs, feed and water hauling, and equipment rental for snow removal when adverse weather makes normal operations impossible.  ELAP does not cover milk loss directly, though USDA expanded ELAP in July 2024 to cover milk production losses from H5N1‑infected herds — a different mechanism.  Notice of Loss: 30 calendar days from when the loss first became apparent. 
  • Noninsured Crop Disaster Assistance Program (NAP) — Covers non‑insured crops and forage in eligible situations. NAP does not cover milk. A Notice of Loss must be filed within 15 days of the loss becoming apparent — that 15‑day window is shorter than LIP and ELAP, so hay and forage losses from this storm need to be reported fast. 
  • Farm Storage Facility Loan Program (FSFL) — Provides low‑interest financing on 3–12 year terms to build, repair, or upgrade on‑farm storage facilities.  USDA’s eligible commodity list explicitly includes milk, and eligible facility types include bulk tanks, so this can apply directly to expanding your on‑farm milk storage capacity.  It doesn’t pay for losses, but it can help you build more buffer for the next storm. 

On the margin side, the farm bill politicians in Washington have been celebrating as a “big, beautiful” win for producers, reauthorizing and improving Dairy Margin Coverage (DMC) through 2031. DMC is margin insurance, not a disaster program, but it’s the main federal backstop on dairy revenue. By late 2023, DMC had paid out about $1.27 billion nationally, with Wisconsin topping the list at roughly $272.2 million — around $63,633 per enrolled operation— according to USDA and prior Bullvine analysis.

Bullvine’s DMC work shows margins slipping below /cwt by late 2025 and into the mid‑s for early 2026, triggering some of the bigger checks in a few years for farms that stayed fully enrolled. Those payouts helped on paper margins. They didn’t do a thing for milk forced down the drain because the road and plant system around you blinked.

On paper, it can look like you’re covered. In the parlor, once you read the fine print, it’s a different story.

Does Any Federal Program Actually Cover Dumped Milk?

Line up USDA’s current tools, and the gap jumps off the page:

ProgramWhat It CoversTrigger MechanismCovers Dumped Milk?2026 Status
LIPLivestock deaths above normal mortality; injured animals sold at discountBlizzard, extreme cold declared eventNOActive — NOL by Mar 1, 2027
ELAPAbove-normal feed costs; feed/water hauling; snow removal equipmentWeather event driving extra input costsNOActive — NOL by Mar 1, 2027
DMCNational all-milk price minus standardized feed cost (margin)Monthly margin falls below elected level (–.50/cwt)NOActive — enrolled thru 2031
NAPNon-insured crops and forage lossesCrop failure / loss event; 15-day NOL requirementNOActive — covers crops only
FSFLLow-interest loans for on-farm storage construction/upgradesN/A — financing, not indemnityNOActive — 3–12 yr terms
MLPMilk dumped due to qualifying weather — impassable roads, power outagesPhysical milk dumped without compensationYES — BUT 2020–2024 ONLYEXPIRED — signup closed Jan 23, 2026

There is one program specifically designed to pay for dumped milk: the Milk Loss Program. Congress has authorized it twice. The first round, under the Consolidated Appropriations Act of 2023, covered eligible losses in 2020, 2021, and 2022 — including extreme weather, supply chain snarls, and COVID‑era processing shutdowns. MLP paid 75% of the milk value for most producers and 90% for underserved producers, including beginning, limited‑resource, and veteran farmers.

The second round, authorized under the American Relief Act of 2025 as part of USDA’s Supplemental Disaster Relief Program, extended MLP to cover qualifying weather events in 2023 and 2024. That signup window opened in late November 2025 and closed in late January 2026 — less than two months before the Henschels’ blizzard.

The March 14–16, 2026, blizzard lands outside both windows. No current MLP authority covers losses for 2025 or 2026. Congress knew about the problem, funded it retroactively twice, and still hasn’t built a permanent program.

So when the Henschels opened that valve, here’s what the safety net really did:

  • Any calves or cows lost to storm stress or injuries? LIP might cover 75% of their value — but you need to file a Notice of Loss within 30 days, which for this storm means roughly by mid‑April 2026. The application for payment deadline extends to approximately March 1, 2027
  • Extra feed, fuel, and snow removal to dig out? ELAP might help — same 30‑day Notice of Loss requirement, with an application deadline of approximately January 30, 2027fsa. usda
  • Margins squeezed this winter? DMC sends a check if the national margin falls far enough below your coverage level.
  • The actual milk they dumped — roughly a full day’s output — sat entirely outside federal coverage in 2026.

That’s not a clerical error. That’s how the net has been structured so far.

How Much Does 72 Hours Without a Milk Truck Actually Cost Your Operation?

Now put some numbers to what a storm like this means in dollars.

March 2026 Class III futures were trading around $16.11/cwt on the CME. Take a realistic daily production number: 80 pounds of saleable milk per cow per day — 0.8 cwt per cow. Daily revenue per cow at that price: 0.8 cwt × $16.11 = $12.89 per cow per day.

Scale that across a herd and across three days of no pickup:

  • 200 cows: 48,000 lb = 480 cwt. At $16.11 ≈ $7,733 down the drain.
  • 500 cows: 120,000 lb = 1,200 cwt. At $16.11 ≈ $19,332.
  • 1,000 cows: 240,000 lb = 2,400 cwt. At $16.11 ≈ $38,664.

For the Henschels, coverage described them dumping “basically almost a day’s worth of milk” when roads kept trucks out. If you assume a mid‑size herd shipping around 32,000 lb per day — 320 cwt — one dumped day at $16.11/cwt is about $5,155. That’s explicitly example math, not their disclosed volume, but it’s the right scale for a lot of upper‑Midwest family dairies.

Herd SizeAvg Daily Pickup (lbs)3-Day Pickup (cwt)At $14.59/cwt (Jan 2026 low)At $16.11/cwt (March futures)At $18.00/cwt (strong market)
200 cows16,000480$7,003$7,733$8,640
500 cows40,0001,200$17,508$19,332$21,600
1,000 cows80,0002,400$35,016$38,664$43,200
2,500 cows200,0006,000$87,540$96,660$108,000
5,000 cows400,00012,000$175,080$193,320$216,000

Here’s the quick version for your own barn:

  1. Grab your last hauler or co‑op statement and find your average daily pickup volume in pounds.
  2. Multiply that number by 3.
  3. Divide by 100 to turn pounds into cwt.
  4. Multiply by today’s Class III or your mailbox price.

That final number is your current three‑day “dump exposure.” Whether you’ve thought about it or not, you’re self‑insuring it.

Does Your Disaster Plan Survive Three Days Without a Pickup?

Most of us say we have a “plan” for storms. What we really have are habits and luck:

  • The township usually plows us early.
  • The hauler always finds a way.
  • The generator has “never let us down.”

Henschel dairy had habits, too. Then they watched the system around them break — drifts higher than the skid steer, I‑94 closed, WisDOT posting “No Travel Advised” across the northern half of the state.

If you want an honest 72‑hour plan, start by knowing your own limits:

  • How many hours to a full tank? Take your tank size in gallons. Multiply by 8.6 (the weight of a gallon of milk in pounds). Divide by your average hourly milk flow. If your 6,000‑gallon tank fills in 30 hours at peak, you don’t have a 72‑hour problem — you’ve got a 30‑hour one.
  • What backup storage do you really have? A clean nurse tank you actually trust? Access to a neighbour’s bulk tank under a mutual‑aid agreement? A rented tanker or portable tank you could bring in ahead of a forecast blizzard? USDA’s FSFL program will finance bulk milk storage tanks at low interest rates, so if you’ve been thinking about adding capacity, the loan structure already exists. 
  • What are your hauler’s hard limits? Do they have written rules for when they pull trucks? Will they combine routes, run nights, or send smaller trucks? Who actually decides when routes are suspended, and how do they let you know?

Power and access matter too. If a storm like this takes down the grid, can your generator actually run the parlor, vacuum, compressors, and essential lights for three days, or just enough to limp along for a few hours? If you don’t know the answer, that’s worth a conversation with your electrician before fall.

You don’t control the plows or the wind. You do control whether you know your own numbers and weak spots before the next tank alarm reminds you how tight your margin for error really is.

Options and Trade‑Offs for Farmers

OptionUpfront Cost / EffortOngoing CostTime to ImplementCovers Which Risk?Key Limitation
Add on-farm storage (extra tank, nurse tanker)High — stainless steel, plumbing, wiring; FSFL loans available at low interestLow — maintenance & cleaning6–18 monthsBuys 12–24 hrs extra bufferHauler still won’t come in whiteout; storage has limits
Tighten hauler/processor agreementLow — phone calls, written planNone30 daysReduces likelihood of no-showCan’t override DOT road closures; hauler serves many farms
Neighbor/mutual-aid milk pactLow — a conversation now, co-op paperworkNone30–60 daysRoutes milk to farm with access/storageCo-op food-safety rules; requires pre-approval before crisis
Push for permanent MLPPolitical capital + timeNone1–3 years (Congress)Creates federal backstop on dumped milkProgram has expired twice; 2026 dumps currently uninsured 

You’ve basically got four paths when you think about the “truck can’t come” problem. None are perfect. Each has trade‑offs.

1. Build more on‑farm or shared storage

When it makes sense: you’re milking enough cows that even one dumped day is a five‑figure event, you have physical space, and your lender understands risk management. A 500‑cow herd with 80 lb/cow/day has about $19,332 at risk in a three‑day storm at $16.11/cwt.

What it requires: capital for a larger bulk tank, a second tank, or a nurse tanker. USDA’s Farm Storage Facility Loan Program offers low‑interest financing on 3–12 year terms, and its eligible commodity list specifically includes milk, with bulk tanks listed as eligible facility types.

Risks and limits: you tie up cash in stainless that mostly sits there until the rare bad week. If your hauler and processor can’t or won’t add emergency routes, you may still end up dumping.

2. Tighten hauler and processor agreements

When it makes sense: you’ve got relationship leverage as a long‑term patron with solid quality.

What it requires: honest conversations before the next storm. During this event, WisDOT posted “No Travel Advised” across the entire northern half of Wisconsin – at that point, nobody was running. But for storms short of that, some co‑ops and haulers have emergency pickup or route‑consolidation protocols. If yours doesn’t, that conversation is worth having now.

Your 30‑day move: write a one‑page “storm plan” with hauler and processor contacts, who calls first, and what you’ve agreed to. Tape a copy on the bulk tank, one in the office, and one at home.

3. Build neighbour and community mutual‑aid pacts

When it makes sense: you’ve got another dairy or two within a few miles, and at least one has different exposure — better road, more storage, different hauler.

What it requires: sitting down now and asking, “If your truck can reach you but not us, could you take one load?” Then work with your co‑op on how that milk is ticketed and paid. Some processors are open to cross‑farm loads if quality can be tracked; others need approvals in place.

We’ve seen this kind of neighbour network in real crises. When Ohio dairyman Reed Hostetler died in a manure pit accident, neighbours stepped in to run chores, haul feed, and keep the dairy going. That same instinct — organized ahead of time — can keep a blizzard from turning into a five‑figure milk loss.

4. Push for policy change

What it requires: calling your members of Congress and being specific: “Congress funded the Milk Loss Program twice — first for 2020–2022 under the Consolidated Appropriations Act of 2023, then for 2023–2024 under the American Relief Act of 2025. Why does the program keep expiring?”

You can also press your co‑op or processor board. During the 2020 milk‑dump crisis, USDA relief dollars flowed through co‑ops to help cover losses. Ask your buyer, bluntly: “If we’re forced to dump because the road or plant is shut, do you share any of that hit, or are we on our own?”

Bullvine Perspective: The Bill That Brags About DMC and Leaves the Drain Uninsured

The latest farm bill made a big deal out of reauthorizing DMC through 2031 and tweaking margins and coverage levels. They lined up for photo‑ops, telling dairy producers they’d “protected family farms.”

Look at the blizzard math again:

  • You do the work.
  • You feed and milk through 5‑ to 15‑foot drifts.
  • The truck can’t get to you.
  • You open the valve and dump thousands to tens of thousands of dollars of milk.

DMC pays based on a national margin. It doesn’t care whether your milk is left in a tanker or runs across the floor. LIP and ELAP pay for dead cows, extra feed, and some snow removal. The only program USDA has built to pay for dumped milk — the Milk Loss Program — has been funded twice, retroactively, for events in 2020–2024, and the last signup closed in late January 2026. Less than seven weeks before the Henschels’ tank overflowed.

Congress knew this was a problem. They funded it. Twice. And still left a gap you could drive a snowplow through.

What This Means for Your Operation

  • If you had any livestock deaths, discounted livestock sales, or major feed disruptions in this storm, your Notice of Loss deadline is roughly 30 days from the event — mid‑April 2026 for March 14–16 losses.  Don’t wait. File with your county FSA office now. The application‑for‑payment deadline extends to early 2027, but the Notice of Loss window is the one that catches people off guard. 
  • If your three‑day milk exposure number makes you flinch when you multiply daily pickup × 3 × current Class III, then it’s not a freak event — it’s a business risk you’re actively self‑insuring, and it belongs in the same conversation as debt service and feed contracts.
  • If you can’t afford more storage, your 30‑day move is to get your paperwork and people in order:document any milk dumps even if they’re not covered yet (you’ll want that record if Congress funds MLP retroactively again), and write down a simple storm plan with hauler and neighbour contacts where everyone can find it.
  • If you’ve been treating DMC as disaster coverage, remind yourself it’s margin insurance, not milk‑dump insurance. Congress has funded the Milk Loss Program twice for past events and let it expire both times.  If you want dumping covered going forward, someone from your area is going to have to say that out loud — using real numbers from storms like this one. 

The Bottom Line

Sandy Chalmers was right: milk can’t wait. The Henschels kept cows milking and fed through 5‑ to 15‑foot drifts, and the federal system around them offered help with feed costs and animal losses — but not with the milk they had to dump.

So here’s your kitchen‑table homework: grab your last hauler statement. Multiply your average daily pickup by three days and by today’s price. Are you actually comfortable self‑insuring that number the next time your road disappears under three feet of snow?

If you want the deeper math on how DMC, processor contracts, and USDA dairy disaster assistance actually fit together — and what happens when it’s not the weather but a plant shutdown that stops the truck — keep an eye out for the next “When the Truck Can’t Come” instalments. We’ll be looking at what the AMPI Paynesville strike and shutdown just taught us about stranded milk, and at whether the $17,500 DMC gamble was really the right bet for a storm year like this.

And one more question to chew on while you’re staring at that bulk tank: Do you know where your co‑op actually stands on renewing a permanent Milk Loss Program — and whether they’re truly pushing for it, or just offering sympathy when you’re the one opening the drain valve?

Complete references and supporting documentation are available upon request by contacting the editorial team at editor@thebullvine.com.

Learn More

The Sunday Read Dairy Professionals Don’t Skip.

Every week, thousands of producers, breeders, and industry insiders open Bullvine Weekly for genetics insights, market shifts, and profit strategies they won’t find anywhere else. One email. Five minutes. Smarter decisions all week.
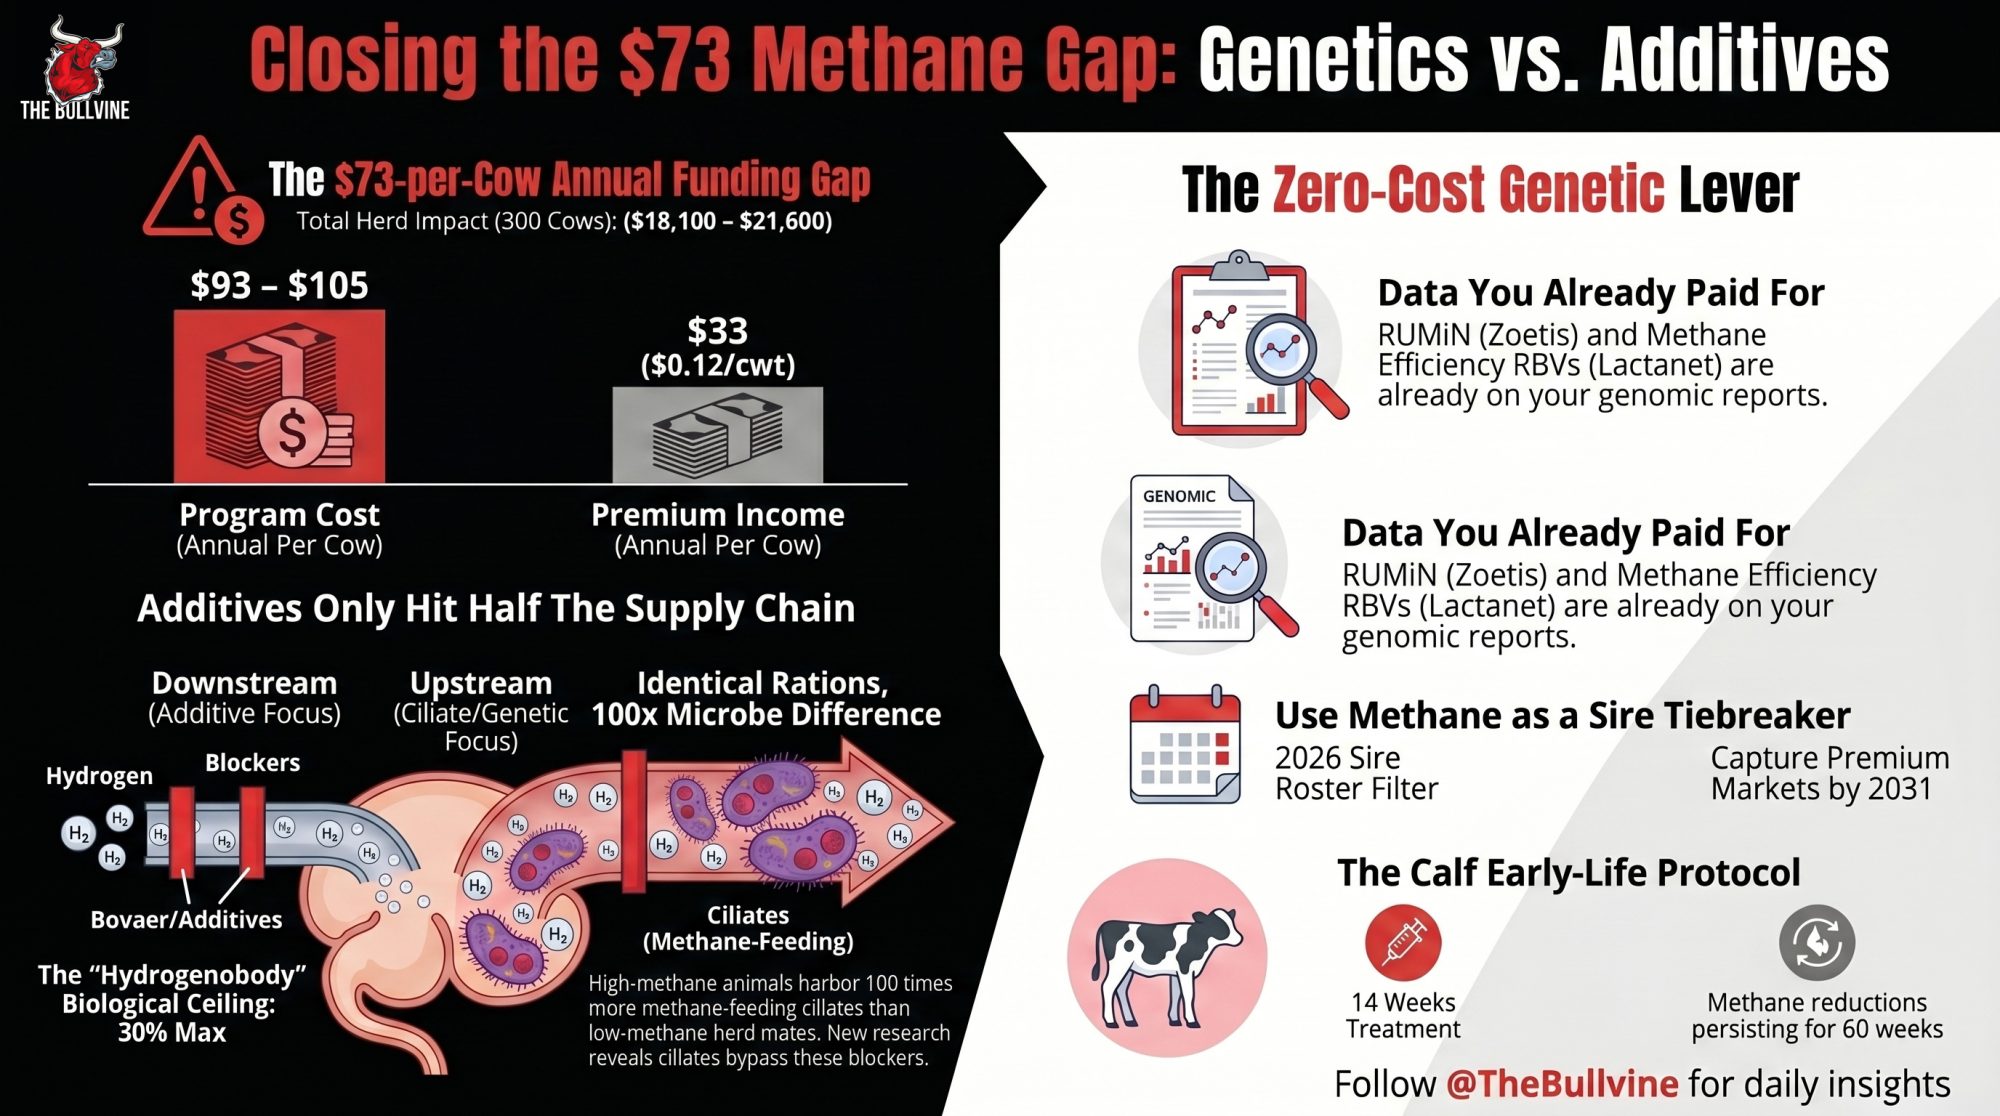
NewsSubscribe
First
Last
Consent
Send this to a friend