Archive for Management – Page 2

The Henschels Dumped $38,664 of Milk After a Blizzard. The Federal Safety Net Paid $0.

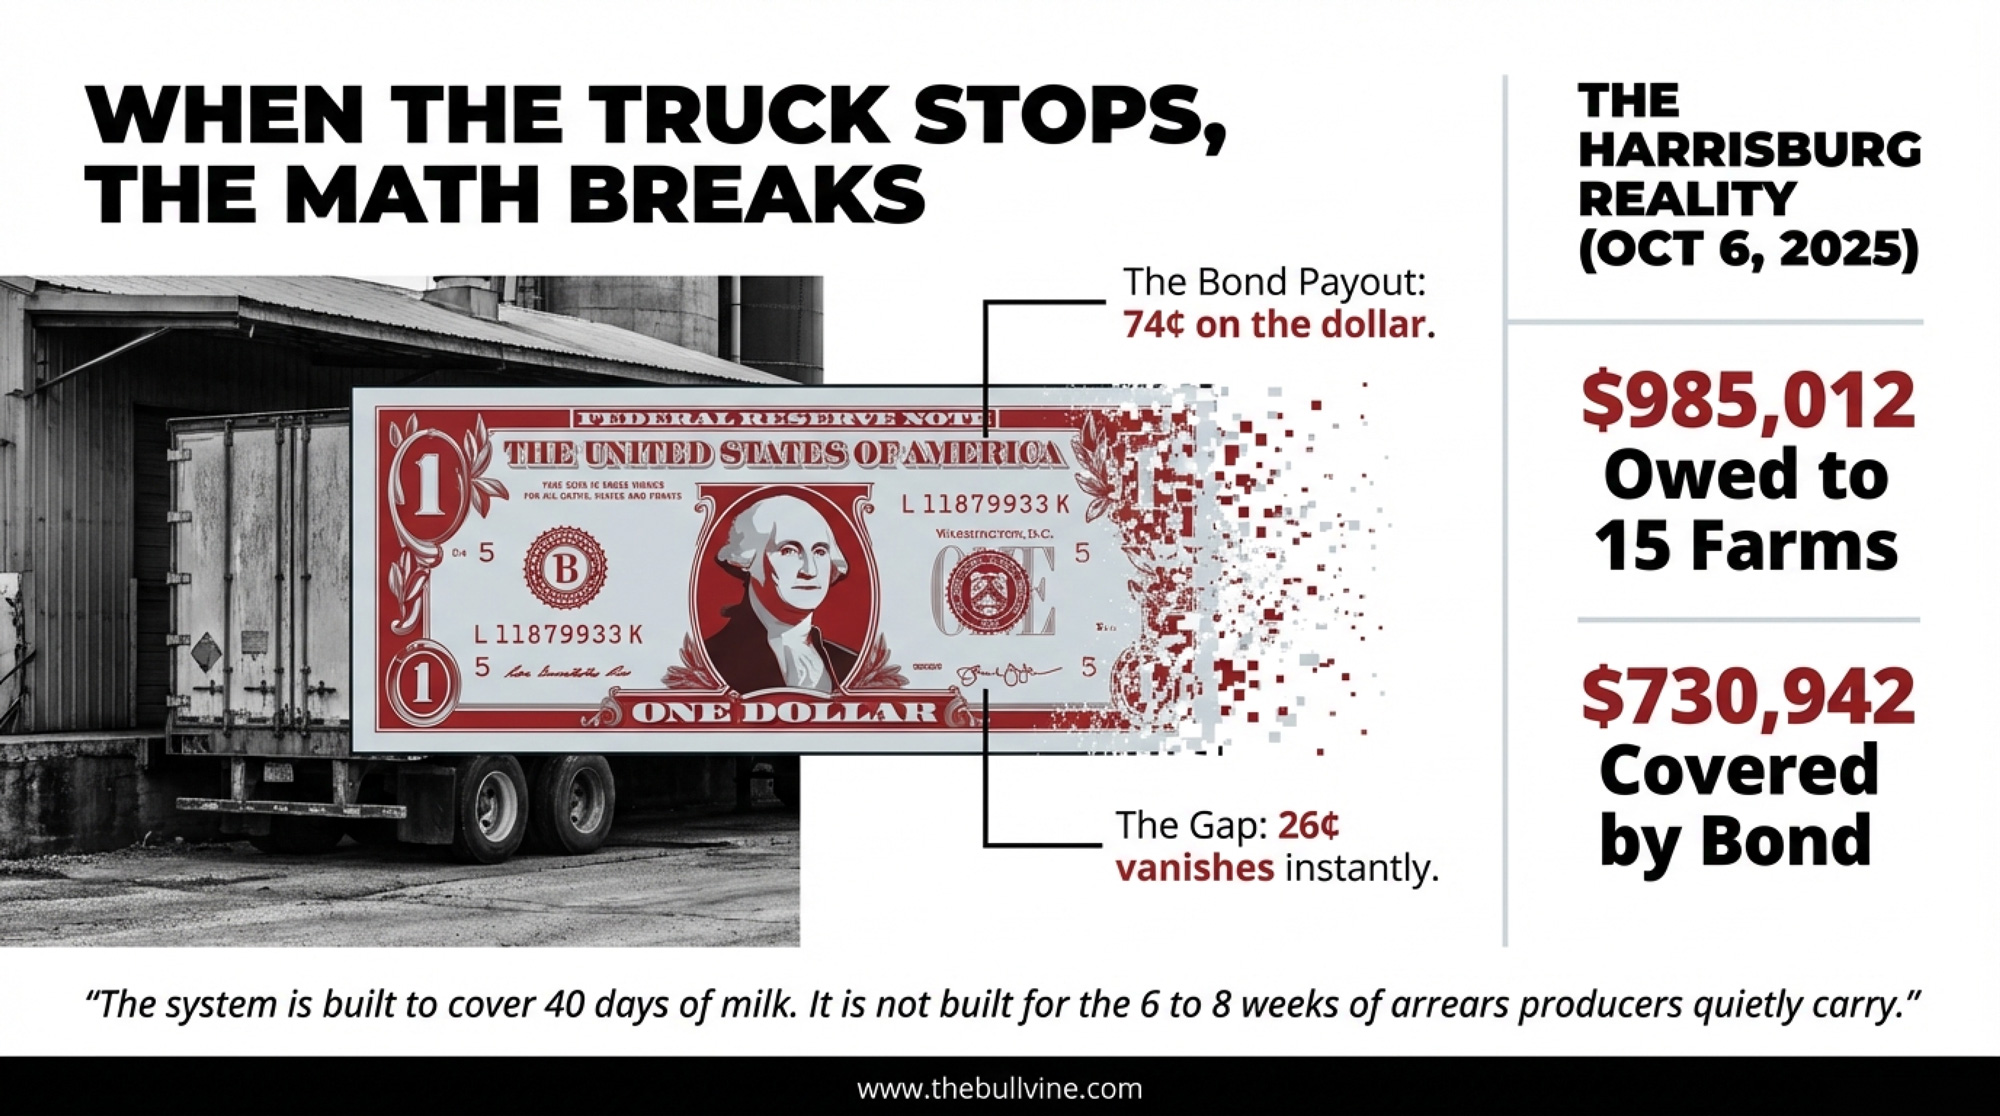
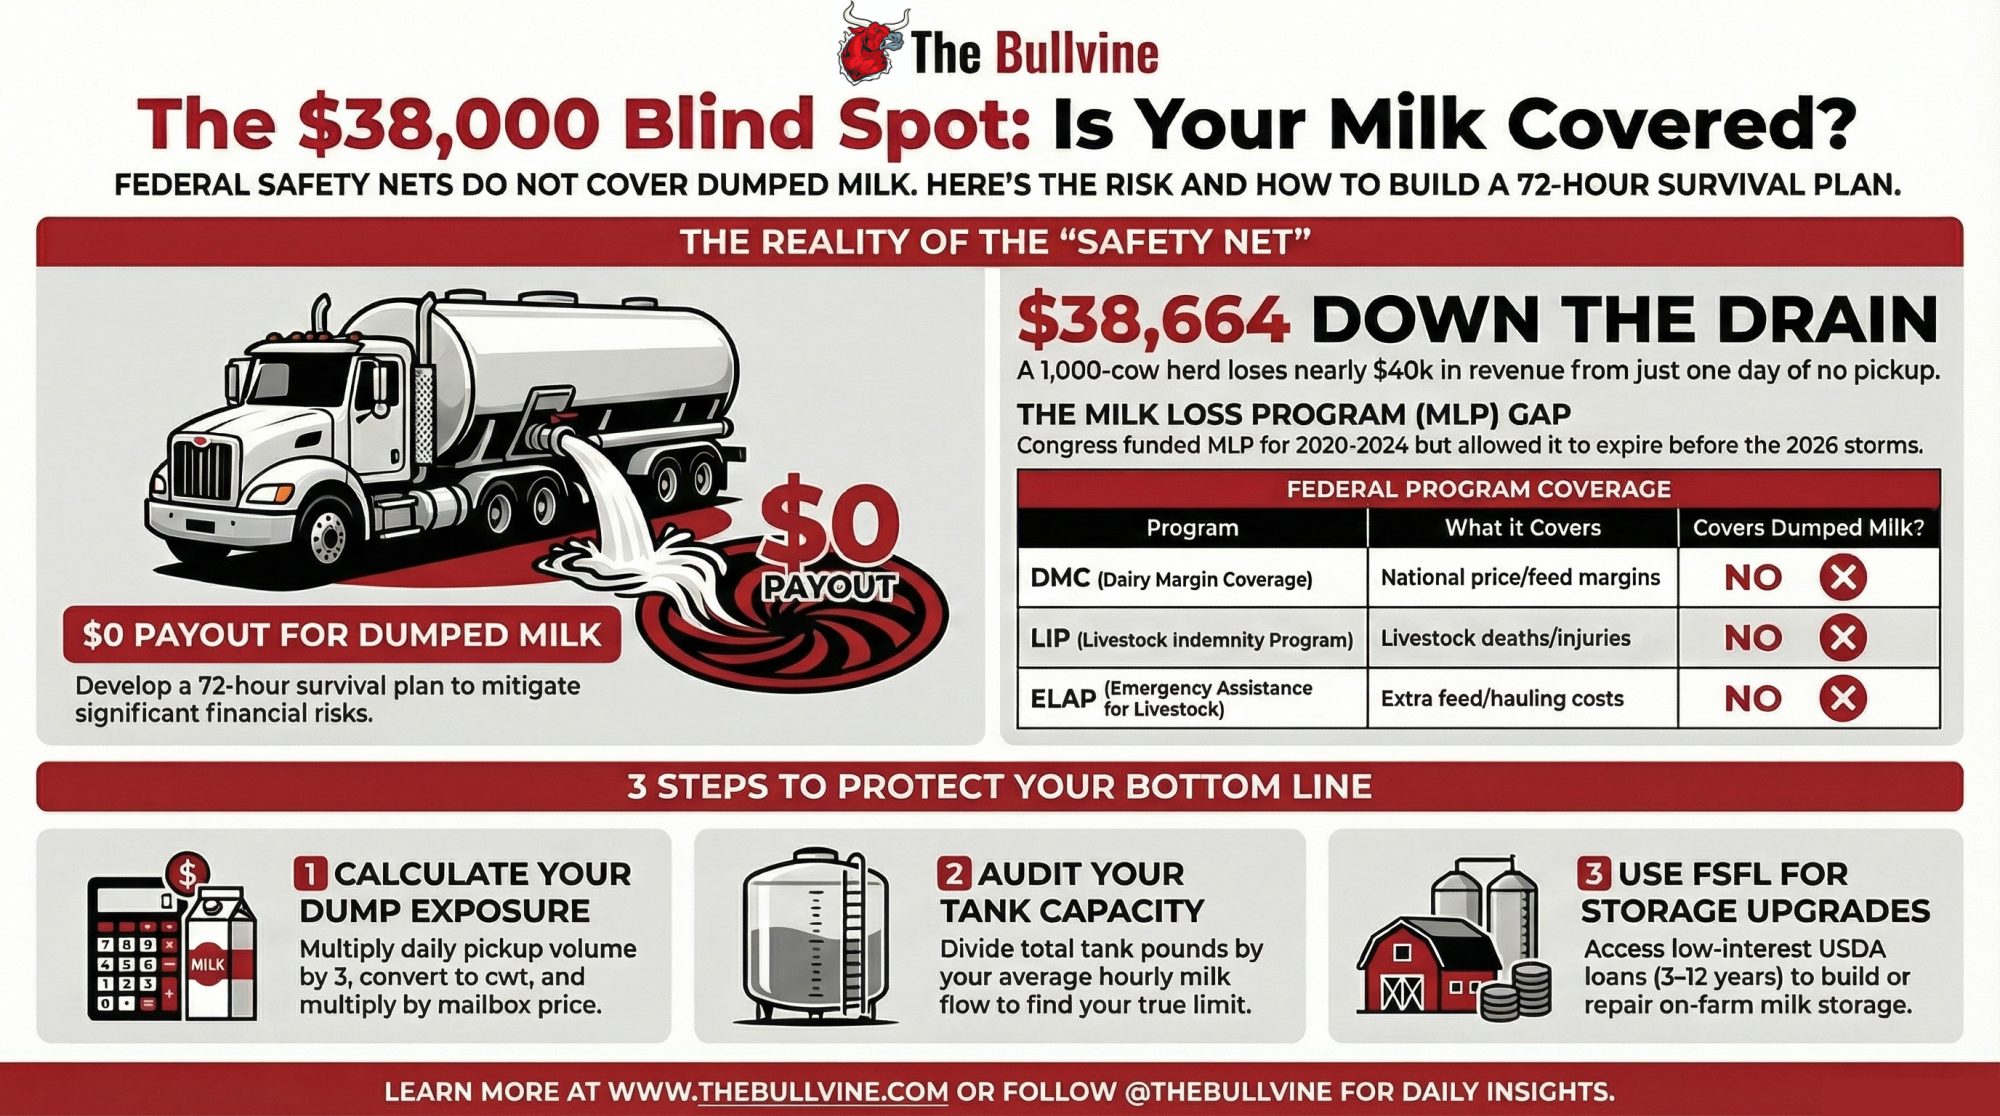
The Henschel family milked through 5‑to‑15‑foot drifts near Manawa — then dumped a full day’s milk because the truck couldn’t come, and no federal program covers the milk you lose.

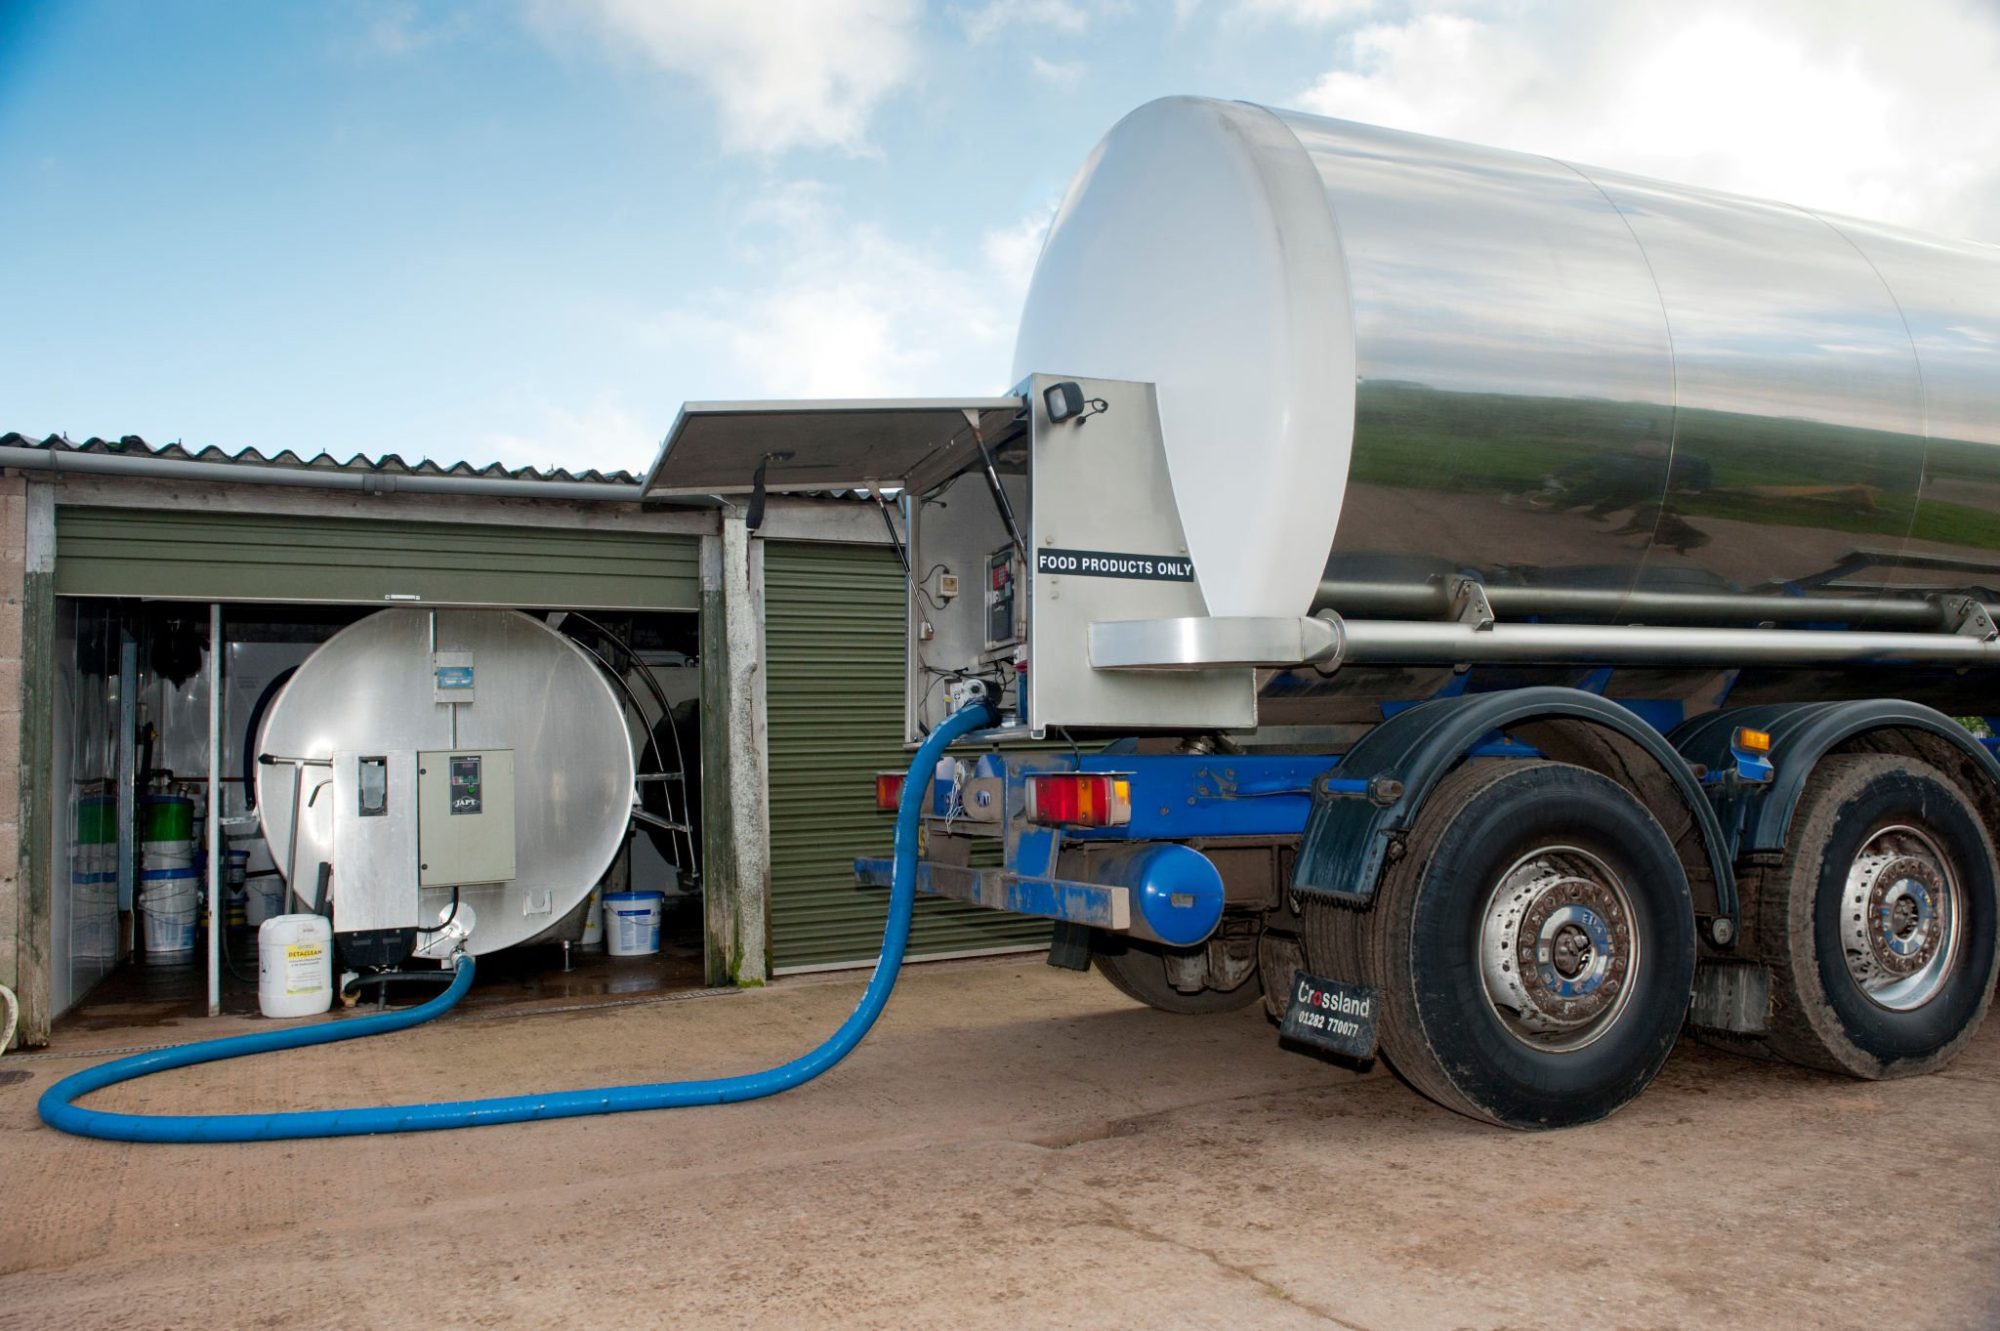
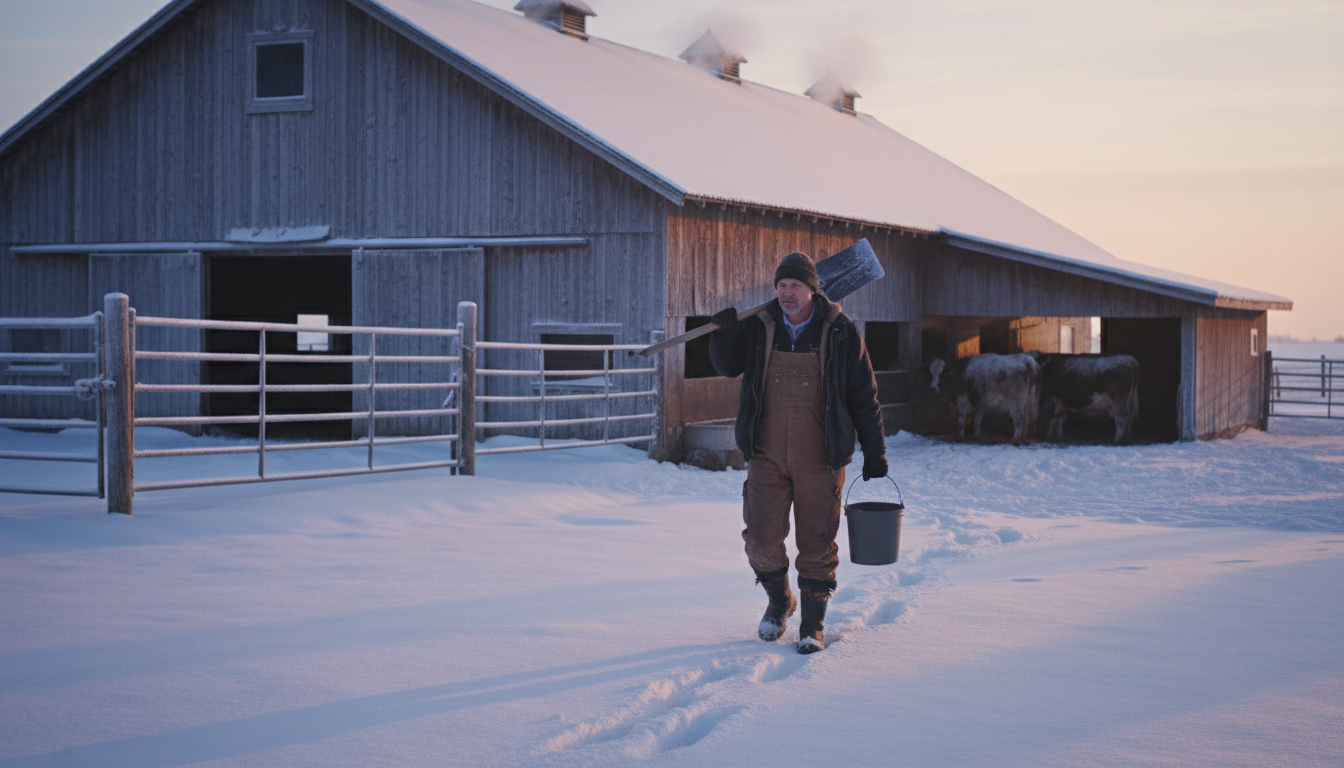
On the Sunday morning of the March 14–16 blizzard, the Henschel dairy near Manawa, Wisconsin, was buried in snow. Drifts on the lane were higher than the skid steer. The milk truck that usually shows up like clockwork couldn’t reach them. Roads were closed, plows were pulled, and for about 36 hours, they were essentially on their own with cows still milking and a bulk tank running out of room.

Chris Henschel told US Farm Report that they were dealing with “whiteout conditions with snow drifts anywhere from 5 to 15 feet high” around the farm, and that the roads were “impassable for about 36 hours.” Keeping feed in front of cows and milk moving out of the parlor didn’t change one hard fact: the tank only holds so much. In the end, Henschel said they dumped “basically almost a day’s worth of milk because nobody could get to the farm.”

They did the work. They hit every milking. They had no way to ship it. Lay the program rules and the barn math beside that picture, and it’s hard not to see your own risk sitting there too.
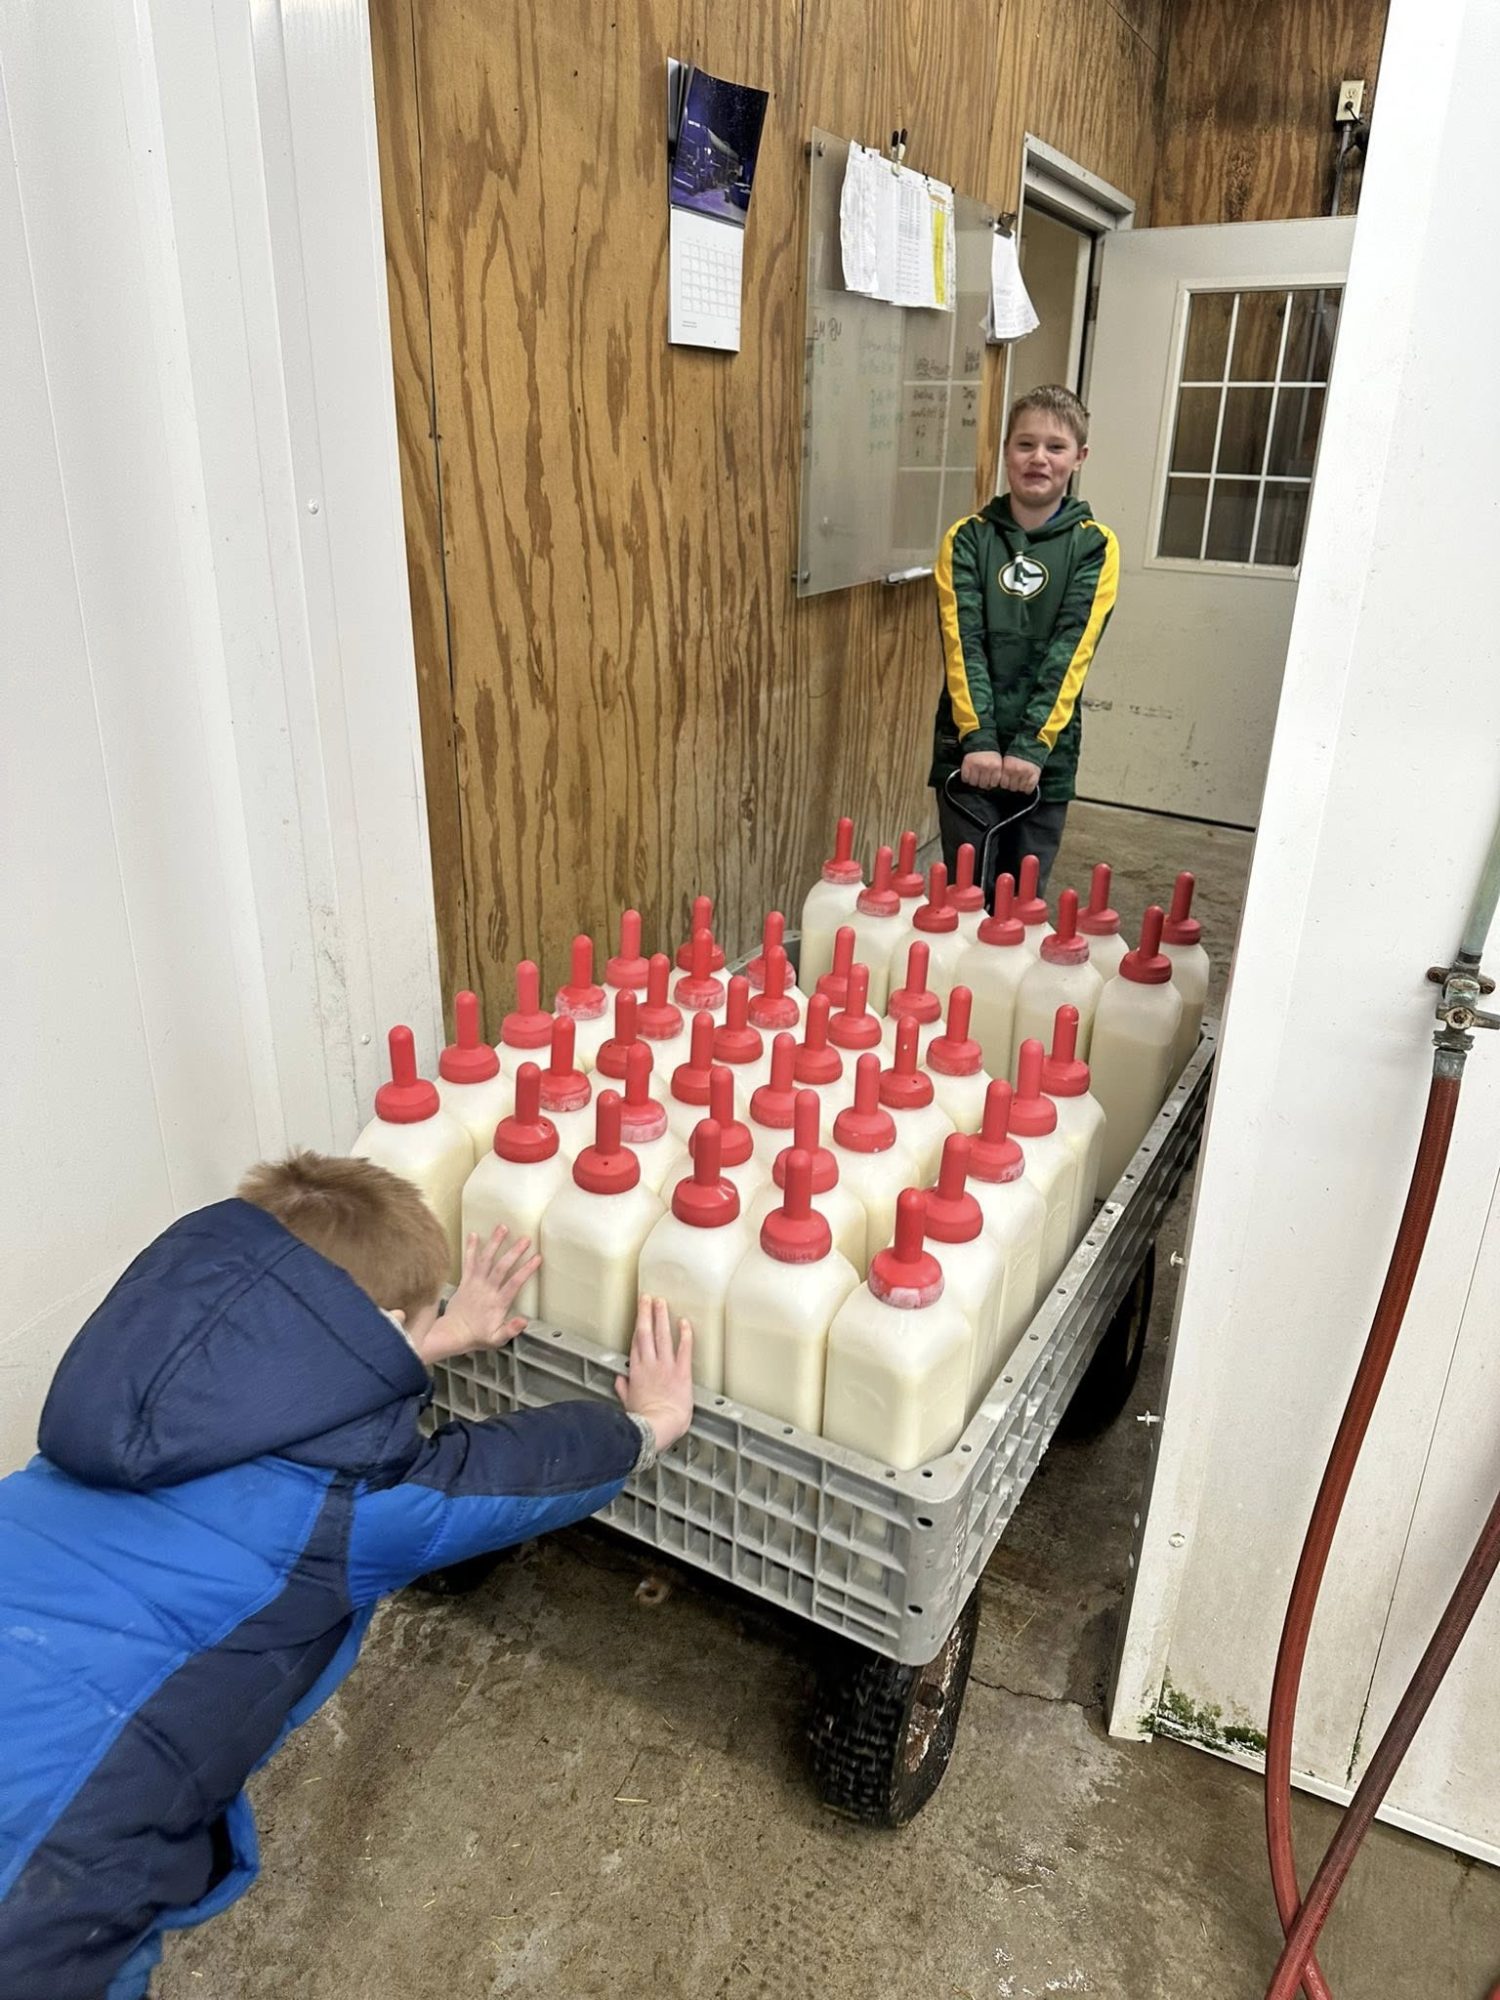
When the crew couldn’t reach the barn and the backup was plowing snow, the backup to the backup crew rolled in — the Henschel boys muscling a cart of milk for calves on that blizzard day.

What the March 14–16 Blizzard Really Did to Dairy Roads

This wasn’t a normal March snow that blows through overnight and melts by the weekend. The National Weather Service called it a “historic, record-setting winter storm” — a potent Colorado low that deepened as it tracked from the central Plains toward Chicago and Lake Huron, pulling Gulf moisture into cold air and hammering the Upper Midwest for more than 48 hours.
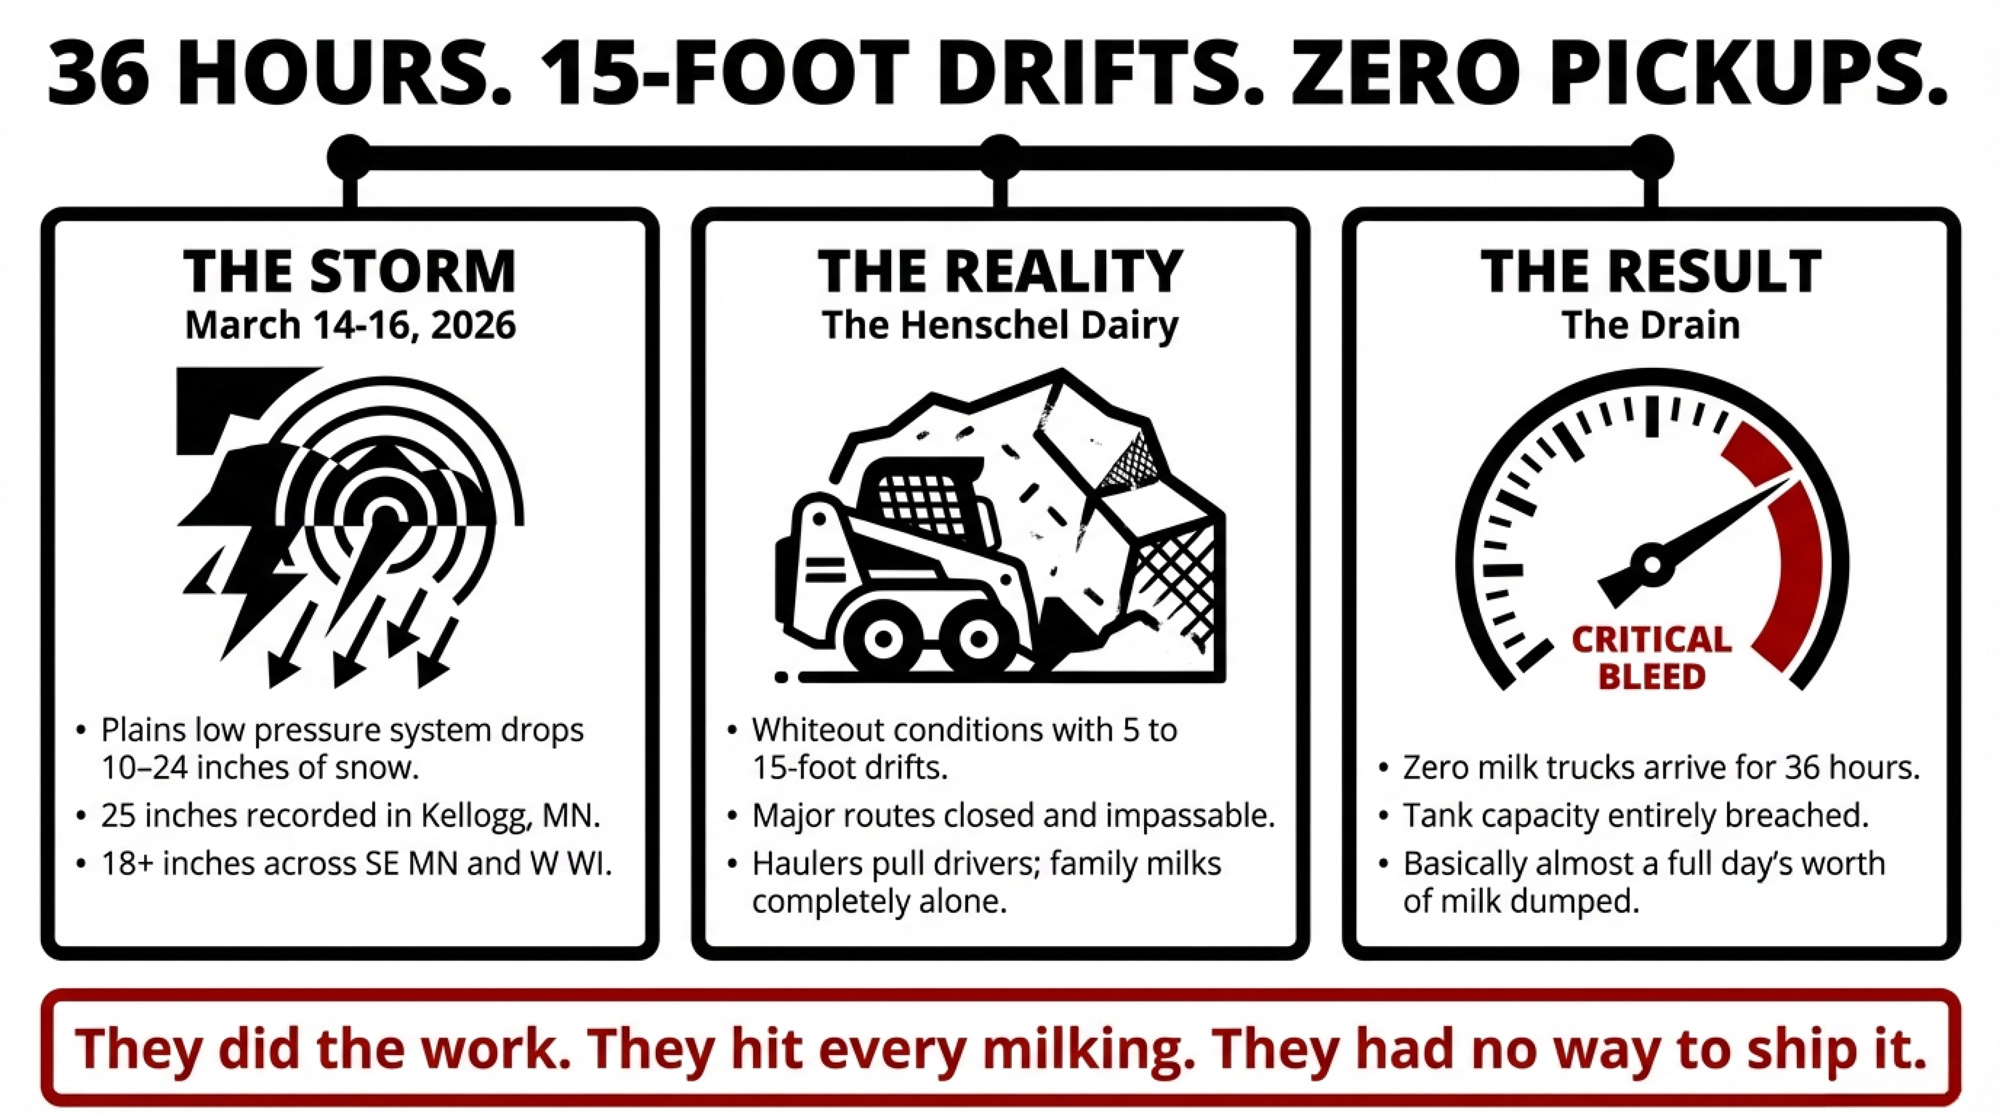
NWS Green Bay reported a widespread 1 to 2 feet across northeast Wisconsin, with localized amounts exceeding 30 inches from Wausau to Marinette and Door County. Green Bay itself recorded 26.6 inches — its second-largest snowstorm on record. Waupaca County, where the Henschel dairy sits near Manawa, saw 25 to 30.5 inches, with nearby Shawano County reporting up to 33 inches. Snowfall rates hit 4 inches per hour at times, with thundersnow and lightning.

To the west, NWS La Crosse confirmed 25 inches at Kellogg, Minnesota, with similar totals across Trempealeau and Clark Counties in Wisconsin — Independence and Strum both hit 25 inches, Granton 25 inches, and Mondovi 26.6 inches. Peak wind gusts reached 59 mph at Green Bay Airport and 60 mph in De Pere, with 40–55 mph gusts common across the region. NWS La Crosse noted reports of 3‑to‑5‑foot drifts were common; NWS Green Bay documented a 10‑foot drift in Ephraim.

The timing was brutal. Storm onset hit Saturday evening, March 14. Peak winds and whiteouts ran late Saturday into Sunday. Interstates 35, 80, and 94 were all closed for a period on Sunday and Sunday night. NWS Twin Cities confirmed that vehicles became stranded on I‑94 between Eau Claire and Osseo during blizzard conditions, and WisDOT posted “No Travel Advised” across the northern half of the state for an extended period. The worst transport window lasted roughly 24–36 hours, during which rural routes were effectively shut down. If your usual truck hits the yard Saturday night or Sunday morning, a 36‑hour shutdown doesn’t just mean “late pickup.” Depending on your tank size and flow, it can mean “no pickup” before you run out of storage.

US Farm Report and Dairy Herd both described the Henschels’ situation as a “rare milk dump” triggered by this storm, noting that towering drifts blocked every path to the farm. On farms across the region, that translated into township and county plows leaving some dairy roads for last, haulers making the call to stay parked rather than risk drivers in whiteouts, and milk plants adjusting schedules or pausing loads until they knew trucks could actually move.

You can’t change the weather. You can be honest about what it costs — and why all the programs that show up after storms like this barely touch the milk itself.

“Milk Can’t Wait”: The Aid That Showed Up — and What It Missed

Within days, USDA’s Farm Service Agency in both Wisconsin and Minnesota was pushing reminders about disaster programs. Sandy Chalmers, FSA State Executive Director in Wisconsin, put it bluntly: “Milk can’t wait. When trucks can’t reach farms or processors on time, producers face costly delays and, in some cases, must dispose of milk that can’t be stored.” She urged producers to report “crop, livestock, and infrastructure-related losses” and to contact their county offices.
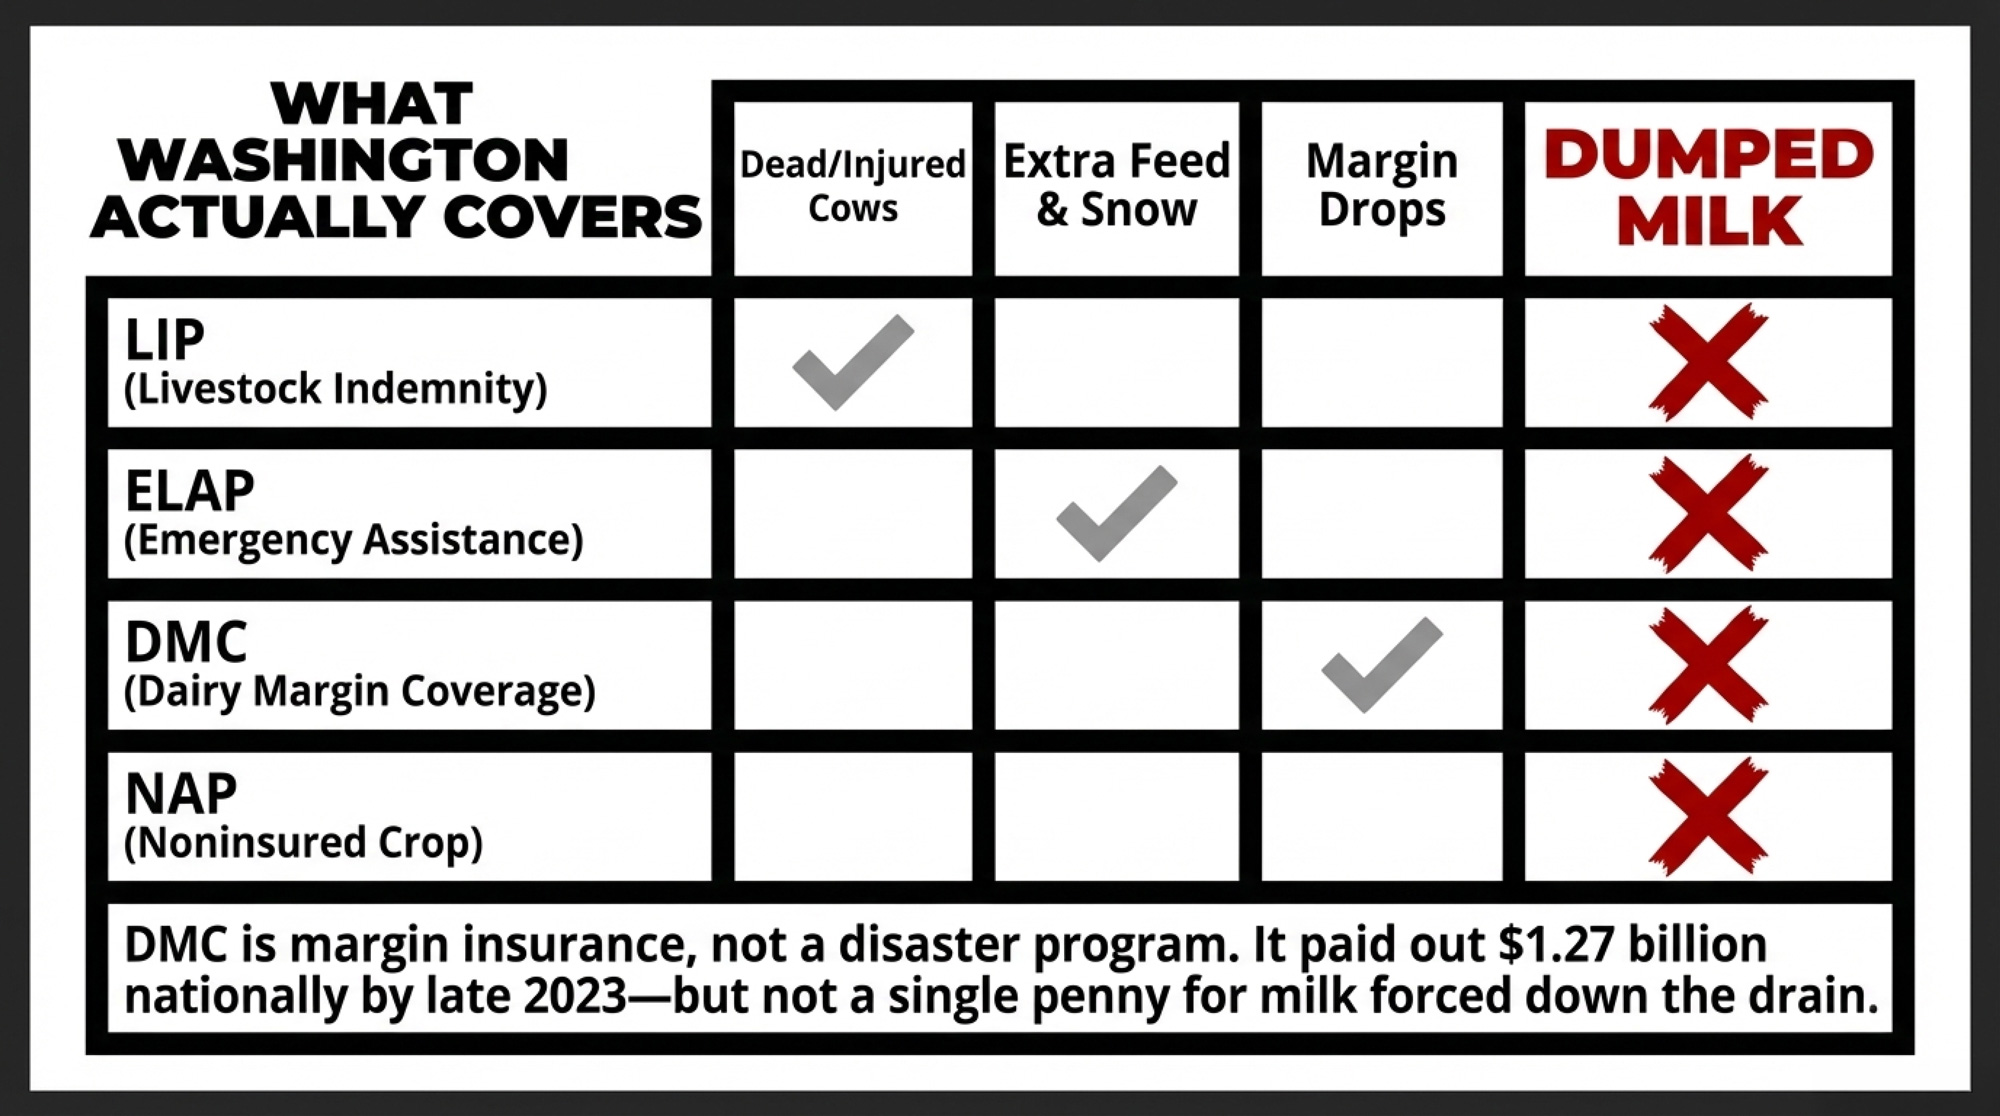
Here’s what was actually on the table for a storm like this:

  • Livestock Indemnity Program (LIP) — Authorized under the 2014 Farm Bill and administered by FSA, LIP pays 75% of the fair market value for livestock deaths above normal mortality due to eligible adverse weather events like blizzards and extreme cold.  It can also cover animals sold at a discount after storm-related injuries. Notice of Loss must be filed within 30 calendar days of when the loss becomes apparent. 
  • Emergency Assistance for Livestock, Honeybees, and Farm‑raised Fish (ELAP) — Provides emergency relief for above‑normal feed costs, feed and water hauling, and equipment rental for snow removal when adverse weather makes normal operations impossible.  ELAP does not cover milk loss directly, though USDA expanded ELAP in July 2024 to cover milk production losses from H5N1‑infected herds — a different mechanism.  Notice of Loss: 30 calendar days from when the loss first became apparent. 
  • Noninsured Crop Disaster Assistance Program (NAP) — Covers non‑insured crops and forage in eligible situations. NAP does not cover milk. A Notice of Loss must be filed within 15 days of the loss becoming apparent — that 15‑day window is shorter than LIP and ELAP, so hay and forage losses from this storm need to be reported fast. 
  • Farm Storage Facility Loan Program (FSFL) — Provides low‑interest financing on 3–12 year terms to build, repair, or upgrade on‑farm storage facilities.  USDA’s eligible commodity list explicitly includes milk, and eligible facility types include bulk tanks, so this can apply directly to expanding your on‑farm milk storage capacity.  It doesn’t pay for losses, but it can help you build more buffer for the next storm. 

On the margin side, the farm bill politicians in Washington have been celebrating as a “big, beautiful” win for producers, reauthorizing and improving Dairy Margin Coverage (DMC) through 2031. DMC is margin insurance, not a disaster program, but it’s the main federal backstop on dairy revenue. By late 2023, DMC had paid out about $1.27 billion nationally, with Wisconsin topping the list at roughly $272.2 million — around $63,633 per enrolled operation— according to USDA and prior Bullvine analysis.

Bullvine’s DMC work shows margins slipping below /cwt by late 2025 and into the mid‑s for early 2026, triggering some of the bigger checks in a few years for farms that stayed fully enrolled. Those payouts helped on paper margins. They didn’t do a thing for milk forced down the drain because the road and plant system around you blinked.

On paper, it can look like you’re covered. In the parlor, once you read the fine print, it’s a different story.

Does Any Federal Program Actually Cover Dumped Milk?

Line up USDA’s current tools, and the gap jumps off the page:
ProgramWhat It CoversTrigger MechanismCovers Dumped Milk?2026 Status
LIPLivestock deaths above normal mortality; injured animals sold at discountBlizzard, extreme cold declared eventNOActive — NOL by Mar 1, 2027
ELAPAbove-normal feed costs; feed/water hauling; snow removal equipmentWeather event driving extra input costsNOActive — NOL by Mar 1, 2027
DMCNational all-milk price minus standardized feed cost (margin)Monthly margin falls below elected level (–.50/cwt)NOActive — enrolled thru 2031
NAPNon-insured crops and forage lossesCrop failure / loss event; 15-day NOL requirementNOActive — covers crops only
FSFLLow-interest loans for on-farm storage construction/upgradesN/A — financing, not indemnityNOActive — 3–12 yr terms
MLPMilk dumped due to qualifying weather — impassable roads, power outagesPhysical milk dumped without compensationYES — BUT 2020–2024 ONLYEXPIRED — signup closed Jan 23, 2026

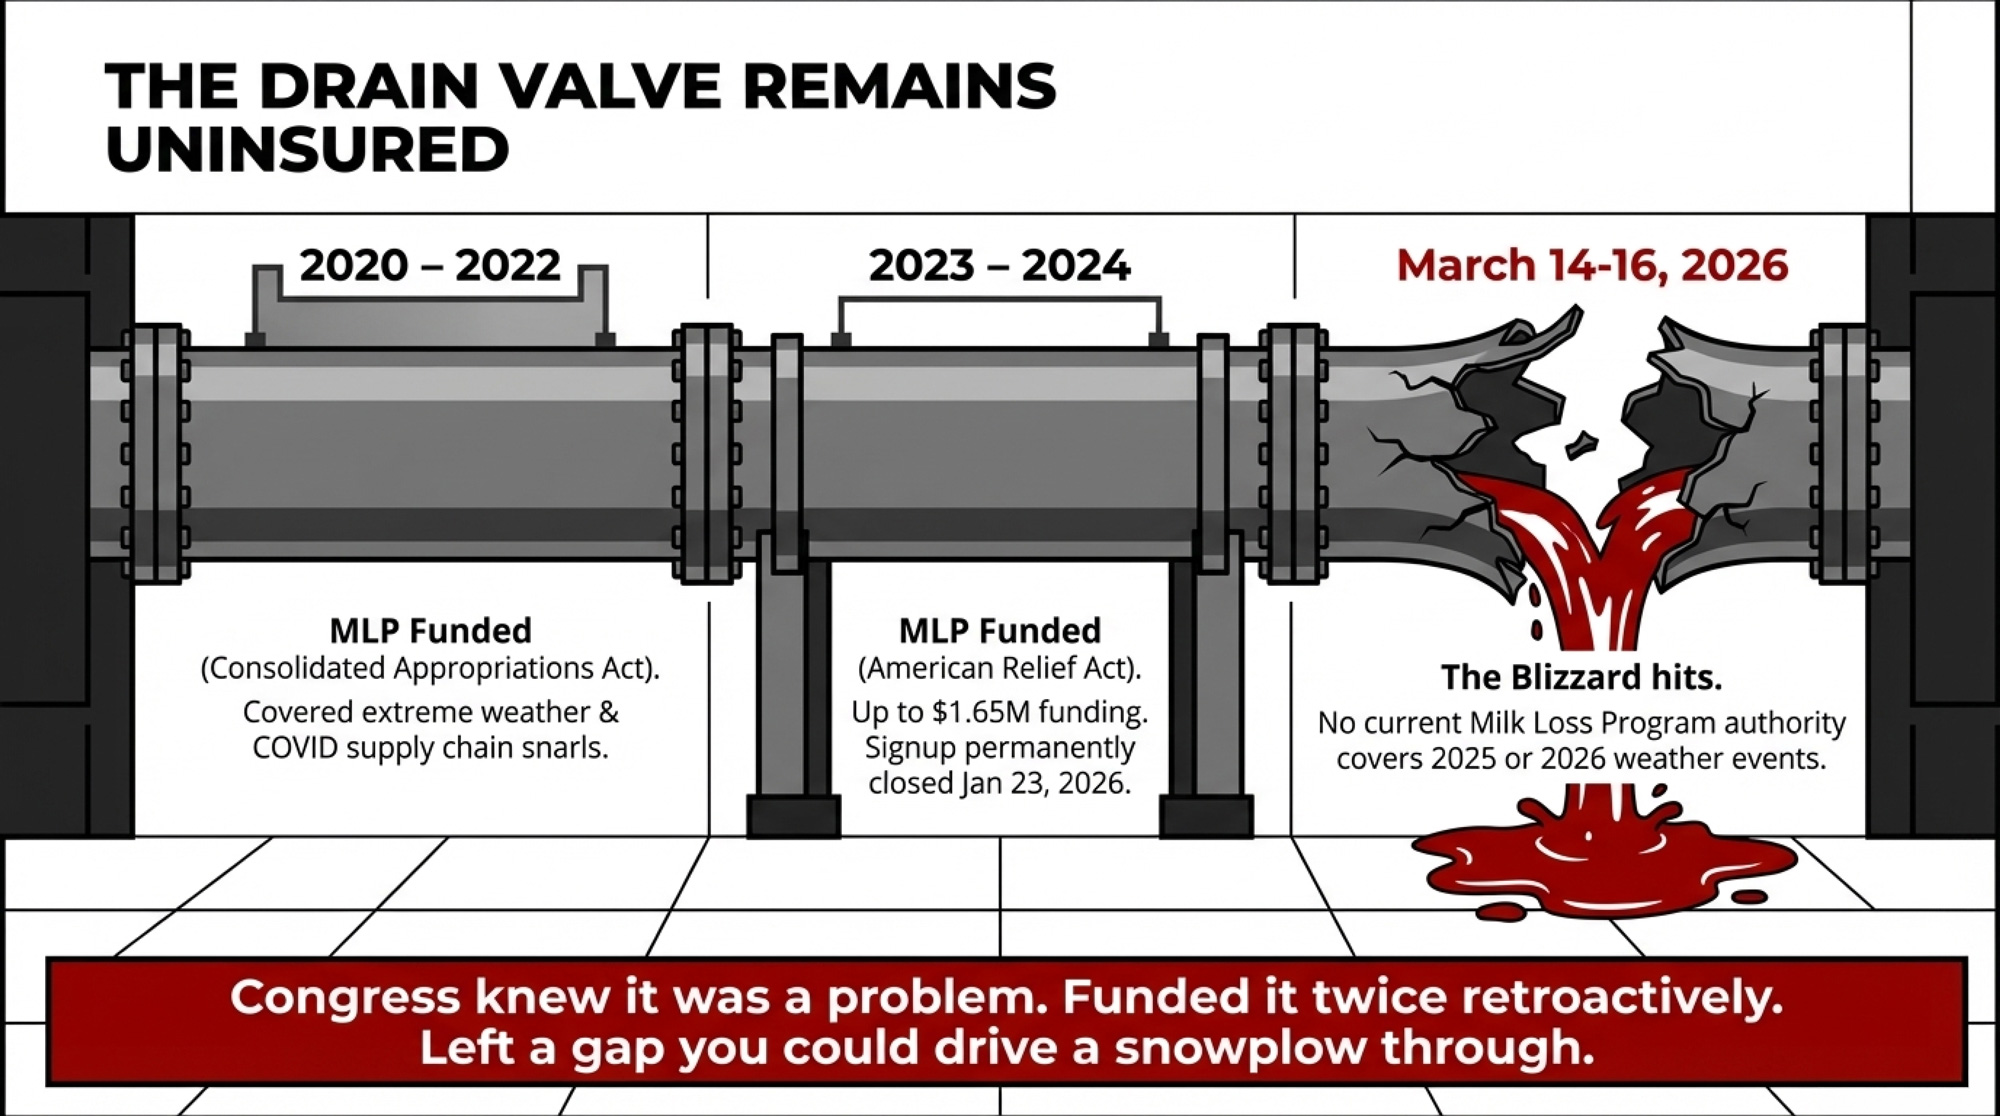
There is one program specifically designed to pay for dumped milk: the Milk Loss Program. Congress has authorized it twice. The first round, under the Consolidated Appropriations Act of 2023, covered eligible losses in 2020, 2021, and 2022 — including extreme weather, supply chain snarls, and COVID‑era processing shutdowns. MLP paid 75% of the milk value for most producers and 90% for underserved producers, including beginning, limited‑resource, and veteran farmers.

The second round, authorized under the American Relief Act of 2025 as part of USDA’s Supplemental Disaster Relief Program, extended MLP to cover qualifying weather events in 2023 and 2024. That signup window opened in late November 2025 and closed in late January 2026 — less than two months before the Henschels’ blizzard.

The March 14–16, 2026, blizzard lands outside both windows. No current MLP authority covers losses for 2025 or 2026. Congress knew about the problem, funded it retroactively twice, and still hasn’t built a permanent program.

So when the Henschels opened that valve, here’s what the safety net really did:

  • Any calves or cows lost to storm stress or injuries? LIP might cover 75% of their value — but you need to file a Notice of Loss within 30 days, which for this storm means roughly by mid‑April 2026. The application for payment deadline extends to approximately March 1, 2027
  • Extra feed, fuel, and snow removal to dig out? ELAP might help — same 30‑day Notice of Loss requirement, with an application deadline of approximately January 30, 2027fsa. usda
  • Margins squeezed this winter? DMC sends a check if the national margin falls far enough below your coverage level.
  • The actual milk they dumped — roughly a full day’s output — sat entirely outside federal coverage in 2026.

That’s not a clerical error. That’s how the net has been structured so far.

How Much Does 72 Hours Without a Milk Truck Actually Cost Your Operation?

Now put some numbers to what a storm like this means in dollars.

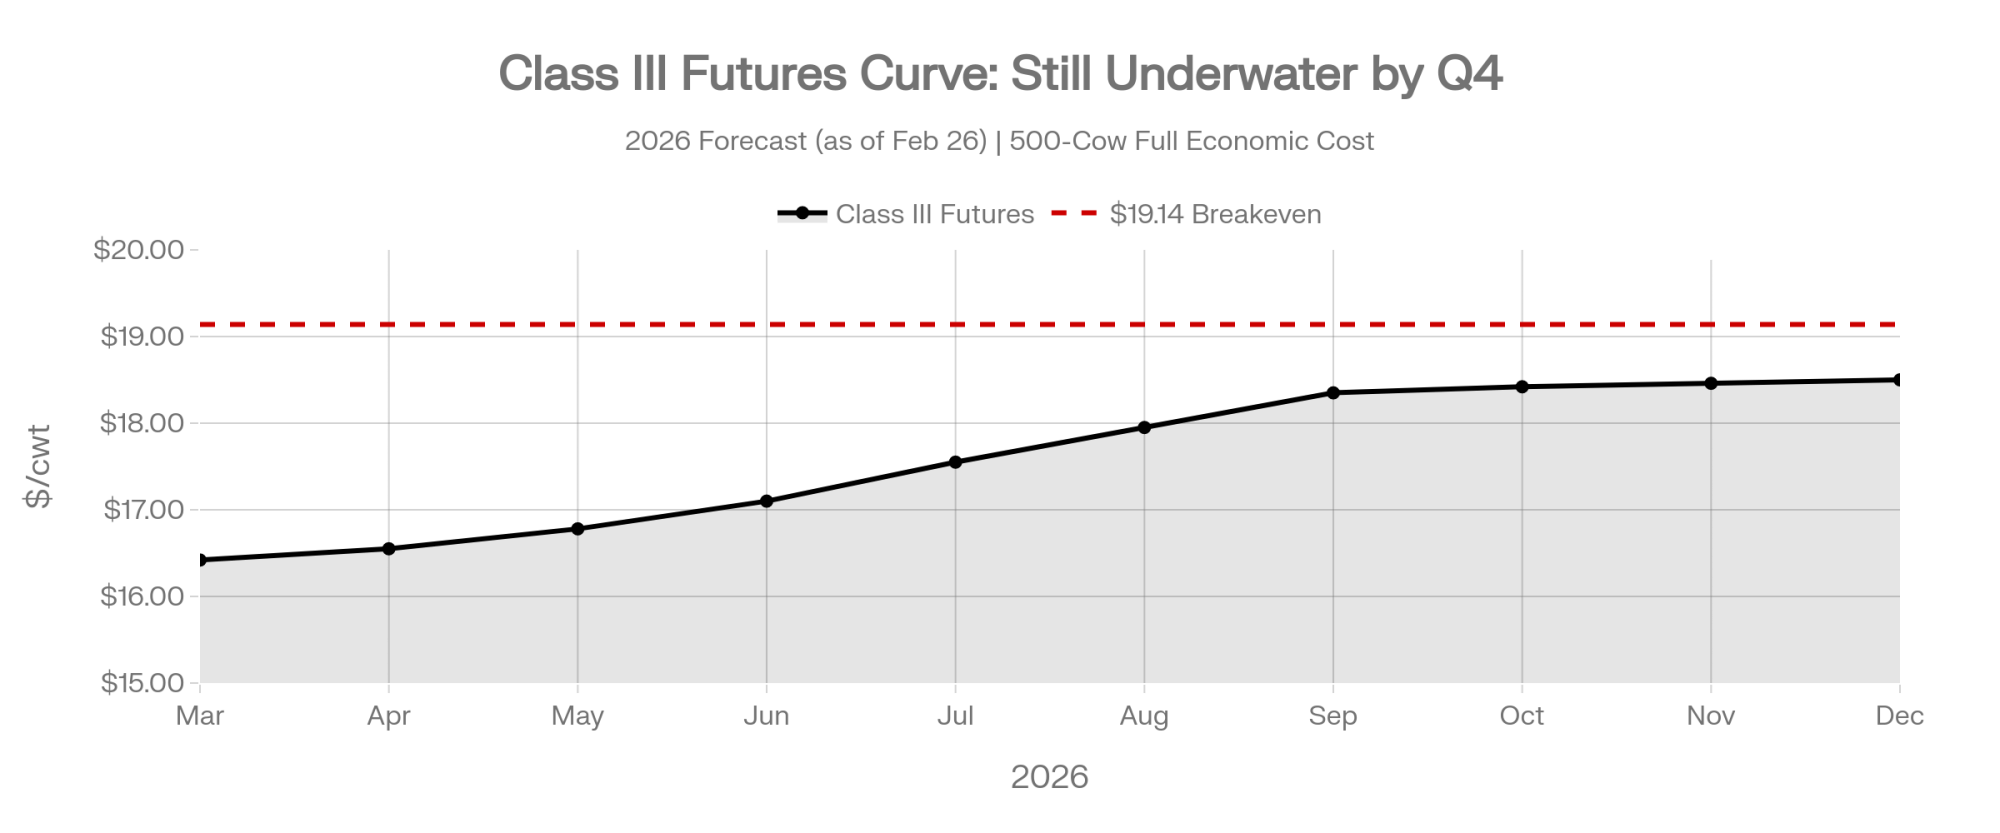
March 2026 Class III futures were trading around $16.11/cwt on the CME. Take a realistic daily production number: 80 pounds of saleable milk per cow per day — 0.8 cwt per cow. Daily revenue per cow at that price: 0.8 cwt × $16.11 = $12.89 per cow per day.
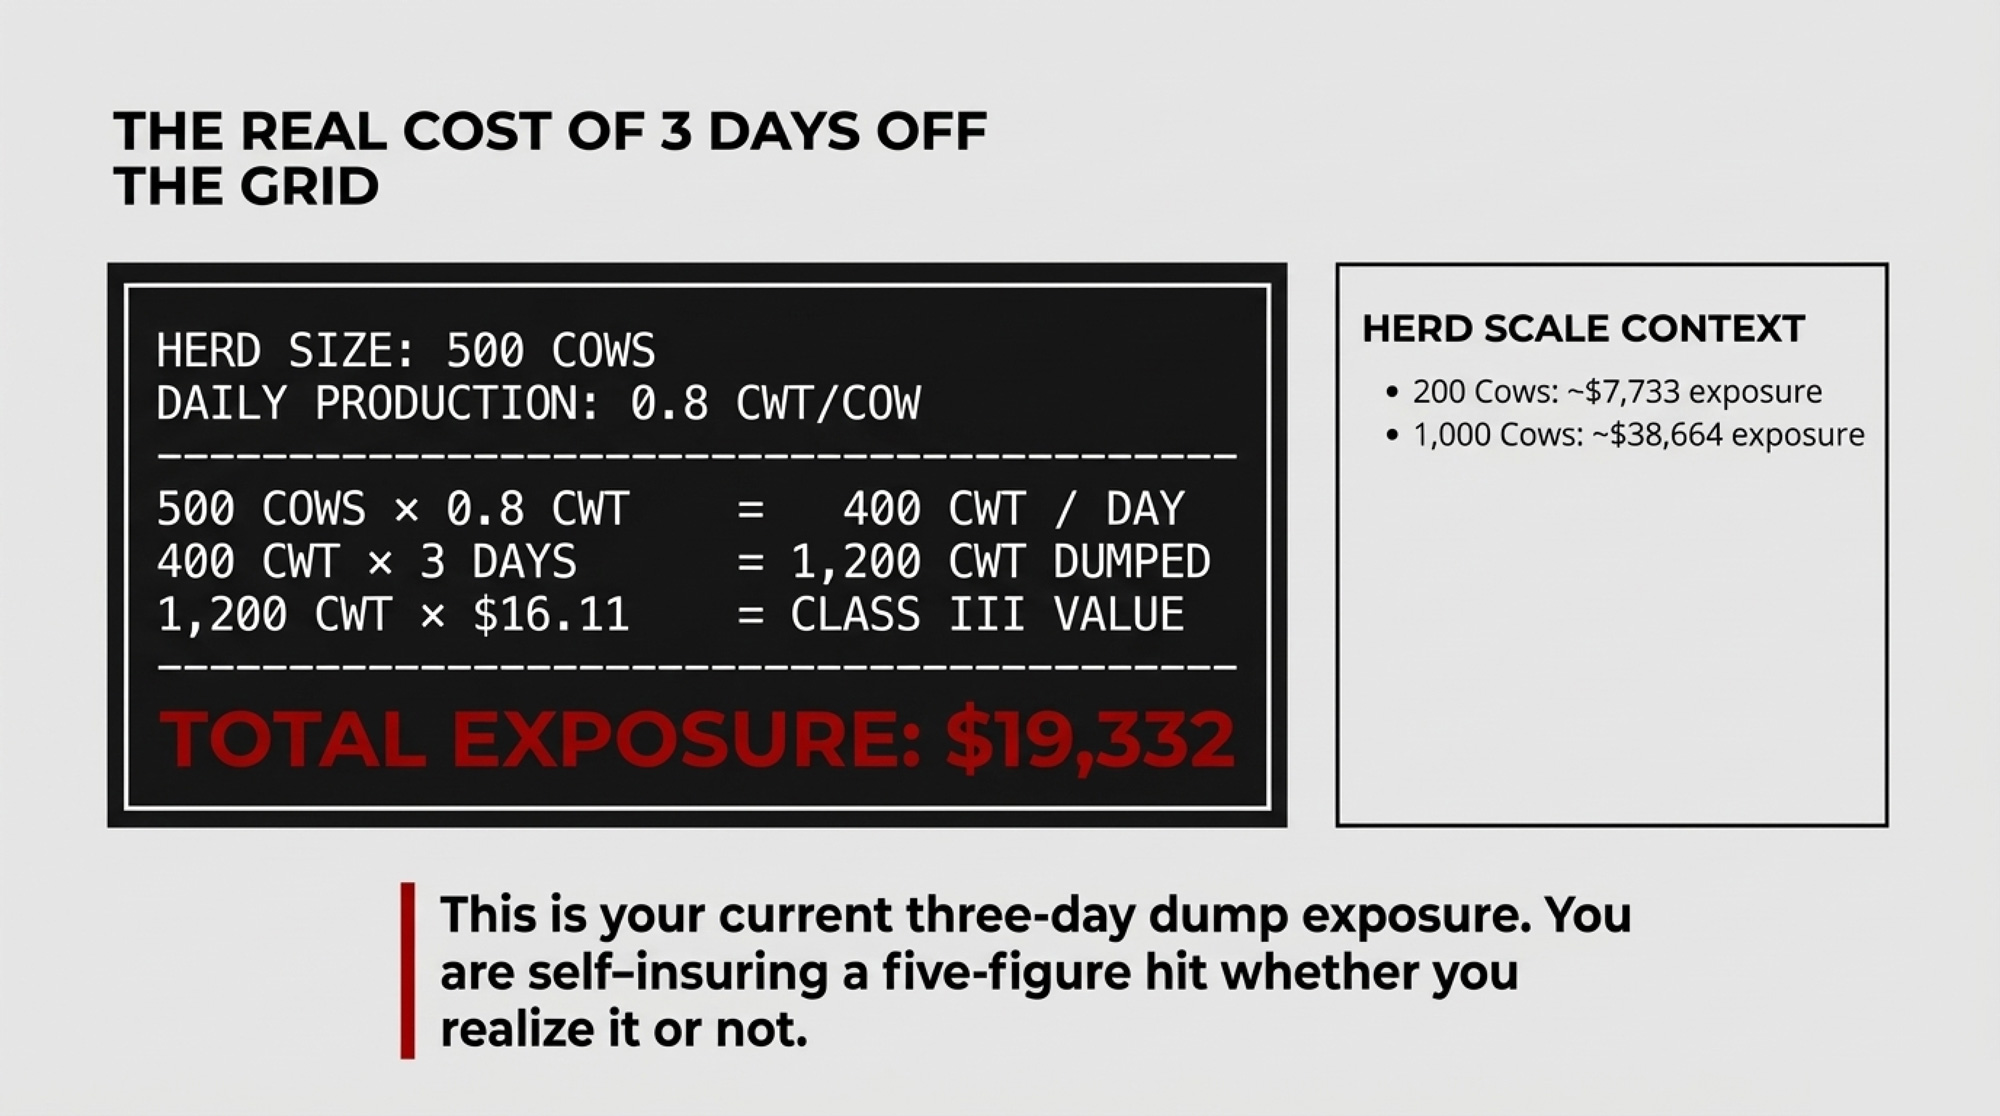
Scale that across a herd and across three days of no pickup:

  • 200 cows: 48,000 lb = 480 cwt. At $16.11 ≈ $7,733 down the drain.
  • 500 cows: 120,000 lb = 1,200 cwt. At $16.11 ≈ $19,332.
  • 1,000 cows: 240,000 lb = 2,400 cwt. At $16.11 ≈ $38,664.

For the Henschels, coverage described them dumping “basically almost a day’s worth of milk” when roads kept trucks out. If you assume a mid‑size herd shipping around 32,000 lb per day — 320 cwt — one dumped day at $16.11/cwt is about $5,155. That’s explicitly example math, not their disclosed volume, but it’s the right scale for a lot of upper‑Midwest family dairies.

Herd SizeAvg Daily Pickup (lbs)3-Day Pickup (cwt)At $14.59/cwt (Jan 2026 low)At $16.11/cwt (March futures)At $18.00/cwt (strong market)
200 cows16,000480$7,003$7,733$8,640
500 cows40,0001,200$17,508$19,332$21,600
1,000 cows80,0002,400$35,016$38,664$43,200
2,500 cows200,0006,000$87,540$96,660$108,000
5,000 cows400,00012,000$175,080$193,320$216,000

Here’s the quick version for your own barn:

  1. Grab your last hauler or co‑op statement and find your average daily pickup volume in pounds.
  2. Multiply that number by 3.
  3. Divide by 100 to turn pounds into cwt.
  4. Multiply by today’s Class III or your mailbox price.

That final number is your current three‑day “dump exposure.” Whether you’ve thought about it or not, you’re self‑insuring it.

Does Your Disaster Plan Survive Three Days Without a Pickup?

Most of us say we have a “plan” for storms. What we really have are habits and luck:

  • The township usually plows us early.
  • The hauler always finds a way.
  • The generator has “never let us down.”

Henschel dairy had habits, too. Then they watched the system around them break — drifts higher than the skid steer, I‑94 closed, WisDOT posting “No Travel Advised” across the northern half of the state.

If you want an honest 72‑hour plan, start by knowing your own limits:

  • How many hours to a full tank? Take your tank size in gallons. Multiply by 8.6 (the weight of a gallon of milk in pounds). Divide by your average hourly milk flow. If your 6,000‑gallon tank fills in 30 hours at peak, you don’t have a 72‑hour problem — you’ve got a 30‑hour one.
  • What backup storage do you really have? A clean nurse tank you actually trust? Access to a neighbour’s bulk tank under a mutual‑aid agreement? A rented tanker or portable tank you could bring in ahead of a forecast blizzard? USDA’s FSFL program will finance bulk milk storage tanks at low interest rates, so if you’ve been thinking about adding capacity, the loan structure already exists. 
  • What are your hauler’s hard limits? Do they have written rules for when they pull trucks? Will they combine routes, run nights, or send smaller trucks? Who actually decides when routes are suspended, and how do they let you know?

Power and access matter too. If a storm like this takes down the grid, can your generator actually run the parlor, vacuum, compressors, and essential lights for three days, or just enough to limp along for a few hours? If you don’t know the answer, that’s worth a conversation with your electrician before fall.

You don’t control the plows or the wind. You do control whether you know your own numbers and weak spots before the next tank alarm reminds you how tight your margin for error really is.

Options and Trade‑Offs for Farmers

OptionUpfront Cost / EffortOngoing CostTime to ImplementCovers Which Risk?Key Limitation
Add on-farm storage (extra tank, nurse tanker)High — stainless steel, plumbing, wiring; FSFL loans available at low interestLow — maintenance & cleaning6–18 monthsBuys 12–24 hrs extra bufferHauler still won’t come in whiteout; storage has limits
Tighten hauler/processor agreementLow — phone calls, written planNone30 daysReduces likelihood of no-showCan’t override DOT road closures; hauler serves many farms
Neighbor/mutual-aid milk pactLow — a conversation now, co-op paperworkNone30–60 daysRoutes milk to farm with access/storageCo-op food-safety rules; requires pre-approval before crisis
Push for permanent MLPPolitical capital + timeNone1–3 years (Congress)Creates federal backstop on dumped milkProgram has expired twice; 2026 dumps currently uninsured 

You’ve basically got four paths when you think about the “truck can’t come” problem. None are perfect. Each has trade‑offs.
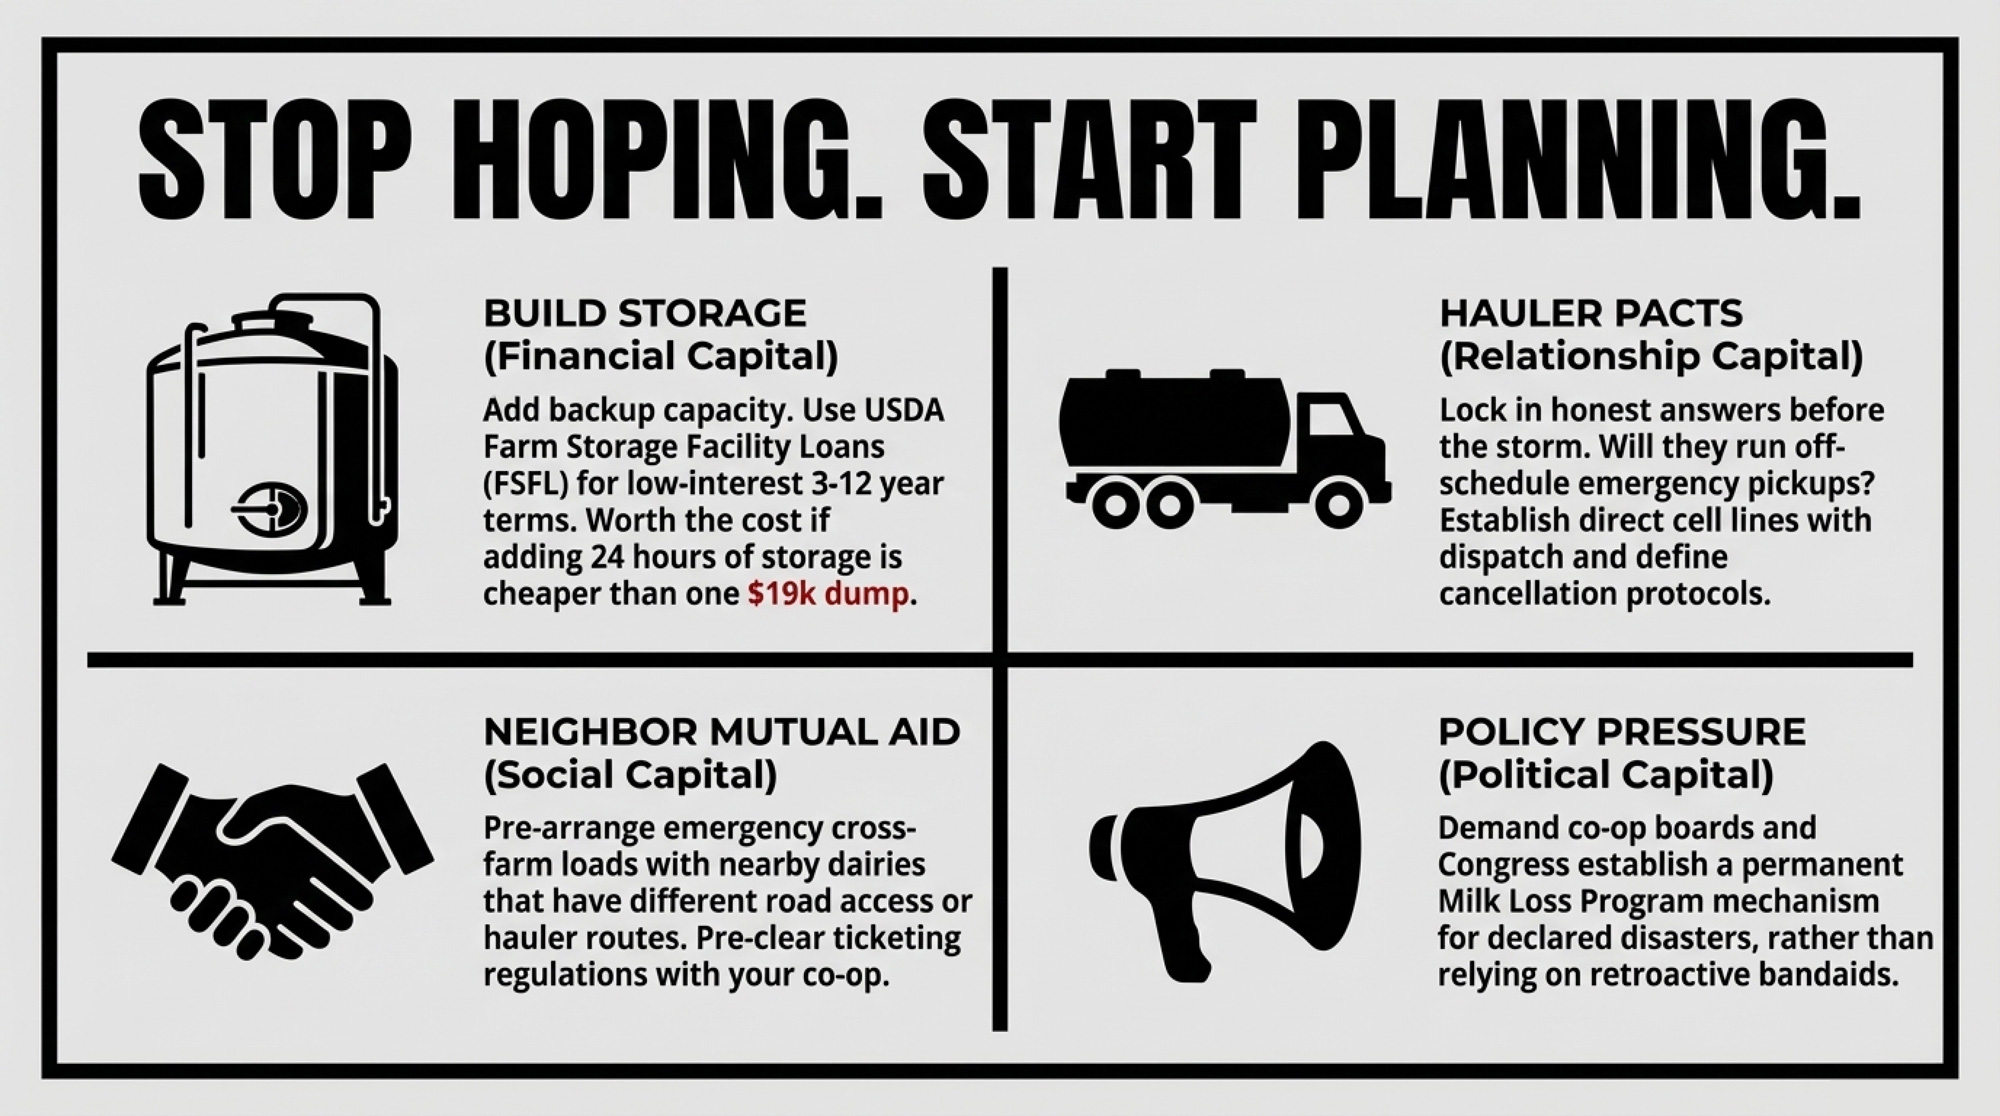
1. Build more on‑farm or shared storage

When it makes sense: you’re milking enough cows that even one dumped day is a five‑figure event, you have physical space, and your lender understands risk management. A 500‑cow herd with 80 lb/cow/day has about $19,332 at risk in a three‑day storm at $16.11/cwt.

What it requires: capital for a larger bulk tank, a second tank, or a nurse tanker. USDA’s Farm Storage Facility Loan Program offers low‑interest financing on 3–12 year terms, and its eligible commodity list specifically includes milk, with bulk tanks listed as eligible facility types.

Risks and limits: you tie up cash in stainless that mostly sits there until the rare bad week. If your hauler and processor can’t or won’t add emergency routes, you may still end up dumping.

2. Tighten hauler and processor agreements

When it makes sense: you’ve got relationship leverage as a long‑term patron with solid quality.

What it requires: honest conversations before the next storm. During this event, WisDOT posted “No Travel Advised” across the entire northern half of Wisconsin – at that point, nobody was running. But for storms short of that, some co‑ops and haulers have emergency pickup or route‑consolidation protocols. If yours doesn’t, that conversation is worth having now.

Your 30‑day move: write a one‑page “storm plan” with hauler and processor contacts, who calls first, and what you’ve agreed to. Tape a copy on the bulk tank, one in the office, and one at home.

3. Build neighbour and community mutual‑aid pacts

When it makes sense: you’ve got another dairy or two within a few miles, and at least one has different exposure — better road, more storage, different hauler.

What it requires: sitting down now and asking, “If your truck can reach you but not us, could you take one load?” Then work with your co‑op on how that milk is ticketed and paid. Some processors are open to cross‑farm loads if quality can be tracked; others need approvals in place.

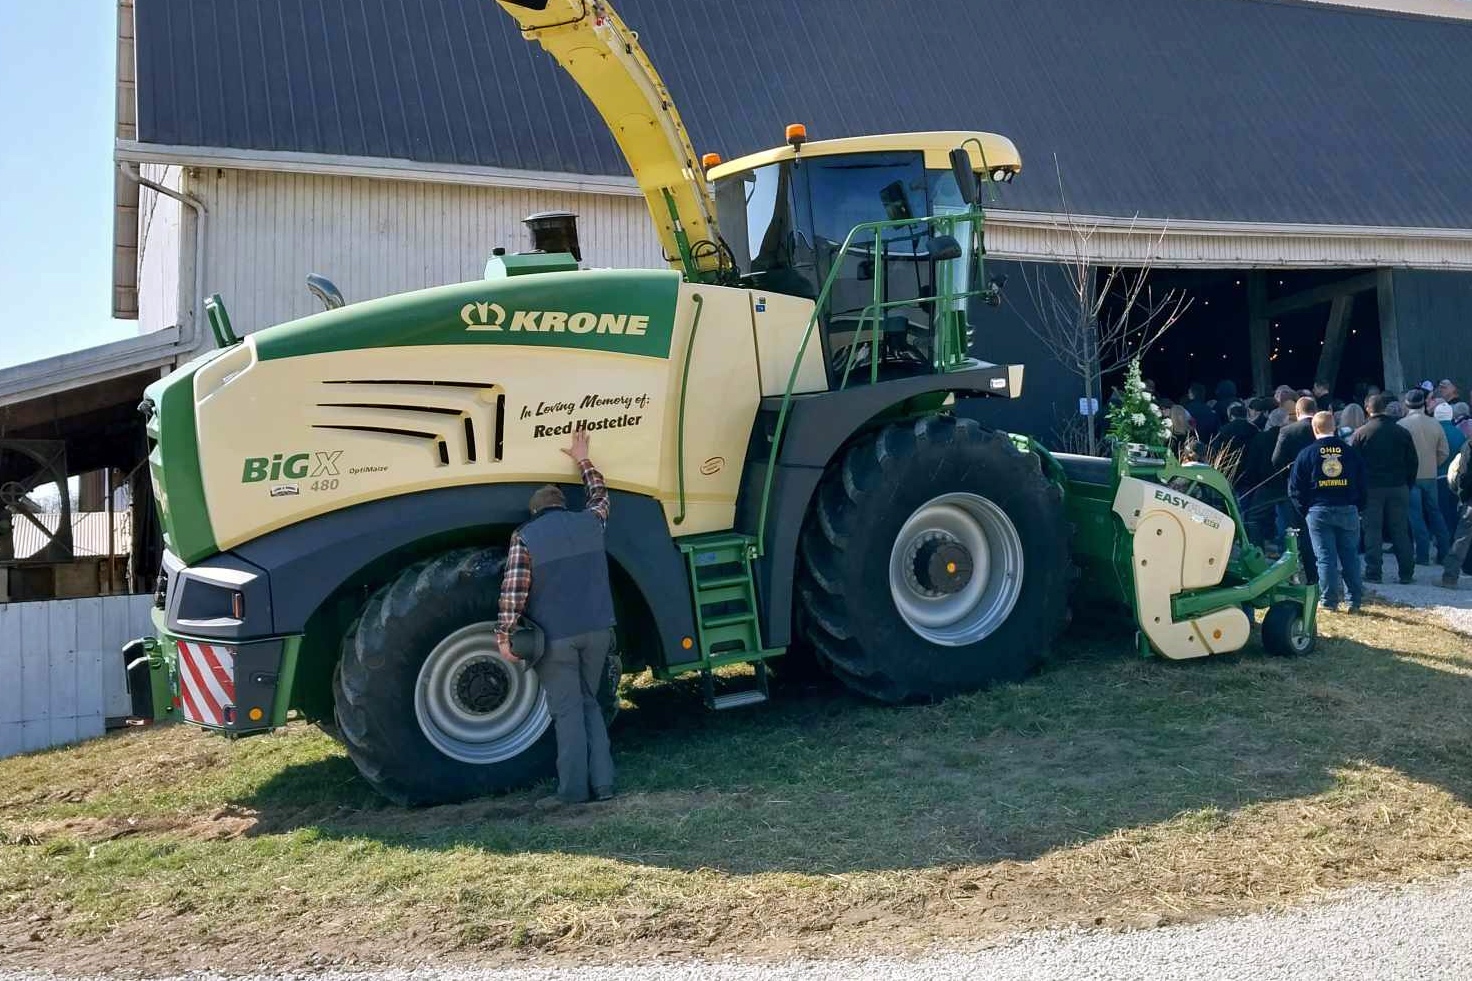
We’ve seen this kind of neighbour network in real crises. When Ohio dairyman Reed Hostetler died in a manure pit accident, neighbours stepped in to run chores, haul feed, and keep the dairy going. That same instinct — organized ahead of time — can keep a blizzard from turning into a five‑figure milk loss.

4. Push for policy change

What it requires: calling your members of Congress and being specific: “Congress funded the Milk Loss Program twice — first for 2020–2022 under the Consolidated Appropriations Act of 2023, then for 2023–2024 under the American Relief Act of 2025. Why does the program keep expiring?”

You can also press your co‑op or processor board. During the 2020 milk‑dump crisis, USDA relief dollars flowed through co‑ops to help cover losses. Ask your buyer, bluntly: “If we’re forced to dump because the road or plant is shut, do you share any of that hit, or are we on our own?”

Bullvine Perspective: The Bill That Brags About DMC and Leaves the Drain Uninsured

The latest farm bill made a big deal out of reauthorizing DMC through 2031 and tweaking margins and coverage levels. They lined up for photo‑ops, telling dairy producers they’d “protected family farms.”

Look at the blizzard math again:

  • You do the work.
  • You feed and milk through 5‑ to 15‑foot drifts.
  • The truck can’t get to you.
  • You open the valve and dump thousands to tens of thousands of dollars of milk.

DMC pays based on a national margin. It doesn’t care whether your milk is left in a tanker or runs across the floor. LIP and ELAP pay for dead cows, extra feed, and some snow removal. The only program USDA has built to pay for dumped milk — the Milk Loss Program — has been funded twice, retroactively, for events in 2020–2024, and the last signup closed in late January 2026. Less than seven weeks before the Henschels’ tank overflowed.

Congress knew this was a problem. They funded it. Twice. And still left a gap you could drive a snowplow through.

What This Means for Your Operation

  • If you had any livestock deaths, discounted livestock sales, or major feed disruptions in this storm, your Notice of Loss deadline is roughly 30 days from the event — mid‑April 2026 for March 14–16 losses.  Don’t wait. File with your county FSA office now. The application‑for‑payment deadline extends to early 2027, but the Notice of Loss window is the one that catches people off guard. 
  • If your three‑day milk exposure number makes you flinch when you multiply daily pickup × 3 × current Class III, then it’s not a freak event — it’s a business risk you’re actively self‑insuring, and it belongs in the same conversation as debt service and feed contracts.
  • If you can’t afford more storage, your 30‑day move is to get your paperwork and people in order:document any milk dumps even if they’re not covered yet (you’ll want that record if Congress funds MLP retroactively again), and write down a simple storm plan with hauler and neighbour contacts where everyone can find it.
  • If you’ve been treating DMC as disaster coverage, remind yourself it’s margin insurance, not milk‑dump insurance. Congress has funded the Milk Loss Program twice for past events and let it expire both times.  If you want dumping covered going forward, someone from your area is going to have to say that out loud — using real numbers from storms like this one. 
The Bottom Line

Sandy Chalmers was right: milk can’t wait. The Henschels kept cows milking and fed through 5‑ to 15‑foot drifts, and the federal system around them offered help with feed costs and animal losses — but not with the milk they had to dump.

So here’s your kitchen‑table homework: grab your last hauler statement. Multiply your average daily pickup by three days and by today’s price. Are you actually comfortable self‑insuring that number the next time your road disappears under three feet of snow?

If you want the deeper math on how DMC, processor contracts, and USDA dairy disaster assistance actually fit together — and what happens when it’s not the weather but a plant shutdown that stops the truck — keep an eye out for the next “When the Truck Can’t Come” instalments. We’ll be looking at what the AMPI Paynesville strike and shutdown just taught us about stranded milk, and at whether the $17,500 DMC gamble was really the right bet for a storm year like this.

And one more question to chew on while you’re staring at that bulk tank: Do you know where your co‑op actually stands on renewing a permanent Milk Loss Program — and whether they’re truly pushing for it, or just offering sympathy when you’re the one opening the drain valve?

Complete references and supporting documentation are available upon request by contacting the editorial team at editor@thebullvine.com.

Learn More

The Sunday Read Dairy Professionals Don’t Skip.

Every week, thousands of producers, breeders, and industry insiders open Bullvine Weekly for genetics insights, market shifts, and profit strategies they won’t find anywhere else. One email. Five minutes. Smarter decisions all week.
NewsSubscribe
First
Last
Consent

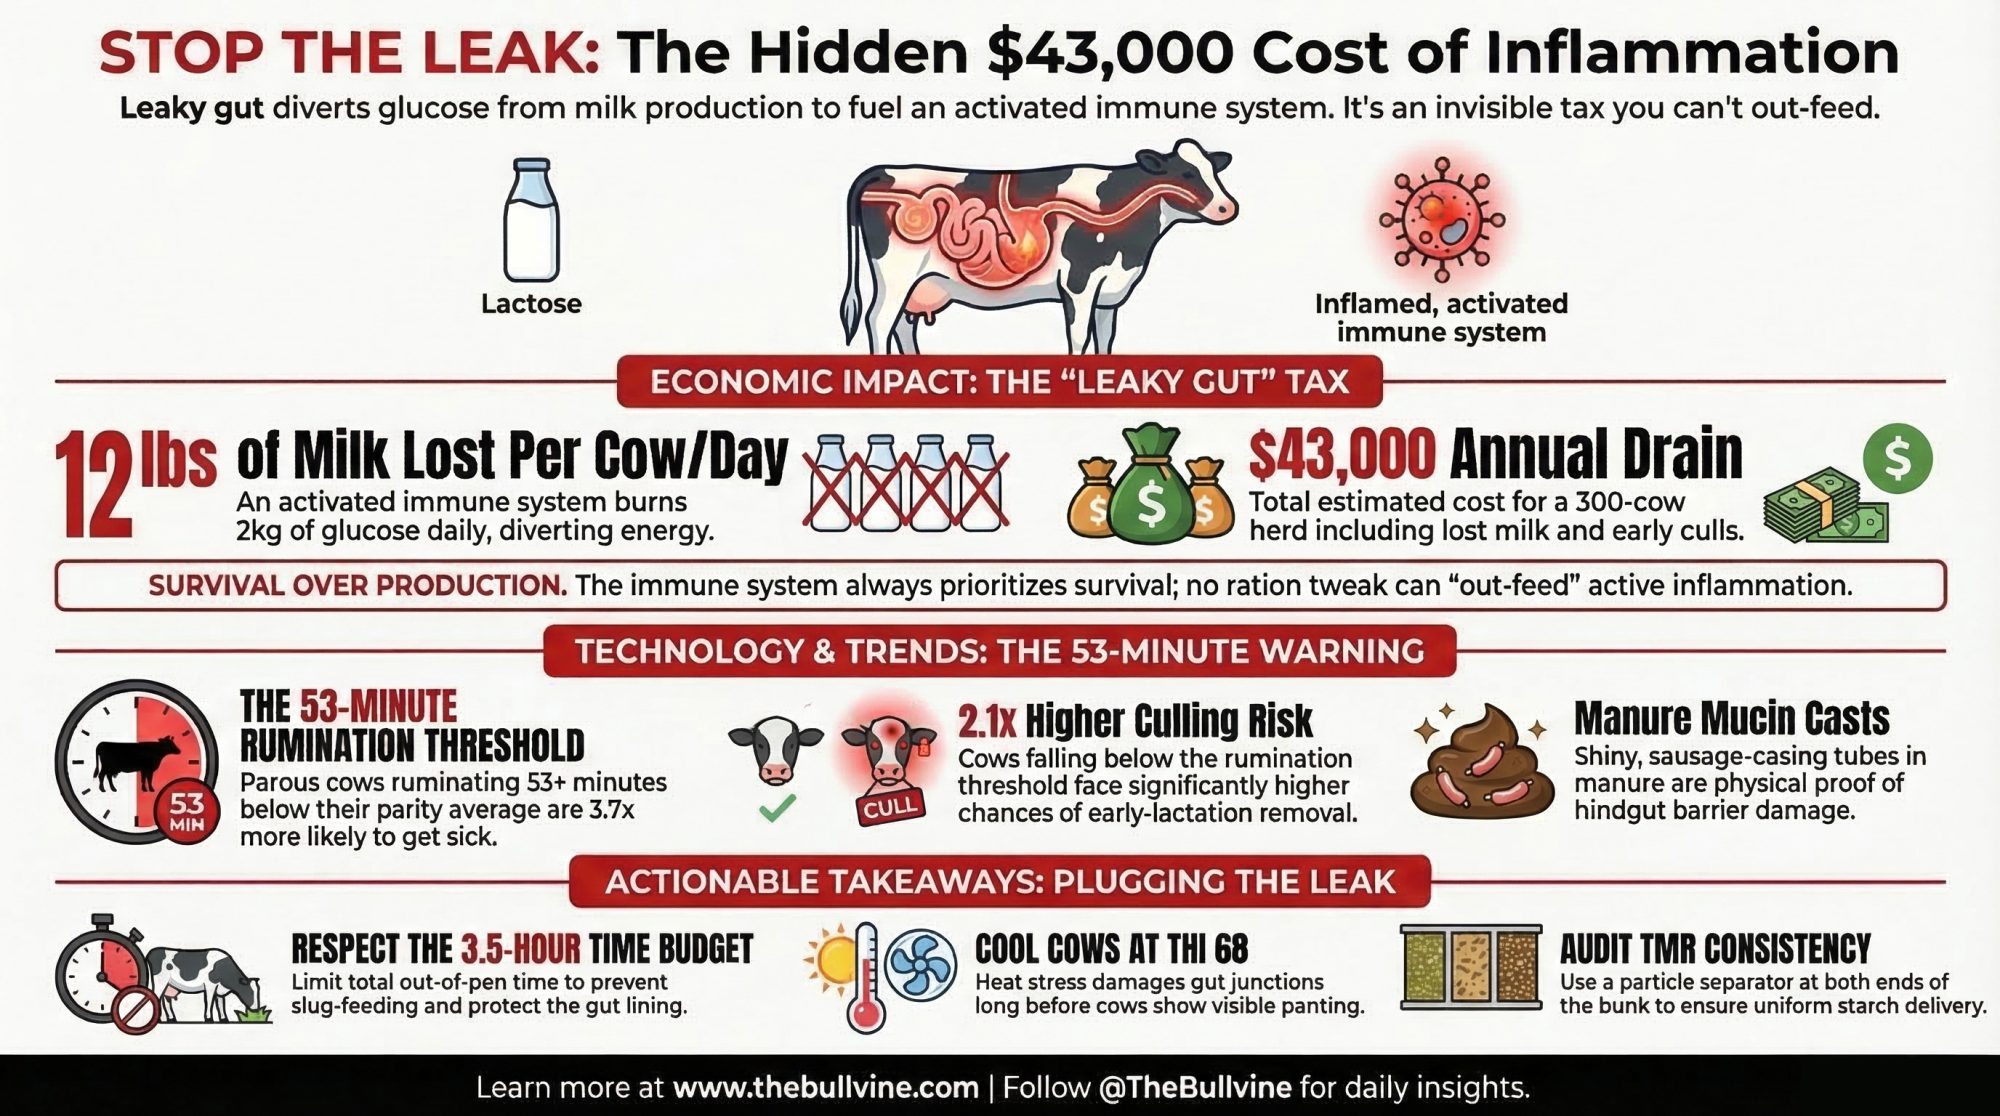
Cornell Found the 3 kg/Day Heat Stress Leak Your Fans Were Never Going to Fix.

A 46‑cow chamber trial proved heat‑stressed Holsteins are losing milk through the gut wall — not just from reduced intake. Here’s the barn math at $18.95/cwt.

Executive Summary: Cornell’s McFadden group proved that heat-stressed Holsteins lose about 3 kg of energy-corrected milk per cow per day through gut-wall failure — independent of reduced feed intake. In their 46-cow chamber trial, a pair-fed group kept cool but eating the same reduced diet still out-milked the heat-stressed cows, which means a real chunk of your summer leak is coming from somewhere fans and soakers can’t reach. What’s actually happening: endotoxins slip through a compromised intestinal barrier, and the immune system burns glucose that should’ve gone to milk — Kvidera’s work showed over 1 kg of glucose torched in just 12 hours. A microencapsulated organic acid/botanical blend restored gut permeability and cut inflammation in the trial, though a follow-up calf study found no growth response, so the strongest case is in lactating cows under sustained THI above 74. At $18.95/cwt, a conservative 2 kg/day recovery on 500 cows over 120 heat-stress days is worth roughly $50,100 in gross milk value — before you subtract product cost. The longer invoice is worse: Laporta’s 10-year Florida data showed daughters of heat-stressed dry cows lost 4.9 months of productive life, with a national cost estimated at 5 million/year.

heat stress milk loss

It’s July. Fans screaming at 100%, soakers drenching the holding pen, and your bulk tank still bleeding out. You’ve done everything the heat stress playbook says — but a Cornell research team reported heat‑stressed Holsteins losing about 3 kg of energy‑corrected milk per cow per day from a place your fans can’t reach: the gut wall.

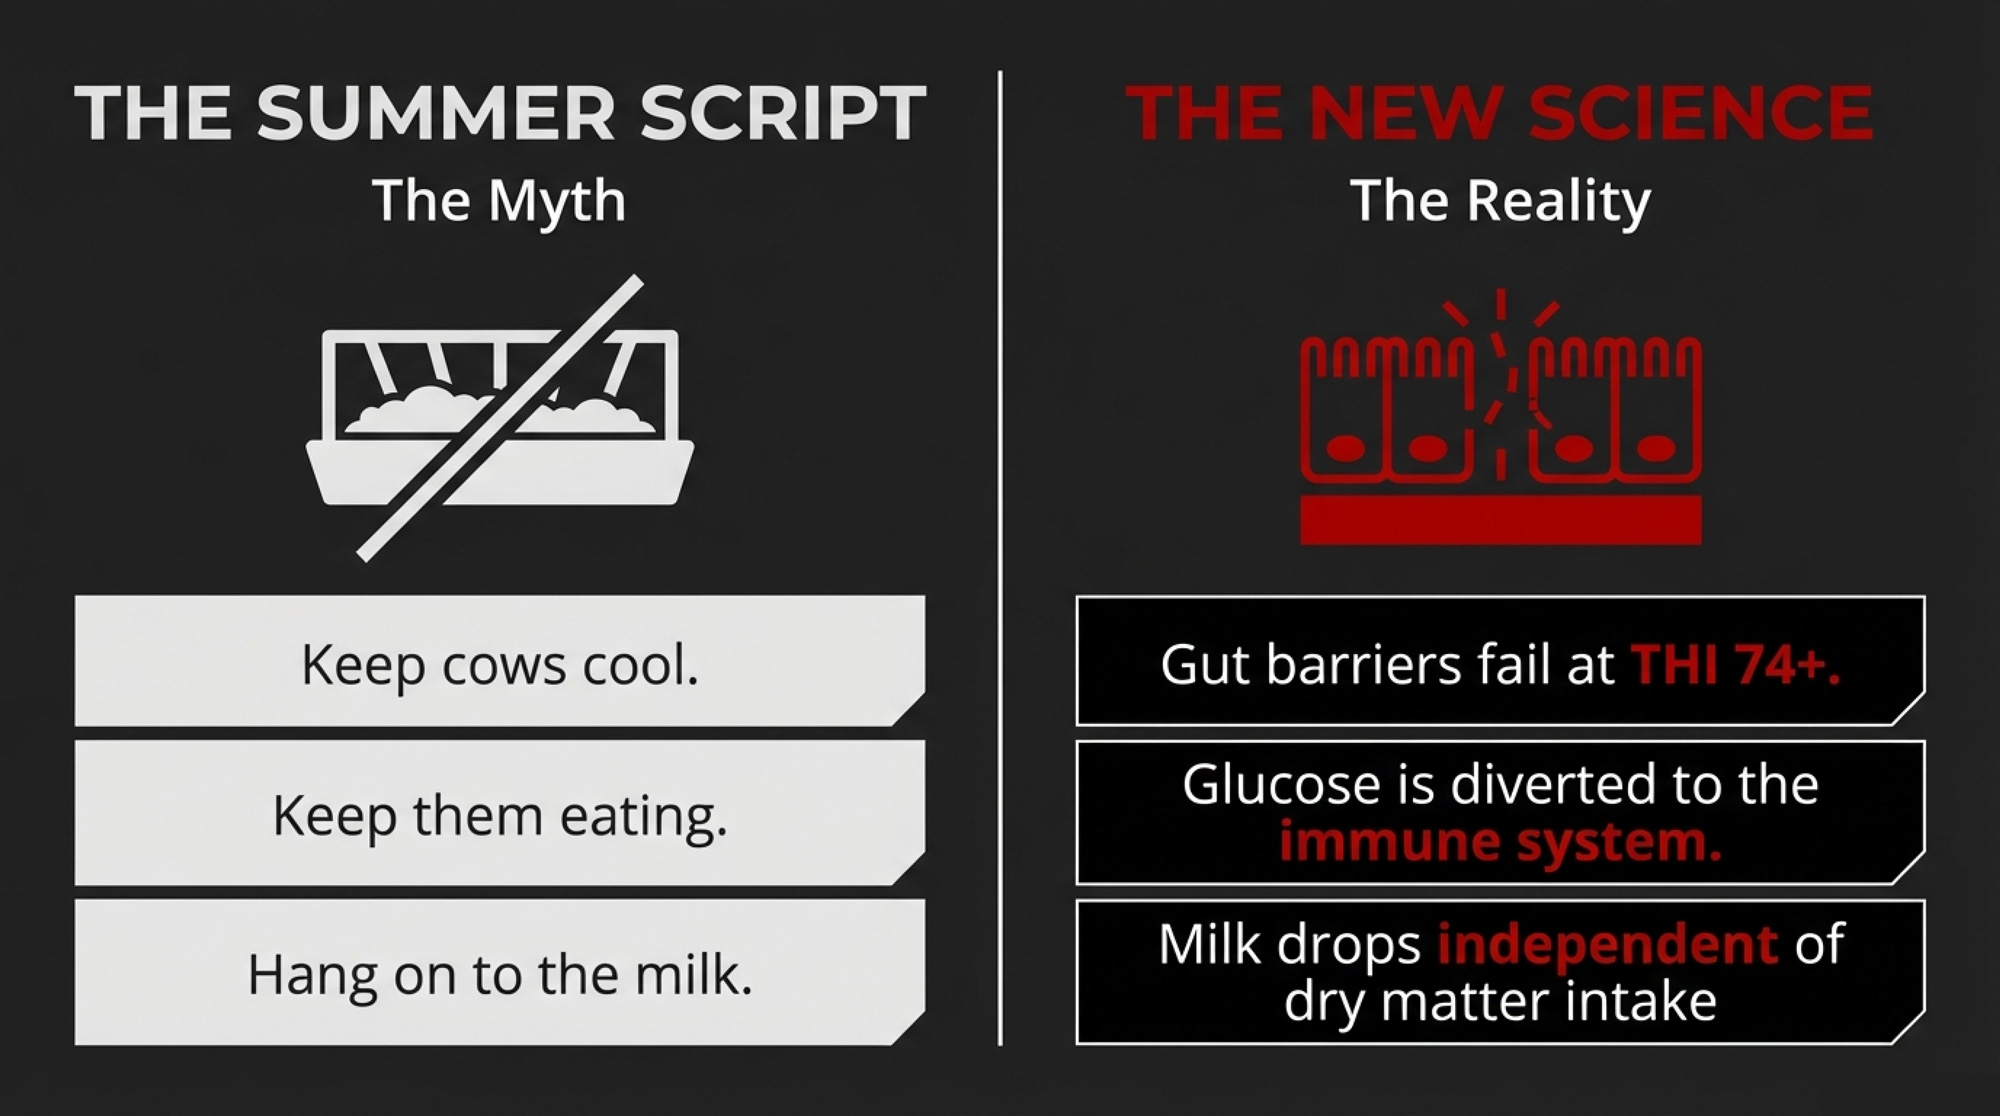
We’ve all been raised on the same summer script: keep cows cool, keep them eating, hang on to the milk. Joseph McFadden’s group at Cornell put that theory to the test in a chamber and showed it’s only half the story. They took 46 multiparous Holsteins, split them into four groups, and proved that even when feed intake is matched, heat stress still punches holes in the intestine and lights up the immune system — stealing glucose that was supposed to end up in your milk cheque (Fontoura et al. 2022, JDS 105:7842–7860).

The Part of Heat Stress Your Fans Can’t Touch

It only took three days of 74+ THI for the gut wall to start failing.

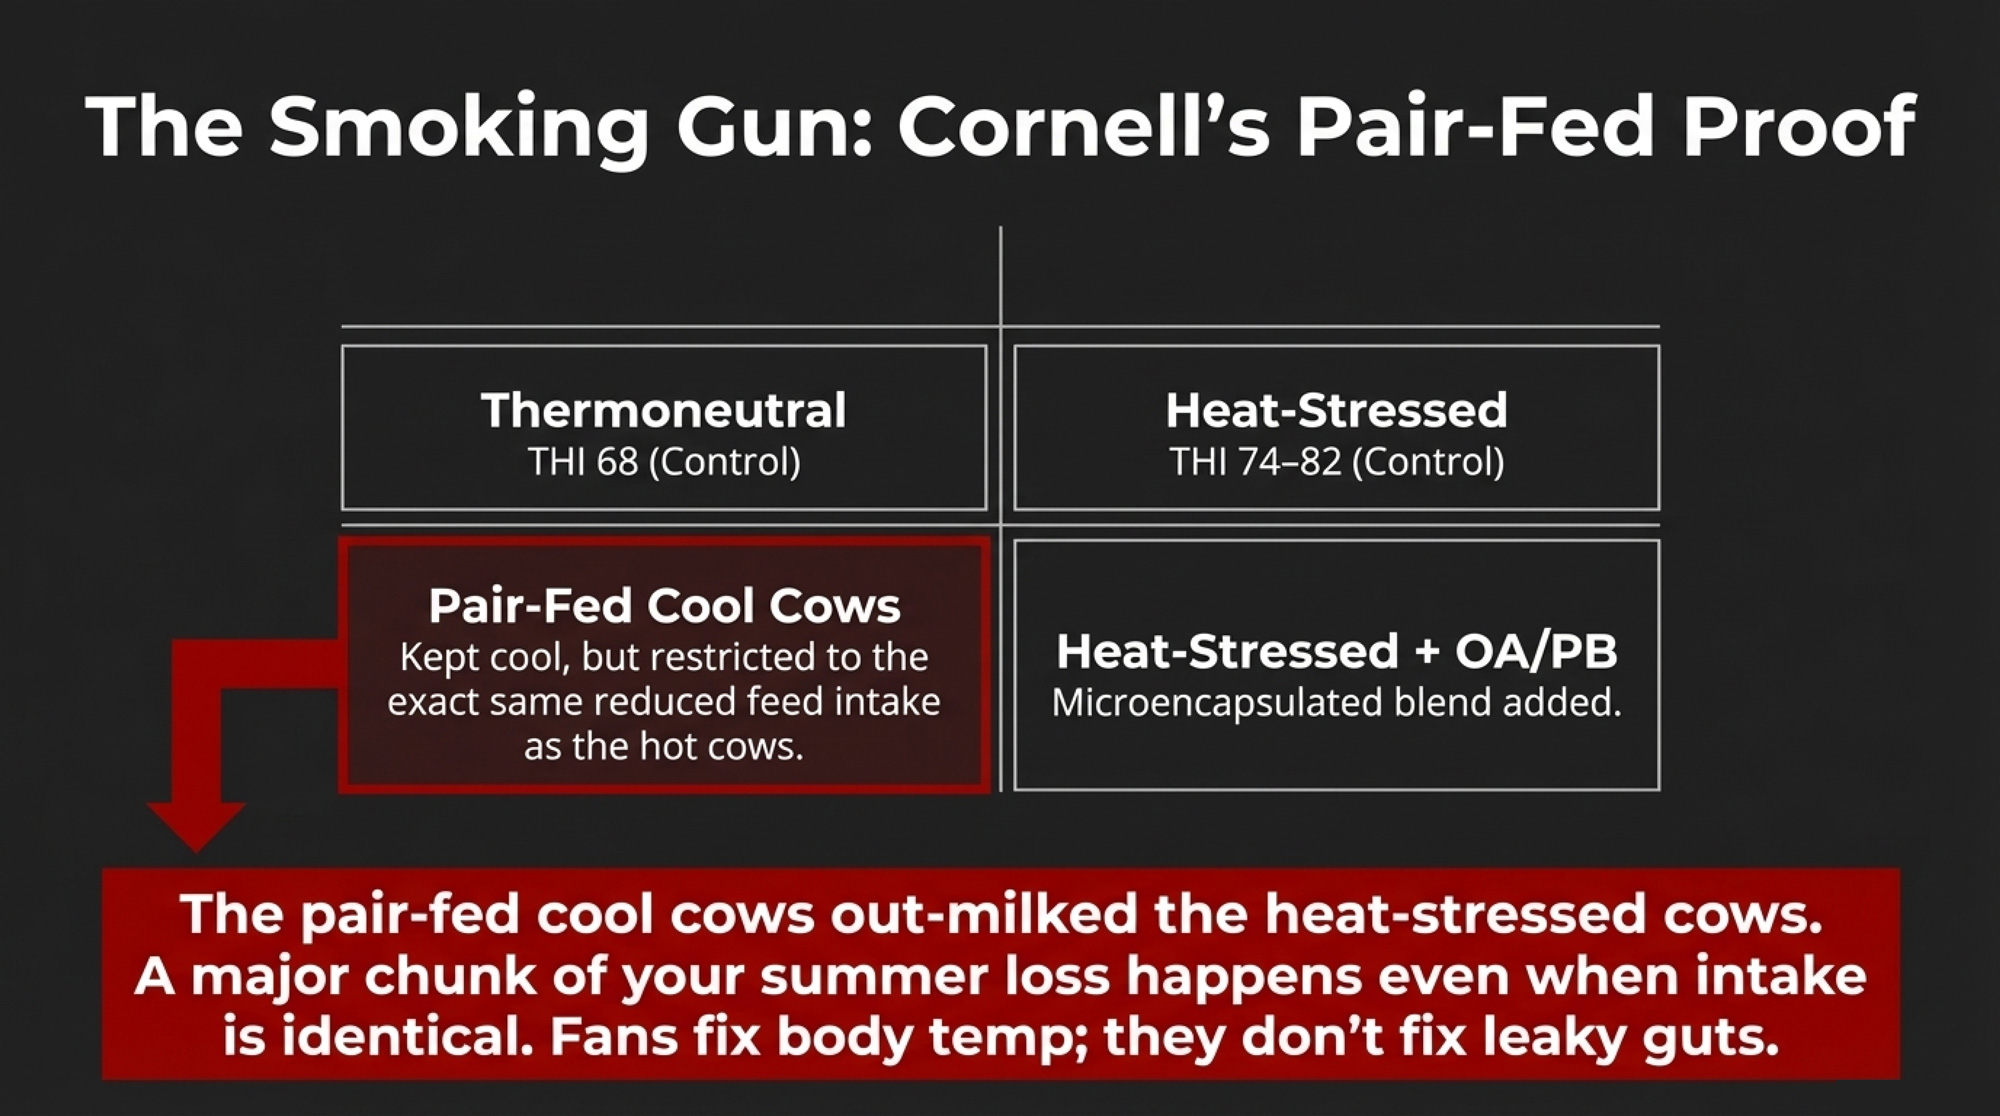
McFadden’s team ran four treatments:

  • Thermoneutral controls at THI 68.
  • Heat‑stressed controls cycling between THI 74 and 82.
  • A pair‑fed group kept cool but was restricted to the same intake as the hot cows.
  • Heat‑stressed cows on a microencapsulated organic acid/pure botanical (OA/PB) blend.

That pair‑fed pen is the smoking gun. Same reduced intake as the hot group, but kept cool — and they still out‑milked the heat‑stressed cows. In other words, a chunk of your summer loss is happening independent of dry matter intake. Fans and sprinklers fix body temperature. They don’t fix a leaky gut.

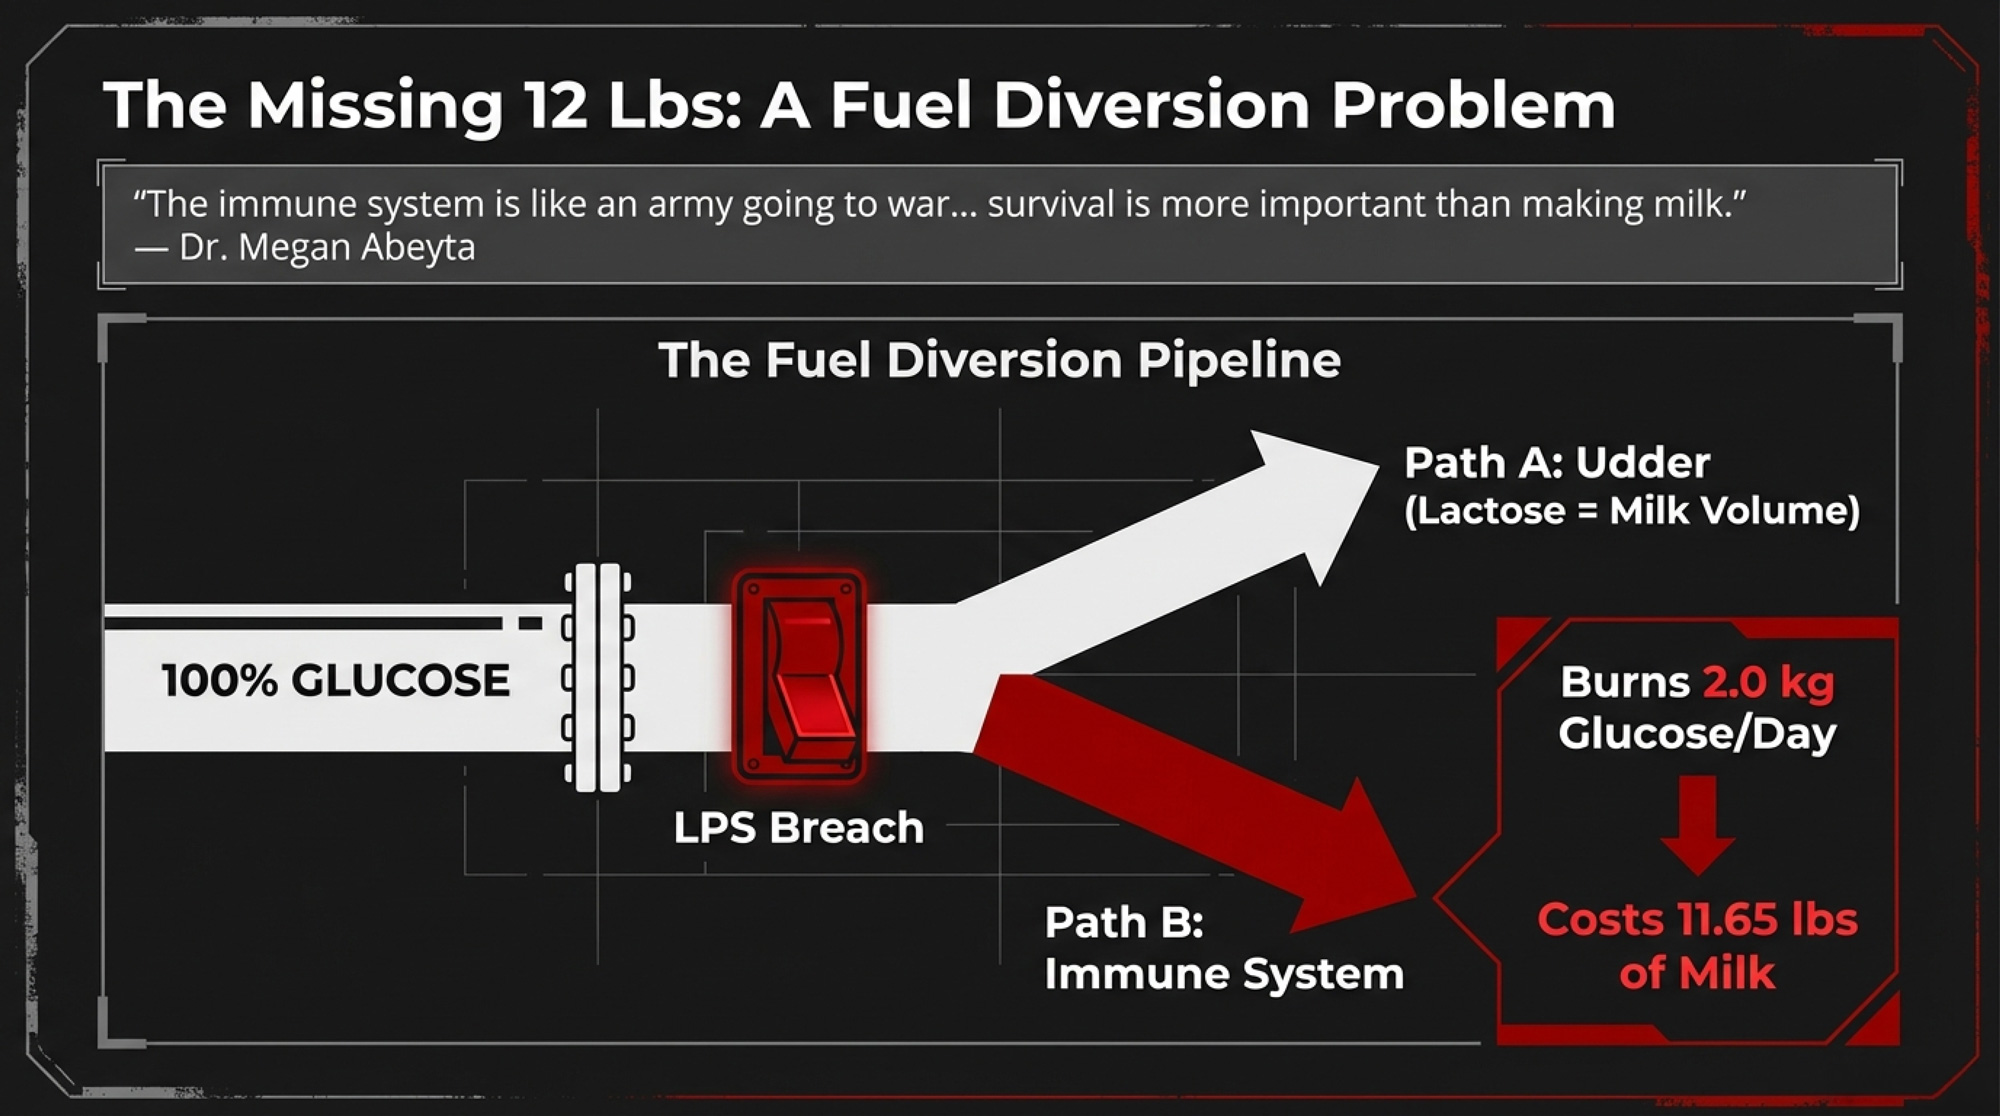
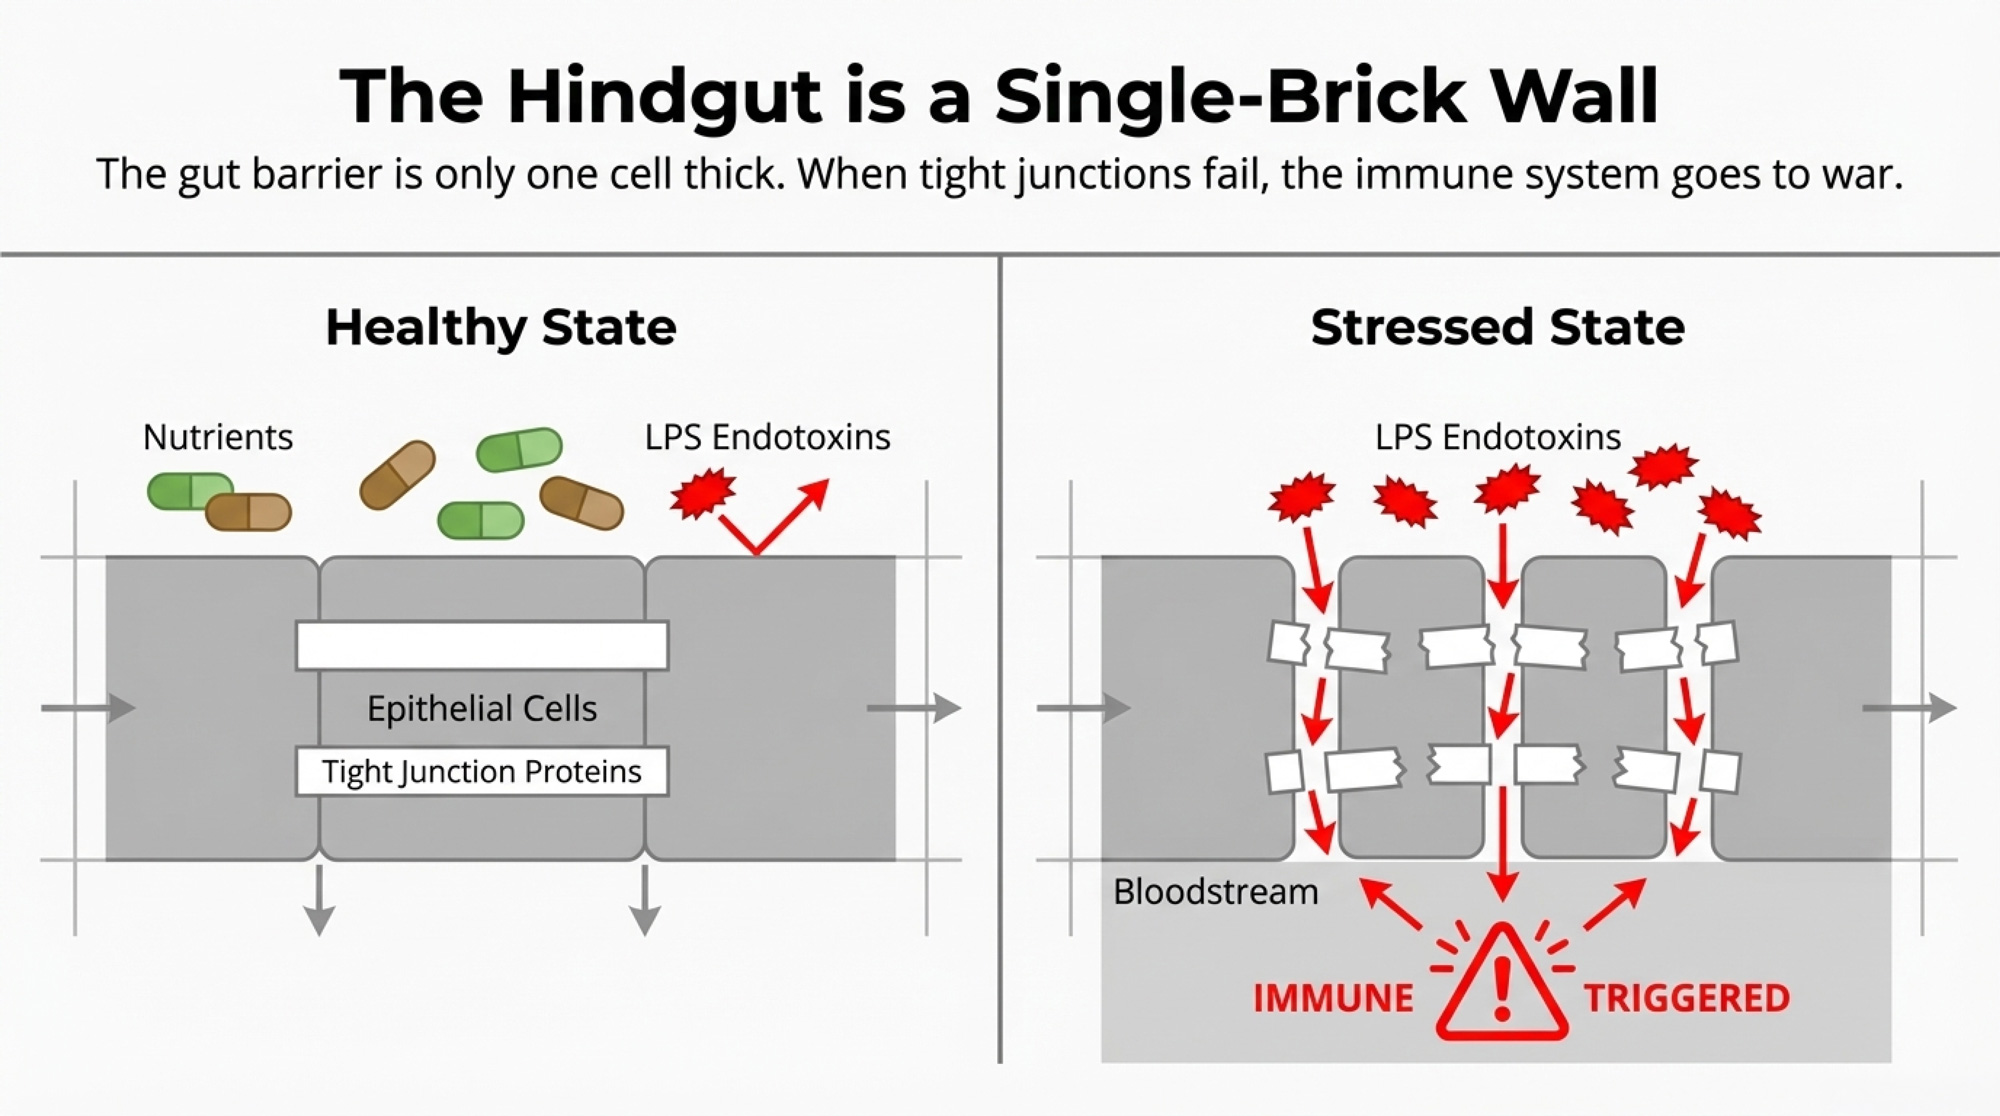
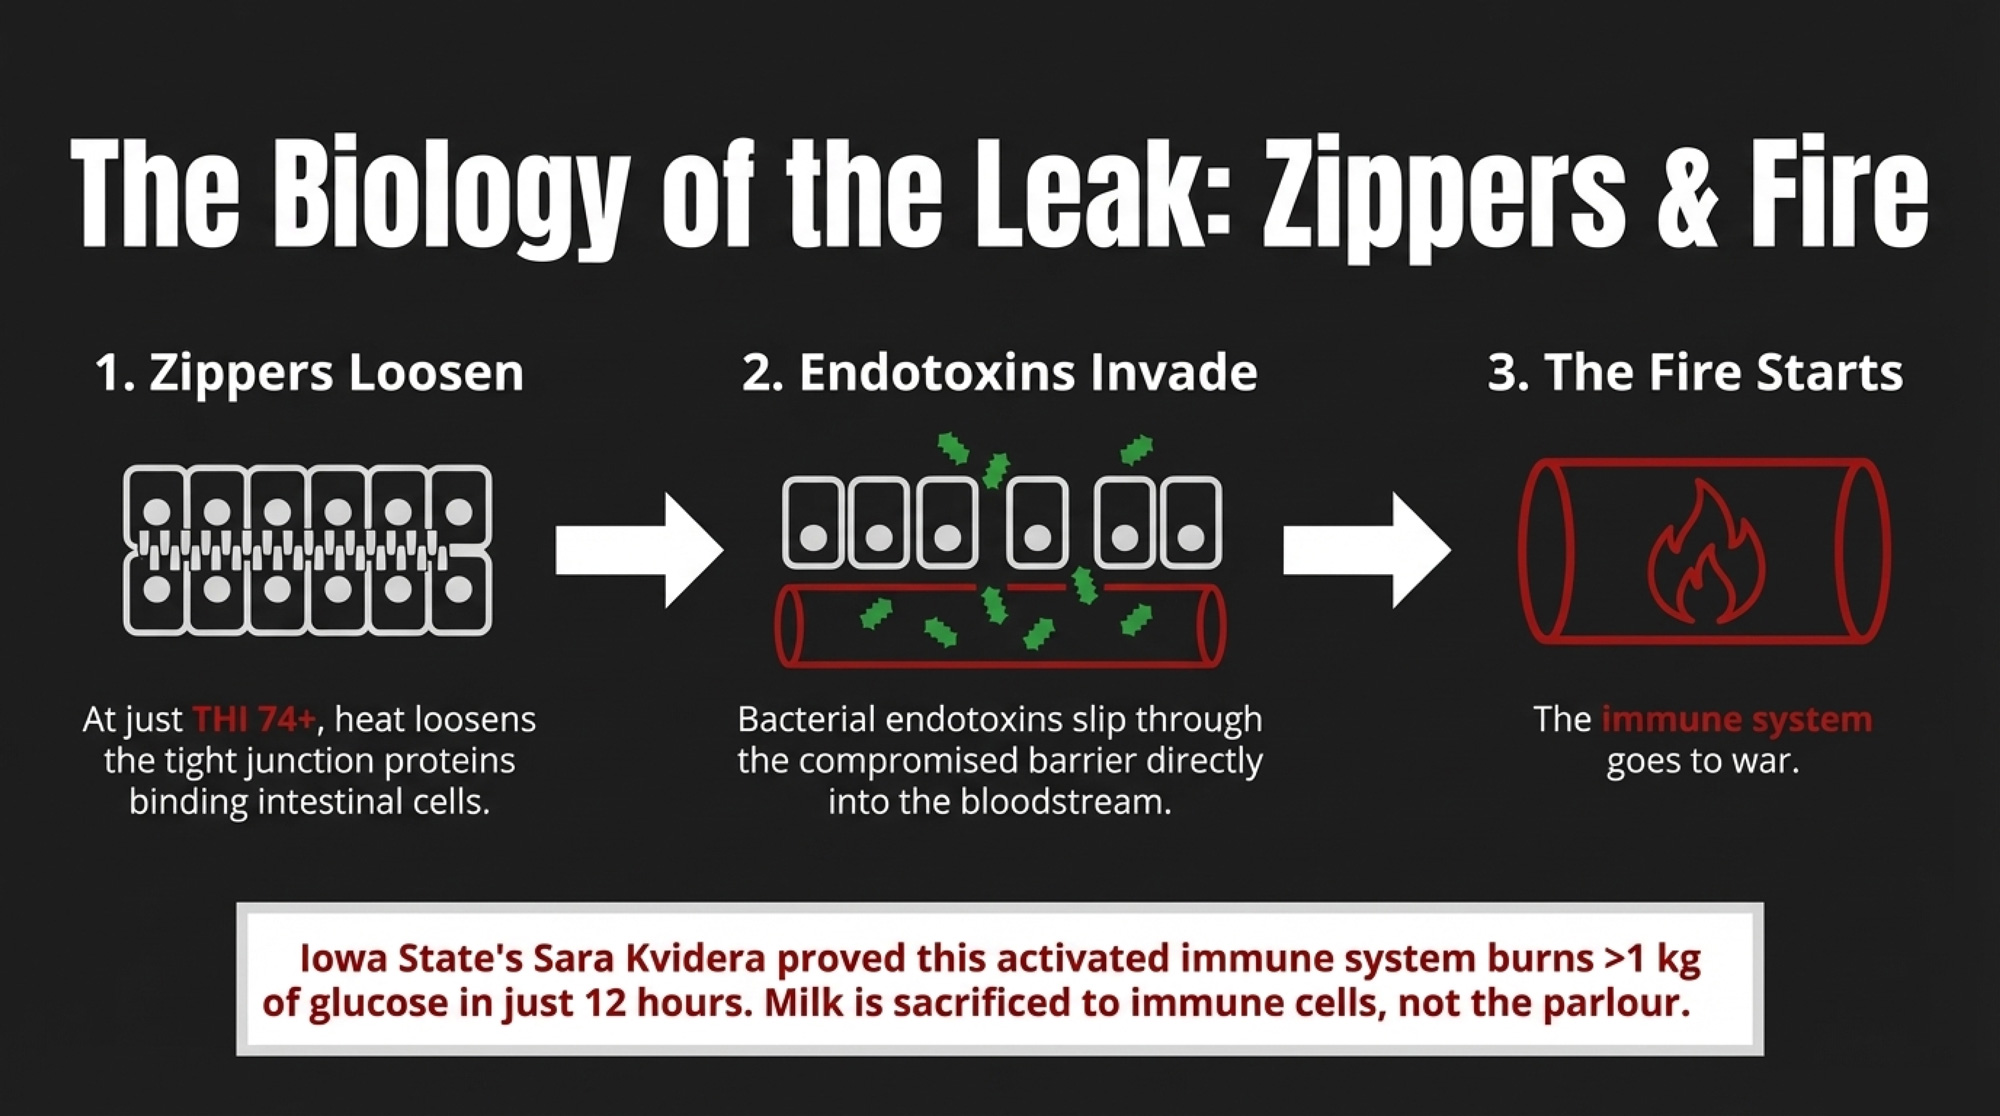
What’s actually happening? Heat stress loosens the tight junction proteins that zip intestinal cells together. Bacterial endotoxins slip through, hit immune receptors, and your cow’s immune system goes to war. Iowa State’s Sara Kvidera showed an acutely activated immune system in a lactating Holstein that burns more than 1 kg of glucose in just 12 hours. That’s several kilograms of milk sacrificed to immune cells instead of the parlour.

Cornell’s team summed it up: heat stress reduces production through “important mechanisms … independent of changes in DMI.” That’s the part your heat abatement system can’t touch.

What Cornell Actually Fed — And Why the Coating Matters

This wasn’t a random “gut health” sprinkle. On a dry‑matter basis, the OA/PB blend in the Cornell trial was:

  • 25.0% citric acid
  • 16.7% sorbic acid
  • 1.7% thymol
  • 1.0% vanillin
  • 55.6% triglyceride (the lipid shell)

The cows got it twice daily as a top‑dress; controls got the same amount of plain triglyceride carrier, so every pen was handled the same way. That triglyceride coating is the whole play. In vitro work showed minimal release in rumen‑like fluid and targeted release under intestinal conditions once lipases crack the fat layer open. Without that fat shell, most organic acids and botanicals get chewed up or absorbed upstream before they ever see the small intestine.

In the chamber, the coated OA/PB did three big things for the heat‑stressed group:

  • Pulled total‑tract gut permeability back toward thermoneutral values.
  • Lowered systemic inflammation markers like LBP and serum amyloid A.
  • Improved energy‑corrected milk and DMI vs. unsupplemented heat‑stressed controls.

Mechanistically, once the shell opens in the gut, the organic acids and botanicals act at three levels: they create pores in undesirable bacterial membranes, dampen mucosal inflammation, and upregulate tight junction proteins to help reseal the barrier.

But it’s not magic. A follow‑up calf study from the same group (Fontoura et al. 2023, JDS 106:2904–2918) showed the OA/PB improved gut‑integrity markers under heat stress but was not able to improve growth performance in heat‑stressed calves — the authors concluded reductions in DMI alone accounted for production losses in that class of stock. The strongest evidence of performance lies in heat‑stressed lactating cows, gut‑barrier endpoints, and milk energy. Not every animal responds the same way.

Disclosure: author E. Grilli is affiliated with Vetagro, the manufacturer of the OA/PB product used in the trial. The work is still a peer‑reviewed Journal of Dairy Science paper, with full affiliation spelled out — standard practice for industry/university collaborations.

Can Gut Integrity Really Pay at $18.95 Milk?

Cornell fed 75 mg/kg of body weight — that’s about 49 g/cow/day on a 650 kg Holstein. Real inclusion, not fairy dust.

The USDA’s February 2026 outlook puts the all‑milk price at $18.95/cwt, down from a revised $21.17/cwt in 2025. So any gut‑integrity program has to pay in a margin year, not just when milk is rich.

Here’s the barn math that matters.

500‑Cow Herd — Conservative (2 kg/cow/day recovery)

Assume you’ll only claw back 2 kg ECM per cow per day instead of Cornell’s ~3:

  • 2 kg × 500 cows × 120 heat‑stress days = 120,000 kg
  • 120,000 kg × 2.205 lb/kg = 264,600 lb = 2,646 cwt
  • Gross milk value: 2,646 cwt × $18.95 ≈ $50,100

750‑Cow Herd — Full Cornell Response (3 kg/cow/day)

If you assume the full ~3 kg ECM/cow/day that Cornell reported under chamber conditions:

  • 3 kg × 750 cows × 120 days = 270,000 kg
  • 270,000 kg × 2.205 = 595,350 lb = 5,953.5 cwt
  • Gross milk value: 5,953.5 cwt × $18.95 ≈ $112,800
Herd SizeRecovery Scenariokg ECM Recoveredlbs RecoveredcwtGross Milk ValueNotes
250 cows2 kg/day (conservative)60,000 kg132,300 lb1,323 cwt$25,071Get a real product quote to net
250 cows3 kg/day (Cornell)90,000 kg198,450 lb1,984 cwt$37,597Chamber result; on-farm ~70% likely
500 cows2 kg/day (conservative)120,000 kg264,600 lb2,646 cwt$50,142Article baseline scenario
500 cows3 kg/day (Cornell)180,000 kg396,900 lb3,969 cwt$75,213
750 cows2 kg/day (conservative)180,000 kg396,900 lb3,969 cwt$75,213
750 cows3 kg/day (Cornell)270,000 kg595,350 lb5,954 cwt$112,817Article full-response scenario
1,000 cows2 kg/day (conservative)240,000 kg529,200 lb5,292 cwt$100,283
1,000 cows3 kg/day (Cornell)360,000 kg793,800 lb7,938 cwt$150,425

Those are gross numbers — the milk value recovered before you subtract product cost. Pricing for microencapsulated OA/PB blends varies by supplier, dose, and contract. Get your real quote, multiply it by your cows and your heat‑stress days, and subtract it from the gross. If the leftover is fat enough, the product earns a season in the ration. If it’s thin or negative, it doesn’t.

One caveat: if your barn rarely sees THI above 72, or your cooling system is genuinely keeping rectal temperatures and respirations tight, gut permeability may not be your biggest leak. This lever matters most for herds that sit in the mid‑70s THI or higher for weeks at a time.

For Canadian readers, the Canadian Dairy Commission approved a 2.3255% farmgate increase effective February 1, 2026, under its pricing formula for butterfat used in dairy products. Different currency, same math — every kilogram you leak in July still lands on your milk cheque.

The Ghost of Heat Stress Past: What It Does to Daughters and Granddaughters

The milk dip hurts in August. The real damage hits you in 2028.

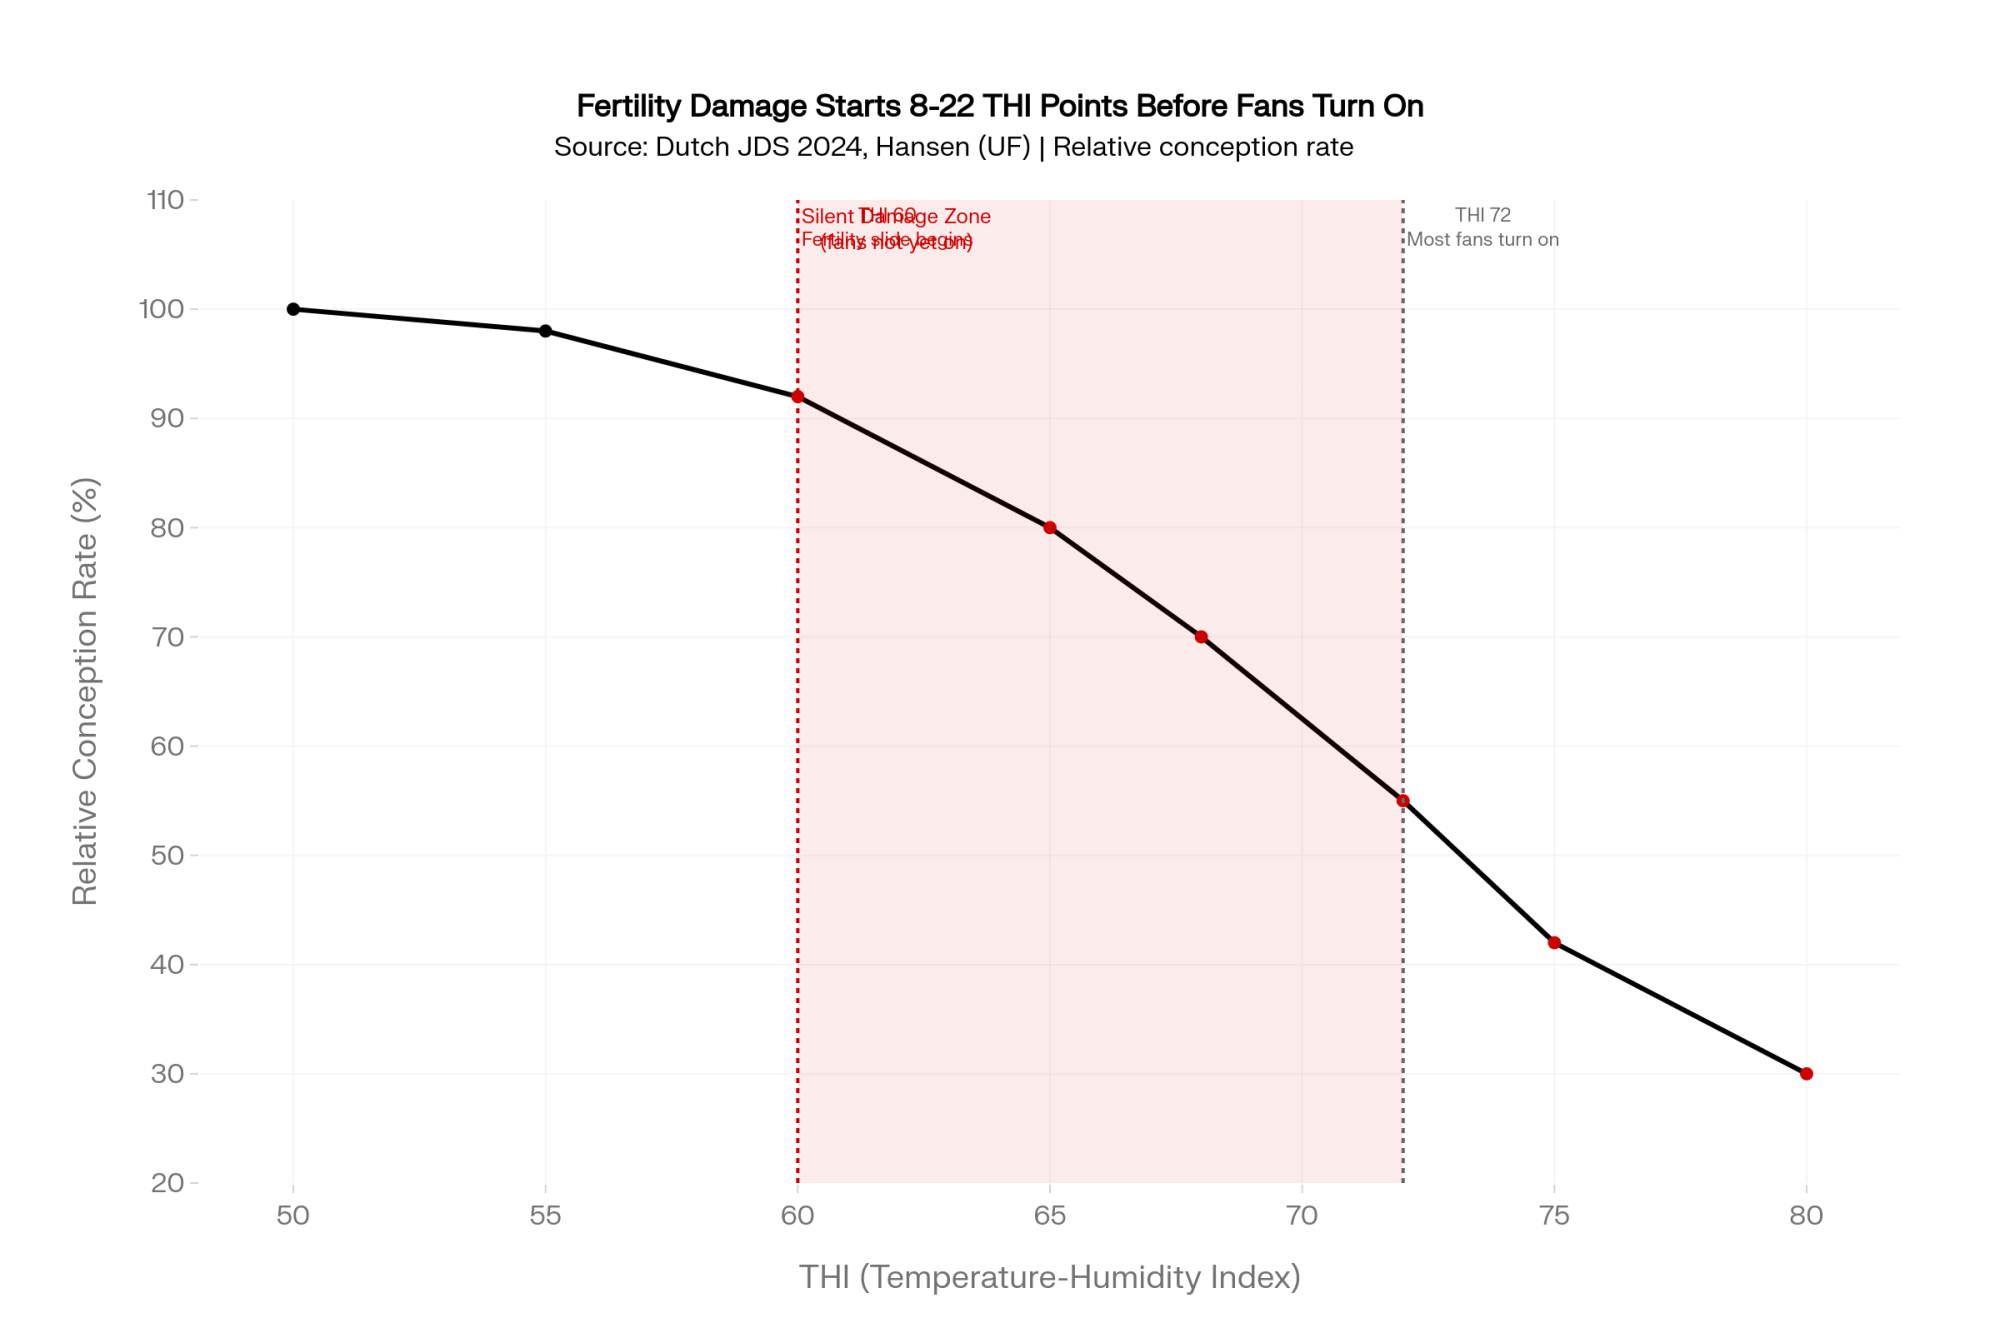
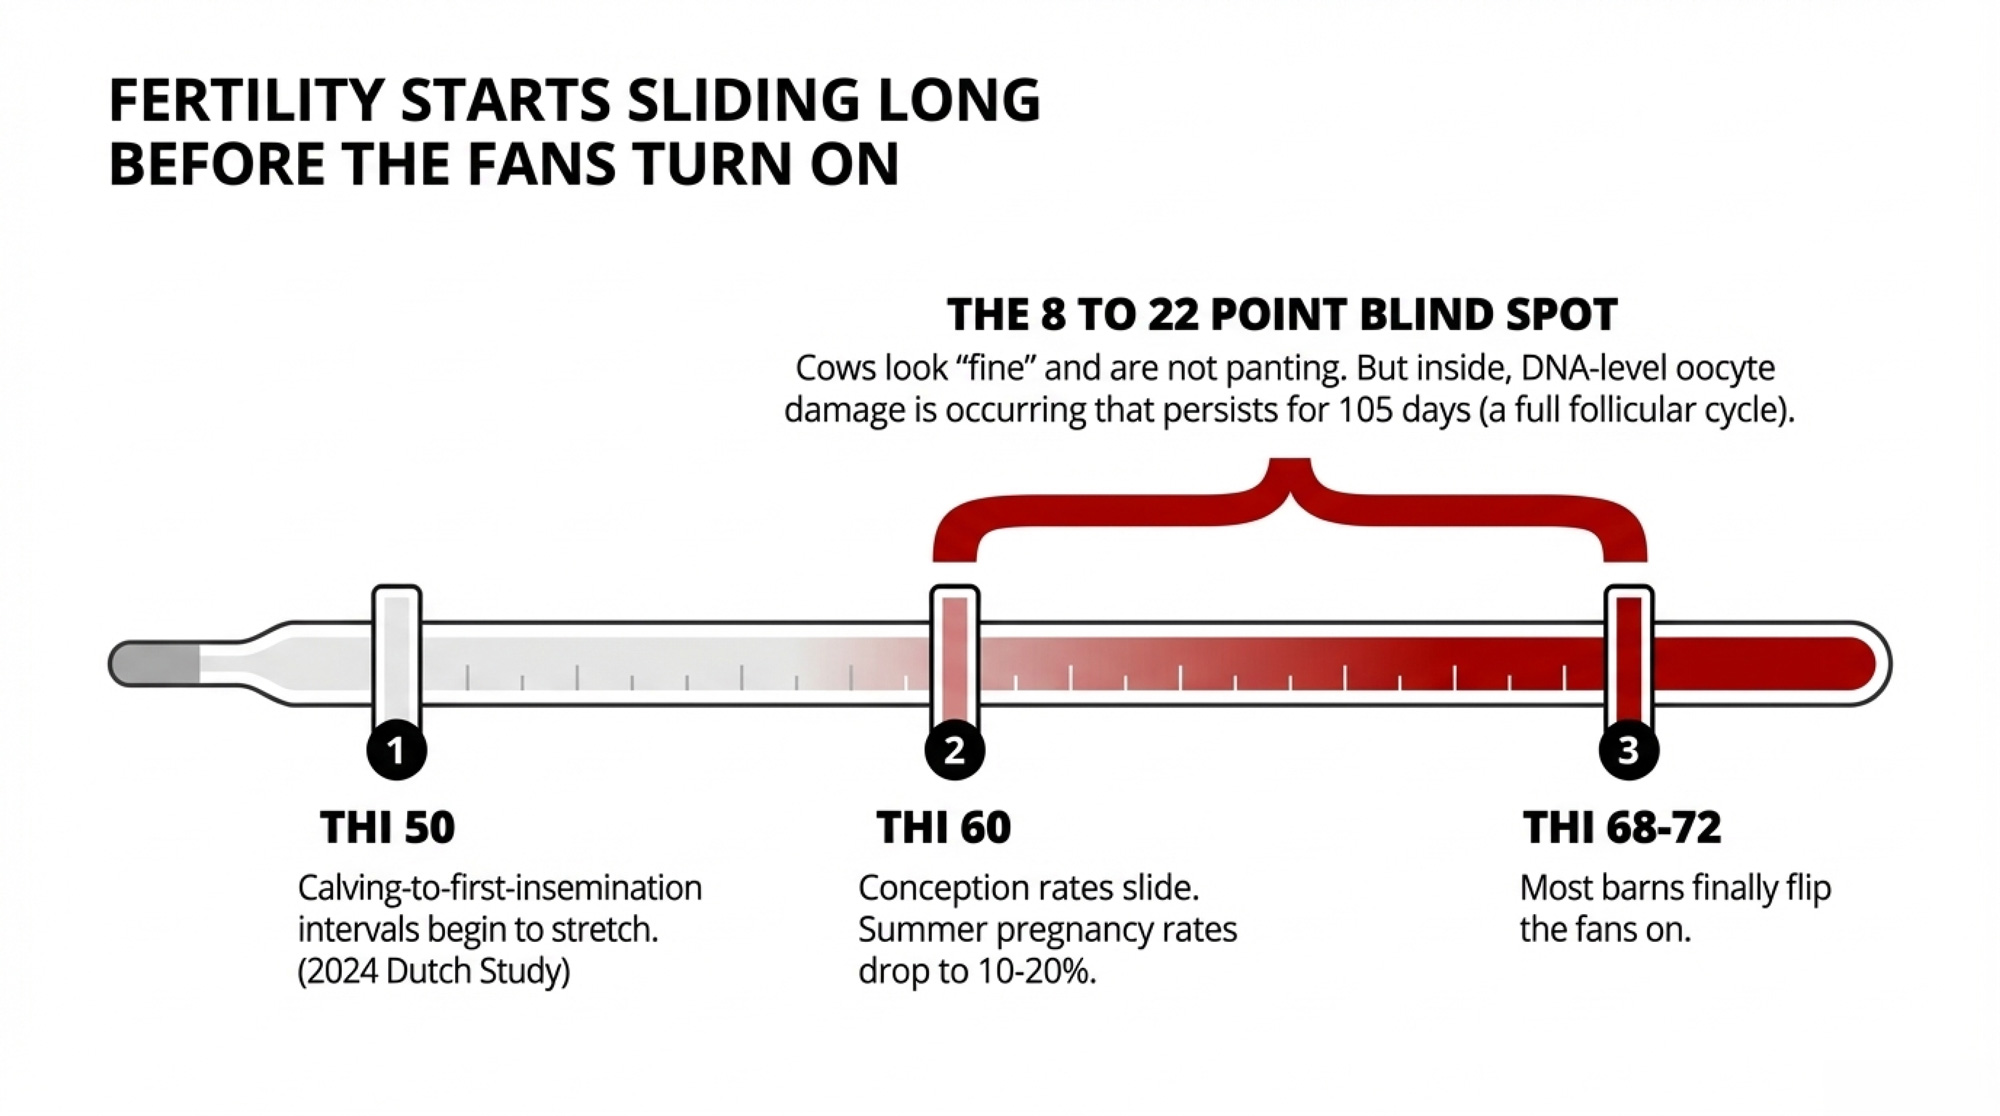
Heat‑stressed breeding seasons are a fertility tax. Peer‑reviewed field work and reviews show summer pregnancy rates routinely dropping from roughly 32–40% in cooler months down to 10–20% in severe heat, depending on region and THI. That’s not just semen baking in a hot AI kit. It’s inflammation, oxidative stress, and early embryos that never stand a chance. If you want to dig deeper into how those THI lines move conception rates, we’ve walked through it before.

The longer invoice comes from the dry pen. Laporta et al. (2020, JDS 103:7555–7568) followed daughters of heat‑stressed dry cows (n=198) against daughters of cooled dry cows (n=196) over 10 years of Florida Holstein data — dams cooled or not cooled during the last 46 days of gestation. A hot, dry cow today is a cull candidate’s mother.

Daughters of heat‑stressed dams:

  • Lost 4.9 months of productive life.
  • Lost 11.7 months of total lifespan.
  • Were culled more often before first calving.

The same paper reported granddaughters of heat‑stressed dams produced 1.3 fewer kg of milk per day in their first lactation than granddaughters of cooled dams. A University of Florida IFAS factsheet estimated that, on a national basis, late‑gestation heat stress in dairy cows costs about $595 million/year once extra heifer‑rearing, reduced longevity, and lost milk yield are added together.

If you’ve ever wondered whether there’s a genetic time bomb hiding in your fresh pen, this is one of the fuses.

You don’t see that bill on your August statement. You see it in a replacement pipeline that’s thinner and more expensive than it should’ve been.

If a gut‑integrity program can take even part of the inflammatory load off those cows — and Cornell’s permeability and inflammation data say it can, at least in mid‑lactation Holsteins — then it belongs in the same planning meeting as shade, soakers, and fan upgrades.

Not Every “Gut Health” Product Is Aimed at the Same Target

Here’s where this gets real in the nutrition office.

A lot of products sold under the “gut health” banner actually have their best published data in the rumen — pH stabilization, fibre digestibility, and components. That work has value. It’s just a different job than sealing an intestinal wall under heat stress.

The yeast and buffer literature is overwhelmingly rumen‑centric. Many of those companies are careful about what they claim — they market for rumen performance, and that’s what their trials measure. Loose organic acids mostly get fermented or absorbed in the upper tract before they ever see the small intestine.

Right now, the peer‑reviewed trials that specifically measure gut permeability, tight‑junction expression, and systemic inflammatory markers in heat‑stressed lactating Holsteins are centred on microencapsulated OA/PB blends like Cornell’s. Comparable published data for yeast, buffers, or unprotected acids at those exact endpoints aren’t readily available in the literature.

That doesn’t make what you’re already feeding bad. It just means different tools belong in different categories:

Product CategoryPrimary Site of ActionRumen-Bypass EvidenceGut Permeability TrialsHeat-Stress (THI ≥74) DataRecommended Use Window
Yeasts & BuffersRumen✗ Not required✗ Limited/none in peer review✗ Not testedYear-round rumen stabilization
Loose Organic AcidsUpper GI tract✗ Minimal✗ Absorbed upstream✗ Not tested at these endpointsFeed hygiene; silage preservation
Unprotected BotanicalsRumen / upper GI✗ Variable✗ Inconsistent✗ Data gapsTMR palatability; mild microbial control
Microencapsulated OA/PBSmall intestine✅ In vitro lipase-release data✅ Tight-junction & LBP data (Fontoura 2022)✅ Lactating Holsteins, THI 74–82Heat stress windows; high-inflammation periods
General ProbioticsHindgut / rumen✗ Species-dependent✗ Minimal heat-stress data✗ Not consistently testedTransition; post-antibiotic recovery
  • Yeast and buffers → rumen stabilizers.
  • Loose organic acids → feed hygiene and upper‑tract support.
  • Microencapsulated OA/botanicals → intestinal‑wall tools for heat stress and other high‑inflammation windows.

🔍 The “Gut Health” Buyer’s Filter

Before you write the next cheque, run every product through three questions:

1. BYPASS — Is there real rumen‑bypass data showing limited release in rumen fluid and targeted release in the intestine? Not a brochure line — actual in vitro or in vivo work.

2. ENDPOINTS — Do the trials measure gut permeability, tight‑junction proteins, or inflammatory markers under heat stress? Or just milk and DMI under thermoneutral conditions?

3. CONDITIONS — Were the key trials run in lactating Holsteins at THI in the mid‑70s or higher? Or in calves, dry cows, or another species entirely?

If your rep can’t clear all three bars, it doesn’t mean the product is junk — it means it wasn’t designed or tested for this specific job. Your expectations (and your spend) should match what the evidence actually supports.

What Would This Look Like on Your Farm?

Say you’re running 650 Holsteins in a THI‑75+ region and your high pen reliably drops 2.5–3.0 kg/cow/day every summer once night‑time THI stays over 70 for more than a week. Cooling is maxed. You can’t justify more concrete and steel. Here’s one way to put the Cornell data to work instead of just reading about it.

Pick a 240‑cow high pen with solid records and leave a matching pen on the base ration. Layer in a microencapsulated OA/PB product at ~49 g/cow/day, delivered as a top‑dress with the PM feeding to match Cornell’s dose. Start two weeks before THI historically climbs, and run the program for three straight calendar months. Track daily ECM, pen‑level DMI, and pregnancy rate on breedings that happen during the heat window.

What should you be looking for? By weeks four to six of real heat, you want to see at least 1.5–2.0 kg ECM/cow/day better than your historic pattern, and summer fertility at least holding where it used to tank. If those numbers aren’t showing up at your product cost and your barn conditions, this lever doesn’t earn its spot. A 3 kg response like Cornell’s is a chamber result. On‑farm, 1.5–2.0 kg is a realistic bar to clear.

Every herd’s noise floor is different. This isn’t academic hand‑waving — it’s how you separate signal from marketing.

Where the Signal Gets Buried

Your barn isn’t Cornell. There are four places where a genuine 1–2 kg response can disappear:

  • Overcrowding at 130%+: Timid cows never see the bunk long enough. You can fix their gut, but if they’re not eating, you won’t see milk.
  • Background inflammation: Lameness, mastitis, metritis, or sloppy transition management already soaking the system in cytokines will drown out incremental gut improvements.
  • Forage swings: Summer forage quality bouncing from load to load can swamp any additive’s signal.
  • Trial too short: Cornell measured gut permeability at day 3 and followed cows through the full heat‑stress exposure. A two‑week “trial” over one hot spell tells you almost nothing.

If your numbers look flat, it doesn’t automatically mean the product is snake oil. It might mean your barn’s noise floor is too high to hear the signal.

What This Means for Your Operation

  • If your summer milk curve reliably drops 2–3 kg/cow/day once THI sits in the 70s, and your only tools so far are fans and sprinklers, you’ve got a quantified gut‑wall lever you haven’t tested. Cornell gives you both a dose and endpoints to benchmark against.
  • In the next 30 days, pull your last two summers of weekly bulk-tank or pen‑level milk data and overlay them against local THI. How many kg/cow/day did you actually lose, and for how many weeks? That’s the size of the hole any gut program has to fill on your farm.
  • Sit down with your nutritionist and ask: “Which products in this ration have peer‑reviewed data on gut permeability in heat‑stressed lactating Holsteins?” If the answer is “none,” there’s a gap between the tag’s gut‑health language and what the research has actually measured.
  • Compare your June–August pregnancy rates with January–March for the last two years. If you’re consistently 10–20 points lower in summer, that’s not bad luck. That’s heat‑driven inflammation and oxidative stress showing up in your repro numbers.
  • Walk your dry cow pens when THI is ugly. Laporta’s data — 4.9 months off productive life, 11.7 months off total lifespan, and roughly $595 million/year in multi‑generation losses across the US — deserves to be in the same budget meeting as shade structures and close‑up soakers.
  • When a rep pitches gut health, run their product through the bypass–endpoint–condition filter before you talk price. If the trials don’t deal with gut permeability and inflammation in heat‑stressed Holsteins, it’s not a gut‑wall tool — and shouldn’t be priced like one.

Key Takeaways

  • If THI routinely sits in the 70s and your summer drop is 2–3 kg ECM/cow/day, don’t stop at cooling. Fans fix body temperature. The Cornell work shows gut permeability is a separate problem with its own price tag.
  • At $18.95/cwt, a 2 kg ECM/cow/day recovery on 500 cows over 120 heat‑stress days is worth roughly $50,100 in gross milk value. Your net depends on product cost and the real response on your farm — not on anyone’s slide deck.
  • Products with rumen‑bypass data, gut‑barrier endpoints, and heat‑stress trials in lactating Holsteins are in a different evidence class from general “gut health” additives whose data stop at rumen pH or thermoneutrality in milk. Both can be useful — just not for the same jobs.
  • The consequences of heat stress don’t end when the weather breaks. They walk through your calving interval, your replacement pipeline, and your cull list for years, and the research team behind Laporta’s work has already put a national dollar figure on it.

The Bottom Line

Your bulk tank already knows how much heat stress is costing you. The real question is whether this is the year you keep calling it “just heat” — or the year you finally find out how much of that 3 kg leak is coming through the gut wall.

Complete references and supporting documentation are available upon request by contacting the editorial team at editor@thebullvine.com.

Learn More

The Sunday Read Dairy Professionals Don’t Skip.

Every week, thousands of producers, breeders, and industry insiders open Bullvine Weekly for genetics insights, market shifts, and profit strategies they won’t find anywhere else. One email. Five minutes. Smarter decisions all week.
NewsSubscribe
First
Last
Consent

Selective Dry Cow Therapy at 240,000 SCC: Are You Saving on Tubes or Losing $6,920?

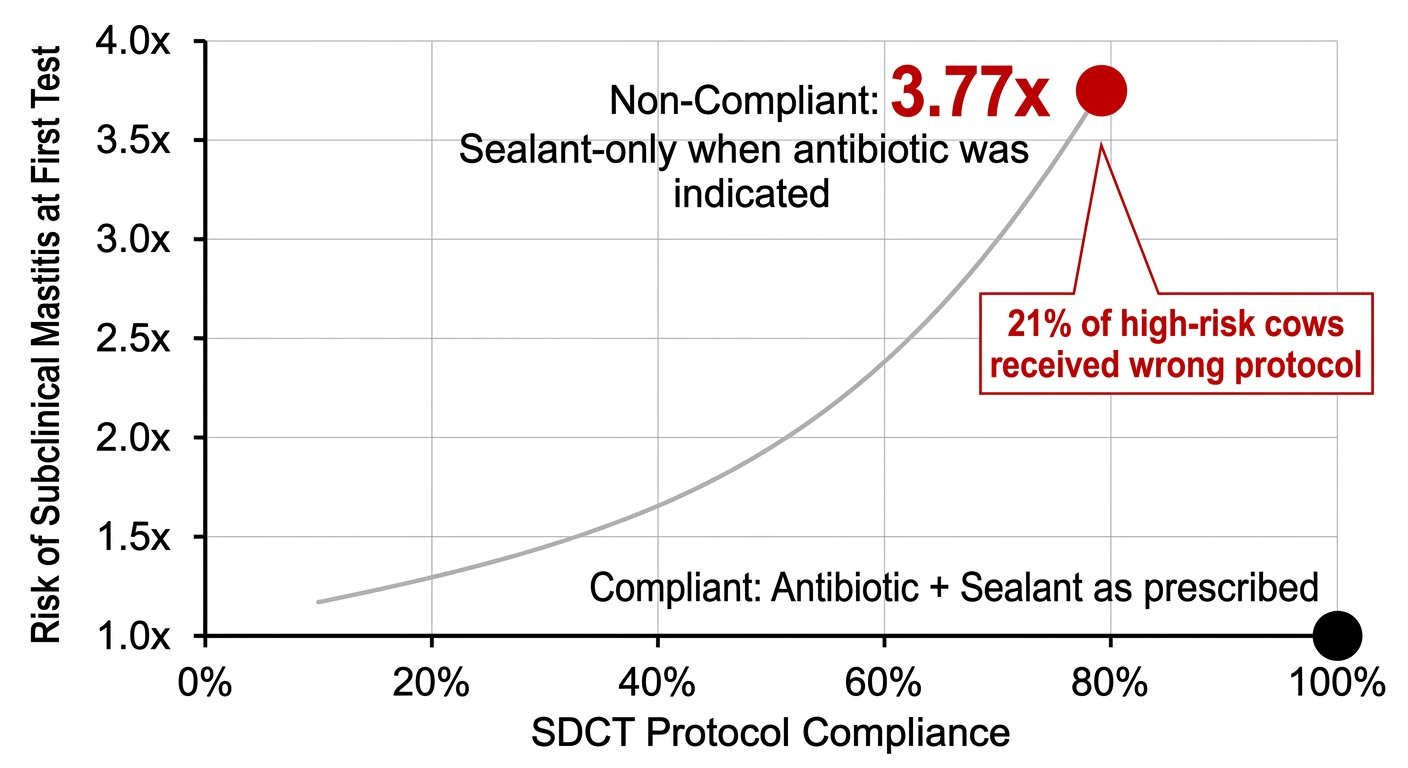
Seven of Cornell’s 24 SDCT herds bailed on the program once their fresh‑cow mastitis numbers hit the fan. Before you join them, you’d better know which group you’re in.

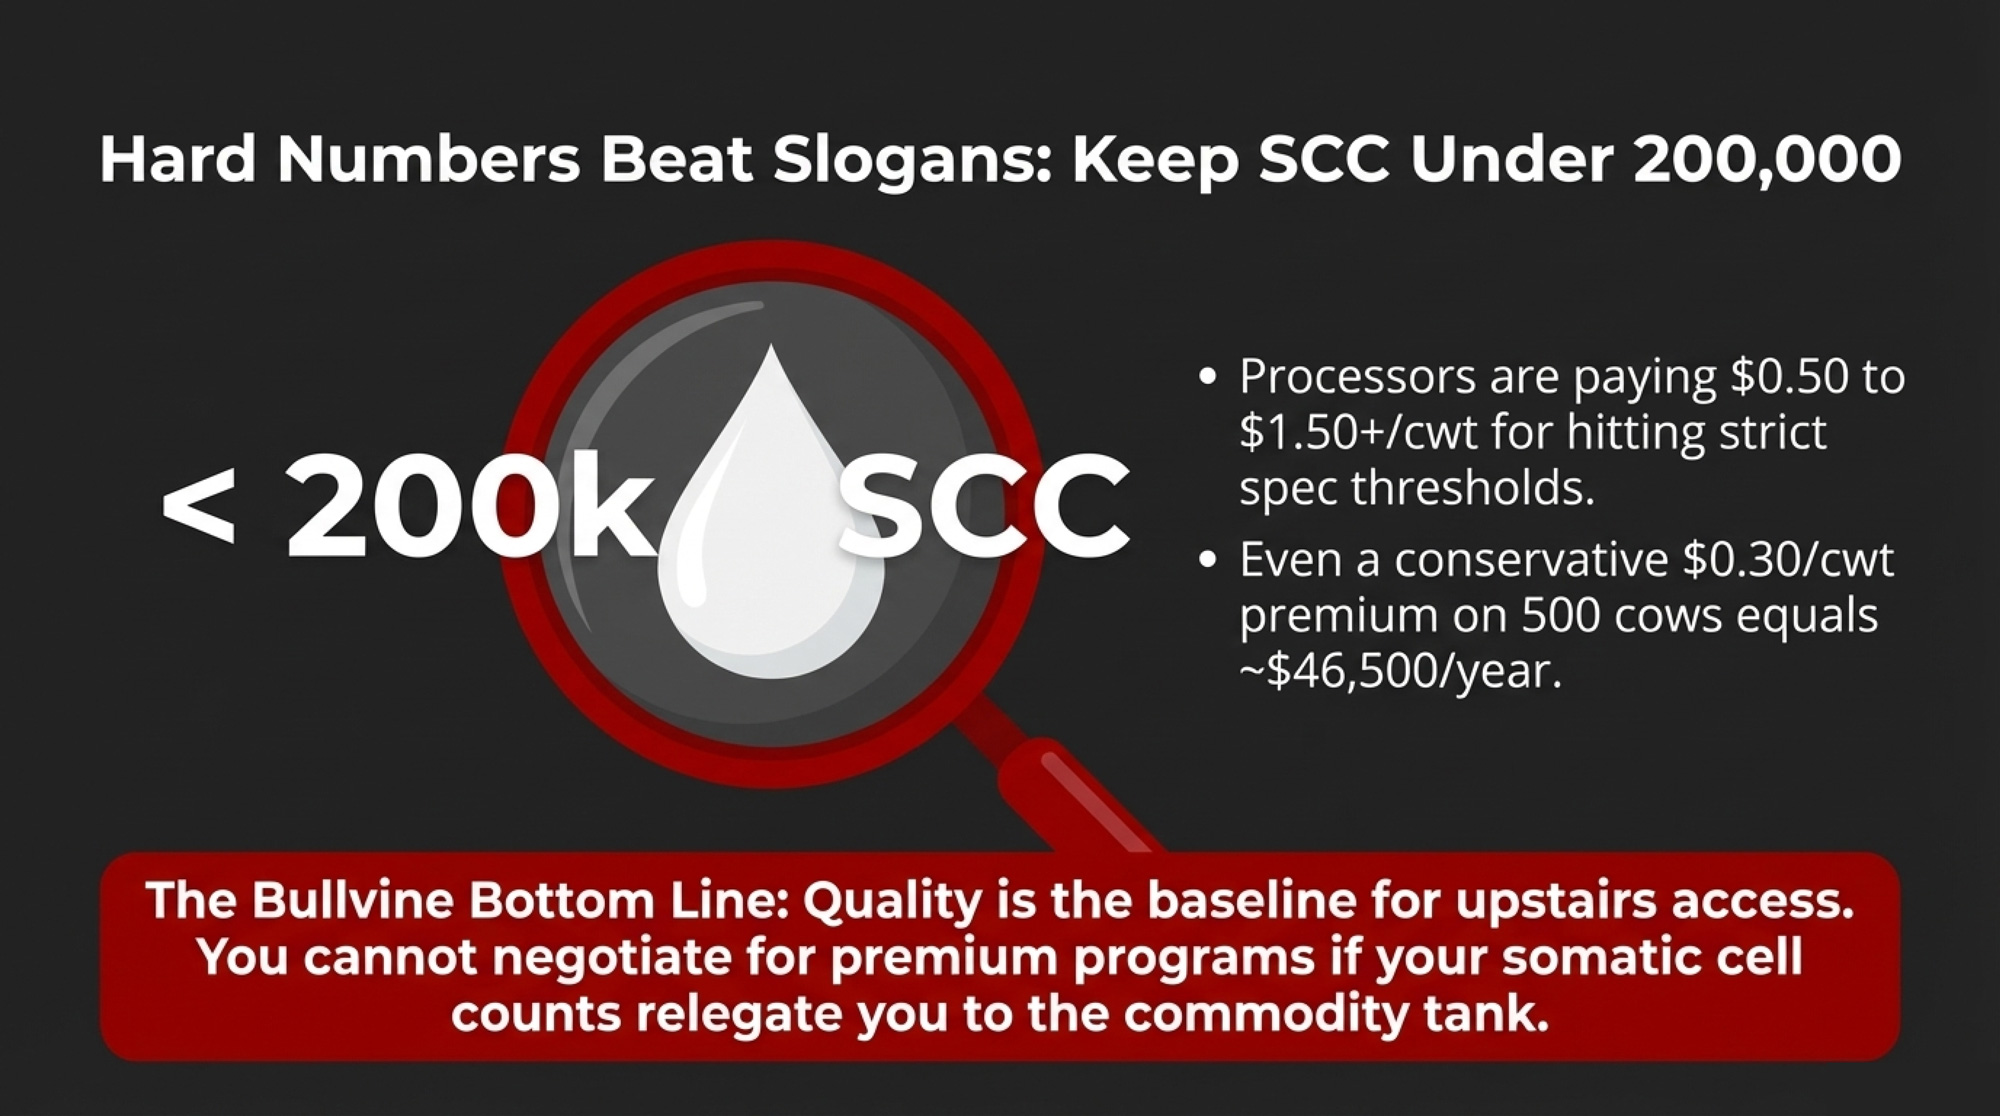
Executive Summary: Herds trying selective dry cow therapy at 240,000 SCC can easily turn “antibiotic savings” into a $6,920 loss on 300 cows once extra mastitis, culls, and lost milk are in the math. Cornell’s 24‑herd SDCT project cut dry‑cow antibiotic use 53% on average, but 7 herds still abandoned SDCT when fresh‑cow mastitis and milk quality slipped. Dutch data shows dairy can cut antimicrobial use roughly 47% without wrecking udder health, but only after years of tightening SCC, housing, and protocols. This piece lays out three realistic paths for higher‑SCC herds under processor pressure: fix infections first, pilot SDCT on the safest slice only, or use that SDCT letter as leverage for a 12–18‑month runway. You’ll see the exact SCC thresholds, AABP readiness criteria, and barn‑math assumptions so you can plug in your own DHIA and cull numbers. If your bulk tank’s been north of 200,000 and your mastitis records are patchy, you’ll likely walk away treating SDCT as a future goal, not a box to tick this dry‑off season.

selective dry cow therapy

When The Bullvine first profiled Mystic Valley Dairy’s move to selective dry cow therapy, one detail jumped off the page: a bulk tank somatic cell count around 78,000 cells/mL and a decision to start skipping dry‑cow tubes on some cows anyway.

Around the same time, Cornell’s Quality Milk Production Services team was quietly tracking 24 New York herdsthrough their own SDCT transition. Those farms averaged 199,000 cells/mL SCC going in and still managed to cut dry‑cow antibiotic use by 53% on average (range: 32–78%) without wrecking udder health. Put those two stories beside a 240,000‑SCC herd with a processor letter on the kitchen table, and the contrast gets real fast.

Mystic Valley’s SDCT Story: Low SCC, High Scrutiny

Mystic Valley Dairy, Sauk City, Wisconsin, milks about 450 registered Holsteins, with a bulk tank SCC typically ranging from 70,000 to 90,000 cells/mL. In The Bullvine’s earlier coverage, owner Mitch Breunig laid out why a herd with that kind of SCC profile would even consider cutting dry‑cow tubes.

Mystic Valley already ticked every box in the 2024 AABP SDCT readiness guidelines and then some: bulk tank SCC regularly less than 250,000; no evidence of Streptococcus agalactiae; Staphylococcus aureus under control; consistent individual SCC testing; written milking and dry‑off SOPs; and internal teat sealant at dry‑off for all cows. On paper, they looked a lot like the 12 Flemish herds in Lipkens, Piepers, and De Vliegher’s 2023 trial, which had a geometric mean bulk tank SCC of 145,000 cells/mL at enrollment (range: 84,000–195,000; median 157,000) and used teat sealants on every dry cow.

Mystic Valley’s criteria were conservative from the start: cows needed three straight SCC tests under 200,000, no clinical mastitis during the lactation, no flagged problem quarters, and a good‑eyes‑on udder check at dry‑off before they were considered for sealant‑only treatment. Everyone else stayed on full dry‑cow therapy plus sealant.

Even in that low‑SCC, well‑run context, Mystic Valley still saw some early‑lactation cows whose performance raised eyebrows. Those early outcomes led the farm and its vet to tighten criteria further and pay closer attention to which cows truly belonged in the sealant‑only column.

The point isn’t that SDCT was easy for them. It’s that they were operating from a starting point — and with protocols — most 240,000‑SCC herds don’t have yet.

Cornell’s 24 SDCT Herds: 53% Fewer Tubes, Not for Everyone

If Mystic Valley shows what SDCT looks like on a very low‑SCC herd, Cornell’s New York project shows what happens when you put it into a broader mix of operations.

Readiness factorMystic Valley Dairy240,000‑SCC herd under pressure
Bulk tank SCC (cells/mL)70,000–90,000; long‑term <150,000240,000+; bounces 230,000–280,000
Individual SCC data3 consecutive tests <200,000 required for SDCT cowsPatchy DHIA; high‑SCC cows not consistently flagged
Contagious pathogensNo Strep. ag; Staph. aureus under controlStaph. aureus “suspected” or intermittently cultured
Dry‑off protocolWritten SOP; one named dry‑off lead; sealant for all cowsShared between milkers; protocol drift between shifts
Teat sealant use100% of dry cows receive internal teat sealantUsed on “problem cows” only or inconsistently
Housing & dry pensStocking density and bedding managed; low overcrowding (implied by low SCC)Overcrowded, wetter pack; limited capital for upgrades
AABP 2024 SDCT checklistTicks every box and moreFails multiple criteria; SDCT pushed by processor, not data

Potter, Forrestal, Capel, and Nydam’s 2022 AABP paper followed 24 commercial dairy farms across New York State. Herd sizes ranged from 65 to 3,774 cows, averaging 985 cows, with a starting bulk tank SCC of 199,000 cells/mL. Farms worked with veterinarians to use individual cow SCC and mastitis history to decide who received full dry‑cow therapy plus sealant and who received sealant only, and then monitored bulk tank SCC, fresh‑cow SCC, and clinical mastitis as they transitioned.

Across those 24 herds:

  • 53% average reduction in dry‑cow antimicrobial use (individual herds ranged from 32% to 78%).
  • No consistent herd‑level spikes in fresh‑cow SCC or mastitis when SDCT was implemented inside the project’s framework.
  • 17 of the 24 farms still used SDCT at the end of the study period.
  • 7 farms stopped SDCT, citing seasonal milk‑quality challenges, more dry‑period clinical mastitis, or flare‑ups of contagious pathogens such as Staph. aureus.

Cornell didn’t treat SDCT as a universal good or an obvious mistake. They treated it as a tool that fit most of those herds — but not all — even with structured support and monitoring. For a 240,000‑SCC herd being pushed toward SDCT, that nuance matters more than the headline number.

When Selective Dry Cow Therapy (SDCT) Helps — and When It Bites

The published science lines up with what Mystic Valley and Cornell saw.

A 2000–2021 systematic review and meta‑analysis found that selective dry cow therapy can deliver udder‑health outcomes similar to blanket dry cow therapy (BDCT) while reducing antibiotic use — but only in herds with low bulk tank SCC, good mastitis control, and consistent use of internal teat sealants in untreated quarters. Winder et al. (2019, Animal Health Research Reviews) concluded that SDCT increases the risk of intramammary infection at calving compared with BDCT unless internal teat sealants are used; with sealants, IMI risk is similar across strategies.

The Lipkens trial offers a clean real‑world comparison. In those 12 Flemish herds (466 cows; 244 BDCT, 222 SDCT), all cows received an internal teat sealant at dry‑off. Total antimicrobial consumption for udder health between dry‑off and 100 DIM dropped from 1.25 defined course doses (DCD) per cow in the BDCT group to 1.06 DCD per cow in the SDCT group — a 22% reduction — with no significant differences in test‑day SCC, clinical mastitis incidence, milk yield, or culling hazard. Only 33.8% of SDCT‑group cows actually skipped antibiotic tubes at dry‑off, and that share varied widely between herds (6.2–73.9%).

At the national scale, the Dutch experience shows how far antibiotic use can fall when an entire system commits to it. The Netherlands set mandatory reduction targets starting in 2009 and banned preventive antimicrobial use — including blanket dry‑cow treatment — beginning in 2012–2013. Across all Dutch livestock, the result was a 70.8% reduction in kilograms of antimicrobials sold since 2009 (Moura et al., 2022, Frontiers in Veterinary Science). Within the dairy sector specifically, Lam et al. (2020, Pathogens) reported a 47% decline in total antimicrobial usage from 2009 to 2015, after which usage stabilized at around 3 DDDA per cow per year.

Critically, Santman‑Berends et al. (2020, Journal of Dairy Science) monitored approximately 17,000 Dutch dairy herds (about 1.67 million cows) from 2013 through 2017 and found that the ban on blanket dry‑cow therapy drove a 63% drop in dry‑cow antimicrobial usage and a 15% reduction in intramammary treatment overall — with no deterioration in udder health at the herd level. An increase in new high‑SCC cases during the dry period was expected, but as their census data showed, it was not observed.

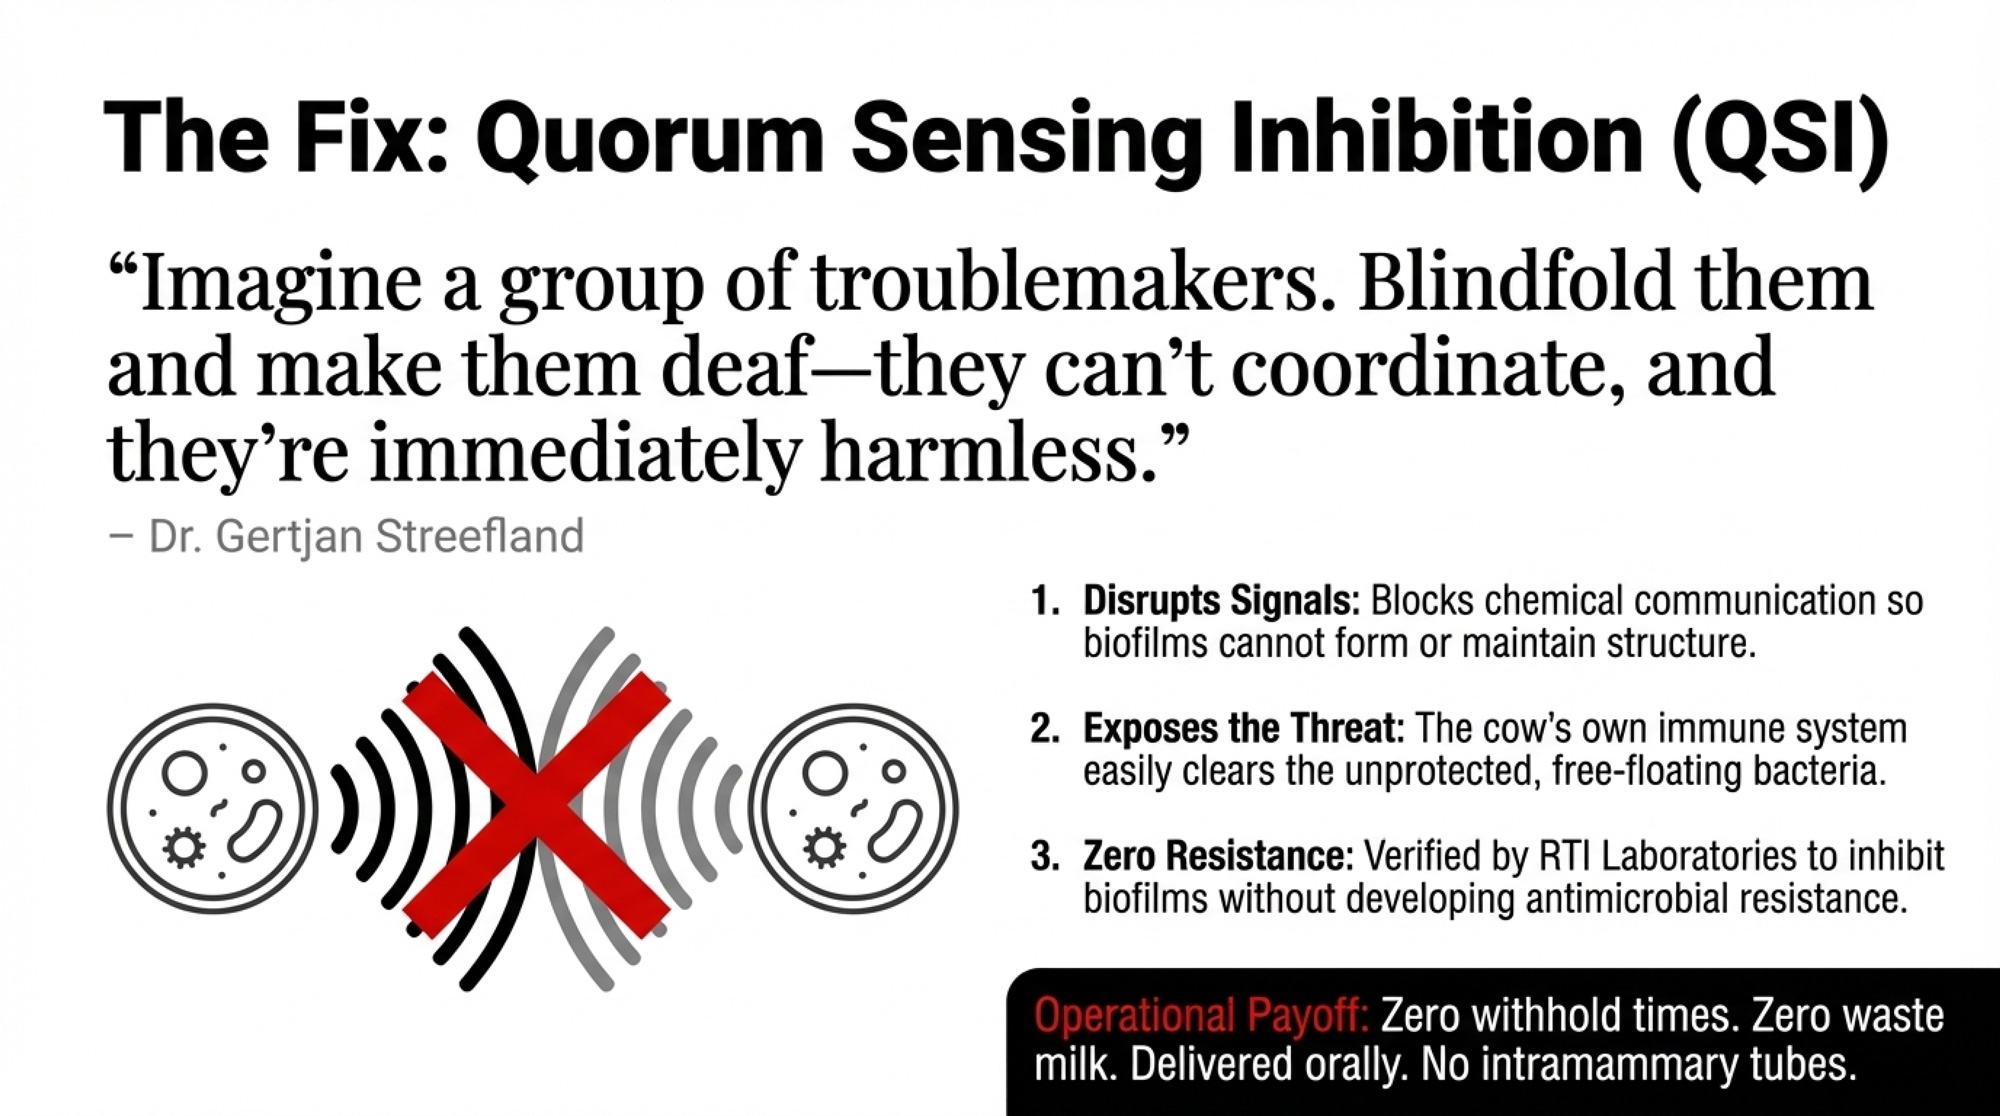
But those same studies underscore a risk that doesn’t appear in tube‑count dashboards: the biofilm and resistance trap. If infected quarters aren’t treated at dry‑off, bacteria have the entire dry period to build biofilms — structured communities that shield them from antibiotics and immune cells. Within those biofilms, resistance genes can move between bacteria more easily via plasmids and mobile DNA elements. When those cows calve and receive intermittent or incomplete lactation treatments, sub‑therapeutic exposure becomes a selection program for resistance.

For low‑SCC herds with solid protocols, that risk is manageable. For a 240,000‑SCC herd with inconsistent records or overcrowded dry pens, it’s a much easier trap to fall into.

Can a 240,000‑SCC Herd Really “Save” on SDCT?

Rollin, Dhuyvetter, and Overton (2015, Preventive Veterinary Medicine) estimated the total cost of a single clinical mastitis case in the first 30 DIM at approximately $444 per case, including lost production, treatment, discarded milk, labour, and culling risk. Other work puts direct costs closer to $120 per case, making a $120–$444 range across studies reasonable.

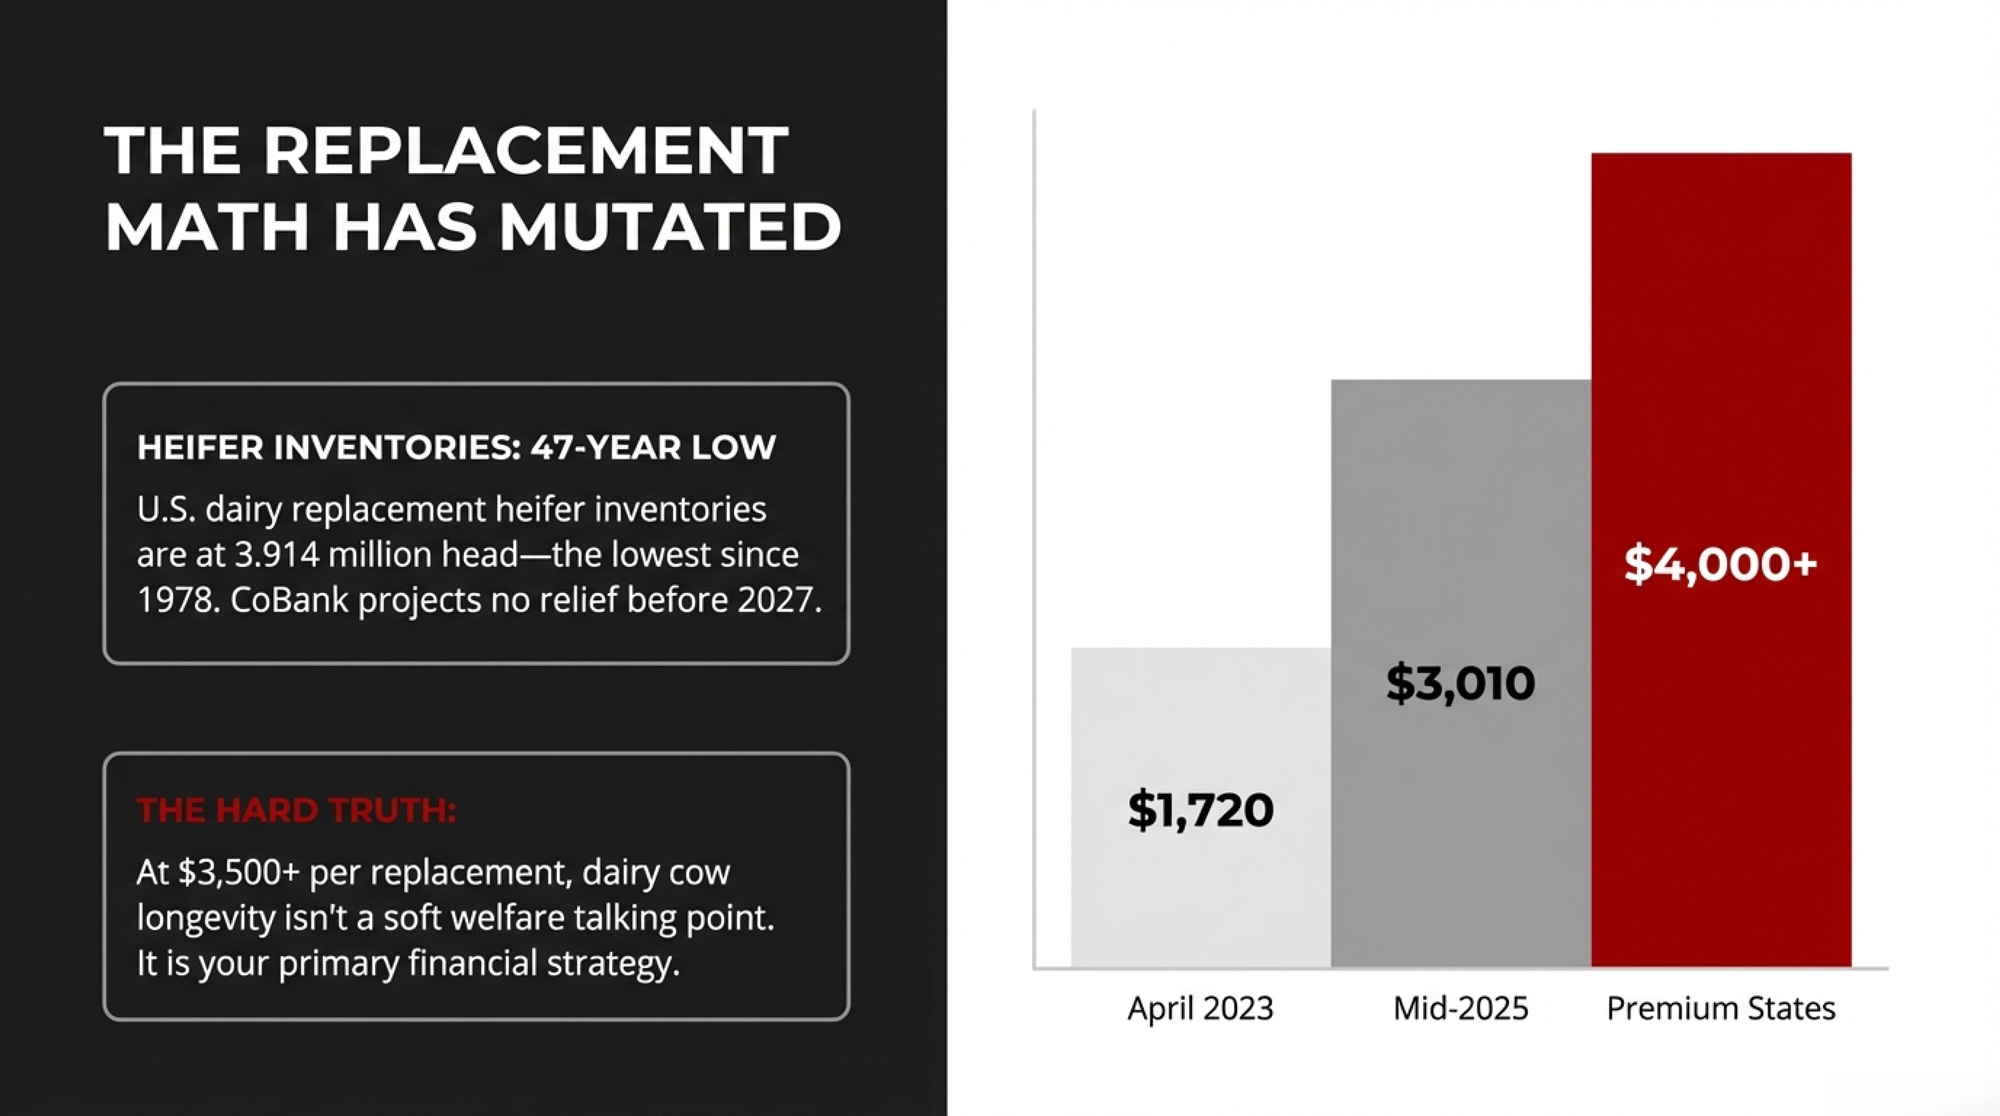
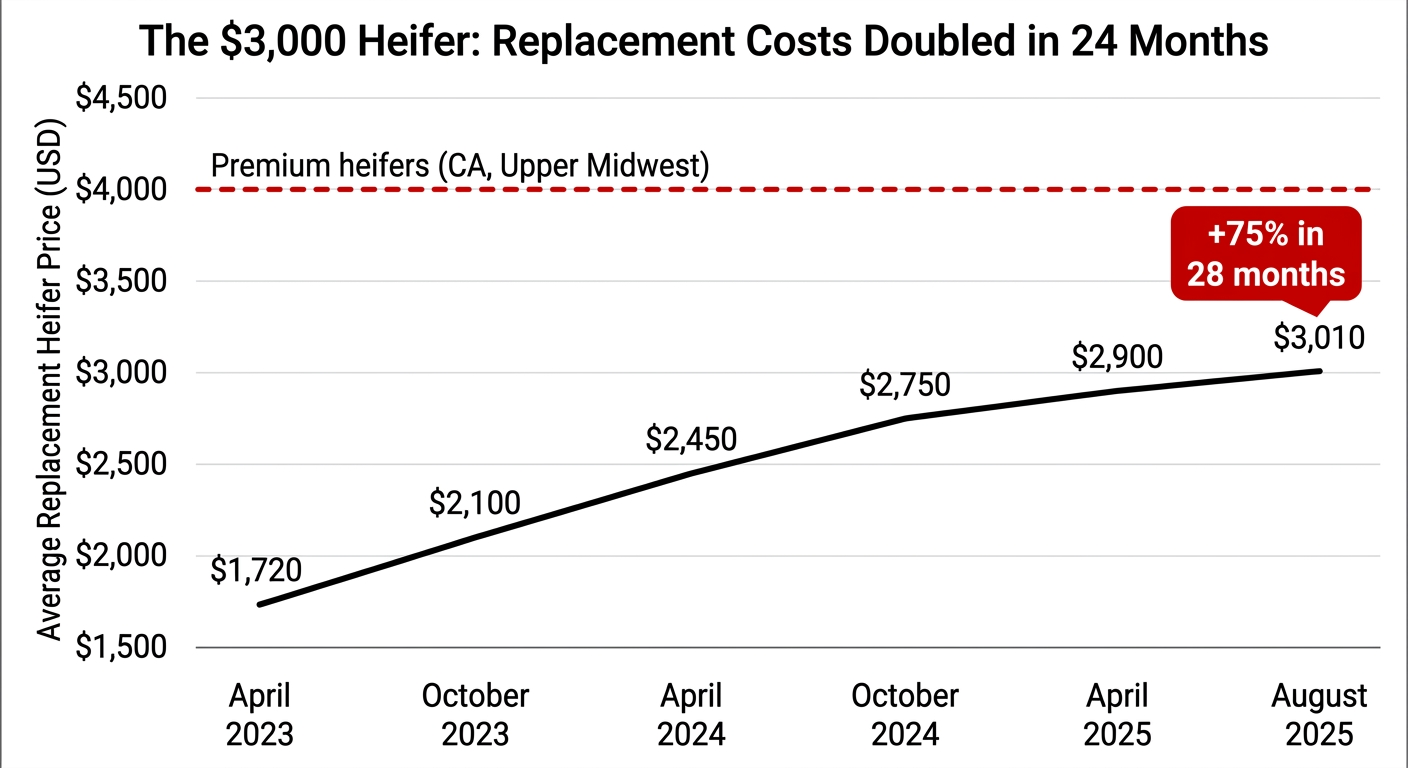
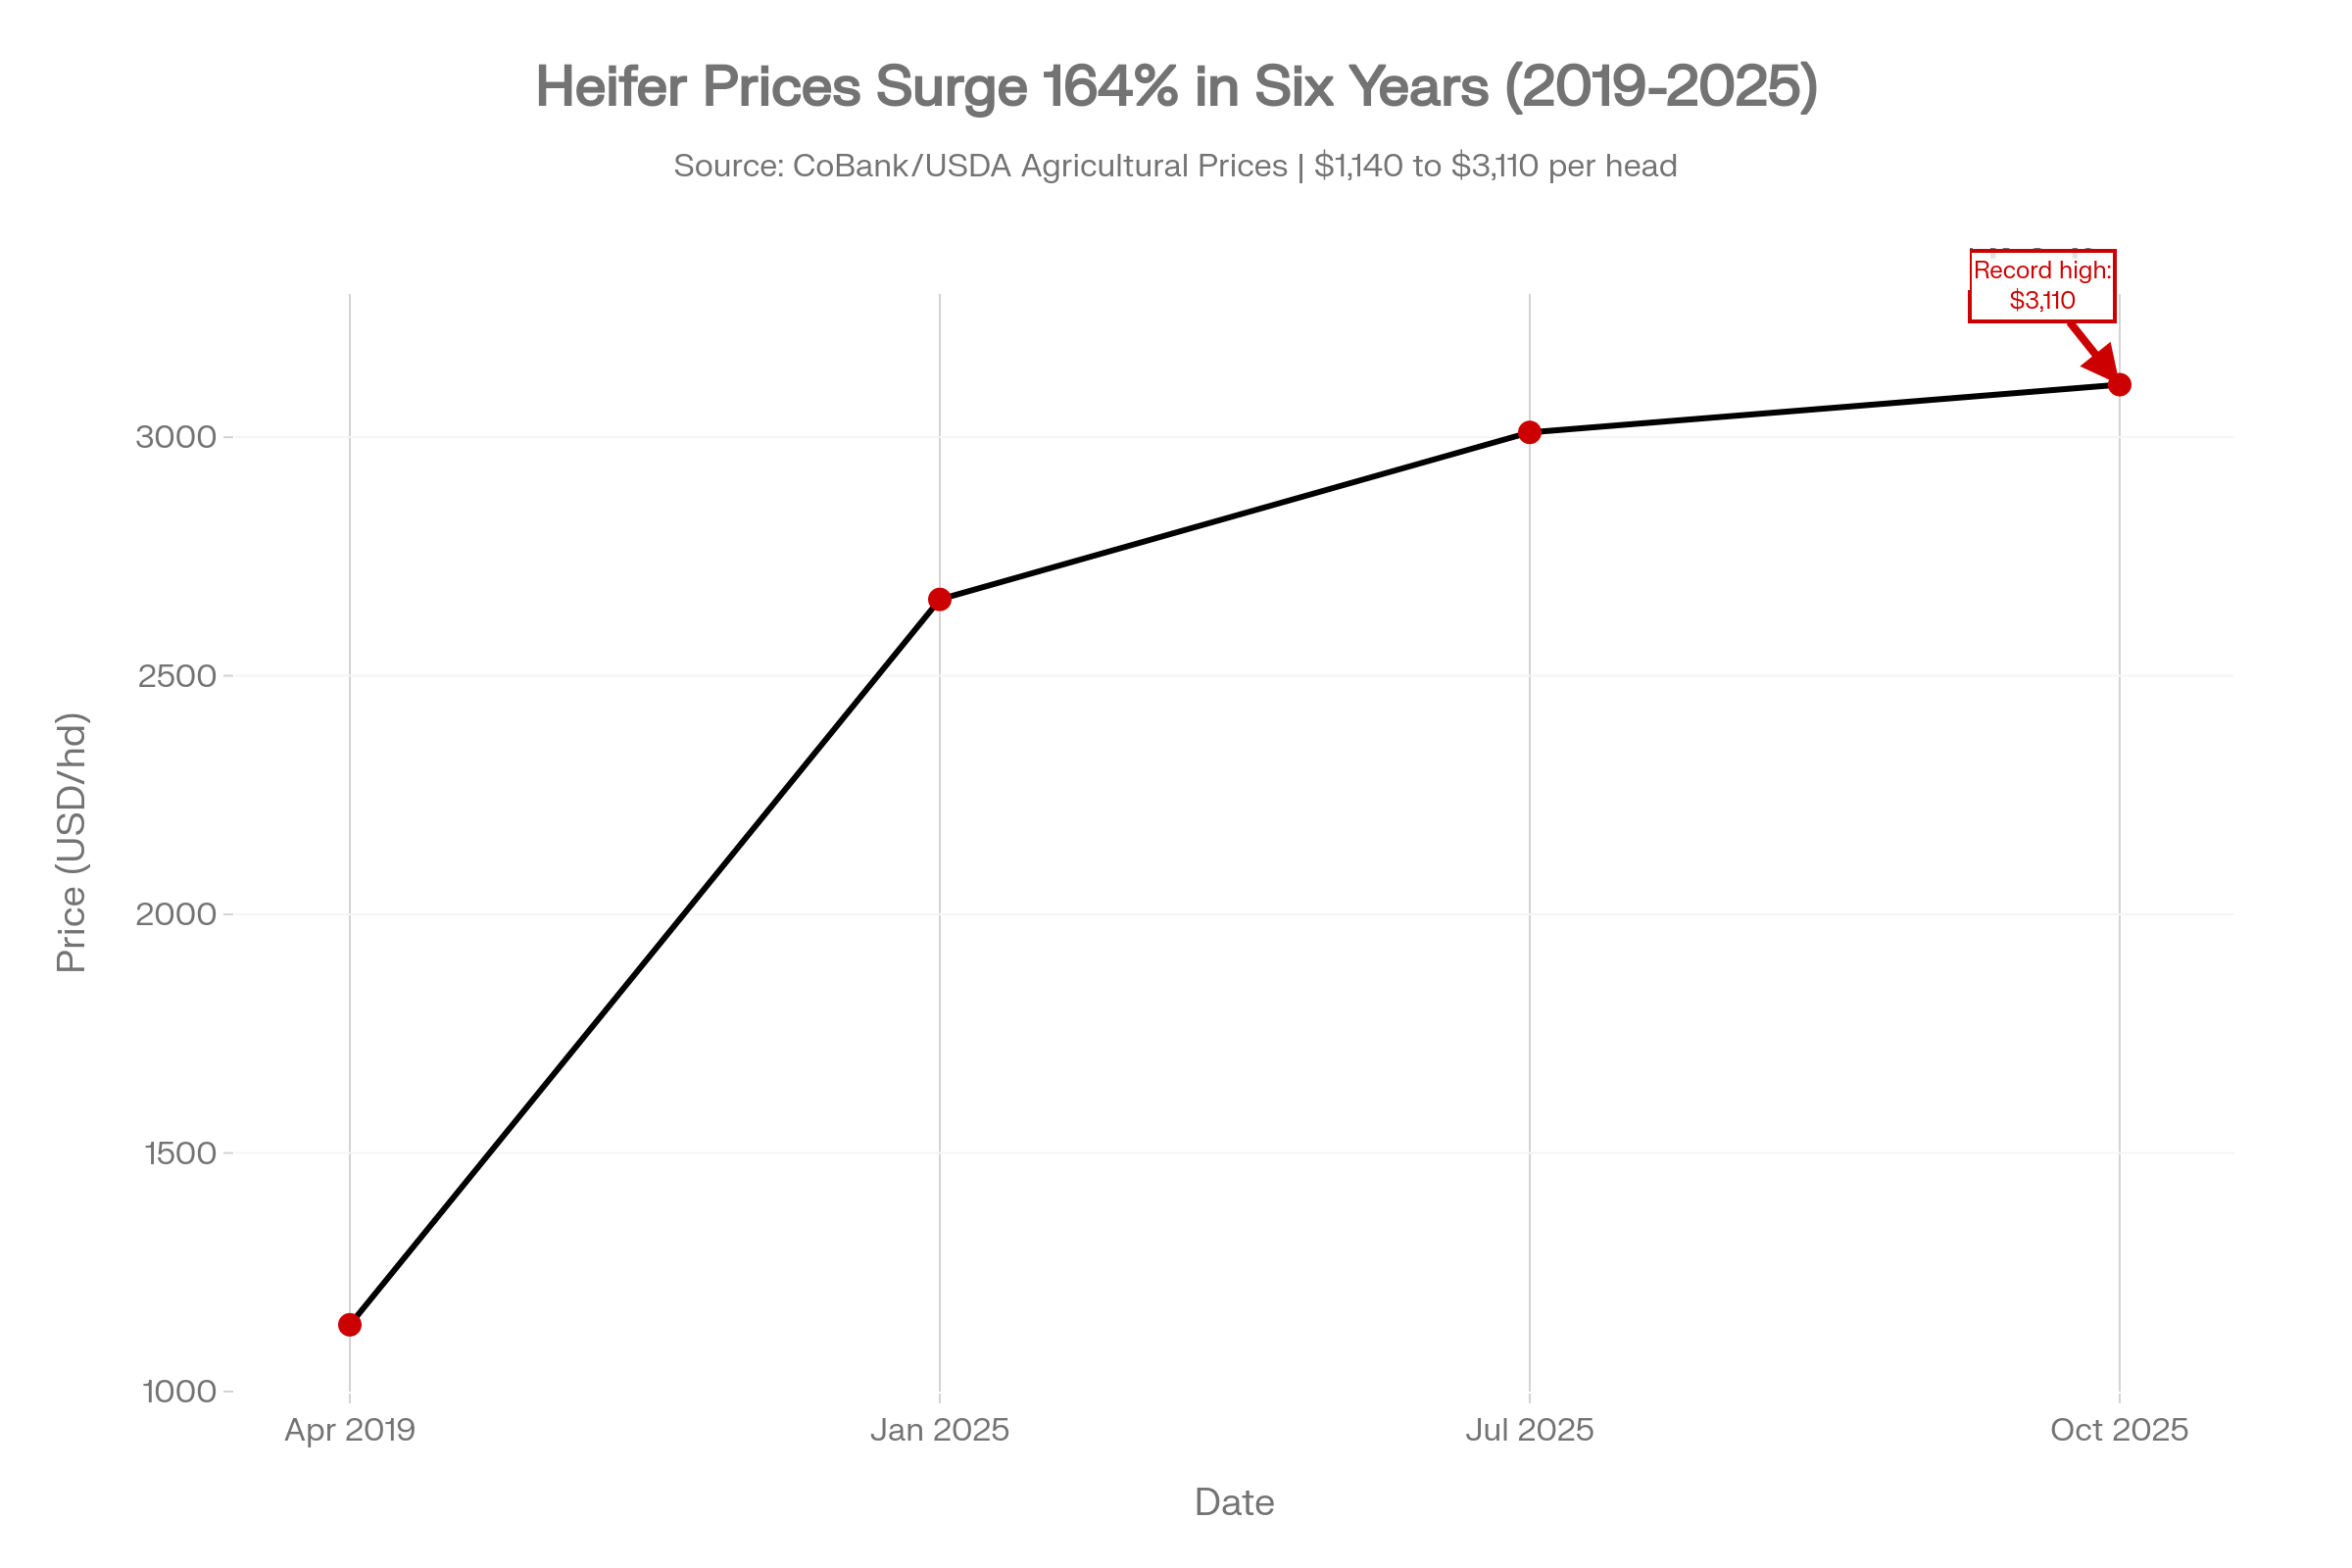
Replacement economics have shifted just as sharply. CoBank and USDA data show:

  • October 2014: dairy replacement heifers at $2,120 per head.
  • April 2019: down to $1,140.
  • January 2025: back up to $2,660.
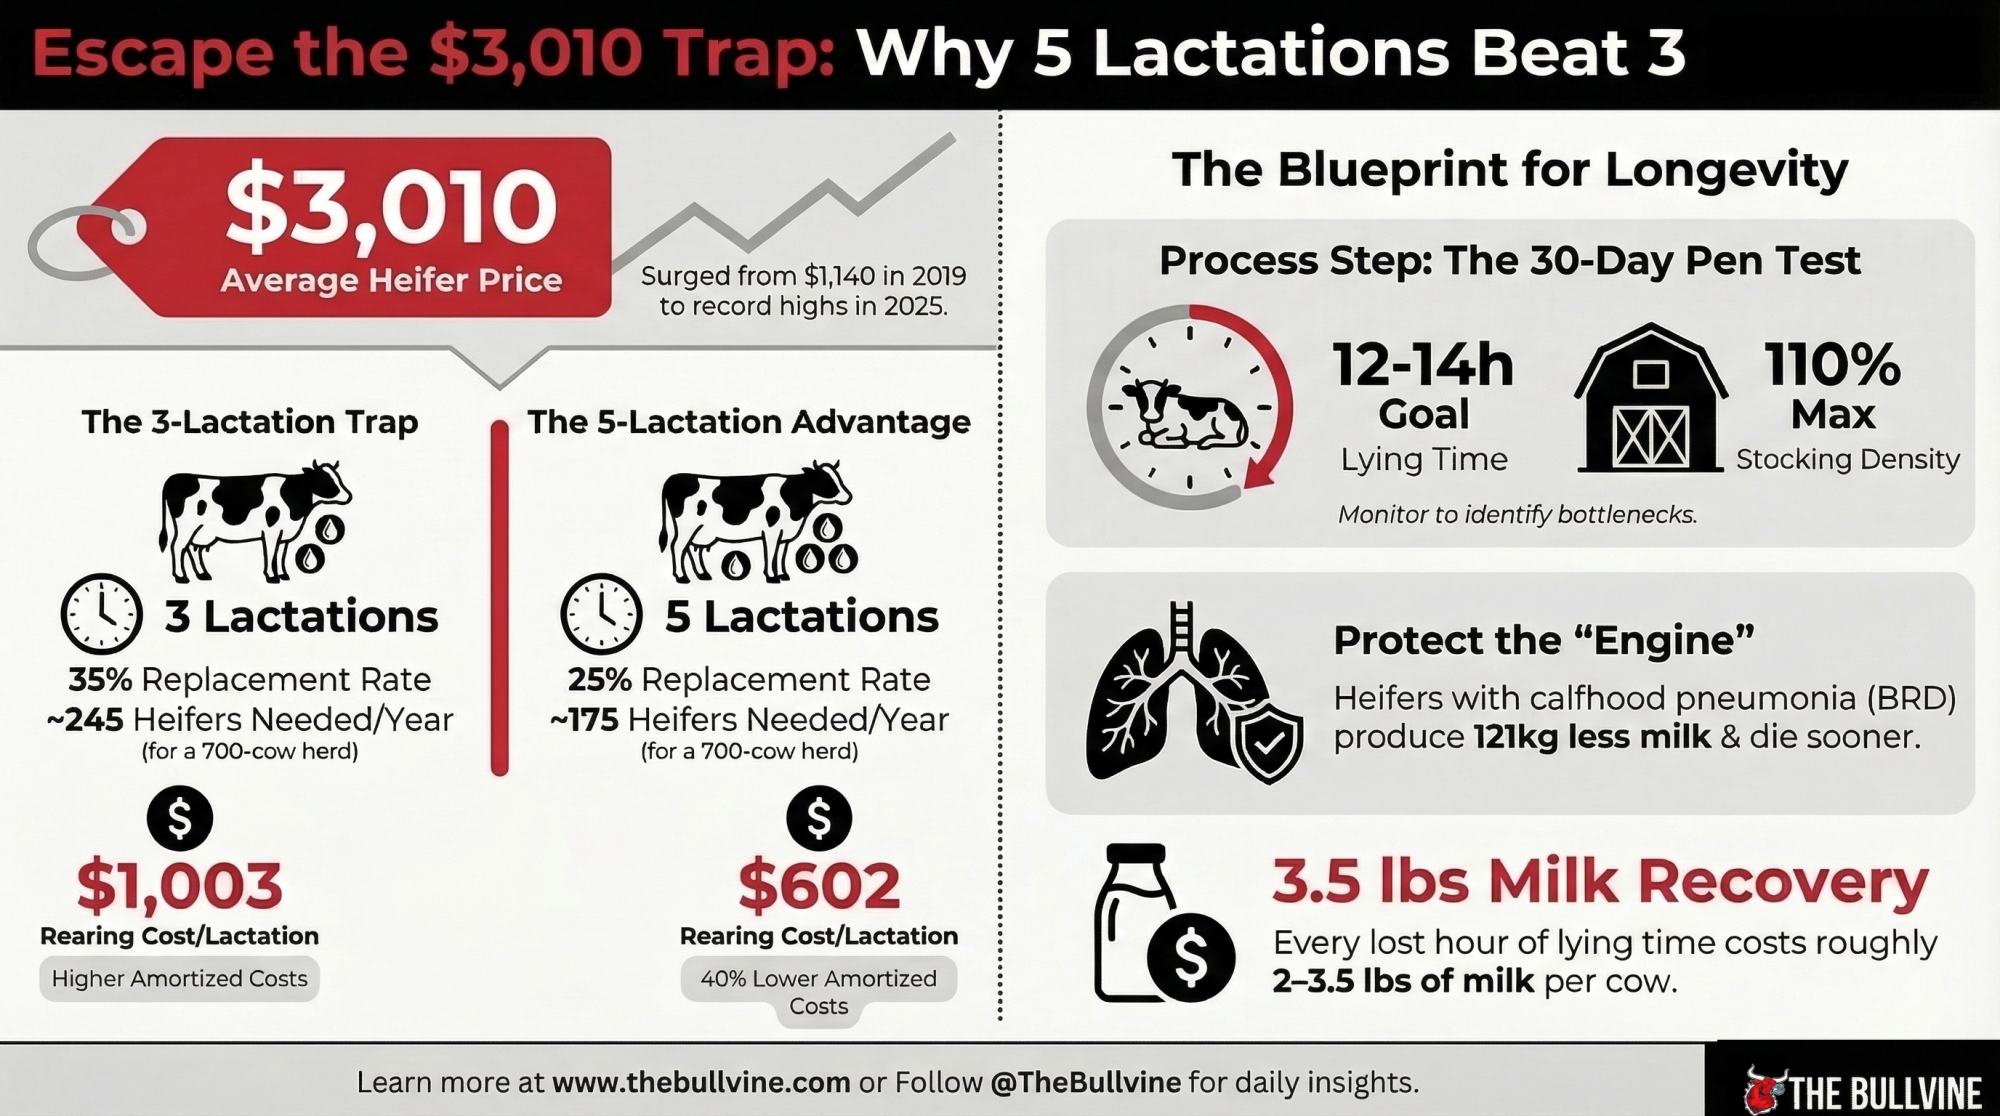
  • July 2025: $3,010.
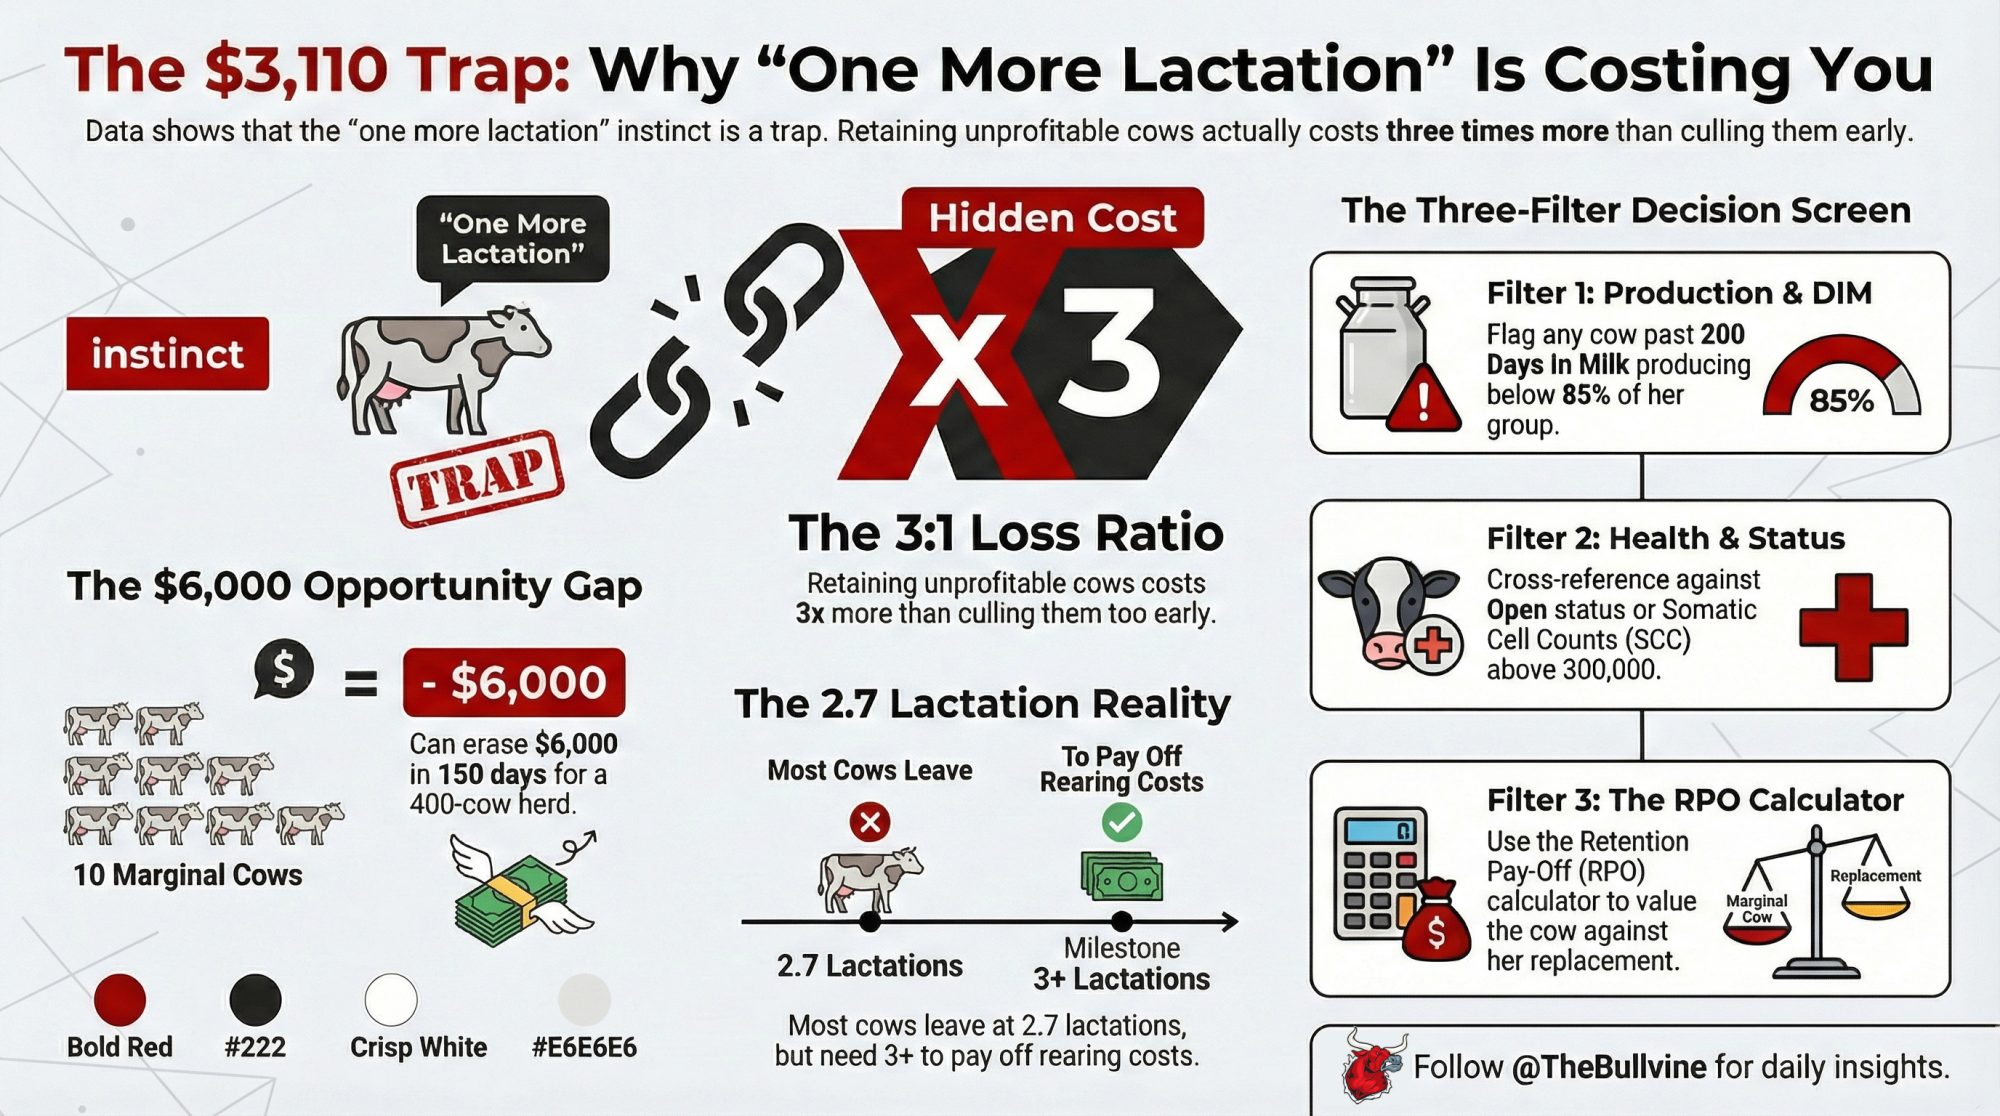
  • October 2025: $3,110 — about a 164% increase from the 2019 low.
  • January 2026: USDA average around $2,860, with individual Holstein springers clearing $4,000+ in some California and Midwest auctions.
Cost itemConservative valueCost vs. $1,080 tube “savings”
Clinical mastitis case (first 30 DIM)$300 per case (mid‑range of $120–$444)image.jpg4 cases = $1,200 (already exceeds tube savings)
Sub‑clinical mastitis over lactation~$200 lost milk/premiums per cowimage.jpg6 cows = $1,200 in hidden loss
Net replacement heifer (Jan 2026 avg)$2,860 − ~$1,400 cull value ≈ $1,500 per headimage.jpg+11 early cull = 1.4× tube savings; 2 culls = 2.8×
High‑end Holstein springer (auction)$4,000+ per head in some marketsimage.jpg+11 cull on premium cow = 3.7× tube savings
90 tubes skipped at dry‑off$12 per tube; total $1,080 “saved”image.jpgBest‑case upside, before any mastitis or cull penalties

Now put that together on a 300‑cow herd with a BMSCC around 240,000 that jumps into SDCT before its infection pressure, and records are ready. If your dry‑off person is also your night milker and calf feeder, SDCT will show every crack in that schedule. And if selection criteria or follow‑through miss even a modest number of quiet infections, you can see a bump in early‑lactation mastitis, a couple of cows pushed into earlier culls, and several sub‑clinical cases dragging SCC and milk across the whole lactation.

Here’s what that looks like, using conservative assumptions:

ItemSavingsCost
90 dry‑cow tubes skipped (@ ~$12/tube)$1,080
10 extra clinical mastitis cases (@ ~$300/case)$3,000
2 extra early culls (net replacement @ ~$1,500/head after cull credit)$3,000
Lost milk from 10 sub‑clinical cows (a few hundred dollars per cow across the lactation)≈$2,000
Net result ≈$6,920+ loss

Assumptions: tubes $8–$15 each (long‑acting dry‑cow products) with $12 used here; mastitis cost $120–$444/case, $300 mid‑range; net replacement cost $2,860 USDA Jan 2026 average minus roughly $1,400 cull cow value ≈ $1,500; sub‑clinical cows losing a few hundred dollars worth of milk and quality premiums per cow across a full lactation.

You’ve shaved about a thousand dollars off your dry‑cow drug bill. You’ve potentially burned seven times that in mastitis, culls, and dead milk.

Mystic Valley’s low SCC, universal sealant use, and disciplined selection meant it could adjust early and keep that risk in check. The Cornell herds that stuck with SDCT had similar structures and data feedback loops. A 240,000‑SCC herd without those pieces is betting $6,920+ a year that its infection status and records are better than they really are.

Three SDCT Paths: Matching the Science to Your Herd

The Mystic Valley and Cornell stories don’t say “don’t do SDCT.” They say “do it on the right herds, with the right prep, and be ready to stop if the data turns.”

For a 240,000‑SCC herd with a processor letter, you’ve got three realistic paths forward.

1. Infection‑First: Fix the Foundation Before You Touch Tubes

This fits herds with BMSCC regularly above 230,000–250,000, chronic high‑SCC cows you already know by number, and dry pens that are too full or too wet.

You tell your buyer SDCT is the endpoint, not the starting point. Then you put 12–18 months into:

  • Standardizing milking routines: consistent prep, lag time, and post‑dip across every shift; fix drift in technique between employees.
  • Tuning the parlour: vacuum levels, pulsation, liners, unit alignment.
  • Improving dry‑cow housing: stocking density, bedding, drainage, airflow.
  • Culling or segregating chronics instead of carrying them through another lactation.

You stay on blanket dry‑cow therapy plus internal teat sealant for all cows while you do that work. That’s exactly how the AABP 2024 SDCT guidelines recommend sequencing for herds that don’t yet meet readiness criteria. You’re trading short‑term antimicrobial‑use “wins” for long‑term udder‑health and economic stability.

2. Pilot SDCT on the Safest Slice — and Let the Data Decide

This fits herds with BMSCC trending toward 200,000 or below, reasonably clean records, and a willingness to course‑correct.

With your vet, you write a short, strict rule:

  • Last three SCC tests all under 200,000.
  • No clinical mastitis this lactation.
  • No known problem quarters or chronic flags.

Cows that pass become eligible for sealant‑only at dry‑off. Eligibility isn’t a guarantee — if anyone on the crew has doubts about a cow, she stays on full treatment.

Then you monitor:

  • Fresh‑cow SCC at first test (5–45 DIM), focusing on the percentage over 200,000.
  • Clinical mastitis in the first 60 DIM, clearly tagged by dry‑off treatment group.

The AABP guidelines include specific DairyComp setups to track this. University of Minnesota Extension’s SDCT resources walk through herd‑level readiness and monitoring in plain language. Cornell used similar metrics to sort their 24 herds into “stayed in” and “opted out.”

If your graphs look like the Lipkens and Cornell success herds — stable SCC, no disproportionate mastitis spike among sealant‑only cows — you can cautiously widen eligibility. If they start to look like the seven Cornell herds that stopped, close the gate and go back to Path 1.

Do this within 30 days: Pull your last six DHIA reports and your current dry‑off list. On a whiteboard, make three columns:

  • “Always treat”
  • “Maybe selective later.”
  • “Pilot no‑antibiotic candidate”

Fill it in honestly. That one exercise will show you how many cows truly belong in the lowest‑risk bucket — and how far your herd sits from one that looks like Mystic Valley or the Lipkens group.

3. Turn the Processor Letter Into Leverage, Not a Deadline

This fits herds that need time and capital to fix underlying issues while facing firm SDCT language from buyers.

Go back to the processor with a framework instead of a yes/no:

  • You’ll pilot SDCT only on the safest slice (as in Path 2) this coming dry‑off season.
  • You’ll report quarterly on the bulk tank SCC trend, the percentage of fresh cows with SCC over 200,000, and the first‑60‑day mastitis incidence.
  • In return, you ask for a 12–18‑month runway to hit agreed improvements in SCC and mastitis, and to address facility bottlenecks, before any push toward wider SDCT.

The Dutch experience backs you up: that 47% dairy‑sector antimicrobial reduction happened over years, not months, and required simultaneous work on management, housing, and monitoring — not just a ban on tubes. A buyer who can show auditors your plan and your numbers is better off than one who forced SDCT onto a high‑SCC herd and then watched the metrics wobble.

What This Means for Your Operation

  • Start with your own SCC curve, not the industry average. If your bulk tank has lived under 200,000 for the last 6–12 months and you can pull a trustworthy mastitis and SCC history for each cow, you’re in the same readiness zone as the Lipkens herds and Cornell’s average SDCT adopter. If you’re swinging 230,000–280,000, you’ve still got infection work ahead of you.
  • Decide who owns dry‑off — by name. SDCT falls apart when three different people “kind of” handle it. One person needs to own that protocol and have enough time and authority to stick to it every day.
  • Use the AABP checklist as your gatekeeper, not your processor’s email. Bulk tank SCC regularly less than 250,000; no Strep. agStaph. aureus under control; individual SCC data; written SOPs; sealant for all cows. If those boxes aren’t ticked, your herd is still in the infection‑reduction phase.
  • Run your own barn math before you skip tubes. At a USDA average of $2,860 per replacement heifer — with individual animals clearing $4,000+ — even two extra early culls from mis‑classified SDCT cows can blow past a full year of tube savings. Put your own numbers into the $6,920 example; don’t just accept the model.
  • Within 90 days: Sit down with your vet and put your last six months of SCC and mastitis data beside the AABP SDCT criteria. Wherever your herd fails on that checklist, that’s where your next management or capital dollar should go.
  • Within 12 months: If you stay on BDCT while fixing management, re‑run your fresh‑cow SCC and first‑60‑day mastitis plots against last year’s. A noticeable step change does more to prove you’re SDCT‑ready than any pledge about tube counts.

Key Takeaways

  • If your herd’s SCC isn’t consistently under ~200,000 and your records can’t reliably sort truly low‑risk dry cows from the rest, SDCT is a future objective, not a current target.
  • If you pilot SDCT, every cow that skips tubes should have three consecutive SCC tests under 200,000, no mastitis this lactation, no problem quarters, and still receive a teat sealant — and you need to track her fresh‑cow outcomes separately from full‑treated cows.
  • If fresh‑cow SCC or first‑60‑day mastitis in your SDCT group climbs above your own baseline, that’s your cue to pause or narrow and invest harder in infection control rather than hoping the numbers settle.
  • If your processor is pushing a hard SDCT timeline, bring them a plan with a pilot cohort, monitoring metrics, and 12–18‑month milestones — not blanket SDCT on a 240,000‑SCC herd that isn’t structurally ready.

The Bottom Line

The herds that will be least stressed by the next round of antimicrobial stewardship rules aren’t the ones bragging about cutting the most tubes. They’re the ones whose data can prove their cows do fine without them.

When you pull up your last year of SCC curves, mastitis logs, and cull codes, do those numbers honestly look like a Mystic Valley‑style foundation for selective dry cow therapy — or are they telling you to keep the tubes while you fix what’s underneath?

Complete references and supporting documentation are available upon request by contacting the editorial team at editor@thebullvine.com.

Learn More

The Sunday Read Dairy Professionals Don’t Skip.

Every week, thousands of producers, breeders, and industry insiders open Bullvine Weekly for genetics insights, market shifts, and profit strategies they won’t find anywhere else. One email. Five minutes. Smarter decisions all week.
NewsSubscribe
First
Last
Consent

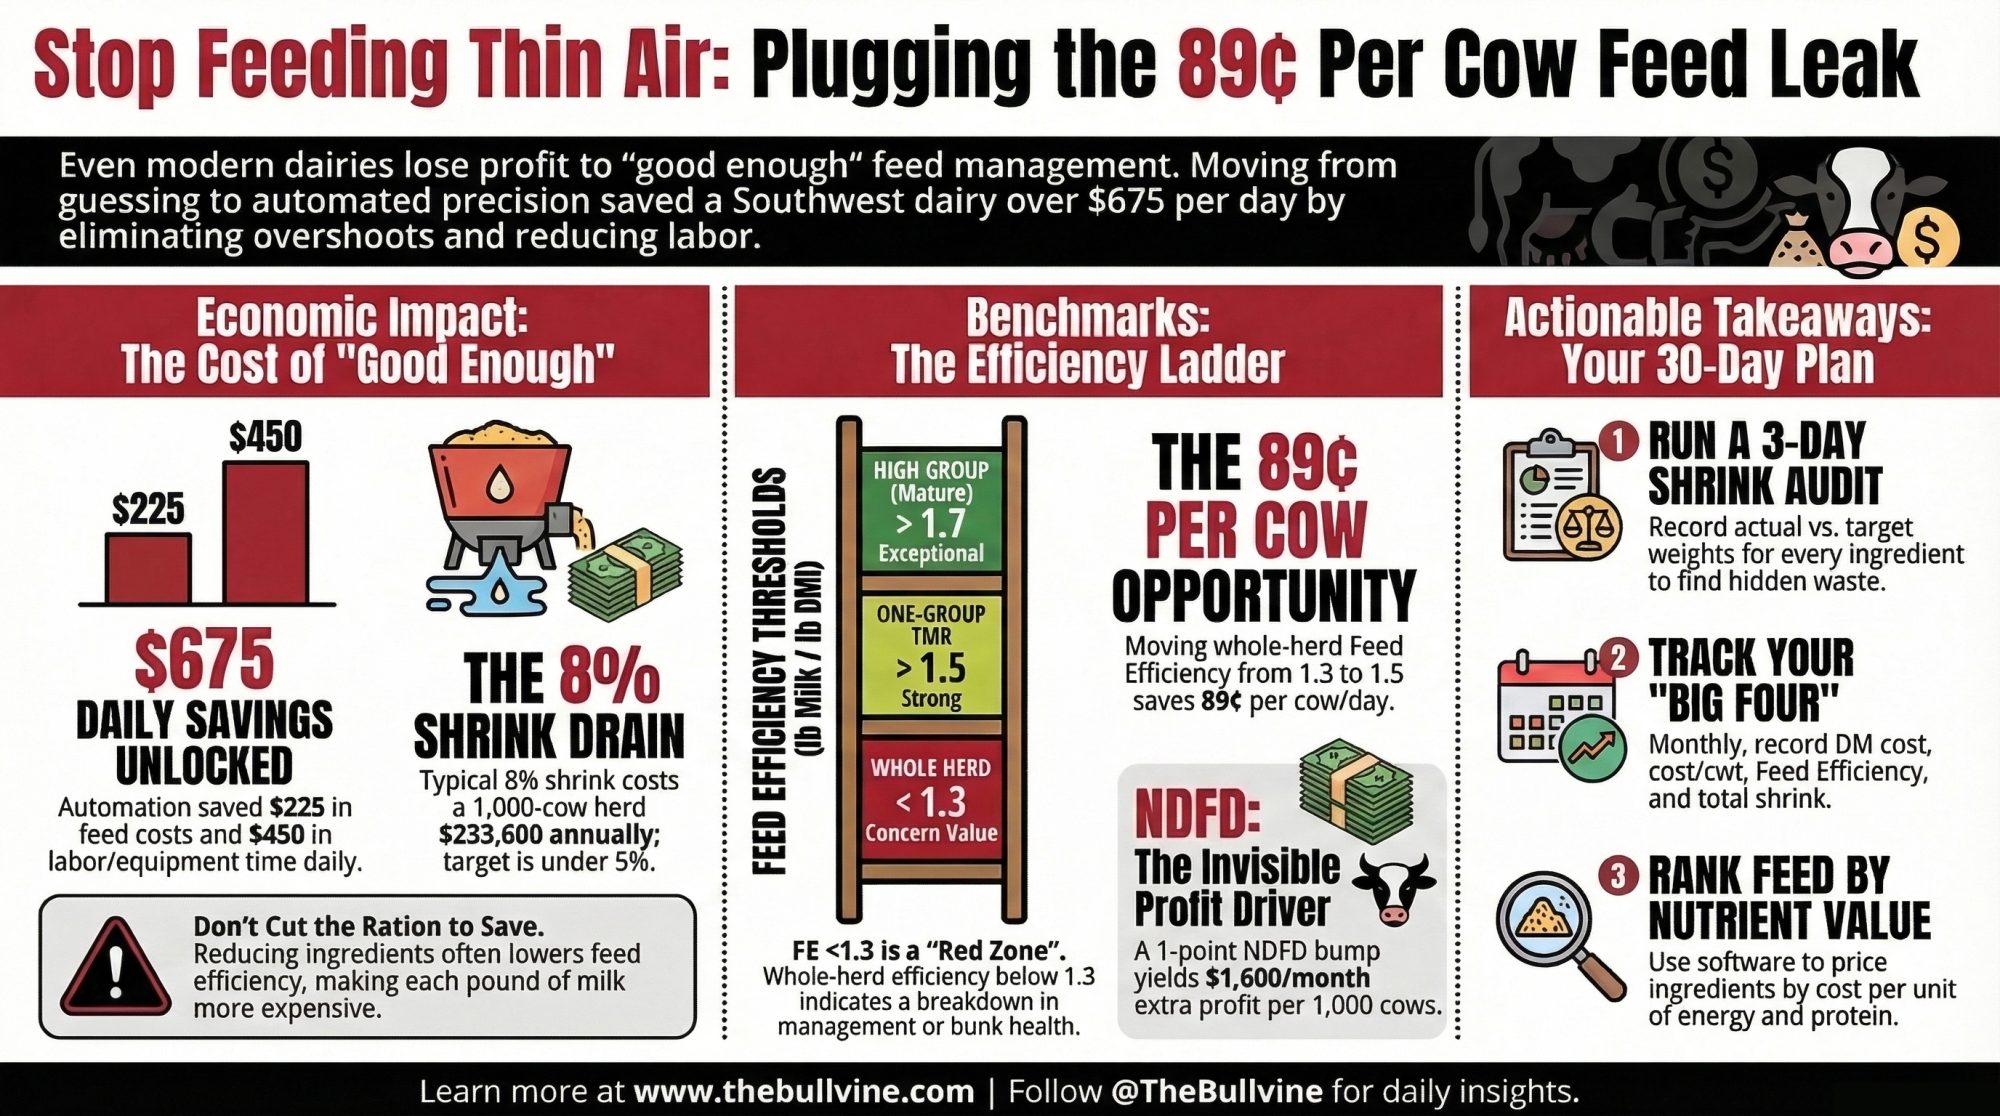
Stuck at 1.3 Feed Efficiency: How One Midwest Dairy’s “Fine” Ration Burned $64,000 in Feed

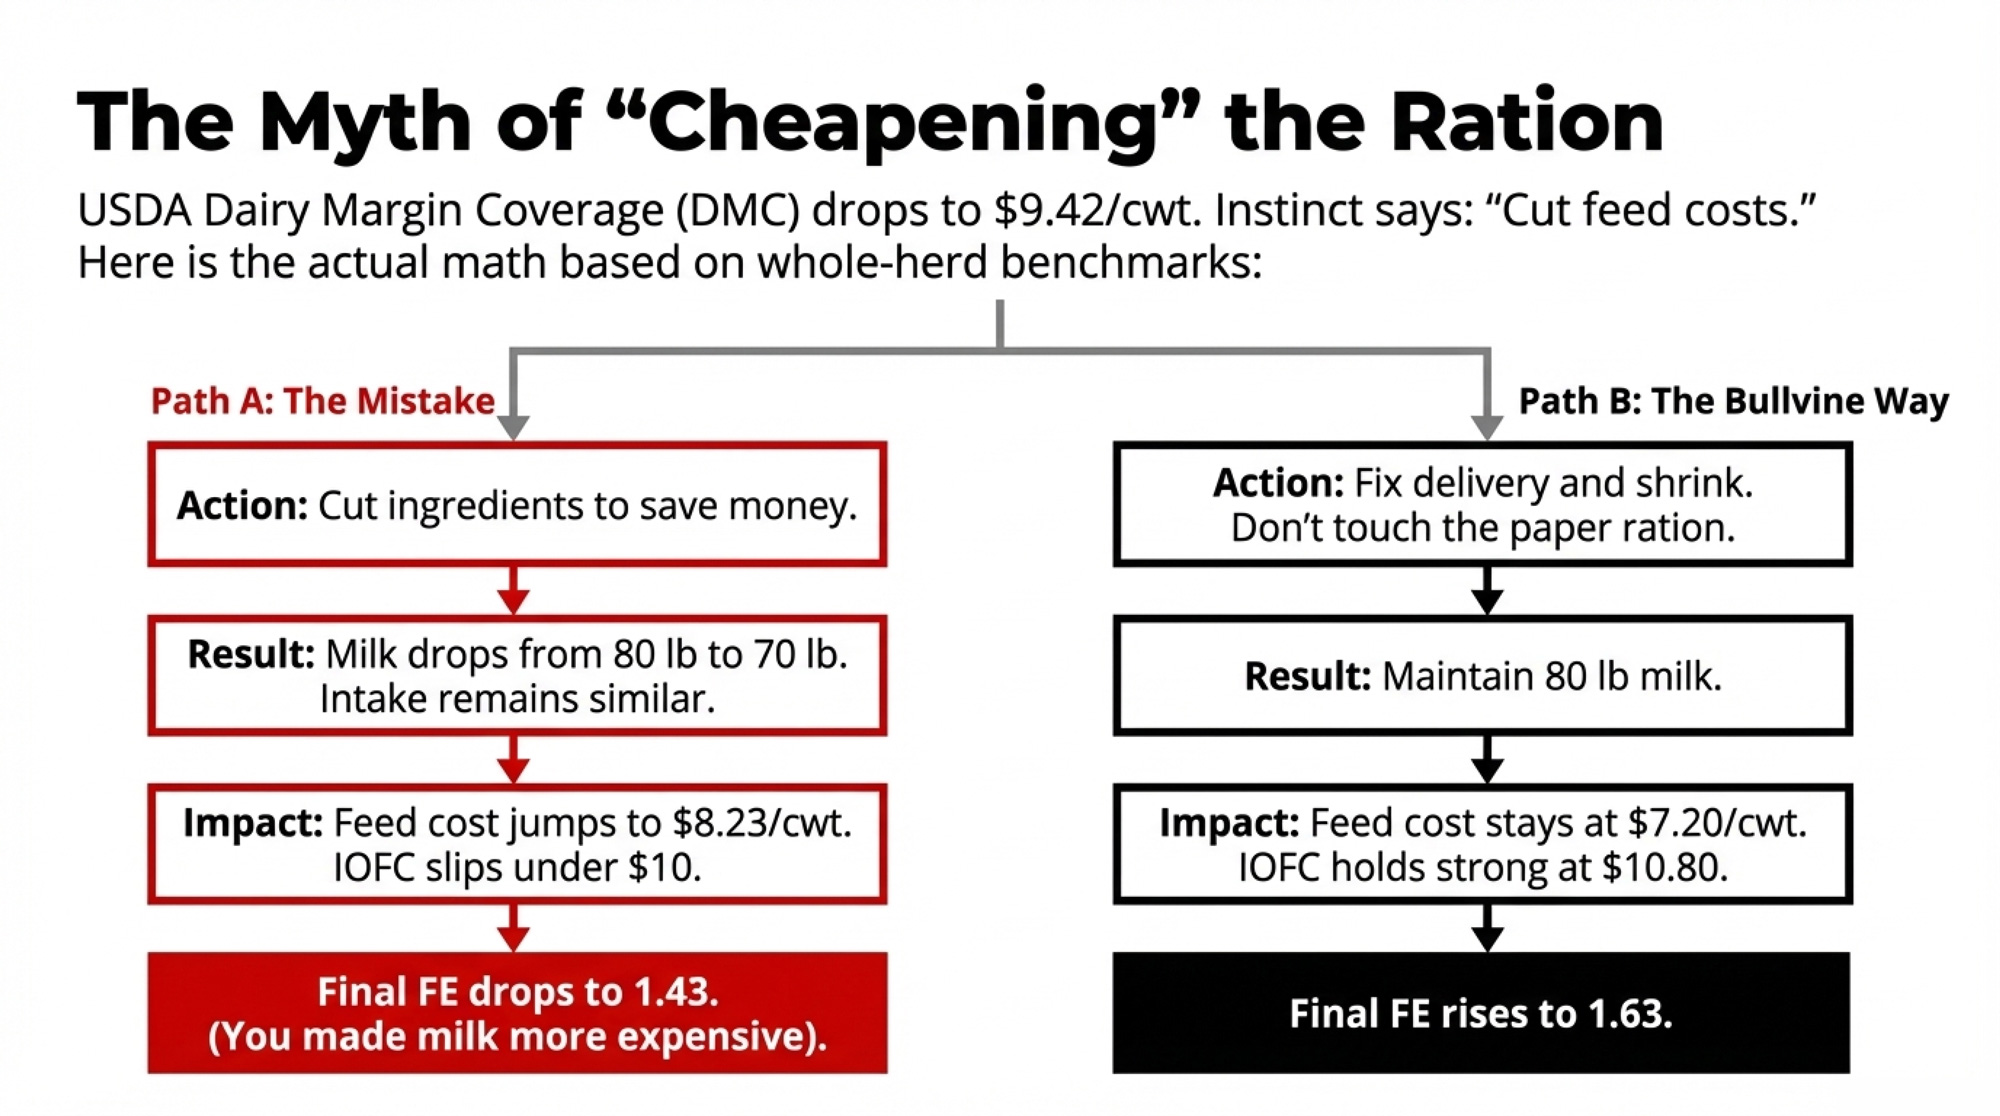
December 2025’s DMC margin hit $9.42/cwt — the only payment all year. One nutritionist pulled the feed tickets. The leak wasn’t price. It was efficiency.

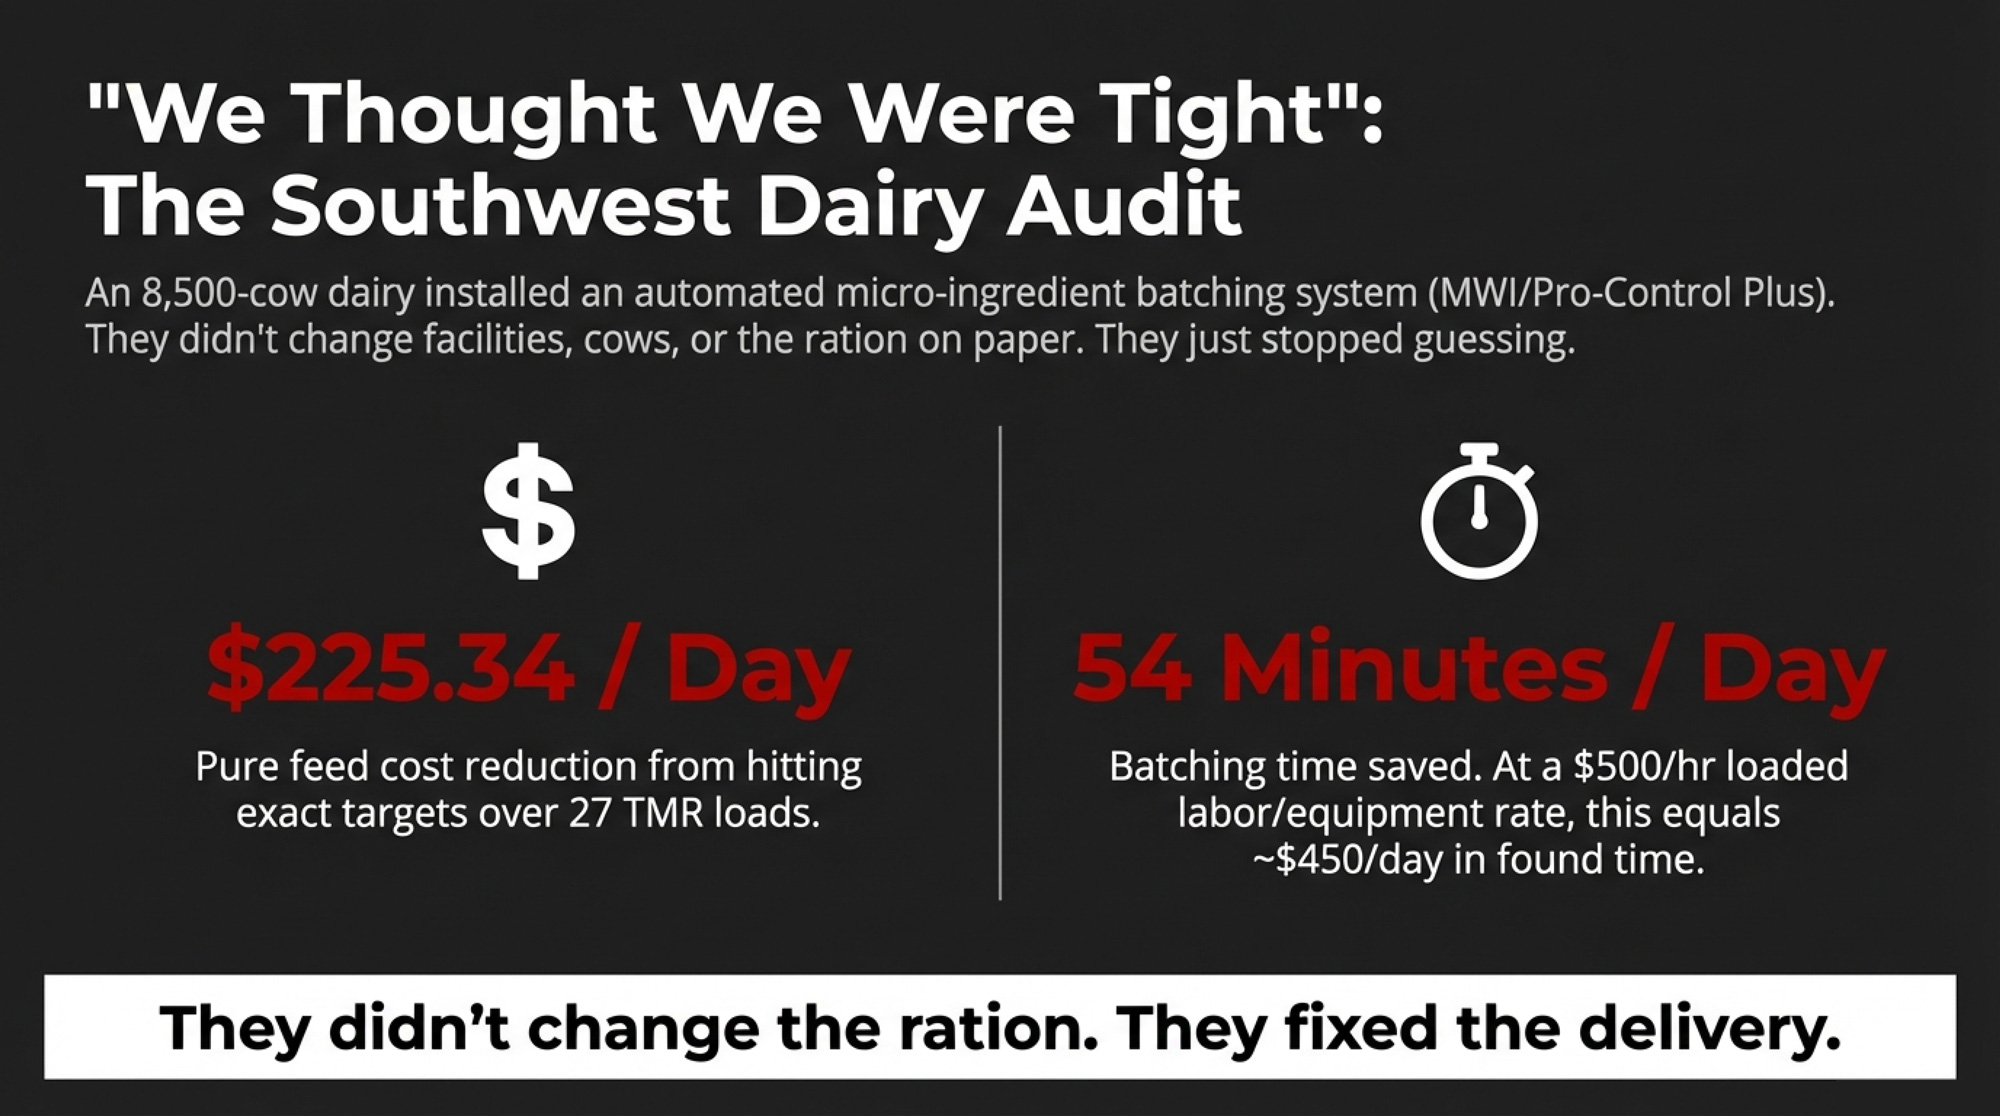
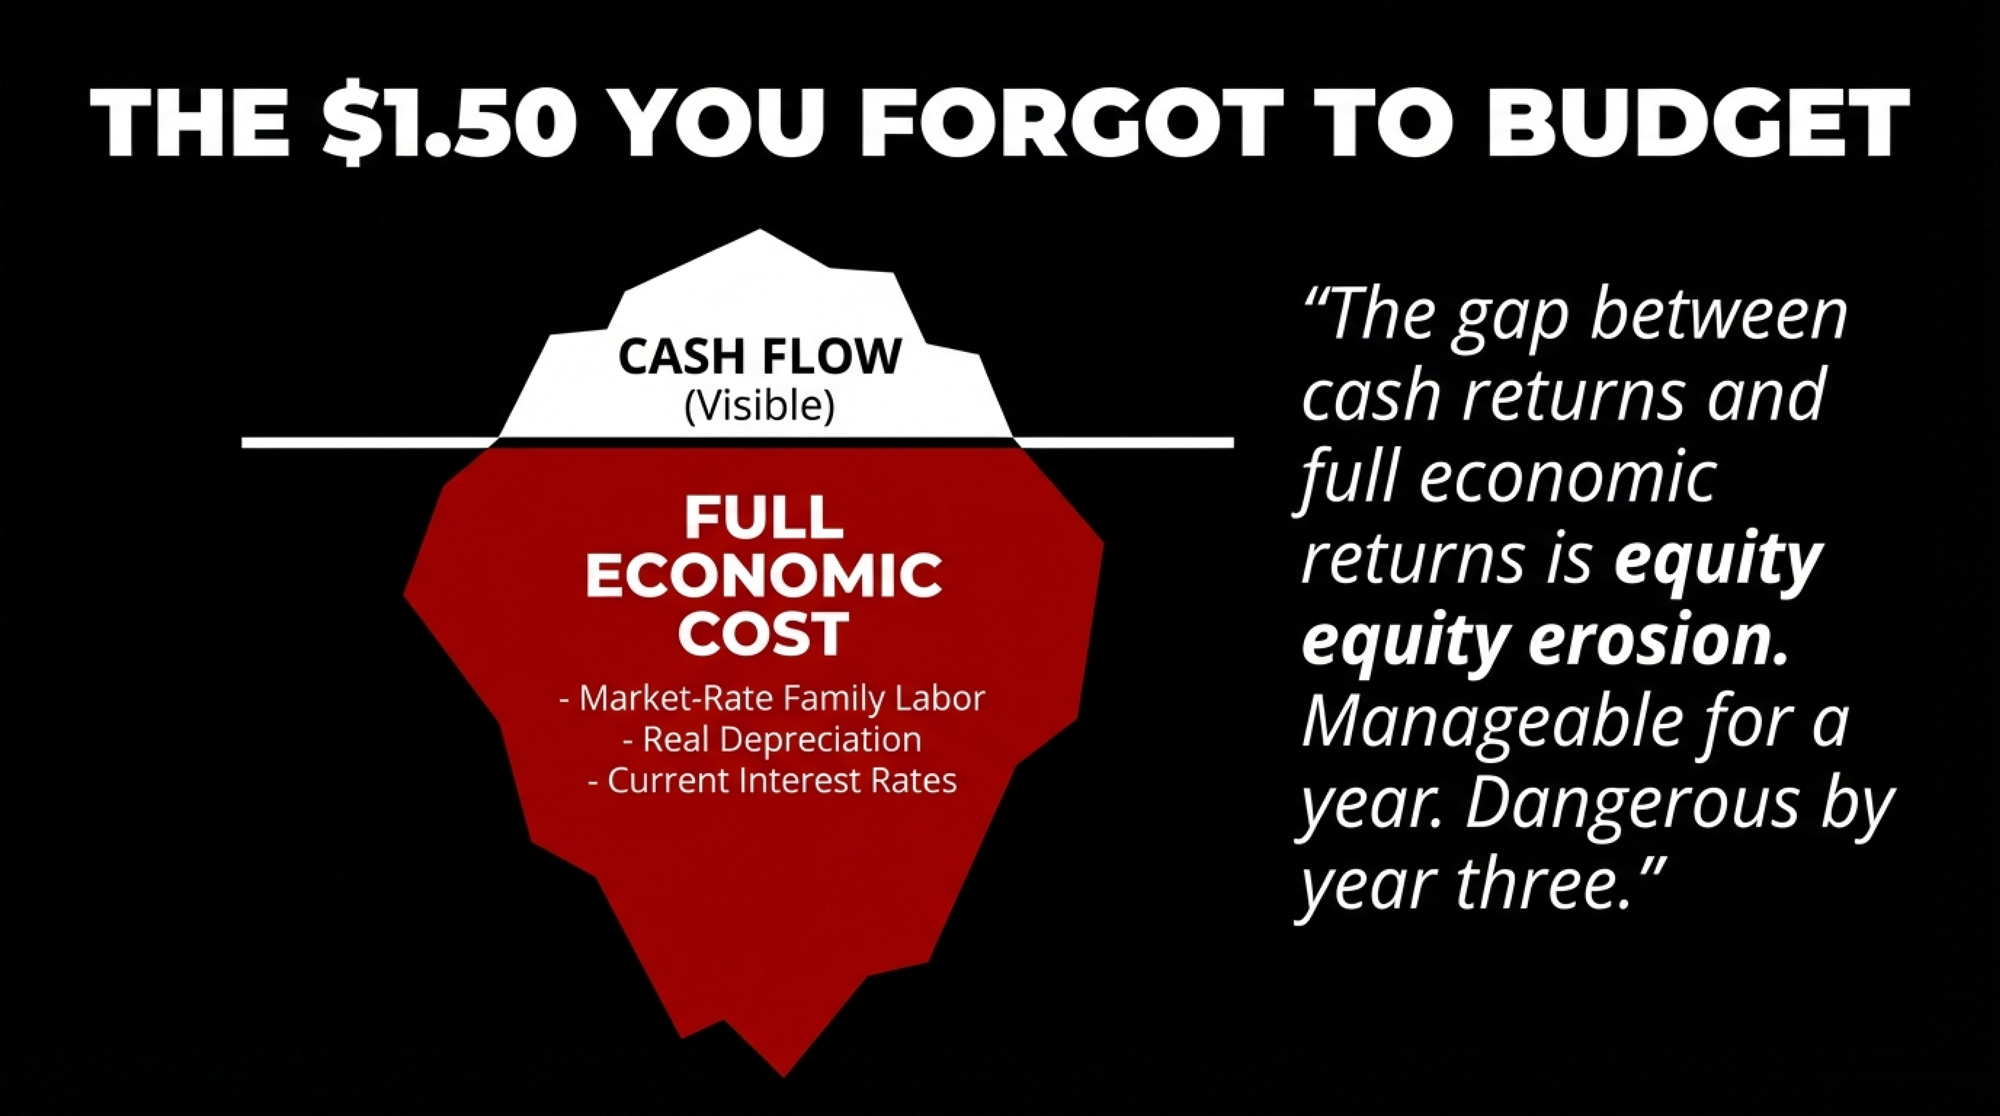
Executive Summary: At 1.3 feed efficiency, a 300‑cow high group feeding a $0.33/kg DM ration is burning roughly $64,000 a year on dry matter it doesn’t need to hold current milk. This article walks through a composite Midwest herd that looked “fine” at 32 kg 3.5% FCM until December 2025, when the DMC margin of $9.42/cwt on $9.58/cwt feed costs exposed how little protection there was in the safety net. Using the updated NASEM 2021 model, the same ration that NRC 2001 would run at higher DMI shows it can support that milk on about 1.8 kg less DMI per cow per day, if bunk management, starch/NDF balance, and cow flow line up. The piece then tackles additives and shows how a common inert fat example — $0.54/cow/day in for $0.37/cow/day back — turns some “supplements” into straight donations to your feed bill. It also hits the mineral blind spot: water with elevated iron, manganese, or sulfate can quietly block copper and zinc and drag down intake even when your premix looks perfect. You’ll come away with specific thresholds (high group FE, RDP %, MUN range, fat and DDGS caps) and a 30‑day plan to calculate FE by pen, re‑run your ration through NASEM 2021, and order a full water test. If your high group is anywhere near 1.3 FE right now, this is a 10‑minute read that could easily be worth $0.50–$0.60 per cow per day in recovered margin.

Feed Efficiency Trap

On a 300‑cow Holstein dairy in the U.S. Midwest, the high group looked fine. Cows were at the bunk, manure looked decent, and the tank was holding around 32 kg of 3.5% fat‑corrected milk per cow. Fine. But when feed costs climbed to roughly $0.33 per kilogram of dry matter — with corn in the $7–$7.60 per bushel range and soybean meal around $440 per ton in recent U.S. examples — “fine” stopped lining up with the milk cheque.

Then the December 2025 Dairy Margin Coverage (DMC) report landed: a national margin of .42 per hundredweight on a .58 per hundredweight feed‑cost component, the first and only DMC payment of the year. When the farm’s nutritionist pulled a week of feed tickets and ran the high‑group ration through the 2021 National Academies (NASEM) dairy model, the alley view and the spreadsheet didn’t match. The high group everyone called “fine” was quietly stuck at 1.3 feed efficiency — and the barn math said that number had a $64,000 price tag.

This isn’t one farm’s story — it’s a composite built from NASEM 2021 data, widely used feed‑efficiency benchmarks, USDA DMC numbers, and common bunk‑side patterns. The math is real. The herd is illustrative.

The $64,000 Feed Efficiency Leak

The nutritionist didn’t start with a software update. They started with a calculator.

Across extension and industry resources, feed efficiency for lactating cows is defined as energy‑ or fat‑corrected milk divided by dry matter intake — for example, 3.5% fat‑corrected milk (FCM) ÷ DMI. On this Midwest dairy, the high‑group numbers looked like this:

  • 32 kg of 3.5% fat‑corrected milk.
  • 24.5 kg of dry matter intake.
  • FE = 32 ÷ 24.5 ≈ 1.3

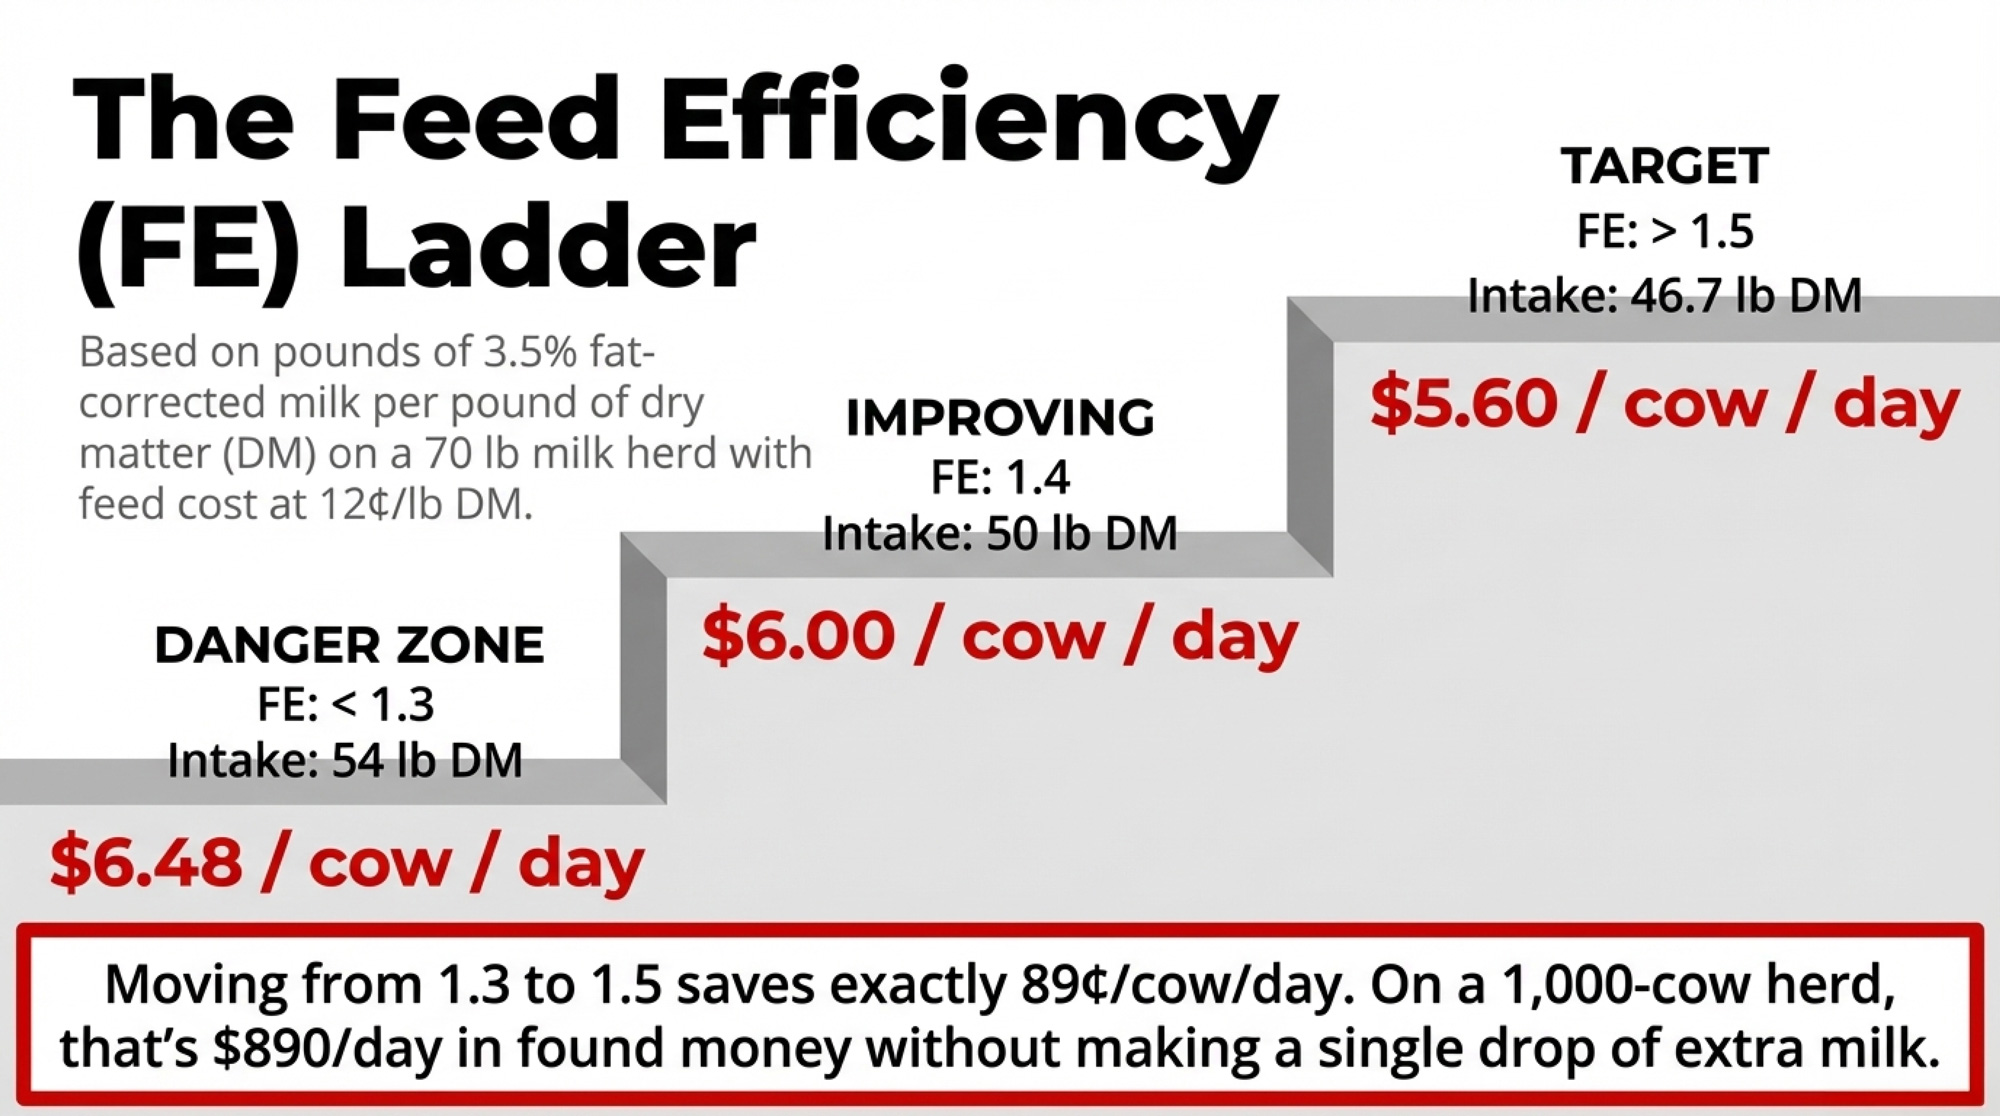
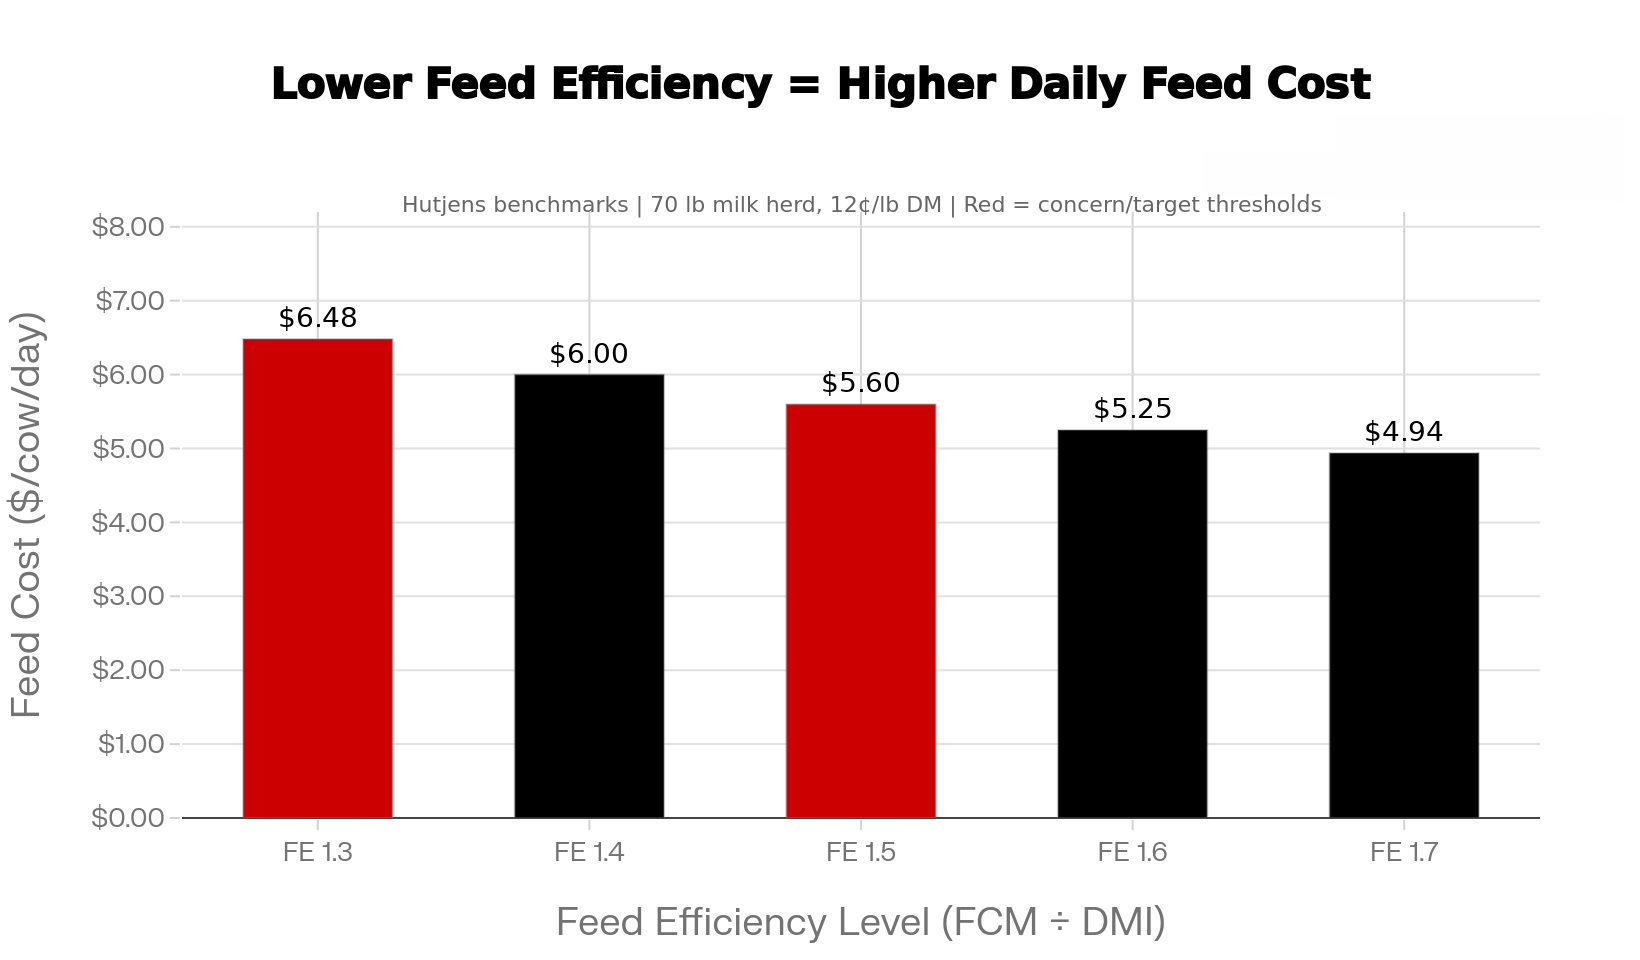
Using a dry‑matter cost of about $0.33 per kg, a very simple barn‑math exercise shows what a move from 1.3 to 1.4 feed efficiency would look like at the same milk:

  • At 1.3 FE, cows eat 24.5 kg of dry matter per day.
  • At 1.4 FE, they’d eat 22.7 kg to produce that same 32 kg of FCM.
  • That’s 1.8 kg less DMI per cow per day.
  • 1.8 kg × $0.33/kg ≈ = $0.59 per cow per day in feed cost. 

On 300 cows, that’s roughly $64,000 per year in dry matter to support the exact same milk. In a year where DMC only paid once — December 2025, with that $9.58/cwt feed‑cost component and $9.42/cwt margin — that extra 1.8 kg of DMI per cow per day starts to look less like “cow comfort” and more like an overdraft.

In plain language, the high group was eating as much as the low group. The bank account didn’t care how “fine” it looked at the bunk.

Is Your High-Group Eating Like a Low-Group?

Recent extension and technical pieces report typical feed‑efficiency ranges for dairy cows of 1.3-1.8, depending on stage of lactation and grouping. Benchmarks commonly used on commercial Holstein herds look roughly like this:

  • High‑group, mature cows: about 1.7–1.8 FE.
  • High‑group, first‑lactation cows: around 1.6 FE.
  • Low group: 1.2–1.3 FE.
  • One‑group TMR herd: about 1.5 FE.
  • Whole herd below 1.3 FE is generally a “look‑out” level — something in the system is dragging.

Tables from university and industry sources that relate milk yield to feed efficiency show the same pattern: as milk moves from the mid‑20s into the 30s and 40s (kg), FE typically rises into the mid‑1.4s and beyond. So a high group giving 32 kg at 1.3 FE is behaving more like a low group, at least on paper.

That’s where our composite Midwest dairy found itself: buying an extra 1.8 kg of dry matter per cow per day for milk that the ration should have been able to support without it.

The first 30‑day job on that farm was straightforward and a bit uncomfortable:

  • Pull a week of pen‑level milk and convert to 3.5% FCM.
  • Weigh actual DMI, refusals included.
  • Write the feed‑efficiency number on the whiteboard in every pen.
  • Stop calling “fine” good if the high group started with 1.3.

If you did the same thing on your farm this week, what number would you be staring at?

The NASEM Shift: Why Feeding to 2001 Costs You in 2026

Plenty of solid rations in North America were built around NRC 2001 assumptions and then tuned over time. In late 2021, the National Academies released the updated “Nutrient Requirements of Dairy Cattle” — often referred to as NASEM 2021 — with new equations for intakes, energy, protein, and minerals.

The new volume runs 482 pages and introduces an updated model that many nutritionists now use to compare rations with current research. The ingredients in this Midwest ration didn’t change. The math underneath them did.

On dry matter intake for a 680‑kg Holstein, the 2021 model makes three big changes relative to the old 2001 book:

  • Predicted DMI for high‑producing cows is about 2 kg lower.
  • Predicted DMI for low‑producing cows is about 1 kg higher.
  • The reduced DMI “penalty” in early lactation shrinks from roughly 90 days to 31 days

Example guideline tables for a 680‑kg Holstein show how the targets move:

Stage2001 DMI (kg)2021 DMI (kg)2001 Milk (kg)2021 Milk (kg)
Far‑off dry14.013.9
Close‑up dry10.012.3
Fresh (≈21 d)15.020.83533
Early lactation30.028.05555
Mid lactation24.027.43543
Late lactation20.020.02525

When a typical high‑cow ration (corn silage, haylage, shelled corn, cottonseed, soybean meal, by‑products) is run through both models for a 700‑kg Holstein, the comparison often looks something like this:

ItemNRC 2001NASEM 2021
DMI (kg)30.028.5
Net energy (Mcal/kg)1.661.81
Energy‑allowed milk (kg)48.554.8

The newer model doesn’t create energy out of thin air — it changes how it discounts the energy you already bought.

In particular, the 2021 equations:

  • Discount energy based on percent of body weight, not just multiples of maintenance.
  • Explicitly subtract energy lost as methane, calculated from digestible NDF.
  • Include the energy cost of excreting excess nitrogen, at about 14.3 Kcal per gram of nitrogen

For our composite Midwest dairy, plugging the existing ration into the 2021 model was a wake‑up call. The model said the energy density was there to support the current milk on slightly lower DMI. Their high group was still eating 24.5 kg and stuck at 1.3 FE. In other words, they weren’t just feeding cows. They were feeding the gap between 2001 and 2021.

Bunk Management: Where Energy Walks Out the Back of the Cow

When the numbers don’t match, you don’t start with a new product. You start at the bunk.

The 2021 model treats starch as a separate nutrient and assumes a default digestibility of around 91%, replacing older NFC groupings with residual organic matter (ROM). That matters when you look at how your corn is processed, not just what the lab sheet says.

Example comparisons of shelled corn forms show the impact on digestible energy:

Feed ingredientDigestible energy (Mcal/kg)Starch (%)
Shelled corn, coarse grind3.0170.4
Shelled corn, medium grind3.4670.4
Shelled corn, fine grind3.5570.4
High‑moisture corn (28% DM)3.7070.9

Same starch. More usable energy. A kilo of fine‑ground corn carries roughly 18% more digestible energy than coarse‑ground, with high‑moisture corn a bit higher again.

On this composite farm, the bunk and manure told a familiar story:

  • Half- and whole-kernel seeds are sitting in the top pan of the shaker box.
  • Shiny, intact corn pieces in manure.
  • Extra forage pushed into the ration when corn got expensive, in the name of “protecting the rumen.” 

To stop guessing, they set their numbers against a commonly used forage‑NDF/starch guide for high‑producing Holsteins:

Minimum forage NDF (%)Minimum total NDF (%)Maximum starch (%)
192530
182728
172926
163124
153322

Drop forage NDF because drought hammered corn silage or hay is pricey, and you can’t keep starch high without flirting with sub‑acute rumen acidosis. Practical levers many nutritionists use:

  • If forage NDF has to come down, either add by‑product NDF (soy hulls, corn gluten feed, citrus pulp, beet pulp) or pull starch back.
  • If chop length is shorter and starch is “fast,” raise your forage‑NDF minimum.
  • Buffers and higher DMI give some room to lower forage NDF, but not limitless room to do so.
  • If cows slug‑feed in robots or parlours, or you’re overcrowded at the bunk, you need more forage NDF, not less. 

On this composite Midwest dairy, the bunk‑side to‑do list looked like this:

  • Tighten corn processing so the energy you’re paying for doesn’t show up in the lagoon.
  • Bring in targeted by‑product NDF to support rumen fill and chewing.
  • Trim ration starch a couple of points once corn is actually disappearing, not decorating manure.
  • Fix overcrowding so cows aren’t slug‑feeding and sorting.

The aim was simple: move feed efficiency from 1.3 toward 1.4+ without exploding lameness, cows off feed, or vet bills.

Are You Buying Supplements — or Making Donations?

Once starch and NDF were under control, the next question was what all those fat and amino‑acid products were actually doing.

Modern ration models, including NASEM 2021, track fatty acids in more detail and group lipids into multiple categories with different digestibilities; basal oils from feeds like corn and corn silage are often modeled at around 70–75% digestibility. The model also reflects what recent research has shown: fat doesn’t generate methane, and polyunsaturated fatty acids (PUFAs) can reduce methane from other nutrients. And unlike older approaches, added fat isn’t automatically hit with a DMI penalty in the equations, especially in early lactation.

On paper, that makes it tempting to think rumen‑protected fats and amino acids are always a good buy. The economics don’t always cooperate.

A typical on‑farm example for inert fat looks like this:

  • 0.30 kg of an inert fat product costs about $0.54 per cow per day.
  • The milk and milk‑fat response brings back about $0.37 per cow per day.
  • Net: roughly −$0.17 per cow per day.

Working guidelines used in many high‑cow programs:

  • Raw or extruded soybeans: up to 1 kg/cow/day.
  • Roasted/cracked soybeans: up to 2 kg/cow/day.
  • Fuzzy cottonseed: up to 2 kg/cow/day.
  • Distillers grains: about 2 kg/cow/day.
  • Keep PUFAs under about 500 g/cow/day and RUFAs around 700 g/cow/day

On the protein side, the 2021 model predicts milk protein from a set of key amino acids and generally points toward RDP around 10% of dry matter as an efficient target, with caution about going much past 12%. Fresh‑cow programs aiming at around 17.5% crude protein with roughly 10% RDP and 7.5% RUP, while holding milk urea nitrogen (MUN) between 8 and 10 mg/dL, are common in both research and field practice.

For our composite Midwest herd, that turned into a very blunt filter:

  • Rumen‑protected methionine or lysine stayed in only if the model clearly showed those amino acids as limiting, and the milk cheque actually rewarded more protein.
  • DDGS were capped near 2 kg/cow/day to stay inside fat and amino‑acid guardrails.
  • Inert fat for fresh cows was judged by its impact on feed efficiency, ketosis, and pregnancy, not just by model output or fat test results.

If a product costs $0.54 and your numbers say it only brings back $0.37, it’s not acting like a supplement — it’s a donation to your input costs. If it can’t pay for itself on your component schedule within 60–90 days, it probably belongs in the “nice idea, wrong economics” pile.

Supplement TypeTypical Cost/Cow/DayTypical Return/Cow/DayNet ROIVerdict
Inert bypass fat (0.30 kg)$0.54$0.37$-0.17❌ Donation
Rumen-protected Met (justified by model)$0.18–$0.22$0.25–$0.40+$0.05 to +$0.18✅ Keep if model confirms limitation
Raw/extruded soybeans (≤1 kg/d)$0.15–$0.22$0.20–$0.30+$0.05 to +$0.10✅ Efficient fat + protein source
DDGS (>2 kg/d cap exceeded)$0.10–$0.14Diminishing return above cap$0.00 to -$0.08⚠️ Cap at 2 kg; beyond that, fat/AA guardrails break
Fuzzy cottonseed (≤2 kg/d)$0.18–$0.25$0.22–$0.32+$0.04 to +$0.08✅ When fat budget allows
Buffer/NDF support (soy hulls, beet pulp)$0.08–$0.12Indirect: fewer health events, steadier DMIPositive when FE improves ≥0.05✅ Structural, not optional

The Blind Spot: Water, Minerals, and What the Model Can’t See

Water ContaminantSafe LevelWatch Level⚠️ Action LevelDairy Impact
Iron (Fe)<0.3 mg/L0.3–1.0 mg/L>1.0 mg/LBlocks copper & zinc absorption; off-taste reduces intake
Manganese (Mn)<0.05 mg/L0.05–0.2 mg/L>0.2 mg/LDepresses intake; competes with copper
Sulfate (SO₄)<500 mg/L500–1,000 mg/L>1,000 mg/LReduces milk fat; elevates Se/Vit E/Cu requirements
Molybdenum (Mo)<0.5 mg/L0.5–2.0 mg/L>2.0 mg/LSeverely blocks copper; can cause scours in high-forage herds
Total Dissolved Solids<1,000 mg/L1,000–3,000 mg/L>3,000 mg/LReduced palatability; lower voluntary water intake
Nitrate-N<10 mg/L10–20 mg/L>20 mg/LInterferes with oxygen transport; heat stress magnifies risk

The last place this farm looked was the one even the best ration model can’t see: water.

NASEM 2021 updates macro‑minerals by basing them on absorbed amounts, using absorption coefficients for most elements except sulfur, iodine, and a few others. Common guideline tables for lactating Holsteins look like this:

MineralNASEM 2021 (%)NRC 2001 (%)Extension guideline (%)
Calcium0.640.600.70
Phosphorus0.390.380.38
Magnesium0.180.210.30
Sodium0.230.220.40
Potassium1.101.071.20
Chloride0.200.290.30
Sulfur0.200.200.25

Because the model doesn’t set explicit DCAD targets for heat stress, many field programs push heat‑stress rations toward about 1.6% potassium and 0.5% sodium of dry matter for high‑producing cows.

Trace‑mineral recommendations for lactating cows typically include: cobalt 0.2 ppm, copper 10 ppm, iodine 0.4–0.5 ppm, iron 20–25 ppm, manganese 30–35 ppm, selenium 0.30 ppm (regulatory cap), and zinc 60–70 ppm. But the model has big blind spots:

  • It doesn’t account for antagonists such as ironsulfur, or molybdenum from water.
  • It doesn’t assign absorption advantages to organic trace minerals.
  • It doesn’t address chromium directly, even though research suggests potential milk and health benefits in some situations.

That’s where water quality steps in. Penn State Extension’s 2024 guidance flags iron and manganese as the most common water‑related culprits for reduced intake and milk production in Pennsylvania herds, with iron levels above 0.3 mg/L and manganese above 0.05 mg/L enough to create off‑tastes that cut intake and production. Elevated sulfatelevels (over 500–1,000 mg/L) have been linked to reduced milk fat and increased requirements for selenium, vitamin E, and copper.

For our composite Midwest dairy, that turned into one more lab report on the kitchen table: a full water test, not just a quick strip check. With actual iron, sulfur, manganese, and molybdenum numbers in hand, they could decide whether to push trace‑mineral levels, change mineral forms, treat water, or leave a program that’s working alone.

If you’ve never put your water report beside your mineral tag and ration printout, you’re asking a model to solve a problem it literally can’t see.

What This Means for Your Operation

  • In the next 30 days, calculate feed efficiency by pen. Pull a week of data, convert milk to 3.5% FCM, weigh actual DMI (refusals included), and divide. If your mature‑cow high group is under about 1.7 FE, your first‑lactation high group under 1.6, or your one‑group herd under 1.5, you’re likely feeding into the same 1.3‑level leak this composite herd showed — especially when the only DMC payment in 2025 came at a margin of $9.42/cwt on $9.58/cwt feed costs. 
  • Within 90 days, sit down with your nutritionist and run your current ration through NASEM 2021. Keep your cow weights and ingredients the same, and compare the old vs. 2021 assumptions for predicted DMI, energy density, and energy‑allowed milk. If the newer model says your ration should carry the same milk on less DMI, that gap is the target for bunk management, grouping, and NDF/starch corrections — not an excuse to pour on more grain. 
  • Audit starch and forage NDF at the bunk, not just in the lab report. Use a shaker box and manure checks to see how much corn you’re dragging through cows. Then line your forage NDF, total NDF, and starch up against a forage‑NDF/starch reference, and adjust with chop length, by‑product NDF, buffers, feeding frequency, and bunk space so you’re not “protecting” cows into low‑group feed efficiency. 
  • Run every fat and amino‑acid product through a simple ROI screen using your own milk cheque. Take the inert fat example — $0.54/cow/day in vs $0.37/cow/day back out, net −$0.17 — as a template. Check that RDP is around 10% of dry matterMUN sits between 8 and 10 mg/dL, and the model shows a genuine amino‑acid limitation before you let those products live in your fresh‑cow ration. 
  • Order a full water test and put it beside your mineral program. If you don’t know your ironmanganese,sulfate, and molybdenum levels, you’re flying blind on trace‑mineral absorption. Compare that report to the ranges in your ration and premix; decide if the bottleneck is actually in the trough, not in the bag. 
  • Over the next year, make feed efficiency part of how you judge every “safety net.” The 1.3→1.4 example — 1.8 kg DMI saved, about $0.59/cow/day, or $64,000/year for 300 cows — shows how much margin sits inside your own feed pad before any government program cuts a cheque. When you look at Dairy Margin Coverage or similar tools, treat feed efficiency as the lever that decides how much of that national margin actually ends up in your bank account. 

Key Takeaways

  • If your high group sits around 1.3 feed efficiency at roughly 30–32 kg of 3.5% fat‑corrected milk, you’re almost certainly feeding about 1.8 kg of dry matter per cow per day that isn’t needed to hold that milk, worth around $0.50–$0.60 per cow per day at a $0.33/kg DM cost. 
  • If your ration is still mentally anchored to 2001‑era assumptions, the updated NASEM 2021 model suggests you may be able to hold or increase milk on less DMI by tightening energy density, fixing corn processing, and getting forage NDF and starch back into a safe but efficient zone — instead of throwing more dry matter and hoping the bunk cleans up. 
  • If your market doesn’t pay rich protein premiums, you still need about 10% RDPMUN between 8 and 10 mg/dL, and DDGS capped near 2 kg per cow per day, but you don’t have to assume every rumen‑protected amino acid or inert fat is money in the bank just because a model tags an amino acid as “limiting.” 
  • If you’ve never set a current water analysis beside your mineral tag and ration printout, you’re leaving a big blind spot in an otherwise tight mineral plan — high iron or sulfate in water can quietly undo a lot of careful copper, zinc, and selenium work and quietly drag down intake and milk. 

The Bottom Line

This Midwest dairy composite isn’t a fairy tale or a horror story. It’s what happens when a “fine” 1.3‑FE ration gets forced through 2021‑era math, December 2025’s DMC margin and a couple of blunt bunk‑side conversations. When you run your own feed‑efficiency, starch, NDF, protein, and water numbers over the next month, do they say you’re getting paid for the dry matter you’re buying — or that your high group is quietly eating like a low group?

Complete references and supporting documentation are available upon request by contacting the editorial team at editor@thebullvine.com.

Learn More

The Sunday Read Dairy Professionals Don’t Skip.

Every week, thousands of producers, breeders, and industry insiders open Bullvine Weekly for genetics insights, market shifts, and profit strategies they won’t find anywhere else. One email. Five minutes. Smarter decisions all week.
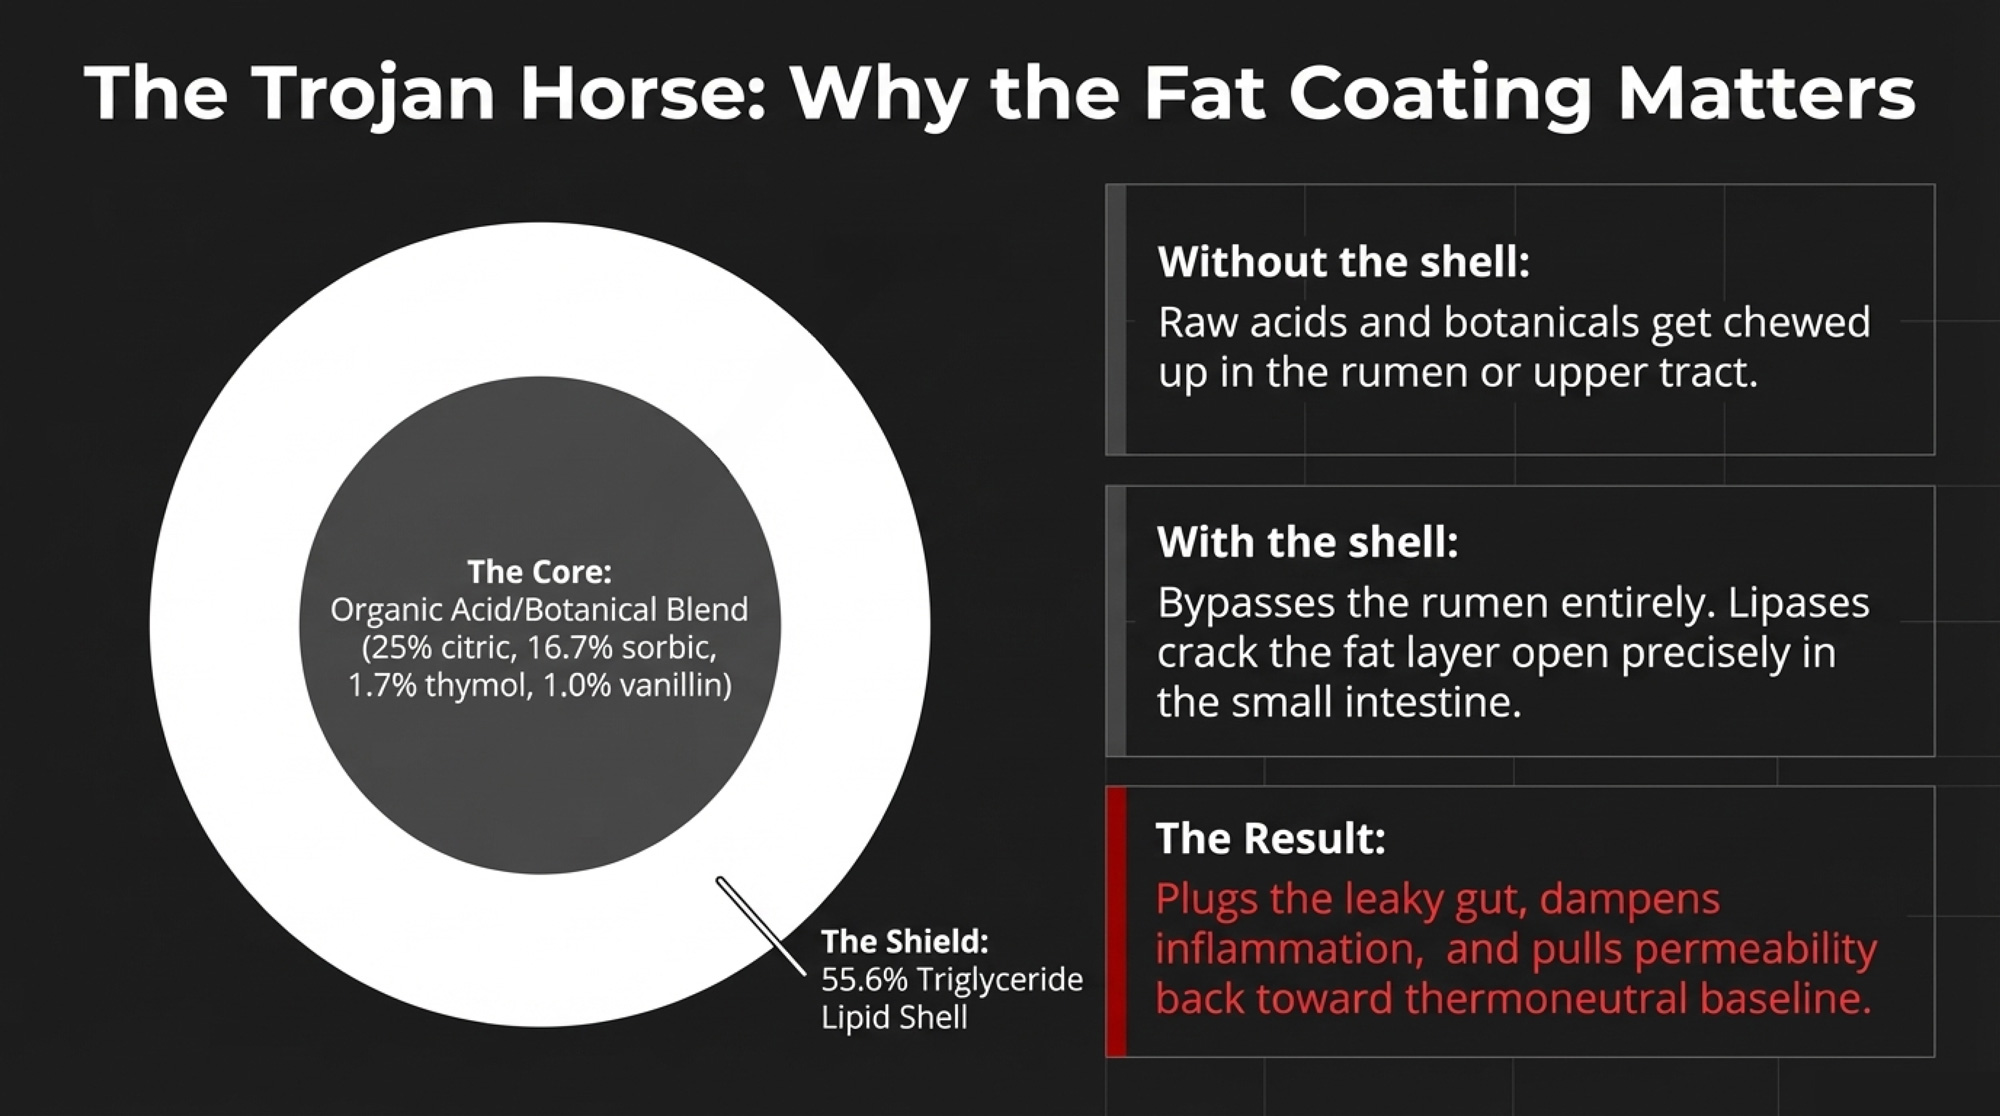
NewsSubscribe
First
Last
Consent

$190 Per Cow: The SGMA Water Cost Trap Forcing Tulare and Kings County Dairies to Stay, Convert, or Move

Stay and pay $190/cow in SGMA fees. Move to Idaho and gamble on processing capacity. Convert to solar and lose those feed acres for 30 years. Pick.

Executive Summary: SGMA has turned groundwater from “free” into a $190–$230 per‑cow, per‑year bill for some Tulare and Kings County dairies once fees and deep‑well costs stack up. Bulletin 118 just confirmed California still has over a billion acre‑feet of groundwater in storage, so the real squeeze is price, not physical shortage. Between Tulare Lake probation fees, Mid‑Kings proposals up to $95/AF, and $500/AF overuse penalties, a 3,000‑cow herd pumping 6,000 AF can see water alone chew through $190/cow before power or feed shifts. Subsidence is forcing faster well turnover, and a single $600K–$700K deep well adds another $40–$47/cow/year when you spread it over 15 years. That level of water cost pushes you toward three paths: stay and absorb SGMA as a formal input cost, convert weaker acres to solar/recharge and buy more feed, or plan a move to cheaper‑water states where processing capacity and contract security are far from guaranteed. The article walks through barn‑math examples, stress‑tests at $80/$120/$150 per AF, and shows where the “$100–$120/cow” danger band starts to threaten debt coverage. If you don’t know your true water $/cow and how it trends under your GSA’s 5‑ to 10‑year plan, you’re already behind the dairies treating SGMA as a capital decision instead of another weather year.

SGMA water costs

For decades, the Central Valley’s competitive advantage was built on “free” groundwater and sunshine. In 2026, the sunshine’s still free — but water just became the most expensive input on your P&L. If you aren’t accounting for the SGMA “tax,” your genetics aren’t the only thing that’s underwater.

The water under California’s southern San Joaquin Valley dairies didn’t disappear. It just got an invoice, and the numbers are big enough to break the wrong business model.

Aaron Fukuda manages the Kaweah Subbasin Groundwater Sustainability Agency in the heart of Tulare County dairy country. In 2024, SGMA pumping costs in his district jumped from roughly $32 per acre to as high as $140, backed by a $5.8 million annual mitigation program that Kaweah partners signed with Self‑Help Enterprises to keep domestic wells functioning as the water table dropped — all of it funded by pumping fees.

For the 1,500‑ to 5,000‑cow dairies sitting on this ground, that fee trajectory isn’t background noise. It’s a line item marching straight at whatever margin you’ve got left.

Here’s the part a lot of people still miss: the aquifer isn’t empty. Released just eleven days ago, on March 12, 2026,California’s Department of Water Resources published California’s Groundwater: Bulletin 118 – Update 2025, calling it the state’s most comprehensive groundwater assessment to date. That report estimates that California’s groundwater basins hold more than 1 billion acre‑feet of storage capacity — roughly 25 times the combined capacity of all surface reservoirs — and that groundwater supplies about 40% of statewide water in average years and 60% in drought years. SGMA isn’t about rationing the last drops. It’s about putting a hard price tag on a resource that used to feel free.

Is SGMA a Water Shortage — or a Water Cost Problem for California Dairies?

A lot of Western producers still treat SGMA like another drought: a physical shortage you solve by drilling deeper, chasing a new well, or squeezing more out of the same acres. That worked when groundwater was effectively unpriced.

SGMA changes the game. It turns groundwater from an open‑ended common pool into a metered, allocated, and increasingly expensive input. The 2040 sustainability deadline is set by law, and Bulletin 118 Update 2025 was released this month to update the map showing where each basin actually stands. GSA implementation budgets are now landing on pumpers. What you’ll pay depends heavily on which subbasin you sit in and how overdrafted your neighborhood has been for the last 50 years.

Fukuda’s Kaweah Subbasin is one early warning sign. Just west, the State Water Resources Control Board put the Tulare Lake Subbasin on probation in April 2024, triggering a $20‑per‑acre‑foot state fee on extractions plus a $300‑per‑well annual registration fee and 25% late charges. In Southwest Kings GSA, directors voted in early 2026 to set allocations at just 0.66 acre‑feet per acre and impose fines of $500 per acre‑foot for pumping above that allotment, with penalties kicking in on October 1. Over in the Mid‑Kings River GSA, a 2024 proposal summarized in local farm‑bureau reporting would charge shallow A and B aquifer pumpers up to $95 per acre‑foot, with overuse penalties as high as $500 per acre‑foot.

Subbasin / GSAStatus (2026)Base FeeOveruse PenaltyAllocation (AF/Acre)Risk Level
Kaweah (Fukuda GSA)Active / Monitoring$32–$140/AFpumping feeNot yet publishedNot yet set🔴 High — rapid escalation
Tulare LakeProbation (Apr 2024)$20/AF state fee + $300/well/yr$20/AF + 25% late chargeUnder probation review🔴 Critical
Southwest KingsActive enforcementAllocation-based$500/AF overuse0.66 AF/Acre🔴 High — tightest allocation
Mid-Kings RiverProposal stage (2024)Up to $95/AF (A/B zone)$500/AF overuseTBD🔴 High — highest base fee
Pixley / Lower TuleActive / Subsidence riskModerate pumping feesModerateTBD🟡 Moderate — subsidence concern
East Kaweah / Foothill zonesLower overdraft historyLow–moderateLowHigher (less overdrafted)🟢 Lower relative risk

Ag media coverage and Self‑Help’s Kaweah case study both describe farms already scrambling to find balance under SGMA — changing crop mixes, investing in recharge, and absorbing higher water costs to keep domestic and ag wells functioning. If you’re running a large dairy in Tulare or Kings, the question isn’t whether your water cost is going up. It’s how fast — and whether your per‑cow margin can take the punch.

What Does $190 Per Cow in SGMA Water Costs Actually Mean for Your Dairy?

Let’s put real numbers to it. Swap in your own volumes and herd size, but the shape of the math won’t change much.

Take a 3,000‑cow drylot dairy in Tulare County:

  • Barn/parlor/cooling water: roughly 300–400 acre‑feet per year (based on regional water‑use benchmarks for large dairies).
  • Feed acres: say 1,200–1,800 acres of alfalfa and silage corn under irrigation.
  • Applied water rate: around 4 acre‑feet per acre — a common figure for Central Valley forage under surface and groundwater irrigation, per PPIC’s San Joaquin Valley work.

That’s 4,800–7,200 AF just for crops. Add barn water, and you’re looking at 5,000–7,500 AF per year. Use 6,000 AF as a working example.

Now layer on the fee stack.

The Fee Stack on 6,000 Acre‑Feet (3,000 Cows)

Fee scenarioRateAnnual cost on 6,000 AFPer‑cow cost (3,000 cows)
State probation fee (Tulare Lake, 2024)$20/AF$120,000~$40
GSA pumping fee (large‑pumper tier — illustrative)$40/AF$240,000~$80
Mid‑Kings A/B zone fee (proposal, 2024)up to $95/AF$570,000~$190
Southwest Kings / Mid‑Kings overuse penalty$500/AFDepends on overage

The $190‑per‑cow figure isn’t a scare tactic. It’s what Mid‑Kings’ own “up to $95/AF” fee pencils out to when you apply it to 6,000 AF of pumping and divide across 3,000 cows. The $20/AF Tulare Lake probation fee is just the base layer. At $500/AF in overuse penalties, even a 300 AF overage adds $150,000 to your water bill — another $50 per cow on 3,000 head.

And none of that touches pump energy, well repairs, or the feed‑side hit when allocations force you to fallow acres and buy replacement tons in a tight market. If allocations drop 20% and you idle 80–100 feed acres, you’re clawing back that tonnage on the open market in the same years every other SGMA‑hit dairy is chasing forage.

What Subsidence Really Costs Your Wells

While fees work from the top down, subsidence is chewing at you from below.

Lower Tule River Irrigation District’s “Subsidence 101” lays it out: parts of the Tule Subbasin have seen up to about 20 feet of cumulative subsidence between 1949 and 2005, with more recent InSAR and GPS data showing as much as 5 additional feet of land‑surface decline since 2015 in sections of Tule and neighboring Pixley. USGS and DWR maps confirm ongoing inches‑per‑year sinking in slices of Tulare and Kern counties, even after wet winters.

Subsidence doesn’t just bend canals. It shortens the life of your wells.

Residential well‑cost tools put basic domestic wells in Tulare County in the $3,750–$15,300 range. But commercial dairy wells are bigger, deeper, and far more complex. California farm and land‑use guidance shows that large, deep, high‑capacity ag wells can run into the hundreds of thousands of dollars, with high‑yield projects pushing toward the $600,000–$700,000+ range once drilling, casing, screens, and development are included.

Hidden cost check:
A single $600,000–$700,000 deep production well, amortized over 15 years on a 1,000‑cow herd, adds roughly $40–$47 per cow per year to your true water price — before you pay a cent in SGMA fees or power.

If subsidence damage forces you to turn wells over every 10–12 years instead of 20–25, those per‑cow numbers climb even higher.

Stack it on top of the fee math. In a high‑fee basin like Mid‑Kings or Southwest Kings, a dairy could be looking at roughly $190/cow in SGMA‑related pumping fees plus $40–$47/cow in deep‑well amortization. You’re quickly north of $230 per cow per year to keep water coming out of the pipe.

USDA ERS “Milk Cost of Production” data and recent economic reviews point to Western dairies juggling some of the highest feed, labor, and overhead burdens in the US, with relatively thin net margins once full costs are booked. When water alone is eating $200‑plus per head, it’s no longer a small line item — it’s the kind of cost that forces you to re‑run whether your current structure still competes in your region.

The Competitive Cliff: When California Efficiency Meets Idaho’s Water Bill

Some Tulare County dairies have already started shifting acreage out of feed production — moving ground into recharge basins, solar installations, and methane digester projects that Central Valley media profiled in recent years. Public reporting doesn’t track every acre, but in the examples The Bullvine has reviewed, conversions in the 15–20% range tend to start with the weakest water‑return parcels. On the surface, it looks like farming less. On the spreadsheet, it reads as capital reallocated to assets that can survive a $100‑plus/AF world.

These operations are also moving away from the question most people still default to: “Do we have enough water to keep farming here?”

In most of these basins, the answer is still “yes, at some price” — at least for the next decade or two, according to DWR and PPIC modeling. Comforting enough to push the hard decision off another year. The sharper question is this: At what water price does your cost structure stop competing — not just with the neighbor who already right‑sized, but with Idaho and Texas operators who don’t carry SGMA overhead at all?

Recent coverage from the Idaho Farm Bureau, drawing on USDA milk production data, shows Idaho and Texas trading places for the No. 3 milk‑producing state in recent years, with Idaho’s output growing by just over 3% year‑over‑year and edging back ahead of Texas into third place. Idaho’s lower land and water costs have helped attract cows and processing investment, including sizeable powder and protein capacity expansions by regional players.

But here’s the steel‑in‑the‑ground reality: processing doesn’t move as fast as cows. New or expanded dairy plants — from Idaho powder and whey facilities to large protein and yogurt projects across the US — typically take several years of capital planning, permitting, and construction before they can absorb additional milk. A dairy can, on paper, relocate in two to three years; a major new processing plant often takes closer to a decade from concept to full operation once you factor in siting, environmental review, construction, and commissioning.

On the California side, that cuts both ways. SGMA makes your water bill painful, but steel is already in the ground: cheese, powder, and high‑value fluid plants with established brands and export channels. If you’re sitting on a guaranteed, high‑value fluid or cheese contract that doesn’t exist yet in the basin you’re eyeing — or that would be much harder to secure there — paying $190/cow in SGMA‑driven water costs might still pencil out better than chasing cheap water into a shed where the co‑op can’t easily take all your milk.

FactorCentral Valley (Tulare/Kings)Magic Valley (Idaho)
Water Cost$190–$230/cow (High Fee)Minimal (Power + Surface Fees)
Regulatory StackHigh (SGMA + Air + Methane)Moderate
ProcessingOver-saturated but High CapacityTight (Limited by Steel in Ground)
LaborHigh Cost / High AvailabilityLower Cost / Lower Availability

So the competitive cliff isn’t just “California vs Idaho water price.” It’s:

  • Your all‑in water and infrastructure cost per cow,
  • Plus your basis for local processing and the security of your offtake contracts,
  • Minus the real cost and risk of betting your next decade on a market where processing capacity and co‑op intake rules are still being built. 
Decision FactorStay & AbsorbPartial ConversionRelocate (Idaho/Texas)
Water Cost/Cow/Yr$190–$230 (and rising)$130–$170 (reduced acres)Minimal (~$15–$30 power only)
Capital RequiredDeep well: $600K–$700KSolar dev: $0 upfront (lease)New barn build: $2,000–$3,000/cow
Processing Security✅ High — steel in ground✅ High — no location change⚠️ RED FLAG: Intake not guaranteed
Feed Cost ExposureModerate⚠️ Rises when acres fallowedLow (local forage typically cheaper)
SGMA Timeline RiskHigh — fee curve uncontrolledModerate — reduces pumping exposureEliminated
30-Year Lock-in RiskNone⚠️ Solar lease = 20–30 yrsModerate (new infrastructure)
Herd Value on ExitDeclines if delayedStableStrong if timed well
Best Fit ForHigh-value contract holdersMid-size operators with marginal acresLarge operators with co-op flexibility

The Partial Conversion Play — and Where It Breaks

Packing up the whole herd and heading to Idaho or Texas isn’t in the cards for everyone. For many outfits, the first real move is a partial conversion of the weakest ground.

Many large California dairies are already net feed buyers. A 3,000‑cow herd farming 600 acres might grow roughly 4,650–4,950 tons of dry matter at 7.75–8.25 tons DM per acre — often only 13–15% of total herd needs once you factor in purchased hay, silage, and byproducts. Cut 120 acres — the lowest‑yield, highest‑water parcels —, and you might lose 900–1,000 tons of home‑grown DM. That’s around 2.5–3% of total herd requirements.

If replacement forage runs about $55/ton DM (a conservative figure in recent California forage markets), that’s roughly $55,000 per year in new purchased‑feed cost.

Now flip the ledger using PPIC’s January 2024 “Solar Energy and Groundwater in the San Joaquin Valley” analysis:

  • Solar lease income: PPIC reports that stakeholders cite annual rents of roughly $1,000–$1,500 per acre for suitable valley sites, totaling $120,000–$180,000 per year on 120 acres.
  • Avoided input costs: water, fertilizer, fuel, seed, labor — conservatively $400/acre, or $48,000 saved.
  • Potential water credits: Some pilot following/recharge programs have tested incentive levels in the $100–$200 per acre‑foot range in parts of the valley. If your GSA offers similar terms and you save 480 AF (120 acres × 4 AF), that’s $48,000–$96,000 in incentive income. Not guaranteed — but worth checking with your basin.

Conservative version (solar + input savings, no water credits):

  • Income: $120,000–$180,000 in lease + $48,000 avoided inputs = $168,000–$228,000.
  • Extra feed cost: about $55,000.
  • Net swing: roughly $113,000–$173,000, or about $38–$58 per cow per year on 3,000 cows.

If real water‑credit programs in your basin pay toward the higher end, your net could push closer to $60–$80 per cow. In some setups, that nearly offsets the SGMA fee curve on the water you still pump.

But this isn’t free money:

  • A 20‑ to 30‑year solar lease means those acres are effectively gone from your forage toolbox for a generation.
  • You gain SGMA breathing room but give up the option to swing those acres back into feed if policy or markets change.
  • The years when your water allocation is tightest are the same years when replacement feed is most expensive — hay, silage, and byproducts all tighten together.

If you’re not lining up forward contracts or at least defined sourcing plans for that 900–1,000 tons of DM, you’re trading water risk for feed‑price volatility. Sometimes that’s still the right trade. But it’s not a simple one.

Your SGMA Water Cost Playbook: What to Do Before Summer 2026

In the Next 30 Days

  • Call your GSA and get your numbers. Ask for your current extraction account balance and projected allocation schedule through at least 2030. That turns SGMA from a policy headline into a cost curve with your name on it.
  • Send that schedule to your lender and accountant. Attach a single line: “I want to understand how this changes our cost structure and collateral position over the next five years.” You want your lender to consider water a capital constraint before the next renewal, not after.
  • Run your water‑per‑cow check. Add up the last 12 months of water‑related spending — GSA fees, state probation fees, pump power, well service, SGMA penalties, replacement feed on fallowed ground. Divide by the average head count. That’s your current water cost per cow/year.

If your lender can’t yet explain how they’re pricing SGMA risk into your loan, that’s not a reason to relax. It’s your reminder to start the conversation.

In the Next 90 Days

  • Break water out as its own budget line. Pull it out from “repairs” and “utilities.” Track: (1) GSA fees, (2) state SGMA probation fees, (3) power for pumping, (4) well service and repairs, (5) replacement feed tied to the fallowing. Until it has its own line, you can’t manage it.
  • Rank your acres by return per acre‑foot. Simple buckets — strong, middle, marginal — based on yield and gross margin per AF. Your marginal bucket becomes your candidate pool for solar, recharge, or sale.
  • Get real solar lease indications, not coffee‑shop numbers. Ask developers about term length, annual rate, escalator, who pays for decommissioning, and how interconnection timelines look in your area. Proximity to transmission and substation capacity can kill an otherwise good lease.

Policy on the Williamson Act, solar on farmland, and SGMA compliance is still moving forward. If rules shift to make it easier to convert non‑viable irrigated acres, early movers often have more leverage to shape lease terms than the fifth guy to call.

In the Next 12 Months

  • Stress‑test your herd at three water prices: $80/AF, $120/AF, $150/AF. Use your actual pumping volumes. Translate each scenario into $/cow/year and into your debt‑service coverage ratio. Where does the math start to fail?
  • If you’re trending toward $100–$120 per cow per year in all‑in water cost on a 5‑ to 10‑year view, schedule a relocation feasibility meeting. Not a commitment. A meeting — you, your accountant, your lender, and someone who’s actually built barns in a lower‑cost state. Look at capital cost per cow, co‑op access, packer/processor options, cull values, and realistic timing. 
  • If you’re in the 800–1,500‑cow band on the hardest‑hit basins, run exit math now. Smaller herds have less scale to spread rising SGMA fees and deep‑well costs, and less collateral to support a full relocation. A deliberate, timed exit while herd values are still decent can beat a rushed sale after covenants are already under stress.

What This Means for Your Operation

  • Water is no longer a background condition. It’s an input with a unit cost. Until it sits on its own line on your P&L, you’re underestimating it.
  • Your water‑per‑cow number is now a key KPI. If you can’t write it down today, your first task isn’t to argue policy — it’s to pull your bills.
  • Partial conversion can free up roughly $38–$80 per cow per year in the right setup — but only if you lock in lease income, understand your basin’s incentive programs, and secure replacement feed before you sign a 20‑year solar deal.
  • Relocation is a spreadsheet question, not a moral one. If water alone is eating a third to half of your average‑year margin on a forward view, you owe it to your family and your lender to at least compare that picture to a different geography.
  • Processing steel matters as much as the price of water. Cheap water without committed plant capacity can strand your milk just as surely as expensive water under a rock‑solid, high‑value contract can keep your dairy viable. 
  • Your most important SGMA conversation this spring is with your lender. Bring real allocation schedules, a water‑per‑cow number, and a rough plan for your weakest acres — instead of waiting for the next appraisal to dictate the options.

Key Takeaways

  • If your all‑in water costs are trending toward $100–$120 per cow per year on a 5‑year projection, you’re in the range where this analysis says staying put without a plan starts to look like a high‑risk strategy. That threshold is the article’s working definition of the danger band — not a magic number, but a line worth testing against your own books.
  • SGMA’s real threat isn’t that California runs out of groundwater — it’s that you get priced out of using it. The state still has over a billion acre‑feet of storage capacity, per DWR’s Bulletin 118 Update 2025. The bill is what’s changing. 
  • Cutting 20% of your weakest feed ground can improve cash flow — but only if lease income, incentives, and replacement feed are nailed down ahead of time. Otherwise, you’re swapping one form of volatility for another.
  • Before you chase cheaper water out of state, put your current SGMA bill beside your contract security and local plant capacity. A painful $190‑per‑cow water line can still beat cheap water feeding into an oversupplied shed with shaky intake rules. 

The Bottom Line

The Tulare County dairies that shifted 20% of their ground out of feed production weren’t chasing a green label. The moves read as accounting choices — capital redirected into assets that can withstand SGMA pricing and subsidence, rather than assuming water costs will remain where they are today. Pull up your own last 12 months of water spending, divide by your herd size, and put that number beside your feed cost per cwt. If you don’t like the gap between those two lines, that’s your real SGMA deadline — and it’s already running.

Complete references and supporting documentation are available upon request by contacting the editorial team at editor@thebullvine.com.

Learn More

The Sunday Read Dairy Professionals Don’t Skip.

Every week, thousands of producers, breeders, and industry insiders open Bullvine Weekly for genetics insights, market shifts, and profit strategies they won’t find anywhere else. One email. Five minutes. Smarter decisions all week.
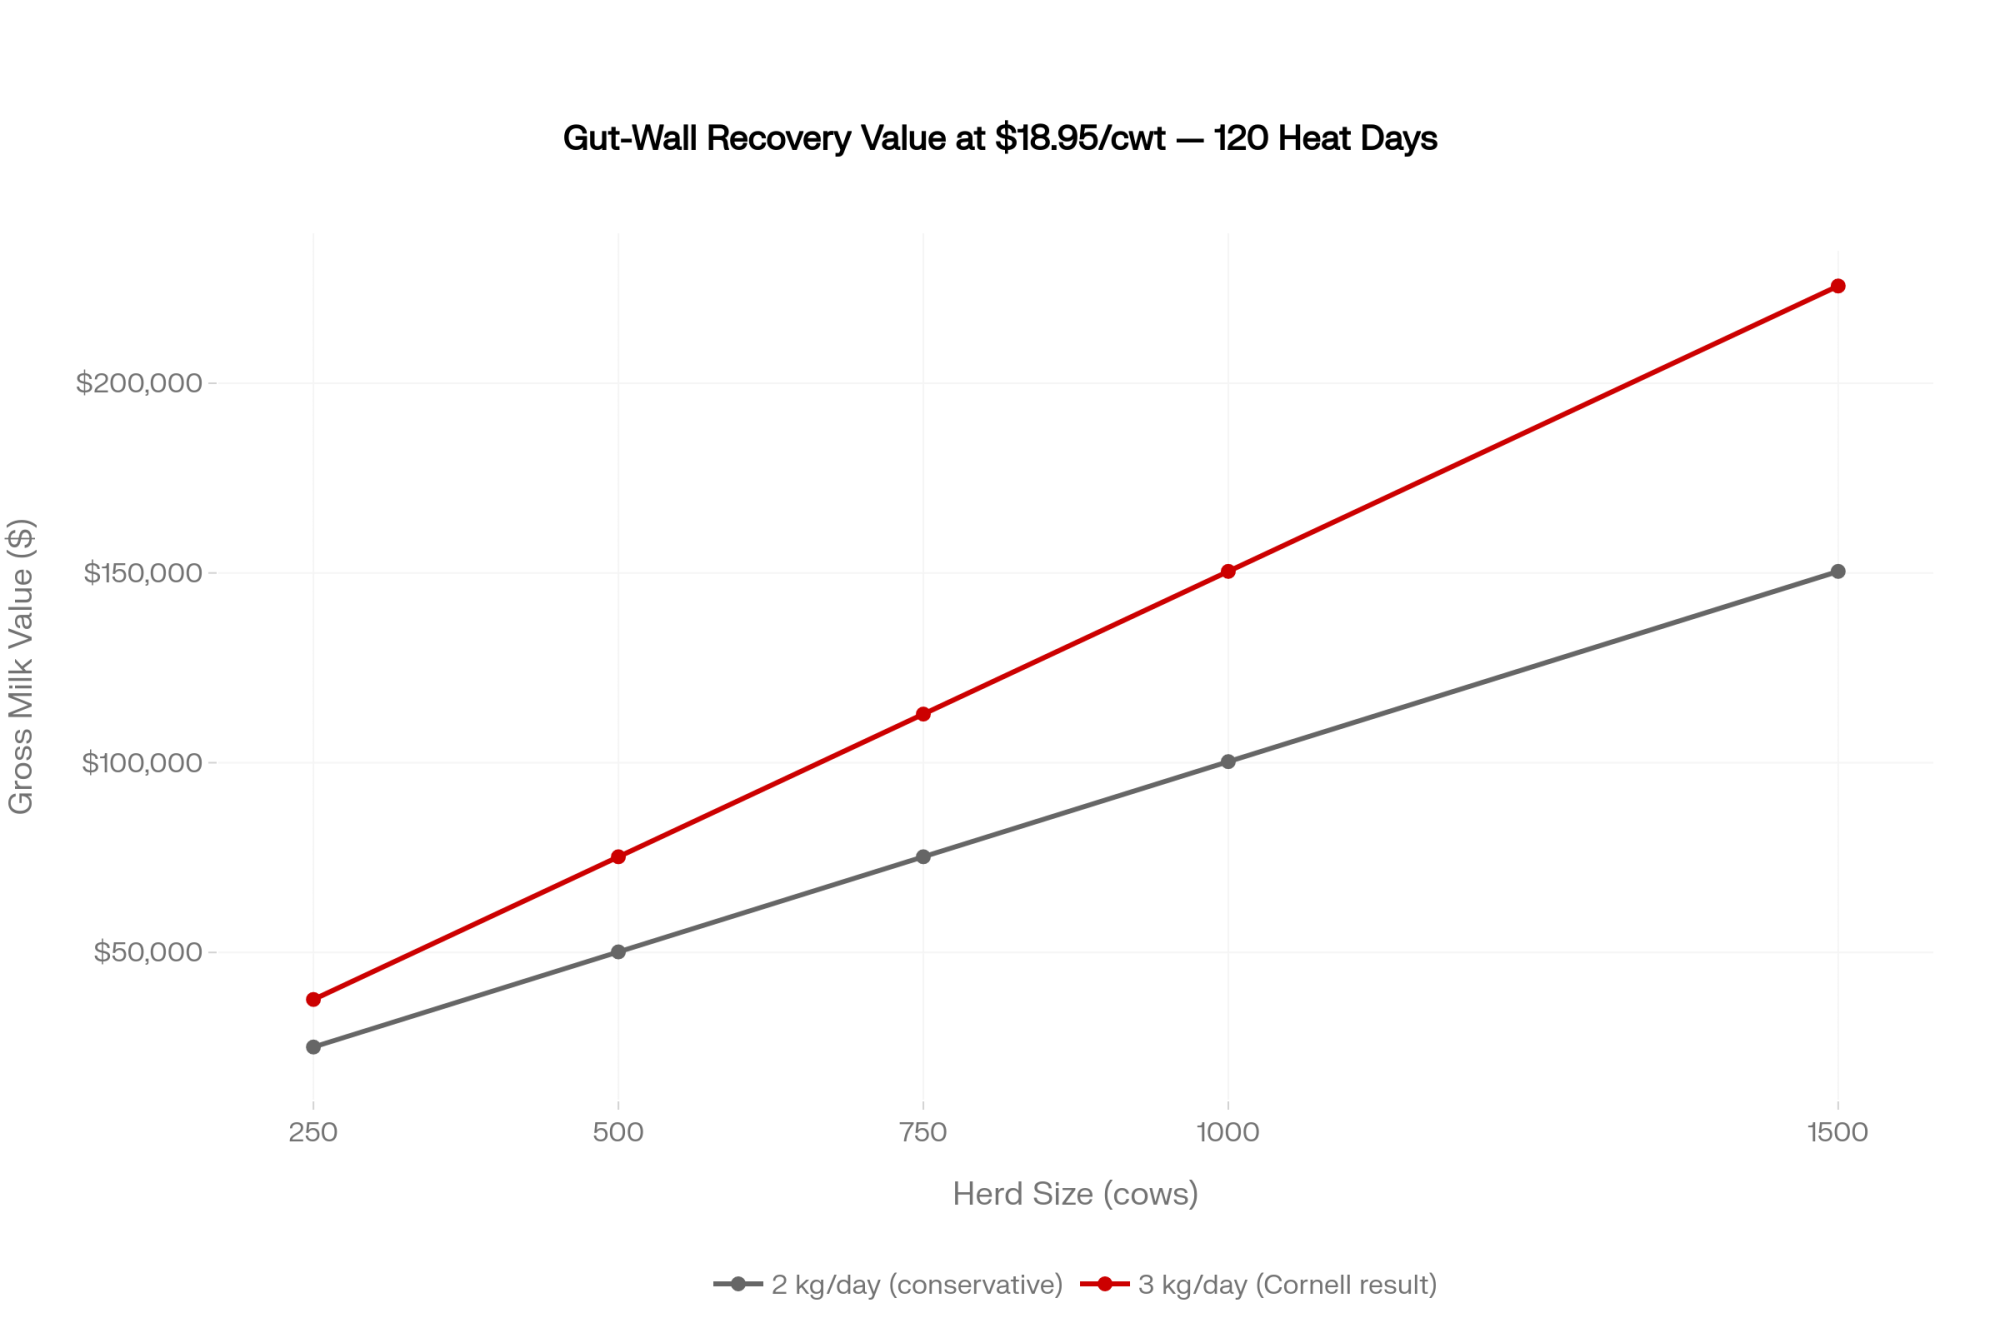
NewsSubscribe
First
Last
Consent

46% Subclinical Ketosis in ‘Good’ Herds – Are Your Transition Cows Any Different?

One herd guessed 4% ketosis. The meter said 40.7%. This is the story behind that gap—and how to find your real number before it costs you.

Executive Summary: Four high‑producing herds thought subclinical ketosis was a minor issue; whole‑herd BHBA testing showed an average 46% of fresh cows were ketotic, including one herd that guessed 4% and actually sat at 40.7%. That kind of hidden SCK rate quietly drives more metritis, fever, extra days open, culls, and lameness—even when cows “look fine” at the bunk. Using published cost estimates, a 300‑cow herd can easily be leaking around $34,800 a year to undetected SCK alone, before you price in extra DAs or foot problems. The article walks through what’s actually working in transition pens right now: realistic DCAD and calcium strategies, where NASEM 2021 sets the floor on MP and methionine, and what newer data say about rumen‑protected methionine, fatty acids, and choline. It also lays out practical guardrails on BCS loss, fat: protein ratios, NEFA, stocking density, and bunk space so you can read early‑lactation milk records like a health report, not just a production snapshot. The core challenge is simple: stop guessing at SCK and fresh‑cow energy balance and start measuring them with BHBA tests and a few key ratios. If you’re willing to run a 30‑day BHBA check and one clean pen trial with your nutritionist, this piece gives you the numbers and thresholds to decide whether your transition program is truly dialed in or looks that way.

The herd thought they knew their fresh cows. Good staff. Clean pens. A close‑up program that had been “working” for years. When the vet asked how many fresh cows were dealing with subclinical ketosis, the manager guessed around four percent. Maybe five on a bad month.

Then they pulled blood on every fresh cow between 3 and 16 DIM with a cow‑side BHBA meter.

The number wasn’t 4%. It was 40.7% — and when the researchers put that herd together with three other high‑producing herds in New York and Wisconsin, the true average was 46% subclinical ketosis, using a BHBA cut‑point of 1.2 mmol/L in early lactation. The cows were standing, eating, and milking. On the surface, they looked fine.

That’s the uncomfortable starting point for any honest conversation about transition cows in 2026. The risk isn’t just in “train wreck” fresh pens. It’s in the gap between what you think is happening and what a simple meter would show.

Three Transition Groups, Three Real Jobs

Most progressive herds now run some version of three transition groups: far‑off drys, close‑ups, and fresh cows. On paper, that sounds basic. In practice, how those three groups are fed, stocked, and managed is where profit gets made or lost.

Far‑off dry cows usually live on a controlled‑energy diet. Think straw or other lower‑energy forages to hold intake and energy down while keeping the rumen full and chewing. Their job is boring by design: don’t get fat, don’t crash, keep the rumen ready to go back to work.

Close‑up cows have a much more delicate assignment in the last three weeks before calving:

  • Step up energy without packing on extra condition.
  • Step up the metabolizable protein to match colostrum and fetal growth.
  • Keep enough bunk and lying space open that they’ll actually eat what you’ve formulated.

NASEM 2021 pegs far‑off dry cows at around 12% crude protein and 7.2% MP, and close‑up cows at 13% CP and 8.6% MP, which works out to roughly 1,000 g of MP per day one week before calving. In the field, many nutritionists now push that closer to 1,100–1,200 g of MP in the last month to cover both a fast‑growing fetus and colostrum synthesis, especially if dry matter intake slips in the last 7–10 days.

Space matters as much as the spreadsheet. Work out of Wisconsin and elsewhere points to 80% of stalls and at least 30 inches of bunk space per cow as realistic targets for close‑up pens. When first‑calvers get jammed in with older cows and bunk stocking goes much past that, Michigan State data shows you can lose about 1.6 lb of milk per day for every 10‑point increase above 80% stocking in early lactation. Those heifers don’t look “sick” — they just never hit the peaks they could have.

Fresh cows then step onto your high‑group TMR with deliberate tweaks Hutjens and others have hammered on for years:

  • Functional fiber: 3–4 lb of long hay or 1–2 lb of processed straw to keep the rumen happy and help keep DAs in check.
  • Additive stack: yeast, monensin, organic chromium, buffer, higher vitamin E, rumen‑protected choline, organic trace minerals — all packed into a 10–21 day fresh window.

On paper, that fresh‑cow ration looks expensive. In the barn, those first two to three weeks largely set the lactation curve.

Does Your Fresh Pen Have a Quiet Calcium Problem?

Clinical milk fever is obvious. Subclinical hypocalcemia? Not so much. Total blood calcium drops below about 8.0 mg/dL, but the cow is still standing, eating, and milking. From the aisle, she looks fine.

Martinez and co‑workers at the University of Florida followed multiparous Holsteins and grouped them by plasma calcium right after calving (JDS 95:7158, 2012). Cows with subclinical hypocalcemia (total Ca <8.0 mg/dL) had:

  • 3.2× higher risk of metritis,
  • 2.4× higher risk of postpartum fever,
  • Higher BHBA (around 1.0 vs 0.7 mmol/L), and
  • About 15 extra days open (124 vs. 109).

If you figure each extra day open beyond target costs in lost opportunity, 15 days open adds –45 per case on top of treatment and milk loss — and that’s before you price in more metritis and fever.

The immune story is even more interesting. Those subclinically hypocalcemic cows had fewer circulating neutrophils, and the ones they did have were less effective at phagocytosis and oxidative burst. In plain language, they walked through the highest‑risk period of their lactation with a weaker front‑line immune response.

You’ve basically got two big levers here:

  • DCAD close‑up programs. Push dietary cation–anion difference below zero a few weeks pre‑calving (often −50 to −100 meq/kg DM, depending on forages and salts). Aim for a urine pH of 5.5–6.0 in Holsteins and 5.0–5.5 in Jerseys, and feed 150–180 g of calcium per day in the close‑up ration so there’s actually calcium in the gut to absorb. 
  • Calcium boluses. Most commercial boluses deliver 50–60 g of calcium from a mix of calcium chloride, sulfate, and/or propionate. Given at calving and again 12–24 hours later, they push blood calcium up for 2–6 hours while the cow’s internal system catches up. 

Especially in older cows, skipping both DCAD and boluses is basically choosing more metritis, more fever, and a blunted immune system in the fresh pen.

Can 1.5% Fat in the First 21 Days Really Move the Needle?

A lot of herds feed fat. Very few have a clean answer to what it’s actually doing in the first three weeks after calving.

Adam Lock’s group at Michigan State ran a trial that has changed how a lot of nutritionists think about fresh cow fat. In de Souza’s study (JDS 104, 2021), fresh Holsteins were fed a fatty acid (FA) supplement at 1.5% of ration DM from calving to 24 DIM:

  • Treatments: control (no FA) or FA blends with palmitic (C16:0) to oleic (C18:1) ratios of 80:1070:20, and 60:30.
  • From 25 to 63 DIM, all cows went on the same diet with no supplemental FA.

Here’s what happened:

Control80:1070:2060:30
Milk (lb/d)102.4106.9107.4109.3
DMI (lb/d)44.745.546.048.0
Milk fat (lb/d)4.184.734.584.60
NEFA (mEq/L)0.720.840.750.67

The 60:30 palmitic: oleic blend was the clear winner. Compared with the control, those cows:

  • Gave about 7 lb/d more milk,
  • Ate 3+ lb/d more dry matter, and
  • Had the lowest NEFA, meaning less body fat mobilization. 

From day 25 to 63, after every cow was on the same non‑supplemented ration, the FA‑supplemented cows kept a production edge. De Souza and Lock called it a carryover effect: those extra fatty acids in the first three weeks seemed to set a higher production level that stuck even after the supplement was pulled.

Will 1.5% fresh‑cow fat pencil in every herd? No. It depends on your base ration energy, fat prices, and how hard cows are mobilizing tissue. But if you’re running high‑producing pens and watching BCS slide hard in the first month, this is the kind of trial you and your nutritionist can design and measure on your own farm.

Methionine in Transition Cows: More Than Just Balancing a Ratio

Methionine used to sit in the “balance it with lysine, then move on” bucket. Work out of Illinois and Wisconsin has pushed it into a different category for transition cows.

Batistel et al. supplemented Holstein cows with rumen‑protected methionine (RPM) at about 0.09% of DM pre‑freshand 0.10% postpartum in a series of trials (JDS 100:7455, 2017). Compared with controls, RPM cows:

  • Produced about 9.5 lb/d more energy‑corrected milk in early lactation,
  • Hit a peak ECM about 10.3 lb/d higher,
  • Ate about 2.6 lb/d more DM pre‑fresh, and
  • Ate 3.5 lb/d more DM as fresh cows, with peak DMI up 3.3 lb/d

That’s not a rounding error. That’s a different gear in the most sensitive part of the lactation.

In a follow‑up trial (JDS 101:480, 2018), the same group dug into what was happening inside those cows. Methionine‑supplemented cows had:

  • A higher liver functionality index,
  • Better neutrophil function (more aggressive about killing bacteria), and
  • Lower markers of oxidative stress and inflammation.

Then they followed the calves. Alharthi and co‑workers reported that calves from RPM‑supplemented dams weighed about 5 kg (11 lb) more at 42 days and about 6 kg (13.2 lb) more at 63 days post‑weaning (J Anim Sci Biotechnol9:78, 2018). They also documented meaningful changes in hepatic gene expression linked to energy metabolism.

That’s where the Illinois group started saying, “Methionine is more than just an essential amino acid.” In transition cows, it looks a lot like a metabolic signal.

NASEM 2021 still treats methionine strictly as an amino acid to meet MP requirements. The committee didn’t increase recommended methionine beyond what’s needed for milk yield and maintenance. Given the Batistel and Alharthi work, many field nutritionists now treat NASEM as the floor and add RPM on top when the economics make sense.

The Four-Herd Ketosis Data That Change How You Read “Fresh Cow Looks Fine”

Back to that 46% number, because it’s not a one‑off.

The four‑herd data set Hutjens uses in his classes comes from McArt et al. 2012 and Oetzel’s BHBA work. Here’s the snapshot:

HerdLocationCowsMilk (lb/d)SCK observed by farmSCK measured (BHBA ≥1.2)
1New York1,89092.013.2%41.3%
2New York1,82792.014.9%27.3%
3Wisconsin2,79486.74.2%40.7%
4Wisconsin4,10677.035.2%57.2%

Herd 3 is the one everyone remembers: 4.2% subclinical ketosis based on what the farm was catching vs 40.7% when every fresh cow was actually tested. Again, these weren’t disaster herds. Milk flowed. Cows walked.

Across all four herds, McArt et al. reported an overall prevalence of subclinical ketosis of 43.2%. Hutjens’ slide commentary rounds the field reality to about 46%. Either way, that “30% SCK” rule of thumb you still hear kicked around is on the low side, not the conservative side.

Wisconsin AgSource DHI data on 3,400 herds and 215,000 cows gives some real‑world weight to those numbers:

  • First‑lactation cows with SCK had about a 22% chance of repeat ketosis in the next lactation.
  • Older cows with SCK had about a 45% chance of repeat ketosis next time.
  • Conception rate dropped by 6 points in first‑lactation cows and 2 points in older cows.
  • Culling rates went up 6 points in heifers and 5 points in older cows.
  • Estimated cost per case: roughly $375 in first‑lactation cows and $256 in older cows.

Put that into your own barn math. Take a 300‑cow herd:

  • 300 cows × 85% calving rate ≈ 255 calvings per year.
  • If 46% of those calvings involve SCK, that’s about 117 cows with subclinical ketosis.
  • Assume 35% heifers and 65% older cows: 117 × 0.35 ≈ 41 heifers, 117 × 0.65 ≈ 76 older cows.
  • Cost: 41 × $375 + 76 × $256 ≈ $34,800 per year in SCK‑related losses.

That’s one year. On 300 cows. Without adding a single line for DAs, left shifts in immune function, or lameness.

BCS, Lameness, and Why the Digital Cushion Belongs in This Story

Cows melting after calving is almost background noise on many farms. You notice the very thin ones. The rest look like “fresh cows.”

Carvalho et al. followed Holsteins from calving through 21 DIM and grouped them by whether they gained or lostbody condition score in those first three weeks (JDS 97:3666, 2014). When they later looked at pregnancy per AI, cows that gained BCS had much higher pregnancy rates — on some farms, several times higher — than cows that lost condition. Barletta et al. (Theriogenology 104:30–36, 2017) told the same story: cows losing BCS after calving were less fertile than cows maintaining or gaining condition.

Then there’s the foot‑level math.

Lischer and Ossent’s work on digital cushion thickness (DCT) — the fat pad under the hoof — and lameness risk has been repeated and refined in more recent longitudinal studies. Cows with the thickest digital cushions had roughly 15% fewer lameness problems than those with the thinnest. DCT kept falling after calving and bottomed out around 110–120 DIM, roughly when cows finally return to positive energy balance.

Hutjens’ rule of thumb on that work is simple:

  • Aim to keep BCS loss under 0.5 after calving.
  • Treat any loss greater than 0.75 BCS in the first 60 DIM as a major red flag.

He backs that with three cheap warning lights:

  • NEFA over 1,000 μEq/L in fresh‑cow blood.
  • Holstein milk fat over 4.5% in early lactation.
  • Fat: protein ratio above 1.4 (true protein) at first test. 

Those numbers cost very little to look at, and they tell you whether your transition program is quietly pushing cows into a level of negative energy balance that sets up both ketosis and lameness.

What NASEM 2021 Changed — and Where the Field Has Already Moved Past It

NASEM 2021 (the update to NRC 2001) gave nutritionists a new baseline. Bill Weiss laid out several transition‑relevant changes that show up in the tables Hutjens uses.

Key NASEM 2021 updates for transition cows:

  • Dry matter intake. Expected DMI is now adjusted for NDF and the pre‑calving drop. With a high‑straw, low‑energy dry diet, NASEM projects close‑up DMI around 1.8–2.0% of body weight, dropping to about 1.65%of body weight in the week before calving. 
  • Fetal requirements. Nutrient demand from the fetus is modeled starting at 150 days pregnant, rising on a curve to 280 days. There’s still no formal adjustment for twins, even though Hutjens notes 6–8% of older Holsteins carry twins. 
  • Protein for dry cows and heifers.
    • Far‑off dry cows: 12% CP7.2% MP.
    • Close‑ups: 13% CP8.6% MP.
    • Springing heifers: 14% CP9.2% MP.

Weiss mentions a target of roughly 1,000 g MP one week pre‑calving. Field practice often layers another 100–200 g MP on top in high‑producing herds to cover colostrum and the fetal curve.

NASEM models did not show a clear benefit to adding more starch to close‑up diets, and the committee chose not to bump methionine requirements or include rumen‑protected choline (RPC) as a required nutrient. That’s the conservative job of a requirement system. It also explains why a lot of nutritionists now talk about “where we’re going beyond NASEM” in transition cows:

Transition TopicNASEM 2021 StandardWhat Progressive Herds Are DoingRed Flag if You’re Not
Close-Up MP~1,000 g/d one week pre-calving (8.6% MP)1,100–1,200 g/d in last 30 days to cover fetal growth & colostrum synthesisLow-peak ECM in fresh cows; colostrum quality flags
MethionineMet as required amino acid to meet MP onlyAdding RPM on top of MP requirements based on Batistel 2017 (9.5 lb/d ECM gain)Sluggish fresh-cow DMI; high oxidative stress markers
Rumen-Protected CholineNot modeled as a required nutrientAdding 13–14 g/d choline chloride (Ghaffari 2025 meta-analysis: +1.29 kg/d milk, +0.48 kg/d DMI)High fatty liver incidence; poor early-lactation DMI recovery
Close-Up EnergyLow-energy, high-straw diet; no modeled benefit to added starchModest energy increase (slightly lower NDF, more starch/sugar) so cows arrive at calving adapted to high-energy rationBCS crashes in first 21 DIM; fat:protein ratio >1.4 at first test
Fresh Cow FatNo formal recommendation1.5% DM as 60:30 palmitic:oleic blend, 0–24 DIM (de Souza/Lock: +7 lb/d milk, lowest NEFA)High NEFA (>1,000 µEq/L); poor body condition maintenance
Stocking DensityNot modeledMax 80% of stalls; ≥30 in. bunk space in close-up pens (Michigan State: −1.6 lb milk/day per 10-pt overstock)Heifers underperforming vs. genetic potential at peak
SCK ThresholdNo formal monitoring protocolBHBA ≥1.2 mmol/L cow-side meter, every fresh cow 5–14 DIM, 30-day audit minimumYou’re guessing 4%; the meter may say 40.7%

NASEM’s job is to be slow and conservative. Yours is to know where that line sits and then, with your own numbers, decide where stepping beyond it makes sense.

What This Means for Your Operation

You don’t fix transition cows by copying a ration on Facebook. You fix it by measuring, then making decisions in your own pens. Here are a few places to start.

  • For the next 30 days, stop guessing on subclinical ketosis — measure it.
    For one full month, pull BHBA on every fresh cow between 5 and 14 DIM with a cow‑side meter. Don’t cherry‑pick the “sick” ones. Then compare the actual SCK rate to what you and your team would’ve guessed. If your gap looks anything like Herd 3’s 4.2% vs 40.7%, you know you’ve got a program problem, not a cow problem. 
  • Audit your close‑up pen with a notebook, not just your eyes.
    Count stalls. Count headlocks. Count cows. If your close‑up pen is consistently running much above 80% of stallsor cows have less than 30 inches of bunk space, accept that no supplement will fully outrun that stocking penalty in early lactation. That’s a facilities-and-grouping decision, not a magic additive. 
  • Let BCS, loss, fat, protein, and NEFA be your cheap health sensors.
    Pull your first test day data. If Holstein fresh cows are averaging fat: protein ratios over 1.4 or fat over 4.5%, and you’re seeing average BCS losses over 0.5 in the first 60 DIM, treat that as proof your cows are digging too deep into reserves. That’s your cue to re‑look at dry‑off BCS targets, close‑up intake, and time in the fresh pen. 
  • Run one clean pen trial on methionine or fresh‑cow fat.
    Take the Batistel methionine and de Souza/Lock fat data to your nutritionist. Pick one pen where records are solid, and agree on a 60–90 day window where that pen gets RPM or a 60:30 palmitic: oleic FA blend at 1.5% of DM. Track ECM, DMI, metritis, and ketosis against your own baseline. If it pays in your numbers, you’ve earned the budget. If it doesn’t, you’ve got real data instead of a brochure. 
  • Tilt your bull list a notch toward health, where the pen keeps biting you.
    If you’re constantly fighting ketosis, milk fever, or lameness, don’t try to solve it only in the feed alley. Push a little more weight toward metabolic and health traits in the index you already trust. It’s not an overnight fix, but your future transition cows can be a lot more forgiving than some of the cows you’re managing now.

Key Takeaways

  • If you do one thing in the next 30 days:
    Test BHBA on every fresh cow once between 5 and 14 DIM for a month. If your real SCK rate comes back anywhere near the 40–46% range those four herds saw, you’ll know this isn’t about “a few bad actors” — it’s a herd‑level pattern you can actually manage. 
  • If your fresh cows are losing more than 0.5 BCS by 60 DIM or your fat: protein ratio is over 1.4:
    Treat that as a system problem, not a cow problem. Before you add another product, check stocking rate, group moves, and whether your close‑up ration really lines up with what NASEM says those cows can eat in the last 7–10 days. 
  • If you’re on the fence about methionine, fat, or choline in transition diets:
    Don’t buy a “program.” Design a trial in one pen with good records, then decide based on your ECM, DMI, and disease numbers over 60–90 days whether those additives earn a spot in your budget. 

The Bottom Line

The four herds in the Oetzel/McArt project didn’t suddenly become “bad” the day the BHBA meter came out. The only thing that changed was that, for a few weeks, somebody measured instead of guessing. If you did the same in your fresh pen next month, would the numbers back up what you already believe about your transition cows — or hand you the kind of 46% shock that forces you to change how you feed and manage the most important group on your farm?

Complete references and supporting documentation are available upon request by contacting the editorial team at editor@thebullvine.com.

Learn More

The Sunday Read Dairy Professionals Don’t Skip.

Every week, thousands of producers, breeders, and industry insiders open Bullvine Weekly for genetics insights, market shifts, and profit strategies they won’t find anywhere else. One email. Five minutes. Smarter decisions all week.
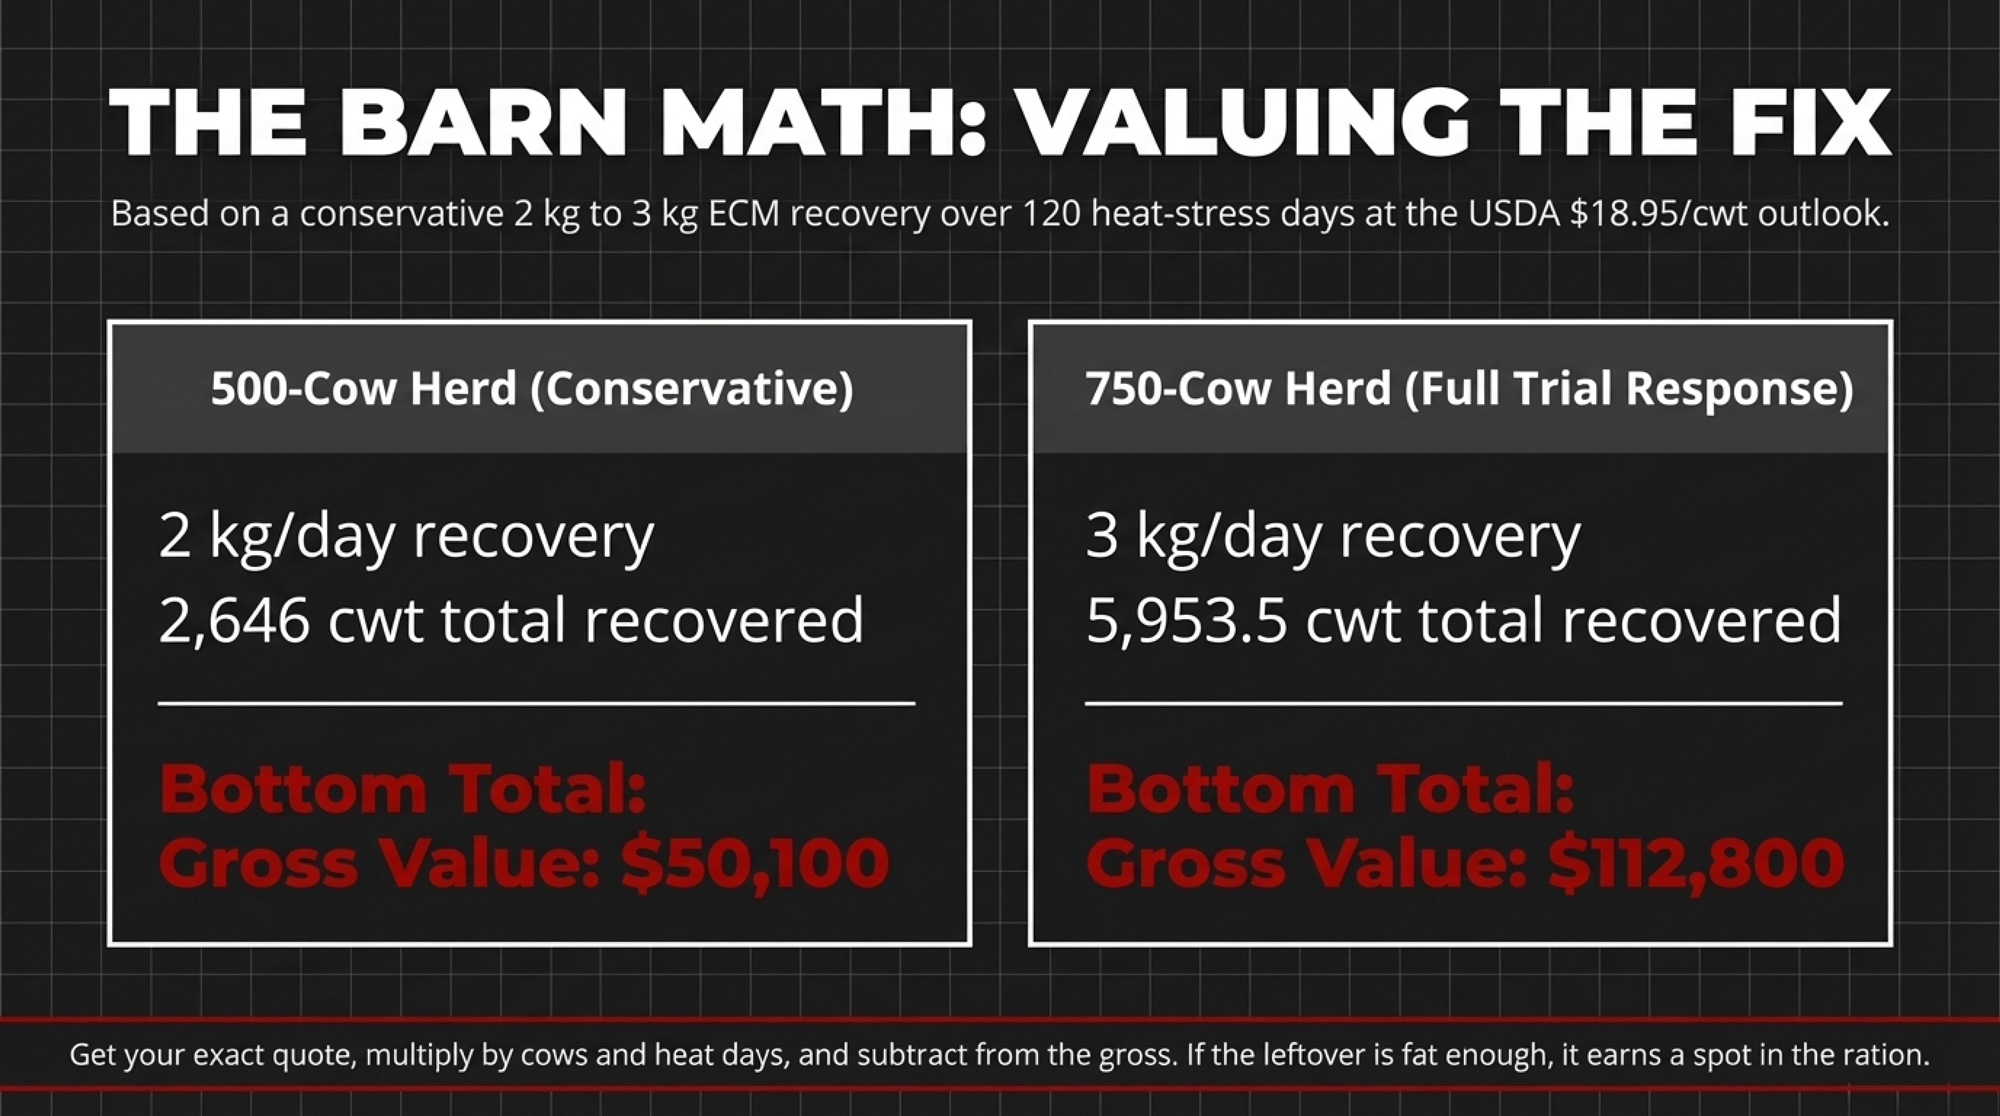
NewsSubscribe
First
Last
Consent

$51,000 a Day in Silence: AMPI’s Paynesville Plant Went Dark, and Nobody Told You

AMPI’s Paynesville plant is dark. Its biggest member sells milk to five other processors. You sell to one. Same co-op. Guess who has a backup plan.

Executive Summary: At 10 a.m. Saturday, 18-year AMPI lab tech Heidi Barg walked out of the Paynesville, Minnesota cheese plant — and a $51,000-a-day clock started ticking for 685 farmer-owners who got zero warning. Teamsters Local 471 declared a formal Unfair Labor Practice strike after nearly a year of rejected demands for better wages, health-care flexibility, and a guarantee that jobs survive if AMPI sells the plant. With the facility processing 1.7 million pounds of milk daily and Midwest spot running $3-under, a 30-day shutdown burns through $1.53 million in co-op revenue — on top of margins that were already negative before a single picket sign went up. AMPI’s largest member, Riverview LLP, ships to five processors and is building its own 4-million-lb/day powder plant 90 miles away; most family-scale members ship to one plant and have no backup. Under Minnesota cooperative law, the board may have no legal obligation to warn you — a governance blind spot that seven Ontario farmers cracked open in 2020, when a single public letter forced province-wide reform. Below: the per-herd loss math, the statutory rights most co-op members don’t know they have, and the one action you can take before your next district meeting.

AMPI dairy strike

Just before 10 a.m. on Saturday, March 21, Heidi Barg hung up her lab coat at the AMPI cheese plant on West Railroad Street in Paynesville, Minnesota, and walked out to the picket line. She’s spent 18 years in that lab, testing the milk that 685 farm families ship into the cooperative every day. A few minutes later, the rest of her co-workers in Teamsters Local 471 — more than 60 employees in all — followed her out, and AMPI’s highest-capacity cheese plant went dark. 

While the lab coats hit the pavement, the clock started ticking — $51,000 a day in lost milk value at the March 19 spot floor, and up to $1.53 million if $3-under conditions persist for a month. That’s a hole your milk check is expected to fill.

“When I started at AMPI 18 years ago, this was a place where people built successful careers in a small town to support their families,” Barg said. “Too many now see it as just a job, and that has been tough for me to watch”. 

Eighteen years of institutional knowledge about milk quality, cheese yields, and production standards — gone from the plant floor in a single morning. And there’s no sign that any of AMPI’s 685 farmer-owners received a real warning that their plant was one step from going dark.

How Did a 12-Month Standoff Turn Into a Surprise Shutdown?

This didn’t start with a one-day blow-up. It started in April 2025, when Paynesville workers — who’d spent 50 years under an independent union — voted 71 to 1 to affiliate with Teamsters Local 471. They believed the Teamsters would give them “the leverage, resources, and collective power necessary to bargain the best contract possible”. 

Since then, it’s been a long, slow grind. Workers came to the table asking for a meaningful wage increase after more than a year without a raise, more flexibility in health care coverage, and a guarantee that, if AMPI sells the plant, their jobs and union contract will go with it. AMPI said no on all three. 

“AMPI has had more than enough time to do right by these workers, but instead they’ve dragged their feet,” said Lyndon Johnson, Secretary-Treasurer of Local 471. “Our members are united in demanding the wages, health care, and job protections they deserve. We’re prepared to stay out as long as it takes”. 

Local 471 has called this a formal Unfair Labor Practice strike — meaning they believe they can prove AMPI hasn’t been bargaining in good faith. That’s a legal accusation that builds over months of bargaining records, not one bad meeting. And the dairy labor crisis driving these negotiations isn’t unique to Paynesville

Three Facilities, One Pattern

FacilityProductWhat HappenedWorkers AffectedTimelineMember Impact
Paynesville, MNCheeseULP strike — plant went dark60+ Teamsters Local 471March 21, 2026685 farmer-owners lose outlet for 1.7M+ lb/day
Blair, WICheddar → Cottage CheeseConversion retool — temporary layoffs86 employeesLayoffs start March 31, 2026; reopen early 2027Milk rerouted during 9–12 month gap
New Ulm, MNButterSold to Grassland Dairy Products185 employees transferredLate 2025AMPI exits butter; “focuses on core business = cheese”

Paynesville isn’t AMPI’s only moving piece. In Blair, Wisconsin, AMPI is converting its cheddar plant into a cottage cheese facility — temporarily laying off 86 workers starting March 31, with a reopening planned for early 2027. In New Ulm, Minnesota, AMPI sold its butter plant to Grassland Dairy Products in late 2025. AMPI Marketing VP Sarah Schmidt confirmed that 185 employees had transferred, saying the sale would allow AMPI “focus on its core business, which is cheese.”

If you’re a Paynesville worker watching AMPI shut one plant and retool another, you’re going to ask for a guarantee that your facility won’t be sold next. Workers asked for exactly that. Management refused.

AMPI did not respond to a request for comment regarding the strike.

What Does It Actually Cost When Your Co-op Plant Goes Dark?

When a plant shuts down, your cows don’t. Milk has to move. And in late March 2026, it’s moving into one of the ugliest spot markets in recent memory.

USDA’s Agricultural Marketing Service reported Midwest Class III spot milk trading at $ 3 under to flat the week of March 19. One week earlier, the Central region spot was $ 5 under to flat, and cheesemakers were “unable to take on additional volumes of milk, as they are already running full schedules.” A March 17 snowstorm across the Upper Midwest made hauling even messier.

Teamsters say the plant was running about 1.7 million pounds of milk per day — roughly 17,000 cwt. AMPI’s own 2025 summer tour materials claim Paynesville can process up to 4 million pounds daily — though the plant’s last publicly documented capacity upgrade, reported by Farm Progress in January 2023, put the figure at 3 million pounds. However you measure it, a lot of milk just got orphaned.

At the co-op level: 17,000 cwt/day × $3.00 spot discount = $51,000 per day in lost value. Thirty days at $3-under is $1.53 million in cooperative revenue that isn’t coming back.

Herd SizeDaily Milk (cwt)Monthly Loss ($1.50/cwt)Monthly Loss ($3.00/cwt)
300 Cows190$8,550$17,100
500 Cows320$14,400$28,800
1,000 Cows640$28,800$57,600

Note: Spot discount losses only. Additional hauling costs (estimated at 20¢/cwt for diversions over 200 miles) would add roughly $1,100–$3,800/month, depending on herd size.

Why the Timing Couldn’t Be Worse

Those dollars land on a base market that’s already bleeding. February’s WASDE put the 2026 all-milk price at $18.95/cwt. ERS estimates the average total cost of production at $19.14/cwt — meaning the average dairy started 2026 losing money before the first truck left the yard. January’s actual Class III came in at $14.59/cwt, the lowest since July 2023. FarmDoc Daily’s December 2025 analysis projected that “economic costs are projected to be above total returns in 2026.”

You’re already underwater. Stack a $3-under spot discount on top of that, and this stops being an academic conversation.

The Member Who Doesn’t Have to Worry — And Why That Should Worry You

Now ask a harder question: who in this cooperative can actually ride out a plant shutdown?

MetricSmall/Mid Family DairyRiverview LLP
Approximate herd size280–1,000 cows135,000+ cows (16 MN feedlots)
Milk processors used15
Own processing capacityNone4M lb/day powder plant under construction (Morris, MN; startup Nov 2027)
Strike/shutdown backup planNone — diverts to spot market at $3-underRoutes volume to 4 other buyers same day
Est. 30-day loss if Paynesville dark$17,100–$57,600 (spot discount only)Near zero — volume absorbed elsewhere
Hauling cost exposure+$1,100–$3,800/month at $0.20/cwtNegligible — contracts with multiple plants
Co-op governance influenceAttends district meetingAMPI featured Riverview on summer tour brochure
Long-term co-op dependencyHigh — one plant, one checkDeclining — exit ramp under construction

Riverview LLP, based in Morris, Minnesota, is the state’s largest milk producer — and it’s not close. According to state feedlot records cited by the Star Tribune on March 16, 2026, Riverview now owns 16 permitted dairy feedlots in Minnesota, housing more than 135,000 cows. The company is also permitted for two North Dakota mega-dairies currently under international environmental review after Manitoba flagged potential nutrient impacts on the Red River watershed.

Riverview is an AMPI member. In 2025, AMPI’s own “Future Focused” summer tour bused visitors to the Paynesville cheese plant, then to Louriston Dairy, a 9,500-cow Riverview operation near Murdock. The co-op literally put Riverview on the brochure.

But Riverview doesn’t need AMPI. As of a late-2024 Red River Farm Network tour, Riverview was selling milk to five different cheese processors. If Paynesville goes dark for a month, Riverview shifts volume to four other buyers before your truck has figured out where to go. And in July 2025, Riverview broke ground on the Stevens Milk Plant — a 148,000-square-foot powder facility in Morris that will process 4 million pounds of milk per day. Startup: November 2027. That’s at or above what AMPI says Paynesville can handle.

Nobody’s saying Riverview shouldn’t build its own plant — they’re managing their own risk, same as you should be managing yours. The question is what it means for the members who can’t. You’re subsidizing the overhead on a plant that Riverview is building an exit ramp from. We broke down the full math on what Riverview’s expansion means for Upper Midwest pricing last week — and this strike makes that analysis hit different.

Two realities under the same “farmer-owned” banner:

  • A 280-cow Stearns County family dairy with one truck, one plant, one milk check.
  • A 135,000-cow-plus member with milk going to five processors and its own powder plant under construction.

Same co-op. Wildly different risk universe. And the consolidation dynamics reshaping cooperative processing aren’t slowing down.

Why Your Co-op Board May Be Legally Required to Keep You in the Dark

AMPI runs a three-tier governance system. You go to district meetings. District reps go to division meetings. Division reps elect a 15-member corporate board on three-year terms. The board oversees management. Management negotiates labor contracts.

There’s no standing labor relations committee you elect. No bylaw trigger that says “if a negotiation drags past 180 days, members get notified.” Nothing.

Minnesota Statute 308A.328 says directors must act “in good faith, in a manner the director reasonably believes to be in the best interests of the cooperative.” Those duties run to the cooperative as a legal entity — not to specific members. Directors can rely on management reports they “reasonably believe to be reliable and competent.” On top of that, directors carry a duty of confidentiality on labor and legal strategy that may actually prohibit them from tipping you off at a district meeting.

Management runs it. The board approves it in a closed room. You find out when the news breaks. That’s not a failure in the system. That’s the system.

What Happened When Seven Ontario Farmers Said “Enough”?

In January 2020, all seven dairy farmers on the Glengarry County milk producer committee in eastern Ontario resigned at once. Their target: Dairy Farmers of Ontario, which had unilaterally switched to third-party verification for its proAction quality program without consulting any of the province’s 48 local committees.

Their letter didn’t mince words: “We have failed as a committee to represent the producers that have elected us.” They estimated the switch would cost Ontario producers at least $500,000 a year on top of what they called “millions and millions” already spent, with absolutely zero to show for it.

Seven farmers. One public letter. Within weeks, DFO board member Bart Rijke told the farm press, “Maybe we made a mistake.” Leadership reached out to committee chair Melanie Trottier. DFO scheduled emergency sessions with all 48 committees. Trottier and six neighbors changed the conversation province-wide. You don’t have to resign from anything. But Glengarry proves that coordinated, specific pushback from a small number of members can move organizations that usually feel untouchable. And when cooperative accountability actually works, it changes what’s possible for the whole community

Does Your Co-op Have the Same Blind Spot?

In Minnesota, your leverage is written into law. Most members just haven’t read the statute.

ToolStatuteThresholdTimelineWhat It Forces
Records InspectionMN 308A (records access)Any single member, written request5 business days after certified noticeBoard must disclose financials relevant to your “proper purpose” — e.g., patronage impact of plant downtime
Special Member MeetingMN 308A.61520% of membership = 137 AMPI farmersBoard must call meeting within 30 daysForces full membership discussion of any governance issue, including labor crisis transparency
Quorum to Transact BusinessMN 308A.63150 members presentAt any duly called meetingMeeting can vote on resolutions, bylaw amendments, or formal demands — 50 farmers is enough
Bylaw AmendmentStandard co-op governanceMajority vote at qualified meetingVariable — next district or special meetingCan add mandatory notification trigger (e.g., “board alerts members if labor talks exceed 180 days unresolved”)

The 20% Rule: Under 308A.615, a petition signed by 20% of the membership — that’s 137 AMPI farmers — forces the president to call a special meeting within 30 days.

The Quorum Factor: Under 308A.631, only 50 members need to be present for the meeting to transact business.

The 5-Day Rule: Members may demand access to the cooperative’s books and records for a “proper purpose” with 5 business days’ written notice. “I need to understand how a plant shutdown is affecting my patronage allocation” is about as proper as it gets.

You’re not asking for a favor. You’re invoking a statute.

What’s Your Actual Monthly Exposure If Your Plant Goes Down?

Plug your own herd into the formula:

Your daily cwt × spot discount ($/cwt) × days offline + extra hauling cost = your monthly strike exposure.

At 500 cows shipping 320 cwt/day with spot $2-under and 20¢ in extra hauling: (320 × $2.00) + (320 × $0.20) = $704/day. Over 30 days: $21,120. That’s why the question for AMPI members isn’t just “Are workers being treated fairly?” It’s “How much is this costing my farm, and did anyone tell me we were getting close to this?”

Even if you’re nowhere near Paynesville, at your next meeting, ask three questions:

  • Does our cooperative have any policy requiring member notification when a contract negotiation drags past a set point?
  • When was the last time the board gave members a plain-English update on labor relations at each plant?
  • What’s our written contingency plan — and member cost estimate — if any plant goes offline for 30, 60, or 90 days?

If nobody has answers, you’ve found the blind spot.

Options and Trade-Offs for Farmers

This Week: File a Records Inspection Demand

Write a short letter stating your proper purpose — evaluating the financial impact of plant downtime on your patronage — and cite Minnesota 308A. Send it certified mail to the CEO and board secretary. They have five business days. If they comply, you learn what the board knew and when it knew it. If they stonewall, that refusal tells you everything. Total cost: postage.

Within 30 Days: Draft a Bylaw Amendment

Something binary and votable. Example: “The board shall notify all members within 30 days when any collective bargaining negotiation at a cooperative facility exceeds 180 days without resolution.” Bring it to your district meeting, on the record. Management will argue disclosure hurts negotiating leverage — and they’re not entirely wrong. But the question isn’t whether to live-stream bargaining on Facebook. It’s whether member-owners deserve a heads-up before their plant goes dark.

Within 90 Days: Bring Your Lender Into the Conversation

Share your barn-math exposure with Farm Credit or your bank. Ask how they evaluate processor concentration riskwhen they underwrite your operation. One borrower raising the flag does nothing. 20 borrowers raising it with the same lender start to move things.

Within 12 Months: Decide If the Needle Moved

Did the board start reporting on labor status? Did they respond to your records demand? Remember: 137 members force a meeting. Fifty make it legal.

Key Takeaways

  • If your plant could go dark, run your own diversion math this week. Your daily cwt × spot discount × 30 days, plus hauling. For a 300-cow herd at $3-under, spot losses alone hit $17,100 over a month — add hauling, and you’re near $18,200.
  • If your co-op has no notification trigger for stalled labor talks, the gap isn’t the strike — it’s the silence.Ask, on the record.
  • If you don’t know your statutory rights, learn them before you need them. Minnesota: five days for records, 20% for a special meeting, 50 for a quorum.
  • If your largest member is building its own plant, pay attention. When they no longer need the co-op, you’re the one paying for the empty capacity.

The Bottom Line

Heidi Barg walked out of that Paynesville lab Saturday morning after 18 years of testing your milk and your neighbors’ milk. Melanie Trottier and six Ontario farmers proved that names on a letter can force a marketing board to sit down and listen. The tools exist. The statutes are on the books. The barn math is real.

The Paynesville strike isn’t just a labor dispute. It’s a transparency stress test. AMPI just failed. Is your co-op next?

Complete references and supporting documentation are available upon request by contacting the editorial team at editor@thebullvine.com.

Learn More

The Sunday Read Dairy Professionals Don’t Skip.

Every week, thousands of producers, breeders, and industry insiders open Bullvine Weekly for genetics insights, market shifts, and profit strategies they won’t find anywhere else. One email. Five minutes. Smarter decisions all week.
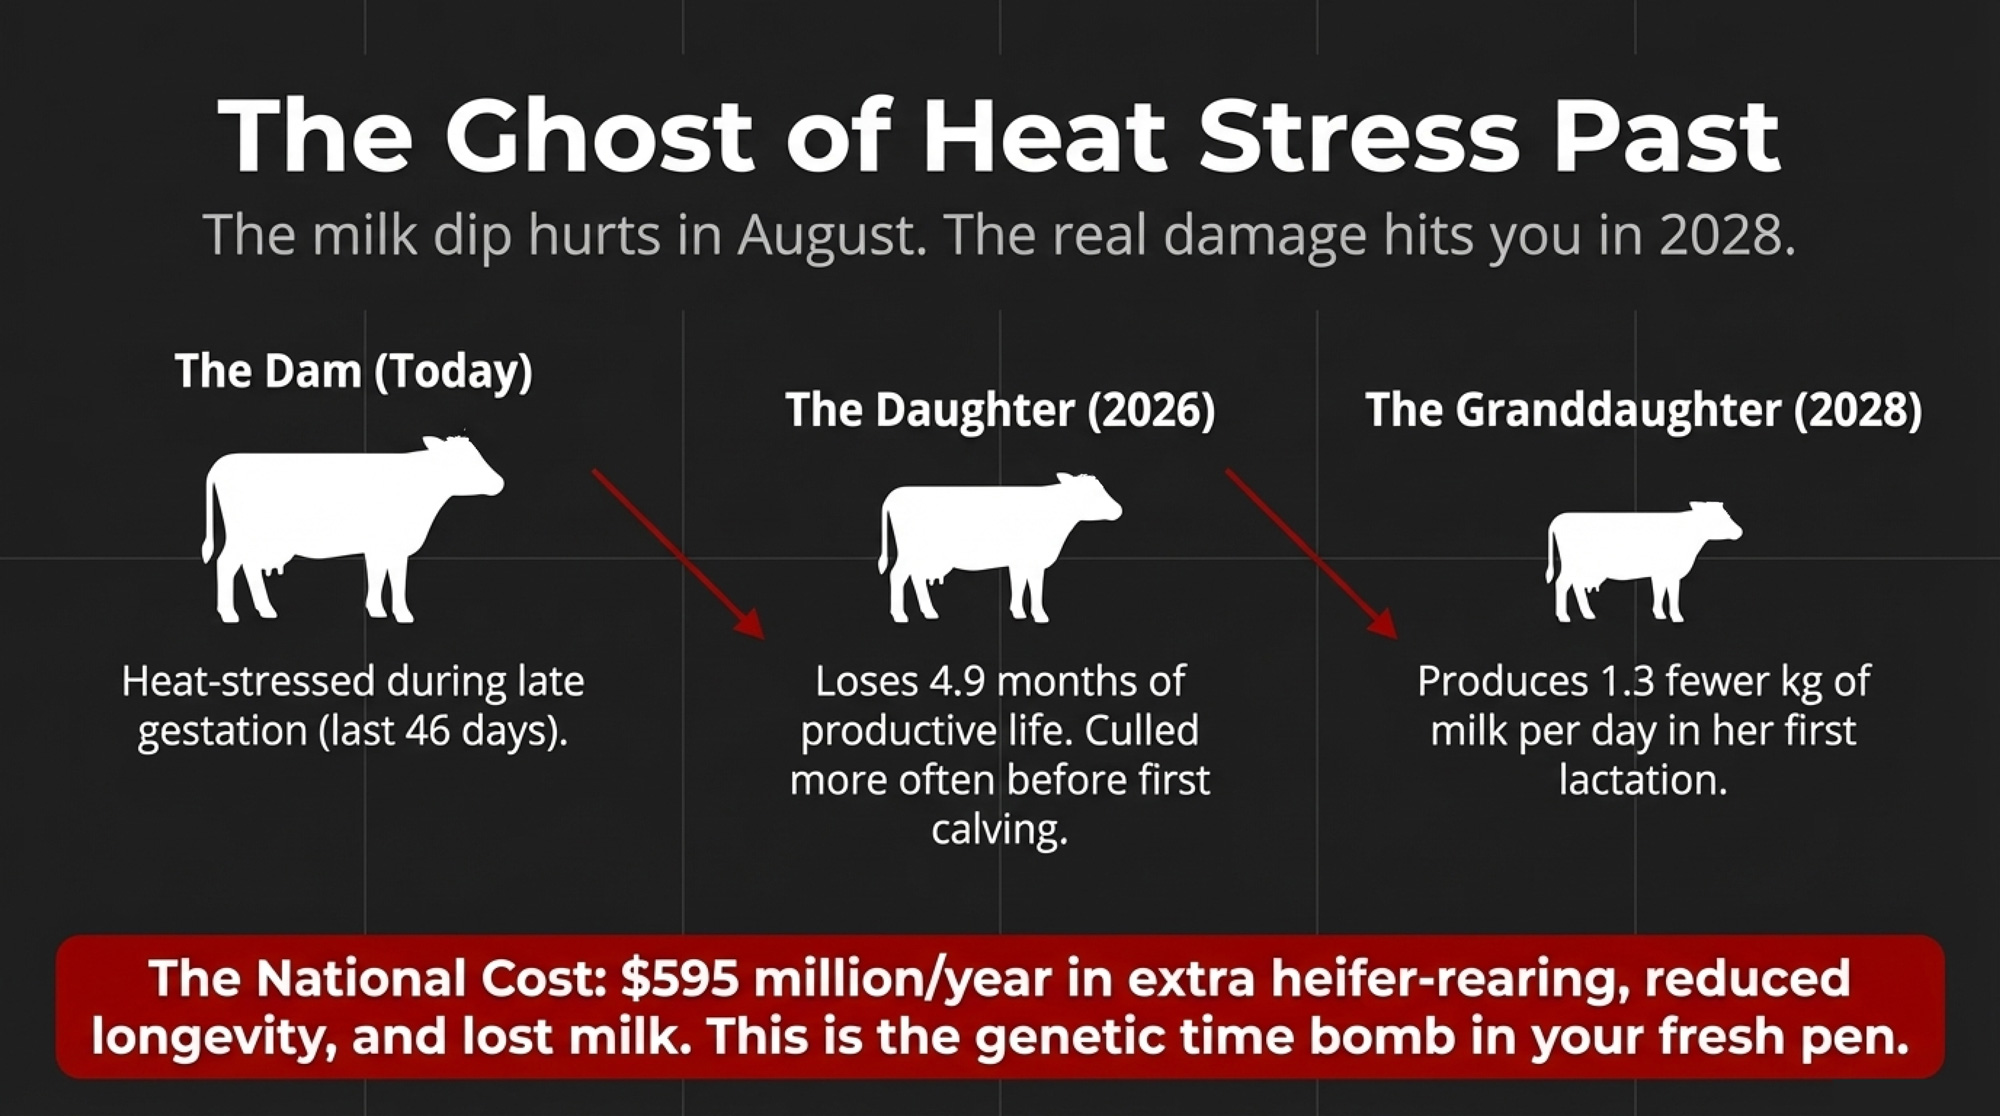
NewsSubscribe
First
Last
Consent

The 89¢ Per Cow Per Day Leak at a Southwest Dairy Found in Its Feed Center

An 8,500‑cow Southwest dairy installed a batching system and suddenly found $225 a day in feed they’d been “feeding” to thin air. Sure, your numbers wouldn’t say the same?

Executive Summary:  A Southwest dairy milking 8,500 cows was sure its feed program was “good enough” until an automated batching system exposed an 89¢ per cow per day leak in the feed center. Tightening micro‑ingredient delivery with MWI’s system and Pro‑Control Plus didn’t change the ration on paper, but it cut $225.34/day in feed cost and saved 54 minutes/day of batching time across 27 loads. Hutjens’ benchmarks and simple barn math show why that matters: whole‑herd feed efficiency below 1.3 and total shrink in the 6.5–8.5% range quietly turn feed into a six‑figure annual drain. The article lays out exactly how those numbers play out — from the 89¢/cow/day FE ladder to the $233,600/year lost at 8% shrink on a 1,000‑cow herd — and why cutting the ration usually makes IOFC worse, not better. It then turns the Southwest dairy’s wake‑up call into a playbook any herd can use: run a 3‑day shrink audit, write down four key numbers (DM cost, feed cost per cwt, FE, shrink), price feeds by nutrient value, and treat NDF digestibility like a trait you get paid for before next harvest. Readers finish with concrete thresholds and 30‑day actions to decide whether their own “good enough” feed program is quietly starving their profits.

Dairy feed efficiency

The feed center at a Southwest dairy wakes up before the sun. Loaders arc in and out of commodity bays. A mixer hums. A feeder jokes with the trucker while the first TMR drops into the bunk. On paper, this 8,500‑cow herd was doing everything right on feed.

Then they put a number on what was actually going into the mixer.

When the dairy installed an automated micro‑ingredient batching system built around MWI Animal Health’s Micro Ingredient Delivery System and Pro‑Control Plus Feed Batching platform, they didn’t change cows, facilities, or even the ration on paper. They just stopped guessing. Within weeks, they could point to $225.34 per day in feed savings and 54 minutes of batching time saved across 27 loads per day, based on their own cost structure and time studies. With the manager’s fully loaded labour and equipment rate of $500/hour, that 54 minutes of saved time was worth about $450/day on its own.

They hadn’t discovered a magic ingredient. They’d discovered how much their “good enough” program was actually costing them.

“We Thought We Were Tight”: When the Ledger Tells a Different Story

This Southwest dairy isn’t a shoestring outfit. It’s a big, modern operation with experienced people and plenty of steel. The manager genuinely believed the feed program was in good shape. The numbers seemed to back that up.

Then 2025 happened.

The USDA’s Dairy Margin Coverage index slid to $9.42/cwt in December 2025, triggering the first and only Tier I indemnity payment of the year — a total of $0.08/cwt. Illinois Farm Business Farm Management data, summarized by economist Bradley Zwilling, showed that while cash returns finally clawed their way back into the black in 2024 and were projected to stay barely positive in 2025, total economic costs were still above total returns on many herds.

That’s the kind of math that keeps managers awake at 2 a.m.

Feed has always been the big line item. Hutjens’ benchmarks put feed at about 60% of total costs on many Midwestern dairies. You can’t move the mailbox price or the DMC formula. You can move what you shovel into the mixer.

Like a lot of operations, the Southwest dairy’s first instinct was to “tighten up” feed. But before they started pulling ingredients, they decided to find out how much feed they were actually buying, batching, and feeding to cows. That decision turned out to be more important than any single tweak to the ration.

The Day They Stopped Guessing in the Feed Center

Before automation, micro‑ingredients at this dairy were classic “good enough.” The feeder was careful and experienced, but micro bins and totes were still handled by eye and habit. Scoop sizes and bucket loads varied a little from batch to batch. Over the course of 27 TMR loads a day, those “little” variations turned into real money.

With the MWI system in place, every micro-ingredient was delivered to the mixer via a controlled delivery line rather than a bucket. The Pro‑Control Plus batching platform logged target and actual weights, as well as time per batch. The manager suddenly had hard data instead of a gut feel.

It didn’t take long to see the pattern:

  • Micro‑ingredients were routinely overshot “to be safe.”
  • Loads weren’t identical; they were “close enough.”
  • The crew was working hard, but the system made it hard for them to be precise.

Once the batching system took over micro‑delivery and locked in targets, the averaged numbers told the story:

  • $225.34/day in feed cost reduction, with the same ration specs and milk targets.
  • 54 minutes less batching time per day, across 27 loads.
  • Less “hero work” and rushing in the feed center; more consistency from batch to batch.

For this Southwest dairy, that was the first big wake‑up: they didn’t have a ration problem. They had a delivery problem.

How Much Is “Good Enough” Feed Efficiency Costing You?

Zoom out from that one farm and look at the math the way Hutjens does in his feed‑cost talks.

Take a mid‑range ration that costs $5.76/cow/day for a lactating Holstein in a Midwestern TMR system. That buys you about 49 lb of dry matter at an average ingredient cost of just under 12¢/lb DM. On a herd averaging 80 lb of milk, that works out to a feed cost of about $7.20/cwt and an income over feed cost (IOFC) around $10.80/cwt at an $18 milk price.

Now imagine your herd slides down to 70 lb of milk because you cut ingredients to save money — but you don’t actually reduce intake much. If feed cost stays at $5.76, your feed cost per hundredweight jumps to $8.23, IOFC slips under $10/cwt, and feed efficiency drops from 1.63 to 1.43.

You didn’t save the feed. You made each pound of milk more expensive.

Milk Yield (lb/cow/day)Feed Cost/Cow/DayFeed Cost ($/cwt)IOFC ($/cwt)Feed Efficiency
80$5.76$7.20$10.801.63
75$5.76$7.68$10.321.53
70$5.76$8.23$9.771.43
65$5.76$8.86$9.141.33
60$5.76$9.60$8.401.20

Feed efficiency — pounds of 3.5% fat‑corrected milk per pound of dry matter — gives you a quick, hard‑number check. Hutjens’ guidelines are simple:

  • High group, mature cows: >1.7.
  • One‑group TMR herds: >1.5.
  • Whole herd: <1.3 is a concern value.

Now run the same 70‑lb herd through those FE numbers:

  • At FE 1.3, cows need about 54 lb DM. Feed cost at 12¢/lb DM: $6.48/cow/day.
  • At FE 1.4, cows need 50 lb DM. Feed cost: $6.00/cow/day.
  • At FE 1.5, cows need about 46.7 lb DM. Feed cost: ≈$5.60/cow/day.

That’s roughly:

  • 48¢/cow/day saved going from 1.3 to 1.4.
  • 40¢/cow/day from 1.4 to 1.5.
  • About 89¢/cow/day from 1.3 all the way up to 1.5 — with the same 70 lb of milk.

On a 250‑cow string, that’s around $222/day. On 1,000 cows, it’s close to $890/day. On 2,500 cows, you’re over $2,200/day.

You don’t need to be an 8,500‑cow operation to feel that.

Dutch dairy farmer and CRV consultant Niels Achten sees exactly that spread in Europe. Working with his own ~280‑cow herd and clients through consultancy firm Liba, he’s watched operations with similar genetics and facilities post very different feed efficiencies purely on management and cow comfort. “Many dairy farmers still have opportunities to increase the feed efficiency on their farms,” he says.

The uncomfortable truth: most of those opportunities aren’t in the nutrition program on paper. They’re in what actually lands in the bunk.

Where 6.5–8.5% of Your Feed Disappears Before Any Cow Sees It

The MWI case study put real numbers on batching losses. Progressive Dairy has done the same with shrink.

Ingredient CategoryTypical Shrink RangeHigh-Risk ThresholdAnnual Loss on 1,000 Cows ($8/day)
Wet byproducts12–40%>20%$35,000–$116,800
Corn silage5–17%>10%$14,600–$49,600
Dry meals & minerals2–10%>6%$5,800–$29,200
Hay/dry forages3–12%>7%$8,760–$35,040
Total feed (all classes)6.5–8.5%>7%$189,800–$248,200

In a 2022 article, they pulled together research and field data and landed on a typical 6.5–8.5% feed shrink across all ingredients at many North American dairies. The range by ingredient is sobering:

  • Wet byproducts: 12–40%.
  • Corn silage: 5–17%.
  • Dry meals and minerals: 2–10%.

Their target: keep total shrink under 5%.

Now plug that into a herd that spends $8/cow/day on feed across all classes. At 8% shrink, you’re losing 64¢/cow/dayyou paid for but never fed. On a 1,000‑cow herd, that’s about $233,600/year that disappears in the feed center, bunker, and bunk.

At 5%, you’re still losing money, but the annual cost drops to roughly $146,000. That’s an $87,600/year gap between “pretty typical” and “tight.”

The Southwest dairy didn’t fix shrinkage everywhere overnight. But by tightening batching and making ingredients hit the mixer consistently, they plugged one of the worst leaks first — the part they could measure fastest.

And that’s a key pattern. You don’t have to solve everything at once. You have to pick the spots where you can actually see what’s going on.

How Forage Quality Quietly Turns Into Milk Cheques

Feed efficiency and shrink live in the feed center. Forage quality lives in your fields and bunkers — but it shows up in the same ledger.

Oba and Allen’s 1999 meta‑analysis in the Journal of Dairy Science is still the go‑to reference on NDF digestibility:

  • For every 1‑point increase in NDFD, dry matter intake goes up about 0.17 kg/day, and 4% fat‑corrected milk goes up about 0.25 kg/day.

On a 1,000‑cow herd, that 0.25 kg (about 0.55 lb) of extra FCM per cow is roughly 5.5 cwt/day. At an $18/cwt milk price, that’s about $99/day of extra milk revenue.

Those cows will eat a bit more to get there, around 0.17 kg (0.37 lb) of extra DM per cow per day. At 12¢/lb DM, that’s roughly $45/day more feed across the herd.

Net result: a 1‑point NDFD bump is worth about $54/day, or roughly $1,600/month, on that 1,000‑cow herd after you pay for the extra feed.

Hutjens and the 2021 NASEM dairy update both push toward the same practical targets:

  • 30‑hour NDFD:
    • Legumes and cool‑season grasses: ≥50%.
    • Corn silage: ≥60%.
    • Low‑lignin corn silage hybrids: ≥65%.
  • uNDF240:
    • Around 5.0–5.3 lb/day of forage uNDF for a 1,400‑lb Holstein — enough to keep the rumen working without choking intake.

Lab summaries from places like Dairyland Labs show a wide spread. Many alfalfa samples peak at around 45% NDFD— shy of the 50% mark. Corn silage, especially low‑lignin hybrids harvested right and stored tight, often sits in the 60–70% NDFD range. Small-grain and grass silages can be anywhere from corn‑like to straw‑like.

Two bunkers can both say “NDF 40%.” If one is 45% NDFD and the other is 60%, those aren’t the same feed at all.

For a herd like the Southwest dairy, that’s the difference between a ration that looks okay on paper and a feed program that actually hits the milk tank the way the nutritionist expects.

The Feed Bunk: Where You Can See If It’s Working

Hutjens calls feed bunk management one of the places producers have the most control — and the least patience.

The guidelines aren’t complicated:

  • Bunk space: About 75 cm (30 inches) per Holstein or Brown Swiss cow.
  • Refusals:
    • Fresh cows: 2–5%.
    • High groups: 1–5%, depending on sorting.
    • Late‑lactation: 0.5–3%.
  • Timing:
    • Drop fresh feed at a consistent time, ideally as cows return from milking.
    • Push up roughly an hour before milking and every 2–4 hours after, depending on cow behavior.
  • Clean‑up:
    • Pull refusals at least daily; more often if you can.

On the Southwest dairy, the new batching system made it obvious when feed was late or uneven. Overhead cameras made it even more obvious. Pictures of bunks taken at regular intervals showed:

  • Red zones with little or no feed where cows were standing.
  • Times when the feed was supposed to be delivered but wasn’t.
  • Spots where cows sorted hard, leaving long particles and rejected bits.

On a 60‑cow freestall, you might not need cameras. A flashlight and your nose work fine.

A simple test: scrape your fingers along the concrete under where the feed sits. If you come up with gunk, slime, or something that makes you wince, your cows noticed it long before you did. Sealed surfaces, epoxy, or tile clean out better than raw concrete and don’t hold that film.

The Southwest dairy team didn’t love what they saw in the first week of bunk photos. But once they could see it, they could fix it — morning feed times, push‑up schedules, bunk‑cleaning routines. None of that required a new wagon. It required a new level of stubbornness.

“We Didn’t Change the Cows. We Changed Our Expectations.”

Feed additives, DCAD, precision grouping — all of that matters. But on a lot of farms, those tools get thrown at problems that start in the feed center and bunk.

Hutjens’ own “needs list” of additives for high‑producing herds is respectably short:

  • Rumen buffers.
  • Yeast cultures or yeast‑based products.
  • Monensin (where legal).
  • Proven silage inoculants.
  • Biotin.
  • Organic trace minerals.
  • Rumen‑protected choline and anionic salts for close‑up and fresh cows.

The Southwest dairy already had a lot of those boxes ticked. What they didn’t have was the discipline to demand a certain level of feed efficiency and shrink — and the tools to see where they were falling short.

That’s the line their manager kept coming back to after they saw the first month of data.

“We didn’t change the cows. We changed our expectations.”

They stopped accepting “good enough” for batching and bunks. They started writing down their own feed efficiency, shrink, and IOFC numbers. They stopped using milk price as an all‑purpose excuse and started looking for dollars they could actually reach.

That’s the part any operation reading this can copy — with or without an automated batching system.

What This Means for Your Operation

You don’t need 8,500 cows or a brand‑new micro‑ingredient setup to get the same kind of reality check. You need to stop guessing and write down a few numbers.

1. In the next 7 days, get your shrink out of the dark.
Pick three consecutive days. For each ingredient, record what should go into the mixer and what actually goes in. Track spoiled feed, wind losses, and what piles up in corners. If your total shrink comes in above 6–7%, that’s not “normal.” It’s a big, fixable cost center.

2. Within 30 days, write down four numbers.

  • Feed cost per pound of dry matter.
  • Feed cost per hundredweight of milk.
  • Whole‑herd feed efficiency (3.5% FCM ÷ DMI).
  • Best estimate of total feed shrink.

If you can’t put all four numbers on a single sheet of paper for your own herd, you’re flying blind.

3. Within 30 days, sit down with your nutritionist and price ingredients by nutrient, not habit.
Use a tool like Ohio State’s SESAME or your own spreadsheets to rank feeds by cost per unit of energy and protein at today’s prices. Corn silage, decent byproducts, and good forages often pencil out better than they look at first glance. Some “cheap” ingredients don’t.

4. Before your next harvest, treat NDFD like you would a proof.
Pull last year’s forage analyses. If your corn silage NDFD is stuck under 55% or your alfalfa under 50%, talk now about hybrid choice, planting decisions, and cutting stage. A 1‑point NDFD bump is worth roughly $1,600/month on a 1,000‑cow herd after extra feed is paid for. That’s as real as any proof change.

5. Any time you feel tempted to cut the ration, force yourself to run the 80‑lb vs 70‑lb math.
On a scratch pad, calculate feed cost per cwt and IOFC at both levels. If cutting ingredients pushes your feed cost per cwt up and IOFC down, your “savings” are just another shrink line — this time in the milk tank.

Key Takeaways

  • If your whole‑herd feed efficiency is under 1.3 for more than a month, treat it as a breakdown signal, not a ration‑cutting excuse. First, fix shrink, forage quality, and bunk behavior.
  • If you’ve never actually measured shrink by ingredient, your easiest money probably isn’t in the ration — it’s in the feed center and bunk. A three‑day audit will show you whether you’re closer to 5% or 8.5% shrink. The difference between those two is too big to ignore.
  • If your first response to a bad DMC margin is to cheapen feed, you’re probably deepening the hole instead of climbing out. The Southwest dairy only started winning when they stopped trying to save their way into profit and started demanding more milk and margin per pound of dry matter.
  • If your forages haven’t been tested for NDFD in the last year, you don’t actually know what you’re feeding. Until you do, you’re building rations on hope, not on what’s really in the bunk.

The Bottom Line

The Southwest dairy didn’t become a different farm when they installed that batching system. They just gave themselves nowhere to hide from their own numbers. If you pulled the last three months of your feed and milk data and wrote those four key numbers on a scrap of paper this week, would you like what you see?

Complete references and supporting documentation are available upon request by contacting the editorial team at editor@thebullvine.com.

Learn More

The Sunday Read Dairy Professionals Don’t Skip.

Every week, thousands of producers, breeders, and industry insiders open Bullvine Weekly for genetics insights, market shifts, and profit strategies they won’t find anywhere else. One email. Five minutes. Smarter decisions all week.
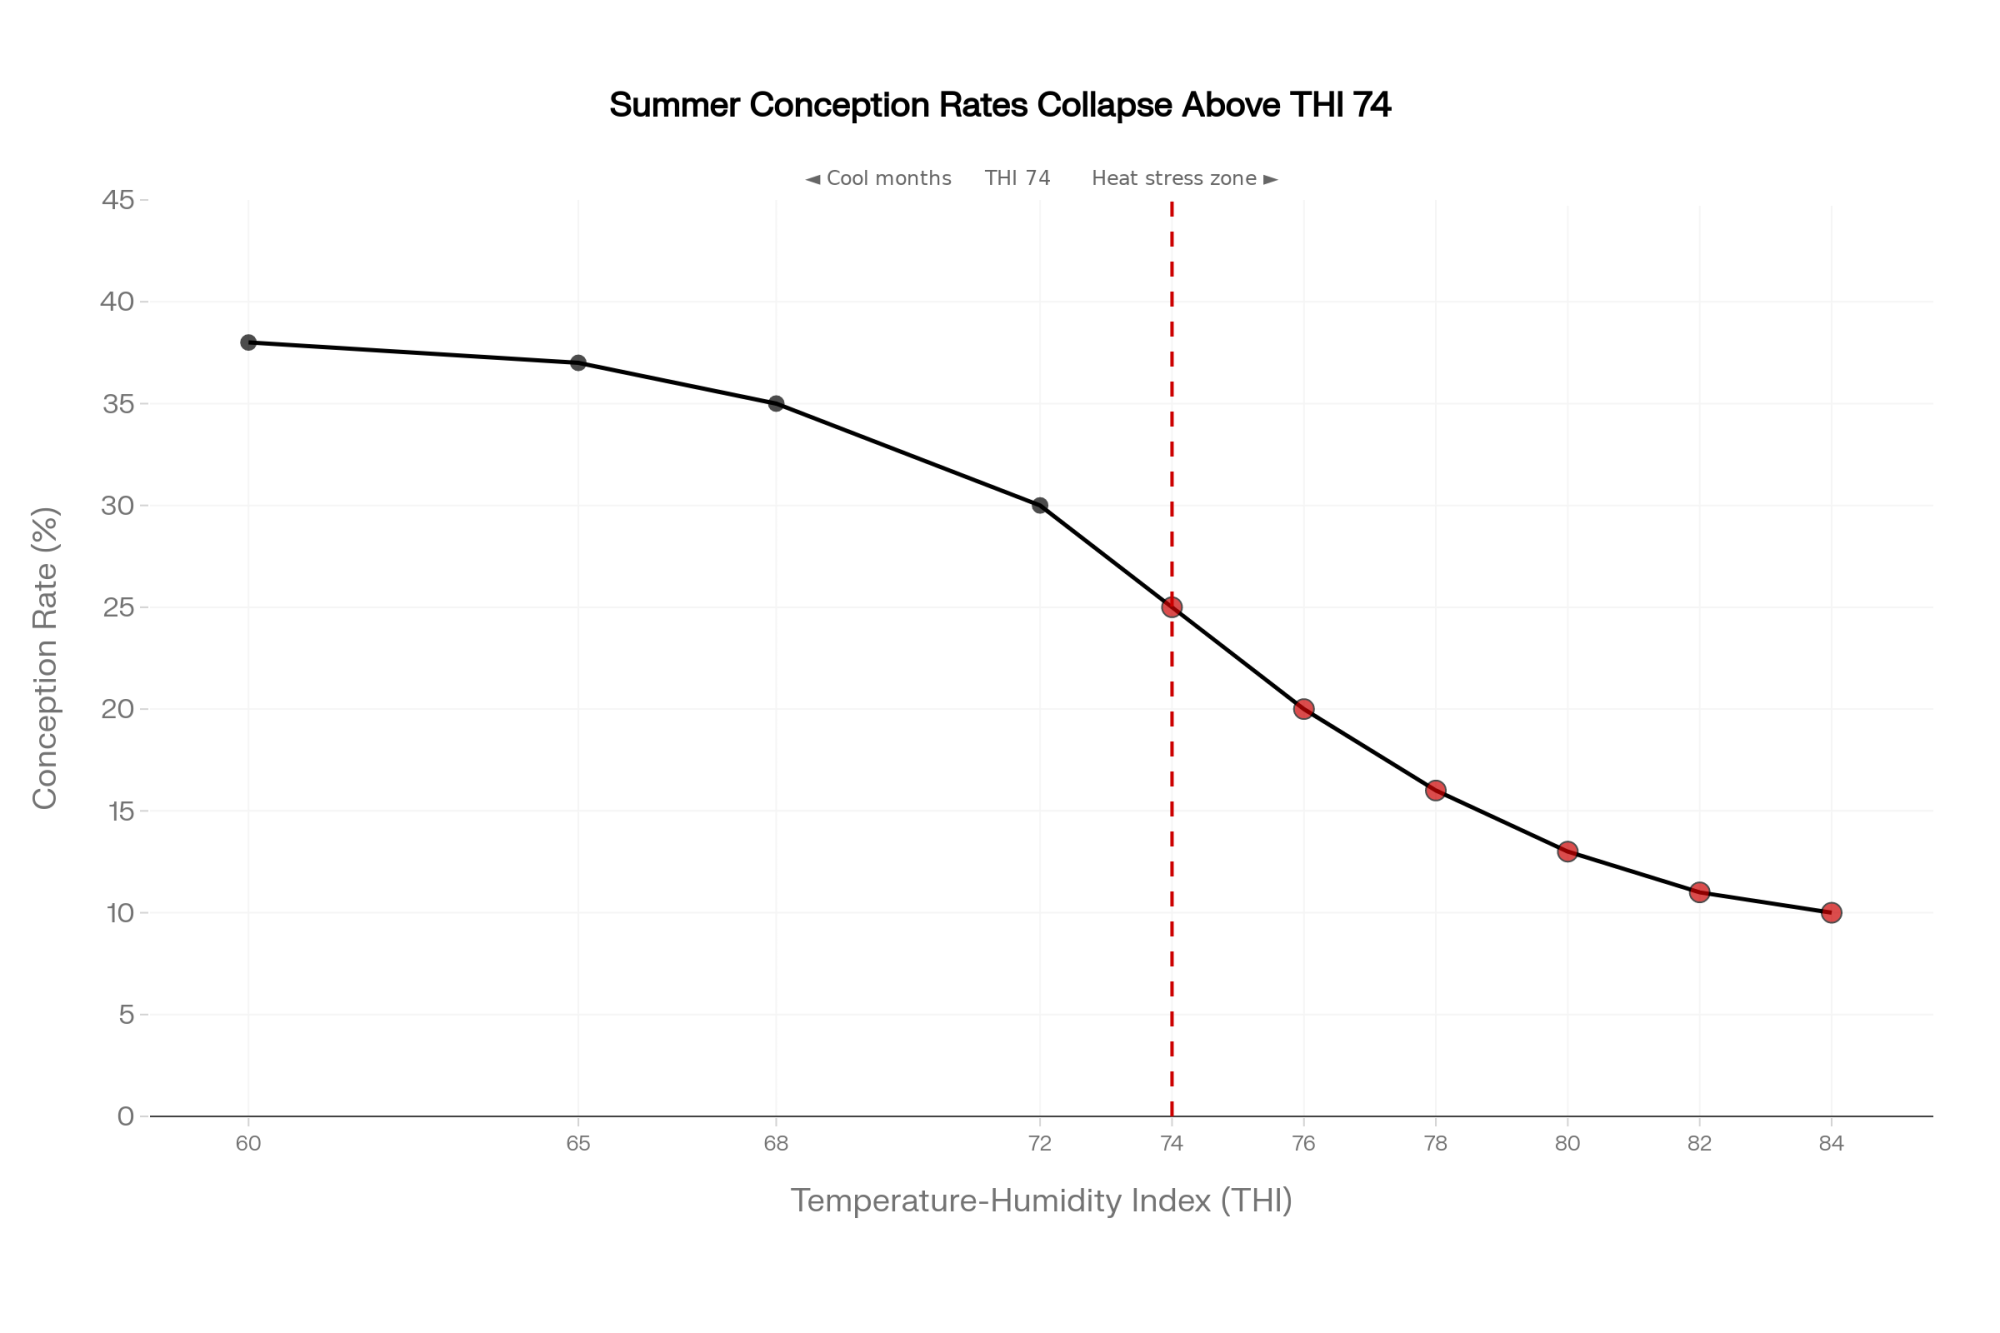
NewsSubscribe
First
Last
Consent

RAW FARM’s 7 Outbreaks: Is Your Raw Milk Premium a $3 Million Gamble?

RAW FARM has weathered 7 outbreaks and 15 recalls. Could your 400‑cow herd survive even one hit like that?

Executive Summary: RAW FARM, the California raw‑milk giant formerly known as Organic Pastures, has been linked to seven outbreaks and 15 recalls since 2006, including a current E. coli O157:H7 raw cheddar investigation that’s sickened seven people in three states. CDC’s 2025 report on “dairy farm A” — widely identified as RAW FARM — logged 171 Salmonella illnesses and 22 hospitalizations, with 70% of cases in kids, showing how hard raw milk hits families when something goes wrong. On your farm, peeling 10% of a 400‑cow herd into raw or direct sales can look like an extra $580,000–650,000 a year, until you price in a realistic $3 million outbreak hit and see how much of that premium disappears. In our barn‑math Punch Test, that $3 million spread over 10 years adds about $8.33/cwt at 3,000 cwt/month — and a painful $25.00/cwt if you’re only moving 1,000 cwt/month. If your liability policy carries the ISO or AAIS raw‑milk exclusions insurance consultant Casey Roberts has flagged, that punch comes out of your equity, not your insurer’s cheque. Dog Mountain Farm in Washington put $75,000 into a USDA‑certified raw goat dairy and then found its carrier had quietly dropped raw‑milk coverage — a reminder that you can lose the safety net even before you have a claim. This article uses RAW FARM’s history, simple per‑cwt math, and a three‑path playbook to help you decide whether your own raw milk premium is strengthening your balance sheet or just turning into a $3 million gamble.

RAW FARM’s position on the current FDA investigation (March 21, 2026)
Statement provided to The Bullvine by RAW FARM CEO Mark McAfee, March 21, 2026

“At Raw Farm our highest priority is nourishing our consumers with safe, Truly Raw, bioactive rich, non-thermalized, French Style, 60 day aged raw cheese. That is why we operate an on-farm pathogen lab. We get confirmation of negative pathogen status before any products are sold. Every batch of raw milk we produce is pathogen free before it becomes Truly Raw aged cheese where it is tested again before release. The FDA action is unfounded and not associated with our raw cheese. We know this because every batch of milk and cheese was tested individually. Three of the seven suspected illness cases denied ever consuming our raw cheese. This is data from PULSENET and collected over nearly 8 months of time. Two of the seven were seen at a hospital, the rest recovered at home. All of our tests and the state tests of products, both now and for the last year, have all tested negative. There is NO Recall and there is NO Outbreak associated with our raw cheese. We have the hard data to prove it. The last claimed illness was nearly two months ago. This action is misleading, unfounded and premature. No investigation has been concluded as required by the Food Safety Modernization Act. There is no threat to public health. If there was, we would be the first to act immediately.”

Editor’s note: McAfee also provided The Bullvine with test documentation including a CAHFS (CDFA) final lab report dated March 19, 2026 showing no detection of Campylobacter, Listeria, Salmonella, or STEC in sampled RAW FARM raw butter, raw cheese, and raw kefir; and RAW FARM’s own qPCR results from 11 retail cheese samples purchased March 17–18, 2026, all negative for E. coli O157:H7. These results reflect the specific lots and dates sampled. FDA’s investigation — based on whole‑genome sequencing of clinical isolates from patients whose illnesses date from September 2025 to February 2026 — remains open. As of this update, FDA confirms that no RAW FARM cheddar cheese products from the relevant time period have tested positive for E. coli.

On March 14, the FDA posted the kind of notice that keeps direct‑sales dairies awake: an E. coli O157:H7 outbreak investigation tying illnesses in California, Florida, and Texas to RAW FARM raw cheddar cheese — not fluid raw milk, which RAW FARM sells only within California. Seven people confirmed sick across three states, with illnesses dating back to September 1, 2025. Two hospitalized. Four of the seven are children — median age three, youngest just one year old. RAW FARM CEO Mark McAfee told The Bullvine that only three of the seven patients reported eating RAW FARM cheese, and that the others identified different brands or locally purchased raw milk in other states.

The FDA recommended that RAW FARM voluntarily recall its raw cheddar. The company refused. RAW FARM President Aaron McAfee told Brownfield Ag News the farm was “not participating in a voluntary recall because they believe the claims are false,” pointing to internal testing at every stage from cow to cheese vat to finished product. In a March 16 consumer statement and in correspondence with The Bullvine, CEO Mark McAfee emphasized that the FDA action was a consumer alert, not a mandatory recall, and that no pathogens have been found by FDA, CDC, or CDFA in any RAW FARM product tested in connection with this event. A CAHFS lab report dated March 19, 2026, provided to The Bullvine by McAfee, confirmed no STEC, Salmonella, Listeria, or Campylobacter in sampled RAW FARM raw butter, raw cheese, and raw kefir. Some retailers pulled the cheese anyway — they didn’t wait for RAW FARM to decide.

Whole-genome sequencing confirmed that the E. coli strains from the sick are genetically closely related, suggesting the patients were likely exposed to the same source. McAfee disputes the sufficiency of this evidence, arguing that WGS and PulseNet epidemiological data are investigative tools, not proof of causation, and that FDA has not performed a root‑cause analysis — including finding pathogens in any RAW FARM product — as he contends is required under the Food Safety Modernization Act. If you sell anything direct — raw milk, farmstead cheese, on‑farm yogurt — this isn’t just someone else’s PR crisis. It’s a case study in what the risk curve looks like when a raw‑dairy operation scales to about $30 million in annual revenue over two decades.

15 Recalls, 7 Outbreaks, and a $30 Million Brand

RAW FARM isn’t a cottage creamery that stumbled into trouble. Under the Organic Pastures name — rebranded to RAW FARM in 2020 after dropping organic certification — the McAfee family built what Forbes in December 2024 called “the country’s biggest producer of raw milk,” with sales exceeding million. Their operation spans about 800 acres near Fresno, California, housing around 1,200 cows according to Mark McAfee’s own account to the New York Times during the current investigation. Before the bird flu quarantine disrupted production, the LA Times reported that 1,800 cows across two farms — Fresno and Hanford — were affected in December 2024.

As of early 2025, KFF Health News reported RAW FARM products available in nearly 2,000 stores, with raw cheddar distributed nationally. Labels emphasize wellness positioning — RAW, A2/A2, TESTED, NON‑GMO, CERTIFIED HUMANE — signaling a premium, health‑conscious brand.

A documented legal and regulatory history

According to federal court records and reporting by Food Safety News and Marler Clark, Organic Pastures pleaded guilty in 2008 to two federal misdemeanor counts of introducing misbranded food into interstate commerce. A federal Permanent Injunction followed in 2010. By July 2023, a U.S. District Court found violations of that injunction, and Mark McAfee accepted a Consent Decree — as reported by Food Safety News in its coverage of United States v. Organic Pastures Dairy Co.

A case history compiled by the plaintiff firm, Pritzker Hageman, citing FDA and state health department records, lists at least 15 recalls and seven outbreaks involving Organic Pastures/RAW FARM products since 2006. Brownfield Ag News has separately reported that the operation has had “more than 10” recalls. RAW FARM has disputed the link between some illnesses and its products but has not publicly challenged those recall counts.

Outbreaks span two decades. A 2006 E. coli outbreak sickened four children ages 7 to 10; all were hospitalized, according to Pritzker Hageman’s case tracking. In 2011, five children ages 1 to 5 fell ill with E. coli — three developed hemolytic uremic syndrome. Campylobacter clusters in 2012 sickened 10 people, six of them kids. A 2016 E. coli outbreak sickened six more children.

The largest documented event

CDC’s MMWR report on the 2023–24 Salmonella outbreak, published in July 2025, anonymized the source as “dairy farm A.” Subsequent reporting by the LA Times, Marler Clark, and Pritzker Hageman has identified “dairy farm A” as RAW FARM. RAW FARM has publicly challenged parts of the FDA and CDC investigations into its products but has not, to date, issued a specific public statement accepting or rejecting that identification.

CDC’s MMWR reported 171 outbreak‑associated illnesses across California and four other states, with 22 hospitalizations. Case profile: 70% of all cases and 82% of hospitalizations were among children and adolescents under 18, with a median age of seven. Four product samples tested positive by whole genome sequencing, including raw‑milk cheese aged 60 days, the very aging period FDA allows for interstate raw cheese sales.

A CDC‑linked analysis of U.S. outbreak data from 1993–2006, published in Emerging Infectious Diseases, found that raw dairy was associated with roughly 150 times more outbreaks per unit consumed than pasteurized dairy. Demand keeps climbing —January 2024 media coverage quoted raw‑milk advocates saying demand has “dramatically increased” across the U.S. and Canada.

California already has one of the tighter raw‑milk regulatory frameworks in North America — Grade A inspection, mandatory pathogen testing, and warning labels. Notably, CDFA has not taken independent enforcement action on the current FDA investigation, and McAfee points to this as evidence that California’s own regulators do not see grounds for action. Even with that framework and a company of RAW FARM’s size and experience, the broader outbreak history shows that risk doesn’t disappear.

Does the Raw Milk Premium Really Look Too Good to Walk Past?

Take a 400‑cow herd averaging 80 lb per cow per day. That’s 32,000 lb — 320 cwt — shipped daily. Peel off 10% into direct‑sales products, and you’re moving about 11,680 cwt a year through your own bottle, vat, or farm store.

Pool that at $19/cwt, and it brings in roughly $221,900. Raw/direct at an illustrative $69–75/cwt — accounting for retailer margins and a mix of fluid and cheese — clears roughly $806,000–876,000 on the same volume. That’s a premium of 0,000–650,000 a year on just a tenth of your milk. You don’t have to squint to see why somebody says “We should be bottling this” every time the mailbox price dips.

Now, lay RAW FARM’s documented history beside those numbers. According to Pritzker Hageman’s tracking, seven outbreaks over twenty years work out to one every 2.9 years. Fifteen recalls are roughly one every 16 months — a frequency that, in our view, raises hard questions about how manageable raw‑dairy risk really is at scale, even at a company that outlets like Forbes have described as the country’s biggest raw‑milk producer. RAW FARM disputes links between some of these events and its products and notes that the current investigation involves raw cheese specifically, not fluid raw milk.

A ‑million‑revenue operation has fundamentally different financial resilience than a 400‑cow family dairy with –3 million in total annual revenue. If an operation at RAW FARM’s scale takes a hit, its balance sheet has a lot more room to absorb it than most family farms ever will. That’s the number most spreadsheets politely ignore.

How Much Risk Per Cwt Are You Actually Carrying?

By processing and selling direct, you keep the money the plant would’ve taken — packaging margin, brand premium, part of the retailer spread. But the risk mechanics blend probability and severity in ways that aren’t intuitive.

CDC and peer‑reviewed data show that unpasteurized dairy — fluid milk and cheese combined — causes many more outbreaks per unit consumed than pasteurized dairy. Kids get hit hardest — in the 2023–24 Salmonella event linked by multiple outlets to RAW FARM, 70% of the 171 cases were under 18, and 82% of hospitalizations were children and adolescents, per CDC’s MMWR. RAW FARM has publicly challenged parts of the investigations into its products.

Outbreak EventTotal Ill% Children / AdolescentsHospitalizations% Hosp. Were KidsWorst Outcome
2006 E. coli (Organic Pastures)4100% (ages 7–10)4100%All 4 hospitalized
2011 E. coli (Organic Pastures)5100% (ages 1–5)3100%3 developed HUS
2012 Campylobacter1060% (6 of 10)Not reportedCluster across multiple households
2016 E. coli6100% (children)Not fully reportedCDPH recall triggered
2023–24 Salmonella (“Dairy Farm A”)17170% under 182282%Multiple pediatric hospitalizations
2025–26 E. coli O157:H7 (raw cheddar)7 (confirmed)57% (4 of 7)2Not specifiedMedian age 3; youngest age 1

Serious cases are expensive. One child’s HUS hospitalization in the 2006 E. coli outbreak associated with Organic Pastures topped $250,000 in direct medical costs alone, according to case records cited by Marler Clark. Pritzker Hageman has described winning over $2 million for a single raw‑milk E. coli client.

Now put that into barn math. Say you’re holding a $50/cwt premium over pool — a farm‑gate around $70 vs a $20 pool cheque. Maybe $3–5/cwt goes to testing, QA, and compliance.

Layer in the outbreak tax. At higher volumes — around 36,000 cwt/year — a $3 million hit spread over ten years adds roughly $8.33/cwt. At 2,500,000 ÷ 360,000, you land closer to $6.94/cwt; shift the assumed hit up to $3 million, and you’re in that $8‑and‑change range. At 12,000 cwt/year, that same $3 million hit works out to $25.00/cwt. Most people never put that number on paper.

Combined, testing overhead and outbreak tax easily eat up roughly $8.50–$ 13/cwt at high volume. At lower volume, it can run $20–30/cwt. If your real premium is closer to $30–35 than $50, you’re in a game where the math only works as long as you never take the punch.

We broke down how processing premiums actually strengthen the balance sheet rather than stretch it in our look at Nebraska’s $186 million gamble.

The Bullvine 10‑Year Punch Test

Step 1. Estimate a single realistic outbreak hit: $3 million all‑in (legal fees, settlements, lost business, brand damage). That’s a round but defensible number when you look at HUS hospitalization costs and multi‑victim settlements in raw‑milk cases.

Step 2. Calculate your 10‑year projected raw/direct volume in cwt. Example: 3,000 cwt/month = 360,000 cwt over a decade.

Step 3. Divide: $3,000,000 ÷ 360,000 = $8.33/cwt.

Step 4. Compare that to your premium over pool. If the punch tax eats much more than about 20–25% of your premium, the economics start to look more like a gamble than a farm business. At a $35/cwt premium, $8.33 is just under 24% of your upside spoken for.

Step 5. Run it at your real volume. A smaller line at 1,000 cwt/month: $3,000,000 ÷ 120,000 = $25.00/cwt — more than 70% of a $35 premium. Scale matters. So does honesty.

Swap in your own premium and monthly volume here. Don’t guess — pull last year’s numbers and do the math.

We walked this same expected‑value logic on a Florida raw‑milk lawsuit — worth comparing those numbers to your own.

Is Your Policy Written for the Product You’re Actually Selling?

This question decides whether an outbreak is “a terrible year” or “we’re selling the home farm.” And it’s not hypothetical — producers have discovered this the hard way. Dog Mountain Farm near Carnation, Washington, invested ,000 in a USDA‑certified raw goat milk dairy and then learned their carrier had dropped their raw‑milk coverage, according to Food Safety News. Owner Cindy Krepky was left searching for a replacement policy after her carrier dropped raw‑milk coverage. Denver insurance broker Kendall Turner told the same outlet that it’s “become very difficult for dairy farms to obtain liability coverage for the sale of raw milk” — and that “the insurance company sometimes has more rules than the state.”

Before you scale — before you sell the first gallon — pull your policies and get this answered in writing:

Does our liability and umbrella coverage explicitly include unpasteurized milk and raw‑milk cheeses we sell directly or through retailers, with no special exclusions or lower sub‑limits for foodborne illness?

Both ISO and AAIS publish standard raw‑milk exclusions that insurers bolt onto farm liability policies. Insurance risk consultant Casey Roberts, writing in IRMI in October 2025, reviewed these exclusions and compared them to “a total pollution exclusion” in how completely they shut out raw‑milk claims.

ISO’s farm liability exclusion reads: “This insurance does not apply to… ‘Bodily injury’, ‘property damage’, ‘personal injury’ or ‘advertising injury’ resulting from the production, processing, distribution, bottling, transportation or selling of raw or unpasteurized milk.”

AAIS’s version (GL 4000 01 17) is similarly broad, excluding bodily injury or property damage “arising out of the consumption of” raw milk or raw milk products. One national farm insurer’s proprietary endorsement goes further — excluding “any duty we have to defend ‘suits’” arising from raw milk. They won’t pay, and they won’t show up in court with you.

Roberts described these exclusions as designed to “completely exclude” all raw‑milk liabilities. If your policy has any version of this language, your headline coverage limit doesn’t apply to your raw line.

Standard Farm Policy vs. Raw‑Specific Product Liability

FeatureStandard Farm PolicyRaw-Specific Product Liability
Pathogen coverage❌ Typically excluded via ISO/AAIS raw-milk endorsement✅ Explicitly includes raw & unpasteurized products
Raw-milk exclusion languageApplies: “does not apply to…production, processing, distribution…of raw or unpasteurized milk” (ISO)No exclusion; raw products named and covered
Recall expense limit$10K–$25K per event (BOP/GL standard)$50K–$500K+ via standalone recall endorsements
Multi-state claims❌ Limited; written for local operations✅ Designed for distribution beyond farm gate
Duty to defend⚠️ May be voided by raw-milk exclusion endorsement✅ Insurer provides legal defence — contractually
Annual premium cost indicatorLower (raw risk not priced in)Higher — but reflects actual exposure
Real-world exampleDog Mountain Farm: $75K invested, coverage dropped silentlyPolicies explicitly named by product line

Within the next 30 days, do this: pull every policy and endorsement touching liability and products. Search for “raw,” “unpasteurized,” “high‑risk food,” “foodborne illness,” and “direct‑to‑consumer.” Get a clear, written answer from your agent on what’s covered and what truly raw‑inclusive coverage would cost at your current volume.

If that exercise leaves you queasy, that’s the most useful thing you’ll learn this month.

Our Florida raw‑milk wake‑up call covers the HACCP and testing basics every on‑farm processor needs nailed down.

Options and Trade‑Offs for Farmers

Once you run the Punch Test on your own numbers and stare your coverage in the face, you’re basically picking one of three paths. None is automatically right or wrong. The danger is drifting in the middle — raw volume big enough to seed a multi‑state outbreak, but structure and coverage still sized for a farm‑gate side hustle.

DimensionPath A — Capped Local PremiumPath B — True Business LinePath C — Stay Out / Lower-Risk Value-Add
Monthly volumeUnder 500 cwt/mo500–10,000+ cwt/moAny — raw not the vehicle
Annual raw revenue (illustrative)<$415K$415K–$8.3M+N/A (pasteurized or genetics premium)
Punch tax exposureLow (<$5/cwt at 500 cwt/mo)$8.33–$25/cwt (volume-dependent)Zero outbreak tail risk
Required liability coveragePolicy explicitly covering raw; local scopeMulti-million, no raw exclusion; recall coverage; multi-stateStandard farm policy adequate
Legal entity structureFarm store side operation acceptableSeparate legal entity essentialN/A
Food-safety program requiredBasic SOPs + traceabilityHACCP, pathogen testing, environmental monitoringStandard GMP
Multi-state outbreak riskLow if volume cappedHigh — you ARE a multi-state operatorNone
Capital at stakeManageable; core farm protectedFarm + processing assets at risk without structureCore farm protected
Who this fitsSmaller family dairies with strong local retailOperations targeting $1M+ raw/direct revenueFarms prioritizing risk-adjusted ROI

Ask yourself three questions:

  1. Volume: Is your raw/direct line under 500 cwt/year, between 500–10,000, or above 10,000?
  2. Coverage: Does your liability policy explicitly name and cover raw/unpasteurized products — yes, no, or “I don’t know”?
  3. Structure: Is your raw/direct operation in a separate legal entity from your land and cows?

Under 500 / yes / doesn’t matter much at this scale → Path A. Above 500 / yes/yes → Path B. Any other combination — especially “I don’t know” on coverage — means you’re in the gap.

Path A: Keep raw as a capped, local premium outlet

You want better cash flow on a small slice of production. Priority: protecting the core farm. Keep volume below the band where one bad batch seeds cases in multiple states. Sell through channels you can trace and recall fast — your own farm store, subscription boxes, a handful of local shops. Build basic but real testing and SOPs, backed by a policy that explicitly covers raw products at your actual volume.

Within 30 days, confirm in writing that your current policy covers your raw products. Put a one‑page recall plan on paper — who you call, how you trace the product, how you notify customers.

Path B: Build raw/direct as a true business line

You’re aiming for serious volume — thousands of cwt, multiple products, multi‑state retail. That takes entity structure, separating land and cows from processing risk; liability limits in the multi‑million range with no raw-exclusion limits; recall coverage; and a real food‑safety program: HACCP plan, pathogen testing, environmental monitoring, and traceability from cow to consumer. RAW FARM reached about $30 million in revenue, and its outbreak history, as documented by the FDA, CDC, and multiple news outlets, shows that scale alone doesn’t eliminate risk.

You gain margin and brand value. You give up the ability to treat an outbreak as “local noise” — every misstep is now a multi‑state event.

Within 90 days, sit down with a food‑savvy attorney and your lender. Walk them through the Punch Test with your actual numbers. Ask both: “Would you be comfortable if we doubled this line next year?”

Path C: Stay out or choose lower‑risk value‑add

Your risk tolerance or capital doesn’t line up with the downside. Other value‑add playbooks — A2A2 contracts, branded but pasteurized on‑farm processing, genetics‑driven component premiums — might deliver better risk‑adjusted returns without putting your farm on a raw‑milk outbreak curve.

Once a year, if you chose Path A or B, revisit your Punch Test numbers, your policy, and your outbreak plan. If the answers don’t still hold, reclassify yourself honestly. RAW FARM’s documented history shows that the twentieth year can look a lot like the first.

What This Really Means If You’re Already Selling Raw

RAW FARM’s case also illustrates a different tension: a producer can run thousands of negative tests and still face an FDA investigation driven by clinical WGS data. Whether you think that’s overreach or proper surveillance, the financial and reputational exposure is real either way. If your policy has any form of raw‑milk exclusion and you’re selling beyond very small, local volumes, you’re effectively self‑insuring a multi‑million‑dollar risk — whether you’ve priced that into your premium or not. If your raw/direct premium per cwt doesn’t clear your punch‑tax number plus real testing and QA costs, that line isn’t adding resilience to your operation — it’s just moving risk from the co‑op’s balance sheet onto yours.

If your Punch Test shows more than about a quarter of your premium disappearing into outbreak risk and overhead, that’s a yellow light. And if one bad batch at your current volume could seed cases in multiple states while your entity structure and insurance still look like a farm‑store side gig, that’s a hard red light.

Key Takeaways

  • If the Punch Test shows more than about 20–25% of your raw/direct premium per cwt going to outbreak risk, the economics say your line is fragile. At 1,000 cwt/month, a single $3M hit works out to $25.00/cwt — over 70% of a $35 premium.
  • If your liability policy contains any ISO or AAIS raw‑milk exclusion, your stated coverage limit does not apply to your raw line. Get that confirmed in writing within 30 days. Dog Mountain Farm’s $75,000 investment in raw production became uninsurable overnight — and they only found out after the carrier dropped them.
  • If one bad batch at your current volume could seed cases in multiple states, but your structure and coverage are still sized for farm‑gate sales, you’re in the gap. Upgrade the structure and coverage or cap volume.
  • If your lender and lawyer both look uncomfortable walking through a large‑scale outbreak scenario with your numbers, believe them. Their discomfort is a better risk signal than your most enthusiastic raw customer’s praise.

The Bottom Line

RAW FARM built a $30‑million brand, ran one of the most tested raw programs in the country — including an on‑farm PCR pathogen lab that McAfee says has generated more than 14,000 negative tests since September 2025 — and operated under California’s tighter oversight. Federal and state records, as compiled by CDC, FDA, and Pritzker Hageman’s case tracking, describe multiple outbreaks and recalls involving Organic Pastures/RAW FARM products over two decades, with more than 200 illnesses documented and some children developing hemolytic uremic syndrome. RAW FARM disputes links between some events and its products. In the current investigation, no pathogens have been found in any RAW FARM product tested to date by FDA, CDFA, or the company itself — though the implicated lots consumed by patients between September 2025 and February 2026 may no longer be available for testing. A company of that size has the balance‑sheet depth to absorb far more risk. Your 400‑cow family dairy, with a multi‑generational legacy tied to that land, almost certainly does not.

Run the Punch Test, pull your policies, and have that conversation this month. If the numbers hold up and your structure matches the risk, build it right. When they don’t? That’s valuable information too — and a lot cheaper to learn now than from a state health department.

We’re building the full cost‑per‑cwt model by herd size and product mix in a Tier 3 economics feature, paired with a Tier 2 food‑safety playbook on entity structure, policies, and recall plans. That’s where the deeper spreadsheets and checklists will live.

Update, March 21, 2026: RAW FARM CEO Mark McAfee responded directly to The Bullvine, providing test data from CDFA’s CAHFS laboratory, RAW FARM’s on‑farm qPCR lab, and a consumer‑facing statement dated March 16, 2026. His positions — including that only three of seven patients reported consuming RAW FARM cheese, that all pathogen tests are negative, and that FDA acted without a root‑cause analysis — have been incorporated into this article above. The Bullvine has reviewed the test documents provided; readers can contact RAW FARM directly for complete test records. The FDA’s investigation remains open.

Complete references and supporting documentation are available upon request by contacting the editorial team at editor@thebullvine.com.

Learn More

The Sunday Read Dairy Professionals Don’t Skip.

Every week, thousands of producers, breeders, and industry insiders open Bullvine Weekly for genetics insights, market shifts, and profit strategies they won’t find anywhere else. One email. Five minutes. Smarter decisions all week.
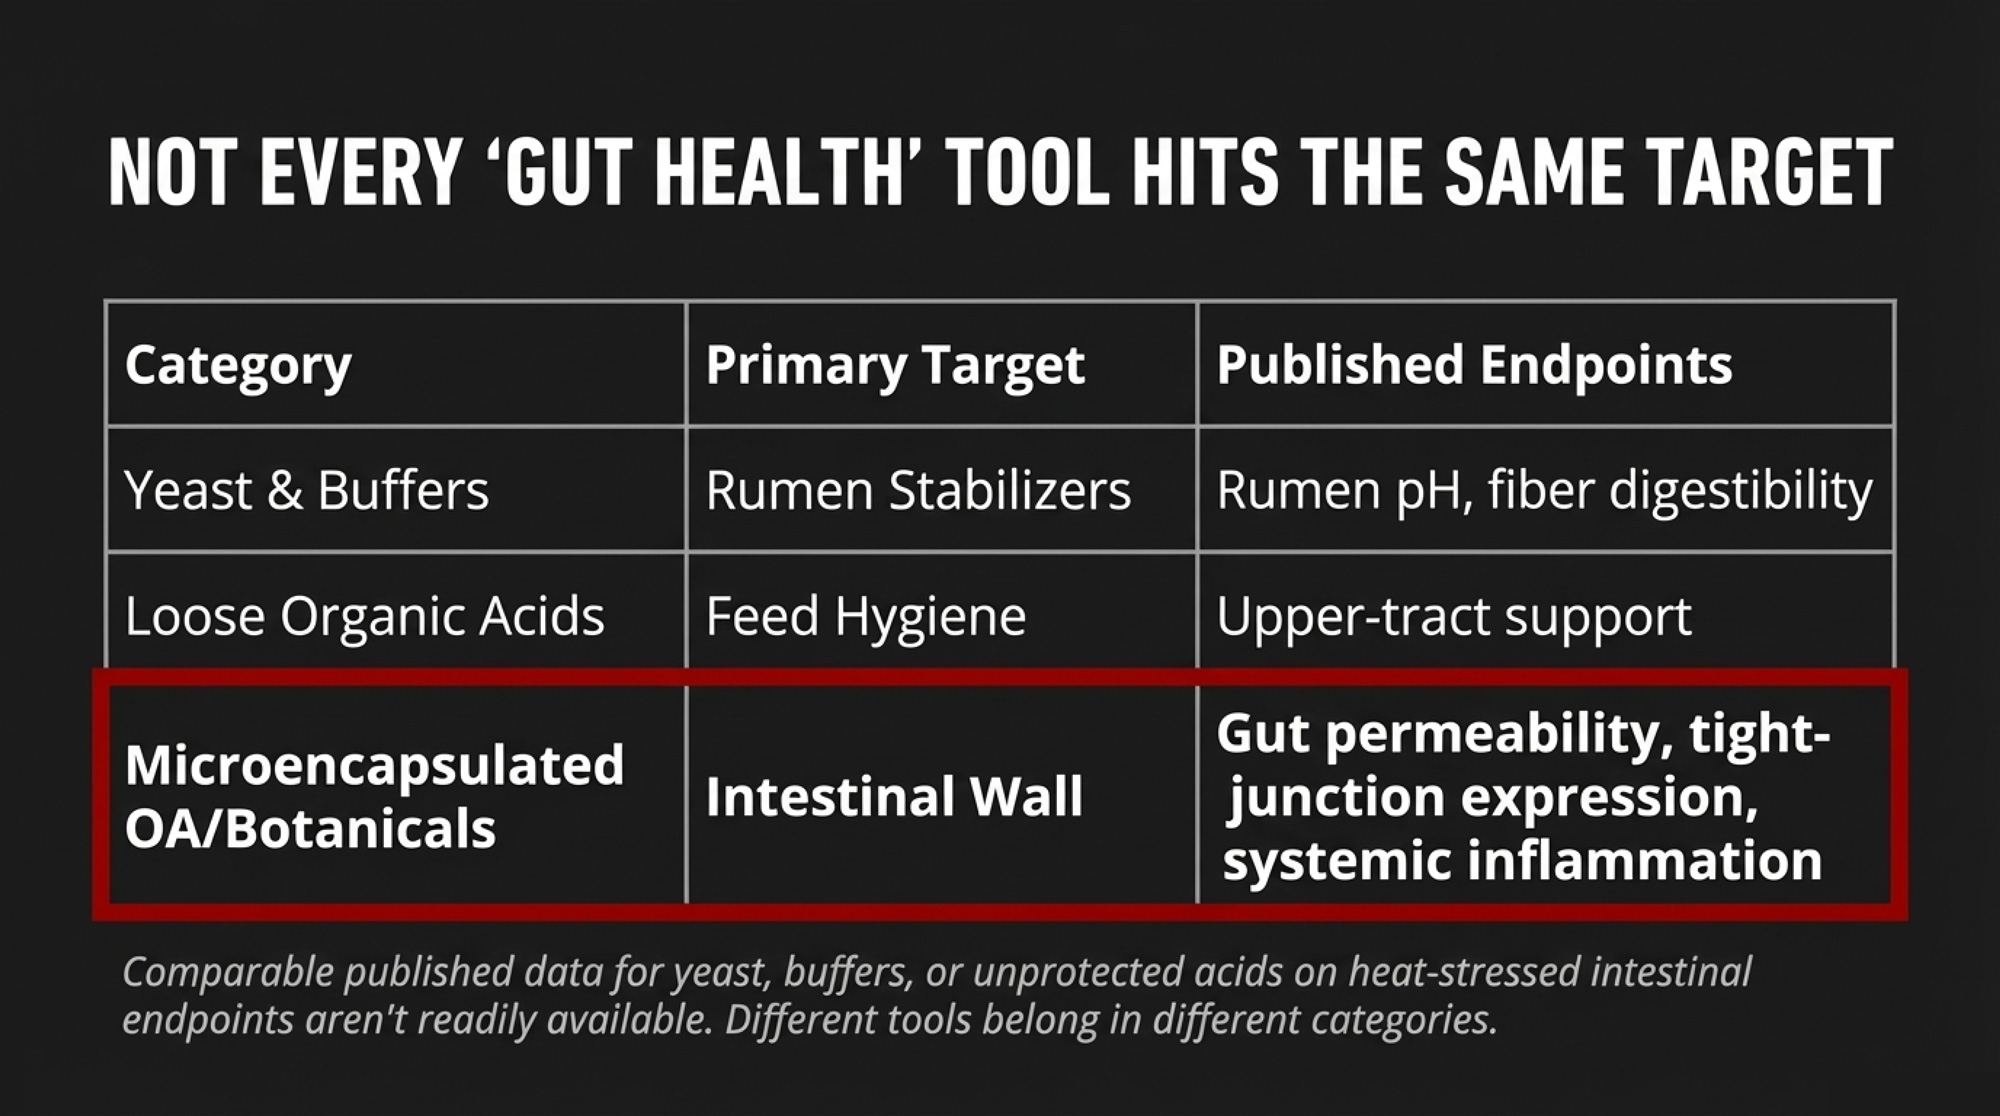
NewsSubscribe
First
Last
Consent

Nigel Cook’s $74 Heat Stress Number Was Never Wrong. It Was Never Finished.

Fertility collapse, feed efficiency erosion, and the wrong potassium source are where heat stress quietly empties the tank — and none of it shows up in that number.

Executive Summary: Nigel Cook’s $74-per-cow heat stress number was never wrong — it only priced the milk, not the pregnancies, culls, and lost efficiency that push his own updated estimate for Wisconsin closer to $120 per cow. New work on THI shows conception rate damage starting around 60, while most barns still wait until 68–72 to flip fans on, so herds are quietly losing pregnancies while cows look “fine.” On the nutrition side, meta-analyses and field trials now point to summer DCAD targets in the +350 to +400 mEq/kg DM range, with roughly 0.5% sodium and 1.8% potassium if you actually want to protect components rather than change a premix tag. Those same trials make it pretty clear that potassium carbonate and potassium chloride aren’t interchangeable: carbonate drives DCAD and milk fat response, and chloride mostly keeps the spreadsheet and the ingredient bill happy. Put together, the 2026 heat stress question isn’t “Is it costing me $74 or $120?” — it’s whether your real summer ration and cooling triggers are set for THI 60 and +350 DCAD, or still stuck on spring settings.

dairy heat stress economics

His milk-loss figure was never meant to capture the full extent of the damage. Fertility collapse, feed efficiency erosion, and the wrong potassium source are where heat stress quietly empties the tank.

Nigel Cook’s heat-stress research at UW–Madison gave the dairy industry one of its most-quoted figures: $74 per cow per year in lost milk production. Clean. Quotable. Easy to multiply by herd size, subtract the cost of fans, and feel like you’ve done the math. But Cook always framed that figure as a milk production estimate — not the total economic hit.

Across the industry, though, $74 quietly became the ceiling on what summer heat was “worth” fixing. Cook himself has since suggested that for the Madison, Wisconsin, climate — roughly 77 days above 20°C, a pattern that looks a lot like southern Ontario — the number is closer to $120 per cow per year. And even that doesn’t touch fertility, lameness, culling, or metabolic costs. Jeff Dahl and colleagues at the University of Florida have estimated total U.S. dairy heat-stress losses at over $1.5 billion annually, once reproduction and long-term effects are factored in. USDA modeling has pegged average per-farm production losses at roughly 183,000 lb of milk in some heat-affected regions.

The $74 was never wrong. It was always scoped to milk loss alone. The problem starts when that number becomes your entire summer budget.

Fertility Starts Sliding Before the Fans Turn On

Most barns flip fans and soakers on around THI 68–72. For visible panting and milk drops, that threshold holds up. Fertility is a different animal.

A 2024 Dutch study published in the Journal of Dairy Science matched reproduction records for hundreds of thousands of first-parity Holsteins against daily THI. The calving-to-first-insemination interval and the overall calving interval began to stretch at THI 50. Conception rate and first-to-last-insemination interval started to slide at THI 60 — a full 8 to 22 points before most cooling systems respond.

At THI 60, the barn looks fine. No panting. Cows lying down. But inside the cow, the damage is already stacking up. Peter Hansen’s work at the University of Florida explains why: heat disrupts hormonal signaling during follicular growth, damages developing oocytes at the DNA level, and reduces the proportion of embryos that reach the blastocyst stage — the point where implantation becomes possible. In many of Hansen’s experiments, the oocyte still got fertilized. It just couldn’t develop properly afterward.

Hansen and Aréchiga reported that summer pregnancy rates per insemination can drop to 10–20%, roughly half to a third of those in cool weather. And oocyte damage persisted for about 105 days after the heat event ended — a full follicular cycle.

Your July heat isn’t just a July problem. It’s why September pregnancy rates sag, fall synch costs climb, and replacement numbers look thin the following spring. None of that shows up in $74.

The Feed Efficiency Staircase

On the production side, deterioration under heat stress is predictable and stepwise. NRC-based modeling, echoed in extension presentations and on-farm data, maps what you’ll see from the parlor:

Barn TemperatureMaintenance EnergyDMI NeededDMI ConsumedMilk (kg)Feed Efficiency
20°C (68°F)100%18.2 kg18.2 kg27.31.50
25°C (77°F)111%19.1 kg16.8 kg23.21.38
30°C (86°F)120%19.5 kg16.4 kg18.21.11

Between 20°C and 25°C — a shift you can get in a single afternoon — the cow drops about 4 kg of milk while eating 1.4 kg less dry matter. She needs more energy, not less, because maintenance jumped 11% just to run her cooling systems. By 30°C, feed efficiency has cratered from 1.50 to 1.11. That’s a completely different economic animal.

But a lower intake only accounts for part of the milk loss. Heat-stressed cows actively repartition nutrients — more glucose gets diverted to survival and heat dissipation, less reaches the udder. You’re fighting on two fronts at once: holding DMI and persuading the cow to send those nutrients back to the bulk tank. Throwing more grain and fat on top of a spring mineral program can raise the feed bill without recovering the milk.

Is Your Summer DCAD Still Running on Spring Settings?

If there’s one number to check before the heat arrives, it’s DCAD.

Most lactating rations sit around +200 to +250 mEq/kg DM. Fine in cool weather. Under heat stress — when cows lose sodium, potassium, and bicarbonate through sweat and faster respiration — that margin gets tight fast.

The 2015 Iwaniuk and Erdman meta-analysis in the Journal of Dairy Science found that milk fat yield and concentration continue to increase as DCAD rises, reaching 400–500 mEq/kg DM. DMI and milk yield plateau between 200 and 300. A 2025 review by Kirby Krogstad at Ohio State, summarized in the Buckeye Dairy News, recommends ≥300 mEq/kg DM for milk fat production, with practical heat-stress targets pushing into the mid-300s to 400 mEq/kg DM range.

Summer mineral targets for high cows, drawn from extension guidelines and applied nutritionist recommendations:

  • Sodium: 0.4–0.5% of DM, primarily from sodium bicarbonate
  • Potassium: 1.5–1.8% of DM, ideally from potassium carbonate
  • Magnesium: 0.30–0.35% of DM, with K: Mg close to 5:1
  • DCAD: >+350 mEq/kg DM, with some research pointing to a “sweet spot” near 400

Getting from a +220 DCAD spring ration to the +350–+400 band with those mineral levels puts you in the zone the research actually supports. Pull real summer rations across dairy farms, and a lot of them are still April diets with a bit more buffer and whatever potassium was cheapest.

The Potassium Source Question: Does KCl Actually Move Your DCAD?

This is the part of the summer ration that gets the least scrutiny and probably costs the most in unrealized response.

MineralCool-Season BaselineHeat-Stress TargetNotes
Sodium0.18–0.22% DM0.40–0.50% DMPrimarily from NaHCO₃
Potassium1.0–1.2% DM1.5–1.8% DMPrefer K₂CO₃ as primary lever
Magnesium0.20–0.25% DM0.30–0.35% DMK:Mg ratio target ~5:1
DCAD+200–+250 mEq/kg+350–+400 mEq/kg<span style=”color:red”>Gap = where fat pounds disappear</span>
ChlorideManaged for DCAD balanceKeep low in lactatingKCl adds Cl without DCAD benefit

Potassium chloride is familiar and cheaper per unit of K. It checks the box on the ration printout. But chloride salts make no net contribution to positive DCAD — the chloride anion essentially offsets the potassium cation on a milliequivalent basis. You add potassium. Chloride takes it right back. Potassium carbonate, by contrast, delivers roughly 20% more DCAD per kilogram than sodium bicarbonate, and the carbonate anion provides direct rumen buffering.

Classic Clemson work, referenced in several extension programs, demonstrated that KCl doesn’t have the same impact on heat-stressed cattle as K₂CO₃. Tom Jenkins at Clemson tested this directly — first in vitro, then in live cows.

A 2014 Journal of Dairy Science continuous-culture study increased potassium from about 1.2% to 2.0% of DM using K₂CO₃ and tracked rumen biohydrogenation. The shift was clear: more stearic acid and cis-9, trans-11 CLA, fewer trans-10 intermediates — the fatty acid profile associated with higher milk fat.

Then came the cow trial. Jenkins and colleagues (2017, JDS) fed 35 early-lactation Holsteins one of five diets: a high-concentrate control (DCAD ~65 mEq/kg), K₂CO₃ (DCAD ~326), KHCO₃ (DCAD ~324), KCl (DCAD ~64), or Na₂CO₃ (DCAD ~322). Results:

  • Milk fat concentration: K₂CO₃ pushed fat to 4.03% versus 3.26% for the control — a 0.77 percentage point lift.
  • Total fat yield: Did not significantly improve, partly because milk volume tended to decrease with K₂CO₃ compared to KCl under that extreme diet.
  • Biohydrogenation pathway: Trans-10 18:1 was higher with Na₂CO₃ than with K₂CO₃, indicating K₂CO₃ specifically favored the pathway associated with normal milk fat.

Two honest caveats. This trial used a very high-concentrate diet (47% NFC) designed to stress milk fat, and the DCAD jump — from 65 to 326 — is much larger than the jump from a spring ration to a summer formulation. The decrease in milk volume with K₂CO₃ likely reflects those extreme conditions. In a more typical TMR, expect a more moderate response.

The piece that actually matters on-farm: when the same potassium level came from KCl, DCAD remained stuck at ~64 mEq/kg, and the favorable fat shifts didn’t appear. Chloride blunted the effect.

One thing worth being clear about: KCl is still the right product for close-up dry cow programs targeting a negative DCAD, and it can meet potassium requirements in rations where DCAD is already on target from other buffering sources. The problem is specific — using KCl as the primary lever to push DCAD higher in a heat-stress lactating ration.

FeatureKClK₂CO₃
Net DCAD impactMostly neutral — Cl⁻ offsets K⁺Strongly positive — ~20% more DCAD/kg than NaHCO₃
Rumen bufferingNoneDirect buffering effect
Fat concentration (Jenkins 2017)No improvement; DCAD stayed at ~64 mEq/kg+0.77 points vs. control (4.03% vs. 3.26%)
Cost per unit KLowerHigher
Best useClose-up dry cows (negative DCAD); meeting K when DCAD already on targetSummer DCAD push + fat support under heat stress

Why Potassium Reaches the Udder — Not Just the Rumen

This isn’t just a rumen story. It reaches the mammary gland, and that’s why a heat-stressed cow losing potassium through sweat isn’t just depleting a mineral. She’s losing her ability to make milk.

Every cell runs a sodium-potassium pump (Na⁺/K⁺-ATPase) that maintains the electrochemical gradient the cell needs to function. Foundational work by Linzell and Peaker in the 1970s identified this pump on mammary epithelial cell membranes and measured intracellular potassium in mammary tissue at approximately 115 mEq/L in guinea pigs, with similar values later confirmed in ruminant models.

Potassium is the primary cation in bovine sweat. Losses spike in hot weather. As circulating K drops, the Na/K pump can’t hold its gradient as effectively. That matters because glucose is the primary precursor for lactose — the sugar that acts as the udder’s osmotic engine, drawing in water and essentially setting milk volume. Mammary cells take up glucose through GLUT1 transporters and convert it to lactose. That whole chain depends on the Na/K pump keeping the cell environment intact.

Every individual link here is well established in dairy physiology. The full end-to-end pathway — heat depletes K, depleted K weakens the mammary pump, weakened pump reduces glucose uptake and lactose synthesis, lower lactose means less milk — hasn’t been demonstrated in a single published study. But the pieces are solid. And they explain why the form of potassium matters: supplying K as chloride in a heat-stress ration may satisfy the K requirement on paper while doing nothing for DCAD, nothing for rumen buffering, and leaving the cow’s acid-base balance to sort itself out.

How Much Extra Butterfat Can K₂CO₃ and DCAD Actually Buy You?

Take a high group averaging 90 lb of milk at 3.70% fat. That’s about 3.33 lb of fat per cow per day. A K₂CO₃-based DCAD shift that conservatively bumps fat to 3.95% — a 0.25-point lift, well under the 0.77-point trial result in Jenkins’ extreme diet — puts you at roughly 3.56 lb of fat. Extra: 0.23 lb per capra al giorno.

U.S. butterfat pricing context as of early 2026: USDA AMS data showed butterfat around $1.45/lb in January, recovering to $1.78/lb in February, with CME futures pointing to summer 2026 (June–August) butterfat in the $2.29–$2.35/lb range. For barn math heading into the heat season, $2.00–$2.20/lb tracks with where summer futures sit.

At $2.00–$2.20/lb, that extra 0.23 lb is worth roughly $0.46–$0.51 per cow per day in gross component value.

On a 1,000-cow herd over 84 summer days, the gross butterfat gain lands around $38,600–$42,800. Scale that to a 300-cow herd and you’re still looking at roughly $11,600–$12,800 — real money, not rounding error.

The K₂CO₃ ingredient premium is real. Industrial potassium carbonate runs roughly $1,600–$1,800/MT versus $300–$500/MT for feed-grade KCl. Your per-cow-per-day cost depends on inclusion rate and your premix supplier’s margin — get a current quote before you commit. But even after netting out that ingredient premium, the IOFC math favors K₂CO₃ at summer 2026 U.S. butterfat futures. If butter drops back toward January’s $1.45 floor, the math tightens. One more reason to track component pricing alongside the ration cost, not in isolation.

Cheapest Feed ≠ Best Margin: The IOFC Lesson

The potassium decision fits a bigger pattern that keeps showing up in herd economics.

A 2014 Journal of Dairy Science study from Penn State examined IOFC records from 95 Pennsylvania herds between 2009 and 2012. The mean IOFC was about $7.71 per cow per day at that era’s prices. The herds with the highest IOFC weren’t the ones spending the least on feed. They landed in the upper quartile for feed cost — $6.27 or more per cow per day at those 2009–2012 price levels.

In plain terms, the herds that spent more on the right inputs made more money. Squeezing purchased feed cost didn’t maximize margin then, and there’s no reason to think the principle has changed.

Judge potassium on cost per ton, and chloride wins every time. Judge it on IOFC per cow per day under heat stress — factoring in butterfat, rumen function, and the actual DCAD shift — and K₂CO₃ starts looking like the investment the ration model alone won’t show you.

You Still Can’t Out-Ration a Hot Barn

All the DCAD and potassium math assumes the infrastructure basics are covered first.

Kansas State’s heat abatement priority list stays simple and right-side-up: shade first to cut solar load, then water on cows via soakers, then air movement from fans, then air cooling (foggers or misters) where humidity is low enough.

Jeff Dahl at the University of Florida has documented a well-managed Gainesville setup: sand-bedded freestalls, fans over stalls, soakers over the feedline. Fans come on at 21.1°C. Soakers cycle 1.5 minutes on, 3.5 minutes off, starting at 22°C. Both activation points are deliberately set before visible cow distress.

Given the Dutch fertility data showing damage at THI 50–60, “early” cooling likely refers to earlier than most operations currently practiced. If the holding pen bakes through the afternoon and fans don’t start until cows are already panting, even a technically perfect ration is bailing water out of a boat with no hull.

What This Means for Your Operation

In the next 30 days, pull your actual summer ration and check the DCAD.

Not the model on a laptop — the formulation that matches what’s going on in the mixer come July. Is DCAD at +350 or higher, or still sitting in the +200–+280 band? Is potassium coming from K₂CO₃ or KCl? Are sodium (0.4–0.5%), potassium (1.5–1.8%), and magnesium (0.30–0.35%) in heat-stress ranges, with K: Mg close to 5:1? If those numbers look like April while the barn feels like July, you’ve found a concrete place to move.

Over 60–90 days, run a controlled pen comparison this summer.

If you have the pen structure, take one group — fresh or high-cow — and swap part or all of the KCl for K₂CO₃ while keeping the total potassium similar. Track components and IOFC per cow per day for a full 60–90 days. No signal? You’ve bought clarity relatively cheaply. Signal shows up? Now you’ve built your own response curve instead of relying on trial averages. You’ll need pen-level component data from your plant. If that’s not available, start with the 30-day DCAD audit.

Over the next year, tie your fall reproduction back to summer.

Pull the pregnancy rate by month and the lameness treatments for the past two years. Lay them alongside local THI data, and when your cooling is actually activated. If September and October sag every year, you’re probably looking at the delayed invoice for summer heat — not a run of bad luck.

Revisit your cooling trigger points.

Given the Dutch data showing fertility damage around THI 60, ask whether fans and soakers should kick on well before cows show visible distress. Dropping the activation trigger from THI 72 into the low 60s costs electricity. Losing pregnancies costs a lot more.

Pick the right benchmark when you price heat investments.

When you’re quoting fans, soakers, shade, or a mineral shift, are you measuring the return against $74, $120, or the full picture? Cook’s figures are milk-loss anchors — regional and conservative. Dahl’s UF estimate accounts for reproduction and long-term effects at the national scale. Whatever number you use to say “too expensive” should match what the research actually says heat stress costs you.

Key Takeaways

  • If your summer DCAD sits below +300 mEq/kg and your potassium comes from chloride, your ration likely isn’t delivering the DCAD shift the research supports. The Iwaniuk/Erdman meta-analysis and current Ohio State recommendations both point to +350–+400 as the working target under heat stress.
  • If your cooling system activates at THI 68–72, the Dutch fertility data on hundreds of thousands of cows suggest you’re missing 8–22 THI points of damage every summer. The conception rate began declining at a THI of 60. That gap is where pregnancies quietly disappear.
  • If you’re selecting a potassium source based on price per ton, you may be optimizing the wrong line on the ration sheet. KCl doesn’t move DCAD, doesn’t buffer the rumen, and doesn’t produce the fat concentration response that K₂CO₃ did in Jenkins’ Clemson work. A conservative 0.25-point fat bump on 1,000 cows over 84 summer days is worth roughly $38,600–$42,800 gross at current U.S. butterfat futures — but only if the ingredient actually shifts DCAD.
  • If your heat-stress budget is still anchored to a milk-loss-only estimate, you’re accounting for the visible hit but ignoring the rest. Cook’s own updated $120/cow/year for Wisconsin doesn’t include fertility, lameness, or culling. Dahl’s UF group puts the national figure above $1.5 billion. The real number for your operation depends on which costs you’re willing to count.

The Bottom Line

Heat stress isn’t a summer problem. It’s a 12-month accounting problem with a 60- to 90-day lag. The cows you breed in August carry that oocyte damage into October pregnancy checks. The DCAD you run in July shows up in the August components. And the potassium source you chose in April — because it was cheaper per ton — quietly costs you fat pounds all summer long. Before the heat arrives, pull the real ration, check the real DCAD, and ask the one question that actually matters: is your potassium moving the number, or just checking the box?

Complete references and supporting documentation are available upon request by contacting the editorial team at editor@thebullvine.com.

Learn More

The Sunday Read Dairy Professionals Don’t Skip.

Every week, thousands of producers, breeders, and industry insiders open Bullvine Weekly for genetics insights, market shifts, and profit strategies they won’t find anywhere else. One email. Five minutes. Smarter decisions all week.
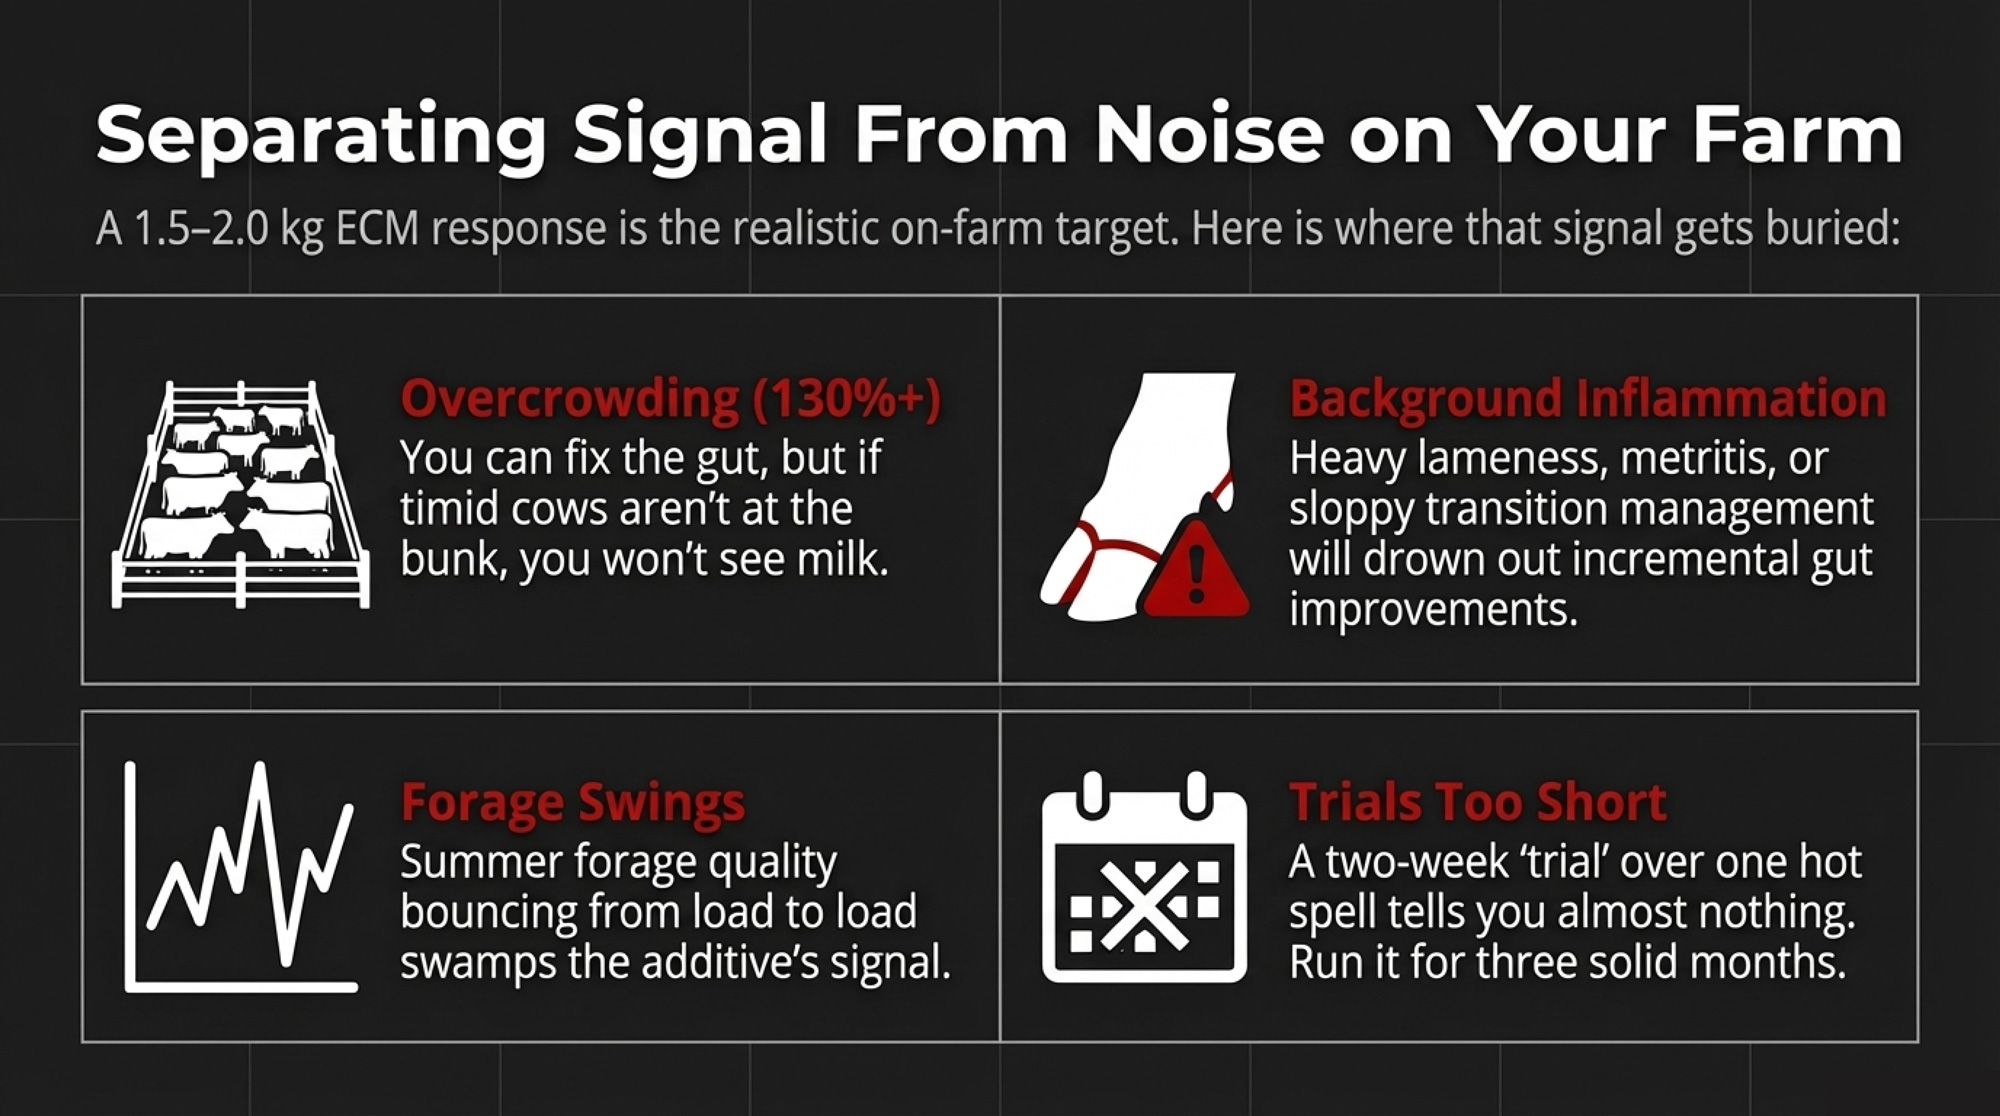
NewsSubscribe
First
Last
Consent

The Metskes’ $31,700 Wake‑Up Call: What ‘Not Yet’ Costs a $4 Million Dairy

Not yet.” Two words. $600,000–$700,000 in damage on a $4 million dairy. Here’s exactly where the money goes.

Executive Summary: Most dairy families know they need a succession plan, but “not yet” wins until something breaks. In 2025, an Ontario court took six years of work on a 152‑acre family dairy and valued it at $31,700 because there was no signed agreement, while an Ohio family that wrote its plan with an ag attorney back in 2002 kept a 650‑cow herd in the family through two sudden deaths, following the buy‑sell terms instead of fighting in court. Using 2024 Wisconsin land values and current estate tax rules, this piece runs barn‑math on a 300‑cow, 400‑acre, $4 million dairy and shows how delaying the conversation can quietly burn $600,000–$700,000 in probate costs, forced‑sale discounts, and extra legal fees when an owner dies without a real transition plan. It then tackles the “fair vs equal” problem when one child farms and others don’t, laying out practical ways to give the on‑farm heir voting control and core assets while paying off‑farm kids through cash, insurance, or non‑voting shares. The payoff is a concrete 30‑day, 90‑day, and 365‑day playbook — starting with one phone call to ask your accountant, “If I died tomorrow, who’s legally in charge here, what hits probate, and what would have to be sold?” — and a launchpad for The Transition Files, Bullvine’s new series on real‑world dairy transitions gone right and wrong.

Tim and Amanda Metske spent six years working on their parents’ 152-acre Ontario dairy — an arrangement that, according to the Ontario Court of Appeal, was never formalized in a binding agreement.

Per a published case analysis by Lerners LLP, the couple ran daily operations and invested in quota and cows based on their understanding that they’d eventually buy the farm on favourable terms. Martin Metske had twice mentioned a combined price of roughly $2 million for the land and quota. But no purchase price, payment terms, or financing was ever committed to writing.

When the relationship broke down, the arrangement ended. A trial judge had awarded roughly $405,000 in damages. The Court of Appeal, in Metske v. Metske, 2025 ONCA 418, reduced that to $31,700 — the documented value of a furnace and specific property improvements. The Court found the family understanding was an “agreement to agree”: too vague to create ownership rights. It also found no unconscionable conduct by the parents — just an informal arrangement that never became a contract.

Two states south, a different family had a different piece of paper. In 2002, the Steiners in Creston, Ohio, engaged an attorney and a financial planner to put their dairy farm succession plan in writing. As Kurt Steiner later told a World Dairy Expo virtual farm tour audience, “It’s tough to plod through — it’s not fun. But you’re not going to be here forever, and you’d better have it together when it comes to succession planning.”

When David Steiner died of a sudden heart attack on February 1, 2009, that plan said who stepped up. When Eric Steiner died of prostate cancer in August 2021, the buyout terms kicked in instead of a lawsuit. Same goal — keep the dairy in the family. Two very different outcomes.

Dimension🔴 Metske Family (Ontario)✅ Steiner Family (Ohio)
Plan formalizedNever — “agreement to agree” onlyWritten buy-sell and partnership structure, 2002
Attorney engagedNo documented ag attorney involvementYes — attorney + financial planner retained
Years of informal labor invested6 years running daily operationsMulti-generational; roles defined from start
First major death/crisisRelationship breakdown → litigationDavid Steiner dies 2009 → documents dictated next steps
Second major crisisN/A — no plan to applyEric Steiner dies 2021 → buyout terms activated
Legal outcomeCourt of Appeal: $31,700 award (from $405K trial award)No litigation — buy-sell terms followed
Farm continuityArrangement ended; no documented transferSteinhurst Dairy continues; 650 cows, 3rd generation entering
Estimated plan cost$0 documented~$15,000 (2002); ~$25,000 in 2026 equivalent
Total value protected~$2M (discussed verbally; never executed)Multi-million-dollar operation across two transitions

At that point, dairy farm succession planning and a real farm transition plan stop being someday conversations. They become math you can’t afford to ignore.

Glossary of Risk: Three Terms From the Metske Decision

Agreement to Agree — A mutual intention to negotiate future terms, without a binding commitment to specific price, timing, or conditions. In Metske v. Metske (2025 ONCA 418), the Court of Appeal found the family’s discussions about a future sale were exactly this — and therefore unenforceable.

Sweat Equity — The uncompensated or under‑compensated labor a family member invests in an operation, often expecting future ownership. The trial court valued Tim and Amanda’s tangible improvements at $33,700. The Court of Appeal upheld that figure for documented improvements but declined to award broader damages.

Probate Drag — The time, cost, and operational paralysis that hits a farm when an estate goes through probate without a clear succession plan. Professional fees can run into six figures on a complex farm estate, and the process can freeze decision‑making for 12–24 months, while the herd still needs feeding, breeding, and milking every day.

What’s Actually Changing for Family Dairies?

Start with the age math. The 2022 Census of Agriculture pegs the average U.S. principal producer at 58.1 years old. Not old — but it’s the front edge of the window where health or burnout can change the story in one season.

UW‑Madison’s Joy Kirkpatrick, who leads Wisconsin’s Cultivating Your Farm’s Future program, points out that a real farm transition — family meetings, entity changes, lender sign‑off, tax planning — takes 3–5 years to execute properly. That means many operators in their early 60s are already in the risk window.

How few have anything in writing? Melissa O’Rourke, an attorney and farm management specialist at Iowa State University Extension, estimates 89% of farmers lack any farm transfer plan, and about 60% don’t even have an updated will. In Wisconsin specifically, the 2020 DATCP Dairy Producer Survey found just 37% of dairy farms had an estate plan and only 42% had identified a successor; among herds under 100 cows, only 30% had named one.

The asset side has quietly inflated. USDA NASS reported Wisconsin cropland at $6,800 per acre in August 2024. Take 400 acres, and you’re at about $2.72 million in land alone. Add a modern 300‑cow facility — freestall barn, parlor, manure system, equipment — and you’re in the $4 million estate range.

The current federal estate tax exemption sits at $15,000,000 per person for 2026, as adjusted under the One Big Beautiful Bill Act. Married, that’s up to $30 million. Most family dairies clear that bar, which can make families assume there’s nothing urgent left to fix.

That assumption is the trap. The big financial leak for a $4M dairy isn’t the IRS. It’s what happens when “we’ll deal with it later” meets a hospital visit, a divorce, or a fight nobody saw coming.

The Steiner Plan: What “Having It Together” Looks Like

According to a Farm Progress profile, the Steiners’ 2002 plan spelled out how many years a family member had to work before becoming a partner, exact ownership percentages between David, sons Kurt and Eric, and uncle John, and what happened to an owner’s interest at death — including buyout terms.

When David died in 2009, the documents said who stepped up. Kurt and Eric became majority owners, uncle John shifted to a smaller role, and the dairy kept running. When Eric died in 2021, the buyout terms kicked in without a fight. Today, Steinhurst Dairy milks about 650 cows three times a day on 700 owned acres and 400 rented acres, and Kurt’s son Christian is moving into what the family describes as the next generation.

If that 2002 plan cost roughly $15,000 in professional fees — realistic for multi‑meeting work on entities and buy‑sell agreements — it protected a business now worth several million dollars. In 2026 dollars, adjusted for the complexity of a 650‑cow operation, a comparable engagement might run around $25,000. That’s roughly eight quality replacement heifers at the $3,010 per head U.S. average as of mid‑2025, with top springers clearing $4,000 in Minnesota and California auctions. You’ll lose a lot more than eight head in a bad transition.

And Bullvine’s own audit of five recent dairy dispersals measured [the gap between a planned exit and a forced one at $400,000–$680,000 on real auction results]. Run the barn math on a $4M estate, and the exposure looks even steeper.

How Much Does “Not Yet” Actually Cost on Your Farm?

Here’s the side‑by‑side on a realistic Wisconsin‑style 300‑cow, 400‑acre dairy with a $4 million total estate, using current land values and conservative discounts:

Cost CategoryPath A: “Not Yet” (No Plan)Path B: Plan in Place
Professional fees$0 upfront$10,000–$25,000 (entities, buy‑sell, trusts, insurance coordination over 1–2 years)
Probate & administration≈$200,000 (attorney, court, executor, appraisal, and accounting fees on a complex ag estate) Minimal or avoided entirely (assets titled into entities/trusts)
Liquidation loss$375,000–$450,000 (15% forced‑sale discount on $2.5–$3M in marketable assets) $0 (controlled transfer, no fire sale)
Legal conflict riskHigh — in Metske v. Metske (2025 ONCA 418), a six‑year informal arrangement with no written agreement resulted in years of litigation and a final award of $31,700 Mitigated by buy‑sell agreement with clear terms and funding
Extra legal/accounting/operating mess$25,000–$50,000 (extra professional time, interim operational chaos) Negligible
Total damage$600,000–$700,000The planning fee

At $6,800/acre in Wisconsin, 400 acres run $2.72 million in land. The whole operation comes to around $4 millionwhen you add up cows, facilities, and equipment.

Path A — you keep saying “we’ll get to it.”

The estate goes through full probate. Attorney fees, court costs, executor compensation, appraisals, and accounting stack up. Research on estate sales triggered by sudden death, published by Andersen, Meisner Nielsen, and Stefansson in the Journal of Financial Economics, found that financially constrained estates face liquidation discounts of 15–25%when assets must be sold under deadline pressure. That’s consistent with Bullvine’s own dispersal analysis.

Apply a conservative 15% to $2.5–$3 million in marketable assets: $375,000–$450,000 gone. Add probate fees and the operational mess of running a farm through 12–18 months of legal process, and you’re $600,000–$700,000 lighter. A brand‑new parlor. A heifer facility. Your kids’ down payments.

Path B — you bite the bullet and plan.

A comprehensive succession engagement — entities, buy‑sell agreements, trusts, coordinated insurance — typically runs $10,000–$25,000 depending on herd size and entity complexity. The Steiners did this kind of work in 2002 for about $15,000. When something happens, the documents say who’s in charge. The bank doesn’t panic. Your kids don’t start with a court date.

Your numbers will be different. The pattern holds: low‑five‑figure planning costs for six‑figure‑plus protection.

Who Actually Runs the Farm Tomorrow Morning?

If you wake up in the hospital next month, who — on paper — can sign milk cheques and payroll, negotiate with the bank, lock in feed contracts, cull cows, or decide whether land gets sold?

On well‑planned farms like Steinhurst, that answer is boring. The successor’s authority is spelled out in operating agreements, buy‑sell documents, and powers of attorney. Kurt Steiner told the WDE audience that after Eric’s death, “there’s hope for our dairy. We don’t know exactly how, but we’re going to get it done.” He could say that because the paperwork was already in place.

On farms without written agreements, you get a vacuum. Grieving family, a banker who suddenly wants everything documented, and a stack of half‑organized files nobody has touched since the last refinance. When succession and debt go sideways at the same time, Chapter 12 becomes the cleanup tool — Bullvine’s Kooser coverage followed one family through filing twice, and the three numbers that told them they were out of runway.

If the person you assume would take over doesn’t have legal authority or a funded plan, you don’t have a transition. You have hope and habit.

Is “Fair” the Same as “Equal” When One Kid Farms and Three Don’t?

Equal division — “everyone gets a quarter of everything” — is how a lot of dairies accidentally end up in a capital structure their lender isn’t comfortable with. 

Give on‑farm and off‑farm heirs identical ownership slices, and you create voting owners who don’t understand farm risk, an on‑farm heir who feels like they’re buying the place twice, and off‑farm siblings who want cash — not more money tied up in silage.

“Fair but not equal” structures turn that into something functional:

  • The farming heir gains voting control and a larger share of the farm’s equity, reflecting labor and risk. 
  • Off‑farm kids get value through liquid assets, life insurance, non‑core land, or non‑voting units that pay when there’s profit but don’t control decisions. 

You’re not playing favorites. You’re matching what each kid actually wants — a living running the place vs. a clean investment return — with the kind of asset that fits.

What to Tell the Off‑Farm Kids

This is the conversation that chokes people up. Ag succession planners, including Kirkpatrick at UW‑Extension, often coach families to reframe it.

  • “We’re not giving your brother the farm — we’re giving him the chance to work for it, while making sure your inheritance is liquid and protected.” The farming heir takes on debt, risk, and 14‑hour days. Off‑farm heirs get value without those strings. 
  • “Your share is designed to actually be worth something to you.” A quarter‑ownership stake in a dairy LLC isn’t liquid. It doesn’t pay tuition or fund a retirement. Cash, insurance proceeds, or non‑voting units that pay dividends do. 

Nobody loves hearing this at first. But the alternative is worse.

  • “If the farm goes under because we split it four ways, nobody gets anything.” An operation that can’t cash‑flow a four‑way buyout ends up at auction — and everyone’s share shrinks by that forced‑sale discount. 
  • “This isn’t about love. It’s about math.” Equal division of an operating dairy can destroy the business and everyone’s inheritance. Fair division preserves the operation and the value that off‑farm heirs actually receive. 

Kirkpatrick frames these as the core “tensions” of farm succession: fairness vs. equality, business vs. family, control vs. inclusion. Ignoring them doesn’t avoid conflict. You hand it to the next generation.

Options and Trade‑Offs for Farmers

TimelineActionWho to CallWhat It CostsRisk If Skipped
30 DaysAsk accountant: “Who’s in charge day one if I die tomorrow?”CPA / farm accountant$0 — one conversationYou assume there’s a plan; there isn’t
30 DaysConfirm signing authority, probate exposure, assets that must be soldCPA / ag attorney$0–$500 consultationFarm paralysis for 12–24 months during probate
90 DaysDraft buy-sell agreement with defined triggers (death, disability, divorce, retirement)Ag-focused attorney (via Farm Credit / Compeer referral)$5,000–$15,000Metske scenario: informal arrangement + litigation
90 DaysReview entity structure (LLC, partnership) for ownership clarityAttorney + CPAIncluded aboveForced equal splits across farming and non-farming heirs
365 DaysFund buy-sell with life insurance; establish trust if neededInsurance advisor + estate attorney$10,000–$25,000 total$375K–$450K liquidation discount on forced sale
365 DaysUpdate operating agreements; name successor formally with legal authorityAg attorneyPart of aboveLender panic, operational vacuum, off-farm sibling conflict
AnnualReview plan, update valuations, revisit heir structuresCPA + attorney$1,000–$3,000/yrPlan drifts out of alignment with actual asset values

1. Order the “x‑ray” (next 30 days)

This is your 30‑day action. Call your accountant or ag attorney and ask one question:

“If I died tomorrow, what happens to this farm on paper — who’s in charge day one, what goes through probate, and what would likely have to be sold?”

If they can’t answer clearly within 48 hours, you don’t have a transition plan. You have tax compliance and exposure.

2. Put a buy‑sell in writing

This is how you formalize what the Metskes’ arrangement lacked. Good farm buy‑sells spell out who can buy an ownership interest, when that right kicks in (death, disability, retirement, divorce), how the price is set, and how the buyout is funded. That’s what the Steiners had when two deaths hit in twelve years. The paper said what happened. The bank knew the plan. The family followed it.

3. Use insurance and leases as pressure valves

Life insurance can retire farm debt so the farming heir services a buyout, and provide cash for non‑farming heirs so the operating unit doesn’t get chopped up. Long‑term leases turn off‑farm heirs into landlords — not surprise co‑operators. You give up flexibility. You pick up stability.

4. Engage an ag‑focused attorney (90 days)

Not your cousin’s real estate lawyer. Ask Farm Credit or Compeer Financial for referrals — most have succession planning programs, and many coordinate with your CPA and lender. Bullvine’s “Top Dairy Farm Transition Planning Traps to Avoid” breaks down entity structures, cash access traps, and retirement timing.

If debt‑service coverage is already tight, stacking a sibling buyout on top can tip your lender from partner to problem. Bullvine’s coverage of tight margins at $18.95 milk and $19.14 costs showed how fast DSCR pressure compounds — and a forced succession layered on top makes it worse.

5. Have the legal structure in place (365 days)

Trusts, buy‑sell, insurance, and updated operating agreements. Review annually. The farms that survive generational transitions aren’t the ones with the best cows. They’re the ones with the best paperwork.


Key Takeaways

  • If your accountant can’t explain “what happens if I die tomorrow” in 48 hours, assume you have exposure, not a plan. Push for a written outline of who’s in charge, what hits probate, and what has to be sold. 
  • If one child farms and others don’t, “equal shares of the land” is a red flag, not a plan. Look at structures where the farm kid has voting control and core assets, while others get value through cash, insurance, or non‑voting interests. 
  • A real transition plan runs low‑five figures — about eight replacement heifers at today’s prices to protect a multi‑million‑dollar operation. Budget for it the way you’d budget for a bulk tank or a new loader: it’s infrastructure, not overhead. 
  • The person you expect to take over needs legal authority to act — now, not after probate. Signing authority, powers of attorney, and a funded buyout path aren’t luxuries. They’re what keep the farm running when you can’t. 

The Bottom Line

Five or ten years from now, the farms that start on this will look…steady. Off‑farm kids still come home for Christmas without arguing about who “really” owns the parlor.

On the other side, you’ll see places where the sign out front has changed. Where siblings drive past the old yard and don’t turn up the lane.

The question isn’t whether succession is coming to your dairy. It’s whether it arrives as paperwork you control — or as a court file somebody else manages. The deeper barn math on how that penalty scales at different herd sizes and debt loads is coming in the Tier 2 and Tier 3 follow‑ups for The Transition Files, where we’ll profile a dairy mid‑transition and walk through a post‑mortem on one that went wrong.

Complete references and supporting documentation are available upon request by contacting the editorial team at editor@thebullvine.com.

Learn More

The Sunday Read Dairy Professionals Don’t Skip.

Every week, thousands of producers, breeders, and industry insiders open Bullvine Weekly for genetics insights, market shifts, and profit strategies they won’t find anywhere else. One email. Five minutes. Smarter decisions all week.
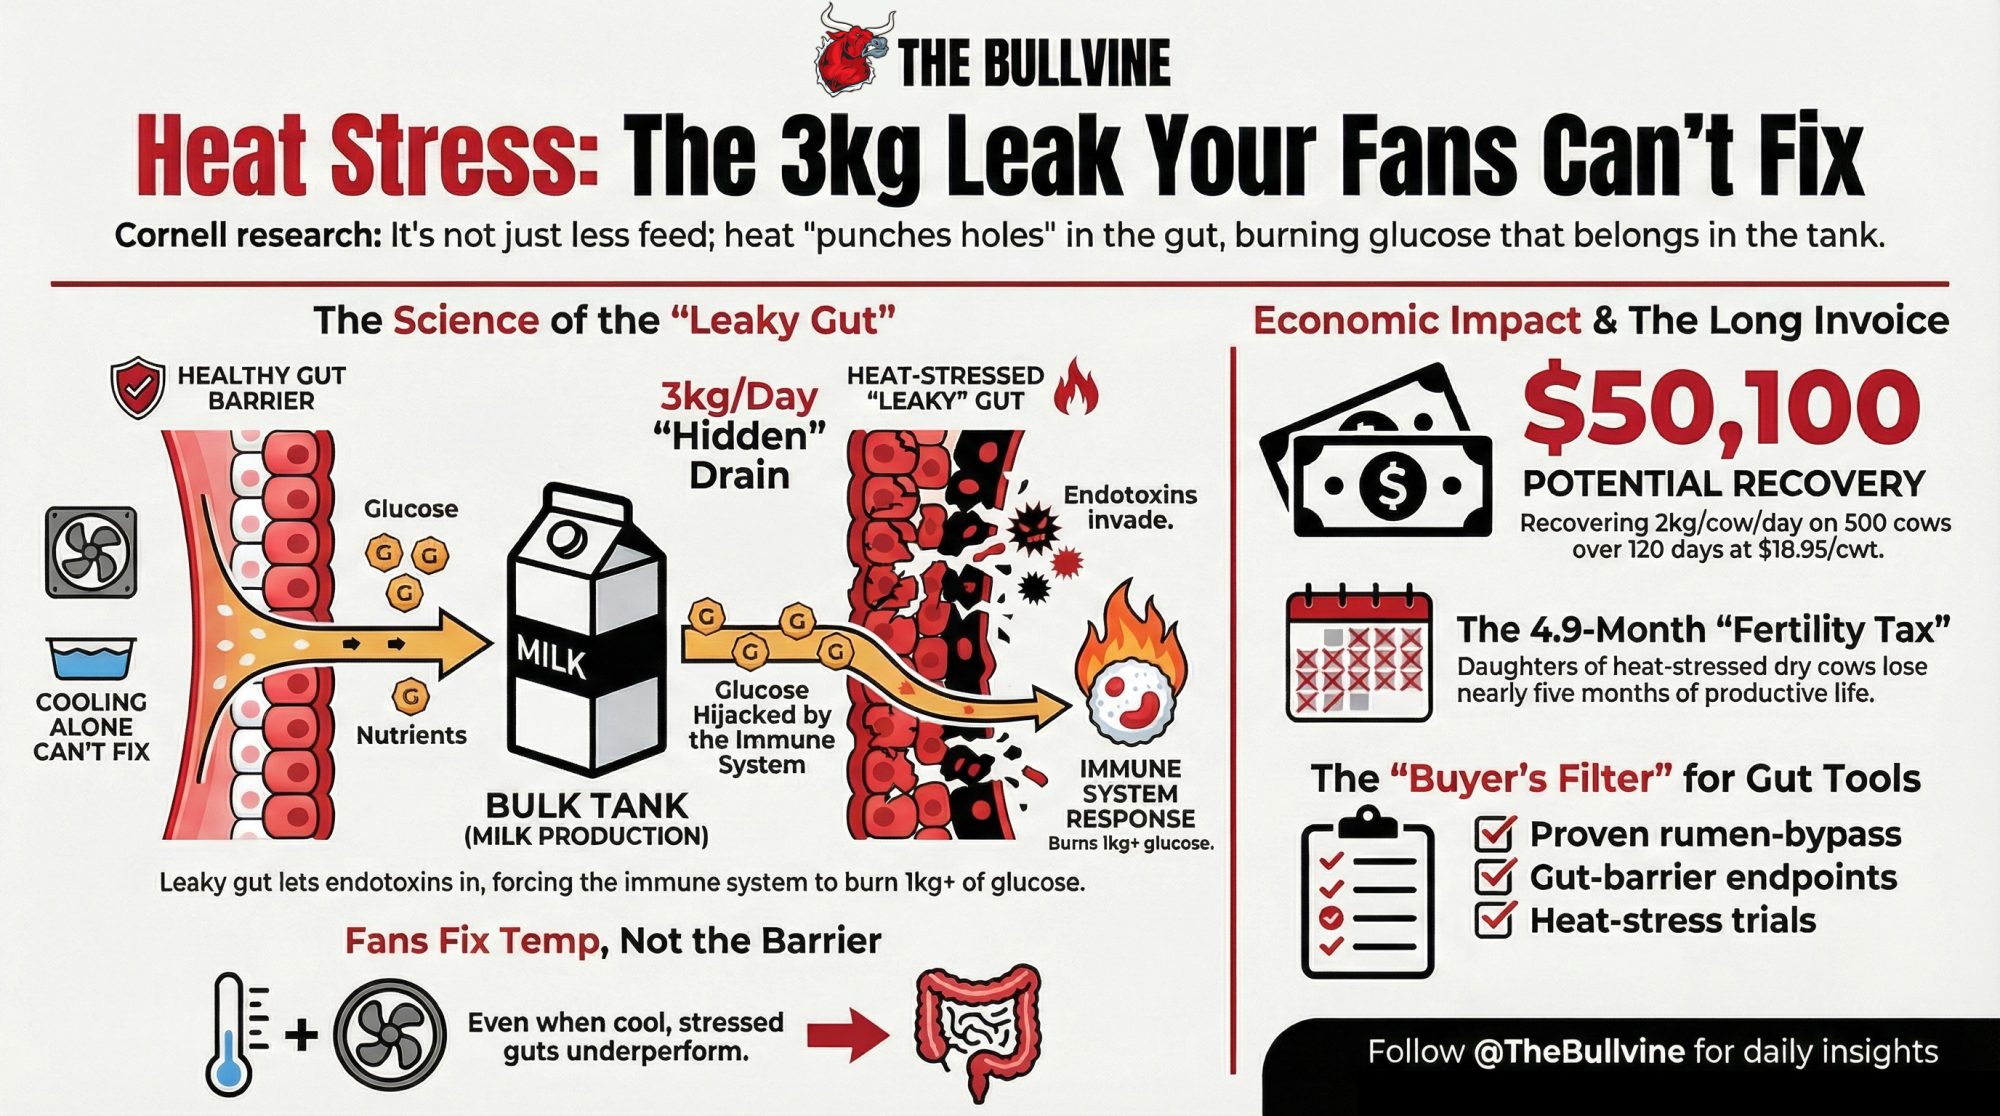
NewsSubscribe
First
Last
Consent

6% or 24%? The RUFAL Audit That Turned a $40,000 Lameness Bill Into a Ration Problem.

Your herd doesn’t have to be a train wreck to bleed money. ‘Average’ lameness is a $40,000 ration problem in a lot of freestall barns.

Executive Summary: Many freestall herds guess lameness at 5–7%, but proper scoring often lands closer to 20–25%, turning “normal” into a roughly $40,000‑a‑year problem at about $337 per case. Using the Robcis 2023 cost model and recent lameness research, this article walks through a composite 500‑cow herd in which one RUFAL audit traced that hidden bill back to the ration rather than just the trim chute. A high RUFAL (over about 3.5% of DM) quietly drives more subclinical acidosis, thinner digital cushions, and extra claw horn lesions — especially when low‑BCS dry cows and TMR sorting pile on. By pulling RUFAL down, enforcing a BCS 3.0 floor at calving, and tightening sorting with the Penn State shaker box, that herd cut lameness from 24 to under 18 cases per 100 cows and avoided roughly ,000 a year in lameness cost. The 30‑Day Lameness Audit and “Paying Twice” Calculator give you a simple way to put your buffer bill, lameness bill, and ration risk on one page. If your own math shows lameness costs bigger than your buffer spend, it’s a strong signal your ration and dry‑cow program — not your hoof trimmer — are the first place to go to work.

dairy lameness costs

Nearly one in four dairy cows in freestall herds worldwide is lame right now — and most owners think their number is under 7%. A 2025 Journal of Dairy Science meta-analysis by Wessels et al. estimates a median lameness prevalence of 29.5% across studies. A 2023 Journal of Dairy Science bioeconomic model by Robcis et al. puts the average cost at €307.50 ($336.91 USD) per case, with digital dermatitis cases roughly $92 more expensive and an extra $13.26 tacked on for every additional week a cow stays lame.

Those two numbers collided on a 500-cow North American freestall operation when the owner put the annual trim-chute costs and the sodium bicarbonate invoice on the same spreadsheet for the first time. What he found: the herd was spending over $40,000 a year on lame cows and another $25,000–35,000 buffering a ration that kept breaking hooves. He wasn’t running a bad dairy. He was running an average one. And the average was expensive.

What follows is a composite management case built from 2023–2025 lameness research and field data. No single farm is named — but the numbers, the patterns, and the ration problems are real.

“We Thought We Were at 6%.”

If you’ve ever guessed your herd’s lameness prevalence before a welfare audit, you already know this part. Someone says five percent. Maybe six. You picture the obvious head-bobbers and move on.

That’s what happened here. The owner and herd manager settled on “six or seven percent.” Then they brought in locomotion scoring — the three-point system (1 = sound, 3 = arched back with shorter stride and head bob, 5 = clearly favoring one or more hooves). Over two sessions, an outside vet scored every cow in the herd. The number wasn’t 6%. It was just under 24%.

The perception gap isn’t unique to this farm. A 2019 review in Animals (Salgado et al., doi:10.3390/ani9050270) found that farmers consistently underestimate lameness prevalence compared to trained scorers — often by a factor of two to four. Put that gap beside the Robcis cost model, and “six percent” starts to look like an expensive myth.

Two hard questions came out of that scoring session: What in our system is actually creating lame cows? And how much are we spending to manage the damage rather than prevent it?

The ration sheet had the first answer.

What Is RUFAL — and Why Is 3.5% the Line?

The cows were milking well. Components looked good. Total dietary fat didn’t seem extreme. But when the herd nutritionist ran the numbers through AMTS — one of the ration-balancing platforms that calculates RUFAL (NDS and CPM Dairy do too, though display units may differ between grams per day and percent of DM) — the story shifted.

RUFAL — Rumen Unsaturated Fatty Acid Load — totals the unsaturated C18:1, C18:2, and C18:3 fatty acids entering the rumen from all ingredients: corn silage, high-moisture corn, DDGS, whole or extruded soybeans, vegetable oils — not just the “fat supplement” line. Dr. Tom Jenkins at Clemson University developed the concept. On this herd, the number came back at about 3.8% of the ration DM.

As Jenkins summarized in a 2013 presentation and later with Harvatine in 2014, values below about 3.5% of DM are viewed as lower-risk fat intakes, while those above 3.5% indicate fatty acid loads that “may be at risk of being too high.” That’s not a hard clinical cutoff — it’s a red-flag level at which rumen fat load warrants closer scrutiny.

Above 3.5% RUFAL, fiber-digesting bacteria take the hit first. Forage doesn’t break down as it should. Rumen pH slides toward subclinical acidosis more often, especially when cows sort and slug-feed. And it changes the mix of volatile fatty acids and endotoxins hitting the bloodstream — some of which are linked to vascular changes and inflammation inside the hoof.

RUFAL Cheat Sheet: What Pushes It Up and What Doesn’t

IngredientRUFAL ImpactApprox. C18 UFA (% EE)Risk Level at Typical Inclusion
Soybean oil / corn oil (free liquid)Very High~85–90%🔴 High — small additions move RUFAL sharply
Corn DDGS (full fat, 10–12% EE)High~60–65%🔴 High — linoleic acid rapidly rumen-available
Whole / extruded soybeansHigh~55–60%🔴 High — extrusion makes oil fully rumen-active
Corn silage (high-oil hybrids)Moderate-High~45–55%🟡 Moderate — adds up fast at 55–65% ration DM
High-moisture cornModerate~40–50%🟡 Moderate — germ oil more available than dry corn
Grass / legume foragesLow-Moderate~35–45%🟢 Lower — fat mostly intact in cell structure
Calcium salts of palm FA (e.g., Megalac)Low~5–10% C18🟢 Low — bypass rumen; mostly saturated
Hydrogenated tallow / prilled fatVery Low~2–5% C18🟢 Very Low — saturated, rumen-inert
C16:0 palmitic acid supplementsNone0% (C16, not C18)🟢 None — not counted in RUFAL calculation

When the Buffer Bill and the Lameness Bill Look the Same

The herd nutritionist stared at the RUFAL printout. Then she pulled up the annual bicarb and monensin invoices.

Buffer + ionophore spend (illustrative field math):

  • 24 kg DM/cow/day × 0.75% sodium bicarbonate = 180 g bicarb per cow per day. 
  • At $0.60–0.80/kg feed-grade bicarb: roughly $0.11–0.14 per cow per day.
  • 500 cows × 365 days: approximately $20,000–26,000/year on bicarb.
  • Monensin at $0.03–0.05/cow/day adds roughly $5,500–9,100/year.
  • Combined: roughly $25,000–35,000 annually.

Lameness bill:

  • 120 cases/year (24 per 100 cows) × $336.91 per case = approximately $40,429 on the Robcis model. 

They weren’t wrong to use buffers and monensin. But here’s the decision frame that changed the conversation: If your RUFAL is below 3.5% and you’re still seeing subclinical acidosis, the buffer is doing its job. If RUFAL is above 3.5%, the buffer is a bandage — fix the ration first.

This herd was paying twice. Once to keep a high-RUFAL ration from falling over, and again when the system still generated enough lame cows to cost $40,000 a year.

📊 The “Paying Twice” Calculator

Cost A — Annual Buffer + Ionophore Spend
(Bicarb kg/cow/day × price/kg × 365 × herd size) + (monensin cost/cow/day × 365 × herd size)

Cost B — Annual Lameness Bill
(Total lameness cases in 12 months) × $337

If Cost B > Cost A, your ration may be working against you despite the additives propping it up.

This herd: Cost A ≈ $30,000. Cost B ≈ $40,429. Gap: over $10,000.

What Were the Thin Dry Cows Telling Them?

The next uncomfortable meeting wasn’t at the mixer. It was in the dry-cow pen.

When they pulled BCS scores, a pattern jumped out: too many cows were drying off below BCS 3.0, and first-lactation heifers were often closer to 2.5–2.75. Those same animals kept reappearing in the trim chute after freshening.

Coverage of a £1 million SRUC/RVC/Liverpool digital cushion study in Dairy Global reported that cows with greater digital cushion thickness had decreased odds of sole lesions (odds ratio about 0.74 for the typical ulcer site). That soft-tissue pad under the sole is thickest late in lactation and thinnest in early lactation — exactly when cows face the most metabolic stress and the most concrete. Earlier work from Tarlton and colleagues showed that hormonal changes around calving loosen the suspensory apparatus inside the claw, allowing the pedal bone to shift downward when cushion thickness is already at its lowest.

More recent work from the University of Nottingham, covered in The Bullvine’s December 2025 JDS roundup, found structural differences in the digital cushions of cows with lifetime histories of hoof horn lesions — including changes in collagen composition that may reduce shock absorption.

If you send a cow into that calving period at BCS 2.5, you’re not just flirting with ketosis. You’re thinning the shock absorber between bone and sole when she’s about to spend more time on concrete and eat a hotter ration. For a deeper look at how prepartum BCS affects DMI and energy balance, The Bullvine’s breakdown of the University of Florida BCS research lays out the numbers by BCS category.

The herd drew a line: mature cows at BCS 3.0–3.25 at dry-off, first-lactation heifers at about 3.25–3.5, and any animal below those targets in the last 60 days of lactation flagged as a “rebuild” cow.

Can RUFAL and Dry-Off BCS Really Change Your Lameness Bill?

Over the next 90 days, the owner, nutritionist, and hoof trimmer agreed on three moves.

1. Pull RUFAL out of the danger zone.

They pulled back on DDGS and free vegetable oil, replaced some of that energy with better forage and starch sources, and shifted a portion of supplemental fat to a rumen-inert calcium salt product. The revised ration landed at about 3.2% RUFAL, down from 3.8%.

On cost: projected DDG prices for late 2025 and early 2026 are in the $145–155/ton range at $4.00 corn and $325 soybean meal, with a realistic band of $125–170/ton depending on corn and soybean meal swings. In many regions, that still makes DDGS a relatively cheap protein-energy source. Pulling it back to lower RUFAL may add $0.10–0.30 per cow per day in feed costs, depending on what replaces it. The question is whether the lameness savings outrun that ingredient cost — and on this herd’s numbers, they did.

2. Build a “rebuild” lane for thin cows.

They flagged cows and heifers under target BCS in the last 60 days of lactation, moved them into a smaller group with better bunk access and a ration targeting roughly 0.25–0.5 BCS gain before dry-off, and enforced a hard floor: no cow calves under BCS 3.0 unless there’s a clear health reason.

This requires pen space and labor. Not every barn layout can support a separate group; if you can’t build one, at minimum, flag thin cows at dry-off and adjust their close-up ration accordingly. For more on why that BCS window matters for fresh-cow outcomes, The Bullvine’s 90-day transition fix shows how calving most Holsteins at BCS 3.0–3.25 supports both fertility and health.

3. Stop letting sorting rewrite the ration.

Running the Penn State particle separator at 0, 6, 12, and 18 hours told the real story. Penn State Extension guidelines flag a change of more than about 3–5 percentage units in any sieve over several hours as meaningful sorting. By 12 hours post-feeding, this herd’s top screen had swung past that. Cows were picking out grain and fines early and leaving a stemmy mess for the last shift.

Countermeasures: forage length cut under about 25 mm, a couple of kilograms of water added at mixing, and more frequent feeding and pushups. For a full walkthrough of the Penn State separator as a weekly tool — including tying it to fecal starch testing — see The Bullvine’s particle separator feature.

Did the Ration Changes Actually Reduce Lameness?

Nobody expected lameness to disappear. It didn’t. But over the next 12 months, lameness dropped from 24 cases per 100 cows to just under 18 per 100 — about 90 cases instead of 120.

That 30-case drop: 30 × $336.91$10,107 in direct lameness cost avoided on the Robcis model. Beyond the spreadsheet, the hoof trimmer saw fewer repeat claw horn disruption lesions in the same claws, slightly better reproductive performance in fresh cows, and a trim list that felt more manageable.

Sodium bicarbonate stayed at 0.75% of DM. Monensin rates held. They didn’t need to crank either one up. Those tools were now supporting a ration that protected hooves rather than propping up one that kept breaking them.

When Is It the Barn — and When Is It the Ration?

All of this played out in a freestall barn that wasn’t perfect but wasn’t a horror show. Stalls were reasonably sized, bedding adequate, alleys scraped regularly, and parlor routines kept cows out of the pen less than four hours a day.

On this herd, the numbers said the environment wasn’t the primary driver. The big step-change came from RUFAL and BCS, backed by sorting control — not a barn redesign. For herds where the barn is the bottleneck, The Bullvine’s deep dive on time out of the pen shows how stall design, stocking density, and holding-pen time drive lameness and lost production. And for a broader look at what most “non-lame” cows are hiding under their feet, The Bullvine’s hoof lesions feature a breakdown of the scale of subclinical damage.

If your herd is sitting on worn concrete, narrow stalls, or overstocked pens, your math will look different. This isn’t a hall pass for ignoring the barn. It’s a reminder that for some freestall operations, the cheapest place to start is in the ration and the dry-off lane.

Your 30-Day Lameness Audit

You’re not running this exact herd. But you can steal a lot from how they put the pieces together.

Week 1: Get Your Three Numbers on One Page

  • RUFAL (% of DM): Run your current ration through AMTS, NDS, or CPM Dairy — or ask your nutritionist to pull it. Flag if it’s above 3.5%. 
  • Lameness cases per 100 cows per year: Pull your trim and treatment records for the last 12 months. If you don’t have them, that’s finding number one.
  • BCS at dry-off: Score every cow entering the dry pen this week. What percentage is below 3.0?

Week 2: Score, Sort, and Stare at the Bunk

  • Locomotion-score the entire milking herd using a 1-3-5 system. Compare your number to what you thought it was. If the gap is more than 2×, you’ve got a detection problem. 
  • Run the Penn State particle separator on fresh TMR, then again at 6 and 12 hours. Any box shifting more than 3–5 percentage units? You’ve got a sorting problem. 
  • Walk the bunk at 18+ hours. If it looks like corn cobs and stems, cows sorted the good stuff out hours ago. 

Week 3: Do the “Paying Twice” Math

  • Calculate your annual buffer + ionophore spend using the calculator above.
  • Calculate your annual lameness cost: (cases/year) × $337.
  • Put them side by side. If your lameness cost exceeds your buffer spend, your ration may be working against you.

Week 4: Decide and Assign

  • If RUFAL is above 3.5%, work with your nutritionist on an ingredient swap plan. Target getting below 3.5% within two ration changes.
  • If more than 15% of dry-off cows are below BCS 3.0, build a rebuild lane or, at a minimum, flag thin cows and adjust their close-up ration.
  • If sorting is confirmed, pick at least two countermeasures: shorter chop, added water, more frequent feeding/pushups, or a wet ingredient.
  • Assign one person to own the connection between RUFAL, dry-off BCS, and the trim-chute report. Nothing changed on this herd until the nutritionist, hoof trimmer, and owner were looking at the same numbers.
InputThis Herd (500 cows)Your Herd (fill in)
Bicarb inclusion (% DM)0.75%________
Bicarb cost ($/kg)$0.70________
Bicarb cost/cow/day~$0.12________
Annual bicarb spend~$23,000________
Monensin cost/cow/day~$0.04________
Annual monensin spend~$7,300________
Total Cost A (Buffer + Ionophore)~$30,300________
Lameness cases per 100 cows/yr24________
Cases per year (total herd)120________
Cost per case (Robcis 2023)$336.91$336.91
Total Cost B (Annual Lameness Bill)$40,429________
Gap (Cost B minus Cost A)$10,129 🔴________

What This Means for Your Ration and Your Trim Bill

If your RUFAL lives north of about 3.5% of DM and you’re seeing more than 30 lameness cases per 100 cows per year, you probably don’t have a “trim faster” problem — you have a ration and dry-cow problem showing up in the hoof.

Bringing RUFAL under 3.5% and enforcing a BCS floor of about 3.0 at calving are two of the cheapest moves you can make to change your lameness math — even before you touch the barn. Pulling RUFAL down may cost you on the ingredient line, especially if DDGS is your cheapest energy source. But if your lameness savings outrun that extra $0.10–0.30 per cow per day in feed cost, the math is still in your favor.

At 90 days, re-score the entire herd for locomotion. Compare your new per-100-cow lameness rate to the baseline you established in Week 1.

At 12 months, run the Paying Twice Calculator again with real post-change data. If your lameness cost dropped more than your ration-change cost, the RUFAL fix paid for itself.

The next time your nutritionist and hoof trimmer are at the same table, don’t just ask how to treat lame cows faster. Ask where your lameness bill really starts — and how long you’re willing to keep paying twice.

Key Takeaways:

  • When proper scoring puts lameness closer to 20–25% than the 5–7% you’d guess, you’re likely staring at a $40,000‑a‑year problem at about $337 per case.
  • Treat 3.5% of DM RUFAL as a warning line: above that, your ration is a major lameness risk, even if the barn and trimmer look good.
  • Don’t calve cows under BCS 3.0; thin cows bring softer digital cushions into the riskiest weeks and show up more often with claw horn lesions.
  • Pulling RUFAL under 3.5%, holding a BCS 3.0 floor, and fixing TMR sorting can realistically drop lameness from the mid‑20s to the high‑teens per 100 cows and keep roughly $10,000 a year in your pocket.
  • Any time your lameness bill is bigger than your buffer and ionophore spend, it’s your ration and dry‑cow program — not your hoof trimmer — that should move to the top of the to‑fix list.

Complete references and supporting documentation are available upon request by contacting the editorial team at editor@thebullvine.com.

Learn More

The Sunday Read Dairy Professionals Don’t Skip.

Every week, thousands of producers, breeders, and industry insiders open Bullvine Weekly for genetics insights, market shifts, and profit strategies they won’t find anywhere else. One email. Five minutes. Smarter decisions all week.
NewsSubscribe
First
Last
Consent

The $1,700 Longevity Paradox: How One 1,700-Cow Dairy Cut Udder Culls in Half

At $3,500 a head, every unnecessary cull hurts. A 1,700-cow operation cut udder-health culls from 1-in-3 to 1-in-7 — saving ~$189K/year on replacements.

Your most profitable cow probably isn’t the one producing the most milk right now. She’s the one who sticks around long enough to pay back what she cost you — and then some. At $3,500 per replacement heifer, dairy cow longevity isn’t a soft welfare talking point. It’s a financial strategy.

That’s a hard sell in an industry that’s spent two decades optimizing for peak lactation production. Push for genetic gain, cull aggressively, slot in a superior replacement, repeat. The logic held when a springer heifer ran you $1,200. It holds a lot less at $3,500.

A peer-reviewed study published in the Journal of Veterinary Health Science (Herrema et al., Vol. 4, Issue 3, 2023) analyzed 162,057 milk production records across 1,208 Dutch farms and 213,047 animals. Farms using a biofilm-disruption protocol — quorum sensing inhibition, which we’ll unpack — averaged €1,578 more profit per cow over her lifetime (roughly ~$1,700 USD at near-parity exchange rates; the study was conducted in the Netherlands, and all financial figures are in euros) and saw a 23% reduction in culling probability. The statistical confidence in that culling number? A P-value of 1e-46. The odds of it being a fluke are effectively zero.

A 1,700-cow operation was culling 1 in 3 cows due to udder health problems. Today it’s 1 in 7. They didn’t change his genetics. Didn’t add staff. He changed how he thought about chronic infections — and the cows that used to cycle through his hospital pen stopped cycling through his cull list.

Full disclosure: the longevity study was conducted using AHV International’s proprietary protocols, and AHV co-authored the research. We’ll flag where the data comes from, AHV’s own analysis versus independent sources throughout. The dataset is large enough — and the supporting evidence broad enough — that the economics deserve a serious look regardless.

The Replacement Math That Changed

USDA’s January 2025 cattle inventory report put dairy replacement heifer inventory at 3.914 million head — the lowest since 1978. CoBank’s August 2025 Knowledge Exchange report tracked heifer prices climbing from $1,720 per head in April 2023 to $3,010 per head by mid-2025, with quality animals in California and the Upper Midwest clearing $4,000. This isn’t a blip. CoBank projects the shortage won’t meaningfully ease before 2027.

So you’re spending ,000–,000 to replace a cow that — if she’d stayed healthy through her 4th and 5th lactation — had already paid back her rearing costs and was producing at or near her lifetime peak. Studies estimate that 50% to 70% of dairy cows are forcibly culled at 4 to 5 years of age (Gosselink et al., 2008, V-focus). The average U.S. dairy cow lasts roughly 2 to 3 lactations (Pinedo et al., 2014, Journal of Dairy Science, 97(5)). The Dutch average, as tracked by CRV, is closer to 6 years (CRV, 2022). Research on the economically optimal replacement age varies — some analyses suggest 5 to 6 parities, while others put it as high as 8 to 9 lactations depending on genetics and carcass values (Evers & de Haan, 2017).

As Dr. Albert DeVries at the University of Florida has noted, U.S. dairy cows in the 1930s often had productive lives of 5 to 10 years after first calving — now that number is under 3 years. Replacement prices reaching record levels make that shortened productive life more expensive than at any point in the industry’s history.

Either way, the gap between optimal and actual productive life is where the €1,578 lives. And at $3,500+ per heifer, that gap got a lot more expensive.

What 162,000 Records Actually Showed

The Herrema et al. (2023) study is worth slowing down on. It’s unusually large for a longevity study, and the methodology is more rigorous than most.

Researchers compared 64,467 cows from 3,171 farms using AHV’s quorum-sensing inhibition protocol against Dutch national averages from CRV, the country’s official herd recording organization. They built separate XGBoost machine learning models for treated and non-treated groups—a counterfactual approach that adjusts for confounding factors like age at first treatment. One caveat: farms self-selected into the AHV protocol, so the dataset may partly reflect operations already focused on herd health. The counterfactual modeling addresses some of that, but observational studies can’t fully control for management quality. That said, 64,467 animals benchmarked against CRV national records is a scale that smooths out much of the individual-farm variation. The differences were statistically significant at levels orders of magnitude below p ≤ 0.001.

MetricQSI Protocol FarmsDutch National Avg (CRV)
Average cow age6.59 years5.74 years
Average lactations completed4.13.3
Culling probability reduction23% lowerBaseline
Additional profit/cow (lifetime)+€1,578 (~$1,700 USD)
Longevity improvement+0.7 years (8.5 months)

The paper’s ROI section used FrieslandCampina milk pricing (Milk Fat: €300/100 kg; Milk Protein: €595/100 kg) to calculate lifetime revenue. AHV-treated cows produced 43,881 kg of milk over their lifetimes, versus 35,228 kg for non-treated cows — a difference of 8,653 kg. That translated to €0.50 more revenue per day of life (€6.37 vs. €5.87), totaling €1,578 in additional lifetime profit from milk revenue alone.

A Benelux subset of 2,161 cows in AHV’s Trial Information Sheet (TIS, 2024) analysis further extended the picture: a 19.8% lower replacement rate on top of the production gains. Factoring in replacement savings, AHV’s own analysis pegs total lifetime ROI at 11.1:1 — approximately €310 (~$335 USD) invested per cow returning €3,447 (~$3,720 USD) through additional milk revenue, reduced replacement spend, fewer hospital pen days, and lower treatment costs. That broader ROI comes from AHV’s TIS marketing analysis, not the peer-reviewed paper. The paper supports the milk-revenue component; the replacement cost savings are AHV’s calculation.

A companion study published in Smart Agricultural Technology (Streefland, Herrema & Martini, 2023, Vol. 6, p.100302) — Elsevier-indexed — validated the milk-yield findings using a Gradient Boosting model with prediction errors under 2.5%, confirming improved yield across all three dairy companies in the trial.

One more journal note: the Journal of Veterinary Health Science (OPAST Publishers) isn’t top-tier—it’s not indexed in PubMed or Scopus. But the Elsevier-published companion validation and the sheer size of the CRV-benchmarked dataset give the production findings more weight than the journal alone would suggest. The direction aligns with independent, peer-reviewed research consistently showing that involuntary culling before optimal age is one of dairying’s largest unmanaged cost centers. The Bullvine’s own deep dive into the hidden costs of shortened productive life mapped this same tension between genetic progress and longevity economics — and that was before heifer prices hit $3,500.

Why Your Best Cows Keep Leaving Before Their 4th Lactation

You know the cow. She freshened well, bred back, and hit her stride in 2nd lactation. By her 3rd, she’s putting serious milk in the tank. Then she picks up clinical mastitis. You treat it. She clears. Two months later, it’s back. Treat again. By the time she’s chronic, she’s on the cull list — not because she can’t produce, but because you can’t keep her healthy.

That treat-clear-relapse-cull cycle is the single biggest driver of premature exit from the milking herd. USDA/NAHMS 2018 data pegs total U.S. removal rates at 37.6% for Northeastern herds — 31.4% live culls plus 6.2% death loss. Only about 26.8% of those removals are voluntary. The rest are forced. Udder health, fertility, and lameness lead the involuntary list.

Here’s what’s actually happening inside those chronic mastitis cases: biofilms. Structured communities of bacteria coating tissue surfaces — think of the slime layer inside an old water pipe, except it’s growing in udder tissue. Biofilms contribute to roughly 80% of chronic and recurrent microbial infections. And bacteria sheltered inside a biofilm show 10 to 1,000 times greater antibiotic resistance than the same bacteria floating freely.

That’s why your antibiotic treatment clears the clinical flare-up but never fixes the underlying problem. You’re killing the bacteria that ventured outside the biofilm. The colony inside it barely notices. The cow clears clinically and returns to the string. Six weeks later, she’s in the hospital pen again. Eventually, she’s on the truck.

What Changed on a 1,700-Cow Dairy

As Dr. Gertjan Streefland, a veterinary microbiologist and AHV’s founder, puts it: “Imagine a group of troublemakers. Blindfold them and make them deaf — they can’t coordinate, and they’re immediately harmless. That’s what we do to the bacteria. We don’t kill them. We cut their communication so they can’t organize.”

That’s quorum sensing inhibition — QSI — in one sentence. Instead of killing bacteria (which hasn’t worked against biofilms for decades), QSI disrupts the chemical signaling bacteria use to coordinate biofilm formation. Block the signal, and bacteria can’t build their protective shield. The cow’s own immune system handles the rest.

AHV’s patented approach uses an allium-derived (onion plant) extract, screened and concentrated in their own BSL-2 lab for the specific fraction with the highest impact on quorum sensing. It’s delivered orally — no injections, no intramammary tubes, no withdrawal periods. RTI Laboratories tested the compounds on field bacteria from cows with active udder health issues — both gram-positive and gram-negative strains — and confirmed biofilm inhibition without the development of antimicrobial resistance.

That last point matters. A lot.

One producer started at dry-off. Another focused on fresh cows. Both saw the same downstream effect.”

On a 1,700-cow dairy, the full udder health turnaround took two years, with fresh cow protocols running for 14 months. That timeline is honest — this isn’t a 30-day fix. But within that window, udder health culling dropped from 1 in 3 to 1 in 7. The result: 10 to 12 additional cows in his daily milking string that would’ve been on the cull truck. Today, 17% of his herd exceeds 5 lactations.

“Come back in 5 years, and I’m extremely confident that we will be using AHV protocols. It just makes sense from a herd health and financial standpoint.” — Large-herd dairy operator.

These results aren’t the only North American data. A 2024 multi-farm trial (AHV TIS, 2024) across 8 U.S. operations— ranging from 1,000 to 20,000 cows, totaling 4,495 trial animals — showed a 34% reduction in metritis incidence3.2 kg/day (~7 lbs/hd/day) more milk in the first 100 DIM, and a positive ROI of €160.76 (~$174 USD) per cow(5.04:1 return) using a transition protocol built on the same QSI platform. A separate 2024 trial (AHV TIS, 2024) across farms in California, Idaho, and Wisconsin — 2,703 cows — showed a 14% reduction in udder health issues and a 70% reduction in mortality rate in the first 60 DIM.

How Much Does Involuntary Culling Cost a 500-Cow Dairy at $3,500 Heifers?

Let’s walk the barn math. Plug in your own numbers where yours differ.

Starting assumptions:

  • Current cull rate: 35% (USDA/NAHMS 2018 pegs total removal at 37.6% for NE herds; 35% is conservative)
  • Replacement heifer cost: $3,500
  • Annual replacements: 500 × 0.35 = 175 cows
  • Annual replacement spend: 175 × $3,500 = $612,500

With a 23% reduction in culling probability (matching the Herrema et al. study average):

  • New effective cull rate: 35% × 0.77 = ~27%
  • Replacements needed: 500 × 0.27 = 135 cows
  • New annual spend: 135 × $3,500 = $472,500
  • Saved: $140,000 per year on replacement costs alone

That’s 40 cows that stayed in the string instead of hitting the truck. At 4th- and 5th-lactation production levels, those cows are converting feed more efficiently than any first-calf heifer in the replacement pen.

Now the numbers from that 1,700-cow dairy. His improvement was specifically in udder health culling — from 1-in-3 to 1-in-7 as a share of total removals. That’s a different calculation than the 23% total-cull reduction from the study, and it’s important to keep the two separate. USDA/NAHMS data shows udder health issues account for roughly 18–19% of all culling decisions. On a 1,700-cow herd running ~33% overall cull rate, that’s approximately 104 udder-health culls per year. Cut that roughly in half — which is what moving from 1-in-3 to 1-in-7 approximates — and they eliminated about 54 udder-related replacements annually. At $3,500 per heifer, roughly $189,000 in avoided replacement cost per year. And that’s just the udder piece.

When you consider that the 800,000-heifer shortage is already forcing some families out of dairying entirely, every cow that stays productive one more lactation isn’t just a spreadsheet win — it’s the difference between expanding and contracting.

Sponsored Post

Does Keeping Older Cows Slow Your Genetic Gain?

With each additional lactation you keep a cow, there are fewer slots for a genomically superior replacement. If you’re running an aggressive genetic improvement program, extending cow life slows the rate of genetic gain. That trade-off is real.

But at what heifer price does it flip? At $1,200 heifers, rapid turnover for genetic gain penciled out for most herds. At $3,500, with a shortage projected through at least 2027, the breakeven has shifted. A 2025 analysis in Animals (MDPI) found that many early replacement decisions remain economically justified when accounting for genomic values and beef-on-dairy carcass premiums. So this isn’t a blanket “never cull early” argument. It’s a targeted one: if a cow is leaving your herd involuntarily for a chronic health issue that’s treatable, and she had two or more profitable lactations ahead of her, the math at today’s heifer prices says you’re almost certainly losing money on that transaction.

For many operations, the crossover point may now sit closer to lactation 3.5 or 4 than the industry has assumed — though your number depends on your genetics program, your replacement costs, and what a cull cow brings at auction.

What This Means for Your Operation

Day 1: Calculate your current average productive life in lactations. If it’s under 2.8, you’re below even the U.S. average, and this analysis applies directly to your herd. This takes five minutes in your herd management software.

In the next 30 days: Pull your involuntary cull rate for the last 12 months, separated by reason code. If udder health culls represent more than 25% of your total removals, you’ve found your single biggest margin leak. Two hours in DairyComp or PCDART. Cost: zero.

In the next 90 days: Run the replacement-cost math against your actual cull reasons. Rank them by economic cost per cull, not by frequency. One udder health cull that removes a 3rd-lactation cow producing 90 lbs/day costs more than three voluntary culls of open heifers. Multiply your involuntary udder culls by your current heifer price. That’s the number you’re managing against.

Over the next 365 days, evaluate a biofilm-aware protocol for your chronic and recurrent clinical cases. Start with a defined cohort — your hospital pen repeat offenders or your 2nd+ lactation cows entering dry-off. At ~€310 (~$335 USD) per cow invested, per the study’s protocol, the costs for a 100-cow pilot cohort run ~$33,500. Budget that against your projected replacement savings. The two-year timeline from that dairy timeline is realistic for a full udder-health turnaround at the herd level. They started at dry-off. They started with fresh cows. Both approaches built evidence before scaling. Benchmark against your own 12-month baseline before deciding on a herd-wide rollout.

Two thresholds to know: If your involuntary cull rate is already below 20% and your bulk tank SCC sits under 150,000, the marginal return from a biofilm-focused protocol is smaller — this math hits hardest for operations where chronic, recurrent cases are driving the cull truck. Conversely, if your average productive life already exceeds 3.5 lactations and your replacement rate sits below 28%, you’ve captured much of the low-hanging fruit. The biggest gains land on herds stuck between high involuntary culling, sound genetics, and cows leaving before they should.

Key Takeaways

  • If your udder health culls exceed 25% of total removals, run your replacement-cost exposure before your next management meeting. At $3,500 per heifer, that’s your single largest controllable cost center — and it’s probably bigger than you think.
  • Before adopting a biofilm-disruption protocol, ask two questions: Does your chronic/recurrent mastitis pattern match the biofilm profile these protocols target? And can you commit to two-year evaluation timeline? This isn’t a 30-day fix. Budget ~$335/cow for the pilot, benchmark your own baseline, and let the data accumulate.
  • The €1,578 (~$1,700 USD) lifetime profit figure is based solely on milk revenue, calculated using FrieslandCampina pricing for 64,467 cows. Factor in replacement savings from a 19.8% lower replacement rate, and AHV’s own analysis puts total lifetime ROI at €3,447 (~,720 USD) per cow. The dataset is large, and the direction is consistent with independent research—but AHV co-authored the study. Weigh accordingly.
  • Run your own breakeven: At what heifer price does keeping a healthy 3rd-lactation cow beat replacing her with a genomically superior heifer? If you don’t know that number for your operation, that’s the first calculation worth doing.

The Bottom Line

The dairy industry spent 20 years optimizing for peak milk per lactation. The economics of 2025 and 2026 may be forcing a different optimization: peak lifetime value per stall. With heifer inventory at a 47-year low and replacement prices that CoBank doesn’t expect to ease before 2027, every involuntary cull carries a price tag that would’ve seemed absurd a decade ago.

A 1,700-cow operation answered the longevity question two years ago. Others came in through dry-off protocols. Your answer might differ, but the replacement math stays the same. What’s your involuntary cull rate, and what would a 5-point drop be worth at your current heifer price?

Complete references and supporting documentation are available upon request by contacting the editorial team at editor@thebullvine.com.

Learn More

The Sunday Read Dairy Professionals Don’t Skip.

Every week, thousands of producers, breeders, and industry insiders open Bullvine Weekly for genetics insights, market shifts, and profit strategies they won’t find anywhere else. One email. Five minutes. Smarter decisions all week.
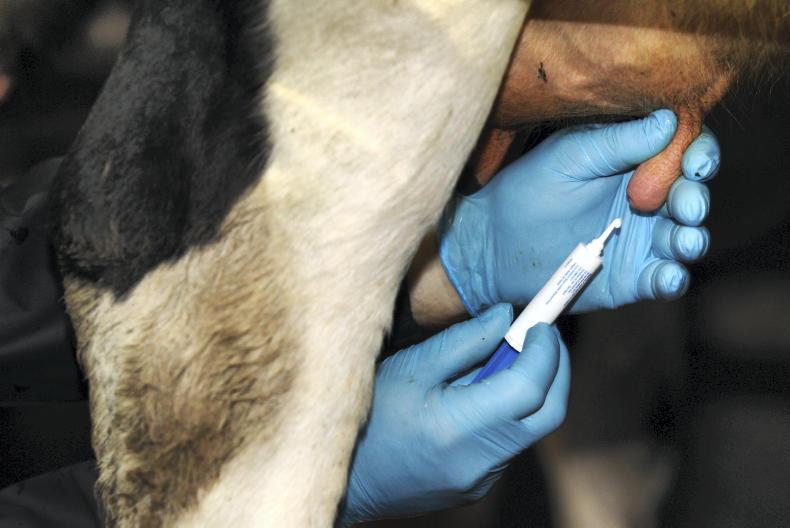
NewsSubscribe
First
Last
Consent

The $52,000 Protein Leak: How 16% Holstein Rations Waste Protein Efficiency

“Safe” 16% rations are bleeding $52,000/year in soybean meal your cows never needed. Two lines of barn math prove it.

Executive Summary: This feature argues that many Holstein herds are leaking profit on protein because they stick with “safe” 16% crude protein rations instead of managing for protein efficiency. Using a composite 500‑cow herd, it shows that dropping from 16% to 14% CP at 22 kg DMI can save about ,000/year in soybean meal at current futures, while Michigan State modelling ranks feed waste reduction and modest CP cuts as the biggest efficiency movers. Extension data from Wisconsin and Vermont are used to set guardrails, with MUN around 10–11 mg/dL, normal Holstein protein: fat ratios near 0.80, and higher fresh‑cow MP needs defining how far you can push CP without hurting milk or components. The article highlights the rumen as the cheapest protein factory on the farm — microbes can cover most amino acid needs when rumen carbs are 38–40% of DM — and shows where rumen‑protected amino acids actually pay once high groups are over 36 kg/day. It closes with a concrete playbook for the next month: calculate your protein efficiency once, average recent MUN scores, run your own 16% vs 14% barn math with current ingredient prices, check your protein: fat ratio, and treat any amino acid program as a defined IOFC trial rather than a permanent add‑on.

Dairy Protein Efficiency

The whiteboard in the office was full.

Dry matter intake, ECM, starch, NDF, and bunk scores from last week’s walk. All the usual suspects that decide whether the month ends in black ink or red.

Then someone asked a question that stopped the room:
“Do we even know our protein efficiency?”

Silence. Lots of numbers on the board. None answering that one. So they grabbed a calculator, pulled the ration sheet and the last milk statement, and did the math. The number that came back was 27.3% protein efficiency — almost exactly where extension work says many U.S. Holstein herds sit today.

That single number changed the whole conversation.

The Protein Efficiency Metric Hiding Beside Feed Efficiency

Feed efficiency has been living on dairy whiteboards for years. Kilograms of ECM per kilogram of dry matter. Milk solids per kilogram of dry matter.

Protein efficiency sits right beside it, but rarely gets tracked:

Protein efficiency (%) = (kg milk protein shipped ÷ kg crude protein fed) × 100

Extension examples use three simple scenarios from a typical Midwest Holstein herd to show how fast that number can move:

Scenario 1Scenario 2Scenario 3
DMI, kg/day222222
Crude protein, %161414
CP fed, kg/day3.523.083.08
Milk, kg/day303033
Milk protein, %3.23.23.3
Milk protein, kg/day0.960.961.09
Protein efficiency27.3%31.2%35.4%

Same cows. Same 22 kg of dry matter.

  • Dropping from 16% to 14% crude protein, while still meeting metabolizable protein and amino acid needs, bumps PE from 27.3% to 31.2%.
  • Pushing milk from 30 to 33 kg and nudging protein from 3.2% to 3.3% on that same 14% diet takes PE to 35.4%.

Modelling work from Cornell and Michigan State suggests rations approaching 40% PE are possible on paper. The reality in most barns is still high‑20s. That’s the gap this story is about.

Is Feed Waste Really a Bigger Lever Than Protein Products?

Here’s the part the product sheets don’t lead with.

Michigan State University modelled how different management changes affect whole‑farm energy and protein efficiency, starting from a base of 28%. For protein, the gains looked like this:

Management leverProtein efficiency gain (points)
Reduce feed waste 10%+3.1
Reduce diet CP by 2 percentage points+1.3
One more lactation per cow+0.5
Increase milk 10%+0.4
Shorten calving interval by 1 month+0.4
Drop age at first calving by 2 months+0.3

Feed waste sits right at the top.

That’s not a new bag or a new additive. That’s the 9 p.m. bunk check. It’s the inches of refusals you tolerate in front of your high group. It’s how often feed gets pushed up on the night shift.

Put another way:

Feed waste reduction (+3.1) and a 2‑point CP trim (+1.3) together deliver more than 4.4 PE points before you buy a single new supplement.

From a 28% baseline, that gets you into the low‑30s. Add better longevity and reproductive timing, and mid‑30s becomes realistic — without touching your semen tank or buying into the latest “protein booster.”

The Barn Math That Starts Arguments

Let’s go back to that composite 500‑cow Holstein herd.

They were feeding 16% CP on a 22 kg DMI. That’s 3.52 kg of crude protein per cow per day. Dropping to 14% CPat the same intake brings that down to 3.08 kg. The difference is:

  • 0.44 kg of crude protein per cow per day

If that protein is coming from standard 48% soybean meal (around 47.5% CP as fed), you’re looking at roughly:

  • 0.44 ÷ 0.475 ≈ 0.93 kg soybean meal per cow per day

Soybean meal futures for mid‑2026 are trading in the low‑$300s per ton. Recent quotes put mid‑2026 contracts around $308–$312/ton, with continuous front‑month near $322/ton. Using a conservative $310/ton (~$0.31/kg) for barn math:

  • 0.93 kg × $0.31/kg ≈ $0.29 per cow per day
  • $0.29 × 500 cows × 365 days ≈ $52,000 per year

That’s the $52,000 protein leak in the headline. It’s straight multiplication off your ration sheet and the current meal board.

When this extension material was first presented, U.S. soybean meal was priced at around $460/ton. Run the same math:

  • 0.93 kg × $0.46/kg ≈ $0.43 per cow per day
  • Roughly $77,000 a year on 500 cows

Feed markets have moved since then, and they’ll move again. The underlying point doesn’t change: 16% isn’t “safe” by default. It’s an unpriced insurance policy that can quietly carry a five‑figure annual premium.

And in your own ration, that entire 0.44 kg CP won’t all come from soybean meal. But once you plug in your actual protein sources and prices, the direction of travel will look very similar.

What Your MUN Is Really Telling You About Protein Efficiency

Here’s the good news: you already have a real‑time nitrogen report card sitting on every milk statement.

Milk urea nitrogen (MUN) is routinely reported for U.S. herds and widely used in extension work. The guidance bands often look like this:

MUN (mg/dL)StatusWhat it tells you
0–8⚠️ LowRumen microbes may be short on nitrogen; may need more rumen‑degradable protein.
8–12✅ TargetBest balance between nitrogen efficiency and milk protein yield.
12–16🟠 Above targetNitrogen use is less efficient; more loss as urine and milk urea.
16–24🔴 HighHigher risk for fertility impacts, nitrogen loss, and environmental load.

A University of Wisconsin model, combined with work by Nousiainen et al. (2004), plotted:

  • The percentage of intake nitrogen captured in milk, and
  • Total milk protein yield

against MUN.

As MUN rises:

  • The share of intake nitrogen showing up in milk drops.
  • Milk protein yield increases with MUN up to about 20–25 mg/dL, then levels off.

The interesting part is where the two curves cross. That crossover — where you keep good milk protein yield without throwing nitrogen away — sits right around 10–11 mg/dL MUN.

So if your rolling MUN average lives in the mid‑teens, you’re paying to move nitrogen through the cow and into the lagoon instead of into the bulk tank.

Why Rumen Bugs Can Replace Expensive Protein

If you’re going to cut crude protein, you need to know something else is doing the heavy lifting on amino acids.

That “something” is your rumen.

A Vermont project compared model‑predicted allowable milk from metabolizable protein with actual milk shipped. The relationship was almost perfectly linear, with an R² of about 72%. In plain terms, metabolizable protein explained roughly three‑quarters of the variation in milk yield.

The source of that metabolizable protein matters. University tables comparing amino acid profiles show this:

Feed sourceLysine (% of MP)Methionine (% of MP)
🏆 Rumen bacteria7.92.6
NRC target7.22.5
Milk requirement7.62.7
Corn silage2.51.5
Corn grain2.82.1
Soybean meal6.31.4
Blood meal9.01.2

Rumen bacteria land almost exactly on the NRC target for 7.2% lysine and 2.5% methionine. When the rumen is firing, it can cover 60–70% of a high‑producing cow’s amino acid needs.

Corn silage and corn grain don’t come close on their own. Heavy corn‑based diets common in the Midwest and Northeast need help — either from high‑lysine ingredients like soybean meal or from rumen‑protected amino acids in the right pens.

The key to unlocking microbial protein isn’t throwing more crude protein at the cow. It’s giving the rumen bugs the right fuel:

Target roughly 38–40% of diet dry matter as “rumen carbs”: starch + sugar + soluble fiber.

That’s what lets microbes grab ammonia and turn it into near‑perfect protein instead of letting it blow off as urea.

How Do You Know If You’ve Cut Protein Too Far?

The big fear with any CP cut is simple: “What if the tank drops?”

That fear is valid. The fix is to put hard guardrails around the change.

The extension material points to some clear red flags:

  • MUN consistently < 8 mg/dL
    Nitrogen is tight for the rumen bugs. You may have over‑cut RDP or shifted too much toward bypass protein.
  • Protein: fat ratio < 0.75
    DHI averages for U.S. Holsteins are 3.81% fat and 3.04% true protein, a ratio of about 0.80. Drop below 0.75, and you’re likely short on amino acids — either from microbial protein or from RUP quality.
  • Fresh cow protein below 3.0% in the first 40 days
    North Carolina DHIA data from 2009–2017 (herds from 19,000 to 30,000 lb RHA across three lactations) showed early‑lactation true protein values consistently under 3.0%, highlighted in red in the original tables. NRC (2001) sets the fresh Holstein MP requirement at 13.8% of DM, while DMI is only about 15 kg/day. There’s almost no cushion.
  • Peak milk softens in the 4–8 week group.
    If peak shifts down after a CP cut, you didn’t improve efficiency — you just shrank the curve.
  • Dry matter intake slides
    According to the same extension talk, protein is a driver of DMI. Lower intake means lower total nutrient delivery, even if PE looks better on paper.

The safest place to start trimming crude protein is not the fresh pen. It’s mid‑ and late‑lactation groups where:

  • MUN is running high
  • Protein tests have headroom
  • Cows are past peak, and intakes are stable

In practice, that means agreeing ahead of time on your floors for milk yield, protein %, and MUN — and booking a 30‑day check‑in before you change anything.

If the cows don’t hold those lines, crude protein goes back up. No drama. No sunk‑cost pride.

When Amino Acid Balancing Is Actually Worth the Money

Once the simple levers — feed waste, crude protein, rumen carbs — are under control, the next question is usually about rumen‑protected amino acids.

Do they pay, or is it just one more shiny bag?

An Ohio State University trial, summarized in the extension slides, offers a clean comparison:

ParameterControlBalanced AA
Crude protein, %16.916.9
Milk, kg/day42.946.6
Protein, %2.993.09
MUN, mg/dL14.313.5
IOFC, $/cow/day$8.74$9.90

Same crude protein. Different amino acid profile.

  • Milk jumped 3.7 kg per cow per day.
  • Protein test nudged up 0.10 percentage unit.
  • MUN dropped slightly while staying in a sensible range.
  • Income over feed cost improved by $1.16/cow/day, including the cost of the amino acid product.

Scaled up to 500 cows for a full year, that’s roughly $212,000 more IOFC — at the feed prices and milk value that applied when the trial was run. Real herds won’t reproduce university results perfectly, but it shows what’s on the table when crude protein is already optimized.

The wider research summarized in the same presentation puts the range of field response roughly here:

  • Milk yield: 0 to 2.3 kg/cow/day
  • Protein test: +0.1 to +0.2 percentage units, often within days
  • Where it works: mostly in early lactation, when cows are setting their curve, and RUP lysine/methionine can be limiting

One rule of thumb from that extension work:

When your high group is consistently over 36 kg/day and shipping about 1.2 kg of milk protein per cow per day, amino acid modelling and RP methionine are much more likely to pay.

Below that line, the big wins usually still come from management.

The key with any amino acid program is to treat it like a trial, not a belief system:

  • Benchmark milk, components, MUN, and IOFC before you start.
  • Run the product for a set period.
  • Decide up front what success looks like.
  • If the numbers don’t show up in 60 days, pull it.

What This Means for Your Operation

  • Within the next 30 days, calculate protein efficiency at least once.
    Use your current ration: estimate kilograms of crude protein fed per cow per day from DMI and CP%. Use your milk shipper statement to get kilograms of milk protein per cow per day. Divide. If that number starts with a 2instead of a 3, you’ve just sized a real opportunity.
  • Pull your last 6–10 MUN results and average them.
    If you’re living between 8 and 12 mg/dL, you’re near the efficiency–yield crossover that the Wisconsin model points to. If you’re consistently in the 13–16 range, some of your protein is walking right past the mammary gland and out through urine.
  • Sit down with your nutritionist and run your own 16% vs 14% barn math.
    Plug in your DMI, your CP %, your actual protein ingredients, and your current delivered meal price. The example here — $0.29/cow/day and $52,000/year at $310/ton soybean meal — is a template, not a budget. Decide which pens, if any, can move toward 14% CP, and set clear guardrails before making any changes.
  • Check your protein: fat ratio this week.
    Take your Holstein herd average. Divide true protein % by butterfat %, and the data says the “normal” is about 0.80. If you’re well above 0.90, chase milk fat depression and rumen health first. If you’re below 0.75, look hard at amino acid supply — especially MP, microbial protein support, and RUP quality.
  • If your high group exceeds 36 kg/day, treat amino acids as a real trial.
    Use a modelling tool to balance lysine and methionine. Pick a rumen‑protected methionine product with published data. Track IOFC, not just milk volume. Set a kill date if the economics don’t show up.

Key Takeaways

  • If your protein efficiency starts with a “2,” management fixes are your first step.
    Reducing feed waste by 10% and trimming diet CP by 2 points can add more than 4 PE points on their own, based on MSU modelling.
  • MUN is a free, powerful nitrogen dashboard you’re probably under‑using.
    Aim for 8–12 mg/dL, with the efficiency–yield sweet spot right around 10–11. Averages in the mid‑teens point to nitrogen — and money — going out in urine.
  • Rumen microbes are the cheapest protein on your farm.
    They can supply 60–70% of a high‑producing cow’s amino acids when rumen carbs sit around 38–40% of DM,and CP is balanced for MP and amino acid profile.
  • Amino acid products pay best when combined with good management, not instead of it.
    The Ohio State trial shows what’s possible at 16.9% CP, but field herds will only see that kind of return once DMI, CP, MUN, and feed waste are under control.

The Bottom Line

None of this requires you to reinvent your feeding program overnight.

It does mean that at your next ration meeting, alongside ECM/DMI and feed cost per cow per day, there probably needs to be one more line on the whiteboard:

Protein efficiency =?

Once that number is up there, what you do with it is where the real management starts.

Complete references and supporting documentation are available upon request by contacting the editorial team at editor@thebullvine.com.

Learn More

The Sunday Read Dairy Professionals Don’t Skip.

Every week, thousands of producers, breeders, and industry insiders open Bullvine Weekly for genetics insights, market shifts, and profit strategies they won’t find anywhere else. One email. Five minutes. Smarter decisions all week.
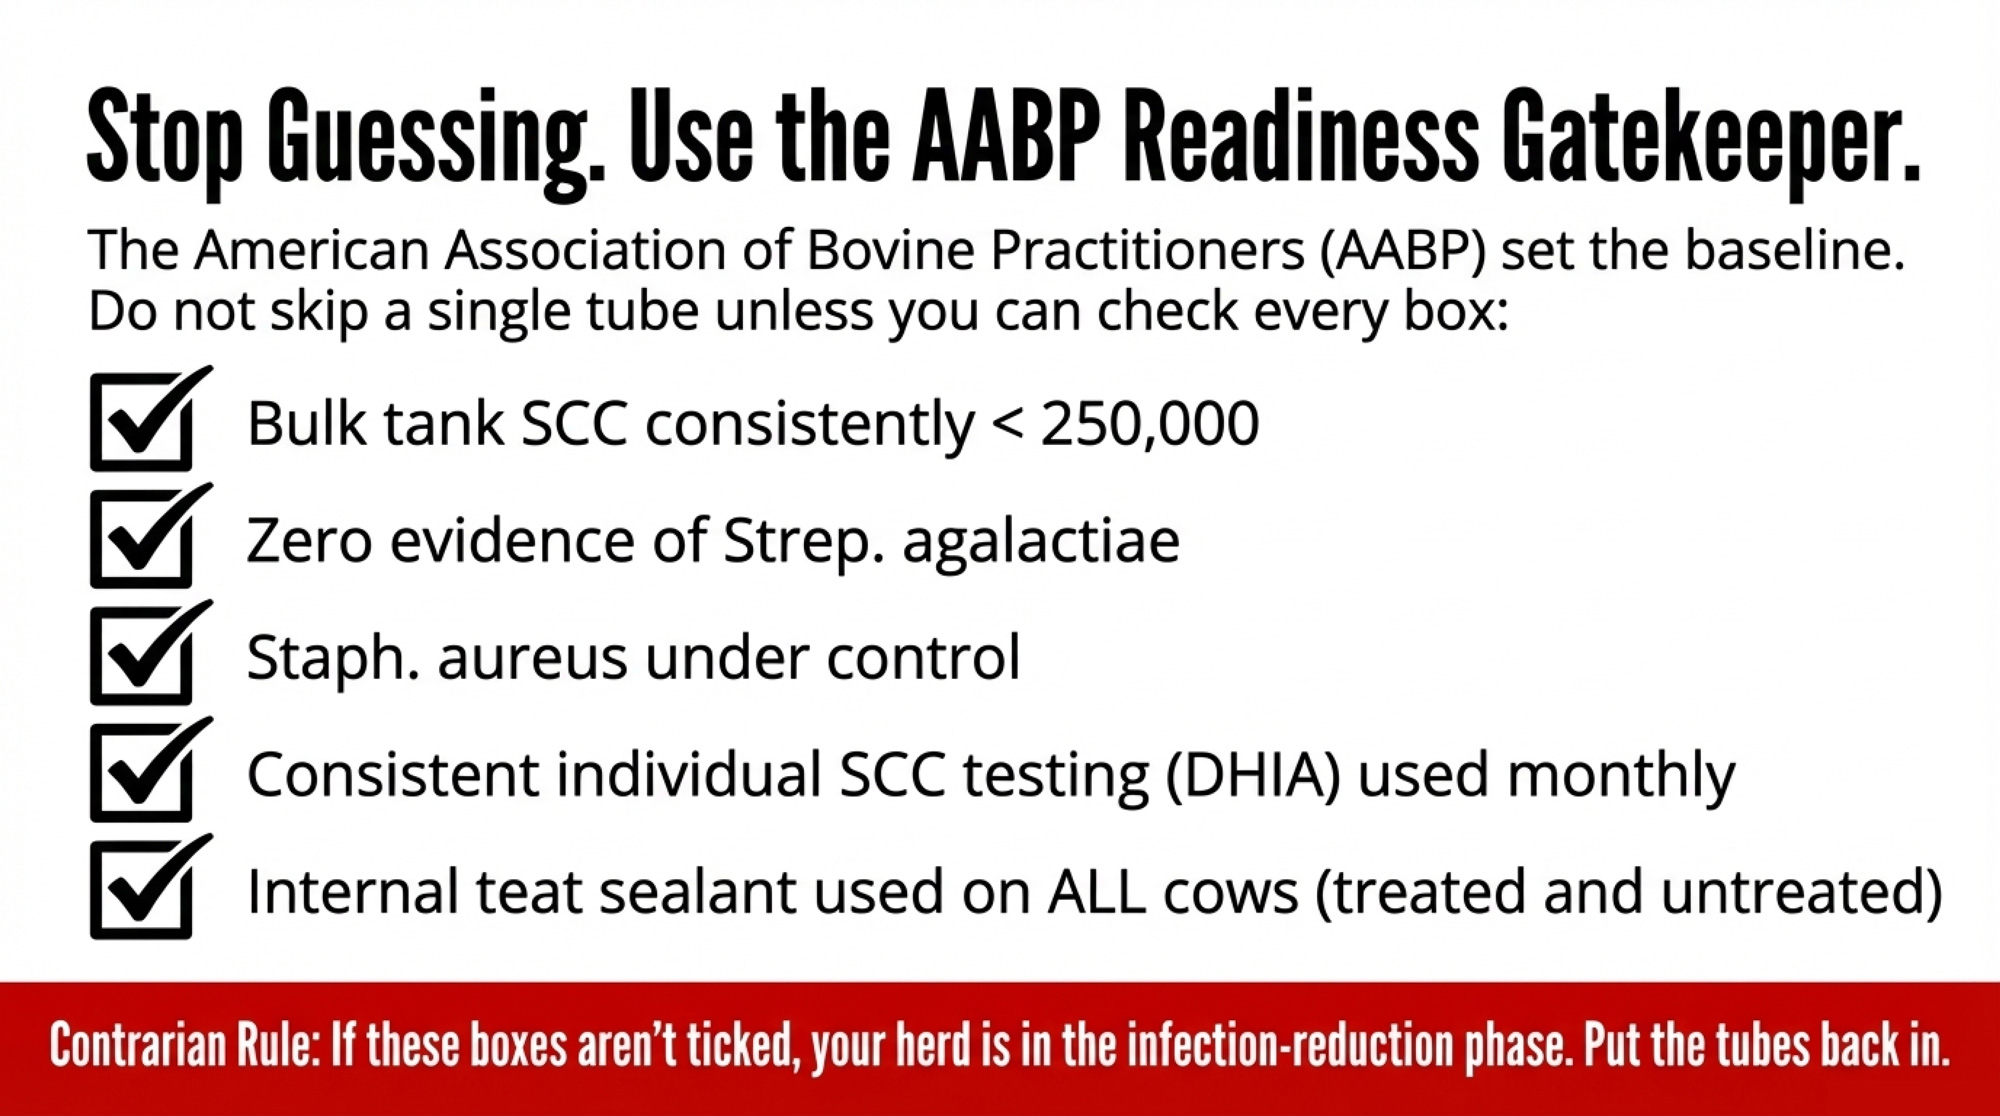
NewsSubscribe
First
Last
Consent

The 12% Power Trap: How a Dairy Electricity Hike Becomes a 9¢/cwt Margin Hit – and the Efficiency Play to Reverse It

On a 750‑cow dairy, a 12% power hike quietly costs 3¢/cwt. One VSD‑level upgrade can swing your margin 9¢/cwt. What’s your electricity cost per cwt?

Executive Summary: Mark’s 750-cow freestall just took a 12% power rate hit. That’s 3¢/cwt gone — $7,650/year. The trap is waiting on efficiency. One VSD vacuum pump upgrade flips his margin by 9¢/cwt (2-6-year payback). Ontario wholesale prices surged 90%+ in 2025. REAP grants are paused. If your DSCRs are near 1.20×, lender talks get harder. This piece runs the barn math and hands you a 30/90/365 playbook to check your own exposure.

Dairy electricity costs

Mark and Lisa are composite illustrations built from published benchmarks and common industry patterns — not specific individuals. All numbers are walked through transparently, so you can plug in your own.

A 12% bump in dairy electricity costs quietly strips about 3¢/cwt — or $7,650 a year on 220,000 cwt — out of a 750-cow dairy’s milk check. That’s not a modeling exercise. It’s what happens when you run the actual kWh through current rates.

Consider a 750-cow freestall — call him Mark — whose power bill climbed that much in early 2025. The reaction from operations in that position is almost universal: We can’t afford to invest in efficiency right now. We’ve got to preserve cash. On the surface, that feels conservative. Look at the math and the timeline to 2030, and it starts to look more like a trap.

Electricity isn’t the fixed overhead line that most producers treat it as. A significant chunk moves with management decisions, herd size, and equipment choices. You can manage it the same way you manage feed cost. The operations that treat power like untouchable overhead? They’re leaving margin on the table every single month.

The Rate Hike Hitting Herds Like Mark’s

Mark’s scenario is a 750-cow North American freestall. Solid component milk, but a 2024–2025 milk price that’s nothing to brag about. Then the electricity bill jumps around 12% in one renewal cycle. No new barn. No robot install. Just rate changes and fees.

And 12% may be mild. Ontario’s wholesale electricity market price (the IESO’s Hourly Ontario Energy Price) averaged approximately 3.4¢/kWh across 2024, per IESO year-end data. Then wholesale prices surged over 90% in 2025 — the highest annual average since 2005, according to Scott Luft’s January 2026 analysis on Cold Air. Ontario utilities layered distribution rate increases on top — Milton Hydro’s OEB-approved distribution rate increase was 3.70% effective January 1, 2026. Total delivered costs for farm customers are partially offset by the Ontario Electricity Rebate (23.5%as of November 1, 2025, per OEB), so the net bill impact is smaller than the headline wholesale jump — but the direction is unambiguous.

Ontario and US benchmarking have found dairy electricity use in confinement systems ranging from 800–1,400 kWh/cow/year, with freestalls averaging around 837 kWh/cow/year and tiestalls near 1,417 kWh/cow/year (Ontario OMAFRA). A 2022 Progressive Dairy article summarizing USDA REAP and EQIP projects noted that energy-efficiency upgrades on dairies can reduce energy costs by 10 to 35 percent, saving 2¢ to 30¢ per hundredweight in avoided costs.

The unspoken bet behind the preserve cash stance is that milk price will bail you out faster than power costs keep climbing. That’s a bet — not a strategy.

What Does a 12% Rate Hike Actually Cost a 750-Cow Dairy?

You don’t feel percentages. You feel dollars leaving the account.

A Minnesota Department of Commerce dairy energy study found that US dairy farms range from 400 to 1,700 kWh per cow annually, with electric utility costs of about $0.035 to $0.045 per cwt in the Midwest. Using freestall averages from Ontario and Midwest data, work with 850 kWh/cow/year for Mark’s 750-cow scenario:

750 cows × 850 kWh/cow/year = 637,500 kWh/year

For the rate assumption, Alberta’s current Rate of Last Resort for farm customers sits at 12.01¢/kWh as of March 2026, per EPCOR’s published schedule. Index (spot) prices ran lower through 2025 — averaging roughly 4–9¢/kWh,depending on the month. To keep the example conservative and broadly applicable, use $0.10/kWh:

Baseline: 637,500 kWh × $0.10 = $63,750/year
After 12% hike: $63,750 × 1.12 = $71,400/year
Annual hit: $7,650

Assuming the operation ships 220,000 cwt/year:

MetricBaseline (2024)After 12% Hike (Doing Nothing)After Efficiency Project*
Annual Electricity Cost$63,750$71,400$51,000
Cost per cwt ($/cwt)$0.29$0.32$0.23
Margin Impact vs. Baseline−$0.03/cwt+$0.06/cwt

*Assumes 20% efficiency gain at the baseline rate, consistent with the 10–35% savings range documented in USDA-funded projects. Note: the 9¢/cwt swing compares the post-hike do-nothing scenario against the baseline with efficiency gains — it combines the cost of the hike (3¢) with the project’s benefit (6¢).

Plug in your own numbers: if your herd ships [X] cwt per year and your annual electricity bill is [Y], your electricity cost per cwt is simply Y ÷ X. Do that once, then rerun it after the next rate change.

The gap between “doing nothing” and “doing one project” isn’t 3¢ — it’s 9¢/cwt of margin swing. If your herd sits closer to the upper end of the 2.3–4.5 kWh/cwt range documented across five US farms, the impact is worse.

How Fast Does a VSD on Dairy Vacuum Pumps Pay for Itself?

Most producers don’t start with digesters or solar. They start with a variable-speed drive on vacuum pumps — the math is straightforward, and field results are documented. The Minnesota Department of Commerce dairy energy study found VSDs on vacuum pumps presented “the greatest savings potential, especially for farms with long milking hours.”

New York parlor studies report that milk harvesting — vacuum pumps, cooling, and water heating — accounts for roughly 40–45% of electricity use on those dairies. Alberta data estimated about 44% for milking on a typical 100-cow dairy. DairyConservation’s VFD practice sheet confirms a VFD “can typically reduce the electricity usage of the vacuum pump system by 50–60% and generally has a fast payback period even without financial incentives.” Wisconsin Extension reports a broader range of 30–80% savings depending on conditions. The National Dairy FARM Program similarly documents 50–60% reductions in vacuum pump electricity use with 3- to 7-year payback periods.

For Mark’s 750-cow operation, assume vacuum and milk pumps burn about 100,000 kWh/year of that 637,500 kWh total — plausible given milking and cooling combine for nearly half the load:

50,000–60,000 kWh saved × $0.10/kWh = $5,000–$6,000/year

You’re likely looking at multiple VSD units across vacuum and milk transfer pumps, potentially new compatible motors, and professional installation. A single 7.5 HP vacuum pump VSD retails around $4,450 from dairy equipment suppliers, and total project costs for multi-pump systems can run $30,000–$50,000 gross before incentives. EQIP typically covers 50 to 75 percent of eligible costs, and several state and provincial incentive programs layer on top — putting realistic out-of-pocket costs in the $10,000–$25,000 range, depending on your program stack:

Payback: $10,000–$25,000 ÷ $5,000–$6,000/year ≈ 2–5 years

That range aligns with Penn State Extension’s assessment: “There is often a 2- to 6-year payback on investments for variable speed drive vacuum pumps, well water pre-cooling of milk, and heat recovery from the refrigeration system,” per Dr. Doug Reinemann’s recommendations published in a Penn State Extension article on parlor retrofits. One caveat: the Minnesota Commerce study found a 6.6-year mean payback specifically for receiver jar milk pump VSDs. Vacuum pump drives pencil faster than milk pump drives, and your mileage depends on milking hours and system configuration.

In Mark’s scenario, that $5,000–$6,000 goes to the utility every year instead. In the Lisa scenario — call her a neighbour running 600-some cows who made a different call — those dollars stay in the operation’s cash flow. The risk of doing the project isn’t zero; equipment can underperform, and one farmer on NewAgTalk reported his VFD controller failed twice at $2,000 per repair. But the risk of doing nothing in a rising-rate world is now visible in the barn math.

Why Your Lender Cares More About This Than You Think

The $7,650/year hit from a rate hike doesn’t just show up on your power bill. It shows up on your lender’s spreadsheet — specifically in your Debt Service Coverage Ratio (DSCR).

Farm Credit Canada defines DSCR as net cash income divided by total annual debt obligations. Many ag lenders look for a DSCR above 1.20–1.25×. Fall below that, and conversations about credit access get harder.

If your DSCR is already sitting near 1.15–1.20× — the zone The Bullvine’s own composite herd analysis of Kansas City Fed data placed at the edge of “significant financial stress” for agricultural producers — a $7,650 swing in annual OPEX can tip a lender conversation from routine to uncomfortable. It’s not just the electricity dollars. It’s the signal. When your lender sees rising energy costs on a flat kWh/cwt line, they see a farm absorbing input inflation with no management response.

When they see a declining kWh/cwt line with audit data and before-and-after numbers? They see the kind of operator they want to keep lending to. That’s the Lisa scenario in a nutshell — same rate hike, different signal to the banker.

ScenarioAssumed DSCR (2025 Baseline)DSCR After Electricity Impact (2026)Lender Risk Tier
Baseline (2025, No Rate Hike)1.251.25Standard
Do Nothing (Post-Hike)1.251.18Elevated Risk
Efficiency Project Executed1.251.32Preferred

Cornell Pro-Dairy’s 2024 Dairy Farm Business Summary (published July 2025, authored by Jason Karszes and Lainey Koval) showed the operating cost gap between New York’s highest- and lowest-earning quartiles widened to more than $6.50/cwt — up from $4.32/cwt in the 2023 DFBS. That’s 129 farms, in the same milk-price environment, separated by efficiency and cost control. RaboResearch’s Lucas Fuess, analyzing 2022 Ag Census data, told Brownfield Ag News that large-herd operators (2,000+ cows) can operate roughly $10/cwt less than 100–199-cow farms. Your lender knows where you sit in those ranges. The question is whether you’re moving in the right direction.

The Real Trap: Why Waiting Until 2027 Makes Everything Worse

Here’s what makes the we’ll deal with it later stance a trap — not just a delay.

The grant money isn’t there right now. USDA paused all REAP grant applications on June 30, 2025, due to an overwhelming backlog of applications. The agency anticipated reopening on October 1, 2025, but as of January 2026, TPI Efficiency confirmed USDA’s REAP page still stated: “The Agency is not accepting REAP grant applications at this time.” REAP remains funded and authorized through at least 2027 via the Farm Bill, with IRA money available for obligation through September 30, 2031 — but the original FY 2026 grant deadlines (September 30, 2025; December 31, 2025; and March 31, 2026) have all passed without reopening. Guaranteed loan applications remain open year-round through local Rural Development offices.

The grant dollars that make fast-payback projects pencil out easiest are in limbo. And USDA has publicly indicated it’s implementing the Secretary’s direction to “disincentivize solar panels on productive farmland” in future application windows, adding further uncertainty to FY 2026 scoring criteria.

Your credit position is eroding. Every year you absorb rising electricity costs without a management response, DSCR drifts lower. By 2027, if milk prices haven’t bailed you out, your lender may not approve the capital for the upgrade you need — precisely because you waited too long to act when conditions were better. Cornell’s 2024 DFBS showed that the lowest-earning quartile of New York farms averaged a debt coverage ratio of just 0.70, while the highest-earning quartile averaged 5.07.

The compounding is relentless. That 3¢/cwt isn’t a one-time hit. It’s $7,650/year, every year, stacking on top of whatever the next rate increase adds. Two more rounds of distribution increases — consistent with Milton Hydro’s 3.70% distribution rate hike for 2026 and Ontario’s wholesale price trajectory — and the electricity line could drift several thousand dollars per year higher without a single new cow or piece of equipment.

In Mark’s scenario, you arrive at 2027, paying whatever the utility charges for the same kWh/cwt as in 2024, with a thinner DSCR and fewer funding options. In the Lisa scenario, you’ve got before-and-after data to show a lender and a kWh/cwt line moving in the right direction.

MetricMark: Do NothingLisa: One VSD Project
Annual Electricity Cost (2026)$71,400$51,000
Cost per cwt (2026)$0.32$0.23
Cumulative 3-Year Loss (2026–2028)−$22,950+$38,400 (savings)
DSCR Trajectory (2026–2027)1.20 → 1.121.20 → 1.35
Lender Conversation (2027)“Concerns about cost control”“Proof of management response”

The Playbook: What to Do in 30, 90, and 365 Days

30 Days: Put Energy on Your Dashboard

No hardware. Just your own bills and milk records. In Mark’s scenario, this step never happens. In Lisa’s, it starts with one ugly spreadsheet.

  • Pull 12 months of electricity bills. Total kWh and total dollars.
  • Pull shipped milk for the same period.
  • Calculate monthly kWh/cwt and $/cwt for electricity.
  • Put those numbers wherever you track feed cost and margin.

Midwest benchmarking suggests $0.035–$0.045/cwt for electricity. If you’re well above that, your exposure is real. Calculate your actual electricity cost per cwt for the last year and write it down. That number is your starting point for every efficiency conversation in the future.

90 Days: Get an Audit Someone Else Helps Pay For

As of early 2026, USDA isn’t accepting REAP grant applications — but guaranteed loan applications remain open year-round, and EQIP energy audits are still available through your local NRCS service center. Most advisors are steering clients to structure projects, so they pencil in loan guarantees alone, treating any future grant awards as upside.

Don’t let the grant pause stop you from getting the audit done now. When applications reopen, farms with completed audits will be first in line. Many state incentive programs operate on their own timelines — Efficiency Vermont offers $1,125 cash back on VFDs for dairy vacuum pumps for herds of 50+ cows, and Wisconsin’s Focus on Energy program provides VFD incentives for dairy farms through participating utilities and equipment dealers.

Projects at the front of the line:

  • Save ≥ 2¢/cwt at current rates
  • Pay back in ≤ 7 years without grant money
  • Target milking, cooling, or ventilation — not nice-to-have gadgets

If your DSCR is already near 1.20× or below, bring your lender into the conversation early. A $5,000–$6,000/year savings improves that ratio over time, but a new payment obligation in year one may tighten it before the savings compound.

365 Days: Execute One Big Win and Prove It Paid

Pick a single project targeting milking, cooling, or ventilation with a post-incentive payback under 7 years. Gather 3–6 months of baseline data before installation. Track the same metrics for 6–12 months after.

Make sure the base-case payback works without the most generous assumptions. Choose projects where savings show up in your own meter data, not just in marketing material. Then take that data back to your lender — before-and-after proof that the investment performed is the strongest possible argument for the next one. That’s exactly how the Lisa scenario becomes a lender conversation her neighbour in the Mark scenario can’t have.

Efficiency QuartilekWh/cow/year (Freestall)$/cwt Benchmark (at $0.10/kWh)Risk Level
Top 25% (Best Efficiency)400–650$0.025–$0.035Low
2nd Quartile650–837$0.035–$0.040Moderate
3rd Quartile837–1,000$0.040–$0.045Elevated
Bottom 25% (High Use)1,000–1,700$0.045–$0.075High Risk

What This Means for Your Operation

  • If your kWh/cwt sits above the 837 kWh/cow/year freestall average from Ontario or the 400–1,700 kWh/cow/year US band, energy is a top-three risk lever heading into 2030.
  • Check your DSCR. If you’re running near 1.20× or below, a $7,650/year swing in electricity OPEX is the kind of line item that shifts a lender conversation. Cornell’s 2024 DFBS showed the lowest-earning quartile averaging a debt coverage ratio of 0.70 versus 5.07 for the top quartile.
  • REAP grants are paused, but loan guarantees remain open, and EQIP energy audits are still available. Structure your project to pencil without grant dollars.
  • Where does your kWh/cwt sit against that $0.035–$0.045/cwt Midwest benchmark — and have you ever shown that number to your lender? 
  • In the next 30 days: pull your last 12 electric bills, divide total dollars by total cwt shipped, and write down your $/cwt for electricity. Until you do, every energy conversation is guesswork.

Key Takeaways

  • If your electricity cost per cwt has climbed and you’re not tracking kWh/cwt, you’re flying blind on one of the few cost lines you can still move before 2030.
  • A 12% hike on a 750-cow dairy quietly shaves roughly 3¢/cwt off margin — but the real gap is the 9¢/cwt swingbetween doing nothing and executing one 20%-efficiency project.
  • The trap isn’t the rate hike itself. It’s that by the time you decide to act, grant money is paused, your DSCR may have drifted below your lender’s comfort zone, and the compounding losses make the upgrade harder to finance — not easier. If your DSCR sits near 1.20× or below, you’re in that zone right now.
  • Any energy project with a post-incentive payback period longer than 7 years belongs at the back of the line — unless it also addresses a non-energy constraint, such as cooling capacity or animal comfort.

The Bottom Line

The dairies that make it to 2030 won’t be the ones with the shiniest solar installs. They’ll be the ones that treated kWh/cwt the same way they treat feed efficiency — a number to chip away at, year after year, while the operations next door were still calling electricity a fixed cost.

Complete references and supporting documentation are available upon request by contacting the editorial team at editor@thebullvine.com.

Learn More

  • The Four Numbers Every Dairy Producer Needs to Calculate This Week – Arms you with a survival-focused framework to stop the “equity bleed.” This diagnostic tool reveals your true breakeven and liquidity runway, transforming reactive worry into a 90-day execution plan for immediate cash-flow stability.
  • The Next 18 Months Will Decide Who’s Still Milking in 2030 – Exposes the structural red lines in debt-to-asset ratios that lenders are watching right now. It delivers a strategic checklist for long-term positioning, helping you navigate global supply shifts before market consolidation forces the choice for you.
  • Unlock Hidden Dairy Profits Through Lifetime Efficiency – Breaks down how selecting for Residual Feed Intake (RFI) can slash feed costs by $251 per cow. It connects genetic advancements to metabolic efficiency, offering a permanent, high-ROI solution to the margin squeeze discussed in this article.

The Sunday Read Dairy Professionals Don’t Skip.

Every week, thousands of producers, breeders, and industry insiders open Bullvine Weekly for genetics insights, market shifts, and profit strategies they won’t find anywhere else. One email. Five minutes. Smarter decisions all week.
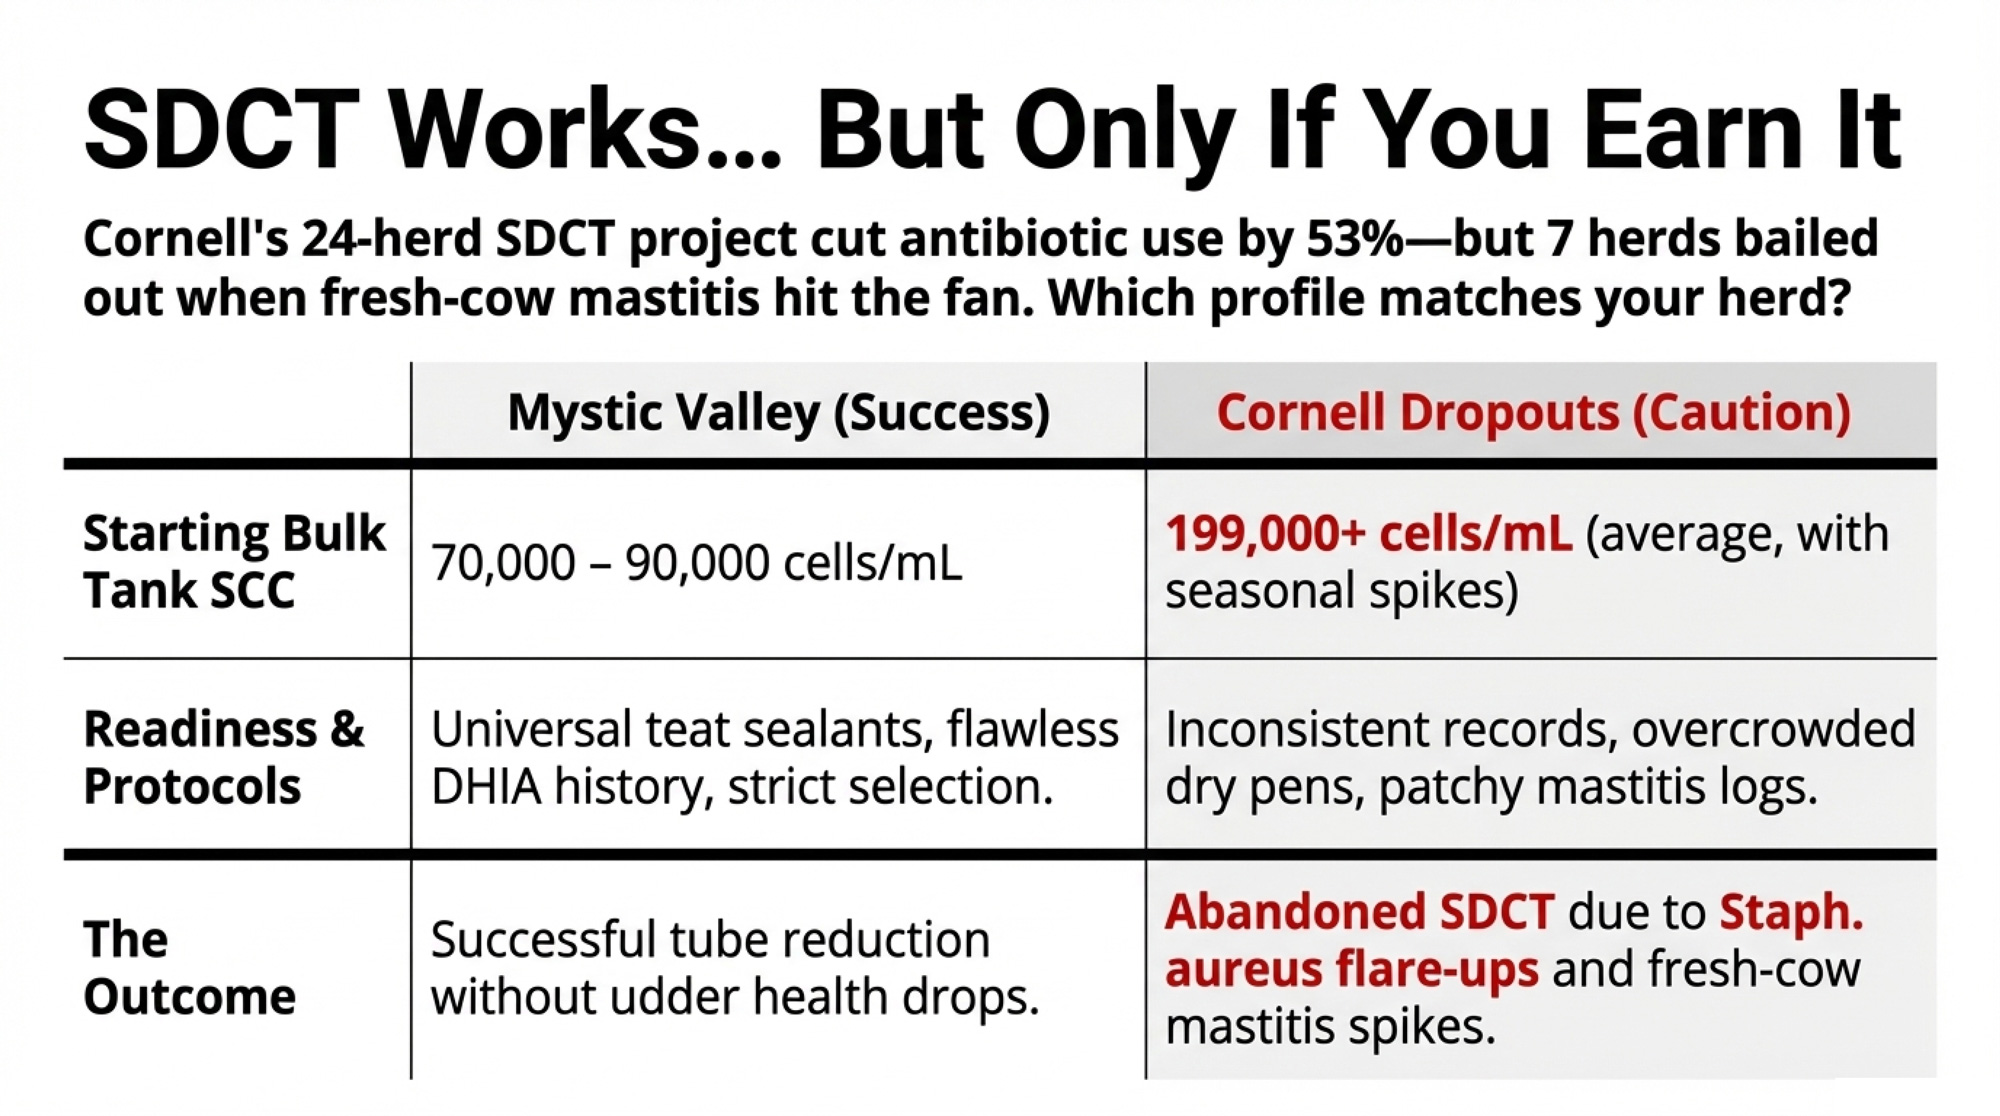
NewsSubscribe
First
Last
Consent

140M Pounds in 45‑Inch Stalls: Why +Stature Sires Don’t Always Pay

Holstein USA widened the stature scale. Most barns didn’t. Here’s the milk you’re leaving on the lunge box.

Kip Law didn’t have a genetics problem. He had a concrete problem.

The stalls in his 70‑cow tiestall in Sherburne, New York, were — in his words — “too small for Holsteins.” More cows than stall spaces, six hours to milk, and a steady stream of animals scrambling in and out of beds that didn’t fit them.  Nothing on a proof sheet would’ve told you that. 

That disconnect — between what genetics are building and what concrete can carry — is quietly bleeding milk and culling cows from progressive Holstein herds across North America.  In late 2024, Holstein Association USA revised its stature linear scale from 51–61 inches to 55–65 inches because the breed had physically outgrown the old range.  It was Dr. Jeffrey Bewley’s 2023 cow measurement project that exposed the discrepancy — Holsteins had become too tall for the existing scale.  Many freestall barns poured during the expansion years of the late 1990s and 2000s are still sitting at roughly 45–46 inches of stall width.  The cows standing in them pay for that gap every time they try to rest. 

How Big Is the Stall Gap, Really?

Start with the frame. Holstein USA’s Body Size Composite and Stature PTA have trended toward larger cows for years.  Stack a couple of points of stature over multiple generations, and you end up milking daughters that carry hundreds of pounds more live weight than the cows your barn was designed around. 

Nigel Cook and the University of Wisconsin’s Dairyland Initiative turned that reality into barn specs.  Their current freestall design table sizes stalls by cow body weight for adult Holsteins: 

  • Around 1,200 lb: recommended stall width (divider spacing) is 45 inches
  • Around 1,400 lb48 inches
  • Around 1,600 lb50 inches
  • Around 1,800 lb54 inches

A lot of older barns were built on 45‑inch centres because they were designed around smaller cows or heifers.  When your cows grow, and your concrete doesn’t, you create a mechanical penalty every time a big cow tries to lie down or get up. 

Visualizing the Stall Fit Gap

Based on the Dairyland Initiative’s freestall dimension table for adult Holsteins: 

Cow size (approx. weight)Recommended stall widthCommon 2000s stall widthThe “gap”
~1,200–1,400 lb45–48 in (45 in @ 1,200 lb; 48 in @ 1,400 lb)45–46 in0–3 in depending on actual cow weight
~1,600 lb50 in45–46 in4–5 in
~1,800 lb54 in45–46 in8–9 in

Imprint width defines minimum stall space—the lateral distance from hock to abdomen when resting narrow. For mature Holsteins, that’s about 132 cm (52 in.). Your 45-inch stalls? They’re forcing cows to compress into a space 7 inches narrower than their resting posture. That’s not comfort—that’s forced perching.” (Source: Ontario Ministry of Agriculture, Food and Rural Affairs

Cook’s team notes that, in most situations, a 48‑inch‑wide stall is already an improvement over a 45‑inch stall for mature Holstein cows.  For a lot of modern +stature cows in older barns, that missing 3–9 inches is exactly what your time‑budget and lameness numbers are screaming about. 

Cook’s analysis of AgSource DHIA data from April 2008 puts production numbers on top of that picture.  In herds with more than 500 cows — mostly freestall operations — the mature‑equivalent milk (ME) gap between first‑lactation and third‑or‑greater‑lactation cows averaged 1,046 kg.  In herds under 100 cows — predominantly tiestalls — the same gap was just 475 kg.  The freestall environment was disproportionately punishing older, bigger cows, not genetics, suddenly “quitting.” In remodels where stalls were widened and surfaces improved, that gap shrank dramatically — in some herds, it essentially disappeared. 

That’s not “bad feet and legs genetics.” That’s the barn punishing the frame those genetics created. 

Why Did Holsteins Outgrow Their Stalls?

At the 130th National Holstein Convention in 2015, Nate Zwald, with Alta at the time, put numbers on something a lot of breeders already felt.  He reported a genetic correlation of about 0.50 between stature and the udder composite, and highlighted how strongly PTAT is associated with stature in the U.S. Holstein population.  In plain language: when you chase UDC and FLC through type, you drag stature along for the ride. 

“We think we are selecting for better UDC and FLC, but the unintended effect is that we are also making bigger cows,” Zwald told the crowd. 

He built the case with three hypothetical bulls.  Same production, same health traits — the only difference was about one point each on type, feet and legs, and udders. The tallest bull landed around 4th on TPI. The moderate bull sat near 100th. The smallest slid toward 1,000th.  That type inflation, driven heavily by stature, was worth roughly 115 TPI points for the tall bull compared to the moderate one — enough to earn elite flushes and heavy semen demand, even though the mid‑ranked bull had more than enough type for commercial freestalls. 

Bull ProfileProductionHealth TraitsType/UDC/FLCApprox. TPI Rank
Tall Bull (+Stature, +PTAT)SameSameHigh~4th
Moderate Bull (0.0 Stature)SameSameModerate~100th
Small Bull (−Stature)SameSameLower Type~1,000th
TPI Gap (Tall vs. Moderate)~115 TPI points

Breeders often keep chasing those bulls for a simple economic reason: high‑TPI and high‑PTAT animals can command higher sale prices for cattle and embryos, even when they’re harder to keep efficient in a crowded commercial stall.  That’s the conflict a lot of herds live with — proofs that look great on paper but quietly work against the barn you already own. 

Holstein USA lists stature as one of the more heritable linear traits, with heritability estimates commonly in the low‑to‑mid 0.4 range in U.S. Holstein evaluations.  When you select for tall, you reliably get tall. Research and breeding work have shown that larger body size and higher stature are unfavorably associated with longevity and fertility — cows bred for size tend to have shorter productive lives and poorer reproductive performance. 

Work from Ontario, Guelph, and the USDA has established a clear economic relationship between body size and feed efficiency: genetically larger cows consume more energy for maintenance and tend to produce milk less efficiently once you account for that overhead.  That’s why the 2021 Net Merit revision put stronger negative economic weight on Body Weight Composite and added a new Feed Saved component, explicitly rewarding breeders who select for more efficient, moderate‑sized cows.  By the 2025 NM$ update, BWC emphasis had reached −11%, and total Feed Saved emphasis hit 17.8% — the index actively penalizes every extra pound of body weight at roughly 5.5 lbs of DMI per lactation. 

The Indexes Caught On. Did Your Mating Plan?

AHDB geneticist Marco Winters has seen the same paradox in UK data.  “Everywhere I go, farmers tell me they don’t want bigger cows,” he’s said, “but all the genetic trends tell us that’s what they’re breeding.”  AHDB figures show average Holstein body weight is climbing, and UK indexes have responded with more emphasis on maintenance and efficiency. 

Holstein USA’s stature scale change in 2024 and classification’s tighter eye on extreme size are another signal.  The math in the national indexes has already turned against huge frames.  The question is whether your mating plan has followed — or whether you’re still penciling in +stature sires into a barn that was poured around smaller Holsteins. 

The genetics drifted. The concrete stayed put.

When Stall Width and Holstein Size Collide

Cassandra Tucker’s group at the University of British Columbia has spent years watching what big Holstein cows actually do in undersized stalls.  In one set of studies, cows averaging roughly 1,600 pounds were housed in stalls 44, 48, and 52 inches wide.  Lying time increased when the stall width increased from 44 to 48 inches, with smaller gains between 48 and 52 inches.  In the narrow stalls, cows spent more time perching — front feet on the bed, rear feet in the alley — exactly the posture you see in mature pens that are too tight for the cows living there. 

“Proper neck rail placement and adequate stall width let cows stand straight with all four feet on the bed—the posture that protects claws and suspensory apparatus. When stalls are too narrow or neck rails are too far forward, cows perch (front feet on bed, rear feet in alley), loading the claw’s suspensory structures and driving sole ulcers. Tucker’s UBC work showed lying time dropped and perching spiked in 44-inch stalls vs. 48-inch stalls. Your barn tells you which side of that line you’re on.” (Source: Ontario Ministry of Agriculture, Food and Rural Affairs)

Perching isn’t just ugly. It’s the first step in a cascade. Longer standing bouts overload the claw’s suspensory apparatus, driving more sole hemorrhage and ulcers.  Once those structural changes happen inside the hoof, you don’t “fix” them; you manage around them until the cow leaves. 

Rick Grant at the Miner Institute translated that behavior into milk.  His work suggests each lost hour of lying time is associated with roughly 2–3.5 lb less milk.  Cook’s freestall time‑budget data from 17 Wisconsin barns found that cows averaged about 11.3 hours, with a range of 2.8 to 17.6 hours.  The worst‑off cows weren’t just a bit behind. They were living in a completely different reality. 

Stall Width Is Only Half the Story: The Lunge Box

As cows get taller, they don’t just need a wider bed. They need somewhere to put their head when they get up. 

The Dairyland Initiative’s adult freestall dimensions specify that a mature Holstein needs about 10 feet of stall length against a wall to allow a full forward lunge, and about 17 feet on a head‑to‑head platform so cows can lunge without colliding with the cow across from them.  They treat 16 feet as a minimum platform length; going shorter forces cows to lunge to the side and lie diagonally, which drives perching and bed contamination. 

Rising cows need 61 cm (24 in.) of forward lunge space, with the nose arcing 10–30 cm above the bed. Short platforms (<16 ft head-to-head) or obstructions force side-lunging and diagonal lying—the perching behavior you see in pens where big cows outgrew the concrete. That missing foot of platform length isn’t a rounding error—it’s a daily lying-time penalty.” (Source: Ontario Ministry of Agriculture, Food and Rural Affairs)

In many older barns, head‑to‑head platforms were built around that minimum 16‑foot length from earlier design recommendations, rather than the 17 feet now preferred for mature Holsteins.  That might have been acceptable for smaller 1,200–1,400‑lb cows.  Push stature toward the top end of Holstein’s new 65‑inch scale, and the nose‑to‑tail length and lunge arc increase — but the concrete doesn’t.  The result: more side‑lunging, more diagonal lying, and more stall‑use frustration you can see in any overgrown pen.


Head-to-head platforms need 5.5 m (18 ft) for mature Holsteins to lunge forward without hitting the cow across from them. Older barns built to 16 ft minimums force cows to lunge sideways through loops or lie diagonally, driving bed contamination and perching. That missing 1–2 feet isn’t a comfort upgrade—it’s the difference between cows using stalls normally vs. fighting the barn every time they lie down.” (Source: Ontario Ministry of Agriculture, Food and Rural Affairs)

Kip Law’s herd was living that reality before he built his new barn. 

Kip Law’s 8‑lb‑a‑Day Concrete Fix

Law’s old setup was a classic Northeast tiestall: a 70‑cow pipeline arrangement with more cows than stalls, Holsteins that had outgrown their beds, and milking that took roughly six hours because cows had to be rotated in and out.  “It was taking us about six hours to milk,” he told Progressive Dairy. Stalls were “too small for Holsteins,” and the facility no longer fit the herd. 

He didn’t start by rewriting a mating program. He started by changing the barn.

Law built a new freestall with a double‑eight parlor, deep sand bedding, proper lunge space, and stalls sized for mature Holsteins.  Within three weeks, milk jumped about 8 lb per cow per day.  Over roughly two years, his average daily production climbed from about 55 lb to 70 lb per cow — a 27% increase.  The milking herd grew from about 80 to 130 cows, and overall milk production doubled.  Somatic cell count dropped to about 100,000

“The overall herd health is a lot better. Our cows are a lot calmer than they used to be,” Law said. “In two years, it’s a completely different herd.” 

Same cows. Same genetics. New concrete.

The Barn Math on Missing Milk

To get a feel for what’s at stake, take a simple example. Say 50 of the biggest cows in a 200‑cow freestall herd — mostly third‑lactation and older — lose just 1.5 hours of lying time per day because stalls are too narrow.  Using Grant’s mid‑range estimate of 3 lb per lost hour,  that’s: 

  • 1.5 hours × 3 lb = 4.5 lb per cow per day.
  • 4.5 lb × 50 cows = 225 lb per day.
  • 225 lb × 305 days = 68,625 lb of milk in a lactation.

That’s barn math, not Law’s actual numbers — but it lives in the same neighbourhood as what he saw when he fixed stall fit and watched milk move. 

Cook’s freestall remodels show the same pattern: widen stalls and improve surfaces, and the 1,046 kg ME gap between first‑calvers and older cows starts to shrink.  In some herds, it disappears. 

Change concrete, milk moves. Change the sire selection, milk moves differently.

Bennink’s Opposite Bet: Breed Smaller, Ship More

In Florida, Don Bennink took the opposite route and ended up in a similar place — cows that fit their environment. 

In a 2017 profile, North Florida Holsteins in Bell, Florida, was milking about 4,200 cows at any one time, with roughly 4,800 cows on the farm and around 10,000 head on site.  They were shipping approximately 140 million pounds of milk per year with a rolling herd average of 29,357 lb at 3.6% fat and 3.0% protein on 3× milking, all through about 4,000 sand‑bedded freestalls in a mix of tunnel‑ventilated and naturally ventilated barns.  Bennink moved his herd from western New York to Florida in 1980 and built the operation from there — figuring out quickly that hot, humid conditions and a Northern European breed demanded relentless attention to comfort, cooling, and housing.  (Read more: NORTH FLORIDA HOLSTEINS. Aggressive, Progressive, and Profitable!!)

“High production, strong health traits and feed efficiency,” Bennink said in that profile. “They are the bywords for breeding profitable cows.”  He doesn’t mince words about what profitable doesn’t look like. The taller, more angular cow favoured in the show ring, the classification system, or the current PTAT formula is “so far removed from what most milk producers want that it is irrelevant to the majority of dairy operations,” he argued. 

The results back up the philosophy. Between 1981 and 2021, more than 200 bulls carrying the NO‑FLA prefix were enrolled with the National Association of Animal Breeders.  Bennink bred the dam of Mr. T‑Spruce Frazz LIONEL‑ET — NO‑FLA Montross 42446‑ET — who topped the TPI list in April 2022, tracing back at least five generations of North Florida breeding.  NO‑FLA MATRIARCH sits in the top 20 all‑time among proven bulls with a PTA Productive Life of 7.3.  The farm has produced 55 dams of merit awardees, 11 gold-medal dams, 9 94‑point animals, and 15 93‑point animals.  In 2024, the National Dairy Shrine honored Bennink as Distinguished Dairy Cattle Breeder — recognition built squarely on functional trait selection and profitability, not show‑ring aesthetics. 

He built his own North Florida Index around pounds of protein shipped, health traits, daughter fertility, and calving ease.  Stature and sharpness don’t enter the equation. He actively selects bulls that are negative for stature, even as many breeders still chase high PTAT and lofty frames. 

If you’re breeding for Madison or the Royal, you’re playing a different game with different priorities. If your milk cheque comes from a 46‑inch freestall, Bennink’s math may be closer to what your barn needs than the TPI top‑ten list. 

He didn’t widen stalls to keep up with ever‑taller cows. He bred cows that work in the freestalls he already had.  The trade‑off is real: go too far shrinking stature without watching udder and locomotion traits, and you can sacrifice udder height or rear‑leg structure, which is why Bennink leans hard on individual udder and leg traits instead of chasing overall type composites. 

Two herds, two different levers. Both stopped letting body size run the show.

The “Stop the Growth” Breeding Manifesto (Month 0–3)

You can stop making the mismatch worse this week without spending a dollar on concrete.

  • Hard cap: Stature PTA ≤ 0.0. Net Merit 2021 and subsequent updates have already placed a negative economic weight on the larger Body Weight Composite due to higher maintenance costs — by 2025, BWC emphasis in NM$ hit −11%.  There’s no financial case for adding more frame in a tight barn. 
  • Weight tax: Body Weight Composite ≤ 0.0. Larger‑bodied cows eat more just to maintain themselves. USDA research behind the NM$ formula estimates that each extra unit of BWC costs roughly 5.5 lbs of DMI per lactation. 
  • The real “type”: Prioritize Productive Life (PL), Daughter Pregnancy Rate, and the individual locomotion traits (rear legs rear view, locomotion, foot angle) instead of chasing PTAT points that are heavily tied to stature. 
  • The goal: A moderate, efficient cow that fits the stall and lasts — not a frame race. The exact weight and production numbers vary by region and system; the point is to stop rewarding size for its own sake in a barn that can’t carry it.

Write it down as a farm rule: “No sires over 0.0 Stature or positive BWC until mature‑cow stalls are at least at Dairyland’s recommendation for our cow size.”  That one line keeps you honest the next time a glossy proof sheet lands on the desk. 

Concrete and Comfort: Sequencing the Physical Fix (Month 0–24)

Chase the Cheap Cow Comfort Wins (Month 0–6)

Concrete can wait a year. Behavior and time budgets can’t.

  • Drop effective stocking density in the fresh and high‑cow groups below about 110% of stalls where you can. 
  • Tighten bedding management: more bedding, more often, with level, well‑groomed beds — especially if you’re on mats or mattresses. 
  • Walk pens with a simple anemometer. If air speed at cow level runs under about 1 m/s in high‑risk pens, you’re leaving heat‑stress risk on the table. 
  • Score locomotion monthly in the fresh and high groups. Treat and block score‑3+ cows quickly and give them the best stalls you have — because a 2022 University of Wisconsin study pegged lameness cases at about $337each in lost milk, treatment, and culling. 

These moves cost time and operating money, not six figures. They can still deliver a few pounds per cow per day and peel points off your lameness rate inside the first six to nine months. 

Pilot Stall Widening Where It Pays Fastest (Month 6–18)

Instead of waiting until you can redo the entire barn, fix one pen.

Pick the highest‑value group — fresh cows or your top production string.  Widen those stalls by moving or replacing divider loops. Using Dairyland’s table, if your average mature cow weighs around 1,600 lb, you should aim for about 50‑inch centres, not 45–46.  Get as close as your building will let you, even if it temporarily reduces stall count in that pen. 

Then track milk, lying behavior, and lameness scores in that pen against unchanged pens.  Cook’s Western Canadian Dairy Seminar work was blunt: after stall-surface changes, increasing stall width for large, mature Holstein cows was the second most important improvement in both sand and mattress facilities.  Your pilot pen becomes proof of that in your own herd — and evidence for your lender. 

Use the Extra Milk to Fund the Concrete (Month 12–24)

If the combination of a genetic freeze and comfort fixes adds even 4 lb/cow/day across 200 cows, that’s 800 lb/day.  Over a full lactation, you’re looking at roughly 244,000 lb of additional milk. The exact margin depends on your component price and feed cost, but that kind of volume moves the needle in a loan conversation. 

Instead of walking into the bank saying, “I read I should widen stalls,” you walk in with a year’s worth of herd data showing that better stall fit in one pen produced real milk.  That’s a fundamentally different conversation. 

What rarely works: still using high‑stature bulls because they rank on the elite lists, and relying on more frequent hoof trimming to outrun the concrete. 

Your 5‑Minute Barn Audit

Use this as a quick pass before you ask your breeding rep to bring another batch of +stature proofs.

  • Stall width vs cow size. Tape‑measure at least five stalls in your mature‑cow pen. Check your average mature cow weight from Lactanet or your nutritionist’s records.  If you’re milking roughly 1,600‑lb cows in 45‑inch stalls, Dairyland says you’re 4–5 inches short. 
  • Platform length and lunge. Measure your head‑to‑head platform. Anything under 16 feet is below Dairyland’s minimum recommendation for forward lunge for mature Holsteins.  Short plus wide forces side‑lunging and diagonal lying. 
  • Lameness and locomotion check. Score 20 mature cows on a 1–5 locomotion scale. If more than about 20% land has a score of 2 or worse, you likely have more lameness than you think — and stall design is almost always part of that story. 
  • Stall Comfort Index proxy. Walk your high group two hours before milking. If more than 20% of cows touching a stall are standing idle instead of lying, your SCI is giving you a clear warning sign — regardless of what your Feet & Legs composites say. 
  • Genetic pressure. Pull the last three years of sire BWC and Stature values. If your average is positive on BWC and above zero on Stature, you’re still breeding cows that are bigger than the ones that built your barn. 
  • Breeding rep reality check. Ask, “Given my stall width and cow size, what’s the maximum Stature PTA you’d be comfortable using here?” If that number is lower than what’s on your current sire list — or they can’t answer — you’ve just found the DNA of your facilities‑genetics mismatch.
  • 30‑day action. In the next 30 days, pull the BWC and Stature values on every active sire in your lineup and cross‑check them against your stall tape.  Any bull that doesn’t fit both your index and your concrete comes off the mating list first. 

What This Means for Your Operation

  • If your three‑year average sire BWC is positive and your mature‑cow stalls are under 48 inches, your mating program and your barn are pulling in opposite directions. You don’t fix that with more hoof‑trimming visits. 
  • Cook’s Wisconsin data showed a 1,046 kg ME gap between first‑lactation and third‑or‑greater‑lactation cows in large freestall herds — more than double the 475 kg gap in tie-stall herds.  That’s the environment punishing bigger, older cows, not genetics suddenly “quitting.” 
  • Law’s herd gained 8 lb/cow/day in three weeks — not by changing sires, but by giving them stalls that actually fit.  Over two years, daily milk increased by 27%, and SCC fell to about 100,000, despite the same genetics. 
  • Bennink ships about 140 million pounds a year (as of 2017) by selecting smaller, tougher cows and ignoring stature‑heavy PTAT — running them through sand‑bedded freestalls he already had.  That’s breeding for the barn you have, not the one on the semen catalogue cover. 
  • The 2021 Net Merit revision began the turn against body size; by 2025, BWC emphasis in NM$ hit −11%, and total Feed Saved emphasis reached 17.8%.  Holstein USA’s updated stature scale and classification changes reinforce that same direction.  The math in the indexes has already turned against huge frames. 
  • Replacement heifers are expensive — and getting more so. USDA Ag Prices data show U.S. dairy replacement values climbing from about $2,140 per head in April 2024 to around $2,660 by early 2025, reaching a record$3,110 in October 2025 before easing to $2,860 in January 2026, with top lots in California and Minnesota still clearing north of $4,000.  Every cow you cull early because she can’t stay sound in an undersized stall is a capital loss, not just a hoof‑trimmer bill. 

Key Takeaways

  • If your average sire BWC is positive and your stalls are built for smaller cows, cap Stature and BWC at 0.0 on your mating list until your concrete catches up. That alone stops the facilities‑genetics mismatch from getting worse. 
  • If your mature‑cow stalls measure 45–46 inches and your average cow is in the 1,600‑lb range, you’re 4–5 inches short of Dairyland’s recommendation. Expect more perching, more lameness, and a bigger ME gap in older cows until that changes. 
  • If more than 20% of cows touching stalls are standing instead of lying two hours before milking, treat it as a red‑alert comfort problem, not a personality flaw in your cows. That’s barn design talking, not “weak feet.” 
  • If your herd is already built on big, sharp cows, you don’t have to choose between genetics and concrete.Freeze height and body size now, chase cheap comfort and ventilation wins, then use the extra milk to justify stall and platform upgrades. 

The Bottom Line

If you walked your barn this afternoon with a tape measure in one hand and your last proof run in the other, would they tell the same story — or would they argue with each other all the way down the alley?

Complete references and supporting documentation are available upon request by contacting the editorial team at editor@thebullvine.com.

Learn More

  • Net Merit 2025 | The Bullvine – This implementation guide reveals how to stop Net Merit 2025’s new $57-per-point “weight tax” from working against you. It arms you with non-negotiable filters for Feed Saved, ensuring your sire stack generates margin rather than just frame.
  • $3,010 Per Heifer. 800,000 Short. Your Beef-on-Dairy Bill Is Due. – This strategic deep dive exposes the massive capital risk hiding in today’s record-high $3,000+ replacement market. It delivers a 90-day blueprint to rebalance your breeding and secure your 2028 pipeline against inventory fragility.
  • Robotic Milking Revolution: Why These Money Machines Are Crushing Traditional Parlors – This innovation brief breaks down how automated systems recover the “hidden hours” lost to parlor routines. You’ll gain a 13% average net return advantage by leveraging precision data to finally match milking frequency with each cow’s biological potential.

The Sunday Read Dairy Professionals Don’t Skip.

Every week, thousands of producers, breeders, and industry insiders open Bullvine Weekly for genetics insights, market shifts, and profit strategies they won’t find anywhere else. One email. Five minutes. Smarter decisions all week.
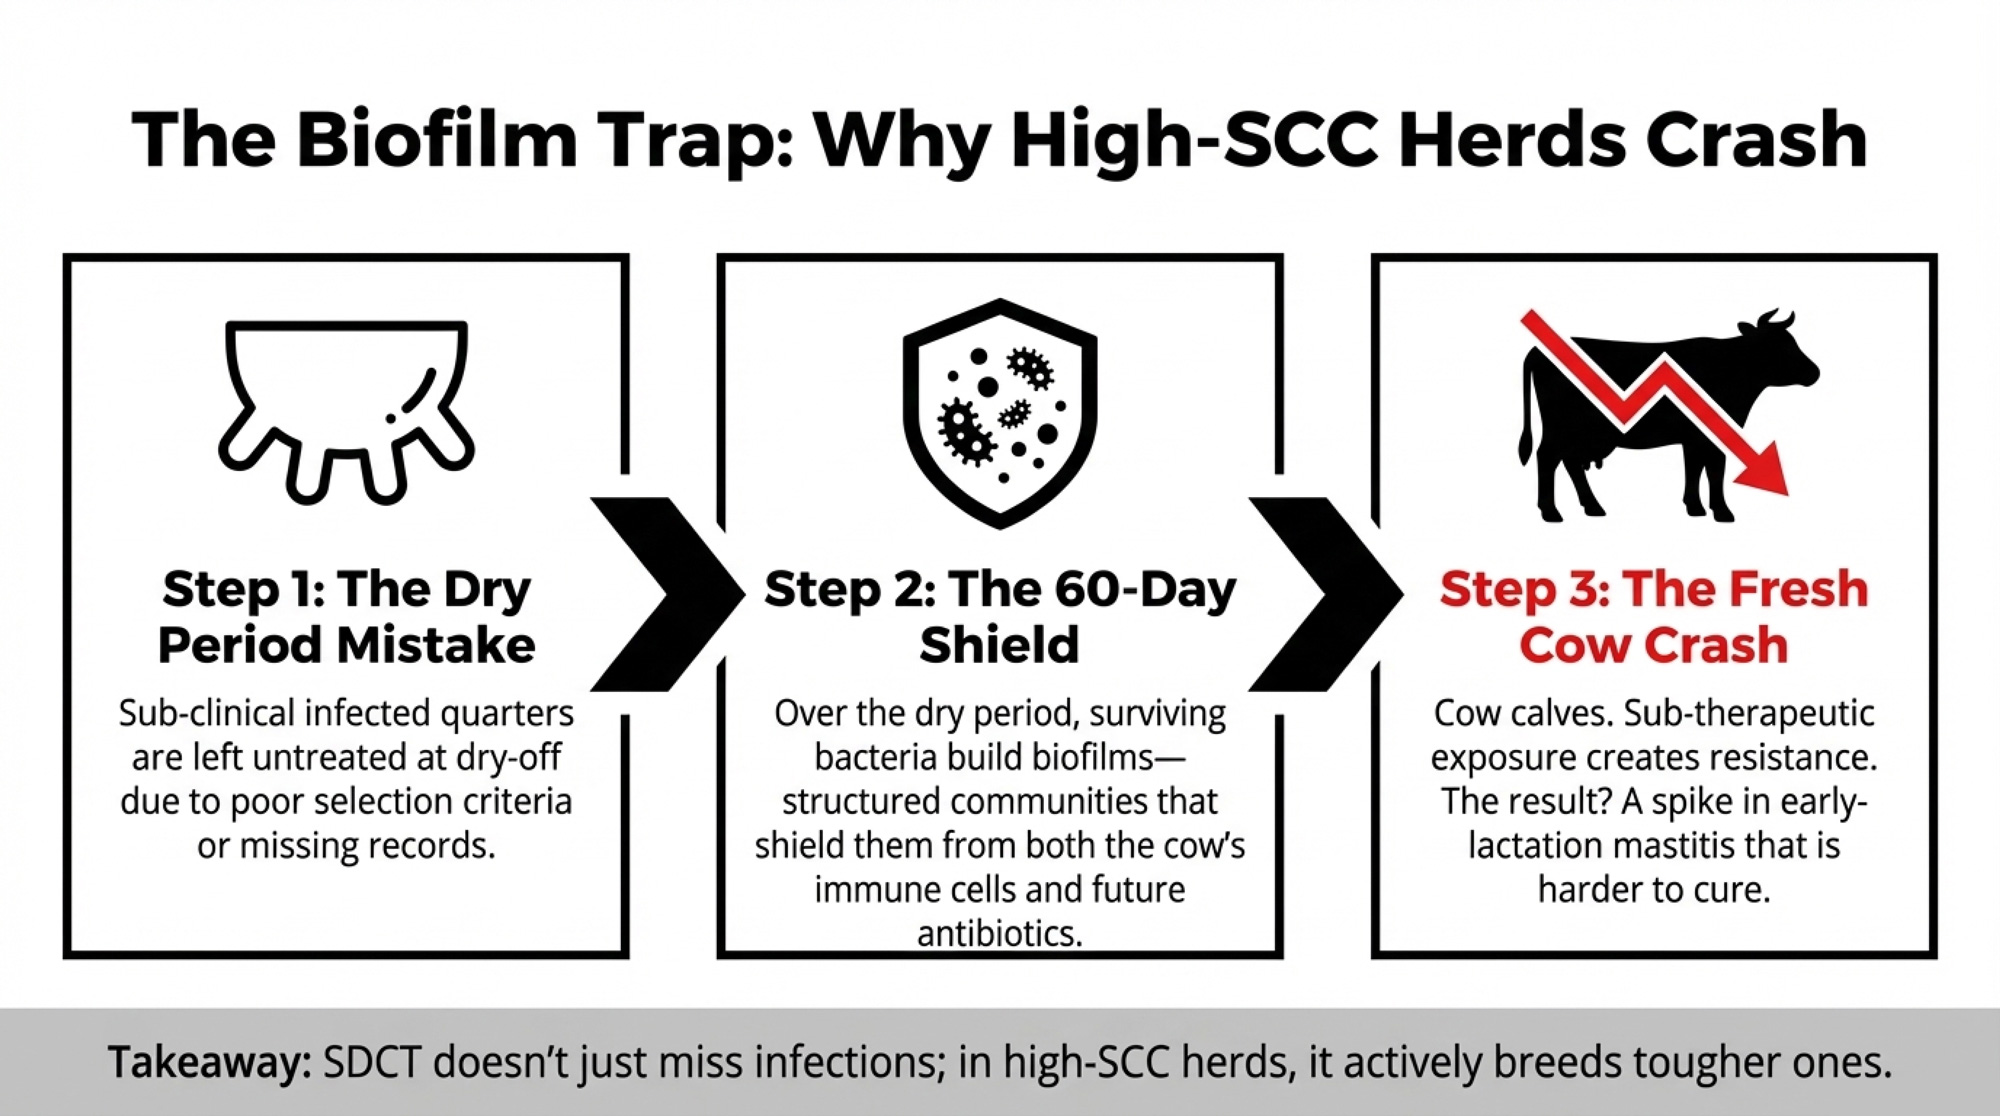
NewsSubscribe
First
Last
Consent

The 11‑Day Vaccine Shift: From Dry‑Off Tax to 1,500‑lb Sensor Edge

A University of Georgia study proves what your rumination curves are already showing: convenient dry‑off routines cost mature cows 1,200–1,500 lb — and the fix is just 11 days away.

Executive Summary: You’re vaccinating cows on dry-off day because it’s convenient — but your sensors see the rumination crash it causes. Wageningen tracked 414 Dutch farms and found conventional herds milking less per cow after installing sensors, turning tech into expensive wallpaper. Samantha Reighard, Standard Dairy Consultants, shows how to fix it: Ontario SARA math reveals $4,900/year leaking from a 60-cow transition pen, while UGA’s 328-cow study proves an 11-day vaccine shift adds 1,200–1,500 lb milk per mature cow. This gives you a 30-day CEO checklist to run the numbers on your own herd and close that gap. In a world of vanishing herds and static milk checks, that’s the difference between surviving and pulling ahead.

When dairy nutritionist Samantha Reighard walks into a herd still vaccinating cows on dry‑off day because it fits the lock‑up schedule, there’s a number she wants you to look at twice. In a University of Georgia study on 328 commercial Holsteins, moving vaccinations to 10–14 days before dry‑off boosted milk in multiparous cows by about 1.9 kg per day in the next lactation. Over 305 days, that’s roughly 1,200–1,500 lb more milk per lactation per mature cow, with better fat tests on top.

Now plug in the USDA’s March 2025 all‑milk price forecast of $21.60/cwt — and given how the rest of 2025 actually played out, that number was generous. On a 500‑cow herd with roughly 200 mature cows cycling through, that 1,200–1,500 lb window is worth in the neighborhood of $50,000–$65,000 in mature‑cow milk revenue over a full herd cycle — just from which side of dry‑off you choose to vaccinate on. You’re not buying new hardware. You’re changing which week a shot goes in the cow.

Reighard, a consultant with Standard Dairy Consultants who spent time in high‑pressure swine genetics at PIC before coming back to dairy, calls transition stress a biological tax on your best cows. Your tags are out there watching rumination crash around dry‑off and after feeding. They’re capturing exactly how much stress your routines are putting on that cow. Some herds use that information as a competitive advantage. Others treat it like expensive wallpaper.

Transition Stress: The Biological Tax You Can’t See from the Alley

Dry‑off and early lactation are already expensive weeks for a cow’s body. She’s dealing with udder involution, ration changes, a different pen, new neighbors, and the push to get up and going after calving. Work from Dr. Lance Baumgard’s group at Iowa State has shown just how costly that is: an activated immune system can divert more than a kilogram of glucose per day from the udder to immune cells, and the level of inflammation at dry‑off can rival that seen at freshening. That’s energy your cows could have turned into saleable milk.

For years, the standard has been to stack vaccinations right on top of dry‑off. It’s simple for you: one handling, one lock‑up, one set of notes. But that means you’re layering a big planned immune hit on a day that’s already a perfect storm. The UGA team — led by Sha Tao’s group — asked a different question: what if you pulled the vaccine response away from the dry‑off event itself and separated those two hits?

In their trial of 328 Holstein cows (174 control, 154 early‑vaccination), animals vaccinated on the day of dry‑off showed a strong, persistent inflammatory response afterward. Cows vaccinated 10–14 days earlier had significantly lower inflammation at dry‑off. Multiparous cows in that early‑vaccination group produced about 1.9 kg more milk per day in the next lactation, while first‑lactation animals changed very little, which makes biological sense, since younger cows haven’t accumulated the same inflammatory load through repeated lactations. The study’s summary translates this into roughly 1,200–1,500 lb of extra milk per mature cow over the lactation period, with a higher fat percentage reported in that group.

DIMControl (lb)Early Vaccination (lb)Advantage (lb)
0000
604,2004,400+200
1209,1009,600+500
18013,60014,400+800
24017,80018,900+1,100
30521,50023,000+1,500

That’s what transition stress looks like when you stop talking about “tough weeks” and start doing barn math. Dry‑off shots on the convenient day aren’t free. They’re part of the tax bill.

Competitive Advantage or Expensive Wallpaper?

Now zoom out from the pen to the whole herd. In a 2019 Journal of Dairy Science study, Wageningen University researchers Steeneveld and Hogeveen tracked 414 Dutch dairy farms to see whether sensor investments actually moved the needle on health and production. The findings weren’t what the tech brochures promise. On farms with conventional milking systems — the kind most closely comparable to a typical North American parlor setup — sensor investment was associated with lower average per-cow production in the years after adoption. Farms with automatic milking systems saw higher production, but also higher somatic cell counts.

Read that again. On conventional farms, cows produced less after the sensors went in. Not because the sensors broke something, but because buying the tags was apparently not the same as using them to change management.

You can see that same split playing out now, just with fewer herds and more milk per farm. U.S. data show that from 2004 to 2024, the number of licensed dairy herds fell from 66,825 to 24,811 — a 63% drop — while total milk production climbed about 32% over the same period. Bigger herds, more technology, tighter per‑cow margins. There’s less room than ever to carry hardware that doesn’t move the needle.

YearLicensed Dairy HerdsTotal U.S. Milk Production (billion lb)
200466,825170
200960,000189
201447,000206
201934,000218
202424,811225

On one side of that split, sensors are clearly a competitive advantage:

  • Cows get pulled into a dry‑cow health list days before they’re visibly sick.
  • Vaccines shift 10–14 days ahead of dry‑off on the cows that benefit most.
  • Slug‑feeding patterns in the transition pen get fixed because the rumination curves make the cost impossible to ignore.

On the other side, you’ve got a dashboard that might get opened once a week, if that. The only line item that’s definitely changed is the equipment payment.

The tech itself isn’t the edge. The edge is whether you’re willing to let those transition‑stress numbers outrank your “it’s always worked” routines.

What’s SARA Doing to Your Transition Pen’s IOFC?

Subacute ruminal acidosis is one of the cleanest places to see transition stress turn into dollars. Field reports and reviews frequently cite SARA affecting 20–30% of cows in high‑producing herds, with some studies reporting even higher rates in certain situations. The Ontario Ministry of Agriculture estimates that SARA costs the North American dairy industry between 0 million and billion (U.S.) per year, with an average hit of about .12 per affected cow per day, mostly due to lost milk and components.

Take a single transition group of 60 cows. If a conservative 20% — 12 cows — are in a SARA zone, you’re dropping roughly $13.44 per day in income‑over‑feed‑cost in that one pen (12 × $1.12). Over a year, that’s just under $4,900 out of a single transition group, and that’s before you count DA surgeries, early culls, or a string of harder‑to‑breed cows.

Transition Pen SizeAffected Cows (20%)Daily IOFC LeakAnnual IOFC Leak
30 cows6 cows$6.72$2,453
60 cows12 cows$13.44$4,906
100 cows20 cows$22.40$8,176

In her interview on the Wisenetics Dairy Podcast Show, Reighard talked about how sensors make that pattern painfully obvious. On slug‑fed pens — once‑a‑day feeding or inconsistent bunk pushes — rumination spikes while cows attack fresh feed, then crashes a few hours later as that starch bomb ferments and rumen pH drops. She compared that with the camera work she sometimes uses: put a camera up for 14 days, pull it down, then spend time reviewing every clip. “Fourteen days with cows, that’s a long time, and it takes 14 days to change the rumen,” she told host Barry Bradford. “And so if we wait that long, you know, we have more sick cows or more issues where I can get ahead of it a lot sooner.”

Your tags are giving you a live feed of how hard your feeding schedule is hitting the rumen. The question is whether you treat that information as another nice‑to‑know or the reason to change how you manage a pen that’s already your highest‑risk group.

What Should a “Normal” Transition Rumination Curve Actually Look Like?

For all the marketing around early disease alerts and heat detection, the most valuable line on your sensor dashboard might be the boring one: the daily rumination curve.

In a well‑run transition pen, total rumination minutes per cow stay relatively steady from day to day. You’ll see small waves as cows rotate between eating, ruminating, and resting, but not a big canyon after feeding. Rumination dips while cows are at the bunk, then climbs back into their normal band within a couple of hours. Overlay 60 cows over a week, and the average line looks like a slightly bumpy road, not a roller coaster.

Around dry‑off, you still expect a dip. That’s a real physiological hit. But the UGA data suggest that when vaccinations move 10–14 days ahead, the inflammatory load at dry‑off is lower. On farms using sensors, you’d expect that to show up as a shallower and shorter rumination drop in mature cows around dry‑off, instead of the deep crater you see when everything gets stacked on one day.

Reighard uses tools such as the CowManager nutrition module to narrow the gap between cows. She looks at each cow against her own history and against her group — heifers with heifers, third‑lactation cows with third‑plus — and focuses on narrowing the spread between the top performers and the laggards. “Keeping that consistent, and then keeping the ruminations consistent throughout her whole lactation,” is how she described the goal to Bradford.

If your transition rumination pattern shows a deep canyon after feeding and a long hole at dry‑off, your sensors aren’t just telling you that cows are different from each other. They’re telling you where your routines are doing the most damage to a cow that’s already under a lot of stress.

What This Means for Your Operation

The uncomfortable question isn’t whether your sensors work. It’s whether you’re willing to let what they show you change “convenient” routines that are quietly expensive.

If you’re still vaccinating on dry‑off day because that’s when cows are already in the headlocks, the UGA numbers say you’re probably taxing your mature cows harder than you need to. You’re stacking immune activation on top of an already tough day and asking the cow to wear the cost in the next lactation.

If your transition rumination graph drops off a cliff after feeding, that’s not just “how your cows eat.” It’s a SARA pattern with a daily IOFC bill attached. The Ontario math shows it doesn’t take many cows per pen to add up to thousands of dollars a year.

If your monitoring system can’t be tied to at least a few concrete protocol changes in the last year — a different vaccination window, a change in feed frequency, a cap on time away from the pen — then it’s an equipment line item right now, not a survival tool. In a world where licensed herds keep disappearing, and total milk keeps climbing, that’s not a great place to be.

The CEO’s Transition Checklist

You don’t need a 20‑page protocol rewrite to start turning transition‑stress data into a competitive edge. You need a short, honest checklist you can run against your own herd this month.

Action LeverWhen It Fits30-Day Trial ProtocolSuccess MetricsDollar Outcome (Potential)
Shift Vaccines Off Dry-Off DayStill vaccinating on dry-off day; have basic trackingMove multiparous cows’ vaccines to 10–14 days before dry-off; tag cows in recordsWatch rumination around dry-off, health alerts in dry pen, early-lactation milk & components through 60 DIM$50,000–$65,000/year (500-cow herd, 200 mature)
Put a Dollar Number on SARATalked about slug feeding, butterfat dips, but no hard cost estimatePull 30 days of rumination/eating data; mark daily gaps; apply $1.12/cow/day × 20% prevalenceWeekly and annual leak number written on office whiteboard; compare to labor/diesel cost of fix$2,500–$8,000/year (30–100 cow transition pen)
Give One Person the Transition DashboardHave sensors, but nobody really owns transition dataPick one person to spend 20 minutes/week on software; adjust one management lever at a timeThree specific protocol changes in 12 months driven by sensor dataEquipment ROI proven (or exposed as wallpaper)
Make Sensors Prove They’re a ToolHad sensors running 1+ year; monthly payment is real; not sure of competitive edgeList three management changes in last 12 months that came directly from sensor dataIf you struggle to get to three, system is wallpaper, not tool—reality check before next upgradePrevents wasted capital on more tags/antennas

1. Shift Vaccines Off Dry‑Off Day — and Measure It

When it fits: You’re still vaccinating on dry‑off day, and you’ve got at least basic tracking on dry and fresh cows.

  • For the next month, move multiparous cows’ vaccines to 10–14 days before dry‑off, matching the UGA timing window as closely as your vet protocol allows.
  • Tag those cows in your records or in your sensor software so you can pull them as a group. Use lock‑ups you already have scheduled — herd check, preg checks, footwork — instead of inventing a brand‑new event.
  • Watch what happens to rumination around dry‑off, the number of health alerts in the dry pen, and early‑lactation milk and components through about 60 DIM.

This is your 30‑day, one‑group trial. You’re not betting the whole farm. You’re just finding out whether that 11‑day move is worth keeping in your barn, not just in a UGA chart.

2. Put a Dollar Number on Your SARA Pattern

When it fits: You and your nutritionist have talked about slug feeding, butterfat dips, or edgy behavior around the bunk, but nobody has ever put a hard number on it.

  • Pull 30 days of rumination and eating data for your close‑up and fresh pens. Mark the daily gaps where rumination craters after feeding.
  • Use conservative math: assume 20% of the pen is in a SARA‑affected zone and apply the $1.12 per cow per day cost estimate from Ontario’s field data. Multiply it out to a weekly and yearly number for that pen.

Once that daily leak is written on the office whiteboard, it gets a lot harder to say you “can’t afford” another feed run or bunk push‑up. You might still decide the labor or diesel isn’t worth it. But you’ll be arguing about real dollars, not gut feel.

3. Give One Person the Transition Dashboard

When it fits: You have a monitoring system, but nobody really owns the transition data. It’s everybody’s job, which means it gets squeezed in between everything else.

  • Pick one person — you, your herdsman, or a trusted outside advisor — to be the “data boss” for transition cows for the next three months. Their job is to spend 20 quiet minutes once a week on the software and pick one management lever to adjust if the numbers point hard at it.
  • That lever might be feed time, vaccination timing, maximum time away from pen, or how often feed is pushed up. Only one at a time.

Reighard told Bradford she learned not to dump a laundry list on farms. “If I go in there and, like, do 5–10 things, it overwhelms them,” she said. The same is true for your crew. One lever, watched carefully, beats five half‑done changes every time.

4. Make Sensors Prove They’re a Tool, Not Just Hardware

When it fits: You’ve had sensors running for at least a year. The monthly payment is very real. You’re not sure the competitive edge is.

  • Sit down with your vet and nutritionist. Make a list of three specific management changes in the last 12 months that came directly from sensor data — not “we found a sick cow earlier,” but actual protocol changes: feed frequency, when you vaccinate, how long cows spend away from the pen, how you handle heat‑stress diets.

If you struggle to get to three, your system is still acting more like expensive wallpaper than a management tool. That’s not a moral failure. But it’s exactly the kind of reality check a CEO needs before signing on for more tags, more antennas, or another subscription upgrade.

Key Takeaways

  • If your mature cows are still getting vaccinated within 48 hours of dry‑off, run a 30‑day early‑vaccination trial on one group and let your own rumination curves and fresh‑cow performance tell you whether that 11‑day shift cuts transition stress in your barn.
  • If you don’t know what SARA is costing your transition pens, pull 30 days of rumination data and apply the $1.12 per cow per day estimate so you can decide whether extra feed runs or push‑ups are actually more expensive than your current IOFC leak.
  • If you can’t name three concrete protocol changes your sensors drove in the last year, you’re paying for hardware, not a competitive advantage — exactly the situation those 414 Dutch dairy farms walked into when Wageningen researchers found conventional‑milking herds actually produced less milk per cow after installing sensors.
  • If lender conversations are getting tighter, start by trimming transition stress with moves that cost time, not new capital — vaccination timing and feeding consistency — before piling on more equipment or expensive additives.

The Bottom Line

A lot of herds right now are only covering full economic costs because cull checks and beef premiums are propping up the cash flow. The milk keeps shipping, but once you add labor, interest, depreciation, and your own time, the math doesn’t look like much of a plan. That’s not a judgment. It’s the reality of the margin stack you’re living in.

The producers who are quietly pulling ahead in that environment aren’t just the ones with the fanciest tags. They’re the ones willing to look at a transition‑pen graph that makes them uncomfortable, admit that “convenient” isn’t the same as “profitable,” and change the routine anyway. As Reighard put it when Bradford asked what separates the most successful dairy professionals: “We got seven pounds of solids. How do we get seven and a half? How do we get eight?”

Complete references and supporting documentation are available upon request by contacting the editorial team at editor@thebullvine.com.

Learn More

The Sunday Read Dairy Professionals Don’t Skip.

Every week, thousands of producers, breeders, and industry insiders open Bullvine Weekly for genetics insights, market shifts, and profit strategies they won’t find anywhere else. One email. Five minutes. Smarter decisions all week.
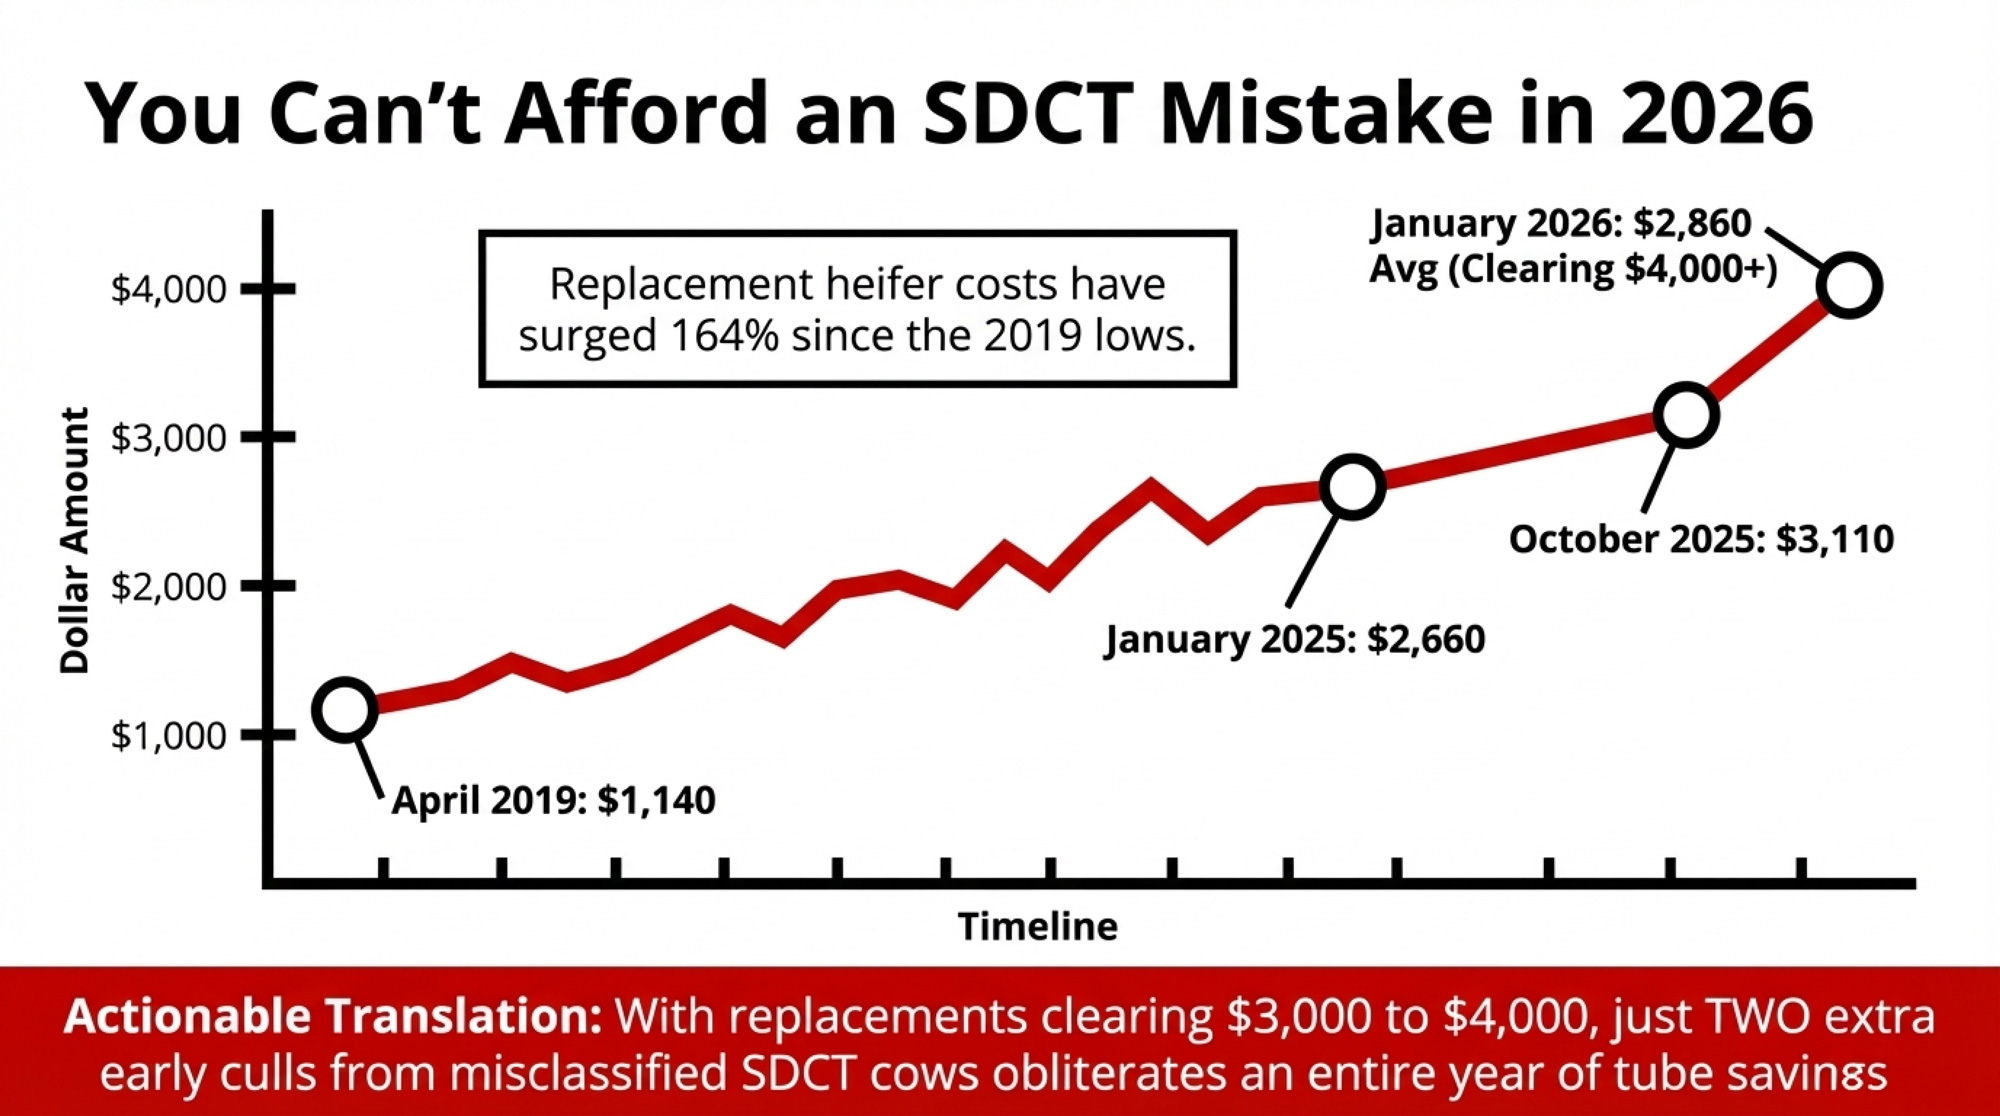
NewsSubscribe
First
Last
Consent

$18.95 Milk, 12 lb Gone Per Cow Per Day: The Leaky‑Gut Cost Hiding in Your Transition Pen

One barrier failure diverts 2 kg of glucose per day to the immune system — and no ration fix claws it back while inflammation persists.

Executive Summary: You’re trying to survive on $18.95/cwt milk with costs around $19.14/cwt, and an activated immune system can quietly steal the energy for about 12 lb of milk per cow per day when the gut barrier leaks. Kvidera and Baumgard’s work shows that a full‑on immune response can burn roughly 2 kg of glucose a day, which the mammary gland would otherwise turn into lactose and milk volume. That “leaky‑gut tax” explains why some herds still wrestle with ketosis, hypocalcemia, and early culls even when DCAD and high‑starch diets look good on paper. Santos’ 2024 study on commercial herds gives you a simple trigger: parous cows ruminating 53 minutes below their parity average pre‑calving were 3.7× more likely to get sick, 2.1× more likely to be culled, and produced several pounds less milk per day. Add in albumin‑to‑globulin ratios one week before dry‑off and manure sieving for mucin casts, and you’ve got a practical on‑farm screen for inflammation risk, not just a lab concept. For a 300‑cow dairy, conservative barn math puts the annual cost of chronic low‑grade inflammation in the $32,000–$43,000 range once you include lost milk and replacement heifers at roughly $3,010/head.

Leaky gut in dairy cows

When a cow’s gut barrier leaks, her immune system can grab about 2 kg (4.4 lb) of glucose a day — enough energy to make roughly 12 lb of milk — and no ration tweak will claw that back while inflammation stays switched on. In a year when USDA pegs U.S. all‑milk at about $18.95/cwt for 2026, that invisible leak is the difference between hanging on and sliding backward.

Dr. Megan Abeyta saw how fast this could go sideways long before it showed up in any spreadsheet. During her PhD at Iowa State with Dr. Lance Baumgard, she injected a healthy mid‑lactation Holstein with lipopolysaccharide (LPS) — the same endotoxin that slips into the bloodstream when the gut wall fails — and watched the cow go down with milk‑fever‑like symptoms almost immediately. The ration hadn’t changed. Calcium intake hadn’t changed. The immune system simply hijacked the cow’s glucose and calcium in seconds.

“You’ve got to remember, the immune system is very energetically expensive,” Abeyta says on the Dairy Nutrition Black Belt podcast. “I like to compare it to an army going to war… and in the hierarchy of functions, survival is more important than making milk.” That hierarchy sits right at the center of modern transition‑cow management.

What Actually Breaks — and Where

Think of your cow’s gut as a long, single‑brick wall between her and a hostile outside world. That “brick” is a one‑cell‑thick epithelium, stitched together by tight junction proteins like occludin, claudins, and the ZO‑family that decide what gets through. Their job is to let in amino acids, fatty acids, and sugars — and keep out LPS, bacteria, and other junk that would light the immune system on fire.

When stress hits hard enough, those tight junctions retract or break down. Microscopic gaps open, and endotoxins such as LPS enter the bloodstream from the gut. The immune system doesn’t shrug that off. It goes to war, pulls glucose and amino acids away from the udder, and you start paying for it in lost milk and weaker cows.

Most people instinctively point at the rumen when they hear “acidosis.” But the real soft underbelly here is the hindgut— the cecum and large intestine. The rumen enjoys a constant rain of salivary bicarbonate and phosphate. The hindgut doesn’t. When high‑producing cows on hot, high‑starch rations push too much starch past the rumen and small intestine, that starch ferments fast in the hindgut, pH falls below about 5.5, and the epithelial lining starts to slough.

If you’re seeing mucin casts in manure — shiny, sausage‑casing tubes in the strainer — that’s your cow trying to “bandage” damaged hindgut with fibrin and mucus. It’s not just a quirky finding. It’s physical evidence that the barrier has already taken a hit.

How Do Stressors Stack Into a Leaky‑Gut Crisis?

On most dairies, leaky gut isn’t caused by one big train wreck. It’s the result of a bunch of “small” stressors stacking until the barrier finally gives way.

Abeyta spends a lot of time walking pens and watching how those stressors line up. “The more small stressors those cows are exposed to, the more likely she’s going to have a worse inflammatory response,” she says.

On the ground, that stack usually looks like this:

  • Heat stress starts to bite around a THI of 68 for uncooled cows, long before you see cows full‑on panting. To keep cool, the cow pulls blood away from the gut and toward the skin; that gut hypoxia and ischemia damage cells and tight junctions and can drive several‑fold increases in circulating LPS. 
  • Nutritional stress comes from SARA, hindgut acidosis, feed restriction, or inconsistent bunk management. High‑starch diets without tight feed management increase fermentable carbohydrate intake in the hindgut; feed restriction and erratic feeding times also stress the epithelium. 
  • Psychological/social stress — rough handling, frequent pen moves, mixing first‑lactation heifers with mature cows — keeps cortisol elevated. Chronic cortisol makes it harder for tight junction proteins to stay in place and lowers the threshold at which other insults cause leaks. 
  • Management stress — overstocked pens, bad stalls, long headlock time, lameness — chews up the time budget. Cows lose lying time, compress eating into fewer, bigger meals, then slug‑feed starch into both the rumen and hindgut. 

You’ve seen versions of this. The cow that’s too lame to lie down. The close‑up group jammed to 130%. The holding pen is a sauna. The gut doesn’t care which one you blame. It just sees stress and starts to leak.

Stress categoryTypical farm triggersWhat it does to the barrier
EnvironmentalTHI ≥ 68, poor air movement, no coolingGut hypoxia/ischemia, oxidative damage, higher circulating LPS
NutritionalHigh starch, SARA, hindgut acidosis, feed restrictionHindgut pH < 5.5, epithelial sloughing, microbiome disruption
PsychologicalRough handling, social mixing, frequent pen movesChronic cortisol, impaired tight junction maintenance
ManagementOverstocking >110%, long lock‑up, poor bedding, lamenessLost lying time, slug feeding, more acidosis risk

How Much Milk Does the Immune System Steal?

Here’s where the “army at war” analogy stops being cute and starts costing you real money.

When LPS slips through a leaky gut, immune cells like neutrophils and macrophages flip into high gear and become obligate glucose users. They’re not interested in fat or ketones. They burn glucose.

A 2017 study by Kvidera and colleagues at Iowa State used an LPS challenge plus a euglycemic clamp in mid‑lactation Holsteins to measure that fuel bill. The acutely activated immune system pulled more than 1 kg of glucose in just 12 hours. When you account for how that response tapers over a full day, Baumgard’s group estimates an active immune system can demand around 2.0 kg (4.4 lb) of glucose per cow per day.

You know where that glucose would normally go: lactose. Lactose pulls water into milk. Less glucose for lactose, less milk in the tank.

Using conservative energy values:

  • Roughly 0.9 Mcal of NEL per lb of glucose equivalent in this context. 
  • Roughly 0.34 Mcal of NEL per lb of 3.5% fat‑corrected milk

Quick barn math:

  • 4.4 lb di glucosio × 0.9 Mcal NEL/lb ≈ 3.96 Mcal.
  • 3.96 Mcal ÷ 0.34 Mcal/lb ≈ 11.65 lb of milk.

Call it about 12 lb of milk per cow per day, diverted from the bulk tank to the immune system when inflammation is active.

And you can’t just “feed that back.” As Abeyta puts it, survival sits at the top of the priority list. As long as the immune army is fighting, it will pull what it needs, no matter how much energy you stack into the ration.

On the protein side, the liver is busy producing acute‑phase proteins such as haptoglobin and serum amyloid A to fight the perceived threat. Those proteins are relatively rich in certain amino acids, so the cow cannibalizes muscle to supply them. Estimates suggest that for every 1 g of acute‑phase proteins synthesized, 1.5–2.0 g of muscle protein may have to be broken down. In a transition cow already in negative protein balance, that’s a fast road to weaker cows and higher early cull rates.

Is Leaky Gut Behind Your Transition‑Cow Failures?

Let’s talk about where this really hurts: the transition window. From roughly three weeks before calving to three weeks after, your cows are going through major hormonal shifts, diet changes, and immune activation around calving itself. Tight junctions are more fragile, the liver is overloaded, and she’s already short on energy and calcium.

Two things keep showing up across research and on‑farm experience:

  • Inflammation and ketosis are joined at the hip. Inflammation is hypophagic — pro‑inflammatory cytokines act on the brain, reducing dry-matter intake. That deepens negative energy balance, drives more NEFA and BHB, and makes it harder for the liver to process that fat load. Cows with elevated inflammatory markers postpartum are more likely to develop clinical and subclinical ketosis and fatty liver. 
  • Some cases of hypocalcemia are inflammation‑driven, not just mineral imbalances. The “Calci‑Inflammatory Network” framing says part of your hypocalcemia problem is rooted in endotoxin. When LPS enters the bloodstream, cytokines such as IL-1, IL-6, and TNF-α can suppress parathyroid hormone secretion, bind to or sequester ionized calcium, and disrupt calcium transporters in the gut and kidneys. That lines up with Abeyta’s own LPS injection experience — watching a previously healthy cow drop with milk‑fever‑like signs almost instantly. 

Cows that never manage to shut down that inflammatory cascade are more likely to leave the herd early in lactation. If you’re routinely losing fresh cows before 60 DIM, you’re probably paying some of this bill already.

How Much Is This Leak Costing at Sub‑$19 Milk?

You’re not managing inflammation in a vacuum. You’re managing it in a year when USDA’s February 2026 outlook pegs all‑milk at around $18.95/cwt and ERS/Bullvine analysis puts average cost of production for larger U.S. herds right around $19.14/cwt. That’s a razor‑thin margin at best.

Let’s take a conservative example; you can adjust it with your own numbers.

  • Herd size: 300 milking cows.
  • At any given time in the first 60 DIM, assume 15% of cows — 45 head — are carrying some level of chronic, low‑grade inflammation.
  • Instead of the full 12 lb/day loss, assume an average of 10 lb/day across that group, once you factor in varying severity. 

Milk loss math:

  • 45 cows × 10 lb/day × 60 days = 27,000 lb of milk.
  • 27,000 lb = 270 cwt.
  • At $18.95/cwt, that’s about $5,117 in lost revenue over that 60‑day window. 
Cost componentAmount (USD)
Lost milk revenue (4–5 transition cohorts/year)$20,000 – $25,000
Replacement heifer costs (4–6 extra culls)$12,000 – $18,000
Total annual inflammation tax$32,000 – $43,000

Now stretch that across the year.

You don’t just have one transition group. If this pattern repeats across four to five transition cohorts annually, you’re staring at roughly $20,000–$25,000/year in milk revenue alone.

Layer in early‑lactation culls linked to unresolved inflammation.

If an extra 4–6 fresh cows leave the herd early because they never recover, and replacement heifers cost around $3,010/head in the current North American market, that’s another $12,000–$18,000/year.

Now you’re in the neighbourhood of ,000–,000/year in a 300‑cow herd — before you count vet bills, lost repro, and the long‑term production drag on cows that stay but never hit their genetic peak.

Plug in your own numbers — herd size, transition‑pen cull rate, your local milk price — and see where you land.

Can Rumination Data Flag Transition‑Cow Inflammation Before You See It?

You don’t have a ketone‑style dipstick for inflammation. But if you’ve already invested in rumination collars or ear tags, you’re sitting on a powerful early‑warning tool. ppl-ai-file-upload.s3.amazonaws

A 2024 Journal of Dairy Science paper by Santos and colleagues looked at prepartum rumination time in commercial Holstein herds. Instead of chasing some magic “X minutes per day” number, they focused on how each cow deviated from her parity group’s average.

For parous cows, they found a clear threshold: animals ruminating 53 minutes per day less than their parity averagein late gestation were the ones that blew up postpartum.

Here’s what that below‑threshold parous group looked like:

OutcomeBelow‑threshold parous cowsAbove‑threshold parous cows
Odds of postpartum clinical disease3.7× higher (adjusted odds ratio 3.7; 95% CI 2.1–6.4)Baseline
NEFA postpartum0.38 mmol/L0.31 mmol/L
BHB postpartum0.53 mmol/L0.49 mmol/L
Milk yield46.3 kg/day48.5 kg/day (≈ 4.8 lb/day more)
Hazard of culling2.1× greater (95% CI 1.2–3.6)Baseline
Probability pregnant by 210 DIM36% lower (hazard ratio 0.64)Baseline

For nulliparous heifers, the same rumination drop didn’t carry much predictive power — the AUC was essentially 0.51, i.e., no better than chance. So this is a parous‑cow tool, not a blanket rule for your whole prefresh group.

From a practical standpoint, that’s gold. You can:

  • Pull prepartum rumination data for parous cows.
  • Calculate the parity‑specific average for the last 7–10 days before calving.
  • Flag any cow sitting 50+ minutes below that average.
  • Tag those cows as high‑risk for inflammation‑linked problems and build them into your fresh‑cow checklists.

Abeyta’s excited about the direction this is headed. “More and more dairies are starting to monitor rumination on farm,” she says. “We have a lot more room to grow regarding identifying inflammatory risk on farms.”

How Should You Use A: G Ratios and Manure to Spot Trouble?

Rumination isn’t your only tool.

The albumin‑to‑globulin (A: G) ratio is a relatively inexpensive blood test that serves as a proxy for chronic inflammatory status. Albumin is a negative acute‑phase protein — its production falls during inflammation as the liver shifts resources to immune proteins. Globulins go the other way, rising.

Research led by Cattaneo and colleagues, published in the Journal of Dairy Science in 2021, looked at the A: G ratio one week before dry‑off. Cows with a higher A: G ratio before dry‑off showed lower inflammatory responses and better milk yield in the subsequent lactation. On‑farm, ratios below about 1.0–1.1 sit in the “worry about chronic inflammation or liver stress” zone.

Then there’s manure. A simple 1.6‑mm strainer can tell you a lot about how hard the hindgut is getting hammered:

  • Mucin casts indicate that the large intestine is actively trying to patch the damage.
  • Foam or bubbles indicate excessive hindgut fermentation.
  • Fiber particles >0.5 inches scream that rumen retention and chewing are off.
  • Obvious feed ingredients (green grass, bright citrus pulp, cottonseed with lint) tell you the feed is blowing through too fast. 

If you’re seeing that package in your transition cows, you’re not just dealing with a “diet quirk.” You’re watching barrier damage in real time.

Manure finding (1.6‑mm strainer)What it signalsImmediate action
Mucin casts (shiny, sausage‑casing tubes)Large intestine trying to “bandage” damaged hindgut with fibrin and mucusTrigger ration & feed‑management review; check for hindgut acidosis
Foam or bubblesExcessive hindgut fermentation; likely starch overloadAudit starch levels, TMR consistency, and feeding frequency
Fiber particles >0.5 inchesRumen retention and chewing time are off; cud time too shortCheck lying time, bunk access, particle size, effective fiber
Obvious undigested feed (green grass, bright citrus pulp, cottonseed with lint)Feed is blowing through too fast; inadequate digestion timeReview feed push‑up schedule, slug feeding, and passage rate

Options and Trade‑Offs for Farmers

Here’s where you turn this from scary biology into a plan. None of these paths is mutually exclusive, but each has a “best fit” and some real limits.

PathWhen it makes senseQuick‑win timelineKey trade‑off
Fix the time budget firstOverstocking >110%, long lock‑ups, short lying time30 daysMay require dropping cow numbers or capital for more stalls
Audit TMR consistency & bunk managementPatchy manure, obvious sorting, cows “surfing” the bunk14–21 daysRequires mixer calibration, frequent push‑ups, tighter labor discipline
Use 53‑minute rumination threshold for fresh‑cow targetingYou already have rumination collars but only use them reactively7 days (report setup)Only works for parous cows; requires consistent data pull & follow‑up
Get ahead of heat stress before THI hits 68Heading into summer, last year you were late on cooling30–60 days (pre‑season)Higher power bills from running fans earlier; upfront equipment maintenance

Path 1: Fix the Time Budget First (30‑Day Action)

When it makes sense: You’re over 110% stocking in key pens, lying time looks short, you’ve got long headlock/holding times, or you’re already seeing slug‑feeding behaviour.

High‑producing cows need roughly 12–14 hours of lying time per day, and they’ll sacrifice eating time to get it. Studies out of Miner Institute and others estimate that each additional hour of rest translates into about 2–3.5 lb more milk per cow per day. When lying time gets squeezed — by overcrowding, bad stalls, sore feet, or long parlor trips — cows spend more time standing in alleys and then hammer the bunk in a few big starch‑heavy meals.

Within the next 30 days:

  • Time one close‑up or fresh‑cow pen from gate to gate: from the moment cows leave the pen for lock‑up or parlor until they’re back. If you’re over 3–3.5 hours/day out of the pen, you’ve got a problem. 
  • Stand in that same pen mid‑morning. If more than about 15% of cows are standing idle in alleys with nowhere comfy to lie, your resting time is probably too short.

Fixing this might mean dropping stocking density, fixing stalls, or changing lock‑up routines. It’s not cheap. But it’s the single most powerful move you can make to cut down on slug feeding and protect the gut.

Path 2: Audit TMR Consistency and Bunk Management

When it makes sense: You see patchy manure across the pen, obvious sorting, or cows “surfing” the bunk waiting for fresh feed.

Your ration can be beautiful on paper and still torch the hindgut if what hits the bunk isn’t consistent. If the front of the bunk gets a fiber‑rich TMR and the back gets a fine, starchy mess, you’ve effectively created two different diets.

Quick checks:

  • Run a Penn State Particle Separator on TMR at both ends of the bunk right after feeding. 
  • Watch how often cows run out of feed. You want them cleaned up, not sitting empty for hours. Frequent push‑ups help spread intake into 9–14 smaller meals per day, which keeps pH more stable. 

If you find big differences in particle distribution or see bunks going bare long before the next feeding, you’re giving the hindgut more work than it can handle.

Path 3: Use the 53‑Minute Rumination Threshold to Target Fresh‑Cow Checks

When it makes sense: You’ve already got rumination data but only use it for “sick cow” alerts.

Using Santos’ work, build a simple parity‑based report for your pre‑fresh cows:

  • For parous cows, calculate the average prepartum rumination time over the last 7–10 days before calving. 
  • Flag any cow that’s 50+ minutes below that parity average. 
  • Put those cows on a high‑risk fresh‑cow list: extra temperature checks, earlier ketone testing, closer feed intake, and manure monitoring.

You’re not treating the number. You’re using it to decide which cows deserve more attention before they crash.

Path 4: Get Ahead of Heat Stress Before THI Hits 68

When it makes sense: You’re heading into summer, and last year you were “a little late” getting fans and soakers dialed in.

Heat stress is one of the cleanest ways to break the gut barrier. THI 68 is where uncooled cows start paying a price; for high‑producing herds, flipping cooling on around THI 65 is often justified.

Right now — not in July — is the time to:

  • Check fan belts, soaker nozzles, controllers, and water supply.
  • Make sure holding pens and return alleys actually get airflow, not just the freestall rows.

The extra power bill from running fans a bit early is almost always cheaper than a few weeks of heat‑driven leaky‑gut problems and the culls they create.

Key Takeaways

  • If your parous cows are ruminating for 50+ minutes below their parity-average pre‑calving, expect them to be 3.7× more likely to get sick, 2.1× more likely to be culled, and to produce roughly 4.8 lb less milk per day. Build a report and start flagging them. 
  • If you’ve done the DCAD work and still fight subclinical hypocalcemia, assume inflammation might be part of the problem and talk with your vet about adding A: G ratio tests and other inflammatory markers pre‑dry‑off and early postpartum. 
  • If more than about 15% of cows in a pen are standing idle mid‑morning and out‑of‑pen time tops 3–3.5 hours/day, your cows are trading eating for lying — and likely slug‑feeding starch their hindgut can’t handle. Fix that time budget first. 
  • If you’re seeing mucin casts, foam, long fiber, or bright undigested feed in manure, treat it as confirmation of a hindgut problem and trigger a ration and feed‑management review — not just a “that’s interesting” moment. 

The Bottom Line

You don’t have to turn your dairy into a research lab to get ahead of this. But you do have to decide whether you’re okay guessing about inflammation while milk sits under $19, or whether it’s time to use the data you already have — rumination, time budgets, simple bloodwork, manure — to plug the leaks.

Complete references and supporting documentation are available upon request by contacting the editorial team at editor@thebullvine.com.

Learn More

The Sunday Read Dairy Professionals Don’t Skip.

Every week, thousands of producers, breeders, and industry insiders open Bullvine Weekly for genetics insights, market shifts, and profit strategies they won’t find anywhere else. One email. Five minutes. Smarter decisions all week.
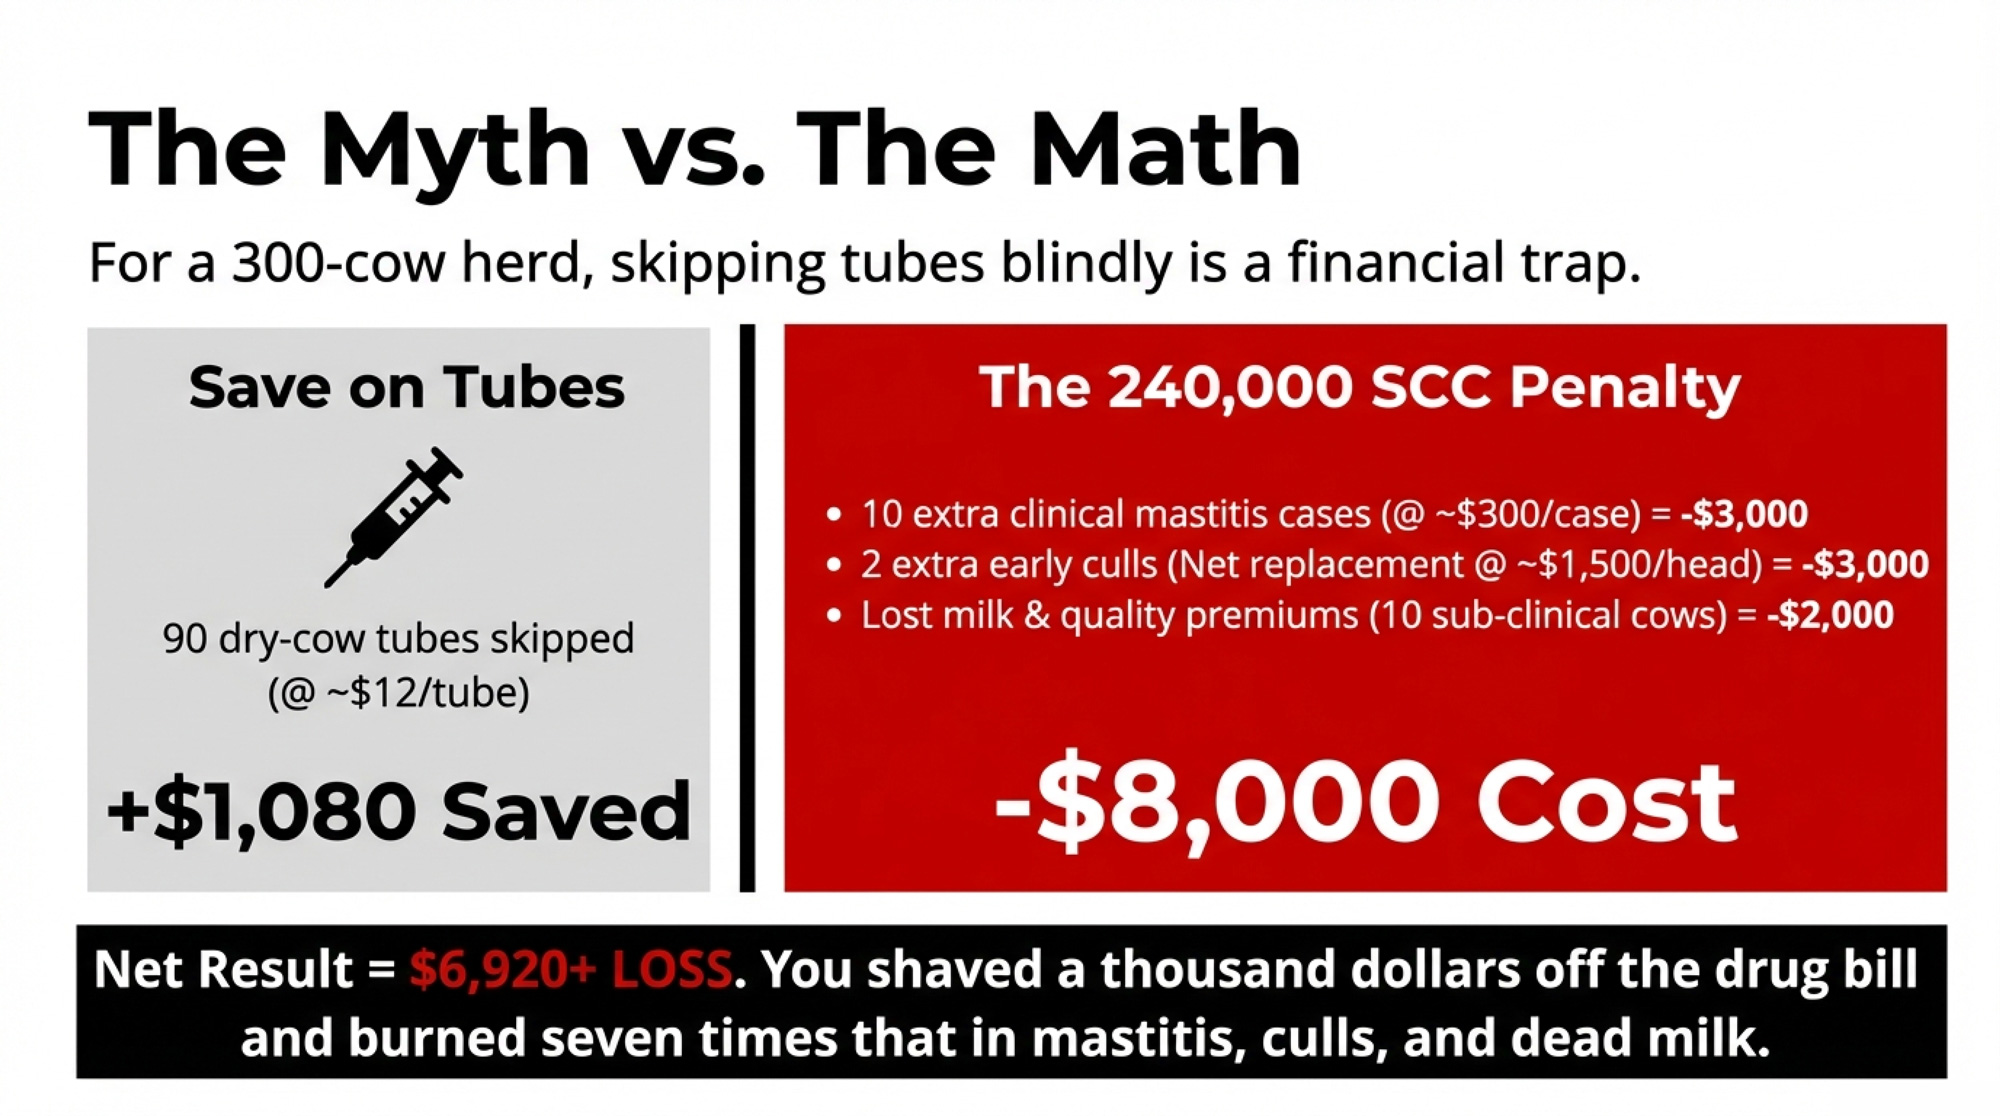
NewsSubscribe
First
Last
Consent

FrieslandCampina Pays €2.63/100kg Sustainability Bonus – Why Your Milk Check Stays Blank.

FrieslandCampina paid farmers €245 million in sustainability bonuses last year — €2.63/100 kg (US$1.25/cwt) as a separate line on every milk check. Your co‑op? Blank.

Executive Summary: FrieslandCampina handed back €245 million to its 2023 members in sustainability premiums — €2.63 per 100 kg (US$1.25/cwt) as a line item every farmer could see and bank on. North America’s Fair Trade (45¢/cwt), Truterra ($21M), Organic Valley ($20/ton), and Athian ($18M) deliver real cash — if you enroll, verify, and qualify. No blanket bonus hits every cwt from every farm. A 300‑cow herd under FC’s formula? €65,857 — roughly US$70k you could plug into stalls or payroll. Your data fuels these programs, yet you’re footing the platform bills while co‑ops quietly blend the upside into base pay. Nebraska Gov. Jim Pillen and Sen. Mike Jacobson want LB525 to flip that: farm data is yours, not vendor fodder. Do this now: Calc your “FrieslandCampina gap” (kg shipped ÷ 100 × €2.63), then email your co‑op rep demanding their sustainability revenue details — pool total, per‑cwt payout, exact line item.

FrieslandCampina reported paying more than €245 million in sustainability premiums to member farms in 2023 — averaging €2.63 per 100 kg of milk, with top performers eligible for up to €3.50 per 100 kg. That’s roughly US$1.25–1.30 per cwt, based on published 2023–24 exchange rates, where €245 million converted to approximately US$263 million, and it appears as a separate sustainability line item that every member can see and audit.

At World Dairy Expo 2025, during a Knowledge Nook seminar on connected data platforms, one of the farmer panelists cut through the tech talk with a blunt question: “Whose data is it? Is it the farmer’s data — the farmer that’s paying for it — or is it the company that’s selling the services?”

That’s the heart of it. If a European co‑op can put a sustainability number on every check with a formula its members can audit, why are so many North American milk checks still blank on that line?

How FrieslandCampina’s Sustainability Premium Formula Actually Works

FrieslandCampina is a farmer‑owned co‑op with members in the Netherlands, Belgium, and Germany. In 2023, it channeled more than €245 million back into member pockets through sustainability‑linked premiums.

Here’s how that breaks down:

  • About €190 million came through the Foqus planet Sustainable Development system, which is tied to nine indicators, including greenhouse gas emissions, animal health, and grazing.
  • More than €55 million came through special milk flows like organic, On the Way to PlanetProof, and VLOG.
  • Farms that hit the toughest GHG reduction targets earned bonuses up to €1.50 per 100 kg on top of the base Foqus planet rate, for a maximum of €3.50 per 100 kg.

Members also fund part of this pool themselves. A cooperative deposit of €0.60 per 100 kg — over €56 million in 2023 — is withheld and later allocated based on Foqus planet scores. Net of that deposit, roughly €2.03 per 100 kg in Foqus planet premiums still ends up back on the check — a mix of company and customer sustainability money flowing to farms.

The trade‑off is real: you gain a predictable sustainability formula you can plan around, but you accept more measurement, more reporting, and the upfront cooperative deposit before that money comes back. FC members decided the visibility and the premiums were worth the paperwork.

FrieslandCampina uses farm‑level data to support sustainability contracts with buyers such as Mars, McDonald’s, and Mondelēz, including a pledge with Mondelēz to cut on‑farm GHG emissions by about 14% by 2025 compared with 2019. They’re not just selling milk. They’re selling documented sustainability performance backed by farm data — and they share that value explicitly with the farmers who generated it.

What North American Programs Actually Pay — And How

North America isn’t empty of sustainability payments. But the structures look very different from a universal per‑100 kg premium.

Fair Trade USA — 45¢/cwt for enrolled farms. In 2023, Fair Trade USA launched a dairy certification with Chobani that pays US$0.45 per cwt each month to participating farms, both organic and conventional. It’s real money and a clear line item, but only for producers who go through Fair Trade certification and ship into that specific program.

Truterra/Land O’Lakes — USM across three years. Land O’Lakes’ sustainability arm, Truterra, reports paying farmers more than US million to sequester or reduce 1.1 million metric tons of carbon across its first three program years. Payments go to farms that enroll and meet practice and verification rules, not to every member on every cwt.

Organic Valley — US$20/ton insetting. Organic Valley’s Carbon Insetting Program pays member farms US$20 per metric ton of verified on‑farm carbon reduction, using funds from a US$25 million Partnerships for Climate‑Smart Commodities grant. Strong signal — but only for enrolled, verified projects.

Athian — USM in livestock carbon credits. Athian’s livestock carbon insetting platform has facilitated about US million in payments to dairy and beef farms since 2024. Dairy Farmers of America bought the first verified livestock carbon credits in early 2024, generated on a Texas dairy after an Elanco protocol reduced nearly 1,150 metric tons of CO₂e.

Those examples matter. They prove that sustainability money isn’t theoretical in North America. But they’re all project‑based: you enroll, you qualify, you get paid. There’s still no equivalent to FrieslandCampina’s published per-100-kg sustainability bonus that automatically applies to every member and appears as a separate line item on every milk check.

Program / Co-opGeographyPayment StructureAmountWho Gets PaidVisibility on Check
FrieslandCampinaNetherlands, Belgium, GermanyUniversal per-100-kg premium€2.63/100 kg (US$1.25/cwt)All membersSeparate line, monthly
Fair Trade USAU.S. (Chobani program)Per-cwt premiumUS$0.45/cwtEnroll onlySeparate line for enrolled farms
Truterra / Land O’LakesU.S.Carbon practice paymentsUS$21M / 3 years poolEnroll + verifyNot disclosed per cwt
Organic ValleyU.S.Carbon insettingUS$20/ton CO₂e reducedEnroll + verifyProject payment, not per-cwt
Athian (DFA purchase)U.S. (multi-state)Carbon credit salesUS$18M facilitatedEnroll + verifyNo standard line item

And meanwhile, a lot of you are paying for the hardware and software that generate the data these programs and your buyers depend on.

What Would €2.63/100 kg Look Like on Your Herd?

Let’s run the barn math, so this isn’t just a European story.

The American Jersey Cattle Association reports that Registered Jerseys averaged 18,400 pounds — roughly 8,346 kg— of actual milk per cow in 2023. At World Dairy Expo’s Knowledge Nook, connected‑data sessions featured producer panels speaking to technology use on herds ranging from a few hundred cows to several thousand. For this analysis, use three realistic herd sizes: about 2,300 cows, 300 cows on robots, and a 260‑cow family operation.

Apply the Jersey average and FrieslandCampina’s € 2.63-per-100-kg sustainability premium.

Step‑by‑step for a 300‑cow herd:

  1. Milk per cow per year: 8,346 kg.
  2. Total herd milk: 8,346 kg × 300 cows = 2,503,800 kg.
  3. Per‑100 kg units: 2,503,800 ÷ 100 = 25,038 units.
  4. Premium: 25,038 × €2.63 ≈ €65,857.
  5. At about US$1.07–1.09 per euro, that’s roughly US$70,000.

Now run it for the other herds — and for yours:

Herd ExampleHerd sizeEst. annual milk (kg)*Premium at €2.63/100 kgUSD equiv. (approx.)Conservative (half rate)
Large Jersey herd2,300 cows19,196,000≈€504,855≈US$530–540,000≈US$265–270,000
300‑cow robot herd300 cows2,503,800≈€65,857≈US$69–72,000≈US$34–36,000
260‑cow family herd260 cows≈2,170,000≈€55–57,000≈US$58–60,000≈US$29–30,000
Your herd_________________________

*Est. Annual milk = herd size × 8,346 kg/cow (2023 AJCA Jersey average). USD values use published 2023–24 exchange ranges where €245m ≈ US$263m (about US$1.07–1.09/euro) and are approximate.

On a 260‑ to 300‑cow herd, US$30–70,000 isn’t spreadsheet noise. That’s a used mixer, new stalls in a problem pen, or one more person on payroll. For a 2,300‑cow operation, a low‑six‑figure sustainability line item changes how you think about capital and debt paydown.

In cwt terms, 8,346 kg is about 184 cwt per cow per year. At €2.63 per 100 kg, you’re looking at roughly US$1.25–1.30 per cwt on the sustainability line. Even a conservative half‑rate — about US$0.60 per cwt — stacks up across a year’s shipments.

You can ballpark your own number in two steps:

  1. Last year’s total kg shipped ÷ 100 × €2.63 = “FrieslandCampina‑style” sustainability premium.
  2. Convert at the current euro rate, then halve it for a conservative benchmark.
Herd DescriptionHerd Size (cows)Annual Milk (kg)Premium at €2.63/100 kg (USD approx.)Conservative Half-Rate (USD)Action
Large Jersey herd2,30019,196,000$535,000$267,500Email co-op: “Where’s my $267k sustainability line?”
300-cow robot herd3002,503,800$70,500$35,250Email co-op: “Where’s my $35k sustainability line?”
260-cow family herd2602,170,000$59,000$29,500Email co-op: “Where’s my $29.5k sustainability line?”
YOUR HERD__________$_____$_____Calc now. Email tonight. Demand details.

You don’t have to be a fan of EU regulation to see what’s missing on your side of the ledger.

Two Data Models: Who Pays, Who Controls, Who Benefits

World Dairy Expo’s Knowledge Nook exists because farms are drowning in data and vendors are lining up with solutions. The hard question is who actually captures the value.

JoinData — farmer data co‑op

JoinData is a non‑profit data cooperative created in 2017 by Agrifirm, CRV, FrieslandCampina, LTO Nederland, and others. It connects more than 16,000 farmers with hundreds of data‑using organizations: processors, slaughterhouses, feed companies, sensor suppliers, accountants.

Farmers use the My JoinData portal to see which companies pull which data, and they can grant or revoke authorizations with a few clicks. Data‑using companies pay transport fees to access the pipe; those fees help fund the platform. Farmers pay a modest annual subscription — about €50 per year — to use the portal and manage permissions.

Companies that want the data write the bigger checks. Farmers keep control over who sees what.

Connected data platforms — data as paid SaaS

Knowledge Nook sessions in recent years have shown how quickly connected‑data offerings are expanding — from UNIFORM‑Agri’s simplified farm data management to DeLaval’s AI‑driven efficiency tools. These systems pull milking, sensors, activity monitoring, and herd management into a single dashboard.

Producers and advisors speaking in these sessions describe real operational wins: catching intake and rumination drops in dry‑cow pens earlier, tracking feed efficiency and daily income over feed cost instead of quarterly, and making ration changes faster when alerts pop up. Dry cows don’t give you daily tank weights — without data streams, some of those problems stay invisible until they cost money.

But the money flow is almost the opposite of JoinData:

  • With JoinData, farmers pay a small flat fee and control authorizations; companies pay to access data through the pipe.
  • With most SaaS platforms, farms pay the subscription; vendors aggregate multi‑farm data and decide how to monetize benchmarks, models, and “insights.”

As The Bullvine documented in “The $30,000 Question: Who Really Owns Your Farm’s Digital DNA?”, at least one Canadian vendor scenario involved a producer being quoted around US$30,000 to export historical data when exiting a robotic milking system. That’s not hypothetical. That’s how “your” data becomes a leverage point when contracts grant vendors broad rights to access and portability.

You’re not just a customer in those models. You’re the unpaid data factory.

Is Nebraska Writing the First Data‑Ownership Line Item for You?

That Knowledge Nook question — “Whose data is it?” — isn’t just a hallway conversation anymore. It’s being written into the proposed law.

In January 2026, Nebraska Governor Jim Pillen told lawmakers he believes “Nebraska’s family farmers own that data — and we’re going to defend our producers from any misguided entity with other ideas.” Legislative Bill 525, introduced by Senator Mike Jacobson, is the first U.S. bill aimed squarely at agricultural data privacy.

The amended bill would:

  • Recognize agricultural data as the farmer’s property.
  • Require explicit consent before any company processes that data.
  • Ban the sale of raw farm data.
  • Give producers the right to request deletion of their data.

It covers crop yields, livestock metrics, GPS tracking, and financial data tied to the operation. In a February 2026 hearing, Jacobson framed it plainly: “A farmer’s data is a byproduct of labor, not a commodity for a tech provider to flip for a profit.”

Nebraska Farm Bureau’s Bruce Riecker drilled into the practical side: “Who owns the data? Who has the right to use it? How do they have the right to use it? And how do we protect the producers so that it can’t be used against them in some predatory way or malicious way?”

Manufacturers and platform providers are pushing back on the “ownership vs. control” distinction and on what counts as “aggregated” or “derived” data. They’re not wrong to worry about compliance cost and innovation friction. But the direction of travel is clear: at least one state is ready to say, in law, that the numbers coming off your fields and cows belong to you first.

LB525 won’t magically put a sustainability line on your milk check. It does set a precedent: the data that powers sustainability premiums and carbon markets is a byproduct of your labor, not free raw material for somebody else’s recurring‑revenue model. And if co‑op governance reformers are already pushing for transparency on milk check deductions and voting power, data ownership is the next frontier.

The 30/90/365‑Day Playbook for Your Own Milk Check

You can’t rewrite your co‑op’s premium structure tomorrow. You can start treating your data like the asset it actually is.

In the next 30 days

  • Run your “FrieslandCampina gap” once. Take last year’s total kg shipped ÷ 100 × €2.63. Convert at the current euro rate. Halve it if you want a conservative benchmark. That number is what a FrieslandCampina‑style program would mean for a herd your size.
  • Send one email to your board rep or member services. Ask three questions: What was the co‑op’s total sustainability revenue pool last year — including climate‑smart grants, branded premiums, and any carbon credit or insetting sales? What’s the average per‑cwt amount paid through to member farms? Where does it appear on individual member milk checks? FrieslandCampina publishes this data annually for its members. If your co‑op can’t answer, or won’t, that’s your first hard data point.
  • Read your own fine print. Pull your milk supply agreement and any platform contracts. Circle three clauses: who owns the data your systems generate; who has rights to aggregated or anonymized insights; and whether you can export your data in a usable format within 30 days, at no extra cost. If those answers are fuzzy, you’re giving vendors more leverage than you realize.

In the next 90 days

  • Calculate your data‑cost‑per‑cwt. Add up software subscriptions, extra advisor time to get systems talking, and staff time spent feeding data into platforms. Divide by total cwt shipped last year. If that number is a meaningful slice of your net margin and you still can’t find a sustainability line on your check, it’s time to start asking harder questions about who’s benefiting.
  • Compare notes with three neighbors on the same truck. Ask whether they’ve ever seen a sustainability pool figure, know what the co‑op received from climate‑smart or carbon programs, or have any easier time exporting their own data. If nobody can get a clear answer, you’re looking at a structural issue, not a one‑off problem.

Over the next 365 days

  • Push for three structural changes. When contracts or policies come up, push for: a separate sustainability line on your milk check; annual disclosure of total sustainability revenue and per‑cwt pass‑through; and a no‑fee, 30‑day export right for all your data from any co‑op‑mandated system.
  • Watch Nebraska’s LB525 and your own state or provincial capitol. If LB525 passes, expect similar bills to surface elsewhere. If your farm organization has a legislative committee, ask whether agricultural data privacy is on their agenda. If it’s not, that’s a lobbying gap you can push to close.
  • Decide your escalation threshold. If a year from now your data‑cost‑per‑cwt is still high and your co‑op still can’t answer those three questions, it may be time to go beyond polite emails — into organized member coalitions, board elections, and bylaw changes. That’s how other farmer groups have finally forced co‑ops to answer the hard questions.

What This Means for Your Operation

  • If there’s no sustainability line on your check, you’re in a risk position you may not have sized. You’re generating data and paying to manage it, but you have no documented sustainability payout tied to it.
  • North American sustainability money exists — it’s fragmented into specific programs. Fair Trade USA pays US$0.45/cwt to enrolled farms. Truterra has sent US$21 million to participating farmers. Organic Valley pays US$20/ton for verified reductions. Athian has facilitated US$18 million in livestock carbon credits. None of that is a universal per‑cwt formula for all members. That’s the structural gap.
  • Treat data clauses the way you treat basis clauses. Before you sign another hardware or software contract, ask: if you needed to walk away in five years, how much would it cost to take your history with you? If the answer isn’t clear, you’re agreeing to more than just the monthly fee.
  • Use your data‑cost‑per‑cwt as a trigger, not a trivia point. If that number is a meaningful chunk of your net margin and the sustainability line on your check is still blank, the economics deserve scrutiny — and you’re justified in pushing for changes at the co‑op and vendor level.
  • Legislation is catching up to what you’ve felt in your gut. Nebraska’s LB525 says plainly that farm data is a byproduct of your labor, not a vendor’s commodity. Even if you never milk a cow in Nebraska, that logic applies to your operation.

Key Takeaways

  • If your last three milk checks don’t show a sustainability premium line, you’re generating data and paying to manage it without any documented sustainability payout tied to it. The €2.63/100 kg benchmark gives you a concrete number to size that gap.
  • FrieslandCampina and JoinData prove that farmer‑controlled data pipes and published sustainability formulas are workable at scale. “Embedded in the blend” is often a structural choice by your co‑op, not a requirement of the marketplace.
  • Nebraska’s LB525 is the first serious U.S. attempt to say, in law, that your farm’s digital exhaust belongs to you. The same arguments Jacobson is trying to codify show up every time you sign a platform agreement without reading the data clauses.
  • The easiest step you can take this week is to send one email. Ask your co‑op for the total sustainability pool, the per‑cwt pass‑through, and where it shows on the check. Their answer — or their silence — tells you a lot about how your data is being treated.

The Bottom Line

FrieslandCampina’s members know their sustainability number. It’s printed on the check, with a formula they can audit. Next time you open your milk statement, look for yours. If it’s not there, you now know how to calculate what’s missing — and who to ask why.

Complete references and supporting documentation are available upon request by contacting the editorial team at editor@thebullvine.com.

Learn More

The Sunday Read Dairy Professionals Don’t Skip.

Every week, thousands of producers, breeders, and industry insiders open Bullvine Weekly for genetics insights, market shifts, and profit strategies they won’t find anywhere else. One email. Five minutes. Smarter decisions all week.
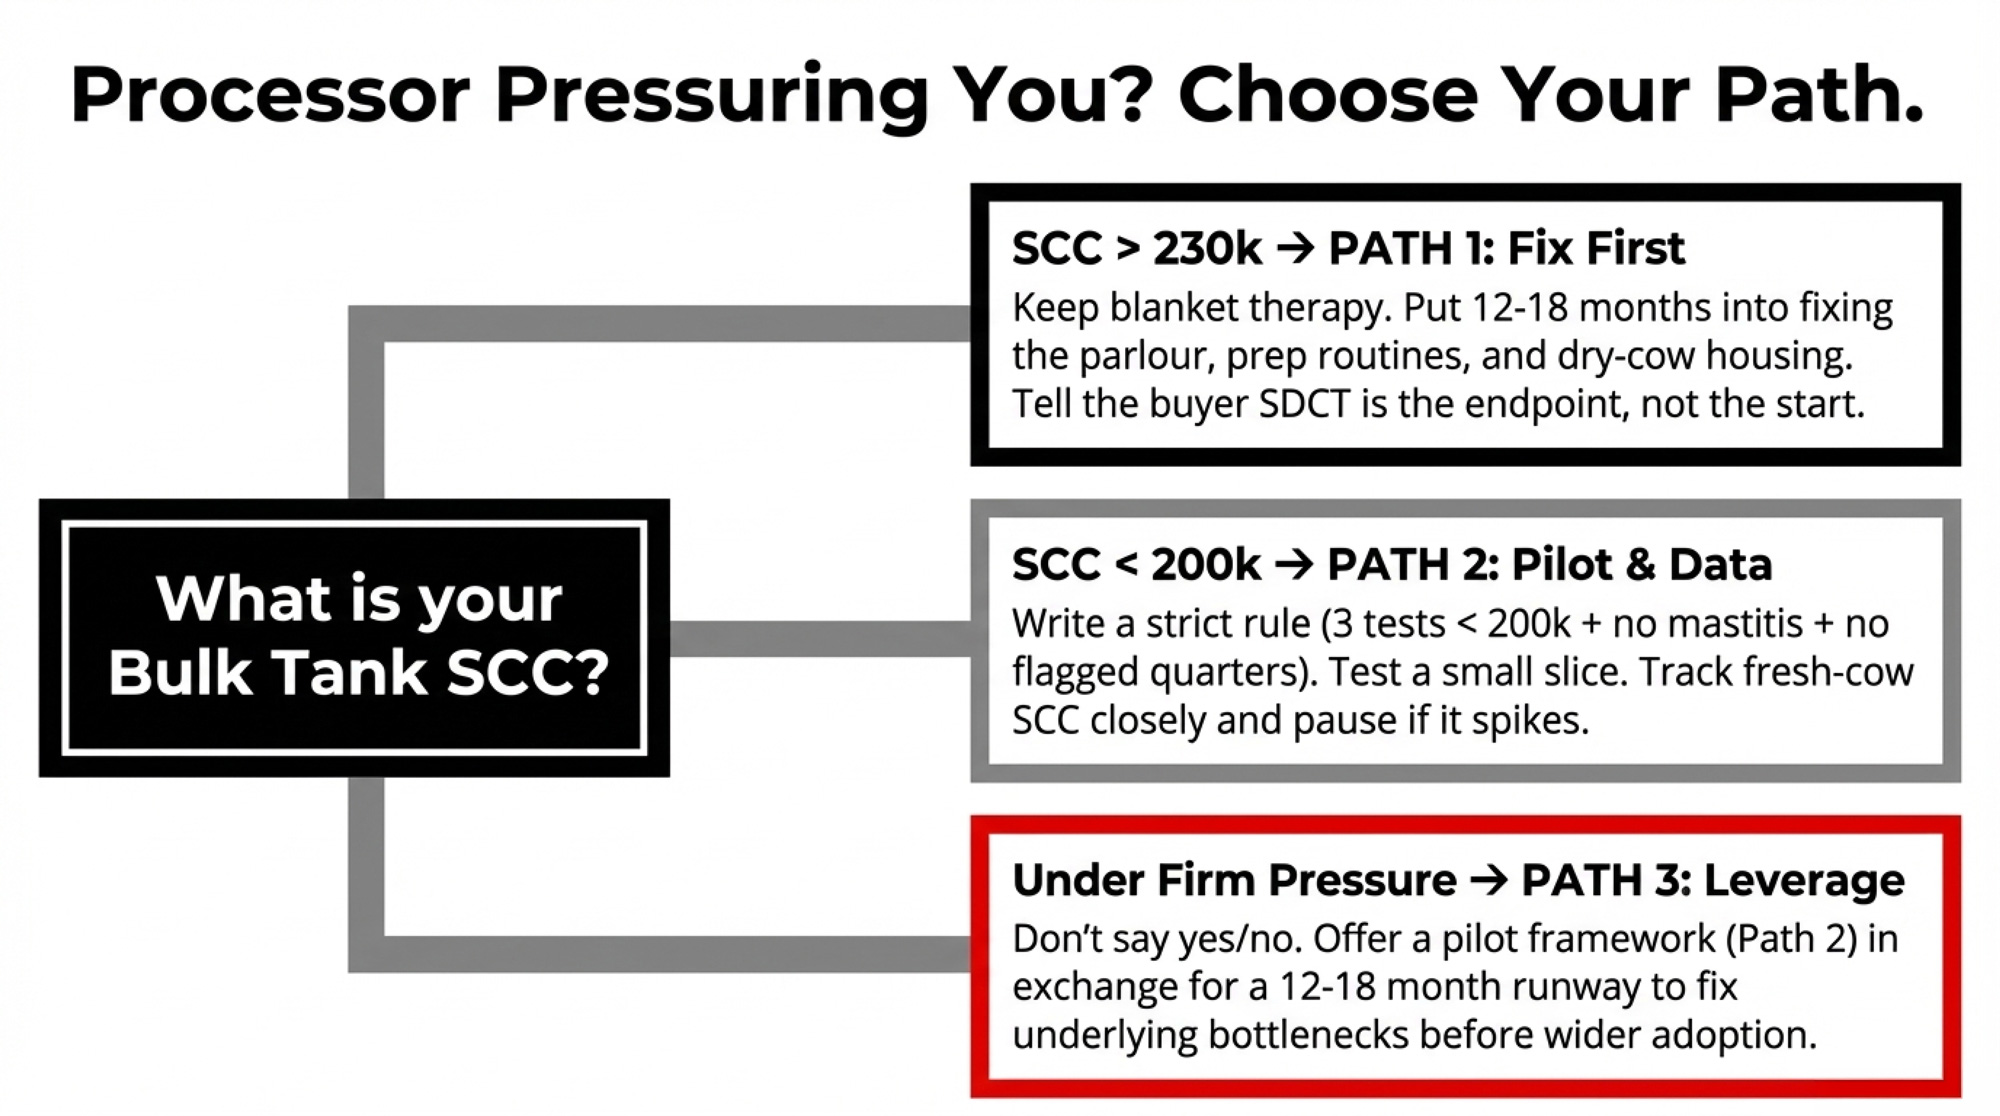
NewsSubscribe
First
Last
Consent

The 3‑Lactation Trap: Are $3,010 Heifers Pushing You Toward Beef Checks Instead of Five‑Lactation Cows?

You say you love five‑lactation cows. Your numbers say three. Is your beef‑on‑dairy program and pen crowding killing your “old ladies” before they ever get there?

Metric3-Lactation System5-Lactation SystemImpact
Rearing cost per heifer$3,010$3,010Same upfront investment
Amortized cost per lactation$1,003$602$401 less per lactation
Annual heifer needs (700 cows)245 heifers/year175 heifers/year70 fewer heifers
Total annual rearing cost$737,450$526,750$210,700 savings
Beef semen usage (typical)70% of breedings~35% of breedingsMore internal replacements

At Glacier Edge Dairy in Wisconsin, Kristen Metaf will tell you her favorite cows are the “old ladies” on their fifth or sixth lactation — the ones that don’t panic in the parlor and turn feed into milk, day after day. She says those fifth‑lactation cows are her moneymakers because they know the routine and don’t waste energy. She runs a herd that, like a lot of progressive dairies, breeds heavily to beef, lung‑scans calves at three to five weeks, and trims hooves three times a year to keep cows on their feet.

On that same World Dairy Expo panel, Pennsylvania herd manager Eric Grodigette shared that cameras over his pens showed fresh cows were spending more time out of the pen than he realized — a few “extra” minutes in the holding area, three times a day, added up to hours of lost rest and more third‑calvers heading to the cull string. Both of them say they want five‑ and six‑lactation cows. But like a lot of U.S. herds, they’re having to make those decisions in an industry where USDA’s January 2026 cattle report counted just 3.914 million dairy replacement heifers over 500 pounds — the lowest since 1978 — and CoBank projects roughly 800,000 fewer heifers over 2025–26 before numbers start to rebound closer to 2027. By mid‑2025, the national average replacement heifer price sat around $3,010 per head, up sharply from about $1,140 in 2019, with top springers in some Western and Upper Midwest auctions topping $4,000.

Bullvine’s analysis of NAAB’s 2024 semen report estimates that about 7.9 million units of beef semen were used in U.S. dairy herds, while NAAB’s own summary shows 9.9 million units of gender‑selected dairy semen, up 17.9% from 2023. Beef‑on‑dairy now supplies an estimated 2.6 million calves to U.S. feedlots, up from roughly 410,000 in 2018. Put bluntly: a lot of barns are managed for three‑lactation cows, even as producers talk about five‑lactation cows and cash beef checks.

What’s Changed — And Why It Hits You Now

For years, the default answer was simple: raise more heifers, milk more cows, keep the parlor full. Heifers were relatively cheap, custom‑grower slots were open, and processors wanted volume.

That world’s gone. USDA’s January 1, 2026, inventory pegged dairy replacements over 500 pounds at 3.914 million, down from 3.951 million the year before and the lowest since USDA reported 3.886 million in 1978. CoBank’s August 2025 outlook says those heifer numbers will shrink by roughly 800,000 head over 2025 and 2026, even as about $10 billion in new U.S. dairy processing capacity comes online through 2027 — all of it needing more milk and components.

Heifer values tell the same story. Hoard’s Dairyman and other market summaries show quarterly U.S. replacement prices around $1,140 per head in 2019, then climbing to the $2,800–3,010 range by mid‑2025. In Wisconsin, USDA and regional reports indicate replacement costs climbed about 69% from late 2023 to late 2024, landing in the mid‑$2,000s, while top springers in some California and Minnesota sales cleared $4,000.

On the calf side, beef‑on‑dairy keeps roaring. NAAB’s 2024 summary recorded 9.9 million units of gender‑selected dairy semen, up 17.9% from 2023, alongside very strong beef‑semen sales. Ever.Ag’s Mike North told Brownfield that newborn beef‑cross calves in early 2025 were “bringing as much as $1,000” in some markets, while Holstein bull calves often traded in the $500–1,000 band — a few‑hundred‑dollar per‑head premium for beef‑cross in many barns.

Now add cow time to the mix. Freestall work across North America and summaries from Wisconsin’s Dairyland Initiative show that when cows have roughly one usable stall per head and spend no more than about 3–3.5 hours per day out of the pen for milking and lock‑ups, they typically lie down 12–14 hours/day. Push stocking density into the 120–140% range and let time out of pen creep past 4 hours/day, and lying time commonly drops by 45–120 minutes/day, with more lameness, lower milk yield, softer components, and higher somatic cell counts. Miner Institute and related field work boil this into a simple rule: each lost hour of lying time is associated with roughly 2–3.5 pounds less milk per cow per day.

When herds run replacement rates in the mid‑30s, breed 60–70% of cows to beef, and crowd pens until cows only get 9–10 hours of rest — and a chunk of that is drowsy standing, not real lying — they’re effectively betting more of their future on expensive purchased heifers and very optimistic IVF performance. That’s the 3‑lactation trap.

What Happens When a 700‑Cow Herd Chases Beef and Longevity at the Same Time?

Busy producers think in pictures and quick comparisons. So let’s put the 700‑cow scenario you’re probably already running in your head into a simple table.

Rearing Payback: 3‑Lactation vs 5‑Lactation System (700‑Cow Herd)

Metric3‑Lactation System5‑Lactation SystemImpact
Rearing cost (est.)$3,010/heifer$3,010/heiferSame base investment
Amortized cost per lactation~$1,003 ($3,010 ÷ 3)~$602 ($3,010 ÷ 5)About $401 less rearing cost per lactation
Heifer needs (700 cows)700 × 0.35 = 245/year700 × 0.25 = 175/year70 fewer heifers to raise or buy
Beef semen usage (typical)High (70% beef matings)Moderate (~40% beef)More beef cash vs more internal replacements

Heifer inventory work from Michael Overton and others suggests many U.S. herds still sit in the low‑to‑mid 30% replacement band, even when owners say “about 30%.” At 35%, a 700‑cow herd needs 245 cows entering the parlor each year to hold head count. Factor in a realistic 15% loss from abortions, stillbirths, and pre‑fresh culls, and you actually need 245 ÷ 0.85 ≈ 288 dairy heifer calves born annually to stand still.

Now plug in a breeding pattern that’s become very common:

  • 70% of breedings to beef semen.
  • 30% to dairy semen (mix of sexed and conventional).
  • About a 50:50 bull‑to‑heifer ratio on dairy conceptions.

On roughly 700 conceptions per year:

  • 700 × 0.70 = 490 beef‑cross calves.
  • 700 × 0.30 = 210 dairy calves, about 105 heifers, and 105 bulls.

You need 288 dairy heifer calves; you’re only making about 105 from conventional dairy breedings. IVF embryos and sexed semen on your top end have to supply the other 180‑plus, or you have to buy heifers at $3,000–4,000 a head. And if IVF comes up short, conception dips, or a respiratory bug hits your “elite” heifer group, you’re forced into the market or into keeping cows and heifers you’d normally ship.

If a herd’s replacement rate slides toward 25% and average lactations move toward five, the math flips. You now need around 175 new cows a year, so 175 ÷ 0.85 ≈ 206 dairy heifer calves born — that’s roughly 82 fewer heifer calves per year compared to the 35% scenario. You can still run some beef, maybe 30–40% of matings, but you’re not mathematically forced into the heifer market or heavy IVF to replace early exits. Longevity and internal growth are finally pulling in the same direction.

That’s why the beef cap matters. In many replacement‑rate scenarios, holding beef semen usage in roughly the 20–35% band is a practical range for internal growth when your replacement rate is coming down, and your calf program is solid. At 70% beef, you’re essentially stating that you will buy heifers or lean heavily on expensive IVF to maintain herd size. There’s no way around the numbers.

The Mechanics Behind the Trap

When you strip the buzzwords away, three choices set the ceiling on average lactations: who you raise, how hard you push beef semen, and what you ask stalls and time budgets to carry.

Calves, Lungs, and the “Ollivett Effect”

Terri Ollivett at the University of Wisconsin–Madison has helped turn lung ultrasonography into a practical on‑farm tool and popularized the #WeanClean mindset — calves should arrive at weaning with healthy lungs, not just acceptable weight gains. Her extrapolation from USDA’s 2014 NAHMS survey is blunt: about 9.5% of U.S. dairy calves show clinical pneumonia, and for every clinical case, there are roughly two to four subclinical cases you only see on ultrasound. That puts preweaning BRD — clinical and subclinical — in the 30–50% range for many herds. North American studies report subclinical BRD prevalence between 23% and 67%, depending on farm and timing.

A 2021 systematic review and meta‑analysis found that heifers diagnosed with calfhood BRD had 2.85 times higher odds of dying and 2.3 times higher odds of herd removal before first calving, plus about 0.067 kg/day lower average daily gain and 121 kg less milk in their first lactation. Progressive Dairy and veterinary summaries add that chronic BRD cases often lead to heifers with limited lung capacity and decreased longevity. That’s the biological core of the longevity story: scar the lungs, and you shrink the “engine.” Those animals can still freshen and produce, but the data show they’re more likely to leave early and produce less, which makes it nearly impossible for them to reach the kind of fourth‑ or fifth‑lactation peaks you bred them for.

OutcomeHealthy Heifers (Baseline)BRD-Diagnosed Heifers
Odds of death before first calving1.0× (baseline)2.85× higher
Odds of herd removal before first calving1.0× (baseline)2.3× higher
Average daily gain (kg/day)Baseline-0.067 kg/day slower
First-lactation milk productionBaseline-121 kg (approx. -267 lb)

At Glacier Edge, every calf gets a 0–5 lung score at 3–5 weeks; larger or repeated lesions get aggressive treatment. That’s smart. But scanning without changing who you raise is just adding cost. The BRD meta‑analysis and Ollivett’s field work point in the same direction — calves with significant BRD damage are much more likely to die, to be culled before first calving, and to give less milk when they do freshen. The only way lung ultrasound really supports longevity is if you’re willing to say, “A calf with a score of 4 and two BRD treatments is never a replacement in this herd,” even when her pedigree looks great.

Genomics belongs in that same “decide who never gets a ticket” bucket. DWP, mastitis PTAs, lameness, and fertility traits give you a durability preview years before a cow hits the parlor. Glenn Klene has 13 years of genomic data at Yun Farms behind him and has seen high‑health‑index home‑breds outlast bought‑ins. But if low‑health‑index heifers with poor calf records still get raised as replacements, you’re paying for information you won’t act on.

What Happens to Your Numbers If You Actually Change?

You can rewrite a protocol in a week. You can’t rewrite your herd’s age structure in one turn of the calendar.

On a 700‑cow herd that truly commits — culling harder on weak young stock, dialing beef usage into that 20–35% range, and protecting rest time — you’re realistically signing up for a multi‑year project.

Year 1 — You change a lot, the numbers don’t

You:

  • Start lung‑scoring calves and mark some as “never replacements.”
  • Cap beef semen in the 20–35% range, aim sexed dairy only at truly top cows and heifers.
  • Pull your worst overstocked pen back toward 105–110% of stalls and keep time out of the pen under 3.5 hours/day.
  • Move from two to three hoof trims a year on higher‑risk pens.

You feel:

  • Short on heifers.
  • Like pens and heifer barns are “too empty.”
  • Pressure from partners or lenders who only see fewer cows in the parlor.

On paper, replacement rate and average lactations barely budge. You’re still milking cows bred and raised under the old rules.

Years 2–3 — The first “new rules” heifers hit second and third lactation

Now you start milking animals that never had wrecked lungs as calves, come from higher‑health genomic matings, and lived in slightly less crowded pens.

You see:

  • Fewer lame, open second‑calvers.
  • Fewer early mastitis train wrecks.
  • Replacement rate drifting from, say, 36% toward 30–32%, because fewer young cows fall out.

Average lactations might move from 3.0 to 3.3–3.5. That’s progress, but it still doesn’t “look” like a five‑lactation herd. And this is exactly where many herds quietly increase beef use again, cram pens back to 130%, or ease up on calf culls.

Years 4–5 — The herd actually looks different

Herds that stay the course usually report more 4th‑ and 5th‑lactation cows, fewer first‑lactation culls, and replacement rates in the 25–30% range. Average lactation at cull inches into the 3.8–4.2 area, with a meaningful tail of fifth and sixth-lactation cows. The payoff is both biological and financial: your “engines” are bigger because you protected lungs and legs early, and your rearing cost per lactation is hundreds of dollars lower because you spread that $3,010 over five lactations instead of three.

The question isn’t whether cows can get there. It’s whether you’ll still be running the hard rules when those years finally show up on your DHIA printout.

Is One Pen Stealing All Your Lactations?

You don’t need a five‑year plan to learn something useful this month. Start with one group.

Field work on time budgets and cow comfort suggests that when cows average around 12–14 hours of lying time per day and spend only about 3–3.5 hours out of the pen for milking and lock‑ups, they produce more milk and stay sound longer. Miner Institute research, echoed in multiple comfort case studies, puts a number on it: each lost hour of lying time is associated with roughly 2–3.5 pounds less milk per cow per day.

At Grodigette’s farm, cameras showed that fresh cows were being pulled to the holding area just a little too early for each milking — that “little” added up to 30 minutes or more of lost lying time a day and more standing on concrete. When they moved that group’s slot 10 minutes later three times a day and retrained movers, the lying time recovered. Using the Miner Institute rule, that kind of rest recovery represents roughly 3–5 pounds of previously “hidden” milk per cow per day that had been sacrificed to standing fatigue. They also saw fewer lame, open third‑calvers coming out of that pen.

Overstocking adds another layer. Work from the Dairyland Initiative, Michigan State, and others shows that stocking freestall pens much above 100–110% leads to more competition, less lying time, higher lameness, lower rumination, and reduced milk yield. When bunk space gets tight in an overstocked pen, cows tend to eat fewer, larger meals — classic slug feeding — which increases the risk of SARA, lower fat test, and laminitis‑type lameness. Those cows might still hit half‑decent first‑lactation numbers, but repeated bouts of SARA and sore feet keep chipping away at longevity. That’s the management face of the 3‑lactation trap.

30‑Day Pen Test: Is This Group Built for Three Lactations or Five?

Within the next 30 days, pick one pen — fresh, high, or the one you complain about the most. For 30–60 days, track:

  • Average lying time per cow per day (collars, cameras, or structured spot checks).
  • Total hours per day that the group spends out of the pen (walk, holding, lock‑ups).
  • Cows per usable stall.

If you see:

  • Lying time under 11.5 hours/day, or
  • Time out of pen over 3.5 hours/day, or
  • Stocking density over 110% of stalls,

treat it like a mastitis outbreak. Within 14 days:

  • Adjust milking order and lock‑up schedules until time out of the pen is ≤3.5 hours/day.
  • Move or ship enough cows to get that pen to about 100–110% of stalls.

Then run those conditions for 60 days and watch: lameness treatments from that pen, “low and open” culls, and milk per stall — not just per cow. If nothing changes, your bottleneck is probably stall design, bedding, or nutrition. If things improve, you’ve just proven with your own cows that overstocking and time budgets were quietly stealing cow years and milk checks.

Options and Trade‑Offs for Farmers

You don’t have to pick the “perfect” path. You do need to admit which game you’re actually playing.

Decision FactorLongevity-FirstBeef-Led Cash FlowHybrid with Guardrails
Beef semen usage20–35% of breedings60–70% of breedings30–50% (data-driven)
Replacement rate target25–28%33–36%28–32%
Average lactations (expected)4.2–5.03.0–3.33.5–4.2
Primary riskEmpty pens, partner pressureHeifer market squeeze, price spikesIVF/sexed semen underperformance
Heifer sourceInternal + selective purchaseHeavy purchase or contract growersInternal + IVF + selective purchase
What you’re betting onBRD control, rest time, genomicsBeef calf premiums, available heifersGenomic accuracy, IVF success
Discomfort you acceptFewer cows, slower growthHigh heifer costs, market volatilityComplex breeding rules, constant monitoring

Longevity First: Fewer Replacements, More Lactations

When it makes sense: You feel the heifer squeeze, you’re not keen on bidding $3,000–4,000 for replacements, and you’d rather cut replacement risk than chase every last beef‑calf premium.

What it requires:

  • Hold beef semen usage in that 20–35% band until your replacement math says you can push higher. At current prices and heifer inventories, 70% beef is basically a commitment to buying heifers or leaning heavily on IVF.
  • Use genomic health indexes and Ollivett‑style lung scores as disqualifiers: repeated BRD or high lung scores mean “never a replacement,” not “we’ll see how she does.”
  • Hard‑wire rest: “No lactating pen stays under 11.5 hours lying time for more than a week; if it does, we get stocking to ≤110% and time out of the pen to ≤3.5 hours/day within 14 days.”
  • Accept a 2–3 year lag before average lactations really move.

Risks and limits: The heifer barn and some pens will look “too empty” for a while. You may have some hard conversations with your banker about why you’re chasing fewer, older cows instead of more, younger cows.

Beef‑Led Cash Flow: Volume and Calf Checks First

When it makes sense: You’re expanding or heavily leveraged, beef‑cross calves in your area reliably bring strong checks, and you’ve got solid access to custom growers or purchased replacements.

What it requires:

  • A clear‑eyed acceptance that your herd will probably sit near 3.0–3.3 average lactations and mid‑30% replacement for the foreseeable future.
  • Firm relationships or contracts that secure enough replacement capacity before you need it, because both heifers and grower space are tight, and CoBank doesn’t see inventories rebounding before 2027.
  • A budget that can handle heifer price spikes beyond $3,010; that number isn’t guaranteed to hold.

Risks and limits: You’re exposed in two markets — beef calf and heifer — so policy, trade, or health hits can double up on you. Longevity stays mostly a story, not a driver of profit. This path isn’t automatically wrong. It just carries different risks than the longevity‑first play.

Hybrid With Guardrails: Beef and Longevity Under One Roof

When it makes sense: You want those beef checks, but you’re willing to let data — not habit — decide who gets beef versus dairy.

What it requires:

  • Broad genomic testing plus good calf and heifer records.
  • A written breeding rule; for example, top 30–40% on DWP + production + health get sexed dairy and IVF consideration; bottom 60–70% get beef semen every time.
  • A simple monthly replacement calculator: heifer calves needed = milking cows × target replacement rate ÷ 0.85. If projected dairy heifer calves (sexed + conventional) fall short, the next breeding round’s beef percentage comes down.

Risks and limits: It depends on IVF and sexed semen performing close to conservative conception assumptions, not the best‑case number in a brochure. And if calf health isn’t tight, even “elite” heifers can carry scarred lungs and fragile legs; your rules must let you bump them to the beef side without blowing up your replacement pipeline.

The 30‑Day Pen Test: A No‑Regrets Start

If you do nothing else in the next month, run that 30‑day pen test. It costs time and honesty, not capital.

When it makes sense: Pretty much always, any herd can learn something from it, whether you’re a 100‑cow tie‑stall or a 2,000‑cow freestall.

What it requires (within 30 days): Pick one pen: fresh, high, or the obvious lameness hot spot. Measure lying time, time‑out‑of‑pen, and stocking density for 30 days. If lying time <11.5 hours/day, time‑out‑of‑pen >3.5 hours/day, or stocking >110%, adjust stocking and schedules inside 14 days and hold that line for at least 60 days.

Risks and limits: You’ll likely move or ship a small group sooner than planned, and it might look “inefficient” on a whiteboard. If results don’t improve, your next step is to look at stalls, bedding, or ration — not to shrug and go back to 130% stocking.

What you gain: Hard numbers from your own barn about whether overstocking, lock‑up, and slug feeding are quietly stealing cow years and 3–5 lb of milk per cow per day. And a story you can tell to partners and lenders when you argue that fewer, better‑rested cows beat more, exhausted cows.

Key Takeaways

  • If your true replacement rate is well above 30%, pull 12 months of cull data and count how many cows are left in first or second lactation for lameness, mastitis, or reproduction. That’s where your “we love old cows” story leaks — and those early exits are exactly the animals BRD and SARA hit hardest.
  • If any lactation pen averages less than 11.5 hours of lying time for a week, treat it like any other health problem: within 14 days, get stocking down toward 100–110% of stalls and total time out of the pen under 3.5 hours/day, then watch lameness, SARA signs, and “low and open” culls from that group.
  • If you’re breeding more than about 35% of cows to beef semen without clear health and genomic cut‑offs,sit down and run the replacement math on paper. With CoBank projecting about 800,000 fewer heifers over 2025–26 and average heifers already at $3,010, heavy beef usage basically commits you to buying heifers or leaning hard on IVF.
  • If you’re lung‑scanning calves but still raising almost all heifers as replacements, add one written rule: lung score ≥4 or two BRD treatments = never a replacement here. The data suggest those heifers are much poorer candidates for five‑lactation careers.
  • If your average lactations haven’t moved in two years despite new tech, stop buying tools and change one structural decision instead — stocking density in one pen, beef percentage, or young‑stock cull thresholds — and give it long enough to show up on your DHIA printout.
  • If you’re serious about five‑lactation cows, pick one number — average lactations, replacement rate, or lying time — and agree that when it looks bad, you’ll change rules, not just stories.

Which Discomfort Are You Willing to Live With?

In the next 30 days, you can pick one pen and find out whether your barn is built for three‑lactation cows or five. In the next 90 days, you can write one non‑negotiable rule — about calves, beef usage, or rest time — and stick with it even when the heifer barn looks too empty. Over the next few years, you’ll see whether you’ve actually built a five‑lactation herd or just told yourself you had one.

Because the cows can do it, the question is whether you’d rather feel the discomfort of culling a few more weak calves and over‑conditioned third‑calvers now, or keep writing checks for an extra 40‑plus heifers a year at roughly $3,010 a head while overstocked, slug‑fed, BRD‑scarred cows quietly age out at three lactations.

Complete references and supporting documentation are available upon request by contacting the editorial team at editor@thebullvine.com.

Learn More

The Sunday Read Dairy Professionals Don’t Skip.

Every week, thousands of producers, breeders, and industry insiders open Bullvine Weekly for genetics insights, market shifts, and profit strategies they won’t find anywhere else. One email. Five minutes. Smarter decisions all week.
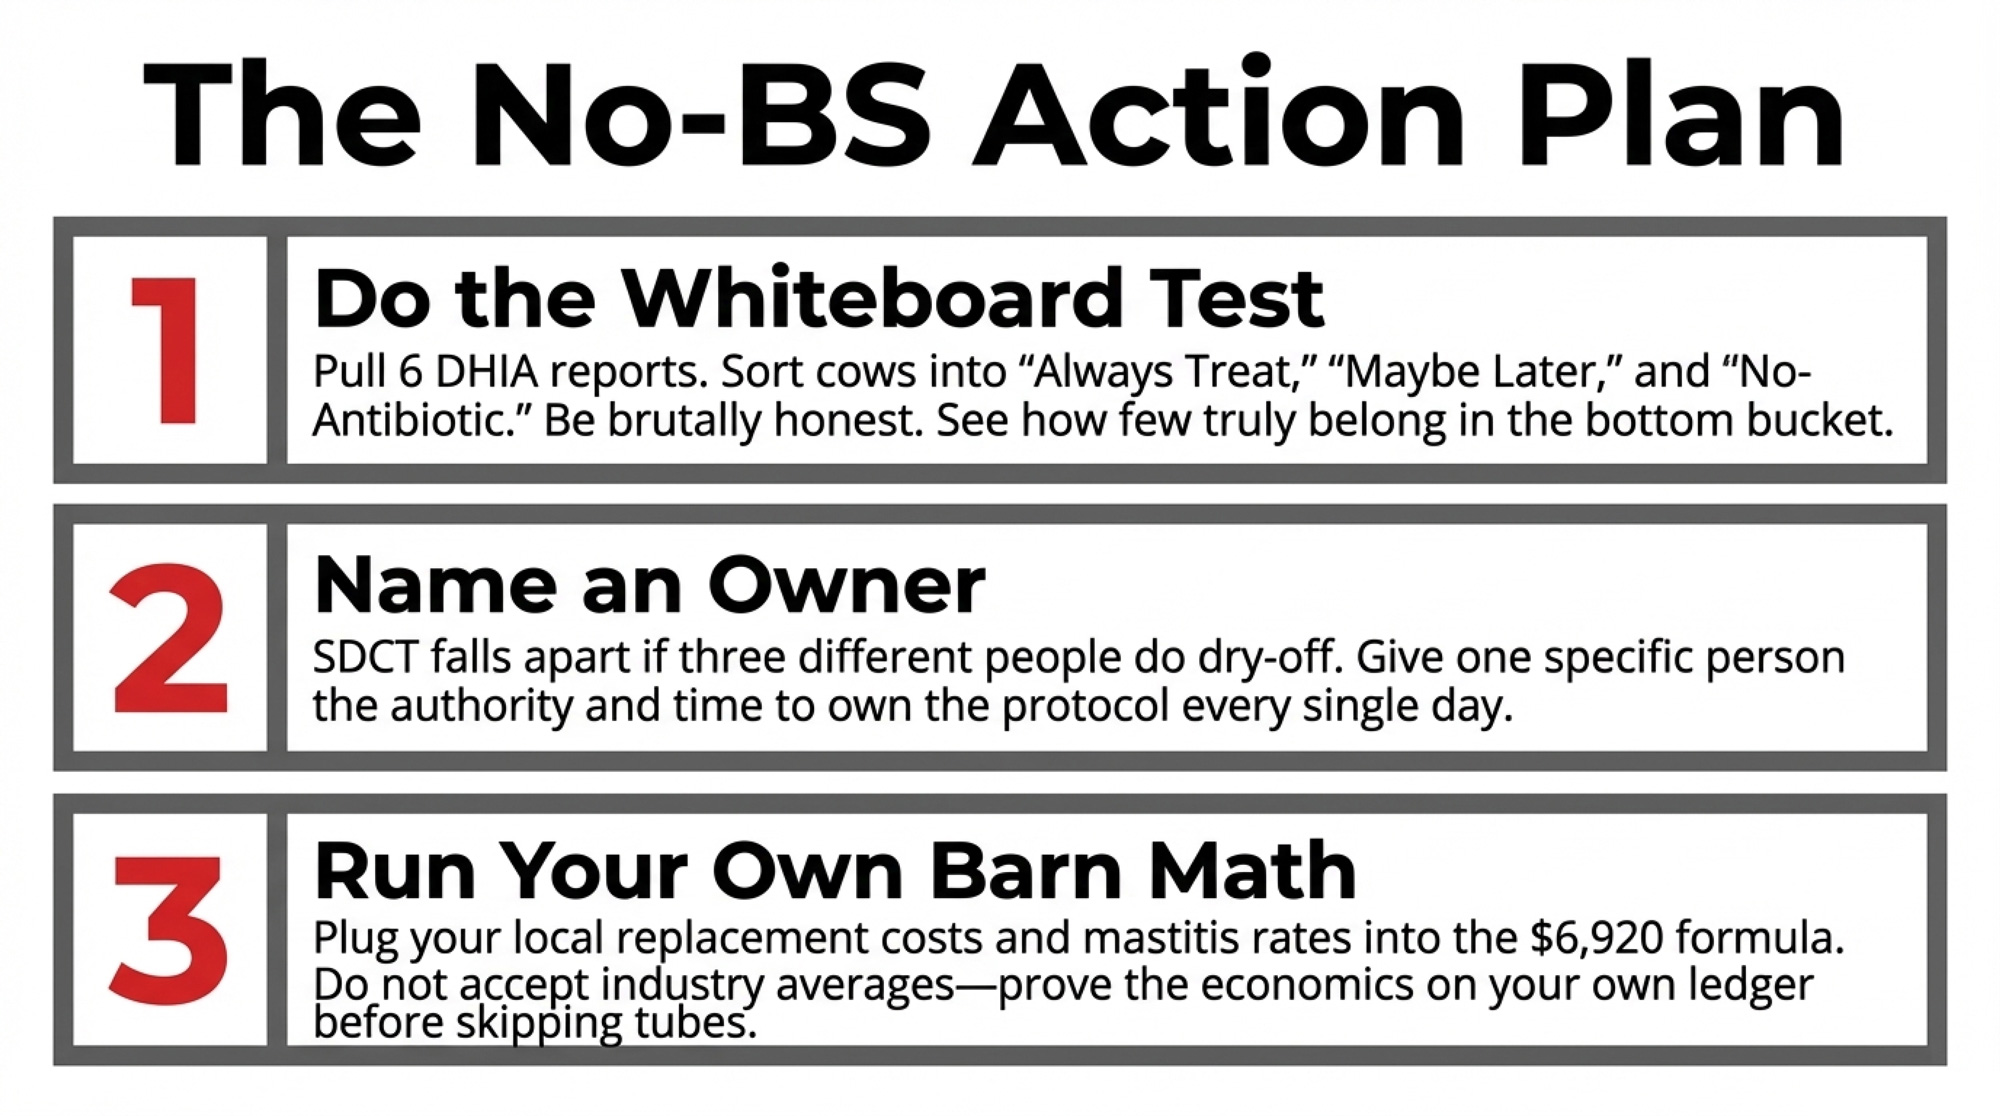
NewsSubscribe
First
Last
Consent

Life After BMR: The $103,000 Corn Silage Decision Behind 4 Pounds of Milk per Cow

If BMR disappeared tomorrow, would you lose 4 lb of milk per cow and $103,000 a year — or nothing at all? Your corn silage NDFD holds the answer.

Executive Summary: Corteva is phasing BMR corn silage out of its seed lineup by 2030, and that’s a big deal if you’ve been using bm3 to buy extra fiber digestibility. For a herd of around 1,800 cows, the article shows that losing just 2 points of ration NDFD can mean roughly 4 lb less milk per cow and about $103,000 a year in lost milk revenue at current Class III prices. It breaks down how much of BMR’s edge came from fiber versus starch, then shows how top-end conventional silage hybrids, chop height, plant population, and kernel processing can claw back a surprising amount of that energy. Short-stature corn and biologicals get a reality check — worth trialing, but nowhere near proven enough to build your whole feeding program around. You’ll finish with a 30-day punch list, including which forage tests to pull and what questions to run past your nutritionist and seed rep, so you can see exactly where your own corn silage stands before BMR disappears.

BMR corn silage phase-out

In March 2025, Corteva confirmed that its brown midrib (BMR) corn silage program would be phased out of Pioneer, Brevant, and Dairyland Seed lineups by the end of this decade. For large dairies that built their high-group rations around BMR’s fiber digestibility advantage, the announcement forced an immediate question: Where does that energy come from now?

Duane Ducat, a partner in Deer Run Dairy in Kewaunee County, Wisconsin, put the stakes plainly in a Brownfield Ag News interview that spring. “We had good conventional digestibility at anywhere from the 63 to 68 NDF30,” Ducat told Brownfield. “With BMR, we’re looking probably eight points higher in digestibility.”

Eight points isn’t a rounding error. It’s milk. “I would say that we’re looking at probably four pounds of milk before energy corrected, so it’s been feeding very well for us, the BMR,” he said. Deer Run milks about 1,800 cows and manages 3,200 crop acres, according to a February 2025 Dairy Business Association profile.

All Ducat quotes in this article are drawn from his March 2025 Brownfield Ag News interview and public remarks. Deer Run Dairy’s herd and acreage figures come from the farm’s February 2025 Dairy Business Association profile.

When a Seed Company Moves Your Goalposts

If BMR feeds that well, why would a major seed company walk away from it?

Corteva says BMR hybrid sales trailed their top conventional silage hybrids, which the company says deliver more tonnage and comparable feed quality. Stacking modern traits — insect protection, herbicide tolerance — onto a BMR background has been harder and more expensive than building them into full-lignin silage lines. And non-BMR silage hybrids have kept marching ahead on yield and agronomics, widening the tonnage gap even when BMR wins on digestibility.

The most widely used BMR gene, bm3, knocks down the activity of a key lignin-pathway enzyme (COMT), which cuts lignin and boosts cell wall digestibility. But peer-reviewed work has tied that same mutation to weaker stay-green, more lodging, and greater disease susceptibility — because lignin is part of the plant’s structural and defense system. Breeders have clawed back a lot of agronomic strength in bm3 backgrounds over the years, but pushing yield, standability, and trait stacks has still been easier in conventional programs that keep full lignin.

The phase-out won’t yank BMR out of your planter tomorrow. Corteva confirmed the timeline runs through no later than the 2030 growing season across its U.S. and Canadian brands. But it puts a clock on any system that’s been leaning on bm3 to buy a few extra points of fiber digestibility quietly.

What BMR Actually Did in Herds Like Deer Run

BMR earned its place in high-production rations because it reliably pushed fiber digestibility and intake — and that showed up on the milk sheet.

The mutation reduces lignin in the plant cell wall, giving rumen microbes a better shot at breaking down neutral detergent fiber. A five-year U.S. study showed in vitro NDFD30 about 7 percentage units higher than conventional hybrids, with the gap ranging up to 10 units historically. BMR silage also comes in with lower uNDF240 — the undigested fiber pool that drives gut fill and caps intake. In a review of BMR feeding trials, 100% of the long-term studies showed higher milk production. Controlled trials have often found bm3 delivering roughly 4–6 lb more milk per cow per day versus isogenic normal corn silage.

“It’s hard to compete with that from a production performance perspective,” said Luiz Ferraretto, ruminant nutrition extension specialist at the University of Wisconsin–Madison, at the February 2026 Midwest Forage Association Symposium.

The flip side shows up just as clearly. Extension and on-farm data keep landing in the same place:

  • Lower yields — often 10–15% less tonnage than strong conventional silage hybrids, especially in older bm3 lines.
  • Lower starch concentration, because bm3 plants shift more biomass into digestible stalk and leaf relative to grain.
  • More agronomic risk, particularly when BMR hybrids don’t carry the latest insect traits.

“Long story short, BMR is a great tool to improve fiber digestibility and increase intake and performance, but you need to be able to afford having less starch and lower yield,” Ferraretto said.

That’s why many herds have targeted BMR at fresh and high-producing pens rather than planting it wall-to-wall. One lever in a system, not a whole-farm crutch.

The Barn Math: What One NDFD Point Is Really Worth

Before you decide how hard to chase BMR-level digestibility, you need to know what each point is actually worth in your barn.

UW–Madison Extension has put a number on it: a one-percentage-unit increase in ration NDFD30 boosts milk production by an estimated 0.55 lb per cow per day. That’s at the ration level, not per ingredient — an important distinction. If corn silage makes up around 40% of total dry matter, a 5-point drop in corn silage NDFD30 translates to roughly a 2-point drop in ration NDFD30 once you blend in haylage, grain, and by-products.

Here’s what that math looks like at a herd Deer Run’s size, using publicly reported figures and the UW response curve against current milk markets:

  • Assumed ration NDFD drop without BMR: 2 points (from losing ~5 points of corn silage NDFD30).
  • Milk impact per cow per day: 2 × 0.55 = 1.1 lb.
  • Herd size (milking): ~1,800 cows, per the DBA profile.
  • Days in milk used for math: 305.
  • Annual milk loss: 1.1 × 1,800 × 305 ≈ 603,900 lb.
  • 2026 Class III forecast: USDA’s March 2026 WASDE projects $17.05/cwt; January 2026 actual was $14.59, and CME futures for the balance of the year trade $15.38–$18.00. Using $17/cwt as a mid-range estimate.

That puts about 3,000/year of gross milk revenue on the line if ration NDFD slips 2 points and you don’t fix it somewhere else. Your acres, yields, and milk price will differ, but the principle holds: each point of ration NDFD is a five-figure decision on most 1,000-plus cow dairies. Scale your own herd into that math, and the number should get your attention even at 500 cows.

Fiber vs. Starch: Two Knobs, Not One

Most conversation around BMR focuses on fiber. But the energy your cows get out of corn silage isn’t just about NDFD — it’s also about starch content and how much of that starch actually gets digested.

bM3 BMR silage comes in with higher NDFD but lower starch concentration than non-BMR counterparts. In some comparisons, high-yielding non-BMR silage hybrids produced more digestible NDF per acre and more starch per acre because their extra tonnage and grain compensated for slightly lower NDFD per ton.

Conventional silage hybrids today also tend to carry higher starch and more vitreous endosperm, which can hold back rumen starch digestibility if you miss on harvest maturity, kernel processing, or storage time. That’s pushed plant breeders to select for more floury endosperm in silage lines — starch that behaves more like a finisher corn than a flint.

Amylase-enabled hybrids like Enogen take a different route, building an alpha-amylase trait directly into the grain. In a Penn State feeding study where corn silage made up 40% of the diet dry matter, cows fed Enogen silage produced about 4.4 lb more milk per day with better feed efficiency at similar intakes. The seed premium varies by dealer and volume — get a quote and run it against your expected milk response before penciling the advantage.

That gives you two knobs when replacing BMR’s energy contribution:

  • Fiber knob: Pick silage-specific conventional hybrids toward the top of the NDFD30 and TTNDFD range and pair them with plant populations and chop heights that protect digestibility.
  • Starch knob: Favour hybrids with strong starch content and kernel texture that fits your system, and where the premium pencils, consider amylase-enabled genetics to pull more energy out of each ton.

The goal isn’t to clone bm3. It’s to get back to “more energy per acre” through a different genetic package.

Can Conventional Hybrids Really Close the Gap?

John Goeser, who works with large dairies through Progressive Dairy Solutions, has been blunt. “BMR corn silage sits in its own class for fiber digestibility,” he said, as reported by Dairy Herd Management in March 2026. “No current conventional hybrid matches it in the same way.”

The nuance lives in those last four words. UW–Madison’s hybrid data show conventional hybrids ranging roughly 47–67% NDFD30 and BMR hybrids roughly 54–74% NDFD30, depending on hybrid, environment, and location. There’s overlap — and Ducat’s own numbers hint at where. His conventional silage was already running 63 to 68 NDF30before BMR. That puts Deer Run’s conventional base squarely in the top tier of UW’s range. And it means Ducat’s telling Brownfield he sees BMR as worth the yield penalty specifically because it stacks on top of an already strong conventional program — not because his conventional base was weak.

MetricBMR (bm3 focus)High-Management Conventional
NDFD30 range~68–72% in good environments~60–64% for top silage-specific lines
Starch (% of DM)~28–32%~34–38%
TonnageFrequently lowerFrequently higher
Agronomic riskHigherLower
Milk per tonHigher (when fiber is limiting factor)Competitive (when starch + NDFD balanced)

Not every operation starts from Deer Run’s baseline. If your conventional silage has been running in the mid-50s, the gap to fill is a lot wider. But a top-end conventional hybrid that consistently tests in the 60–65% NDFD30 band can hang with an average BMR on predicted milk per ton once you account for its higher starch, lower uNDF, and yield advantage.

Chad Staudinger, agronomist with Dairyland Seed, has spoken publicly about that trade-off in the context of their conventional “high DF” silage line. “Our customers and our clientele, I think we’re not going to skip a beat,” he told Brownfield. “We’re going to move right into high DF and other products that show the benefits we need to feed our cattle and make milk and meat.”

On pure fiber digestibility curves, conventional won’t fully replace BMR. On milk per ton and milk per acre in a well-managed system, some of these hybrids get closer than the headlines suggest.

Does Raising the Chopper Bar — or Dropping the Seeding Rate — Really Pay?

Two of the biggest levers you can pull without changing seed are chop height and plant population. Both work by the same principle: diluting the lignified lower stalk that drags down digestibility.

“When we increase chop height, all we are leaving in the field is extra stalk — maybe we are leaving one leaf,” Ferraretto explained at the 2026 MFA Symposium. “We are diluting the undigestible material and consequently have more fiber digestibility in the silage.” A 2018 meta-analysis from his Wisconsin team (Ferraretto et al., averaging seven studies) found that for each centimeter you raise cutting height, corn silage gains 0.08 units of starch and 0.08 units of NDFD — but you lose 0.05 Mg/ha of dry matter yield.

Penn State Extension pulled together 11 university and on-farm trials showing that raising chop height by about 12 inches cut DM yield roughly 7% while boosting starch and NDFD by 2–4 units, trimming predicted milk per acre only about 2%. In one high-yield year, high-cut silage actually produced more milk per acre and per ton.

Cutting Height (inches)NDFD30 Gain (pts)DM Yield Loss (%)
6 (baseline)00%
9+1.0–2.5%
12+2.0–5.0%
15+3.0–7.5%
18+4.0–10.0%

But when Penn State put high-cut silage in front of cows, milk fat slipped from about 3.7% to 3.4% — likely because the ration’s effective fiber dropped when the forage got more energy-dense. The fix: when they reduced grain inclusion by 3 percentage units, holding ration energy constant, there were no differences in milk yield, fat, or protein. Treat high-cut silage like a more energy-dense forage and pull some purchased grain out. That’s how you keep milk steady and trade field biomass for a lower grain bill.

“I’m not trying to convince you that raising the chop height is not a good thing. I think it’s quite good, but it’s not BMR,” Ferraretto told the MFA crowd. “It’s different, and farmers have to realize that.”

On population, UW–Madison works with the Midwest Forage Association, which found that 30,000 plants per acre produced significantly higher NDFD than 35,000 or 40,000. Barry Visser, a nutritionist with Vita Plus, wrote in Dairy Star in November 2025 that “several farms have found success in improving the fiber digestibility of their conventional corn silage by controlling the planting population” — though quality responses “may not be consistent across different hybrids.”

Goeser reinforced the principle during a 2025 Hoard’s Dairyman webinar: “The more leafy tissue we have — the less midrib and the less stover we have — the greater fiber digestibility.” He also noted that while higher populations can boost yields, “this may negatively affect feed value.” Pioneer’s multi-year analysis using UW corn silage trial data found milk per acre peaked at about 41,000 plants, with NDFD only slipping about a point across the range. A one-point swing from population is a much smaller deal than a five-point swing from hybrid choice or harvest timing.

For a place like Deer Run, managing 3,200 crop acres, there’s room to run different populations on different fields — dialing back on the best ground to chase quality, pushing harder on marginal acres where tonnage matters more. Stop treating seeding rate as a single farm-wide number.

Ferraretto’s team has built a Corn Silage Cutting Height Calculator that lets you plug in your own yields, nutrient analyses, and proposed chop heights to estimate the impact on nutritive value, DM yield, and production cost per ton. The tool is based on a meta-analysis by Cole Diepersloot, Randy Shaver, and Ferraretto (presented at the XX International Silage Conference, Florida, 2025) and includes both imperial and metric tabs. Worth running those scenarios before a wet fall forces a seat-of-the-pants call at the edge of the field.

Why the Management Margin Just Got Thinner

When BMR was doing half the digestibility work, you could get away with “pretty good” on the rest of the silage decisions. That buffer is going away.

“Everything we can do to change fiber digestibility in corn silage reduces biomass that you bring to the silo,” Ferraretto said. “There is nothing out there that can increase fiber digestibility and keep — or increase — biomass.”

That pushes more weight onto levers that don’t require leaving tons in the field:

  • Harvest timing: Hitting the right whole-plant dry matter and kernel milkline remains the biggest single driver of both NDFD and starch capture.
  • Kernel processing: Across multiple UW and field studies, the kernel damage score shows up as the biggest factor in starch availability, regardless of hybrid. A wrench on the processor is cheaper than another load of corn.
  • Packing and fermentation: Air pockets, poor face management, and visible spoilage will erase the NDFD and starch advantage you paid for with seed, fuel, and time.

More herds have started tracking TTNDFD — total-tract NDF digestibility — alongside NDFD30 because it ties better to intake and performance across the whole cow. Losing BMR nudges you from chasing one number on the forage report to managing TTNDFD plus starch digestibility as a package.

UW’s “Beyond BMR” factsheet also flags that BMR hybrids without modern insect traits may need heavier fungicide and insecticide programs to manage ear disease and mycotoxins — adding to the yield penalty you’re already absorbing. None of that is new science. What’s changed is the room for sloppiness. Without BMR as a backstop, those 2–3-point swings in NDFD30 from timing, processing, or bunk management start looking like real money — the kind of money in the barn math above. For mid-size operations already navigating tighter strategic margins, losing the BMR crutch means every other management lever has to work harder.

Is Short Corn the Next BMR?

When a silver bullet gets taken off the table, everybody hunts for the next one. Short-statured corn is the loudest candidate right now — and two Wisconsin operations are already testing the idea from different angles.

UW–Madison agronomist Harkirat Kaur’s early work suggests short-statured corn can post higher NDFD than standard-height hybrids while maintaining similar grain yield, largely because the plant carries less lignified lower stalk per ton. Iowa State’s 2024 report adds practical reasons for the buzz: short hybrids decrease lodging risk, improve standability, and let you run full-season ground rigs without worrying about tassel damage.

Andy DeVries, a silage farmer from Rosendale, Wisconsin, got an early look through Bayer’s Ground Breakers program. “Preceon delivered yields comparable to BMR, but with exceptionally high starch and similar digestibility,” DeVries shared during a January 2026 Ground Breakers session, as recounted by Bayer senior VP Elzandi Oosthuizen. “Watching Preceon silage go into the wagon made it easy to understand where that starch is coming from.” That field-level observation lines up with what Michigan State’s VandeHaar lab found when they put br2 short corn head-to-head against BMR — the br2 silage shipped 2.5 lb more ECM per cow per day than BMR in mid-lactation Holsteins, even though BMR still owned the NDFD column in the lab.

Ferraretto and Italian collaborators (Catellani et al., published in the Journal of Dairy Science, February 2026) compared short-statured silage to conventional in rations where corn silage sat at about 40% of dry matter. Nutrient analyses showed NDF digestibility and starch slightly higher for short corn — numbers that resembled BMR analyses, Ferraretto said. But the cow data told a different story.

“The question is, are cow responses similar to BMR? The answer is no,” he asserted at the MFA Symposium. Total milk production still improved, but there was no statistical difference in feed intake — suggesting a different biological mechanism. Here’s the catch: the conventional corn was planted at 32,500 seeds per acre, while the short corn was planted at 54,600.

“It’s very promising, but we have a lot to learn about it,” Ferraretto stated.

Biologicals — seed treatments, inoculants, foliar products — are the other hot category. UW’s “Beyond BMR” factsheet describes that market as “vast and relatively unregulated,” stressing that independent testing will be crucial. There’s nothing wrong with testing short corn or a biological in your own plots. The risk is treating either one like a guaranteed BMR replacement before you’ve seen multi-year, replicated data in your region.

What This Means for Your Operation

You don’t have to milk 1,800 cows to be in the same boat as Deer Run. If BMR has been part of how you buy room for higher forage rates and strong components, the clock is ticking.

In the next 30 days:

  • Pull your last two years of forage tests. Circle every corn silage sample with NDFD30 at or above 60% and strong TTNDFD. Those results are your proof that non-BMR acres can carry a bigger share of the ration’s digestibility load.
  • Sit down with your nutritionist and seed advisor. For every conventional or short-corn hybrid on the table, ask for multi-year local trial data — NDFD30, TTNDFD if available, starch, yield, and trait package. If a hybrid can’t consistently reach the high-50s to low-60s for NDFD30 in your environment, it doesn’t belong in your high-group bunk.

Before you plant:

  • Decide which fields can trade a little tonnage for quality. On those acres, consider pulling plant population back toward 30,000–32,000 plants/acre and pairing that with higher chop height in a normal-or-better crop year.
  • For each field, sketch a Plan A and Plan B chop height — one setting for when inventories and grain prices let you leave stalk, another for when you need every ton. Run both through UW’s cutting-height calculator so the decision is math, not a guess.

At harvest and feedout:

  • Check kernel processing score early in the run, then again when crews are tired. Slowing the chopper or tightening a processor is cheaper than hauling more corn because starch is locked in whole kernels.
  • Match your highest-quality lots to the groups where digestibility pays hardest. Let late-lactation cows and heifers eat the “nice but not great” silage.
  • If you raise chop height, make sure your nutritionist adjusts for effective fiber — don’t trade butterfat for a few extra pounds of milk.

Over the next 12 months:

  • Compare milk per ton, milk per acre, TTNDFD, and purchased feed costs from your first non-BMR crop against your last season with BMR.
  • Where there’s still a shortfall, pin down exactly where it lives. Intake on the hottest days? Butterfat when you raised the chop height? Milk from fresh cows? Specific answers drive next year’s hybrid, population, and ration decisions — vague disappointment doesn’t.
TimelineAction ItemWhy It Matters
Next 30 DaysPull last 2 years of forage tests; circle every corn silage sample with NDFD30 ≥60% and strong TTNDFD.Proves your non-BMR acres can carry more digestibility load. If you don’t have samples above 60%, your gap to BMR is wider than Deer Run’s.
Next 30 DaysSit with nutritionist and seed advisor; demand multi-year local trial data (NDFD30, TTNDFD, starch, yield, traits) for every hybrid on the table.If a hybrid can’t consistently hit high-50s to low-60s NDFD30 in your environment, it doesn’t belong in your high-group bunk.
Next 30 DaysRun UW’s Corn Silage Cutting Height Calculator for your fields (link in article).Model Plan A and Plan B chop heights before fall—turn a cab decision into math.
Before PlantingDecide which fields trade tonnage for quality; pull population to 30k–32k plants/acre on those acres.Dilutes lignified stalk, boosts NDFD ~1–2 points. Don’t treat seeding rate as farm-wide—vary by field goals.
Before PlantingSketch Plan A (high-cut) and Plan B (standard-cut) chop heights by field; cost both scenarios in the calculator.Wet fall or tight inventories kill high-cut plans. Have the math done ahead so you’re not guessing at harvest.
At HarvestCheck kernel processing score early in the run, then again when crews are tired.A wrench on the processor is cheaper than hauling more corn because starch is locked in whole kernels.
At Harvest/FeedoutIf you raise chop height, flag it for your nutritionist—don’t trade butterfat for milk.Penn State saw milk fat slip from 3.7% to 3.4% on high-cut silage until they pulled 3 points of grain to rebalance effective fiber.
At FeedoutMatch highest-quality silage lots to high-producing and fresh pens; let late-lactation and heifers eat “nice but not great” silage.Digestibility pays hardest in groups where intake and milk yield are highest. Stop feeding one-size-fits-all TMR.
Over Next 12 MonthsCompare milk/ton, milk/acre, TTNDFD, and purchased feed costs from first non-BMR crop vs. last BMR season.Shows you exactly where the shortfall lives—intake on hot days? Butterfat? Fresh-cow milk? Specific answers drive next year’s seed plan.
Over Next 12 MonthsTrack forage test results monthly; flag any NDFD30 or TTNDFD drift below your baseline.Early warning system. If quality slips mid-year, you can adjust ration or pull different silage lots before milk checks show the damage.
OngoingTrial short-statured corn or biologicals on 10–20 acres—but don’t build your program around them yet.Promising, but multi-year replicated data doesn’t exist. Test them; don’t bet the farm on them.
OngoingAsk your nutritionist to calculate ration-level NDFD30, not just forage-level—that’s what drives milk response.UW’s 0.55 lb milk per NDFD point is at the ration level. If corn silage is 40% of DMI, a 5-pt drop in silage = ~2-pt drop in ration NDFD.

Key Takeaways

  • Price your fiber insurance now. Using UW’s 0.55 lb/cow/day per ration NDFD point, a 2-point ration NDFD drop on a 1,800-cow herd works out to roughly $103,000/year at USDA’s 2026 Class III forecast of $17.05/cwt — scale for your own herd size and milk price.
  • Your conventional baseline is the whole story. Ducat’s own program ran 63–68 NDFD30 before he added BMR — that’s the neighborhood you need to be in. Top silage-specific conventionals in the 60–65% NDFD30 range with strong starch and trait packages can compete with average bm3 on milk per ton and per acre. If your conventional sits in the mid-50s, the gap is wider and the urgency is higher.
  • Treat chop height and plant population as ration levers, not just chopper settings. A ~12-inch bump in cutting height tends to shave ~7% off DM yield, boost starch and NDFD by 2–4 units, and trim milk per acre only ~2% — but the win only sticks if you rebalance for effective fiber or pull back on grain.
  • Demand more than a plot tour from short corn and biologicals. DeVries saw promising starch and digestibility from Preceon, and VandeHaar’s lab found br2 shipped 2.5 lb more ECM than BMR — but Ferraretto’s own cow data didn’t match BMR-level responses, and multi-year replicated data across regions doesn’t exist yet. Trial them. Don’t build your feeding program around them.

The Bottom Line

Ducat’s 63-to-68 conventional baseline and 8-point BMR bump aren’t just Deer Run numbers — they’re a measuring stick. If you know where your conventional silage sits on that scale right now, you already know how much work you’ve got ahead of you. The tools to close most of that gap are already in your hands. What matters is whether you pick them up before Corteva’s timeline picks for you.

Learn More

Iran War and Hormuz: How $4.16 Diesel Masks a $1.5M Fertilizer Hit on Your Dairy’s Bottom Line

If Iran keeps Hormuz choked, your 500‑cow dairy won’t lose $7K at the fuel tank — it’ll lose $146K in the feed lane.

Executive Summary: The Iran–Hormuz war has shoved U.S. diesel over $4/gal and yanked fertilizer prices sharply higher, but for a 500‑cow Iowa dairy, $4.16 diesel is the distraction — the real 2026 hit is a fertilizer‑driven feed shock. USDA’s 2026 all‑milk price sits near .95/cwt while full‑cost benchmarks for many herds run –/cwt, so a lot of dairies start the year structurally in the red before that feed increase even shows up. In the modeled 500‑cow herd, higher diesel adds roughly ,000 a year, but a realistic .00/cwt jump in feed cost tied to spiking urea and sulfur markets adds about 6,000 — pushing the 24‑month full‑cost shortfall toward .5 million if nothing else changes. That’s exactly why Kansas State economist Gregg Ibendahl argues fertilizer is “by far and away a bigger percent of total farm expenses than what fuel is” when Middle East conflict drives oil higher. The article walks through that barn math step‑by‑step and then gives a 30/90/365‑day playbook: run a 24‑month fertilizer‑shock scenario with your own numbers, set DSCR and working‑capital trip wires with your lender, pair milk‑side tools like DMC/DRP with feed coverage, and use strong cull and land markets as levers instead of last‑minute fire sales. In the end, it forces a decision every 300–700‑cow herd can’t dodge: if feed stays $1.00/cwt higher for the next two years, are you scaling, tightening up to survive, or planning a strategic exit while asset values still work in your favour?

For a typical 500‑cow family dairy based on real Iowa financials near Waterloo, and the 24‑month picture lands at roughly $1.5 million in negative cash flow once a fertilizer‑driven $1.00/cwt feed shock is layered into the barn math.

The herd we’re modeling here is a composite, built from the financials of several real Iowa operations. It isn’t one specific farm — but the math is designed to land close to what a lot of 500‑cow Midwest herds are actually facing: home‑grown forage and corn, buying the rest, carrying a normal amount of debt. Diesel at $4.16/gal feels like the obvious villain after the Iran conflict and the Strait of Hormuz closure pushed U.S. diesel prices to their highest level in nearly two years. But when you plug USDA’s $18.95/cwt all‑milk outlook into a 24‑month projection for a herd like this — then add a $1.00/cwt feed increase tied to fertilizer — it isn’t the fuel bill that does the real damage.

From Hormuz Headlines to a Fertilizer Squeeze

The year didn’t start with spreadsheets. It started with fuel tickets.

In late February and early March 2026, Iran’s war and attacks in the region raised the risk of serious disruptions in the Strait of Hormuz, the narrow corridor that handles a large share of global crude and refined product flows. Energy analysts warned it wasn’t just crude at stake — refined products like diesel and jet fuel that transit Hormuz were also in the line of fire, and buyers in Europe and Asia were already scrambling.

By early March, Reuters reported the U.S. national average diesel price hitting $4.04/gal — up 14.7¢ in a single dayand the highest in almost two years. Diesel futures on NYMEX surged more than 60¢/gal in two trading sessions, hitting a two‑year high as Hormuz risk repriced the entire energy complex. Regional rack prices in the Corn Belt climbed accordingly, putting posted farm prices like $4.16/gal across much of Iowa squarely in line with what herds are seeing at the pump right now.

While diesel was getting the headlines, the fertilizer market was moving just as fast — and in a way that cuts much closer to your feed line.

Brownfield Ag News reported that fertilizer bidding in parts of the U.S. was effectively paused as traders tried to price the Iran conflict. Argus Media showed New Orleans (NOLA) urea barge prices jumping from roughly $470/short ton to the $520–$550/st range in about a week, driven by shipping risk and short‑term supply fears. Analysts estimate that a large share of global fertilizer nutrients — roughly one‑third by some trade counts, including around 30% of seaborne urea — normally moves through Hormuz.

Sulfur was already on a tear. Brownfield quoted Fertilizer Institute economist Veronica Nigh, who said sulfur prices had roughly tripled compared to pre‑2022 levels, and that the Iran‑Hormuz situation was “only going to escalate markets” for sulfur‑dependent fertilizers like MAP and DAP. Those higher sulfur and nitrogen costs ripple straight into the N‑P‑K blends that underpin Corn Belt corn production.

Kansas State ag economist Gregg Ibendahl made the same point to Brownfield: fertilizer is “by far and away a bigger percent of total farm expenses than what fuel is.” That’s why he sees fertilizer as the bigger worry if oil stays high — and it’s the core tension driving the dairy feed cost 2026 story this article unpacks.

For a 500‑cow Iowa herd, those headlines don’t show up as lines on a Bloomberg chart. They show up as a much fatter feed‑cost line on the ledger.

Why “We Grow Our Own Corn” Isn’t a Free Pass on Fertilizer Risk

The first pushback you’ll hear at the coffee shop: “We grow our own corn — why should higher fertilizer prices hit our TMR?”

That’s where opportunity cost bites. Even if you never cut a check to a grain buyer, the economic cost of your corn is whatever you could reasonably sell it for in today’s market. If fertilizer pushes the cost of production per bushelhigher, you either:

  • Raise your internal cost of corn in the ration, or
  • Let the “crop side” of the business quietly eat that higher cost so the dairy side can pretend corn is still cheap.

Here’s what that looks like in practice. Say it costs you $4.50/bu to grow corn this year — and the local elevator bid is $5.20/bu. Your TMR is using $5.20 corn whether you wrote a check or not. That extra $0.70/bu flows straight through to feed cost per cwt. On a ration running roughly 55 lb of corn silage equivalent per cow per day across 500 cows, that spread adds up faster than most herds want to admit. And when fertilizer prices spike, the gap between your growing cost and your opportunity cost can widen — or your growing cost itself climbs toward that market price, erasing the discount you thought you had.

Corn budgets from land‑grant economists across the Corn Belt consistently show fertilizer as the single biggest line item in production costs, often topping $200/acre for N‑P‑K when nitrogen prices spike. Iowa and Minnesota extension economists are blunt: when key inputs run higher, the cost per bushel of own‑grown corn rises, whether you sell that corn or feed it yourself.

If you don’t price home‑grown corn at its true opportunity cost, your checkbook might say the dairy is breaking even — but your crop enterprise is quietly subsidizing the cows. In 2026, with fertilizer linked directly to Hormuz risk and global trade, pretending home‑grown corn is insulated from that world is more wishful thinking than risk management.

What Does a $1.00/cwt Feed Shock Really Cost a 500‑Cow Herd?

USDA’s February 2026 Livestock, Dairy, and Poultry Outlook pegs the U.S. all‑milk price forecast at $18.95/cwt. At the same time, USDA‑ERS cost‑of‑production data and The Bullvine’s own analysis show average full‑cost benchmarks for large U.S. herds around $19.14/cwt, with the smallest herds north of $42.70/cwt. Even before diesel and fertilizer prices are re‑priced, many dairies start 2026 structurally in the red.

For this modeled 500‑cow herd, the working assumptions look like this, based on 2025 actuals and ERS‑style cost curves:

  • 500 milking cows, averaging 80 lb/cow/day (0.8 cwt/day).
  • Annual shipments ≈ 292 cwt/cow → about 146,000 cwt/year.
  • Milk price assumption: $18.75/cwt (USDA all‑milk less a modest local basis).
  • Full‑cost baseline: $23.00/cwt (feed, labour, interest, repairs, utilities, fuel, depreciation, and unpaid family labour).

The barn math:

  • Milk revenue: 146,000 cwt × $18.75 ≈ $2,737,500/year.
  • Total full cost: 146,000 cwt × $23.00 ≈ $3,358,000/year.
  • Full‑cost shortfall: about $620,500/year.

Before any 2026 shocks, a herd built like this is already staring at roughly $620,500/year in full‑cost red ink. Equity is quietly covering the gap.

How Much Does $4.16 Diesel Actually Add?

USDA‑ERS and extension budgets typically put fuel and oil in the ballpark of $40–$60/cow/year when diesel sits closer to $3.25/gal. For this model, call it $50/cow/year at that lower level.

If the 2026 diesel average ends up at $4.15–$4.20/gal due to Hormuz disruptions and tighter inventories, that’s roughly a 28% increase in fuel costs.

Back‑of‑the‑envelope:

  • Extra fuel cost per cow: $50 × 0.28 ≈  $14/year.
  • For 500 cows: 500 × $14 ≈ $7,000/year.

Seven thousand dollars isn’t nothing. You still feel it every time you fill the tank. But set it beside a $620,000/year full‑cost gap, and it isn’t what decides if your farm is solvent in 24 months.

What Happens When Feed Runs $1.00/cwt Higher?

Feed is where the fertilizer story shows up on the ledger.

Between DMC margin reports and independent economic work, the underlying numbers suggest that many U.S. herds carried total feed costs in the $9–$12/cwt range through 2024–25, depending on ration and region. That’s where this composite herd lands.

Now layer in the fertilizer picture:

  • NOLA urea up $50–$80/st in a week, with barges trading $520–$550/st vs. roughly $470/st the prior week.
  • A large share of globally traded urea and other nutrients — estimates run around 30% — normally transits Hormuz.
  • Sulfur prices have roughly tripled compared to pre‑2022 levels, squeezing MAP/DAP and other sulfur‑dependent fertilizers.

Under that setup, it’s realistic to model total feed ending up $1.00/cwt above 2025 for this herd.

For 146,000 cwt:

  • Extra feed cost: 146,000 × $1.00 = $146,000/year.

Roll that into the full‑cost picture:

  • Effective full cost: $24.00/cwt.
  • New total cost: 146,000 cwt × $24.00 = $3,504,000/year.
  • Gap vs. $18.75 milk: ≈ $766,500/year.
ScenarioAnnual Full-Cost Gap24-Month ShortfallDriver
Baseline (No Shocks)$620,500/year$1,241,000Milk $18.75, Costs $23.00/cwt
With Fertilizer Feed Shock$766,500/year$1,533,000Feed +$1.00/cwt = $146K/year extra
Feed Shock Alone (Incremental)+$146,000/year+$292,000Urea, sulfur, opportunity cost
Diesel Increase (Context)+$7,000/year+$14,000$4.16/gal, 28% above baseline

Stretch it over two years:

  • Without the feed shock, roughly $1.24 million in modeled full‑cost shortfall over 24 months.
  • With the feed shock: roughly $1.53 million over 24 months.

That ~$290,000 difference over two years comes mostly from the fertilizer‑driven feed hit. And the feed shock itself — $146,000/year — is more than 20 times the modeled diesel increase on this herd.

On a cash‑cost basis — just bills paid — you might convince yourself you’re roughly breaking even at $19.00 milk. But once you include economic costs like depreciation, unpaid family labour, and realistic opportunity cost on home‑grown feed, this model says you’re still effectively short about $4.00/cwt. That’s how family equity quietly disappears over a 24‑month run — not in one crash, but in a slow bleed.

Picture three bars side‑by‑side:

  • Diesel at $4.16/gal adds about $7,000/year.
  • $1.00/cwt feed shock adds about $146,000/year.
  • The existing full‑cost gap is about $620,500/year — climbing to $766,500/year with the feed hit, and roughly $1.53 million over two years.

On that chart, the diesel bar barely clears the x‑axis.

The Turn: When Fuel Complaints Become Margin Decisions

Once that 24‑month picture is on the table, the lender conversation shifts — fast. Suddenly, the questions aren’t about fuel surcharges anymore.

The pattern playing out in lender offices across Iowa and Wisconsin this winter looks something like this: a producer walks in focused on $4‑plus diesel and shop bills, and by the time the 24‑month model is on screen, the conversation has shifted to feed cost per cwt, DSCR, and working capital per cow.

In those meetings, the math usually walks through three simple lines:

  • USDA’s $18.95/cwt 2026 all‑milk forecast as the revenue anchor.
  • The herd’s own 2025 full‑cost per cwt is in the $23–$24 range as the base.
  • $0.50–$1.00/cwt feed increase tied to fertilizer and acreage shifts if input prices stay elevated.

Seeing a mid‑six‑figure negative full‑cost margin per year in black and white changes priorities. Diesel stops being the complaint and becomes a line item inside a larger margin plan. The discussion moves from arguing over fuel surcharges to “What are my coverage options on milk and feed?” and “What happens to my DSCR if I don’t move?”

The contrarian takeaway is blunt: in 2026, building your risk plan around diesel alone is a distraction. The combination of sub‑$19/cwt milk, ERS full‑cost benchmarks, and a very realistic $1.00/cwt increase in feed costs is where the survival decision sits.

30/90/365‑Day Playbook for Fertilizer‑Driven Feed Risk

Once you accept a 24‑month picture like this one, the diesel surcharge argument stops mattering. What matters is the timeline.

Next 30 Days: Put the Risk on Paper

1. Run a 24‑Month Fertilizer‑Shock Scenario

Use your actual numbers, not somebody’s averages:

  • Start from 2025 milk shipped and full costs from your own books.
  • For 2026–27, plug in:
    • All‑milk near $18.95/cwt, adjusted for your basis.
    • Total feed at 2025 feed/cwt + $1.00.
    • Non‑feed costs are flat unless you already know they’re moving (labour raises, interest resets, major repairs).

If that model shows a six‑figure annual full‑cost gap, the exact dollar amount matters less than the direction: if nothing changes, equity is doing the work.

2. Ask Your Nutritionist for Two “What‑If” Rations

Skip the small talk. Give them scenarios:

  • Scenario A: corn $0.50/bu higher than your current purchase or opportunity cost; realistic protein prices.
  • Scenario B: corn $1.00/bu higher, similar protein assumptions.

For each, ask for the updated feed cost per cwt and expected milk and components under your conditions. You’re not trying to guess the market. You’re trying to know your Plan B and Plan C before you’re forced into them.

3. Audit Your Fertilizer Exposure with Your Retailer

Sit down and actually map it:

  • Tons of N, P, and K have already been purchased for 2026, and at what prices?
  • Remaining tons still open while NOLA urea and related products trade higher on Hormuz news.
  • Any signals of no bid, allocation, or tonnage caps on nitrogen, phosphate, or sulfur‑linked products from their suppliers.

For a herd like this one, that audit often surfaces an uncomfortable number: a sizable chunk of planned nitrogen for 2026 corn acres still unpriced — one of the key drivers behind the modeled $1.00/cwt feed risk.

4. Write This Number on the Whiteboard

What percentage of your 2026 milk and feed is actually priced or protected today? Write it down next to your current DSCR. If both answers make you uncomfortable, that’s the signal to act on the next two sections — not wait for better numbers.

Next 90 Days: Move from Drift to Defined Trip Wires

5. Put Numeric Trip Wires on the Wall — and Share Them with Your Lender

Exact thresholds vary by lender and operation, but these bands are consistent with how many Midwest ag banks think about DSCR and working‑capital risk:

MetricHealthy (Green)Warning (Yellow)Critical (Red)
DSCR> 1.25×1.0× – 1.25×< 1.0×
Working capital/cow> $600/cow$400 – $600/cow< $300/cow
Feed cost vs 2025Baseline+$0.50/cwt (3 months)+$1.00/cwt (3 months)

The key is for you and your lender to react to the same signals, rather than for them to quietly watch your ratios slip from the other side of the desk.

6. Pair Milk‑Side Tools with Feed‑Side Coverage

Dairy Margin Coverage (DMC) still has a role, but it only protects income over feed and doesn’t touch the sharp rise in non‑feed costs since 2021 — often 15–25% higher once you factor in labour, interest, repairs, and utilities on many herds.

The matched approach that pencils best for a herd in this position:

  • On the milk side, use Dairy Revenue Protection (DRP) and/or forward contracts to put floors under a portion of projected 2026 milk, on top of DMC where it still pencils.
  • On the feed side, layer in cash contracts, HTAs, or options to cover 50–70% of expected corn and protein usage at levels that still work in the 24‑month model.

You give up some upside. In return, you reduce the chance that low milk and high feed hit at the same time and shove your DSCR under 1.0× for multiple quarters.

7. Use Strong Cull Cow Prices as a Strategic Lever

USDA and market reports show record‑high average cull cow prices in 2024, with national averages near $127/cwt, and outlooks suggest 2025 stays historically strong with tight U.S. beef supplies.

In a herd running this model, the logical cull protocol looks like this:

  • Identify the bottom 5–10% of cows by margin — factoring in reproduction, components, health, and feed efficiency, not just volume.
  • Compare the economics of feeding those cows another year at higher feed costs versus shipping them into today’s beef market.
  • Look at how many stalls would be better filled by more profitable cows or left open in a high‑feed‑cost environment.

Fewer cwt shipped in the short term vs. potentially stronger cash flow per stall when feed is expensive. That’s the trade‑off.

Next 365 Days: Decide Whether You’re Scaling, Surviving, or Exiting

If the Iran conflict, Hormuz closure, and tight fertilizer supplies stretch through the 2026 planting and harvest windows, this isn’t just a rough patch. It’s the operating environment for at least one full feed year.

At some point in the next year, most mid‑size herds will be pushed into one of three lanes:

  • Scaler: You see a credible path to lower cost per cwt by growing more cows per worker, better use of parlours and barns, and stronger purchasing power. This demands capital, management depth, and a lender willing to back it. You gain lower unit costs if it works; you give up flexibility and increase exposure if markets turn faster than you can adapt.
  • Survivor: You aim to hold the current scale but treat DSCR, working capital per cow, and feed cost per cwt as non‑negotiable dashboard metrics. That means consistent use of DMC/DRP and feed coverage so you’re managing margins, not just prices.
  • Strategic Exit: You recognize that with $18.95/cwt milk and $23–$24/cwt full costs, your current structure may not carry the risk you’re facing. You use still‑strong land values, elevated cull and replacement prices, and, if necessary, restructuring tools to exit or reshape the business on your own timeline instead of waiting for the bank to decide.

Brownfield and Iowa State survey work describe remarkably resilient Iowa and Corn Belt farmland values into 2024 and 2025, with high‑dollar sales continuing and roughly 80–84% of Iowa farmland reported as debt‑free in recent data. For operations under real margin strain, that resilience is a capital‑preservation lifeline.

If you act before you’ve burned through working capital, strong land values can function as a strategic exit ramp — letting you pay down debt, reposition, or walk away with balance‑sheet strength intact, rather than waiting until the bank is making the decisions for you.

The point isn’t which lane is “right.” It’s that pretending those choices aren’t on the table is the riskiest move of all.

What This Means for Your Operation

  • If your rolling 3‑month feed cost per cwt is already $0.50–$1.00 above your 2025 average, you’re absorbing a fertilizer‑driven feed shock that can add roughly $70,000–$150,000/year to a 500‑cow herd.That’s the scale of risk this article is working with — not just a few cents on diesel.
  • If your 24‑month cash‑flow at roughly $18.95/cwt milk and $23–$24/cwt full costs shows a six‑figure annual gap, you’re effectively financing operations with equity unless you change something. That’s when you have to decide: to scale, to survive, or to exit strategically.
  • If your lender can’t hand you your current DSCR and working capital per cow, you’re making risk calls with less information than they have. Ask for those metrics and agree on trip wires that trigger specific actions — not “we’ll see what happens.”
  • If your risk work focuses only on milk price and leaves feed completely open, you’re betting that fertilizer, corn, and protein behave. The 2026 fertilizer and Hormuz situation suggests that’s not a bet to leave unhedged.
  • If you haven’t given your nutritionist and fertilizer supplier concrete “what if” scenarios to model, your next 30‑day move is simple: book those meetings and come out with backup rations, clear feed‑cost numbers, and a map of how much 2026 fertilizer is already priced.
  • If you’re in the bottom DSCR or working‑capital bands and still planning business as usual, you’re letting the market decide when you hit the wall. Choose your lane while beef, land values, and buyer demand still work in your favour.

Key Takeaways

  • If your total feed cost per cwt ends up more than $1.00 above your 2025 baseline, then on a 500‑cow herd shipping ~146,000 cwt/year, you’re looking at roughly $146,000/year in extra feed cost — a 20× issue compared to the diesel increase in this model.
  • If your full‑cost model at around $18.95/cwt milk and $23–$24/cwt costs stays negative for two years, the real decision isn’t whether you can “tough it out” — it’s whether to scale, survive with tight trip wires, or pursue a strategic exit while asset values still work for you.
  • If you don’t run a 24‑month fertilizer‑shock scenario and set DSCR, working‑capital, and feed‑cost trip wires in the next 30 days, you’re letting the fertilizer and feed markets decide how much equity you burn.

The Bottom Line

The 500‑cow Iowa herd in this article isn’t your farm. But its math looks uncomfortably close to what USDA and ERS numbers imply for a lot of real herds in 2026. Diesel is still going to sting every time you fill the tank. The real question is whether your feed and fertilizer lines are quietly doing far more damage over the next two years.

Pull your 2025 feed cost per cwt, your latest DSCR, and your working capital per cow. Layer in a $1.00/cwt feed increase on a 24‑month projection. What do your own numbers say — and do your current contracts protect you if that’s the path you’re on?

Complete references and supporting documentation are available upon request by contacting the editorial team at editor@thebullvine.com.

Learn More

The Sunday Read Dairy Professionals Don’t Skip.

Every week, thousands of producers, breeders, and industry insiders open Bullvine Weekly for genetics insights, market shifts, and profit strategies they won’t find anywhere else. One email. Five minutes. Smarter decisions all week.
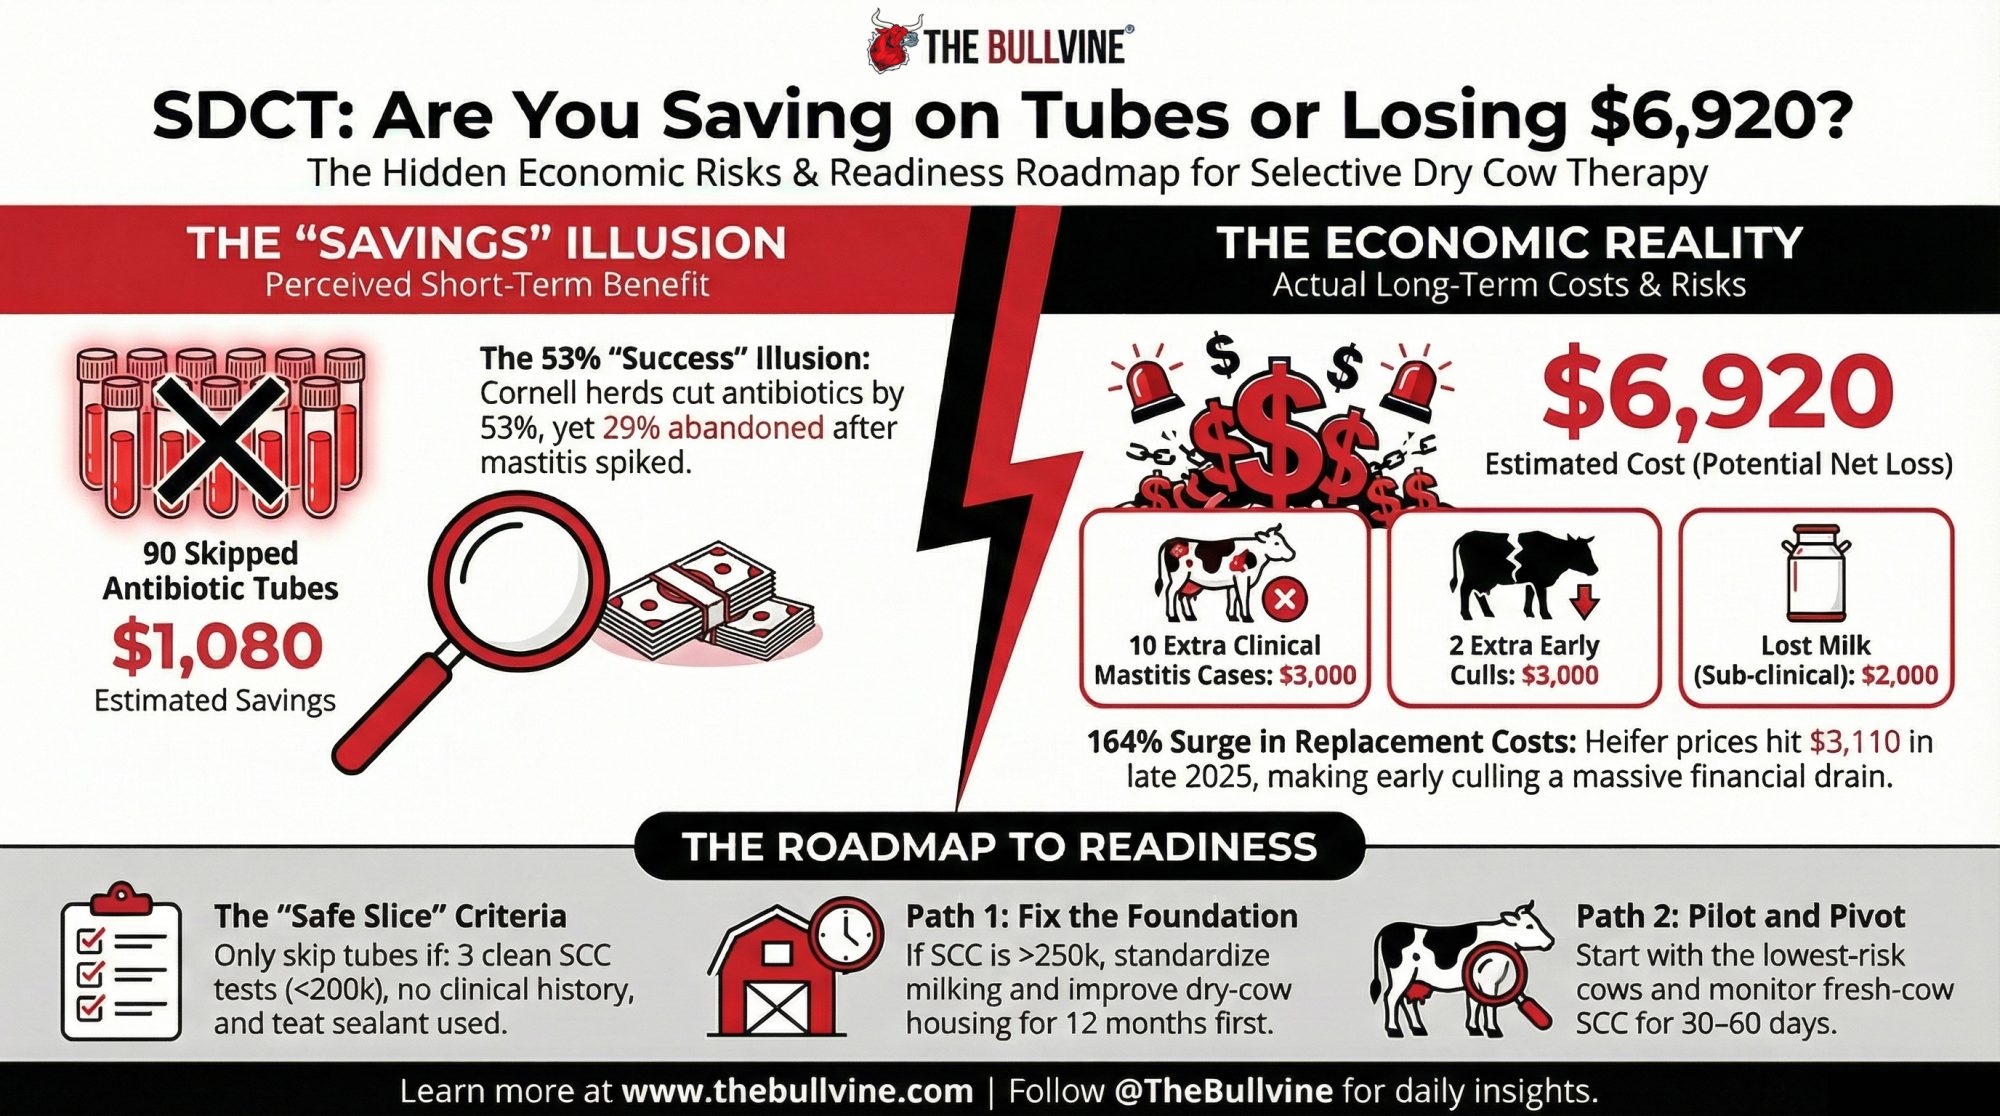
NewsSubscribe
First
Last
Consent

Overton’s 85-Herd Beef-on-Dairy Study: Why a 79% Heifer Completion Rate Limits Beef to About One-Third of Your Pregnancies

Overton’s 85-herd study found a 79% heifer completion rate. That math says most herds can only afford about one-third of pregnancies as beef-on-dairy.

Executive Summary: Beef-on-dairy has been a bright spot on many milk cheques, but new numbers show plenty of herds are quietly overbreeding to beef and starving their future heifer supply. In an 85-herd dataset presented at the 2026 High Plains Dairy Conference, Mike Overton found an average 79% heifer completion rate from liveborn heifer calf to first calving, not the 90% many breeding plans assume. Layer that on top of CoBank’s forecast that U.S. dairy heifer inventories will shrink by roughly 800,000 head before rebounding in 2027, and the room for error on replacement planning almost disappears. For a typical 500-cow herd using sexed and conventional semen, realistic math often limits beef-on-dairy to about one-third of pregnancies if the goal is to avoid buying springers back at record prices instead of producing them at home. This article walks you through that “Overton reality check” step by step, then shows how to audit breeding cards for parlor drift, tighten tier-based breeding rules, and reverse-engineer your beef sire lineup from your buyer’s cheque using tools like $AxH and HOLSim. It finishes with a 30-day beef-audit checklist and annual replacement-pipeline review so you can keep beef-on-dairy as a profit center without blowing a hole in your 2028 milking string.

Heifer Completion Rate

The breeding cards were supposed to confirm the plan.

A herd manager spread a week’s worth of cards across the office table, grabbed a red marker, and circled every beef mating. It didn’t take long before everyone in the room could see it: beef semen on cows that weren’t truly bottom‑third genetics, chronic mastitis cows bred again instead of marked DNB, and a lot more red circles than the “about 25% beef” the farm thought it was running.

That gap between the breeding plan in your head and the breeding cards in your hand is exactly where this story sits. In 2025–26, with heifer numbers tight and beef‑on‑dairy still hot, getting that gap wrong isn’t a rounding error — it’s a replacement pipeline problem waiting to surface right when you least want to be buying springers.

The 21% Leak: Why Your Heifer Pipeline Is Thirstier Than You Think

Veterinarian and dairy economist Mike Overton went looking for hard numbers on replacement risk when he analyzed data from 85 commercial U.S. herds and presented it at the High Plains Dairy Conference in Amarillo, Texas, on March 3–4, 2026.

Across those herds, the average heifer completion rate from liveborn heifer calf to first calving was about 79%, with most herds landing between 74 and 84%. Just over one in five heifer calves never make it into the milking string. Some are lost at, or shortly after birth, some in the calf and grow‑out phases, some to disease or injury, and some are culled before they ever freshen.

Overton’s point to the HPDC crowd was blunt: a lot of operations are still planning their replacement needs as if nearly every heifer calf eventually freshens. His datasets say those assumptions are quietly loading risk into every decision about sexed semen usage, beef‑on‑dairy percentage, and whether a herd will be forced to compete in a record‑high springer market a couple of years down the road.

The national backdrop doesn’t leave much margin for error. USDA’s January 1, 2025, cattle estimates put dairy heifers 500 pounds and over at 3.914 million head, the lowest count in that category since 1978. CoBank’s August 2025 Knowledge Exchange report projected dairy heifer inventories would shrink by roughly 800,000 head over the following two years before beginning to rebound in 2027, with heifer prices already at record highs and potentially moving well beyond ,000 per head in some markets as supply tightens. When $3,000‑plus springers are the new normal, pretending your herd runs at 90% heifer completion when the real number is closer to 79% is an expensive fantasy.

Parlor Drift: Is Your 4:00 a.m. Tech Killing Your Genetic Progress?

On paper, the breeding strategy in a lot of progressive herds already sounds sharp.

The binder in the office usually says something like: the top genomic tier and key cow families get sexed dairy semen; the middle third get conventional dairy; the true bottom third get beef from carefully chosen Angus or SimAngus sires; and obvious problem cows are DNB. That’s the clean terminal‑program diagram you walk through with your vet, nutritionist, and semen rep.

The decision about which straw goes in which cow doesn’t happen on that whiteboard, though. It happens at 4 a.m. in the parlor.

If today’s list says “breed these 14 cows” without telling the tech who gets sexed, who gets conventional, who gets beef, and who shouldn’t be bred at all, the plan starts to leak:

  • A high‑genomic heifer that missed first service on sexed gets conventional “just this once” so she’s not open again.
  • A third‑lactation cow, the crew is sick of treating, gets beef because she was open again, not because she’s truly bottom‑tier genetically.
  • A lame, stale cow that should be hard DNB gets a straw anyway because she’s already in the headlocks and the tank is right there.
  • A cow flagged for beef on the list gets conventional dairy because the tech grabbed the wrong tank canister, and nobody caught it until reconciliation — if reconciliation happens at all.

None of those calls look crazy in isolation. Stack them up over 52 weeks, and it’s easy for a beef target in the mid‑20s to creep into the low‑ or mid‑30s without anyone ever sitting down and saying, “Let’s change the plan.” Until someone reconciles pregnancies by semen type against the replacement math, that drift stays invisible.

If you haven’t done it recently, a simple 20‑minute “beef audit” on your breeding cards is eye‑opening. Grab a recent week, highlight every beef mating, and cross‑check those cows against your genomic or index‑based tier list and DNB list. When more than a handful of beef straws are landing on cows that aren’t truly bottom‑tier, the day‑to‑day realities in the parlor are quietly pulling the program off the plan.

The 500-Cow “Overton Reality Check.”

Overton’s 79% completion figure isn’t just an interesting stat to quote at meetings. It’s the anchor for a simple backward pipeline calculation you can run on your own herd to find your real beef‑on‑dairy ceiling.

Here’s how a hypothetical 500‑cow herd looks when you put the math side by side with typical planning assumptions:

MetricYour Value (Est.)The “Overton” Reality Check
Herd Size500500
Replacement Rate35% (what you’d like)37% (what many herds actually run)
Heifers Needed175185 (+15 buffer = 200)
Completion Rate90% (goal in your head)79% (85‑herd actual)
Heifer Calves Needed194253
Beef Ceiling~50% of pregnancies (on paper)~34% of pregnancies (with sexed + conventional mix)

Walking through the right‑hand column in barn‑math terms:

  • At a 37% annual cull/turnover rate, you need 185 replacements to stand still (0.37 × 500 = 185). 
  • Add a modest 3% buffer for flexibility — about 15 extra heifers — and you’re targeting 200 heifers calving in per year.
  • At a 79% heifer completion rate, those 200 heifers require roughly 253 heifer calves born alive (200 ÷ 0.79 ≈ 253).
  • If 60% of your dairy pregnancies use sexed semen (≈90% heifers) and 40% use conventional (≈50% heifers), the weighted average female fraction per dairy pregnancy is about 0.74. 
  • To get 253 heifer calves at 0.74 heifers per pregnancy, you need about 342 dairy‑sired pregnancies per year(253 ÷ 0.74 ≈ 342).

Total pregnancies per year in a 500‑cow herd vary with the reproduction program, but for illustration, say you generate around 520 pregnancies annually. In that scenario:

  • 520 total pregnancies − 342 dairy‑sired pregnancies needed = 178 pregnancies available for beef.
  • 178 ÷ 520 ≈ 34% of pregnancies.

That 34% isn’t a magic industry standard. It’s the ceiling in this particular example with these assumptions. If your actual completion rate is lower than 79%, your safe beef ceiling drops. Dial back sexed semen usage — or see weaker conception on sexed — and it drops again. Want more than a 3% heifer surplus to sell into a strong replacement market? It drops further still.

Overton showed how the math scales on a larger herd in that same HPDC talk. In one 2,500‑cow scenario from his presentation, he modeled using sexed dairy semen versus beef semen on the final 100 pregnancies. Once he included three‑year replacement costs, his model showed the sexed semen strategy generating about $216,000 more net value than the beef‑semen strategy on those same 100 pregnancies. Most of that difference came from not having to buy high‑priced springers into a market where $3,000‑plus per head isn’t rare.

The calf cheque from beef is visible right away. The springer cheque is delayed and much less fun to write. The arithmetic doesn’t care which one feels better.

DecisionBeef-on-Dairy PregnancySexed Dairy PregnancyDifference
Immediate Calf Value+$1,200 (beef calf)+$750 (dairy heifer calf)+$450 to beef
Heifer Raised01 @ $1,700 raising cost-$1,700 to beef
Springer Purchased Later-$3,200$0-$3,200 to beef
Net Present Value-$2,000+$850-$2,850 net loss for beef

Are You Breeding for the Bull Book or the Buyer’s Cheque?

Once you’ve got a handle on how many pregnancies you can safely point at beef‑on‑dairy, the next question is uncomfortable and simple: are you picking beef bulls for your buyer, or for your semen catalog?

Plenty of herds still select beef semen on a mostly dairy‑centric checklist — calving ease, conception rate, semen price, and maybe coat color — instead of starting with the traits their calf buyer actually pays for. Meanwhile, calf buyers and feedlots are looking at a different checklist: calves that grow, hang a decent carcass, and are consistent enough they don’t need a spreadsheet to figure out what they’re feeding.

Extension and university work — including Kansas State’s analysis of Holstein and beef‑dairy cross calves in video auctions — shows that well‑bred beef‑on‑dairy calves often sell above straight Holstein steers on a per‑hundredweight basis, narrowing the gap to native‑beef calves in many sales. Generic black‑hided calves that still feed and hang like Holsteins don’t earn those premiums consistently.

Instead of guessing, start that conversation at the other end of the chain. Ask your buyer:

  • What breed or breed type do you actually want on these calves — straight Angus, or are SimAngus/HOLSim crosses on the table if they’re black and muscled?
  • Do you need predominantly black‑hided calves for your program?
  • Are you insisting on polled calves?
  • At what weight do you buy — day‑old, 250 pounds, 500 pounds, or heavier?
  • Are you paying primarily on live weight, or is there carcass/grid feedback that matters?

Those answers translate directly into trait priorities on the sire side: growth and feed efficiency to hit target weights, muscling and ribeye area to avoid “dairy‑type” carcasses, marbling to hit Choice or better, moderate frame consistently, and the calving ease you need on Holstein or Jersey dams. Color and horn status become hard filters, not catalog fluff.

On the genetics side, two indexes do a lot of heavy lifting:

  • The Angus $AxH index was developed specifically for Angus sires used on Holstein dams. It blends calving ease, growth, muscling, and marbling while penalizing excessive yearling height — directly addressing the carcass‑length and cut‑size issues common in straight Holstein steers. In one Angus Genetics Inc. summary from 2022, just 15 of 9,690 sires ranked over 150 on $AxH, which tells you how small the truly elite slice was at that point. 
  • The HOLSim program, a joint effort between Holstein Association USA and the American Simmental Association, launched in 2019 and designates SimAngus bulls that are homozygous black and homozygous polled and exceed a Holstein‑specific terminal index threshold, balancing calving ease and carcass traits. Eligible bulls must be SimAngus with a breed composition of 3/8 to 3/4 Simmental, with the balance Angus. 

Beef semen used in dairy herds has often been cheaper on average than top‑end terminal options, as Dairy Herd and Progressive Dairy have both noted. The real question isn’t whether you can save a few dollars per straw. It’s whether the sires you’re using actually work for the person writing the cheque.

For many 200‑ to 1,000‑cow herds, the practical move isn’t a 20‑bull lineup. It’s a small, consistent group — often three to five sires — that rank well on $AxH or HOLSim and match your buyer’s spec sheet. And then the discipline to stick with them. No off‑list bulls go in the tank “just this once.” No “cleaning out the tank” by throwing calves into the pipeline, your buyer didn’t ask for.

  • Don’t just take the cheque; demand the data. Ask for carcass or grid information back from your buyer, where possible. If your high‑index beef‑crosses aren’t consistently grading Choice or Prime, you’re giving away leverage on next year’s price discussion — and you won’t know it until you ask. 

📖 Recommended Reading:
Overton’s heifer inventory deep‑dive — “A new perspective on right-sizing your heifer inventory.”

Can You Get the Beef-on-Dairy Benefit Without Fancy Tech?

A lot of the breeding‑strategy case studies making the rounds right now feature fully integrated setups: automated sort gates, activity monitors feeding into DairyComp or BoviSync, cow‑level breeding reports, semen assignment protocols. If you’re there already, great.

Plenty of 200‑ to 800‑cow herds aren’t there yet. And they’re not going to install a six‑figure tech stack to straighten out beef usage.

You don’t need another app to remove most of the slop from your program. You do need a clear, written plan, a slightly smarter breeding sheet, and a ruthless 20 minutes once a week.

The minimum viable system looks something like this:

  • Write a one‑page breeding policy and hang it where cows actually get bred. Define top, middle, and bottom tiers using your genomic or index ranking. In one line per tier, spell out which semen types are allowed on which services. Then list your DNB criteria in plain language — chronic mastitis, chronic lameness, multiple failed services, stale lactation, whatever fits your herd.
  • Print a color‑coded cow list out of your genomic file or herd software. Sort by your chosen index (NM, or a custom ranking), then tag green for top, yellow for middle, red for bottom. Put a dot or symbol next to the cows you already know should be DNB. Keep that list beside the breeding cards, not in the office drawer.
  • Add one column to your breeding card or work list: “Tier + Allowed Semen.” When the tech goes to breed cow 4123, they don’t just see an ID. They see “green — sexed only” or “red — beef only.” If “Angus” gets written next to a green cow, that mismatch is easy to spot on Friday.
  • Block 20 minutes once a week for a three‑count audit:
    • Count how many beef straws went to green or yellow cows instead of red.
    • Count how many services were sexed, conventional, and beef — and compare that mix to the replacement plan you just ran with your own numbers.
    • Count how many cows marked as DNB on your list still got bred.

You won’t get a slick dashboard out of this. You will get a clear yes‑or‑no answer to a hard question: is your beef‑on‑dairy program being driven by your genetic and replacement plan, or by whoever happened to be standing in the parlor with an AI gun at 4 a.m.?

What This Means for Your Operation

Think of this as a set of reality checks, not a recap:

  • Within 30 days, run the breeding‑card beef audit. Pick a recent week, highlight every beef mating, and cross‑check each cow against your genomic tier list and DNB list. If more than a third of your beef straws are landing on cows that aren’t truly bottom‑tier, it’s a sign the day‑to‑day realities in the parlor are quietly pulling the program off the plan.
  • Calculate your own heifer completion rate instead of guessing. Take a recent calf crop, divide the number of heifers that actually calved in by the number of live heifer calves born in that group. If you’re near Overton’s ~79% average — or below — your safe beef‑on‑dairy percentage is tighter than it looks in your winter planning meeting. 
  • Run the backward pipeline math once a year. Start with herd size and actual replacement rate, add a small buffer, then work back through your real completion rate and sexed/conventional mix to find how many dairy pregnancies you need. Whatever’s left is your genuine beef ceiling. If your current beef percentage is higher than that, you’re pre‑loading a replacement deficit.
  • Sit down with your calf buyer or integrator before your next semen order and get their specs in writing: breed, color, horn status, target weight, and how they pay. Build your beef sire list backward from that conversation using $AxH or HOLSim bulls that fit, instead of forward from whichever bull picture looks best in the catalog. 
  • Make the breeding sheet match your plan. If you’re asking staff to remember which cows get what semen type in their heads, you’re almost guaranteeing drift. The moment you write “green — sexed only” and “red — beef only” on the card, you’ve given people a fair chance to hit the target.
  • Watch the opportunity cost, not just the calf cheque. In a market where replacement heifers can sell well above $3,000 per head, that extra $150–$200 on a beef‑cross calf can disappear fast if you later have to buy a heifer to replace the one you didn’t create. The gap is on the order of a couple of thousand dollars, not a rounding error. 

Key Takeaways

  • If you don’t know your own heifer completion rate, you’re guessing about how much beef‑on‑dairy your herd can afford — and Overton’s 85‑herd dataset suggests those guesses are often 10 points too optimistic. 
  • If your breeding cards and your genomic tier list don’t line up on where beef semen is actually going, you’ve got more of a beef‑on‑dairy storyline than a fully enforced strategy.
  • If your beef sire lineup came from the bull book forward instead of from the buyer’s cheque backward, you’re likely leaving premiums on the table — especially if you aren’t tracking whether those calves are actually grading Choice or Prime once they reach the packer. 
  • If you can’t explain — in one hallway conversation — how many dairy pregnancies you need each year to protect your replacement pipeline, it’s a sign you don’t yet have full control over how beef‑on‑dairy fits into your herd.

The Bottom Line

The heifer shortage isn’t going to disappear this year or next. Beef‑on‑dairy isn’t going away either. On Monday morning, before you do anything else with the next semen delivery, grab last week’s breeding cards, a highlighter, and your genomic list — and find out whether your beef‑on‑dairy program is protecting your 2028 milking string or just making it more expensive to buy back later.

Complete references and supporting documentation are available upon request by contacting the editorial team at editor@thebullvine.com.

Learn More

The Sunday Read Dairy Professionals Don’t Skip.

Every week, thousands of producers, breeders, and industry insiders open Bullvine Weekly for genetics insights, market shifts, and profit strategies they won’t find anywhere else. One email. Five minutes. Smarter decisions all week.

NewsSubscribe
First
Last
Consent

The Great Milk Divorce: The $383,000 IOFC Gap Splitting 500‑Cow Midwest Herds Into Upstairs and Downstairs Milk

On a 500-cow Midwest dairy, FMMO and UPF rules can turn the same 425 cwt/day into either solid margins or a $383,000 IOFC hole.

Executive Summary: Federal make‑allowance changes and looming UPF rules are quietly splitting processor milk into “upstairs” and “downstairs” streams, with huge IOFC consequences for 500‑cow herds. Using Illinois FBFM data, the article shows how a 500‑cow Midwest dairy shipping 425 cwt/day can see a $383,000/year swing in income over feed as feed costs rise 10–20% and processors squeeze premiums on UPF‑exposed products. Mark, a composite based on 2024 FBFM economics, sits below full‑cost breakeven at $20 milk once the June 2025 FMMO make‑allowance cuts pull about $0.85–$0.93/cwt from his milk check. Sarah, built from the same regional benchmarks, closes that gap by driving SCC under 200,000, selecting for BB kappa casein and A2/A2, and renegotiating to tie her herd to school, hospital, and clean‑label programs. The piece walks through three IOFC scenarios, a transparent $0.15/cwt “UPF hit” calculation, and the math behind SCC and protein‑variant premiums. It then lays out a 30/90/365‑day playbook so producers can diagnose whether they’re upstairs or downstairs milk today, and what it takes to move up a tier in their buyer’s supply plan.

dairy milk quality premiums

A 500‑cow Midwest operation shipping 425 cwt a day can see about a 3,000/year swing in income over feed depending on which side of the plant its milk lands on. Two forces that have hit in the last nine months are widening that gap fast.

The June 2025 FMMO make‑allowance increase pulled an estimated $337 million from producer pool revenues in its first 90 days, per AFBF economist Danny Munch’s September 2025 Market Intel analysis, with Class price reductions ranging from $0.85 to $0.93/cwt. Now, a federal UPF definition — possibly arriving in 2026, based on HHS Secretary RFK Jr.’s public statements about FDA timelines — could sort every dairy plant’s product lines into “upstairs” (clean‑label, school‑compliant, high‑protein) and “downstairs” (likely to face UPF classification under proposed frameworks, with growing regulatory and market pressure on shelf velocity and margins).

Two composite operators — call them Mark and Sarah — show how that split plays out on real milk checks, benchmarked to Illinois 2024 FBFM data. They’re composites built from regional averages, not real people. But the math is real.

Mark’s Baseline: A Good Herd on the Wrong Side of the Plant

Mark runs 500 cows. Solid management. Reasonable genetics. His milk goes to a regional plant running both institutional and retail/UPF product lines.

His 2024 cost structure comes straight from the Illinois Farm Business Farm Management Association’s annual summary (farmdoc daily, December 18, 2025, Bradley Zwilling):

  • Feed cost: $11.64/cwt
  • Non‑feed costs: $11.92/cwt (a record high)
  • Total economic cost: $23.56/cwt
  • Milk production: 23,530 lbs/cow (up 549 lbs from 2023)

The actual 2024 milk price averaged $21.63/cwt — already $1.93 below total economic cost, costing Illinois producers negative $409/cow for the year. For this analysis, we model a $20.00/cwt milk price — in line with farmdoc’s 2025 projection of approximately $20.15/cwt and USDA’s outlook for further price decreases into 2026.

At $20.00 milk against $11.64 feed cost:

  • IOFC: about $8.36/cwt
  • Daily IOFC (425 cwt): ~$3,553/day
  • Annual IOFC: ~$1.30 million/year

He’s well below full‑cost breakeven. Then the ground moved.

The FMMO make allowance hit: On June 1, 2025, USDA raised allowances for butter, cheese, whey, and nonfat dry milk. Munch at AFBF estimated the hit to Class prices at $0.85–$0.93/cwt, shifting roughly $337 million from producer pools to processors in 90 days. That money went to the plant side of the ledger — funding reformulation, equipment upgrades, and premium‑grid tightening.

The UPF policy timeline is stacking up just as fast. In July 2025, HHS, FDA, and USDA issued a formal Request for Information on UPFs. USDA school meal standards now cap added sugar in flavored milk at 10 g/8 oz by the 2026–27 school year, and IDFA’s Healthy School Milk Commitment brought average added sugar in school milks down to 7.2 g/serving by July 2025.

That’s the federal picture. At the state level, California’s AB 1264 requires identification of harmful UPFs by July 1, 2026, with phased K–12 removal running through 2035. And north of the border, Canada’s mandatory front‑of‑pack nutrition labelling went live January 1, 2026, with enforcement beginning the same date.

Mark didn’t change his cows, his feeding program, or his contract. The economics around him changed plenty.

What Does a $383,000 Dairy IOFC Gap Look Like in 2026?

Most kitchen‑table talk still treats UPF as a nutrition story or a PR problem. Run the numbers, and it’s a feed and IOFC issue.

The following scenarios are not based on any specific processor’s current or announced pricing. They model what the economics could look like if UPF‑related policy changes affect feed costs and processor pricing grids over 3–5 years.

An IIED analysis of 2016–2021 agricultural support across 72 countries plus the EU, led by principal researcher Alejandro Guarín (published May 2025), found $14.5–$42.5 billion/year in support effectively subsidizing UPF ingredients — corn, soy, wheat, sugar — while penalizing fresh fruits and vegetables by about $16.3 billion/year. IIED’s modeling suggests repurposing those supports toward fruits, vegetables, and pulses would reduce production of previously subsidized commodities in OECD countries, though the exact percentage depends on how governments redesign the programs.

For this analysis, a 10–20% increase in feed costs over 3–5 years is the stress‑test range — not a forecast. But the directional pressure is real. USDA’s May 2025 Feed Outlook flagged that protein costs, soybean meal in particular, are expected to remain firm or increase even as corn softens — creating what the report described as a “barbell economy” of feed expenses. Purdue ag economist Michael Langemeier separately flagged DDG price shifts as a factor that could push livestock feed costs higher in 2026, with estimated DDG prices ranging from $145 to $155 per ton.

Three Scenarios for Mark’s 500‑Cow Herd

ScenarioFeed/cwtMilk Price/cwtIOFC/cwtDaily IOFCAnnual IOFC
Baseline (FBFM 2024 costs, projected price)$11.64$20.00$8.36$3,553~$1.30M
+10% feed$12.80$20.00$7.20$3,060~$1.12M
+20% feed + UPF hit$13.97$19.85$5.88$2,499~$0.91M

Note: The bottom scenario uses this article’s modeled assumptions — 30% of volume exposed to UPF‑side SKUs, $0.50/cwt plant markdown on that slice. These are illustrative. Your exposure depends on your buyer’s product mix and pricing grid.

The gap between baseline and the bottom row: about $383,000/year in IOFC. Same herd. Same people. Very different economics.

Where Does the $0.15/cwt “UPF Hit” Come From?

This isn’t on anyone’s milk statement yet. It’s a calculated risk tied to what happens when the plant’s downstairs side starts losing shelf velocity.

When Chile’s mandatory warning labels and marketing restrictions took effect, purchases of “high‑in” beverages — primarily sugary drinks — fell 23.7% over 18 months (Taillie et al., PLOS Medicine, February 2020). Canada’s black‑and‑white warning symbols for high‑sugar, high‑sodium, and high‑saturated‑fat products went live in January 2026, with immediate enforcement. FDA’s proposed front‑of‑pack labels could follow.

Plants won’t eat reformulation and marketing costs on slow‑moving UPF‑flagged SKUs forever. They’ll pass more of that pressure back through the pool — lower premiums, tighter quality grids, higher marketing deductions.

If 30% of Mark’s volume feeds UPF‑exposed SKUs and the plant shaves $0.50/cwt on that slice, the effective hit across his whole pool is 0.30 × $0.50 = $0.15/cwt. New effective price: $20.00 − $0.15 = $19.85/cwt.

IOFC in the $5.88–$6.10/cwt range, while non‑feed costs sit near $11.92/cwt, is where operations start living off depreciation, open lines of credit, and lender patience.

How Are Dairy Processors Sorting Upstairs From Downstairs Milk?

The Wisconsin Cheese Makers Association, representing more than 850 companies and cooperatives across 44 states, laid this out directly in their September 22, 2025 position statement: “In practice, a cup of fortified yogurt or a protein‑packed slice of cheese could be treated as nutritionally suspect, because it required pasteurization, culture development, or added rennet to create.” NMPF filed formal comments on October 23, 2025, warning that how UPFs are ultimately defined “could affect how [dairy] products can be marketed, and whether or not they will be included in federally funded programs such as SNAP, WIC or school meals programs.” IDFA urged the FDA not to rush a definition that lumps all processing together.

That’s the public positioning. The private math is sharper.

Upstairs products — school milk meeting sugar caps, clean‑label yogurts, high‑protein UF, A2‑certified brands, hard and specialty cheeses — are politically and contractually protected. Products more likely to face UPF classification— heavily sweetened yogurts, flavored snack cups, sugary retail-flavored milks, and private‑label processed cheese — are facing growing regulatory and market pressure.

Plants now have more manufacturing margin from the make‑allowance bump to fund that upstairs transition. They’ll pay more for milk feeding the upstairs lines — and spend less to keep the downstairs pool happy.

Where plant capacity is tight, and every tanker matters, that shift hasn’t landed yet. Generic volume still has negotiating power. But plants investing in upstairs products are getting pickier about which herds earn those seats — and building the kind of buyer relationships that survive the next downturn.

Mark’s milk goes to both places. His contract doesn’t specify which.

Sarah’s Turn: What Moving Upstairs Actually Takes

Sarah farms in the same region. Similar size. She looked at the same FMMO and UPF calendar and saw a 24‑month repositioning window, not a label headache.

She asked her processor one question: When you pitch school milk or hospital yogurt, is our herd one of the names in the deck? The honest answer — good volume, but not the herd they highlight in RFPs — told her everything.

So she made three moves.

Move 1: Crush SCC and Bacteria Counts

Pulling herd SCC from the mid‑300k band under 200,000 unlocks consistent quality premiums. The Bullvine’s own reporting on processor expansion found that farms hitting spec thresholds are seeing premiums ranging from $0.50 to over $1.50/cwt, and an 85‑cow Pennsylvania operation captured $0.75/cwt through relatively simple bypass protein and consistent feed push‑ups. Even at a conservative $0.30/cwt SCC premium on 500 cows shipping 425 cwt/day, that’s 425 × $0.30 = $127.50/day, roughly $46,500/year. That’s before the extra pounds and lower treatment costs.

Move 2: Get Specific on Protein Variants

Sarah’s genetics team didn’t just target “more solids.” They targeted which solids matter for products that survive UPF scrutiny.

Kappa Casein BB: Cheese from BB cows clots around 25% faster, produces curd roughly twice as firm, and yields about 1.0–1.5 lbs more cheese per cwt — roughly 10% more — than AA cows. For a cheese plant, that’s not a nice‑to‑have. That’s money. Lactanet data (CDN document #586, August 2022) show BB is the dominant genotype in Jerseys (82.2%) and Brown Swiss (61.5%), but in Holsteins, it’s just 37.6% — meaning active selection toward BB and AB sires matters most where most milk is produced.

A2/A2 Beta‑Casein: Lonnie Holthaus at Milkhaus Dairy in Fennimore, Wisconsin, has selectively bred his Holsteins for A2/A2 — more than half the herd now produces only A2 protein milk, with products available through local grocery stores and direct‑to‑consumer channels. UW–Madison Extension notes the Holstein breed “is quickly moving to be an A2A2 only breed,” with a survey of five A.I. studs turning up over 800 A2A2 Holstein bulls — by far the most common beta‑casein combination now offered.

Lactanet’s published breeding guidance spells out the path: producers can increase BB frequency by “selecting for BB or AB sires,” and increase A2 frequency by “preferred use of A2A2 or A1A2 sires.” It’s not a complicated selection — it just has to be intentional.

New U.S. plant capacity backs the same direction. IDFA reported in October 2025 that processors have committed more than $11 billion in new and expanded manufacturing capacity across 19 states — over 50 individual building projects between 2025 and early 2028. A significant share of the capacity is for cheese and whey, positioned for what MarkNtel projects as a global whey protein market growing from .5 billion (2023) to .2 billion by 2030. UW–Madison Extension dairy economist Leonard Polzin noted that fat and protein components keep climbing “every single year” — and the new processing infrastructure is built to reward exactly that. Volume‑first herds are losing ground.

Sarah pivoted sire selection toward BB kappa casein and A2/A2 alongside health, solids, and longevity. Not a one‑month fix — it took a lactation cycle to start showing up in tank averages.

Move 3: Renegotiate Her Seat in the Supply Plan

Instead of asking for a better average price, she brought 12 months of cleaned‑up SCC, strong components, and documented A2/BB testing to the table. She pushed for program language tying her herd to specific products and 12‑month notice periods, so she wasn’t locked in if the plant doubled down on UPF‑heavy retail.

Two years from now, both herds could still be shipping 425 cwt/day. The difference sits on the milk check. Sarah carries a stable stack of quality and program premiums — consistent with The Bullvine’s reporting on processor expansion, which documented premiums of $0.50 to over $1.50/cwt for farms meeting spec thresholds, with top‑tier programs potentially reaching higher for herds that qualify on components, protein variants, and SCC simultaneously.

MetricMark (Downstairs)Sarah (Upstairs)Gap Impact
Herd Size500 cows500 cowsIdentical
Daily Volume425 cwt/day425 cwt/dayIdentical
SCC Average320,000185,000−42% SCC
Kappa Casein / A2 StatusNot testedBB & A2/A2 selectedActive selection
Processor Contract TypeGeneric pool volumeNamed in school/hospital RFPsProtected seat
Quality/Program Premiums$0.10/cwt$0.80/cwt+$0.70/cwt
Feed Cost/cwt$13.97$13.97Identical
Milk Price Received$19.85/cwt (base − UPF hit)$20.80/cwt (base + premiums)+$0.95/cwt
IOFC/cwt$5.88$6.83+$0.95/cwt
Annual IOFC~$912,000~$1,059,000
Annual IOFC Difference+$147,000/year

Mark is still letting his milk feed the downstairs pool.

Can You Move Off the Downstairs Staircase in 24 Months?

Federal UPF definitions, front‑of‑pack labels, and school standards all have dates attached. Here’s what to do with that calendar.

In the Next 30 Days

  • Pull the last 3–6 months of milk statements. What’s your average SCC? Where are protein and butterfat sitting? How much per cwt is the base vs. quality vs. program premiums?
  • Print your milk supply agreement. What’s the notice period? Does it mention specific programs — school milk, branded UF, clean‑label — or are you just generic pool volume?
  • Ask your field rep one blunt question: “When you pitch our plant’s school and clean‑label contracts, is our herd one you mention by name — or are we just filling tanks?”
  • Check your herd’s kappa casein and A2/A2 status. Individual tests run about $40/head through labs like UC Davis VGL; the full Milk Protein Panel (A2 + kappa casein + beta‑lactoglobulin) runs $93/head (UC Davis VGL pricing, October 2023). On 500 cows, that’s $20,000–$46,500 — significant upfront, but budget it against the $46,500/year SCC premium recovery alone. If you’re already running broader panels, Zoetis CLARIFIDE Plus costs roughly $43/head, including health and wellness traits.

Red flag: No quality or program premiums on your statement, no program language in your contract, and your buyer can’t link your herd to anything strategic? You’re deep in the downstairs story right now.

Green flag: Your buyer names your herd specifically in RFP submissions, your contract ties to at least one program, and you’ve got 12+ months of SCC under 200K on record? You’re upstairs. Protect that seat — keep specs high, contract language specific, and your testing documentation current.

In the Next 90 Days: Pick Your Branch

  1. Upgrade into the A‑pool where you are. Targets: SCC consistently <200,000, protein >3.15%, start genomic testing for kappa casein BB and A2/A2. You gain leverage with your current buyer, but you’ll spend more upfront on vet work, cow comfort, nutrition, and testing.
  2. Scout a processor switch. Map processors within a realistic hauling radius that are building school, hospital, “no UPF,” A2, or specialty cheese contracts. You gain alignment with a buyer who values upstairs milk. You take on hauling changes, relationship risk, and the chance that if the new buyer’s program changes specs mid‑contract, you’re rebuilding from scratch in a market where your old plant already filled your slot.
  3. Renegotiate your seat at the table. Push for a program language that ties your herd to products that must survive UPF rules. Aim for 12‑month notice periods. You keep the relationship you know, but it may be a harder conversation if your buyer isn’t under immediate pressure yet.

Opportunity signal: If your buyer is already talking about school sugar caps, UPF definitions, or “real food” wins with institutions, they’re feeling the heat. That’s when A‑team milk becomes more valuable inside their business than it looks on your statement.

Over the Next 365 Days

Build a 6–12 month run with SCC under 200,000 and documented component and protein‑variant testing. Lean hard into sires that bring BB kappa casein, A2/A2, solids, and longevity. After that, go back to your buyer with a simple ask: “Here’s our updated quality and component record. Which of your school, hospital, or clean‑label programs could we qualify for, and what premiums go with them?”

What This Means for Your Operation

  • If your IOFC is under about $7/cwt and quality/program premiums are thin on your statement, you’re in the zone this $383,000 gap describes. Run your own numbers — swap in your feed cost, your milk price, and your best guess at how much of your buyer’s volume feeds UPF‑exposed products.
  • If your buyer can name specific products and contracts your herd supports, you’re already upstairs. Don’t assume that the seat is permanent — keep your specs high and your contract language specific.
  • If your contract doesn’t mention notice periods or programs, assume you’re the shock absorber, not the protected volume. That doesn’t mean panic. It means read the fine print and decide if that’s where you want to sit in your buyer’s supply plan.
  • If you don’t know your herd’s kappa-casein or A2 status, you can’t negotiate for traits you haven’t tested for. At $40–$93/head, that’s cheap insurance relative to the premium it could unlock.

Signals to Watch

  • FDA UPF definition timeline: If a federal definition arrives in 2026, processor contract language could start shifting within 90 days of publication. We’ll be tracking processor responses and contract grid changes as they surface — this is the story to watch for the next 18 months.
  • California’s AB 1264 identification deadline (July 1, 2026): The first real test of which products get flagged and which don’t. What happens in California school districts will signal how other states and federal programs respond.
  • Your buyer’s institutional wins: Track whether your processor is growing school milk and hospital contracts. If those are growing, your leverage is growing too.

Key Takeaways

  • If your IOFC on a 500‑cow herd is drifting under ~$7/cwt, today’s FBFM‑style costs and a small UPF‑driven markdown can easily add up to a $383,000/year gap between you and a neighbour on the upstairs side of the plant.
  • The fastest upgrades into that upstairs pool are hard numbers, not slogans: SCC consistently under 200,000, protein north of ~3.15%, and a clear plan to move your herd’s genetics toward BB kappa casein and A2/A2 for cheese, school, and clean‑label programs.
  • Your most important 30‑day check isn’t on a spreadsheet; it’s one question for your field rep: “When you pitch school and clean‑label contracts, is our herd one you mention by name—or are we just filling tanks?”
  • If your contract doesn’t spell out program links and at least a 12‑month notice period, assume you’re in the cut‑first volume, not the protected pool—and build a 365‑day plan to either upgrade in place, switch buyers, or renegotiate your seat.

The Bottom Line

In the next 30 days, do one thing: calculate your real IOFC — not from memory, from your actual milk statements and feed records. Break down how much of your check is base price vs premiums. Then ask your buyer in plain language: Is our herd part of the milk you rely on for your safest contracts, or are we in the pool you can cut first?

What’s your real IOFC this month — and does your buyer know your milk by name, or just by tank number?

Complete references and supporting documentation are available upon request by contacting the editorial team at editor@thebullvine.com.

Learn More

The Sunday Read Dairy Professionals Don’t Skip.

Every week, thousands of producers, breeders, and industry insiders open Bullvine Weekly for genetics insights, market shifts, and profit strategies they won’t find anywhere else. One email. Five minutes. Smarter decisions all week.
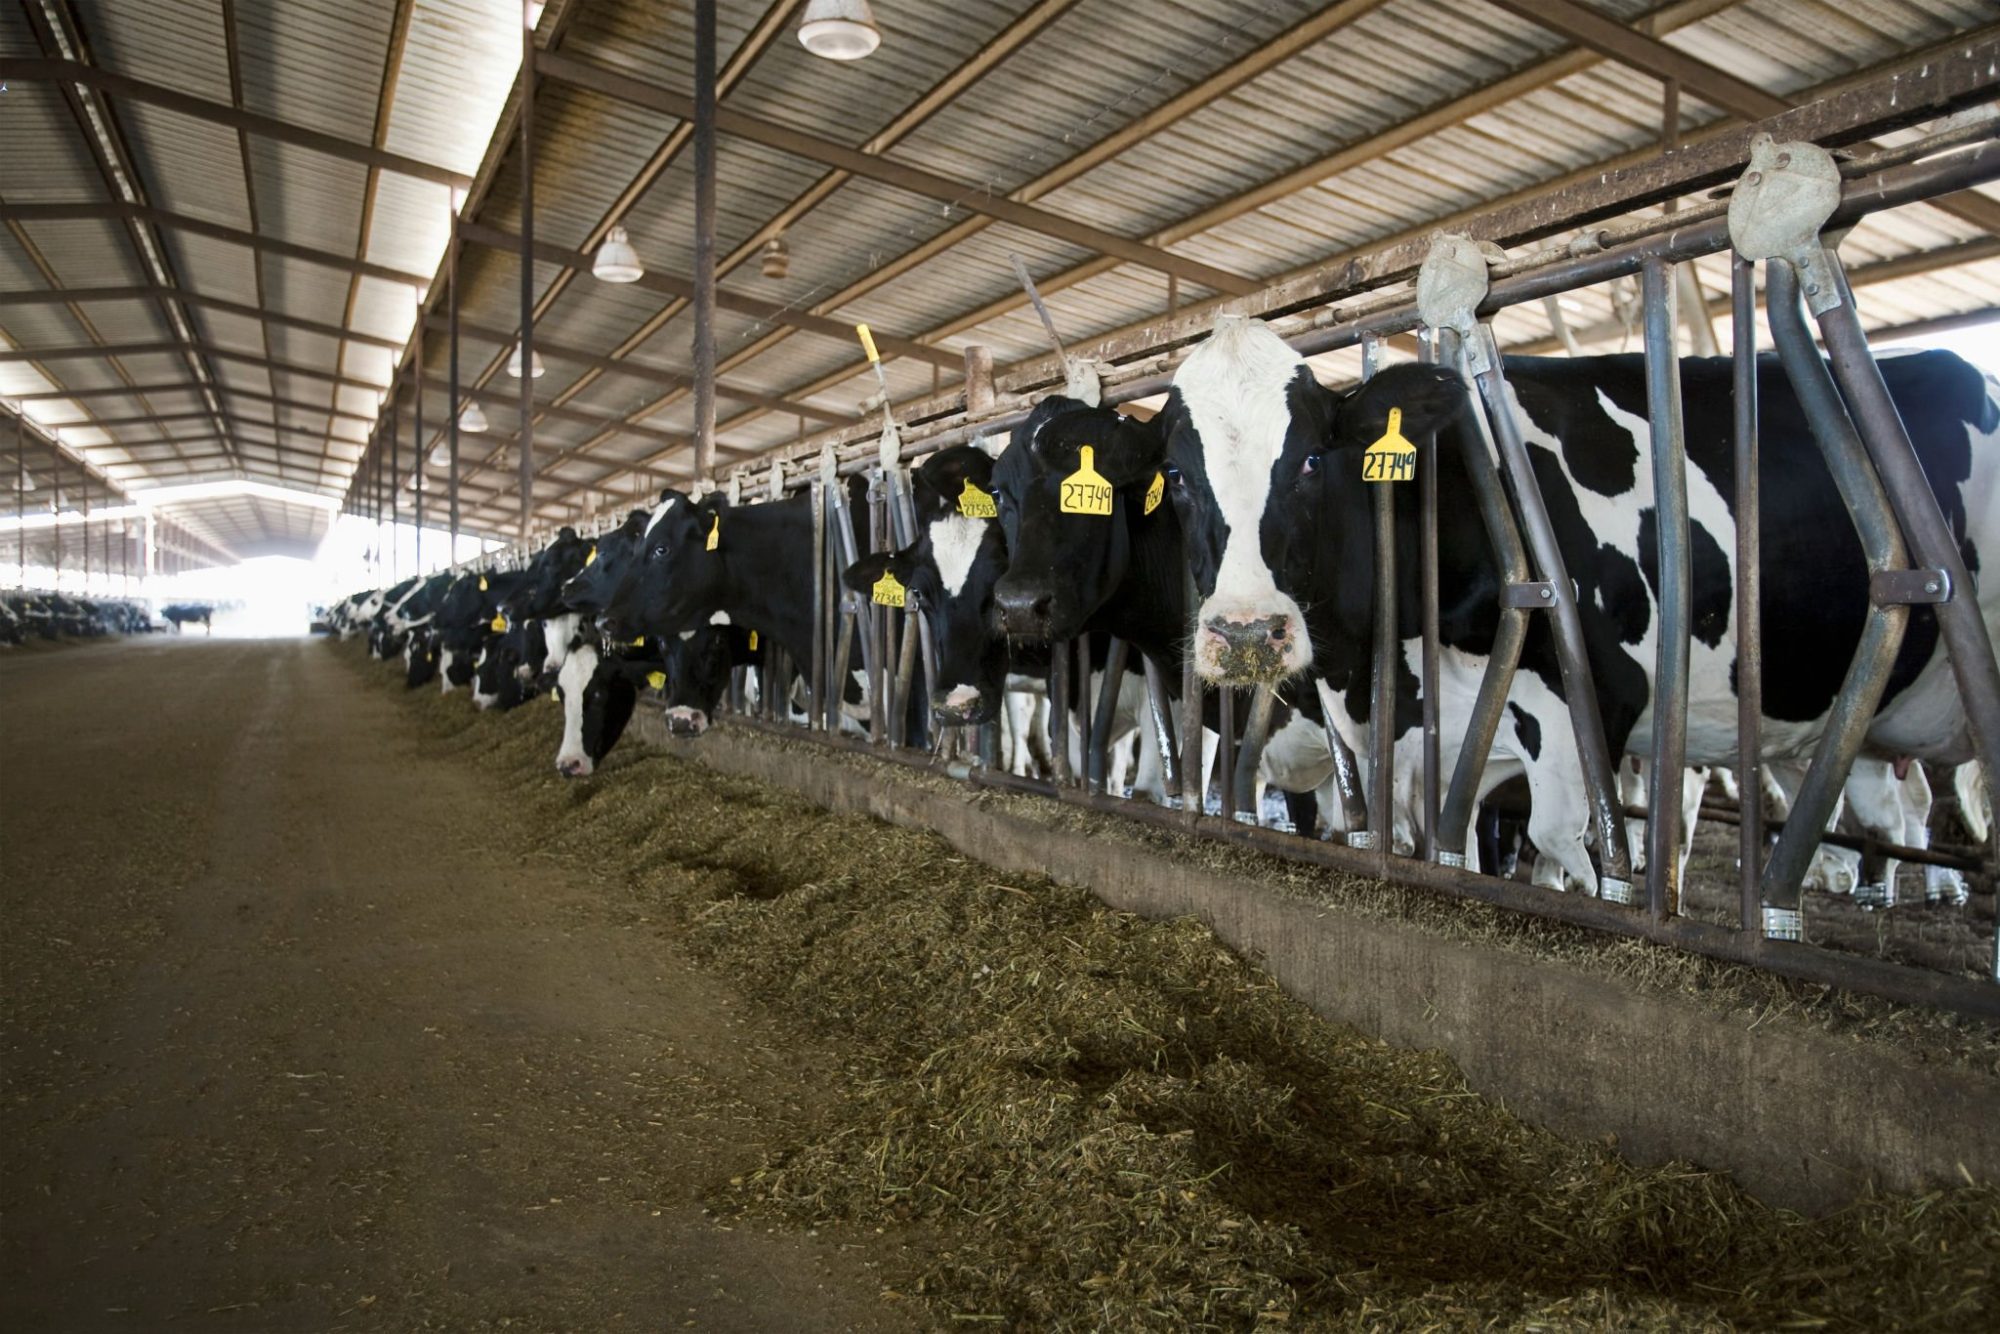
NewsSubscribe
First
Last
Consent

The $31,200 Raw Milk Trap: How a Florida Outbreak Turned One Farm’s Side Hustle Into a Bet‑the‑Farm Lawsuit

Raw milk is legal in 32 states — and still 840× more likely to make someone sick than pasteurised milk. The law may say ‘yes.’ Your insurer might already be saying ‘no.’

Executive Summary: Raw milk looks like an easy side hustle, but the Keely Farms case in Florida shows how fast it can turn into a bet‑the‑farm liability. In 2025, a raw-milk outbreak linked to Keely left 21 people sick, including six children, and led to a lawsuit from a mother who says she nearly died and lost her unborn baby. At the same time, only about 3.2% of Americans drink raw milk, yet unpasteurised dairy is linked to an estimated 96% of dairy-related illnesses and an 840× higher risk of illness than pasteurised milk. Insurers have responded by carving raw milk out of standard farm policies, dropping some producers entirely, and pushing specialty coverage that can chew through 20–30% of the typical $31,200 gross margin from a 100‑gallon‑per‑week raw-milk stream. Real-world cases — from Dog Mountain Farm’s $75,000 raw‑milk investment that lost its insurer to pediatric HUS patients with six‑figure hospital bills — show how quickly one claim can erase the upside. This article walks producers through concrete checks on policy exclusions, co‑op contracts, and cost‑of‑production math, then lays out safer ways to tap “wellness” demand through pasteurised value-add, genetics, and efficiency. The core message is simple: before you bottle a drop of raw milk, treat it like a high‑stakes business decision, not a casual side hustle.

You’re being pulled in two directions right now: the desperate need for margin and the terrifying reality of liability.

In August 2025, the Florida Department of Health identified Keely Farms Dairy in New Smyrna Beach as the likely source of raw milk linked to 21 cases of E. coli and Campylobacter — including six children under 10 and seven hospitalisations. Officials said the illnesses stretched back to January, and news coverage describes at least two patients with severe complications. One of those patients was Rachel Maddox of Seminole County, who said she contracted Campylobacter while caring for her toddler after the child drank raw milk she’d purchased from a store in Longwood, Florida. “I became very ill — and I mean the sickest I’ve ever been in my life,” Maddox told News 6 in 2025. “I came really close to dying, and our son did die.” Her 20-week fetus did not survive, and Maddox was diagnosed with sepsis.

Keely Farms labelled its products “not for human consumption” and sold them under Florida’s pet‑food exemption. According to state records and reporting, the farm held a valid animal‑feed licence with no cited compliance issues at the time. Farm manager Keely Exum said in an emailed statement that the dairy was “blindsided” by the DOH announcement: “The Department of Health has not informed Keely Farms of any investigation or administrative action.” The Farm-to-Consumer Legal Defense Fund, which assisted with the farm’s legal response, reported that the DOH never visited the farm, never collected on-farm samples, and never notified the farmer before issuing its public statement. FTCLDF’s public records requests seeking the underlying data went unanswered. The farm did not respond to phone and email messages from The Associated Press.

That legal label didn’t stop people from drinking the milk. Maddox told News 6 she’d asked about the “for consumption by animals” label at the store and was told “that was a technical requirement to sell ‘farm milk.'” She didn’t question further. State and media reports make clear that many buyers were consuming the product despite the labelling — and the label didn’t prevent Keely Farms from being named in the outbreak investigation.

Business Reality Check #1: In a courtroom, a “Pet Milk” label is often viewed as a “wink-and-nod” agreement; if a jury sees evidence that you knew (or should have known) humans were drinking the product, that label rarely acts as the liability shield producers hope it will be.

Business Reality Check #2: Keely Farms was cleared — negative lab tests, passed inspection, lawsuit dropped. The farm still spent months defending itself against national headlines triggered by a press release with no on-farm investigation. Being right doesn’t make you whole.

In August 2025, national food‑poisoning law firm Ron Simon & Associates, along with Orlando‑based Newsome Law, filed the first lawsuit in Seminole County on behalf of Maddox. Keely Family Farms filed a motion to dismiss, arguing the complaint didn’t identify facts showing contamination or describe any “root-cause investigation of illness,” and that its labelling complied with Florida Department of Agriculture requirements.

The farm’s own independent lab tests — conducted by CentralStar (PCR testing, August 8 and 15, 2025) and the Florida Department of Agriculture (culture, August 12, 2025) — came back negative for both Campylobacter and E. coli across multiple samples. The FDACS routine inspection cleared the farm. Four days after Keely filed its motion to dismiss, Maddox voluntarily dropped the case. No formal notice of violation, shutdown order, or administrative proceeding was ever initiated against the farm.

That outcome should concern raw-milk producers as much as the outbreak itself. Keely Farms was ultimately cleared — negative lab results, passed inspection, case dropped. But by that point, the farm had already endured months of national headlines, a high-profile lawsuit from a major food-poisoning firm, and the kind of reputational damage that no lab result can undo. You don’t have to lose in court for raw milk to become a bet-the-farm event. You just have to get named.

A 2025 National Agricultural Law Center update reports that 32 states allow raw‑milk sales when certain conditions are met, while 18 still ban it outright. Three states — Arkansas, Utah, and North Dakota — enacted laws updating their raw‑milk regulation in 2025 alone. As of early 2026, several more state legislatures have bills moving. You’re feeling that pressure: wellness‑minded customers asking why they can’t buy “real” milk at the farm, homesteaders paying double‑digit prices per gallon, and social feeds full of raw‑milk reels.

The premium looks real. But the “ghost” liabilities sitting behind it — in your insurance policy, your co‑op contract, your lender relationship, and your social licence to operate — can quietly swallow that $31,200 before it ever hits the bottom line.

What’s Actually Changing — and Why It Lands on Your Yard

Raw milk has shifted from fringe wellness fad to active policy and public‑health battleground. A CDC‑linked risk‑modelling study estimated that from 2009 to 2014, unpasteurised milk was consumed by about 3.2% of the U.S. population and unpasteurised cheese by 1.6%, yet an estimated 96% of illnesses from contaminated dairy products were caused by unpasteurised milk and cheese.

Per serving, consumers of unpasteurised dairy were about 840 times more likely to get sick and 45 times more likely to be hospitalised than those consuming pasteurised dairy. If the share of unpasteurised consumption doubled, outbreak‑related illnesses were projected to rise by roughly 96%.

Dairy typeShare of US population consumingShare of outbreak illnessesIllness risk per servingHospitalisation risk
Pasteurised milk & cheese~96.8% / 98.4%~4%Baseline (1×)Baseline (1×)
Unpasteurised milk & cheese3.2% / 1.6%~96%≈840× higher≈45× higher

On the consumer side, raw‑milk advocates talk about “alive” enzymes, gut health, and European “farm‑milk” allergy studies. They show beautiful jars and frothy latte shots. They rarely mention the 840× number.

Agencies are blunt. A 2012 Pennsylvania Campylobacter outbreak sickened 148 people across four states; investigators concluded that consumer avoidance of raw milk was the only way to prevent similar events. A CDC report published in July 2025 documented a Salmonella Typhimurium outbreak linked to commercially distributed raw milk that sickened people across California and four other states between September 2023 and March 2024 — one of the largest raw‑milk outbreaks in recent U.S. history.

And then there’s H5N1. In 2024, USDA confirmed that highly pathogenic avian influenza was circulating in U.S. dairy cattle, and the FDA warned consumers that the virus could be shed into raw milk from infected cows. By December 2024, the USDA ordered mandatory H5N1 testing of raw milk. A January 2026 veterinary case report documented a cat’s death linked to consuming recalled raw milk from a California dairy — the kind of headline that turns a food‑safety debate into a kitchen‑table panic.

That’s the tension you’re sitting in. Your customers see jars and “natural.” Your risk partners see 840×, Salmonella, and H5N1.

How Does the Raw‑Milk Margin Really Look on a 200‑Cow Herd?

Let’s run the barn math everybody’s whispering about but not writing down.

Say you’re milking around 200 cows, shipping roughly 75 pounds per cow per day. That’s about 15,000 pounds — roughly 1,750 gallons — leaving in the tanker every day.

Now carve out a small raw‑milk stream:

  • You bottle 100 gallons of raw milk a week.
  • Over a year, that’s 100 × 52 = 5,200 gallons.
  • If you can reliably get a $6‑per‑gallon premium over what that volume would bring in your normal cheque, you’re looking at $31,200 in extra gross revenue.

You’ve shifted about 5–7% of your annual volume into a higher‑margin channel. Real money on a 200‑cow herd. It’s also the point where you stop being “just” a supplier and start acting like a high‑risk food business in your own right.

Now layer in the risk side — and pay attention to the dates, because this isn’t new.

Back in 2014, Hoard’s Dairyman reported that more insurers were classifying raw milk as too risky to cover. That trend hasn’t softened. According to Food Safety News (October 2014), Farm Bureau–owned Rural Mutual Insurance Co. in Wisconsin sent notices in 2012 to farm policyholders stating that their coverage “does not provide for the sale and/or distribution for offsite consumption of unpasteurized (commonly called raw) milk from cows, sheep, and goats for human consumption.” Not barn‑talk gossip. A specific exclusion in black-and-white.

Published reporting documents a pattern across the industry:

  • Flat refusals to cover farms that sell raw milk for off‑farm consumption.
  • “Raw milk and raw milk products” exclusion endorsements — like the one documented by the Allegany Group — that carve those claims out of otherwise standard farm policies.
  • Broad bacteria or contaminant exclusions can be used to deny any foodborne illness claim.

Re‑insurers are watching too. Tami Griffin, deputy national director for Aon Risk Solutions’ Food Systems, Agribusiness & Beverage Group, told Food Safety News that raw‑milk sales are “definitely on the radar of insurance companies” and that “I have heard some carriers are not willing to provide coverage for those selling it.”

Dog Mountain Farm near Carnation, Washington, learned what that looks like in practice. The farm had invested $75,000 in a USDA‑certified raw goat milk dairy — and then found out its carrier was dropping raw‑milk coverage. Owner Cindy Krepky said the farm would continue its other operations — cider, apple butter, 15 varieties of apples, pears, and quince — while hunting down a carrier willing to insure the raw goat milk business. Seventy‑five thousand dollars in infrastructure, and the insurance market pulled the rug.

Specialty raw‑milk liability policies do exist. Denver broker Kendall Turner says coverage is still possible, but that “the insurance company sometimes has more rules than the state.” Producers and brokers report that meaningful raw‑milk coverage can run into the five‑figure range per year once limits, fees, and surplus‑lines taxes are added.

On that 5,200‑gallon scenario, a realistic specialty premium could chew through 20–30% of your $31,200 gross margin before you’ve bought a single cap or label.

Most specialty policies carry $1–2 million per‑occurrence limits. To understand how fast you can hit that ceiling, consider the case of five‑year‑old Maddie Powell in eastern Tennessee. In 2018, Hoard’s Dairyman reported that Maddie developed hemolytic uremic syndrome (HUS) — a potentially fatal kidney disease — after drinking raw milk linked to an E. coli outbreak. She was on dialysis within 24 hours of admission, endured six blood transfusions, two surgeries, and spent weeks in the hospital, in and out of intensive care. Her mother, Cassie Powell, told Food Safety News that medical bills topped $125,000 in just the first two weeks, with the hospital room alone running $6,000 per day. Food safety attorneys cited in the same reporting pointed to other pediatric E. coli/HUS patients whose bills reached $250,000 and over $450,000 before discharge. A 2014 Food Safety News analysis concluded that treatment of a child or senior with severe E. coli O157:H7 or Listeria complications “not uncommonly” results in direct medical costs exceeding $1 million — deciding to go without coverage “literally a bet-the-farm kind of decision.”

One severe case bumps right against your policy ceiling. And if you’re not carrying specialty coverage — and your farm policy excludes raw milk or bacteria — you’re using your land base, barns, and family equity as the backstop.

On a 200‑cow herd, one raw milk lawsuit isn’t just betting your milk cheque. It’s betting the equity your grandfather spent 40 years building.

Coverage ScenarioStandard Farm LiabilityWith Raw Milk ExclusionSpecialty Raw Milk Policy
Slip-and-fall on farm✓ Covered✓ Covered✓ Covered
Contaminated bulk tank milk (to processor)✓ Covered✓ Covered✓ Covered
Customer sick from raw milk sold off-farmLikely EXCLUDEDEXCLUDED✓ Covered ($1–2M limit)
E.coli outbreak traced to your raw milkLikely EXCLUDEDEXCLUDED✓ Covered (if limits sufficient)
Annual premium (estimated)$2,000–$4,000$2,000–$4,000$6,000–$9,000
Your exposure on $250K claim$250,000 (self-insured)$250,000 (self-insured)$0 (if within limits)

How Much of a Raw Milk Lawsuit Would Your Insurance Actually Cover?

If you’re anywhere near selling raw milk, this is the first number you need. Not the last.

Pull your current farm‑liability policy and look for three things:

  • Any endorsement that mentions “raw” or “unpasteurized” milk or dairy products, including pet food, and “not for human consumption” language.
  • Any broad exclusions mentioning “bacteria,” “contaminants,” or “foodborne illness.”
  • How your umbrella coverage “follows form” — because if the underlying policy excludes raw‑milk risk, the umbrella usually does too.

Then email your broker one question you can screenshot and save:

“How would this policy respond if someone got sick from raw milk I sold off the farm?”

If the answer is vague, or if you spot clear raw‑milk or bacteria exclusions, assume your current policy won’t stand behind a raw‑milk claim. Ruhl Insurance in Pennsylvania puts it plainly on their blog: “Many farm insurance companies will not write a policy for a farmer who sells raw milk; therefore, if you decide to undertake this business pursuit, you should expect your options of where to obtain coverage for your farm to shrink.”

Get an actual quote for specialty raw‑milk liability. Don’t guess. Put the premium beside your barn‑math gross margin.

If your specialty liability bill eats more than about 25–33% of your projected raw‑milk gross margin, you’re effectively self‑insuring a significant slice of catastrophic risk. The question you’re really answering at that point isn’t “Can I sell raw milk?” It’s “Am I comfortable using my family’s land and barns as collateral for somebody else’s food‑safety risk?”

What Happens to Your Market When the Farm Down the Road Gets Named?

You might decide you’ll never touch raw milk. That doesn’t mean the farm five miles over feels the same way.

In Florida, state officials publicly identified Keely Farms as the likely outbreak source — before conducting an on-farm investigation and despite the farm’s own lab tests later coming back negative. Coverage emphasised that the farm operated under a legal pet‑food licence but that many customers were drinking the milk anyway. For most consumers, the nuances of lab results and dropped lawsuits don’t register. They read: “raw milk from a Florida farm made people sick.” Full stop.

Public‑health responses after outbreaks almost always reach beyond the farm named in the press release:

  • State‑level warnings that explicitly call out raw milk as higher risk and advise people not to drink it.
  • Tighter scrutiny of raw‑milk permits and sometimes more frequent inspections of other dairies in the same region.
  • Calls from medical, consumer, and industry groups to tighten raw‑milk regulations or stall new legalisation efforts.

In Wisconsin, concern over the potential damage of a single outbreak to the state’s dairy reputation was one reason cited when Governor Jim Doyle vetoed a raw‑milk bill. “We have worked successfully over the last seven years to modernize Wisconsin’s dairy industry,” Doyle said in his veto statement. “An outbreak of disease from the consumption of raw milk could harm our reputation for providing healthy dairy products, and damage the entire industry.” That’s social licence to operate in action: the informal permission society gives an industry to do its work. When a high‑profile child hospitalisation makes the evening news, history shows regulators and activists push for tougher rules on all small‑ and mid‑size dairies — not just the one that sold the milk.

Co‑ops build this into their risk calculus. In May 2010, the CROPP Cooperative — the farmer‑owned organisation behind Organic Valley — voted to prohibit its member dairies from selling raw milk as a side business. The initial board vote was 4–3; a subsequent vote went 7–0 to cap any raw‑milk sales at no more than 1% of a member’s volume. CEO George Siemon told Grist at the time: “It’s not a fun issue here. Everyone on the board drinks raw milk.” An estimated 10% of Organic Valley’s member farms — roughly 150 to 200 dairies — were selling raw milk at the time. For those members, the choice was stark: stay in the co‑op or chase raw‑milk premiums, but not both. The board’s concern, as reported by Food Safety News and the Northeast Organic Dairy Producers’ Association, was straightforward: if one Organic Valley member’s raw milk triggered a public outbreak, the fallout could tar the entire brand.

Even if you ship to a different buyer, your neighbour’s decision matters. When raw‑milk headlines hit a region, buyers revisit supplier lists, side businesses, and contract clauses around “uniform marketing,” “conduct that harms the co‑op,” or “damage to brand and markets.” One farm’s raw‑milk gamble can mean more paperwork, more audits, and less patience from your own processor — even if every drop you ship is Grade A into the tanker.

What About Those Allergy and Asthma Studies?

You’ve probably heard the line: “Farm kids who drink raw milk don’t get asthma.” Like most simple stories, the truth is more complicated.

The large European PARSIFAL and GABRIELA studies did find that children growing up on or near farms and consuming farm milk had lower rates of asthma and allergies. One PARSIFAL analysis reported that farm‑milk consumption was associated with about a 26% reduction in asthma, 33% reduction in hay fever, and up to 58% reduction in food allergy compared to kids who didn’t drink farm milk.

Raw‑milk marketers often flatten that to: “Raw farm milk protects kids from allergies.” The researchers did not say that.

The PARSIFAL authors are explicit: their study “does not allow evaluating the effect of pasteurized vs. raw milk consumption” because they had no objective verification of how farm milk was handled at home. Farm kids breathe barns, dust, animal microbes, and everything else in the environment, along with whatever’s in the milk. That’s the “farm effect” — not just “raw milk.”

Follow‑up work points to multiple possible mechanisms: fatty‑acid profiles, whey proteins, milk‑fat‑globule membrane components, dust‑bound particles, even microRNAs — not just live bacteria. Independent reviewers have reached a consistent bottom line: there is a real association between farm‑milk consumption and lower allergy/asthma rates, but that doesn’t mean drinking raw milk is a safe or recommended prevention strategy.

A 2024 Foodfacts review summarising PARSIFAL, GABRIELA, and related work puts it plainly: the evidence “doesn’t prove a protective effect of raw milk consumption,” and the scientists behind the farm‑milk effect explicitly caution that raw farm milk “cannot be recommended” as a preventive measure.

When a customer tells you they want raw milk for their kid’s allergies, the evidence‑based answer is uncomfortable but simple: the “farm effect” is real, and the path forward is to isolate the protective components — not to ignore the 840× risk and pour raw milk for children. That’s a pasteurised product opportunity, not a raw‑milk justification.

Paths That Keep Your Insurer in the Picture

Other paths keep pasteurisation — and your coverage — intact.

Branded pasteurised, your name on the bottle

You’ve got some capital, extra labour, and local customers who want “your” milk with your farm name on it. State dairy‑plant licensing, a HACCP‑style QA system, a small pasteuriser and packaging line, and time to build accounts — that’s the investment. But you can sell cream‑top whole milk, chocolate milk, drinkable yogurt, soft cheeses, ice‑cream mix — all pasteurised, all within frameworks your insurer recognises. The 143‑hour weeks at Clark Farms show what the real math of on‑farm creamery ROI looks like — it’s not glamorous, but the liability picture is completely different.

The catch: you take on inventory risk, marketing, and customer service. If you under‑estimate your time or over‑estimate demand, the margin disappears. But what doesn’t happen is a public‑health investigation with your farm’s name attached.

Breed into the wellness premium instead of bottling around it.

Your processor already pays for components. What if you captured the wellness‑market demand inside a pasteurised, regulated system? Align sire selection, culling, and heifer strategy to hit A2A2, higher components, grass‑fed, organic, or non‑GMO programs — leaning harder on genomic testing and mating programs to shift herd profile. You get paid a premium on every load, not just what you can bottle. Instead of selling raw “A2 milk” directly from the tank, you ship to brands that pay for it, with pasteurisation and QA sitting between you and end consumers.

The trade‑off: organic and grass‑fed limit feed options and stocking rates. Niche programs can lose premium if the market shifts or too many herds pile in. But the regulatory and liability profile is night‑and‑day compared to raw.

Tighten COP before chasing “sexy” revenue.

Maybe the answer isn’t a new product at all. If side hustles look attractive mainly because the base business is barely breaking even, start with a hard COP review — your nutritionist, accountant, and lender in the same conversation. Feed efficiency, shrink, heifer numbers, replacement strategy, and targeted automation.

StrategyGross Revenue Potential (200-cow herd)Insurance ImpactRegulatory BurdenLawsuit Tail RiskROI Timeline
Raw milk direct sales$31,200/year (100 gal/week @ $6 premium)Policy exclusion likely; specialty $6K–$9K/yearHigh (state permits, testing, H5N1 mandates)840× illness risk; $250K–$450K exposure per case6–12 months (if no claims)
Branded pasteurised value-add$25,000–$40,000/year (cream-top, flavored, soft cheese)Standard coverage; no exclusionsModerate (dairy plant license, HACCP, QA)Normal food-product risk (pasteurisation barrier)18–36 months
Genetics-driven premiums (A2A2, grass-fed, organic)$15,000–$35,000/year (component uplift on full volume)No change to farm policyLow (breed strategy, herd testing, processor contract)Zero direct consumer contact24–48 months (herd turnover)
Cost-of-production tightening$27,000–$41,000/year ($0.50–$0.75/cwt savings × 54,750 cwt)Improves debt-to-asset ratioNone (internal process)None12–18 months

Here’s the barn math: for a 200‑cow herd shipping about 54,750 cwt per year, trimming $0.50/cwt from COP is worth roughly $27,000 per year. At $0.75/cwt, it’s about $41,000. Same neighbourhood as the raw‑milk gross margin — without any of the outbreak-and-lawsuit tail risk. It also lowers your breakeven, which directly strengthens your debt‑to‑asset picture. Not Instagram‑friendly. Just a quieter, more resilient balance sheet. If you want to see how mid‑size dairies are crunching the 2026 margin math, that’s worth reading alongside this.

On‑farm experiences and curated boxes

If you’re in a region with strong local‑food energy and your family is comfortable having people around, there’s a different way to harvest the trust that draws customers to raw milk. Partner with other farms for CSA‑style boxes or local‑food bundles featuring your pasteurised dairy. Lean into education, transparency, and your story. You deepen your social licence by showing urban neighbours where their food comes from, and your insurer doesn’t flinch.

Know yourself before you build the parking lot, though. If your location is remote, your labour is stretched, or the family isn’t keen on hosting, agri‑tourism adds stress rather than margin.

Key Takeaways

  • If your raw‑milk liability premium quote comes in above 25–33% of your projected raw‑milk gross margin,you’re effectively self‑insuring a significant chunk of catastrophic risk. That should trigger a hard rethink — not a “maybe it’ll be fine.”
  • If your co‑op or processor contract includes “uniform marketing,” “harm to co‑op,” or broad “conduct” language — and you don’t have explicit written approval for raw‑milk side sales — assume they can force a choice between staying in the truck line and filling jars. Organic Valley already drew that line in 2010 for 150–200 of its member farms. Ask in writing before you buy equipment.
  • If your current farm‑liability policy has a raw‑milk or bacteria exclusion endorsement, treat that as no coverage for exactly the risk you’re adding. Dog Mountain Farm invested $75,000 before discovering the coverage wasn’t there. Your backstop is your own equity — land, barns, and everything you’ve built.
  • If the wellness crowd is what’s pulling you, breed toward A2A2 or other specialty traits and capture that demand through pasteurised, branded programs. The consumer gets what they want. You keep your coverage.
  • If you’re using European allergy studies to justify a raw‑milk business decision, re‑read the original research. The scientists behind PARSIFAL and GABRIELA explicitly say raw farm milk cannot be recommended as an allergy‑prevention tool. That’s not an opinion. It’s their conclusion.

The Bottom Line

Raw milk isn’t something your cousin argues about on Facebook anymore. A 2025 legal review counts 32 states that allow raw‑milk sales in some form, three states updated their laws in 2025, and more bills are moving in 2026. The access question is being answered. The liability question isn’t.

Within the next 30 days, pull your insurance policy, your co‑op or processor contract, and your most recent balance sheet out of the drawer. Email your broker, your field rep, and your lender one question each: “How would this policy or contract respond if I started selling raw milk from this farm?” If any of those answers makes your stomach tighten, you’ve already got more clarity than most people bottling straight from the tank.

The full cost‑per‑cwt model comparing raw milk, pasteurised value‑add, and specialty‑contract strategies across different herd sizes is the kind of deeper math that deserves its own piece — and it’s coming. Some gambles you can make on gut feel. This one deserves real numbers.

Complete references and supporting documentation are available upon request by contacting the editorial team at editor@thebullvine.com.

Learn More

The Sunday Read Dairy Professionals Don’t Skip.

Every week, thousands of producers, breeders, and industry insiders open Bullvine Weekly for genetics insights, market shifts, and profit strategies they won’t find anywhere else. One email. Five minutes. Smarter decisions all week.
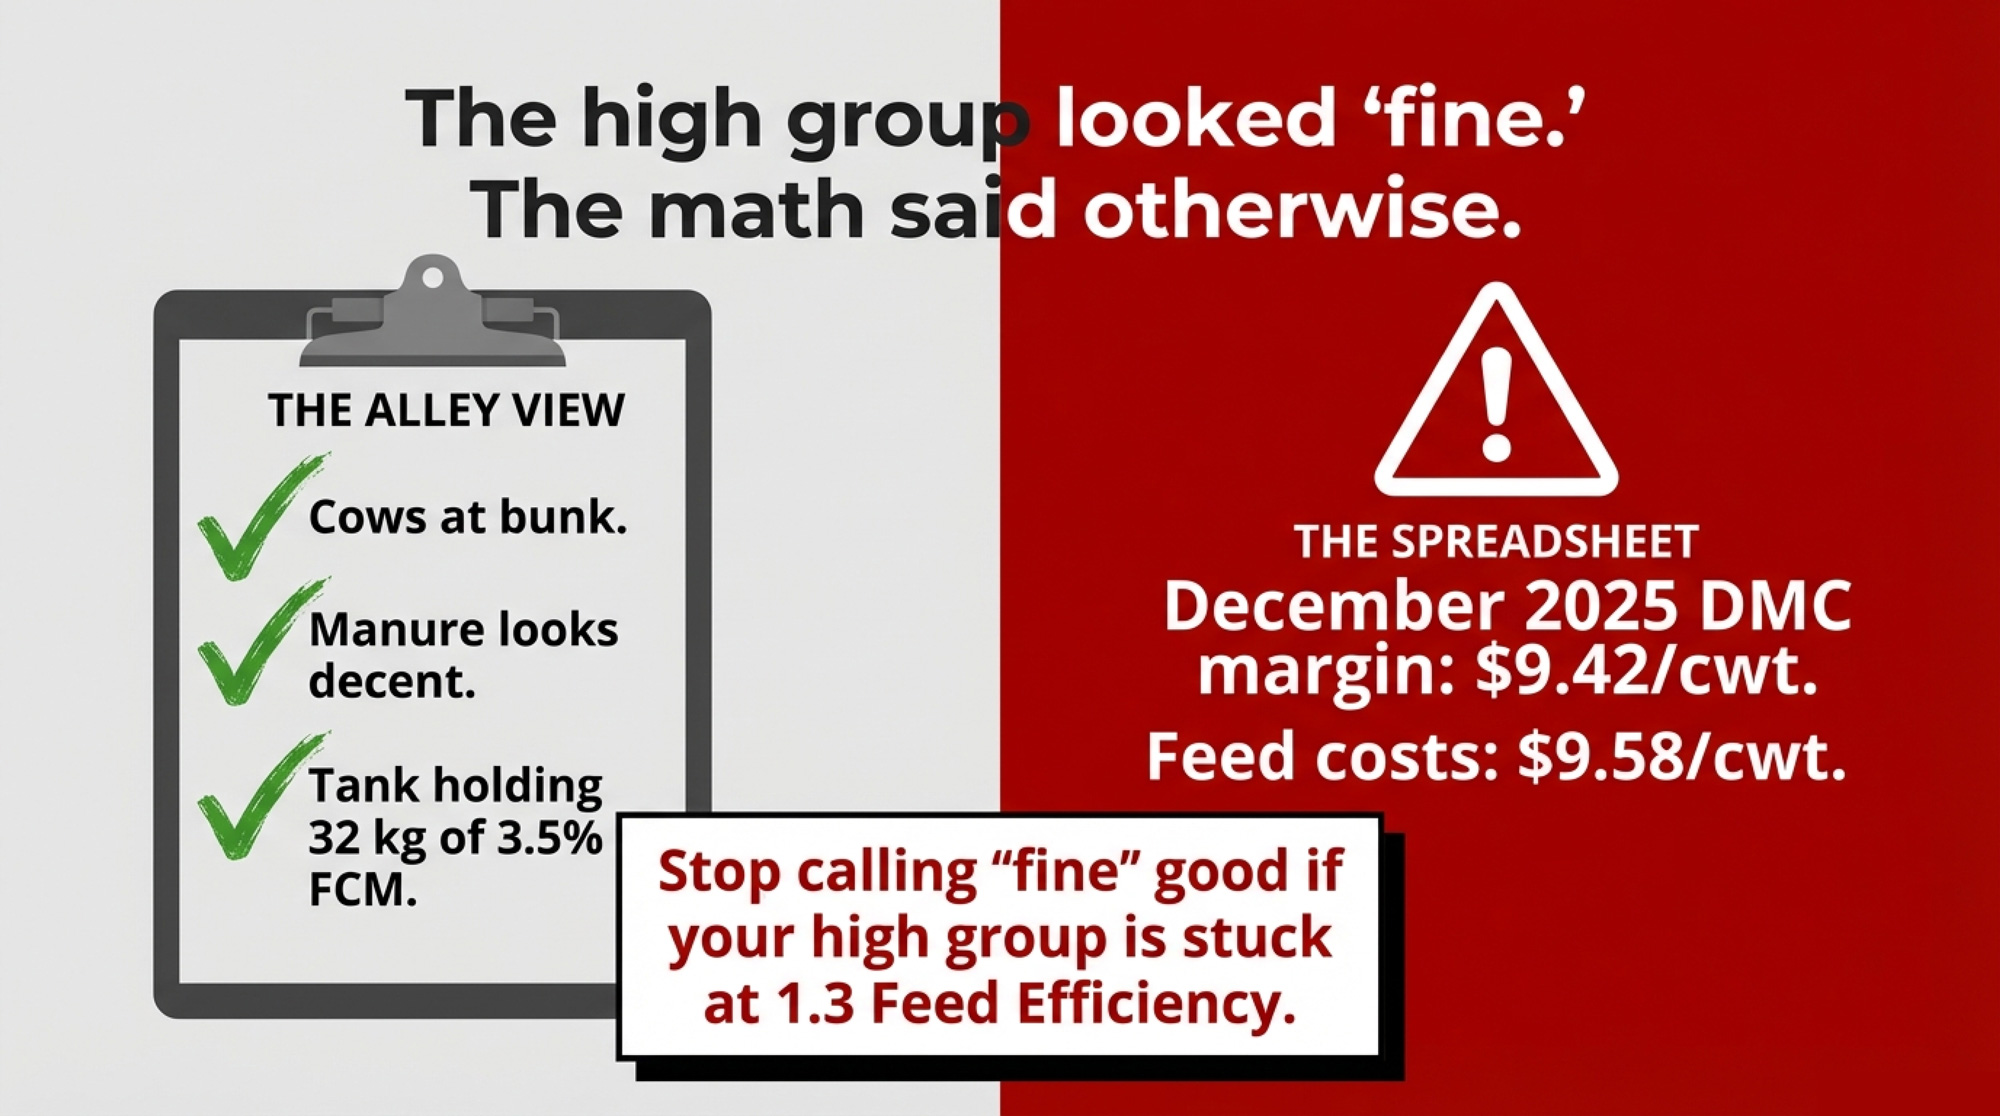
NewsSubscribe
First
Last
Consent

The $16,600 DMC Farm Bill “Win” vs a 0.9x DSCR: The 2026 Decision for 400‑Cow Herds

Your 400‑cow herd can “win” $16,600 on DMC in 2026 and still sit at 0.9x DSCR the minute your banker deletes those dollars from the cash‑flow.

Executive Summary: In 2026, a typical 400‑cow U.S. herd can save about $16,600 in DMC premiums on 6 million pounds — roughly $41.50 per cow — and still sit at 0.9x debt‑service coverage once the banker removes DMC and other program dollars from the cash‑flow. The piece shows the barn math step‑by‑step: $1.66/cwt DMC premium savings, $18.95/cwt all‑milk outlook, and $18–21/cwt true breakeven costs that leave many mid‑size herds below the 1.15–1.25x DSCR comfort band lenders want. It argues that when DSCR clears only 1.0–1.1x with DMC included, DMC has shifted from a safety net to a crutch for a business model that doesn’t pencil. From there, it outlines three realistic branches for 300–500‑cow herds: a turnaround to get “no‑program” DSCR above 1.2x, a reshape into a leaner or premium model, or a staged transition that uses DMC, FSA, and EQIP to protect equity and control timing instead of waiting for the bank to decide. The article also shows which farm‑bill tools actually move your cheque, showing where FSA loan limit increases, EQIP/methane funding, DNIP, and school milk changes genuinely move your milk cheque” or “your margins. It closes with a simple test every operator can run over the next 30 days: calculate DSCR with and without DMC, and ask whether your lender would continue financing the version that stands on its own.

2026 Farm Bill Trap

A lot of 400‑cow U.S. dairies look “saved” by the 2026 farm bill on paper. Strip out DMC and other program dollars, and some of those same farms are sitting at about 0.9x debt‑service coverage — not generating enough cash to cover principal and interest on their own.

That’s exactly where a composite 400‑cow freestall operator we’ll call ‘Mark’ lands in 2026. His freestall saves roughly $16,600 a year on Dairy Margin Coverage premiums thanks to the new Tier 1 expansion — about $41.50 per cow. Early‑2026 Extension analysis suggests several months of $1‑plus/cwt DMC indemnities on covered milk if margins track the 2019–2023 pattern at the kitchen table, that looks like protection.

Across the lender’s desk, once his banker, Julie, pulls DMC and other program dollars out of the cash flow, the number is simple: around 0.9x DSCR. Without government support, the cash flow doesn’t fully cover annual debt service.

All numbers and policy tools in this piece refer to U.S. non‑quota herds operating under federal programs (DMC, FSA, EQIP, DNIP).

Composite scenario built from producer and lender patterns, Extension data, and ag‑lending benchmarks — not a single real named farm.

“The Farm Bill Saved Us”… Or Did It?

Mark looks a lot like many mid‑size family dairies in 2026. He milks 400 cows, ships about 11 million lbs/year — roughly 110,000 cwt. Two capital projects sit behind him: a parlour upgrade and manure system work, both financed when rates were low and now reset to higher levels. His labour mix mirrors the broader industry — a 2015 Texas A&M/National Milk Producers Federation study estimated immigrant workers account for roughly 51% of U.S. dairy labour and produce close to 79% of the nation’s milk.

On the policy side, he’s done everything right in the new farm‑bill world:

  • Maxed Tier 1 DMC at $9.50/cwt on the expanded 6 million lbs production history limit, after USDA raised Tier 1 from 5 to 6 million pounds and allowed history updates to each farm’s highest year from 2021–2023.
  • Locked in the six‑year DMC commitment with a 25% premium discount on Tier 1 premiums from 2026 to 2031.
  • Layered revenue protection on part of his milk to catch the downside that the DMC formula doesn’t see.

On paper, that’s a safety‑net success story. The deeper math tells a different story.

DMC history between 2019 and 2023 shows the margin trigger paying indemnities in roughly half the months at $9.50 Tier 1 coverage, per Farm Bureau and Extension DMC analyses. But in months where the official DMC margin sat near $12/cwt, many farms were still unprofitable once non‑feed costs were layered in. USDA ERS 2021 ARMS data puts the full economic cost of production at roughly $20.54/cwt for 500–999‑cow U.S. herds and $19.14/cwt for herds of 1,000+. Multi‑state Extension work — including UW–Madison benchmarks for mid‑size Wisconsin dairies — lands full costs around –19/cwt.

For Mark, the picture snaps into focus:

  • A realistic, fully loaded breakeven in the high‑teens to low‑$20s/cwt.
  • A DMC margin trigger that calls the farm “covered” as long as income over standardized national feed costsstays above $9.50/cwt — with no view of labour, interest, energy, or family draw.

The comfortable story in a lot of 2026 farm‑bill coverage: “With the new DMC and FSA tools, mid‑size dairies are finally protected.”

The minute Mark’s scenario hits a DSCR calculator, that story flips.

What Does the 2026 DMC Expansion Really Do for a 400‑Cow Herd?

Four changes matter most for a herd like Mark’s:

  • Tier 1 coverage jumps to 6 million lbs of production history, up from 5 million.
  • Production history can be updated to the farm’s highest annual marketings from 2021, 2022, or 2023.
  • six‑year lock‑in offers a 25% discount on Tier 1 premiums if you enroll in the same coverage from 2026 to 2031.
  • Tier 1 premiums for $9.50 coverage: $0.15/cwt (before the lock‑in discount).

The Premium Math: Where $16,600 Comes From

Swap in your own production numbers:

  • Extra milk moving from Tier 2 to Tier 1: 1,000,000 lbs (the new 6M minus the old 5M cap).
  • Old Tier 2 premium at $8.00 coverage (comparable risk level): $1.81/cwt.
  • New Tier 1 premium at $9.50 coverage: $0.15/cwt.
  • Per‑cwt savings: $1.81 − $0.15 = $1.66/cwt.
  • Annual premium savings: 10,000 cwt × $1.66 = $16,600/year.
  • Per cow: $16,600 ÷ 400 = $41.50/cow/year.

That’s money you keep whether DMC pays a dime in indemnities. If 2026 margins track the 2019–2023 pattern, total indemnities could add tens of thousands more, depending on how long margins remain below the $9.50 trigger.

Real cash. The kind that catches up feed bills and keeps the operating line from going deep red.

But the catch is what DMC pays on. It’s the margin over the standardized feed, not the full cost of production. Farm Bureau’s March 2026 analysis calls it a “vital backstop showing its limits” for exactly this reason — it never sees the gap between a $9.50 margin and a $20‑plus all‑in cost on many farms.

So when Julie runs 2026 projections on Mark’s herd, she does it two ways:

  1. With DMC and other program income in the numerator.
  2. Without any program income at all.

That’s where the 0.9x shows up.

What Does a 0.9x DSCR Really Mean for a 400‑Cow Herd?

Here’s the barn math a lot of 400‑cow producers and their lenders are walking through right now.

Assumptions (national outlooks + farm‑level benchmarks):

  • Herd: 400 milking cows, ~27,500 lbs/cow/year → 11 million lbs, or 110,000 cwt.
  • Milk price scenario: USDA’s February 2026 WASDE puts the annual all‑milk forecast near $18.95/cwt. Once basis and component adjustments hit the cheque, the realized price can land several dollars lower.
  • Full cost of production: $18–21/cwt depending on herd size, efficiency, and region (USDA ERS 2021 ARMS; UW Extension mid‑size Wisconsin benchmarks).
  • Annual debt service: In this composite, Mark carries $600,000–900,000 in annual P&I — roughly $1,500–2,250 per cow. That’s not a national average; it’s a realistic range from lender examples and recent mid‑size capital projects.

For DSCR, lenders go back to basics:

(Milk and other income − cash expenses) ÷ annual principal and interest.

The Lender’s Circle

Julie slides the printout across the desk and circles two numbers:

MetricWithout DMC & ProgramsWith DMC & Programs
Annual Milk Sales (110,000 cwt @ $18.95/cwt)$2,084,500$2,084,500
DMC Premium Savings$0$16,600
Other Cash Expenses$1,484,500$1,484,500
Net Cash Available for Debt Service$600,000$660,000
Annual Debt Service (P&I)$700,000$700,000
DSCR0.86x0.94x
Lender Comfort Zone1.15–1.25x1.15–1.25x

Adjust a few assumptions — slightly higher net cash, slightly lower debt service — and you can push the “with DMC” number just north of 1.1x. Without DMC, it sags back toward 0.9x.

Most ag‑lenders treat a DSCR of roughly 1.15–1.25x as their comfort zone. Anything under 1.0x signals cash‑flow that can’t service its own debt without outside help.

Neither number in that table clears the band. One looks less alarming.

The Turn: Is DMC Your Backstop or Your Business Model?

That question is Mark’s turn, and for a lot of 300–500‑cow operations, reading the same headlines.

The comfortable narrative has sounded like this: DMC is stronger and cheaper. FSA operating and ownership loan limits are higher. Conservation and methane dollars are flowing. Farm Credit and the American Bankers Association have pushed for FSA to raise guaranteed operating loan limits toward $3 million, arguing lenders need those levels to keep financing modern farms.

For a dairy with a solid DSCR, that’s true — higher guaranteed limits unlock better terms and responsible restructures. For a 0.9x herd like Mark’s, the math goes another way:

If your bankable DSCR only works when program dollars are in the numerator, DMC has drifted from being a backstop to a core revenue stream.

Rolling the operating line for another year isn’t risk management at that point. It’s a timing decision on when — and how — the operation changes or exits.

Three Branches — None Start with “Hope DMC Keeps Paying”

Once the math is on paper, most 400‑cow herds in this band end up with three branches.

Branch 1: Turnaround — Get DSCR Above 1.2x Without Programs

Mark’s in this lane if “no‑program” DSCR can realistically climb to ≥1.2x within 12–24 months through specific moves: a disciplined cull plan that raises milk per stall; a concrete labour change that lowers non‑feed cost/cwt; selling non‑core assets to knock down debt per cow. In that world, DMC works as designed — a floor under feed‑margin risk, not a permanent revenue line.

Branch 2: Reshape — Change What the Cows Produce

If Mark can’t get there on cost cuts alone, he may still change the model: move into a premium lane with documented, contractual component or identity‑preserved premiums that actually show up on the cheque; simplify the capital footprint so fixed costs match realistic revenue.

The red line stays put: if the reshaped model still needs DMC to get DSCR to 1.0x, that usually looks more like buying time than fixing core economics.

Branch 3: Use the Tools to Stage a Stronger Exit

The hardest conclusion. For many families — Mark’s included — this isn’t spreadsheet math. It’s a barn your grandfather built, and it’s where your kids learned to drive a skid steer.

But the farm‑bill tools aren’t about keeping a struggling model alive indefinitely. They’re about choosing the timing, the terms, and the shape of what comes next on your schedule, not your lender’s:

  • Use DMC indemnities and premium savings to pay down the ugliest debt first.
  • Use FSA‑backed refinancing to restructure into a form that works for a buyer, successor, or landlord in a 2–3 year window.
  • Consider EQIP/energy projects only if they raise resale or lease value without adding obligations the next operator won’t want.

Choosing this path isn’t failure. It means you’re writing the next chapter, not waiting for the bank to write it for you.

What This Means for Your Operation

If you’re in the 300–500‑cow band and this feels uncomfortably close:

  • Within 30 days, run the “no‑program” DSCR test. Bring your last 12 months of milk cheques, a full cost‑of‑production breakdown (including labour at replacement cost), and your P&I schedule. Calculate DSCR with and without DMC. If it’s below 1.0x without programs, you’re looking at a business‑model question, not just a rough year.
  • Use the next 90 days to decide which branch you’re really on. If no combination of realistic cost cuts and genuine premiums gets DSCR to ≥1.2x without programs, you’re in “reshape or transition” territory. Better to name that now than let the bank name it in 18 months.
  • Treat DMC as protection, not entitlement. Max out Tier 1 and lock in the six‑year discount. Then ask: “Does this business stand on its own if DMC pays nothing for two years?”
  • Handle FSA like a scalpel, not a shovel. Model what happens to DSCR if you only restructure existing debtversus if you add new principal. If a new loan doesn’t improve your no‑program DSCR, it’s not expansion money — it’s extra risk.
  • Pick EQIP and energy projects that move cost per cwt. Plate coolers, VFDs, targeted manure improvements — cost‑share can cover 50–75% on smaller projects in some states. Full‑scale digesters mostly belong to herds with thousands of cows and corporate advisory teams. If a project doesn’t clearly lower $/cwt or raise asset value within three years, it’s probably not your project.
  • Build your risk plan around your own cheque. DNIP and school whole‑milk rules are demand‑side tailwinds. Most of those program dollars flow through retailers and processors first, touching your milk cheque only indirectly.
  • Make labour your first policy response. Immigration isn’t fixed in this farm bill, but it’ll decide more 400‑cow futures than any DMC tweak. Hang on to your core crew and keep compliance tight.
Farm Bill ToolDirect Impact on Your ChequeAction for 400-Cow Herds
DMC Tier 1 expansion$41.50/cow/year premium savingsMax out immediately. Lock in 6-year discount.
DMC indemnities (when triggered)$15–30/cow (varies by margin)Enroll at $9.50 coverage. Don’t count on it as income.
FSA operating loan limit increasesIndirect (better terms if DSCR ≥1.2x)⚠️ Use to restructure, not to add debt if sub-1.0x DSCR.
EQIP cost-share (plate coolers, VFDs)$5–15/cow (one-time savings on projects)Take it if project lowers $/cwt within 3 years.
DNIP & school milk programs$0 direct (flows through processors)Demand-side tailwind. Doesn’t change your cheque in 2026.
Full-scale anaerobic digesters$50–200/cow (only for 1,000+ cow herds)Skip. Needs corporate advisory team, not 400-cow scale.
Methane funding (small projects)$8–20/cow (manure improvements)⚠️ Consider if resale value increases. Not for survival cash.

Key Takeaways

  • If your DSCR sits below 1.0x without DMC, you’re past a rough‑year problem. You’re looking at a business‑model question the 2026 farm bill can’t fix on its own.
  • DMC’s ~$16,600 in premium savings ($41.50/cow) and likely 2026 indemnities are real — but they’re a backstop on margin over feed, not on total cost per cwt. Use them to buy time for decisions, not as a permanent source of income.
  • Higher FSA loan limits only win if they lower your no‑program DSCR or make a future sale/transfer cleaner. If they increase total debt on a sub‑1.0x operation, they accelerate an exit.
  • Choosing to transition isn’t choosing to fail. If no credible scenario gets your no‑program DSCR above 1.0x, the farm‑bill tools let you control timing, protect your family’s equity, and hand over something cleaner than a foreclosure.

The Bottom Line

At the end of a meeting like this, Julie slides the printout back across the desk and circles the two DSCR numbers. One with DMC, one without.

If DMC went away tomorrow and 2026 milk stayed near the USDA’s $18.95/cwt all‑milk forecast, what would your own DSCR be — and would your bank still lend into that model?

Complete references and supporting documentation are available upon request by contacting the editorial team at editor@thebullvine.com.

Learn More

The Sunday Read Dairy Professionals Don’t Skip.

Every week, thousands of producers, breeders, and industry insiders open Bullvine Weekly for genetics insights, market shifts, and profit strategies they won’t find anywhere else. One email. Five minutes. Smarter decisions all week.
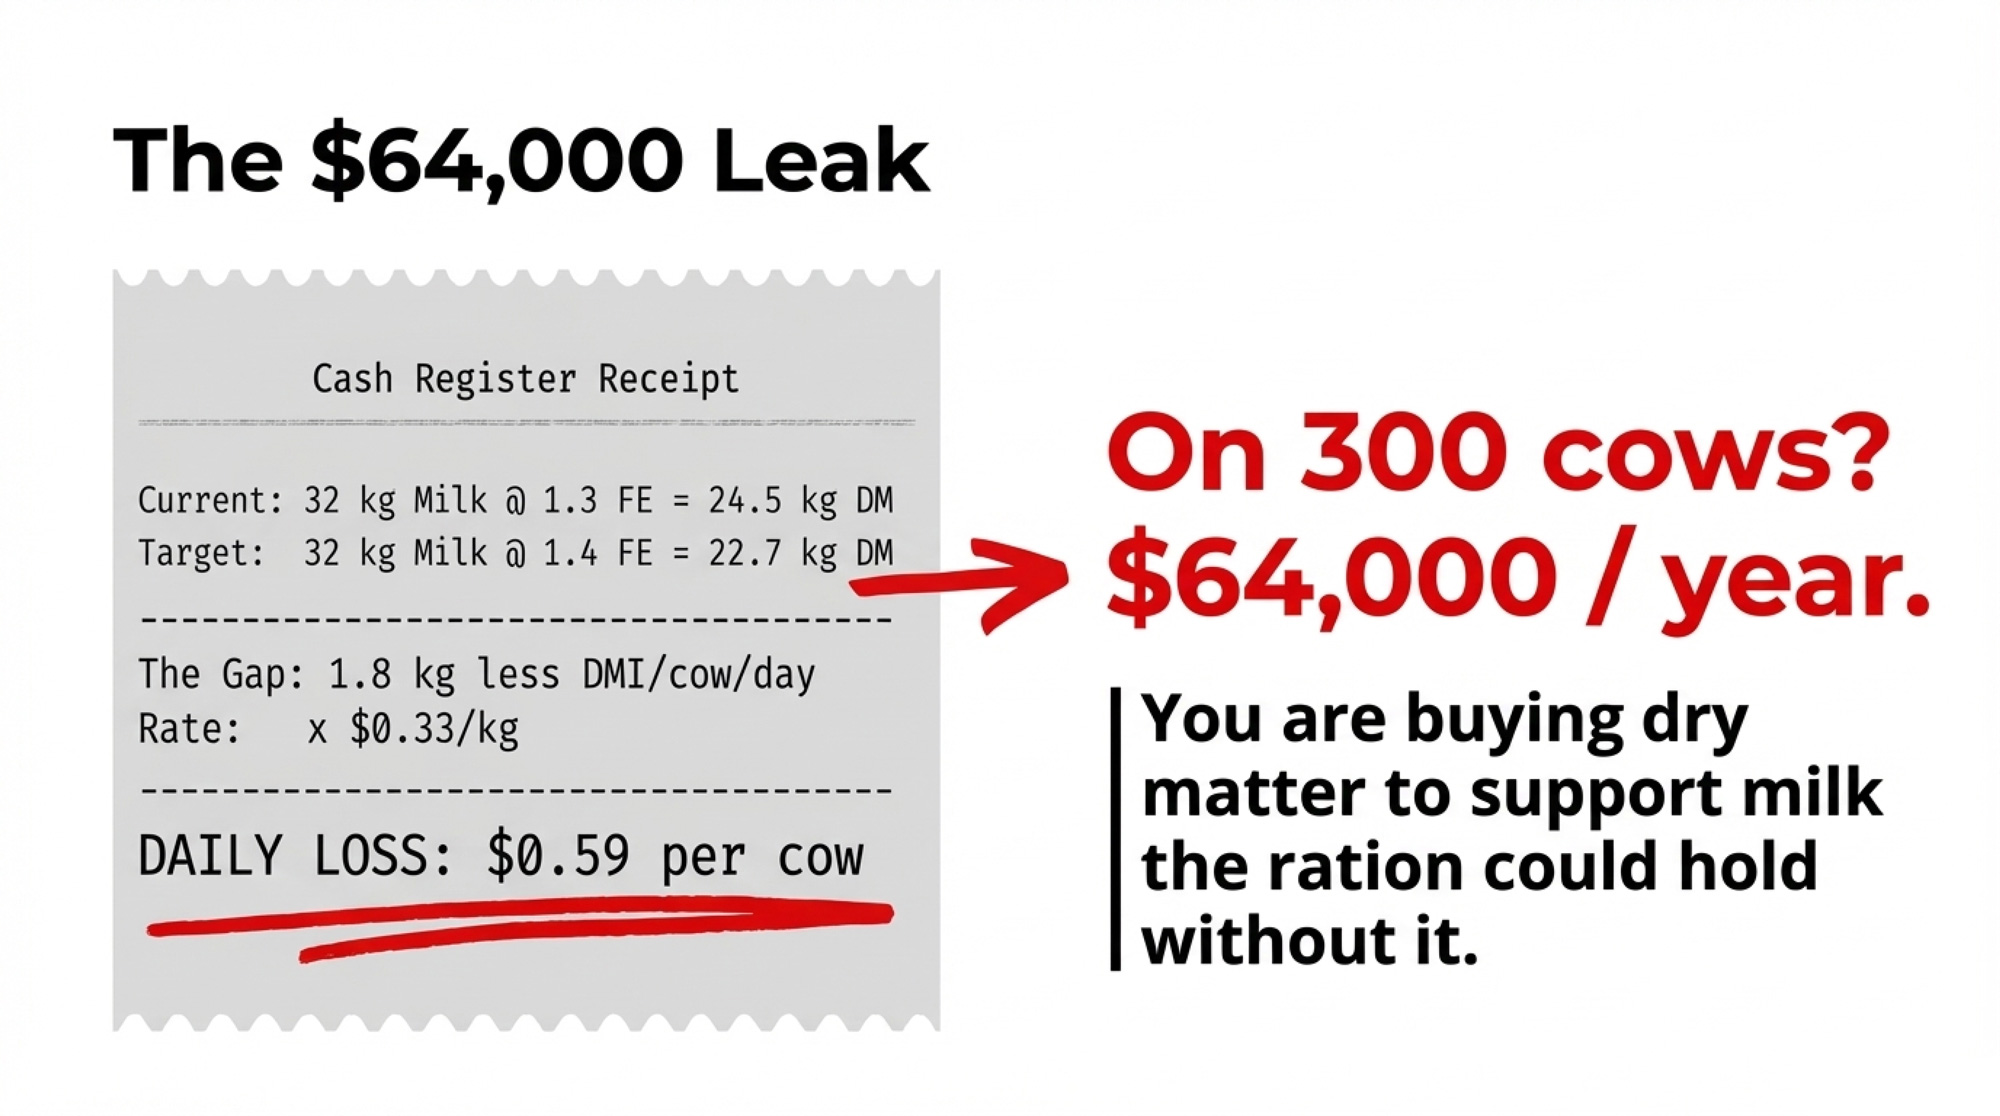
NewsSubscribe
First
Last
Consent

Emily Miller-Cushon’s Physics-to-Dairy Pivot: Pair Housing’s 130g/Day Gain Edge and $3,300/Heifer Savings

She ditched physics for dairy calves. Emily Miller-Cushon’s PECASE-winning research: pair housing saves $9,900/year in heifer losses. Ready to test it on your farm?

Emily Miller-Cushon observes a Holstein heifer calf at the University of Florida Dairy Unit, part of her five-year longitudinal study proving pair housing builds resilient feeding behavior worth $9,900/year in replacements.

On a February morning in Gainesville, Florida, Emily Miller-Cushon walked through the calf barn at the University of Florida Dairy Unit and checked on animals she’d been tracking since the day they were born — some for nearly five years. Not somatic cells. Not feed conversion. She was watching how they behaved, whether they approached unfamiliar pen-mates or hung back. How confidently they ate at the bunk when competition showed up.

Those aren’t the measurements most dairy scientists build careers on. But Miller-Cushon isn’t most dairy scientists — she started in physics. And that background, plus the unconventional path that followed, is reshaping how the industry understands how a calf’s lifetime performance is affected by decisions you make in her first two weeks of life.

From Quantum Mechanics to Calf Pens

Miller-Cushon grew up in rural Ontario, surrounded by small farms and animals, but headed straight into a physics and mathematical physics program at the University of Waterloo — one of Canada’s most rigorous STEM schools. The work was intense, and she was good at it. By her senior year, though, she had a problem: she couldn’t see where it connected to anything she actually cared about.

“I wanted to make a tangible difference in areas that personally interested me,” she’s said. The summer before her final year, she assisted with animal science research. A mentor recognized something in her excitement that Miller-Cushon hadn’t fully seen herself — and encouraged her to pivot.

So she did. Walked away from physics entirely. Entered a doctoral program in animal science at the University of Guelph, working under Trevor DeVries at the Campbell Centre for the Study of Animal Welfare. Finished her PhD in 2014, joined the University of Florida faculty, and now runs one of the most closely watched calf welfare research programs in North America.

The pivot cost years of career momentum. Physics colleagues didn’t always get it. But what she brought from that training — a comfort with long data sets, statistical rigor, the habit of questioning assumptions — turned out to be exactly what calf welfare research needed.

What Does a Physicist See in a Calf Barn?

Here’s what makes Miller-Cushon’s work different from most calf welfare research you’ve read: she doesn’t just measure what happens during the preweaning period. She has followed animals for years.

One USDA-NIFA-funded project tracked calves from birth through their second lactation — a five-year study that ran from 2020 through 2025, straight through a pandemic. “Tracking animals into adulthood was hard work that took a team of dedicated students,” Miller-Cushon told UF/IFAS. “It has been worth it, though, to see the long-term impact of early life experiences for dairy calves on welfare into adulthood.”

Most calf housing studies end at weaning. Hers didn’t. And the results challenge some comfortable assumptions about what “good enough” looks like in a calf program.

A 2024 JDS paper from her lab tracked Holstein heifers raised in pairs versus individually, then observed their behavior during a social regrouping and a housing transition as pregnant heifers. The pair-housed animals spent 4.2 more minutes per hour feeding and visited the feed bunk nearly twice as often — 1.5 visits per hour versus 0.8 for individually raised heifers. The difference was most dramatic under competitive pressure, exactly the conditions your fresh heifers face when they enter the milking string.

“These results suggest that preweaning social housing had long-term effects on behavior and ability to adapt to a novel environment, which became most apparent under heightened competitive pressure,” the study concluded.

Translation: the housing decision you make in week one shows up in the bunk two years later.

MetricIndividually HousedPair-Housed (Birth)
Feed bunk visits/hour under competitive pressure0.81.5
Additional feeding time (min/hour)Baseline+4.2
Preweaning ADG advantageBaseline+130 g/day
BRD risk increase (7 studies reviewed)0% increase

Can a Simple Housing Change Actually Move the Needle on Performance?

The short answer: yes, if you look past weaning.

Research from Miller-Cushon’s lab and collaborating institutions has consistently shown that pair-housed calves eat more solid feed earlier — a finding she attributes to social learning. “We underestimate the role of the social environment in determining when and how much animals eat,” she’s told The Dairy Podcast Show. Calves develop preferences for feeds that others in the group are eating. They learn where to go and what to eat from pen-mates, before they ever see a feed bunk in a freestall.

A 2025 scoping review in Frontiers in Veterinary Science, examining pair-housing studies published since 2016, confirmed that pair-housed calves often exhibit better growth performance than individually housed peers. And the health concern that has kept many producers in individual hutches? Seven out of seven BRD studies in that review found no association between pair housing and increased respiratory disease.

That’s not a cherry-picked number. That’s every BRD study they examined.

Health/Behavior ConcernResearch FindingMitigation Strategy
Bovine Respiratory Disease (BRD)No increase (7/7 studies)Keep groups ≤2 calves; standard biosecurity
Scours incidenceTendency for reduced cases (Miller-Cushon 2021)Paired housing may improve gut health
Cross-sucking behaviorOccurs without hay provisionProvide hay from Day 1 with starter grain
Disease transmission above 8 calves/penRisk climbs in large groupsPair housing (2 calves) keeps biosecurity manageable

Research from the University of British Columbia, published in 2023, found pair-housed calves averaged 130 grams per day more weight gain than individually housed calves — a finding consistent across multiple Canadian studies. At UF, Miller-Cushon’s own 2025 study (n=100 pens, 50 individual vs. 50 paired) showed clear performance benefits from pair housing from birth, with advantages particularly strong during cooler months.

The performance edge compounds over time. Pair-housed heifers adapted faster to freestall environments after weaning, ate more aggressively when stocking density climbed, and showed lower displacement rates at the feed bunk. On a commercial dairy where fresh heifers compete with mature cows for bunk space, that behavioral resilience translates directly to dry matter intake — and intake drives milk.

Laura Whalin, a UBC graduate researcher, put it: “Pair housing sets the heifer up for easier transitions such as moving to new pens, changing diets, or learning to cope with an automatic milking system.”

What’s This Worth to a 300-Cow Operation?

You’re not going to change your calf housing because a scientist says it’s “better for welfare.” You’ll change it when the math works. So let’s run it.

Start with replacement economics. Holstein springer heifers are currently trading between $2,500 and $4,000+ per head, depending on region, genetics, and health records, with national averages around $3,300 as of late 2025, according to Ever.Ag and ISU Extension data. Premium strings with sexed semen confirmation have cleared $4,000 in Northwestern and Upper Midwest markets. Meanwhile, heifer inventory sits at 3.914 million head — the lowest since 1978, per USDA’s January 2025 cattle report. CoBank projects the number will fall further before any recovery begins around 2027. Every heifer you raise is worth more today than at any point in the last two decades.

Now consider calf mortality. The most recent USDA NAHMS data (2014, with the next study currently in the field) put preweaned calf mortality at 5.0% nationally. Many operations run higher. If you’re calving 300 cows annually and losing 6% of heifer calves preweaning, that’s 9 dead heifer calves per year. At today’s replacement value, you’re looking at $25,000 to $36,000 in lost inventory — before you count the feed, labor, and vet costs already invested.

Pair housing alone doesn’t eliminate mortality. But the behavioral and health data from Miller-Cushon’s research and the broader literature suggest lower disease incidence, stronger development of feed intake, and better transition outcomes. If pair housing helps you move from 6% preweaned mortality to 4% — a conservative improvement consistent with the published literature — that’s 3 fewer dead heifer calves per year.

At $3,300 per replacement heifer (near the national average), that’s roughly $9,900 in annual saved inventory value on a 300-cow dairy.

Add the downstream performance benefits. Heifers that visit the feed bunk 1.5 times per hour instead of 0.8, that eat 4.2 more minutes every hour under competitive conditions — those are heifers that peak higher and stay healthier in early lactation. You can’t quantify the exact first-lactation milk premium yet (that data is still coming from Miller-Cushon’s five-year study), but the mechanism is clear: more resilient animals produce more consistently.

Is Pair Housing Actually Practical — or Just a Research Ideal?

This is the honest friction point. Miller-Cushon’s research is rigorous. The welfare benefits are real. But your calf barn wasn’t built for pairs, and you’ve got real concerns about cross-sucking, disease transmission, and labor.

Here’s what the evidence actually says:

Cross-sucking. It happens. Miller-Cushon’s own research shows that providing hay from starter grain significantly reduces cross-sucking behavior. “Pretty much universally, we’ve seen benefits to giving calves hay earlier in life,” she’s stated. Hay provision around weaning — when the motivation to cross-suck peaks — is low-cost and effective.

Disease. The scoping review data are unambiguous: across multiple university studies (UC Davis, UW-Madison, University of Florida, UBC, and others), pair housing did not increase BRD or scours incidence. Miller-Cushon’s own 2021 JDS work found “a tendency for reduced scours in pair-housed calves, providing evidence that social housing does not negatively affect, and may benefit, early-life calf health.” The caveat: group size matters. Risk climbs above 8 calves per pen, particularly in continuous-flow systems. Pair housing — two calves — keeps the biosecurity math manageable.

Facility conversion. You don’t need a new barn. Laura Whalin’s UBC commercial farm study used a straightforward approach: two standard hutches with a shared outdoor space. Many operations convert existing individual setups by removing a shared wall or placing hutches end-to-end. The capital cost is minimal compared to the value of the heifer at stake. UW-Madison’s dairy welfare program has published a step-by-step pair housing introduction guide specifically designed for commercial operations already using hutches.

The regulatory trajectory. Canada’s draft Code of Practice for the Care and Handling of Dairy Cattle requires healthy calves be housed in pairs or groups by two to four weeks of age, effective 2031. The Netherlands has a similar timeline targeting 2030. If you’re shipping genetics or dairy products into those supply chains, the direction is clear. Staying ahead of mandates is cheaper than scrambling to comply.

Options and Trade-Offs for Your Calf Program

Path 1: Start pairing this calving season (30-day action). Pick your next 10 heifer calves and pair them at 3–5 days of age. Use existing hutches modified for shared space — Whalin’s UBC model works with standard commercial equipment. Offer hay from day one alongside the starter. Track feed intake, health events, and weaning weights against your individually housed calves from the same period. You’ll have your own data in 8 weeks — and your own data beats anyone’s published study when it comes time to decide whether to scale up.

Path 2: Full transition over 90 days. Convert your entire preweaned heifer program to pair housing. Requires modifying hutch layouts or pen configurations, adjusting milk feeding schedules (automated feeders simplify this considerably), and training staff to monitor pairs rather than individuals. Budget for modest facility modifications — the main cost is labor time for reconfiguration, not materials. The payoff: consistent behavioral development across your entire replacement pipeline, plus labor savings from feeding and monitoring paired calves rather than individuals.

Path 3: Wait and watch (risk-aware hold). If your current preweaned mortality is already below 3% and your heifer transition performance is strong, the incremental gain from pair housing may be smaller for your operation. But track your fresh heifer feed intake and first-lactation peak carefully — if heifers are slow to compete at the bunk post-calving, the early housing environment may be the variable you haven’t tested yet. As processor audits increasingly incorporate calf welfare metrics through the FARM Program, having a pair- or group-housing protocol in place positions you ahead of compliance timelines rather than behind them. Miller-Cushon now serves on the FARM Program’s animal care committee — the research-to-policy pipeline is short and getting shorter.

Key Takeaways

  • If your preweaned heifer mortality exceeds 5%, pair housing is one of the lowest-cost interventions available — the research shows equal or better health outcomes, and every percentage point of mortality reduction is worth roughly $4,950/year on a 300-cow dairy at the current national average heifer price.
  • If you’re concerned about cross-sucking, provide hay from the time you introduce starter grain — Miller-Cushon’s data and the broader literature consistently show it reduces abnormal oral behaviors.
  • If your fresh heifers are slow to eat in the milking string, investigate whether their preweaning social environment is part of the problem — pair-housed calves visited the feed bunk nearly twice as often (1.5 vs. 0.8 visits/h) under competitive pressure in Miller-Cushon’s 2024 JDS study.
  • If you sell genetics or products into Canadian or European markets, pair/group housing mandates are coming (Canada 2031, Netherlands 2030) — getting your protocol in place now costs less than retrofitting under a deadline.

The Outsider Advantage

Miller-Cushon has won the two biggest early-career honors available to a dairy scientist in the United States: the 2025 PECASE — the Presidential Early Career Award for Scientists and Engineers, the highest recognition the U.S. government gives early-career researchers — and the 2025 ADSA Foundation Scholar Award in Dairy Production.

“My enthusiasm for research is in part due to the opportunities to mentor amazing graduate students and network with the broader scientific community in animal behavior and welfare,” she’s said. “Good research is a team effort.”

The dairy industry has a history of breakthroughs that came from outside the usual channels. Robert Chicoine showed what one unconventional thinker could do with a bull nobody else wanted. Miller-Cushon is showing what a physicist’s training does when you point it at a calf barn — and the data says it changes outcomes your heifers carry for life.

What’s the most unconventional background on your farm team right now — and what are they seeing that the dairy lifers might miss? We’re building a deeper playbook for pair housing conversions and running the full replacement heifer lifecycle economics in upcoming Bullvine coverage. And keep an eye out for the next installment of “The Outsiders” — the software engineer who rewrote how we read bull proofs.

Executive Summary: 

Emily Miller-Cushon traded her University of Waterloo physics degree for dairy calf research at the University of Florida—and just won the U.S. government’s top early-career science award (PECASE). Her five-year study shows that pair-housed calves develop more resilient feeding behavior: 1.5 bunk visits/hour vs. 0.8 for individually raised heifers under competitive pressure. That’s 130g/day more gain preweaning, carrying through to adulthood. Barn math: $9,900/year saved in heifer inventory on a 300-cow dairy at $3,300/head. No BRD risk increase (7/7 studies), hay from Day 1 cuts cross-sucking. 30-day test plan: pair your next 10 heifers this calving season.

Complete references and supporting documentation are available upon request by contacting the editorial team at editor@thebullvine.com.

Learn More

The Sunday Read Dairy Professionals Don’t Skip.

Every week, thousands of producers, breeders, and industry insiders open Bullvine Weekly for genetics insights, market shifts, and profit strategies they won’t find anywhere else. One email. Five minutes. Smarter decisions all week.
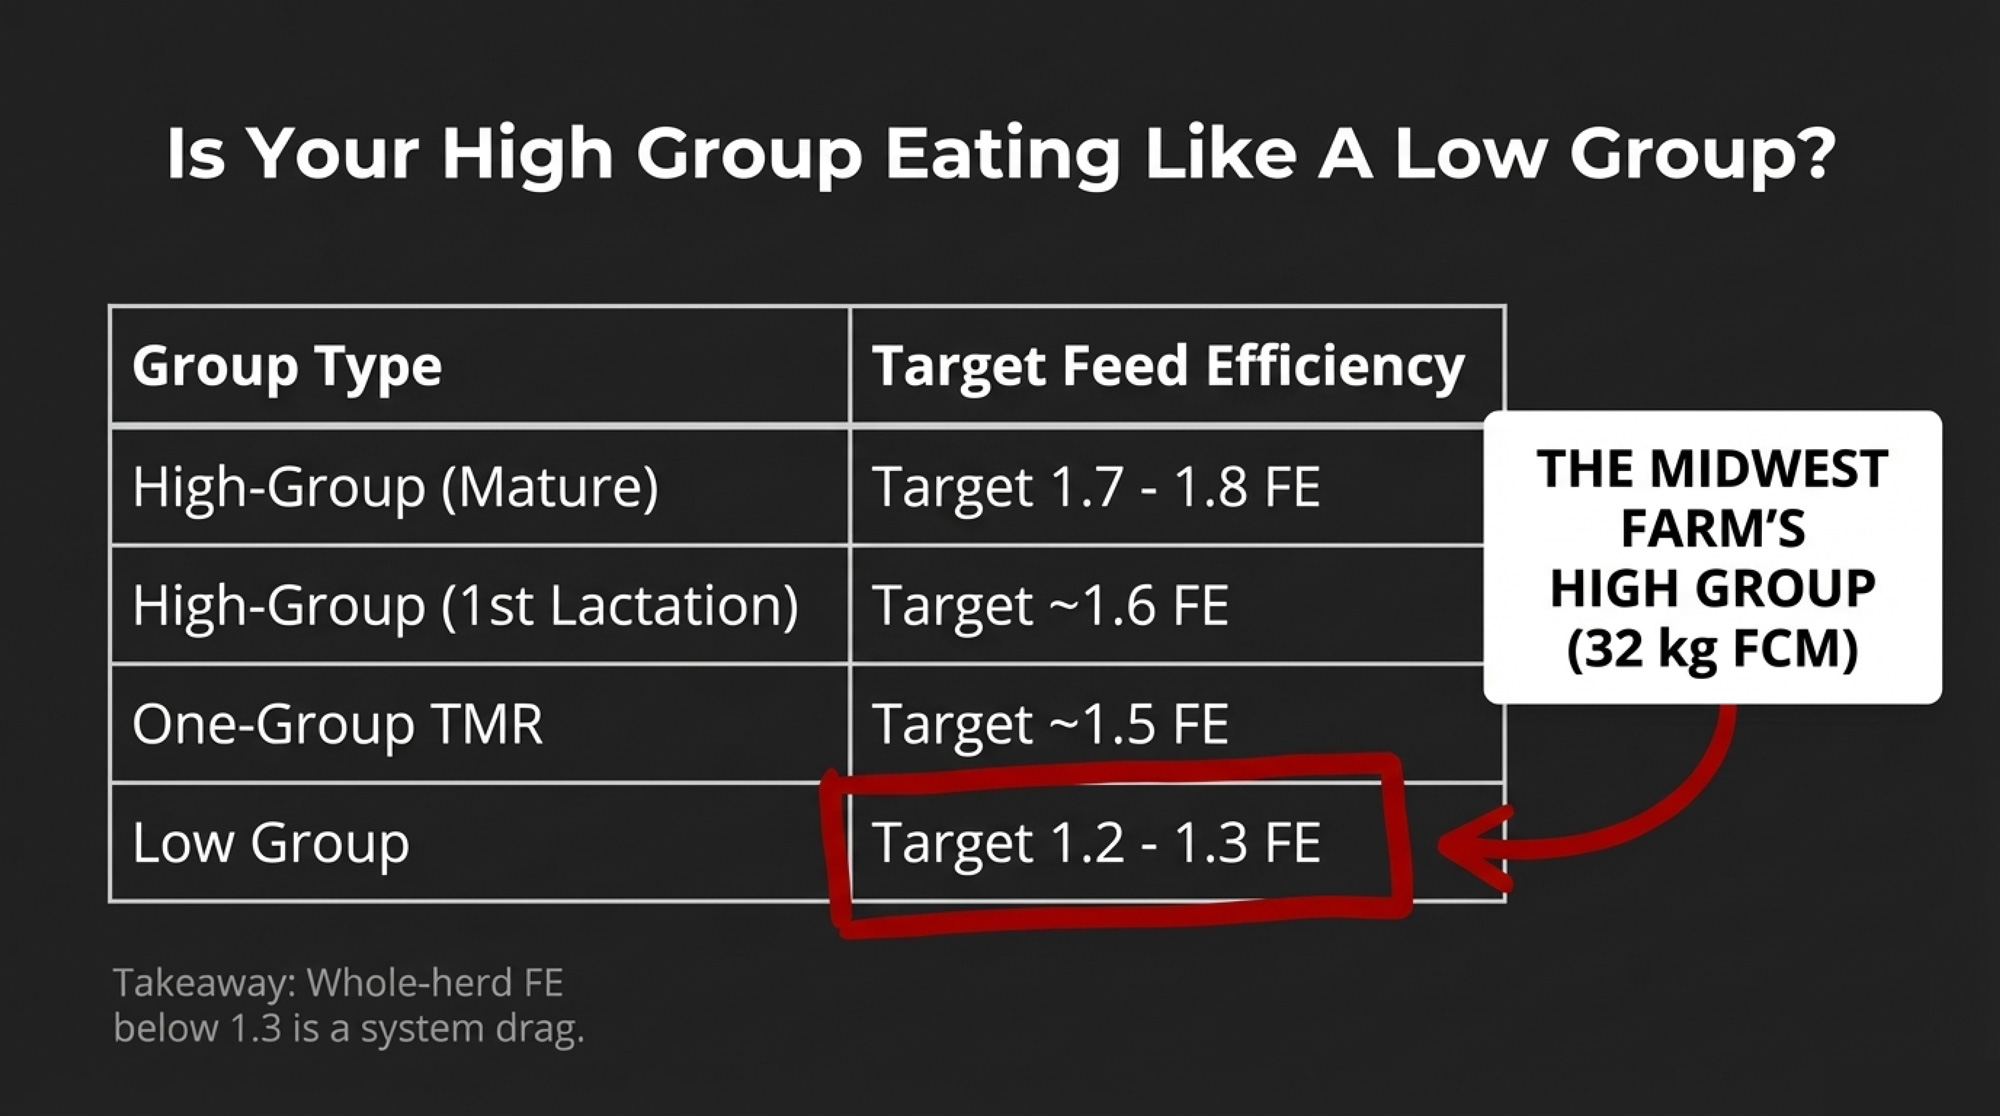
NewsSubscribe
First
Last
Consent

They Lost Cows and Still Cut Tubes: Mystic Valley’s Selective Dry Cow Therapy Math

Lose cows, save $277 on tubes, risk $2,220 in mastitis. Mystic Valley ran that math and still chose selective dry cow therapy. Would your herd?

Executive Summary: Mystic Valley Dairy tried selective dry cow therapy with all the “right” prerequisites—low SCC, Food Armor, strong records—and still lost cows in the first 60 days. Instead of reverting to blanket dry-cow therapy, they changed how they used teat sealant, tightened fresh‑cow monitoring, and kept SDCT in the protocol. This article pairs that real‑world experience with 2021–2024 research showing that algorithm‑guided SDCT can deliver average net returns of about 7–8 USD per cow at dry‑off and culture‑guided SDCT around 2 USD per cow, assuming udder health stays comparable to blanket therapy. It also draws on a 37‑herd Wisconsin cost study showing typical dry‑off product costs of about 19.57 USD per cow, with modeled SDCT protocols trimming partial direct costs by roughly 1–5 USD per cow, depending on product mix and how many cows still receive treatment. A simple barn‑math example for a 300‑cow herd (about 277 USD saved on tubes versus 2,220 USD in potential mastitis costs) turns SDCT from a philosophical debate into a concrete risk‑reward decision. Genetics aren’t an afterthought: health traits like mastitis resistance, livability, and DPR are positioned as the long‑term lever that makes SDCT safer and more scalable. The piece closes with a 90‑day playbook—paper‑testing an SDCT algorithm on last year’s dry‑offs, tightening records, and piloting one low‑risk group—plus clear “go/no‑go” signals on SCC, compliance, and mastitis trends so owners and herd managers can decide when SDCT makes sense and when it doesn’t.

In 2018, Mystic Valley Dairy in Sauk City, Wisconsin, was already an outlier — treating fewer than 20% of cows with antibiotics at dry‑off. Owner Mitch Breunig’s 450 registered Holsteins averaged just over 30,000 pounds of milk per cow, with a bulk tank somatic cell count sitting at 78,000 cells/mL. He’d already gone through the Food Armor antimicrobial stewardship program and was confident enough in his selective dry cow therapy (SDCT) system to change something most dairies still considered untouchable.

The results didn’t cooperate.

In published interviews, Breunig said the herd lost a couple of cows in the first 60 days of SDCT, likely due to toxic gram‑negative mastitis. He could’ve gone straight back to blanket dry cow therapy. Instead, he changed the way his team handled dry‑off — and doubled down on SDCT anyway.

Quick Stats: Mystic Valley and SDCT

  • Herd: ~450 registered Holsteins, Sauk City, Wisconsin 
  • Milk: Just over 30,000 lb per cow per year (2018) 
  • Bulk tank SCC: ~78,000 cells/mL 
  • BAA: 105.2, ranked 7th in the U.S. for herds >300 cows at the time 
  • Dry‑off antibiotics: <20% of cows treated when SDCT began 
  • Energy‑corrected milk (2025): ~125 lb ECM/cow/day, 4.5% fat, 3.4% protein 

Why Blanket Dry Cow Therapy Is Under Pressure

For decades, the default was simple: every cow, every quarter, every dry‑off got an antibiotic tube. Blanket dry cow therapy cured existing infections and helped prevent new ones during the dry period. It was effective and, honestly, easy.

That’s changing.

The EU’s Farm to Fork strategy targets a 50% reduction in antimicrobial sales for farmed animals and aquaculture by 2030, which directly pressures routine blanket treatments. In the U.S., the FDA’s Guidance for Industry #263 — which pulled all over‑the‑counter medically important antibiotics under veterinary oversight — took full effect in June 2023. In states like New York, lawmakers have introduced bills targeting routine or prophylactic antimicrobial use in food animals, adding another layer of scrutiny to practices such as blanket dry cow therapy.

A Wisconsin study of 37 large herds found the average dry‑off product cost under blanket therapy was 19.57 USD per cow, with a range of 8.72–24.04 USD depending on the product mix. When researchers modeled a standard SDCT algorithm with fixed tube prices, the average modeled cost dropped from 18.68 USD per cow under blanket DCT to 17.69 USD per cow under SDCT, while observed farm‑specific antibiotic costs alone averaged 11.54 USD per dried cow (range 8.72–15.44 USD). There’s real spread between herds — and between products — in what dry‑off actually costs, which is why your per‑cow savings may land anywhere from “about a buck” to several dollars.

Not everyone thinks those dollars are a good enough reason to switch. Larry Fox at Washington State University has argued that there’s no solid evidence that blanket dry cow therapy has selected for resistant mastitis pathogens, and that, for many herds, the established protocol remains the safest default. That tension — between regulatory pressure, economics, and herd health reality — is exactly where selective dry cow therapy sits.

Algorithm vs. Culture: Two Selective Dry Cow Therapy Paths

A lot of the SDCT debate boils down to how you decide who gets a tube.

Side‑by‑Side: Algorithm vs. Culture‑Guided SDCT

FeatureAlgorithm‑Guided SDCTCulture‑Guided SDCT
Core inputDHIA SCC history, mastitis treatment records, sometimes milk at dry‑offQuarter milk samples cultured before dry‑off on on‑farm media
Typical ruleAny SCC >200,000 cells/mL or clinical mastitis = antibiotic + sealant; others = sealant onlyTreat based on what grows; high‑risk pathogens get antibiotic, low/no growth may get sealant only
Antibiotic reductionCuts dry‑off antibiotic use by roughly half in trial and field settings when protocols are followedSimilar magnitude of reduction when implemented correctly
Average economic impact+7.85 USD per cow vs blanket (5–95%: 3.39–12.90 USD; 100% of iterations ≥0 USD) +2.14 USD per cow vs blanket (range −2.31 to 7.23 USD; 75.5% of iterations ≥0 USD)
StrengthsCheaper, faster, easy to implement where records are strongMore pathogen‑specific info that can improve mastitis control beyond dry‑off
Weak pointsRelies heavily on SCC and mastitis records being accurate and completeMore labor, supplies, and training; practical fit for fewer herds

Rowe, Godden, Nydam, and colleagues’ 2021 partial budget analysis in the Journal of Dairy Science showed that when SDCT is implemented properly, both algorithm‑guided and culture‑guided programs can be economically favorable compared with blanket therapy, with algorithm‑guided SDCT delivering more consistent positive returns. The algorithm approach produced a mean net cash impact of +7.85 USD per cow, with every modeled scenario at or above break‑even, while culture‑guided SDCT averaged +2.14 USD per cow but included some scenarios with a small net loss.

In applied projects, including Cornell‑linked implementation efforts across New York dairies, farms tended to gravitate toward algorithm‑based SDCT because it fit better with their existing labor and record systems. Culture‑guided SDCT demanded more time, equipment, and training than many herds could justify. Health outcomes can be equivalent when the fundamentals are solid — but the logistics and risk tolerance aren’t the same across herds.

Inside Mystic Valley: The Criteria, the Crash, and the Turn

Breunig didn’t land on SDCT by accident. He came in through the Food Armor program, which forced his team to look hard at every antimicrobial they were using.

By 2018, his herd’s public record looked like this: 450 registered Holsteins, herd average just over 30,000 lb of milk per cow, bulk tank SCC around 78,000 cells/mL, and a BAA of 105.2, ranking the herd seventh in the U.S. for herds over 300 cows at the time. To decide which cows could skip antibiotics at dry‑off, he used four specific criteria: last SCC of the lactation, second‑to‑last SCC, peak SCC during the lactation, and any treatment for clinical mastitis. If any test was well above 200,000 cells/mL, or she’d been treated for mastitis, she still got antibiotic dry cow therapy; if not, she was a teat‑sealant‑only candidate.

On paper, that’s a textbook algorithm‑guided SDCT. The results didn’t match.

Breunig said the herd lost a couple of cows in the first 60 days, likely due to toxic gram‑negative mastitis. For any herd, losing cows in the first two months of a new protocol raises an immediate question: Is the system wrong, or the execution?

Breunig was initially using internal teat sealant on all cows — treated and untreated — at dry‑off. After those early losses, he changed course: Mystic Valley now uses internal teat sealant only on cows that also receive antibiotic dry cow treatment. That’s a departure from many published SDCT protocols, which typically recommend teat sealant on all cows, and it reflects Mystic Valley’s specific experience and veterinary guidance — not a one‑size‑fits‑all recipe.

He also tightened monitoring. The herd moved to weekly SCC checks at freshening to catch subclinical spikes before they became clinical mastitis or necessitated culling.

Over time, the system held. A later Bullvine profile reported Mystic Valley averaging about 125 pounds of energy‑corrected milk per cow per day with roughly 4.5% fat and 3.4% protein. Breunig has publicly attributed the progress to a lot of small management decisions lining up over time, and selective dry cow therapy was one of those decisions.

Can Your Records Actually Support This?

The science is the easy part. The messy part is your records.

Among 11 early‑adopter Italian dairy farms studied by Guadagnini, Moroni, and colleagues, a specific slice of SDCT non‑compliance emerged: 21% of cows that should have received antibiotic treatment at dry‑off were instead given only internal teat sealant. Those non‑compliant cows were 3.77 times more likely to have subclinical mastitis at their first DHI test post‑calving compared with cows that received the recommended antibiotic plus sealant.

The research team reported that both veterinarians and farmers were unaware of the compliance deviation until data analysis was performed. When they dug into why it happened, 10 of the 11 herds attributed the problem to a lack of any monitoring system for whether the dry‑off protocol was actually being followed. There wasn’t malice or laziness. There just wasn’t a feedback loop, which is exactly how you end up with one in five high‑risk cows slipping through without the antibiotic the protocol calls for and a 3.77‑times higher risk of subclinical mastitis at first test.

A Cornell‑linked implementation project across New York dairies ran into the same kind of friction. The biggest barrier wasn’t herd health — it was recording and consistency. Some farms only started documenting mastitis events when they began SDCT, which made it look like mastitis was suddenly increasing when, in reality, they were finally writing everything down. A couple of herds pulled the plug on SDCT early, convinced it was causing extra mastitis in the dry period, and later review suggested that at least one of those spikes was part of a broader herd event unrelated to SDCT.

Compliance Failure PointWhat Happened in ResearchRisk MultiplierFix Before You Start SDCT
No monitoring system10 of 11 Italian herds had no way to verify dry-off protocol was followed3.77x mastitis riskCreate dry-off checklist + weekly compliance audit
Incomplete mastitis recordsNY herds only started logging clinical events when SDCT began; looked like spikeFalse alarm, protocol pauseBackfill 12 months of mastitis/treatment history
Crew turnover/training gapsHigh-risk cows received sealant-only when algorithm called for antibiotic21% non-compliance rateWritten protocol + hands-on demo for every person doing dry-off
Seasonal pressure ignoredSome herds ran SDCT through peak heat; environmental mastitis spikedNot quantified, but protocol pausedPilot SDCT in lowest-risk season (fall/winter in most climates)
Blame the wrong variableHerds attributed mastitis increases to SDCT when broader herd event was occurringEarly protocol abandonmentTrack 0–90 DIM mastitis separately; compare to baseline by dry-off group

Then there’s Jean Amundson — a veterinarian and co‑owner of Five Star Dairy near Elk Mound, Wisconsin. She and her partners milk about 1,000 cows and ship around 90 pounds of milk per cow per day. Amundson enrolled her herd in a University of Minnesota SDCT research trial and reported that the trial reduced dry‑cow antibiotic use by about half, thereby validating their approach. But her herd had been running on‑farm cultures and tight treatment records for years before the trial; selective dry cow therapy didn’t strengthen their data, strong data made SDCT possible.

The Genetics Angle: Why Health Traits Matter for SDCT

SDCT lives at the intersection of management and genetics.

The Council on Dairy Cattle Breeding (CDCB) publishes a mastitis resistance evaluation (MAST PTA) expressed as percentage points above or below the breed average, and these evaluations are favorably correlated with lower somatic cell scores, longer productive life, and better livability and fertility. That matters for SDCT because the herds that do best with selective dry‑off are the ones with consistently low SCC, good cure rates, and fewer chronic cows — exactly the profile you build when you lean harder on mastitis resistance and health traits in sire selection.

As you put more selection pressure on health traits — including mastitis resistance, livability, and fertility — in your breeding program, you’re gradually building a herd with fewer high‑risk animals at dry‑off and more cows that legitimately qualify as “low risk” in an SDCT algorithm. Over time, that shrinks the gap between what the algorithm recommends and what you’re actually comfortable doing.

The published SDCT studies in Italy, Belgium, and North America mostly focus on protocols, economics, and compliance rather than dissecting the role of genetic evaluations in those herds. But the direction is clear: genetics and management are beginning to work together to address mastitis, and herds that lean into both will have more room to pull tubes without paying for it in the fresh pen.

Does the SDCT Math Actually Pencil Out on Your Farm?

So what does the math look like when you actually take the tubes out of the cart?

Leite de Campos and Ruegg’s 37‑herd Wisconsin study provides a real‑world benchmark for direct product costs, assuming udder health remains comparable between blanket DCT and SDCT. That’s the starting point before you ask what happens if mastitis creeps up:

  • Average blanket‑therapy dry‑off cost (observed): 19.57 USD per cow (range 8.72–24.04 USD) 
  • Average cost per dried cow when only intramammary antibiotic DCT was considered: 11.54 USD, with a range from 8.72 to 15.44 USD across herds 
  • Modeled cost using fixed prices for intramammary products: 18.68 USD per cow for blanket DCT vs 17.69 USD per cow for selective DCT — about 0.99 USD per cow savings at those standard prices 

Other modeled scenarios in that dataset and related work show that, depending on product choices and how aggressively you pull tubes, partial direct cost reductions can reach roughly 5 USD per dry cow in some herds, but be closer to 1 USD in others. The per‑cow savings on tubes can range from “a noticeable line item” to “pretty modest,” depending on your current products and how aggressively you already use them.

If you’re running a 300‑cow herd and drying off about 280 cows a year, a 0.99 USD per‑cow savings at dry‑off is roughly:

280 cows × 0.99 USD ≈ = 277 USD in tube savings per year at standardized prices.

If your current protocol uses higher‑priced tubes and extensive sealant, your actual product savings under SDCT could exceed the modeled figure; if you already run a lean protocol, your savings could be smaller.

Year one is messier. You’ll spend money and time on veterinary consults to set up a herd‑specific algorithm, cleaning up mastitis and SCC records, writing a protocol people can actually follow at 4:30 p.m. in the parlor, and training the crew that does the dry‑off work. There isn’t a clean, published “X USD per herd” setup figure for this, but you should plan on meaningful first‑year overhead in vet time, staff time, and management attention that might eat most of the savings in year one.

And if your execution is sloppy, it can eat more than that. Rollin and colleagues estimated the total economic cost of a clinical mastitis case in the first 30 days of lactation at approximately 444 USD per case on U.S. dairy farms, including direct costs and lost future milk. Turn five extra fresh‑cow mastitis cases loose because you misclassified cows or botched dry‑off hygiene, and you’ve just burned 5 × 444 USD = 2,220 USD — easily more than a year’s worth of SDCT tube savings for a 300‑cow herd under many product‑cost scenarios.

Your quick math: take the number of cows you dry off per year and multiply by a realistic, herd‑specific per‑cow savings number — which might be around 1 USD per cow if your current drugs and sealant use look like the modeled Wisconsin herds, and potentially more if you’re using higher‑priced tubes. Then set that against the cost of a handful of extra mastitis cases at roughly 444 USD each.

Now ask yourself what one bad dry‑off month — with a half‑dozen explosive mastitis cases — would do to that balance.

What This Means for Your Operation

These aren’t talking points. They’re checks you can run on your own herd.

  • Can you pull a complete SCC and mastitis treatment history for every cow in your current lactation? If the answer is “sort of” or “not really,” SDCT should wait; your first 30 days should go into fixing the records, not the tubes. 
  • Do you know your pathogen mix? At minimum, confirm your herd is clear of Streptococcus agalactiae and has Staphylococcus aureus under control before you pull antibiotics at dry‑off, because SDCT is a bad place to discover a chronic contagious mastitis problem. 
  • Who actually does dry‑off on your farm? The more people involved, the more ways the protocol can drift, and European work on dry‑off routines and the Cornell experience both found that technique — not theory — was often the weak link, which is why checklists and monitoring systems matter. 
  • Is your dry pen ready for cows without antibiotic safety nets? Stocking density, bedding, ventilation, and transition management all matter more when more quarters head into the dry period with only a teat sealant barrier. 
  • When would you start? Some New York herds in that implementation work paused SDCT during peak heat when environmental mastitis pressure spiked; if you’re going to experiment, start in your lowest‑risk season. 
  • Are you tracking fresh‑cow mastitis separately? If your 0–90 DIM mastitis rate climbs more than about two percentage points above your pre‑SDCT baseline for two consecutive dry‑off groups, that’s a loud signal to pause and audit before continuing. 
  • Can your software help? Herd software like DairyComp 305 and others can run SDCT‑style classifications off DHIA data or at least help you pull the logic together in reports; if you’re not on a full‑featured platform, even a simple spreadsheet with cow IDs, SCC history, and mastitis events can get you close as long as the data’s real. 
  • Is your breeding program moving in the right direction? If you’re already pushing health traits tied to mastitis resistance and cow longevity in your AI matings — including CDCB mastitis resistance, livability, and DPR where available — you’re quietly building a herd that should be a better SDCT candidate five years from now than it is today. 
  • Where do you want to be in a year? Within 12 months of your first pilot, you should be able to decide — based on your own mastitis and SCC data — whether SDCT is a permanent protocol, a seasonal tool, or something you park for now. 

What to Do in the Next 90 Days

You don’t need to change a tube or buy a culture plate to learn something useful.

First 30 days

  • Pull your last 12 months of DHIA records and export the SCC history for every cow you dried off in that period. 
  • Run a simple SDCT algorithm on paper: for each dry‑off, ask “Did this cow ever test over 200,000 SCC this lactation, or receive clinical treatment for mastitis?” and mark which cows would’ve been “sealant‑only.” 
  • Compare your “sealant‑only” list to fresh‑cow outcomes: which of those cows had mastitis in the first 30 days of lactation, and which ones were clean all the way through? 

If that paper exercise makes you sweat, that’s useful information; it shows you where your protocol or your confidence is weak before you risk the cows.

Days 30–90

  • Sit down with your vet and walk through the results from the paper exercise: where do your records have gaps, where does the algorithm agree with what you already suspected, and where does it surprise you? 
  • If the paper exercise looked promising, pilot SDCT on one dry‑off group during your lowest environmental mastitis pressure window, monitor 0–90 DIM outcomes for that group against your baseline, and track compliance from day one. 
  • At the same time, pull your last two proof runs and look at how strongly you’re actually selecting for health traits tied to mastitis risk and longevity — including mastitis resistance and related CDCB health traits where available — and adjust your mating plan before you treat SDCT as your new normal if those traits are an afterthought. 

Key Takeaways

  • If your bulk tank SCC isn’t consistently under about 250,000 cells/mL, your mastitis records aren’t rock solid, or you haven’t cleaned up contagious pathogens like Strep agalactiae and Staph aureus, SDCT isn’t your next move; tighten those fundamentals and fix the bugs first. 
  • Algorithm‑guided SDCT can deliver savings on tubes — but the per‑cow number is often modest, and the real money is made or lost in mastitis cases, not boxes of product; a few extra fresh‑cow mastitis cases can easily erase a year’s worth of tube savings. 
  • Compliance isn’t a detail, it’s the whole ballgame: those Italian early‑adopter herds saw one in five high‑risk cows miss the antibiotic they should’ve received, and those cows were 3.77 times more likely to show up with subclinical mastitis at first test. 
  • Genetic selection for health traits is now real and measurable: CDCB health traits — including mastitis resistance — and their favorable correlations with somatic cell score, productive life, and fertility give you a way to breed cows that fit SDCT better over time instead of relying on management alone. 
  • The safest way to start is on paper: running the algorithm on last year’s dry‑offs gives you a real‑world stress test of your data and your cows’ behavior without risking this year’s dry pen. 

The Bottom Line

Mystic Valley’s first 60 days on SDCT included cow losses that would’ve sent most herds back to blanket therapy, but Breunig changed his sealant protocol, tightened monitoring, and kept going. Amundson’s herd at Five Star Dairy got there after years of building a culture‑and‑records foundation, and the University of Minnesota trial basically confirmed they were on the right track.

The tubes you pull — or don’t — on your farm will sit on top of your own system, not theirs. If your system can’t spit out clean mastitis data and your dry‑off crew can’t follow a checklist on a busy Friday, pulling tubes is the wrong place to start. So before you put down the dry cow gun, here’s the real question: if you ran a selective dry cow therapy algorithm on your last 100 dry‑offs tomorrow, would you trust what it told you?

Complete references and supporting documentation are available upon request by contacting the editorial team at editor@thebullvine.com.

Learn More

The Sunday Read Dairy Professionals Don’t Skip.

Every week, thousands of producers, breeders, and industry insiders open Bullvine Weekly for genetics insights, market shifts, and profit strategies they won’t find anywhere else. One email. Five minutes. Smarter decisions all week.
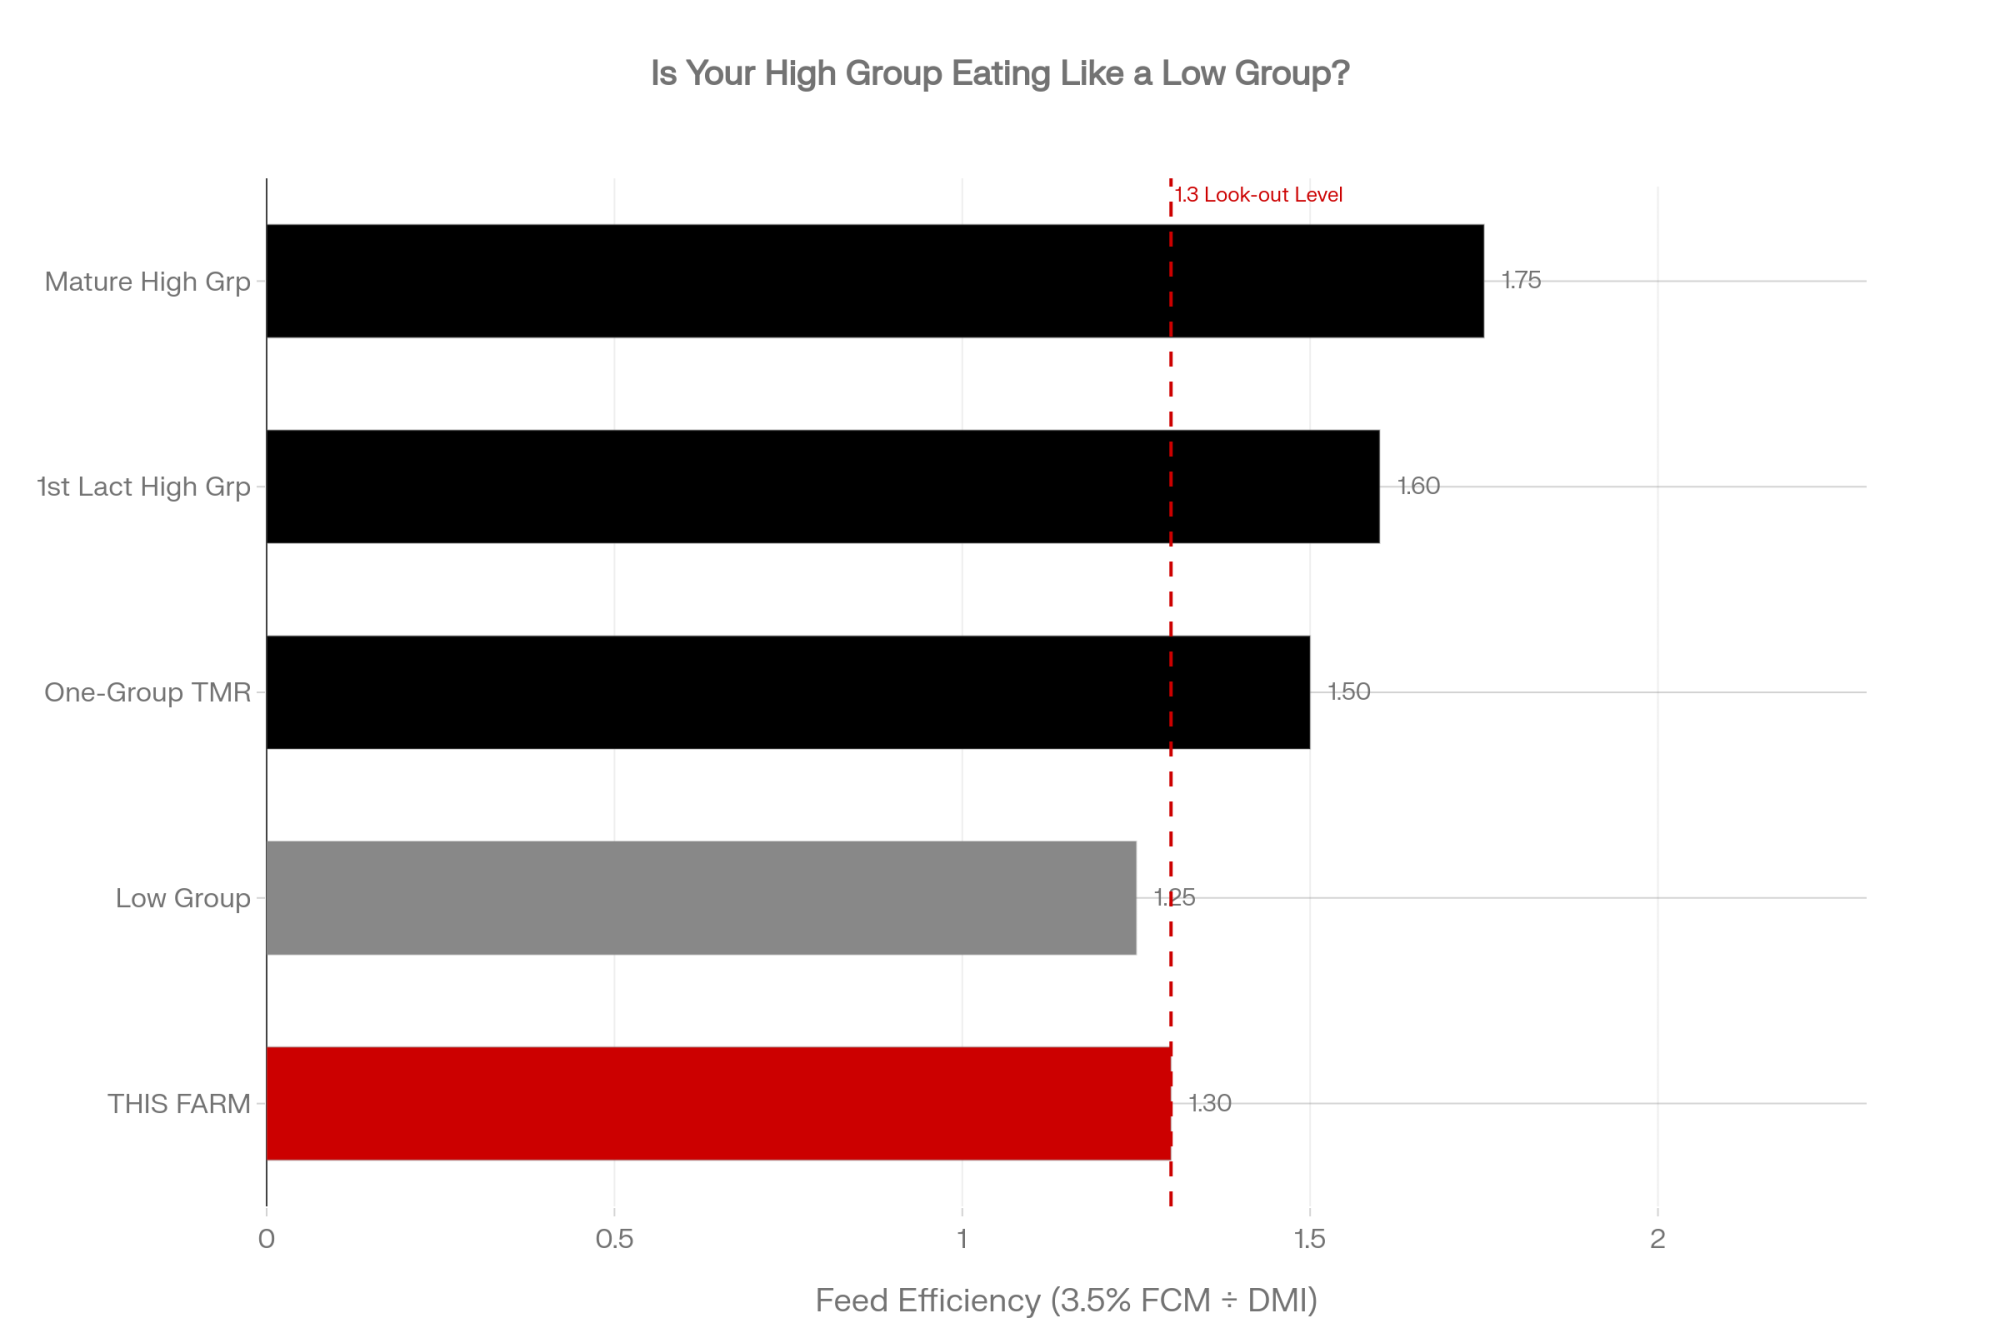
NewsSubscribe
First
Last
Consent

From 6 Crises to 75 Tractors: Reed Hostetler’s Death and the $470K Page That Rewrote Dairy’s Road

OSHA priced six dead dairy workers at $246,609. Wayne County priced one dead dairyman at 75 tractors and weeks of unpaid chores.

Reed Hostetler was 31, co-owner of L&R Dairy in Marshallville, Ohio, and father of three kids under five. On March 5, 2025, he was killed in an accident involving the manure pit at the family farm.

Within days, the same barn where Reed and Abby Hostetler had been married was pressure-washed, scraped, and transformed into a funeral venue — by neighbours who showed up without being asked. An estimated 75 to 100 tractors, trucks, semis, and implements lined the road outside Grace Church in Wooster, organized by local farmers and custom harvesters, according to Farm and Dairy. Weeks later, people were still arriving before dawn to feed calves and clean pens, then leaving before anyone could thank them.

A mourner rests a hand on the Krone forage harvester bearing Reed Hostetler’s name outside the barn-turned-church at his March 12 funeral on the family dairy.

Wayne County didn’t have a crisis-response committee. It had relationships — built over years of co-op meetings, barn clean-outs, and late-night calving calls. That’s what this piece is actually about. Not the crisis. The thing you build before one. (Read more: A 31-Year-Old Dairy Farmer Died in a Manure Pit. What Wayne County Did Next Is a Playbook You Can Steal.)

The Same Pattern, Six Times

We tracked six dairy crises across five years and four structural threats — climate, immigration enforcement, workplace safety, and processing collapse. Different regions, different triggers, same lesson: operations with community infrastructure before the crisis recovered faster than those without.

When the River Turned a Dairy Region Into a Lake

On November 14, 2021, an atmospheric river dumped a month’s worth of rain on British Columbia’s Fraser Valley in 48 hours. The Nooksack River breached into Sumas Prairie — one of Canada’s most productive dairy regions — and the B.C. The Dairy Association reported more than 600 farms affected, with thousands of animals stranded.

Abbotsford Fire Chief Darren Lee told CBC News the flooding moved at a rate he’d never seen in 30 years of emergency services. B.C. Agriculture Minister Lana Popham said she’d been on video calls with farmers who had dead cattle visible behind them.

The community response started before the government’s. Sumas Prairie farm women Jimi Meier and Alison Arends launched a Facebook donation page that collected more than $470,000 in hay, feed, equipment, and cash — tracked through a 2022 Rotary Club accounting. Dairy families from the Fraser Valley, Chilliwack, and Vancouver Island drove in feed while roads were still partially impassable.

Dr. Lisa McCrea Hemphill, a veterinarian who documented the disaster for the Western Canadian Dairy Seminar in 2024, put it bluntly: the 2021 event “was not the first of its kind for Sumas Prairie and it will not be the last.”

In November 2021, the atmospheric river put 3.5 feet of water in U&D Meier Dairy #1’s parlour and sent 14 loads of milk down the drain (top). By December 2025, pumps, planning, and a neighbour network built from that loss kept stalls dry and cut the damage to a single missed pickup (bottom).

The people who showed up first knew which farm had a flatbed, which neighbour had generator power, and which operation kept extra feed on hand. That informal network — built over years of milk truck routes and co-op meetings — was the actual first responder. For the full story of how Sumas Prairie dairy families turned three floods into a rebuild blueprint, read “Three Floods, One Lifetime”.

What Happens When 35 Workers Disappear in One Morning?

June 4, 2025, at Outlook Dairy in Lovington, New Mexico. ICE officers detained 35 workers in what the Albuquerque Journal described as a targeted enforcement operation. Owner Isaak Bos told the Journal the workers had provided false documentation, and the dairy was cooperating fully with the investigation — the dairy itself was not accused of wrongdoing. But the operational hit was immediate: Bos said milking and feeding “effectively ceased” for a period after the detentions.

Replacing a 35-person crew in Lea County — one of the most remote dairy regions in the country — isn’t a phone call. It’s a months-long rebuild.

What the Outlook Dairy story exposed isn’t about one farm’s hiring practices — Bos made clear the dairy cooperated fully and wasn’t accused of wrongdoing. It’s about an industry-wide labour structure that everyone in dairy knows, and almost nobody talks about publicly. NMPF’s 2015 economic analysis with Texas A&M estimated immigrants account for 51% of all U.S. dairy labour, and dairies employing immigrant workers produce 79% of the nation’s milk supply. Dr. Robert Hagevoort of New Mexico State University, speaking at the Dairy Cattle Reproduction Council in late 2024, said he believes the true percentage is even higher — that study’s a decade old, and dairy’s reliance on immigrant labour has only deepened.

What happened next: family members, office staff, and local teenagers traded summer plans for scraping alleys and attaching milking units. Neighbours from surrounding operations covered shifts. Three days later, at a town hall in Hobbs, Governor Michelle Lujan Grisham heard about the impact firsthand. “It is a real issue, and I’m very worried about it,” she told the Albuquerque Journal.

Nobody had a playbook for “ICE raid response.” They built one in real time. The full account of how Lovington built a response from nothing goes deeper into the labour math and what happened in the months after.

The Three-Day Rule — and the Road That Broke It

Most tragedies in farm country follow a pattern: three days of intensity, three weeks of fading attention, then silence — while the family is still trying to figure out how to milk cows and raise three kids alone.

Wayne County broke that pattern after Reed Hostetler’s death.

Shuttle buses ran from Marshallville Park to the barn funeral. Local companies brought gravel to shore up the lane. A phrase circulated — “Lead Like Reed” — and it served as a decision rule, not a bumper sticker. If something needed doing — calves to feed, kids to watch, hay to chop — people didn’t wait to be asked. They just did it.

Green Elementary’s PTO, led by president Shelly Baumgardner, organized a “Dine to Donate” night at a local restaurant, using a student day-off incentive to bring in more families and raise money for the Hostetlers. Groceries, diapers, and hot meals kept arriving for weeks. As Abby told Farm and Dairy: ‘It has shown me that when our community needs help, help comes. And… the next time our community needs help, I will be there and I will show up.

What made Wayne County different wasn’t that people cared more than anywhere else. It’s that the support network was already there. People had been helping each other with harvest, calving, and equipment breakdowns for years. Reed’s reputation — the kind of guy who’d show up in someone else’s barn without being asked — was the deposit. The community’s response was the withdrawal.

For the piece-by-piece breakdown of what Wayne County built — the shuttle logistics, the gravel, the fundraisers, the chore crews — that’s the playbook worth stealing.

Six Workers Dead in Minutes — and the Fines OSHA Proposed

Five months after Reed’s death, the same hazard — manure gas — killed six workers at Prospect Valley Dairy in Keenesburg, Colorado.

On August 20, 2025, according to OSHA’s investigation, a pipe connected to the manure management system disconnected, releasing hydrogen sulfide. One worker went down almost immediately. Then five more went in to save him. All six died. The Weld County coroner confirmed toxic gas exposure as the cause of death.

The victims: Alejandro Espinoza Cruz, 50, of Nunn, and two of his sons — Oscar Espinoza Leos, 17, and Carlos Espinoza Prado, 29. Jorge Sanchez Pena, 36, was related to the family by marriage. Ricardo Gomez Galvan, 40, and Noe Montanez Casanas, 32, rounded out the toll. A father, two sons, and three more men — gone in minutes.

“They were extremely hardworking and humble,” Tomi Rodriguez, an outreach worker for Project Protect Food System Workers, told CPR News. “They were a very united family.”

OSHA cited three businesses in February 2026, classifying the violations as “serious” — not “willful.” Total proposed fines across all three entities came to $246,609 — about $41,000 per life lost. The largest single penalty: $132,406 to Prospect Ranch LLC, the entity operating Prospect Valley Dairy. OSHA calculates fines per violation, not per fatality, but the math is hard to ignore either way.

All citations remain proposed and subject to employer contest. Prospect Ranch LLC has not publicly commented on the citations beyond the formal contest process.

Attorney Sam Cannon of Cannon Law in Fort Collins, representing four of the victims’ families, told KUNC: “We’re no nearer figuring out why this system malfunctioned.” He added: “Family members deserve to understand why this system was operating when it wasn’t safe.”

That impulse — I’m going in after him — is the rawest form of community response. Workers risking their lives for a friend, a father, a coworker. But this story doesn’t have Wayne County’s arc. In Keenesburg, the community showed up with condolences, a benefit dance, and organized services for the families, as the Colorado Sun reported.

Wayne County’s sustained, months-long operational support — the before-dawn chore crews that were still running weeks later — requires a pre-existing infrastructure that not every community has in place when a crisis hits. That gap isn’t about generosity. Every road has generosity. It’s about whether the relationships were already built. For the full OSHA citation breakdown and what the industry hasn’t done, that piece walks through every violation, every dollar, and the confined-space fix that costs less than two cows.

What Does Your Road Look Like When There’s Nobody Left to Call?

Not every crisis arrives with sirens. Some arrive as a letter from your processor.

North Dakota went from 1,810 dairy farms in 1987 to 18 by early 2026 — a 99% decline in less than four decades, per USDA Census data and the Holle family’s own count. That collapse left the state with almost no local processing infrastructure. The Holle family runs Northern Lights Dairy, a 1,000-cow operation about 12 miles south of Mandan — one of just 18 Grade A dairy farms left in the state. After Prairie Farms closed its Bismarck plant in 2023 and DFA ceased operations at Pollock in 2024, the Holles were forced to find a new market for their milk twice in 30 months. They now ship to a Bongards plant in Perham, Minnesota — a five-hour haul, one way.

The Holle family — Andrew, Jennifer, and their four children — at their fifth-generation Northern Lights Dairy south of Mandan, North Dakota. They milk 1,000 cows and haul every load five hours to Minnesota. When we asked what comes next, their answer was: “We don’t know what we are going to do.

But the Holles aren’t waiting for an answer to find them. The family is exploring adding on-farm processing — Dawson Holle, their son and a state representative who sits on the House Agriculture Committee, told the North Dakota Monitor the family has plans for a processing plant, though the timeline remains uncertain. And two new large-scale dairies announced for eastern North Dakota along the I-29 corridor are projected to bring $122–$227 million in annual gross revenue to the state, according to a December 2025 NDSU Extension analysis. The 18 farms still standing aren’t just surviving — they’re building the infrastructure that disappeared around them.

(Read more: From 1,810 Dairy Farms to 18: How North Dakota’s Processing Collapse Cornered the Holle Family – and Could Corner You)

Agriculture Commissioner Doug Goehring has publicly noted that “with no other processors nearby, those dairies will likely pay for shipping longer distances that will be deducted from their milk checks.” Every extra mile eats into the milk check — and the further you haul, the harder it gets to pencil out staying in business.

And when a herd sells out in a region this thin, there’s nobody to absorb the loss — no neighbour to take on heifers, no local market for the genetics, no route density to keep the hauler coming.

From 1,810 farms to 18 is what community infrastructure looks like after it’s gone. For the full 1,810-to-18 diagnostic, including the Holle family’s testimony and the processing closures that cornered them, that piece is the warning label.

How Do You Spot the Farm That’s Quietly Going Under?

Not every crisis shows up as a manure pit or a flood. Some show up as yards that don’t look quite like they used to. Ration sheets that haven’t been updated in weeks. A kid who quietly steps back from 4-H. A familiar face missing from the co-op meeting — not once, but three meetings running.

University of Guelph researchers have documented what most producers already sense: farmers carry higher levels of stress, depression, anxiety, and burnout than the general population. Financial pressure and workload consistently top the list. CDC studies published in the agency’s Morbidity and Mortality Weekly Report — including Peterson et al. (2020) analyzing 32 states and Sussell et al. (2023) covering 49 states — have consistently found suicide rates among agricultural workers significantly elevated compared with the general working population. Earlier state-level studies found the disparity to be two-fold or higher when measured against the broader population.

The rescue in this story isn’t dramatic. It’s a vet walking back to the truck after a DA, leaning on the door instead of climbing in, and saying, “You look worn out. How are you really holding up?” It’s a retired dairyman feeding calves three mornings a week without being asked. It’s the neighbour who notices the late barn lights and calls — not texts, calls — to say, “I’ll swing over. Put the coffee on.”

Those interventions buy something that doesn’t show up on any milk statement: time to think clearly. When stress is driving your decisions, you’re more likely to make rushed calls on genetics, culling, expansion, or exit that feel necessary in the moment but leave you with fewer options six months out. The data behind why dairy farmers face a 3.5× higher suicide risk — and what the people closest to them can actually do — goes deeper than any headline.

What Does a Lost Herd Actually Cost Your Road?

Here’s a piece of math most people skip. When a 250-cow herd sells out, you don’t just lose one family’s income. You lose roughly 6.4–6.8 million lbs of annual milk volume on the truck route — that’s 250 cows at 70–75 lbs/day, every day of the year — and your processor starts thinking about rationalizing pickups and consolidating drop points.

That exit takes an estimated $8,000–$15,000/year in genetics purchases with it — semen, embryos, show heifers — money that supported your local AI tech and breed association. Gone, too, are an estimated 50–100 hours of informal labour and equipment sharing per year that nobody tracks but everybody depends on. And you lose one seat at the co-op board, one voice at herd improvement days, one barn where kids learned to fit calves for the ring.

On a 200-cow herd, a single missed milking costs roughly $1,100–$1,400 in lost milk alone — January 2026 Class III hit $14.59/cwt per USDA AMS, the January all-milk price came in at $17.50/cwt per USDA Agricultural Prices (Feb. 27, 2026), and USDA’s February WASDE forecasts $18.95/cwt all-milk for the full year. That’s before the SCC spike and mastitis risk that compounds for days afterward. If your neighbour’s crisis means your backup milker no longer exists, that math applies to your bulk tank too.

Community isn’t charity. It’s risk management you can’t buy from an insurance company.

What You Can Build in 30 Days

You can’t control floods, raids, pit gases, or processor closures. You can control whether anyone on your road faces one alone.

Build a phone tree this week.

Eight to ten names — neighbours, church, co-op, school. Who calls whom in the first 15 minutes after an accident, barn fire, or sudden death? Write it down in the milk house. Tape it next to the bulk tank. This costs nothing and takes one evening. If you can’t fill 8 names without thinking hard, that tells you something.

Check three farms this month.

Not by text. By call or visit. “How are you doing — really?” Be ready for the answer to take longer than you planned. If a yard on your road has been slipping — gates not closed, lane rough, a familiar face missing from meetings — that’s not “busy.” That’s a signal. The earlier you show up, the more steering room exists.

Know your backup processor before you need one.

If your only buyer closes or tightens terms, where does your milk go tomorrow? Contact your co-op or marketer to request a contingency routing plan. The Holle family at Northern Lights Dairy didn’t get a warning. Neither will you.

Put mental health on the agenda — out loud.

At your next discussion group, dairy association meeting, or men’s breakfast, share one real story. Be the person who goes first. In the U.S., Farm Aid’s hotline (1-800-FARM-AID) connects you with staff who understand agriculture. In Canada, the Do More Agriculture Foundation maintains a current directory of crisis lines and counselling by province. If a conversation turns serious and you’re worried about someone’s safety, the 988 Suicide & Crisis Lifeline (U.S.) and Crisis Services Canada (1-833-456-4566) are 24/7.

Give your kids a crisis role

4-H and FFA clubs can own comfort jobs — cards, freezer meals, calf chores. Clear roles mean kids grow up knowing how to show up. And the families that keep their kids connected to 4-H, shows, and herd improvement days through the rough years are quietly protecting the infrastructure that decides who’s still farming in a decade.

Not Every Road Has a Wayne County

This piece would be dishonest if it pretended that every road has that kind of response waiting to be activated.

Some barns are too far apart for quick drop-ins. In some regions, most families work full-time off-farm, and there aren’t extra hands available. Pride keeps good people from speaking up until they’re closer to the edge than anyone’s comfortable with. And sometimes the structural forces — processing deserts, debt loads, a market that doesn’t want your milk at any price — are bigger than anything a neighbour with a skid steer can fix.

Farmer suicide — rates significantly elevated compared with the general working population, per Sussell et al. in CDC’s MMWR (December 2023) — isn’t something you solve with casseroles. It requires professional support, funded infrastructure, and an industry culture that treats “I’m not okay” as maintenance, not weakness.

But here’s what six stories across five years and six provinces and states prove: operations with community infrastructure before the crisis recovered faster — financially and operationally — than those without it. That’s not soft thinking. That’s business continuity.

Key Takeaways

  • If you can’t name 8 people who’d be in your yard within 15 minutes of a crisis, you don’t have a phone tree. Build one this week — it’s the single cheapest piece of risk management on your operation.
  • If you don’t know your second processor option, call your co-op or marketer this month and ask for contingency routing. The Holles didn’t get a warning.
  • If a yard on your road has been slipping for a month, that’s not “busy.” Call — not text — and ask one honest question. Early is always cheaper than late.
  • If missing one milking costs you $1,100–$1,400 and you don’t own standby power, know whose generator you’d borrow and whether it’s wired to connect. Virginia Tech Extension’s standby generator guide walks through the sizing math.

Whose lane are you turning into tonight?

Randy Roecker is training milk haulers to spot the signs that a farmer is in trouble — because haulers are the last person on every road, every other day. That story is worth 10 minutes of your time. And if the deeper economics of processor loss, generator ROI, or what it really costs your road when another herd exits — that’s the kind of analysis we build out in The Bullvine Weekly and our Tier 2 management playbooks. North Dakota’s 1,810-to-18 collapse is the diagnostic tool.

Tonight, the only math that matters is the distance between your lane and the next one over.

Learn More

The Sunday Read Dairy Professionals Don’t Skip.

Every week, thousands of producers, breeders, and industry insiders open Bullvine Weekly for genetics insights, market shifts, and profit strategies they won’t find anywhere else. One email. Five minutes. Smarter decisions all week.
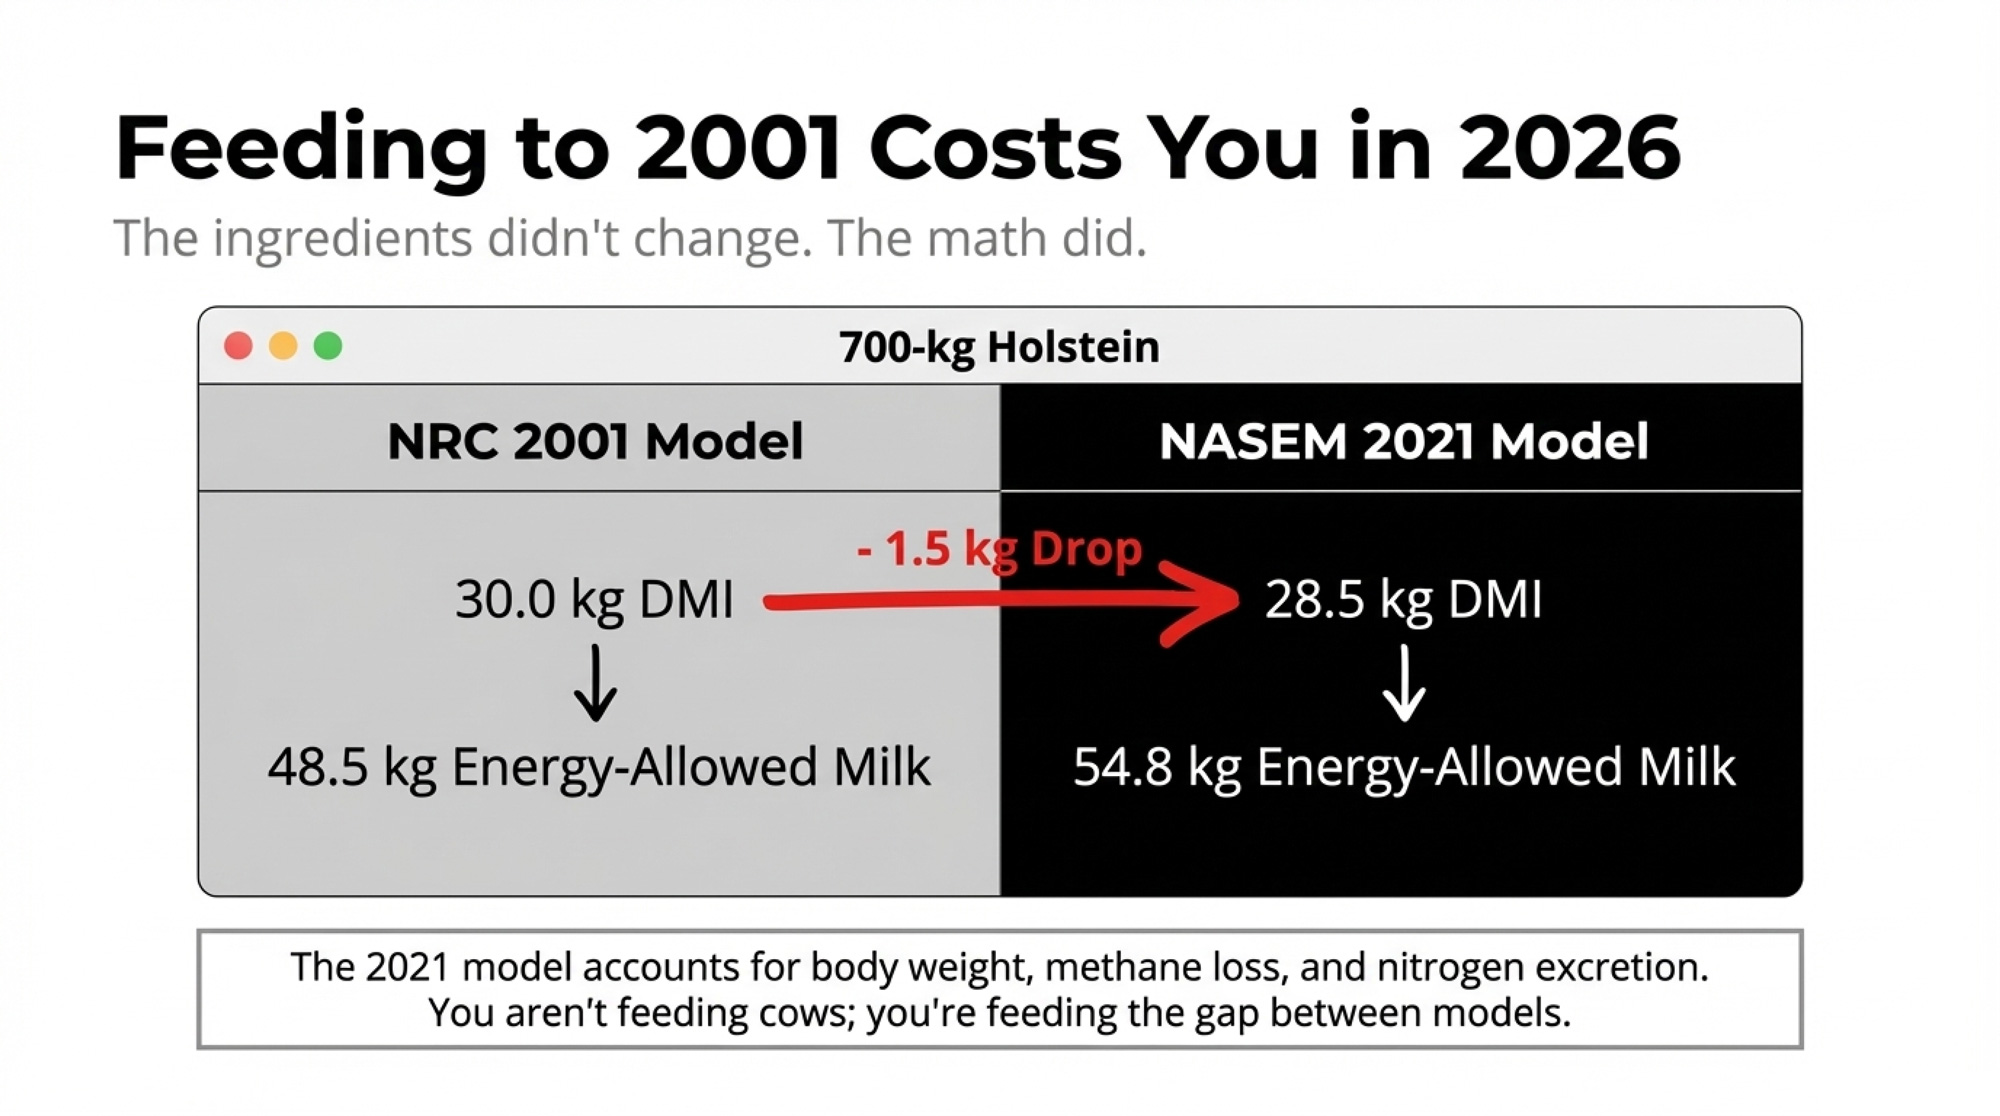
NewsSubscribe
First
Last
Consent

$14.59 Milk, $20.54 Costs: The $182,850 Margin Trap Squeezing 500‑Cow Herds

One 500‑cow Wisconsin herd found its ‘cost’ number was off by $1.50/cwt. That was $172,500 they weren’t seeing. How far off is yours?

Executive Summary: Mid‑size dairies are staring at barn math they can’t ignore: January Class III at $14.59/cwt against USDA full economic costs of $20.54/cwt for 500–999 cow herds, a $5.95 gap that means roughly $182,850 in red ink for a 500‑cow herd at 23,000 lbs. USDA’s 2026 all‑milk forecast sits at $18.95/cwt. The Class III futures strip has rallied — March through November now trades around $18.00–$18.46 — but January’s $14.59 and February’s ~$15.00 already dragged the strip-weighted annual average to roughly $17.65, still well below ERS full economic cost. ERS and Hoard’s data confirm what you feel in your own books: mid‑size herds carry about $1.40/cwt more cost than 2,000‑cow operations, and cheaper corn hasn’t erased that structural disadvantage. Butter and cheese prices are both down double digits, so income over feed is projected $1.50–$2.30/cwt lower than 2025, even with $4.15 corn, while cull cows look rich at $160/cwt and replacements still sit near $2,860–$3,110. The article walks through a full 500‑cow barn‑math example, then lays out five concrete moves: audit feed shrink, rerun true-cost-of-production, calculate your burn rate, rethink cull vs. replacement timing, and use fall Class III and risk tools only where the numbers actually pencil. You finish with practical thresholds — from months of burn‑rate runway to $18.50 lock‑in triggers — and one uncomfortable but useful question: if you plug in your own herd’s numbers, how long before your working capital runs out?

dairy cost of production

January 2026 Class III hit $14.59/cwt — the lowest since July 2023, per USDA AMS data released February 4. Three weeks later, USDA’s Economic Research Service published a structural report that pegged the full economic costs for herds of 500–999 cows at $20.54/cwt. That’s a $5.95 gap on every hundredweight. And the cheapest corn in five years isn’t going to close it.

Feed costs are down. Milk is down further. And the structural cost disadvantage that 500-cow herds carry — roughly $1.40/cwt more than operations running 2,000-plus cows, per the same ERS data — doesn’t move with commodity prices.

The $1.50 Nobody Budgets

A mid-size Wisconsin dairy recently ran a full cost-of-production analysis through a UW Extension-affiliated farm financial counseling program. The analysis put their actual all-in cost roughly $1.50/cwt higher than the figure the operation had been using for planning — a gap driven by market-rate family labor, real depreciation on aging equipment, interest repriced at current rates, and health insurance.

That gap is common. UW Extension benchmarks for mid-size Wisconsin herds land at $18–$19/cwt on a full economic cost basis. The ERS national figure is higher — $20.54 for 500–999 cows, drawn from the 2021 Agricultural Resource Management Survey, published February 22, 2026. That’s the most recent herd-size breakdown available; post-2021 inflation in input costs likely pushes current numbers higher.

Bradley Zwilling, vice president of data analysis at the Illinois Farm Business Farm Management Association, framed the tension in a January 2026 interview with Brownfield Ag News: “From an economics standpoint, we’ve got lots of negative numbers, but when we look at the cash side, we’re still able to squeak out a profit margin.” That was Zwilling’s read on Illinois dairy farms specifically, speaking with Brownfield’s Larry Lee. His underlying study — a December 2025 economic review of milk costs published through farmdoc daily — projects that economic costs will remain above total returns through 2026, even as cash margins stay barely positive.

The gap Zwilling describes — between cash returns and full economic returns — is equity erosion. Manageable for a year. Dangerous by year three.

David Kohl, professor emeritus of agricultural economics at Virginia Tech and a regular keynote speaker at PDPW conferences, offers a specific metric for gauging how long you can sustain it: your burn rate — working capital divided by monthly shortfall. “You’d like to have a burn rate of 3½ years or more,” he has told PDPW audiences. Below 2½ years, Kohl calls it the red-light zone.

Related: As we detailed when the February WASDE dropped, even the USDA’s upgraded $18.95 all-milk forecast doesn’t close this gap for the average mid-size operation.

Why Does It Cost $1.40 More Per Cwt to Run 500 Cows Than 2,000?

Herd SizeFull Economic Cost ($/cwt)
<50 cows$42.71
50–99 cows$32.18
100–199 cows$26.44
200–499 cows$22.89
500–999 cows$20.54
1,000–1,999 cows$19.67
2,000+ cows$19.14

The ERS data lay it out starkly. Full economic cost drops from $42.71/cwt for herds under 50 cows to $20.54 for 500–999 and $19.14 for 2,000-plus. That $1.40/cwt gap between mid-size and large is almost entirely structural.

Labor is the biggest driver. USDA’s 2020 consolidation report (ERR-274) documented total labor costs of $8.14/cwt for herds under 50 cows versus $1.85/cwt for herds above 2,500 — a $6.29 spread driven overwhelmingly by unpaid family labor in smaller operations. Hoard’s Dairyman benchmarks place commercial mid-size dairies in the $3–$4+/cwt range for total labor. Average hired dairy wages hit $19.52/hour as of May 2025, up 30% from $15.07 in April 2020.

At 500 cows, you’re the owner, the herd manager, the HR department, and the risk manager. At 3,000, those are four separate positions — and their combined salary is spread across six times the production.

Hoard’s data reinforces the broader point, too: operations with over 2,000 cows carry cash costs roughly $1.50/cwt below the all-size average, with most of that decline coming from non-feed expenses. But management quality still matters. Hoard’s has also reported that the best-managed small herds produce within $0.20/cwt of the best-managed large herds. That’s best-to-best, though. The average mid-size herd carries a measurable disadvantage that doesn’t disappear with cheaper grain.

Related: For more on how replacement costs and labor shifts compound these structural pressures, see why replacement costs are rewriting mid-size dairy economics.

What Does $16.50 Class III Look Like on a 500-Cow Herd?

Here’s the barn math. A 500-cow herd at 23,000 lbs/cow produces 115,000 cwt per year.

ScenarioMilk PriceAnnual Grossvs. $20.54 ERS Full Cost
Strip-weighted 2026 avg (~$17.65 Class III)$17.65/cwt$2,029,750–$332,350

Math: 500 cows × 23,000 lbs ÷ 100 = 115,000 cwt × price = gross. Subtract 115,000 × $20.54 ($2,362,100) for full economic cost. Divide the gap by 500 for the per-cow figure.

Even at USDA’s more optimistic $18.95 annual average, a 500-cow herd at national ERS cost runs $182,850 in the red for the year. The only scenario with positive returns? Last year’s prices. And USDA projects 1.3% more production in 2026 (234.5 billion lbs) from a January 1 herd of 9.568 million cows, up 188,000.

Plug in your own numbers. Replace 500 with your herd size, 23,000 with your rolling herd average, and $20.54 with your actual full economic cost. If you don’t know your full economic cost — including market-rate family labor, real depreciation, and current interest — that’s the first number to find.

Cheap Feed Won’t Close the $5.95 Gap.

Corn at $4.15/bushel, soybean meal at $319/ton, alfalfa hay at $177/ton — all near five-year lows. But income over feed costs for 2026 projects at roughly $10–$11.40/cwt, down $1.50–$2.30 from 2025. Feed dropped. Milk dropped faster.

The component breakdown shows why:

Commodity2025 Avg2026 ProjectedChange
Butter$2.22/lb$1.68/lb–24%
Cheese (blocks)$1.79/lb$1.60/lb–11%
Whey$0.60/lb$0.69/lb+15%
NDM$1.24/lb$1.32/lb+6.5%

Source: USDA 2026 Agricultural Outlook Forum, February 19, 2026

Butter and cheese drive your Class III check, and both are down double digits. National milk-fat tests averaged 4.32%in 2025, up from 4.24% in 2024 — more fat per pound of milk than the market can absorb. Lucas Sjostrom, executive director of Minnesota Milk, told the Red River Farm Network in January 2026: “Although milk is milk, it’s the components that we sell, and we’ve got all sorts of components on the market.”

Fat-heavy herds are losing more ground than protein-heavy herds right now. Pull your last three checks and compare fat revenue per cwt to the same months in 2025. If your herd tests fat-dominant, the 24% butter decline is hitting your check harder than national averages suggest. Protein-heavy herds are partially insulated. Your checks tell you which camp you’re in — USDA averages won’t.

Related: For how the widening Class III–IV spread compounds this pain, see the $3 milk trap and what it means for your 500-cow check.

USDA Says $18.95. The Futures Strip Finally Caught Up — Almost.

USDA’s February WASDE pegs 2026 all-milk at $18.95/cwt. When the article was first drafted in late February, the Class III strip was pricing $15.38 for February and $17.13 for March. By month-end, a sharp cheese rally — blocks surging past $1.86 — pulled March to $18.00 and lifted June through November above $18.00. USDA’s own quarterly projections from the Outlook Forum (February 19): Q1 at $17.90, climbing to Q4 at $19.90.

That $19.90 fourth quarter still has to do heavy lifting — but the gap between the strip and USDA’s forecast has narrowed sharply. The problem is January ($14.59) and February (~$15.00) are already in the books. Those two months drag the strip-weighted annual average to roughly $17.65, even with $18+ contracts the rest of the year.

For budgeting, the futures strip is where actual contract money trades. The strip now prices $18.00–$18.46 from March through December — much closer to USDA’s $18.95 than it was two weeks ago. But the damage from a $14.59 January and ~$15.00 February is already baked in. Your strip-weighted annual average sits closer to $17.65 than $18.95, and that’s before accounting for basis and actual mailbox discounts.

The Replacement Squeeze Making Culling Decisions Harder

The standard margin playbook says cull the bottom 5–8% and capture cash. Cull values are cooperating: CattleFax analyst Mary Kurzweil confirmed live-market support at $160/cwt in late February, with 90s trim projected into the mid-$440s. At $160 live, a 1,400-lb Holstein brings roughly $2,240 per head. Shipping 25–40 cows from a 500-cow herd generates $56,000–$90,000 in immediate cash.

ItemNational Average (Feb 2026)
Cull cow revenue (1,400 lb @ $160/cwt live)$2,240
Replacement cost (springer heifer, national avg)$2,860
Net cost per cow culled & replaced–$620

But replacements complicate that equation. Heifers hit a record $3,110/head nationally in October 2025. By January 2026, the average eased to $2,860 — but top springers at Pennsylvania’s Premier Livestock & Auctions still cleared $2,850–$4,050 at the February 18 sale. Net cost of culling and replacing at national averages: roughly $620 per cow. And dairy replacement heifers per 100 milk cows hit their lowest percentage since 1991 as of January 1, 2026.

Internal rearing runs roughly $2,034/head in Pennsylvania and $1,709 in the Midwest, per Penn State Extension data updated December 2025. That’s substantially cheaper than buying — but it takes 24–26 months to reach the milking string. If your beef-cross rate exceeds 40%, every cull today has pipeline consequences in 2028.

Five Moves That Pencil Out Right Now

Each has a verified dollar amount and a named source.

1. Audit feed shrink this month. Dr. Mike Brouk at Kansas State presented the math at the 2019 Vita Plus Dairy Summit, and it still holds: a 500-cow dairy running $7.50/cow/day in feed costs can capture roughly $50,000/year from a 4-point reduction in shrink. “Comparatively speaking, capturing $50,000 from milk price alone for a 500-cow herd would require an additional 32 cents per cwt for the year,” Brouk said. No capital required.

At scale, the payoff compounds. According to a 2018 Dairy Global profile, the Statz Brothers dairy — run by Joe Statz, his two sons, and cousins Troy and Wesley — milks 4,400 cows near Marshall, Wisconsin. They built a dedicated feed center and dropped shrink from around 10% to 2–3%. Todd Follendorf, then a nutritionist at Cornerstone Dairy Nutrition in Waunakee, described the rationale in that profile: “Shrink control has been the main reason why we built the whole facility. Before, we had shrink percentages of around 10% every single day. Now, we have reduced this to 2% to 3%.” At $8/cow/day feed cost and a 5-point reduction across 4,400 cows, the documented savings exceed $500,000 per year.

2. Cull strategically — but count your pipeline first. At $2,240/head cull revenue and $2,860 per replacement, every cow you ship without a heifer behind her costs more than the check you deposit. Run the math both ways before loading the trailer.

3. Lock fall production if Class III contracts clear $18.50. September–December contracts sat at $18.35–$18.46 in late February. That’s close to lockable. You give up upside if the market rallies past $19, but if you’re carrying significant debt service, certainty may matter more than optionality.

4. Review your component profile against current prices. Butter down 24%, cheese down 11%, whey up 15%. If your herd tests fat-dominant, your check is being hit harder than national averages suggest. Pull actual checks, not projections.

5. Talk to your lender before April — on your terms. If the operating note assumed $19+ milk, those assumptions broke in January. Build a revised projection off the futures strip (~$18.00–$18.46 March through fall) — but weight your annual average for the $14.59 January and ~$15.00 February already in the books. That pulls your working number closer to $17.65 than $18.95. Kohl’s burn-rate formula gives you the framing: working capital ÷ monthly shortfall = months of runway.

The Safety Net Covers Half — Maybe

DMC payouts above $1/cwt are projected for January through April 2026, with smaller payments through July. The Tier 1 coverage expansion to 6 million pounds helps mid-size herds. But a 500-cow dairy producing 11.5 million lbs annually gets coverage on about 52% of its milk. The other 48% rides exposed.

William Loux, senior vice president of global economic affairs at the National Milk Producers Federation, framed it in a January 2026 interview with Dairy Herd: “It’s good that DMC is paying out, but it’s almost always better for prices, and better for dairy farmers, if they don’t.”

Related: For a deeper comparison of DMC vs. DRP in the current price environment, see how DRP compares to DMC for spring 2026 risk management.

A Note for Canadian Readers

This analysis uses U.S. Federal Milk Marketing Order pricing, USDA cost data, and the DMC safety net — none of which apply directly under Canadian supply management. COP-based pricing, quota value, and a fundamentally different risk structure change the math. But the underlying question — do you know your actual full cost of production to within a dollar? — crosses the border. If your quota-adjusted breakeven hasn’t been stress-tested against current feed, labor, and interest costs, the same $1.50/cwt gap could be showing up in your numbers, too.

What This Means for Your Operation

  • Find your real breakeven this month — not the one in your head. The mid-size Wisconsin dairy that ran a full COP analysis found a $1.50/cwt gap between their working estimate and reality. At 115,000 cwt on a 500-cow herd, a gap that size means $172,500/year in costs you’re not tracking. Contact your Extension office, farm financial counselor, or lender’s ag team.
  • Calculate your burn rate this week. Working capital ÷ monthly cash shortfall = months of runway. Below 30 months is Kohl’s red-light zone — and at that point, you should be making active decisions, not waiting for the market.
  • Compare your actual component revenue to the same months in 2025. This tells you whether national averages apply to your check or whether the 24% butter decline is disproportionately eating your margin.
  • Run the cull-vs.-Replace math before shipping. Net cost of culling without pipeline: roughly $620/cow at current national averages. If your heifer inventory is already thin, aggressive culling generates cash today and creates a $2,860+/head problem in 2028.
  • Audit feed shrink before the end of March. Brouk’s math: roughly $50,000/year on 500 cows from a 4-point reduction. That’s the cheapest margin improvement available — no capital, no contract, no market recovery required.
  • Watch the September–December Class III strip. Above $18.50 = lockable protection on fall production. Below $17.50 = restructuring timeline accelerates.

Key Takeaways

  • If your full economic cost exceeds $18/cwt and your strip-weighted annual Class III averages ~$17.65, you’re eroding equity at roughly $2.89/cwt × your annual production. For a 500-cow herd: roughly $332,000/year. The strip has rallied from where it sat in mid-February — but $18+ contracts for the rest of the year can’t fully erase a $14.59 January.
  • The structural scale gap — $1.40/cwt between 500- and 2,000+-cow herds, per ERS — doesn’t change with corn prices. Cheap feed narrows the feed-cost piece slightly, but can’t close a gap built on labor, management overhead, and purchasing power.
  • Income over feed is down $1.50–$2.30/cwt from 2025 despite lower input costs. The market priced in more milk and softer demand for fat before it priced in cheaper corn.
  • The first 30-day move is free. A feed shrink audit and a full cost-of-production analysis cost time, not money — and they’re the only two things on this list that work regardless of what the market does next.

The Bottom Line

What’s your actual full economic cost per cwt — not the number you’ve been carrying in your head, but the one that survives a spreadsheet with market-rate family labor, real depreciation, and today’s interest rate? If you don’t know that number to within a dollar, it’s the most important thing you can find out before the next milk check arrives.

Complete references and supporting documentation are available upon request by contacting the editorial team at editor@thebullvine.com.

Learn More

The Sunday Read Dairy Professionals Don’t Skip.

Every week, thousands of producers, breeders, and industry insiders open Bullvine Weekly for genetics insights, market shifts, and profit strategies they won’t find anywhere else. One email. Five minutes. Smarter decisions all week.
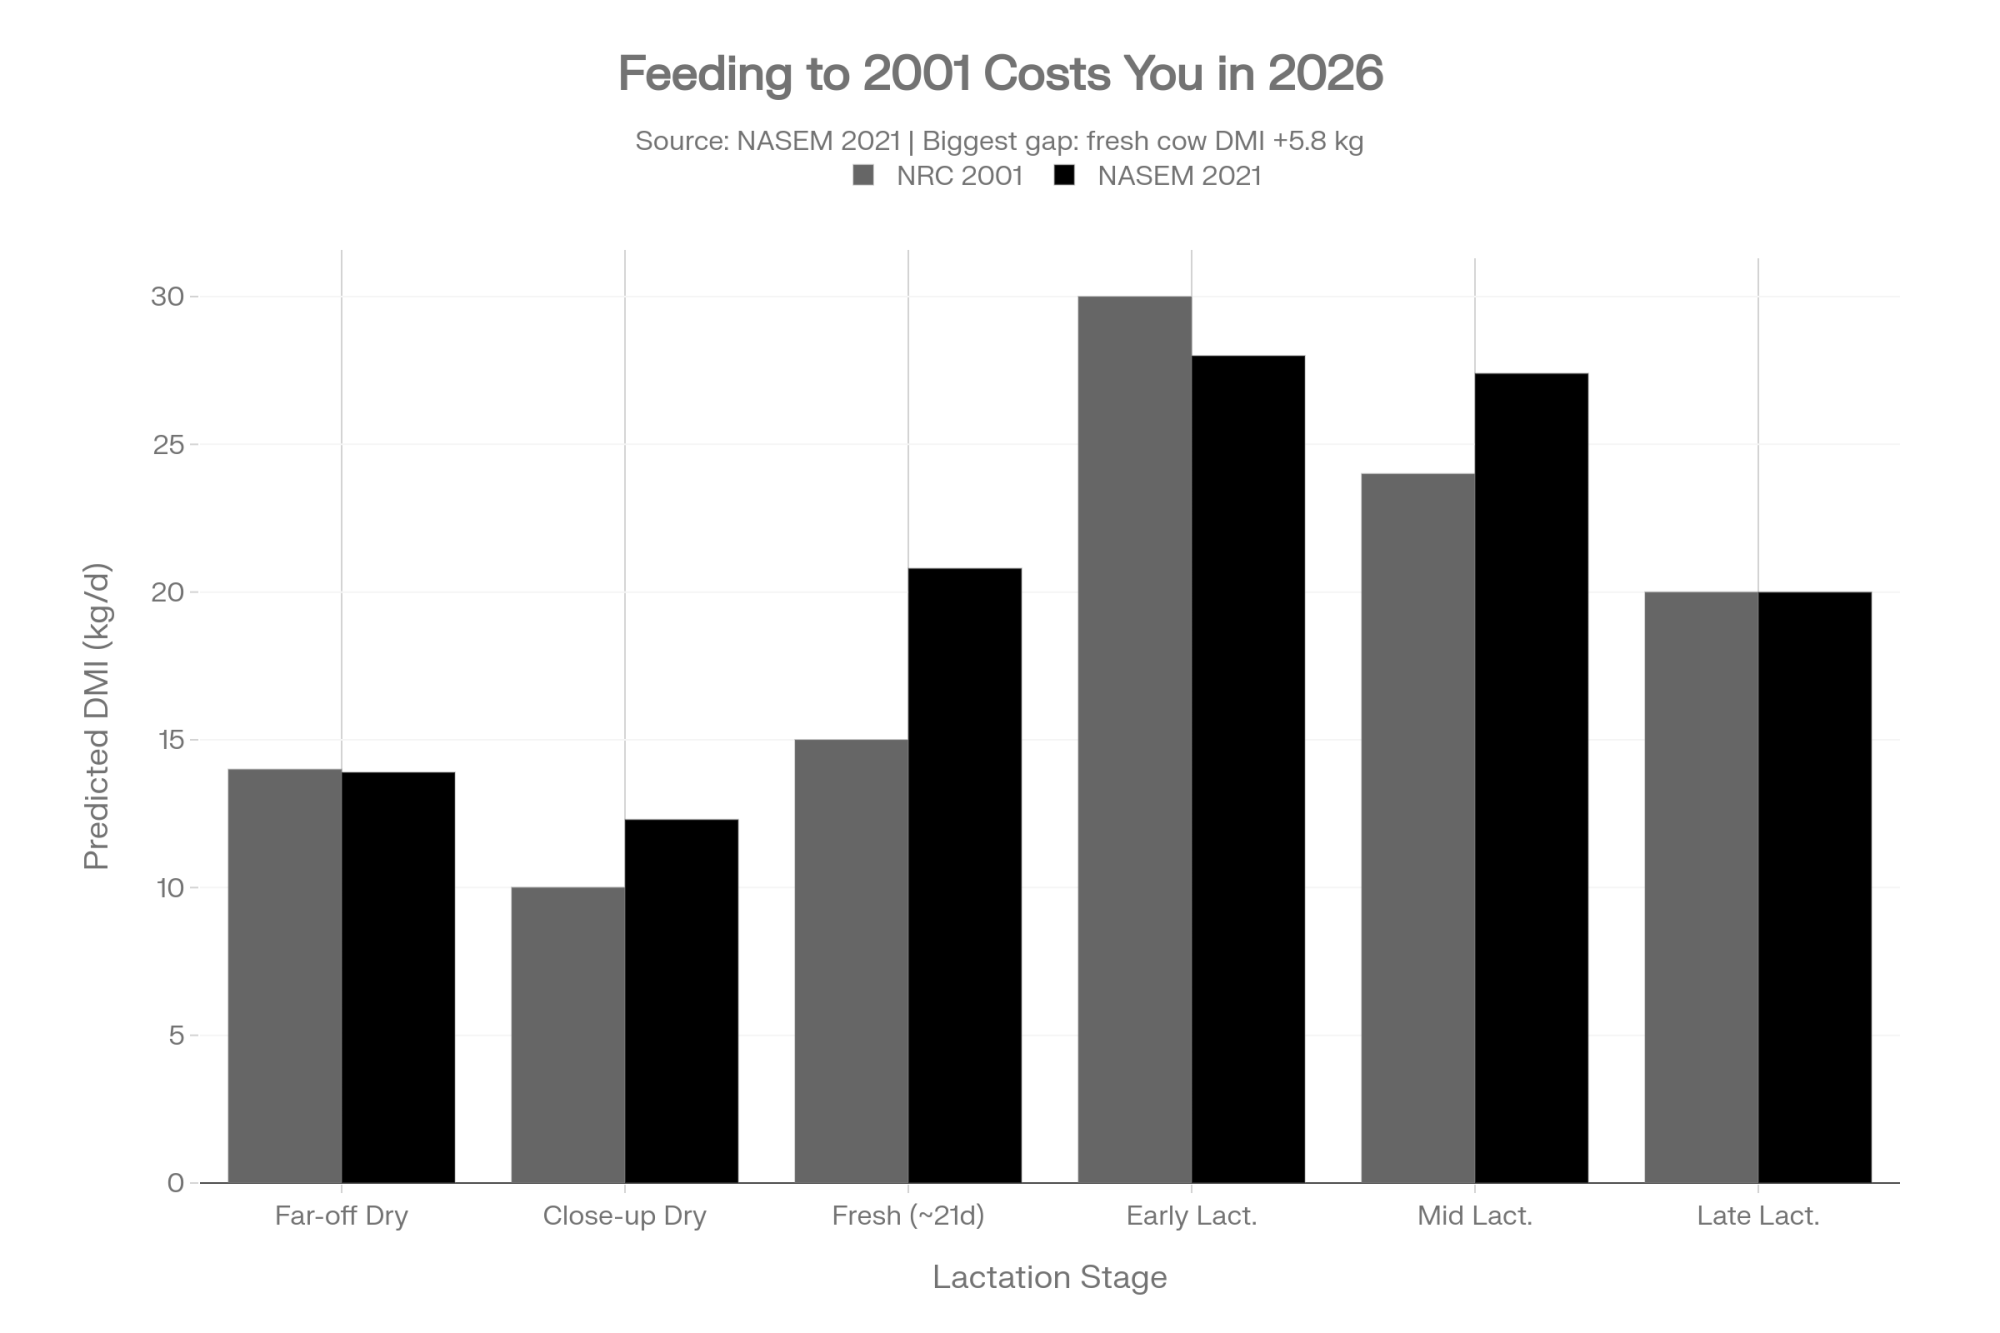
NewsSubscribe
First
Last
Consent

Dr. Bray’s $5 Sodium Bisulfate Gamble: Zero Lung Lesions and the Real Cost of Calf Barn Ammonia

BRD treatment runs $42 a calf. In Dr. Bray’s trial, a $5 sodium bisulfate protocol delivered zero lung lesions on the treated side.

Executive Summary: Dr. Joey Bray, a poultry scientist who jumped to dairy in 2023, helped run two calf barn trials that turned ammonia from a background nuisance into a hard-dollar decision. In a 60‑day South Dakota trial, a simple sodium bisulfate protocol — roughly 1 lb per hutch whenever ammonia pushed toward 5 ppm — produced zero lung lesions on the treated side in a blinded veterinary ultrasound. A second trial at Casper’s Calf Ranch in Illinois confirmed lower ammonia and showed statistically higher average daily gain and bodyweight for calves on the same $5‑per‑calf program. Using UC Davis BRD treatment costs and published first‑lactation loss data, the article walks through barn math showing a 200‑calf operation spending about $6,864 a year on sodium bisulfate to avoid $7,500–$9,800 in BRD‑related losses, plus cohort‑wide milk gains if the ADG effect holds. With replacement heifers now worth roughly $2,300 and inventories at 30‑year lows, the piece argues that ammonia control is no longer optional background hygiene — it’s a line item in your heifer and milk‑yield strategy. A 30/90/365‑day playbook gives producers concrete steps to test ammonia at calf height, fix ventilation first, trial sodium bisulfate, and then re‑check BRD, mortality, and milk numbers against their own baseline. The article is candid about the catch: both trials were manufacturer‑funded and require independent university replication, and sodium bisulfate addresses only bedding chemistry, not structural ventilation failures.

A licensed veterinarian who had no idea which calves were which ran lung ultrasound on every calf after a 60-day rearing period in an enclosed calf barn in South Dakota. The calves on the treated side — the ones whose hutches got roughly a pound of sodium bisulfate whenever ammonia crept toward 5 ppm — showed zero lung lesions. Zero. BRD is the leading cause of preweaned calf death in the United States.

With replacement heifers running $2,300 and heifer inventories at their lowest since 1991, every calf lung matters more than it ever has.

The man behind the trial wasn’t even a dairy guy. Dr. Joey Bray spent over a decade in poultry science — BS and MS from Stephen F. Austin State University, PhD in poultry management from Texas A&M, then years as a professor and department chair at SFA before joining Jones-Hamilton Co. in January 2023. The problem he’d been solving in broiler houses — ammonia destroying respiratory tissue at concentrations most producers can’t even smell — looked identical when he walked into that curtain-sided calf barn. It was the kind of career bet most researchers never make. 

The Trial Nobody Expected to Work This Clean

The setup was straightforward. An enclosed barn with calf hutches running down both sides at a large dairy in South Dakota. One side received sodium bisulfate (marketed as SurPHace — the “pH” is intentional) at roughly 1 pound per hutch whenever ammonia readings rose toward 5 ppm. The other side got standard management. No other variables changed.

After 60 days, calves moved to transition pens. The vet was completely blinded to which calves came from which side. Ultrasound doesn’t lie, and it didn’t hedge — the treated group came back clean.

That’s the kind of result that makes you set your coffee down. But it’s also the kind of result that earns healthy skepticism. One trial. One barn. A product manufacturer was funding the work. Anyone who’s sat through an industry trade show has heard a clean dataset from a company-backed study before — and learned to wait for the second act. So they ran it again.

Casper’s Ranch Ran It Again — and the ADG Numbers Got Interesting

The second trial moved to Casper’s Calf Ranch in Freeport, Illinois — a dedicated contract research facility with capacity for 192 calves in Calf-Tel hutches — operated by Dr. David Casper, a senior dairy nutritionist with MS and PhD degrees from South Dakota State University. This time the protocol was tighter: twice-weekly application, roughly a pound per hutch, over 8 weeks.

Ammonia levels came back statistically lower on the treated side. But Casper went further, tracking what most calf studies don’t — production parameters. Calves on sodium bisulfate had statistically higher average body weight, average daily gain, and body weight gain than controls. Exact sample sizes and p-values weren’t publicly disclosed — the trials haven’t appeared in a peer-reviewed journal yet — but the design (blinded veterinary evaluation, split-barn controls) is methodologically strong for pilot data.

“Everything showed very, very good promise,” Bray said on The Dairy Podcast Show (Episode 184, February 2026).

Those ADG gains aren’t just weaning numbers. They compound. A Cornell meta-analysis by Soberon and Van Amburgh found that for every 1 kg increase in preweaning ADG, first-lactation milk yield increased by 1,550 kg. And a decade-long Penn State study by Jud Heinrichs concluded that days of illness before 4 months of age had significant effects on first-lactation production in Holsteins — Hoard’s Dairyman cited his data in October 2024, putting the figure at 278 pounds of first-lactation milk lost per day of preweaning disease. That’s among the higher published estimates; a broader BRD meta-analysis put total first-lactation loss at roughly 267 lbs per episode. But Heinrichs’ 10-year dataset remains the most granular per-day figure available.

Run that backward: anything suppressing ADG in the first 60 days — chronic low-level ammonia exposure, for instance — is compounding milk losses years before that heifer ever enters the parlor. 

ScenarioBaseline First-Lactation Milk (200 calves)Additional Milk from ADG ImprovementTotal First-Lactation Value
Baseline (no SBS)$40,000$0$40,000
With SBS protocol (0.05 kg/day ADG improvement)$40,000+$6,800$46,800

Is 5 ppm the Real Ammonia Threshold for Calves?

Here’s the thing about ammonia in calf barns: readings at your nose height and readings at calf height aren’t the same number.

A 2024 Swiss study strapped mobile sensors directly onto calves and compared them to stationary sensors at the barn level. The stationary sensors peaked at 5.9–9.4 ppm. The mobile sensors — recording what the calves actually breathed — hit 11.3 to 14.7 ppm. Nearly double.

And it doesn’t take a worst-case barn to get there. The University of Wisconsin Extension published a review of calf housing air quality in April 2025 (lead author Neslihan Akdeniz) and reported that well-managed hutches typically remain at a few ppm. But in localized pockets or under poor ventilation, their site visits found ammonia climbing to 10–20 ppm — two to four times the level now linked to lung damage. UW-Extension pushed the target below 5 ppmbecause Belgian research found that ammonia levels above 4 ppm were associated with higher lung lesion prevalence. Italian research published in 2022 found respiratory disease risk climbing above 6 ppm, with some studies flagging problems as low as 3.5 ppm.

The standard advice for a generation has been “keep it under 10 ppm.” That number was calibrated to human worker exposure limits, not calf respiratory biology. The science moved. Your protocols probably didn’t.

In one case documented through USDA’s SARE program, a producer brought in university researchers over concerns about elevated calf mortality in their compost-bedded pack barn. When the team arrived, they discovered wind shadows from surrounding structures were choking natural ventilation and creating stagnant ammonia zones — a problem the producer suspected but couldn’t see.

Ammonia hits calves from two directions. It damages the respiratory epithelium directly — fewer ciliated cells, impaired mucociliary clearance, stripping the calf’s first line of airway defense. Meanwhile, the same high-pH, high-moisture conditions that drive ammonia production are a bacterial playground. So the calf gets respiratory irritation andelevated pathogen loads simultaneously.

“As we stress the animal, weaken their immune system… those bacteria really have the opportunity now to come in and cause problems,” Bray explained.

Does BRD Really Cost $42 a Case? It’s Worse Than That

The commonly cited $42.15 per affected calf comes from the “BRD 10K study” — a UC Davis project that tracked 11,470 preweaned calves across California dairies. That figure covers short-term treatment costs. It doesn’t include the long tail.

And the long tail is where the real money disappears. USDA estimated cattle mortality losses from BRD at $907.8 million annually (2017 data). Add treatment costs, labor, and production losses — which USDA acknowledges are poorly estimated — and total BRD-related losses likely exceed $1 billion per year, a figure confirmed by a 2025 review in Frontiers in Veterinary Science.

Now layer on the heifer inventory picture. As of January 1, 2026, USDA reported 3.90 million milk replacement heifers, and dairy replacement heifers expected to calve fell to 2.922 million, the lowest since USDA began tracking in 2001. The heifer-to-cow ratio sits at 41.9, the lowest since 1991. At $2,300-plus per head, BRD isn’t just a calf health problem anymore. It’s a balance-sheet problem. 

The $5 Fix vs. the $4,170 Milk Loss

Sodium bisulfate in bulk runs roughly $0.23–$0.50 per pound, depending on volume and delivery. The LPELC reported $0.23/lb for bulk agricultural-grade SBS in 2024. UC Davis Extension listed $0.33/lb for bulk dairy delivery. Retail 50-lb bags have historically run around $0.50/lb. Jones-Hamilton doesn’t publish SurPHace pricing publicly — contact them for current dairy bulk quotes.

At the Casper’s Calf Ranch protocol — 1 lb per hutch, twice weekly, 8 weeks — that’s roughly 16 lbs of SBS per calf:

  • At bulk pricing ($0.33/lb): $5.28 per calf
  • At retail pricing ($0.50/lb): $8.00 per calf

An independent calculation from Calf Notes pegged it at roughly $12 per calf, based on $0.50/lb using a slightly heavier three-times-per-week protocol over 60 days — same ballpark.

Scale it to a 200-calf operation running SBS year-round (assuming year-round calving):

Line ItemCalculationAnnual Value
SBS cost (bulk)200 hutches × 104 apps/yr × 1 lb × $0.33$6,864
Direct BRD treatment avoided25 cases × $42.15 (BRD 10K study)$1,054
First-lactation milk lost from BRD25 calves × 3 sick days × 278 lbs/day × $0.20/lb$4,170
1–2 heifer deaths prevented1–2 × $2,300 replacement value$2,300–$4,600

Avoided losses: $7,524 to $9,824 conservatively. SBS cost: $6,864. That’s roughly breakeven on direct costs alone. For seasonal calving operations, the annual cost drops proportionally — but you also lose the winter data that matters most, since ammonia is highest when barn doors stay closed.

There’s a labor trade-off, too. At 200 hutches, figure roughly 1.5 to 2 hours per application round — broadcasting a pound of dry, white granules per hutch is comparable to hand-spreading bedding conditioner. Twice weekly, that’s 3 to 4 hours of additional calf crew time per week. Weigh that against the time your team currently spends treating BRD cases, pulling calves for retreatment, and writing up the records.

Cost CategoryPer Calf200-Calf Operation (Annual)What You’re Really Paying For
SBS Protocol (8 weeks, bulk pricing)$5.28$6,864Bedding chemistry + labor
Direct BRD Treatment (avoided)$42.15$1,054 (25 cases)Antibiotics, vet time, records
First-Lactation Milk Loss (avoided)$166.80 (3 sick days)$4,170 (25 affected calves)278 lbs/day × 3 days × $0.20/lb
Heifer Mortality (avoided)$2,300 (1–2 deaths)$2,300–$4,600Replacement heifer @ Jan 2026 price
Total Loss Exposure$2,509–$4,809$7,524–$9,824What ammonia actually costs
Net Benefit (conservative)Breakeven to +$19/calf$660–$2,960/yearBefore cohort-wide ADG gains

But here’s where it flips. That barn math only counts the calves that would’ve gotten sick. What the Casper trial showed was improvement in ADG across the entire treated cohort. Per the Soberon formula, even an illustrative 0.05 kg/day ADG improvement across 200 calves — a conservative scenario, since the trial reported statistical significance but didn’t disclose the exact delta — would translate to roughly 34,000 lbs of additional first-lactation milk across the group. At $20/cwt, that’s another $6,800 in value that never shows up in the BRD treatment ledger.

The real ROI question isn’t “does SBS pay for the BRD it prevents?” It’s “Does the cohort-wide ADG improvement hold up under replication?” If it does, the math tips decisively in its favor.

How Sodium Bisulfate Traps Ammonia at Bedding Level

The granules — white, crystalline, coarse-salt texture — soak up moisture from the bedding, activate on contact, then chemically trap ammonia before it reaches the air. Sodium bisulfate releases hydrogen ions that convert gaseous ammonia (NH₃) back into solid ammonium (NH₄⁺), locking it into the bedding instead of the calf’s lungs.

That pH drop does double duty. Lower pH means less ammonia volatilization and a hostile environment for pathogenic bacteria and fly larvae. UC Davis research documented a 60% reduction in ammonia from fresh dairy manure treated with SBS. A peer-reviewed 2010 study on calf hutch bedding found that SBS applied three times per week reduced house fly larvae by 99–100% and bacterial counts by 68%. An independent horse barn study found similar reductions in ammonia and flies at 5–10 lbs per 100 sq ft.

It’s on the EPA’s Safer Choice List and used in human food processing. You can apply it with animals present — a real advantage over formaldehyde-based alternatives nobody wants to handle.

What This Article Doesn’t Tell You (Yet)

Two things should give you productive pause.

Both calf trials were funded or facilitated by Jones-Hamilton, the company that sells the product. That doesn’t make the data wrong — the blinded vet design is strong, and lung ultrasound results are hard to argue with. The supporting science is solid: SBS reduces ammonia in poultry (established for 30+ years), in dairy slurry (UC Davis), in calf bedding (peer-reviewed, Doane et al. 2010), and in horse barns (independent, peer-reviewed). But calf-specific lung lesion and ADG data from an independent university trial — with full publication of sample sizes, p-values, and methodology — would move this from “promising” to “proven.” Until that publication lands, treat it as strong pilot data. Not settled science.

Second, sodium bisulfate treats the chemistry, not the airflow. If your ammonia problem is fundamentally a ventilation problem (and in converted hog barns across Iowa, Minnesota, and Wisconsin, it very often is), no bedding amendment fixes insufficient air exchange. UW-Extension recommends a minimum of 4 air exchanges per hour in cold weather for indoor calf housing. SBS manages what’s happening at the bedding level. Ventilation manages the air above it. The best protocol combines both. 

SIDEBAR: Can Sodium Bisulfate Replace Copper Sulfate in Your Footbath?

Jones-Hamilton took SurPHace to RTI Labs for footbath testing, mixing different concentrations and inoculating them with fresh dairy manure at 90-gram intervals — roughly mimicking cow-after-cow traffic — up to a total of 360 grams.

pH stayed consistently low through the manure loading. Aerobic bacteria stayed statistically lower. When they tested specifically against Treponema — the organism behind digital dermatitis — sodium bisulfate “greatly reduced” the count.

Head-to-head against copper sulfate, it performed as well or slightly better. Mixed, the two showed a synergistic effect. Jones-Hamilton claims SBS runs 50–130% less than copper sulfate for footbath use.

The caveat: single lab trial from the manufacturer. Independent replication of the footbath would strengthen the case. But for operations frustrated with formaldehyde and watching copper sulfate prices climb, it’s a third option worth running numbers on with your hoof trimmer.

Your Move

  • In the next 30 days, test your calf barn ammonia at calf nose height — not yours. Colorimetric detection tubes cost a few dollars each and give you a reading in minutes. The threshold is 4–5 ppm, not the old 10 ppm. Remember that the Swiss study found calf-height readings nearly double those from stationary sensors.
  • Pull your preweaning BRD records from the last 12 months. Calculate your real cost per case — treatment, labor, mortality. Then estimate the first-lactation milk you’re leaving on the table: each day of preweaning illness costs roughly 278 lbs of first-lactation milk, according to Heinrichs’ Penn State data. At $2,300+ per replacement heifer, what’s your actual exposure?
  • If your calf facility started life as a hog barn, give it extra scrutiny. Ventilation was designed for a different animal at a different stocking density. These barns are notorious ammonia traps in winter.
  • Apply the ventilation-first rule. Below 4 air exchanges per hour? Fix that before you spend a dollar on bedding chemistry — no amendment compensates for dead air. If ammonia stays above 5 ppm after adequate ventilation, then bedding chemistry is your next lever.
  • Run the SBS cost against your herd. At bulk pricing, the protocol costs roughly $5 per calf for an 8-week cycle. Factor in 3–4 hours of extra calf crew time per week for a 200-hutch operation. Breakeven on direct BRD costs is tight — but if the cohort-wide ADG improvement holds, the return tips positive. Contact Jones-Hamilton for current dairy bulk pricing.
  • Within 90 days, build a weekly ammonia monitoring routine at calf height and track BRD incidence against your baseline. You need 8–12 weeks of data to separate a real protocol effect from seasonal variance.
  • At 12 months, compare BRD costs, mortality, and weaning weights against the prior year. If ADG improves, project the first-lactation milk value using the Soberon formula: 1,550 kg per 1 kg increase in ADG. That’s where the real payback shows up — years downstream, not at weaning. 
ScenarioAnnual SBS Cost (200 calves)Avoided LossesAdditional UpsideNet ROI
Conservative (direct BRD/mortality only)$6,864$7,524–$9,824None assumed+$660 to +$2,960
If ADG gains hold (cohort-wide milk)$6,864$7,524–$9,824+$6,800 (first-lactation milk, 0.05 kg/day ADG improvement)+$7,460 to +$9,760
Labor cost (3–4 hrs/week × 52 weeks × $18/hr)–$2,808 to –$3,744Factor into net
Breakeven threshold$6,864Need to avoid 13–17 BRD cases + 1 deathNoneConservative case
Decision pointTrial for 90 daysTrack BRD, mortality, weaning weightsRe-evaluate at 12 months against baselineGo/no-go based on your numbers

Key Takeaways

  • If your calf barn ammonia is above 4–5 ppm at calf height, you’re in the damage zone — recent work shows calf-level readings can run nearly twice as high as stationary barn sensors, with lung lesions and BRD risk climbing fast.
  • If you can get ammonia under that 4–5 ppm line, a $5‑per‑calf sodium bisulfate protocol is at least breakeven on BRD and heifer losses for a 200‑calf operation ($6,864/year product cost vs. roughly $7,500–$9,800 in avoided treatment, mortality, and first‑lactation milk loss).
  • If your barn is under 4 air exchanges per hour, fix ventilation before you touch bedding chemistry — sodium bisulfate can trap ammonia in the bedding, but it won’t rescue calves from fundamentally dead air.
  • If you’re short on replacements or paying $2,300+ for heifers, ammonia control becomes a genetics and milk‑yield strategy, not just hygiene, because early‑life ADG and disease now tie directly into first‑lactation production and herd structure.
  • If you decide to trial sodium bisulfate, treat the current data as strong but manufacturer‑funded pilot work — run your own 30/90/365‑day numbers and watch for independent university replication before betting the whole protocol on it.

The Bottom Line

Walk into your calf barn tomorrow morning. Get down to calf height. Take a breath. If you can smell ammonia, you already have your answer about whether this conversation applies to your operation. The next question is what you’re going to do about it — and we’ll be watching for independent university replication data on these SBS trials to report as it comes in.

Complete references and supporting documentation are available upon request by contacting the editorial team at editor@thebullvine.com.

Learn More

The Sunday Read Dairy Professionals Don’t Skip.

Every week, thousands of producers, breeders, and industry insiders open Bullvine Weekly for genetics insights, market shifts, and profit strategies they won’t find anywhere else. One email. Five minutes. Smarter decisions all week.
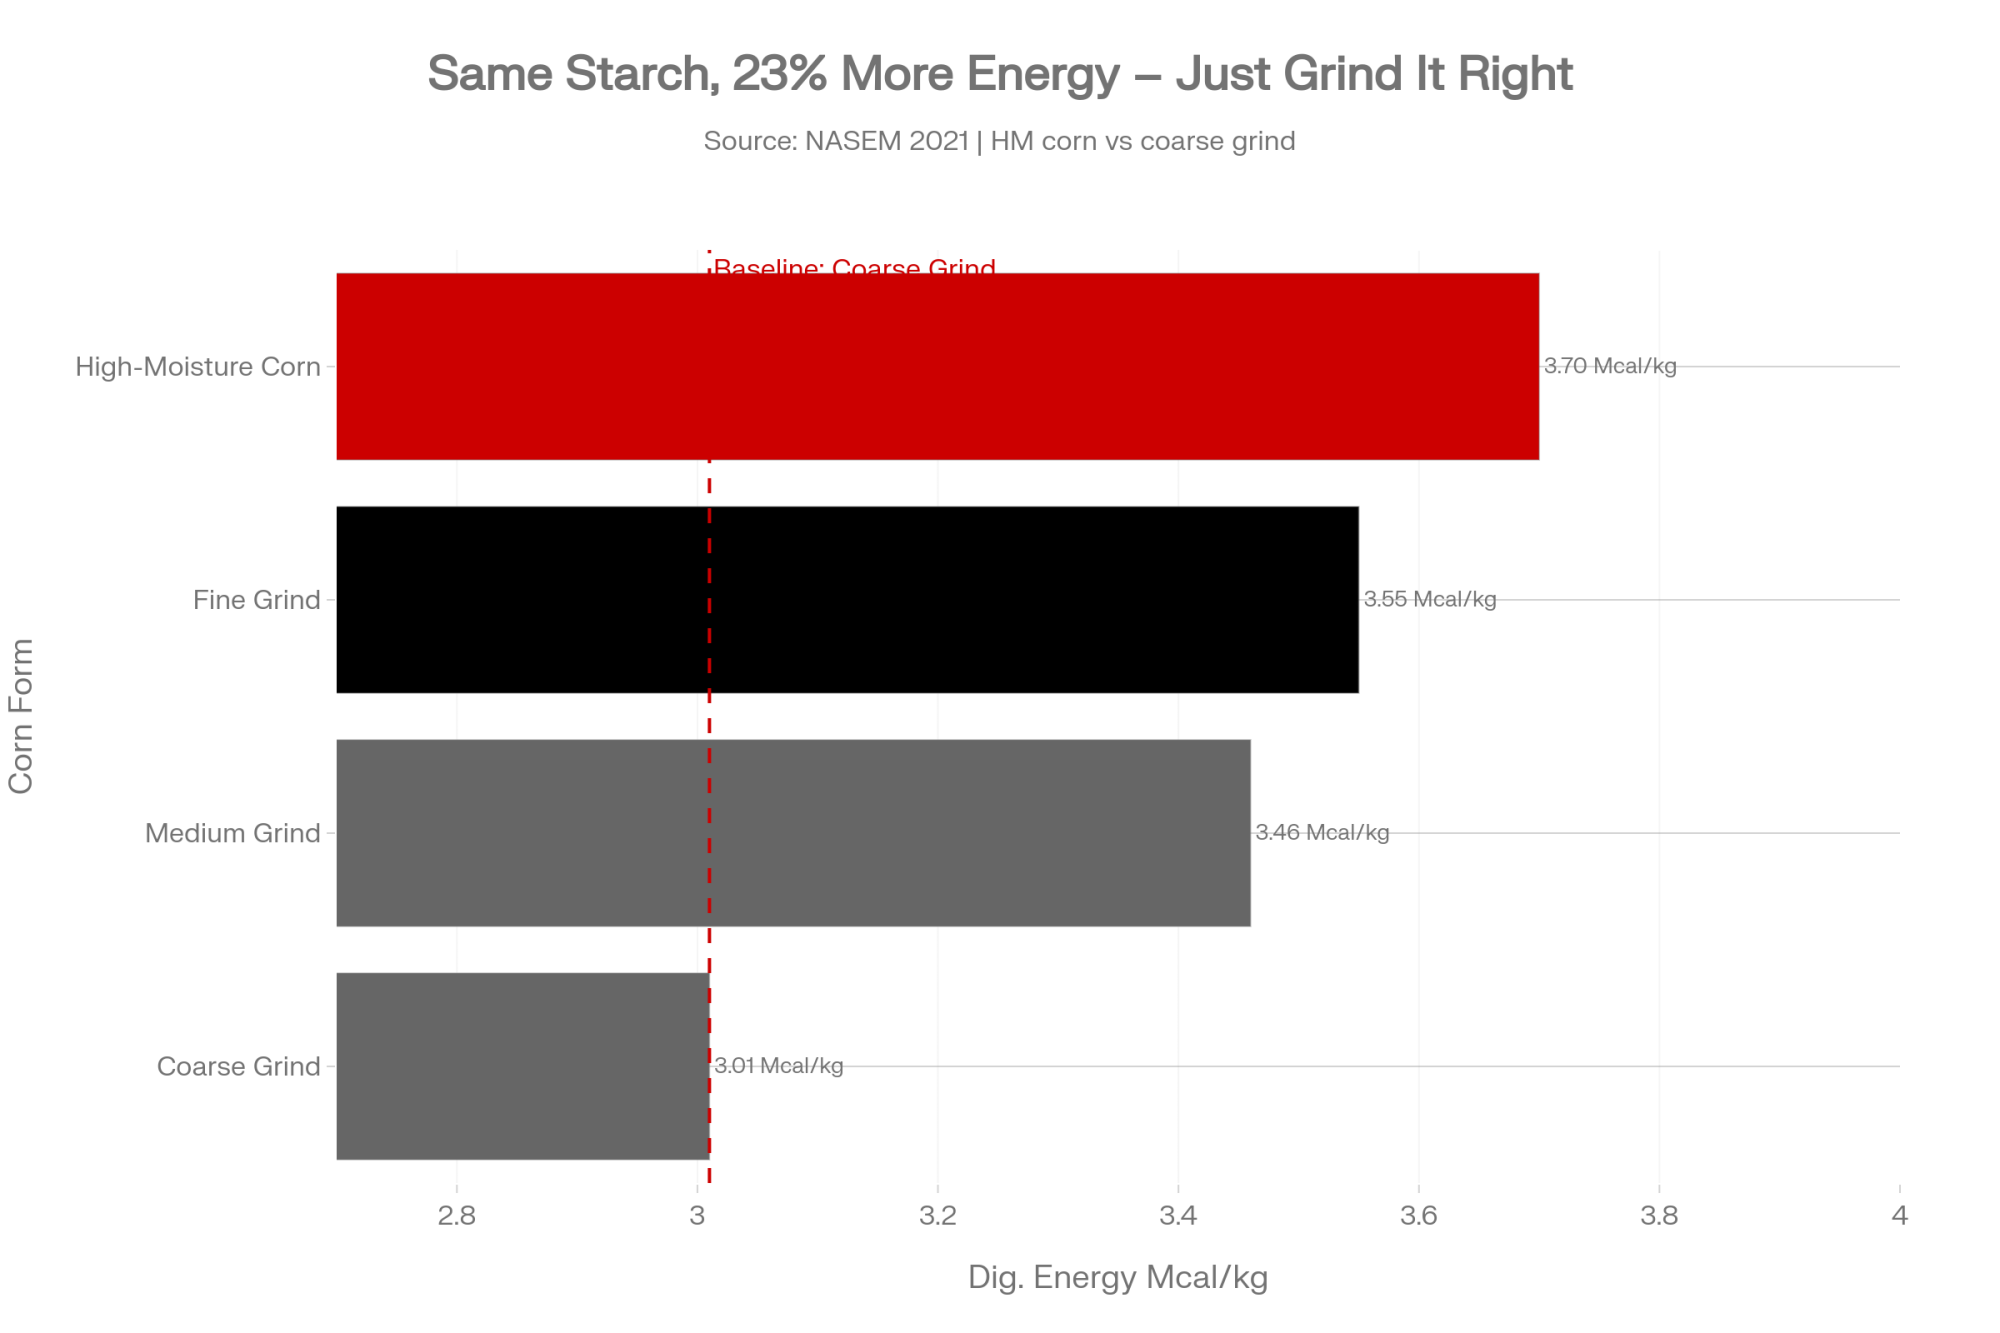
NewsSubscribe
First
Last
Consent

Harrisburg Dairies’ Bankruptcy Left $985,012 in Unpaid Milk – And Put 15 Farms in a Clawback Trap.

You think the worst day is when the truck stops. For 15 Harrisburg shippers, the real hit came later — when $985,012 in milk became a risk of a bankruptcy clawback.

Executive Summary: Harrisburg Dairies’ October 2025 shutdown left 15 Pennsylvania farms owed $985,012 for milk that was already sold, with the state’s bond and security fund covering only about 74% of that total. That shortfall exposes the real limits of Pennsylvania’s Milk Producers’ Security Act on a working dairy — it’s built to cover roughly 40 days of milk, not the six to eight weeks of arrears many producers quietly carry. When the company filed Chapter 11 in February 2026, it opened a 90‑day clawback window that could yank money back out of farms’ accounts for checks they’ve already cashed. The article walks through barn‑level math for a 200‑cow herd and a 300‑cow herd so you can plug in your own numbers and see exactly what a 74% recovery means in dollars. It then uses the Dean Foods precedent to explain, in practical terms, how ordinary‑course, subsequent‑new‑value, and contemporaneous‑exchange defenses can cut clawback exposure. The core mindset shift is simple: the Board optimizes for system stability, but you have to optimize for your own balance sheet. The back half is a concrete 30/90/365‑day playbook — from setting a hard limit on unpaid milk, to lining up a backup buyer, to stress‑testing whether your cash flow can survive a three‑month revenue gap if your processor ends up looking like Harrisburg.

$985,012. That’s the total owed to 15 central Pennsylvania dairy farms when Harrisburg Dairies permanently ceased operations on October 6, 2025, according to Pennsylvania Milk Marketing Board executive secretary Betsy Albright in state milk board records and local coverage from October 2025. The company’s security bond and collateral covered $730,942.29 — roughly 74 cents on every dollar owed. The other 26 cents? That’s the gap the system wasn’t built to close.

Rob Barley chairs the PMB and co-owns Star Rock Farms, a 1,500-cow Lancaster County operation. When Harrisburg Dairies went dark on Monday, October 6, at least five farms were still actively shipping to the plant — bulk tanks with nowhere to go. “We will do everything possible that the law will allow to help farmers receive the maximum amount of funds available,” Barley told reporters in October 2025. Note the qualifier: what the law allows. All five farms have since been accepted by cooperatives operating in the area, according to Barley. But the milk they’d already shipped and never been paid for — that’s a separate problem.

On November 5, 2025, the PMB issued Official General Order A-1021 directing the pro rata distribution of the Harrisburg Dairies security fund and collateral bond proceeds. Kevin High, one of the 15 shippers, was awarded $43,728.01. That’s what 74 cents on the dollar looks like on one farm’s milk statement.

Then, on February 20, 2026, Harrisburg Dairies filed Chapter 11 in Pennsylvania’s Middle District Court (Case No. 1:26-bk-00474, Chief Judge Henry W. Van Eck), represented by Robert E. Chernicoff of Cunningham and Chernicoff PC. Court filings show nearly $4.6 million in assets against roughly $3.6 million in liabilities, primarily loans from Mid Penn Bank, which has filed a Request for Notice. Only about five employees remain, with a pending payroll of $7,624. WGAL reported on February 24 that the company has identified a prospective buyer and is seeking to use cash collateral to reorganize. First Day Motions filed on February 23 included requests for cash collateral use, assurance of utility service, and pre-petition payroll, with an expedited hearing set for February 26 at the Sylvia H. Rambo U.S. Courthouse in Harrisburg.

That filing triggered a second wave of financial exposure — the 90-day preference clawback — that could force farms to return payments they’ve already deposited and spent.

What Actually Breaks When the Truck Doesn’t Show Up

A 200-cow dairy produces roughly 16,000 pounds of milk per day. Without a scheduled pickup, the bulk tank is full in 48 hours. The cows don’t stop. The feed bill doesn’t pause. Every gallon dumped destroys revenue, with the cost already incurred.

But the cascade goes deeper than a full tank. Farmers reported that hauling deductions withheld from their milk checks were not being forwarded to haulers. So the driver who’s supposed to pick up Tuesday’s milk has his own cash-flow crisis — and no obligation to keep showing up for a defunct processor’s route. The weekly payment that was supposed to arrive under the PMB’s special order? It stopped.

Most of these farms were already six to eight weeks behind on payments when the plant went dark. Finding a new buyer takes weeks, and the first check from a cooperative takes a month or more. The real revenue gap isn’t six to eight weeks. It’s closer to 10 to 12 from the last real payment to the first new check.

One producer told reporters he’d “calculated the risk in staying with Harrisburg Dairies given the prior late payment citations and continued lapses in their required weekly payments.” He stayed anyway. “It’s also a dream, of sorts, to be shipping to a local brand,” another anonymous producer explained. That loyalty — to a 94-year-old local processor — kept them shipping right up until the truck stopped coming. It’s the same generational pull that keeps families tied to the loyalty that keeps a family shipping to the same buyer for generations even when the math says otherwise. And some farms may have stayed simply because route geography, co-op-based programs, or timing barriers left them without a realistic alternative.

How Far Does Pennsylvania’s Milk Security System Actually Go?

Pennsylvania’s Milk Producers’ Security Act requires licensed dealers to file a surety or collateral bond equal to a minimum of 75% of the highest aggregate amount owed to all producers for 40 days during the preceding 12 months. A smaller subset of the roughly 193 dealers licensed by the Board participates in a security fund, posting a minimum 30% bond and making monthly contributions of 2¢ per hundredweight. As of April 2024, the fund held more than $3 million, with more than $100 million in total collateral and surety bonds across all dealers. Pennsylvania is one of only a few states that provide this type of buyer-default protection — worth remembering if you’re shipping to a proprietary plant outside PA.

For Harrisburg, Albright confirmed in news reports that the available security instruments totaled $730,942.29 — against $985,012 owed. The statute is clear: “the moneys available shall be divided pro rata among producers.” No floor. No minimum payout per farm. Kevin High’s $43,728.01 payout shows exactly what that haircut looks like.

Bottom line: The system covers roughly 40 days of exposure. When a dealer falls further behind than that before anyone pulls the trigger, the math breaks.

Running the Numbers: Your Exposure at 200 Cows

Take a 200-cow herd averaging 80 pounds per cow per day at $20/cwt:

  • Daily production: 16,000 pounds
  • Weekly milk revenue: roughly $22,400
  • Six weeks behind: $134,400 in unpaid milk
  • Eight weeks behind: $179,200 in unpaid milk
  • At 74% recovery, you’re eating $34,944 to $46,592 that no security fund will cover

The 15 Harrisburg farms averaged roughly $65,700 each in total unpaid milk, some substantially more. At a 74% recovery rate, the average unrecovered loss per farm is around $17,000. Plug in your own herd size. At 300 cows, eight weeks at $20/cwt is $268,800. At 74% recovery, you’re absorbing nearly $70,000 in losses.

Herd Size (cows)Total Unpaid (8 weeks @ $20/cwt)74% Recovery (Security Fund)Unrecovered Loss
100$89,600$66,304$23,296
200$179,200$132,608$46,592
300$268,800$198,912$69,888
500$448,000$331,520$116,480
750$672,000$497,280$174,720

Could Your Dairy Farm Get a Clawback Letter After Harrisburg Dairies’ Bankruptcy?

The October closure broke daily operations. The February 20 bankruptcy filing broke the legal recovery. Under 11 U.S.C. § 547, payments made during the 90 days before a Chapter 11 filing are considered “preference” payments. The bankruptcy estate can demand repayment of those payments.

Harrisburg’s 90-day window reaches back to approximately November 22, 2025. Any partial payments clearing old balances during that window could be subject to clawback demands — from farms that were already underwater.

This isn’t hypothetical. When Dean Foods filed Chapter 11 in November 2019 — a collapse The Bullvine covered extensively, from the $850 million DIP financing to how two years of changes led to two major bankruptcies — approximately 500 independent former Dean milk suppliers received demand letters from ASK LLP, a St. Paul, Minnesota firm authorized to pursue preference actions as of September 1, 2020. About 100 of those letters went to Pennsylvania dairy farmers alone. AFBF called the letters “a predatory shakedown,” and General Counsel Ellen Steen demanded ASK withdraw them within 10 business days.

Three defenses cut that exposure — sometimes to zero:

  • Ordinary course of business: If that December check looks like how you’d always been paid — same lag, same method — courts often side with you. For milk, where everyone knows standard pay cycles, this defense is strong.
  • Subsequent new value: Kept shipping after that payment and never got paid for the later milk? That unpaid “new value” offsets the preference dollar-for-dollar. Got a $28,000 check in December but shipped another $25,000 in unpaid milk afterward? Real exposure drops to $3,000.
  • Contemporaneous exchange: If the payment and the milk delivery were roughly simultaneous, there’s no old debt to claw back.

The critical detail from the Dean precedent: the PMMB — working with the Pennsylvania Attorney General’s office and ASK LLP — developed standardized declaration forms that farmers could submit instead of full financial records. ASK agreed to accept the declarations and close files for producers who demonstrated ordinary-course-of-business payments. Board Secretary Carol Hardbarger credited cooperation from the AG’s office, the Center for Dairy Excellence, and the PA Farm Bureau for enabling the quick resolution, a sentiment echoed by Barley.

If Harrisburg Dairies’ estate pursues similar preference actions, that Dean playbook is your template. Don’t pay. Don’t ignore. Get a bankruptcy-savvy ag attorney, pull 12–18 months of invoices and payment dates, and respond with: “We’re evaluating defenses. Extend the deadline.” The broader processor concentration problem driving these collapses — and what your options actually look like — is something we broke down in the consolidation math reshaping who buys your milk.

What Do Dean Foods, Borden, and Harrisburg Dairies Have in Common?

Here’s the uncomfortable pattern: in each of these cases, regulators had documented evidence of deterioration months before the collapse — and chose to keep the processor operating.

Harrisburg Dairies was under a weekly payment order since September 2023. By May 2025, the PMB had evidence of violations dating back to at least December 2024 and found grounds to revoke the dealer’s license. They chose not to. “Doing so would not serve the best interests of the Pennsylvania dairy industry,” the Board ruled on May 7, 2025, according to PMMB Sunshine Meeting minutes from May 7, 2025 and local coverage summarizing the Board’s decision. The Board’s decision reflected a structural tension built into the Act itself: revoking a license protects producers from future losses but can strand current shippers with no buyer at all.

Instead: stricter conditions, a higher bond, and weekly payments at 110% of the previous month’s lowest class price. “They lost a big customer. There wasn’t much we could do but give them the 28 days. We also made sure someone could take the milk from those farms,” Barley told news reports in July 2025. Pennsylvania has limited processing capacity, and the alternative to an imperfect processor is sometimes no processor at all. Doug Eberly, PMB chief counsel, confirmed the termination approval was narrow: “This is not a blanket approval — it applies only to this particular volume loss.”

Two consequences followed. Arrears stretched from two to three weeks behind in mid-July to six to eight weeks by early October. And milk volume continued to flow through a processor whose bond covered only 74% of producer exposure.

The common assumption: “If it gets really bad, the Board will shut them down before I get too exposed.”

Collapse IndicatorDean Foods (2019)Borden (2020)Harrisburg (2025)
1. Payment Terms DeteriorateFailed Oct 2019 Class I obligations before Nov 12 filingNeeded court permission to pay Dec 2019 milk billsWeekly payment order since Sept 2023, violated for months
2. Company Shrinks to SurviveClosed 6+ facilities, carried >$1B net debtFiled Ch 11 in Jan 2020 citing debt loadLost Whole Foods (229K lbs/wk), terminated 7 farms July 2025
3. Regulatory Involvement EscalatesActive FMMO issues, public scrutinyCourt oversight of paymentsPMB payment order, license revocation debate

The data says otherwise. The Board optimizes for system stability — keeping enough processing capacity alive so farms have somewhere to send milk tomorrow. You need to optimize for your own balance sheet.

Three signals showed up 6–12 months before each of these collapses:

  1. Payment terms deteriorate and never recover. Not one late check — a new, worse normal. Dean failed to make October 2019 Class I obligations to most regional FMMOs in the month before its November 12 filing, according to The Milkweed. Harrisburg’s weekly order was violated for months before closure.
  2. The company shrinks to survive. Harrisburg lost its Whole Foods Market contract — 229,116 pounds per week — then terminated seven Lebanon County farms in July 2025 to match the volume loss. Dean closed at least a half-dozen facilities and carried more than $1 billion in net debt as of its November 2019 filing. The Walmart second-plant story tells that same tale from the other side — 18 months after Walmart’s first plant opened, Dean filed.
  3. Regulators become characters in the story. Payment orders, missed pool payments, PMB hearings, and special oversight. Borden needed court permission to pay the December 2019 milk bills. When your buyer’s name starts appearing regularly on regulatory hearing agendas, treat it as a serious risk signal — not a guarantee of failure, but a pattern that preceded every processor collapse examined here.

The moment you see all three on the same timeline, stop asking “Will they make it?” Start asking “How fast can I move my milk?”

Your Buyer Just Got a Payment Order. Now What?

If your processor is on a payment order right now, you’re in the window where Harrisburg’s farms found themselves in mid-2025. Here’s the playbook they wish they’d had.

This week (30-day actions):

  • Document everything. Pull 12–18 months of milk statements, deposit dates, component data, and payment timelines. This is your evidence for ordinary-course and new-value defenses if clawback letters arrive.
  • Know your number. Calculate your unpaid balance in dollars and days. Set a hard threshold: “We will not carry more than 30 days of unpaid milk with this buyer.” For a 200-cow herd at $20/cwt, that’s roughly $96,000. If that figure makes your stomach turn, you have your answer.
  • Make two phone calls. Contact at least two alternative buyers — co-ops or other plants in your draw. Ask bluntly: “If my current buyer fails, how fast could you start picking up?” The farms that moved before October had already started those conversations. The ones still there on October 6 were caught without a backup.

Next 90 days:

  • Call your lender before they call you. Your operating lender is watching the same PMB orders you are, updating your risk profile without telling you. Say this: “Here’s our exposure, here’s our Plan B, here’s the working capital we’ll need for a 60-day cash gap. Are you in or out?”
  • Stress-test for a three-month revenue gap. Harrisburg’s farms were 6–8 weeks behind at closure, then waited another month-plus for first checks from new buyers. That’s roughly 90 days of revenue disruption. If your operation can’t survive that without the banker making survival decisions for you, your financial structure needs work, regardless of processor risk. We’ve written extensively about the liquidity buffer that separates farms that survive a revenue gap from those that don’t.

This year (365-day actions):

  • Track your buyer’s regulatory record. PMB sunshine meeting minutes and docket entries are public. Harrisburg’s problems were documented for over two years before closure. Treat those filings like forward-price signals.
  • Stay transition-ready. Keep SCC strong, records current, and relationships warm with at least one alternative buyer. Our deep dive on keeping your components and SCC where a co-op field rep says yes, lays out the protocol.

Red flag: Your buyer is on a payment order AND has lost a major customer or closed a facility in the past 12 months. That’s two of three collapse indicators active.

Opportunity: Your co-op field rep confirms route capacity and 30-day pickup timeline. That’s your exit ramp — keep it open. But understand what the equity retained on your co-op milk check actually costs you before you sign.

Key Takeaways

  • If your buyer is more than 21 days behind on payment, your exposure already exceeds the PA Milk Security Act’s 40-day bond coverage window — and the gap widens every week you keep shipping. Run the math from the 200-cow example above with your own herd size.
  • If you received any payment from a distressed processor within the 90 days before their bankruptcy filing, pull your records now. Your ordinary-course-of-business defense depends on documentation you can produce — not on what you remember.
  • If your processor has been on a payment order for more than six months, you’re past the warning-signal stage. Two of Harrisburg’s three pre-collapse indicators (deteriorating terms + regulatory involvement) are already active. The only question is whether the third (shrinking to survive) has started.

The Number That Decides Who Survives the Transition

Consider two operations on the same route in Harrisburg. Same buyer, same October 6 closure. The one with modest debt and three months of breathing room rides it out — switches to a cooperative, absorbs the equity retained on the new milk check, moves on. The one with maxed-out operating credit and razor-thin liquidity hits a 60-day payment gap, and suddenly the banker — not the co-op — is making the survival call.

Processor risk and leverage risk are the same animal when the plant goes dark.

That anonymous Harrisburg producer who told news reports he’d “calculated the risk in staying” — he did the math and stayed. The bond covered 74 cents. Kevin High’s $43,728.01 check from the PMB tells you what the 74 cents actually buys. The other 26 cents is a hard lesson in the distance between what the system promises and what it delivers.

Pull your last three milk statements. How many days behind is your buyer right now? Multiply your daily production by that number, then by your pay price. That’s your current uninsured exposure — and the only forecast that matters before Tuesday’s truck doesn’t show up.

Days Behind100 Cows200 Cows300 Cows500 Cows750 Cows
15 days$12,000$24,000$36,000$60,000$90,000
21 days$16,800$33,600$50,400$84,000$126,000
30 days$24,000$48,000$72,000$120,000$180,000
45 days$36,000$72,000$108,000$180,000$270,000
60 days$48,000$96,000$144,000$240,000$360,000

Complete references and supporting documentation are available upon request by contacting the editorial team at editor@thebullvine.com.

Learn More

The Sunday Read Dairy Professionals Don’t Skip.

Every week, thousands of producers, breeders, and industry insiders open Bullvine Weekly for genetics insights, market shifts, and profit strategies they won’t find anywhere else. One email. Five minutes. Smarter decisions all week.
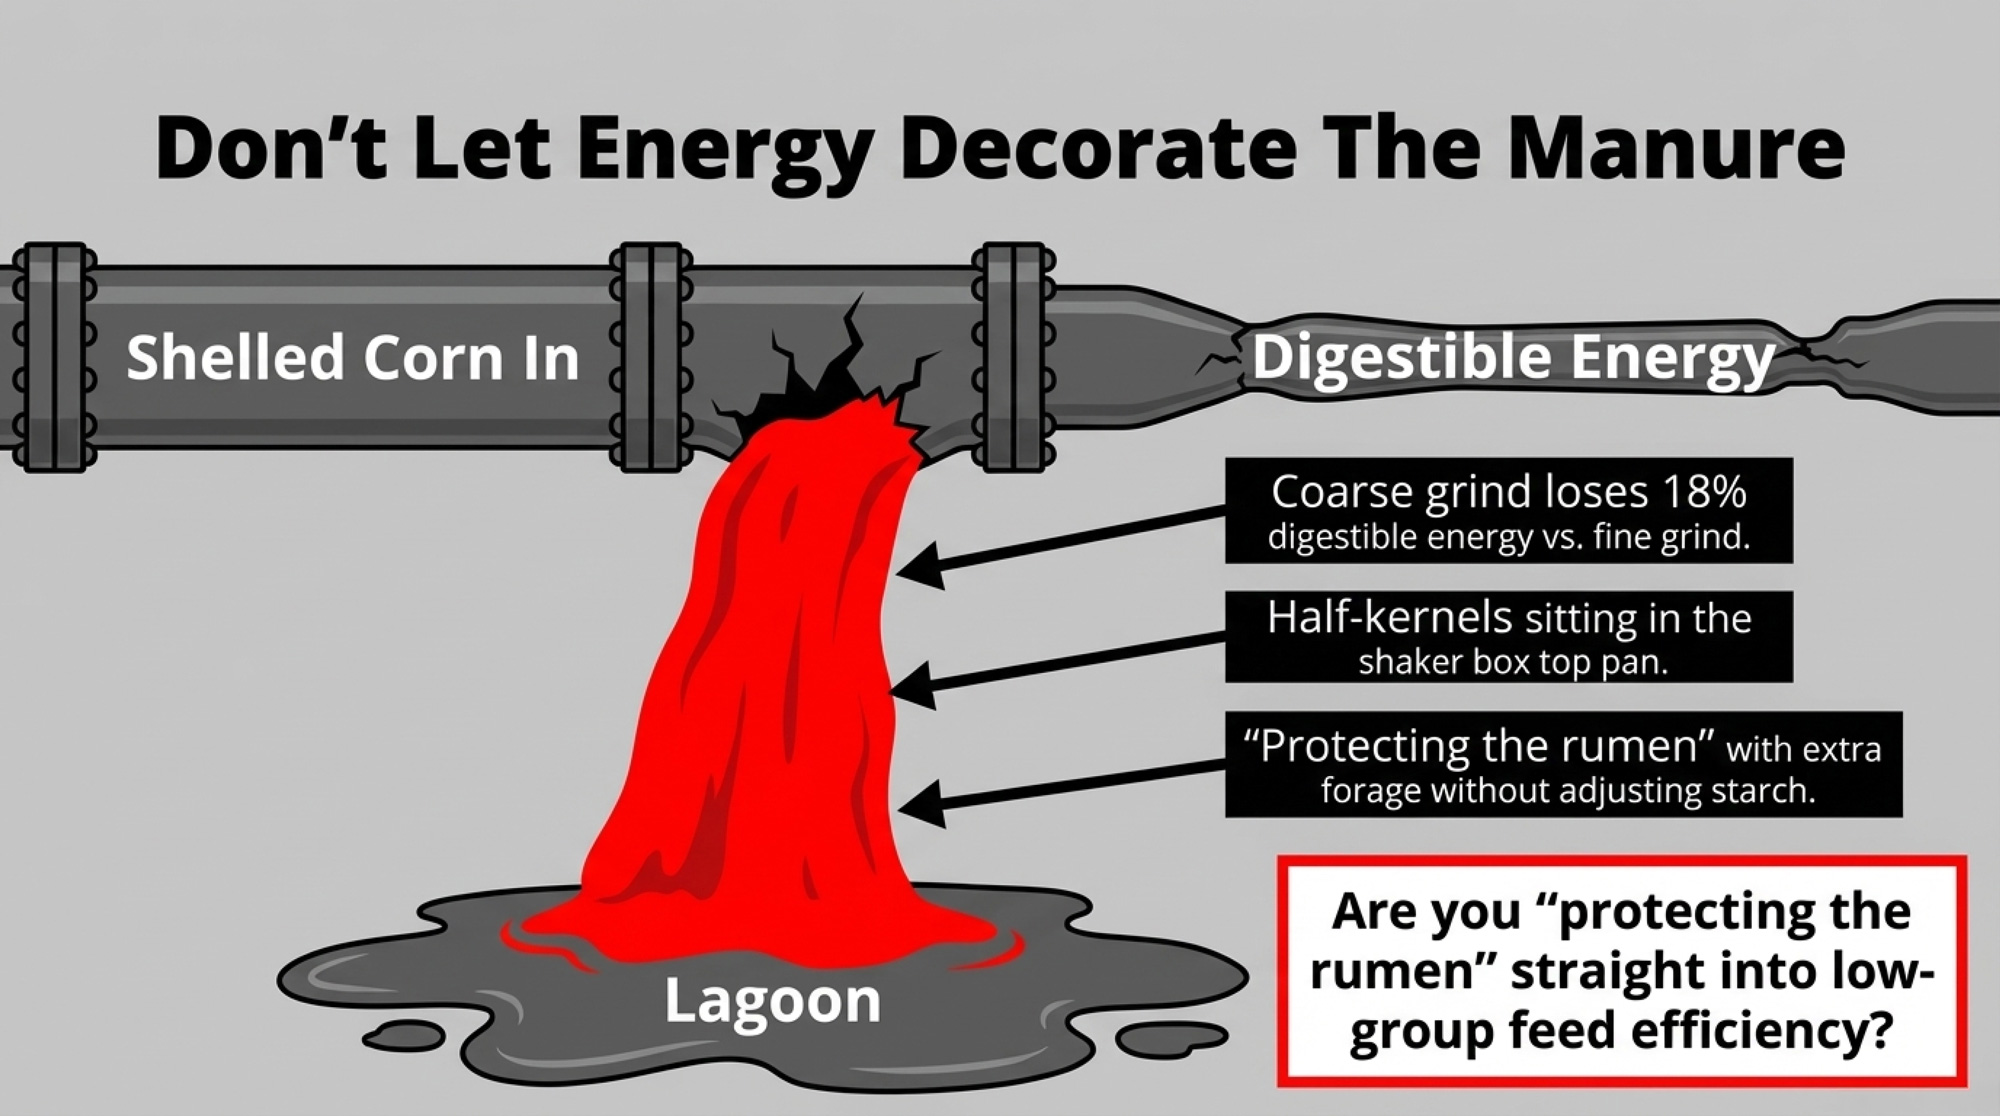
NewsSubscribe
First
Last
Consent

Mary Creek’s $1,000 Plywood Calf Hutch Fix – And the Farmer-Made Ingenuity Contest That Put It on the Map

A plywood calf hutch panel, a combo silage bucket, and a kid‑safe bale opener just beat the catalog. Three Farmer‑Made fixes that saved calves, feed, and fingers — and might be hiding in your shop too.

Executive Summary: The Center for Dairy Excellence’s first Farmer-Made Ingenuity Contest showed how far barn-made fixes can go when three dairy families beat the catalog with what was already in their shop. Palmyra Farm’s Mary Creek won $1,000 using a 30×30-inch plywood panel on her calf hutches — a scrap-wood windbreak that can pay for itself thousands of times over if it saves even one replacement heifer now worth about $3,000. In Pennsylvania, Donny Bartch welded his silage defacer onto the bucket so he never has to swap attachments, a simple change that lines up with UW Extension data showing better face management can keep roughly $3,800 of feed a year from rotting on the bunk in a 100‑cow herd. At Love Haven Farm, Susan Spadaro’s homemade bale opener let 4‑H kids cut twine without carrying knives, a small safety upgrade in a sector where at least 33 children are seriously hurt on farms every day. The pattern is clear: when the problem is simple, the risk is low, and the materials are already lying around, building your own solution can save calves, feed, and fingers faster than waiting on a sales rep. If you’re reading this, your 30‑day job is to walk your barn, find one thing you complain about every week, and ask whether an hour in the shop could turn it into your own Farmer‑Built fix.

Mary Shank Creek has spent her life building one of the most accomplished Ayrshire breeding programs in the country. Palmyra Farm — the five-generation family operation she runs with her brother Ralph Shank Jr. in Hagerstown, Maryland — has produced over 150 cows with lifetime production exceeding 100,000 pounds of milk, exported embryos to 10 foreign countries, and was the first U.S. operation to utilize embryo transfer in the Ayrshire breed. That work earned them the 2022 Robert “Whitey” McKown Master Breeder Award at World Dairy Expo. Three years earlier, Creek and Shank received the National Dairy Shrine’s Distinguished Dairy Cattle Breeder Award.

So when the Center for Dairy Excellence launched its first-ever Farmer-Made Ingenuity Contest and asked dairy farmers across the mid-Atlantic to submit their best homegrown innovations, you’d expect Creek to show up with something sophisticated.

She submitted a piece of plywood.

A 30-by-30-inch piece of plywood, rigged as a calf hutch accessory to block wind and hold warmth for newborns during the winter months. That plywood panel — simple, easy to construct, easy to move — won first place and $1,000. It tells you everything about the gap between what the equipment catalog sells and what actually works when a newborn calf needs to survive a winter night.

11 Entries, Five States, More Than 500 Votes

The contest was open to dairy producers and employees in Pennsylvania, Maryland, Delaware, New Jersey, and West Virginia. The Center collected 11 submissions, then opened a digital public vote. More than 500 people weighed in. Winners were spotlighted at the PA Dairy Summit in February.

Three took home cash prizes: $1,000 for first, $500 for second, and $250 for third. But the Center published all 11 innovations in a digital library at centerfordairyexcellence.org/farmer-made-library, making every submission available to any farmer looking for ideas.

“We were so impressed by the ingenuity of our dairy farmers,” said Jayne Sebright, Executive Director of the Center for Dairy Excellence. “We’ve already heard from other producers who are saying, ‘Hey, I could do this on my farm’ when they see some of the ideas. That’s what makes this type of idea-sharing so special. We learn the most from one another.”

The three winners tell very different stories about what farmer innovation looks like — and each one is specific enough to steal.

Creek’s Calf Hutch Fix: When Less Is More

The $1,000 winner: Creek’s plywood panel held in place by two zip ties and a metal hutch pole — sized to block wind while leaving 3–6 inches of ventilation gap on each side. It started with a preemie calf they were afraid they’d lose. (Photo: Center for Dairy Excellence / Farmer-Made Ingenuity Contest)

Creek’s first-place innovation solves one of the most fundamental problems in calf management: keeping newborn calves warm in winter hutches without suffocating them.

“We used a piece of plywood approximately 30 inches by 30 inches,” Creek explained. “We use it to cover the opening in our calf hutches to keep calves warmer until they are ready to face the winter temperatures, but allow reasonable ventilation. The sizing allows air to move through the hutch but reduces the exposure for the first few days of the calf’s life.”

The design is intentionally minimal. Block the wind. Retain body heat during the most vulnerable window. Remove it when temperatures allow. That’s it.

“It keeps them warm early in their lives and promotes healthy growth so they can use more of their ration for growth and less for maintaining body heat,” Creek said. “It is simple, easy to construct, move, and store. It has saved calves.”

THE BUILD SPECS

What Creek described: One piece of plywood, approximately 30×30 inches. Covers the hutch opening to block wind exposure while leaving enough gap around the edges for ventilation. Goes in at night, comes out during the day when temperatures allow. Stays in full-time during the calf’s first few days.

What you need: A single piece of exterior-grade plywood (a quarter-sheet of standard 4×8 will yield two panels). A saw. Five minutes.

Fastening and fit: Creek’s submission describes the panel as covering the hutch opening but doesn’t specify the attachment method—whether it leans, clips, or straps to the frame. If you’re adapting this for your hutches, the principle matters more than the method: size the panel smaller than the opening so air moves around the edges, blocking direct wind on the calf while allowing enough exchange to prevent moisture buildup and respiratory problems. The 30×30-inch dimensions suggest standard poly hutch openings in the 36-to-42-inch range, providing 3–6 inches of ventilation gap per side. Bungee cords work. So does a wire hook, or just leaning the panel against the opening. Try what fits your hutch brand.

That last sentence — “It has saved calves” — matters a lot more when you run the numbers.

The Barn Math on a Piece of Plywood

USDA pegged average dairy replacement heifer prices at $3,010 per head in July 2025 — a 164% jump from $1,140 in April 2019. By October 2025, that number climbed to a record $3,110 per head. Heifer inventory has dropped to a 47-year low, sitting at 3.92 million head — 18% below 2018 levels. Premium heifers at auction have been clearing north of $4,000.

A 30×30-inch piece of plywood costs less than a trip through a drive-through. If Creek’s modification prevents even oneheifer calf death per winter, the return is north of $3,000 on materials you could buy with pocket change. Prevent two, and you’re over $6,000 — from scrap plywood.

Cold stress starts earlier than most people think, too. Calves have a lower critical temperature near 50°F — meaning they’re already burning feed for heat instead of growth when the barn thermometer reads what feels like a mild autumn night. That’s energy diverted from frame, organs, and early mammary development. Creek’s plywood panel addresses exactly that gap: the first few days when a calf is most vulnerable and least able to thermoregulate on its own.

Creek didn’t engineer a heated, insulated, sensor-equipped hutch modification. They cut a piece of plywood. And they did it from a farm that has produced over 150 cows with lifetime production exceeding 100,000 pounds of milk — including five with over 200,000 pounds. Palmyra Farm has the knowledge, the resources, and the breeding expertise to buy anything in the catalog. That tells you something about what experienced producers actually trust.

For a deeper look at how cold stress costs compound before you see them on a vet bill: → Winter Calves, Hidden Losses: Feed, Bedding, and Cold Stress That Can Cost You 1,000 kg of Milk per Lactation

Bartch’s Defacer Combo: Solving a Human Problem, Not an Equipment Problem

Bartch’s second-place combo at the bunker face: a silage defacer welded on top of a standard bucket, mounted on a Kubota skid steer at Merrimart Farms in Loysville, Pennsylvania. One attachment, no swapping, no excuse to skip defacing — a behavioral fix that UW Extension research suggests could save a 100-cow operation roughly $3,800 a year in feed losses. (Photo: Center for Dairy Excellence / Farmer-Made Ingenuity Contest)

Donny Bartch’s second-place innovation at Merrimart Farms in Loysville, Pennsylvania, is a different kind of fix. Where Creek solved a calf welfare problem, Bartch solved a behavior problem — his own.

“We combined two pieces of equipment into one,” Bartch explained. “We took a silage bucket and mounted a silage defacer on top of it. We wanted to maintain the quality of the silage face with the defacer without having to hook and unhook hydraulic hoses and buckets all the time.”

You know the routine if you feed from a bunker silo. Pull silage out, then deface the exposed surface afterward — scrape it smooth and tight to minimize oxygen penetration, heat buildup, and spoilage. Research from Penn State Cooperative Extension’s Dr. Ken Griswold found that the top third of a bunker silo — where density is lowest and air penetration greatest — loses 11.7% of dry matter, compared to just 5.6% in the lower third. Dr. Brian Holmes at UW Extension recommends silage density above 15 pounds of dry matter per cubic foot to minimize that shrinkage.

But when defacing means unhooking one attachment, hooking up another, and spending extra time in weather you’d rather not be standing in — people skip it. Bartch built the excuse out of the equation.

“No more bucking into face with a bucket for 500 more pounds or having 500 extra pounds lying on the concrete until the next feeding,” Bartch said. “No matter if it’s raining, snowing, or even extremely hot, you can stay in the cab to deface and load all the silage needed.”

He didn’t build a better defacer. He eliminated the reason he wasn’t using the one he had.

The Napkin Math on Skipping the Deface

UW Extension research, reported in Progressive Dairy, put real dollars on silage face management: on a 500-cow dairy feeding 75 lbs of silage per cow per day, reducing dry matter losses by 3–4 percentage points through better face management saved more than 250 tons of silage — over $19,000 per year.

Scale that down. On a 100-cow operation, the proportional math works out to roughly 50 tons and $3,800 per year in feed that’s rotting on your bunk face instead of going through a cow.

Creek’s plywood saves $3,000 in one catastrophic moment — a dead calf. Bartch’s combo saves $3,800 in invisible daily losses you never see on a single bill. Different math, same lesson: the fix that costs almost nothing beats the problem you’ve learned to ignore.

For the full economics of what bunker mismanagement costs across a year: → Is Your Feed Storage Destroying Your Dairy Profits?

Spadaro’s Bale Opener: A Tool That Outlasted the Herd

Spadaro’s third-place bale opener up close: an old haybine section screwed to a wooden handle — two screws, no moving parts. Her dad built the first one so she could open bales at the fair without carrying a knife. Her kids used the same tool through their 4-H careers. The cattle were auctioned in 2023. The tool’s still in the showbox. (Photo: Center for Dairy Excellence / Farmer-Made Ingenuity Contest)

Susan Spadaro’s third-place entry from Love Haven Farm in Scottdale, Pennsylvania, is the quietest of the three winners. It’s also the one that sticks with you.

Love Haven Farm has been in the Miller-Love family since 1902 — five generations in East Huntingdon Township, Westmoreland County, as profiled by TribLive when the family held its dispersal auction in 2023. Susan’s father named it Love Haven after marrying Sharon in 1971. The family raised and showed Brown Swiss and Ayrshire cattle for decades. Susan’s children, Grace and Anthony, carried on the tradition at the All-American Dairy Show.

In 2023, the family auctioned 100 Brown Swiss and 25 Ayrshires. But the tool Susan submitted to the contest is still in use.

“I created a simple bale opener that makes cutting baler twine quick and easy,” Spadaro said. “The tool is made from a small wooden handle with an old haybine section screwed to it. This design allows you to strike the baler twine, and the sharp edge slices it cleanly without needing a knife.”

Simple enough. What makes this one land differently is why she built it.

“It eliminated the need for young kids to carry knives, making the process safer and easier,” she said. “When I was showing cattle, it gave me independence. Later, my children used the same tool throughout their 4-H careers, and it became a go-to item for other kids as well.”

The safety angle is bigger than it might seem at first glance. According to the NCCRAHS 2022 Childhood Agricultural Injuries Fact Sheet — the most recent available — each day, at least 33 children are seriously injured in U.S. agricultural incidents. About every three days, a child dies. Between 2001 and 2015, 48% of all fatal occupational injuries to young workers occurred in agriculture — youth worker fatalities in agriculture exceed all other industries combined. A tool that lets a 10-year-old open bales without carrying a knife around livestock isn’t just a convenience. It’s a safety decision.

And then there’s this, from Spadaro: “It has become more than just a practical fix — it’s a piece of family history that connects generations through hard work, creativity, and tradition.”

A wooden handle. An old haybine section is headed for the scrap pile. The cattle are gone now, auctioned in 2023. But the tool Susan submitted to the contest outlasted the herd — built from scrap, used by her children, and passed to other kids along the way. That’s a farm that’s been in the family since Teddy Roosevelt was president.

If you’ve raised kids on a dairy farm, you know exactly why that resonates. For more on what farm kids learn before they’re old enough to appreciate it: → When 5:30 AM Chores Matter More Than the NHL Draft: The Martin Family’s Extraordinary Lesson in Raising Dairy Kids

When Should You Build Instead of Buy?

The three winning innovations share a trait worth noticing. None required specialized skills or expensive materials. Plywood. A welder and existing equipment. A wooden handle and a discarded haybine section. The shop inventory was the R&D budget.

Creek’s hutch mod works whether you’re running 40 head or 400 — the physics of wind exposure and calf thermoregulation don’t change with herd size. But “farmer-built” isn’t always the right answer. Commercial solutions exist because they solve real problems at scale, consistently, and sometimes with safety or regulatory considerations that a shop project can’t match.

The question isn’t whether homemade is always better. It’s whether the problem you’re solving actually requires a commercial-grade solution — or just a trip to the shop with whatever’s on hand.

How to Decide

If the problem is simple and the materials are already there, build it. Creek’s plywood panel is the poster child. Wind exposure on newborn calves didn’t need electronics, sensors, or precision engineering. It needed to block a hole. Same-day build with scrap lumber. Your 30-day action: walk your barn this Saturday and identify one simple physical problem you’ve been living with instead of fixing. If the materials are already in your shop, block out two hours and build the fix.

Bartch’s innovation targets a different kind of problem — behavioral friction. He didn’t need a better defacer. He needed to stop having a reason to skip the step. Walk through your own feeding routine this week: where are you skipping something because the setup takes too long or requires an extra attachment swap? That friction point is your build project.

Spadaro’s innovation matters for a different reason entirely — safety. A dedicated tool beats a workaround whenever kids or new workers are involved. Her bale opener prevented a knife from falling into the hands of children working around livestock. That math doesn’t need calculating.

Where commercial earns its price: precision, compliance, and data logging, don’t homebrew your milk quality testing or your bulk tank monitoring. The cost of getting those wrong exceeds the cost of buying right. For a sharp look at when commercial equipment earns its price tag — and when it doesn’t: → The Robot Metric Dealers Don’t Emphasize — And Why It Predicts Your Payback

And for a reality check on how the “do-it-yourself” math works in a different context — building your own on-farm creamery versus shipping bulk: → The 143-Hour Week at Clark Farms: The Real Math of On-Farm Creamery ROI and Your Time

Key Takeaways

  • If your calf hutches are open-faced in winter and you’re losing calves to cold stress, Creek’s 30×30-inch plywood panel is a same-day build. With dairy replacement heifers hitting a record $3,110 per head in October 2025, even one calf saved per winter pays for the modification thousands of times over.
  • If you’re feeding from a bunker and your silage face management is inconsistent, audit your routine for the attachment-swap step you keep skipping. UW Extension research found that on a 500-cow dairy, reducing DM losses by 3–4 percentage points through better face management saved over $19,000 per year. On 100 cows, that’s roughly $3,800 in feed rotting rather than being produced.
  • If young workers or family members handle bales with knives around livestock, build a dedicated tool this weekend. Youth ag fatalities exceed all other industries combined. A bale opener made from shop scrap is a safety upgrade you can finish Saturday morning.
  • Before you open the equipment catalog, check your shop. All three winning innovations used materials already on the farm. The Bartch test: ask yourself what you’re skipping because the setup is too annoying. That’s your build project.

The Bottom Line

The Center for Dairy Excellence reopens the Farmer-Made Ingenuity Contest for new submissions in November 2026. Dairy producers and employees in Pennsylvania, Maryland, Delaware, New Jersey, and West Virginia are eligible. Questions? Contact Emily Barge at CDE: ebarge@centerfordairyexcellence.org or 717-346-0849.

Learn More

The Sunday Read Dairy Professionals Don’t Skip.

Every week, thousands of producers, breeders, and industry insiders open Bullvine Weekly for genetics insights, market shifts, and profit strategies they won’t find anywhere else. One email. Five minutes. Smarter decisions all week.
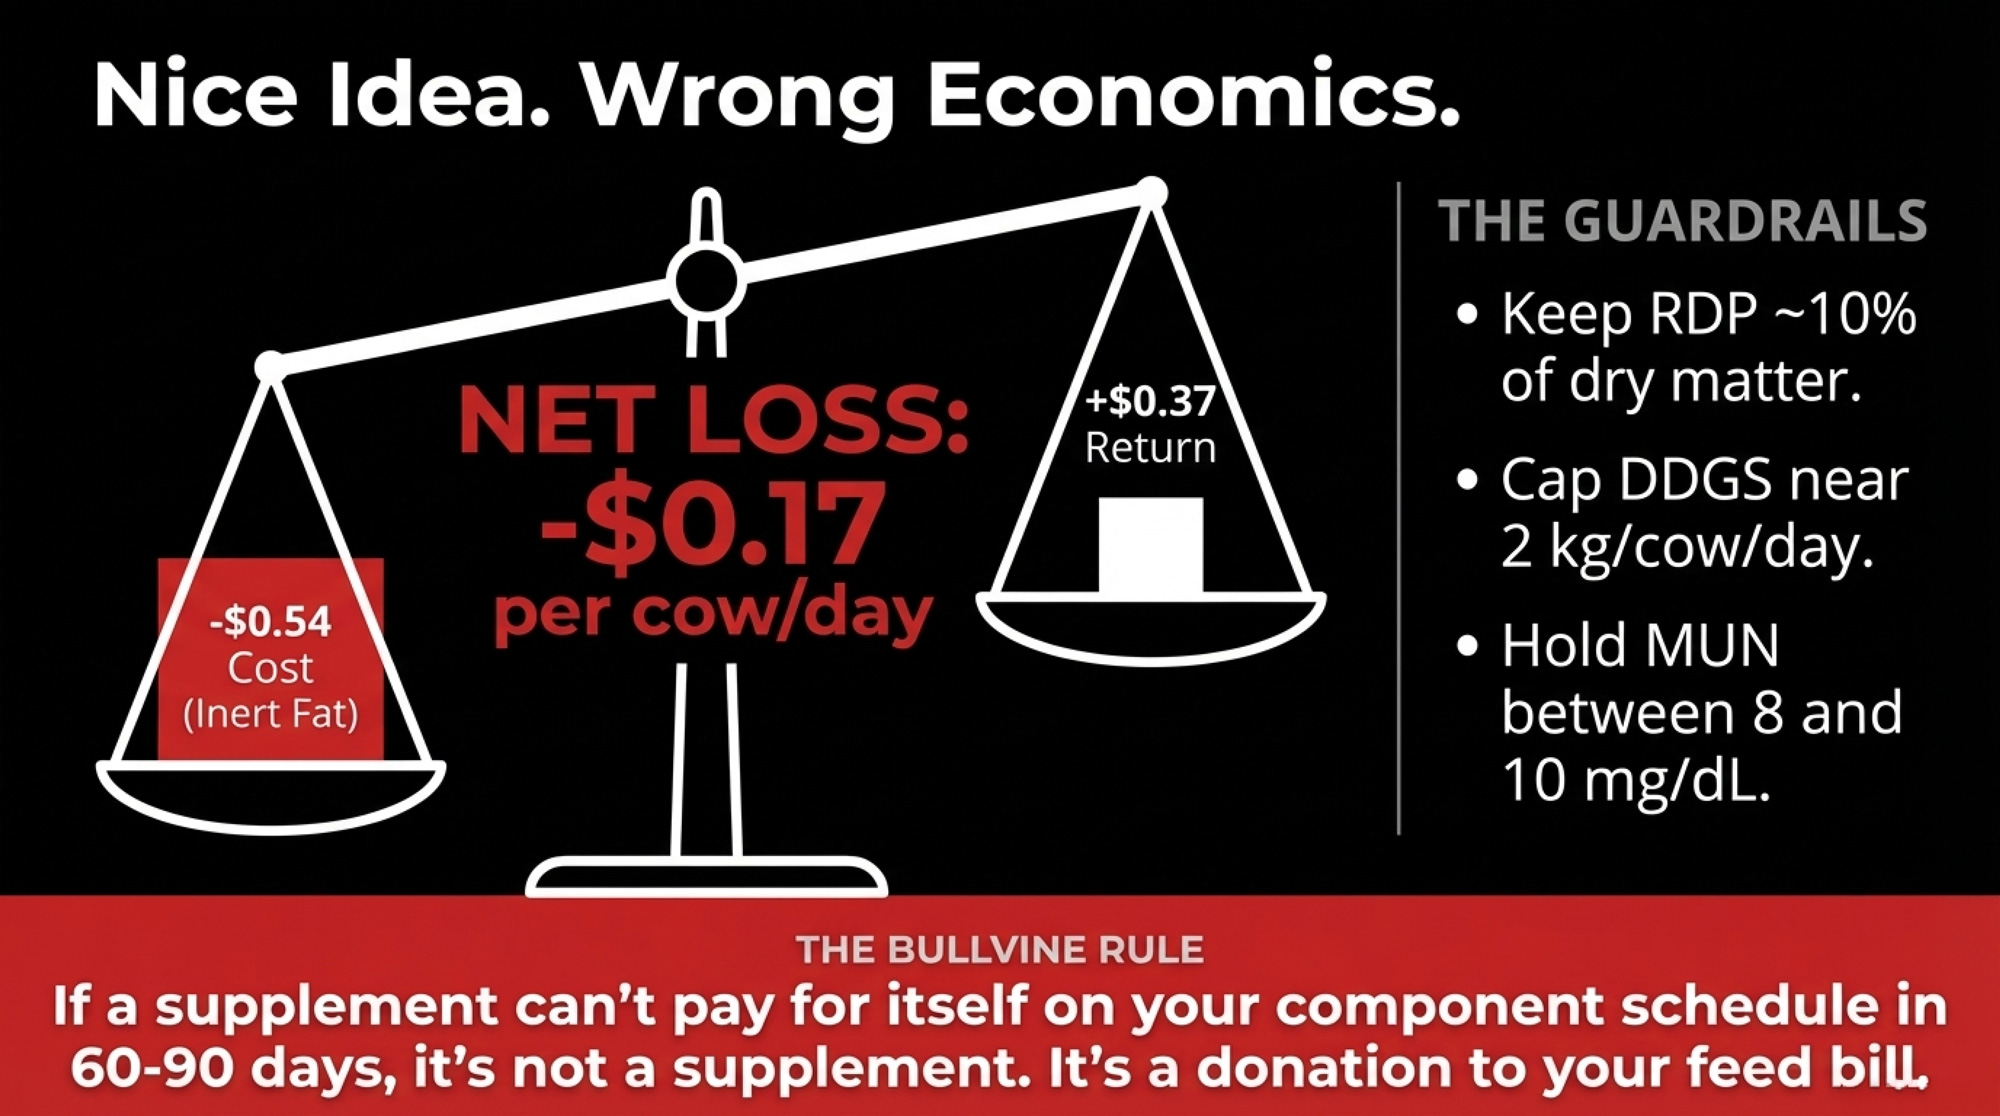
NewsSubscribe
First
Last
Consent

br2 Short Corn Beat BMR: 2.5 lb More ECM on Mid‑Lactation Cows

BMR won the NDFD test. br2 short corn still shipped 2.5 lb more ECM per cow. Ready to see why the cows disagreed?

Executive Summary: Michigan State’s first short‑stature br2 feeding trial put three br2 hybrids head‑to‑head with a tall conventional and a Pioneer BMR — and the br2 silage shipped 2.5 lb more ECM per cow per day than BMR in mid‑lactation Holsteins. On paper, BMR still owned the NDFD column, but cows on br2 ate about 2 kg more dry matter and pulled more energy out of organic matter, starch, and protein, so total‑tract digestibility and milk moved their way. Fat test slipped roughly 0.13 points versus BMR while fat pounds stayed similar, which looks a lot less scary once you know CoBank is already warning about butterfat oversupply and cheesemakers chasing a tighter protein‑to‑fat ratio. When you turn it into barn math, that ~2.5 lb ECM bump pencils out to roughly $36,500 a year on 200 cows (and north of $90,000 on 500) at a $20/cwt pay price, against about $50/acre more in seed cost from higher-priced bags and higher plant populations. br2 also brings standability and optionality BMR can’t — similar or better DM yield than tall corn, less lodging risk in storms, and the option to shell it for grain if the milk‑to‑corn ratio flips, instead of being stuck chopping every acre. The fine print: feed efficiency was lower on br2, BMR still has the best data in very early lactation, and we’re talking about one Michigan trial plus an Italian study that only tested brachytic against tall corn, so this is strong first evidence, not a universal law yet. For 2026, the smart move is to trial br2 on a slice of your silage acres, budget the seed premium up front, and sit down with your nutritionist so higher forage intake actually replaces purchased energy instead of just giving you a bigger feed bill for the same milk.

br2 corn silage vs BMR

When Bayer’s Ground Breakers program offered Andy DeVries a chance to test Preceon short-stature corn on his Rosendale, Wisconsin, silage acres, the pitch was standability. What he found went further.

“Preceon delivered yields comparable to BMR, but with exceptionally high starch and similar digestibility,” DeVries shared during a January 2026 Ground Breakers session, as recounted by Bayer senior VP Elzandi Oosthuizen. “Watching Preceon silage go into the wagon made it easy to understand where that starch is coming from.”

Then, Michigan State University published the numbers, turning his field observation into a peer-reviewed challenge to a long-standing industry assumption.

For twenty years, 30-hour NDF digestibility has been the number on every seed brochure. Higher NDFD, more milk. Simple, intuitive, and — according to the first published feeding trial of br2 corn silage — incomplete.

Mid-lactation Holsteins fed short-stature br2 corn silage produced 1.1 kg more energy-corrected milk per day than cows on BMR (37.6 vs. 36.5 kg/d, P = 0.01), even though BMR had a 3- to 6-point NDFD advantage in the lab. The hybrid bred specifically for fiber digestibility lost to the one that wasn’t, because the cow measures everything, not just fiber.

Measurebr2 (avg of 3)BMRDifferenceP-valueWinner
DMI (kg/d)26.524.5+2.0< 0.01br2
Milk (kg/d)33.232.0+1.2< 0.01br2
ECM (kg/d)37.636.5+1.10.01br2
Fat (%)4.324.45−0.13< 0.01BMR
Fat (kg/d)1.431.40+0.030.14—*
Protein (kg/d)1.151.10+0.05< 0.01br2
ECM/DMI1.431.51−0.08< 0.01BMR

One caveat up front: br2’s ECM advantage over tall conventional corn was not statistically significant in this trial (P = 0.11). The bulletproof comparison is br2 vs. BMR. That distinction matters when you’re deciding which fields to switch.

Nobody Bred This Corn for Your TMR

The brachytic2 mutation shortens internodes — the stem segments between leaf nodes — while preserving leaf area, ear size, and grain fill. It cuts plant height by roughly a third. Same engine, lower chassis.

Bayer picked up the trait for grain standability, not silage quality. The 2020 Midwest derecho drove the investment. Bayer’s own research (Barten et al., 2022, published in Crop Science) documented that short-stature plots in the derecho’s path suffered only 10–15% damage from 50–75 mph winds, while tall corn in adjacent fields was, in some cases, “completely unharvestable.”

Shawn McDonald, a Bayer agronomist, told Brownfield Ag News in September 2024 that Preceon is “only about 7 feet tall with 24-to-28-inch ear heights,” and that it “has significant reductions in green snap risk.” The dairy feeding angle came later. But when VandeHaar’s lab fed br2 silage to lactating Holsteins, the cows rewrote the priority list.

40 Cows, Five Hybrids, One Question

Sarmikasoglou et al. published in JDS Communications (2025; 6(6):776–780). Here’s what they set up:

  • 40 Holstein cows (20 primiparous, 20 multiparous), 150 ± 42 DIM, averaging 35 ± 6.4 kg milk/d at enrollment
  • Incomplete Latin square with three 21-day periods, balanced for carryover effects
  • Five silage hybrids: one tall conventional (DKC59-07RIB, Dekalb/Bayer), one BMR (P0956AMX, Pioneer), and three short-stature br2 hybrids (Bayer)
  • All diets formulated to 18% CP, ~24% forage NDF, and ~26% starch on a DM basis
  • Preplanned contrasts: Tall vs. Short (average of three br2 hybrids) and BMR vs. Short
  • Silage planted May 15, 2023, at the MSU Dairy Cattle Teaching and Research Center; chopped September 21–22 at 34% DM; feeding trial ran January–April 2024

One cow was removed for clinical mastitis; her data were excluded. Funding came from Bayer Crop Science, and co-authors D. Hammer and T. Dietz are Bayer employees — standard practice for industry-university trials. The study was peer-reviewed and published in JDS Communications.

What the Cows Actually Said

Here’s the statistically significant comparison — br2 vs. BMR:

Measurebr2 (avg of 3)BMRDifferenceP-value
DMI (kg/d)26.524.5+2.0< 0.01
Milk (kg/d)33.232.0+1.2< 0.01
ECM (kg/d)37.636.5+1.10.01
Fat (%)4.324.45−0.13< 0.01
Fat (kg/d)1.431.40+0.030.14
Protein (kg/d)1.151.10+0.05< 0.01
ECM/DMI1.431.51−0.08< 0.01

Against tall conventional, br2 bumped milk yield (33.2 vs. 32.5 kg/d, P = 0.02) but the ECM gap — 37.6 vs. 37.0 — wasn’t significant (P = 0.11). Fat yield was nearly identical (P = 0.39). Don’t project revenue off that comparison.

br2 beat BMR on production at the cost of lower feed efficiency and a lower fat test. If your market pays hard on fat percentage, that 0.13-point drop versus BMR isn’t a footnote — it’s a spreadsheet conversation.

A note on scope: The trial tested one Pioneer BMR hybrid (P0956AMX). BMR performance varies across genetics and growing conditions — this result speaks to one hybrid in one Michigan field in one year, not BMR technology broadly.

Why Did Mid-Range NDFD Win at the Feedbunk?

Line up the 30-hour in vitro NDF digestibility and BMR wins on paper: Tall 53%, short hybrids 57–60%, BMR 63%. If you’ve spent a decade picking hybrids off that NDFD column, the choice looks obvious.

The cows disagreed.

Total-tract digestibility told a different story:

NutrientBMRShort (avg of 3)P-value
Organic matter52.2%~59.9%< 0.01
Starch98.1%~99.3%< 0.01
Crude protein67.2%~71.1%< 0.01
NDF45.4%~45.2%0.88

BMR’s fiber was more digestible in the test tube. But in the cow — where OM, starch, and protein digestibility all contribute to energy supply — br2 captured more total nutrients. And the cows ate 2.0 kg/d more of it than BMR.

More intake multiplied by better total-tract digestibility equals more ECM shipped. That’s a story about NDFD’s limits as a sole selection metric, not NDFD’s irrelevance. The in vitro number accurately measured one thing. The cow measured everything.

The Caveats MSU Disclosed

The MSU team was candid. Diets ran higher NDF (~29% DM) and lower starch (~26% DM) than what’s typically optimal for mid-lactation cows. They noted the 2023 Michigan drought could have affected BMR silage quality, and mycotoxin levels weren’t tested.

They also acknowledged that mid-lactation cows may respond differently to BMR than early-lactation cows, where fill limitation is the main intake constraint. Honest limits from the researchers themselves.

BMR Is a Commitment. br2 Is Optionality.

Here’s something the NDFD column on a seed brochure can’t tell you: BMR is a commitment. Once it’s in the ground, you’re chopping it. Period. BMR’s lower DM yield and poorer standability make it a poor candidate for leaving in the field past optimal chop timing, and its grain yield doesn’t justify combining.

Every BMR acre is a silage-only acre. br2 is optionality.

In the MSU trial, br2’s DM yields ran comparable to — or better than — tall conventional. One short-stature hybrid hit 21 t/ha, compared with 19 for tall and just 17 for BMR. That yield drag on BMR is well-documented: the MSU paper cites Sattler et al. (2010) and Wallau et al. (2022), noting that “bm3 corn typically has lower DM yields and poorer standability compared with conventional corn.”

Think about what that means in practice. You plant 200 acres of br2 for silage, but milk prices soften mid-summer while corn basis strengthens. You redirect acres to grain without taking a yield hit. Try that with BMR, and you’re looking at lower grain yields from a hybrid that wasn’t bred for it — if it’s still standing. That’s the kind of per-acre economics that separates surviving operations from the ones that don’t make it.

CharacteristicBMRbr2Advantage
DM yield vs. tallLower (−2 t/ha in MSU trial)Similar or betterbr2
StandabilityPoorer (lodging risk)Better (low green snap)br2
Harvest flexibilitySilage only (poor grain yield)Can pivot to grainbr2
NDFD (in vitro)Highest (63%)Mid-range (57–60%)BMR
Total-tract OM digestibility52.2%59.9%br2
Total-tract starch digestibility98.1%99.3%br2
ECM (mid-lactation cows)36.5 kg/d37.6 kg/dbr2
Feed efficiency (ECM/DMI)1.511.43BMR
Market optionalityNone (committed to silage)High (silage or grain)br2

In a volatile corn market, the question isn’t just “which hybrid makes the most milk?” It’s “which hybrid gives me the most options if the market moves?”

Are You Shipping Fat or Shipping Energy?

br2 silage dropped fat percentage versus both tall and BMR — 4.32% vs. 4.43% tall and 4.45% BMR (P < 0.01 for both). Fat yield in kg/d wasn’t significantly different from tall (P = 0.39) or from BMR (P = 0.14).

The percentage drop matters in markets that pay on component test. Before you react, look at how ECM is actually calculated.

The widely used Tyrrell and Reid formula adjusts milk to 3.5% fat and 3.2% protein:

ECM (lb)=(0.327×milk lb)+(12.95×fat lb)+(7.65×protein lb)

BMR cow producing 71 lb of milk at 4.45% fat (3.1 lb fat) and 3.46% protein (2.4 lb protein) ships roughly 82 lb ECM.

br2 cow producing 73 lb of milk at 4.32% fat (3.2 lb fat) and 3.47% protein (2.5 lb protein) ships roughly 84 lb ECM.

Two more pounds per day despite the lower fat test — because the volume gain and protein bump more than offset the fat-percentage drop. The fat coefficient (12.95) is heavy, but it multiplies pounds of fat, not percentage.

(The MSU paper used NASEM 2021’s NEL-based ECM equation, which weights fat, protein, and lactose somewhat differently. The illustration above uses the simpler Tyrrell and Reid formula common in extension materials. Both point in the same direction.)

Where the Component Markets Are Heading

CoBank’s Corey Geiger laid out the butterfat oversupply case in a September 24, 2025, Knowledge Exchange report titled “Soaring demand for dairy foods fueled a US butterfat boom, but cheesemakers need milk protein levels to catch up.”

“For 10 years, the market couldn’t supply enough of it, and now there’s an oversupply — it’s almost too much of a good thing,” Geiger wrote. Cheesemakers, he noted, “strive for a protein-to-fat ratio near 0.80.”

By January 2026, he was telling Brownfield that 2026 could be tough for dairy producers, with butterfat production running 5–6% above year-ago and spot butter already down nearly $0.70 from its August high. If you’re watching where component markets are heading, br2’s lower fat test may actually align with the shift.

But if your FMMO class puts steep weight on fat test, run the math both ways with your own component differential before committing acres.

Does Italy Confirm the Pattern?

A separate trial in the Journal of Dairy Science (Catellani et al., published online February 25, 2026; Università Cattolica del Sacro Cuore with UW-Madison’s Ferraretto) pointed in the same direction from a different angle.

Their brachytic hybrid was fed to 24 Holsteins (SSC group at 82 ± 31 DIM, TSC group at 85 ± 34 DIM), which produced 1.8 kg more milk per day (44.7 vs. 42.9 kg/d) with higher energy density but on lower DMI (25.0 vs. 26.8 kg/d). More milk from less feed. The opposite intake mechanism from MSU.

Two trials, same production direction, two different pathways. Catellani’s trial only compared brachytic to tall — no BMR head-to-head. Treat them as converging evidence, not interchangeable results.

The MSU paper referenced an earlier, unpublished version of Catellani’s work (cited as a personal communication) that “found no effects on DMI, ECM, or BW.” The published version told a different story — a reminder of why peer-reviewed data matters more than conference-corridor results.

The Revenue Math — and What It Costs to Get There

Our August 2025 coverage cited a +5 lb ECM figure based on preliminary, pre-publication data. The peer-reviewed numbers came back lower. Here’s what the published data actually support, using the statistically significant br2-vs-BMR comparison:

Herd SizeDaily ECM Gain (~2.5 lb)Annual Added Revenue (@ $20/cwt)
200 cows500 lb/d~$36,500
500 cows1,250 lb/d~$91,250
1,000 cows2,500 lb/d~$182,500

Assumptions disclosed: +2.5 lb ECM/cow/day (1.1 kg/d, P = 0.01, from Sarmikasoglou et al.), full-year feeding, $20/cwt blended pay price. Your real-world response depends on hybrid, growing conditions, lactation stage, and ration design.

The Seed-Cost Compounding Effect

Seed premiums for br2 run roughly 15–25% higher per bag, and the per-acre gap widens because Preceon growers plant at significantly higher populations. Bayer’s February 2026 press release reported Ground Breakers planted Preceon at an average of approximately 41,600 plants per acre, compared to roughly 34,500 for traditional corn.

MSU Extension’s Jonathan LaPorte published “Seed Selection: Beyond Yield and Disease Resistance (Corn Edition)” on July 10, 2025, with a cost-comparison tool showing how bag-price differences narrow or widen dramatically depending on seeding rate. When both bag price and seeding rate climb simultaneously — as they do with Preceon — the per-acre premium compounds.

VariableConventionalbr2 (Preceon)Premium
Seeding rate (plants/acre)34,50041,600+20%
Seed cost per bag~$280~$335+20%
Cost per acre$110–120$160–175~$50
Total premium (200 acres)$10,000
Annual revenue gain (200 cows)$36,500
Annual revenue gain (500 cows)$91,250
ROI multiple (200 cows)3.5:1
ROI multiple (500 cows)9.1:1

At a conventional seed cost of roughly $110–120/acre (a typical 80,000-kernel bag at ~$280 and 32,000–34,500 seeds/acre), a 20% seed premium plus a 20% increase in population pushes br2 toward $160–175/acre. That’s roughly $50/acre more.

On 200 silage acres, that’s about $10,000 in extra seed. Set against a 200-cow herd’s projected $36,500 annual ECM advantage, the math pencils to roughly 3.5:1. A 500-cow herd on the same acreage? Closer to 9:1.

Then there’s the equipment question. All silage respondents in Bayer’s 2025 post-season survey reported “achieving target moisture at harvest” with “comparable packing and processing characteristics relative to traditional corn,” according to Bayer’s February 2026 press release. Header modifications for short corn may carry a meaningful cost — our August 2025 coverage cited estimates of $15,000–22,000 per machine based on conversations with Midwest equipment dealers, though no independently verified figure has emerged from the 2025 Ground Breakers feedback. Newer machines appear to adapt better, but expect setup changes and a learning curve in year one. Talk to someone who’s actually chopped it at your latitude before you assume your setup works as-is.

What Your Nutritionist Needs to Hear Before Planting

br2’s advantage over BMR in this trial ran through intake — cows ate 2.0 kg/d more on br2. If nobody adjusts the ration to let that extra forage intake substitute for purchased energy — corn, bypass fat, commodity supplements — you’re feeding more total DM without optimizing the economic return.

The cow produces more milk, but your feed costs rise alongside it. That’s the difference between a management strategy and a feed bill problem.

To get this right, you need to move past the “wait and see” approach.

The 2-Minute Nutritionist Drill

Don’t let your nutritionist treat br2 like “shorter tall corn.” If you do, you’re leaving money on the table. Ask these three questions before the seed hits the soil:

  1. The Displacement Question: “If these cows eat 2.0 kg more forage, which purchased energy source are we dropping first to keep the ration cost-neutral?”
  2. The Component Pivot: “Our fat test might dip 0.13 points. Does the volume gain at 3.5% ECM still beat our current BMR margin at today’s component prices?”
  3. The Starch Strategy: “Since br2 has higher total-tract starch digestibility (99.3%), can we pull back on ground corn without losing peak milk?”

By forcing these questions early, you ensure that the extra 2.5 lb of Energy Corrected Milk isn’t “eaten up” by an unadjusted feed bill. You aren’t just looking for a nutritionist who can balance a ration; you’re looking for one who can balance a budget.

That’s not a nutrition question. It’s a feed-cost question.

Where the Data Gets Thin

No trial result transfers perfectly. Be skeptical in these spots:

Early lactation, high-starch rations. The MSU trial tested mid-lactation cows (150 DIM) on higher-NDF, lower-starch diets. Whether br2’s advantage holds in early lactation on aggressive starch levels is an open question.

The paper cited Oba and Allen (2000), which documented BMR’s advantage with fill-limited, early-lactation cows. Separately, Utah State researchers (Holt et al., 2013) fed BMR vs. conventional corn silage from calving through 180 DIM to 28 multiparous Holsteins and found a 2 lb ECM/cow/day advantage for BMR. That’s the feeding window where BMR still has the strongest evidence.

Feed-efficiency-constrained operations. Feed efficiency (ECM/DMI) was significantly lower on br2 than BMR — 1.43 vs. 1.51 (P < 0.01). If you’re purchasing most of your forage, that efficiency gap costs real money per ton DM.

Regions without adapted hybrids. Bayer’s Preceon portfolio is expanding to 16 hybrids for 2026, including five new additions in the 100–118 day relative maturity range, with geographic expansion into the Northeast. It’s still available only through the Ground Breakers program, with a minimum commitment of 40 acres.

“The roadmap is deliberate,” said Lindsey Battle, Preceon Strategy and Launch Lead, in Bayer’s February 2026 press release. “We are scaling in phases — validating performance across more acres, more environments, and more management systems as we move to full commercial launch.” Bayer’s Ader told Hoosier Ag Today in December 2025 that the biotech version of the short-stature trait “should start launching in 2027 and will continue scaling from that area.”

One trial, one year, one drought-stressed Michigan field. The MSU team planted all five hybrids on 2.19-hectare (5.4-acre) plots on Marlette fine sandy loam, used Vita Plus Titanium inoculant, and sent samples to Cumberland Valley Analytical Services.

They wrote: “Further studies in other growing environmental conditions seem warranted.” VandeHaar presented the same data at a Balchem webinar on November 4, 2025. His lab is part of a USDA-funded multi-university effort, with related trials underway at the University of Maryland under Dr. Fabiana Cardoso. But multi-site, multi-year data doesn’t exist yet.

What br2 Means for Your 2026 Silage Acres

  • Frame your hybrid decision around br2 vs. BMR, not br2 vs. tall. That’s where the ECM data are statistically significant (P = 0.01). If you’re switching acres, switch BMR acres first — especially on fields where standability has cost you.
  • Run the fat-test math with your own component differential. Fat percentage dropped 0.13 points on br2 vs. BMR, but fat pounds per day were not significantly different (P = 0.14). Use the ECM formula with your herd’s actual numbers. CoBank’s Geiger flagged in September 2025 that butterfat oversupply is already compressing prices. If that trend continues, the fat-test trade-off shrinks.
  • Budget ~$50/acre extra for seed. Ground Breakers in 2025 averaged 41,600 plants/acre vs. 34,500 for traditional corn. The premium comes from both a higher bag price and higher planting rates.
  • Think about the insurance policy. In a volatile corn market, br2 gives you a harvest pivot that BMR never will. Every br2 acre can go to grain if the milk-to-corn ratio shifts.
  • If your fat premium is steep and stable, br2’s 0.13-point fat-test drop versus BMR could narrow the margin. But fat pounds per day were statistically identical (P = 0.14). Model both sides.
  • If seed cost is the concern, roughly $10,000 extra (about $50/acre) on 200 acres against a projected $36,500 ECM gain (200 cows) or $91,250 (500 cows) yields a 3.5:1 to 9:1 return — assuming the trial response holds at full or even half strength.
  • If you’re feeding early-lactation cows on high-starch rations, BMR still has the stronger evidence base — both from Oba and Allen (2000) and Holt et al. (2013). Target br2 to mid-lactation pens or fields where standability and dual-purpose optionality matter most.
  • 30-day action: Sit down with your nutritionist and agree on the ration adjustment plan before seed goes in the ground. The MSU data show br2 cows eat 2.0 kg/d more than BMR cows. How does that extra intake flow through your ration economics — and what purchased feed does it replace?
  • 90-day action: After chopping, run a separate silage analysis on your br2 versus your conventional or BMR storage. Get NDFD, starch, and OM digestibility from Cumberland Valley or equivalent — so you have your own total-tract comparison by fall.
  • 365-day action: Compare ECM per acre across hybrids at year-end. Not ECM per cow — ECM per acre planted. That’s the number that captures yield, quality, and optionality together.
  • If you can get into the Ground Breakers program, trial br2 on 10–20% of your silage acres this spring. Bayer is expanding to 16 hybrids across the 100–118 day RM range for 2026. Target your most wind-exposed fields or BMR ground that hasn’t clearly outearned conventional on ECM per acre. Map those acres for separate harvest and dedicated storage to keep your feeding comparison clean.

Key Takeaways

  • If you’re feeding mid‑lactation cows off BMR today, MSU’s first br2 trial says short‑stature corn can ship about 2.5 lb more ECM per cow per day, even when BMR wins on NDFD in the lab. ​
  • If your milk cheque still rewards volume plus protein more than fat test, a ~0.13‑point fat‑% drop on br2 looks a lot smaller next to higher ECM and CoBank’s warning that butterfat is already drifting into oversupply.
  • If you can afford roughly $50/acre extra in seed, the projected ECM gain pencils out to about $36,500/year on 200 cows and $90,000+ on 500, which more than covers the seed premium as long as your ration allows extra forage intake to replace purchased energy.
  • If standability and flexibility matter on your acres, br2 gives you similar or better DM yield than tall corn, less lodging risk, and the option to shell for grain — something BMR’s lower yield and standability don’t offer. ​
  • If you’re thinking about going all‑in, remember the fine print: lower feed efficiency than BMR, better data for BMR in early‑lactation high‑starch diets, and only one Michigan plus one Italian trial so far — this is a “trial 10–20% of your acres and watch the ECM per acre” move, not a flip‑the‑whole‑farm overnight move.

The Bottom Line

DeVries tested Preceon for standability and found a feeding advantage. VandeHaar’s lab gave it a P-value. The question now isn’t whether br2 can outproduce BMR — one peer-reviewed trial says it did. The question is whether it will do the same on your ground, in your growing year, fed to your cows.

Pull your field-by-field yield records from 2025. Convert to tons DM per acre. Multiply by your nutritionist’s milk-per-ton estimate for each silage. Which hybrid actually won on ECM per acre — and does it match the one you’re about to put in the planter?

Complete references and supporting documentation are available upon request by contacting the editorial team at editor@thebullvine.com.

Learn More

The Sunday Read Dairy Professionals Don’t Skip.

Every week, thousands of producers, breeders, and industry insiders open Bullvine Weekly for genetics insights, market shifts, and profit strategies they won’t find anywhere else. One email. Five minutes. Smarter decisions all week.

NewsSubscribe
First
Last
Consent

$18.95 Milk, $19.14 Costs: The $287,500 Equity Decision Facing Mid‑Size Wisconsin Dairies

Same milk price. One 500-cow Wisconsin dairy kept $480,000 in equity; their neighbors walked away with under $200,000. The real difference was when they believed their breakeven point and acted on it.

Executive Summary: This feature breaks down the 2026 margin squeeze for 300–800 cow dairies, where January Class III at $14.59/cwt and USDA’s $18.95 all‑milk forecast run into ERS full economic costs of $19.14/cwt for large herds. For a 500‑cow operation at 23,000 lbs/cow, that means a $287,500 annual gap at $16.50 milk versus a $19 breakeven and only break-even at best if the forecast hits. One Wisconsin family believed in math early and preserved about $480,000 in equity through a planned exit, while neighbors on the same milk price ended up with under $200,000. The article shows how tightening feed shrink from 8–12% down toward 4% can recover $50,000–$80,000/year as a 90‑day bridge — enough runway to choose, not react. From there, it walks through four concrete paths for mid‑size herds (strategic exit, specialty pivot, downsizing with contract lock‑in, and internal heifer rebuild), with specific “when it fits/where it backfires” trade‑offs. A closing playbook gives 30/90/365‑day checks on burn rate, DMC coverage, contract timing, and heifer strategy so you can decide, with your own numbers, whether to fight through, right‑size, or sell while equity is still on the table.

Dairy breakeven costs

A Wisconsin dairy family ran the same numbers every mid-size operator is running right now: March Class III futures closing at $16.42/cwt on February 26, while their all-in costs ran above $19. They made the call with 8–10 months of runway left. Preserved roughly $480,000 in family equity.

Exit ScenarioTimingCow Value/HeadEquipment RecoveryFamily Equity Preserved
Strategic ExitQ1–Q2 2026 (8–10 months runway left)$1,850Full auction value$480,000
Forced LiquidationLate 2027 (lender-initiated)$1,400Distressed/scrap pricingUnder $200,000
Equity Destruction12–18 month delay−$450/head−40–60%−$280,000
Decision DriverProactive lender audit in MarchGenomic testing ($45/head) before dispersalPlanned vs. distressed auction timingBelieving the math while assets hold value

The family down the road, milking a similar herd, waited. By the time their lender initiated the conversation, the number was under $200,000.

That $280,000 gap isn’t about who’s a better farmer. It’s about who ran the real numbers first — and believed what they showed.

What Does $14.59 Class III Actually Mean for Your Herd?

January’s Class III came in at $14.59/cwt. December was $15.86. USDA’s February WASDE raised the 2026 all-milk forecast to $18.95/cwt — still $2.22 below the revised 2025 average of $21.17.

For a 300-cow herd shipping 69,000 cwt/year, that’s a $153,000 drop in gross milk revenue year over year.

Here’s the walk-through for a 500-cow operation producing 23,000 lbs/cow — that’s 115,000 cwt/year:

  • At $16.50 milk vs. $19 breakeven: $2.50/cwt × 115,000 cwt = $287,500 annual shortfall
  • At $16.50 milk vs. $21 breakeven: $4.50/cwt × 115,000 cwt = $517,500 annual shortfall
  • At $18.95 (USDA forecast) vs. $19 breakeven: Still underwater by $5,750/year — and that’s the optimistic case

Where does your breakeven point sit? Plug it in: (your all-in cost/cwt − milk price/cwt) × annual cwt shipped = your annual shortfall.

Lucas Sjostrom, executive director of Minnesota Milk, framed the oversupply problem driving these prices in a January 2026 interview with the Red River Farm Network: “Although milk is milk, it’s the components that we sell, and we’ve got all sorts of components on the market.” Milk-fat tests averaged 4.32% in 2025, up from 4.24% in 2024, while skim-solids hit 9.12%. More components per pound of milk means more product per pound of milk — and right now the market has more than it can absorb.

One critical distinction: USDA’s ERS puts the full economic cost for the largest operations (2,000+ cows) at $19.14/cwt. That figure includes imputed family labor at market wages and opportunity cost on owned land. Your cash-cost breakeven is typically $3–6/cwt lower, but the ERS number captures the real drain on family wealth, which is what matters when you’re asking whether to stay or go.

The Assumption That’s Breaking Down

For 40 years, “get big or get out” has been dairy’s operating principle. Scale solves margin problems. That was the thesis.

But when ERS data shows the most scaled herds in the country starting 2026 at $19.14/cwt against $18.95 milk, scale alone clearly isn’t solving it.

And some operations read that data and do the opposite of what conventional wisdom prescribes. A 500-cow herd strategically culled to 300 cows, captured strong cull revenue at historically high beef prices, slashed operating costs by 40%, and improved per-cow profitability by tightening management and focusing on its best genetics.

The ERS data also explains why the herd keeps expanding even as margins compress. In 2025, dairy farmers culled fewer cows and expanded the productive herd as new processing capacity came online — 2.81 million fresh cow additions against 2.64 million slaughtered. December’s dairy cow inventory hit 9.567 million head, up 212,000 from a year earlier.

More cows, more components per cow, more total milk — hitting a market already drowning in solids. The contrarian play in 2026 isn’t expansion. It’s strategic right-sizing paired with contract lock-in and cost discipline.

The $584/Cow Bridge to Q4

Before choosing a path — exit, downsize, pivot, or rebuild — you need time to consider it. And the fastest way to buy time without touching herd size, production, or capital is attacking feed shrink.

Dr. Mike Brouk at Kansas State laid it out at the Vita Plus Dairy Summit, and the math still holds: a 500-cow dairy running $7.50/cow/day in feed costs can capture $50,000 or more per year by reducing shrink just 4 percentage points. “Or we can reduce our feed shrink to gain $50,000,” Brouk said. “Comparatively speaking, capturing $50,000 from milk price alone for a 500-cow herd would require an additional 32 cents per cwt for the year.”

That 32-cents-per-cwt equivalent is the number that should stop you. It means shrink recovery at current margins is worth more than most of us will get from the futures curve over the next 6 months.

University of Minnesota Extension’s Jim Salfer documented even larger returns: a 100-cow dairy saves $58,400 annually when moving from high to low shrink—that’s $584/cow. Scale that to 500 cows, and you’re looking at $50,000–$80,000 in recoverable margin, depending on ration cost and starting shrink level.

Most operations run 8–12% total ration shrink. Well-managed herds hit 4% or less. Penn State’s Dr. Lisa Holden describes how the gap opens: procedural drift “creeps in like a fog and bad habits really take root like weeds.” On a 1,000-cow dairy running $8/cow/day ration cost, 8% shrink costs $233,600 annually — cutting it to 4% recovers half of that.

Joe Statz and his brothers showed what’s possible at scale. Their 4,400-cow operation near Marshall, Wisconsin, built a dedicated feed center — a 60,000-square-foot commodity barn with drive-through bays and a centralized mixing system — and dropped shrink from 10% to 2–3%, according to a 2018 Dairy Global report. The documented savings: over $500,000 per year in recovered feed value. Their nutritionist, Todd Follendorf from Cornerstone Dairy Nutrition in Waunakee, put it this way: “Shrink control has been the main reason why we built the whole facility.”

You don’t need Statz-level infrastructure. As The Bullvine reported in November, five targeted improvements — face management, scale calibration, ingredient tracking, right-sized bunkers, and refusal optimization — can recover $100,000+ annually on a large operation for an investment under $20,000.

Here’s why this matters for the survival math: $50,000–$80,000/year in recovered margin is the funding mechanism for whichever path you choose. It doesn’t fix a $287,500 shortfall. But it buys 2–4 months of additional runway — and in a year where the difference between strategic and forced exit is $280,000 in family equity, that extra runway is worth more than anything else you can do in the next 30 days without writing a check.

If you don’t have weighed shrink data from the past 90 days, that’s action item number one this week.

How Bad Is the Survival Math?

David Kohl, professor emeritus of agricultural economics at Virginia Tech, has been warning about the pressure this cycle is putting on lenders. Speaking at the Professional Dairy Producers of Wisconsin annual business conference: “Lenders will be under tremendous scrutiny from regulators this year.”

That scrutiny flows downhill. If your debt-service coverage ratio drops below 1.0, it can trigger technical default — even when payments are current.

Kohl’s metric for self-assessment: calculate your burn rate — how quickly working capital depletes. “You’d like to have a burn rate of 3½ years or more,” he says. “Determining your burn rate gives you some boundaries as to when you have to make some tough decisions. Murphy’s Law is merciless when you don’t have working capital.”

Below 2½ years? That’s what Kohl calls the red-light zone.

Here’s what exit timing looks like for a representative 500-cow operation carrying $2.5–3M in total assets against $1–1.5M in debt:

Exit TimingCow ValueEquipment RecoveryKey Action Requirement
Strategic (Q1–Q2 2026)~$1,850/headFull auction valueProactive lender audit by March
Forced (Late 2027)~$1,400/headDistressed/scrapWaiting for a call from the bank

These are illustrative scenarios for editorial purposes only. Actual values depend on herd genetics, health status, registration, market timing, and regional demand. Assumes Upper Midwest region, mixed owned/rented land, mid-life equipment. Consult your lender, accountant, or ag attorney for operation-specific analysis.

That $1,850/head figure depends heavily on what you’re selling. USDA’s October 2025 Agricultural Prices report showed the price received for milk cows hit a record $3,110 per head nationally. At Premier Livestock & Auctions in Pennsylvania, top-quality springing heifers fetched $2,850–$4,050 at the February 18 sale, with top-quality fresh cows bringing $3,000–$3,800. At their January 27 special heifer auction, open heifers in the 700–850 lb range hit $1,550–$3,000 per head.

But those prices went to cattle with verified quality. Commodity Holsteins with no papers and no genomic data sell at commodity prices. Genomic testing runs roughly $45 per calf and generates about $34 in additional profit per cow per year through better culling and selection decisions. In an exit scenario, that $45 test becomes the difference between your dispersal attracting genetics buyers at $2,850+ per head versus commodity buyers bidding $1,400.

Four Paths — and What Each One Costs

Path 1: Strategic Exit While Asset Values Hold

  • When it fits: DSCR trending below 1.0, burn rate under 2½ years, debt-to-asset above 50%, no succession plan
  • What it requires: Decision by Q2 2026, proactive lender conversation, 6–12 months for proper real estate and cattle marketing, and genomic testing of the herd before the dispersal
  • Where it backfires: Waiting until forced sale can destroy $200,000+ in recoverable equity — and that spread widens when auction markets get crowded
  • Tax angle: Chapter 12 bankruptcy provisions can allow qualifying family farm operations to restructure certain capital gains tax obligations as unsecured debt — consult an ag attorney for specifics

The Wisconsin family we opened with? They chose this path — and started genomic testing the same week they called their lender.

Path 2: Pivot to Specialty/Premium Markets

  • When it fits: Strong component genetics, willingness to reduce herd size, regional processor relationships
  • What it requires: Organic certification (3-year transition), A2 genetic testing (~$40/cow), identity-preserved handling
  • Where it backfires: Premium markets have capacity limits — not everyone can pivot simultaneously.

Path 3: Strategic Downsizing with Contract Lock-In

One Northeast producer interviewed by The Bullvine reduced herd size by roughly 20% in late 2025 and saw per-cow profitability improve as labor costs dropped faster than revenue. Tighter management of fewer, better animals made the difference.

  • When it fits: Labor costs consuming disproportionate margin, cull values historically elevated, processor relationships strong
  • What it requires: Multi-year component premium contracts negotiated before mid-2026
  • Where it backfires: If processor contracts don’t materialize, you’ve shrunk without securing the premium position.
  • Why the window exists: Billions in new processing capacity needs committed milk, but replacement heifer inventories dropped to just 3.905 million head as of January 1, 2026 — that’s 40.8% of productive cows, down from 41.7% a year earlier. CoBank projects this won’t rebound before 2027. That mismatch gives producers unusual contract leverage — for now.

Path 4: Internal Heifer Rebuild

  • When it fits: Currently heavy on beef-on-dairy, strong genetic base, 3–5 year time horizon
  • What it requires: Cutting beef-on-dairy to the bottom 10–15% of the herd, sexed dairy semen on top genetics, accepting 3–4 years of reduced beef-calf revenue
  • The replacement math: Internal rearing costs sit around $2,034/head for Pennsylvania farms and $1,709/headin the Midwest, per Penn State Extension data updated December 2025 (range: $1,411–$2,301). Compare that to $2,850–$4,050 for purchased springers at Premier Livestock’s sale on February 18. The per-head advantage is significant — but raising your own takes 24–26 months to show up in the milking string. The Bullvine’s February analysis of the national heifer paradox — 9.57 million cows, just 3.91 million replacements — shows why the external market isn’t getting easier anytime soon.

Signals That Tell You Which Way This Goes

Class III futures for fall 2026. March Class III closed at $16.42 on February 26. USDA’s annual Class III forecast sits at $16.65 — just 23 cents above where the front month settled. The back half has to do most of the heavy lifting to deliver even that modest average. If September–December contracts move above $18.50 by mid-year, the survival math loosens. They’re currently near the $18.35–$18.46 range — right at the edge, not safely above it.

Culling pace. ERS reports dairy cow slaughter is running above year-ago levels in the first four weeks of 2026, even though the herd is 212,000 head larger. Farmers retained older cows through 2025 to sustain output — now they’re culling them. If culling accelerates, the herd will shrink faster than expected, and milk prices could firm in H2.

Your shrink audit results. If the 90-day measurement comes back at 10%+ and your ration runs $7–8/cow/day, you’re sitting on $50,000–$80,000 in recoverable margin. The Statz Brothers documented it. Brouk at Kansas State calculated it. You can capture it before Q3 — and it funds whichever path you choose.

DMC enrollment. The 2026 Dairy Margin Coverage program, reauthorized through 2031 under the One Big Beautiful Bill Act, closed enrollment on February 26. Tier I coverage now extends to 6 million pounds. December 2025’s margin fell to $9.42/cwt — below the $9.50 trigger — producing the only indemnity payment of the year.

DMC isn’t free money — premiums eat into the payout, and if you’re already locked into forward contracts or carry strong component premiums, the incremental protection may be thin. But for operations running on straight Class III with no hedge, it’s a floor worth having at these margin levels.

What $18.95 Milk Means for Your 500-Cow Operation

TimelineAction ItemWhy It MattersSuccess Metric
This WeekCalculate burn rate: Working capital ÷ monthly shortfallKohl says minimum 3.5 years; below 2.5 years = red-light zoneKnow exact months of runway
This WeekStart measuring feed shrink with actual weightsDifference between 10% and 4% = $50k–$80k/year on 500 cowsBaseline shrink % documented
This WeekConfirm DMC enrollment status (closed Feb 26)December 2025 already triggered $9.42 indemnity—early 2026 could repeatCoverage locked or opted-out decision made
By March 31Stress-test cash flow at $16.50 milk (H1) and $17.50 (H2)January came in at $14.59; March futures at $16.42—if you assumed $19+, you’re wrongUpdated 2026 projections with real futures data
By March 31If considering exit within 18 months: Order genomic testing now$45/head test = difference between $2,850+ genetics buyers vs. $1,400 commodity biddersHerd genomically profiled before dispersal
By March 31Schedule proactive lender auditWisconsin family who exited strategically preserved $480k; neighbors who waited: under $200kMeeting scheduled—on your timeline, not theirs
By June 30Pull full economic cost of production (include market-rate family labor, depreciation, interest)Lender cares about cash cost; family wealth depends on full economic figure—know bothBoth numbers calculated and validated
By June 30Commit to a path: Lock contracts if fighting through, finalize marketing timeline if exitingHeifer shortage window won’t stay open indefinitely—processor leverage exists nowContract signed OR exit timeline finalized
By Dec 31Evaluate whether H2 deliveredIf Sept–Dec Class III average < $18, your 2027 plan needs to start now—not in JanuaryDecision: continue, pivot, or exit

This week:

  • Calculate your burn rate. Working capital ÷ monthly cash shortfall = months of runway. Kohl says you want a minimum of 3½ years. Below 2½ years, you’re in the red-light zone. That single number determines whether you’re choosing your path — or having it chosen for you.
  • Start measuring feed shrink — with actual weights. The difference between 10% and 4% represents $50,000–$80,000 annually on a 500-cow operation. Fastest path to bought time.
  • Confirm your DMC enrollment status. December 2025 already triggered an indemnity at $9.42 — early 2026 could do the same.

By the end of March:

  • Stress-test your cash flow at $16.50 milk through June, $17.50 through December. January came in at $14.59. March futures closed at $16.42. If your projections assumed $19+ milk, they’re wrong. Redo them.
  • If you’re considering an exit within 18 months, order genomic testing now. At $45/head, it’s cheap equity insurance. Schedule the lender audit for March — before they call you.

By June:

  • Pull your full economic cost of production. Include market-rate family labor, depreciation, and interest at current rates. Your lender cares about cash cost; your family’s long-term wealth depends on the full economic figure. Know both numbers.
  • Commit to a path. Lock in processor contracts if you’re fighting through. Finalize your marketing timeline if you’re exiting. The producer leverage window created by the heifer shortage won’t stay open indefinitely.

By December:

  • Evaluate whether H2 was delivered. If the September–December Class III average is below $18, your 2027 plan needs to start now—not in January.

Key Takeaways

  • If your full economic breakeven sits above $19/cwt, USDA’s $18.95 all-milk forecast doesn’t save you.March Class III closed at $16.42 on February 26. The futures curve says H1 2026 is significantly worse than the annual average implies.
  • Decision timing determines equity preservation. The gap between a Q1 strategic exit and a late-2027 forced liquidation can exceed $200,000 in a representative 500-cow scenario. Verified genetics pushes the strategic number toward the top of the range.
  • Feed shrink is your 90-day bridge — not your solution. Kansas State puts recoverable savings at $50,000+ for a 500-cow herd. The Statz Brothers captured over $500,000 annually on 4,400 cows. That buys runway. Use it to fund a path choice, not to delay one.
  • “Get big or get out” is becoming gospel. One Northeast producer improved per-cow profitability by reducing herd size roughly 20%. Another went from 500 to 300 and saw the same pattern. The math worked because the downsizing was strategic — paired with cost discipline and a focus on the best genetics in the herd.

The Bottom Line

That Wisconsin family didn’t have better genetics or cheaper feed than their neighbors. They had a timeline, a spreadsheet, and the willingness to believe what the numbers showed.

Where does your real breakeven sit against $18.95 milk? And how many months does Kohl’s formula say you’ve got?

This article is intended for informational purposes only and does not constitute financial, legal, or tax advice. Data, projections, and scenarios are based on publicly available information as of February 26, 2026, and should not be relied upon as the sole basis for business decisions. Consult qualified professional advisors for guidance specific to your operation.

Complete references and supporting documentation are available upon request by contacting the editorial team at editor@thebullvine.com.

Learn More

The Sunday Read Dairy Professionals Don’t Skip.

Every week, thousands of producers, breeders, and industry insiders open Bullvine Weekly for genetics insights, market shifts, and profit strategies they won’t find anywhere else. One email. Five minutes. Smarter decisions all week.
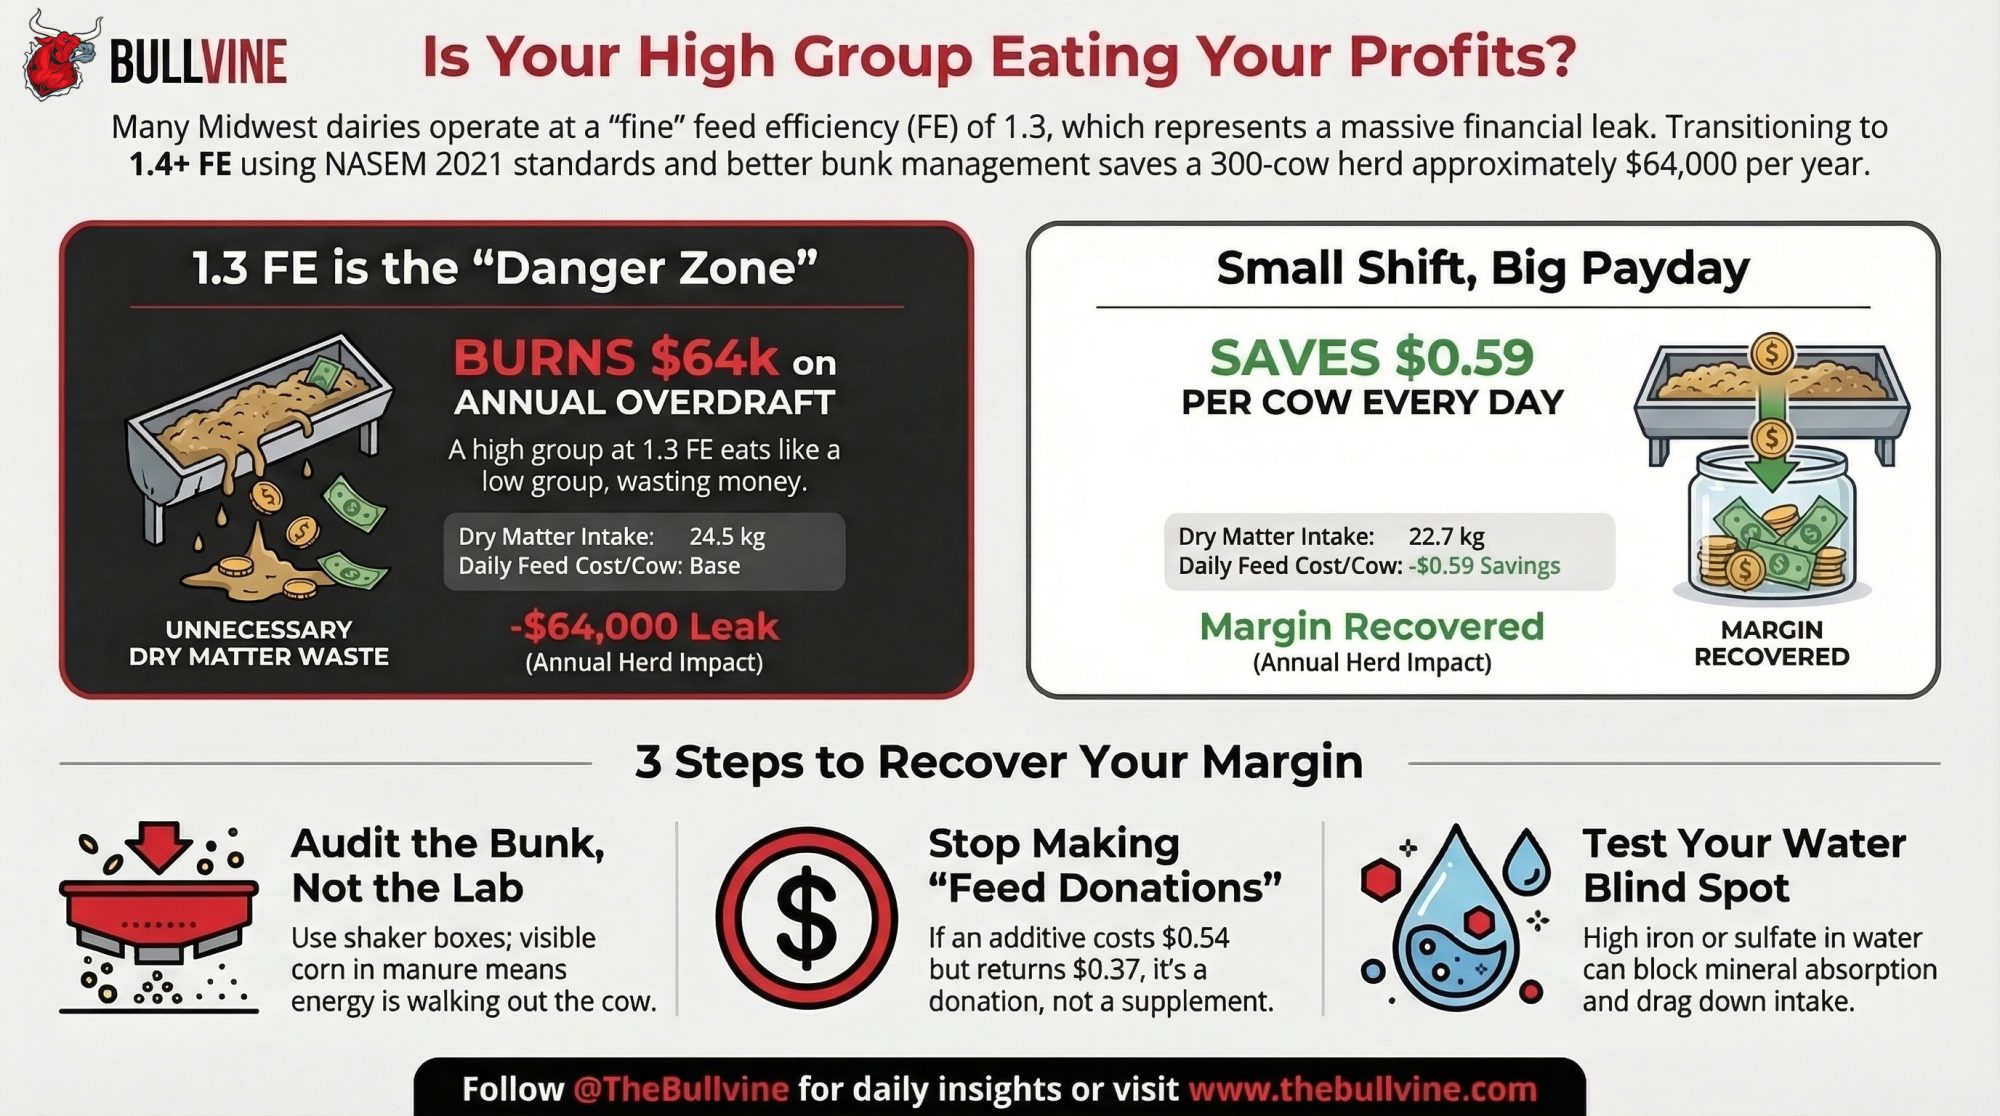
NewsSubscribe
First
Last
Consent

Six Colorado Dairy Workers Dead. OSHA’s Price: $41,101 a Life – and no jail time.

The confined-space program that could’ve saved six men costs about two cows. This Colorado dairy never had it.

At approximately 6:30 p.m. on August 20, 2025, a pipe in the manure management system disconnected inside an enclosed pump room at Prospect Valley Dairy — operating as Prospect Ranch LLC — near Keenesburg, Colorado. Manure water and hydrogen sulfide gas filled the space. A Fiske Inc. employee and a Prospect Ranch employee entered to stop the flow and were overcome by the gas. Then four more workers went in after them. 

By the time first responders arrived, six men were dead.

The entrance to Prospect Ranch at 32063 CR 18, Keenesburg, Colorado. On the evening of August 20, 2025, six men went to work behind this sign. None of them came home. (Photo: Jesse Kuncz/CPR News)

NameAgeHometownRoleFamily Connection
Alejandro Espinoza Cruz50Nunn, CODairy service technician, High Plains RoboticsFather of Oscar and Carlos
Oscar Espinoza Leos17Nunn, COIntern, High Plains Robotics; senior at Highland High SchoolSon of Alejandro
Carlos Espinoza Prado29Evans, COService technician, High Plains RoboticsSon of Alejandro
Jorge Sanchez Pena36Greeley, CO(Role not specified)Married into Espinoza family
Ricardo Gomez Galvan40Keenesburg, CO(Role not specified)
Noe Montañez Casañas32Keenesburg, COVeterinarian (Hidalgo, Mexico; working in U.S. under visa)Remains repatriated to Mexico

Alejandro Espinoza Cruz, 50, of Nunn — a dairy service technician for High Plains Robotics, a dairy equipment contractor and division of Fiske Inc.  His son, Oscar Espinoza Leos, 17, of Nunn, was a senior at Highland High School in Ault and worked as an intern for his father’s company. His other son, Carlos Espinoza Prado, 29, of Evans, was also a High Plains Robotics service technician. Jorge Sanchez Pena, 36, of Greeley, was married into the Espinoza family. Ricardo Gomez Galvan, 40, of Keenesburg. Noe Montañez Casañas, 32, of Keenesburg — a veterinarian from the state of Hidalgo in central Mexico, working in the U.S. under a visa. His remains were later repatriated to Mexico, according to the Mexican consulate in Denver. 

Four of the six came from the same extended family. All six were Hispanic males.

“They were extremely hardworking and humble,” said Tomi Rodriguez, an outreach worker for Project Protect Food System Workers, in an interview with CPR News. “They were a very united family.” 

A father and his teenage son. A pump room on a Wednesday evening in August. If you’ve read our coverage of a 31-year-old dairy farmer who died in a manure pit, you know this pattern doesn’t stop on its own.

Six months later, OSHA’s response landed. On February 24, 2026, the agency announced proposed fines totaling $246,609 against three companies. Divide that across six deaths and the proposed penalties work out to $41,101.50 per worker killed. That’s not what the government says a life is worth — but it’s what the enforcement system produced. And it’s less than the cost of a single robotic milking unit. 

ItemCost
Replacement dairy cow (USDA NASS, Q4 2025)$3,110
Bred heifer$3,500–$4,200
Bulk tank replacement$15,000–$25,000
Single robotic milking unit$150,000–$200,000
Full confined-space safety program (Year 1)$3,805–$6,520
OSHA proposed penalty per worker killed$41,101.50
Average civil settlement, confined-space fatality$10–$17 million

What OSHA Found — and What It Couldn’t Charge

OSHA cited all three companies with serious violations. Here’s how the proposed penalties break down: 

Prospect Ranch LLC — the dairy operator, headquartered in Bakersfield, California, and a Dairy Farmers of America member farm  — faces $132,406. OSHA cited serious violations for failure to protect workers from atmospheric hazards, failure to maintain a written hazard communication program, and failure to train workers on methods to detect hazardous gases. Prospect Ranch did not respond to the AP’s request for comment. 

Fiske Inc. / High Plains Robotics — a dairy equipment contractor that employed four of the six workers who died  — faces $99,306. OSHA cited serious violations for failing to protect employees from hazardous atmospheres and for failing to provide training on hydrogen sulfide detection. In a public statement, Fiske and owner Kevin Fiske said the company disagrees with the findings and is reviewing its options, while affirming its commitment to preventing future tragedies. In earlier reporting by Denver7, sources familiar with the operation said the contractor had been following proper protocols and that the manure storage had been mostly empty due to maintenance work. OSHA’s investigation reached different conclusions. 

HD Builders LLC — a contractor whose employees were present but unharmed — faces $14,897 for failure to maintain a written hazard communication program and failure to train workers on hydrogen sulfide detection. HD Builders declined comment, according to the AP. 

Every citation is classified as “serious.” Not one classified as “willful.” The investigation took six months. 

That classification matters. Willful violations can result in a penalty of $165,514 per violation under the January 2025 penalty schedule. More importantly, willful citations are the only category that can trigger criminal referral — though even then, the maximum is a misdemeanor carrying up to six months in jail. But proving willfulness requires evidence that the employer already knew about a hazard or standard and chose to ignore it. Prior citations. Internal memos. Documented refusals. 

The Enforcement Gap: Why Agriculture’s Missing Standard Limits OSHA’s Options

Here’s the structural problem: it isn’t unique to these three companies. It runs through the whole agricultural sector.

Agriculture doesn’t have a specific OSHA confined-space standard. General industry has 29 CFR 1910.146. Construction has 29 CFR 1926 Subpart AA. Farms get the General Duty Clause — Section 5(a)(1) of the OSH Act — which requires employers to keep workplaces “free of recognized hazards” but doesn’t mandate atmospheric testing, written entry permits, or rescue plans for manure pits. 

OSHA’s own confined-space fact sheet for agriculture says it plainly: “OSHA’s confined spaces standard at 29 C.F.R. 1910.146 does not apply to agricultural operations, but serves as a guide”. 

A guide. Not a requirement. The distinction between “standard” and “guide” matters more to lawyers than it does to the six families in Weld County. But without a specific standard to violate, the willful threshold becomes nearly impossible to clear on any agricultural operation — regardless of the circumstances.

A congressional appropriations rider in place since 1976 compounds the gap: OSHA can’t spend funds to inspect farms with 10 or fewer employees that don’t maintain temporary labor camps. Purdue University’s 2024 agricultural confined-space data shows that most known incidents happened on operations exempt from OSHA standards, in which facility exemption status was known, occurred primarily on operations exempt from OSHA standards. 

For comparison: when OSHA cited Burnett Dairy Cooperative in Wisconsin after a 2014 grain bin death, investigators found two willful and eight serious violations totaling $193,200. Grain handling is subject to a specific federal standard. Manure pits don’t. The same structural vulnerability that squeezes mid-size dairy operations shows up here in its most lethal form. 

All three companies have 15 business days to comply, request an informal conference with OSHA, or contest the findings before the independent Occupational Safety and Health Review Commission. OSHA’s own release notes state that “penalties and citations may be adjusted throughout the course of the case.” 

“Do Not Go in After Them.”

OSHA determined that a Fiske employee and a Prospect Ranch employee entered first to address the disconnected pipe. The gas overcame them. Then three more Fiske employees and one more Prospect Ranch employee entered — almost certainly trying to save their co-workers. Their family. 

Denver7 reported that an on-site supervisor was telling workers not to enter the pump room. They went in anyway. 

This is the rescue cascade. It’s the pattern that keeps turning accidents into mass funerals.

Purdue’s Agricultural Confined Space Incident Database — 2,429 cases documented between 1962 and 2024 — has tracked this pattern for decades. Of 409 livestock waste incidents between 1975 and 2021, about 11% involved multiple victims. The victim’s average age was 37 years. Every time someone collapses, someone else rushes in, and the gas takes both of them. 

It happened in Northern Ireland in 2012. Dairy farmer Noel Spence slipped into a slurry tank on his farm in County Tyrone. His sons Graham and Nevin went in after him. All three died. Their sister Emma tried too — she survived only because the rescuers pulled her out in time. 

And it happened at Prospect Valley Dairy on an August evening when four members of the same family followed the first two workers in.

What stops the cascade is one piece of blunt, specific training: If someone collapses in a confined space, you do not go in after them. You call 911. You ventilate from outside if you can. You do not enter without a gas monitor, a rescue plan, and a team trained to execute it.

The supervisor at Prospect Valley Dairy apparently knew this. But the workers who rushed in hadn’t been trained to override the instinct that says save them. That’s the gap training is supposed to close — not information, but muscle-memory refusal to enter a space that will kill you too. 

The Weld County Coroner’s Office confirmed through autopsy and toxicology that each victim died of “sudden death due to acute hydrogen sulfide exposure.” Thiosulfate levels in the victims’ blood ranged from 4.0 to 7.3 mcg/mL — highly elevated and consistent with lethal H₂S inhalation. 

What the Industry Said After Six Workers Died

DFA — the nation’s largest dairy cooperative and the co-op Prospect Ranch belongs to — issued a single public statement in August 2025: “This incident deeply saddens us, and our thoughts and most sincere condolences go out to the friends and families of the deceased. At this early stage, we have no further details,” according to the Colorado Sun. As of late February 2026, no follow-up statement or confined-space safety initiative from DFA has appeared in public reporting. 

NMPF’s October 2025 newsletter covered screwworm prevention, Taiwan trade missions, PFAS contamination, government shutdown monitoring, and eleven other items. None referenced Prospect Valley, dairy worker safety, or confined-space hazards. In December 2025, NMPF published detailed preparedness materials on foot-and-mouth disease, including biosecurity protocols, vaccination strategies, and supply chain contingencies. Biosecurity and worker safety involve different organizational mandates and regulatory structures. But the FMD response demonstrated the industry’s capacity for rapid, organized action on threats it prioritizes — and raised an obvious question about why confined-space reform hasn’t received similar urgency. 

NMPF’s FARM Program does maintain a voluntary Safety Self-Assessment that includes a confined-space section — covering hazard assessment, engineering controls, training, and inspections. It existed before the deaths in Prospect Valley. What doesn’t exist, six months later, is a new industry-wide initiative in response to them.

The Idaho dairy industry is the exception. After manure pit deaths in 2016–2017 — including one worker who’d been on the job only two weeks — the Idaho Dairymen’s Association launched statewide safety training aimed at its predominantly Spanish-speaking workforce. “We won’t shy away from the fact that those fatalities provided a wake-up call . . . that we need to be more robust in safety training,” Rick Naerebout, then IDA’s director of operations and now its CEO, told the Washington Post. 

IDA Consulting Services now provides on-farm training and safety programs to roughly 400 dairy operations across Idaho. National numbers are suggestive — Purdue’s 2024 summary found only three livestock waste incidents across the entire U.S. that year, down from 11 in 2020 and 13 in 2021. Researchers caution that up to 30% of incidents go unreported, and they can’t confirm whether training programs drive the decline. But Colorado, six months after losing six workers in a single evening, hasn’t produced an equivalent response. 

Does Your Operation Have a Confined Space That Could Kill Someone This Week?

Most dairies do.

Hydrogen sulfide is heavier than air — specific gravity 1.19. It pools in every pit, pump room, and below-grade channel on your operation. At low concentrations, you smell rotten eggs. At 100 ppm, the gas deadens your sense of smell — and 100 ppm is the NIOSH “Immediately Dangerous to Life or Health” threshold. Between 500 and 700 ppm, you lose consciousness within minutes. Above 1,000 ppm, a single breath can paralyze your diaphragm. 

For context, hydrogen sulfide in biogas from anaerobic digestion of manure typically ranges from 2,000 to 4,000 ppm. That’s not a gradual risk. That’s a light switch. 

Since the early 1960s, nearly 150 people have died in the U.S. from manure-related gas incidents. Almost half occurred on dairy farms. The most common activity at the time of death: repairing manure-handling equipment or attempting to rescue another worker.

What It Costs to Prevent This — and What It Costs to Skip It

Now run those numbers against what’s at stake. A full confined-space entry program for a mid-size dairy — gas monitor, ventilation blower, annual training for an eight-person crew, rescue tripod and winch, signage, and written procedures runs roughly $3,800 to $6,500 in year one.

ItemCostSource
4-gas monitor (Honeywell BW Flex4)$700–$900SPI.com, Safe-Fast.com  
Portable ventilation blower$250–$895Major Safety, RamFan UB20 line  
Confined-space training, 8 workers$1,200–$2,400/yrHAZWOPER-OSHA ($25–$50/person online; ~$200/person instructor-led)  
Rescue tripod + winch (FrenchCreek)$1,455–$2,025Major Safety  
Signage and written procedures$200–$300
Full program, Year 1$3,805–$6,520 

Now run those numbers against what’s at stake:

  
Replacement dairy cow (USDA NASS, Q4 2025)$3,110/head  
Bulk tank replacement$15,000–$25,000
Single robotic milking unit$150,000–$200,000
Proposed OSHA penalty per worker killed$41,101.50  
Average civil settlement, confined-space fatality$10–$17 million  

Your full confined-space program costs about what you’d pay for two replacement cows at today’s record prices.

William Field, the Purdue professor who maintains the agricultural confined-space database, told the AP that OSHA fines in these cases are often reduced upon appeal, or partially waived in exchange for safety investments. OSHA’s own release notes that penalties may be adjusted throughout the case. But Purdue’s database — 2,429 cases over six decades — shows wrongful death settlements in agricultural confined-space fatalities typically range from $10 million to $17 million.

The enforcement system produces penalties that can be absorbed as a line item. The civil system produces the number that changes behavior — but only after someone is already in the ground.

If you’ve been following how 38.8% turnover is bleeding dairies dry you already know how broken dairy workforce economics are. This is the most extreme version.

The People Who Were Lost

When a father, two sons, and a son-in-law die in the same pump room on the same evening, the ripple isn’t abstract.

The community around Keenesburg organized fundraising — a dance, haircuts, a car wash — to support the families. A GoFundMe page for funeral expenses raised over $63,000 toward its $70,000 goal, with individual donations ranging from $5 to $5,000. Local churches held a memorial service at the Weld County fairgrounds in early September. The Weld Re-9 School District made counseling available to students and staff at Highland High School — Oscar’s school. 

On the GoFundMe page, a former classmate named Jaxson Robson left a $20 donation and a comment: “I knew Oscar in middle school; we shared a room at the YMCA. He was such a nice kid, I can’t wait to see him again in heaven.” 

Nationally, more than half of the dairy industry’s roughly 150,000 workers are immigrants, according to industry estimates. In Idaho, approximately 90% of the state’s 8,100 dairy farmworkers were born outside the United States. Many come from tight-knit communities rooted in specific regions of Mexico and Central America, just like the Espinoza and Montañez families, who also came from tight‑knit communities in Mexico.

The industry’s failure to protect workers from physical hazards like  is mirrored by its failure to protect the men at the top from the psychological hazards of the job. We’ve reported on dairy farmers facing a 3.5× higher suicide risk than the general population — drawing on CDC occupational mortality data and research in the Journal of Rural Health. Male farmers, ranchers, and agricultural managers die by suicide at a rate of 43.2 per 100,000, versus 27.4 for all other occupations. 

Every one of these stories — the suicides, the manure pit deaths, the mental health crises — comes back to the same thing. Preventable loss on operations that didn’t have the systems to catch it. At Prospect Valley Dairy, the prevention system costs about two cows. The question nobody asked those six workers is the same question nobody asks the ones we lose to despair: Was anyone looking out for you?

Randy Roecker’s milk hauler mental health training program proved that the audience for that question exists, whether the rest of the industry answers it before the next funeral.

What to Do About It — Starting This Week

Within 30 days (under $1,500):

The Honeywell BW Flex4 (left) and Flex5. A 4-gas monitor like this runs $700–$900 — less than a bred heifer. It alarms before hydrogen sulfide reaches lethal concentrations. Nobody at Prospect Valley Dairy was carrying one on August 20, 2025. 

  • Buy a 4-gas monitor. The Honeywell BW Flex4 runs $700–$900. Clip it on before anyone enters a pit, pump room, or below-grade vault. If it alarms, back out. No exceptions. No heroics. 
  • Walk the operation. Tag every confined space — every manure pit, pump room, under-floor channel, silo base, and mechanical chase — with “DANGER: NO ENTRY WITHOUT ATMOSPHERIC TESTING.”
  • Have one blunt conversation with your crew in their language. Three sentences: One breath can kill you. If someone goes down in a pit, nobody goes in after them. You call 911.

Within 90 days ($1,200–$2,400):

A FrenchCreek confined-space rescue tripod with self-retracting lifeline and winch — $1,455 to $2,025. This is what stops the rescue cascade. You pull a worker out from above instead of following them into the gas. At Prospect Valley, four people followed.

  • Complete confined-space entry training for all employees. HAZWOPER-OSHA offers online courses at $25–$50/person and virtual instructor-led sessions at roughly $200/person. State extension or safety council programs may run at a lower cost. 
  • Write a buddy system and rescue plan. Post it at every tagged confined space. Pick up a ventilation blower — Major Safety’s RamFan UB20 line, $250–$895  — and a rescue tripod with winch — FrenchCreek systems, $1,455–$2,025. 

365-day cycle:

  • Annual refresher training.
  • Equipment calibration.
  • Written confined-space entry permit program.

Key Takeaways

  • If you have a manure pit, pump room, or any below-grade enclosed space and no gas monitor, your operation is carrying a version of the same risk that killed six people at Prospect Valley Dairy. A Honeywell BW Flex4 costs less than a bred heifer. 
  • If nobody on your crew has been specifically trained not to enter a confined space to rescue someone, you’re one disconnected pipe from a rescue cascade. Have that conversation this week — in every language your workers speak.
  • Don’t count on OSHA’s proposed penalties to deter anything. The Prospect Valley case produced $41,101.50 per life lost — and both OSHA’s release and Purdue’s research indicate that number often shrinks through the review process. The real financial consequence arrives in civil court at $10 to $17 million, after someone is already gone. 
  • If you have 10 or fewer employees, the 1976 appropriations rider likely means OSHA can’t inspect your operation. The gas doesn’t check your headcount. 

The Bottom Line

Alejandro Espinoza Cruz was 50, from Nunn. Oscar Espinoza Leos was 17, interning with his father’s company, a high school senior with a friend who remembered him from the YMCA. Carlos Espinoza Prado was 29. Jorge Sanchez Pena was 36. Ricardo Gomez Galvan was 40. Noe Montañez Casañas was 32, a veterinarian from Hidalgo, Mexico. 

The confined-space program that could have sent all six home that night costs about two cows.

When’s the last time someone on your operation entered a pit without a monitor?

If you or someone on your operation is struggling: 988 Suicide & Crisis Lifeline (call or text 988), Farm Aid hotline (1-800-FARM-AID), Do More Ag Foundation (domore.ag).

Executive Summary: 

Six Colorado dairy workers — including a father, his two sons, and a son‑in‑law — died when hydrogen sulfide gas filled a pump room at Prospect Valley Dairy in August 2025. OSHA has proposed $246,609 in fines against the dairy and two contractors, effectively valuing each death at about $41,101 — less than a bulk tank, far less than a robot, and nowhere near typical civil payouts for confined‑space fatalities. Investigators issued only “serious” violations, not “willful” ones, so no one is facing criminal charges or jail time despite six preventable deaths. The case exposes how agriculture’s OSHA exemptions and the lack of a specific confined‑space standard leave dairy workers protected mainly by a vague General Duty Clause rather than clear rules. While DFA and NMPF have offered condolences and point to existing voluntary FARM safety checklists, neither has launched a new confined‑space safety push even as the sector mobilizes quickly on issues like disease outbreaks. The article runs the barn math: a basic confined‑space program on a mid‑size dairy costs roughly the price of two cows, but skipping it invites $10–$17 million lawsuits and the kind of funerals Weld County just lived through. It closes with a blunt 30/90/365‑day checklist for producers who don’t want their own pump room to become the next scene like this.

Complete references and supporting documentation are available upon request by contacting the editorial team at editor@thebullvine.com.

Learn More

The Sunday Read Dairy Professionals Don’t Skip.

Every week, thousands of producers, breeders, and industry insiders open Bullvine Weekly for genetics insights, market shifts, and profit strategies they won’t find anywhere else. One email. Five minutes. Smarter decisions all week.
NewsSubscribe
First
Last
Consent

Dam-Sourced Colostrum Drops Calf Mortality from 8.9% to 6.2% – Inside the 93-Herd Protocol

In a 93‑herd study, farms feeding pooled colostrum lost ~20 calves out of 220. Dam‑fed herds lost 14. The only change was which colostrum hit the gut first.

Executive Summary: A 93‑herd German study of 54,474 calves showed farms feeding dam‑sourced colostrum as the first meal had 6.2% mortality, while herds relying on pooled or random colostrum ran 8.9%. On a 200‑cow dairy, that gap pencils out to roughly six extra dead calves a year if you stay with pooled colostrum—before you add treatment costs and lost first‑lactation milk. The same dataset flagged two unglamorous but powerful levers: replacing bucket teats at the first sign of wear and knocking down dust with better calf‑barn ventilation, both tied to 3–4 point swings in mortality. Economically, sliding mortality from 8.9% toward 6.2% easily clears $2,000–3,000 per year in avoided dead‑calf costs on mid‑size herds, with much bigger upside once lifetime production is factored in. The practical play is to reserve pooled or bank colostrum for Johne’s‑high and problem cows, feed dam‑sourced first to low‑risk calves, tighten teat cleaning and replacement, and treat dust and air quality like you treat vaccines—non‑negotiable. If your pre‑weaning losses live closer to 9% than 6%, your fastest ROI isn’t another gadget; it’s whose colostrum fills the first bottle and how clean the rubber and air are when that calf takes its first drink.

Dam-Sourced Colostrum

When Dr. Michael Steele stood before the Smart Calf Rearing Conference audience in January 2026, he didn’t mince words about what the industry has been getting wrong. “We’ve been so focused on IgG that we’ve missed half the story,” the University of Guelph calf nutrition researcher told the room. “Colostrum isn’t just a passive transfer vehicle. It’s programming the calf’s entire immune system—and whose colostrum matters more than we thought.”

A month earlier, a German study had landed that put hard numbers behind that claim. Steffi Keller and colleagues tracked 54,474 calves across 93 Thuringian dairy herds and found something that should make every calf manager pull their protocols off the wall and take a harder look. Farms that fed dam-sourced colostrum as the first meal averaged 6.2% calf mortality. Farms feeding pooled or random colostrum averaged 8.9% calf mortality.

Age (Months)Dam-Sourced Mortality (%)Pooled/Random Mortality (%)
00.00.0
12.13.2
23.85.5
45.27.4
66.28.9

Same country. Same genetics. Similar scale. One management change. A 30% relative reduction in dead calves.

The uncomfortable part? According to USDA NAHMS data, the average U.S. dairy takes 3.6 hours to deliver first colostrum—and the majority still feed only two quarts at that first feeding. Timing and source are crucial; feeding dam‑sourced colostrum promptly maximizes immune benefits and reduces mortality.

The 54,474-Calf Study That Changed the Conversation

The Keller study wasn’t a boutique trial with 80 calves and ideal conditions. It was real-world, messy farm data: 93 large herds, all rearing their own replacements, almost all with 100+ cows. From March 2017 to March 2018, they tracked every live birth and every death for up to 6 months, then matched those numbers to management practices observed during farm visits.

Four things stood out in the mixed-model analysis:

  • Dam-sourced colostrum for the first feeding
    6.2% mortality vs. 8.9% when colostrum was pooled or randomly assigned.
  • Replacing bucket teats at the first sign of wear
    5.4% mortality vs. 9.0% when teats were only swapped out once visible damage appeared.
  • Dust control as a respiratory trigger
    Farms that didn’t see dust as a big deal averaged about 10% mortality; those that identified dust and acted on it ran closer to 6.5%.
  • Objective body condition scoring of cows
    4.9% vs. 7.9% mortality where BCS was scored consistently, not just eyeballed.
Management PracticeLow Mortality (%)High Mortality (%)Mortality Swing (points)
Dam-sourced colostrum (first feeding)6.28.92.7
Teat replacement at first sign of wear5.49.03.6
Dust recognized as respiratory trigger6.5~10.03.5
Objective body condition scoring (BCS)4.97.93.0

None of this needs new hardware or a subscription. It’s the kind of nuts‑and‑bolts management that calf people control already—if the barn is willing to actually change habits.

The most controversial of the four? Putting the dam’s own colostrum back at the center of the protocol in an era where pooled “colostrum banks” and replacers have become the safety net.

Why Dam-Sourced Colostrum Hits Harder Than Pooled

We’ve all spent 20 years talking about IgG levels, total volume, and the four-litres-within-two-hours rule. Those don’t go away. What the Thuringian study adds is a stronger push to identify who that colostrum comes from.

Here’s what stacks up behind it:

Maternal leukocytes carry “memory.” Maternal colostrum isn’t just protein and IgG. It’s loaded with viable leukocytes that carry the dam’s immune history into the calf. Those cells cross the gut, show up in the calf’s bloodstream, and start shaping how that immune system responds to the bugs actually on your farm.

Fresh beats stored for immune programming. Work comparing fresh vs. frozen colostrum has shown that calves fed fresh whole colostrum mount faster, exhibit more efficient innate responses, and avoid the prolonged inflammatory overdrive that hammered frozen-fed calves.

Maternal colostrum beats replacer on cell-mediated immunity. A recent Japanese Black calf study found maternal colostrum increased T- and B-cell populations and activated the immune system earlier and more effectively than a replacer, even when IgG transfer looked adequate on paper.

As Dr. Steele put it at the January conference: “The calf’s gut is only open to those maternal immune cells for about 24 hours. After that, the window closes. If you’re feeding pooled colostrum from three different cows, you’re diluting that targeted immune programming.”

Immune FactorDam-Sourced ColostrumPooled ColostrumColostrum Replacer
Live maternal leukocytes✓ High (carry dam’s immune memory)⚠ Diluted (mixed from multiple cows)✗ None (heat-processed)
Targeted pathogen exposure✓ Farm-specific (dam’s exposure history)⚠ Mixed signals (multiple dams’ histories)✗ Generic (no farm-specific immunity)
Cell-mediated immunity (T/B cells)✓ Faster activation (research-backed)⚠ Moderate (depends on pool quality)⚠ Adequate IgG, weaker cell response
Bioactive factors (fresh vs. processed)✓ Maximum (if fed fresh)⚠ Reduced (if frozen/thawed)⚠ Reduced (heat treatment affects some)

Layer that over Keller’s simple mortality math, and the picture is pretty blunt: dam-sourced colostrum appears to combine good IgG transfer with immune “software” tailored to that dam’s pathogen experience.

Pooling colostrum from multiple cows, or randomly grabbing “whatever’s thawed,” may hit your Brix target. But you’re stripping that tight dam-calf match out of the first meal.

The Gap Between Knowing and Doing

Here’s what makes the Keller findings sting: most producers already know colostrum quality matters. NAHMS 2014 data showed 79.7% of U.S. operations were not pooling colostrum—meaning most farms were already doing some version of individual cow sourcing.

But “not pooling” isn’t the same as “feeding dam-sourced first.”

The same NAHMS data revealed the friction points hiding in plain sight:

  • Average time to first colostrum feeding: 3.6 hours (well past the ideal 1-2 hour window)
  • The majority of operations feed only 2 quarts at first feeding (half the recommended volume)
  • Only 10.6% of operations separating calves from the dam in less than 1 hour
Colostrum PracticeU.S. Industry Average (NAHMS 2014)Thuringian Protocol Target
Time to first colostrum feeding3.6 hours<1 hour (dam milked), <2 hours (fed)
Volume at first feeding2 quarts (majority of farms)4 liters (~4.2 quarts) or 10% birthweight
Calf separation from damOnly 10.6% separate in <1 hour<1 hour (minimize disease exposure)

The system was designed around convenience, not biology. Calves get born at 2 a.m., the fresh cow doesn’t get milked until morning chores, and whatever’s thawed or available becomes “good enough.”

“What we’re seeing in the German data,” says Dr. Steele, “is that ‘good enough’ might be costing farms 2-3 extra dead calves per hundred. That’s not a rounding error—that’s real money walking out the door.”

The Thuringian Colostrum Protocol in Plain English

Keller’s paper doesn’t read like an SOP. It reads like a regression model. But if you strip the statistics back to management decisions, the protocol is straightforward.

1. First meal: dam-sourced, fast, and enough

  • Milk the fresh cow as soon as she can be safely moved—aim for within 1 hour of calving.
  • Feed 4 litres (or 10% of birthweight) of that dam’s colostrum within the first 2 hours.
  • Only reach for the bank or replacer when the dam is a known high-Johne’s risk, has obviously poor colostrum, or can’t be milked safely.

2. Second and third meals: high-quality, fresh or frozen

  • Keep targeting 6-8 litres within the first 12-24 hours, but don’t stress if these meals come from banked colostrum.
  • Prioritize fresh where practical—immune cell viability and some bioactives drop with heat treatment and storage, even if IgG holds.

3. Switch the cleaning standard for teats and buckets

Keller’s team didn’t just see a mortality difference with teat replacement. They highlighted a nearly 40% relative reduction when teats were replaced at the first sign of wear, rather than waiting for obvious damage (5.4% vs. 9.0%).

Teat Replacement ProtocolCalf Mortality Rate (%)
First sign of wear5.4
Obviously damaged9.0
Difference (mortality swing)3.6 points

That lines up with what hygiene work on calf feeding equipment keeps showing:

  • Residues from colostrum and milk are ideal biofilm starters on rubber and plastic.
  • Once biofilms establish, standard rinsing won’t touch them; they shed bacteria into every feed.
  • Worn, roughened teats are prime real estate for biofilm.

The practical protocol most farms can live with:

  • Rinse all teats and buckets in lukewarm water first, then wash with 60°C water and proper detergent, then disinfect and air-dry.
  • Keep twice as many teats as you need in rotation; when a teat shows the first whitening, soft spots, or hairline cracks, it goes into the discard bin—not “one more week.”
  • Budget to replace every teat at least every 2-4 weeks in heavy use.

4. Take dust personally in calf housing

In Keller’s model, dust perception wasn’t just a comfort issue. Farms that recognized dust as a respiratory trigger—and actually did something about it—had roughly 6.5% mortality vs. around 10% on farms where dust remained unchecked.

That matches what ventilation research and extension folks repeat every winter:

  • Poor ventilation, humidity, and dust levels combine to increase the risk of pneumonia.
  • Positive-pressure tube systems can deliver 4-6 air exchanges per hour without chilling calves if designed correctly.
  • The “tell” is simple: if it smells stale, looks dusty, or your glasses fog up when walking in, calves are breathing that too.

You don’t need a European research grant to fix this. You need:

  • A smoke bomb or fog test to find dead air zones.
  • A simple positive-pressure tube design sized to your barn and pen layout.
  • Someone walking the barn and asking, honestly, “Would I want to lie in this pen and breathe this air?”

The Economics: What Does a 30% Mortality Drop Actually Buy You?

Keller’s paper didn’t put a dollar figure on each dead calf. North American numbers do.

Recent economic analyses peg total cost per dead calf at around $395, including market value, invested treatment, labor, and disposal. Other Bullvine work has shown that prevention protocols costing $40-50 per calf routinely deliver 17-26x ROI when you look at lifetime production and culling risk.

Let’s keep it basic and stay on just the mortality math.

Take a 200-cow herd calving roughly 1.1 calves per cow per year:

  • Calves born alive: 220 per year
  • At 8.9% mortality (pooled group), you’d lose about 20 calves
  • At 6.2% mortality (dam‑sourced group), you’d lose about 14 calves
  • ”That’s 6 calves a year not dying before six months.

At $395 per dead calf, that’s $2,370 in direct, conservative savings. If you use higher all-in numbers, some systems now see (upwards of $500-600 when you factor lost first-lactation milk), the avoided loss climbs well past $3,000-$3,500.

Colostrum ProtocolDirect Dead-Calf CostTreatment & LaborTotal Annual Cost
Pooled/Random Colostrum$7,900$1,200$9,100
Dam-Sourced Colostrum$5,530$900$6,430
Savings (Dam vs Pool)$2,370$300$2,670

And the cost to unlock that?

  • Teat replacement: even at $3 per teat, swapping 30 teats every two weeks costs <$100/month.
  • Dust control: a basic positive-pressure tube system for a 40-calf barn runs $1,500-3,000 installed. Spread over 5-10 years, it disappears in the noise.

The dam-sourced colostrum shift itself? It’s mostly labor and habit. There’s no subscription fee.

Johne’s: The Objection Everyone Thinks First

The second you say “feed dam-sourced colostrum,” somebody in the room says “Johne’s.” And they’re not wrong to bring it up.

The Thuringian herds were, in a European context, subject to their own control programs. They didn’t exclude Johne’s-positive herds, but they weren’t feeding colostrum from obviously diseased cows either. The study wasn’t designed to settle the Johne’s debate once and for all.

For herds with active Johne’s issues, a rigid “dam-only, no questions asked” protocol is reckless. But the answer isn’t to throw Keller’s mortality data in the garbage. It’s to sort cows differently:

  • Test and classify cows by Johne’s status. High-titre or clinical cows are never colostrum donors. Full stop. Their calves receive high-quality banked colostrum or a replacer.
  • Feed dam-sourced colostrum from low-risk cows. For test-negative, low-risk cows, the mortality and immune benefits of dam-sourced colostrum look hard to ignore.
  • Pasteurize strategically where needed. Colostrum pasteurization can reduce bacterial load, including MAP risk, but can also affect some bioactives if done badly. Where Johne’s is a real concern, work with your vet to design which pools get pasteurized and how.

This is where your own risk tolerance and herd status matter more than any paper. The Thuringian study says “dam-sourced first feed is powerful.” Your Johne’s profile decides how wide you open that door.

What This Means for Your Operation

Here’s how to translate the Thuringian protocol into decisions in your own barn.

  • Run your own mortality math in the next 30 days. Pull 3 years of calf records. What’s your 0-6 month mortality rate? If you’re at or above 8-9%, you’re functionally in the pooled-colostrum group Keller described.
  • Audit where your first colostrum actually comes from. Don’t look at the SOP. Look at last week’s calves. How many got their own dam’s colostrum at the first feeding? How many got pooled or banked colostrum because it was easier?
  • Trial dam-sourced only on low-risk cows for 60 days. Work with your vet to define Johne’s-low cows. For 2 months, commit to the idea that every eligible calf gets dam-sourced colostrum first, even if you’re tired or it’s 2 a.m. Track mortality, treatments, and growth. Don’t change anything else.
  • Tighten your teat and bucket regime. If you’re honest and admit teats only get replaced when they’re obviously rough, move that line up. Start swapping at the first visual sign of wear. Hit equipment with the full rinse-wash-disinfect-dry cycle every feeding, not “when it looks bad.”
  • Walk your calf barn with a dust and air lens. Use a cheap fog machine or smoke bomb to visualize airflow. If you have dead zones or heavy dust, get quotes on a simple positive-pressure tube system sized for your pen count. If $2,500 feels steep, compare it to your last bill for a pneumonia outbreak.
  • Decide your Johne’s comfort zone in writing. With your vet, set a written policy: which cows’ colostrum is always discarded, which is always dam-fed, and which goes to the bank. If you’re going to bend the dam-sourced rule, make sure it’s a conscious, risk-based choice—not reflex.

Key Takeaways

  • If your pre-weaning calf mortality is hovering around 8-9%, you’re right where the pooled/random colostrum farms in Keller’s 93-herd study were—and about 30% worse than herds feeding dam-sourced first.
  • The dam’s own colostrum brings more than IgG. It delivers an immune “starter kit” of live leukocytes and bioactives that seem to translate into fewer dead calves and less chronic disease in the first months.
  • Regularly replacing bucket teats at the first hint of wear and treating dust like a real respiratory trigger aren’t nice-to-haves. In the Thuringian data, they’re tied to a 3-4 point swing in mortality.
  • The protocol change that moves you from pooled to dam-sourced first feed doesn’t require a new building or a six-figure check. It requires different night-calving habits, slightly more disciplined milking of fresh cows, and a written plan for Johne’s risk.

The Bottom Line

The herds in Keller’s paper weren’t running 0% mortality fairy-tale calf programs. They were big, commercial dairy farms—just like yours. The difference between their 6.2% and 8.9% wasn’t magic. It was colostrum, rubber, and dust.

The question now is pretty simple: over the next 12 months, are you going to keep trusting the pooled colostrum bank model you built a decade ago, or are you willing to test whether your calves do better when they start life with their own dam’s immune story in the bucket?

Complete references and supporting documentation are available upon request by contacting the editorial team at editor@thebullvine.com.

Learn More

The Sunday Read Dairy Professionals Don’t Skip.

Every week, thousands of producers, breeders, and industry insiders open Bullvine Weekly for genetics insights, market shifts, and profit strategies they won’t find anywhere else. One email. Five minutes. Smarter decisions all week.
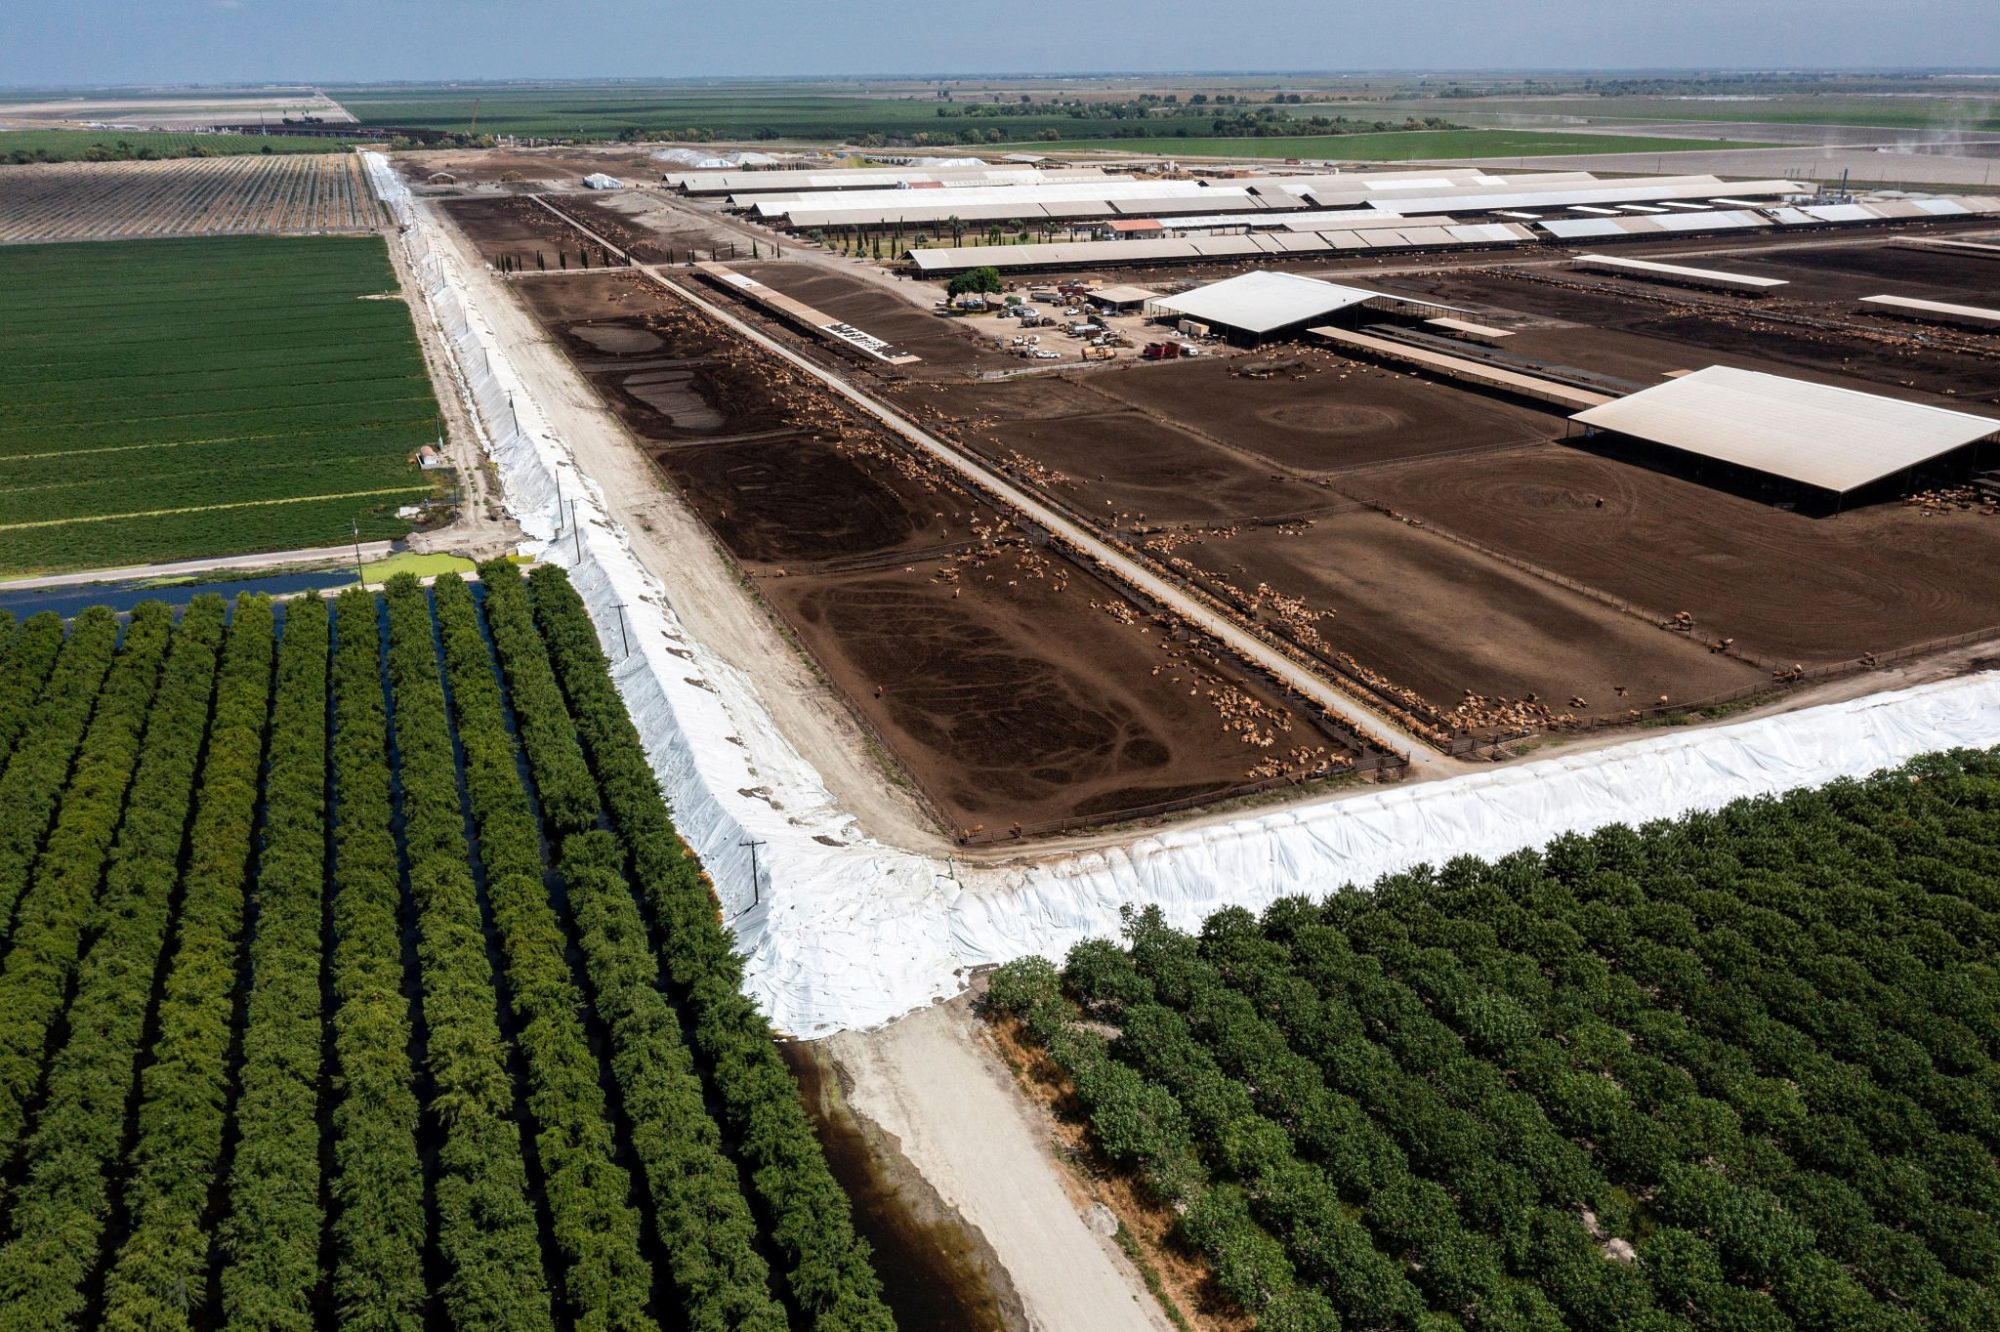
NewsSubscribe
First
Last
Consent

Penn State’s $3,110 Heifer Trap: When “One More Lactation” Costs 3× More Than Replacing Her

Glenn Kline ran the numbers at $3,110 heifers. The cows he kept were not the ones he expected.

Executive Summary: Record‑high replacement heifer prices — topping $3,110 per head in October 2025 — have pushed a lot of dairies to keep cows longer, but the math says that instinct is upside down. A five‑year study of 3,003 cows on 29 Swiss farms found that hanging onto unprofitable cows costs about three times more than culling them a bit early, and Penn State’s NAHMS work shows 73.2% of U.S. culls are still driven by health and fertility failures, not strategy. When you add Lunak’s finding that it takes more than three lactations to pay off a heifer that only averages 2.7 lactations before she leaves, “one more lactation” stops being a brag point and starts looking like the costliest habit in your barn. This feature walks through barn‑floor math for a 400‑cow herd using current USDA milk prices, cull cow values, and feed costs, showing how just ten marginal cows can quietly erase $3,750–$6,000 in 150 days. You then get a simple three‑filter screen (DIM, production versus group, SCC, and pregnancy status) plus practical use of Dr. Victor Cabrera’s Retention Pay‑Off calculator and Albert De Vries’ “profitability per cow per year” lens to make real keep‑or‑replace calls. A 30/90/365‑day action plan spells out what to change first if you’re leaning hard on beef‑on‑dairy, running high first‑lactation percentages, or managing under Canadian quota.

Dairy Cow Culling Strategy

Glenn Kline doesn’t agonize over which cows stay and which ones go. At Y Run Farms in Pennsylvania, he genomically tests everything, breeds his lower performers to beef, and uses IVF to concentrate replacements from his top females. “Back in 2011, we started on genomic testing, and boy, that’s made a huge difference on our herd,” Kline told the audience at CDCB’s 2025 industry meeting at World Dairy Expo. His approach is ruthlessly cow-by-cow. And at current heifer prices, that precision is worth more than ever.

DateHeifer Price (USD/head)
April 2019$1,140
January 2025$2,660
July 2025$3,010
October 2025$3,110

In October 2025, USDA’s Agricultural Prices report pegged the average U.S. replacement dairy heifer at $3,110 per head — the highest figure ever recorded. By January 2026, that number eased to $2,860, but top heifers in California and Minnesota auction barns were still clearing north of $4,000. Those prices have convinced a lot of producers that holding cows longer is the smart play. Fewer replacements purchased, lower turnover, better welfare optics. Sounds logical.

That logic is costing you more than the heifers ever would.

A 2025 study published in Animals by Schlebusch et al. tracked replacement decisions across 29 Swiss dairy farms and 3,003 individual cows over 5 years (2018–2023), comparing actual culling decisions with a dynamic bio-economic model. The economic loss from retaining unprofitable cows (1.18 CHF per cow per month) was approximately three times greater than the loss from culling cows too early (0.33 CHF per cow per month). 

Not marginally worse. Three times worse. The instinct to squeeze one more lactation out of a cow past her economic peak was the more expensive mistake by a wide margin.

The Longevity Myth That’s Costing You

There’s a persistent belief — reinforced by some breeding indexes, welfare programs, and conference presentations — that longer-lived cows are inherently better. Lower cull rate equals better management. More lactations per cow equals more profit. In some individual cases, that’s absolutely true. But as a herd-level management principle, it falls apart under scrutiny.

According to Penn State Extension specialist Robert Lunak, drawing on 2018 USDA/NAHMS data for the Northeastern U.S., the average cull rate was 37.6% — including a 6.2% on-farm death rate. Of total culls, 73.2% were involuntary: infertility (23.3%), mastitis (18.6%), lameness (9.1%), injuries (3.5%), respiratory disease (2.4%), metritis (2.2%), displaced abomasum (2.0%), and other causes (12.1%).

Voluntary culling — the part you actually control — was just 26.8% of the total.​

Nearly three-quarters of the cows leaving your herd aren’t leaving because you decided they should. Biology decided for you. Mastitis. Infertility. Lameness. So when someone tells you that driving your cull rate from 38% to 30% will improve profitability, the right question is: which part of the 38% are you cutting?

Cull Reason% of Total CullsClassification
Infertility23.3%Involuntary
Mastitis18.6%Involuntary
Lameness9.1%Involuntary
Injury3.5%Involuntary
Respiratory disease2.4%Involuntary
Metritis2.2%Involuntary
Displaced abomasum2.0%Involuntary
Other involuntary12.1%Involuntary
Voluntary culling26.8%Voluntary
TOTAL100%

If you’re reducing involuntary culls through better transition management, better foot care, better reproduction protocols — that’s real progress. But if you’re just keeping marginal cows around longer to hit an arbitrary benchmark, you’re stacking losses.

Why Is 73% of Your Culling Involuntary?

The NAHMS data doesn’t just describe what’s happening — it reveals what isn’t happening. Lunak points out that mastitis, lameness, metritis, DA, respiratory problems, and injuries together represent almost 40% of biological culls. These aren’t mysterious losses. They’re preventable ones. 

The Schlebusch study’s farm-level data supports this. Across all 553 culling events recorded over five years, the three leading causes of replacement were fertility issues (26.4%), udder health problems (22.6%), and inadequate performance (9.8%). First- and second-parity cows together accounted for 36% of all removals — cows that hadn’t yet recovered the investment in their rearing.

Lunak’s own analysis underscores the scale of this problem: it takes more than three lactations to recoup the roughly $2,000 cost of raising a replacement heifer, but the average productive life of a U.S. dairy cow is currently just 2.7 lactations. USDA data indicates that 70% of cows are culled within their first three lactations. Break-even, at best. 

And here’s where survivorship bias creeps in. The cows you see in their fourth, fifth, sixth lactation — the ones putting up big numbers — they survived. They’re the genetic and management winners. The cows that didn’t make it can’t show up in your herd average. You don’t have their third-lactation production data because they never got there.

Looking at your oldest cows and concluding they produce the most milk? Of course, they do — the ones that couldn’t produce got culled or died. That’s not evidence that aging improves productivity. It’s evidence that your culling process works. The mistake is building your replacement policy around that survival data.

Is Your Culling Rate Too Low — or Too High?

Very few people want to engage with this question honestly. CoBank has closely tracked the heifer supply situation, and the picture isn’t pretty. USDA’s February 2026 Agricultural Outlook Forum confirmed that dairy replacement heifer inventory remains near its lowest level since the early 1990s — the ratio of dairy heifers per 100 milk cows hit its lowest since 1991.

Geiger’s analysis for CoBank traces the trajectory: heifer values climbed from $1,140 per head in April 2019 to $2,660by January 2025, then surged to a record $3,010 in July 2025 — a 164% jump. By October 2025, USDA’s quarterly estimate hit $3,110. Replacement heifer inventory fell to a 47-year low in early 2025, and the structural shift toward beef-cross breeding shows no sign of reversing.

Heifers are scarce and expensive. That’s a fact. But scarce and expensive doesn’t mean your fourth-lactation cow with a 350,000 SCC and an open status at 180 DIM is suddenly a good investment. It means you’re stuck between two bad options — and you need math, not sentiment, to pick the less bad one.

The Barn Math: What a $3,110 Heifer Actually Costs Your Herd

Run the numbers on a 400-cow freestall. January 2026 Class III milk came in at $14.59/cwt. The all-milk price for 2026 is forecast at $18.95/cwt per the February 2026 WASDE — but early-year actuals are running well below that annual average.

ScenarioReplacement Heifer Cost (USD)Cull Cow Value (USD)Net Replacement Cost (USD)
Low$2,860$1,600$1,260
Mid$3,110$1,500$1,610
High$3,110$1,400$1,710
  • Replacement heifer cost: $2,860–$3,110 per head (USDA Agricultural Prices, January–October 2025)​
  • Cull cow value: January 2026 National Dairy Comprehensive Report shows cutter cows at roughly $285–$292/cwt dressed weight; on a live-weight basis for a 1,400-lb dairy cow, approximately $1,400–$1,600 per head depending on condition.
  • Net replacement cost: approximately $1,260–$1,710 per head after cull cow credit
  • Daily feed cost for a below-average cow producing 55–60 lbs/day: Penn State Extension’s feed cost framework shows at $0.12–$0.14/lb dry matter and 50 lbs DMI, total daily feed runs $6.00–$7.00/day.​

At $18.95/cwt all-milk, a cow producing 55 lbs/day generates $10.42 in gross milk revenue. That leaves a daily margin of $3.42–$4.42 — before labor, breeding, health costs, and overhead.

Now compare her to the heifer on your bench. CDCB’s 2020 genetic base change showed Holsteins gained 984 pounds of milk through genetic improvement alone over the five-year base period (2010–2015 births) — roughly 197 lbs/year. The 2025 base change, reflecting 2015–2020 births, shows even larger component gains: +45 lbs of butterfat and +30 lbs of protein over that period. Since genomic selection took hold, the average annual increase in Net Merit has been $85/year, compared to $40 during the previous five years. That genetic progress is sitting on your heifer bench right now — and it compounds across her lifetime.

If the older cow is past 200 DIM, producing 15% below her group’s rolling herd average, open or questionable on pregnancy status, and carrying elevated SCC, her real daily margin after all variable costs may be negative.

On a 400-cow herd, keeping just 10 cows past their economic optimum adds up fast. If each marginal cow generates $2.50–$4.00/day less margin than her replacement would, that’s $25–$40/day across the group. Over 150 days, that’s $3,750–$6,000 in lost opportunity, just for those 10 cows. Scale it to 15 or 20, and you’re looking at $5,625–$12,000 in a single cycle that never shows up as a line item on your milk check.

ScenarioDaily Margin Loss Per CowNumber of Marginal CowsTotal Loss Over 150 Days
Conservative$2.5010$3,750
Moderate$3.2510$4,875
High-loss$4.0010$6,000

The Heifer Shortage Doesn’t Change the Math

USDA’s February 2026 Outlook Forum makes clear that the dairy heifer pipeline isn’t recovering anytime soon — the number of heifers expected to calve declined again, and beef-on-dairy continues to pull potential replacements out of the system. 

But expensive doesn’t mean “don’t replace.” It means replace smarter.

The Schlebusch study nails it: farmers consistently underestimate the cost of keeping cows too long and overestimate the cost of culling too early. Across all 29 farms, cows retained despite having negative economic value accounted for 3,557 CHF in cumulative losses, versus just 1,101 CHF in losses from premature culling — a 3.2:1 ratio. And that’s in a system where the average replacement heifer cost was 3,123 CHF (roughly $3,435 USD at 2023 exchange rates) — not far off from what North American producers face right now.

Decision TypeCumulative Loss (CHF)
Kept Too Long3,557
Culled Too Early1,101

That’s the sunk cost trap working on you. You’ve invested $2,860 to get that heifer into the herd. She had a rough first lactation — mastitis, slow to breed back. The instinct is to keep her longer to “pay off” that investment. But that $2,860 is gone whether she milks for one more day or one more year. The only question that matters: starting today, will she generate more margin than the next heifer in line?

If the answer is no, keeping her isn’t protecting your investment. It’s compounding the loss.

When Does “One More Lactation” Stop Making Money?

Think of it like professional sports. As long as a player is performing — earning her spot through production, health, and reproductive success — she stays on the roster. The day she’s not outperforming the next player on the bench, she gets replaced. Nobody keeps a veteran around just because his signing bonus was expensive.

Eric Grotegut at Grotegut Dairy in Wisconsin has pushed his replacement rate down to 25% — but he didn’t do it by holding on to marginal cows. Better calf management, upgraded facilities, and consistent hoof work drove the involuntary culls out. “Instead of culling problem cows or culling lower performers, genetically they’re definitely able to stay longer,” Grotegut told the CDCB panel at World Dairy Expo in 2025. That’s a low cull rate that was earned, not manufactured.

Some cows deserve exactly that kind of long career. Great genetics, sound feet, clean udders, breed back on schedule, throw high-index daughters — the breeders who proved genetic progress compounds built their programs around those animals. The Schlebusch data confirms it: the biological and economic optimum sits at five to six parities — but only for cows whose health, fertility, and production justify it. 

“Some cows deserve long careers” is not the same as “all cows should have long careers.” And “our cull rate should be 28%” isn’t a management strategy. It’s a bumper sticker.

What $3,110 Heifers Mean for Your Culling Strategy

Albert De Vries at the University of Florida has spent years modeling this exact question. His framing cuts through the noise: “You want to maximize profitability per unit of the most limiting factor, and a reasonable metric for that is profitability per cow per year.” Not lifetime production. Not lifetime longevity. Profit per cow per year. 

Pull your DHIA 202 Herd Summary tonight and run these three filters:

FilterThreshold / RuleWhy It Matters
Days in Milk (DIM)>200 DIMCow is past peak; if she’s underperforming now, she won’t recover margin before dry-off
Production vs. Group<85% of group rolling herd averageShe’s a bottom-tier performer relative to her peers — genetic progress is sitting on your heifer bench
SCC & Pregnancy StatusSCC >300,000 or open past 200 DIMHigh SCC signals chronic mastitis; open status means no future lactation income to recover her feed cost
  • Flag every cow past 200 DIM producing below 85% of her group’s rolling herd average.
  • Cross-reference against pregnancy status and SCC. Any cow that’s open past 200 DIM with SCC above 300,000 — she’s your first candidate.
  • Calculate her daily margin using your actual milk price and feed cost, not herd averages. Dr. Victor Cabrera’s Dairy Management group at UW-Madison offers a free Retention Pay-Off (RPO) calculator at dairymgt.wiscweb.wisc.edu that values each cow relative to her potential replacement, accounting for production, butterfat, pregnancy status, feed cost, replacement cost, and cull cow price. De Vries’s group at the University of Florida offers comparable tools. Both let you plug in your own numbers.

If your operation carries 40%+ first-lactation heifers, you will sacrifice bulk tank volume. First-lactation animals produce 80%–85% of the milk that a cow in her third or greater lactation can produce — that’s a 15%–20% gap per cow. A first-lactation animal makes roughly 15% less than a second-lactation cow and 25% less than one in her third or fourth. First-lactation cows already account for 38%–40% of the milking herd on many operations, so pushing that number higher will absolutely show up in your tank average.

But those younger cows also carry better reproductive performance, lower health costs, and the genetic progress you’ve been paying for through your semen purchases. The trade-off is real — lower volume now in exchange for better margins and a genetically stronger herd going forward. Whether that trade makes sense depends on your milk contract structure, component premiums, and how quickly your replacements ramp up.

For Canadian producers operating under quota, the economics shift because the quota value per cow substantially changes the replacement cost calculation. A cow’s implied quota value can exceed her biological value. Run the same filters, but adjust the threshold — a marginal cow holding quota may warrant a longer runway than the same cow in a non-quota system.

For operations where heifers clear $3,500+ (California, Minnesota, parts of Wisconsin): the “keep” window for marginal cows extends modestly. But document the monthly cost of every cow you’re holding past the filter screen. If you haven’t replaced her in 90 days, she’s not a bridge — she’s your new standard.

The 30/90/365 Playbook

In the next 30 days: Pull your DHIA 202 and identify every cow that fails the three-filter screen. Run at least five through Cabrera’s RPO calculator at UW-Madison or the University of Florida equivalent using your actual January–February milk price and feed cost. If the calculator says replace, start the process.

In the next 90 days: Review your breeding protocol. Glenn Kline’s approach at Y Run Farms is a good model: beef semen on lower performers, IVF on your best females, and genomic testing to know the difference. How many straws of beef semen are you using on cows, and how many might you need as replacements? Every beef-cross pregnancy is terminal for your replacement pipeline. Align your breeding decisions with your actual heifer needs—not just your calf-check revenue.​

In the next 365 days: Build a quarterly cull review into your management calendar. Heifer prices will move. Milk prices will move. The cows that were borderline keeps at $3,110/heifer may be clear culls at $2,500 or clear keeps at $3,800. The point isn’t to set a policy and forget it — it’s to make this decision with data, every quarter, cow by cow.

Key Takeaways

  • Across 29 farms and 3,003 cows, hanging onto unprofitable cows cost about 3× more than culling a bit too early — keeping is the more expensive instinct.
  • Penn State data shows 73.2% of culls are involuntary, and it takes more than 3 lactations to pay off a heifer that only averages 2.7, so “one more lactation” often destroys margin instead of proving good management.
  • On a 400‑cow herd with today’s USDA prices, ten marginal cows can quietly erase $3,750–$6,000 in 150 days without ever appearing as a separate line on your milk check.
  • A three‑filter screen (DIM >200, production <85% of group, high SCC/open) plus Cabrera’s RPO calculator and De Vries’ “profitability per cow per year” metric give you a repeatable way to rank cows as investments, not pets or statistics.
  • High first‑lactation percentages, beef‑on‑dairy, and Canadian quota change how aggressive you can be, but not the core rule: if a cow can’t beat her replacement on profit per cow per year, she’s on borrowed time.

The Bottom Line

Count the cows past 200 DIM below 85% of their group average tonight. Run five through a retention payoff calculator. At $18.95/cwt all-milk forecast but $14.59 January Class III actual, your margin for error on marginal cows is thinner than it’s been in two years. That’s the math Kline runs at Y Run Farms every time he reaches for a beef straw instead of a dairy one. The question isn’t whether you can afford to cull them at $3,110 per replacement. The question is whether you can afford not to.

Complete references and supporting documentation are available upon request by contacting the editorial team at editor@thebullvine.com.

Learn More

The Sunday Read Dairy Professionals Don’t Skip.

Every week, thousands of producers, breeders, and industry insiders open Bullvine Weekly for genetics insights, market shifts, and profit strategies they won’t find anywhere else. One email. Five minutes. Smarter decisions all week.
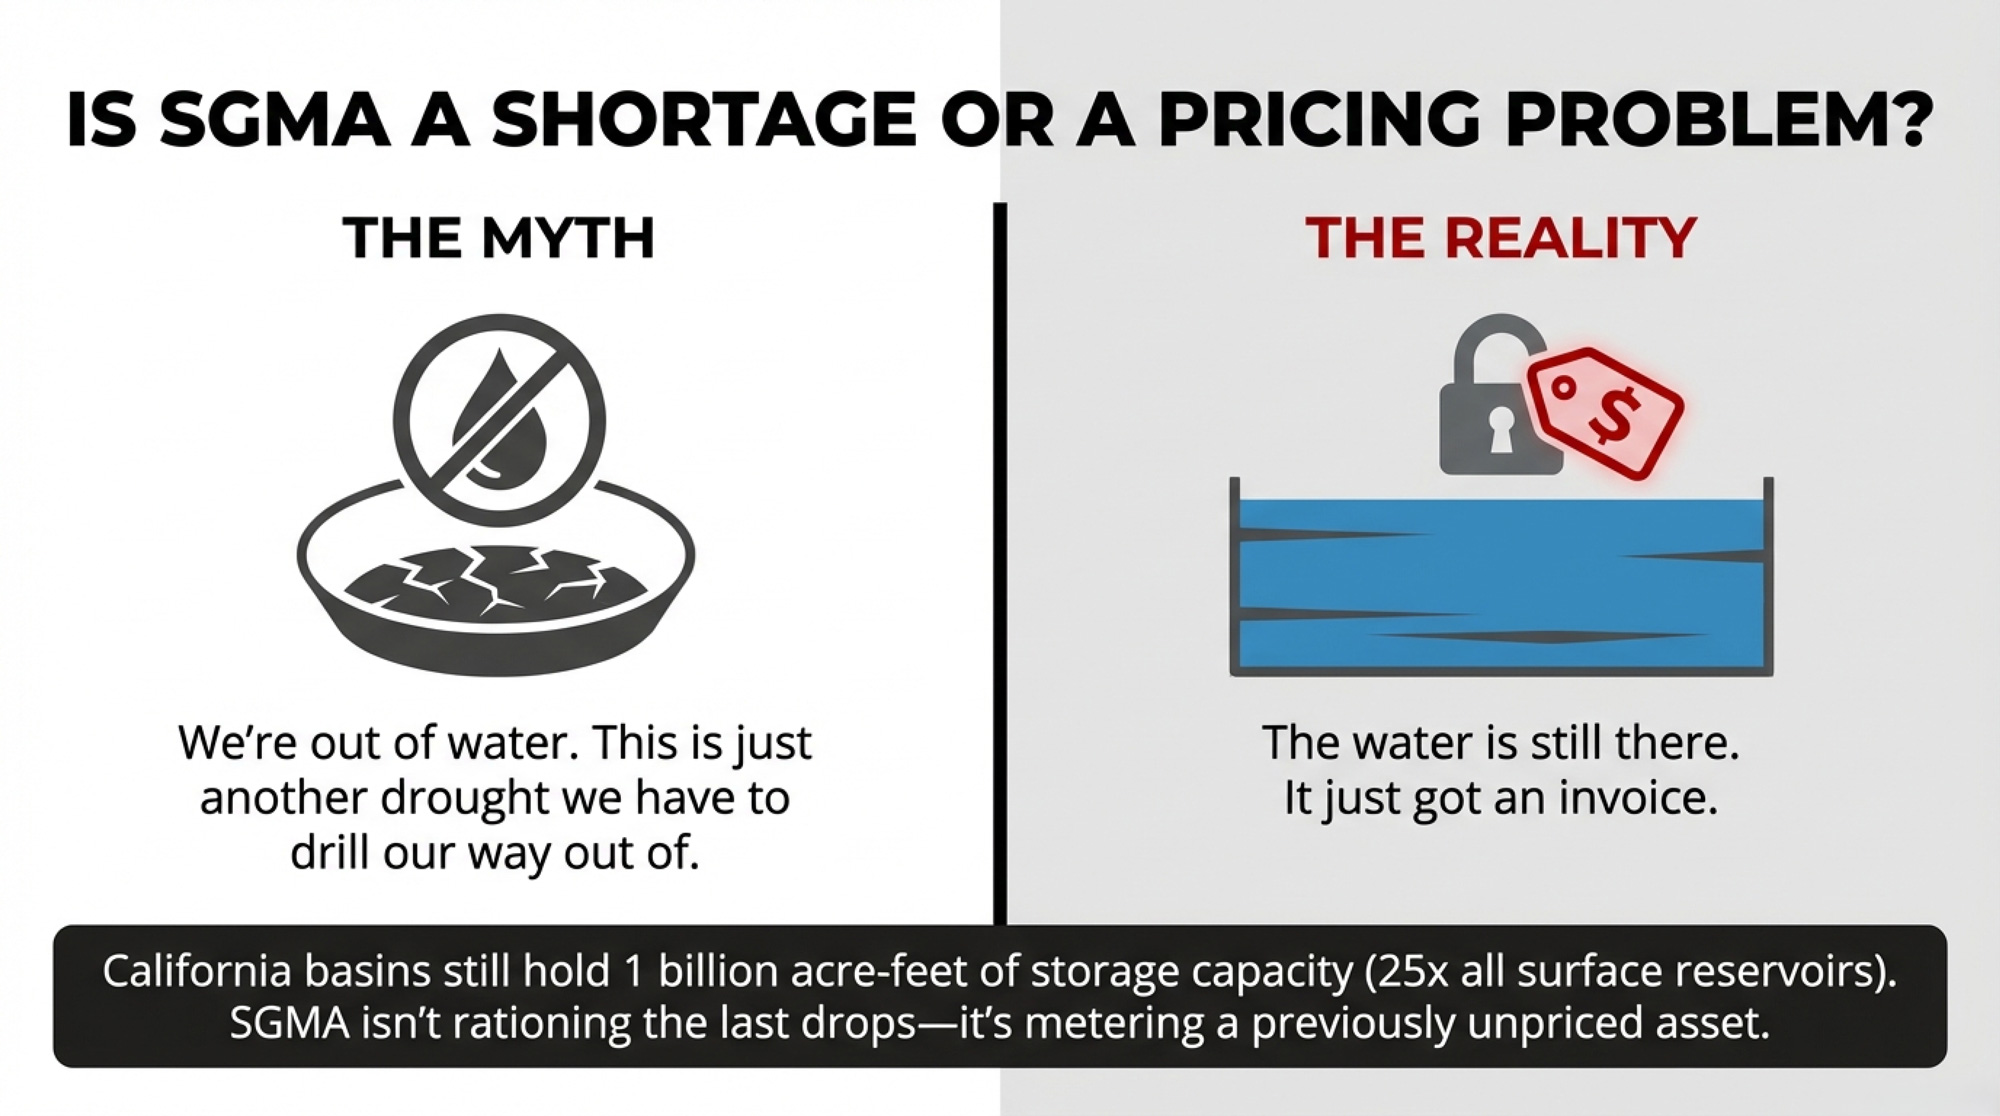
NewsSubscribe
First
Last
Consent

3 Temptations Taking Down Dairy Farms in 2026- and the 40-Day Discipline That Saves Them

315 farms filed Chapter 12. A 20,000‑cow dairy thrived. The difference? Three temptations almost every farm faces — and a 40‑day pause most never take.

Executive Summary: Three hundred fifteen farms filed Chapter 12 in 2025 — a 46% surge. This feature uses the Lenten Gospel’s three temptations as a mirror for the three decisions destroying dairy operations: chasing unproven genomic sires over disciplined genetics, expanding on record margins into record debt, and surrendering independence to a single processor. McCarty Family Farms’ 20,000-cow, data-first program anchors the survival side; Kooser Farms’ second bankruptcy in six years anchors the warning. A 40-day framework then layers across Lent, the fresh cow transition window ($200–$500/cow at stake), and the darkest weeks of winter — when one in four Canadian farmers surveyed reported thoughts of suicide. The piece closes with a concrete audit protocol: pull your real cost-of-production, stress-test at $18/cwt, and run the ratios before any spring commitment. Every major claim traces to CDCB, USDA, AFBF, Penn State Extension, CDC MMWR, and University of Guelph primary sources.

dairy farm management discipline

Ken McCarty found 28% of his parentage records were wrong.

That number came out when McCarty Family Farms started genomically testing every heifer across an operation that has grown from 7,000 to nearly 20,000 cows — using the Zoetis Clarifide Plus program. “How can we ever drive the appropriate rate of genetic progress, reduce inbreeding to levels where we want them to be, make the types of breeding decisions that will propel our business forward” without fixing that foundation first, McCarty asked on the Uplevel Dairy Podcast in December 2024. The answer was they couldn’t. So they fixed it, ranked every animal — top half breeds the next generation, bottom half goes to beef — and daily output per cow climbed from 70 pounds to over 100, while somatic cell counts held steady between 120,000 and 180,000.

Meanwhile, on October 2, 2025, Kooser Farms LLC filed for Chapter 12 bankruptcy in the Western District of Pennsylvania — Case #25-22656. It was their second filing in six years. Liabilities between $1 million and $10 million. Assets between $100,001 and $1 million.

YearTotal FilingsMidwestSoutheastMilk Price
20231394238$20.50
20242167162$21.80
2025315121105$22.40
2026???$18.95

Same industry. Same economy. Radically different outcomes. And the difference wasn’t luck — it was which temptations each operation said yes to.

If you went to church this past Sunday — the First Sunday of Lent — you heard the Gospel of Jesus facing three temptations in the wilderness. Stones into bread. Throw yourself from the temple. All the kingdoms of the world. It’s a story about what happens when you’re exhausted and under pressure, and someone offers you a shortcut that seems like salvation.

The pattern playing out on dairy farms right now is the same one. Three temptations. Three lies dressed up as opportunity. And the farmers who recognize them are the ones still shipping milk.

Temptation One: Turning Stones Into Bread

“Command these stones to become bread.” In the Gospel, it’s a temptation to use power for instant gratification when you’re hungry and desperate. On a dairy farm, it’s chasing short-term genetic flash over long-term herd health.

Every proof run brings a new wave of genomic young sires with dazzling indexes. The numbers look incredible — on paper. But a genomic young sire carries roughly 70% reliability. That means 30% of the prediction is noise. A first-crop daughter-proven sire sits around 83%. Second crop? North of 99%. The U.S. genomic selection program has doubled the rate of genetic gain — the average annual increase in Net Merit jumped from $40 to $85 per cow since 2010. Real progress. But those gains come from disciplined use of genomic data across the whole herd, not from betting the farm on a single young sire’s first proof.

Building your sire stack entirely on unproven genomic predictions is turning stones into bread. It looks like food, but it won’t sustain your herd through five lactations.

That’s not an argument against genomics. McCarty Family Farms proves what disciplined use actually looks like. They test everything. They rank ruthlessly. They use indexes like TPI and Dairy Wellness Profit to manage the 60% of their budget that goes to feed. But they don’t anchor their program to any single young sire before he has daughters in milk. Dan Weigel, the Zoetis geneticist who has worked closely with the McCartys, explained on the same podcast that genomic testing unlocked parentage accuracy first—and that gave the farm a dependable foundation to build every other breeding decision on.

What Does the Genetic Gamble Actually Cost?

Here’s the barn math. The Council on Dairy Cattle Breeding estimates genetic gain savings from Net Merit selection at approximately $50 per cow per year — a figure that climbs toward $75 when you factor in the expanded trait indexes added since 2021, including feed saved, heifer livability, and early first calving. On a 200-cow herd, that’s $10,000–$15,000 annually in genetic progress you’re leaving on the table if you refuse to use genomic information at all. University of Alberta research frames it differently: a $50 reduction in genetic lag translates to roughly $33 per cow per year in realized value, using the formula of twice the PTA difference divided by average lactation lifespan.

But chasing unproven sires below 80% reliability and having even 15% of those matings disappoint? You could wipe out that gain through higher cull rates, lower components, and daughters that don’t match their pedigree predictions.

The discipline isn’t choosing genomics or not. It’s choosing which genomic information to trust, and when.

Temptation Two: Throwing Yourself From the Temple

“Throw yourself down, for the angels will catch you.” The second temptation is about presumption — testing limits because you believe you’re protected. On a dairy farm, it’s expanding on record margins because the debt math looks survivable.

The genetic temptation erodes your herd over the years. This one can sink you in months.

Chapter 12 farm bankruptcy filings hit 315 in 2025 — a 46% jump from 2024’s 216 cases, according to the American Farm Bureau Federation. The Midwest took the hardest hit: 121 filings, up 70% year-over-year. Wisconsin went from 2 filings in 2024 to 16 — a 700% increase. Iowa jumped 220%. Missouri, 167%.

Ask Kooser Farms how expansion confidence ends. This Mill Run, Pennsylvania, operation filed its second Chapter 12 in six years. During the first bankruptcy in August 2019, they sold their entire dairy herd and pivoted to crops. Attorney Daniel White of Calaiaro Valencik explained the logic to the Pittsburgh Business Times: the farm had shifted from monthly milk payments to annual crop revenue and needed a payment structure to match. It made sense on paper. Then, adverse weather hammered yields for consecutive seasons, and “Plan B” became a second restructuring.

On February 9, 2026, Judge Taddonio confirmed Kooser Farms’ second restructuring plan. Whether it holds is an open question — the plan still has to survive three to five years of execution in an agricultural economy that already broke it once.

Many of the 315 operations that filed in 2025 expanded when milk prices made the numbers sing. At $24/cwt, you can make almost any barn pencil out. But 2024’s dairy cash receipts hit $50.7 billion, and USDA’s February 2026 WASDE projects $18.95/cwt all-milk for 2026 — down from the revised 2025 average of $21.17/cwt. For a 300-cow herd shipping 69,000 cwt a year, that’s roughly $153,000 in lost gross milk revenue. Total farm debt is expected to hit a record $624.7 billion in 2026, with interest expenses reaching $33 billion.

You see where this goes. Expansion debt taken on at $24 milk has to be serviced at $18 milk. And if your term debt coverage ratio doesn’t clear 1.25 — meaning for every dollar you owe in annual debt service, you’re generating $1.25 in cash available to pay it — you’re one bad quarter from a lender conversation you don’t want to have. Penn State Extension is explicit: many lenders require a minimum term debt coverage of 1.25 just to consider a plan viable, and flag 1.75 or better as the green zone. The University of Wisconsin Extension’s Farm Finance Scorecard uses the same thresholds — below 1.25 is “a concern and a weakness.” Stay below a 4:1 debt-to-EBITDA ratio. No exceptions.

Can Your Expansion Survive $3,500 Heifers and $18 Milk?

What makes the 2026 expansion especially dangerous? Replacement heifer inventory is at a 20-year low, and prices have hit $2,660–$4,000 per head depending on region, with premium auction heifers routinely clearing $4,000 in California, Minnesota, and Pennsylvania. Beef-on-dairy crossbreeding has been enormously profitable for calf value, but it’s drained the pipeline of dairy replacements.

So you’re building a bigger barn. Your heifer costs alone might run $530,000–$800,000 for a 200-head expansion at those prices. The milk check is falling. Your interest rate isn’t 2022’s anymore. And you’re betting the angels will catch you.

They won’t.

Temptation Three: All the Kingdoms of the World

“All these I will give you, if you fall down and worship me.” The third temptation is about surrendering your independence for the promise of everything. On a dairy farm, it’s tying your operation’s survival to a single processor or consolidation play.

U.S. dairy processors have committed over $11 billion to new and expanded manufacturing capacity across 19 states, with more than 50 individual projects slated for 2025 through early 2028, according to the International Dairy Foods Association. The top five states by investment: New York ($2.8 billion), Texas ($1.5 billion), Wisconsin ($1.1 billion), Idaho ($720 million), and Iowa ($701 million).

Hilmar’s $600 million cheese plant in Dodge City, Kansas, and Leprino Foods’ roughly $1 billion complex in Lubbock, Texas, are the anchors of a processing wave pulling milk production toward the Southern Plains. Ben Laine, senior dairy analyst at Terrain, sees the optimistic read: “If you’re building new cheese plants and you need to fill them with milk, you’re going to pay what it takes to get the milk in there… producers might be able to negotiate and move around, and that’s not something they’ve had in a long time.”

That’s one read. The cautious one is simpler: those plants will fight hard for milk from the most scalable suppliers. They aren’t following milk. They’re creating gravity wells.

For larger operations positioned to fill those plants, this is a real opportunity. But for a mid-size dairy that signs an exclusive supply agreement with a single processor? That’s a kingdom built on sand. When that processor shifts its sourcing, renegotiates terms, or simply doesn’t renew your contract, you’re left with a barn full of cows and nowhere to ship.

How Dependent Is Too Dependent?

In most industries, lenders and risk analysts flag customers with revenue above 20–25% as a concentration concern. Dairy’s regional processor limitations push that practical ceiling higher—but as a working threshold, never let any one buyer control more than 60% of your revenue. Above that, you don’t have a customer. You have an owner who hasn’t filed the paperwork.

Most farms already feel like they’re in this boat. In a lot of regions, you’re effectively tied to one co‑op or processor, with the hauler taking you to the same plant every day. You don’t flip a switch and suddenly have three buyers fighting for your milk — but carving out even 10–20% of your volume for a secondary outlet (on‑farm processing, a specialty contract, or a second plant where geography allows) turns absolute dependence into something closer to leverage.

CoBank’s Corey Geiger warned in October 2025 that protein is overtaking fat on the milk check: “Protein will take over the pole position on milk checks because we need more of it.” That shift will reshape which contracts pay what, and operations locked into a single buyer won’t have room to pivot.

Diversifying market access is easier said than done, especially in regions where one processor dominates. But the time to explore alternatives — a specialty contract here, cooperative membership that spreads your risk there — is before you need them. Not after the call comes.

The 40 Days That Test Everything

Lent’s framework isn’t just a metaphor for the three temptations. Forty days shows up in the dairy in ways that are almost eerie, how precisely they parallel the spiritual discipline.

The 40-Day Fresh Cow Window. The transition period — roughly three weeks before calving through three weeks after — is where profitability is won or lost at the individual cow level. Penn State Extension research on transition cow management confirms that over a third of fresh cows develop multiple health problems in their first 30 days, and that targeted protocols addressing subclinical ketosis ($300–$350 per case) and metritis ($300–$500 per case) can deliver a net benefit of $200–$500 per cow per lactation.

The barn math on this is straightforward. A 200-cow herd that freshens year-round puts roughly 65–70 cows through transition in any given 40-day period. If your protocols recover even $250 per cow across those animals, that’s $16,000–$17,500 in margin over 40 days. That’s what farms implementing targeted protocols — body condition scoring at dry-off, DCAD ration management, consistent fresh-cow checks — actually deliver when they execute consistently.

The 40 Darkest Days. And then there’s the window nobody wants to talk about. Late January through early March. Days are shortest, isolation peaks, and the cumulative weight of winter sits heaviest on the people doing the milking.

Dr. Andria Jones-Bitton’s research team at the University of Guelph surveyed over 1,100 Canadian farmers and found that 45% reported high stress, 57% met classifications for anxiety, and 35% met classifications for depression. Published in Social Psychiatry and Psychiatric Epidemiology in 2020, it was one of the first large-scale examinations of farmer mental health in Canada. A follow-up study during COVID-19, conducted in 2021, found the numbers held or worsened — 76% reported moderate or high perceived stress. One in four farmers surveyed reported having thought their life wasn’t worth living or had thoughts of taking their own life in the prior 12 months.

Jones-Bitton told the Saskatoon StarPhoenix that the public’s romanticized image of farming “underestimates the range of stressors that farmers are actually experiencing.” As one participant wrote in the COVID-era survey: “There is no sick note for farmers.”

The National Rural Health Association reports that farmers die by suicide at 3.5 times the rate of the general population — a figure drawn from University of Iowa research covering 1992–2010 that has been cited in federal testimony and NRHA policy briefs. The most recent CDC data, published in MMWR in December 2023 using 2021 death records from 49 states, found that male workers in agriculture, forestry, fishing, and hunting had a suicide rate of 47.9 per 100,000 — compared to 32.0 per 100,000 for all male working-age adults. That’s roughly 50% higher than the national average for men. By either measure, farming remains one of the deadliest occupations for suicide in America.

The wilderness that tests the herd is the same wilderness that tests the farmer. And the Gospel’s answer is the same as the research: you don’t fight the desert alone.

If you or someone you know is struggling:

  • Farm Aid: 1-800-FARM-AID
  • 988 Suicide & Crisis Lifeline: Call or text 988
  • Do More Ag Foundation: domore.ag
  • Crisis Services Canada: 1-833-456-4566

What You Do Before Spring Decisions

Path 1: Impose a 40-day audit before any major decision. Before you sign a breeding overhaul, barn expansion loan, or new processor agreement — stop. Pull your herd’s actual cost of production. Not the number in your head. The real one, with family labor at $18–$22/hour, depreciation at replacement value, and opportunity cost included. Run your debt-to-EBITDA ratio. Stress-test every scenario at $18/cwt all-milk price for six months — USDA’s February WASDE pegs 2026 all-milk at $18.95/cwt, but January’s actual Class III was $14.59. If the decision survives that test, proceed. If it doesn’t, you just saved your operation.

30-day action: This week, pull your last 12 months of actual expenses and calculate your true cost of production — including family labor and depreciation at replacement value. Do it before you commit to any spring decisions.

Path 2: Rebalance your sire stack toward proven reliability. If more than half your matings go to genomic young sires with reliability below 80%, you’re speculating. Use young sires on your bottom-half animals — the ones going beef anyway — and anchor your keeper matings to bulls with at least one daughter-proof cycle behind them. McCarty Family Farms runs nearly 20,000 cows this way. The $85/cow/year in Net Merit gains since 2010 came from whole-herd testing and data-driven culling, not hero-bull betting.

The risk: You may sacrifice some short-term index flash. You gain consistency across lactations. As the 2026 proof runs release, track which young sires maintain their rankings from genomic to daughter-proven. That transition — or lack of it — tells you everything.

Path 3: Audit your processor concentration now. Map your revenue sources. If one buyer accounts for more than 60% of your milk check, start building alternatives before the $11 billion processing investment wave reshuffles your region’s milk market.

Signal to watch: If your processor starts offering longer contract terms with volume floors, they’re locking you in. Negotiate optionality, not commitment.

Path 4: Treat transition like the 40-day audit it already is. If you’re not body-condition scoring at dry-off, you’re flying blind into your most expensive 40 days. Start there.

30-day action: Score every dry cow this month. Set up a tracking sheet — BCS at dry-off, calving date, health events through day 30. 90-day checkpoint: Review outcomes. You’ll have the data to see exactly where your transition dollars are leaking. 365-day benchmark: Run the full audit again next Lent. Compare your February 2027 numbers to this year’s baseline. If you’ve held the line, you’ll know it in the data.

Key Takeaways

  • If more than 50% of your matings go to sires below 80% reliability, you’re not using genomics — you’re gambling with it. Tier your sire stack: proven bulls on keepers, young sires on beef-cross candidates. McCarty Family Farms found 28% parentage errors before genomic testing cleaned the records. Fix the foundation first.
  • If your expansion can’t cash-flow at $18/cwt for six months, don’t build. USDA projects an all-milk price of $18.95/cwt for 2026. January’s Class III was $14.59. Stay below 4:1 debt-to-EBITDA. Insist on 1.25 term debt coverage. Kooser Farms filed Chapter 12 twice in six years. Plan B doesn’t always get a Plan C.
  • If one processor controls more than 60% of your revenue, you have a dependency, not a marketing plan. Start diversifying before the $11 billion processing wave reshuffles your region.
  • If someone on your operation is struggling, that matters more than any ratio in this article. Call 988 or 1-800-FARM-AID. Isolation is the accelerant. Reaching out is the intervention.

The Bottom Line

The farms that make it through this cycle won’t be the ones who never faced temptation. Every dairy farmer alive has stared at a young sire’s proof and wanted to believe the number. Run the expansion math at peak milk price and felt the pull. Looked at a processor contract and thought, this solves everything.

The ones still milking in 2030 will be the ones who built in the pause. Forty days. Real numbers. And the willingness to admit that some shortcuts aren’t salvation — they’re just stones.

Where does your breakeven actually sit right now? Not last spring’s number. The one that accounts for $3,500 heifers, $624.7 billion in sector-wide debt, and a milk check that just dropped from $21.17 to $18.95 in a single year.

Pull it. Run it. Then decide.

Complete references and supporting documentation are available upon request by contacting the editorial team at editor@thebullvine.com.

Learn More

The Sunday Read Dairy Professionals Don’t Skip.

Every week, thousands of producers, breeders, and industry insiders open Bullvine Weekly for genetics insights, market shifts, and profit strategies they won’t find anywhere else. One email. Five minutes. Smarter decisions all week.
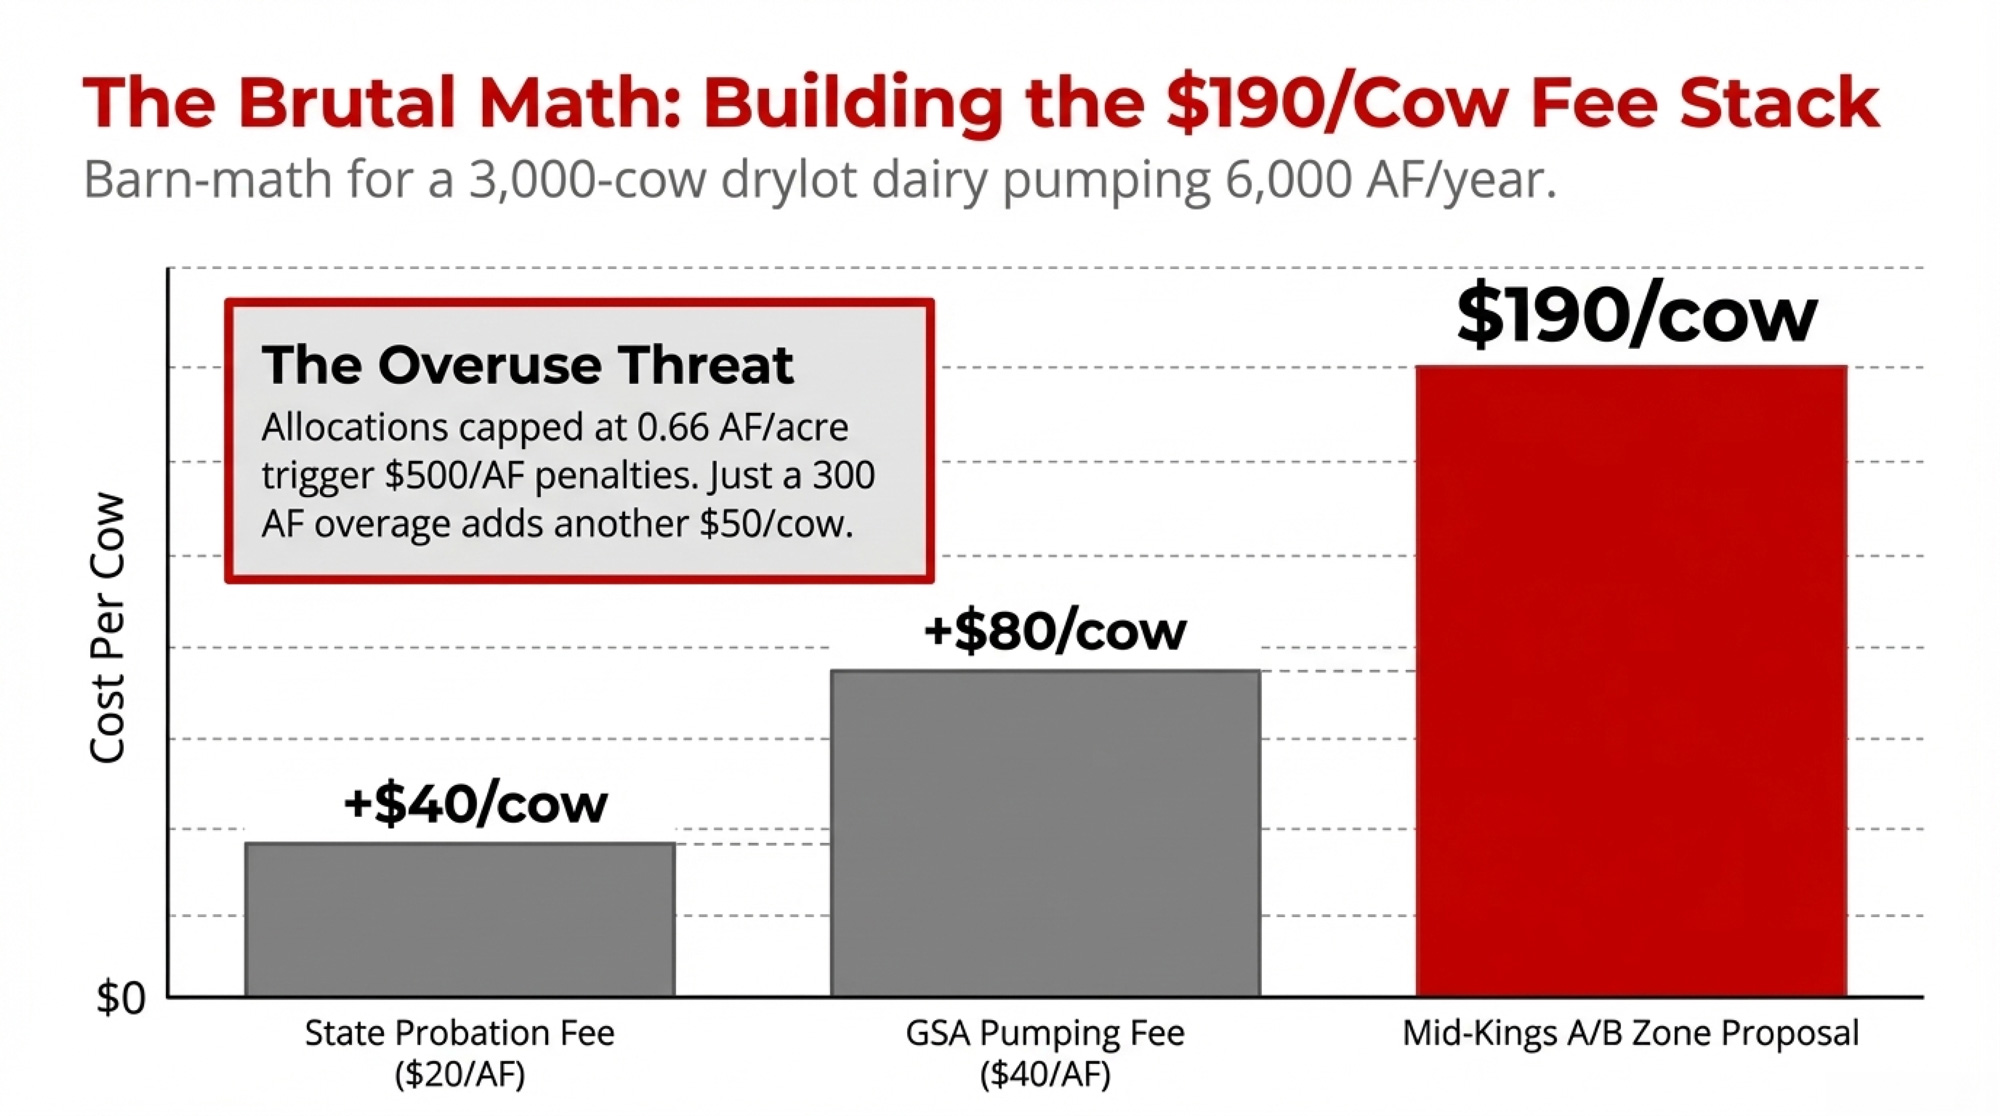
NewsSubscribe
First
Last
Consent

Calf Weaning by Starter Intake: Jim Quigley’s 15 kg NFC Threshold

Drop the afternoon milk, and you’ve just cut a calf’s ME by 50%. Jim Quigley says that’s an energy crash, not a weaning strategy.

Executive Summary: Most dairies still wean calves by age, but Jim Quigley’s work shows the rumen isn’t truly ready until a calf has consumed about 15 kg of NFC from the starter — roughly 33 pounds of fermentable carbohydrate. Many 8‑week weaning programs, especially on higher milk intakes, never reach that mark, which helps explain the post‑weaning growth checks and treatment spikes producers see. Research from Quigley, NASEM 2021, and Jim Drackley’s 2025 weaning review all point in the same direction: later, intake‑based weaning with a gradual step‑down beats abrupt, calendar‑driven protocols on biological and performance outcomes. Wagner Farms in Wisconsin built their calf program around intake targets and a 28‑day weaning step‑down and recorded zero calf losses in the year. Free tools like CalfSim and NASCalf let you model when your own calves will reach the 15 kg NFC threshold and how different feeding plans affect intake, growth, and cost. The extra 7–14 days on milk might add $30–40 per calf, but the article walks through how smoother weaning, better growth, and higher first‑lactation yield can repay that investment — and gives a 30/90/365‑day plan to test it in your own calf barn.

intake-based weaning

Only 21.5% of U.S. dairy farms wean calves based on starter intake rather than a fixed age. That’s the most recent national figure — USDA NAHMS Dairy 2014, now 12 years old and still the best we have. (The next NAHMS dairy study is anticipated in 2026, and anecdotal evidence suggests intake-based weaning has gained traction, but no national update exists yet.) What it means: roughly four out of five operations are pulling milk on a calendar. Jim Quigley thinks the calendar is broken.

Walk into a calf barn on weaning day, and you know the result. Bawling calves, scattered starter, a handful of 8-week-olds that clearly aren’t ready. Starter intake drops. A few get pulled for treatment. Growth flatlines, then slowly recovers.

Weaning ProtocolTypical Cumulative Starter Intake at Day 56Cumulative NFC ConsumedQuigley’s Readiness Threshold
Industry Standard (8 weeks, 6L milk/day)25–28 kg11.5–13 kg NFCSHORT by 1.5–3.5 kg
Accelerated Milk (8 weeks, 10L milk/day)18–22 kg8.3–10.1 kg NFCSHORT by 4.9–6.7 kg
Extended Intake-Based (9–10 weeks, 10L milk/day)31–34 kg14.3–15.7 kg NFC✓ Threshold met
Quigley’s Biological Threshold31 kg (55% NFC starter)15 kg NFCRumen functionally ready

The calf nutrition researcher behind Calf Notes (calfnotes.com) has spent years arguing that weaning by intake is the only approach that lines up with what’s actually happening inside the rumen. His benchmark is specific: roughly 15 kg of cumulative non-fiber carbohydrates from the starter. That’s about 33 pounds. And on a lot of North American dairies running accelerated milk programs, his modeling suggests calves don’t cross that line until week 9 or 10.

If you’re pulling milk at week 8, you’re asking the rumen to do a job it can’t yet handle. One Wisconsin operation already proved what happens when you stop asking.

Zero Calves Lost: What Wagner Farms Proved

Wagner Farms in Oconto Falls, Wisconsin, doesn’t wean by the calendar. Profiled in Hoard’s Dairyman in 2020, the operation feeds whole milk with a milk balancer, uses paired calf housing, and weans calves based on starter intake. Laura Raatz, the farm’s calf manager, shared the approach at the Purina Leading Dairy Producers Conference.

Protocol ElementIndustry Standard (Most U.S. Dairies)Wagner Farms (Intake-Based)
Weaning TriggerFixed age (8 weeks)Starter intake threshold: 8 lbs/day (summer), 10 lbs/day (winter)
Step-Down Duration5–7 days28 days
ME Reduction per Step~50% (drop afternoon milk)<25% per step
Cumulative NFC at Weaning8–13 kg (typically SHORT)≥15 kg (threshold met)
Post-Weaning Treatment Rate10–15% (typical)Not disclosed; zero calves lost (profile year)
Calf Losses (Profile Year)5–8% (U.S. average, USDA NAHMS)0%

Their step-down stretches for a full 28 days — dramatically longer than the 5–7-day transitions common on most North American dairies. The targets are concrete: at least 8 pounds of starter per head per day in summer and 10 pounds in winter before calves finish weaning. “The more consistent the solids stay, the happier your calves will be,” Raatz told Hoard’s.

Their result for the profile year: zero calves lost.

That’s not just a health number. It’s a management statement. Wagner Farms wrapped nutrition, housing, social environment, and weaning timing into one coherent system — one where protocol-level changes empty hospital pensrather than fill them. Intake-based weaning didn’t work in isolation. It worked because the entire front end of the program was designed to get calves to eat grain early and consistently.

So what does biological readiness actually look like in numbers? That’s where Quigley’s research and Drackley’s review converge on a specific answer.

Why Higher Milk Programs Broke the 8-Week Rule

Here’s the paradox nobody planned for. Over the past decade, the industry moved hard toward feeding more milk — 8, 10, even 12 liters per day — because the data linking higher pre-weaning growth to first-lactation performance are strong. Soberon and Van Amburgh’s 2012 Journal of Dairy Science work at Cornell showed that for every 1 kg of preweaning ADG, heifers produced 850 kg more milk during first lactation in the university herd (1,244 animals) and 1,113 kg more in a commercial herd. Preweaning ADG accounted for 22% of the variation in first-lactation milk yield.

That was the right move. But higher milk intake suppresses early starter consumption.

The NASEM 2021 dairy nutrient requirements model confirms it: the more liquid energy a calf gets, the slower she ramps onto grain. Quigley sees the same thing in the field. When he looks at herds feeding 8–10 L/day and still weaning at 8 weeks, his verdict is blunt: more milk means less grain, so the rumen simply isn’t ready when the calendar says it’s time to quit milk.

The “glide path” to weaning has to be longer, or you drive calves into negative energy balance and ruminal acidosis during the transition — what he calls the “dark side” of feeding more milk. So we upgraded the front half of the feeding program without adjusting the back half.

James Drackley’s invited review in Applied Animal Science (Volume 41, Issue 3, June 2025) — “The Weaning Transition in Dairy Calves—Why So Traumatic?” — and Quigley in his ongoing Calf Notes work both point to this mismatch as the root of most post-weaning problems on well-managed dairies.

The Post-Weaning Slump You’re Probably Not Costing Out

NASEM 2021’s analysis of 64 studies found that solid-feed intake for weaned 8-week-old calves ranged from 2.16% to 4.45% of body weight — a wide range at the same age. Some of those calves are functioning as small ruminants. Others are essentially pre-ruminants with an underdeveloped fermentation vat.

When calves in that second group lose their milk, the energy math falls apart. Drackley’s review documents increased disease risk and depressed growth when weaning is too early or too abrupt, noting that “ruminal acidosis is likely more common than has been recognized and causes decreased intake, decreased growth, and diarrhea, especially in calves soon after weaning.”

Eckert et al. (2015, Journal of Dairy Science) showed this clearly: Holstein calves on an elevated plane of nutrition weaned at 8 weeks achieved 50% higher daily gains during the weaning transition than those weaned at 6 weeks. By three months of age, the later-weaned calves were 9 kg heavier and held that advantage through 150 days.

The 50% Energy Cut Nobody Talks About

Here’s a detail that doesn’t get enough attention. A lot of farms “step down” by simply cutting the afternoon milk feeding the week before weaning. Do the math on that. You just slashed ME intake by roughly 50% overnight.

Quigley’s take is direct — a reduction greater than about 25% of ME intake is probably excessive. He’s upfront that hard numbers on that threshold don’t exist in the published literature, but the biology lines up. At a 50% ME cut, the calf may be barely above maintenance. You can’t expect an animal to keep growing under that kind of energy shock.

Think about it from the calf’s perspective: in nature, the cow’s milk production tapers gradually along her lactation curve. Calves don’t just quit drinking on a Tuesday afternoon. Wagner Farms’ 28-day step-down mimics that natural taper. Most 5–7 day transitions don’t even come close.

The pattern holds across a much larger evidence base. Welk, Neave, and Jensen at Aarhus University reviewed 44 studies in a 2024 Journal of Dairy Science systematic review (Volume 107, Issue 8, pages 5237–5258) and found “consensus for positive effects (or at least no negative effects) on overall growth of calves weaned at later ages, over longer durations, based on starter intake.” They also found that “weaning based on starter intake had superior growth and feed intakes compared with calves weaned at a fixed earlier age.”

Wagner Farms’ 28-day step-down isn’t radical. It’s just what the science — and basic biology — supports when you actually follow it.

How Much Starter Before Dairy Calf Weaning? Quigley Put a Number on It

Quigley’s team went looking for the threshold in digestibility data. His 2019 Journal of Dairy Science symposium review compiled results from 83 calves and 24 pens across three published studies and back-calculated how much metabolizable energy calves actually extracted from the starter at different ages. Early in life, the real energy yield was well below what the NRC tables predicted. The rumen’s microbial community and papillae simply weren’t mature enough.

The tipping point: when calves consumed at least 15 kg of NFC, “ME calculated from digestibility measurements was similar to the ME calculated using NRC equations”—the rumen was finally “online.” Below it, your ration software is quietly overstating how much energy that grain is actually delivering.

When Quigley first shared that 15 kg cumulative NFC number, the research community’s reaction was basically, “Yes, biologically that makes sense.” The pushback wasn’t about the biology. It was the practical question every producer would ask next: how the heck do we know when a calf actually hits 15 kg?

For a typical calf starter at 55% NFC on a dry matter basis, that 15 kg of NFC works out to roughly 31 kg of total starter consumed as-fed. With a lower-NFC starter (50%), you’re looking at closer to 34 kg. The exact target depends on your starter’s composition.

Drackley’s daily intake gates pair with Quigley’s cumulative threshold. His Applied Animal Science review concluded that “calves should not be weaned until they are consuming an adequate amount of starter to allow the discontinuation of milk intake and should be weaned gradually rather than abruptly.” The Hoard’s Dairyman summary of his work raised the bar above the old rule of thumb: ≥1.5 kg/day starter DM for large-breed calves and ≥1.0 kg/day for small breeds, each for 3 consecutive days.

The old “1 kg/day for 3 days” isn’t enough for Holsteins. At that intake, NASEM modeling shows calves barely cover maintenance once milk disappears. Stack both gates — cumulative NFC near 15 kg and daily intake at the breed-appropriate threshold — and you’ve got a weaning signal grounded in physiology, not the calendar.

What Do CalfSim and NASCalf Tell You About Your Weaning Date?

You don’t have to run this math on a whiteboard. Joao Costa’s group at the University of Vermont built CalfSim — a free, web-based decision-support tool that runs your feeding program using NASEM 2021 equations. Plug in breed, birth weight, milk program, starter composition, and environment. It gives you predicted daily and cumulative starter intake, NFC accumulation, ADG, bodyweight, and rearing costs.

Costa et al. (2025, JDS Communications) tested CalfSim against 27 studies covering 1,585 calves and 76 treatment groups. Bodyweight predictions hit an R² of 0.91 with an RMSE of 8.56 kg — meaning predictions can be off by about 19 lbs per calf.

Quigley’s own consulting work pushed the next step. Under Calf Notes Consulting, he launched NASCalf (tools.calfnotes.com), a more detailed intake and growth modeling tool built from the same biological logic. NASCalf goes deeper than CalfSim with a feed library, knowledge base, and more granular prediction of when calves accumulate enough NFC to support weaning.

A word of honest caution on both tools — and Quigley himself is the first to say it: don’t overpromise and underdeliver. CalfSim and NASCalf are models. They predict average performance. Your individual calves will scatter around that average, and farm-specific curveballs — a scours outbreak, a cold snap, poor-ventilation stress, a high-pathogen housing environment — can throw off even the best prediction. Think of the output as directional, not diagnostic. It tells you roughly when your program should get calves to the NFC threshold. It doesn’t tell you that calf #47 in hutch row B is ready today.

That said, directional beats are blind. Run your 6 L/day and 10 L/day programs side by side in either tool. You’ll see the high-milk calves reach the 15 kg cumulative NFC and 1.5 kg/day starter gates days or even weeks later. That gap is invisible until you model it.

What It Actually Costs — and What You Get Back

Let’s not pretend this is free. If calves need an extra 7–14 days on liquid feed, that’s real money. With U.S. Class III at just $14.59/cwt in January 2026 (USDA AMS, February 4, 2026) — and USDA’s own cost-of-production estimate showing expenses at $19.14/cwt against an $18.95 all-milk price — every input dollar has to earn its way back.

Cost or Return CategoryPer-Calf Impact150-Calf Herd (Annual)
Added Liquid Feed Cost (10 extra days @ $2/day)+$20+$3,000
Added Bedding & Labor+$10–20+$1,500–3,000
Total Added Rearing Cost per Calf+$30–40+$4,500–6,000
Reduced Treatment Costs (6% fewer treatments @ $25/treatment)+$1.50 (savings)+$225 (savings)
Faster Growth (15 kg heavier at 6 months)Value: ~$45 (3% lower age at first calving)+$6,750
First-Lactation Milk Gain (+850 kg @ $0.35/kg)+$297.50+$44,625
Net ROI per Calf (24-month payback)+$257.50–267.50+$38,625–40,125
Break-Even TimelineFirst lactation (month 24–26)First lactation cohort

Here’s the rough math on a 300-cow dairy raising 150 replacements per year. Extending weaning by 10 days, at roughly $2/day in added liquid feed costs, adds an extra $20 per head on the milk side alone. Factor in slower hutch turnover, additional bedding, and labor for intake monitoring, and the total added cost per head likely runs $3,0–40, depending on your system. On a tight-facility dairy, that 10-day extension could also require a temporary overflow solution or staggered starts for hutch turnover. Across 150 calves, that’s roughly $4,500–6,000 in added rearing expense.

A University of Wisconsin-Extension survey of 26 farms (published 2018) found autofeeder calves ran $6.35/day total vs. $5.84/day for individually housed, with liquid feed higher ($2.08 vs $1.60/day) but labor lower ($1.01 vs $1.39/day). Those costs have risen since, but the relative structure holds.

Against that, Soberon and Van Amburgh’s 2012 data showed 850–1,113 kg more first-lactation milk per 1 kg/day of preweaning ADG. Van Amburgh’s 2013 Journal of Animal Science meta-regression estimated roughly 1,551 kg of first-lactation milk per 1 kg/day of preweaning ADG. Even a conservative reading — say half the growth advantage holds — puts the first-lactation payback well ahead of the calf-barn cost.

But those returns arrive 24+ months later. That’s the tension: the expense hits now, the payoff compounds later. And the payoff only comes home if you’re keeping the heifer. If you’re raising beef-on-dairy calves headed for sale or feedlot, the NFC threshold still matters for health — but there’s no first-lactation payback. Run those numbers separately. 

Three Phases to Testing It in Your Barn

Nobody’s asking you to overhaul your calf program overnight. Quigley summed it up neatly: farms need simplicity and consistency, or the best protocol on paper will die in the barn. Variation is hard to manage. Intake-based weaning only works if your team can repeat it.

Phase 1 — 30-Day Baseline. Pick 15–20 calves approaching weaning. Measure starter intake with pre-weighed buckets and weigh-backs, even 2–3 times per week. Weigh calves before and after weaning. Run your current program through CalfSim or NASCalf. At the end of 30 days, answer one question: are your calves hitting the intake thresholds by the age you’re pulling milk?

Phase 2 — 90-Day Intake Gate Trial. Set a new rule: calves wean within an 8–10 week window, but only when they meet the daily starter gate. Stretch the step-down to 10–14 days minimum—and keep the ME reduction at any single step under 25%. Use CalfSim/NASCalf to predict when those gates should be reached, then compare that to what you see at the bunk. Track ADG and health events against your baseline.

Phase 3 — 365-Day Comparison. Run two cohorts for a full year — one on your old calendar, one on intake-based weaning informed by CalfSim or NASCalf. Track growth to 6 months, age at breeding, treatment costs, and first-lactation milk as records come in. This is where you build your own ROI case and decide how much complexity your crew can realistically manage every day.

Performance MetricAge-Based Weaning (8 weeks, calendar-driven)Intake-Based Weaning (9–10 weeks, gradual step-down)
Post-Weaning Treatment Rate (%)12–15%6–8%
ADG Post-Weaning (kg/day, weeks 9–12)0.52–0.680.75–0.88
Body Weight at 6 Months (kg)178–185193–201
Age at First Breeding (days)420–435405–415
First-Lactation Milk Yield (kg, 305d)10,200–10,80011,050–11,650 (estimated +850 kg)
Calf Losses (%)5–8% (U.S. average)2–4% (improved health)
Added Rearing Cost per CalfBaseline+$30–40 (extra milk days)

What This Means for Your Operation

If you’re feeding 4–6 L/day and weaning at 6–7 weeks, You likely need both more milk and a later weaning target. CalfSim or NASCalf can show which change moves the needle more.

If you’re feeding 8–10 L/day and weaning at 8 weeks: Your calves may be 1–2 weeks short of the NFC threshold. Run CalfSim or NASCalf with your actual starter analysis. If cumulative NFC at day 56 falls well below 15 kg, that’s your gap. And if your step-down protocol is “drop the afternoon feeding,” you’re probably cutting ME by 50% in one shot. That’s too much. Spread it out.

If you’re already weaning at 9–10 weeks with a gradual step-down, you may be closer than you think. A 30-day baseline will confirm it—and if your calves show no post-weaning ADG dip, don’t fix what’s working.

If you’re running an automated calf feeder that already tracks individual intake, you’ve solved the hardest part. Your feeder data tells you cumulative consumption. Map that to the NFC threshold using your starter’s NFC%, and you have an individualized weaning signal without any additional labor.

If you’re running a smaller herd raising 15–25 calves per year: Individual observation replaces modeling. You already know your calves. The value of CalfSim/NASCalf indicates whether your instincts align with the NFC math.

As a rough benchmark: if your current 8-week calves maintain an ADG above 0.75 kg/day for 2 weeks after weaning and your post-weaning treatment rate stays under 10%, you may not need to change anything. These aren’t published thresholds—they’re practical guideposts. Track your own data and let it tell you.

Quick NFC check for any program: Total starter consumed (kg as-fed) × 0.89 (DM factor) × your starter’s NFC%. For a 52% NFC starter, that’s roughly: total kg starter × 0.46. When that running total hits 15, you’re in the zone.

Key Takeaways

  • 15 kg cumulative NFC (roughly 31–34 kg starter as-fed depending on NFC content) is Quigley’s research-based threshold for rumen readiness at weaning (Quigley et al., 2019, JDS).
  • Daily intake gates: ≥1.5 kg/day for large-breed calves, ≥1.0 kg/day for small breeds, for at least 3 consecutive days before finishing weaning (Drackley, Applied Animal Science, Vol. 41, Issue 3, June 2025).
  • Don’t cut ME by more than 25% at any single step-down. Dropping the afternoon feeding slashes ME intake by roughly 50% — that’s a maintenance-level energy shock, not a weaning transition. Taper gradually, like the cow’s own lactation curve would.
  • Wagner Farms weans by intake with a 28-day step-down. The year Hoard’s profiled them, they lost zero calves. The calendar didn’t earn that result.
  • CalfSim and NASCalf are directional, not diagnostic. They predict average performance — your individual calves will scatter around that average, and farm-level curveballs will shift the timeline. But directional beats blind, and both tools finally answer the question producers have been asking: when should my calves be ready?
  • The extra milk days aren’t free — but the post-weaning slump isn’t free either, and only one of those costs shows up on your feed invoice.

The Bottom Line

Laura Raatz doesn’t check the calendar to decide when milk stops at Wagner Farms. She checks the bucket. And the science — from Quigley’s NFC threshold to Drackley’s Applied Animal Science review to Welk’s 44-study systematic review — says the bucket is right.

Pull your CalfSim or NASCalf report. Does cumulative NFC at your current weaning age hit 15 kg — or are you weaning calves that aren’t ready?

Learn More

The Sunday Read Dairy Professionals Don’t Skip.

Every week, thousands of producers, breeders, and industry insiders open Bullvine Weekly for genetics insights, market shifts, and profit strategies they won’t find anywhere else. One email. Five minutes. Smarter decisions all week.
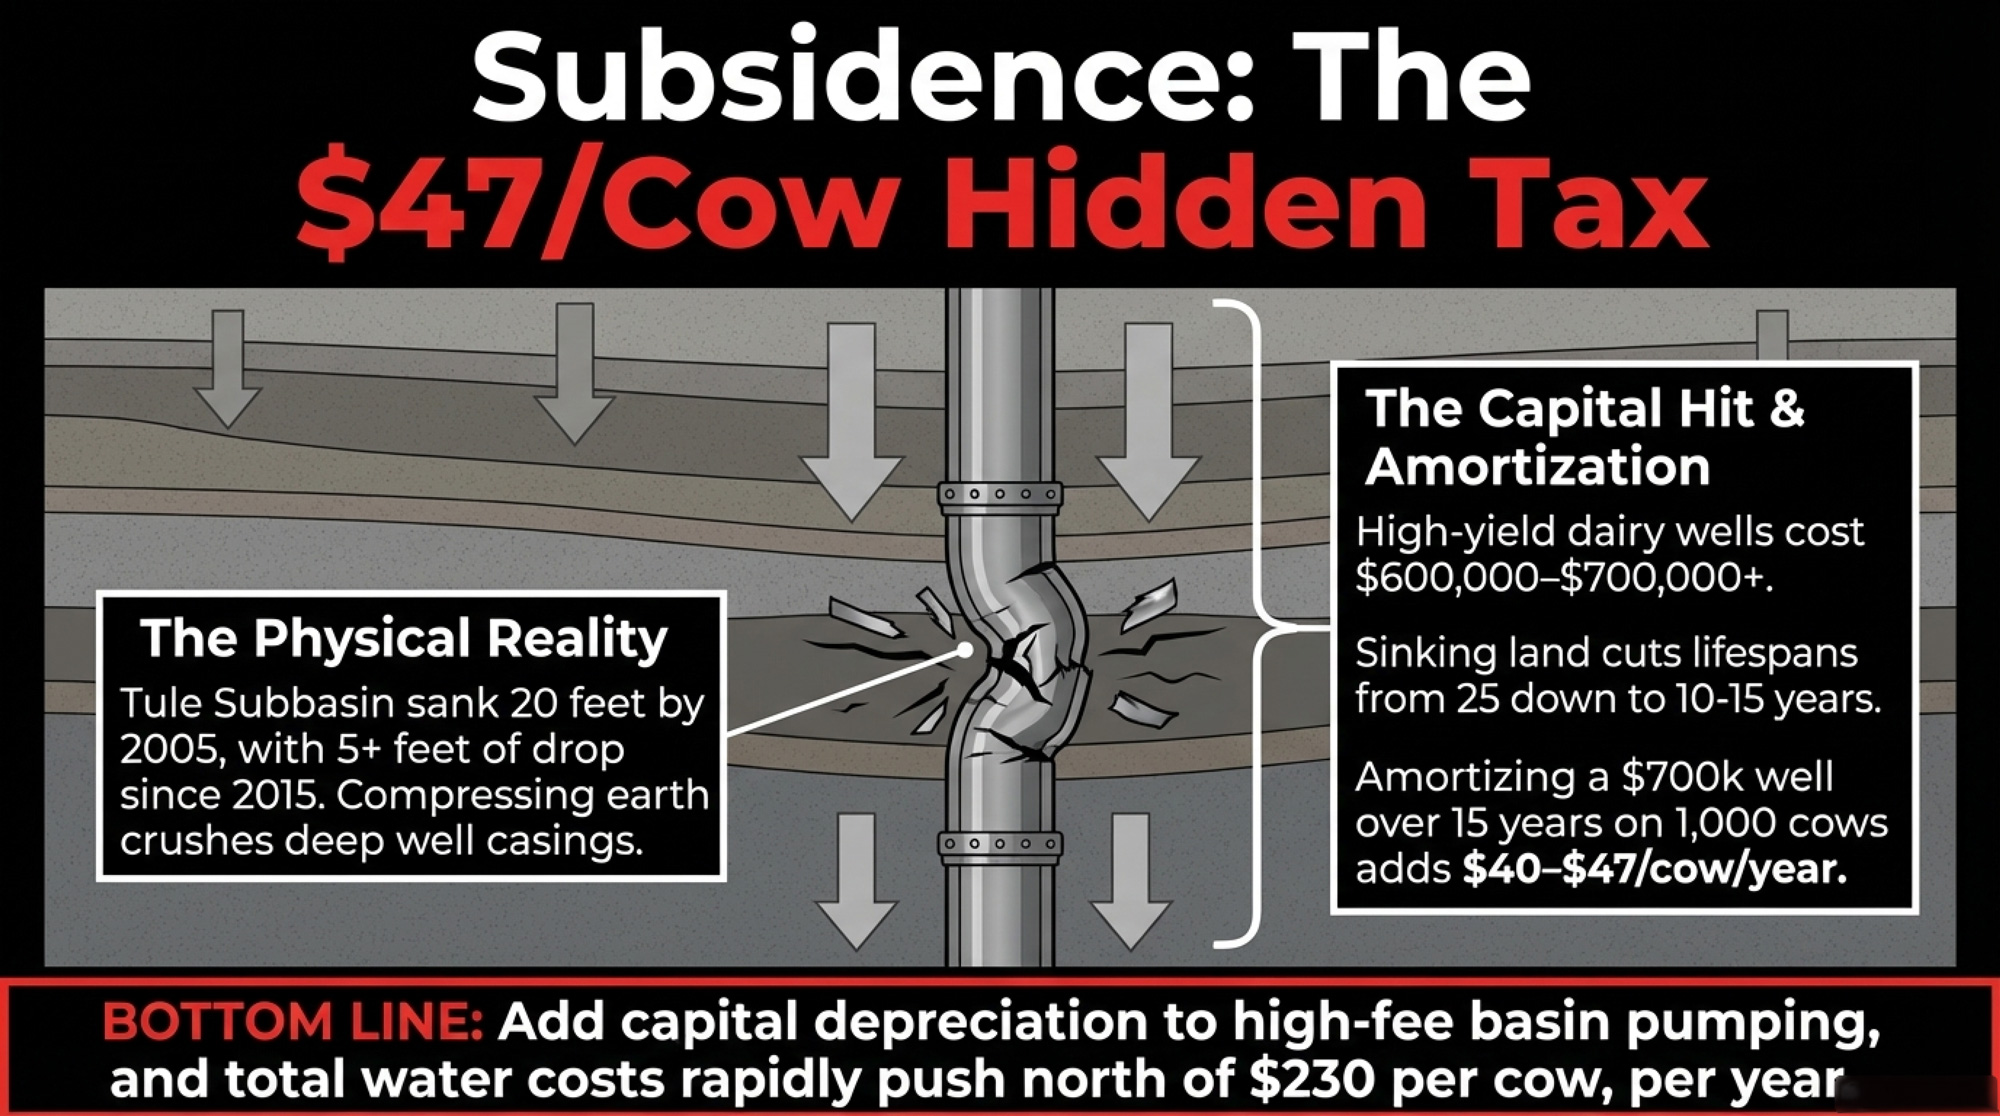
NewsSubscribe
First
Last
Consent
Send this to a friend