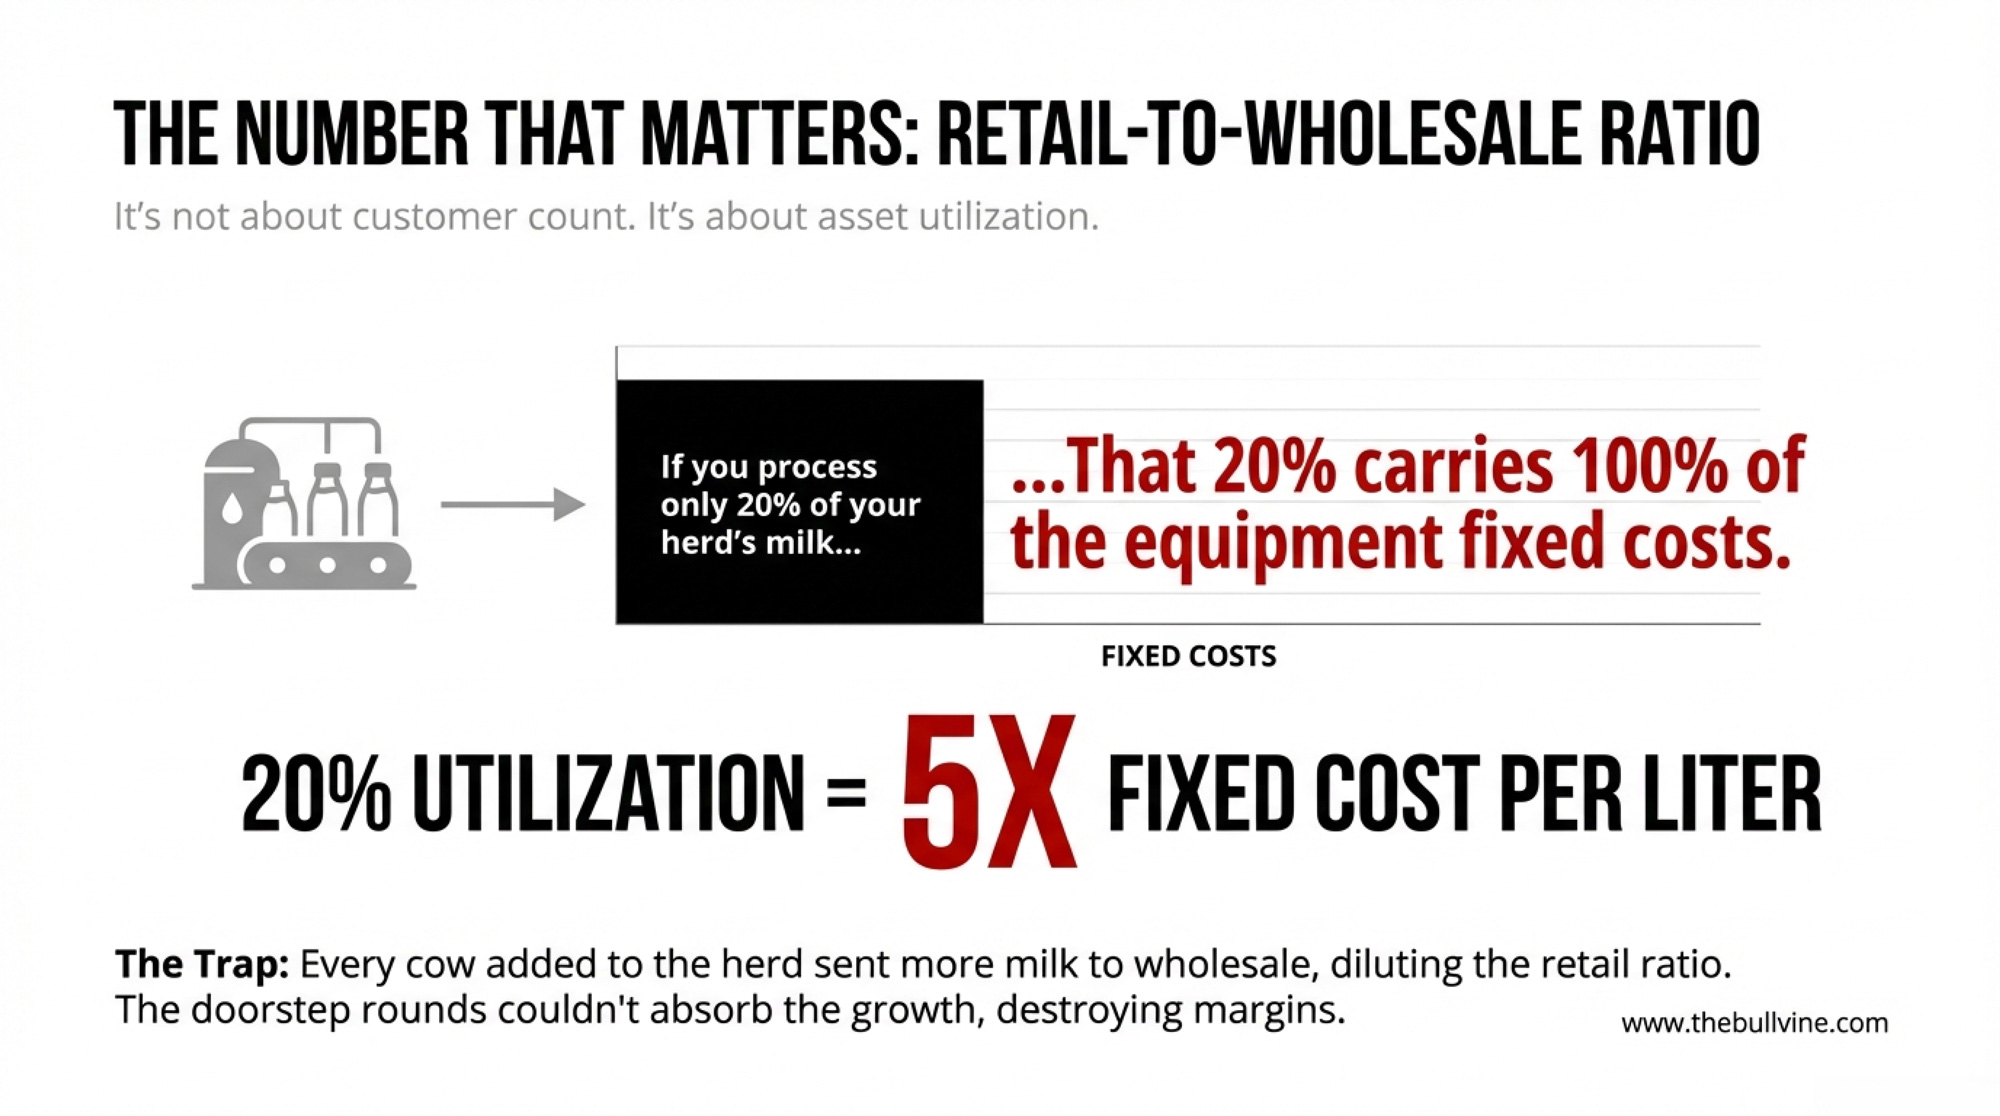
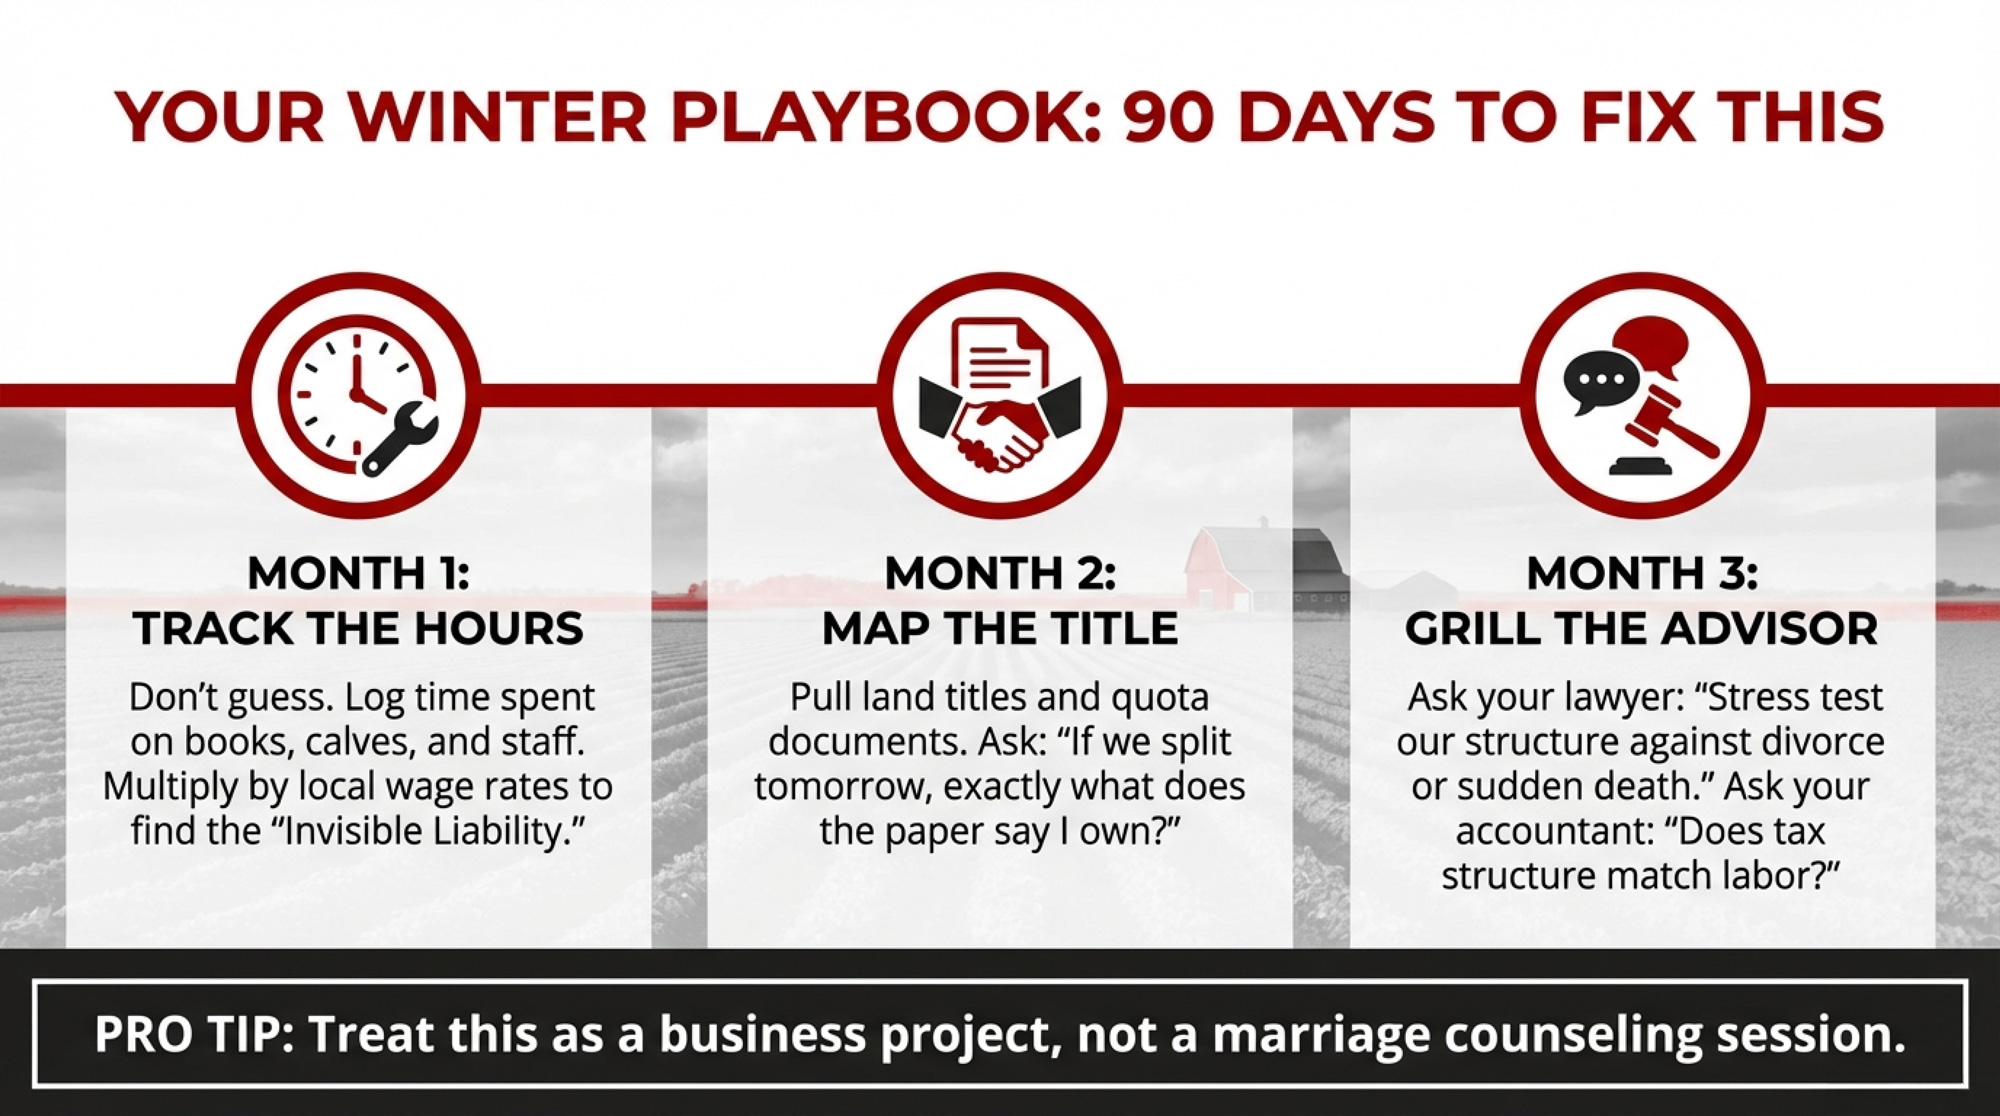
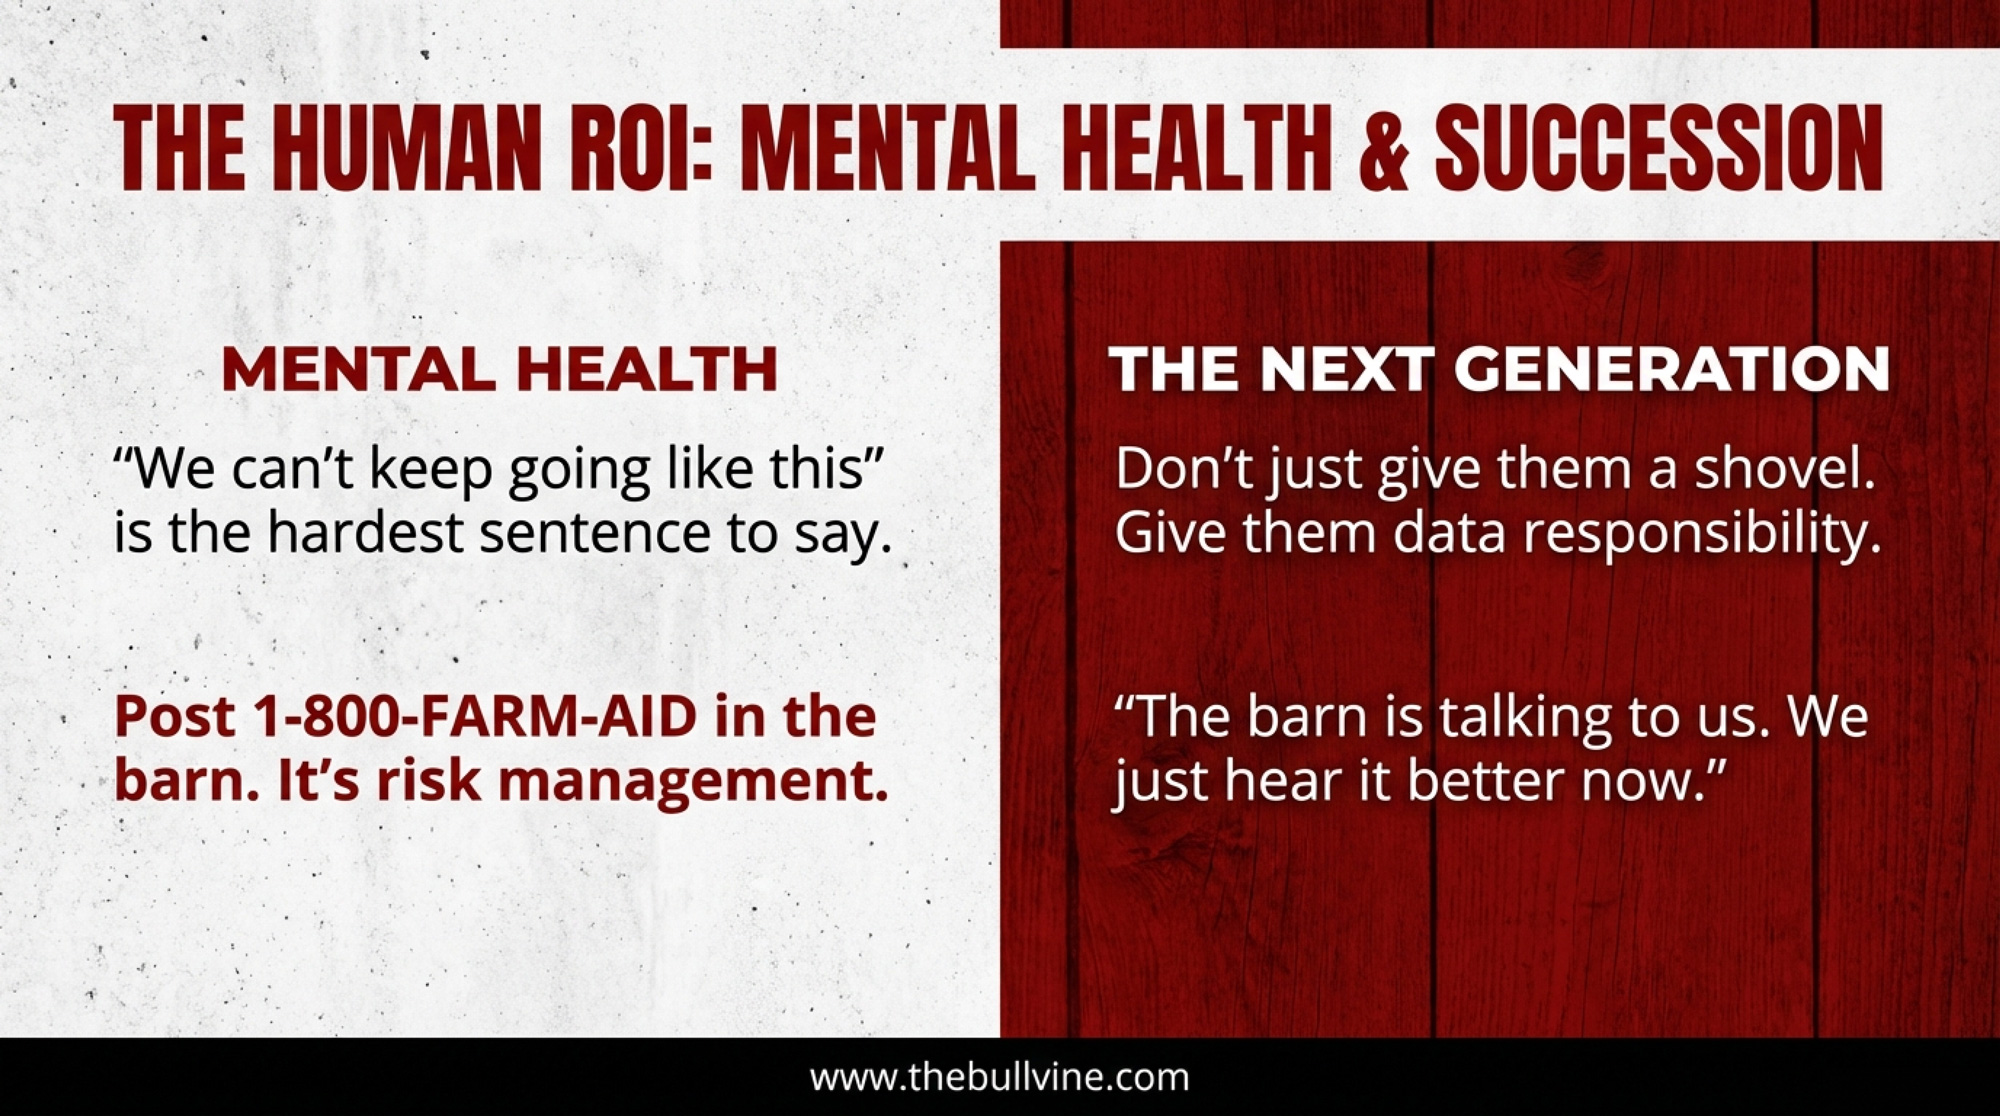
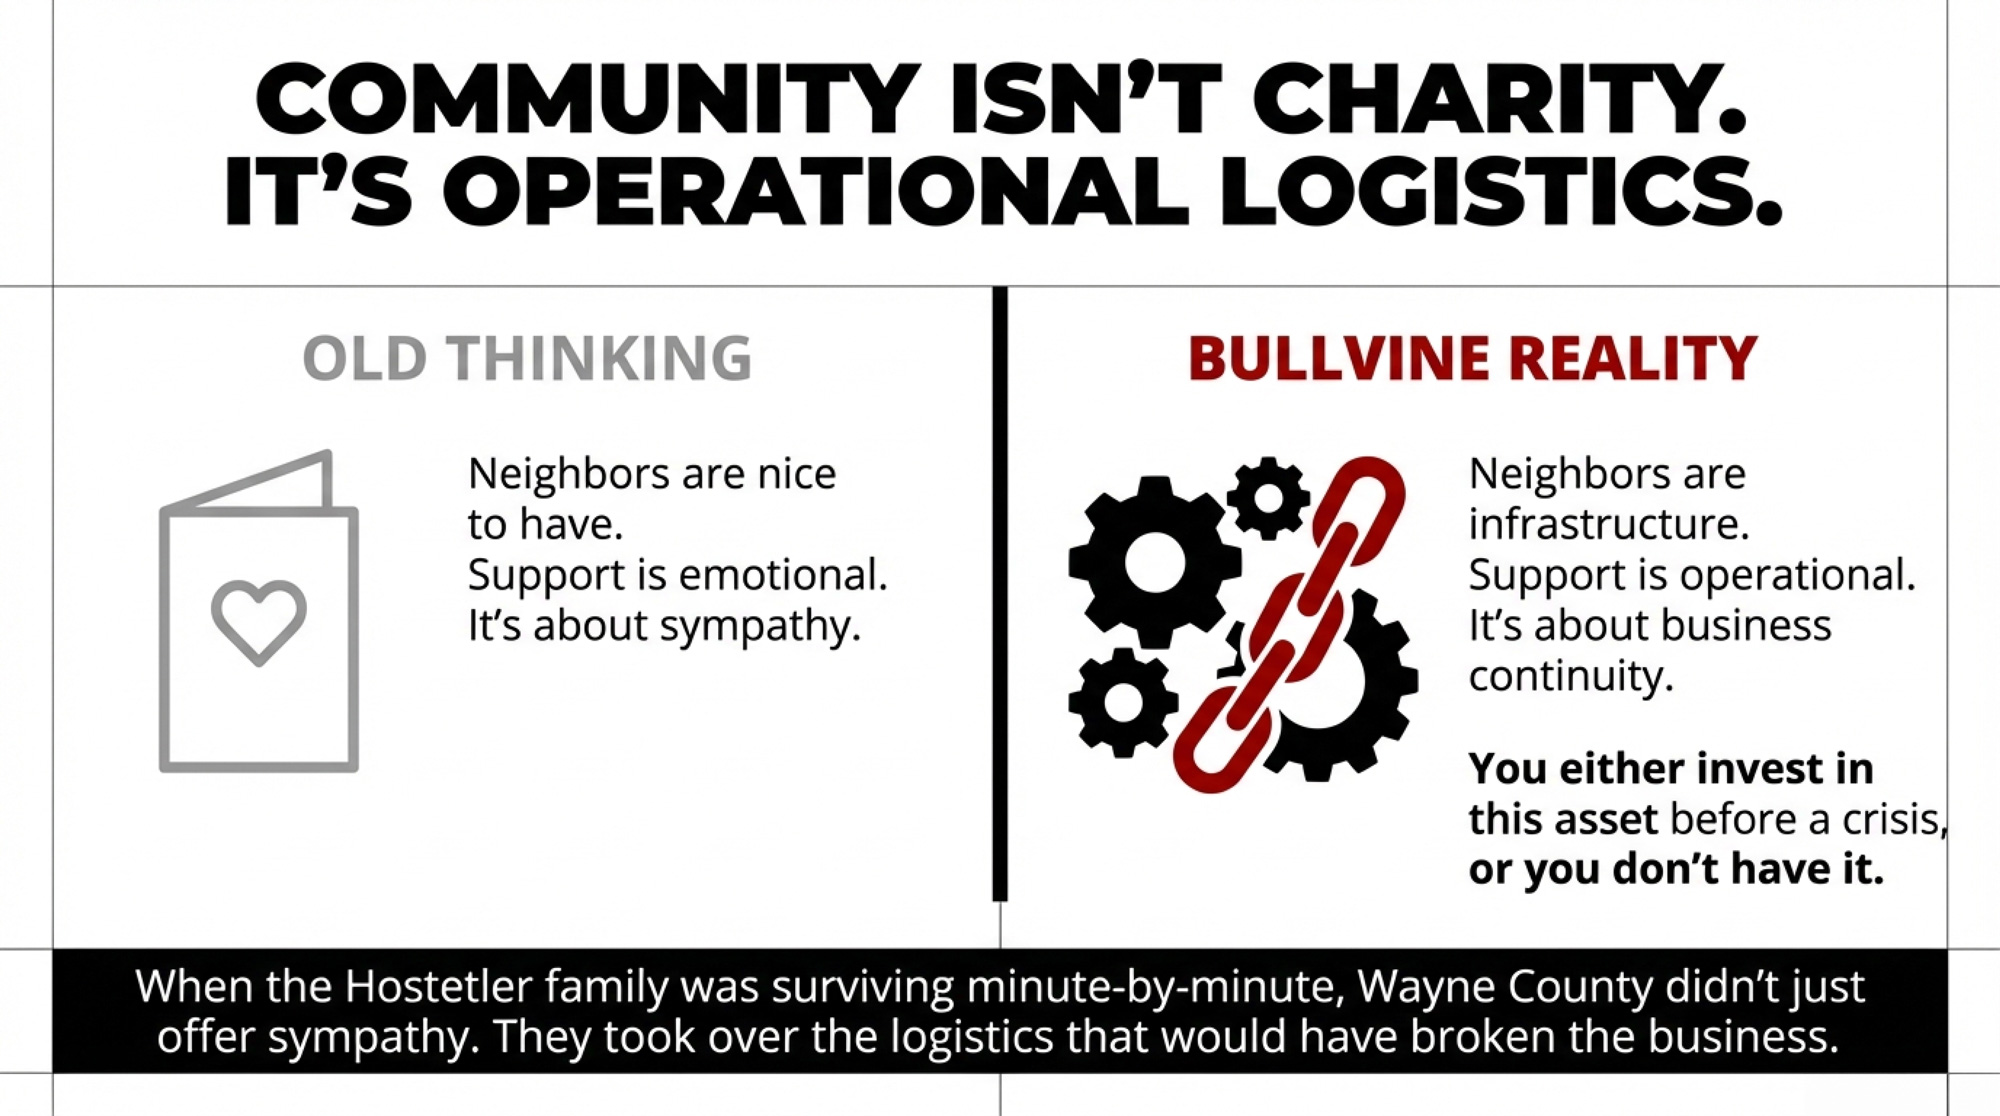
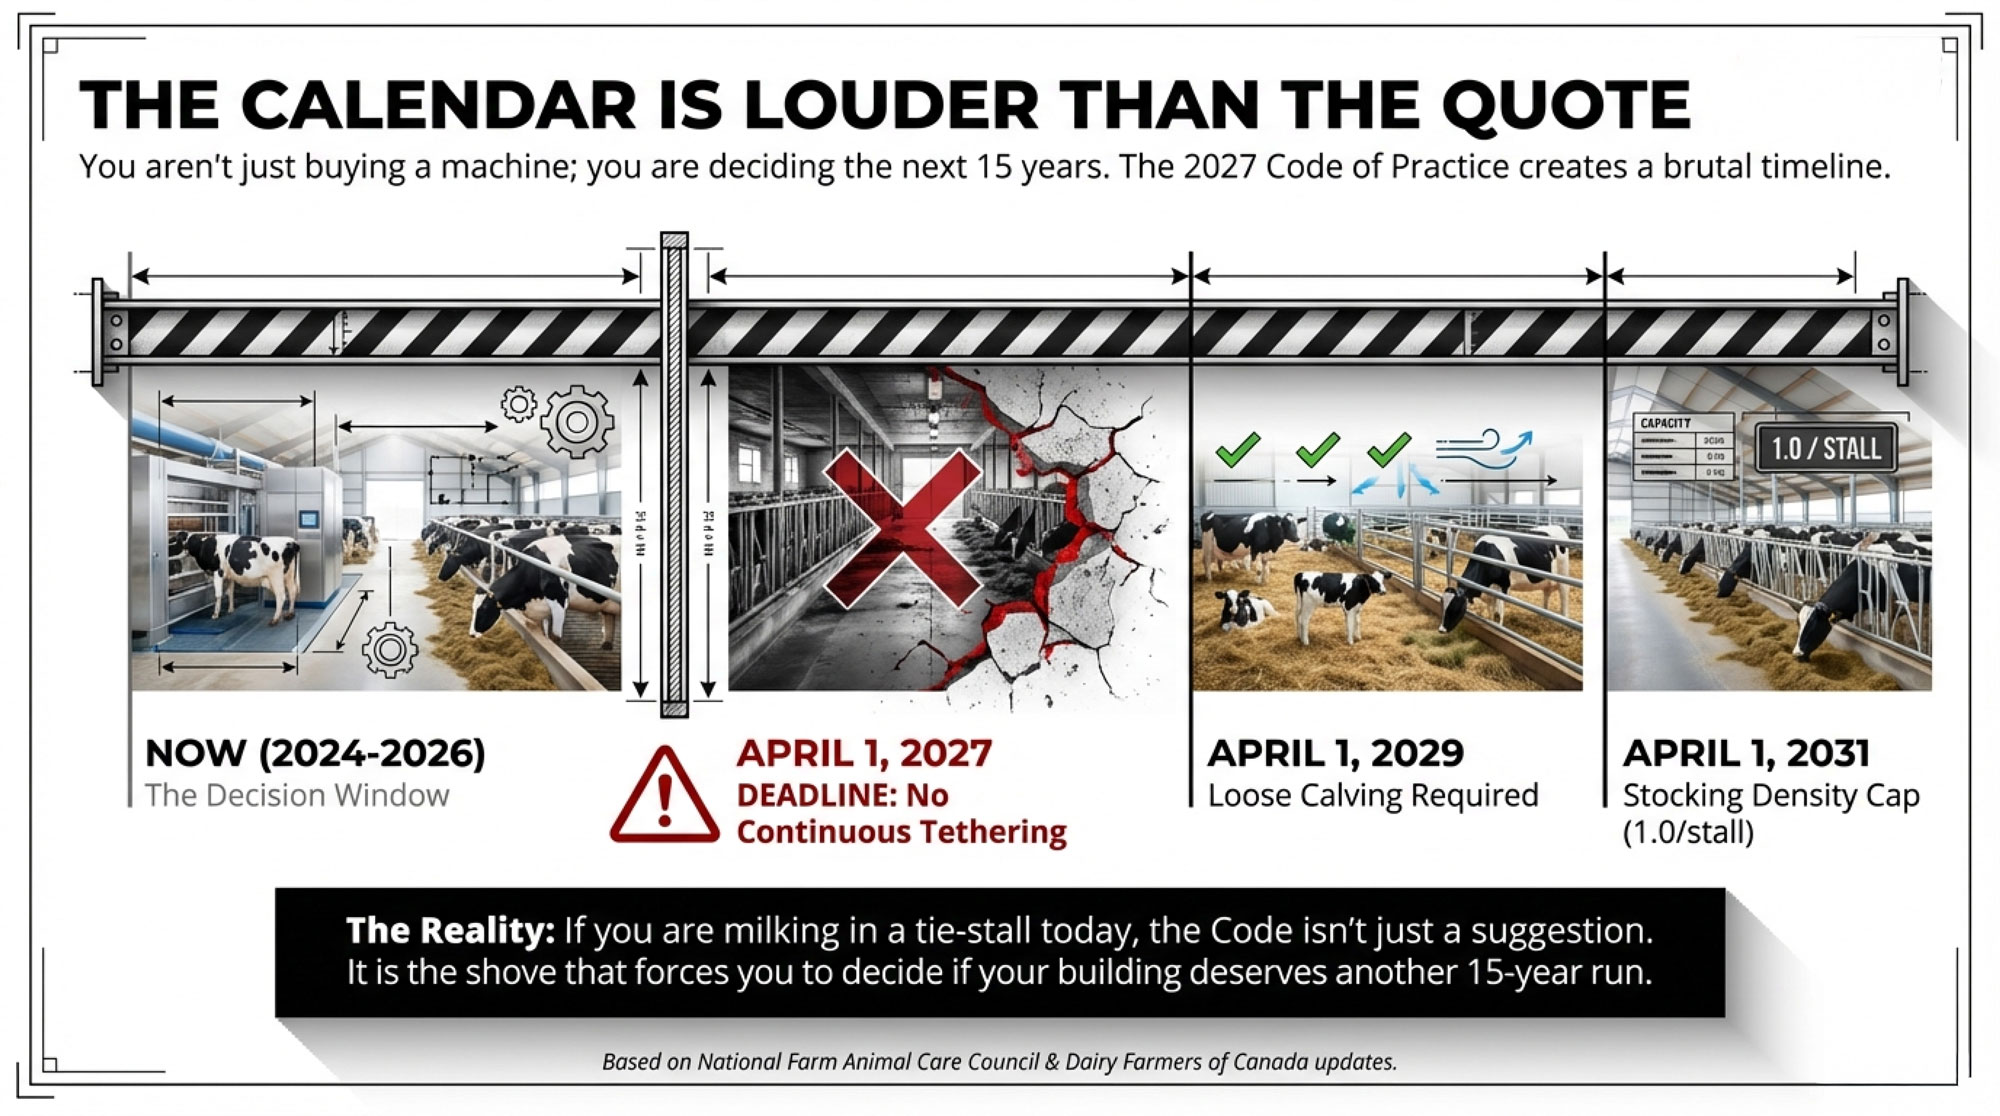
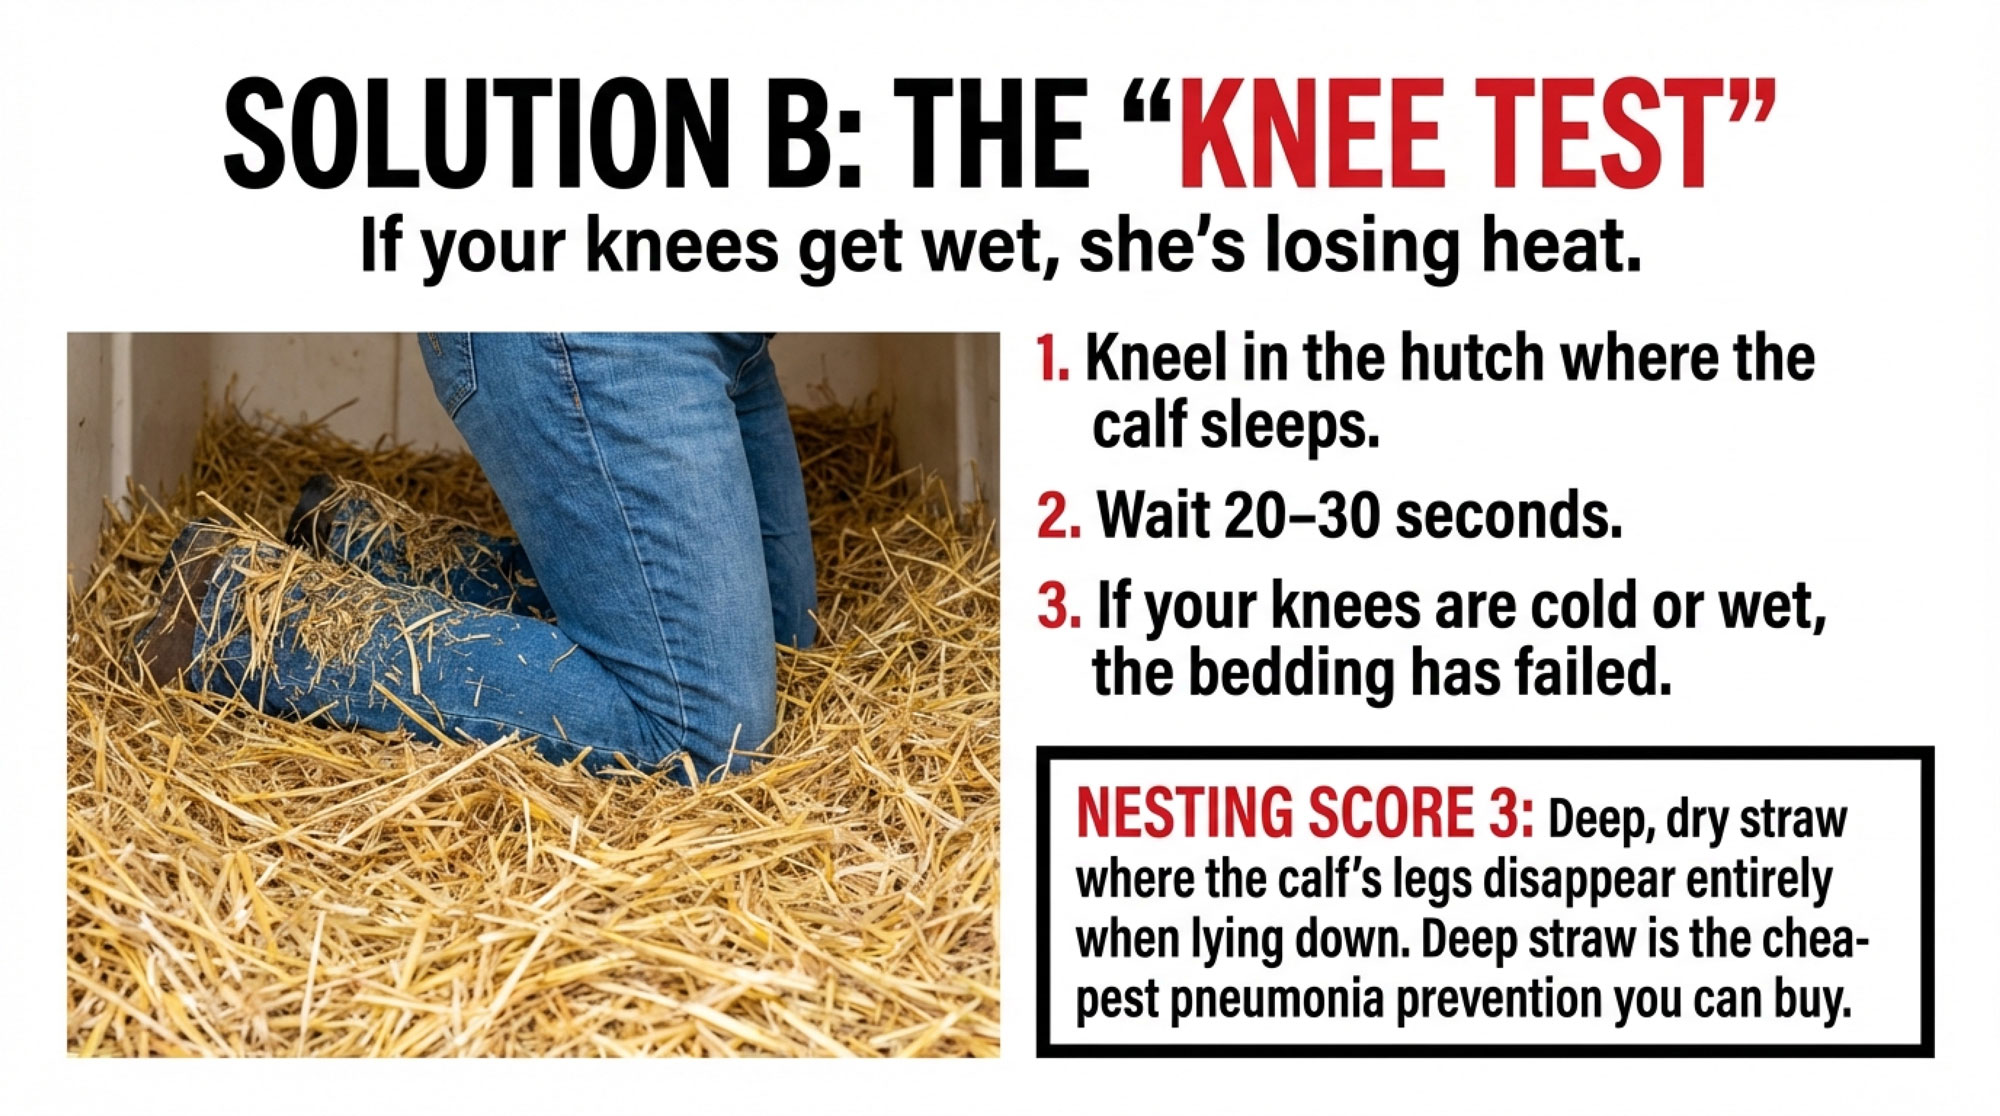
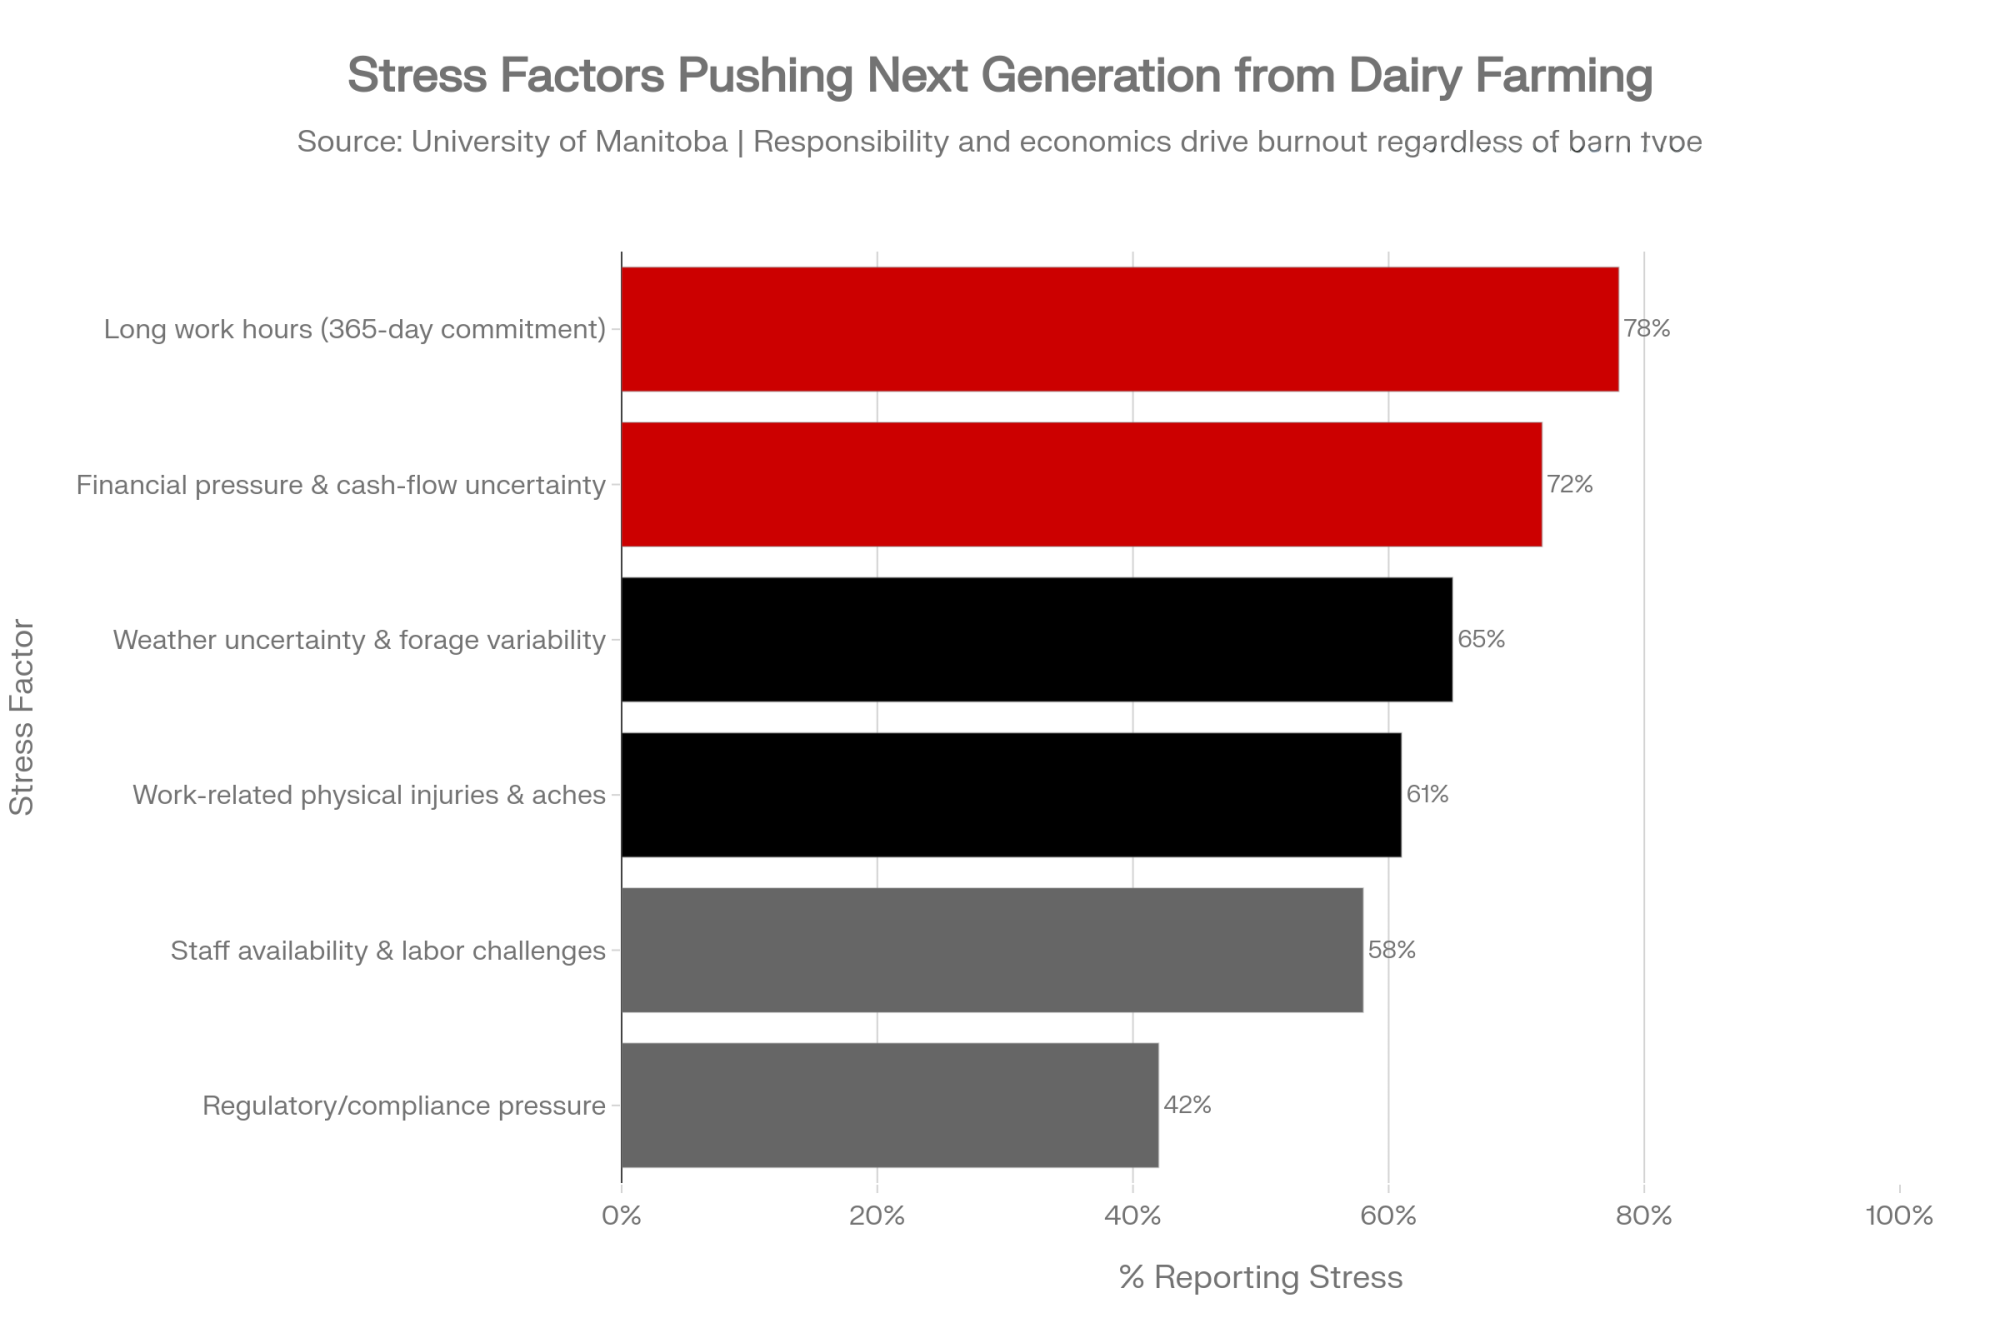
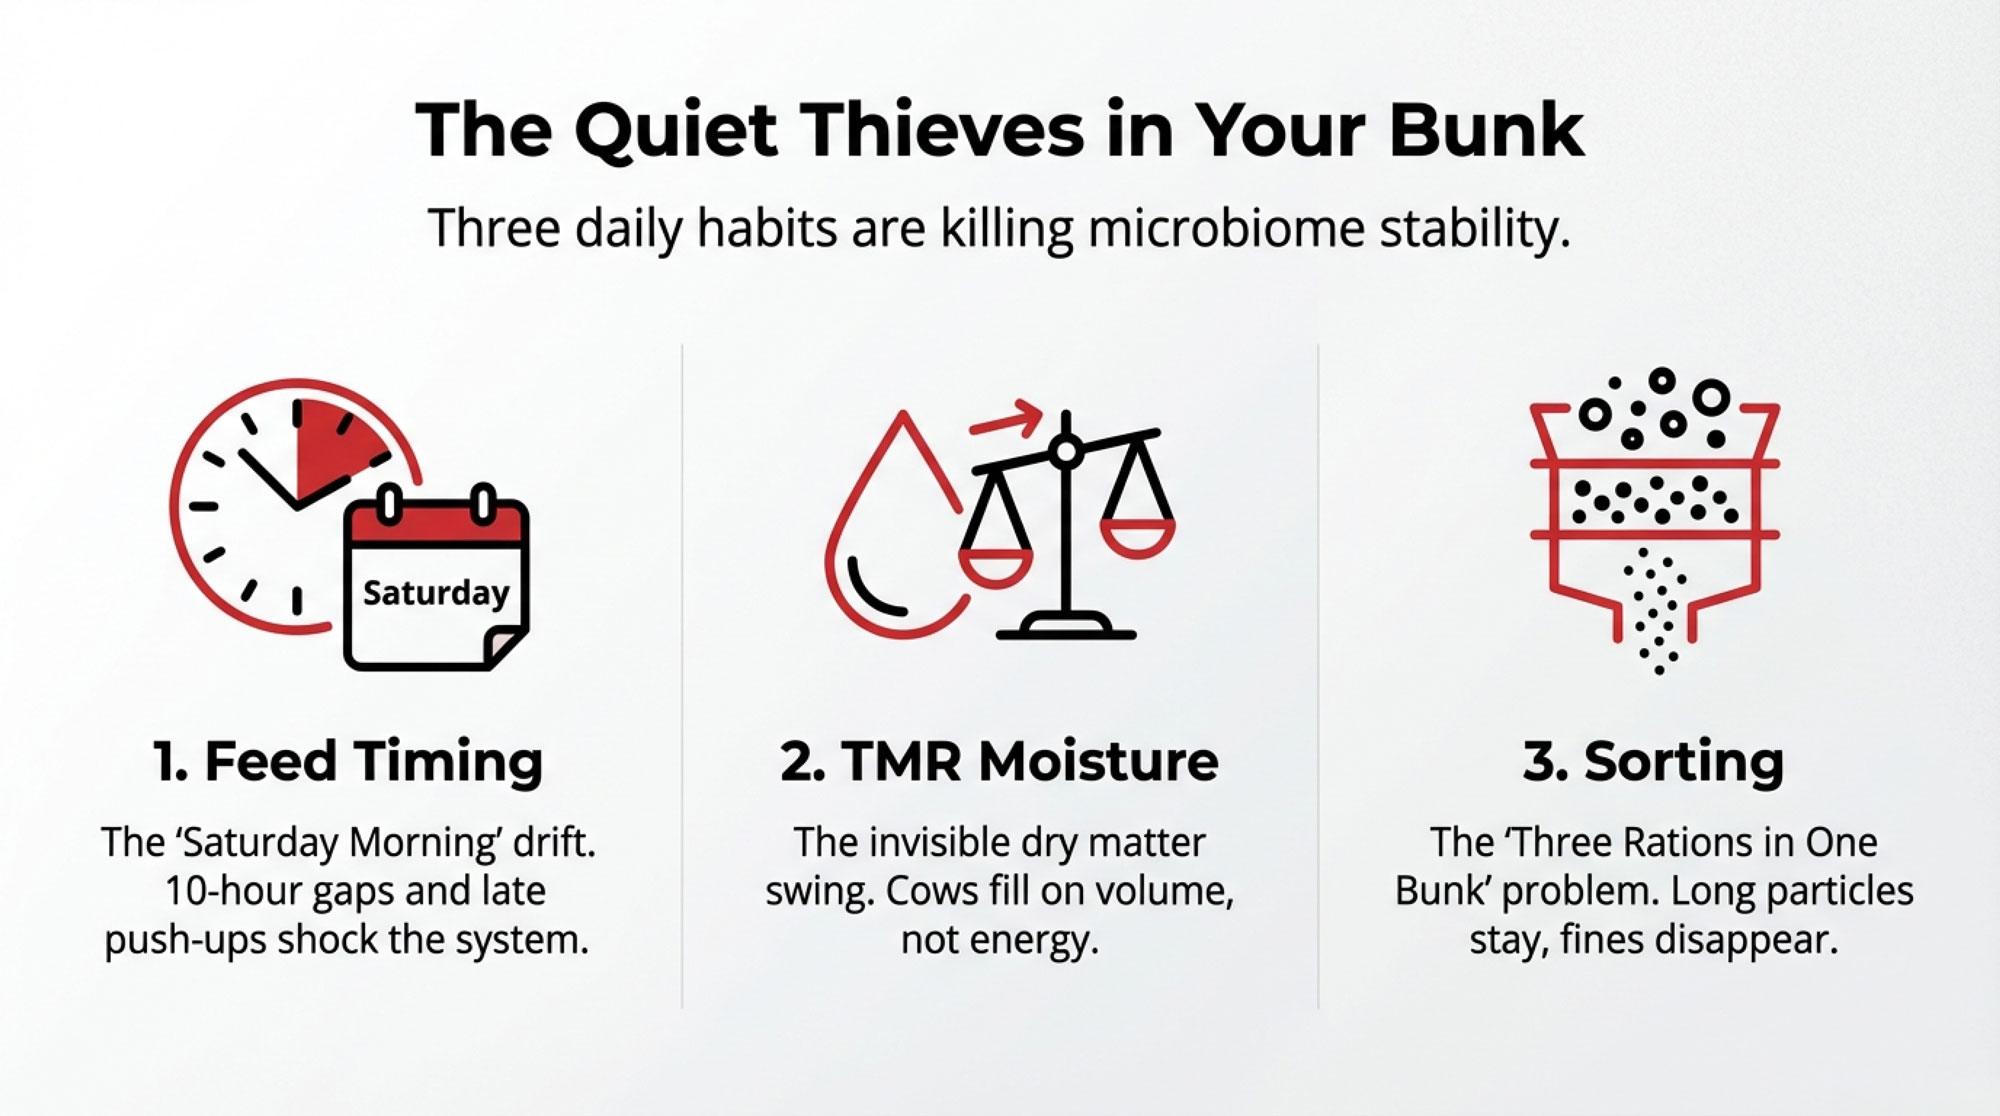
Written SOP on the wall? A 2024 study found that herds with SOPs but no training actually had higher SCC than herds with no SOP at all.
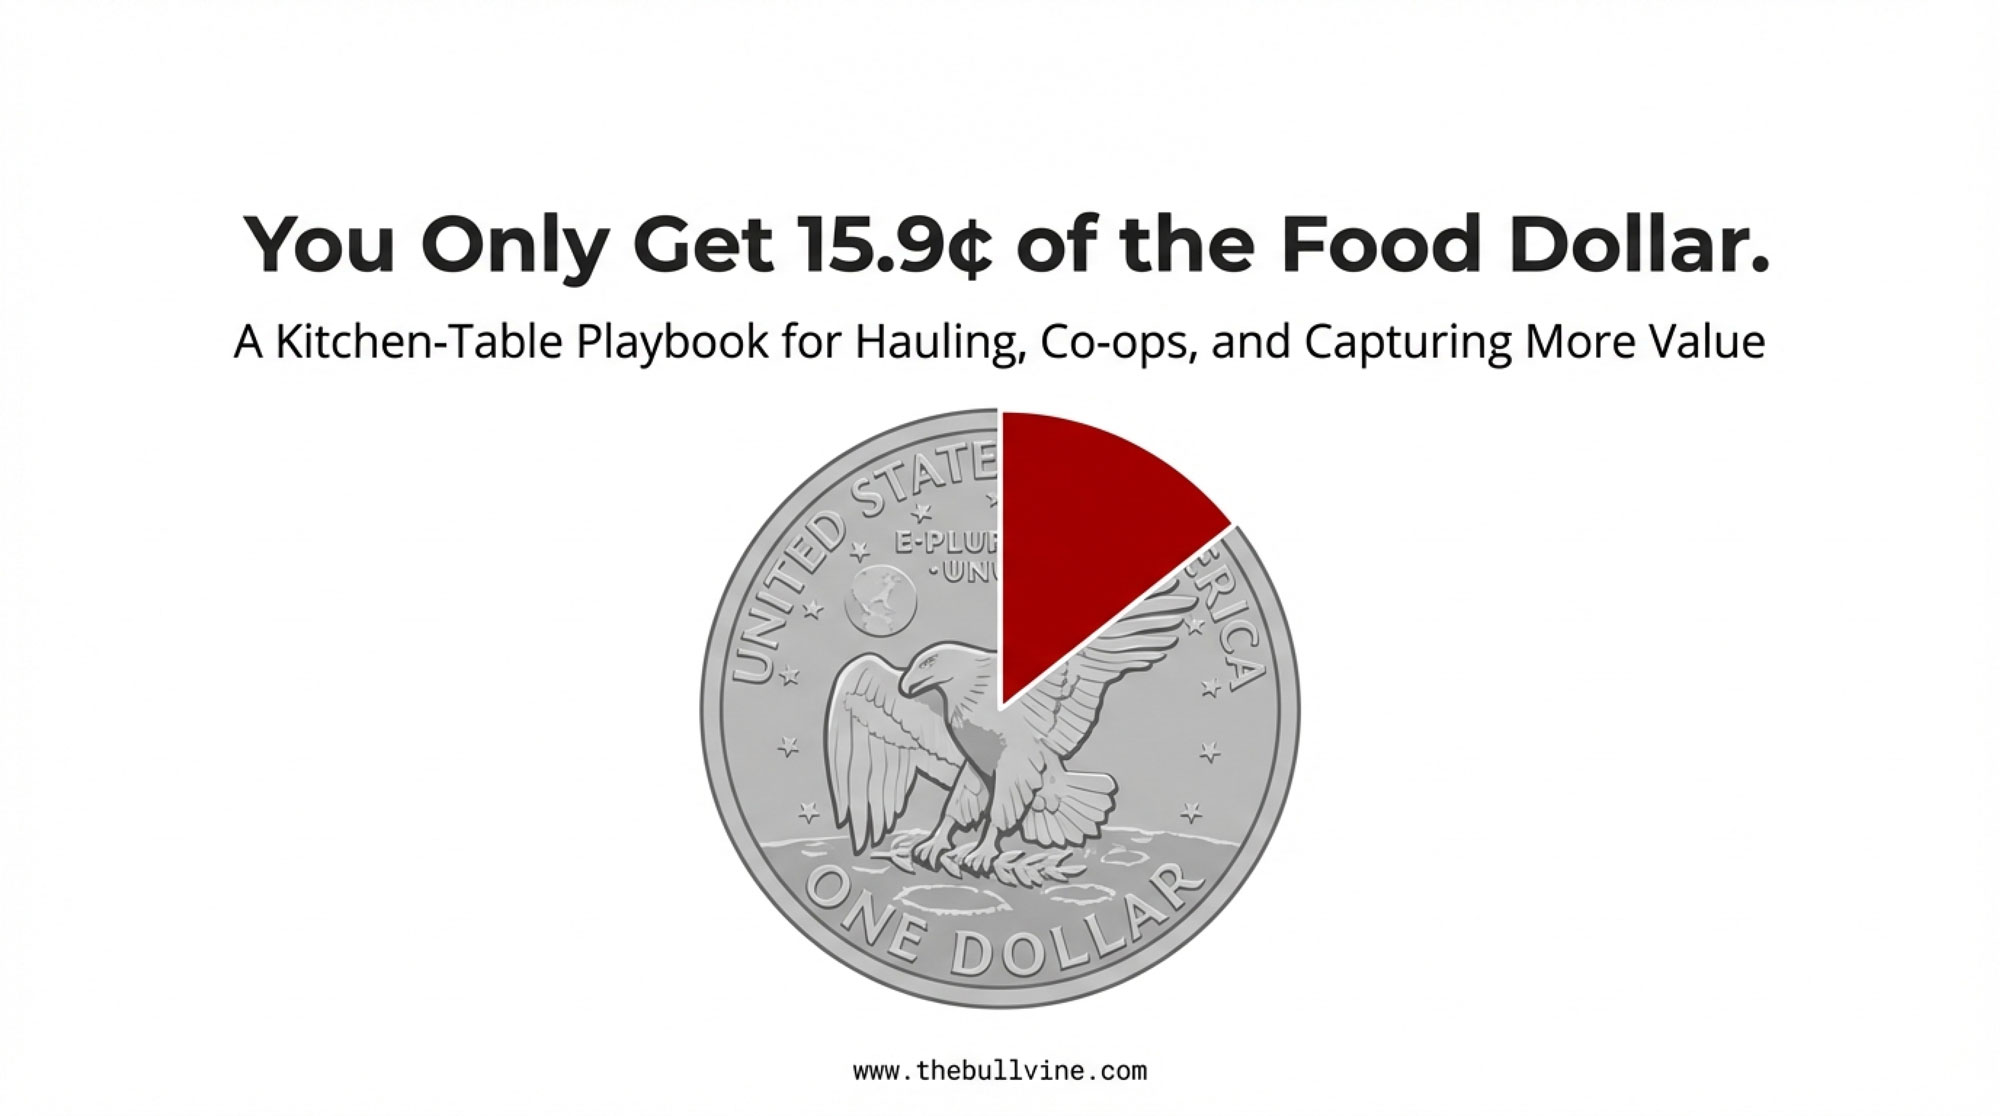
Executive Summary: Most dairies already have written milking SOPs, but Rodriguez’s 16-herd study in Michigan and Ohio showed the people in the pit only averaged 49.3% on a basic routine quiz — and that gap was costing money. One bilingual training session per farm moved knowledge scores to 67.6%, cut inadequate prep from 69% to 48%, reduced missed post-dip coverage, and shaved 25–43 seconds off milking time per cow while stabilizing SCC trends. When you put those shifts beside real-farm results — like an 850‑cow Wisconsin dairy turning a $12,500 training spend into roughly $78,000 in first‑year return while dropping SCC from 245,000 to 175,000 — training stops looking like a “soft” expense and starts penciling out as a $55–$73‑per‑cow‑per‑year opportunity on a 300‑cow herd. The article also leans into the uncomfortable finding that herds with written SOPs but no training actually had higher SCC than herds with no SOP at all, and it ties that to a 38.8% annual turnover rate that constantly erodes protocol compliance. Using national SCC premium grids, mastitis cost data, and regional wage benchmarks, it walks readers through barn math they can plug their own numbers into instead of guessing at training ROI. The piece closes with a four‑path playbook — from UW’s MQUW train‑the‑trainer program to free bilingual online modules and a 30‑day parlor audit — so producers can decide how far to go in formalizing milker training and what kind of return they should expect in their own parlor.
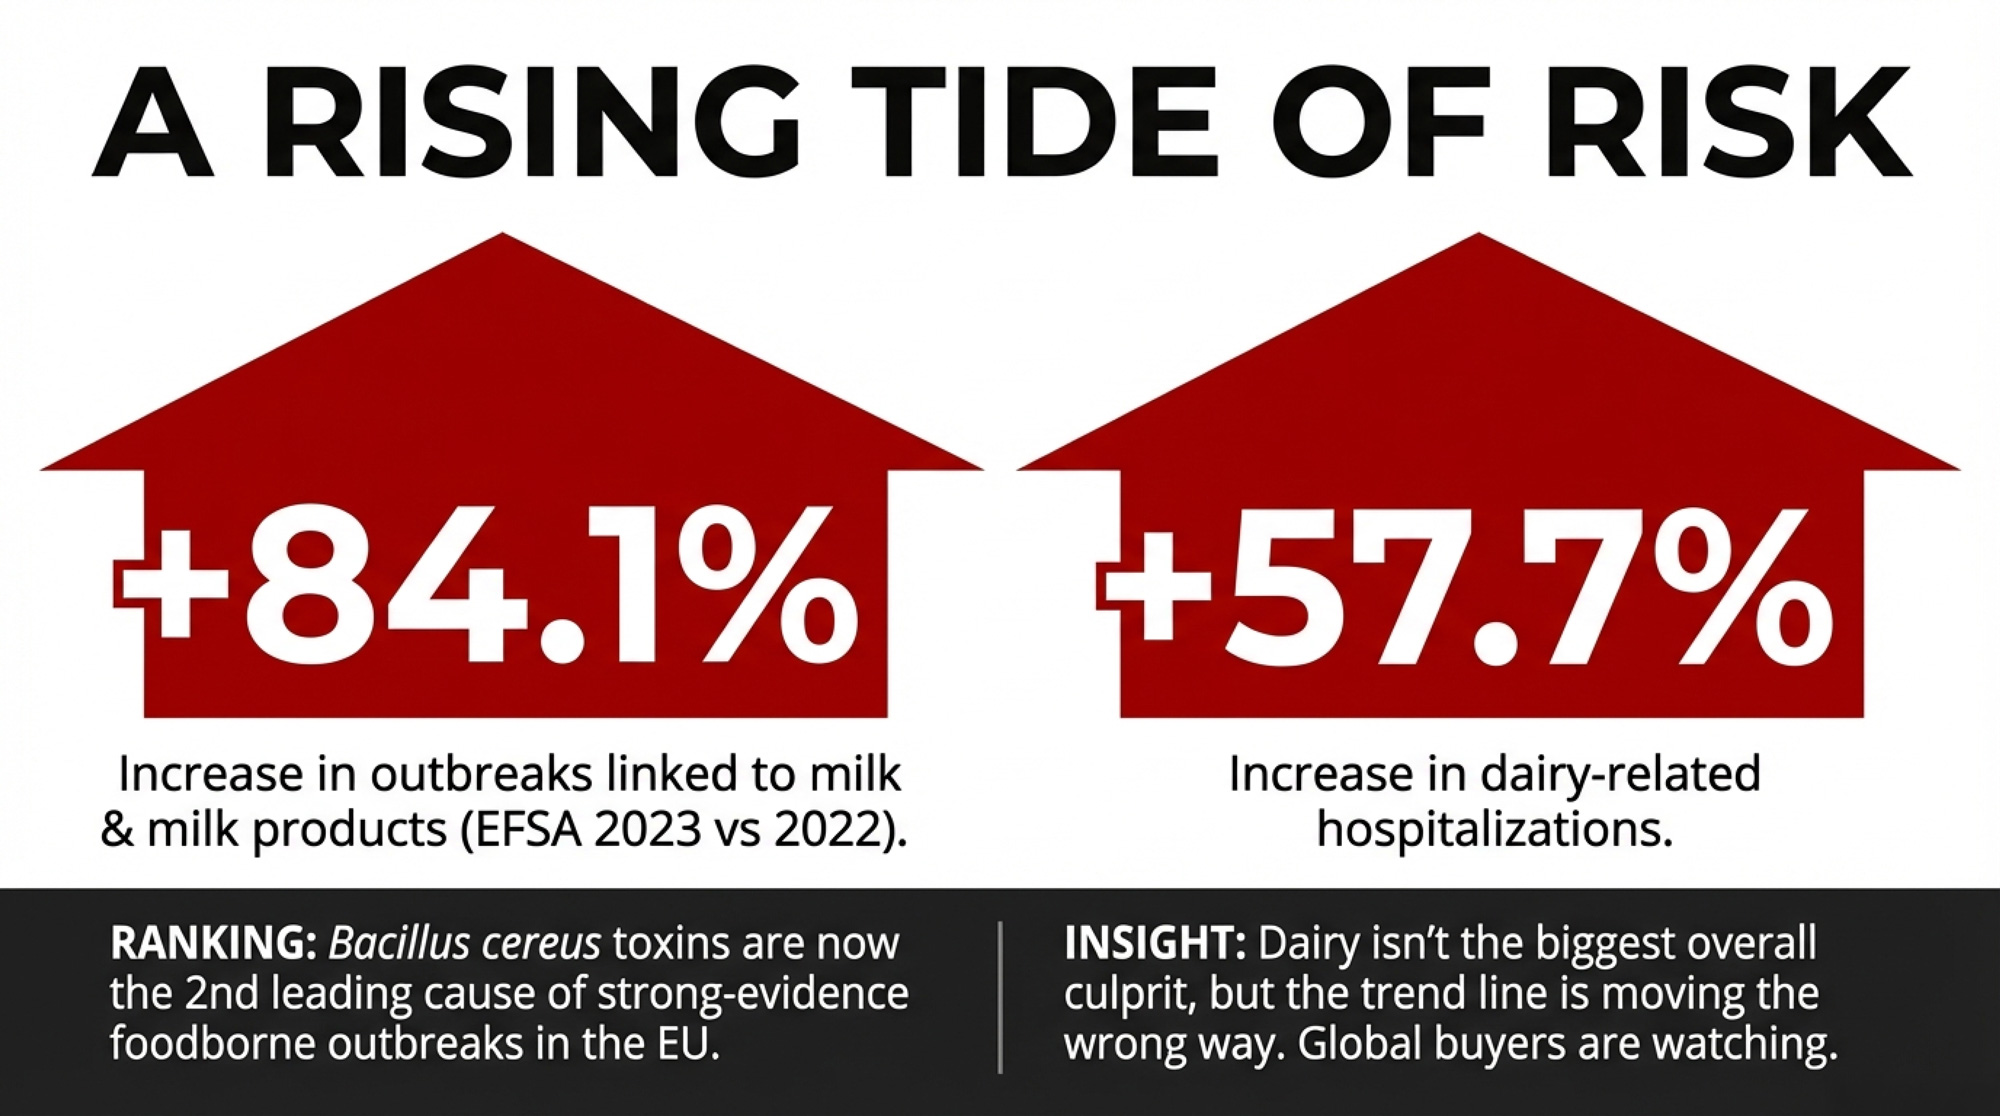
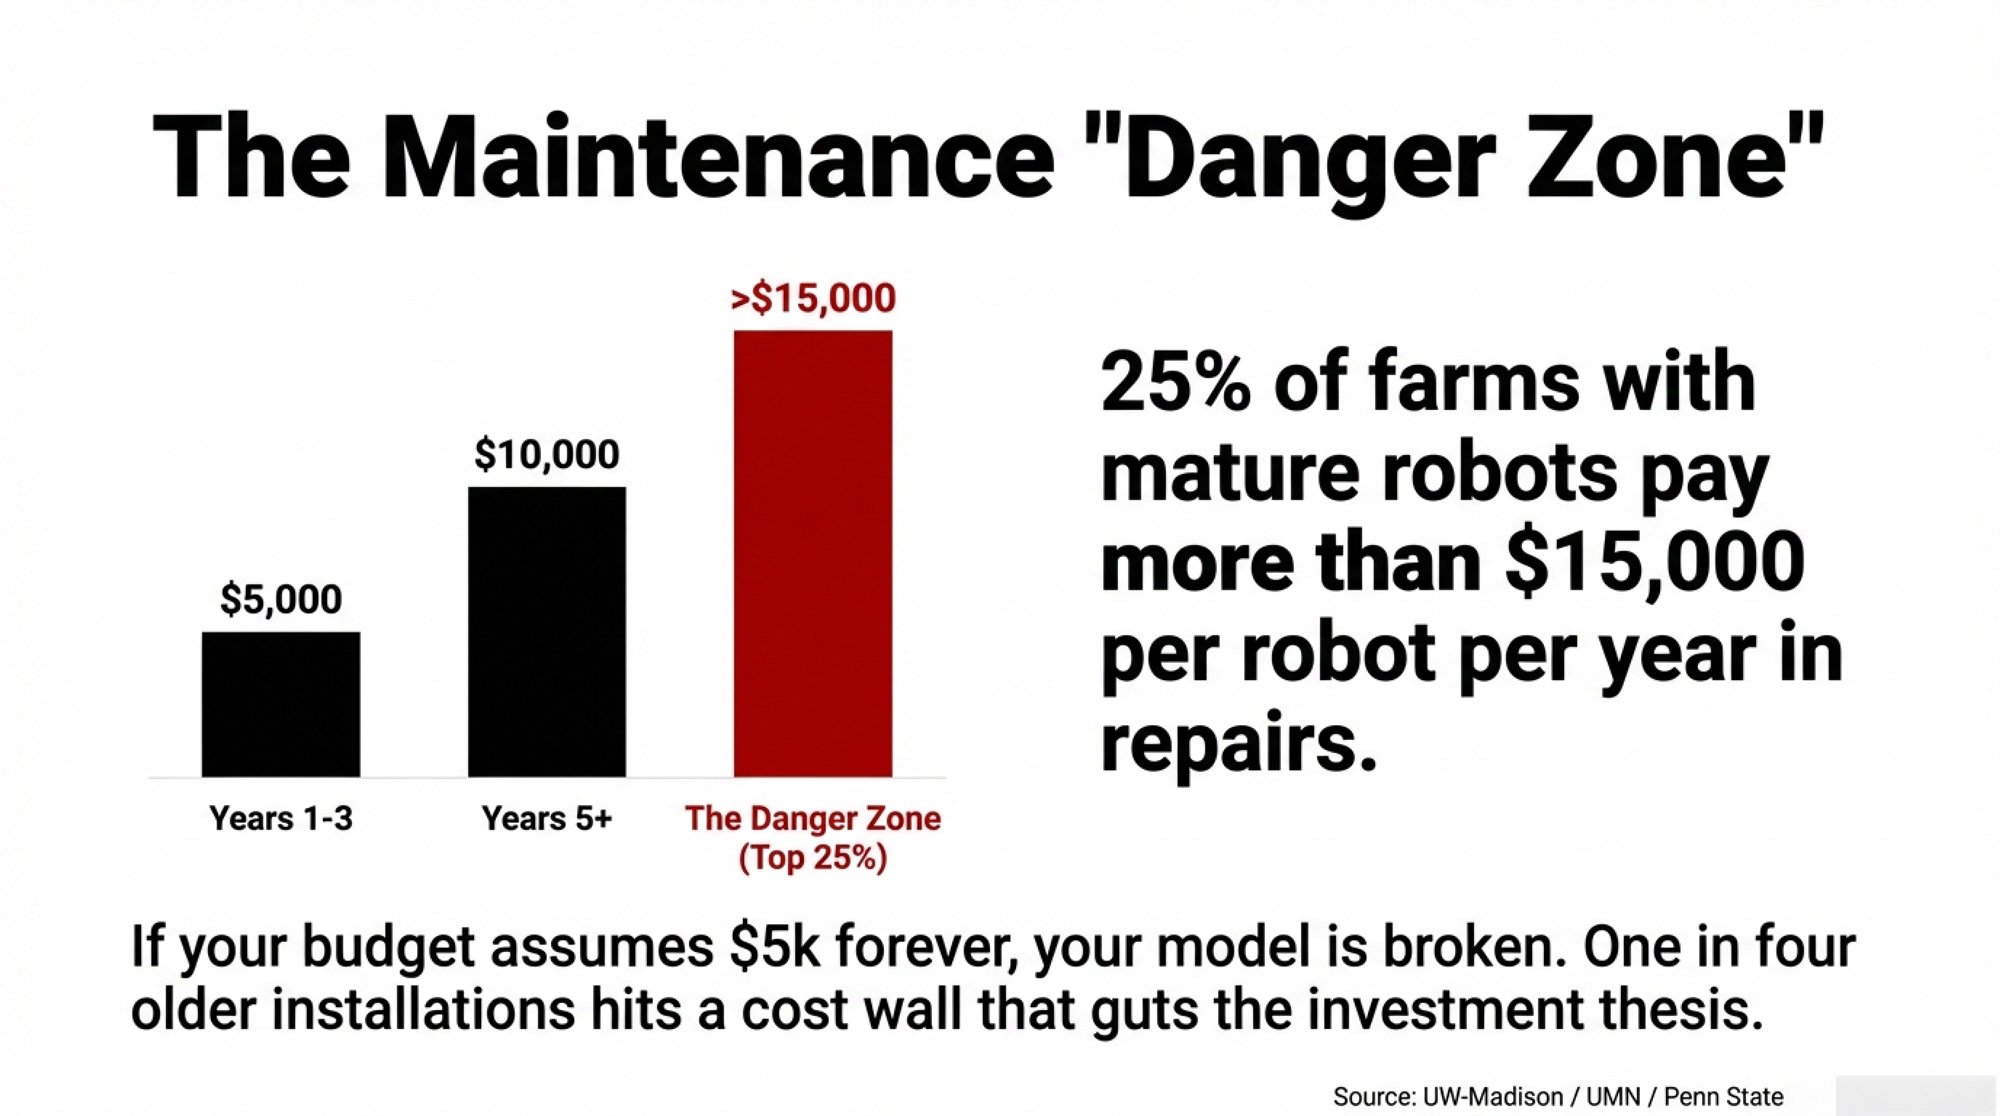
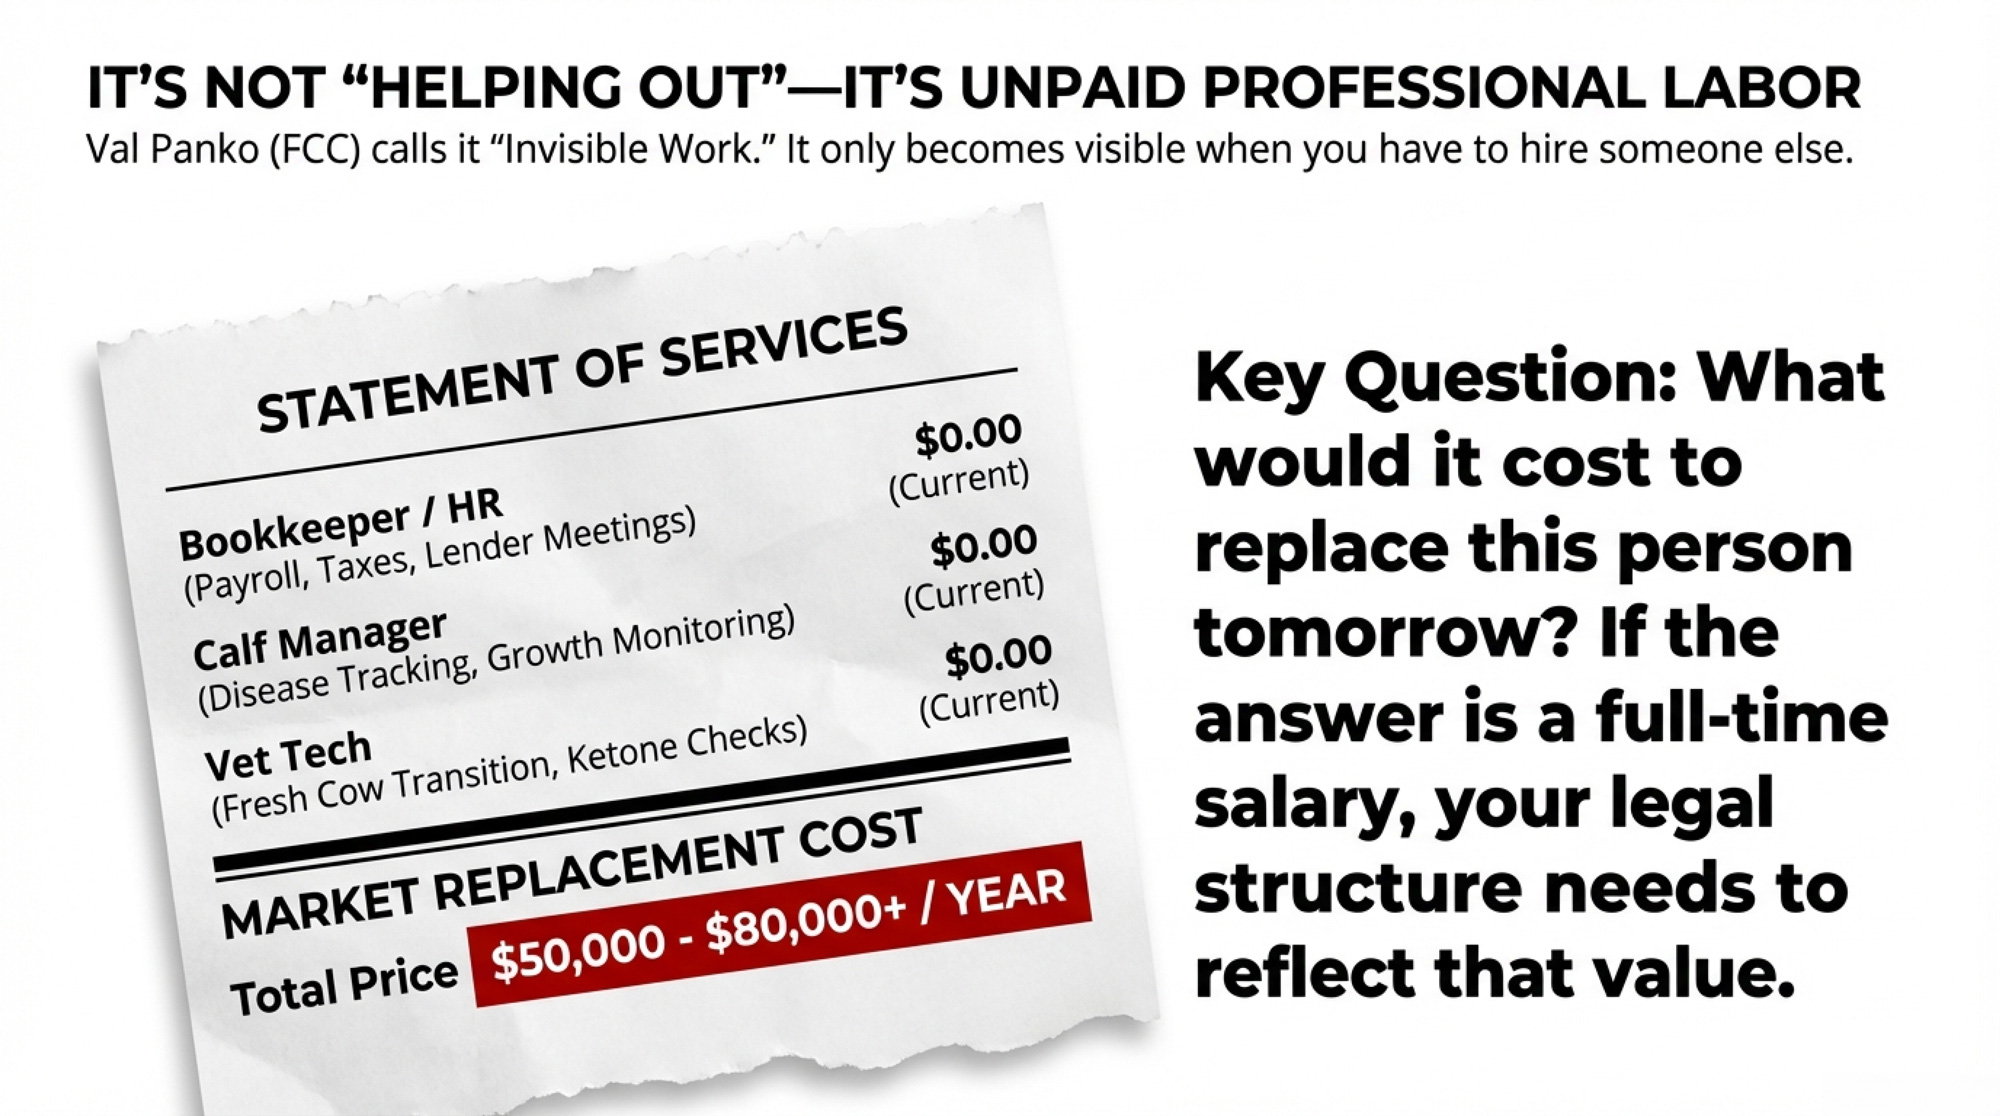
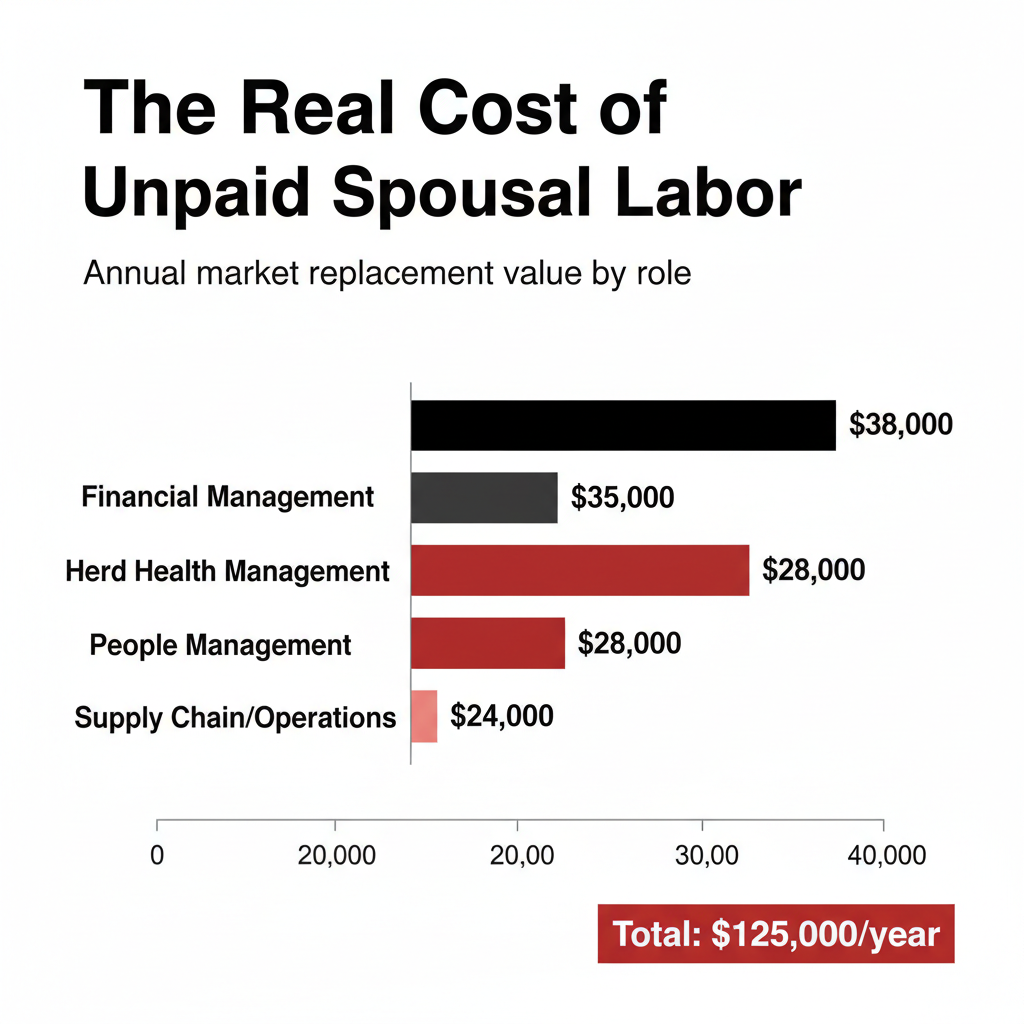
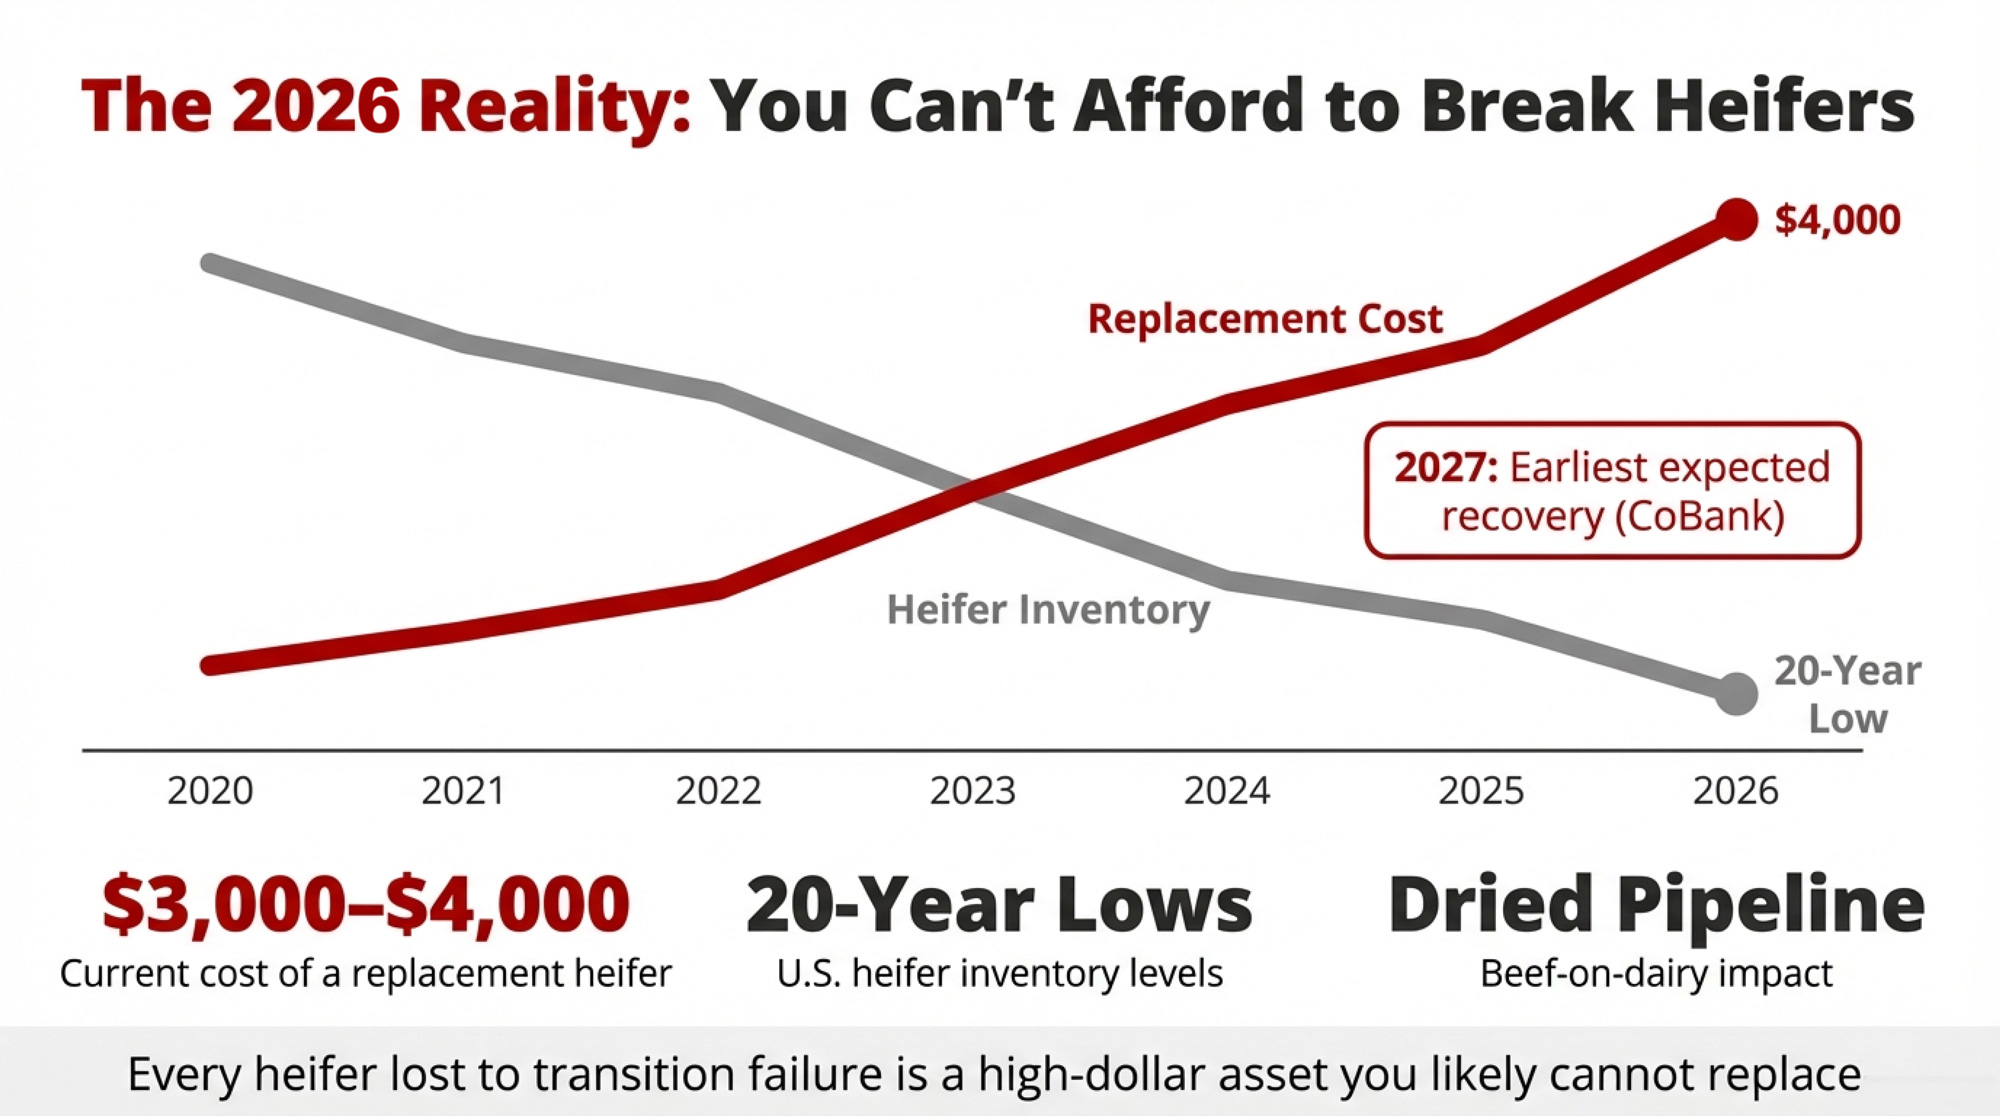
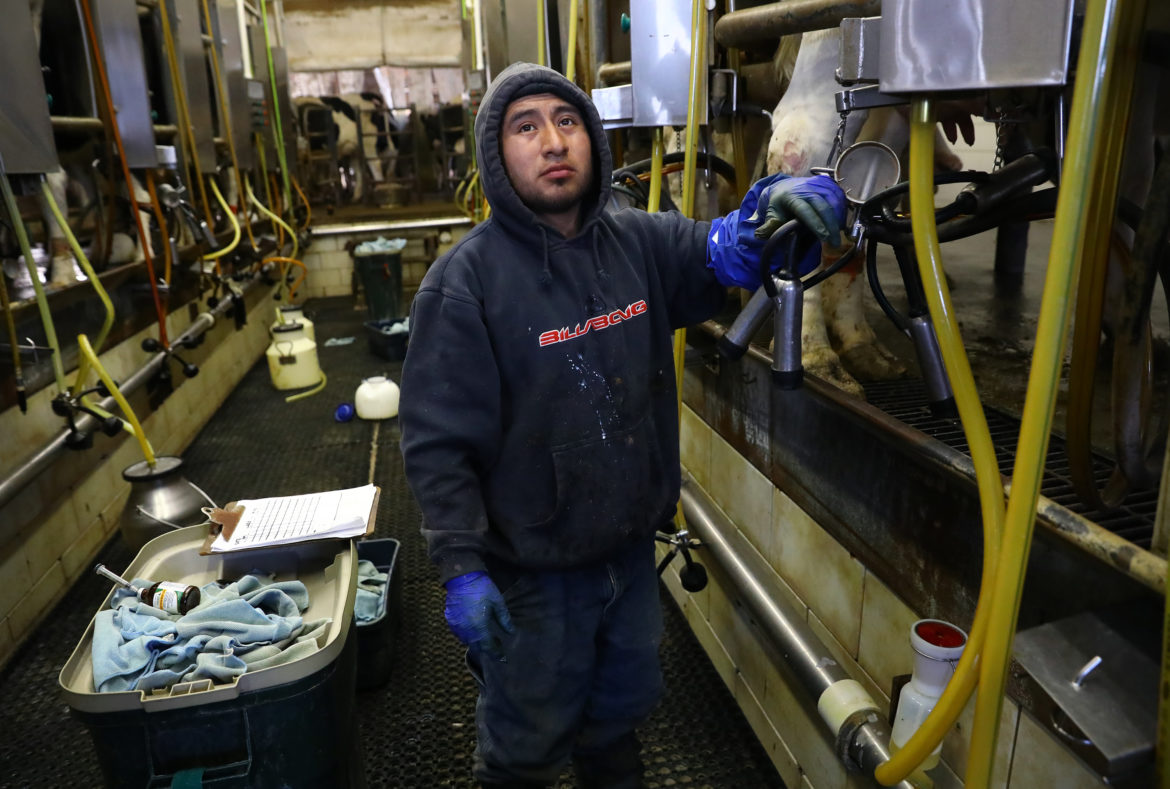
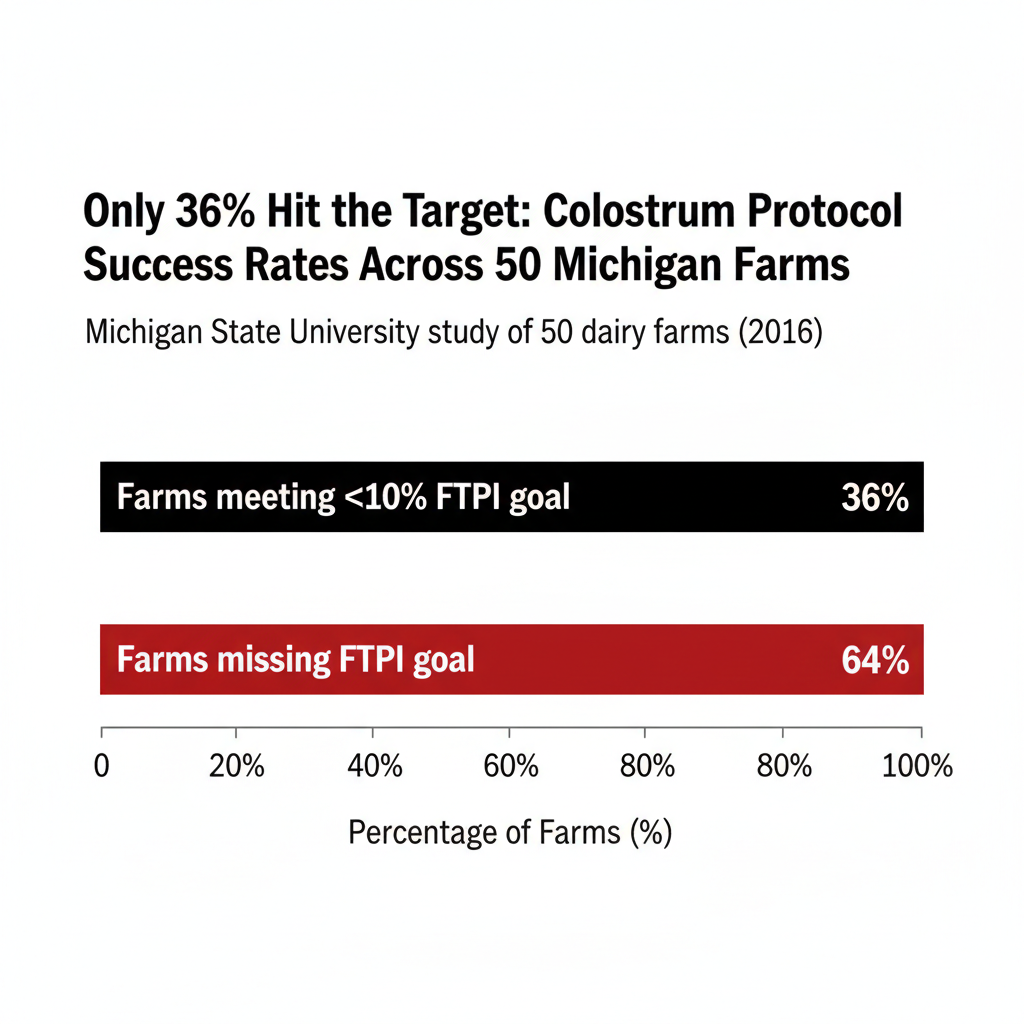
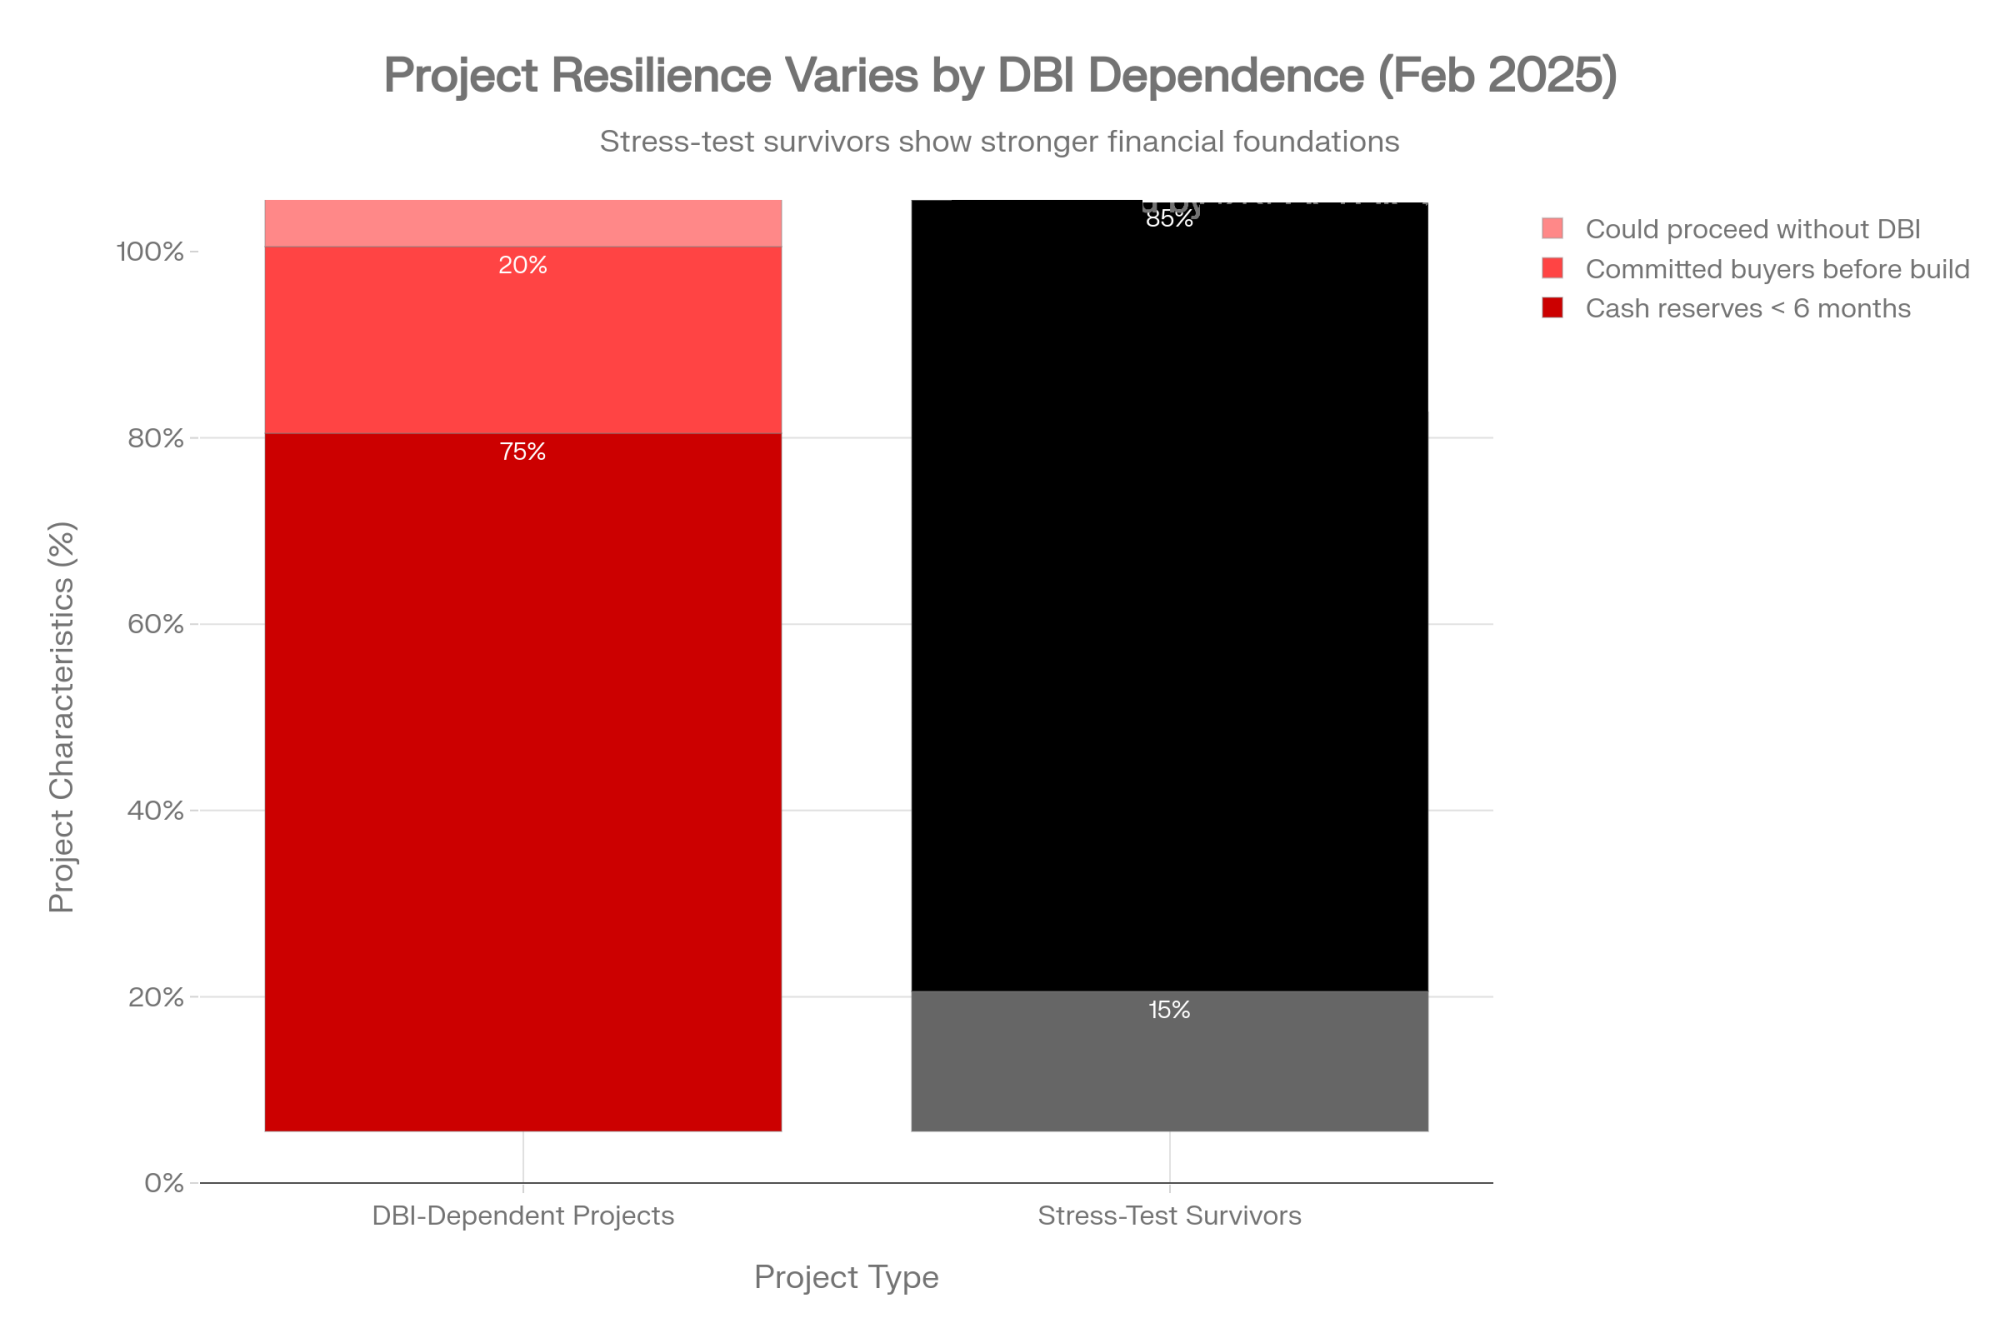
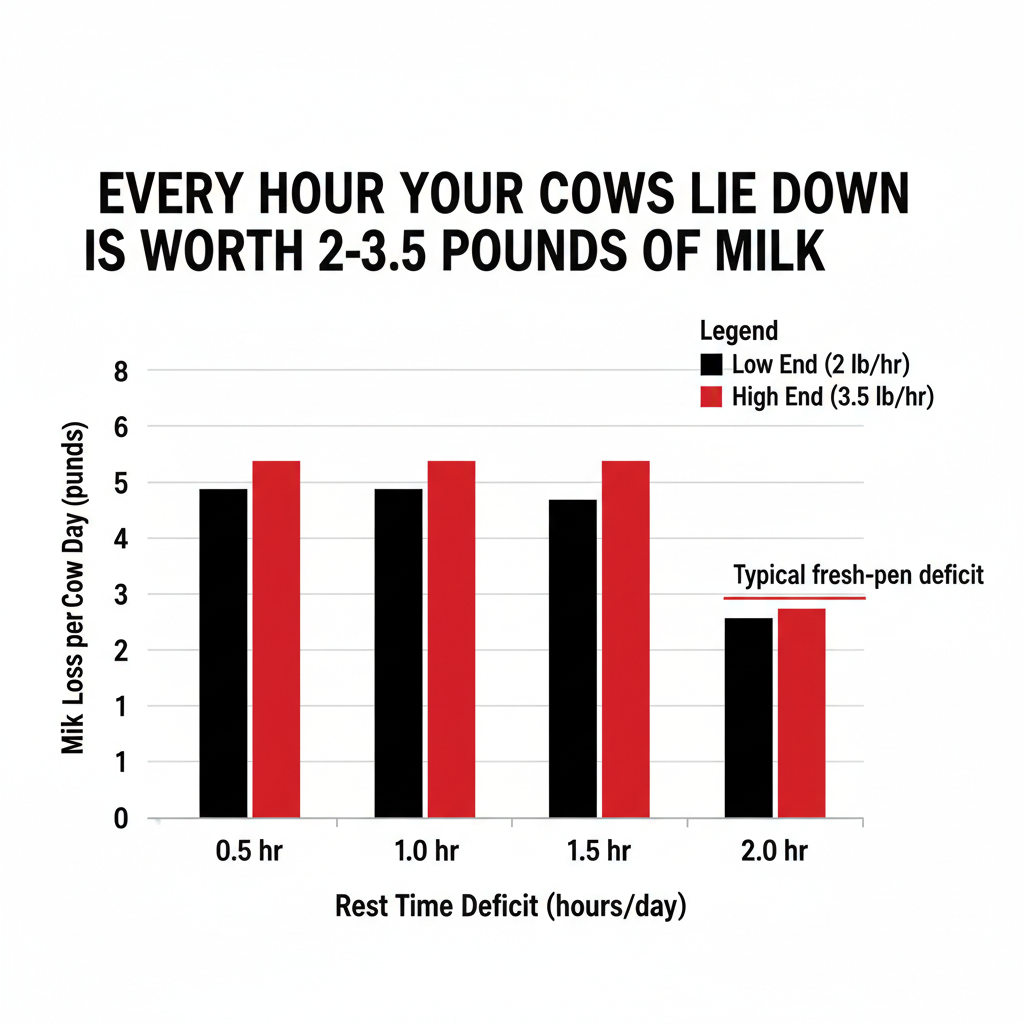
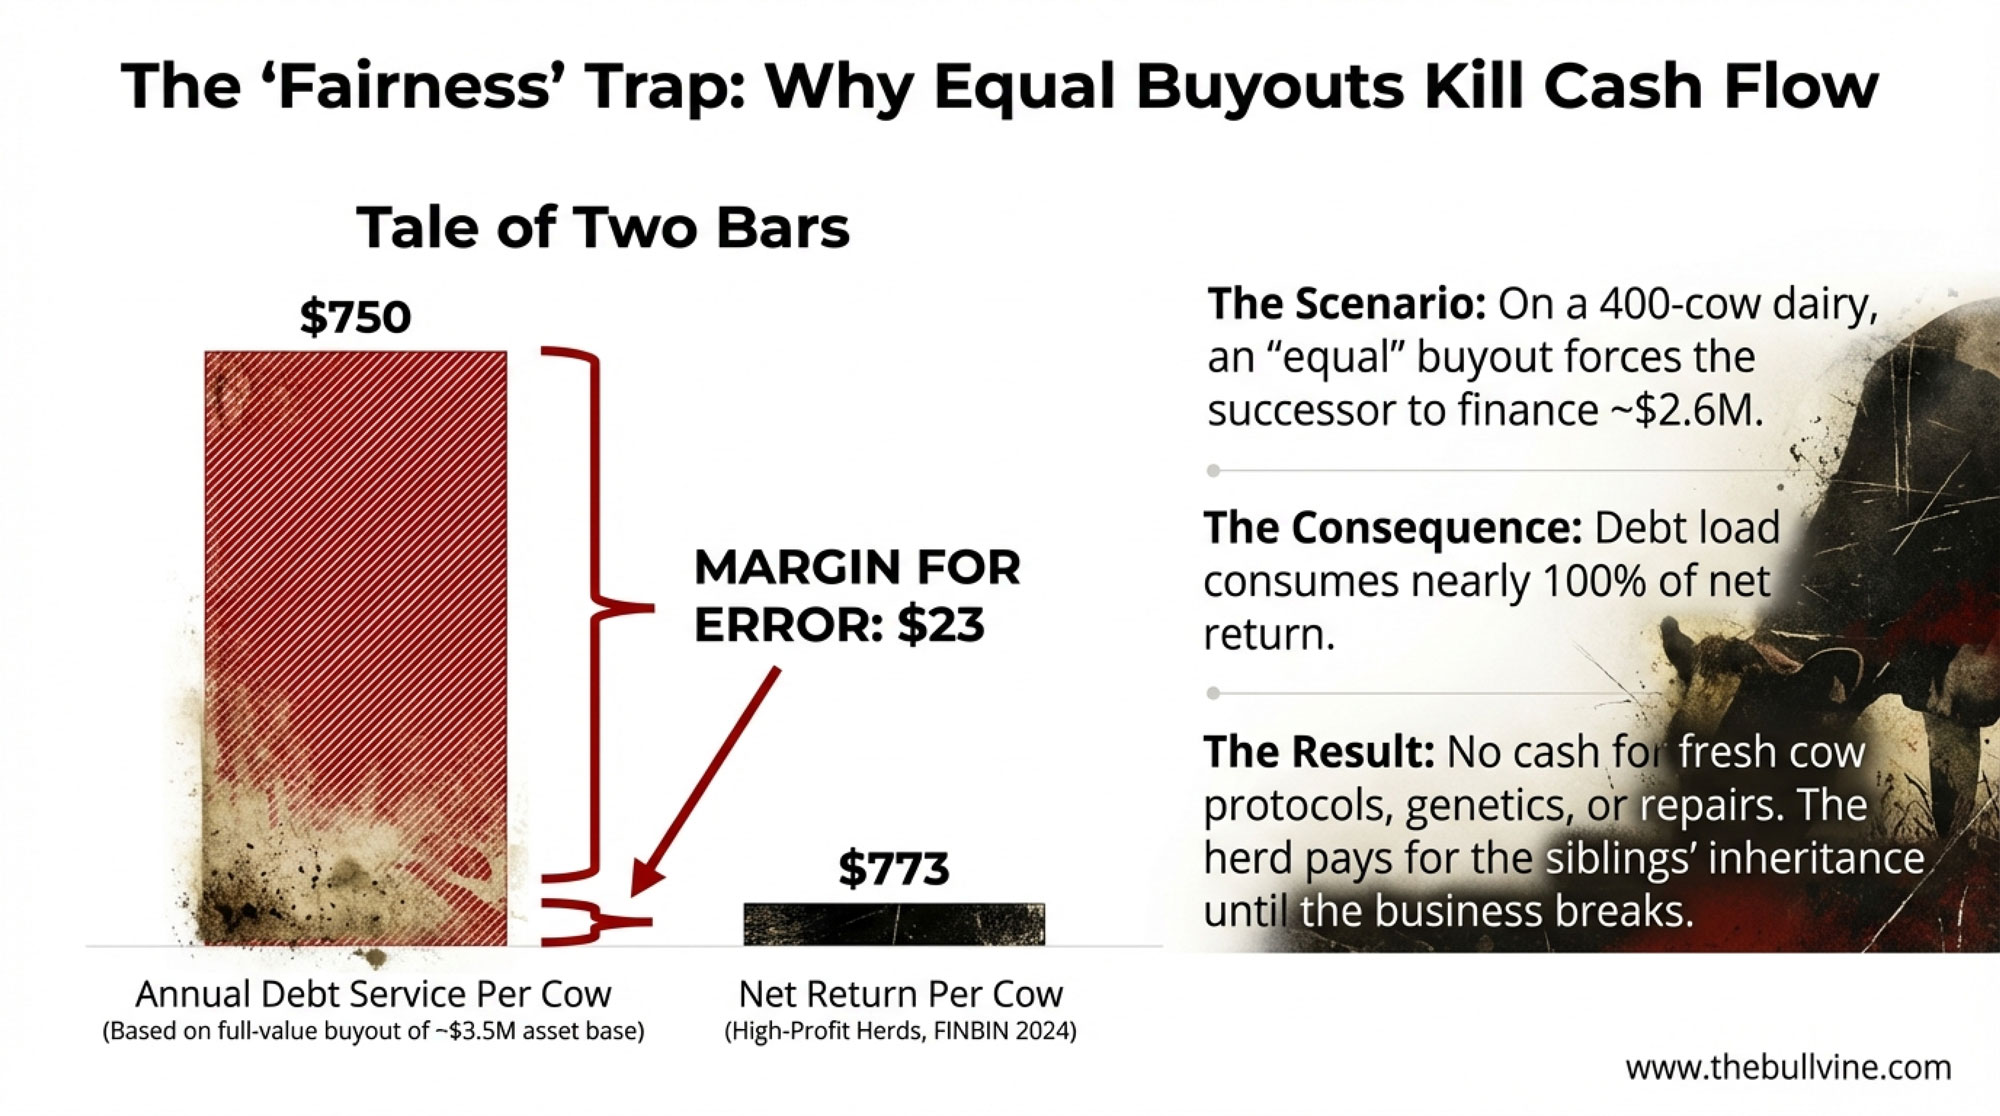
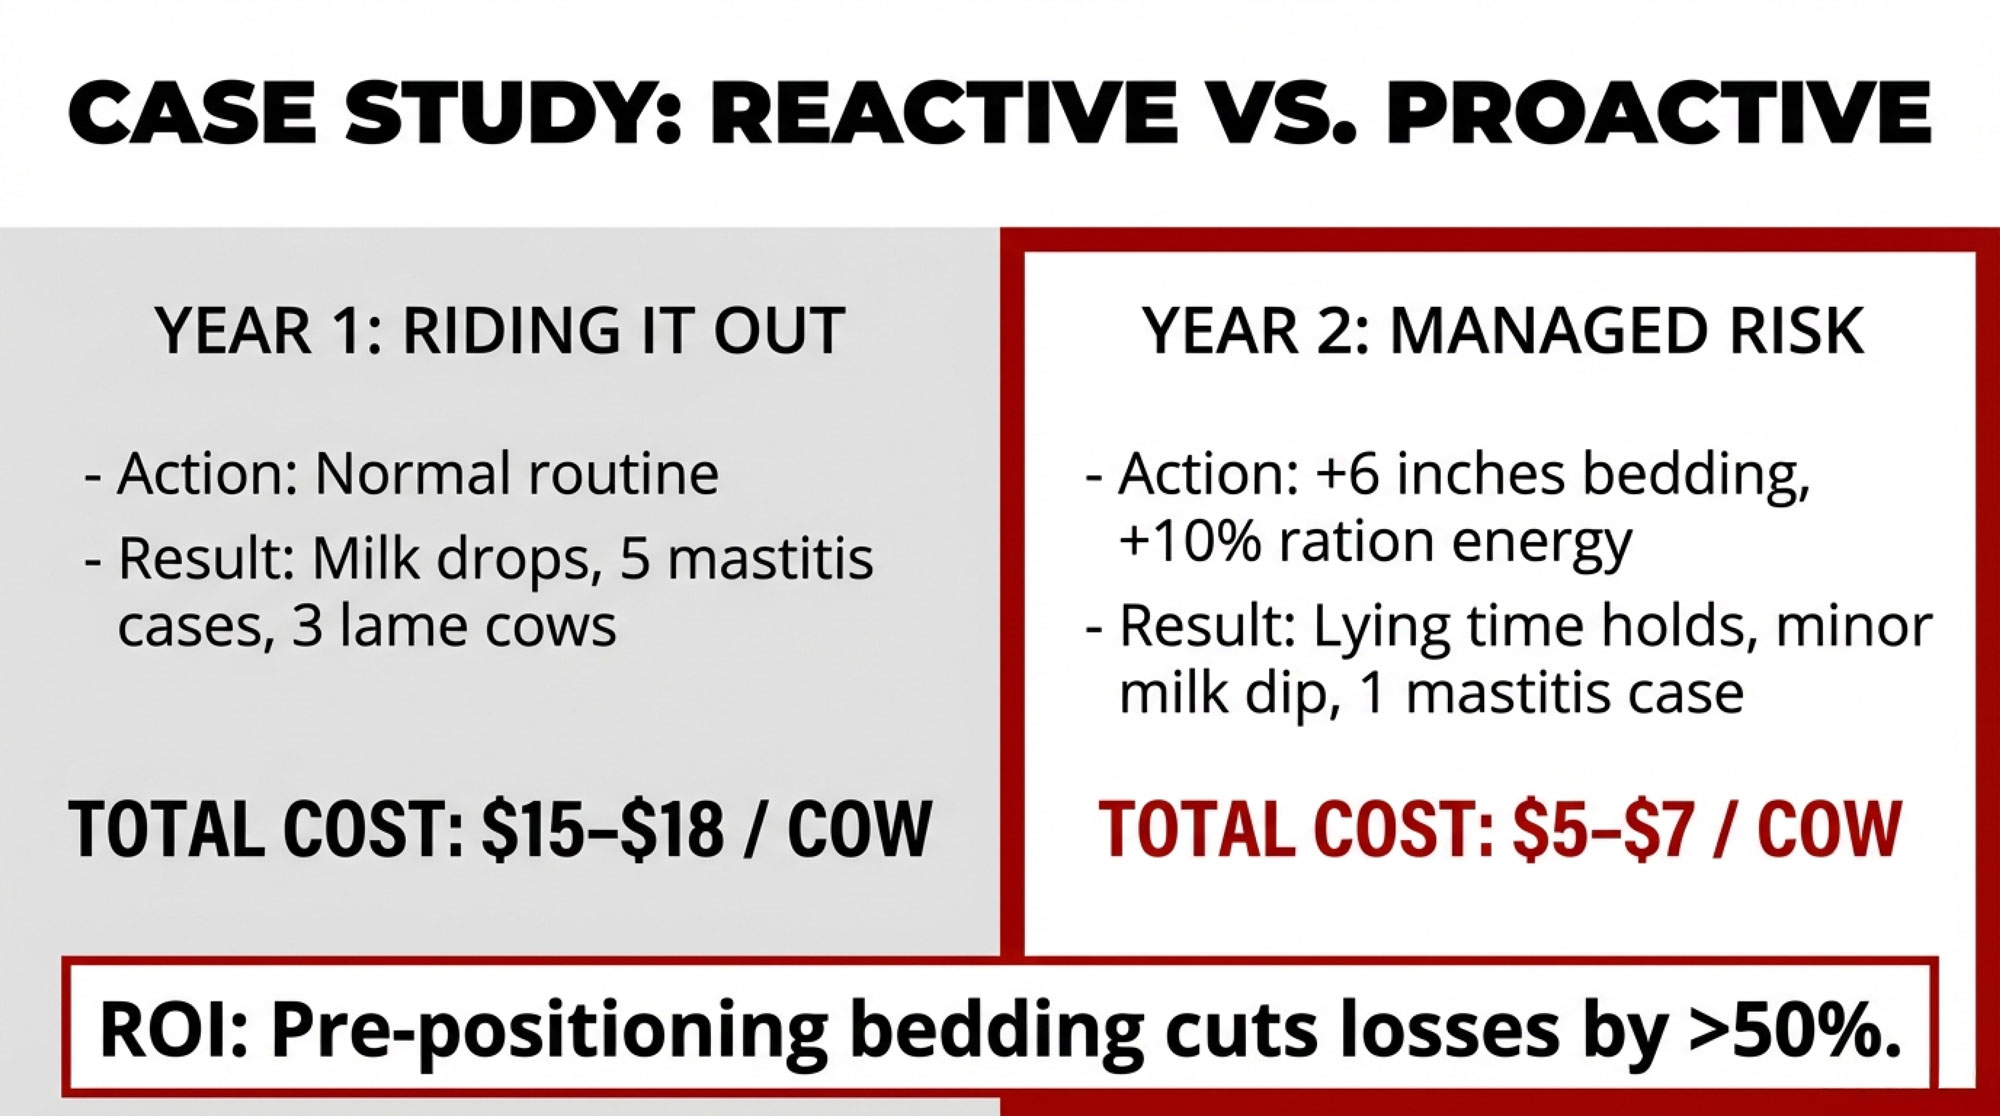
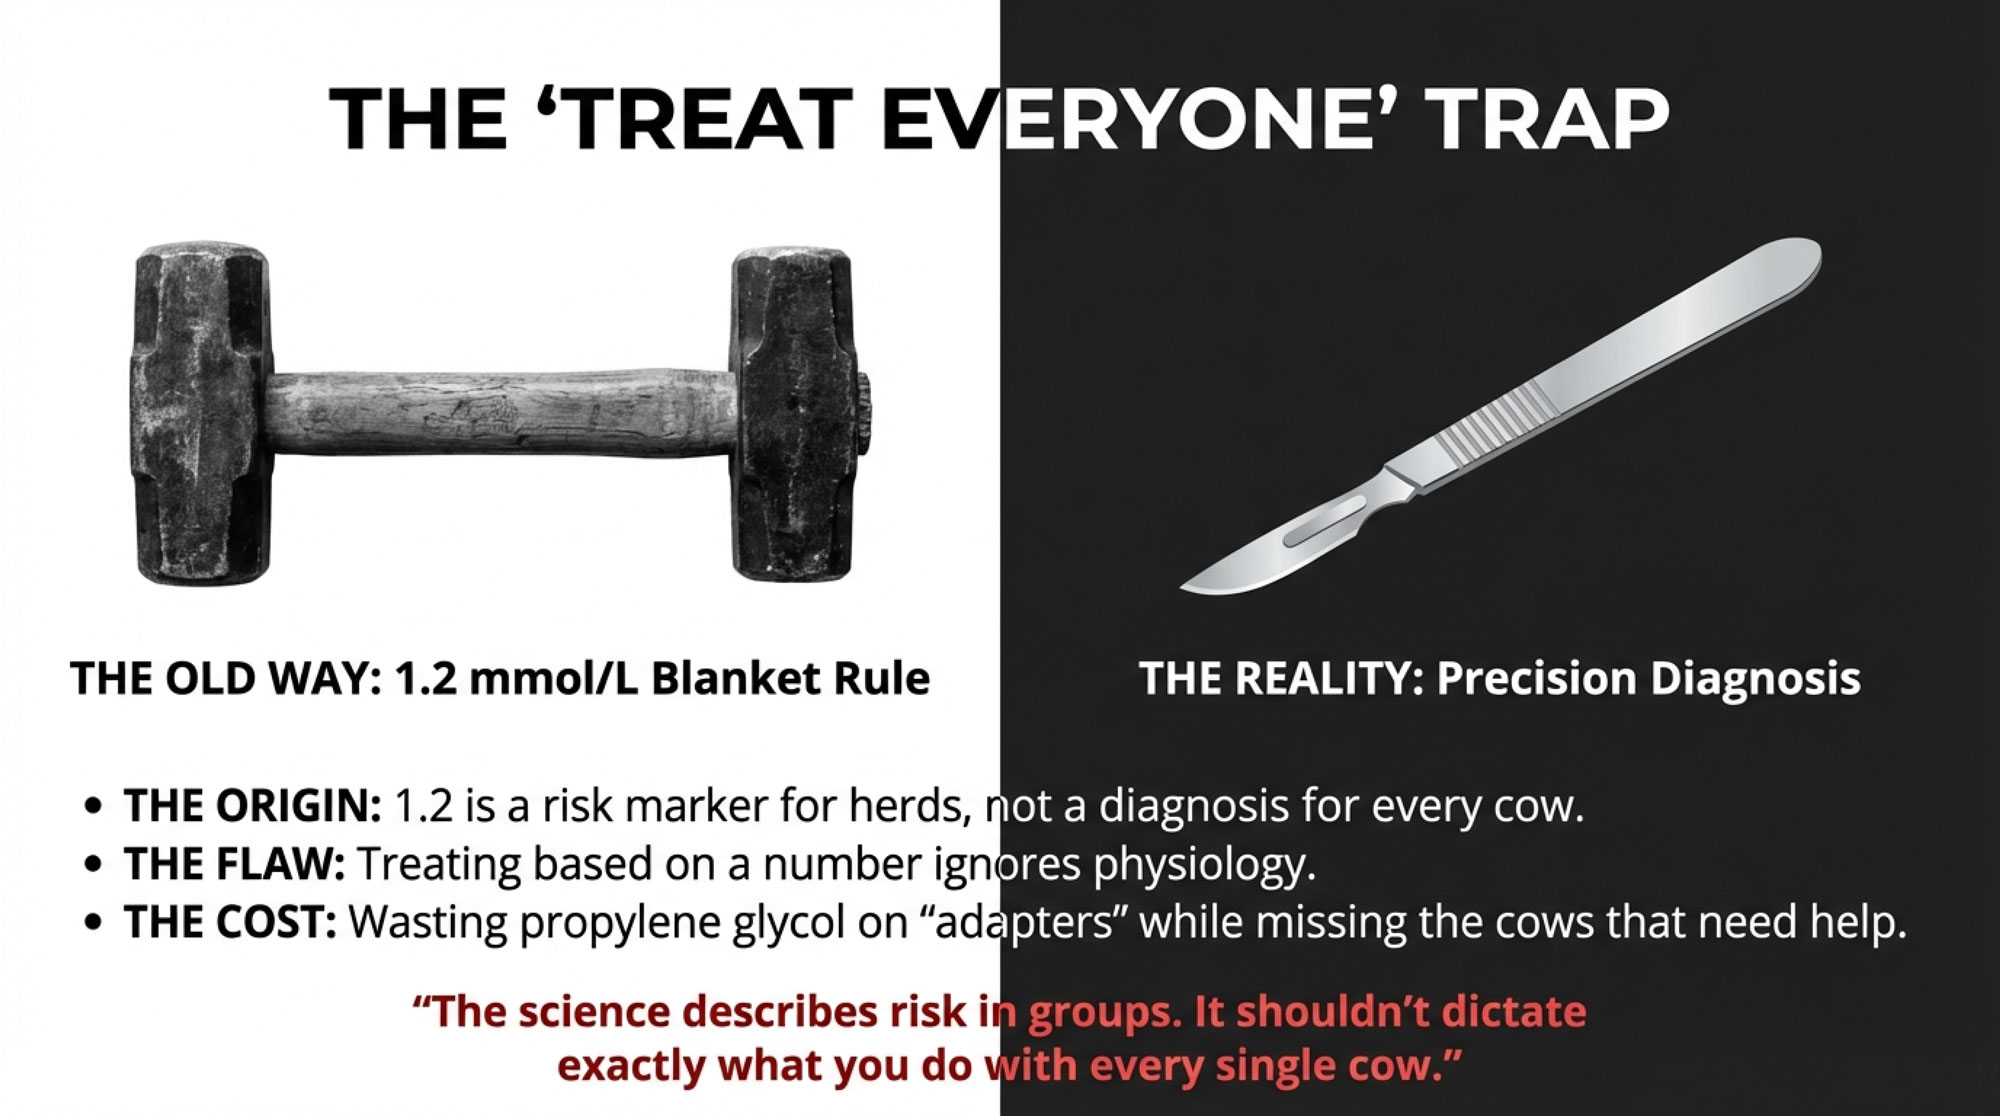
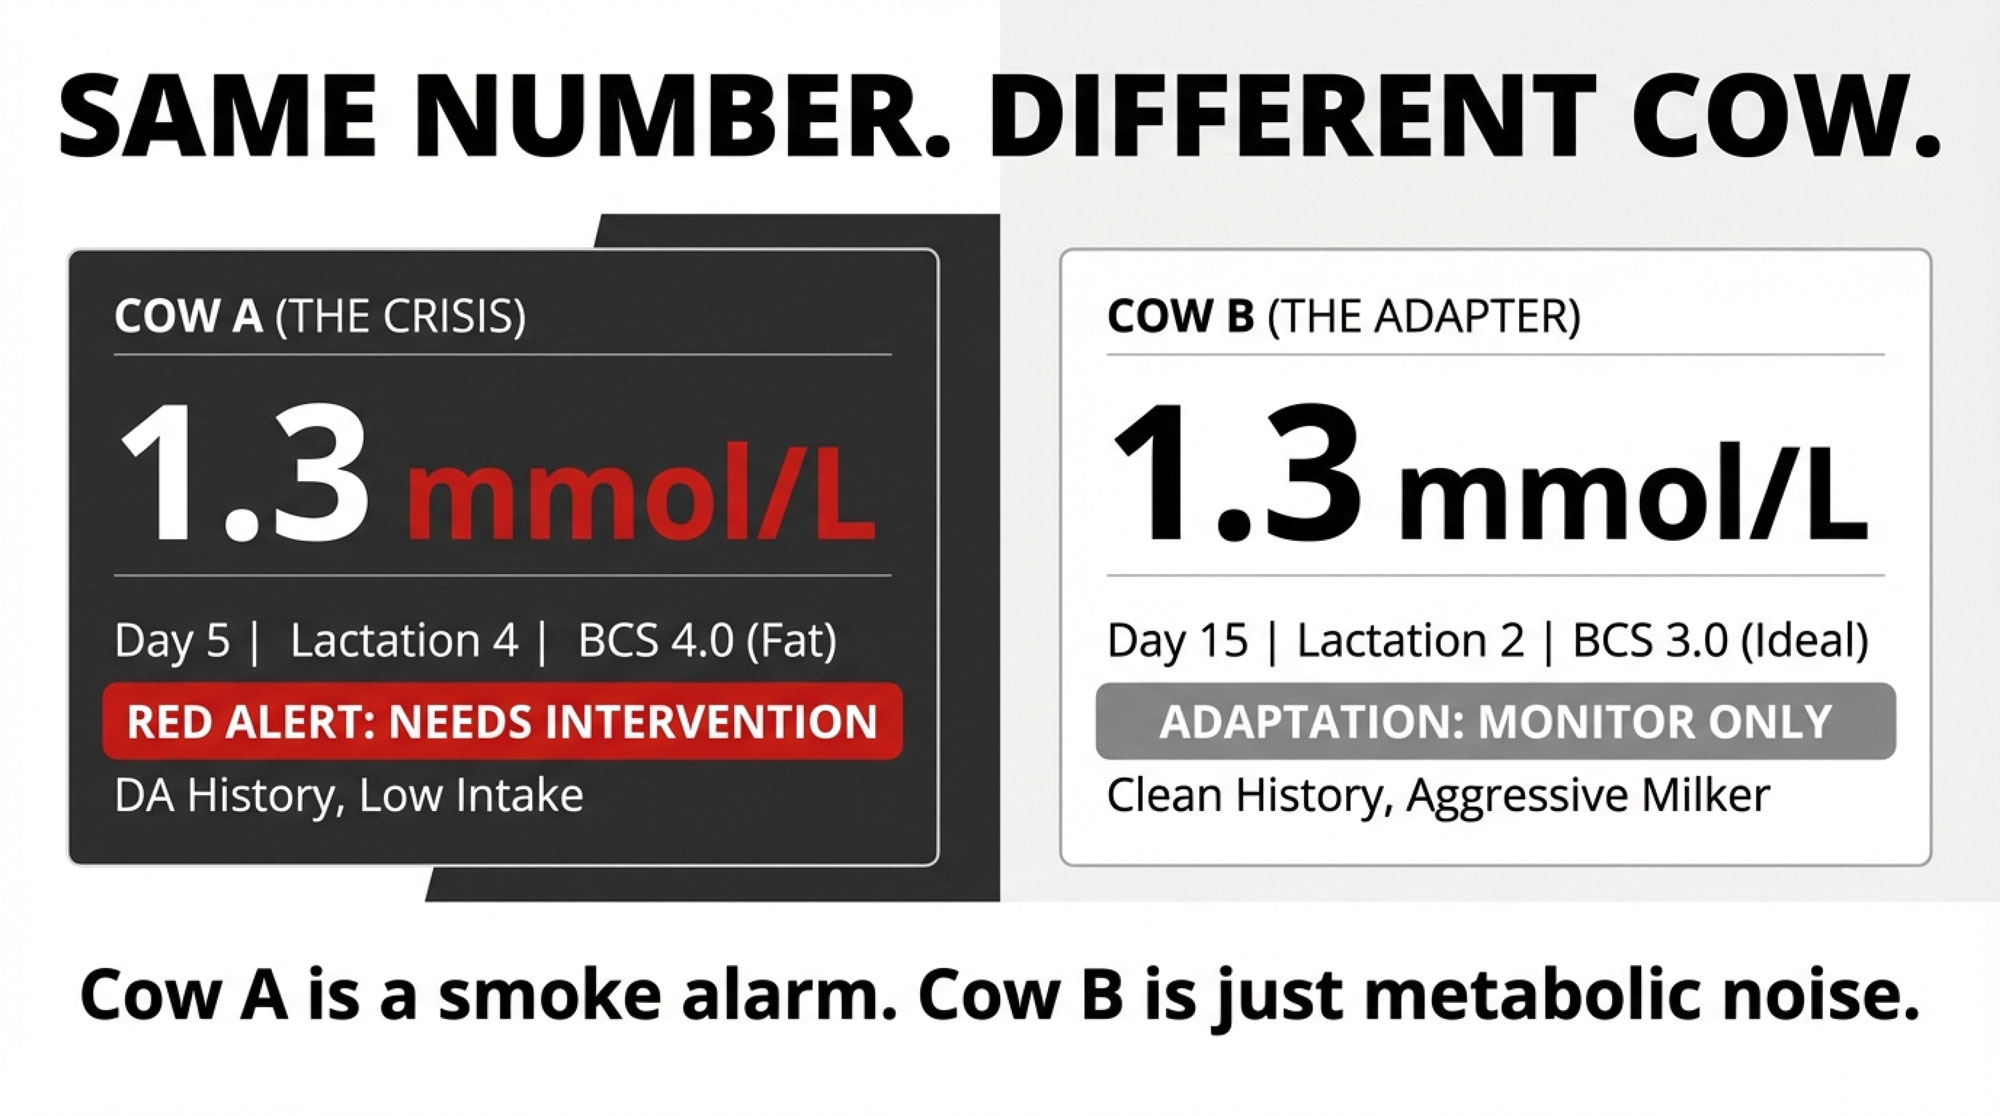
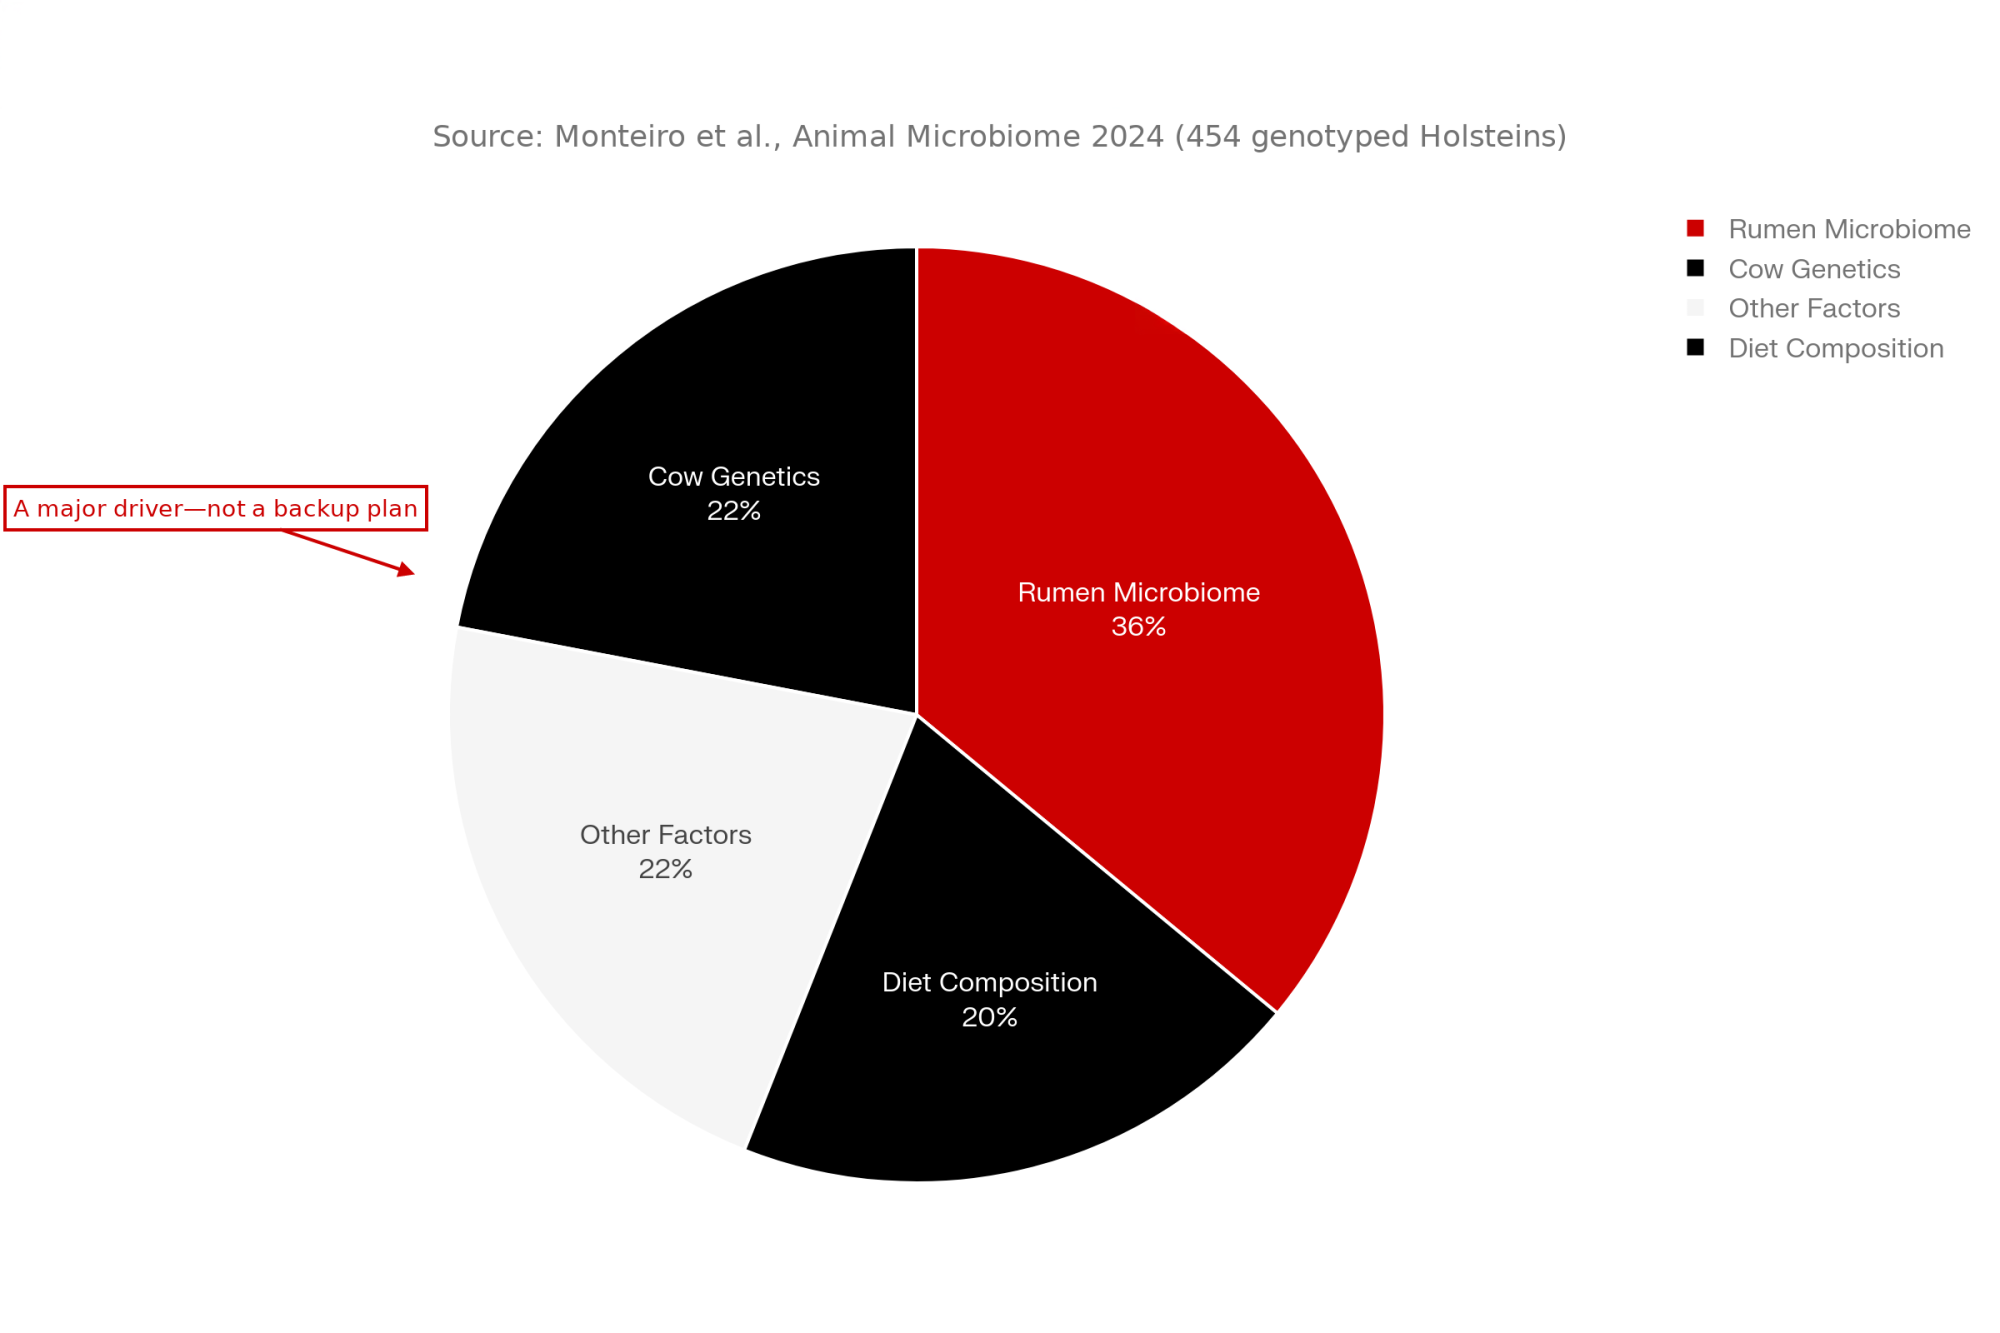
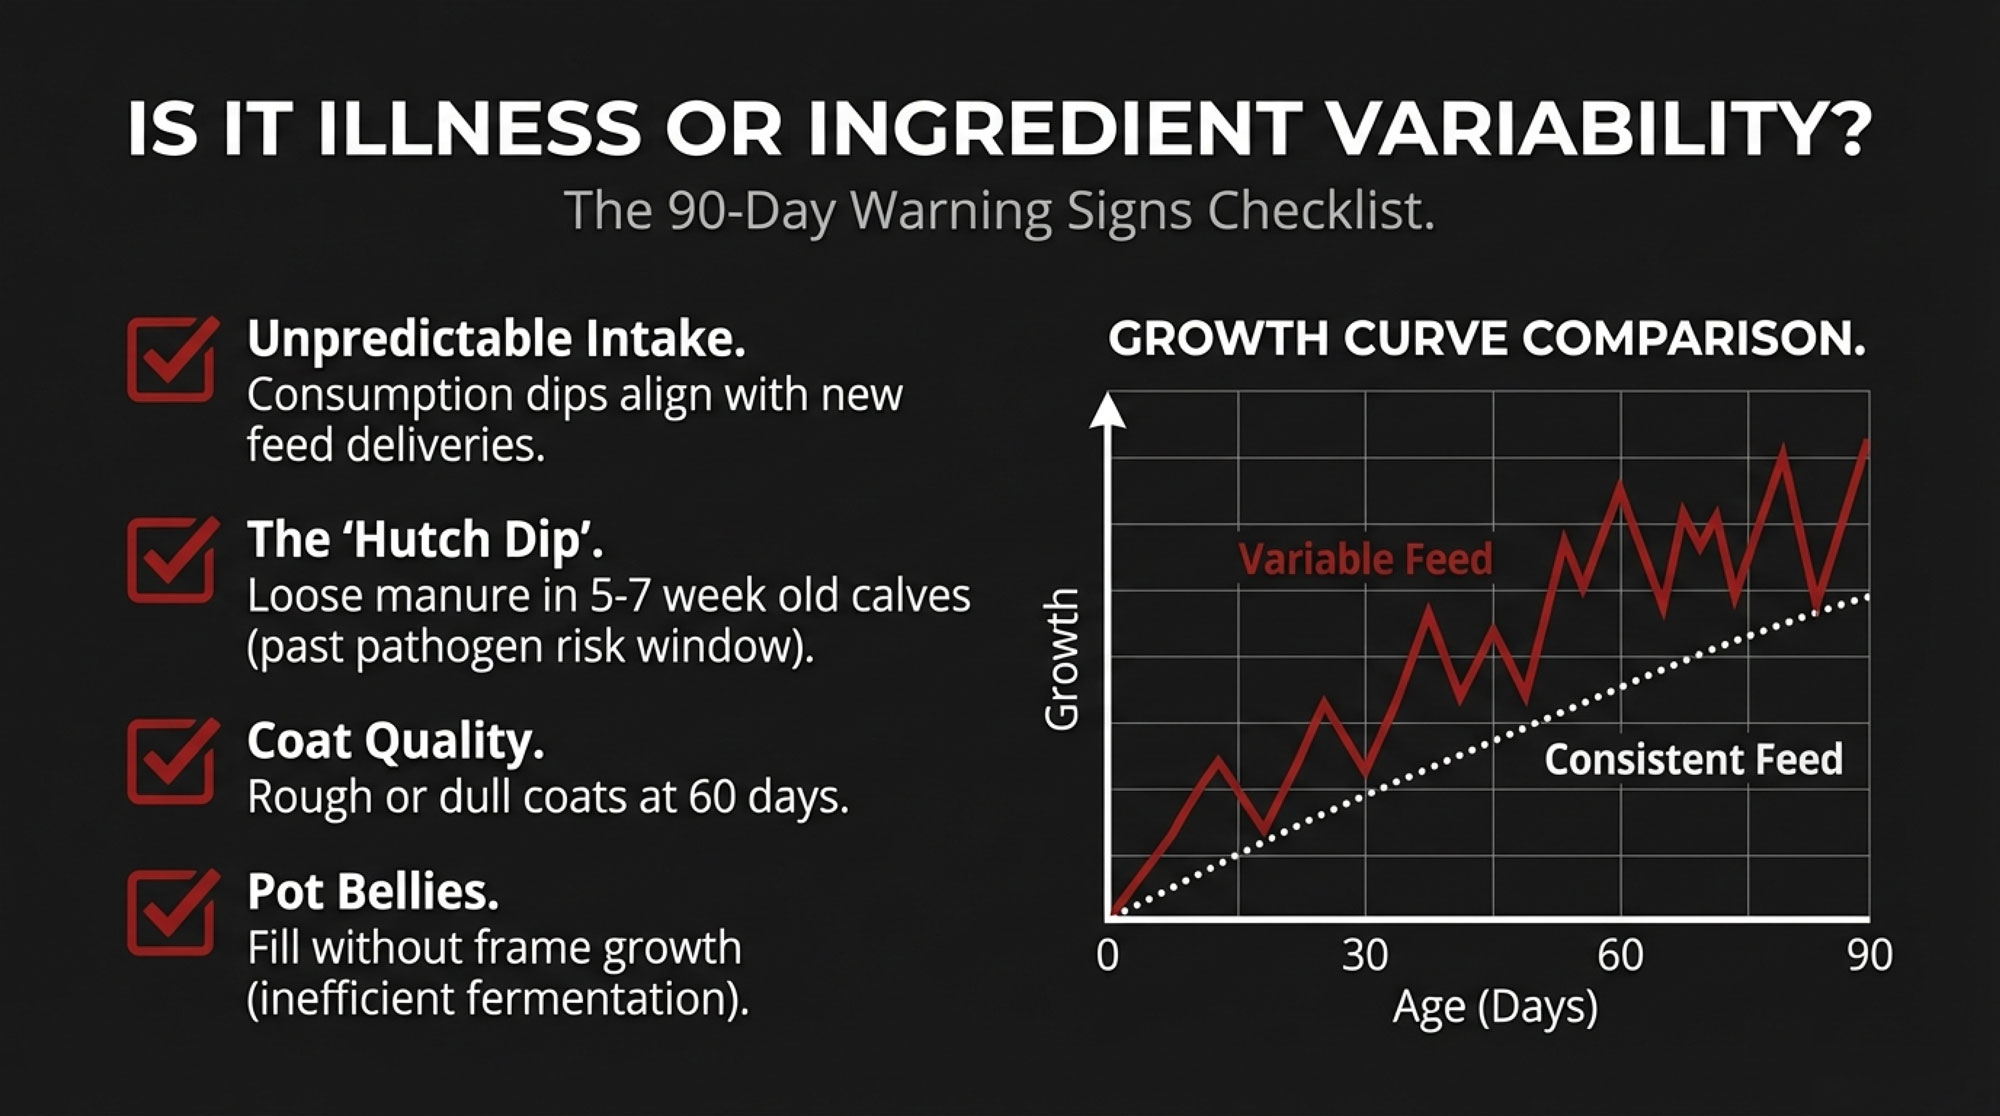
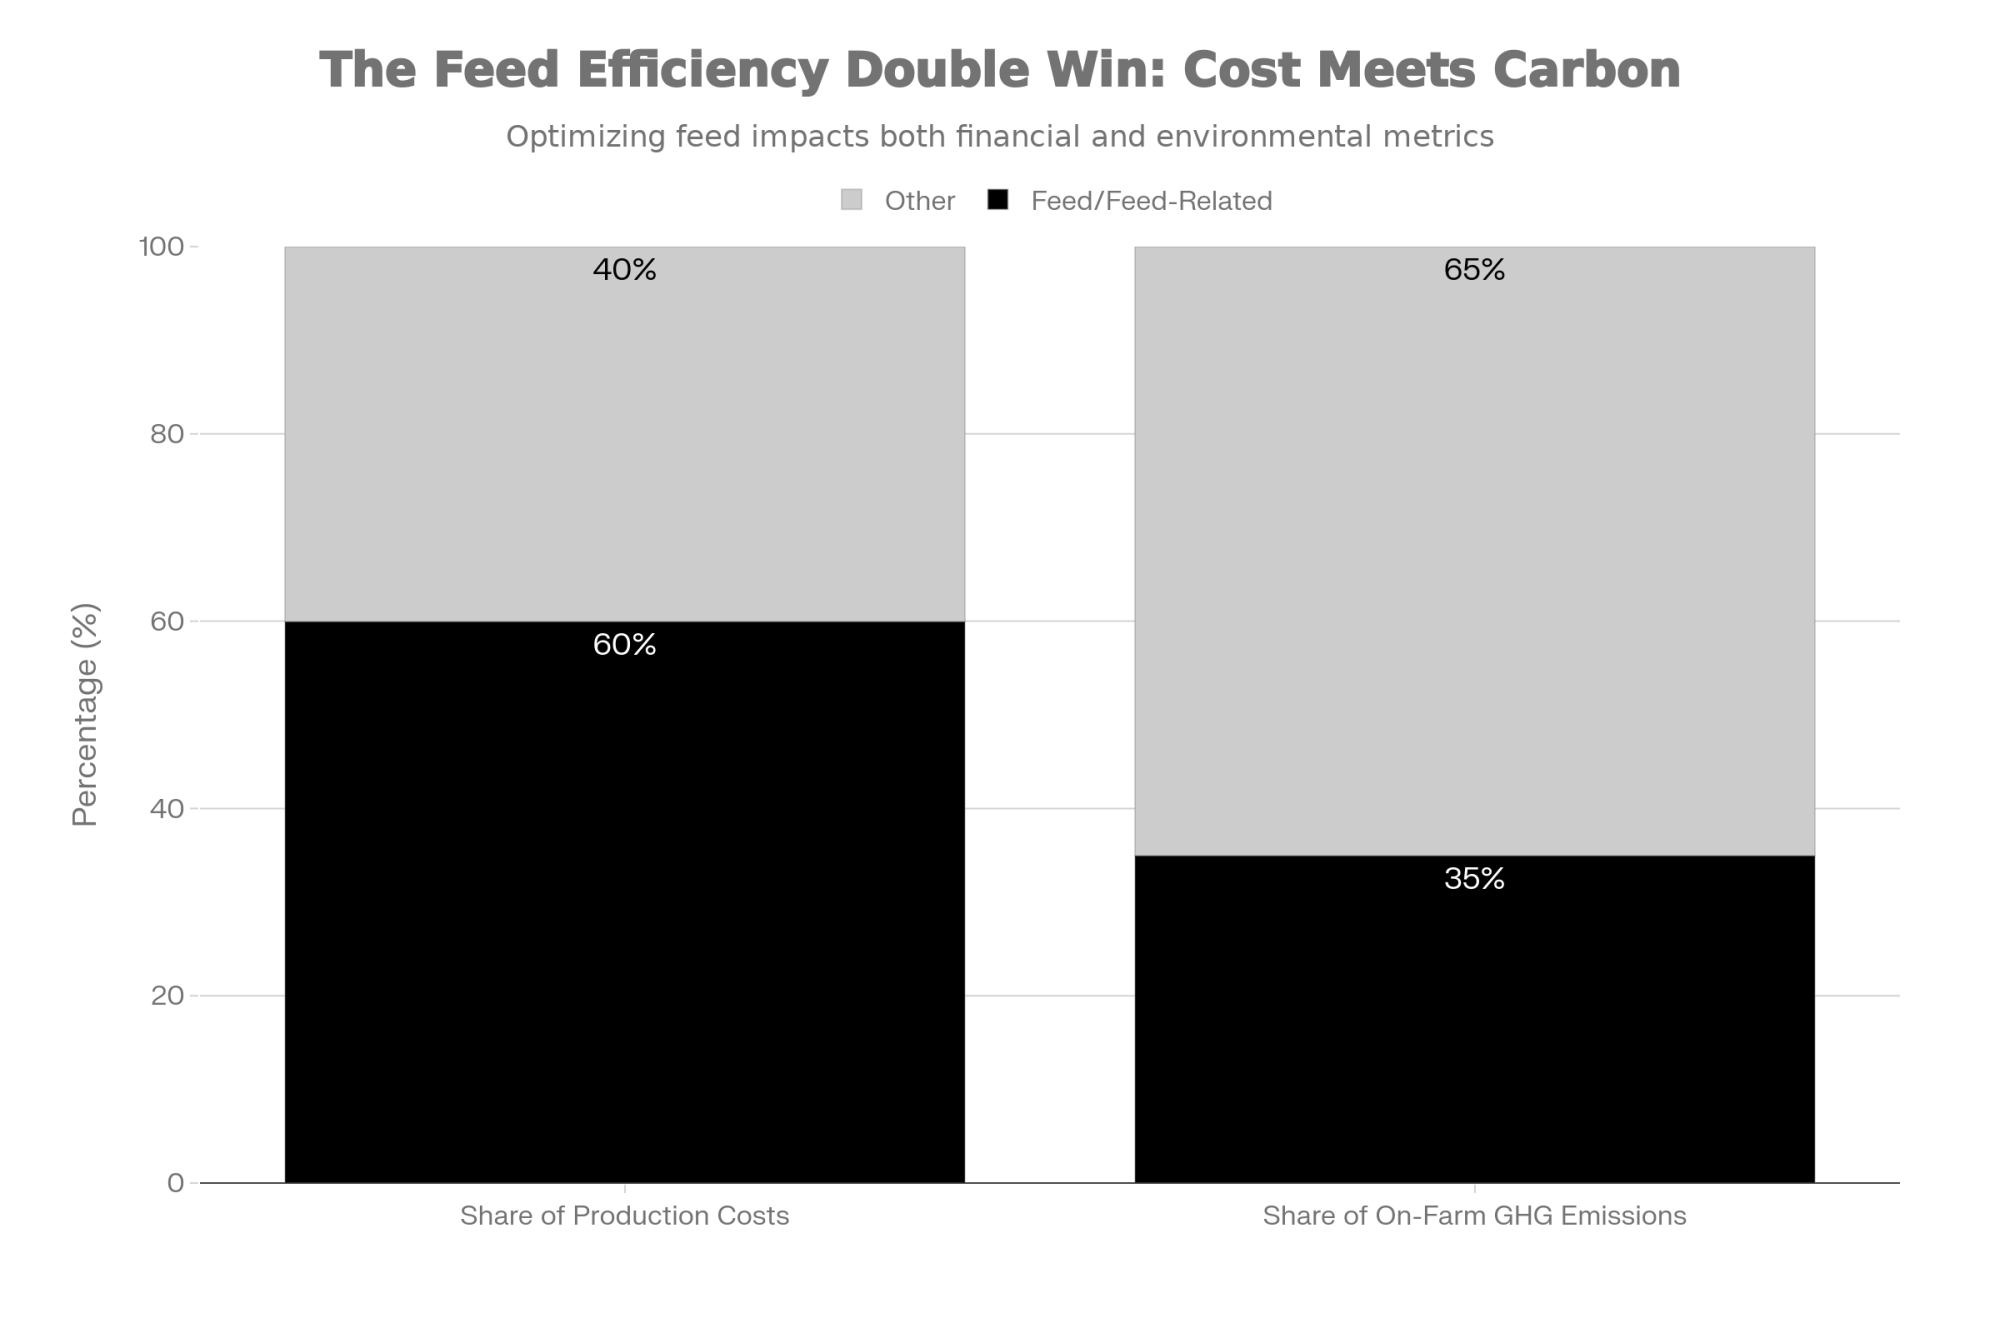
The average score on a basic milking-routine knowledge quiz across 112 parlor workers? 49.3%. That’s what Zelmar Rodriguez — a dairy veterinarian and assistant professor at Michigan State University’s College of Veterinary Medicine — found when he evaluated 16 Michigan and Ohio dairies totaling 17,205 cows between April and September 2023. Half the people touching udders twice a day couldn’t explain why they do what they do. And Rodriguez’s data shows that the gap has a price tag — in SCC premiums lost, mastitis cases missed, and parlor minutes wasted on every shift.
Not a failure rate, either — a group average. Plenty of milkers scored well below that line. “It’s incredible the difference among employees and their learning process. The gap is huge,” Rodriguez said on the Dairy Science Digest podcast in December 2024. These weren’t small pasture herds. Median herd size was 1,101 cows, ranging from 280 to 2,330 lactating, with an average of 15 employees per farm. Study participants were 82% male and 74% Spanish-speaking. Rodriguez told Dairy Global: “People need to know why they have to do what they have been told to do”. His data says roughly half the people in the pit don’t.
Your Written SOP Might Be Making Things Worse
Here’s the part that should make you look at your own parlor wall a little differently.
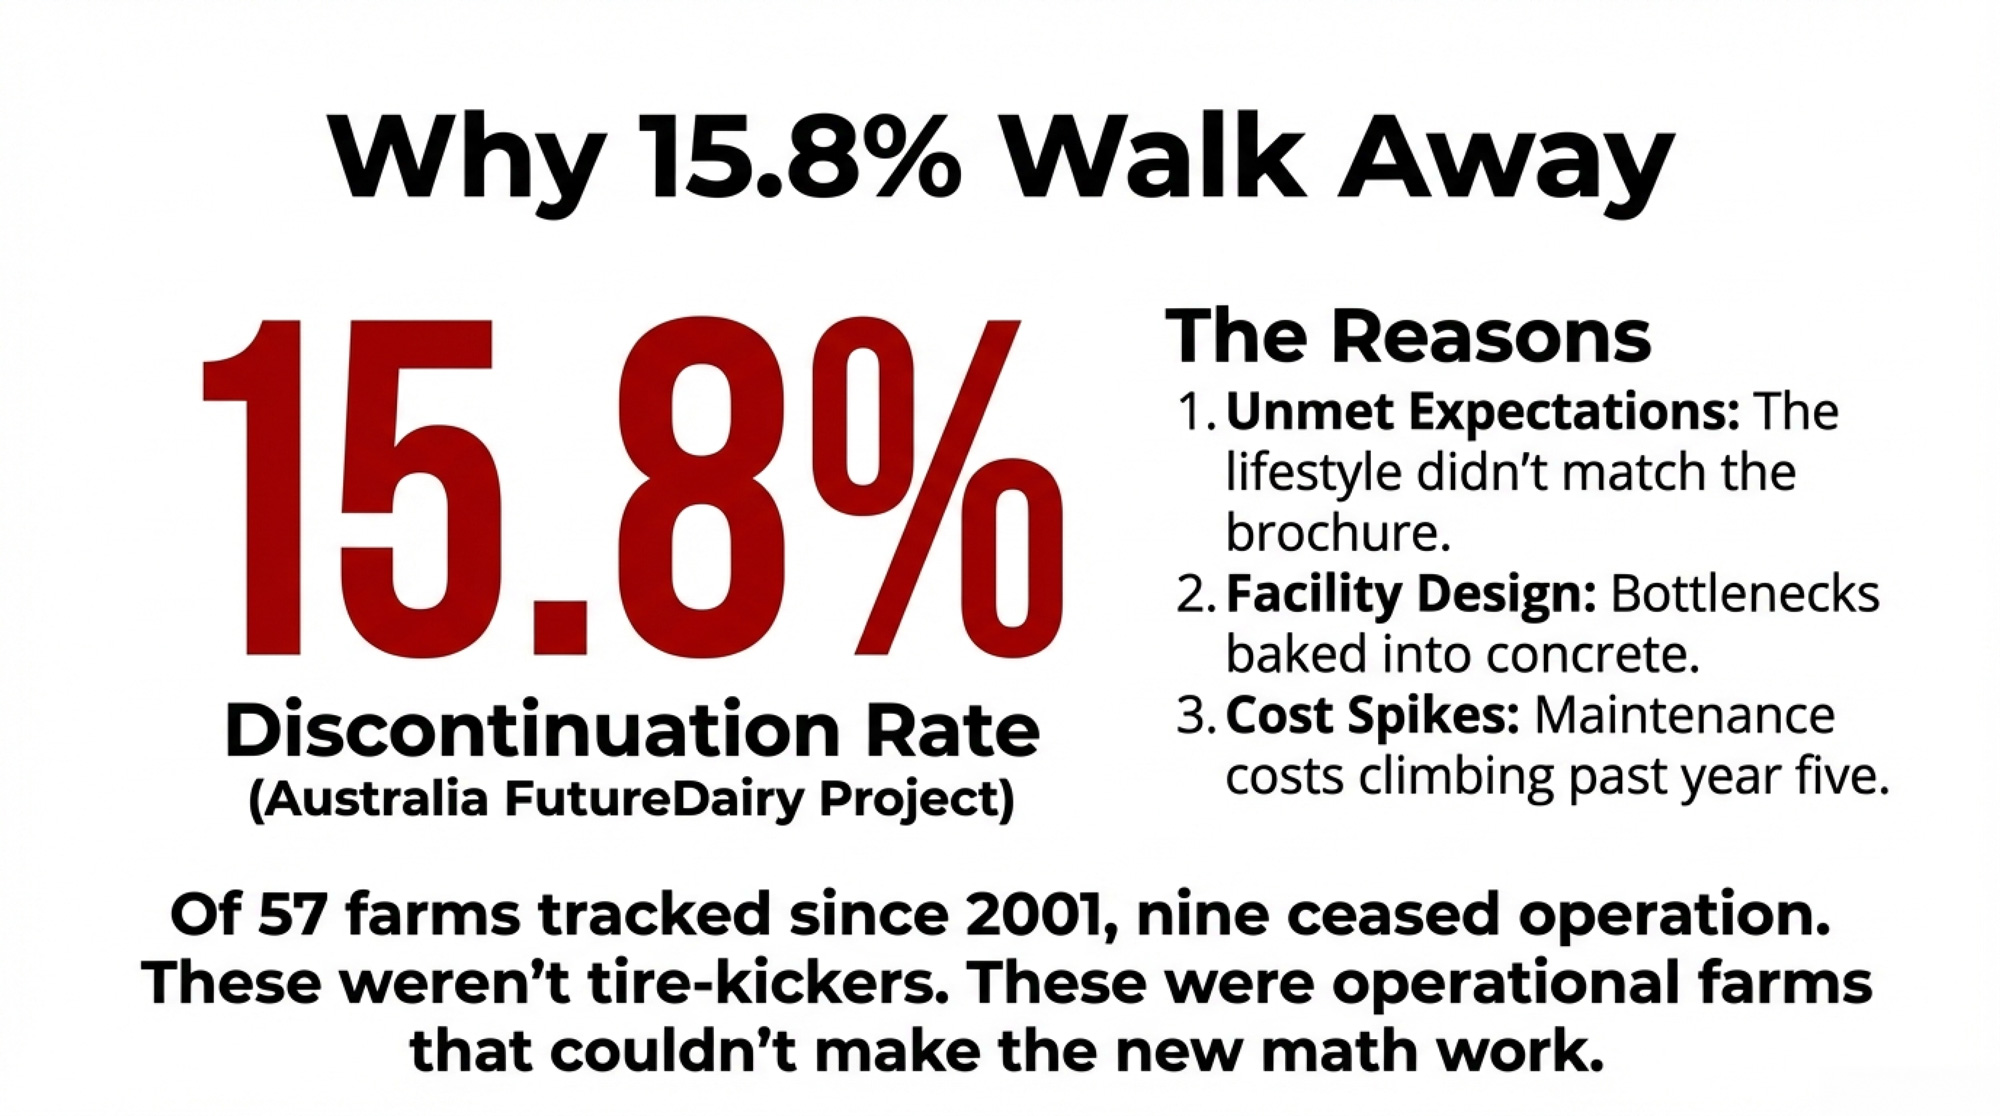
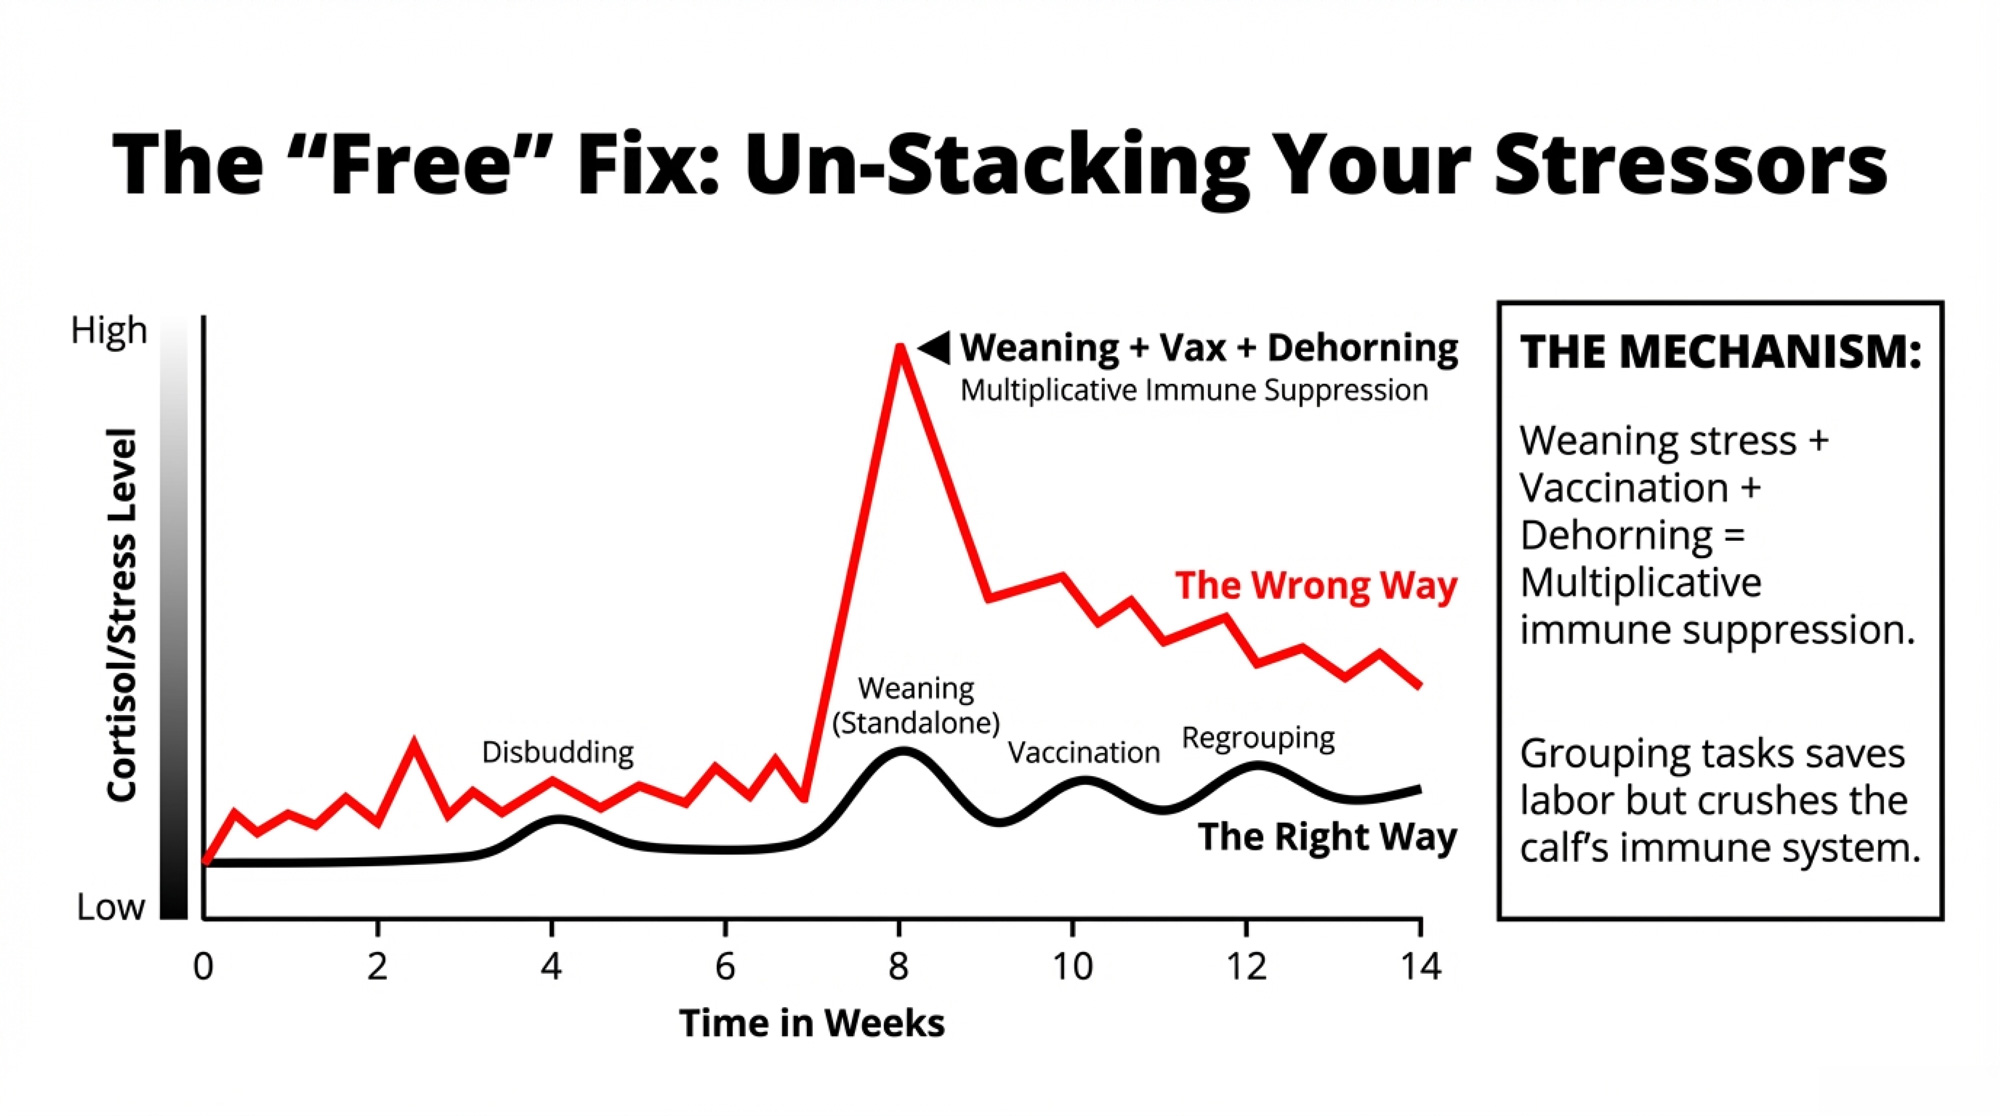
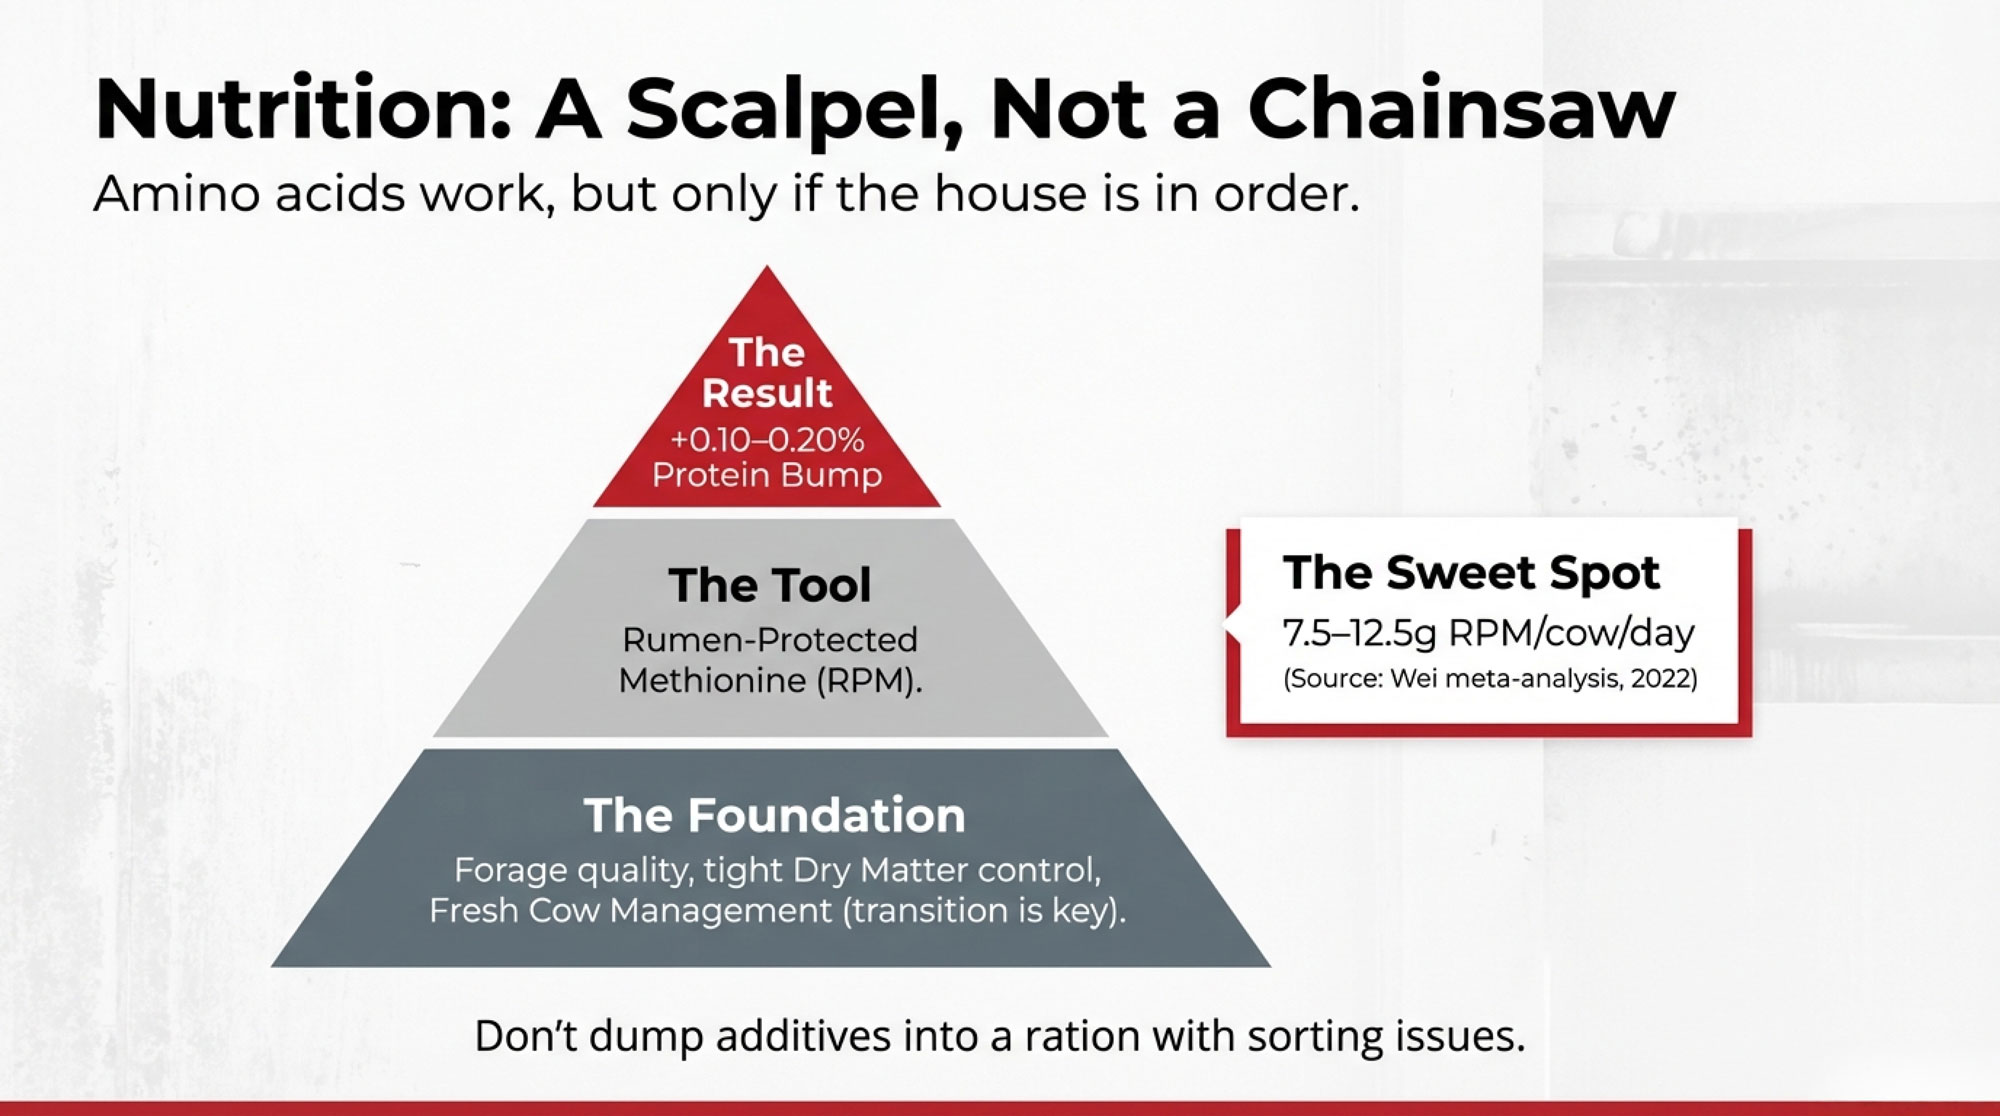
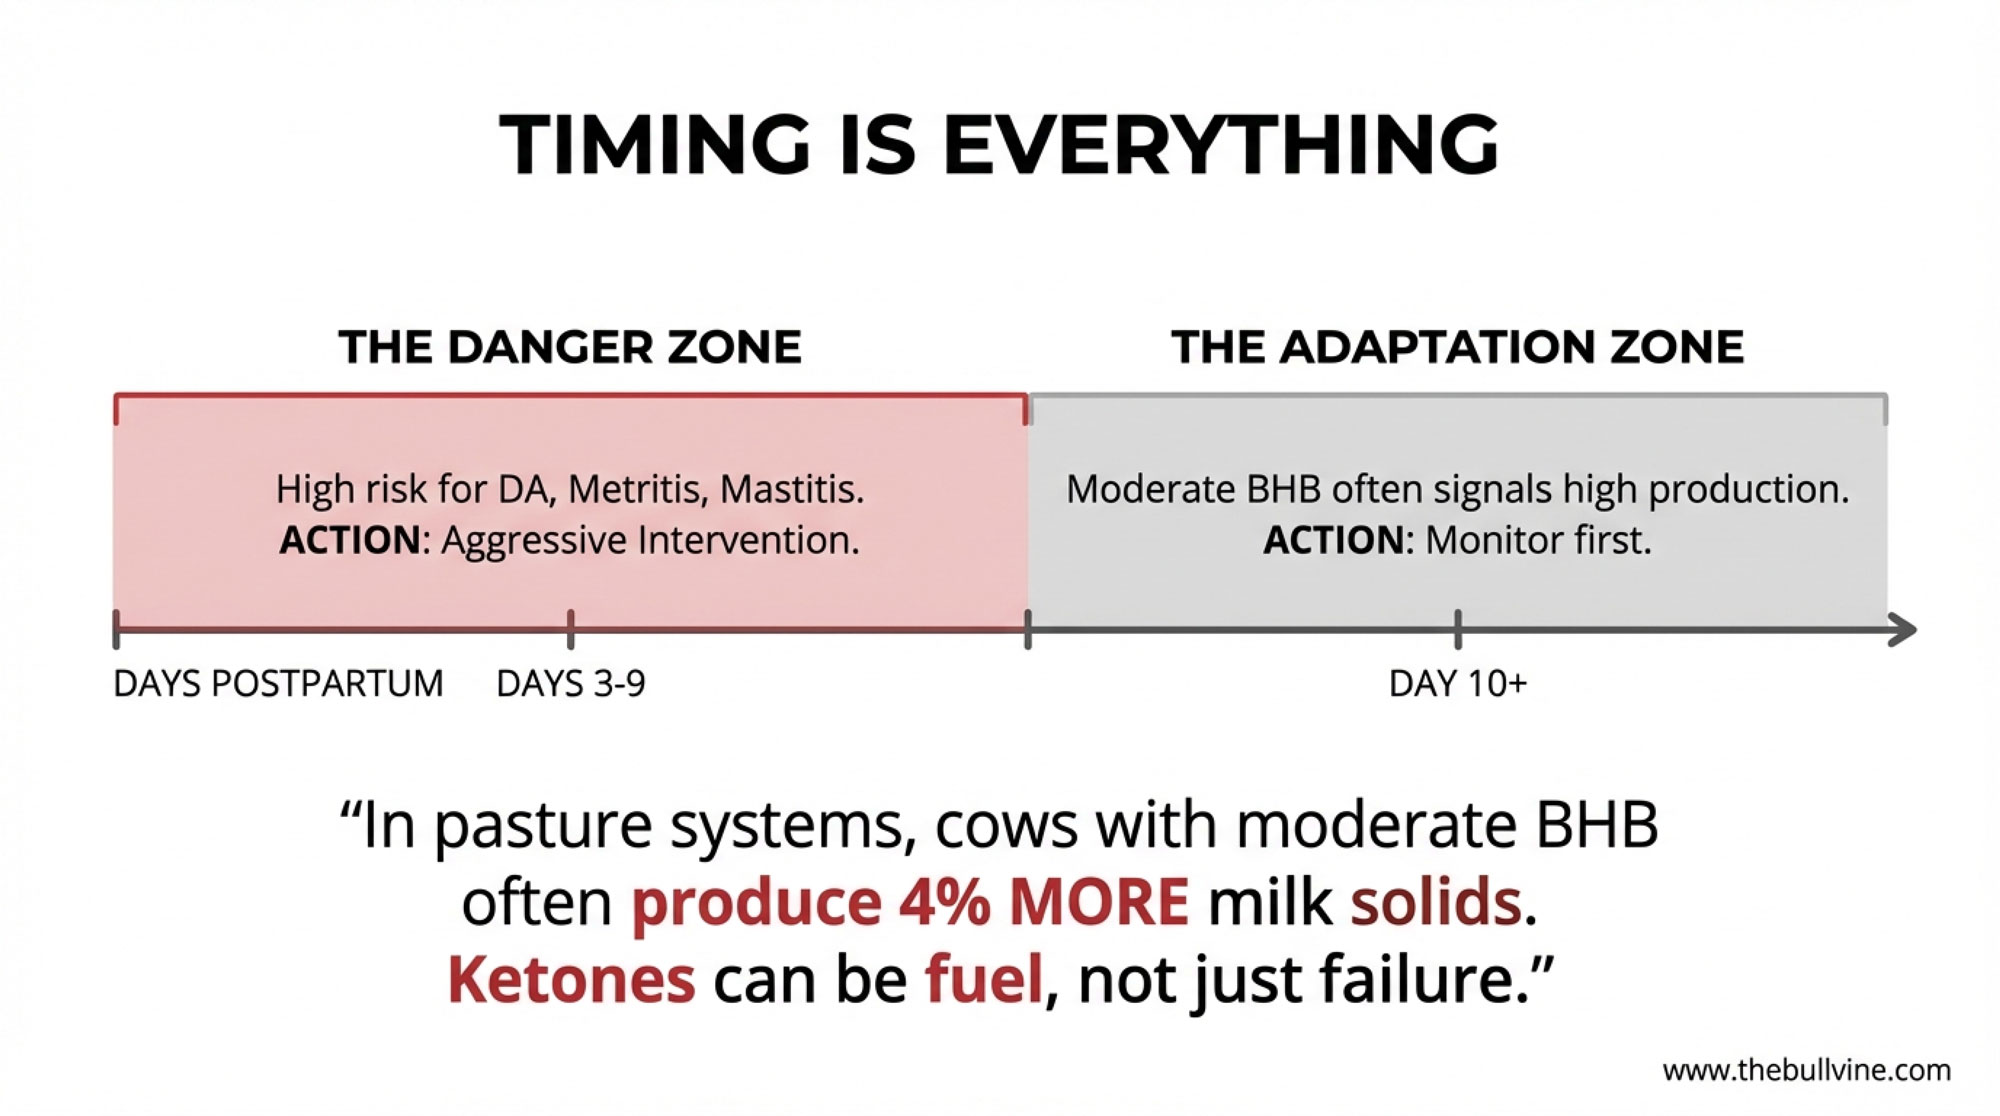
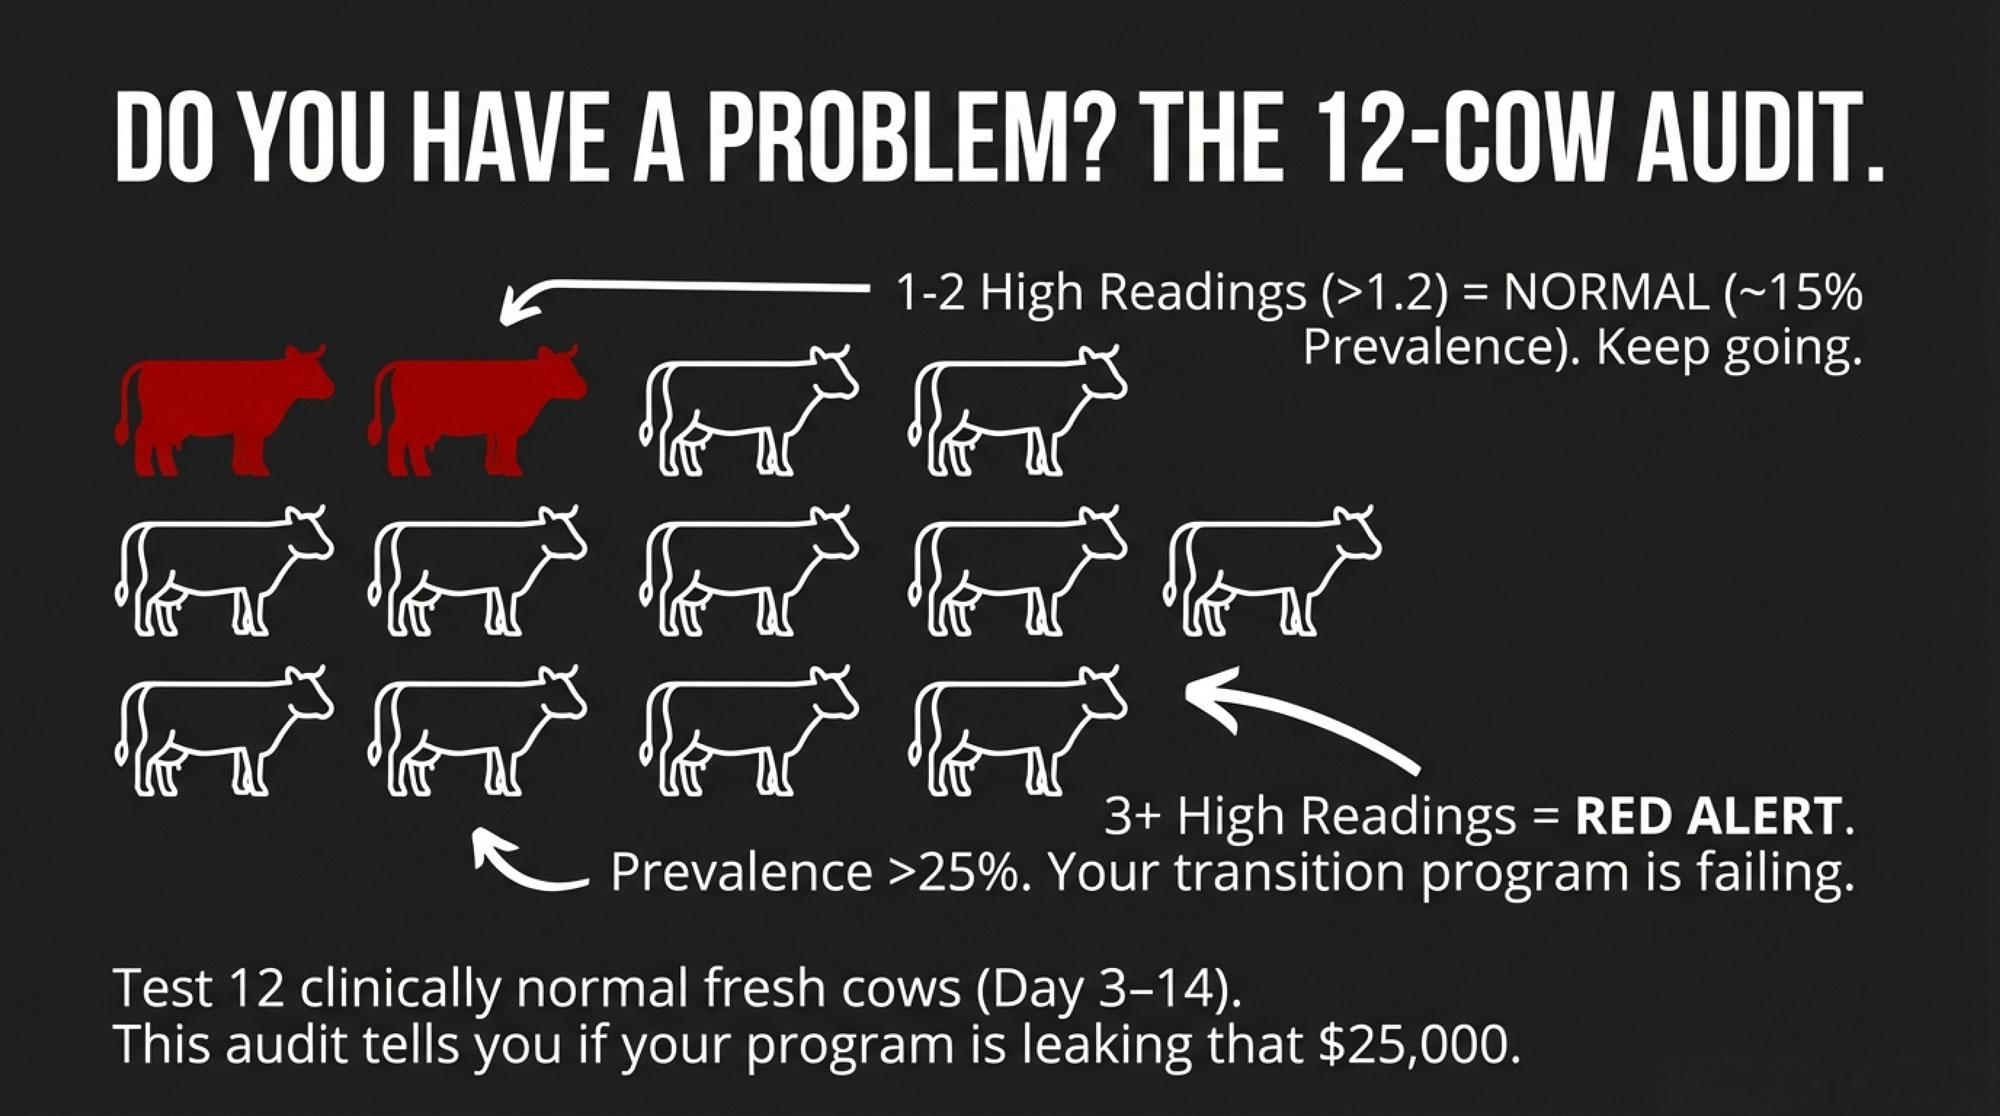
A 2024 study by Farre and colleagues — published in Veterinary Sciences by researchers from SEGES Innovation in Denmark, the University of Copenhagen, and Wageningen University — surveyed 88 Danish dairy herds with hired employees and parlor or rotary systems. They split farms into three groups: no written milking SOP, a written SOP with no structured training, and a written SOP actively used in training. The results flipped expectations. Herds with a written SOP and no training performed worse than herds with no SOP at all — BTSCC was 21,600 cells/mL higher,and new infection risk was 0.15 percentage points higher. Only herds that actually trained milkers on their SOP saw improvement: a 0.16 percentage-point drop in new infection risk.
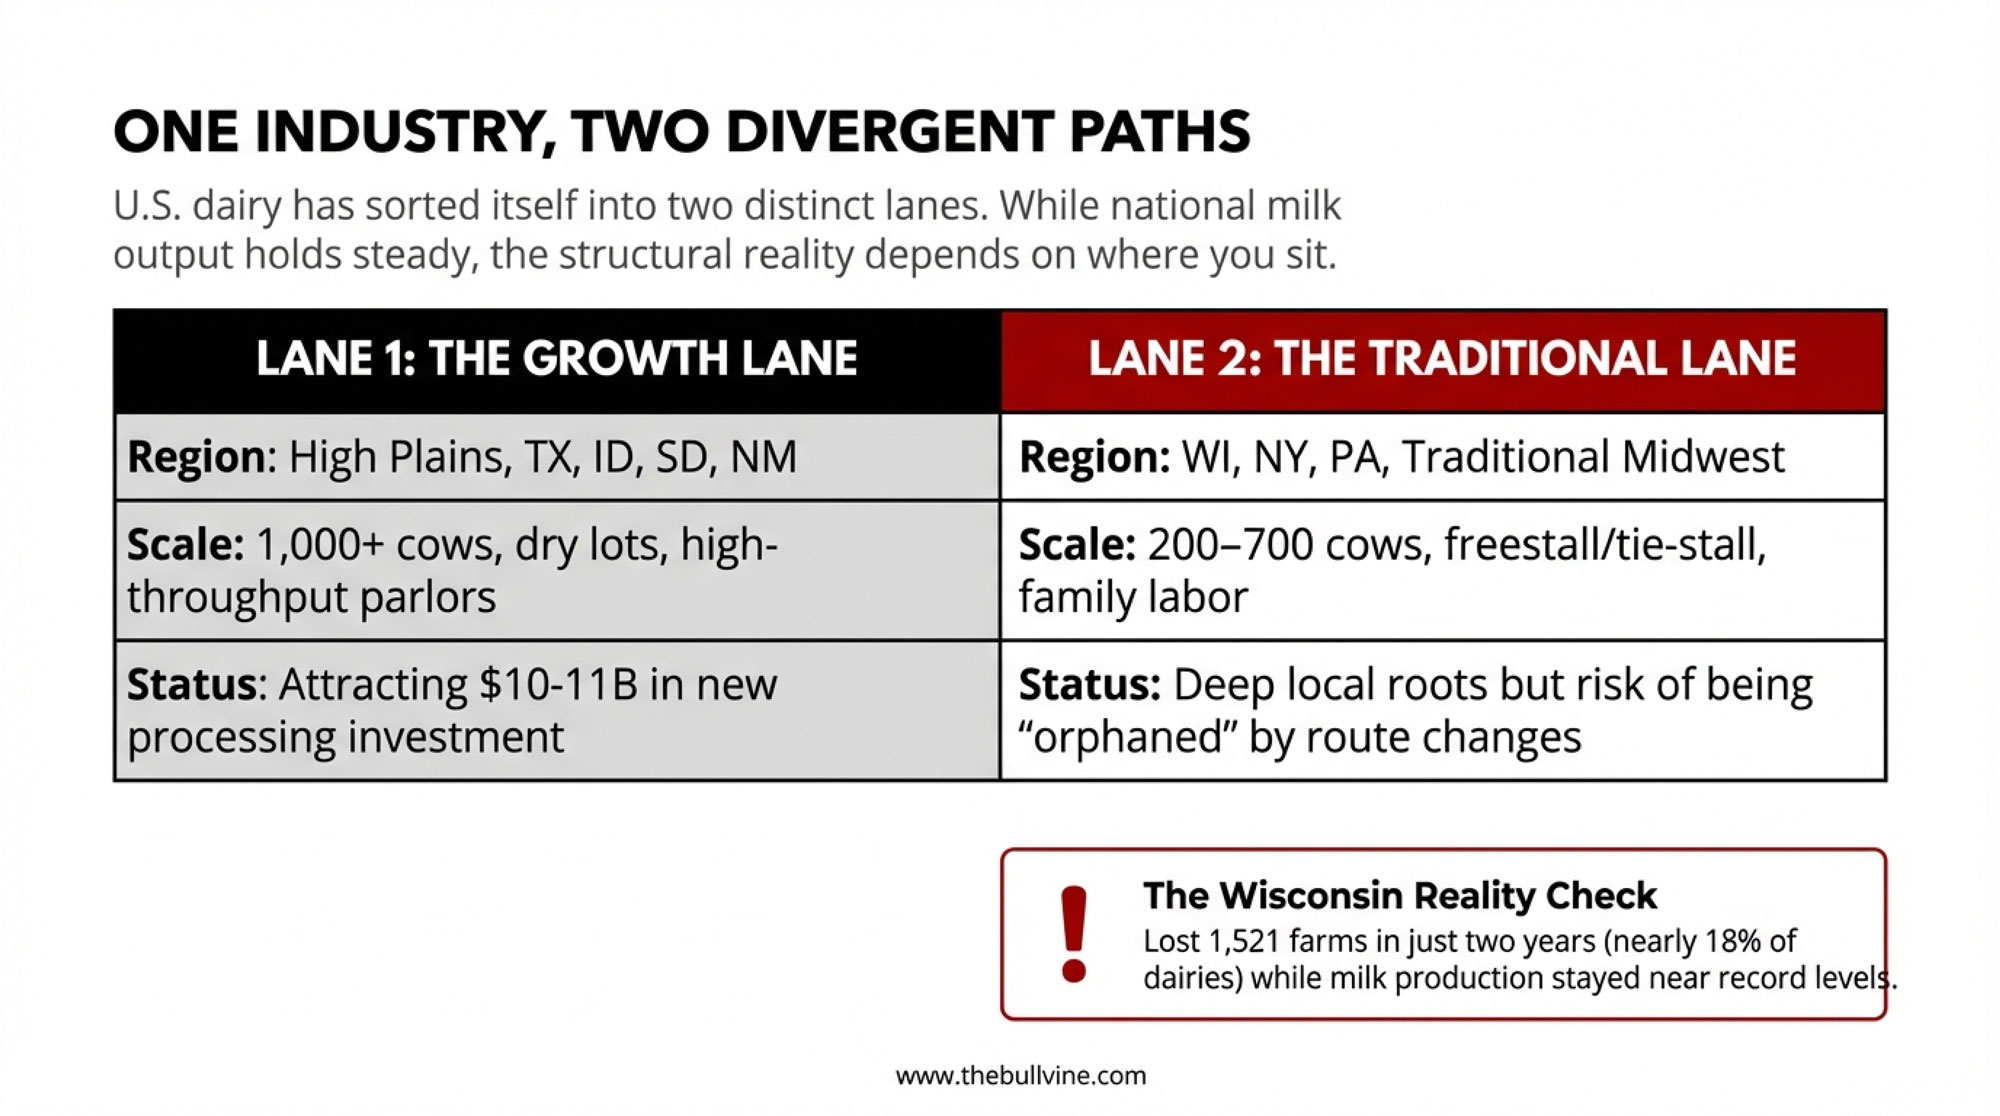
Herd Type
Bulk Tank SCC Change
New Infection Risk Change
No written SOP
Baseline
Baseline
Written SOP, No Training
+21,600 cells/mL
+0.15 percentage points
Written SOP + Active Training
Improved
−0.16 percentage points
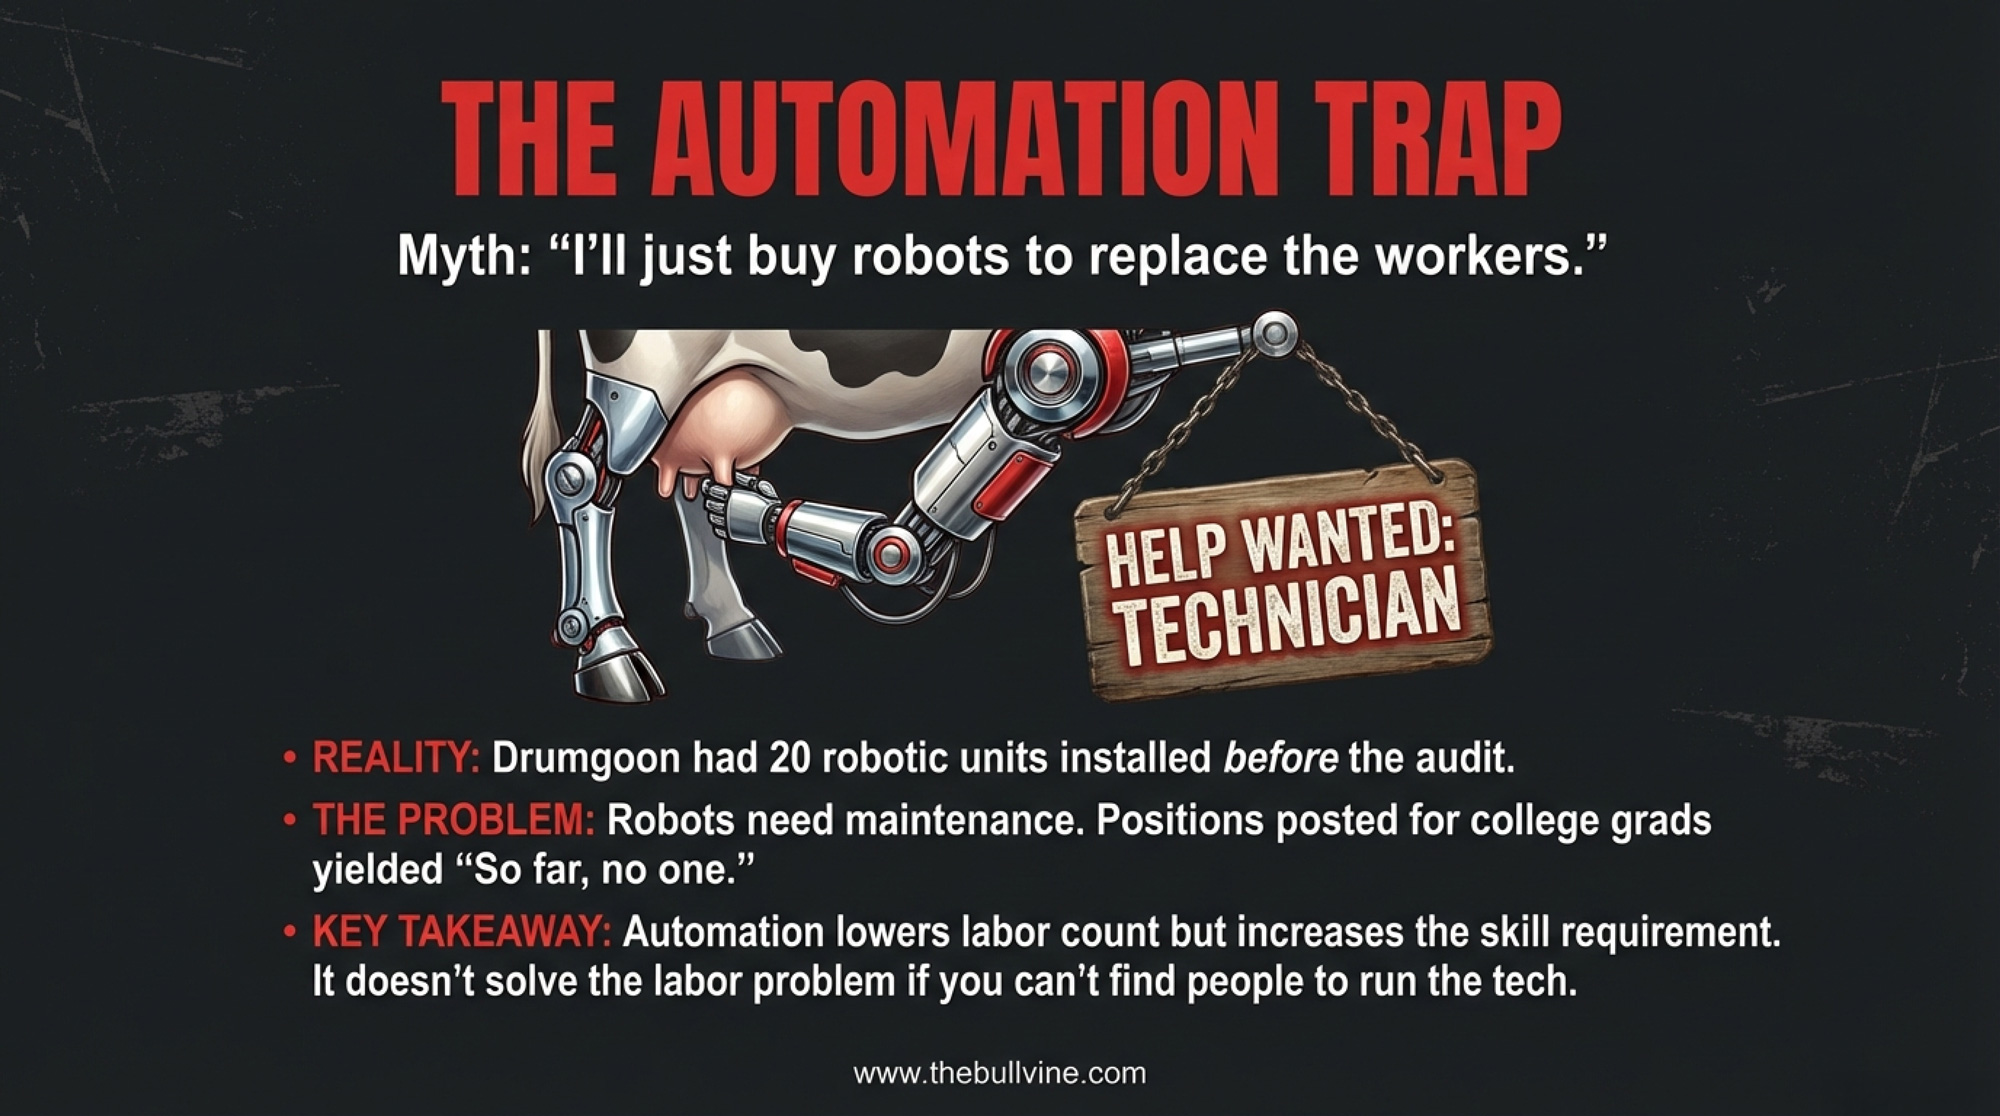
A binder in English on a farm where most of the crew speaks Spanish isn’t training. It’s wallpaper. New hires figure out within a week which rules on the wall are “real” and which ones everyone ignores. Then they follow the veteran milker, not the laminated sheet.
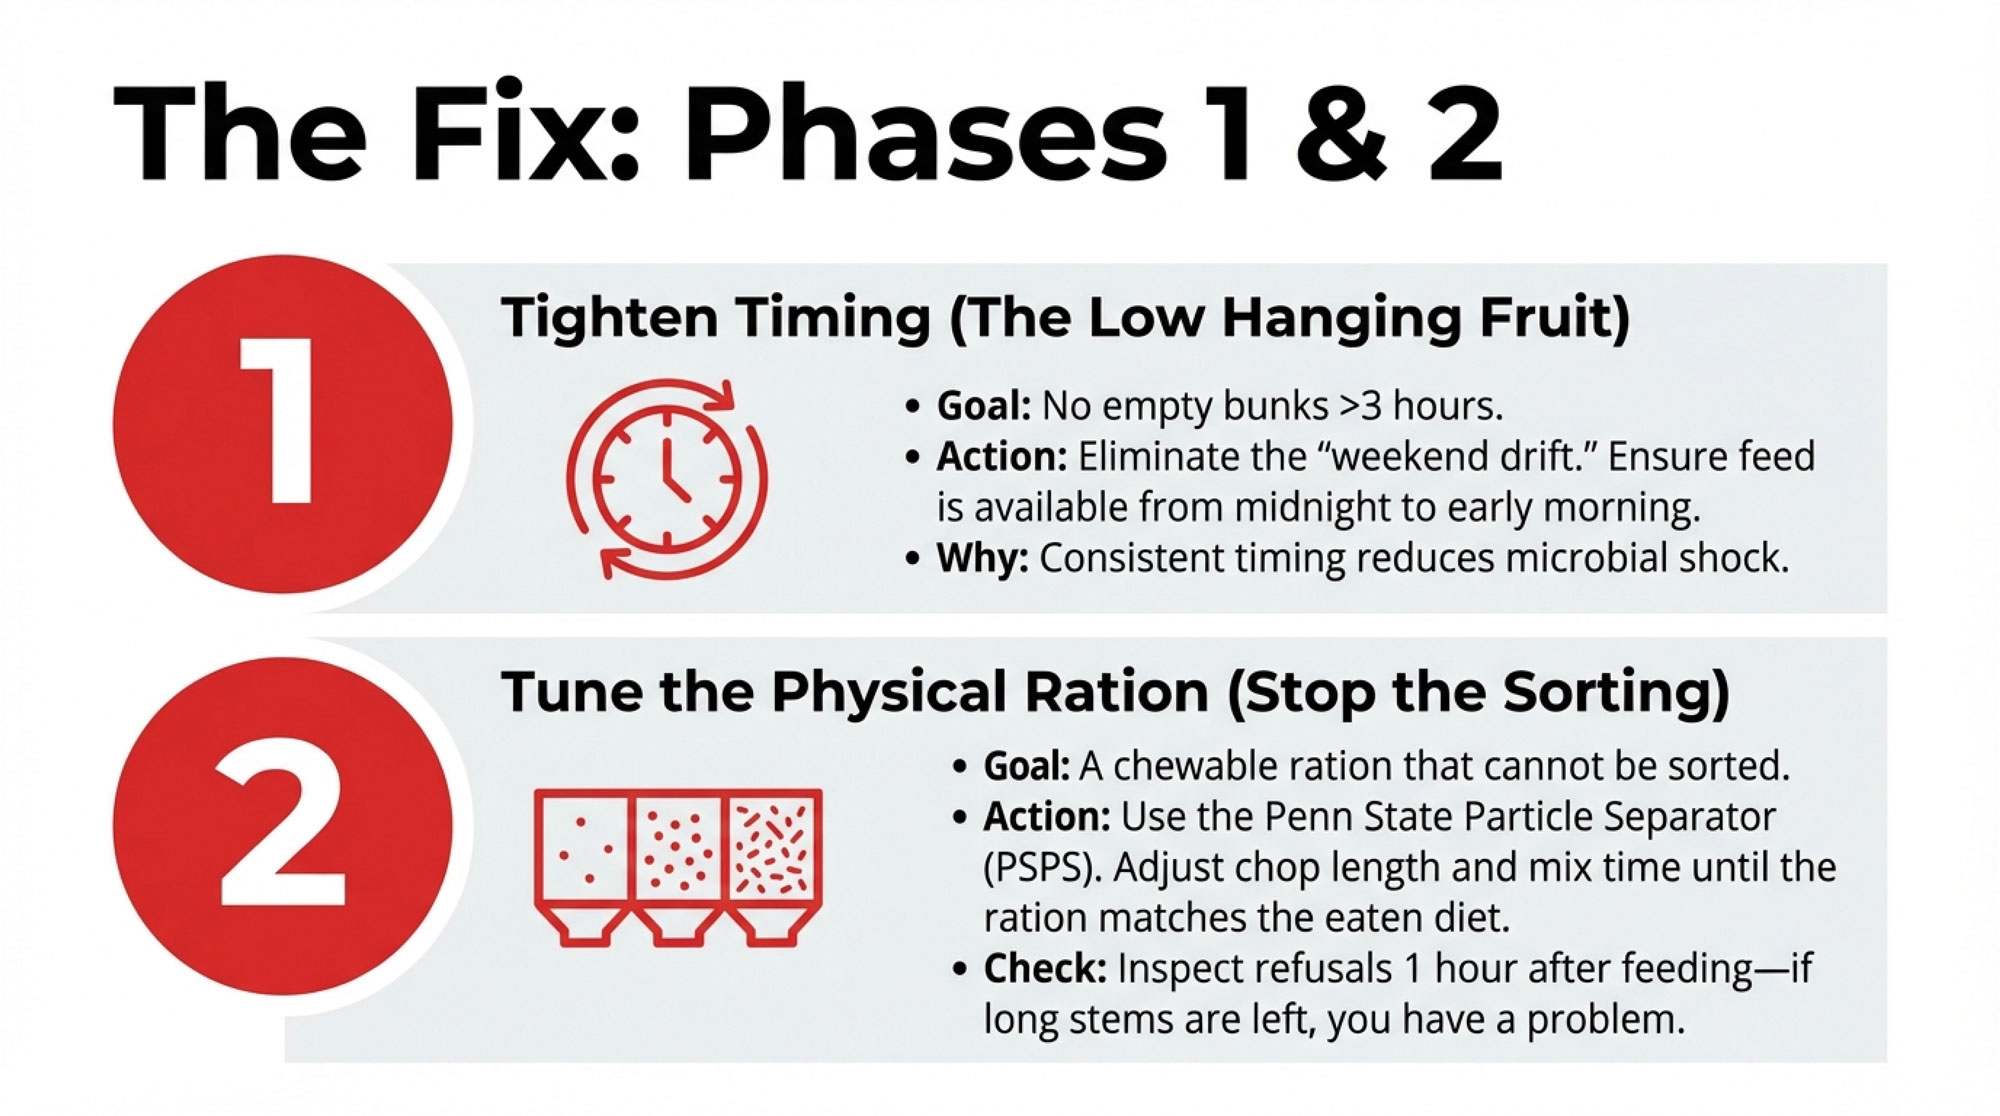
Rodriguez’s 16 herds fit that pattern. SOPs were posted. Equipment functioned. But when he timed what actually happened in the pit, 69% of milkings fell short on preparation time, and about 1 in 10 cows left the parlor without full post-dip coverage. The routine changed with the crew, not the cow.
One Session. One Day. Here’s What Moved.
Getting farms to sign up was its own challenge. “It wasn’t as easy to get study participants as I thought it would be,” Rodriguez admitted. “They all would say, ‘We just don’t have time'”. Owners came around once they learned the training would only take about an hour.
Each farm got one structured training session — bilingual, practical, and built around explaining the biology behind each step of that farm’s milking routine. Rodriguez used the National Mastitis Council’s free online resources to draft a curriculum focused on mastitis identification, risk factors, and proper milking procedures. During the pre-assessment, researchers captured photographs of the parlor being worked on — this helped participants visualize their own farm and better relate to the concepts. Workers and managers reviewed the parlor evaluation together and agreed on adjustments based on Rodriguez’s observations during his first visit.
The crews responded. Employees rated the training 4.5 out of 5 for practical use on their farm. Most were milking technicians (61.1%), and 70% had been on the job for less than 1 year, with a median tenure of just 9 months. “We can’t expect employees to come in with this knowledge,” Rodriguez said. These weren’t lifers. They were the people you’re usually hoping will just “pick it up” from watching.
One practical lesson surfaced everywhere. “Confusion around how to handle abnormal milk was one question that bubbled to the surface on every farm enrolled,” Rodriguez reported. “It is critical that owners or parlor management are present at the training to answer questions just like these that are a bit subjective and vary from farm to farm”.
On the follow-up visit, Rodriguez ran the same checks again:
Metric
Before
After
Change
Knowledge quiz score
49.3%
67.6%
+18.3 points
Milkings with inadequate prep
69%
48%
−21 points
Insufficient post-dip coverage
9.8%
5.9%
−3.9 points
Pre-dip contact time
Below target
+9 sec/cow
Toward 30s target
Proper lag time (60–120 sec)
Baseline
+20% compliance
Improved
Milking time per cow
Baseline
−25 to −43 sec
Fewer re-attachments
One thing caught attention: clinical mastitis cases went up after training. Sounds like bad news — until you think about forestripping. Once milkers actually started stripping out and looking, they caught abnormal milk that had been going straight into the tank.
Two Farms That Actually Ran the Numbers
Before you dig into per-cow math, it helps to see what actual farms saw when they swapped “watch and learn” for real training.
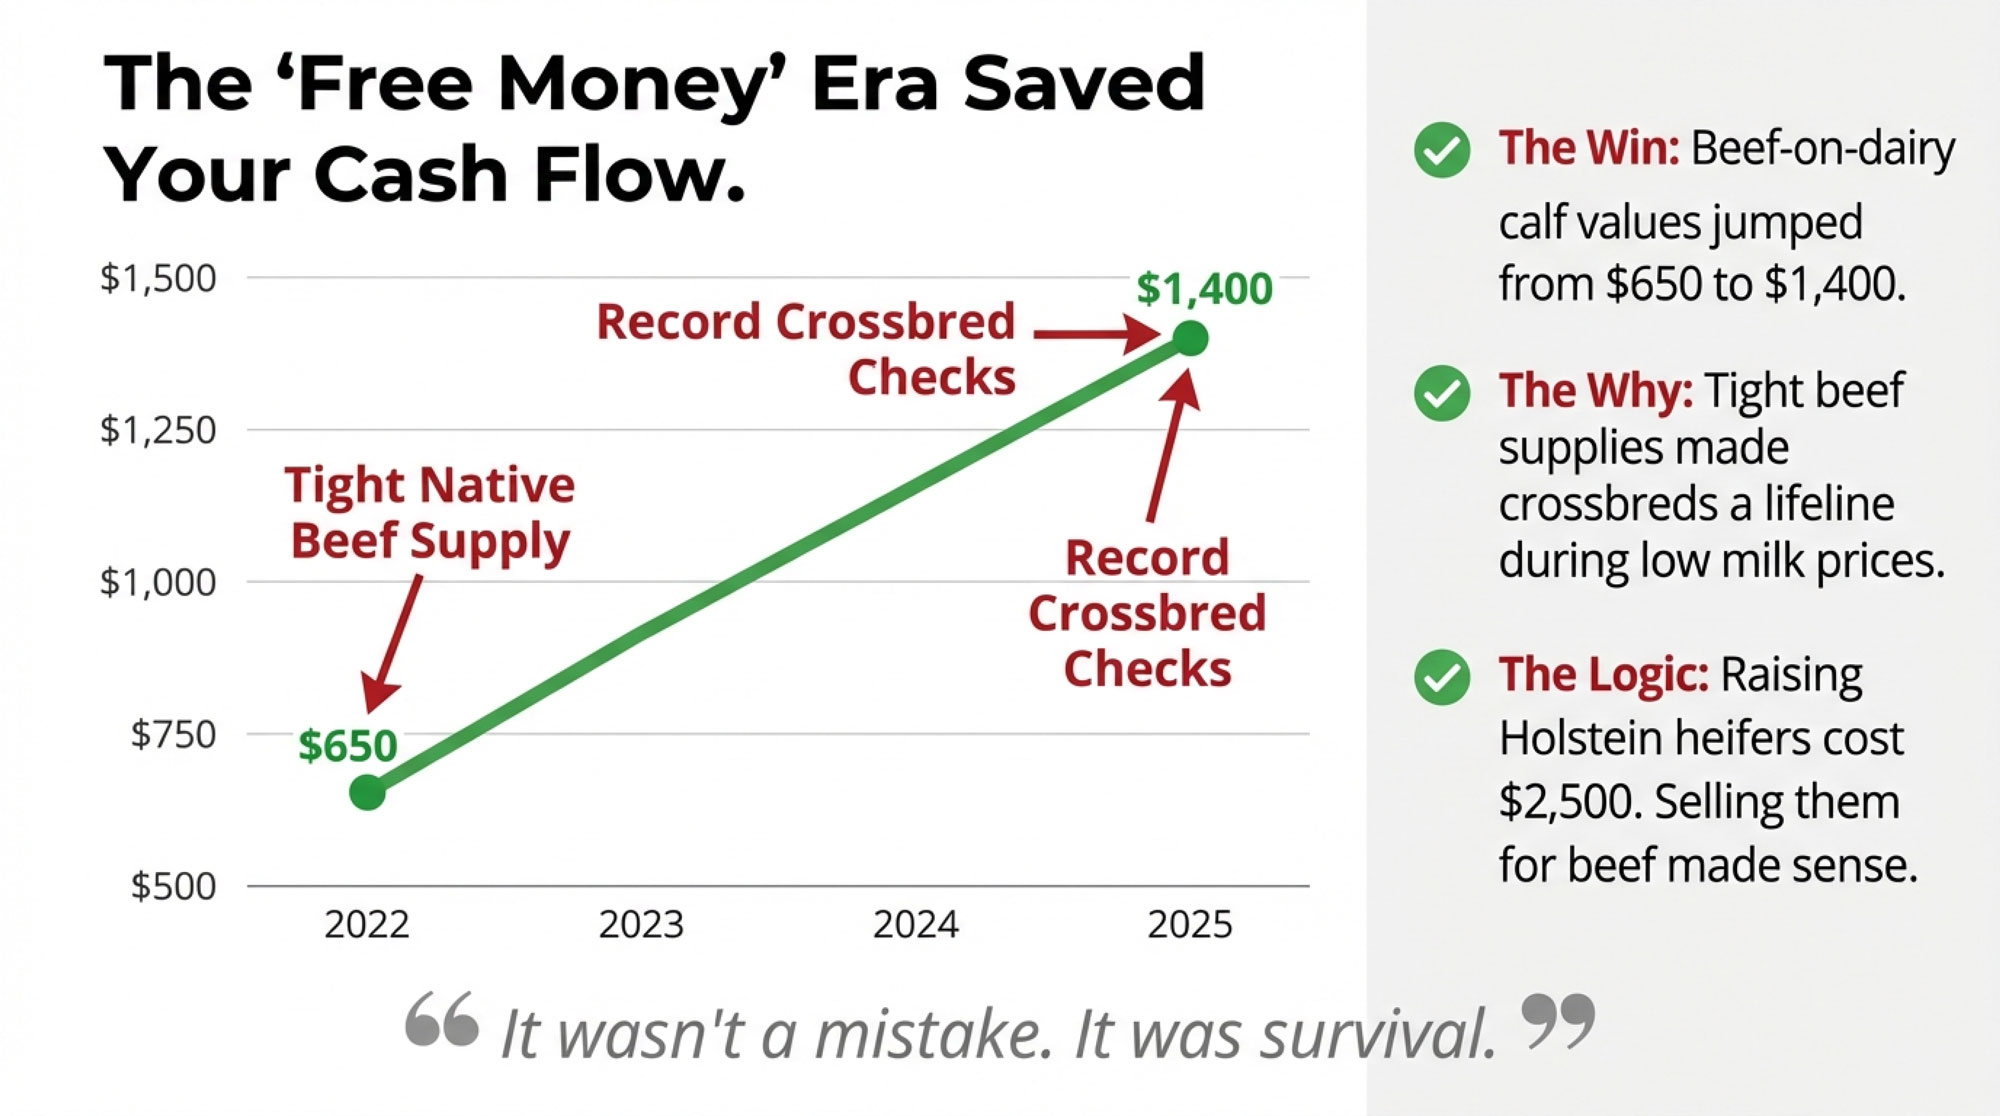
In 2022, an 850-cow Wisconsin dairy invested $12,500 in a bilingual training overhaul — agricultural Spanish classes for management, bilingual signage and SOPs, and monthly bilingual safety meetings with a professional translator.
Metric
Result
SCC
245,000 → 175,000
Employee turnover
Down 64%
Workplace injuries
Down 47%
Production
Up 3.2 lb/cow/day
First-year return
~$78,000 (524% ROI on $12,500)
A second Midwest dairy worked with a Hispanic employee training service. Over nine months, SCC dropped from 325,000–350,000 into the sub-200,000 range. Employee turnover fell from one to two departures a month down to one departure in six months on a 20-person crew.
Farm
Investment
First-Year Return
SCC Change
Turnover Change
Wisconsin 850-Cow
$12,500
$78,000 (524% ROI)
245K → 175K
Down 64%
Midwest Dairy
Not disclosed
Not disclosed
325K → <200K
2/month → 1/6 months
Neither farm saw a magic overnight turnaround. But once milkers understood why they were doing what they’d always been told to do, protocol drift slowed. And the numbers moved.
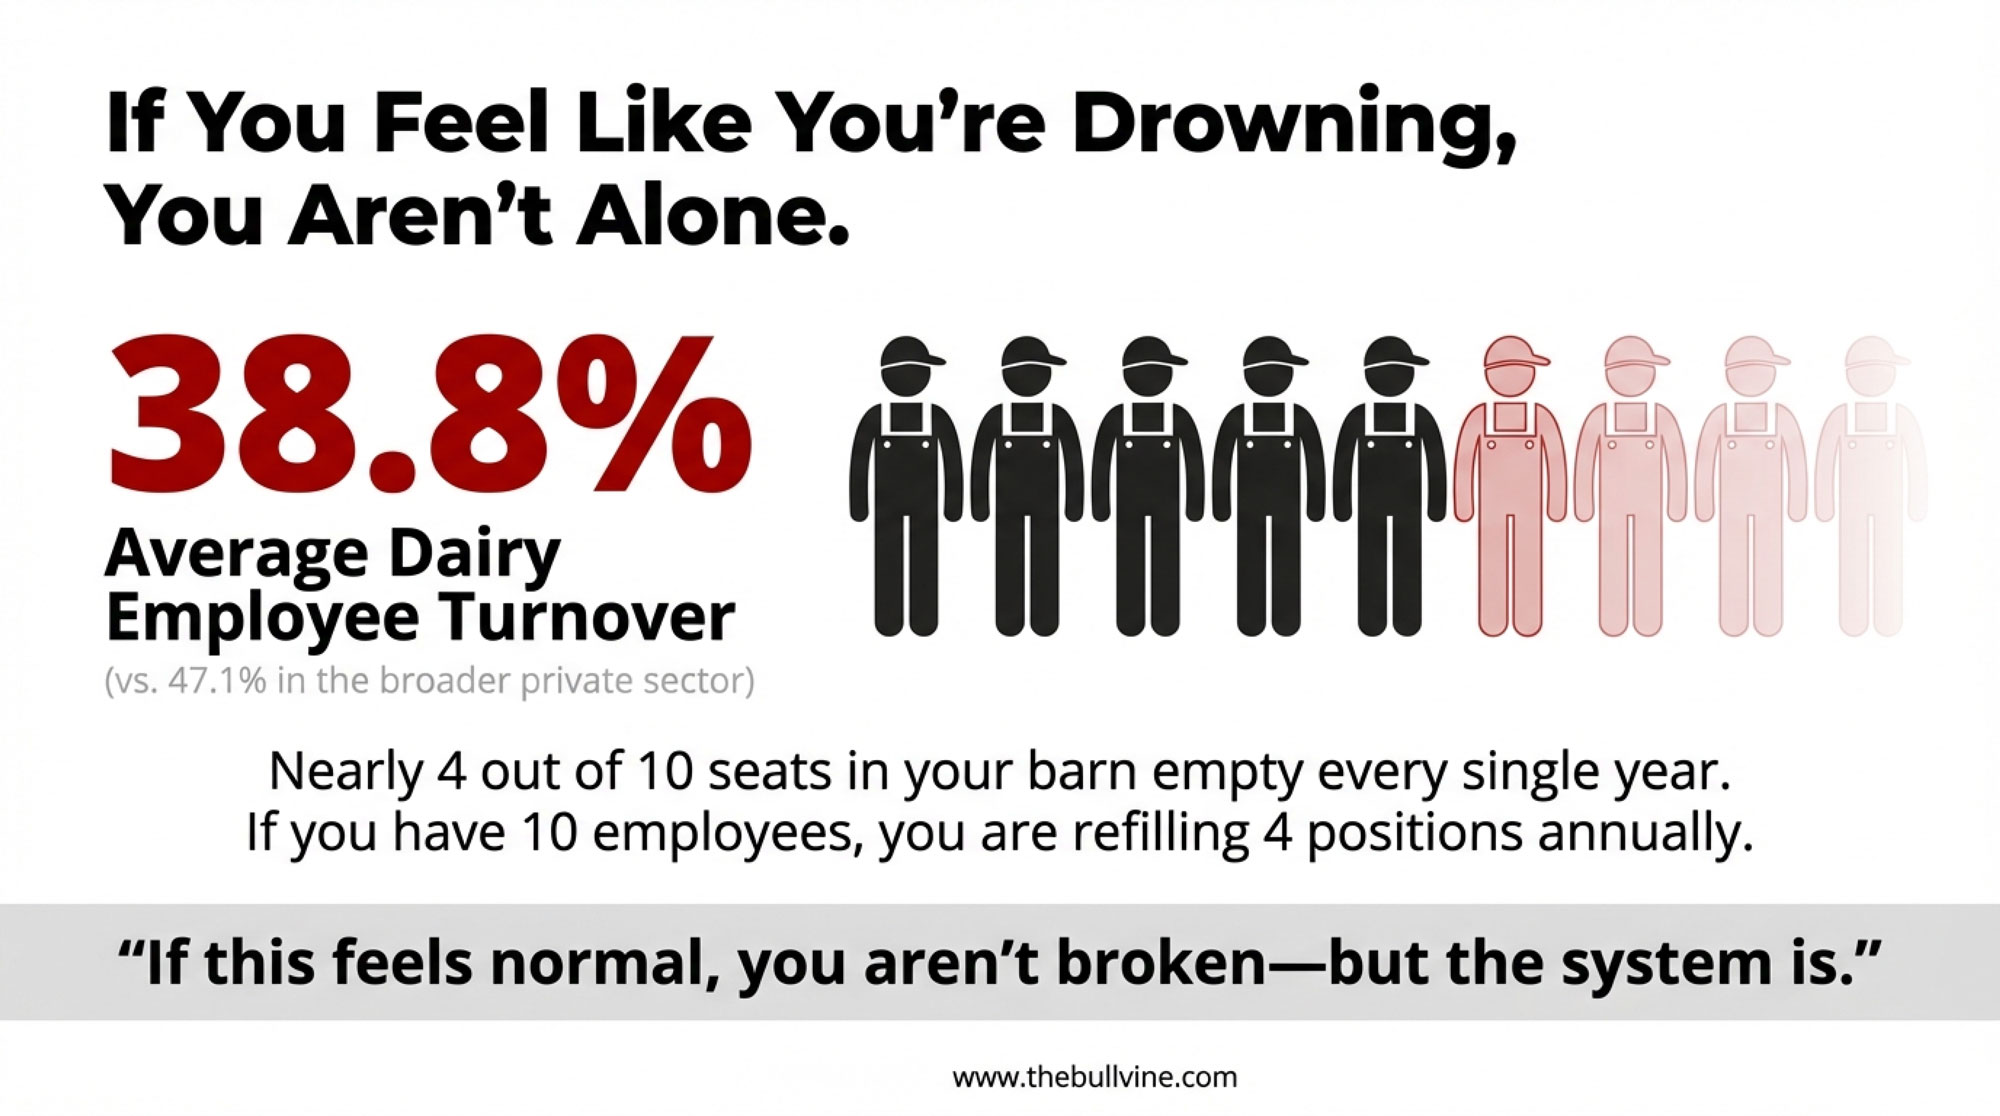
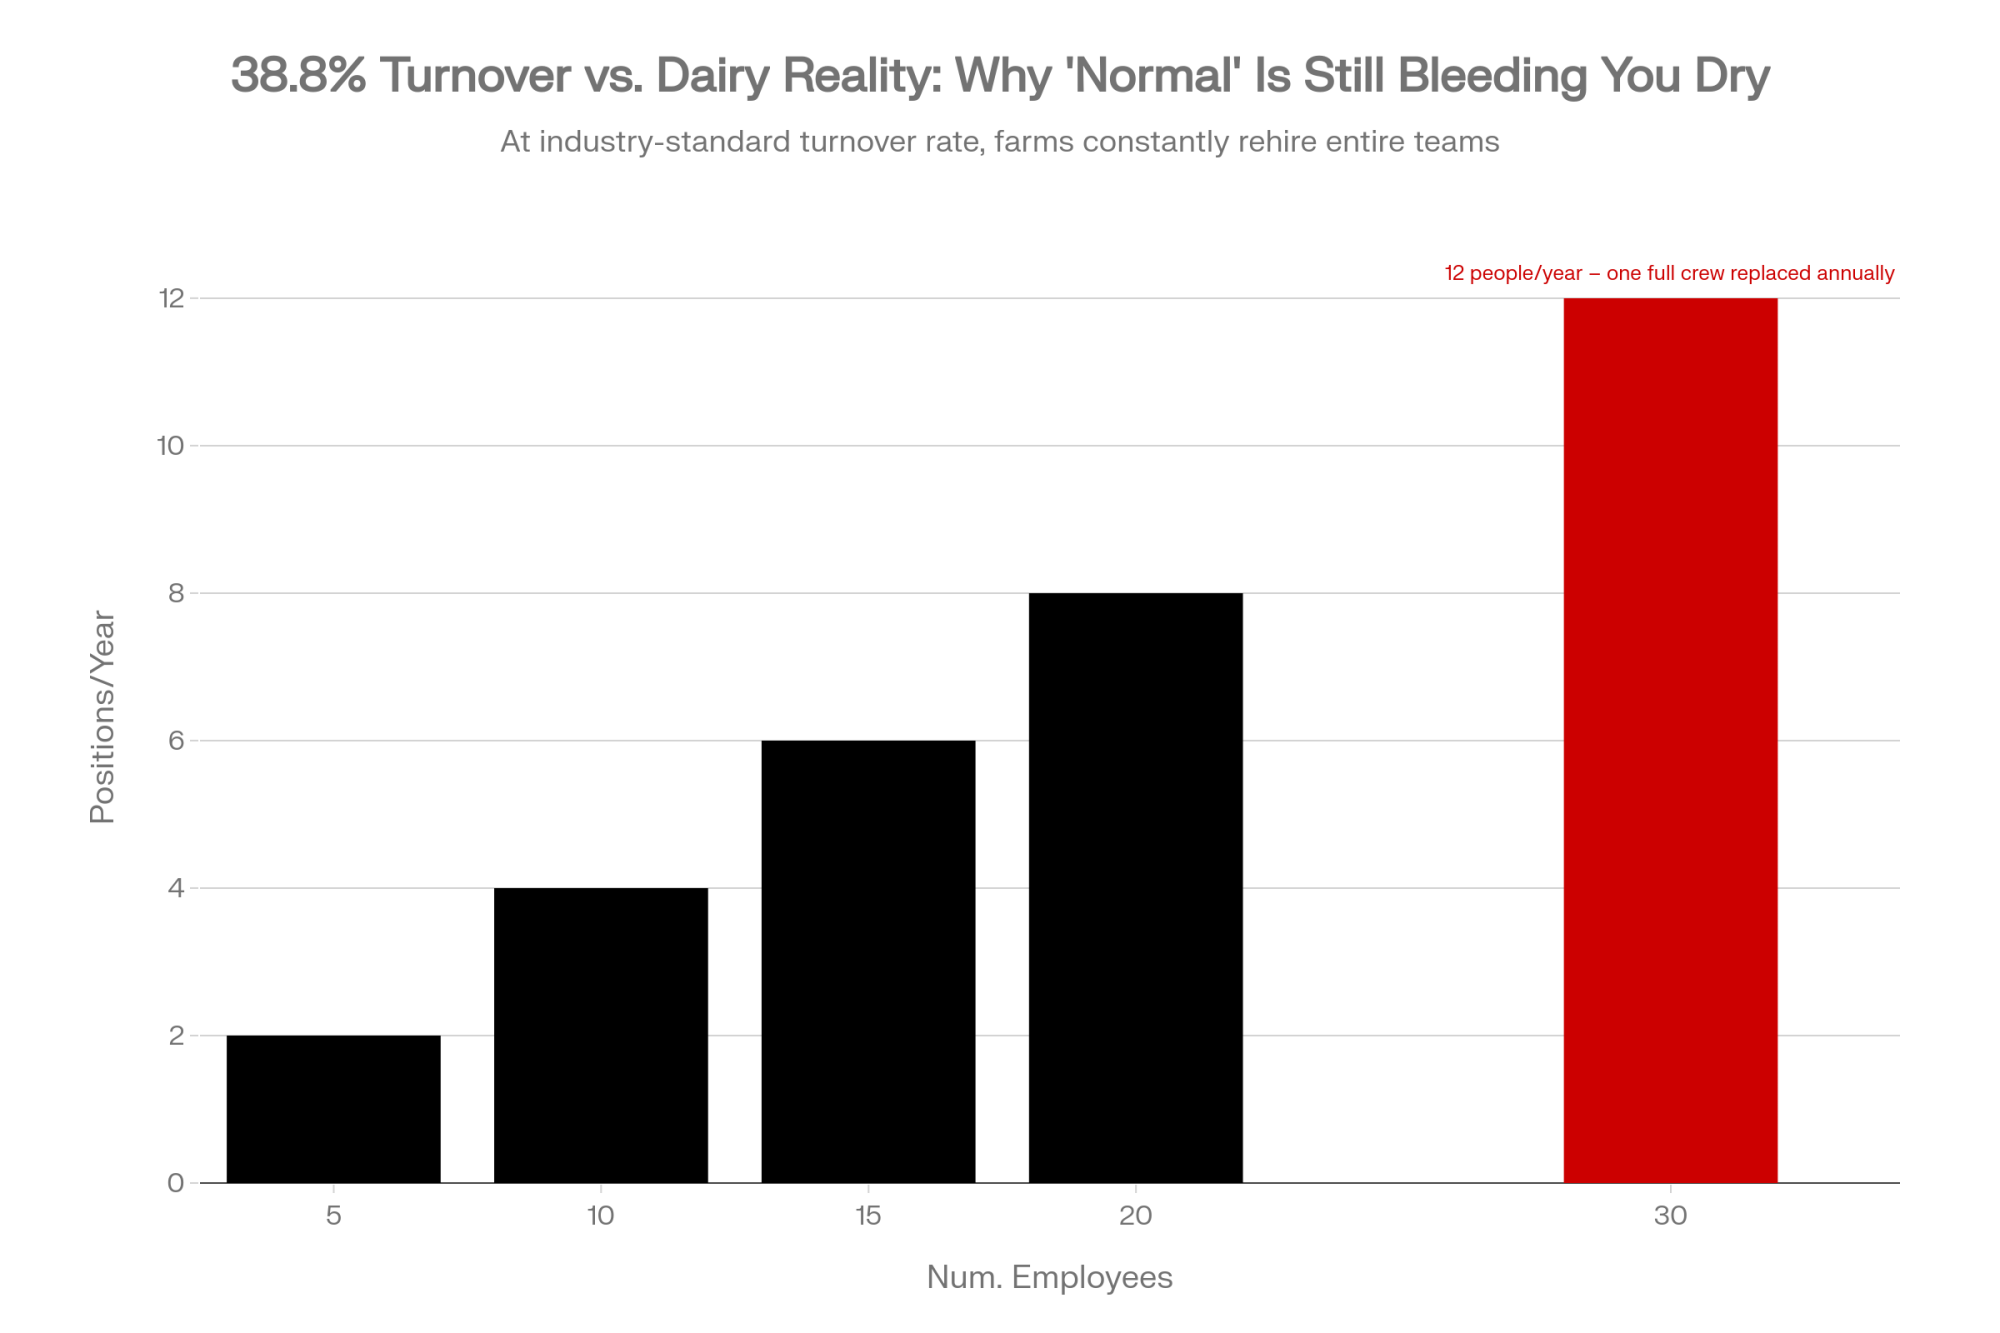
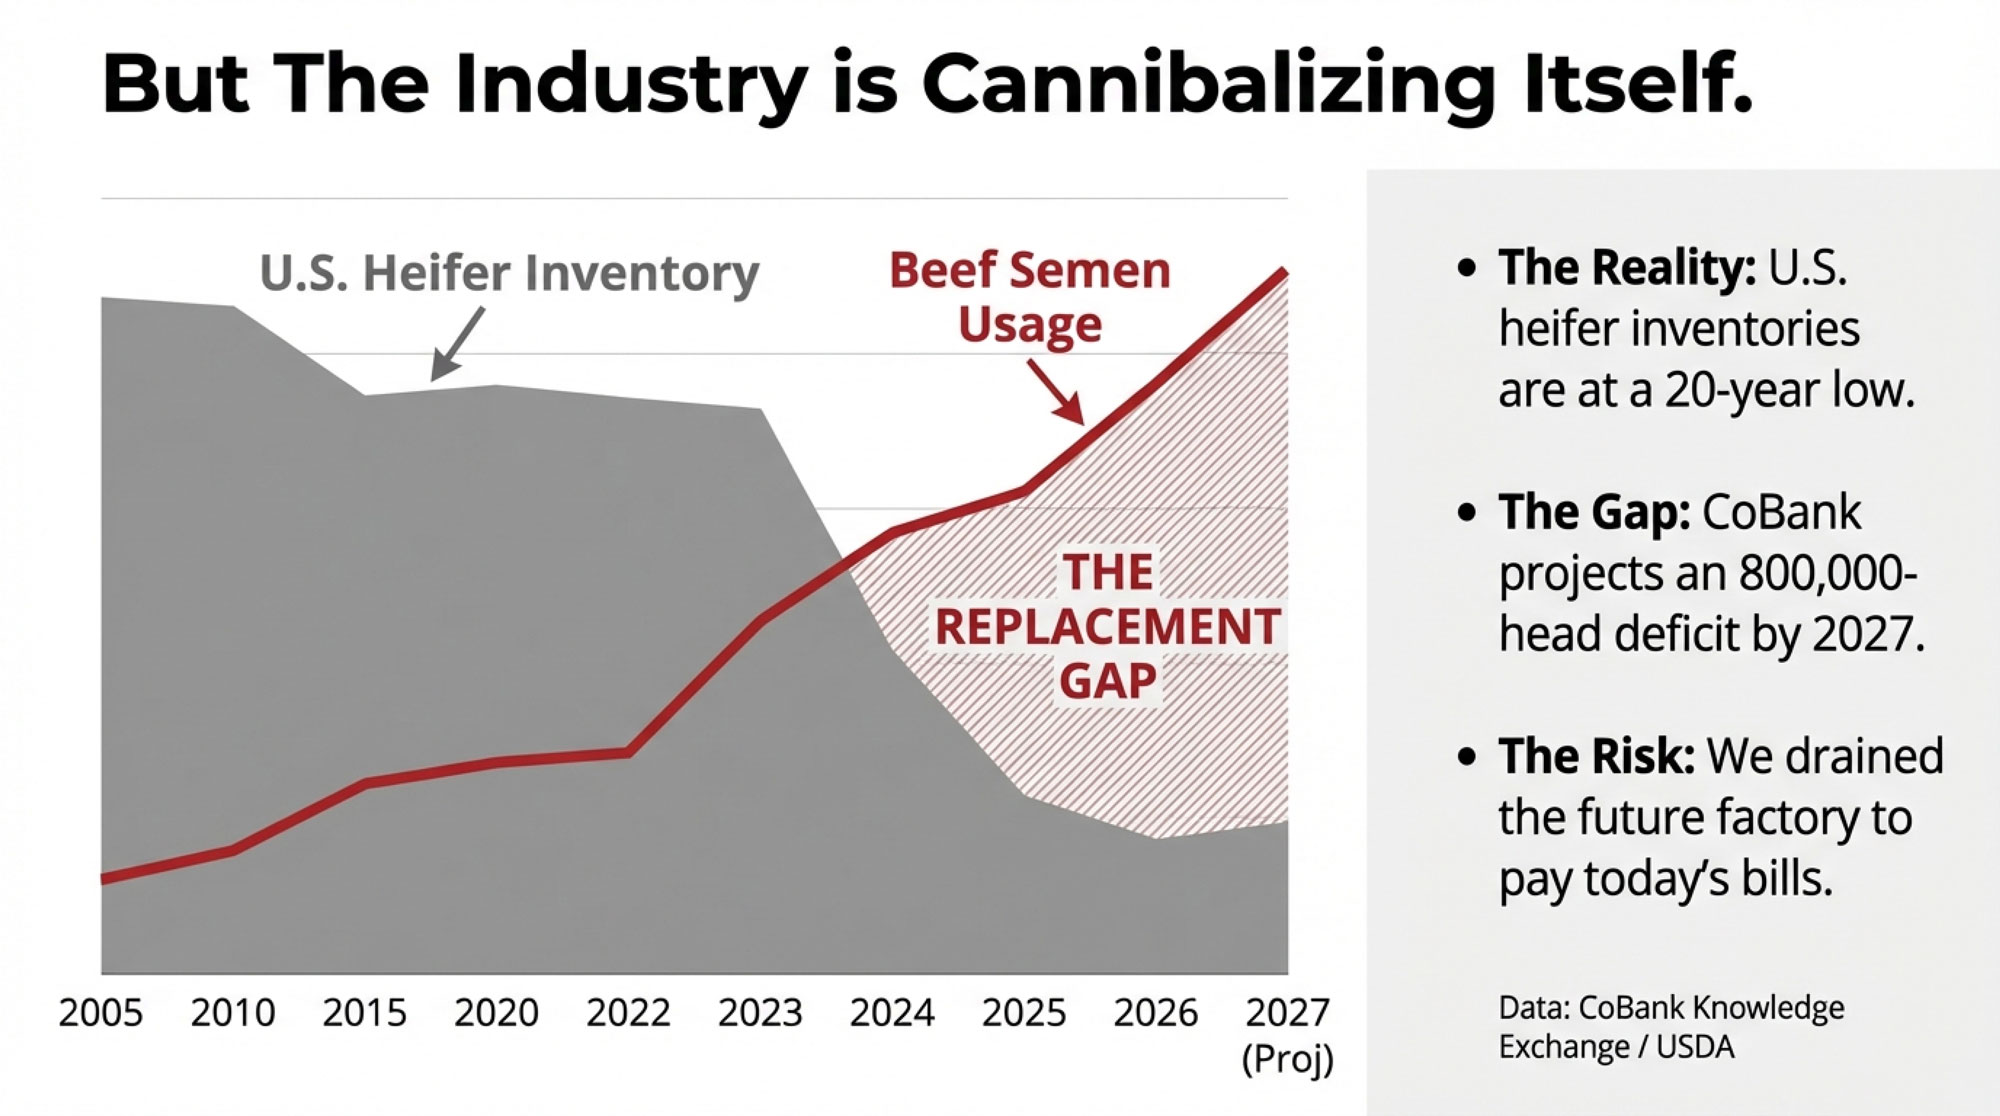
Here’s the part that makes training a rolling cost, not a one-time fix. Nationally, dairy operations turn over 38.8% of their workforce every year. Nearly 4 out of 10 parlor positions are refilled annually.
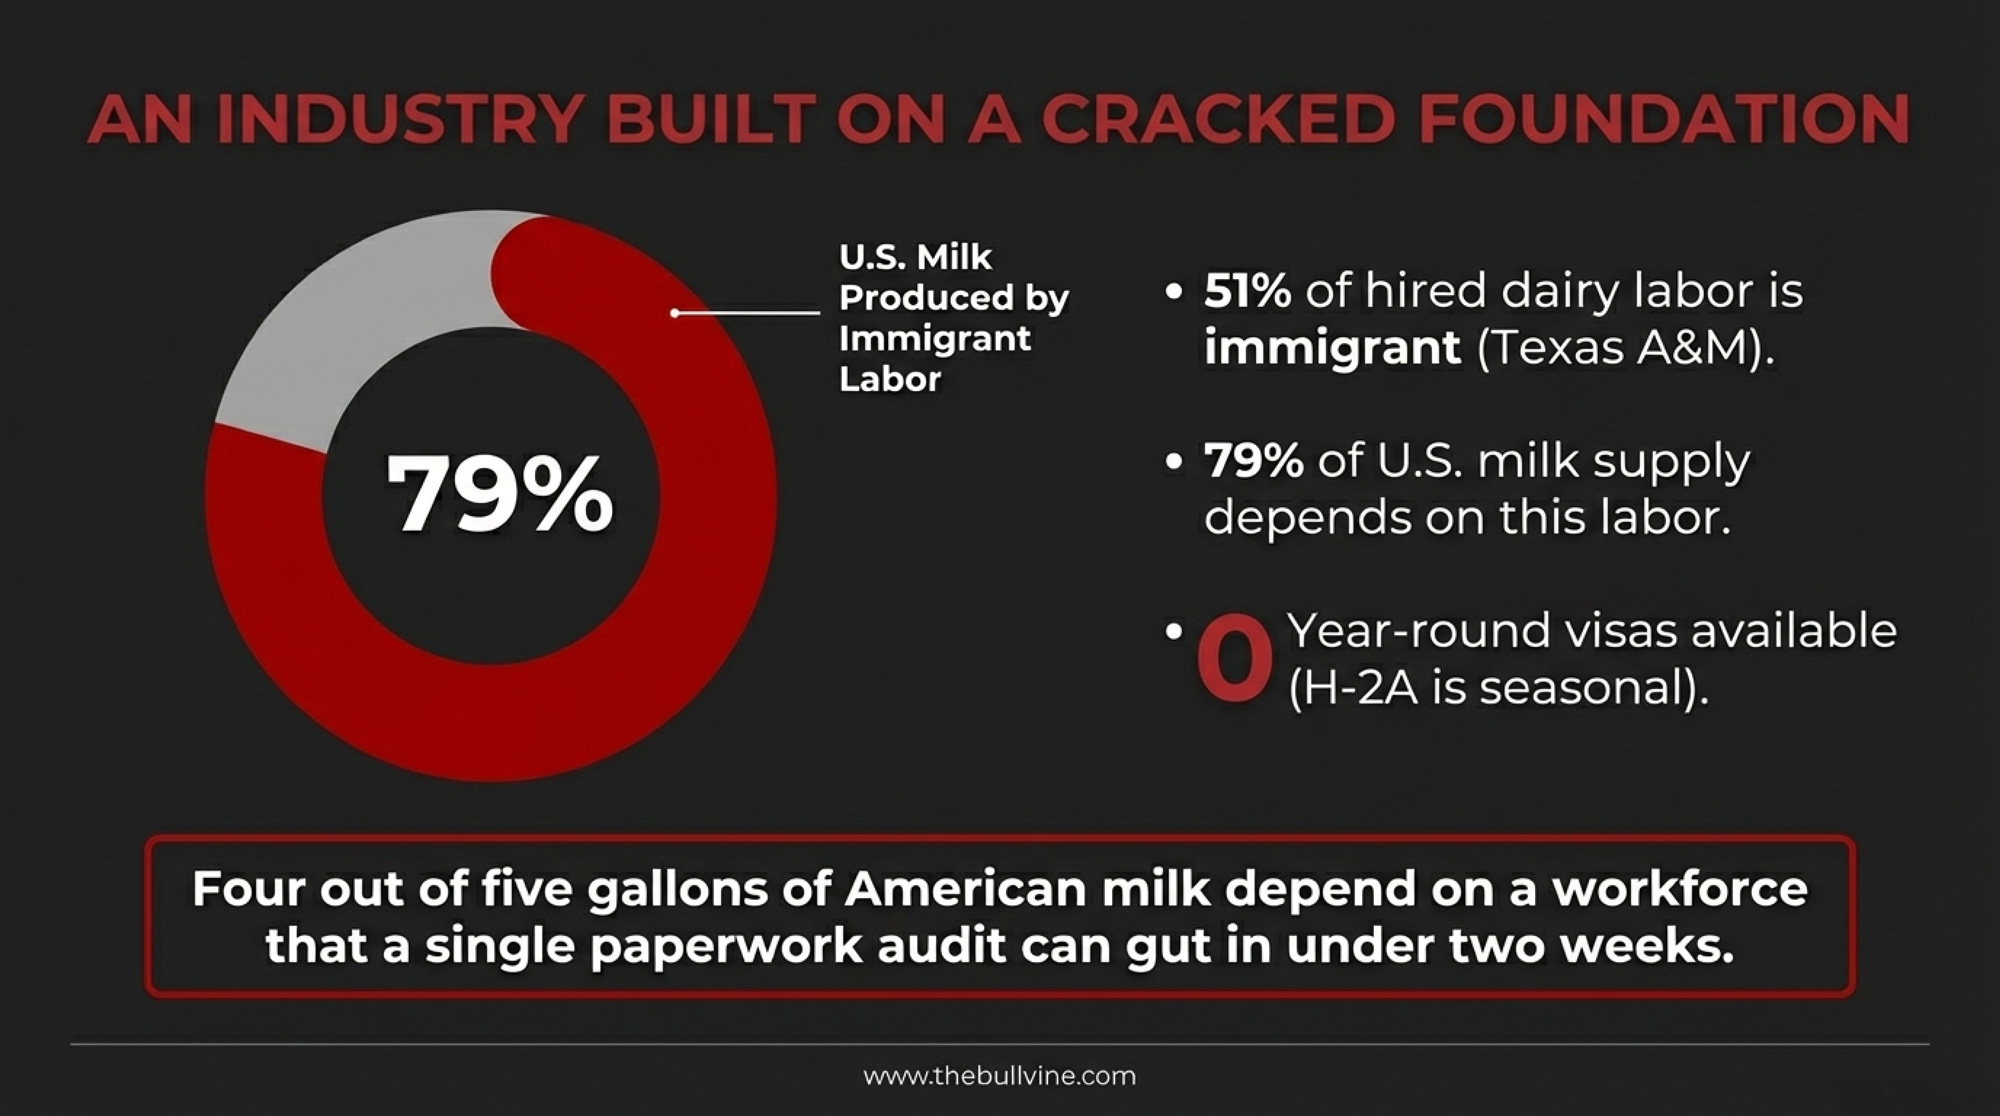
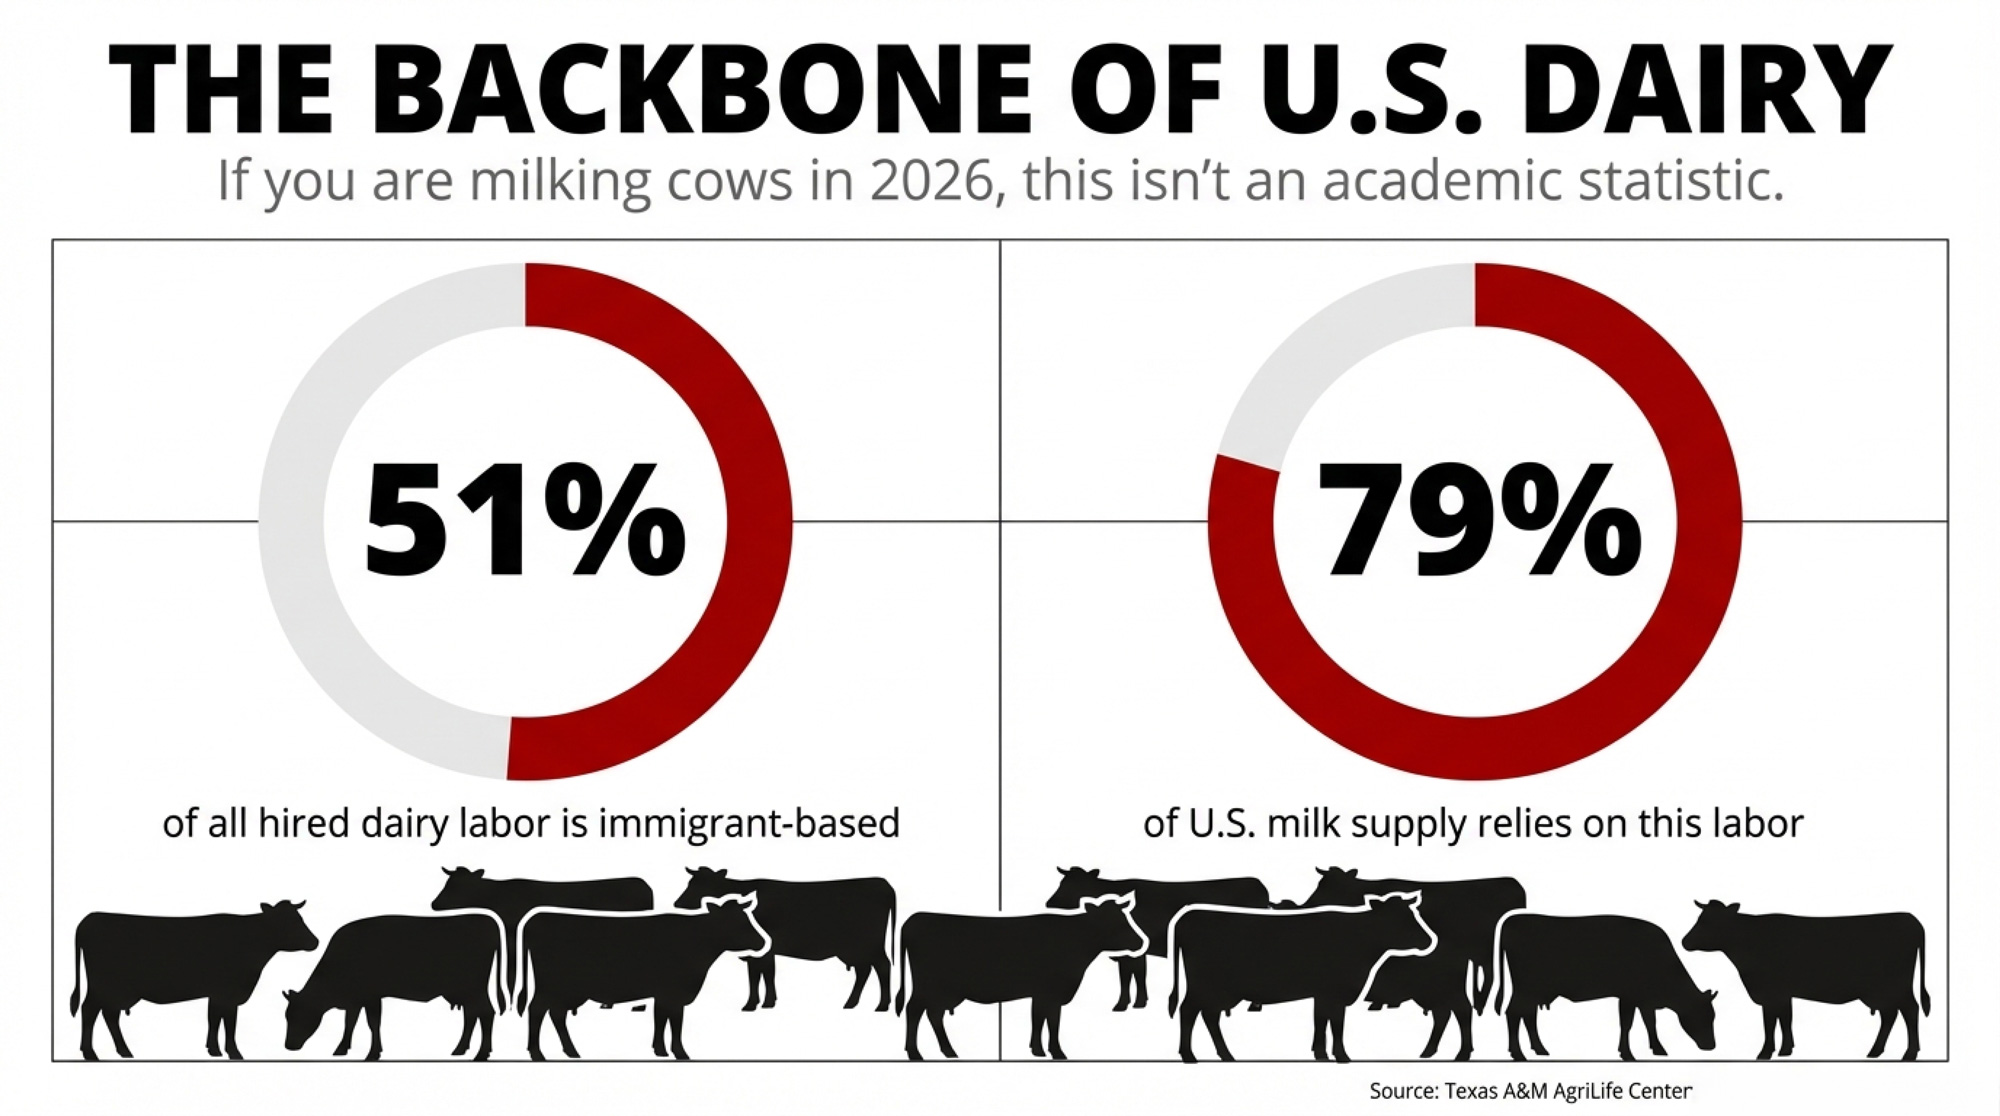
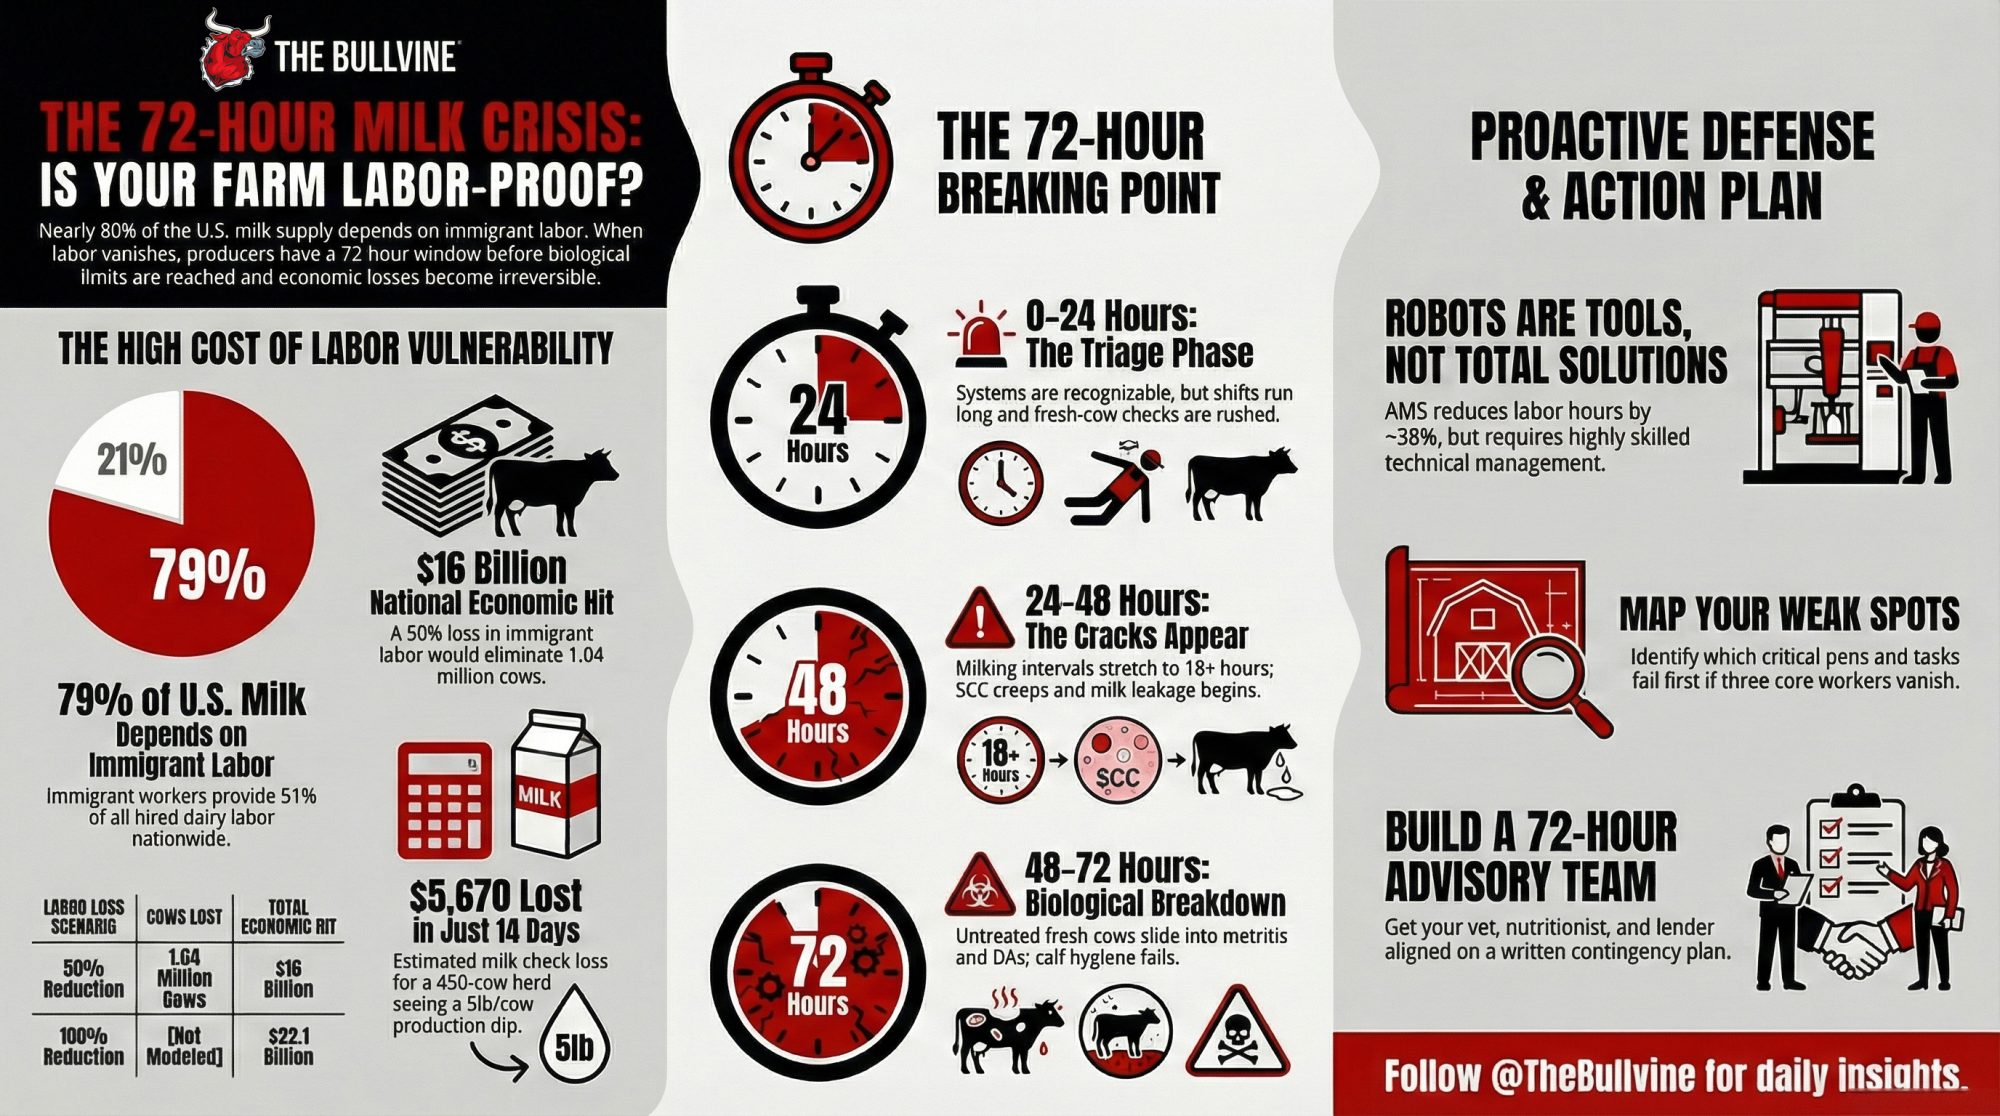
Every time a trained milker leaves, your investment walks out the door — and whoever fills that spot learns more from the coworker beside them than from anything posted on the wall. Think about that next time someone frames dairy’s labor problem as a matter of finding “better” workers. It’s not. It’s about training the workforce you actually have. Immigrant labor provides 51% of all U.S. dairy workers, and dairies employing immigrant labor produce 79% of the milk supply. Jorge Delgado, the on-farm dairy specialist who oversees Alltech’s Training, Talent Development, and Retention Program, said in a February 2024 statement: “Better education and training not only bolster the workforce’s efficiency but also safeguard milk markets and assure consumers that the industry prioritizes animal welfare through rigorous worker training”.
How Much Does Milking Training Actually Save Per Cow?
Rodriguez charted bulk tank SCC over time and saw the trend flatten after training — the seasonal upward creep in BTSCC stopped. Not the dramatic plunge that wins a plaque. But enough to keep herds inside their quality premium range rather than sliding out.
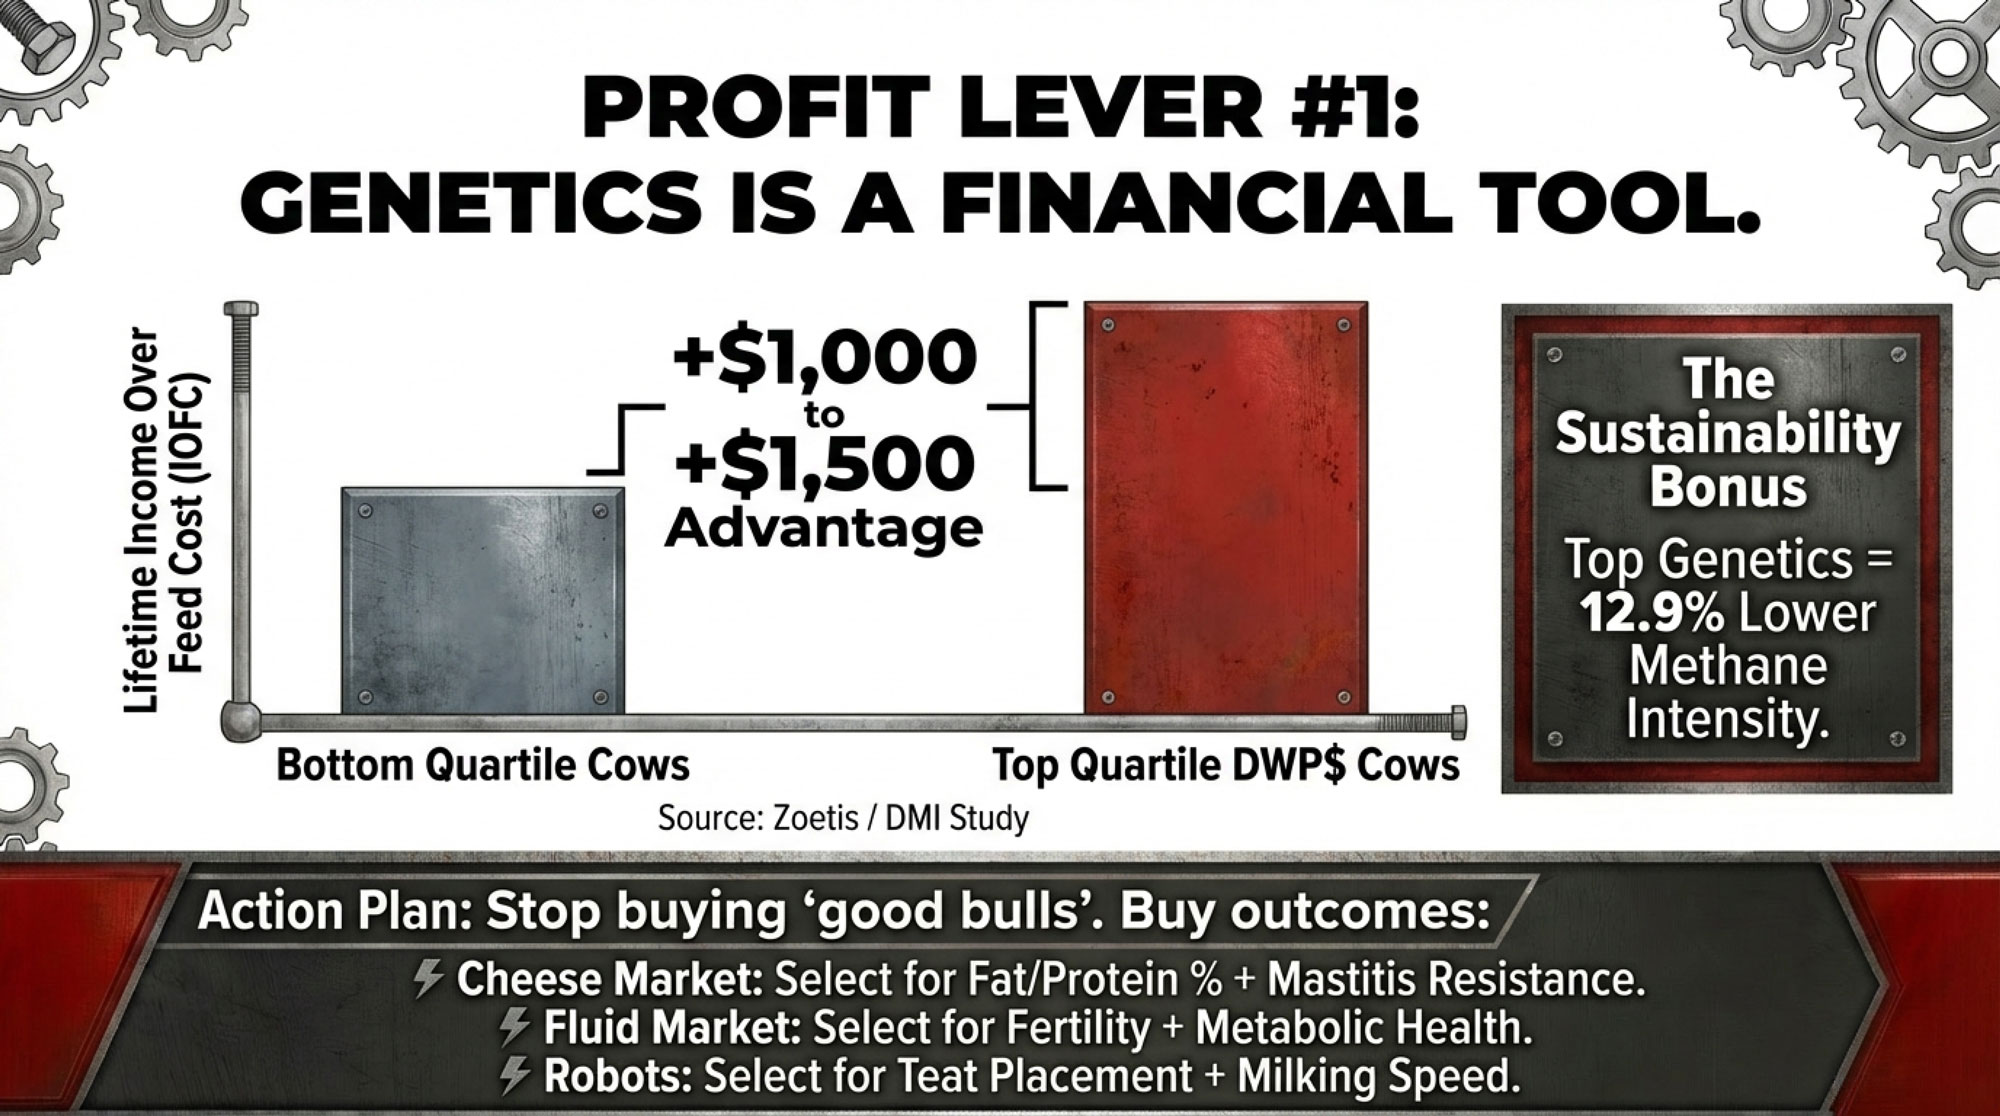
Nationally, the average DHI test-day herd SCC was 181,000 cells/mL in 2024 — the same as in 2023, according to CDCB. Genetics on somatic cell score keep improving. If the national average isn’t budging, the bottleneck isn’t in the semen tank. It’s in the parlor.
Here’s the barn math on a 300-cow herd shipping 75 lb/cow/day. Swap your own numbers into any line.
Line 1: SCC Premium Protection
Four Federal Milk Marketing Orders adjust milk payments for SCC using a per-1,000-cells/mL variation from a 350,000 baseline tied to monthly cheese prices. Co-ops and processors stack their own quality premiums on top. Herds consistently shipping sub-200,000 SCC milk see premiums in roughly the $0.40–$1.00/cwt range, depending on processor and region.
Your math (conservative, $0.40/cwt): 300 cows × 75 lb/day × 365 days = 8,212,500 lb = 82,125 cwt 82,125 cwt × $0.40 = $32,850/year≈ $109/cow/year in premium income kept or lost
If your co-op’s grid pays closer to $1.00/cwt for sub-150K milk, triple that line.
Line 2: Mastitis Cost Reduction
In a separate study, Pamela Ruegg’s group at MSU examined the actual costs of clinical mastitis cases on 37 commercial dairy farms in Wisconsin. Average direct cost: $192 per case, with a range of roughly $120 to $350depending on the farm. Discarded milk accounted for 53–80% of those direct costs. USDA’s NAHMS Dairy 2014 study — the most recent nationally representative data — found clinical mastitis in 24.8% of cows.
Your math (300-cow herd at national average): 300 cows × 24.8% = ~75 cases/year. If improved compliance trims incidence from 20% to 15%, 15 fewer cases × $192 = $2,880.Total: ~$2,880/year ≈ $10/cow/year
A note on that 20%: Rodriguez’s study actually showed clinical mastitis cases going up after training — because crews were finally detecting them through forestripping. The case-reduction math is a projection of what should happen over 6–12 months as better detection leads to earlier treatment and fewer chronic infections. Track your own before-and-after numbers rather than assuming this figure.
Separately, Ruegg found that each unnecessary treatment day costs about $65 in discarded milk and drugs. If you and your vet tighten treatment protocols alongside parlor training — a different conversation, but one that pairs well with what we covered in our mastitis overtreatment piece — the savings stack.
Line 3: Labor Efficiency
Two sources report different figures for the milking time reduction Rodriguez measured, and both are credible. MSU’s own summary and the Dairy Global report both show a 25-second reduction per cow — attributed specifically to fewer re-attachments. Hoard’s Dairyman, reporting on Rodriguez’s December 2024 appearance on the Dairy Science Digest podcast, cites an average reduction of 43 seconds per cow, with no change in employee performance. The broader figure may reflect total milking time savings, including prep efficiency gains alongside re-attachment reduction.
Your math (300-cow, 2× herd — conservative, using 25 sec): 25 sec × 300 cows × 2 milkings = 250 min = 4.17 hours/day 4.17 hrs × 365 = 1,521 hours/year 1,521 hrs × $19.70/hr (USDA Lake Region livestock wage, May 2025) = $29,960≈ $100/cow/year in time-value
If the 43-second figure applies to your operation: 43 sec × 300 cows × 2 milkings = 430 min = 7.17 hours/day 7.17 hrs × 365 = 2,617 hours/year 2,617 hrs × $19.70/hr = $51,555≈ $172/cow/year in time-value
Honest catch: “time-value” doesn’t automatically land in your checking account. Crews get paid for the shift, not by the minute. That time becomes real money when you can milk more cows with the same hours, cut overtime, or eventually trim scheduled labor. A 2022 Cornell-led study by Alanis, Virkler, and colleagues — published in JDS Communications— evaluated milking training across 15 farms in northern New York and found equipment-related problems that milkers should have detected and reported on 14 of 15 farms, with inadequate milking routines flagged on 13 of 15. That’s the kind of inefficiency where saved seconds start converting to real dollars once the crew knows what to watch for.
Nobody captures every dollar. But even a quarter — $55 to $73/cow, or $16,400 to $21,800/year on 300 cows — comes in against a training spend that tops out around $6,000. The 25% figure is editorial judgment, not a study finding. Your actual capture depends on how consistently you maintain the new routine through turnover cycles.
What Does a Structured Milking Training Protocol Look Like?
UW–Madison’s Milk Quality from the Udder World (MQUW) trainer certification program runs $95 per person. That covers a self-paced online course (about 2 hours across five modules), a one-day in-person workshop, lunch, laminated parlor training materials with QR codes linking to short educational videos, and certification. Sessions run in English one day and Spanish the next.
Location
Spring 2026 Dates
Luxemburg
Feb 18–19
Madison
Mar 18–19
Abbotsford
Apr 1–2
Fond du Lac
Apr 7–8
De Soto
Apr 29–30
(The Luxemburg session begins February 18 — check dairy.extension.wisc.edu for remaining seats. Four more sessions run through April 30.)
It’s a train-the-trainer model. You send your parlor manager, a bilingual lead, or maybe yourself—and they bring the knowledge home to coach everyone else. Rodriguez himself used the NMC’s free online resources to build his curriculum. On-farm, the pattern is simple: explain the biology, demonstrate on actual cows in your setup, then stand in the pit and coach real-time until the new routine holds.
Realistic annual training budget (300-cow herd, 15 milkers)
Item
Cost
MQUW fees — 3 trainers × $95
$285
Wages + travel for trainer attendance
$1,000–$1,500
On-farm rollout (trainer time + milker hours during coaching)
$2,000–$3,000
Quarterly refreshers (fight turnover drift)
$1,000–$2,000/yr
Total
$2,000–$6,000
Most of that is your own payroll, not program fees.
Can’t get to Wisconsin? Iowa State University Extension and the University of Nebraska–Lincoln Dairy Extensionbuilt a free online milker training program in English and Spanish at go.iastate.edu/milkertraining. Each module has Spanish-language videos with English subtitles and quizzes in both languages with Spanish audio. The Alltech–FARM Program also launched bilingual cow-handling modules in 2024 that cover stockmanship fundamentals. Neither replaces someone standing beside a new milker in your pit — but both are a massive step up from “follow Joe.”
Farms with 3+ milkers, bilingual crews, need for repeatable internal training
Free Bilingual Online Modules (Iowa State/UNL)
$0
Self-paced (videos + quizzes in English/Spanish)
Step-by-step videos, quizzes, certificates
Bridge option for farms that can’t attend in-person training this year
DIY 30-Day Parlor Audit
$0
3 milkings across shifts (stopwatch + notepad)
Baseline data: lag time, post-dip coverage, re-attachments, forestrip compliance
Immediate baseline before committing to training spend—start here
On-Farm Custom Training (Rodriguez Model)
$2,000–$6,000/year
1-hour initial session + quarterly refreshers
Bilingual, farm-specific, coached in your parlor, ongoing reinforcement
Farms ready to formalize training as a rolling annual investment
What This Means for Your Operation
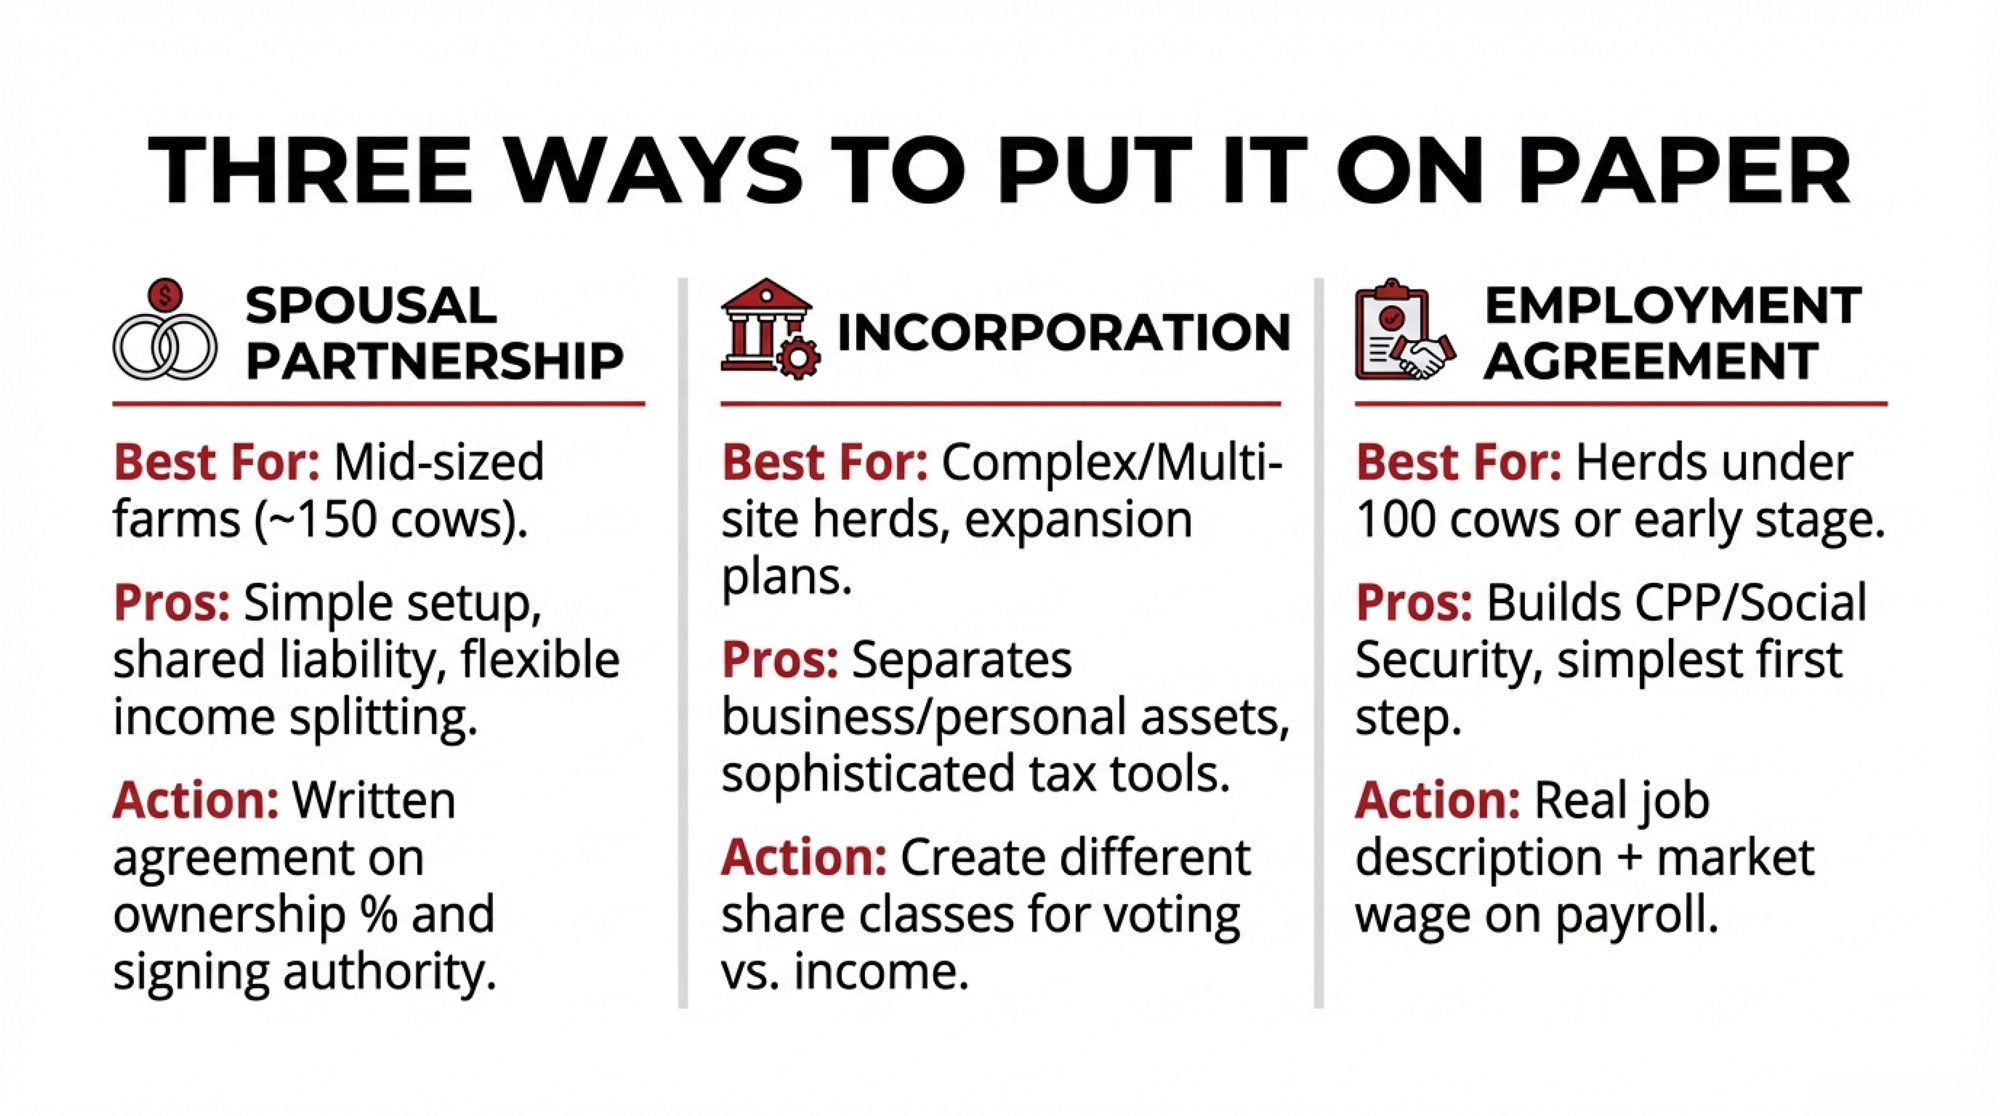
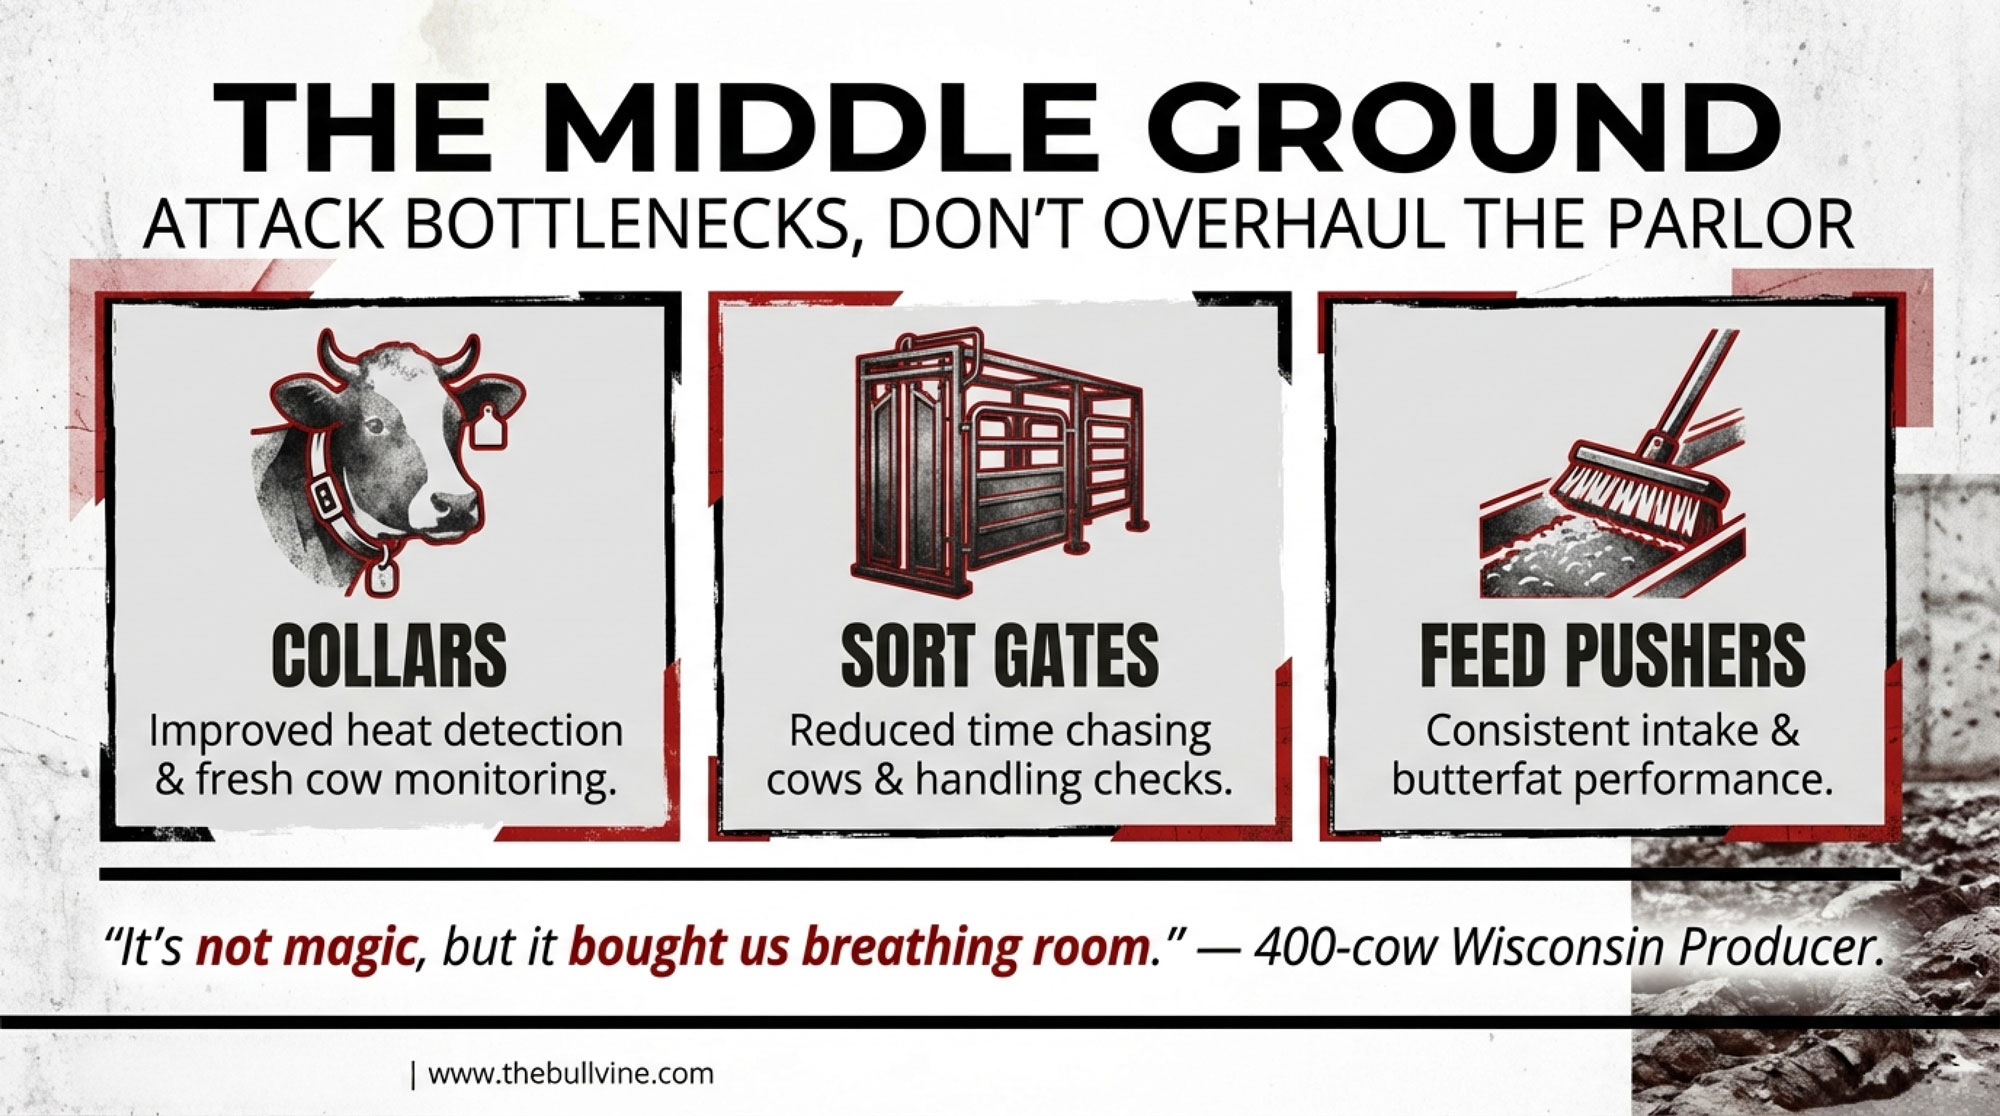
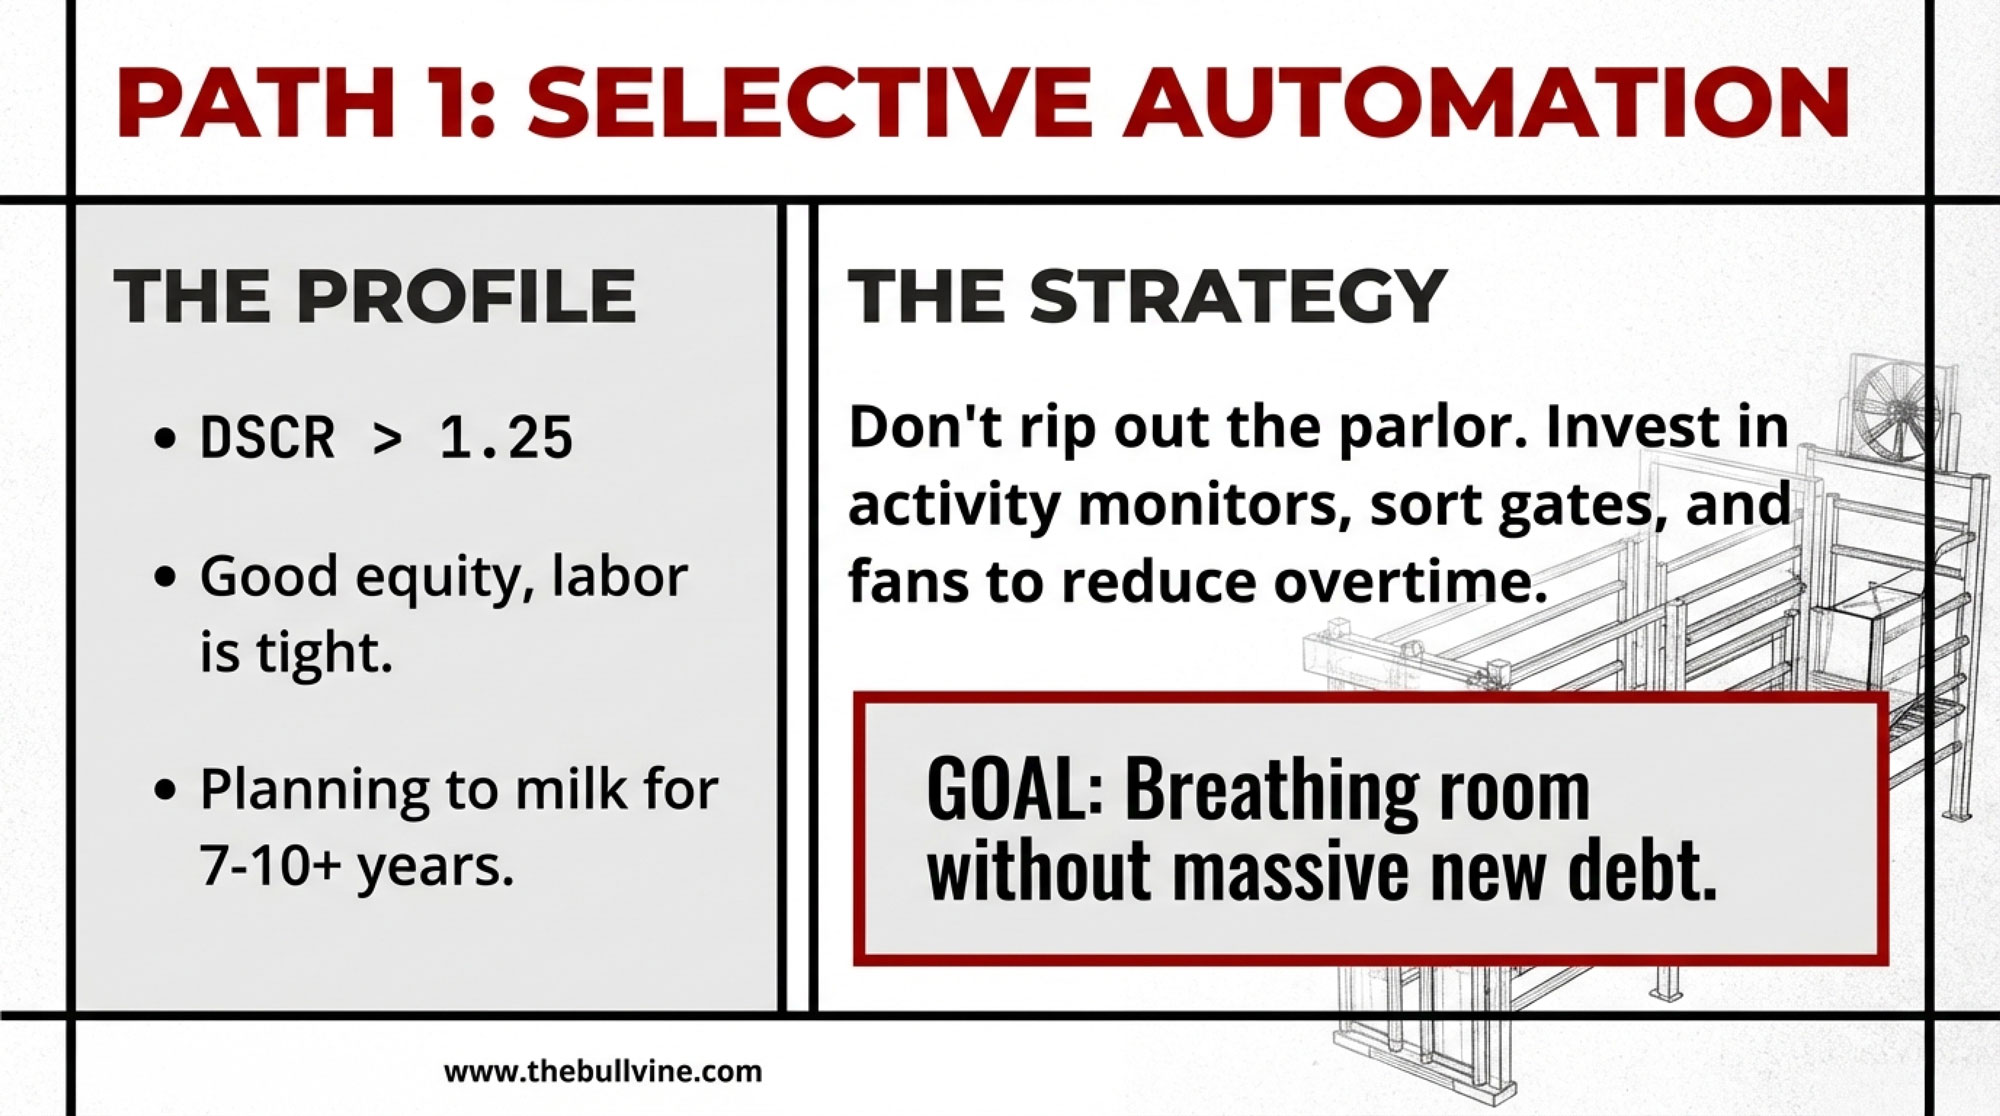
Path 1: Enroll in a train-the-trainer program like MQUW — the $285 path. Makes the most sense if you’ve got more than one person milking and you want the routine done the same way on every shift. At $95 per person for a full day, it’s one of the lowest-cost ways to address parlor consistency. The catch: if your only certified trainer quits, your training program walks out the door. Send at least two people — three if you can — so you’re not starting from zero when turnover hits. And don’t assume robotic milking gets you off the hook. It just shifts the training need from unit attachment to software, alerts, and cow management.
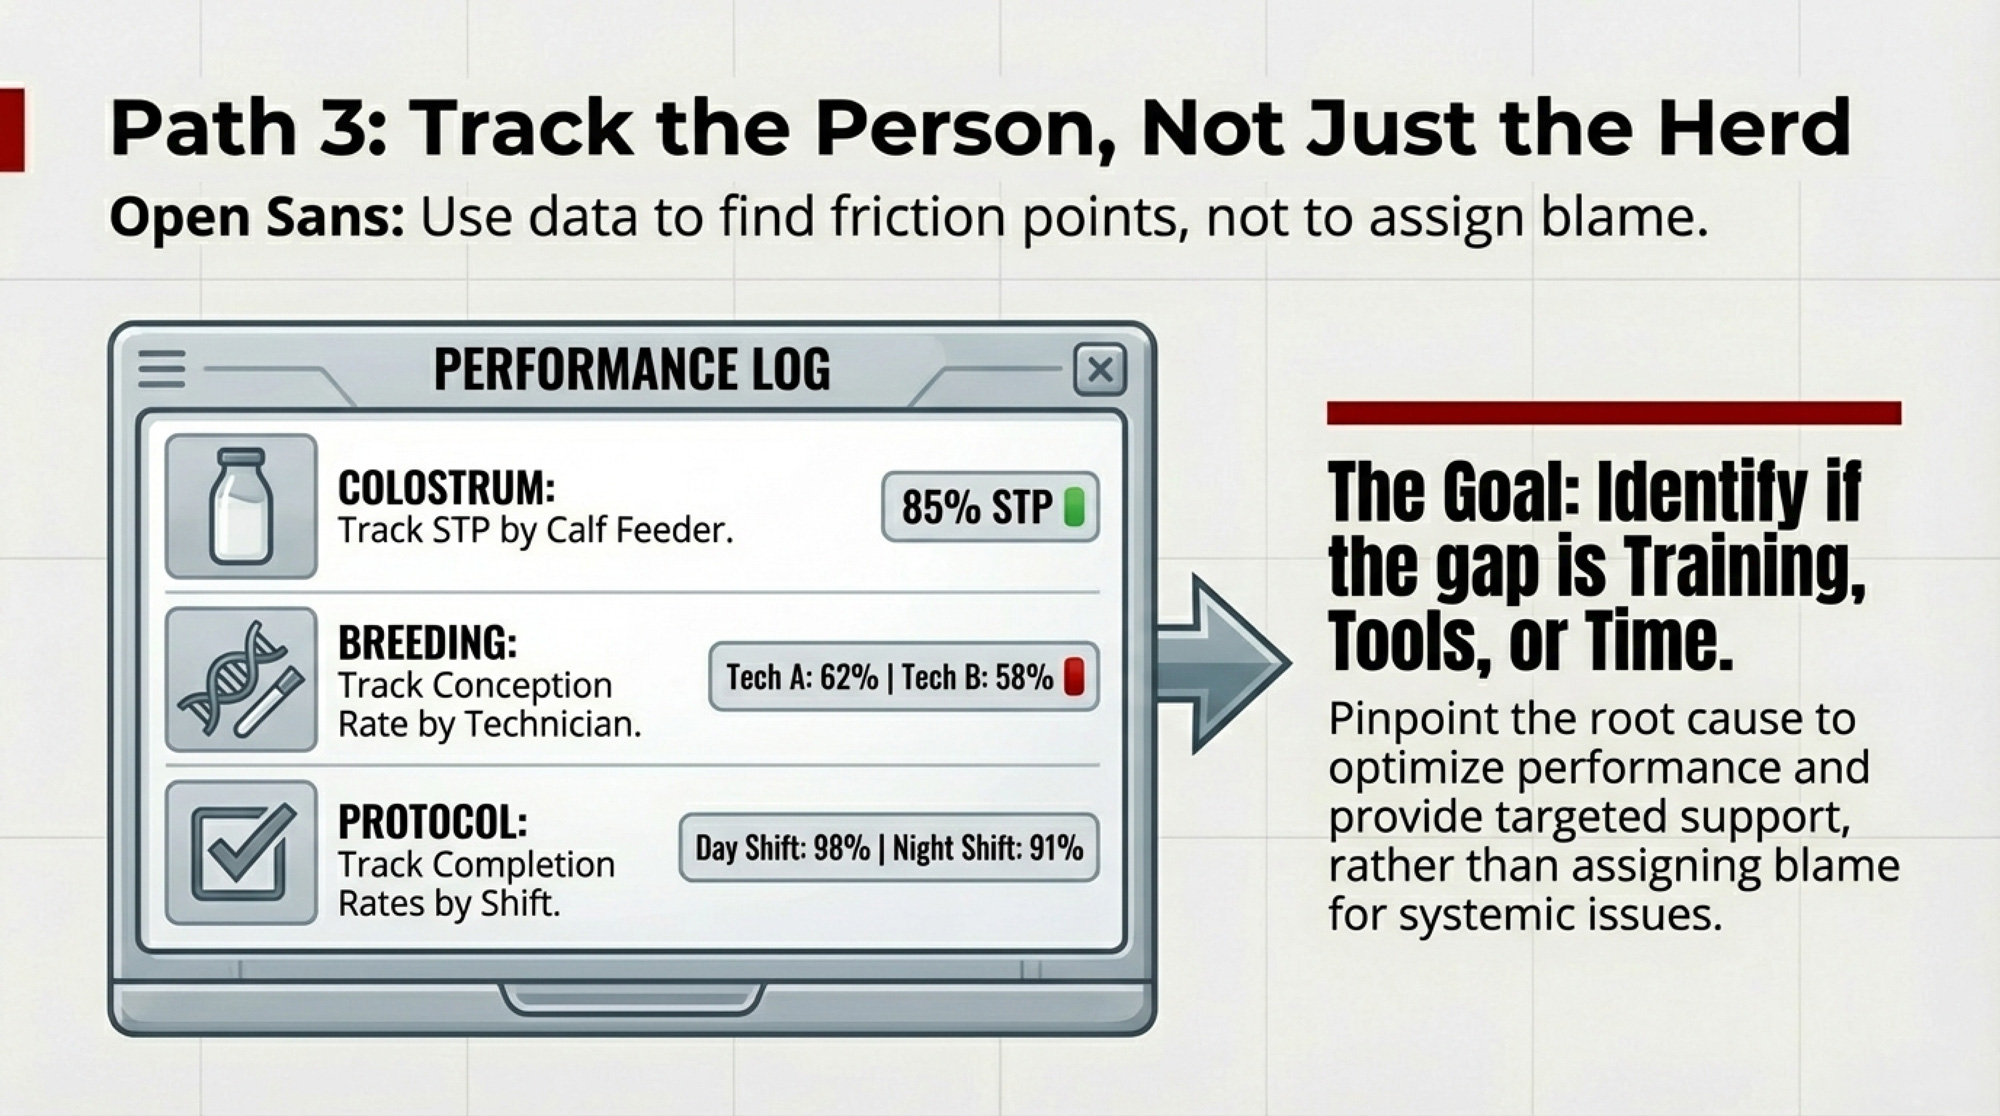
Path 2: Start with a parlor audit this month — no cost, immediate baseline. Grab a stopwatch and a notepad. Spend three consecutive milkings in the parlor across different shifts. Time at least 20 cows per milking from first touch to unit attachment. Score post-dip coverage: full, partial, or missed. Count how many cows aren’t forestripped at all. By the end of that week, you’ll know whether lag time falls within the 60 to 120 seconds that NMC, University of Minnesota Extension, and Penn State Extension all recommend from first tactile stimulation to unit attachment. Frame it for your crew as “we’re checking our system, not checking up on you”—or you’ll create pushback before you even talk about training.
Path 3: Use free bilingual resources as a bridge. If MQUW is out of reach this year, the Iowa State/UNL online milker training gives you step-by-step videos and quizzes in both languages. Neither replaces farm-specific coaching in your parlor. But they’re a real step up from dropping a translated SOP on the breakroom table and hoping it sticks.
Path 4: Post micro-metrics and run quarterly refreshers. Training isn’t one-and-done — especially with 38.8% annual turnover. After your initial push, pick a few visible numbers: prep-time compliance rate, average lag time, dip coverage percentage, and re-attachments per 100 cows. Post them where your crew sees them. Plan a 30–45-minute refresher for each crew every quarter. Maybe 40–50 hours of paid, non-milking time per year across your whole milking staff to keep everyone aligned. Skip the refreshers? Within a couple of turnover cycles, your crew looks a lot like Rodriguez’s study group did on day one.
Key Takeaways
If your herd SCC has stayed flat or crept up while your SCS genetics have improved, the gap is probably in the parlor, not the semen tank. The national DHI average has remained at 181,000 cells/mL over the past 2 years. Pull your last three DHIA tests and see if your trend is any different.
If you’ve got a written milking SOP that nobody has formally trained on in the past 12 months, the Farre et al. (2024) research says you might actually be worse off than having no SOP at all. A binder nobody understands teaches your crew that written rules don’t matter.
Within the next 30 days, run your own stopwatch test. Time 20 cows’ prep-to-attachment intervals on two different shifts. The NMC-recommended target is 60 to 120 seconds from first stimulation to unit attachment. If a significant share of your cows fall outside that window, training — not equipment — is probably where your next dollar should go.
Budget $2,000 to $6,000 per year for structured milking training on a 300-cow herd and compare that to what you spend on genetics, nutrition, and facilities that all depend on consistent milking to pay off.
The Bottom Line
When’s the last time you stood through a full milking in your own parlor and didn’t touch a unit — just watched what actually happens, step by step, across shifts?
Rodriguez did that on 16 farms, scored 112 workers, and measured the gap between what farms thought their milking routine looked like and what was actually happening in the pit. Your bulk tank already knows how consistent your milking routine really is. The question is whether you’re ready to stand in the pit, run the stopwatch, and find out what it would take to close that gap on your operation.
Complete references and supporting documentation are available upon request by contacting the editorial team at editor@thebullvine.com.
Learn More
The 90-Second Milking Window That’s Paying $126,000 – and Beating Every Robot – You’ll gain a surgical method for auditing pit efficiency and capturing six figures in “lost” milk without buying a single robot. This breakdown delivers the exact protocols and ROI math to turn parlor drift into measurable profit.
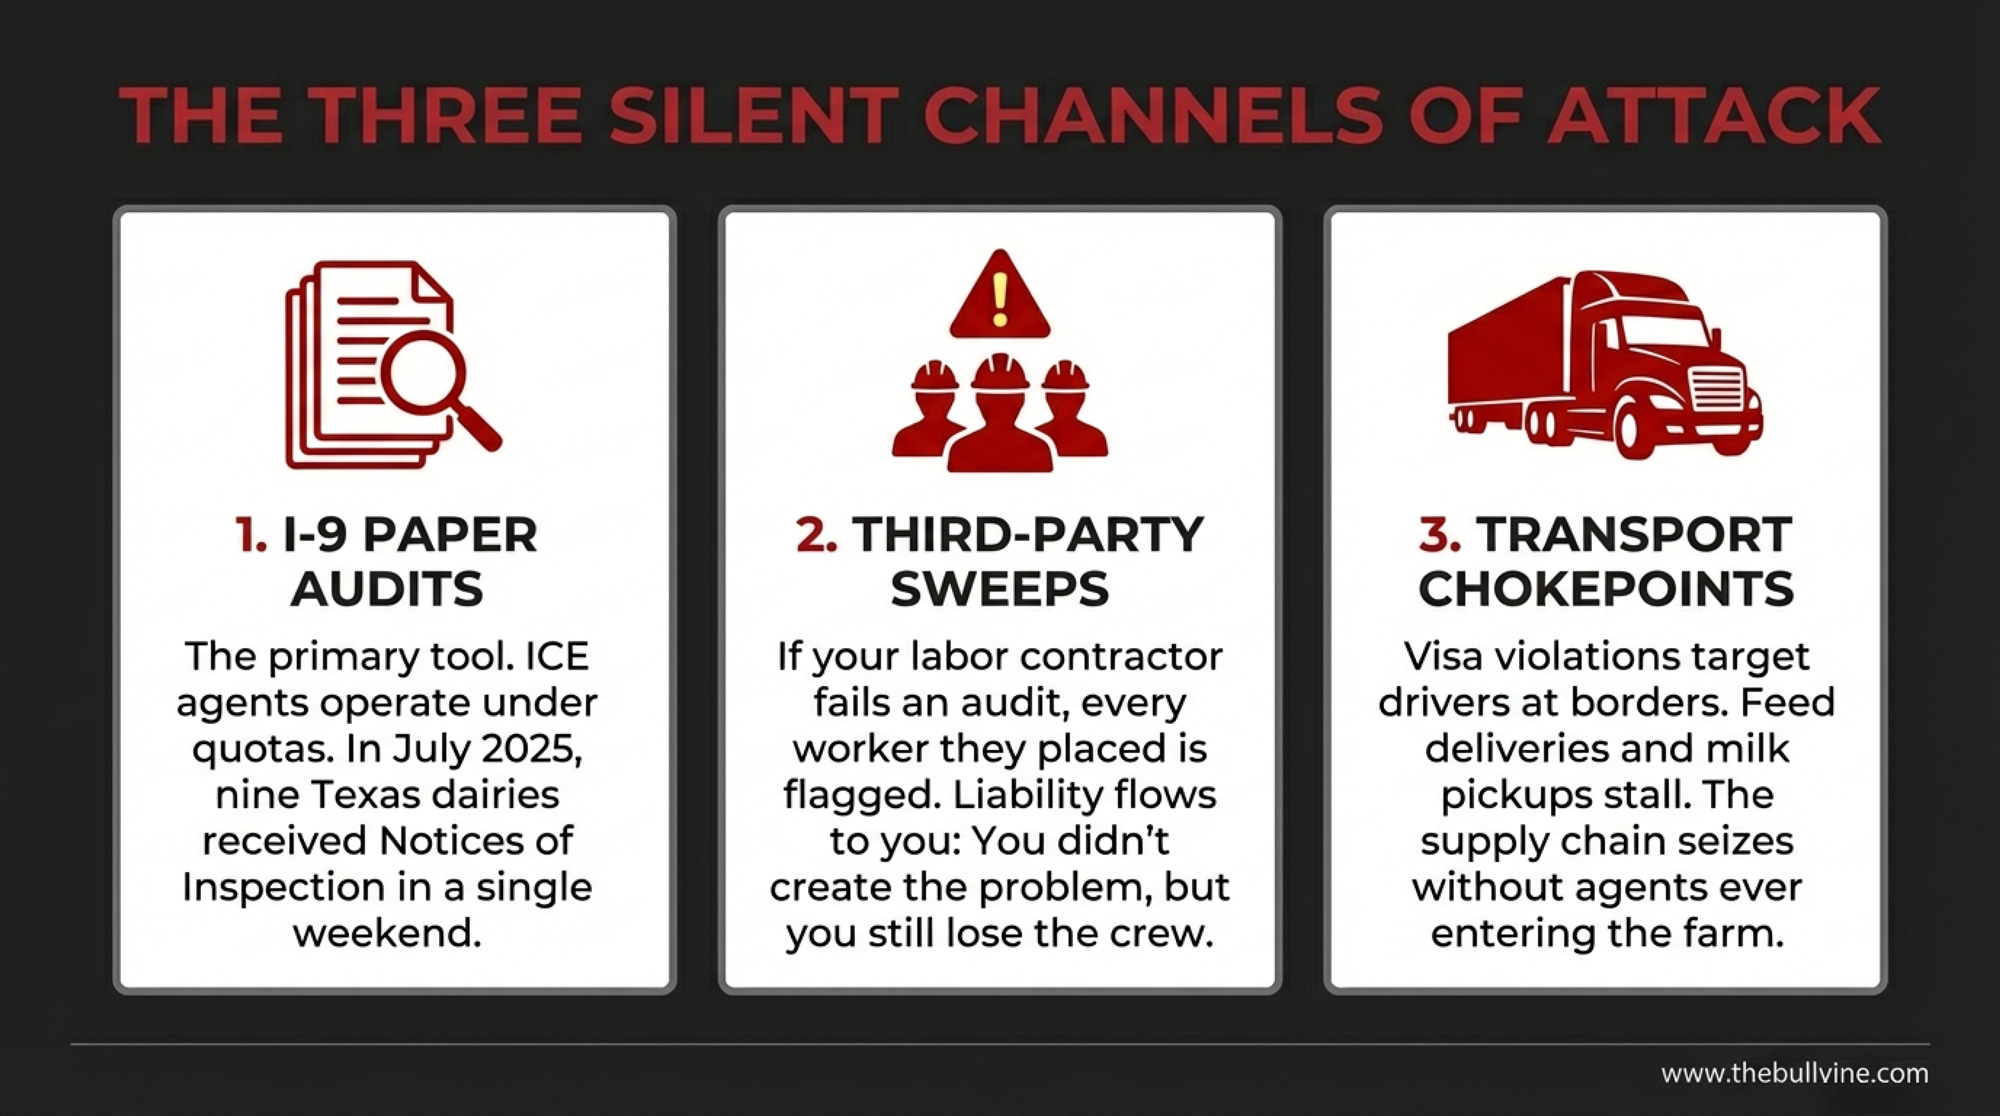
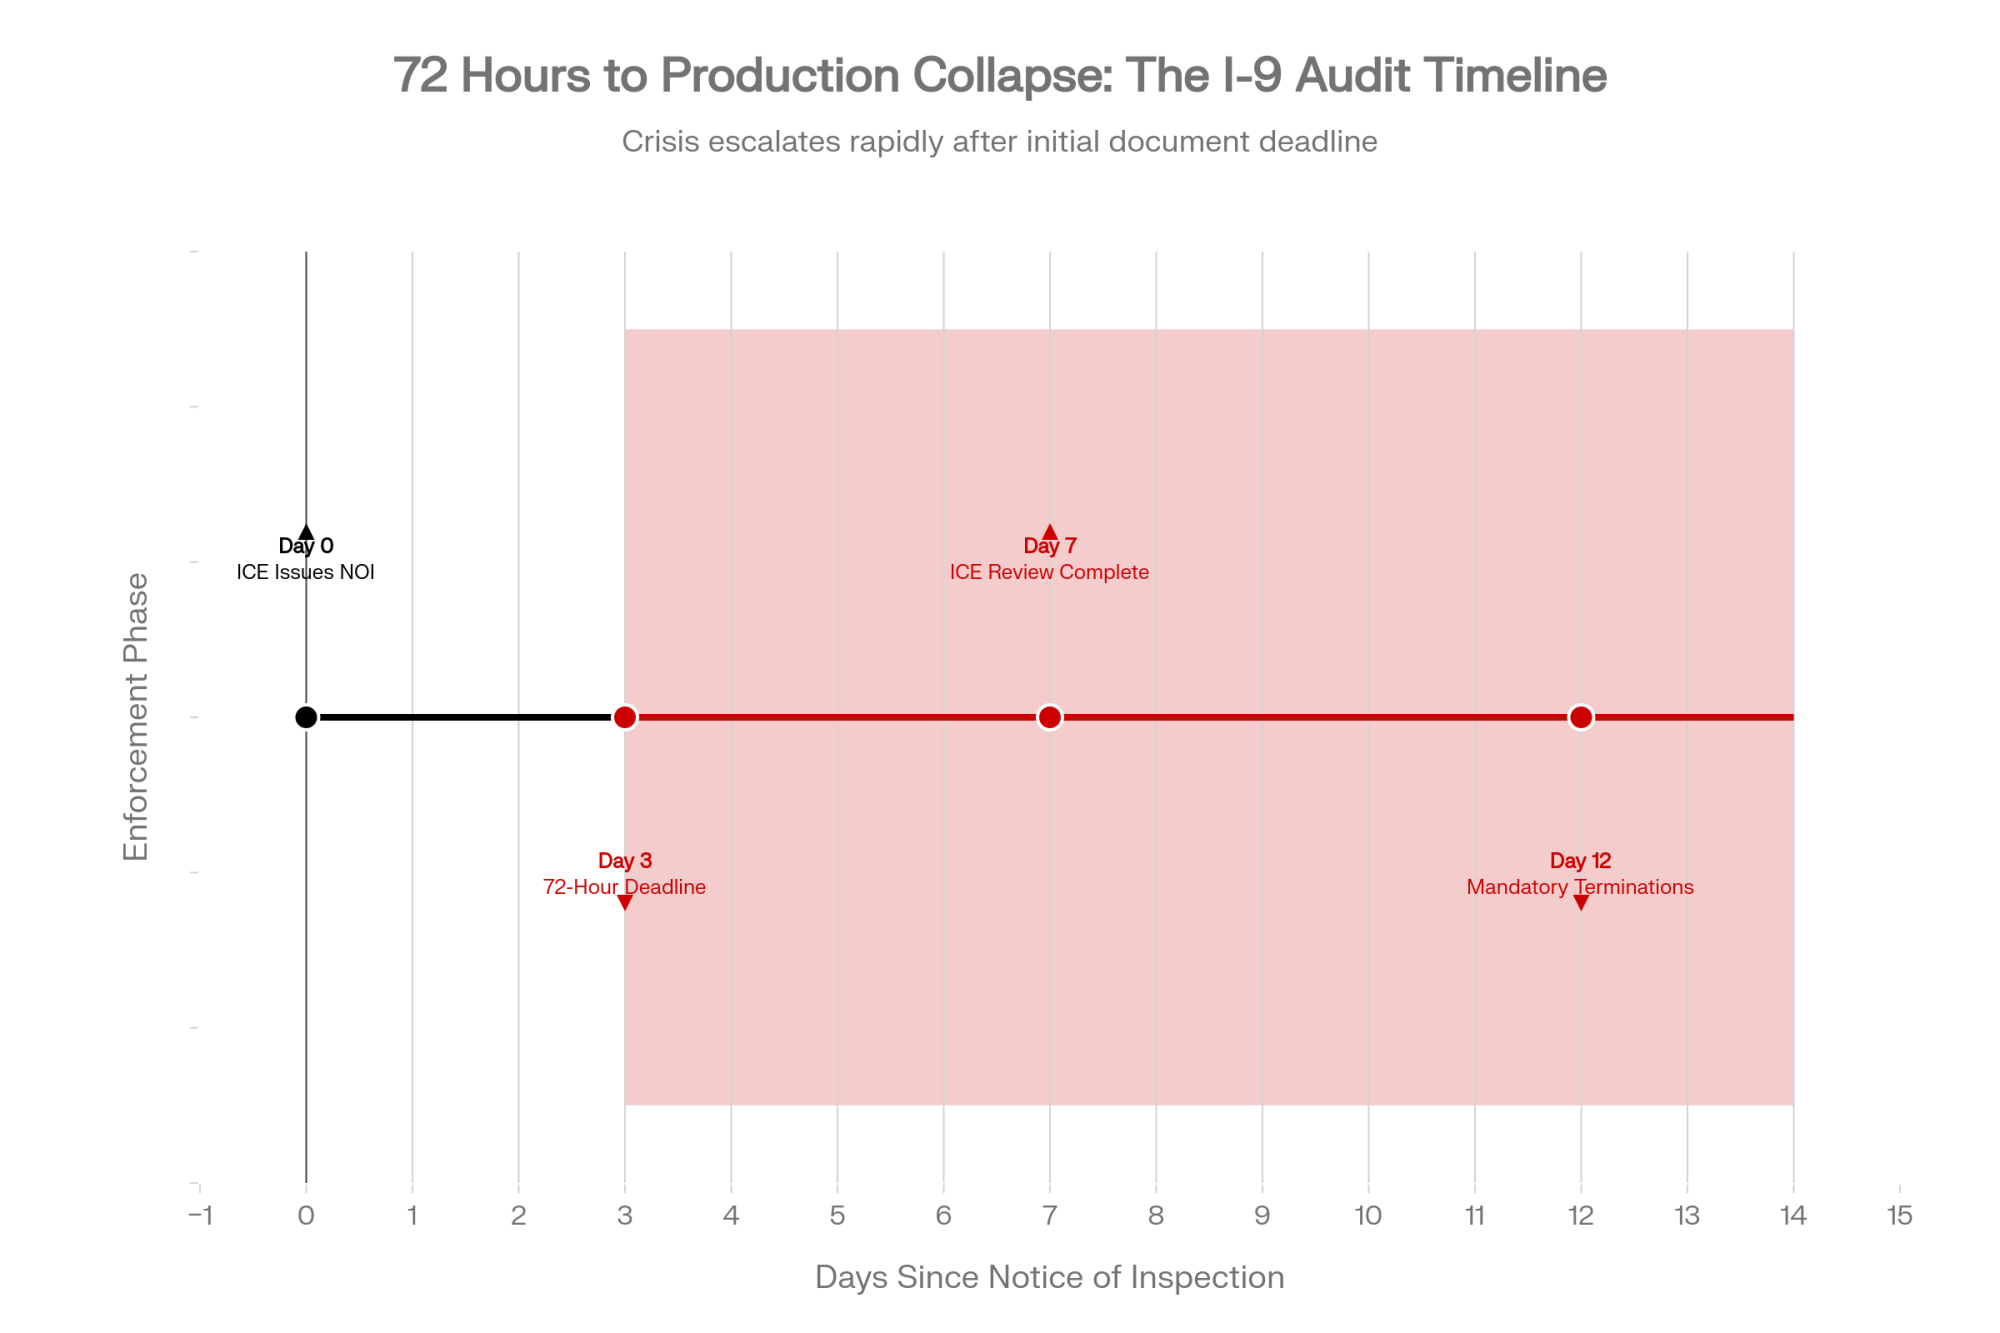
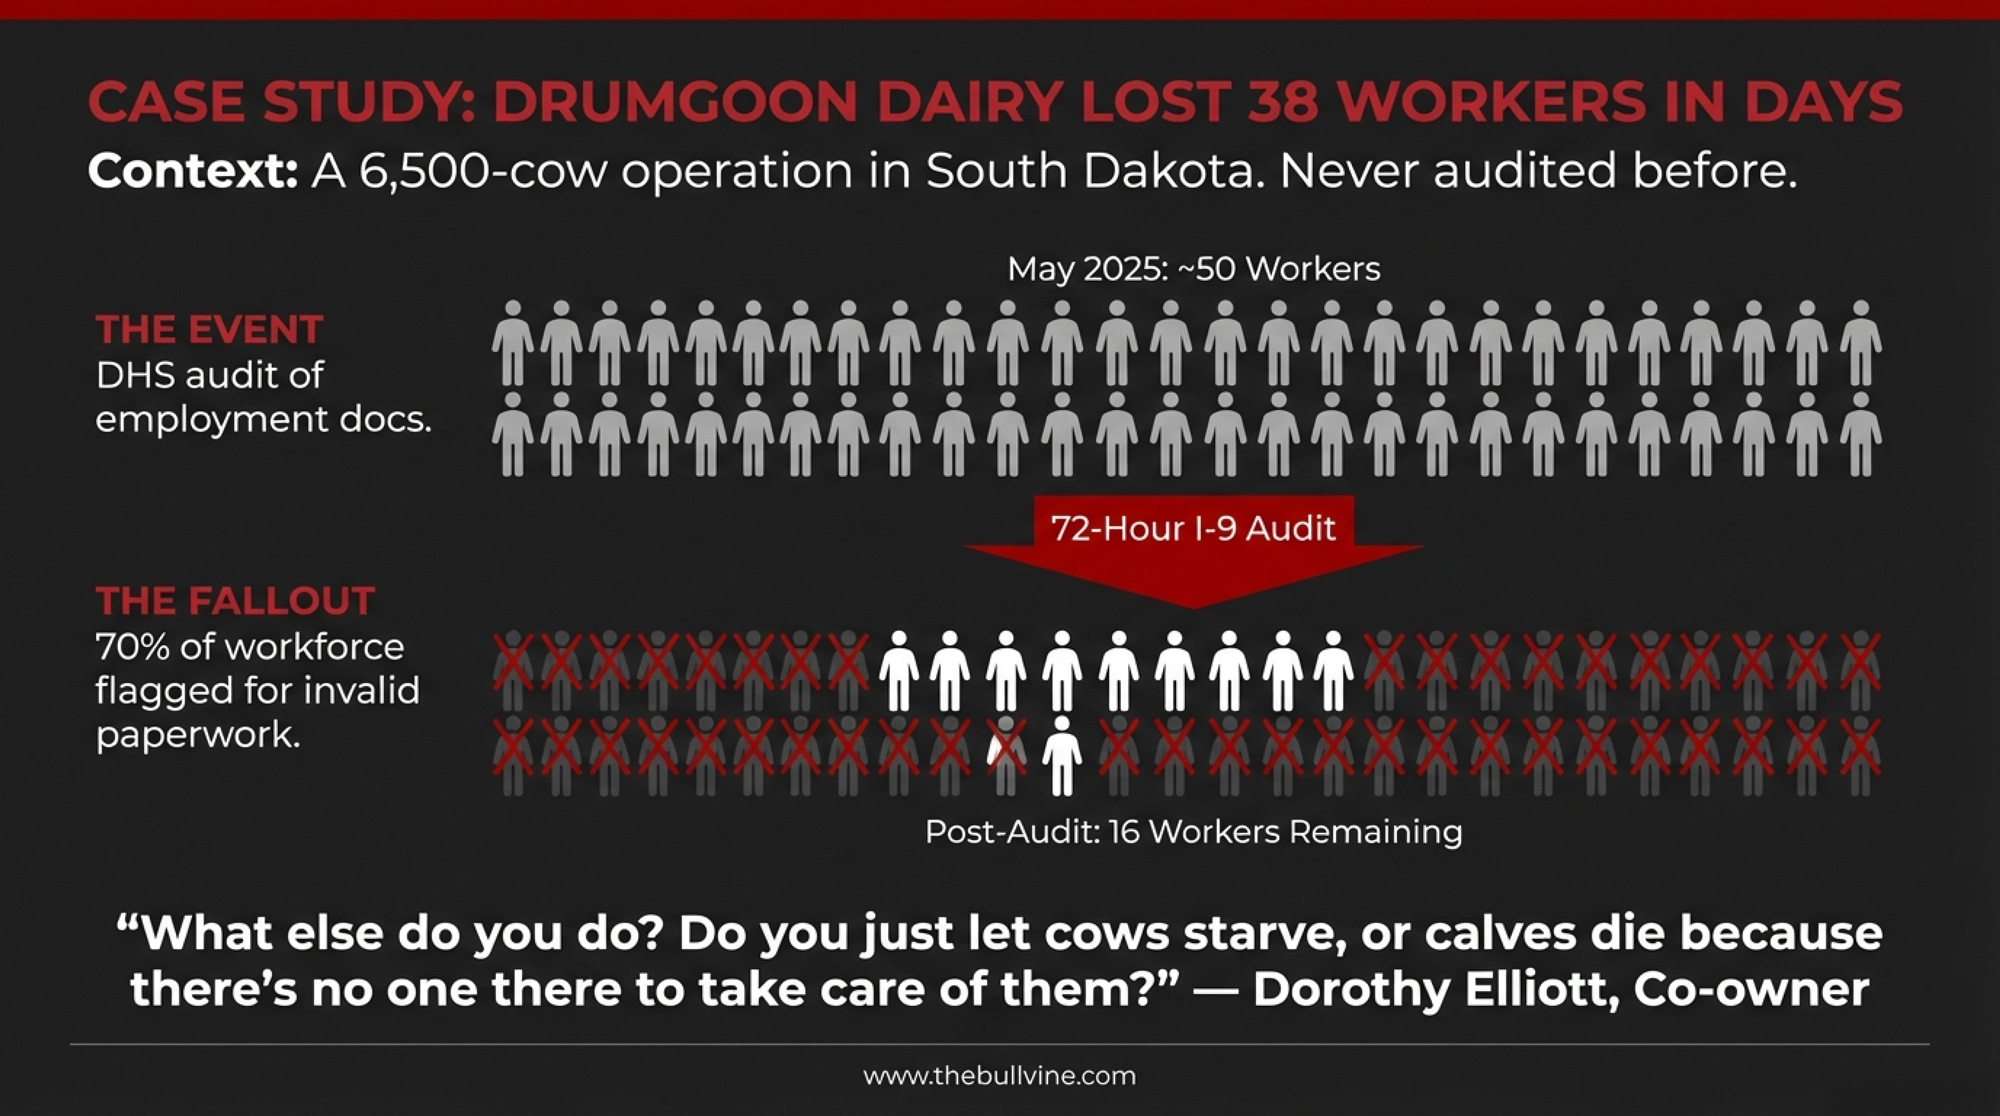
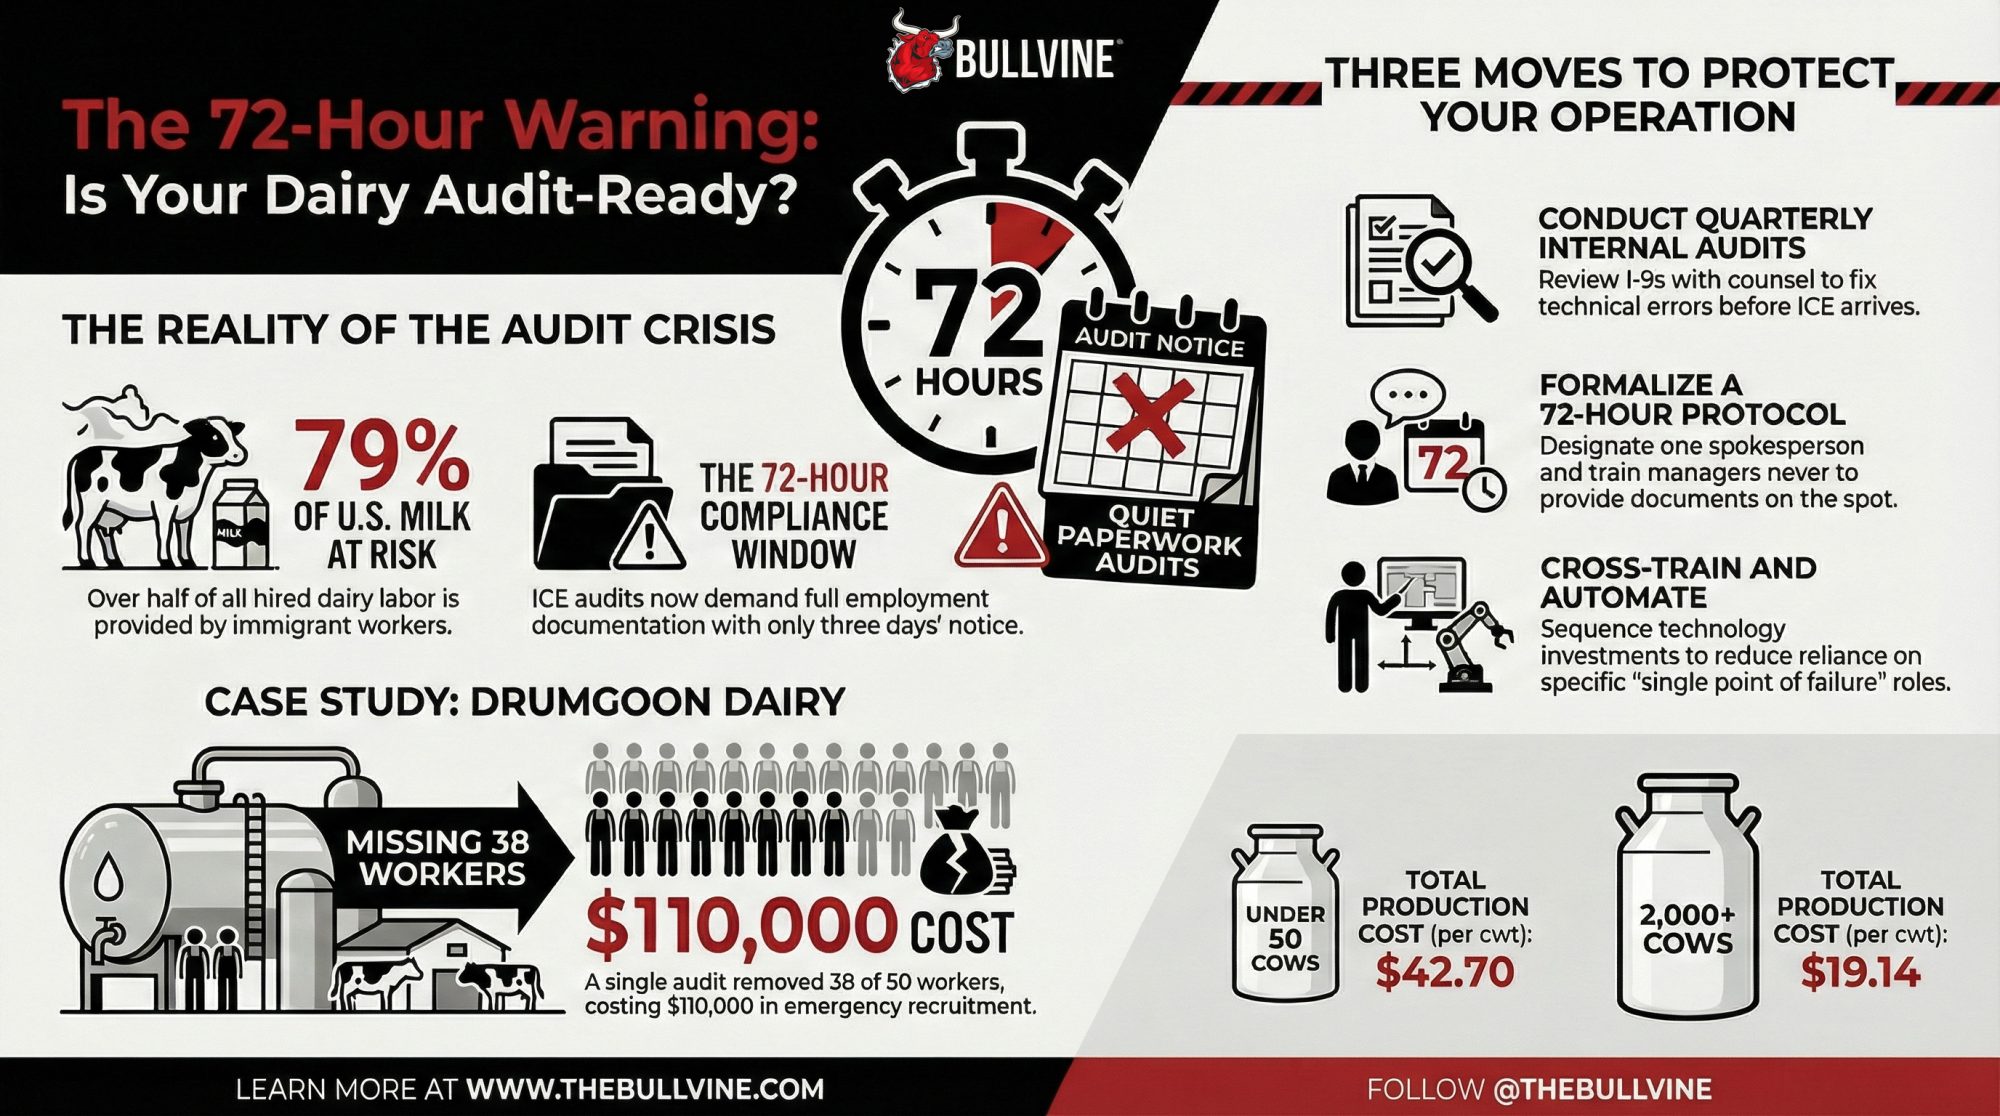
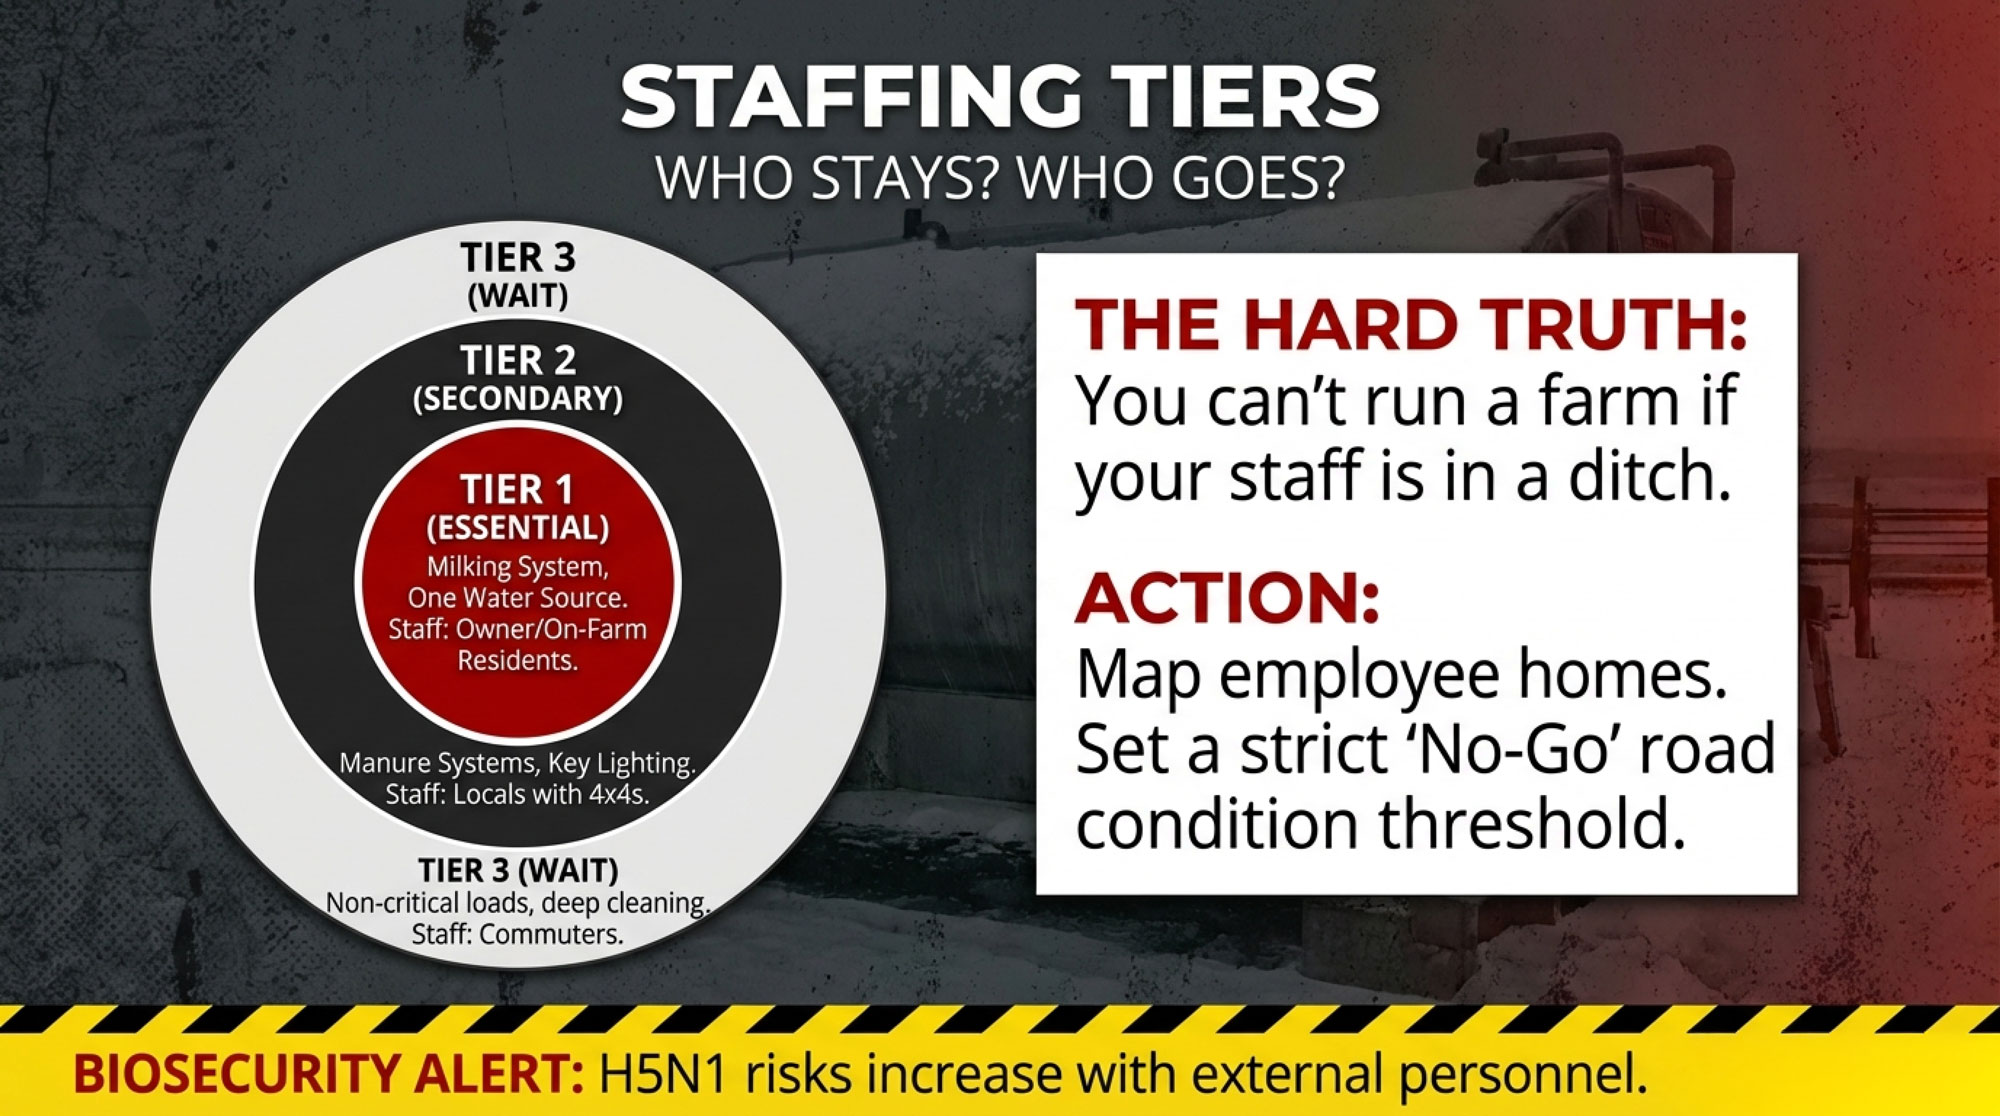
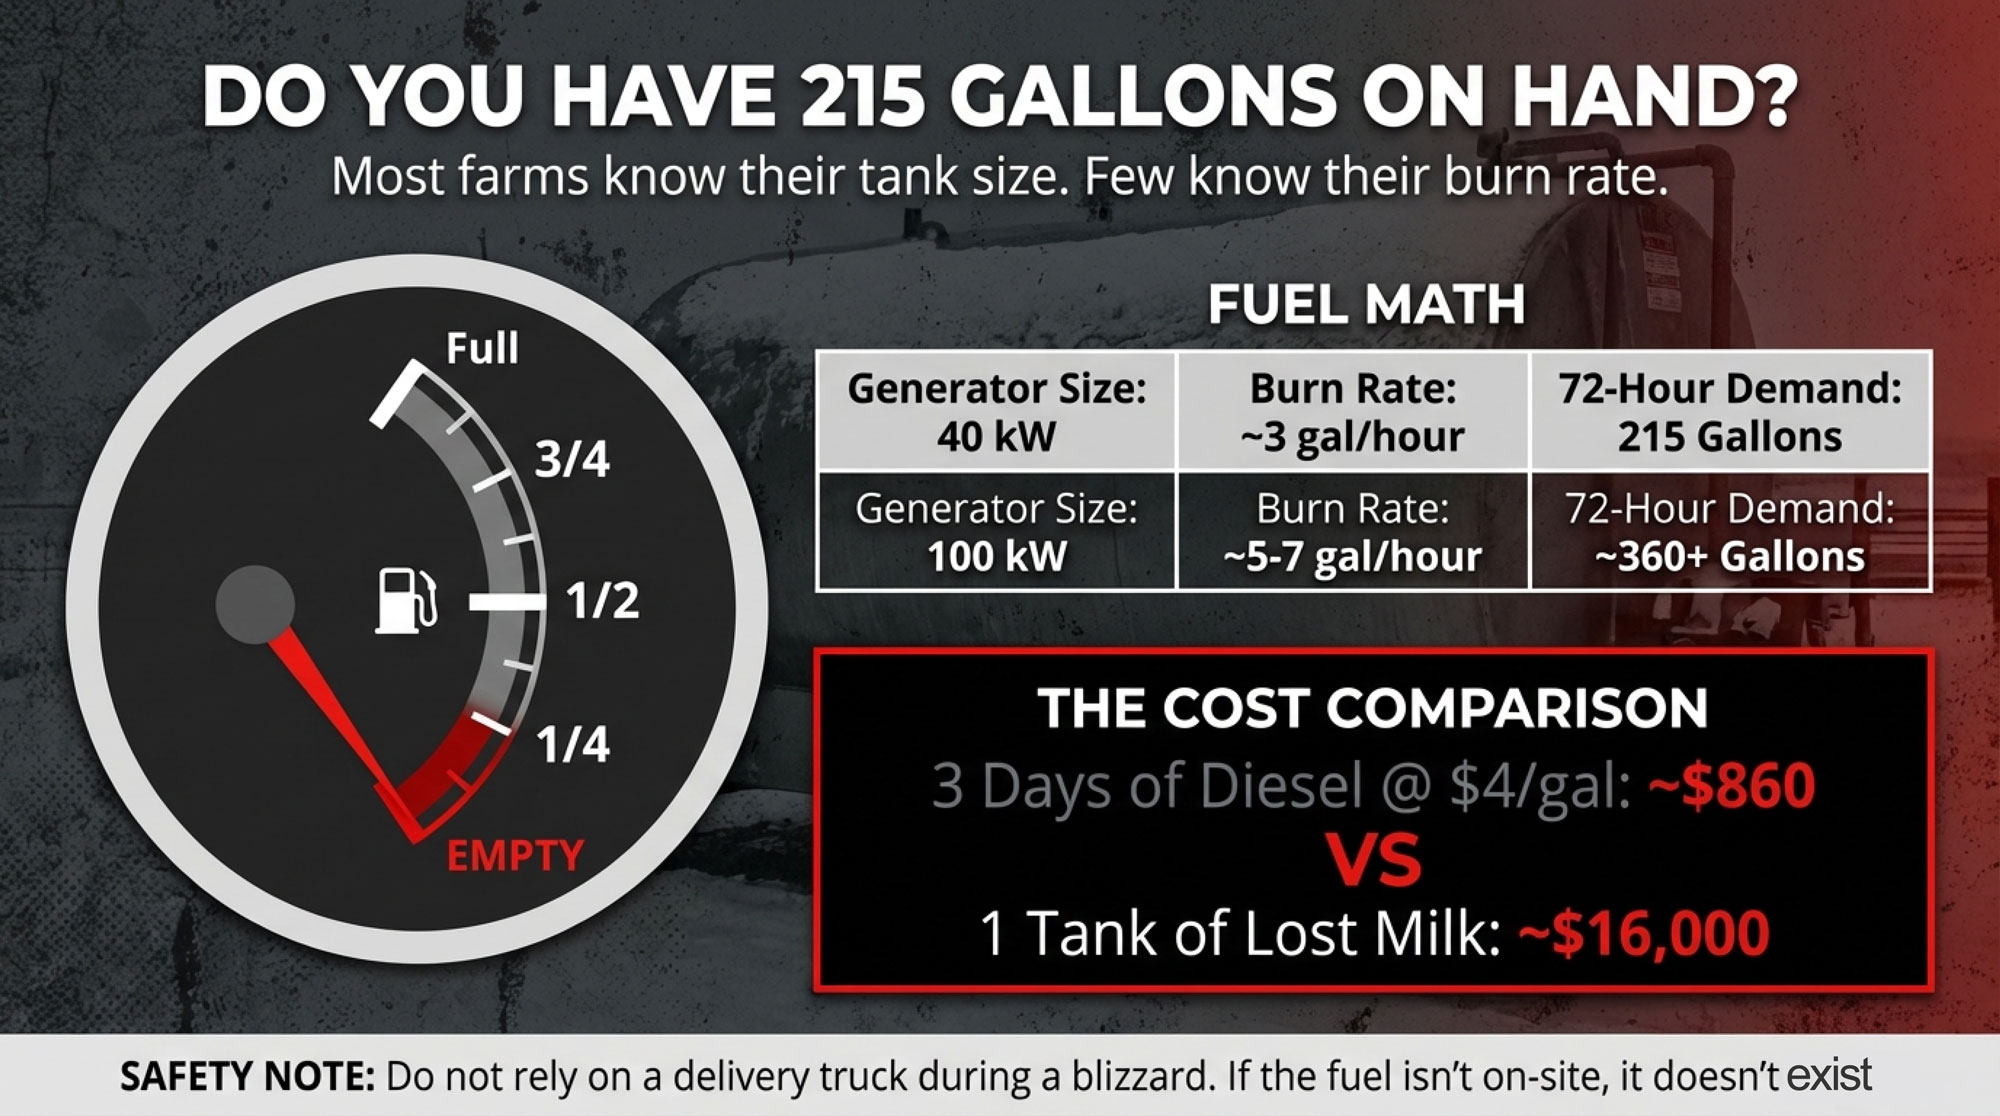
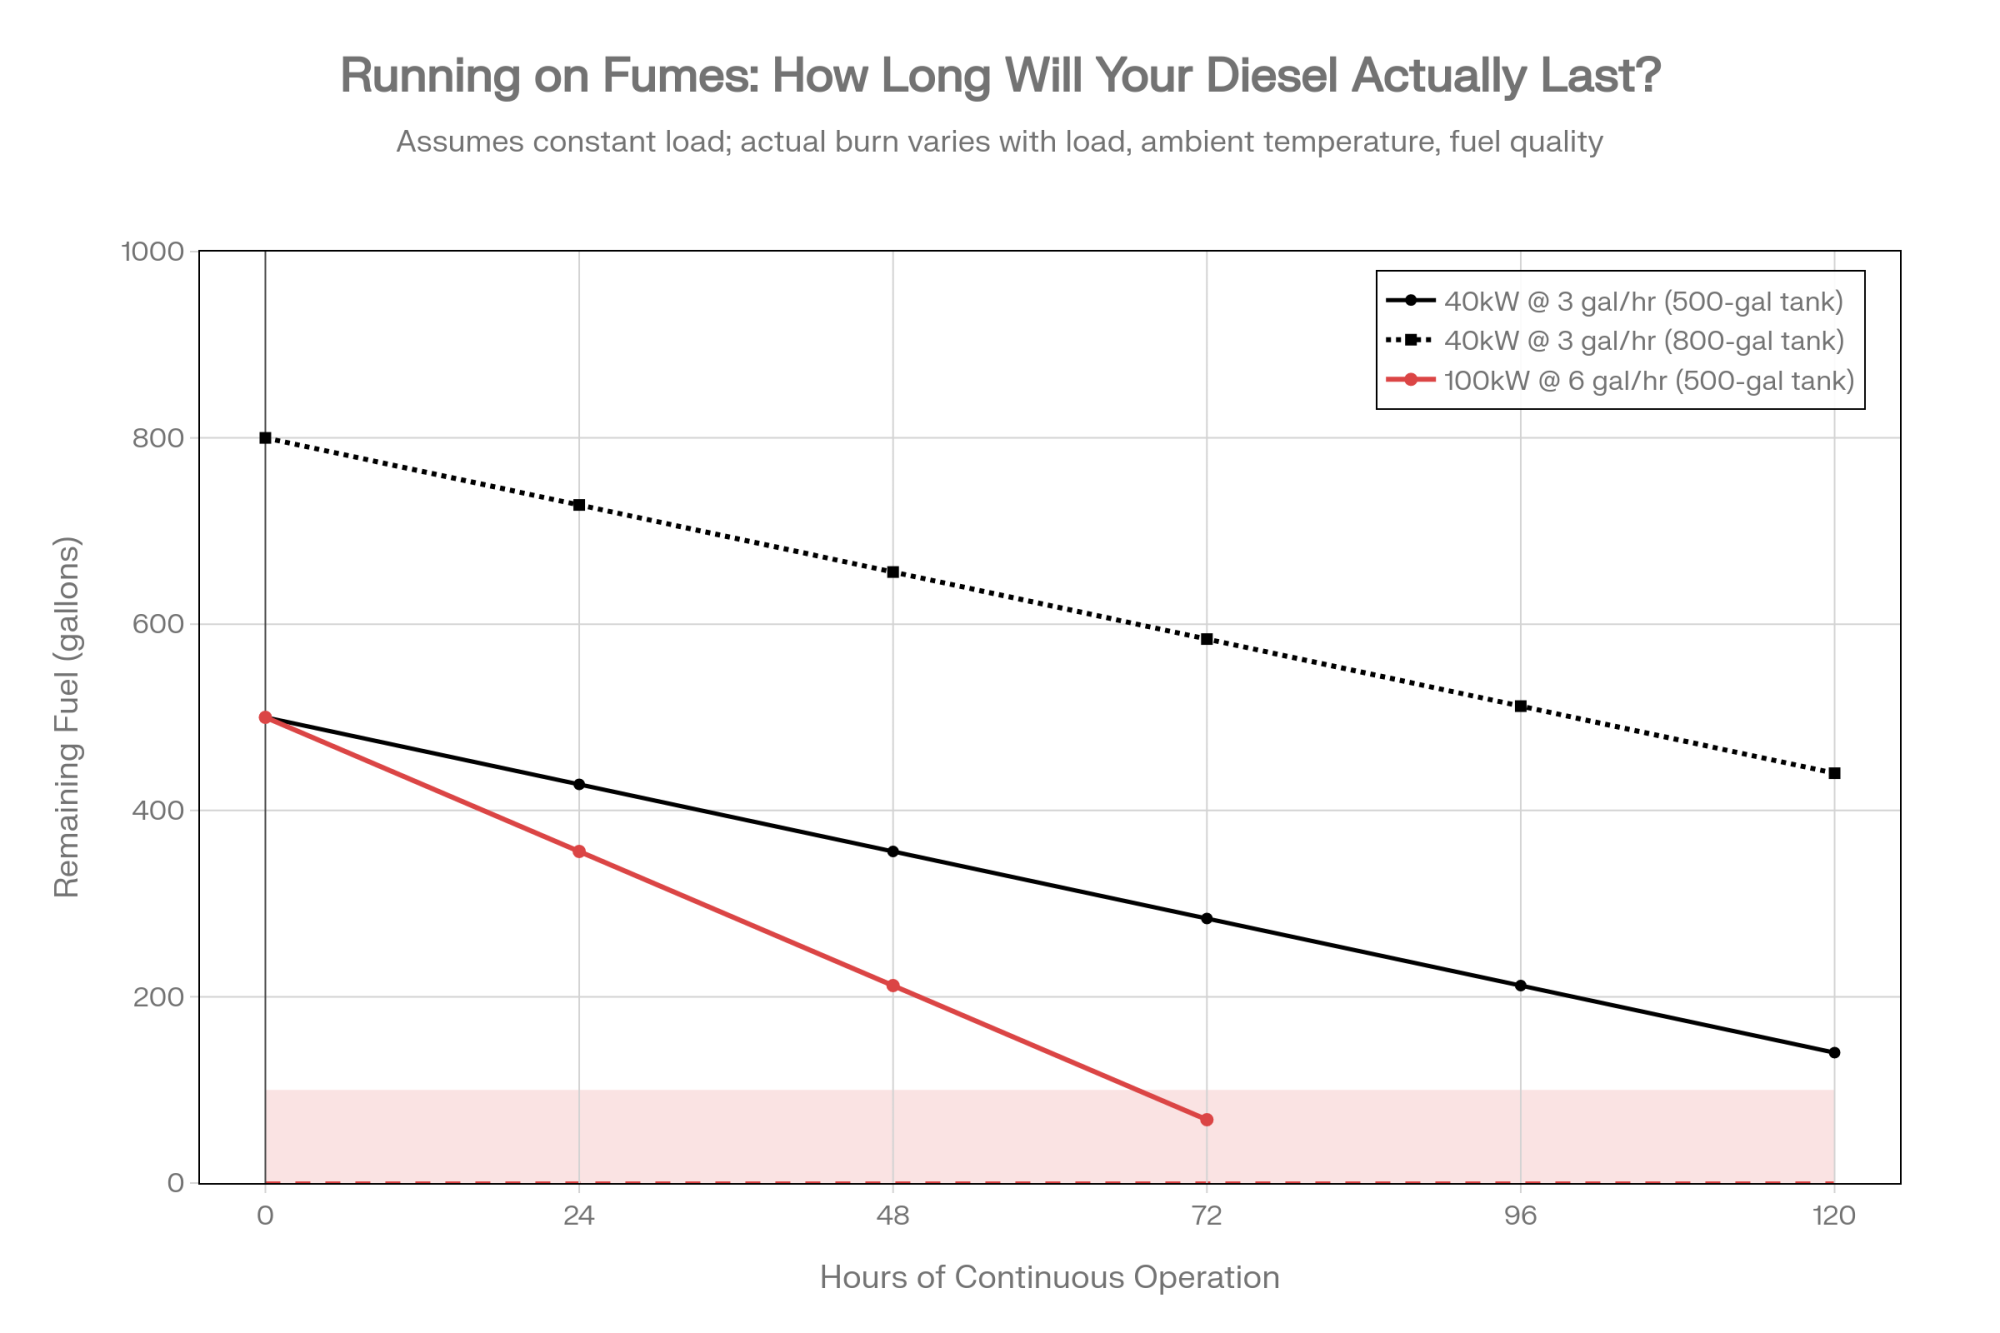
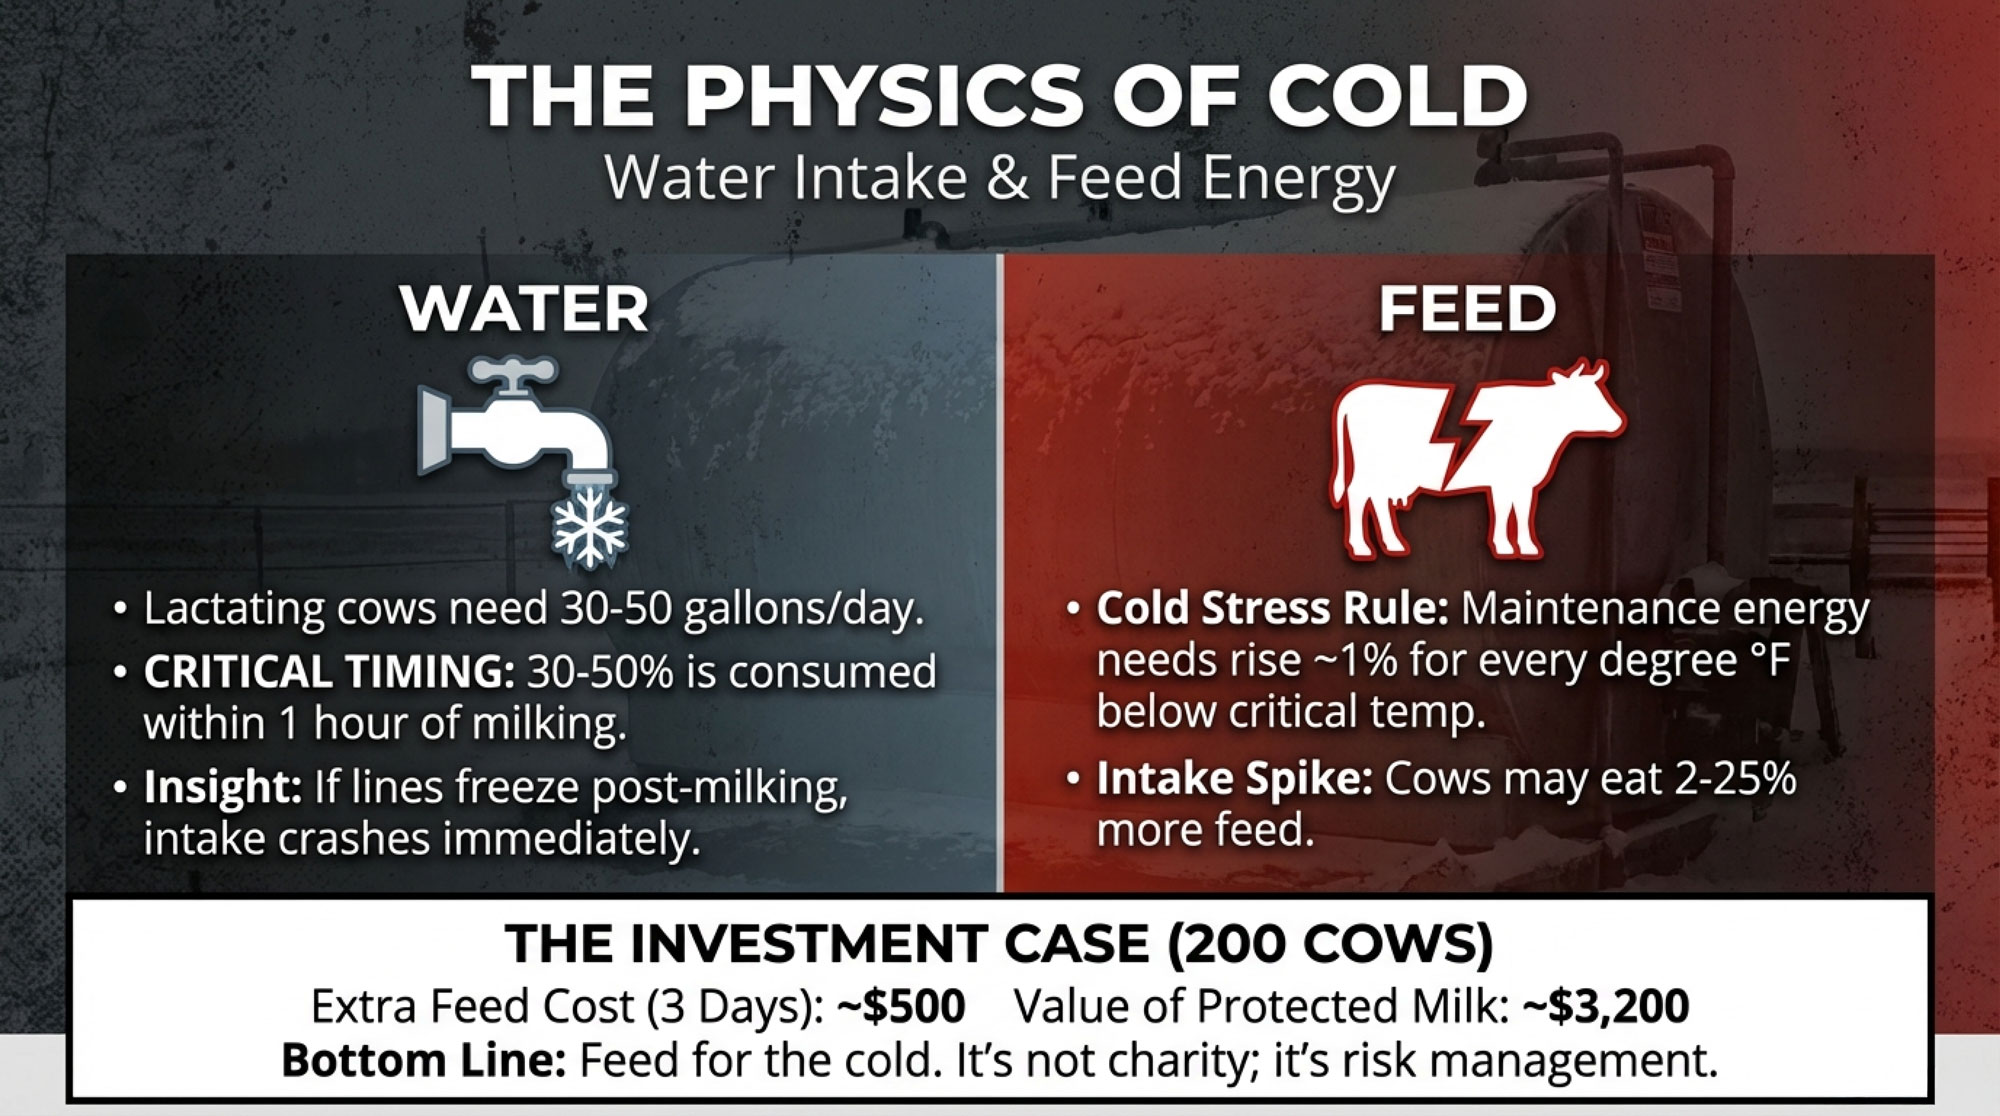
79% of U.S. Milk Runs on Immigrant Labor. If Yours Vanishes, You Have 72 Hours. – This reveals the brutal reality of our industry’s workforce dependence and arms you with a 72-hour survival strategy for labor shocks. You’ll position your operation to weather policy storms while protecting the milk volume currently at risk.
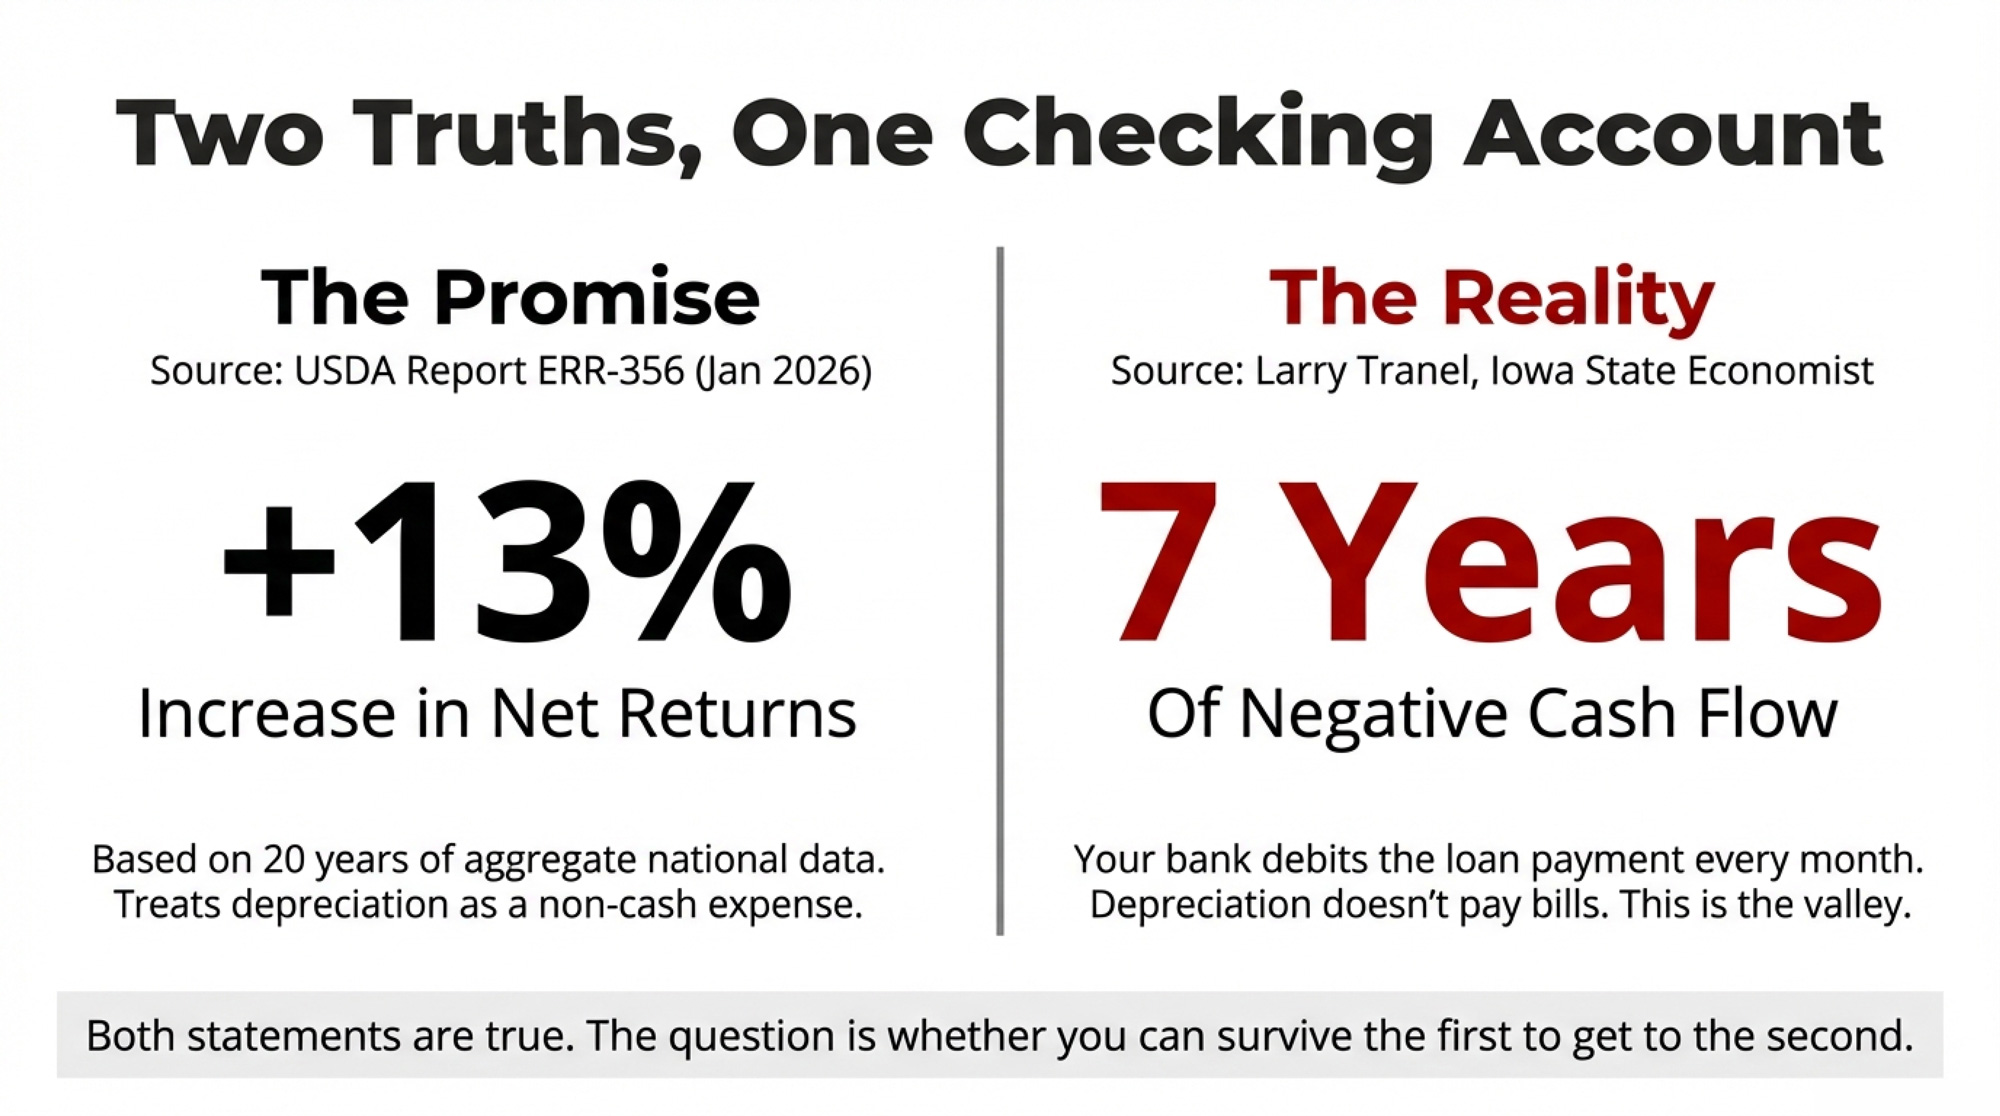
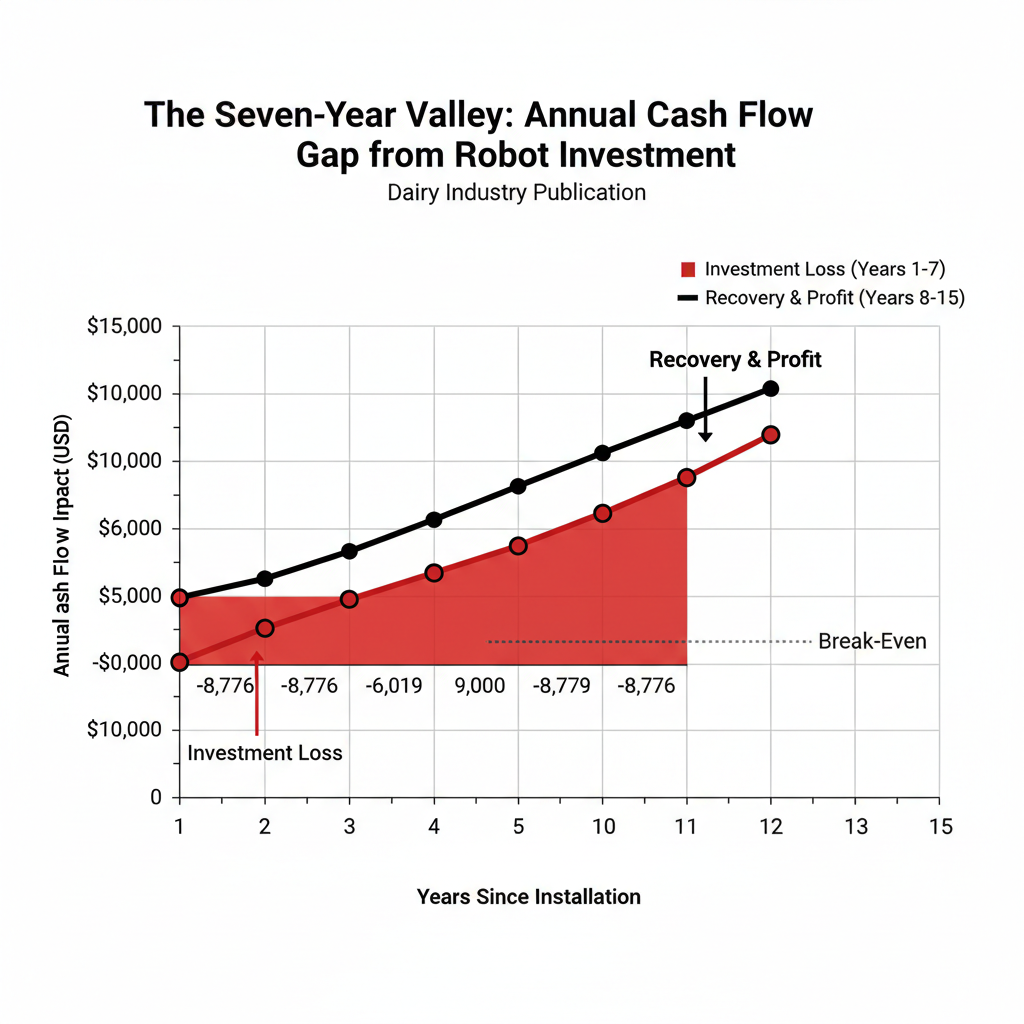
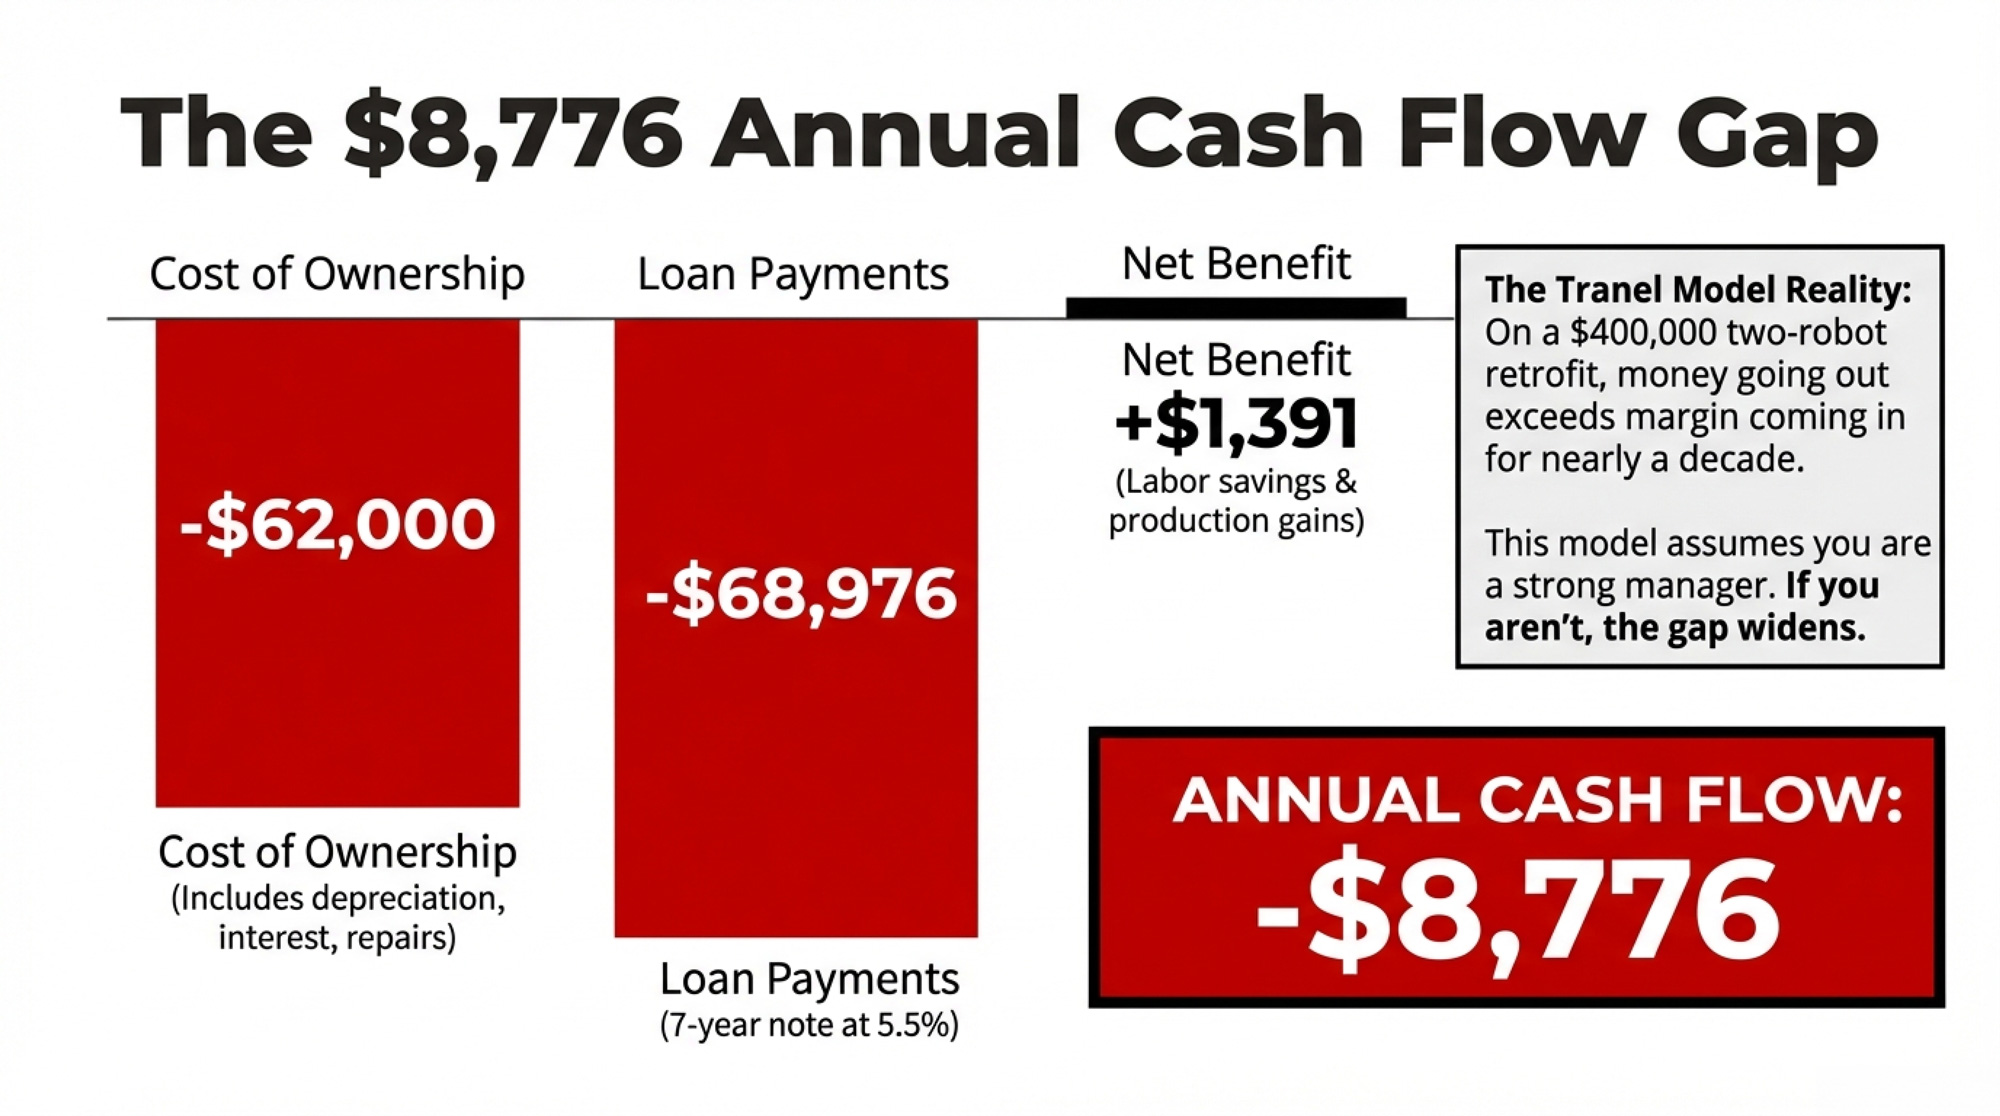
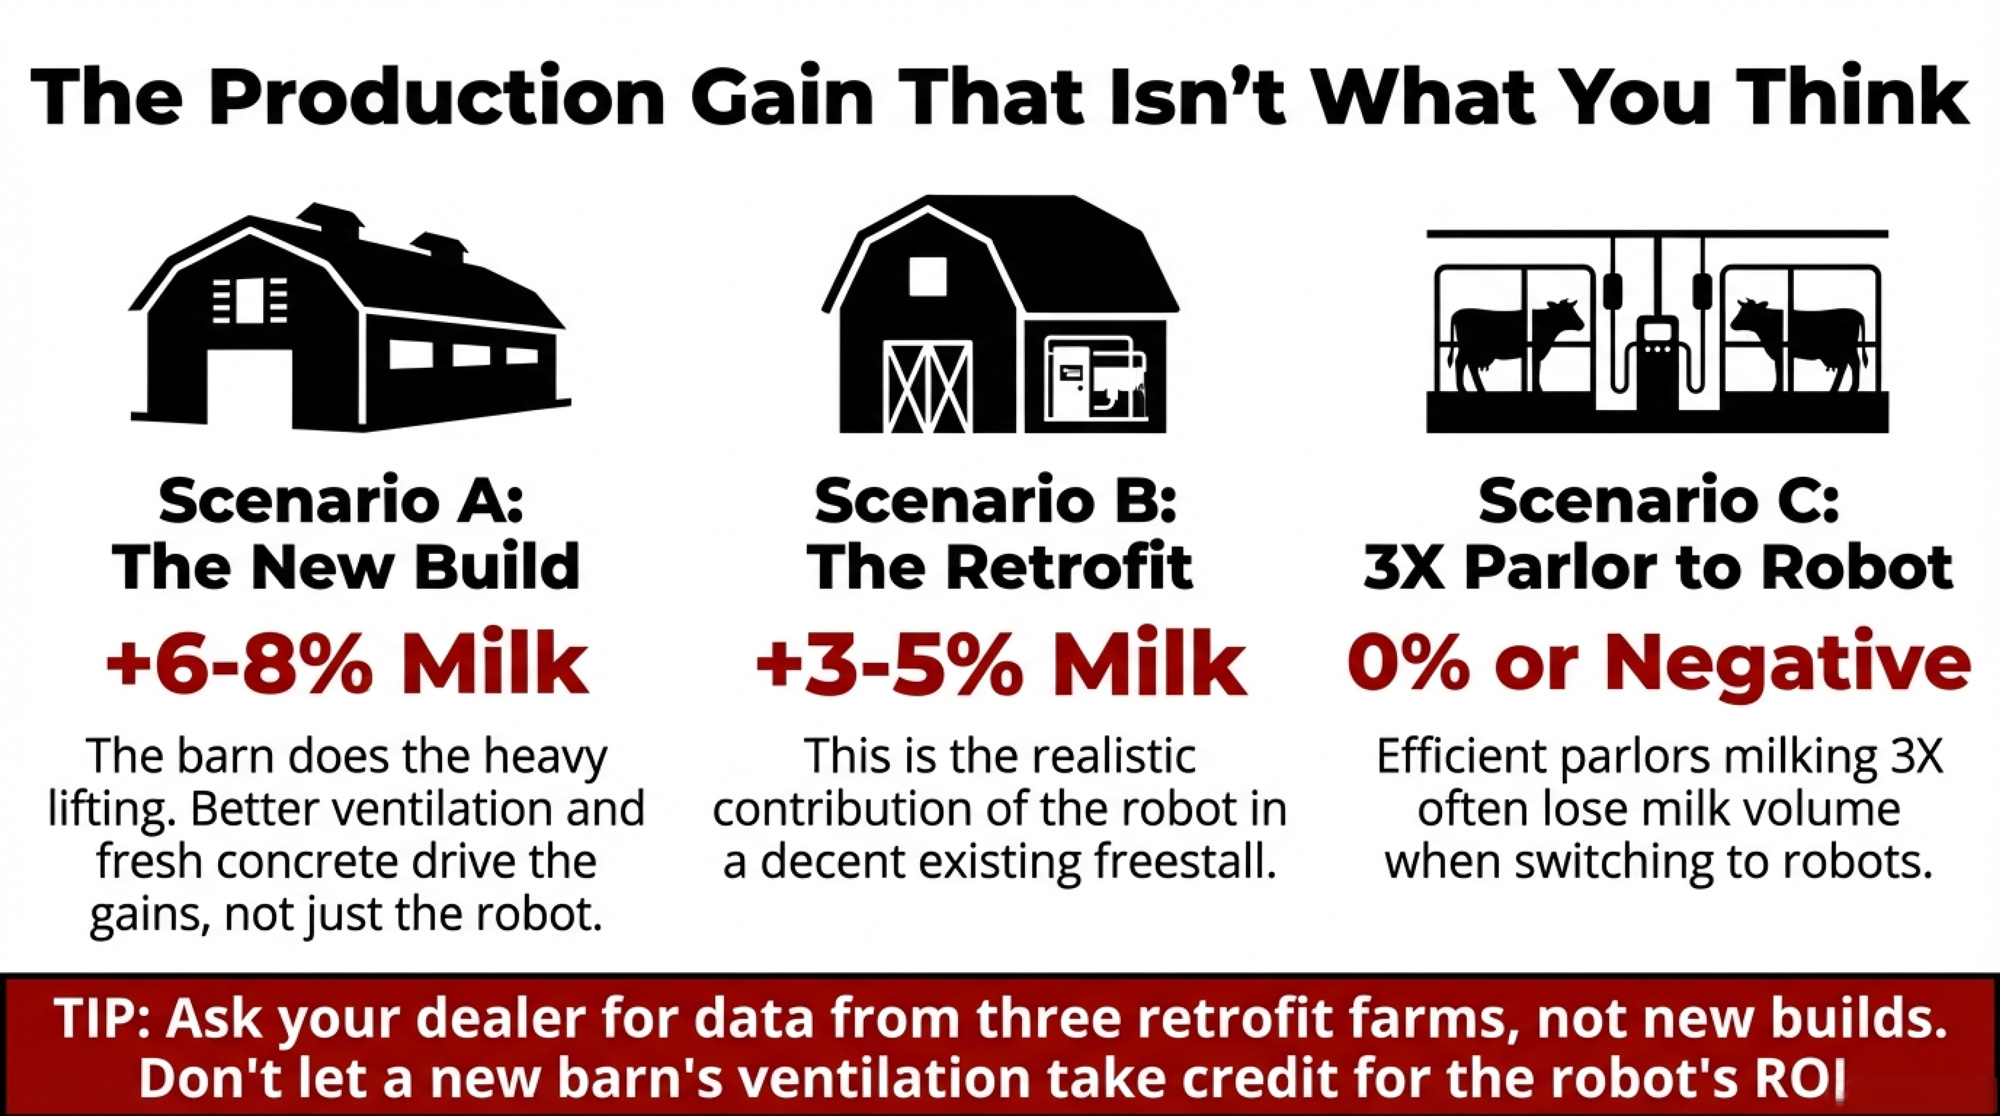
Robotic Milking Pays 13% More – After 7 Years of Red Ink – This exposes the gap between trade-show promises and actual barn-floor returns on robotic milking. It delivers verified payback periods and management thresholds, helping you decide if automation is a survival tool or an expensive mistake for your herd.
The Sunday Read Dairy Professionals Don’t Skip.
Every week, thousands of producers, breeders, and industry insiders open Bullvine Weekly for genetics insights, market shifts, and profit strategies they won’t find anywhere else. One email. Five minutes. Smarter decisions all week.
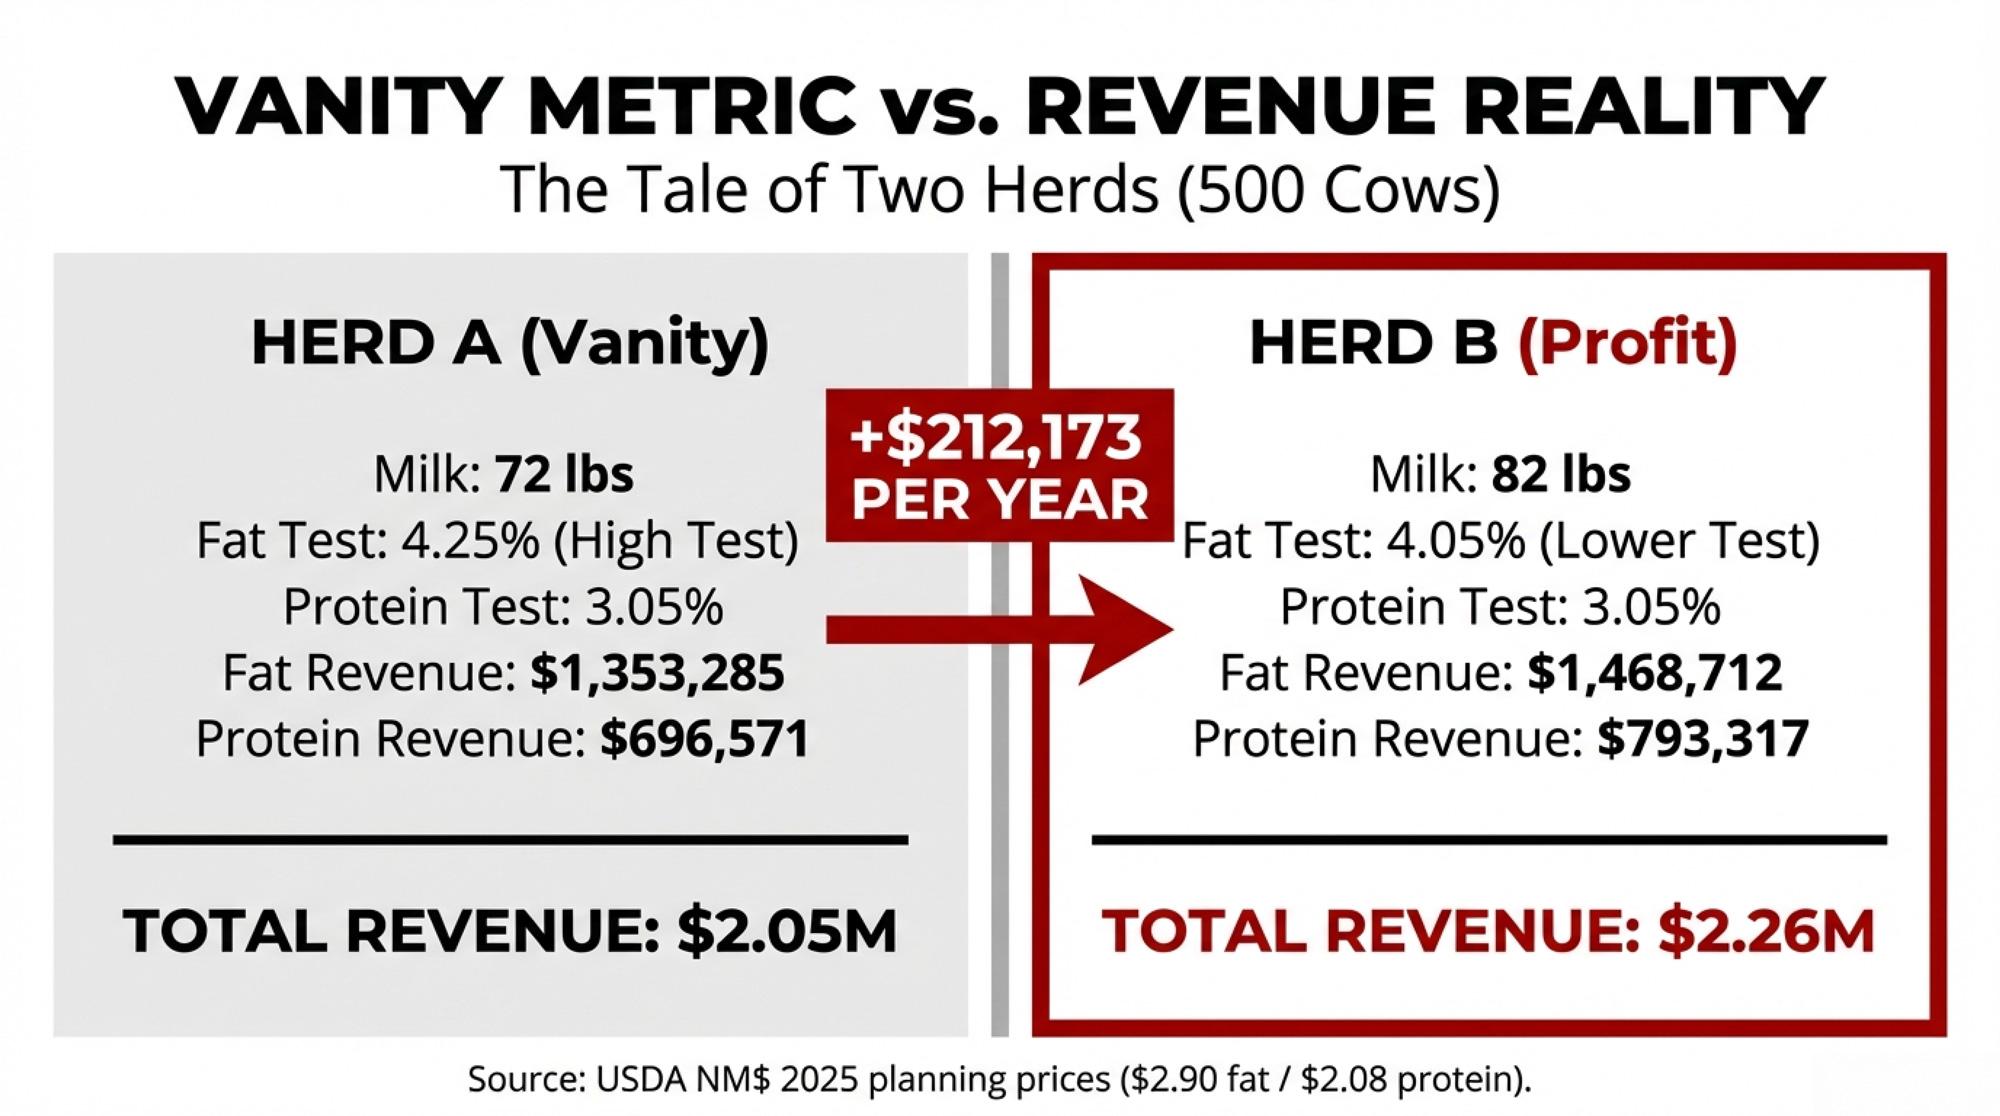
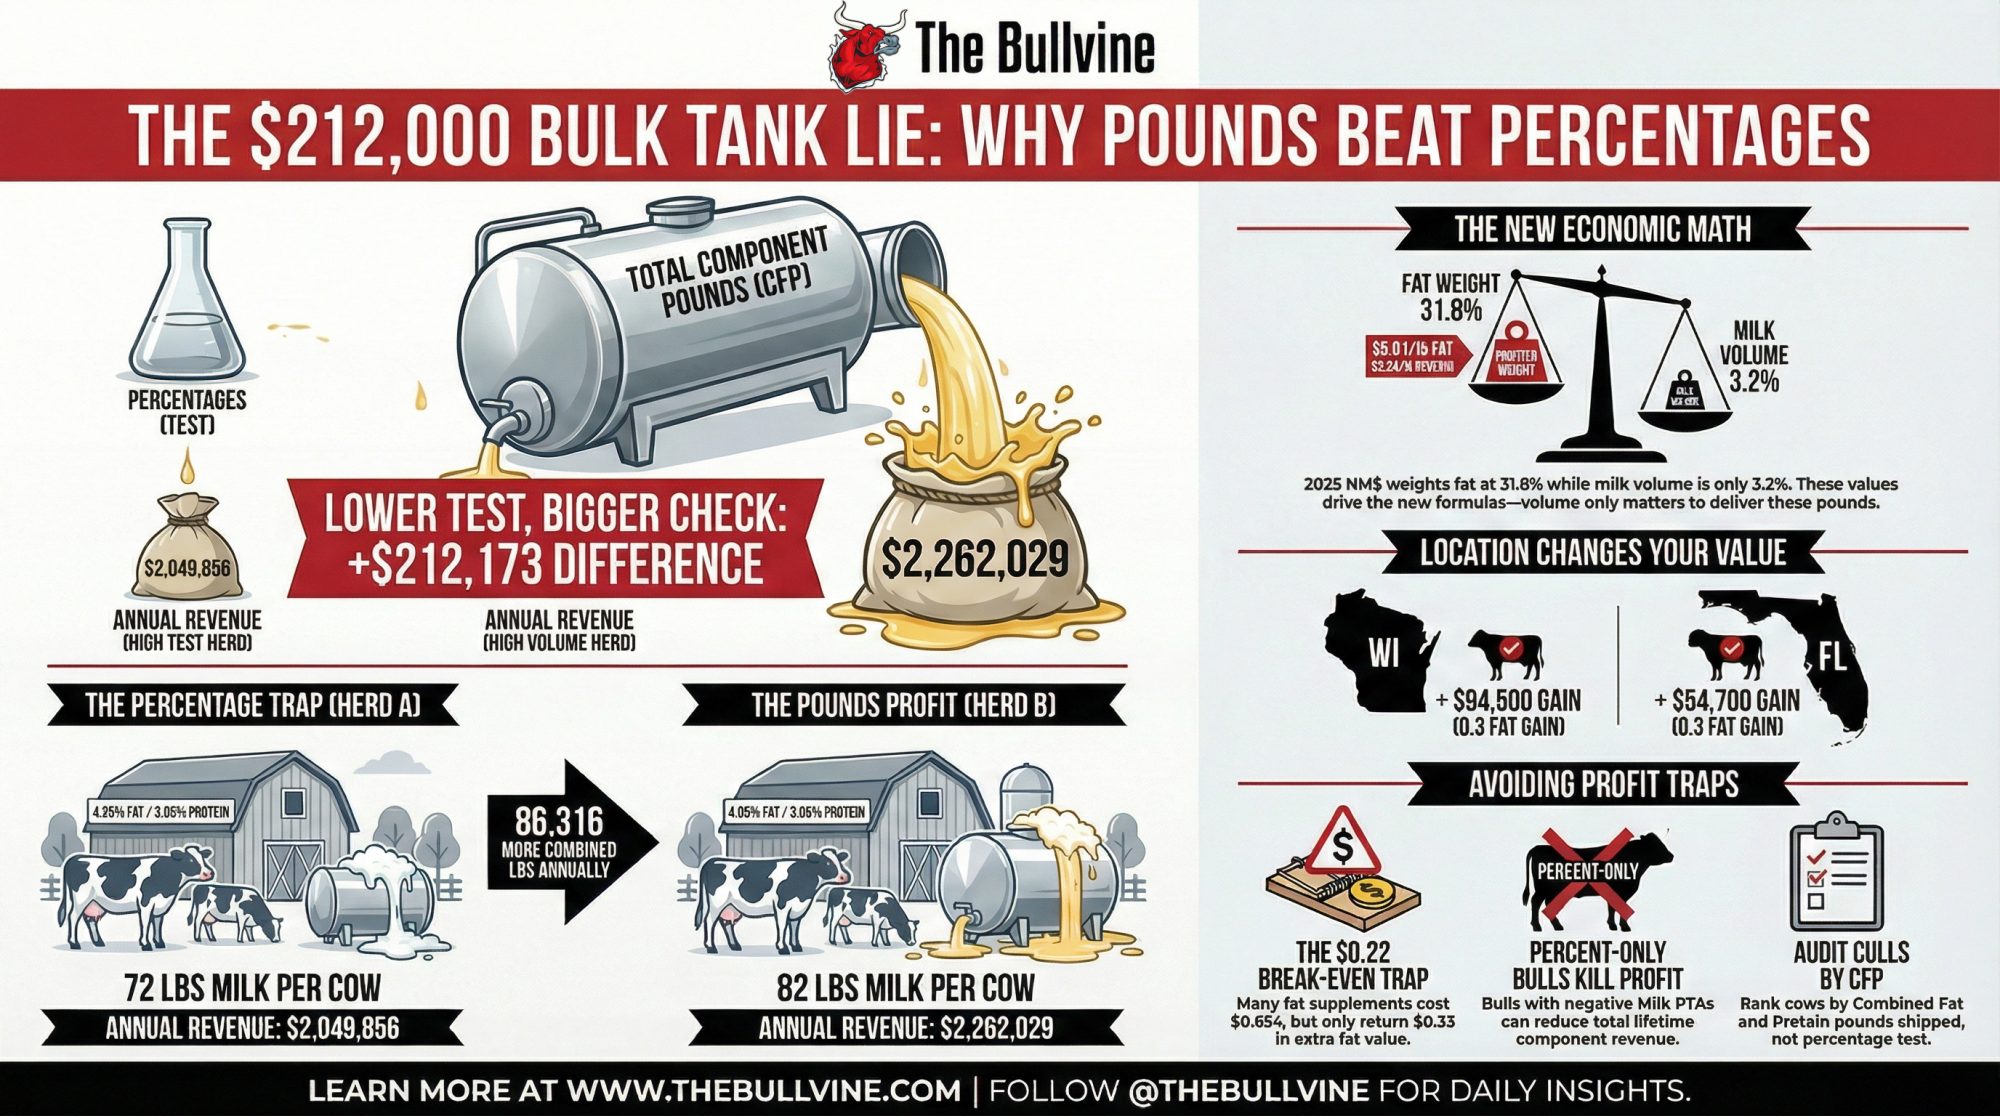
A lower-test herd shipped $212,000 more than its 4.25% neighbor. If you’re chasing percentages, this barn math is your wake-up call.
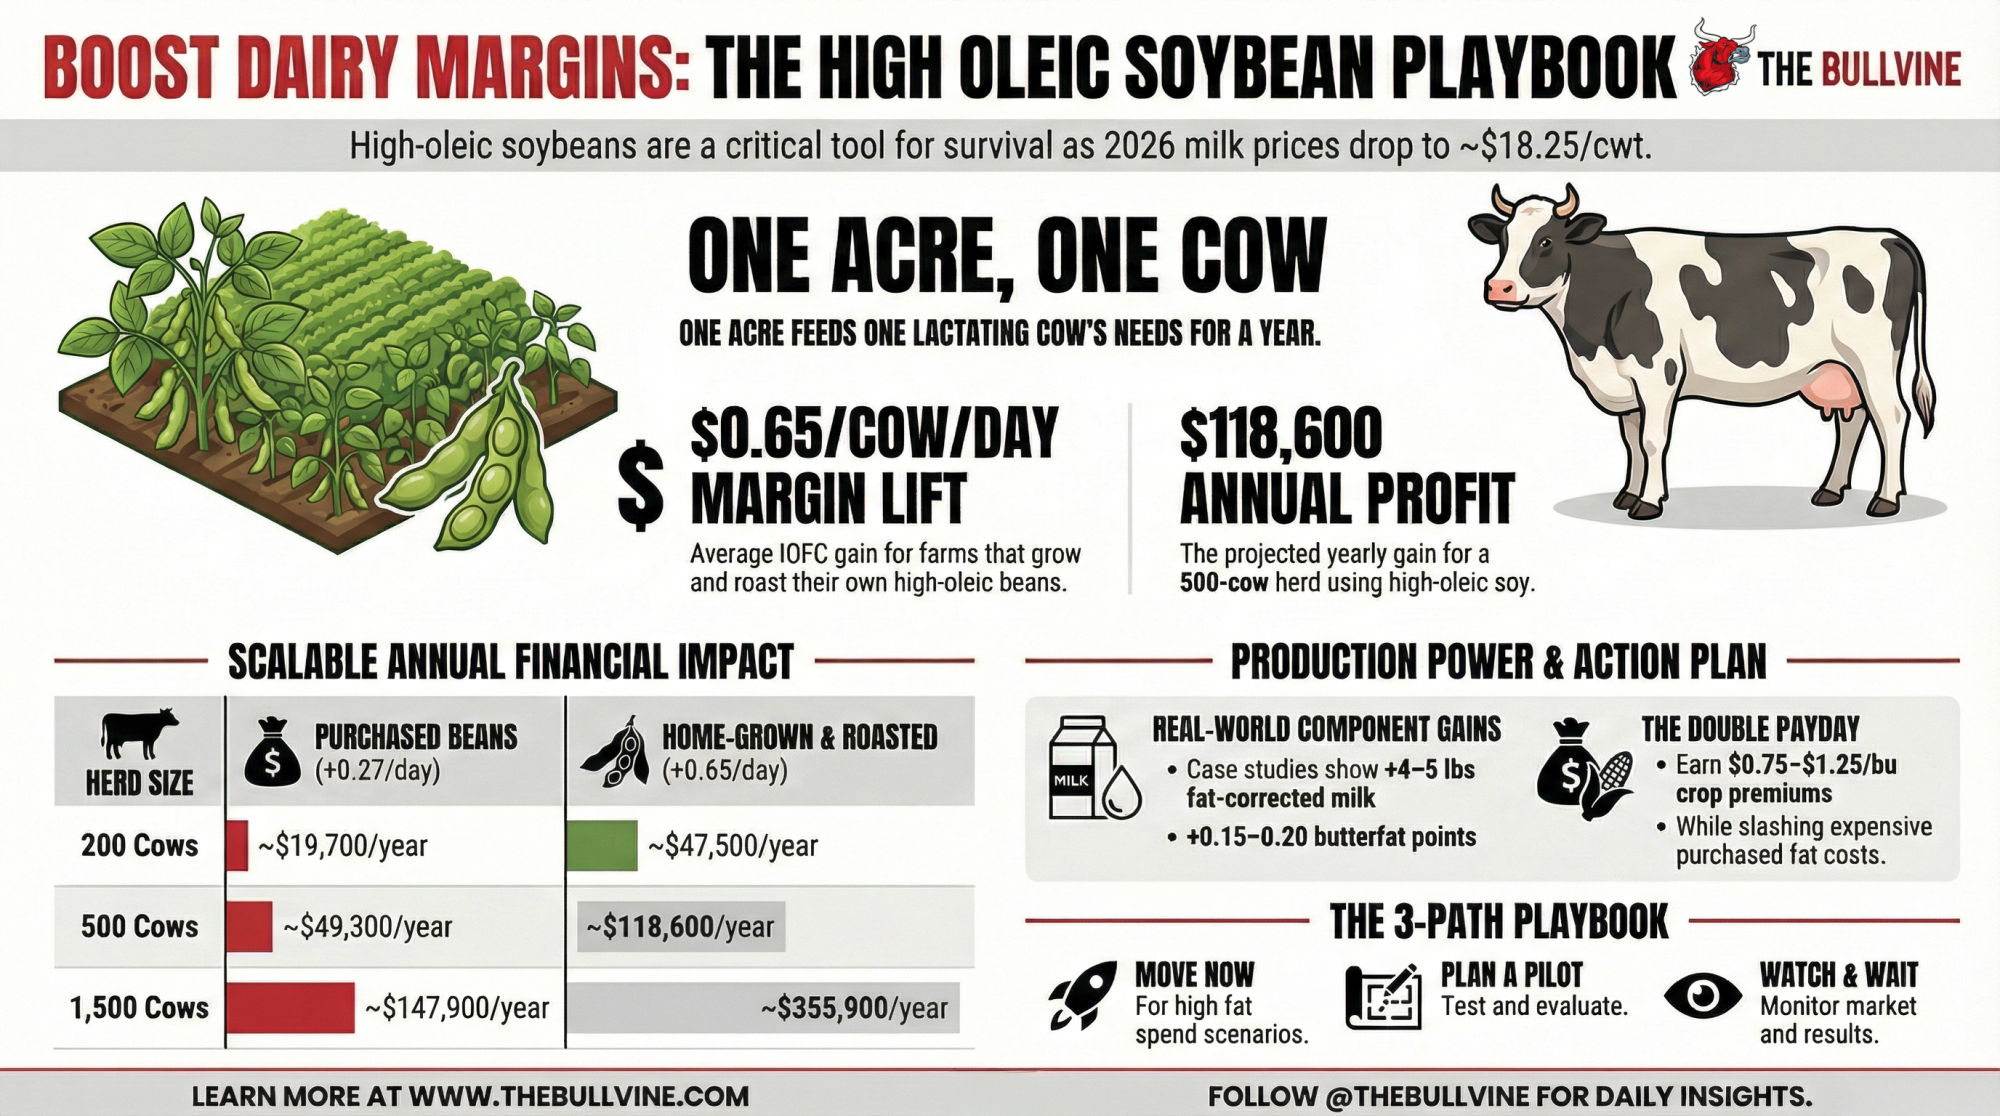
Executive Summary: June 2025 FMMO reforms and the 2025 NM$ revision have flipped the script so that fat and protein pounds shipped, not test percentages, drive your milk check. A side‑by‑side model of two 500‑cow Upper Midwest herds shows the lower‑test herd (4.05% fat at 82 lbs) shipping $212,000 more fat and protein value per year than a 4.25% herd at 72 lbs, using the USDA’s NM$ planning prices. NM$ now gives 31.8% weight to fat and only 3.2% to volume, which means “percent‑only” bulls with negative Milk PTAs can quietly cut lifetime component revenue even when their proofs look good on fat percentage. On the ration side, C16:0 supplement programs that add +0.10 fat test often cost three to four times more than the extra fat is worth once you do the barn math at $0.65–$1.00/cow/day. Your federal order then decides how much of that value you actually see: the same 0.3‑point fat gain is worth roughly $94,500 in a Wisconsin MCP plant but closer to $54,700 in a fluid‑heavy Florida order. The article walks through these calculations step by step and finishes with a four‑point playbook — track CFP, cull on pounds, match spending to your order, and pick sires on component pounds — so you can stress‑test your own numbers instead of trusting what the bulk tank report says.
A 500-cow Upper Midwest dairy can leave $212,000 in combined fat and protein revenue on the table by chasing a higher bulk tank test instead of shipping more component pounds. That’s not a hypothetical — it’s what the math shows when you model two herds side by side using USDA’s own NM$ planning prices.
A nutritionist working with herds in the region described the pattern: a 500-cow operation watches butterfat climb from 3.9% to 4.1% over six months. Everyone celebrates. Then somebody runs the real numbers — 78 lbs/day at 3.9% versus 74 lbs/day at 4.1% — and realizes they’re shipping nearly identical fat pounds. The test improved. The milk check didn’t.
What June 2025 Changed — And What It Cost
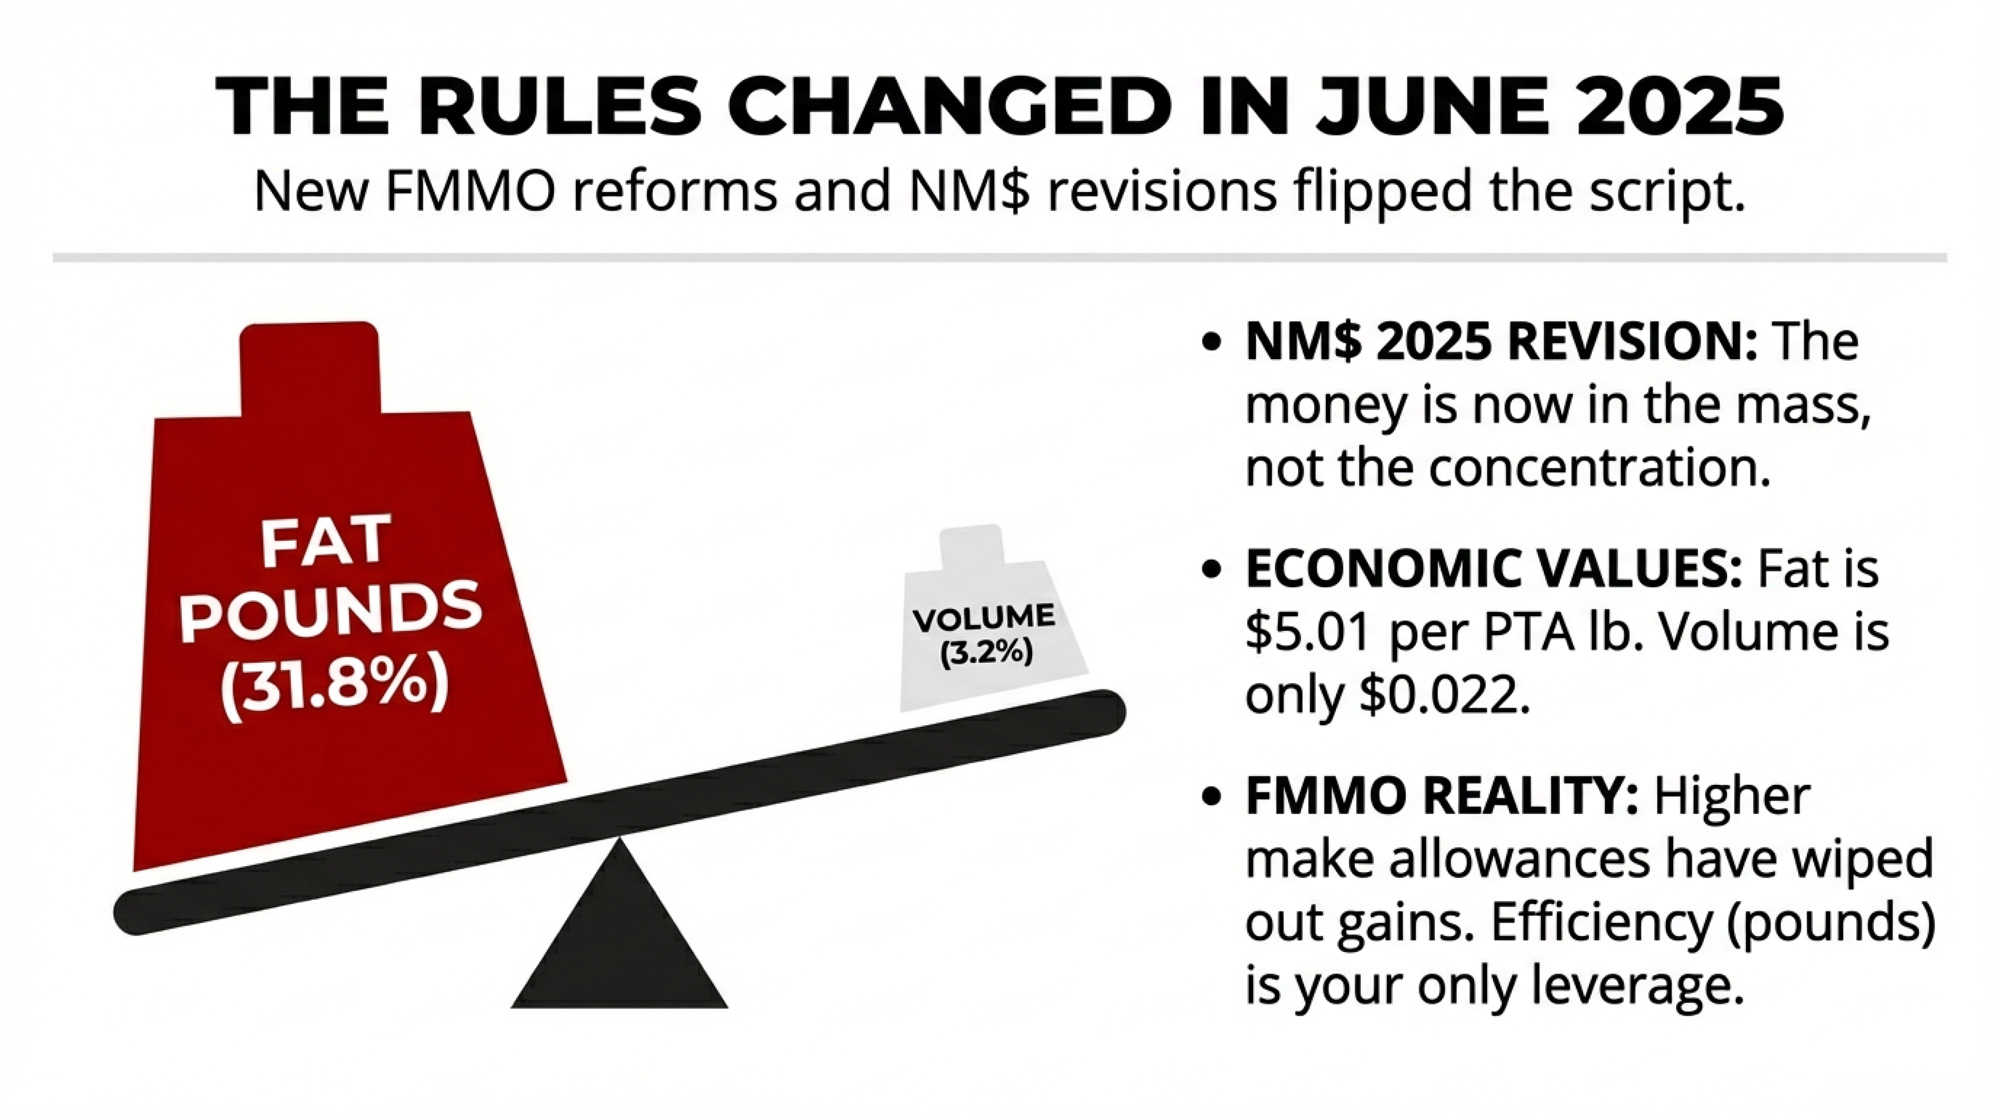
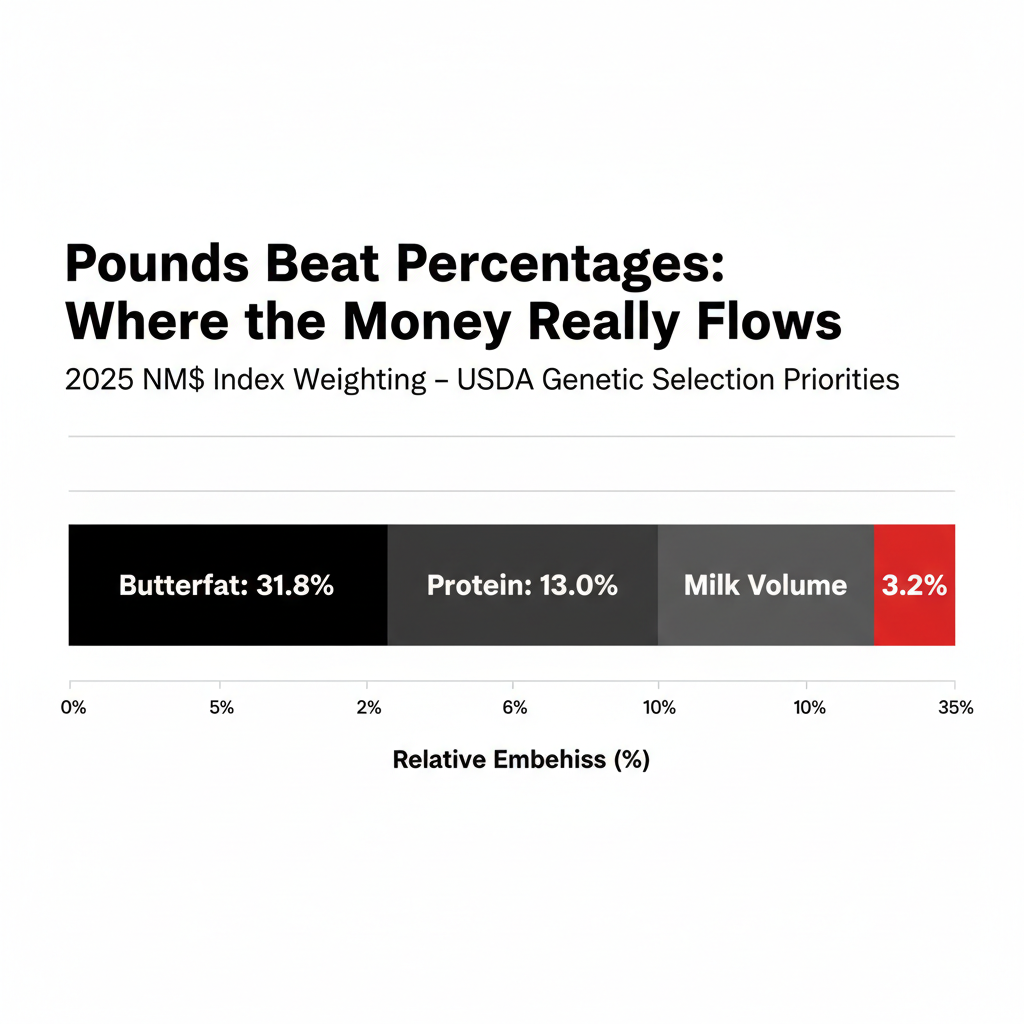
USDA’s April 2025 Net Merit revision pushed butterfat to 31.8% relative emphasis in NM$ — up from 28.6% in 2021 (VanRaden et al., NM$8 and NM$9). Protein carries 13.0%. Milk volume? Just 3.2%. The economic values are blunter still: fat at $5.01 per PTA pound, protein at $3.33, volume at $0.022.
Then the FMMO reforms hit on June 1, 2025. AFBF economist Daniel Munch calculated that in the first three months, producers lost more than $337 million in combined pool value — class price reductions of 85 to 93 cents per hundredweight depending on the order (AFBF Market Intel, September 2025). As Munch told Brownfield Ag News, the higher make allowances “more than wipe out” the gains from other reforms.
Upper Midwest Order 30 absorbed the worst of it. Roughly 69% of pooled milk went to Class III cheese in October 2025, with just 11.3% to Class I fluid (FMMA30 Dairy News, November 2025). That heavy cheese utilization means component value flows directly to producers — but the make allowance increase hit just as directly.
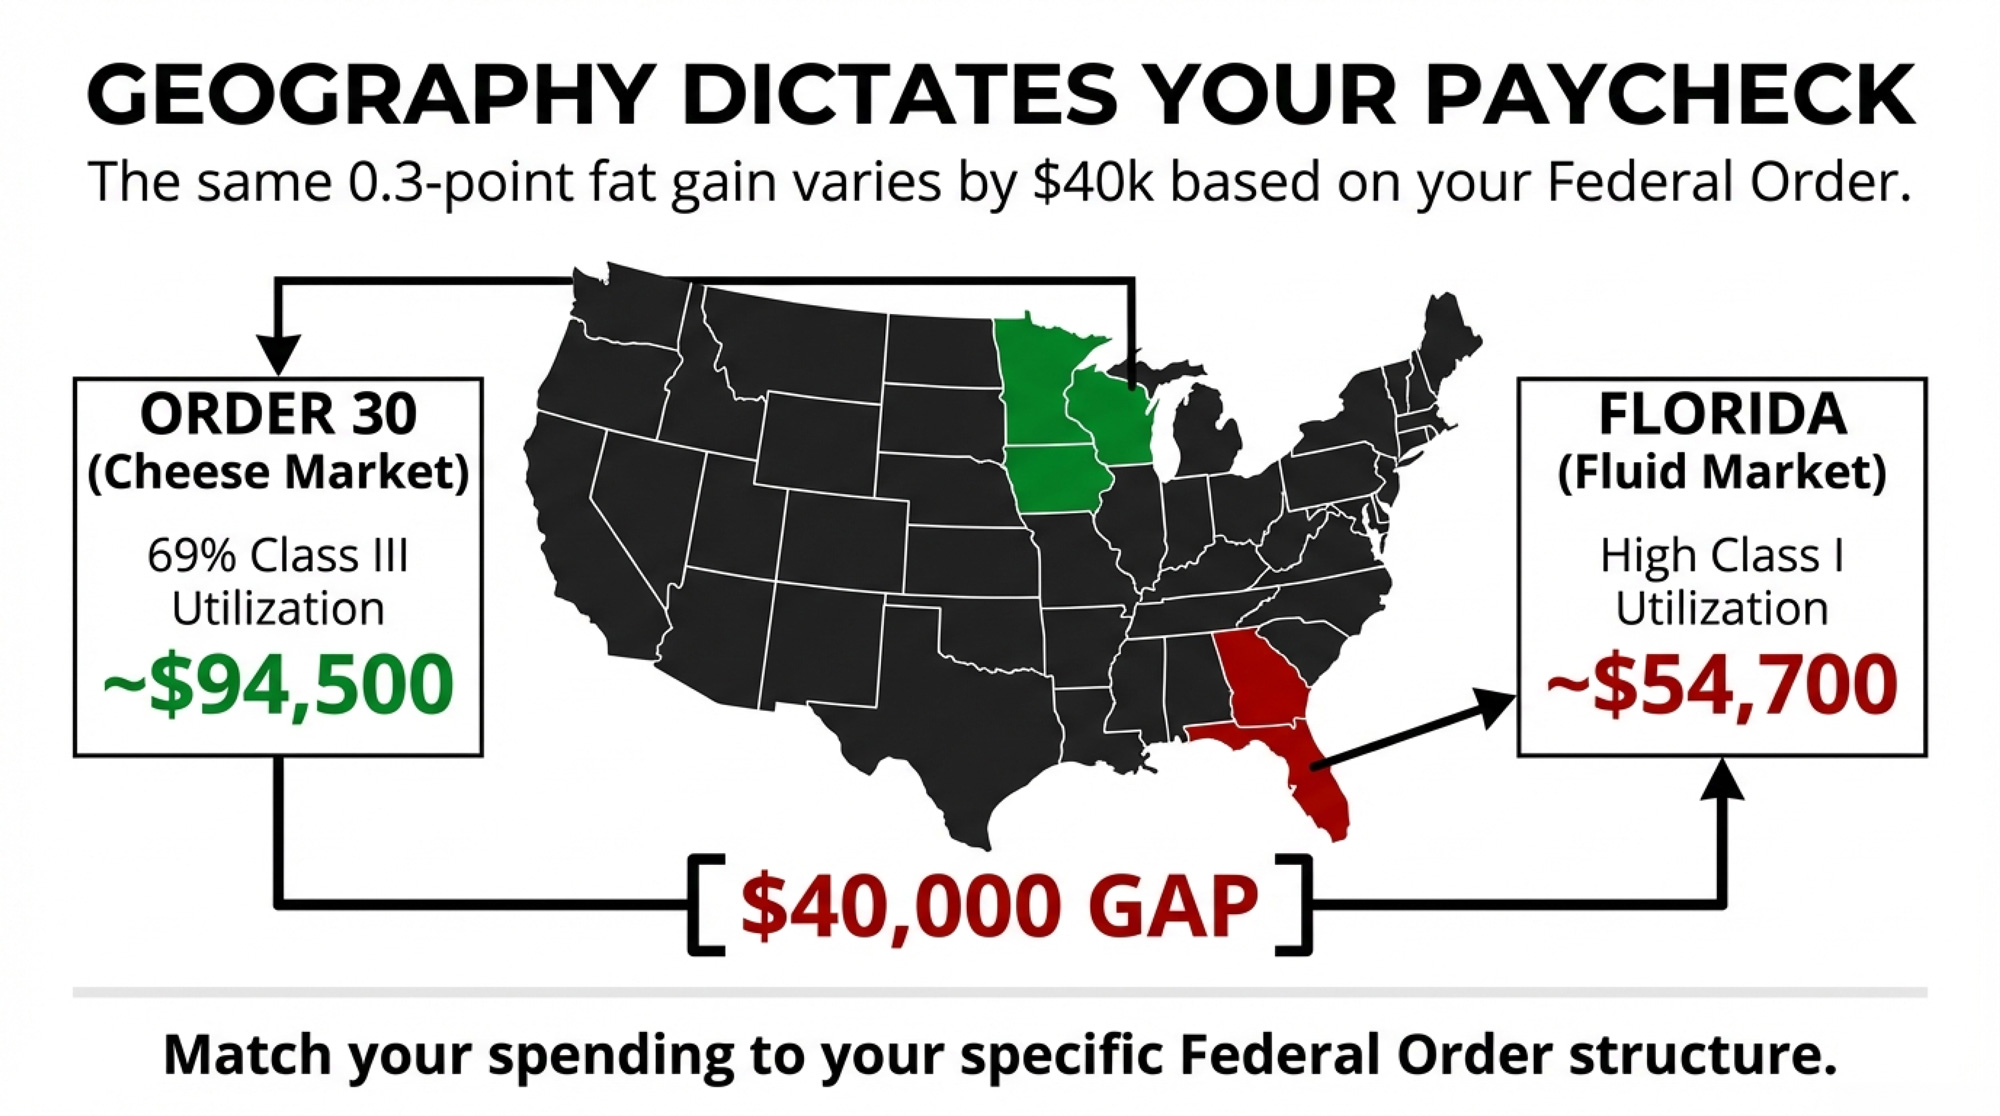
And regional structure amplifies everything. A 0.3-point butterfat improvement on a 500-cow herd captures an estimated $94,500 annually in Wisconsin’s MCP system versus approximately $54,700 in Florida’s skim-fat system. Same genetics. Same nutrition. A $40,000 gap from the order structure alone.
How $212,000 Disappears Into a Better Bulk Tank Test
Two 500-cow herds, both running 305-day lactations, were modeled using NM$ 2025 planning prices of $2.90/lb fat and $2.08/lb protein (VanRaden et al., January 2025). These are multi-year forecast prices; USDA built the index on non-spot prices. Actual FMMO butterfat ran about $2.95/lb in January 2025 and fell to approximately $1.45/lb by January 2026. The pounds principle holds at any price level; the dollar gap moves with the market.
Metric
Herd A (High Test)
Herd B (High Volume)
Difference
Milk/Cow/Day
72 lbs
82 lbs
+10 lbs
Fat Test
4.25%
4.05%
−0.20 points
Protein Test
3.05%
3.05%
Same
Annual Fat Shipped
466,650 lbs
506,453 lbs
+39,803 lbs
Annual Protein Shipped
334,890 lbs
381,403 lbs
+46,513 lbs
Fat Revenue @ $2.90/lb
$1,353,285
$1,468,712
+$115,427
Protein Revenue @ $2.08/lb
$696,571
$793,317
+$96,746
Combined F+P Revenue
$2,049,856
$2,262,029
+$212,173
Herd B — the lower-test herd — ships nearly 40,000 more pounds of fat and over 46,500 more pounds of protein. At actual January 2025 FMMO prices ($2.95 fat, $2.33 protein), the gap widens to roughly $226,000 because protein is priced higher than the NM$ assumption.
Three Places the Trap Compounds Silently
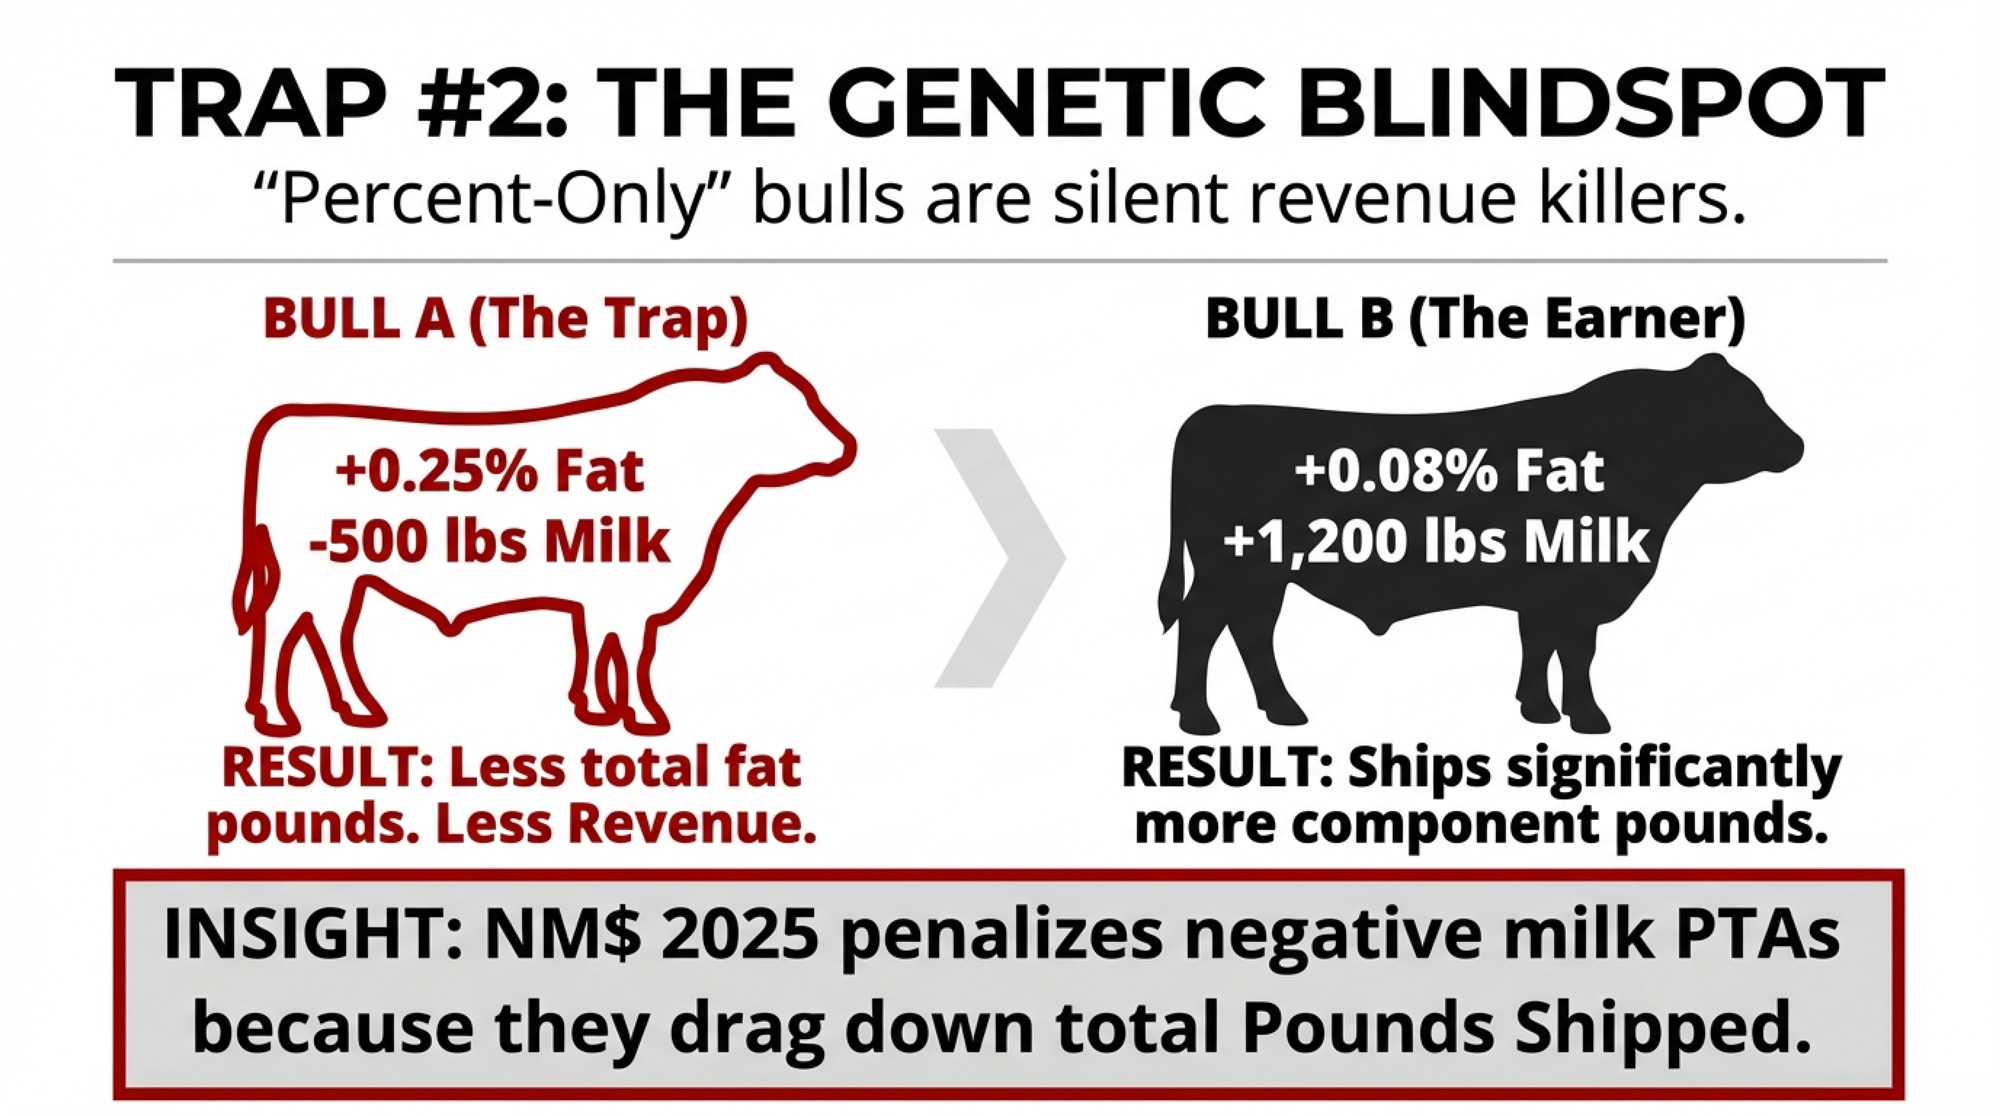
Genetics. The 2025 NM$ penalizes “percent-only” bulls with deeply negative Milk PTAs. A bull posting +0.25% fat but −500 lbs Milk loses on all three lines — less volume means fewer total fat pounds, fewer protein pounds, and less volume revenue. A bull at +0.08% fat with +1,200 lbs Milk often ships more total component pounds per lactation. That’s exactly what the $5.01/lb and $3.33/lb economic values reward.
Nutrition. Research from Prof. Kevin Harvatine’s lab at Penn State found C16:0 palmitic acid boosts fat test by +0.30 to +0.50 percentage points at ~2% of diet DM (Dairy Global, November 2023). Michigan State’s de Souza lab (J. Dairy Sci., 2024) showed mid-lactation cows at 40–50 kg/day responded best. But supplements run $0.65–$1.00/cow/day, and the protein test can slip 0.02–0.03 points. If milk yield doesn’t climb with the fat test, the P&L can go negative while the bulk tank report looks great.
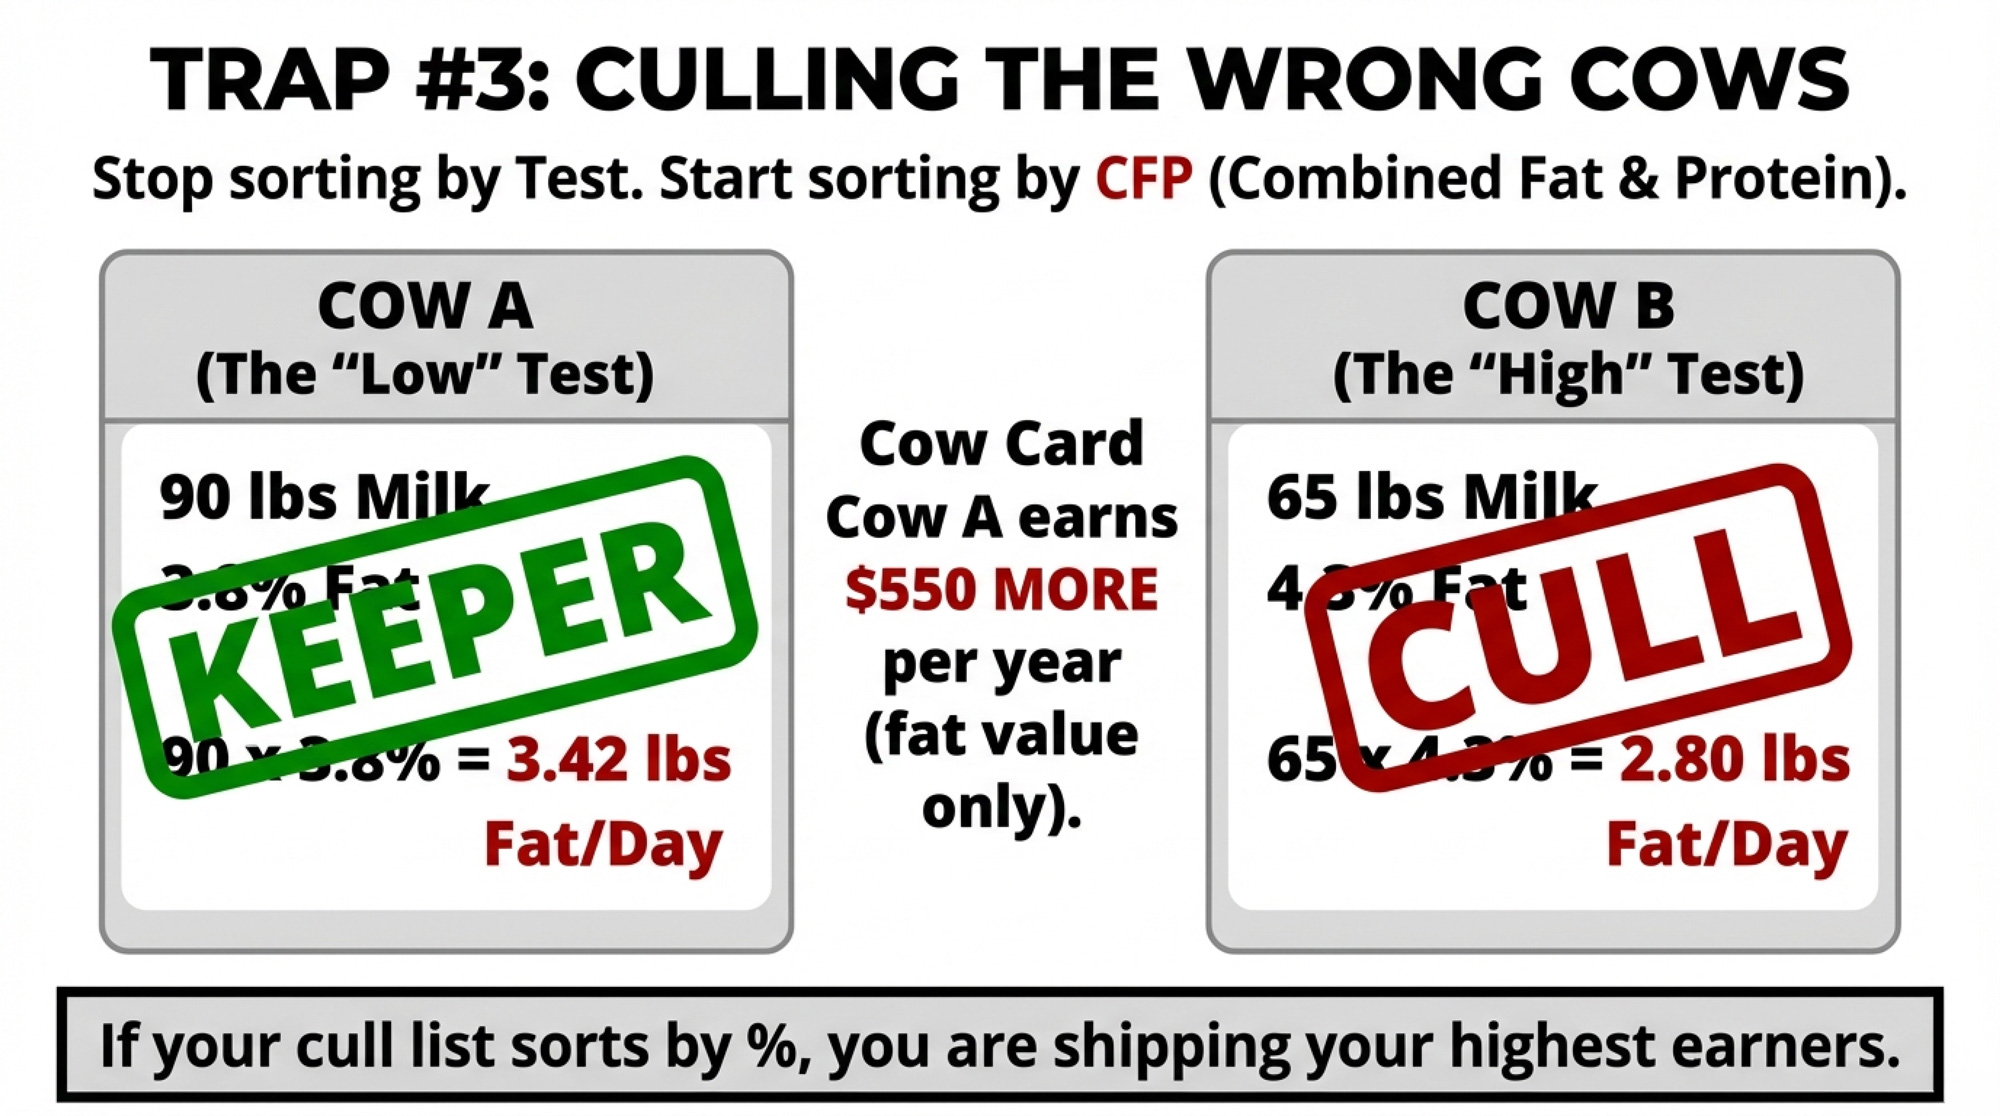
Culling. Cow 1 at 90 lbs/day and 3.8% fat ships 3.42 lbs fat/day. Cow 2 at 65 lbs/day and 4.3% ships 2.80 lbs. The “low test” cow delivers 0.62 more lbs of fat daily — about $550/year at $2.90/lb. If your cull list sorts by test instead of CFP (combined fat and protein pounds shipped), you may be shipping the wrong animals.
Does Chasing +0.1% Fat Actually Pay Under Component Pricing?
Full walkthrough: a program promising +0.10 points fat test on 500 cows averaging 75 lbs/day.
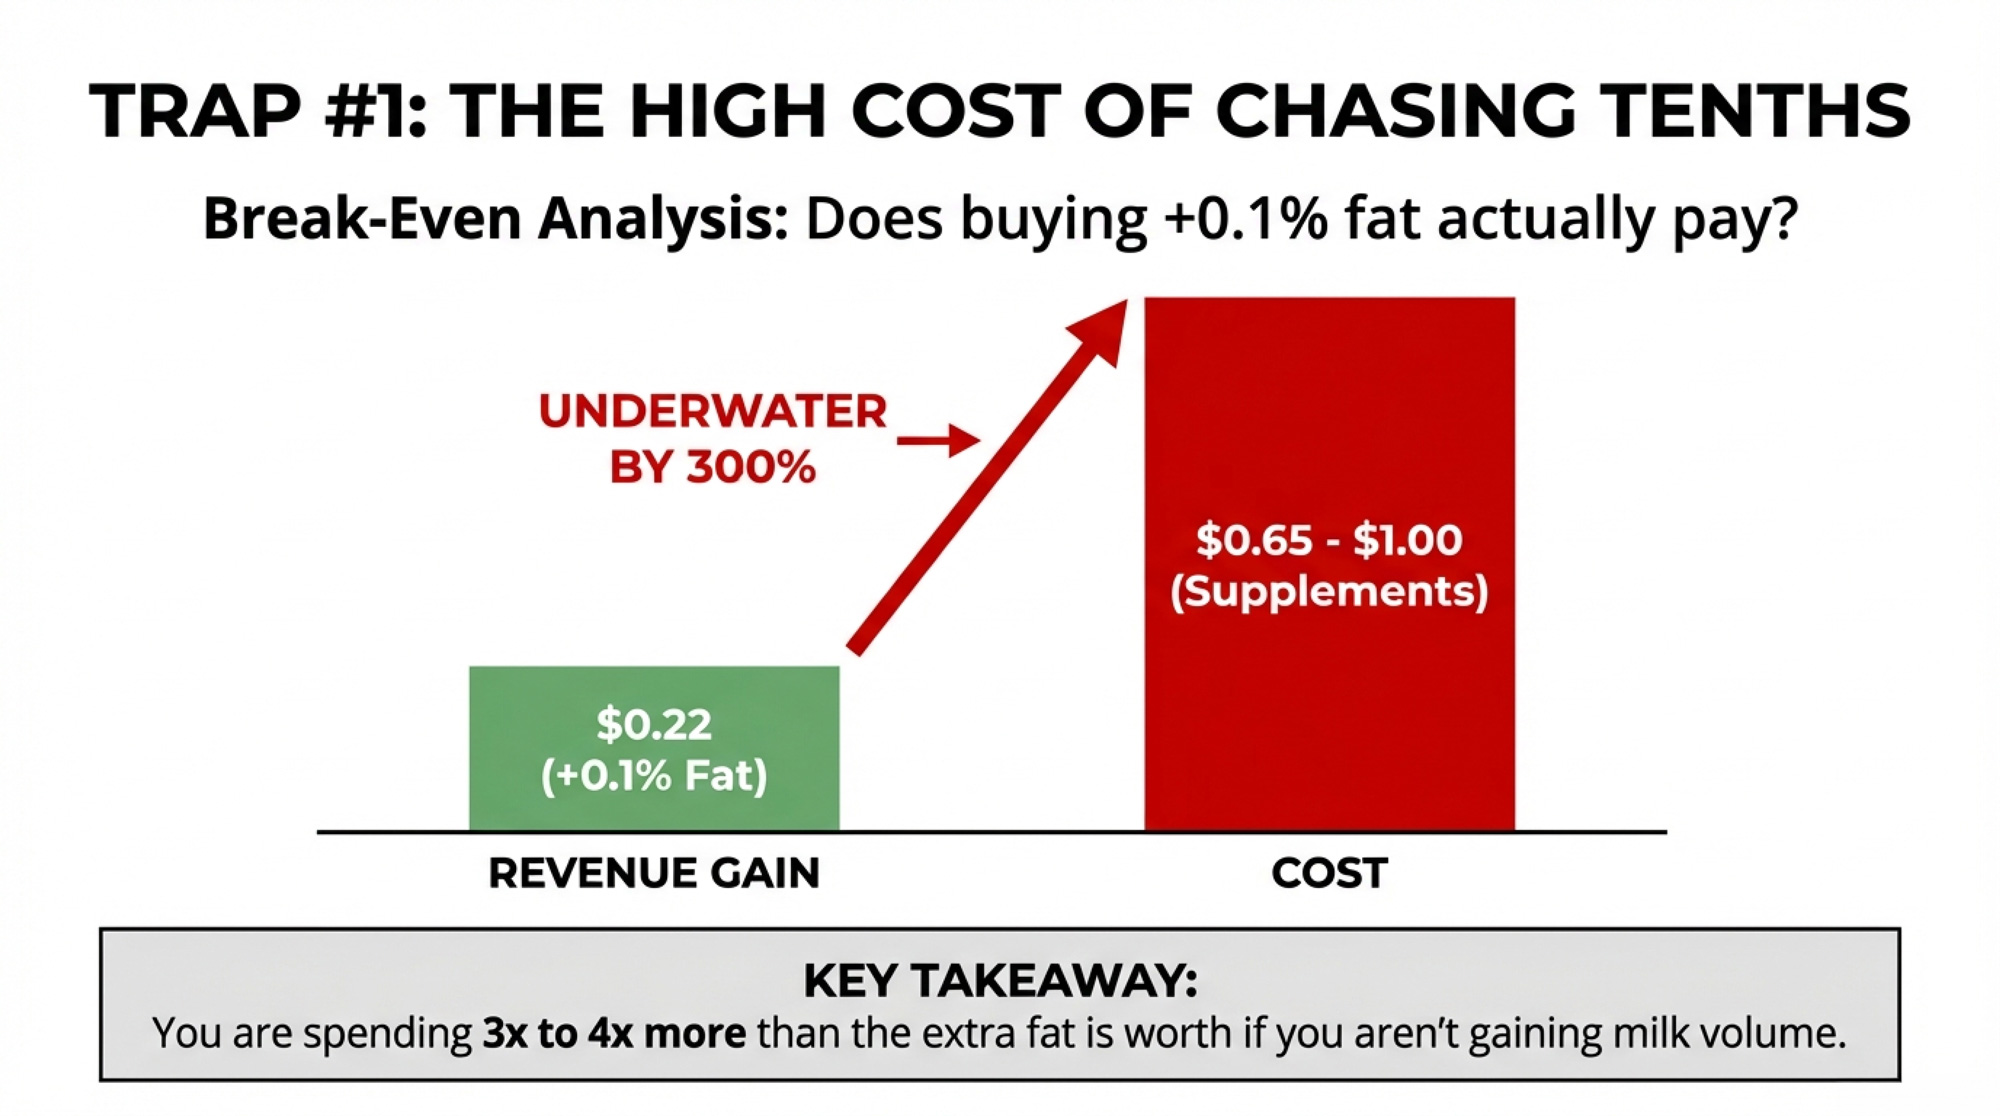
Break-even: about $0.22/cow/day. That’s three to four times below what any published C16:0 program costs. If a tenth of a point on fat test is the only gain — and you’re losing milk or protein in the process — the math is underwater.
The Shift: From Test Reports to Pounds Shipped
For herds getting ahead of this, the pivot starts with one change: they stop celebrating test and start tracking CFP per cow per day. Instead of “Our herd’s at 4.1% fat,” they’re asking: “How many pounds of fat and protein did we ship per cow today?”
That reframes every proposal — a new sire lineup, a nutrition tweak, or a cull list — around one question: does it raise CFP?
The Playbook: Four Ways to Manage for Pounds
1. Make CFP your primary metric. Calculate combined fat + protein pounds per cow per day, minimum monthly. 30-day action: pull last month’s data and establish your baseline. Trade-off: watching fat test flatten while CFP climbs feels wrong. It’s not.
2. Rebuild the cull list around CFP. Rank by shipped CFP first, then overlay fertility, health, and age. 90-day action: audit last quarter’s culls against CFP. Trade-off: you still need to watch for milk fat depression — tests aren’t irrelevant, just not the sorting metric.
3. Match spending to what your order actually pays. Order 30’s 69% Class III utilization means component value flows through relatively directly. In skim-fat orders with heavy Class I, the math is different. 30-day action: call your field rep and ask how much component value hits your check. Trade-off: even within the same order, different handlers deliver different capture.
4. Run genetics and nutrition on parallel tracks. Long-term: component-pound genetics (NM$, CFP). Short-term: nutrition for quick wins. 365-day action: rebalance your sire lineup at the next proof run using pound PTAs, not percentage PTAs. Trade-off: if component prices sag — January 2026 butterfat at ~$1.45/lb is a reminder — nutrition plays may need to scale back. The genetics keep compounding regardless.
What This Means for Your Operation
Run your own Herd A vs. Herd B table. Plug in your daily lbs, fat test, protein test, cow count, and your most recent FMMO component prices. If a lower-test scenario ships more pounds, you’ll need to decide.
The break-even for a +0.1% fat program is $0.22/cow/day. Published C16:0 costs range from $0.65 to $1.00. If you’re spending three to four times the break-even, the fat gain alone doesn’t cover it.
Audit your culls. Pull three to five cows you shipped for “low components” and check their CFP against cows you kept. If CFP sorts the list differently than test did, rebuild it.
Know your order structure. Order 30’s 69% Class III means the component value flows through. If you’re in a fluid-heavy order, your capture math is different — and so is every component investment decision.
Key Takeaways
If your success metric is fat test rather than fat and protein pounds shipped, you’re managing to the wrong number. The post-June 2025 FMMO system and the 2025 NM$ ($5.01/lb fat, $3.33/lb protein) both reward pounds.
The $212,000 gap is $115,427 from fat and $96,746 from protein at NM$ planning prices. At actual January 2025 FMMO prices, it’s closer to $226,000.
The 2025 NM$ penalizes percent-only bulls. Fat emphasis jumped from 28.6% to 31.8%, but milk volume still carries a positive value. A sire whose Milk PTA drags may produce daughters that ship fewer total component pounds.
Regional structure reshapes every component decision. A 0.3-point fat gain isn’t worth the same $94,500 in Wisconsin as it is in a fluid-heavy Southeast order.
The Bottom Line
The herds that come out of this stronger won’t necessarily be the ones with the prettiest bulk tank reports. They’ll be the ones that ran the barn math and were honest about what actually pays. So — where does your herd sit: managing for the number that feels good, or the pounds that move the check?
Complete references and supporting documentation are available upon request by contacting the editorial team at editor@thebullvine.com.
Learn More
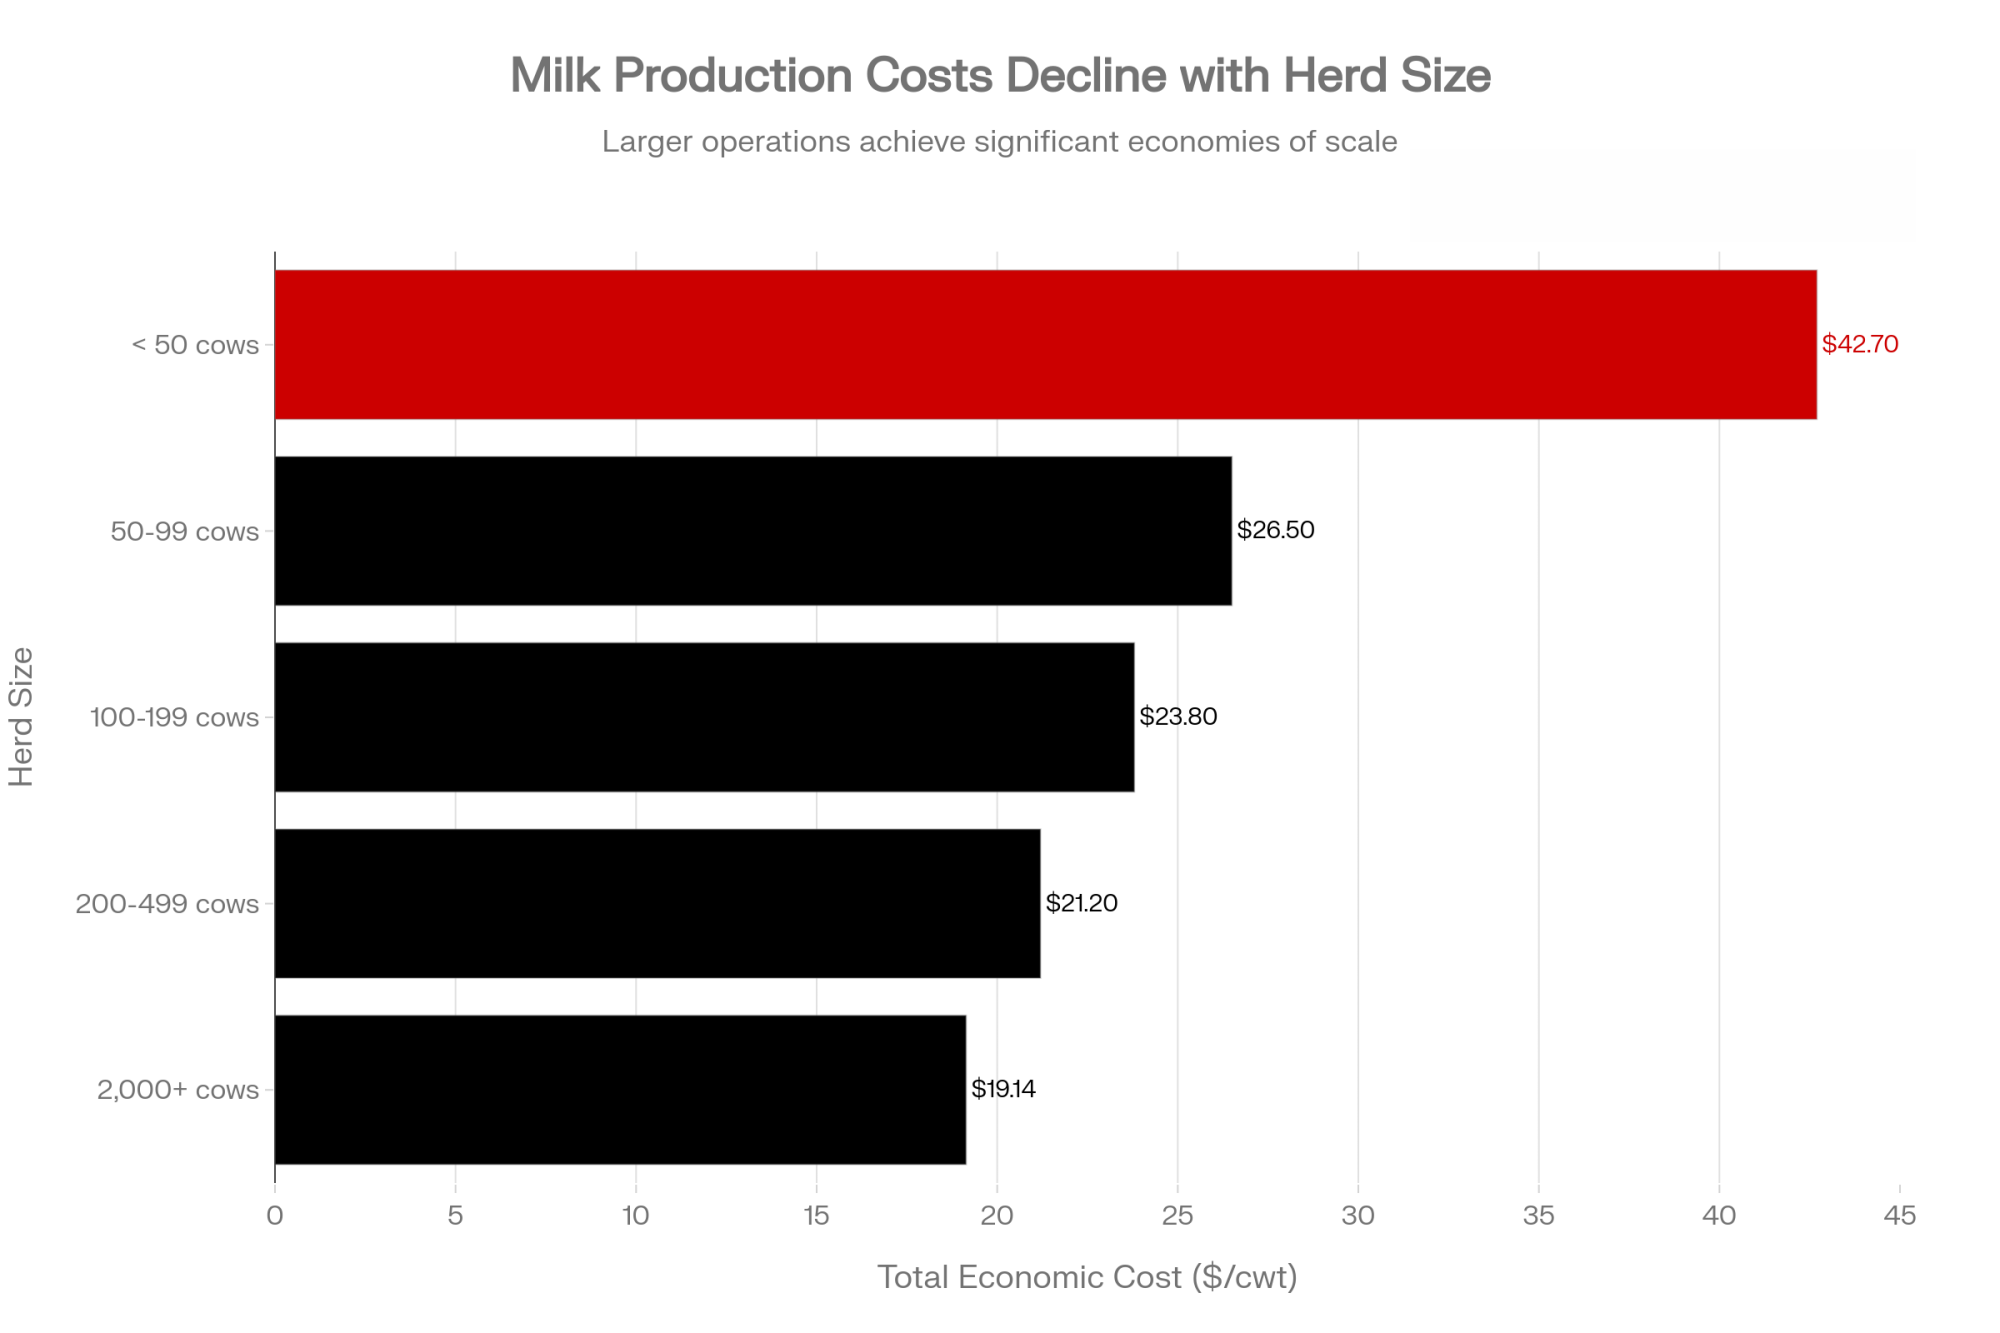
$19.14 Costs vs. $18.95 Milk: Is Your Barn Tech Paying the Difference? – Stop leaving margin on the barn floor. This analysis exposes why you’re 19¢/cwt underwater and arms you with the specific ROI calculations to ensure your current technology actually pays for itself through increased efficiency.
Every week, thousands of producers, breeders, and industry insiders open Bullvine Weekly for genetics insights, market shifts, and profit strategies they won’t find anywhere else. One email. Five minutes. Smarter decisions all week.
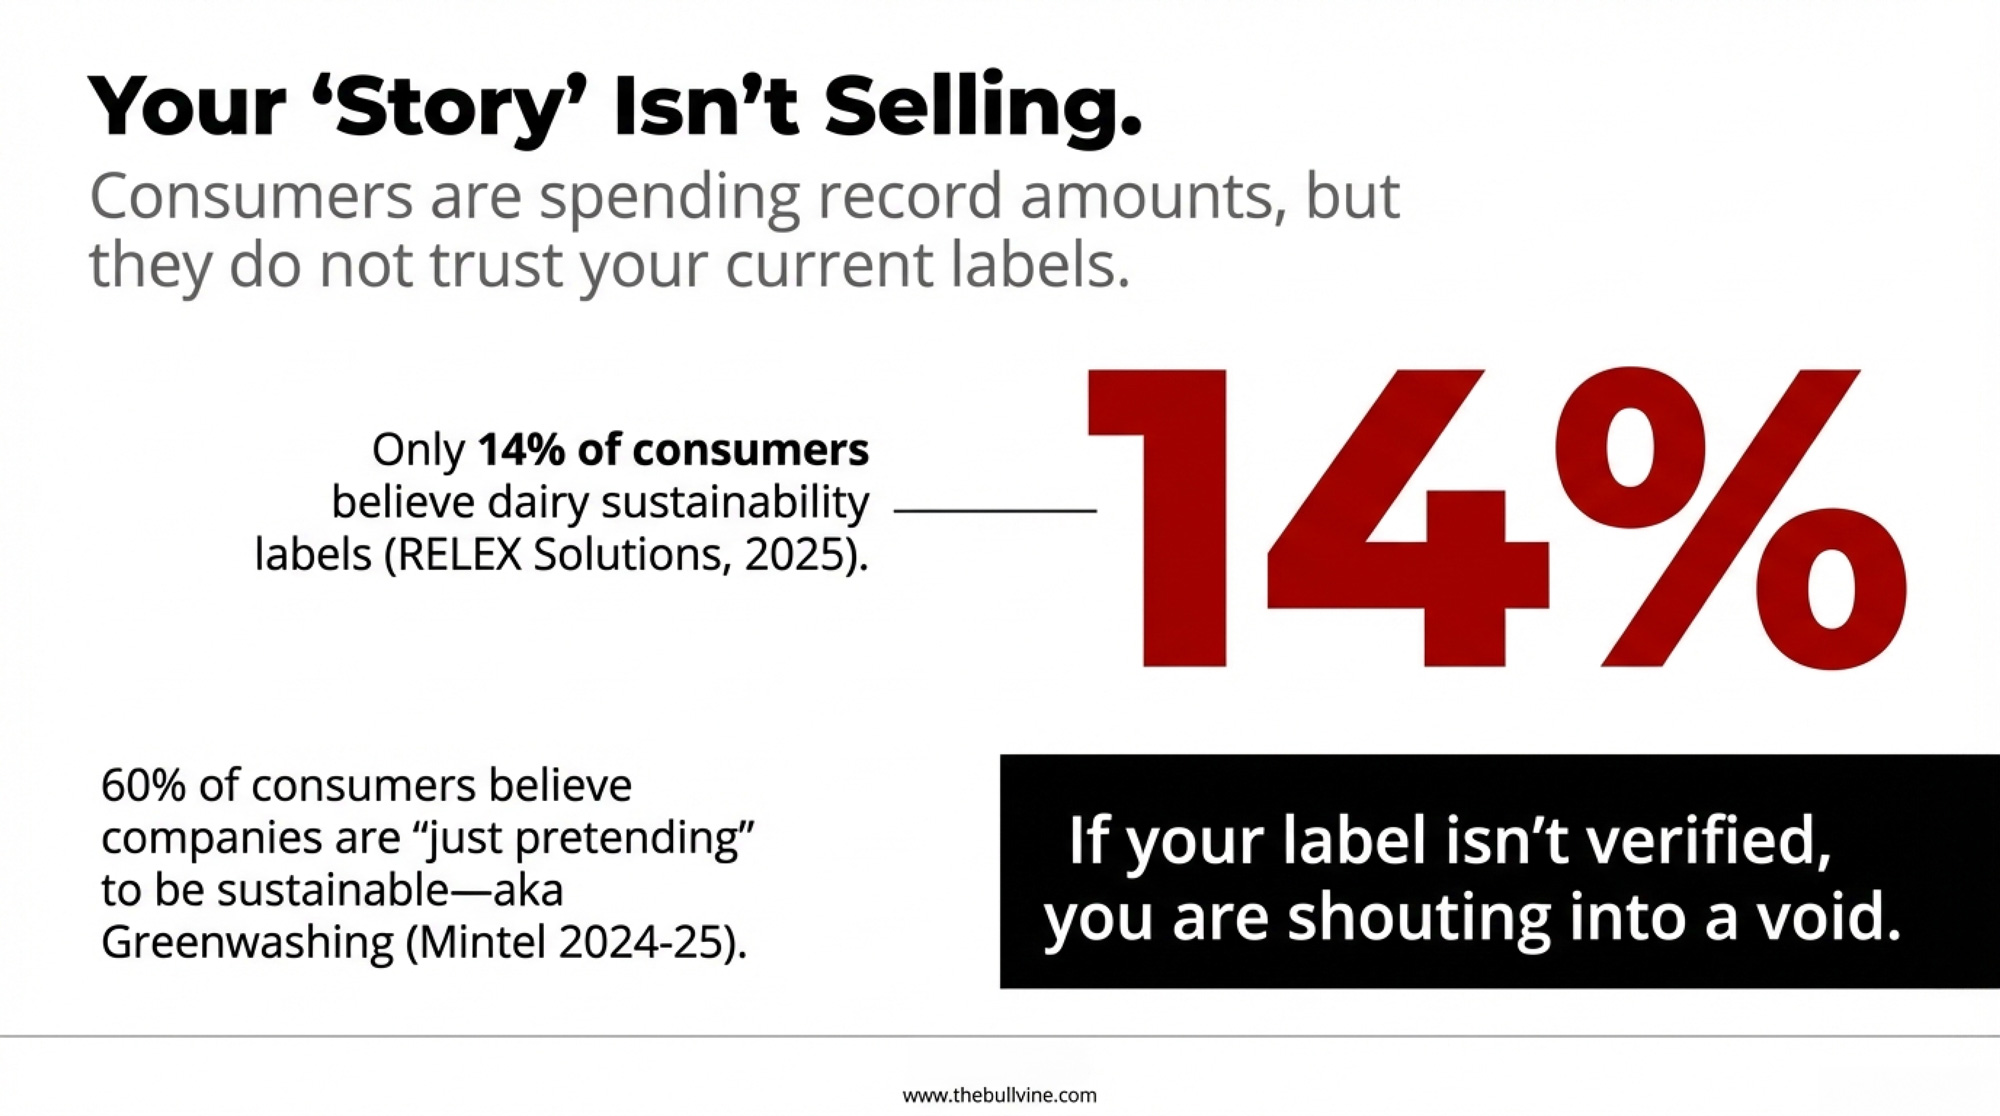
Only 14% of consumers believe dairy labels. Jasper Hill still gets $22 a wedge. If you aren’t turning welfare and certification into margin, you’re leaving money on the shelf.
Executive Summary: Valentine’s Day spending is hitting records, but only 14% of consumers believe sustainability claims on dairy labels, which means your “story” probably isn’t buying you much margin right now. Across U.S., Canadian, and European research, shoppers consistently rank animal welfare ahead of carbon when they choose dairy, and they’re willing to pay more when a credible certification backs that claim. That’s why organic, grass-fed, and welfare-certified brands like Jasper Hill, Maple Hill, Alexandre Family Farm, and AGW-certified herds are already seeing retail premiums of $2.63 per half gallon and farm-gate pay prices in the $40–$50/cwt range against a $14.70 conventional Class I base. At the same time, hot-button issues like cow–calf separation and child labor in cocoa are shaping how consumers judge the ethics of the cheese and chocolate they put on a Valentine’s board. You’ve already got programs like FARM and proAction running in the background, and pasture-based herds can add AGW, Validus, or Regenerative Organic Certification on top — but none of that pays unless you translate it into a plain-language welfare story consumers can find and trust. This piece gives you a concrete playbook for three types of operations — co-op shippers, regional/specialty suppliers, and direct-to-consumer farms — to turn welfare and certification into better contracts, stronger brands, and higher-value Valentine’s sales, rather than leaving money on the shelf.
Somewhere tonight, a shopper will pick up a $22 wedge of aged cheddar for their Valentine — and flip it over looking for a dairy animal welfare certification before they check the price. Valentine’s Day spending will hit a record $29.1 billion in 2026, up from $27.5 billion last year, with the average American budgeting $199.78 on gifts (National Retail Federation, January 2026, n=7,791 U.S. adults). Dairy is increasingly part of that haul: Wakefield Research data (December 2025, n=1,000 U.S. adults) commissioned by Wisconsin Cheese found 66% of Americans now call cheese their “love language,” and 64% would trade a dozen roses for a curated cheese board.
Jasper Hill Farm’s underground aging cellars turn high‑welfare milk into $22 wedges that can survive a Google search — the kind of welfare‑backed story most dairy labels never tell.
One farm has figured out how to make that moment work for them. In Greensboro, Vermont, brothers Andy and Mateo Kehler built Jasper Hill Farm into the gold standard of artisan dairy — pasture-based and regenerative, their cheeses aged in 22,000 square feet of underground cellars. Jasper Hill blue cheese was featured at the Obama White House state dinner for French President François Hollande in February 2014 — accompanying the dry-aged rib eye on a menu designed to showcase America’s best small-farm producers. Their Harbison won Best of Show at the 2018 American Cheese Society competition, topping 1,954 entries. Most dairy labels can’t survive that level of scrutiny. Jasper Hill’s can, and that difference is worth real money in 2026.
Feel-good spending numbers aside, only 14% of U.S. consumers fully trust grocery sustainability claims (RELEX Solutions, 2025 U.S. consumer survey), and Mintel’s Global Outlook on Sustainability: A Consumer Study 2024-25found 60% think companies are “just pretending” to be sustainable. Dairy animal welfare certification should be the credibility tool that closes this gap. For most operations, it isn’t — because most operations aren’t talking about it.
Dairy’s Valentine’s Moment — More Shelf Space, No Story Behind It
Candy still leads the Valentine’s gift list at 56%, followed by flowers and evenings out. But dairy keeps gaining ground in ways the commodity numbers don’t capture. In the UK, cheese volumes surged by an additional 1.2 million kg around Valentine’s compared to pre-COVID levels, with specialty and continental varieties accounting for 24% of that increase (AHDB, 2022 UK data).
Wisconsin Cheese’s “Wedges of Love” — a $100 curated box of nine artisan cheeses from producers like Roelli Cheese Haus and Uplands Cheese Company — was released in limited drops from January 20 through February 8, available while supplies lasted. As their Chief Marketing Officer, Suzanne Fanning put it, “cheese is always welcome to the party.” And when 62% of consumers say they’re bored of traditional Valentine’s gifts, the market opening for dairy is obvious.
Wisconsin Cheese’s $100 “Wedges of Love” box — nine artisan wedges from producers like Roelli and Uplands, launched January 20, sold in limited drops. When 62% of consumers say they’re bored of roses, this is what a dairy Valentine’s marketing play looks like.
The industry keeps putting cheese on the shelf without a credible story to back it up. As Jasper Hill Farm describes its approach on their website, great cheese starts with good milk, good milk starts with healthy animals, and healthy animals start with a healthy landscape. That’s not marketing copy—it’s a supply chain philosophy. It’s also exactly what consumers are hunting for when they flip over that label, and it’s what separates a $22 wedge from a $4 block in the same dairy case.
Under-35 Shoppers Read Your Label — Then Google It
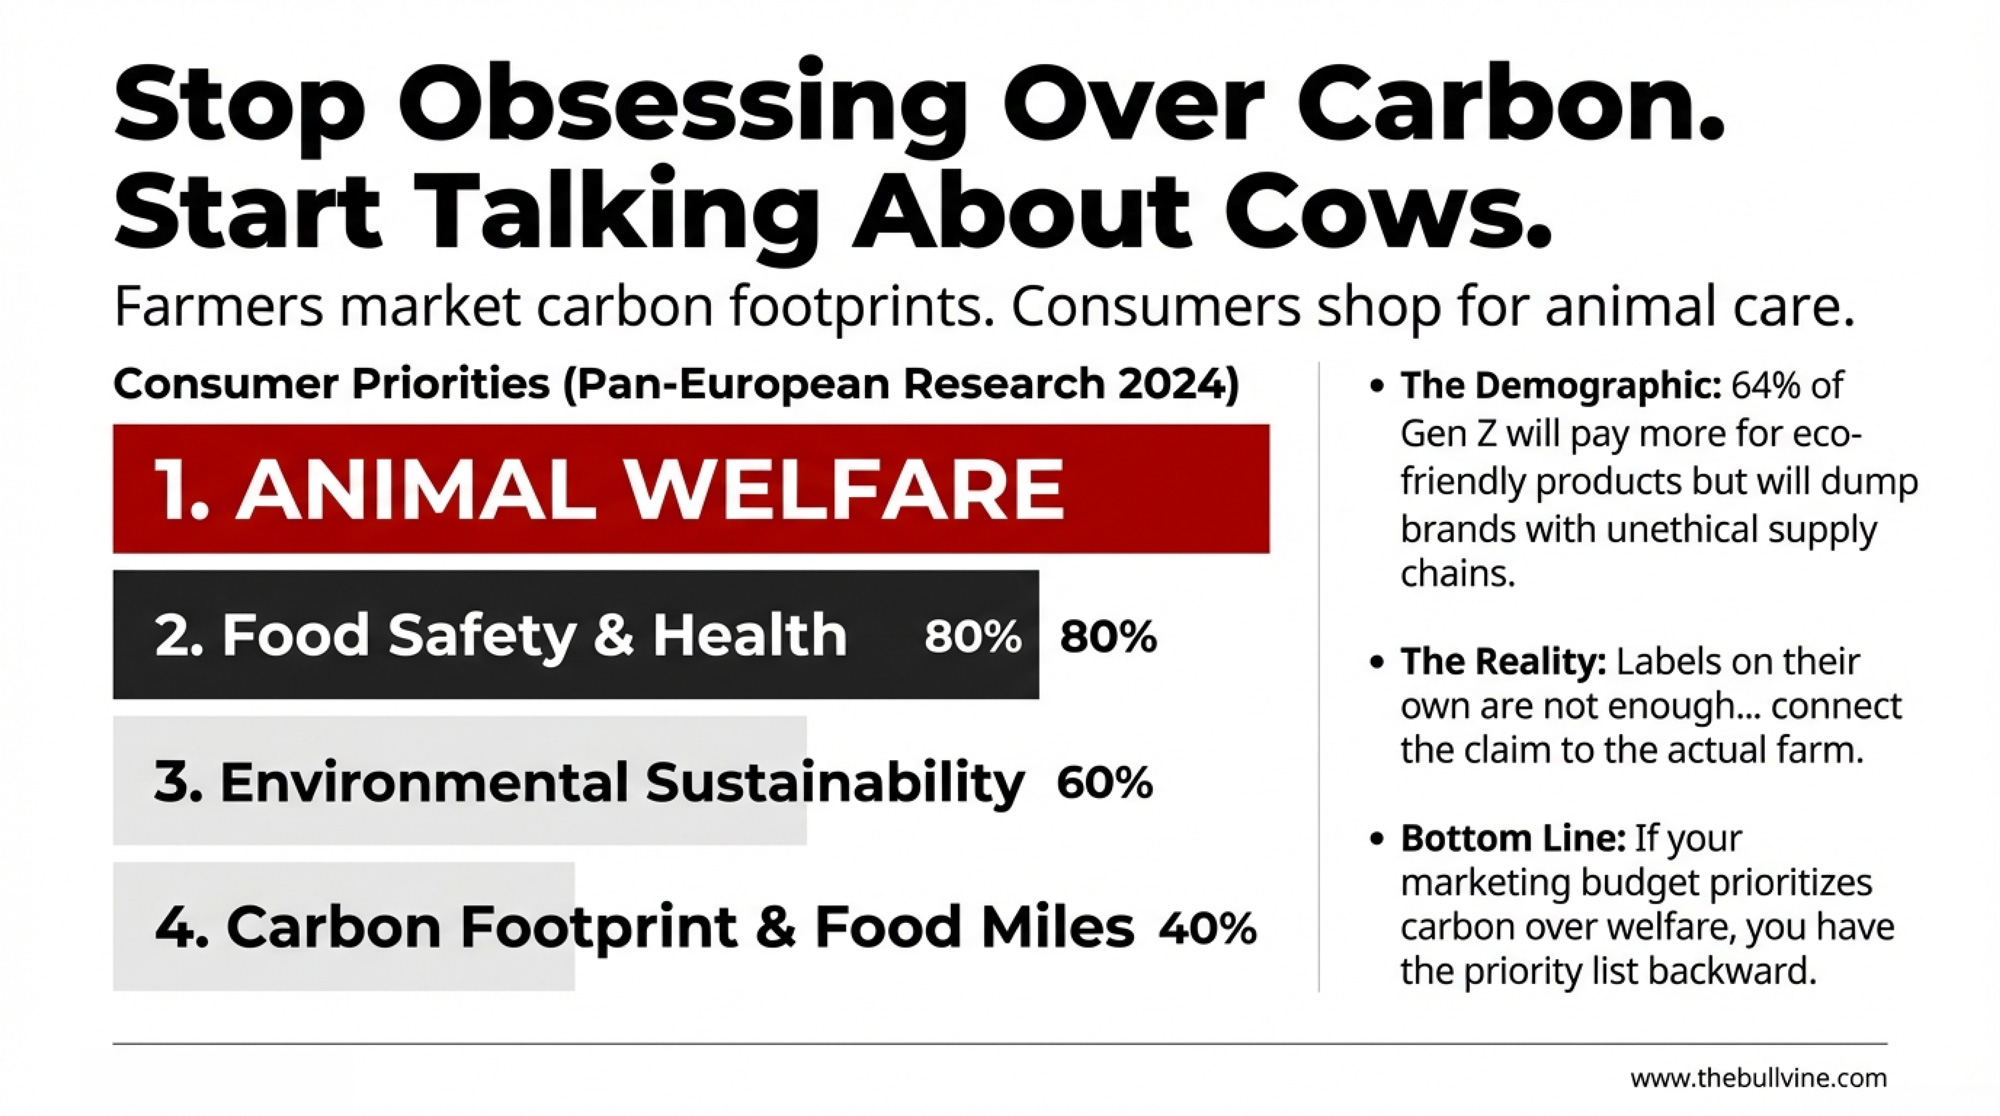
Over 70% of consumers under 35 say they’re more likely to buy from brands demonstrating genuine sustainability commitments (The Dairy Mail, January 2025 analysis). Among Gen Z specifically, 64% say they’d pay more for eco-friendly products — and the same 64% would dump a brand exposed for unethical supply chain practices (Britopian, 2025, U.S. data).
This isn’t just survey talk. In the UK, one in ten consumers boycotted a go-to brand in the past year over sustainability concerns, and 17% actively check labels for certifications before buying (Speciality Food Magazine, November 2024 UK survey). Among 24-to-35-year-olds, 10% said they’d pay up to 50% more for verifiably sustainable products.
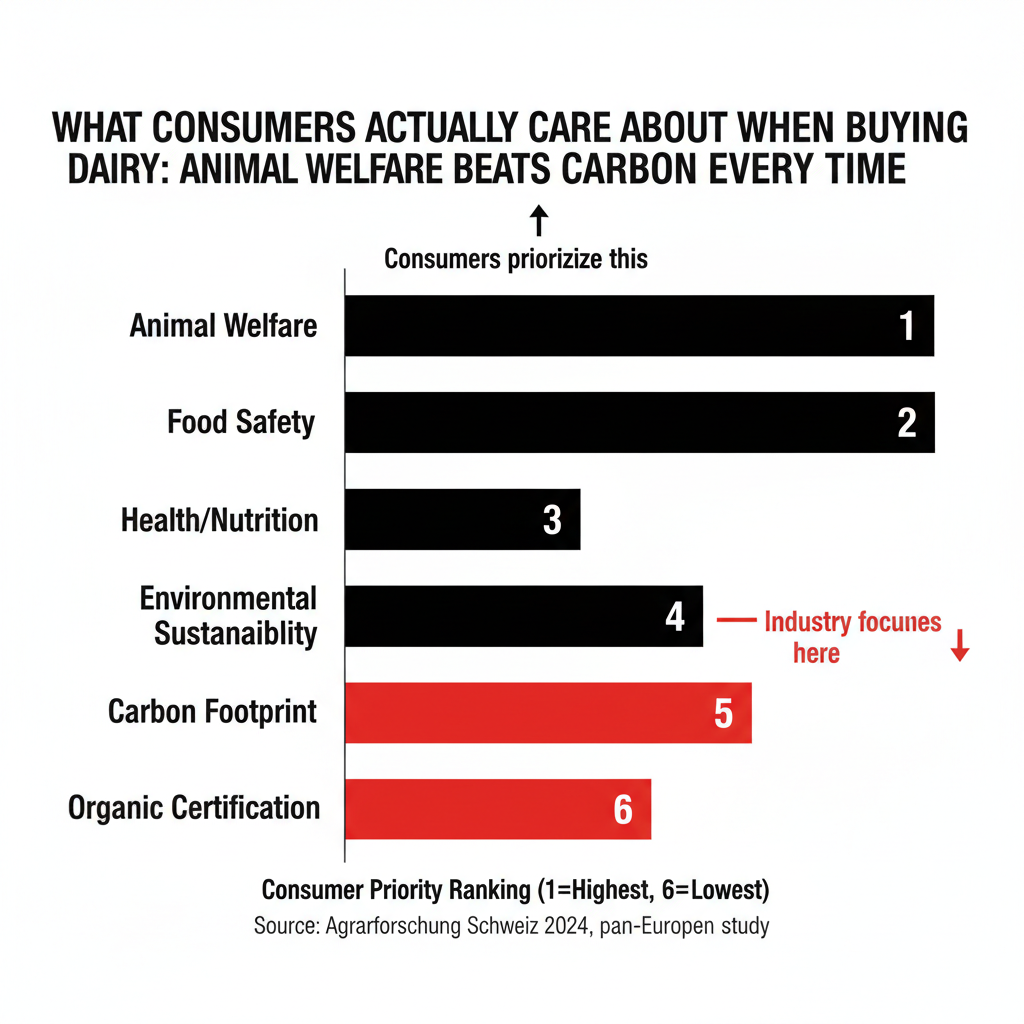
A 2024 pan-European study published in Agrarforschung Schweiz (Swiss Agricultural Research), surveying consumers across five countries, laid out what this demographic actually prioritizes when buying dairy:
Animal welfare — ranked first, ahead of every other sustainability attribute
Food safety and health — second and third, reflecting practical self-interest
Environmental sustainability — important, but consistently ranked below welfare
Carbon footprint, food miles, and organic certification — at the bottom of the list
The researchers noted that “labels on their own are not enough to change behaviour” and recommended pairing labels with communication connecting the claim to the actual farm. If your marketing budget prioritizes carbon messaging over animal welfare communication, you’ve got the priority list exactly backwards.
Welfare Outranks Carbon — And the Premium Is Real
A November 2025 study in the Journal of Dairy Research found 70% of consumers expressed willingness to pay a premium for animal welfare-certified dairy, with women and younger consumers showing significantly higher interest; 91% agreed pasture access improves welfare. American Humane’s 2024 Farm Animal Welfare Survey (a nationally representative U.S. sample, November 2024) found 67% prefer humanely raised products, 67% emphasize the importance of third-party certification, and 58% are willing to pay more for humanely raised labeling.
Does willingness-to-pay always translate at the register? Anyone who’s watched a consumer reach for the cheaper jug knows the gap between survey answers and checkout behavior. But the premiums already flowing through the dairy case say this isn’t hypothetical anymore.
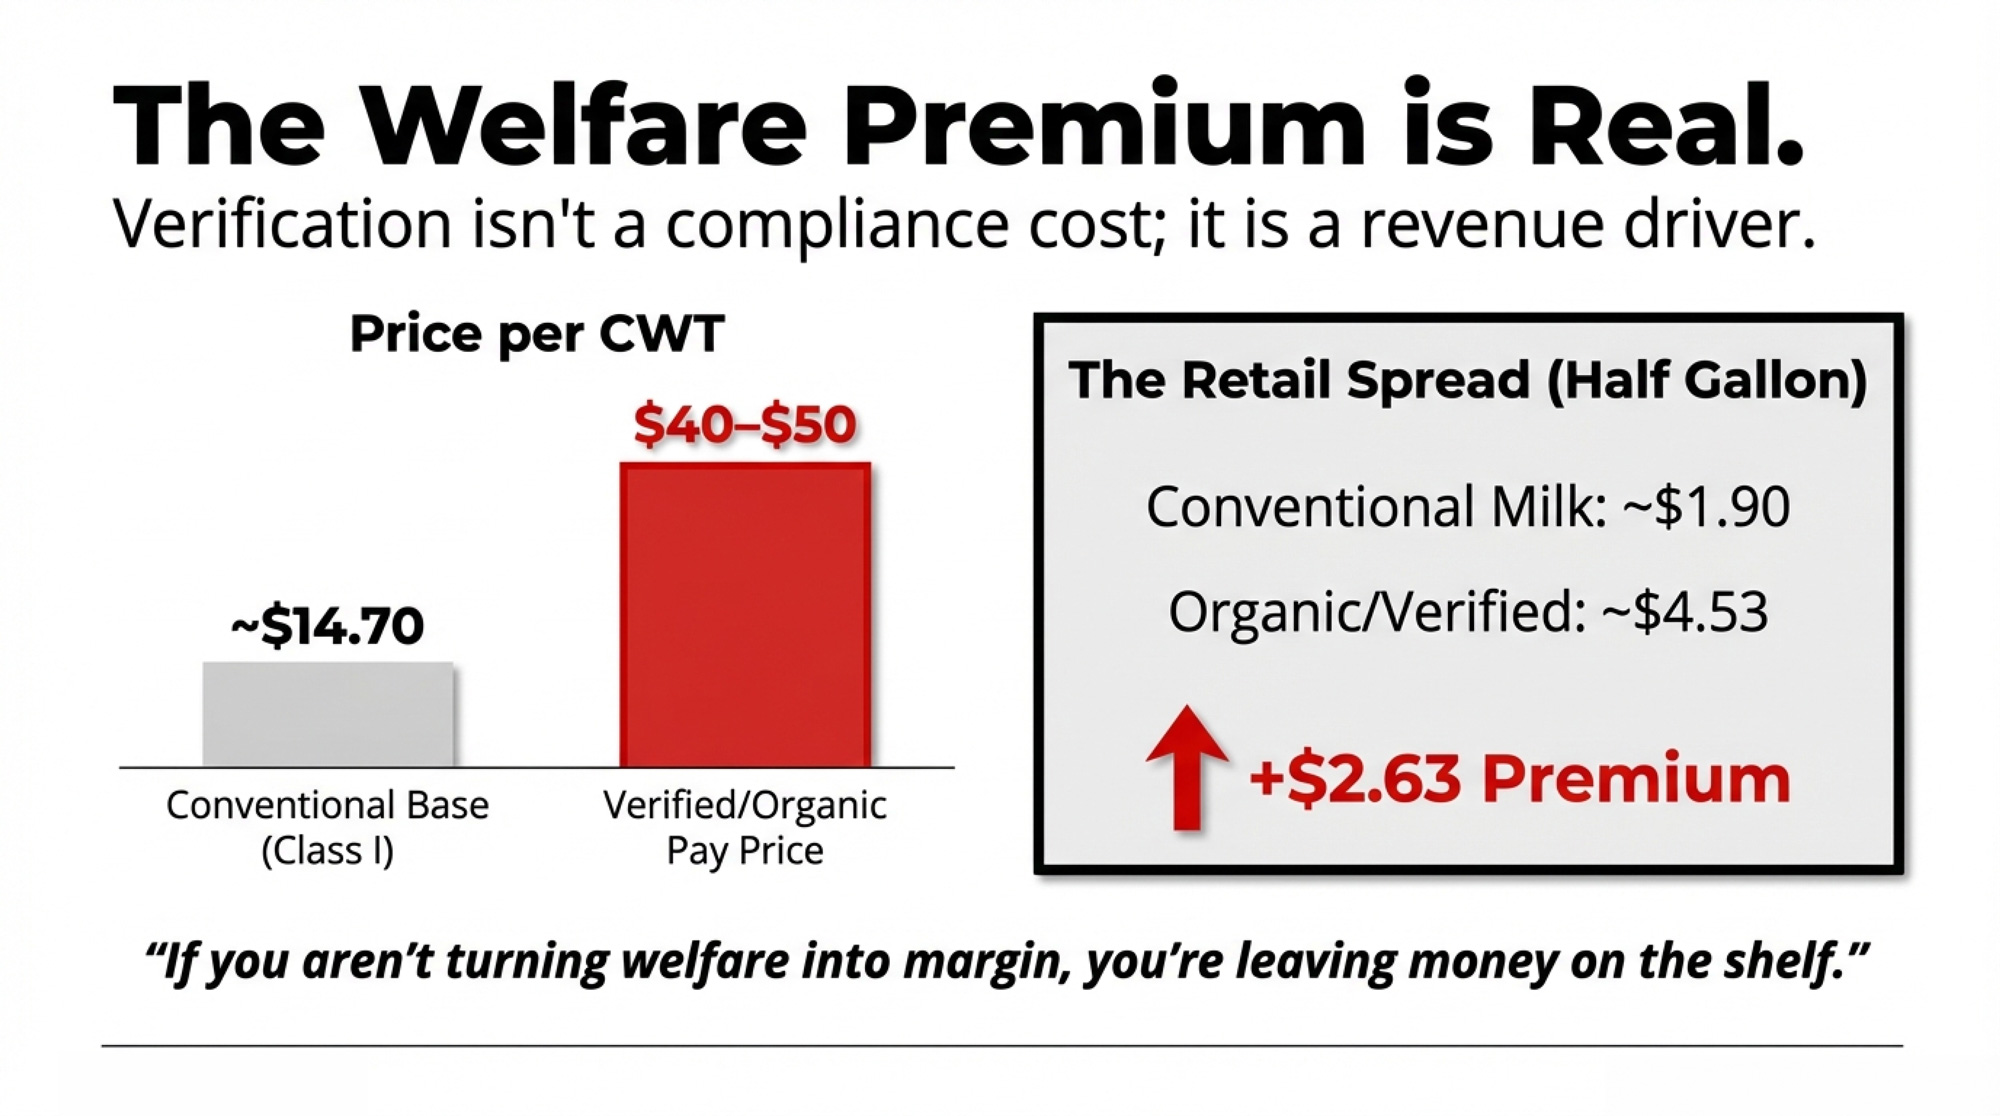
USDA AMS data from February 2026 shows organic half-gallon milk averaging $4.53 retail versus $1.90 for conventional — a $2.63 premium. Organic gallon milk: $8.66 versus $2.79, a $5.87 spread (USDA AMS, November 2025). Organic farm-gate pay prices in 2025 ranged from Horizon contracts at $40+/cwt to Maple Hill targeting $45/cwt and newcomer Origin Milk near $50/cwt (NODPA, May 2025) — against a conventional Class I base price of $14.70/cwt (USDA AMS, February 2026).
Product/Certification Type
Retail Price (per unit)
Conventional Baseline
Retail Premium ($)
Farm-Gate Pay ($/cwt)
Conventional Milk
$1.90 (half-gal)
$1.90
—
$14.70
Organic (Horizon)
$4.53 (half-gal)
$1.90
+$2.63
$40.00+
Maple Hill (Grass-Fed Organic)
$7.59 (half-gal)
$1.90
+$5.69
$45.00
Alexandre Family Farm (Regenerative Organic)
$7.49–$8.89 (48–59 oz)
~$1.52–$1.83 (equiv.)
+$5.97–$7.06
$45.00–$50.00
Origin Milk (Organic)
Not disclosed
$1.90
Not disclosed
~$50.00
AGW-Certified (Autumn’s Harvest)
Premium pricing
Conventional
+20% sales lift
Processor-dependent
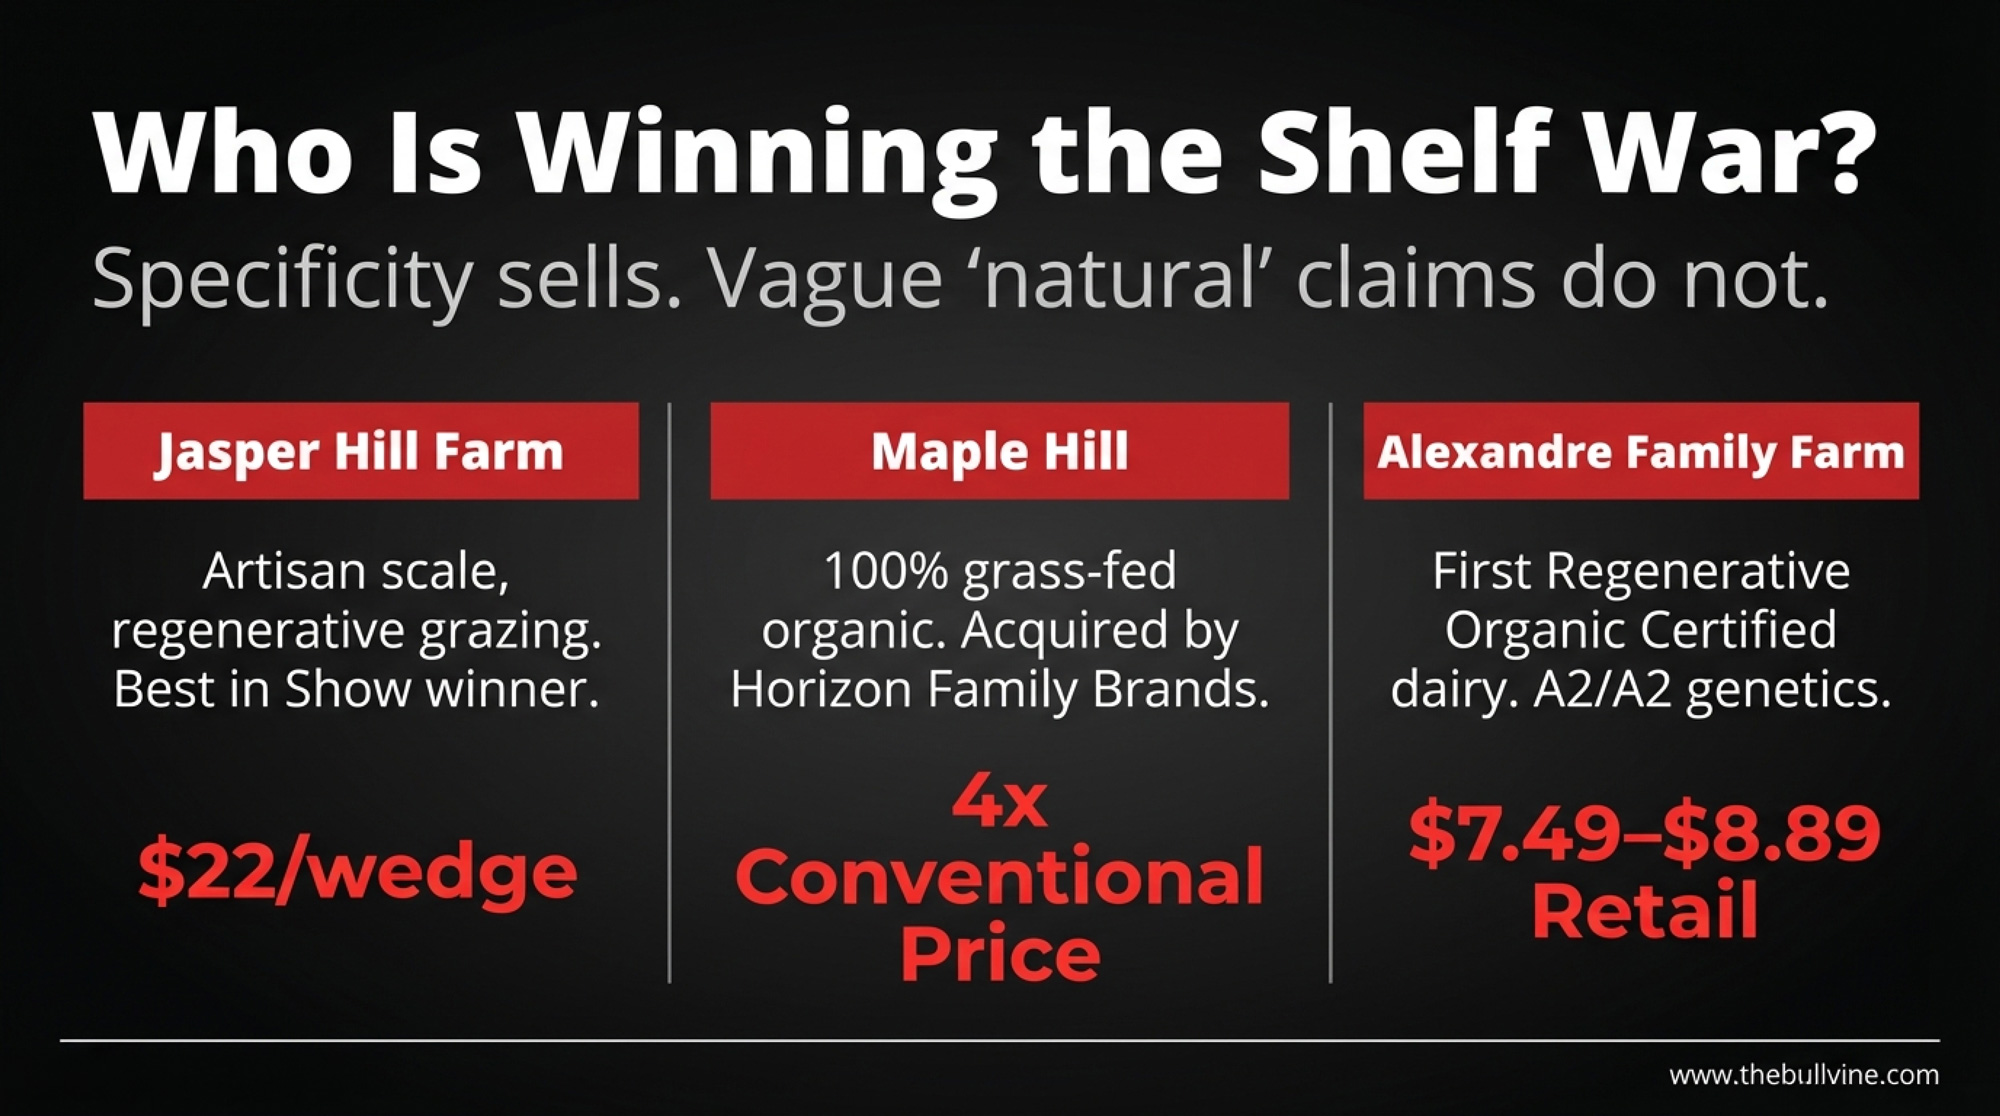
You can see it at the shelf. Maple Hill Creamery — now part of Horizon Family Brands after a December 2025 acquisition, but still marketed as 100% grass-fed organic and PCO certified — retails at $7.59 per half gallon at Target. Four times the conventional price. Alexandre Family Farm in Crescent City, California — the first Regenerative Organic Certified dairy in the U.S., pasture-based, A2/A2, a multi-generational family operation — retails at $7.49–$8.89 for 48–59 oz. Whether your operation captures any of that value or watches it flow to someone else’s label depends entirely on what story you’re telling.
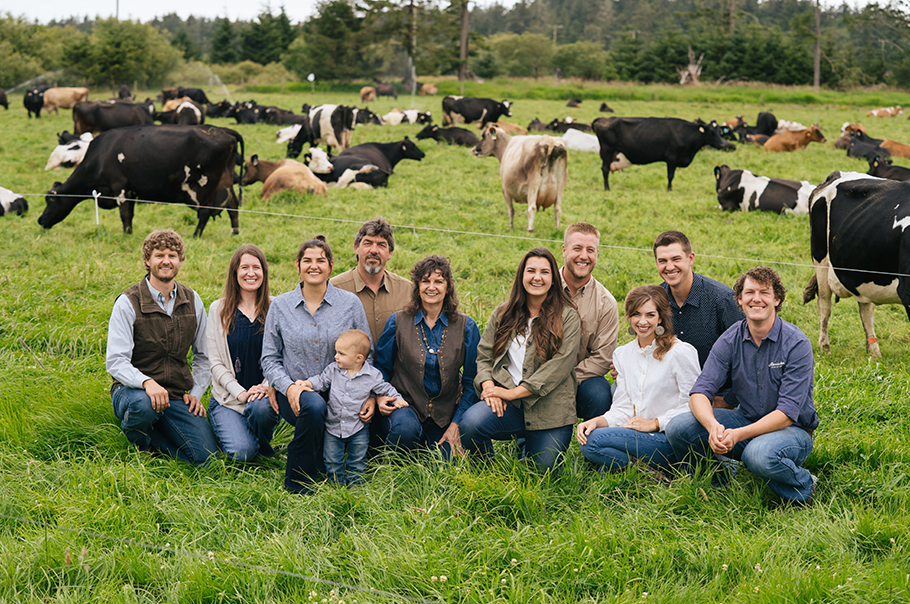
The Alexandre family on pasture in Crescent City, California — a multi-generational operation, the first Regenerative Organic Certified dairy in the U.S., retailing A2/A2 milk at $7.49–$8.89. This is what a welfare story that survives a Google search looks like.
About that Maple Hill acquisition. Platinum Equity bought the Horizon Organic and Wallaby brands from Danone in April 2024 and rebranded as Horizon Family Brands in August. By December 2025, they’d acquired Maple Hill as their first bolt-on — CEO Tyler Holm called its grass-fed expertise a complement to Horizon’s “capabilities and vision for the future.” When private equity is paying acquisition prices for grass-fed organic brands, the market is telling you something about where the value is heading.
Here’s the baseline most consumers have never heard of: 99% of U.S. domestic milk production already participates in the FARM Animal Care program, covering more than 31,000 dairy farms across 49 states. In Canada, proAction is mandatory on every dairy farm. The programs exist.
The consumer communication doesn’t. Jamie Jonker, then NMPF’s vice president of sustainability and scientific affairs, put it well in a FARM Program report: “Farmers have a great story to tell when it comes to animal care on their farms. The goal of animal-care programs, like the FARM Program, is not to be an additional burden for farmers, but rather to collect the data that provides positive proof of what we already know to be true: farmers take excellent care of their animals.”
That story is just not reaching the people buying your milk. The premium opportunity is real — but so is the risk, because the welfare story consumers hear most often isn’t the one you’d choose to tell.
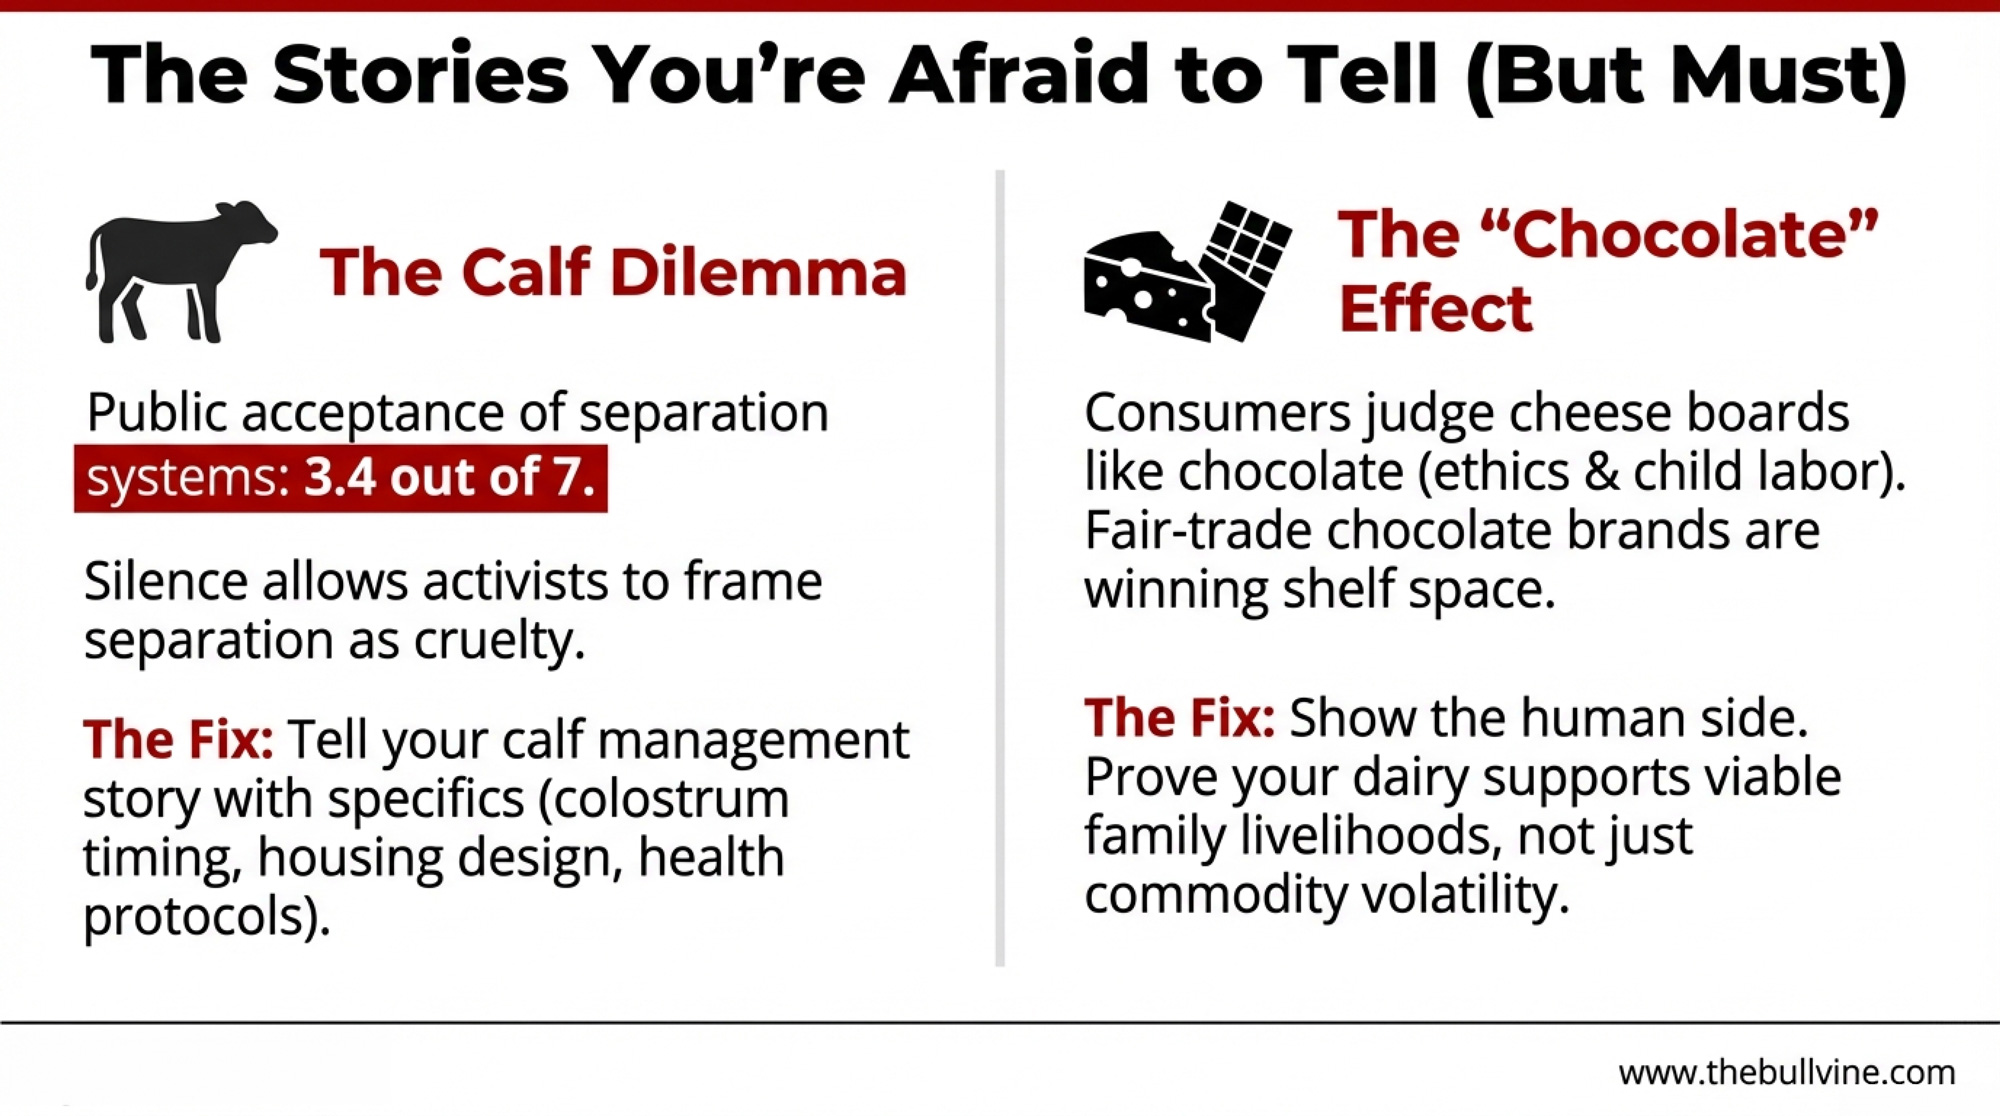
Calf Separation: The Story Activists Tell When You Won’t
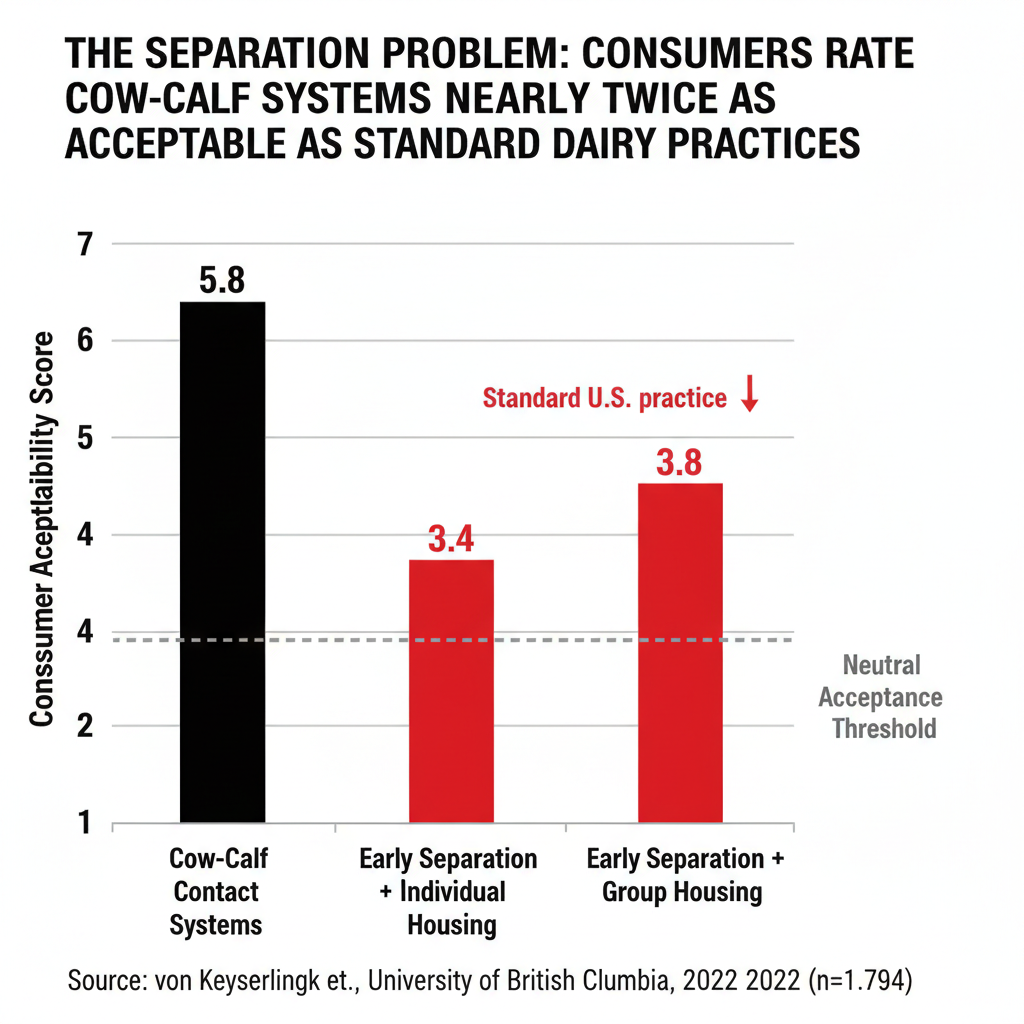
Anyone who’s walked through a maternity pen at 2 a.m. knows the bond is real — and that managing it responsibly is complicated. Early cow-calf separation followed by individual housing is still standard practice on most dairy operations. Public acceptance of it is remarkably low.
Dr. Marina (Nina) von Keyserlingk, NSERC Industrial Research Chair in Dairy Cattle Welfare at the University of British Columbia, published a 2022 study — a convenience sample of 307 Canadians plus a nationally representative sample of 1,487 Americans — and found that on a 7-point scale, cow-calf systems scored 5.7–5.8, while separation systems scored just 3.4–3.8 regardless of housing type. Faunalytics research confirmed the pattern: after visiting a working dairy farm, the most common new concern was calf separation, and exposure didn’t neutralize it. It amplified it.
The health argument for day-one separation? Muddier than either side wants to admit. A 2019 Journal of Dairy Sciencesystematic review by Beaver et al. found that extended cow-calf contact showed “beneficial or no effects” on calf health for scours and respiratory disease. A 2023 JDS perspective argued the practice “carries the risk of eroding public trust in the dairy industry if it is not addressed.”
Advocacy groups know Valentine’s Day — a holiday built on bonding — is the perfect moment to run campaigns about separating mothers from their calves. The default “you don’t understand farming” response stopped working years ago. Telling your calf management story with specifics, before someone else tells it about you, is the only play that actually works.
Your Cheese Board’s Other Credibility Problem
The chocolate next to your cheese carries its own baggage — and it’s baggage that makes your label look worse by association. The U.S. Department of Labor estimates 1.56 million children work on cocoa farms in the Ivory Coast and Ghana (Forbes, February 2025). Hershey, Mars, and Nestlé have repeatedly missed self-imposed deadlines to eliminate child labor from their supply chains. Brands emphasizing fair-trade sourcing — Taza Chocolate and Divine Chocolate — are capturing more Valentine’s spend as consumers connect the dots.
Here’s why this matters if you’re a dairy producer: consumers are building their Valentine’s cheese boards with the same ethical lens they use for chocolate. If the fair-trade bar on the board tells a better sourcing story than the wedge sitting next to it, that’s a comparison you lose at the point of sale. Jasper Hill closes that gap with specifics: regenerative grazing, whey recycling, and partnerships with small neighboring dairies that get premium pay for premium milk. Their approach keeps family-scale operations in Greensboro connected to a viable livelihood instead of the volatile commodity market.
Third-Party Proof: The Only Labels That Work
Verified certification is the antidote to consumer skepticism. Not all certifications carry the same weight, though — and the operational requirements differ more than most producers realize.
Certification
Cost to Farmer
Core Requirement
Audit Frequency
AGW Certified Animal Welfare Approved
Free — AGW covers all costs
Continuous outdoor pasture access, entire life
Annual on-farm audit
Validus CARE Certified
Processor-arranged
80%+ compliance across welfare, environment, and worker care
Annual third-party audit
Canada proAction + Blue Cow
Included in DFC membership
82 requirements across welfare, food safety, and biosecurity
Regular on-farm validation
Certified Grass-Fed Organic (OPT/EarthClaims)
Organic certification cost + verification
Zero grain, 60% DMI from pasture, 150-day grazing season
Annual third-party verification
AGW carries one of the highest welfare ratings from Consumer Reports, and the barrier to entry is lower than you’d think. Steffen Schneider at Hawthorne Valley Farm in Ghent, New York, put it simply: “It’s a wonderful service to provide free to farmers. People know it and look for it.” Timothy Haws at Autumn’s Harvest Farm in Romulus, New York, reported a 20% increase in sales after getting certified: “People love it!” Not sure if your operation qualifies? AGW offers free eligibility assessments — the cost of finding out is a phone call.
In Canada, Dairy Farmers of Canada ran its first-ever proAction consumer communication campaign in 2024, reaching 14.4 million Canadians and hitting an all-time high for Blue Cow Logo recognition — highlighting 57 environmental practices and 82 program requirements. What all these certifications share is straightforward: somebody who doesn’t work for you shows up, checks the books, and puts their name on it.
The Greenwashing Trap: 60% of Consumers Think You’re Faking It
The trust numbers are ugly everywhere anyone’s bothered to measure. In the U.S., 31% of consumers don’t trust companies to be honest about their environmental impact (Mintel, Global Outlook on Sustainability 2024-25). Sixty percent agree that many companies are “just pretending.”
“60% of U.S. consumers agree that many companies are ‘just pretending’ to be sustainable.” — Mintel, Global Outlook on Sustainability: A Consumer Study 2024-25
In the UK and Germany, the Changing Markets Foundation’s “Feeding Us Greenwash” report (March 2023, YouGov polling) found trust in sustainability claims on meat and dairy averages roughly 15%, with 59% expressing high concern about greenwashing. The Foundation flagged JBS for net-zero claims, Nestlé for carbon-neutral KitKat labeling, and Danish Crown for calling pork “climate controlled” — plus widespread use of idyllic pasture imagery on products from confined operations.
You might not be Nestlé. But if your local co-op’s marketing materials feature rolling green pastures and contented cows while the actual operation looks nothing like the brochure, you’re the one holding the reputational risk when a journalist or advocacy group comes knocking. A 2025 Corporate Climate Responsibility Monitor found that major food companies “exploiting loopholes in voluntary standards,” and Danone stands out as one of the few dairy-adjacent companies to have set a specific methane-reduction target (30% from fresh milk by 2030). Mintel’s Richard Cope noted that greenwashing education now feeds consumer skepticism more than engagement. Numbers, not slogans.
What This Means for Your Operation
If you ship a commodity to a co-op, you don’t control the retail label, but you shape what your processor can credibly claim. Your co-op is sitting on a consumer-facing story that 99% of the U.S. milk supply already qualifies forthrough FARM, covering 31,000+ farms across 49 states. In Canada, proAction is mandatory.
Can’t change your system? Change your communication. DFC reached 14.4 million Canadians with proAction messaging in 2024. If your processor isn’t generating equivalent consumer-facing value, put this on your Q2 2026 board agenda with a specific ask: What’s our consumer-facing welfare communication plan? Which retail accounts are deploying it? And why isn’t 99% FARM participation translating into any brand value at the shelf?
If you sell through regional brands or specialty processors, this is where certification ROI gets tangible. AGW certification costs you nothing — no audit fees, no annual charges, plus free marketing support. The operational hurdle is real — you need pasture access, and you need to meet their welfare standards, full stop. If your operation is confinement-based, AGW isn’t your path. Look at Validus CARE or push your processor to leverage FARM communication instead. Timothy Haws at Autumn’s Harvest Farm reported a 20% sales increase after becoming AGW-certified. And organic dairy commands $2.63 per half gallon over conventional at retail (USDA AMS, February 2026), with farm-gate organic pay reaching $40–$50/cwt in 2025 versus a Class I base of $14.70. One caveat worth being honest about: organic transition takes 36 months and carries real costs during the conversion period. The premium exists, but the runway to capture it isn’t short.
If you sell direct-to-consumer or artisan, you own the customer relationship. Valentine’s is your moment. Build a holiday offer around the specifics that differentiate you — not a generic “sustainable” badge. Jasper Hill does it with regenerative grazing, whey recycling, and partnerships that keep neighboring small dairies viable. Alexandre Family Farm does it with Regenerative Organic Certification, A2/A2 genetics, and a multi-generational family story — retailing at $7.49–$8.89 for less than a half gallon. Wisconsin’s Roelli Cheese Haus does it with craft and provenance.
The trade-off nobody talks about: Telling your welfare story proactively invites scrutiny. Someone will ask harder questions. But the alternative — staying silent while advocacy groups and competitors write the narrative about your practices — is worse. The von Keyserlingk research is unambiguous: consumers who learn about standard dairy practices don’t become more accepting of them. They become more concerned. Control the story, or it controls you.
What to Do Before Next Valentine’s Day
Build a holiday communication calendar now—and start six weeks out. Wisconsin Cheese launched “Wedges of Love” on January 20, a full 25 days before February 14. That’s the lead time that works. Valentine’s Day, Mother’s Day, and Christmas are your three highest-visibility moments. Plan your social media, farm tour invites, and retail signage around these dates—they’re when consumers are most emotionally primed to care about how their food is produced.
Lead with animal welfare, not carbon. Pan-European research (Agrarforschung Schweiz, 2024) confirms consumers rank welfare above environmental sustainability when choosing dairy. If your messaging leads with carbon footprint, flip the order.
Pursue the certification that fits your system. AGW costs nothing and delivers measurable results, but it requires pasture access. Confinement operations should push processors to activate FARM or Validus communication at retail. Canadian producers should demand that their co-op leverage proAction and the Blue Cow more aggressively.
Get specific about calf management. Publish your calf care protocol on your website or in your direct-to-consumer materials. Vague assurances don’t work. Specifics — colostrum timing, housing design, health protocols, how long calves stay with dams, if applicable — do.
Audit your own label for greenwashing risk. If you use words like “sustainable,” “humane,” or “natural” without third-party verification, you’re one investigative journalist away from a credibility crisis. Only 14% of consumers trust those claims as it stands. Either back them up or remove them.
Run the premium math for your operation. Organic half-gallon commands $2.63 over conventional at retail. AGW-certified Autumn’s Harvest reported a 20% sales lift. Maple Hill retails at 4x conventional — and was attractive enough for Horizon Family Brands to acquire outright in December 2025. What would even a fraction of that premium mean for your bottom line?
Every Valentine’s Day, millions of consumers make choices that signal what they value. Those signals are getting louder, more specific, and harder to ignore. When a consumer picks up your product on February 14th, does your label tell a story that holds up — or one that falls apart the moment they Google it?
Key Takeaways
Stop betting on vague claims. Only 14% of consumers believe dairy sustainability labels, but research shows they care most about animal welfare, not carbon slogans.
Follow the money, not the noise. Welfare-backed and organic brands like Jasper Hill, Maple Hill, Alexandre Family Farm, and AGW-certified herds are already seeing $2.63/half-gallon retail premiums and $40–$50/cwt farm-gate pay versus a $14.70 Class I base.
Use the programs you already have. FARM and proAction cover almost all U.S. and Canadian milk, and pasture-based herds can add AGW, Validus, or Regenerative Organic Certification on top — but they only pay if you turn them into a clear welfare story on your label, website, and social.
Plan around “treat holidays.” Build a simple communication plan for Valentine’s Day, Mother’s Day, and Christmas that shows how you handle calves, pasture, and herd health — instead of letting activists or competitors define your practices.
Pick one concrete next step. Call AGW for a free eligibility check, push your co-op to activate FARM or proAction in retail messaging, or publish your calf-care protocol so shoppers don’t have to guess.
Complete references and supporting documentation are available upon request by contacting the editorial team at editor@thebullvine.com.
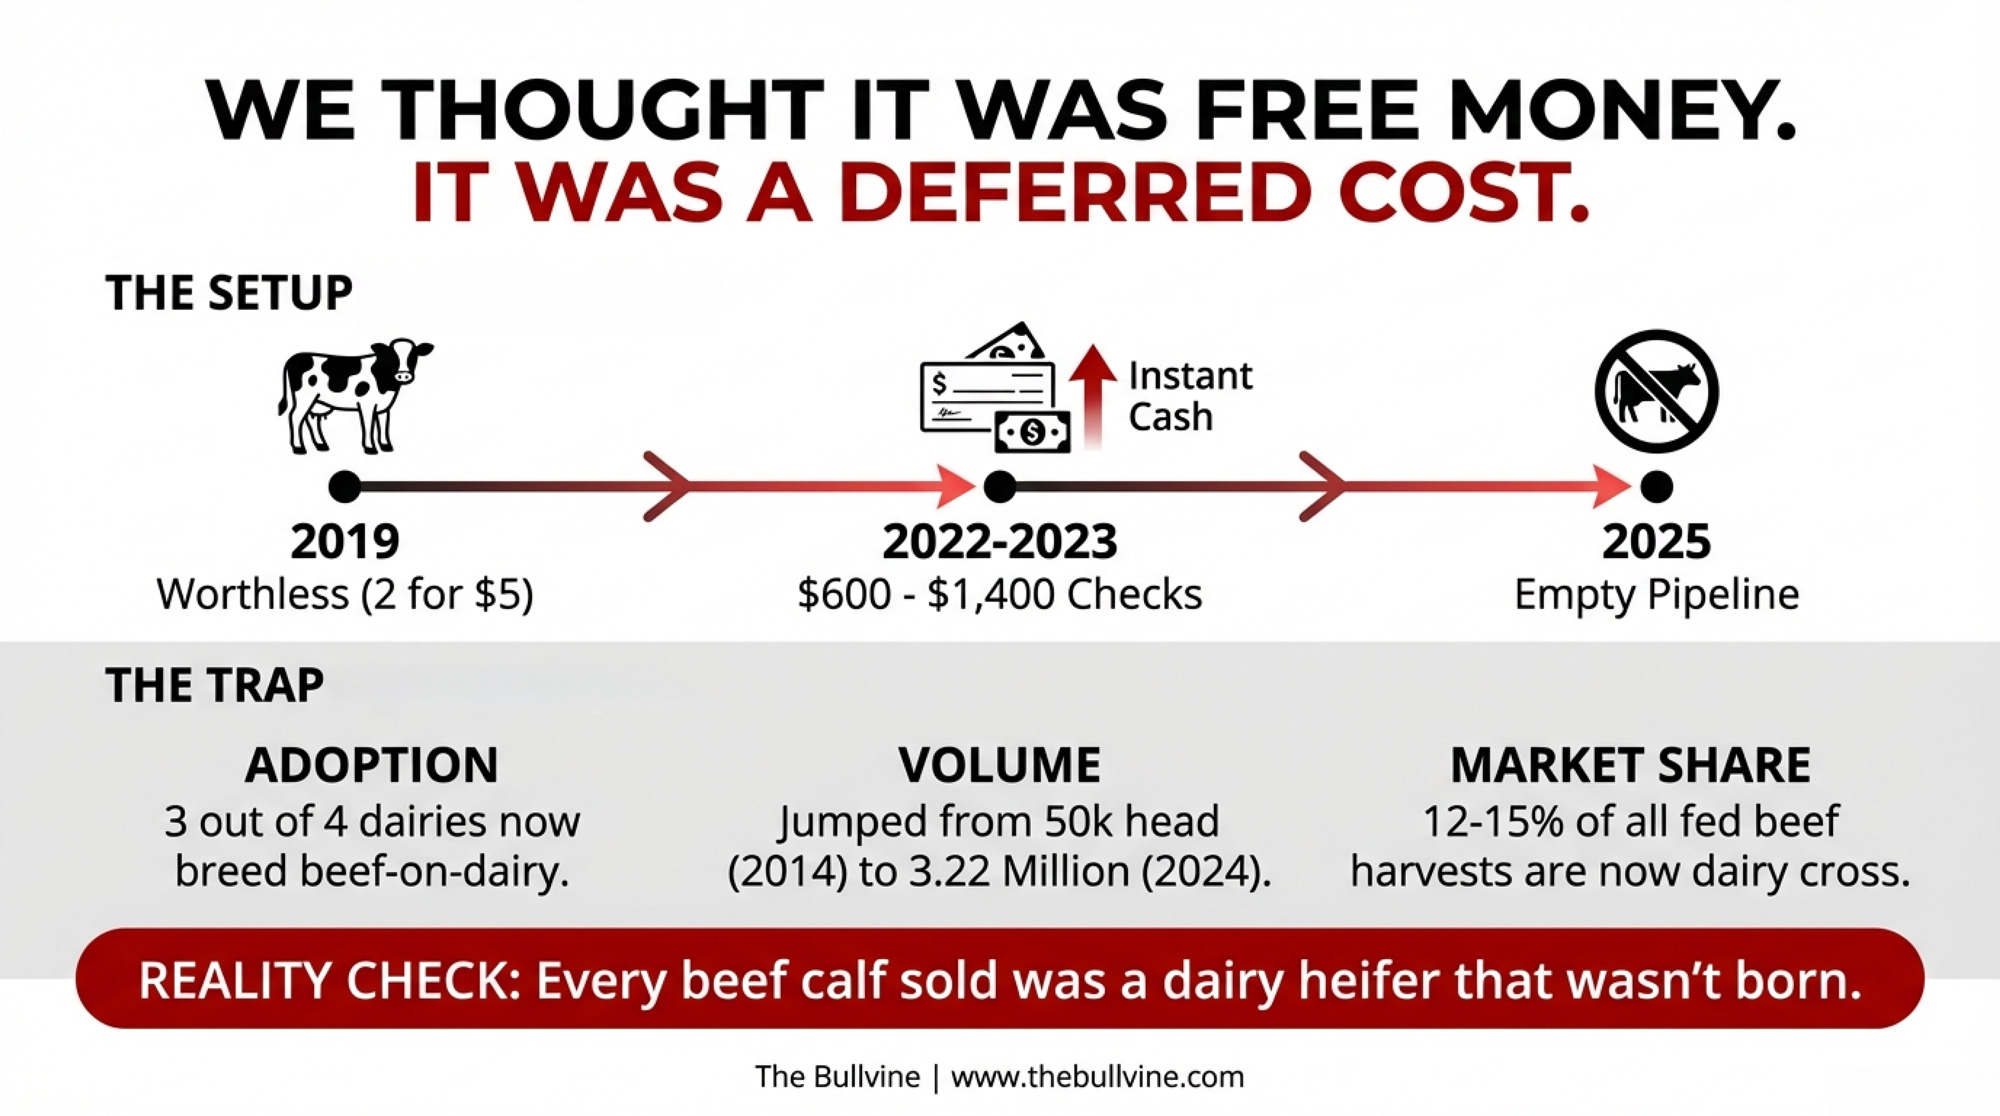
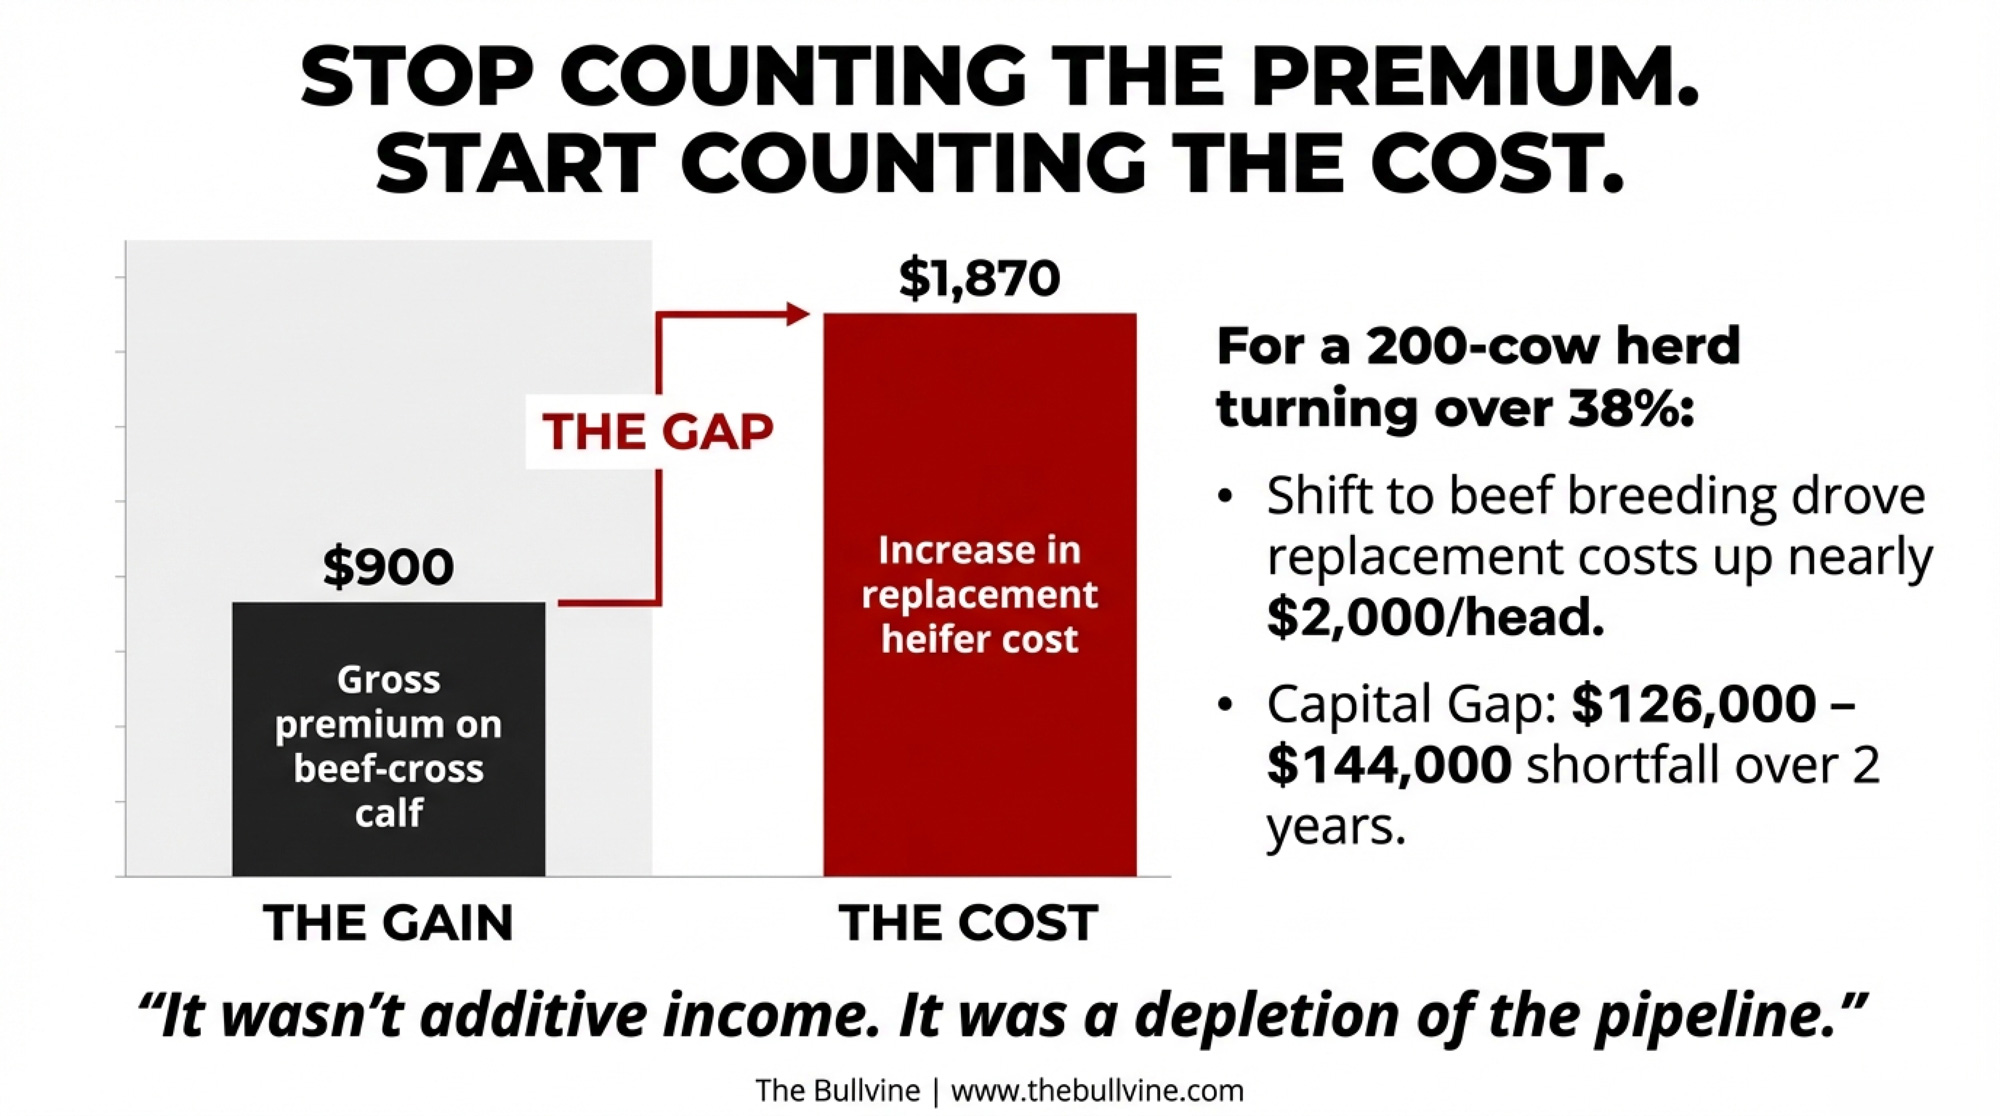
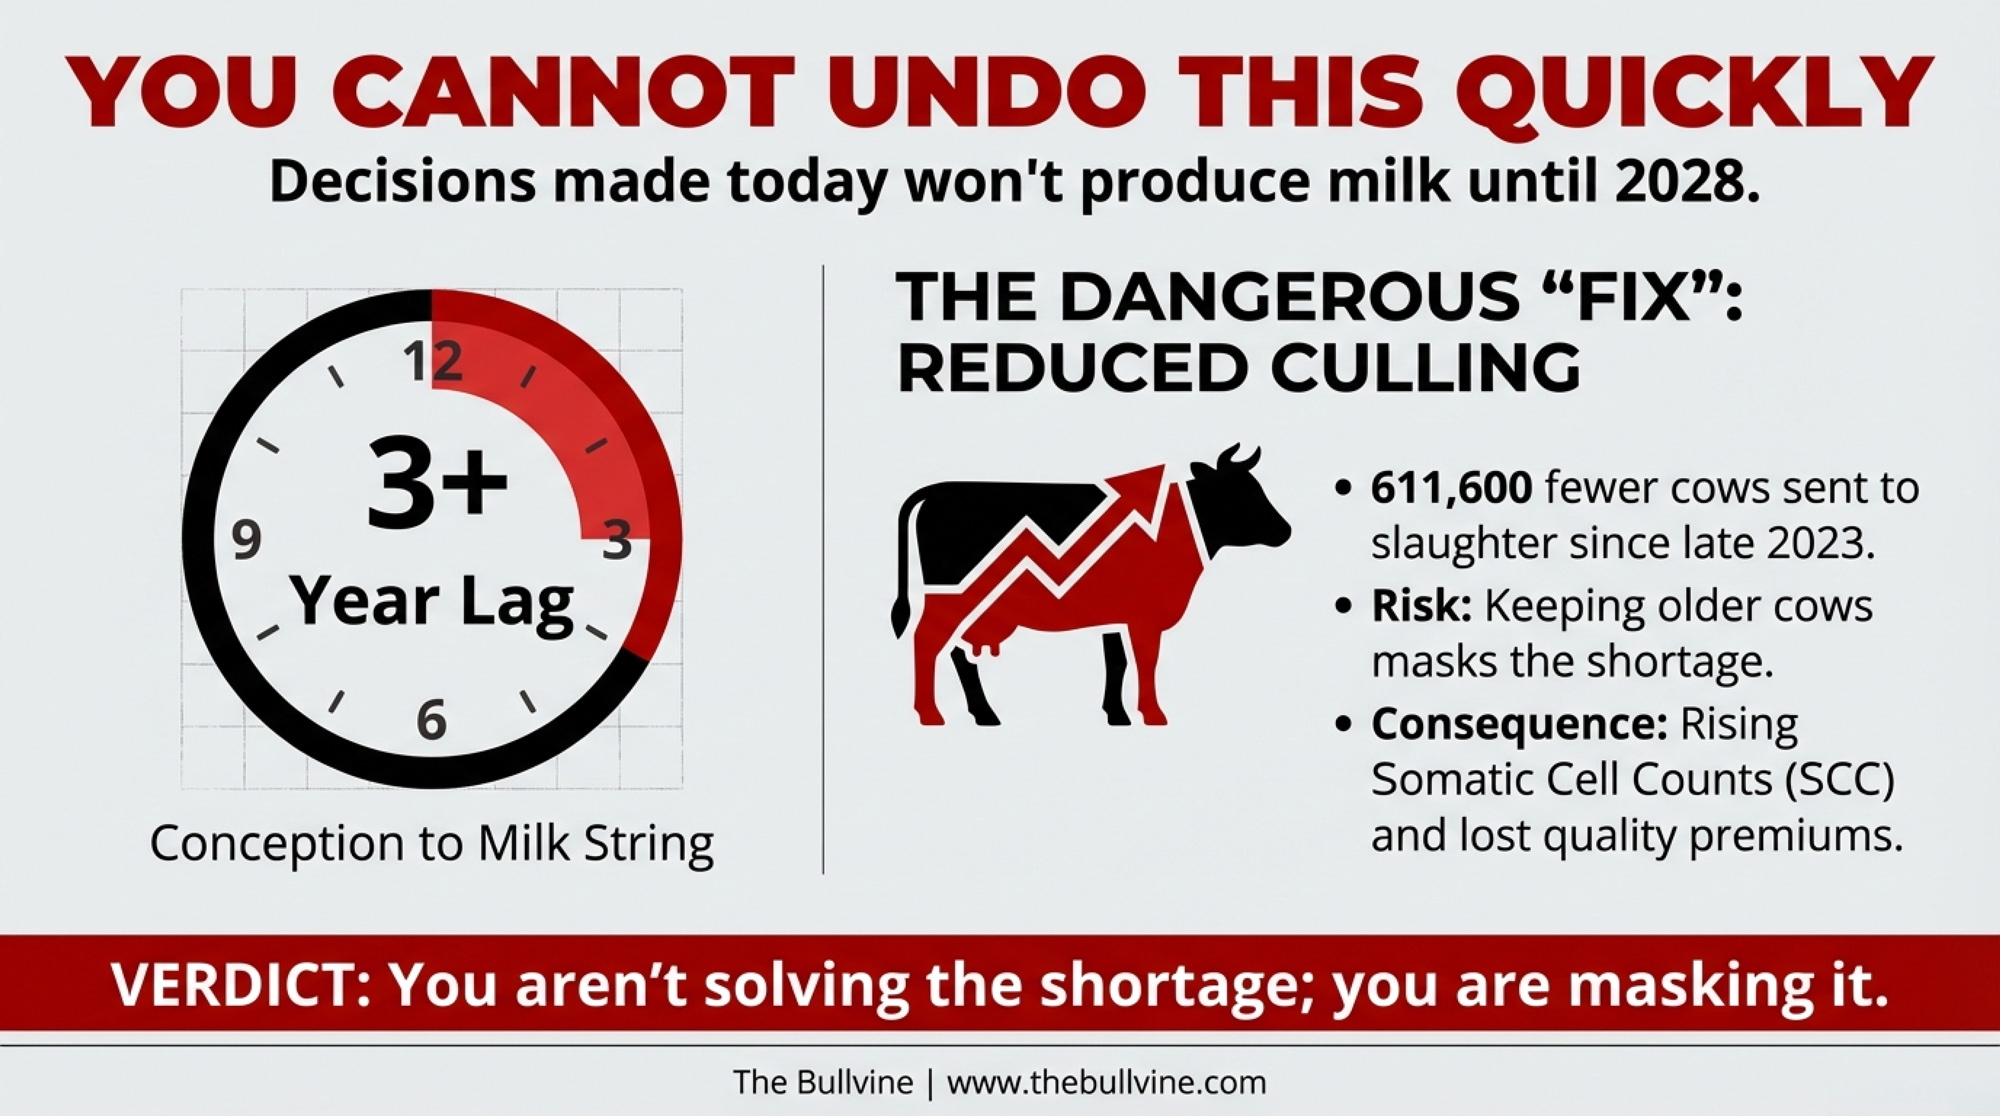
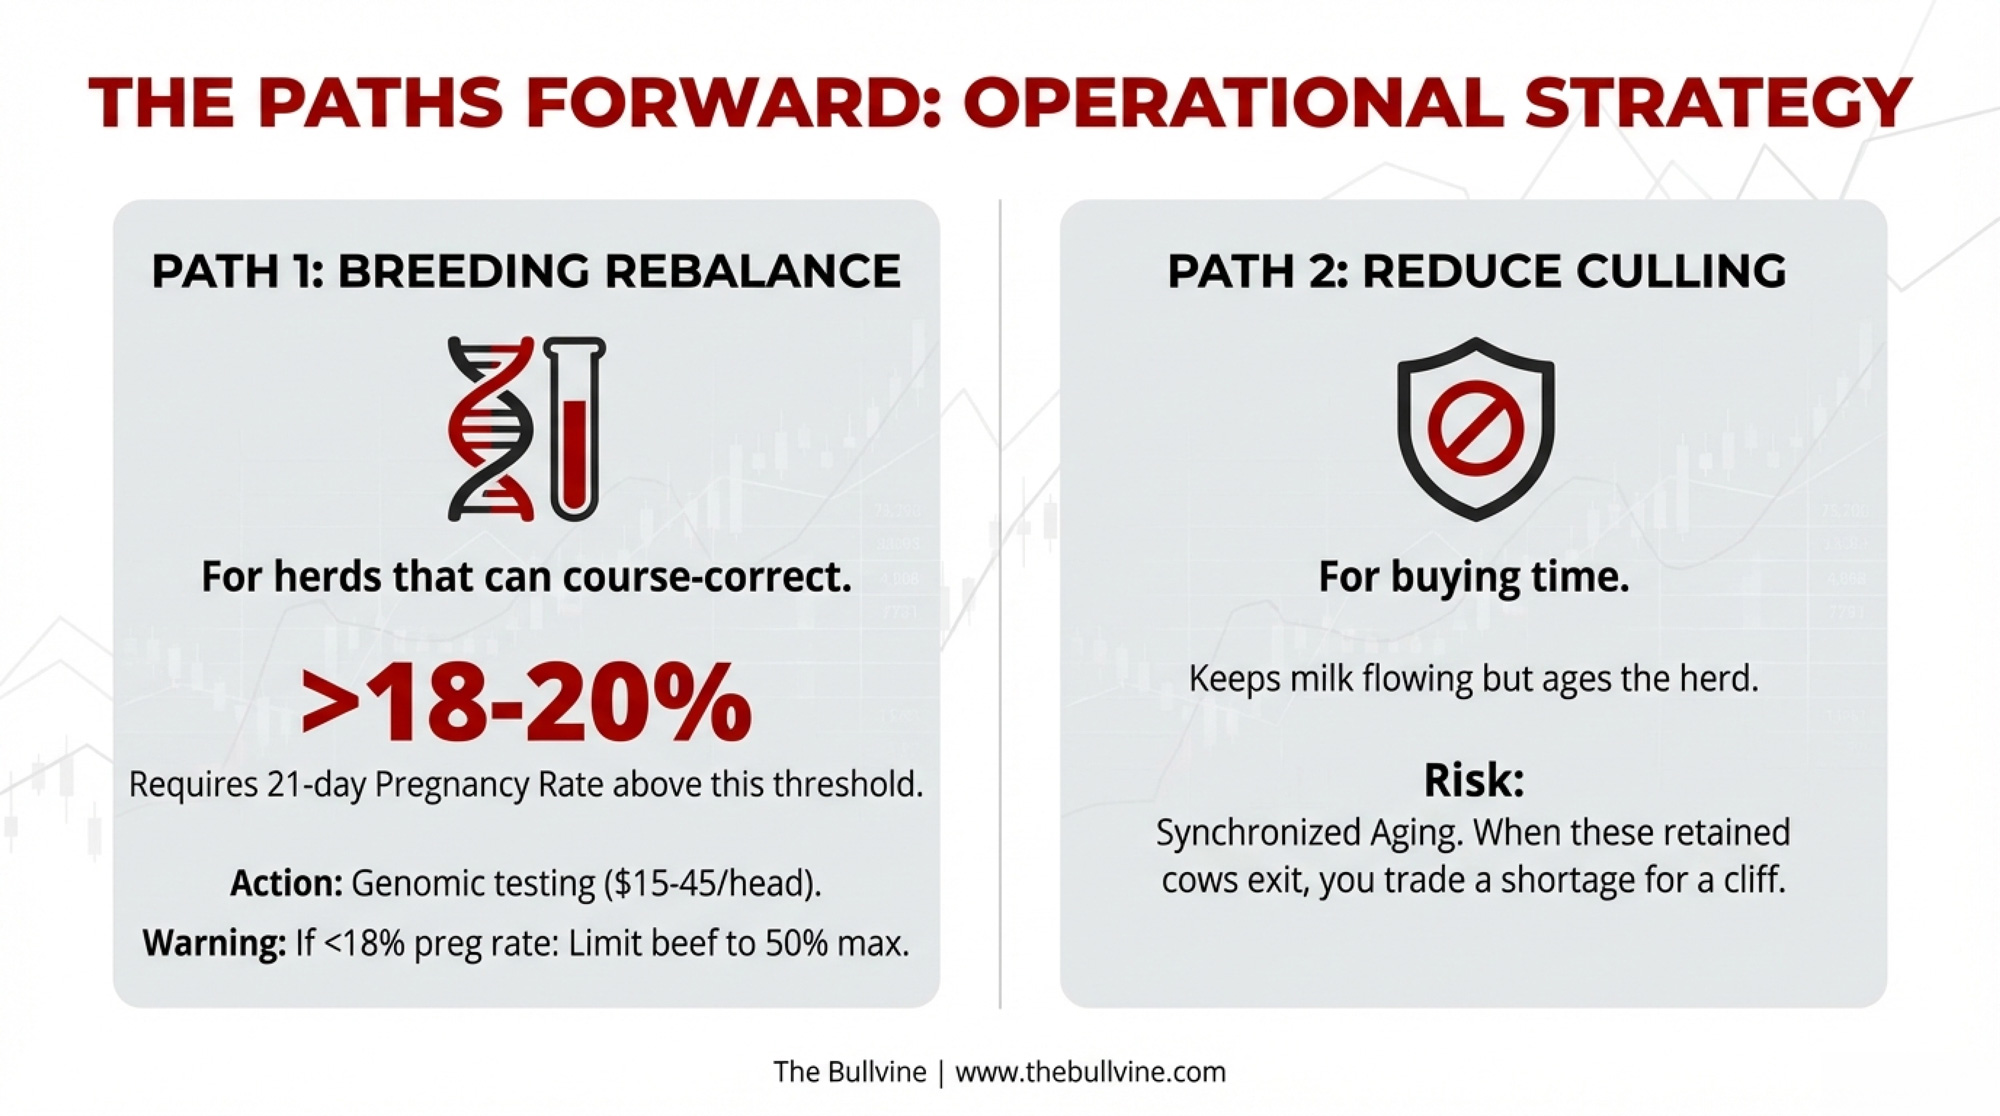
The $1750 Calf: Is Your 2026 Breeding Plan Leaving $800 a Head on the Table? – Secure your future herd while capturing massive beef-on-dairy premiums by weaponizing your genomic data. This guide breaks down the surgical breeding methods that turn surplus pregnancies into a high-margin revenue stream that significantly outpaces commodity milk income.
Tech Reality Check: The Farm Technologies That Delivered ROI in 2024 (And Those That Failed) – Master your next capital investment with verified payback periods for robotics, sensors, and AI. This reality check delivers the brutal gap between glossy brochures and barn-floor returns, ensuring your technology drives measurable margin instead of just adding complexity.
The Sunday Read Dairy Professionals Don’t Skip.
Every week, thousands of producers, breeders, and industry insiders open Bullvine Weekly for genetics insights, market shifts, and profit strategies they won’t find anywhere else. One email. Five minutes. Smarter decisions all week.
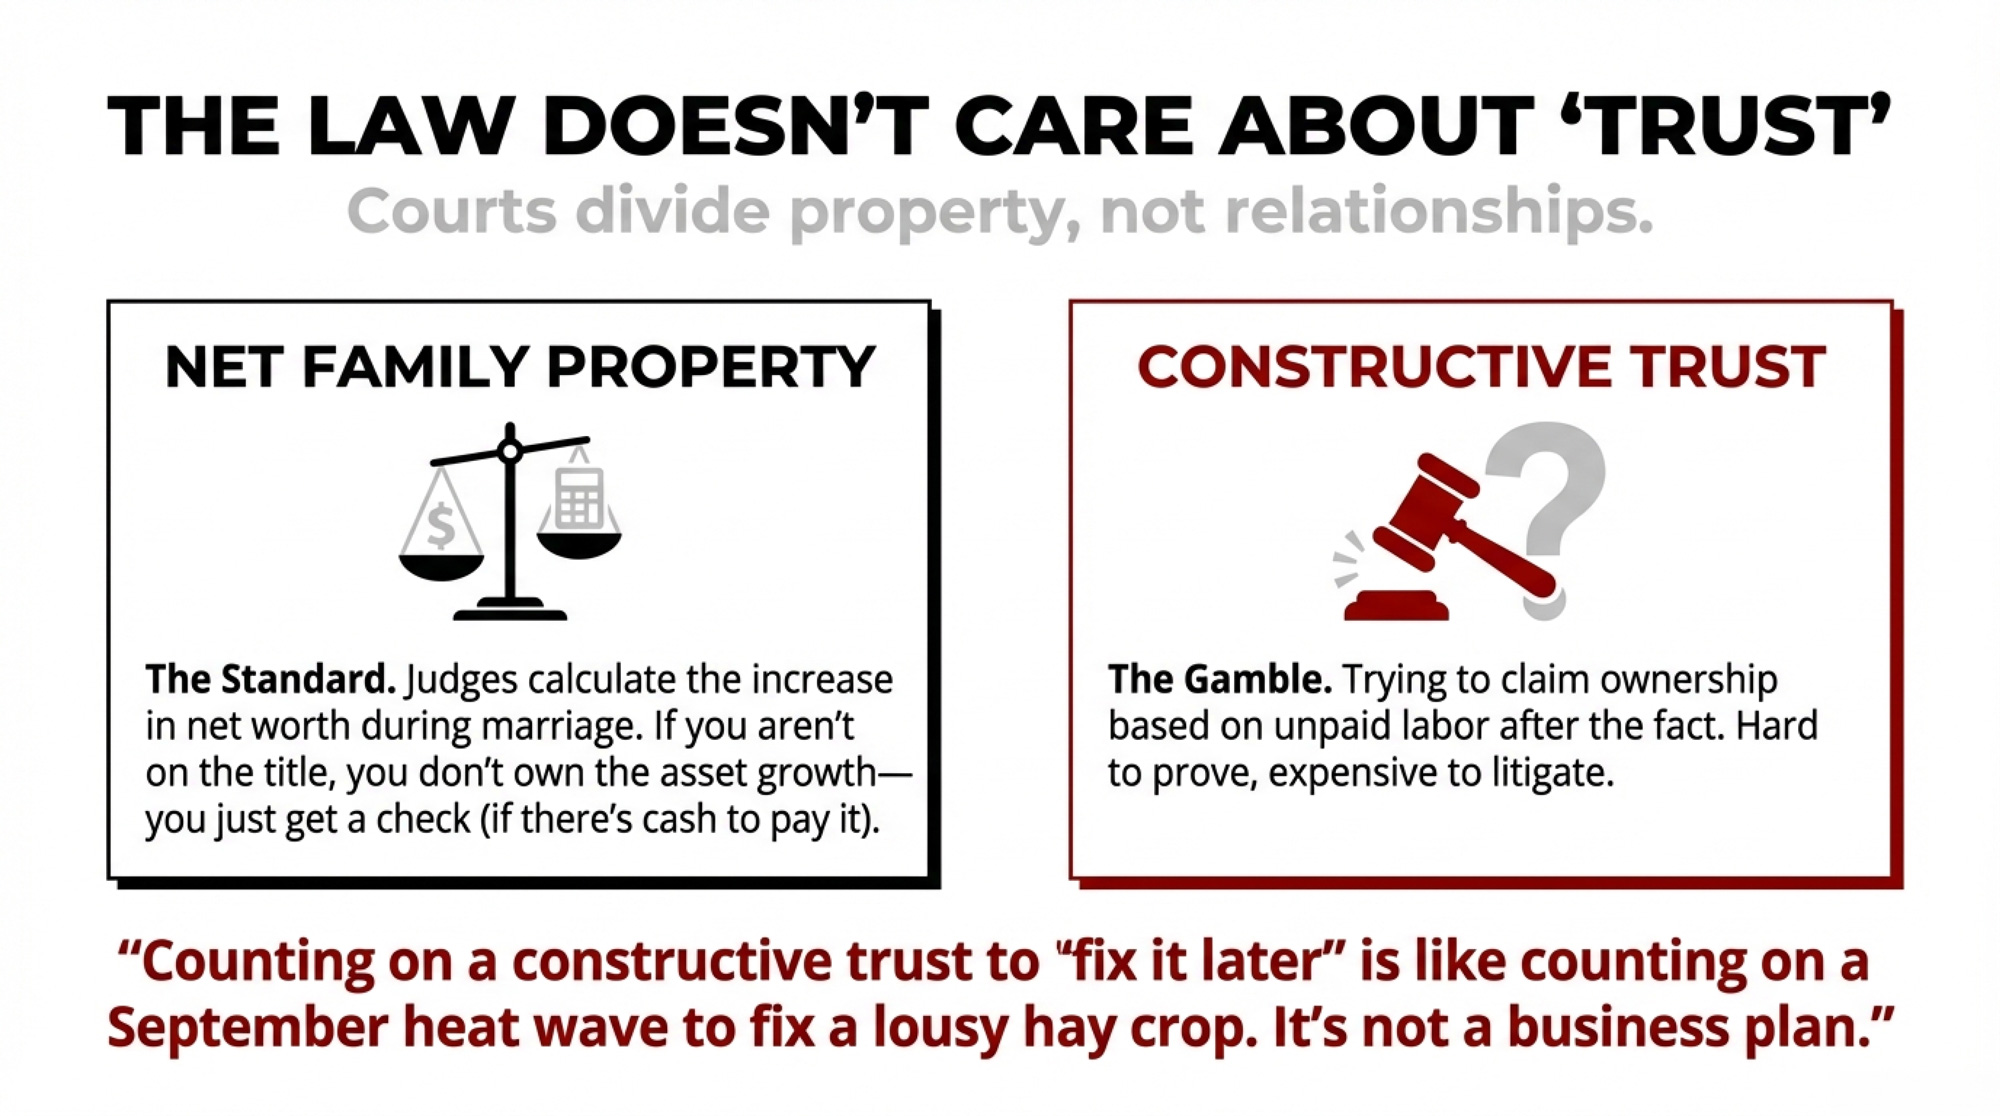
Your kid’s sweat equity is worth $0 without a signed agreement. A 2025 dairy farm court ruling just proved it the hard way.
Executive Summary: If your succession plan only lives in family conversations, this piece shows why that’s a bet you can’t afford to keep making. A 2025 Ontario court ruling in Metske v. Metske cut six years of a son’s sweat equity down to $31,700, because the family never put clear price, terms, or timelines on the transfer. At the same time, U.S. dairy farm numbers are down 39% in five years, farmland has more than doubled in value since 2010, and average net earnings sit around $592 per cow — a mismatch that makes “equal” inheritance almost impossible to cash‑flow. You see the flip side in Minnesota’s 150‑year Heusinkveld dairy, where education, scale, and structure give the next generation a real shot instead of just hopes and handshakes. The article walks you through why “equal” splits usually force a sale, while “equitable” transfers — separate entities for land and cows, earned buy‑ins, and written, bank‑vetted agreements — keep the doors open. You also get hard numbers to work with (4:1 max debt‑to‑EBITDA, 1.25+ term debt coverage, current FSA rates) and a 90‑day triage plan to start turning vague expectations into signed paper your lender and your kids can actually rely on.
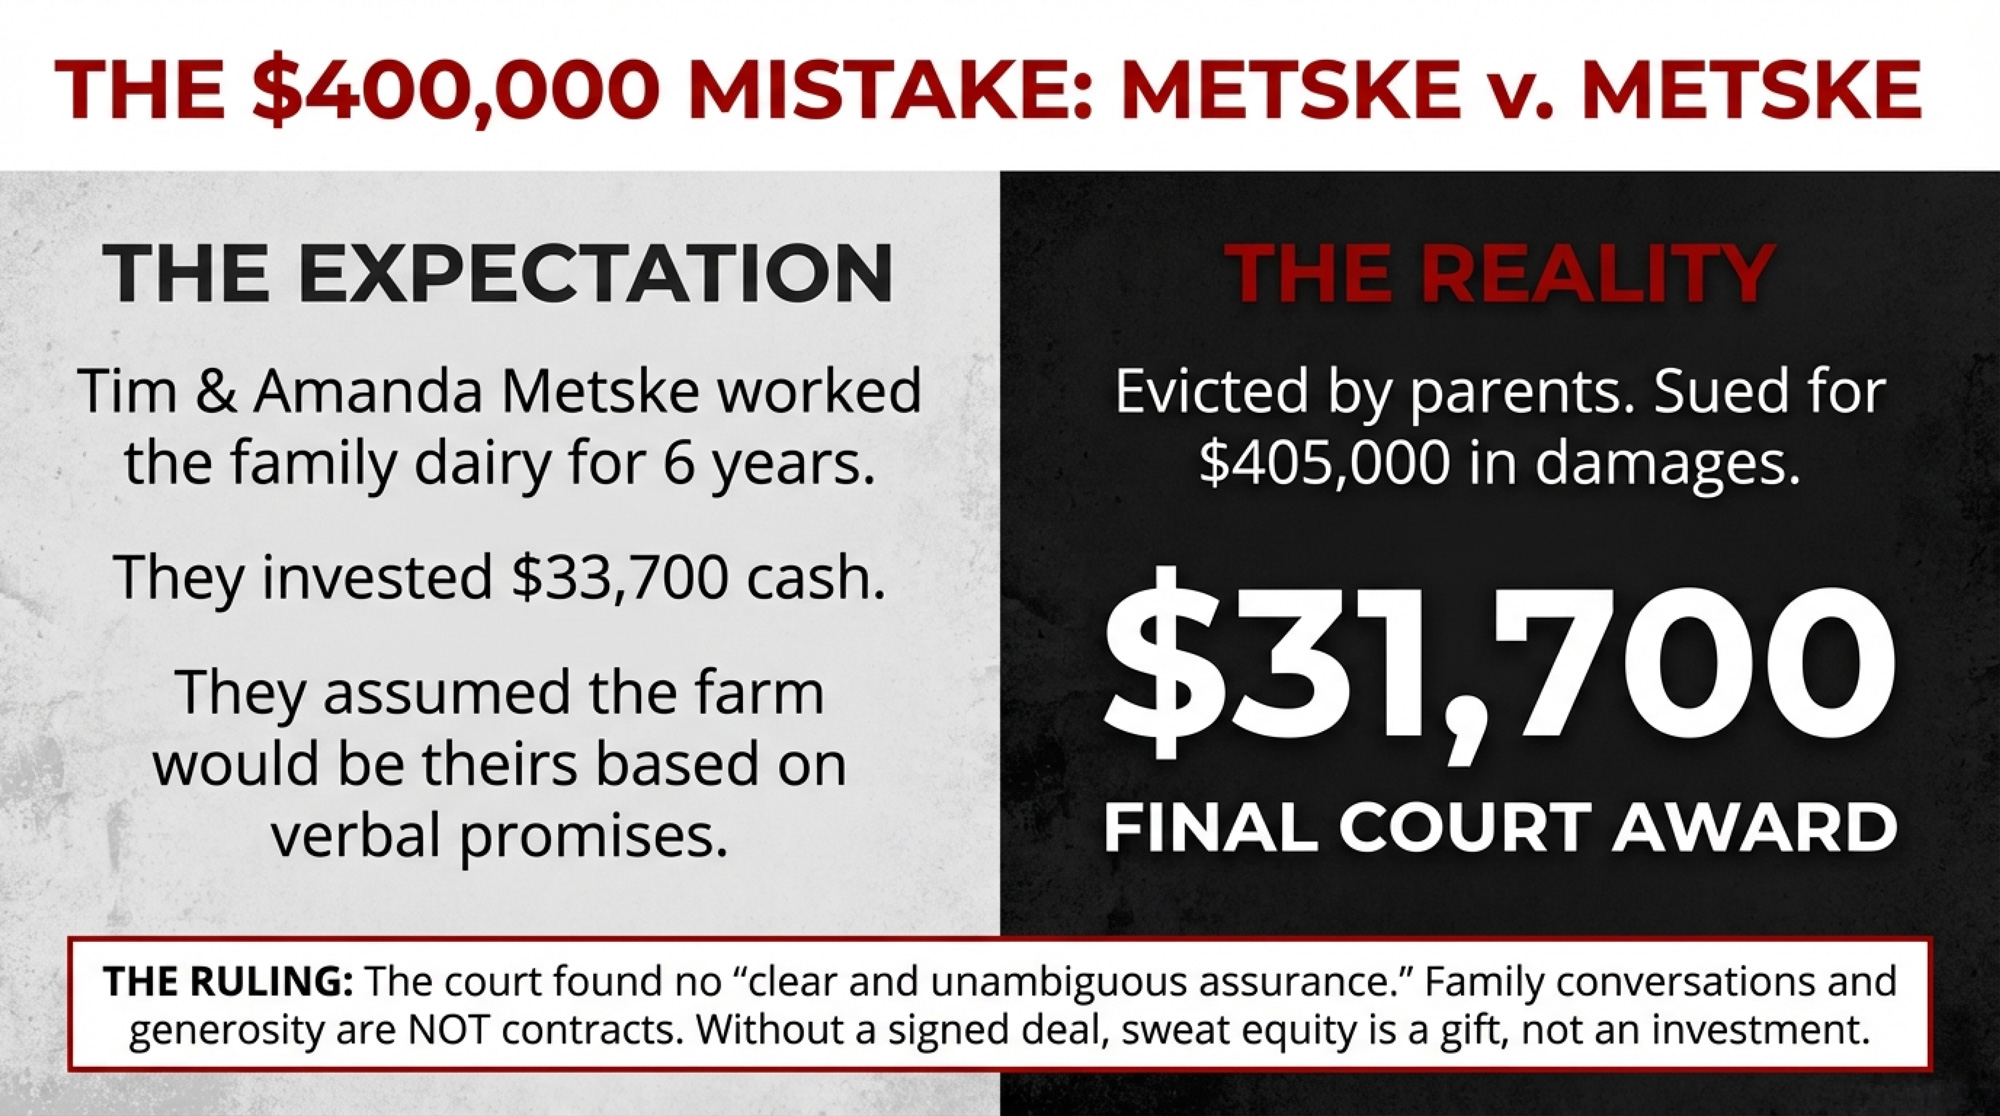
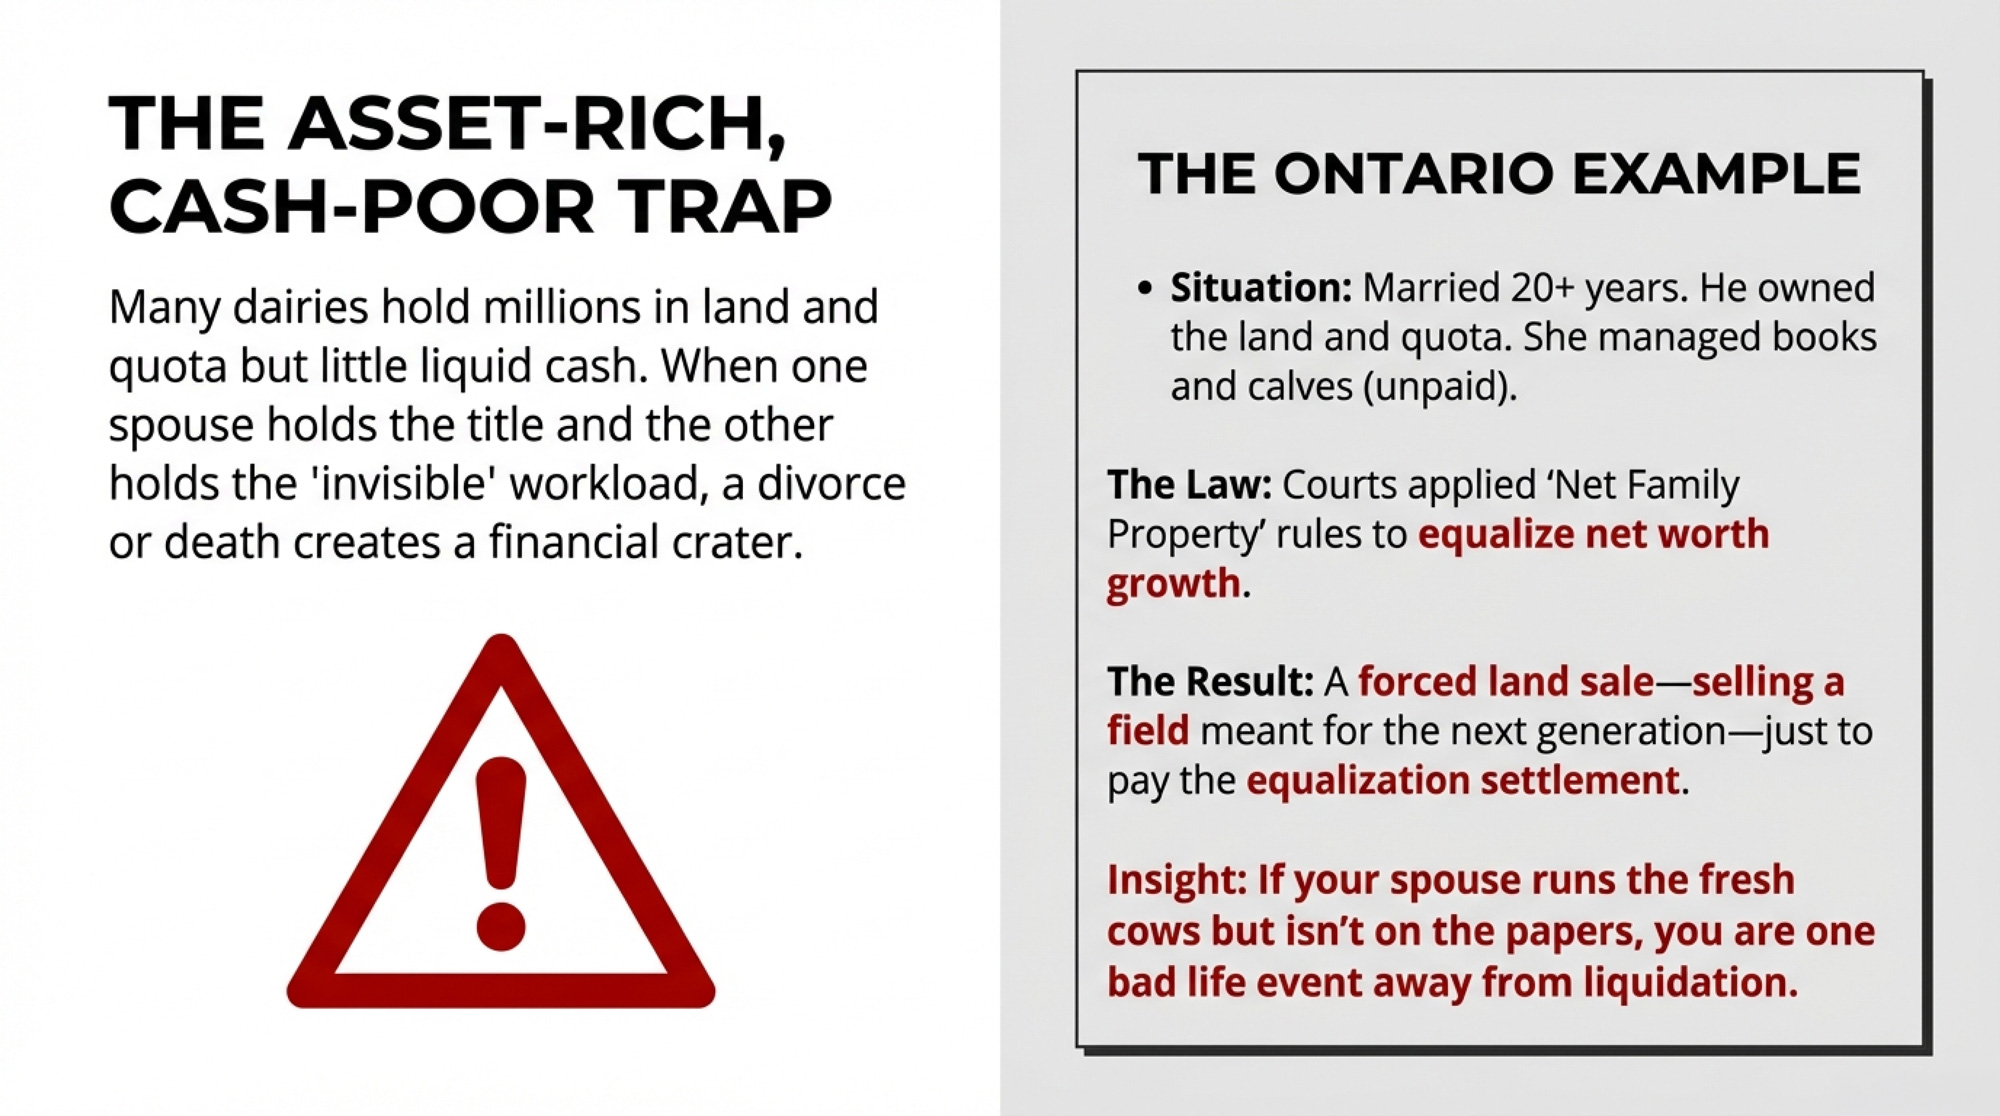
By every outward measure, Tim Metske was building his future. Starting around 2012, he and his wife, Amanda, ran his parents’ Ontario dairy — bought the herd from Martin and Roseanne Metske for approximately $90,000 (funded by a bank loan Martin co-signed), leased the quota, and drew up a business plan for the bank. They invested $33,700 of their own money in property improvements, including a furnace and repairs. The whole time, they operated under what the trial judge later described as “favourable but undefined” terms for eventually acquiring the land and buildings.
Nobody wrote anything down.
In April 2018, Roseanne told them to leave by the end of May. Forced off the land and without the dairy quota attached to it, they disposed of the herd at a loss and sued. The trial judge awarded $405,000 in damages. Martin and Roseanne appealed. In 2025, the Ontario Court of Appeal — in Metske v. Metske, 2025 ONCA 418 — overturned the bulk of that award and reduced Tim and Amanda’s recovery to $31,700: the net value of tangible improvements minus $2,000 in damages to the farmhouse.
Six years of sweat equity, reduced to a number smaller than the original investment. The court couldn’t build a structure that the family never built.
Why the Court Ruled the Way It Did
The Court of Appeal’s reasoning exposes exactly why informal dairy farm succession plans collapse.
The court found no “clear and unambiguous assurance.” The Metskes’ family conversations never crystallized beyond a willingness to negotiate. Price, financing, timing, and even which properties were included — all remained undefined. An “agreement to agree,” the court held, isn’t enough to ground a legal claim.
Here’s the part that should keep every dairy family up at night: Tim and Amanda’s own business plans worked against them. The documents they’d prepared for the bank showed acquisition at fair market value. The Court of Appeal said this contradicted any claim of a promised below-market deal. Martin’s past generosity, even Roseanne’s warm words at the wedding, weren’t enough to establish “donative intent”.
And the financial reality sealed it. When Tim tried to secure financing for the dairy quota in 2013, the bank insisted on a 10-year amortization, which the projected cash flow couldn’t support. From that moment forward, the contemplated succession was financially dead — but nobody acknowledged it for another five years.
As Lerners LLP noted in their analysis: proprietary estoppel “protects against the unfairness of a promisor resiling from a promise, not against the commercial risk of an aspirant purchaser who cannot perform”.
The law can’t save you from a plan that was never a plan.
What Is Proprietary Estoppel — And Why Should You Care?
You’ve probably never heard this term. But if your succession “plan” is built on verbal promises, it’s the legal concept that will decide your family’s future.
Proprietary estoppel is a legal claim that arises when one person relies on another’s promise regarding property — and suffers a loss when that promise is broken. In farm succession disputes, the incoming generation typically argues: “You told me I’d get the farm, I worked for years based on that promise, and now you’ve pulled the rug out.”
The Metske ruling shows how hard it is to win this claim. Ontario’s Court of Appeal required a “clear and unambiguous assurance” — not vague encouragement, not general family goodwill, not a willingness to negotiate someday. The court also demanded proof that the promise was specifically intended as a commitment, not just an optimistic conversation. Tim and Amanda’s own bank documents — showing they expected to buy at fair market value — contradicted any claim of a guaranteed below-market deal.
The bottom line: “My dad said I’d get the farm” is not a contract. It’s not even close. If the terms aren’t written, signed, and witnessed — with independent legal advice for both sides — they don’t exist in the eyes of the law.
The Numbers Behind the Crisis
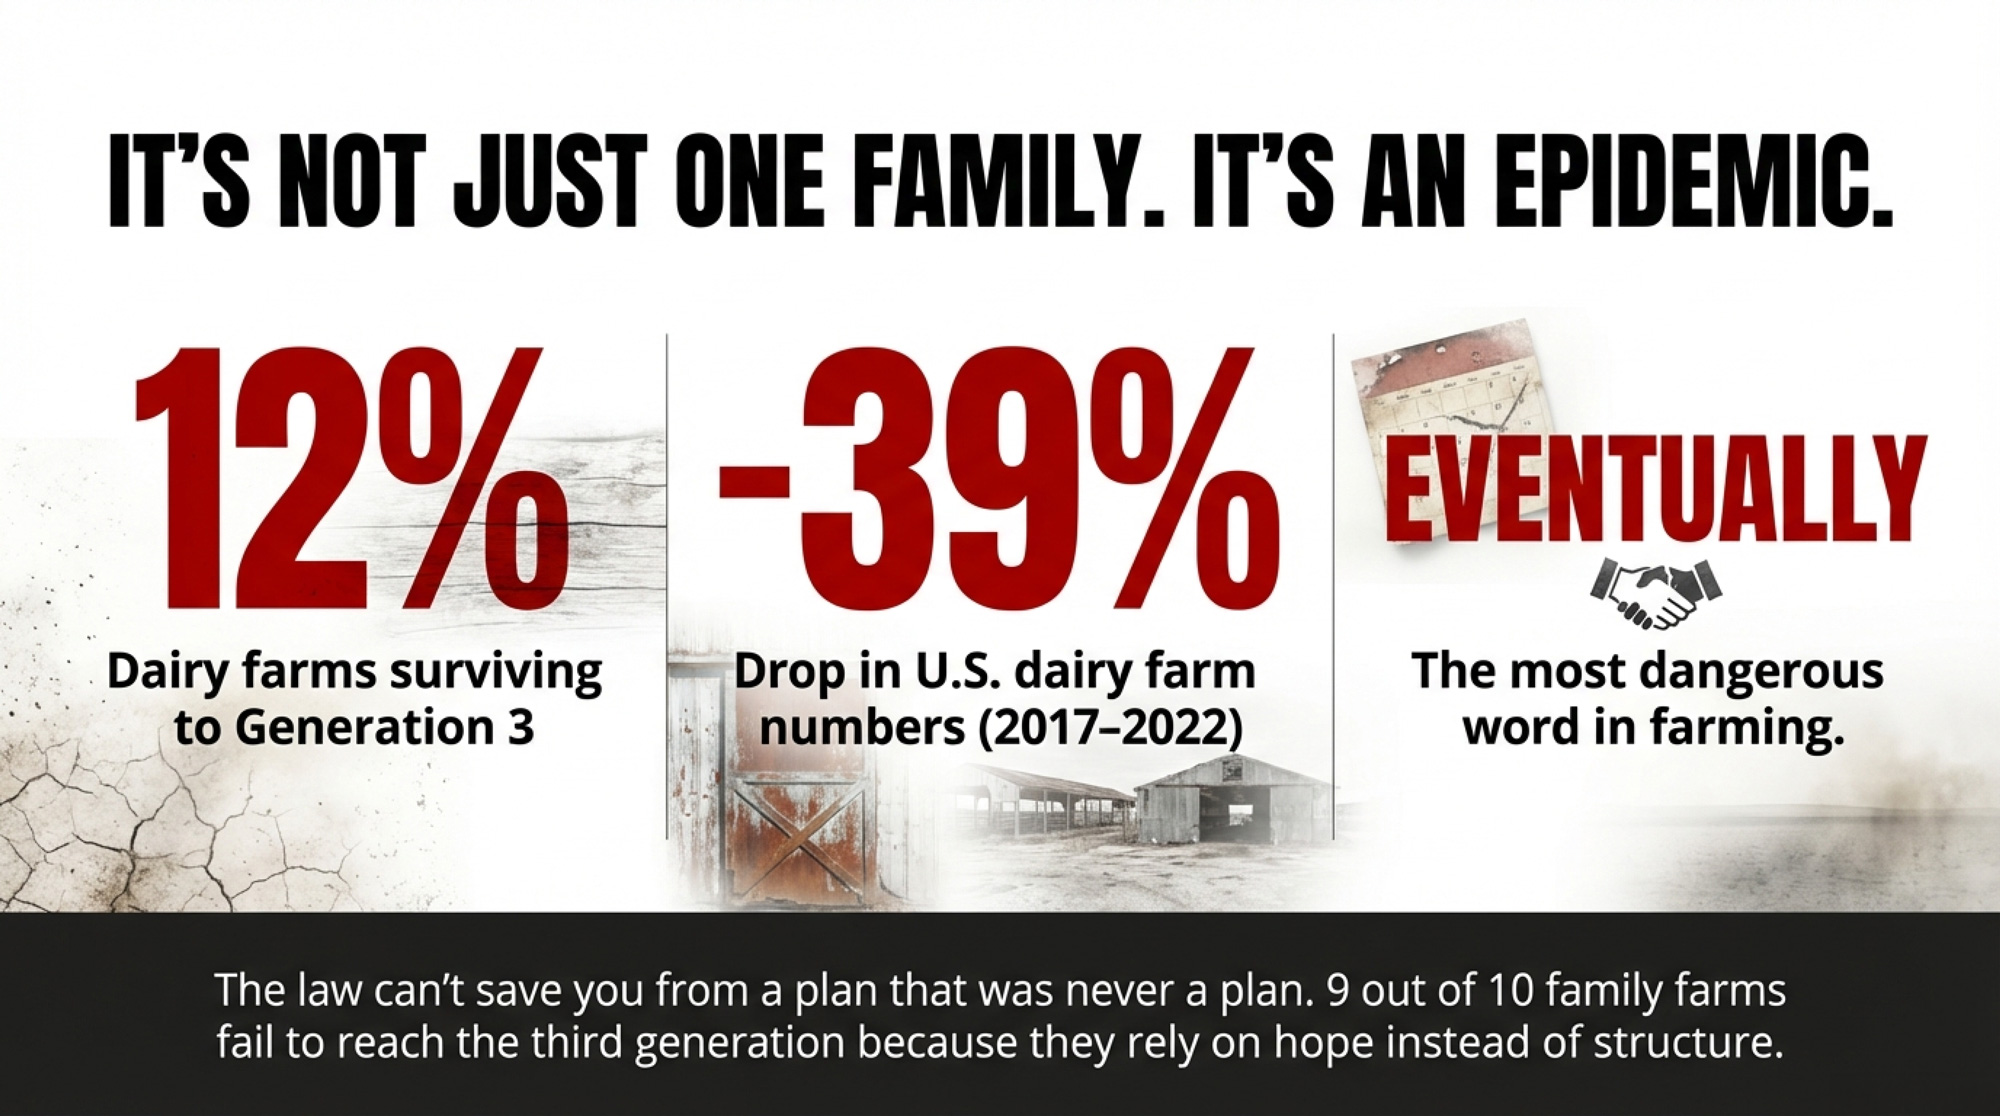
The Metskes aren’t an outlier. They’re a pattern.
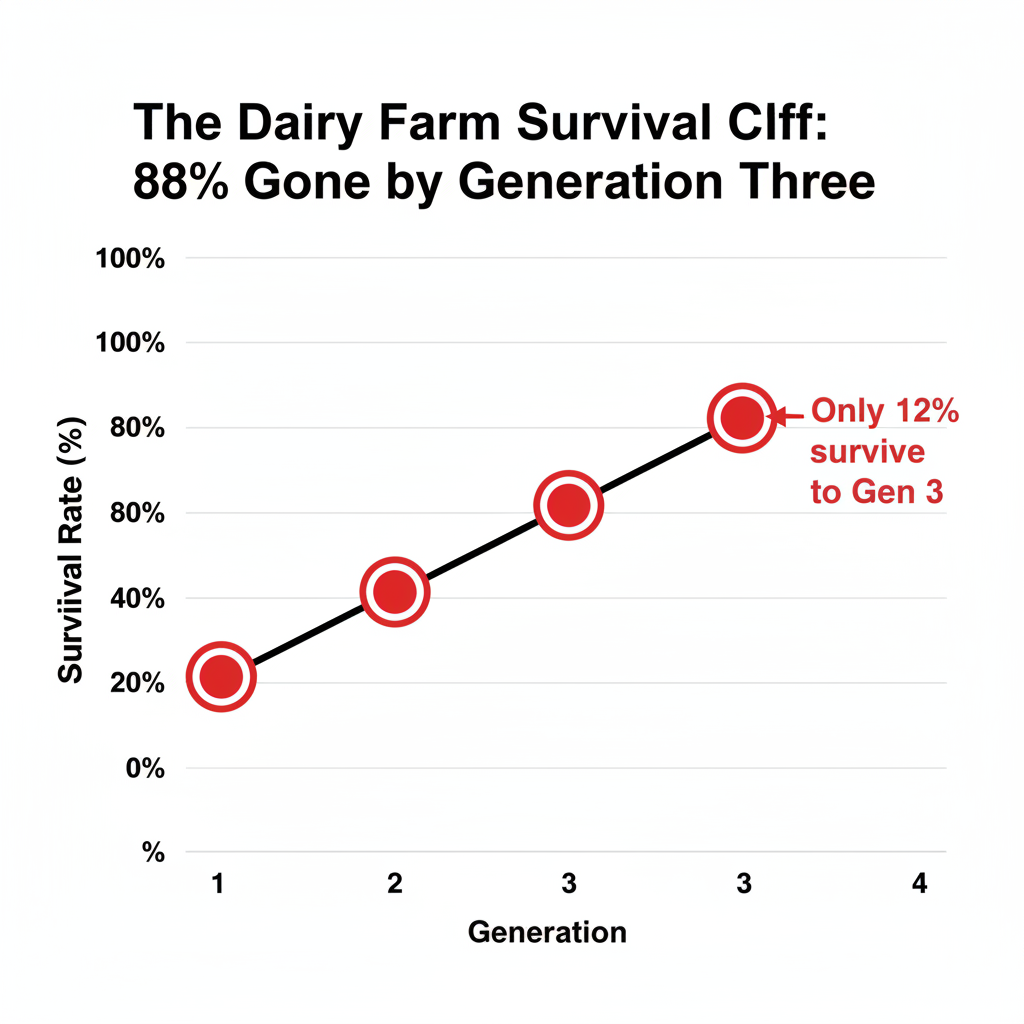
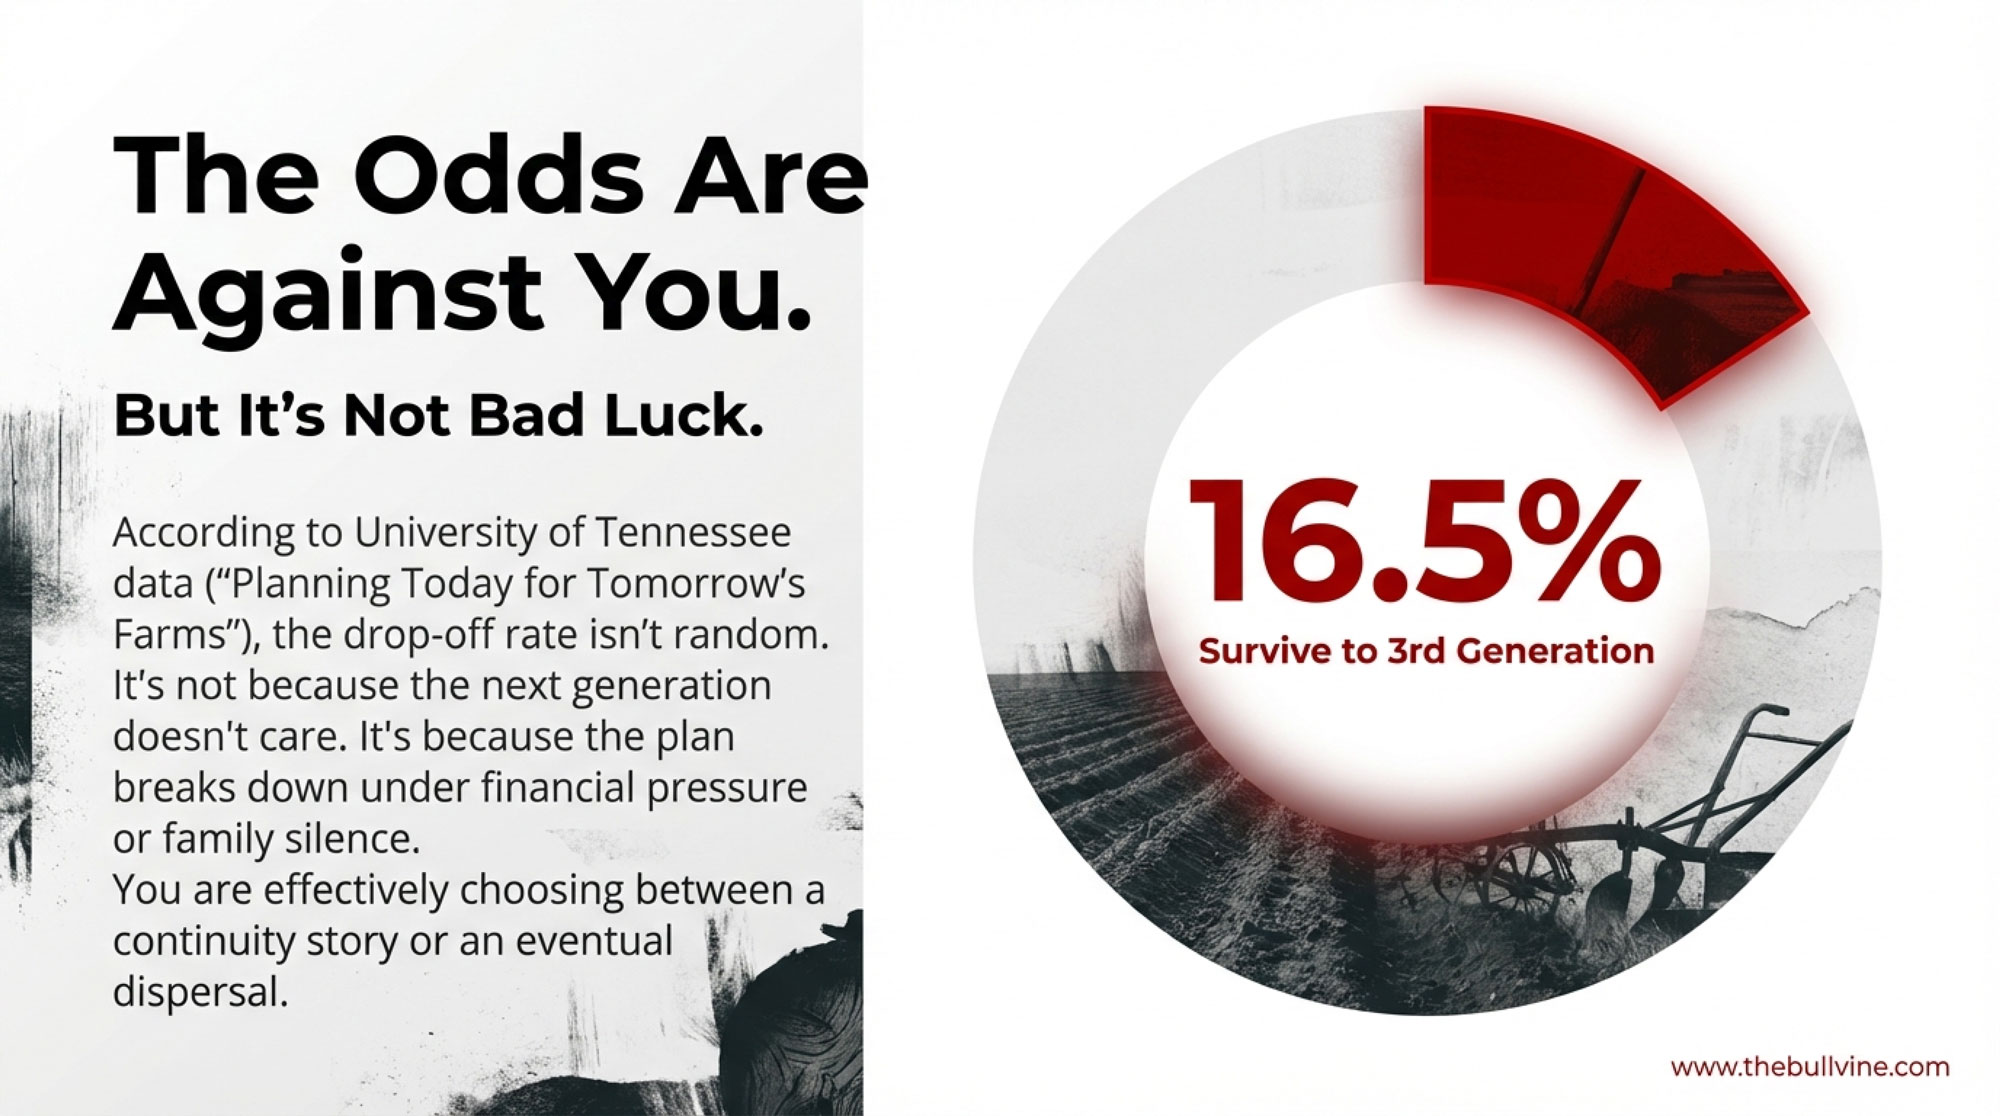
Ron Hanson, professor emeritus at the University of Nebraska, has spent his career studying farm succession. His numbers: 30% of family farms survive to the second generation. Just 12% make it to the third. Only 3% reach the fourth. John Ward’s foundational 1987 research at Northwestern’s Kellogg School of Management found similar results across all family businesses — roughly 30% to the second generation, 10–15% to the third.
Nearly 9 in 10 family farms don’t survive to see a third generation at the helm. Not because the kids don’t want the farm. Because nobody built the structures to make the transfer work.
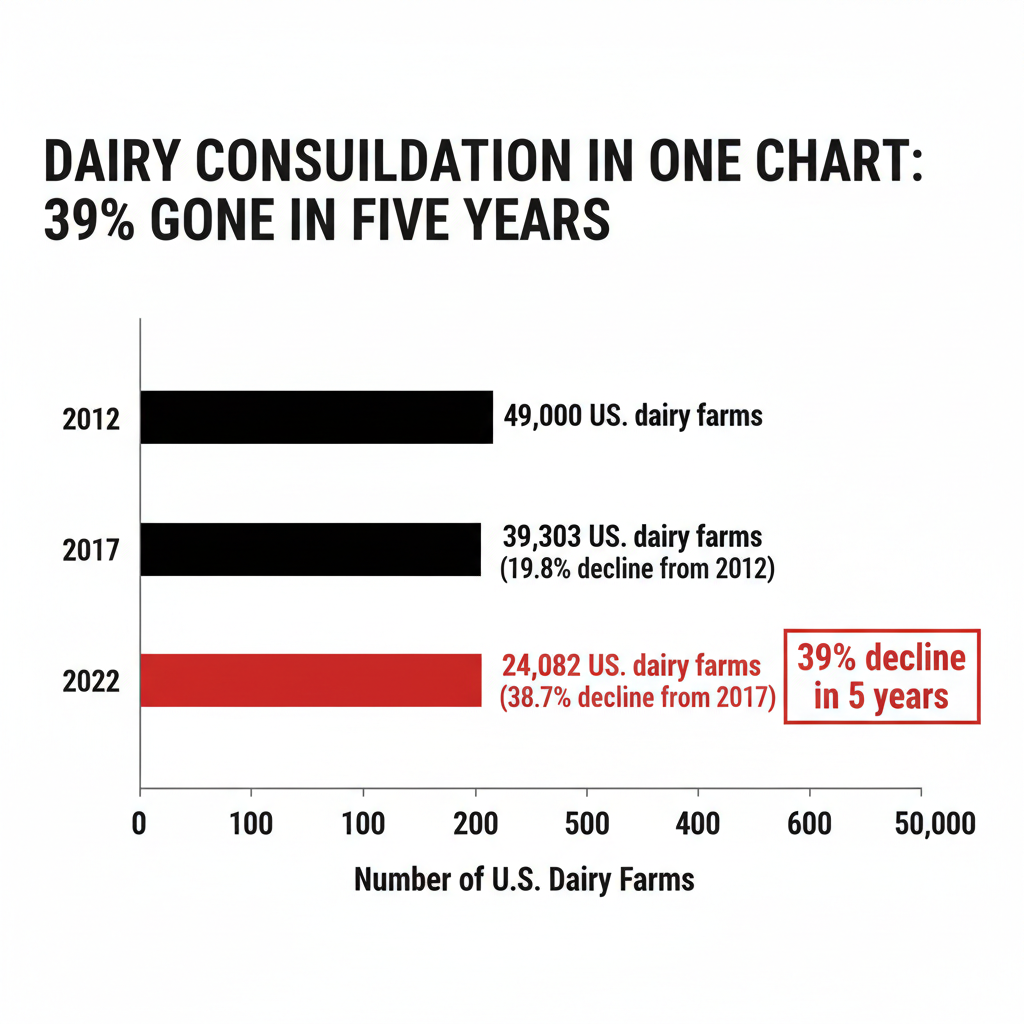
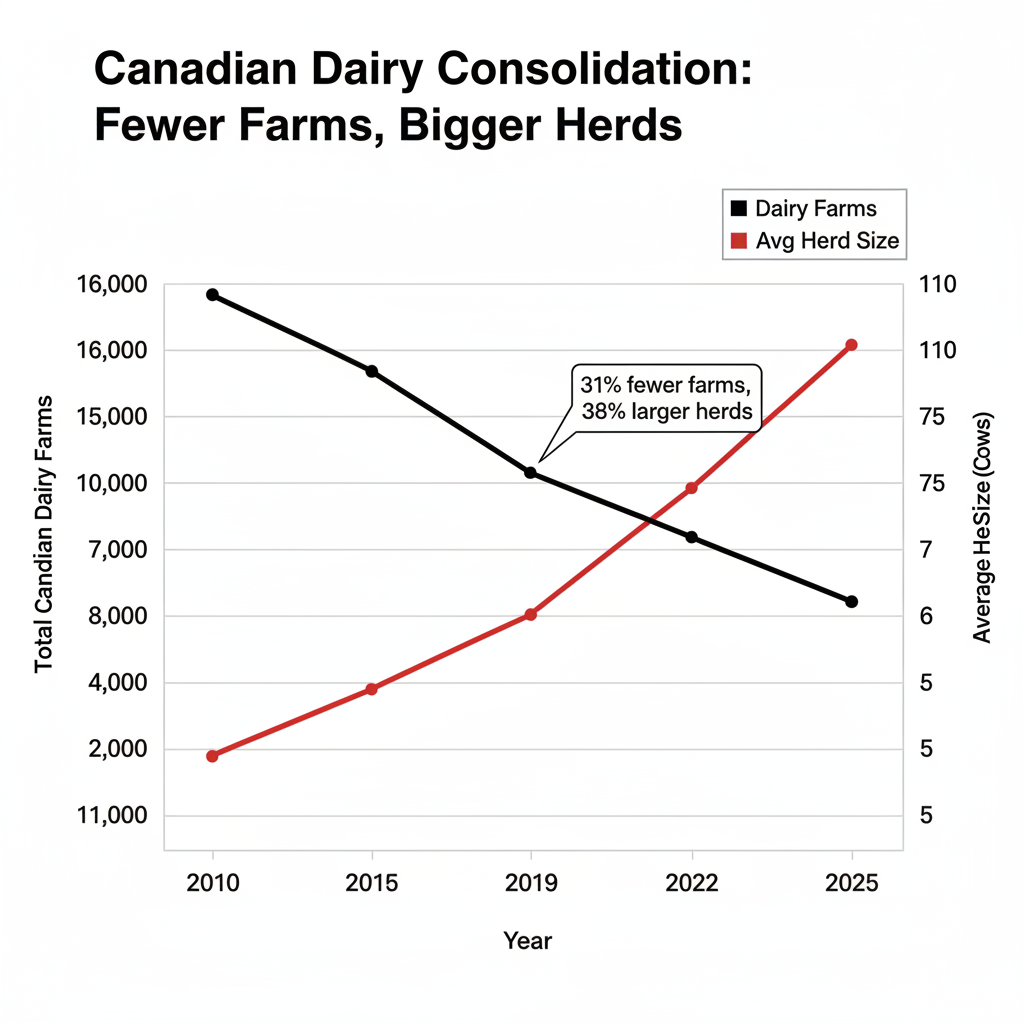
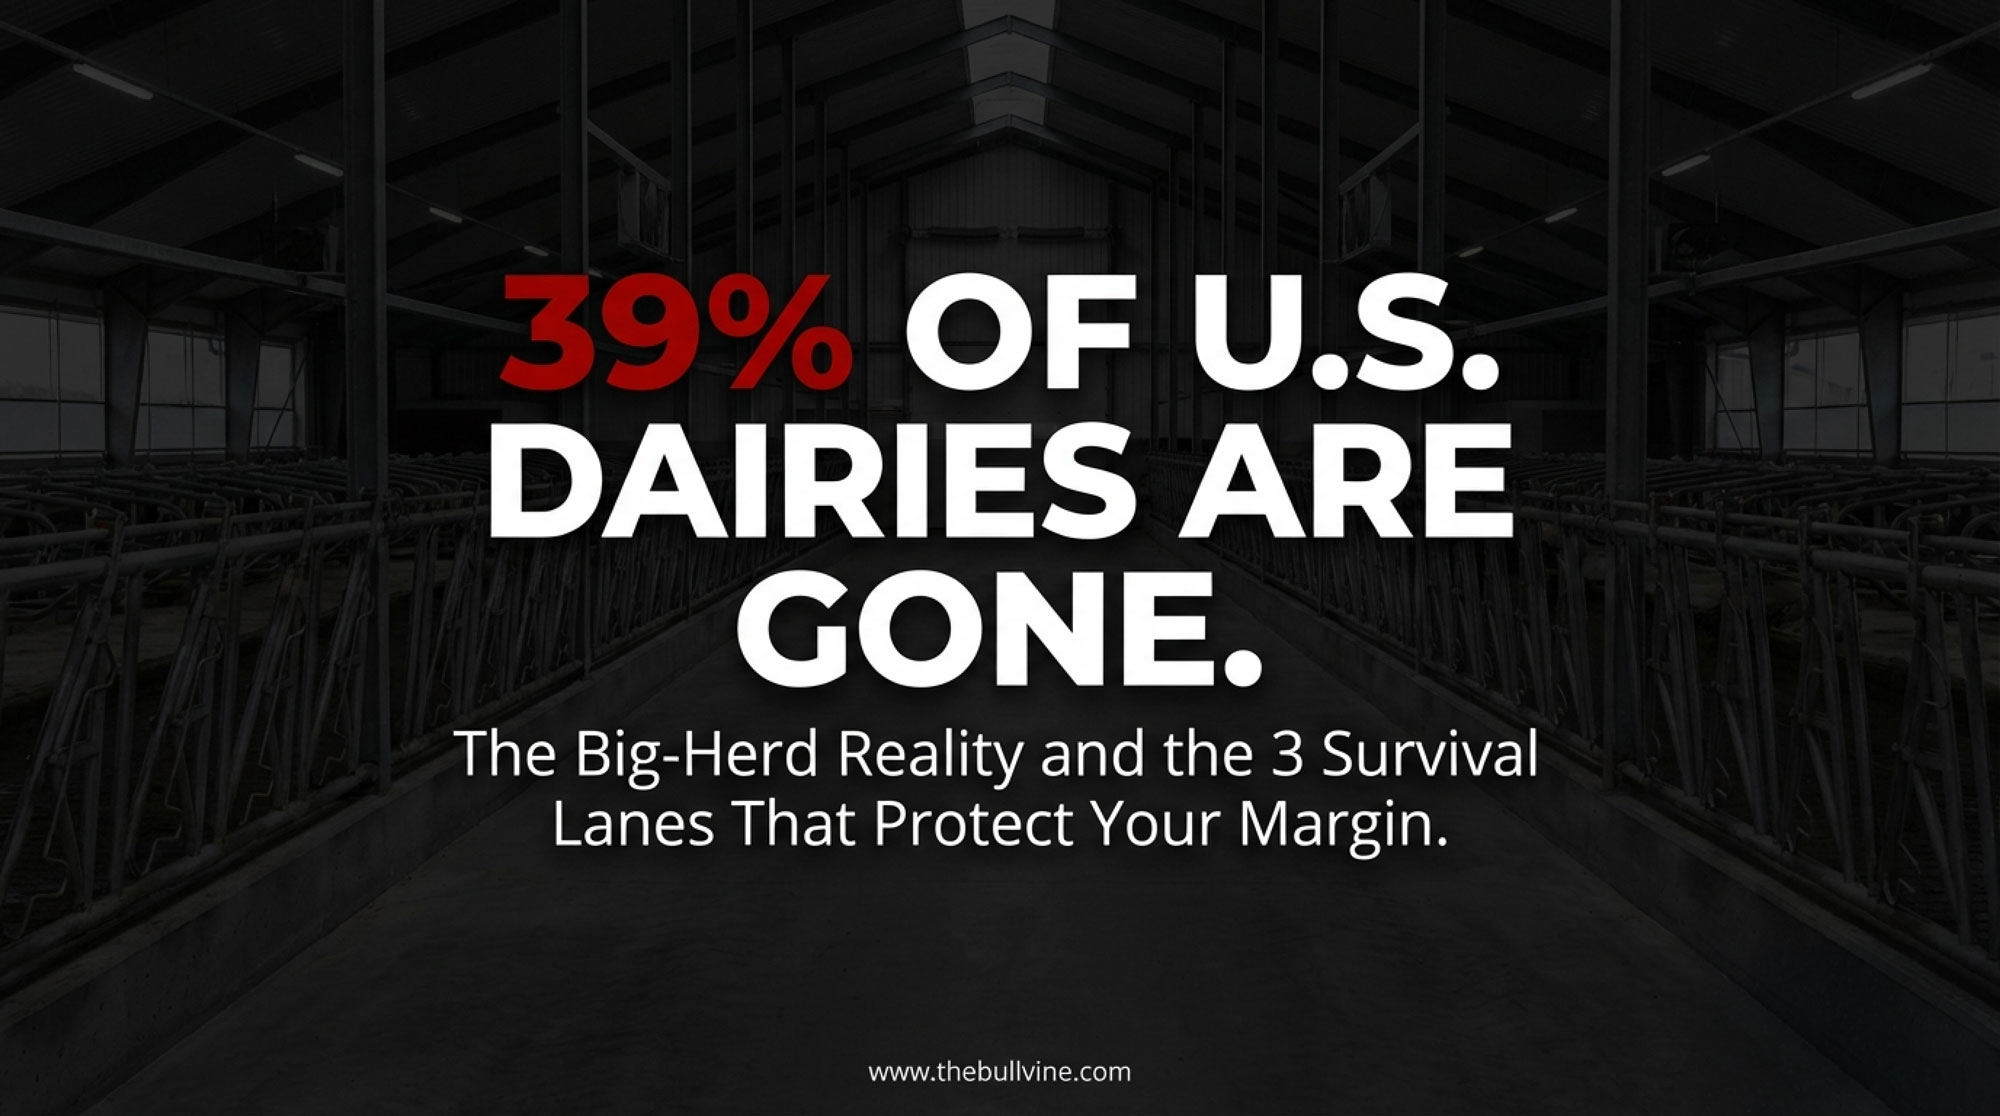
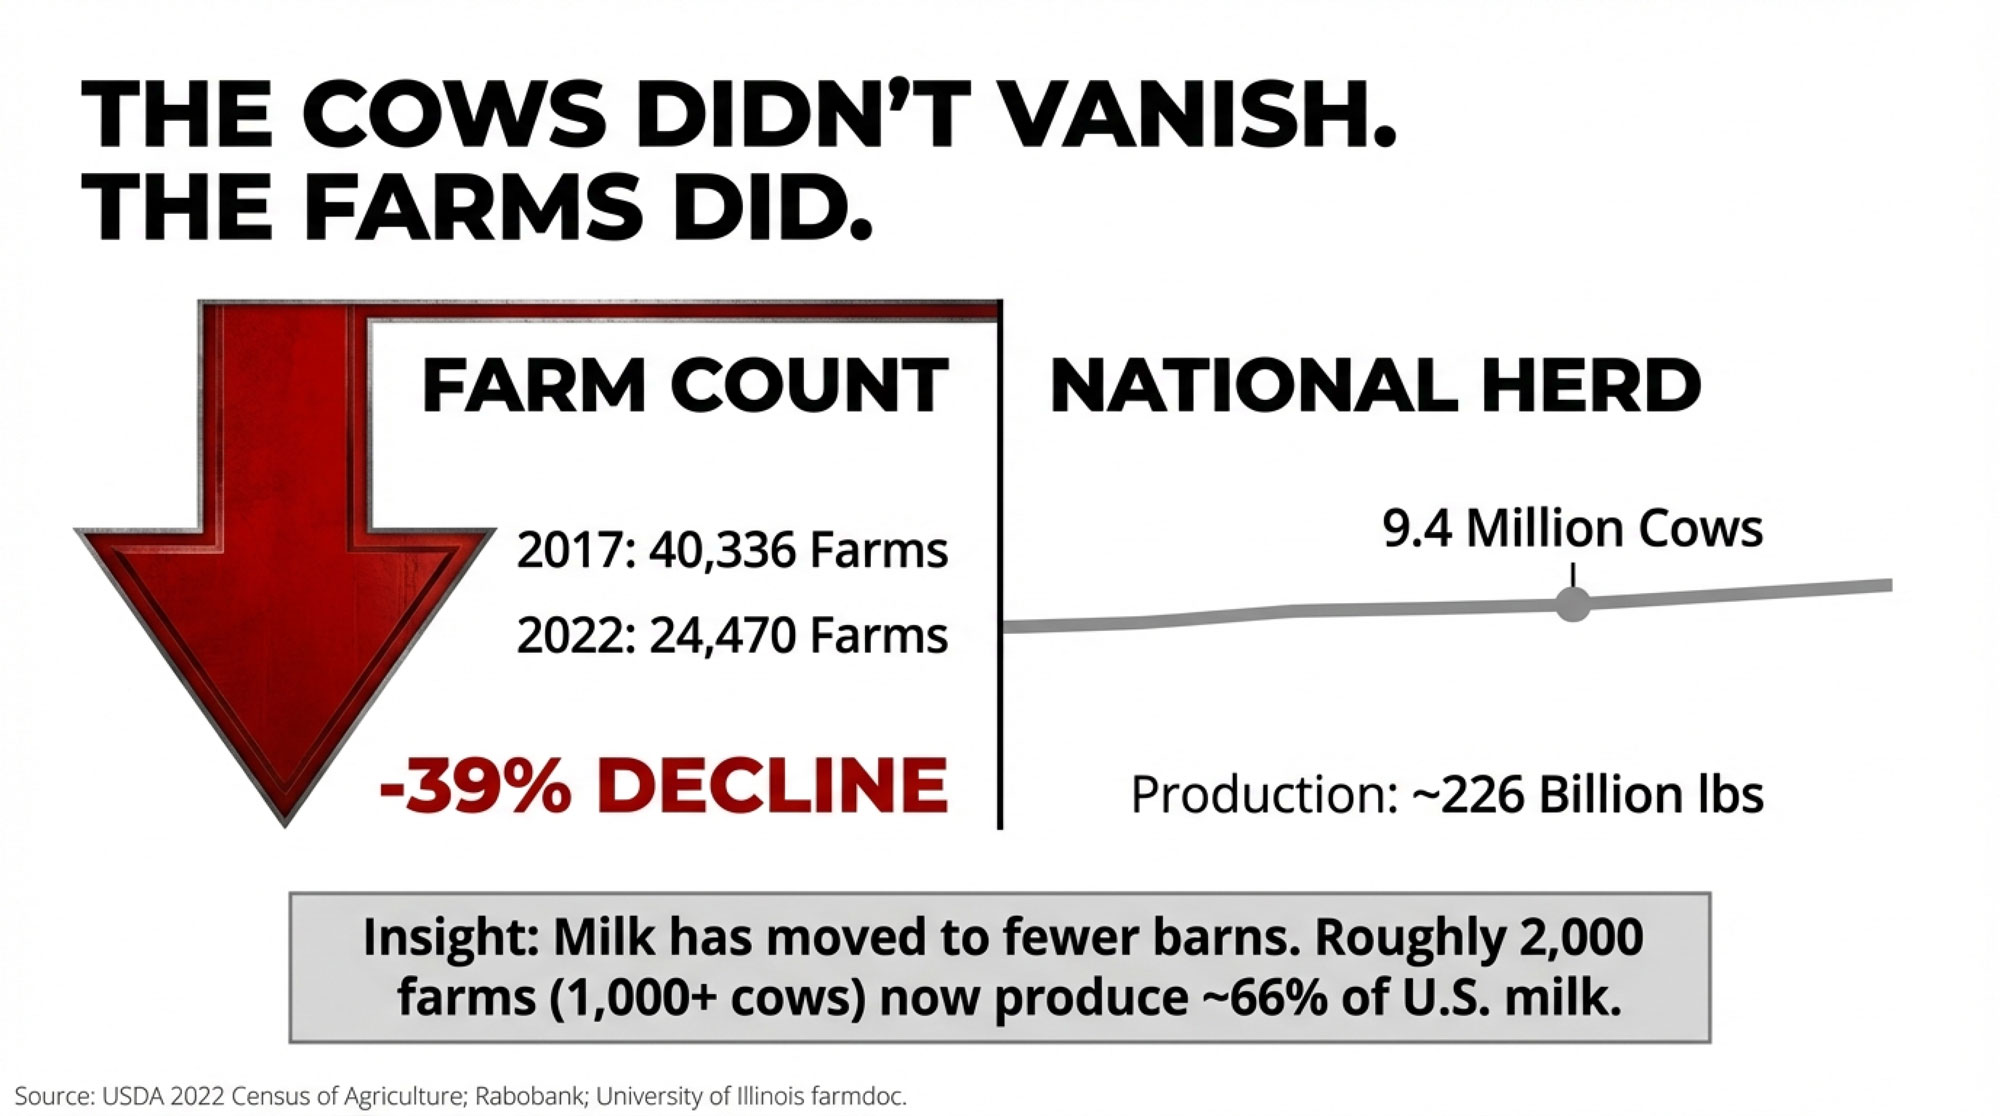
The consolidation data tells the same story from a different angle. The 2022 USDA Census of Agriculture shows U.S. dairy farms dropped from 39,303 operations in 2017 to 24,082 in 2022 — a 39% decline in five years, and 51% down from 2012. Canada tracks the same direction: the Canadian Dairy Information Centre reports 12,007 dairy farms in 2014, down to 9,256 by 2024 — a steady 2.6% annual decline. Wesley Tucker, MU Extension agriculture business specialist, puts the pipeline in even starker terms: 70% of farms are projected to trade hands in the next 20 years.
Farms with 1,000 or more cows — roughly 2,013 operations, about 8% of all U.S. dairies — now produce approximately two-thirds of the country’s milk, according to Rabobank analysis. The mid-size family dairy is getting squeezed from both ends: too big to walk away from, too asset-heavy to hand off without a structure in place.
This article draws on an Ontario court ruling, Canadian farmland data, U.S. census figures, and a Minnesota family operation. The legal frameworks differ at the border — Canadian supply management and quota add layers that the American system doesn’t have, and property law varies province to province and state to state. But the math and the human nature remain the same. Families that don’t formalize their plans lose the farm, whether it’s sitting on 500 acres outside Guelph or in Fillmore County, Minnesota.
Why the Math Keeps Getting Worse
The asset-value problem isn’t easing up. It’s accelerating.
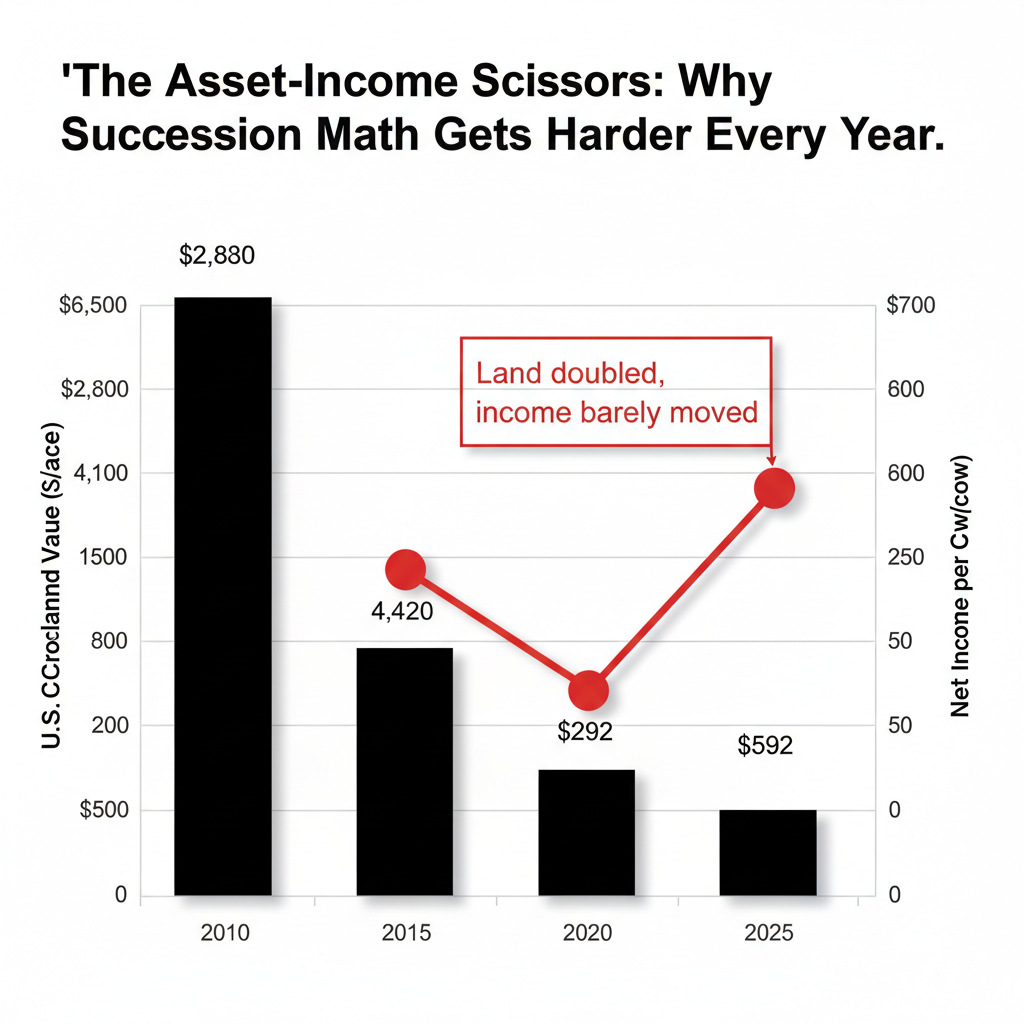
U.S. farm real estate averaged $4,350 per acre in 2025, up 4.3% year-over-year and more than double the $2,150 average in 2010, according to the USDA’s August 2025 Land Values Summary. Cropland specifically hit $5,830 per acre — up 4.7% from the prior year, compared to $2,980 in 2011. In major dairy states, the numbers climb higher: Michigan farmland jumped 7.8%, and Iowa cropland averaged $10,300 per acre.
North of the border, Farm Credit Canada’s mid-year 2025 review showed Canadian cultivated farmland values rose 6.0% in the first half of 2025 alone, a slight acceleration from the 5.5% growth in the same period of 2024. Over the 12 months from July 2024 to June 2025, Canadian farmland appreciated 10.4%. Manitoba led the nation at 11.2%, while Ontario farmland values held flat.
Now stack those asset values against what milk actually pays. Zisk projections for 2025 ranged from $531 to $1,640 per cow, depending on region and herd size. A 2024 Northeast Dairy Farm Summary pegged average net earnings at $592 per cow, up from $292 the year prior. Better than 2023, sure. But $592 per cow against land that doubled in 15 years — that’s the succession math in one sentence.
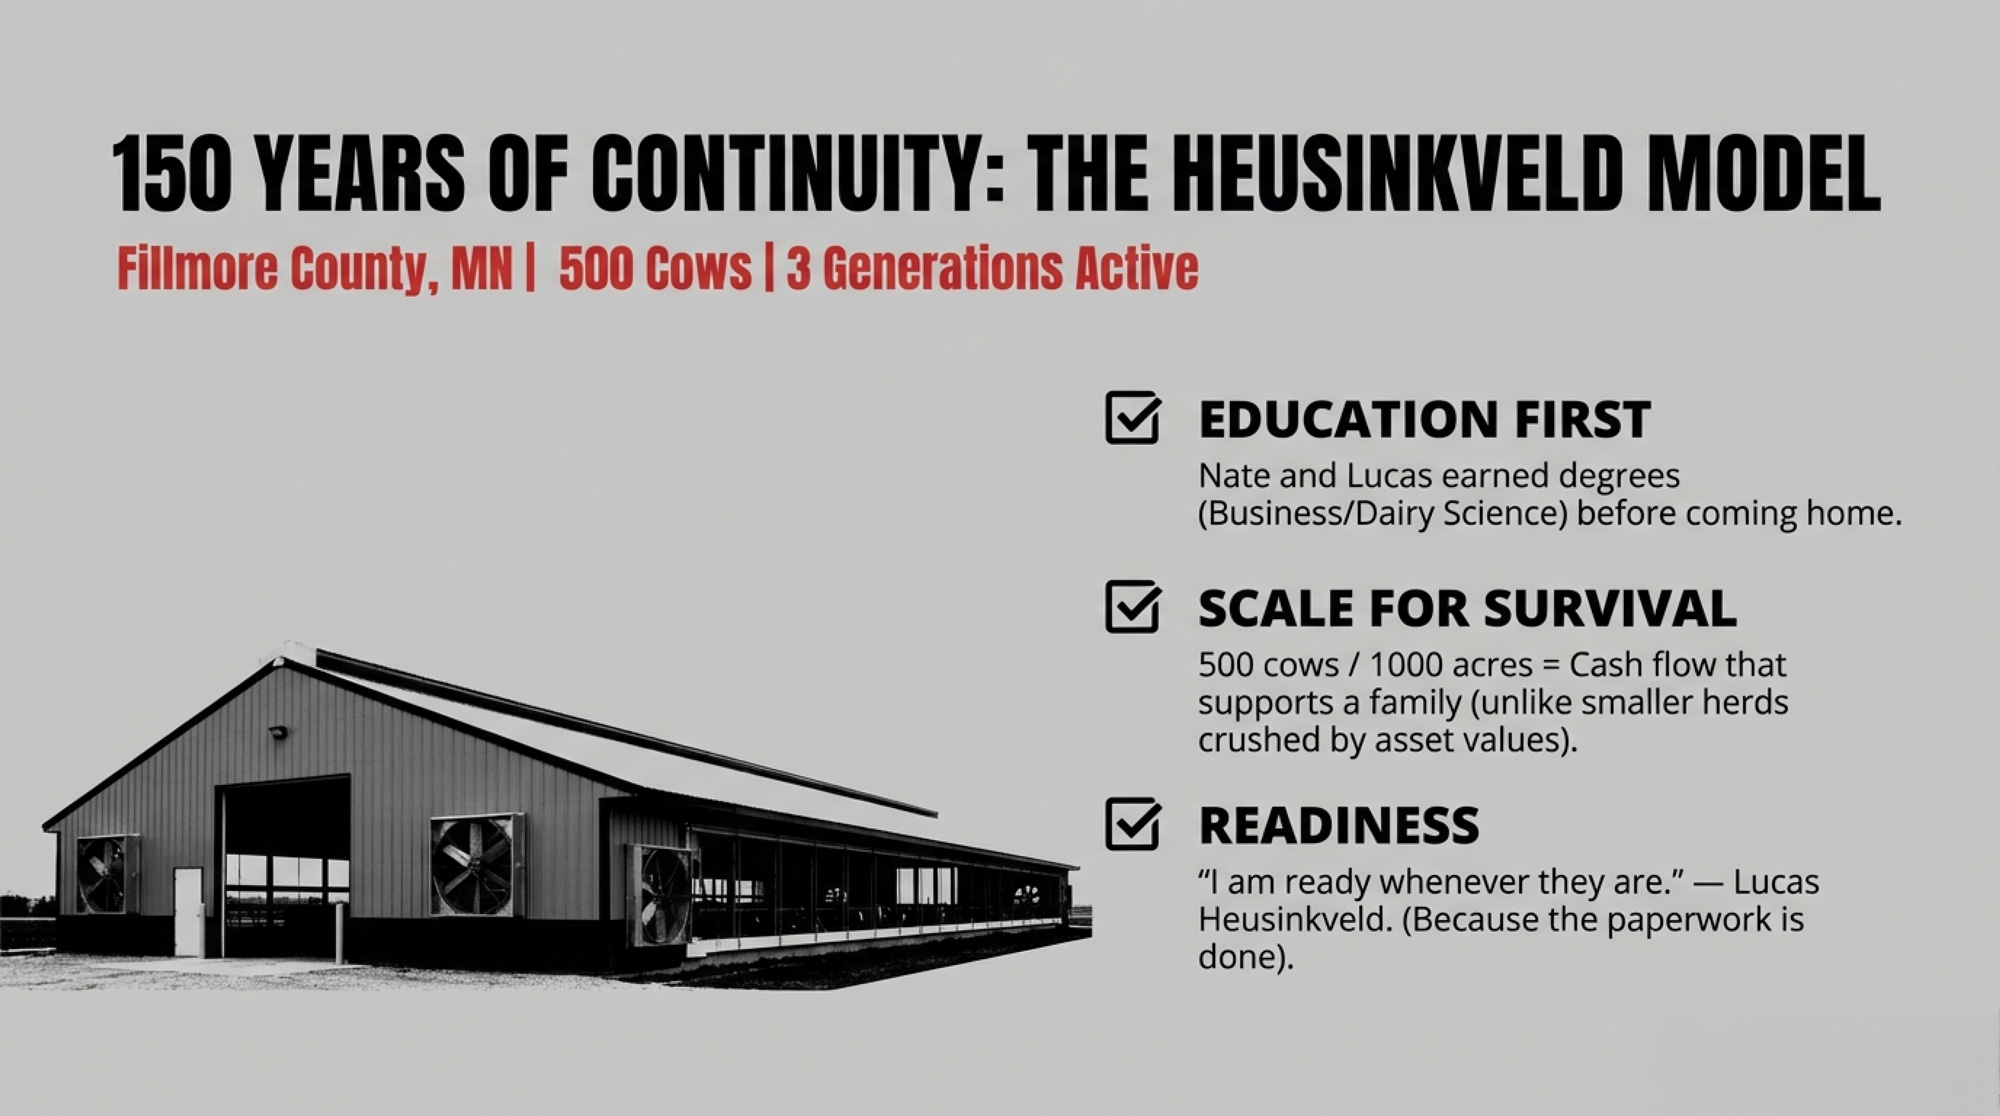
What 150 Years of Continuity Looks Like
In Fillmore County, Minnesota, the Heusinkveld dairy tells a different kind of story.
The operation has run continuously for about 150 years — a milestone the Fillmore County Journal covered in April 2024. Jeff and Steve Heusinkveld took their turn running the farm in 1970. Jeff’s son, Nate — an agri-business management degree from Mankato State — came back to take over. He married Misty in 2000 and moved onto the farm.
Today, Nate runs the operation. Jeff has since passed away, but Nate’s mother, Darla, still lives on the farm and handles the calf chores. The dairy has grown to 500 cows — 450 milked three times daily through a double-12 parallel parlor — plus 85 beef cows. They crop 350 acres of hay and 550 acres of corn, and seven full-time employees round out the crew.
The next generation is already in the barn. Nate’s son Lucas earned a dairy science degree from NICC Calmar, Iowa, and works alongside his dad every day. “I am ready whenever they are,” Lucas told the Fillmore County Journal — talking about the day Nate and Misty decide it’s his turn.
What jumps out about this family: education before entry. Nate got his business degree, and Lucas got his dairy science degree, both before coming home. And 500 cows on nearly a thousand crop acres generates the kind of cash flow that can actually support a transition — unlike operations where asset values dwarf annual income by a factor of 10 or more.
The Inheritance Math That Breaks Most Transitions
Farm Credit Canada’s transition resources put it bluntly: “unspoken expectations are the silent killers of transition plans.” Their guidance notes that agriculture has a deeply ingrained pattern of assumed succession — “Either the parent assumes a particular child will farm, or a child thinks they’ll get the farm — but they’ve never had a conversation about it”.
When parents want to treat all kids “equally,” the farming heir has to buy out siblings at asset-value prices, somehow using cash-flow-level income. At $5,830 per acre for U.S. cropland, a 500-acre operation’s land alone is worth $2.9 million before you count cattle, equipment, or buildings. Now run the debt math. Analysts recommend staying below a 4-to-1 debt-to-EBITDA ratio to cash flow expenses and meet scheduled debt payments. Penn State Extension notes that many lenders require a term debt coverage ratio of at least 1.25 — meaning the farm generates $1.25 in cash flow for every $1.00 in scheduled intermediate- and long-term debt payments — just to consider a plan viable. They flag 1.75 or better as the green zone.
So ask yourself: if your successor takes on $2.9 million in land debt alone at current FSA rates of 5.750% for farm ownership loans, can that 500-cow herd, generating $592 per cow in net earnings, cover the payments and still operate? One tough milk year tips the balance. Two tough years and you’re looking at a forced sale.
As agricultural attorney Trent Hilding told the Michigan State Dairy Extension podcast: “In a lot of cases, for the farms to be viable and successful, they do have to transfer in a fashion that’s not equal.” But he added, “it still could be considered equitable and fair.”
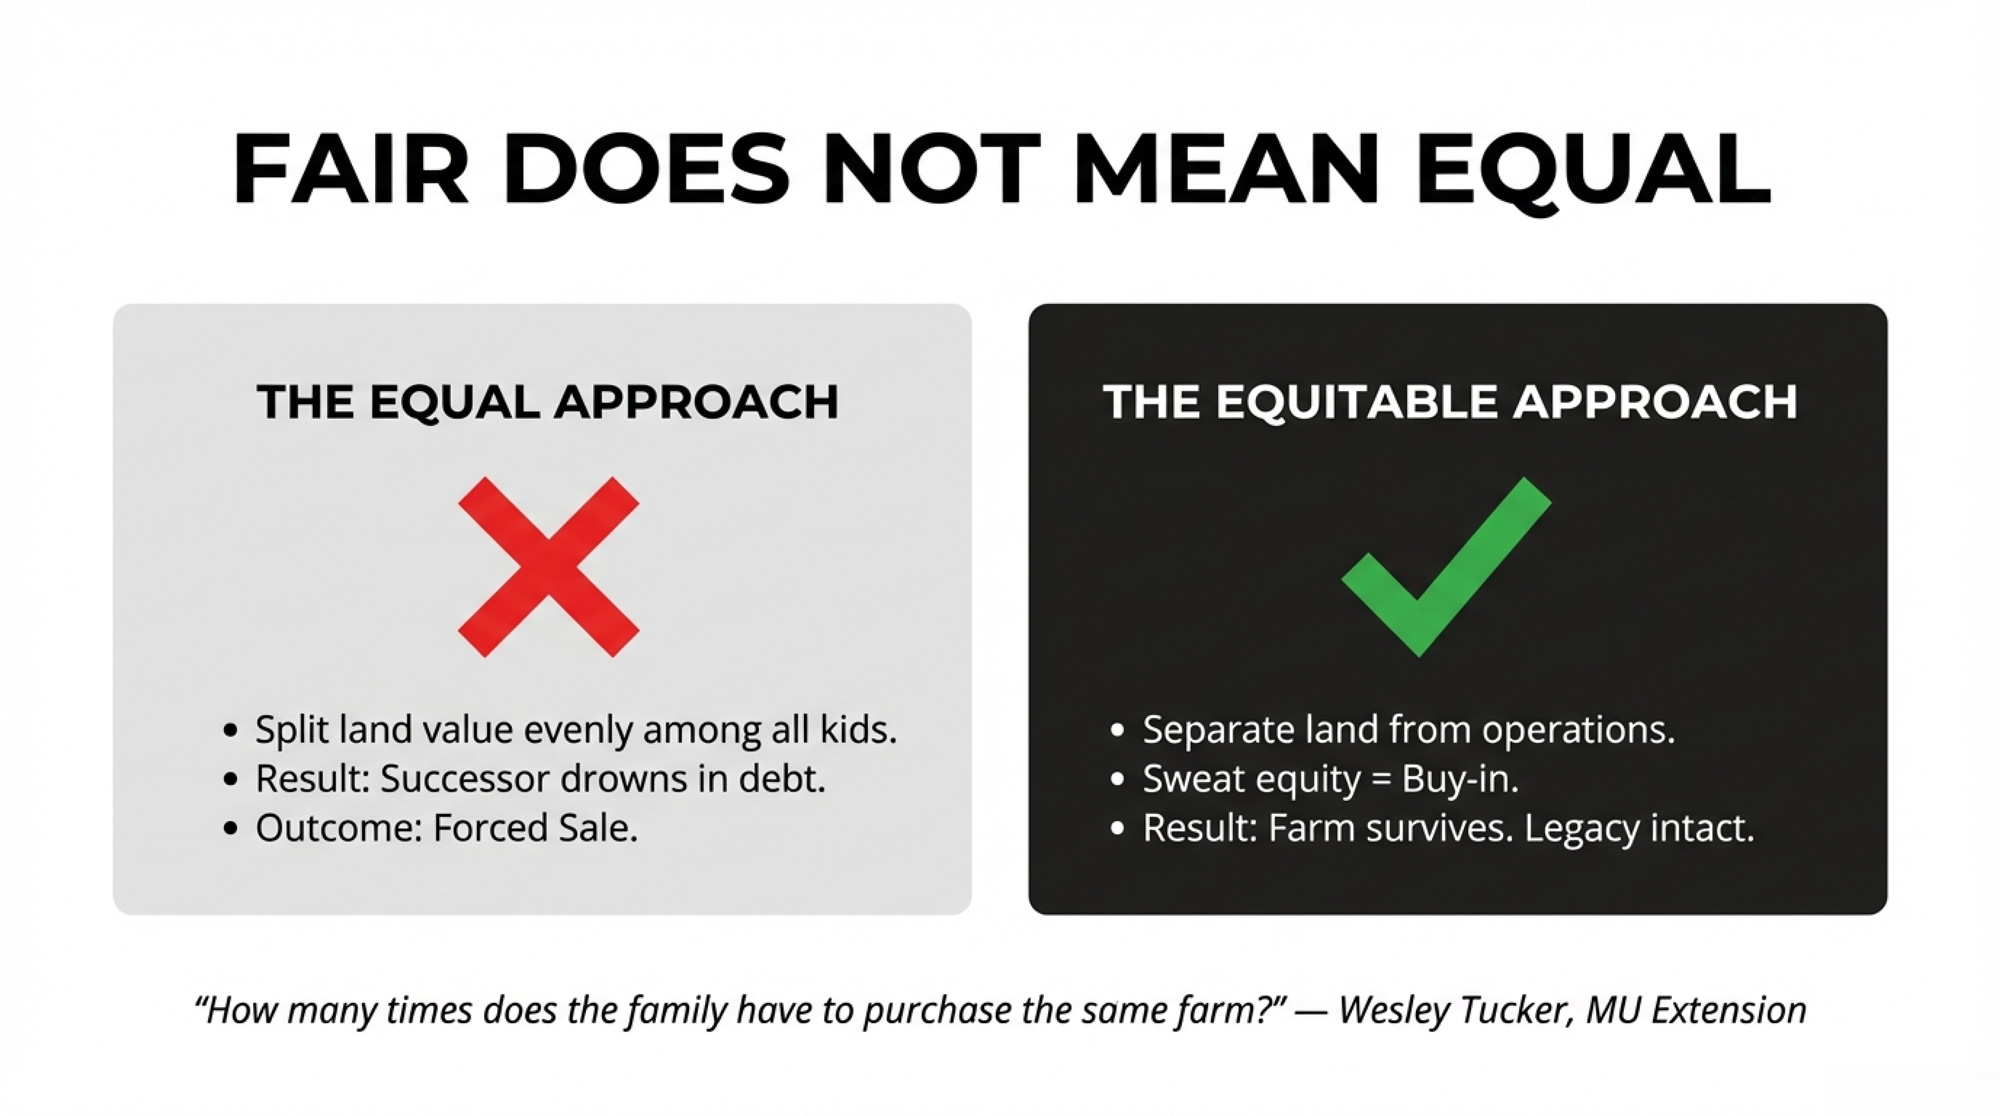
Equal vs. Equitable: Why the Distinction Decides Your Farm’s Future
Most families default to “equal.” Split everything evenly among the kids. It feels right. It isn’t. Here’s how the two approaches play out:
The “Equal” Approach
The “Equitable” Approach
Land & Assets
Divide the total land value by the number of children. Each gets an equal dollar share
Separate operational assets from land ownership using distinct entities. Farming heir acquires the operation; land held separately
Sibling Buyout
Farming heir must buy out siblings at full fair market value — $2.9M+ on a 500-acre operation at $5,830/acre
Use long-term leases, gradual equity earn-in, or infrastructure investment counted as buy-in. As Wesley Tucker asks: “How many times does the family have to purchase the same farm?”
Documentation
Reliance on handshake agreements and family goodwill — exactly the approach the Metske court rejected
Written, witnessed, and bank-vetted contracts with independent legal advice for both parties
Debt Load
Successor likely exceeds the 4:1 debt-to-EBITDA threshold and fails the 1.25 term debt coverage minimum before day one
Debt sized to what milk actually generates — $592/cow — with payments structured to maintain viability
Typical Outcome
Forced sale or bankruptcy. The Metske family got $31,700 after six years.
Multi-generational continuity. The Heusinkveld family just passed 150 years.
The families that survive figure out something the rest don’t: the “inheritance fairness” problem and the “business continuity” problem are two separate challenges that need two separate solutions. Blending them together is what kills the farm.
How to Structure It So the Farm Survives
Hilding’s advice provides a practical starting framework:
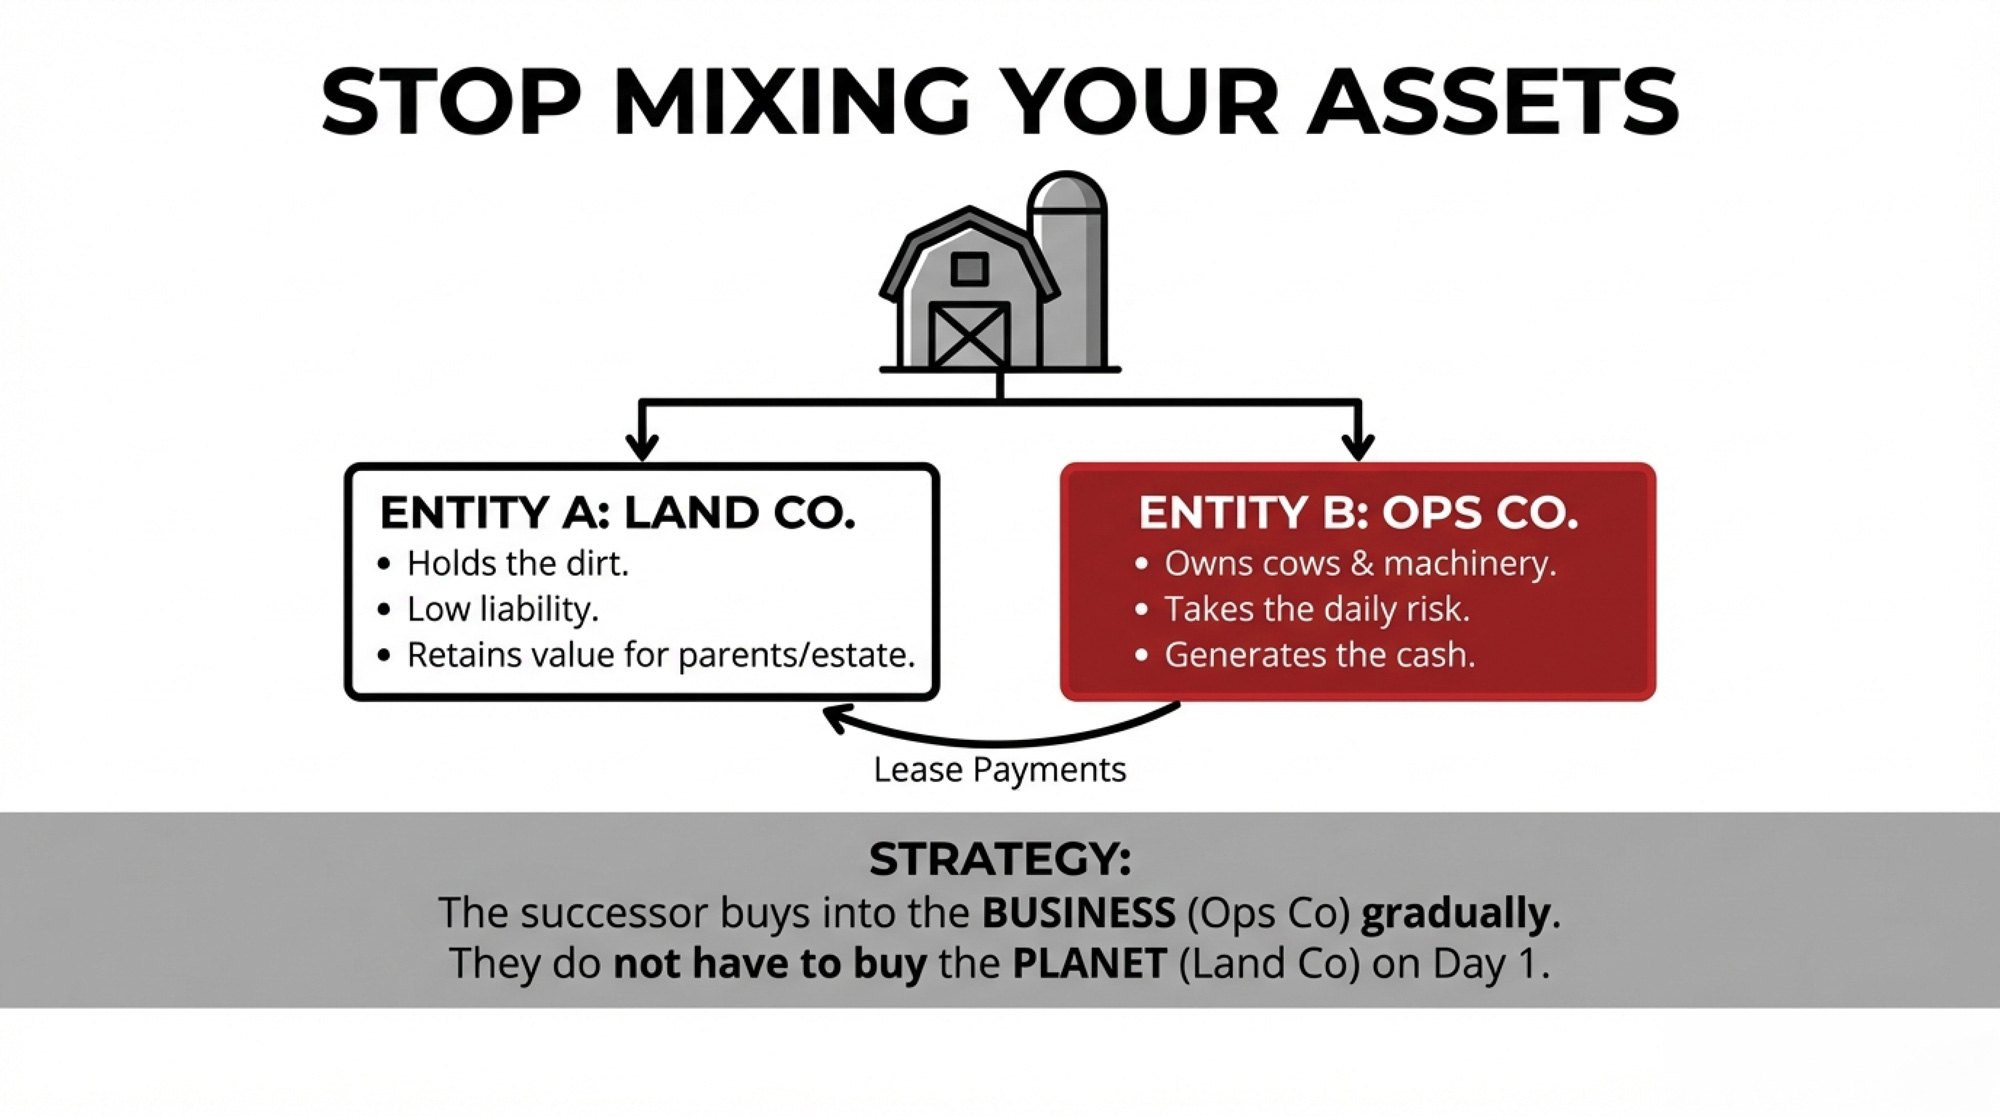
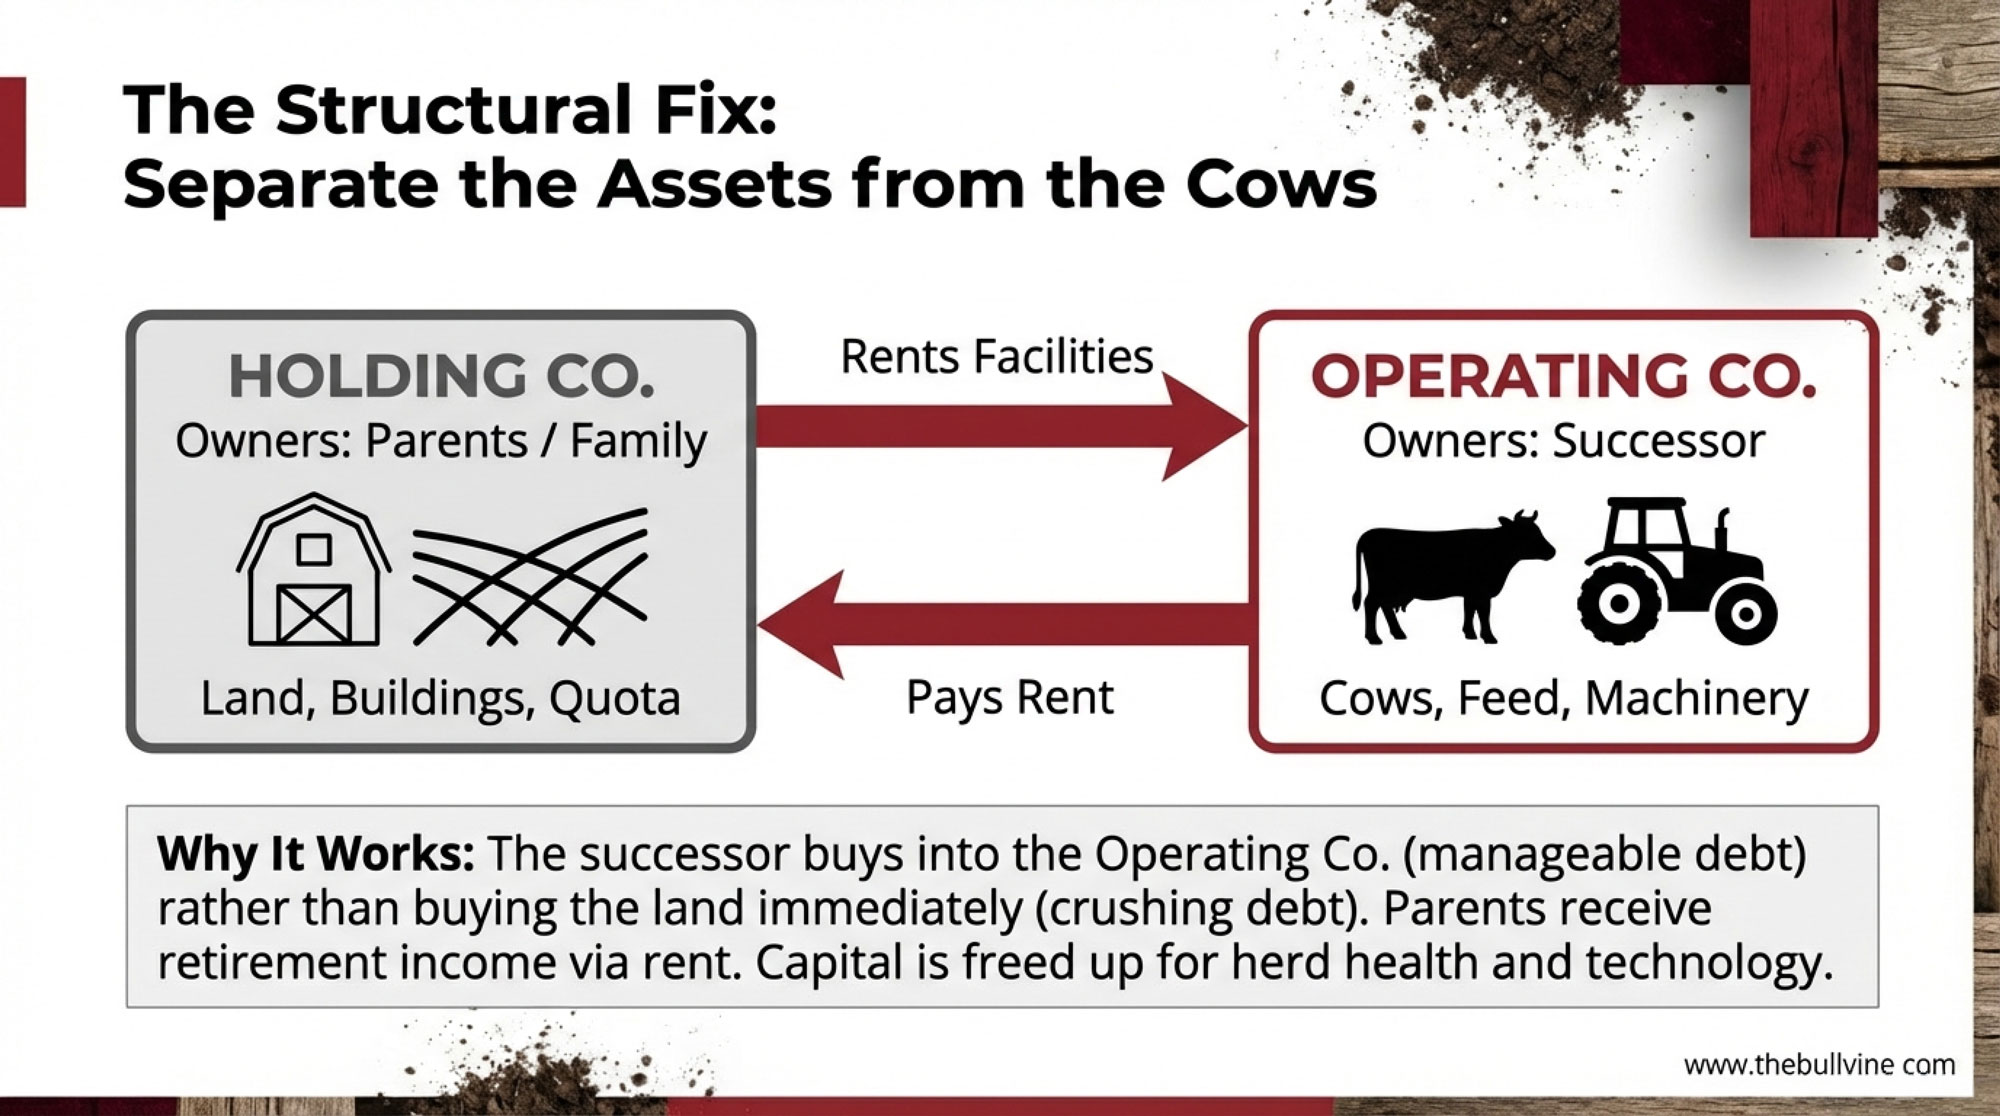
Separate operations from real estate. Establish one entity for the dairy operation and another to hold the real estate. “The real estate is a key investment you want to be separate from your liability, your employees, and the risk factors you have in your operation,” Hilding said. An incoming generation can’t afford to buy everything at once. Separating the assets gives everyone room to work. One trade-off to flag: entity separation adds legal and accounting overhead, and if structured carelessly, it can trigger tax consequences. Get advice specific to your province or state before you file anything.
Get the base documents done. A will or trust is the foundation. “No matter your age or amount of assets, having who you want in charge in writing makes a big difference,” Hilding advised.
Start the financial transparency early. The biggest misstep Hilding sees: the older generation withholding too much information, usually because they’re afraid of losing control. His advice — involve farming heirs in regular financial meetings and discussions with the lender. “Just because we do something on paper doesn’t mean you’re not showing up and aren’t part of the farm”.
Reagan Bluel, MU Extension dairy specialist, wrote in August 2025 that there’s another angle worth considering: treat infrastructure reinvestment as “buy-in”. When the incoming generation invests in a new parlor or freestall expansion that improves net income for everyone, that investment should count toward their stake. “When you include the purchase of the land in addition to a major piece of infrastructure, such as a parlor, the cash flow rarely works,” Bluel wrote.
Bluel sees this play out in real time across Missouri operations. “I recall hearing a prevailing statement by the older generation over and over when talking to farm families, ‘I didn’t have this farm given to me,'” she wrote. That pride is real — but so is the math. The assets needed for a dairy to succeed today are vastly different from 40 years ago, and Missouri land prices alone have increased an average of 6% annually over time.
What the Metske Ruling Teaches About Documentation
The Lerners LLP analysis of the court decision reads like a checklist of what the Metske family should have done:
Kill the “agreement to agree.” An outline without price, payment schedule, or valuation mechanism leaves your successor exposed. The court specifically rejected the idea that ongoing negotiations equal binding commitments.
Document the journey, not just the destination. Incremental steps — such as sales, quota leases, and vendor-takeback loans — need to be recorded and cross-referenced to a future transfer agreement. A memorandum of understanding, supported by independent legal advice for both parties, bridges the gap between kitchen-table discussions and enforceable agreements.
Align financing with the plan from day one. Tim and Amanda’s inability to secure lending doomed the succession before it started. Bring the lender in early. Confirm serviceability. Match payments to what the operation actually generates.
Make any below-market terms explicit. If you genuinely intend to offer your kid favorable pricing, write it down. Promissory notes. Side agreements. Signed and witnessed. The court rejected the notion that general family generosity amounts to a binding commitment.
Ontario producers have a free resource most haven’t opened: Publication 70, the Ministry of Agriculture’s Farm Succession Planning Guide — 120 pages covering business organization options, operating agreements, ownership transfer methods, and taxation implications.
Factor
Documented Succession Plan
Undocumented (Metske Case)
Written Agreement
Signed purchase agreement with price, terms, timeline, and independent legal advice
None—”agreement to agree” rejected by court
Equity Recognition
Years of sweat equity and capital improvements credited toward purchase price or ownership stake
$33,700 in improvements reduced to $31,700 net after damages
Bank Involvement
Lender pre-approves financing structure; cash-flow viability confirmed before transfer
Bank refused 10-year quota financing in 2013—plan was already dead
Parental Intent
Donative intent (below-market terms) explicitly documented and tax-structured
Business plans showed FMV purchase—no proof of gifting intent
Dispute Resolution
Binding arbitration or mediation clauses; clear exit terms if plan changes
Six years of litigation; family relationships destroyed
Legal Outcome
Enforceable ownership transfer; successor builds generational wealth
Trial award of $405,000 overturned to $31,700 on appeal
Multi-Gen Continuity
Farm survives to generation three (12% club)
Farm lost; 88% attrition statistic
Why “Eventually” Is the Most Dangerous Word in Succession
Hanson told Brownfield Ag News that this is exactly what families avoid. “To someday admit that I may not be on my farm, or I may not be operating or managing my farm, is very hard for a lot of farm producers,” he said. FCC’s transition resources don’t sugarcoat it: “Farm transition planning that starts at a funeral is a worst-case scenario”. That’s why advisors recommend starting 10–15 years out — not because the paperwork takes that long, but because restructuring entities, transferring equity, and getting everyone comfortable with a plan that’s fair but not equal all take time you can’t manufacture in a crisis.
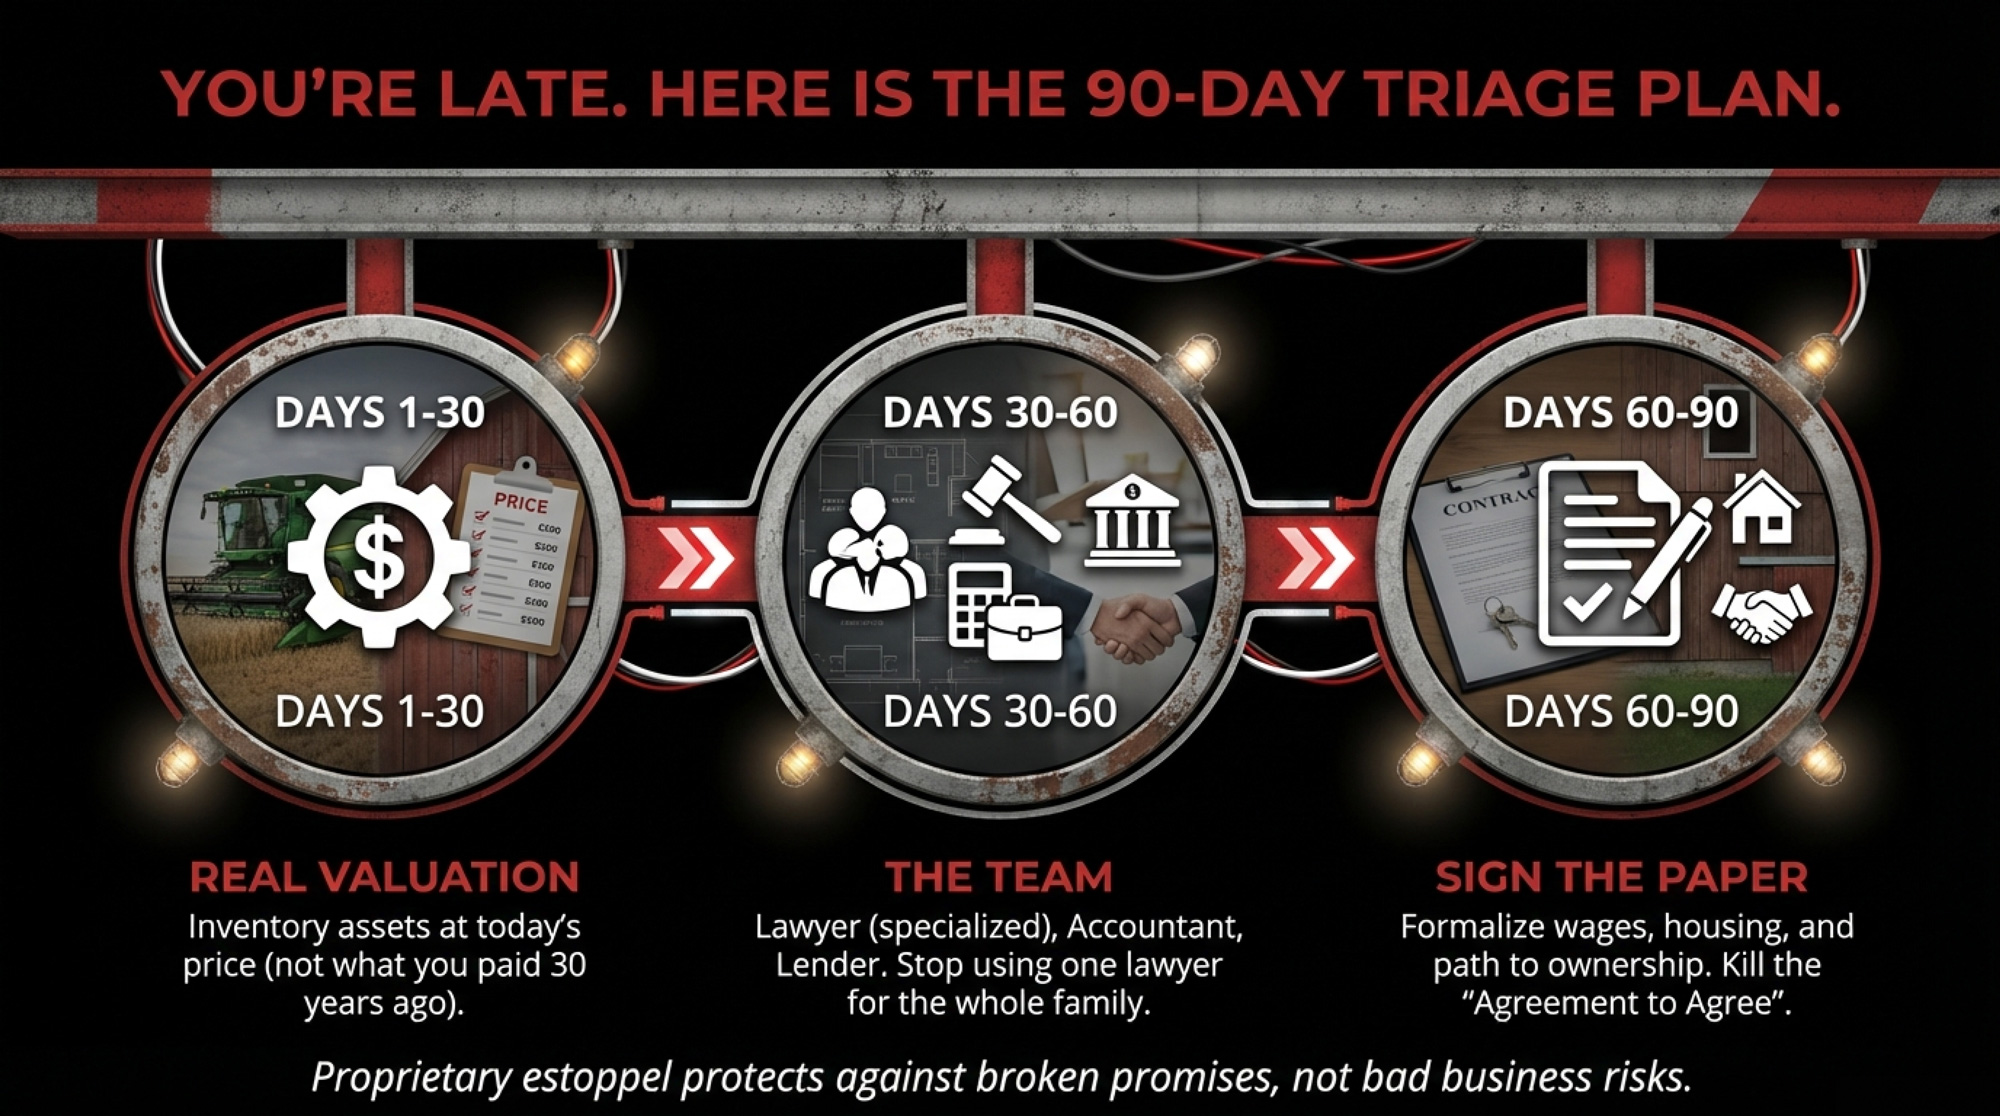
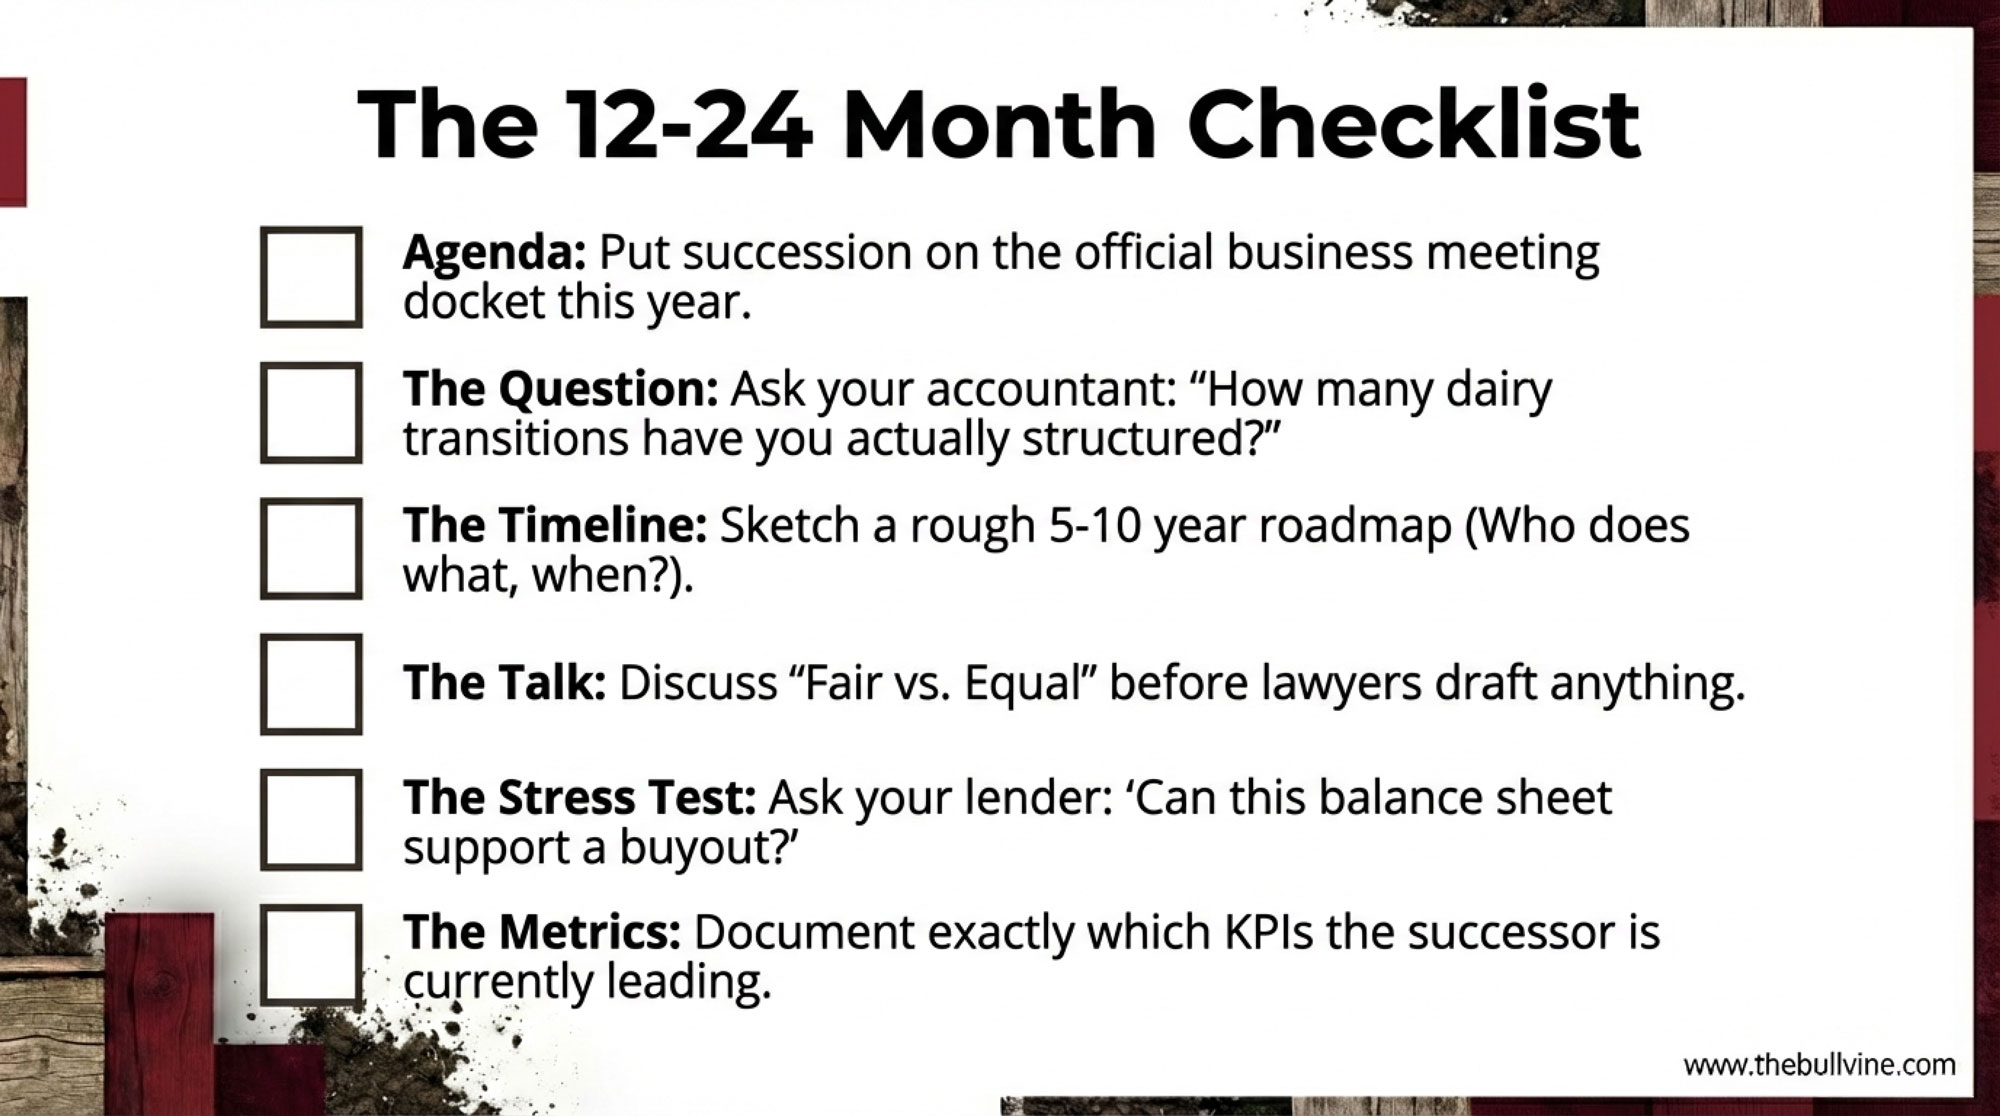
The 90-Day Triage: When You’re Already Behind
Timeline
Core Task
Key Deliverables
Red Flags to Address
Days 1–30
Asset inventory with real values
Land, cattle, equipment, quota, buildings valued at current market (not what you paid). Calculate debt-to-EBITDA ratio.
Debt-to-EBITDA above 4:1? Any succession plan that adds debt is dead.
Days 15–45
Assemble advisory team
Attorney (farm succession specialist), accountant (ag tax treatment), lender (current FSA rates: 5.750% ownership, 4.625% operating). Get independent legal advice for all parties.
Using one family lawyer for everyone? Lerners LLP says that’s insufficient—parties need independent counsel.
Days 30–60
First real family conversation
All stakeholders in room (off-farm siblings included). Schedule quarterly strategic meetings focused solely on transition. Create accountability for agenda portions.
FCC warns: unspoken expectations are “silent killers.” If you haven’t had this talk, you’re in the 88%.
Days 60–90
Document current arrangements
Formalize terms TODAY: compensation, housing, vehicle use, decision authority, path to ownership. Write. Sign. Date. File with attorney.
Working without a written agreement? Metske court says sweat equity = $0 without documentation.
Days 90+
Bank viability review
Lender confirms: 1.25+ term debt coverage ratio? Payments sized to $592/cow income reality? If no, restructure before transfer.
Penn State: below 1.25 coverage ratio, lenders won’t even look at your plan.
If you’re 5–7 years from transition with nothing documented, here’s how to stop the bleeding:
Days 1–30: Asset inventory with real values. Land, cattle, equipment, quota, buildings — what’s it worth today? Not what you paid. Not what you hope. What a buyer would actually pay. With U.S. cropland averaging $5,830 per acre and climbing 4.7% year-over-year, and Canadian farmland up 6.0% in just the first half of 2025, every month you wait makes the math harder for your successor. Then run your debt-to-EBITDA ratio. If you’re above 4-to-1, any succession plan that adds more debt is dead on arrival.
Days 15–45: Assemble your advisory team. Attorney with farm succession experience. Accountant who understands agricultural tax treatment. Lender who knows your operation. Current USDA Farm Service Agency direct ownership loans sit at 5.750%, with operating loans at 4.625% as of February 2026, and the Federal Reserve Bank of Chicago reported that ag credit conditions weakened in Q2 2025, with loan repayment rates falling and banks demanding more collateral. Your successor needs to know what lending actually looks like right now, not what it looked like when you last borrowed. The Lerners analysis recommends independent legal advice for all parties, not having one family lawyer serve everyone.
Days 30–60: First real family conversation. All stakeholders in the room — off-farm siblings included. FCC recommends scheduling quarterly strategic meetings focused solely on transition, with everyone accountable for a portion of the agenda. Day-to-day operations will overshadow long-term planning unless you carve out dedicated time.
Days 60–90: Document current arrangements. If your kid is already working on the operation, formalize the terms today. Compensation, housing, vehicle use, decision authority, and path to ownership. Write it down. Sign it. Date it.
What This Means for Your Operation
Your farming heir already knows you haven’t planned this. Every year, without a formalized agreement, they’re calculating whether they’re building equity or providing cheap labor for a promise that might not survive a family disagreement. FCC calls unspoken expectations “the silent killers of transition plans”. They’re right.
The Metske ruling is a legal precedent, not just a cautionary tale. Ontario’s Court of Appeal stated explicitly that vague family assurances, parental generosity, and years of labor don’t create property rights. Your kid’s sweat equity is worth $0 without documentation.
The asset gap is widening faster than earnings can close it. U.S. farmland doubled in value since 2010. Analysts reported an average net earnings per cow of $592 in 2024. Penn State Extension says you need at least a 1.25 term debt coverage ratio for a lender to even look at your plan. Does your succession math clear that bar?
“Fair” and “equal” aren’t the same thing — and treating them as synonyms is what kills the farm. As Hilding puts it: farms have to transfer in a fashion that’s not equal” to survive. Separate the inheritance question from the business continuity question, and solve each one with the right tools.
Key Takeaways
The 12% of family farms that reach generation three started earlier. They formalized arrangements when things were good, not when a crisis forced their hand.
Size transition payments to what milk can actually carry. If your plan requires the successor to service debt, the operation can’t cash-flow — as Tim Metske discovered when the bank demanded a 10-year amortization on the quota — you don’t have a succession plan. You have a countdown. Stay below 4-to-1 debt-to-EBITDA. Insist on at least 1.25 term debt coverage. If you can’t hit those numbers, restructure before you transfer.
Separate the land from the operation. Hilding’s advice to create distinct entities for real estate and operations isn’t just good lawyering — it’s the only way most families can make the math work for everyone.
Document everything. Today. The distance between $31,700 and a successful transition isn’t luck or family harmony. It’s paper. Signed, dated, witnessed paper.
The Bottom Line
In Fillmore County, Minnesota, Lucas Heusinkveld milks cows beside his dad, just like Nate once milked beside Jeff. “I am ready whenever they are,” Lucas says. He can say that because somebody — in every generation — made sure the next one was prepared before the crisis arrived.
Don’t let your legacy be a court docket number. Pick up the phone tomorrow. Call the accountant first, then the lawyer. Your kids are waiting for a plan, not a promise.
Complete references and supporting documentation are available upon request by contacting the editorial team at editor@thebullvine.com.
How Holstein USA’s Million-Cow Study Should Change Your Linear Type Strategy – Breaks down the $2,678-per-cow gap between top and bottom conformation. This massive study reveals how precision breeding for structural durability, rather than just production, creates a significant long-term cash-flow advantage in robotic and parlor systems.
The Sunday Read Dairy Professionals Don’t Skip.
Every week, thousands of producers, breeders, and industry insiders open Bullvine Weekly for genetics insights, market shifts, and profit strategies they won’t find anywhere else. One email. Five minutes. Smarter decisions all week.
Foreign money looks cheap until CFIUS, AFIDA and a 50‑acre cap show up at your kitchen table. Still think it’s the best deal?
Executive Summary: Wisconsin’s AB 218 would slash the state’s foreign‑owned ag land cap from 640 acres to 50, putting a lot of dairy expansion plans that use foreign partners straight into the risk zone. This feature shows how that change, plus CFIUS review fees and AFIDA penalty math, can turn foreign capital from “cheaper money” into slower, more expensive, and higher‑risk money once you count the friction. A 1,400‑cow Wisconsin family dairy serves as the working example to compare domestic and foreign funding using real Seventh District interest rates, CFIUS filing fees, and AFIDA non‑compliance exposure. The article also unpacks how solar, wind, and digester projects can quietly trigger foreign‑ownership rules in the top five dairy states — none of which provide carveouts for energy deals. Arizona’s Fondomonte case drives the point home with wells dropping more than 200 feet, lawsuits, lease cancellations, and a new active management area landing on an operation that was legal when it started. It all builds to one survival test and a practical checklist to help you decide when foreign money is a smart preference for your dairy and when it’s a bet that could take the whole farm down with it.
Picture a typical 1,400‑cow family dairy in southwestern Wisconsin. It’s late 2025, chores are done, and the kitchen table is buried under barn plans, lender letters, and a milk cheque. The family needs about $8.2 million for a new freestall, 400 more acres, and modernized equipment. Farm Credit will stretch to roughly $5.5 million. A European ag fund is offering to fill the $3 million gap as equity.
Looks like the deal that gets the barn built and the next generation anchored. Then their lawyer starts talking about foreign ownership caps, CFIUS, and AFIDA—and suddenly this isn’t a straightforward capital decision anymore. It’s a question about whether foreign investment belongs in your operation’s future, and what happens if regulators rewrite the rules after you’ve already built around the money.
Two Federal Acronyms That Now Sit at Your Kitchen Table
Foreign capital used to mean one thing for most dairies: a bigger cheque or a more flexible partner. In 2025–2026, it also means regulators have a say in who you do business with.
CFIUS — the Committee on Foreign Investment in the United States — is the big one. On July 7, 2025, the USDA signed a memorandum of understanding with the Treasury to coordinate on reviews of transactions involving farmland, ag businesses, or ag biotech. That formally pulled agriculture into what used to be a defence‑tech conversation. Once CFIUS accepts a filing, it has 45 days for an initial review. If a full investigation follows, that’s another 45 days, plus 15 days for a presidential decision — and that’s before your state‑level reviews even start.
CFIUS also charges filing fees based on transaction value: for a deal in the $5 million to $50 million range — which covers most dairy expansions involving foreign equity — the fee alone is $7,500, according to the U.S. Treasury’s published fee schedule. And as of 2024, the maximum CFIUS penalty for violations was raised to $5 million per violation, according to a DLA Piper analysis of the 2024 annual report.
Then there’s AFIDA — the Agricultural Foreign Investment Disclosure Act. It’s tracked foreign interests in U.S. ag land since 1978, but USDA is modernizing enforcement with an online portal and tougher penalties. In 2024, AFIDA penalties exceeded $1.2 million — the highest single‑year total on record — predominantly for late filings, according to an American Farm Bureau Federation analysis. The penalty structure isn’t trivial: under federal regulations, late filings carry a fine of 0.1% of the fair market value of the foreign person’s interest per week the violation continues, capped at 25% of FMV. Failure to file or to submit false information can trigger fines of up to 25% outright, per the National Agricultural Law Center.
The scale of foreign ownership keeps climbing. The 2022 AFIDA annual report showed more than 43 million acres in foreign hands, per a January 2024 GAO report. The most recent USDA data pushes that to nearly 45 million acres — about 3.6% of all privately held farmland — with Canadian investors holding the largest share. An AFBF analysis of the 2023 data, reported by Brownfield in June 2025, put the total closer to 46 million acres. Up more than 1.5 million in a single year.
And then there’s a fast‑moving state‑by‑state patchwork on top of it all.
The State‑by‑State Patchwork Is Moving Fast
On top of the federal layer, states are writing their own rules — and they vary wildly. Here’s where the top five dairy‑producing states stand right now:
State
Current Restriction?
Pending Legislation
Energy Carveout?
Wisconsin
Yes — 640‑acre cap under §710.02 (AG upheld, 2014)
AB 218 would reduce the cap to 50 acres, add a 10‑mile military buffer, and ban adversaries. Passed Assembly; pending Senate committee. Session ends ~March 2026.
No
California
No — Art. I §20 gives noncitizens equal property rights
SB 1084 passed the legislature 75–0 / 37–0 in 2022, but Gov. Newsom vetoed it Sept. 27, 2022
No
Idaho
Yes — adversary‑nation ban
SB 1149 & HB 356 (April 2025) added AG enforcement, expanded the banned‑country list
No
Texas
Yes — S.B. 17 effective Sept. 1, 2025
Criminal offense for designated‑country nationals acquiring real property
No
New York
No — N.Y. Real Prop. Law §10 gives noncitizens equal rights
A3440 (Jan. 2025, Assemblymember Santabarbara) would ban adversary‑nation purchases; referred to Judiciary Committee, no vote yet
No
Sources: Climate Solutions Law, January 2026; Wisconsin Legislature records; NY Senate; governor’s veto message (CA). According to a Climate Solutions Law analysis, New York has nearly 2,800 dairy farms and approximately 950,000 acres (~5%) of private ag land in foreign hands.
Notice the last column. Not one of these five states carves out renewable energy deals from foreign ownership restrictions. That matters — and we’ll come back to it.
Under Wisconsin Statute §710.02, non‑resident aliens and foreign corporations can’t acquire, own, or hold — directly or indirectly — more than 640 acres of land in the state. That’s been the law for decades, and the Wisconsin Attorney General upheld it in a 2014 advisory opinion. But proposed Assembly Bill 218, introduced in April 2025 by Representative Clint Moses and a bipartisan group of cosponsors, would slash that cap to 50 acres for agricultural land, widen who counts as a foreign person under the law, and cut the sell‑off window from four years to three. Assembly Substitute Amendment 1 added restrictions within ten miles of military bases and a flat ban on adversary‑nation ownership. According to a January 2026 Climate Solutions Law analysis, AB 218 passed the Assembly and is pending in a Senate committee — with the Wisconsin legislative session ending around early March 2026.
Beyond Wisconsin, Idaho, Texas, and Florida — along with Arkansas, Tennessee, Montana, and others — have passed laws restricting or banning adversary‑nation buyers from holding interests in agricultural land. Idaho tightened its rules further in April 2025 with Senate Bill 1149 and House Bill 356, adding enforcement through the Attorney General’s office. Texas’s S.B. 17, effective September 1, 2025, creates a criminal offense for nationals of designated countries acquiring real property. On September 11, 2024, the U.S. House passed Representative Dan Newhouse’s Protecting American Agriculture from Foreign Adversaries Act (H.R. 9456) by a bipartisan vote of 269–149, per congress.gov. As of late 2025, roughly 36 states have enacted some form of restriction on foreign ownership of real property. The list is still growing.
How Foreign Investment Actually Changes Your Expansion Math
Back to that Wisconsin dairy. Once the attorney digs in, the “simple” equity offer gets complicated fast.
Under §710.02, if the fund takes a 25% stake in a single LLC holding both cows and 1,250 acres, regulators could count 312.5 of those acres as foreign‑owned. Today, that passes under the 640‑acre cap. If AB 218 becomes law and drops the limit to 50 acres, the same deal is suddenly offside — a structure that was legal on signing day could violate state law a year later.
The standard workaround: land in one domestic entity owned entirely by the family; cows, equipment, and employees in a separate operating company; foreign investor buys into the operating entity only. That keeps foreign money away from direct land ownership. But it comes with real friction.
Domestic Lender (e.g., Farm Credit)
Foreign Equity Fund
Typical Rate (mid‑2025, Seventh District)
7.02% – 7.63%
Often 1–2 points lower (base)
CFIUS Filing Fee
N/A
$7,500 (for $5M–$50M transaction value)
Closing Timeline
60 – 90 days
120 – 180 days (CFIUS + state review)
Ongoing Reporting
Standard bank covenants
AFIDA filings, multi‑entity accounting, and potential federal audit
Regulatory Risk
Low
High (state law shifts, CFIUS scrutiny)
Non‑Compliance Exposure
Standard loan default
AFIDA: up to 25% of FMV; CFIUS: up to $5M per violation
Domestic rates from the Federal Reserve Bank of Chicago AgLetter, August 2025 (Seventh District, as of July 1, 2025) — the lowest real estate rates in that region since Q4 2022. CFIUS filing fee per U.S. Treasury fee schedule. The 120–180‑day foreign timeline reflects CFIUS’s statutory 45+45+15‑day review structure plus state processes. AFIDA penalty structure per National Agricultural Law Center (October 2025) and Polsinelli (January 2025). CFIUS penalty ceiling per DLA Piper analysis, August 2025.
On top of these verified costs, ag attorneys who handle foreign‑involved transactions report that total legal and compliance fees — including state‑law opinions, multi‑entity structuring, AFIDA analysis, and CFIUS consultation — run significantly higher than a comparable domestic deal. The Wisconsin State Bar’s October 2025 analysis of §710.02 makes clear that even figuring out who qualifies as a “foreign person” under the statute requires significant legal work. And Bloomberg Law’s October 2025 analysis warns that participants should “expect USDA involvement and prepare for inquiries related to biosecurity measures, agricultural health risks, research affiliations, supply chain vulnerabilities, cybersecurity practices, and land‑use plans.”
Capital Source
Typical Rate (mid-2025, Seventh District)
CFIUS Filing Fee
Closing Timeline
Ongoing Reporting
Regulatory Risk
Non-Compliance Exposure
Domestic Lender (e.g., Farm Credit)
7.02% – 7.63%
N/A
60–90 days
Standard bank covenants
Low
Standard loan default
Foreign Equity Fund
Often 1–2 points lower (base)
$7,500
120–180 days
AFIDA filings, multi-entity accounting, federal audit
High
AFIDA: up to 25% of FMV; CFIUS: up to $5M per violation
Even if the foreign base rate is lower, how much cheaper is that equity really once you stack the friction on top? For single‑site expansions where foreign terms aren’t dramatically stronger than the best domestic offer, the friction usually tips the math back toward staying local.
Cost Component
Domestic Term Sheet ($3M, Farm Credit)
Foreign Equity Fund ($3M)
Base Rate / Expected Return
7.25%
5.50%
CFIUS Filing Fee
$0
$7,500
Legal & Structuring (Multi-Entity Setup)
$8,000 – $12,000
$25,000 – $40,000
Ongoing Compliance (AFIDA, Audit, Reporting)
Minimal (standard covenants)
$5,000 – $8,000/year
Timeline to Close (Opportunity Cost)
60–90 days
120–180 days
Potential AFIDA/CFIUS Exposure (Risk-Adjusted)
None
<span style=”color:#CC0000″>Up to $750,000 (25% of $3M land FMV) + $5M CFIUS penalty risk</span>
When Your Solar Lease Triggers Foreign Ownership Rules
This isn’t just about barns and freestalls. It runs straight through the new revenue streams many dairies are chasing.
Some dairy operations in the upper Midwest and Great Lakes region see utility‑scale solar ground‑lease offers ranging from roughly $800 to $1,500 per acre per year on 20–35‑year terms, depending on grid access and project scale. That’s income that doesn’t move with the milk price. But look at who’s behind the developer — a lot of “U.S.‑branded” solar and wind companies are ultimately owned by European utilities, Canadian pension funds, or Asian trading houses. A June 2025 Brownfield analysis noted that much of the foreign‑owned farmland in Texas — roughly 5.7 million acres — is already tied to timber and wind rather than traditional agriculture.
In a cap state like Wisconsin, a 25‑year ground lease on 150–200 acres may be treated as an “interest in agricultural land.” In a ban state, a long‑term lease tied to an adversary nation is dead on arrival. And as the table above shows: no energy carveouts in any of the top five dairy states. A January 2025 Polsinelli analysis specifically warned renewable energy developers that AFIDA penalties are now a real cost — failure‑to‑report fines can hit 25% of fair market value.
According to a December 2025 Dairy Business MEA report citing MarketIntelo research, the global dairy farm biogas market was valued at ~US$4.2 billion in 2024 and is projected to reach ~US$10.7 billion by 2033 at a 10.8% CAGR. The opportunity is real. But if foreign money is behind your digester, you need to know whether your state treats that site as an interest in land — and whether you’re close enough to a military base to trigger extra CFIUS scrutiny. Under AB 218’s proposed amendment, Wisconsin would add a ten‑mile buffer zone around military installations.
The Fondomonte Warning Shot
This might feel a world away from your freestall. It’s not.
Fondomonte, a subsidiary of Saudi dairy giant Almarai, has been growing alfalfa in Arizona’s Ranegras Plain groundwater basin and shipping it overseas. According to an extensive Los Angeles Times investigation published December 27, 2025, well data tells a stark story: one well’s water level dropped 242 feet since the early 1980s; another declined 136 feet. Arizona’s chief hydrologist, Ryan Mitchell, told residents that current pumping “isn’t sustainable” and land is sinking as much as 2 inches per year in parts of the basin.
Arizona AG Kris Mayes filed a lawsuit alleging Fondomonte uses at least 36 wells and accounts for more than 80% of all pumping in the basin. The state had already terminated Fondomonte’s leases on 3,520 acres of state‑owned farmland after an Arizona Republic investigation revealed below‑market rates — about $83,000 annually for over 6,000 combined acres. Then, on January 9, 2026, Arizona’s Department of Water Resources designated a new active management area in the Ranegras basin — the state’s eighth — prohibiting additional irrigation of farmland. Fondomonte owns 22,873 acres in La Paz County.
Here’s what matters for your dairy: Fondomonte’s structure was legal when it began. A decade later, lease terminations, lawsuits, and a brand‑new AMA designation are reshaping what the company can do on land it owns and leases. A domestic company running the same heavy‑pump, export‑only model would’ve hammered the same aquifer. But most foreign‑ownership bills target who owns the land, not how they use it. That gap matters — and it won’t protect you when the political wind shifts.
The One Question You Can’t Afford to Skip
Before you decide whether your dairy should take foreign money, run every deal through this filter:
If this deal gets blocked, unwound, or challenged eighteen months from now, can my operation survive the fallout?
Don’t answer with your heart. Walk through the ugly versions.
Scenario
What Happens
Risk Level If No Domestic Backup
Deal Blocked Before Closing
CFIUS flags the structure after 6 months, legal fees, steel orders placed. Foreign fund walks.
High Risk — Can you activate a domestic term sheet on 30 days’ notice?
Deal Challenged After Closing
Barn is full, cows are milking, state tightens the cap. You’re forced to buy out foreign partner or refinance domestically under pressure.
High Risk — Do you have $3M+ in emergency refinancing capacity?
Deal Becomes Political Anchor
Structure is legal, but partner’s home country is all over the news. Co-op board, banker, and neighbors ask uncomfortable questions.
High Risk — Are you prepared to carry reputational and credit risk for 10+ years?
Deal blocked before closing. You’ve spent six months, paid lawyers, maybe ordered steel. Then CFIUS flags the structure. The fund walks. Do you have a domestic lender with a live term sheet ready to step in?
Deal challenged after closing. The barn is full, the acres are in rotation. Then your state tightens the cap. Can you afford to buy out your foreign partner or refinance domestically on short notice? That’s what’s playing out in Arizona right now.
Deal becomes a political anchor. The structure is legal, but your partner’s home country is all over the news. Your co‑op board asks uncomfortable questions. Your banker quietly re‑assesses risk. Are you ready to carry that for a decade?
When foreign money is a preference — cheaper or more flexible, but not your only lifeline — you can price the regulatory risk and make a clear‑eyed call. When it’s a lifeline, you’re betting the farm on a political horizon nobody can predict.
What This Means for Your Operation
Nail down whether your deal truly touches land. Operating lines, equipment loans, and barn builds with domestic lenders usually don’t trigger foreign‑ownership rules. The moment a foreign party will own, lease, or hold security over your land — even indirectly — you’re in the regulated zone. Wisconsin’s statute covers direct and indirect interests.
Map the foreign “nexus” before you fall in love with the terms. Ask bluntly: who ultimately owns this fund, the developer or the lender? Is adversary‑nation capital in the stack? Vague answers are a warning sign, not an invitation to keep talking.
Know your state’s line in the sand. Use the five‑state table above as a starting point — then have your ag lawyer dig into your specific statutes before committing to any structure. California and New York have no restrictions today, but SB 1084’s unanimous passage (before the veto) and A3440’s introduction tell you where the current is running.
Price the friction into your cost of capital. Add CFIUS filing fees ($7,500 for most dairy‑scale deals), potential AFIDA exposure (0.1% of FMV per week for late filings), multi‑entity legal structuring, and ongoing compliance costs before declaring foreign capital “cheaper.” Compare that to a current domestic term sheet dated in 2025, not 2021.
Line up domestic options first—not as a backup. Talk to Farm Credit, your primary bank, and at least one other lender before you go deep with a foreign investor. If a foreign deal falls apart at the last minute, you want to be adjusting an existing domestic proposal rather than starting from scratch.
Think about succession and exit. A buyer pool that depends on foreign capital is a buyer pool you don’t fully control. Under current Wisconsin law, violators of the 640‑acre cap face forced divestiture within 4 years — AB 218 would cut that to 3 years.
Treat two‑entity structures as tools, not magic. Separating land and operations can keep some foreign deals alive. But the Wisconsin State Bar’s October 2025 analysis notes that even the “permitted purpose” exceptions under §710.02 require careful structuring. For smaller deals, a cleaner domestic structure at a slightly higher rate is often cheaper and safer.
Key Takeaways
The real question on foreign investment isn’t “is it legal?” It’s “can my dairy survive if this deal gets taken away after we’ve built around it?”
Foreign‑linked money now carries verified, concrete friction costs — a $7,500 CFIUS filing fee, AFIDA penalties up to 25% of FMV for non‑compliance, potential CFIUS penalties of up to $5 million per violation, timelines of 120–180 days, and multi‑entity structuring complexity — that must be added to your cost‑of‑capital math before you compare it to domestic options.
State laws and your partner’s home country matter as much as the rate and terms. California and New York have no restrictions today, but both saw unanimous or near‑unanimous legislative votes to add them — only a governor’s veto and committee timing stand in the way. Idaho, Texas, and Wisconsin already have restrictions with real teeth — and none of the top five dairy states carve out energy deals.
Domestic capital at 7% in the Seventh District looks expensive until you price in compliance friction and regulatory risk on the foreign side. That gap shrinks fast.
The Fondomonte case is a live example of what happens when foreign‑linked agricultural deals meet shifting regulatory ground — wells dropping 242 feet, an 80%‑of‑basin pumping allegation, and a brand‑new active management area imposed in January 2026.
Roughly 36 states now have foreign ownership restrictions on the books, and the list is still growing.
The Bottom Line
Most of these conversations won’t happen in a boardroom. They’ll happen right where this one started — around the kitchen table, after chores, with kids drifting in and out and tomorrow’s milking already on your mind. If foreign money helps you build what your dairy needs without putting that table at risk, it deserves a hard look. If it only works as long as politicians and regulators stand still, you’re better off tightening the plan and betting on capital you can count on when the rules shift again.
Complete references and supporting documentation are available upon request by contacting the editorial team at editor@thebullvine.com.
Every week, thousands of producers, breeders, and industry insiders open Bullvine Weekly for genetics insights, market shifts, and profit strategies they won’t find anywhere else. One email. Five minutes. Smarter decisions all week.
Your yogurt or formula plant adds ‘low‑risk’ ingredients after pasteurization. The last time it went wrong, it ended up at €134M. What’s your plan?
Executive Summary: A single “low‑risk” ingredient has just turned into a high‑stakes stress test for dairy’s whole value chain. Cereulide‑contaminated ARA oil from Cabio Biotech forced Nestlé, Danone, Lactalis, and Hochdorf into recalls across 60+ countries and pushed EFSA to set the first‑ever toxin limits for infant formula. For producers, the clearest warning sign is still the Fonterra–Danone case, where a precautionary recall that never sickened anyone ended in roughly €134 million in damages and a hit to earnings, even as the co‑op insisted the farmgate milk price was unchanged. This time, the contamination is real, regulators are reacting in real time, and processors face higher verification and compliance costs that can squeeze plant investment, premiums, and long‑term contract terms. Herds whose milk feeds yogurt, fortified milk, and formula lines are most exposed, because those products depend on post‑pasteurization ingredients like oils, cultures, and vitamin blends supplied by a small group of global players. The article lays out five concrete moves to cut ingredient and recall risk — plus specific questions you can take to your co‑op manager or field rep to understand how much of your milk cheque depends on what happens after pasteurization.
If you’re supplying milk to any plant that makes yogurt, specialty cheese, fortified fluid milk, or export‑grade powder, the 2025–26 infant formula crisis isn’t just someone else’s problem. It’s a live stress test of the ingredient supply chain your milk flows through — and the contracts your revenue depends on.
Since late November 2025, four major manufacturers — Nestlé, Danone, Lactalis, and Hochdorf — have pulled infant formula off shelves in more than 60 countries after cereulide, a heat‑stable toxin produced by certain Bacillus cereusstrains, was detected in ARA oil traced to Cabio Biotech, a Wuhan‑based supplier. The French Agriculture Ministry identified Cabio as the producer of the contaminated ARA oil, though the company has said it sent products for independent testing and plans to publish the results. Hochdorf Swiss Nutrition AG recalled 10,000 packs of a Bimbosan goat milk product on January 13, 2026, as a precautionary measure after confirming that ARA oil from the same supplier had been processed in small quantities at its facility.
France has opened investigations into two infant deaths, though authorities have stressed that no causal link to the recalled formula has been scientifically established. Danone shares dropped as much as 12% intraday during the worst of the late‑January sell‑off, with cumulative declines of roughly 8–10% over the week the news broke. And on February 2, 2026, EFSA published the first‑ever safety thresholds for cereulide in infant formula — 0.054 μg/L for standard formula and 0.1 μg/L for follow‑on — because until that moment, no legal limit existed anywhere.
Nestlé said recalled batches represent less than 0.5% of its annual group sales. That sounds small — until you remember the Fonterra precedent.
The Fonterra Precedent: Recalls Cost Real Money
In August 2013, Fonterra issued a precautionary recall of its WPC80 whey protein concentrate due to suspected contamination with Clostridium botulinum. The fear turned out to be unfounded. No one got sick. But Danone, which used WPC80 in its Nutricia baby formula plants across Asia, pulled the product from eight markets and sued.
Danone sought hundreds of millions in damages, with claims reported at various stages ranging from €200 million to €370 million. The arbitration tribunal in Singapore ruled in November 2017 that Fonterra must pay NZD $183 millionin recall costs. Danone’s counsel, Simpson Thacher, later stated that the total, including interest and legal costs, reached €134 million — roughly US$165 million.
Fonterra told the market the decision had “no impact on the forecast Farmgate Milk Price”. But it also revised its FY17/18 earnings‑per‑share forecast downward — from 45–55 cents to 35–45 cents — partly citing the arbitration. That capital is absorbed somewhere. Plant upgrades deferred. Component premiums that could have been more competitive.
CEO Theo Spierings said the co‑op was “disappointed that the arbitration tribunal did not fully recognise the terms of our supply agreement with Danone, including the agreed limitations of liability”.
That was for a scare that turned out to be nothing. The current cereulide situation involves real toxin detections, confirmed product contamination at multiple manufacturers, active government investigations, and a named supplier — Cabio Biotech — at the center of a root‑cause analysis still underway.
Why Cereulide Sits Outside Most HACCP Plans
The root problem wasn’t dirty raw milk or a failed pasteurizer. It was a “clean,” high‑value oil ingredient in sealed containers, classified as low‑risk in standard HACCP protocols, and added after the main heat step. Industry experts are already recommending that ARA oil be upgraded from “low‑risk” to “high‑risk” to intensify scrutiny.
Cereulide is extremely heat‑stable. A 2024 technical brief from the Food Research Institute at the University of Wisconsin–Madison documents that it can withstand temperatures around 121–126°C in oily matrices — well above standard pasteurization and many UHT processes. A 2021 Applied and Environmental Microbiology study by Walser and colleagues showed that when cow’s milk fat content rose from 0.5% to 50%, the proportion of cereulide in the lipid phase climbed from 13.3% to 78.6%. It concentrates in fat, and there’s no practical way to remove it once it’s there.
Professor Monika Ehling‑Schulz of the University of Vienna, who co‑developed the ISO detection method, shared that the core problem is the absence of established reference doses — “Nobody knows what this ‘low’ concentration actually means, because the limit has not been defined yet”. Marcel Zwietering, professor of food microbiology at Wageningen University, told the same outlet that the most likely scenario is B. cereus growing and producing cereulide during or before oil production, not in the oil itself — meaning the contamination occurs upstream and hitches a ride into the dairy plant.
EFSA’s new acute reference dose of 0.014 μg/kg body weight for infants is the first regulatory benchmark anywhere. But it applies only within the EU, and only to infant formula for now. Cereulide remains “largely unregulated outside the bloc”. No equivalent limits exist for yogurt, enriched milk, or any other dairy category in any market.
Your Plant’s Post‑Pasteurization Blind Spot
Bring this into your plant. Whether it’s a yogurt operation in Wisconsin, a drinking‑yogurt line in Ontario, a Lactalis UHT facility in Brazil, an enriched‑milk plant in Western Europe, or a powder site on New Zealand’s South Island, the pattern looks the same.
Raw milk gets standardized, pasteurized, and cooled. Then a stack of ingredients is added after the kill step: starter cultures, probiotic blends, vitamin premixes, microencapsulated oils such as DHA and ARA, fruit preparations, flavours, stabilizers, and bioprotective cultures. Every one of those additions jumps past pasteurization. And most HACCP plans classify them as low‑risk — exactly how ARA oil was classified before this crisis blew up.
Ingredient category
Typical use in dairy lines
Contamination impact if compromised
Overall recall & contract risk*
Microencapsulated oils (ARA/DHA)
Infant formula, enriched milk, yogurt drinks
Systemic recall across brands and countries
Very High
Vitamin & mineral premixes
Fortified milk, pediatric formulas
Wide lot‑to‑lot spread, hard to detect in plant
High
Starter & probiotic cultures
Yogurt, cheese, fermented drinks
Product spoilage, off‑flavours, some safety risk
Medium
Fruit preparations & flavours
Yogurt, desserts, drinking yogurts
Localized recalls, limited to flavoured SKUs
Low–Medium
One contaminated ingredient from one supplier — Cabio Biotech — cascaded through four multinational manufacturers and 60+ countries in weeks. If your plant’s cultured or fortified lines depend on similar post‑pasteurization ingredients sourced from the same small pool of global suppliers, you’re exposed to the same structural risk across different product categories. That’s true whether your milk ships to a Fonterra site in Canterbury or a Conaprole plant in Uruguay.
What EFSA’s Outbreak Data Add to the Picture
There’s a broader signal worth watching. EFSA’s 2023 foodborne outbreak report showed that cases linked to the “milk and milk products” food group increased by 392 compared to 2022 — an 84.1% jump. Hospitalizations rose by 30, up 57.7% year‑over‑year.
One large norovirus outbreak in Germany involving dairy desserts drove most of that spike — 538 of 858 strong‑evidence cases in this food group. Dairy was far from the biggest overall source of foodborne illness in 2023; multi‑ingredient foods, meat, eggs, and fish still dominated. But Bacillus cereus toxins ranked second among the leading causes of strong‑evidence foodborne outbreaks across all EU foods that year. And EU outbreak numbers influence how global buyers and retailers think about dairy risk everywhere — including your export markets.
Dairy may not be the biggest culprit in the outbreak data. But the trend line is moving in the wrong direction, which makes the following steps table-stakes for any operation shipping into high‑value or export‑facing lines.
5 Moves to Cut Dairy Ingredient and Recall Risk
You’re not going to solve global toxicology from the parlour. But there are concrete steps that shift the math.
Reclassify post‑pasteurization ingredients as high‑risk by default. If an ingredient is fermentation‑derived and added after the last heat step, it belongs in your hazard analysis as a distinct, high‑scrutiny line item — not buried under “low‑risk dry ingredients.” Industry experts are already recommending this for ARA oil specifically.
Ask your suppliers harder questions. “Are you GFSI‑certified?” is table stakes. What matters now: “Do you test finished lots for emetic B. cereus or cereulide? Which methods? What changed in your program after the 2025–26 recalls?” If you’re on a co‑op board, this is a fair question for your plant management team.
Write change‑notification clauses into specs and contracts. Require suppliers to notify you before shifting production to a different facility, changing a critical raw‑material source, or receiving a regulatory finding. That won’t prevent contamination, but it gives you a window to ratchet up verification before a lot of high‑value milk gets committed.
Build in independent verification testing where margins justify it. Certificates of analysis show you what the supplier tested for. For post‑pasteurization ingredients that support a big share of your premium lines, periodic independent testing — especially when onboarding a new supplier — adds a layer that COAs don’t. The FDA’s October 2024 BAM method for quantitative cereulide analysis gives labs a standardized protocol.
Avoid putting all your ingredient risk on one supplier. This crisis traces to a single ARA oil supplier — Cabio Biotech — that fed four multinational manufacturers. Qualifying at least two sources for each critical post‑pasteurization ingredient costs some volume discount and logistics simplicity — but eliminates the single point of failure. Most serious herds already think this way about forage and semen. Apply the same logic upstream.
What This Means for Your Operation
Ask your co‑op manager, field rep, or dairy company liaison — whatever the title is in your market — one question first: “What proportion of our milk goes into lines that rely on ingredients added after pasteurization?” Whether you’re supplying a processor in Ontario, shipping into a facility in southern Brazil, or delivering to a Fonterra collection point in the Waikato, this is the starting point. If you don’t know the answer, that’s the first gap to close.
Ask what changed post‑recall: “Since the cereulide infant formula situation, what concrete changes have we made in how we qualify and monitor ingredient suppliers?” If the answer is “nothing yet,” that’s a signal — and it applies equally to a plant in Idaho and one in Minas Gerais or Victoria.
Understand your contract exposure. Fonterra’s arbitration payout — ultimately reaching an estimated €134 million, including interest and costs — stemmed from an unfounded scare. If your processor absorbs a real recall, what happens to plant investment, premium payments, and long‑term contract terms? Run the question out loud at your next producer meeting — whether that’s a DFC town hall, a Fonterra supplier session, or a co‑op AGM in Latin America.
If your milk mainly feeds commodity powder and cheddar, the exposure is different but not zero. Plants with large value‑added sidelines can see margin pressure from those lines spill over into the commodity pool. Ask: “If our premium lines paused for a quarter, what would that do to our blend price?”
Watch the regulatory calendar. EFSA’s new cereulide thresholds are EU‑only and infant‑formula‑only for now. But when EU regulators move, export markets take notice — including the buyers that Argentina, Uruguay, New Zealand, and Australia depend on in North Africa, Southeast Asia, and China. If similar limits expand to other dairy categories, compliance and testing costs fall on processors and, eventually, on milk prices. Worth tracking wherever you farm.
Herd profile & milk destination
Share of milk in value‑added lines (%)
Baseline blend price (CAD/hl)
Estimated impact on blend price if premium lines pause 1 quarter (CAD/hl)
Margin impact per cow per quarter (CAD, 40 L/cow/day)
High‑value herd – yogurt, formula, enriched milk heavy
70
90
‑7.50
‑225
Mixed herd – cheese, powder, some cultured & fortified lines
40
80
‑3.00
‑90
Commodity‑leaning herd – powder & cheddar focus
15
72
‑1.00
‑30
Export‑exposed herd – strong infant formula & UHT linkages
60
88
‑6.00
‑180
Key Takeaways
The 2025–26 infant formula crisis exposed a structural gap — post‑pasteurization ingredients classified as low‑risk — that exists in yogurt, enriched milk, and cultured‑product plants through which your milk flows. ARA oil from one supplier, Cabio Biotech, cascaded through four manufacturers and 60+ countries.
The Fonterra–Danone precedent shows the real financial cost: an estimated €134 million in total recall damages from a scare that turned out to be nothing. The current situation involves real contamination, real regulatory action, and active investigations.
EFSA’s February 2, 2026, cereulide thresholds are the first legal benchmark anywhere in the world. More categories and more jurisdictions may follow. Your processor’s readiness for that shift affects your pay price, your premiums, and your long‑term contract stability.
The single most useful thing you can do right now: find out what share of your milk goes into lines that depend on post‑pasteurization ingredients, and ask what your plant changed in its ingredient qualification program since December 2025.
The Bottom Line
The producers who come through shocks like this in decent shape are the ones who asked the uncomfortable questions before the answers showed up on a recall notice. That’s true on a 200‑cow operation in Quebec, a 2,000‑cow dry lot in the San Joaquin Valley, a pastoral herd in the Waikato, or a growing operation in Buenos Aires province. One hour at the kitchen table with your milk cheque and a few pointed questions is worth more than another year of assuming the paperwork has it covered.
211,000 More Dairy Cows. Bleeding Margins. The 2026 Math That Won’t Wait. – Secure your 2026 survival by decoding the structural reset currently upending traditional dairy economics. This strategic analysis arms you with the math to navigate beef-on-dairy traps and replacement shortages that threaten your long-term contract stability and equity.
Lab-Grown Milk Has Arrived: The Dairy Innovation Farmers Can’t Ignore – Lead the next dairy revolution by understanding the “molecularly identical” threat and opportunity of lab-grown whole milk. This disruptor report reveals how mammalian cell technology is moving toward market pilots, reshaping global competition and redefining future dairy value.
Complete references and supporting documentation are available upon request by contacting the editorial team at editor@thebullvine.com.
The Sunday Read Dairy Professionals Don’t Skip.
Every week, thousands of producers, breeders, and industry insiders open Bullvine Weekly for genetics insights, market shifts, and profit strategies they won’t find anywhere else. One email. Five minutes. Smarter decisions all week.
One I-9 audit resulted in the dismissal of 38 workers at Drumgoon Dairy. If ICE knocked tomorrow, how long could your parlor run?
Executive Summary: Immigrant workers provide 51% of hired dairy labor and help produce 79% of U.S. milk, but there’s still no visa designed for year‑round dairy work. One I‑9 audit at Drumgoon Dairy in South Dakota removed 38 employees — about 70% of its crew — in a matter of days, showing how fast a paperwork review can turn into a production and animal‑care emergency. USDA’s latest cost‑of‑production data puts small herds under 50 cows at $42.70/cwt versus $19.14/cwt for 2,000‑plus‑cow herds, so the farms least able to absorb a labor shock are already on the wrong side of the cost curve. The Farm Workforce Modernization Act and the Dignity Act of 2025 would legalize some existing workers and modestly expand year‑round visas, but together they still cover only a fraction of dairy’s foreign‑born workforce. That’s why more operators are treating immigration enforcement like any other major business risk: they’re auditing I‑9s with counsel, training managers for a 72‑hour response, cross‑training crews, and modeling what happens if they lose 25%, 50%, or even 70% of their people. The operations that come through this period will be the ones that can show good‑faith compliance on paper, keep their parlors running when the crew changes overnight, and use automation and legal visas where they lower their true cost per cwt.
Dairy immigration enforcement doesn’t look like what you think it does. The ICE van at the farm gate makes the news. But the real damage in 2025 and into 2026 arrives in envelopes — formal I-9 audits that give operators 72 hours to produce employment documentation for every worker on the payroll, with fines up to $28,619 per violation and mandatory termination of employees whose paperwork doesn’t hold up. As of February 2026, law firm Ballard Spahr confirms ICE continues to be “empowered to take aggressive actions to enforce immigration laws,” with major enforcement events expanding beyond agriculture into manufacturing, education, and healthcare (Ballard Spahr, February 3, 2026). For dairy, that means more agents, more audit experience, and fewer second chances.
According to a NMPF-commissioned study conducted by Texas A&M AgriLife Research — the most recent comprehensive national dairy workforce survey available, based on 2014 data from 1,223 U.S. dairy farms and published in September 2015 — immigrant workers make up 51% of all hired dairy labor, and dairies employing them produce 79% of the total U.S. milk supply.
An NMPF comparison released in December 2018 found that immigrant workers on dairy farms increased 35% between 2009 and 2015, suggesting the current share is likely higher still. Dr. Robert Hagevoort of New Mexico State University, speaking at the Dairy Cattle Reproduction Council Annual Meetings in Arlington, Texas, in November 2024, said he believes the true percentage has continued to grow as herd sizes and employee counts have expanded. Four out of five gallons of American milk depend on a workforce with no dedicated legal visa channel — and one that a single paperwork audit can gut in under two weeks.
The Enforcement Shift: I-9 Audits, Staffing Sweeps, and Transportation Choke Points
The visible workplace raid still happens. Homeland Security agents hit a New Mexico dairy near Lovington in mid-2025, arresting nearly a dozen workers and forcing the immediate termination of two dozen more. But that kind of action is now the minority of enforcement events reaching dairy.
Three quieter channels do most of the damage.
I-9 paper audits have become the primary tool. ICE issues a Notice of Inspection demanding that every I-9 on file be produced, with a 72-hour compliance window. According to compliance-tracking firm I-9 Intelligence (August 2025), field agents now operate under quarterly worksite inspection quotas, with agriculture designated as a priority sector. In July 2025, at least nine Texas dairies received NOIs over a single weekend, as reported by Dairy Herd Management’s Tyne Morgan on July 15, 2025. Employees with deficient documentation must be terminated within 10 business days.
Third-party staffing audits blindside operators who use labor contractors. When the staffing company fails an audit, every worker they placed on your farm gets flagged — even though you never completed their paperwork. You didn’t create the problem. You still lose the crew.
Transportation enforcement targets visa violations among truck drivers at border crossings. When haulers get sidelined, feed deliveries, bulk milk pickup, and livestock transport all stall. No one sets foot on your dairy, but your supply chain seizes up anyway.
Drumgoon Dairy: 38 Workers Gone in Days
If you want to understand what this enforcement shift actually does to a working dairy, look at Drumgoon Dairy near Lake Norden, South Dakota.
Rodney and Dorothy Elliott moved from Northern Ireland to South Dakota in 2006 and built Drumgoon Dairy — named after their home townland in Co. Fermanagh — into a 6,500-cow enterprise with more than 50 employees over nearly two decades. Some staff had been with the operation since its earliest years. As Elliott told the South Dakota Searchlight (October 2025), she reviewed applicants’ documents personally and turned candidates away “a dozen times over the years” when IDs looked questionable — the standard the law sets for employers. Drumgoon had never been audited before.
In late May 2025, DHS audited Drumgoon’s employment documentation and determined that 38 workers had inaccurate, outdated, or incomplete proof of work authorization. Elliott asked them to provide updated documents. Most couldn’t. The workforce dropped from over 50 to 16.
The aftermath tested the operation’s limits. Elliott told the South Dakota Searchlight that remaining employees were making mistakes from the long hours — including reversing a payloader into a manure pond — or because they were new to farm work. Some got just one or two days off in a 15-day stretch. Nearby farms sent workers to help for a couple of days at a time over the summer. Elliott and her husband spent over $110,000 on recruiters and transportation to hire 22 visa workers from Mexico — but the visas came with restrictions on the types of jobs those workers could do, so the Elliotts still needed to hire a dozen more locally and wanted another 10 to 15 beyond that.
“What else do you do? Do you just let cows starve, or calves die because there’s no one there to take care of them?” — Dorothy Elliott, co-owner, Drumgoon Dairy (South Dakota Searchlight, October 2025)
Elliott had already invested in automation before the audit hit. Drumgoon installed 20 robotic units and posted maintenance positions to attract graduates from the Lake Area College program. The response, as she told reporters: “So far, no one.” Automation helps. It doesn’t solve the labor problem by itself when you can’t find people to maintain the technology.
South Dakota Farm Bureau president Scott VanderWal confirmed that dairy audits in the state have increased significantly compared to prior years. Texas Association of Dairymen executive director Darren Turley has called the audits “without a doubt the biggest issue today for the Texas dairy industry.” Drumgoon isn’t an outlier. It’s a preview.
20 units (but no qualified maintenance staff hired)
Recruitment & Visa Costs
Normal payroll operations
$110,000+ spent on recruiters, transport, visa processing
Operational Status
Stable, 20-year operation
Employees working 13-15 day stretches; mistakes from fatigue (payloader into manure pond); neighbors sending temporary help
Why the $23/cwt Cost Spread Makes Smaller Farms Most Exposed
The enforcement risk isn’t distributed evenly. It concentrates on the operations least equipped to absorb it.
USDA’s Economic Research Service, using its 2021 Agricultural Resource Management Survey (the most recent available, published in 2023), reports total production cost per hundredweight of $42.70 for herds under 50 cows versus $19.14 for herds of 2,000 or more. That $23 spread isn’t primarily about feed. Operations above 2,000 cows posted cash costs $1.50/cwt below the all-size average, with the majority of the savings coming from lower nonfeed costs — including labor.
When an audit hits, the 5,000-cow dairy with an HR department, immigration counsel on retainer, and reserves to absorb a two-week disruption survives. It’s damaged, but it has institutional resources. The 200-cow family dairy that loses six of eight employees, with no HR infrastructure and no capital to automate, often doesn’t recover.
The 2022 Census of Agriculture recorded 24,082 dairy operations, down 39% from 39,303 in 2017, while total milk production increased 5% (USDA NASS, 2024). Farms with 1,000-plus head — just 8% of operations — now produce approximately 67-68% of U.S. milk by volume. Enforcement that disproportionately hits smaller operations with fewer compliance resources accelerates that consolidation. Rabobank senior dairy analyst Lucas Fuess projects that small dairies will remain numerically, but their production share will keep shrinking.
The Compliance Trap You Can’t Solve Under Current Law
Here’s the bind every dairy operator is sitting in, whether they’ve named it or not.
Requirement
What H-2A Visa Offers
What Dairy Operations Need
Job Duration
Seasonal/Temporary work ONLY
Year-round, permanent labor (cows need milking 365 days/year)
Application Timeline
75-day minimum before start date; 30-day certification lead time; 4+ months in practice
Workers needed immediately when audit removes crew
Housing Requirement
Employer must provide compliant housing at no cost to worker
Many mid-size operations lack capital for housing infrastructure
Annual Cap for Dairy
FWMA proposes 10,000 dairy-specific visas (if passed)
Estimated 150,000+ immigrant dairy workers currently employed
Current Coverage
~8-9% of workforce (if FWMA passes)
51% of hired dairy labor is foreign-born
Federal law requires you to accept documents that “reasonably appear genuine” during the I-9 process. You can’t demand extra documentation beyond what the form specifies — that could constitute discrimination. But when those same documents fail under audit scrutiny years later, you’re liable for having accepted them. Exposure runs in both directions.
The H-2A visa program — the only agricultural worker visa — is limited to seasonal and temporary labor. NMPF’s Jaime Castaneda has confirmed: “Dairy farmers largely have not been able to use H-2A visas because the current program is limited only to the temporary and seasonal labor needs of agricultural employers” (Hoard’s Dairyman, July 2021). Ohio State’s Margaret Jodlowski backs this up at the farm level: “If they are trying to get workers through the H-2A program, their applications are often turned down. Their labor needs are constant.”
Even where H-2A technically applies to seasonal dairy tasks, the timeline is brutal. DOL regulations require applications filed at least 75 days before the start date of need, and certification must be issued 30 days before workers arrive (DOL Office of Foreign Labor Certification, flag.dol.gov). In practice, Sarah Black of Great Lakes Ag Labor Services told Brownfield Ag News (December 2024) that farmers should “plan ahead at least four months before you want the guys to arrive, because you’ve got to figure out housing and get it inspected, and there are a lot of pieces that have to be in place before you even file.” When the federal government shut down in late 2025, Black reported a 40-plus-day processing blackout during which no applications were filed at all (Brownfield Ag News, November 18, 2025).
Elliott’s experience at Drumgoon proves the point. She spent $110,000 to bring in 22 visa workers from Mexico — and still couldn’t fill every role because the visas restricted what jobs they could do. That’s the system working as designed. It just wasn’t designed for dairy.
Your lender expects regulatory compliance. Your processor needs a consistent volume. Federal law mandates I-9 verification. And the labor market delivers a workforce where roughly half carry documentation that won’t survive scrutiny. You can’t satisfy all four simultaneously. The system doesn’t work. It can’t — not as long as the visa program ignores the way dairy actually operates.
What the FWMA and the Dignity Act Fix — and What They Don’t
Two legislative vehicles are attempting to close this gap, and both may have a better shot in 2026 than in any prior session.
The Farm Workforce Modernization Act (H.R. 3227, 119th Congress, introduced May 2025) is the industry’s most direct ask. Title I creates Certified Agricultural Worker (CAW) status for undocumented farmworkers who can prove 180 days of agricultural labor in the prior two years, with a path to permanent residency after 8-10 years. Had this existed, the 38 workers Drumgoon lost could have applied based on their years of documented service. Title II opens H-2A to year-round operations, with a cap of 20,000 workers — half designated for dairy — on visas extendable for up to 3 years, with electronic filing and wage rate increases capped at 3.25% annually through 2030.
The Dignity Act of 2025 (H.R. 4393), introduced July 14, 2025, by Reps. María Elvira Salazar (R-FL) and Veronica Escobar (D-TX) takes a broader approach — mandatory E-Verify for all employers, an earned legal status program for long-term undocumented residents with clean records, and asylum system reforms. As of January 27, 2026, it had secured 35 bipartisan cosponsors and 60 national stakeholder endorsements, support spanning from Florida to Washington state — up from 25 cosponsors in early December 2025 — making it the fastest-growing immigration reform proposal in Congress.
Both are meaningful but incomplete for dairy. The FWMA’s 10,000 dairy-specific visas cover roughly 8-9% of the foreign-born dairy workforce. The housing requirement — employers must provide compliant housing at no cost — adds a real estate obligation many mid-size operations will struggle to absorb. The Dignity Act would stabilize existing workers, but doesn’t create a dairy-specific visa channel.
The political ground, though, is shifting faster than it has in a decade. A Pew Research Center survey published April 15, 2025 (5,123 adults, February 24–March 2) found that 42% of Americans — including 41% of independents — expect deportations to increase food prices in their area. On June 17, 2025, Rep. Andy Harris (R-MD), chair of the House Freedom Caucus and the House Appropriations Subcommittee on Agriculture, joined an American Business Immigration Coalition call and said: “We need to revise and expand visa categories like H-2A and H-2B, or create a new visa program to meet economic demands.” In September 2025, the Trump administration reversed its own July directive and streamlined H-2A visa renewals, allowing returning workers to skip in-person consulate interviews.
Mike Stranz, Vice President of Advocacy for the National Farmers Union, put the 2026 outlook this way in December 2025: “With the seeming improvements to border security concerns, paired with the greater emphasis we’ve all had on the need for a secure and reliable farm workforce, that adds up to a better shot for the Farm Workforce Modernization Act to move forward. I think that reaches across both parties, and it could be an opportunity to make some real headway in 2026” (AgInfo, December 7, 2025). Whether the window stays open long enough for legislation actually to pass is another question entirely.
Five Risk Reduction Moves You Can Start This Week
No strategy eliminates the underlying risk while the legal framework stays broken. But several approaches measurably reduce your exposure.
Conduct an internal I-9 audit with legal counsel this quarter. Pull every form. Correct technical errors with a single line-through, initial, and date — never white-out. Identify substantive gaps before ICE does. Ballard Spahr’s February 2026 compliance guidance confirms that “internal audits demonstrate good faith compliance in the event of an I-9 government audit.” Operations with 15-plus employees should have immigration counsel on retainer; smaller operations should budget for at least an annual external review — agricultural attorneys typically charge $150-$500 per hour (Farmland Access Legal Toolkit), so a focused I-9 audit for a small dairy may run a few thousand dollars.
Build a one-page enforcement response protocol and train every manager on it. Designate one person to interact with agents. Exercise the 72-hour window — you’re not required to produce documents on the spot. ICE agents don’t have an automatic right to enter nonpublic areas of your facilities without a judicial warrant signed by a judge, not an administrative warrant (Ballard Spahr, February 2026). Penn State agricultural law attorney Brook Duer put it this way: “You should have people whose roles on your payroll are already established in terms of what they are going to do — who’s going to handle the auditors directly. That person should be well-rehearsed” (Dairy Reporter, June 2025). Post the protocol in the farm office. Run it once out loud, like a fire drill.
Cross-train every employee on at least two critical functions. Document SOPs for milking, feeding, calf care, and manure handling. You’re not making everyone an expert at everything—you’re building a minimum viable operation that can absorb a 25-30% workforce loss without immediate animal welfare collapse. Drumgoon’s actual loss was roughly 70%. Run the scenario for your operation honestly.
Establish emergency labor-sharing agreements with 2-3 neighboring dairies. Drumgoon’s neighbors sent workers over for a couple of days at a time during summer 2025 — it helped, but it wasn’t a permanent fix. Mutual aid works for short disruptions of one to two weeks. For longer recovery, identify staffing agencies with verified E-Verify compliance before you need them, not the morning after the NOI lands. Build that network when nobody’s in crisis.
Sequence automation investment by vulnerability, not by flashiness.Robotic milking systems reduce direct milking labor by approximately 60% while typically increasing production 15-20%. Capital runs $430,000-$740,000 for two units serving 100-120 cows, with breakeven at five to seven years under optimized management. With the 2025 all-milk price forecast at $22.25/cwt (USDA ERS, July 2024 outlook), breakeven sits toward the middle of that range. But Drumgoon’s experience is a reality check: Elliott installed 20 robots and posted maintenance positions targeting Lake Area College graduates. “So far, no one,” she told reporters. Automation lowers your labor count. You still need people who can keep the technology running.
What This Means for Your Operation
Every item below can be started this month with no capital expenditure except the attorney review.
Start with one honest question: what percentage of your crew is foreign-born? If it’s more than a third, enforcement preparation isn’t a someday project — it belongs in your top three management priorities right now.
Know your I-9 exposure before ICE does. If you haven’t audited your files in the last 12 months, you’re running blind on your single largest operational risk.
Audit your staffing agencies. Ask for their E-Verify compliance paperwork. If they can’t produce it, you need a different agency before their problem becomes yours.
Map your single points of failure. If losing four specific people would shut down your operation, those four represent an existential risk you need to mitigate by cross-training, documenting, or automating their roles.
Model the enforcement scenario. What happens to your milk volume if you lose 25% of your workforce in a week? What about 50%? Drumgoon lost roughly 70%. Run the numbers for your herd size and your crew.
Tell your story to your legislators — now, while the window is open. Contact your representative and both senators—not a form letter. A specific, numbers-driven account of your operation, your workforce, and what an enforcement event would mean for your production and your community. Idaho Dairymen’s Association CEO Rick Naerebout says there’s more traction than ever: “We’ve not had this kind of traction with an administration ever on this issue… but we’re cautiously optimistic.”
Engage any available visa pathway. USDA began accepting H-2A applications for dairy operations on a pilot basis in select states in late 2025. Sarah Black of Great Lakes Ag Labor Services warns that the process takes a minimum of 4 months from the first filing to the worker’s arrival (Brownfield Ag News, December 2024). Each legal visa worker is permanently audit-proof — and the housing cost, which could run six figures, still compares favorably to the $110,000 the Elliotts spent on recruiters and transport just to fill the gap partially.
Key Takeaways
The dominant enforcement channel hitting dairy has shifted from visible raids to I-9 paper audits, staffing company sweeps, and transportation documentation checks — all operating below the headlines but producing the same workforce losses. As of February 2026, ICE enforcement continues to expand.
Drumgoon Dairy lost 38 of roughly 50 employees to a single documentation audit, then spent over $110,000 on recruiters and transportation to partially rebuild — and still couldn’t fill every position. The “never been audited” era is over.
The $23.56/cwt cost-of-production spread between the smallest and largest herds (USDA ERS, 2021 ARMS data) means enforcement pressure concentrates on the operations least able to absorb it — accelerating consolidation that’s already taken 39% of U.S. dairy farms off the map since 2017.
Two legislative vehicles — the FWMA (dairy-specific visas) and the Dignity Act (35 bipartisan cosponsors as of January 2026) — are advancing with more momentum than at any point in the past decade, but neither has reached a floor vote.
Every dairy that hasn’t conducted an internal I-9 audit, verified staffing agency compliance, and built a workforce disruption contingency plan is carrying unquantified risk on its balance sheet.
The Bottom Line
Rodney and Dorothy Elliott moved from a 140-cow farm in Fermanagh to build something bigger in South Dakota. Twenty years, 6,500 cows, 20 robots, and more than 50 employees later, a federal audit removed roughly 70% of that workforce in days.
“All the time, money, effort, investment, and hard work that has gone into it will be null and void if there isn’t a workforce,” she told reporters.
Every morning, 9.4 million dairy cows need milking. The question for your operation isn’t whether Congress will eventually act. It’s whether you’ll have the crew — and the plan — to keep milking if the envelope arrives before they do.
Complete references and supporting documentation are available upon request by contacting the editorial team at editor@thebullvine.com.
Learn More
Texas I-9 Raids Are Spreading—Here’s How to Keep Your Dairy Out of the Crosshairs – Arms you with a “fire drill” protocol for I-9 audits, revealing how a small investment in compliance software neutralizes six-figure liabilities. It delivers immediate action steps to protect your payroll before the next surprise NOI lands.
Every week, thousands of producers, breeders, and industry insiders open Bullvine Weekly for genetics insights, market shifts, and profit strategies they won’t find anywhere else. One email. Five minutes. Smarter decisions all week.
CVC Capital Partners just bought one of the biggest names in your feed supply chain. Here’s the math on what changes, what might actually improve, and the four moves you should make before the deal closes.
EXECUTIVE SUMMARY: CVC Capital Partners bought dsm-firmenich’s entire Animal Nutrition & Health division on February 9, 2026, for €2.2 billion — carving one of the world’s largest dairy nutrition suppliers into four separate companies by year-end. For a 300-cow Midwest U.S. dairy carrying $73,000–$83,000 a year in mineral, vitamin, and premix exposure through this supply chain, the ownership change is anything but abstract. CVC brings genuine dairy experience through Urus and a proven digital-transformation playbook, but also brings PE margin discipline that typically hits input pricing within the first 24 months. Three structural risks matter most: vitamin allocation now runs through commercial negotiations rather than internal management, over 73% of global vitamin production is concentrated in China, and quarterly return targets can incentivise quiet reformulations that take weeks to show up in your bulk tank. Producers have roughly 10 months before closing to document current formulations, audit feed mill sourcing, trial a second premix supplier, and lock contract terms with substitution-notice and change-of-control protections. That playbook starts with one phone call to your nutritionist — this month.
On February 9, 2026, dsm-firmenich sold its entire Animal Nutrition & Health division to private equity firm CVC Capital Partners for approximately €2.2 billion, including an earnout of up to €0.5 billion. Combined with last year’s €1.5 billion sale of its feed enzymes stake to Novonesis, the total ANH divestiture reaches €3.7 billion — implying a 10x EV/Adjusted EBITDA multiple on the combined value. That’s ANH’s entire €3.5 billion-a-year operation and roughly 8,000 employees changing hands.
Those are the corporate numbers. Here’s the farm-level number: a 300-cow dairy spends roughly $73,000 to $83,000 a year on the minerals, vitamins, and premix that flow through this supply chain, based on the University of Missouri Extension’s 2025 confinement dairy planning budget at $840/ton and 577–656 lbs per cow (a Midwest U.S. estimate — your region’s numbers will differ, but the exposure ratio holds). Minerals and vitamins? Bigger line item than you’d guess. And the companies supplying them just changed hands.
One Division Becomes Four Companies
The nutrition supply chain that used to run through a single integrated ANH division is being carved across four separate businesses — all effective by the end of 2026:
Entity
What They Supply
Owner
HQ
Solutions Company
Premix, performance products, precision services
CVC Capital Partners
Kaiseraugst, Switzerland
Essential Products Company
Vitamins, carotenoids, aroma ingredients
CVC Capital Partners
Kaiseraugst, Switzerland
Novonesis
Feed enzymes (phytase, xylanase, protease)
Novonesis
Denmark
dsm-firmenich (retained)
Bovaer, Veramaris
dsm-firmenich
Kaiseraugst, Switzerland
dsm-firmenich retains a 20% equity stake in both CVC-owned entities but holds no operational control. Feed enzymes went to Novonesis in a deal completed in June 2025, representing approximately €300 million in annual net sales. Novonesis will continue a long-term commercial relationship with ANH for re-sale of its feed enzymes through the premix network.
So that “single supplier” relationship many producers had? It’s now four commercial relationships with four distinct P&Ls. Four separate sets of incentives deciding what goes into your premix, what it costs, and who picks up the phone when something goes wrong. This is part of a broader consolidation wave reshaping the dairy sector — and it’s accelerating.
Company Name
What They Supply to Dairy
Owner
Your Risk
Revenue (Annual)
Solutions Company
Premix, performance products, precision services
CVC Capital Partners
Third in vitamin allocation queue
~€2.0–2.5 billion
Essential Products Company
Vitamins, carotenoids, aroma ingredients
CVC Capital Partners
73%+ China concentration; spot market priority
~€1.0–1.5 billion
Novonesis
Feed enzymes (phytase, xylanase, protease)
Novonesis (independent)
Re-sale through premix network only
~€300 million
dsm-firmenich (retained)
Bovaer (methane), Veramaris (omega-3)
dsm-firmenich
Cost-benefit gap; unclear processor co-funding
~€100–200 million
The PE Playbook: What Actually Changes on Your Farm
Let’s be honest — “private equity buys a feed company” usually makes producers nervous. Sometimes that’s warranted. Sometimes it isn’t. Here’s how to think about it clearly.
CVC isn’t a nutrition company. They manage roughly €201 billion in assets across 150+ companies with combined annual sales over €165 billion. But here’s the thing that matters for dairy: CVC already owns Urus, which they describe as “a global leader dedicated to serving dairy and beef cattle producers around the world with cutting-edge genetics and customised reproductive services”. They’re not walking into animal agriculture blind. And this isn’t even their first deal with dsm-firmenich — CVC held a majority stake in the ChemicaInvest joint venture with DSM back in 2015.
The return math, simplified: CVC paid roughly 7x normalised EBITDA for ANH. Their recent PE exits have averaged 3.3x invested capital at a 27% gross IRR. If historical patterns hold, a €2.2 billion acquisition needs to grow toward €6–7 billion over a five-to-seven-year hold. That’s the number shaping every pricing, staffing, and product-line decision going forward.
What does that mean in plain language? PE ownership follows a predictable sequence:
Phase 1 (Years 1–2): Margin improvement — operational efficiencies, overhead reduction, portfolio rationalisation. This is the phase most likely to touch your feed bill.
Phase 2 (Years 2–5): Bolt-on acquisitions to build scale and market share.
Phase 3 (Years 5–7): Position for premium-multiple exit or IPO.
The Private Equity Stakeholder Project tracked 129 PE deals in U.S. agriculture between January 2018 and December 2023 using Pitchbook data — outcomes ranged widely, from genuine platform growth to Prima Wawona, where Paine Schwartz Partners merged two profitable stone fruit growers into a single entity that entered Chapter 11. CVC’s track record looks materially different. But the underlying dynamic — new owners optimising for return metrics on a fixed timeline — applies across every PE-owned supplier.
Where PE Ownership Could Actually Help
Here’s where I’ll push back on the doom narrative. PE ownership isn’t all margin pressure and cost-cutting. CVC has been aggressive about deploying AI and digital transformation across its 120+ portfolio companies, classifying each by AI readiness and prioritising where technology can unlock measurable value. ANH already built precision livestock tools — Sustell for farm-level sustainability measurement, Verax for animal health monitoring, and FarmTell for data-driven herd management. Under a PE owner with CVC’s tech orientation, investment in those platforms could accelerate.
Steven Buyse, CVC’s Managing Partner, said in the announcement: “The Solutions Company will continue to drive innovation and efficiency in animal farming, delivering tailored solutions with high proximity to its global customer base. The Essential Products Company will be built as a resilient global leader in essential feed, food, and fragrance ingredients”.
Translation: CVC sees two distinct value-creation stories. The Solutions Company gets the precision services and innovation mandate. The Essential Products Company gets built for supply reliability and cost efficiency. If CVC executes well, producers could see better digital tools, more professionalised logistics, and sharper supply-chain management. That’s a real potential upside.
The catch? Those digital tools and precision services tend to come bundled with longer-term contracts and proprietary data ecosystems. More on that in a minute.
Three Structural Risks That Still Deserve Your Attention
You Might Be Third in the Vitamin Supply Queue
When ANH was one division, vitamin production and premix blending shared a single management team. During the 2023 vitamin price crash — Chinese oversupply drove ANH’s adjusted EBITDA down 91% year-on-year in Q3, with a vitamin price effect of about €120 million — the integrated structure absorbed the hit. When BASF’s Ludwigshafen plant fire in July 2024 sent Vitamin A prices surging from roughly $21/kg to $72/kg — a 243% spike — internal allocation kept the premix business supplied.
Post-split, those allocation decisions become commercial negotiations. The Essential Products Company now serves three customer types:
dsm-firmenich — contractually guaranteed volumes under a long-term supply agreement, backstopped by a €450 million loan facility and up to €115 million in additional liquidity support from dsm-firmenich
Spot buyers — willing to pay premium prices during supply squeezes
The Solutions Company — a customer relationship, not a guaranteed supply line
During a disruption, dairy premix customers could find themselves third in that queue. In November 2022, DSM announced a temporary halt to Rovimix Vitamin A production at its Sisseln, Switzerland, plant for at least 2 months, along with significant reductions in Rovimix Vitamin E-50. DSM stated it would “honour existing contractual commitments” while activating allocation procedures. That kind of allocation triage gets harder when the vitamin producer and the premix blender sit on separate balance sheets — and it’s exactly the type of supply chain vulnerability that dairy producers have been caught flat-footed by before.
The China Concentration Risk Underneath Everything
The vitamin CVC market the company is stepping into is arguably the most geopolitically exposed input market in agriculture. AFIA president Constance Cullman told the 2025 NAFB Convention that over 73% of vitamins originate in China. The European Feed Manufacturers’ Federation (FEFAC) puts the concentration even higher for specific vitamins:
Vitamin D3: ~93% China-sourced
Vitamin B1: ~97% China-sourced
Folic acid: nearly 100% China-sourced
“We believe this is a national security issue.” — Constance Cullman, AFIA president, 2025 NAFB Convention
China imposed provisional anti-subsidy tariffs of 21.9% to 42.7% on certain EU dairy products in late 2025. If that escalation touches vitamin exports — or if China simply prioritises domestic supply during a disruption — ANH’s European vitamin capacity becomes CVC’s most strategically valuable asset. And CVC will price it accordingly. On the flip side, CVC has both the capital and the incentive to invest in non-Chinese vitamin capacity — that’s exactly the kind of strategic asset-building that could justify a premium multiple at exit.
Biology Doesn’t Run on Quarterly Reporting
Trevor DeVries at the University of Guelph presented research at the 2019 Western Canadian Dairy Seminar, establishing that “dairy cow health, production, and efficiency are optimized when cows consume consistent rations, both within the day and across days”. More variability between delivered and formulated rations increases the chance that cows won’t perform to expectations.
Here’s the problem: when a margin-driven reformulation — swapping chelated zinc for zinc oxide, trimming vitamin inclusion from above-NRC to minimum-NRC — saves a few dollars per tonne of premix, the production effects may not show in the tank for six to eight weeks. By then, the cost saving has been booked to the current quarter’s EBITDA. The component drift? That’s your problem to diagnose.
This isn’t unique to PE ownership. Any supplier under margin pressure can make these moves. But PE’s quarterly discipline and fixed-horizon exit timeline sharpen the incentive.
Four Moves to Make Before the Deal Closes
The transaction is expected to close by the end of 2026. That gives you roughly 10 months. Use them.
1. Get your formulation on paper. Call your nutritionist and request the complete premix specification for every product you’re running — full ingredient list, inclusion rates, source identifications (not just “zinc” but zinc methionine vs. zinc sulfate vs. zinc oxide), and guaranteed analysis. Dated and signed. This costs nothing, takes one conversation, and enables every other protective move. Without a baseline, you can’t detect reformulations, comparison-shop credibly, or hold anyone accountable.
2. Audit your feed mill’s sourcing. If you’re a 200–400 cow dairy, your premix likely comes through a feed mill, not directly from ANH. Ask three questions: Where do they source vitamins? How many suppliers? What’s the contingency if the primary goes on allocation or raises prices 20%? If your mill single-sources from the Essential Products pipeline, their vulnerability is yours.
3. Test a second supplier on part of your herd. Running 10–15% of volume through an alternative creates a tested backup and real negotiating leverage. Here’s a rough threshold: if your total premix spend exceeds $20,000 a year and you currently single-source, that trial is manageable. The premix market offers genuine options: Trouw Nutrition, Adisseo, Evonik, and regional specialists such as Animine, Devenish Nutrition, and Novus International. The ADM-Alltech joint venture, announced in September 2025, combines Alltech’s 33 feed mills (18 U.S., 15 Canada) with ADM’s 11 U.S. feed mills into a 44-mill network — another competitor entering the space. The trade-off: your nutritionist needs time to validate formulation equivalence, and rumen adaptation matters. Transition gradually.
4. Lock contract terms while there’s an incentive to deal. Before closing, both sides want a smooth handover. Use that to formalise: 30-day written notice before any ingredient substitution; service-level commitments; pricing escalation caps indexed to verifiable benchmarks; and a change-of-control clause allowing renegotiation if either entity is subsequently sold. But remember — long-term contracts cut both ways. When vitamin prices crashed in 2023, locked-in terms would have left you paying above-market rates. Indexed pricing structures beat fixed rates in a volatile input market.
Action Item
Timeline / Deadline
Cost to Execute
Risk If You Don’t
Who to Call First
1. Document current premix formulation
This month (Feb 2026)
$0 (one phone call)
No baseline to detect reformulations or hold suppliers accountable
Your nutritionist
2. Audit feed mill’s vitamin sourcing
Before April 2026
$0 (3 questions)
Feed mill’s single-source vulnerability becomes your cash flow crisis
Your feed mill rep
3. Test second premix supplier on 10–15% of herd
May–Aug 2026
$1,500–$3,000 trial cost
Zero negotiating leverage; no tested backup during allocation squeeze
Independent nutritionist or alt supplier
4. Lock contract terms with substitution protections
Before Oct 2026 (deal close)
Legal review: $500–$1,500
Eat reformulations and price increases with no recourse or exit clause
Feed supplier + lawyer (change-of-control clause)
The Bovaer Split: Who Pays for Methane?
dsm-firmenich kept Bovaer and Veramaris while selling everything else. That means the company promoting methane reduction on your farm is no longer the company managing your daily nutrition.
Elanco estimates a potential annual return of “$20 or more per lactating dairy cow” through voluntary carbon markets and government incentives — but that figure reflects projected potential, not observed farm-level returns. Greg Hocking, Mars Snacking’s global VP of R&D for New Innovation Territories, was direct in a December 2025 interview: “Consumers will benefit from these efforts, but we don’t expect them to pay extra for sustainability”. Denmark is moving toward subsidised adoption and may mandate methane-reducing additives. If that regulatory model spreads, processor co-funding could follow.
But the gap between the additive cost and the documented on-farm returns means the economics of voluntary methane programs are still tight. Evaluate any value-chain program carefully — we dug into the details in Bovaer Unleashed: The Controversial Additive Changing Dairy Forever.
What This Means for Your Operation
Your mineral and vitamin line item is more exposed than it looks. At $242–$275 per cow per year for a Midwest U.S. confinement dairy (University of Missouri Extension, 2025 ), a 10% cost increase means $7,000–$8,000 on a 300-cow operation. Your region’s absolute numbers will differ—benchmark your feed costs against strategic alternatives with your nutritionist.
The financial incentives behind your supplier just changed — but that’s not automatically bad. PE ownership optimises for 5–7 year return cycles, not 20-year relationships. That could mean tighter margins andbetter digital tools. Verify rather than assume. Watch what actually happens to service levels and product specs.
Your feed mill is the invisible middleman. If they single-source vitamins from ANH’s Essential Products pipeline, a pricing or allocation squeeze hits you even if your name isn’t on the contract. Ask the question this week.
Precision services come with strings. If CVC invests in Sustell, Verax, or FarmTell — dsm-firmenich’s existing data platforms — those tools could genuinely improve your herd management. Just understand what data you’re handing over and which contract terms come with it.
Collective purchasing deserves a conversation. If you sell through a cooperative, ask whether group nutrition procurement is on the board’s agenda. Volume leverage is the strongest counter to supplier concentration — and building financial firewalls against supplier disruption starts with knowing where the risk sits.
Key Takeaways
Get your complete premix formulation documented this month — dated, signed, with source identifications for every active ingredient. One phone call, zero cost, foundation for everything else.
Test an alternative premix supplier on 10–15% of your herd before the deal closes. A credible alternative is the only pricing leverage that consistently works in concentrated markets.
Evaluate whether your nutritionist works for the company selling you premix. If so, get a second opinion from an independent consultant.
Run the stress test: if premix costs rose 10% while milk prices dropped $2/cwt simultaneously, what does your cash flow look like? Run that number now, not after closing.
Don’t dismiss PE upside. CVC’s digital investment track record and its existing dairy exposure through Urus mean this could bring genuine improvements in supply-chain efficiency and precision tools. Stay skeptical, but stay open.
Watch for CVC-branded communications in your feed mill or nutritionist’s feed after closing — that’s the signal the margin-optimisation phase has started.
Herd Size
Current Annual Premix Cost
After 10% Increase
Annual Cost Impact
Impact as % of Milk Revenue
100 cows
$24,200–$27,500
$26,620–$30,250
$2,420–$2,750
0.5–0.6%
300 cows
$72,600–$82,500
$79,860–$90,750
$7,260–$8,250
0.5–0.6%
500 cows
$121,000–$137,500
$133,100–$151,250
$12,100–$13,750
0.5–0.6%
750 cows
$181,500–$206,250
$199,650–$226,875
$18,150–$20,625
0.5–0.6%
1,000 cows
$242,000–$275,000
$266,200–$302,500
$24,200–$27,500
0.5–0.6%
The Bottom Line
The ownership of your dairy’s nutrition supplier changed on February 9, 2026. Your formulation, your service levels, and your contract terms haven’t changed yet. That gap is your window—and it closes when this deal does at year-end. How are you planning to use it?
Complete references and supporting documentation are available upon request by contacting the editorial team at editor@thebullvine.com.
Learn More
Feed Costs Just Rewrote the Dairy Playbook—and Your ZIP Code’s Calling the Shots – Arms you with the metrics to track Income Over Feed Cost (IOFC) like your survival depends on it. This analysis exposes why geography and breed-specific mineral packages now dictate a massive 20% margin swing between competing operations.
The Bovaer Warning: How Denmark’s Methane Mandate Went from Law to Crisis in 6 Weeks – Reveals the high-stakes reality of mandating methane additives before the science is fully settled. This case study deliverscritical exit-trigger strategies and monitoring protocols to protect your genetic progress from regulatory-driven production volatility.
The Sunday Read Dairy Professionals Don’t Skip.
Every week, thousands of producers, breeders, and industry insiders open Bullvine Weekly for genetics insights, market shifts, and profit strategies they won’t find anywhere else. One email. Five minutes. Smarter decisions all week.
Thinking about adding or expanding on‑farm processing? Read this 75-year doorstep story first. It might change your plan.
On January 31, 2026, Juan Hargraves finished the last doorstep milk delivery Cooil’s Dairy would ever make — ending an on-farm dairy processing and direct delivery operation his wife Kirsty’s family had run for more than 75 years in the south of the Isle of Man. For some customers, those rounds had been part of life for more than 60 years. Three generations of the same households opening the same door to find the same family’s milk before dawn.
Nobody was angry. Nobody was bankrupt. The herd of 120 to 130 cows is still milked every morning. But the processing plant needed significant investment that the operation couldn’t justify, and Juan and Kirsty made the call while they still had choices—to refocus on farming and family life. “After much discussion and careful consideration,” they wrote, “we are not in a position to make this investment in the current climate”. If you’re running on-farm processing for a retail channel that only handles a minority share of your total output, the number that killed Cooil’s retail operation — their retail‑to‑wholesale ratio — is one you should know cold.
Juan and Kirsty Hargraves with two of their six children at home on the Isle of Man. For 75 years, the Cooil’s Dairy milk round started just after 1 a.m. — but the hardest work always happened under this roof.
Three Generations, One Route
Leslie Cooil started farming in the Port Erin area around 1942 or 1943, and the doorstep dairy that would define the family business for the next 75 years followed in the early 1950s. “The very start of it would have been Leslie Cooil in about 1942/1943, from what I can get from Ian and Gary Cooil,” Juan told Manx Nostalgia. Ian and Gary — Leslie’s sons — carried on their father’s legacy in the early 1970s, when Ian was about 21 and Gary about 5 years younger. The operation became known locally as Cooil Brothers.
By 2010, Juan had gone from the kid who jumped on the back of the milk truck to a business partner. He first hopped on a Cooil’s truck in 1987, when he was 7, and later went up to the farm to help and worked there until he was 17. In 2004, he took in 120 acres of bare land neighboring the Cooils, running sheep and a few suckler cows while working full‑time on another farm. Buildings went up on that greenfield site in 2007, with more added over time to move the cows to newer facilities and expand the operation. In 2010, entered in to a partnership with the Cooils. In 2014, he bought Ian out upon Ian’s retirement. And in 2020, just six hours after their youngest child was born, Kirsty was signing the papers to buy out Gary’s share of the business — swapping her life as an estate agent for being fully in the dairy with Juan. All of that sits behind the one‑line summary: “Juan and Kirsty took over fully.”
“We’re Cooil’s Dairy Limited. We’ve been Cooil’s Dairy Limited since about 3 years ago now, when my wife, Kirsty, and myself took it over fully,” Juan told Manx Nostalgia in December 2023. “Obviously, our surname is Hargraves, but we’ve kept Cooil as the known trading name”.
By the time they made the decision to close, they were delivering to about 850 houses. Juan is clear: just over 1,000 would have been the peak of COVID, when they took on everyone who wanted deliveries and lived in their area. As customers went back to their usual routines — and as older clients passed away — the number settled back to roughly 850 households.
The team was small and tight. Mark ran two delivery rounds, working pretty much six days a week. Brian handled a third round on Monday, Wednesday, and Friday, and washed every bottle that came back. Lorna bottled the milk. Kirsty managed the office, the accounts, and all Farm Assurance paperwork — which Juan noted had become “a massive thing to undertake.” Juan covered the farm, the milking, and filled in on delivery routes whenever someone was off. Five people. About 850 households. Every week.
And it wasn’t just milk. Cooil’s delivered fresh Manx milk and cream in recyclable glass bottles, plus eggs, potatoes, homemade cakes, and ice cream.
“We’ve made so many friends over the years, saved lives, moved furniture round and even caught criminals in the act,” Juan wrote in the farewell message. During the blizzard of 1994, the family later recalled, the team delivered by tractor and trailer because the milk had to get through. During COVID‑19, Cooil’s took on a wave of new customers as island residents turned to doorstep delivery — a surge that placed heavy additional demands on processing equipment already built for the existing base.
Two Sites, One Dairy
There’s another piece you don’t see if you only watch the milk truck pull up at the door. The processing plant wasn’t even on the same site as the cows by the time the last round went out.
The herd moved to a new greenfield site in 2015, onto the newer facilities Juan and Kirsty had been building since 2007. The processing stayed at the original Cooil’s site. To bridge the gap, they retro‑fitted a DX bulk tank onto an old grain trailer chassis and hauled milk back for processing five days a week. Every load meant diesel, time, and one more moving part that could go wrong between parlour and pasteurizer.
And the work didn’t stop when the van pulled into the yard. “Every evening we had to make sure we had made any customer changes so that the rounds were ready to go just after 1 a.m., the vans were ok to go and there was enough potatoes etc. to go for the morning,” Juan wrote. Even now, a week later, with the rounds done, they’re still catching up invoices. The reality, he says, “hasn’t fully kicked in” — but they already feel a sense of freedom.
“So it fell to me to cover whatever needed doing,” he admitted. In their house, six children meant Kirsty’s hands were full, especially in the mornings. A young lad was working on the farm, but with limited experience, he couldn’t do it all on his own. Relief staff? They couldn’t afford them — and that’s if you could even find someone willing to milk cows one day, bottle milk the next, and drive rounds in the dark the day after that.
“I’ve seen it a few too many times to care to remember,” Juan wrote, “that I’ve had a milkround to cover and I’ve gone out after tea (evening meal), done half of the round, got home for midnight, up at 5 to milk the cows and then finish the round afterwards, all the while we had customers ringing to say they haven’t had their delivery yet.” His own summary of those years is simple: “I was constantly plate spinning.”
The community felt it. “Thank you, Cooil’s Dairy Ltd for your service over the years in rain, hail, and sun — but usually in the dark,” the Ballasalla Village community page posted. “It’s the end of an era”.
The Collapse of the Middle
Cooil’s closure fits a pattern that’s been tightening for decades. In the early 1970s, an estimated 99% of UK milk was delivered to doorsteps, according to Andrew Ward’s No Milk Today. By the late 2010s — before the pandemic temporarily reversed the trend — that share had fallen to roughly 3%. But the closures aren’t spread evenly. They concentrate in a specific zone.
At the top end, scale operators grow. McQueens Dairies in Scotland expanded well before COVID, with turnover climbing 30% in the year before their 2019 facility announcement, per BBC Scotland. By early 2021, they’d opened 11 distribution depots across Scotland and northern England and recruited more than 200 new staff in 12 months.
At the bottom end, micro‑operators survive by stripping overhead to nearly zero. Gareth Baird, a young farmer in Carrickfergus, Northern Ireland, launched his doorstep round in July 2020, targeting 30 bottles on his first night — he delivered 120. No employees. No bottling line. Minimal fixed cost.
The operators disappearing are the ones in between. Family dairies milking 80 to 200 cows, running their own on‑farm processing, employing a small team, and serving a few hundred to a couple thousand retail customers while sending the bulk of their milk to a cooperative. Cooil’s — 120 to 130 cows, five people, 850 houses at the end (just over 1,000 at the COVID peak), 80% of milk to the Creamery — was textbook middle‑zone. And the mechanics that made it unsustainable aren’t unique to the Isle of Man.
Why the Math Stopped Working
If you’re running on‑farm processing, the number that matters most isn’t your customer count. It’s your retail‑to‑wholesale ratio — the share of your total milk output that actually flows through your bottling plant.
At the time of closure, Cooil’s sent approximately 80% of its milk to the Isle of Man Creamery at the cooperative wholesale price, per Manx Radio and 3FM. But that ratio had been worsening. In his Manx Nostalgia interview, Juan described it as “approximately about three quarters” to the Creamery, explaining: “We milk more cows. We’ve got more sort of surplus if you like, and then the rest goes on to the doorstep”. Every cow they added sent more milk to wholesale because the doorstep rounds couldn’t absorb the growth. By the end, only about 20% flowed through the family’s own pasteurizer, bottler, and delivery rounds — and that 20% had to carry the entire fixed cost of processing equipment that costs roughly the same whether it handles a fifth of the herd’s output or all of it (20% utilization means each litre through the bottler carries 5× the fixed cost it would at full capacity).
Here’s what that equipment costs to replace. At the micro end, a basic batch pasteurizer starts around $14,000 USD (Tessa Dairy Machinery), while a complete micro‑processing system runs roughly $18,000 USD (MicroDairy Designs). But Cooil’s wasn’t micro — they were making skimmed, semi‑skimmed, and whole milk plus cream for hundreds of doorsteps. The Northeast Dairy Business Innovation Center’s 2024 Processor Modernization grants show real costs at this level: awards ranged from $62,000 to $350,000 per facility for vat pasteurizers, rotary filler‑sealers, and packaging lines.
Take a bottling line with, say, a 12‑year service life and a $150,000 replacement cost. That’s $12,500 set aside every year just to fund its own successor. Spread that across 850–1,000 customers, and it’s roughly $12–$15 per customer per year in depreciation alone — before energy, bottles, labor, fuel, trailer haul‑back, or vehicle maintenance. And every hour Juan spent nursing a bottling line past its service life was an hour not spent on herd genetics, forage quality, or transition cow management — the core drivers of the 80% of the milk that actually paid the bills. That’s opportunity cost, and it compounds quietly.
Cooil’s faced an additional constraint that most mainland operators don’t. The processing plant and the cows were on different sites. Every litre destined for doorstep delivery was pumped into that DX bulk tank on an old grain trailer, hauled back for processing five days a week, then bottled and delivered. That’s haulage, handling, and risk you don’t see on the milk cheque — but you pay for it.
They also operated under a regulated retail price ceiling. The Isle of Man’s Milk Marketing Committee sets retail milk prices by government order. The price per pint rose to 90p in July 2025, the first increase in roughly two and a half years. When your costs are rising, and your price ceiling is externally fixed, the only lever you have is volume. On an island of around 84,000 people, volume has a hard ceiling, too.
QUICK CHECK: Is Your Retail Channel Paying Its Way?
What would it cost to pay yourself and your partner market rate for every hour you spend on the retail side? That number is your unpaid family labor subsidy. If the retail channel can’t cover it, you’re already eroding — you just can’t see it on the P&L.
Divide your processing equipment’s total replacement cost by its remaining service life in years. Are you banking that amount annually? If not, you’re consuming the asset without replacing it.
Call your cooperative and ask one question: “Could you absorb our full supply volume within 90 days?” If yes, your safety net exists. Knowing that changes how you evaluate everything else.
Juan’s answer to those checks is pretty clear in hindsight. “We were understaffed really, and we could not afford to have relief staff,” he wrote, “and that’s if you could find someone who would do a bit of everything.” In the end, it fell to him to cover whatever needed doing. “All these factors led to my heart not being in the job,” he admitted. The bad days — the midnight‑home, 5 a.m. milking, customers ringing because the milk wasn’t there yet — weren’t constant. But they were frequent enough that, by the end, he was “almost begrudging having to do a milkround” while a new building on the farm and six kids at home all needed him too.
“So the end of an era, saying that seems to be the most commonly used phrase,” he wrote. “Yes, it is in its own way, so many people loved our products and are going to miss them.” But the other line that matters is this one: “At the end of the day, it wasn’t a decision that happened overnight, and we have made it for what we feel is right for us going forward as a family.”
Same Island, Two Models, Opposite Outcomes
Carl Huxham runs Cronk Aalin Farm in Sulby on the Isle of Man
A useful comparison sits on the same island. Carl Huxham runs Cronk Aalin Farm in Sulby, milking 40 cows but routing 100% of his output through nine delivery rounds using electric vans. Nothing goes to the Creamery. He built the operation from scratch, starting in 2006, buying a second‑hand 16‑point Fullwood parlour and bulk tank for £8,000. Every piece of equipment was sized for the volume it actually serves.
“Being on an island, our input costs are all quite high as everything incurs a shipping cost,” Huxham shared. He sells at the same regulated price ceiling that Cooil’s operated under.
The difference isn’t geography or regulation. It’s ratio. At 100% retail, Huxham’s processing equipment is fully utilized by the revenue it generates. At Cooil’s 80/20 split, theirs couldn’t be. If you’re considering building a farm‑direct operation from scratch, Huxham’s model is the template. If you’re inheriting one that’s already split between retail and wholesale, Cooil’s is the cautionary math.
Four Paths Forward
Across the UK and North America, family dairies navigating the same pressure points are finding distinct paths:
The clean exit to cooperative supply. Cooil’s path: cease retail, route all milk through the cooperative. It eliminates processing and delivery costs entirely, preserves the farm, and can execute within 60 to 90 days. The trade‑off is permanent — you surrender the retail premium and the direct community relationship.
The radical downscale. Baird’s model in Northern Ireland strips out every cost layer that burdened Cooil’s: no paid delivery staff, minimal equipment, a radius one person covers before breakfast. It doesn’t scale. And it depends entirely on one body holding up indefinitely.
The channel swap to vending. Milk vending machines have become one of the fastest‑growing farm‑direct channels in UK dairy. A setup costs roughly £30,000, with margins of 60-80 pence per litre, according to The Bullvine’s July 2025 analysis. The model eliminates delivery cost by bringing the customer to you — but also eliminates the community welfare function.
The community‑supported model. Stroud Micro Dairy in Gloucestershire operates as a cooperative, with customers subscribing to seasonal shares. Over 800 community shareholders own Tablehurst and Plaw Hatch Farms in Sussex. When customers pre‑pay for a season’s milk, you know in January what February looks like. The catch: board meetings, annual reports, and governance paperwork most dairy families didn’t sign up for.
Path
Entry Cost
Key Trade‑off
Best Fit
Clean exit to cooperative
Minimal
Lose retail premium permanently
Retail <30% of output; equipment aging
Radical downscale
$5K–$15K
No growth; one person’s stamina
Young farmers; no employees
Vending
~£30K / ~$38K
Lose doorstep relationship
Farms near roads with footfall
Community cooperative
Variable
Governance complexity
Peri‑urban; engaged consumer base
What This Means for Your Operation
This isn’t abstract. Clark Farms Creamery in New York was processing roughly 25% of the farm’s milk — about 3,000 gallons a week — with the remaining 75% still being trucked off. As The Bullvine reported in January, the real premium was roughly $1.15–$2.15 per gallon in extra margin at the cost of 70–90 more hours a week on top of a full dairy workload. Clark shut the creamery down in January 2026 while keeping the cows milking — the same decision Cooil’s made, on the opposite side of the Atlantic.
Strategic Path
Entry Cost (USD/CAD)
Key Trade-Off
Best Fit
Clean Exit to Cooperative
Minimal ($0-$5K transition costs)
Lose retail premium permanently
Retail <30% of output; equipment aging; no succession plan
Radical Downscale
$5K-$15K (minimal equipment, no employees)
No growth; limited by one person’s stamina
Young farmers with no family; high energy; willing to work 7 days/week
Vending Machine Model
~$38K CAD / ~£30K GBP
Lose doorstep relationship and community role
Farms near high-traffic roads; peri-urban locations; strong local brand
Community Cooperative
Variable ($10K-$50K legal/admin setup)
Governance complexity; board meetings; reporting
Peri-urban locations; engaged customer base willing to invest; strong local food movement
On Vancouver Island, Mark at Promise Valley Farm took the opposite approach — a small organic Guernsey herd with 100% A2A2 genetics, processing all milk on‑farm through a self‑serve dispensing machine. “Processing our own milk and making value‑added products has to be part of the conversation for future producers,” he shared. But notice: small herd, all milk through the store. Ratio, again.
The advantage you have that Cooil’s didn’t: pricing freedom. No government committee sets your retail price. You can charge what the local market will bear—but only if you use it deliberately. If you’re pricing farm‑store milk just a dollar above the grocery store “to stay competitive,” you may be leaving the margin on the table that would fund your equipment reserves. And here’s the piece that ties to your breeding program: if your herd’s component profile — butterfat, protein — commands premiums through the cooperative, every litre you divert to flat‑rate retail bottles is leaving that premium on the table. If you’re operating under Canadian supply management, the ratio math shifts because your wholesale floor is higher — but the equipment depreciation math doesn’t.
The wholesale safety net itself is under pressure. AHDB warned in January 2026 that farmgate prices are “set to stay under pressure into mid‑2026” as oversupply squeezes values, with the spring flush likely to make the first half of the year particularly difficult. The UK average farmgate price for December 2025 came in at 40.29 pence per litre, down 6.1% from November and 13% below December 2024. Exiting retail into a weakening wholesale market is still a viable move — but the window where wholesale alone feels comfortable is narrower than it was six months ago.
Confirm your cooperative or processor can absorb your full supply before you need them to. Cooil’s transition to the Creamery happened smoothly on February 1 because that relationship was already in place. Your safety net should exist long before the pasteurizer starts making noises it shouldn’t.
The Technology Temptation (Don’t Wait for It)
If you’ve heard about Lely’s Orbiter — an automated on‑farm processor that pasteurizes, homogenizes, and bottles with minimal labor — you might be thinking automation could change this math. As of December 2025, five units were operational in the Netherlands and Belgium, with sales expanding into Germany. The Orbiter page is live on Lely’s North American website. But there’s no announced NA availability date, no published pricing, and no regulatory pathway confirmed. Lely’s own Astronaut A5 Next milking robot won’t reach the US and Canada until “after local validation in 2026”. The Orbiter is further back in the queue. If your bottling line is at year 9 of a 12‑year service life, you can’t afford to wait for technology that may not arrive at a price point that works for your herd. Cooil’s made the call at their convenience. That’s worth more than any piece of equipment.
Key Takeaways
Track your retail‑to‑wholesale ratio, not just your customer count. When your direct retail channel handles less than 30% of total output, the processing infrastructure is almost certainly overbuilt for the volume. Cooil’s saw that ratio worsen as the herd grew, from about 75% wholesale to 80%. Clark Farms hit the same wall at 75%.
Count your unpaid family labor as a real cost. Cooil’s ran the entire processing and delivery operation with five people, in addition to the farm work. Add six kids and a second site into that mix, and you can see why Juan described his life as “plate spinning.”
You need an equipment replacement plan, not just a repair budget. If your retail margin isn’t building a reserve to replace the bottler, the day it fails, the decision happens to you, not with you.
Surge demand will lie to you. Cooil’s peaked at “just over 1,000” houses during COVID, then settled back to about 850 as people returned to normal. AHDB and Kantar saw similar patterns nationally. Don’t invest based on the peak; invest based on the plateau.
Genetics and components matter to this decision. Every litre you pull from a high‑component herd and sell at flat retail is a litre that doesn’t earn the cooperative’s butterfat and protein premiums. That’s genetics ROI you’re giving away.
Year 8 is your red‑flag year. If your processing equipment is past year 8 of a 12‑year life, you should already be working through your options: full retail, clean exit, downscale, vending, or cooperative model. Not when something breaks. Not when Lely announces an Orbiter for your market. Now.
The Bottom Line
Juan and Kirsty Hargraves closed their retail operation while the farm was still healthy, the staff could be thanked by name, and the community had time to say goodbye. “We would like to think that nobody was ever let down,” they wrote. From Leslie Cooil’s first delivery in the early 1950s, through Ian and Gary’s decades behind the wheel, to Juan and Kirsty’s final round on January 31, 2026 — the milk showed up before dawn, to hundreds of doorsteps, every week. That’s not a failure story.
The question for your operation isn’t whether something like this could happen to you. It’s whether you’d recognize the signals at year 8 — not year 12.
If the weight of a decision like this is sitting on you — or on someone you know — the Farm Aid hotline (1‑800‑FARM‑AID) and the Canadian Ag Mental Health Alliance can help. You don’t have to sort it out alone.
Complete references and supporting documentation are available upon request by contacting the editorial team at editor@thebullvine.com.
English Dairy Farms See Earnings Surge in 2024-25 – But Don’t Get Comfortable – Exposes the danger of relying on temporary farmgate surges. This analysis reveals how to leverage current earnings to fortify your operation against the inevitable price slides that catch unprepared producers off-guard in the three-year outlook.
Milk Vending Machines: Why They Are The Fastest-Growing Farm-Direct Channel – Breaks down the high-margin, low-overhead blueprint for on-farm sales. Discover how vending technology captures a 60-80 pence per litre premium while slashing the delivery and labor costs that eventually sank the traditional doorstep model.
The Sunday Read Dairy Professionals Don’t Skip.
Every week, thousands of producers, breeders, and industry insiders open Bullvine Weekly for genetics insights, market shifts, and profit strategies they won’t find anywhere else. One email. Five minutes. Smarter decisions all week.
3 out of 4 dairies bred beef-on-dairy. Now 800,000 heifers are missing, and replacements are $3,010 a head. Where does your herd sit in that math?
Executive Summary: If you chased beef‑on‑dairy premiums in 2022–23, you’re now buying replacements in a world where heifer prices jumped from $1,140 in 2019 to $3,010 in mid‑2025 and often top $4,000 in high‑demand regions. At the same time, U.S. replacement inventories have dropped to their lowest level since 1978, leaving roughly 800,000 “missing” heifers across 2025–2026 and making it harder—and more expensive—to keep herds at size. For a 200‑cow herd turning over 35–38% per year, that shift alone can mean an extra $126,000–$144,000 in replacement capital over the next two years if you have to buy those animals instead of calving them in. This piece breaks your options into four concrete paths—breeding rebalance, reduced culling, strategic exit, and processor lock‑in—and spells out where each helps, where it backfires, and the thresholds (like an 18% pregnancy rate or culling below 30%) that should force a rethink. It also links your barn‑level math to the bigger picture: beef‑on‑dairy calves now account for 12–15% of fed beef harvests, and roughly $10 billion in new dairy plants are scheduled to come online by 2027, keeping processor demand for reliable milk flows high even as replacements stay tight. The goal is simple: give you enough numbers and clear decision rules to decide whether your 2026 breeding sheet keeps you in the group processors treat as long‑term partners—or in the group scrambling for $3,000+ heifers with everyone else.
Ken McCarty of McCarty Family Farms still remembers trying to sell Holstein bull calves: “Two for $5″—with no takers. That painful baseline explains why dairy producers didn’t hesitate when beef-on-dairy calves started bringing $600, then $1,000, then $1,400 per head. The math seemed obvious. The check was immediate.
But it wasn’t free money. It was a deferred bill. And that bill has arrived.
CoBank data shows replacement heifer prices climbed from $1,140 per head in April 2019 to $3,010 by July 2025—with top-quality animals in California and Minnesota auction barns commanding $4,000 or more. USDA’s January 30, 2026, cattle inventory report confirmed the national herd continues to contract. For operations that bred heavily to beef in 2022 and 2023, the pipeline is now empty. For those who maintained balance, a window is opening.
The Scale Nobody Predicted
The adoption curve was staggering. Beef semen sales into dairy herds grew from 1.2 million units in 2010 to 9.4 million units by 2023—roughly 84% of which went into dairy cows, according to a 2024 Purina survey. That same survey found almost three-fourths of U.S. dairy farmers are now actively crossbreeding using beef genetics, with another 16% considering it.
CattleFax puts the production numbers in starker terms: beef-on-dairy calf production jumped from 50,000 head in 2014 to 3.22 million in 2024, with projections reaching 5–6 million head by 2026. These crossbred cattle now account for 12–15% of fed beef harvests.
Every one of those calves was a dairy heifer that wasn’t born.
The Pipeline Math That’s Already Locked In
Sarina Sharp at the Daily Dairy Report flagged in early 2024 that dairy heifer inventories had declined for six consecutive years. USDA’s January 2025 snapshot put milk replacement heifers at 3.914 million head—the lowest since 1978, a full 18% below 2018 levels.
CoBank economist Corey Geiger quantified the gap in an August 2025 report: 357,490 fewer dairy heifers available in 2025, then 438,844 fewer in 2026. Add those up. That’s roughly 800,000 missing replacements across a two-year window. And as Geiger commented: “We don’t see a rebound until 2027, and that will be up 285-thousand, but you’ve got to remember, that’s going to be after 800-thousand fewer heifers”.
Regional variation tells its own story. Wisconsin replacement values jumped 43% year-over-year between October 2023 ($1,990) and October 2024 ($2,850), according to USDA data. Yet Wisconsin actually gained 10,000 heifers while Texas lost 10,000 head. “Watch” on the Northwest (Idaho/Washington), where prices have reportedly hit that $4,000+ “north of the border” threshold. That divergence comes down to processor relationships and infrastructure, not just breeding decisions.
The Beef-on-Dairy Miscalculation
Here’s what producers believed: beef-on-dairy premiums were an additive income. Extra revenue layered on top of normal operations without meaningful trade-offs.
Here’s what actually happened.
When beef-on-dairy calves climbed toward the $1,400 average that Purina’s Laurence Williams cited by 2024-2025, producers weren’t making a one-time decision. They were depleting a pipeline that takes three-plus years to rebuild. Every beef breeding looked like a $900 gain. What nobody penciled in was the replacement heifer that wouldn’t exist three years later—an animal that now costs $1,870 more than it did in 2019.
CoBank’s analysis is blunt: from conception to a cow in the milk string is a “three-plus year proposition”. You can’t undo aggressive beef breeding quickly.
And the 2024 NAAB semen sales data reveals how producers tried to have it both ways. Gender-sorted dairy semen surged 17.9%—an additional 1.5 million units. But beef semen held steady at 7.9 million units. No retreat.
How This Lands on Real Operations
When Mike North of Ever.Ag started seeing two-to-three-day-old beef-cross calves bringing $1,000, his framing captured the logic perfectly: “Why feed an animal for 18 months when the money’s sitting there at day three?”
But North also flagged the inflection point when the math flipped: “Some animals moving in the northwest last week were north of $4,000 an animal. That’s a pretty tall price, and so now, guess what? We’re seeing people starting to switch some of their breeding back to that replacement animal”.
One Minnesota producer’s current allocation illustrates the hedging strategy most operations have adopted: 10% of cows bred to sexed semen, while the rest go to beef; for heifers, 50% bred to sexed semen, while the other half go to beef. That’s not a correction—it’s a bet that partial measures will thread the needle.
Meanwhile, culling rates have collapsed. Dairy farmers have sent 611,600 fewer cows to slaughter since Labor Day 2023, according to CoBank’s analysis of USDA data. That keeps milk flowing but ages the herd.
Running the Numbers: Gross Premium vs. Net Replacement Cost
Here’s the full picture for a typical 200-cow Holstein operation in the Upper Midwest:
The spread:
Beef-cross premium over Holstein bull: ~$750-$1,200/head (2024-2025 market)
Incremental heifer cost increase (2019 vs 2025): ~$1,870/head at national averages
The math: If your replacement ratio means 1.5-2 beef breedings per “lost” heifer, and premiums average $900, you’ve captured $1,350-$1,800 in gross premium. But across the industry, the collective shift toward beef breeding drove replacement heifer costs up $1,870 per head. For a 200-cow operation needing 70-80 replacements annually (35-38% turnover), that gap represents $126,000-$144,000 in additional replacement capital over 24 months—if you can find animals to buy at all.
Metric
Value
Notes
Herd Size
200 cows
Typical Upper Midwest operation
Annual Replacement Rate
35-38%
70-76 replacements needed yearly
Beef-Cross Premium (2024-25)
$750-$1,200/head
Average $900 across regions
Gross Premium Captured
$1,575/replacement
Assumes 1.75 breedings per heifer @ $900
Heifer Cost Increase (2019-2025)
+$1,870/head
From $1,140 to $3,010 national average
Net Gap per Replacement
-$295/head
Premium didn’t cover cost inflation
Total Additional Capital (24 months)
$126,000-$144,000
For 140-152 replacements over 2 years
Critical Time Horizon
2026-2027
When depleted 2022-23 pipeline hits
And here’s the kicker: The $10 billion in new dairy plants are set to come online through 2027, meaning processor demand for milk will keep climbing even as replacement supply stays pinched.
Four Paths Forward—And Where Each Can Backfire
Chris Wolf’s Michigan State analysis of 14,824 farm records found that performance variation among small farms is 38% farm-related compared to only 15% for large farms. Your response to this crisis matters more at 200 cows than at 2,000.
Path 1: Breeding Rebalance
Path 2: Reduce Culling
Path 3: Strategic Exit
Path 4: Processor Lock-In
Best for
Herds that can still course-correct the pipeline
Healthy older cows; buys time
Monthly losses; owners near retirement
Stable herds that can prove supply
Requires
Genomic testing ($15-45/head); sexed dairy on top 35-40%
Transition management; accept lower avg production
Honest market assessment before values erode
Documented 24-month replacement pipeline
⚠️ Backfire risk
Below 18% pregnancy rate, can’t maintain pipeline AND premiums
Failing to deliver on the supply commitment damages the relationship
Key threshold
21-day pregnancy rate ≥20% for optimal beef allocation
Monitor herd age distribution and SCC quarterly
Compare current liquidation value vs. projected 2027 value
Can you document pipeline sustainability?
Path 1 is where the Journal of Dairy Science analysis matters most: beef semen becomes economically optimal when crossbred calf price hits at least 2x dairy calf price, AND herd achieves ~20% 21-day pregnancy rate. ⚠️ Below 18%, limit beef allocation to 50% maximum. Only about 10% of Florida producers use genomic testing, per University of Florida estimates—adoption rates vary significantly by region.
Path 2 carries a hidden cost. Retaining older cows often means rising somatic cell counts, which can erode quality premiums from your processor—compounding financial strain at exactly the wrong time. Worse, when a wave of retained cows exits simultaneously, you’ve traded a gradual shortage for a cliff.
Path 3 isn’t a failure. With beef cattle prices at record highs, liquidating today captures significantly more equity than waiting until the shortage resolves. ⚠️ Waiting preserves optionality but erodes equity if exit becomes forced rather than chosen.
Path 4 is the angle most producers haven’t considered. Strong signals suggest processors expecting 2-3% milk supply growth and getting 0.4% are becoming choosy about who they keep. If you can document pipeline sustainability, you may find yourself first in line for favorable contract terms as competitors struggle to guarantee supply.
Signals to Watch
Heifer inventory trajectory. CoBank projects inventories won’t normalize until 2027 at the earliest. Watch USDA semi-annual reports for evidence that national heifer numbers have stopped declining.
Regional price spreads. The gap between Wisconsin’s $2,850 and Northwest prices “north of $4,000” reflects infrastructure differences, not just supply. Where does your region sit?
Your own replacement math. How many dairy heifer pregnancies must you generate annually to maintain herd size at the target age structure? If you don’t know that number, you can’t evaluate your breeding allocation.
What This Means for Your Operation
Calculate the real cost, not the gross premium. The $900 beef-cross check was real income—but if replacement costs have jumped $1,500+ per head since 2022, determine whether premiums actually offset that increase or simply deferred it
Run your replacement pipeline projection: at current breeding allocation and reproductive performance, will you have the heifers you need in 2028?
If “hard to breed” or “lower producing” remain your primary beef allocation criteria, the room for instinct-based allocation has narrowed sharply
Check your culling rate—if you’ve dropped below 30%, you’re likely masking a shortage rather than solving it—and check your SCC trends while you’re at it
Ask your processor what they value. If you can demonstrate a documented 24-month replacement pipeline, you may be in a stronger negotiating position than you realize
Opportunity signal: Balanced breeding programs with adequate heifer inventory could mean more favorable processor contracts as competitors struggle to guarantee supply
Key Takeaways
The 800,000-head shortage is locked in through 2026. Breeding decisions made today won’t produce milking cows until 2028-2029. The next 18 months are about managing what’s already baked in.
Don’t confuse gross premium with replacement reality. Across the industry, the collective shift drove replacement costs up $1,870 per head. For operations now buying replacements, the premium captured doesn’t come close to covering the increase in costs.
The 18% pregnancy rate threshold matters. Below that level, aggressive beef allocation creates unavoidable replacement shortfalls regardless of premium levels.
$10 billion in new dairy plants through 2027 means processor demand for milk keeps climbing while replacement supply stays pinched. Processors are likely choosing partners rather than just buying milk.
The Bottom Line
The operations that survive this won’t be those who avoided beef-on-dairy—many of the largest, most sophisticated dairies bred heavily to beef. They’ll be the ones who tracked replacement pipeline math while capturing premiums, rather than assuming the check today wouldn’t create a bill tomorrow.
Where does your operation sit on that spectrum—and what does your 2026 breeding sheet say about the answer?
Complete references and supporting documentation are available upon request by contacting the editorial team at editor@thebullvine.com.
High-Value Crosses: The Next Phase of the Beef-on-Dairy Revolution – Breaks down advanced terminal crossbreeding strategies that maximize carcass value without sacrificing your herd’s future. It delivers the blueprints for “Elite Beef” programs that command significantly higher premiums than standard auction barn crosses.
The Sunday Read Dairy Professionals Don’t Skip.
Every week, thousands of producers, breeders, and industry insiders open Bullvine Weekly for genetics insights, market shifts, and profit strategies they won’t find anywhere else. One email. Five minutes. Smarter decisions all week.
Here’s the cash flow math the dealer didn’t show you — and the one number that predicts whether your robots will pay
A brand-new USDA Economic Research Service report — Precision Dairy Farming, Robotic Milking, and Profitability in the United States (ERR-356, January 22, 2026) — finds that robotic milking increases U.S. dairy net returns by 13 percent on average. The researchers drew on five waves of USDA Agricultural Resource Management Survey data spanning 2000 through 2021, and they controlled for the fact that stronger managers tend to adopt first. That 13% is an adjusted treatment effect. It’s the strongest national evidence yet that AMS profitability is real.
And yet. Iowa State dairy economist Larry Tranel — the guy who’s been running AMS economics since before most dealers had a demo unit — puts it this way: “Cash flow of a robot tends to be very negative in the first seven years, then pretty positive for rest of the life of the AMS, but that is dependent on many variables, especially repair costs across the whole life of the robot.”
Both things are true. The question is whether your operation can survive seven years on the wrong side of the ledger to reach the right one.
The $8,776 Gap Your Checking Account Feels Every Year
Here’s how the math works in Tranel’s partial budget model for a two-robot retrofit with a total investment of $400,000. Annual ownership costs — depreciation, interest, repairs, insurance — run roughly $62,000. Against that, the net financial benefit from labor savings, production gains, and reduced hired help comes to just $1,391 per year before you assign a single dollar to quality of life.
Now layer on the loan. A 7-year note at 5.5% means an annual payment of $68,976. The capital recovery cost for a 10-year useful life is $60,200. The gap: negative $8,776 per year in cash flow — and that’s before you account for any labor you didn’t actually eliminate.
Why does the USDA aggregate picture look so much rosier? Depreciation. In the national profitability calculation, it’s a non-cash expense spread over the equipment’s useful life. In your checking account, the loan payment is debited every month. For seven years, money going out exceeds the margin improvement coming in. That’s the valley.
Worth noting: the USDA report says only 6% of U.S. milk came from cows milked via box robots as of 2021. AMS remains the minority, meaning the profitability data reflects a population skewed toward early adopters who tend to be stronger managers to begin with.
The Production Gain That Isn’t What You Think
Tranel puts the typical production bump at 3 to 5 percent for herds switching from twice-daily milking. Some farms hit 10% or more. But here’s what gets glossed over at the open house: “Often, much of the increase reported on AMS is due to the new cow housing facility, not just the AMS, as new facilities often increase production 6 to 8 percent over old, worn-out facilities. This is an important point often overlooked.”
That 10% jump your neighbor reported? Maybe 3–5 points came from the robot. The rest came from the new barn. Better ventilation. Fresh concrete.
Already milking 3X in an efficient parlor? Tranel doesn’t sugarcoat it: “Producers currently milking 3X may experience a decrease in milk production.”
Where You’re Starting
Realistic Gain
2X in older tie-stall or worn-out freestall
6–8% (new barn + robot combined)
2X in decent existing freestall (retrofit)
3–5% (robot contribution)
3X in an efficient parlor
0% or potentially negative
Source: Tranel, Iowa State Extension (2018)
💡 The Bullvine Tip: Before you sign an AMS contract, ask the dealer for production data from three retrofit farms — not new-builds. If the big gains only show up where somebody also poured a new barn, the robot isn’t the hero. The ventilation and stall comfort are doing the heavy lifting. Purina Canada’s 2025 analysis of Canadian retrofit herds found a trending average of +3 liters/cow/day — about C$2.70/cow/day at a Canadian milk price of roughly 90 cents/liter. A useful reference point, but Canadian pricing doesn’t translate directly to U.S. operations.
At Tranel’s benchmark of 4,500 lb of milk per robot per day, AMS milking costs run about $2.13/cwt (range: $1.77–$3.00). A well-run swing-12 parlor? Roughly $1.08/cwt. That’s a dollar-plus gap you have to close with production gains, labor savings, and management value. Every month.
Cost Component
AMS ($/cwt)
Swing-12 Parlor ($/cwt)
Ownership (depreciation, interest, insurance)
$1.05
$0.38
Maintenance & Repairs
$0.54
$0.22
Labor (net after savings)
$0.34
$0.38
Throughput & Efficiency
$0.20
$0.10
Total Milking Cost
$2.13
$1.08
Gap You Must Close
+$1.05/cwt
—
Where the Maintenance Money Goes
The 2019 joint survey by Extension educators at UW-Madison, the University of Minnesota, and Penn State — with more than 50 complete responses — tracked how costs change as robots age.
Early years: repairs and maintenance average around $5,000 per robot per year. As units get older, those costs climb to roughly $10,000, driven mainly by bigger repair bills while routine maintenance stays fairly steady.
But averages mask the danger zone. Among farms running robots for 5 years or more, 25% reported maintenance costs exceeding $15,000 per robot per year. A few blew past $25,000. Those producers, in their written comments, “made it clear that adaptation to AMS didn’t go well for them and that they were transitioning back to conventional milking systems or exiting the dairy sector.”
One in four older installations is hitting a cost wall that guts the investment thesis. That’s not a tail risk. That’s a quartile.
One bright spot from the same survey: 45% said dealer service had improved since they first adopted. When your robot goes down, how fast the technician arrives is the difference between a hiccup and days of lost production.
The Labor Savings Are Real. The Mental Load Is the Surprise.
Tranel’s data show a 75% decrease in milking labor hours — from 6.5 hours/day to 1.5 on a typical two-robot farm. The UW–UMN–Penn State survey confirmed average savings of 38% per cow and 43% per hundredweight. At $15/hour, that works out to about $1.50/cwt in labor savings. Top-quartile farms saved $2.40/cwt or more.
But 8% of respondents reported no labor savings at all — mostly because maintenance demands ate the hours right back.
And the labor spreadsheet misses the changes that happen between your ears. A 2014 survey of 228 Finnish AMS farmers — published in 2016 by Karttunen, Rautiainen, and Lunner-Kolstrup in Frontiers in Public Health — found 71.5% reported mental stress from nightly AMS alarms and 51.7% experienced stress from the 24/7 standby. Overall, 93.4% mentioned at least one AMS-related issue causing mental strain.
That survey is now a dozen years old, and alarm management tech has improved. But the underlying reality hasn’t changed — a robot never clocks out. Christina Lunner Kolstrup of the Swedish University of Agricultural Sciences, a co-author on the Finnish study, put it plainly in a summary of her qualitative research reported by Dairy Global in 2021: “Previously, with conventional milking, the working day had a clear and natural ‘start’ and ‘end’, but with the AMS, there are no specific working hours. The informants claimed that they are working longer hours now than before. They are never really done after a working day, as there is always something more to be done in the dairy barn.”
One Wisconsin producer in the Extension survey nailed it: “AMS is not stress free. Physically, it is easier. Mentally stressful.” Another said: “Anyone considering robotics should understand that there is still plenty of daily work involved in milking, robots just give you more flexibility with your time.”
You trade the 5 AM and 5 PM grind for 2 AM alerts. If you run a family operation, that trade-off deserves a kitchen-table conversation before it deserves a dealer quote.
Factor
The Financial Gain (Quantified)
The Mental Load Reality (Survey Data)
Milking Labor Hours
75% reduction (6.5 hrs/day → 1.5 hrs/day)
51.7% report stress from 24/7 standby requirement
Labor Cost Savings
38–43% per cow; $1.50–$2.40/cwt
71.5% report stress from nightly AMS alarms
Top-Quartile Labor Savings
$2.40/cwt or higher
Workdays no longer have clear “start” or “end”
Zero Labor Savings
8% of adopters (maintenance ate the hours back)
93.4% report at least one AMS-related mental strain
Physical Demand
Significantly easier (no 5 AM/5 PM milking)
“Mentally stressful… never really done after a working day”
Schedule Flexibility
More control over daily timing
Trade 5 AM/5 PM grind for 2 AM alerts; alarms wake you at night
The 15.8% Who Stopped
Dr. Nicolas Lyons, dairy technology leader at NSW Department of Primary Industries and a key researcher on Australia’s FutureDairy project, tracked the country’s entire AMS adoption history: “Of the 57 farms that commissioned robots since 2001, now there were only 48 operating. We had nine cease — some went back to a conventional dairy, and some left the industry entirely.”
Nine of 57. A 15.8% discontinuation rate — not among tire-kickers, but among farms that installed robots, ran them, and walked away.
Lyons didn’t dodge the reasons: “It basically comes down to things like expectations weren’t met; some couldn’t make it work; some didn’t have a good relationship with the equipment provider; and some didn’t achieve what they had hoped.”
The pattern usually starts with facility design — cow traffic bottlenecks baked into concrete you can’t move. It compounds when maintenance costs climb past year five. And it breaks open when the promised lifestyle improvement collides with the grind of 24/7 systems management.
What the Satisfied Farms Actually Said
De Assis Lage and colleagues surveyed large U.S. AMS operations — farms running 7 or more milking boxes, median herd around 940 lactating cows — in a 2024 study published in MDPI Animals. The results: 54% would recommend AMS. Another 38% advised careful consideration before adopting. Just 8% were neutral or wouldn’t recommend.
That 38% isn’t a rejection. It’s producers who know it works—and exactly what it costs to get there.
Production results: 58% reported increases, and 32% saw higher fat and protein content. Top adoption motivations for these large herds: labor costs (81%), cow welfare (78%), herd performance (74%). Quality of life came in fourth at 44%. For big U.S. operations, AMS is a labor and performance investment first. The lifestyle argument carries more weight on smaller Canadian and European farms, where it consistently ranks as the top driver.
The regret data matters most: 68% would do something differently. Barn design modifications topped the list (32%), followed by improvements to cow flow (16%). Two-thirds wished they’d planned their facility better — the one thing you absolutely cannot fix without jackhammering concrete.
What Your Lender Sees
Brad Guse, Senior Vice President of Agriculture at BMO Harris Bank, frames the question the way your banker will: “Given the significant capital outlay for robotic dairy equipment, how are you going to repay the debt?”
Tranel’s model answers that bluntly. On a $400,000 investment at 7 years and 5.5%, the payment is $68,976/year. Capital recovery is $60,200/year. The cash squeeze starts on day one.
Guse warns specifically against balloon payments — you’re deferring principal at exactly the point maintenance costs start climbing.
And Tranel raises a timeline question that rarely comes up at the dealer’s table: “If you will be farming for at least another 13 to 17 years, that increases the propensity to put in robotics, but if you are only planning on farming about seven years, then it might not make sense.” Looking at 20 more years? “You need to consider needing to make a second investment of money in 15 years when the equipment wears out.”
The One Number That Predicts Your Return
Tranel is clear: milk per AMS unit is “very highly correlated” to AMS profitability — more so than milk per cow. The 2019 survey data showed robot visits ranging from 2.4 to 3.1 per cow per day, and milk per visit ranging from 21.4 to 39 lb.
That spread — 21.4 to 39 lb per visit — separates the robots that pay from the ones that bleed you dry. And the gap isn’t about the machine. It’s cow flow, feed management, lameness protocols, stall comfort, and whether you run the data like a systems manager or treat the robot as a very expensive hired hand.
What This Means for Your Operation
Budget AMS milking at $2.00–$2.50/cwt against roughly $1.08/cwt for a good parlor. Your labor savings, production bump, and management-software value have to clear that gap. Monthly.
Plan for maintenance to roughly double by year five — and for the real possibility you land in the top quartile at $15,000+ per robot. If your cash flow model assumes $5,000/year in perpetuity, it’s wrong.
If you’re milking 3X in an efficient parlor, don’t model production gains from AMS. Tranel’s data says you may lose ground. Be honest about your starting point before you model the finish.
Run Tranel’s spreadsheet — search “Iowa State Extension dairy team milking systems” for the free download. [Verify URL is current before publication.] Stress-test your numbers at $17 milk, not just $22. If the math only works at high prices, you’re making a bet, not an investment.
Facility design is the regret you can’t undo. Visit retrofits, not just new-builds. Walk through at peak milking time. Ask every operator the same thing: “What would you do differently?”
Know your timeline. Less than 10 years to exit? The valley may outlast your career. Twenty years out? Budget for a full equipment replacement at year 15.
Have the family conversation about mental load before you have the dealer conversation about price. The Finnish data is clear: 71.5% of AMS farmers reported stress from nightly alarms. Alarm tech has improved since that 2014 survey, but the 24/7 nature of robot management hasn’t changed.
Key Takeaways
The January 2026 USDA report (ERR-356) confirms that AMS boosts net returns 13% on average. But Tranel’s cash flow model shows seven years of red ink before you reach the payoff. Both are true. The difference is what you measure.
Production gains of 3–5% are realistic for 2X herds. Much of any larger gain comes from new facilities—not from the robot itself. Ask for retrofit data before you sign.
AMS milking costs roughly double a good parlor — $2.13/cwt vs. $1.08/cwt in Tranel’s model.
54% of large U.S. AMS farms recommend the technology, but 38% say do your homework first. And 68% wish they’d planned their barn differently.
Maintenance costs nearly double as robots age. One in four older installations tops $15,000/robot/year.
Of Australia’s 57 AMS adopters since 2001, nine stopped entirely — a 15.8% discontinuation rate driven by unmet expectations and poor dealer relationships.
The Bottom Line
The producers who recommend AMS without hesitation didn’t just buy different equipment. They became different managers — relentless about the gap between 21.4 and 39 lb per visit, obsessed with cow flow, and brutally honest about what the investment demands.
Where does your operation actually sit in that picture? Answer with a spreadsheet — not a brochure — before you pour the concrete.
Executive Summary:
USDA’s 2026 ERR-356 report says robotic milking and precision tech boost U.S. dairy net returns by about 13% on average, but Iowa State economist Larry Tranel’s cash flow work shows that a typical two-robot install often spends roughly seven years in the red before that upside appears. In his model, a $400,000 system carries about $62,000 in annual ownership costs and nearly $69,000 in loan payments, with only around $1,400 in net financial benefit — leaving an estimated $8,776/year cash flow gap in the early years. Extension surveys echo that pressure, finding that maintenance and repair costs commonly rise from about $5,000 to $10,000 per robot as units age, and that roughly one-quarter of mature AMS herds pay more than $15,000 per robot per year. On the positive side, those same data sets show 3–5% milk increases in most 2X herds that adopt robots, 38–43% labor savings, and better components in many large U.S. dairies, especially when upgrades include new barns. Mental health research from Finland and Sweden then adds a human price tag, with more than 70% of AMS farmers reporting stress from nightly alarms and describing workdays that no longer have a clear start or finish. The full article combines these numbers into a clear playbook — from cost per cwt and milk per robot box to maintenance risk and farming timeline — so you can decide, with eyes open, whether robotic milking fits your herd and your life.
Complete references and supporting documentation are available upon request by contacting the editorial team at editor@thebullvine.com.
Learn More
Dairy Tech ROI: The Questions That Separate $50K Wins from $200K Mistakes – Gain a definitive roadmap for tech upgrades by identifying the robot profitability “sweet spot.” This breakdown exposes the infrastructure failures that sink 62% of investments and arms you with the labor-wage thresholds required for a positive return.
More Milk, Fewer Farms, $250K at Risk: The 2026 Numbers Every Dairy Needs to Run – Secure your operation against 2026’s projected margin compression by mastering the “more milk, fewer farms” math. This strategic briefing reveals the $250,000 revenue gap facing mid-sized dairies and delivers actionable culling and hedging tactics to protect your bottom line.
The Next Frontier: What’s Really Coming for Dairy Cattle Breeding (2025-2030) – Capture an additional $3,000 per cow in annual revenue by positioning your herd for the gene-editing revolution. This forward-looking analysis breaks down how designer milk and genomic health markers will fundamentally reshape your competitive advantage and profit potential by 2030.
The Sunday Read Dairy Professionals Don’t Skip.
Every week, thousands of producers, breeders, and industry insiders open Bullvine Weekly for genetics insights, market shifts, and profit strategies they won’t find anywhere else. One email. Five minutes. Smarter decisions all week.
If your spouse runs the books, calves, and fresh cows but isn’t on the papers, divorce or death could cost you a field.
Executive Summary: Many dairy farms in 2024–2026 are asset‑rich but exposed: one spouse holds the land, quota, and loans, while the other runs books, calves, fresh cows, and staff with no legal stake. Under Ontario’s Net Family Property rules and U.S. marital‑property laws, that setup can turn unpaid spousal work into forced land sales or crushing equalization payments when divorce or death hits. Drawing on Canadian consolidation data, global research on women in agriculture, and Root Capital’s finding that women‑led enterprises have a 4.12‑point lower default rate, this piece shows why treating spousal roles as “helping out” is now a business risk, not just a family issue. It walks through three practical tools—spousal partnerships, shared incorporation, and employment agreements—and shows how real farms like West River Farm in B.C., Korn Dairy in Idaho, and the Kaaria family in Kenya have formalized women’s roles while improving resilience. Producers get a clear winter playbook to map who owns what, put a value on invisible work, stress‑test their structure with advisors, and bring the next generation into frank succession talks. The goal isn’t more paperwork; it’s making sure the person who keeps your herd and cash flow on track also shows up on the documents that decide who keeps the farm.
If your spouse is doing the books, calves, fresh cows, and people management but isn’t on the papers, your dairy is one bad life event away from a legal and financial mess. In a high‑asset, high‑rate environment, family farms sitting on millions in land, quota, and steel but short on cash can be pushed into land sales or ugly buy‑outs when divorce or death hits. The fix isn’t magic. It’s structure: partnerships, shares, or wages that match who actually keeps the place running.
The Hard Question Nobody Wants to Ask
If you’re milking cows in 2024–2026, you’re thinking about milk price, feed costs, labour, interest rates, robots, genetics, maybe even beef‑on‑dairy. But here’s the hard truth: a lot of family dairies are running into the riskiest part of your business: who actually owns it on paper when divorce, death, or succession comes up.
On an Ontario dairy not that long ago, a couple split after more than twenty years of milking Holsteins together. His name was on the land, the quota, and the chopper. Hers was on the calf cards, the feed sheets, and the QuickBooks file. Like many Ontario dairies, they had significant value in land, quota, and steel on paper—and a lot less cash in the bank to fund any payout. When the lawyers applied Ontario’s Net Family Property rules—the system that compares how much each spouse’s net worth grew during the marriage and then equalizes the difference—he ended up owing a substantial equalization payment, took on new debt, and sold a field he’d always pictured his kids cropping someday. She left with some money in hand, but no direct ownership stake in the business she’d poured half her life into.
You probably know a version of that story in your own county. When you strip away the legal jargon, three realities keep coming up:
Your dairy probably leans hard on women’s unpaid and often invisible work.
The law doesn’t automatically treat that work as ownership, even if everyone on the yard knows the farm wouldn’t run without it.
When women are formal business partners or co‑leaders, there’s solid evidence that businesses are more stable and handle shocks better.
If cows, cash flow, genetics progress, and succession all depend on those roles, why leave them off the paperwork?
What the Law Actually Sees on Your Farm
Let’s start with the part you hope you’ll never test: what the law actually sees when a marriage ends.
In Ontario, when a legally married couple separates, the Family Law Act doesn’t say “split the farm down the middle.” It uses “equalization of Net Family Property.” Each spouse calculates their net worth on the date of separation, subtracts their net worth on the date of marriage (with special rules for the matrimonial home), and the spouse whose Net Family Property grew more pays the other spouse half the difference. One 2024 family‑law explainer puts it bluntly: it’s not the assets that are shared, it’s the increase in net worth during the marriage.
On many family dairies, that can look like this in practice:
Land, barns, milk quota, and major equipment registered to one spouse, or to a company that the spouse controls.
The other spouse is doing the books, feeding calves, tracking treatments, watching fresh cows, and handling a lot of informal HR.
When the marriage ends, the spouse on title owes an equalization payment. The other spouse doesn’t automatically get co‑ownership of land or quota unless there’s a contract or a successful extra claim like unjust enrichment or constructive trust.
Farm‑law commentators in Ontario say judges often treat the equalization payment as the main way to compensate a disadvantaged spouse and are cautious about adding a constructive trust on top, because it can look like double‑compensation. The constructive trust tool is there, but it’s not guaranteed, and it usually takes a long legal fight to get it.
Counting on a constructive trust to “fix it later” is like counting on a September heat wave to fix a lousy hay crop. It might bail you out once in a while. It’s not a business plan.
In the U.S., the labels change—community property in places like California and Washington, equitable distribution in states like Wisconsin and New York—but the basic frame is similar. Property division depends heavily on whose name is on the title, how state law draws the line between “marital” and “separate” property, and what’s in any pre‑ or post‑nuptial agreements. “She’s always helped me on the farm” doesn’t carry much weight unless there’s paper behind it.
Two extra wrinkles that often get missed:
Common‑law or long‑term unmarried partners can face very different rules than legally married spouses, depending on the province or state. Get local legal advice if your relationship isn’t formally registered.
In some places, the house is treated differently from the rest of the farm, even if it sits right in the middle of your lanes and bunks.
The main pattern is this: if a spouse’s role isn’t formalized before there’s a crisis, the outcome is driven by statutes and judges—not by your idea of what’s fair or by who’s actually kept the wheels turning.
Quick Comparison on Your Phone: Partnership, Shares, or Wage?
Here’s a simple, high‑level comparison you can glance at while the parlour turns or the robot finishes a group. This isn’t legal advice; it’s how these tools usually behave on real farms once the dust settles.
Feature
Spousal Partnership
Incorporation (Shareholder)
Employment Agreement
Setup cost
Generally low to moderate (professional time, legal/accounting fees)
Generally higher (legal setup, possible asset roll‑in, ongoing corporate costs)
Minimal (HR/payroll setup, advisor time)
Legal protection
Shared liability; both partners on the hook
Higher separation between business and personal assets when structured properly
Low (but still needs a clear job description and pay structure)
Best for
Mid‑sized family farms wanting shared decision‑making
Larger or more complex operations with multiple stakeholders or growth plans
Early‑stage operations or herds under ~100 cows are starting to formalize roles
The “right” column for you depends on herd size, debt level, family goals, and how you’re handling genetics, management, and expansion decisions over the next 5–10 years. If you’re under roughly 150–200 cows with a simple ownership picture, a spousal partnership is often the first rung. Once you’re multi‑site or have several stakeholders, incorporation is usually required. That’s a pattern, not a hard rule.
When “Invisible Work” Finally Gets a Price Tag
All of this sounds pretty legal until you sit down at the kitchen table and write out who’s doing what. That’s where it stops being theoretical.
Val Panko, a business advisor with Farm Credit Canada who works with farm families across the Prairies, has been talking a lot about what she calls “invisible work”—jobs on farms, often done by women, that “don’t show up on a T4” but are absolutely critical to the business. In a 2025 Western Producer feature, she notes that this work is usually only properly discussed when families start formal succession planning and an advisor forces everyone to list roles.
According to Panko, the list almost always starts with something like, “Dad milks and makes the decisions.” Then they keep talking, and it turns out Mom is:
Keeping the books, handling payroll, and meeting with the accountant and lender.
Scheduling the vet, logging treatments, and keeping herd‑health records straight.
Running calf and heifer programs—hutches, group pens, or dry lot systems—and tracking growth and disease.
Coordinating relief milkers and seasonal help, including all the messy people issues.
Watching fresh cows through the transition period to make sure protocols like ketone checks actually happen, and early problems get caught.
None of that shows up on a pay stub if she’s not officially paid. But once families start asking “What would it cost to replace this?” and look at what local postings pay for a bookkeeper, calf manager, or office manager, many realize they’ve been leaning on the equivalent of at least one significant part‑time—and often a full‑time—position in unpaid labour. On a 90‑cow Ontario dairy grossing a few hundred thousand dollars a year, that’s a serious chunk of risk in one person who might have no legal stake.
Panko also points out that some families don’t really see it until they start outsourcing pieces of that work—paying a catering company to get hot meals to the field during harvest, for example—because nobody at home has the bandwidth to cook anymore. That’s when the “free” labour suddenly gets a line item.
Putting a precise dollar figure on invisible work is almost impossible because it’s woven into daily life. But the moment you look at realistic replacement costs, its economic weight becomes obvious. That first honest task map almost always reveals that the “non‑owner” spouse is quietly covering the equivalent of multiple paid positions.
This isn’t just a Canadian story. Purdue Extension’s succession‑planning team in Indiana has been working with farm families for well over a decade. In their “Secure Your Future” materials, they stress the importance of clearly defined roles and expectations, because fuzzy responsibilities and unspoken assumptions—often around spousal labour—are a common source of tension in succession talks. The details change from county to county, but the pattern doesn’t.
Everyone on the farm usually knows who’s keeping things together. It just doesn’t always show up in the legal or financial structure—until an advisor drags it into the open, or a divorce lawyer does.
What the Data Says When Women Actually Have a Say
So far, we’ve talked about risk and recognition. The next question is obvious: does formalizing these roles actually move the needle on performance?
When Women Have the Same Tools
There’s a decent stack of agricultural economics research on gender and productivity. Most of it isn’t dairy‑specific, but the patterns are worth paying attention to.
World Bank–linked work and systematic reviews of agricultural value‑chain projects in countries like Ethiopia, Ghana, Malawi, and Uganda show a consistent pattern: when women’s plots yield less than men’s, the gap almost always traces back to different access to land, fertilizer, hired labour, and extension—not to ability. When you control for those differences, most of the yield gap disappears.
A mixed‑methods systematic review on women’s economic empowerment in agriculture, published in the early 2020s, found that when women have equal access to productive resources, they achieve similar yields to men. Several African case studies are summarized in a gender‑focused ag‑finance research report that shows that when women have comparable access to land and inputs, their plots can be as technically efficient as men’s. The point is the same: the gap is usually about access, not ability.
World Bank–supported analysis using the Women’s Empowerment in Agriculture Index (WEAI) in places like Bangladesh has shown that higher empowerment scores—more say over production, income, and time use—are associated with higher farm productivity and better resilience to shocks. What that means for you: when both partners can actually make calls, problems get caught earlier, and responses are faster.
When Women Are in the Finance Seat
On the finance side, Root Capital—a lender working with agricultural businesses in Latin America, Africa, and Indonesia—put some solid numbers to this question. In its 2022 report, “Inclusion Pays: The Returns on Investing in Women in Agriculture,” Root Capital analyzed more than 250 agribusinesses over roughly a decade, comparing those led by women with those led by men.
Ownership Structure
Default Rate
Legal Protection
Asset Risk on Divorce/Death
Formally Documented Women-Led Enterprises
3.88%
Full contractual + marital property rights
Low – shared assets protected
Invisible/Informal Partnership (“Helping Out”)
8.00%
None – no legal standing
Critical – forced land sale likely
Spousal Partnership Agreement (Documented)
4.12%
Moderate – depends on jurisdiction
Moderate – some protection
Shared Incorporation
3.95%
Strong – corporate veil + shareholder rights
Low – business continuity preserved
They found that women‑led enterprises in their portfolio had lower year‑to‑year revenue volatility and lower loan default rates than those not led by women. One detail that jumps off the page: women‑led clients showed an average default rate 4.12 percentage points lower than non‑women‑led clients, and the authors are careful to note that this particular figure is just shy of statistical significance. Even so, the overall pattern is clear: enterprises with more women in leadership and on staff tend to have lower default rates, and lenders may see less risk associated with those enterprises.
This isn’t a magic guarantee for your loan, and it’s not dairy‑specific. But it’s a strong signal that when women are formally part of leadership—not just “helping out”—the financial ride often gets steadier.
Where Barn Decisions Hit Repro, Culling, and Genetics
Now zoom right down into the barn, where the decisions that actually drive repro, culling, and your genetics plan get made.
A 2022 Canadian study in Frontiers in Veterinary Science surveyed dairy producers on disease‑prevention priorities and highlighted lameness, body condition, and stress management as key welfare and performance concerns. A 2024 paper in Frontiers in Animal Science on “positive welfare” reports that more producers are thinking beyond just minimizing negatives like pain and disease and are starting to factor in comfort, natural behaviour, and enrichment into their picture of good welfare.
Those papers line up with what you see in your own repro and cull data:
Cows that calve under‑conditioned—body condition scores down in the low 2s—are much more likely to underperform early in lactation than cows calving around 3.0–3.5. That means more days open, more services per conception, and a higher chance they leave the herd for reproductive failure.
Lame cows are less likely to conceive, take longer to get pregnant, and are more likely to be culled; multiple studies show substantially higher odds of being open at key checkpoints if a cow is lame compared with sound.
On many herds, it’s often the spouse who notices that a fresh cow is hanging back from the bunk, that a dry pen in a dry lot system isn’t bedding as dry as it should be, or that a particular heifer’s gait has changed. When that person not only has the responsibility but the authority to change bedding schedules, push for a ration tweak, or call the hoof trimmer, those early observations turn into better repro, fewer involuntary culls, stronger component and butterfat performance—and, over time, a more durable genetics strategy, because you’re not burning your best heifers on preventable problems.
If they see all that and they’re still legally treated as “helping out” with no ownership or defined role, the farm is effectively free‑riding on one of its most important managers—on both the management and the genetics side.
How Producers Are Actually Putting This on Paper
If we accept two things—that there’s real risk in leaving spousal roles informal and real upside in recognizing them—then the next question is: how do you put this on paper in a way that works on a live dairy?
Looking at what producers are doing from Atlantic Canada to Idaho to California, most lean on some mix of three tools in their family farm legal structure:
Spousal partnerships
Corporations with shared ownership
Employment agreements
You don’t need to use all three. The right mix depends on herd size, how complex your business already is, how you’re investing in genetics and management, and how much compliance you’re prepared to manage.
Spousal Partnership: Simple, But Powerful
A spousal partnership is often the first, easiest step away from “it’s all in one name.”
On paper, that usually means:
A written partnership agreement that spells out ownership percentages, capital contributions, and who’s accountable for which parts of the operation.
An income split between partners that reflects both labour and capital, built with help from a farm‑savvy accountant.
Clear signing authority for each partner, often with dollar thresholds for bigger decisions.
Accountants who focus on dairy farms in Ontario and the Prairies say that moving from a sole proprietorship into a spousal partnership often gives a more honest picture of how the farm actually runs—and can open up some tax planning options—if it’s structured properly. In practice, for small to mid‑sized herds, shifting into a spousal partnership is usually a winter‑project level change: a few meetings, some paperwork, and professional fees that are real but manageable relative to the value tied up in land and quota.
The real hurdle is almost never the dollars. It’s sitting at the kitchen table, saying out loud what everybody already knows, and being willing to sign it.
Incorporation With Both Spouses on the Cap Table
For larger or more complex herds—multi‑site operations in Quebec, 300‑cow robot barns in Ontario, 1,000‑cow parlour herds in the western U.S.—incorporation is often already the norm.
In that world:
The farm runs through a company, and both spouses can own shares. Advisors often create different share classes so you can separate voting control from income rights.
A shareholders’ agreement lays out what happens if someone wants out, dies, becomes disabled, divorces, or retires. It can define valuation formulas and buy‑out terms so you’re not inventing them in a panic.
You use some blend of salaries and dividends to manage tax and build retirement savings, with guidance from a farm‑literate CPA.
Under Canada’s quota system, tax specialists closely monitor how land and quota are transferred into a corporation so families can use rollover provisions and capital gains exemptions where applicable. In the U.S., similar care goes into structuring S‑corps, LLCs, and partnerships with buy‑sell clauses, especially when there are off‑farm heirs or multiple siblings.
There is a trade‑off: incorporation can give you more separation between business and personal assets and more tax and transition tools over the long term, but it adds accounting and legal complexity compared with a simple partnership. This is where you want advice from someone who truly understands both dairy economics and family farm law.
Producers who’ve gone through more involved restructurings will tell you it felt like a winter’s worth of paperwork—but still cheaper and calmer than letting a judge sort out their life’s work.
Employment Agreement: A Practical First Step
Sometimes, especially on herds under 100 cows, the most realistic place to start isn’t ownership at all. It’s a wage.
That might look like:
Writing a job description for what your spouse already does—office manager, calf/youngstock lead, HR/payroll.
Setting a wage based on real local numbers—what job boards and wage surveys show for those roles in your area.
Putting your spouse on payroll so they build CPP/QPP or Social Security contributions and retirement‑savings room.
On some Ontario and Wisconsin farms, the spouse holds both shares and a salaried role—say, as office manager or youngstock manager. That’s often a comfortable middle ground: they’re recognized both as an owner and as someone with a defined, paid job.
There is a cash‑flow trade‑off. Paying a wage increases your short‑term outlay, but it also builds your spouse’s personal financial stability and retirement base. If margins are tight, it may make sense to start with a modest wage and revisit it as herd size, butterfat premiums, or component pricing improve. Think of it like a piece of necessary maintenance: not exciting, but a lot cheaper than the breakdown it’s preventing.
As a rule of thumb, if your spouse is consistently covering the equivalent of half to a full‑time role and your herd is beyond “small hobby” territory—say, 80 cows or more—that’s a good signal to at least explore a formal employment agreement, a partnership, or both with your advisors. It’s not a legal threshold, just a gut check producers and advisors often use.
What Actually Changes When You Formalize Roles?
The question that comes up at almost every kitchen table is, “If we do this—change the structure, add a partnership—what really changes tomorrow?”
From the cows’ point of view, nothing. They still want feed on time, have clean stalls, and calm handling. On the business side, a few important guardrails finally appear.
Banking, Contracts, and Big Decisions
Once your lender, processor, and major suppliers are doing business with a partnership or corporation, the entity—not just one individual—is the client. That makes it easier to spell out who can sign what.
In practice, that often means:
Either spouse can sign cheques up to a set amount; cheques over that amount require both signatures.
New debt or long‑term leases over an agreed threshold require joint sign‑off.
Major moves—buying or selling land, building a new barn, taking on large equipment financing—are defined in your agreement as decisions you make together.
That doesn’t change who orders mineral or who calls the hoof trimmer. But it makes it a lot harder for one person to take on big obligations in secret.
Visibility and Security
Formalizing roles tends to lead to more regular sit‑downs around real numbers. Many advisors push for monthly or quarterly “kitchen table reviews” where both spouses look at:
Milk income and any other revenue.
Feed, vet, labour, and energy costs.
Repairs, fuel, and maintenance.
Debt payments—principal and interest.
Capital plans for the next 6–12 months.
When both names are on the ownership, and both are recognized decision‑makers, it’s natural for both to be in these conversations. Over time, that shared visibility makes it less likely that a bad line of credit, a missed payment, or a looming refinancing blindside anyone.
From a personal security standpoint, the spouse who used to be “just helping” now has documented ownership, a wage, or both. That matters for their retirement, their access to benefit programs, and how the next generation sees their role.
When adult kids see both parents’ names on ownership documents, they naturally include both in conversations about expansion, robots, beef‑on‑dairy, and succession. The paperwork doesn’t create respect, but it helps lock the reality into place.
When You’re Coming to This Late
A lot of you reading this have been married 25 or 30 years and have never had this conversation. You might be thinking, “We’ve made it this far. Is there any point now?”
Earlier is easier. But late is still a lot better than never.
Late‑Stage Adjustments That Still Help
Even if you’ve been farming as a sole proprietor for decades, there’s usually room to improve the picture:
Shift into a formal partnership and bring your spouse in as a partner.
Incorporate and issue shares to both spouses where it makes tax and transition sense.
Put a wage around the work your spouse is already doing.
Advisors can help you:
Put realistic values on land, quota, cattle, and equipment.
Decide how to recognize past “sweat equity” in ownership going forward.
Use tax tools and rollovers to avoid triggering big tax bills when you move assets into a new structure.
Set up a more realistic income split that matches who is actually working in the business.
Farmers who’ve gone through this often describe it as a winter project: a handful of focused meetings, some back‑and‑forth on drafts, and professional fees that hurt a bit but are manageable relative to the value of the place and the stress it takes off the table.
You generally can’t rewrite history—claim wages that were never paid or pretend you’ve always been a partnership on past tax returns. And once divorce is already in play, judges in Ontario or U.S. states will look very closely at last‑minute structural changes, especially if those moves look like an attempt to dodge equalization or marital‑property rules.
When Lawyers Are Driving the Bus
Once a separation or divorce is properly underway, your room to manoeuvre shrinks fast.
In Ontario, judges apply the Family Law Act equalization rules, decide whether an unequal‑division claim has merit, and weigh unjust enrichment and constructive trust arguments based on the evidence. Outcomes at that point depend heavily on documentation and case law. In U.S. states, courts lean on the title, state law definitions of marital property, and any existing agreements.
At that stage, “we always treated it as ours” doesn’t carry nearly as much weight as people assume. We tell ourselves that trust is enough. The law, frankly, doesn’t care about that part. As one Ontario farm‑law specialist told a producer group, courts don’t divide trust; they divide property and documented entitlements.
That’s why some lenders, extension services, and succession programs—including FCC’s transition resources in Canada and Purdue’s workshops in the U.S.—now treat formal structures around spousal roles as part of basic risk management, not just something to think about when a marriage is already in trouble.
Real Farms, Real Women, Real Outcomes
To keep this grounded, it helps to look at how this plays out on actual dairies, not just in spreadsheets and court documents.
Sarah Sache – Fraser Valley, British Columbia
Sarah Sache at West River Farm near Rosedale, B.C. She came into dairy from a business background, took over the farm’s finances—and then took a seat on the BC Dairy board when she noticed no women were at the table. She now sits on the Dairy Farmers of Canada board, shaping quota policy and producer support at the national level.
In the Fraser Valley—one of the highest land‑value dairy regions in North America—Sarah and Gene Sache, along with Gene’s brother Grant, run West River Farm near Rosedale. They milk a few hundred Holsteins and crop a relatively modest acreage in a very quota‑tight part of the valley. BC Dairy and Country Life in BC profiles have highlighted strong herd management, including solid butterfat performance where every kilogram of quota counts.
Sarah came into dairy from a business background and ended up managing the farm’s financial side—bookkeeping, cash flow, lender relationships, and regulatory paperwork. In 2018, she noticed there were no women on the BC Dairy board and decided that it needed to change. She ran, won a seat, later served as vice‑chair of BC Dairy, and now sits on the board of Dairy Farmers of Canada.
She’s talked openly about how intimidating that first board meeting felt—right down to not knowing where to sit—but also about realizing policy needed people who understood both the parlour and the balance sheet. Since she joined, she’s noted that more women have stepped into BC Dairy board and committee roles, broadening who shapes quota policy, promotion, and producer support. On her own farm, her role is formal, visible, and clearly tied to business decisions. That’s not just good optics; it’s good governance.
Kim Korn – Idaho
Kim Korn at Korn Dairy in Terreton, Idaho. She helps run a “small but mighty” herd that wins quality awards, then carries that parlour and fresh‑cow experience into the Dairy West boardroom.
In Idaho, Kim and her husband run a relatively small dairy at Terreton. Their Korn Dairy herd has been recognized as a “small but mighty” operation in regional coverage. Dairy Farmers of America named Korn Dairy its 2019 Mountain Area Member of Distinction, and industry newsletters have highlighted their quality awards and consistent milk performance.
Kim serves as a board member for Dairy West, representing Idaho producers at the regional level. Industry profiles also note that she has taken on leadership roles in national dairy promotion and policy discussions through boards such as the National Dairy Promotion and Research Board and through her involvement with national checkoff organizations.
Profiles credit careful milking routines, parlour sanitation, and strong fresh-cow management as key reasons their somatic cell counts remain low, and their milk quality remains high. Here again, a relatively modest‑sized herd that treats the spouse as a formal manager and leader ends up punching above its weight on quality, reputation, management, and influence.
Martha and Stephen Kaaria – Meru County, Kenya
On Martha and Stephen Kaaria’s farm in Meru County, Kenya, VWB/Canada volunteers Kaitlyn Lawson and Elyse Perrault (left) join Martha, Stephen and gender specialist Patricia Kanyiri (right) after harvesting sweet potatoes—one of the changes that helped boost milk from about 14 litres to 18–25 litres per cow per day when Martha’s role as a full farm decision‑maker was recognized.
In Meru County, Kenya, Martha and Stephen Kaaria started with two cows and modest yields. Volunteers with Veterinarians Without Borders–Canada and their local co‑op, Meru Dairy, offered training on mastitis control, reproduction, nutrition, cow comfort, calf care, and basic farm economics.
Before training, peak production on their farm averaged around 14 litres per cow per day. Roughly six months after they started applying what they’d learned—better milking hygiene, improved ration balancing, more focus on cow comfort and fresh cow management—peak milk per cow jumped into the 18–25 litre range. They also started making maize silage, changed their cropping plans, and bought more land for forage. Those changes improved their food security and allowed them to spend more on their children’s schooling and health.
Crucially, Martha isn’t described as “helping.” VWB–Canada materials present her as a farmer and co‑decision‑maker. Different continent, different scale, same pattern: when women’s roles are central and formal, performance and resilience tend to improve.
Farm
Location
Legal Structure Chosen
Implementation Timeline
Key Outcome
River Ranch Dairy
Idaho, USA
Limited Liability Company (LLC) with equal spousal ownership shares
18 months (legal + financial restructuring)
Credit access improved; both spouses on loan covenants; succession plan pre-filed with county
Kaaria Family
Kenya
Registered family partnership with documented land + income rights for women
Required external mediation (lawyer + accountant for River Ranch; NGO facilitator for Kaaria)
Both families now use formal ownership as competitive advantage in credit markets and succession planning
Dairy Succession Planning: What This Actually Means for Your Operation
How you handle spousal roles over the next decade is going to shape who’s still milking, who owns the assets, and who has a voice in the industry.
Under Canada’s quota system, a large share of your balance sheet is in land and butterfat quotas. From 2014 to 2024, the number of dairy farms declined from 12,007 to 9,256—about a 2.6% average annual drop—while total dairy farm cash receipts rose from roughly $6.1 billion to $8.9 billion. Average farm milk price per hectolitre climbed from about $81.79 to $97.38 over that same period. That’s fewer farms, bigger asset bases, and more milk per farm. [Source: Canadian Dairy Information Centre, 2024.]
Despite the drop in farm numbers, total milk production increased from 78.26 million hectolitres in 2014 to 96.61 million hectolitres in 2024—about a 23% jump. Productivity increased even as farm numbers declined. [CDIC 2024.]
That makes equalization and buy‑outs even more stressful relative to cash flow—especially in high land‑value regions like the Fraser Valley and parts of Quebec, where on‑paper wealth can dwarf available cash or operating credit.
In fluid/component markets like the U.S., you’ve got more price volatility and a different asset mix, but the same basic pinch: a lot of wealth on paper, heavy debt and capital needs, and not a lot of slack if you suddenly have to carve up equity under court timelines.
If more farms treat this as risk management, not “nice‑to‑have”:
Succession runs smoother. When both spouses’ roles and ownership stakes are documented, it’s easier to design transitions that feel fair to farming and non‑farming kids and still keep the operation viable.
Divorce doesn’t automatically equal liquidation. Clear ownership and buy‑sell mechanisms give families more options to keep cows milking during a separation, rather than dumping everything at a bad moment.
Businesses get more resilient. If the patterns in empowerment research and Root Capital’s portfolio show up in dairy—even partly—then more women in formal leadership tend to align with steadier revenues, more cautious borrowing, and better risk planning.
Leadership tables get stronger. When women move from “office help” to recognized co‑managers or partners, they bring real‑world, fresh cow management, labour, finance, genetics, and marketing experience into co‑op and boardrooms that badly need it.
If most farms keep relying on trust and habit:
Succession logjams keep clogging the pipeline. Transition programs and lenders already talk about a “succession challenge” driven by aging operators and limited planning. Leaving spousal roles informal just adds another knot when it’s time to decide who runs and who owns what.
We keep hearing quiet hard stories. Long‑term contributions don’t always translate into proportional claims on farm assets when everything rests on equalization formulas and title. Those stories may not make the local paper, but they’re in every coffee shop.
Consolidation keeps nibbling away at family herds. CDIC data already shows fewer dairy farms and larger average herds, even as production grows. When otherwise viable herds are sold under pressure—divorce, succession fights, estate disputes—the buyers are often expanding neighbours or multi‑site outfits. There’s nothing inherently wrong with scale, but if the trigger is preventable structural risk, that’s a very expensive way to avoid some paperwork.
Here’s a quick “what this means” snapshot by situation:
Under ~100 cows with one spouse doing books + calves + fresh cows: Start by tracking hours and putting a realistic job description and wage on that work. Then talk to your accountant about whether a simple spousal partnership makes sense in your tax context.
100–300 cows, or already incorporated/considering robots or a new parlour: You’re in the zone where share structure, shareholder agreements, and formal spousal roles can make or break a future buy‑out or transition. Make sure both spouses are listed as owners and signatories, not just for chores.
Adult kids in the barn and tension about “who gets what”: Treat formalizing spousal roles and expectations as urgent, not something for “after harvest.” Involve the next generation in understanding who owns what, who does what, and how spouses fit in going forward.
What This Means for Your Operation
Strip away the gender and the law talk, and this comes down to three simple questions for your own yard:
Who actually keeps this place running, day in and day out?
What would it cost to replace them if they walked away tomorrow?
Does your paperwork—and your paycheques—reflect that reality?
If the honest answer to #3 is “not even close,” then you’ve got some work to do.
What You Can Actually Do This Winter: A Practical Playbook
Here’s what you can realistically do in the next 12 months, even with everything else on your plate—fresh cow follow‑up, feed costs, labour headaches.
1. Put Rough Numbers on Invisible Work
Over the next month or two:
Ask your spouse to track the hours they spend on bookkeeping, HR, calves, heifers, and fresh cow checks.
Pull local job postings for farm bookkeepers, office managers, or calf/youngstock managers and note wage ranges.
Multiply those hours by realistic pay rates to get a ballpark replacement‑cost number.
You’re not putting a price on your marriage. You’re giving your business a clearer picture of how much unpaid labour it’s quietly leaning on, so you can judge risk and fairness with open eyes.
2. Map Who Owns What and Who Gets Paid
Gather the basics:
Land titles and mortgage statements.
Quota or pooling documents.
Loan and lease agreements.
Any partnership or corporate records you already have.
Last year’s tax returns.
Then sit down with your accountant or lawyer and ask three blunt questions:
Who legally owns what on this farm right now?
If we had to divide this tomorrow under our province’s or state’s rules, what would that look like on paper?
How is farm income currently split between us on the tax return, and does that reflect reality?
You might not like all the answers. At least you’ll know the starting point.
3. Grill Your Advisors About Structure
Once you know where you stand, take it a step further. Ask:
Given how we actually work, would a spousal partnership, adjusted share structure, or clean employment agreement be the best first move for us?
What are the tax implications—good and bad—of each option for the next 5–10 years?
If one of us died, became disabled, or if we separated, how would this structure actually behave?
For small to mid‑sized dairies, shifting into a partnership or tightening up shares can usually be done in a few focused meetings over a winter, with professional fees in a “painful but manageable” range relative to your asset base. Larger and more complex herds will spend more, but still usually less than the cost—financial and emotional—of a messy breakup or forced sale.
If your advisor brushes off these questions or can’t explain your exposure in plain language, treat that as a red flag. It may be time to get a second opinion from someone who understands the legal structure of a family farm and dairy economics.
4. Bring the Next Generation Into the Picture
If your adult kids or in‑laws are already part of the operation—milking, cropping, managing fresh cows, or running calves:
Sketch a simple diagram of who owns what and who does what today.
Ask them how they see fairness and risk for themselves and their partners.
Consider attending a succession‑planning workshop together. FCC offers transition programming in Canada, and Purdue Extension and others do the same in the U.S., often with content on family and spousal roles.
Younger farmers have seen enough neighbours get burned that they’re often more comfortable with formal agreements—and even with prenups—than their parents. That’s not a lack of trust. It’s respect for what’s at stake.
5. Treat This as Protection, Not Accusation
How you talk about this around the table is as important as what you do on paper. Families that handle it well tend to use language like:
“We insure our barns and parlours. This is how we insure our relationships and our business.”
“We’re just writing down what we’ve really been doing for years.”
“This protects all of us—us, our kids, and the farm.”
If you do nothing else this winter:
Map who owns what and who does what.
Ask your accountant and a farm‑literate lawyer to show you what divorce, death, or disability would look like on paper under your local rules.
Decide together whether you’re okay with that picture—or whether it’s time to change it before the next big life event forces your hand.
For more help, look at Farm Credit Canada’s transition resources, Canadian Bar Association guides on family farm succession, and Purdue Extension’s succession‑planning materials. They’re not a replacement for personalized advice, but they’re a good way to get the conversation started and to know what questions to ask.
Key Takeaways
Trust isn’t a legal structure. Courts don’t divide trust; they divide property and documented entitlements. If your spouse’s role isn’t on paper, the law may treat them like a helper, not a co‑owner.
Invisible work is a real risk. If your spouse walked away tomorrow, you’d probably have to hire at least one person—maybe more—to cover what they do. Start tracking that work and put a realistic value on it.
Formal roles improve resilience. Research from WEAI‑based studies and Root Capital shows that when women have real authority and access to resources, farms and agribusinesses tend to be more stable and less risky.
Structure choices have trade‑offs. Partnerships are simpler but offer fewer tools; corporations add complexity but open up more tax and transition options. The right mix depends on your size, region, genetics strategy, and goals.
You don’t have to fix everything at once. Start with what’s most out of line with reality—usually the spouse doing major management work with no wage or ownership—and build from there.
The Bottom Line
At the end of the day, formalizing women’s roles doesn’t suddenly give anyone new instincts in the barn. The same person will still know which fresh cow is most likely to slip into ketosis, or which heifer is going to stir up every group she’s in.
What it does change is who’s recognized—by the law, by the bank, and by the next generation—as a full partner in those decisions and in the future of the herd. Either you decide how your spouse’s role shows up on paper, or your local statute and a judge will make that call for you when something breaks. One path’s uncomfortable. The other can cost you the farm.
When your kids look back in twenty years, do you want them to say, “That’s when we finally put on paper how Mom kept this place running,” or “That’s when the court told us who really owned the farm”?
Complete references and supporting documentation are available upon request by contacting the editorial team at editor@thebullvine.com.
The Real Reason Dairy Farms Are Disappearing (Hint: It’s Not About Better Farming) – Secure your future by understanding why market leverage and price transparency now dictate survival more than top cow performance. This investigation arms you with the strategic benchmarks required to navigate the industry’s aggressive consolidation curve.
Four Farms Exit Daily: The $100K Decision Reshaping Dairy Survival – Capture over $100,000 in new annual revenue by pivoting your bottom-end genetics toward high-value beef-on-dairy contracts. This analysis breaks down the disruptive math that allows savvy managers to outpace consolidation and secure a permanent competitive advantage.
The Sunday Read Dairy Professionals Don’t Skip.
Every week, thousands of producers, breeders, and industry insiders open Bullvine Weekly for genetics insights, market shifts, and profit strategies they won’t find anywhere else. One email. Five minutes. Smarter decisions all week.
Under 500 cows and eyeing robots? Before you sign a $1M note, answer this: Who shows up your lane when the barn goes dark?
Executive Summary: If you milk under 500 cows and you’re eyeing robots, this piece shows why a USD $1 million AMS note won’t automatically fix your labor problem—and might bury you if the math and the people aren’t there. It breaks down current immigrant‑labor dependence, Wisconsin’s drop from 16,000+ herds to just over 5,300, and what real AMS budgets and labor‑savings studies say about when robotic milking ROI actually pencils out. You’ll see a side‑by‑side look at parlor‑only, hybrid “parlor + tech,” and full AMS paths, with clear thresholds—like whether you can truly staff milking for around USD $200,000 a year—that help you decide if you should upgrade, automate, or plan a clean exit. The article also ties genomics and proofs straight to robot performance, showing why milking speed, udder traits, health, and beef‑on‑dairy decisions are now core to your AMS payback, not just nice extras. Alongside the math, it tackles storms, backup power, mental health, and the 4‑H kid with a calf who might be your next key employee or successor. You’ll walk away with a 30‑day checklist, practical questions to take to your lender and family, and one blunt test that matters more than any sales pitch: when the barn goes dark, who actually turns up your lane?
The trucks in the lane usually tell the truth before any robot ever will.
They’re strung along the driveway at a small robot barn in central Wisconsin—feed company pickups, a neighbor’s welding rig, the vet’s SUV, a church friend’s minivan. Inside, the old parlor is half‑gutted, and three new robotic milking systems sit on concrete that still looks damp. If you’re running a small or mid‑sized herd in 2024–2026 and even thinking about robots, this is your world: broken labor, big capital decisions, and a hard choice between AMS, a hybrid setup, or an exit while you’re still ahead.
This piece walks straight through that choice—the math, the decision rules, and the people around you who decide whether you’re still milking in five years or reading your own dispersal catalog.
Editor’s note: This is a composite story built from real 2023–2025 data and patterns on robot herds across Wisconsin and the Midwest—not a blow‑by‑blow profile of one specific farm. The economics and pressures are real; the names and scenes are representative.
The Labor Bomb Under a 200‑Cow Dairy
Let’s start where you actually live—at the kitchen table with a calculator and a coffee that went cold an hour ago.
By late 2023, a typical 180‑cow herd in central Wisconsin looked a lot like yours might. Margins tight. Kids in school. Parents still doing more 4 a.m. milkings than they’ll admit. And a labor situation that quietly shifted from “hard” to “not sustainable.”
A lot of herds have walked this path:
Starting milkers at USD $16/hour with housing.
Bumping to $18, then $20–22 with more flexible hours.
Edging toward $24 with a decent bunkhouse and still watching people leave for climate‑controlled warehouse jobs with weekends off and no risk of a frozen yard.
That’s not just bad luck. A National Milk Producers Federation study with Texas A&M found that immigrant workers make up about 51% of all hired U.S. dairy labor, and that farms employing them produce roughly 79% of the nation’s milk. In that same modeling work, if that immigrant workforce disappeared, more than 7,000 dairies would shut down, and retail milk prices would jump nearly 90%.
In Wisconsin, a UW–Madison School for Workers analysis—summarized in recent industry coverage—estimated more than 10,000 undocumented workers doing around 70% of the state’s dairy labor, with researchers warning that without them, Wisconsin’s dairy industry would be at serious risk of rapid collapse.
Lay that on top of herd numbers. USDA‑NASS and state data show:
16,264 licensed dairy herds in Wisconsin in 2003.
Around 6,140 herds by late 2022.
Just over 5,300 by early 2025, with cow numbers and total milk roughly holding.
Same or more milk. Fewer families. More ground to cover with fewer people.
At some point, you’re down to three real options: pay legal labor what it actually costs and design your system around that, automate the hardest work, or plan a clean exit while you still have equity and energy.
Everything else is creative stalling.
The Night You Finally Say “We Can’t Keep Going Like This”
On the farms that are still breathing a few years later, the turning point is almost never a glossy robot brochure.
It’s the night someone at the table finally says, “We can’t keep going like this.”
On too many farms, that sentence dies in the kitchen. On the ones that make it, it doesn’t stay inside the house.
The smarter move we’re seeing more often now is simple but not easy: before signing an automatic milking system contract, you call the people who’ll actually be in your lane when things go sideways.
Picture a scene you’ve probably lived:
One neighbor has toured a robot barn a county over.
Another has a cousin on AMS in Ontario.
A younger dairyman down the road is “robot‑curious” but still in a double‑8.
The 4‑H leader knows half your heifers by name.
They pile into your kitchen with chili, kids, and opinions.
“We’re not sure we can do this,” you admit. “But we’re sure we can’t keep doing what we’re doing.”
On the barns that survive, that’s the moment it stops being your problem and becomes our barn.
You hear real commitments, not just sympathy:
“I’ll cover morning feeding if construction runs long.”
“We’ll shuffle concrete work so your robot pad gets poured before frost.”
“When it’s time to train cows, I’ll bring the 4‑H kids—they’re not going to forget it.”
Robots stop being a lonely, high‑risk hardware purchase. They become a community project.
You’ll hear some version of this line:
“What keeps us going isn’t just the cows—it’s the people around us.”
And that’s before a single robot milks a single cow.
The $1.2 Million Question
Now we get to the part most sales pitches slide past: the actual ROI of robotic milking.
The Bullvine’s own robotics position is blunt: every robot sold under 500 cows in the U.S. is at best a dangerous luxury and at worst malpractice—unless your labor cost is insane or you literally can’t hire. That doesn’t mean no herd under 500 cows should ever go robotic. It means the automatic “yes” is gone. The default answer is “no” until your local numbers force you to “maybe.”
Here’s what typical AMS budgets look like when you strip away the sales pitch.
Capital and service costs
On small and mid‑sized herds in the Upper Midwest, 2023–2025 manufacturer quotes and independent budgets commonly put a three‑box install covering roughly 180–210 cows in the following ballpark:
Robotic milking systems + installation: roughly USD $180,000–250,000 per box, including software and accessories.
Barn modifications: often another USD $100,000–300,000, depending on how “robot‑ready” your layout is.
Put that together, and many 3‑box projects end up somewhere in the USD $800,000–1,200,000 range once the dust settles. Analysis notes that each automatic milking system can reasonably be assumed to cost about USD $200,000, including USD $15,000–20,000 in facility renovation per unit, numbers that align with these ranges.
Service doesn’t disappear either:
On many farms, service contracts, parts, and callouts can cost tens of thousands of dollars per box per yearover the life of the system, totaling hundreds of thousands of dollars over a decade.
Labor savings and milk flow
On the other side of the ledger:
University of Wisconsin–Madison Extension reports AMS herds in their sample saving around 0.06 hr/cow/day, which worked out to about a 38% drop in labor per cow and 43% per cwt—roughly USD $1.50 per cwt in labor savings at a USD $15/hour wage, with some farms reporting savings closer to USD $2.40 per cwt.
A Cornell‑led multi‑state study, cited in Bullvine’s own AMS analysis, found AMS herds cutting overall labor costs by about 21%, raising milk output 3–5 lb/cow/day, and improving milk quality metrics in roughly 32% of barns surveyed. Results weren’t universal: some herds did very well, some were neutral, and a minority struggled.
This is where your robotic milking ROI either holds or falls apart.
Here’s the hard truth on that:
If you’re paying USD $15–18/hour, and you can still hire decent milkers, robots are a tough sell on dollars alone.
Once your real, legal, fully loaded milking labor cost creeps toward USD $28–35/hour, and you’re burning out trying to keep staff, AMS stops being a toy and starts looking like a survival tool.
If you’re under 250–300 cows, and you haven’t squeezed the cheap levers—activity monitors, sort gates, and feed pushers—you should be very nervous about skipping straight to robots.
A simple comparison looks like this:
Option
10‑Year Capital Outlook (typical)
Labor Impact
Management Stress
Best Fit
Keep parlor, no tech
Lowest capital, rising repair cost
High, fixed shifts
High physical, high mental
Areas with relatively cheap, reliable labor
Parlor + sensors + sort gates + feed pusher
Medium capital (tens of thousands for ~180 cows, not hundreds of thousands)
20–40% labor efficiency gain
Medium (more tech, same cows)
Herds <300 cows, labor ~USD $18–25/hr
Full AMS (3 boxes, 180–210 cows)
Very high capital (USD $800,000–1,200,000 + ongoing service)
30–40% labor savings, more flexibility
Less physical, more tech and mental load
Labor USD $28+/hr or no reliable hire pool; strong management bench
That hybrid package matters. For a lot of herds in older parlors, a mix of activity monitors, a sort gate, and a feed pusher is a tens‑of‑thousands‑of‑dollars investment instead of a million‑dollar note. On herds that actually use the data and gates, that kind of setup can free up substantial milking‑related labor and tighten up heat detection and health monitoring. It won’t take you out of the pit, but it can move your labor efficiency significantly closer to AMS levels at a fraction of the capital cost—and it buys you time to decide whether you truly need robots or just a better‑designed system.
If you’re in Canada under quota with component pricing and a more stable milk cheque, the AMS payback can look different than on a volatile U.S. Class III cheque. The same basic math still applies, but your revenue line won’t whip around as hard. You still need to plug your own numbers into a milk board or advisory cost‑of‑production sheet before you buy anybody’s ROI pitch.
Here’s a test worth running quietly with your lender and accountant:
Can you hire and keep three reliable people to cover milking for USD $200,000/year or less total cost?
If the honest answer is yes, humans probably still beat robots on pure economics for most sub‑500‑cow herds.
If the answer is “no chance” and you’ve already tried, then you’re in the “AMS or exit” conversation, whether you like it or not.
And for some small or heavily leveraged herds, the most profitable move might still be an orderly dispersal while there’s equity left—not taking on a million‑dollar note because a dealer says “everyone is going robotic.”
Mentorship, Genomics, and Cow Sense in a Robot Barn
Robotic milking doesn’t change the fact that fresh cow management still makes or breaks your month, SCC still hits your milk cheque, and components still pay the bills.
It does change who is watching what.
On the best AMS herds, you see a familiar pattern with new tools:
An older generation walks pens and spots the fresh cow whose eyes are a bit dull or whose cud is slow.
The next generation pulls up the robot dashboard and shows that same cow’s milk visits, milking speed, conductivity, and rumination trend.
They argue a little, walk out together, and usually both end up half right.
A 2024 U.S. AMS study reported that many owners reported labor cost reductions of 20% or more, and many reported better control of mastitis, lameness, and reproductive problems on their farms. Many of those same farmers also said robots improved their quality of life by changing when, not just how much, they worked.
This is where genomic proofs and sire lists quietly make or break your AMS ROI.
In a robot barn, you suddenly care a lot more about:
Milking speed and temperament—slow, jumpy cows choke box capacity.
Udder attachment and teat placement—functional PTAT, not just show‑ring pretty.
Health and hoof traits that keep cows sound and productive long enough to pay off your capital.
Genomic Trait
Importance in Parlor Herd
Importance in AMS Herd
Why It Matters for Robots
Milking Speed
Medium
CRITICAL
Slow cows choke box throughput; every extra minute per cow = fewer total milkings per box per day
Still critical in AMS, but conductivity sensors catch problems faster than twice-a-day visual checks
Components (Fat/Protein %)
High (market pays you)
HIGH (market still pays you)
Higher frequency can dilute components slightly; select bulls that hold % under 3x milking
If your sire list doesn’t reflect that, you’re breeding for the wrong barn.
Practical steps:
Screen bulls for robot‑relevant traits—milking speed, udder depth, teat position, daughter behavior—alongside Net Merit, Pro$, or LPI, depending on where you ship.
Use genomic testing to push the bottom 15–20% of heifers straight into beef‑on‑dairy or terminal matings, not into your replacement pool.
Treat your top 30% as the engine room: sexed semen, targeted embryo work, and matings that stack components and longevity with robot‑friendly udders.
When you look at proof sheets, treat milking speed and udder traits as non‑optional filters for AMS herds, not “nice extras.”
If you want the next generation actually to want the keys one day, they need more than a shovel in their hands.
Give them real responsibility:
Make a teenager or young adult responsible for one metric on the AMS or herd‑management software—SCC alerts, “red cows,” abnormal visits.
Let them sit in on breeding and culling meetings where AMS performance, genomic proofs, and fat/protein kilos actually shape decisions.
Ask what they see in the data that you’ve been feeling in the barn.
One young producer on an AMS herd put it this way to her grandfather: “The barn’s talking to us all day now.” His reply was simple: “It always was. We just hear it better now.”
Storms, Blackouts, and Who Backs a Tractor Up to Your Panel
Six months after startup, the real test on a lot of robot barns isn’t software.
It’s a thunderstorm.
A fast‑moving cell rips across the township. Trees down. Lines down. One minute, the robot room hums; the next, it’s dead. Vent fans are silent. Lights gone. Cows are mid‑cycle and starting to wonder what’s wrong.
This is where you find out if you bought machines or built a support system.
On the barns that get through nights like this without permanent damage to cows, people, or cashflow, you see the same pattern:
Within fifteen minutes, headlights swing into the yard.
One neighbor backs a tractor‑driven generator up to the panel like he’s done it twenty times.
Another shows up with portable lights and coffee.
A cousin‑electrician arrives with a headlamp and a coil of wire.
By the time the power company truck finally grinds in, the robots are already milking again. Cows are agitated but under control. Everyone is wiped. But nobody is arguing about whether automation “was the right call” anymore—because the real question was never robots vs parlor.
It was: “When the barn goes dark, who turns up your lane?”
If you can’t answer, right now, whose tractor is backing up to your panel, who milks if you land in the hospital, and who you call first in a disease outbreak or barn fire, that’s not a theoretical risk.
That’s a hole in your survival plan.
The Hardest Sentence in the Barn: “We Can’t Keep Going Like This”
We’ve all seen the mental‑health headlines. Too many of us know the families behind them.
Farmer stress and mental health aren’t side topics anymore. They sit right in the middle of whether your barn is still lit five years from now.
It’s bad enough that national and regional groups have put serious resources behind it. The Farm Aid Hotline (1‑800‑FARM‑AID) provides confidential assistance to farmers in distress or crisis, connecting them to financial, legal, and mental‑health resources. States and provinces now maintain ag‑specific counsellor lists and crisis lines. Farm organizations quietly slip those numbers into meetings and newsletters.
Robots don’t fix that. A USD $1 million AMS note and a constant stream of alerts can make your head even louder.
On the farms that actually get healthier, there’s almost always a moment before anyone signs a contract when someone finally says:
“We can’t keep going like this.”
Short‑staffed. Watching neighbors sell out. Lying awake, wondering whether your kids will resent you more for selling now or handing them a mess in ten years. Afraid that saying it out loud means you’ve failed.
On the barns that make it through, people around them don’t accept “we’re fine” as an answer.
Common patterns:
A neighbor couple shows up most Sunday evenings during the transition, not to critique cows but to ask, “What went a little better this week? What’s still chewing on you?”
Vets and nutritionists leave mental‑health resource cards by the computer and say plainly, “These are here for anyone on this farm. Including you.”
Pastors, teachers, and coaches with farm roots stop by during chores, not to preach, just to sit at the table and listen.
When those farmers look back, the line that sticks isn’t about robots.
It’s some version of:
“The moment that changed everything wasn’t when the robots started. It was when we realized we didn’t have to pretend we were fine anymore.”
If you’re serious about staying in dairy, this isn’t fluff. It’s risk management. Cows don’t care how tough you are. Your family and your lenders care very much that you’re still here.
The 4‑H Calf That Keeps a Kid – and a Farm – Connected to Dairy
Every county has a story that quietly explains why community still matters.
A quiet kid drifts into a 4‑H dairy club meeting. No farm background. New boots, still clean. Home life? Let’s just call it complicated.
A local dairyman offers him a calf from his herd for the summer. Nothing out of the World Dairy Expo showstring. Just a decent heifer with a kind eye and a shot at VG down the road if things line up.
All summer, that calf gives him a reason to get up and go somewhere safe twice a day. He learns to halter, to brush, to read her moods. When she walks into the robot for the first time, he’s there with a hand on her flank, talking her through the new noise and the spray.
At the fair, they land squarely in the middle of the class. You’d think they’d just won the Supreme.
Fast‑forward a couple of years, and that “quiet kid” shows up as:
A part‑time worker at a dairy down the road.
A student in an ag or ag‑tech program.
The older 4‑H’er is clipping calves and teaching younger kids how to lead a heifer without panicking.
Ask what changed his path, and he’s not going to say “robot model numbers” or “Net Merit.”
He’ll tell you, “Somebody trusted me with something that mattered.”
If you want to talk long‑term herd strategy and genetics, that’s it in one sentence. Your best cow families and proofs don’t mean much if there’s nobody young who wants to be under those cows when they calve, milk, and show.
Robots and genomics might keep your herd competitive.
Kids and the community keep it alive.
What This Means for Your Operation
This isn’t a feel‑good Hallmark story. It’s a survival checklist.
If you’re reading this with a knot in your stomach, you’re exactly who this section is for.
Run Your Robot vs Human vs Hybrid Math in $/cwt
Sit down with your lender and accountant and write it out:
Calculate your real milking labor cost per hour—wages, housing, benefits, turnover, and your own unpaid time. Convert that to $/cwt using your shipped volume.
Get a real AMS quote: equipment, barn modifications, and at least 10 years of service contracts.
Price out a serious hybrid package—activity monitors, sort gates, and a feed pusher. For many 180‑cow herds, that’s a tens‑of‑thousands‑of‑dollars investment, not a million‑dollar note.
Work out your projected $/cwt labor cost for “keep the parlor,” “parlor + tech,” and “full AMS” at five and ten years. If you’re not sure how to do that, ask your lender or extension adviser to walk you through it.
Then ask yourself:
Can I hire and retain three reliable people to cover milking for a total cost of USD $200,000/year or less?
If yes, humans still likely beat robots on pure economics for most sub‑500‑cow herds.
If no, you’re in AMS‑or‑exit territory and need to treat this like the survival decision it is—not a gadget purchase.
If AMS debt would push your total farm debt service well beyond your historic cashflow comfort zone, a clean, profitable exit or a smaller hybrid investment deserves a serious look.
Build a Three‑Farm Emergency Ring
Before the next storm, disease outbreak, or health crisis:
Sit down with two or three nearby dairies.
Agree on who brings the tractor‑driven generator, who understands your panel, and who will show up if you’re suddenly out of commission.
Swap cell numbers, gate codes, and panel details now, not at midnight in a blizzard.
Write it down and post it in the office and on at least one truck.
If you don’t know whose tractor is backing up to your panel, that’s the first hole to patch.
Put Mental Health on the Wall
Take ten minutes and:
Print the Farm Aid hotline (1‑800‑FARM‑AID) and any state/provincial ag mental‑health numbers you can find.
Tape them where people actually look—office fridge, milk house door, robot room.
Tell your family and crew once, “If you ever feel like you can’t keep going, you can talk to us—or you can call these numbers. Both are okay.”
It’ll feel awkward. Do it anyway.
Make Youth Part of Real Decisions, Not Just Photo Ops
If you want someone to care about your herd in 2035, give them work that matters in 2026.
Hand a teenager or young adult a login to your robot or herd‑management software and make them responsible for one metric—SCC alerts, irregular visits, “problem cows.”
Let them sit in on some breeding and culling discussions where AMS performance, genomic proofs, Net Merit/Pro$/LPI, and component performance actually shape the choices.
Put a 4‑H calf or a small project in the hands of one non‑family youth and let them earn your trust.
You’re not just filling labor gaps. You’re building your successor pool.
Tie Genetics Directly to the System You Actually Run
Your sire list should match the barn and milking routine you have now, not the one you had ten years ago.
On AMS herds, prioritize bulls with milking speed, balanced udders, good teat placement, and sound feet and legs alongside components and fertility.
Use genomic tests to push the bottom 15–20% of heifers toward beef‑on‑dairy or terminal matings, protecting your replacement slots for daughters who fit your system.
Treat your top 30% as the cow families that will carry your prefix forward: stack them with sires that fit your milking system, labor realities, and market.
If you’re paid on butterfat and protein, give extra weight to sires whose daughters hold components under higher milking frequency.
If you’re still using bulls that made sense for a twice‑a‑day tie stall in 2008, you’re breeding for nostalgia, not for the farm you’re trying to keep alive.
Key Takeaways
Robots don’t replace neighbors. They raise the stakes on having the right people in your corner when things go sideways.
Under 500 cows, AMS isn’t an automatic yes. If you can still hire and keep good milkers at an honest wage, a hybrid “parlor + tech” setup often delivers most of the benefits at a fraction of the cost.
Your labor market decides more than your dealer does. If you genuinely can’t staff your barn, robots may be the lesser risk—but only with a strong community and management bench behind them.
Genetics has to match your system. Milking speed, udder design, health, and hoof traits become expensive blind spots in a robot barn if you ignore them.
Mental health isn’t soft. It’s a leading indicator of whether your family and business will still be here when the next price cycle turns.
Youth and 4‑H aren’t side projects. They’re your succession plan, your future labor, and the bridge that keeps your best cow families relevant in 20 years.
The Bottom Line
In a world where Wisconsin has dropped from over 16,000 herds to just above 5,300, and immigrant labor holds up half of the hired workforce that keeps the milk flowing, the real question on your farm isn’t “robots or parlor.”
It’s a lot simpler, and a lot harder:
If things go sideways tonight, who is actually turning up your lane?
If you don’t have a clear answer, that’s your real project this year.
Robots might help you milk.
Your people are the reason you’ll still be here to push “start” tomorrow.
Complete references and supporting documentation are available upon request by contacting the editorial team at editor@thebullvine.com.
The $1750 Calf: Is Your 2026 Breeding Plan Leaving $800 a Head on the Table? – This breaks down how to weaponize genomic data to capture massive beef-on-dairy premiums. It delivers a surgical breeding method that turns surplus pregnancies into a second, high-margin revenue stream that significantly outpaces commodity milk income.
The Sunday Read Dairy Professionals Don’t Skip.
Every week, thousands of producers, breeders, and industry insiders open Bullvine Weekly for genetics insights, market shifts, and profit strategies they won’t find anywhere else. One email. Five minutes. Smarter decisions all week.
“Reminder: every extra pound of pre‑weaning gain can mean 1,000+ lbs more milk later. Are your calves leaving money on the table?
You know that frustration when calves look fine one week and then crash the next? Weaning dip stretches into three weeks of depressed intake, respiratory disease clusters right around that vulnerable transition window, and it happens no matter what you try. Most of us have been there—whether you’re running 200 cows in Vermont or 2,000 in the Central Valley. It’s one of those persistent challengesc in calf nutrition and heifer development that never quite seems to get solved.
For decades, we’ve treated this as just the cost of doing business. Calves are fragile. Weaning is stressful. Budget for the treatments and move on.
But here’s what’s interesting—a growing body of research and a smaller group of producers willing to rethink their protocols suggest something different. The weaning dip may be less about inevitable stress and more about accumulated decisions made weeks earlier. And the solutions aren’t necessarily expensive or complicated. They’re just… different from how most of us learned to do things.
I want to walk through what the research actually shows, what some operations are finding when they apply it, and—just as importantly—why this approach doesn’t work for everyone.
The Economics Nobody Wants to Talk About
Let’s start with the numbers, because that’s ultimately what drives decisions.
Dr. Michael Steele’s research group at the University of Guelph has been tracking the long-term consequences of early-life calf health for years. Their work, combined with Swedish research by Svensson and Hultgren, which has been widely cited in the Journal of Dairy Science, documents something that should give us pause: calves experiencing diarrhea in their first month of life produce roughly 340-350 kg (748 – 770 lbs) less milk in their first lactation than healthy calves.
That’s not a typo. We’re talking about nearly 350 kg (770 lbs) of milk—gone—because of a bout of scours in week two.
Dr. Alex Bach, an ICREA research professor working with IRTA in Spain, has been equally direct about respiratory disease. His research shows that heifers treated for bovine respiratory disease before weaning have significantly higher odds of dying or being culled before first calving—with survival rates often running 10-20 percentage points lower than healthy cohorts. The immune insult doesn’t resolve simply because the calf clinically recovers. It reverberates through her productive life.
This connection between early-life health and lifetime performance continues to be reinforced by ongoing research. A 2025 study by Leal and colleagues in the Journal of Dairy Science demonstrated that suboptimal preweaning nutrition creates measurable metabolic differences that persist through first lactation—effects visible in glucose metabolism and overall metabolic profiles well into the heifer’s productive life.
Now, here’s where I think our industry gets stuck. These are long-term consequences. The treatment costs are visible today—you see them on this month’s vet bill. The first-lactation milk penalty won’t appear for 2 years. Most operations—understandably—optimize for what they can see and measure right now.
The challenge, as multiple dairy economists have noted, is convincing producers to invest today for returns they won’t see until that heifer’s second lactation. It’s fundamentally different from evaluating the price of a bag of milk replacer.
And it’s worth sitting with that tension for a moment, because it explains why adoption of these practices has been slower than the research might predict.
What’s Actually Happening in the Calf’s Gut
To understand why certain interventions work, you need to understand what’s developing inside the calf during those first critical weeks. The science here has advanced dramatically in the past decade—and it’s reshaping how progressive operations think about their calf programs.
The Small Intestine Window
Before the rumen becomes functional—roughly weeks one through five—the calf is essentially a monogastric animal. The small intestine handles the heavy lifting for nutrient absorption, and it’s susceptible to early nutrition choices.
Research published in peer-reviewed nutrition journals has mapped digestive enzyme development in young calves, and what these studies have found matters for anyone making decisions about milk replacer formulation: pancreatic proteases operate at only a fraction of adult capacity at birth, gradually maturing over the first three to four weeks.
Why does this matter practically? The calf’s enzyme systems evolved to digest milk proteins, including casein and whey. When you substitute milk proteins by plant proteins like soybean meal or wheat gluten (often done to reduce costs), you’re asking an immature digestive system to handle substrates it’s not fully equipped to handle.
Work published in the Journal of Dairy Science by Ansia and colleagues compared nitrogen digestibility between all-milk protein replacers and those supplemented with enzyme-treated soybean meal. The pattern was clear: all-milk formulas showed notably better digestibility by week three compared to plant-supplemented formulas. That gap represents protein that isn’t nourishing the calf—it’s passing through to the hindgut, where it can feed the wrong bacteria.
Research presented at the 2024 Healthy Calf Conference in Ontario reinforced this point: early-life nutrition—specifically the first 60 days—affects digestive function throughout the animal’s productive life. That framing helps explain why the details matter so much during this critical window.
The Rumen Transition
As starter intake increases around weeks five through eight, something remarkable happens. The rumen transforms from a collapsed, non-functional organ into the calf’s primary fermentation chamber. This transition depends entirely on establishing stable populations of beneficial bacteria—and this is where substrate consistency becomes critical.
Dr. Phil Cardoso’s lab at the University of Illinois has done elegant work tracking how rumen microbial communities develop. Here’s the part that surprised me when I first dug into this literature: rumen bacteria are extraordinarily substrate-specific.
Different bacterial species have evolved enzymatic machinery optimized for specific fermentation substrates. When feed composition shifts—different molasses sources, varying grain suppliers, new protein ingredients—the microbial community has to reorganize around the new substrate profile.
A 2024 study published in Frontiers in Microbiology, which tracked fecal microbiota development in Holstein and Jersey heifer calves, found that the gut microbiome changes rapidly during early life. Instability during colonization leaves the microbial community vulnerable to dysbiosis, where pathogenic species can outcompete beneficial microbes, leading to suppressed immune function and inflammation.
The time required for microbial reorganization varies considerably depending on what you’re measuring and how dramatic the diet change is. Some studies suggest bacterial communities can shift within a week or two. Others indicate that full functional stabilization can take considerably longer, sometimes several weeks or more.
The practical takeaway? During that reorganization period, volatile fatty acid production becomes erratic. And VFAs—particularly butyrate—are what drive rumen papillae development. Inconsistent VFA production means inconsistent rumen development.
Sponsored Post
The Substrate Consistency Question
This is where things get practical, and also where opinions start to diverge among nutritionists.
Several nutritionists I’ve spoken with point to ingredient consistency as the single most overlooked variable in calf programs. The logic is straightforward: if rumen bacteria need stable substrates to establish and function, then constantly changing feed ingredients creates perpetual instability.
Research from the University of Minnesota and other institutions has documented this pattern: calves on fixed formulations show much more consistent day-to-day starter consumption than calves on least-cost programs where ingredients shift with commodity prices. The intake variability isn’t dramatic on any given day, but it compounds over the critical period of rumen development.
Industry estimates suggest the cost premium for specification-guaranteed, consistent-source ingredients is approximately 2-4%—typically $8-12 per calf over a 12-week rearing period. That number varies by region and current commodity markets, but it gives you a ballpark for planning purposes.
The Other Perspective
Now, I want to be fair here, because this isn’t settled science. Not every nutritionist is convinced that ingredient consistency matters as much as some of the research suggests.
“Look, rumen bacteria are adaptable,” argues one dairy nutritionist who asked not to be named because he works with several least-cost formulation systems. “They’ve evolved to handle dietary variation. A healthy calf can adjust to different molasses sources reasonably quickly.”
He has a point about adaptability—cattle wouldn’t have survived as a species without metabolic flexibility. And the research on substrate consistency, specifically in pre-weaned calves (as opposed to mature cattle), is still developing. Most of the microbial stabilization studies were conducted in older animals.
What we can say with confidence is that operations running fixed formulations generally report lower variability in calf performance. Whether that’s causation or correlation with other management factors—like the kind of attention to detail that leads someone to specify ingredients in the first place—is harder to untangle.
Stage-Matched Microbial Support
The growing interest in probiotic supplementation for calves has created what I’d call an implementation gap. Most operations using probiotics deploy the same blend in both milk replacer and starter feed, assuming gut health support works the same way throughout development.
The research suggests otherwise—and this is where things get interesting.
Different Ecosystems, Different Needs
The small intestine during liquid feeding operates in a microaerobic environment—there’s oxygen present. Effective probiotics for this phase include facultative anaerobes like Bacillus subtilis, Lactobacillus, and Bifidobacterium species that can survive stomach acid and establish quickly.
A 2024 study in ASM Spectrum demonstrated that compound probiotics containing multiple Lactobacillus and Bacillusstrains accelerated both immune function development and the establishment of a healthy gut microbiome in newborn Holstein calves—reducing the abundance of harmful bacteria while promoting beneficial populations.
Research published in Scientific Reports and the Journal of Animal Science has shown how certain Bacillus species secrete compounds that promote intestinal epithelial cell differentiation and help inhibit pathogenic biofilm formation. There’s good evidence for measurable improvements in gut barrier function when appropriate strains are delivered during the liquid feeding phase.
The developing rumen is a completely different environment—strictly anaerobic. Oxygen is toxic to the bacteria that should dominate there. Effective rumen probiotics include obligate anaerobes such as Megasphaera elsdenii and Butyrivibrio species, which would die immediately if exposed to the oxygen-rich environment of the small intestine.
“Using the same probiotic blend in milk and starter is like planting the same crops in two completely different climates,” explains Dr. Mike Flythe, a microbiologist with the USDA Agricultural Research Service in Lexington, Kentucky. “You might get something to grow, but you’re not optimizing for either environment.”
Gut Environment
Oxygen Level
Effective Probiotic Species
Primary Mechanism
What Happens If Mismatched
Small Intestine (liquid feeding phase)
Microaerobic (oxygen present)
Bacillus subtilis, Lactobacillus, Bifidobacterium
Epithelial cell differentiation; pathogen inhibition; gut barrier function
Anaerobic rumen species die immediately upon exposure
Developing Rumen (starter feeding phase)
Strictly anaerobic (no oxygen)
Megasphaera elsdenii, Butyrivibrio species
VFA production optimization; pH stabilization; fiber digestion
Oxygen toxic to obligate anaerobes
Industry Standard (single-blend approach)
Both environments, same formulation
Mixed facultative species
Compromise formulation attempting dual-use
Suboptimal colonization in both environments
Stage-Matched Approach
Environment-specific formulations
Oxygen-matched species for each developmental phase
Optimized for gut compartment and maturity stage
Maximizes colonization success and functional support
That analogy stuck with me—it’s a useful way to think about what we’re trying to accomplish.
What the Market Offers
Several feed companies have developed stage-matched probiotic programs. Kalmbach Feeds’ LifeGuard and Opti-Ferm XL technologies represent one approach—different formulations designed for the liquid and solid feeding phases, respectively. Other companies offer similar stage-specific options, and the market continues to evolve as the research develops.
Stage-matched programs do represent a greater investment than basic single-probiotic approaches, though the actual cost differential varies considerably by program design, feeding rates, and supplier. For operations weighing this decision, it’s worth getting specific quotes based on your calf numbers and current protocols—the investment can range from modest to meaningful depending on how programs are structured.
Whether that investment makes sense depends heavily on your baseline performance. Operations already running tight calf programs with low disease incidence will see smaller marginal returns than operations struggling with persistent scours or respiratory challenges. This isn’t a universal solution—it’s a tool that works better in some contexts than others.
The Stress Calendar: Potentially Free Improvement
Here’s something that costs nothing but requires real management discipline—and it might be the most overlooked opportunity in calf management.
Research on weaning stress—particularly work from Dr. Jeff Carroll and colleagues at the USDA-ARS Livestock Issues Research Unit—shows that cortisol elevation from weaning alone is acute but manageable. Elevated for 3-5 days, then returning toward baseline as the calf adapts.
But when weaning coincides with vaccination, dehorning, regrouping, or housing changes, cortisol can remain elevated for 2 weeks or longer, resulting in sustained immune suppression. The calf never gets a chance to recover before the next challenge hits.
The mechanism isn’t additive—it’s multiplicative. Each stressor independently activates the hypothalamic-pituitary-adrenal axis. When stressors overlap, you’re compounding the immune suppression rather than just extending it.
What this means practically: the common approach of “we have the crew here anyway, let’s do everything at once” may be one of the most costly management decisions we make. It’s efficient from a labor standpoint. It’s terrible from a calf physiology standpoint.
Building a Stress Calendar
Operations that separate stressors generally report meaningful improvements. The specific timing depends on your operation, but here’s a general framework:
Disbudding/dehorning: Position 4-5 weeks before weaning, allowing full recovery before weaning stress begins
Weaning: Gradual over 5-7 days (the most recommended weaning is step down process for 10 – 14 days, even if it is not the most used), treated as a standalone event with no concurrent stressors
Vaccination: 7-14 days post-weaning, after acute stress resolves
Regrouping/housing changes: 2+ weeks post-weaning when possible
Research presented at the 2024 Healthy Calf Conference emphasized that gradual weaning has become non-negotiable for operations feeding today’s higher milk volumes. When calves consume eight to twelve liters of milk per day, abrupt weaning creates severe physiological stress. Comparing five-day versus ten-day weaning programs, longer-weaned calves performed better in both gain and grain intake, with fewer health issues during the transition.
I’ve spoken with producers in Wisconsin and across the Upper Midwest who’ve tried separating procedures, and the feedback has been generally positive—many report noticeable reductions in post-weaning respiratory cases. A producer in central Minnesota told me his post-weaning BRD treatments dropped by about a third after implementing a stress calendar. That’s anecdotal, but it’s consistent with the research’s predictions.
That said, I’ve also heard from smaller operations—particularly in the Northeast, where labor is especially tight—where this approach is genuinely impractical. The separated stress calendar requires scheduling flexibility that not every operation has.
And that’s okay. Not every intervention works for every farm.
What Implementation Actually Looks Like
The operations I’ve spoken with that have successfully adopted systems-based approaches share a common thread: they didn’t try to change everything at once. That seems to be the critical success factor.
A Phased Approach
Months 1-2: Establish measurement baseline and address substrate
Lock in ingredient specifications with your feed supplier
Begin rigorous daily measurement—fecal scores, intake tracking, treatment records
Expected outcome: Modest improvement in consistency; proof of concept that builds confidence for next steps
Months 3-4: Optimize milk program
Transition to all-milk protein if appropriate for your operation and budget
Evaluate milk allowance; the research increasingly favors higher volumes in early life
Expected outcome: Improved pre-weaning growth and intake stability
Months 5-6: Implement stress calendar
Separate management procedures where labor and facilities allow
This is the “free” intervention—no additional cost, just scheduling discipline
Expected outcome: Reduced weaning dip severity and faster recovery
Months 7+: Layer in stage-matched probiotics
Add appropriate formulations to milk replacer and starter
Expected outcome: Further optimization of gut development and immune function
Research consistently shows that sequencing matters when implementing these changes. Layering probiotics onto an unstable nutritional foundation often produces disappointing results. The operations seeing the best outcomes start by stabilizing their feed program, then build additional interventions on that foundation.
That’s advice worth taking seriously. The producers who struggle with this approach are usually the ones who tried to implement everything simultaneously and couldn’t tell what was working.
Honest Talk About Economics
Let me lay out the math as clearly as I can, with the caveat that these figures will vary based on your specific situation, region, and current market conditions.
Investment Breakdown (Per Calf Estimates)
Component
Estimated Range
Notes
Substrate consistency premium (Calf Starter with fixed formulation)
Intestine-phase and rumen-phase formulations; get specific quotes based on your feeding rates
Stress calendar implementation
$0
Labor reallocation only
Total Investment
Varies
Depends on baseline program and scope of changes
Potential Long-term Return
+350 kg first-lactation milk
Per heifer kept healthy through weaning (Svensson & Hultgren research)
What the Research Suggests You Might Get Back
Reduced treatment costs: Often in the $15-25 per calf for operations with high baseline disease incidence
Labor savings from fewer sick calves: Variable but meaningful for operations currently spending significant time on treatments
Improved growth trajectory affecting age at first calving (AFC): This is the big variable, and honestly, the hardest to pin down precisely
The age-at-first-calving benefit is where the math gets compelling—or speculative, depending on your perspective. If improved early-life health allows you to gain 30 -60 days on AFC and you’re spending $2.50-3.00 per day to raise a heifer (a reasonable estimate for many operations), you’re looking at meaningful savings per animal.
The timing challenge: You invest in month one. You might see reduced treatments by month two. But the AFC benefit doesn’t materialize for 18-24 months. That requires patience and cash flow that not every operation has, especially in tight milk price environments.
As dairy economists frequently point out, the ROI is real, but the payback period tests most producers’ patience and cash flow.
Who This Works For—And Who It Doesn’t
Let me be direct about something the advocates for systems-based calf programs don’t always acknowledge: this approach isn’t right for every operation. Understanding that might save you time and money.
It likely makes sense if:
You’re experiencing persistent calf health challenges—say, diarrhea incidence above 25% or respiratory disease above 15%
You have the management bandwidth for more rigorous protocols and measurement
Your cash flow can absorb increased upfront costs for 6-12 months without strain
You’re tracking lifetime performance and can actually measure long-term returns
You’re raising your own replacements and capturing the downstream value
It may not make sense if:
Your current calf program is already performing reasonably well (if it ain’t broke…)
Labor constraints make separated stress events genuinely impractical
You’re operating on thin margins that can’t absorb any additional costs right now
You’re selling calves rather than raising replacements—someone else captures the long-term value
Paul Rapnicki, DVM, who has extensive experience consulting with dairies across the Midwest, puts it this way: “I’ve seen operations transform their calf programs with this approach. I’ve also seen operations spend money on premium ingredients and probiotics while ignoring basic management—clean water, dry bedding, adequate ventilation. The fancy stuff doesn’t fix the fundamentals.”
That’s worth remembering. Before you invest in stage-matched probiotics and specification-guaranteed molasses, make sure your calves have clean, dry housing and fresh water available at all times. Get the basics right first.
Practical Takeaways
For producers considering a more systematic approach to calf gut health, here’s what seems to matter most:
Start with measurement. You can’t improve what you don’t track. Daily fecal scoring, intake monitoring, and treatment records create the baseline you need to evaluate any intervention. Without data, you’re just guessing—and guessing gets expensive.
Fix one thing at a time. The phased implementation approach isn’t just about budget management—it lets you identify what’s actually working. Change everything at once, and you’ll never know what made the difference. You’ll also have nowhere to go if something doesn’t work.
Respect the stress calendar. Of all the interventions discussed here, separating management stressors has clear research support and zero additional cost. If you do nothing else, consider this. It’s the closest thing to a free lunch in calf management.
Be realistic about timelines. The full benefit of optimized early-life nutrition takes 18-24 months to materialize. Plan accordingly and ensure your operation can sustain the approach long enough to see results. Starting and stopping is worse than not starting at all.
Talk to your nutritionist. The research on substrate consistency and stage-matched probiotics is interesting, but the application depends on your specific operation. A good nutritionist can help evaluate whether changes make sense for your situation—and which changes to prioritize given your current performance and constraints.
The Bottom Line
Your calves don’t care about tradition, and they don’t care about how busy you are. They only reflect the system you build for them.
Stop treating the weaning dip as a mystery and start treating it as a management decision. The research is clear: early-life gut health programs and lifetime performance. The tools exist. The question is whether you’re willing to invest in month one for returns that show up in year two.
For some operations, the answer is yes—and they’re seeing the results. For others, the timing isn’t right, and that’s a legitimate business decision too.
But don’t let inertia make the choice for you. Run the numbers for your operation. Talk to your nutritionist. Look at your treatment records from last year.
Then decide deliberately.
KEY TAKEAWAYS
One week of scours = 350 kg less milk in first lactation — The cost is invisible for two years, but the research is clear: early-life gut health programs lifetime productivity
The weaning dip is a management decision, not inevitable — Outcomes trace back to nutrition and timing choices made weeks before weaning begins
Ingredient consistency may matter more than ingredient cost — Rumen bacteria are substrate-specific; least-cost formulations that shift with commodity markets create ongoing microbial disruption
Separate your stressors—it’s free — Spacing dehorning, weaning, and vaccination prevents compounding immune suppression; it’s the closest thing to a free lunch in calf management
This approach isn’t right for every operation — If your current program performs well or you’re selling calves rather than raising replacements, the investment may not pay back for your situation
EXECUTIVE SUMMARY
The weaning dip isn’t bad luck—it’s a management decision. Research confirms that calves experiencing diarrhea or respiratory disease in their first month lose 340-350 kg of milk production in the first lactation, a penalty that stays hidden for two years but compounds across your herd. This feature examines why some operations are rethinking calf nutrition entirely: stabilizing feed ingredients to support rumen microbial development, matching probiotic strategies to different gut environments, and separating management stressors from weaning. One intervention—the stress calendar—costs nothing beyond scheduling discipline, and producers report meaningful reductions in post-weaning respiratory disease. The full approach requires patience; ROI takes 18-24 months to materialize and depends on your baseline performance. For operations already running successful calf programs, the investment may not pencil out. But for those watching the same health patterns repeat season after season, this research offers something more valuable than another treatment protocol: a different set of decisions to make.
Complete references and supporting documentation are available upon request by contacting the editorial team at editor@thebullvine.com.
Learn More
17-26x ROI: Why Top Dairies Stopped Saving Calves and Started Preventing Loss – Arms you with the hard numbers on the “prevention vs. treatment” debate. It breaks down how a simple Brix refractometer delivers massive returns, allowing you to stop bleeding capital on sick calves and capture $800 in added lifetime value.
Every week, thousands of producers, breeders, and industry insiders open Bullvine Weekly for genetics insights, market shifts, and profit strategies they won’t find anywhere else. One email. Five minutes. Smarter decisions all week.
86% of fresh heifers have udder edema. That’s not a cosmetic issue — it’s $3,500–$16,000 a year walking out your door.
That rock-hard, swollen udder on your fresh heifer isn’t just “how it is.” It’s a disease process with a measurable price tag — and in 2025–2026, that price just got a lot steeper.
Work by Emma Morrison and colleagues, published in the Journal of Dairy Science in 2018 using data from three commercial freestall herds, found udder edema in 86% of first-lactation heifers and around 56% of second-lactation cows in early lactation. When you apply conservative economics — recent U.S. milk prices, realistic assumptions for extra mastitis, slow-milking heifers, and earlier culling — Bullvine’s 2025 modeling puts herd-level losses at roughly $3,500–$16,000 a year on a 100-cow operation. The fix? About $40 per heifer in targeted vitamins and ration adjustments.
If you’re raising replacements at $3,000–$4,000 a head — and that’s where the U.S. market sits right now — watching even a few of them leave early isn’t just frustrating. It’s a serious hit to your balance sheet.
The Fresh-Heifer Problem You’re Underpricing
Morrison’s 2018 JDS paper scored udder edema on 1,346 cows across three North American freestall herds during the first three weeks in milk. The pattern held across all three operations:
86% of first-lactation heifers had udder edema
About 56% of second-lactation cows showed edema, with prevalence dropping in older animals
Michigan veterinarian Dona Barski called udder edema “a disease, not just a cosmetic swelling.” She linked it directly to increased mastitis risk and subclinical ketosis in early lactation.
Here’s the milk math. Using Morrison’s health and performance associations and Bullvine’s 2025 fresh-cow economic modeling, a conservative estimate of the direct milk loss per affected heifer is around 316 lb per lactation. At roughly $20/cwt — a reasonable working average for recent U.S. Class III/IV prices — that’s about $63 per heifer in milk alone.
But that’s just the opening act. Morrison’s data shows cows with edema are more likely to:
Have clinical mastitis in the first 30 days (approximately 5% vs 2% in non-edema cows)
Show higher BHBA levels and more subclinical ketosis in week 2
Those are the heifers that burn through treatment dollars, waste saleable milk, slow down your parlor or robots, and hit the cull pen a lactation earlier than their clean-uddered herdmates.
The Herd-Level Economics
Take a 100-cow herd, with 40 replacement heifers freshened per year. If your incidence looks anything like Morrison’s study herds, 80–90% of those heifers show edema at some level — that’s about 34 affected animalsannually.
Bullvine’s 2025 modeling — which treats these components as scenario-based ranges, not precise accounting — puts annual losses at $3,500/year on the low end (minimal mastitis, no early culling) to $8,000–$16,000/year in more realistic scenarios that include mastitis complications, slow-milking heifers, and one or two early culls.
Your mileage will vary based on your actual edema rates, how quickly you catch problems, and what replacements cost in your market. But the pattern holds: edema isn’t free.
Why the Stakes Are Higher in 2026
The heifer shortage is real, it’s historic, and it’s not going away soon.
According to CoBank’s August 2025 heifer inventory outlook, which draws on USDA data, U.S. dairy replacement heifer inventory sat at approximately 3.9 million head in January 2025 — the lowest level since the late 1970s and roughly 18% below 2018 levels. CoBank’s projections show heifer numbers continuing to tighten through 2026, with recovery not expected until 2027 at the earliest.
USDA’s Agricultural Prices series and market reports show average replacement heifer prices climbing from around $1,700 in 2023 to roughly $3,000 by mid-2025, with many auction lots bringing $4,000 or more for top genetics.
That’s not a typo. Replacement costs have nearly doubled in about two years.
Why the squeeze? Beef-on-dairy worked. Day-old crossbred calves now bring $800–$1,000 in many U.S. markets, compared to around $100 for straight Holstein bull calves just a few years back. As Mike North with Ever.Ag shared in early 2025: “If I’ve got an opportunity to make a thousand dollars on a calf without having to feed it for a year and a half, that’s a fantastic opportunity.”
The math made sense — until the replacement pipeline dried up.
CoBank’s 2025 report notes that producers have responded by “hoarding cows” and delaying culls, but warns that “this historic pullback cannot be sustained long-term” as cull cow values and herd health pressures build.
The bottom line: Any heifer you lose early — whether edema is the main driver or part of a bigger transition train wreck — likely means spending $3,000–$4,000 to replace an animal that cost far less a few years ago. Even one or two extra heifers leaving early on a 100-cow herd can add $6,000–$8,000 a year in replacement costs, before you count the milk and health losses that led up to that decision.
The Opportunity Cost You’re Not Counting
Here’s an angle that doesn’t get enough attention: the opportunity cost isn’t just about buying replacements. It’s about the sales you’ll never make.
If you were positioned to sell surplus heifers into this $3,000–$4,000 market, every heifer that leaves early to edema complications is revenue that evaporates. You don’t just pay more to replace her — you lose the check you would have banked from selling one of her herdmates.
For herds running tight on replacements, that math is bad enough. For herds that built their beef-on-dairy strategy around selling a few extra dairy heifers each year at premium prices, it’s a double hit.
Why Fresh Heifers Get Hammered
First-calf heifers don’t have the same mature vascular network as older cows. Their milk veins are still developing, so they’re less equipped to handle the surge of blood flow and fluid that comes with calving and ramping up production.
Meanwhile, we ask them to:
Finish their own skeletal growth
Carry and calve their first calf
Jump straight into a high-yield first lactation — often because we bred them off impressive genomic proofs
Then we compound the problem with nutrition that was never designed for them.
Classic JDS trials on sodium and potassium showed that high-salt anionic diets significantly increased edema scores and slowed recovery in heifers. Cora Okkema with MSU Extension advised that heifers should not receive the same strong DCAD ration as older dry cows.
You see it every day in the barn: tight, shiny quarters with a disappearing cleft. Heifers standing wide, flinching at the unit, or kicking. Quarters that won’t empty properly for the first several days.
When swelling lingers, it stretches ligaments, predisposes cows to pendulous udders, and creates a moist, damaged skin environment where udder cleft dermatitis takes hold. A 2020 review links chronic swelling and compromised skin to long-term udder problems and higher culling rates.
“A bit of swelling” isn’t cosmetic. It’s the front door to a shorter career.
Three Levers That Can Move the Needle
You don’t need robots or a new barn to make progress here. Field reports from herds that get serious about edema management — implementing all three levers below and tracking results over 12–24 months — suggest it’s realistic to push incidence from the 70–90% range down toward 30–40%, and hold severe cases under 10–15%.
Results will vary by herd, and edema is one of several transition issues competing for your time and capital. But it’s one of the cheaper levers to move because the fixes are more about feed allocation and fine-tuning premixes than buying new steel.
Lever 1: Nail Body Condition
Overconditioned heifers repeatedly appear as higher-risk animals. Extra fat around the udder and brisket increases tissue pressure and makes it harder to move fluid out.
Stage
Target BCS
Why It Matters
2–3 weeks pre-calving
3.25–3.5
Enough reserve, not over-fat
At calving
3.25–3.5
Sweet spot for transition
60 DIM
2.75–3.0
Controlled loss, no crash
If most of your heifers are calving at 3.75–4.0, you’re pre-buying edema and transition risk.
Lever 2: Stop Feeding Heifers Like Old Dry Cows
This is where good herds get burned — not from laziness, but logistics. One close-up pen. One mixer. Everybody eats the same high-salt, strong-anionic ration designed for multiparous cows.
That’s a recipe for swollen heifers.
Top herds handle it differently:
Separate late-gestation heifer ration wherever possible
Lower sodium and potassium than the cow prefresh ration
Neutral to only slightly negative DCAD — not the deep negative aimed at older cows
If you’ve only got one mixer, use headlocks to feed a heifer-specific load into one row twice a day. Pull free-choice salt blocks out of heifer prefresh pens. Something is better than nothing.
Decision rule: If heifers and cows are on the same prefresh ration, and more than 60% of fresh heifers show any edema with more than 15% severe, separating diets moves from “nice to have” to “this month.”
Lever 3: Tune Vitamin E and Selenium
Oxidative stress spikes at calving. If tissues are inflamed and antioxidant capacity is low, more damage and slower healing follow.
NASEM’s 2021 Nutrient Requirements of Dairy Cattle update reinforces the importance of adequate vitamin E and selenium in close-up diets for both cows and heifers. Selenium supplementation levels remain constrained by FDA limits and didn’t change in the 2021 update — yet many herds are still using premix formulations from years ago.
High-performing herds:
Compare heifer vitamin E levels against current recommendations — not a premix label from 2015
Audit selenium intake from forage, premix, and injectables — adequate but not excessive, especially in high-Se regions
You’re not going to vitamin-shot your way out of bad BCS or wrong DCAD. But you can reduce tissue damage while you fix those fundamentals.
Lever
What Good Looks Like
What Risky Looks Like
Cost per Heifer
Time to Results
Body Condition
BCS 3.25–3.5 at calving; controlled gain through transition
BCS >3.75 at calving; over-fat heifers crowding udder with tissue pressure (red text)
~$0–$10 (monitoring only)
6–12 months (requires earlier heifer program changes)
Heifer-Specific Prefresh Ration
Separate heifer diet with lower Na/K; neutral to slightly negative DCAD; no free-choice salt
Heifers eating same strong-anionic cow ration; shared mixer loads; salt blocks in pen (red text)
~$15–$20 per heifer (ration cost, not capital)
2–4 months (immediate once ration separated)
Vitamin E / Selenium
Prefresh levels match NASEM 2021 targets; premix formulation reviewed in last 2 years
Using premix formulation from 2015+; selenium “adequate” but never audited (red text)
~$10–$15 per heifer (premix upgrade)
3–6 months (tissue response builds over time)
What This Means for Your Operation
If more than 60% of your fresh heifers score ≥1 for edema, and more than 15% hit scores 2–3, you’ve got a transition risk that belongs in the same conversation as DAs and metritis.
On a 100-cow herd with 40 heifers freshening annually, Bullvine’s modeling suggests at least $3,500/year in edema-related losses on the low end — and more realistically $8,000–$16,000/year once you factor in mastitis, slow-milkers, and early culls at current replacement prices.
With U.S. replacements at $3,000–$4,000+ and inventory at 20-year lows per CoBank’s 2025 outlook, any heifer that leaves early is an asset you can’t easily replace. The opportunity cost of surplus sales you’ll never make adds to the sting.
Run a simple cost comparison: $40 per heifer for your top management changes vs the combined cost of one extra early cull plus a replacement at current prices. If the replacement side is bigger — and at $3,000–$4,000, it almost certainly is — edema work moves up your list.
Score your next 30–40 fresh heifers using a simple 0–3 scale. Not what you think edema looks like — what it actually is. Compare your baseline to Morrison’s research benchmarks.
Audit your prefresh program with your nutritionist: Are heifers actually on a different ration, or just a different pen eating the same feed? Get real Na, K, and DCAD numbers on paper.
Check BCS at close-up and calving. If most heifers are over 3.5, talk with your team about heifer growth rates and age at first calving.
Edema Score
What It Looks Like
Herd-Level Threshold (40 Heifers/Year)
Decision Rule
0
No visible swelling; normal udder contour
Baseline — track your percentage
Monitor; this is your target for >40% of heifers
1
Mild swelling; slight puffiness but udder cleft still visible
If <60% of heifers: Keep monitoring
Continue current program; fine-tune as needed
1
Mild swelling; slight puffiness but udder cleft still visible
If >60% of heifers: ACT
Audit BCS and prefresh ration — you’ve got a systemic issue
2–3
Moderate to severe; tight, shiny quarters; cleft disappearing or gone; heifer standing wide or kicking
If <15% of heifers: Monitor closely
Watch for progression; tighten BCS and vitamin protocols
2–3
Moderate to severe; tight, shiny quarters; cleft disappearing or gone; heifer standing wide or kicking
If >15% of heifers: ACT NOW
Separate heifer prefresh ration immediately; review BCS and premix with your team this week
The Bottom Line
Udder edema hits 86% of fresh heifers in Morrison’s published research, with direct and downstream costs that Bullvine’s modeling places at $3,500–$16,000/year on a 100-cow herd at current U.S. prices. Replacement heifer costs have nearly doubled since 2023, with inventory at historic lows and no relief expected until 2027, according to CoBank. That makes every heifer that leaves early more expensive to replace — and every surplus heifer you can’t sell a missed opportunity in a seller’s market.
Three management levers — heifer BCS, heifer-specific prefresh rations, and tuned vitamin E/Se programs — can significantly reduce edema incidence when applied consistently over 12–24 months. About $40 per heifer in targeted changes gives you a realistic shot at cutting the edema penalty on animals that now cost four grand to replace.
You can keep treating this as “just fresh-heifer stuff” and quietly tax your best genetics every year. Or you can invest $40 per heifer and give yourself a realistic shot at cutting that penalty.
Score your next 30–40 fresh heifers. Separate their diet from the older cows as best you can. Tighten body condition. Fix the vitamins. Then look at your own numbers and decide: are you done paying the edema tax—or is this the transition change you finally make stick?
Key Takeaways
Udder edema hits 86% of fresh heifers (Morrison 2018 JDS), costing $3,500–$16,000/year on a 100-cow herd when you add up milk loss, mastitis, and early culls.
With heifers at $3,000–$4,000 and U.S. inventory at 20-year lows, every edema-related early exit is a high-dollar loss you can’t easily replace — and a surplus sale you’ll never make.
Three levers move the needle: heifer body condition, heifer-specific prefresh rations, and updated vitamin E/selenium — all for about $40 per heifer.
Know when to act: if more than 60% of fresh heifers show edema and more than 15% score severe, separating diets is no longer optional.
Executive Summary:
Udder edema hits 86% of fresh heifers in Morrison’s 2018 JDS study, and, when you stack up milk loss, mastitis, slow‑milkers, and extra culls, Bullvine’s 2025 modeling puts the bill at $3,500–$16,000 a year on a 100‑cow herd. In a 2025–2026 U.S. market where replacement heifers cost $3,000–$4,000, and inventories sit at 20‑year lows, every heifer who leaves early because edema derails her transition is now a high‑dollar asset gone. The piece walks through how edema links to higher early mastitis and ketosis, udder damage, and earlier culling, so you can see how it’s taxing both your best young cows and your labor. It then lays out three practical levers — heifer body condition targets, heifer‑specific prefresh rations, and updated vitamin E/selenium programs — that field reports show can significantly cut edema over 12–24 months. On most herds, those changes work out to roughly $40 per heifer, which is inexpensive risk management on an animal worth $3,000–$4,000. Finally, you get a simple edema‑scoring system, clear thresholds (60%+ incidence, 15%+ severe), and a 60‑day on‑farm trial so you can run your own numbers and decide where this fits in your transition priorities right now.
Complete references and supporting documentation are available upon request by contacting the editorial team at editor@thebullvine.com.
The $1750 Calf: Is Your 2026 Breeding Plan Leaving $800 a Head on the Table? – Exposes the structural heifer shortage through 2027 and delivers the “guard rails” for your breeding mix. This strategy reveals why over-relying on beef semen today creates a high-cost replacement gap you can’t afford to fill later.
42% Heritability: The Milking Speed Breakthrough That Fixes Your Labor Problem – Reveals how to leverage the massive 42% heritability of milking speed to breed out parlor bottlenecks. This breakthrough guide breaks down how to balance flow-rate gains with udder health, securing a permanent labor advantage for your next generation.
The Sunday Read Dairy Professionals Don’t Skip.
Every week, thousands of producers, breeders, and industry insiders open Bullvine Weekly for genetics insights, market shifts, and profit strategies they won’t find anywhere else. One email. Five minutes. Smarter decisions all week.
One year after Reed Hostetler’s death at L&R Dairy in Ohio, his community is still proving what farm safety and resilience look like when farmers refuse to let one of their own stand alone.
Executive Summary: Reed Hostetler was 31, co-owner of L&R Dairy in Ohio, and father of three when his tractor tipped into the manure pit on March 5, 2025. He didn’t survive. What his community built in the year since—a barn transformed into a funeral venue, tractors lined up in tribute, months of meals, chores, and quiet financial support that never stopped—is a blueprint every dairy should steal. This article connects Reed’s death to the systemic pit risks that killed six at a Colorado dairy five months later, and to the margin and mental-health pressures squeezing farm families through 2024–2026. It delivers a concrete playbook: phone trees, neighbor check-ins, youth crisis roles, safety protocols that don’t vanish when one person does. The core argument is blunt—community is infrastructure, and the operations that have it recover faster when everything falls apart. Nearly one year later, the only question is whether your road is ready.
The faces behind the “Lead Like Reed” legacy: For the Hostetler family, community isn’t just a sentiment—it is the vital human infrastructure that ensures no dairy operation has to face its darkest day alone.
On March 5, 2025, a 31-year-old dairy farmer drowned after his tractor tipped into the manure pit at L&R Dairy in Marshallville, Ohio. Reed Hostetler was a husband, a father of three young kids, and co-owner of the family operation. He was also, by every account, the kind of guy who showed up when his neighbors needed help.
Almost a year later, his community is still showing up for his family. And that’s the part of this story you can actually copy.
You’re not getting a safety manual here. You’re getting something harder to build and more important to have: a real-world playbook for community resilience and dairy farm safety, forged in the worst possible way.
From Barn Wedding to Barn Funeral
Years before the accident, Reed and Abby Hostetler were married in the main barn at L&R Dairy. Same beams. Same alley. Same cows shuffling in the background.
In March 2025, that same barn became the gathering place for family and friends to say goodbye.
Hosting a large crowd in a working dairy barn isn’t just sweeping the alley and stacking a few straw bales. It’s parking logistics, liability questions, shuttle coordination, sound systems, seating, and making sure the space looks like a celebration of a life, not a Tuesday afternoon herd check.
The Hostetlers didn’t have to figure any of that out on their own.
Neighbors and friends showed up days ahead to pressure-wash walls, scrape alleys, and transform the barn into a place where a casket and grieving family could stand with some dignity. Local companies and neighbors brought gravel and equipment to shore up the lane before vehicles started rolling in. Shuttle buses ran from Marshallville Park, so the yard and road didn’t lock up.
While the family was just trying to survive minute by minute, the community quietly handled the logistics that would have broken them.
Reed and Abby’s three kids—Baer (4), Claire (2), and Axe (1) at the time—were too young to remember most of it. But they’ll hear it for the rest of their lives: the barn was full. People came. We weren’t alone.
That’s not sentimental. That’s an asset. You either have it before a crisis—or you don’t.
The Tractor Line That Said What Words Couldn’t
A mourner puts their hand on a forage harvester parked outside Reed Hostetler’s funeral service, which was held at his family dairy farm March 12. Reed died March 5 after an accident at the farm (Jane Schmucker photo).
There’s a sound you don’t forget: a line of tractors and semis idling in low gear outside a church or a farm. Not parade noise. Heavier. Slower. You feel it in your chest.
At Grace Church in Wooster, where the reception was held, tractors, semis, trucks, and implements lined the parking lot and road as a silent, steel-and-diesel guard of honor.
Local equipment dealers, co-ops, and farmers coordinated the lineup. Once the first few units were committed, the rest followed. Some of the tractors were polished. Others still carried field mud and manure dust. That mix mattered. It wasn’t a show. It was the working dairy community saying, “He was one of ours.”
As one neighbor put it, it was the hardest funeral they’d ever been to—not just because of who they lost, but because of what they watched happen around the family.
Among friends and neighbors, a simple phrase started making the rounds:
“Lead like Reed.” If something needed doing—hay to chop, kids to watch, cows to milk—people asked, “What would Reed do?” and then they just did it. No committee. No sign-up sheet. Just action.
You don’t get that kind of reputation overnight. You build it one favor, one late-night call, one “yeah, I’ll be there” at a time.
When Our Community Needs Help, Help Comes
Most tragedies follow a pattern: three days of intensity, three weeks of fading attention, and then a long, quiet stretch where the family is expected to “get back to normal” while everything inside them is still upside down.
That’s not how this played out.
Weeks and months after the funeral, people kept showing up: groceries, diapers, dinners; neighbors stepping in for chores unannounced; friends checking in not once but over and over.
Abby has said that seeing people show up changed how she thinks about community—and how she plans to show up the next time someone else needs help. That shift, from “How will we survive this?” to “How do we pay this forward?” is the proof that community isn’t just nice. It’s infrastructure.
The support didn’t stop at the farm gate.
Green Elementary’s PTO organized a “Dine to Donate” night at a local Applebee’s, using a “student day off” incentive to bring in more families and raise money for the family. The dollars helped. The message mattered more: “Your school sees what your family is going through. You’re not invisible.”
A crowdfunding campaign drew donations from people who knew the Hostetlers well and from others who only knew them as “the young dairy family in Ohio.” It turned years of quiet relational equity into real, practical support when the family needed it most.
Someone told Abby that because of the way Reed lived, he’s still taking care of his kids even after his death. In strictly financial terms, that’s true. But the bigger truth is this: he’d invested in people, and when it all went sideways, those people cashed that investment in for his family.
Who Reed Was—and Why It Matters Now
Reed wasn’t just “helping out” on the home farm. He was co-owner of L&R Dairy, part of the next generation taking over and pushing the operation forward.
He’d hiked the entire Appalachian Trail. He’d ridden bulls. He’d done mission work in Thailand. Back home, he was the guy who could fix nearly any piece of machinery on the place and still make time to talk with a neighbor in the yard. Neighbors remember him as the kind of person you’d see under a mixer wagon at 11 p.m. and then at someone else’s place the next morning, making sure their chopper started.
Like most dairy producers, Reed knew manure pits are dangerous spaces. He wasn’t inexperienced or careless around equipment. But as this tragedy shows, sometimes the margin between “busy day” and “life-changing day” is just physics and bad timing.
At home, Reed and Abby were in the same season a lot of you are in right now: three little kids, a 24/7 operation, and a calendar that only worked because somebody gave up sleep. Abby picked up nursing shifts at the hospital and was learning more of the farm side to help cover when family needs shifted.
They were raising calves, raising kids, and—often without noticing—raising the bar on what it means to be part of a community.
The wave of support after the accident didn’t appear out of nowhere. It came from years of small decisions: taking a call instead of letting it go to voicemail, showing up with a skid steer when a neighbor’s barn burned, buying a few extra tickets for a school fundraiser, saying yes when something needed doing.
None of those actions looked like “strategy” at the time. Together, they’re the reason people felt personally responsible for being in that barn and that driveway when everything fell apart.
You can’t fake that after the fact. You either build it before you need it, or you don’t have it.
Why One Ohio Manure-Pit Accident Should Change How Your County Shows Up
It’s tempting to file this under “heartbreaking story from another state” and move on. That’d be a mistake.
Manure pits have been recognized as a deadly hazard for decades. In a 1993 bulletin titled “Manure Pits Continue to Claim Lives,” NIOSH warned that the oxygen-deficient, toxic atmosphere in manure pits has “claimed many lives” and that hydrogen sulfide, methane, and other gases can overcome workers within seconds when conditions line up the wrong way. A 2012 clinical review published in the Journal of Agromedicine described manure-pit injuries as “rare, deadly, and preventable,” noting that while these incidents don’t happen often compared to other farm injuries, the fatality rate is extremely high once something goes wrong.
And it’s not just Ohio.
On August 20, 2025, six workers—including a 17-year-old—died in a manure-pit accident at Prospect Valley Dairy in Keenesburg, Colorado. Investigators and local reports indicate that a contractor doing routine work likely triggered a hydrogen sulfide release and was overcome almost immediately. Five other workers went in after him in attempts to rescue him. None of them came back out.
When The Bullvine looked back at 2025’s defining dairy stories, Reed’s death in Ohio and the Colorado tragedy both made the list for the same reason: they exposed how thin the margin really is between an ordinary workday and a permanent hole in a family, a workforce, and a local dairy economy. These aren’t freak one-offs. This is systemic risk we’ve tolerated for too long.
Now layer that on top of 2024–2026 realities—consolidation, processor leverage, stubborn input costs, labor shortages, and interest rates that haven’t dropped the way anyone hoped. You’ve got a mental-health load that doesn’t show up on your milk check but absolutely shows up in your barn and your house.
You know people in this business who are running close to the edge—physically, mentally, and financially. “Showing up” can’t just mean after a visible accident. It has to include watching for the quieter stuff: the guy who stops returning calls, the coworker making more mistakes than usual, the family where one bad month of prices seems to hit harder than it should.
Mini-Moments That Show What “Showing Up” Actually Looks Like
Big headlines are built from small, unglamorous decisions. A few details from Wayne County are worth stealing outright.
The food. Abby jokes that Wayne County people sure know how to cook. For weeks, the kitchen counters stayed full: hot casseroles, snack trays, grab-and-go items for the kids. The food itself wasn’t the point. The point was the message: “You don’t have to think about supper tonight. We’ve got that piece.”
The quiet chores. One neighbor made a habit of showing up early, doing a full round of chores, and leaving before anyone could say thank you. Calves fed, pens cleaned, gates latched. No Facebook post, no photo, no public pat on the back. Just work done when the farm needed fewer decisions, not more.
The school connection. Green Elementary’s PTO could’ve checked the “we sent a sympathy card” box and moved on. Instead, they organized the restaurant fundraiser and used a “student day off” incentive to bring in more families. They told the kids, in actions: “Your school sees what your family is going through. You’re not invisible.”
The tractors. Those machines parked outside the church didn’t fix anything on paper. What they did was silently tell Reed’s kids: “Your dad mattered to a lot of people.” Ten years from now, those kids will remember that wall of iron as clearly as any words they heard.
None of these actions use the word “community.” They don’t have to. They define it.
What This Means for Your Operation
If you strip away the emotions, what Wayne County proved is simple: community is infrastructure. You either invest in it before you need it, or you find out what it costs not to have it when everything goes wrong.
Farm families that aren’t alone recover faster—financially and operationally—because chores, crops, and kid logistics don’t collapse alongside grief. That’s not soft thinking. That’s business continuity.
Here are the hard questions worth asking this month:
If a tractor rolled or a fire started on your place tomorrow, who are the first three people who would be in your yard without being asked?
If it happened to a neighbor instead, would anyone automatically assume you were one of those three?
If you had to line up 20 tractors and trucks as a sign of respect, who would answer that call—and who wouldn’t notice?
Who on your team or in your circle has been quieter, shorter-tempered, or more withdrawn than usual lately—and when was the last time you looked them in the eye and asked how they’re really doing?
If you can’t rattle off names without thinking too hard, you don’t have a phone tree. You have a hope and a prayer.
And if you sign the checks or make the schedule, you’re the one who can change that.
What You Can Actually Do This Month
If you’re wondering where to start, here’s the short list.
Build a simple phone tree now. Don’t overcomplicate it. Aim for at least 8–10 key people on your road, in your church, and in your school community. Decide who calls whom in the first 15 minutes if there’s an accident, sudden death, major health crisis, or barn fire. Write it down where people can actually see it—in the milk house, office, or group chat.
Pick three farms to check on. Not with a text. With a quick call or visit. Ask, “How are you doing—really?” and be ready for the answer to take longer than you planned.
Involve your youth on purpose. 4-H and FFA clubs can own “comfort” jobs in a crisis: cards, posters, freezer meals, calf chores. Give them clear roles so they grow up knowing how to show up instead of watching from the sidelines.
Talk about mental health out loud. Put it on the agenda at your discussion group, local dairy association meeting, or men’s breakfast. Share one real story, even if it’s uncomfortable, and be the one who goes first. Make it normal to say, “I’m not okay right now,” before someone breaks. That’s not weakness; it’s maintenance. If you or someone on your team feels overwhelmed, talk to your doctor, a trusted advisor, or a local mental-health provider.
Practice before the crisis. Help each other with harvest, planting, big herd moves, or barn clean-outs, so you already know how to work together. You’ll spend a few hours now—or you’ll scramble from zero on your worst day.
Tie safety and support together. As you review protocols around pits, lagoons, and confined spaces—gas monitors, ventilation, entry rules—ask yourself: “Who else knows this? Who would enforce it if I’m not here?” If there’s any task on your farm that only one person can do safely, that’s a red flag. Train at least one backup and write down the protocol. Safety that only lives in your head isn’t safety.
None of this replaces hard safety work around manure pits, lagoons, and confined spaces. You still need lock-out/tag-out, proper equipment, training, and clear protocols.
But when safety systems fail, insurance is slow, milk prices are tight, and official help ends—this is what catches people.
Key Takeaways
Community doesn’t appear out of thin air in a crisis. It’s built on years of small, quiet favors when nothing is on fire.
Kids are watching. Who shows up, who kneels down to their level, who keeps coming back after the casseroles are gone—that’s what they’ll remember long after the details fade.
Leadership on a dairy isn’t just about numbers and banners. It’s about who you are when someone down the road is in trouble.
“Showing up” includes the quiet stuff. Burnout, withdrawal, depression—these don’t announce themselves the way a tractor accident does. Check on your people before they break.
Safety that lives only in your head is a liability. If nobody else on your operation knows your protocols or would enforce them without you, that’s a gap you can fix this week.
Lead Like Reed
Underneath all the grief, this is a story about assets—just not the kind your accountant can depreciate.
On the hard-numbers side, you chase efficiency, butterfat, component premiums, and labor stability because the economics of 2024–2026 don’t leave much slack. If you’re not on top of genetics, feed, and contracts, you get run over. We all know that.
On the human side, there’s another question that matters just as much to long-term survival: when—not if—something goes very wrong, is your farm part of a community that knows how to respond?
That’s not a feel-good side issue. It’s about whether your family, your workforce, and your local dairy ecosystem can take a hit without collapsing.
So here’s the challenge, almost a year after Reed’s accident:
Look at your own road. Who would need you if something happened tomorrow?
Look at your own barn. Who would you call first if it was your tractor in the pit, your fire, your heart attack in the parlor, or your brain finally saying “enough” after too many bad months in a row?
Look at your own kids and grandkids. What stories do you want them telling 10 years from now about how your community handled hard things?
Reed didn’t get a vote on what happened on March 5, 2025. His brothers did everything they could in a window that physics, machinery, and toxic gas had already stacked against them. His wife, kids, and parents didn’t choose any of it.
What they did get—and what they’re still getting a year later—is a community that decided they weren’t going to carry it alone. A community that turned a barn into both a wedding hall and a sanctuary of grief. A community that lined up tractors, cooked meals, ran fundraisers, and kept showing up long after the news cycle moved on.
Support Type Wayne County Response Typical Farm Crisis Response Immediate Response (0-3 days) 20+ neighbors in yard day 1, full chore coverage Family handles alone, maybe 1-2 calls Funeral/Memorial Logistics Barn transformation, shuttle buses, tractor line, parking coordination Funeral home handles, family figures out details Food/Meals Weeks of daily hot meals, grab-and-go for kids, coordinated delivery 3 days of casseroles, then silence Financial Support Crowdfunding, school fundraiser ($5,000+), sustained donations Maybe a GoFundMe, no follow-up Chore/Labor Coverage Daily unannounced chore coverage for weeks, crop/haying help 1 week if lucky, then “back to normal” School/Kids Support PTO-organized fundraiser, student engagement, visible recognition Sympathy card, kids expected to cope alone Long-Term (3+ months) Ongoing check-ins, continued meals, relationship maintenance “How are you holding up?” texts, no action Phone Tree/Coordination Pre-existing relationships, clear roles, no central organizer needed Confusion, duplicate efforts, gaps in coverage Mental Health Follow-Up Community members trained to recognize signs, ongoing support “Let us know if you need anything” (passive) Business Continuity Farm operations maintained, no production loss, equity preserved Operations suffer, milk quality drops, financial losses compound
You can’t control every accident or every market swing. You can control whether anybody in your circle ever has to face one alone.
So the next time you hear about a farm accident, a diagnosis, or a sudden death—whether it’s in your county or three states away—don’t just shake your head and scroll on.
Ask yourself, honestly: “What would ‘lead like Reed’ look like where I live?”
Then do one concrete thing this month to make sure no farmer on your road has to stand alone when their barn—or their mind—goes dark.
Week
Action Item
Output/Deliverable
Time Required
✓
Week 1
Build your phone tree
List of 8-10 names: neighbors, church, school contacts who would respond in first 15 minutes if something went wrong
2 hours
☐
Week 2
Make 3 farm check-ins
Call or visit 3 farms in your area—ask “How are you doing, really?” and be ready for the answer to take longer than you planned
3 hours
☐
Week 3
Assign youth crisis roles
Meet with local 4-H/FFA club—define specific “comfort jobs” (cards, posters, freezer meals, calf chores) youth can own during next community crisis
1.5 hours
☐
Week 4
Put mental health on agenda
Add mental health discussion to your next dairy association meeting, men’s breakfast, or discussion group—share one real story and go first
1 hour
☐
BONUS: Practice Before Crisis
Help a neighbor with harvest, planting, big herd move, or barn cleanout so you already know how to work together when everything falls apart
Completed joint work project with neighboring farm
4-6 hours
☐
Complete references and supporting documentation are available upon request by contacting the editorial team at editor@thebullvine.com.
Digital Dairy: The Tech Stack That’s Actually Worth Your Investment in 2025 – Exposes the tech-stack hype and highlights the predictive analytics and sensor fusion actually boosting bottom lines in 2026. Gain a competitive advantage by identifying the specific integrations that turn raw barn data into profitable management decisions.
The Sunday Read Dairy Professionals Don’t Skip.
Every week, thousands of producers, breeders, and industry insiders open Bullvine Weekly for genetics insights, market shifts, and profit strategies they won’t find anywhere else. One email. Five minutes. Smarter decisions all week.
79% of U.S. milk runs on immigrant labor. One Idaho dairy lost a third of its crew in 3 weeks—no raid, just fear from one 50 miles away. You have 72 hours.
Executive Summary: Seventy-nine percent of U.S. milk comes from farms that depend on immigrant labor. When that labor vanishes, you don’t have weeks to pivot—you have 72 hours before milking intervals stretch, SCC climbs, and fresh cows slide into DAs and metritis while you’re too short-staffed to catch them. A Texas A&M modeling study found that losing half of immigrant dairy workers would eliminate 1.04 million cows and 24.2 billion pounds of milk, causing $16 billion in economic damage. One Idaho dairy saw a third of its crew disappear in three weeks—not from a raid on their farm, but from fear after enforcement hit a plant 50 miles away. For a 450-cow herd at $18/cwt Class III, losing 5 lb/cow/day for two weeks means $5,670 off the milk check before you count the fresh cows that went south. This article delivers a working 72-hour contingency plan: map your weak spots, quantify your labor exposure, stress-test your AMS assumptions, build a crisis reserve, and get your vet, nutritionist, and lender in the same room before you need them.
Armando, a Mexican employee at Rosenholm Farm in Cochrane, Wis, works in the milking parlor. He asked that his last name not be used because of his immigration status. Armando is among the estimated 51 percent of all dairy workers nationwide who are immigrants. His boss, John Rosenow, says that if his foreign-born employees were deported, or decided to look for work elsewhere, Americans would lose their jobs too, because the farm would be forced to shut down.
If you’re milking cows in 2026, the fact that immigrant workers provide about 51% of hired dairy labor and help produce roughly 79% of U.S. milk isn’t an academic statistic—it’s the foundation of your pay price. When that foundation cracks, you don’t have months to pivot. You have a 72-hour window before your herd health and your balance sheet start taking hits.
How Exposed Is Your Operation?
The Texas A&M AgriLife Center for North American Studies surveyed 973 dairies across 18 states to quantify who’s actually doing the work on U.S. farms. Their findings still anchor most labor discussions:
Immigrant labor accounts for about 51% of all dairy labor.
Farms employing immigrant workers ship nearly 80% of the U.S. milk supply.
Compared with earlier surveys, both the immigrant share of the labor force and milk production had increased, not decreased.
That’s the national backbone. How it lands on your farm depends on where you milk and how you’re set up.
Wisconsin: Fewer Herds, More Cows Per Farm
Wisconsin had about 5,661 licensed dairy herds as of January 2024—down from 9,304 in 2017 and roughly 29,000 in 1995. Average herd size climbed from roughly 138 cows in 2017 to about 224 cows in 2023.
That’s 86 more cows per farm in six years. Nobody added 86 new family members to the payroll.
Consultants working with 300–600-cow freestall dairies in the Fox Valley and central Wisconsin see a consistent pattern: farms that used to run on family plus a couple of locals now rely heavily on immigrant workers. The larger ones simply don’t operate without them.
Northeast: Smaller Herds, Same Reliance
In New York and Vermont, herd sizes tend to run smaller on average, but labor dependence looks familiar once you hit commercial scale. Research on Latino dairy workers in both states shows they’re concentrated in milking, cow-side treatment, bedding, and health-spotting roles.
Vermont-focused studies estimate roughly 1,000–1,200 Latinx immigrant farmworkers support that state’s dairy sector at any given time.
Those workers don’t show up in your DHIA printout. They show up in whether the parlor, fresh pen, and calf barn stay on schedule when somebody disappears.
West and Southwest: Thousands of Cows, 24/7 Systems
In Texas, Idaho, New Mexico, and Arizona, many dairies run herds in the thousands across multiple sites. Multi-shift parlors, feed centers, and hospital pens operate around the clock. Foreign-born workers sit at the center of that system.
Take that labor away, and the math turns ugly fast.
Bottom Line: If immigrant labor wobbles, it doesn’t just hit someone else’s mega-dairy. It hits the backbone of the U.S. milk supply and any herd depending on hired help to keep parlors, fresh cows, and calves on schedule.
The Big Math
Texas A&M stress-tested what would happen if immigrant labor dropped. Here’s what the models show:
Scenario
Cows Lost
Milk Production Change
Economic Hit
Retail Impact
50% labor loss
1.04 million
−24.2 billion lb (−11.7%)
−$16 billion
Moderate increase
100% labor loss
Not modeled
Farm sales down $11.6B
−$32.1 billion total
Prices nearly double
These are modeled scenarios, not guarantees. But they frame what’s on the line when policy shifts—or enforcement heats up.
Your Parlor, Your Numbers
Say you’re milking 450 cows at 80 lb/cow/day. A labor shock doesn’t close your doors, but it drags your routine enough to cost you 5 lb/cow/day for two weeks:
450 cows × 5 lb × 14 days = 31,500 lb less milk
31,500 lb ÷ 100 = 315 cwt
Herd Size
Lost Milk (cwt)
Milk Price ($/cwt)
Milk Check Loss
300 cows
210
$18.00
−$3,780
450 cows
315
$18.00
−$5,670
1,000 cows
700
$18.00
−$12,600
The November 2025 Class III price hit $17.18/cwt, $2.77 below the November 2024 price. The 2025 benchmark Class III averaged about $18.01/cwt. At $18:
315 cwt × $18 = $5,670 off your milk check in 14 days
That’s just the volume loss. It doesn’t count fresh cows sliding into DAs or metritis while you were short-staffed, or calves getting shorted on bedding.
Bottom Line: The national models tie immigrant labor to millions of cows and tens of billions of dollars. At the farm level, a modest production slip in a 450-cow herd means a four-figure hit in two weeks—before you count health and calf costs.
When Enforcement Heats Up: The Fear Effect
A working paper on 2025 ICE raids in California’s Oxnard/Ventura County estimated what happens when immigration enforcement ramps up in an agricultural region:
20–40% reduction in available agricultural workers
$3–$7 billion in modeled crop losses
5–12% retail price increases for some produce
Those are estimates, not line-by-line ledgers. But they match what farmworker researchers describe as the “chilling effect.” Once enforcement becomes visible—raids, news footage, community chatter—workers don’t just leave the farm that got visited. They leave the region, the sector, or the country.
The total workforce loss ends up being multiple times the number of people actually detained.
A nutritionist servicing several 1,000-cow freestalls in Jerome County, Idaho, reports one client saw its workforce shrink by roughly a third within three weeks of a high-profile enforcement action at a nearby packing plant. Nobody came to the dairy. Workers simply decided the risk picture had changed.
You don’t need flashing lights in your driveway to wake up short-handed.
Even if agents never set foot on your yard, enforcement actions in your region can strip out a big share of the labor pool in weeks. Your exposure is bigger than the names on your own payroll.
Why 72 Hours Is the Breaking Point
On a well-run herd, milking locks in at 12-hour intervals for 2× herds, or tighter for 3× herds. Push high-yield cows beyond that, and you pay with SCC, mastitis risk, and lost milk.
Vets and consultants who’ve walked herds through blizzards, flu waves, and bad luck report a similar 72-hour patternwhen crews shrink faster than you can replace them:
0–24 hours: Scrambling, but intact. Every pen still gets milked and fed. Shifts run long. Fresh checks get rushed. Calf feeding technically happens, but not how you’d like. You’re triaging, but your system is still recognizable.
24–48 hours: Cracks appear. Some pens stretch to 16–18 hours between milkings. Over-full udders and milk leakage show up. SCC creeps. Fresh cows that were “a bit off” yesterday now have fevers or poor appetite, and you don’t have enough eyes to sort through them. Calf hygiene slips.
48–72 hours: You’re not running the same herd. Low-priority groups can slip beyond 24 hours between milkings if you’re not ruthless about priorities. Untreated fresh cows slide into full-blown metritis, severe ketosis, or DAs. Calf scours or pneumonia spikes.
Those three days are the difference between “we had a brutal week” and “we’re still digging out a year later.”
Then there’s welfare and legal risk. States like California and Wisconsin have clear animal care standards. If a vet or inspector walks in on day three and sees over-distended udders, untreated down cows, and underfed calves, they’re not seeing a rough patch. They’re seeing whether you had a plan.
You don’t control when a labor crisis hits. You control whether those first 72 hours are organized around a written plan—or around panic and hope.
Robots: Strong Tools, Not Magic Exits
Whenever labor risk comes up, robots aren’t far behind. The real question: what can automatic milking systems (AMS) actually do in a 72-hour crisis—and what can’t they do?
What the Data Shows
A University of Wisconsin Extension survey of 50 U.S. farms that installed AMS found:
Labor hours per cow dropped by about 38% on average
Labor hours per cwt dropped by about 43%
At $15/hr, that’s roughly $1.50/cwt in labor savings
But the same work shows wide variation:
Around 8% of respondents reported no labor savings—maintenance and management ate the gains
About 25% reported savings above $2.40/cwt at $15/hr
Producer comments make the point bluntly: “Still need experienced labor to keep robots running” and “AMS is not stress free… mentally stressful.”
Robots don’t replace management. They expose it.
The Capital Side
AMS projects can run into the high six- to low seven-figure range once you factor in robots, construction, electrical, and barn changes. Divide by cows, and you’re often looking at several thousand dollars per head.
For a modern 500–1,000-cow freestall with good records and a lender who understands dairy, AMS often pencils as a labor tool. For a 150–250-cow herd in an older barn, the math is tighter—those projects hinge as much on succession and lifestyle as on pure labor savings.
In a 72-hour crisis, robots keep milking. But they don’t fix weak fresh-cow protocols, poor cow traffic, or a lack of cross-training on feeding and troubleshooting. They lower your day-to-day labor needs. If you lose the few people who understand the system, the risk just changes shape.
Robots take real pressure off labor in milking, but they shift risk to capital and technical management. They’re a tool in your labor strategy, not an escape hatch.
Region by Region: Same Biology, Different Wrappers
The biology doesn’t care where you live. The economics and options do.
Upper Midwest and Northeast: Many herds run 50–300 cows in older barns that have been upgraded over time. Deep processor relationships, tight land limits, and a mix of family and hired labor, where losing two or three key people can cripple the system. Their questions: How do we stay resilient without overleveraging? Where do we modernize without betting the whole place?
Southwest and Mountain West: Larger herds, often multiple sites and shifts. Heavy reliance on immigrant crews. Strict water and environmental rules. Their playbook leans into formal HR and immigration counsel, larger capital projects, and multi-site risk management.
Canada: Supply management and quota, with Temporary Foreign Worker (TFW) and provincial nominee programs. Federal and provincial reports show livestock sectors rely significantly on temporary foreign workers and wrestle with housing, retention, and program uncertainty. For an Ontario herd under quota, the labor crunch might first show up as missed butterfat targets and under-used quota days.
Quota or not, 50 cows or 5,000—the labor risk lands the same way. If key people vanish, you’re fighting biology and welfare expectations on a short clock.
Region
Typical Herd Size
Labor Dependence
Policy/Program Tools
Risk Level
Upper Midwest / Northeast (WI, NY, VT)
50–600 cows
Moderate to high; mix of family + immigrant workers
Limited H-2A access; state labor regs vary
High
Southwest / Mountain West (TX, ID, NM, AZ)
500–5,000+ cows
Very high; multi-shift operations heavily reliant
Some H-2A use; strict environmental/water rules
Very High
Canada (ON, QC, AB)
50–300 cows (quota)
Moderate; TFW + provincial nominees fill gaps
TFW program, provincial nominees; quota stability
Moderate
California
1,000–10,000+ cows
Extremely high; industrial-scale reliance
H-2A limited for dairy; strict labor + animal welfare laws
Extreme
The 72-Hour Contingency Plan
Treat this as a working plan, not just a read.
Map your weak spots. Write out: if three core workers didn’t show tomorrow, which cows, pens, and tasks would be at risk within 72 hours? Make sure at least two people besides you know that plan and where it’s kept.
Size your exposure. Look at how many critical roles are held by immigrant workers versus others. You don’t need to label anyone’s status—just understand where your labor risk actually lives.
Run the math with your numbers. Plug your herd size, production, and current pay price into the 5 lb/cow/day scenario. If that milk-check hit makes you flinch, that’s your starting point for crisis-reserve and staffing goals.
Treat AMS as one option, not salvation. If you’re considering robots, insist on farm-specific budgets, conservative labor-savings assumptions, and a clear plan for who will manage the system on day 1, day 100, and day 1,000.
Use your advisory team together. Bring your vet, nutritionist, and lender into one conversation. Lay out your 72-hour plan, your crisis-reserve goals, and your automation ideas. Ask them where they see your blind spots.
Benchmark by region and system, not emotion. Compare your staffing and cows-per-worker to operations like yours—same region, similar size and system—not just the biggest herd in the next state.
Key Takeaways
Your labor risk isn’t theoretical. Immigrant workers are behind about half of the hired dairy labor and nearly 80% of U.S. milk. When enforcement heats up, that dependence can translate fast into fewer cows, less milk, and higher prices.
The 72-hour window is real. Within two to three days of losing key workers, biology and welfare rules start calling the shots more than your intentions do.
Robots lower labor, not responsibility. AMS can significantly reduce milking labor on average, but some farms see no savings, and many need more skilled staff.
A crisis reserve buys decisions, not miracles. Money set aside for labor and legal shocks doesn’t guarantee a soft landing. It buys choices—legal help, overtime, temporary support—so you’re not making bad decisions because the account is empty.
Cross-training and culling are cheap, powerful levers. Teaching extra people to handle key tasks and moving out cows that don’t fit your system cost far less than a new barn or robots.
The Bottom Line
A third-generation dairyman from Clark County, Wisconsin—someone who’s lived through the 1980s interest squeeze, the 2009 crash, and 2020’s chaos—put it this way at a winter meeting: he can’t control Washington or Ottawa, but he can control how hard his own farm is to knock over.
You don’t get to choose when the phone rings with bad news about your crew. You do get to choose whether that call lands on a blank slate—or on a 72-hour contingency plan, some cash in reserve, and a herd that actually fits the people you have.
Complete references and supporting documentation are available upon request by contacting the editorial team at editor@thebullvine.com.
How Holstein USA’s Million-Cow Study Should Change Your Linear Type Strategy – Exposes the critical genetic link between linear type choices and robot efficiency. You’ll gain a high-impact framework to breed the “functional cow” required to maximize your automation investment and eliminate technical drama in the parlor.
The Sunday Read Dairy Professionals Don’t Skip.
Every week, thousands of producers, breeders, and industry insiders open Bullvine Weekly for genetics insights, market shifts, and profit strategies they won’t find anywhere else. One email. Five minutes. Smarter decisions all week.
If your best employee can’t hit the protocol, your farm has a six‑figure problem — not a training issue.
Executive Summary: In a heifer‑short, dairy‑beef market where it costs US$2,094–2,607 to raise a replacement, and day‑old beef‑on‑dairy calves can bring about US$1,400, sloppy execution has turned into a six‑figure problem for many dairies. This article uses McCarty Family Farm’s “top half only” genomic rule to show what happens when breeding, colostrum, and culling decisions actually match the math instead of the emotion. Data from MSU, Taiwanese sire‑checks, and large‑herd audits make the leak obvious: only 36% of farms hit FTPI targets, 27.78% of recorded sires are wrong, and even small timing errors in Double‑Ovsynch leave roughly a quarter of cows off‑protocol. From there, you get four concrete paths — harder genomic cutoffs with heifer‑inventory guardrails, redesigning impossible protocols instead of retraining, tracking results by person, and treating consistency as infrastructure — plus the trade‑offs on each. The summary farm‑level math on RPO, stall value, STP, and calf checks gives you simple “run your own numbers” thresholds so you can decide when to breed dairy, breed beef, or ship a cow based on what that stall can really earn over the next 12–24 months.
The most expensive execution gap on your dairy isn’t your semen bill, your ration, or even the latest heifer price spike. It’s the distance between what your protocols say and what actually happens when someone is standing in front of a cow with the wrong straw in his hand. In a heifer‑short, dairy‑beef world where total raising cost runs US$2,094–US$2,607 per heifer on many U.S. farms and can approach US$2,900 in higher‑cost systems, while top dairy‑beef calves in strong programs are bringing around US$1,400 per head, that gap adds up fast.
McCarty Family Farm in Kansas reports, based on its own records, that it has genomically tested more than 75,000 females since 2018. Their rule is brutally simple: the top half of the breeding herd creates the next generation, the bottom half goes to beef — regardless of age or stage. Applied consistently across breeding, colostrum, and culling, that kind of discipline can drive a six‑figure annual swing in profitability for larger herds compared to “raise every heifer” systems once you factor in stall value, heifer cost, and dairy‑beef calf prices.
If you’re running genomics, dairy‑beef, or both, this isn’t theory. This is your milk cheque, your replacement pipeline, and your risk exposure for 2024–2026.
Only 36% of Farms Hit Their Colostrum Targets
Back in 2016, Michigan State University Extension and collaborators looked at the failure of passive transfer (FTPI) and colostrum management on 50 Michigan dairy farms. Only 18 of those 50 farms (36%) hit the industry goal of less than 10% FTPI, meaning at least 90% of calves achieved successful passive transfer. That left 32 farms missing the target, and on six of those herds, half or more of the calves failed. These weren’t wrecks. They were farms that thought their colostrum program worked.
You see the same pattern in breeding records. A 2022 SNP‑based sire‑verification study from Taiwan checked 2,059 cows on 36 dairy farms and found that 27.78% of recorded sires were incorrect — wrong bull codes, wrong storage location, or recording errors. In other words, more than one in four matings went to a different bull than the records claimed.
Semen handling has its own quiet leak. Extension and A.I. handling guidelines generally recommend that sexed semen be deposited within about 10 minutes of thawing to protect fertility. On a busy timed‑AI morning with 40–80 cows, that window gets stretched more often than anyone likes to admit.
Feed isn’t immune. Nutritionists will tell you there are three rations on every dairy: the ration on paper, the ration delivered, and the ration cows actually consume. Forage dry matter swings, over‑mixing that chews up effective fiber, and real intakes drifting several percentage points from the estimate are common. A lot of the math you use on feed cost and income over feed cost still assumes a ration that your cows never really eat.
This isn’t a “people don’t care” problem. It’s a “protocols don’t fit reality” problem.
The Retraining Fallacy
Here’s the default move that quietly costs you: a protocol misses its target, so you schedule more training. Another meeting. Another sign.
But when the same protocol keeps failing after you’ve retrained more than twice, you’re almost never looking at a knowledge problem. You’re looking at work that simply can’t be done the way it’s written.
MSU’s colostrum work shares a good example from the maternity pen. Feeders in one herd were expected to check calving progress every 30 minutes, in addition to cleaning stalls, processing newborns, and treating sick cows. On paper, that looks like “best practice.” On a rough day, it’s physically impossible.
There’s a sharper question than “Who screwed up?” Ask this instead: Does your best employee also struggle with this protocol? If the person you trust most can’t hit it consistently, the protocol is broken—not them. At that point, more training isn’t a solution. It’s self‑deception.
And if you’ve watched a good A.I. tech or feeder drowning in a pile of “must‑do” tasks, you’ve seen exactly how that plays out.
“If your best employee can’t hit the protocol, the protocol — not the person — is broken.”
The 13% Colostrum Gap You Don’t See Until You Measure It
At one large U.S. dairy, a retrospective review of colostrum results showed that an employee measured serum total protein (STP) using a simple refractometer. Same herd, same colostrum, same written protocol — just different people doing the work.
One feeder averaged 6.0 g/dL STP.
Another averaged 5.3 g/dL STP.
On that farm, that’s roughly a 13% performance gap between 6.0 g/dL “excellent” results and 5.3 g/dL borderline passive transfer. The only real difference was who mixed and fed the colostrum.
Economically, FTPI is a slow bleed. Calves with FTPI have higher morbidity and mortality, weaker pre‑weaning growth, and higher treatment costs. Some never reach first calving. Others enter the milking string and never deliver the production their genetics suggest they can. Spread that 13% gap over a few hundred calves, and you’re looking at a five‑figure cost that never shows up as a separate line on the milk cheque.
Now layer in dairy‑beef. A 2025 Purina/CattleFax analysis put average day‑old dairy‑beef calves around US$1,400, up from roughly US$650 three years earlier — more than double in a short window. Hoard’s Dairyman has been blunt that dairy‑beef calf prices are “breaking records” at many U.S. sales. A calf that ships at three days old with poor passive transfer is more likely to get sick, die, or need heavy treatment, and those problems pull down the prices buyers are willing to pay.
Colostrum research from MSU, Wisconsin, and others all point the same way: what you did with colostrum this morning is one of the main predictors of that heifer’s health and productivity down the road. If you haven’t pulled STP by employee lately, you’re relying on a farm average that might be hiding your weakest link.
Where Good Breeding Programs Quietly Go Sideways
On paper, your breeding plan might be elite. Genomics. Customized matings. Sexed semen on your best heifers. Beef semen on the bottom half.
But if the wrong semen ends up in the cow, or the right straw gets mishandled, the whole thing quietly falls apart.
The Taiwanese SNP‑based sire‑verification study puts hard numbers to that risk: 27.78% of recorded sires were wrong across 36 herds and 2,059 cows. That’s not a rounding error. That’s more than one in four cows with a different sire than your records say.
Here’s where the leaks show up on‑farm:
Tank chaos. Straws from multiple bulls share a goblet. The breeder fishes for the right code with the canister too high in the neck, exposing every straw they aren’t using to warm air. Semen‑handling guides warn that when liquid nitrogen depth drops below about 6 inches, the temperature in the neck can rise sharply; straws left above the frost line quickly take damage. Late nights, cramped spaces, and tanks tucked into corners all make it easier to stay above the frost line longer than you should.
Service‑number blind spots. Your plan says: sexed dairy for first and second service, beef from third service on. But if service numbers aren’t updated promptly, the person with the gun can’t follow the plan, no matter how good the spreadsheet looks.
Synchronization drift. Double‑Ovsynch is powerful — six injections, tight timing, strong conception when done right. Do the math: at just a 5% error rate per shot, the chance of a cow receiving all six injections correctly is about 74%, because 0.95 6 ≈ 0.735. That means roughly a quarter of your herd is on some other version of the protocol than you think.
The herds that consistently post top‑end reproduction numbers almost always share one habit: the same person both breeds and records, backed by a setup that makes the right straw easy and the wrong straw hard. Every handoff — between people, between shifts, between paper and software — is another leak you have to pay for.
Why That 95‑Pound Cow Is Still Standing in Your Barn
McCarty’s “top half only” rule sounds ruthless until you stand in front of a cow who’s right on the bubble.
Picture a second‑lactation cow giving 95 pounds, sitting in your bottom‑third genomically. On your genetic ranking, she’s an easy cull. In the parlor, she looks like money. Human brains are wired to value today’s visible rewards — that full unit of milk — more than abstract, future gains like a higher‑merit daughter calving in three years.
Culling work backs this up. Dairy Herd Management’s 2024 review of USDA/NAHMS data shows that about 70% of cows leave the herd within their first three lactations, and the average productive life is just 2.7 lactations. That same piece notes it takes more than three lactations to recoup roughly US$2,000 in raising cost. In other words, the “she hasn’t paid herself off yet” argument doesn’t hold up for most cows — they’re likely to leave before that point anyway.
This is where Retention Pay‑Off (RPO) earns its keep. RPO is the expected profit difference between keeping a cow versus replacing her in that stall. That 95‑pound cow might be cash‑positive day to day. But if a replacement would generate US$2.40/day more in the same stall, you’re effectively giving up US$2.40/day by keeping her. Over 200 days, that’s US$480 in missed profit per stall. The cow isn’t necessarily losing money — she’s just blocking a more profitable animal from using that space.
Recent reports show that average U.S. raising cost at US$2,355 per head, with most farms between US$2,094 and US$2,607. Other cost‑of‑raising work shows some systems pushing near US$2,900 per heifer. With those numbers and a 2.7‑lactation average productive life, hanging onto every decent cow just because she’s milking OK is usually the more expensive choice, not the safer one.
So the real money question isn’t “Is she still paying for herself?” It’s: “What’s the best use of this stall over the next 12–24 months?”
Four Practical Paths to Close the Execution Gap — and Protect Profit
You don’t close this gap with a nicer poster or one more meeting. You close it by picking an approach that fits your people and facilities, then building systems that still hold together on the worst days.
Path 1: Genomic Ranking With Hard Cutoffs
When it fits. You’re already genomic‑testing, you’ve got more heifers than you absolutely need, and you’re willing to let numbers overrule emotion when it comes to who gets dairy semen versus beef.
What it takes.
Genomic tests running roughly US$40–US$50 per head in many programs.
Software and discipline to rank animals, keep that list current, and get it in front of whoever is breeding.
A clear rule: top 40–60% by index get dairy semen, the rest get beef. No exceptions.
Where it bites back. CoBank’s August 2025 analysis — echoed by Hoard’s Dairyman and other outlets — projects U.S. replacement heifer inventories hitting a 20‑year low, dropping by roughly 800,000 head before they start rebounding in 2027. Fresh heifer prices “vaulted far into record territory” in spring 2025, with baseline pregnant heifers averaging about US$2,870 and premium groups fetching “upward of US$4,000” per head. Over‑culling in that environment can easily push you into US$3,000–US$4,000 heifer purchases just to refill stalls. If your replacement inventory isn’t at least 10–15% aboveminimum needs, going full “top half only” overnight is asking for trouble.
Phone‑friendly takeaway: Use genomics to steer dairy vs. beef, but only go harsh on the bottom half if you’ve clearly got a 10–15% replacement surplus and you’re truly comfortable buying heifers at US$3,000+ if you mis‑judge it.
Path 2: Redesign the System Before You Rewrite the Protocol
When it fits. You’ve already retrained a protocol two or three times, and you’re still not seeing the results move. Your best employees are missing steps or improvising on the fly.
What it takes.
A blunt look at time and motion: can one person actually do what you’re asking on a bad day?
A shorter list of critical steps that really move the needle (for colostrum, that usually means timing, volume, and quality at the first and second feeds).
Tools that remove choices: organized semen racks, simple color‑coding, auto‑ID checks, and checklists that must be signed off.
Where it bites back. You can absolutely overcorrect and strip out tasks that genuinely pay — like a documented second colostrum feeding — in the name of simplicity. The sweet spot is the simplest protocol that still pays, given your milk price, calf value, and labor cost.
Phone‑friendly takeaway: If your best person can’t hit the protocol, shorten it until they can. Then, only add back steps that clearly improve profit.
Path 3: Track Results by Person, Not Just Herd
When it fits. You know there are good days and bad days, but you’re not sure where the swings are coming from.
What it takes.
STP by calf feeder for the next 30–60 days.
Conception rate and pregnancy risk by A.I. technician and by protocol (e.g., Double‑Ovsynch vs. natural heats).
Protocol completion rates by shift for things like second colostrum feeds, vaccines, and synchronization shots.
The Michigan colostrum work and that large‑herd STP example both show it: the gap between “excellent” and “fair” passive transfer can sit almost entirely in who mixes and feeds colostrum.
Where it bites back. If you jump straight from data to blame, you’ll destroy trust. The order has to be:
Check whether they had the time, tools, and information.
Fix those gaps.
Then, coach, reassign, or change staffing if you still see the same pattern.
Phone‑friendly takeaway: Use the numbers to identify friction points and training needs—not to pin everything on one person.
Path 4: Treat Consistency as Infrastructure
When it fits. Every operation, regardless of size or system.
What it takes.
Written, non‑negotiable checklists for key jobs (colostrum, transition cows, breeding, semen tank handling).
Documented second colostrum feeding where your disease risk and calf value justify the extra pass.
Scheduled mixer‑wagon calibrations and forage dry‑matter checks so your ration on paper stays close to the ration in the bunk.
Feeding times that stay within a tight window day after day to smooth out intakes.
Where it bites back. Consistency without review can lock you into executing a plan that no longer fits 2024–2026 economics. Feed prices, calf values, and heifer costs have all moved since 2020. Consistency has to be paired with regular “does this still make money?” checks.
Phone‑friendly takeaway: Lock in consistency for the handful of jobs that really drive calf health, conception, and stall value — then put a date on the calendar to re‑run the math.
Running the Numbers: Dairy‑Beef Calves vs. Raising Replacements
Scenario
Raise as Dairy Replacement
Sell as Dairy‑Beef Calf
Raising cost
US$2,094–US$2,607 per heifer on typical U.S. farms; some systems near US$2,900
≈US$50–US$75 in first‑week costs
Forgone dairy‑beef sale
≈US$1,400/calf (recent U.S. average in strong programs)
Depends on genetics, health, and reaching 3+ lactations; average life ≈2.7 lactations
≈US$1,400 day‑old income in active programs
Break‑even requires
More than 3 lactations to recoup the raising cost
Essentially week one
Exact numbers depend on your region and marketing channel. Recent U.S. commentary shows day‑old dairy‑beef calves averaging around US$1,400, with some lots higher and some lower, while straight Holstein bull calves still trail by several hundred dollars.
This isn’t a blanket order to stop raising heifers. It’s a reminder that every “just in case” heifer carries a real opportunity cost in a heifer‑short, dairy‑beef world.
Regional Sidebar: Calf and Heifer Prices Outside the U.S.
If you’re reading this from outside the U.S., the exact dollar or euro values look different. But the pattern is starting to feel very familiar.
Canada. Manitoba and national beef‑market reviews for 2024–2025 point to stronger calf prices lifted by tighter beef cow inventories. At the dairy end, Ontario auction reports show fresh milk cows and bred heifers trading in the C$3,000–C$4,400 range at selected sales, with individual top cows over C$5,000 and quality springers frequently around C$3,000–C$3,800, while open heifers often fall in the C$1,500–C$2,250 band. That’s not a national average, but it’s a clear signal that replacements aren’t cheap.
European Union (example: Ireland and Denmark). In June 2025, the Irish Farmers Journal reported that Friesian bull calf averages jumped to €209, nearly three times the roughly €67 average a year earlier, while Angus and Hereford dairy‑beef calves were regularly trading in the mid‑€200s to mid‑€300s. Teagasc’s mid‑2025 update noted that €500–€700 for very strong dairy‑beef calves had become “the new normal” for the top of the trade in some rings. In Denmark, there is a national calf‑pricing scheme where a 60 kg Holstein x beef calf earns about €100, plus bonuses that can add another €100 for the best male calves.
The exact dollar or euro values are different, but the pattern is similar: stronger beef prices and constrained replacement supplies are lifting both dairy‑beef calf values and in‑calf heifer prices in Canada and parts of Europe. The stall‑value and opportunity‑cost questions in this article still apply — you just need to plug in your local calf and heifer prices.
The Execution Cost in One Table
Leak Point
Statistical Frequency
Economic Impact (per event)
Incorrect sire recording
27.78% of cows had a wrong recorded sire in one Taiwanese dataset
Loss of expected genetic gain; weaker matings; less reliable proofs
Colostrum execution (STP)
13% performance gap between 6.0 g/dL and 5.3 g/dL by an employee on one large herd
Higher morbidity and mortality, more treatments, and lost milk in the first lactation
Timed‑AI protocol errors
5% error per shot ≈ , 26% of cows missing at least one of six Double‑Ovsynch injections
More open cows, longer calving intervals, fewer high‑value dairy pregnancies
Culling delay (RPO)
N/A (herd‑specific)
Example: ≈US$480 missed profit per stall over 200 days at US$2.40/day lost opportunity
Signals to Watch Over the Next 24–36 Months
Your own execution data.
If you want to know where your biggest leaks are:
Pull STP distributions by feeder for the next 30–60 days.
Track conception and pregnancy risk by technician and by protocol type.
Audit how many cows actually complete full synchronization protocols and second colostrum feeds.
Until you see those numbers by person and protocol, you’re guessing where your execution gap really sits.
Replacement pipeline stress.
CoBank’s August 2025 report predicts that: U.S. replacement heifers are expected to hit a 20‑year low, with an ~800,000‑head reduction before inventories start to rebuild in 2027. Heifer prices have already “vaulted far into record territory,” with baseline bred heifers near US$2,870 and premium groups “upward of US$4,000.” Any aggressive culling or dairy‑beef plan has to start with an honest count of how many replacements you have and how many you really need.
Dairy‑beef premium durability.
Dairy‑beef calves are benefiting from tight beef supplies and expanded fed‑beef capacity. CoBank’s outlook suggests 2027 as a likely turning point in the heifer cycle, and broader beef‑market work points to eventual easing of the tightest supply conditions. That doesn’t mean the bottom falls out, but it does mean the easiest premiums can narrow. Herds with consistently low FTPI and strong calf health should stay at the top of the dairy‑beef market even when everyone else starts catching up.
What This Means for Your Operation
If your best person can’t hit a protocol, stop retraining and start redesigning. Before the next “training session,” audit the time, tools, and information they actually have. If the protocol doesn’t fit reality, fix the protocol—not the person.
Audit colostrum by person, not just herd average. If STP by employee shows a spread of 0.5–1.0 g/dL, you’ve got an execution gap that will come back at you in treatment costs, death loss, and weak first‑lactation cows.
Run RPO, not emotions, on your bottom third. When a cow’s projected daily profit is clearly below what a replacement could do in that stall — and your heifer inventory is solid — it’s time to let her go, even if her current milk looks good.
Use genomic ranks to control who gets dairy semen, but only as aggressive as your replacement math allows. If your replacement count isn’t at least 10–15% above minimum needs, phase in hard cutoffs instead of flipping the switch to “top half only” overnight.
Treat dairy‑beef as a serious margin tool, not a fad. It only really pays if your colostrum and calf care are strong enough to deliver high‑value calves consistently. If FTPI is shaky, fix that first before you chase top‑tier calf checks.
Spend time in the parlor and by the tank. Watch how IDs are read, how long the canister stays in the neck, and how often people hunt for the right straw above the frost line. The cheapest fixes usually hide in daily habits, not in new technology.
Key Takeaways
Execution gaps — not genetics or feed alone — may be one of the biggest hidden costs on modern dairies, once you line up the FTPI data, sire‑error rates, and heifer economics against what you thought your protocols were delivering.
Only 36% of the 50 Michigan farms in a major colostrum project actually met passive transfer goals, even though most believed their routines were solid. Until you track STP by person, you honestly don’t know where your farm sits.
When you’ve retrained a protocol twice, and results haven’t moved, the problem is almost always the system — not the people. Redesign the work, remove failure points, and then retrain with a protocol that fits real‑world conditions.
Retention Pay‑Off and stall opportunity cost matter more than whether a cow is “still paying for herself” on paper, especially when 70% of cows leave before three lactations and the average heifer raising cost sits around US$2,355 per head.
Tight heifer inventories and record dairy‑beef calf values make poor execution more expensive than ever.In 2024–2026, every protocol miss has the potential to waste a historically valuable calf and a historically valuable stall.
The Bottom Line
The herds that win over the next few years won’t be the ones with the fanciest protocols in a binder. They’ll be the ones that build simple, durable systems their people can hit on the worst days, not just the best.
If you pulled your numbers tomorrow, which protocol would look the worst — and what’s your plan to rebuild it before it costs you another year?
Complete references and supporting documentation are available upon request by contacting the editorial team at editor@thebullvine.com.
Learn More
Beef-on-Dairy’s $6,215 Secret: Why 72% of Herds Are Playing It Wrong – Arms you with the reproductive benchmarks and genomic multipliers needed to separate elite operators from the 72% currently leaking cash. You’ll gain a direct method for identifying high-value pregnancies that turn standard heifers into six-figure margin drivers.
438,000 Missing Heifers. $4,100 Price Tags. Beef-on-Dairy’s Reckoning Has Arrived. – Exposes the structural $4,100 heifer shortage and delivers a long-term roadmap for surviving the “missing heifer” era. This analysis positions your operation for 2027 by breaking down how to balance immediate beef-check revenue against future milk-string stability.
CDCB’s December ‘Housekeeping’ Is Actually Preparing Dairy Breeding for an AI Revolution – Reveals the digital infrastructure being built for the 2028 AI transition and arms you with the data-quality steps needed today. This guide ensures your breeding program stays competitive as machine learning replaces traditional evaluations to maximize genetic accuracy.
The Sunday Read Dairy Professionals Don’t Skip.
Every week, thousands of producers, breeders, and industry insiders open Bullvine Weekly for genetics insights, market shifts, and profit strategies they won’t find anywhere else. One email. Five minutes. Smarter decisions all week.
420 dairy businesses, $28.6 million frozen—and why USDA’s Dairy Business Innovation grants still only cover 4–7% of a real creamery build.
Executive Summary: The average DBI grant is $112,600. The average creamery costs $1.5–2.5 million. That gap—grants covering just 4–7% of real project costs—is why the February 2025 funding freeze hit so hard: 420 dairy businesses with $28.6 million in pending reimbursements suddenly learned whether their plans could survive without the money they’d been counting on. The projects that weathered it shared a pattern: solid base dairy economics, committed buyers before pouring concrete, and business cases that penciled without grants. Farms like Hill Valley Dairy in Wisconsin and Nash Family Creamery in Tennessee fit that profile—DBI helped them move faster, but it wasn’t the reason their businesses existed. For producers weighing value-added processing, the deciding question isn’t whether to apply—it’s whether your project survives the zero-grant scenario when your cost of production already pushes $40/cwt or higher. DBI is an accelerator for viable businesses, not a rescue for struggling ones.
You know the story. A grant program comes along, the brochures look shiny, and suddenly everyone’s talking about building a creamery.
If you’re milking somewhere in the 80–300 cow range and thinking about value-added processing in 2025 or 2026, you’ve probably heard about USDA’s Dairy Business Innovation grants. The pitch sounds great: federal money to help you build a plant, bottle your own milk, make cheese, escape the commodity trap. What you don’t hear as often is that the average DBI award covers roughly 4–7% of a realistic project budget—and that 420 dairy businesses learned the hard way in early 2025 just how quickly “sure thing” grant money can freeze up.
This is the conversation we’d be having over coffee: what DBI actually is, what it costs to build a real plant, who wins with this program, and how to figure out if it makes sense for your operation.
What DBI Actually Covers—And What It Doesn’t
Let’s start with the basics, because a lot of producers overestimate what DBI can do.
USDA’s Dairy Business Innovation Initiatives came out of the 2018 Farm Bill. Since 2019, the four regional DBI centers have together awarded just over $79.2 million in competitive funds to 704 unique entities—farms, processors, and allied dairy businesses—across 40 states and Puerto Rico, according to the DBII Combined Impact Report published in September 2025. That averages out to roughly $112,600 per funded entity, nationwide.
Those four centers are the Dairy Business Innovation Alliance (DBIA) in the upper Midwest, the Northeast Dairy Business Innovation Center (NE-DBIC) based in Vermont, the Southeast Dairy Business Innovation Initiative (SDBII) run by the University of Tennessee, and the Pacific Coast Coalition coordinated by Fresno State.
USDA has kept money flowing. By late 2024, DBI had invested more than $64 million across about 600 projects, and another $11-plus million went out to the four centers. In January 2026, USDA announced another round—again over $11 million—to keep DBI grants going into processing, market expansion, and workforce projects.
Here’s the part that changes the conversation when you’re sitting with your banker.
DBI grants are reimbursement-based. NC State Extension, the University of Tennessee folks, and the Wisconsin Cheese Makers Association all make that clear. You pay out of your own pocket or on your line of credit first, then submit the paperwork and get reimbursed. At least half of all DBI funds must be awarded as subawards to farms and processors, and some programs—like SDBII’s farm grants—require a 25% cash match for certain infrastructure projects.
In plain terms: DBI is designed to share risk on projects that already make sense. It was never free money to turn a weak idea into a strong business.
When $28.6 Million Got Frozen: The Stress Test Nobody Asked For
In early 2025, every DBI recipient in the country got a sharp reminder of that reality.
On February 26, 2025, NC State’s dairy extension team posted a notice titled “SDBII 2025 Funds Frozen.” USDA had told all four DBI centers to pause reimbursements on grant expenses, effective January 19, 2025. Any DBI-eligible costs after that date wouldn’t be reimbursed until further notice.
Roughly 420 dairy businesses across the four centers had projects underway, and about $28.6 million in reimbursements were suddenly in limbo. The Wisconsin Cheese Makers Association provided more detail: 88 businesses in the DBIA region alone were waiting on nearly $6.5 million.
The freeze lasted about a week and a half before pressure from cheesemakers, WCMA, and lawmakers—including Wisconsin Senator Tammy Baldwin—got USDA to reverse course. Brownfield reported on March 6, 2025, that the freeze had been lifted and reimbursements were back on track.
Here’s what matters: the freeze acted like a stress test. It didn’t create weak balance sheets—it exposed how fragile some projects already were, something lenders and industry groups pointed out as they watched which projects wobbled when reimbursements paused. WCMA noted in its communications that some smaller operations had structured their entire cashflow around those expected reimbursements. When the money stopped, mid-project builds got shaky fast. The businesses that weathered it were the ones that could have survived without it.
That’s not a knock on any individual operation. It’s a lesson in what happens when you build a plan that depends entirely on money you don’t control.
A lot of lenders looked at that situation and asked a simple question: “If this project only works with DBI plugged into the spreadsheet, should we really be doing it?”
The Real Start-Up Bill: Why “We’ll Just Build a Creamery” Means Seven Figures
So let’s talk about the check you’re actually writing.
University of Tennessee’s on-farm processing work is a good place to start. One of their scenarios looks at building a cow-milk processing plant of about 14,400 square feet—not a boutique hobby, but a modest commercial plant with room to grow.
The estimates in that example break down like this:
Roughly $1.5 million for the facility
Just over $1 million for processing equipment
More than $1.3 million in year-one cashflow needs for labour, utilities, ingredients, and loan payments
Cornell’s research on farmstead cheese companies tells a similar story. When you tally up a new building, stainless steel, and the operating money you need to get through the first year or two, total start-up needs can easily push into the $2.5 to $3 million range, especially if you’re doing aged cheeses or a wide product mix.
If you’re renovating an existing space and picking up some used equipment, your costs can come down. But not nearly as much as the back-of-the-napkin plans usually assume.
Pulling from those University of Tennessee, Cornell, and Penn State examples, here’s what a realistic range often looks like for a small-to-mid processing project:
Category
Illustrative Range
Why It Sneaks Up on You
Processing Equipment
$700,000–$900,000
Pasteurizers, vats, and the “stainless steel tax.”
Facility & Cold Storage
$350,000–$600,000
Flooring, drainage, and refrigeration are non-negotiable.
Compliance & QC
$25,000–$75,000
The cost of proving your milk is safe every single day.
Working Capital (24 mo)
$500,000–$1,000,000
Carrying inventory while waiting for retailers to pay.
TOTAL PROJECT
$1.57M–$2.57M+
The average DBI grant (~$112K) covers roughly 4–7%.
Stress Test Question: Could your project survive for 6 months without DBI reimbursements?
This isn’t pulled line-for-line from one single budget, but those bands are right in line with what university models and real farms end up with once the last invoice comes in. Even when you scale down and use some sweat equity, “we’ll just build a creamery” still usually means a total project somewhere in the $1.5 to $2.5 million neighbourhood.
Now, place DBI into that picture.
If DBI has awarded about $79.2 million across 704 unique entities, that’s an average of roughly $112,600 per recipient. Against a $1.57-$2.57 million project, that average award works out to roughly 4–7% of total capital—useful, but nowhere near a full funding solution.
Cost Category
Low Range
High Range
Avg. DBI Grant
Coverage %
Processing Equipment
$700,000
$900,000
$112,600
12.5–16%
Facility & Cold Storage
$350,000
$600,000
$112,600
18.8–32%
Compliance & QC
$25,000
$75,000
$112,600
Exceeds cost
Working Capital (18–24 mo)
$500,000
$1,000,000
$112,600
11.3–22.5%
TOTAL PROJECT
$1,575,000
$2,575,000
$112,600
4.4–7.1%
The Cost Gap: Why Some Herds Start Behind Before They Process a Litre
You probably know this from your own balance sheet, but USDA’s Economic Research Service spells it out clearly.
In an August 28, 2024, Chart of Note, ERS looked at 2021 cost-of-production data by herd size (ERS national averages). When they added up both operating costs—feed, vet, supplies—and allocated overhead—buildings, equipment, land, and unpaid family labour—they found:
Farms with fewer than 50 cows had total economic costs around $42.70 per hundredweight.
Farms with 2,000 cows or more came in around $19.14 per hundredweight.
ERS notes that larger herds are generally better able to spread fixed costs and invest in labour-saving technology, thereby reducing their cost per cwt.
What does that mean in practical terms?
Some of the lowest-cost herds in the 100–199 cow bracket can get total economic costs down near $19.76 per hundredweight—competitive with or better than some high-cost 2,000-cow herds. So small doesn’t automatically mean uncompetitive. But on average, smaller herds start higher on the cost curve and have less room to make mistakes.
If your cost of production for milk alone is already at the high end—closer to that $40 range—it’s going to be a steep climb to make money once you add processing risk. If you’re in that $20-something band with good butterfat levels and tight fresh cow management, your odds of making a creamery pencil out improve a lot, as long as you’re disciplined.
The DBI projects that still look smart five or ten years out share a handful of traits. These patterns show up across case studies from the Midwest, Northeast, Southeast, and Pacific Coast regions.
The dairy was solid before any stainless steel showed up. These herds know their cost of production per cwt and how it compares to other farms of their size. Their fresh cow management during the transition period is under control, reproduction is consistent, SCC is competitive, and butterfat and protein levels support both the milk check and the planned product line. Research from the University of Guelph on resilient dairy farms has shown that operations that lean into innovation and value-added are usually already strong in basic management and efficiency, not the other way around.
They treat DBI as an accelerator, not the engine. If the DBI money disappeared, they’d still go ahead—maybe with more used equipment or slower expansion—but the business case stands on its own. Penn State’s value-added cashflow guidance comes back to this point over and over again: you want the core farm business to be viable before you start layering in grants and loans.
Take Hill Valley Dairy in Wisconsin. It’s a third-generation family farm that started making artisan cheese in 2015. They received a DBIA grant to purchase equipment for a new alpine-style cheese line—helping them use more of their own milk and expand into new markets. But as Hill Valley puts it: “We are building a long-term venture that supports both the small dairy farm and cheesemaking businesses.” The grant helped them move faster; it wasn’t the reason the business existed.
Or look at Nash Family Creamery in Tennessee. They received SDBII grants in 2021, 2022, and 2023 for operational improvements—including custom printing for new containers to begin selling ice cream wholesale. When asked how processing has impacted the family business, Cody Nash said: “It’s been really great adding that extra revenue stream and to have that extra interaction with the public to where we’re not just a dairy that’s off the road, that’s making raw milk that people are kind of disconnected from. We’ve been able to tie everything from growing feed to making ice cream back to the customer.”
They plan for 18–24 months of ugly cashflow. On-farm cheese plants that age product—and even bottled milk plants building new accounts—often burn cash for a year or two. The Tennessee examples show year-one cash needs exceeding $1 million when you include wages, inputs, and loan payments. The farms that survive have committed operating lines and reserves that cover 18–24 months, not just a few lean weeks.
They lock in customers before they pour concrete. Cornell and Penn State both hammer on this. Successful processors are already having serious conversations with grocery buyers, distributors, and restaurants before they build. They get letters of intent, pilot-scale commitments, or at least emails spelling out what volume and price range a buyer is willing to try.
They grow into processing instead of flipping everything at once. Many healthier projects start by processing maybe 10–20% of the farm’s own milk, leaving the rest under a co-op or processor contract. They might bottle whole milk and cream, do one or two cheeses, and test the waters. Only when that side of the business has proven it can move volume and support its own cashflow do they talk about scaling up.
Three Situations Where DBI Actually Fits Well
So where does DBI make sense?
You’re already selling product, and capacity is your bottleneck. Maybe you’ve been bottling a small share of your own milk for years. Maybe you’ve got a few cheeses that consistently sell out. Butterfat levels are good, your SCC is steady, and the question isn’t “will anyone buy this?” but “how do we keep up?” In that case, a DBI grant can help you step up to a larger pasteurizer, vat, or filler that you already know you can keep busy with.
That’s exactly the situation Tulip Tree Creamery in Indianapolis found itself in. In 2024, they received a $74,000 DBIA grant to install a cheese cutting and packing line. Co-owner and CEO Fons Smits told Brownfield Ag News: “Right now, our capacity is very limited. We make some really good artisan hard aged cheeses, but we can only [cut and pack] so much.” The grant didn’t create the demand—it helped them meet demand they’d already built.
You’re diversifying a healthy dairy, not escaping a sinking one. Your cost of production is reasonably close to regional averages for your herd size, and you’re steadily tightening feed efficiency, labour, and repro. You decide to put 10–20% of your milk into a simple product line and keep the rest on your co-op contract. If the value-added side doesn’t take off, you still have a core dairy that pays its way.
You’re building something the next generation—or a buyer—would actually want. Some families are looking at modest processing as a way to add a branded revenue stream that boosts overall sale or succession value, or to create roles for kids more interested in marketing and product development than in scraping stalls. A DBI-backed project can help get a moderate plant off the ground with less strain on retirement timing, as long as the economics work without assuming endless grant support.
On the other side, there are situations where the bravest move is to step back from the grant opportunity.
You’re already losing money on milk. If your cost of production is running several dollars per cwt above your pay price—think roughly in the $4–6 range for more than a few months—your first priority probably isn’t a plant. It’s tightening that gap. Adding a high-risk venture on top of that is more likely to magnify the pain than solve it.
Your banker only likes the plan with DBI on the spreadsheet. If the project goes from “tight but OK” to “no way” when you remove the grant, that’s a sign of how dependent it really is on something you don’t control. Treat that as a red flag and have your lender walk through the zero-grant version with you before you commit.
You’ve never lived through lumpy cashflow. If your entire experience is steady co-op checks and relatively smooth bills, jumping straight into a seven-figure plant with slow-pay wholesale accounts and seasonal retail swings is a big leap.
Your main fuel is frustration with your current processor. Being angry about component pricing, basis adjustments, or hauling charges is understandable. But “I’m sick of my co-op” isn’t the same thing as “I’ve got committed buyers and a business plan that works.” Many of us have watched producers pour money into projects mainly to “show the co-op who’s boss,” only to end up in a tougher spot. Spite is a terrible basis for a business plan. For some herds, pushing harder on component premiums, quality bonuses, or contract terms may deliver better risk-adjusted returns than building a plant out of frustration.
“Not this round” doesn’t mean “never.” It means fix the base dairy first, then revisit the plant once the math works without grants.
A Note for Canadian Producers
If you’re operating under quota in Canada, your starting point is different—and in some ways, harder.
You’ve got stable base revenue thanks to supply management and provincial boards that oversee pricing and the allocation of processing capacity. You’re more likely looking at provincial grants, co-op investments, or local funds than U.S.-style DBI dollars.
But here’s what many producers don’t factor in: the entry cost into on-farm processing can be higher in Canada due to regulatory and quota complexities. A 2018 Ontario government release on proposed Milk Act changes noted that small dairy processors, such as artisan cheesemakers, can spend up to one-third of their construction budget on building requirements under current regulations—especially for layout, drainage, and food-safety requirements for plant licensing. And that’s before you get into the maze of quota transfer rules.
Dairy Farmers of Ontario’s policies include restrictions on moving quota purchased through ongoing farm purchases for 5 years, limits on shared-facility arrangements, and complex approval processes for any unconventional setups. Quebec has its own layers of regulation around artisan processing and the “fromage fermier” designation. None of this is impossible to navigate, but it adds time, cost, and uncertainty that doesn’t show up in the brochure math.
Research from the University of Guelph, Agriculture and Agri-Food Canada, and the Canadian Dairy Commission on regional and on-farm processing shows that niche markets—grass-fed, A2A2, organic, farmstead cheese—can open doors, but these projects still entail significant capital and labour demands.
Picture a typical Ontario quota farm deciding between joining a local co-op plant expansion or building a very small on-farm processing plant. Even with a quota underpinning milk revenue, the plant has to stand on its own economics—and the regulatory overhead can eat into margins faster than you’d expect.
The core questions look a lot like the U.S. version: Does the plant work on its own numbers without assuming permanent program support or sky-high premiums? Do you have the working capital and management bandwidth to handle inventory and receivables, in addition to quota payments, feed bills, and labour? Are the buyers and volumes real enough—ideally in writing—to justify the risk?
What This Means for Your Operation
Before you sign anything, here are the questions and thresholds that matter:
Run the zero-grant scenario. Create a version of your budget that assumes you receive no DBI funds. If the project flips from “tight but doable” to “dead in the water,” you’ve learned how fragile it really is. That’s not a green light—it’s a red flag.
Build the full capital budget. Include everything: buildings, equipment, regulatory work, inventory, and at least 18–24 months of operating capital. Then sit that total beside university models from Tennessee and Cornell. If your number is dramatically lower, figure out what you’re assuming that they aren’t.
Know your cost of production. If you’re closer to that $40/cwt ERS number than the low-$20s, a creamery adds risk on top of an already thin margin. Get the base dairy tighter first.
Lock in at least one serious buyer before you lock in the loan. Talk to the grocery chain, distributor, or foodservice customer you’re counting on. Ask for something concrete: volume ranges, a trial period, and a realistic price band.
Agree on your kill switches up front. Sit down with your family and your lender and write down your thresholds: how much extra capital you’re willing to inject, how long you’ll give it to reach break-even, minimum volume, or margin targets by certain dates.
Consider the alternatives. For some operations, negotiating harder on processor premiums, quality bonuses, or contract terms may deliver better risk-adjusted returns than building a plant.
Review your DBI exposure with your lender before applying. Walk through the capital plan, the reimbursement timeline, and what happens if funds are delayed. If your banker can’t get comfortable with the zero-grant scenario, that’s important information.
Ask the operations in your county that built plants five or ten years ago what they’d do differently if DBI disappeared tomorrow. Their answers might surprise you.
Key Takeaways
DBI covers 4–7% of a typical $1.5–2.5 million processing project. It’s an accelerator for viable businesses, not a rescue for struggling ones.
The 2025 freeze was a stress test. It didn’t create fragile projects—it exposed them. If your plan can’t survive a short-term reimbursement delay, it’s too dependent on money you don’t control.
Cost of production matters before you add stainless. Herds with milk costs near the high end of ERS benchmarks face steeper odds on processing.
The winners share a pattern: solid base dairy, committed buyers, 18–24 months of cash flow runway, and DBI treated as a bonus rather than a foundation.
“Not this round” can be the smartest strategy if your core dairy needs work first, or your plan only pencils with the grant included.
The Bottom Line
The best time to use a program like DBI is when your plan already works without it. The worst time is when you need the grant to rescue numbers that are already telling you “no.”
Where does your operation sit on that spectrum? That’s the question worth answering before you pour a yard of concrete.
Complete references and supporting documentation are available upon request by contacting the editorial team at editor@thebullvine.com.
Learn More
The Hidden Contract Clause That Could Cost Your Dairy $55,000 in 2026 – This expose arms you with a 30-day action plan to navigate massive liability shifts in new 2026 milk contracts. It reveals how to dodge the $55,000 “allergen tax” while protecting your net profit from unlimited processor liability.
211,000 More Dairy Cows. Bleeding Margins. The 2026 Math That Won’t Wait. – This structural analysis reveals the biological trap of beef-on-dairy that is currently starving the replacement pipeline. It delivers a genetic playbook to reposition your herd’s break-even point before the next processing wave resets industry margins.
The Tech Reality Check: Why Smart Dairy Operations Are Winning While Others Struggle – This investigation breaks down the real ROI of robotics, revealing why total implementation costs often run 40% above sticker price. It provides the productivity benchmarks you need to ensure automation delivers genuine labor savings rather than just more debt.
The Sunday Read Dairy Professionals Don’t Skip.
Every week, thousands of producers, breeders, and industry insiders open Bullvine Weekly for genetics insights, market shifts, and profit strategies they won’t find anywhere else. One email. Five minutes. Smarter decisions all week.
If you don’t know your stall‑standing index, you don’t know how much of that $18 milk your neck rails are quietly stealing every month.
Executive Summary: If your freestall Holsteins aren’t getting close to 12 hours of lying time a day, you’re almost certainly leaving milk—and margin—on the table. Rick Grant’s Miner Institute work ties each extra hour of rest to roughly 2–3.5 lb more milk per cow per day, which matters a lot when USDA is only forecasting about $18.25/cwt all‑milk for 2026. In a 100‑cow pen with a 1.5‑hour rest deficit, that math points to roughly $1,600–$2,800/month in potential gross revenue at current price levels. Most of that loss comes from fixable things you already walk past: neck‑rails that don’t fit today’s bigger cows, transition pens stocked well over 100%, and cows spending more than 3–3.5 hours a day out of the home pen. The piece lays out four practical paths—from low‑cost “wrench and tape” stall tweaks to comfort‑plus‑tech strategies—so you can choose what fits your herd size, cash position, and risk tolerance. It closes with specific barn‑level checks (stall‑standing index, neck‑rail measurements, lying‑time math, transition stocking counts) you can run this week to see how much of that “unbilled milk” might be hiding in your own pens.
Let’s be blunt. If your cows can’t lie down when they want to, you’re shipping less milk than your genetics and facilities are built to produce. You just don’t see that line on the milk cheque.
Dr. Rick Grant at William H. Miner Agricultural Research Institute in New York has spent more than two decades putting hard numbers on cow time budgets. His work shows that each extra hour of rest time is associated with roughly 2–3.5 pounds of additional milk per cow per day in freestall Holstein herds. That band comes from controlled stocking‑density and time‑budget trials in Miner’s freestall research barn—not coffee‑shop math.
At the same time, USDA’s January 2026 Livestock, Dairy, and Poultry Outlook forecasts the 2026 all‑milk price at $18.25/cwt and Class III at about $16.35/cwt. In Canada, the Canadian Dairy Commission has approved a 2.3255% farm‑gate price increase effective February 1, 2026, which, together with higher carrying charges, translates into a combined impact of about 2.3750% and “just over 2 cents per litre” at the processor level. Helpful, sure. Game‑changing for your dairy economics? Not really. So the question that matters is simple: how much unbilled milk are your stalls, stocking decisions, and time budgets hiding at those price levels?
The Core Number: How Grant Got to 2–3.5 lb per Hour
Grant’s WDMC 2004 paper “Stocking Density and Time Budgets” is the backbone for most serious lying‑time economics.
In Miner’s freestall research barn, Holsteins were stocked at different densities. When stocking increased from 100% to 145% of stalls, two key changes showed up:
Lying time dropped by about 1.1 hours per cow per day
Milk yield dropped by 3.3 lb per cow per day (from 94.6 to 91.3 lb)
Across that and related trials, Grant and colleagues distilled a practical rule: when comfort improves, and cows actually use it, each additional hour of lying time is associated with roughly 2–3.5 lb more milk per cow per day in freestall Holstein herds.
Biologically, it tracks. When a cow lies down, her heart doesn’t have to work as hard against gravity to pump blood to the udder. More blood per minute flows through the mammary tissue, carrying more nutrients for milk synthesis. You don’t see that in one milking, but you sure see it when you look at weekly averages or how close high‑index cows get to the peaks their proofs suggest.
What Real Herds Saw When They Fixed Comfort
Grant’s 2015 “Economic Benefits of Improved Cow Comfort” paper, prepared for Novus International, compiled data from commercial herds that invested in stall design and lying surfaces. Across those farms, improving cow comfort was associated with:
3–14 lb more milk per cow per day
6–13% lower annual turnover
37,000–102,000 cells/mL lower bulk tank SCC
15–20% less lameness
That’s a wide range because starting points varied. A herd moving from overstocked, short, thin‑bedded stalls to well‑bedded, correctly sized freestalls at sane stocking densities will see more change than a herd that was already close to the target.
Economically, though, even the low end—3 lb/cow/day, a modest SCC drop, and a few points off turnover—pays back fast when your U.S. baseline is $18.25/cwt all‑milk, and your Canadian baseline is a low‑single‑digit percentage increase on top of 2025 prices. In both systems, you earn your living on margin per cow, not just gross litres.
The 2026 Math: Turning Rest into $/Cow
Now put Miner’s 2–3.5 lb/hour band against today’s projected prices.
USDA’s January 2026 outlook pegs the 2026 all‑milk price at $18.25/cwt and Class III at $16.35/cwt. Your actual milk cheque will move with components, basis, and pooling, but $18.25/cwt is a fair reference.
Say your early‑lactation pen averages 10.5 hours of lying time per day. That’s a common number in overstocked high and fresh groups once someone actually measures time budgets. Behaviour and welfare work, including extension summaries, often point to about 12 hours per day as a realistic lying‑time target for high‑producing Holsteins in well‑designed freestalls.
You’re looking at a 1.5‑hour rest deficit per cow per day.
Using Grant’s response band:
Scenario
Rest Deficit
Milk Loss
Daily Revenue Loss
Monthly Revenue Loss
Low End (2 lb/hr)
1.5 hr
3.0 lb/cow
$54.75
$1,643
High End (3.5 lb/hr)
1.5 hr
5.25 lb/cow
$95.81
$2,874
Conservative (1/3 capture)
1.5 hr
1.0–1.75 lb/cow
$18.25–$31.94
$548–$958
You’re not guaranteed that exact gain. But even if you only capture a third—1–2 lb/cow/day—you’ve still paid for a lot of neck‑rail steel, extra bedding, or hoof‑trimming in a few months.
Where the Hours Go: Stall Design, Stocking, and Time Out of the Pen
Those 1.5 missing hours usually aren’t hiding. They’re standing right in front of you.
Stall Geometry That Doesn’t Fit Today’s Cows
The Dairyland Initiative’s 2025 “Freestall Design and Dimensions” guide lays out recommended dimensions based on cow size and stall type. For large, mature Holsteins in many mattress‑style stalls, their tables and supporting extension pieces typically land around:
Neck‑rail height: about 48–50 inches above the top of the bed
Neck‑rail forward position: about 68–70 inches from the rear curb, within a broader 64–72 inch range depending on stall length and design
In many older barns consultants walk into, neck rails still sit in the mid‑40‑inch range and closer to the rear curb—dimensions originally laid out for smaller cows than the roughly 1,500‑lb Holsteins many herds are milking today. Dairyland and Cook’s freestall work both show that low, tight neck rails increase perching (front feet in the stall, rear feet in the alley) and standing time in stalls instead of lying.
That perching time is exactly where you quietly lose lying time. And Miner’s research tells you exactly what an hour of lost lying time costs.
Stocking Density: Especially in Transition Pens
Miner’s WDMC 2004 trial already showed that jumping stocking from 100% to around 145% of stalls cost cows 1.1 hours of lying time and 3.3 lb of milk per day.
Work on grouping and stocking by Chebel and others adds a transition‑specific lens. In one frequently cited trial, pre‑fresh Holsteins were stocked at target headlock densities of 80% vs. 100% (actual about 74% vs. 94.5%), and cows at the lower density experienced fewer displacements and had more time to eat and lie down. Combining that with Miner and other behaviour studies, transition specialists now commonly recommend:
Target around 80% stocking density in close‑up and fresh pens (both stalls and headlocks)
Recognize that consistently running those pens in the 100–120%+ range increases competition, cuts lying time, and raises transition‑disease and lameness risk
On a spreadsheet, a 120%‑stocked fresh pen looks efficient. On the vet bill and in the cull list, it often doesn’t.
Time Out of the Home Pen
Even if stalls and stocking aren’t terrible, time budgets can still get shredded by hours away from the pen.
Cook’s cow‑comfort indices and Dairyland’s barn‑design tools emphasize time out of the home pen—holding pens, headlocks for repro and herd health, hoof‑trimming—as a third big thief of lying time. Their guidance, grounded in time‑budget and behaviour data, frequently aims to keep total time out of the home pen under about 3–3.5 hours per day on 2× milking to protect lying time.
If your routine quietly pushes cows over that line, the 1.5 missing hours aren’t mysterious. You’ve scheduled them.
Lying-Time Thief
What Research Shows
Typical Time Loss
Audit Check
Neck Rails Too Low/Close
Dairyland: 48–50″ high, ~68–70″ forward for big Holsteins. Low/tight rails → perching & standing in stalls (Cook/Miner)
Miner: 145% stocking cut lying time 1.1 hr, milk 3.3 lb/day. Chebel: ~80% density (stalls + headlocks) in close-up/fresh reduces competition
1.0–1.5 hr/cow/day
Count cows, stalls, headlocks in fresh pen. Are you >100%?
Time Out of Pen
Cook/Dairyland: Keep total time out <3–3.5 hr/day (2× milking) to protect lying time. Includes milking, repro, hoof trim, holding
0.5–1.0 hr/cow/day
Track total hours in holding, lockups, parlor. Add it up honestly.
The Global View: Hut’s Dutch Time‑Budget Data
This pattern isn’t just showing up in North America.
Pieter Hut and colleagues at Utrecht University published a 2022 PLOS ONE paper on sensor‑based time budgets in eight commercial Dutch Holstein herds. They used leg and neck sensors on 1,163 cows in freestall barns to track lying, standing, and activity over the lactation.
One number stands out:
Primiparous cows lost about 215 minutes (3.6 hours) of lying time per day from the month before calving to the first month in milk.
Older cows also lost substantial lying time during early lactation, then gradually increased lying time as lactation progressed, though the exact number of minutes differs by parity.
So even in well‑managed Dutch freestall herds, fresh cows start lactation in a deeper rest deficit than they had in late gestation. Add in overstocking, short or unforgiving stalls, or long time out of the pen, and you’re digging that hole deeper—exactly where Miner’s 2–3.5 lb/hour economics say it hurts the most.
Steel First, Then Sensors: Getting Sequence and ROI Right
There’s no shortage of clever hardware on the market. The key is spending in the right order.
What Sensors Do Well
Validation work shows that leg‑mounted and neck‑mounted accelerometers can measure lying and standing time with very high agreement (correlations often above 0.9) compared to direct observation in freestall herds. Commercial systems translate that into:
Total lying time per cow per day
Number and duration of lying bouts
Activity and often rumination or eating time
Alerts when an individual cow’s behaviour deviates from her baseline
That makes them powerful for flagging cows whose rest or rumination crashes before they look obviously sick, quantifying before/after changes when you move neck rails or change stocking, and letting bigger herds manage by exception instead of scanning every cow, every day.
Where ROI Actually Shows Up
There isn’t a single national dataset that tells you payback by herd size. But extension reports and vendor case summaries show consistent patterns:
Under ~50 cows: If you’re in the barn all the time and know every cow, dedicated lying‑time monitoring alone is a tougher ROI case. A watch, a notebook, and disciplined barn walks catch a lot.
Around 50–150 cows: In herds already battling repro or fresh‑cow health issues, integrated systems (heat, rumination, activity, lying time) have shown roughly 1–3‑year paybacks in documented case examples, especially where they replaced labour‑heavy heat detection.
150+ cows: At this scale, many managers say they have to manage by exception; behaviour data helps focus limited labour on the 10–20% of cows that truly need attention on a given day.
Those bands aren’t hard rules from a formal study. They’re a synthesis of case reports and advisor experience. Your own ROI will move with your milk price, starting health and repro status, and how aggressively your team actually uses the data.
What doesn’t change is this: no sensor can unlock Miner’s 2–3.5 lb/hour response if neck rails are wrong and transition pens are jammed. Steel, bedding, and stocking are the foundation. Tech is the amplifier.
Sequence
Action
What It Fixes
Typical Cost
Payback Window
1. Wrench & Tape
Adjust 10–20 neck rails in one row; measure SSI before/after
Standing in stalls, perching (low-end: +1–2 lb/cow/day)
$0–$500
1–2 months
2. Protect Transition
Audit close-up/fresh stocking; move toward ~80% density (stalls + headlocks)
Fresh-cow rest deficit, DA/ketosis risk, lameness
$0–$2,000(mostly management changes)
2–4 months
3. Comfort + Tech
Fix worst stalls/stocking first, then add sensors to confirm gains & flag outliers
Scales individual-cow management; tracks ROI of comfort investments
$15,000–$40,000+(system-dependent)
1–3 years
4. Wait & See
No action; continue with current stalls, stocking, routines
Nothing—but ongoing cost continues every month
$0 upfront
Negative ROI (lose $1,600–$2,800/mo per 100-cow pen)
Four Realistic Paths Herds Are Taking
Pull the research, economics, and 2026 price forecasts together, and you see four real‑world paths.
1. “Wrench and Tape” First
For cash‑tight herds with obvious stall issues.
Run a 10‑minute stall‑standing index (SSI) check two hours before milking in your best freestall pen.
If it’s consistently 20% or higher, too many cows are standing in their stalls when they should be lying down.
Measure neck‑rail height and forward position. If they’re below about 48 inches high or shorter than around 68 inches from the rear curb for big Holsteins, pick one row of 10–20 stalls and adjust into Dairyland’s target range for your stall type.
Re‑check SSI, perching, and stall use 7–10 days later at the same time.
SSI Result
What It Means
Likely Causes
What to Check This Week
<15%
Excellent stall comfort; cows lie down readily
Stalls sized/positioned well for herd; bedding + stocking OK
Trade‑offs: Minimal cost; you’re testing Miner’s economics in your own barn, not in a spreadsheet. But it won’t fix under‑sized stalls, poor traffic flow, or a chronically undersized barn.
2. Protect the Transition Pen
For herds getting chewed up on DA’s, ketosis, and lame fresh cows.
Audit close‑up and fresh pens: cows vs. stalls vs. headlocks.
If you’re routinely living in the 100–120%+ range, compare that to the ≈80% stall and headlock density used in Chebel’s grouping work and many transition‑management talks.
Look at levers: smoothing calving peaks, grouping heifers away from dominant older cows, or temporarily reducing numbers in close‑up and fresh pens during heavy calving.
Trade‑offs: Aligns with research linking lower transition stocking to better lying time, intake, and fewer antagonistic interactions. But you may give up some short‑term shipped volume or flexibility in pen use, especially when under quota or processor-volume expectations.
3. Comfort and Tech Together
For mid‑sized and larger herds with some capital flexibility.
Use barn walks and design guides to fix the worst stall and stocking problems first.
Then add an integrated monitoring system to confirm that lying‑time and behaviour actually improved, flag fresh or lame cows whose time budgets still lag, and track whether your comfort investments are paying back in milk, SCC, lameness, and turnover.
Trade‑offs: Structural changes plus data‑driven management; lets you scale without losing individual‑cow focus. But it’s a higher upfront spend, and ROI depends on whether someone actually has time and authority to act on the alerts.
4. Wait and See
For herds in a holding pattern.
Facilities are maxed, labour is stretched, contracts or quota plans feel rigid.
You know stalls and stocking aren’t ideal, but everything else feels more urgent.
Trade‑offs: No new cash or time outlay in the short run. But you keep paying the ongoing cost of rest deficits—lost milk, more disease, higher turnover—that never shows up as a neat line on the P&L but quietly drags margin every month.
Doing nothing is still a decision. It just means the unbilled milk keeps walking out of the parlour.
What This Means for Your Operation
Here’s how to turn all of this into decisions and numbers on your own farm.
Run your own lying‑time math. If you have sensors, pull 30‑day average lying times for your early‑lactation group. If not, work with your vet or advisor to build a time‑budget snapshot. Compare your number to a 12‑hour/day target for high‑producing Holsteins in freestalls. Multiply the gap by 2–3.5 lb/hour and your actual $/cwt. That’s your own estimate of the unbilled milk on the line.
Do the SSI walk this week. Two hours before milking, in your best pen, calculate SSI. If more than 20% of cows touching stalls are standing, Miner and Cook’s work both say lying time and hoof health are taking a hit, you’ll eventually see on the milk sheet and the cull list.
Put a tape on your neck rails. Compare your measurements with Dairyland’s freestall and neck‑rail placement guidance for your cow size and stall type. If you’re significantly below roughly 48 inches high or short of around 68 inches from the curb in a group of big Holsteins, you’ve probably found a low‑cost project with some of the best documented returns available.
Be brutally honest about transition stocking. Count cows, stalls, and headlocks in close‑up and fresh pens. If you’re consistently over 100% and unhappy with fresh‑cow health, ask what it would take—breeding adjustments, regrouping, or pen‑use changes—to trend toward 80% during peak calving stretches.
Sequence your spending. If stall geometry and stocking are obviously off, move steel and cows before you add more hardware. Once comfort is closer to what Miner, Dairyland, and Hut’s Dutch data suggest, then use technology to hold gains and sharpen management.
If your SSI is already below ~15% and lying time is near 12 hours, your next ROI dollar is probably better spent on transition stocking, tech, feed, or something else—not more stall tweaks.
Key Takeaways
Grant’s 2–3.5 lb/hour rule turns lying time into a hard economic variable. It’s built on controlled stocking‑density trials and real‑farm economic data showing 3–14 lb/cow/day gains when comfort improves.
Fresh cows in freestall systems that have been studied start lactation in a serious rest deficit. Hut’s Dutch work shows that primiparous cows lose 215 minutes (3.6 hours) of lying time from late gestation to early lactation, with similar but varied patterns in older cows.
Simple stall and stocking changes are often your cheapest tons of “invisible feed.” Adjusting neck rails into Dairyland’s typical range and easing the worst overstocking in transition pens can unlock part of that 2–3.5 lb/hour response without pouring a new barn.
At 2026 price forecasts, the cost of waiting is real money. In realistic scenarios, a 100‑cow pen running 1.5 hours short on rest can easily be talking about $1,600–$2,800/month in potential gross revenue, before you even count health and survival changes.
Tech pays best as a multiplier, not a crutch. Sensors and dashboards help you manage by exception once stalls and stocking are close to right; expecting them to fix bad steel is just adding depreciation on top of lost milk.
The Bottom Line
Tomorrow morning, before you refresh futures or open the milk‑cheque email, walk into your best freestall pen two hours before milking. Pick one cow that clearly wants to lie down and watch what she does next.
Does she step into a stall, drop, stretch out, and start chewing her cud like she owns the place—or does she hit steel, perch with her back feet in the alley, or just stand and wait for space? Her answer might be the clearest look you’ll get this year at how much unbilled milk your barn is holding back.
Complete references and supporting documentation are available upon request by contacting the editorial team at editor@thebullvine.com.
Learn More
Concrete, Air, and Shade: The Real Drivers Behind Milk Yield – Capture a massive competitive advantage by mastering the stall geometry and cooling tweaks that deliver 300% ROI. This breakdown reveals how to blow past the biological production ceilings currently capping your herd’s profitability.
Every week, thousands of producers, breeders, and industry insiders open Bullvine Weekly for genetics insights, market shifts, and profit strategies they won’t find anywhere else. One email. Five minutes. Smarter decisions all week.
Breeding 14,000 kg Holsteins but milking them in a 9,000 kg barn? Your genetics can’t outrun bad concrete.
Executive Summary: Canadian tie‑stall herds are heading into the 2027 Dairy Code with a brutal choice: spend roughly $480K on a retrofit or about $1.48M on a new robot barn for 60 cows. The article shows why the cheapest quote often isn’t the best bet once you price in cow‑flow, ventilation, fetch time, and mid‑life “correction” projects that can add $75,000–$100,000 back onto a tight retrofit. Using current Canadian Holstein averages — 11,364 kg in 305 days at 4.15% fat and 3.36% protein — it walks through how even a 5% drop in performance and an extra 275 hours of fetching per robot per year can erase a $200K saving over 15 years. Producers get three clear paths: minimal Code‑compliant upgrades to buy time, a serious long‑term retrofit for barns with good bones, or a full new robot barn for growth‑minded, multi‑generation herds. Along the way, it ties barn design back to labour, succession, and the ability to actually express the 14–15,000 kg Holstein genetics many Canadian breeders are already paying for. The core takeaway is simple: start your AMS decision with the building and your 15‑year horizon, or risk locking your robots—and your genetics—into bad concrete.
Here’s the picture. It’s a cold January morning in an older 60‑cow tie‑stall. The pipeline’s humming, the concrete’s polished from years of hooves and boots, and you’ve got a robotic milking quote on the table that says you can “go automated” for about $17,000 less per cow if you retrofit instead of building new. On paper, that looks like the easy choice.
But the calendar is louder than the quote. As of April 1, 2027, Canada’s updated Dairy Code of Practice says cows in existing barns can’t be tethered continuously through their production cycle anymore. Not long after that, new rules land for loose calving and stocking density, all while you’re staring at a seven‑figure gap between the cheapest retrofit and a purpose‑built robot barn — plus your own body, your family’s future, and your quota investment. If you’re milking in a Canadian tie‑stall in 2024–2026 and thinking about robots, you’re not just buying a machine. You’re deciding what kind of barn — and what kind of life — you want for the next 15 to 20 years.
The New Code, Real Money, and Real Cows
Recent Canadian analysis of automated milking system (AMS) costs after tie‑stalls pegs a green‑site robotic facility at about $24,718 per cow once you factor in everything. That breaks down to roughly $6,800 per cow for the milking equipment and $10,700 per cow for the barn and core infrastructure, plus handling, feed storage, and manure systems. For a 60‑cow herd, you’re looking at roughly $1.48 million tied up in that project.
In a retrofit, the robot cost doesn’t change much. A single box typically runs in the $150,000–$220,000 range and realistically serves about 55–60 cows, with a working life of 7-15 years, depending on usage and maintenance. The savings show up when you reuse concrete and steel that are already in the ground. In some Canadian retrofit case studies, the total invested cost is closer to $8,000–$14,000 per cow once you upgrade floors, ventilation, and electrical systems, while keeping the shell. On a 60‑cow herd, that’s roughly $480,000–$840,000.
Now add the Code pressure. The 2023 Dairy Code of Practice update — released by the National Farm Animal Care Council and rolled into Dairy Farmers of Canada’s timelines — lays out three big structural dates:
By April 1, 2027, cows in existing barns must not be tethered continuously throughout their production cycle.
By April 1, 2029, all calving must take place in loose housing that allows cows to turn around — pens, yards, or pasture — not in a tie‑stall.
By April 1, 2031, stocking density in freestall systems must not normally exceed 1.0 cow per stall, stepping down from earlier allowances of 1.2 then 1.1 cows per stall.
At the same time, reporting around the Code notes that nearly two‑thirds of Canadian dairy farms still use tie‑stall housing. Some of those barns already provide turnout or loose housing that help meet the new “freedom of movement” requirement, but there’s no national count of how many. If your barn is tired, your body’s tired, and you’re looking at robots anyway, the Code isn’t just a welfare document — it’s the shove that forces you to decide whether that building really deserves another 15‑year run.
You’re not just weighing a robot quote. You’re deciding whether to bolt a complicated, very expensive piece of automation onto something that might already be past its best‑before date — and how much that’s going to cost you in labour, milk, and sanity down the road.
Same Robot, Two Very Different Barns
What producers keep finding is pretty simple: the robot almost never lets you down. The barn design does.
Think about one of the better retrofits you’ve toured.
You walk into the old tie‑stall, and the first thing you notice is space. The family bit the bullet, dropped from 90 milking cows to around 60, and made the building fit one robot instead of trying to squeeze two into a footprint that couldn’t handle it. They tore out a row of stalls to carve out 15 to 20 feet of open approach in front of the robot, gave cows a clean exit lane that leads straight past fresh water, and built a small but functional separation pen for fresh, lame, and “special” cows.
Ceiling height is 10–12 feet instead of a tight 8. The foundation and posts checked out structurally, and there’s enough sidewall height to hang curtains and install big fans without blowing air into the beams instead of the cows. They didn’t try to force guided cow traffic into a shoebox. They went with free‑flow, grooved and leveled the floors so cows weren’t skating, and gave cows reasons to walk past the robot on their own — feed, water, and an easy path.
Startup was still messy — every AMS startup is. But once cows and people settled, fetch time landed in the “normal” range you see out of AMS field data: roughly 45–60 minutes per robot per day, depending on stage of lactation and season. Fetching is still work, but it feels like the system is on your side.
Now picture another barn you’ve walked into, where the quote looked great and the robot “fit” on paper.
The box is shoved into an end wall because that’s where it was easiest to cut concrete. There’s one narrow alley, maybe 8 feet wide, leading to it with a sharp corner around a post. Dominant cows love to stand there, blocking timid heifers and fresh cows. There’s no real waiting area and no proper separation pen because no one wanted to give up stalls. It technically fits. Practically? It’s a choke point.
Research on automatic milking systems has documented fetch time per robot anywhere from 5 minutes to 120 minutes per day, heavily influenced by barn layout, stocking density, and cow traffic design. In herds with bottlenecks like that second barn, the fetch list never really shrinks. In at least one AMS cow‑traffic study, increasing stocking density by just over ten percentage points made cows roughly one‑and‑a‑half times more likely to end up on the fetch list. That’s the difference between a quick pass through the barn and another hour and a half of “come on girl, let’s go.”
Ventilation amplifies it. When robots and robot rooms are tucked into sidewalls without thinking about inlets and outlets, they can block the main curtain area. Work using Canadian Holstein data and climate records has shown that heat stress hits production and components well before cows are visibly panting, especially in barns with weak air movement. In a retrofit where the robot approach is the hottest, stalest air in the barn, you’re literally asking cows to walk into a sauna to get milked. They’re not going to volunteer.
Component
Good Ventilation (Well-Designed)
Weak Ventilation (Compromised Retrofit)
Difference
Butterfat %
4.15%
4.00%
−0.15%
Protein %
3.36%
3.26%
−0.10%
Same robot. Two very different barns. And completely different lives for the cows and people inside them.
Metric
Good Layout
Compromised Layout
Difference
Daily fetch time per robot
45 min
90 min
+45 min
Annual fetch hours per robot
274 hrs
549 hrs
+275 hrs
Labour cost per hour (loaded)
$30
$30
—
Annual fetch labour cost
$8,220
$16,470
+$8,250
15-year cumulative labour cost
$123,300
$247,050
+$123,750
The Barn‑Design Math You Don’t See on the Quote
Here’s where the “cheapest option” can quietly turn into the most expensive barn you own.
For a 60‑cow herd, using the Canadian cost work above as a guide, the three basic options look like this:
Full new robotic build: About $24,718 per cow in total → roughly $1.48 million. Clean‑sheet layout, designed cow flow, new manure and ventilation systems.
Strategic retrofit with proper upgrades: Around $14,000 per cow → roughly $840,000. Serious spend on floors, air, robot area, and separation, but within the old shell.
Minimal retrofit (robot dropped into existing layout): As low as $8,000 per cow → roughly $480,000. Robot, basic wiring and plumbing, but little to no change to alleys or ventilation.
If you stop there, minimal retrofit wins every time. That’s why so many kitchen‑table conversations end at the quote.
But AMS economics don’t end at installation. They run for over 10–15 years.
AMS comparisons from several North American and European extension projects have reported labour savings of roughly 10–29%, depending on herd and system, when cow flow and stocking match the robot’s capacity. That’s the upside.
On the downside, the gap between a barn fetching 45–60 minutes per robot per day and one fetching 90–120 minutes per robot per day is enormous. If your retrofit ends up on the wrong side of that line, you’ve effectively given yourself a permanent labour tax:
Roughly 275 extra hours per robot per year of fetch time when you jump from 45 to 90 minutes a day.
At roughly $25–$35 per hour for fully loaded labour on many dairy farms today, that’s about $6,875–$9,625 per robot per year just to drag cows to the box.
Production is the other quiet killer. Recent Canadian Dairy Information Centre data show Holsteins averaging 11,364 kg in 305 days, 4.15% fat, and 3.36% protein in 2024. If a compromised layout and heat load cost you even 5% of that potential, you’re giving up around 570 kg of milk per cow per year, plus components. On 60 cows, that’s over 34,000 kg of milk a year gone.
Stretch that over a 15‑year robot life, and the real cost of that “cheap” retrofit starts to show itself. A project that saves a couple hundred thousand dollars on day one can easily give that back — and more over 15 years — through extra labour, lost milk, and the kind of “year eight correction” AMS designers warn about.
That correction cheque usually shows up when the compromises you thought you could live with stop being tolerable: tearing out and re‑pouring the main alley, moving a robot that was jammed into the wrong corner, cutting new curtain openings, or finally building the separation pens you knew you needed from day one. In some retrofits, those correction projects can easily reach$75,000–$100,000.
So you’re not really choosing between a $480,000 retrofit and a $1.48 million new barn. You’re choosing between:
A cheaper‑to‑build, potentially more expensive‑to‑operate barn that could lock you into chronic labour and production penalties.
A more expensive‑to‑build facility that, if designed right, is cheaper and saner to live with for the next 15–20 years.
Year
Minimal Retrofit
Strategic Retrofit
New Robot Barn
0
$480,000
$840,000
$1,480,000
5
$590,000
$920,000
$1,520,000
10
$730,000
$1,020,000
$1,570,000
15
$900,000
$1,140,000
$1,630,000
New construction isn’t automatically “right.” For some herds, the capital hit and land base requirements make it a non‑starter. But if you’re only looking at the quote and not the 15‑year picture, you’re flying blind.
Quick Comparison: Retrofit vs New Robot Barn
A lot of this comes down to how much risk you’re willing to carry — and for how long.
Path
Typical Investment (60 cows)
Labour Relief
Best For
Biggest Risk
Minimal Compliance(No Robot)
$50K–$150K(loose pens, ventilation, turnout)
None
<10 yrs to retirement, no successor, tight capital, already offer turnout
Cutting corners on air/flow turns it into a bridge you never leave
Bridge Retrofit(Robot Now, New Barn Later)
$480K–$600K(clean one-robot setup)
Moderate(temporary)
Next generation committed, need relief now, capital for Phase 2 coming
Bridge quietly becomes destination—Phase 2 never happens
Purpose-Built Robot Barn
$1.48M (clean-sheet design)
High (best layout)
Growth-minded, multi-generation, want 15–20 yrs of good cow-flow
Highest upfront cost—requires strong balance sheet and land base
Three Realistic Paths Between Now and 2027
If your tie‑stall barn still has decent bones, you’re not stuck between “retrofit now” and “build new now.” In practice, most serious Canadian producers are landing in one of three lanes.
Path A: Minimal Compliance, Maximum Optionality
This lane says, “I’ll get Code‑compliant by 2027, but I’m not ready to bet six or seven figures on robots yet.”
It fits when you already give cows turnout or pasture, or have loose pens for dry and close‑up cows, so you’re not continuous tethering today. It also fits when there’s no clear successor, or you’re within 10–12 years of stepping back. And it fits when debt capacity is tight, and a $500,000–$1 million project would stretch things uncomfortably.
On this path, you focus on making freedom‑of‑movement time real and defensible, upgrading or adding loose maternity pens well before the April 2029 deadline, and fixing obvious stall, bedding, and ventilation issues within your tie‑stall footprint to protect comfort and longevity. You watch AMS tech and neighbour experience, so when you do make a move, it’s on your terms—not because you panicked.
The trade‑off is straightforward: you guard flexibility and your balance sheet, but you don’t ease the daily labour grind much. If your body’s already telling you you’re done with twice‑a‑day pipeline milking, this path buys time — not relief.
Path B: Strategic Retrofit as Your Long‑Term Barn
Path B is for when you look at your barn and honestly say, “She’s got another 15 years in her — if we don’t cut corners.”
It fits when a structural engineer has reviewed the foundation, posts, and roof and given you the green light for robot pads and ventilation upgrades. You can carve out 15–20 feet of clear approach in front of the robot, plus a clean exit lane and at least one functional separation pen. Ceiling height is closer to 10–12 feet than 8, or you’re committed to opening up low loft space to gain headroom. Once you’ve made room for cow flow and separation, your stall count still matches realistic robot capacity — about 60 cows per box, not 80 or 90 forced through. And you don’t see yourself doubling cow numbers in the next decade.
Here’s where it gets uncomfortable: you may have to drop from 90 cows to 60. That means less quota in the main string and, on paper, less milk shipped. But if those 60 cows are closer to their genetic potential in a barn that flows, with a robot that isn’t choking on overstocking, your dollars per cow and dollars per labour hour can look a lot better than fighting 90 in a compromised setup. Run the margins both ways before you decide.
If you choose this lane, you have to mean it. Floors, air, cow‑flow, and separation are the engine room of your AMS system. If that’s where you decide to save money, you’re setting your future self up to write that correction cheque and wonder why you didn’t do it right the first time.
Here’s a rough rule of thumb barn planners talk about: if your strategic retrofit budget is climbing past about half of what a new barn would cost and you’re still compromising on cow flow and air, that’s your cue to run full‑build numbers side by side seriously.
Path C: Retrofit as a Bridge to the Next Barn
This lane is for families where the next generation is coming home, but the timing and capital for a full new build aren’t there yet.
It works when the current operator needs physical relief now — backs, knees, and shoulders are sore from tie‑stall milking. The next generation is committed to staying in dairy and sees future growth in cow numbers or robots. The existing tie‑stall can be turned into a solid one‑robot, 60‑cow barn with honest upgrades, but everyone agrees it’s not the 2040 barn.
Here, you retrofit cleanly for one robot and about 60 cows with good cow flow and air, knowing this is Phase 1. You use this barn as your AMS training ground — learning how your cows behave in free‑flow, how to manage data, feed tables, and alarms. You start planning the new build right away: land base, manure storage, feed layout, number of robots, and cow capacity. And you put a real-time frame on Phase 2 (even if it’s a range like 2030–2033) and build your capital plan around it.
The risk? The bridge quietly becomes the destination. A few years in, payments feel normal, the worst of the old problems are gone, and the push for a purpose‑built barn fades. That’s how you end up a decade later, still in a building you meant to use “for a while,” staring again at the same cow‑flow and expansion walls.
What This Means for Your Operation
Start with the building, not the robot. Before you call a single dealer, get a structural engineer and a barn/AMS designer to walk your place. If your foundation is suspect, ceiling height is under 9 feet across most of the barn, or you can’t find 15–20 feet of clear approach space for a robot, you’re not choosing between two good options. You’re choosing between a new barn and an AMS retrofit that may never work right.
Run 15‑year numbers, not 15‑month paybacks. Sit down with your lender or advisor and build three cash‑flow models—minimal compliance, strategic retrofit, and new build—out 15 years. Use realistic labour assumptions (including fetch time at $25–$35/hour) and plug in current Canadian Holstein production as a baseline, then model what happens if you’re 5% under that due to layout and air. The spreadsheet might tell a very different story than the quote.
Be brutally honest about herd size and quota. If a workable robot layout means dropping from 90 cows to 60, are you actually going to do it? Or are you planning to sneak cows back in until the barn is overstocked again? Be honest about how many cows your footprint can truly handle and how that lines up with robot capacity.
Use fetch time as a barn‑health metric. If you’re regularly spending more than about 90 minutes per robot per day fetching cows once the system is “broken in,” treat that as a warning sign. It’s not just a bad day — it’s your layout, stocking density, or air telling you something.
Separate “Code‑compliant” from “livable.” You may be able to meet the 2027 tethering rule with turnout, exercise yards, or loose housing for some groups without robots. That might be the right move if capital’s tight and you can still physically handle the pipeline. But if your body is already done, that’s just postponing the real decision.
Match your path to your horizon. If you’re a decade from retirement and no one’s stepping in behind you, a smart retrofit or even minimal compliance might be perfect. If your kids are already talking about 120 cows and two robots, your plan should focus on where you want to be in 2035, not just how to squeeze one more trick out of a 1970s barn.
Check if your barn matches your genetics. If your breeding decisions and proofs say 14–15,000 kg Holsteins and strong component genetics, ask yourself honestly whether your barn is built for that — or whether the concrete and air in front of your robot are still a 9,000‑kg design. Genetics can’t outrun a barn that holds them back.
Scenario
Realized Milk (kg/year)
Lost to Layout/Heat (kg/year)
Genetic Potential (kg/year)
Good Layout (New Barn)
11,364
0
11,364
Moderate Retrofit
10,796
568
11,364
Compromised Layout
10,296
1,068
11,364
Talk it through before you call the dealer. Sit down with your family and your lender, map each of these paths on paper, and make sure everyone’s aligned on which lane you’re actually in — before anyone falls in love with a shiny robot quote.
Watch your cows for a week before you draw lines on paper. Set the notebook and the quote aside and just watch. Where do cows hesitate? Where do they bunch up? Who owns which alleys? Any robot layout that fights their natural movement will cost you in fetch time, milk, and patience for as long as that concrete is there.
Key Takeaways
The robot is the cheap part. The expensive part is where you bolt it. If the cow flow and air are wrong, that box will spend 15 years amplifying every design mistake.
A $17,000‑per‑cow cost gap between a retrofit and a new build can disappear over 15 years if you’re burning an extra 30–60 minutes a day on fetching at $25–$35/hour and running 5% under your herd’s production potential.
Strategic retrofits work when the barn has genuinely good bones, your realistic future herd size lines up with about 60 cows per robot, and you’re willing to give up stalls and invest in floors, ventilation, and separation.
Minimal‑change “compliance only” strategies can buy you time on the Code and protect your borrowing capacity, but they don’t fix labour, ergonomics, or succession pressures.
Bridge‑style retrofits only make sense if everyone’s honest that Phase 2 — a true, purpose‑built robot barn — is coming, with a rough date and a financial plan. If that’s never going to happen, treat the retrofit as permanent and design it that way.
A well‑designed robot barn isn’t just about labour; it’s how you actually realize the ROI on your high‑LPI and genomic investment. You can’t breed for 14,000–15,000 kg and build for 9,000 kg and expect those proofs to show up on the milk sheet.
Cost Category
Minimal Retrofit
Strategic Retrofit
New Robot Barn
Initial Investment (60 cows)
$480,000
$840,000
$1,480,000
Robot & equipment
$200,000
$200,000
$200,000
Barn/infrastructure
$280,000
$640,000
$1,280,000
Hidden Operating Costs (Annual)
Extra fetch labour (vs. good layout)
+$8,250/yr
+$2,000/yr
$0
Lost production (5% vs. genetic potential)
+$8,500/yr
+$3,000/yr
$0
Mid-Life Correction Project (Year 8)
+$85,000
+$25,000
$0
15-Year Total (All-In)
~$900,000
~$1,140,000
~$1,630,000
Real 15-Yr Cost Gap vs. New Barn
−$730,000 (not −$1M)
−$490,000
Baseline
The Bottom Line
At the end of the day, you’re not just picking a milking system — you’re designing how every single day is going to feel in that barn in 2030 and 2035. The Code, the cost of concrete and steel, and the genetics you’ve already paid for are all going to meet in that alley. Before you chase the cheapest ticket into robotic milking, ask yourself one blunt question: when you’re walking that alley with a fetch list in year eight, will this still feel like a smart move — or just the move that cost the least on paper?
Complete references and supporting documentation are available upon request by contacting the editorial team at editor@thebullvine.com.
Learn More
Dairy Tech ROI: The Questions That Separate $50K Wins from $200K Mistakes – Gain a hard-nosed checklist for Monday morning that stops you from buying trade-show hype. This breakdown exposes the $27/hour labor threshold and armors your operation against the infrastructure failures that sink 62% of automation projects.
More Milk, Fewer Farms, $250K at Risk: The 2026 Numbers Every Dairy Needs to Run – Secure your farm’s 2026 viability by running the five mission-critical numbers lenders are watching. It delivers a risk-management playbook that shifts you from simply watching Class III prices to proactively protecting your regional processor contract.
Every week, thousands of producers, breeders, and industry insiders open Bullvine Weekly for genetics insights, market shifts, and profit strategies they won’t find anywhere else. One email. Five minutes. Smarter decisions all week.
Clark Farms operated a creamery for 6 years, serving dozens of accounts. They just shut it down—and kept milking. Here’s the math.
Executive Summary: Clark Farms, a fifth‑generation dairy in Delhi, NY, ran an on‑farm creamery for six years with dozens of local accounts, then shut the plant down in January 2026 while keeping the cows milking. Their numbers show what you’re really trading with on‑farm creamery economics: you’re not going from $1.85 milk to $5.50 milk, you’re buying roughly $1.15–$2.15 per gallon in extra margin at the cost of 70–90 more hours a week in processing and delivery on top of a full dairy workload. Backed by USDA, Rabobank, Cornell Dyson, and PASA data, the article walks through how consolidation, cost gaps, and thin processing margins make “just add a creamery” a much riskier survival plan than it looks on paper. It puts Clark’s pause alongside operations like MOO‑ville, Ronnybrook, and Hudson Valley Fresh that do make processing pay by staffing it as a true second business or sharing plants and brands across multiple herds, instead of piling everything onto one family. You also see how legacy, family bandwidth, and herd genetics change the risk math: a project that steals time from components, repro, and succession can quietly cost you more than it earns. The piece finishes with a clear playbook for your own decision—map out real weekly hours, set hard limits on account numbers and delivery time, build an off‑ramp before you pour concrete, and answer one non‑negotiable question: who’s actually milking while you’re bottling the milk?
A fifth‑generation New York dairy built a creamery with dozens of accounts, then hit pause in 2026—showing exactly how far the real numbers of on‑farm creamery economics can pull away from the brochure version.
If you’ve ever thought, “We should bottle our own milk,” this one’s for you. Clark Farms in Delhi, New York, did almost everything by the book—stainless, brand, accounts, community—and still chose to shut the creamery down while keeping the cows milking. That decision says a lot about survival, hours, and the actual premium left after processing and delivery.
The 2024–2026 Reality: Why On‑Farm Processing Looks Like a Lifeline
Let’s start with your world, not the grant brochure.
USDA’s 2022 Census of Agriculture dairy highlights show that the number of U.S. farms with milk sales from cowsfell from 40,336 in 2017 to 24,470 in 2022—a 39% drop in five years. Over that same period, the value of milk sales climbed 44%, from $36.7 billion to $52.8 billion, while the national herd sat around 9.3 million cows. Fewer farms. Similar cow numbers. More milk money is stacked on a smaller group of operations.
Rabobank analysis calculated that in 2022, farms with more than 1,000 cows produced about 67% of U.S. milk, up from 60% in 2017. Brownfield Ag News, quoting Rabobank’s Lucas Fuess, reported that farms milking more than 2,000 cows carried total costs around $23.06/cwt in 2022, roughly $10/cwt lower than typical costs on 100–199‑cow farms. In a market where Class III, Class IV, or all‑milk prices bounce in the high teens to low‑$20s, that cost gap is the line between breathing room and quietly wondering how much longer you can hang on.
In Delaware County, New York—Clark’s backyard—county plans and extension work describe a long slide in dairy farm numbers since the 1990s, leaving only a fraction of the former herds still milking. You don’t need a chart if you live there. You see it in empty barns and fewer bulk tanks meeting you on the road.
Against that backdrop, on‑farm processing looks like a lifeline. In recent months, New York’s all‑milk price has often sat in the high‑teens to low‑$20s per hundredweight; USDA pegged the New York all‑milk price at $21.40/cwt in November 2024, roughly $1.85 per gallon before hauling and pooling. Farmstead creamery case studies and Cornell‑linked reports show small processors selling branded fluid milk in the mid‑single‑digit dollars per gallon, several dollars above that effective blend value.
On paper, you’re trading $1.80 milk for $5‑plus milk. When the feed bill is chewing up your cheque, that’s a tempting trade.
Clark Farms took that road. Their experience shows you where the math—and the calendar—start to bite back.
Clark Farms: A Real‑World Test of the Dream
Clark didn’t just bolt a filler onto a corner of the milkhouse. They built a serious on‑farm creamery.
The farm sits on about 630 acres outside Delhi, New York, anchored by a barn Peter Clark built in 1907. A 2022 feature in Scribner Hollow describes it as a fifth‑generation dairy, already milking cows on that hill for about 114 years.
Kyle Clark picked up the processing bug while studying dairy business management at SUNY Morrisville. Scribner Hollow reports that he spent roughly four years digging into New York regulations, working through inspections, and hunting down used dairy‑grade stainless pasteurizers, tanks, and bottlers from all over the country before the creamery opened in 2020. That’s not a spur‑of‑the‑moment pivot. That’s a long, careful build.
By early 2022, the creamery was processing **about 25% of the farm’s milk—roughly 3,000 gallons a week—**with the remaining 75% still leaving on a tanker. That milk became bottled whole milk, flavored milks like chocolate and coffee, plus cream and butter under the Clark Farms Creamery label.
They didn’t just sell from the farm store:
Their products moved through small groceries, cafés, and farm stands across the Catskills—Delhi, Andes, Phoenicia, Woodstock, and more.
Cafés like Prospect and Fellow poured Clark milk into lattes and gelato and told that story to their own customers.
Locals knew the Clark name when they opened a fridge door in town.
Demand wasn’t the snag. The cows were milking. The creamery was moving product.
On January 28, 2026, Clark Farms posted on Facebook that “after careful consideration,” they would be closing their creamery operations, while continuing to run the dairy farm. They wrote that “it has been a great joy to be able to produce dairy products for the community over the last six years,” thanked customers for their support, and admitted that keeping both the farm and the creamery to their standards had become too much. WBNG‑TV shared the news as “Clark Farms in Delaware County is closing its creamery doors after years of service,” and the comments quickly filled with people grabbing the last pints and thanking the family.
So the hard question isn’t “Why didn’t people support them?” It’s “What did the money and the hours really look like when they chose to stop?”
The Big Math: What You’re Actually Trading
Here’s where on‑farm creamery economics stops being a dream and turns into a decision.
The Revenue Side
Picture a herd in the Clark range: roughly 200 Holsteins in milk, in a system where cows can produce around 80 pounds per day. Once you factor in dry cows, heifers, and the fact that no week ever runs perfectly, you’re in the ballpark of 9,000–10,000 gallons of milk per week for a solid 200‑cow Holstein herd in New York.
If every gallon went into the pool at an effective $1.85/gallon (using that $21.40/cwt November 2024 New York all‑milk price as a real example), you’re looking at roughly $16,650–$18,500 per week in milk cheques at that volume, before hauling and other deductions.
Now drop in the 25% processing share Scribner Hollow documented. In 2022, Clark was bottling about 3,000 gallons a week and shipping the rest as bulk. Say you can wholesale those 3,000 gallons at $5.50/gallon, right in the middle of what small on‑farm fluid and flavored milks often fetch locally.
On a typical week, the rough revenue picture looks like:
Total: about $27,600–$29,450/week, versus $16,650–$18,500/week if every gallon went bulk at $1.85. On gross, that 25% slice looks like $9,000–$12,800 in additional cash flowing through the business.
That’s the number you hear in most creamery seminars. Now we get honest about what’s left after costs.
The Cost Side
Cornell’s Dyson School looked at 27 value‑added dairy businesses in New York, Vermont, and Wisconsin and didn’t sugar‑coat it: value‑added processing “is not a panacea.” In that study, mean net income from processing was modest at best and often negative, and average returns per cwt of processed cow milk were about $90/cwt lower than full economic costs once you charged a fair wage for family labor and a return on investment. The top performers did well, but the average small plant wasn’t swimming in cash.
Farmstead creamery case studies from PASA and Penn State show direct processing costs (excluding milk) for small fluid plants often run about $1.00–$1.50 per gallon, once you add electricity, hot water, CIP chemicals, packaging, labels, maintenance, and required testing. That’s just to get a gallon into a bottle safely.
Distribution costs pile on. Those same case studies document delivery expenses—fuel, truck payments, insurance, repairs, and driver labor—adding another $0.50–$1.00 per gallon in many rural, small‑drop routes.
Now the comparison on a processed gallon looks more like this:
Extra revenue over blend: $5.50 – $1.85 ≈ $3.65.
Less processing + delivery: roughly $1.50–$2.50 per gallon combined.
That leaves a real premium of about $1.15–$2.15 per gallon before you pay yourself or cover downtime. On 3,000 gallons, you’re talking roughly $3,450–$6,450 per week more than sending that milk down the driveway.
Still serious money. But the “$5.50 instead of $1.85” story has already shrunk by more than half once stainless, cardboard, and diesel get their cut.
The Part Nobody Prints in the Brochure
For the days you’re reading this in the tractor cab, here’s the premium at a glance:
The Metric
The “Brochure” Dream
The Clark‑Style Reality (Illustrative)
Gross revenue
$5.50/gal (wholesale price)
$5.50/gal
Base milk value
(Often ignored)
($1.85/gal)
Processing & delivery
“Minimal”
($1.50 – $2.50/gal)
Real premium
$3.65/gal
$1.15 – $2.15/gal
The “price” you pay
“Being your own boss.”
70–90 extra hours/week
You’re not really selling $5.50 milk. You’re selling about $1.50 of margin and a second full‑time job.
The Time Math: Buying Margin with Hours
Here’s where on‑farm creamery economics stops being just dollars and starts being bodies and weeks.
PASA/Penn State’s farmstead creamery report logs weekly labor for small plants that easily hits 40–60 hours of processing and packaging once volumes reach a few thousand gallons. Add full cleaning and sanitation—CIP cycles, scrubbing floors and drains—and you’re realistically looking at about 40–50 hours inside the plant on a 3,000‑gallon week.
Distribution and admin sit on top of that. For farms serving a couple of dozen accounts, those case studies show another 30–45 hours per week spent on ordering, route planning, loading, driving, stocking shelves, talking with store managers, invoicing, and chasing cheques.
Now remember what the dairy alone demands. Cornell’s long‑running dairy farm business work shows that a 200‑cow Holstein herd with crops, youngstock, maintenance, and paperwork can easily soak up 50–70 hours a week from your core people. You probably don’t need Cornell to tell you that—you feel it in your knees.
Put it together:
Dairy: 50–70 hours.
Creamery: 40–50 hours.
Distribution/admin: 30–45 hours.
You’ve put in yourself well over 100 hours of work every week just to keep both sides upright. On a lot of family places, it feels like a 130‑ or 140‑hour week spread across three or four people, even if nobody ever writes it down.
Work Category
Weekly Hours (Conservative)
Weekly Hours (Realistic)
Notes
Dairy Operations
50
70
Milking 2×, feeding, bedding, calves, breeding, maintenance, crop work
Spread across 2–4 family members—still unsustainable
$ Premium per Extra Hour
$27–$49/hr
$36–$90/hr
Based on $3,000–$6,000/week margin ÷ 70–90 processing hours
Now take that extra $3,000–$6,000/week and divide it by the 70–90 extra hours wrapped up in processing and delivery. You’re effectively buying that premium at roughly $35–$85 of extra work per hour. On a spreadsheet that can be edited with a pencil. In a family that already feels stretched, it’s a different conversation.
At some point, many family‑run creameries, Clark’s included, look at that trade‑off and decide it no longer fits their standards for product quality, family time, or herd care.
When On‑Farm Processing Really Works
This isn’t “never build a creamery.” It’s “be honest about what kind of creamery actually works.”
When You Build It for Scale
MOO‑ville Creamery & Westvale‑View Dairy (Nashville, Michigan). Doug and Louisa Westendorp started milking about 50 cows in 1992. When their six kids—including twins and triplets—wanted to stay on the farm, the family opened MOO‑ville Creamery in 2005 rather than chasing a multi‑thousand‑cow expansion. Today, Westvale‑View milks around 240 Holsteins, averaging over 100 pounds per cow per day, and MOO‑ville processes about 18,000 gallons of milk per week—roughly six times Clark’s processed volume. They’ve grown to four retail locations and products in over 140 retail stores and 50 ice cream shops. Their chocolate ice cream won first at the North American Ice Cream Association Conference in 2021, and vanilla followed in 2022. Every kid has a defined lane—herd, crops, ice cream, retail, tours—so nobody’s trying to juggle dairy, plant, and distribution alone.
Ronnybrook Farm Dairy (Pine Plains, New York). Ron and Rick Osofsky started bottling unhomogenized milk in glass bottles at their Hudson Valley farm in the early 1990s. Thirty years on, Ronnybrook employs about 50 staff, crops roughly 760 acres, and sends milk, yogurt, and butter from their herd to 13 New York City Greenmarkets plus supermarkets across the region. In 2023, Scenic Hudson and Columbia Land Conservancy permanently conserved the farm, calling Ronnybrook “a local icon.” They built glass bottles and direct distribution into the business model from day one and staffed accordingly.
In both cases, processing isn’t a side hustle tacked onto the dairy. It’s a second, fully staffed business.
Operation
Gallons Processed/Week
Processing/Retail Staff (Approx.)
Herd Size
Outcome
Clark Farms
3,000
2–3 (family)
~200 cows
Paused 2026
MOO-ville
18,000
15–20+
~240 cows
Thriving, 4 retail locations
Ronnybrook
~20,000+
~50
Large herd + 760 acres
Regional icon, 30+ years
When You Share the Load
Hudson Valley Fresh (Hudson Valley, NY). Instead of each farm building a plant, 10 family dairies pool their milk into a shared processing facility at Boice Brothers Dairy, a family‑run plant dating back to 1914. Member farms—Jersey, Holstein, Guernsey, Brown Swiss, Ayrshire—must meet tight quality standards: somatic cell counts under 200,000, and raw bacteria counts under 5,000. In return, Hudson Valley Fresh has historically paid a premium, as evidenced by $23/cwt vs. $16/cwt for the commodity, through a base price plus quarterly profit‑sharing. The brand is strong, the creamery is centralized, and no single farm has to own all the stainless and all the route headaches.
The pattern is pretty clear:
Some farms make processing work by building enough scale and staffing to treat it as a true second business.
Others make it work by sharing the plant and brand so their own time stays focused on cows and crops.
Clark’s situation—running a full dairy and a full processing/distribution business with essentially the same core people—is where a lot of smaller creameries stall out.
The Accidental Trucker: When Your Farm Becomes a Logistics Company
When you first picture an on‑farm creamery, you see stainless steel and glass bottles. When it actually starts to succeed, you see routes.
Wholesale food moves on trucks, not spreadsheets. Dairy plant and creamery closure coverage—like Hastings Creamery in Minnesota or Prairie Farms plant changes—regularly points to transportation, labor, and maintenance costs chewing up thin margins. Grocery distributors live on low‑teens gross margins and 1–3% net margins once trucks, fuel, drivers, insurance, and warehouses are paid. They make it work with dense routes and big drops at each stop.
A single‑farm creamery starts with none of that. You’re hauling your own product, on your own dime, to customers who might order heavy one week and light the next.
Somewhere between “a few good accounts” and “we deliver to everyone,” there’s a line. On one side, you’re still basically a farm that brings your own milk. Cross it, and you’ve become a logistics company that happens to own cows.
PASA’s case studies suggest that once you slide into the 15–20 account range, route planning, cooler space, and delivery windows start dictating your week more than milking times. With products in multiple groceries, cafés, and farm stands across the Catskills, Clark was clearly operating on that logistics side of the line.
There’s nothing wrong with that if it’s what you want. MOO‑ville runs multiple delivery trucks and has staff just for routes and retail. Ronnybrook built those NYC market runs into its identity from the start. But you want to choose to become a logistics business, not wake up in one by accident.
Why Clark Could Hit Pause and Keep Milking
Here’s a part of Clark’s story that deserves as much airtime as the shutdown: they could step off the creamery treadmill and keep the dairy running.
Look at a few structural choices they made:
They never processed all their milk. In 2022, about 25% went through the plant, while the rest still shipped as bulk. When they shut the creamery, they had somewhere to send that milk.
They leaned into used, movable stainless. Scribner Hollow describes Kyle sourcing used pasteurizers, tanks, and other equipment from all over, rather than pouring everything into custom, immovable installations. That kept sunk costs lower and resale or repurposing options open.
They didn’t strap the entire farm to the plant’s fortunes. We don’t see their loan documents, but the fact that the dairy stayed standing tells you the creamery wasn’t financed in a way that automatically dragged land and cows down when they hit pause.
When WBNG shared the closure, locals piled into the comments talking about buying the last pints of milk and cream cheese and thanking the family for years of product. Another nearby business posted, “Sad news from our friends over at Clark’s farms! We’re wishing them the best and hoping to hear they re open in the future!” It read more like a community send‑off than a failure.
That’s what an off‑ramp looks like when you actually need it. You don’t build it because you’re aiming to quit. You build it because you respect your dairy enough not to let one project drag the whole place down if the numbers or the hours stop lining up.
Legacy Changes the Risk Math
None of that math happens in a vacuum. Legacy sits right in the middle of it.
If you’re first‑generation with no clear successor, a creamery can feel like one more business shot. If it doesn’t work, you sell what you can, pay who you can, and move on. Ugly, but simple.
On a five‑generation place like Clark’s, the stakes hit different.
That 1907 barn overlooking Delhi was built by Kyle’s great‑great‑grandfather. By the time Scribner Hollow profiled the farm in 2022, they were already 114 years into the family dairy story. When the creamery pause hit social media, locals weren’t piling on—they were saying “thank you” and wishing the family well.
Academics call it socioemotional wealth—all the non‑financial value tied up in keeping your farm in the family, protecting your name, and handing something real to the next generation. Put simply: how sick you’d feel being the one who lost the place.
If you’re in Kyle’s boots, you’re not just asking, “Does this creamery cash flow in 2025?” You’re also asking, “If this ever pulls the dairy down, am I the one who ends 100‑plus years of work on this hill?”
That question doesn’t show up on your cost‑of‑production sheet. But it does show up when you decide whether to grind through another year of 140‑hour weeks or step back and protect the core dairy. Clark chose to protect the dairy. A lot of Bullvine readers would, too.
Don’t Forget the Herd: Genetics, Components, and Long‑Term Value
There’s another engine running through this story that’s easy to overlook when you’re staring at stainless: your herd.
If you’ve spent years breeding for Fat, Protein, fertility, and health, that’s not just hobby genetics. It’s a big piece of your risk and return.
Milk cheques. In component‑priced systems, FMMO and co‑op schedules have been paying strong money for butterfat and Protein. When butterfat values in the Northeast climb above $3.00/lb, a herd running just a few tenths higher in components than the blend can easily see $2–$4/cwt more than average herds shipping the same volume. That shows up whether your milk goes into your own bottle or someone else’s cheese.
Replacement pressure. Better fertility, health, and livability mean fewer heifers needed to maintain herd size. Analysts talking about the “processing gap” have also flagged tight heifer supplies and higher replacement prices, especially as more calves go beef‑on‑dairy. That makes every genomic and mating decision more expensive to mess up.
Reputation and options. Strong cow families with performance and type give you options—embryos, breeding stock, bulls in AI, or simply better conversations with lenders and partners who know you’ve built something with resale value.
If a creamery forces you to rob time from fresh‑cow checks, repro, and data review, you’re not just putting this year’s processing margin at risk. You’re putting the next decade of herd progress at risk, too.
When Clark stepped away from the creamery while keeping the dairy, they didn’t just protect cash flow. They protected a herd and a genetic trajectory, they’ve built one generation at a time. If you’re serious about breeding and components, that needs to sit right beside any stainless quote you’re considering.
What This Means for Your Operation
Here’s where you stop looking at Delaware County and start looking at your own kitchen table.
1. Start with the One Question You Can’t Dodge
Before you chase a grant or sign a creamery loan, ask this out loud:
Who will milk the cows while I’m bottling the milk?
If your answer is “We’ll just work harder” or “We’ll figure it out,” you don’t have a plan. You’ve got a hope.
A real answer sounds like:
“I’ll run the plant from 9 to 3, my parents stay on both milkings for now, we hire a part‑time milker for two evenings, and if someone’s sick, we cancel one processing day and roll that product into the next run.”
If you can’t write down that level of detail—with names, hours, and backups—you’re not ready to buy stainless. You’re ready to go back to the whiteboard.
Factor
Bulk Milk (No Processing)
On-Farm Creamery (25% Processed)
Revenue per gallon
$1.85 (blend/pool price)
$1.85 (bulk) + $5.50 (processed, 25% of volume)
Net margin per processed gallon
n/a
$1.15–$2.15 (after processing + delivery costs)
Extra weekly margin (3,000 gal)
$0
$3,450–$6,450
Weekly labor (family)
50–70 hours (dairy only)
120–160 hours (dairy + plant + delivery)
Effective hourly rate for extra work
n/a
$35–$85/hour (before equipment ROI)
Capital investment
Minimal (routine dairy equipment)
$150,000–$500,000+ (plant, truck, cold storage)
Flexibility to scale down
High—adjust herd size, cull strategically
Low—fixed plant overhead, route commitments, debt service
Risk to core dairy
Low—focus stays on cows and crops
High—time/capital diverted; plant failure can drag dairy down
Exit options if stressed
Steady—co-op/processor always needs milk
Limited—selling used stainless at discount, breaking customer commitments
Best fit for…
Farms prioritizing herd genetics, land base, simplicity, or nearing succession
Farms with committed next-gen, dedicated staff, dense local market, long runway
2. Put Your Week on Paper
Do this with the people who’ll actually be working it.
List every dairy job you do now with honest hours: milking, scraping, feed mixing, bedding, calves, breeding decisions, cropping, breakdowns, and paperwork.
List every processing job you’re adding: receiving, batching, pasteurizing, cooling, bottling, labeling, stacking, cleaning, swabbing, record‑keeping, and inspector visits.
List every distribution job: loading, driving, unloading, stocking, talking with buyers, invoicing, chasing cheques.
Add up those hours against the people you actually have—not the extra hire you “hope” will show up. If your plan needs any core person over 60–65 hours/week beyond a short start‑up push, be honest: you’re designing a burnout schedule, not a sustainable business.
3. Decide When You’re Willing to Become a Logistics Business
Draw this line before you start adding accounts.
Write down:
The maximum number of wholesale accounts you’ll serve before you cost out a dedicated driver or route person—maybe that’s 12, maybe 18, but write a number.
The minimum drop size that makes a stop worth it—how many cases have to come off the truck to justify the fuel and time.
Which types of accounts you’re willing to walk away from if your route starts looking like spaghetti and you’re spending more time behind a café than behind a cow.
If you don’t set those rules now, your route will quietly run you.
4. Build the Off‑Ramp While You’re Pouring Concrete
If you go ahead, don’t wait until you’re exhausted to think about exit options.
Keep your co‑op or processor relationship alive, even if you’re shipping less. You want a place to send milk if you need to dial the creamery back.
Work with your accountant and lender, so the creamery debt doesn’t automatically drag land and cows into the fire if the plant has a bad year.
Favor used or modular stainless steel, you could realistically sell if you change course.
Set “stop rules” now: for example, “If after three years the creamery isn’t generating at least $X/month in net cash and our average weekly hours are still above Y, we pause and reassess.” Adjust X and Y to your reality—but don’t ignore them later.
5. Check Processing Against Your Herd Strategy
Your creamery plan shouldn’t be in a separate binder from your breeding plan. It should sit on top of it.
Ask yourself:
“Does this creamery help us capture more value from the components and health traits we’ve been selecting for, or does it risk pulling attention away from managing them?”
“If cash gets tight, do we cut repro and replacement investment first, or do we slow down creamery expansion and marketing?”
If the honest answer is “we’d sacrifice herd investment to keep the plant going,” you’re trading long‑term herd value for short‑term plant cashflow. That might be the right call in a specific situation. Just make sure it’s a conscious choice, not something you stumble into.
Key Takeaways
The on‑farm creamery premium is real—but it isn’t free. Processing a 25% slice of your milk might add several thousand dollars a week in margin, but you usually buy it with 70–90 extra hours of processing and delivery piled on top of a full dairy week.
Once you’re past roughly 15–20 accounts, you’re running a logistics business. At that point, route density, drop size, and store delivery windows matter as much as butterfat tests.
The farms that make processing work long‑term add people, not just stainless. MOO‑ville, Ronnybrook, and Hudson Valley Fresh all spread the load across family, staff, or co‑ops instead of forcing one family to carry everything.
A well‑built off‑ramp is a form of insurance. Clark Farms could pause the creamery and keep milking because they never welded the farm’s survival to the plant’s success.
Your herd and land are still the backbone. A strong Holstein herd on owned ground will outlast any value‑added project that only works if you live a 143‑hour week.
The right time to discover your breaking point is on paper—not at 11 p.m. in the plant. If your creamery plan only works with everyone running at 110% forever, it doesn’t actually work.
The first real due‑diligence question is simple. “Who will milk the cows while I’m bottling the milk?” If you can’t answer that clearly, you’ve already learned something important from Clark Farms’ experience.
The Bottom Line
Clark Farms didn’t fail at diversification. They ran a full‑scale, real‑world trial of on‑farm processing under today’s economics, then listened when the premium and the hours stopped lining up. They made the hard call to protect the dairy that’s been there since 1907, honour their family’s work, and leave the door open for whatever comes next.
If you’re weighing a creamery of your own—or you’re already living a week that feels a little too close to 143 hours—the real question isn’t just “Can this make money?” It’s “What does this do to our time, our cows, and our ability to hand something solid to whoever comes next?”
That’s the answer you want in hand before the stainless rolls into your yard.
Complete references and supporting documentation are available upon request by contacting the editorial team at editor@thebullvine.com.
Beyond Efficiency: Three Dairy Models Built to Survive $14 Milk in 2026 – Gain a strategic roadmap for the “end of the middle” by identifying which structural model fits your region. It reveals the long-term positioning required to survive $14 milk and helps you choose between scale or branding.
211,000 More Dairy Cows. Bleeding Margins. The 2026 Math That Won’t Wait. – Secure a competitive advantage by exposing how beef-on-dairy premiums are masking structural unprofitability. It breaks down the disruptive “27:100” heifer ratio and reveals why breeding for protein is the key to outlasting the 2026 reset.
The Sunday Read Dairy Professionals Don’t Skip.
Every week, thousands of producers, breeders, and industry insiders open Bullvine Weekly for genetics insights, market shifts, and profit strategies they won’t find anywhere else. One email. Five minutes. Smarter decisions all week.
If 38.8% turnover feels normal on your farm, you’re not broken. The dairies that are surviving just moved the labor crisis to the kitchen table—and brought neighbours with them.
The neighbour’s text came before sunrise.
“Heard you lost a couple of good guys lately. I’ve got someone you should talk to. Coffee at the diner when you’re done milking?”
It was still dark outside. Steam rolled off the backs of the cows as they shifted in the holding pen. In the milk house, under the hum of the cooling compressor, Mark wiped his hands on his coveralls and stared at his phone.
Milking was only halfway through. His mind was already racing ahead to a feed delivery, a meeting with the banker, and a scraper chain that had started thumping again. He’d lost more good people in a year than in the decade before, and he was out of ideas. It was the labor crunch he’d been trying not to think about showing up in his own milk house.
The message was from his neighbour, Dave. Dave farms on the next road over. He’s ten years older, the kind of guy who’s seen enough tight years and hard decisions to read trouble from a distance. He’d noticed the steady stream of new faces in and out of Mark’s barn.
Mark thumbed out a reply.
“Yeah. I’ll be there.”
Standing in that milk house, still in the middle of the first milking, he felt something he hadn’t let himself feel in a while.
Maybe they didn’t have to figure this out alone.
He wasn’t the only one.
I’ve heard that same moment described at more than one kitchen table these last few years: a pressure point that feels impossible, someone finally saying out loud that they’re in over their head, and then—almost in spite of everything stacked against them—the neighbours start to show up.
What kept these families going wasn’t just the cows.
It was the people around them.
Editor’s Note: The farm stories in this article blend real interviews, conversations, and events from the last few years. Names and identifying details have been changed to protect privacy, and individual scenes and dialogue are composites drawn from multiple farms, not a single family. The situations and community patterns are real, used with permission, and told with care. If you see yourself in Mark, Jennifer, or Jake and Emily, that’s the point—they’re built from the stories we keep hearing at kitchen tables across dairy country, not from just one farm. Every scene and decision in this piece is drawn from real conversations with producers, workers, vets, and advisors. We’ve blended details to protect privacy, not to soften the truth.
The Dairy Labor Crisis by the Numbers
Here’s what’s really going on behind these stories.
In the FARM Program’s nationwide dairy labor survey, conducted by Texas A&M’s Center for North American Studies and published in 2019, U.S. dairies reported an average employee turnover rate of 38.8 percent, compared with 47.1 percent in the broader private sector. That still means nearly 4 out of 10 positions are turning over every year on the typical dairy. If you’ve got 10 employees, you’re basically refilling almost four seats a year.
Labor is already one of your biggest line items. Michigan State University Extension notes that labor typically accounts for around 14 percent of total cash expenses on dairies, with the exact share varying by herd size and region. When the people you’re investing that money in keep cycling out the door, the quiet bleed on profit and herd performance is worse than most budgets show.
At the same time, the workforce you depend on is structurally fragile. A national survey of dairy farms conducted for the National Milk Producers Federation in 2014 found that immigrant workers accounted for about 51 percent of all dairy labor, and dairies that employed immigrant labor produced roughly 79 percent of the U.S. milk supply. In key dairy states, that reliance runs even higher. If anything shakes that foundation—policy changes, enforcement swings, or fear—it hits your parlor and your bulk tank, not just a headline.
North of the border, the Canadian Agricultural Human Resource Council’s recent forecasts for 2023–2030 show agriculture facing persistent and growing labor shortages, with dairy among the sectors expected to see higher vacancy rates if nothing changes. Whether you’re shipping to a U.S. cooperative or a Canadian board‑regulated plant, the story is the same: there aren’t enough people lining up to do this work under status‑quo conditions.
So if you feel like you’re constantly training, constantly short, constantly one resignation away from a crisis—you’re not imagining it. You’re sitting right in the middle of the math.
When Neighbours Became Teachers
The diner was half empty by the time Mark walked in. The smell of bacon and coffee hung in the air. Dawn was just starting to pull over the hills.
Dave was already in the corner booth, two mugs on the table.
“I remember he didn’t start with advice,” Mark said. “He just looked at me and asked, ‘How are you sleeping?’ And I laughed, because I thought he was joking. But he wasn’t.”
Mark let out a slow breath.
“I told him the truth. ‘Not great.'”
Over eggs and toast, the conversation drifted from milk prices and weather to the thing they’d both been circling around: people leaving.
“I can’t keep anybody,” Mark admitted. “The ones I really trust, the ones who know fresh cow routines and don’t miss heifer heats, they’re the ones living with the most fear.”
Over the years, he’d watched more than one trusted employee disappear almost overnight. One day, they were putting in a new group of fresh cows, and the next day, their bunk was empty. Families who’d become part of the rhythm of his barn packed up quietly and left, tired of living with the feeling that one traffic stop or one letter in the mail could change everything.
“There wasn’t even a chance to say goodbye,” he said quietly. “Their kids played with my kids. We just…lost them.”
Dave nodded. His eyes went to the window for a second.
“We had that happen here, too,” he said. “You don’t forget it.”
Research across dairy regions confirms what guys like Mark and Dave are living: immigrant and foreign‑born workers are the backbone of modern dairy, and policy uncertainty isn’t an abstract debate—it shows up as fear, turnover, and empty bunks in the bunkhouse.
In the mid‑2020s, when the labor crunch and immigration stalemate seemed to tighten another notch every season, Dave tried one of the legal paths dairy farms can use to give long‑time workers some real footing. It felt like a maze of forms, fees, and deadlines.
“It’s expensive, it’s slow, and the paperwork might as well be written in a different language the first time you see it,” he told Mark. “But it’s one of the only ways we can look somebody in the eye and say, ‘We’re willing to stand beside you.'”
He slid a business card across the table. The name on it was an immigration attorney who’d grown up on a small dairy and knew enough Spanish and farm talk to bridge both worlds.
“She knows cows,” Dave said. “She knows the law. And she’ll tell you what you don’t want to hear, not just what sounds good.”
That night, Mark and his wife spread the first stack of papers out on their kitchen table. They looked at the fees. They thought about the time they’d already poured into training people, about the families who’d already left, about their own kids and the way it shook them every time someone they loved simply vanished from the lane.
They decided to try.
But they also decided they weren’t going to walk that path by themselves.
The next week, they invited a few neighbours over for supper. A handful of couples and a single farmer crowded around the table. The attorney joined on a laptop screen at the end, her face propped between salt and pepper shakers.
They asked every question they could think of.
What if a case gets denied? How long does this really take? What happens if the rules change in the middle? How do we even start talking about this with our workers?
Nobody had a neat, tidy answer for everything. What they did have was a room full of people nodding along.
“By the end of that night, none of us had a clean roadmap,” Mark said. “But we all knew we didn’t want to keep pretending the way things were was okay.”
That kitchen‑table meeting turned into a regular thing. Once a month, after evening chores or on a rainy Sunday, more trucks crowd into the driveway than the yard was ever designed for. People bring casseroles and cookies. Kids drift in and out, grabbing snacks and listening from the stairs.
Around that table, they swap stories.
Someone passes a letter from the government around, the paper soft from being folded and unfolded. Someone else talks about a worker whose case is stuck somewhere in the system and how they’re trying to keep his hopes grounded. The co‑op field rep sits in sometimes, mostly to listen.
“I thought I understood ‘labor issues’ before I sat at that table,” he admitted one night. “I didn’t. Not really.”
He started talking differently at co‑op meetings after that.
“I told them, ‘You think this is a policy issue. Our members are living this at their kitchen tables,” he said. “It changes how you argue for something when you’ve looked those people in the eye.”
Every now and then, an extension educator joins them, too, listening more than talking and jotting notes on what farmers actually need from the next round of workshops.
Over time, farms in that little circle have helped a number of long‑time workers start some kind of legal path forward. Not every case has gone smoothly. There have been delays that felt like gut punches. There have been nights when someone came in ready to give up.
“And then you have three other farmers saying, ‘Yeah, we hit that wall too. Here’s how we got through it—or how we’re still trying,” Mark said. “That’s when it feels less like you versus the system and more like all of us, together, trying to do right by our people.”
One afternoon, long after the paperwork marathon had started, a worker walked into the parlor, holding an envelope as if it were a fragile calf.
Mark took one look and knew what kind it was.
“We just stood there,” he said. “He handed it to me with both hands. He couldn’t say much at first.”
When he found the words, he said something Mark won’t forget: “My daughter can grow up here now.”
Later, someone in the group mentioned that the worker’s child had drawn a picture of the farm at school and told the teacher, “This is where we get to stay now.” That simple comment said more than any thank‑you card ever could.
On rough mornings, when a pump won’t prime, or a heifer finds a new way to wedge herself where she shouldn’t, Mark thinks about that kid.
“I still worry about what might change in town or in the capital,” he said. “But I don’t wake up every day wondering who’s going to be in the parlor anymore. That alone feels different.”
Somewhere in that same valley, another worker’s case is still sitting in a stack of files. The group hasn’t forgotten him. His name comes up at every meeting. Somebody always volunteers to make the next call.
Raising Kids, Cows, and Community in Minnesota
The night everything came to a head for Tom and Sarah, the house was too quiet.
They’d finished evening milking late. Their roughly 200‑plus cows were settled, the parlor was washed, and the pipeline was humming as it cooled. Upstairs, their daughter was sprawled across her bed with textbooks open and earbuds in.
Sarah set a plate of reheated casserole on the table and poured herself a cup of tea, which she never did drink. Tom sat down across from her, shoulders slumped in a way she’d started to see more and more.
“I remember staring at that plate and thinking, ‘If I try to eat this, I’m going to fall asleep right here,'” she said. “I was that tired.”
Over the past months, a string of milkers had come and gone. One left for a job with benefits in town. Another found work with more predictable hours. Others just drifted away. Each time, they scrambled. Each time, they told themselves they’d figure it out.
That night, Sarah finally said what had been rattling around in her head for weeks.
“I don’t even know who’s on the schedule tomorrow,” she told Tom. “I just know I’m bracing for a text at five a.m. that says, ‘Sorry, can’t come.’ And I’m so tired of training people who are already looking for the next thing.”
When they’d asked their daughter not long before if she’d ever think about coming back to the farm after college, she didn’t sugarcoat it. She talked about what she saw: her parents exhausted, a schedule that never let up, and friends working in town who had predictable shifts and benefits.
“She wasn’t trying to hurt us,” Tom said. “She was just telling us what it looked like from where she sat.”
That night at the table, he set his fork down.
“We can’t keep doing this,” he said quietly. “Not to ourselves. Not to them.”
There was a long pause. The clock on the wall ticked louder than usual.
The next day, between vet checks and feeding calves, they started talking seriously about robots.
They’d heard all the stories. Some neighbours swore their automatic milking systems had saved their backs and their marriages. Others grumbled about never‑ending alarms and cows that refused to cooperate. The dealer had glossy brochures full of graphs and smiling families.
Tom and Sarah made a choice that surprised even them. They didn’t start by calling the dealer.
They started by calling their people.
They invited their herd vet, their nutritionist, a neighbour who’d installed robots a couple of years earlier, and their pastor to the farm for a Sunday afternoon.
“It felt a little strange at first,” Sarah admitted. “Like, why is the pastor in the shop talking about robots? But he knew us. He’d seen what the last few years had done to our family. That mattered as much as the numbers.”
They sat on folding chairs in the machine shed with two whiteboards, a pot of coffee, and more nervous energy than any of them wanted to admit. The wind rattled the overhead door. A few calves bawled outside.
They talked about what a bigger loan would really mean for their debt load. They talked about how many hours they could realistically take out of the parlor. They talked about what it would look like for their crew—who might be excited, who might be nervous. They talked about what it would mean for their kids if the farm started to look like something they could actually imagine being part of.
Their vet didn’t sugarcoat it.
“A robot can’t fix a bad ration or a bad attitude,” he told them. “It can change your workload. It might change your stress. But the biggest question is, what do you want your life to look like five years from now?”
Their pastor asked a different question.
“Who are you going to call when something breaks at two in the morning?” he said. “Because it will. And you two can’t be the only answer to that.”
They made a list. The neighbour with robots. The dealer techs. The vet. A couple of younger producers in the area who’d talked about wanting to learn more about AMS. One of their farm‑credit advisors offered to run worst‑case and best‑case cash‑flow scenarios so they weren’t guessing in the dark.
They also did something they hadn’t done before.
They put emergency mental‑health contacts where they could see them—farm stress hotline numbers, their doctor’s office, their pastor’s cell—right on the fridge. Just in case.
The robots did come. The first weeks were rough. Cows balked at the new lanes. Alarms went off for reasons no one could explain. There were nights when Sarah, standing in the glow of a robot screen at three a.m., wondered if they’d made a terrible mistake.
But slowly, the work started to shift.
They sat down with their crew and told them the truth.
“We’re not replacing you,” Tom said. “We’re asking you to work differently.”
They asked who might be interested in learning more about health, breeding, and data.
A quiet milker who’d been with them for a few years raised her hand.
“I don’t want to wash units forever,” she said with a small smile. “Teach me something else.”
They did.
She began working closely with the vet, learning how to read the robot’s reports—conductivity graphs, milk‑flow patterns, visits per cow. A few months in, she noticed that one group’s milking times were creeping up, and the conductivity in a couple of quarters was just a tick higher than normal.
“I thought, ‘Something’s going on in that pen,'” she said. They pulled a few samples and found the beginnings of a mastitis issue they could get ahead of.
The vet shook his head, smiling.
“The robot gave us numbers,” he said. “She gave us insight. That’s the part you can’t buy in a crate.”
Task
Pre‑Robot Hours
Post‑Robot Hours
Milking / Parlor Work
16
6
Cow Health & Repro Tasks
4
6
Data & Planning
1
3
Upstairs in the farmhouse, something else was shifting. Their daughter, who’d sworn she’d never come back, started wandering into the office when she was home on weekends. At first, she just clicked around the software because it looked like a game. Then she started asking questions about cull rates, reproductive performance, and which cows were actually paying for their stall.
As her daughter dug into the robot data, she also started asking which cows were actually paying for their stall and which matings were producing the kind of trouble‑free cows the robots love.
“For the first time,” she said, “the farm started to look like a place where I could use my brain, not just my back.”
At her university’s dairy club, she found herself helping younger 4‑H members figure out their own families’ robot reports. On show day, she’d be leaning over laptops with twelve‑year‑olds in belts and boots, explaining how to read a graph of milkings per day and why a cow dropping to 1.5 visits needs eyes on her fast.
A few months after that, a neighbour, thinking about robots, called late one night, overwhelmed by costs and alarms he’d heard about.
“Tom sat at the kitchen table and just walked him through the first week,” Sarah said. “We remembered how it felt to sit where he was. It felt good not to let him sit there alone.”
The robots didn’t fix everything. The debt still sat on the balance sheet, heavy as a silo. There were still nights when alarms went off at the worst possible time. There were still hard conversations about who was going to be “on call” over Christmas.
But there were more evenings when the family sat around the table before nine p.m., and more mornings when Tom and Sarah woke up feeling like they hadn’t been run over.
“I won’t pretend it’s all sunshine,” Sarah said. “But we’re not as close to the edge as we were. And the farm looks more like a place our kids might want to come back to, instead of a place they want to run from.”
Down the road, a smaller tie‑stall couple with no real interest in robots at all drove home from one of those barn days and told each other, “We’re not the only ones struggling with labor. That helps.” Their solution looks different—tighter shifts, a shared weekend milker with a neighbour—but they still came away with the same thing.
They’re not alone.
What Fair Wages Really Built in Vermont
The wind cut across the Vermont hillside, blowing fine snow into the ends of the freestall barn. Cows stood in rows, chewing calmly, their breath hanging in the air. In the farmhouse kitchen, a pot of coffee gurgled and the old radiators hissed to life.
Jennifer spread a stack of pay stubs and scribbled notes across the table. Across from her sat two of her employees.
“I want you to understand how we got here,” she told them. “Because this isn’t charity. This is math. And it’s also about what kind of place we want this to be.”
A few years earlier, her roughly 150‑cow organic dairy had started to feel like a revolving door. On paper, the farm looked fine. Good components. Strong butterfat. Pastures that made the milk truck driver smile. But the people side was bleeding.
“I was paying what everyone around here was paying,” she said. “And still, every time I turned around, somebody was leaving.”
She sat down with her accountant and her dad—who’d milked cows on that hill before her—and really looked at the numbers.
The Real Cost of Employee Turnover
Here’s the math Jennifer was staring at, stripped of wishful thinking.
A 2025 Michigan State University Extension analysis estimates turnover costs at 100–150 percent of annual salary for hourly dairy positions, and shows how a $25,000–$30,000 job can generate $37,500–$45,000 in replacement costs when you factor in hiring, training, and lost productivity. On a 20‑employee dairy with 10 percent turnover, that adds up to $75,000–$90,000 per year.
The FARM Workforce Development resources and related industry analysis often use a baseline of about one‑third of annual salary per replacement. With experienced dairy employees commonly earning around $40,000–$42,000 per year, that puts visible replacement costs in the $13,000–$14,000 range before you even count subtle herd impacts.
A number of farm workforce studies and extension resources suggest that $15,000–$25,000 per experienced worker is a realistic minimum once you add up recruiting, training, lower efficiency, and those ripple effects on SCC, reproduction, and cull rates.
To make it a little easier to picture, here’s a simplified breakdown you can lay beside your own numbers:
Category
Estimated Cost (USD)
What It Includes
Recruitment & Hiring
$500–$2,000
Advertising, interviewing time, background checks, and management hours
Training (First 90 Days)
$3,000–$6,000
Lower efficiency, mentor’s lost time, errors during the learning curve
Lost Productivity & Herd Impact
$5,000–$12,000
Higher SCC, missed heats, protocol slips, extra vet work, milk loss
Transition Disruption
$2,000–$5,000
Coverage gaps, overtime, and burnout risk in the remaining crew
Total Per Departure (Conservative)
$10,500–$25,000+
Varies by farm size and role complexity
Scenario
Wage/worker
Turnover
Turnover cost (10‑employee crew)
Status quo – low wage
$38,000
40%
$60,000
Slight raise, no benefits
$40,000
30%
$45,000
High‑retention wage + basic housing
$45,000
15%
$22,500
Jennifer‑style full package
$50,000
10%
$15,000
That’s the “hidden math” behind a help‑wanted ad that never seems to come down.
Jennifer and her dad realized that on a farm, even with three or four key positions turning over regularly, they were quietly burning through more money than it would cost to make those jobs worth keeping.
It wasn’t a fancy spreadsheet. It was a pen, a legal pad, and a lot of honest math.
Her dad slid his coffee mug to the side, like he was making room for something important.
“If you can’t afford to treat people right,” he said, “you can’t afford to be in business.”
It wasn’t a lecture. It was the plain truth of someone who’d seen what happens when you don’t.
So they did something that felt a little crazy.
They rebuilt their labor plan from the ground up.
They landed on a pay and benefit package that worked out to roughly the mid‑twenties an hour for full‑time work once you factored in housing and basics. They decided to include family housing on the farm, with heat. They added health and dental insurance. They put in paid vacation and sick time. And they set aside money each year per employee household for education, whatever that meant to that family.
Then came the harder part: sitting down with their crew and walking through it.
“We’re not used to bosses opening the books,” one of them said later. “She showed us what the farm could pay, what it cost when people left, what it would mean if we stayed.”
That conversation changed something.
It didn’t magically solve every problem, but it shifted the ground under their feet. Suddenly, this wasn’t just a job that might disappear in six months. It was a place willing to put its money and trust where its words were.
A while later, Jennifer checked in with one of her employees about his son. The boy had been struggling in school; teachers had been sending notes home about focus and math.
“We were worried all the time,” the dad said. “When you don’t know if you’ll have a job next month, it’s hard to think about anything else.”
Jennifer suggested using some of the education support to pay for extra help through the school. At first, he hesitated. He’d never had an employer offer something like that.
They tried it.
Over the following months, the boy’s confidence grew. The grades came up. But what stuck with Jennifer wasn’t one report card moment. It was watching the strain slowly ease from the parents’ faces and hearing them talk about their son’s future with something besides fear.
“I realized I wasn’t just cutting paychecks and hoping people showed up,” she said. “I was part of their family’s story, and they were part of mine.”
That new sense of responsibility started to show up in other places, too.
One summer, a neighbour with a small tie‑stall herd found himself short‑handed with almost no notice. The loss of a key milker came at the worst possible time—middle of the growing season, no backup plan, and real fear about how he’d manage.
Jennifer heard about it from her crew before she saw anything online.
“They came to me and said, ‘We can cover his weekends for a while,'” she said. “They’d already talked it over among themselves. They had a little schedule written out.”
For several weekends, one of her employees pulled into that neighbour’s driveway in the dark, milked his cows, washed his pipeline, and headed back to their own jobs. They refused extra pay.
“We told him, ‘Someday it’ll be somebody else. You’ll be the one showing up in their yard,” one of them said.
In the middle of that neighbour’s fear, when he could barely face walking into that barn alone, his neighbours showed up anyway.
It didn’t fix every problem. It didn’t make the bills go away. But it meant he didn’t have to face that barn alone.
Twice a year, Jennifer opens her kitchen to other farmers. She calls it a “labor open house,” but it feels more like a neighbourhood gathering. There’s chili or soup. Kids run up and down the hallway. Spouses lean on counters with coffee mugs.
She lays out what she pays, what she offers, what it’s costing her, and what she feels like it’s saving her.
The first time she did it, one of the older farmers looked at the numbers and shook his head.
“I can’t pay like that,” he said.
“Maybe not,” Jennifer answered. “But maybe you can do something else. Maybe it’s housing. Maybe it’s one extra day off a month. All I know is, doing nothing is costing us more than we think.”
A little while later, that same farmer teamed up with two neighbours to fix up a worn‑out farmhouse at the end of their road. They turned it into shared housing for families who worked across their farms. The floors creak. The paint is old. But the walls are insulated, the furnace works, and the kids who live there get to stay in the same school all year.
One of the moms who moved in told him, “We’ve never had heat we could count on before. The kids sleep through the night now.”
For those three farms, that farmhouse has become more than just a rental. It’s a promise that they’re planning for people, not just hoping someone will show up.
“It’s not about copying what we do dollar for dollar,” Jennifer said. “It’s about deciding that people are worth planning for, not just hoping for.”
Finding Family in Unexpected Places
On a cold November morning in Wisconsin, the gravel road to Jake and Emily’s farm was lined with bare trees and frost‑covered fence posts. Their couple of hundred cows were already halfway through the morning milking. The skid steer beeped in the yard as someone pushed feed up.
Inside the parlor, an older employee named Pete was rinsing units when a man with a navy stocking cap and a careful smile stepped in.
This was the new hire’s first winter on the farm.
When the call came from a local refugee resettlement agency asking if Jake would consider interviewing someone with livestock experience from halfway around the world, his first reaction had been a knot in his stomach.
“I thought, ‘We’re already behind. I can’t add language barriers and paperwork on top of this,” he said. “But I also thought, ‘We can’t keep doing what we’re doing.'”
Two local high school kids had left for college. A long‑time worker had retired. Ads on the bulletin board at the feed store weren’t getting calls anymore.
So he said yes to a short trial.
On the first morning, there were awkward moments. Communication was harder than anyone expected. At one point, Pete got frustrated trying to explain a change in the feeding routine, and Jake worried the whole thing was about to fall apart.
Then Pete pulled out his phone and opened a translation app. What could have been the end of the trial became the beginning of a solution. They went back and forth like that for a while—half gestures, half phone screen, half shared cow sense. By the end of the week, the two of them had found a rhythm.
“That guy knew more about cattle than half the people I’ve worked with,” Pete said later. “We just had to figure out how to talk to each other.”
Back home, in another country and another climate, the new hire had grown up tending cattle and goats. The cows here were different. The barn was different. The weather could cut you in half. But the animals were still animals.
“I didn’t come here to be saved,” he said. “I came here to work and to build something again. They gave me a chance. I want to make good on it.”
Months later, his wife and kids arrived. They were among the few newcomer families in the little town.
“The first day of school, I walked my daughter in and felt every eye on us,” his wife said. “It was…a lot.”
The principal stepped forward, shook her hand, and said, “We’re glad you’re here.” It wasn’t a speech. It was just one sentence in a crowded hallway, but it mattered.
Emily noticed her hanging back at school pick‑up, hovering near the door. She recognized that careful watching—the way you assess a new situation before committing. One afternoon, she walked over and invited her for coffee.
They sat at Emily’s kitchen table, the same one where so many farm bills had been paid and so many 4‑H posters had dried, and traded stories—with help from a phone app and a lot of gestures. Emily asked if she’d teach her how to make one of her favorite dishes. In return, Emily showed her how she planned meals around milking and chores.
“What started as me trying to help,” Emily said, “turned into me realizing how much I had to learn.”
Out of those visits came the idea for a “cultural night” in the machine shed.
They swept out one bay, set up folding tables, and plugged in slow cookers and coffee pots. The new family brought their food. Emily made chili and apple crisp. Pete brought venison sausage. Somebody else showed up with a pan of bars.
A small crowd of neighbours, a couple of other farmers, a teacher, the mail carrier, and one notoriously private uncle who almost never leaves his own place came that first year.
They didn’t do speeches. There were no name tags. People just ate. Kids ran around the tractors. Someone pulled out a guitar. At one point, the new worker pulled out his phone and showed photos of the cows and fields from home. A few people recognized the look in his eyes when he talked about weather and crop failures. Different country, same worry.
The shift in the neighbourhood didn’t come from one dramatic moment. It came from a hundred small ones. Conversations at the feed mill sounded different. People who’d been quietly skeptical started asking practical questions about how the partnership was working—housing, schedules, school.
“It wasn’t like a switch flipped,” Jake said. “It was more like people kept showing up, and over time, everybody relaxed a little.”
In the months that followed, word spread quietly. A couple of other farms were called the same resettlement agency. One hired someone with small‑ruminant experience to help with calves and yard work. Another found a woman who’d worked at a dairy co‑op overseas and wanted to be back around cows.
Not everything went smoothly. There were miscommunications—about time off, about holidays, about small things that felt big in the moment. Once, a misunderstanding about a schedule change left a pen of calves bedded later than they should’ve been. It took a couple of uncomfortable conversations, more translation‑app back‑and‑forths, and a lot of listening to sort it out.
“But we got there,” Jake said. “We messed up. We apologized. They messed up. They apologized. That’s how families work. That’s how communities work, too.”
Some of those connections stretch beyond the road now. One of the FFA kids who helped set up tables started a group chat with other local farm kids and a few she met at a state conference. They trade photos of calves, swap ideas for farm safety projects, and send “You okay?” messages on the rough weeks.
When you drive past Jake and Emily’s place now, it’s not unusual to see their kids and the newcomer kids racing their bikes down the lane together, or a group of parents—old neighbours and new ones—standing by the yard gate talking about school and silage in the same breath.
A local FFA student who helped set up tables last year tried to put it into words.
“I’ve been to a lot of meetings in that shed,” she said. “I’ve never seen that many different people in here at once, just talking and laughing. It made me want to stick around and see what we build next.”
“What kept us going wasn’t some big plan,” Emily said. “It was small decisions, over and over, to show up for each other.”
Four Models of Community Support: What These Farms Built
Each of the farms in this story found a different path through the labor crisis. None of them had a perfect playbook. But together, they offer a menu of approaches you can adapt.
Farms with core immigrant crews under status pressure
Tech + People – Robot Transition
Community‑guided AMS adoption
Capital for robots + support network
Reduces parlor hours; shifts staff into higher‑skill roles
Mid‑size herds facing burnout and succession questions
High‑Retention Wages & Housing
Above‑market pay, housing, benefits, open books
Higher wage line, housing, benefit admin
Dramatically lower churn; stronger loyalty and peer support
Solid herds with margin willing to trade cash for stability
Refugee Partnership & Cultural Bridge
Work with resettlement programs; invest in integration
Time, patience, school and town relationships
Access to new skilled workers; revitalized rural communities
Areas with shallow local labor but active newcomer programs
These models aren’t mutually exclusive. A high‑retention wage farm can still partner with a refugee program. A robot barn can still host immigration nights. The point isn’t to copy anyone line‑for‑line. It’s to stop pretending the labor crisis is something you can “manage” with one more ad, one more meeting, or one more guilt trip on your kids.
The Ripple Effect Nobody Put in a Plan
None of these families sat down and wrote a mission statement about community.
Most days, they were just trying to keep their heads above water and get the cows milked on time.
That group in the valley didn’t set out to create an “immigration network.” They just didn’t want to see any more bunks emptied in the middle of the night. The monthly meetings around that kitchen table grew because one farm after another realized it was better to face those letters and forms with a crowd than alone.
The co‑op rep, who had mostly come to listen, found himself talking differently in board meetings.
“I told them, ‘You think this is a policy issue. Our members are living this at their kitchen tables,” he said. “It changes how you argue for something when you’ve looked those people in the eye.”
A few months later, the co‑op quietly added an immigration Q&A and a mental‑health resource slide to its winter producer meeting, not because a consultant told them to, but because members wouldn’t stop bringing it up.
In Minnesota, Tom and Sarah’s robot decision turned into something bigger than their own barn. The neighbour who’d advised them at that first shop meeting invited them to a barn day the next year. They rotated host farms. People walked through robot rooms, talked about fresh cow management and butterfat performance, and stood quietly in corners, admitting they were tired.
“One young couple with a small tie‑stall herd came just to listen,” Sarah said. “They’re not ready for robots. They might never be. But on the drive home, they told us, ‘Just knowing we’re not the only ones struggling with labor made the day worth it.'”
In Vermont, the twice‑yearly labor open houses became a kind of community checkup.
“I thought the first one would be two people,” Jennifer said. “We ended up with farms from across the road and the next valley over around the table. A couple of months later, I started hearing about people changing their schedules, looking for housing, and talking to their kids about what the farm will look like ten years from now. That’s when it hit me—this isn’t just about us.”
One neighbour who’d always sworn he would never commit to a regular day off started guaranteeing his main milker one Sunday a month with his kids.
“He told me, ‘I thought I’d lose production. What I lost was a lot of resentment. He comes in on Monday happier. So do I,” she said.
The shared farmhouse down the road—patched roof, new wiring, coats and backpacks on hooks by the door—became a symbol of that shift. Three farms, who once mostly talked about milk prices at the diner, now sit together sorting out who will pay for which plumbing repair and how to share a worker’s time fairly.
For some much bigger herds a few counties over, the details look different—more formal HR, larger bunkhouses instead of one old farmhouse—but the questions are the same: Who will work here? How will we treat them? And will our kids ever want to carry on this work?
Whether you’re milking 40 cows in a tie‑stall or 2,000 in six rows of freestalls, the math looks different, but the people questions don’t let you off the hook.
Back in Wisconsin, that simple night in the machine shed has turned into an annual event. The second year, the local FFA chapter helped set up tables. The 4‑H dairy club did a little showmanship demonstration for the younger kids. The school principal brought new staff and told Emily, “This is my favorite night of the year now.”
The pastor came too. At the end, he said, quietly, “I didn’t know what I was walking into. What I walked into was community.”
A teenager looked around that second year and said, “I didn’t realize how much our town had changed until I saw everybody in this shed together.”
Some of these connections now cross roads and county lines. A handful of the farmers and families in this story stay in touch through group texts and online producer forums, trading advice about labor, paperwork, and those 2 a.m. robot alarms that never seem to ring at a good time. Once in a while, someone they first met in a comment thread ends up sharing coffee in the stands at a show or sitting beside them at a co‑op meeting, and another piece of this informal network clicks into place.
None of this came from a government program or a glossy industry campaign. It came from kitchen tables and machine sheds, because farmers got tired of waiting for someone else to fix what was breaking them.
Nobody wrote any of that into a strategic plan.
They just made food, opened doors, and let people be people.
The Bottom Line
If you’ve read this far, you don’t need another graph to convince you there’s a dairy labor crisis. You’re living it. You’re fielding texts at 4 a.m. You’re watching good people leave because the system around them is broken. You’re wondering if your kids will ever want to step into your boots.
These farms don’t have all the answers. They’re still wrestling with debt, with time, with rules that don’t quite fit the way dairy actually works. They still have hard days. They still get blindsided by life. Some of them will still have to sell out someday, even with all this support.
But they did something simple and brave.
They started talking.
They let the cracks show. They told the truth about how exhausted and scared they were. And instead of turning inward, they opened their doors—to a neighbour, to an attorney, to a vet, to a pastor, to a resettlement worker, to an employee’s family, to the kid who said she couldn’t see a future on the farm as things stood.
What came out of those conversations wasn’t perfection.
It was a connection.
It was the valley kitchen table crowded with farmers passing around a letter from the government and saying, “You’re not the first. You won’t be the last. Here’s how we handled it.”
It was the Minnesota shop full of whiteboards and coffee and nervous laughter as a family talked about robots and burnout in the same breath, and their pastor asked, “Who are you going to call at two in the morning?”
It was the Vermont parlor where a dad looked at the progress his son was making in school and realized—for once—the farm had made something easier at home instead of harder.
It was the Wisconsin machine shed where a newcomer family and long‑time neighbours ended up swapping recipes, farm stories, and school concerns under the same roof.
Sometimes, even with all the coffee and kitchen tables in the world, a farm still has to sell out. Community matters there too—the neighbours who show up on sale day, the friend who helps polish a résumé, the church ladies who make sure there’s a pan of lasagna in the fridge when the last cow leaves.
Small, Realistic Things You Can Try
So what can you actually do with all this?
Not a list of “10 easy steps to fix labor.” Those don’t exist.
But there are small, realistic things almost any dairy community can try:
Pick one neighbour and invite them over for supper—or coffee at the diner at an odd hour—and talk honestly about labor. Not just wages. The stress. The fear. The kids. The times you’ve thought, “Maybe we’re done.” Start with, “What’s one part of labor that’s keeping you up at night?”
Open your kitchen table once with an expert—an attorney, a vet, someone from extension, someone from a resettlement agency—and a couple of neighbours. Put a real letter, contract, or form in the middle of the table and ask, “What are we not seeing clearly about this?”
Look at what you can offer families, not just workers. Maybe it’s shared housing with a neighbour. Maybe it’s one weekend off a month. Maybe it’s helping an employee’s child get to 4‑H meetings or FFA events because those things take time and gas money that some families don’t have.
Ask your co‑op or processor, “What are you doing to help us with labor?” and be ready with realistic suggestions—immigration/legal clinics, translation help, training sessions, mental‑health resources at winter meetings. If your co‑op shrugs, that’s still data. It tells you who’s willing to sit at your kitchen table and who isn’t.
Look around your area for a refugee resettlement group or newcomer program. One phone call—”If you ever have someone with farm or livestock experience who needs a job, give us a call”—can start a whole new chapter.
Take rural mental health seriously. If Tom and Sarah’s late‑night kitchen table sounds too familiar, write a number on a sticky note and put it on your own fridge. Talk to your doctor, your pastor, your spouse, your neighbour, and say the words, “I’m not okay,” and see who shows up.
Decide that if you’ve had more than a couple of core employees leave in a year, that’s your signal—not just to grumble—but to call one neighbour and start a different kind of conversation about what needs to change.
If there’s nobody on your road you feel close to yet, start with someone you met at a meeting or in an online dairy group. Swap phone numbers. Once in a while, send a message that just says, “How’s your week going, really?”
Honestly, if you don’t have time to do all of this, start with the one thing your own turnover math is screaming for—whether that’s a wage rethink, a housing conversation, or one kitchen‑table meeting with the people on your road.
None of that will fix everything.
There will still be long days and short nights. There will still be bills that don’t care how tired you are. There will still be cows calving at the worst possible moment and kids with homework due the same day.
But the work feels different when you know you’re not the only one carrying it.
When a neighbour’s truck shows up in your driveway before daylight.
When a worker walks into the parlor holding an envelope like it’s made of glass and says, “We can stay.”
When a robot alarm goes off, and you’re not the only name on the list.
When the road to your farm fills up—not with headlights for a funeral, but with people coming to learn, to eat, to help, to see each other.
The labor crisis is real. The exhaustion is real. The grief is real.
So is a worn‑out kitchen table, a pot of coffee, and a few neighbours who refuse to walk away.
It won’t fix milk prices or rewrite policy. Nobody in a suit is coming to fix this for you. That’s the bad news.
The good news is, you don’t have to wait for them.
We’ve been waiting a decade for policy solutions that never came. These farmers stopped waiting.
That steady, stubborn decision—shared across fence lines and county lines and sometimes language lines—to keep showing up for each other when the industry shrugs and says, “That’s just how it is,” is already part of the reason some barns are still lit tonight.
They may not say it out loud, but every time they show up for each other, the message is pretty simple: we’re not done yet.
Key Takeaways:
38.8% turnover is bleeding you dry: Replacing one experienced worker costs $15,000–$25,000+ when you add up recruiting, training, lost productivity, and herd hits like SCC spikes and missed heats.
Four playbooks are actually working: immigration support circles, community-backed robot transitions, high-retention wage/housing models, and refugee partnerships—all built by neighbours, not policy.
The difference isn’t robots or wages alone—it’s who’s at your table: Farms stabilizing labor brought vets, pastors, attorneys, and neighbours into the conversation and started treating people decisions like breeding decisions.
You don’t need a 10-step plan—you need one honest conversation: Invite a neighbour for coffee, put a real problem on the table, and ask who else should be in the room.
Nobody in a suit is coming to fix this: The dairies still lit tonight stopped waiting and started showing up for each other.
EXECUTIVE SUMMARY:
Average dairy employee turnover is 38.8% a year, and this story goes inside the barns and kitchen tables of composite families who decided they weren’t going to face that alone. It walks through four real‑world playbooks—an immigration support circle, a community‑driven robot transition, a high‑retention wage and housing model, and a refugee partnership—that turn constant churn into more stable, skilled teams. Along the way, it shows how honest conversations about turnover math, debt, mental health, and kids’ futures reshape labor decisions just as much as any robot or new ration. For you as an owner or manager, the piece connects people decisions directly to profitability, risk, and whether anyone in the next generation actually wants your keys. It finishes with concrete, low‑drama steps—who to invite, what to put on the table, and when your own turnover should be a stop‑sign—not just “be nicer to employees” theory.
Complete references and supporting documentation are available upon request by contacting the editorial team at editor@thebullvine.com.
Continue the Story
Is Your Dairy Farm a Great Place to Work? – Wrestling with the same management shifts as Jennifer, this story proves that moving from a “hiring boss” to a true leader isn’t just about kindness—it’s the only way to build a farm that survives the current churn.
The Human Side of Robotic Milking – Much like Tom and Sarah’s kitchen-table epiphany, this piece explores the world where technology and human emotion meet, showing how automation can either bridge the generational gap or create a whole new set of burdens.
The Modern Dairy Farm: It’s All About People – Carrying forward the spirit of the Wisconsin machine shed, this narrative proves that our industry’s true legacy won’t be found in the bulk tank, but in the stubborn, shared commitment of the people standing beside us.
The Sunday Read Dairy Professionals Don’t Skip.
Every week, thousands of producers, breeders, and industry insiders open Bullvine Weekly for genetics insights, market shifts, and profit strategies they won’t find anywhere else. One email. Five minutes. Smarter decisions all week.
$18 milk in 2026. T&H Dairy hit $0.65/cow/day with high-oleic soy—$118K/year on 500 cows. One acre feeds one cow. How does your fat spend compare?
Executive Summary: USDA’s January 2026 outlook drops the U.S. all‑milk price forecast to about $18.25/cwt, which makes every extra $0.30–$0.60/cow/day in margin a survival number, not a bonus. New Michigan State University research shows high‑oleic soybeans can deliver that kind of lift, with modeled IOFC gains of $0.27/cow/day when purchased roasted and about $0.65/cow/day when farms grow and roast their own beans, and roughly one acre of high‑oleic soy feeding one lactating cow for a year. T&H Dairy in Michigan is already seeing 4–5 pounds more fat‑corrected milk, 0.15–0.20 points more butterfat, and about $0.65/cow/day in IOFC at 7.5–8 pounds of roasted beans, which works out to around $118,600 a year on 500 cows and well into six figures on larger herds. United Soybean Board data adds crop‑side upside, with high‑oleic contracts across 16 states paying $0.75–$1.25/bu (and in some cases around $2.20/bu) over commodity beans—roughly $40–70/acre extra at typical yields before those beans ever hit the bunk. The article makes the case that high‑oleic soybeans are a serious 2026 fat tool—not a magic bullet—and walks owners and managers through a three‑path playbook (move now, plan a pilot, or watch and wait) plus a simple checklist to decide whether their acres, bins, and fat bill justify turning high‑oleic into part of their long‑term margin strategy.
Here’s what’s really going on. USDA’s January 2026 Livestock, Dairy, and Poultry Outlook pegs the 2026 U.S. all‑milk price at about $18.25 per hundredweight, down from a forecast of over $21 for 2025. At the same time, Class III futures are sitting down in the mid‑$16s, which is exactly the gap The Bullvine flagged earlier this month as a $150,000‑plus budgeting problem for a 300‑cow herd if you bet on the wrong number.
On paper, that 2026 downgrade doesn’t look dramatic. In the real world—spread across 200, 500, or 1,500 cows—it’s the difference between sleeping at night and explaining to your lender why your cash flow projections missed by six figures.
What’s interesting right now is that Michigan State University’s work with high‑oleic soybeans says farms that grow and roast their own beans are seeing about $0.65 per cow per day in extra income over feed cost, while farms buying roasted beans are still picking up around $0.27 per cow per day. At the feeding rates MSU is using, one acre of high‑oleic soybeans can cover one lactating cow’s needs for a full year, which suddenly makes your soybean acres feel a lot closer to your milk cheque than they did five years ago.
The real question isn’t “Are high‑oleic soybeans magic?” It’s whether your acres, your ration, and your infrastructure give you a realistic shot at turning this into repeatable dollars instead of one more “great idea” that never quite pencils out on your farm.
Looking at This Trend: What’s Actually Different in the Fat?
Let’s start where your nutritionist will start: the fat profile.
According to Michigan State University Extension’s 2025 “High‑oleic, high reward” analysis, typical commodity soybean oil is about 23% oleic acid and 50–54% linoleic acid. That big linoleic fraction is exactly why most nutritionists start putting on the brakes when they see a lot of whole beans show up in the diet—linoleic is more prone to producing rumen biohydrogenation intermediates that can chip away at butterfat performance when you push too hard.
Fatty Acid Component
Commodity Soybeans (%)
Plenish® High-Oleic (%)
SOYLEIC® Non-GMO (%)
Oleic Acid
23
75–80
78–84
Linoleic Acid
50–54
4–7
6–8
Crude Fat (approx.)
~20
~21
~20–21
Crude Protein (approx.)
~38
~38–39
~38–39
High‑oleic soybeans flip that around. MSU Extension reports that Plenish® high‑oleic soybeans usually test about 75–80% oleic acid and only 4–7% linoleic acid, while non‑GMO SOYLEIC® lines often run 78–84% oleic and 6–8% linoleic. The crude fat and protein values still look like soybean values. What’s changed is the fatty acid mix.
That shift matters because it changes how the cow sees the ration. With more oleic and less linoleic in the diet, you can bring more energy in through soybeans without taking the same butterfat punch you’d expect from piling on commodity beans or other high‑linoleic fats—if you actually rebalance starch and fiber instead of just “adding a little more.”
Dr. Adam Lock, professor of dairy nutrition at MSU and head of the Dairy Lipids Nutrition Program, has spent much of his career looking at how different fatty acids—palmitic, oleic, and others—shift milk yield, component percentages, body condition, and income over feed cost. A 2025 summary of his high‑oleic work noted that increasing oleic while trimming palmitic in fat supplements boosted milk components and total production, especially in high‑producing cows, when the rest of the ration was in good shape.
Penn State research led by Dr. Alexander Hristov found that feeding Plenish high‑oleic soybeans and extruded high‑oleic soybean meal increased milk fat percentage by about 0.2 points with minimal change in milk volume or dry matter intake. MSU’s more recent trials with roasted high‑oleic soybeans, highlighted by Extension in 2025, saw milk yield climb at inclusion rates around 16% of ration dry matter while holding milk fat steady—as long as starch and fiber were managed sensibly.
From a fresh cow and whole‑herd ration standpoint, that’s a very different lever than just writing another cheque for bypass fat and hoping your butterfat hangs on.
Inside MSU’s New Dairy: Where the Big Questions Are Being Tested
Looking at this trend from the research side, MSU didn’t just tweak a few diets on a small research herd and call it a day. They built a full‑scale commercial‑style test dairy to figure out what happens when you really lean into high‑oleic and related changes.
The new MSU Dairy Cattle Teaching and Research Center is a roughly $70 million facility, with about 40% of that funding provided by the State of Michigan. The barn is set up to house about 680–688 cows—more than triple the old MSU dairy—and uses tunnel‑ventilated freestall housing that looks a lot like the modern freestall and dry lot systems you see across the Upper Midwest.
Dr. Barry Bradford, Chair of Dairy Management at MSU, has been pretty blunt about the main question they’re chasing: if more of your diet’s energy comes from high‑oleic soybeans and other targeted fats, what does that do to the “right” level of starch that many herds locked in 15–20 years ago in the corn‑silage‑plus‑commodity‑co‑products era? In a January 2026 Brownfield interview, he talked about going back to first principles on starch levels instead of assuming yesterday’s numbers automatically fit tomorrow’s fatty acid profiles.
To do that, MSU invested about $1 million in individual robotic feeding stations that record dry matter intake cow‑by‑cow, rather than relying on pen averages. The new dairy and its connected greenhouse complex are expected to host around 10,000 visitors a year—students, industry, and consumers—so people can see what a data‑heavy, commercially styled research herd actually looks like.
Producers tend to trust research more when the barn in the photos looks like theirs. In this case, we’re not talking about 40 cows in tie‑stalls; we’re talking hundreds of cows in group housing on rations that wouldn’t look out of place on a 500‑ or 1,500‑cow operation. That makes MSU’s high‑oleic work a lot easier to take seriously when you’re sitting down with your own feed sheets.
What Producers Are Actually Seeing: From “Trial” to “System” on a Michigan Dairy
Research is great. Cash flow is better. Let’s talk about what’s happening on the ground.
T&H Dairy: Turning Beans into Butterfat and IOFC
T&H Dairy, run by Mike Halfman and his family near Fowler, Michigan, milks roughly 1,600 cows and farms about 4,400 acres of corn, alfalfa, wheat, and soybeans. For a long time, soybeans were just another cash crop disappearing into the commodity stream.
In 2024, they changed gears. T&H planted about 900 acres of high‑oleic soybeans and contracted another 300 acreswith a neighbour, with the specific goal of roasting the beans and feeding them to their high‑producing cows. According to MSU Extension’s 2025 profile, they started cautiously at around 3 pounds of roasted high‑oleic soybeans per cow per day. At that level, they saw 2–3 pounds more milk per cow per day, but butterfat percentage stayed pretty flat.
Once they installed on‑farm roasting and pushed inclusion to roughly 7.5–8 pounds of roasted high‑oleic soybeans per cow per day in their top groups, the response shifted. Halfman reports that fat‑corrected milk jumped by more than 4–5 pounds per cow per day, and butterfat percentage improved by around 0.15–0.20 points. That lines up almost exactly with the 0.2‑point milk fat increase Hristov documented at Penn State with high‑oleic diets.
On the economics, MSU’s modeling across several case farms—including operations like T&H—found that dairies producing and roasting their own high‑oleic soybeans saw an average income‑over‑feed‑cost (IOFC) advantage of about $0.65 per cow per day. Farms that didn’t grow beans but bought roasted high‑oleic product still saw modeled IOFC advantages around $0.27 per cow per day.
The Michigan Alliance for Animal Agriculture (M‑AAA), which is co‑funding this work, points to a southwest Michigan dairy that pulled out expensive bypass fats and proteins as they ramped up high‑oleic beans and ended up north of $1.00–1.20 per cow per day in IOFC improvement. One of the owners told MSU that they normally celebrate 5–6 cents per cow per day, so they called this “a once‑in‑a‑generation change.”
Let’s be honest: not every herd is going to hit $1.20. But when multiple well‑documented farms consistently land in the $0.27–$0.65 range—and a few blow past that when they really redesign the ration—that’s not just coffee‑shop talk anymore.
Where the Acres and Premiums Actually Are
All that IOFC talk falls apart if the crop piece doesn’t hold.
The United Soybean Board’s May 2025 high‑oleic briefing reports that farmers in 16 U.S. states planted more than 1.1 million acres of high‑oleic soybeans in 2023 and around 800,000 acres in 2024. That 2024 drop wasn’t because crushers lost interest; USB and MSU both point to seed availability and contracting capacity as the main bottlenecks.
USB notes that in 2024, growers had access to 21 high‑oleic varieties across the Plenish® and SOYLEIC® programs, covering maturity groups 1.9-4.8. That covers a big chunk of the traditional soybean belt, with new maturities being developed for shorter‑season northern regions.
On pricing, USB says high‑oleic growers typically earn premiums of $0.75–1.25 per bushel over commodity beans, depending on contract and delivery terms. Brownfield Ag News and USB farmer‑leaders have highlighted cases like Indiana farmer Kevin Wilson, a USB director, who’s reported cash premiums around $2.20 per bushel on his high‑oleic contracts with ADM for recent crops.
If you match those premiums with USDA‑reported average U.S. soybean yields around 50–55 bushels per acre, you’re realistically talking about $40–70 per acre in extra crop revenue before you feed anything. Then, if those beans roll through your roaster and displace purchased fats and proteins in the ration at a profit, that same acre is effectively getting paid twice: once at the elevator and once at the bunk.
Brownfield’s 2025 coverage quoted USB treasurer Matt Gast saying roughly 35% of high‑oleic beans are now heading into dairy rations, about 60% into food, and the remaining 5% into industrial uses. So dairy isn’t an afterthought in this market. We’re a major end user.
Agronomics and Defensive Traits: Are You Sacrificing Yield?
Whenever somebody says “specialty crop,” most growers quietly translate that to “yield drag” unless they see evidence otherwise.
USB and partner organizations have been clear that high‑oleic traits are being stacked on elite yield and defensive backgrounds, not on leftover genetics. Corteva’s Plenish® beans, for example, commonly carry soybean cyst nematode resistance, Phytophthora tolerance, and the Enlist E3 herbicide trait, giving you access to modern weed control and disease packages you’d expect from top‑end commercial beans. On the non‑GMO side, SOYLEIC® varieties developed by Missouri Soybeans and programs in states like Georgia are being stacked with resistance to SCN, root‑knot nematode, and frogeye leaf spot.
MSU Extension points out that from an agronomy standpoint, the day‑to‑day management of high‑oleic beans looks a whole lot like conventional soybeans, aside from the identity‑preserved handling and any herbicide restrictions tied to specific trait packages. You still have to match maturity, disease package, and herbicide system to your fields—the same homework you should already be doing with commodity beans.
From yield reports and field experience shared through USB and state soybean groups, high‑oleic beans can run with strong commodity lines when you put them on appropriate ground and treat them like serious production varieties rather than side projects. Are there weak performers out there? Of course. But “high‑oleic” does not automatically mean “yield anchor”.
The Catch: Identity Preservation and the Work Between the Drill and the Roaster
Here’s the part that looks great on slides and then blows up in the yard if you’re not careful: identity preservation.
High‑oleic beans are almost always grown under identity‑preserved (IP) contracts, because crushers and end users have to know they’re actually getting the fatty acid profile they’re paying for, not a blend of whatever fell into the bin. That makes your planting, harvesting, hauling, and storage plan part of the value chain, not an afterthought.
USSEC’s High Oleic Sourcing Guide lays out the basics: clean planters, combines, grain carts, augers, and bins thoroughly when you switch between commodity and high‑oleic beans; keep high‑oleic lots segregated; and track beans from field to bin to delivery. Soy Canada’s identity preservation resources add the same themes—clear bin labeling, separate handling lines, and documented flows—based on decades of non‑GMO and food‑grade experience.
Wisconsin Extension adds a very practical farm‑gate layer: mark high‑oleic fields clearly, make sure custom operators know which fields are IP and what herbicide system they’re in, and don’t send a combine into those fields with commodity beans still in the hopper from yesterday’s job.
If your plan is to “sprinkle on a few beans” and call it good, you’re not going to see MSU‑level responses. If nobody on your team owns the IP details—bins, augers, cleaning, record‑keeping—high‑oleic will be a headache long before it becomes a margin tool.
On the flip side, if you’re already handling non‑GMO or food‑grade grain streams, most of this will feel like structured discipline you already understand, with a different premium and trait stack attached. Even if your primary goal is feeding your own cows, commingling still matters. If your nutritionist is formulating around high‑oleic fatty acid profiles but the bin is half commodity beans, you can’t expect butterfat performance or IOFC to match the research.
The High‑Oleic Math: From Acres to Cows to IOFC
Now for the part you can actually plug into your budget.
MSU’s 2025 Extension work, supported by the Michigan Alliance for Animal Agriculture, modeled two main scenarios using real farm performance data and realistic feed costs:
Farms producing and roasting their own high‑oleic soybeans saw an average IOFC advantage of about $0.65 per cow per day.
Farms purchasing roasted high‑oleic soybeans saw an average IOFC advantage of about $0.27 per cow per day.
At the inclusion rates and yields MSU is working with, one acre of high‑oleic soybeans can supply enough beans to feed one lactating cow for a full year, assuming on‑farm roasting and feeding patterns similar to the case farms.
Here’s how that IOFC advantage plays out across different herd sizes:
Herd size
IOFC +$0.27/cow/day
IOFC +$0.65/cow/day
200 cows
≈ $19,700/year
≈ $47,500/year
500 cows
≈ $49,300/year
≈ $118,600/year
1,500 cows
≈ $147,900/year
≈ $355,900/year
Those are straight annualizations of MSU’s IOFC averages, not “best barn at the meeting” numbers.
On the crop side, USB’s premium range of $0.75–1.25 per bushel, combined with 50–55 bushel per acre yields, points to around $40–70 per acre extra crop revenue before you feed anything. In some contracts, like the ADM deals highlighted by Brownfield and USB farmer‑leaders, premiums up near $2.20 per bushel have been reported, which pushes those crop‑side gains higher when conditions line up.
What producers are finding is that the biggest wins show up when:
High‑oleic acres are reasonably close to the dairy, keeping transport sane.
The ration has a meaningful purchased fat and “fancy ingredient” line item that you can actually replace.
There are enough cows to spread roasting and IP overhead, so it doesn’t feel like a science fair project.
If your purchased fat and specialty ingredient line is already north of about $0.40 per cow per day, and you can realistically commit 0.5–1 acre of soybeans per cow into high‑oleic over the next couple of years, you’re in the zone where this deserves serious, numbers‑on‑paper attention.
Three Paths: Move Now, Plan a Pilot, or Watch and Wait
Decision Factor
Move Now Farms
Plan & Pilot Farms
Watch & Wait Farms
Herd Size
300+ cows, or 200+ with flexibility
200–400 cows, moderate flexibility
<200 cows, or grazing-dominant systems
Soybean Acreage & Fat Spend
Grow soybeans; >$0.40/cow/day purchased fat spend
Some soybean acres; modest fat spend
Little to no soybean acres; minimal purchased fat
Infrastructure
Bins, augers for IP handling; access to roaster
Bins/augers with planning; may need upgrades
No grain infrastructure or not scalable for IP
2026 Action
Sit with nutritionist on IOFC scenarios; contract high-oleic; pilot 90 days
Commit 0.3–0.5 acres/cow to pilot; run “what-if” scenarios; track pilot results
Monitor university work, regional Extension updates, co-op messaging; revisit in 2027–2028
Expected IOFC Gain
$0.27–$0.65/cow/day (basis: buy vs. produce)
$0.15–$0.50/cow/day (conservative, pilot-stage)
Deferred; focus on other margin levers now
Next Step
Schedule call with nutritionist + elevator; list candidate fats to displace
Design a small-group pilot on fresh pen or high group; define tracking metrics
Assess forage, fresh cow transition, SCC; revisit high-oleic in 2027
Looking at this trend with both optimism and a bit of healthy skepticism, most herds fall into one of three buckets.
1. “Move in the Next 12 Months” Farms
You’re probably in this group if:
You milk 300+ cows and already grow soybeans, or could easily partner to hit 0.5–1 acre per cow in high‑oleic.
Your ration includes purchased bypass fat, palm fat, or other high‑priced energy sources you’d love to cut back on.
You have—or could add—storage and handling to keep an identity‑preserved stream separate.
You either have reliable access to a custom roaster or can justify investing in on‑farm roasting equipment.
For you, the next moves aren’t “order some seed and see what happens.” They’re:
Sit down with your nutritionist and list exactly which fats and supplements you’d pull at 3–4 pounds and then at 7–8 pounds of roasted high‑oleic soybeans per cow per day.
Have them show you IOFC projections on paper using MSU’s $0.27 and $0.65 per cow per day ranges as bookends, plugged into your component prices and ingredient costs.
Call your elevators or processors and get specific: which high‑oleic contracts exist, their maturities, premiums, delivery windows, and the penalties if loads miss specs.
Walk your grain system and decide which bins and augers will actually carry the high‑oleic stream, who cleans them, and who signs off.
If your nutritionist can’t show you, in numbers, how high‑oleic beans would displace existing fats and supplements in a way that adds up, you’re not ready to shift acres. If they can, you’re a strong candidate for a 90‑day high‑oleic feeding trial as soon as beans and roasting are lined up.
2. “Plan and Pilot” Farms
You’re in this lane if:
You milk 200–400 cows and have some soybean acres, but you don’t have endless flexibility.
Your ration uses some supplemental fat, but you’re not chasing 100‑lb tanks.
You have bins and handling that could manage an IP stream, but only with planning and maybe a couple of modest upgrades.
For you, 2026–2027 probably looks like:
Committing a modest amount of high‑oleic acres—say 0.3–0.5 acres per cow—aimed at a specific high group or fresh pen, rather than the whole herd.
Using MSU’s IOFC estimates as realistic boundaries: $0.27 per cow per day if you’re buying roasted product, $0.65 if you end up producing and roasting your own.
Running “what‑if” scenarios with your advisor: what happens if butterfat price softens from today’s levels? What if you only capture half the modeled IOFC bump, or if premiums slide toward the low end of USB’s range?
Treating year one as a structured pilot with defined rations, groups, and tracking, not a casual “we tried some beans one month and didn’t see anything dramatic.”
Your goal isn’t to redesign your entire feed system overnight. It’s to get your own data—on your cows, your acres, and your premiums—so if margins tighten more, you’re making decisions with real numbers instead of guesses.
3. “Watch and Wait” Farms
You’re probably here if:
You run a grazing‑dominant or seasonal system with relatively low concentrate feeding.
You don’t grow soybeans and don’t have bins or grain handling set up for IP crops.
Your current ration uses little to no purchased fat, so there’s not much displacement value to capture.
For you, the smartest move may be to stay informed rather than jump in. That can look like:
Keeping an eye on MSU and other university work on fatty acids and high‑oleic, plus your regional Extension updates on feed costs and butterfat premiums.
Hammering out lower‑cost wins closer to home—fresh cow transitions, forage quality, milking routine, SCC—before you commit to a specialty ingredient with IP requirements.
Watching how your co‑op or processors evolve component pricing and whether they start hinting at “diet‑friendly” fat programs or call out high‑oleic in their own messaging.
Re‑evaluating high‑oleic in a couple of years, when seed availability, contract options, and case studies will all be deeper.
You don’t lose ground by waiting thoughtfully if your system doesn’t have the acres, bins, or fat spend to make this pay right now.
A Quick “What This Means for Your Operation” Checklist
Before you sign anything—or blow it off—run through this with your team:
Crops: How many acres can we realistically move into high‑oleic without starving our corn silage and forage program?
Fat spend: What did we actually spend last year on bypass fats, palm products, and other specialty energy sources on a $/cow/day basis?
Contracts: What specific high‑oleic contracts exist in our trucking radius—premiums, maturities, delivery windows, quality specs, and penalties if we miss them?
Infrastructure: Do we have bins and augers that can be dedicated to an identity‑preserved stream, and what would it cost—in time and money—to properly clean and separate?
Ownership: Who on our team is going to “own” the high‑oleic/IP system day‑to‑day so it doesn’t become everybody’s job and therefore nobody’s job?
If you can’t answer those questions yet, that’s your next step. Not ordering seed. Not pricing roasters. Clarity.
Stepping Back: A New Fat Tool in a Tough 2026 World
Stepping back from all the charts and quotes, high‑oleic soybeans are best viewed as a new fat tool, not a magic button. They give you a way to bring more energy—and a more butterfat‑friendly fatty acid profile—into the ration from your own acres, especially if you’re already cutting big cheques for purchased fats.
The combination of:
USDA’s 2026 price outlook is pointing to tighter margins,
MSU’s full‑scale dairy research with individual intake data,
USB’s long‑term investment in high‑oleic traits and premiums,
And real‑farm experience from herds like T&H and other Michigan dairies,
means this is not just a shiny idea in a conference slide deck.
At the same time, the IP discipline, seed and contract access, storage needs, and scale realities mean high‑oleic beans won’t be the right play for every operation in 2026. Canadian quota and butterfat pool rules, EU Green Deal pressures, and pasture‑based systems in places like New Zealand all shape different price signals and contract structures, even if the underlying IOFC and fatty acid logic stay the same.
So what should you actually do with this?
First, pull last year’s fat and supplement bills and run the IOFC scenarios—$0.27 and $0.65 per cow per day—on your actual herd size.
Second, ask your nutritionist to design a 90‑day high‑oleic trial that truly replaces purchased fats and proteins, not just sprinkles beans on top of an unchanged ration.
Third, talk to your elevator or processor about real, not hypothetical, high‑oleic contracts—what’s on offer, what they expect, and how they fit with your harvest and storage realities.
You don’t have to chase every new trait or every new feed idea that shows up in a slide deck. But if your acres, ration, and fat bill line up with what MSU and USB are seeing, ignoring high‑oleic soybeans completely could mean leaving serious five‑ or even six‑figure money on the table every year. In a world where USDA is talking $18‑milk, and some regional Class III projections are hovering near $16, that’s not a side note. That’s a strategic decision.
Key Takeaways
2026 margins leave no room for fluff. USDA’s $18.25/cwt all-milk forecast means a $0.30–$0.65/cow/day IOFC gain isn’t a bonus—it’s survival math.
One acre of high-oleic soy feeds one cow for a year. MSU’s modeling shows $0.65/cow/day IOFC gains for farms that grow and roast their own beans—roughly $118,600/year on 500 cows.
T&H Dairy in Michigan is already banking results: 4–5 lbs more fat-corrected milk and 0.15–0.20 points higher butterfat at 7.5–8 lbs of roasted high-oleic beans per cow per day.
Your soybean acres can pay you twice. High-oleic contracts add $0.75–$1.25/bu over commodity beans ($40–70/acre extra at typical yields)—then those same beans boost IOFC in the bunk.
High-oleic is a system, not a sprinkle. It only works with IP handling, dedicated bins, roasting, and real ration changes. The article’s three-path playbook (move now, plan a pilot, or watch and wait) helps you decide if your farm is ready.
Complete references and supporting documentation are available upon request by contacting the editorial team at editor@thebullvine.com.
Every week, thousands of producers, breeders, and industry insiders open Bullvine Weekly for genetics insights, market shifts, and profit strategies they won’t find anywhere else. One email. Five minutes. Smarter decisions all week.
At 50°F, your calf is already cold-stressed—burning feed for heat, not growth. That’s 1,000+ kg of milk you’ll never see. Warm water. Deep straw. Simple fixes, big payoff.
Executive Summary: Your winter calves might look healthy, but at about 10°C (50°F), they’re already cold‑stressed and burning feed for heat instead of growth. That’s a big deal, because Cornell research and a large meta‑analysis show every extra kilogram per day of preweaning gain can add roughly 850–1,550 kg of milk in first lactation, and a 2024 study links each extra kilogram of weaning weight to about 25.5 kg more milk plus extra fat and protein. Slow‑gaining winter calves are quietly locking in lower lifetime milk and butterfat cheques, even if they never break with scours or pneumonia. The good news is the levers are simple: bump milk replacer roughly 2% for every degree below 5°C, feed 4 L of warm, high‑Brix colostrum within two hours, bed to a true nesting score of 3 with deep dry straw, and offer warm water so the rumen isn’t fighting ice‑cold buckets. Herds that make those changes—and put one person clearly in charge of calves—see higher preweaning gains, heavier weaning weights, and fewer pulls in the fresh‑cow group a few years later.[page:aphis.usda.gov] For a 400‑cow operation raising 200 heifers a year, even a conservative 200–300 kg increase in first‑lactation milk per heifer adds up to a solid five‑figure annual return and more freedom in how aggressively you cull and where you use sexed or beef‑on‑dairy semen.
Picture this. It’s a January morning, wind cutting across the yard, and you’re walking past a row of hutches. Fifteen calves under three weeks old, all standing, all drinking, no scours, no coughing. It’s pretty natural to think, “They’re fine.”
Last winter, a 400‑cow herd I was in southern Ontario thought the same thing—until they finally weighed calves and realized their December–February heifers were weaning almost 20 lb lighter than their summer calves, despite “clean and bright” calves in the line. When we overlaid Cornell data, LifeStart results, and a 2024 colostrum and health study, it became obvious: those “fine” winter calves were quietly giving up hundreds of kilos of first‑lactation milk and a chunk of butterfat cheque three years down the road.
Scenario
Season / Condition
ADG (lb/day)
Weaning Weight at 56 Days (kg)
Light feeding, warm (20°C)
Summer
1.0
75
Light feeding, cold (5°C)
Winter, underheated housing
0.55
63
Heavy feeding, warm (20°C)
Summer
1.7
95
Heavy feeding, cold (5°C)
Winter, well-bedded hutch
1.3
86
Here’s what’s really going on—and what you can actually change before the snow melts.
When “Cold” Starts for a Calf (Hint: It’s Warmer Than You Think)
For calves under about three weeks of age, work from the Miner Institute and University of Wisconsin puts the thermoneutral zone—the range where they don’t have to spend extra energy to stay warm—at roughly 15–25°C, or 59–77°F. Below that range, every degree drop means more energy burned on heat and less on growth.
CalfCare Canada’s cold weather feeding guide takes a practical run at this. It recommends increasing milk or milk replacer once temperatures fall below about 10°C (50°F) for calves under three weeks old, and below about 0°C (32°F) for older preweaned calves in unheated housing. That’s their way of telling you: once you’re into typical winter temperatures, a young calf is out of her comfort zone and into “maintenance overload.”
Temp (°C)
Temp (°F)
Heavy Program ADG (lb/day)
Light Program ADG (lb/day)
Est. First Lac. Milk Diff (kg)
20
68
1.6
1.0
0
15
59
1.55
0.85
-400
10
50
1.3
0.55
-900
5
41
1.1
0.35
-1,300
0
32
0.8
0.15
-1,650
-5
23
0.5
0.08
-2,000
In plain language, when the air is in the upper‑40s or low‑50s°F, a 10‑day‑old calf is already giving up some growth just to stay warm.[page:aphis.usda.gov] She may look bright, drink well, and never spike a temp, but she’s quietly spending nutrients on heat instead of frame, organs, and early mammary development.
Using NRC models, you can see how this plays out in example scenarios: a 45‑kg (100‑lb) calf on a light feeding program in cold conditions might only gain around 0.4 lb per day, while a similar calf on a higher‑energy program in better housing can push past 1.6 lb per day. As the thermometer drops, the gap between “alive” and “growing to full potential” gets wider.
So when your yard thermometer says 35°F, and you’re telling yourself, “It’s cold but manageable,” your 10‑day‑old heifer is already playing nutritional catch‑up.
How a Calf Spends Energy When She’s Cold
Once you think about how a calf spends energy, the winter pattern starts to make sense.
Her priorities are brutally simple:
Keep core temperature and vital organs functioning
Run basic metabolism—heart, lungs, brain, kidneys
Support the immune system
Use whatever is left for growth and early mammary development
Reviews on calf thermal stress and welfare make it very clear: once a calf leaves her thermoneutral zone, she diverts nutrients away from growth and immune function toward heat dissipation and basic life support. You won’t see that on a thermometer. You’ll see it on the scale.
USDA’s Dairy 2014 Calf Component Summary found that average preweaning gains in Holstein heifers ranged from about 1.5 to 1.7 lb per day, depending on whether calves were fed milk replacer, whole milk, or a combination. Calves on combination diets topped the list.[page:aphis.usda.gov] Many heifer programs now treat roughly 1.6–1.8 lb per day as a realistic “top‑end” target for well‑managed Holsteins.
When you overlay that with NRC winter models, you see what’s happening on a lot of farms: summer calves may flirt with those 1.6–1.8 lb gains, while winter calves—on the same program, in colder air—slide down toward the bottom of the 1.5–1.7 average, or worse, without anyone really noticing. Two calves can stand in a row of hutches on a frosty morning, both look bright and drink well, but if one is gaining 1.7 lb a day and the other is stuck under 0.6 lb, you’re essentially raising two very different first‑lactation cows.
If you haven’t actually weighed winter calves lately, odds are they’re growing slower than you think.
Why Scours at Two Weeks and Pneumonia at Four Weeks Feel Inevitable
You know this story already. Most of us have lived it.
Scours hits hardest in the first two to three weeks.
Pneumonia peaks somewhere between three and eight weeks.
USDA Dairy 2014 data and multiple veterinary reviews line right up with that experience: diarrhea is most common in the first three weeks of life, while respiratory disease is more common later in the preweaning period, often affecting around a quarter of calves in some herds.
Layer that onto the cold‑stress and colostrum picture.
In the first day or two, the calf is riding on passive immunity. If she doesn’t get enough IgG, if it’s fed late, or if bacterial load is high, she starts life with fewer antibodies and more bugs than you’d like. Now put that calf in a 10°C (50°F) or colder environment where she’s burning extra energy just to hold core temperature. That’s hitting the immune system from both sides.
By 7–21 days, the pathogen pressure in your calf area—rotavirus, coronavirus, cryptosporidium—is often high, especially in winter when bedding and cleaning get stretched. Calves with weak passive transfer and tight energy budgets are the first to tip into clinical scours. Then, from three to eight weeks, viruses and bacteria behind bovine respiratory disease (BRD) take center stage. Calves that had poor colostrum or early diarrhea are at higher risk of BRD later.
A 2024 Journal of Animal Science paper by Emily McFarland and colleagues connected those dots all the way to the bulk tank. They found that calves with stronger colostrum programs and fewer preweaning disease events weaned heavier and then produced more milk, fat, and protein in the first three lactations. In that dataset, every extra kilogram of weaning weight was associated with 25.5 kg more milk, 0.82 kg more protein, and 1.01 kg more fat in the first lactation.
This is where it stops being a “baby calf” conversation. It’s not just about whether she survives scours or pneumonia. It’s about how much health baggage she drags into your fresh cow group three years from now.
The Frozen Rumen: Why Cold Water Is a Growth Killer
Before we dive into feeding rules, let’s hit one of the most underrated winter levers: water temperature.
Back in the 1960s, researchers measured rumen temperature in calves after they drank water at different temperatures. Sarah Morrison, PhD, at the Miner Institute, summarized that work: when calves drank water between about 46 and 81°F, rumen temperature dropped for roughly 1 to 2 hours and by as much as 15°F at the coldest temperatures. When they drank water at around 99°F, the rumen temperature changed minimally and only for a short time.
Newer work from the University of Wisconsin extension tells the same story: when calves drink very cold water—around 45°F—the rumen temperature drops noticeably and takes about an hour to recover. Warmer water, in roughly the 60–100°F range, still cools the rumen briefly, but the drop is smaller, and recovery is faster.
Why should you care? Because the rumen is where starter fermentation kicks off, and that fermentation generates metabolic heat that helps calves handle cold and grow. When you chill the rumen with ice‑cold water, you essentially shut down the fermentation furnace for a while and force the calf to burn extra energy just to warm everything back up.
Calves prefer warm water, and offering water near 100°F means they don’t have to spend as much energy heating it in the rumen. Very cold water not only drains energy from warming the fluid, but also lowers rumen temperature enough to reduce rumen efficiency and metabolic heat production.
So on a morning when the bucket is half ice, and you’re thinking, “At least they’ve got water,” ask yourself if you’d drink it. If the answer is no, that calf isn’t thrilled either—and if she does drink, she’s paying for it with growth.
Preweaning Growth and Lifetime Milk: The Big Math
Now to the part that should make every replacement‑minded breeder sit up.
At Cornell, Fernando Soberon and Mike Van Amburgh followed calves from birth through first lactation. In one analysis, each additional kilogram per day of preweaning average daily gain (ADG) in the Cornell research herd was associated with about 850 kg more milk in first lactation. In a commercial herd they looked at, the response was about 1,113 kg per kilogram of preweaning ADG.
Then they zoomed out. A 2013 meta‑analysis looking across 13 different calf studies found an even stronger relationship: roughly 1,550 kg of additional first‑lactation milk for each extra kilogram per day of preweaning ADG. That’s not a small bump. That’s a whole lactation’s worth of difference in some systems.
LifeStart’s industry work points the same way. In the Kempenshof LifeStart trial, calves on an elevated preweaning feeding program gained about 150–155 g per day more than conventionally fed calves and produced roughly 400 litres more fat‑corrected milk in first lactation. A broader LifeStart review notes that elevated nutrition levels in several trials increased preweaning ADG by 70–355 g/day, with consistent improvements in lifetime performance, including milk yield and survival.
A 2016 meta‑analysis on preweaning nutrition and later performance concluded that calves offered higher nutrient intake before weaning had significantly higher milk yield and better survival later in life. More recent work in 2023 on immune and metabolic development in intensively fed heifers shows that the benefits of better early nutrition carry through in immune competence and metabolic markers.
Add McFarland’s 2024 data to the pile: every 1 kg increase in weaning weight was associated with 25.5 kg more milk, 0.82 kg more protein, and 1.01 kg more fat in first lactation, with positive effects across later lactations as well. In component‑driven markets, those extra kilos of fat and protein are exactly what keep the banker calmer and the cull list shorter.
Estimated Revenue Impact @ 35¢/kg Milk & Extra Fat (CAD/heifer)
+0.1 lb/day (+45 g/day)
+2.5
+106
+155
+$52–$65/heifer
+0.2 lb/day (+91 g/day)
+5
+213
+310
+$104–$130/heifer
+0.3 lb/day (+136 g/day)
+7.5
+319
+465
+$156–$195/heifer
+0.4 lb/day (+182 g/day)
+10
+425
+620
+$208–$260/heifer
+0.5 lb/day (+227 g/day)
+12.5
+532
+775
+$260–$325/heifer
Now, not every herd will see 1,500 kg of extra milk per kilogram of ADG or 400 L per calf. Genetics, disease load, housing, and how consistently you run your program all matter. Pasture‑based and organic systems with more variable post‑weaning nutrition may see a smaller response. But across Cornell, LifeStart, the meta‑analyses, and field data, the direction is iron‑clad: better preweaning growth goes with more milk and stronger butterfat performance later on.
Those first eight weeks aren’t just “calf chores.” They’re one of the most valuable phases in your entire herd strategy.
Colostrum: The First Non‑Negotiable
Look at herds that consistently do well with winter calves, and you’ll almost always see the same thing: colostrum protocols that you could write on the wall and everyone knows by heart.
The science‑backed targets are remarkably consistent:
At least 150–200 grams of IgG in the first feeding.
For Holsteins, that typically means 4 litres of good‑quality colostrum with a Brix score of around 22 percent or higher.
First feeding within 2 hours of birth, followed by a second feeding of colostrum or transition milk within roughly 12 hours.
Clean collection, rapid cooling or feeding, and increasingly, heat‑treating colostrum at about 60°C for 60 minutes to cut bacterial load while preserving IgG.
In winter, colostrum temperature matters even more. Feeding it at or near body temperature—roughly 38–40°C (100–105°F)—means the calf isn’t spending scarce energy warming up cold colostrum and improves gut motility and antibody absorption.
Colostrum Program & Serum TP Outcome
Serum TP (g/dL)
Passive Transfer Quality
Preweaning Scours & Pneumonia Rate (%)
First-Lactation Milk Impact vs. Poor Transfer (kg)
Poor: Late feeding, low Brix, cold colostrum
<5.0
Failure
35–40
–200 to –400
Fair: On-time (6–12 hr), adequate Brix, lukewarm
5.0–5.5
Partial
20–25
–75 to –150
Good: Within 2 hr, high Brix (22%), warm (4L)
5.5–6.5
Adequate
10–12
+50 to +100
Excellent: 4L high Brix within 2 hr, heat-treated, warm
>6.5
Excellent
5–7
+200 to +300
When farms actually implement those steps and check serum total protein in calf samples, they see many more animals land in the “excellent passive transfer” category. Down the road, that shows up as fewer preweaning disease events and better growth. That pattern has been documented in North American and European studies that follow the same colostrum benchmarks.
And it doesn’t care what kind of parlor you milk in. Tie‑stall dairies in the Northeast, 1,000‑cow freestalls in the Midwest, pasture‑based systems bringing calves into pens straight off pasture—if you hit volume, quality, timing, cleanliness, and temperature, you stack the deck in your favor.
If your scours cases spike in January compared to July, it’s not just “weather.” That’s your sign to look hard at both colostrum and cold stress.
For extra depth on the first feeding, pair this article with Bullvine’s past colostrum management features when you publish it.
Bedding, Nesting, and the “Would You Kneel Here?” Test
Once colostrum and nutrition are in a decent place, the next big winter lever is the stuff under the calf.
The Dairyland Initiative and the Dairy Calf and Heifer Association lean on a simple nesting score system:
Score 1: calf lying down with all legs clearly visible.
Score 2: some legs are partially covered but still visible.
Score 3: legs disappear in the bedding; calf is deeply nested.
Dairyland’s fieldwork shows that calves consistently housed at a nesting score of 3 in cold weather have lower respiratory disease rates than those on thinner or wetter bedding. You don’t need to memorize the exact odds ratios; what matters is the direction: deep, dry straw is about as cheap a pneumonia‑prevention tool as you’ll ever buy.
Canadian veal and calf housing resources say the same thing in their own way: use enough long straw over a dry base so calves can nest, and their legs disappear when lying down. That keeps them insulated from cold ground and shielded from low‑level drafts.
Here’s a no‑excuses test you can use in any system: the knee test. Step into the hutch or pen, kneel where the calf lies, and stay there 20–30 seconds. If your knees get cold and wet, the bedding isn’t doing its job. Farms that adopt the nesting score and knee test tend to move from “We bed on a schedule” to “We bed to a standard”—the standard being, “Can this calf actually nest?”
Nesting Score
Mild Winter (5–10°C)
Cold Winter (–5 to 5°C)
Very Cold (≤–15°C)
Average BRD Cases per 100 Calves
Score 1 (legs visible)
12%
24%
38%
24.7
Score 2 (partial cover)
8%
16%
28%
17.3
Score 3 (deeply nested)
5%
8%
12%
8.3
Now add wind. In exposed sites—prairie hutches, hilltops, western dry lots—wind at calf level can turn a 35°F day into something that acts like the low‑20s°F in terms of heat loss. Ventilation guides from Lactanet and U.S. extension stress the same simple rules: block drafts at calf level, let fresh air in overhead. Turning hutches so their backs face prevailing winds, lining bales, or adding snow fencing can all cut effective wind chill.
We’ve seen farms in Ontario, New York, and the Dakotas cut winter BRD cases significantly just by getting serious about nesting score 3 bedding, knee tests, and basic wind control. No magic products, just physics and straw.
Winter Calf Feeding: The 2% Rule and Beyond
This is where the rubber meets the road: if maintenance needs go up when it’s cold, how much more should you actually feed?
CalfCare Canada gives a simple starting point: for young calves in unheated housing, increase milk replacer by about 2 percent for every degree the temperature falls below 5°C (41°F).
So if your baseline is 6 litres per day at 5°C and the average temperature drops to –5°C (a 10°C drop), that rule points to roughly a 20 percent increase—about 7.2 litres per day—as a starting point. You then fine‑tune that with your nutritionist based on your calves’ growth and manure.
Hoard’s Dairyman’s NRC‑based examples show why this matters. At around 20°C (68°F), a standard feeding program might support about 1.0–1.1 lb of daily gain. Take the same program down to 0°C (32°F), and the potential gain drops sharply. At –18°C (0°F), some lightly fed calves may barely gain at all, because nearly all of the energy they consume is going to maintenance. That lines up with northern extension messaging: maintenance requirements increase as temperatures drop, especially for the youngest calves.
In real herds, that 2% rule gets translated into moves like:
Bumping young calves from 4 litres per day of whole milk in mild weather to 6 litres per day in winter.
Increasing milk replacer from roughly 1.25–1.5 lb per day up toward 2.0–2.25 lb per day when temperatures stay below freezing, keeping total solids in the 12–15 percent range to avoid nutritional scours.
Adding a third feeding in very cold stretches so total energy goes up without dumping huge meals into cold calves.
Research on higher planes of preweaning nutrition and automatic feeders shows that, when managed well, higher milk allowances improve growth and are associated with higher first‑lactation milk yield. Reviews on early‑life feeding also show better immune and metabolic markers in calves that receive more nutrients before weaning.
The catch is how you get out the other end. Studies on weaning timing and milk allowance show that calves on higher planes of nutrition can get hammered by abrupt weaning, especially in groups. That’s why so many advisers now push step‑down weaning, particularly on autofeeders: reduce milk gradually while calves increase starter, instead of dropping them off a cliff.
Even with that wrinkle, the core truth doesn’t change: if winter calves are on the same liquid program as summer calves, you’re choosing lower lifetime milk for those winter heifers. Biology doesn’t read the calendar.
Why Some Herds Sail Through Winter and Others Just “Get By”
Talk to vets, extension folks, and calf specialists, and you see a pattern.
Dairy 2014 and follow‑up work on preweaned heifer management found herds with higher ADG and lower mortality often had a few things in common: written colostrum and feeding protocols, clearly assigned calf‑care staff, regular training, and at least basic data tracking—serum total protein, birth and weaning weights, and disease recording. Case examples from North America and Europe show that herds with very low preweaning mortality often run tight, monitored calf programs.
On the people side, research on stockperson attitudes and training has shown that better-supported calf caregivers tend to have fewer issues with growth and respiratory disease. That’s not “soft” stuff; that’s part of your health and performance program.
Honestly, one of the biggest turning points I see on farms in New York, Wisconsin, and Ontario is when calf care stops being “whoever has time after milking” and becomes somebody’s job. When one or two people truly own the calf program and are empowered to say, “We need more straw here,” or “These weaning weights aren’t cutting it,” numbers usually shift faster than any bag of powder can manage.
Different Systems, Same Calf Biology
Now, let’s be clear: there isn’t one “correct” way to house calves.
Some of you are running:
Individual hutches on gravel or concrete pads in Ontario or the Prairies
Group pens with autofeeders in insulated barns in Wisconsin or Minnesota
Super‑hutches in the Northeast
Small pack or tie‑stall setups for the youngest calves on family farms
Dry lot systems with shade and windbreaks in California and other western states
The good news is the calf doesn’t rewrite her biology based on where she sleeps. Her thermoneutral zone, immune development, and growth response to nutrition are the same whether she’s drinking from a bottle in a single hutch or a teat bar on a robot feeder.
In group pens with autofeeders, the winter conversation usually centers on:
Setting higher maximum milk allowances for the youngest calves during cold periods.
Watching software closely so shy calves aren’t getting left behind.
Managing drafts and humidity so calves aren’t breathing cold, damp air all day.
In naturally ventilated barns in Quebec, New York, and the Midwest, producers talk about:
How they set curtains and inlets
Airspeed at calf level
Whether bedding depth really delivers a nesting score of 3 in January, not just in photos.
In western dry lot systems, the focus shifts to:
Windbreaks (trees, solid fences, stacked bales)
Raised, well‑drained mounds or pads
Feeding plans based on night‑time lows, not just daytime highs.
Extension educators and consultants working across these systems frequently report the same pattern: herds that step up winter milk allowances, bedding, and colostrum protocols see fewer pneumonia treatments and more consistent weaning weights within a couple of seasons. Eastern Canadian tie‑stall herds that commit to deep straw and warm water report steadier winter performance and fewer scours calls.
If you’re in a pasture‑based or organic system where milk allowance is capped, your big winter levers are colostrum quality, dry deep bedding, and blocking wind at calf level. You might not be able to change everything, but you can still move the needle with those three.
Every system has winter levers. The question isn’t whether you’re in hutches or pens; it’s whether you’re actually pulling the levers your system gives you.
A Coffee‑Table Example: Turning Research into a Herd-Level Decision
Let’s sketch this like we would on a napkin over coffee.
You’ve got a 400‑cow Holstein herd in a northern climate—southern Ontario, northern New York, or Wisconsin. You’re raising about 200 heifer calves a year. A big chunk are born from December through March in outdoor hutches.
Right now, your winter program might be:
About 1.5 lb per day of a 20‑20 milk replacer, fed twice a day
Four to six inches of straw over a lime base in each hutch
Colostrum is usually fed within a few hours of birth, of decent quality, but not always warmed to body temperature
No regular weighing; “looks good” is the main metric
One winter, you finally weigh. You heart‑girth a batch at birth and at weaning and realize:
Winter calves: ~0.55 lb/day gain
Summer calves: ~0.9 lb/day gain
Over a 56‑day preweaning period, that’s roughly a 20‑lb gap in weaning weight.
Now think back to the numbers we just walked through:
Cornell: 850–1,113 kg more first‑lactation milk per 1 kg/day extra preweaning ADG in individual herds.
Cornell meta‑analysis: ~1,550 kg per 1 kg/day ADG across 13 data sets.
Kempenshof: 150 g/day extra ADG → ~400 L more FCM.
McFarland 2024: 1 kg extra weaning weight → 25.5 kg more milk plus extra fat and protein.
If you take a conservative slice of that—say your herd only ever captures 200–300 kg extra milk in first lactation per heifer for an improvement in preweaning growth—that’s still meaningful. At typical component‑adjusted values, those extra kilos per heifer show up as a noticeable bump in revenue. Multiply that across 200 heifers, and you’re easily into a five‑figure herd‑level impact.
That’s the “$3,000 calf you’re raising for $800” concept: you’re putting in a modest preweaning investment, and that calf is capable of paying you back over and over again—but only if you feed and house her like you actually believe she’ll make it to second lactation.
Now flip the napkin and sketch a modest winter upgrade, grounded in the research and extension work we’ve talked about:
Move toward ~2.0 lb/day of milk replacer in winter for young calves, keeping solids in the 12–15% range.
Add a third feeding for the youngest calves during the worst cold snaps.
Bed to a true nesting score of 3 and check with the knee test regularly.
Treat 4 L of warm, high‑Brix colostrum within 2 hours, plus warm water, as non‑negotiables in winter.
Cold‑weather feeding suggestions from CalfCare and university extension say that such a program adds the equivalent of a few dozen dollars per calf to preweaning costs, depending on your replacer and straw prices. You won’t know your exact number until you cost it out, but even if you only capture a fraction of the milk response those Cornell, LifeStart, and McFarland datasets suggest is possible, it doesn’t take long before the spreadsheet leans in your favor.
On top of the math, extension educators and consultants often report smoother fresh‑cow transitions, fewer pulls, and more flexibility in culling and replacements once early‑life growth and health improve. That’s hard to put into a single number, but you feel it when you’re not standing in the fresh pen every morning, wondering which calving‑pen mistake is about to bite you next.
For some progressive herds, better winter calf performance has also opened the door to more strategic use of sexed semen and beef‑on‑dairy matings: raise only the top‑tier replacements you truly need and use beef sires on lower‑merit animals to boost calf value. That takes winter calves out of the “cost center” bucket and puts them squarely in your genetics and marketing strategy.
What This Means for Your Operation
Here’s a checklist you can literally tape to the calf‑barn wall. It’s not theory; it’s a simple way to see where your winter levers really are.
1. Measure at least a few calves
Weigh or heart‑girth a batch of winter calves at birth and again at weaning.
Compare their gains to that 1.6–1.8 lb/day “top‑end” target many heifer programs use for Holsteins.
If winter calves are lagging summer calves by more than a couple of tenths of a pound, you’ve just found cheap milk in your own system.
2. Feed to the weather, not the calendar
Once temps are in the low‑50s°F or below, young calves are already dipping below their thermoneutral zone.
Use the CalfCare rule of thumb—about 2% more milk replacer for every 1°C drop below 5°C (41°F)—as a starting point, then adjust with your nutritionist.
Remember NRC’s message: if you don’t feed more when it’s cold, you’ve told that calf growth is optional.
3. Protect from cold, wet, and wind
Aim for a nesting score of 3: if you can see calves’ legs when they lie down, you’re not there yet.
Use the knee test weekly. If your knees are cold and wet after 20–30 seconds, the calf is losing energy through the floor.
Walk the site with your hood down on a windy day and feel what the calves feel; then use windbreaks, bale lines, or hutch orientation to take the edge off.
4. Make colostrum and water non‑negotiables
Feed 4 litres of clean, high‑Brix colostrum within 2 hours of birth, followed by a second big feeding within about 12 hours.
Keep colostrum close to body temperature; cold colostrum in a cold calf is a double hit.
In freezing weather, dump ice‑cold water and replace it with warm water multiple times a day; it’s one of the cheapest ways to support rumen development and starter intake.
5. Put someone clearly in charge of calves
Make calf care somebody’s job, not everybody’s chore.[page:aphis.usda.gov]
Give that person the authority to say, “No, this isn’t enough straw,” or “We’re changing this feeding rate.”
Check in regularly with data—weights, serum total protein, health records—, so you’re not just going by gut feel.
Turn that list into a laminated sheet in the calf barn, and suddenly, winter calf care stops being “whatever we’ve always done” and starts being a program.
Cost / Benefit Category
Current Winter Program (200 heifers/yr)
Proposed Winter Upgrade
Incremental Cost or Gain
PREWEANING INPUTS
Milk replacer (1.5 → 2.0 lb/day × 56 days)
$14,000
$18,500
+$4,500
Deep straw & bedding materials (nesting score 3)
$2,000
$3,200
+$1,200
Warm water setup & labour (daily in winter)
$500
$1,800
+$1,300
Total Preweaning Cost Increase
$16,500
$23,500
+$7,000/yr
FIRST-LACTATION PAYBACK (Years 1–3)
Preweaning ADG improvement
0.55 lb/day
0.70 lb/day
+0.15 lb/day
Weaning weight increase per calf (kg)
~63
~72
+9 kg
Est. first-lactation milk per heifer
baseline
+250 kg
—
Revenue per heifer @ 35¢/kg milk + fat/protein
—
+$87.50
—
Total Revenue from 200 Heifers (Years 1–3)
—
—
+$17,500
NET HERD-LEVEL PAYBACK (3 years)
—
—
+$10,500
Three Changes to Make This Winter
If you only have the bandwidth to tackle a few things before spring, these are the heavy hitters.
Feed to the actual temperature. As soon as ambient temperatures fall below 5°C (41°F), start increasing milk or milk replacer by roughly 2% for every 1°C drop, and work with your nutritionist to keep total solids in the safe 12–15% range and avoid nutritional scours.
Use straw and windbreaks as cheap health insurance. Commit to a real nesting score of 3 (legs buried in straw), check with the knee test, and fix drafts at calf level with windbreaks or better hutch orientation. It’s low‑tech, high‑impact BRD prevention.
Stop letting cold water and cool colostrum steal growth. Make 4 L of warm, high‑quality colostrum within 2 hours and warm drinking water in winter is non‑negotiable; ice‑cold water and lukewarm colostrum silently siphon energy away from growth and into basic heating.
The Bottom Line
When you connect the dots—from Cornell’s 1,550‑kg‑per‑kg ADG meta‑analysis, to LifeStart’s 400‑L gains, to McFarland’s 2024 component numbers—it’s pretty tough to keep thinking of winter calves as just a “cost center” off to the side.
Those first eight weeks, especially in winter, are the front end of your fresh‑cow group three years from now. Early growth and health don’t just shift calf‑barn stats; they show up in first‑lactation milk, butterfat performance, fertility, and longevity across multiple lactations.
Not every farm is going to rebuild calf facilities or double feeding rates overnight. There are always trade‑offs—milk price versus replacer cost, straw versus labour, replacement targets versus beef‑on‑dairy opportunities.[page:aphis.usda.gov] But most of the big levers we’ve talked about—feeding to the weather, bedding to a nesting score of 3, blocking wind, warming colostrum and water, and giving someone ownership of the calf program—are already in your hands.
In a tight‑margin world, standing still on winter calves is really just a slow decision to grow a slightly weaker fresh‑cow herd three years from now. If you only change a couple of things this winter:
Weigh 10 winter calves from birth to weaning
Bump feeding rates on the next cold snap and see what the scale says
Walk the calf line with the knee test this weekend
Make sure that the first colostrum is big, clean, warm, and on time
Farms that commit even that much often say the calf barn feels different by the end of the season—and a few years later, the fresh‑cow pen starts to look different too.
So maybe the question for this winter isn’t “Are my calves fine?” It’s “Knowing what we now know about cold stress and lifetime milk, what one or two changes are we actually willing to test—in our system, with our cows—to move winter calves from just surviving to truly growing, and then let the bulk tank tell us whether it was worth it?”
And while you’re at it, I’d genuinely like to hear from you: What’s the coldest temperature your calves have truly thrived in, and what winter bedding or water hacks have made the biggest difference on your farm?
Key Takeaways
Cold stress starts at 50°F—not freezing. At about 10°C (50°F), your young calves are already burning feed for heat instead of growth, even when they look perfectly fine.
Preweaning growth shows up in your bulk tank for years. Cornell and meta-analysis data show each extra kg/day of preweaning ADG can add 850–1,550 kg of first-lactation milk. A 2024 study found that every extra kg of weaning weight adds ~25.5 kg more milk plus extra fat and protein.
The winter playbook fits on a napkin. Bump milk replacer ~2% for every degree below 5°C. Feed 4 L of warm, high-Brix colostrum within 2 hours. Bed to nesting score 3. Replace ice-cold water with warm water.
Fix the calf barn now, see it in your fresh-cow pen later. Fewer scours and pneumonia cases, heavier weaning weights, and smoother fresh-cow transitions—starting about three years from now.
A five-figure payback is within reach. For a 400-cow herd raising 200 heifers/year, even a conservative 200–300 kg increase in first-lactation milk per heifer delivers meaningful annual ROI and more flexibility in culling and breeding.
Complete references and supporting documentation are available upon request by contacting the editorial team at editor@thebullvine.com.
Learn More
$3,010 Heifers, 30% Labor Jumps: The Mid-Size Dairy Survival Crisis – Grasp the raw math behind the $3,010 replacement crisis. This breakdown arms you with 2025 labor and interest benchmarks, revealing exactly why internal heifer raising now offers a massive cost advantage over buying into a depleted market.
Beef-on-Dairy’s $3,000 Trap: 800,000 Missing Heifers and Who Pays the Bill – Expose the 800,000-heifer shortage redrawing the dairy survival map. This strategy guide delivers the “guard rails” for pregnancy rates and breeding ratios to ensure you aren’t quietly scheduling a catastrophic inventory gap for late 2027.
Every week, thousands of producers, breeders, and industry insiders open Bullvine Weekly for genetics insights, market shifts, and profit strategies they won’t find anywhere else. One email. Five minutes. Smarter decisions all week.
A 0.15% protein bump can be worth 25–40¢/cwt. The real question is: does your contract let any of it reach your milk check?
Executive Summary: Protein has quietly become dairy’s growth engine, as IFIC surveys, new 2025–2030 U.S. dietary guidelines, and GLP‑1 usage all push consumers toward higher‑protein foods and drinks. Circana and CoBank data show where the money is going: strong unit growth in high‑protein yogurt and cottage cheese, and RTD dairy‑based protein shakes surging from about $4.7B to $8.1B in four years. Processors have responded with billions in cheese, whey, yogurt, and cultured plant investments, which means they increasingly want “right milk”—high‑component milk that hits yield and margin targets without expensive ingredient protein. For many herds on Class III‑based component grids, a roughly 0.15‑point protein gain can be worth 25–40¢/cwt, but co‑op pooling vs direct, solids‑driven contracts largely determines how much of that ever reaches your milk check. On‑farm, the article shows how solid forage and fresh cow management, followed by smart amino acid balancing, can realistically add 0.10–0.20 points of protein, while the April 2025 NM$/TPI changes mean cheese‑market herds should rethink index choices and sire filters. A 90‑day playbook walks you through nailing your baseline, grilling your nutrition and milk pricing, updating your sire plan, and then deciding—based on your plant map and contracts—whether protein should be a major strategic lever or a secondary priority.
If you just stare at Class prices and milk production reports, it still feels like the same old dairy story. Flat or drifting‑down fluid, a few wild price spikes, a lot of noise. But here’s what’s really going on underneath that: a growing share of your customers are quietly reorganizing their diets around protein, processors are pouring billions into plants built around solids, and the indexes we use to pick bulls have already shifted toward that new reality.
On a typical Class III‑based component grid in the Upper Midwest, moving a herd from roughly 3.05% true protein to 3.20% at 80 pounds of milk per cow per day can easily be worth 25–40 cents per cwt on the protein line alone, before you factor in cheese yield bonuses. That’s a few thousand dollars a year on a 100‑cow herd, and tens of thousands on a 1,000‑cow operation, if your market actually rewards those components. The catch—the part most folks skip—is that not every plant, co‑op, or region passes that value back the same way.
Let’s walk through this the way we’d talk about it at your kitchen table: what’s changed with consumers, what the retail and plant numbers actually say, where nutrition and genetics can realistically move the needle, how co‑ops and contracts change who keeps the premium, and then a 90‑day plan you can use to decide how hard to chase protein in your own herd.
Looking at the Protein Trend from the Consumer’s Side
Looking at this trend from the consumer side first makes the rest of the story make a lot more sense.
The International Food Information Council (IFIC) has been running its Food & Health Survey for over twenty years. In their protein‑focused work from 2022–2025, they found that 59% of Americans said they were trying to consume protein in 2022, 67% in 2023, and 71% in 2024, with the 2025 survey showing interest holding at 70%. Those numbers come from nationally representative online samples of 1,000–3,000 adults each year, weighted for age, gender, and region, not just some fitness‑blog poll. IFIC’s July 2025 “Protein Spotlight” also notes that when these people say they care about protein, the most common thing they look for on labels is the grams of protein per serving.
Analysis of IFIC’s findings noted that roughly a quarter of Americans admit they don’t know how much protein they actually need. They’re chasing “high protein,” but they’re a bit foggy on the math. That confusion is important because it means simple, high‑protein messages on dairy labels can carry a lot of weight.
On the nutrition science side, several reviews over the last decade—published in journals like Nutrients and Applied Physiology, Nutrition, and Metabolism—have argued that the old adult RDA of 0.8 grams of protein per kilogram of body weight per day is probably too low for many older adults who want to maintain muscle and function. Those reviews generally support intakes of 1.0–1.2 g/kg/day for healthy older adults and 1.2–1.6 g/kg/day for those aiming to optimize muscle and metabolic health. When the 2025–2030 Dietary Guidelines for Americans were released in late 2025, coverage from Harvard’s School of Public Health and ag media highlighted that the new guidelines lean much more into higher‑protein patterns for older adults and explicitly recognize dairy as one of the key high‑quality protein sources.
Then there’s the GLP‑1 wave. A July 2024 JAMA article using KFF survey data reported that about one in eight U.S. adults had used a GLP‑1 drug like Ozempic or Wegovy, and KFF’s November 2025 polling found that roughly 12% of adults said they were currently taking a GLP‑1 medication for weight loss, diabetes, or related conditions. CoBank’s 2026 “Dairy Poised to Help Meet Consumers’ Growing Demand for Protein” report connects that to food choices: GLP‑1 users are eating fewer sugary, low‑protein snacks, but they still want foods and drinks that deliver satiety and protect lean mass. That has pushed many of them toward high‑protein yogurts, cottage cheese, and ready‑to‑drink protein shakes—many of which are dairy‑based.
So, putting that together:
More people are consciously chasing protein than even a few years ago.
Official guidelines are finally catching up and telling older adults to eat more protein.
A growing group of GLP‑1 users has fewer calories to “spend” and is steering more of them toward protein‑dense foods and drinks.
Dairy protein is complete, familiar, and easy for processors to formulate with.
The demand signal is there. The question is: where is that money actually showing up in the dairy case, and how does it flow back to your farm?
Where the Protein Money Is Showing Up in Retail
When you stop obsessing over fluid charts and look at scanner data, the protein story jumps off the page.
Analysis of retail performance for the 52 weeks ending November 2025 shows that across the entire grocery store, four dairy categories land in the top ten for unit growth:
Yogurt, led by Greek and other high‑protein styles, is second overall, with unit sales up 9.5%.
Natural cheese is third in unit growth, driven by snacking and shredded formats.
Cottage cheese is sixth, with a 14.5% jump in units—a big comeback story fuelled by high‑protein positioning.
Dairy creamers are tenth, with unit sales up 31.9%.
Its important to emphasize that these are unit increases, not just inflation. They also spell out that this data doesn’t include most of the ready‑to‑drink protein shake aisle, because those products are usually categorized under beverages or sports nutrition rather than traditional dairy.
Year
RTD High-Protein Shake Sales (USD Billions)
Growth Rate
2022
4.7
—
2023
5.9
+25.5% YoY
2024
7.0
+18.6% YoY
2025
8.1
+15.7% YoY
CoBank fills in that gap. Their January 2026 analysis, based on Circana retail data, reports that U.S. RTD high‑protein shakes grew from $4.7 billion in annual sales to $8.1 billion over four years—about 71% growth. The report makes it very clear that the majority of that protein is dairy‑derived: whey protein concentrates and isolates, milk protein concentrate, and micellar casein. These products often sit near energy drinks or health foods, not in the milk case, but the protein in them is coming out of our cows.
So the retail reality looks like this:
High‑protein yogurts and cottage cheeses are growing solidly inside the dairy case.
Dairy creamers—many of them higher in added fats and flavors—are booming.
A multi‑billion‑dollar RTD protein market built largely on dairy ingredients is exploding just beyond the dairy aisle.
The dollars are chasing dairy protein, not just white milk.
The $2.8 Billion Processor Bet on “Right Milk.”
Now let’s sit where the processor sits for a minute.
2026 outlook estimates that roughly $2.8 billion has been invested in yogurt and cultured product plants in recent years, much of it in New York. Those plants are designed to handle high‑solids milk and turn it into Greek, skyr, cultured drinks, and other protein‑focused products. When you add in expansions at cheese and whey plants, fluid milk plants, and yogurt/cultured facilities, these categories account for just over 80% of new and expanded U.S. dairy processing capacity.
CoBank and Cheese Reporter coverage point to about $8 billion in total new or expanded U.S. dairy processing projects through 2026, with roughly half of that aimed at cheese and whey. Wisconsin and neighboring states have seen significant expansions in cheese and whey production. Idaho and other Western states have invested in cheese, skim milk powder, and nonfat dry milk plants, partly geared toward export markets. Texas and the southern Plains have attracted new large‑scale plants built around big herds, solids, and export‑oriented products.
Here’s the problem processors are running into—and it ties straight back to what’s in your bulk tank.
Category
Investment (USD Billions)
Percentage of Total
Focus
Cheese & Whey Plants
4.0
50%
Solids-driven
Yogurt & Cultured
2.8
35%
High-protein products
Fluid & Powder
1.2
15%
Solids standardization
Total
$8.0B
100%
—
Over the last decade, U.S. Holstein genetics have pushed butterfat up fast. CDCB has documented that butterfat gains over the last base period have been impressive. Many American‑style cheese plants now receive milk with more butterfat than their vats can handle; they have to skim cream and standardize to target fat levels. If protein doesn’t rise in step with fat, the plant either:
Accepts a lower cheese yield per hundredweight than its business model assumed.
Buys milk protein concentrate or ultrafiltered milk to bring protein up.
Starts paying more attention to which farms deliver higher‑protein milk and looks for ways to reward that.
If a plant’s financial model is built around a milk pool averaging 3.3–3.4% true protein and the actual pool is closer to 3.1%, that gap is painful—especially at millions of pounds per day. More and more plant managers are saying, quietly but firmly, that they want “the right milk” rather than just “more milk.” In 2025, “right milk” often means higher solids, especially protein.
What Producers Are Really Seeing in the Ration
So what does it look like on your farm when you try to move protein in a way that actually pays and doesn’t wreck the ration?
What nutritionists and producers are finding is that the herds consistently making progress on protein don’t treat it as a one‑product miracle cure. They treat it as a fine‑tuning opportunity on top of good basics:
Strong forage quality and tight dry matter control.
Rumen‑friendly feeding with minimal sorting and consistent TMR delivery.
Solid fresh cow management in the transition period, so cows actually peak and don’t crash.
Once those pillars are in place, amino acid balancing starts to make sense.
A 2022 meta‑analysis by Chunbo Wei and co‑authors in the MDPI journal Animals compiled data from rumen‑protected methionine (RPM) trials conducted between 2010 and 2022. Their conclusion: when methionine is limiting in the diet, supplementing RPM doesn’t always push total milk volume higher, but it does significantly increase milk protein percentage and milk fat percentage, especially in high‑producing cows on well‑balanced rations. Using dose‑response models, they identified a sweet spot around 7.5–12.5 grams of RPM per cow per day for maximizing protein and fat percentages without wasting product.
Other work in Animals and the Journal of Dairy Science has shown similar patterns: microencapsulated methionine and newer methionine dipeptide products can raise milk protein yield and improve nitrogen efficiency when the rest of the ration is dialed in.
On the ground, nutritionists in Wisconsin, New York, Ontario, and Idaho describe results that match that research:
In well‑managed herds already producing 80–90 lb with decent butterfat performance, adding RPM and balancing methionine and lysine often nudges protein up by 0.10–0.20 points over 60–90 days, with small bumps in butterfat.
After confirming the response, some rations can safely trim crude protein—usually by reducing soybean meal or other expensive protein sources—while keeping or even lowering the ration cost per cwt and improving component levels.
Honestly, this is where most herds get tripped up. They hear about a neighbor’s protein bump, throw RPM into a ration built on variable corn silage and stressed fresh cows, and then complain when nothing happens. The Wei meta‑analysis and university work are clear: RPM is a scalpel, not a chainsaw. It works best on top of a good system, not instead of one.
If you’re thinking about amino acids, here’s a practical way to frame the conversation with your nutritionist:
Given our forage tests, butterfat performance, and current production, do you genuinely think methionine is limiting in our diet? Show me where you see that.
If we add, say, 10 g/cow/day of RPM, exactly which ingredient or crude protein level can we cut back on to make this a trade‑off, not just an extra cost?
In herds similar to ours—320‑cow freestall in Wisconsin, 80‑cow tie‑stall in Quebec, 900‑cow dry lot in Idaho—what milk protein and butterfat responses have you actually seen, and over what timeline?
Then, track components weekly for at least two to three months after changes. Don’t just go on gut feel.
Genetics: How the April 2025 Changes Repriced Protein
Nutrition is the short game. Genetics is the long game. And the rules of that long game shifted in April 2025.
USDA’s Animal Genomics and Improvement Laboratory (AGIL) and the Council on Dairy Cattle Breeding (CDCB) rolled out a major revision to Net Merit $ (NM$) in April 2025. According to the official AGIL report, the economic weights changed as follows:
Protein’s weight dropped from 19.6% to 13%.
Fat’s weight increased from 28.6% to 31.8%.
Milk volume’s weight rose from 0.3% to 3.2%.
Residual Feed Intake (as a feed efficiency trait) sits at about –6.8%.
Health, fertility, and longevity together account for just over 30% of the index.
AGIL explains that this shift reflects recent trends in U.S. markets: butterfat prices have been strong, and producers care more than ever about feed efficiency. Brownfield Ag News noted that the correlation between the old and new NM$ formulas is 0.992, meaning the reweighting doesn’t scramble the sire rankings—but it does send a message: fat is king right now in NM$, and protein has been dialed back.
Trait
Pre-April 2025 Weight
Post-April 2025 Weight
Change (points)
Interpretation
Protein
19.6%
13.0%
–6.6
De-prioritized in NM$ formula
Fat
28.6%
31.8%
+3.2
Elevated; now top-weighted trait
Milk Volume
0.3%
3.2%
+2.9
Newly valued; reflects market preference
Feed Efficiency (RFI)
—
–6.8%
—
Penalty weight; cost-conscious trait
Health & Fertility
~30% combined
~30% combined
Stable
Consistent importance
On the TPI side, Holstein Association USA’s formula continues to place significant weight on both fat and protein, with production traits still accounting for a large share of the index. In the Feed Efficiency $ (FE$) component, the formula is:
So both fat and protein are strongly valued, with fat currently worth slightly more per pound in that equation. Cheese Merit $ (CM$) also continues to place heavier emphasis on protein and cheese solids than NM$, making it a better index for herds shipping mainly to cheese plants.
At the same time, the April 2025 base change shifted the reference point from 2015‑born cows to 2020‑born cows. CDCB documents show that the average Holstein PTA dropped by roughly 45 lb fat and 30 lb protein at the base reset, reflecting the genetic gains made over the previous five years. Brownfield’s coverage called this out explicitly and reminded producers that a lower PTA number doesn’t mean bulls got worse overnight; it means the average moved up.
From a practical standpoint, here’s what this means for your sire list:
If you’re shipping mainly into cheese markets, blindly chasing NM$ might not match your plant’s actual economics anymore. You probably want to look more at CM$ or create a custom index that boosts protein weight without overvaluing milk volume.
In those cheese markets, bulls with strong protein percentage deviations (+0.08% and higher) and good protein pounds fit the economics better than bulls that just add volume with flat or negative protein %.
If you’re in a more fluid‑oriented or heavily pooled market, you still care about protein pounds to maximize solids shipped, but you may not need to push percentage as hard—so long as you hold butterfat and health traits where they need to be.
ABS Global’s December 2025 sire summary basically spells this out, saying they’ve adjusted their sire lineup to “balance the scale with protein because of the significant improvements made in fat.” That’s a diplomatic way of saying: “We bred fat so hard for a decade that if we don’t deliberately select for protein now, we’ll drift off balance.”
If you’re still using the same sire selection rules you had before April 2025—circling the top NM$ list and calling it good—it’s worth asking yourself whether those rules still match how your milk is being paid in your market in 2025.
Co‑ops, Contracts, and Who Actually Keeps the Protein Premium
Now we come to the nerve point: even if you move your herd from 3.05% to 3.25% protein, who actually pockets that extra value?
In most of the Northeast and Upper Midwest, and everywhere in Canada, co‑ops and pooling dominate. Co‑ops do important work—balancing markets, managing risk, and giving farms a home for their milk when plants are full. But the way many co‑ops are structured, they also smooth out component and plant‑specific value across a broad membership.
2026 outlook hints at this when it explains how strong performance at yogurt and cheese plants in the Northeast flows back through co‑op pooling. Some of the value from high‑component milk going into those plants gets spread across all members, according to policy, rather than being laser‑targeted to the highest‑protein herds.
So if you push your herd’s protein from 3.10% to 3.25% and your neighbor sits at 2.95%, you’ll see some advantage through the pay grid and herd‑level quality bonuses, but you may not see the full premium that the plant is willing to pay for high‑protein milk.
On the flip side, CoBank has documented an increase in direct supply contracts in central New York, western Michigan, parts of Idaho, California, and Texas. In those systems, large herds ship directly to cheese plants, yogurt processors, or RTD beverage plants under contracts that specify:
A base price (usually tied to Class III or a blend).
Detailed component premiums and penalties, including quality.
Volume, consistency, and sometimes animal welfare or sustainability expectations.
In that setup, if a 2,500‑cow dairy lifts its protein 0.15–0.20 points, more of that value is likely to show up in their own milk check, because the contract spells out how components are rewarded. The trade‑off is that you’re tied more tightly to one buyer’s fortunes and performance metrics.
The point isn’t that co‑ops are bad and private contracts are good. It’s that the route your milk takes from the tank to the market that determines how much of the protein premium you keep.
A very practical exercise is to sit down with your milk statements and, if possible, your co‑op rep or buyer, and walk through:
How many dollars per cwt are you’re being paid for protein today at your current level.
What that would that look like if you were 0.15 points higher, using your own plant’s published grid or contract.
Whether there are specific programs—cheese pools, high solids tiers, quality alliances—you could realistically qualify for if you hit certain protein and butterfat levels.
If nobody can clearly show you how your extra protein would be paid, that’s your signal to start asking harder questions before you sink a lot of money into chasing it.
Geography: Your Hidden Advantage or Built‑In Handbrake
Another factor we don’t talk about enough when discussing components is geography. You can’t pick up your farm and move it closer to a better plant, but you can factor your location into how hard you push protein.
It is clear that New York is a prime example of a “high‑option” region: roughly $2.8 billion in yogurt and cultured investment, existing cheese plants, and multiple co‑ops and private buyers competing for milk. A 320‑cow freestall in central New York might be within an hour’s haul of several plants that value high‑solids milk, plus programs designed to reward it.
Region / Scenario
Plant Density
Co-op / Pool Structure
Protein Premium (¢/cwt)
Contract Direct Premium (¢/cwt)
Competitive Intensity
Recommended Strategy
NY (Central/Western)
High (3–4 plants within 60 min)
Co-op + Direct options
28–40
35–45
Very High
Lean hard into protein
WI / Upper Midwest
High (2–3 cheese/whey plants)
Co-op dominant
22–35
30–40
High
Protein is a strong lever
Idaho / West
Medium (1–2 regional plants)
Mix of co-op/direct
15–28
25–35
Medium
Protein helpful, not essential
Remote / Single Plant
Low (1 plant, 90+ min haul)
Pool dominated
8–12
18–25
Low
Feed efficiency > protein
Canada (ON/QC)
Medium (regional plants + boards)
Quota/board + co-op
18–30
28–38
Medium
Protein + solids focus
CoBank and Cheese Reporter highlight similar clusters:
In Wisconsin and surrounding states, there’s ongoing expansion in cheese and whey capacity. High‑component milk fits those plants very well.
In Idaho and the broader West, new cheese and powder plants have come online to serve export markets where solids are crucial.
In Texas and the southern Plains, newer large plants are hungry for efficient, high‑solids milk from large herds.
In those zones, pushing protein has a clearer upside because multiple processors and programs value that milk and can compete for it.
Now compare that to a 450‑cow dry lot in a more remote Western area with one major plant 90 minutes away and heavy pooling. Hauling is expensive, options are thin, and the local pool may not pay enough extra for higher protein to justify an aggressive push, especially if the plant is more focused on balancing volume. For that operation, it may make more sense to:
Keep protein in the competitive range for the pool.
Put more emphasis on feed efficiency (components per pound of dry matter), reproductive performance, and cash flow.
Make sure butterfat stays strong, since it still drives many checks.
In Canada, quota and provincial boards change the pricing math, but the plant reality is similar: processors still need solids to hit cheese and yogurt yields. A Quebec or Ontario herd close to major plants may have more incentive programs tied to solids than a more remote herd in a region with less processing.
The bottom line is that your plant map—distance, options, and growth trends—is just as important as your ration when you’re deciding how far to lean into protein.
Beyond the Dairy Case: Ingredient Markets and Snack Aisles
Another piece of the protein puzzle sits outside the traditional dairy section.
CoBank has reported on the growth of dairy protein ingredients—whey protein concentrate and isolate, milk protein concentrate, micellar casein—in everything from breakfast bars and cookies to “functional” beverages and meal replacements. Rising exports of U.S. whey products and skim milk powder/nonfat dry milk as global demand for high‑quality protein increases, especially in parts of Asia.
Research in Animal Frontiers and Nutrients has stressed that dairy proteins are high‑quality, complete proteins with excellent digestibility compared to many plant proteins. Those studies don’t ignore environmental concerns, but they reinforce dairy’s role in meeting protein needs, particularly for older adults and physically active people. Food companies read those papers and act on them.
So even when there’s no cow on the label, a big chunk of the protein in that “15 grams per serving” bar or drink may be coming from milk. That’s part of why you see whey plants being built and upgraded, and why processor and investor presentations keep coming back to “protein platforms” as a strategic focus.
Again, whether that shows up in your milk check depends on how your milk is pooled and priced. But the long‑term signal is that dairy protein demand isn’t fading away anytime soon.
What This Actually Means for Your Milk Check
So how does all this big‑picture stuff translate into dollars per cwt on your statement?
On a typical Upper Midwest Class III‑based component grid that pays for protein and butterfat directly, a move from roughly 3.05% to 3.20% true protein at 80 lb/cow/day can reasonably add 25–40 cents per cwt on the protein portion of the check, depending on the exact protein price that month. If you’re shipping to a plant that pays cheese yield bonuses based on both fat and protein, that higher protein percentage can also bump you into a better yield category worth another 10–20 cents per cwt.
Herd Size
Current Protein %
Target Protein %
Protein Gain (points)
Protein Premium (¢/cwt)
Cheese Yield Bonus (¢/cwt)
Total Added Value (¢/cwt)
Annual Milk Volume (cwt)
Annual Revenue Gain (USD)
100 cow
3.05%
3.20%
+0.15
28
8
36
8,000
$2,880
320 cow
3.08%
3.23%
+0.15
30
10
40
25,600
$10,240
1,000 cow
3.10%
3.25%
+0.15
32
12
44
80,000
$35,200
On a 100‑cow herd shipping 8,000 cwt per year, that might be “only” a few thousand dollars—a nice improvement but not transformational. On a 1,000‑cow herd shipping 80,000 cwt, it can easily be tens of thousands of dollars per year if you actually capture it.
The big “if” is key:
If you’re in a market or pool where much of that value is spread across a wide membership, your own milk check will only see part of that.
If you’re in a direct contract or a plant‑specific program that pays explicitly for higher protein, you’re more likely to see the full impact.
That’s why it’s dangerous to talk about protein as if it’s automatically a gold mine for everyone. Where you are and how you’re paid matters as much as what your cows can do.
A 90‑Day Plan That Fits Real Herds
If you’re thinking, “We should at least know where we stand on this,” here’s a 90‑day plan that fits real life on a working dairy.
Step 1: Get Your Real Baseline (Weeks 1–2)
Pull 60–90 days of milk testing reports.
Write down your average true protein and butterfat, plus the range—don’t rely on memory.
Note your herd’s average days in milk and pounds per cow over that period.
Ask: are we consistently below 3.15–3.20% protein, or more in the 3.25–3.30% zone?
If you’re stuck under about 3.15% protein with unstable butterfat, that’s usually a forage and cow‑care issue before it’s an amino acid issue.
Step 2: Have a Focused Nutrition Strategy Session (Weeks 3–4)
Sit down with your nutritionist when neither of you is in a rush. Bring the numbers.
Ask if they believe methionine is actually limiting in your current diet, based on your forage tests and production. Ask them to show you where in the model they see that.
Discuss whether an RPM or methionine dipeptide product makes sense for your herd, referencing the published 7.5–12.5 g/cow/day “sweet spot” from the Wei meta‑analysis as a starting point—not a rule.
Insist on specificity: if we add 10 g/cow/day of this product, what exactly are we pulling back on—soybean meal, canola, bypass protein—so ration cost per cwt is neutral or close to it?
Define success up front: for many herds, a realistic target is a 0.08–0.12 percentage point increase in protein in 60–90 days without hurting butterfat or cow health.
Step 3: Tear Down Your Milk Check (Weeks 4–6)
Get your latest milk statements and, if you can, invite your co‑op field rep or plant buyer to walk through them with you.
Identify exactly how many dollars per cwt you’re currently earning from protein at your current level.
Calculate what your check would look like if your true protein were 0.15 points higher, using your plant’s real grid or contract.
Ask about plant‑specific programs: cheese pools, high‑solids tiers, or quality alliances that pay more for the kind of milk you could produce.
If the difference between your current protein and a realistic target is worth less than 10–15 cents per cwt under your structure, you may want to focus your next dollar somewhere else first. If it’s worth 25–40 cents per cwt and you’re within reach, protein should move up your priority list.
Step 4: Recalibrate Your Sire Strategy (Weeks 6–8)
Pull your current sire lineup and any bull proofs you’re using:
Look at PTA Protein (lbs) and protein% deviation alongside PTA Fat and fat%.
Check NM, and health traits like SCS, DPR, and Productive Life (or their equivalents).
Then talk with your AI rep:
Ask which bulls or mating strategies they’d recommend for a herd shipping mainly to cheese plants—or high‑protein yogurts—where protein percentage really matters.
Ask which bulls make more sense for a pooled, volume‑oriented market where protein lbs matter but % may not be heavily rewarded.
Ask how long it will realistically take for those genetic changes to show up in your bulk tank, given your culling and replacement rates.
If you’ve been breeding in “autopilot NM$” mode, this is the time to tweak your filters so you’re breeding for the pay formula you actually face, not the one you faced five years ago.
Step 5: Make a Conscious Strategic Call (Weeks 10–12)
By the end of 90 days, you should have:
A clear picture of your current protein and butterfat performance.
A grounded sense of what your herd can do with sensible nutrition and cow care.
Hard numbers on what extra protein is worth under your specific milk pay structure.
A refreshed sire plan that either leans into protein or deliberately doesn’t.
Then you make a conscious choice.
If you’re in a region with multiple solids‑focused plants, clear premiums, and a herd close to the thresholds, it probably makes sense to treat protein as a major strategic lever for the next three to five years.
If you’re in a single‑plant, heavily pooled environment where an extra 0.15 points of protein doesn’t move the needle much, you may decide to keep protein respectable but put more energy into feed efficiency, robot utilization, debt management, or labor—things that may offer a better return under your conditions.
There isn’t one right answer. But what’s become pretty obvious is that protein isn’t just a rounding error anymore. Consumers, guidelines, processors, and indexes have all moved. You can either let that movement happen to you, or you can decide where protein fits in your plan—with your plant map in one hand, your proofs and ration in the other, and your milk check right there on the table.
Key Takeaways
Protein demand is surging: 70% of Americans are actively seeking protein (IFIC 2025), RTD dairy shakes have grown from $4.7B to $8.1B in 4 years (CoBank), and new dietary guidelines support higher intakes.
Processors are rebuilding around solids: Billions have gone into U.S. cheese, whey, yogurt, and cultured plants—they want “right milk” that hits yield targets, not just volume.
The milk check math is real but contract-dependent: A 0.15-point protein gain can add 25–40¢/cwt on Class III grids, but co-op pooling often dilutes it; know your pay formula before you invest.
Nutrition works—if basics are solid first: Rumen-protected methionine at 7.5–12.5 g/cow/day can lift protein by 0.10–0.20 points, but only in herds with strong forage and fresh-cow management already in place.
Genetics shifted in April 2025—adjust your sire filters: NM$ now weights fat more heavily; cheese-market herds should prioritize CM$ or custom indexes and look for bulls with strong protein % deviation alongside health traits.
Complete references and supporting documentation are available upon request by contacting the editorial team at editor@thebullvine.com.
Every week, thousands of producers, breeders, and industry insiders open Bullvine Weekly for genetics insights, market shifts, and profit strategies they won’t find anywhere else. One email. Five minutes. Smarter decisions all week.
If your “fair” buyout loads $600+ of debt on every cow, you’re not doing succession—you’re planning a dispersal in slow motion.
You know how some topics just keep coming up over coffee at farm meetings? Succession is one of those.
Let’s walk through what the numbers and the real‑world experience are telling us about keeping dairy farms in the family—and how the roughly 16.5% who pull it off tend to do things differently.
The Odds Aren’t Great—but They’re Not Hopeless
Most family business owners have heard some version of the “three‑generation rule.” A lot of talks and articles still repeat the old line that about 30% of family businesses make it to the second generation, around 10–15% to the third, and only 3–5% to the fourth. You’ve probably heard that at a seminar at some point.
A critical look in Family Business Magazine noted that those specific percentages aren’t a universal law, but they’re a decent rule of thumb: many family firms fall away at each transition, and only a minority make it to the third or fourth hand‑off. The Family Business Consulting Group goes a step further and says you should think of it as “about one‑third survive each generational transition,” not a guaranteed 30/13/3 every time.
The University of Tennessee took that one‑third idea and did the farm math. Their Planning Today for Tomorrow’s Farms workbook walks through the logic: if roughly a third of family businesses survive the first transition, and about a third of those survive the second, then you’re looking at something like 16.5% of family farms reaching a third generation of ownership. And they’re very clear that weak or non‑existent succession planning is one of the big reasons many don’t get that far.
Generation Milestone
Percentage Surviving
1st Gen to 2nd Gen
~100% (baseline)
2nd Gen to 3rd Gen
~33% (of 2nd)
3rd Gen to 4th Gen
~11% (of 3rd)
Farms Reaching 4th+ Gen
~3.5% (of original)
So, yes, the odds are tough. But they’re not a death sentence. What I’ve found, looking at the research and listening to farmers in places like Wisconsin, Ontario, and the Atlantic provinces, is that the families who do land in that 16‑odd percent tend to make a set of very specific choices—on timing, money, fairness, and leadership.
Let’s talk about those, in plain dairy terms.
Why Dairy Succession Feels Heavier Than Most
You don’t need a journal article to tell you dairy is a 365‑day grind, but it’s worth seeing how the data lines up with what you’re living.
The 365‑Day Workload Your Kids Have Watched
A 2024 doctoral thesis from the University of Manitoba interviewed dairy farmers in Western Canada and Ontario about health and workload. It found what most of us already know in our bones: a lot of producers reported work‑related injuries, aches, and pretty high stress levels. The main culprits were long hours, heavy workloads, financial pressure, and weather uncertainty.
What’s interesting is that the study didn’t see big differences in health outcomes between tie‑stall and freestall, or between parlors and robots—once you controlled for other factors, the stress seemed to come from the responsibility and economics as much as from the barn layout.
If your kids grew up watching you drag yourself in after dealing with fresh cow issues in the transition period, juggling butterfat levels for that component premium, and worrying about the line of numbers on the cash‑flow sheet, they absorbed all of that. In more than a few kitchen‑table meetings, I’ve heard young people say something along the lines of, “I love the cows and the genetics. I’m just not sure I want to live exactly like my parents did.”
That doesn’t mean they won’t come back. But it does mean we can’t pretend the lifestyle piece isn’t part of the succession puzzle.
Stress Factor
% of Farmers Reporting High Levels
Relative Impact
Long work hours (365-day commitment)
78%
High
Financial pressure & cash-flow uncertainty
72%
High
Weather uncertainty & forage variability
65%
Medium-High
Work-related physical injuries & aches
61%
Medium-High
Staff availability & labor challenges
58%
Medium
Regulatory/compliance pressure
42%
Medium
The Capital Load Has Quietly Gotten Bigger
On the balance‑sheet side, dairy has become a very capital‑intensive business. A 2021 paper in the journal Agricultureexamined family farms in Catalonia and found that dairy farms in that region carry particularly high levels of fixed capital in land and buildings compared to other sectors. That’s not news to anyone who’s priced out a new freestall, manure system, or robotic milking setup lately.
In many North American dairy areas, USDA land value surveys and provincial numbers show land values have trended upward over the last decade, especially where urban growth or high‑value crops compete with dairy for acres. Add in barns, parlors or robot rooms, manure storage, feed storage, and in Canada, quota on top of it—and it’s easy to see how a “modest” family dairy can end up with several million dollars tied up in fixed assets.
It’s worth noting what’s happened on the return side. The 2024 Minnesota FINBIN report showed that dairy farms had a much better year than 2023: median net farm income for dairies was up sharply, and milk price and production per cow both improved. High‑profit dairy farms in that dataset earned about 773 dollars per cow in net return. At the same time, the average Minnesota farm across all sectors posted about a 2% rate of return on assets in 2024.
So you’ve got more capital tied up, a better 2024 than 2023, but still a business that, on average, is spinning out something like a 2% return on the total asset base. Many Midwest producers will tell you they feel that in their gut: it’s good enough to keep going and reinvest a bit, but there isn’t a lot of slack for big mistakes.
Decision #1: Start the Transition While You Still Have Time, Not When You’re Exhausted
One of the most encouraging things I’ve seen in the last few years is how much more open producers are to talking about timing. Instead of waiting until someone is 68 and worn out, more families are at least asking, “When should we start this?”
Extension folks in a lot of places are saying roughly the same thing. Guides from Michigan State University, OMAFRA in Ontario, and Alberta Agriculture all stress that transition is a multi‑year process and that it works best when you start while the senior generation still has a decade or more of working life ahead of them—often when parents are in their 50s, and a potential successor is in their 20s or 30s. Tennessee’s workbook makes the same point: succession is a process, not a single event.
You probably know this already, but it’s worth saying out loud: “We’ll deal with that when I’m ready to quit” almost never leads to a calm, orderly hand‑off. What it usually leads to is rushed decisions under pressure—health issues, burnout, or a financial shock—and far fewer tools on the table.
Off‑Farm Experience Isn’t the Enemy
There was a time when a lot of us were terrified that if the kids left, they’d never come back. And sure, that still happens sometimes. But the research and real‑world examples suggest the picture is more nuanced.
A 2018 article in Rural Sociology followed young farmers in England and looked at how education and off‑farm work shaped their paths back to the farm. The authors found that time away often gave these successors a broader perspective and a more entrepreneurial mindset. They came back with different ideas about management, markets, and where the farm could go.
On the ground, in Wisconsin operations and across Western Canada, you see it play out like this:
Someone spends a few years as a herdsman or assistant manager on a 1,000‑cow freestall or large dry‑lot, really owning fresh cow management and transition‑period decisions.
Another works as a nutrition or genetics rep, seeing how different herds manage feed costs per cwt, butterfat and protein, SCC, repro, and genomic selection.
Others spend time in lending, farm management consulting, or robotics, and start thinking more about ROI on capital, not just getting through chores.
When those people come back, what I’ve found is that they usually appreciate how hard the home farm has worked to stay afloat, but they’re also more comfortable questioning things that don’t pencil out. That’s exactly the kind of “absorptive capacity” the Brazilian succession study talked about—being able to bring in outside knowledge and actually use it on the farm.
Instead of seeing off‑farm work as “losing” a successor, you can look at it as sending them out for free training in someone else’s barn.
Competency Area
With Off-Farm Experience
Home-Farm-Only Experience
Fresh-cow / transition management
8.2
5.8
Financial / ROI thinking
7.9
4.1
Feed economics & forage management
8.1
5.2
Staff leadership & HR
7.6
4.3
Technology adoption & problem-solving
8.4
5.5
Ability to question & improve existing systems
8.3
4.9
Trial Management Back Home: Give Them the Keys, Watch the Numbers
Once they’re back home, the real test isn’t how many hours they work. It’s whether they can actually manage. Extension material from Missouri, Wisconsin, and groups like Land For Good all encourage farms to have a genuine trial‑management period before full partnership.
That might look like:
Turning fresh cow management over to them for two full years—rations, protocols, pen moves—and then sitting down together to look at transition disorders, early cull rates, and milk curves.
Letting them design and run the cropping plan, then tracking forage quality, yield, cost per ton of dry matter, and how that feeds into milk production and component levels.
Giving them responsibility for staff scheduling and day‑to‑day HR, then watching labor turnover, how often you’re short‑staffed, and how the culture feels.
In Minnesota FINBIN herds and in lender meetings I’ve sat in on, those kinds of documented responsibilities and results make it much easier for a bank to say, “Yes, we can finance a staged buy‑in here.” You’re not just asking them to trust a last name—you’re showing them a track record.
Decision #2: Treat the Old “Equal at Full Value” Plan as a Red Flag, Not a Default
Here’s where the math and the emotions collide. A lot of us grew up with the idea that the “fair” plan was to figure out what the farm was worth, divide by the number of kids, and have the one who stays buy out the rest at that value. On paper, that sounds tidy. On a modern dairy balance sheet, it can quietly set the farm up for failure.
Let’s walk through an example—strictly as an example, not as a “this is what every 400‑cow herd looks like.”
An Illustrative 400‑Cow Scenario
Say you’ve got a 400‑cow herd with assets that look a lot like what FINBIN sees in Minnesota dairies:
Roughly 2 million dollars in land and buildings
Around 800,000 dollars in cows and replacements
Maybe 700,000 dollars in machinery and other assets
That’s about 3.5 million dollars in total assets. If you’ve got four kids and decide everybody’s share should be equal in dollar terms, each person’s “piece” is about 875,000 dollars. If only one child is farming, the on‑farm heir is on the hook to come up with something like 2.6 million dollars to buy out the other three.
Now bring in the income side. FINBIN’s 2024 report showed high‑profit Minnesota dairy farms earning about 773 dollars per cow in net return. Let’s say your 400‑cow herd is in that neighborhood. That’s just over 300,000 dollars in net return available.
If you finance a 2.6‑million‑dollar buyout on typical terms, annual payments can easily land somewhere in the 250,000 to 300,000‑dollar range, depending on the interest rate and amortization. On a 400‑cow base, that works out to roughly 625 to 750 dollars per cow per year just to service buyout debt.
Item
Amount
Per-Cow Impact
Notes
Total Farm Assets
$3,500,000
—
Land ($2M) + Cows/Replacements ($800K) + Machinery ($700K)
Leaves little room for reinvestment, feed spikes, or technology
Here’s what’s interesting: the same FINBIN report tells us the average Minnesota farm only earned about a 2% rate of return on assets in 2024. So you’re asking a business with a 2% return profile to finance a 100% buyout of all that equity and still have enough left over to invest in cows, barns, manure systems, maybe a robot or two, not to mention handle feed spikes and milk‑price dips.
In a lot of cases, that math just doesn’t leave room for fresh cow improvements, better transition‑period facilities, or upgrading genetics and technology. Many of us have seen what happens next: land and cows get sold off piece by piece to relieve the pressure, and the farm slowly shrinks or disappears.
Why “Fair” Doesn’t Always Mean “Equal” in Dollars
Farm Credit Canada has been very straightforward about this. In their article “Family farm transition – is fair always equal?”, transition specialist Rick Roozeboom uses that exact line: a million dollars in farm assets is not the same thing as a million dollars in cash. In their 2024 piece “What’s fair when everyone contributes differently?”, FCC digs into how different kids contribute to the farm—some with labor and management, others by simply being part of the family story—and why treating those contributions identically, in strict dollar terms, can create real problems.
It’s worth noting that some parents still decide, after seeing the numbers, that equal division is the value they care about most—even if that ultimately means the farm will be sold. People like farm‑family coach Elaine Froese, who works full‑time on this, see that choice fairly often. That’s not “wrong.” It just needs to be honest: you’re choosing an exit strategy, not a continuity strategy.
Decision #3: Use Structure to Avoid a Capital Train Wreck
The good news is you’re not limited to the “equal shares at full appraised value” model. There are other ways to structure things so the farming child isn’t crushed and non‑farming children aren’t left feeling shut out.
One Yard, Two (or More) Businesses
In Canadian dairy, especially, you often see accountants and advisors using a holding‑company plus operating‑company model. Firms like MNP and Baker Tilly often discuss this in their farm‑succession resources.
The basic idea goes like this:
Land, buildings, and quota sit in a holding company or partnership, often owned primarily by the parents and, eventually, by a mix of family members.
The operating company holds the cows, replacements, feed, and machinery, and runs the day‑to‑day dairy.
Over time, the successor acquires the operating company through staged share purchases, profit‑sharing, or a combination.
This gives you a few levers to pull:
Parents can receive retirement income from rent or dividends paid by the holding entity.
The successor doesn’t have to debt‑load themselves all at once with land, barns, and quota; they can focus capital on keeping cows healthy, improving butterfat levels, managing SCC, and investing in genetics or automation.
With good advice, you can line this up with tools like the intergenerational rollover and the Lifetime Capital Gains Exemption.
In Ontario and Quebec quota herds, where the value of quota alone can be massive, this kind of structure can be the difference between having a path forward and quietly setting up a forced sale.
Other Tools That Often Get Overlooked
In U.S. herds without quota, you still see some of the same themes:
Partnerships or LLCs in which the successor buys units over a decade or more, funded partly with profits.
Land companies that hold farmland, sometimes with both farming and non‑farming siblings as owners, and long‑term leases to the operating dairy.
Planned growth or diversification—adding cows, custom heifer‑raising, beef‑on‑dairy programs, or on‑farm processing—to create enough cash flow to support a buy‑in and reinvestment.
A 2021 article in Sustainability looking at small U.S. farms (not just dairy) found that producers who combined enterprise decisions with financial risk‑management tools—like insurance, off‑farm income, and contracts—tended to have stronger economic sustainability. That lines up with what many of us see: the farms that think in terms of structure and risk management, not just “who works hardest,” usually have more options when it’s time to transition.
Decision #4: Build a Successor as a Leader, Not Just the Go‑To Worker
Every dairy has someone who knows exactly which cows are in trouble in the transition period, who notices a butterfat dip before anyone else, and who can read a robot alarm in their sleep. They’re often the first person you call when something’s off.
It’s worth noting, though, that being the most reliable worker and being the person who carries the bank meeting, the staff reviews, and the five‑year capital plan are different skill sets.
That Brazilian study I mentioned earlier found that successors with higher absorptive capacity—basically, better at absorbing and using new information—and stronger social networks were more likely to be in place and engaged in management on family farms. Other work on family‑firm resilience suggests that leadership development and adaptability are key to who survives shocks like droughts, price crashes, or major policy changes.
So here’s the question I’d encourage you to ask: “Are we intentionally building a leader here, or are we just giving more jobs to the person who never says no?”
Trial Management with Real Metrics
We already talked about giving the next generation specific areas to run. The key is to pair that with clear metrics and then actually look at them together. In practice, that might be:
Fresh cow and transition management: track fresh cow health events, early culls, peak milk, and repro performance.
Cropping: track forage quality (protein, NDF digestibility), yield, and cost per ton of dry matter, then connect that to milk production and butterfat levels.
People: track turnover, missed shifts, and the consistency with which standard operating procedures are followed.
In many cases, lenders in Wisconsin and Minnesota have said, “Show me how they’ve done when they were responsible, not just when they were helping,” before they sign off on financing a buy‑in. It’s not about being harsh; it’s about giving everyone confidence that the next person can actually drive the ship.
Shifting Real Authority, Step by Step
A lot of extension material, including from Wisconsin and Missouri, discusses moving successors through stages—from employee to enterprise manager to multiple‑enterprise manager to primary operator, and finally to lead owner. Groups like Land For Good emphasize writing down who makes what decisions at each stage.
What’s encouraging is that when families do this on purpose—rather than on the fly—you see the older generation relax a bit because they’re not handing over everything at once. And the younger generation builds confidence because they’re making meaningful decisions before the paperwork changes hands.
Key Factor
Farms Making It to Gen 3 (16.5%)
Farms at Risk of Dispersal (83.5%)
Succession Timing
Start serious talks 10–15 years out; parents in 50s, successor in 20s–30s
Wait until burnout, health crisis, or parent age 65+; rushed decisions
Successor Development
Off-farm experience + trial management in specific areas with measurable KPIs
No off-farm training; successor does many jobs but leads none; vague accountability
Capital Structure
Use holding/operating split, staged buy-ins, or sweat-equity recognition to spread debt load
Full market-value buyout; successor inherits $600–$750 debt per cow
Real Authority Transfer
Written plan: who owns what decisions at each stage; regular progress reviews
Vague handoff; older gen still making calls behind the scenes; confusion and resentment
Fairness Discussion
Explicit conversations about “fair vs equal”; non-farm kids acknowledged; neutral facilitator
Assumptions left unspoken; non-farm kids blindsided; explodes in lawyers’ offices later
Advisory Team
Lawyer, accountant, lender, family coach at same table; coordinated advice
Each advisor in silo; conflicting tax and legal advice; family navigates alone
Plan Documentation
Written succession plan reviewed annually; timeline clear; metrics tracked
Vague intentions; no written plan; nobody knows what “done” looks like
Contingency for Non-Family Succession
If no family successor emerges, explored non-family paths early (leases, land-access programs)
“We’ll sell when it’s time” or “Nobody wants this farm”; fire-sale dispersal
Decision #5: Tackle “Fair vs Equal” While Everyone’s Still Talking to Each Other
If there’s one topic that tends to tighten people’s shoulders around the table, it’s fairness. How do you treat non‑farming kids fairly without burying the one who stayed?
Research on family businesses and values makes it clear that “fair” means different things to different family members. The on‑farm child might look at years of lower wages, risk, and sacrifice. The off‑farm child might be thinking, “We grew up in the same house; why is my share smaller?”
FCC has tried to normalize that tension a bit. In their fairness articles, they break it down simply: equal is one version of fair, but not the only one. They highlight tools like:
Using life insurance or off‑farm investments to help non‑farming kids while directing more farm assets toward the successor.
Separating land from operations so siblings can share in land ownership while the farming heir controls and builds the operating business.
Putting numbers on sweat equity—years of below‑market wages and capital contributions—so the successor’s extra skin in the game isn’t invisible.
As many of us have seen, families that talk through this with a neutral person—a mediator, coach, or extension specialist—tend to come out with solutions that everyone can live with. It doesn’t make every conversation easy, but it makes them a lot less explosive.
Decision #6: Bring a Real Advisory Team Around the Same Table
One thing Teagasc in Ireland has really leaned into—and I think it’s worth watching from this side of the ocean—is the idea of coordinated advisory teams. They call it the Multi‑Actor Succession Teams approach.
Instead of the family bouncing between their Teagasc advisor, their accountant, and their solicitor, each giving advice in isolation, Teagasc arranges meetings where everyone sits together, looks at the same facts, and works toward a plan the family can actually implement.
The Irish government even backs this up with the Succession Planning Advice Grant. That grant can contribute up to 1,500 euros toward eligible professional costs—lawyers, accountants, and so on—for families who go through a structured succession process.
We don’t have that exact grant in Canada or the U.S., but the principle still applies. In FCC stories and in a lot of North American advisory work, the farms that make the cleanest transitions tend to have a team that looks something like:
A lawyer who does farm transfers regularly, not just basic wills.
An accountant who understands farm tax rules, intergenerational rollovers, and the quirks of quota or depreciation.
A lender who’s seen both good and bad transitions and can talk plainly about what the balance sheet can support.
A family‑business coach or mediator who keeps the conversation moving and honest.
A financial planner who helps the senior generation turn this plan into a retirement that doesn’t depend entirely on guilt or generosity.
What’s interesting is that when you get these folks in the same room—even just once or twice—you cut down a lot of the “he said / she said” between offices. You also tend to catch conflicts between tax ideas, legal structures, and bank policies before they become expensive mistakes.
Decision #7: If There’s No Family Successor, Don’t Assume “Sell Next Month” Is the Only Path
We also have to be honest: sometimes, nobody in the next generation wants to run the dairy. Or they want to stay connected as owners, but not in the day‑to‑day.
In that situation, it’s easy to feel like the only choices are: run yourself into the ground or sell everything at once. But there’s some interesting work happening here, too.
The Journal of Agriculture, Food Systems, and Community Development has published several papers on land‑access and transition policies. One 2020 study examined “land access policy incentives”—such as state tax credits and USDA’s Conservation Reserve Program–Transition Incentives Program—and how they’re being used to transfer land to younger and beginning farmers through long‑term leases or sales. A 2024 evaluation of the Transition Incentives Program highlighted its role in helping older farmers transition CRP land to new operators in a more controlled way.
And Tennessee’s succession workbook explicitly says that if there’s no interested or prepared family successor, it’s worth looking at non‑family options—long‑time employees, young neighbors, or other beginning farmers—through structured leases or phased sales.
So in many cases, your choices might look more like:
Gradually leasing facilities and herd to a non‑family operator with a clear agreement.
Selling land but keeping some involvement in the herd or youngstock for a few years.
Working with a land‑link program or policy incentive to bring in a new operator under defined terms.
That’s not going to fit every situation, but it’s better than assuming there are only two buttons to push: “ignore it” or “disperse immediately.”
A Realistic 12–24‑Month Game Plan
If you’re thinking, “This is all fine, but we’re not a decade out, we’re three to five years out,” you’re not alone. A lot of families are in that position. The goal in that case isn’t to build the perfect binder. It’s to move from “vague intentions” to a written, realistic plan.
Here’s a simple roadmap that I’ve seen work on real farms:
1. Put Succession on the Farm Agenda This Year
It sounds almost too basic, but the first step is to stop treating succession as a late‑night worry and start treating it as business. Tools from OMAFRA, New Brunswick’s farm‑transition checklists, and Tennessee’s workbook all include question sets that ask, for example, “Who wants to be involved and in what way 10–15 years from now?” and “What do you want this farm to look like then?”
In many cases, just getting those answers written down is a big step forward.
2. Ask Your Advisors a Very Direct Question
At your next accountant or lawyer visit, try this:
“How many farm successions have you helped structure in the last five years, and what kinds of structures did you use?”
If the answer is “not many,” that doesn’t mean they’re a bad fit for everything. But it’s a sign you may want to bring in someone who spends most of their time on farm transfers, even if it’s just for a few key meetings.
A lot of the train wrecks I’ve seen weren’t because the people involved were careless; they were simply working with advisors who didn’t specialize in the complexity of farm assets, quota, and family dynamics.
3. Sketch a Rough Timeline
You don’t have to frame this on the wall, but it helps to see it. Write down:
Your age
The age of any realistic successor
Then ask:
“When would I like to be mostly out of day‑to‑day decisions?”
“When does this person need to be fully in charge for this to feel responsible?”
Alberta’s transition planning guide and other resources offer examples of 10–15‑year transition timelines. Even if you only have five years, putting rough mileposts down—“by Year 2 they handle cropping decisions; by Year 4 they’re lead on fresh cows and people; by Year 5 we finalize ownership changes”—gives everyone something concrete to work toward.
4. Start the Fair vs Equal Talk Before Lawyers Draft Anything
If you can, bring in a neutral facilitator—an extension specialist, a mediator, or a farm‑family coach—and have a meeting with all children, farming and non‑farming.
Some good questions:
“What would feel fair to you if you’re the one farming here?”
“What would feel fair if you’re not farming but want to stay connected?”
“What worries you most about how this might be handled?”
Research on family climate and succession planning suggests that families who discuss expectations openly, rather than leaving them implied, tend to have smoother transitions and fewer broken relationships in the long run.
5. Document Where the Successor Already Leads
If someone’s already making key calls, get that down on paper.
Make a short list:
Decisions they currently own (transition‑period protocols, breeding program, staff scheduling, major purchases).
The numbers you’re using to judge success (milk per cow, butterfat and protein levels, SCC trends, repro KPIs, heifer inventory, feed cost per cwt).
That list isn’t just for the bank. It’s for you too. It shows you where you can start stepping back—and where you may need to push them to take more responsibility.
6. Sit Down with Your Team and Ask How to Avoid the Capital Crunch
When you’ve got your accountant, lawyer, lender, and maybe a coach at the table, put this question on the flip chart:
“If we don’t want to rely on a full market‑value buyout to be fair, what options do we have that you’ve seen work for dairies like ours?”
In many cases, that’s when ideas like holding/operating structures, land companies, staged share purchases, or long‑term leases with built‑in buyout formulas start to surface. The mix that makes sense for a 90‑cow tie‑stall in New Brunswick won’t be the same as for a 1,200‑cow freestall with robots in Wisconsin, but the goal is the same: keep capital demands aligned with what the business can support.
7. If There’s No Family Successor, Explore Non‑Family Paths on Purpose
If no family member wants to run the dairy, consider whether a longtime employee or a young neighboring producer could be part of a structured transition plan. Research on land‑access policy incentives and the Transition Incentives Program shows that staged sales and long‑term leases are already being used across North America to help older farmers exit without simply putting up a “For Sale” sign and walking away.
Timeline
Step
Owner
Key Output
Success Looks Like
Year 1 (This Year)
1. Put Succession on the Farm Agenda
Family
Written answers to “Who wants in? What does the farm look like 10–15 years out?”
Everyone has read the workbook questions; one family meeting completed
2. Ask Your Advisors a Direct Question
Parent + Advisor
List of advisors with farm-succession experience
You have at least one advisor who’s structured 5+ farm transitions in the last 5 years
3. Sketch a Rough Timeline
Family
One-page timeline with ages, transition milestones, key decision dates
You can see when the successor needs to be fully in charge; you know when you want to step back
Year 2
4. Start the Fair vs Equal Talk
Family + Facilitator (optional)
Written record of what each child views as fair; areas of agreement & concern
Non-farming kids feel acknowledged; farming successor feels supported; no surprises later
5. Document Where the Successor Already Leads
Family + Successor
List of current decisions owned by successor; KPIs used to measure success
You have 3–5 areas where the successor is fully responsible and hitting targets
6. Meet with Your Team & Address the Capital Question
Family + Lawyer + Accountant + Lender
Outline of 2–3 structures that could work (holding/operating, staged buy-in, land lease, etc.)
You understand which structure fits your farm; you know what equity needs to move and when
Year 2–3
7. If No Family Successor, Explore Non-Family Paths
Family + Land-Link or Extension
Preliminary conversations with potential long-term employees or neighboring operators
You have a Plan B if the family route doesn’t work; you’re not forced into a fire-sale dispersal
Outcome by Month 24
Written Succession Plan
Family + Advisors
Final plan document (2–5 pages); annual review schedule set
You have a one-page summary everyone agrees on; annual check-in on the calendar; confidence that this farm will be here in 20 years
The main thing is to look at this while you still have energy and flexibility—before age or burnout makes the decision for you.
Most of us have stood by the ring at a dispersal sale and felt that twist in our gut watching cow families, genetics, and years of work roll out the lane. Sometimes that’s the right choice—especially when it’s planned and keeps the family whole.
But if your hope is to see cows in those barns and milk leaving your lane under your family’s name into the next generation, the data and the lived experience line up on this: the families who make it into that 16‑odd percent don’t get there by luck. They start earlier than feels comfortable. They treat “equal at full value” as something to stress‑test, not a default. They build a successor who can actually lead, not just work. They use structures that reflect today’s capital load and margins. And they get a real team around the table instead of trying to carry it all alone.
You don’t have to overhaul everything by next spring. But if sometime this year you say, “Okay, who might realistically succeed us?”, sketch a rough timeline, and ask your advisors how to do this without crushing the farm, you’ll be ahead of where most families start.
And from what many of us have seen, that’s usually how good transitions begin—not with a perfect binder, but with one honest conversation, a few real numbers on the page, and a family deciding they’d rather write their own odds than live by someone else’s statistic.
Key Takeaways
The survival math is brutal: Only about 16.5% of dairy farms make it to a third generation—and weak or late succession planning is one of the biggest reasons why.
“Equal at full value” can quietly kill the farm: A traditional buyout can load $600–$750 of debt per cow onto the farming heir, leaving almost nothing for cows, barns, genetics, or the next bad year.
The 16.5% start earlier and build leaders: Families who beat the odds begin serious transition talks a decade out, give successors real management responsibility (with measurable outcomes), and use off‑farm experience as free training—not a threat.
Fair doesn’t have to mean equal in dollars: Sweat equity recognition, holding/operating structures, staged buy‑ins, and land‑lease arrangements can balance retirement, fairness, and herd survival without forcing a fire sale.
A real team beats a scattered one: Getting your accountant, lawyer, lender, and a family coach around the same table—like Teagasc’s Multi‑Actor Succession Teams—helps you dodge tax traps, catch conflicts early, and keep relationships intact.
Executive Summary:
Only a small slice of dairy farms—roughly that 16.5%—make it to a third generation, and it’s not because the rest didn’t care enough about legacy. This article digs into what separates the survivors, combining family‑business research, FINBIN 2024 dairy numbers, and fresh work on farmer stress and leadership to show where most plans quietly break down. You’ll see how a “fair” full‑value buyout can stack $600–$750 of debt on every cow, why that’s so dangerous in a 2%‑ROA business, and how structures like holding/operating companies and staged buy‑ins can keep both retirement and reinvestment on the rails. We walk through the timing piece—starting conversations while parents still have a decade to work, using off‑farm experience as training, and giving successors real management oxygen instead of just more chores. There’s a straight‑talk section on “fair vs equal” for farming and non‑farming kids, and how coordinated advisory teams (the kind Teagasc and FCC are pushing) help you avoid tax shocks and family blow‑ups. The article also opens the door to non‑family succession routes and land‑access programs when there’s no heir in the barn. You’ll finish with a concrete 12–24‑month checklist to test your own plan and a clearer sense of whether you’re quietly planning a continuity story—or an eventual dispersal.
Complete references and supporting documentation are available upon request by contacting the editorial team at editor@thebullvine.com.
Learn More
The Family Dairy Time Bomb: Why 83.5% of Operations Fail by the Third Generation – Gain a five-step readiness audit to defuse transition risks before they fracture your family’s equity. This guide delivers the financial structures and communication protocols needed to move your succession plan from theory into a stable, operational reality.
Decide or Decline: 2025 and the Future of Mid-Size Dairies – Capture a 2025 positioning strategy that maps expansion against optimization to protect your long-term margins. This analysis exposes the debt-ratio discipline and regional shifts required to keep your mid-size operation competitive in an era of consolidation.
Every week, thousands of producers, breeders, and industry insiders open Bullvine Weekly for genetics insights, market shifts, and profit strategies they won’t find anywhere else. One email. Five minutes. Smarter decisions all week.
Your 72-Hour Playbook—Generators, Fuel, Water, and the MLP Paperwork That Actually Pays Back
EXECUTIVE SUMMARY: Winter Storm Uri saw Texas dairies dump over 1,800 semi-loads of milk, resulting in $14 to $21 million in losses in a single week. For a 200-cow herd, three days without power means roughly $10,000 in dumped milk before equipment failures or dead animals add to the toll. The math is simple: $1,000 in diesel keeps your generator running; skipping it risks ten times that down the drain. This playbook covers the 72 hours before a major storm hits—generator sizing, fuel planning, water backup, cold-stress feeding, staffing decisions, and the H5N1 biosecurity realities now complicating neighbor-to-neighbor mutual aid. It also details the USDA Milk Loss Program paperwork (dates, volumes, written reasons) that can recover 75-90% of your losses—but only if records exist before the bulk tank overflows. From 70-cow Ontario tie-stalls to 2,000-cow Texas dry lots, the dairies that survive these storms aren’t lucky—they’re the ones who ran the numbers while the sky was still clear.
So here’s a question I’ve been asking farmers lately, and you know, most don’t have a great answer: how many days can your operation actually run if the grid goes down and stays down?
I bring this up because big winter storms aren’t rare “acts of God” anymore. They’re stress tests—of your barns, your people, and honestly, your balance sheet. When Winter Storm Uri slammed Texas in February 2021, agricultural economists with Texas A&M AgriLife Extension estimated initial losses at more than $600 million. And here’s what stuck with me: AgriLife Extension director Jeff Hyde, Ph.D., warned those costs could “plague many producers for years to come.” That wasn’t just a bad week. That was a structural blow to many good operations.
Let me bring that down to a scale we can actually picture. Say you’re milking 200 cows, averaging around 80 lb per cow per day. That’s 16,000 lb daily, or about 160 cwt. At 20 dollars per cwt—your number might be higher or lower depending on components and premiums—one day of completely dumped milk means roughly 3,200 dollars in gross revenue gone. Three days? You’re staring at nearly 10,000 dollars, and that’s before we even talk about butterfat levels or quality premiums you’re losing.
During Uri, Darren Turley—he’s the executive director of the Texas Association of Dairymen—told Brownfield Ag News that Texas dairies ended up dumping over 1,800 semi loads of milk in roughly a week. Plants couldn’t process it, trucks couldn’t move, and power and natural gas were just gone. Dairy market analyst Sarina Sharp, estimated the regional total at 2,000 to 3,000 loads. If you put even a conservative value of 7,000 dollars per load on that, we’re talking 14 to 21 million dollars of milk literally washed down the drain.
Here’s what’s encouraging, though: policy actually reacted. In 2023, USDA’s Farm Service Agency rolled out the Milk Loss Program—MLP for short—to compensate dairy operations for milk that got dumped or removed from commercial markets due to qualifying natural disasters. The program covers events from 2020, 2021, and 2022, and the rules are pretty specific: eligible dairies can claim up to 30 days of lost milk per year, with payments at 90 percent of the calculated loss for underserved producers and 75 percent for everyone else.
So looking ahead to the next named winter storm, the real question becomes: in the 72 hours before it hits, what can you do on your dairy—right here, with your labor, cash flow, and setup—to keep the next storm from erasing months of hard-won margin?
Key Numbers Worth Keeping in Your Head
Before we get into the details, here are the figures I’d jot on a notepad:
30–50 gallons/cow/day — typical water intake for lactating cows, according to Penn State Extension
2–4 gal/hour — approximate fuel burn for a 40 kW diesel generator, depending on load, per industry fuel consumption data
5–7 gal/hour — fuel consumption range for larger 100 kW units at working capacity
About 1% per °F — added maintenance energy demand once cattle drop below their lower critical temperature, per SDSU and NDSU Extension
2–25% — range of intake increases you might see in cold-stressed cattle when forage quality allows, again from SDSU
30 days — maximum MLP coverage per year
75% / 90% — MLP payment rates for standard producers versus underserved producers
$3.6 billion — estimated uncovered U.S. farm losses from 2020 natural disasters alone, according to American Farm Bureau Federation analysis
$21+ billion — crop and rangeland losses from 2022 severe weather events, per AFBF
A 10-Minute “If You Don’t Do Anything Else” Checklist
You know, what I’ve found talking to producers is that you don’t need a thick binder to be materially more ready. You need a few focused moves. If you only have ten minutes this week, I’d put them here.
Run the generator under real load. Start it, switch through the transfer switch, and put actual critical loads on it: vacuum pump, milk pump, cooling, one well pump, and key lights. Let it run 30–60 minutes. The true test—and every farm electrical guide will tell you this—is whether it can start and carry those motors without sagging or tripping. Running smooth with no load? That tells you almost nothing.
Know your fuel math, not just your tank size. Industry fuel consumption charts show that a 40-kilowatt diesel generator under decent load burns about 2–4 gallons of fuel per hour, while a 100-kilowatt unit typically requires 5–7 gallons an hour at working capacity. Run that 40 kW set at around 3 gal/hour for 72 hours straight, and you’re at roughly 215 gallons. At 4 dollars per gallon, that’s about 860 dollars of diesel. Now put that against one 25,000-liter load of dumped milk—around 700–800 cwt—at 20 dollars per cwt. That’s 14,000 to 16,000 dollars gone. Three days of fuel starts looking like pretty cheap insurance.
Stage three to five days of water access. Penn State Extension notes that lactating dairy cows typically drink 30–50 gallons of water per day, with most of that from drinking rather than from feed moisture. Use 35–40 gallons as a planning number, and that same 200-cow herd needs 7,000–8,000 gallons a day. Over three days, you’re north of 20,000 gallons. Nurse tanks, overhead storage, and extra troughs positioned now give you a buffer if lines freeze or a pump fails.
Walk every water line and heated waterer. In colder regions—and this is consistently shown in livestock water system bulletins from Ontario and the northern U.S. states—self-regulating heat cable rated for potable water is recommended for exposed or problem lines. It adjusts its output based on temperature and is considered safer than constant-wattage tape. Flip breakers, feel heaters, check thermostats, and look hard at elbows, risers, and any line you’ve “meant to insulate later.”
Look at rations through a cold-stress lens. SDSU Extension and NDSU both use a practical rule of thumb: once cattle are below their lower critical temperature, maintenance energy requirements rise by about 1% for every degree Fahrenheit below that point. They also report that cattle under cold stress often increase intake by 2 to 25 percent when forage quality allows, with the higher end of that range kicking in when effective temperatures drop below about 5°F. So if cows are effectively 18°F below LCT, you could be looking at around 18 percent more energy demand. On a 200-cow herd feeding 50 lb/head/day, that’s an extra 9 lb/head/day—1,800 lb of TMR daily. At 8 cents per lb of dry matter, that’s roughly 144 dollars per day. Over three days, call it 400–500 dollars in extra feed. Put that against the risk of losing 3–4 lb of milk per cow per day over three days—2,400–3,200 dollars at 20 dollars per cwt—and the math very clearly favors feeding for the cold.
Get brutally honest about who can actually reach the farm. Farm emergency planning tools in British Columbia and the Prairie provinces encourage mapping where employees live and how storms affect their routes. More dairies now designate one or two core people—often the owner and a key herdsman or herdswoman—as “on-farm no matter what,” and set clear thresholds beyond which staff farther away are told not to risk the roads. That clarity saves accidents and, indirectly, protects the herd.
Talk to your milk hauler and your co-op or processor. Brownfield’s coverage of Uri showed how chaotic those first days were for plants, haulers, and farms. Many processors in Texas, the Upper Midwest, and the Northeast now have more defined storm protocols. This is the time to ask, “If the plant is down or roads are closed for two days, what happens to my milk?” Their answer will tell you whether your real risk is a full tank or a dead tank.
Post an emergency contact sheet where everyone can see it. Vet clinic, hauler dispatch, field rep, electric and gas utilities, fuel supplier, FSA office, insurance agent, and a couple of neighbors—that’s the bare-bones list most farm emergency guides recommend. Tape it in the milk house. When phones die or get lost, that paper is still there.
Add bedding and wind protection for outside groups. Cold-stress articles from NDSU, Wisconsin, and others note that effective windbreaks and deep, dry bedding can substantially reduce energy requirements and help cattle maintain condition during severe cold. Straw, stalks, bale stacks, and panel lines are low-tech, high-ROI tools to stage before the weather hits.
Turn documentation into a habit, not a scramble. The MLP fact sheet emphasizes that producers must document dates and volumes of dumped or removed milk, provide marketing statements, and describe the qualifying event and how it prevented normal marketing. Similar documentation underpins the Livestock Indemnity Program, ELAP, and the Emergency Conservation Program. Jotting a quick note—”PM milking, Jan 10, ~150 cwt dumped, hauler cancelled, plant closed”—and snapping a photo can be worth thousands later.
If that’s all you manage before the next big system, you’re still a long way ahead of where many good dairies found themselves going into Uri or the big High Plains and Dakota blizzards.
72–48 Hours Out: Getting Real About Power and Water
Looking at post-storm reports across Texas, the High Plains, and eastern Canada, the pattern is pretty consistent: herds with even basic backup power and water plans had miserable days, but they stayed in the game. Herds with no plan? They jumped straight to crisis.
Sizing Backup Power for the Farm You Actually Run
In many Ontario tie-stalls and Wisconsin freestalls, as well as smaller parlors in New York and Vermont, backup power usually means a PTO generator or an older diesel tied into the parlor and one well. In larger dry lot systems in New Mexico or the Texas Panhandle, you’ll more often see big automatic units, but you know, many 500–1,000 cow herds still depend on PTO sets.
Generator sizing guides from provincial ministries and suppliers generally start the same way:
List your “must-run” loads: vacuum pump, milk pump, plate cooler or bulk tank compressor, at least one deep-well pump, and minimum lighting.
Convert motor horsepower and amps to kilowatts and total your running load.
In their worked examples, modest parlor setups often fall in the 25–40 kW range for true critical loads. Once you add larger parlors, multiple compressors, robot systems, sand separation, and more ventilation, those examples quickly move into the 75–150 kW band or higher, depending on what’s bolted to the floor.
And here’s the catch that bites a lot of people: motors don’t draw their running amps when they start. Electrical references and generator manuals consistently note that induction motors can draw 2 to 3 times their running current at start-up. That’s why most electricians and sizing tools push you to build serious headroom above that neat running-load number.
So if you and your electrician calculate a critical running load of about 60 kW, it’s common to recommend a generator in the 80–90 kW range to handle multiple motors starting without constant tripping. One pattern I keep seeing: when producers balk at the bigger unit, it’s usually because they’re thinking about “amps right now,” not “worst-case start-up” during a blizzard.
Tier & Critical Load
Est. kW Running
Recommended Gen Size
Typical Cost
Fuel/72hr @ $4/gal
What’s Covered
Tier 1: Parlor + Well + Cooling
25–40 kW
40–50 kW
$12,000–$18,000
$860–$1,440
Milking, water, bulk tank cooling
Tier 1+2: + Lighting + Manure
45–65 kW
75–90 kW
$20,000–$32,000
$1,440–$2,160
+ Alley lights, pump-out capability
Full Farm (Rare)
80–120+ kW
120–150+ kW
$35,000–$60,000+
$2,160–$3,600+
Everything except non-essential loads
Undersized (60 kW / no headroom)
60 kW listed
Often fails under real load
$15,000–$22,000
$1,080/72hr
Risk: motors trip/stall at startup
PTO Gen (Tractor-Driven)
Variable (20–40 kW typical)
Depends on tractor
$8,000–$15,000
Fuel from tractor tank
Limited to parlor + one well; no automatic failover
Put some dollars on this. Say upgrading from a marginal 60 kW unit to a properly sized 90 kW backup costs around 25,000 dollars. One full 25,000- to 30,000-liter load of dumped milk, at 20 dollars per cwt, is roughly 14,000–16,000 dollars. Two loads in a week and you’ve essentially burned the cost of that larger unit—without actually owning it.
One non-negotiable point: safety. Every electrical safety sheet from utilities and farm safety programs says the same thing—use a proper transfer switch that isolates your system from the grid when the generator runs. Backfeeding through improvised cords isn’t just illegal; it’s dangerous for line crews and for your own family.
For many small and mid-size herds, especially in the Northeast and Upper Midwest, the practical goal is tiered backup, not full-farm coverage. Farm emergency templates often describe it like this:
Tier 1: Milking system and one dependable water source.
Tier 2: Parlor and key alley lighting, one manure system, minimal fans in tight barns.
Tier 3: Calf housing and non-critical loads, only if capacity allows.
The farms that revisit this after a bad outage usually say the same thing: “We didn’t need everything backed up—we just needed Tier 1 rock-solid and Tier 2 clearly mapped.”
Fuel: How Long Can You Really Keep Running?
Here’s a question worth asking in a quiet moment: “If we had to run this generator almost continuously, how long would our fuel actually last?”
As we covered, a 40 kW diesel set under good load burns about 2–4 gallons an hour; a 100 kW unit typically requires 5–7 gallons an hour. At 3 gal/hour, 72 hours straight is roughly 215 gallons. At 4 dollars per gallon, you’re near 860 dollars in fuel.
Hours
40kW @ 3 gal/hr (500-gal tank)
40kW @ 3 gal/hr (800-gal tank)
100kW @ 6 gal/hr (500-gal tank)
0
500
800
500
24
428
728
356
48
356
656
212
72
284
584
68
96
212
512
(empty)
120
140
440
(empty)
Cold-climate extensions like NDSU often use a three- to five-day window for worst-case winter planning. Not every farm can or should store five days’ worth of diesel on-site—fire code and risk are real—but knowing you can cover at least three days, and that your supplier has an emergency plan with you, moves you from “wishful thinking” to “managed risk.”
The herds that treat “fuel days on hand” as seriously as “days of feed on the pit” tend to sleep a bit better when the lines start buzzing.
Water: The Other Utility You Can’t Fake
If there’s one thing every dairy nutritionist agrees on, it’s that water drives intake. Penn State’s “Value of Water” bulletin says lactating cows typically drink 30–50 gallons a day, with most of their requirement met through drinking water. And here’s the part that matters for storm planning: cows typically drink 30–50 percent of their daily water within an hour after milking, according to both Penn State and Michigan State. So if your waterers go down right after milking, you’re hitting them at the worst possible time.
For a 2,000-cow freestall herd, using that verified 30–50 gallons per cow per day just for drinking, total daily drinking water needs could range from 60,000 to 100,000 gallons—and that’s before accounting for wash water.
When it comes to water, most resilient farms lean on three basics:
Keeping lines from freezing. Adequate burial depth for your local frost line, insulation on exposed runs, and self-regulating heat cable on vulnerable sections are all standard recommendations in winter watering guides from Ontario, the Prairies, and northern U.S. states.
Keeping drinkers ice-free. Heated waterers, sheltered troughs, and constant-flow systems that use ground heat are among the winter advice from the extension offices in Ohio, Minnesota, and Wisconsin. Shielding tanks from wind and checking them more frequently can be as important as the hardware itself.
Having backup supply options. Nurse tanks on running gear, portable troughs, and valves that let you re-route water if a main line or pump fails are common suggestions in Purdue and similar extension resources.
In many Wisconsin and Ontario herds I’ve walked, the operations that ride out January cold best treat water almost like feed: they build in redundancy and know exactly where the weak points are.
48–24 Hours Out: Feed, People, and Communication
Once you’ve shored up power and water as best you can, the next day is really about three levers: how you feed through the cold, who’s actually going to be on site, and whether the right conversations have happened before the snow flies.
Feeding Cows Through Cold Without Trashing the Ration
You probably know this already, but the research backs it up nicely. SDSU Extension’s winter feeding guidance uses the rule of thumb we mentioned: once cattle are below LCT, maintenance energy needs increase by about 1% per degree Fahrenheit. And according to their data, cold-stressed cattle may increase intake anywhere from 2–25 percent if the ration allows it, with the lower end of that range (2–5%) occurring at milder cold (41–59°F), and the upper end (8–25%) kicking in once effective temperatures drop below about 5°F.
So let’s walk through the math. If cows are effectively 18°F below LCT, that guideline implies an additional 18 percentin energy demand. On a 200-cow herd feeding 50 lb/head/day, you might bump to 58–60 lb/head/day for a few days—an extra 1,600–2,000 lb of TMR daily. At 8 cents per lb of dry matter, that’s roughly 128–160 dollars per day. Over three days, call it 400–500 dollars in extra feed.
Scenario
Extra TMR/Day
3-Day Cost
Protected Milk Income
Net ROI
Do Nothing (18°F below LCT)
0 lb
$0
$0 (lose 3–4 lb/cow/day)
–$2,400–$3,200
Modest Bump (5 lb/head/day)
1,000 lb
$240
$2,400–$3,200
+$2,160–$2,960
Aggressive Bump (10 lb/head/day)
2,000 lb
$480
$2,400–$3,200
+$1,920–$2,720
Feed Waste Scenario (20% spoilage)
1,000 lb
$300 (with waste)
$2,400–$3,200
+$2,100–$2,900
If you avoid losing 3–4 lb of milk per cow per day across that period, you’re protecting roughly 2,400–3,200 dollars of milk. When you see it that way, feeding for the cold isn’t charity—it’s risk management.
What stands out in herds that ride these spells out well is a consistent pattern:
They consciously bump TMR for high groups during the worst cold—5–10 lb/head/day is common—and then dial back once temperatures normalize.
Their nutritionist adjusts energy sources, nudging rations toward more digestible forage and carefully managed by-products or fats, while keeping an eye on starch intake so it doesn’t wreck rumen health or butterfat levels.
They give extra attention to fresh cow management and cow comfort during the transition period, not just in mid-lactation pens, because those cows are already under stress.
On the calf side, calf welfare research and industry pieces in Hoard’s Dairyman note that dairy calves can begin experiencing cold stress at temperatures just below 50°F, especially in damp or drafty housing. That’s why jackets, deep straw packs, and draft control in hutches and calf barns are basically standard from late fall into spring in many Midwest and Northeast herds.
Staff and Family: Who Will Actually Be There?
Talking with producers from Vaughan across Ontario, through Wisconsin, and down into New Mexico, this is often where the conversation turns very real. It’s one thing to say “we all pitch in,” and another to say, “I don’t want my feeder on 45 minutes of black ice at 4 a.m.”
Farm emergency plans in British Columbia and Alberta encourage producers to structure staffing the way they structure power—deliberately and in tiers. Many dairies are doing something like this:
Identifying one or two core people—often a family member and the lead herdsman or herdswoman—who will be on-farm if conditions demand it.
Setting clear thresholds—snowfall, ice, visibility, road closures—beyond which staff who live farther away are told to stay home.
Defining “must do” vs “can wait” tasks, so limited labor can focus on milking, feeding, water, and fresh cows first.
What’s interesting is that when farms communicate this clearly, it tends to build—not erode—trust. People like knowing that their safety matters as much as getting the third milking in.
Communication and Mutual Aid
In the Upper Midwest and eastern Canada, you’re seeing more talk of mutual aid between farms. After big blizzards and ice storms, USDA field staff and co-op reps have noted that herds with pre-storm conversations about sharing capacity—tank space, generator power, even labor—had more options than those trying to negotiate in real time.
Those conversations usually revolve around questions like:
If a neighbor’s bulk tank fails, can anyone else take a load, subject to the processor’s rules and biosecurity requirements?
If one generator dies and another farm has spare capacity, is there a safe way to power a well or a small barn temporarily?
But here’s where things get more complicated in 2025 and 2026—and you probably know where I’m going with this. Biosecurity concerns have intensified dramatically since highly pathogenic avian influenza H5N1 was first detected in U.S. dairy cattle on March 25, 2024. The CDC confirmed that initial Texas case, and by late 2025, according to Dairy Reporter, the virus had spread to dairy herds across 16 or more states, with California hit particularly hard.
The European Food Safety Authority published a detailed assessment in December 2025, noting that transmission within farms is primarily driven by contaminated milk and milking procedures, while farm-to-farm spread is mainly linked to cattle movement and shared equipment.
What does that mean for mutual aid during a storm? A few practical realities:
Tank sharing is much trickier now. Mixing milk from different herds—even temporarily—creates traceability headaches and potential exposure to disease. Before you assume a neighbor can take your load, talk to your processor and your state or provincial veterinarian about what’s actually permitted. USDA’s Federal Order, effective April 29, 2024, requires that lactating dairy cattle receive a negative test for Influenza A virus at an approved laboratory before interstate movement.
Shared equipment is a known risk factor. EFSA’s assessment specifically identifies shared equipment and contact with external personnel as risk factors for between-farm spread of HPAI. If you’re borrowing a loader, a pump, or even a set of milking claws, the expectation now is that equipment gets properly cleaned and disinfected before it crosses property lines—something that’s harder to manage in the middle of a blizzard. If equipment must move between properties, ensure a 10-minute contact time with an EPA-registered disinfectant effective against Influenza A (H5N1) before it touches your driveway.
Isolation protocols matter more than ever. Biosecurity surveys have consistently found that many U.S. dairy operations lack formal quarantine facilities or protocols for introduced cattle—a gap that USDA and state veterinarians have identified as a significant risk factor for disease spread. The National Milk Producers Federation’s biosecurity guidance recommends isolating newly introduced or returning cattle for at least 30 days and limiting livestock movement. Their guidance also notes potential risk when feeding unpasteurized dairy products to cattle and recommends heat treatment or pasteurization of milk from sick cows to help inactivate H5N1.
None of this means mutual aid is dead—it just means the conversations need to happen earlier and with more detail. When a cluster of farms, their fieldman, and their hauler sit down in November instead of mid-January, and when they explicitly address biosecurity alongside logistics, it turns vague goodwill into usable options that won’t blow up in anyone’s face come spring.
And it’s worth noting that the American Farm Bureau Federation estimates farmers had at least 3.6 billion dollars in uncovered losses across all sectors from 2020 natural disasters alone, and more than 21.4 billion dollars in crop and rangeland losses from 2022 severe weather—losses not fully insured or compensated. Those numbers should make all of us a bit more interested in neighbors, paperwork, and plans—even when the rules around sharing have gotten stricter.
24–0 Hours: Animal Comfort and Final Checks
As the radar colors get louder and the start time firms up, you’re out of the “build new systems” phase and firmly in “put animals where they’ll cope best and tighten the loose ends.”
Understanding Cold Limits in Real Barns
Decades of extension work basically backs up what you already know: a mature cow with a dry winter coat and decent condition can tolerate surprisingly low air temperatures if she’s out of the wind and staying dry. A wet, wind-blasted cow at the same temperature is a different story entirely.
Livestock extension materials often use approximate LCT values around the high teens Fahrenheit for cattle in full winter coat, and much higher thresholds—mid-40s up toward about 59°F—for animals with wet or thin coats. The exact number doesn’t matter as much as the principle: wind and moisture move the goalposts.
From there, your tool kit is familiar but powerful:
Windbreaks that actually work. Barn walls, shelterbelts, trees, bale stacks, and panel/tarp setups can all reduce wind speed, lowering energy demand and helping cows maintain body condition.
Deep, dry bedding. Enough straw or stalks so cows can nest and stay off frozen concrete or mud. Producers on both sides of the border report better production and fewer sick cows when they treat bedding like feed during a cold snap.
Timing higher-energy feeding. Beef work from Kansas State and others has shown benefits from timing higher-energy feeding so peak fermentation and heat production align with the coldest period of the night. Dairy herds with some scheduling flexibility can apply the same concept to TMR delivery.
For calves, the margin is tighter, which is why jackets, deep straw, closing drafts, and sometimes bumping milk solids a bit in prolonged cold show up in calf-management guidance.
A Deliberate Walk-Through Before It Hits
In the last 12–24 hours, a lot of seasoned producers do a slow walk-through that looks a lot like a pre-flight check:
Start the generator, switch through the transfer switch, and listen and watch as motors start and stop.
Fill overhead tanks, nurse tanks, and portable troughs so a single pump hiccup doesn’t immediately turn into a water crisis.
Top up fuel in loaders, skid steers, and tractors so feed doesn’t stop when a machine runs out of fuel.
Look up at roofs, trees, and attachments near parlors, calf barns, and feed sheds for obvious ice-load or wind risks—something producers in the Northeast and Quebec remember all too well from past ice storms.
More farms are also adding one simple item to that checklist: “How and when are the people staying on-farm going to rest?” When you read post-storm write-ups in regional farm media, a surprising number of costly mistakes come down to fatigue, not a lack of knowledge.
During the Storm: Triage and the Milk That Might Not Move
Once the storm is fully on top of you, you’re not building resilience—you’re deciding what to protect first and what can wait without breaking the operation.
Most farm emergency plans—and a lot of producer stories—in the extension literature boil priorities down roughly like this:
People first. No extra scraping or third milking is worth a serious injury on ice or under a stressed roof.
Water and basic feed next. Cows handle dirty alleys better than empty bunks or dry waterers.
Milking frequency and fresh cows after that. In some storms, temporarily moving from 3x to 2x milking makes sense to protect staff and equipment. That’s a decision to make with your vet and adviser because it affects udder health, production, and butterfat performance.
Everything else, as conditions allow. Manure handling, bedding changes, and non-critical repairs are “do when it’s safe,” not “do at all costs.”
You can’t be everywhere, so many herds settle into a rhythm: quick checks every couple of hours on generator output, fuel, main waterers, bulk tank temperature, and vulnerable groups (fresh, hospital, calves), plus broader walks every four to six hours to look at feed access, drifting, and overall stress.
And if the milk has nowhere to go?
Uri made the picture painfully clear. Turley’s 1,800 dumped semi-loads in Texas and Sharp’s estimate of 2,000–3,000 dumped loads regionally weren’t projections—they were full tanks washed away. That’s exactly the kind of loss the Milk Loss Program was created to soften.
According to the FSA fact sheet, to claim MLP, you’ll need to file Form FSA-376, supply milk marketing statements from the month before and the month of the loss, and provide a written description of the qualifying event and how it prevented normal marketing.
Dumped milk daily: date, volume, cause (hauler cancel, processor closure)
Keep with farm records
Up to 30 days/year covered
Hauler/Processor Notice
Screenshot/save texts/emails from milk hauler and processor explaining disruption
Email or text, saved
Supports “prevented normal marketing” proof
Photo Documentation
Photos of generator running (if applicable), drifts blocking milk house, any visible stress or dead stock
Take during event
Visual evidence of qualifying disaster
FSA-376 Filing
Milk marketing statements (month before, month of loss); written description of event and impact
File with FSA within 60 days of loss
75% standard / 90% underserved producers
Claim Processing
FSA calculates loss based on milk price (announced price, not spot), volume, and payment tier
FSA review period ~60–90 days
Max claim: 30 days of milk loss per claim year
MLP Check Arrives
Payment issued; typically 75–90% of documented loss value
Processed after FSA approval
75–90% of loss recovered
So in the middle of the storm, if you’re forced to dump, two small habits make a big difference later:
Note the date, milking (AM/PM), and approximate volume dumped, plus the reason (no pickup, plant down, no power to tank).
Save any texts, emails, or written notices from haulers or processors explaining the disruption.
Those details are what convert a five-figure loss from “total write-off” into something MLP can at least partially cover.
After the Storm: Counting the Cost and Closing the Gaps
When the storm passes, and the lights stay on, the instinct is to jump straight into fixing. Some repairs can’t wait. But USDA disaster guidance and provincial emergency manuals keep returning to the same message: document first, then repair when you can.
On the documentation side, that usually means:
Taking photos of damaged barns, parlors, calf barns, feed sheds, and manure storage from multiple angles.
Recording equipment failures—generators, pumps, bulk tanks, robots, feeders—with make and model when possible.
Logging livestock losses with dates, numbers, and veterinary input when available.
Keeping a simple log of dumped milk: dates, milking times, approximate amounts, and reasons.
Those records are the backbone of claims not only for MLP, but also for the Livestock Indemnity Program (for eligible livestock deaths beyond normal mortality), ELAP (for certain feed and water-related costs), and the Emergency Conservation Program (for land, fence, and structure repair). They also give you numbers you can take to your lender and insurer.
Let’s circle back to the bigger math. That same 200-cow herd dumping a full 7,000-gallon load is losing something like 1,600 cwt of milk. At 20 dollars per cwt, that’s 32,000 dollars in gross revenue. Under MLP, a standard producer might recoup around 75 percent of that, about 24,000 dollars, assuming full eligibility and no caps. That still leaves roughly 8,000 dollars uncovered—and that’s before any building damage, dead cows, or feed spoilage.
The American Farm Bureau Federation’s analysis of 2020 disasters estimated at least 3.6 billion dollars in uncovered farm losses that year, and their 2022 assessment put crop and rangeland losses from severe weather at over 21.4 billion dollars—losses not fully covered by insurance or disaster programs. The takeaway is pretty clear: insurance and disaster programs matter, but they rarely make you whole. Planning and documentation are what turn “disaster” into “serious but survivable.”
Then there’s the debrief. A week or two after the dust settles, when you’re not running purely on adrenaline, is the time to ask with your family or team:
What worked the way we hoped?
What failed—or almost failed—and why?
If this exact storm hit again next winter, what would we want in place before it started?
Sometimes the answers are big—new generator, roof work, major drainage, or windbreak projects. More often, they’re a string of smaller but powerful changes: upping minimum fuel days on hand, adding one more nurse tank, tightening fresh cow protocols when storms are forecast, or agreeing that any dumped milk or unusual death gets logged the same way, every time. Those steady, unglamorous moves are what keep a bad week from becoming a bad year.
Four Decisions That Belong on Every Dairy’s List
So, from a practical standpoint, what moves belong on almost every dairy’s list? I’d argue at least these four:
Know your generator math. Work with your electrician to nail down your true Tier-1 load and the cost to back it up properly. Then calculate how many hours or days of fuel you can reliably cover.
Set a simple documentation standard. Decide that any dumped milk or unusual livestock loss gets a date, volume/count, reason, and a couple of photos recorded the same way every time. That’s your ticket into MLP, LIP, ELAP, and a more intelligent discussion with your lender.
Put your own number on a lost load. Use your current milk check—price, components, any premiums—and put a real dollar figure on one full lost load for your herd. Write that number at the top of your storm plan. It will change how you view fuel, backup power, and staff rest.
Pick one program to understand truly. Whether it’s MLP, LIP, ELAP, or the Emergency Conservation Program, spend 10–15 minutes on the phone with your local FSA office or provincial counterpart to clarify how it actually works and what records they need before you ever file a claim.
From Ontario to the Upper Midwest and down into the High Plains, resilience rarely comes from one big, dramatic project. It comes from stacking a series of honest conversations and incremental decisions: a better transfer switch here, an extra tank there, a cleaner staffing plan, a habit of writing things down. That’s how you end up on the right side of the $3.6 billion gap between disaster and survival.
The storms aren’t going away. The cows aren’t going to stop milking. The leverage for all of us, season by season, is making sure the systems and numbers around those cows are just a little more ready each time the sky turns that particular shade of winter grey.
What’s the one piece of equipment—or one decision—that saved you in the last big blow? Drop it in the comments. Whether it was a generator that finally paid for itself, a nurse tank you’d almost sold, or just having the right people on site, your experience might be exactly what another producer needs to hear before the next storm rolls in.
KEY TAKEAWAYS
Three days without power = ~$10,000 in dumped milk for a 200-cow herd—before equipment failures or dead animals add to the toll.
$1,000 in fuel or $10,000 down the drain. A 40 kW generator burns roughly 215 gallons over 72 hours. That’s a 10:1 return you can’t afford to gamble.
MLP recovers 75-90% of milk losses—but only with paperwork. Document dates, volumes, and reasons as you dump. No records, no payment.
H5N1 rewrote mutual aid rules. Since March 2024, sharing tanks or equipment carries real biosecurity risk—have those neighbor conversations now, not when the snow’s flying.
Survival isn’t luck—it’s math. Generator sizing, fuel reserves, water backup, and one simple documentation habit separate a tough week from a devastating year.
Complete references and supporting documentation are available upon request by contacting the editorial team at editor@thebullvine.com.
Learn More
Dairy Management in the Face of Adversity: Focus on What You Can Control – Safeguard your margins by mastering the variables within your fence line. This breakdown identifies critical management levers that minimize losses during volatility, ensuring your operation remains profitable regardless of the weather or market shocks hitting your neighbors.
The Future of Dairy Policy: Navigating Evolving Disaster Support – Arms you with the intelligence needed to navigate shifting federal disaster relief and insurance frameworks. Discover how evolving support structures provide new financial layers of protection, securing your operation’s longevity against increasingly frequent and severe climate events.
Off-Grid Resilience: Integrating Renewable Energy on the Modern Dairy – Delivers a blueprint for technical and financial independence through on-farm energy production. Explore how solar and biogas integration creates a resilient safety net, eliminating grid dependency while slashing long-term overhead and boosting your farm’s sustainability profile.
The Sunday Read Dairy Professionals Don’t Skip.
Every week, thousands of producers, breeders, and industry insiders open Bullvine Weekly for genetics insights, market shifts, and profit strategies they won’t find anywhere else. One email. Five minutes. Smarter decisions all week.
Is your herd’s protein‑to‑fat ratio making your processor money—or quietly costing you on every 2026 milk check?
Executive Summary: Looking at 2026, what’s really moving the needle on dairy profitability isn’t just how many hundredweights you ship—it’s how much protein and butterfat are in each one. CoBank’s recent component analysis points out that U.S. herds excelled at boosting butterfat, but processors and cheese plants now need more protein, and that’s starting to change which components lead the milk check. USDA outlooks add another layer of pressure, with softer butter prices and tighter margins, meaning component value and processor fit will matter more than ever. This feature unpacks that “component economy” in plain language, explains why your herd’s protein‑to‑fat ratio matters to plant yield and standardization costs, and shows how nutrition, fresh cow management, and genetics can be tuned to support stronger protein without sacrificing fat. It also walks through how this plays out differently in Upper Midwest cheese country, Western dry lot systems, Northeast fluid markets, and under Canadian quota, so you can see your own reality in the numbers. By the end, you’ll have a clear set of questions to ask at your own kitchen table—about your milk check, your processor contracts, and your breeding and feeding strategy—so you can decide if you’re still built for the butterfat era or ready for protein to do more of the heavy lifting.
You know, after watching milk checks and component trends for a lot of years now, I’m more convinced than ever that we’re in one of those quiet turning points you only really see clearly in hindsight. In October 2025, USDA’s National Agricultural Statistics Service reported that the 24 major dairy states shipped about 18.7 billion pounds of milk, up 3.9% from the previous October, with total U.S. production up 3.7% year‑over‑year. That’s real growth on top of an already big base. What’s interesting here is that when you look under the hood, the story isn’t just about more milk—it’s about what’s in that milk, especially in terms of butterfat performance and protein yield.
The herds that read this shift right are going to hang on to more dollars per cow in 2026. The ones that don’t may find money quietly slipping away, even if the tank looks full.
Looking at This Trend From the Plant Side
Looking at this trend from the plant side, you start to see a different layer of the story. A 2025 analysis from CoBank’s Knowledge Exchange group, led by Corey Geiger—lead dairy economist at CoBank—dug into how milk components have changed over the last decade. They found that butterfat levels in U.S. milk climbed about 13.1% over 10 years, while butterfat levels in the European Union and New Zealand rose only about 2.4–2.5%. Geiger’s team linked that jump to strong domestic demand for butter and full‑fat dairy products, plus component‑based pricing in many Federal Orders that paid generously for fat. Other market coverage has pointed out that U.S. cows are shipping more total fat and protein per hundredweight today than they did a decade ago, thanks to genetics and feeding.
Year
Butterfat Growth (%)
Protein Growth (%)
Protein-to-Fat Ratio
2015
0.0
0.0
0.82
2017
3.5
1.2
0.81
2019
7.2
2.1
0.79
2021
9.8
3.0
0.78
2023
12.1
3.8
0.77
2025
13.1
3.9
0.77
On paper, that sounds great—and to be fair, it has been. Many Midwest producers will tell you there were years when butterfat premiums essentially “saved the year” on cheese‑market milk. But as butterfat kept rising, something else began to appear in the data. CoBank’s follow‑up commentary and articles in dairy media have begun asking whether the U.S. might actually have more butterfat than some processors really need, especially cheese plants that also depend heavily on protein to make both cheese and whey efficiently.
If you look at late‑2025 market coverage, you see that tension showing up in prices. News outlets reported butter falling sharply from the record territory seen in 2022, with analysts warning that lower butter values and larger supplies were helping pull down milk prices and setting up weaker milk checks moving into 2026 as production stayed strong. USDA’s own outlook work around the same time projected continued growth in milk production and lower average butter, cheese, and all‑milk prices compared with those earlier highs.
Now, here’s where components and ratios come into play. Cheesemaking research and USDA work on predicting cheese yield have shown for years that cheese and whey yields are highly sensitive to the balance of protein and fat in the vat. Plants can standardize milk, of course, but they run most efficiently when the incoming milk is already in a workable range. Industry guidance and component tables suggest that, for many common U.S. cheeses, milk somewhere just over 3% true protein and in the upper‑3s to around 4% butterfat—often yielding a protein‑to‑fat ratio near 0.80—makes life a lot easier in the plant.
It’s worth noting that this isn’t about chasing a single magic target to two decimal places. What CoBank’s report points out is the trend: for much of the 2000s and early 2010s, the U.S. protein‑to‑fat ratio hovered around 0.82–0.84, then drifted down toward roughly 0.77 as butterfat grew faster than protein. When that ratio drops, cheesemakers are forced to do more standardizing—adding protein or skimming off fat—to hit the composition they need. That extra work is routine, but it isn’t free.
In an article on “reading the signs” from milk components, Mike Hutjens—Emeritus Professor of Animal Sciences at the University of Illinois—suggests using the protein‑to‑fat ratio as a simple “dashboard light.” He notes that when herd averages sit below about 0.75, cows are often “missing milk protein,” and when they’re above about 0.90, milkfat may be depressed. That rule of thumb aligns with what cheesemakers and plant managers have been telling CoBank and others: they don’t just want high butterfat levels; they want balanced components that fit their vats and product mix.
Herd Size (cows)
Protein-to-Fat Ratio
Herd Type
Region
80
0.88
Tie-stall
Northeast
125
0.85
Organic
Northeast
150
0.76
Freestall
Wisconsin
220
0.82
Organic
Midwest
300
0.78
Freestall
Wisconsin
400
0.81
Freestall
California
700
0.74
Drylot
California
1200
0.79
Freestall
Midwest
2000
0.75
Drylot
California
So the big takeaway from the plant side is this: butterfat is still valuable, but now that we’ve pushed fat so hard, protein is starting to carry more weight in cheese and ingredient markets. And more plants are watching that protein‑to‑fat ratio than a lot of farms realize.
Looking at This Trend in Consumer Behavior and GLP‑1
You’ve probably heard plenty of noise about GLP‑1 medications like Ozempic and Wegovy and what they might do to food demand. Some general media stories make it sound like these drugs are going to hollow out the whole snack aisle and maybe dairy with it. When you dig into the food‑industry analysis that actually looks at what these consumers buy, the picture is more measured.
Analysts following GLP‑1 users’ eating habits report that, as use of these medications grows, many people do change how they eat: they generally cut overall calories, but they also tend to gravitate toward foods that deliver more protein and nutrition per bite. Several large food and dairy companies, in their own product briefings and category outlooks, have pointed to high‑protein Greek yogurts, strained yogurt drinks, cottage cheese, and cheese‑based snacks as growth areas for health‑conscious consumers. A theme that keeps coming up is grams of protein per serving and satiety in a smaller portion.
For plants making concentrated or high‑protein dairy products, that puts a premium on milk that brings strong protein content right through the door. Filtration and concentration technology can boost solids, but starting with milk that already has good protein levels makes the whole system more efficient. So instead of seeing GLP‑1 as “anti‑dairy,” it’s probably more accurate to say it nudges part of the market further toward higher‑protein, nutrient‑dense dairy products—a direction that was already building.
The Bigger Protein Story That’s Been Building for Years
Stepping back from GLP‑1 for a moment, the bigger story is that consumers have been chasing protein for quite a while. Surveys from the International Food Information Council over the last several years, including a 2025 spotlight on protein, have found that roughly seven in ten Americans say they’re actively trying to increase their protein intake. Trade coverage summarizes this as a kind of “protein obsession”—you’ve likely noticed how often “high protein” shows up on packaging now, from snack bars to coffee creamers.
Dairy naturally sits in the middle of that trend. Peer‑reviewed nutrition research has repeatedly described dairy proteins as high‑quality, with complete amino acid profiles and good digestibility. Phillip Tong, Professor Emeritus of Dairy Science at California Polytechnic State University and former director of the Dairy Products Technology Center, has emphasized in his work that milk proteins provide not just nutrition but also functional properties—gelling, foaming, water‑binding, emulsifying—that make them valuable to food manufacturers. Those properties are a big reason why whey protein concentrates, isolates, and milk protein ingredients have grown steadily in sports nutrition, medical nutrition, products for older adults, and a whole list of “better‑for‑you” foods.
So when you line these things up—consumer protein interest, functional advantages of milk protein, and CoBank’s finding that butterfat has outpaced protein growth and pulled the national protein‑to‑fat ratio downward—the pattern is pretty clear. We’re not just living in a “butterfat era” anymore. We’re operating in a component economy where protein is moving closer to center stage, especially in processing‑heavy, cheese‑oriented regions.
What Farmers Are Finding at the Feed Bunk
All right, enough big‑picture talk. Let’s bring this back to decisions you can make at the feed bunk and in fresh cow management.
Land‑grant university nutrition work—from Nebraska, Illinois, and others—has reinforced for years that butterfat and protein both respond to the basics: forage quality and chop length, effective fiber, starch fermentability, physically effective NDF, and overall energy balance. They also stress that the transition period and early fresh cow management are critical. Poor intakes, subclinical ketosis, and cow comfort problems in the first weeks after calving often manifest later in milk volume and components.
You probably know this from your own records: when energy gets tight, or rumen health slides, protein is often the first to sag while fat hangs on a bit longer. That’s a signal.
Over the last decade, a lot of herds leaned on palmitic‑rich rumen‑protected fat supplements to push butterfat performance. Research and field experience have shown that, in well‑balanced rations with healthy rumens, these products can bump milkfat percentage and, in some cases, fat yield. Combined with genetics and management, that helped drive regional butterfat averages upward. Some herds in the Upper Midwest increased their components toward 7 pounds of fat and protein per cow per day by focusing on both nutrition and genetics.
Scenario
Component
Annual Cost/Value
Result
2022 Butter Peak
Supplement Cost
-$54,000
Baseline
2022 Butter Peak
Butterfat Value @ $2.20/lb
+$43,362
Net: +$10,638
2026 Outlook
Supplement Cost
-$54,000
Baseline
2026 Outlook
Butterfat Value @ $1.35/lb
+$26,608
Net: –$27,392
Protein-Focused Alternative
Nutrition + Genomics Cost
-$30,000
Baseline
Protein-Focused Alternative
Protein Value @ $1.80/lb
+$31,200
Net: +$1,200
But as butter prices have come off their highs and more processors are paying attention to protein, it’s worth sharpening the pencil on those investments. The exact cost per cow per day and the exact response in butterfat for any one product will depend on your ration and conditions. Rather than relying on a canned example, the best move is to sit down with your own numbers:
What are you actually paying per cow per day for any fat supplement?
What change in butterfat test and fat pounds shipped have you documented when using it versus not using it?
What’s your current value per pound of butterfat on your milk check?
If, after that exercise, the extra butterfat dollars comfortably outrun the cost—and you’re not harming rumen health or protein—then that tool may still have a solid place in the ration. If the margin has narrowed or turned negative under today’s component prices, it might be time to consider shifting some of that budget into strategies that help both protein and overall efficiency, like higher‑quality forages, more precise starch and fiber balance, or amino acid balancing.
On the protein side, extension and research consistently highlight a few themes in diets that support higher true protein:
Forages harvested at the right stage and moisture, with consistent quality across the year.
A solid balance of rumen‑degradable and rumen‑undegradable protein, so microbes and the cow both get what they need.
Enough fermentable starch to fuel microbial protein production without driving subacute ruminal acidosis.
Targeted methionine and lysine supplementation when diets are limited in those key amino acids.
Strong transition and fresh cow programs that keep intakes up and cows out of deep negative energy balance.
Hutjens’ component “dashboard” fits nicely with this. When the protein‑to‑fat ratio averages below about 0.75 across a herd, there’s usually room to improve protein yield. When the ratio climbs above about 0.90, milkfat may be compromised. That gives you a simple, herd‑level way to keep an eye on how well your feeding program, fresh cow management, and genetics are working together.
So here’s a practical check that’s worth doing: pull your last 12 months of test results and calculate the average protein‑to‑fat ratio. If most of your milk goes to cheese and that ratio is consistently down in the low‑to‑mid 0.70s, it’s probably time to sit down with your nutritionist—and maybe your plant field rep—and ask whether your feeding program and your plant’s needs are still aligned.
Genetics: The Quiet Lever Behind Tomorrow’s Components
Once you’ve taken a hard look at the feed bunk, the next quiet lever is genetics.
Genetic evaluations in Holsteins and Jerseys show that fat and protein yields are positively correlated—selecting for more milk and better components generally moves both traits upward, though not always at the same rate. Economic indexes like Net Merit (NM$) put explicit economic weights on fat and protein, and USDA’s 2021 revision documented changes to those values based on updated milk and component prices. For much of the last decade, strong butterfat pricing helped push index emphasis toward fat, and that made sense in the markets at the time.
As plants and markets begin to value protein more heavily—particularly in cheese, whey, and protein ingredients—that weighting becomes worth a second look. Some recent commentary and genetic updates have already noted that bulls with strong protein proofs and overall solids are climbing in rankings as the economics shift.
Genomic testing has made it much more practical for commercial herds to act on this. Many herds now test heifers genomically, at costs typically ranging from the mid‑teens to around $50 per head, depending on the panel and country, and use those results to:
Rank replacement heifers by projected lifetime profit, including fat and protein yields.
Identify families that consistently underperform on components.
Tune sire selection so that the component profile—fat and protein percentages and pounds—matches where their milk actually goes.
Breed mix also plays a role. Typical Holstein herd averages often sit around 3.7% butterfat and just over 3.1% true protein, giving a protein‑to‑fat ratio in the mid‑0.80s. Jerseys commonly run up in the high‑4s for fat and around 3.8% protein, with a ratio just under 0.80. Crossbred herds land in between, depending on the breeds and selection emphasis. None of these profiles is “right” or “wrong” on its own. The key is whether your genetics give you a component profile that fits your market.
What I’ve noticed, looking at sire lists in a lot of herds, is that there’s still a tendency to default to a single index number and only later ask, “Does this bull actually fit my processor’s needs?” In a world where cheese plants and ingredient makers are increasingly vocal about wanting more protein to catch up with butterfat, it’s worth pulling out those proofs and asking a slightly different question: “Is my sire selection moving my herd toward a better protein‑to‑fat balance for where my milk is going?”
Region
Primary Market
Ideal Butterfat
Ideal True Protein
Target P:F Ratio
Payment Emphasis
Upper Midwest (WI, MN, MI)
Cheddar, mozzarella, whey concentrate
3.8–4.0%
3.2–3.4%
0.80–0.85
Ratio-sensitive; protein gaining
Western States (CA, ID, NV)
Mixed (cheese, powder, fluid, ingredients)
3.6–3.9%
3.0–3.2%
0.77–0.82
Volume + flexibility; less ratio-rigid
Northeast & Atlantic Canada
Fluid, yogurt, regional cheese, specialty
3.4–3.7%
3.1–3.3%
0.85–0.95
Quality premium + components vary
Canadian Quota Markets
Butter, cheese, powder (supply-managed)
3.9–4.1%
3.1–3.3%
0.78–0.82
Factors adjusted annually; quota limits output
Organic Processors
Premium fluid, specialty cheese, yogurt
3.5–3.8%
3.0–3.2%
0.80–0.88
Organic premium overshadows fine diffs
Regional Realities: One Trend, Many Local Versions
As many of us have seen, these trends don’t play out exactly the same way everywhere, and it’s important to respect that.
In Wisconsin and other Upper Midwest cheese states, the fit between components and plant needs is front and center. A large share of the milk in these regions is used to make Cheddar, mozzarella, and other cheeses, thanks to modern whey recovery systems. CoBank and regional market coverage have emphasized that cheesemakers there are especially sensitive to the protein‑to‑fat ratio and total solids because both cheese and whey yields depend heavily on those numbers. Education pieces walking through new pricing rules have shown examples where herds with modestly lower fat but stronger protein outperform very high‑fat, low‑protein herds at the same cheese plant, purely on yield and component value. That’s the kind of quiet math that makes protein more than just a “nice to have” in those markets.
In Western states like California, the picture gets more layered. Many herds are large, often in dry lot systems, and ship into a mix of cheese, powders, fluid milk, and value‑added products. At the same time, they’re operating under high feed costs, water limitations, and some of the toughest environmental regulations in the business. Market analysis and sustainability work from that region make it clear that components still matter, but they’re just one lever among many—alongside stocking density, water use, regulatory risk, and plant capacity.
In the Northeast and across Atlantic Canada, much of the milk ends up in fluid markets, regional brands, yogurt plants, and specialty cheeses. Some cooperatives and proprietary processors in these areas have moved more aggressively toward component‑based payments, including protein, while others still lean heavily on volume and quality premiums. In Canada, national supply management and quota limit total output, but planning documents from the Canadian Dairy Commission emphasize the need to manage components to meet butter and cheese requirements; component allowances and factors are adjusted accordingly.
Organic herds see yet another twist. Many have a base premium for organic milk that can overshadow fine‑grained component differentials, but processors and organic brand programs still pay attention to components because they affect product yield and cost. Some organic buyers include composition and quality benchmarks as part of their sourcing criteria, even if the pay formula is simpler.
So while the big pattern says protein is gaining importance, the way it shows up in your milk can be quite different in Wisconsin, California, New York, or Ontario. That’s why those local conversations with your nutritionist, field rep, and lender matter just as much as the national reports.
What the Outlook for 2026 Is Really Saying
When you bring together USDA’s outlooks, CoBank’s component analysis shared that the picture for 2026 is pretty consistent: it’s likely to be another tight‑margin year for many dairies. USDA projections anticipate continued growth in milk production, driven mainly by higher milk per cow, while average prices for butter, cheese, and the all‑milk price are expected to stay below the highs we saw a few years ago. Analysts have already noted that rising supply and strong component levels are weighing on prices, and that “weaker milk checks” are a real possibility if production doesn’t moderate.
At the same time, more and more people in the industry are using that “component economy” language to describe where we are. Fat and protein are being priced, managed, and in some cases hedged more independently. New or revised pay formulas are paying closer attention to how each component contributes to product yield and plant margins.
For your farm, the message is pretty straightforward: when base prices soften, the share of your milk check that comes from components, quality, and program premiums becomes more important. If protein is gradually gaining ground in your pay structure and your herd’s protein‑to‑fat ratio is drifting in the wrong direction, you can end up working just as hard for a less competitive milk check.
Year
Base Milk
Butterfat Premium
Protein Premium
Quality/Other
Total
2022
18.50
3.42
1.86
0.92
24.70
2024
18.20
2.64
2.07
0.89
23.80
2026E
17.90
2.10
2.42
0.88
23.30
Practical Questions to Ask at Your Own Kitchen Table
So, with all that in mind, if we were sitting together at your kitchen table with a stack of milk checks and test reports between us, here are the questions I’d want to walk through:
Over the past 12 months, what’s your average protein‑to‑fat ratio—not just on one test, but across the year? Are you closer to 0.72, 0.78, or 0.85? How does that compare to the 0.75–0.90 “healthy range” Hutjens and others talk about?
Looking at your milk checks, how many dollars per hundredweight in the last year came from butterfat, and how many from protein? Has that mix shifted as butter prices eased and protein held or strengthened?
When was the last time you asked your processor or cooperative, “If you could design the ideal butterfat and protein tests for your plant today, what would they be—and how would you pay for that?” Some plants and contracts are quietly adjusting to encourage the component balance they need.
Are you still spending money on fat supplements mostly to chase higher butterfat levels, and have you re‑run that ROI using your current butterfat value, actual response in your herd, and today’s feed costs?
Are you using genomic testing—or at least looking closely at sire proofs—to nudge your herd toward a component profile that matches where your milk actually ends up: cheese, yogurt, fluid, or export ingredients? Are protein traits getting the weight they deserve on your bull list?
When you look at your top sires, how many are genuinely strong on protein, not just fat and total yield?
The answers will look different for a 120‑cow tie‑stall herd in the Northeast, a 400‑cow freestall in Wisconsin, a 2,500‑cow dry lot in California, or a quota‑managed herd in Ontario. And that’s okay. The goal isn’t to chase every trend or copy the neighbor. It’s to be intentional about which trends actually matter to your milk check and which don’t.
A Balanced Way to Look at the Future
When you line up the current numbers—from USDA’s production and price outlooks, from CoBank’s component growth analysis, from IFIC’s consumer protein surveys, and from cheesemaking research and extension work—the pattern is pretty clear: protein is becoming a bigger part of how milk is valued, especially in cheese and ingredient markets. That doesn’t mean butterfat suddenly stops mattering. Butter, cream, and full‑fat dairy products still resonate with consumers, and strong butterfat performance will remain a point of pride on many farms.
What’s encouraging is that a lot of the practices that help protein also help build durable, resilient dairies in general: good forages, thoughtful starch and fiber balance, strong fresh cow and transition management, attention to cow comfort, and smart use of genetics and genomics. You’re not being asked to tear your operation down to the studs. You’re being invited to fine‑tune a few dials based on where the money seems to be heading instead of where it used to be.
For some herds, that might mean easing off an “all‑in on fat” mindset and giving protein a bit more focus in both rations and sire selection. For others, especially those already shipping to plants that pay well for protein and running healthy protein‑to‑fat ratios, it might simply confirm that the path you’re on lines up well with your market.
Either way, as you look ahead to the next few seasons, it’s probably worth pouring another coffee, spreading out those milk checks and test reports, and asking yourself a simple question: Is your herd set up for the protein pivot that’s shaping 2026 milk checks—or mainly for the butterfat boom we were cashing in a few years ago?
Key Takeaways:
Butterfat won the decade—protein didn’t keep pace: U.S. fat jumped ~13% in ten years while protein lagged, pulling the national ratio from ~0.82 to ~0.77. Cheese plants are pushing back.
Your plant needs balance, not just fat: Cheese and whey yields hinge on a ~0.80 protein-to-fat ratio. Fat-heavy milk means extra standardization—and that cost comes back to you.
Protein is about to do more heavy lifting on your milk check: Butter prices are off their highs, USDA sees tighter 2026 margins, and component formulas are shifting toward protein.
Know your number and act on it: Pull your 12-month protein-to-fat ratio. Below 0.75? Protein opportunity. Above 0.90? Possible fat depression. Tune rations, transition protocols, and your bull lineup.
One trend, many local versions: Upper Midwest cheese plants are ratio-obsessed; Western herds weigh components against water and regulations; Canadian quota adjusts factors to hit national targets.
Complete references and supporting documentation are available upon request by contacting the editorial team at editor@thebullvine.com.
Same Tag, Different Feed: The Molasses Problem – Protect your heifer investment from hidden nutritional swings that derail growth. This research breakdown exposes massive variability in common feed ingredients and delivers the critical questions you need to ask your supplier to ensure performance.
The Sunday Read Dairy Professionals Don’t Skip.
Every week, thousands of producers, breeders, and industry insiders open Bullvine Weekly for genetics insights, market shifts, and profit strategies they won’t find anywhere else. One email. Five minutes. Smarter decisions all week.
Fresh-cow problems get protocols. Cold snaps get shrugs. Both cost $15/cow. One has a $250 fix that most herds skip.
EXECUTIVE SUMMARY: Most herds have tight protocols for fresh-cow problems but treat cold snaps as weather to ride out—yet both cost roughly the same: $15–$18 per cow per event, or $3,000–$4,000 for a 200-cow herd during a single three-day storm. The connection isn’t coincidental: cold stress triggers the same metabolic cascade as transition challenges—elevated cortisol, spiking NEFAs, and suppressed immunity—which explains why mastitis, lameness, and missed breedings cluster in the weeks after severe cold. What makes this manageable is timing. Cows signal distress 3–5 days before the tank drops through behavioral shifts: increased idle standing, shortened feeding bouts, and bunching in sheltered spots. OMAFRA and Beef Cattle Research Council research confirms that wet coats are the real multiplier, shifting a cow’s cold-stress threshold from -8°C to 15°C and dramatically increasing energy demands. Herds that pre-position $150–$250 in extra bedding and bump ration energy 24–48 hours ahead are cutting losses by more than half, turning a $15/cow storm into a $5–$7 event. The bottom line: cold snaps deserve the same proactive management as calving, and the ROI strongly favors getting ahead of them.
You know how it goes. January turns mean, the wind cuts across the yard, and we slide into that winter routine: check the waterers, push up feed, throw some bedding where it looks worst, and watch for frozen teats or a few cows coughing. It feels like “normal winter chores” when you milk cows where winter actually shows up.
Here’s the thing, though. When you line up newer work from government, universities, and industry with what a lot of good herds are seeing in their own barns, a single cold snap starts to look less like “just winter” and more like a four-figure risk event per herd. The math says these storms can quietly pull three to four thousand dollars out of a 200-cow herd every time they roll through, if you’re not ahead of it. And in a winter where butterfat premiums are making components the profit driver, every pound of lost milk and every tenth of a percent drop in fat hits harder than it would have a decade ago.
Extension specialists are now openly framing winter dairy management as an economic risk because the milk loss, mastitis, lameness, and repro hangover add up fast. The old “they’ll tough it out” mindset still pops up in coffee-shop conversations, but the physiology says something different.
Cold stress isn’t just about the number on the thermometer. Researchers studying cattle in cold environments describe it as a metabolic state within the animal, with shifts in hormones and energy use that look a lot like what we worry about in the transition period. And that’s the part we can manage.
Once you start looking at winter through that lens, a lot of those “mystery January problems” make more sense: the jump in mastitis and pneumonia a week after a brutal cold snap, the dip in lying time right before the tank slides, and the reason two herds under the same winter sky can come out of it with very different results.
Let’s walk through what’s going on, using what the science says and what farms are actually dealing with in Ontario, Wisconsin, the U.S. Northeast, and out in dry lot systems further west.
Dry vs. Wet Coats: Where the Real Math Starts
You probably know this already from winter meetings, but most cold-stress charts start at the same point: the lower critical temperature (LCT). That’s the point where a cow has to start burning extra energy just to keep her core temperature steady.
The 2024 “Cold stress in cows” factsheet from the Ontario Ministry of Agriculture, Food and Rural Affairs uses some practical examples based on haircoat. For cattle with a dry, heavy winter coat and decent body condition, they give an example LCT of minus 8 °C (about 18°F) for animals that are dry and sheltered from wind. Alberta’s provincial guidance and the Beef Cattle Research Council’s December 2024 “Winter Management of Beef Cattle” resources use the same basic concept and show that winter-coated cows in good flesh tolerate much lower temperatures than thin or wet animals.
Where cold stress goes from annoying to expensive is when that coat is wet, and the wind comes up.
OMAFRA notes that when a heavy winter coat becomes wet, its insulating value drops sharply, and cold stress is amplified even at temperatures that would otherwise be tolerable. The Beef Cattle Research Council’s tables show that the estimated LCT for cattle with a wet coat jumps to around 15°C—that’s about 59°F. So a cow with a soaked coat can start to feel cold stress at temperatures in the high single digits Celsius, or the 50s Fahrenheit, instead of down near freezing.
Going from dry to wet can effectively shift that cold-stress threshold upward by several tens of degrees Fahrenheit. You don’t need a research paper to relate to that. Anyone who’s worn a soaked parka in a stiff north wind knows how fast the chill goes straight to the bone.
Coat Condition
Lower Critical Temperature (°C)
Lower Critical Temperature (°F)
Estimated Energy Increase*
Dry winter coat, sheltered
-8°C
18°F
Baseline
Dry winter coat, light wind
-3°C
27°F
+10% energy demand
Wet coat, sheltered
5°C
41°F
+26% energy demand
Wet coat, 20 mph wind
15°C
59°F
+60% energy demand
The physics make sense when you think about it. A dry winter coat traps air between the hairs, and air doesn’t conduct heat very well. Once that haircoat is wet, water replaces the trapped air, and water carries heat away from the body much faster. Add wind, and now cold air is being driven through that wet coat, pulling heat off the cow at a much higher rate. OMAFRA notes that if the animal is wet or dirty, their wind-chill tables actually underestimate the effect.
The Energy Math
Here’s where the simple rule of thumb comes in. OMAFRA’s factsheet and the Beef Cattle Research Council’s winter-management resources both use the same guideline: for every 1 degree Celsius the effective temperature drops below a cow’s lower critical temperature, her energy requirement increases by about 2%.
Kansas State and Ohio State extension materials express it slightly differently for American audiences—roughly 1% more energy per degree Fahrenheit below LCT—which works out to the same math when you convert.
If you think about a situation where—because of a wet coat and some wind—the effective environment is ten to fifteen degrees Celsius below that cow’s LCT, you’re realistically looking at maintenance energy needs that could be twenty to thirty percent higher than on a calm, dry winter day.
If intake doesn’t keep up, she has to find that energy somewhere. In many cases, that “somewhere” is body reserves, and that’s when we start walking into transition-style problems.
Cold Stress Feels a Lot Like a Transition Problem
What farmers and advisors are finding—and what the research is now backing up—is that cold stress has more in common with transition-period stress than most of us were taught.
A 2023 review in the journal Animals by Kim and colleagues at Chungnam National University pulled together data on how beef cattle respond to cold stress. They showed that when cattle are exposed to low temperatures, you see the classic stress response: the hypothalamic–pituitary–adrenal axis kicks in, cortisol rises, heart rate changes, and energy metabolism shifts. Their work showed significant increases in non-esterified fatty acids (NEFAs) and changes in standing and lying behavior under extreme cold conditions.
Cortisol isn’t “bad” in the short term—it helps the animal cope by freeing up glucose and other substrates, allowing her to generate more heat. The trouble is when that elevated state drags on.
The Physiology in Plain English
Hoard’s Dairyman and several transition-cow reviews have compared cows entering calving with different levels of NEFA and ketone bodies. Cows with higher NEFA and beta-hydroxybutyrate tend to have more metritis, more displaced abomasums, and more early-lactation health issues.
Here’s the barn-level translation: when a cold snap pushes a cow deeper into negative energy balance, she’s not just cold—she’s more vulnerable to mastitis, metritis, and missed heats.
On the immune side, work looking at neutrophils from high-NEFA, low-glucose cows have shown that those cells are less capable of migrating to infection sites, engulfing bacteria, and killing them. Think of it this way: it’s like asking the immune system to do a full day’s work on half a tank of fuel.
Recent reviews of stress and behavior in dairy cattle, including a 2024 paper in Frontiers in Veterinary Science, keep returning to the same triangle: stress hormones, elevated NEFA, and a compromised immune response that manifests as more disease and lost production.
And reproduction? It sits downstream from all of this. Studies examining cows with higher NEFA and BHBA levels in early lactation consistently show more days open and lower conception rates. When winter pushes cows deeper into energy deficits and bumps up mastitis and lameness risk, fertility doesn’t tend to improve.
So when you and I ask, “Are the cows cold?”, the more useful follow-up question is, “Are we quietly adding transition-style stress to cows that are already working hard?”
Lying Time: The Quiet Number That Moves Your Tank
So far, we’ve been talking about internal biology. Let’s step back into the barn and talk about something you can see without a blood test: how many hours a day cows actually spend lying down.
Over the last decade, Cassandra Tucker’s group at UC-Davis and others have put a lot of effort into understanding lying behavior in dairy cows. A summary of her work, shared through Cornell Extension, notes that most lactating cows lie down for 10 to 12 hours per day when conditions are good. Some researchers suggest that 12 to 14 hours may be optimal, and illustrate how herds with very high lying times achieve strong performance and health.
When cows get significantly less rest than that, the wheels start to wobble. Time-budget and welfare studies have linked reduced lying time to higher lameness risk, more udder problems, and lower milk yields.
Many of you have seen the practical side of that: the pen where cows spend more time milling around on the concrete is usually the one where hoof-trimmer day is more interesting, and the tank isn’t as pretty.
Day
Event Phase
Lying Time (hrs/day)
Milk Yield (kg/day)
Day 1 (Mon)
Pre-event baseline
11.5
37.8
Day 2 (Tue)
Pre-event baseline
11.4
37.6
Day 3 (Wed)
Pre-event (behavioral shift begins)
11.0
37.4
Day 4 (Thu)
Cold snap – full stress
9.0
34.8
Day 5 (Fri)
Cold snap – ongoing
9.2
35.2
Day 6 (Sat)
Cold snap – ending
10.1
36.1
Day 7 (Sun)
Post-event recovery
11.3
37.2
The Math That Gets Everyone’s Attention
Miner Institute work, echoed in Cornell extension materials, reports that each additional hour of rest per day can be associated with roughly 2 to 3.5 pounds of extra milk per cow per day in freestall herds, depending on the herd and conditions. It’s become a practical rule of thumb across the industry.
If cold or drafty conditions shave two hours off a pen’s lying time, you could reasonably see something like three to seven pounds less milk per cow per day. At current winter milk values in Canadian and northern U.S. component markets, that’s not a rounding error.
And here’s something to keep in mind: for herds paid on components, those three to seven pounds of lost winter milk often come with softer butterfat performance, which hits the milk cheque twice.
Deprivation studies show that cows prevented from lying down exhibit clear signs of stress—restlessness, altered behavior, and, in some trials, short-term drops in milk yield and changes in udder health markers. That lines up with what producers across the Midwest and Ontario have said for years: cows that don’t get their rest just seem more fragile, and udder trouble finds them more easily.
While lying time sometimes gets treated as a soft welfare number, it’s actually a hard performance metric. It connects comfort, milk yield, lameness, udder health, and the smoothness of your transition program.
Behavior as an Early Warning System
What’s encouraging in all of this is that cows almost always tell us something is off before the milk graph or the mastitis list does. They tell us with behavior.
When you look at the research and then talk to producers in places like Ontario, Wisconsin, upstate New York, or the Prairies, three winter behavior patterns keep showing up as useful early warning signs.
Timeline
Behavioral Sign
What’s Happening Physiologically
Action to Take
Cost of Inaction
Day –5 to –3 Before Cold
Subtle increase in idle standing; cows lingering in feed bunk longer
Early cortisol rise; NEFAs beginning to climb; immune system loosening
Increase ration energy 10–12%; monitor lying time. No visible herd cost yet.
Lying time returning to baseline; bunching dispersing; most herds stabilizing
Metabolic recovery underway; immune response ramping back up if no secondary infection established
Return ration to baseline gradually; document all cases for winter protocol refinement
Missed learning opportunity
Too many cows just standing idle. If you walk a freestall pen at a quiet time and see a big chunk of cows just standing in the alleys—no headlocks, not really eating, not at the water—that’s worth paying attention to. Experienced cow-comfort consultants often use a simple rule during barn walks: if roughly a quarter or more of the cows in a pen are just standing around during a quiet period, it’s time to take a harder look at stall comfort and drafts.
In winter, common culprits are cold stall surfaces, thin bedding on mats or mattresses, or a draft across the platform at cow height. Ventilation specialists from groups like Lactanet routinely use smoke tests or handheld airflow meters to show how a small leak in a curtain can turn the outside row into the “avoid” zone for cows.
“Graze-and-go” at the feed bunk. Under decent conditions, feeding-behavior research suggests that cows spend about 3 to 5 hours per day eating, broken into roughly 9 to 14 meals. In winter barns where drafts or freezing feed are a problem, producers often describe a different pattern: cows rush to the bunk, grab a quick bite for maybe five or ten minutes, and then back away—even though there’s plenty of TMR in front of them.
Winter-feeding articles have warned about this: frozen TMR and cold air blowing on cows’ necks at the bunk reduce palatability and discourage a calm, steady meal.
Bunching in the same “safe” spots. If the same group is using the same “preferred” spot at mid-morning, mid-day, and late afternoon, and there’s no obvious feed or water reason, that area is probably offering a nicer microclimate: a little less draft, perhaps a bit warmer, often just drier.
What’s powerful here is that these patterns—more idle standing, shorter feed bouts, consistent bunching—often show up several days before there’s a noticeable change in milk yield, SCC, or disease incidence. That gives you a window—often three to seven days—to fix drafts, deepen bedding, or adjust the ration before the costs show up.
Year One vs. Year Two: A Real-World Comparison
Let’s walk through a realistic scenario. This isn’t a single farm; it’s a composite of what several sand-bedded freestall herds in Ontario and the Upper Midwest have described, and it aligns well with the economic data.
Year One: Riding It Out
A 220-cow Holstein herd in sand-bedded freestalls, shipping around 36–38 kilograms of milk per cow per day with solid butterfat performance. A three-day cold snap hits: daytime highs around minus ten, overnight lows near minus eighteen, winds around twenty miles an hour, and one night of freezing drizzle.
The farm does what many of us would recognize as “being prepared”—waterers checked, modest ration energy bump, extra bedding tossed into obviously wet stalls, curtains at their usual winter setting.
Cows wearing leg-mounted accelerometers show average lying time dropping from about 11.5 hours a day down to roughly nine. More cows than usual stand idle in the alleys. Some TMR sections freeze overnight.
Milk drops by roughly two to three kilograms per cow per day and takes close to a week to climb back to baseline. Five new clinical mastitis cases show up over the next 10 to 14 days, mostly due to environmental organisms. Three new lame cows are identified.
Economic work led by Pam Ruegg, DVM, MPVM, at Michigan State University, along with a 2023 study of 37 Wisconsin dairy farms published in the Journal of Dairy Science, estimates the cost of a clinical mastitis case at about $120 to over $300 per case. Those five cases cost somewhere in the $600–$1,500 neighborhood. Add lameness costs, lost milk, and knock-on effects on fresh cows, and the total impact of that single cold event comes to roughly $3,000 to $4,000.
Divide that by 220 cows, and you’re looking at $15–$18 per cow for one storm.
Quick math for your herd: multiply your cow count by $15 to see what a single bad storm might cost you.
Year Two: Treating It Like a Manageable Risk
The next winter, a similar cold snap is on the way. This time, the farm treats it more like a transition-pen challenge—something you plan for.
A Midwest nutritionist summed up the mindset shift at a recent winter cow-comfort workshop: “We’ve started thinking about cold snaps the same way we think about calving—get ahead of it, watch the right numbers, and don’t be cheap on bedding.”
Forty-eight hours out, they order extra straw and chopped dry hay. They bump the ration’s energy density by about 10 to 12 percent and start feeding that adjusted ration the day before the cold hits. Staff are briefed to flag immediately any idle standing, short feed bouts, or unusual bunching.
Twenty-four hours out, all stalls in high-risk and fresh-cow pens get an extra six inches of straw and chopped hay—roughly three tons of bedding, about $150–$200. Curtains on the windward side are adjusted down to reduce drafts at cow height.
During the cold snap, lying time bottoms out around 10.5–11 hours instead of dropping to nine. Milk still takes a hit, but it’s smaller and shorter: two to three pounds for a few days, back to baseline within three days. One clinical mastitis case, no obvious lameness spike.
The extra bedding and labor cost around $250. Total impact: closer to $1,000–$1,500.
Spread across 220 cows, that’s $5–$7 per cow instead of $15–$18.
Cost Component
Year One
Year Two
Reduction
Bedding & Labor
$0.00
$1.82
–
Milk Loss (kg × milk price)
$6.82
$2.27
$4.55 (67% reduction)
Mastitis Cases (5 vs. 1)
$6.36
$1.27
$5.09 (80% reduction)
Lameness Costs (3 cases vs. 0)
$1.82
$0.00
$1.82 (100% reduction)
Total per Cow
$15.00
$5.36
$9.64 (64% reduction)
It’s not a randomized controlled trial, but the pattern lines up well with mastitis-cost studies, lameness economics, and energy-requirement math. It also mirrors what many producers describe when they compare winters in which they “rode it out” to those in which they went in with a plan.
Different Systems, Different Levers
While the cow’s biology is the same whether she’s in a 300-cow freestall in Ontario or a 2,000-cow dry lot in southern Alberta, the levers you pull look different.
System Type
Key Winter Levers
Primary Risk Factors
Freestall (Ontario, Wisconsin, NY)
Bedding depth, stall surface temperature, cow-level wind protection, ration energy density
Freezing rain, soaking coats, drafts on outside rows, ice in crossovers
Compost/Bedded Pack(NY, MN, Quebec)
Pack depth and dryness, drainage, airflow balance
Closing the barn too tight creates a damp pack; wet bedding kills the insulation value
Dry Lot/Outwintering(Prairies, Western U.S.)
Windbreaks, dry bedded mounds, feed/water placement, pre-winter body condition
Open exposure, mud, wind without shelter
Calf Housing (All regions)
Extra bedding, calf jackets, and higher-energy liquid feeding
Thermoneutral zone 15–25°C (MSU); much higher than adult LCT
Beef Cattle Research Council fact sheets show clearly that cattle with adequate wind shelter and dry lying areas maintain body condition and performance much better than those on open, muddy, windy ground. Dairy dry cows and heifers sharing those environments follow the same rules.
And for calves—pre-weaned calves under three weeks of age have a thermoneutral zone approximately between 15°C and 25°C (roughly 59 to 77°F), according to resources from South Dakota State, Michigan State, and Canadian calf-care programs. That’s a lot higher than the LCT for adult cows with winter coats. Extra bedding, calf jackets, and higher-energy liquid feeding during cold snaps aren’t pampering—they’re matching the biology.
Why Winter Risk Feels Bigger Now
If it seems like winter is more of a financial and health risk factor than it used to be, you’re not imagining it.
Category
Year One (Reactive)
Year Two (Proactive)
Bedding & Labor
$0
$1.14
Ration Energy Bump
$0
$0.68
Post-Storm Milk Loss
$6.82
$2.27
Disease/Lameness
$8.18
$1.36
Total per Cow
$15.00
$5.45
Kim and colleagues, in their 2023 review, cite IPCC projections, noting that winter extreme weather events are likely to become more frequent in the near future. Climate-trend work looking at Canadian dairy regions has started documenting what many of you have noticed: more variable winters, more frequent swings, more rain-on-snow events.
Think about a scenario that’s becoming more common in Ontario and the Great Lakes: a couple of mild, rainy days in January, then a hard turn to minus fifteen with wind. That’s exactly the wet-coat-to-cold transition where OMAFRA’s LCT math tells us cows can suddenly be far more stressed than the air temperature alone would suggest.
On top of that, genetics, nutrition, and much tighter fresh cow management have pushed production higher. That’s great for the milk cheque, but it means cows are running closer to their metabolic ceiling. The margin for error around extra stress—whether it’s heat stress in summer or cold stress in winter—is smaller than it used to be.
Can the winter plan that “worked fine” for 60-pound herds twenty or thirty years ago really keep 90-pound herds out of trouble today?
In a lot of ways, cold stress feels like where fresh cow problems were a couple of decades ago. Back then, milk fever, retained placenta, and early-lactation mastitis were often shrugged off as “things that happen.” As more research and field data came in, we reframed those issues as largely preventable and closely tied to diet, cow comfort, and transition-period management.
Cold stress is walking down a similar path. The farms still treating January like it’s 1995 are going to keep wondering why their fresh cows struggle every spring.
What You Can Do This Winter
If we were sitting around the farm office, and you wanted a few core ideas to bring back to your team, here’s how I’d boil it down.
The Big Picture
Cold stress is defined by what happens inside the cow, not just by the thermometer. Haircoat condition, moisture, and wind speed at cow level matter just as much as what the weather app says.
Wet coats and wind are the big game changers. OMAFRA and BCRC data show that soaking a winter coat can raise the temperature at which cold stress begins from around minus eight degrees Celsius to fifteen degrees Celsius. You’ll almost always get more return by keeping cows dry and cutting drafts at cow height than by trying to “heat” a barn.
Behavior gives you a head start. Idle standers, short “graze-and-go” feeding bouts, and repeated bunching show up days before milk, SCC, or disease data tell the story.
Lying time is a powerful indicator. Ten to twelve hours of daily lying time is where high-producing cows do best, and each extra hour of rest can be worth a couple of pounds of milk or more.
Deep, dry bedding usually pays for itself. Spending roughly a dollar per head before the storm vs losing $10–$15 per head afterward is the kind of math that wins in a tight-margin year.
Your Pre-Storm Checklist
Set a lying-time and idle-standing threshold for each pen. Know what “normal” looks like so you can spot drift early.
Build a simple pre-storm bedding and ration protocol. Order extra straw or dry hay 48 hours ahead, bump the ration energy the day before, and make curtain adjustments on a schedule.
Decide how you’ll watch behavior—sensors, pen walks, or both. Make it somebody’s job to track lying, standing, and bunching patterns and flag changes quickly.
Have a post-storm huddle to tally milk, mastitis, and lameness. If you don’t track it, you can’t improve it—and you won’t know if your pre-storm investments are paying off.
The Bottom Line
Yes, extra bedding and ration tweaks cost money. But the real winter choice usually isn’t “spend or save.” It’s whether you pay upfront for bedding and energy, or pay later for milk, mastitis, and days open.
Once you start treating cold stress the same way you treat the transition period—something you monitor, anticipate, and actively manage—the “mystery problems” that show up in January and February become a lot less mysterious. They become part of a plan you can actually influence.
And in a business where margins are tight and cows are bred to work hard, turning winter from something that happens to you into a risk you manage isn’t just better for the cows. It’s better for the tank, the treatment log, the breeding board, and the butterfat performance that’s actually paying the bills this winter.
KEY TAKEAWAYS
$15–$18 per cow, every storm—a single three-day cold snap costs a 200-cow herd roughly $3,500, yet most operations still treat winter as weather to endure
Cold stress hits like a fresh-cow problem—same physiology (spiking cortisol, elevated NEFAs, suppressed immunity), same downstream costs (mastitis, lameness, days open)
Your cows warn you 3–5 days early—idle standing, shortened meals, and bunching in sheltered spots signal cold stress before the tank does
Wet coats are the multiplier—a soaked haircoat shifts cold-stress threshold from -8°C to 15°C, which is why rain-before-freeze hits hardest
$250 in prep beats $3,500 in losses—pre-storm bedding and ration bumps cut per-storm costs by more than half
Complete references and supporting documentation are available upon request by contacting the editorial team at editor@thebullvine.com.
Learn More
Forget Keeping Barns Warm: Why Winter’s Your Most Profitable Season – Arms you with the immediate maintenance hacks and ventilation targets needed to transform your barn from a damp bacteria factory into a high-component profit center. Stop guessing on curtain heights and start protecting your winter milk cheque today.
Unlocking Cow Comfort: The Hidden Driver of Milk Production in 2025 – Delivers the strategic blueprint for 2025, proving why bedding is your highest-return investment. Break away from old-school crowding mindsets to safeguard your herd’s long-term production ceiling and financial resilience in a tightening market.
Every week, thousands of producers, breeders, and industry insiders open Bullvine Weekly for genetics insights, market shifts, and profit strategies they won’t find anywhere else. One email. Five minutes. Smarter decisions all week.
Your robot’s mastitis alerts aren’t gospel. A $15 strip cup plus selective treatment beat blanket tubes on cost, antibiotics, and cow survival.
Executive Summary: Most dairies still tube every mastitis cow “just to be safe,” but a 2023 Journal of Dairy Science meta‑analysis of thirteen trials found that selective treatment of non‑severe cases based on bacterial diagnosis can maintain cure, SCC, milk yield, and culling while cutting antimicrobial use. One 500‑cow Holstein herd in southern Brazil, for example, dropped its clinical mastitis treatment costs from US$27,559.97 to US$17,884.34 in a year—a 24% reduction, roughly US$6,000—after switching from blanket treatment to on‑farm culture–guided selective therapy. At the same time, a Bavarian field study showed that robot mastitis alerts have only 61–78% sensitivity and 79–92% specificity, depending on the brand, which means AMS systems are great at generating “cows to check” lists but shouldn’t be deciding which quarters automatically get tubes. This article pulls those threads together into a three‑phase playbook: tighten detection with strip cups, run a six‑ to eight‑week on‑farm culture “learning phase,” then build a vet‑driven selective protocol that fits your pathogen mix and labour reality. The focus is squarely on lowering mastitis costs and antibiotic use while protecting milk, SCC, and butterfat levels in real freestalls, tie‑stalls, and robot barns. The bottom line is that if your SOP still says “treat every case,” you’re probably spending more than you need to on tubes and discarded milk—and this gives you a practical path to test that on your own farm.
Outcome Measured
Selective Treatment (Diagnosis-Guided)
Blanket Treatment (All Non-Severe Cases Tubed)
Statistically Significant Difference?
Key Insight
Bacteriological Cure Rate
✓ Maintained
✓ Maintained
NO
Both protocols achieve cure; diagnosis-guided doesn’t lose ground
One more day to visual recovery is negligible vs. cost savings
Bulk Tank SCC
✓ Maintained / Improved
✓ Maintained
NO
Selective treatment does NOT compromise herd SCC
Milk Yield (kg/day)
✓ Maintained
✓ Maintained
NO
No yield penalty; both manage production equally
Recurrence Rate
✓ Maintained
✓ Maintained
NO
Future mastitis risk is identical between groups
Culling Rate
✓ Maintained
✓ Maintained
NO
Selective treatment does NOT increase forced culls
Antibiotic Use (volume & exposure)
↓ Significantly Lower
✓ High
YES – Selective Wins
Fewer cows receive tubes; direct reduction in farm-level antibiotic footprint
Treatment Cost (relative)
Base: 100%
Base: 131%
YES – Selective Wins
24–31% cost savings in real herds (see Visual 2)
Picture us at a winter dairy meeting, coffee on the table, and someone says, “We treat every ropey quarter the same way—grab a tube and go.” A lot of heads still nod at that. It’s familiar. It feels safe.
Here’s what’s interesting. A 2023 meta‑analysis in the Journal of Dairy Science, led by Dutch and Canadian researchers, including Ellen de Jong, pulled together results from 13 studies that compared selective treatment of non‑severe clinical mastitis to blanket treatment, in which every mild case receives intramammary tubes. The data suggests that when treatment decisions are based on bacterial diagnosis, selective protocols did not worsen bacteriological cure, clinical cure, somatic cell count, milk yield, recurrence, or culling compared with treating every non‑severe case automatically. The only clear trade‑off they picked up was a very small difference—on the order of half a day—in how long it took cows to look clinically normal again.
So that old reflex—tube every non‑severe case “just to be safe”—made sense in a world with less information and less pressure on antimicrobial use. But what this newer work is telling us is that on many farms in 2025, that reflex is quietly draining money in drugs and discarded milk, and it’s not necessarily buying you better udder health.
What I’ve found, walking barns in Ontario, Wisconsin, and across the Northeast, is that the herds making selective treatment work aren’t just university herds or fancy show strings. They’re regular freestalls, tie‑stall barns, and some well‑managed dry lot systems that have tightened up detection, put simple on‑farm culture plates on a bench, and started making more targeted treatment calls. And at the centre of that shift, there’s usually a strip cup that cost about fifteen dollars.
Looking at This Trend: What’s Actually in That Mastitis Quarter?
To make sense of selective treatment, it helps to start with what’s actually going on in the quarter when you see a clinical case.
Herd Category
Culture-Negative (%)
Gram-Negative (E. coli, Coliforms) (%)
Gram-Positive (Strep, Staph, Lacto) (%)
Sample Size / Source
Typical North American Herds (Meta-analysis range)
20–40%
25–35%
30–50%
13 trials, meta-analysis
Modern European Dairy (mixed systems)
18–35%
28–40%
35–52%
Frontiers Vet Sci, JDS reviews
High-SCC Problem Herds
10–20%
20–25%
60–70%
Contagious mastitis-dominant
Well-Managed Low-SCC Herds
25–45%
30–40%
25–45%
Environmental mastitis-dominant
Recent reviews on mastitis in journals like Frontiers in Veterinary Science and Journal of Dairy Science describe how milk from clinical mastitis is usually grouped into three broad categories in research trials and on‑farm diagnostics work:
Culture‑negative cases, where no growth appears on routine culture media
Gram‑negative infections, often Escherichia coli and related coliforms
Gram‑positive infections, like Streptococcus uberis, Streptococcus dysgalactiae, and various staphylococci
Across modern datasets from North American and European herds, researchers often report that a substantial share—commonly in the 20 to 40 percent range—of clinical mastitis samples are culture‑negative when they hit the plate. You know how that goes: by the time you see clots or watery milk, and you grab a sample, the cow’s own immune system may already have knocked bacterial numbers down below the detection limit of the culture system.
And here’s where the math starts to matter.
In the non‑severe clinical mastitis trials that fed into that 2023 meta‑analysis, culture‑negative cases were either treated with intramammary antibiotics or left without intramammary therapy, with both groups monitored closely and supported as needed. When researchers pulled those results together, they didn’t see worse bacteriological or clinical cure, SCC, or recurrence in the culture‑negative cows that were managed without intramammary antibiotics, compared with those that received tubes. In plain terms, a lot of those culture‑negative, non‑severe cases were going to get better either way.
For non‑severe gram‑negative cases—especially E. coli—the story is similar in many of the better‑controlled studies. Several trials, including work from Brazil and Europe, show that mild and moderate E. coli mastitis has a relatively high spontaneous cure when cows are otherwise healthy and well monitored. When you look at the numbers in those trials, intramammary tubes don’t always give you a big extra jump in cure compared with careful observation and supportive care, as long as you’re ready to move fast with systemic treatment if a cow spikes a fever, goes off feed, or otherwise starts looking systemically ill.
That’s where good fresh cow management during the transition period and overall environment really start pulling their weight. In herds where cows come into early lactation in good condition, with clean, dry stalls or well‑drained lots and minimal stress, it’s a lot easier for the immune system to do its part in these milder environmental mastitis hits.
Gram‑positive infections are trickier. For years, most of us have felt that these “pay” for a tube, and some work backs that up. Trials are showing that certain gram‑positive pathogens, especially some streptococci and staphylococci, respond better to intramammary antibiotics than to no treatment. At the same time, a 2024 randomized trial in JDS Communications that followed non‑severe gram‑positive mastitis cases identified by on‑farm culture—many of them Lactococcus—found no significant difference in bacteriological cure between several intramammary regimens and no treatment during a 21‑day follow‑up.
So the honest summary is this:
For non‑severe culture‑negative and many gram‑negative clinical mastitis cases, there’s good evidence that you can withhold intramammary antibiotics and lean on careful monitoring and supportive care without harming overall udder‑health outcomes—provided you still treat severe cows aggressively.
For non‑severe gram‑positive cases, the evidence is mixed. Some pathogens and situations clearly benefit from targeted intramammary therapy; others, like the Lactococcus‑dominated cases in the 2024 trial, don’t show a big difference in cure either way.
And that’s exactly why just looking at a ropey strip on the floor doesn’t get you very far. As mastitis specialists at places like Minnesota and Penn State keep reminding people, foremilk appearance and udder feel by themselves simply don’t tell you which pathogen group you’re dealing with. If you want a true selective treatment program—not just a dressed‑up version of “treat everything”—you need some sort of diagnostic information, usually from an on‑farm culture plate or a rapid lab test.
A Real‑World Case: A 500‑Cow Herd That Ran the Numbers
Let’s ground this in a real farm.
Metric
Blanket Treatment Year
Selective Therapy Year
Difference
% Reduction
Total CM Treatment Cost (USD)
$27,559.97
$17,884.34
$9,675.63
24.23%
Number of CM Cases
361
238
123 fewer
34% case reduction
Cost per Case (USD)
$76.35
$75.17
$1.18
1.5% per-case efficiency
Antibiotic Spend Component (est.)
$15,200
$8,900
$6,300
41% reduction
Discarded Milk Cost (est.)
$12,360
$8,984
$3,376
27% reduction
A 2023 Brazilian study in Revista Brasileira de Saúde e Produção Animal followed a commercial Holstein herd of about 500 lactating cows in Rio Grande do Sul as it transitioned from blanket clinical mastitis treatment to selective therapy based on on‑farm pathogen identification. They ran it for two full years: one year before the new protocol and one year after.
During those two years:
They recorded 599 clinical mastitis cases: 361 in the blanket‑treatment year (period one) and 238 in the first selective‑therapy year (period two).
They calculated the full cost of treating CM, including antibiotics and discarded milk. Across both years, CM treatment cost the farm US$45,444.31.
In the blanket year, costs were US$27,559.97.
In the first year with selective therapy, costs dropped to US$17,884.34.
That’s a 24.23 percent reduction in total CM treatment costs from year one to year two—around US$6,000 saved in that first selective‑therapy year—while also reducing antibiotic use and the volume of milk discarded because of treatment.
It’s worth noting that this wasn’t some disinfected research station. This was a compost‑bedded pack herd, milking twice a day with mechanical parlour equipment, producing roughly 14,000 litres of milk per day at the time of the study. In other words, a big, normal, working dairy.
Now, your milk price and drug costs aren’t going to match that dollar for dollar. But that kind of shift—24% lower CM treatment costs while maintaining udder health—is exactly the kind of “big math” that makes people sit up and ask, “Are we tube‑happy on our farm too?”
You Know This Step Already: Forestripping Still Matters
We can’t talk about selective treatment without talking about detection, because the whole program falls apart if you only find mastitis when the quarter is hard, and the cow is obviously miserable.
National Mastitis Council guidelines, along with extension programs from places like Wisconsin and Minnesota, still place a lot of emphasis on foremilk stripping into a strip cup or onto a dark surface, and on actually looking at that foremilk before you attach the unit. Reviews on on‑farm mastitis diagnostics have pointed out that subtle changes—slightly watery milk, a few fine flakes, a mild shift in colour—often show up before you feel heavy swelling or heat in the udder.
On the ground, in parlours from Ontario to Wisconsin, as many of us have seen, this step can quietly slip. In some operations, it becomes one quick squirt on the floor with barely a glance, and mastitis effectively doesn’t show up on the radar until things are already severe. In others, who’ve decided to do selective treatment or just take udder health seriously, you’ll see strip cups in every milker’s hand and people actually looking at what’s in them.
What’s encouraging is that it doesn’t take a big technology investment to tighten this up. A strip cup is cheap, and retraining people to use it mostly comes down to attention and habit. Once you’re catching more mild cases early, the idea of waiting 18–24 hours to see what grows on a plate in a non‑severe case doesn’t feel as risky as it does when every case you see is already advanced.
Robots and Sensors: Great Assistants, Not Autopilots
A lot of you are milking with robots now, especially in Western Canada, parts of Ontario, the Upper Midwest, and northern Europe. Whether it’s Lely, DeLaval, GEA, or another brand, your automatic milking system is already collecting a ton of data every milking: electrical conductivity, quarter yield, milking interval, flow curves, and in some setups, colour, blood, and somatic cell count.
The natural question is, “If the robot sees all this, do we still need strip cups and culture plates, or can we just let the system decide?”
A 2022 study out of Bavaria, published in the journal Animals, took a close look at that question. Researchers there evaluated four major AMS manufacturers on commercial Bavarian dairy farms and calculated the sensitivity and specificity of each system in detecting clinical mastitis under real‑world conditions.
AMS Manufacturer
Sensitivity (% of true mastitis detected)
Specificity (% of non-mastitis correctly ruled out)
What This Means in Plain Language
False Positive Rate (approx.)
Field Notes
Lely MQC / MQC-C
~78%
~86%
Catches 78 of 100 real mastitis cases; flags ~14% of normal cows as mastitic
~14%
Colour, EC, temp; somatic cell if MQC-C enabled. Best sensitivity.
DeLaval MDi
~61%
~89%
Misses ~39 of 100 mastitis cases; very conservative alerting (fewer false alarms, more missed cases).
~11%
Conductivity + blood detection + interval. Lowest sensitivity; flag for high-risk quarters.
GEA DairyMilk M6850
~76%
~79%
Catches 76 of 100; flag rate on false positives is highest among the four (~21%).
~21%
Permittivity-based SCC categories; no reagents. Good yield of data; more labour on false checks.
Specialty systems; strong on ruling out false mastitis. Slower to escalate.
Theoretical “Perfect” System
99%+
99%+
Would catch nearly all real cases, rarely flag false alarms.
<1%
Not commercially available; cutting-edge machine learning in development labs.
They found that:
The Lely systems in the study showed sensitivity around 78% and specificity around 86%.
DeLaval systems came in with a sensitivity of around 61% and a specificity of around 89%.
GEA units had a sensitivity of around 76% and a specificity of around 79%.
Lemmer‑Fullwood systems showed sensitivity around 68% and specificity around 92%.
The authors described detection performance as “satisfactory,” which is fair. But they also pointed out that none of the systems achieved the 99% specificity needed to eliminate false alarms nearly, and that low specificity can mean more milk unnecessarily discarded and more staff time spent checking cows that ultimately aren’t truly mastitic.
It’s worth knowing what those alerts actually mean.
Lely’s Milk Quality Control (MQC) system tracks quarter‑level electrical conductivity, colour, and temperature. Farms that bolt on MQC‑C also get real‑time somatic cell count readings, a big step up in monitoring udder health.
DeLaval’s Mastitis Detection Index (MDi) combines conductivity, blood detection, and milking interval into a single score. Somatic cell counts are handled separately in the DelPro system.
GEA’s DairyMilk M6850 uses electrical permittivity to give quarter‑level SCC categories without needing reagents, which is attractive for some robot herds that want frequent SCC information.
And in the research world, people are layering machine‑learning approaches on top of SCC data and other signals to improve detection performance beyond these simple thresholds. Those systems have shown they can approach very high sensitivity and specificity when built and trained well, although they’re not yet standard on most commercial farms.
So, if we’re being practical, AMS data is powerful, but it’s not magic. Sensitivity in the 60–70‑something percent range means some mastitis cows are missed. Specificity below the mid‑90s means you’ll get some false positives. That’s fine, as long as you use the system for what it’s good at.
On better managed robot herds I’ve visited—from two‑robot setups in Quebec to larger systems in northern Europe—the farms getting the most out of the technology tend to use the alerts like this:
The robot generates an “attention list” based on MDi, MQC, conductivity jumps, yield changes, and milking intervals.
Staff treat that list as “cows to check,” not “cows to tube automatically.” They strip those cows, feel the udder, and decide whether it really looks like clinical mastitis or just a funky day.
If a quarter truly looks like non‑severe mastitis, they take a clean sample before treating and let their selective protocol, plus the culture result, guide whether they use an intramammary product.
When you treat AMS data as a list generator, not as an autopilot, you get the benefit of the technology without turning it into an expensive random‑number generator for mastitis treatments.
Key Numbers That Are Worth Putting a Pencil To
If you’re like most producers, you probably want to see what this looks like in numbers before you consider changing anything.
A few data points are worth having in your back pocket:
That 2023 meta‑analysis on non‑severe CM treatment found that, across thirteen studies, selective treatment based on bacterial diagnosis did not worsen bacteriological or clinical cure, SCC, milk yield, recurrence, or culling compared with blanket treatment, aside from a small increase in time to clinical cure.
In the 500‑cow Brazilian Holstein herd, clinical mastitis treatment costs dropped from US$27,559.97 in the blanket‑treatment year to US$17,884.34 in the first year of on‑farm culture–guided selective therapy—about a 24.23% reduction, roughly US$6,000 in that one year—while CM cases fell from 361 to 238, and overall CM treatment across the two years totalled US$45,444.31.
The Bavarian AMS study showed sensitivity values in the 61–78% range and specificity from just under 80%to the low 90s, depending on the manufacturer, with the authors warning that lower specificity increases labour and discarded‑milk costs due to false alarms.
Those numbers aren’t your herd, of course. Milk price, mastitis incidence, labour costs, and your payment system will change the exact dollars per cow or per hundredweight. But the pattern across these very different situations is pretty consistent: when you’re able to decide which quarters truly need intramammary treatment, and you stop tubing the ones that don’t, you usually see a meaningful drop in antibiotic use and CM treatment costs without wrecking udder health.
A Simple Three‑Phase Playbook That’s Working on Real Farms
What I’ve found is that the herds that make selective treatment work don’t usually jump straight from “treat everything” to a complicated new protocol overnight. They roll it in over time.
Phase 1: Tighten Up Detection
This is the lowest‑cost, lowest‑risk step, and it pays off whether you ever go fully selective or not.
Place a strip cup with a dark insert at each milking unit or in each AMS mastitis‑check area.
Build deliberate foremilk checks back into your milking SOP, not just in your head.
Use your own herd’s milk—jars of abnormal foremilk, photos, short parlour demos—as training material so everyone sees what “normal,” “borderline,” and “this is mastitis” actually look like in your barn.
In Ontario and Wisconsin operations that do this well, I’ve seen vets and milk quality advisors walk the parlour with staff, looking into strip cups together. You strip some cows, talk through which quarters you’d culture, which you’d treat on sight, and which you’d flag for monitoring. Those conversations often show you that people aren’t always reading the same cow the same way.
Phase 2: Run a 6–8 Week “Learning Phase” With On‑Farm Culture
Once you’re actually catching non‑severe cases early and consistently, the next step is to figure out what bugs you’re dealing with.
For six to eight weeks:
Pick a validated on‑farm culture system with your vet—something like the Minnesota Easy Culture System or another kit backed by a university.
Set up a simple incubator and a clean spot for plates, and train one or two key people in aseptic sampling and reading plates using extension resources.
Culture every clinical mastitis case you reasonably can, but don’t change your treatment protocol yet.
At the end of this “learning phase,” you’ll know:
What proportion of your CM cases are culture‑negative?
How many are gram‑negative versus gram‑positive.
Whether your current habit of tubing every non‑severe case is actually aligned with the kinds of infections that benefit most from intramammary therapy.
In many Midwest and Canadian herds that have done this, people are surprised by how many CM cases are either culture‑negative or mild gram‑negative infections with good spontaneous cure. In other herds, particularly where contagious mastitis is still an issue, they find more gram‑positive problems than they realized. In both cases, the conversation shifts from “studies say” to “this is what our plates are showing.”
Phase 3: Build a Written Selective CM Protocol With Your Vet
If your culture results and your comfort level say it’s a good idea, then it’s time to sit down with your herd vet and map out a selective treatment protocol that fits your reality.
The protocols that travel well between herds usually look something like this:
Severe CM cases—cows with fever, depression, or other systemic signs—are always treated aggressively and promptly with appropriate systemic therapy and, when indicated, intramammary products. No waiting for culture there.
Non‑severe cases—abnormal milk with possibly mild udder changes, but no systemic illness—should be sampled aseptically before any intramammary treatment. Often, they’ll also get an anti‑inflammatory for comfort while you’re waiting for results.
Culture‑negative non‑severe cases are typically managed without intramammary tubes, with clear monitoring instructions for the next several days.
Non‑severe gram‑negative cases are often managed with observation and supportive care, with systemic treatment ready to go if the cow deteriorates.
Gram‑positive cases receive intramammary treatment where evidence and experience suggest there’s a reasonable benefit, with product choice and duration agreed on with your vet.
In Canada, Dairy Farmers of Canada and the Canadian Dairy Network for Antimicrobial Stewardship and Resistance have highlighted this kind of selective, diagnosis‑based CM treatment as one of the key opportunities to reduce antimicrobial use without sacrificing udder health, and it lines up neatly with proAction’s expectations on protocols, veterinary involvement, and responsible drug use. In the U.S. and Europe, major mastitis reviews and one‑health antimicrobial guidelines are making the same point: selective treatment of non‑severe CM is one of the more practical levers farms can pull.
Phase
Duration
Key Task(s)
Main Deliverable
Cost & Effort
Expected Payoff by End of Phase
Success Signal
Phase 1: Tighten Detection
Weeks 1–4 (parallel to normal ops)
– Place strip cup at every unit – Retrain staff on foremilk checks – Use herd’s own milk as training reference – Spot-check compliance weekly
Written SOP for forestripping; trained staff; strip cups in use
~$50 (strip cups) + 2–3 h management time
Catch 20–30% more non-severe cases early; catch cases beforeudder swelling severe
Foremilk checks are daily habit; staff can name “normal vs. mastitis” by look
Phase 2: Learning Phase (On-Farm Culture Pilot)
Weeks 5–12 (8-week pilot)
– Select culture system with vet (e.g., Minnesota Easy Culture) – Set up incubator & clean bench – Train 1–2 key staff on aseptic sampling & plate reading – Culture every CM case (continue normal treatment SOP) – Log & analyze results at weeks 4 and 8
Culture database of your herd’s pathogen breakdown: % culture-negative, % gram-neg, % gram-pos; cost per case baseline
Know your herd’s pathogen mix; baseline CM costs; early confidence in “we can do this”
% culture-negative cases, pathogen ratios, and staff competence confirmed; no major surprises
Phase 3: Build & Implement Selective Protocol
Weeks 13–24 (parallel ramp, then full protocol)
– Sit down with vet; review phase 2 culture results – Draft written selective CM protocol (severe vs. non-severe; thresholds for tube vs. observe) – Train staff on new decision tree – Run first 4–6 weeks as “soft launch” (staff practice; vet checks calls) – Adjust protocol based on early feedback; go full by week 20 – Measure outcome (SCC, cases, costs) at weeks 12, 24
Written, vet-approved selective CM protocol; staff trained & confident; data showing cost drop & SCC maintained
~$0–200 (any consumables; mostly vet & management time) + 1–2 h/week for first 6 weeks (ramp)
15–25% reduction in CM treatment costs (based on real herd data) Antibiotic use down 20–30% SCC & cure rates stable or improved
Herd costs drop $5,000–15,000 (scaled to size); staff confidence high; vet sees fewer auto-tube calls
People and Training: Where It Either Sticks or Slides Back
It’s worth noting—and you’ve probably seen this yourself—that nothing in mastitis management sticks just because it’s written down once.
Reviews of milking routines and mastitis risk keep coming back to the same thing: herds that combine written SOPs, actual staff training, and periodic feedback tend to have better udder health than herds that just have “the way we do it” floating around in people’s heads.
In practice, on farms that make selective CM treatment part of their culture, you see things like:
An initial team meeting where someone walks through the herd’s CM numbers and costs, shows some culture results, and explains why the protocol is changing.
Short “toolbox talks” every few weeks in the parlour or robot room, going over a couple of recent CM cases and what was learned.
Occasional observation of milking and culture work by the herdsperson or manager, followed by specific, friendly feedback.
A yearly sit‑down with the vet—and sometimes the nutritionist—to review CM incidence, bulk tank SCC, mastitis‑related culls, antibiotic use, and the economics, then adjust the protocol if needed.
In many Wisconsin and Midwest operations, this kind of rhythm already exists for fresh cow checks or repro programs. Selective CM treatment just gets folded into that same cycle of “plan, do, check, adjust.”
When Selective Treatment Makes Sense—and When It Might Need to Wait
Selective CM treatment isn’t the right first move for every herd, and that’s okay.
It tends to work best on farms that:
Have bulk tank SCC at least under moderate control
Keep udders reasonably clean and dry in their freestalls or well‑managed dry lots
Have fairly stable milking routines across shifts
And have at least one or two people who can reliably handle sampling, culture plates, and record‑keeping
If your bulk tank SCC is high, contagious mastitis problems like uncontrolled Staph aureus are still walking the barn, or staff turnover is so high that basic milking routines aren’t consistent, then your best return in the short term is probably on the fundamentals: stalls, bedding, teat prep, fresh cow management through the transition period, and dealing with chronic high‑cell cows.
If your SCC is on fire, it usually makes more sense to put your energy into the basics first and treat it selectively as a second‑phase project once the house is more in order.
The research base is still growing, too. Most CM-selective treatment trials have been conducted in herds with at least reasonable monitoring and mastitis control. Newer studies are starting to tackle different pathogens and management systems, and we’re seeing some differences, like that 2024 gram‑positive RCT with Lactococcus. That’s why it’s helpful to treat the published data as a strong guide, but still test things against your own herd’s results.
So What’s the Take‑Home in 2025?
If you zoom out and look at this through a 2024–2025 lens—with more talk about antimicrobial stewardship, labour that’s not getting cheaper, and milk cheques that depend more than ever on SCC and butterfat levels—the idea of selective treatment for non‑severe clinical mastitis stops being a theoretical exercise and starts looking like a practical tool.
For a 100‑cow herd shipping on components, pulling even a few fewer high‑SCC cows out of the bulk tank over the year can be the difference between hanging onto a quality premium and watching it slip. For that 500‑cow Brazilian herd, a 24‑percent drop in CM treatment costs was worth about US$6,000 in one year—enough to matter for anyone’s budget.
If you don’t change anything else in your mastitis program this year, four moves are worth your time:
Put real numbers on your mastitis costs. Work with your vet or advisor to tally up what CM is costing you in drugs, discarded milk, and mastitis‑related culls—per cow and per hundredweight—so you know what your current reflex is actually costing.
Make strip cups and foremilk checks non‑negotiable again. Get strip cups into everyday use, retrain people as needed, and spot‑check that forestripping and visual checks are happening at every milking, whether you’re in a parlour or running robots.
Run a six‑ to eight‑week on‑farm culture pilot. Culture every CM case you can without changing your treatment protocol yet, then sit down with your vet to look at what percentage of your cases are culture‑negative, gram‑negative, and gram‑positive.
Use your own herd’s data to decide on a selective protocol. Don’t just copy the Brazilian farm or a university script. Use your culture results, your cost numbers, and your vet’s judgement to decide if selective treatment of non‑severe CM makes sense for your herd right now—and if it does, write it down and train people on it.
You know as well as I do that doing nothing usually means you keep spending on tubes that don’t always change outcomes, while other herds slowly move those dollars into genetics, better fresh cow programs, improved housing, and lower SCC.
In the end, the question isn’t simply “treat or not treat.” It’s: Which quarters actually pay to treat—and how do you figure that out reliably on your farm?
From that 500‑cow compost‑barn herd in southern Brazil to AMS barns in Europe and North America, the gap between guessing and knowing in mastitis treatment has turned out to be worth a lot more than the price of a strip cup. And quite often, the very first step in closing that gap isn’t new software or a new sensor. It’s a cheap strip cup in a milker’s hand and a small, intentional decision, right in the middle of a busy shift, to pause for a couple of seconds, really look at what’s coming out of each teat, and start letting that information guide where your tubes—and your mastitis dollars—actually go.
Key Takeaways
The blanket‑treatment reflex is costing you. A 2023 meta‑analysis of 13 trials found that selective treatment of non‑severe mastitis—guided by on‑farm culture—maintained cure, SCC, milk yield, and cow survival while cutting antibiotic use.
Real‑farm math: 24% lower mastitis costs. One 500‑cow Holstein herd dropped CM treatment spending from US$27,559 to US$17,884 in a single year—about US$6,000 freed up for genetics, transition‑cow programs, or equipment upgrades.
Your robot’s mastitis alerts aren’t gospel. Field data show that AMS systems achieve only 61–78% sensitivity and 79–92% specificity—great for building a “cows to check” list, but terrible for auto‑tubing decisions.
Start with a $15 strip cup, not new software. Restore real foremilk checks, run a 6–8 week on‑farm culture pilot, then build a vet‑approved selective protocol matched to your herd’s actual pathogen mix.
Not every herd is ready today—and that’s okay. If SCC is on fire, contagious mastitis is loose, or staff turnover is constant, lock down the basics first; selective treatment pays best when the foundation is solid.
Complete references and supporting documentation are available upon request by contacting the editorial team at editor@thebullvine.com.
Learn More
83% of Dairies Overtreat Mastitis – That’s $6,500/Year Walking Out the Door – Gain immediate financial relief by identifying the clinical cases that don’t need expensive tubes. This breakdown delivers the hard math on a 90-day payback system that stops thousands of dollars from walking out your barn door annually.
The Milking Speed Game-Changer That’s About to Shake Up Your Breeding Program – Reveals how new sensor-based genetic traits are ending the era of subjective milking speed scores. This method leverages objective data to breed a faster, more efficient herd that maintains udder health while slashing total parlor labor.
The Sunday Read Dairy Professionals Don’t Skip.
Every week, thousands of producers, breeders, and industry insiders open Bullvine Weekly for genetics insights, market shifts, and profit strategies they won’t find anywhere else. One email. Five minutes. Smarter decisions all week.
39% of U.S. dairies gone in 5 years. Milk production? Still up. The survivors picked a lane. Have you?
Executive Summary: Over the last census period, nearly 40% of U.S. dairies with milk sales disappeared, even as national cow numbers and total milk production held steady – a clear sign that milk has consolidated into fewer, larger herds. The numbers now show that roughly 2,000 farms milking 1,000 cows or more produce close to two‑thirds of U.S. milk and often enjoy cost advantages of up to about $10/cwt over 100‑ to 199‑cow herds, while many smaller herds stay profitable by squeezing more milk solids, labour efficiency, and cow longevity out of every stall. Against that backdrop, the article lays out three realistic “survival lanes” – scale with discipline, an efficiency sweet spot for 150‑ to 800‑cow herds, and niche/value‑added models – and illustrates each with concrete examples from a New York tie‑stall, a Wisconsin freestall, and a New Mexico dry lot. It then dives into genetics and technology as profit levers, showing how DWP$‑driven selection can add $1,000–$1,500 lifetime income over feed cost per top‑quartile cow, and how AMS, collars, sort gates, and feed pushers can either strengthen or weaken margins depending on milk lift, labour changes, and interest costs. Labour and sustainability pressures are treated as hard economics rather than buzzwords, tying turnover, welfare metrics, and Net Zero goals back to cost per cwt and processor relationships. The piece finishes with five direct questions owners can use at the kitchen table to decide which lane they’re really in, which investments to prioritize, and where “doing nothing” might actually be the riskiest move of all.
You know, in the time it took you to raise your current group of two‑year‑olds, almost four out of ten U.S. dairy farms disappeared. That’s not just coffee‑shop talk. USDA’s 2022 Census of Agriculture shows that farms with sales of milk from cows dropped from 40,336 in 2017 to 24,470 in 2022 – a 39% decline – while the national milking herd stayed close to 9.4 million cows and total milk production held in the mid‑220‑billion‑pound range in USDA and industry summaries.
So the cows didn’t vanish. The milk didn’t vanish. It just moved to fewer barns.
Metric
2017
2022
% Change
Dairy Farms (000s)
40.3
24.5
−39%
Milking Cows (millions)
9.4
9.4
0%
Milk Production (bn lbs)
215
220
+2.3%
Looking at this trend, farmers are finding that the industry’s structure has quietly shifted under their feet. USDA economists, Rabobank analysts, and a detailed 2024 review from the University of Illinois farmdoc team all point out that a relatively small group of large herds – those with 1,000 cows or more – now produce roughly two‑thirds of U.S. milk by value. That farmdoc piece breaks it down very clearly: only about 2,013 farms in the 1,000‑plus‑cow category accounted for around 66% of U.S. milk sales in 2022. Dairy industry coverage of the same data has gone further, noting that roughly 65% of the nation’s dairy cows now live on farms with 1,000 cows or more.
Herd Size
Farm Count
% of Farms
% of Milk
Visualization
1,000+ cows
2,013
~8.2%
66%
Large, red-bordered segment
500–999 cows
~1,800
~7.4%
~18%
Medium grey segment
250–499 cows
~3,500
~14.3%
~10%
Smaller segment
50–249 cows
~16,000
~65%
~6%
Remaining sliver
Here’s what’s interesting: while farm numbers are falling, consumer demand for dairy hasn’t collapsed. USDA per‑capita use data, summarized by industry outlets, show Americans now drink roughly 120‑plus pounds of fluid milk per person per year – that part’s been sliding for decades – but cheese consumption has climbed into the low‑40‑pound range per person, and butter use has pushed above six pounds per person, around modern‑era record levels. People haven’t walked away from dairy; they’ve just walked over to cheese, butter, and ingredients.
When you dig into profitability work from groups like the Kansas Farm Management Association and international dairy efficiency studies, a pattern pops out. High‑profit and low‑profit herds in the same region often receive very similar milk prices. The spread shows up in feed efficiency, butterfat performance, labour cost per hundredweight, fresh cow management in the transition period, and how effectively barns, parlours, robots, and people are actually used.
And over the last couple of years, with interest rates higher and feed and fertilizer bouncing around, those efficiency gaps have hurt. Coverage in 2023–2024 margins has highlighted how many herds – especially in higher‑cost western regions – have seen their total cost per cwt push toward or above the milk price, with some large western herds facing total costs in the $20–$21/cwt band while milk prices weren’t far above that. The room for error has gotten pretty thin.
Taken together, this development suggests something many of us already feel: the system today rewards margin per cwt and solids, not just volume, and certainly not just the fact that we’re milking cows.
That’s where this idea of “survival lanes” actually helps make sense of things.
Looking at This Trend: Three Survival Lanes Most Farms Are Already In
What I’ve found, looking at the Census numbers, USDA reports, Rabobank, and farmdoc analysis – and honestly, just talking with producers from California to New York – is that most viable dairies today are already drifting into one of three lanes:
Lane 1: Scale with discipline – big herds, high throughput, a relentless cost‑per‑cwt focus.
Lane 2: The efficiency sweet spot – mid‑size herds, sharp management, targeted tech.
Lane 3: Niche and integrated – smaller herds leaning on premiums and value‑added strategies.
You don’t have to love those labels. But if you look around your neighbourhood and across the U.S., they’re pretty much what the numbers and the barns are telling us.
Here’s a simple way to picture the lanes while we’re topping up the coffee.
How the Three Lanes Tend to Look
Feature
Lane 1: Scale
Lane 2: Efficiency
Lane 3: Niche/Integrated
Typical Herd Size
1,500+ cows
150–800 cows
50–250 cows
Main Focus
Cost per cwt
Margin per cow & per stall
Premium stability
Labour Setup
Larger hired teams, formal structure
Mixed family/staff, targeted tech
Mostly owner/family, a few key hires
Main Risk
Policy, interest, feed & water
“Stuck in the middle,” capital creep
Market volatility, buyer dependence
So the real question isn’t “which lane sounds nicest?” It’s “which lane do our barns, our contracts, and our debt load already put us in – whether we’ve said it out loud or not?”
Lane 1: Scale With Discipline
Let’s start with the herds that get most of the headlines. This is the lane of the 2,000‑ to 5,000‑cow operations you see in California’s Central Valley, Idaho’s Magic Valley, the Texas Panhandle, those big New Mexico dry lot systems, and along I‑29.
The 2022 Census, and the way farmdoc and Rabobank have unpacked it, show that the 2,500‑plus‑cow class was the only herd‑size group that actually grew in number between 2017 and 2022. Most smaller herd‑size categories shrank. Rabobank economists, leaning on USDA cost data, have highlighted that herds milking more than 2,000 cows can operate at total costs around $23/cwt and roughly $10/cwt cheaper than 100‑ to 199‑cow herds in 2022 when you look at all‑in cost per cwt. That lines up with USDA ERS work documenting that average costs tend to drop sharply as you move into the 1,000‑plus‑cow range.
Cost‑of‑production benchmarking from large western herds has shown total costs often in the low‑20s per cwt in recent years, with some examples in that $20–$21 range when feed was expensive. When milk prices were higher and costs were under control, those herds had decent margins. When milk softened, and feed stayed high, there wasn’t much cushion.
What’s interesting here is that scale really can work, but only if it’s paired with discipline and a clear view of risk. On a 2,500‑cow dry lot in eastern New Mexico or west Texas, a $2/cwt swing in margin can mean hundreds of thousands of dollars a month. Heat stress, water rights, feed price spikes, and regulatory changes all magnify at that scale. Producers in those regions consistently talk about cooling systems, water security, and manure and nutrient plans because they don’t have the luxury of ignoring those things.
In a lot of western dry lot systems, the focus tends to be on:
Reproduction and days open, because milk per stall is everything.
Heat abatement – fans, soakers, shades – to keep feed intake and rumination from breaking down during long, hot spells.
Feed efficiency and shrink control, given the volume of commodities moving through the yard.
Manure and water systems that keep regulators, neighbours, and processors onside.
So if you’re in this lane – or seriously thinking about stepping into it – the question shifts from “should we add more cows?” to “does this next big capital decision lower our cost per cwt or take a major risk off the table over the next 10 or 15 years?” New rotary? Digester? More housing? At that scale, the lens really has to be long‑term margin and resilience, not just filling an empty pad.
Lane 2: The Efficiency Sweet Spot
Now, let’s talk about where a lot of well‑run Midwest and Northeast herds actually live: somewhere between 150 and 800 cows. Solid freestall barns, a mix of family and hired help, and a lot of pride in butterfat performance and cow comfort.
Kansas Farm Management Association comparisons of high‑, medium‑, and low‑profit dairies have shown that the most profitable herds aren’t always the biggest. They’re the ones with higher milk sold per cow, better feed conversion, fewer labour hours per cow, and controlled overhead. An international study looking at dairy farm performance across countries reached a similar conclusion: technical efficiency – things like milk per cow, feed use, and labour use – plus management decisions explain profitability differences much more than milk price alone.
Farm ID
Herd Size
Milk per Cow (lbs/yr)
Net Farm Income per Cow (USD)
Region
A
280
24,500
$2,180
Wisconsin
B
320
23,200
$1,850
Wisconsin
C
450
25,300
$2,310
Wisconsin
D
520
24,800
$2,095
Iowa
E
380
26,100
$2,480
Wisconsin
F
650
23,900
$1,720
Wisconsin
G
520
24,100
$1,950
Minnesota
H
420
25,800
$2,420
Illinois
I
480
23,500
$1,880
Iowa
J
580
26,300
$2,550
Wisconsin
K
390
25,900
$2,400
Wisconsin
L
610
24,200
$1,760
Minnesota
In Wisconsin, herds shipping to cheese plants, the paycheque is built on components. Producers are getting paid for butterfat and protein, not just pounds of skim, so milk solids per cow and per stall become the key levers. Hoard’s Dairyman benchmarking and Dairy Herd coverage of component pricing have underlined that top‑profit herds in these markets tend to combine strong fat and protein yields with good herd health and reproduction.
In many Northeast operations – think 80–150‑cow tie‑stalls or smaller freestalls in New York or Pennsylvania – the economics look surprisingly similar, even if the barns are older. Butterfat performance, SCC, and reproduction determine whether to stay in business or set a dispersal date. The facilities differ; the margin math stays the same.
What farmers are finding in this lane – especially in those 300‑ to 600‑cow freestalls – is that they don’t need to chase 3,000 cows to be successful. They do need to be absolutely clear about:
Butterfat and protein yield per cow and per stall, not just tank weight.
Fresh cow management through the transition period – calcium, energy balance, rumen health, and calm, clean calvings.
Involuntary cull rates and how long cows stay productive in the herd.
Labour per cwt and whether there are too many hands doing too many half‑defined jobs.
Many of the stand‑out herds in this lane use technology as a scalpel, not a shovel. You’ll see activity and rumination collars, some well‑designed sort gates, herd management software that someone actually uses, maybe a feed pusher. But the filter isn’t “is this new and shiny?” It’s “does this clearly move margin per stall and labour per cwt on our farm?”
Lane 3: Niche and Integrated Models
Then there’s the lane a lot of smaller herds either already operate in or quietly eye: organic, grassfed, A2A2, farmstead cheese, on‑farm bottling, or tight specialty contracts.
A Vermont study of organic dairies, using about ten years of farm‑level data, found that profitable organic farms tended to have strong forage management, controlled purchased feed costs, and organic milk prices that more than covered their higher expenses. Another paper looking at organic and grassfed dairy farms reported that higher‑producing grass‑based herds typically had better forage quality and more grazing management experience, which reinforces that “grassfed” doesn’t automatically mean low output.
Economic work on organic and value‑added dairy suggests something else important: these farms often generate more local economic activity per dollar of milk sold because more processing, marketing, and labour occur in the local community. That matches what many small organic and farmstead operations in Vermont, New York, and the Upper Midwest describe – more local jobs and spend, but also more work per unit of milk.
So yes, a 100‑cow organic herd in Vermont or a 70‑cow farmstead cheese operation in New York can outperform a 300‑cow conventional herd in terms of income per cwt when premiums, volume, and costs are well managed. The trade‑off is that you’re not just running a dairy – you’re running a food business with capital‑heavy equipment, regulations, labels, shipping, and customers attached.
Here’s the honest part about this lane that doesn’t always make it into the glossy stories: it’s not a magic profit button. The farmers who thrive here genuinely enjoy the marketing and relationship side – tastings, farmers’ markets, social media, restaurant accounts – not just the idea of a higher pay price. If you don’t enjoy people, paperwork, and problem‑solving beyond the farm gate, this lane can wear you out fast.
Feature
Lane 1: Scale with Discipline
Lane 2: Efficiency Sweet Spot
Lane 3: Niche / Integrated
Typical Herd Size
1,500–5,000+ cows
150–800 cows
50–250 cows
Primary Focus
Cost per cwt (volume + relentless efficiency)
Margin per cow & per stall (quality + management)
Premium stability & value-added processing
Labour Model
Large hired teams, formal shift structure
Mixed family + staff, targeted technology use
Mostly owner/family + 2–4 key hires
Tech Emphasis
Cooling, feed efficiency, herd logistics, data systems at scale
Direct marketing, on-farm processing, customer relationships
Revenue Lever
Volume + operational discipline
Components (fat/protein) + reproductive health + longevity
Organic/grassfed/A2A2 premiums + direct sales markup
Main Economic Risk
Policy, interest rates, feed/water volatility → margin shrinks fast at scale
Stuck in the middle: not big enough for economies of scale, not focused enough on niche
Market volatility, buyer dependence, capital intensity of processing equipment
Typical Cost per cwt
$20–$23 (with discipline)
$24–$27 (depending on efficiency)
$26–$32 (offset by premiums)
The Economics Behind the Lanes
If we step back from individual barns and look at the bigger picture, USDA’s cost‑of‑production work and ERS research on consolidation are pretty consistent: on average, total cost per cwt falls as herd size increases, at least up into the 1,000‑plus‑cow bracket. Fixed costs and specialized labour get spread over more cows. That’s a big part of why those large herds have grown their share of the milk.
At the same time, when you look inside any given size category – this shows up clearly in the Kansas data and the international comparisons – the herds at the top of the profit pile aren’t automatically the biggest ones. They’re the ones with more milk sold per cow, better feed efficiency, and leaner labour use. The laggards often have similar milk prices but higher costs per cwt due to lower yields, poor reproduction, health problems, or poorly organized labour.
On the organic and value‑added side, the Vermont research and similar studies report that total costs per cwt are usually higher – often in the high‑20s or low‑30s – but strong organic or specialty premiums can still leave attractive margins when stocking rates, forage programs, and processing capacity fit together.
And in the real‑world conditions of 2023–2025, with feed, fuel, and fertilizer on a roller coaster and interest costs higher, that margin for error has shrunk for almost everyone. Industry analysis has shown how quickly margins swung negative for many herds when feed stayed expensive, and Class III and IV prices dropped back.
So the old “get big or get out” line is too blunt. The more accurate version is probably closer to: get crystal clear on which economic lane you’re in and manage aggressively for that lane’s realities.
Genetics: Turning Genomic Numbers Into Real Barn Dollars
Let’s shift to genetics for a bit, because this is one of those levers that doesn’t shout at you day‑to‑day but quietly adds up over time.
Since genomic testing really took off around 2009, geneticists and AI organizations have documented significantly faster genetic progress for traits like production, fertility, and health compared with the old, slower progeny‑test system. Peer‑reviewed work in the Journal of Dairy Science has confirmed that when you select on genomic lifetime merit indexes consistently, you see real differences in lifetime performance show up in the parlour and on the cull list.
Zoetis and Dairy Management Inc. analyzed barn‑level data using the Dairy Wellness Profit Index (DWP$) and found that cows in the top 25% generated roughly £1,300 more lifetime income over feed cost than those in the bottom quartile in a UK study, and about US$1,474 more in comparable U.S. herds.
A more recent study published in the Journal of Dairy Science and summarized by Zoetis looked at 11 U.S. herds and found something that really grabs attention in 2025: cows in the top DWP$ quartile weren’t just more profitable – they also produced milk with about 12.9% lower methane intensity and roughly 9.5% lower manure nitrogen intensity per unit of milk compared with bottom‑quartile cows.
Metric
Top Quartile
Bottom Quartile
Difference
% Advantage
Lifetime Income Over Feed Cost (USD)
$3,474
$2,000
+$1,474
+74%
Lactations in Herd
4.2
2.8
+1.4
+50%
Milk Solids per Lactation (lbs)
3,240
2,580
+660
+26%
Methane Intensity (kg CO₂e per lb milk)
0.92
1.05
−0.13
−12.9%
Manure N Intensity (g N per lb milk)
4.8
5.3
−0.5
−9.5%
So, when you put those pieces together, it’s reasonable – and supported by the field data – to say that in herds using DWP$ as intended, top‑quartile cows can be expected to generate somewhere on the order of $1,000 to $1,500 more lifetime income over feed cost than bottom‑quartile cows. It’s a range, not a promise, but it lines up across both UK and U.S. studies.
Now picture a 400‑cow freestall in Wisconsin turning over about 30% of its cows each year – roughly 120 heifers entering the parlour. If genomic testing and DWP$‑based selection mean 80 of those animals land in your top genetic quartile instead of being a random mix, and each of those cows brings in just $1,000 more lifetime income over feed cost, that’s about $80,000 in extra lifetime margin from that one group of replacements. That doesn’t even count the peace of mind from having fewer train‑wreck cows.
What I’ve noticed in herds that really make genetics pay is that they do three things clearly:
Cheese‑market herds emphasize fat and protein yield, fertility, mastitis resistance, and good feet and legs because those traits show up directly in the milk cheque and cull bill.
Fluid‑market herds in the Northeast and Upper Midwest still value volume, but they’ve learned that better fertility, lower mastitis, and fewer metabolic problems often save more money than chasing a little extra milk.
Robot herds pay close attention to udder structure, teat placement, milking speed, and temperament because they’ve seen, the hard way, how box visits, refusals, and nervous cows turn into lost milk and burned‑out staff.
Genetics tends to work best when the herd has a simple, written plan that answers three questions:
Which economic index—DWP$, Net Merit, Pro$, or a custom mix—actually reflects how we get paid and why we cull cows?
Who gets sexed semen, who gets conventional dairy, and who gets beef‑on‑dairy, and how does that match our replacement needs and calf market?
Where does genomic testing clearly earn its keep, and where are we comfortable making decisions without it?
When you revisit those answers once a year with your vet, nutritionist, and breeding advisor, genetic decisions stop being “we buy good bulls” and start being another tool in your profitability plan.
Robots, Parlours, and Tech That Actually Pays
Now to the topic that comes up at almost every winter meeting: robots versus parlours, and which technology actually pays.
A 2022 feature pulled together several automatic milking system studies and reported that AMS can increase milk production by up to about 12% and reduce milking labour needs by as much as 30% in well‑managed herds. One of the highlighted studies showed robot‑milked cows producing roughly 2.4 kilograms – about 5.3 pounds – more milk per day than parlour‑milked cows, thanks mainly to more frequent milking and tighter routines. Other research in peer‑reviewed journals and extension materials echoes those possibilities, while repeatedly stressing that results depend heavily on barn design and management.
On the cost side, Wisconsin Extension’s 2022 “Building Cost Estimates – Ag Facilities” gives some solid ballpark figures that many lenders and consultants are using:
Retrofitting an existing parlour typically costs $3,500 to $7,000 per milking stall.
Building a new parlour with its own structure, concrete, utilities, and support spaces can cost $28,000 to $36,000 per stall.
A complete AMS setup – robots, barns or major renovations, manure systems, and cow‑flow infrastructure – commonly comes in around $12,000 to $13,000 per stall when you add everything together.
Case studies presented at the Precision Dairy Conference and shared by consultants in North America often cluster AMS projects in the $11,000 to $14,000 per cow range once all related infrastructure is factored in.
So let’s walk through a realistic example. Take a 240‑cow freestall in Wisconsin or Pennsylvania, considering four robots:
Capital outlay: It’s not hard, once you add robots, stall work, some concrete, building adjustments, and basic manure and cow‑flow changes, to end up near $2.5 million in total capital.
Milk lift assumption: Say an extra 5 lb per cow per day. That’s on the optimistic side but consistent with upper‑end AMS study results when barn layout and management are dialled in.
Labour savings: If milking labour is genuinely reorganized, many case farms have reported trimming the equivalent of roughly 1.5 full‑time positions from milking chores.
Annual benefit: With those assumptions and typical milk and wage levels, it’s reasonable to see more than $150,000 per year in combined extra income over feed cost and labour savings.
In that kind of scenario, the payback math can look pretty decent.
But here’s where a lot of producers quietly nod: in plenty of real‑world AMS installs, the milk lift ends up closer to 2–3 lb per cow, and labour doesn’t truly drop because the farm is short‑staffed elsewhere or the daily schedule never really gets redesigned. Industry case reports and extension consultants have been honest about that. In those herds, the payback stretches out and sometimes never really hits what the original spreadsheet promised.
Robots don’t fix a broken schedule or a toxic work culture. They just make those problems more expensive.
That’s why a lot of very profitable 400‑ to 600‑cow herds in the Midwest and Northeast still see their best returns coming from:
A well‑designed, efficient parlour that cows move through calmly and quickly.
Strong fresh cow management and transition pens that keep problems small and short.
High‑quality forage systems and consistent feeding routines that support components.
A handful of “workhorse” tech tools that support those systems rather than distract from them.
Those workhorse tools often include:
Activity and rumination collars that improve heat detection and flag health issues early, which multiple studies and field reports have tied to better reproductive performance and lower disease‑related losses.
Feed pushers that keep TMR in front of cows and frequently bump milk a couple of pounds per cow per day in both research and on‑farm results.
Sort gates, in‑line milk meters, and mastitis sensors that make grouping, fresh cow checks, and mastitis detection more systematic and less dependent on one person’s memory.
For most U.S. herds, the filter that seems to work best is simple: at conservative milk prices and realistic interest rates, can we honestly say this technology will improve dollars of margin per stall and labour per cwt on our farm? If the math only works when everything goes perfectly, it probably belongs on the “someday” list.
Labour: The Bottleneck Behind Everything Else
If there’s one theme that keeps coming up from New York freestalls to Idaho dry lot systems, it’s labour – finding people, keeping people, and getting consistent work from people.
A national survey done under the National Dairy FARM Program’s Workforce Development initiative, with Texas A&M leading the analysis, surveyed more than 600 dairies and found average annual employee turnover around 38.8% on U.S. dairies. Dairy Herd’s coverage of that work noted that while this isn’t wildly different from some other private‑sector averages, it’s a major challenge for farms that struggle to find and train reliable employees.
A 2018 paper in the Journal of Dairy Science that examined employee management practices on large U.S. dairies found annual employee turnover ranging from 8% to 144%, meaning some operations were turning over more than their entire workforce in a year. That level of churn doesn’t just hurt morale. It hits milking consistency, fresh cow monitoring, calf care, and training costs in ways you feel in both the tank and the cheque.
Extension programs through Cornell PRO‑DAIRY and universities in Michigan and Wisconsin have also highlighted how heavily many dairies rely on immigrant labour, and how housing, immigration uncertainty, language support, and basic management practices influence whether good employees stay. Producers in those programs often report that high turnover shows up as:
Inconsistent parlour prep and higher bulk tank SCC.
Missed early signs in transition cows that later turn into expensive problems.
Shortcuts in calf protocols and higher calf morbidity.
Lower average milk yield and more stress for owners and managers.
Annual Turnover Rate
Bulk Tank SCC (cells/mL)
Fresh-Cow Disease Rate (%)
Calf Morbidity (%)
Milk Loss per Cow (lbs/yr)
Est. Monthly Cost per 300-Cow Herd (USD)
<15% (Low)
150K–180K
8–12%
5–8%
200–400
$2,500–$4,000
15–30% (Moderate)
220K–280K
15–18%
10–12%
600–800
$6,500–$9,500
30–50% (High)
320K–420K
22–28%
15–18%
1,000–1,400
$12,000–$18,000
>50% (Severe)
500K+
35%+
22%+
1,800–2,200
$22,000–$35,000
What I’ve noticed in operations that seem “lucky” with labour is that luck usually looks a lot like design:
Barns and work routines are set up so that on a bad day – when someone is off or quits suddenly – the system still functions safely and adequately, even if it’s not perfect.
Core tasks like milking prep, colostrum handling, sick cow checks, and pre‑fresh monitoring have simple written SOPs, and someone actually takes time to train people on them.
Technologies like sort gates, collars, and feed pushers are chosen not just for their ROI on paper, but because they remove repetitive or physically punishing tasks that burn people out.
So the real question for a lot of herds is this: if you put a realistic dollar value on lost milk, extra treatments, extra culls, and your own stress when turnover is high, what would it actually be worth to have a more stable, better‑trained crew? Sometimes the answer looks a lot like higher wages, better housing, more structure – and only then more gadgets.
Environment, Consumers, and Where Policy Is Pointed
Whether we like it or not, environmental and consumer expectations are part of the lane conversation now.
The Innovation Center for U.S. Dairy has laid out a sector‑wide goal for greenhouse‑gas neutrality by 2050 through the Net Zero Initiative, and this goal is supported by life‑cycle assessment work from universities such as Texas A&M. Those LCAs consistently show that most of dairy’s greenhouse‑gas footprint comes from feed production, enteric methane, and manure management.
What’s encouraging is that many of the steps that shrink that footprint – better feed efficiency, stronger fresh cow management, longer productive lives, fewer involuntary culls – also tend to improve cost per cwt and margins. That DWP$ study is a good example: cows selected for higher DWP$ were more profitable and produced milk with lower methane and manure nutrient intensity per unit of milk.
On the market side, the shift toward cheese, butter, and other ingredients is prompting more questions from processors and retailers about animal welfare, environmental impact, and traceability. In practice, that’s showing up as programs that ask farms to document things like:
Bulk tank SCC and mastitis treatment rates.
Lameness levels and reasons cows leave the herd.
Transition‑cow performance, stillbirths, and overall cow mortality.
Manure-handling practices and, in some programs, basic carbon or nutrient values.
In Wisconsin and Northeastern plants supplying branded retail milk and yogurt, this is already happening through sustainability questionnaires, on‑farm audits, and sometimes through price incentives or program bonuses for certain performance levels.
It’s easy to see all of that as “one more thing.” But the flip side is that the metrics processors want to see often align with what already matters for profitability and labour sanity. Getting a handle on your SCC trends, cull reasons, lameness, and transition‑cow outcomes isn’t just for paperwork; it’s also good business.
On‑Farm Processing and Branding: Romantic and Real
For a 90‑cow tie‑stall in upstate New York or a 150‑cow herd in Pennsylvania, it’s natural to look at a successful farmstead cheese maker or local milk brand and wonder if that’s the way through.
University of Vermont and other land‑grant work has followed organic and value‑added farms that improved their financial position by adding on‑farm processing or direct marketing. When there’s strong local demand, and the owners have both the interest and the skill set, on‑farm processing can absolutely lift income per cwt.
But those same studies are pretty blunt about what it takes:
Capital for plant renovations, pasteurizers, vats, coolers, and packaging can easily be in the hundreds of thousands of dollars, even on a modest scale.
Owners suddenly need to learn food safety regulations, distribution logistics, branding, marketing, and customer service – on top of managing cows, crops, and people.
Cash flow in the first few years can be tight, and success depends heavily on the local market and whether someone on the farm truly enjoys the business side.
So if you’re thinking about going down that road, it really helps to compare two honest scenarios side by side:
Putting that capital and management energy into your own processing and marketing.
Putting the same resources into better forage, higher butterfat performance, stronger fresh cow and calf programs, and labour and tech improvements inside your current marketing channel.
In a lot of case studies, both paths can work. The winner usually comes down to your people and your local market, not just what the spreadsheet says.
Three U.S. Farm Types, Three Practical Paths
To make this less theoretical, let’s walk through three common U.S. farm profiles and talk about where they likely sit and what that suggests.
1. A 100‑Cow Tie‑Stall in Upstate New York
Likely lane: efficiency, with a bit of niche potential.
Reality: smaller tie‑stall herds in the Northeast are often shipping into competitive fluid and cheese markets, where butterfat levels, SCC, and day‑to‑day consistency can make the difference between staying afloat and calling an auctioneer.
Practical focus might look like:
Pushing butterfat performance and overall component yield through better forage quality, balanced rations, and tight fresh cow management in the weeks around calving.
Keeping SCC low and reproduction steady to protect days in milk and minimize involuntary culls.
If there’s strong local demand – and someone on the farm genuinely wants to deal with customers – exploring a small, manageable value‑added product like seasonal cream or limited cheese runs, with extension support on food safety and realistic capital budgets.
2. A 450‑Cow Freestall in Wisconsin
Likely lane: efficiency sweet spot.
Reality: shipping to a cheese plant under multiple‑component pricing, with a mix of family and hired staff and a typical Upper Midwest forage base.
Practical focus might include:
Using a custom genetic index that emphasizes fat and protein yield, fertility, and health – potentially blending DWP$ or other health‑focused indexes with your pay price and culling patterns.
Running a conservative AMS‑versus‑parlour comparison using Wisconsin cost benchmarks, realistic milk‑lift assumptions, and local wage and labour availability, rather than best‑case numbers from brochures.
Prioritizing tech that clearly improves transition‑cow outcomes, labour per cwt, and data visibility – activity collars, sort gates, feeding tools – before committing to bigger, more complex systems.
3. A 2,500‑Cow Dry Lot System in New Mexico
Likely lane: scale with discipline.
Reality: exposed to feed cost swings, water and environmental rules, and a competitive labour market in a hot, dry climate.
Practical focus could be:
Leaning into genetics for fertility, mastitis resistance, and moderate mature size to support longevity and milk per stall under heat stress.
Using beef‑on‑dairy strategically to monetize lower‑end genetics, improve calf value, and avoid raising more replacements than you really need.
Prioritizing capital for cooling, water infrastructure, feed efficiency, and manure management first – the things that hit both cost per cwt and environmental risk – before simply adding more cows.
Building a basic set of sustainability and welfare metrics (SCC trends, cull reasons, lameness levels, manure handling) so you’re ready when processors and lenders start asking tougher questions.
None of these paths are easy. But each one looks more manageable when you’re honest about which lane you’re really in and what your main constraints actually are.
Five Kitchen‑Table Questions to Print Out
If you’re still here, you’re already thinking harder about this than most. Here are five questions you might want to print and stick on the fridge, office wall, or milkhouse door:
Which lane are we actually in – scale, efficiency, or niche – and do our barns, labour setup, contracts, and debt load truly match that lane?
Do our genetic goals – and how we use sexed, conventional, and beef‑on‑dairy semen – really line up with our milk cheque, our barn design, and our culling reasons, or are we just following the latest sire list?
Which technologies on our wish list can we honestly say will improve dollars of margin per stall and labour per cwt at conservative milk prices and realistic interest rates?
What is high staff turnover actually costing us in lost milk, health problems, training time, and stress – and what would it be worth to have a more stable, better‑trained crew?
If our processor, lender, or a key customer asked tomorrow, what welfare, health, and environmental numbers could we share confidently – and where are the easiest improvements that would cut both costs and emissions?
In a world where nearly 40% of U.S. dairy farms disappeared in just five years, and where roughly two‑thirds of American milk now comes from 1,000‑cow‑and‑up herds, staying “as we’ve always done it” is its own kind of decision.
What’s encouraging is that the tools to make smarter decisions – good data, solid research, better genetics, and thoughtfully chosen technology – are more available than they’ve ever been. The hard part, as many of us have seen around kitchen tables, shop benches, and barn alleys, is being brutally honest about which lane we’re in, and then steering into it on purpose, with our eyes open, instead of getting dragged there by default.
And if you’re still reading at this point, you’re already acting more like an owner than a passenger. That’s a pretty good place to start.
Key Takeaways
The shakeout is real: Nearly 40% of U.S. dairy farms vanished in five years – but the cows didn’t. They moved to fewer, bigger barns while total milk production held steady.
Scale helps, but it’s not the only way to win: Herds milking 2,000+ cows can operate about $10/cwt cheaper than small herds, yet mid-size and niche operations stay profitable by pushing components, labour efficiency, and cow longevity harder.
Profit separates on efficiency, not milk price: Top-profit herds at any size win on feed conversion, butterfat and protein yield, fresh cow management, and labour per cwt – the milk cheque is usually similar; the cost side isn’t.
Genetics and tech pay only when they fit: DWP$-driven selection can add $1,000–$1,500 lifetime IOFC per top-quartile cow; AMS, collars, and sort gates strengthen margins only when milk lift, labour changes, and interest costs actually pencil.
Inaction is a decision: Five closing questions help owners identify which survival lane they’re really in – and where standing still may be the riskiest move of all.
Complete references and supporting documentation are available upon request by contacting the editorial team at editor@thebullvine.com.
From $1.5 Million to $150,000: The Dairy Genetics Shakeout and Your Next Move – Gain a strategic roadmap for the JIVET era by navigating the corporate takeover of dairy genetics. This breakdown delivers a clear-eyed perspective on shrinking breeder revenues and the emerging niches where independent operations can still win.
Every week, thousands of producers, breeders, and industry insiders open Bullvine Weekly for genetics insights, market shifts, and profit strategies they won’t find anywhere else. One email. Five minutes. Smarter decisions all week.
Stuck at 15.9¢ of the food dollar? Here’s how smart hauling, co‑op questions and premium milk can add real cents per cwt to your cheque.
Executive Summary: USDA’s own numbers say farmers now get just 15.9¢ of every U.S. food dollar, and Bullvine modeling shows dairy farmers are likely capturing only about half as much of the retail dairy dollar as they did a few decades ago. At the same time, ERS data show fluid milk has dropped in every decade for more than 70 years while cheese consumption has climbed to record highs, pushing more value toward components and away from jugs. This feature explains why milk demand is more flexible than gasoline demand—which is why an “OPEC for milk” won’t fix your cheque—and then zeroes in on levers still on your side of the laneway. You’ll see how smarter hauling and shared services, local producer groups at the plant gate, and tougher co‑op and board questions can each add real cents per cwt without adding a single stall. The article also walks through when premium or program milk (organic, lactose‑free, A2, cheese‑aligned) actually improves margins—and why you should be looking for at least a 15–20% net premium before you jump. Put together, it reads like a kitchen‑table playbook for nudging more of the dairy dollar back toward your farm over the next five to ten years, one practical decision at a time.
You know, for a long time, the unwritten deal in dairy felt pretty simple. If you stayed on top of fresh cow management, kept butterfat performance respectable, and shipped clean milk on time, you’d get a fair share of what families were paying at the store. A lot of parlors, dry lot systems, and succession plans were built on that basic understanding.
What’s interesting now is that when you really look at today’s numbers, that deal has shifted more than most of us would like. USDA’s Economic Research Service runs the Food Dollar Series, which tracks how every dollar consumers spend on domestically produced food is split between farms and everything that happens after the farm gate. In its latest update, ERS reports that in 2023, farmers received 15.9 cents of each dollar spent on domestically produced food as the farm share, and that the remaining 84.1 cents was the marketing share for processing, transportation, packaging, retailing, and foodservice. ERS also breaks out farm production’s own value-added, which was 9.1 cents in 2023, down from 9.3 cents the year before.
And just to be clear, that’s across all domestically produced food, not just dairy. But it tells you pretty clearly where the leverage sits in today’s food economy.
On the dairy side, ERS doesn’t publish a tidy “dairy-only” farm-share series. So at The Bullvine, we rolled up our sleeves. Using ERS’s price-spread approach and USDA farm and retail price data for milk, cheese, butter, and yogurt, we built an internal estimate of how much of the retail dairy dollar is likely making it back to farms over time. The data suggest that, compared with several decades ago, dairy farmers today may capture only around half as much of the retail dairy dollar as they once did. That’s our modeling based on published ERS methods and USDA data—not an official ERS series—, but it matches what a lot of producers say when they look at their milk cheques over a working lifetime.
Either way you slice it, the farmer’s share of the dairy dollar is a lot smaller than it used to be.
At the same time, ERS economists have been tracking what’s happening at the glass, not just at the checkout. In a 2022 Amber Waves article, ERS economist Hayden Stewart and colleagues used USDA’s Food Availability data and national dietary surveys to show that U.S. per-capita fluid milk consumption has been trending downward for more than 70 years and fell at a faster rate during the 2010s than in each of the previous six decades. They also found that between 2003 and 2018, consumers of all ages drank less fluid milk, and younger generations consistently drank less than older generations did at the same ages. That’s not just a couple of bad years—that’s a structural change in how people drink.
So here we are in 2025: farms are getting a smaller slice of the overall food dollar, our share of the dairy dollar looks to be roughly half of what it once was, people are drinking less fluid milk per head, and the dairy case is crowded with products that didn’t exist when many of us started. The natural question over coffee in the morning is, “How much of that missing money is still realistically in play for my farm—and where can I actually move the needle?”
Looking at This Trend: Where Did Your Share Go?
Looking at this trend from above, ERS basically divides the food dollar into two buckets: the farm share and the marketing share. The farm share is what farms receive for selling raw commodities for food. The marketing share is everything after the farm gate—processing, packaging, transportation, storage, wholesaling, retailing, and foodservice. For 2023, ERS says the farm share was 15.9 cents and the marketing share 84.1 cents, with farm production’s own value-added piece at 9.1 cents.
When we apply ERS’s price-spread methods to a basket of dairy products—fluid milk, cheese, butter, yogurt—and compare farm value to retail value over time, our Bullvine estimate suggests dairy’s farm share has likely dropped to roughly half of what it was a few decades ago. Again, that’s a modeled estimate based on ERS methods and USDA price data, clearly separate from ERS’s official aggregate series. But it aligns closely with what many of you have seen in your own numbers over a working lifetime.
On the demand side, Stewart’s fluid-milk work helps explain why that shrinking share feels so painful. Using the Food Availability series and dietary recall data, his team showed that U.S. daily per-capita fluid milk consumption has decreased in each of the past seven decades, and that the decline was sharpest in the 2010s. From 2003 to 2018, consumers of all ages drank less fluid milk, and younger generations drank less than older generations did at the same ages.
You probably don’t need a chart to see the rest. Walk into a grocery store in Ontario, Wisconsin, or Idaho, and the cooler that used to be mostly white jugs is now sharing space with almond, soy, oat, pea, and coconut drinks, lactose-free milk, ultra-filtered high-protein products, and every flavor of ready-to-drink shake you can imagine. ERS analyses using supermarket scanner data show that plant-based beverages do compete with cow’s milk, but their sales growth is much smaller than the long-run drop in fluid cow’s-milk sales, so they explain only a small portion of the overall decline. The bigger drivers are lifestyle and habit: fewer sit-down breakfasts, more snacking, and a lot more beverage choice.
It’s also worth noting that medical research has long shown that lactose malabsorption is more common among African Americans, American Indians, Asian Americans, and Hispanic/Latino populations than among people of Northern European descent. Once lactose-free dairy products and plant-based alternatives became widely available and affordable, households finally had options they didn’t have a generation or two ago, especially in urban markets with large retail assortments.
While the glass has been sliding, the plate tells a different story. USDA ERS statistics reports that U.S. per-capita cheese consumption reached a record 40.54 pounds in 2023, up one‑third of a pound from 2022’s record and more than 10 pounds above the 30.48‑pound level in 2002. ERS data also show that per-capita cheese consumption has set new records in most years since 2011.
Why Milk Isn’t Oil—and Why That Matters
Every so often, at a milk meeting, someone says, “We just need an OPEC for milk.” That feeling usually comes out of years of price volatility, rising costs, and the sense that someone else is always turning the dial.
The trouble is, dairy demand simply doesn’t behave like gasoline demand.
Energy agencies and market analysts describe gasoline demand as relatively inelastic in the short term: when prices spike, people complain, but most still need to drive to work and school. They may cut back a bit on discretionary trips or switch to more fuel‑efficient vehicles over time, but in the short run, many trips still have to happen. Even International Energy Agency scenarios that assume strong electric‑vehicle growth and aggressive climate policies project that oil demand declines gradually, not overnight, because transportation, freight, and industry are so tied to liquid fuels.
Milk is different. ERS’s long‑run work on fluid consumption shows that as prices have moved and as more alternatives have appeared, people have steadily adjusted how much milk they drink and when they drink it. When budgets are tight or preferences shift, most households can maintain their calorie and protein intake by switching to other foods, drinks, or dairy products like cheese and yogurt. The Amber Waves analysis makes it clear that per‑capita fluid milk has dropped in every decade for more than 70 years, while per‑capita cheese consumption has climbed to record levels.
So milk demand—especially for fluid—is simply more elastic than gasoline demand. When people have more beverage options, more snacking, and more ways to get their nutrients, they can and do adapt. If milk prices rise too far at retail relative to other foods, or if eating patterns continue to move away from sit‑down breakfasts, fluid milk volumes are going to keep feeling that pressure.
That’s why an “OPEC for milk” isn’t likely to work the way some people hope. Oil exporters deal with a commodity whose short‑term demand is relatively inflexible and whose global supply is influenced by large producers. In dairy, especially fluid dairy, consumers have more substitutes and greater flexibility. That doesn’t mean supply management or quota systems can’t exist—as Canada demonstrates—but it does mean you can’t count on tight supply alone to guarantee a higher or more stable cheque without watching what’s happening on the demand side.
Attribute
Gasoline
Milk (esp. Fluid)
Key Implication
Notes
Short-term elasticity
Low (inelastic)
High (elastic)
🔴 People can reduce milk consumption; they can’t easily stop driving.
ERS data: fluid consumption down 60% in 70 years; gasoline still central to transport
Substitutes available
1–2 (electric vehicles, public transit—long adoption lag)
5–7+ (plant-based, other beverages, yogurt, cheese, whole other food categories)
🔴 Milk competes with dozens of options at breakfast and snack time; oil has no real substitutes short-term.
Grocery store reality: one cooler used to be 90% milk; now it’s 30% milk, 70% alternatives + specials
Consumer habit flexibility
Rigid (people need to commute; no easy substitutes)
So rather than waiting for some central “milk OPEC” to rescue margins, it’s more useful to focus on the levers that actually change how much value you capture in your own business.
That’s where the stripper‑well story and the German producer‑group experience come in.
What Tiny Oil Wells Can Teach Small and Mid‑Size Dairy Farms
If you’re running a small or mid‑size dairy, the stripper‑well story is probably more useful than the OPEC analogy.
Back in the early to mid‑1980s, when inflation‑adjusted oil prices dropped sharply, a lot of higher‑cost wells were shut in, and many producers left the industry. Yet one class of wells—marginal “stripper” wells—often kept quietly producing.
The U.S. Energy Information Administration defines stripper oil wells as those producing no more than 15 barrels of oil equivalent per day on a 12‑month average. Using state data and its own estimates, EIA reported that at the end of 2015, the United States had about 380,000 stripper oil wells and roughly 90,000 non‑stripper wells, and that stripper wells still accounted for around 10 percent of total U.S. crude oil production that year.
When you look at U.S. Department of Energy programs and case work focused on small producers, a few patterns show up again and again:
Multiple owners use joint operating agreements so they can share costs and spread risk while one operator handles day‑to‑day decisions.
Infrastructure—gathering lines, tank batteries, workover rigs, diagnostic tools—is often shared, so fixed costs are spread across more barrels.
The focus is on modest, low‑cost improvements rather than big, speculative expansions.
The wells stayed small. But they plugged into shared systems, so they weren’t paying “tiny operator” prices for every truck, every repair, and every service.
If you picture a 70‑cow tie‑stall in Quebec, a 220‑cow freestall in New York, or a 600‑cow dry lot system in Idaho, it’s not a bad analogy. Those herds may not want to become 3,000‑cow outfits—and in many cases they shouldn’t—but they also can’t afford to pay a full “small farm” penalty on every truck, every ton, and every vet or nutritionist call.
Hauling is one obvious place to start.
A classic bulk milk assembly report and more recent analysis of milk hauling charges in the Upper Midwest show that average hauling cost per cwt tends to decline as route volumes and individual stop volumes increase, and that smaller, scattered producers often pay higher per‑cwt hauling charges than larger or more concentrated producers. The Upper Midwest Federal Order staff paper on hauling charges, for example, documents that as producers’ milk volumes increase, their average hauling charges per hundredweight tend to fall, partly because many handlers charge flat hauling amounts regardless of volume moved.
Service
Solo Cost $/cwt
Pooled Cost $/cwt
Savings $/cwt
% Savings
Hauling
$0.85
$0.60
$0.25
29%
Nutrition/Vet
$0.70
$0.50
$0.20
29%
Inputs (bulk feed, etc.)
$0.60
$0.45
$0.15
25%
Tech access (robots, data)
$0.45
$0.35
$0.10
22%
Miscellaneous services
$0.25
$0.15
$0.10
40%
TOTAL
$2.85
$2.05
$0.80
28%
In practical terms, what that’s meant in places like Wisconsin is that co‑op staff and university dairy economists have sat at kitchen tables with maps and spreadsheets and redrawn pickup loops so trucks spend more time moving full loads and less time criss‑crossing between small, scattered stops. When three or four farms along a road or closely clustered on the map coordinate pickup days and tighten the loops—especially in winter when roads are rough, and diesel isn’t cheap—many of them see their hauling cost per cwt start lining up better with what those hauling studies predicted.
On the purchasing side, many Midwest producers report that forming input‑buying groups has helped them push back on feed costs. Cooperative development centers and county extension offices describe groups of anywhere from a handful of farms to a dozen or more that pool orders for grain, minerals, or certain inputs and ask suppliers to bid on the combined volume. Case reports from extension staff show that those groups often secure better per‑ton pricing or more favorable payment terms than individual farms were getting.
Then there’s the service side. In regions like the Northeast and Great Lakes, independent nutritionists and veterinarians have built models where several herds share higher‑end services—a tighter focus on the transition period, more frequent ration checks, and deeper data monitoring. Penn State Extension, for example, has summarized research showing that common transition‑period diseases—retained placenta, metritis, ketosis, displaced abomasum—can each cost several hundred dollars per cow when you factor in vet and labor costs, lost milk, extra days open, and higher culling risk. When several farms share a nutritionist or vet who’s serious about transition management, each herd pays less per cow while still seeing improvements in fresh‑cow health, milk yield, and components.
On the technology side, extension economists have done a lot of work on robotic milking. A 2025 dairy extension article on robotic milking economics notes that profitability depends heavily on things like labor savings, milk per cow, milk per robot per day, and useful life, and that high capital costs—often around $150,000–$200,000 per robot for 50–70 cows—mean payback requires realistic assumptions. Some producers have explored shared service contracts, co‑operative ownership of certain technologies, or other arrangements that spread those costs and risks across more cows and more herds.
What I’ve noticed, talking with producers who’ve gone in this direction, is that they don’t feel like they’ve lost their independence. They still make breeding decisions, determine how they manage fresh cows and the dry period, and weigh the trade-offs between robots and parlors. They’ve just decided to stay moderate in cow numbers and big where scale really pays.
That’s the stripper‑well lesson for dairy: your herd doesn’t have to be big, but how you handle hauling, purchasing, and expert support doesn’t have to stay small.
What Farmers Are Finding in Germany: Co‑ops, Producer Groups, and Pushing Back
Germany is one of the largest milk producers in the European Union, and since EU‑wide milk quotas ended in 2015, German producers have been working under the Common Agricultural Policy and single‑market rules without a national milk‑quota system like Canada’s supply management. In that environment, farmer‑owned co‑ops and legally recognized producer organizations (POs) carry significant weight in how farmers interact with processors and retailers.
Looking at this trend, the co‑operative structure is a big part of the story. A significant share of German milk is marketed through farmer co‑ops that handle both collection and processing. DMK Deutsches Milchkontor, for example, describes itself as a major dairy co‑operative owned by thousands of farmers, running multiple plants in Germany and neighboring countries, with a governance setup that includes a representative assembly and a supervisory board where farmers have a voice.
For farmers shipping to investor‑owned processors, the EU’s “Milk Package,” introduced after the 2009 dairy crisis, created a framework for recognized dairy POs that can negotiate contracts—including price formulas and volume terms—on behalf of their members within defined competition‑law limits. A European Commission inventory prepared by Wageningen University found that in 2019, more than 46 percent of German milk deliveries were marketed through POs or PO associations, and that one large association represented 137 POs and about 5.8 billion kilograms of raw milk in negotiations.
The data and case studies suggest that as a producer group’s share of a processor’s intake grows, its bargaining leverage increases, even though there isn’t a single magic percentage that works everywhere. At some point, the plant can’t treat you like just another supplier.
When German farmers have felt backed into a corner, they’ve also demonstrated they’re willing to push back—sometimes dramatically. During the 2008–2009 dairy crisis, organizations like the Bundesverband Deutscher Milchviehhalter helped coordinate “milk strikes,” where some producers withheld milk or even dumped it to protest prices they said didn’t cover costs. German and international media widely covered those actions and were later analyzed in the EU work on dairy market crises.
You don’t have to agree with every tactic to see the pattern: in Germany, farmer‑owned co‑ops with processing assets and legally recognized POs have helped producers maintain more leverage in a concentrated value chain.
Where U.S. Co‑ops Help—and Where They’ve Drifted
While German farmers were building POs and refining co‑ops within the EU framework, U.S. dairy co‑ops were taking their own path.
USDA co‑operative statistics and Rural Development reports tell that story pretty clearly. In 1964, there were 1,244 dairy cooperatives in the U.S.; by 2017, that number had dropped to around 118. Over those decades, the average co‑op grew larger, and more co‑ops owned or controlled processing plants. Many traditional “bargaining co‑ops,” which focused on negotiating price and terms with processors, either merged into larger processing co‑ops or disappeared. At the same time, investor‑owned processors were consolidating too, reshaping the processing side of the dairy business.
As co‑ops invested in plants and brands, boards and managers naturally spent more time on processing margins, plant utilization, branding, and navigating the demands of big retail chains. Farmers also know firsthand that processors and retailers are under pressure from rising labor, energy, and transportation costs.
The tension is to ensure those realities don’t pull co‑op strategy too far from the needs of member farms whose milk pays the bills.
Dairy Farmers of America (DFA) is the best‑known example, simply because of its national footprint. Congressional research and industry profiles describe DFA as a national dairy co‑op that markets a large share of U.S. milk, earns billions in annual revenue, and owns or has interests in many processing plants. DFA’s own reporting emphasizes member services, net income, patronage, and equity payments.
At the same time, the DFA has been involved in several major antitrust cases. In the Southeast, a class‑action lawsuit over milk marketing practices ended in 2013 with the DFA agreeing to a $140 million settlement while explicitly denying wrongdoing in the settlement documents. In the Northeast, a similar case concluded with a $50 million settlement finalized in 2016, again without an admission of liability. More recently in the Southwest, DFA and Select Milk Producers settled litigation involving price‑fixing and market manipulation allegations; DFA agreed to pay about $24.5 million and Select about $9.9 million, while both co‑ops continued to deny liability in court filings.
So on one side, co‑ops like DFA and many regionals still provide essential services: market access, balancing, logistics, risk pooling, and “a home for your milk” when things are messy. On the other hand, consolidation and vertical integration have led many producers to question how closely co‑op strategies align with farm‑gate needs.
Co‑op governance research adds another layer. A USDA Rural Development report on dairy co‑ops in the 21st century found that member participation—attending meetings, voting, serving on boards—is higher when members strongly support the one‑member‑one‑vote principle, feel a sense of ownership, and value working with other co‑ops. Academic studies of co‑operative governance have also found that transparency, active member involvement, and clear accountability structures tend to improve alignment between management choices and member interests.
Economists who study co‑ops often make a simple point: if members don’t read financial reports or show up with specific, numbers‑based questions, decisions about how margins are used will still get made—they just get made without much owner input.
In Canada, the tools differ—quotas, regulated prices, provincial marketing boards—but the underlying questions remain the same. A 2025 article in the Canadian Journal of Agricultural Economics used input–output data from 1997 to 2021 to examine farmers’ share of the consumer food dollar in Canada and concluded that farm share is relatively low overall, varies by product, and is particularly small in food‑away‑from‑home channels. Under supply management, how much value reaches farms depends heavily on how provincial boards negotiate with processors and how premiums for components or value‑added products get shared.
What I’ve noticed is that producers who feel most confident about their co‑ops or boards tend to treat governance as part of their risk‑management plan. They make time—even during busy seasons—to read annual reports and financial statements. They work to understand equity revolvement policies. And they walk into meetings with specific, business‑focused questions instead of general frustration.
If your co‑op or board meeting feels more like a scripted ceremony than a working business session, that’s usually a signal.
Milk Price Volatility and the Missing Share: What’s Really in Play?
This is where the big‑picture stats start to meet day‑to‑day decisions.
Right now, ERS’s Food Dollar work tells us farmers capture 15.9 cents of each dollar U.S. consumers spend on domestically produced food, with farm production’s own value‑added at 9.1 cents. Bullvine’s modeling suggests dairy farmers are probably capturing only around half as much of the retail dairy dollar as they did several decades ago. ERS and Cheese Reporter data show fluid milk consumption has declined in every decade for more than seventy years, while cheese consumption has hit record highs. ERS work also makes it clear that plant‑based beverages explain only a small slice of the fluid decline.
Lay that against recent Class III prices, higher feed costs, rising wages, interest rates, and energy bills, and it’s no surprise many farms feel like they’re running just to stand still. In that environment, a 10–20 cent per cwt shift in your favor isn’t pocket change—it can be the difference between comfortably servicing principal and slowly falling behind.
We don’t have a precise government chart that divides the “missing” share of the dairy dollar into “structural, can’t touch” and “recoverable, if you organize.” But when you combine the Food Dollar data, processing and retail consolidation, German PO experience, global trade pressures, and co‑op history, the problem naturally sorts into two piles.
On one side, you’ve got slow‑moving forces:
Decades of consolidation among processors and retailers.
A grocery sector where a relatively small number of chains control a large share of volume.
Long‑standing consumer habits that reduce sit‑down meals and reshuffle beverage choices.
Big capital investments in plants, distribution centers, and logistics networks that can’t be unwound overnight.
Federal Milk Marketing Order rules are undergoing modernization following a national hearing and USDA’s recommended decision, with changes that will take time to implement.
Global trade dynamics and competition from other export regions shape baseline price levels.
On the other side, you’ve got levers much closer to your driveway:
How milk hauling is organized in your area, and whether routes and stop sizes are as efficient as they could be.
Whether your processor contracts and co‑op policies are written, clear, and anchored to public price signals.
How actively you and your neighbors participate in co‑op or board governance.
Whether at least some share of your milk is tied to markets or programs that pay for something more than just volume—components, quality, production system, or specific end uses.
To give that some shape without pretending there’s a universal benchmark, imagine a 100‑cow freestall averaging about 24,000 pounds per cow per year. That’s around 2.4 million pounds of milk annually. Suppose—just as a model—that the dairy products made from that milk end up generating about $900,000 in retail sales across grocery and foodservice. If the farm effectively captures about a quarter of that value, that’s roughly $225,000 in farm‑level revenue. If, over time, better hauling arrangements, clearer and stronger contracts, more responsive co‑op governance, and some program milk allow similar farms to capture something closer to 40 cents of each retail dollar tied to their milk, that same volume could correspond to something like $360,000 in revenue.
Those figures are illustrative, not predictions. But they show why even recovering part of that gap—through a few more cents per cwt from better organization and targeted decisions—matters a lot. Those extra cents can come from multiple directions at once: a small saving on hauling, a modest feed discount from a buying group, a few extra cents from stronger components going into cheese, and a bit of premium from a specialty program can start to show up in your year‑end numbers.
The structural issues—retail concentration, FMMO modernization, competition policy, global trade—will take years of industry work and policy arguments. They’re real, but they move slowly.
The closer‑to‑home levers can move sooner if you decide to pull them.
Practical Paths You Can Actually Start On
So let’s bring this down from charts and hearings to things you could realistically start on this year. What farmers are finding is that you don’t have to change everything at once. You can start with one or two levers that fit your operation, your neighbors, and your appetite for change.
Path 1: Stay Small in Cows If You Want To—Think Big in Services
As many of us have seen, adding cows doesn’t automatically fix a weak cheque. Often, the bigger wins come from running certain parts of the business at a larger effective scale while keeping herd size in line with your land base, labor, and family goals.
Some practical places to look:
Hauling and route density. Ask yourself: are you and your neighbors shipping to the same plant on routes that actually make sense today, or just routes that made sense twenty years ago? Research on bulk milk assembly and hauling charges shows that as route volumes and stop volumes go up, average hauling cost per cwt tends to go down, and small, scattered stops tend to pay more. In Wisconsin and other Upper Midwest operations, Federal Order staff and extension economists have worked with co‑ops and producers to categorize hauling charges by volume group and region, and have repeatedly found that larger, denser pickups reduce the cost per cwt. Sitting down with neighbors and your hauler or co‑op to redraw routes can nudge your hauling bill in the right direction.
Input‑buying groups. Cooperative development centers and county extension offices have established buying groups that pool orders for feed, minerals, or other inputs and invite suppliers to bid on the combined volume. In many cases, those groups see better per‑ton pricing or more flexible terms than individual farms were getting.
Shared expertise around the transition period. Research summarized by Penn State Extension and other university sources shows that common transition‑period diseases can each cost several hundred dollars per case when you add lost milk, extra days open, and culling risk. At the same time, herd‑level studies show that better transition‑period management improves peak milk production, milk components, and overall health. In the Northeast and Great Lakes, some independent nutritionists and veterinarians have built service models where several herds share higher‑touch transition‑period programs—more frequent ration checks, more data review, closer monitoring of fresh‑cow health—at a per‑cow cost that works for modest herd sizes.
Robotic milking and tech, without carrying it all yourself. Extension economists have looked closely at the economics of robotic milking systems. A 2025 dairy extension analysis notes that robot profitability depends heavily on labor savings, milk per cow, milk per robot per day, and useful life, and that high capital costs—often around $150,000–$200,000 per robot for 50–70 cows—mean payback requires realistic assumptions. Some producers are exploring shared service contracts, co‑operative ownership of certain technologies, or other arrangements that spread those costs and risks across more cows and more herds.
You still control your breeding program, your fresh‑cow management, and whether the next big project is robots, a parlor remodel, or a feed center. You’re just choosing not to pay full “small farm” rates for every truck, every ton, and every specialist.
Path 2: Build Producer Groups Where Your Milk Meets the Plant
What farmers are finding—in Europe and increasingly in North America—is that a lot of leverage sits right where your milk crosses into the plant. That’s the moment it stops being “your” milk and becomes someone else’s raw material.
If you and other shippers want more say at that point, a practical plan might look like this:
Map who ships to your plant. Quietly figure out which farms ship to the same plant as you. Talk one‑on‑one and see who’s open to exploring a producer group. EU research on dairy POs and North American experiences with marketing groups show that as a group’s share of a processor’s intake grows, its bargaining leverage usually increases—although there’s no single magic percentage.
Push for clear, written contracts. The first step typically isn’t threatening to withhold milk; it’s asking for clarity. If you don’t have a written contract, work as a group to request one. If you do have a contract but the language is vague, push for more precise terms. That can mean tying payment for butterfat, protein, and other solids to published price series; clearly defining quality premiums and penalties; and including a reasonable notice period for major changes to pay formulas or terms. In practice, some producer groups have negotiated 60‑ to 90‑day notice requirements so farms can adjust.
Use tested governance templates. USDA co‑op and rural‑development programs, along with university co‑op centers, provide model bylaws and marketing agreements that can be adapted for dairy producer groups. With guidance from an agricultural lawyer who understands your region, you can build a simple one‑farm‑one‑vote structure that keeps the group democratic and business‑focused.
You don’t have to reinvent the wheel. But you do have to decide whether you want to keep walking into the plant gate as separate, small suppliers, or as a group representing volume the plant can’t shrug off.
Path 3: Treat Co‑op and Board Governance as Risk Management, Not Politics
Given how much milk still moves through co‑ops in the U.S. and through provincial boards and co‑ops in Canada, treating governance as “just politics” can quietly cost you money.
For your next co‑op delegate meeting, AGM, or provincial board session, it might be worth walking in with a short list of specific questions, such as:
Over the last five years, how has our average mailbox price compared with prices paid by other plants in this region for similar milk, after hauling and premiums?
How are processing margins reported—by plant, by product, or only as an aggregate—and how much of those margins actually flows back to members through pay price, patronage, and equity revolvement?
How does our equity revolvement plan work in practice, and what does that mean for younger producers versus older members nearing retirement?
When big decisions like de‑pooling under a Federal Order or investing in a new plant get made, how are the impacts on member pay price and risk explained to producers?
With Federal Milk Marketing Order modernization moving ahead, what scenarios has our co‑op modeled for changes in make allowances and component pricing, and how would those scenarios affect member pay prices?
Under Canada’s supply management system, the questions change a bit, but the spirit is the same. You’ll want to know how provincial boards negotiate with processors, how component and specialty product premiums are shared, and what the long‑term plan is for processing capacity and market access in your province.
What’s encouraging is that when producers keep showing up with these kinds of concrete, numbers‑based questions—not just general frustration—the tone of co‑op and board governance often begins to shift. Research on co‑ops suggests that higher member engagement and stronger accountability tend to improve alignment between management decisions and member interests.
If your co‑op or board meeting feels more like a polished presentation than a working business conversation, that’s a signal that something needs attention. And if you’re not ready to run as a delegate yourself, you can still support someone who will ask the tough questions on behalf of producers like you.
Path 4: Use Differentiation as a Risk Tool, Not a Religion
With long‑term pressure on fluid milk and a very crowded beverage aisle, relying 100 percent on undifferentiated bulk milk carries more risk than it used to. That doesn’t mean every farm should jump into organic, grass‑fed, A2, or on‑farm processing. It does mean it’s worth asking whether at least a small slice of your volume—five to ten percent—should be tied to something that pays for more than just pounds.
If none of your milk is in any kind of program—no organic, no grass‑fed, no lactose‑free stream, no direct tie to specific cheese or yogurt production—you’re essentially betting your entire milk cheque on commodity swings.
Here are some paths producers are using, with research and real‑world evidence behind them:
Organic and grass‑fed programs. Economic analyses of organic and grass‑fed dairy systems in North America and Europe show these programs can offer higher pay prices but also entail higher feed costs, certification expenses, and, often, lower yields. When feed prices spike and program pay prices lag, margins can compress quickly. These systems work best when a farm’s land base, forage program, and family goals align with the requirements.
Lactose‑free and specialty fluid programs. In markets with more lactose intolerance and strong demand for premium, high‑protein, or reduced‑sugar dairy drinks, processors producing lactose‑free and specialty milks sometimes offer premiums to farms that consistently hit quality and volume specs. Strong components, low bacteria counts, and reliable deliveries are usually non‑negotiable.
A2 and other niche milk programs. In some regions, processors and brands have built A2 or other specialty fluid programs that pay premiums to herds meeting specific genetic and management criteria. Those programs require deliberate breeding and marketing, but for some farms, they fit well into existing strategies.
Cheese and cultured alignment. Given that per‑capita cheese consumption is at record highs, aligning more of your milk with cheese and cultured plants can tie your income more closely to where demand is growing. For herds with strong components and quality, component‑based pricing at cheese plants can make butterfat and protein yields show up more directly in the milk cheque.
On‑farm and local processing. Co‑op development centers and extension case studies showcase farms that have gone into on‑farm bottling, cheese, yogurt, or ice cream and built local brands. Those stories consistently point out that success depends on location, capital, labor, and marketing skills. It’s not a quick fix, but for the right families, it can help capture more of the dairy dollar and diversify income.
When you pull those experiences together, a pattern emerges. If only a tiny fraction of your milk is in any differentiated or program market, most of your risk still sits squarely on the commodity side. Starting by putting something like 5–10 percent of your volume into a program that genuinely fits your farm lets you learn without betting everything.
Based on economic studies of organic, grass‑fed, and other specialty programs and what farms report in their own budgets, if you can’t realistically see a path to at least a 15–20 percent price premium net of extra costs, the program often doesn’t improve the bottom line for most operations. Being honest with that math up front can save a lot of heartburn later.
Program Type
Typical Premium %
Extra Costs $/cwt
Net Premium $/cwt
Meets 15–20% Hurdle?
Quick Notes
Organic
+25–35%
$3.50–$4.50
$1.50–$2.50
🟡 MARGINAL
High certification costs, forage dependency, yield risk, organic feed premiums eat margin. Works IF: excellent forages + labor cost low + strong management. Risk: premium drops in weak market.
Grass-Fed/Pasture
+20–30%
$2.00–$3.50
$0.50–$1.50
🔴 NO
High labor, seasonal feed cost volatility, lower yields. Only pencils if land base is free/cheap and labor is family. High risk in feed spikes.
Lactose-Free Specialty Fluid
+12–18%
$0.40–$0.80
$0.80–$1.40
🟡 MARGINAL
Premiums depend on market (urban > rural). Quality/comp specs are strict. Works IF: strong components + reliability. Risk: low upside vs. commodity risk.
A2 Milk Program
+8–15%
$0.30–$0.60
$0.40–$1.00
🔴 NO
Genetic requirements (breeding cost), buyer concentration risk, small market size. Premium often doesn’t compensate for breeding complexity.
Cheese-Aligned/Component
+5–12% (via butterfat/protein premium)
$0.20–$0.50
$0.80–$1.50
🟢 YES
Lowest extra cost, most reliable. Butterfat/protein visibility in pay check. Market demand strongest. Best entry for testing differentiation.
On-Farm Processing (cheese, yogurt, bottling)
+30–60%
$5.00–$8.00 (capital, labor, marketing)
$0–$2.00 net
🔴 NO (initially)
Very high barrier: capital, licensing, marketing skills needed. 3–5 year payback typical. Only for specific locations + entrepreneurial family.
Bringing It Back to Your Bulk Tank
By this point, you probably don’t need another chart to know where this is heading.
ERS’s Food Dollar Series tells us that farmers currently capture about 15.9 cents of every dollar U.S. consumers spend on domestically produced food, with 9.1 cents reflecting farm production’s own value‑added in 2023. Bullvine’s modeling suggests dairy farmers now capture roughly half as much of the retail dairy dollar as they did a few decades ago. ERS and industry data show that per‑capita fluid milk consumption has declined in every decade for more than seventy years, while per‑capita cheese consumption has risen to record levels, like that 40.54‑pound mark in 2023. ERS analysis also makes it clear that plant‑based options are only a small part of the fluid story.
What’s encouraging is that not all of that missing share is gone for good. Some of it still sits in places where farmer decisions and farmer organization matter: in how you and your neighbors handle hauling and purchasing, in whether you show up at the plant gate alone or as part of a producer group, in how seriously you treat co‑op or board governance, and in whether at least a slice of your milk is tied to markets that pay for more than just volume. fmma30
Your first three moves might be simpler than they look on paper:
Talk hauling and routes with your neighbors. One honest conversation with the farms on your road about coordinating pickups could tighten routes and trim a few cents per cwt off hauling, especially in winter when every extra mile costs more. It’s not flashy, but it’s real money on every load.
Map who ships to your plant and explore a producer group. Find out who else is delivering to the same plant. Start a kitchen‑table conversation about contracts, change-notice periods, and tying pay formulas to public prices. The goal isn’t revolution—it’s clarity and fair, predictable terms.
Pick one realistic differentiation angle for five to ten percent of your milk. That might mean shifting more volume to a cheese plant that pays well for components, joining a lactose‑free or specialty fluid program that fits your herd, or taking the first step toward a niche that truly aligns with your resources and values. Start small, insist on a net premium that clears that 15–20 percent hurdle after costs, and learn before you scale.
The big structural questions—FMMO modernization, retail concentration, global trade rules—will take years of industry work and policy debate. They matter, and The Bullvine will keep covering them. But they’re not going to change your milk cheque next month.
The levers closer to home might.
What I’ve noticed over the years is that when farmers start moving even one of those controllable levers, the math begins to shift—maybe just by a few cents per hundredweight at first—but this time those cents are moving in your direction.
And over the next five or ten years, those few cents of the milk dollar can be the difference between just hanging on and building something your son or daughter—or that ambitious young couple down the road—actually wants to step into.
Key Takeaways:
Your slice of the dairy dollar has roughly halved. USDA reports farmers get just 15.9¢ of every food dollar; Bullvine modeling suggests dairy’s share of the retail dairy dollar is about half what it was a generation ago.
Fluid keeps falling, cheese keeps climbing. Per-capita fluid milk has dropped every decade for 70+ years while cheese hit a record 40.54 lbs in 2023—your cheque now rides on butterfat and protein more than ever.
Milk isn’t oil—and that’s why “OPEC for milk” won’t work. Consumers can swap milk for other foods and drinks far more easily than they can stop driving, so supply control alone won’t rescue margins.
Four levers you can actually pull. Tighter hauling routes, local producer groups at the plant gate, pointed co-op governance questions, and well-chosen premium programs can each add 10–20¢/cwt without adding a single stall.
Set a 15–20% net premium hurdle before you jump into any program. If the math doesn’t clear that bar after extra costs, it’s probably not worth the hassle.
Complete references and supporting documentation are available upon request by contacting the editorial team at editor@thebullvine.com.
Which Lane Is Your Dairy In? The $10B Shift You Need to Map Now – Arms you with the market intelligence to navigate the $10 billion shift in processing capacity, helping you choose the right “lane” for your operation before local plant consolidation and retail contracts make the decision for you.
Every week, thousands of producers, breeders, and industry insiders open Bullvine Weekly for genetics insights, market shifts, and profit strategies they won’t find anywhere else. One email. Five minutes. Smarter decisions all week.
Still drenching every cow over 1.2? The latest data says that the blanket rule is costing you more than the propylene glycol.
Picture this. We’re standing at the fresh cow pen, coffee in one hand, ketone meter in the other. A cow reads 1.3 mmol/L on a blood BHB test, she gets flagged as subclinically ketotic, and somebody reaches for the propylene glycol. You know the routine.
Here’s what’s interesting. When you run the numbers the way the researchers did, how you react to that one reading can swing something like $25,000 to $35,000 a year in modeled losses for a 500‑cow Holstein freestall herd in today’s conditions. A Canadian modeling study based on real herd data pegged the cost of a subclinical ketosis case at about 203 Canadian dollars per cow, once you factor in lost milk, increased disease risk, reduced fertility, and early culling. That work was led out of Guelph and published in 2016, and it’s still the go‑to number many economists use.
On the US side, a team including Christopher McArt, DVM, PhD at Cornell, developed a deterministic model for early‑lactation hyperketonemia—basically elevated BHB in the first couple of weeks—and came up with an average cost of about 289 US dollars per case when you include the downstream metritis and displaced abomasum that tend to travel with high ketones. That’s a different model and a slightly different definition, but it gives you the same basic message: once cows slide into that high‑BHB zone, the bill adds up.
Now take a 500‑cow herd. If about a quarter of those cows quietly drift into subclinical ketosis in the fresh cow window—which is right in line with big global surveys using a 1.2 mmol/L cut‑point—that’s about 125 cows a year. A multicountry project that tracked 8,902 cows on 541 farms across 12 countries found an average subclinical ketosis prevalence of 24.1 percent using the same 1.2 mmol/L blood BHB definition. At 203 dollars a case, 125 cows comes out to something like $25,000 in modeled losses; plug in the 289‑dollar estimate, and you’re looking at closer to $36,000.
And if that herd can trim SCK prevalence from roughly 25 percent (125 cows) down to 15 percent (75 cows) by tightening transition management and being smarter about which cows actually get treated, the math shifts quickly. That’s 50 fewer cases. On the Canadian model, you’ve just saved a bit over $10,000, and on the hyperketonemia model, you’re up around $14,000–$15,000 in modeled savings.
Whether you’re selling under Canadian quota, US component pricing, milk‑solids contracts in New Zealand, or more volume‑weighted arrangements in Europe, those per‑case costs don’t care. Once herd‑level prevalence creeps from the low‑20s into the 25–30 percent band, the leak becomes large enough to show up in the year‑end numbers.
And yet, on many farms, the whole conversation still begins and ends with one simple line on the meter: 1.2 mmol/L. So let’s talk about where that line came from and why, in 2025, it probably works best as a reference point—not as the only rule you live by.
Where That 1.2 Line Really Came From
It’s worth noting right off the bat that 1.2 wasn’t pulled out of thin air. Over the past couple of decades, researchers have linked blood BHB levels to things you and I lose sleep over: displaced abomasums, retained placenta, metritis, mastitis, lost milk, and open days.
When a pile of those studies were pulled together in an invited review on diagnosing and monitoring ketosis in high‑producing cows, the authors found that cut‑points in the 1.2 to 1.4 mmol/L range did a pretty solid job of identifying cows that were more likely to run into trouble, without burying you in false positives. In practice, 1.2 proved a handy “early tripwire” for subclinical ketosis in many trials and on many farms.
Other reviews that focus on ketone bodies in dairy cows land in roughly the same place. Subclinical ketosis is most commonly defined at about 1.2 mmol/L blood BHB, and 3.0 mmol/L and above is usually where people start talking about clinical ketosis. When you couple those BHB numbers with non‑esterified fatty acids (NEFA), the pattern is clear: cows that come out of the transition period with both BHB and NEFA on the high side see more metabolic disease and poorer fertility.
On the physiology side, the newer work has filled in some of the “why.” A 2024 review on the big metabolic diseases in the transition period, along with related work on body condition and adipose tissue, shows that cows in deeper negative energy balance mobilize more fat, load the liver with triglycerides, and start sending off more inflammatory and oxidative stress signals. Ketotic cows in those studies had higher NEFA levels, more liver fat, and a different inflammatory profile than their herd mates, even when they didn’t appear “sick” in the classic sense. Multi‑omics papers—where they look at dozens or hundreds of metabolites and proteins at once—back that up with a distinct metabolic fingerprint in cows that develop ketosis.
So at the herd level, 1.2 mmol/L is a very useful risk marker. If a high proportion of your fresh cows are over that line, especially in those first couple of weeks, the odds go up for disease, lost milk, and slower rebounds. That’s why you see that number in so much university research and extension material.
But it’s just as important to remember what that line was designed to do. It was meant to describe risk in groups of cows, not to dictate exactly what you must do with every single cow that pings 1.2 or 1.3 on the meter.
Cost Component
Canadian Model ($203 total)
US Model ($289 total)
Note
Lost milk (reduced production for 30–60 days)
$95
$135
Largest driver
Increased disease risk (metritis, mastitis, DA treatment)
$65
$110
Cascading costs
Reduced fertility (extended open days, re-breeding)
$35
$35
Long-term impact
Early culling / forced early exit
$8
$9
Replacement herd cost
Total per case
$203
$289
Difference reflects severity & follow-on issues
Looking at the Big Picture: How Common Is This, Really?
If you zoom out from your own herd and look at the global picture, you see pretty quickly that you’re not alone.
That multicountry field project we just mentioned—8,902 cows, 541 farms, 12 countries—sampled cows at 2-21 days in milk and used 1.2 mmol/L as the blood BHB cut-off. Overall, subclinical ketosis prevalence averaged 24.1 percent, but the range across countries was wide: some places were down around 8–9 percent, while others, including some pasture‑heavy systems, pushed above 40 percent.
More recent syntheses that pull together multiple SCK and hyperketonemia studies land in the same ballpark. Global prevalence sits in the low‑to‑mid‑20 percent range when you use something like 1.2 mmol/L as your line in the sand, with individual herd results scattered across the range depending on management, genetics, and climate. The Merck Veterinary Manual and updated transition reviews also underline that most hyperketonemia cases show up in the first two to three weeks after calving, and that multiparous cows are consistently at higher risk than first‑lactation animals.
So if you run a quick fresh‑cow audit in an Ontario or Wisconsin freestall—or in a Quebec tiestall herd—and find that about one in four clinically normal cows in the first three weeks are testing over 1.2, that actually lines up pretty well with what these big data sets describe as “normal” for modern Holstein herds. It doesn’t mean it’s where you want to stay long‑term, but it does mean you’re fighting a battle a lot of herds are in the middle of right now.
What the numbers really help with is this: they tell you that once prevalence drifts into the mid‑20s and stays there, the cost per case math starts to really matter. That’s where it’s worth asking not just “how many cows are over 1.2?” but “which cows are over it, and when?”
Same Number, Two Very Different Cows
This is where the story gets more interesting, once you come back down from the spreadsheets to the cows in front of you.
In barns I’ve walked—Midwest freestalls, Quebec tiestalls, Western dry lot systems—the same pattern keeps showing up. You pull blood on two fresh cows. Both read 1.3 mmol/L. But when you actually look at them, they’re not the same animal at all.
Cow A: Trouble Brewing in Week One
Cow A is the kind of cow many of us could pick a mile away:
Day 5 in milk
Fourth‑lactation Holstein
Walked into the close‑up pen heavier than you’d like (body condition around 3.75–4.0 on a five‑point scale)
History of displaced abomasum in the last lactation
Hanging back at the bunk; rumen fill looks flat
Maybe giving 55 pounds of milk with butterfat levels that feel low for her genetics and stage
Blood BHB: 1.3 mmol/L
Cow B: The High‑Output Adapter in Week Two
Cow B, on the other hand, looks like a different species some mornings:
Day 15 in milk
Second‑lactation Holstein
Calved at a tidy BCS of about 3.0–3.25
Clean first lactation—no DA, no recorded ketosis
Right up at the bunk, every push‑up, rumen fill is excellent
Pushing close to 95 pounds with strong butterfat for the pen
Blood BHB: 1.3 mmol/L
To make that contrast easier to see, here’s a quick side‑by‑side:
Feature
Cow A: Early-Window Risk
Cow B: High-Output Adapter
What This Means
Days in Milk
Day 3–9
Day 10+
Early trouble vs. normal adaptation
Body Condition
3.75–4.0 (over-conditioned)
3.0–3.25 (moderate)
Deeper NEB = greater metabolic stress
Clinical Signs
Poor rumen fill, sluggish, weak milk
Aggressive eater, excellent fill, strong solids
Feeding behavior predicts outcome
Blood BHB (1.3 mmol/L)
🚩 Red Flag
⚠️ Background Noise
Identical reading, opposite meaning
Treatment Decision
Treat immediately with PG + support
Monitor & retest in 24–48 hours
Context beats blanket rules
Financial Impact
$203–$289 loss without treatment
Likely self-resolving; treat waste money
Smarter triage = $10K+ savings
Now, if you lay Cow A alongside what the research is telling us, she ticks almost every high‑risk box. Transition‑period reviews and body condition work show pretty consistently that cows calving with a BCS of 3.75 or higher are more likely to run into ketosis, displaced abomasum, fatty liver, and related problems—especially if they then lose a lot of condition after calving. Multiparous cows in those early days in milk simply have higher odds of subclinical ketosis and its knock‑on effects than heifers do.
A 2024 review on metabolic diseases in the transition period went so far as to say that cows calving at or above BCS 3.75 should be considered at increased risk of ketosis compared to leaner cows, and earlier work supports that. Add in her history of DA and the fact she’s already hanging back at the bunk with mediocre rumen fill, and that 1.3 reading starts to look like the tip of a bigger iceberg.
Cow B, by contrast, looks a lot more like what some people call a “high‑output adapter.” She’s not fat, she’s eating hard, she’s ruminating well, and she’s throwing milk and components. In that context—and especially once you’re past day 10 or so—that 1.3 reading may be telling you something very different.
So what’s interesting here is this: same BHB number, two very different risk stories.
Why Timing and Physiology Change the Story
If you step back and look at this across studies, the timing piece just keeps jumping off the page.
That big multicountry field project sampled cows at 2-21 DIM, and, as many of you have seen, most subclinical ketosis cases clustered in the first part of that window. Transition reviews and metabolic profiling studies repeatedly show that the lion’s share of ketosis and fatty liver issues hit in the first two to four weeks postpartum, with a lot of the real trouble packed into days 3–14.
Some of the more detailed work that follows cows from the dry period into early lactation shows that cows that eventually develop hyperketonemia often have higher NEFA, different liver enzyme profiles, and other “out of balance” signals in the last week or two before calving and the very first week after. In other words, by the time the meter says 1.3 at day 5, the underlying physiology has been heading that way for a while.
On the flip side, newer reviews on ketone metabolism in dairy cows are reminding us of something many of us sensed: ketones aren’t just “bad fuel.” They’re also a normal energy source and signaling molecule. How much risk a given BHB number carries depends a lot on when you see it and what else is going on in that cow’s life—her body condition, her intake, her milk curve, her parity, and so on.
You see this really clearly when you look at pasture‑based systems. DairyNZ’s “Blood BHB and Cow Performance” project followed 980 cows in three seasonal herds and tested blood BHB three times a week for the first five weeks after calving. They defined moderate hyperketonemia as 1.2 to 2.9 mmol/L. In that study, about 76 percent of cowshad at least one test in that moderate range, and about 11 percent had at least one severe result at or above 2.9 mmol/L.
Here’s the twist that sticks with a lot of people: in that specific pasture‑based context, cows that had at least one BHB test over 1.2 mmol/L actually produced about 4 percent more milk solids in the first 15 weeks than cows that stayed below 1.2. And when they looked at uterine health and six‑week in‑calf rates, they didn’t find a consistent negative relationship with those moderate BHB elevations in those herds.
That doesn’t mean ketones are “good” now. What it does suggest is that in some pasture systems, a moderate bump in BHB can just be part of the metabolic dust that comes with high output, especially when cows aren’t over‑conditioned and are eating aggressively.
So a cow like B—two weeks fresh, moderate BCS, strong intake, strong rumen fill, high milk and solid components—can easily show you 1.3 on the meter and still be doing just fine. A cow like A, at day 5, older, fatter, off feed, and with a DA history, is in a very different place. Treating those two cows exactly the same, just because the numbers are identical, is where a lot of hidden costs creep in.
Why “Treat Every Cow Over 1.2” Often Leaves Money on the Table
Once you put Cow A and Cow B side by side, it gets tougher to defend a blanket rule that says, “we automatically treat every cow over 1.2 mmol/L exactly the same way, every time.”
The DairyNZ work is a good example of why. In one of their follow‑up trials, they took cows with moderate hyperketonemia (1.2–2.9 mmol/L) and split them into two groups. Half got daily monopropylene glycol drenches until their BHB dropped below 1.2. The other half were left untreated. As you’d expect, the drenched cows were more likely to bring their BHB down and less likely to progress into severe hyperketonemia over 2.9 mmol/L.
But when the team followed those same cows for milk solids production and six‑week in‑calf rates, the story got more complicated. They didn’t see consistent improvements in milk or reproduction across all herds and seasons. Some groups did better, some didn’t, and overall, they described the performance response as not strongly or consistently positive.
A 2022 open‑access study from Italy looking at subclinical ketosis and early propylene glycol treatment came to a similar kind of conclusion: early diagnosis and treatment can absolutely help in some situations—especially when prevalence and risk are high—but the benefit in terms of production and fertility depends heavily on the herd’s baseline management, the underlying transition program and the economics on that particular farm.
So what I’ve found, and what the data support, is that propylene glycol is still a very useful tool. It’s just that a blanket “treat every cow at or above 1.2” rule doesn’t always pay you back in milk or pregnancy rates, particularly in pasture or hybrid systems where many cows will have at least one moderate BHB bump while still doing just fine.
If your written protocol still says “treat every cow over 1.2,” there’s a good chance you’re spending money and labor on some cows that don’t need it, and not spending enough attention on the cows that really do.
Where the Money Actually Leaks in a 500‑Cow Freestall
Let’s go back to that 500‑cow Holstein freestall many of you are picturing right now—maybe in Wisconsin, maybe in western Ontario or New York State.
One simple herd‑level check that many vets and extension folks recommend is to grab a small sample of clinically normal, fresh cows—say 10 to 12 animals between days 3 and 14 in milk—and test their blood BHB. You’re not trying to micromanage those particular cows; you’re just taking the herd’s pulse.
Experience and some basic statistics say that if only one or two cows out of twelve come back at or above 1.2 mmol/L, your herd‑level prevalence is probably in the mid‑teens, give or take. Not perfect, but within a range many modern herds find manageable with decent transition programs.
But when three or more out of twelve test at or above 1.2—especially if it’s four or five—you’re probably nudging into that 20–25 percent or higher zone that the global surveys talk about. That’s when the cost‑per‑case math we walked through earlier really starts to bite.
At that point, many Midwest and Northeast herds that have gone through this exercise, often with their vets and nutritionists, found they were doing what a lot of us did at first: testing every fresh cow once or twice a week, treating every reading at or above 1.2, and feeling like they were “on top of ketosis.”
And they were catching more cases than before. But they were also spending a fair chunk of time and PG on:
Heifers that were eating and milking well
Moderate‑BCS second‑lactation cows with no history of transition trouble
Cows that were over 1.2 for a day or two but never showed a real clinical ripple
What’s encouraging is that more and more extension pieces and milk‑recording organizations are now highlighting farms that have moved away from that blanket approach. Instead, they pick out high‑risk cows in advance—older cows, over‑conditioned cows, cows with past DA or clinical ketosis—watch them more closely in the first week, and then use small herd‑level audits like this to see whether the overall transition program is really working.
Those herds often end up with similar or better health and reproduction, fewer nasty surprises in the fresh pen, and less time and money tied up in treating marginal cases that were never likely to crash in the first place.
Timing Really Is Everything
Looking at this trend across study after study and many real barns, timing keeps coming back as the pivot point.
The main ketosis diagnostic reviews and the 2024 transition‑disease papers all say the same thing in slightly different ways: subclinical ketosis and hyperketonemia are most common and most impactful in the early postpartum period, especially the first two weeks. That’s exactly when we see most of the fatty liver, most of the displaced abomasums, and a lot of the metritis and mastitis that really dent early lactation.
Some of the more detailed metabolic profiling work shows that cows that end up hyperketonemic often have “off” metabolic profiles—higher NEFA levels and altered liver enzymes—even three weeks before calving. By the time they’re at day 5 or 7 in milk with a 1.3 or 1.4 reading, you’re seeing the tail end of a much longer energy and lipid story.
Clinicians like McArt and others have been pretty clear in their teaching: you can’t read a BHB number in isolation. You’ve got to look at day in milk, parity, body condition, history, appetite, and rumen fill to decide whether a 1.3 reading is a smoke alarm or just static.
So a pattern that many of us are working with now looks something like this:
In roughly days 3–9 postpartum, especially in freestall and tiestall herds, a BHB at or above 1.2–1.4 mmol/Lin a multiparous, over‑conditioned cow that’s backing off the bunk is much more likely to be the start of costly trouble—DA, metritis, mastitis, lost milk, and poor reproduction. That’s the window where catching and treating subclinical ketosis tends to have the biggest health and economic payback.
After about day 10, a mild BHB elevation—say 1.2–1.7 mmol/L—in a cow that’s eating well, ruminating, and milking hard (especially if she’s a moderate‑BCS animal with no ugly transition history) often carries much less risk. In pasture and hybrid systems, that kind of moderate elevation is sometimes more of a physiological footprint of high production than a red warning light.
So the better question when the meter flashes 1.3 isn’t “is she ketotic?” It’s “where is she in her fresh curve, and what else about her says she needs help—or doesn’t?”
Building a Simple Risk List That Actually Works
The nice thing is, you don’t need a supercomputer to do a better job of this. Most of you already have the key pieces either in your herd software or in your head.
Across Wisconsin freestalls, Ontario and Quebec tiestalls, and Western dry lot systems, the same pattern shows up again and again. The cows at higher risk for subclinical ketosis and transition disease tend to be:
Third‑lactation and older animals
Cows that calved over‑conditioned (BCS 3.75 or higher)
Cows with a previous displaced abomasum or clinical ketosis, or a rough transition with severe metritis or retained placenta
The 2024 metabolic disease review and other transition‑period papers support that. They show higher odds of ketosis and related problems in multiparous cows, and they consistently flag high BCS at calving—especially over 3.75 on a five‑point scale—as a risk factor for deeper negative energy balance, fatty liver, and clinical disease. Epidemiology work and practical field studies also highlight prior DA and clinical ketosis as “repeat offenders” when it comes to risk.
What many herds are doing now, often with their vet and nutritionist at the table, is tagging these cows as “high‑risk” at calving. That might be a note on the calving list, a flag in the herd management software, or even a colored chalk mark on the rump in some tiestall barns. Then they make sure:
Those cows get more frequent BHB checks in the first week postpartum.
Their appetite and rumen fill are watched more closely.
Early treatment decisions factor that risk status into the call.
Meanwhile, lower‑risk cows—heifers and moderate‑BCS second‑lactation cows with clean histories—might get one BHB test somewhere around day 7–10, and then only get pulled in again if their milk, rumen fill, or behavior raises a red flag.
What farmers are finding is that this risk‑based approach lets them concentrate attention and treatment where the payoff is highest, without ignoring cows that actually need intervention. It also lines up pretty nicely with what big milk‑recording datasets and predictive ketosis models are telling us: if you’re going to spend time and money on extra diagnostics, you get the most bang by focusing on cows that already have known risk factors.
Using Herd-Level Audits Without Losing the Forest for the Trees
Risk lists help you with individual cows. The herd‑level audit helps you answer a different question: “is our fresh cow program leaking more than it should?”
Audit Result(out of 12 fresh cows)
Estimated Herd Prevalence
Herd Status
Action Required
0–1 cows ≥1.2 mmol/L
< 15%
✅ Healthy
Continue current program; sample annually.
2–3 cows ≥1.2 mmol/L
15–20%
⚠️ Monitor
Good baseline. Tighten BCS at calving; check stocking & bunk space.
4–5 cows ≥1.2 mmol/L
20–25%
🚩 Action Zone
Likely 25% prevalence. Review stocking, nutrition, heat abatement. Build risk list; test high-risk cows more frequently.
6+ cows ≥1.2 mmol/L
25%+
🚨 Red Alert
Critical. Transition program broken. Vet + nutritionist urgent. Review stocking (<100%), bunk space (24″ min), BCS (3.0–3.5). Major changes required.
As we mentioned earlier, several reviewers and extension teams suggest a simple approach: pull 10–12 clinically normal, fresh cows between days 3 and 14 in milk and check their BHB. You’re not using this to decide who to drench right now; you’re using it to estimate how big the subclinical ketosis problem is in the group.
If only one or two of those cows are at or above 1.2 mmol/L, herd‑level prevalence is likely somewhere under the 15‑percent mark. Given today’s genetics and production, many herds find that level manageable with good transition programs.
If three or more out of the twelve cows are at or above 1.2—especially if the number pops higher than that—you’re probably in that 20–25 percent or higher range that global field work keeps showing. At that point, it’s less about arguing whether optional treatments are “worth it” and more about asking whether the entire close‑up, calving, and fresh cow package is doing what it should.
So that little audit doesn’t just tell you who to treat. It tells you whether your transition period is doing its job or quietly bleeding you of $25–35K a year.
Turning the Research into a Practical Treatment Framework
At some point, all this has to live somewhere other than a good conversation over coffee. It needs to be in the actual fresh cow protocols your team pulls out at 4:30 in the morning.
Here’s one way many herds—working with their vets and within their local regulations—are starting to translate the research and field experience into a more nuanced playbook. This isn’t a one‑size‑fits‑all prescription, but it gives you a flavor of how people are moving beyond the “treat everyone over 1.2” mindset.
Days 3–9 postpartum (freestalls or tiestalls)
Treat cows with blood BHB readings of 1.8 mmol/L or higher with propylene glycol and appropriate supportive care, especially if they’re multiparous or over‑conditioned. That early window is where high BHB most closely aligns with costly diseases like DA and metritis.
Look closely at cows in the 1.2–1.7 mmol/L band if they’re on your high‑risk list—older, heavy cows with a history of transition trouble—and if they’re showing poor appetite, low rumen fill, or milk that’s clearly below their genetic potential. Those cows are often where early treatment pays the most.
For cows in that 1.2–1.7 range that are bright, eating, ruminating, and milking as expected, many vets now recommend retesting in 24–48 hours and using the trend plus clinical signs to decide, instead of automatically drenching.
Day 10 onward
Focus treatment on cows with BHB around 2.0 mmol/L or higher, especially if they’re showing clinical signs or have a rough transition history. In that later window, the cows that are still that high often have deeper problems.
For cows with BHB in the 1.2–1.9 mmol/L range that are otherwise healthy, eating and milking well—particularly in pasture or hybrid systems—many teams shift toward closer monitoring, retesting, and watching butterfat levels and rumen fill, instead of reflexively grabbing the PG jug.
This kind of framework still respects 1.2 mmol/L as a meaningful reference point. It just stops letting that single number be the only voice at the table.
And when you sit down with your nutritionist, this kind of structured approach is gold. You can show them your latest audit results, your risk list, and your current treatment rules, and then talk through where ration design, energy density, fiber, bunk management, and fresh cow monitoring can change so fewer cows ever drift into those high‑risk BHB zones in the first place.
Letting Technology Help You Aim, Not Replace You
What I’ve noticed in a lot of Wisconsin freestalls, New York herds, Western dry lot systems, and even some Ontario barns is that technology works best when it helps you aim your eyes and hands, not when it pretends to make the decision for you.
If you’re running activity and rumination collars on your fresh cows, you’ve probably seen this pattern: a cow’s rumination starts to drop, her activity isn’t quite right, and she just looks a bit “off” in the pen a day or two before she really spikes a fever or shows you a nasty udder or uterus.
Several studies using SCR/Allflex and similar platforms have documented that those drops in rumination and shifts in behavior often show up before obvious clinical disease, including metabolic issues and mastitis. More recent work specifically comparing subclinically ketotic cows with healthy cows found significantly lower rumination and distinct activity patterns in the SCK group, which aligns well with what many of us see on farm.
On herds that are using this tech well, the routine often looks like this:
The system flags cows whose rumination or activity has clearly deviated from their own baseline and that of their pen mates.
The fresh cow manager takes that list out to the pen, checks those cows for rumen fill, manure, temperature, feet, milk, and general attitude, and then decides who gets a BHB test and who just needs a closer eye.
Over time, the vet and farm team tweak the alert thresholds so they’re catching most true problems without drowning in false alarms.
Then there’s the milk‑recording side of the story. Fat‑to‑protein ratio (FPR) has been a favorite “quick read” on energy balance for years. Research has shown that high FPR values early in lactation—often in the 1.4–1.5 or higherrange—tend to signal negative energy balance and a higher risk of metabolic problems when you look at groups of cows.
But when people have tried to use FPR on its own to diagnose subclinical ketosis in individual cows, the accuracy just hasn’t been strong enough. One study that used inline FPR to decide which cows got propylene glycol found that FPR was helpful for triage—deciding which cows deserved a closer look—but it wasn’t reliable enough to be the only trigger for treatment.
In the last few years, there’s also been quite a bit of work using machine learning models that combine daily milk yield with traits like fat‑to‑protein ratio, lactose, solids‑non‑fat, and milk urea nitrogen to predict which cows are at higher risk of subclinical ketosis. Some of those models reach reasonably good accuracy, but they’re far from perfect and are best treated as decision‑support tools rather than automatic treatment engines.
On top of that, there’s the mid‑infrared (MIR) side. Several studies now show that you can use MIR milk spectra from routine milk recording to predict blood BHB and related ketosis risk traits with moderate accuracy. One big Canadian dataset was used to develop a predicted hyperketonemia (pHYK) trait, and cows with higher pHYK scores tended to have lower milk and protein yields, higher fat, higher somatic cell counts, and poorer fertility. That’s a genetic and management story rolled into one.
So the message for 2025 is pretty straightforward: use collars, FPR, ML predictions, and MIR risk reports to help you decide where to look more closely—which cows to test, which pens to walk again, which herds might need a transition rethink. Don’t hand over the steering wheel and let them replace your eyes, your hands, and your meter.
The Transition Period: Where the Big Levers Still Live
We can spend all day talking about meters and numbers, but if 20–30 percent of your fresh cows are ketotic, the biggest levers almost always live in the transition period, not in how many times you poke a cow’s ear vein.
A 2024 review on the major metabolic diseases in dairy cattle during the transition period pulled together a lot of what many of you already know from experience:
Body condition: Cows calving too fat—BCS 3.75 or above—have a higher risk of ketosis, displaced abomasum, fatty liver, and other metabolic problems. Cows that then lose a lot of condition after calving are more likely to end up in a deeper negative energy balance, which can affect immune function and fertility.
Stocking and bunk space: Close‑up and fresh pens that sit at more than 100 percent stocking density for stalls or bunk space see more competition, less lying time, and lower dry matter intake. Extension guidance, including work from Michigan State and others, has been pretty consistent: keep those groups at or below 100 percent and provide at least 24 inches of bunk space per cow if you want to give them a fair shot.
Heat stress: Dry and close‑up cows under heat stress eat less, and multiple studies have shown that cooling dry cows with shade, fans, and soakers improves postpartum performance—better intake, more milk, and fewer health issues in the next lactation.
In Canada, Lactanet’s transition benchmarking has helped put numbers to what a lot of producers have been seeing. Herds that keep most cows calving between BCS 3.0 and 3.5, avoid chronic overcrowding in transition pens, and stay on top of bunk management tend to run lower rates of metabolic disease—including subclinical ketosis—while still delivering high milk and components. Similar stories come out of well-managed herds in the US Midwest and Northeast.
So if your close‑up pen is sitting at 115 percent stocking most of the time, or your Western dry cows are riding through too much summer heat without shade and water‑based cooling, it’s not hard to see how some portion of that $25–35K modeled ketosis leak is actually sitting in stocking density, bunk access and heat abatement—not just in how often you test or how much PG you buy.
The data suggest that, in many cases, the first dollars are best spent on getting body condition, stocking density, bunk space, and cooling right, and then using testing and treatment to mop up what’s left, rather than the other way around.
Looking Ahead: Breeding for “Ketosis Resilience”
One more piece that’s slowly moving from research into the barn conversation is genetics.
We’ve known for a while that mid‑infrared milk spectra can be used to predict a variety of traits beyond just fat and protein. Now, several studies have shown that MIR‑based predictions of BHB and related hyperketonemia traits have moderate accuracy and non‑zero heritability. In plain terms, some families of cows are genetically more prone to high BHB in early lactation than others.
That big Canadian study that developed the pHYK trait is a good example. When the researchers looked at thousands of lactations, cows with higher pHYK scores—meaning higher predicted ketosis risk—tended to give less milk and protein, more fat (that classic “ketotic fat cow” profile), and they had higher somatic cell counts and poorer fertility. That’s not just a one‑off cow; that’s a pattern with genetic legs under it.
The Merck Manual and other summaries have also started noting that specific genetic markers and modest heritabilities have been identified for ketosis and related metabolic traits. We’re not at the point where every proof sheet has a big “ketosis resilience” index printed on it, but the building blocks are there.
In the meantime, many breeding programs are quietly adding more health and metabolic traits into their overall indexes, and as MIR‑based BHB and pHYK predictions become more common in national evaluation systems, it’s not hard to imagine that “lower ketosis risk” will become one more dial you can turn when picking bulls and culling cows over the next decade.
So while you’re working on fresh cow management and transition nutrition in the short term, genetics is lining up to be a slow but steady ally in the background.
From “Is She Ketotic?” to “Does She Need Help Right Now?”
So, where does all of this leave you the next time you’re in the fresh group and the meter flashes 1.3?
The research and what many of us are seeing on the ground say the same thing: keep using the meter. That 1.2 mmol/L cut‑point is still a valuable benchmark for understanding herd‑level risk. The large field studies and global summaries are very clear that when too many cows are spending time above that line early in lactation, herds pay for it in disease, lost milk, and poorer reproduction. The cost‑per‑case models remind us that each one of those cows has real dollar signs attached.
What’s changed is how we interpret the number and what we do next. Instead of stopping at:
“Is this cow ketotic?”
it’s a lot more useful now to ask:
“Given this cow’s day in milk, parity, body condition, history, appetite, and BHB value, does she need help right now—and if she does, what kind of help is going to pay us back?”
If you’re looking for a simple, practical way to bring this into your next herd meeting—or your next coffee with your vet and nutritionist—here’s a five‑step checklist that many farms are using as a starting point:
Check your prevalence once in a while. Pick 10–12 fresh cows between days 3 and 14 in milk and see how many are at or above 1.2 mmol/L. If it’s one or two, you’re probably in the mid‑teens on prevalence. If it’s three or more, assume you’re up in that 20–25 percent‑plus zone, and it’s time to look hard at the overall transition and fresh cow program.
Build and use a risk list. Flag older cows, over‑conditioned cows, and cows with a past DA or clinical ketosis as high‑risk at calving. Make sure they get more frequent BHB testing that first week, and that their intake, rumen fill, and early milk are watched more closely than the “easy” cows.
Rewrite your PG protocol with your vet. Shift away from “treat everyone over 1.2” and put day in milk and risk status into the written rules. Treat the early, clearly high‑risk cows more aggressively; be willing to monitor and retest the later, lower‑risk “adapters” before you drench.
Walk your transition pens with fresh eyes. Look at body condition distribution, stocking density, bunk space, and heat abatement in your close‑up and fresh groups. A lot of the most consistent ketosis wins still come from getting these basics right and then using diagnostics to keep score.
Use tech to focus your effort, not to replace your judgment. Let rumination collars, FPR, ML predictions, and MIR/pHYK risk reports tell you where to look harder—which cows to test and which pens to fix. But keep the final decisions tied to what you see in front of you: the cow’s behavior, her rumen fill, her milk, her stage of lactation, and her story.
From what I’ve seen in freestalls in Wisconsin and New York, tiestalls in the Northeast, dry lot systems in the West, and pasture herds in New Zealand, the farms that combine solid transition management with this more context‑aware use of ketone testing are the ones quietly getting ahead. They see fewer metabolic surprises in the fresh pen, spend their testing and treatment dollars where they matter most, and have a lot more cows that slide into peak lactation instead of stumbling their way there.
Key Takeaways:
The “treat every cow over 1.2” rule is quietly expensive. At roughly $200 per case, a 500‑cow herd running 25% subclinical ketosis prevalence is leaking $25,000–$35,000 a year in lost milk, extra disease and open days.
Same number, very different risk. A 1.3 mmol/L reading on day 5 in an over‑conditioned older cow with a DA history is a red flag; that same 1.3 on day 15 in a moderate‑BCS cow eating hard and milking 95 pounds is often just high‑output physiology.
Days 3–9 are where the money is. Elevated BHB in that early window lines up strongly with DA, metritis and lost production; after day 10, moderate elevations in otherwise healthy cows usually carry far less risk.
Risk lists beat blanket protocols. Flag older, over‑conditioned and previously sick cows at calving, watch them closely in week one, and let lower‑risk cows prove they need help before you reach for the PG jug.
Fix transition before you fine‑tune treatment. Stocking under 100%, 24 inches of bunk space, dry cow cooling and calving BCS of 3.0–3.5 cut ketosis prevalence more than any amount of propylene glycol after the fact.
Executive Summary:
Many herds are still using a simple “treat every cow over 1.2 mmol/L” rule for ketosis, but the economics say that blanket approach is quietly leaking money. In a 500‑cow Holstein freestall, realistic models put the cost of subclinical ketosis at roughly 200 dollars per case, which means a “normal” 25 percent prevalence can drain around 25,000 dollars a year in lost milk, extra disease, and fertility hits, and closer to 35,000 if you use more conservative cost estimates. The science behind the 1.2 mmol/L line is solid for describing herd‑level risk, yet newer work shows that timing, parity, body condition and intake completely change what a 1.3 reading actually means for an individual cow. What’s encouraging is that herds that combine risk lists (older, over‑conditioned and previously sick cows), small fresh‑cow audits, and day‑in‑milk–based treatment thresholds are seeing fewer metabolic surprises while spending less time and money treating marginal cases. The article lays out a practical fresh cow playbook that ties together better transition management, smarter propylene glycol use, targeted BHB testing, and on‑farm tech like rumination collars and MIR‑based ketosis risk to help producers cut subclinical ketosis prevalence from the mid‑20s into the teens. For progressive dairies in 2025, the core shift is moving from “Is she ketotic?” to “Given this cow’s story, does she need help right now—and what’s the most profitable way to give it?”
Complete references and supporting documentation are available upon request by contacting the editorial team at editor@thebullvine.com.
Learn More
The $42,000 Transition Mistake: Why Blanket Protocols Are Failing Your Best Cows – Gain immediate control of your fresh pen costs with a validated three-tier protocol. This strategy breaks down how to stop over-treating low-risk cows and focus resources where they actually drive milk-in-the-tank and calving-to-breeding success.
Squeezed Out? A 12-Month Decision Guide for 300-1,000 Cow Dairies – Exposes the structural shifts reshaping the 2026 dairy landscape and arms you with a 12-month survival guide. It reveals how to leverage component pricing and automation to outpace industry consolidation and protect your operation’s equity.
Every week, thousands of producers, breeders, and industry insiders open Bullvine Weekly for genetics insights, market shifts, and profit strategies they won’t find anywhere else. One email. Five minutes. Smarter decisions all week.
Dairy just sorted itself into two lanes. $10B in new plants is flowing to one. The other lost 1,521 farms while milk output held steady. Where does a 300-cow herd fit? Let’s map it.
EXECUTIVE SUMMARY: U.S. dairy has sorted into two lanes—and most 300-cow herds didn’t pick theirs. Lane 1 (large operations in Texas, Idaho, the High Plains) is pulling $10-11 billion in new processing investment, per CoBank and IDFA data. Lane 2 (mid-sized family dairies in Wisconsin, New York, the traditional Midwest) watched 1,521 farms disappear in two years while milk output held steady. The pressure is structural, not cyclical: heifer inventories at a 20-year low, bred replacements topping $3,000, GLP-1 drugs shifting grocery spending, and sustainability mandates like Bovaer adding $0.30-0.50/cow/day. Here’s the playbook—stress-test your margins against hard scenarios, map your processing exposure, calibrate beef-on-dairy carefully, vet sustainability contracts like any major deal, and have the family conversation about whether staying, growing, or a well-timed exit is your version of winning. The math is uncomfortable. But it’s yours to run.
If you sit around enough kitchen tables in Wisconsin, New York, Pennsylvania, or Minnesota, you start to hear a very different conversation than the one you get on the conference stage.
On stage, the slides say U.S. dairy is strong, national milk volumes are holding, and there’s a massive wave of new stainless going into places like South Dakota and the Texas Panhandle. And you know what? Those slides aren’t wrong.
CoBank’s dairy economists peg new U.S. dairy processing investment at about $10 billion expected to come online through 2027, much of it in large cheese, powder, and beverage plants anchored in high‑volume regions. The International Dairy Foods Association announced in October 2025 that processors are investing more than $11 billion in 50 new or expanded plants across 19 states between 2025 and early 2028.
Region
2025 ($B)
2026 ($B)
2027 ($B)
Total ($B)
Texas Panhandle / High Plains
3.5
4.2
2.8
10.5
Idaho / Western Growth
1.2
1.5
0.9
3.6
Wisconsin / Northeast / Traditional
0.3
0.5
0.4
1.2
But over coffee, the conversation sounds more like this:
“Given everything that’s changed—markets, plants, even what people eat now—does it really make sense for us to keep milking 250 or 400 cows? Or are we better off stepping out while we still have something solid to pass on?”
You can’t answer that honestly without stepping back and looking at how the whole system has shifted. So let’s walk through the big pieces together, then bring it right back to a farm that probably looks a lot like yours.
Five Big Forces Hitting Mid‑Sized Dairies Right Now
Year
Farms
Milk Production (B lbs/yr)
2014
7,850
2.92
2016
7,200
3.04
2018
6,700
3.11
2019
5,882
3.15
2021
5,700
3.18
2023
5,200
3.22
2024
5,100
3.20
Here’s the quick snapshot before we dig in:
Processing geography is shifting. That $10–11 billion in new capacity? It’s heavily concentrated in growth regions—the High Plains, Texas Panhandle, parts of the West and Upper Midwest—where large herds and cheap land can feed big plants efficiently.
Farm numbers are dropping fast, even when milk holds. In Wisconsin alone 818 licensed dairy farms disappeared in 2019—over 10% of the state’s dairies in a single year. Farm Progress adds that 703 farms shut down in 2018, bringing the two‑year total to 1,521 farms gone—nearly 18% of Wisconsin’s dairies—while milk production stayed near record levels.
Replacement heifers are tight and expensive. U.S. replacement heifer inventories have fallen to about a 20‑year low. CoBank’s modeling projects an additional 800,000‑head decline over the next two years before a rebound in 2027. And bred heifer prices? They’ve climbed well above $3,000 per head in many markets.
GLP‑1 weight‑loss drugs are changing grocery carts. A Cornell University–Numerator study found that households with a GLP‑1 user cut grocery spending by about 5–6% within six months, with higher‑income households cutting nearly 9%. The biggest reductions hit calorie‑dense, processed items—spending on savory snacks, baked goods, and cookies dropped between 6.7% and 11.1%.
Sustainability is real money now. The FDA approved Elanco’s methane‑reducing feed additive Bovaer for U.S. dairy cattle in May 2024. Studies show it can cut enteric methane emissions by about 30%—roughly 1.2 metric tons of CO₂‑equivalent per cow per year. But it’s not free. Independent technical reviews and industry coverage suggest early commercial costs tend to fall in the $0.30–0.50 per cow per day range, depending on region and feeding system.
Those are the big gears turning while you’re focused on butterfat levels, fresh cow management through the transition period, and whether that next heifer pen will be full.
Two Lanes, One Industry: Where Does Your Herd Really Fit?
You’ve probably noticed this yourself: U.S. dairy has quietly split into two main “lanes,” even though nobody formally labeled them that way.
Lane
Typical Regions
Herd Size
Housing & Systems
Key Upside
Key Risk
Lane 1
Texas Panhandle, eastern New Mexico, Idaho’s Magic Valley, eastern South Dakota
1,000+ cows
Dry lot systems, high‑throughput parlors
Scale, hauling efficiency, tight and fit with the new capacity
Dependence on large‑plant contracts
Lane 2
Wisconsin, New York, Pennsylvania, Vermont, broader Northeast/Upper Midwest
200–700 cows
Freestall or tie‑stall, family plus small hired teams
Deep local roots, flexible management
Risk of being “orphaned” by route changes
Lane 1: Big herds in growth corridors
In one lane, you’ve got the big outfits—often 1,000 cows and up—in places like the Texas Panhandle, eastern New Mexico, Idaho’s Magic Valley, and eastern South Dakota. They run dry lot systems or hybrid housing, big parlors, and high daily ship volumes.
CoBank and IDFA data show that much of that $10–11 billion in new processing capacity is landing in exactly these regions. From the processor’s point of view, that makes sense. Fewer farms, bigger loads, more predictable butterfat and protein flows for specific product specs and export programs.
Lane 2: Mid‑sized family barns in traditional regions
In the other lane are the herds many of us grew up around: 200–700 cows, freestall or tie‑stall barns, double‑8 or double‑12 parlors, family labour plus a handful of employees.
Take Wisconsin as the clearest example. Using National Ag Statistics Service data, reported that the state lost 818 licensed dairy farms in 2019—over 10% in a single year. The decline was the largest in state history.
In addition, 703 farms shut down in 2018, bringing the two‑year total to 1,521 farms—nearly 18% of Wisconsin’s dairies—while milk production stayed near record levels as larger herds added cows and pushed components.
So at the state level, the narrative is “Wisconsin dairy is holding its own.” At the township level, it’s more like, “We’ve lost a third of the trucks that used to go past this mailbox.”
If you’re milking 300 cows in Marathon County or 450 in northern New York, you’re in that second lane whether you chose it or not. And the system treats you differently than it treats a 3,000‑cow dry lot in the Panhandle.
What Co‑ops and Plants Are Really Optimizing For
You probably already sense this from watching milk routes in your area, but it’s worth laying out the math plainly.
When Associated Milk Producers Inc. announced in late 2019 that it would discontinue production at its Arlington, Iowa, nonfat dry milk plant and its Rochester, Minnesota, cheese plant, AMPI pointed straight at lower regional milk production and the long‑term loss of dairy farms as key reasons.
Their statement noted that Minnesota had lost 40% of its dairy farms since 2008, and Iowa has lost 50% during that same period.
Here’s the part that stings but tracks with every hauling study:
A 300‑cow freestall might add 1,500–2,000 gallons per pickup.
A 1,500‑cow dairy can fill a tanker—or more—from one driveway.
When several mid‑sized farms exit, and their volume consolidates onto larger herds, a co‑op’s per‑unit hauling cost and plant efficiency can actually improve, even as rural communities feel hollowed out.
Here’s the blunt reality: if your co‑op’s last three big announcements were about plants two states away, they’re telling you something about where they see their future milk coming from. It’s frustrating, but it’s not random.
GLP‑1 Weight‑Loss Drugs: The New Demand Wildcard
Now let’s step off the farm for a minute. GLP‑1 medications—Ozempic, Wegovy, Mounjaro, and similar—started as diabetes drugs, but their use for weight loss has exploded.
Industry tracking suggests approximately 15 million U.S. adults were using GLP‑1 medications by 2023, and clinical reviews show these drugs can cut daily calorie intake by around 20%.
Cornell University and Numerator linked shoppers’ survey‑reported GLP‑1 use to their actual grocery purchases. The study found that households with a GLP‑1 user cut grocery spending by about 5–6% within 6 months of starting the medication, roughly $ 400 per year on average, and by 9% for higher‑income households.
The biggest cuts landed on calorie‑dense, processed categories. Spending on savory snacks fell by about 10%, while categories like baked goods and cookies saw reductions of 6.7% to 11.1%.
Category
Average Household Spending Change
% Change
Milk Relevance
Savory Snacks (chips, crackers, popcorn)
−$24 to −$32
−10.0%
High—processed milk/whey used
Baked Goods (cookies, cakes, pastries)
−$18 to −$26
−6.7% to −11.1%
High—butter, milk powder, butterfat
Candy & Confections
−$12 to −$18
−8.5%
Moderate—dairy ingredients
Block Cheese (cheddar, American, processed)
−$8 to −$14
−4.2%
HIGH RISK—commodity pressure
Butter (salted, unsalted)
−$6 to −$10
−3.1%
HIGH RISK—indulgence category
Greek Yogurt (high-protein)
+$4 to +$8
+3.2%
WINNER—protein focus aligns
Cottage Cheese (high-protein)
+$3 to +$5
+2.8%
WINNER—protein focus aligns
Fresh Milk (milk, cream, fresh dairy)
−$2 to +$1
−0.8% to +0.5%
Neutral to slight decline
Organic/Specialty Dairy
+$6 to +$10
+4.1%
WINNER—premium positioning
Meanwhile, yogurt and fresh produce saw modest increases.
What does this mean for your milk? If most of your production ends up in commodity cheese blocks and butter, GLP‑1 makes those categories a little more crowded. If it’s heading into high‑protein dairy—Greek yogurt, cottage cheese, protein drinks—you’re closer to where the growth is.
You can’t fix GLP‑1 from the parlor. But you can understand where your milk is going and whether that’s a “protein‑forward” lane or an indulgence lane.
When Plants Move, the Local Math Changes
You don’t need a consultant to tell you that when a local plant closes or changes hands, everything around it feels it. We’ve already talked about AMPI’s closures and the logic behind them.
Economic impact work for USDA and state ag departments has consistently shown that every dairy cow supports multiple off‑farm jobs—feed, vet, fuel, trucking, processing, retail. When processing capacity leaves a region, that ripple shrinks.
Meanwhile, the fresh steel is going into places that CoBank and IDFA keep pointing to: South Dakota, Texas, New Mexico, Idaho, parts of Kansas, and the Upper Midwest, where milk production is rising and component‑rich milk can efficiently fill new plants.
Cows follow plants, and plants follow cows—it’s a feedback loop.
For a 300‑cow family dairy in Marathon County or northern Pennsylvania, the processing map now matters almost as much as your soil map. If your buyer is putting new capital into your region, that’s one kind of future. If most of their big announcements are two or three states away, that’s another.
Sustainability and Bovaer: Real Emission Cuts, Real Costs
Let’s talk sustainability, because it’s showing up in almost every processor and retailer playbook now.
Bovaer is one of the most talked‑about tools on the enteric methane side. In May 2024, the FDA completed its review and approved Bovaer for use in U.S. dairy cows.
Elanco’s data shows that feeding one tablespoon per lactating dairy cow per day can reduce methane emissions by about 30%—roughly 1.2 metric tons of CO₂‑equivalent per cow per year.
On cost, the picture is still evolving. Independent technical reviews, including Dellait’s analysis and industry coverage, suggest early commercial costs tend to fall in the $0.30–0.50 per cow per day range, depending on region and feeding system.
On a 300‑cow herd, that works out to roughly $33,000–$55,000 per year before any incentives.
Some co‑ops and processors are offering payments tied to documented methane reductions, and a few early pilots show those can offset part of the cost—especially for larger herds or brand‑aligned programs. But in many cases, the net benefit to a 250–600‑cow herd is still very case‑by‑case.
What’s encouraging is that not all sustainability steps look like pure cost. Extension work on energy efficiency, manure storage, and nutrient management shows that improving fans and pumps, optimizing manure handling, and tightening nutrient management plans can lower energy bills, reduce purchased fertilizer, and sometimes improve milk quality at the same time.
The big takeaway? Treat sustainability offers like any other major business contract: get the full cost per cow and per hundredweight, understand how incentives are calculated and how long they last, and talk to producers already in the program before you sign.
Beef‑on‑Dairy: Great Tool, Dangerous Autopilot
Most of you have already seen the beef‑on‑dairy story firsthand. A decade ago, Holstein bull calves in many Midwest barns weren’t worth the time it took to haul them. Today? That’s changed.
In 2024–2025, newborn beef‑on‑dairy cross calves have often sold in the $600–$900 range in the Midwest and Western markets, with some lots hitting or exceeding $1,000 when beef supplies are especially tight.
Compared to the $50–$150 Holstein bull calves many of us remember, that’s a different world entirely.
Here’s the catch. As more producers bred a high share of cows to beef, replacement heifer inventories dropped.
CoBank’s 2025 report concludes that U.S. replacement heifer numbers have already fallen to a 20‑year low and could shrink by another 800,000 head across the next two years before recovering in 2027.
Year
Heifer Inventory (M head)
Bred Heifer Price ($/head)
2015
2.35
$1,800
2017
2.28
$1,950
2019
2.15
$2,100
2021
2.08
$2,350
2022
2.02
$2,650
2023
1.95
$2,900
2024
1.88
$3,100
2025E
1.82
$3,150
2026E
1.75
$3,050
2027E
1.81
$2,700
During the same period, bred heifer prices have spiked “well above $3,000 per head” and in some cases significantly more.
So if a 320‑cow herd runs several years of aggressive beef‑on‑dairy use without a disciplined replacement plan, it can easily end up short on heifers and forced to buy back in at a painful price.
What farmers are finding is that beef‑on‑dairy works best as a controlled tool:
Set your replacement target. Use your actual cull rate, age at first calving, and herd size to calculate how many heifers you truly need each year. Many herds land near 30–36 replacements per 100 cows per year, depending on goals and longevity.
Use sexed dairy semen and genomics where they pay. Focus dairy semen on your top‑end cows and heifers—animals that will move butterfat performance, protein yield, and health traits in the right direction for your market.
Then layer beef‑on‑dairy on the rest. Once you’ve covered replacements, you can confidently use beef semen on the remainder to capture calf premiums without jeopardizing your future herd.
It’s like balancing protein and energy in a ration. Pushing beef semen to the max without watching replacement numbers might feel good in the short term, but the payback can hurt.
Canada’s Supply Management: Different Rules, Different Outcomes
Whenever the conversation gets tough in U.S. barns, someone inevitably says, “Canada doesn’t seem to be going through this the same way. What are they doing differently?”
Statistics Canada census data shows that Canadian dairy farm numbers have declined while average herd sizes have grown—a pattern similar to the U.S., but from a different starting point and under different rules.
Western Canada tends toward larger freestall herds while Québec maintains many smaller, tie‑stall family dairies.
Canadian dairy operates under supply management: production quotas, farmgate prices set by cost‑of‑production formulas, and import controls that cap foreign dairy entering the market. That framework has helped maintain relatively stable farmgate milk prices and a higher proportion of mid‑sized family dairies than in the U.S.
Could the U.S. copy that model? Realistically, not quickly. The U.S. sector is far larger, heavily involved in export markets, and bound by trade agreements that assume relatively open dairy trade.
The point here isn’t that one country is “right” and the other “wrong.” It’s that the rules you play under matter a lot. Canadian mid‑sized herds operate in a structure designed to support them. U.S. mid‑sized herds operate in a structure that rewards volume, efficiency, and export competitiveness.
The Human Load: When the System Sits on People
Under all these numbers are people—families, hired teams, neighbors.
In 2023 that farmers may face a suicide rate roughly 3.5 times higher than the general U.S. population, citing CDC‑linked occupational mortality data.
The National Rural Health Association and Senator Chuck Schumer’s office have both cited similar figures based on CDC research. Rural Minds, a nonprofit focused on rural mental health, notes that suicide rates in rural areas climbed significantly faster than in metro areas over the past two decades.
You see that in real life when a neighbor sells out under pressure or when a family member quietly struggles.
What’s encouraging is that more support is becoming available. Rural Minds maintains directories of confidential mental‑health and stress resources for farm families, and the Farm Aid hotline (1‑800‑FARM‑AID) connects farmers to local financial, legal, and crisis support.
Many states now have dedicated farm stress lines and behavioral‑health programs through their departments of agriculture and extension systems.
Reaching out for that kind of help is not a sign you “can’t handle it.” It’s part of taking care of yourself and the business in an industry where the pressures are structurally high.
Back at the 320‑Cow Freestall: What Do You Actually Do With This?
Let’s bring this down to the barn level.
Picture a fairly typical operation in central Wisconsin or upstate New York: about 320 cows in a freestall barn, a double‑8 or double‑12 parlor, corn silage and alfalfa on a few hundred acres, butterfat performance around 3.9–4.2% with solid protein test, shipping to a co‑op that’s already changed plant destinations once or twice in the past decade, and one or two younger family members quietly wrestling with whether to come home full‑time.
Here are five practical steps that kind of herd—and many like it—can take using the “uncomfortable math” instead of being blindsided by it.
1. Run a real stress test, not just a hope test
Sit down with your lender or advisor and run a few realistic stress scenarios:
Milk price in the mid‑teens for 12–18 months.
Beef‑on‑dairy calf prices are dropping 30–50% from current highs.
A methane‑reduction requirement adding $0.30–0.50 per cow per day without guaranteed long‑term premiums.
On 320 cows, that additive alone could run $35,000–$58,000 per year. If you’ve been selling 80–100 beef‑cross calves at $800 and the market falls back toward $500–600, you could be looking at $16,000–$24,000 less revenue from calves.
When you spread those costs and revenue hits over your annual milk shipped, it can easily move your effective margin by $0.50–$1.00 per cwt, depending on production.
Scenario
Milk Price
Beef Calf Price
Bovaer Adoption
Replacement Heifer Shortage
Annual Margin Impact
Margin/cwt vs. Baseline
Baseline (Normal)
$18.50
$800
None
None
$52,000
+$0.80
Scenario 1: Mild Stress
$17.00 (−$1.50)
$700 (−$1,100)
Optional
None
$38,500
+$0.59 (−$0.21)
Scenario 2: Moderate Stress
$16.00 (−$2.50)
$550 (−$22,500)
Mandated ($0.40/day)
5 heifers forced to buy @ $3,100
$19,200
+$0.30 (−$0.50)
Scenario 3: Hard Stress
$15.00 (−$3.50)
$450 (−$31,500)
Mandated ($0.50/day)
10 heifers forced to buy @ $3,100
−$8,900
−$0.14 (−$0.94)
Scenario 4: Structural Crisis
$14.50 (−$4.00)
$400 (−$36,000)
Mandated ($0.50/day)
15 heifers forced to buy @ $3,100
−$61,500
−$0.95 (−$1.75)
Some families will find they’re more resilient than they feared. Others may realize that one hard cycle like that would dramatically change their options.
2. Map your marketing and processing exposure
Just like you map soil types and yield history, sketch out your marketing picture:
How many serious buyers exist within a practical hauling radius for your size?
Which plants have closed, reduced capacity, or changed ownership within that radius over the past 10–15 years?
Where are your co‑op’s and main buyer’s latest big processing investments—locally, or in other states?
If you’re located near multiple growing plants, you’ve got a different risk profile than if you’re in a region with flat or shrinking capacity.
3. Calibrate beef‑on‑dairy as a tool, not autopilot
The starting point is knowing your true replacement needs. Work with your records, your cull rate, and extension benchmarks to set a realistic target.
Use sexed dairy semen and genomic testing where they actually pay—on the top tier of cows and heifers that will move your components and herd health the right way. Once those replacement slots are safely covered, assign beef semen to the rest.
Over‑raising heifers ties up capital, but under‑producing replacements pushes you into a high‑priced replacement market like the one we’re in now.
4. Approach sustainability projects like any other major contract
When someone pitches you a sustainability project—Bovaer, a digester, a low‑carbon milk program—try to approach it like you would a custom harvesting contract or a parlor upgrade.
Questions to put on paper:
What’s the total cost per cow and per hundredweight, including product, equipment, extra labour, data collection, and verification?
How exactly are incentives or premiums calculated, and how long are they guaranteed?
Can you talk one‑on‑one with two or three producers already in the program to hear what works and what surprised them?
5. Make space for the family conversation about “what’s next.”
Most multi‑generation 250–600‑cow farms will eventually have to sit down and talk about who really wants to be on the farm in 5, 10, or 15 years, what level of debt and volatility everyone is willing to live with, and what “winning” means: staying roughly the same size, expanding, diversifying, or planning an orderly exit.
Many farm families are discovering that having a neutral third party—a mediator, succession planner, or extension specialist—at the table helps those conversations stay constructive. fb
I’ve heard from families in Wisconsin and New York who decided that selling a 280‑cow herd while land values were strong and equity was intact was their version of success. They’d run the numbers, talked with their kids, and realized they could leave with their health and their equity—and, for them, that felt like winning.
That won’t be the right path for everybody. Some will grow, some will pivot, some will partner, some will exit.
Your Next Three Moves
The math in this piece isn’t meant to scare you into any particular decision. It’s meant to show you the landscape clearly so you can choose your path with your eyes open.
If you take nothing else from this:
Run the uncomfortable stress test and write down the results. Not in your head—on paper or in a spreadsheet, with real numbers.
Decide whether you’re playing in Lane 1 or Lane 2—and whether that matches your long‑term goal. If there’s a mismatch, that’s the conversation to have next.
Make a timeline for a real family conversation, with outside help lined up if you need it. Succession planning isn’t about giving up. It’s about choosing your terms.
Doing nothing is also a decision—it just hands the timing and terms to markets, processors, and lenders.
The uncomfortable math is a planning tool, not a verdict. The decision about whether to stay, grow, partner, or step away while you’re still on your feet—that still belongs to you, your family, your cows, and your land.
KEY TAKEAWAYS
Two lanes, diverging fast: Lane 1 (1,000+ cow herds) is pulling $10-11B in new plants. Lane 2 (mid-sized dairies in WI, NY, PA) lost 1,521 farms in two years while milk output held steady.
Heifer trap is set: 20-year-low inventory. 800,000 more head gone by 2027. Bred replacements topping $3,000. Beef-on-dairy without a replacement plan backfires hard.
GLP-1 is sorting winners: Users cut grocery spending 5-6%—snacks down 10%, sweets down 11%. Greek yogurt and cottage cheese are gaining popularity. Know where your milk lands.
Sustainability has a price tag: Bovaer cuts methane 30% but costs $0.30-0.50/cow/day ($33K-55K/year for 300 cows). Incentives rarely cover it. Negotiate like it’s a major contract.
This is structural, not cyclical: Stress-test your margins. Map your processing exposure. Decide if staying, growing, or exiting on your terms is the win.
Complete references and supporting documentation are available upon request by contacting the editorial team at editor@thebullvine.com.
The $11 Billion Reality Check: Why Dairy Processors Are Banking on Fewer, Bigger Farms – Expose the hidden processor contracts that have already locked in 80% of future milk supply. You’ll gain the strategic clarity to navigate the permanent structural shift toward high-volume corridors before the December 2026 repositioning window slams shut.
5 Technologies That Will Make or Break Your Dairy Farm in 2025 – Slash your fresh cow treatment costs by 40% and reclaim your sleep with AI-powered sensors that catch health crises a week early. This breakdown reveals the specific ROI of autonomous systems that turn your herd into a self-monitoring profit engine.
The Sunday Read Dairy Professionals Don’t Skip.
Every week, thousands of producers, breeders, and industry insiders open Bullvine Weekly for genetics insights, market shifts, and profit strategies they won’t find anywhere else. One email. Five minutes. Smarter decisions all week.
If you’re milking 300–600 cows, the real choice isn’t H‑2A or robots—it’s which math keeps you in business 10 years from now.
Executive Summary: If you’re running 300–600 cows, the biggest decision in front of you isn’t just H‑2A or robots—it’s what the labor math says about your next ten years. This piece digs into new USDA‑ERS, Rabobank, and university data to show why H‑2A rarely ends up “cheap,” how global cost gaps are shifting the ground under your feet, where robotic milking and targeted automation genuinely save labor, and how compliance risk fits into the picture. Along the way, it looks at real-world systems—from California dry lots to Wisconsin freestalls and Ontario mixed herds—to ground the numbers in the kind of operations you actually recognize. The article then lays out three honest paths for mid-size dairies: selective automation around bottlenecks, fully legal higher‑cost labor in exchange for stability, or a planned transition out of milking while you still control the terms. It finishes with a practical 30‑day checklist—know your true labor cost per cow and your multi‑year DSCR—so you can stop guessing and see which path really fits your farm.
If you sit down with a table of dairy folks this winter—whether it’s in Wisconsin, California’s Central Valley, or around eastern Ontario—you’ll hear the same three things come up over coffee: labor, margins, and what the next ten years really look like for that 300‑ to 600‑cow family operation. You know the look on people’s faces when the talk turns to “who’s going to milk these cows in five years?”—it’s the same in a lot of kitchen tables and vet trucks right now.
What’s interesting here is that two big storylines keep colliding almost immediately. One is the rapid growth of the H‑2A visa program, which economists at USDA’s Economic Research Service and Congressional analysts say has become a central labor pipeline for a big chunk of U.S. agriculture. The other is the steady march of automation—from collars and sort gates to full robotic milking—backed by university and peer‑reviewed research showing real changes in how labor is used on both small and large herds. Put those alongside the structural lift in global production costs that Rabobank’s dairy team has been documenting, and the real question for most dairies becomes, “Given our cost structure, our people, and what we want this farm to look like in ten years, do we lean into selective automation, formalize labor at a higher cost, or plan a controlled transition while we still have options?”
If you’re in that 300–600 cow bracket, this is the labor math that’s going to have a lot to say about whether you’re still milking in ten years.
How H‑2A got so big, so fast
Looking at this trend from thirty thousand feet, USDA economist Marcelo Castillo and his team did a deep dive on H‑2A for the journal Choices. They found that the U.S. Department of Labor certified employers to fill just under 372,000 seasonal farm jobs with H‑2A workers in fiscal year 2022—more than seven times the number in 2005 and roughly double what it was in 2016. That’s a huge structural shift in less than two decades.
And it’s not just that the program has grown; it’s who’s using it. Castillo’s work shows that around 12,200 employers were certified in 2022, but the top 5 percent—roughly 620 operations, each approved for 100 or more H‑2A workers—accounted for about two‑thirds of all certified jobs. Farm labor contractors alone supplied a large share of those positions. So, as many of us have seen, H‑2A has turned into a core labor tool for labor‑intensive crops, not a side program used by a handful of farms.
Dairy, by comparison, has mostly been watching from the sidelines. A big reason is baked into the design. H‑2A was built for “temporary or seasonal” work. Congressional Research Service reports spell that out clearly: by statute, year‑round industries like dairies, greenhouses, and many livestock operations don’t fit neatly into the current rules. Folks at American Farm Bureau Federation have said the same thing in interviews, pointing out that dairy, livestock, and greenhouse employers often can’t legally use H‑2A for the year‑round jobs they need filled.
Looking at this trend politically, pressure to change it is building. Dairy and meat industry leaders have pushed hard for access to year‑round H‑2A labor, and several recent immigration and farm labor proposals in Congress—including versions of the Farm Workforce Modernization Act and related efforts—have included provisions for limited year‑round H‑2A visas that would explicitly cover dairies and other non‑seasonal operations. Policy coverage into 2025 and early 2026 notes that these proposals would, if enacted, create capped pools of year‑round H‑2A positions and formally recognize dairy’s year‑round labor needs, but as of early 2026, they remain proposals rather than settled law. So the mix of hope and frustration producers feel—“Every politician says they understand dairy’s problem, but we still don’t have a year‑round fix”—is grounded in the current policy reality.
If you hop north into Ontario, the mechanics are different, but the flavor is similar. Canadian producers rely on the Temporary Foreign Worker Program and the Seasonal Agricultural Worker Program, and federal guidance makes it clear that those programs also come with strict requirements around approved housing, travel arrangements, and documentation. The tool names change across the border; the core challenge doesn’t. You can get legal, reliable labor, but it takes real money and real management.
H‑2A labor costs: it’s a lot more than an hourly wage
On the surface, H‑2A starts with one number: the Adverse Effect Wage Rate, or AEWR. That’s the minimum hourly wage you’re required to pay H‑2A workers in your state. USDA and CRS explain that AEWR is based on USDA’s Farm Labor Survey and, in many states, has moved into the mid‑ to high‑teens per hour, with some regions above that. American Farm Bureau government affairs staff have pointed out that, nationally, AEWR has jumped by roughly 20 percent over about five years, while revenue for many labor‑intensive crops hasn’t kept pace.
Cost Category
Amount (USD)
% of Total
AEWR Wages (6 months @ $18.50/hr, ~1,080 hours)
$19,980
67.7%
Housing (on-farm or rental, utilities, maintenance)
$4,200
14.2%
Transportation (airfare, ground travel, visa)
$3,800
12.9%
Recruitment & Admin (legal, HR, processing fees)
$1,520
5.2%
Total Employer Cost
$29,500
100%
But what I’ve found is that the hourly wage is only the tip of the iceberg.
Castillo’s ERS analysis emphasizes three big non‑wage buckets that matter just as much as the posted rate.
Housing. Employers have to provide housing that meets specific federal and state standards at no cost to the worker. In practice, that often means building or renovating bunkhouses on‑farm or renting apartments in town, then paying for utilities, maintenance, and inspections. USDA’s own H‑2A assistance initiatives and Farmers.gov resources highlight housing as one of the biggest cost and compliance barriers.
Transportation. H‑2A employers must pay for workers’ travel from their home country to the job site and back, and they’re responsible for daily transportation between housing and the farm. Congressional researchers list transportation costs as a major recurring expense across H‑2A employers.
Recruitment and administration. Someone has to prepare job orders, manage consulate appointments, track wages and hours precisely, and maintain records for potential audits. Many farms either dedicate a staff member or hire an outside consultant or attorney. Employment experts interviewed by Brownfield describe the program as “complex” and “paperwork‑heavy,” which aligns with what many producers have encountered.
When Castillo’s team put numbers to a “typical” six‑month H‑2A contract, they estimated that wages alone came to about $19,500, and, once you add in minimum housing, transportation, and other non‑wage costs, total employer cost lands at least around $29,500 per worker. So the idea that foreign labor is “cheap” doesn’t hold up very well when you look at that full bill.
On several Midwestern and Northeastern dairies that have used H‑2A, the pattern is similar. Folks go into it thinking, “We’ll finally get cheap, reliable help,” and walk out saying, “We did get stability and legal peace of mind, but we paid more per worker than we expected once housing, travel, and compliance were counted.” For some operations, that trade—higher cost in exchange for stability—is worth it. For others, it just doesn’t pencil.
Why compliance has become a management job, not just paperwork
Even if you never touch H‑2A paperwork, labor compliance has drifted into the same category as mastitis control and fresh cow management: you can’t afford to ignore it.
Farm Size
Herd (cows)
Full-Time Employees
5-Yr Audit Probability
Average Fine if Audited
Disruption Cost (Lost Production)
Total Risk Impact
Small
200–300
3–4
8%
$2,500
$25,000
$2,700 (probability-weighted)
Mid-Size
400–600
8–12
18%
$8,500
$85,000
$16,900
Large
800–1,200
15–20
28%
$15,000
$150,000
$46,200
Current federal penalty schedules show that mistakes on I‑9 forms can result in fines ranging from the low hundreds of dollars per form to the low thousands as the share of incorrect forms and prior violations increases. The latest CRS report on H‑2A and farm labor notes that more serious violations—repeat offenses, unsafe housing or transportation, clear wage underpayment—can lead to significantly higher penalties, back‑wage orders, and, for H‑2A users, possible debarment from the program.
On a dairy, that’s not theoretical. If an audit or enforcement action suddenly disrupts part of your crew, you feel it almost immediately in milking routines, fresh cow checks, and even butterfat performance. Milking shifts run longer, night checks get rushed, and transition cows don’t get quite the eyes they need. And if you, as the owner or manager, are tied up for days gathering records and sitting in meetings, that’s less time walking pens, watching TMR consistency, and working with your people.
So it’s worth noting that more herds and advisors are treating labor compliance as a risk management line item instead of something you hope never lands on your doorstep. That might mean budgeting a modest amount each year for an attorney or HR professional to review I‑9s and wage practices, scheduling internal audits of paperwork, and putting in place at least a basic HR system. Not because anyone enjoys it, but because the “do nothing and hope” model has just gotten too risky.
The global cost squeeze: why, where, and how you milk matters more
Now, zooming out a bit helps explain why these labor decisions feel so tight right now.
Region
Cost/Litre (USD)
Cost/cwt (approx.)
Gap vs. NZ
New Zealand
$0.370
$16.95
Baseline
Australia
$0.376
$17.27
+$0.006
Ireland
$0.470
$21.58
+$0.100
Netherlands
$0.480
$22.03
+$0.110
Upper Midwest US
$0.485
$22.27
+$0.115
California
$0.510
$23.41
+$0.140
China
$0.620
$28.47
+$0.250
Rabobank’s dairy team has been benchmarking milk production costs across the major exporting regions—New Zealand, Australia, the U.S., the EU, and others. In a 2025 release, they described seeing a “structural uplift” in production costs across eight key exporters over roughly the last five years, with average costs up by low double‑digit percentages since 2019 as feed, fertilizer, and labor all climbed.
Here’s what’s interesting. Even with those cost increases, New Zealand and Australia still sit near the bottom of the global cost ladder. Rabobank senior dairy analyst Emma Higgins notes that the two Oceania countries have “competed neck and neck” as the lowest‑cost producers, and that New Zealand currently holds about a five‑U.S.‑cents‑per‑litre cost advantage over Australia for 2024. Looking at the last five years, Rabobank estimates average total production costs of roughly US$0.37 per litre for both New Zealand and Australia, compared with around US$0.48 per litre for the other exporting regions. They also point out that exchange rate movements have effectively widened New Zealand’s cost edge by about 8–9 percent compared with 2019.
A lot of that comes back to system design. New Zealand’s pasture‑based setups, high cows‑per‑worker ratios, and relatively light permanent infrastructure keep capital and operating costs per litre low. Australian systems share some of those traits, though higher labor and input costs have eroded their relative advantage somewhat.
When you swing back to North America, the picture changes:
In California, you’re talking about high‑input freestall and dry lot systems, a heavy reliance on purchased or custom‑grown feed, relatively high wage rates, and a lot of capital tied up in manure handling and environmental compliance, as Western U.S. cost of production and policy reports show.
In the Upper Midwest, many herds benefit from strong homegrown forage and proximity to grain, but long winters mean housing cows, managing manure, and maintaining barns, all of which show up in fixed costs per cow in university cost‑of‑production summaries.
In the Northeast and Ontario, plenty of farms run mixed systems—grazing when the weather allows, then housing herds through the cold months. That brings some pasture advantages, but the reality of winter infrastructure doesn’t go away, as regional and provincial benchmarks make clear.
So when Rabobank says there’s been a structural cost lift across the world, what the numbers are also saying is this: the systems that started lean have more room to absorb those cost increases. If you’re in a higher‑input, higher‑capital setup in North America, every decision about labor, feed, and investment hits your cost per hundredweight harder, and that matters when you’re competing with milk coming from lower‑cost pasture‑based regions.
What the numbers really say about robots and labor
Let’s bring robots into this, because that’s where a lot of labor conversations end up.
Herd Size
Annual Labor Savings ($/year)
Payback Period @ 3%
Payback Period @ 5%
Payback Period @ 7%
Payback Period @ 8.5%
250 cows
$90,000
2.0 yr
2.3 yr
2.7 yr
3.2 yr
350 cows
$126,000
1.4 yr
1.7 yr
2.1 yr
2.4 yr
400 cows
$168,000
1.1 yr
1.4 yr
1.7 yr
2.0 yr
500 cows
$210,000
0.9 yr
1.1 yr
1.4 yr
1.6 yr
The University of Wisconsin conducted a careful analysis of what automatic milking systems actually do to reduce labor on U.S. farms. In a survey of 50 dairies that adopted box‑style AMS, extension economists found that, on average, farms reduced labor time by a little over 0.06 hours per cow per day. When they looked at it per hundredweight, labor time dropped about 0.10 hours per cwt. At an assumed wage of $15 per hour, that worked out to about $1.50 in labor cost savings per hundredweight of milk shipped.
In percentage terms, the Wisconsin team reported that the time required per cow fell by about 38 percent and the time per hundredweight by about 43 percent after AMS adoption. Some farms saw very little savings—often due to maintenance headaches or management issues—but roughly a quarter of the herds reported much larger reductions, translating to more than $2.40 per hundredweight in labor savings at that same $15 wage.
Now, put that into a herd size that many of you are in. Say you’re milking 400 cows and averaging 28,000 pounds per cow per year. That’s about 11.2 million pounds of milk annually, or 112,000 hundredweight. Multiply that by $1.50 per cwt in labor savings and you’re looking at roughly $168,000 per year in reduced labor costs, before you account for any changes in milk yield, components, or the extra time someone spends managing the technology. That’s the kind of math that will make anybody stop stirring their coffee and think, “Okay… what would that look like here?”
Researchers looking at AMS adoption in Norway have heard similar things, even though their systems and labor markets differ from ours. A recent peer‑reviewed paper in the journal Animals found that Norwegian farmers using multi‑box AMS generally perceived substantial reductions in labor needs, earlier detection of sick cows, and better mastitis management, and a meaningful share reported improved milk fat and protein levels after switching. Those are perceptions, not controlled trials, but they align with what many AMS herds in Europe and North America report to extension staff and industry journalists.
The work changed on those farms. Instead of spending as many hours in the pit, producers and staff spent more time looking at herd management software, following up on activity and rumination alerts, and handling preventive maintenance and troubleshooting.
“The work changed… Some described the shift as trading barn boots for a laptop—a sentiment echoed across both sides of the Atlantic.”
Extension folks and consultants here have been making the same point for years: robots don’t remove labor; they change the kind of labor you need. You trade a chunk of routine milking time for tech oversight, data interpretation, and cow‑flow management. That can be a very good trade if you’re struggling to fill repetitive milking positions and you have the management bandwidth—or someone on your team—who enjoys the technical side.
On the capital side, nobody pretends that AMS is cheap. A single robotic unit capable of handling 60–70 cows can cost between $150,000 and $275,000, depending on the model and support package. University economic tools and field experience often use a working range of about $180,000 to $220,000 per box before barn modifications, and real‑world projects frequently climb higher once you include concrete, cow‑traffic changes, sort gates, power upgrades, and so on.
At today’s interest rates, that financing cost becomes a big part of the payback equation. That’s why AMS investment tools from universities like Michigan State and Wisconsin encourage farms to plug in multiple milk price and interest rate scenarios, not just a best‑case line. If your DSCR has been under 1.0 for three of the last five years, it’s a fair question to ask: are you really in a position to add another big pile of robot debt?
The middle ground: automation that isn’t “all or nothing.”
What farmers are finding—especially on mid‑sized herds—is that the most realistic automation story often sits between “old parlor” and “full robots.”
In a lot of Wisconsin and Minnesota freestall herds, the starting point isn’t to rip out the parlor. It’s to add activity and rumination collars, automatic sort gates, and a robotic feed pusher. Collars give better eyes on heat detection and fresh cow behavior. Extension studies and case reports have shown that well‑managed activity systems can significantly improve heat detection rates and reduce days open. Automatic sort gates reduce the time and hassle of chasing cows for herd checks or hoof trimming. Robotic feed pushers keep TMR consistently in front of cows, which helps sustain dry matter intake and butterfat performance—something multiple UW and industry case studies have highlighted.
Several UW Extension profiles have featured 300‑ to 400‑cow freestall operations that added collars and a feed pusher, then reported cutting overtime hours, reducing emergency night checks, and catching transition‑period problems a day or two earlier than before. One producer summed it up nicely by saying, “It’s not magic, but it bought us some breathing room.” That sentiment comes up a lot when you talk to farms that have taken that incremental approach.
In California and the Southwest, where dry lot systems and intense summer heat are everyday realities, many dairies first consider automating feed handling and cooling before even considering robots. That can mean upgrading feed delivery controls, installing variable‑speed fans with automated controls, or integrating soaker systems tied to temperature and humidity sensors. Case studies from hot‑climate herds show that better-targeted cooling not only protects milk yield and reproduction during heat stress, but also frees up labor that used to be tied up shuffling cows in and out of shade or manually adjusting valves and timers.
In Northeast herds that split time between pasture and freestalls, automation often appears around the transition period and during seasonal moves. Activity and rumination monitors help managers see which cows aren’t handling the move from pasture back into the barn, or which fresh cows are slipping early in lactation, so the team can intervene sooner. Extension veterinarians and consulting nutritionists in those regions consistently point to early detection of subclinical problems as one of the biggest wins from these monitoring systems.
Across all of these examples, university and trade publications report that some farms see a pretty quick payback on targeted tools through reduced overtime, fewer emergency nights, and more consistent routines, while others see more modest gains. The common thread is that none of this technology is plug‑and‑play. It works best when it’s aimed at a clear bottleneck and someone on the farm is responsible for watching the data and adjusting management accordingly.
Domestic labor: “won’t work” or “can’t afford”?
You probably know this already, but the line “Americans won’t milk cows anymore” shows up in almost every labor conversation. It comes from a real place—some producers have posted milker positions for weeks and never had a local applicant, especially in isolated rural areas.
At the same time, economists and policy analysts looking at farm labor and immigration point out that non‑farm sectors—construction, warehousing, logistics, food processing—have expanded and pulled in a lot of the same working‑age people dairies used to rely on. CRS and other analyses make it clear that this competition from non‑farm employers offering higher pay, more predictable schedules, and jobs closer to town is a major factor behind the surge in H‑2A usage.
On the farm side, dairy HR specialists at universities like Wisconsin and Michigan State emphasize a couple of practical points. When dairies in more populated areas offer wages that truly compete with local non‑farm employers, provide at least some benefits, and offer more predictable time off, they can and do attract domestic workers into milking, feeding, and calf care roles. These advisors also point out that job design matters. Roles that mix equipment operation, basic maintenance, and parlor work tend to be more attractive than jobs that are “just in the pit” all day.
The hard reality is that not every dairy can afford to match those wages and conditions at current milk prices with their existing debt load. So the bottleneck often isn’t that nobody wants to milk cows; it’s that the farm can’t afford to pay what the rest of the local economy is offering for similar effort. That’s a tough truth, but it lines up with both the labor market data and the farm financials.
And that’s where H‑2A comes back into play. The program can give farms access to workers willing to take dairy jobs, but only if the operation can carry the full cost—AEWR wages plus housing, transportation, and compliance expenses. Leaders at AFBF have described H‑2A in interviews as a “mixed bag”: essential for some growers, too expensive for others, and, under current law, an imperfect or inaccessible fit for many year‑round operations like dairies. That mix of outcomes is exactly what producers are staring at when they put their numbers into a spreadsheet and compare H‑2A against domestic labor and against automation.
The labor problem on a lot of dairies isn’t that nobody will milk cows—it’s that the farm can’t afford to pay what the broader labor market is paying for comparable work.
For a 400‑cow dairy, what are you really choosing between?
So let’s bring this right back to a herd size many Bullvine readers live in: roughly 350 to 500 cows, a mix of family and hired labor, with a freestall or dry lot system and a parlor that might be ten to twenty years into its life.
Metric
Path 1: Selective Automation
Path 2: Legal Higher-Cost Labor
Path 3: Planned Transition
Capital Required
$50K–$150K (collars, sort gates, feed pusher)
$0–$25K (HR systems, legal setup)
$0–$10K (valuation, transition consulting)
Annual Debt Service
$8K–$18K (5-year amortization @ 6%)
$0 (operational cost, not debt)
$0 (exit phase)
Annual Labor Cost Impact
–$80K to –$120K (labor savings)
+$30K to +$50K (legal wages/housing vs. baseline)
N/A (phasing out)
DSCR Requirement
>1.15 (need room for new debt service)
>1.0 on average (can absorb higher wages)
>0.85 (can sell from position of strength)
3-Year Cash Flow Net
Positive if herd productivity holds
Neutral to slightly positive (wages offset labor efficiency)
Wage pressure continues; if milk price crashes, margin squeeze is acute
Market timing: land/cow values may soften; need to execute transition professionally
From conversations with producers, lenders, and extension folks—and backed by research and numbers—the choices for a farm like that often fall into three broad paths.
Path 1: Selective automation around real bottlenecks
This first path fits farms that:
Have generally been able to cover debt payments, with at least some cushion
Feel the labor pressure—long days, hard‑to‑cover shifts—but aren’t in outright crisis
Expect to keep milking for at least the next seven to ten years
The starting point is to put hard numbers on labor and debt. That means figuring out your total labor cost per cow—including family labor, overtime, housing, payroll taxes, and any HR or legal expenses—and then looking at your debt service coverage ratio (DSCR) over three to five years. Many agricultural lenders get nervous about major new capital projects if DSCR hasn’t been consistently above 1.0, and often they’re more comfortable when it’s around 1.25 or higher on average.
Once you know where you stand financially, you can go hunting for your bottlenecks. Maybe it’s late‑night fresh cow checks. Maybe it’s heat detection and breeding. Maybe it’s feed push‑up and bunk management. Maybe it’s the time you spend chasing cows for herd health or hoof trimming.
Extension advisors in Wisconsin, California, and the Northeast repeat the same advice: match the technology to the specific bottleneck, and your odds of seeing a return go up. So you look at one or two targeted tools—activity monitors, sort gates, a feed pusher, upgraded fans, and soakers—and build budgets with your accountant or consultant. The UW AMS work and other automation studies give you benchmarks for what’s possible, but the key is plugging in your own wage rate, herd size, and management style.
This path doesn’t require you to bolt robots to the floor tomorrow. It’s about picking off the worst bottlenecks and using focused automation to reduce overtime, improve consistency in fresh cow management and the transition period, and give your team a bit more breathing room without taking on unmanageable debt.
Path 2: Fully legal labor at a higher cost, in exchange for more stability
The second path is less about squeezing every last dollar of margin and more about lowering risk and sleeping at night. It tends to fit farms that:
Have maintained reasonably healthy margins on average, even through some tough price years
Don’t really want to add major new capital obligations right now
Have at least a rough sense of succession or a timeline for milking
Here, most of the hard work happens on paper. With your lender or a good farm management advisor, you build two parallel labor budgets.
One assumes a fully domestic, documented crew, paid at wages and benefits that genuinely compete with local non‑farm employers, plus housing where appropriate, all payroll taxes, and some allowance for HR and compliance work. The other assumes a blend of domestic and foreign workers—H‑2A in the U.S. or Temporary Foreign Workers in Canada—with realistic costs for housing, transportation, legal fees, and administrative time, in addition to the AEWR or equivalent wage.
Then you stress‑test both budgets. What happens to DSCR and family living under different milk price and interest rate scenarios? That kind of scenario planning is exactly what many extension farm management programs are teaching right now. If those budgets show that you can afford a fully legal labor structure—domestic, H‑2A, or a mix—and still keep DSCR in acceptable territory across most scenarios, then this path can dramatically reduce your compliance risk and mental load. You’re choosing to pay more for labor in exchange for predictability and legal security.
If your DSCR falls below 1.0 in most of those scenarios, you’re not buying stability—you’re buying more risk. And if the numbers don’t work in any reasonable scenario, that’s a strong signal that something deeper needs to change in scale, system, or long‑term plans.
Path 3: A planned transition out of milking while you still have choices
The third path is the one nobody loves to talk about, but more families are facing it head‑on. It usually becomes a serious option when:
DSCR has been weak for several years, not just during one ugly price cycle
Even “good” milk price years haven’t really improved equity or family living
There’s no next generation that’s both ready and genuinely eager to shoulder the risk
In that situation, throwing more debt at robots or locking yourself into an expensive labor program may not fix the underlying problem and can make the business more fragile.
This is where lenders, accountants, and transition advisors often urge families to take a hard look at updated land, cow, and equipment values and explore options before they’re forced into a fire sale. Depending on your region and setup, those options might include selling the herd and leasing your facilities to a neighbor, selling cows and barns but keeping the land for cropping or rental, or stepping away from dairy entirely and shifting into another enterprise.
In the Northeast, the Upper Midwest, and Ontario, extension case studies include real examples of families who sold their milking herds, kept the land, and moved into custom heifer raising or cash cropping. The common thread in the better outcomes is that they made those decisions before the bank or the barn decided for them.
Those are never easy conversations. But they can be responsible choices, especially if the numbers and family dynamics are pointing that way.
The Bottom Line
So why does all of this matter when you’re standing in your own yard, looking at your cows and your crew?
Because labor, automation, and long‑term strategy have basically braided themselves together. H‑2A and similar programs have expanded dramatically and can deliver legal, predictable labor, but at a premium once you factor in housing, travel, and compliance. Domestic labor is under pressure from non‑farm jobs that often pay more and offer more predictable lives, and not every dairy can match those offers on today’s milk prices. Automation—whether it’s collars and sort gates or full AMS setups—can change how work gets done and open up new options, but it takes capital and management horsepower in an interest rate environment that’s tighter than it was a few years ago. And global cost shifts have tilted the playing field in favor of leaner, pasture‑based systems, which means higher‑input confinement and dry lot setups have to be that much sharper on costs and execution.
What’s encouraging is that there isn’t only one “right” answer.
A 450‑cow freestall herd in Wisconsin might look at their numbers and decide the most realistic path is to keep the parlor, add monitoring and a feed pusher, maintain a solid domestic crew, and focus hard on fresh cow management and butterfat performance to squeeze every bit of value out of components. A 1,000‑cow dry lot dairy in California might decide that, despite the cost, H‑2A or other foreign worker programs are essential just to have enough hands on deck, then use targeted automation to make those people as effective as possible in the heat. A 320‑cow family operation in the Northeast or Ontario might look at five years of DSCR and equity trends and conclude that the most responsible decision is to sell the herd while they’re still in control, keep the land, and write the next chapter on their own terms.
What I’ve found, both in the research and around kitchen tables, is that the herds that come through periods like this in the best shape are the ones that don’t kid themselves. They know their all‑in labor cost per cow, including family labor and housing. They’ve looked at their debt coverage over several years, not just one good or bad season. They have a realistic sense of where their system sits on the cost spectrum compared with other options, both here and overseas. And then they pick a path—selective automation, fully legal higher‑cost labor, or a planned transition—that actually aligns with their numbers and goals.
If you do nothing else after reading this, here’s one practical step. In the next month, take an hour to pull your last three to five years of financials. Calculate your true labor cost per cow, including family labor. Work with your lender or advisor to figure out your average DSCR over that stretch. That quick snapshot will tell you a lot about whether you’re in a position to buy more labor stability, buy more automation, or buy yourself time to design a dignified exit.
The worst place to be isn’t on the “wrong” path—it’s drifting with no path at all. These aren’t easy decisions. But they’re exactly the kind of decisions that make the difference between reacting to the next crisis and steering your farm where you actually want it to go—for you, your family, your cows, and whoever might come next.
Step
Metric to Calculate
Data Source(s)
Your Farm’s Number
Red Flag / Decision Rule
Day 1–3
Total Annual Labor Cost (All-In)
Payroll records (wages, taxes), family draw (owner/spouse labor), housing, transportation, HR/compliance
$____ per year (or $____ per cow)
>$1,500/cow? Automation or labor program may be necessary. >$1,800/cow? Path 3 (transition) worth exploring.
Day 4–7
3-Year Average Debt Service Coverage Ratio (DSCR)
Last 3 years’ tax returns or P&L, total debt service (principal + interest), net operating income
DSCR: ____ (target: >1.15)
<1.0? Stop new debt; focus on cash flow / Path 2 or 3. 1.0–1.15?Proceed cautiously; Path 1 automation is risky. >1.25? Healthy; Path 1 or 2 feasible.
Day 8–10
Current Interest Rate on Farm Debt
Loan agreements, bank statements, capital plan notes
If no clear bottleneck, targeted automation (Path 1) may not pay off. If multiple bottlenecks, prioritize & sequence tools (collars first, then sort gates, then robots).
Day 16–20
Succession Plan & Timeline
Family conversation, advisor notes, estate plan
Next operator identified? ☐ Yes / ☐ No Expected transition year: ____ (or N/A)
No next operator + 5–10 years to retirement? Path 3 (planned transition) is likely the right move. Clear next operator + strong DSCR? Path 1 or 2 can position the farm for growth.
Day 21–25
Multi-Year DSCR Trend
Last 5 years of financials, plot DSCR year by year
DSCR trend: ☐ Improving / ☐ Flat / ☐ Declining
Declining DSCR + weak bottleneck case = Path 2 or 3 most prudent. Improving DSCR + strong bottleneck case = Path 1 opportunity.
Day 26–30
Decision: Which Path Aligns with My Numbers & Goals?
Once decided, build 3–5-year action plan with lender, advisor, or consultant. No path is “wrong”—but drifting is.
Key Takeaways
H‑2A isn’t “cheap.” Once you add housing, transportation, and compliance, total cost per worker often hits around $29,500 for a six‑month contract—far above the posted wage.
Robots save labor, but demand capital and management. UW research shows AMS can cut labor costs by about $1.50/cwt on average—roughly $168,000/year on a 400‑cow herd—but payback depends heavily on interest rates and your team’s tech skills.
Global cost gaps are real. Rabobank data shows New Zealand and Australia produce milk at about US$0.37/litre versus US$0.48/litre for most other exporters—a gap that puts extra pressure on higher‑input North American systems.
Compliance risk belongs on your management list. Labor audits and I‑9 mistakes can disrupt crews and hit your P&L hard; treating compliance like herd health is now table stakes.
Three paths for mid‑size dairies. Selective automation, fully legal higher‑cost labor, or a planned exit—your multi‑year DSCR and true labor cost per cow will tell you which one your farm can actually afford.
Complete references and supporting documentation are available upon request by contacting the editorial team at editor@thebullvine.com.
Learn More
Robotic Milking: 3 Hard Truths Every Owner Must Face – Master the transition to automation without blowing your budget. This analysis reveals the hidden management shifts required to make robots pay off, arming you with a realistic implementation plan that protects your cash flow and sanity.
The New Dairy Economy: Strategies for Long-Term Resilience – Position your farm to thrive despite structural cost increases. It exposes the long-term trends shaping the next decade, delivering the strategic framework you need to align your capital investments with the realities of a shifting global milk market.
Wearable Tech: How Monitoring Systems Are Changing the Breeding Game – Gain a competitive advantage in reproductive performance by leveraging the latest sensor technology. This piece breaks down how high-tech monitoring delivers superior pregnancy rates and labor savings that traditional heat detection simply can’t match.
The Sunday Read Dairy Professionals Don’t Skip.
Every week, thousands of producers, breeders, and industry insiders open Bullvine Weekly for genetics insights, market shifts, and profit strategies they won’t find anywhere else. One email. Five minutes. Smarter decisions all week.
$700/cow is hiding in your bunk. Weekend feed drift, DM swings, and sorting are quietly stealing it. Here’s the four-phase fix.
Sit at enough kitchen tables across dairy country, and you start hearing the same line in different accents.
“We’ve got good cows. The ration looks right on paper. But the milk just isn’t where it should be.”
You know that feeling. The ration balances, butterfat performance ought to be stronger, you’ve invested in genetics and decent forage… and the bulk tank still isn’t telling the story you’d expect.
What’s interesting here is that, in the last few years, some very solid research has started to put a name and a number on part of that gap: the rumen microbiome, and how stable—or unstable—we make it with day‑to‑day management, not just with what we put in the mixer.
A 2024 paper in Animal Microbiome, led by H.F. Monteiro at the University of California, Davis, used an AI‑based ensemble model on 454 genotyped Holsteins from commercial herds in the U.S. and Canada and found that the rumen microbiome alone accounted for about 36% of the variation in residual feed intake (RFI), even after diet composition and cow traits were accounted for. The authors described the microbiome as a “major driver” of feed efficiency, sitting alongside ration and genetics rather than behind them. That lines up with other work showing that when you follow Holstein cows across a full lactation, the composition of the rumen and lower‑gut microbiomes tracks closely with feed efficiency and production traits, and the prediction of efficient versus inefficient cows improves when microbiome data is added to diet and genetic information.
On top of that, newer host–microbiome projects—such as the 2024 “host genome–microbiome networks” study on mid‑lactation Holsteins—are showing that parts of the core rumen microbiome are heritable and linked to both feed efficiency and methane output. In other words, the cow’s genome and her microbial passengers are working together to shape how she uses feed and what comes out the front of the tank and out the back as gas.
So we’re not throwing out ration formulation or genetics. But the data suggests the microbiome is a third leg of the stool. And, as many of us have seen in the barn, those bugs are very sensitive to how consistent their world is.
Looking at This Trend: What the Bugs Are Quietly Telling Us
What I’ve found, looking at this research alongside what producers are seeing on their own farms, is that microbiome‑first thinking mostly backs up what good cow people have been saying for years. It just gives those instincts a clearer scientific backbone.
You probably know this already, but the rumen community isn’t one thing. Reviews of how the rumen microbiota shifts from the dry period into early lactation show a fairly consistent pattern: bacteria that specialize in rapidly fermentable carbohydrates tend to increase as starch and sugars rise, while classic fibrolytic species such as Fibrobacter and Ruminococcus are more sensitive to drops in rumen pH and rough dietary changes. When the feeding environment is steady—similar ration, predictable feeding and push‑up times, consistent dry matter—those different groups can settle into a balance that supports both butterfat performance and feed efficiency. When we keep changing the rules on them, the fast opportunists win more often, and the slower fiber‑digesters get pushed back.
And as many of us have seen, that can show up as:
Butterfat levels are bouncing more than the diet changes would suggest
Fresh cows in the transition period that don’t ramp up on dry matter intake the way we’d expect based on the ration
More days where rumination, manure consistency, and overall cow behavior feel “off,” even though nothing obvious changed on paper
It’s worth noting that when you line up the science with on‑farm experience, three everyday management areas keep coming up as the main microbiome disrupters: feed timing and access, TMR dry matter, and particle size/sorting.
Let’s walk through each one, because that’s where a lot of the opportunity is hiding.
Feed Timing and Access: The “Saturday Morning” Problem
Looking at this trend on real farms, feed timing and access are usually the first places where the microbiome story becomes very concrete.
In many Wisconsin freestall herds—and plenty of Ontario, New York, and Pennsylvania barns too—the weekday schedule on paper looks quite good. Feed at 6 a.m., push up several times in the next few hours, second feeding mid‑afternoon, a couple more push‑ups before night. Then Saturday and Sunday arrive. That 6 a.m. feeding quietly becomes 6:30 or 7:00, the early‑morning routine gets “flexible,” and late‑night push‑ups happen only if there’s time. I’ve noticed that pattern over and over, sitting in farm kitchens from the Midwest to the Northeast.
On larger Western dairies in California or Idaho, the pattern can be different, but the result is similar. You might have multiple feeding crews, and one crew is very tight on timing while another is a bit looser. To the cows—and to their microbes—that still feels like an irregular routine.
Penn State’s “Benefits of Timely Feed Delivery and Push Ups,” written by extension educator Dr. Virginia Ishler and colleagues, brings together several studies that quantify what many of you have already felt. In their summary of work by Collings et al. and Matzke & Grant, cows that were restricted from feed for about ten hours—typically overnight—ate 3.5 pounds less dry matter per day and produced 7.9 pounds less milk per day than cows that had feed available throughout the night. A Dairy Herd article by Penn State educator Michal Lunak echoes those numbers and adds that herds routinely pushing feed up produced, on average, over eight pounds more milk than herds that didn’t.
When feeding and push‑up practices were adjusted so that feed remained available from midnight to early morning and was pushed up more consistently, dry matter intake and milk yield increased, and cows spent more time both lying and eating. Penn State also highlights that bunk empty time should be kept under about three hours; beyond that, cows’ motivation to eat rises sharply, and they’re more prone to slug‑feeding when feed returns.
From the microbial side, what’s happening is intuitive once you think about it. When cows go through long stretches with an empty bunk, they’re more likely to slug‑feed when the TMR finally arrives—packing in a big meal quickly. That dumps a heavy load of fermentable carbohydrate into the rumen all at once, causing rumen pH to drop more sharply and the slower fiber‑digesting microbes to get stressed or washed out. In herds that have taken the time to log feed delivery and push‑up times (some have done this with simple charts or camera snapshots), those longer gaps—especially on weekends—often match up with the days when butterfat drops and fat: protein ratios point toward subacute acidosis.
There’s also a broader transition‑cow angle. Work on transition cow nutrition in North American herds has shown that more consistent routines around the dry and fresh periods—fewer abrupt diet changes, grouping, and environmental shocks—are associated with better metabolic profiles and stronger early lactation performance. Feeding schedule is one of the major “time cues” the cow’s system responds to. The microbes, even though they don’t have watches, are reacting to the same pattern.
So one of the first microbiome‑friendly questions to ask is very simple: “How long are my cows actually going without feed they can reach?” Penn State emphasizes that bunks should not be empty for more than about three hours, and that more frequent push‑ups in the first hours after feeding are strongly associated with higher DMI and milk yield. The microbiome is one more good reason to take that seriously.
TMR Dry Matter: The Quiet Thief in the Bunker
The second lever, TMR dry matter, is one of those things that quietly steals profit when no one’s looking.
Penn State’s “Total Mixed Rations for Dairy Cows,” by Dr. Virginia Ishler and the dairy nutrition team, spells out how changes in TMR dry matter affect what cows actually eat. When a TMR gets wetter but batch weights don’t change, cows fill up on volume but take in fewer kilograms of dry matter than the ration assumes they will. The bulletin shows farms where actual DMI drifts away from predicted intake as TMR moisture changes, and notes that herds that keep actual DMI within about 5% of expected intakes—and pay close attention to TMR accuracy—consistently achieve higher milk and more stable components than herds where DMI and TMR DM are rarely checked.
Industry pieces on TMR moisture, including extension articles and dairy nutrition case reports, have shown that when TMR moisture comes in higher than expected, and no one adjusts, early‑lactation cows can lose several percent of their DMI and a few kilograms of milk per day until someone finally tests dry matter and corrects the ration. Many of you have lived that scenario: “Nothing changed… except we opened a new corner of the bunker or switched bags and didn’t test.”
From the microbiome’s point of view, those moisture swings do two things at once:
On wetter days, cows reach rumen fill sooner and don’t get the expected dry matter. Passage rate increases, long fiber particles spend less time in the rumen, and fiber‑digesting bacteria have less chance to colonize and break them down.
On drier days, the same volume of TMR carries more dry matter and more fermentable energy, so the fermentation runs “hotter” and rumen pH can dip more sharply, again putting pressure on the fiber‑digesting community.
What farmers are finding is that you don’t have to nail TMR dry matter at one exact number. But you do want to keep day‑to‑day changes in a reasonable band and adjust batch weights when moisture moves outside that band. Many Midwest and Northeast herds now do at least one or two TMR dry matter checks a week, more often when they start a new section of bunker or change forage sources, and they treat it as part of routine bunk and fresh cow management rather than just troubleshooting.
The evidence suggests that habit alone can prevent many “mystery” weeks in which milk and components slip for reasons nobody can quite explain until someone dusts off the Koster tester.
Particle Size and Sorting: Three Rations in One Bunk
The third piece is particle size and sorting—the classic “three rations in one bunk” problem that shows up on farms of all sizes.
After feeding a TMR, it’s common to walk the bunk an hour later and see a line of longer stems pushed out of the way while the finer material has been cleaned up. By early afternoon, cows are picking over what’s left, and what’s left doesn’t look much like the ration the nutritionist balanced. I’ve noticed that on everything from 80‑cow tiestalls to 4,000‑cow freestall barns.
The Penn State Particle Separator (PSPS) has become a standard tool for seeing what’s really happening. For many corn‑silage‑based rations, Penn State guidance suggests that only about 2–8% of the TMR should remain on the top sieve, roughly 30–50% on the next sieve, 10–20% on the 4 mm sieve, and no more than 30–40% in the bottom pan for high‑producing cows. Hoard’s articles on ration particle size have highlighted research showing that diets with overly long particles and high undigested NDF reduced DMI by 5–6 pounds per day, and that finer chopping and better PSPS distributions restored DMI and milk yield.
When a TMR has too much long material on that top sieve, cows can sort around it. They end up eating a diet richer in starch and poorer in effective fiber than intended. Industry articles and extension pieces have repeatedly called out that gap between the “paper ration” and the “eaten ration” as a major driver of inconsistent butterfat performance and subacute rumen acidosis, even when the formulation itself looks sound.
From a microbiome perspective, heavy sorting means you’re constantly pushing the rumen community toward the organisms that thrive on rapidly fermentable carbohydrates, while making life harder for the slower, fiber‑digesting bacteria that underpin fiber utilization and rumen health.
What’s encouraging is that producers in very different environments—freestall barns in Ontario, tiestalls in Quebec, and dry lot systems in hot regions—have all reported improvements after making particle size checks and bunk observations a regular habit. Running the separator weekly for a period, adjusting chop length and mixing time, and watching what’s left at the bunk an hour after feeding are simple, practical tools that align very well with what the bugs seem to be asking for.
Management Gap
What Happens
Milk Loss per Cow/Day
Butterfat Impact
Annual Cost per 1,000 Cows
10-Hour Overnight Feed Restriction
Cows slug-feed; rumen pH crashes; fiber-digesting microbes washed out
−7.9 lbs
−0.4% (subacute acidosis)
$1,153,600
TMR Dry Matter Drift (+2–3 points)
Cows fill on volume but get fewer kg DM; passage rate increases; fiber digestion drops
−3.5 to −5 lbs
−0.2–0.3%
$510,500–$728,750
Excessive Sorting (Long particles, fine refusal)
Cows select around fiber, eating richer diet; slow fiber-digesters starved out
What Farmers Are Finding: A Four‑Phase Plan That Fits Real Herds
So with all that on the table, the natural question is: how do you actually use this microbiome‑first lens on your own farm?
What I’ve noticed, talking with producers from Wisconsin, Ontario, the Northeast, and the West, is that the herds getting the most from this approach tend to move through four broad phases. They don’t always call them phases, but the progression shows up again and again, and it lines up nicely with what extension and research folks are seeing.
Phase 1: Tighten Timing and Feed Access
Phase 1 is about getting honest about feed access.
A straightforward starting point looks like this:
For two weeks, write down when feed really hits each group and when it’s last pushed up at night. Don’t rely on memory. Include weekends and holidays.
Look for recurring long gaps—especially overnight—where cows don’t have feed in front of them or can’t reach it.
Given your labor and layout, decide what’s realistic in terms of extra push‑ups, an automatic feed pusher, or improved hand‑offs between shifts to shorten those gaps.
Penn State’s work and related industry articles have shown that when cows move from long overnight feed restrictions to continuous access, dry matter intake and milk yield increase in ways that match the 3.5 lb DMI and 7.9 lb milk responses measured when feed is restricted versus available overnight. In a microbiome‑first mindset, you’re reducing the size and frequency of the shocks the microbial community has to deal with each day.
Phase 2: Tune Up the Physical Ration
Once cows can depend on there being feed in front of them most of the time, Phase 2 is about what that feed looks like physically.
On farms where this has really moved the needle, Phase 2 typically includes:
Running the Penn State Particle Separator on the TMR weekly for a period and working with the nutritionist and forage team to adjust chop length, kernel processing, and mixing until the ration consistently falls into the recommended PSPS distributions for your forage mix.
Spending time at the bunk 45–60 minutes after feeding, especially in fresh and high pens, to see how much sorting is actually happening and what is left in front of the cows.
Watching kernel processing scores for corn silage and keeping an eye on haylage or straw length to avoid overloading the top sieve and inviting sorting.
The goal is a ration that’s chewable but not easily sorted. Research and field experience both show that when you hit that sweet spot, you see more consistent chewing, better saliva production, smoother manure, and more stable butterfat performance.
Phase 3: Make Dry Matter Checking Routine
By the time herds get to Phase 3, many notice they’re not seeing as many “mystery” swings in milk and components. Phase 3 is about turning TMR dry matter checks into a standard part of bunk management.
In practical terms, that often means:
Testing TMR dry matter at set times each week—often early and late in the week.
Logging those numbers so you and your nutritionist can track when moisture shifts as you move along the bunker or between forage sources.
Agreeing on a simple trigger—such as a two‑point or greater difference between actual and assumed TMR dry matter—that prompts ration adjustments rather than “wait and see.”
Penn State’s TMR bulletin and related herd‑level analyses suggest that farms with tighter control over TMR dry matter and loading accuracy see higher milk yield and more consistent components than those where dry matter is rarely checked. For the microbiome, this kind of consistency means fewer sudden jumps in fermentable load and a more predictable environment in which to work.
Phase 4: Use Additives to Fine‑Tune, Not Patch
Only after those three pieces feel reasonably solid does it make sense to lean into live yeast, buffers, and other additives.
The research on live Saccharomyces cerevisiae in dairy cows brings several themes together:
In transition‑cow trials, such as those led by Marinho and colleagues, supplementing live yeast around calving improved postpartum dry matter intake and rumination, led to milder inflammatory and liver stress markers, and increased milk yield compared with unsupplemented cows on the same base ration.
Reviews and industry summaries that pool results from multiple mid‑lactation trials often report milk yield gains in the range of 1–2 kilograms per day and more stable rumen pH when live yeast is added, particularly in herds with solid basic management.
Under heat-stress conditions, especially in hot, dry regions, live yeast has been shown to help stabilize rumen pH and support production when combined with effective cooling and feeding strategies.
At the same time, extension and university reviews are clear that additives cannot overcome fundamental problems such as poor forage quality, erratic feeding schedules, or severe overcrowding. In many commercial herds, responses to yeast and buffers are variable, and benefits tend to be largest where the basics are already in decent shape.
In a microbiome‑aware framework, that means treating additives as a way to fine‑tune a system that’s already working reasonably well, rather than as a band‑aid for underlying management issues.
Putting Numbers to the Four Phases: The Economics on a 1,000‑Cow Herd
So why is all this significant? Economics plays a big part in the story.
Imagine a 1,000‑cow freestall herd with:
Average production is around 38–39 kilograms (about 85 pounds) of milk
Butterfat at roughly 3.2% and protein just over 3.1%
Dry matter intake near 25 kilograms (55 pounds) per cow per day
Milk price is around $0.40 per kilogram, and feed cost is roughly $0.20 per kilogram of dry matter
Those numbers won’t fit every farm, but they’re realistic for many North American herds right now based on recent Hoard’s Dairyman economic analyses and regional milk price reports.
If Phase 1—tightening feeding times and improving access—helps you realistically recover around 0.75–0.8 kilograms of milk per cow per day by eliminating long overnight feed gaps (a conservative figure compared to the 7.9 lb milk response Penn State reports when cows move from restricted to continuous night access), that’s roughly $0.30–0.35 per cow per day. Over a year and 1,000 cows, you’re looking at about $110,000–120,000 in additional milk revenue.
If Phase 2—getting particle size and sorting under control—adds another 1.3–1.4 kilograms of milk per cow per day and nudges butterfat up a bit, that can easily translate into a couple of hundred thousand dollars a year in combined volume and component pay, depending on your milk pricing and how much room there was for improvement. That’s consistent with the kind of DMI and milk yield recoveries seen when rations shift from “too long and sorted” toward better PSPS targets and reduced excessively long particles.
Phase 3—keeping TMR dry matter in line with regular checks and adjustments—might reasonably prevent a 0.5–0.6 kilogram per cow per day loss during those weeks when moisture shifts used to drag DMI and milk down quietly. Extension examples and field data show that even modest, unnoticed drops in DMI from dry matter changes can add up to tens of thousands of dollars per year on larger herds.
Then, in Phase 4, if a well‑designed live yeast program on top of this more stable foundation adds another 0.7–0.8 kilograms of milk per cow per day in the pens you target—figures that fall within the 1–2 kg/day range often reported when live yeast is used in well‑managed herds—then after covering product cost you might realistically net on the order of $50,000 per year.
Put those pieces together, and it’s not hard to model a total improvement on the order of $500,000–700,000 per year for a 1,000‑cow herd. On a per‑cow basis, that’s about $500–700. Early indications from extension economic estimates and field experience suggest that those kinds of gains are achievable in herds with significant room to tighten timing, dry matter control, and sorting—provided they treat this as a stepwise management project rather than a quick fix.
Even if you only capture half of that modeled upside, you’re still talking about a six‑figure swing in annual income on a 1,000‑cow unit. That’s the kind of math that justifies taking a hard look at your feeding routine, DM checks, and PSPS readings.
Of course, if your feeding program is already very tight, your upside may be smaller. And if other bottlenecks like lameness, poor ventilation, water limitations, or chronic fresh cow problems are holding cows back, those will cap how much any microbiome‑focused approach can deliver until they’re addressed.
Looking a bit further ahead, this development suggests that herds that get serious about microbiome‑aware management now may also be better positioned for future shifts in breeding goals and processor expectations—especially as more emphasis is placed on feed efficiency and methane in proofs, and as sustainability programs look more closely at emissions and feed conversion.
How This Plays Out on Different Types of Farms
It’s also important to note that microbiome‑aware management doesn’t look the same in every system. The principles are the same; the levers change.
Smaller Family Herds
On a 120‑cow tie‑stall in Quebec or a 200‑cow freestall in Wisconsin, the total dollar amount won’t be as large as on a 1,000‑cow dairy, but the per‑cow impact can look very similar. Many of these farms have a key advantage: the people making decisions are the ones feeding cows and walking the alley every day, so they notice subtle changes quickly.
The constraint is usually time. One person may be handling feeding, milking, fresh cow management, and fieldwork. On these operations, the most successful microbiome‑aware changes are often:
Keeping feed times reasonably consistent every day, including weekends
Adding a simple weekly TMR or key forage dry matter check, rather than trying to test constantly
Using the particle separator at least occasionally to see whether sorting might be part of why butterfat performance is more variable than expected
Additives like live yeast or buffers are often targeted at small groups—such as fresh cows during the transition period or high‑risk pens—where the return is easiest to see and monitor.
Grazing and Seasonal Systems
In grazing and seasonal systems—such as many in Atlantic Canada, parts of the Northeast, Ireland, and New Zealand—the basic microbial principles remain the same, but the feeding context differs.
Instead of asking, “When does the TMR arrive?” the questions sound more like:
“How consistent are turnout times onto fresh pasture?”
“Are parlor concentrates or supplementary TMR fed at predictable times and rates?”
“Are we giving fresh cows enough time to adapt when moving from a winter ration to lush spring grass?”
Pasture‑based management guides and research reviews emphasize that consistent grazing rotations, careful pasture dry matter measurement, and smooth transitions between conserved feed and pasture are critical for avoiding digestive upsets and performance drops. In these systems, a microbiome‑aware approach often leads to more deliberate use of fiber sources or buffers alongside high‑sugar grass, and particular attention to fresh cow management so the rumen isn’t shocked by abrupt diet changes.
Hot, Dry Regions and Dry Lot Systems
In hot, dry regions—such as parts of California, Arizona, and Texas—dry lot systems under high temperature‑humidity index conditions add heat stress to the rumen‑stability conversation. Research and field observations show that heat stress depresses intake, alters rumen fermentation (more acid load, lower pH), and can reduce fiber digestibility, making the rumen more fragile.
On those dairies, producers who are thinking in microbiome terms often work on three fronts at once:
Feeding more of the ration during cooler times of day so cows actually feel like eating
Making sure shade, fans, and soakers are set up and managed so cows can stay comfortable enough to use the feed that’s in front of them
Using live yeast and buffers strategically, once cooling and feeding basics are in place, to help stabilize rumen pH and fermentation under heat stress
Industry sources have reported that, under those conditions, live yeast can provide a positive return when it’s part of a broader heat‑stress management package, not a stand‑alone solution.
As promising as this way of thinking is, it’s not a magic wand. There are a few common ways it can go sideways.
One is partial implementation. If a herd tightens up feeding times but leaves a very sortable ration unchanged, cows may simply eat more of the fast‑fermenting portion of the diet more consistently. In the short term, that can actually increase the risk of rumen acidosis rather than reduce it, which aligns with PSPS‑based research and field reports showing that excessively long particles encourage sorting.
Another is overestimating labor capacity. On many family farms, it’s simply not realistic to add frequent night push‑ups and multiple TMR dry matter tests per week. Extension advisers often recommend starting with one or two high‑impact changes—like a weekly DM check and better weekend feeding consistency—that everyone believes can be sustained.
A third is expecting additives to solve structural issues. In herds where forage quality is poor, dry cow and fresh cow housing are limiting, or stocking density is excessive, yeast and buffers might help at the margins, but they won’t turn the situation around on their own. Reviews of direct‑fed microbials and buffers emphasize that these tools complement, but cannot replace, sound ration formulation, forage management, and cow comfort.
So while the microbiome lens is very useful, it’s healthiest to treat it as a way to prioritize and sharpen management decisions, not as a replacement for the fundamentals.
A Practical Starting Checklist
If we were wrapping this up over coffee in your farm office, here’s the simple checklist I’d leave on the table:
Log what really happens. For two weeks, write down actual feed delivery and push‑up times by group, including weekends and holidays. Let those numbers—not memory—show where the biggest gaps are.
Watch the bunk after feeding. Stand at the bunk 45–60 minutes after a TMR delivery. What are cows doing? What’s left on the bunk? If you can borrow or buy a particle separator, run both fresh TMR and refusals at least once to see how much the ration changes between wagon and cow.
Add one dry matter check to your week. Pick a day each week to test TMR dry matter and compare it to the value in your ration program. Talk with your nutritionist about adjusting when the difference becomes large enough to matter for DMI.
Use pen‑level data as an early warning. Look at fat: protein ratios, rumination indices (if you have monitors), and manure scores by group. Treat changes there as early hints that the rumen—and the bugs—may not be as stable as you’d like.
Put additives in their proper place. Once timing, TMR structure, and dry matter are under reasonable control, then sit down with your nutritionist to design a focused, time‑limited trial with yeast or buffers in specific pens, rather than making a blanket change and hoping for the best.
The Bottom Line
At the end of the day, we’re not just feeding cows. We’re managing microbial ecosystems that live inside those cows and turn this season’s feed bill into next month’s milk cheque.
What’s encouraging is that many of the things those microbes seem to like—steady routines, consistent dry matter, well‑structured rations, thoughtful fresh cow management—line up closely with what good producers have been working toward for a long time. The microbiome‑first perspective doesn’t throw any of that out. It simply connects the “why” and the “how much” in a way that helps you decide where your next management tweak should be, whether you’re milking 80 cows in a tie stall or 8,000 cows in a dry lot system.
KEY TAKEAWAYS
The rumen microbiome drives 36% of feed efficiency—manage it or lose it. A 2024 AI study on 454 Holsteins found microbiome composition rivals genetics and diet in determining which cows convert feed to milk efficiently.
Three bunk-management gaps are quietly draining your tank. Weekend feed-time drift, unnoticed TMR dry matter shifts, and sortable rations cost pounds of DMI and milk every single day—often without any obvious ration change.
A 10-hour feed gap costs 3.5 lb DMI and 7.9 lb milk per cow per day. Penn State data shows that fixing overnight access alone can recover much of that loss. Bunks should never sit empty for more than three hours.
Additives can’t fix bad timing or a sortable ration. Follow the four-phase playbook: tighten feed delivery and push-ups first, tune particle size with the PSPS, make weekly DM checks routine, then use live yeast to fine-tune—not to patch.
The math: $500–700 per cow per year. Stack those four phases on a 1,000-cow herd, and you’re looking at $500,000–700,000 in recoverable margin. Even capturing half changes your year.
Executive Summary:
If your ration looks right but the bulk tank keeps coming up short, this article explains why the missing piece may be your cows’ rumen microbiome—and how you manage the bunk around it. It starts with new AI‑based research showing the rumen microbiome accounts for roughly 36% of residual feed intake variation in Holsteins, then ties that directly to three daily levers you control: feed timing and access, TMR dry matter, and particle size/sorting. Using Penn State data, it quantifies how 10‑hour overnight feed gaps, unnoticed TMR moisture shifts, and highly sortable rations can quietly cost 3.5 lb of DMI and 7–8 lb of milk per cow per day—even in herds that think they’re “feeding well.” From there, it lays out a four‑phase, microbiome‑aware playbook: tighten feeding schedules and push‑ups, get the physical ration right with the PSPS, make routine DM checks part of bunk management, then use live yeast and buffers as fine‑tuning tools instead of expensive band‑aids. A realistic 1,000‑cow example shows how stacking those phases can unlock about $500–700 per cow per year—$500,000–700,000 across the herd—if you’re starting from the “common” level of drift in timing, DM, and sorting. Finally, the article shows how this approach scales from 80‑cow tiestalls to 8,000‑cow dry lot systems, with a simple checklist you can use to pick your first one or two changes and start turning microbiome theory into extra dollars on your milk cheque.
Complete references and supporting documentation are available upon request by contacting the editorial team at editor@thebullvine.com.
Learn More
Your Feed Room’s Hidden $58400 Leak – And How Smart Dairy Farms Are Plugging It – Exposes the invisible “shrink” that drains $58,400 from average herds every year. This guide arms you with precision-tracking methods to eliminate loading errors, ensuring the expensive ration you paid for actually reaches the rumen instead of the floor.
The Cheap Feed Trap: Why the Wall of Milk Won’t Break and How to Protect Your Margins – Multi-year highs in milk-to-feed ratios are creating a dangerous “cheap feed trap” for North American producers. This analysis delivers a strategy for long-term positioning, helping you protect margins by looking beyond simple ration spreads to total business cost.
Every week, thousands of producers, breeders, and industry insiders open Bullvine Weekly for genetics insights, market shifts, and profit strategies they won’t find anywhere else. One email. Five minutes. Smarter decisions all week.
What the 28-point sugar swing in molasses means for your calf program—and the five questions your supplier should be able to answer.
You know how it is when you’re standing at the feed store or reviewing a quote from your supplier, trying to make sense of what you’re actually buying? Most of us zero in on the guaranteed analysis—crude protein, minimum fat, maximum fiber. Those numbers feel solid. They seem like they’re telling the whole story.
But here’s what I’ve been thinking about lately. A growing body of research, combined with what calf managers are observing from Wisconsin to California to the Northeast, suggests that one of the most common ingredients on that tag may be affecting heifer development in ways the guaranteed analysis simply doesn’t capture.
That ingredient is molasses.
What appears as a single, standardized commodity actually represents one of the most variable ingredients in animal nutrition. A 2020 study published in the Journal of Dairy Science by Palmonari and colleagues documented sucrose content in cane molasses ranging from 39% to 67% on a dry-matter basis. That’s not a minor fluctuation—we’re talking about a swing that can meaningfully alter energy delivery, fermentation patterns, and rumen development in young calves.
Researchers studying early-life nutrition have noted that, while this variability is well documented in the scientific literature, its practical implications for calf programs are often overlooked at the farm level. When you’re looking at a 28-percentage-point swing in sugar content, you’re essentially dealing with different ingredients showing up under the same name on that feed tag.
For operations investing significant resources in replacement heifer programs—and that’s most of us these days, given heifer values—understanding this variable is becoming increasingly important for achieving consistent results.
What the Research Actually Shows
The assumption that “molasses is molasses” doesn’t hold up once you start digging into laboratory data. The Palmonari study systematically characterized molasses samples from suppliers around the world, and honestly, the compositional differences they documented were more dramatic than I expected when I first came across this work.
Here’s what stood out:
Sucrose content in cane molasses averaged about 49% but ranged from 39% to 67% on a dry matter basis
Crude protein differed dramatically between sources—beet molasses averaged 13.5% while cane molasses averaged just 6.7%
Potassium levels in cane molasses ranged from roughly 2.8% to 7.7%, nearly a threefold variance
Dietary Cation-Anion Difference (DCAD) in cane molasses showed a range from -76 to +155 meq/100g DM
Why does this matter for your calf barn? Molasses serves a dual biological function in calf starters. Beyond driving palatability and encouraging early dry matter intake (which we all know is critical for rumen development), molasses provides the rapidly fermentable sugars that fuel rumen microbial populations. These microbes produce volatile fatty acids—particularly butyrate—which directly stimulates the growth of rumen papillae. Those finger-like projections are what allow the calf to absorb nutrients efficiently throughout her productive life.
When molasses quality fluctuates, so does this entire digestive process. A batch of starter containing low-sugar molasses delivers less fermentable substrate to rumen microbes, potentially slowing butyrate production during the critical pre-weaning window.
Industry reviews and technical reports indicate that many feed manufacturers source molasses from multiple suppliers throughout the year. That’s just the nature of commodity markets—and it’s not necessarily a criticism. But it does mean batch-to-batch variability can creep into your calf program without anyone specifically tracking it.
Cane Versus Beet: Two Different Ingredients
The differences between cane and beet molasses go well beyond their plant origins. These are functionally different ingredients that affect calf metabolism differently—yet feed tags rarely specify which type is being used.
Parameter
Cane Molasses
Beet Molasses
Clinical Significance
Crude Protein
6.7% avg (range: 2.2–9.3%)
13.5% avg (range: 10.7–15.6%)
Beet provides 2× more protein; impacts amino acid balance in starter
Sugar Profile
Sucrose + glucose + fructose (mixed)
Almost exclusively sucrose
Cane ferments faster; beet requires enzymatic breakdown first
Potassium (K)
Highly variable: 2.8–7.7%
Consistently high (~4.5–5.5%)
Wide cane variability can stress DCAD balance; beet more predictable
DCAD Range
–76 to +155 meq/100g DM
More consistent: +66 avg meq
Cane swings create acid-base stress; beet better for budding system maturity
Regional Availability
South (FL, LA, TX), Caribbean, S. America
Midwest (MN, ND, MI, ID)
Geography determines typical molasses type by region
Consistency (Year-Round)
Batch-to-batch variability common
More consistent sourcing
Beet easier to specify; cane requires active supplier vetting
Data Source: Palmonari et al., Journal of Dairy Science, 2020
I’ve looked at dozens of calf starter tags over the years, and almost universally, they just say “molasses” or “molasses products.” That’s perfectly legal, but it doesn’t tell you much about what you’re actually getting.
Parameter
Cane Molasses
Beet Molasses
Crude Protein
6.7% average (range: 2.2–9.3%)
13.5% average (range: 10.7–15.6%)
Sugar Profile
Sucrose + glucose + fructose
Almost exclusively sucrose
Potassium
Variable (2.8–7.7%)
Consistently high
DCAD
Highly variable (-76 to +155 meq)
More consistently positive (+66 avg)
Data from Palmonari et al., Journal of Dairy Science, 2020
The sugar profile difference is worth understanding, though in practice, molasses typically accounts for only 5–7% of the starter’s dry matter. Cane molasses contains appreciable free glucose and fructose—monosaccharides that rumen microbes can ferment immediately. Beet molasses is almost exclusively sucrose, which must be enzymatically broken down before fermentation proceeds.
Since both sugar sources are ultimately fermented and molasses inclusion is relatively modest, dramatic shifts in calf performance from source switching alone would be unusual in well-formulated starters. However, the cumulative effect of multiple ingredient variables—including molasses quality—can influence consistency, particularly in operations monitoring intake and growth patterns closely.
What matters more, from a practical standpoint, is consistency within a given source type. Whether a mill uses cane or beet molasses is less important than whether it uses the same type with a similar composition batch after batch.
A note on regional sourcing: Geography plays a meaningful role here. Cane molasses is produced primarily in the South—Florida, Louisiana, Texas—or imported from the Caribbean and South America. Beet molasses comes from processing plants in Minnesota, North Dakota, Michigan, Idaho, and other northern regions. If you’re a producer in Wisconsin or Minnesota, the locally available molasses is almost certainly beet. Operations in the Southeast have easier access to cane. This doesn’t mean one is inherently better, but “standard molasses” means different things in different regions—and switching suppliers can inadvertently switch your source type.
The Mineral Balance Question: When Consistency Matters
One of the more significant findings from the research involves DCAD and mineral variability. The 200+ milliequivalent swing in DCAD between molasses batches represents meaningful compositional variation, though the practical impact depends heavily on overall diet formulation and molasses inclusion rate.
In typical calf starter formulations where molasses represents 5–7% of dry matter, mineral imbalances severe enough to cause clinical problems are relatively uncommon. However, what producers may observe is more subtle: slight variations in intake consistency, minor changes in manure character, or small differences in how calves transition through weaning.
Here’s what’s worth watching for:
“The calves look fine, but performance isn’t quite as consistent as it was last quarter.”
This pattern—where nothing is dramatically wrong but consistency has declined—is where ingredient variability often shows up first. It’s not necessarily pathogenic scours or clinical acidosis. It’s the kind of variability that makes it harder to predict which calves will hit weaning targets on schedule.
Here’s a reference I’ve found useful for distinguishing between different types of digestive upset:
Clinical Sign
Nutritional Variability
Pathogenic Scours
Calf demeanor
Generally normal, eating
Dull, depressed, off-feed
Outbreak pattern
Subtle, affects consistency metrics
Progressive, spreads calf-to-calf
Temperature
Normal (<103°F)
Often elevated (>103°F)
Manure character
Variable consistency, not severe
Often contains mucus or blood
Response to management
Improves with consistent feed
Requires treatment protocol
What’s encouraging is that the industry has made real progress on calf survival over the years. USDA NAHMS data from the Dairy 2014 study found preweaning heifer mortality at about 5.0%, with digestive disorders accounting for roughly 32% of known causes of death. Earlier NAHMS studies from the 1990s and 2007 reported somewhat higher mortality rates—around 7.8–8.4%—with scours historically accounting for a larger share of the total.
So we’re moving in the right direction as an industry. But as mortality rates have improved, attention is increasingly shifting to consistency and performance optimization—the difference between calves that simply survive and calves that thrive.
Making Sense of DCAD
Dietary Cation-Anion Difference represents the balance of key minerals and influences acid-base status. If you’ve worked with close-up dry cows (and most of us have spent plenty of time thinking about transition period management), you know DCAD for milk fever prevention. But its impact on calves receives far less attention.
Think of DCAD like pH balance in a swimming pool. There’s an ideal range where everything works. Push too far in either direction and problems emerge.
For calves, those problems manifest as metabolic stress that diverts energy away from growth.
The challenge is that cane molasses DCAD can swing by more than 200 milliequivalents between batches. When a strongly anionic load arrives, it nudges the calf toward metabolic acidosis. When a highly cationic batch follows, the system has to readjust in the opposite direction.
Why does this matter more in calves than in mature cows? Adult cattle produce 50-plus gallons of saliva daily—essentially a massive buffer tank of bicarbonate that helps neutralize pH swings. Pre-weaned calves produce very little saliva and lack this buffering capacity. Their kidneys are also still maturing, which limits their ability to excrete excess minerals efficiently.
The observable result is often erratic feed intake. Calves experiencing metabolic stress from DCAD fluctuations frequently self-regulate by reducing consumption—a biological brake that protects against further imbalance but at the expense of growth.
If you’re seeing unexplained intake variability that doesn’t match weather patterns or management changes, ingredient consistency might be worth examining.
Thinking Through the Economics
For operations raising replacement heifers, the economic impact of ingredient variability can compound across multiple factors. I want to be upfront here—these aren’t hard universal numbers. They’re illustrative scenarios based on reasonable assumptions and published biological relationships. Your specific situation will depend on your herd, management, and many other variables.
For every 1 kilogram of additional preweaning ADG, first-lactation milk yield increased by roughly 850–1,100 kilograms—about 1,870 to 2,425 pounds of milk.
— Soberon and Van Amburgh, Cornell University, 2012–2013
Cost Component
Low Impact ($)
Typical ($)
High Impact ($)
Growth lag (1 week delay at $5.50/day)
35
38.50
42
Additional monitoring & treatment
10
18
25
Subtotal: Direct variability costs
45
56.50
67
First-lactation milk (per lactation per calf)
—
—
—
Assumed growth lag recovery gap in FL milk
200 lbs milk × $18/cwt
360 lbs milk × $18/cwt
500 lbs milk × $18/cwt
Value recovery potential
$36
$65
$90
Net cost after recovery (or risk exposure)
$9
–$8.50
–$23
Potential hidden costs of variability per calf:
Growth lag: If inconsistent nutrition adds even a week to reaching weaning targets, at typical pre-weaning costs of $5–6/day, that’s $35–40 per calf
Treatment costs: Additional monitoring, electrolytes, and labor when performance becomes unpredictable—perhaps $15–25 per affected calf
Future milk: When inconsistent nutrition suppresses early growth, that milk production difference follows those heifers into first lactation and beyond
The investment side:
Nutritionists working with multiple mills often note that starters made with tightly specified, tested ingredients tend to command a noticeable per-ton premium compared with least-cost commodity formulations. The exact spread depends heavily on region, ingredient markets, and additive packages—somewhere between $30 and $70 per ton, based on conversations I’ve had.
When you consider extra days on feed, management complexity, and potential milk yield differences, it becomes easier to see how relatively small per-calf investments in ingredient consistency might deliver meaningful returns.
What some producers are observing:
On several dairies in the Upper Midwest, calf managers working closely with their nutritionists have noticed a pattern worth sharing. Every six to eight weeks, starter intake would become slightly less predictable, and a small percentage of older hutch calves—the 5–7 week olds who should be past the high-risk window for most pathogens—would show softer manure than usual.
When these herds began tracking feed deliveries against calf performance, the timing often correlated with new starter batches. In some cases, further investigation revealed that ingredient sourcing was changing based on market prices—sometimes cane, sometimes beet, sometimes blends—without the farm being specifically informed.
After switching to starters with fixed formulations and specified ingredient sourcing, those same operations commonly reported smoother intake curves and more predictable weaning outcomes.
Are these controlled trials? No—and I want to be clear about that distinction. But the observations align logically with the compositional variability documented in the research.
Early Indicators: What to Watch in the First 90 Days
You don’t have to wait two years for first-lactation data to assess whether your starter program is delivering consistent results. Several indicators become visible within the first 90 days—if you know what to look for.
Monitoring Focus
Days 1–14
Days 15–35
Days 36–60
Days 61–90
Intake Patterns
Establish baseline
Watch for daily consistency; compare delivery dates
Identify correlation between new feed batches and intake dips
Confirm steady upward curve or flag variability
Manure (older calves)
Monitor for pathogenic scours
5+ week olds should be past acute phase
Watch for unexplained soft manure (suggests metabolic drift)
Should be firm; loose manure = performance concern
Coat Quality
Rough coats normal (early)
Gradual improvement expected
Should be noticeably slick and shiny
Dull or rough coat = potential absorption issue
Body Condition vs. Frame
Assess baseline body/frame ratio
Monitor for pot belly without frame growth
Pot belly pattern = slow fermentation signal
Strong frame growth, minimal fill = good metabolic health
Post-Weaning Momentum
N/A
N/A
Prepare for transition
Calves should maintain growth through weaning, not plateau
A 90-Day Monitoring Approach:
Intake patterns: Is daily starter consumption following a steady upward curve, or does it fluctuate after new feed deliveries? Tracking this for a few weeks can reveal patterns that correlate with delivery dates.
Manure in older calves: Are 5–7 week old calves experiencing loose manure episodes that don’t respond to typical treatment? These older calves should be past the high-risk window for most pathogens.
Coat quality at 60 days: Calves should display a slick, shiny hair coat approaching weaning. Rough, dull coats can suggest metabolic stress or absorption issues.
Body condition vs. fill: Are calves developing “pot bellies” without corresponding frame growth? This pattern can indicate slow fermentation and inefficient nutrient conversion.
Post-weaning momentum: Do calves maintain growth through weaning, or do they plateau for 7–10 days when milk is removed? A well-developed rumen should carry them through this transition more smoothly.
Patterns of inconsistent intake, unexplained digestive changes in older calves, and post-weaning growth stalls might suggest the starter program is delivering variable nutrition even while meeting tag guarantees.
Why the Supply Chain Makes Consistency Challenging
Why does ingredient variability persist? The supply chain itself creates structural barriers that even well-intentioned manufacturers face.
Most molasses travels through multiple stages: sugar mills produce it as a byproduct of varying quality, brokers purchase from multiple sources across regions and seasons, and central terminals often commingle batches in shared storage. By the time a tanker reaches a feed mill, the contents may be a blend of uncertain composition.
For manufacturers seeking consistency, maintaining separate storage for specified sources requires significant capital investment. Shipping cane molasses from Florida to Upper Midwest mills costs considerably more than sourcing local beet molasses. Most mills also lack dedicated quarantine capacity to test incoming loads before production.
This explains why some manufacturers invest in “Fixed-Process Assurance”—defined specifications, testing every load, and maintaining formulations regardless of commodity prices—while others follow standard procurement practices. Both approaches have their logic; they just produce different outcomes for ingredient consistency.
It’s worth noting that commodity suppliers aren’t cutting corners maliciously. The system evolved for volume and efficiency, which serves many applications well. It just wasn’t designed for the tight specifications that performance-focused calf nutrition may require.
Questions for Your Supplier
Producers evaluating calf starter programs can learn a lot by asking specific questions about ingredient sourcing and quality control. The goal isn’t confrontation—it’s building an informed partnership. Most feed representatives genuinely want to help, but they may not volunteer technical details unless you ask directly.
Five questions that reveal quality commitment:
Question to Ask
Strong Answer
Worth Following Up
“Does this starter use a fixed formula, or does it adjust based on commodity prices?”
Fixed formula—ingredients don’t change batch to batch
“We use the least-cost formulation,” or “It adjusts based on markets.”
“Is the molasses cane, beet, or a blend? Does that stay consistent year-round?”
Specific source named, consistent throughout the year
“Standard blend” or “Whatever’s available.”
“What’s your minimum specification for sugar content in incoming molasses?”
Specific number cited (e.g., “43% TSI minimum”)
“Industry standard” or “We trust our suppliers.”
“Do you test every incoming molasses load, or rely on supplier certificates?”
In-house testing on each delivery before production
“We rely on supplier documentation.”
“How do you monitor mineral balance for calf feeds specifically?”
Active monitoring with defined limits for calf products
Focus only on meeting guaranteed analysis minimums
Suppliers committed to quality typically welcome these questions and provide specific, confident answers. The conversation itself often reveals how much thought has gone into ingredient consistency. If you’re getting vague responses or a lot of “industry standard” language, that tells you something, too.
A Practical Approach
For producers who want to explore whether ingredient variability might be affecting results, here’s a measured approach that minimizes risk while gathering useful information.
Step 1: Document current performance. Track starter intake patterns, digestive consistency, and weaning weights for your current calf group. Even a simple notebook log gives you concrete information for conversations with your nutritionist.
Step 2: Start a conversation. Approach your nutritionist or feed representative with curiosity: “I’m seeing some variability in my calf performance that I can’t fully explain with management factors. Can we look at the ingredient specifications in my starter?”
Step 3: Consider a comparison. Rather than switching everything at once, test a fixed-process starter on one group of calves while maintaining the current program for another. Compare intake consistency, health events, and weaning outcomes over 60–90 days.
Step 4: Evaluate total cost. When assessing results, account for management time, predictability, and growth outcomes—not just the per-ton price. The lowest-cost bag isn’t always the lowest-cost option when you factor in the complete picture.
Sponsored Post
Key Takeaways
What the research indicates:
Molasses composition varies more than feed tags reveal, with sugar content ranging from 39% to 67% and DCAD differing by over 200 milliequivalents between batches
Cane and beet molasses have different compositional profiles, though practical impacts depend on inclusion rates and overall formulation
Ingredient variability can manifest as subtle inconsistencies in intake patterns and growth performance
What producers are finding:
The guaranteed analysis represents a legal minimum, not a guarantee of batch-to-batch consistency
Performance indicators are often visible within 90 days—well before first-lactation data arrives
The economics can favor investing in consistency, though specific returns vary by operation
Practical next steps:
Ask specific questions about ingredient sourcing, testing protocols, and specifications
Document calf performance patterns to identify potential variability effects
Evaluate feed programs based on total cost and predictability, not just initial price
The broader lesson here is that consistency may be among the most underappreciated attributes in calf nutrition. A calf’s developing rumen needs steady, predictable substrate to build the biological foundation for a productive cow. What progressive producers are recognizing is that this consistency doesn’t necessarily arrive automatically with every delivery—it often needs to be specified, tested, and verified through intentional quality management.
The feed tag tells you what should be in the bag. The question worth exploring is whether anyone has verified that’s what you’re consistently getting.
Executive Summary:
The feed tag says “molasses.” It doesn’t tell you whether this batch has 39% sugar or 67%—a swing documented in the Journal of Dairy Science that represents one of the widest compositional ranges in animal nutrition. At typical inclusion rates of 5-7% of starter dry matter, this variability won’t cause dramatic clinical problems. But it does contribute to the subtle inconsistencies producers notice: unpredictable intake curves, variable manure in older hutch calves, uneven weaning performance. Dairies that track feed deliveries against calf metrics often discover that performance dips align with new starter batches—sometimes because molasses sources changed without anyone mentioning it. The takeaway isn’t about cane versus beet or switching suppliers. It’s about asking specific questions: fixed formula or least-cost? In-house testing or supplier certificates? For operations spending $5-6 per calf per day on replacement heifers, ingredient consistency may be the difference between calves that survive and calves that thrive.
Complete references and supporting documentation are available upon request by contacting the editorial team at editor@thebullvine.com.
Dairy Tech ROI: The Questions That Separate $50K Wins from $200K Mistakes – Stop gambling on automation and use this ROI-focused analysis to identify the 15% return threshold for your next investment. It shows how precision sensors detect illness 48 hours early, effectively bulletproofing your calf barn against nutritional volatility.
The Sunday Read Dairy Professionals Don’t Skip.
Every week, thousands of producers, breeders, and industry insiders open Bullvine Weekly for genetics insights, market shifts, and profit strategies they won’t find anywhere else. One email. Five minutes. Smarter decisions all week.
Beef-on-dairy doubled your calf checks. It also drained 800,000 heifers from the U.S. pipeline. Here’s how to keep winning without wrecking your 2027 herd.
EXECUTIVE SUMMARY: Beef-on-dairy has been a lifeline—$650 calves three years ago now bring $1,400, and those checks have kept plenty of operations in the black. But there’s a cost building in the background. U.S. heifer inventories just hit a 20-year low, CoBank projects an 800,000-head gap by 2027, and $10 billion in new processing plants are coming online hungry for milk and butterfat. The math nobody wants to do: every breeding decision today locks in your replacement options two years out. Herds running 35-40% beef semen without a clear pipeline picture could face $3,500+ springer bills when the shortage really bites. The good news is that a simple 24-month dashboard can help you keep cashing beef checks without building a hole you can’t fill come 2027.
You know that feeling when you open the calf check from your buyer and think, “Wait, this can’t be right”? A lot of us have had that moment over the last few years. What used to be a drag on cash flow—those plain Holstein bull calves nobody wanted—has turned into serious money when you cross the right cows with beef sires.
Average day-old beef-on-dairy calf prices have climbed more than 100% in just three years, turning calf checks into a major revenue stream
And the numbers back it up. Average day‑old beef‑on‑dairy calves have climbed from roughly 650 dollars to around 1,400 dollars over the last few years, depending on your region and calf weights. Dairy‑beef cross calves keep breaking records at sales—often bringing 1,000–1,500 dollars per head in strong markets.
So that’s the good news. Here’s where it gets more complicated.
A 2025 CoBank Knowledge Exchange report flagged something that should get our attention: U.S. dairy heifer inventories have dropped to a 20‑year low, and they’re projected to shrink by about 800,000 head before starting to recover in 2027. That’s not a small number. And on top of that, Rabobank analysis shows Brazil overtook the U.S. as the world’s top beef producer in 2025—roughly 12.5 million metric tons versus 11.8 million for us.
Year
0–3mo
3–6mo
6–12mo
12–18mo
18–24mo
Total
2023
0.85
0.80
1.10
0.95
0.90
4.60
2024
0.82
0.78
1.05
0.92
0.85
4.42
2025
0.78
0.75
1.00
0.88
0.80
4.21
2027E
0.80
0.77
1.02
0.90
0.91
4.40
What does that mean for your operation? Well, in practical terms, many of us aren’t just selling milk with some cull cows on the side anymore. We’re running dual‑market protein businesses—milk plus cattle—and how those two sides interact over the next 24 months will have a lot to say about herd stability, fresh cow management, butterfat performance, and honestly… who’s still milking come 2030.
Here’s what’s encouraging, though: you don’t have to abandon beef‑on‑dairy to protect your future herd. But you probably do need to think differently about time, replacements, and risk.
How Beef‑on‑Dairy Got So Big, So Fast
Looking back just a few years, the shift toward beef semen on dairy cows made a lot of sense. The economics lined up almost too well.
Why Those Beef Calf Checks Took Off
A few big forces hit at the same time:
Native beef supplies got tight. USDA’s 2024 cattle inventory report showed the U.S. beef cow herd at its smallest level since the early 1960s, years of drought‑driven liquidation finally catching up. By 2025, U.S. beef output had declined to approximately 11.8 million tons, according to Rabobank figures.
Brazil stepped on the gas. They expanded feedlot capacity, improved genetics, and increased carcass weights. Rabobank estimates Brazilian beef production hit roughly 12.5 million tons in 2025, nudging past the U.S. and easing the global squeeze a bit.
Beef‑on‑dairy premiums exploded. As packers and feeders got comfortable with crossbred performance, prices followed. Calves that averaged around 650 dollars three years ago were commonly selling near 1,400 dollars by 2025. Dairy‑beef crosses repeatedly setting highs, often more than doubling what straight Holstein bulls once brought.
Raising every heifer stopped penciling. You probably know this already, but economic analyses from land‑grant universities and journals like Journal of Dairy Science consistently show it costs 2,000–2,500 dollars in direct costs to raise a heifer from birth to calving once you factor in feed, housing, labor, and health. When you could buy Holstein springers for less than that for several years running… well, it made sense to sell more calves for beef.
And the genetics side backs this up, too. A 2022 board‑invited review in Translational Animal Science found that beef × dairy crossbreds—when sires are chosen correctly—can deliver better average daily gain, feed conversion, and carcass weights than straight Holsteins. A companion carcass perspective analysis, also in Translational Animal Science, showed that these crosses can capture real carcass premiums through good marbling and red meat yield when genetic and management decisions align.
So when you put it all together—tight native beef, strong calf prices, underpriced Holstein heifers, better beef × dairy genetics—it’s no surprise so many herds leaned into beef‑on‑dairy. The behavior made sense at the time.
But Here’s the Other Side of That Ledger
On the replacement side, the picture looks very different.
That CoBank report from August 2025 spells it out pretty clearly:
The number of dairy heifers expected to calve into the U.S. herd has dropped to a two‑decade low.
Based on their modeling, heifer inventories will shrink by roughly another 800,000 head over the next two years before starting to rebound—assuming breeding patterns adjust.
At the same time, we’re in the middle of an historic 10‑billion‑dollar wave of dairy processing investment. New plants coming online through 2027, all of which will need more milk—and in many cases, more butterfat and protein—once they’re fully running. While plants are being built, the industry is cannibalizing the very ‘units of production’ (heifers) needed to fill them. It’s a collision course between steel and biology.
Metric
Current State (2025)
Projected Need (2027)
Heifer Pipeline Support
Gap / Risk
U.S. Dairy Herd
9.4M cows
9.5M–9.7M cows
800,000 fewer heifers available
SHORTAGE: –2.5M gal/day by 2028
New Processing Capacity
—
$10B invested
Assumes +2–3M gal/day milk
Supply assumption unmet
Annual Heifer Output Needed
2.8–3.0M dairy calves
3.2–3.4M dairy calves
Beef 35–40% of breeding
Deficit: –300K–400K heifers/yr
Heifer Replacement Rate
28–32% average
32–35% needed
Currently 22–26% net
Culls > freshening. Herd flat.
Heifer Price Impact
$3,000–$3,500
$4,000–$5,000 projected
Limited availability
Margin erosion: +$1,000–$1,500
CoBank economist Tanner Ehmke put it bluntly: those new plants will require more annual milk and component production, and it’s going to take many more heifer calves in future years to bring the national herd back to where it needs to be. The thing is, It will be tight.
On the ground, what many producers are seeing matches that:
In 2024–2025, according to classifieds and sale reports, good Holstein and Jersey springers have commonly been listed in the 3,000–3,800‑dollar range, with high‑end animals bringing more where supply is really thin. In parts of the Upper Midwest, springers have been trading $200–400 above the national average in recent sales
CoBank reminds us that rebuilding the replacement pipeline is a “three‑plus year proposition” from the time you adjust your semen strategy to when that bigger wave of heifers actually freshens.
So right now we’ve got:
Beef‑on‑dairy calves are generating record checks in many barns.
Heifers are getting more expensive and, in some areas, genuinely hard to source.
Global beef supply easing a bit as Brazil grows, but domestic replacement supply staying tight.
That’s the setup most of us are working with.
Three Ways Dairies Are Playing the Dual‑Market Game
Talking with producers and advisors across different regions, you start to see some patterns in how herds are handling beef‑on‑dairy and replacements. These aren’t formal categories—just what I’ve observed.
1. The “Set It and Forget It” Approach
Plenty of herds—small, mid‑size, and big—land here:
At some point, they decided, “We’re a 40% beef herd,” or “We’ll breed 35–50% of cows to beef,” based on the calf checks and semen promotions at the time.
That percentage doesn’t move much unless something feels really broken—maybe calf prices collapse, or the vet mentions they’re running light on replacements.
They know roughly how many heifers are in the hutches, but there’s no regular projection of heifer inventory by age group against expected culls over the next 18–24 months.
And look, many of these operations used beef‑on‑dairy to get through some tough milk price years. When milk checks were barely covering feed, beef‑on‑dairy gave them non‑milk income they simply didn’t have before.
The risk is that, because biology runs on a long clock, you can slowly build a replacement deficit without feeling it—right up until you suddenly need 40 more springers than you’ve got coming.
2. The “Portfolio Managers.”
On the other end, there are herds—often 800 cows or more, though not always—that treat milk and cattle as one revenue and risk package.
What that typically looks like:
Quarterly breeding strategy meetings where they review heifer inventory by age band (0–3, 3–6, 6–12, 12–18, 18–24 months), target replacement rate (usually 28–32%), current beef‑on‑dairy calf prices, and recent heifer values from auctions.
Dynamic beef percentages. Instead of locking in 40% year‑round, they might run 20–25% when short on heifers and 30–35% when they’ve built a cushion.
Targeted semen use. Genomic tests to rank cows, then sexed semen for the top group and beef semen for lower‑index or problem cows.
Some are exploring tools like Livestock Risk Protection (LRP) for feeder cattle or talking to commodity brokers about limited CME feeder cattle futures.
Extension educators note that many larger, more risk‑focused herds use some form of forward pricing or revenue protection for a portion of their milk. A smaller but growing subset are starting to apply similar thinking to cattle revenue.
What you hear from managers in this group isn’t about hitting home runs—it’s about smoothing the ride so they can keep investing steadily in fresh cow management, dry cow facilities, and butterfat performance instead of lurching from crisis to crisis.
3. The Relationship‑Driven Opportunists
There’s also a healthy group—often 250‑ to 1,000‑cow family dairies—that lean less on spreadsheets and more on market relationships and timing.
Their system often looks like:
A standing weekly call with a trusted calf buyer: “What are you seeing? Are beef‑on‑dairy calves trading up, down, or sideways?”
Regular touchpoints with a heifer broker or custom grower: “What are folks paying for springers? How many do you have for Q1 next year?”
Ongoing conversation with their nutritionist about feed markets, including how Brazil’s growing grain exports are shaping costs.
When that three‑way radar starts blinking—calf prices softening, heifer bids climbing, feed markets shifting—they move quickly. Maybe they sell a group of calves a little early, grab springers out of a dispersal, or pull their beef percentage back sharply for a trimester.
The common thread among producers who operate this way? They’re willing to move when conditions change. It’s not about perfection—it’s about responsiveness.
The Two Mechanics That Really Matter
Once you get past the day‑to‑day, two things stand out as the real drivers of future pain or stability: biological lag and unhedged cattle revenue.
Biology Runs on a Two‑Year Clock
Every breeding decision is really a 24‑month decision, whether we think of it that way or not.
Here’s the rough math:
Day 0: You breed a cow—beef, conventional dairy, or sexed—based on today’s cash flow and cull list.
~280 days later: A calf hits the ground. Beef‑cross bull? That’s a sale within days. Heifer? She heads into the replacement stream.
~22–26 months after breeding: That heifer, if she makes it, walks into the parlor as a fresh cow and starts contributing to your milk and component pool.
CoBank and university extension educators have been clear on this: if the industry waits until heifer prices are screaming and auctions are thin to pull back on beef breedings, we’re reacting to a shortage set in motion a couple of years ago. Replenishing that pipeline is a multi‑year project, not a one‑season fix.
So when someone says, “We’ll cut back on beef when we really see heifer prices take off,” what they’re really saying is, “We’ll accept being behind for a couple of years before we start catching up.” That’s not necessarily wrong if you have strong access to outside replacements. But it’s important to see the trade‑off clearly.
Hedging Milk, Letting Cattle Ride
Here’s the other pattern that jumps out: how uneven our risk management has become.
On the milk side, many herds now use Dairy Revenue Protection (DRP) or LGM‑Dairy to cover a portion of their milk, or have forward contracts with their cooperative.
On the cattle side, it’s different. Even though beef‑on‑dairy calves and cull cows can represent a significant share of gross farm revenue—by some industry estimates, 10–15% or more on certain operations—relatively few dairies use formal tools like LRP, CME feeder cattle futures, or structured forward contracts in a consistent way.
And cattle markets still show their usual volatility. 20% price swings over a season aren’t unusual for feeder and live cattle futures.
For a 600‑cow herd, that might mean 250–300 beef‑on‑dairy calves a year at 1,200–1,400 dollars each, plus cull cow checks. Total cattle revenue in the low‑ to mid‑six figures. Leaving that entire stream unprotected while carefully hedging milk is a bit like putting a surge protector on your parlor controls but plugging the compressor straight into the wall.
Nobody needs to become a commodities trader. But it’s worth asking: is there room to set a floor under even 25–40% of that beef revenue, especially when prices look historically high?
From 90‑Day Survival to 24‑Month Planning
At the heart of all this is a basic question:
Are we making breeding and culling decisions based mainly on what we need this quarter, or on what we know we’ll need two years from now?
What 90‑Day Thinking Feels Like
Most of us have been there. Milk prices barely covering costs. Feed isn’t cheap. Loan renewal coming up. And you’re standing in the office thinking:
Beef semen costs a bit more per straw, but that crossbred calf brings three or four times what a Holstein bull would.
Raising every possible heifer feels like pouring expensive feed into animals you might not need.
So you push another 5–10 cows into the beef column. Understandable. You’re solving for cash flow.
The tough part is that you’re also chipping away at your 2027 and 2028 replacement pool. Unless you’ve got a clear plan—strong access to custom heifer growers, a standing agreement with a broker, confidence in cross‑border sourcing—those decisions add up.
What 24‑Month Thinking Looks Like
On herds that seem to navigate this with less drama, a few habits show up:
They know their replacement need. For example: 1,000 cows × 30% replacement rate = 300 heifers/year. About 25 freshening per month just to stay flat.
They know their pipeline. How many heifers are in each age band? How many are due to freshen each month over the next year?
They connect that to breeding. Before deciding “35% beef for six months,” they ask, “What does our January 2028 heifer count look like if we do that?”
Once you put those numbers on one page, many decisions become clearer. You might still run 30% beef because your region has decent heifer access. But you’ll be doing it with eyes open.
A Simple Tool: The 24‑Month Replacement Dashboard
So let’s talk about something practical you can do this month that doesn’t require a consultant or fancy software.
Metric
Current Herd (2025)
Conservative Scenario (25% Beef)
Balanced Scenario (35% Beef)
Aggressive Scenario (45% Beef)
Projected Status (2027)
Milking Cows
700
700
700
700
—
Annual Replacement Need
210 (30% cull)
210
210
210
210
Dairy Breedings (%) / Year
—
75%
65%
55%
—
Beef Breedings (%) / Year
—
25%
35%
45%
—
Expected Heifer Calves / Year
—
210–215
185–190
160–165
—
Projected Heifer Inventory (18–24mo, 2027)
180–195
215–225
185–195
155–165 (–45 SHORT)
Shortfall cost: $3,500 × 45 = $157,500
Think of it as a 24‑month replacement dashboard—a one‑page reality check you update monthly.
What This Usually Includes
Basic herd math.
Current milking + dry cows.
Target replacement rate (26–32%, depending on culling and growth).
Monthly dairy breedings with sexed semen × conception rate × 70–90% female ratio (varies by bull and program).
Beef breedings counted as zero heifers.
A simple projection.
For each month over the next 18–24 months, how many heifers are scheduled to freshen?
Compare that to your replacement needs.
Several land‑grant extension bulletins use similar frameworks for “raise vs. buy” decisions. The key is making the future visible in a way that’s easy to revisit.
How It Changes the Conversation
Once that’s on the wall in your office:
When your AI tech asks, “How many are we doing beef this month?”, you’re not guessing. You can say, “We’re 40 heifers short 18 months out. Let’s pull beef back a few points and revisit in 30 days.”
When your lender comes by, you can show them exactly why you’re trimming beef breeding—to avoid an ugly replacement bill in two years. That goes over better than a surprise heifer spending spree later.
When calf prices spike, you’ve got context. Heifer‑long? Maybe bump beef to capture those checks. Heifer‑short? Resist the urge to chase every dollar.
This tool doesn’t make decisions for you. It just prevents the “I didn’t realize it was that bad” moment that’s put more than a few herds in a bind.
Here’s an example of how this plays out: A herd running around 700 cows might build a simple spreadsheet version and discover they’re on track to be 40–50 heifers short in 20 months. Rather than slamming on the brakes, they trim beef breeding by 5–7 points over two quarters and push more sexed semen on top cows. A year later, they’re almost exactly on target—and they never had to scramble for expensive springers.
Not Everyone Sees the “Crisis” the Same Way
It’s worth noting that not all experts agree on how severe or long‑lasting the replacement squeeze will be.
CoBank sees a clear, multi‑year shortage keeping a lid on how quickly U.S. milk output can grow, especially as new plants come online.
Some producers, especially in regions with strong custom heifer grower networks—think parts of Wisconsin, New York, or Quebec—argue that while things are tighter, they’re not in crisis mode. They point to increased sexed‑semen use on top cows, growing interest in contract‑raising, and potential to import replacements when prices justify it (though that brings disease, adaptation, and logistics questions).
There’s also a valid point that some of this shortfall is a correction from years when we over‑raised marginal heifers with little genetic upside. Some industry observers have noted that a chunk of this is the industry finally being more selective—and that’s healthy. The trick is not overshooting the mark.
From a practical standpoint, the takeaway isn’t that you must agree with the most pessimistic forecast. It’s that you probably can’t afford to ignore the possibility that replacements stay tight and expensive while new processing capacity ramps up. A simple dashboard lets you stress‑test your own farm against both scenarios.
Practical Takeaways
So what can you actually do with all this? Here are a few points to chew on.
1. Treat Cattle Checks as Core Business
If beef‑on‑dairy calves plus cull cows bring in a significant share of your revenue, it’s time to:
Track that income as its own line in your financials.
Ask about tools like LRP feeder cattle coverage or forward‑price agreements with trusted buyers.
You don’t have to hedge every animal. Even protecting 25–40% can take a lot of edge off.
2. Make Replacements a Standing Agenda Item
Before setting this year’s beef percentage, take one evening to:
Write down current cow numbers and a realistic replacement rate.
Pull the heifer inventory by age group.
Sketch a rough 18–24 month projection.
Then ask directly: “If we keep breeding 40% beef, do we have a plan—and capital—to buy the heifers we’ll be short?”
3. Adjust in Steps, Not Swings
If you’re on track to be 50 heifers short two years out, you don’t have to yank the wheel:
Drop beef breedings by 3–5 points this trimester.
Shift more sexed semen onto your best genomic cows.
Re‑evaluate quarterly.
Gradual change is usually more realistic and easier on cash flow than dramatic one‑time shifts.
4. Bring Your Lender In Early
Most farm credit officers are reading CoBank and our own analysis—they know the heifer story. What they don’t always know is how you’re thinking about it.
Show them a simple replacement projection and a modest rebalancing plan. You’re more likely to get support for small proactive adjustments than for emergency financing later.
5. Respect Regional Realities
What makes sense on a 3,000‑cow dry lot in western Kansas isn’t identical to a 300‑cow tie‑stall in eastern Ontario or a 1,200‑cow free‑stall in Wisconsin.
In some western regions, access to custom heifer raisers changes the calculus.
In parts of the Northeast and the Upper Midwest, strong local demand can push heifer prices above the national average.
In quota systems like Quebec or Ontario, butterfat incentives may tilt decisions toward maximizing fresh cow performance rather than just head count.
The point isn’t to copy your neighbor’s beef percentage. It’s to understand how your replacement pipeline, local markets, and processor signals fit together.
Managing the Whole Game
What’s become clear is that beef‑on‑dairy is here to stay. Peer‑reviewed work in Translational Animal Science and Journal of Dairy Science confirms what the market already knew: beef × dairy calves are now a recognized, important part of the North American beef supply chain.
That’s good news. There’s real value on the table, and it’s helping a lot of dairies keep doors open and invest in what matters—better fresh-cow facilities, healthier transition programs, more comfortable housing, improved butterfat performance.
At the same time, reports from CoBank remind us we can’t pull replacements out of thin air. If everyone leans too hard into beef‑on‑dairy at once, the industry doesn’t magically get the heifers it needs in 2027 or 2028. Somebody ends up short—and often it’s the operations that didn’t see the shortfall coming.
The goal here isn’t to scare anyone away from beef‑on‑dairy. It’s to help you turn today’s beef premiums into durable, long‑term profit—without waking up two years from now wondering where the replacements went.
If there’s one step worth taking in the next 30 days:
Put your current heifer numbers and realistic replacement needs on a single page.
Project them out 18–24 months.
Let that picture have a real say in how much beef semen you use this year.
It doesn’t require perfect data. Just honest numbers. And that quiet little habit is often what separates the herds that “manage to get by” from the ones that keep growing and improving—no matter what Brazil, the cattle futures, or the next drought throws at them.
At The Bullvine, we’ll keep tracking these shifts so you’ve got the information and tools you need to play the whole game, not just the next move.
Key Takeaways:
$1,400 calves today, $3,500 heifers in 2027: The beef-on-dairy math only works if your replacement pipeline can handle it—and for many herds, it can’t
The shortage is already locked in: U.S. heifer inventories hit a 20-year low, CoBank projects 800,000 head short by 2027, and new processing plants are coming online hungry for milk
Every breeding decision is a 24-month bet: By the time heifer prices scream, the shortage was set two years ago—waiting for signals means you’re already behind
Adjust in steps, not panic: Dropping beef semen 3-5 points per quarter protects your pipeline without blowing up this year’s cash flow
A one-page dashboard can save you six figures: Track heifers by age against replacement needs monthly, and you’ll see the gap before it becomes a $3,500-per-head crisis
Complete references and supporting documentation are available upon request by contacting the editorial team at editor@thebullvine.com.
Learn More
Beef-on-Dairy’s $6,215 Secret: Why 72% of Herds Are Playing It Wrong – Stop leaking cash by treating beef-on-dairy like a side hustle. This deep dive delivers the reproductive benchmarks and tiered management protocols that separate elite $6,000/month profit-makers from the 72% of herds currently playing the game wrong.
Every week, thousands of producers, breeders, and industry insiders open Bullvine Weekly for genetics insights, market shifts, and profit strategies they won’t find anywhere else. One email. Five minutes. Smarter decisions all week.
Forget carbon credits. The real money is in your cull rate. Farms that dropped 7 points kept $210,000—and watched their emissions fall. No new tech. Just management.
EXECUTIVE SUMMARY: The farms with the lowest carbon footprints aren’t sacrificing profit—they’re the ones making more of it. University of Guelph research found low-carbon Ontario dairies earned C$1,200 more per cow, driven by feed efficiency and herd management rather than carbon credits or new tech. Replacement rate is where the big money hides: dropping from 35% to 28% on a 1,000-cow herd saves roughly $210,000 annually, while eliminating nearly two years of feed, manure, and methane from 70 heifers you no longer need to raise. Factor in mastitis averaging C$662/cow/year and feed accounting for 50-65% of production costs, and the efficiency gains compound quickly. This article delivers the research, the math, and a 90-day action plan that works whether you’re running a 70-cow tie-stall in Quebec or a 400-cow freestall in Wisconsin. The bottom line: emissions and margin aren’t competing goals—they respond to the same management decisions you’re already making.
Walk into any dairy meeting this winter, and you can almost bet carbon footprints, “Scope 3,” and net-zero targets will show up on the agenda before the coffee cools. Processors are publishing sustainability reports, retailers are promising climate-friendly shelves, and a lot of producers are quietly asking the same thing: “Alright, but how does any of this actually show up in my milk cheque?”
Here’s what’s interesting. When you get past the buzzwords and look at credible numbers, a pretty consistent story emerges. The same management decisions that bring down greenhouse gas emissions per kilogram of milk are often the ones that improve margin per cow. In Canada, the latest national life cycle assessment led by Groupe AGÉCO for Dairy Farmers of Canada shows that producing a litre of milk at the farm gate now generates about 0.94 kilograms of CO₂-equivalent—and that footprint fell by 9 percent between 2011 and 2021 as milk per cow rose and feed efficiency improved. What’s encouraging is that Canadian milk’s footprint per litre sits at less than half the global average of 2.5 kilograms, according to FAO data. That’s thanks largely to relatively high yields and solid feed and manure management across our systems.
On the profit side, a University of Guelph Alliance project took real numbers from Ontario dairy farms and found something that caught my attention. Lower-footprint herds weren’t sacrificing income at all. Research associate Dr. Susantha Jayasundara and greenhouse gas specialist Prof. Claudia Wagner-Riddle found that farms with a lower carbon footprint per unit of milk profited by more than C$1,200 per cow compared to higher-footprint farms in the same study. And the dominant drivers weren’t offsets or big infrastructure projects—they were productivity, feed efficiency, and herd management.
So what farmers are finding is this: when you manage the herd more efficiently, emissions per kilogram of milk tend to go down, and profit per stall often goes up. Replacement rate, feed efficiency, and health losses are doing more to shape both your footprint and your margin per cwt than any carbon program ever will.
What Low-Carbon Farms Are Actually Doing
It helps to pin down what “low-carbon” really means in practical terms. A life cycle assessment adds up all the greenhouse gas emissions associated with milk production on the farm—enteric methane from the cows, manure storage and spreading, feed production, and on-farm energy use—and divides that total by the amount of milk produced.
In Canada’s most recent LCA update from Dairy Farmers of Canada, the national average farm-gate footprint sits at 0.94 kilograms of CO₂-equivalent per litre of fat- and protein-corrected milk. The improvement since 2011 has mainly come from higher milk yield per cow, better feed efficiency, and improved manure and fertilizer management. And as many of us have seen in practice, livestock management plus feed production account for the great majority of a dairy farm’s greenhouse gas footprint.
South of the border, work presented through the American Dairy Science Association last year estimated average field-to-farm-gate carbon intensity in 2020 at about 1.3 kilograms of CO₂-equivalent per kilogram of milk. That analysis found that to reach greenhouse gas neutrality by 2050, the U.S. dairy sector would need to reduce its intensity to roughly 0.67 kilograms—nearly a 50 percent cut from current levels.
Now, the part that really matters in your barn is how those lower-footprint farms actually run. In the Ontario data set, the Guelph team didn’t find that low-footprint farms were defined by being huge or packed with state-of-the-art technology. The herds with lower footprints and higher profits tended to:
Rely heavily on homegrown feed, especially high-quality corn silage and alfalfa-grass hay, as the backbone of the ration
Use grouped feeding and well-designed total mixed rations to match nutrients to the stage of lactation and production level
Maintain shorter calving intervals and heifer programs that kept more stalls filled by third- and fourth-lactation cows—animals that usually have excellent feed efficiency and butterfat performance
As Prof. Wagner-Riddle summarized this work: “A lot of the improvement in carbon footprint has to do with feed efficiency and how producers are managing their herds.”
From what I’ve noticed across different regions, those traits keep showing up. Whether it’s a 70-cow tie-stall in Quebec, a 180-cow freestall in eastern Ontario, a 400-cow sand-bedded barn in Wisconsin, or a 2,000-cow dry lot system in California’s Central Valley, the herds that look good on both profit and footprint tend to be the ones that have been quietly tuning up forage quality, fresh cow management, and herd structure for years.
Replacement Rates: The Quiet Link Between Emissions and Margin
Replacement rate is one number that quietly connects the economic and environmental sides of the story. In many Holstein freestall herds in Ontario, the Northeast, and upper Midwest states like Wisconsin and Minnesota, annual replacement or culling rates around 36 percent are still common—Dr. Albert De Vries at the University of Florida has documented this extensively in his work on dairy production economics. Fertility, mastitis, and lameness remain the main reasons cows leave the herd.
A 36 percent replacement rate may be “normal” on paper, but that doesn’t mean it’s the profit-maximizing or emissions-smart choice for your herd. De Vries has shown that economically optimal cull rates often fall in the 25-27 percent range when heifer-rearing costs are significant and involuntary culling can be controlled. And when you run scenarios through whole-farm models, the answer is often “you can do better than that.”
System-level modeling studies in countries like Australia and New Zealand have demonstrated that cutting replacement rates—from, say, 35 percent down to 20–25 percent—reduces the greenhouse gas intensity per kilogram of milk solids. The reason is straightforward: you’re raising fewer non-productive heifers. One Australian analysis using graze-based dairy systems found that reducing replacement by around 15 percentage points lowered emissions intensity by roughly a kilogram of CO₂-equivalent per kilogram of milk solids.
The ideal target will vary. In quota systems like Canada, quota policy, land base, and forage capacity limit how fast you can push production per cow. In non-quota regions, like much of the U.S., cash flow, milk price volatility, and contracts with heifer growers come into play. But across systems, the data suggests that if you can reduce preventable culling and avoid replacing cows too soon, you’re often better off on both cost and emissions.
You probably know this already, but heifer economics are significant. Recent extension budgets from Penn State, University of Wisconsin, and University of Nebraska-Lincoln commonly estimate the cost to raise a replacement heifer from birth to first calving at roughly US$2,000–2,800 per head, depending on feed, labour, and housing. Bred heifer prices reported by USDA market services over 2023–2024 have ranged from around US$2,000 to over US$2,850 in Midwest auctions, with premium animals commanding even more in tight markets.
So, for the sake of discussion, consider a 1,000-cow freestall herd in Wisconsin running at a 35 percent replacement rate. That’s 350 replacements per year. If your all-in cost per heifer—whether raised or purchased—averages US$2,500–3,000, you’re tying up roughly US$875,000-US$1.05 million a year in replacement capital. If, over a couple of years, you improve fresh cow management, hoof health, and reproduction enough to bring that rate down to 28 percent, you’d need around 280 replacements. That’s 70 fewer heifers, which at US$2,500–3,000 each is on the order of US$175,000–210,000 less capital committed annually.
What Replacement Rate Controls
At 36% (Industry Avg)
At 28% (Optimized)
Hidden Impact
Heifer Capital Tied Up
$990,000 annually
$770,000 annually
$220,000 freed up
Non-Productive Animal-Years
720 heifer-years
560 heifer-years
160 animal-years eliminated
Mature Cow Share of Herd
Lower (more 1st-lactation)
Higher (more 3rd+ lactation)
Better feed efficiency & components
Emissions from Replacements
Higher methane load
Lower methane load
~2 years feed & methane saved
What’s interesting here is that the emissions picture moves in the same direction. Those 70 “missing” heifers represent nearly two years of feed, manure, and methane that don’t occur because you’ve kept more mature, efficient cows in the herd instead. Whole-system models, such as Agriculture and Agri-Food Canada’s Holos framework, consistently show that replacement heifers account for a meaningful share of total emissions in dairy herds precisely because they’re non-productive for an extended period.
I’ve noticed that when farms start documenting every cull for a couple of months, patterns emerge that weren’t obvious before. Often, you’ll see clusters of young cows leaving for transition-related problems that might respond to better fresh cow management, or repro culls that never had a full exam, or “low-milk” culls coming out of the same group where feed access or cow comfort is compromised. That’s where targeted changes can help both the milk cheque and the carbon story at the same time.
Feed Efficiency: Where Feed Costs and Carbon Meet
You don’t need anyone to tell you feed is your biggest cost. What’s worth emphasizing is that it’s also one of the biggest levers in your greenhouse gas footprint.
The DFC life-cycle assessment work shows that livestock management and feed production are the main sources of emissions on Canadian dairy farms. Feed production—including fertilizer and field operations—can account for around a third of farm-gate emissions, with enteric methane and manure management accounting for the rest.
International reviews of dairy systems are similar. FAO and academic analyses often estimate feed-related emissions at 30–40 percent of on-farm totals, depending on the system and region. And with feed taking 50–65 percent of production costs on many North American dairies—California operations often running at the higher end of that range—even meaningful improvements in feed efficiency show up fast on the cash flow.
Analysis from last year shows that moving from around 1.3 kg CO₂-equivalent per kilogram of milk down to roughly 0.67 by 2050 will require major improvements in feed efficiency and overall productivity, alongside emerging tools such as methane-reducing feed additives and improved manure systems. But the researchers stress that those new tools are complements, not replacements, for efficient feeding and strong herd management.
On farms in very different regions, the lower-intensity herds that also look good on cost tend to share some feed-related habits:
They consistently achieve strong milk per kilogram of dry matter across key groups—that reflects genetics, cow comfort, and rations tuned to production level and butterfat performance
They have forage programs that deliver. In Ontario and the Northeast, that often means high-digestibility corn silage and well-managed alfalfa-grass haylage. In Wisconsin and Minnesota, more grass and small-grain silages are part of the mix. In California’s Central Valley, high-quality corn silage and alfalfa hay are balanced against heat stress and water constraints.
They group and feed with intent. Instead of a single universal TMR, they adjust for fresh and high cows versus mid- and late-lactation cows and heifers, so each group gets what it needs without costly overfeeding.
A Canadian whole-systems analysis using the Holos model compared alfalfa-silage-based and corn-silage-based systems and found that differences in greenhouse gas footprint were driven more by system-wide factors—milk yield, stocking rate, nutrient balance—than by forage choice alone. That fits what many nutritionists see in practice: it’s the integration of crop rotation, ration design, feeding management, and manure handling that really drives cost and emissions.
Extension work from institutions like Cornell and Penn State has shown that better forage testing, tighter batching, and smarter grouping can often deliver meaningful feed cost savings, with payback periods typically measured in years rather than months. The opportunity will look different in a 70-cow tie-stall in Quebec than in a large dry lot system in California, but the underlying principle holds across systems.
On the genetics side, both Lactanet in Canada and USDA genetic evaluations in the U.S. are increasingly accounting for traits related to feed efficiency, fertility, and longevity, alongside production and type traits. As those traits get more weight in sire selection, herds gradually shift toward cows that convert feed into milk more efficiently, stay healthier, and remain in the herd longer.
From a carbon perspective, the logic is simple: when you produce more milk and components from roughly the same feed and manure base, emissions per kilogram of milk go down. What’s encouraging is that the management changes that improve feed efficiency are the same ones that help you ride out tight feed markets and lower your cost per hundredweight.
Health and Disease: The Hidden Emissions in Everyday Problems
Most producers already know that mastitis, lameness, and transition-period issues are expensive. The last decade of research has sharpened our understanding of just how expensive it is.
On the mastitis front, a 2018 study of Canadian dairy farms led by researchers at the University of Guelph and published in Frontiers in Veterinary Science estimated median mastitis-associated costs at about C$662 per cow per year, accounting for treatment, discarded milk, lost production, increased culling, and prevention costs. Earlier economic work from Europe estimated the cost of a generic clinical mastitis case at roughly US$200–300, depending on milk price, culling risk, and fertility impacts.
Lameness has a similar profile. Studies from Europe and North America show that lame cows produce less milk, have longer calving-to-conception intervals, incur higher treatment costs, and are more likely to leave the herd early, with per-cow annual costs often reaching several hundred dollars.
From an emissions point of view, European whole-farm models that incorporate disease incidence into greenhouse gas calculations have found that higher rates of mastitis and lameness can increase emissions per kilogram of milk by several percent—typically in the low- to mid-single-digit range—because more resources are going into maintenance and recovery and fewer into saleable milk. From a carbon standpoint, that sick cow is doing more harm than her treatment bill suggests: a chronically lame or mastitic cow in a freestall, tie-stall, or dry lot system still eats, still produces manure, and still emits methane, but often ships less milk and is more likely to be replaced early, adding heifer-rearing emissions into the mix.
What farmers are finding is that when they really lean into fresh cow management, udder health, and hoof care, the benefits show up in both the financial and emissions stories. Herds that focus on transition-period nutrition and cow comfort, maintain consistent milking routines and hygiene, and invest in regular hoof trimming and early detection tend to see fewer early-lactation problems, less discarded milk, more cows completing profitable later lactations, and lower replacement pressure. That pulls both cost per hundredweight and emissions per kilogram of milk in the right direction.
Carbon Intensity: Making an Abstract Metric Useful
“Carbon intensity” can sound like something dreamed up in an office far away from the parlour, but at its core, it’s just a ratio: total greenhouse gas emissions divided by total milk produced. If a farm emits 100 kilograms of CO₂-equivalent to ship 100 hundredweights of milk, its intensity is 1.0 kilogram of CO₂-equivalent per cwt. Simple enough.
At the U.S. national level, analysis reports a current average of 1.3 kg CO₂-equivalent per kilogram of milk and outlines how achieving roughly 0.67 kg CO₂-equivalent per kilogram would align the sector with climate-neutrality goals by 2050. For Canada, the DFC life-cycle assessment yields a farm-gate footprint of 0.94 kg CO₂-equivalent per litre of milk—among the lowest in the world on a per-litre basis.
Most of the calculators and tools being rolled out—whether by processors, co-ops, or government programs—break your intensity number into components you already recognize: animal numbers and age structure, milk yield and components, feed intake and ration makeup, manure storage and handling, fuel and electricity use.
When you see carbon intensity laid out that way, it’s not a mysterious figure anymore. It’s another way of looking at the same replacement decisions, feed efficiency, herd health, and energy use you already manage.
The Canadian LCA work, the Guelph Alliance project, and global reviews keep landing on the same message: farms that show lower emissions per kilogram of milk are usually the ones that already run a tight ship—they waste less feed, cull fewer cows prematurely, and move more milk through the same barns and milking systems.
Why Some Buyers Are Starting to Pay Attention
On the market side, some large buyers are starting to reflect this in how they work with suppliers. Companies like Danone have used tools such as the Cool Farm Tool to estimate farm-level emission factors and develop reduction plans with producers. And we’re seeing processors in Europe and North America begin testing practice-based sustainability programs—though program structures and payment levels vary significantly from one region and processor to the next. Early carbon marketplaces like Athian in the U.S. are exploring ways for verified on-farm emission reductions to generate credits that processors and branded products can purchase from participating farms.
Some lenders and co-ops are also beginning to consider environmental metrics as part of their risk and long-term resilience assessments—Farm Credit Services and some provincial programs have started incorporating sustainability factors into their conversations with producers. It’s early days, and there’s still a lot of uncertainty around how these programs will settle out, especially for smaller family farms and different contract structures. But the direction of travel seems clear: lower carbon intensity is increasingly seen not just as an environmental goal, but as a marker of an efficient, resilient dairy business.
You don’t need to sign a carbon contract tomorrow. But it’s worth noting that these programs are now rewarding the same efficiencies you already track.
Three Metrics Worth Watching on Your Farm
If you don’t want to spend your winter evenings diving into LCA spreadsheets but you do want to put your operation in a stronger position—both financially and in terms of footprint—here are three metrics worth watching. Many producers find it useful to review these monthly, then sit down with their vet, nutritionist, and financial advisor for a deeper review each quarter.
Replacement rate. Based on De Vries’s economic work at the University of Florida, economically optimal replacement rates often fall in the 25–27 percent range for herds with solid health and fertility programs—well below the 36 percent average he’s documented across North American Holsteins. The right target for your farm will depend on heifer-rearing cost, quota or non-quota status, land base, and whether you rear heifers on-farm or use custom growers. The evidence suggests that reducing involuntary culling and avoiding premature replacement can often improve both profit and emissions by increasing the share of mature, efficient cows in the herd.
Feed cost per cwt and milk per kilogram of dry matter. Alongside feed as a percentage of total cost, it’s valuable to track feed cost per hundredweight shipped and milk or fat-corrected milk per kilogram of dry matter in your major groups. Comparing those figures to benchmarks for similar herds in your region—freestall to freestall, tie-stall to tie-stall, pasture-based to pasture-based—can highlight where the biggest opportunities lie. The specifics will look different in a small tie-stall in Quebec than in a large dry lot system in California, but the underlying math is similar.
Disease-related losses. Instead of just counting cases, try putting a dollar figure on mastitis, lameness, and transition-period problems. That Canadian research suggests mastitis-related costs can reach around C$662 per cow per year when all factors are included. When you translate those numbers into dollars per cow and per hundredweight, investments in cow comfort, fresh cow monitoring, milking routine refinement, and hoof care often start to look more like solid investments than “extra costs.”
You don’t need a carbon calculator to track these metrics. But if you later plug your farm data into a footprint tool—whether through your processor, a co-op, or a government program—you’ll likely see that improvements in replacement, feed efficiency, and disease control show up as lower emissions per kilogram of milk as well.
A 90-Day, No-Capital Starting Plan
So, practically speaking, what can you do in the next 90 days without pouring new concrete or signing a lease on major equipment? Here’s a simple plan that herds in Ontario, the Prairies, the Northeast, and the Midwest have used as a starting point. Whether you’re milking 60 cows or 600, the basics scale up or down.
Put culling decisions under a 48-hour lens. For the next 60–90 days, before any cow leaves, have someone on your team fill out a basic cull review sheet: cow ID, lactation number, days in milk, primary cull reason, last three test-day yields and somatic cell counts, breeding history, and major health events in the last 90 days. And one question: “Is this realistically fixable inside 30 days, and what would it cost?”
This isn’t about keeping every marginal cow. It’s about making culling decisions with more context and then stepping back after two or three months to see what patterns emerge. De Vries’s research suggests that a meaningful share of removals are tied to issues that can be reduced with better fresh cow management, hoof care, and reproductive programs. If you looked back at your last year of culls with this lens, how many would fall into the “avoidable with better management” bucket?
Hold a weekly health huddle. Once a week, bring together the fresh cow team, the person who handles treatments, and whoever manages breeding to talk through how many calvings occurred and any difficult or high-risk calvings, fresh cow health events, new clinical mastitis cases and which pens or strings they’re in, new lameness cases and any common threads, and any recent changes in routines, pens, bedding, or rations that might be linked.
Herd-health research has shown that disease events often cluster in specific pens, time windows, or management situations rather than being random. A weekly “health huddle” is a simple way to catch those clusters early. It also signals to your team that their observations matter, which often improves reporting and early detection.
Run a basic feed efficiency check. Choose two groups of cows on the same ration—one from roughly the top third of the herd for milk or fat-corrected milk, one from the lower third, making sure cows are otherwise healthy and at similar days in milk. For about 30 days, track milk and component yields, body condition changes, any health events, and age and lactation distribution.
Then ask yourself: Is the lower group dominated by first-calf heifers and cows with a history of mastitis or lameness? If so, that points toward heifer development and health. Or is it a mix of ages and histories, suggesting issues with grouping, bunk access, or ration delivery?
At the end of the 90 days, sit down with your vet, nutritionist, and financial advisor to review what you’ve learned from these three exercises. In many herds, one or two clear priorities emerge—whether it’s fresh cow management, hoof care, grouping, or repro—which can then be tackled in a more structured way.
The Bottom Line
Looking across the research and on-farm experience, the message is fairly consistent. Emissions per kilogram of milk and profitability per stall aren’t pulling in opposite directions; most of the time, they’re reflecting the same core management decisions. High replacement rates, chronic health problems, weak fresh-cow management, and poor feed efficiency all drive up the cost per hundredweight and emissions per kilogram of milk. When you tighten those areas up, both lines tend to move in your favour.
What’s encouraging is that the herds showing up as “low-footprint” in Canadian and international work aren’t necessarily the biggest or the most high-tech. They’re the ones that have been steadily improving forage quality, feed efficiency, fresh cow management, hoof health, and culling strategies over time. The current focus on carbon intensity is simply putting a new lens on practices that already make economic sense.
There’s still a lot we’re learning—about methane-reducing feed additives, manure treatment technologies, and how carbon markets and processor programs will work for different farm sizes and regions. Those tools will matter, especially for larger supply chains trying to document in-value-chain emission reductions. But they’re likely to be add-ons to strong fundamentals rather than replacements for them.
In the next quarter, pick one of the three metrics—replacement rate, feed cost per cwt, or mastitis and lameness losses—and commit to measuring and improving it. Ask your team one simple question at your next herd meeting: “Where are we wasting cows, feed, or health in ways that don’t show up on our carbon report yet—but do show up in our bank account?”
The next time someone asks you about your “carbon number,” it might help to think of it as one more KPI alongside milk per cow, butterfat performance, pregnancy rate, and SCC. If you’re making progress on replacement rate, feed efficiency, and herd health, chances are good that both your cost per hundredweight and your emissions per kilogram of milk are moving in the right direction—even if the carbon program cheque hasn’t arrived yet.
KEY TAKEAWAYS
Low-carbon farms aren’t sacrificing profit—they’re making more. Guelph research found low-footprint Ontario dairies earned C$1,200 more per cow. The drivers? Feed efficiency and herd management—not carbon credits or fancy tech.
Your replacement rate is bleeding cash and carbon. Dropping from 35% to 28% on a 1,000-cow herd saves $210,000 annually—and cuts nearly two years of feed, manure, and methane from 70 heifers you won’t need to raise.
Feed efficiency pays twice. Feed takes 50-65% of your costs and 30-40% of your emissions. Tighten your rations, win on both lines.
Sick cows leak margin and carbon. Mastitis averages C$662/cow/year, and those cows keep eating and emitting while shipping less milk. That’s a double hit to your numbers.
90 days, no capital, clear direction. Document every cull, hold weekly health huddles, and run a basic feed efficiency check. The patterns will show you exactly where the money is hiding.
Complete references and supporting documentation are available upon request by contacting the editorial team at editor@thebullvine.com.
Every week, thousands of producers, breeders, and industry insiders open Bullvine Weekly for genetics insights, market shifts, and profit strategies they won’t find anywhere else. One email. Five minutes. Smarter decisions all week.
To provide the best experiences, we use technologies like cookies to store and/or access device information. Consenting to these technologies will allow us to process data such as browsing behavior or unique IDs on this site. Not consenting or withdrawing consent, may adversely affect certain features and functions.
Functional
Always active
The technical storage or access is strictly necessary for the legitimate purpose of enabling the use of a specific service explicitly requested by the subscriber or user, or for the sole purpose of carrying out the transmission of a communication over an electronic communications network.
Preferences
The technical storage or access is necessary for the legitimate purpose of storing preferences that are not requested by the subscriber or user.
Statistics
The technical storage or access that is used exclusively for statistical purposes.The technical storage or access that is used exclusively for anonymous statistical purposes. Without a subpoena, voluntary compliance on the part of your Internet Service Provider, or additional records from a third party, information stored or retrieved for this purpose alone cannot usually be used to identify you.
Marketing
The technical storage or access is required to create user profiles to send advertising, or to track the user on a website or across several websites for similar marketing purposes.
To provide the best experiences, we and our partners use technologies like cookies to store and/or access device information. Consenting to these technologies will allow us and our partners to process personal data such as browsing behavior or unique IDs on this site and show (non-) personalized ads. Not consenting or withdrawing consent, may adversely affect certain features and functions.
Click below to consent to the above or make granular choices. Your choices will be applied to this site only. You can change your settings at any time, including withdrawing your consent, by using the toggles on the Cookie Policy, or by clicking on the manage consent button at the bottom of the screen.
Functional
Always active
The technical storage or access is strictly necessary for the legitimate purpose of enabling the use of a specific service explicitly requested by the subscriber or user, or for the sole purpose of carrying out the transmission of a communication over an electronic communications network.
Preferences
The technical storage or access is necessary for the legitimate purpose of storing preferences that are not requested by the subscriber or user.
Statistics
The technical storage or access that is used exclusively for statistical purposes.The technical storage or access that is used exclusively for anonymous statistical purposes. Without a subpoena, voluntary compliance on the part of your Internet Service Provider, or additional records from a third party, information stored or retrieved for this purpose alone cannot usually be used to identify you.
Marketing
The technical storage or access is required to create user profiles to send advertising, or to track the user on a website or across several websites for similar marketing purposes.


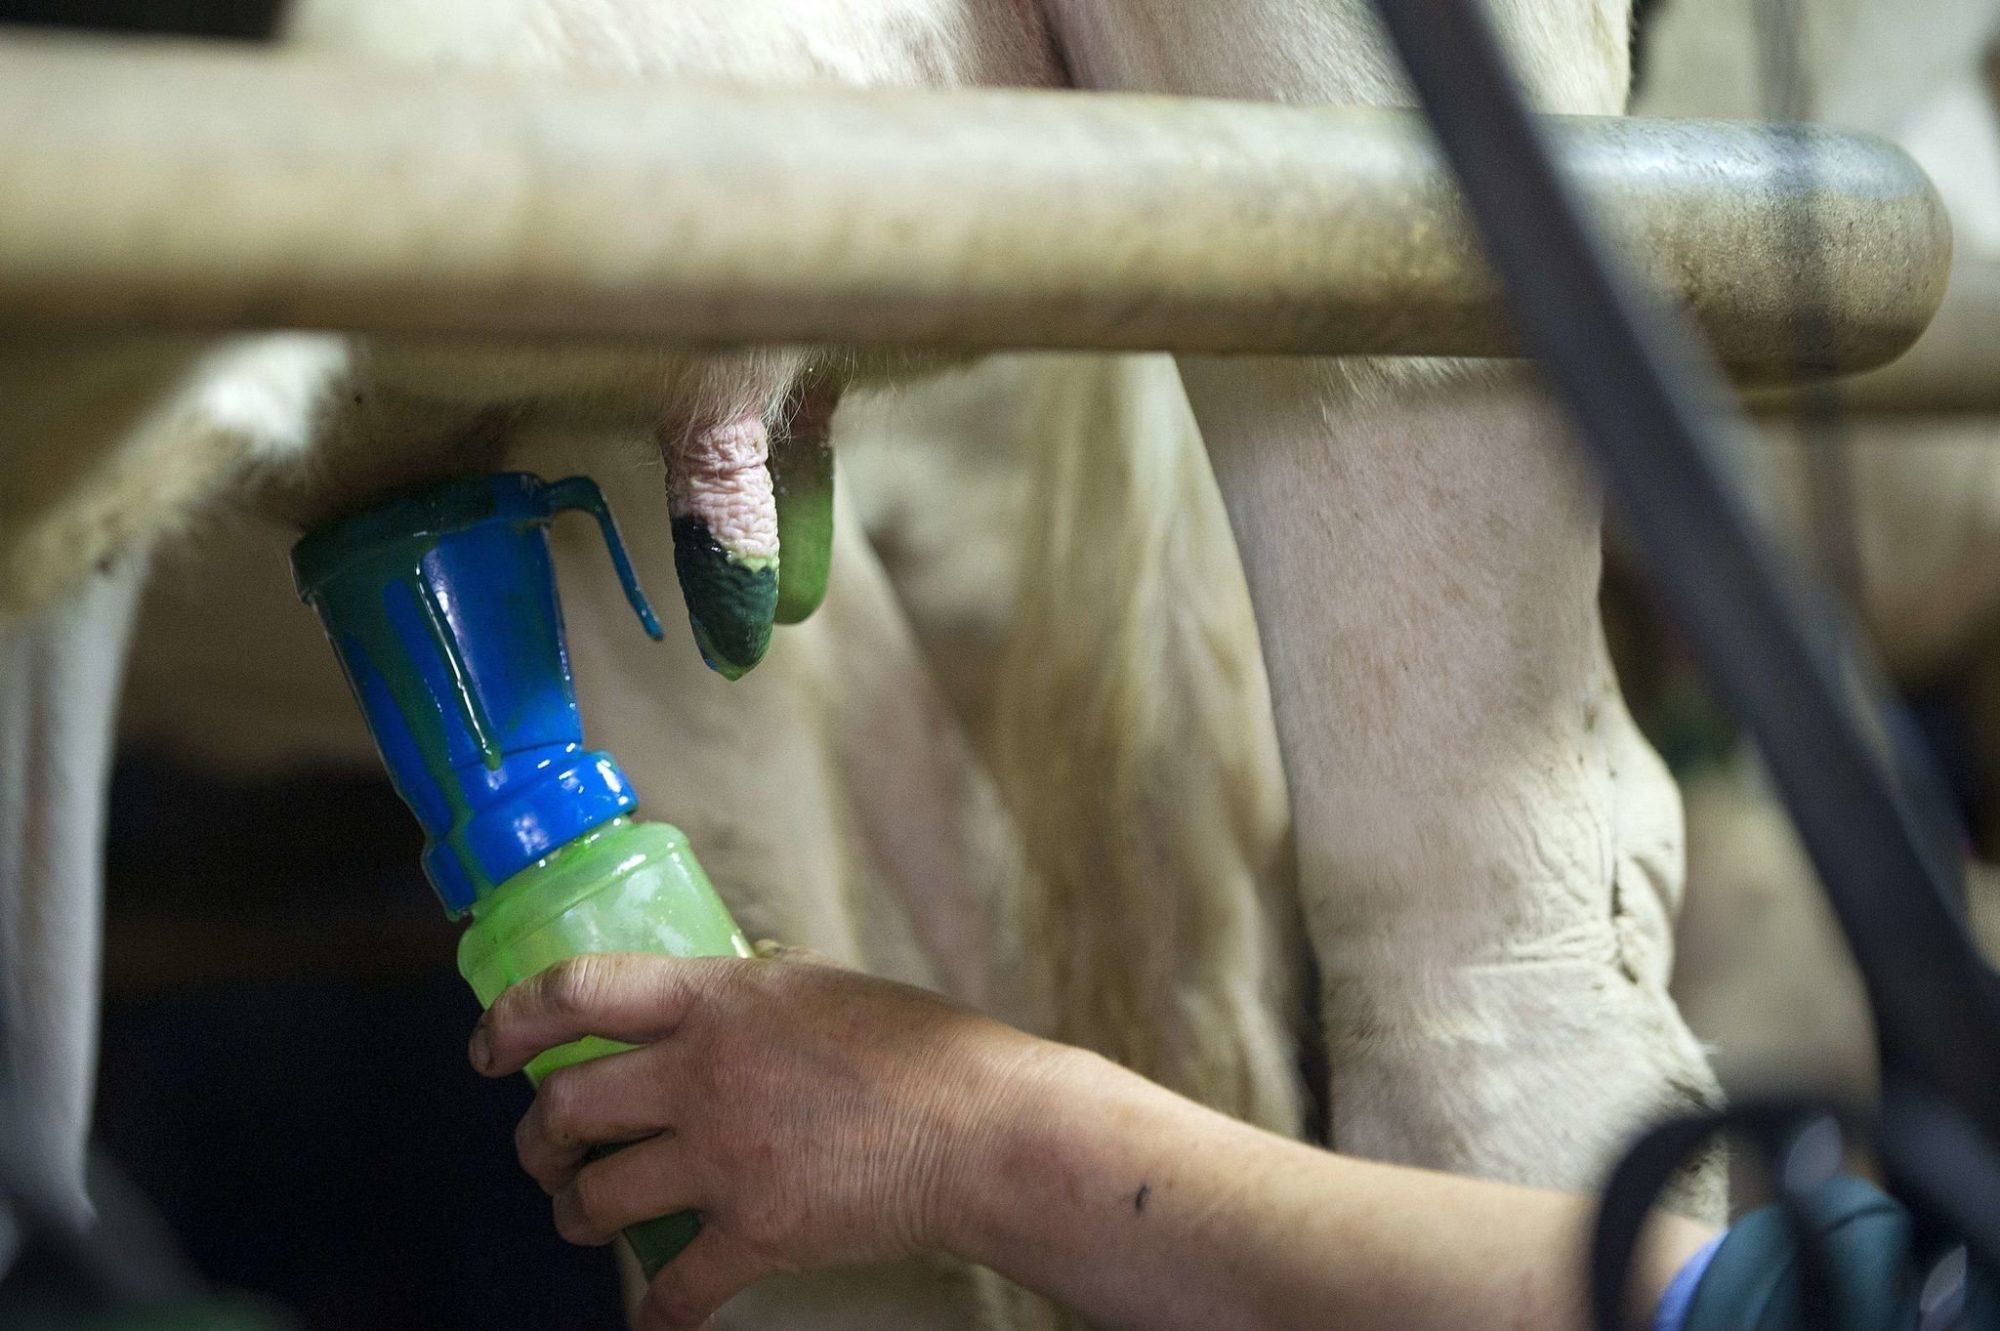
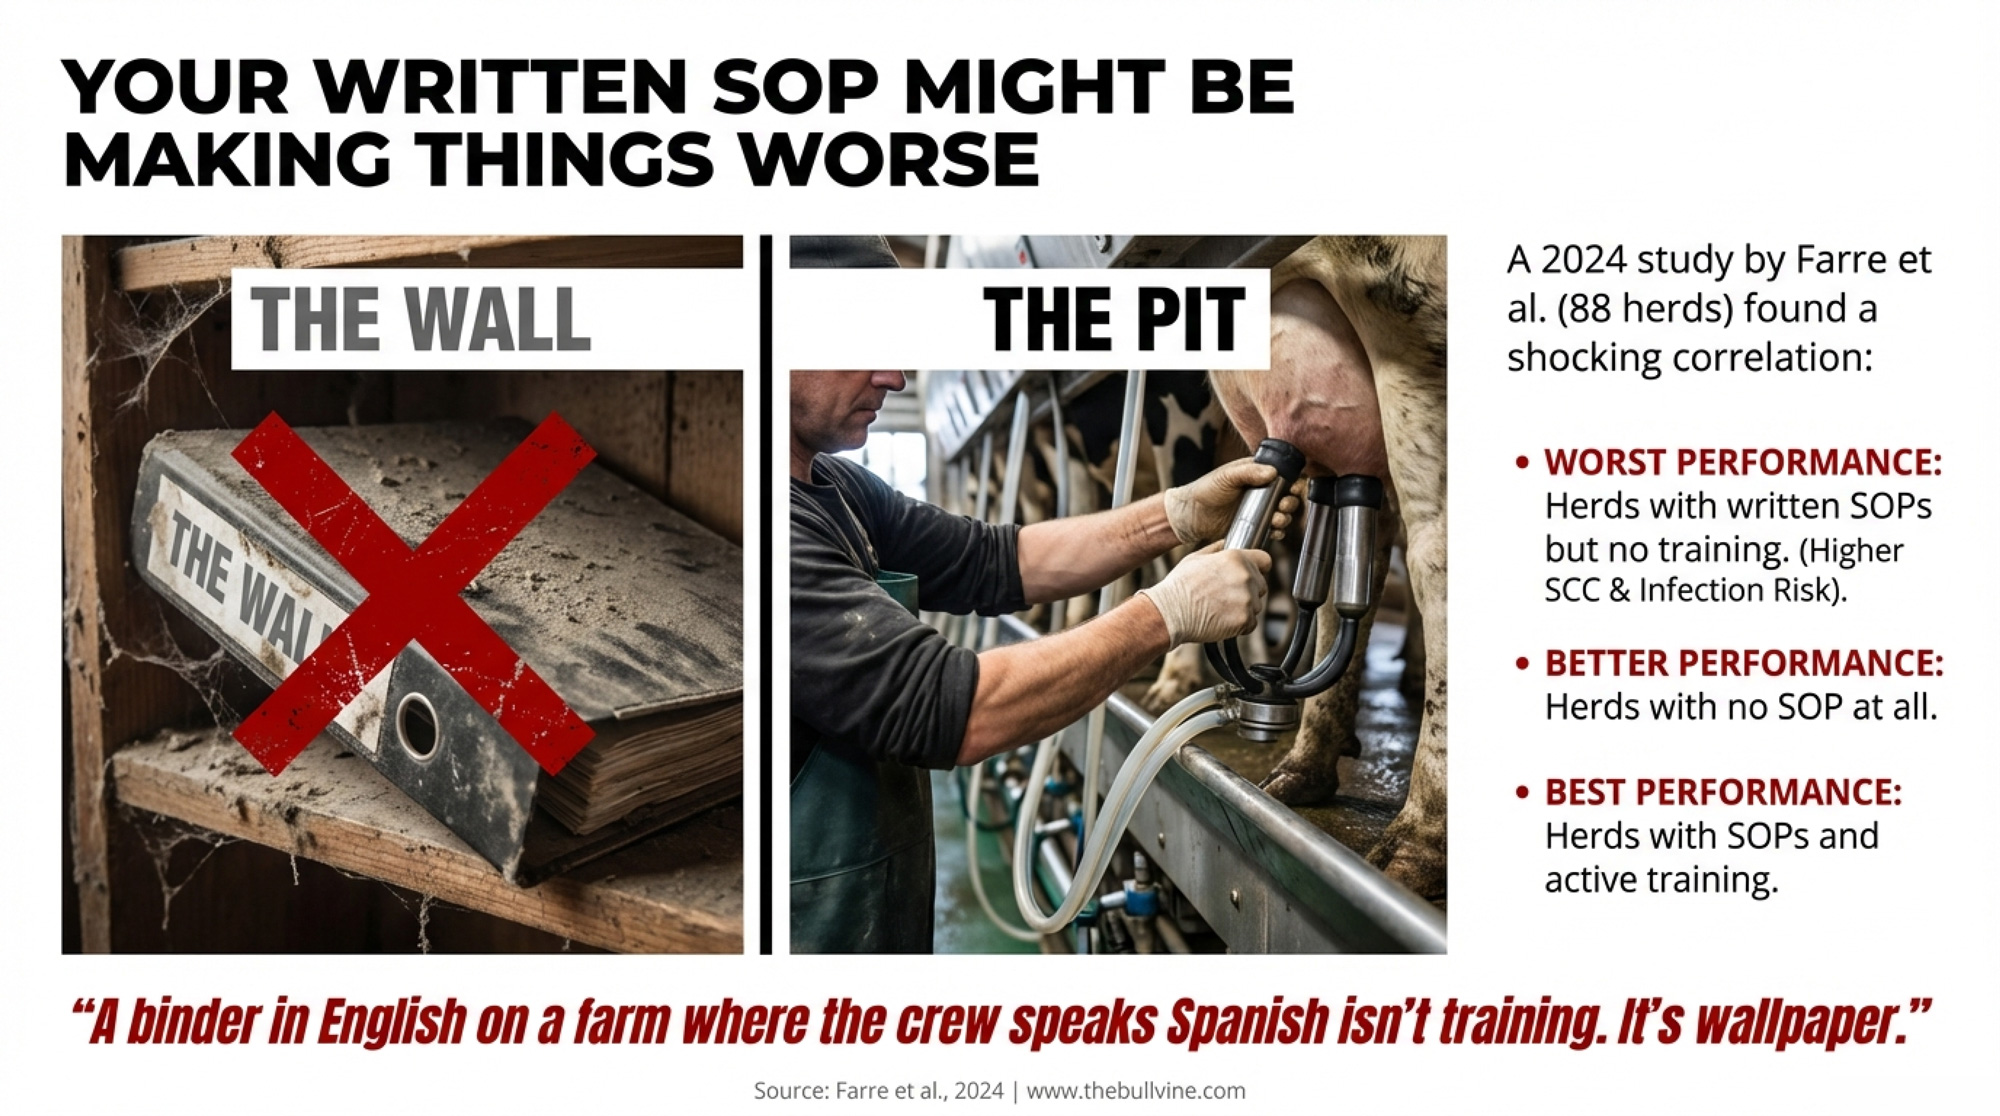
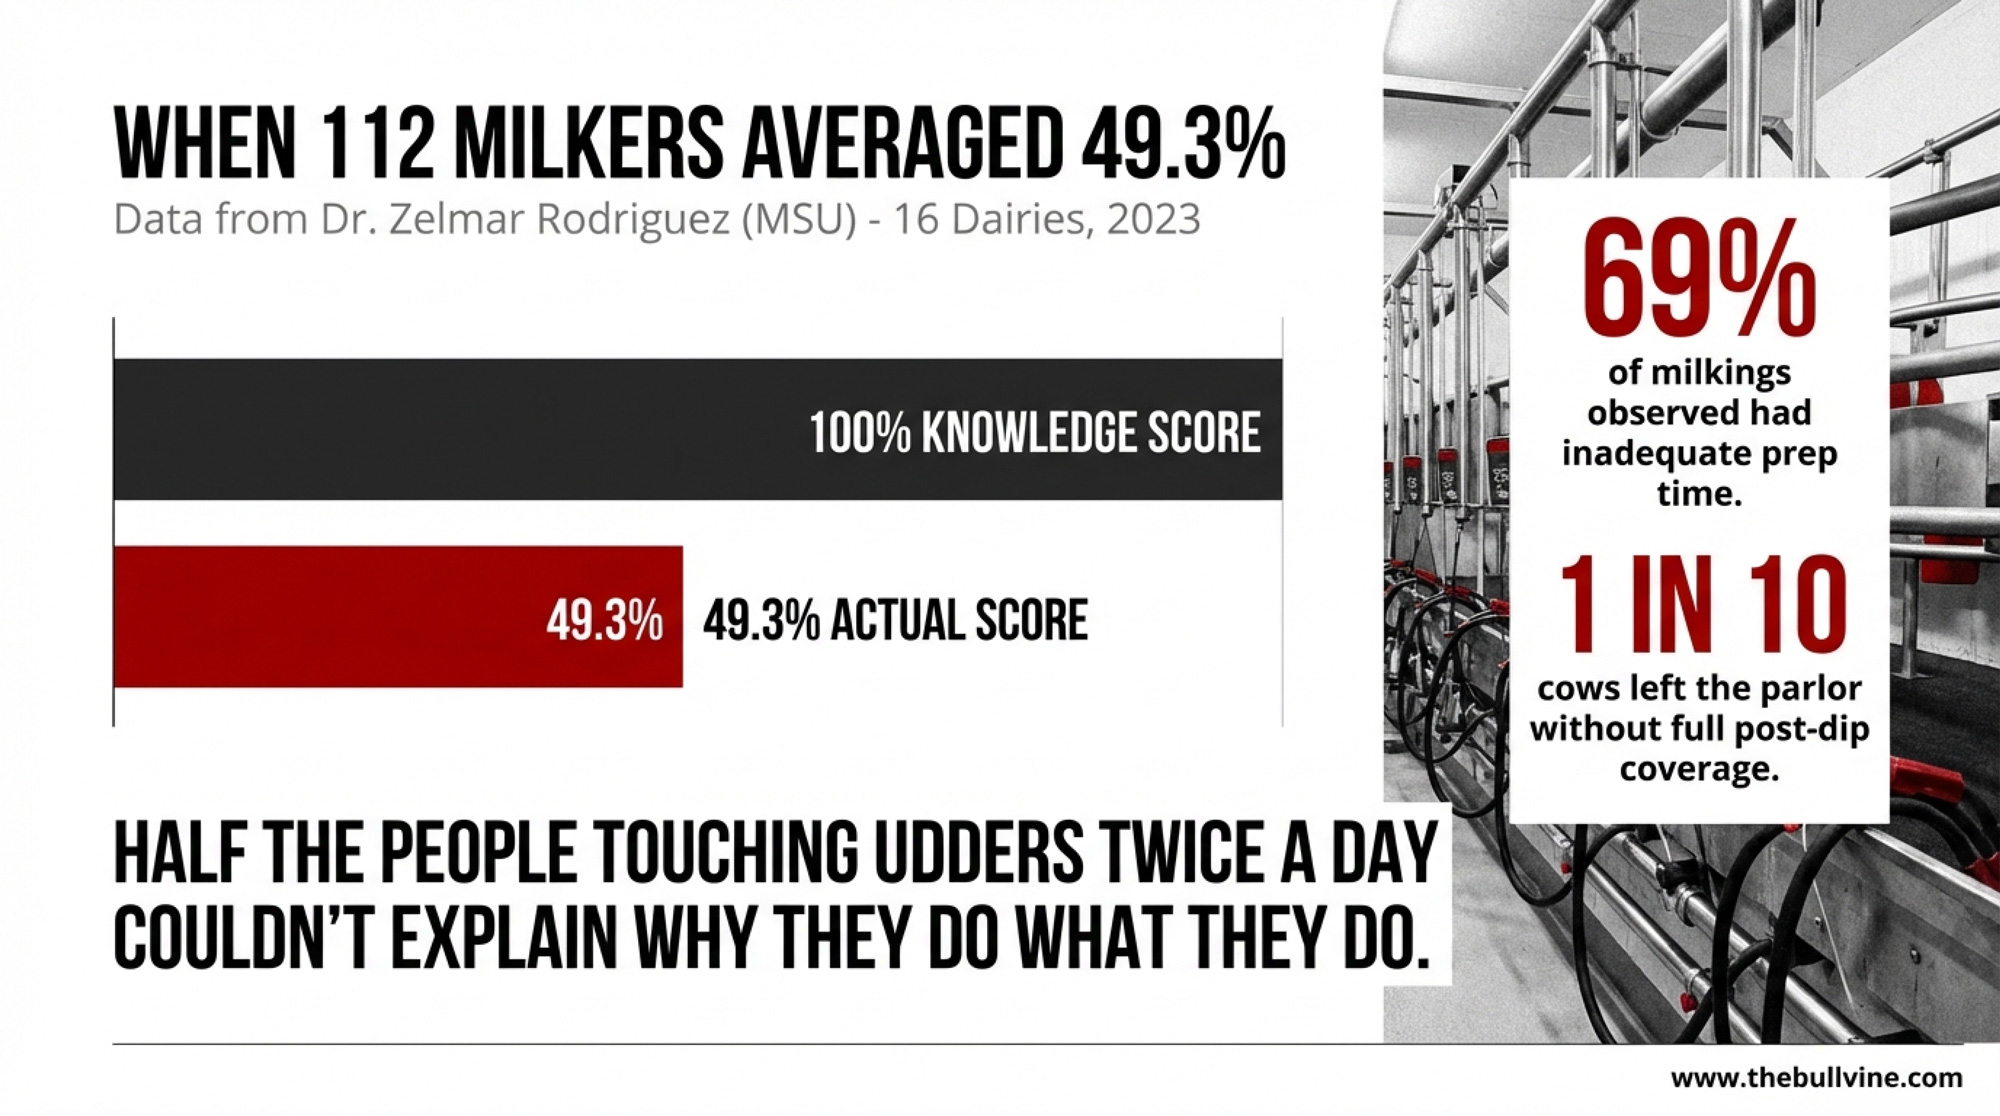
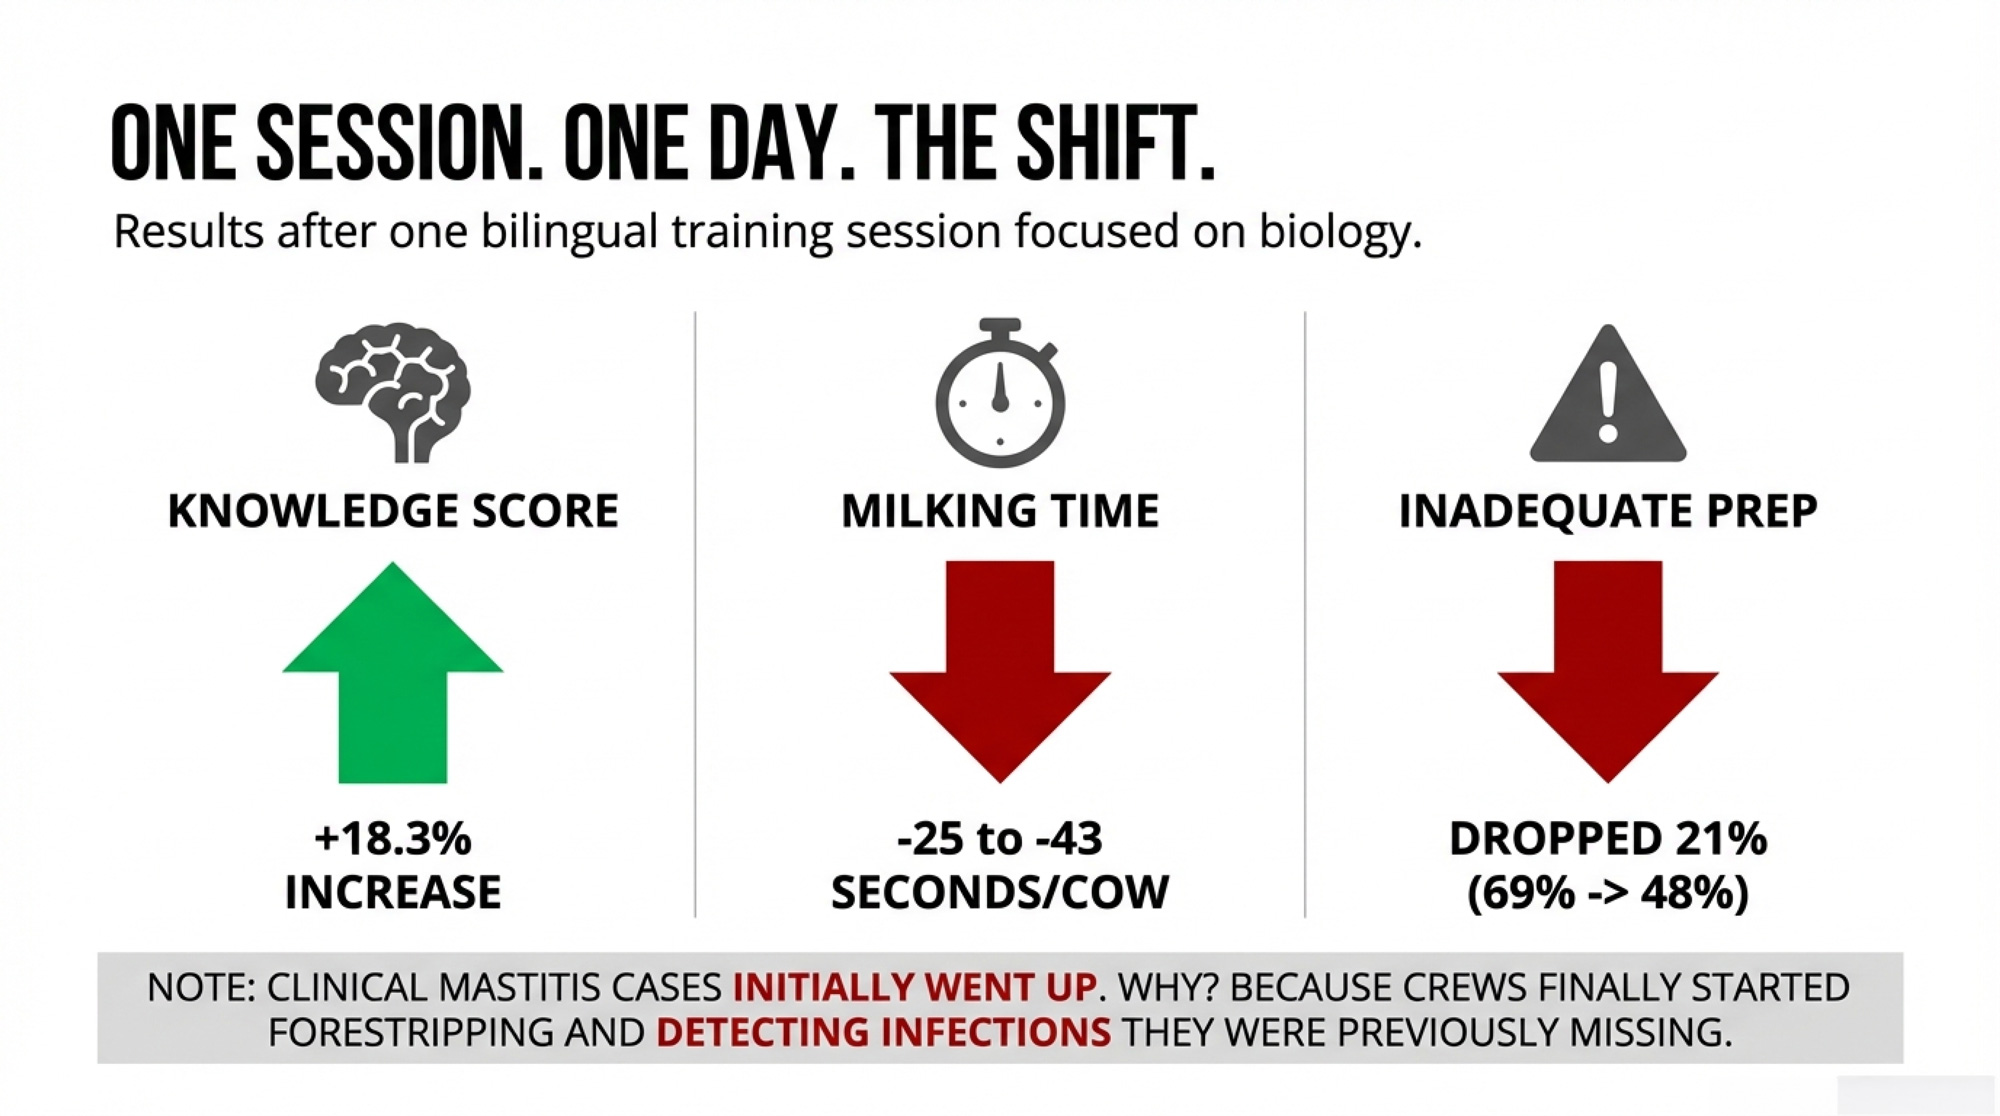
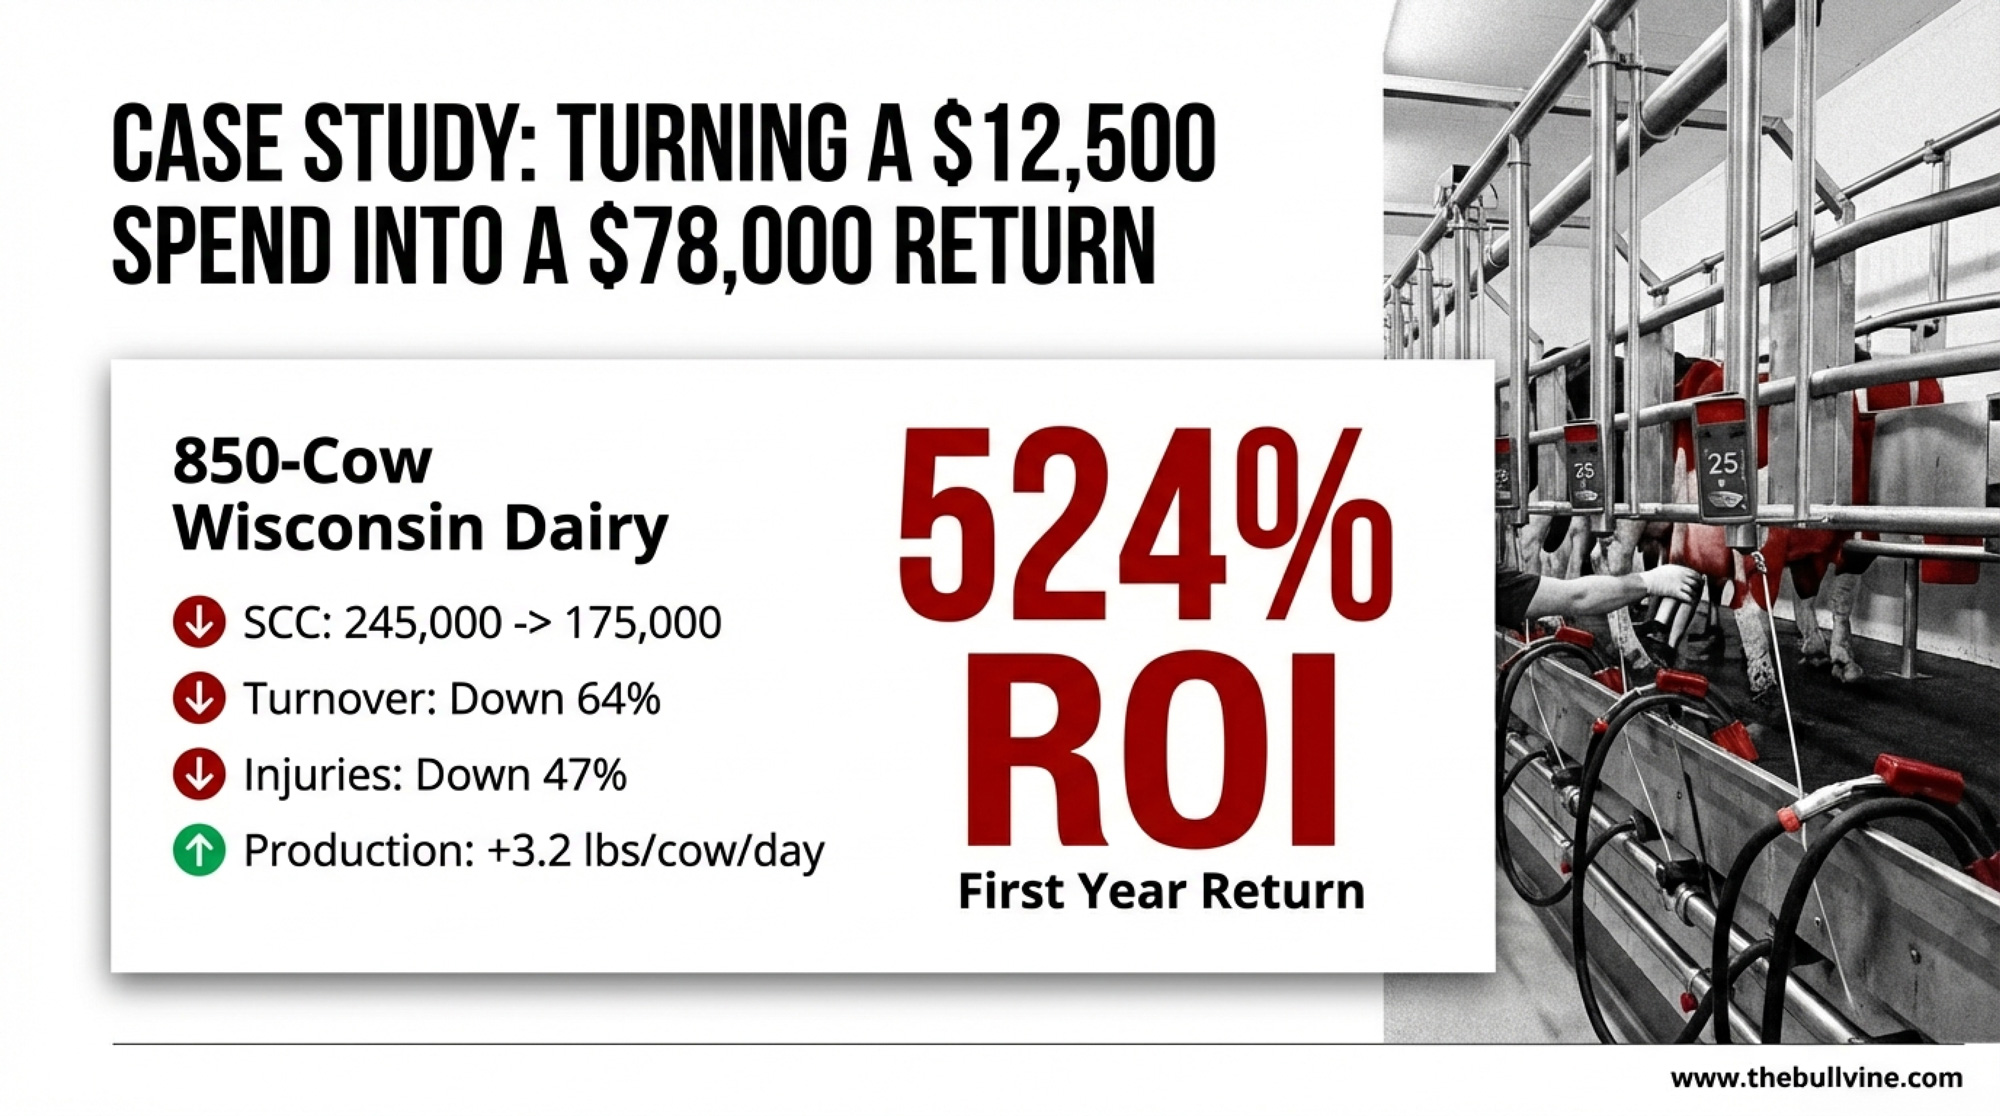
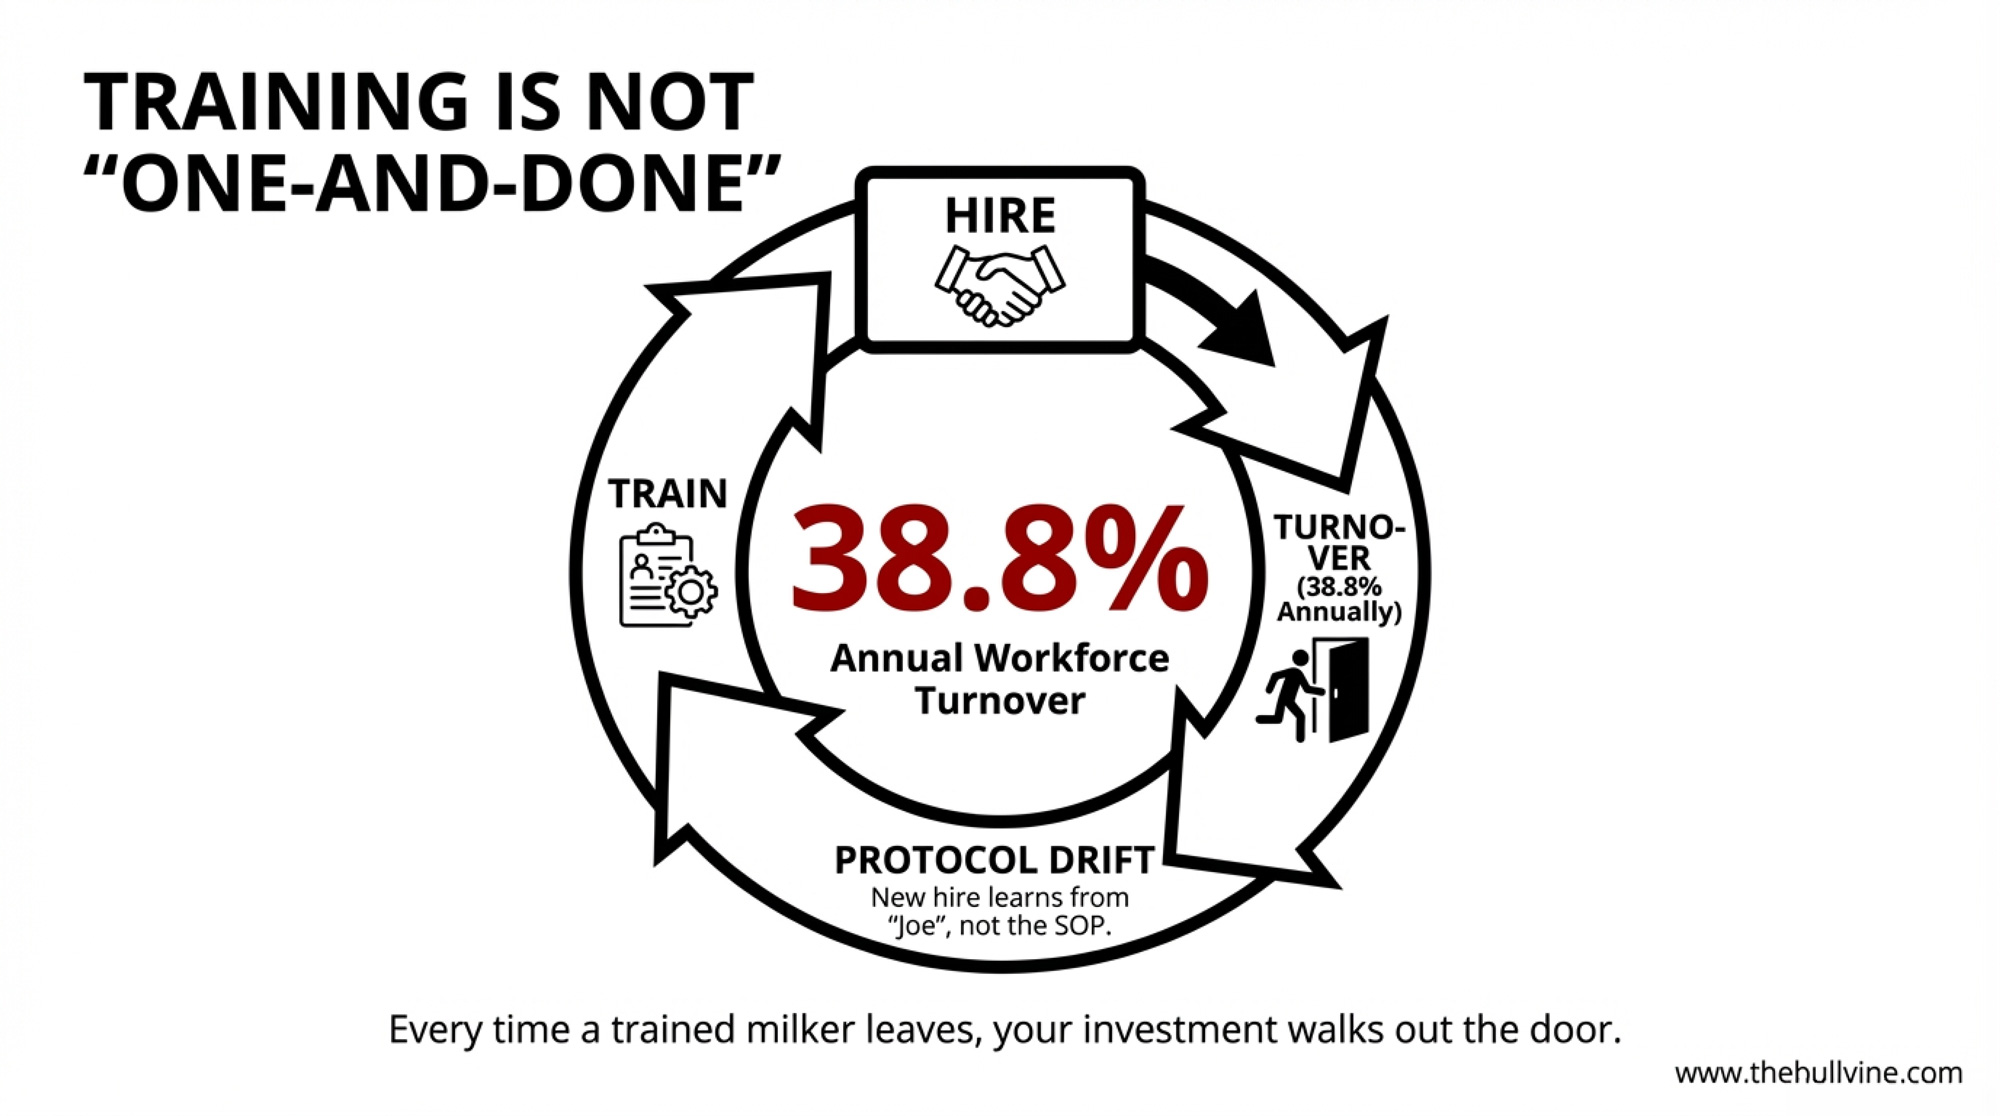
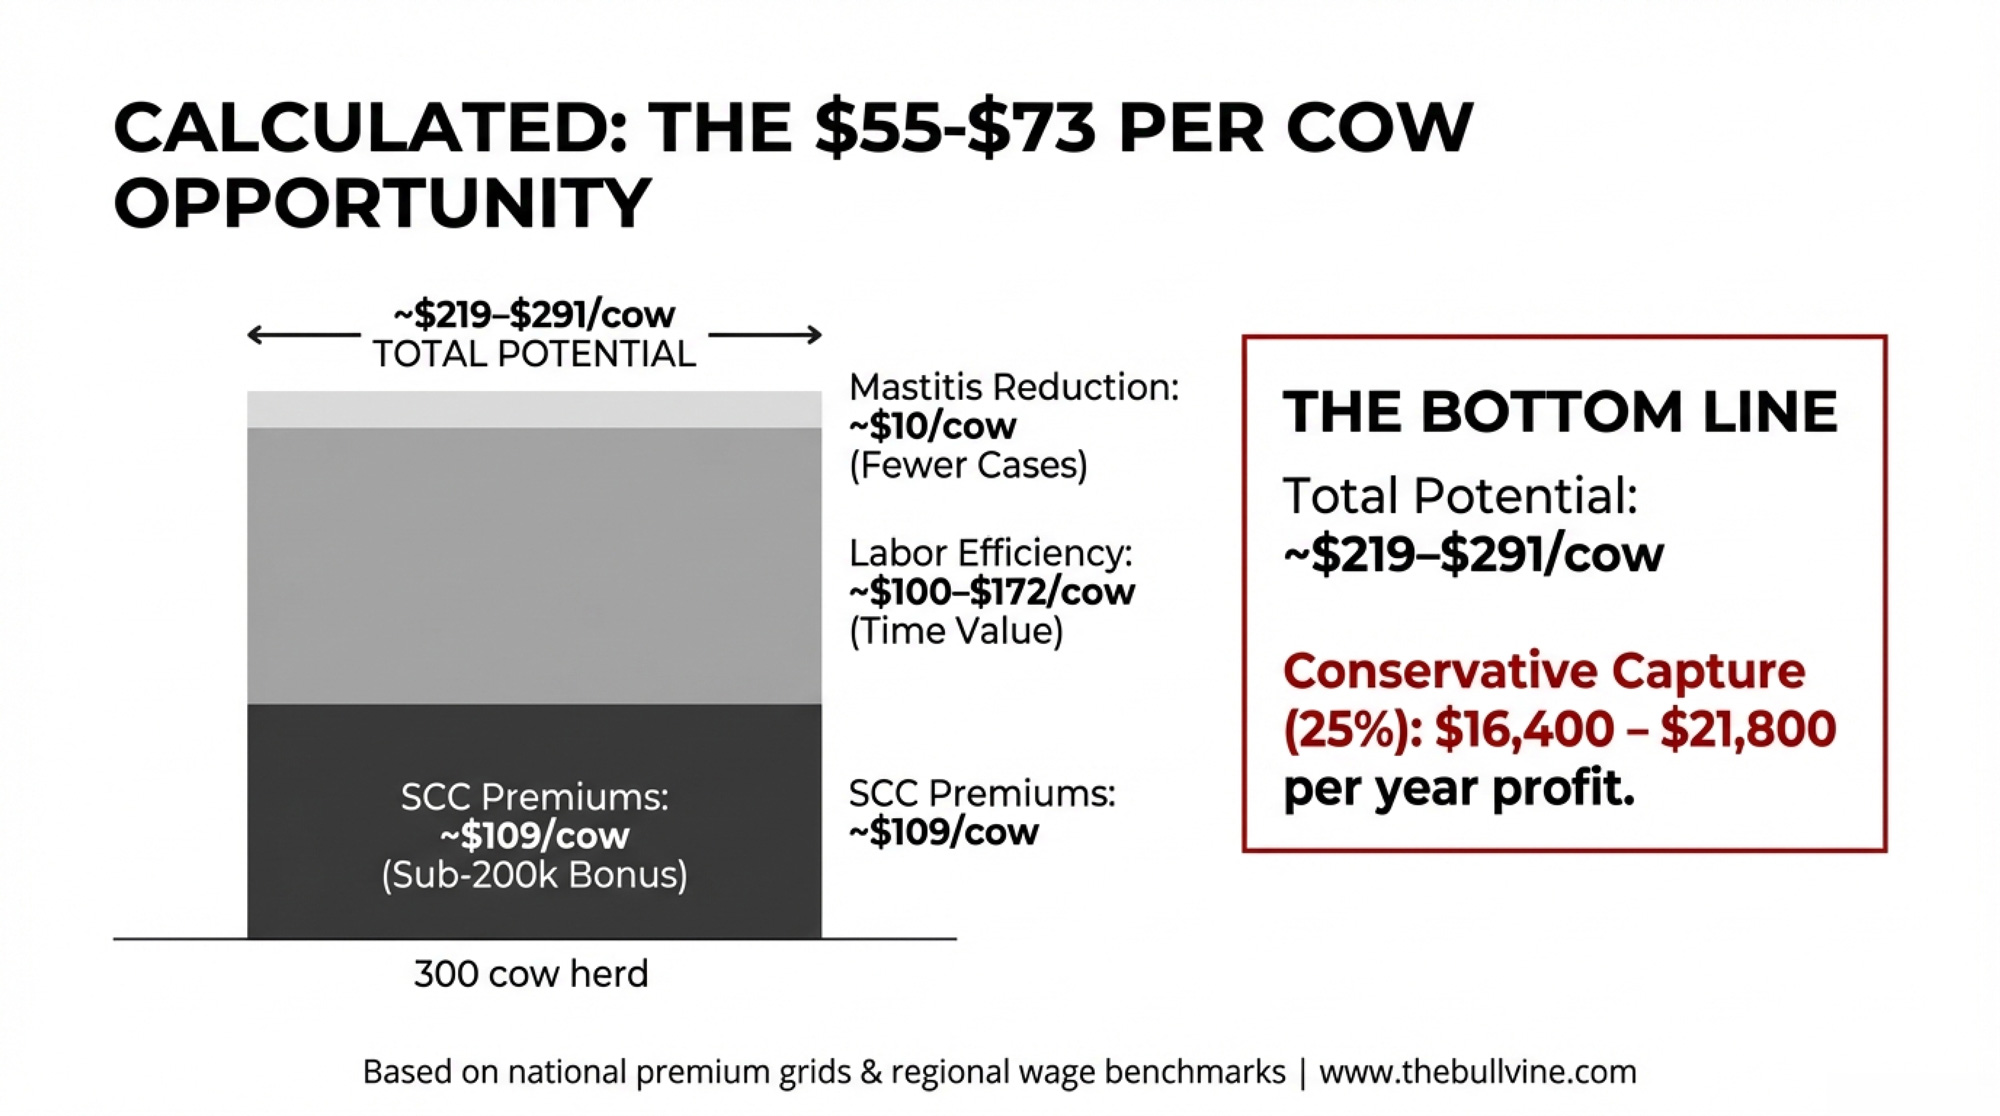
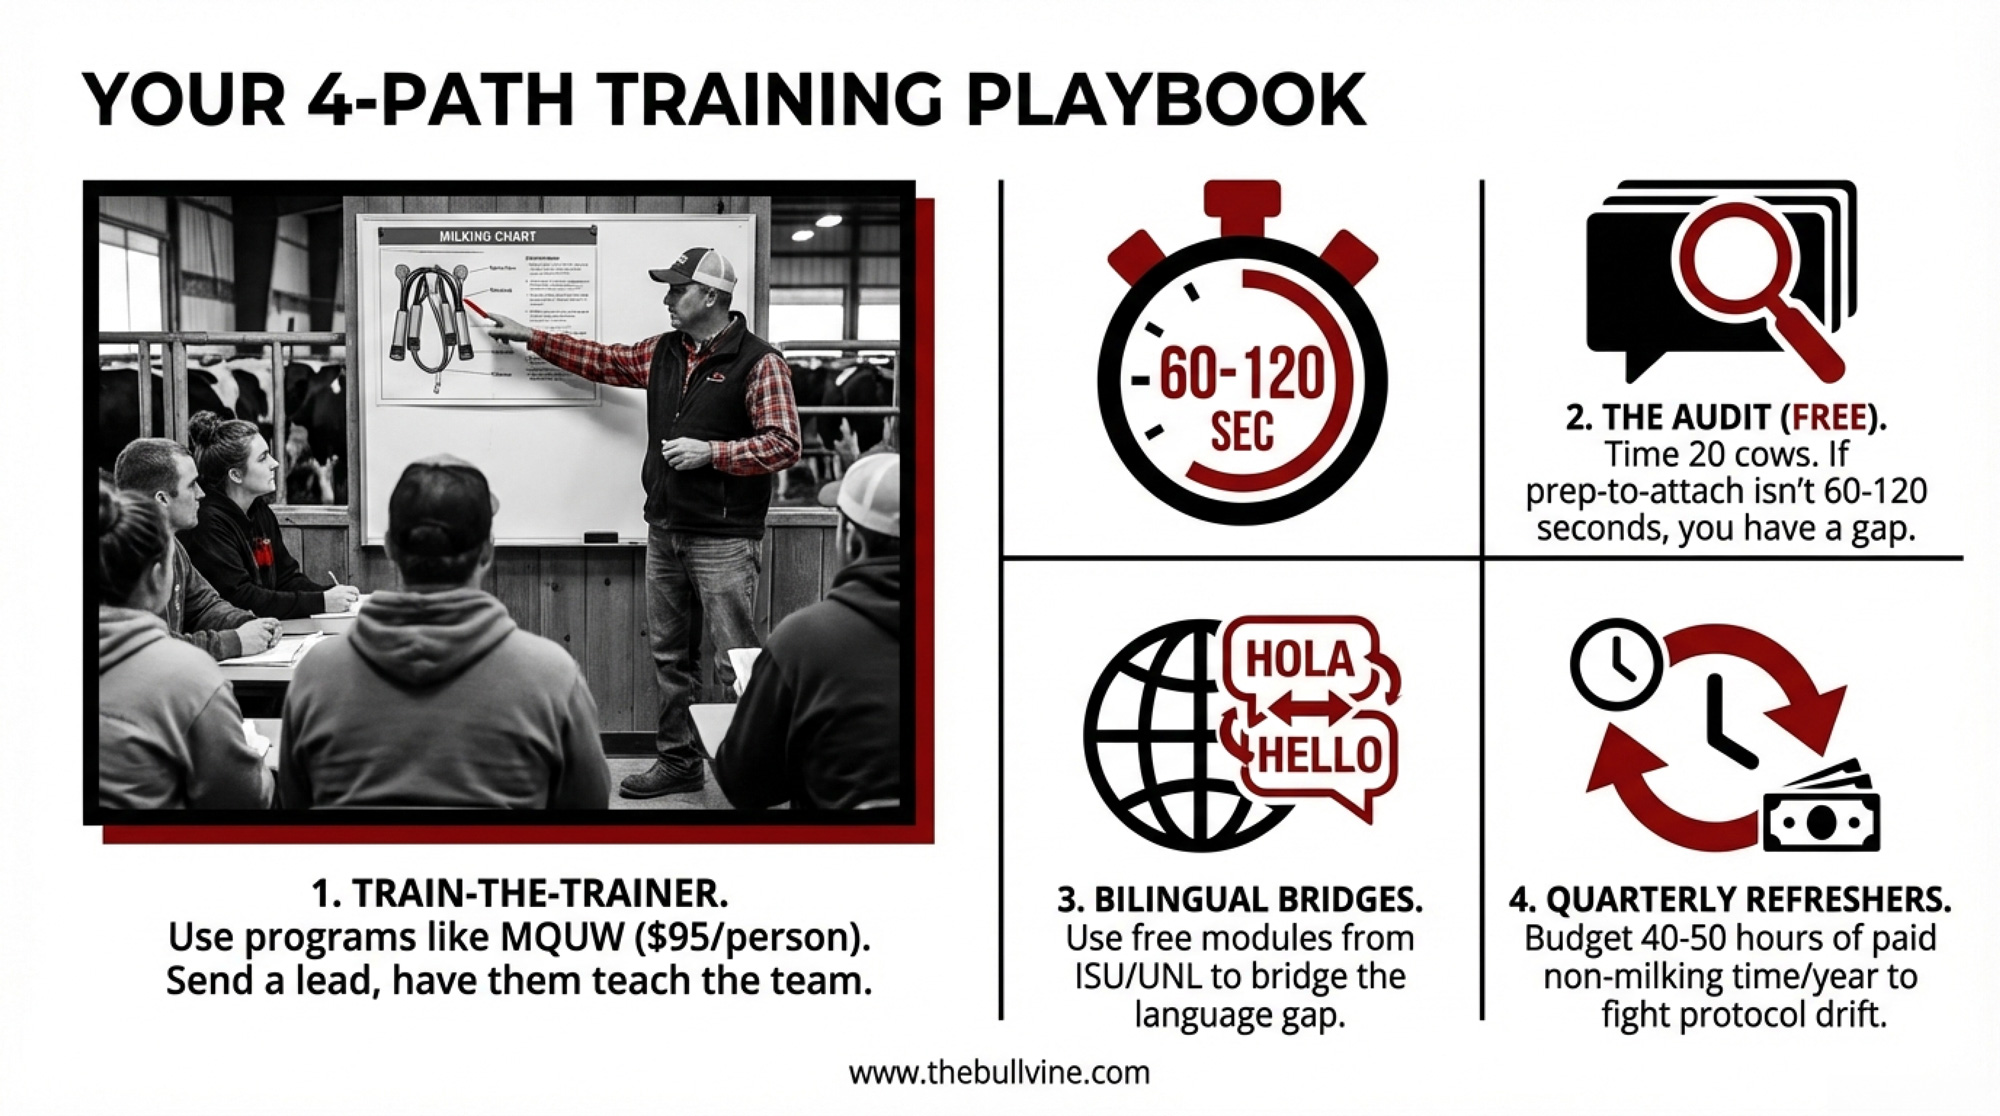
 The Sunday Read Dairy Professionals Don’t Skip.
 The Sunday Read Dairy Professionals Don’t Skip.