Archive for transition cow nutrition

A Wisconsin Herd’s DCAD Said −120. A 50‑Cent Urine Strip Said Otherwise.

When a Wisconsin dairy finally tested urine pH, their “negative” ration was doing exactly nothing — and the latest research says they’re far from alone.

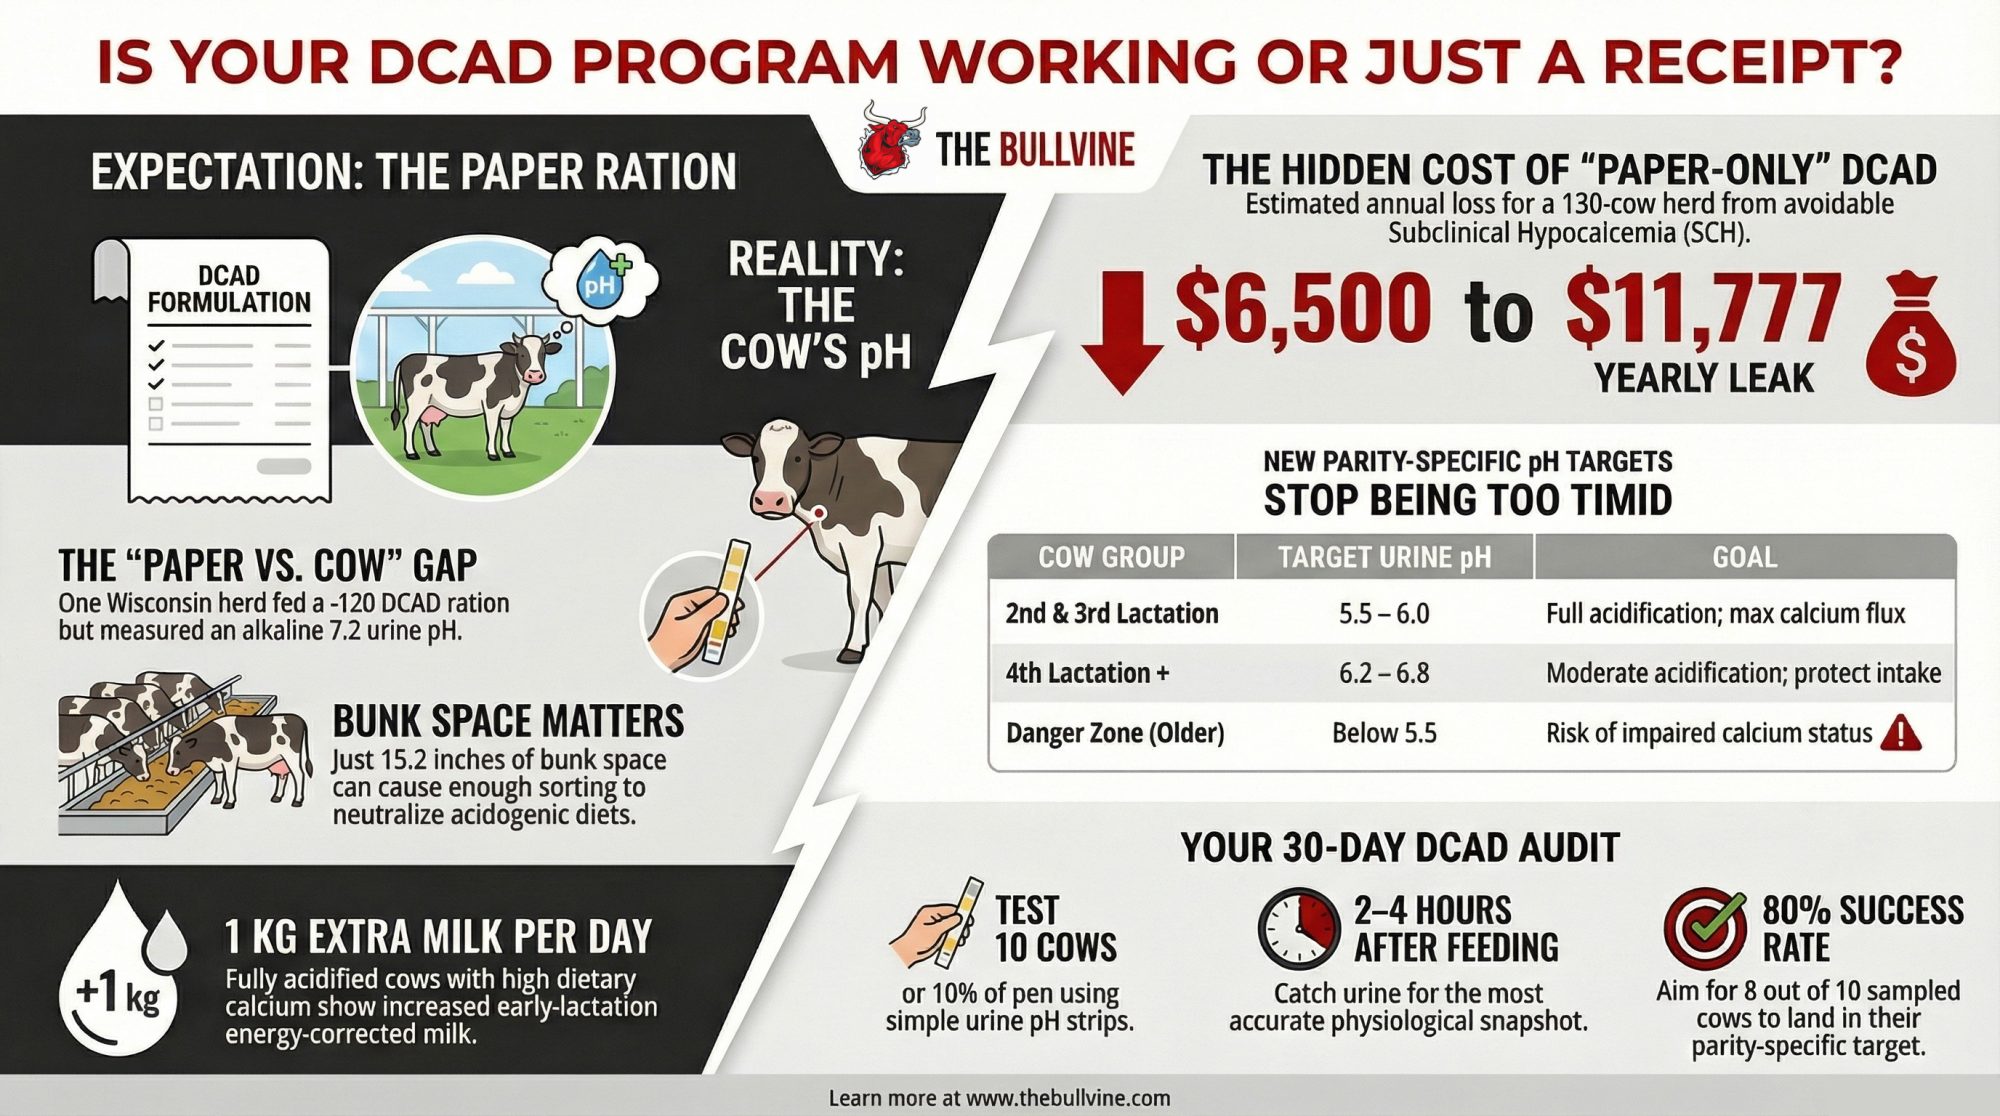
Executive Summary: One herd in a published six-farm investigation was feeding negative DCAD at −100 to −160 mEq/kg DM and still averaged a urine pH of 7.2 — functionally alkaline — because 15.2 inches of bunk space caused enough sorting to gut the diet entirely. Goff’s 2025 meta-analysis (660 multiparous Holsteins across 9 studies) now provides parity-specific targets: 5.5–6.0 for 2nd–3rd lactation, 6.2–6.8 for 4th-plus cows, where dropping below 5.75 actually harms calcium status. The safety case for full acidification is stronger than the industry’s been acting — Graef’s trial put fully acidified cows at just 3.5 mmol/L urinary ammonium with blood pH steady at 7.39–7.41. SCH runs $125 to $226.46 per affected cow, depending on the model, and at 45–80% multiparous incidence, a 130-multiparous-cow herd faces $6,500 to $11,777 per year in avoidable drag. With the CDC’s 2.3% farmgate increase tightening input scrutiny in 2026, a 50-cent urine strip and 10 close-up cows will tell you whether your DCAD dollars are working in the cow or just living on the ration sheet.

Negative DCAD monitoring

You’re probably paying for a DCAD program you aren’t actually getting. In Wisconsin, the Schaefer family thought their −120 mEq/kg close‑up ration was bulletproof. The “Animate” bill was paid, the spreadsheet looked perfect, and the cows looked fine.

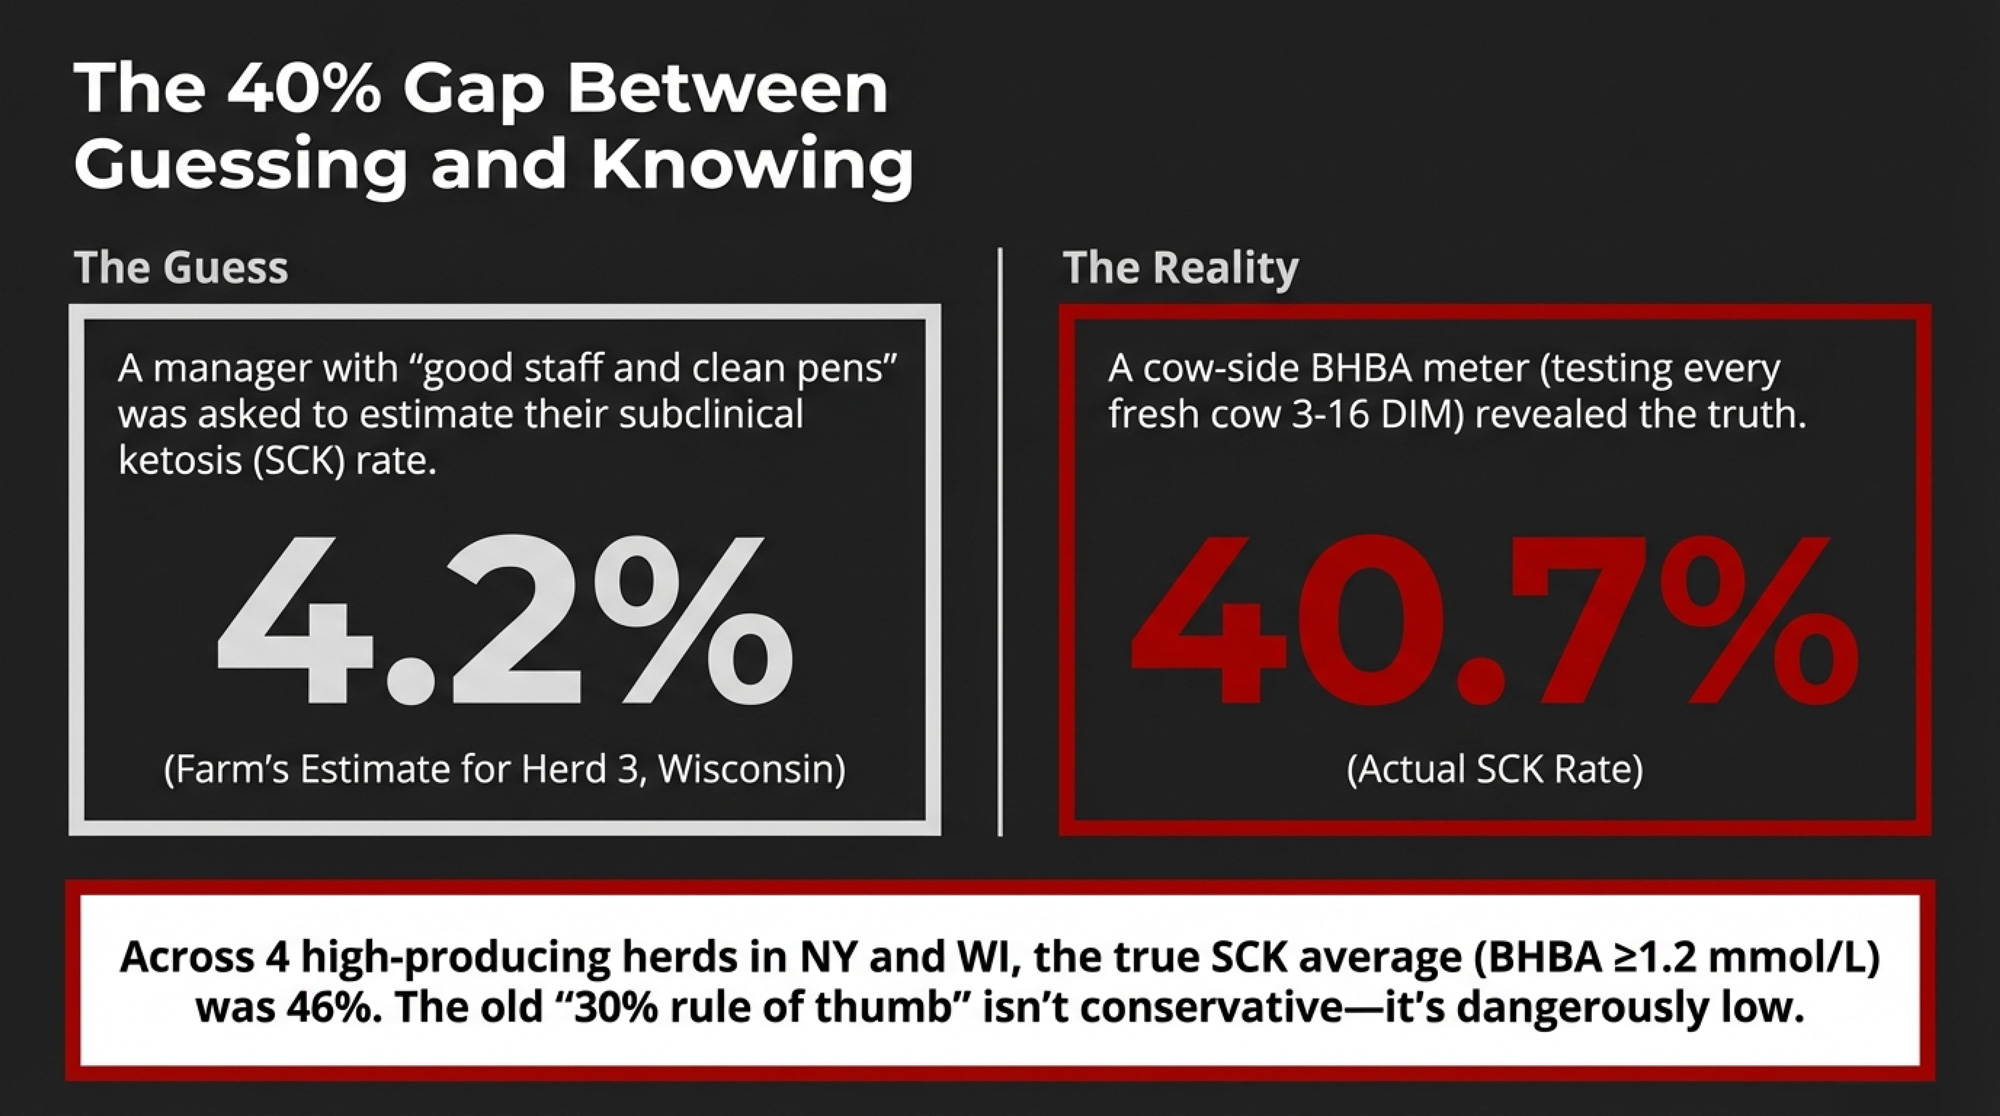
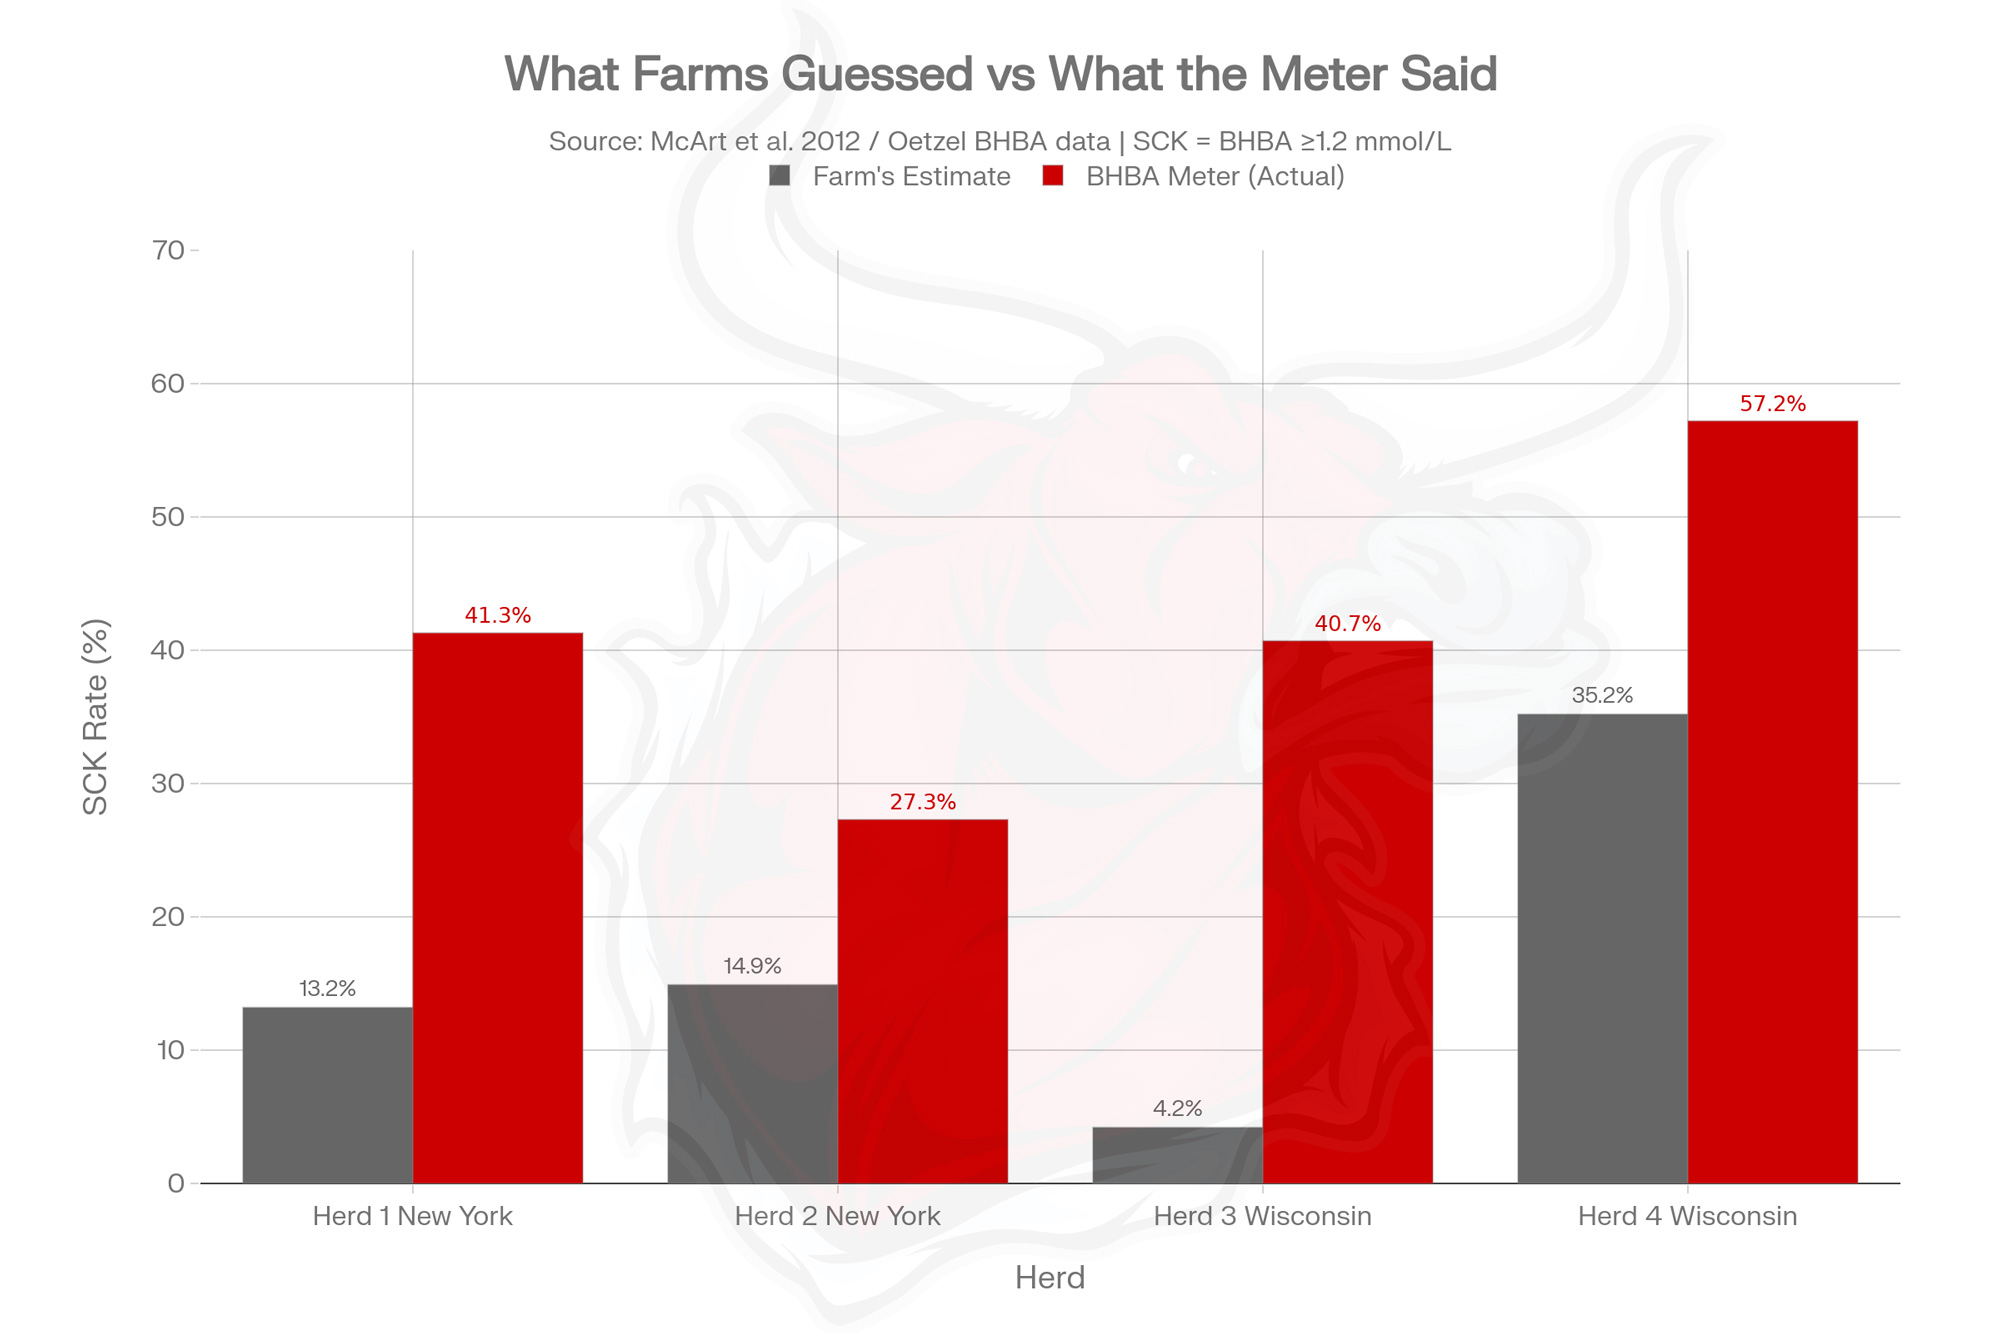
Then they finally dipped a 50‑cent urine strip. The average pH in their close‑up pen was 7.5. Their “negative” DCAD was doing exactly nothing. When they and their nutritionist rebuilt the ration actually to hit a 5.5–6.0 urine pH, their fresh‑cow list quietly shrank — fewer slow starts, fewer mild ketotics, and less time babysitting older cows in the first week fresh.

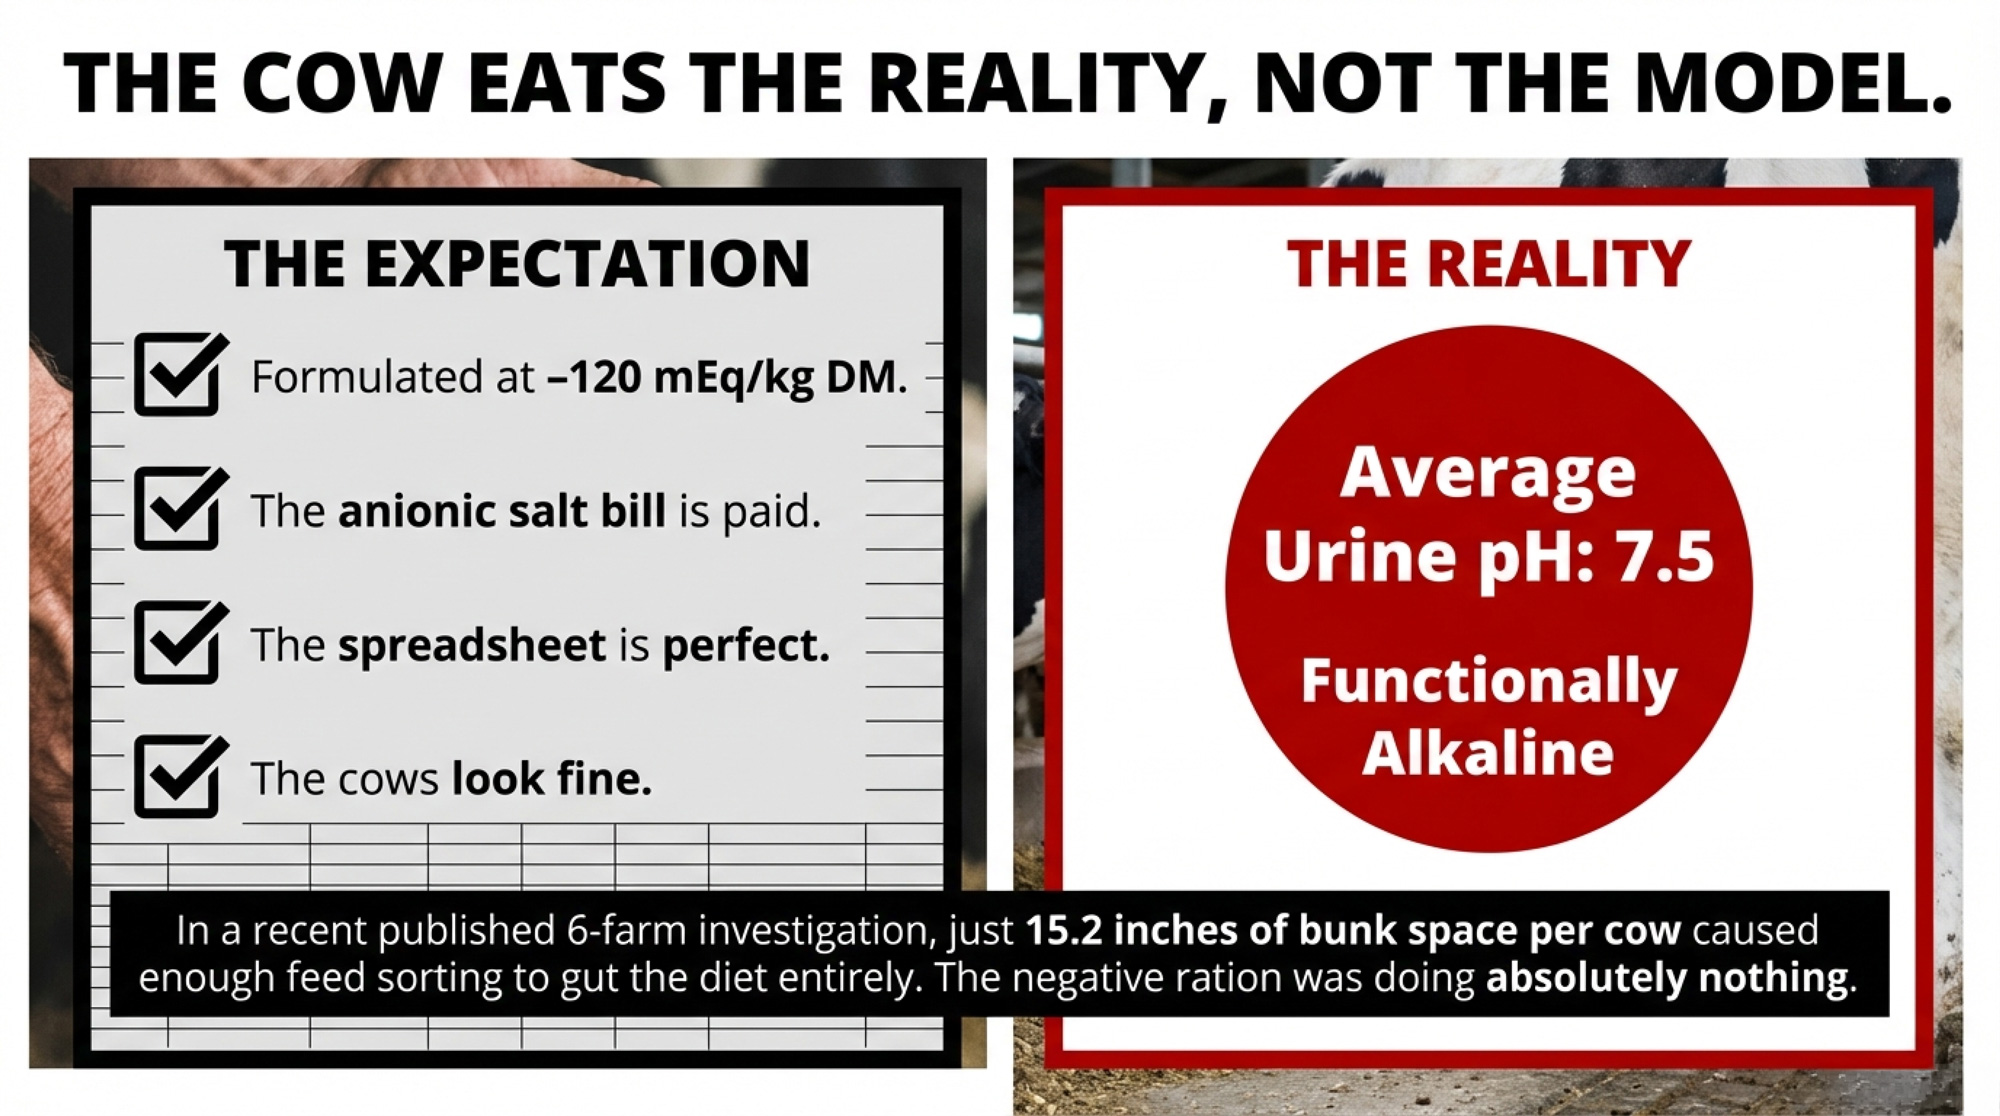
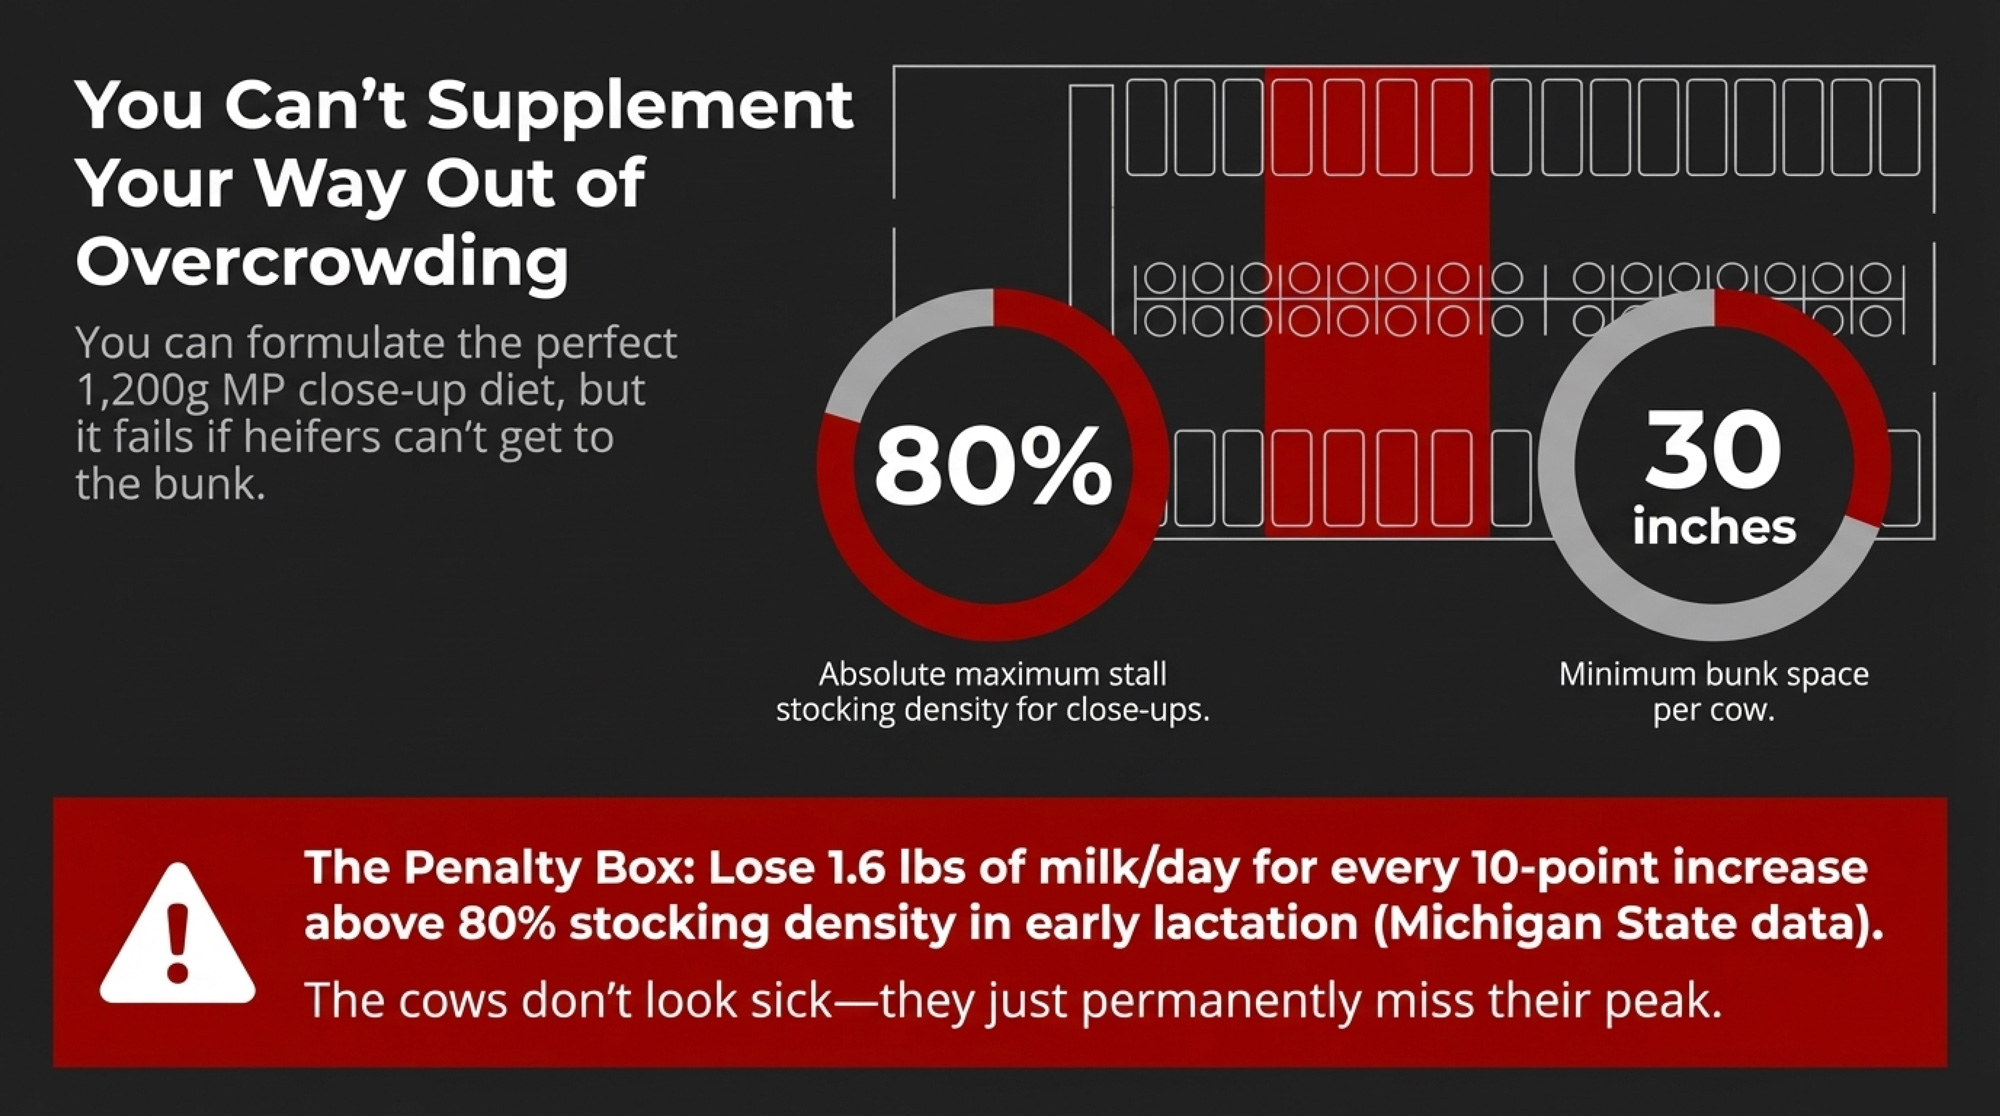
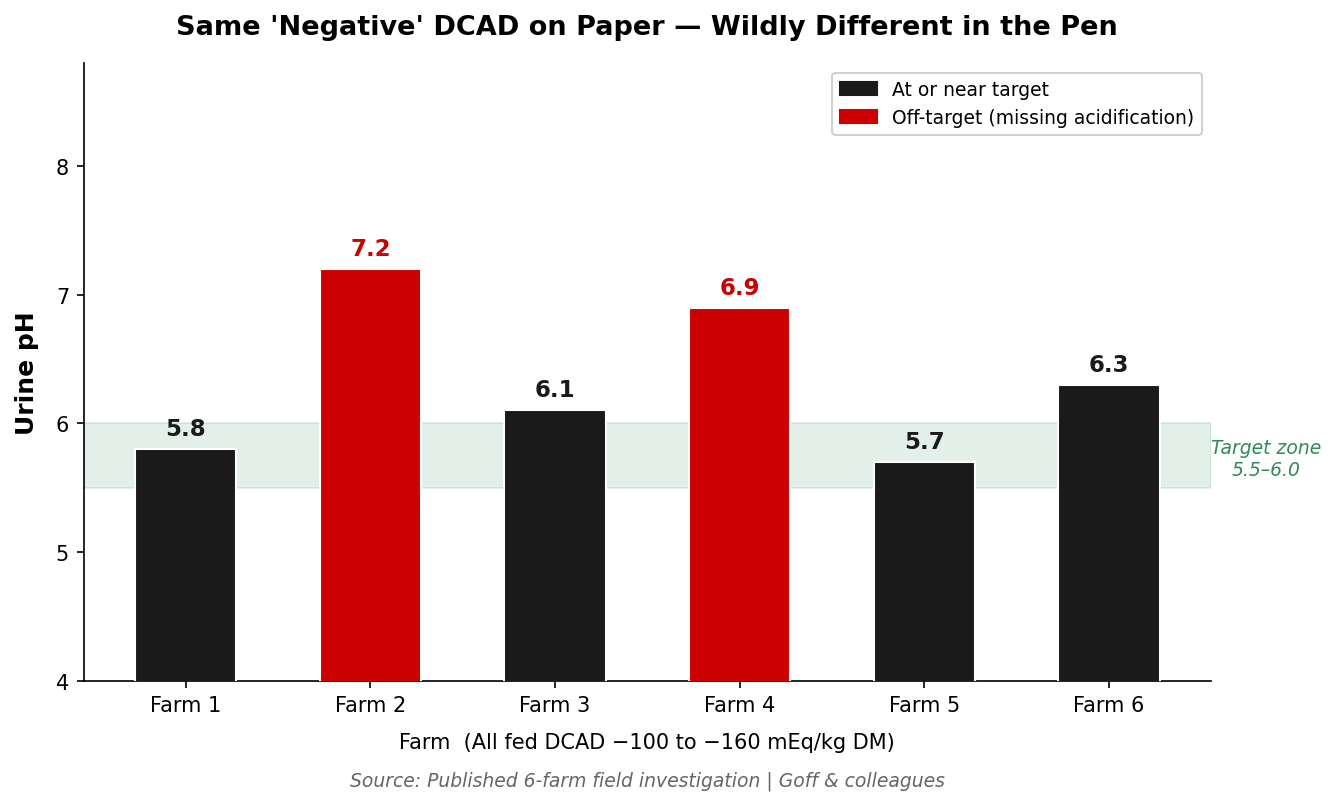
They’re not alone. In a published field investigation across six herds all feeding correctly formulated negative‑DCAD TMRs, one farm averaged a urine pH of 7.2 — not because the ration was wrong on paper, but because 15.2 inches of bunk space per cow caused enough sorting to neutralize the acidogenic diet entirely. The ration analyzed fine. The cows weren’t eating it the way the model assumed.

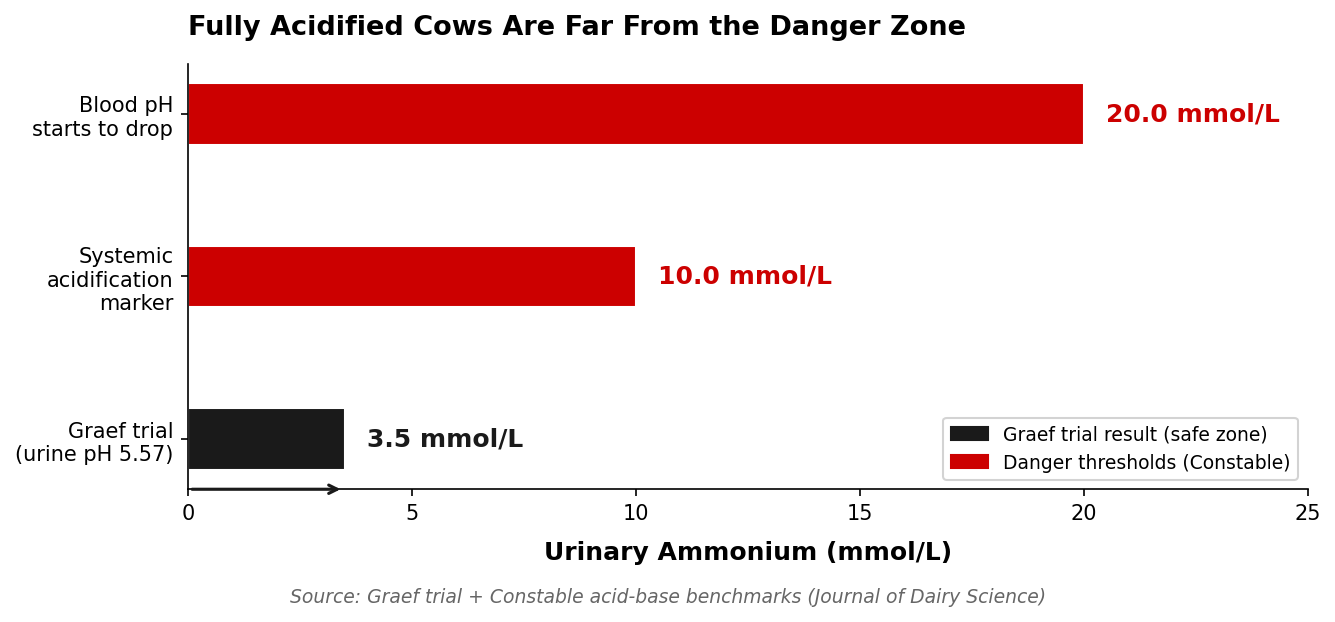
Here’s the twist the latest research adds: in fully acidified cows, the average urinary ammonium is just 3.5 mmol/L. That low ammonium number shows that low urine pH by itself does not equal acidosis danger. The real warning isn’t “don’t go too low.” It’s “stop being too timid” — because staying alkaline is what keeps subclinical hypocalcemia quietly chewing through your margins. With the CDC’s 2.3% farmgate price increase effective February 2026, pushing input scrutiny higher than ever, you can’t afford to keep writing checks for a program that isn’t actually working in the cow.

Why That 3.5 mmol/L Number Really Matters

In a recent trial led by Graef, Holsteins on a fully acidogenic pre‑fresh ration landed at a mean urine pH of 5.57 — squarely in the full‑acidification zone. The eye‑opener was their urinary ammonium.

Those cows averaged only 3.5 mmol/L of ammonium, far below the levels associated with systemic over‑acidification. Constable’s work on net acid excretion suggests two guideposts worth knowing:

  • At around 10 mmol/L, urinary ammonium is a reliable indicator of systemic acidification.
  • Once ammonium climbs above roughly 20 mmol/L, blood pH tends to drop by about 0.02 units — that’s where acid‑base safety becomes a real concern.

In the Graef work, cows never got close to either line at a urine pH most of us would call “aggressive.” Blood pH stayed in the 7.39–7.41 range, and serum bicarbonate sat at or near the lower edge of the typical 22–30 mmol/L window in related negative‑DCAD studies.

When your ration is properly balanced, full acidification (urine pH 5.5–6.0) operates safely within the cow’s compensation system. The danger zone isn’t “anything below 6.5.” It’s keeping cows alkaline because you’re afraid of numbers that the research says are actually safe.

How Low Is Too Low — And For Which Cows?

A 2025 meta‑analysis led by Jim Goff pulled together data from 660 multiparous Holsteins across nine studies to answer the question that really matters in the barn: which pre‑fresh urine pH ranges line up with better blood calcium after calving?

The answer changes with parity:

  • For 2nd‑ and 3rd‑lactation cows, the big step is just getting them out of the alkaline zone. Cows with prepartum urine pH below 7.75 had significantly better calcium status than those above that threshold, and driving pH lower within the acidified band didn’t provide much additional benefit.
  • For 4th‑lactation and older cows, the sweet spot is narrower. Cows with urine pH between 6.26 and 6.75 had the highest blood calcium nadirs, while cows above 7.25 or below 5.75 showed poorer calcium outcomes.

That moves you from a one‑size‑fits‑all DCAD target to a parity‑specific playbook.

Urine pH Targets by Parity

Cow GroupTarget Urine pHBlood Calcium OutcomeKey ThresholdRisk if Outside Range
2nd–3rd Lactation5.5–6.0Best Ca status; strong fluxpH must drop below 7.75Staying alkaline (>7.75) impairs Ca
4th Lactation+6.2–6.8Peak Ca nadir in this bandSweet spot is narrower<5.75 harms Ca status
4th Lactation+>7.25Poor blood calcium nadirSame group, high endAlkaline = no DCAD benefit
Any parity — Danger<5.5Ca status trends wrongVery low DCAD (~−220)Uncompensated metabolic acidosis

If you’ve watched a mixed‑parity close‑up pen, you’ve likely seen this play out already. Second‑ and third‑calvers usually cruise on a hot close‑up ration. It’s the 4th‑ and 5th‑lactation cows that look duller, lose more condition, or keep showing up on the fresh‑cow problem list when the diet is pushed as hard as the youngsters’.

What Does “Safe” Full Acidification Actually Look Like?

Pull the DCAD research together, and the safety story is clearer than the coffee‑shop debates.

From recent trials and reviews:

  • Fully acidogenic diets drop urine pH into the 5.5–6.0 band, but blood pH hangs around 7.39–7.41, well above the 7.30 “start to worry” threshold for systemic acidosis.
  • In a 2022 JDS study, very low DCAD treatments reduced serum bicarbonate by about 8–9%, landing near the lower edge of the 22–30 mmol/L reference range; more moderate negative DCAD diets kept bicarbonate comfortably within normal limits.
  • In a Florida trial by Zimpel and colleagues, cows on a strong fully acidogenic program had urine pH around 5.4, but still carried ≈25 mmol/L bicarbonate — squarely normal.
  • The real trouble shows up in extremely negative DCAD experiments. A “very low DCAD” diet around −220 mEq/kg DM pushed cows into uncompensated metabolic acidosis with lower blood pH, depressed intakes, and clear metabolic strain. In a separate herd case, dry cows on a diet near −143 mEq/kg DM had urine pH in the 5.2–5.8 range; when the diet was adjusted to about −53 mEq/kg DM, postpartum blood calcium didn’t change — only the acid load and metabolic strain improved.

In practice, negative DCAD diets in roughly the −100 to −150 mEq/kg DM range, paired with adequate fiber and minerals, tend to put cows in a compensated metabolic acidosis zone — enough to prime calcium metabolism without pushing blood pH into dangerous territory.

The real‑world risk for most herds isn’t “too low” DCAD. It’s never getting low enough in the right cows, or pushing the oldest cows too far, because nobody ever checks a strip.

BiomarkerNormal Reference RangeGraef Trial (Urine pH 5.57)Systemic Acidosis ThresholdStatus
Blood pH7.35–7.457.39–7.41<7.30✅ Normal
Serum bicarbonate (HCO₃)22–30 mmol/L~22–24 mmol/L (low-normal)<18 mmol/L✅ Within range
Urinary ammonium (NH₄)3.5 mmol/L>10 mmol/L (systemic marker)✅ Far below threshold
Urinary ammonium (NH₄)3.5 mmol/L>20 mmol/L (blood pH drops)✅ Far below threshold
Urine pH5.57Not a direct danger indicator✅ Target achieved

How Much Is Subclinical Hypocalcemia Really Costing You?

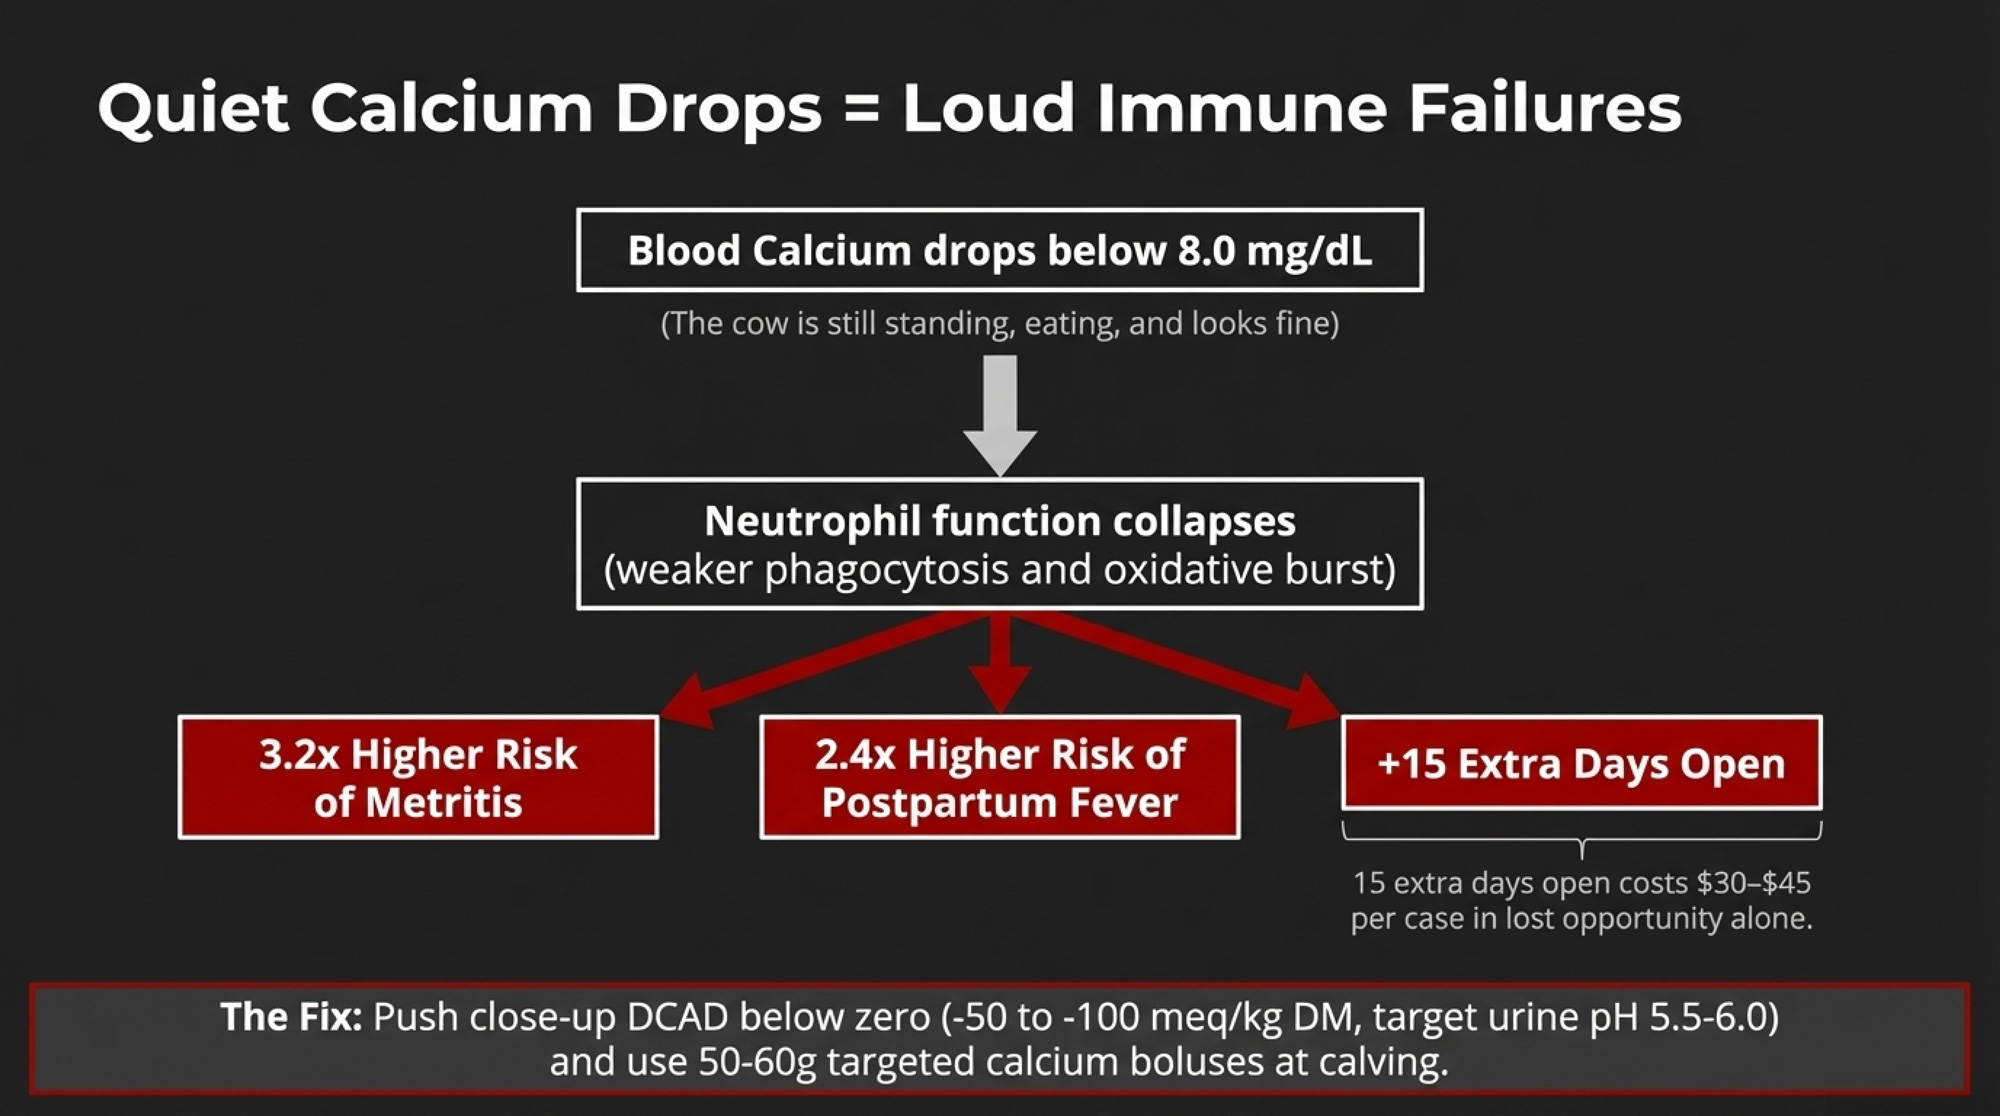
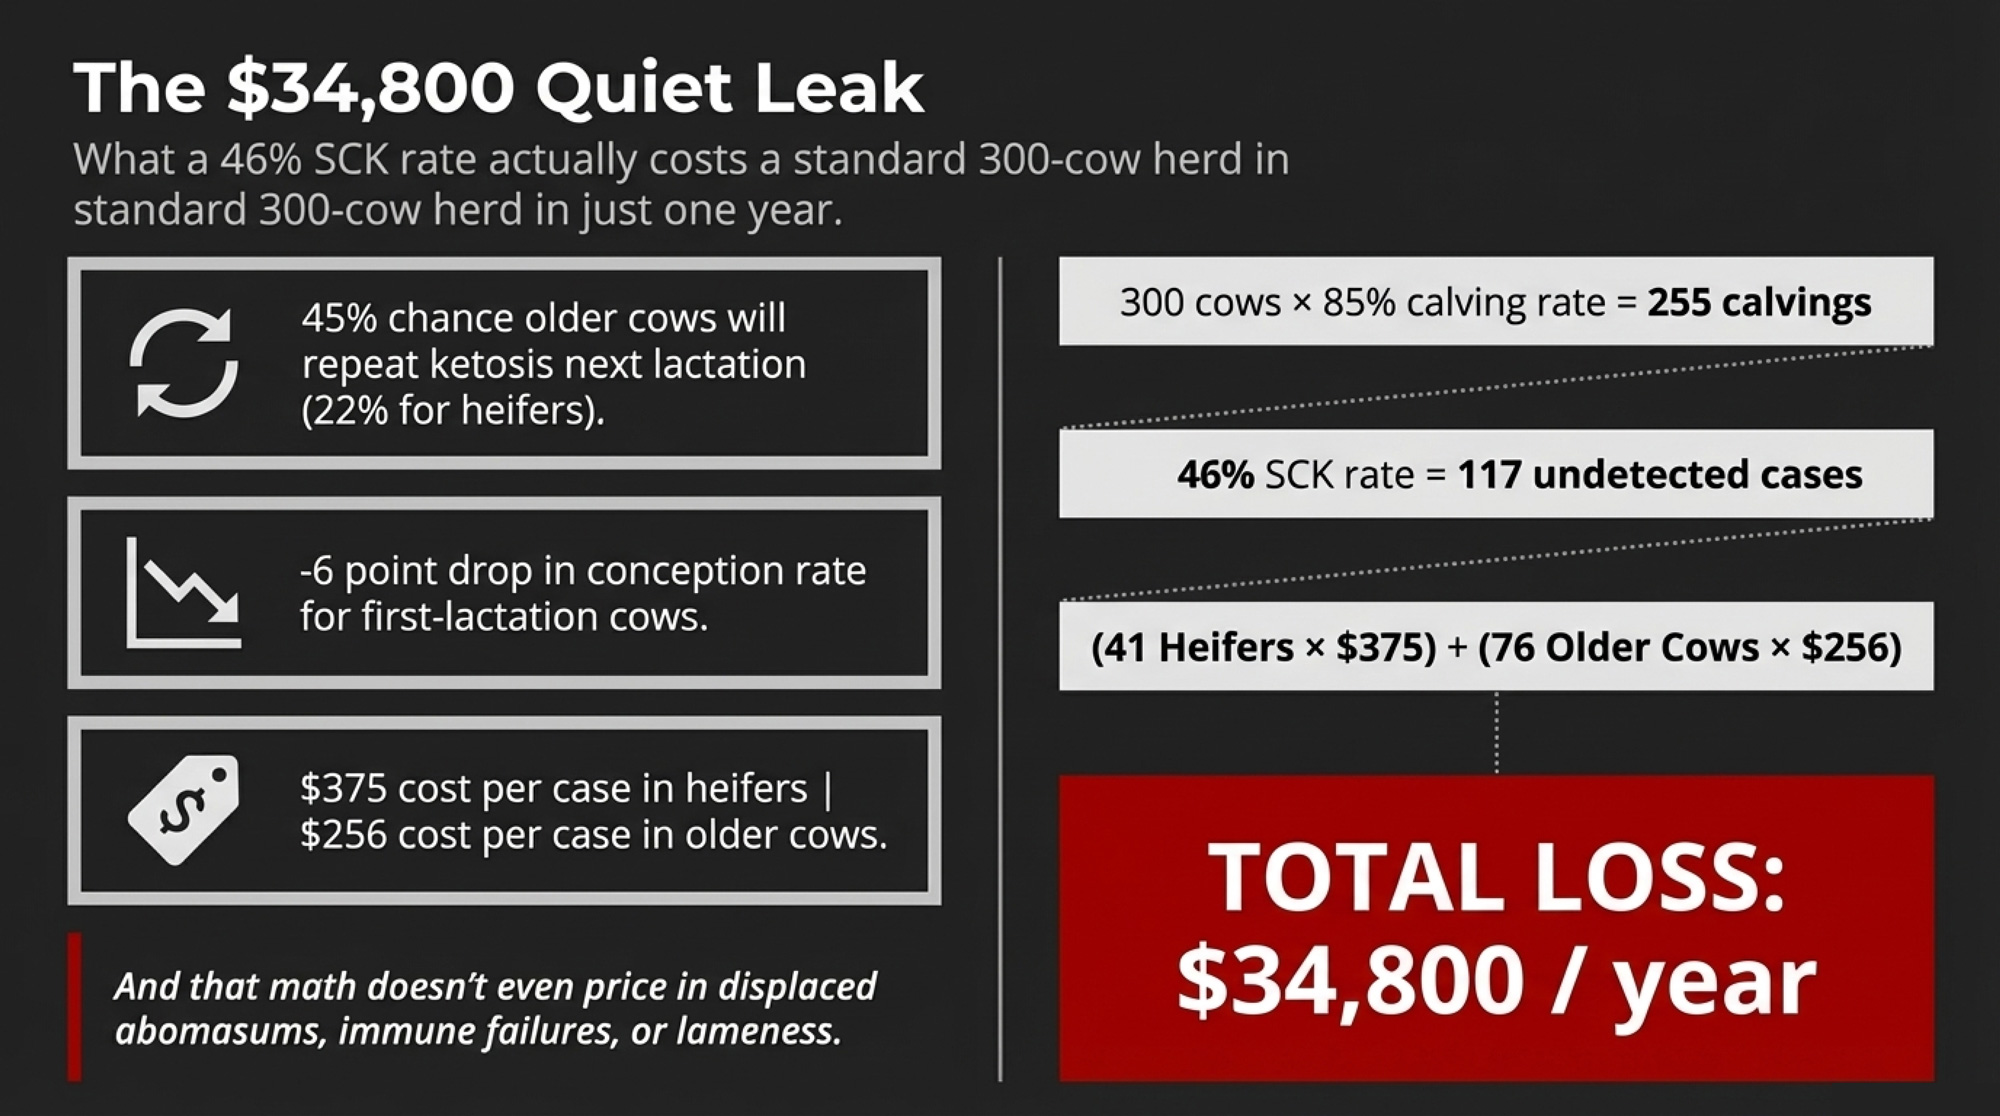
You see the classic downer cows. The quieter hit comes from subclinical hypocalcemiacows that stay standing but run with low blood calcium for a day or two after calving.

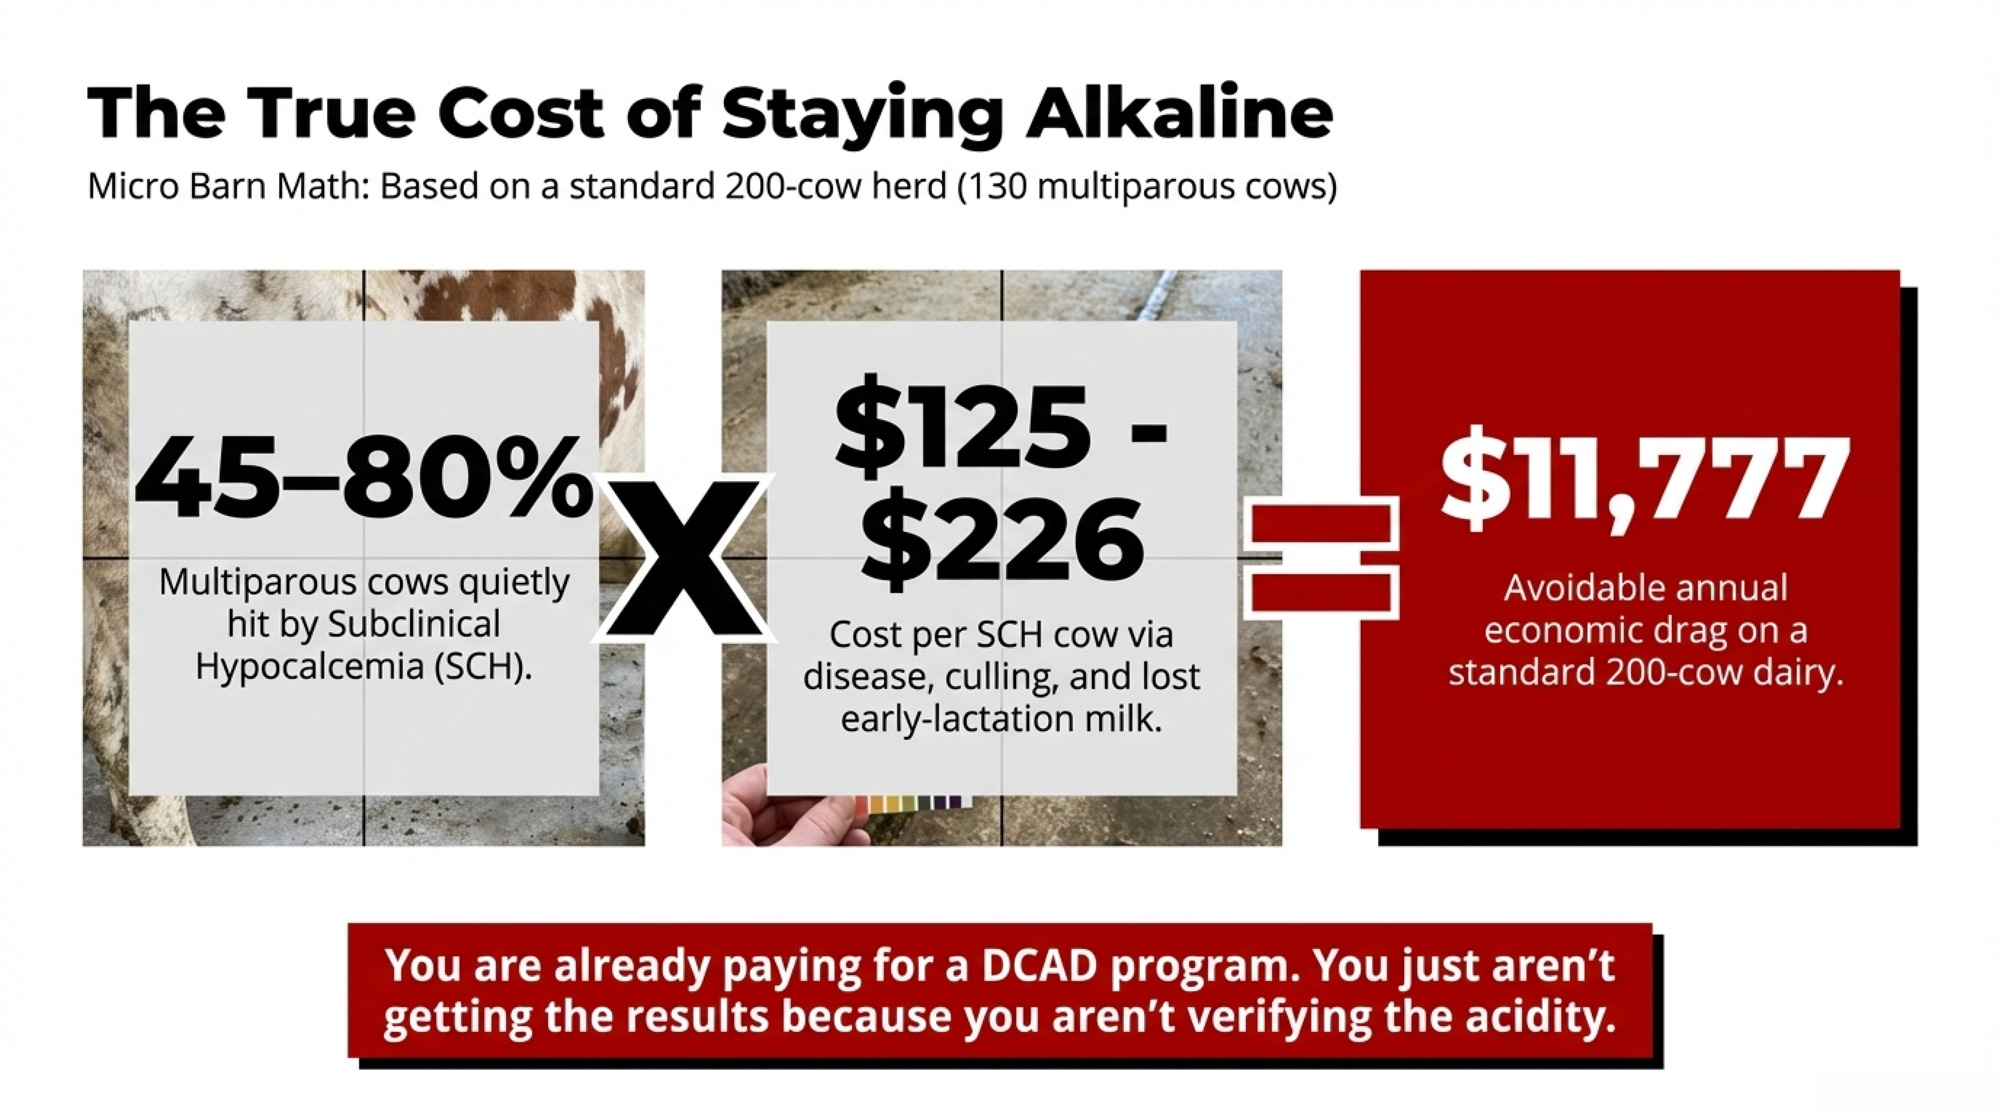
Reviews and field surveys suggest SCH often hits 25–40% of first‑calvers and 45–80% of multiparous cows in high‑producing herds. That means roughly half or more of your older cows may be affected. Those are the ones that calve “fine,” then quietly drag around mild ketosis, metritis, DAs, and a few extra weeks open.

On the economics side:

  • Progressive Dairy / University of Minnesota model built around a 1,000‑cow herd estimated SCH‑related losses — added disease, culling, and lost milk — at $67,938, or $226.46 per affected cow.
  • Prince Agri/Progressive analysis uses a more conservative $125 per SCH case and roughly $300 per milk fever case, while still accounting for both health and production impacts.
  • A 2022 study from North‑West Ethiopia estimated SCH losses at 3,026.25 ETB per cow per lactation, which the authors converted to about US$69.6 for their conditions.

Taken together, a realistic SCH cost range is around US$60 to US$ 226 per cow, depending on milk price, herd health, and how broadly you count ripple effects.

Micro barn math: what that looks like on your farm

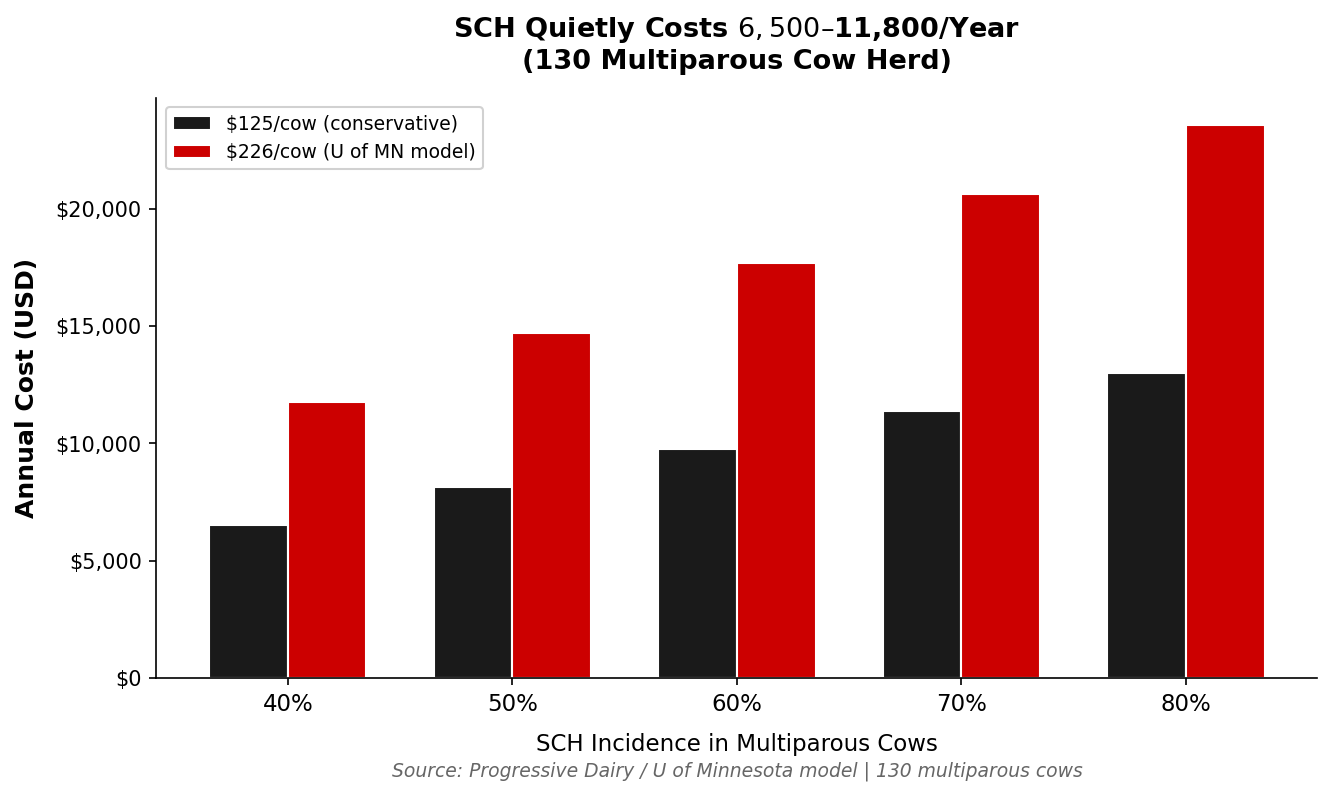
Come back to a 200‑cow herd like the Schaefers, with 130 multiparous cows. Even if 40% of those multiparous cows are subclinically hypocalcemic — a conservative number given that 45–80% range — that’s 52 SCH cows in a year.

At the $125 per‑case estimate:

  • 52 cows × $125 ≈ $6,500 per year in SCH‑linked losses.

At the $226.46 per‑case estimate:

  • 52 cows × $226.46 ≈ $11,777 per year.

If your “negative DCAD” program isn’t actually lowering that SCH burden — either because it’s not acidifying cows or it’s hammering the wrong cows — you’re spending money on the right idea and the wrong execution.

How Much Milk Are You Leaving on the Table?

The cost of SCH isn’t just in vet work and displaced abomasums. It’s also milk that never hits your bulk tank.

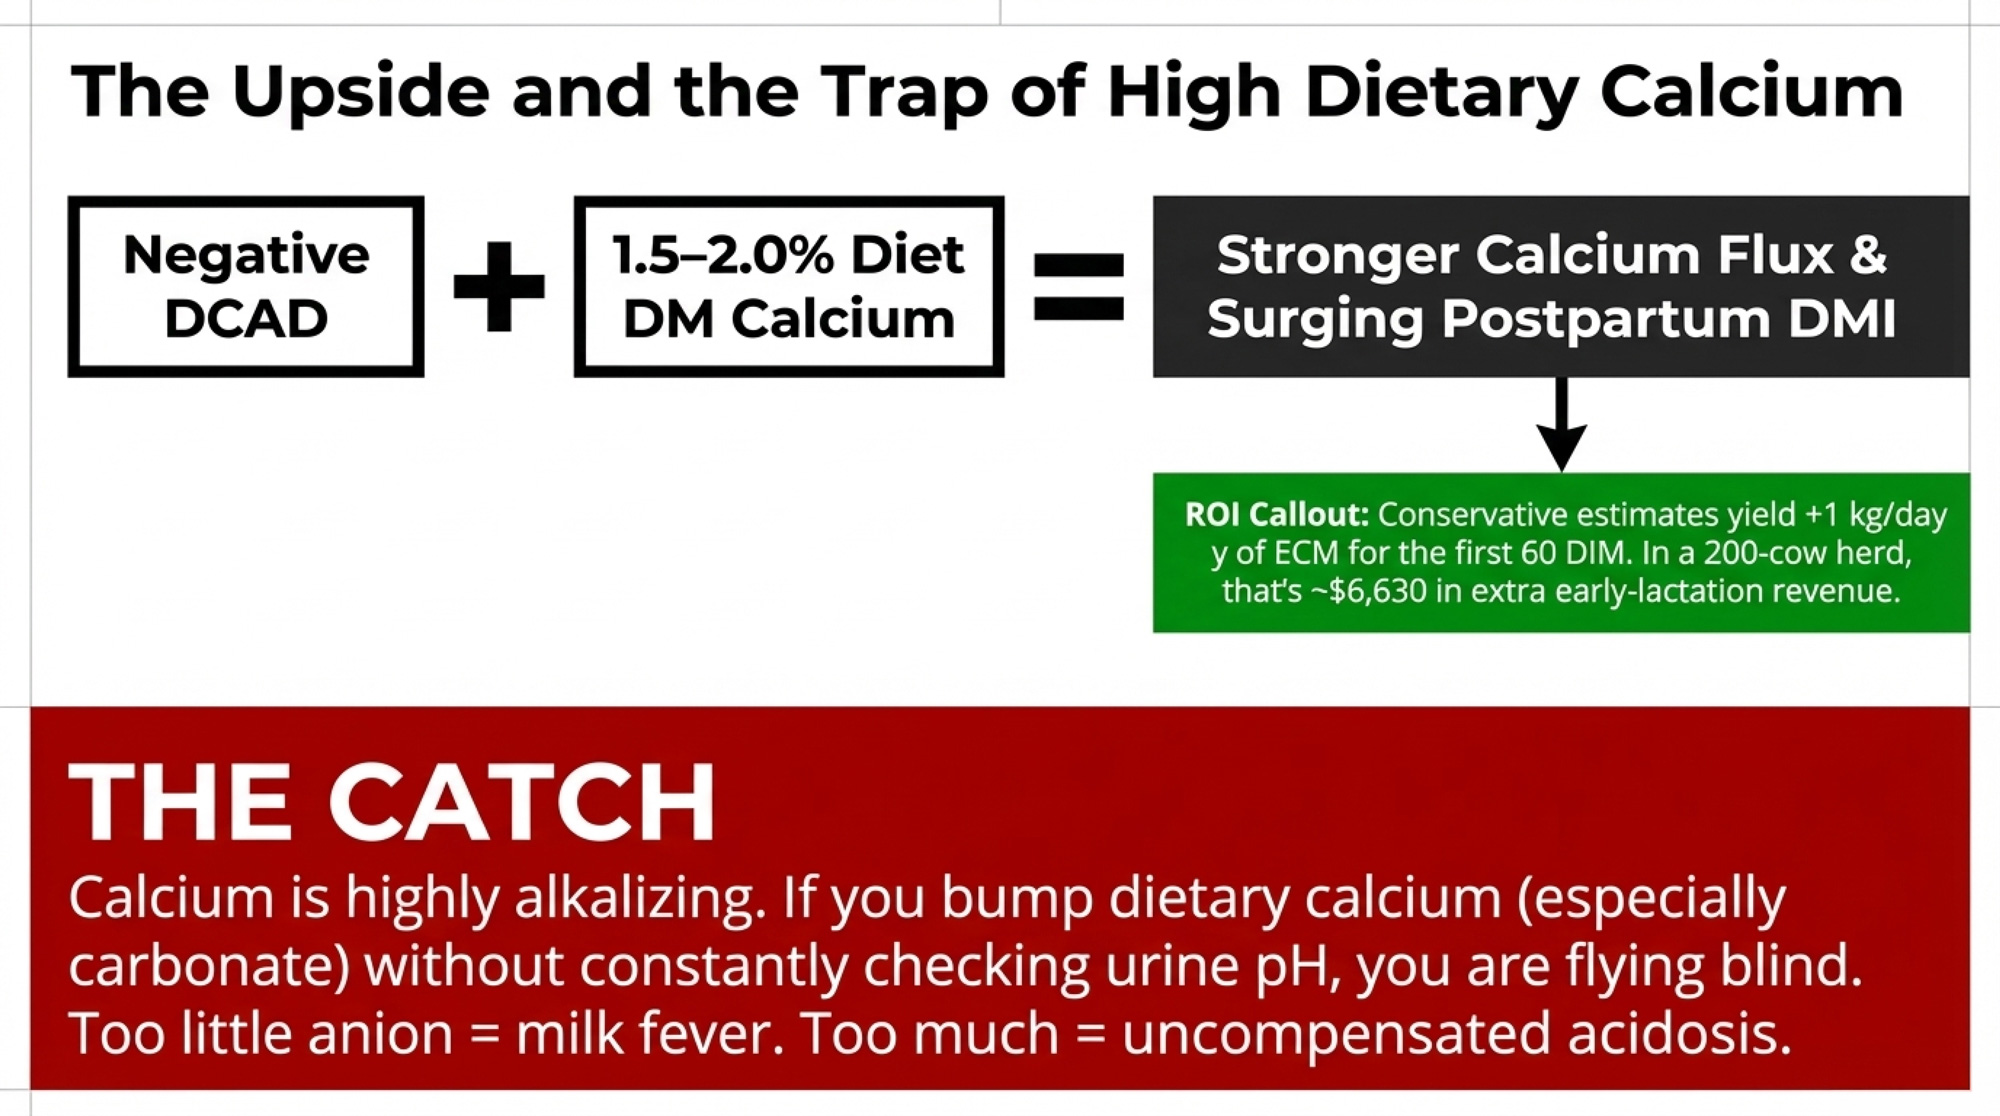
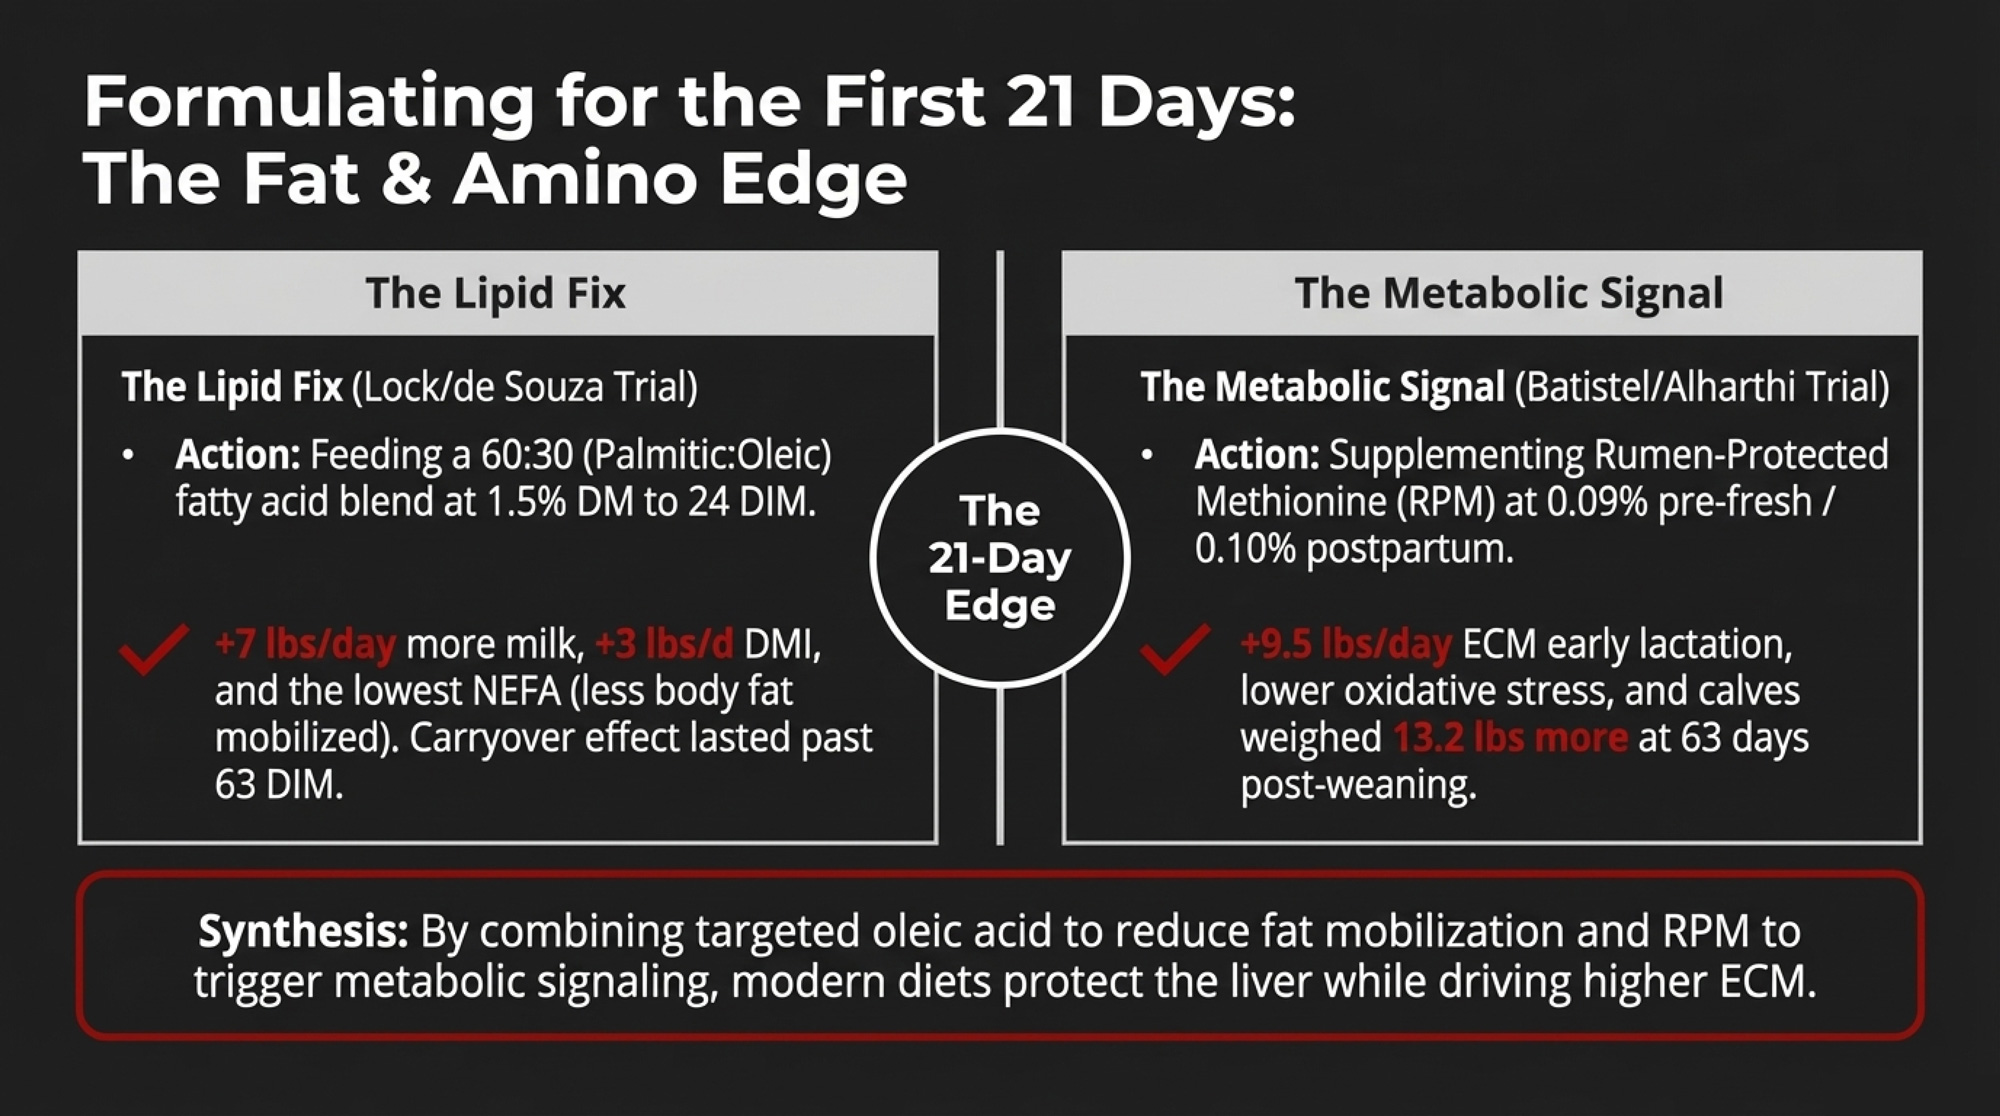
A series of trials looked at fully acidogenic pre‑fresh diets combined with higher dietary calcium — roughly 1.5–2.0% of diet DM — and followed cows through the first two months postpartum. Across those studies:

  • Cows on negative DCAD plus higher calcium showed stronger calcium flux around calving, maintained or improved pre‑fresh DMI, and had higher postpartum DMI than cows on low‑calcium acidogenic diets.
  • Those same cows produced more energy‑corrected milk (ECM) in early lactation than cows on positive DCAD or low‑calcium fully acidogenic diets.

Keep the barn math conservative. Say that program buys you 1 kg/day of ECM for the first 60 DIM in your multiparous cows. In that 200‑cow herd with 130 multiparous cows, that’s:

  • 130 cows × 1 kg/day × 60 days = 7,800 kg of extra ECM.

Use the Ontario blend value of about $0.85/kg — based on DFO’s June 2025 average net of $87.96/hL after deductions — and you get:

  • 7,800 kg × $0.85 ≈ $6,630 in extra milk revenue in the first two months of lactation.

(Note: these calculations use $0.85/kg based on Ontario’s June 2025 net blend; adjust to your local mailbox price. With the CDC’s 2.3% farmgate increase effective February 2026, your local number may now be slightly higher.)

Even if the real bump on your place is half that, you’re still talking several thousand dollars a year on top of avoided SCH‑linked disease. But you can’t tap any of that upside if the cows in front of you never actually reach the acidification zone you think you’re feeding for.

Is Your DCAD Program Actually Hitting Its pH Target?

The economic question underneath all of this is simple: Is your DCAD program working in the cows, or just on paper?

That published field investigation across six herds shows just how common the gap is. All six farms delivered TMRs that analyzed at a DCAD of −100 to −160 mEq/kg DM — right where they should be. All used the same commercial anionic product. But when urine pH was systematically collected from randomly selected multiparous cows over three days, not all farms met the 5.5–6.0 target. Farm 2 averaged 7.2 — functionally alkaline despite a correctly formulated ration. The culprit: 15.2 inches of bunk space per cow, which caused enough sorting and DMI disruption to neutralize the diet. Farm 4 had a similar miss tied to forage particle size and TMR mixing issues.

The lesson: DCAD value is a formulation number. Urine pH is what the cow is actually experiencing.

A practical monitoring protocol from Goff and others:

  • Sample at least 10 cows, or about 10% of the close‑up group, whichever is bigger.
  • Make sure they’ve been on the pre‑fresh ration for at least 48 hours, ideally 3–21 days before calving.
  • Catch urine 2–4 hours after cows get access to that ration, when pH is at its lowest and results are tightest.
  • Aim for around 80% of sampled cows to land in your target pH band.

Using the parity‑specific data:

  • 2nd‑ and 3rd‑lactation cows: target urine pH 5.5–6.0 — full acidification, with safe blood pH and bicarbonate profiles supported by multiple trials.
  • 4th‑lactation and older cows: target urine pH around 6.2–6.8, where Goff’s meta‑analysis saw the best calcium outcomes and a clear calcium decline below 5.75.

If your first audit comes back with an average of 7.2 — like Farm 2 in that field study — you don’t have “moderate DCAD.” You have a ration that isn’t acidifying those cows at all.

And if you see a string of older cows under 5.5, especially alongside intake or condition concerns, you’ve probably pushed anions too hard relative to fiber, magnesium, or overall palatability. That’s the edge where the very low DCAD work — down near −220 mEq/kg DM — tipped cows into uncompensated acidosis.

You can’t manage what you won’t measure. But you can buy a box of urine strips for less than a DA surgery — and a lot less than a weekend tied up in the hospital pen.

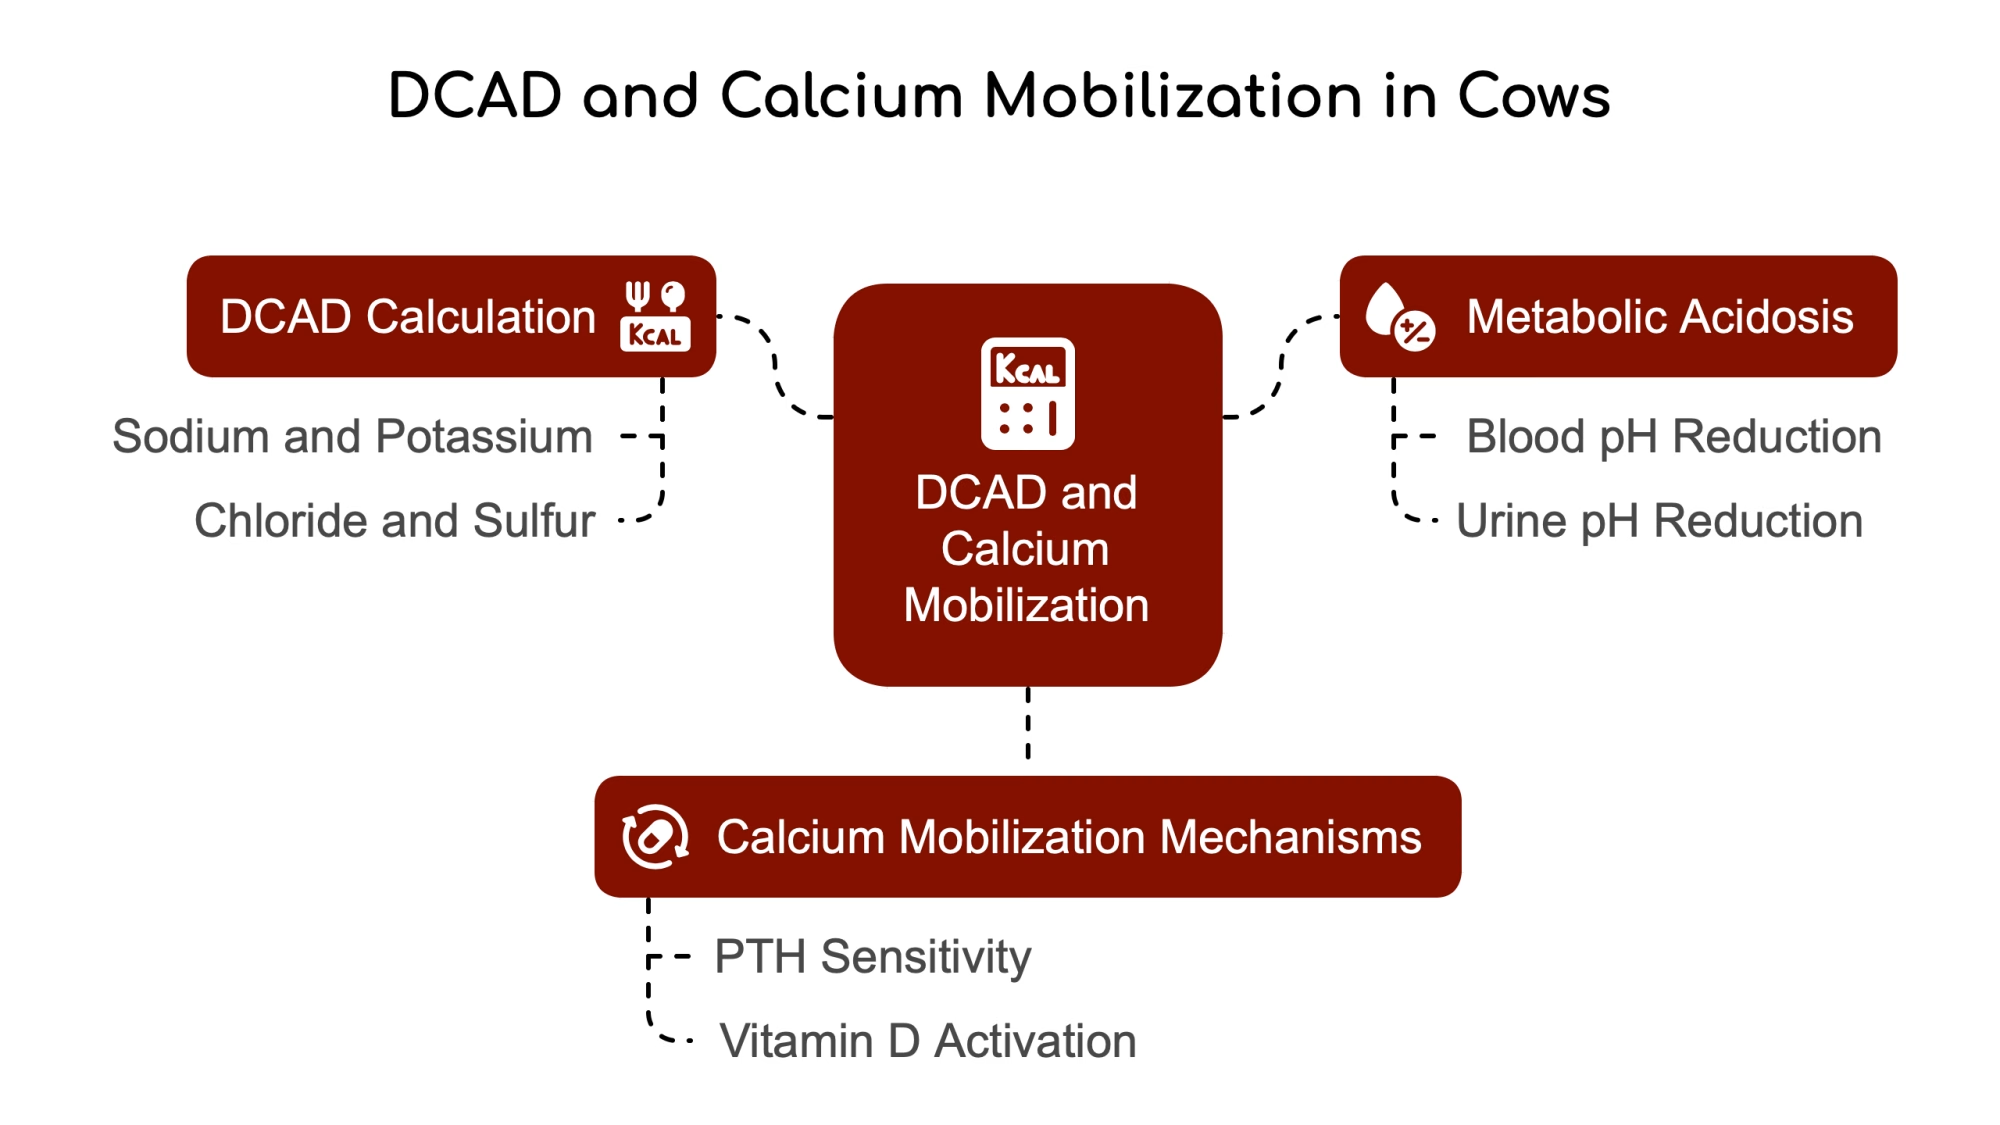
Are You Feeding Enough Calcium With Your Anions?

Old transition‑cow dogma said “never feed high calcium pre‑fresh.” Newer DCAD and mineral work says that, under a properly negative DCAD, high calcium plus anions is often where the payback is.

Across recent studies:

  • Cows on negative DCAD diets with 1.5–2.0% Ca in diet DM had stronger calcium flux, better postpartum DMI, and higher ECM than cows on low‑calcium fully acidogenic diets.
  • High‑calcium fully acidogenic diets did a better job of holding DMI than low‑calcium FAS diets, which showed bigger intake dips.

The chemistry catch is that calcium is alkalizing. When you bump dietary calcium — especially as carbonate — you usually have to adjust anion supply to hold the same urine pH. If you crank anions every time you bump Ca, and never check what cows are actually peeing, you’re back to guessing.

Too little anion with high Ca and high‑K forages, and you recreate the old “high‑potassium hay + high‑calcium close‑up” milk fever trap. Too much anion, especially in pens heavy with older cows, and you risk dragging that group below 5.5 pH, where Goff’s meta‑analysis saw calcium status trending the wrong way.

The sweet spot isn’t a single DCAD target on paper. It’s the balance between DCAD, calcium level, and who’s actually standing in your close‑up group.

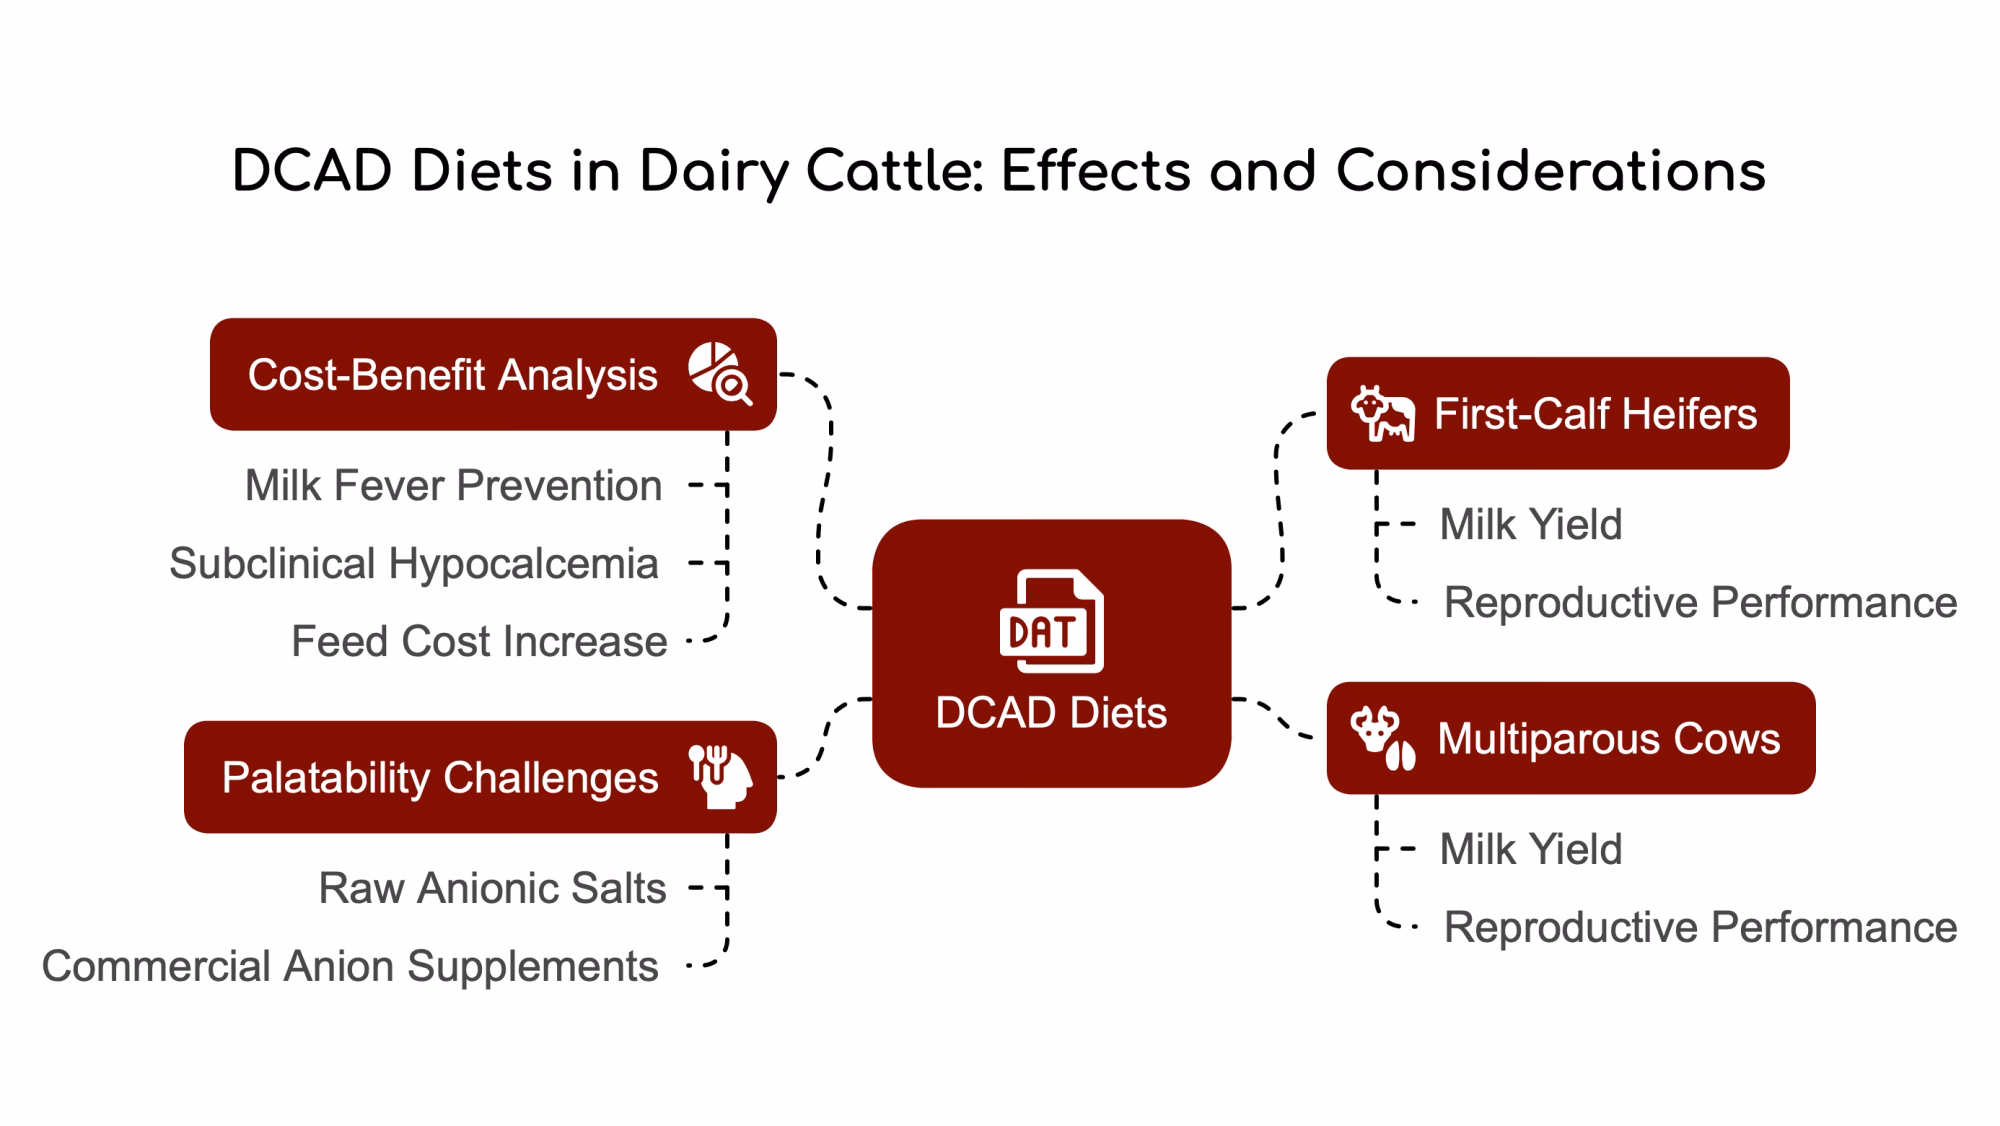
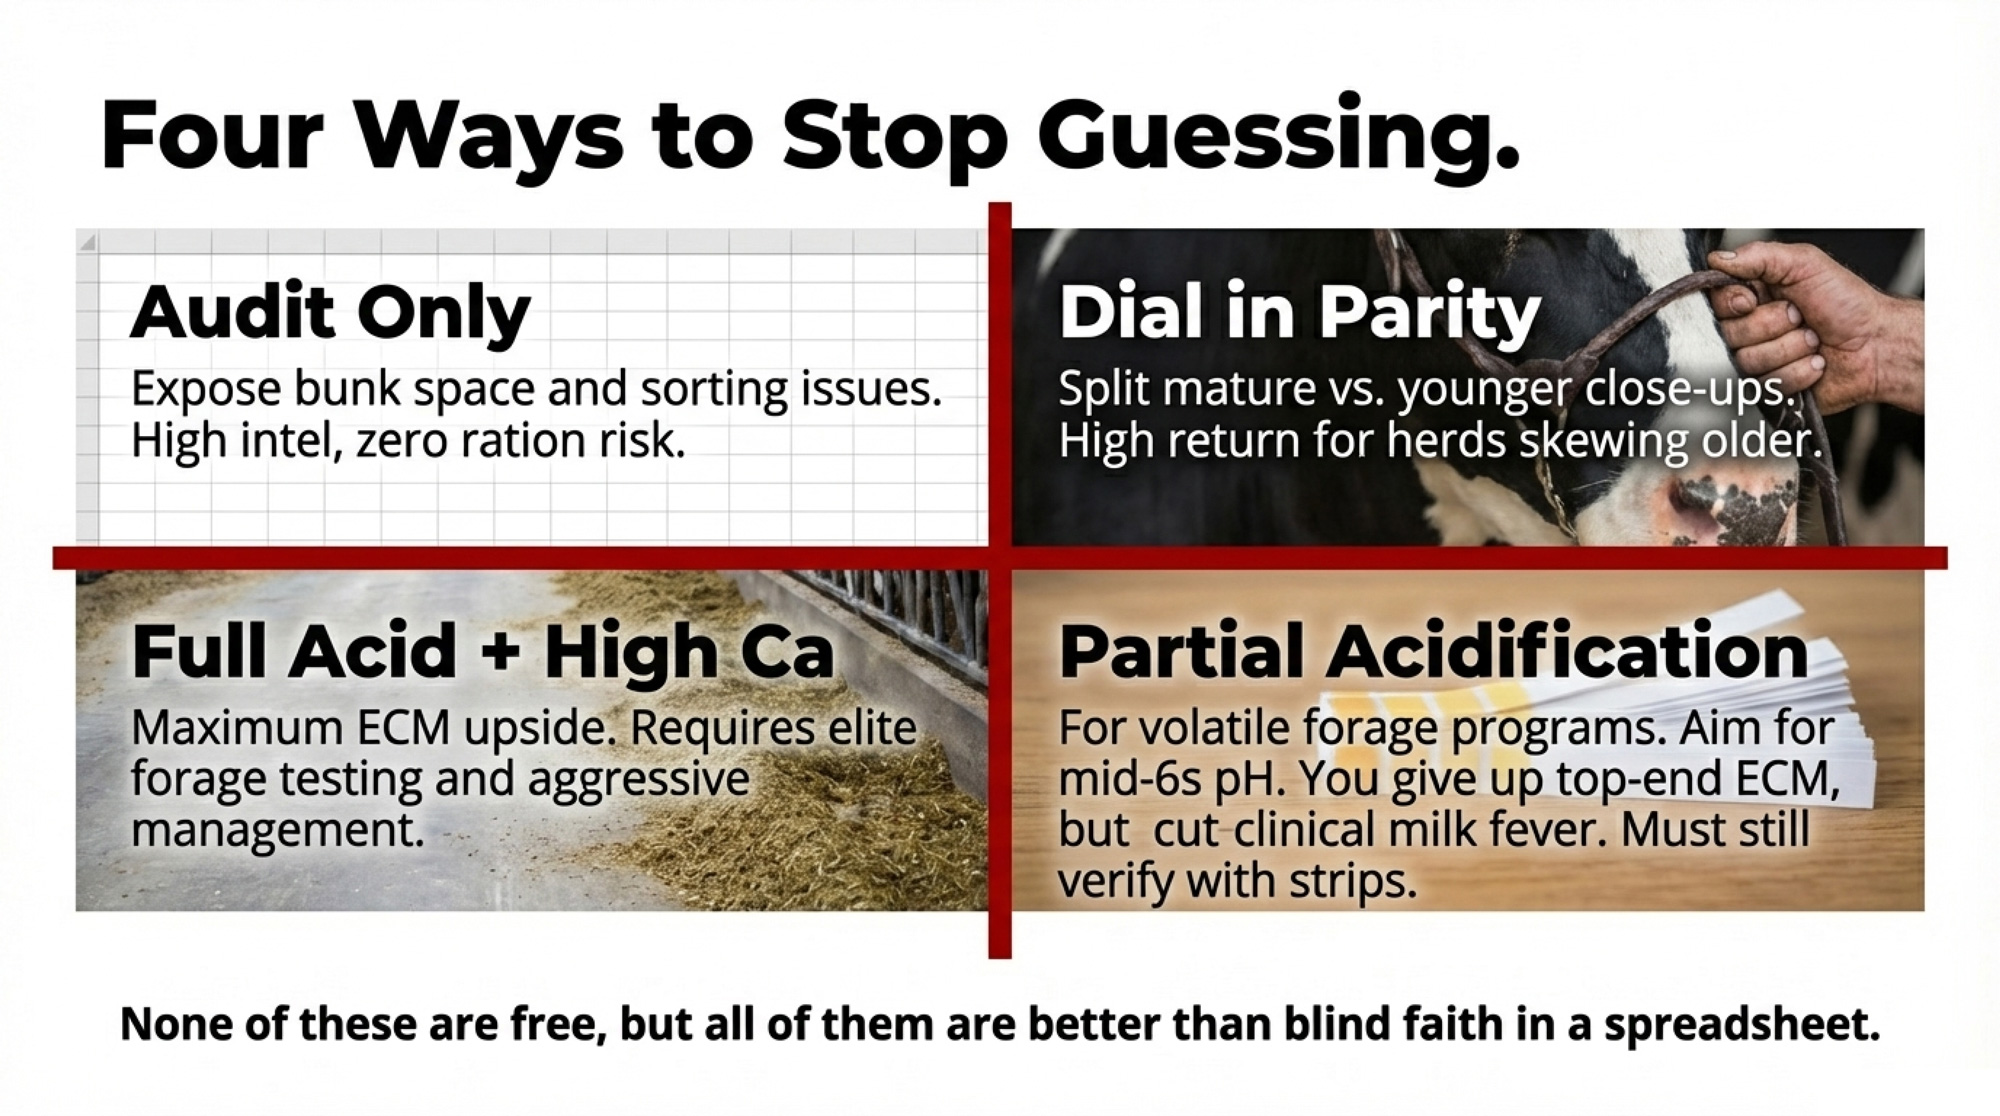
Options and Trade‑Offs for Farmers

You’ve got four real ways to play this — none of them free, but all of them better than guessing.

StrategyBest Fit ForWhat You GainWhat You Give UpKey Risk
30-Day Urine pH AuditAny herd — starting pointActual data on whether DCAD is working30 min + cost of stripsFinding out your program is doing nothing
Parity-Specific TargetsHerds >30% 4th+ lactation cowsTighter Ca support for oldest cowsPen complexity, management timeOver-acidifying older cows below pH 5.75
Full Acidification + High CaStable forage, strong advisory teamMaximum ECM gains, lowest SCHRequires accurate, frequent forage testingPushing anions without checking urine pH
Partial Acidification (Proven)Variable forage K, no parity sortingLower milk fever risk vs. no DCADWon’t capture full SCH/ECM benefitCosmetic program at pH 7.8 = money wasted

1. 30‑Day Action: Audit Your DCAD in the Cows, Not on Paper

This is the low‑risk, high‑information starting point — the same move that exposed the problem in the Schaefer example and that documented field investigation.

  • Within 30 days, run a urine pH profile on your close‑up pen: at least 10 cows, or 10% of the group, 2–4 hours after feeding, on the ration for at least 48 hours.
  • Mark strips by parity (“P2–3” vs “P4+”) so you can see whether older cows live in a different pH band.
  • Sit down with your nutritionist and vet and compare those numbers to your calculated DCAD and your latest forage K analyses.

Patterns you’re likely to find:

  • Rations that look fully acidogenic on paper but leave cows at pH 7.0–7.8 because forage potassium came back higher than assumed — or, like Farm 2, because bunk space or mixing issues prevent cows from eating what you think they’re eating.
  • Older cows sit at 5.2–5.4, while younger cows hover near 5.8–6.0, and those same older cows are turning up too often on your “problem fresh” list.

This doesn’t fix the ration. It just tells you whether your main problem is being too timid overall, too aggressive with certain cows, or something as simple as bunk management.

2. Dial in Parity‑Specific Targets

If about a third or more of your close‑up pen is 4th lactation or older, Goff’s parity‑specific data says you shouldn’t chase the same pH for them as for your 2nd‑calvers.

In practice, that can look like:

  • Grouping by parity when barn design allows: a “mature‑cow close‑up” and a “younger‑cow close‑up.”
  • Running a parity‑specific mineral strategy: same base forage, slightly different DCAD and Ca levels by pen.
  • Re‑checking urine pH and, if you’re keen, spot blood calcium by group a couple of times a year.

You gain tighter support for the cows most likely to crash. You give up some simplicity and pen flexibility.

3. Strengthen Full Acidification + High Calcium Where It Fits

For herds with stable forage programs and a strong advisory team, leaning into full acidification plus higher calciumcan be a high‑return move.

Best fit when:

  • You’re already getting reliable mineral analyses back from your forage lab.
  • You’re willing to watch DMI, manure, and fresh‑cow health closely during any ration changes.
  • Your vet and nutritionist are aligned on DCAD targets and SCH benchmarks.

It demands:

  • Accurate DCAD math using up‑to‑date Na, K, Cl, and S lab numbers.
  • Dietary Ca in the 1.5–2.0% DM range.
  • Adequate magnesium and effective fiber to keep cows on feed.

Risks:

  • Over‑pushing anions to “fix” what’s really a forage‑testing problem, edging toward uncompensated acidosis.
  • Raising calcium without enough anion, which blunts the very calcium‑mobilizing system DCAD is designed to prime.

4. Stick With Partial Acidification — But Prove It

Some barns aren’t good candidates for full acidification: volatile forage potassium, no room to sort by parity, and limited labor.

In those systems, aiming for more moderate urine pH — often in the mid‑6s instead of around 8.0 — can still cut clinical milk fever risk compared with no DCAD program at all, even if you never push pH into the 5.5–6.0 band.

The key is honesty:

  • You likely won’t get the full SCH and ECM benefits seen in FAS + high‑calcium research.
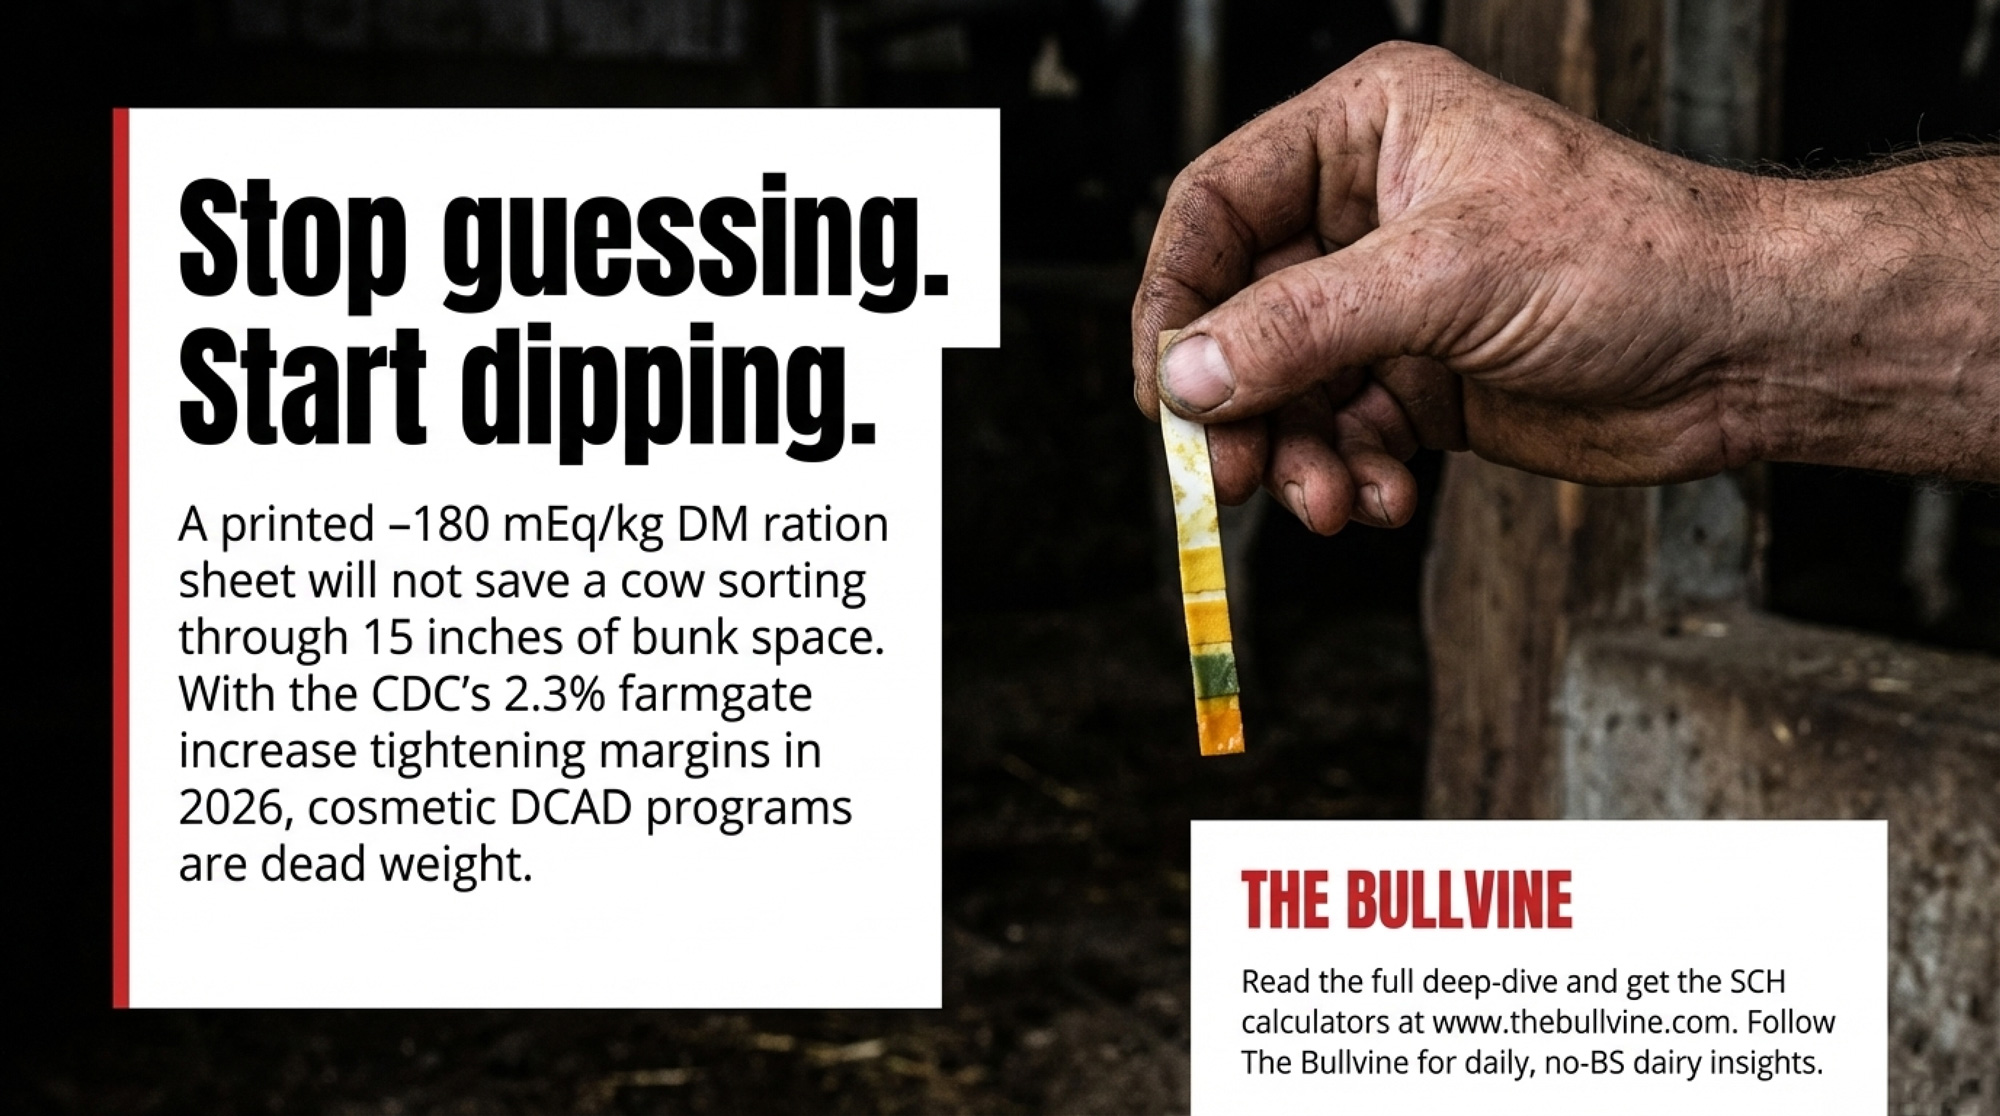
  • You still have to test. A ration “designed” for pH 6.5 that yields pH 7.8 in the pen is cosmetic, not partially acidified.

As ingredient costs keep climbing, cosmetic programs are going to be harder to justify than well‑measured ones.

Key Takeaways

  • If you’re not pulling urine pH strips on your close‑up cows at least a few times a year, you don’t have a DCAD program — you have a DCAD expense. Start with a 10‑cow, 2–4‑hour post‑feeding sample and see if your cows are anywhere near your target pH.
  • If roughly a third or more of your close‑up group is 4th lactation or older, don’t chase 5.5 pH for everyone. Aim those cows around 6.2–6.8 and reserve the 5.5–6.0 band for 2nd‑ and 3rd‑calvers, where full acidification is both safe and effective.
  • If your SCH prevalence in multiparous cows is north of about 30% and you’re already paying for anionic salts, assume a verification gap before you decide “DCAD doesn’t work here.” Use the US$60–$226 per‑case range to ballpark what SCH might be costing you and whether a DCAD tune‑up pencils out.
  • If your ration DCAD is printed at −180 mEq/kg DM and your older cows are peeing at 5.2, you’ve probably gone past the point of diminishing returns. Back off anions until those cows’ urine pH and calcium status are closer to 6.5, then re‑check urine pH and calcium status instead of assuming “hotter” must be better.

The Bottom Line

You’re already writing checks for anionic salts and pre‑fresh minerals. It’s worth knowing whether those dollars are actually buying fewer SCH cows, more milk, and calmer fresh pens — or just living on a ration sheet. Start with that 30‑day urine pH audit. From there, you’ll know whether your next move should be more anion, more calcium, smarter grouping, or tighter forage testing.

If you want the deeper math — SCH calculators, DCAD formulation walkthroughs, or parity‑specific transition strategies — watch for the follow‑up playbooks and Bullvine Weekly breakdowns. Once you’ve seen your own pH strips, you won’t look at that “−120 mEq/kg” printout the same way again.

Complete references and supporting documentation are available upon request by contacting the editorial team at editor@thebullvine.com.

Learn More

The Sunday Read Dairy Professionals Don’t Skip.

Every week, thousands of producers, breeders, and industry insiders open Bullvine Weekly for genetics insights, market shifts, and profit strategies they won’t find anywhere else. One email. Five minutes. Smarter decisions all week.

NewsSubscribe
First
Last
Consent

46% Subclinical Ketosis in ‘Good’ Herds – Are Your Transition Cows Any Different?

One herd guessed 4% ketosis. The meter said 40.7%. This is the story behind that gap—and how to find your real number before it costs you.

Executive Summary: Four high‑producing herds thought subclinical ketosis was a minor issue; whole‑herd BHBA testing showed an average 46% of fresh cows were ketotic, including one herd that guessed 4% and actually sat at 40.7%. That kind of hidden SCK rate quietly drives more metritis, fever, extra days open, culls, and lameness—even when cows “look fine” at the bunk. Using published cost estimates, a 300‑cow herd can easily be leaking around $34,800 a year to undetected SCK alone, before you price in extra DAs or foot problems. The article walks through what’s actually working in transition pens right now: realistic DCAD and calcium strategies, where NASEM 2021 sets the floor on MP and methionine, and what newer data say about rumen‑protected methionine, fatty acids, and choline. It also lays out practical guardrails on BCS loss, fat: protein ratios, NEFA, stocking density, and bunk space so you can read early‑lactation milk records like a health report, not just a production snapshot. The core challenge is simple: stop guessing at SCK and fresh‑cow energy balance and start measuring them with BHBA tests and a few key ratios. If you’re willing to run a 30‑day BHBA check and one clean pen trial with your nutritionist, this piece gives you the numbers and thresholds to decide whether your transition program is truly dialed in or looks that way.

The herd thought they knew their fresh cows. Good staff. Clean pens. A close‑up program that had been “working” for years. When the vet asked how many fresh cows were dealing with subclinical ketosis, the manager guessed around four percent. Maybe five on a bad month.

Then they pulled blood on every fresh cow between 3 and 16 DIM with a cow‑side BHBA meter.

The number wasn’t 4%. It was 40.7% — and when the researchers put that herd together with three other high‑producing herds in New York and Wisconsin, the true average was 46% subclinical ketosis, using a BHBA cut‑point of 1.2 mmol/L in early lactation. The cows were standing, eating, and milking. On the surface, they looked fine.

That’s the uncomfortable starting point for any honest conversation about transition cows in 2026. The risk isn’t just in “train wreck” fresh pens. It’s in the gap between what you think is happening and what a simple meter would show.

Three Transition Groups, Three Real Jobs

Most progressive herds now run some version of three transition groups: far‑off drys, close‑ups, and fresh cows. On paper, that sounds basic. In practice, how those three groups are fed, stocked, and managed is where profit gets made or lost.

Far‑off dry cows usually live on a controlled‑energy diet. Think straw or other lower‑energy forages to hold intake and energy down while keeping the rumen full and chewing. Their job is boring by design: don’t get fat, don’t crash, keep the rumen ready to go back to work.

Close‑up cows have a much more delicate assignment in the last three weeks before calving:

  • Step up energy without packing on extra condition.
  • Step up the metabolizable protein to match colostrum and fetal growth.
  • Keep enough bunk and lying space open that they’ll actually eat what you’ve formulated.

NASEM 2021 pegs far‑off dry cows at around 12% crude protein and 7.2% MP, and close‑up cows at 13% CP and 8.6% MP, which works out to roughly 1,000 g of MP per day one week before calving. In the field, many nutritionists now push that closer to 1,100–1,200 g of MP in the last month to cover both a fast‑growing fetus and colostrum synthesis, especially if dry matter intake slips in the last 7–10 days.

Space matters as much as the spreadsheet. Work out of Wisconsin and elsewhere points to 80% of stalls and at least 30 inches of bunk space per cow as realistic targets for close‑up pens. When first‑calvers get jammed in with older cows and bunk stocking goes much past that, Michigan State data shows you can lose about 1.6 lb of milk per day for every 10‑point increase above 80% stocking in early lactation. Those heifers don’t look “sick” — they just never hit the peaks they could have.

Fresh cows then step onto your high‑group TMR with deliberate tweaks Hutjens and others have hammered on for years:

  • Functional fiber: 3–4 lb of long hay or 1–2 lb of processed straw to keep the rumen happy and help keep DAs in check.
  • Additive stack: yeast, monensin, organic chromium, buffer, higher vitamin E, rumen‑protected choline, organic trace minerals — all packed into a 10–21 day fresh window.

On paper, that fresh‑cow ration looks expensive. In the barn, those first two to three weeks largely set the lactation curve.

Does Your Fresh Pen Have a Quiet Calcium Problem?

Clinical milk fever is obvious. Subclinical hypocalcemia? Not so much. Total blood calcium drops below about 8.0 mg/dL, but the cow is still standing, eating, and milking. From the aisle, she looks fine.

Martinez and co‑workers at the University of Florida followed multiparous Holsteins and grouped them by plasma calcium right after calving (JDS 95:7158, 2012). Cows with subclinical hypocalcemia (total Ca <8.0 mg/dL) had:

  • 3.2× higher risk of metritis,
  • 2.4× higher risk of postpartum fever,
  • Higher BHBA (around 1.0 vs 0.7 mmol/L), and
  • About 15 extra days open (124 vs. 109).

If you figure each extra day open beyond target costs in lost opportunity, 15 days open adds –45 per case on top of treatment and milk loss — and that’s before you price in more metritis and fever.

The immune story is even more interesting. Those subclinically hypocalcemic cows had fewer circulating neutrophils, and the ones they did have were less effective at phagocytosis and oxidative burst. In plain language, they walked through the highest‑risk period of their lactation with a weaker front‑line immune response.

You’ve basically got two big levers here:

  • DCAD close‑up programs. Push dietary cation–anion difference below zero a few weeks pre‑calving (often −50 to −100 meq/kg DM, depending on forages and salts). Aim for a urine pH of 5.5–6.0 in Holsteins and 5.0–5.5 in Jerseys, and feed 150–180 g of calcium per day in the close‑up ration so there’s actually calcium in the gut to absorb. 
  • Calcium boluses. Most commercial boluses deliver 50–60 g of calcium from a mix of calcium chloride, sulfate, and/or propionate. Given at calving and again 12–24 hours later, they push blood calcium up for 2–6 hours while the cow’s internal system catches up. 

Especially in older cows, skipping both DCAD and boluses is basically choosing more metritis, more fever, and a blunted immune system in the fresh pen.

Can 1.5% Fat in the First 21 Days Really Move the Needle?

A lot of herds feed fat. Very few have a clean answer to what it’s actually doing in the first three weeks after calving.

Adam Lock’s group at Michigan State ran a trial that has changed how a lot of nutritionists think about fresh cow fat. In de Souza’s study (JDS 104, 2021), fresh Holsteins were fed a fatty acid (FA) supplement at 1.5% of ration DM from calving to 24 DIM:

  • Treatments: control (no FA) or FA blends with palmitic (C16:0) to oleic (C18:1) ratios of 80:1070:20, and 60:30.
  • From 25 to 63 DIM, all cows went on the same diet with no supplemental FA.

Here’s what happened:

Control80:1070:2060:30
Milk (lb/d)102.4106.9107.4109.3
DMI (lb/d)44.745.546.048.0
Milk fat (lb/d)4.184.734.584.60
NEFA (mEq/L)0.720.840.750.67

The 60:30 palmitic: oleic blend was the clear winner. Compared with the control, those cows:

  • Gave about 7 lb/d more milk,
  • Ate 3+ lb/d more dry matter, and
  • Had the lowest NEFA, meaning less body fat mobilization. 

From day 25 to 63, after every cow was on the same non‑supplemented ration, the FA‑supplemented cows kept a production edge. De Souza and Lock called it a carryover effect: those extra fatty acids in the first three weeks seemed to set a higher production level that stuck even after the supplement was pulled.

Will 1.5% fresh‑cow fat pencil in every herd? No. It depends on your base ration energy, fat prices, and how hard cows are mobilizing tissue. But if you’re running high‑producing pens and watching BCS slide hard in the first month, this is the kind of trial you and your nutritionist can design and measure on your own farm.

Methionine in Transition Cows: More Than Just Balancing a Ratio

Methionine used to sit in the “balance it with lysine, then move on” bucket. Work out of Illinois and Wisconsin has pushed it into a different category for transition cows.

Batistel et al. supplemented Holstein cows with rumen‑protected methionine (RPM) at about 0.09% of DM pre‑freshand 0.10% postpartum in a series of trials (JDS 100:7455, 2017). Compared with controls, RPM cows:

  • Produced about 9.5 lb/d more energy‑corrected milk in early lactation,
  • Hit a peak ECM about 10.3 lb/d higher,
  • Ate about 2.6 lb/d more DM pre‑fresh, and
  • Ate 3.5 lb/d more DM as fresh cows, with peak DMI up 3.3 lb/d

That’s not a rounding error. That’s a different gear in the most sensitive part of the lactation.

In a follow‑up trial (JDS 101:480, 2018), the same group dug into what was happening inside those cows. Methionine‑supplemented cows had:

  • A higher liver functionality index,
  • Better neutrophil function (more aggressive about killing bacteria), and
  • Lower markers of oxidative stress and inflammation.

Then they followed the calves. Alharthi and co‑workers reported that calves from RPM‑supplemented dams weighed about 5 kg (11 lb) more at 42 days and about 6 kg (13.2 lb) more at 63 days post‑weaning (J Anim Sci Biotechnol9:78, 2018). They also documented meaningful changes in hepatic gene expression linked to energy metabolism.

That’s where the Illinois group started saying, “Methionine is more than just an essential amino acid.” In transition cows, it looks a lot like a metabolic signal.

NASEM 2021 still treats methionine strictly as an amino acid to meet MP requirements. The committee didn’t increase recommended methionine beyond what’s needed for milk yield and maintenance. Given the Batistel and Alharthi work, many field nutritionists now treat NASEM as the floor and add RPM on top when the economics make sense.

The Four-Herd Ketosis Data That Change How You Read “Fresh Cow Looks Fine”

Back to that 46% number, because it’s not a one‑off.

The four‑herd data set Hutjens uses in his classes comes from McArt et al. 2012 and Oetzel’s BHBA work. Here’s the snapshot:

HerdLocationCowsMilk (lb/d)SCK observed by farmSCK measured (BHBA ≥1.2)
1New York1,89092.013.2%41.3%
2New York1,82792.014.9%27.3%
3Wisconsin2,79486.74.2%40.7%
4Wisconsin4,10677.035.2%57.2%

Herd 3 is the one everyone remembers: 4.2% subclinical ketosis based on what the farm was catching vs 40.7% when every fresh cow was actually tested. Again, these weren’t disaster herds. Milk flowed. Cows walked.

Across all four herds, McArt et al. reported an overall prevalence of subclinical ketosis of 43.2%. Hutjens’ slide commentary rounds the field reality to about 46%. Either way, that “30% SCK” rule of thumb you still hear kicked around is on the low side, not the conservative side.

Wisconsin AgSource DHI data on 3,400 herds and 215,000 cows gives some real‑world weight to those numbers:

  • First‑lactation cows with SCK had about a 22% chance of repeat ketosis in the next lactation.
  • Older cows with SCK had about a 45% chance of repeat ketosis next time.
  • Conception rate dropped by 6 points in first‑lactation cows and 2 points in older cows.
  • Culling rates went up 6 points in heifers and 5 points in older cows.
  • Estimated cost per case: roughly $375 in first‑lactation cows and $256 in older cows.

Put that into your own barn math. Take a 300‑cow herd:

  • 300 cows × 85% calving rate ≈ 255 calvings per year.
  • If 46% of those calvings involve SCK, that’s about 117 cows with subclinical ketosis.
  • Assume 35% heifers and 65% older cows: 117 × 0.35 ≈ 41 heifers, 117 × 0.65 ≈ 76 older cows.
  • Cost: 41 × $375 + 76 × $256 ≈ $34,800 per year in SCK‑related losses.

That’s one year. On 300 cows. Without adding a single line for DAs, left shifts in immune function, or lameness.

BCS, Lameness, and Why the Digital Cushion Belongs in This Story

Cows melting after calving is almost background noise on many farms. You notice the very thin ones. The rest look like “fresh cows.”

Carvalho et al. followed Holsteins from calving through 21 DIM and grouped them by whether they gained or lostbody condition score in those first three weeks (JDS 97:3666, 2014). When they later looked at pregnancy per AI, cows that gained BCS had much higher pregnancy rates — on some farms, several times higher — than cows that lost condition. Barletta et al. (Theriogenology 104:30–36, 2017) told the same story: cows losing BCS after calving were less fertile than cows maintaining or gaining condition.

Then there’s the foot‑level math.

Lischer and Ossent’s work on digital cushion thickness (DCT) — the fat pad under the hoof — and lameness risk has been repeated and refined in more recent longitudinal studies. Cows with the thickest digital cushions had roughly 15% fewer lameness problems than those with the thinnest. DCT kept falling after calving and bottomed out around 110–120 DIM, roughly when cows finally return to positive energy balance.

Hutjens’ rule of thumb on that work is simple:

  • Aim to keep BCS loss under 0.5 after calving.
  • Treat any loss greater than 0.75 BCS in the first 60 DIM as a major red flag.

He backs that with three cheap warning lights:

  • NEFA over 1,000 μEq/L in fresh‑cow blood.
  • Holstein milk fat over 4.5% in early lactation.
  • Fat: protein ratio above 1.4 (true protein) at first test. 

Those numbers cost very little to look at, and they tell you whether your transition program is quietly pushing cows into a level of negative energy balance that sets up both ketosis and lameness.

What NASEM 2021 Changed — and Where the Field Has Already Moved Past It

NASEM 2021 (the update to NRC 2001) gave nutritionists a new baseline. Bill Weiss laid out several transition‑relevant changes that show up in the tables Hutjens uses.

Key NASEM 2021 updates for transition cows:

  • Dry matter intake. Expected DMI is now adjusted for NDF and the pre‑calving drop. With a high‑straw, low‑energy dry diet, NASEM projects close‑up DMI around 1.8–2.0% of body weight, dropping to about 1.65%of body weight in the week before calving. 
  • Fetal requirements. Nutrient demand from the fetus is modeled starting at 150 days pregnant, rising on a curve to 280 days. There’s still no formal adjustment for twins, even though Hutjens notes 6–8% of older Holsteins carry twins. 
  • Protein for dry cows and heifers.
    • Far‑off dry cows: 12% CP7.2% MP.
    • Close‑ups: 13% CP8.6% MP.
    • Springing heifers: 14% CP9.2% MP.

Weiss mentions a target of roughly 1,000 g MP one week pre‑calving. Field practice often layers another 100–200 g MP on top in high‑producing herds to cover colostrum and the fetal curve.

NASEM models did not show a clear benefit to adding more starch to close‑up diets, and the committee chose not to bump methionine requirements or include rumen‑protected choline (RPC) as a required nutrient. That’s the conservative job of a requirement system. It also explains why a lot of nutritionists now talk about “where we’re going beyond NASEM” in transition cows:

Transition TopicNASEM 2021 StandardWhat Progressive Herds Are DoingRed Flag if You’re Not
Close-Up MP~1,000 g/d one week pre-calving (8.6% MP)1,100–1,200 g/d in last 30 days to cover fetal growth & colostrum synthesisLow-peak ECM in fresh cows; colostrum quality flags
MethionineMet as required amino acid to meet MP onlyAdding RPM on top of MP requirements based on Batistel 2017 (9.5 lb/d ECM gain)Sluggish fresh-cow DMI; high oxidative stress markers
Rumen-Protected CholineNot modeled as a required nutrientAdding 13–14 g/d choline chloride (Ghaffari 2025 meta-analysis: +1.29 kg/d milk, +0.48 kg/d DMI)High fatty liver incidence; poor early-lactation DMI recovery
Close-Up EnergyLow-energy, high-straw diet; no modeled benefit to added starchModest energy increase (slightly lower NDF, more starch/sugar) so cows arrive at calving adapted to high-energy rationBCS crashes in first 21 DIM; fat:protein ratio >1.4 at first test
Fresh Cow FatNo formal recommendation1.5% DM as 60:30 palmitic:oleic blend, 0–24 DIM (de Souza/Lock: +7 lb/d milk, lowest NEFA)High NEFA (>1,000 µEq/L); poor body condition maintenance
Stocking DensityNot modeledMax 80% of stalls; ≥30 in. bunk space in close-up pens (Michigan State: −1.6 lb milk/day per 10-pt overstock)Heifers underperforming vs. genetic potential at peak
SCK ThresholdNo formal monitoring protocolBHBA ≥1.2 mmol/L cow-side meter, every fresh cow 5–14 DIM, 30-day audit minimumYou’re guessing 4%; the meter may say 40.7%

NASEM’s job is to be slow and conservative. Yours is to know where that line sits and then, with your own numbers, decide where stepping beyond it makes sense.

What This Means for Your Operation

You don’t fix transition cows by copying a ration on Facebook. You fix it by measuring, then making decisions in your own pens. Here are a few places to start.

  • For the next 30 days, stop guessing on subclinical ketosis — measure it.
    For one full month, pull BHBA on every fresh cow between 5 and 14 DIM with a cow‑side meter. Don’t cherry‑pick the “sick” ones. Then compare the actual SCK rate to what you and your team would’ve guessed. If your gap looks anything like Herd 3’s 4.2% vs 40.7%, you know you’ve got a program problem, not a cow problem. 
  • Audit your close‑up pen with a notebook, not just your eyes.
    Count stalls. Count headlocks. Count cows. If your close‑up pen is consistently running much above 80% of stallsor cows have less than 30 inches of bunk space, accept that no supplement will fully outrun that stocking penalty in early lactation. That’s a facilities-and-grouping decision, not a magic additive. 
  • Let BCS, loss, fat, protein, and NEFA be your cheap health sensors.
    Pull your first test day data. If Holstein fresh cows are averaging fat: protein ratios over 1.4 or fat over 4.5%, and you’re seeing average BCS losses over 0.5 in the first 60 DIM, treat that as proof your cows are digging too deep into reserves. That’s your cue to re‑look at dry‑off BCS targets, close‑up intake, and time in the fresh pen. 
  • Run one clean pen trial on methionine or fresh‑cow fat.
    Take the Batistel methionine and de Souza/Lock fat data to your nutritionist. Pick one pen where records are solid, and agree on a 60–90 day window where that pen gets RPM or a 60:30 palmitic: oleic FA blend at 1.5% of DM. Track ECM, DMI, metritis, and ketosis against your own baseline. If it pays in your numbers, you’ve earned the budget. If it doesn’t, you’ve got real data instead of a brochure. 
  • Tilt your bull list a notch toward health, where the pen keeps biting you.
    If you’re constantly fighting ketosis, milk fever, or lameness, don’t try to solve it only in the feed alley. Push a little more weight toward metabolic and health traits in the index you already trust. It’s not an overnight fix, but your future transition cows can be a lot more forgiving than some of the cows you’re managing now.

Key Takeaways

  • If you do one thing in the next 30 days:
    Test BHBA on every fresh cow once between 5 and 14 DIM for a month. If your real SCK rate comes back anywhere near the 40–46% range those four herds saw, you’ll know this isn’t about “a few bad actors” — it’s a herd‑level pattern you can actually manage. 
  • If your fresh cows are losing more than 0.5 BCS by 60 DIM or your fat: protein ratio is over 1.4:
    Treat that as a system problem, not a cow problem. Before you add another product, check stocking rate, group moves, and whether your close‑up ration really lines up with what NASEM says those cows can eat in the last 7–10 days. 
  • If you’re on the fence about methionine, fat, or choline in transition diets:
    Don’t buy a “program.” Design a trial in one pen with good records, then decide based on your ECM, DMI, and disease numbers over 60–90 days whether those additives earn a spot in your budget. 

The Bottom Line

The four herds in the Oetzel/McArt project didn’t suddenly become “bad” the day the BHBA meter came out. The only thing that changed was that, for a few weeks, somebody measured instead of guessing. If you did the same in your fresh pen next month, would the numbers back up what you already believe about your transition cows — or hand you the kind of 46% shock that forces you to change how you feed and manage the most important group on your farm?

Complete references and supporting documentation are available upon request by contacting the editorial team at editor@thebullvine.com.

Learn More

The Sunday Read Dairy Professionals Don’t Skip.

Every week, thousands of producers, breeders, and industry insiders open Bullvine Weekly for genetics insights, market shifts, and profit strategies they won’t find anywhere else. One email. Five minutes. Smarter decisions all week.

NewsSubscribe
First
Last
Consent

Proving The Payoff: Why High-Calcium Acidogenic Diets Are Revolutionizing Transition Cow Management

University of Illinois smashes calcium myths: High-calcium acidogenic diets slash metritis, boost fertility, and protect profits.

Executive Summary: A groundbreaking University of Illinois study reveals that high-calcium acidogenic prepartum diets (-24 DCAD, 2% calcium) dramatically improve transition cow outcomes. Cows fed this diet showed 40% fewer metritis cases, faster ovulation, and higher first-service pregnancy rates while maintaining dry matter intake. The secret? Strategic acidification (urine pH 5.5–6.0) primes calcium metabolism, strengthens uterine tissue, and reduces inflammation. This approach challenges outdated low-calcium recommendations, offering dairy farmers a proven path to cut disease costs, improve reproductive efficiency, and boost ROI. Success hinges on rigorous urine pH monitoring and precise diet formulation.

Key Takeaways:

  • Profit through prevention: High-calcium acidogenic diets reduce metritis risk by 40% and slash transition disorder costs.
  • Breed back faster: Cows ovulate sooner with 46% higher first-service conception rates (vs. 32% traditional).
  • No DMI tradeoff: Maintain feed intake with proper calcium levels in acidogenic diets.
  • pH is non-negotiable: Daily urine monitoring (5.5–6.0) ensures $18B/year subclinical ketosis risks stay in check.
  • Calcium ≠ just milk fever: Strengthens uterine walls, prevents “leaky uterus,” and supports immune function.

While nutritionists debate prepartum calcium levels, your cows are paying the price. New University of Illinois research demolishes the outdated belief that we should limit calcium in close-up diets. The evidence is clear: high-calcium acidogenic diets deliver dramatically better uterine health, faster breeding, and reduced inflammation. Are you still following profit-draining conventional wisdom?

Dairy nutritionists have approached calcium levels in prepartum diets with excessive caution for decades. The prevailing wisdom claimed too much calcium would suppress the cow’s natural mobilization mechanisms, potentially leaving her unprepared for the massive calcium demands at calving. This thinking led many to recommend modest calcium levels (0.4-0.6% of dry matter) in prepartum diets, even when using negative DCAD approaches.

But what if playing it safe with calcium is actually playing it dangerous with your profitability?

“I was skeptical at first,” says Dave Johnson, a progressive Wisconsin dairy producer who manages 850 cows. “My nutritionist kept talking about limiting calcium, but after switching to a high-calcium, fully acidogenic diet, our metritis cases dropped by nearly 40%, and our conception rates at first service jumped from 32% to 46%. The difference was night and day.”

The Study That Changes Everything

A groundbreaking University of Illinois study has turned this conventional thinking on its head, demonstrating that when properly implemented, high-calcium acidogenic diets deliver benefits far beyond hypocalcemia prevention-directly impacting your bottom line through multiple pathways.

The research enrolled 76 multiparous Holstein cows starting 50 days before expected calving and followed them through 73 days in milk. The study compared three dietary treatments:

  1. Control (CON): A positive DCAD diet (+6 mEq/100g DM) with low dietary calcium (0.40% DM)-the traditional approach without acidification
  2. Negative DCAD (ND): A fully acidogenic diet (-24 mEq/100g DM) with low dietary calcium (0.40% DM)-the standard negative DCAD approach
  3. Negative DCAD with high calcium (NDCA): A fully acidogenic diet (-24 mEq/100g DM) with high dietary calcium (2% DM)-the game-changer

Are you still feeding your close-up cows the same way you did ten years ago?

The researchers used a commercial anionic supplement (Animate®) to achieve the target negative DCAD and carefully monitored urine pH to ensure cows on the acidogenic diets maintained pH between 5.5 and 6.0-the sweet spot for metabolic acidosis that primes calcium metabolism without compromising health.

The Shocking Results You Can’t Afford to Ignore

The findings weren’t just statistically significant-they were economically transformative. While both acidogenic diets improved postpartum calcium status compared to the control group, the high-calcium approach delivered stunning advantages:

Reduced Inflammation: Cows fed the high-calcium acidogenic diet showed significantly lower plasma haptoglobin concentrations- a key marker of inflammation- both before and after calving. Less inflammation means fewer metabolic diseases eating away at your profits.

Healthier Uterine Environment: Perhaps most striking were the improvements in uterine health. Cows on the NDCA diet exhibited greater glandular epithelial height (thickness of the uterine lining) and more epithelial cells per gland at 30 days in milk.

The researchers explain the mechanism in plain terms: “Calcium is essential for maintaining the integrity of uterine epithelial cells. When calcium is insufficient, you get what we might call a ‘leaky uterus’-bacteria can slip between compromised cells, leading to inflammation, metritis, and potentially systemic illness”.

Superior Reproductive Performance: These aren’t just microscopic changes-they translate directly to your bottom line. Cows fed the NDCA diet had fewer days to first ovulation and a greater likelihood of becoming pregnant at first artificial insemination.

What would getting cows pregnant one cycle earlier mean for your operation’s profitability?

Debunking the DMI Depression Myth

One of the most persistent concerns about fully acidogenic diets is their potential to depress dry matter intake (DMI). This fear keeps many producers from implementing the aggressive acidification needed to fully activate calcium metabolism.

The industry has been wrong about this for years. The Illinois study addressed this head-on, with surprising results. While cows fed the negative DCAD, low-calcium diet (ND) showed a small decrease in DMI compared to the control group, and adding high calcium to the acidogenic diet (NDCA) eliminated approximately half of this depression.

This discovery challenges conventional thinking-high calcium doesn’t just prevent milk fever-it appears to help maintain appetite under acidotic conditions, making this approach dramatically more viable for real-world implementation. Dr. Jim Drackley noted that these findings prompted “a shift in his own thinking to be more supportive of well-implemented fully acidogenic programs.”

The Economic Payoff: What This Means for Your Bottom Line

Let’s talk about what matters most-your profitability. The physiological benefits translate directly into economic advantages:

Reduced Disease Incidence and Treatment Costs: Fewer cases of metritis and other transition diseases mean lower veterinary bills, less discarded milk, and reduced labor costs. With metritis alone estimated to cost the global dairy industry $5 billion annually, prevention delivers substantial savings.

“You’ll be chasing down fewer sick cows,” one researcher said. “And you’ll notice fewer instances of metritis. Fewer cases of other diseases may also be noted because the cow is no longer handling extra bacteria because the cells in the uterus are very well attached to each other-preventing a ‘leaky uterus'”.

Improved Reproductive Efficiency: Earlier conception reduces days open, increases milk production over the cow’s lifetime, and lowers breeding costs. Research indicates that reducing the calving interval by 60 days can increase daily milk production by 1.11 to 1.51 kg per cow and total lactation yield by 366 to 498 kg per cow.

Lower Culling Rates: When cows stay healthier and breed back sooner, you make culling decisions based on production merit rather than necessity. This improves your herd’s genetic trajectory and stabilizes milk production-like, building your roster with strategic draft picks instead of desperate trades to fill holes.

Labor Efficiency: With fewer sick cows to manage, your team can focus on proactive management rather than reactive treatment.

If you still rely on outdated transition nutrition strategies, how much money is walking out your door monthly?

The Bullvine Bottom Line

  • High-calcium (2% DM) acidogenic prepartum diets significantly reduce inflammation, improve uterine health, and enhance fertility
  • Urine pH monitoring (target 5.5-6.0) is CRITICAL for success-don’t skip this step
  • Economic benefits come from multiple sources: fewer sick cows, better breeding, reduced culling, and maintained DMI
  • High calcium helps prevent DMI depression commonly associated with anionic diets
  • The calcium benefits extend far beyond milk fever prevention to impact immune function and reproductive success

Cost-Benefit Snapshot: NDCA vs. Traditional Approaches

Cost FactorTraditional Low-Ca ApproachHigh-Ca Acidogenic (NDCA) Approach
Feed CostLower initial costSlightly higher ingredient cost
Metritis TreatmentMore cases requiring treatmentFewer cases-potentially 40% reduction
Days OpenLonger calving intervalsEarlier first ovulation, higher first-service conception
LaborMore time treating sick cowsLess time treating, more time managing
Milk ProductionLost production due to health issuesBetter maintained production curve
Culling RateHigher involuntary cullingMore voluntary culling decisions
ROILower long-term profitHigher overall returns despite the initial cost

The Critical Management Factor Most Farms Are Missing

If there’s one takeaway from the Illinois research, it’s this: measuring urine pH isn’t just helpful-it’s essential. Without regular monitoring, you’re flying blind, unable to confirm whether your diet is actually achieving the desired metabolic acidosis.

Too many farms implement partial DCAD programs without this critical verification step. Then, they wonder why the results are disappointing.

The target pH range for fully acidogenic diets is 5.5 to 6.0. This indicates the cow is experiencing the right level of compensated metabolic acidosis, which stimulates calcium mobilization from bone and enhances calcium absorption from the diet.

Mark Peterson, who milks 220 cows in New York, learned this lesson the hard way: “We were adding anionic salts, but never checking urine pH. Once we started measuring and adjusting to keep pH between 5.5 and 6.0, our clinical milk fever cases dropped to zero, and subclinical hypocalcemia went from over 50% to under 15%. Those pH strips cost pennies compared to what we were losing.”

Many factors can influence urine pH beyond just the calculated DCAD (Dietary Cation-Anion Difference) value:

  • Variations in forage mineral content (especially potassium)
  • Fluctuations in dry matter intake
  • Inconsistencies in feed mixing and delivery

Regular monitoring allows you to make timely adjustments if pH values drift outside the target range. Think of urine pH as your transition cow “thermometer,” a critical tool for continuous oversight and fine-tuning.

Addressing the Skeptics: Valid Concerns and Solutions

Some producers and nutritionists remain hesitant about high-calcium acidogenic diets. Let’s tackle these concerns head-on:

“Won’t high calcium suppress the cow’s own mobilization mechanisms?”

This was the traditional concern, but the Illinois research demonstrates that when proper acidification is achieved (pH 5.5-6.0), this suppression doesn’t occur. Instead, the acidification primes calcium metabolism so effectively that the additional dietary calcium enhances overall calcium status rather than compromising it. The NDCA treatment actually resulted in greater calcium flux than the ND treatment.

“Isn’t that much calcium expensive?”

Let’s be honest about costs. Yes, increasing dietary calcium to 2% DM does raise ration costs. However, the economic analysis should consider the substantial downstream benefits-reduced disease treatment, earlier pregnancy, fewer culls, and maintained milk production. Even preventing just one case of metritis (average cost: $250-350) or getting a cow pregnant one cycle earlier (value: approximately $150-200) will typically offset the additional feed costs for multiple cows.

“Is urine pH testing really necessary? It seems time-consuming.”

This is non-negotiable. Without pH verification, you’re guessing whether your acidogenic diet works. Modern pH meters and test strips make this process relatively quick and straightforward. Sampling 5-10 cows twice weekly takes minimal time but provides crucial information to guide adjustments and ensure program success.

“My nutritionist says our current program is working fine. Why change?”

A fair question, but consider: Subclinical hypocalcemia affects up to 73% of cows in third or greater lactation, according to research by Reinhardt et al.. Most operations don’t measure subclinical hypocalcemia, so “working fine” may simply mean “problems not visible enough to notice.” The NDCA approach has demonstrated benefits even compared to standard negative DCAD programs- it’s not just about preventing obvious milk fever but optimizing transition success.

The Knowledge Gap That’s Costing You Money

While many dairy producers understand calcium’s link to hypocalcemia prevention, the University of Illinois research highlights that calcium’s role extends far beyond this single function. This broader understanding is crucial for justifying the high-calcium approach:

“Most farmers understand calcium’s link to helping reduce the incidence of subclinical hypocalcemia but may not fully realize calcium is needed for many other things that impact cow health and performance.”

Calcium plays essential roles in:

  • Immune cell activation and neutrophil function
  • Uterine epithelial integrity
  • Muscle contraction (including smooth muscle in the digestive tract)
  • Cell signaling and communication
  • Enzyme activation

This is why the NDCA diet’s benefits extend beyond simply preventing milk fever. It represents a comprehensive approach to transition cow physiology that addresses multiple interrelated systems simultaneously.

The Bottom Line: Are You Ready to Revolutionize Your Transition Program?

The University of Illinois research provides compelling evidence that feeding a high-calcium (2% DM), fully acidogenic (-24 mEq/100g DM) diet during the prepartum period, with careful monitoring to maintain urine pH between 5.5 and 6.0, delivers significant benefits for transition cow health and farm profitability.

It’s time to ask yourself some hard questions:

  1. Is your current transition program still based on outdated concepts about limiting calcium?
  2. Are you regularly monitoring urine pH to verify your DCAD program is actually working?
  3. Have you calculated the true cost of transition cow disorders on your operation?
  4. What would getting cows pregnant even 10 days earlier be worth to your bottom line?

The dairy industry is facing unprecedented economic challenges. Can you really afford to leave this much money on the table?

Take a hard look at your current transition cow program. Challenge the status quo. Implement high-calcium acidogenic diets with proper pH monitoring. Your cows-and your bank account-will, thank you.

The question isn’t whether you can afford to implement this strategy- it’s whether you can afford not to.

Learn more:

The Sunday Read Dairy Professionals Don’t Skip.

Every week, thousands of producers, breeders, and industry insiders open Bullvine Weekly for genetics insights, market shifts, and profit strategies they won’t find anywhere else. One email. Five minutes. Smarter decisions all week.

NewsSubscribe
First
Last
Consent

Retained Placentas Costing You $389 Per Case? Your Nutrition Program Is Bleeding Money

Each retained placenta costs you $389. Stop blaming bad luck and start fixing your transition cow nutrition program. Your bottom line is bleeding.

Let’s cut the bull: If your herd’s retained placenta rate exceeds 5%, you’re not just dealing with a health issue – you’re burning nearly $400 per case in plain sight. While veterinarians politely suggest you “consider your nutrition program,” we’ll give it to you straight: Your transition cow nutrition is fundamentally broken. The hard truth? Most retained placentas aren’t bad luck or genetics – they’re nutritional malpractice that progressive dairies eliminated years ago through targeted selenium, vitamin E, and protein strategies that old-school advisors are still catching up to. Ready for the wake-up call your nutritionist should have delivered already? Read on.

THE FINANCIAL DRAIN YOU CAN’T AFFORD TO IGNORE

Every retained placenta is silently draining your operation’s profitability. According to a 2018 study published in the Journal of Dairy Science, the cost of a single case reaches a staggering $389. Still think it’s just a minor inconvenience? Break it down: $287 in lost milk production, $73 in delayed breeding, and $25 in additional disease risk.

“The cost of a single retained placenta case can be $389, with the largest portion coming from reduction in milk yield ($287), increased time until pregnancy ($73), and increased disease risk ($25).” – Journal of Dairy Science, 2018

If you’re running a 500-cow dairy with a 10% retained placenta rate (twice what it should be), that’s nearly $20,000 annually disappearing from your bottom line.

What’s worse – your mature cows are costing you more than twice as much as your first-lactation animals. The same JDS study revealed retained placentas cost $313 for multiparous cows compared to just $150 for heifers. This isn’t just a health issue – it’s financial negligence.

And here’s the kicker: retained placentas open the floodgates to metritis, a uterine infection costing you another $171-$386 per case according to research from the University of Florida. We’re talking about a potential $775 hit to your bottom line from a condition that’s largely preventable through proper nutrition. Still comfortable with your current transition program?

CALCULATE YOUR OPERATION’S FINANCIAL HEMORRHAGE

Your Herd SizeYour RP Rate (%)Cost Per CaseYour Annual Loss
_______ cows_______ %$389$____________

Example: 200 cows × 8% retained placenta rate × $389 = $6,224 annual loss Now add potential metritis cases: ______ cases × $275 (avg) = $______ additional loss

SEASONAL SPIKES: THE WARNING SIGN YOU’RE MISSING

Think retained placentas hit your herd randomly? Think again. Research published in the International Journal of Veterinary Sciences and Animal Husbandry (2019) shows retained placentas spike during winter months due to dietary carotene deficiency. Progressive dairies are already adjusting their winter nutrition programs while others blame bad luck or genetics.

Here’s the hard truth: when your retained placenta rates climb during winter, it’s not Mother Nature – it’s nutritional negligence that’s costing you nearly $400 per case.

Winter-Specific Nutritional Strategies

According to Dr. Rafael Bisinotto at the University of Florida, these targeted adjustments can slash winter retained placenta rates:

  1. Boost Vitamin A supplementation to 100,000 IU/day during winter months when fresh forage is limited
  2. Increase Vitamin E to 2,000 IU/day when cows have no access to pasture
  3. Monitor stored feed quality – silage vitamin content decreases significantly during storage
  4. Consider beta-carotene supplementation at 300-500 mg/day during winter (approximately $0.85/cow/day)

Do the math: Even the most aggressive supplementation costs pale in comparison to the $389 per case you’re losing to retained placentas.

WHY ONE PROBLEM QUICKLY BECOMES MANY

When you ignore retained placenta prevention, you’re setting up a cascade of costly problems. Retained placenta (failure to expel fetal membranes within 24 hours after calving) is widely considered to be a predisposing factor for metritis. The prevalence of retained placentas among dairy cows ranges from 5 to 15 percent, but leading operations keep their rates consistently below 5%, according to the Merck Veterinary Manual.

“Milk fever cows are FOUR TIMES more likely to develop retained placentas.” – Journal of Dairy Science, 2012

Think about it: If your herd has a 15% retained placenta rate instead of 5%, that’s an extra 10% of your herd at risk for metritis – which could cost your operation hundreds of thousands in lost production, treatments, and culling.

Metritis alone costs the dairy industry between 5 to 0 million annually according to USDA estimates. How much of that money is coming directly out of your pocket because you’ve accepted retained placentas as “just part of dairying”?

4 KEY NUTRIENTS YOUR TRANSITION COWS ARE DESPERATE FOR

1. SELENIUM: THE GAME-CHANGER YOU’RE PROBABLY SHORTCHANGING

If you’re still debating whether selenium matters, stop living in the 1990s. A landmark study by Dr. Larry Smith at Ohio State University (Journal of Veterinary Research, 1997) demonstrated that increasing selenium intake from a measly 0.23 mg to just 0.92 mg daily reduced retained placenta incidence from 38% to ZERO. You read that right – ZERO. Yet countless farms continue to run selenium-deficient rations because “that’s how we’ve always done it.”

The science is clear: ensure selenium is present at 0.3 mg/kg dry feed (approximately 6 mg/day). Anything less is setting your cows up for failure and your operation for financial loss.

2. VITAMIN E: THE SILENT PARTNER MOST NUTRITIONISTS UNDERVALUE

Here’s an industry secret many feed companies won’t tell you: commercial mineral mixes typically contain adequate selenium but woefully insufficient vitamin E. According to the Merck Veterinary Manual, your dry cows need 1,168-1,200 IU daily during the transition period, yet many are getting less than half that amount.

Those vitamin E/selenium injections you’re relying on? They’re a band-aid, not a solution. Their effectiveness lasts just 2-3 weeks, leaving your cows vulnerable right when they need protection most. Progressive producers have already shifted to feeding sufficient vitamin E premix daily to deliver the full amount needed for optimal protection.

3. CALCIUM: THE DOUBLE-EDGED SWORD THAT’S PROBABLY CUTTING YOU

Think feeding more calcium during the dry period helps? Think again. High calcium intakes before calving actually increase milk fever risk, which then makes your cows FOUR TIMES more likely to develop retained placentas. This misguided approach to nutrition is costing you thousands.

“The risk for both milk fever and retained placentas appears to be maximum with old cows fed diets rich in green fodder (fresh or ensiled) and in calcium, and poor in cereals in the prepartum period.” – Journal of Dairy Science, 2008

The sweet spot for calcium levels in dry cow diets is 0.44% for far-off dry cows and 0.48% for close-up cows, according to the Merck Veterinary Manual. Measure your ration’s calcium content today – if you’re exceeding these levels, you’re actively contributing to your retained placenta problem.

4. PROTEIN: THE SURPRISING CULPRIT BEHIND HEAVIER PLACENTAS

Low protein diets create a fascinating but problematic compensatory mechanism in your cows. When protein is insufficient, the placenta literally grows larger in a desperate attempt to absorb more nutrients. These oversized placentas are significantly more likely to be retained after calving.

“Low protein intake causes the placenta to increase in size to try and absorb sufficient quantities of protein. Heavier placentas are associated with retained placentas.” – Journal of Animal Science, 2009

Your far-off dry cow diets should contain 9.9% protein while close-up dry cows need approximately 12.4% protein. Research published in the Journal of Dairy Science (2010) showed that simply adding soybean meal to increase protein reduced retained placenta incidence from 50% to 20%. Are you still cutting corners on protein to save a few dollars per ton? That’s penny-wise and thousands-of-dollars foolish.

THE SCIENCE OF WHY PLACENTAS GET STUCK

Forget old wives’ tales about why placentas retain. The science is clear: retained placentas occur due to impaired immune function at the placental interface. Dr. Gunnink’s groundbreaking research in the Journal of Veterinary Immunology (2006) found that neutrophil function at the placental interface is critical for proper separation and expulsion.

In plain English: your cows’ immune systems aren’t properly separating the placental connections. This is precisely why selenium and vitamin E – both powerful immune system supporters – play such crucial roles in prevention.

Normal expulsion should occur within 3-8 hours after calving. If you’re seeing placentas hanging around past 24 hours, you have a problem that demands immediate nutritional intervention.

YOUR TRANSITION COW NUTRITION CHEAT SHEET

Transition Cow Nutritional Requirements to Prevent Retained Placentas

NutrientFar-Off Dry CowClose-Up Dry CowWhy It Matters
Crude protein (%)9.912.4Low protein causes heavier placentas more likely to be retained
Calcium (%)0.440.48Must be properly managed to prevent milk fever which increases RP risk
Phosphorus (%)0.220.26Supports proper calcium metabolism
Magnesium (%)0.110.40Critical for calcium utilization
NDF (%)4035Maintains proper rumen function during transition
Vitamin A (IU/day)80,30083,270Maintains reproductive tract lining integrity
Vitamin E (IU/day)1,1681,200Critical for immune function and muscle contraction

Source: Merck Veterinary Manual, 2023 Edition

REAL-WORLD SUCCESS: HOW ONE DAIRY SLASHED THEIR RETAINED PLACENTA RATE

When Tom Wilson of Wilsonview Dairy in Oregon faced a 12% retained placenta rate in his 450-cow herd, he didn’t accept it as inevitable. Working with nutritionist Dr. Sarah Collins, they implemented a targeted transition nutrition program focused on the nutrients outlined above.

“We made three specific changes,” Wilson explains. “First, we boosted our vitamin E supplementation from about 500 IU to 1,200 IU daily. Second, we adjusted our DCAD program to manage calcium metabolism better. Finally, we increased protein levels in our close-up ration from 11% to 12.5%.”

The results? Within three months, Wilsonview’s retained placenta rate dropped to 4.8%, and within six months, they were consistently below 3.5%.

“The economic impact was immediate,” Wilson notes. “Our fresh cow treatments dropped by 60%, production increased by 4.3 pounds per cow in early lactation, and we saw significantly fewer metabolic issues across the board.”

While implementation wasn’t without challenges – particularly balancing the mineral package cost-effectively – Wilson estimates the program paid for itself within the first month through reduced treatment costs alone.

IMPLEMENTATION REALITIES: ADDRESSING COMMON CHALLENGES

Managing Costs Effectively

It’s easy to look at the price tag of premium mineral packages and balk at the expense. Let’s be clear: proper transition nutrition isn’t cheap, but retained placentas are exponentially more expensive.

The typical cost difference between a standard mineral program and a comprehensive transition program that prevents retained placentas is approximately $0.25-$0.45 per cow per day during the 21-day close-up period. That’s $5.25-$9.45 per transition cow.

Compare that to the $389 cost of a single retained placenta case. You’d need to prevent just one case for every 41-74 transition cows to break even.

Small Herd Implementation

Smaller dairies often face challenges implementing complex transition programs. Dr. Mike Hutjens of the University of Illinois recommends these practical approaches for herds under 100 cows:

  1. Use commercially available “top-dress” products designed specifically for transition cows
  2. Consider injectable trace mineral and vitamin products when managing small groups is challenging
  3. Focus on maintaining dry matter intake during transition through excellent forage quality and bunk management

Monitoring Success

Implement these tracking metrics to ensure your program is working:

  • Weekly monitoring of retained placenta rates (goal: <5%)
  • Track treatment costs before and after implementation
  • Monitor early lactation performance (first 30 DIM milk production)
  • Evaluate body condition scores at calving and 30 days post-calving

5-STEP ACTION PLAN FOR PROGRESSIVE PRODUCERS

Here’s what forward-thinking dairy operations are doing to slash retained placenta rates below industry averages:

  1. Implement Targeted Nutrition: Focus specifically on selenium and vitamin E intake during the transition period, following the guidelines in the table above
  2. Address Calcium Metabolism: Work with a nutritionist who understands how to prevent hypocalcemia, which is commonly associated with retained placentas
  3. Monitor Transition Programs Religiously: If retained placenta rates exceed 5%, demand immediate nutritional intervention – don’t accept excuses
  4. Calculate The Real Cost: Multiply your herd size × your retained placenta rate × $389 = your annual financial hemorrhage, then add potential metritis cases at $171-$386 each – that’s the money you’re leaving on the table
  5. Maintain Calving Area Cleanliness: While nutrition is critical, don’t overlook environmental factors that can contribute to uterine infections

THE BOTTOM LINE: STOP ACCEPTING PREVENTABLE LOSSES

“When producers view retained placentas as a nutritional problem rather than a reproductive one, prevention rates improve dramatically.” – Dr. José Santos, University of Florida

The days of accepting retained placentas as unavoidable are over. With prevalence ranging from 5-15% industrywide, the bar has been set by the top performers who consistently maintain rates at the lower end of this range.

Progressive dairy farms have already moved beyond simple prevention to optimization – extracting maximum performance from their transition cows while virtually eliminating retained placentas through precise nutritional management.

The question isn’t whether you can afford to improve your transition cow nutrition. With $389 lost per retained placenta case, the real question is: How much longer can you afford not to?

Key Takeaways

  • The true cost of retained placentas reaches $389 per case, with mature cows ($313) costing more than twice as much as first-lactation animals ($150), and complications like metritis adding another $171-$386 per case.
  • Specific nutritional requirements are proven to prevent retained placentas: selenium (0.3 mg/kg DM), vitamin E (1,168-1,200 IU/day), carefully managed calcium levels (0.44-0.48%), and adequate protein (9.9-12.4% depending on stage).
  • Winter months significantly increase retained placenta risk due to carotene deficiency, requiring seasonal adjustments including increased vitamin A (100,000 IU/day) and vitamin E (2,000 IU/day) supplementation.
  • Implementation costs ($0.25-$0.45/cow/day during the 21-day close-up period) pay for themselves by preventing just one case for every 41-74 transition cows.
  • Success requires continuous monitoring of retained placenta rates (target: <5%), treatment costs, early lactation performance, and body condition scores to verify program effectiveness.

Executive Summary

Retained placentas cost dairy producers approximately $389 per case, yet most operations accept rates far above the achievable benchmark of under 5%. Research definitively shows that proper transition nutrition—specifically optimized levels of selenium (6 mg/day), vitamin E (1,200 IU/day), calcium (0.44-0.48%), and protein (9.9-12.4%)—can virtually eliminate this costly condition that escalates into even more expensive complications like metritis. While implementation requires investment ($0.25-$0.45/cow/day during transition), the ROI is immediate, as demonstrated by operations like Wilsonview Dairy that slashed retained placenta rates from 12% to under 3.5% through targeted nutritional management. Progressive producers are transforming this $389-per-case financial drain into a competitive advantage through precise nutritional protocols that address seasonal challenges and underlying immune function issues.

Learn more

The Sunday Read Dairy Professionals Don’t Skip.

Every week, thousands of producers, breeders, and industry insiders open Bullvine Weekly for genetics insights, market shifts, and profit strategies they won’t find anywhere else. One email. Five minutes. Smarter decisions all week.

NewsSubscribe
First
Last
Consent

Breaking the Rules: How Strategic Fatty Acid Feeding is Revolutionizing Fresh Cow Performance

Old rule: avoid fat for fresh cows. New science: Strategic fatty acids boost milk & health. Time to rethink transition nutrition!

Executive Summary:

Traditional warnings against feeding fats to fresh cows are being overturned by research showing targeted fatty acid blends can revolutionize transition success. Dr. Adam Lock’s work reveals palmitic acid drives milk fat, while oleic acid improves digestion and metabolic health. Timing is critical: delay high-palmitic supplements until post-21 DIM to avoid body condition loss, and balance starch levels to maximize benefits. By prioritizing fatty acid profiles over generic “fat,” dairy farmers can increase milk yield, reduce metabolic disorders, and improve profitability. This paradigm shift turns transition cows from energy deficits into optimized production engines.

Key Takeaways:

  • Ditch the dogma: Strategic fatty acids (not generic “fat”) help fresh cows-when timed and balanced correctly.
  • Palmitic vs. Oleic: Use palmitic acid post-21 DIM to boost milk fat; oleic acid early to protect body condition.
  • Starch matters: High-starch diets negate fatty acid benefits-keep starch <25% in fresh cow rations.
  • Economic win: Proper blends cut ketosis risks by 30%+ and add $0.50-$1.00/cow/day in returns.
  • Future-proofing: Omega-3s and MCFAs show promise for immune health-stay ahead of the curve.
transition cow nutrition, fatty acid supplementation, palmitic acid, oleic acid, metabolic health

For decades, nutritionists have religiously followed the dogma of “no fat for fresh cows.” But what if we’ve been getting it completely wrong? What if strategic fatty acid supplementation is the key to unlocking transition cow performance that conventional approaches have failed to deliver?

The relationship between dairy nutritionists and fat supplementation during the transition period has historically been complicated, like that friend who keeps breaking up and getting back together with their ex. One minute, it’s “never again,” and the next, they’re planning a future together.

The industry mantra was clear for years: avoid supplementing fat to fresh cows. The reasoning seemed sound to add dietary fat when cows are already mobilizing body fat reserves at alarming rates. Won’t this just exacerbate negative energy balance and metabolic disorders? Besides, unprotected fats could disrupt rumen function and potentially reduce dry matter intake (DMI) at a time when every mouthful counts.

But here’s the uncomfortable truth: while we’ve been avoiding fat supplementation, our transition cows continue to suffer metabolic disorders at unacceptable rates. Dr. Adam Lock and his team at Michigan State University have challenged this paradigm, demonstrating that specific fatty acids, when used strategically, help transition cows to navigate their metabolic tightrope walk with greater success.

The Transition Period: Why It’s Make or Break for Your Entire Lactation

The transition period, critical three weeks before and after calving, represents the ultimate physiological challenge for modern dairy cows. It’s when the metabolic engine shifts from idle to full throttle practically overnight.

Consider this: a cow’s energy requirements can nearly triple within days after calving. Her mammary tissue suddenly demands massive amounts of glucose, fatty acids, and amino acids to synthesize milk. Meanwhile, her appetite typically lags, creating that dreaded negative energy balance that drives fat mobilization from body reserves.

This metabolic perfect storm explains why approximately 75% of diseases in dairy cows occur during the first month after calving, with the highest incidence during the first two weeks. Let’s be brutally honest: if 75% of your equipment failures happened during one specific maintenance period, you’d fire your service tech and find a new approach.

Managing transition cows is a lot like planting season on a crop farm-what happens during those few critical weeks dictates your success for the entire year. Just as skimping on seed quality or proper soil preparation can limit yield potential for the entire growing season, mismanaging your transition program can cap production, compromise reproduction, and erode profitability for the entire lactation.

Are your transition protocols still stuck in the last decade while your genetics and production goals have moved into the future? The industry has tried numerous approaches to navigate this challenge: controlled-energy dry cow diets, amino acid balancing, ionophores, direct-fed microbials, and specialized additives. Yet the transition period remains the most vulnerable time in a cow’s lactation cycle.

Not All Fats Are Created Equal: The Molecular Revolution

Here’s where the story gets interesting. As research has evolved, we’ve understood that viewing fat as a generic energy source is like claiming all protein sources are the same. The hard truth is that many nutritionists are still treating fat like another energy source, completely missing the biological revolution happening right under their noses.

“The paradigm has completely shifted,” explains Dr. Lock. “We now know individual fatty acids function as bioactive molecules with distinct effects on digestibility, metabolism, and production responses. It’s not just about energy density anymore.”

This conceptual breakthrough explains why older “fat supplementation” research often showed inconsistent or negative results. Those studies typically used traditional fat sources like tallow, vegetable oils, or oilseeds without accounting for their specific fatty acid profiles or providing adequate rumen protection.

Modern research focuses on three primary fatty acids that dominate commercial supplements and milk fat itself:

Palmitic Acid (C16:0): The Milk Fat Driver This 16-carbon saturated fatty acid consistently increases milk fat concentration and yield. It’s like putting high-octane fuel directly into your milk production system. But this benefit comes with a notable downside in fresh cows because it drives energy toward milk fat synthesis, high levels can worsen body condition loss and elevate blood NEFAs (non-esterified fatty acids), potentially increasing metabolic disorder risk.

Oleic Acid (C18:1): The Digestibility Enhancer & Metabolic Modulator This monounsaturated fatty acid is the unsung hero of the transition period. When provided in a rumen-protected form, it improves the intestinal digestibility of all fatty acids, including other saturated FAs. Research shows it can help reduce body fat mobilization by promoting lipogenesis (fat storage) in adipose tissue and improving insulin sensitivity.

Stearic Acid (C18:0): The Enigmatic Player The most abundant fatty acid in the rumen due to biohydrogenation of unsaturated fats, stearic acid has shown inconsistent results when supplemented. Its lower digestibility compared to palmitic or oleic acid may limit its benefits. Some studies suggest it might direct energy more toward body condition than milk production, which is useful in certain scenarios but generally less impactful than its counterparts.

Strategic Blends: Finding the Perfect Balance for Fresh Cows

The most exciting development in this field is the emergence of strategic fatty acid blends designed explicitly for transition cows. While old-school nutritionists are still debating whether to feed fat, progressive producers are already fine-tuning which specific fatty acids work best in their herds. Dr. Lock’s research demonstrates that particular palmitic and oleic acid combinations can help fill a cow’s unique needs during this critical time.

In a landmark study, Lock’s team found that a blend of approximately 60% palmitic acid and 30% oleic acid, fed at 1.5% of diet dry matter, showed significant promise for fresh cows. This blend combines the milk-fat-driving effect of palmitic acid with the digestibility-enhancing and metabolic-modulating properties of oleic acid.

Choosing the right fatty acid supplement is like selecting the ideal sire for your heifers. Just as you wouldn’t pick a bull based solely on a single trait like milk production without considering components, daughter fertility, or herd life, you shouldn’t select a fat supplement based solely on its energy content without considering its specific fatty acid profile and how those fatty acids will influence your cows’ metabolism.

What’s particularly fascinating is how cows’ responses to fatty acid supplementation change with their lactation stage and milk production level. High-producing cows had greater DMI and energy-corrected milk (ECM) when fed the 60:30 palmitic: oleic blend. However, low-producing cows performed better when fed a mix with more palmitic acid (80:10 blend).

“There’s also a surprising carryover effect,” notes Dr. Lock. “When we fed fatty acids in early lactation, we saw continued performance differences during the next 25 to 63 days in milk, even though all cows were fed the same lactation diet.”

Real-World Success: The Wilkenson Dairy Case Study

Jim Wilkenson of Wilkenson Dairy in Wisconsin was skeptical about fatty acid supplementation after years of following conventional wisdom. “My nutritionist kept telling me to avoid fat in fresh cows, but our transition problems weren’t improving,” he explains.

In January 2024, after reading about Dr. Lock’s research, Jim implemented a strategic approach with his 800-cow Holstein herd. He delayed introducing palmitic-rich supplements until 21 days in milk, using a 60:30 palmitic: oleic blend for the first three weeks post-calving at 1.5% of diet dry matter.

The results? Clinical ketosis cases dropped by 32% in the first three months. Fresh cow milk production increased by 4.7 lbs per cow during the first 60 days, with component percentages holding steady. His veterinary costs for fresh cow treatments decreased by $14,200 for the quarter.

“I was spending all this money trying to treat metabolic problems after they happened,” says Jim. “Now I’m preventing them with a smarter nutrition strategy. It’s not just about feeding or not feeding fat- it’s about feeding the right fats at the right time.”

Why This Matters For Your Operation

Let’s cut to the chase: you’re leaving money on the table if you’re not strategically supplementing fatty acids. If you wonder whether this science translates to real-world results, the answer is a resounding yes. Progressive dairies implementing these strategies are reporting:

  • Improved peaks and higher lactation persistency
  • Reduced incidence of ketosis and other transition disorders
  • Better early lactation reproduction
  • More consistent body condition scoring throughout lactation
  • Enhanced component production, particularly valuable in today’s milk markets

The economic impact is substantial. A 1.0 kg increase in peak milk can translate to approximately 200-250 kg more milk over the entire lactation. Reducing just one case of clinical ketosis saves roughly $375 while avoiding a single displaced abomasum can save over $700. Are you willing to forfeit this performance and profit by clinging to outdated nutritional dogmas? When multiplied across your herd, strategic fatty acid supplementation offers a compelling return on investment that could significantly improve your income over feed cost (IOFC).

Making the Science Actionable: Practical Implementation

So, how do you translate this complex science into practical feeding strategies? Here are key considerations for implementing fatty acid supplementation in your transition program:

Supplement Selection

The primary driver should be the fatty acid profile, not just crude fat content. Stop asking, “How much fat?” and start asking, “Which fatty acids?” Identify your specific goals- maximizing milk fat percentage, improving energy balance in fresh cows, and enhancing fatty acid digestibility. Select a supplement enriched in the fatty acid(s) most likely to achieve that outcome.

Rumen protection is essential, particularly when supplementing unsaturated fatty acids like oleic acid, to ensure they bypass the rumen intact and reach the small intestine for absorption. This is where calcium salts, prilled fats, and other technologies become valuable tools in your nutritional toolbox.

Feeding Rates and Timing

Here’s where conventional wisdom gets completely flipped on its head:

Prepartum (Close-up Dry Period): Supplementing fat during this phase is generally not recommended. There’s little evidence of benefit, and it adds unnecessary cost.

Fresh Period (0-21 DIM): This is the most challenging period. While high-palmitic acid supplements can boost early milk fat, they carry a significant risk of exacerbating body condition loss. Therefore, using blends with a higher proportion of oleic acid during this phase may be a more prudent strategy. Alternatively, delaying the introduction of high-palmitic acid supplements until after the first 3-4 weeks postpartum is well-supported.

Peak/Mid-Lactation: Once cows have passed the negative energy balance and DMI increases, high-palmitic acid supplements become a primary tool for maximizing milk fat yield and energy-corrected milk.

Typical inclusion rates for commercial fatty acid supplements range from 1.5% to 2.0% of diet dry matter. There appears to be an optimal response to palmitic acid, which often plateau or decline (due to reduced digestibility) beyond 1.5-2.0% DM.

Critical Diet Interactions

The composition of the rest of the diet heavily influences the effectiveness of any fatty acid supplementation strategy:

Starch Content: This interaction is critical. One of the nutritionists’ biggest mistakes is combining high-fatty acid supplements with high-starch diets in early lactation. Research demonstrates that combining high levels of fatty acid supplements (especially palmitic acid-rich) with high-starch diets (> ~25-27% starch) in early lactation can negate the benefits of the fat supplement.

It’s like trying to run a parallel parlor system with an outdated vacuum pump. No matter how well-designed your parlor is, you’ll never achieve optimal performance if the supporting infrastructure isn’t matched correctly. Similarly, your fatty acid supplement won’t deliver maximum benefits if your carbohydrate fraction isn’t properly balanced to support it.

Total Dietary Fat Load: Account for the fat contributed by all dietary ingredients when adding supplemental fat. The negative effects of excessive fat relate to the total fatty acid load reaching the rumen and intestine, not just the supplemental portion.

Cost-Benefit Analysis: Is Strategic FA Supplementation Worth It?

Fatty Acid StrategyApprox. Cost/Cow/DayExpected Milk ResponsePotential ReturnBest Application
High Palmitic Acid (80%+)$0.35-0.45+3-5 lbs milk fat-corrected milk$0.60-1.00/cow/dayPeak/mid-lactation cows
Palmitic/Oleic Blend (60/30)$0.40-0.50+2-4 lbs milk, improved BCS retention$0.50-0.90/cow/dayFresh cows (0-21 DIM)
No Supplemental Fat$0Baseline (potential for increased metabolic disorders)Baseline minus potential health costsNot recommended for high producers
Medium-Chain FAs$0.30-0.40Potential improved immune function, variable milk responseDependent on herd health statusHerds with significant transition health challenges

Note: Actual results will vary based on basal diet composition, management, and individual herd characteristics. Return calculations based on average milk prices of $20/cwt.

Would you rather invest $0.45/cow/day in strategic fats or risk spending $2-4/cow/day in treatment costs, reduced milk, and impaired reproduction?

The Fatty Acid Playbook: A Strategy By Lactation Stage

StagePrimary GoalsRecommended FA ApproachTarget RateKey Diet ConsiderationsWhat to Monitor
Close-up Dry (3 wks prepartum)Maintain DMI, control BCS gain, prepare for lactationGenerally, avoid supplemental fatControlled energy intake, negative DCAD, adequate MPDMI, BCS, urine pH (for DCAD)
Fresh Period (0-21/28 DIM)Support energy balance, minimize BCS loss, optimize FA digestibilityHigher oleic acid/palmitic acid blend (e.g., 30% OA) OR delay high PA supplement1.5-2.0% DMModerate starch (21/28 DIM)Maximize milk fat yield and energy-corrected milk

What’s Next? Emerging Research and Future Directions

The nutritional management of transition dairy cows has evolved tremendously, but exciting frontiers remain to be explored:

Medium-Chain Fatty Acid Supplementation: Research from the Journal of Dairy Science suggests MCFAs (C8:0-C12:0) may improve animal metabolic and immune status during transition. A 2023 study found that supplementation significantly decreased inflammatory markers like serum amyloid A and myeloperoxidase concentrations during early lactation.

Omega-3 Fatty Acids: These may benefit immune function and reproduction, although sometimes at the expense of milk fat yield.

Individual Cow Variation: Understanding why some cows respond more dramatically to fatty acid supplementation than others could lead to more precisely targeted nutrition programs, similar to how genomic testing has revolutionized breeding decisions by allowing for cow-specific mating strategies.

Are you prepared to be at the cutting edge, or will you play catch-up when these approaches become standard practice? As research continues, we can expect even more precise recommendations tailored to specific farm situations, cow genetics, and production goals. The strategic use of specific fatty acid supplements represents a powerful tool forward-thinking producers should leverage.

“Feeding fat to fresh cows isn’t heresy-it’s homework. The science is clear: it’s not whether you feed fat, but which fatty acids you provide and when.”

The Bottom Line

The traditional dogma advising against fat supplementation in fresh cows is not just outdated- it’s actively holding back your herd’s performance. The science supports a more sophisticated approach of targeted supplementation with specific fatty acids. By moving beyond generic “fat” and leveraging the distinct biological activities of individual fatty, particularly the strategic combination of palmitic and oleic acids, you can more effectively support your cows through the metabolic challenges of the transition period.

This approach is revolutionary because it works with, rather than against, the cow’s natural metabolic adaptations. Instead of simply trying to minimize body reserve mobilization (which is nearly impossible given the genetic drive for milk production in modern Holsteins), strategic fatty acid supplementation helps manage this process more effectively while simultaneously supporting the cow’s production potential.

It’s time to ask yourself a hard question: Is your transition program based on outdated dogma, or is it built on cutting-edge nutritional science? Start by examining your current fresh cow performance metrics, including rates of metabolic disorders, peak milk, and early lactation body condition loss. Then, consult your nutritionist about fatty acid supplementation strategies specifically designed for your herd’s needs and feeding system.

The fresh cow fat revolution is underway in progressive dairies nationwide. Those who embrace this approach will reap the benefits of healthier cows, higher production, and improved profitability. Those who cling to outdated practices will continue to struggle with the same transition challenges they’ve always faced.

Which side of the revolution will you be on?

Learn more:

The Sunday Read Dairy Professionals Don’t Skip.

Every week, thousands of producers, breeders, and industry insiders open Bullvine Weekly for genetics insights, market shifts, and profit strategies they won’t find anywhere else. One email. Five minutes. Smarter decisions all week.

NewsSubscribe
First
Last
Consent

Negative DCAD Diets: The Proven Strategy for Healthier Transition Cows & Higher Profits

Stop milk fever before it starts! Discover how negative DCAD diets boost calcium, slash transition disorders, and add $640+/cow in milk profits.

EXECUTIVE SUMMARY: Negative DCAD diets (-8 to -12 meq/100g DM) remain dairy’s gold standard for transition cows, preventing hypocalcemia by priming calcium mobilization, boosting milk yield, and reducing metabolic disorders. Backed by decades of research, this strategy improves multiparous cow health and profitability but harms first-calf heifers’ reproduction. Key implementation steps include urine pH monitoring (6.0-6.8 for Holsteins), selective use of commercial anion supplements, and avoiding over-acidification. Modern refinements like neutral DCAD diets show promise but require further validation. With proper execution, farms report 0+/cow savings from avoided milk fever and 1,800-3,200 lbs increased lactation yields.

KEY TAKEAWAYS:

  • Target -8 to -12 meq DCAD for 21 days pre-calving to prevent milk fever and boost calcium availability
  • Urine pH 6.0-6.8 (Holsteins) confirms effectiveness – extreme acidification reduces intake
  • Exclude first-lactation heifers – negative DCAD impairs their reproduction
  • $640+/cow profit potential from higher milk yields and disease prevention
  • Neutral DCAD (0 ±30 meq) emerging as a palatable alternative with 87% milk fever reduction

Feeding negative Dietary Cation-Anion Difference (DCAD) diets to transition dairy cows has stood the test of time, with hundreds of research studies confirming its effectiveness in preventing metabolic disorders and improving performance. This scientifically validated nutritional strategy significantly reduces the risk of hypocalcemia (milk fever) and enhances overall migration to cow health. This report examines the mechanisms, benefits, implementation strategies, and latest research on negative DCAD diets for dairy producers seeking to optimize transition cow management.

Why DCAD Works: The Science Behind Calcium Mobilization

DCAD represents the diet’s balance between positively charged cations (primarily sodium and potassium) and negatively charged anions (chloride and sulfur). The most used formula to calculate DCAD is DCAD (meq) = (Na + K) – (Cl + S). A negative DCAD diet contains proportionately more chloride and sulfur in relation to potassium and sodium, thus lowering the dietary cation-anion difference value.

When cows consume a negative DCAD diet, they enter a state of compensated metabolic acidosis, which results in a slight reduction in blood pH and a significant reduction in urine pH. This subtle change in blood pH plays a crucial role in calcium metabolism. The slight acidification increases the sensitivity of tissues to parathyroid hormone (PTH), which helps mobilize calcium from bone reserves and enhances calcium absorption in the intestine.

This metabolic adaptation is significant during the transition period when calcium demands skyrocket. When a cow begins lactation, her calcium requirement suddenly increases dramatically as calcium moves from the bloodstream into colostrum and milk. Proper metabolic preparation can lead to a dangerous drop in blood calcium levels. Negative DCAD diets essentially “prime” the cow’s calcium metabolism system to respond more efficiently to this challenge.

The Calcium Mobilization Pathway: How DCAD Unlocks Bone Reserves

The biological pathways involved in calcium mobilization are complex but well-understood. When blood pH is slightly reduced through negative DCAD feeding, PTH receptors become more responsive. This enhanced sensitivity triggers two key calcium-regulating mechanisms: first, PTH has a direct effect on bone, stimulating the breakdown of bone tissue and releasing stored calcium into the bloodstream; second, PTH stimulates the kidneys to produce more active vitamin D, which in turn increases calcium absorption from the digestive tract.

3 Major Benefits of Negative DCAD Diets That Boost Your Bottom Line

The benefits of feeding negative DCAD diets during the transition period extend far beyond just preventing clinical milk fever. Research has consistently demonstrated multiple advantages for dairy cows and farm productivity.

1. Slash Hypocalcemia Rates: Stop Milk Fever Before It Starts

Hypocalcemia occurs in both clinical (milk fever) and subclinical forms. While clinical cases are obvious when cows go down and cannot stand, subclinical hypocalcemia affects a much more significant percentage of the herd, often 50% of mature dairy cows and 25% of first-calf heifers. These cows appear normal but have reduced blood calcium levels that impair muscle function throughout the body, including the digestive tract and uterus.

A meta-analysis of controlled experiments showed that feeding a negative versus positive DCAD diet reduced the relative risk of developing milk fever to between 0.19 and 0.35. This represents an impressive 65-81% reduction in milk fever risk simply through dietary management. Research has consistently shown that negative DCAD diets can eliminate clinical hypocalcemia and drastically reduce the incidence of subclinical hypocalcemia.

2. Boost Milk Production: More Milk in the Tank

Beyond disease prevention, negative DCAD diets have been shown to enhance lactation performance. A comprehensive meta-analysis found that lowering DCAD increased ionized calcium in blood before and at calving. This improved calcium status supports higher milk production in early lactation.

Research consistently shows that properly implemented negative DCAD programs lead to higher milk production, particularly in second lactation and older cows.

3. Reduce Transition Disorders: Healthier Cows, Fewer Vet Bills

The benefits extend to other transition disorders as well. Studies show a decreased incidence of retained placentas, metritis, displaced abomasums, and improved reproductive performance in cows fed negative DCAD diets. This is partly because calcium is necessary for proper muscle contraction throughout the body, including the uterus and digestive tract. When calcium levels are maintained, these systems function more effectively.

How to Implement a Successful DCAD Program on Your Dairy

Implementing a negative DCAD program requires careful attention to diet formulation and monitoring. Research has identified optimal ranges and practical approaches to achieve the desired effects.

The Perfect DCAD Range: Don’t Go Too Low

The scientific consensus points to an optimal negative DCAD range of -8 to -12 meq per 100 grams of dry matter for transition cows. This level can produce the desired metabolic effects without excessive acidification or decreased feed intake.

Interestingly, research shows that pushing DCAD levels beyond -12 does not provide additional benefits and may be counterproductive. Studies found that reducing the level of negative DCAD too far reduced prepartum dry matter intake and induced a more exacerbated metabolic acidosis. This demonstrates that more is not necessarily better regarding DCAD manipulation.

Table 1: DCAD Implementation Guidelines

ParameterRecommended RangeKey Considerations
Prepartum DCAD-8 to -12 meq/100g DMAvoid < -15 meq for intake
Postpartum DCAD+35 to +45 meq/100g DMSupports lactation
Urine pH (Holstein)6.0-6.8Test 3+ days after initiation
Urine pH (Jersey)5.5-6.0Breed-specific metabolism
Feeding Duration21-42 days prepartumLonger periods are still effective

4 Steps to Implement DCAD Successfully on Your Farm

Successful implementation of a negative DCAD program requires several key steps:

  • Analyze feed ingredients thoroughly: Conduct chemical analysis to know the exact DCAD levels of your feed ingredients and forages. This is crucial because natural variation in mineral content, especially in forages, can significantly impact the final DCAD value.
  • Minimize dietary potassium and sodium: Decrease these cations as much as possible in the transition diet. This often means avoiding or limiting high-potassium forages like certain alfalfa hays.
  • Add appropriate anionic supplements: Adjust DCAD to the target negative range by adding a palatable anion source to the ration. While raw anionic salts were used in early research, many commercial products now offer improved palatability and consistency.
  • Ensure adequate mineral balance: Formulate magnesium above 0.40% of total dry matter and provide sufficient calcium and phosphorus. Research has demonstrated that when more than 180 grams of dietary calcium are fed with a fully acidogenic diet, cows become more resistant to decreases in serum calcium concentrations.

Monitoring Success: The Urine pH Test You Need to Master

Urine pH testing is the simplest and most effective way to monitor whether a negative DCAD diet works appropriately. This non-invasive, low-cost method provides immediate feedback on the cow’s metabolic acid-base status.

Target pH Ranges: Not Too High, Not Too Low

For Holstein cows, the target urine pH range is typically 6.0-6.5, while Jersey cows generally require a slightly lower range of 5.5-6.0 due to breed differences in acid-base metabolism. Some sources recommend a broader range of 6.0-6.8 for all cows. If urine pH falls outside the recommended range, adjustments to the diet or feeding management are needed.

Recent research indicates that urine pH readings below 6.0 may not be reliable indicators of metabolic acid-base status. Once urine pH drops below 6.3, the kidneys change how they remove hydrogen ions from the blood, making urine pH a less reliable indicator of how close the cow is to uncompensated metabolic acidosis.

Simple Testing Protocol: No Need to Check Every Cow

After introducing a negative DCAD diet, wait at least three days before testing urine pH to allow the metabolic effects to develop. Rather than testing every cow daily, select a representative sample (approximately 10%) of cows on the diet for several days. Testing should be done consistently relative to feeding, as there can be diurnal variations in urine pH.

It’s important to remember that the goal is not to achieve the lowest possible urine pH. Instead, urine pH indicates that the negative DCAD diet is achieving the desired metabolic effect. There’s no benefit to extremely low urine pH values, which may indicate excessive acidification.

Timing Matters: When to Start and Stop DCAD Feeding

The timing and duration of negative DCAD feeding are essential factors in maximizing its benefits while managing costs and logistics.

Optimal Feeding Window: The 3-Week Sweet Spot

The standard recommendation is to feed negative DCAD diets during the last three weeks before expected calving. This timeframe allows sufficient opportunity for the diet to influence calcium metabolism before the calcium challenge of lactation begins.

Some research indicates that feeding a negative DCAD diet for more extended periods, up to 42 days before calving, can also be practical and doesn’t appear to cause problems. This flexibility can benefit farms with limited ability to move cows between groups frequently.

Group Housing Strategies: Making DCAD Work in Your Barn

If pen moves or grouping strategies don’t allow a separate transition group to be formed 21 days prepartum, farms can still benefit from negative DCAD feeding. Research suggests that starting negative DCAD diets earlier in the dry period can yield health and production benefits like the standard three-week protocol.

However, it’s important to note that DCAD manipulation is not recommended for lactating cows, where a positive DCAD diet is beneficial for milk production. Research suggests a negative DCAD in the prepartum stage and a positive DCAD in the postpartum stage for optimal milk production efficiency and minimal metabolic disorders.

Critical Considerations: The Latest Research Findings You Need to Know

While negative DCAD diets have proven highly effective, there are some important considerations and potential limitations to keep in mind.

First-Calf Heifers: Why DCAD May Hurt, Not Help

Recent research has revealed that nulliparous cows (first-calf heifers) respond differently to negative DCAD diets than multiparous cows. Studies have found that reducing DCAD improved milk, fat-corrected milk, fat, and protein yields in multiparous cows; however, in nulliparous cows, reducing DCAD either did not affect milk and protein yields or reduced fat-corrected milk and fat yields.

Research has found that the reproductive performance of first-lactation heifers was impaired when fed negative DCAD diets, in contrast to their older herd counterparts. This research suggests that different DCAD recommendations may be needed for first-calf heifers, and negative DCAD diets are not recommended for this group.

Table 2: Parity-Specific Responses to Negative DCAD

OutcomeMultiparous CowsNulliparous Cows
Milk Yield Change+1.7-3.2 kg/dNo improvement/Reduction
Reproductive PerformanceImprovedImpaired
Recommended DCAD-8 to -12 meq/100g DMNeutral/Positive DCAD
Metabolic BenefitStrong calcium mobilizationMinimal benefit

Palatability Challenges: Keeping Feed Intake Strong

One of the main drawbacks of traditional negative DCAD programs is palatability issues with raw anionic salts, which can reduce feed intake. Decreased prepartum feed intake is an expected response when feeding negative DCAD diets due to induced metabolic acidosis. However, modern commercial anion supplements often have improved palatability compared to raw anionic salts.

Research has clarified that the depression in feed intake is not necessarily related to the inclusion of acidogenic products but is caused by the metabolic acidosis induced by the acidogenic diet.

The DCAD Cost-Benefit Analysis: Is It Worth It? (Spoiler: Yes!)

Decreasing the ration DCAD to achieve very low urine pH values adds unnecessary cost without additional benefits. When formulating from a base diet of +18 to a negative DCAD of -8, there is a cost associated with adding anionic supplements. Pushing beyond necessary levels (e.g., from -10 to -14) adds cost with no added benefit.

Given that first-lactation heifers may not benefit from negative DCAD diets and could experience reproductive impairment, selective use of negative DCAD diets only for multiparous cows could provide significant cost savings.

Table 3: Economic Impact of DCAD Implementation

FactorTypical ImpactEconomic Value
Milk Fever Prevention65-81% reduction$300/case avoided
Subclinical Hypocalcemia50% reduction$125/cow in lost production
Feed Cost Increase$0.65/cow/day
Milk Yield Increase1,800-3,200 lbs/lactation$360-640/cow (@$0.20/lb)
Reproductive Efficiency15% improvement$150/cow in reduced losses

Cutting-Edge DCAD Research: What’s New in Transition Cow Nutrition

Research on DCAD continues to evolve, with scientists exploring refinements and alternatives to traditional approaches.

Moderate vs. Extreme Acidification: Finding the Sweet Spot

Recent research has focused on moderate acidification (pH 6.0-7.0) and extreme acidification (pH below 6.0). The evidence suggests that moderate acidification provides the benefits of improved calcium metabolism without the risks of uncompensated metabolic acidosis that can occur with extreme acidification.

Studies have shown that regardless of the blood calcium threshold used to establish hypocalcemia, the incidence of hypocalcemia and related health problems was not decreased by making cows extremely acidotic.

Neutral DCAD: A Promising Alternative?

While negative DCAD diets remain the gold standard, some researchers are investigating whether a neutral DCAD (0 ± 30 mEq/kg) might offer benefits while reducing palatability issues. A cross-sectional study of eight dairy herds found that adjusting DCAD to neutral values reduced clinical parturient paresis (milk fever) occurrence by an average of 87% compared to baseline. This approach might improve ration palatability by requiring lower levels of acidogenic salts.

However, more research is needed to fully validate this approach, particularly its effects on subclinical hypocalcemia and feed intake.

Immune Function Boost: An Unexpected Benefit

Research has examined whether negative DCAD diets affect immune function. Studies assessing effects on blood neutrophil function found that negative DCAD diets can improve neutrophil function in parous cows, particularly the proportion of neutrophils with killing activity. This suggests that the metabolic benefits of negative DCAD feeding may extend to improved immune function.

Long-term Performance Effects: The Gift That Keeps Giving

Controlled trials on commercial dairy farms have confirmed that feeding negative DCAD diets improved milk production in multiparous cows, particularly in early lactation. This adds to the growing body of evidence supporting the long-term performance benefits of this approach beyond just transition health.

Bottom Line: DCAD Still Delivers Results When Done Right

Negative DCAD diets remain among the most well-researched and effective nutritional strategies for managing transition cows. The evidence strongly supports their use to prevent hypocalcemia, reduce other transition disorders, and improve subsequent lactation performance, particularly in multiparous cows.

The optimal implementation involves feeding a diet with DCAD in the range of -8 to -12 meq per 100 grams of dry matter during the last three weeks before calving, monitoring effectiveness through urine pH (targeting 6.0-6.8), and ensuring adequate levels of calcium, magnesium, and phosphorus.

Essential updates to traditional recommendations include:

  1. Negative DCAD diets should NOT be fed to first-lactation heifers, as they may impair reproductive performance in this group.
  2. Moderate acidification (urine pH 6.0-6.8) is preferable to extreme acidification (urine pH below 6.0).
  3. After calving, cows should transition to a positive DCAD diet (+35 to +45 meq/100g DM) to support milk production.
  4. While negative DCAD remains the gold standard, neutral DCAD (0 ± 30 mEq/kg) shows promise as an alternative that may improve palatability while still reducing milk fever incidence.

For dairy producers seeking to optimize transition cow health and performance, implementing a well-designed negative DCAD program for multiparous cows represents a science-backed investment in cow health and farm profitability.

Key Questions for Your Nutritionist:

  • What is the current DCAD level in our transition cow diet?
  • Are we monitoring urine pH regularly to confirm our DCAD strategy is working?
  • Should we consider separating first-calf heifers from our negative DCAD program?
  • What is the cost-benefit analysis of our current DCAD implementation?

Learn more:

Join the Revolution!

Join over 30,000 successful dairy professionals who rely on Bullvine Daily for their competitive edge. Delivered directly to your inbox each week, our exclusive industry insights help you make smarter decisions while saving precious hours every week. Never miss critical updates on milk production trends, breakthrough technologies, and profit-boosting strategies that top producers are already implementing. Subscribe now to transform your dairy operation’s efficiency and profitability—your future success is just one click away.

NewsSubscribe
First
Last
Consent
Send this to a friend