A $511 metritis case rarely announces itself — it hides in the herd average. But your fresh-cow records flagged it days early. Here’s the 30-minute Monday habit that catches the cow before the tank does.
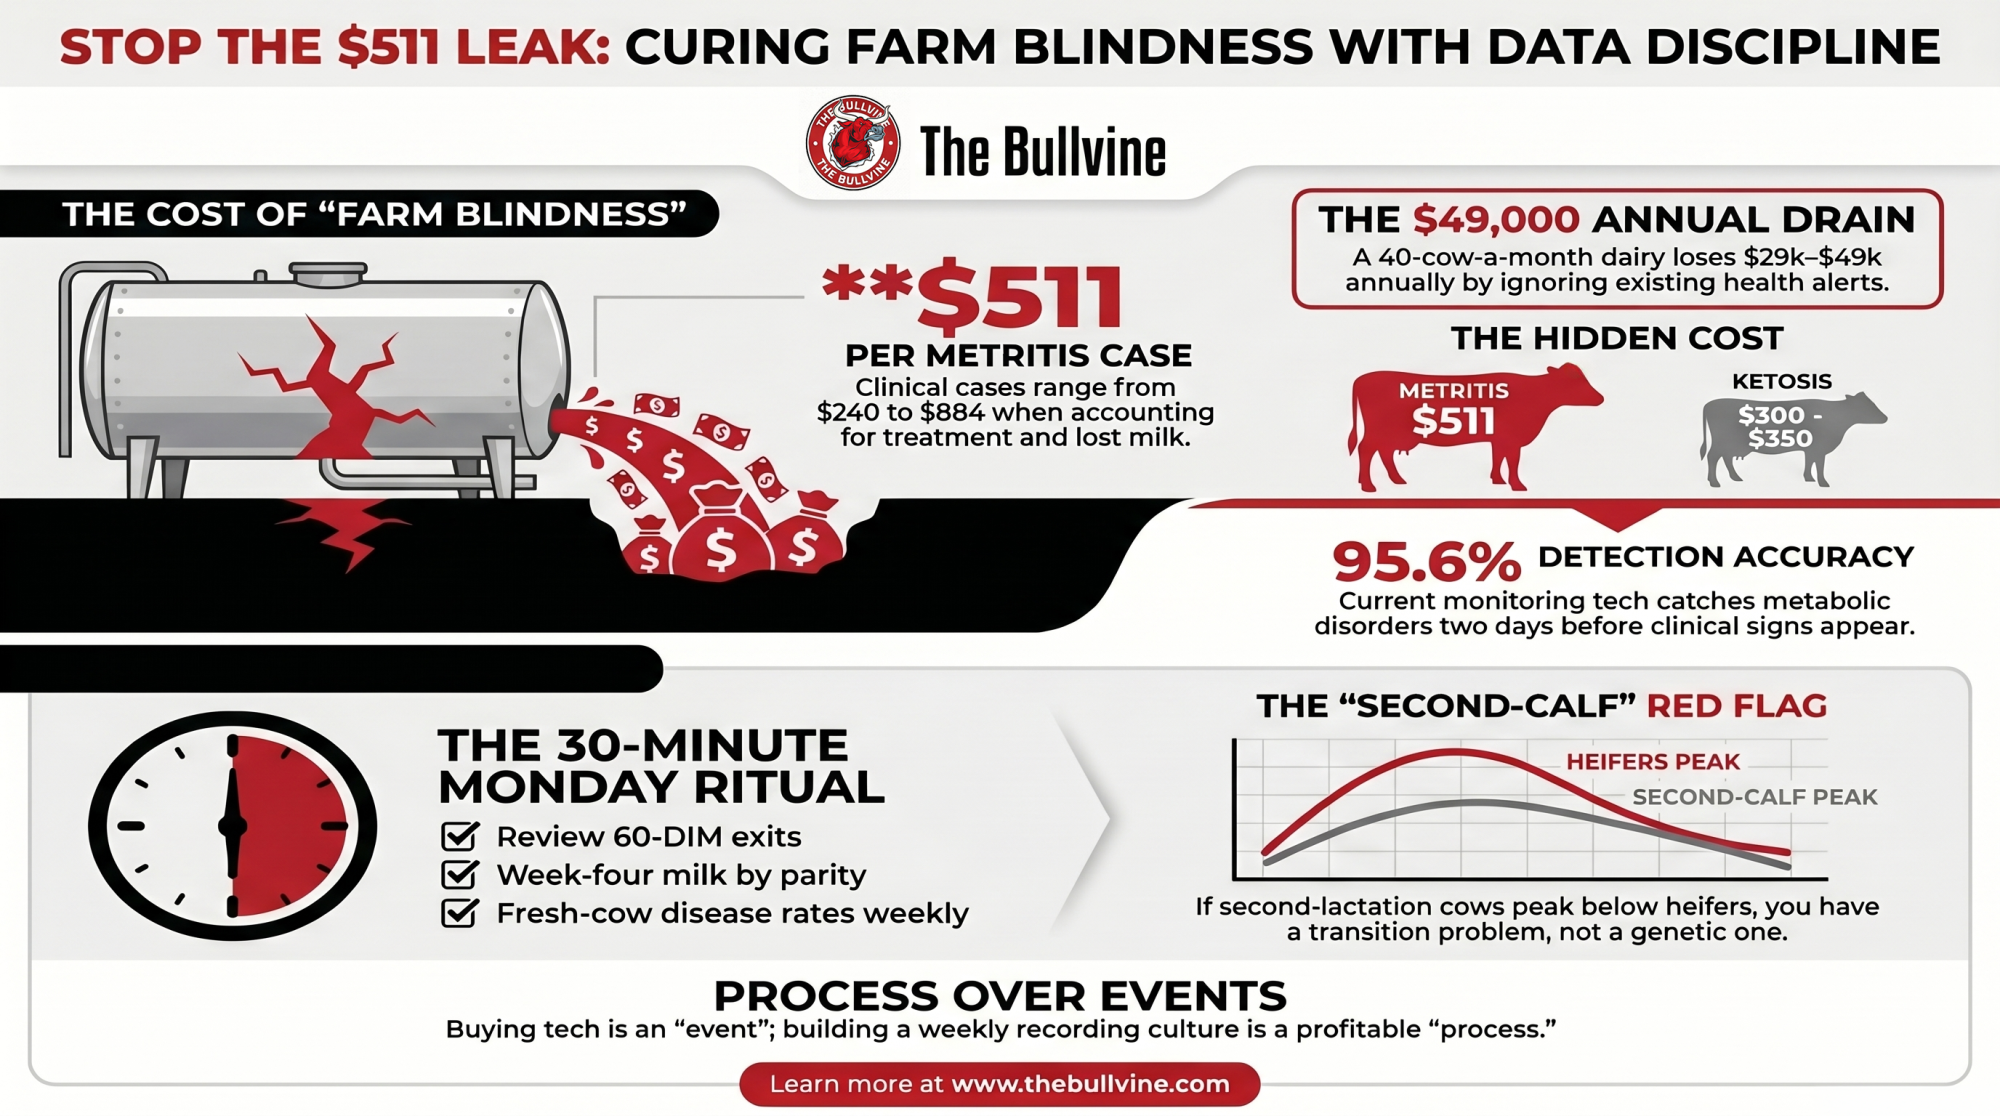
Executive Summary: Metritis quietly pulls $29,000 to $49,000 a year out of a 40-cow-a-month dairy, one $511 case at a time — and most of those cases were visible in your records before they ever hit the tank. Most mid-size dairies already own the tech to catch them; Cornell’s monitoring work flags fresh-cow trouble at 95.6% accuracy, about two days before clinical signs. The leak isn’t the gear — it’s that nobody reads the reports the system’s already generating, what Teagasc’s John Mee calls “farm blindness.” Watch your second-calf cows especially: when they peak under your first-calf heifers, that’s a transition signal, not a genetics one, and it’s fixable from the dry pen. The fix costs nothing you haven’t already bought — a 30-minute Monday review of three numbers: 60-DIM exits, week-four milk by parity, and fresh-cow disease per 100 calvings. Pull those before the barn takes over tomorrow, and if you can’t pull them cleanly, that’s your first finding.
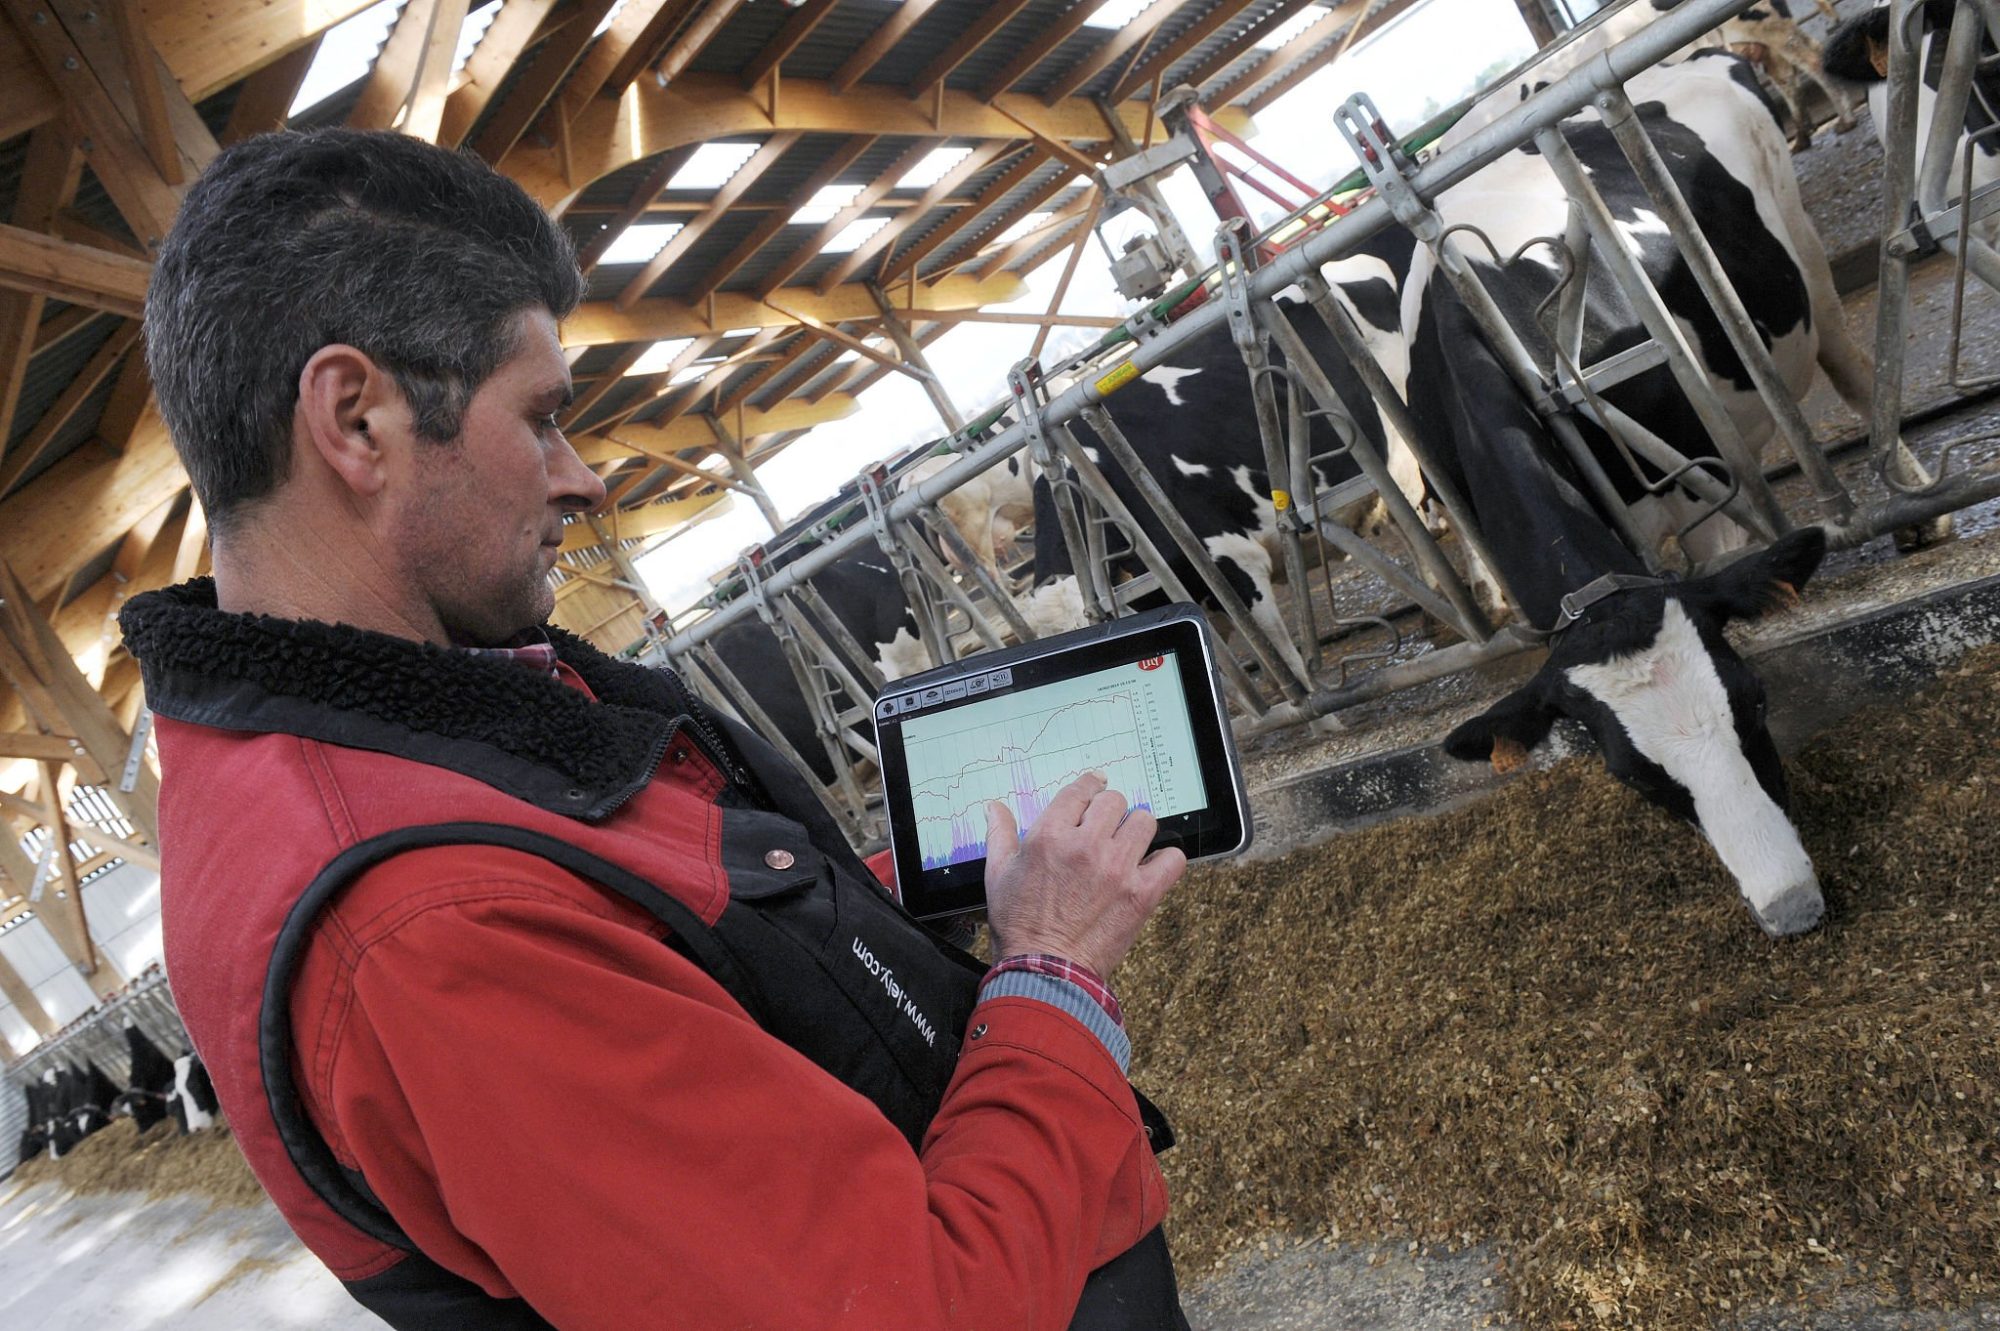
One operator walks into the office on Monday morning, grabs a coffee, and spends 20 minutes reviewing a transition report before he starts the day. Another walks in to three sick cows from the weekend and a list of fires to put out. Both are milking roughly the same number of cows. Only one of them is actually making money.
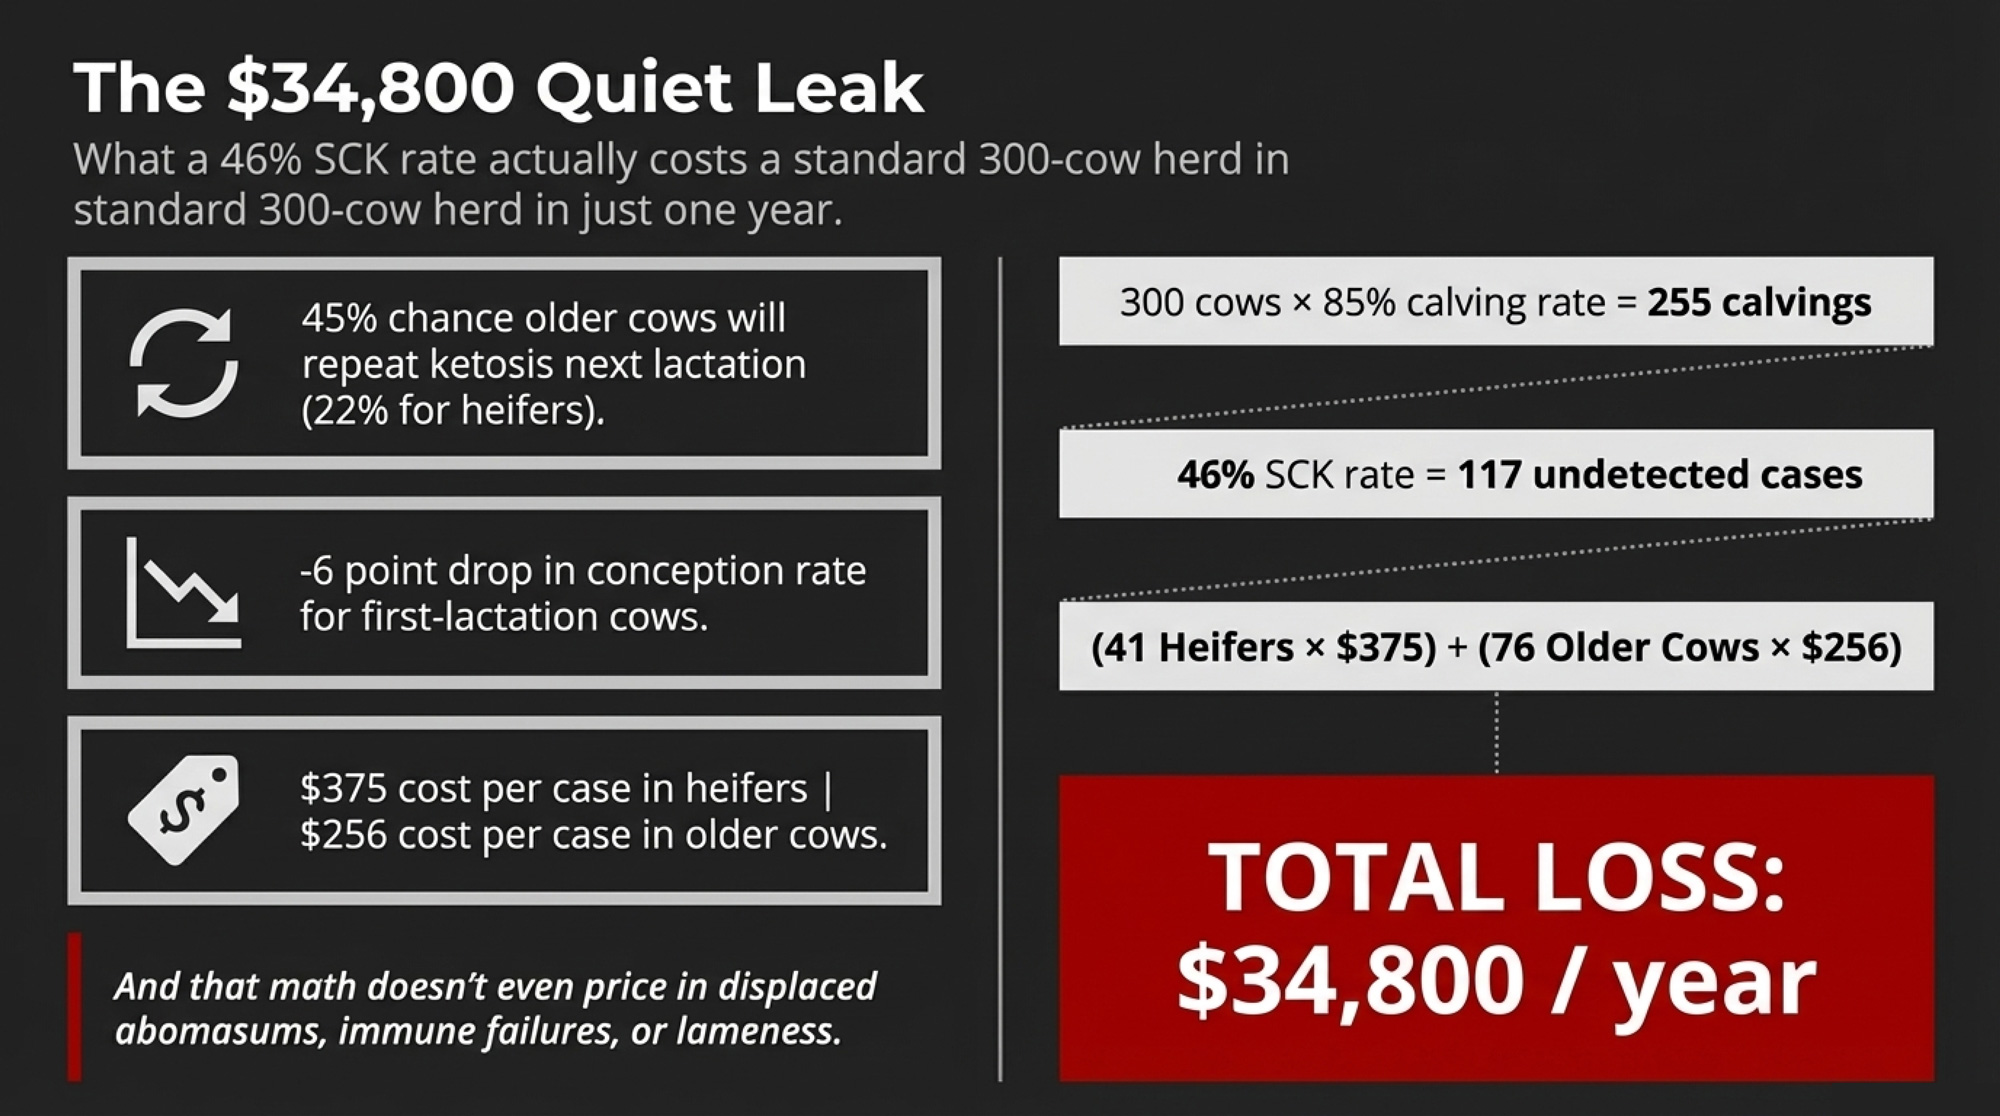
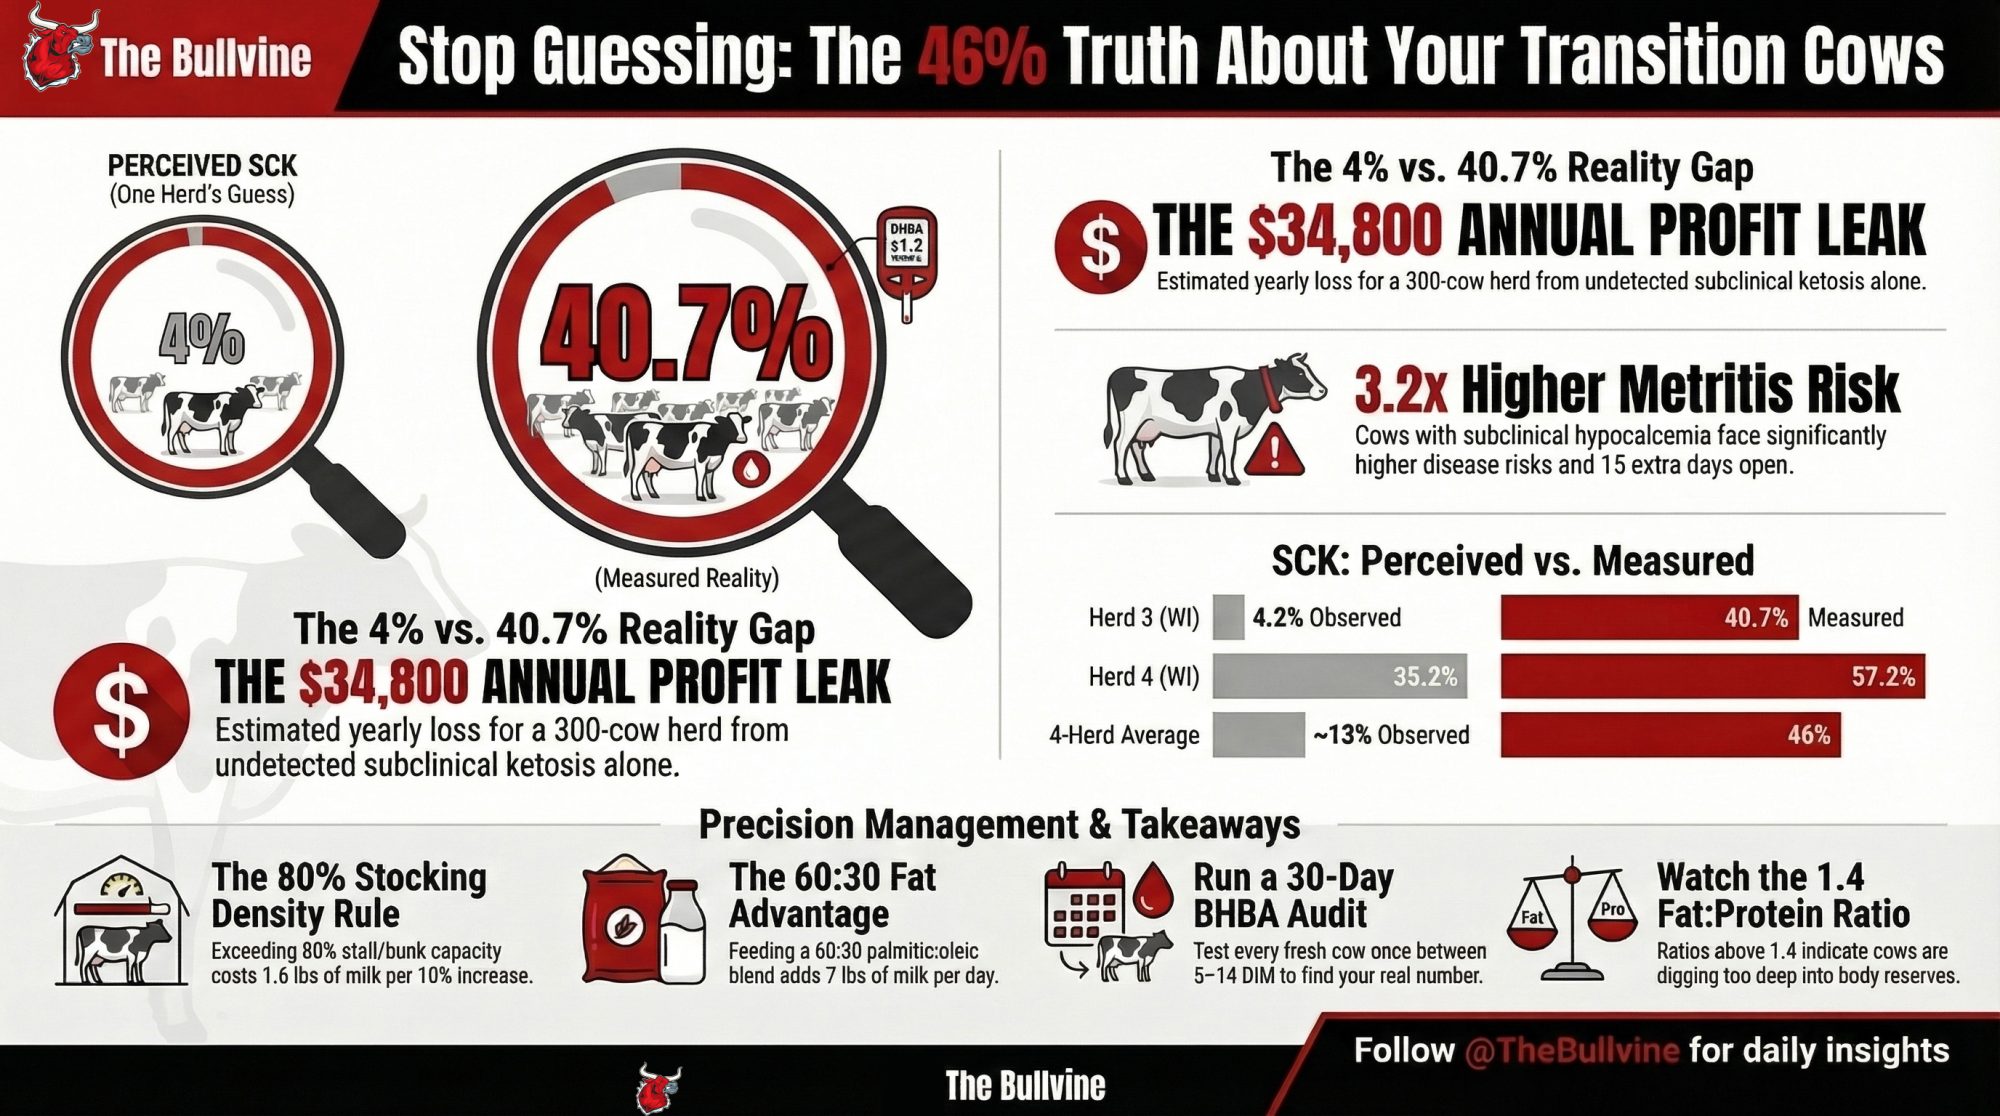
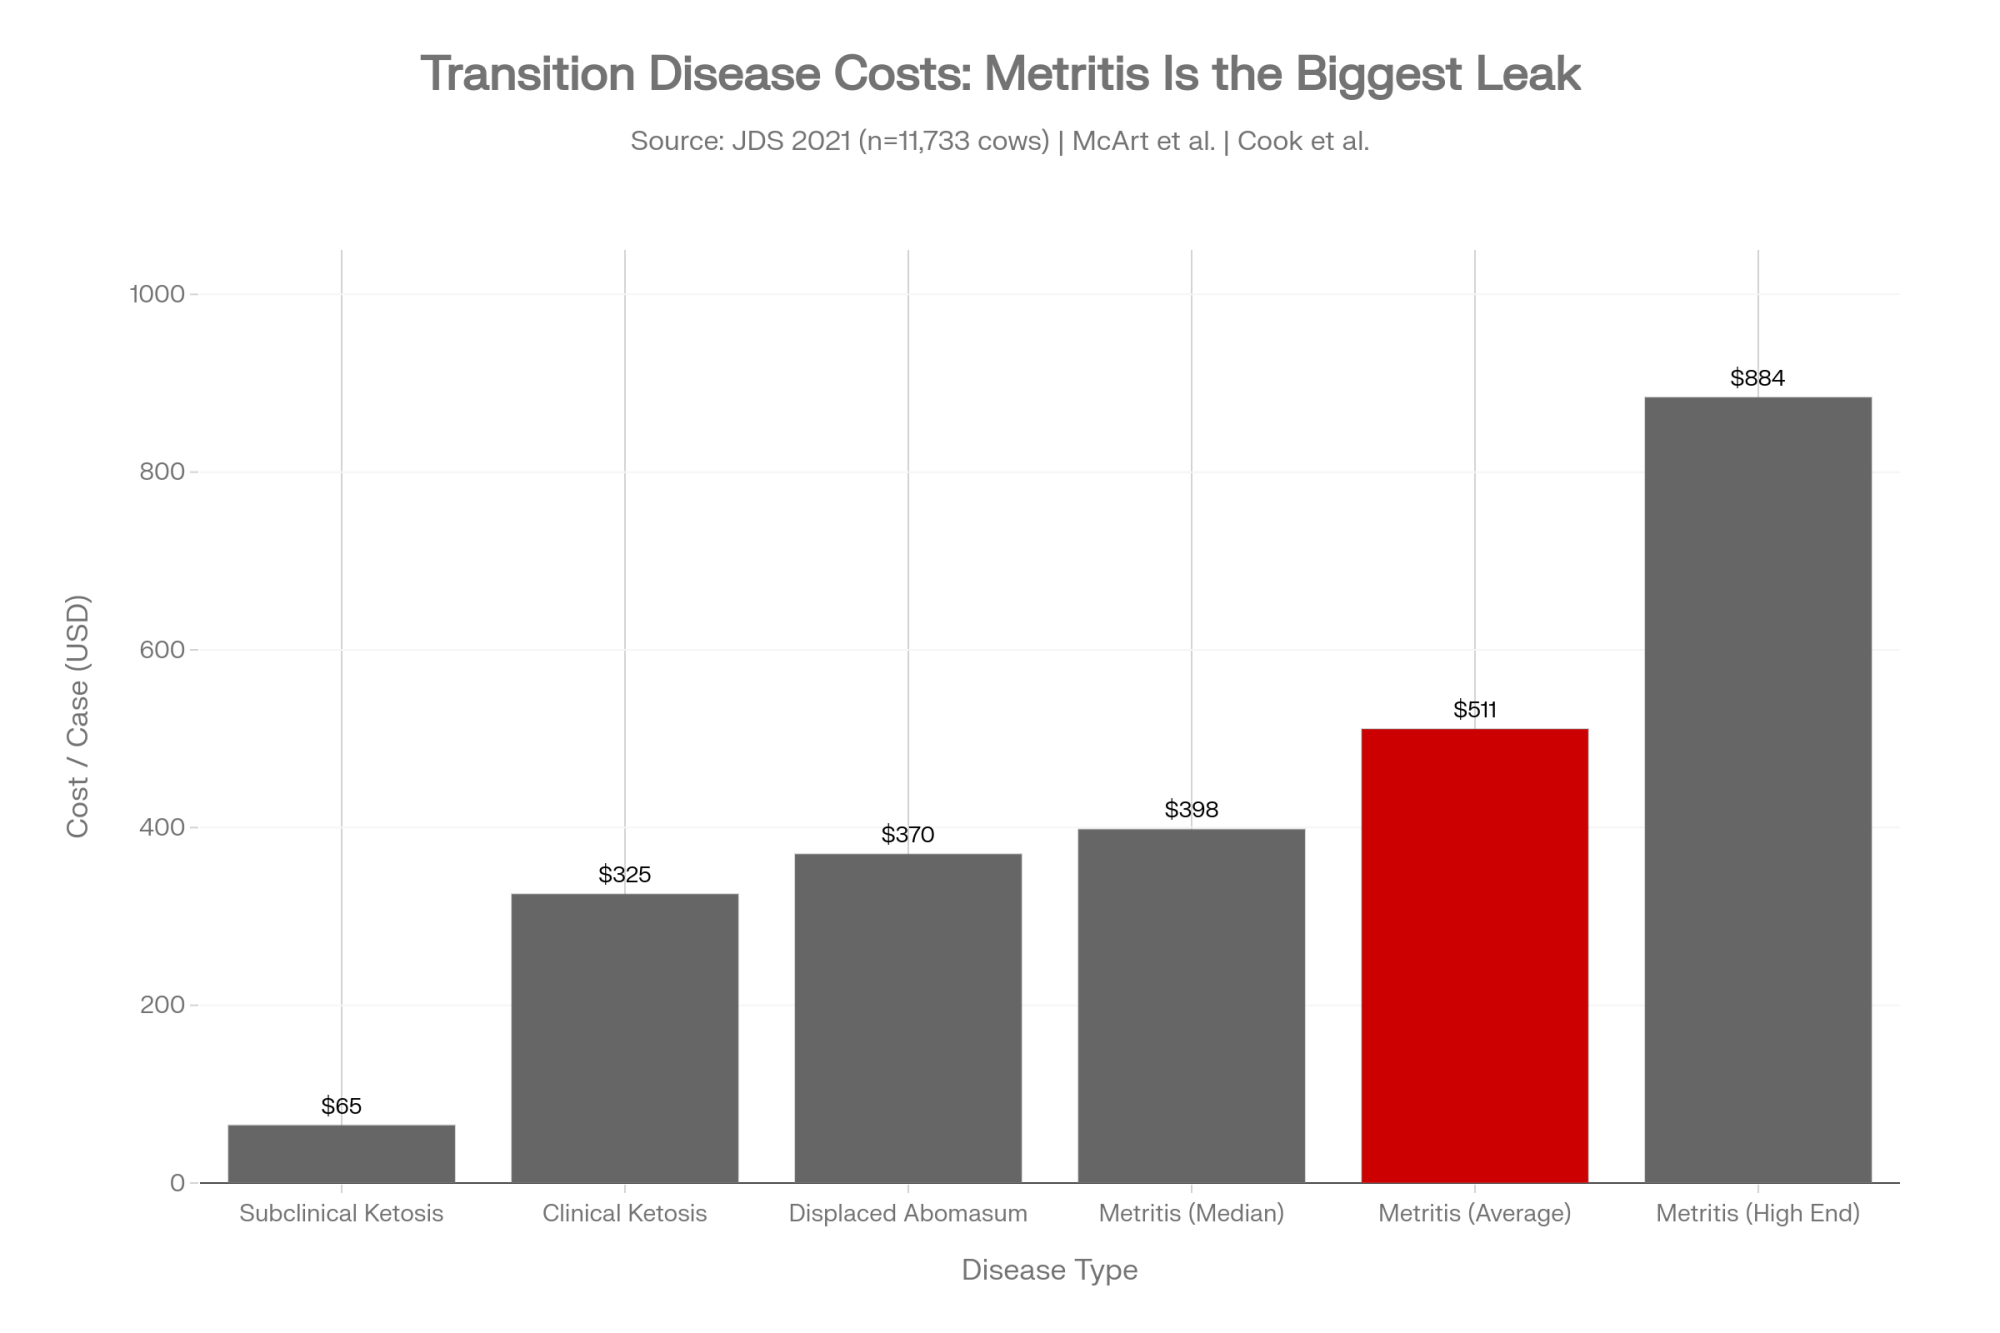
That gap — between a farm that uses the data it already has and one that keeps buying the next shiny thing — is where many mid‑size dairies are either quietly winning or slowly bleeding out. And the leak isn’t small. A single clinical ketosis case runs an estimated $300 to $350 once feed, treatment, lost milk, and reproduction are added up. Metritis is worse: a 2021 Journal of Dairy Science study of 11,733 cows across 16 U.S. herds pegged the average metritis case at $511 (median $398), with most cases ranging from $240 to $884.
Miss a handful of those a month, and you’re not running a dairy. You’re running a slow drain.
The squeezed middle nobody wants to talk about
Mid‑size dairies sit in a brutal spot. Too big to run on family labor and gut feel alone. Too small to spread the cost of every sensor, software platform, and specialist across thousands of cows. They feel it every month.
So they do what the industry’s been telling them to do for years. They install activity monitors. They add fresh‑cow tags. They buy the herd‑management platform. Then they run all of it at maybe half of what it could deliver, because the management side — the recording discipline, the clear protocols, the person who actually reads the reports — never catches up to the capital they poured in.
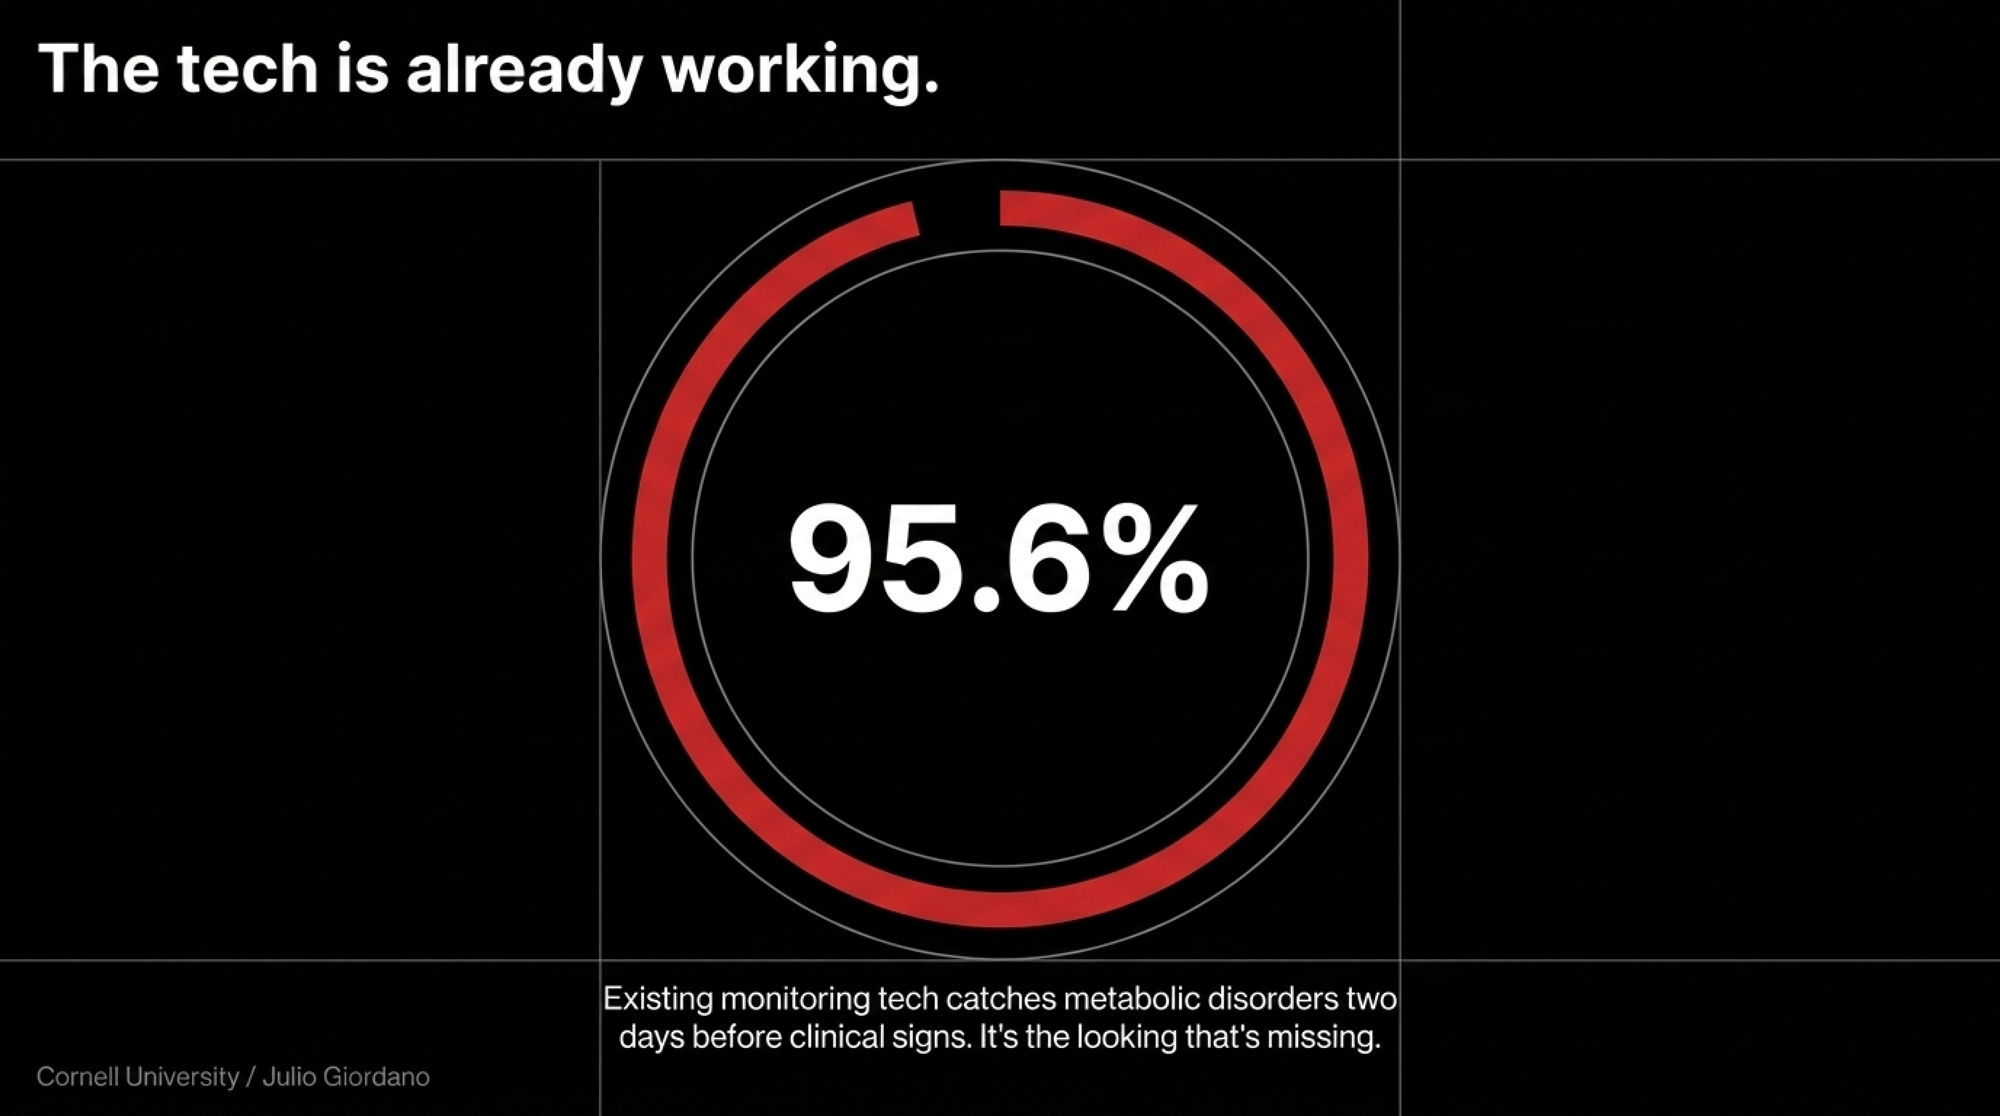
Here’s the irony. The technology has gotten genuinely good. Cornell work led by Julio Giordano found activity‑and‑rumination monitoring flagged illness across an 80‑day‑in‑milk window with 95.6% accuracy, catching metabolic disorders an average of about two days before clinical signs, at a false‑positive rate of just 2.4%. Farms that act on those early warnings report 40 to 70% lower treatment costs through earlier intervention. The warning is sitting in the system, days ahead of the problem. It’s the looking that’s missing.
What you get instead isn’t a crash. It’s a drift. A few more retained placentas than there should be. Fresh cows that always seem “a bit slow.” Ketosis that feels “about normal for us.” Over time, those patterns stop reading as problems. They just become your farm.
Teagasc researcher John Mee gave that drift a name in a 2020 paper: farm blindness — the misperception that what you see every day on your own place is normal, even when it isn’t. A new normal you quit questioning. And the data that would prove something’s off is usually already on the farm. It’s just not getting used.
Why does the shiny object always win?
Walk through what happens when a salesperson offers you a new piece of technology.
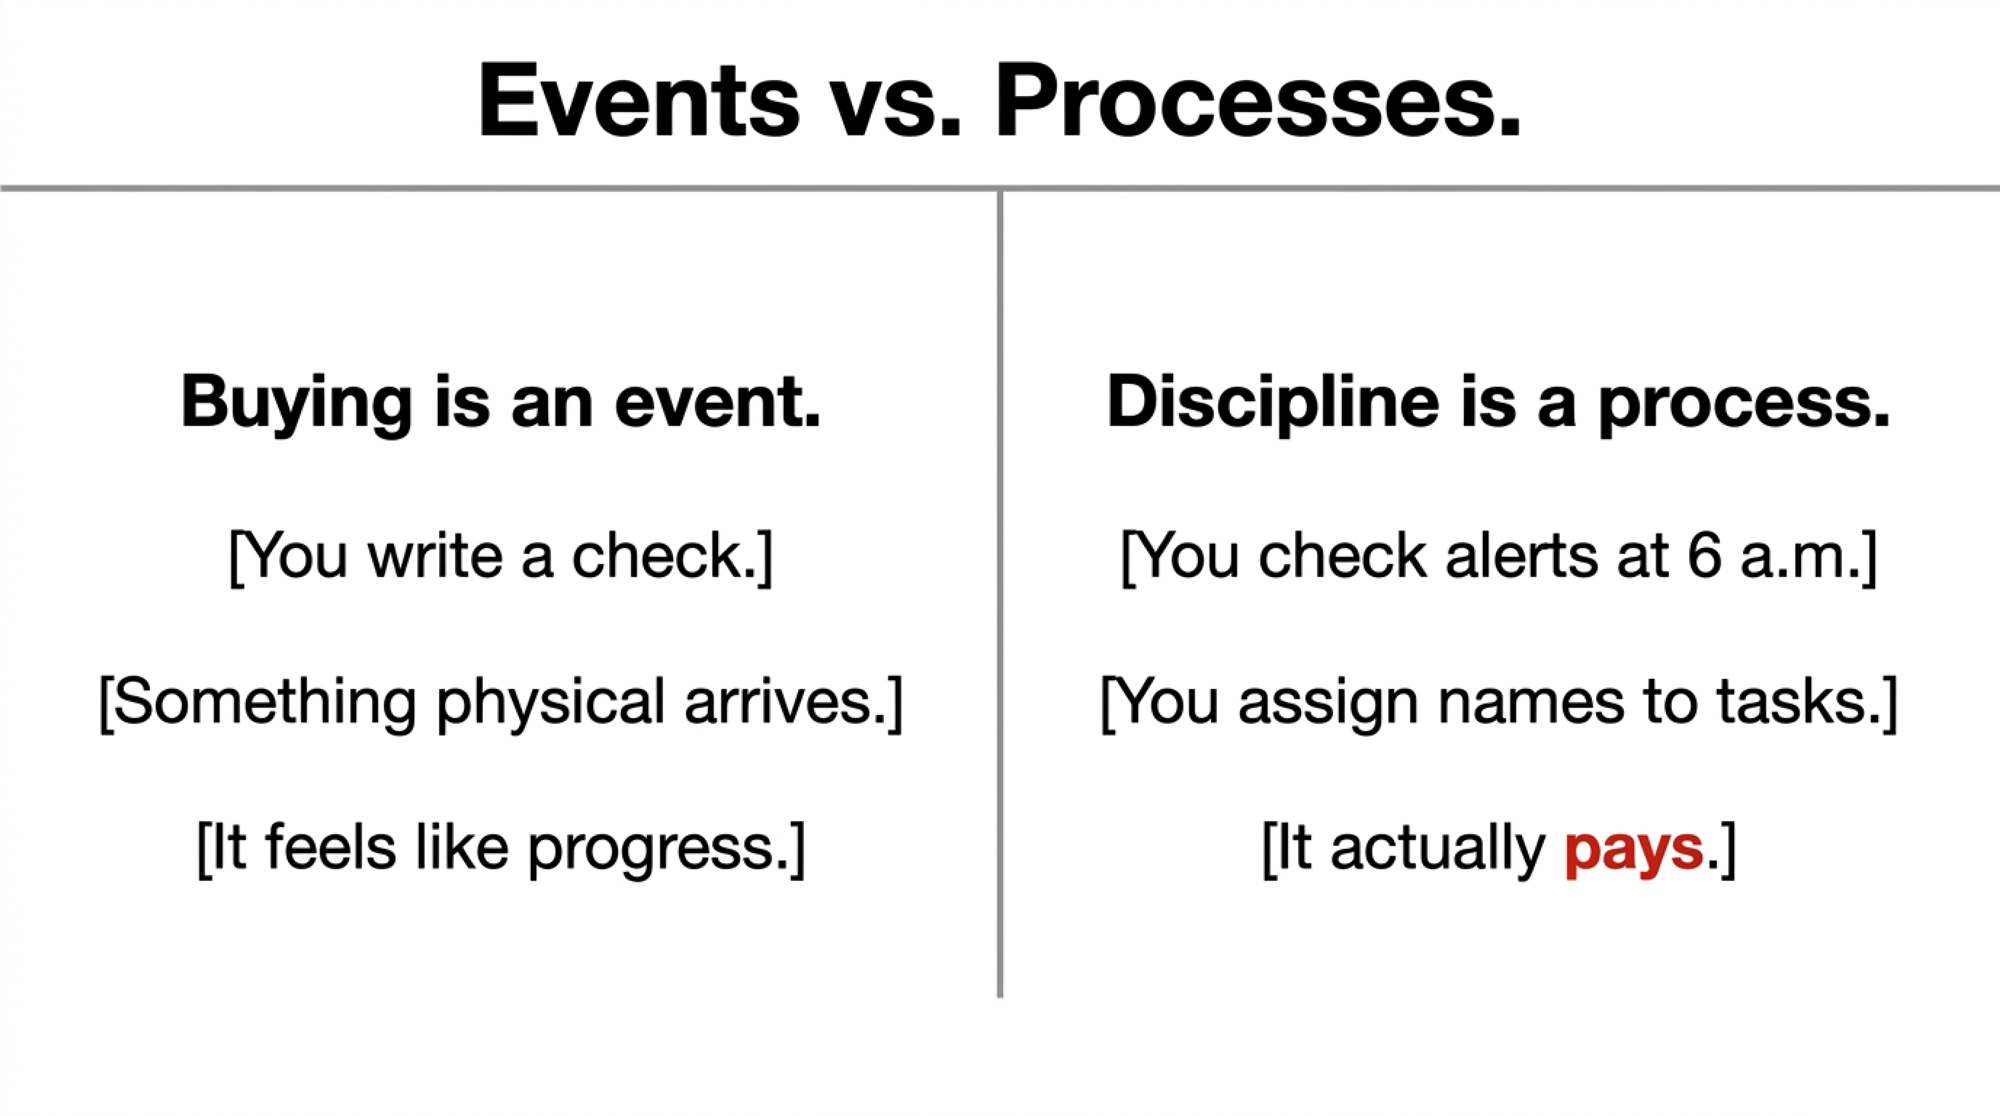
You can see a sensor on the cow. You can show your banker the invoice. You can tell your neighbor, “We just put in fresh cow monitoring.” It feels like a decision you can point to. You write a cheque, and something physical shows up.
Discipline doesn’t look like anything. It’s the weekend employee logging a metritis case on the right day in milk, with the right definition. It’s the written rule about who checks the alert list at 6 a.m. and what they do when rumination drops on three fresh cows. It’s the operator who actually pulls a week‑four milk report every Monday and reads it.
Nobody gives you a dealer discount for that. You can’t stand up at a producer meeting and say, “We wrote a better protocol,” and expect applause.
Tech marketing leans on a quiet promise: this will solve your problem. The framing implies the problem is a lack of technology, not a lack of execution. So a farm that already struggles to follow through buys a system that assumes follow‑through. When the results don’t show, it’s easier to say “we need a newer system” than “we never built the discipline around the one we have.” Worth knowing, too: only about 5% of commercial monitoring tools have been externally validated, even as the precision‑livestock market hit $5.59 billion in 2025.
Events feel like progress. Processes feel like work. Buying is an event. Building a culture where people record, review, and act every single week is a process. It doesn’t impress anyone. But it’s the thing that actually pays.
Two Mondays, same herd size, very different futures
Put two Monday mornings side by side. Same gear, same cow numbers, same week.
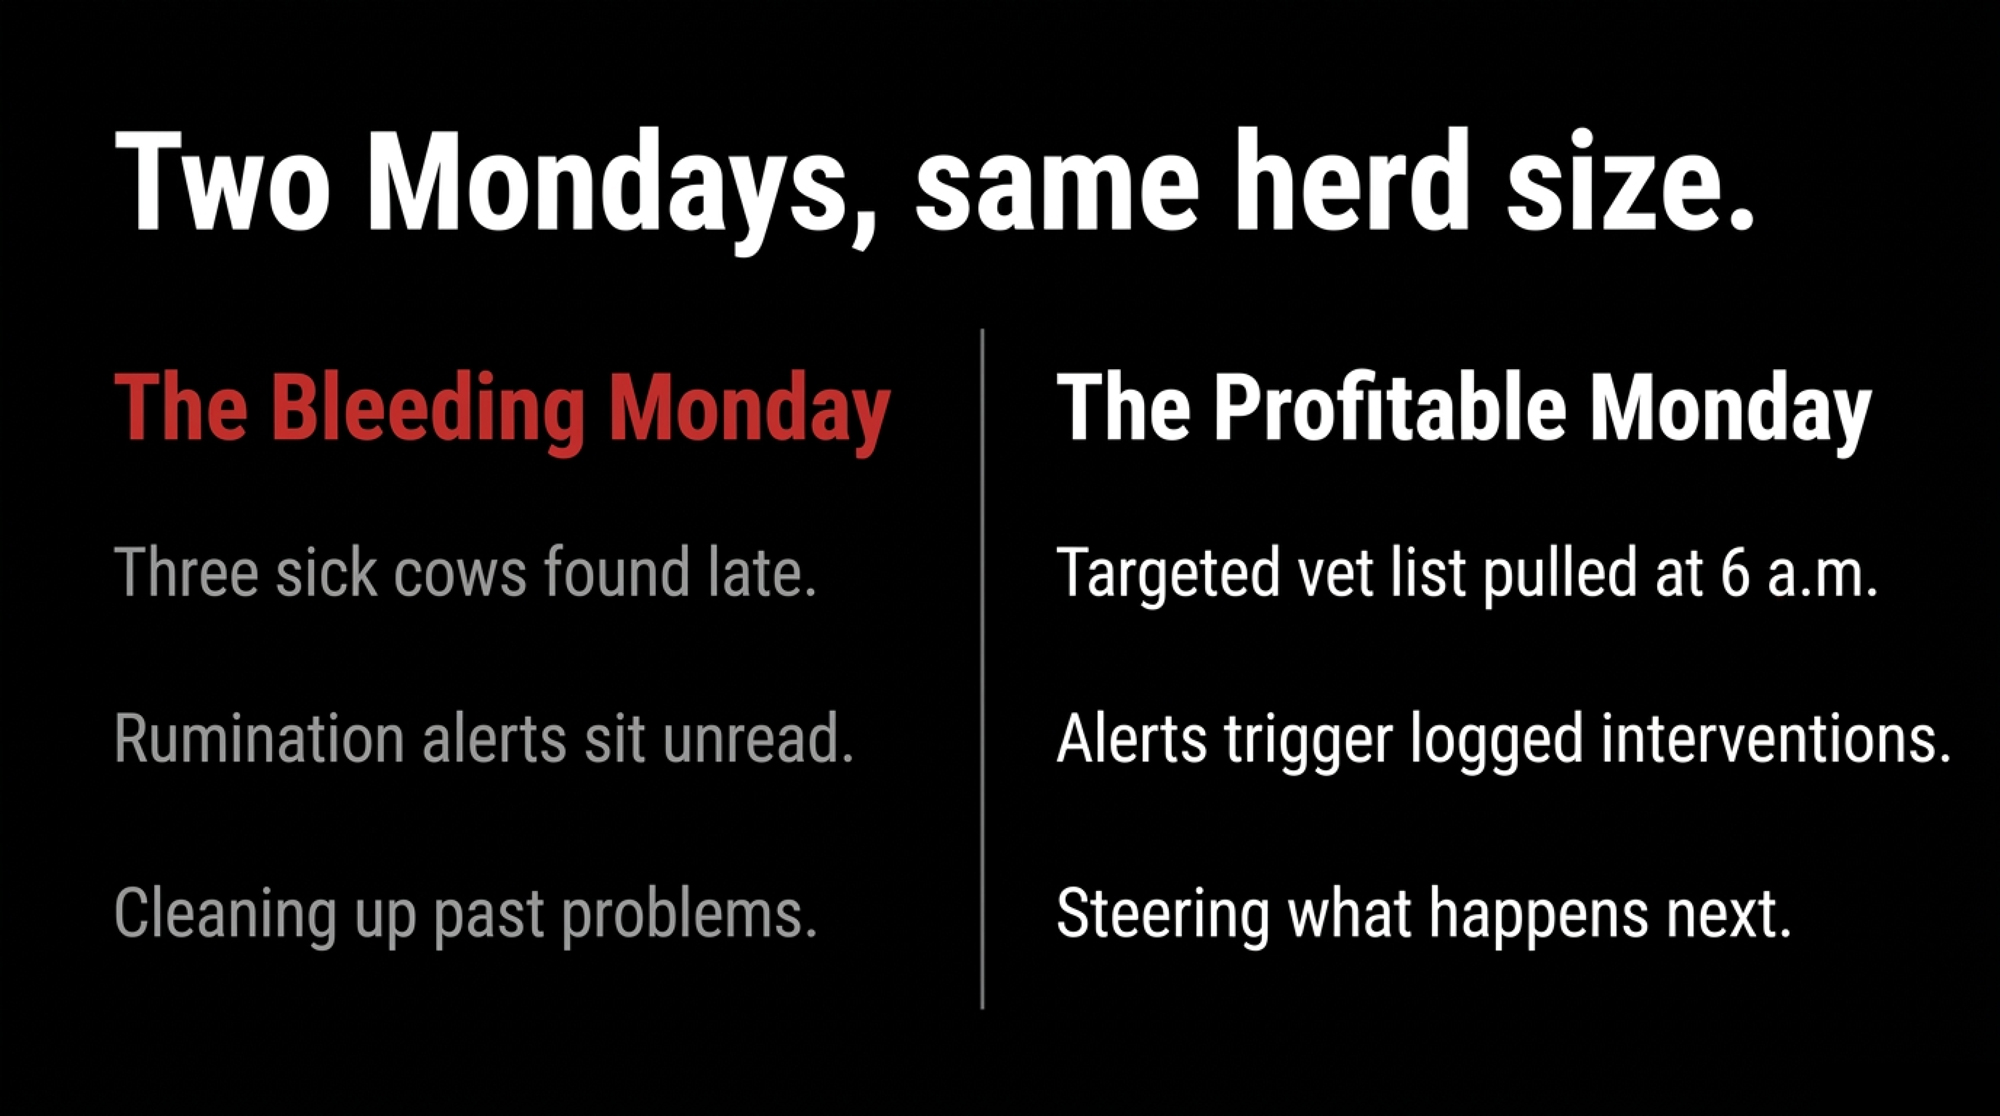
The bleeding Monday — reactive, looking backward:
- Three sick cows turned up over the weekend; nobody caught them when they were just a little off.
- The freshening date in the software is wrong, so days‑in‑milk can’t be trusted.
- A Saturday metritis case got logged as a vague “uterine infection” by weekend staff, so it won’t count right anywhere.
- Week‑four milk by parity? Not pulled. The nutritionist arrives Wednesday to a cold start.
- The close‑up pen is overcrowded because the predicted fresh list got buried two weeks ago.
- A Friday alert on four cows with dropping rumination is still sitting there, unread.
This operator isn’t lazy. He’s in the barn, the parlor, on the phone all day. But everything he touches is cleanup on problems that started days or weeks ago.
The profitable Monday — same effort, pointed forward:
- He opens the report before the barn. Week‑four milk is split by parity; first‑lactation cows are on target, second‑lactation cows are a few pounds light. That gets a note for tomorrow’s vet visit.
- Two weekend rumination alerts both show an intervention, both logged within hours.
- Close‑up stocking is right because he moved cows Thursday off a predicted fresh list he pulled the Monday before.
- He already knows his monthly metritis number before his advisor brings it up. If it’s high, the question is “why,” not “if.”
Then he goes and works a day that, from the road, looks a lot like the first operator’s. The difference is direction. The data he already owns is steering what he does next.
How one 500-cow dairy turned its own data back on
Here’s where it gets concrete. Picture a mid‑size operator — call him the profitable Monday — running about 500 cows. Tags on every animal. A herd‑management platform he’d mostly been using for heat detection. His fresh‑cow program was “fine.” Cows got looked at twice a day. Problems got handled when someone caught them. On paper, a well-run dairy.
Then he hit a stretch of fresh‑cow losses he couldn’t explain. Three cows down in a bad ten days, two of them culled before 60 DIM. Nothing in the weather, nothing in the ration he’d changed. Just a run of bad cows — or so it felt at the time. His vet, flipping back through the records during a herd check, said the line that stuck: “This has been building for a couple of months. It’s in your numbers.” That’s the moment farm blindness cracks. The losses hadn’t come out of nowhere. He just hadn’t been looking where they were written down.
So he stopped buying and started reading. First move: he pulled week‑four milk by parity, something his test‑day data already supported and he’d never broken out. His second‑calf cows were peaking below his first‑calf heifers — a clear flag that something in transition was costing him, and exactly the pattern the research warns about, since a cow’s second freshening runs harder on body reserves than her first. Second move: he fixed how disease got recorded. One definition for metritis, logged at a consistent day in milk, no more weekend “uterine infection” guesses that counted nowhere. Third move: the 6 a.m. alert list became one named person’s job, with a standing rule that anything off-target went to the vet by noon.
None of that came off an invoice. He didn’t add a sensor or swap platforms. He turned the gear he already owned back on, on the management side.
The research says that loop pays, and it isn’t subtle. Cornell’s work found that acting on the automated alerts the system was already generating produced greater early‑lactation milk yield and fewer cows culled than visual observation alone. Poor transition management quietly costs 10 to 20 pounds of peak production per cow, and preventing clinical disease lifts 305‑day yield by roughly 3.5%. For a 500-cow herd, even a few pounds of recovered peak across the fresh string is real money in the tank — the kind that shows up without a single new piece of hardware on the cow.
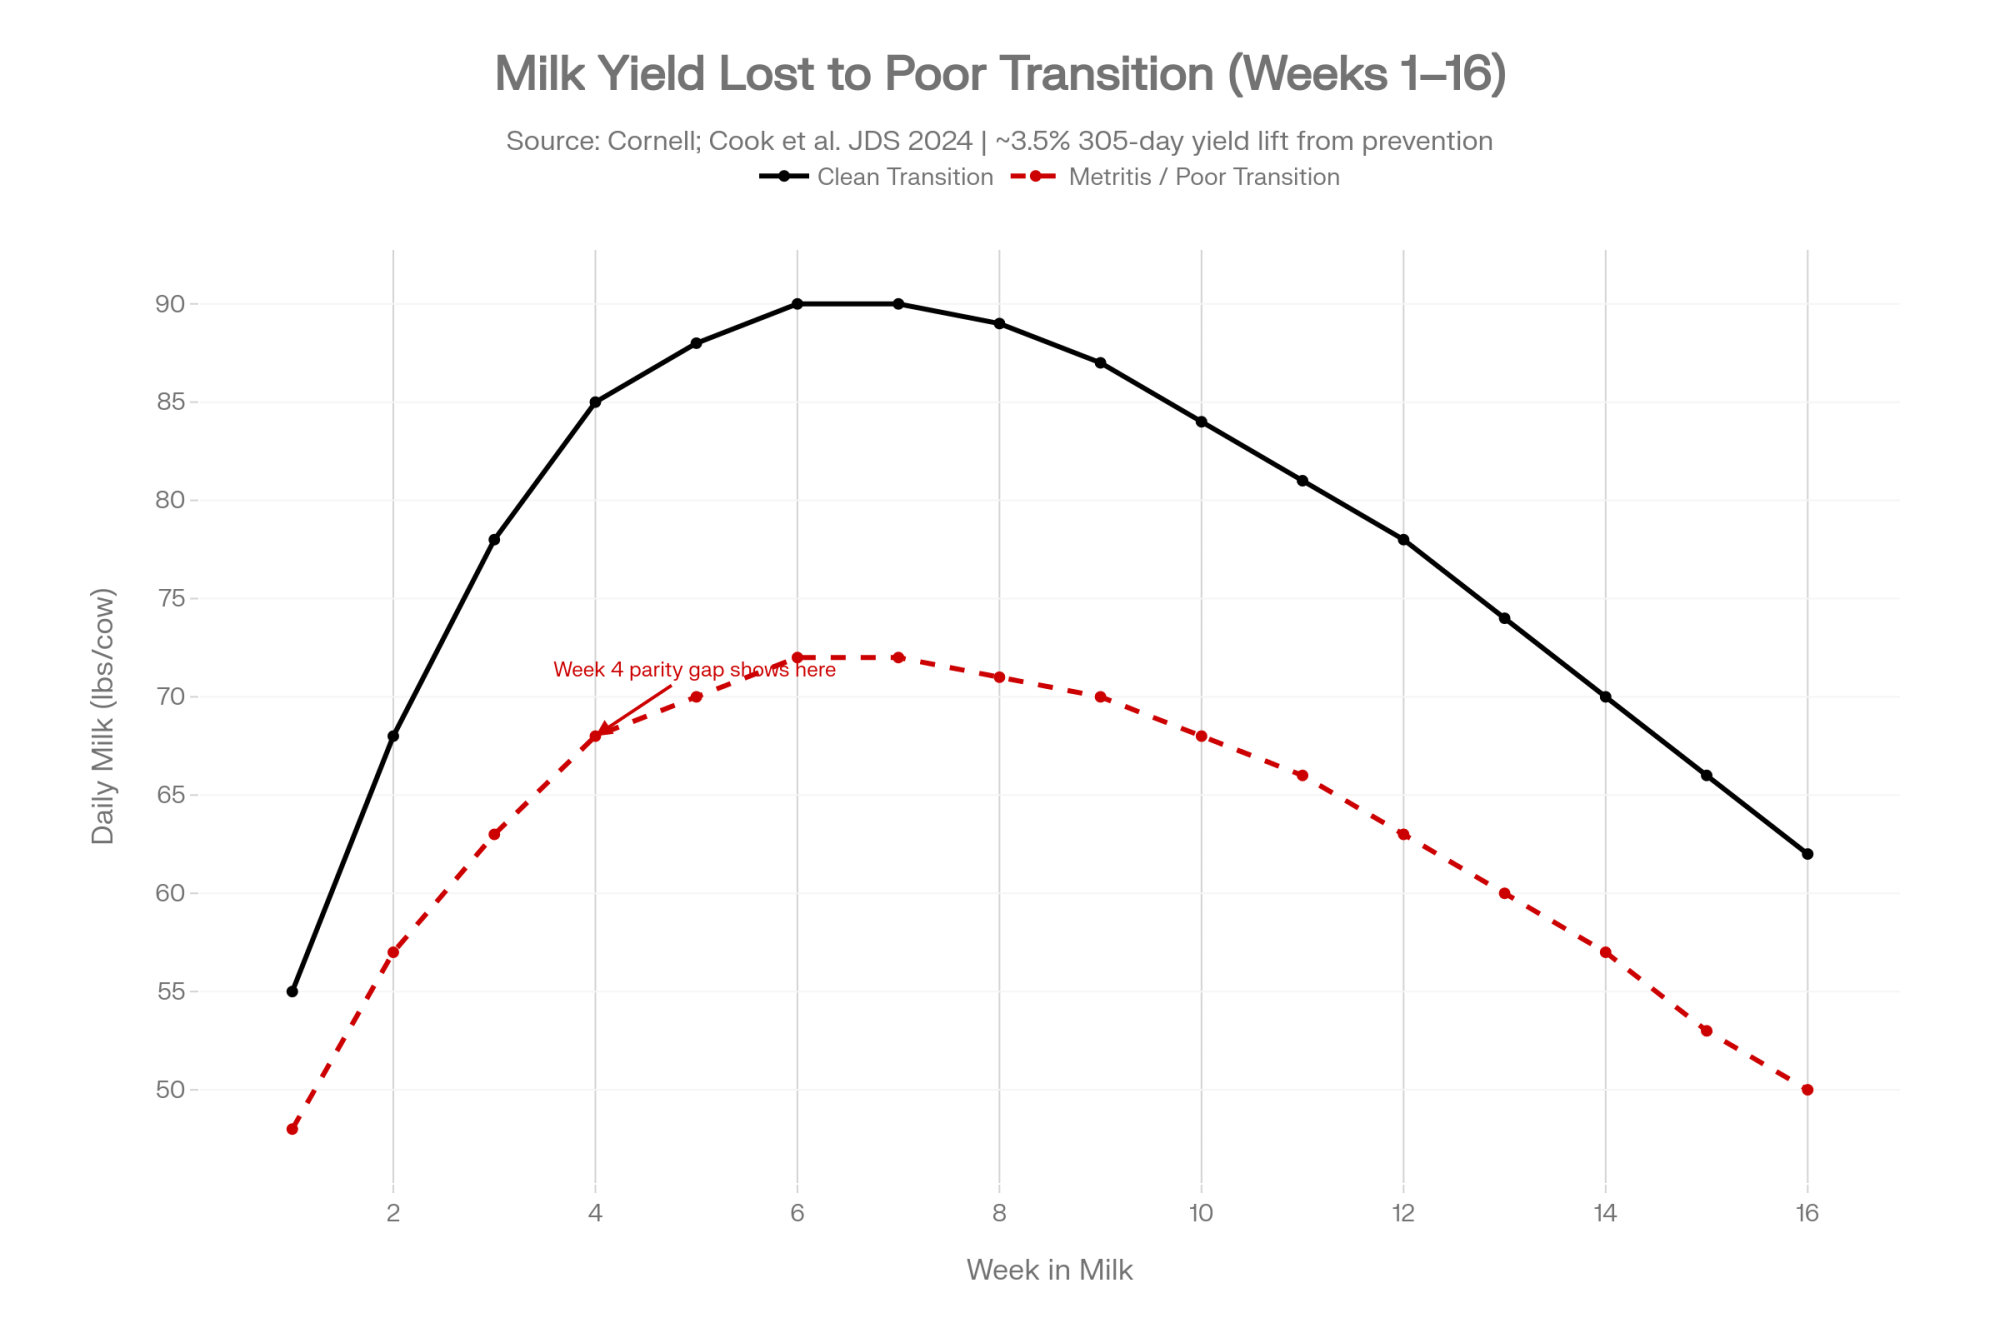
That’s the uncomfortable part for many farms. The system that’s “not working” is usually working fine. It’s the record‑review‑decide loop on the human side that broke. And it’s the one part nobody’s selling you.
What does a transition cow cost when it goes wrong?
Most farms never run the math on what their transition problems actually cost. It’s easier to wave off the odd loss as “one of those things” than to see the pattern.
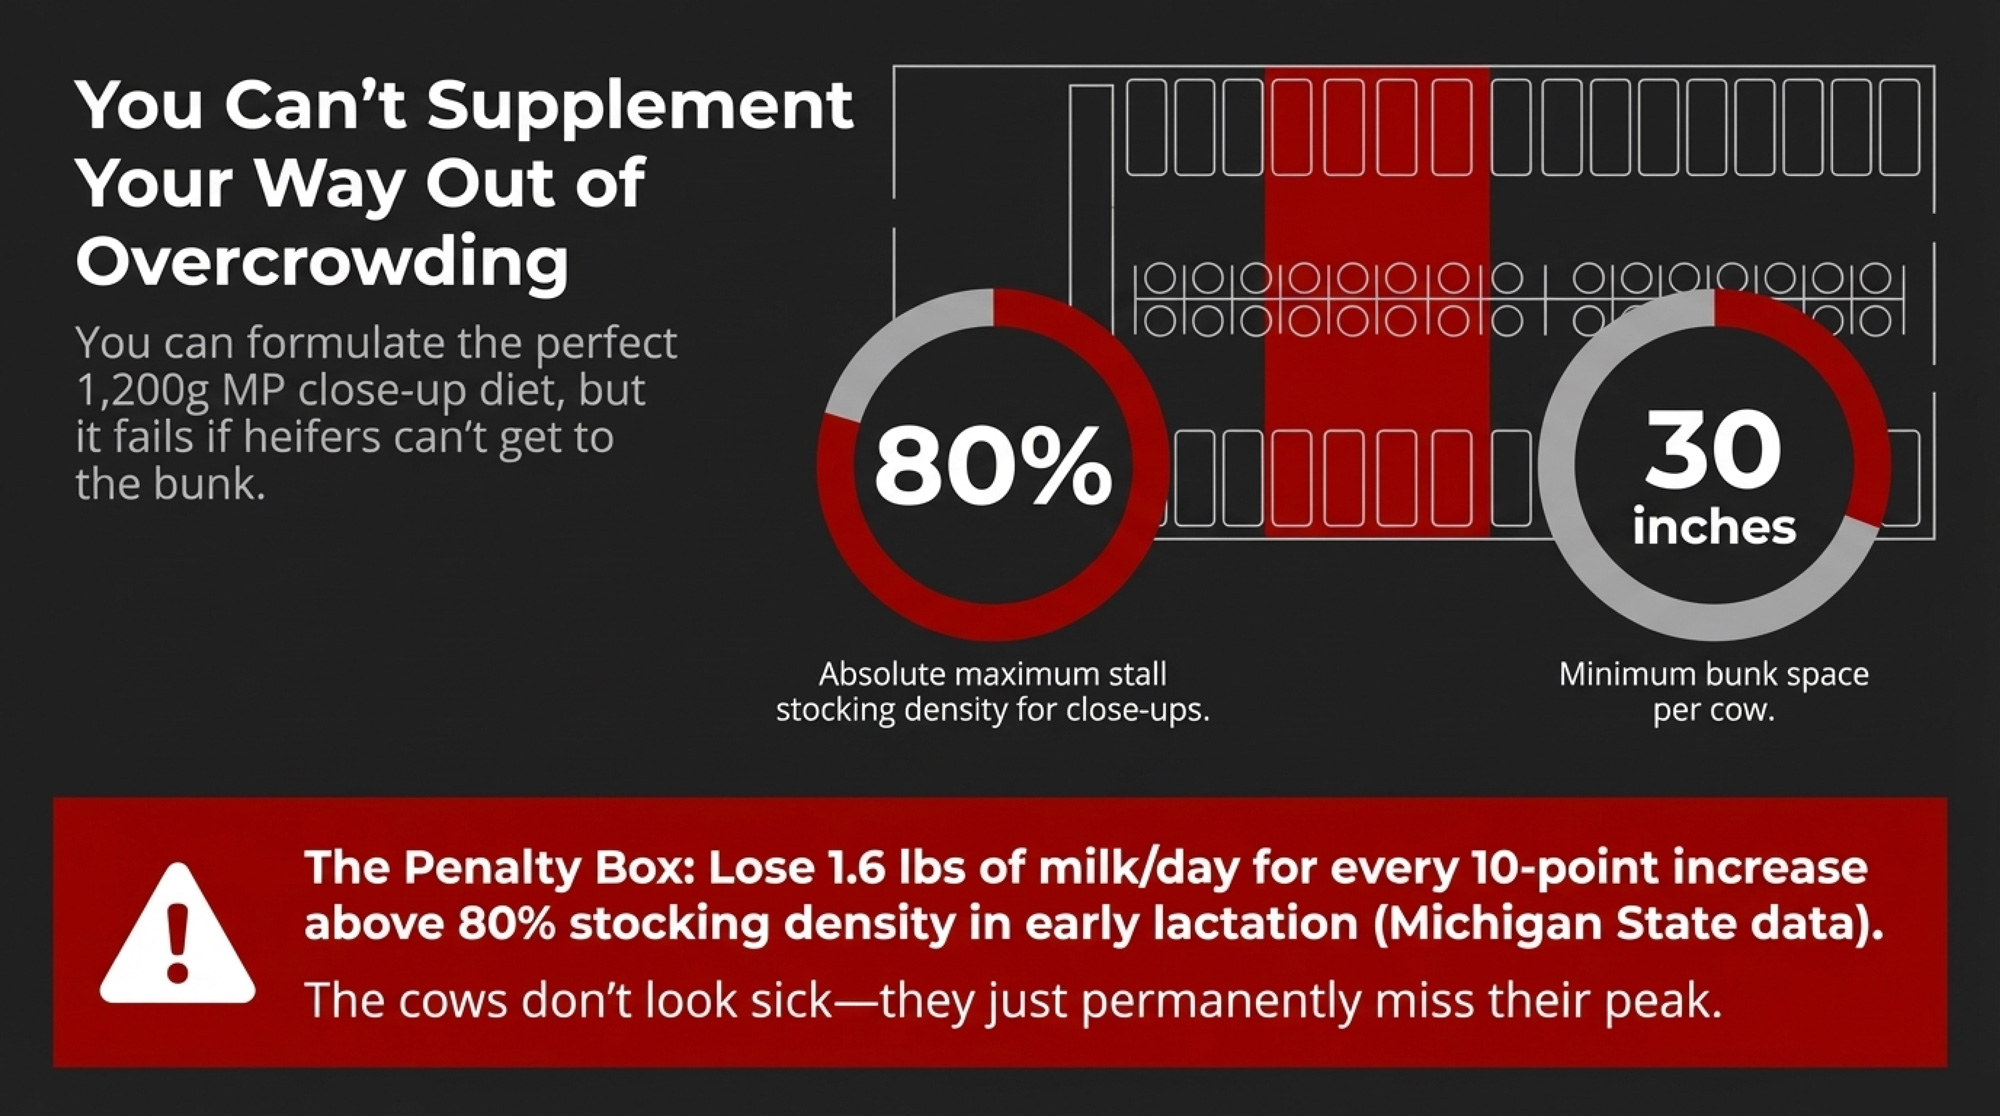
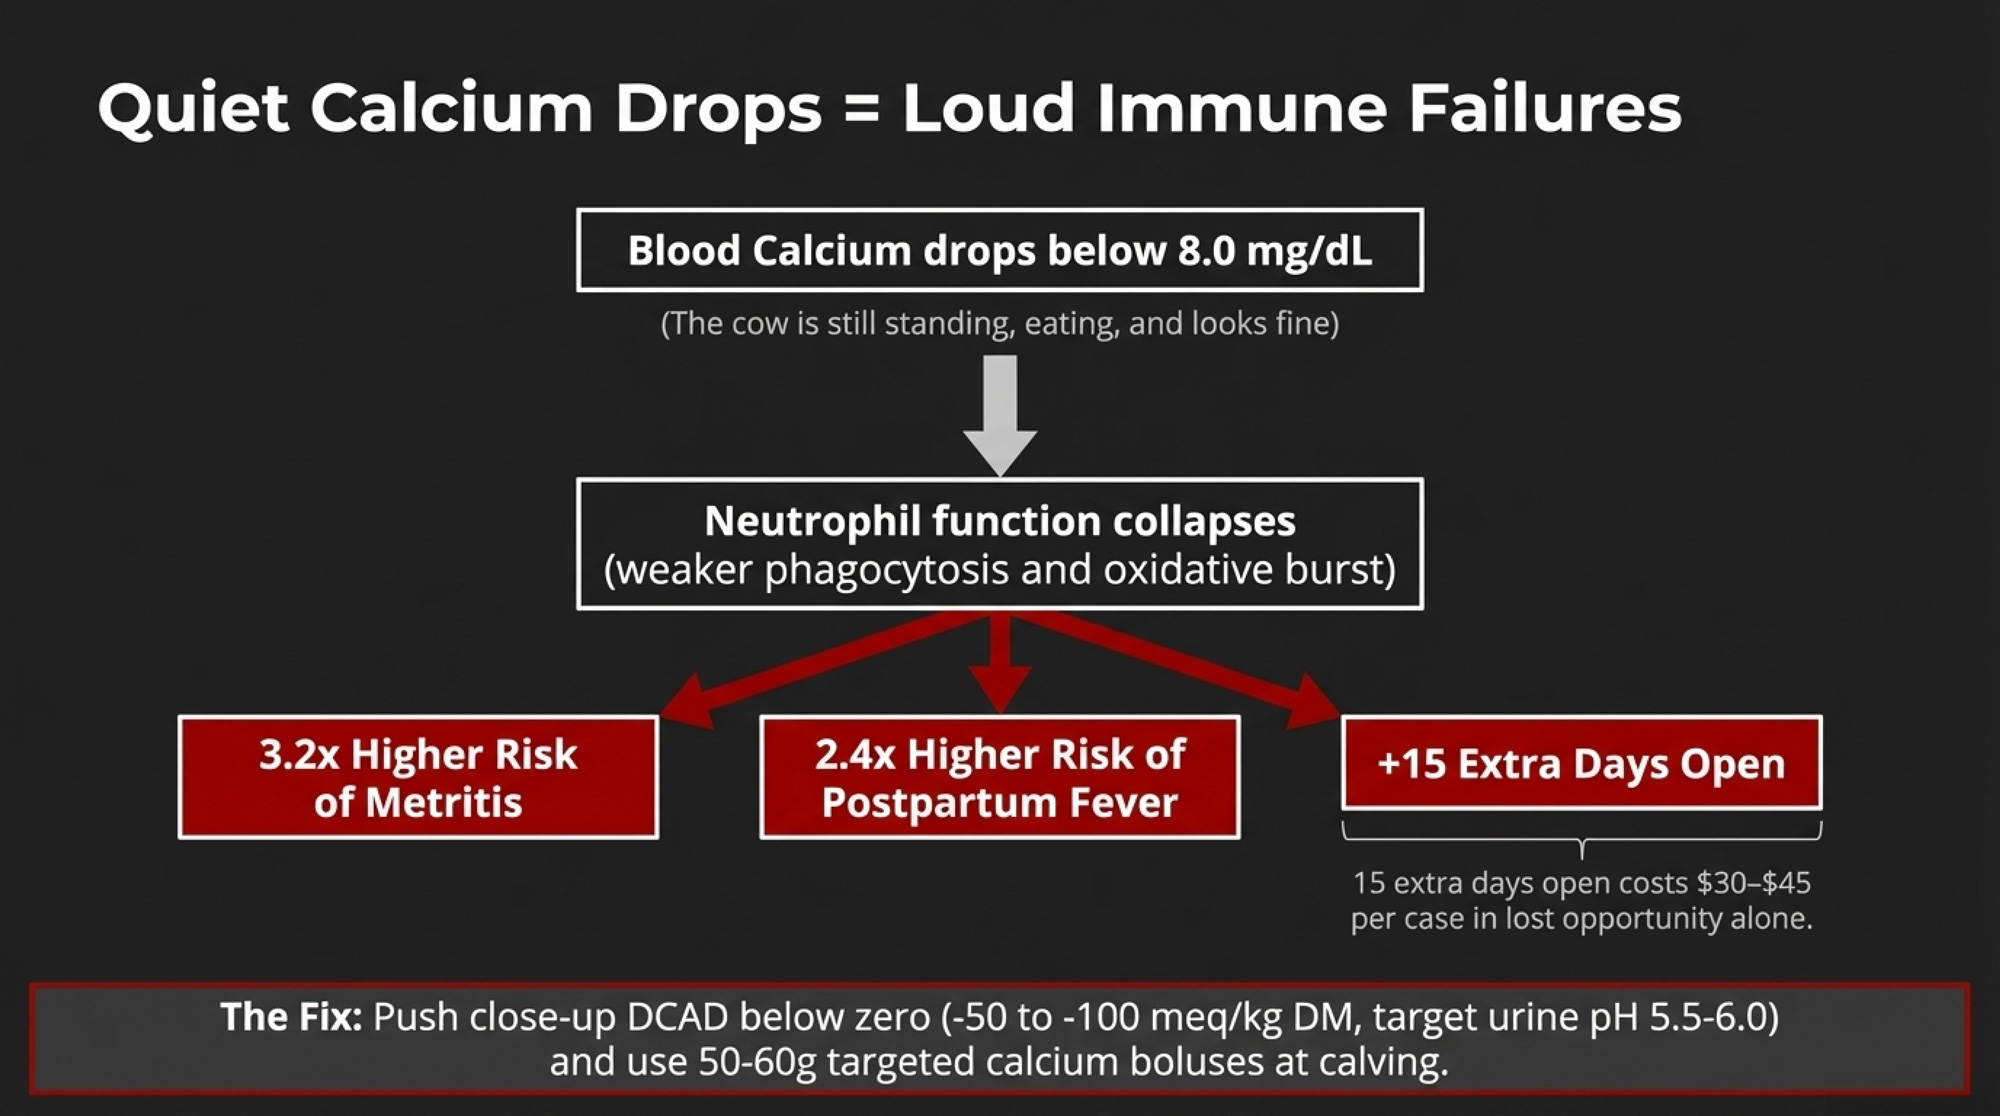
So here’s the pattern, with real numbers under it. McArt and colleagues’ foundational work, adjusted for current feed and treatment costs, puts clinical ketosis at roughly $300 to $350 a case. The 2021 Journal of Dairy Science metritis study put the average at $511. Crowd a dry pen, and the milk loss compounds: a 2024 Journal of Dairy Science study by Cook and colleagues, covering 2,780 cows in two UK herds, linked higher close‑up stocking density and shorter close‑up time directly to more early‑lactation disease.
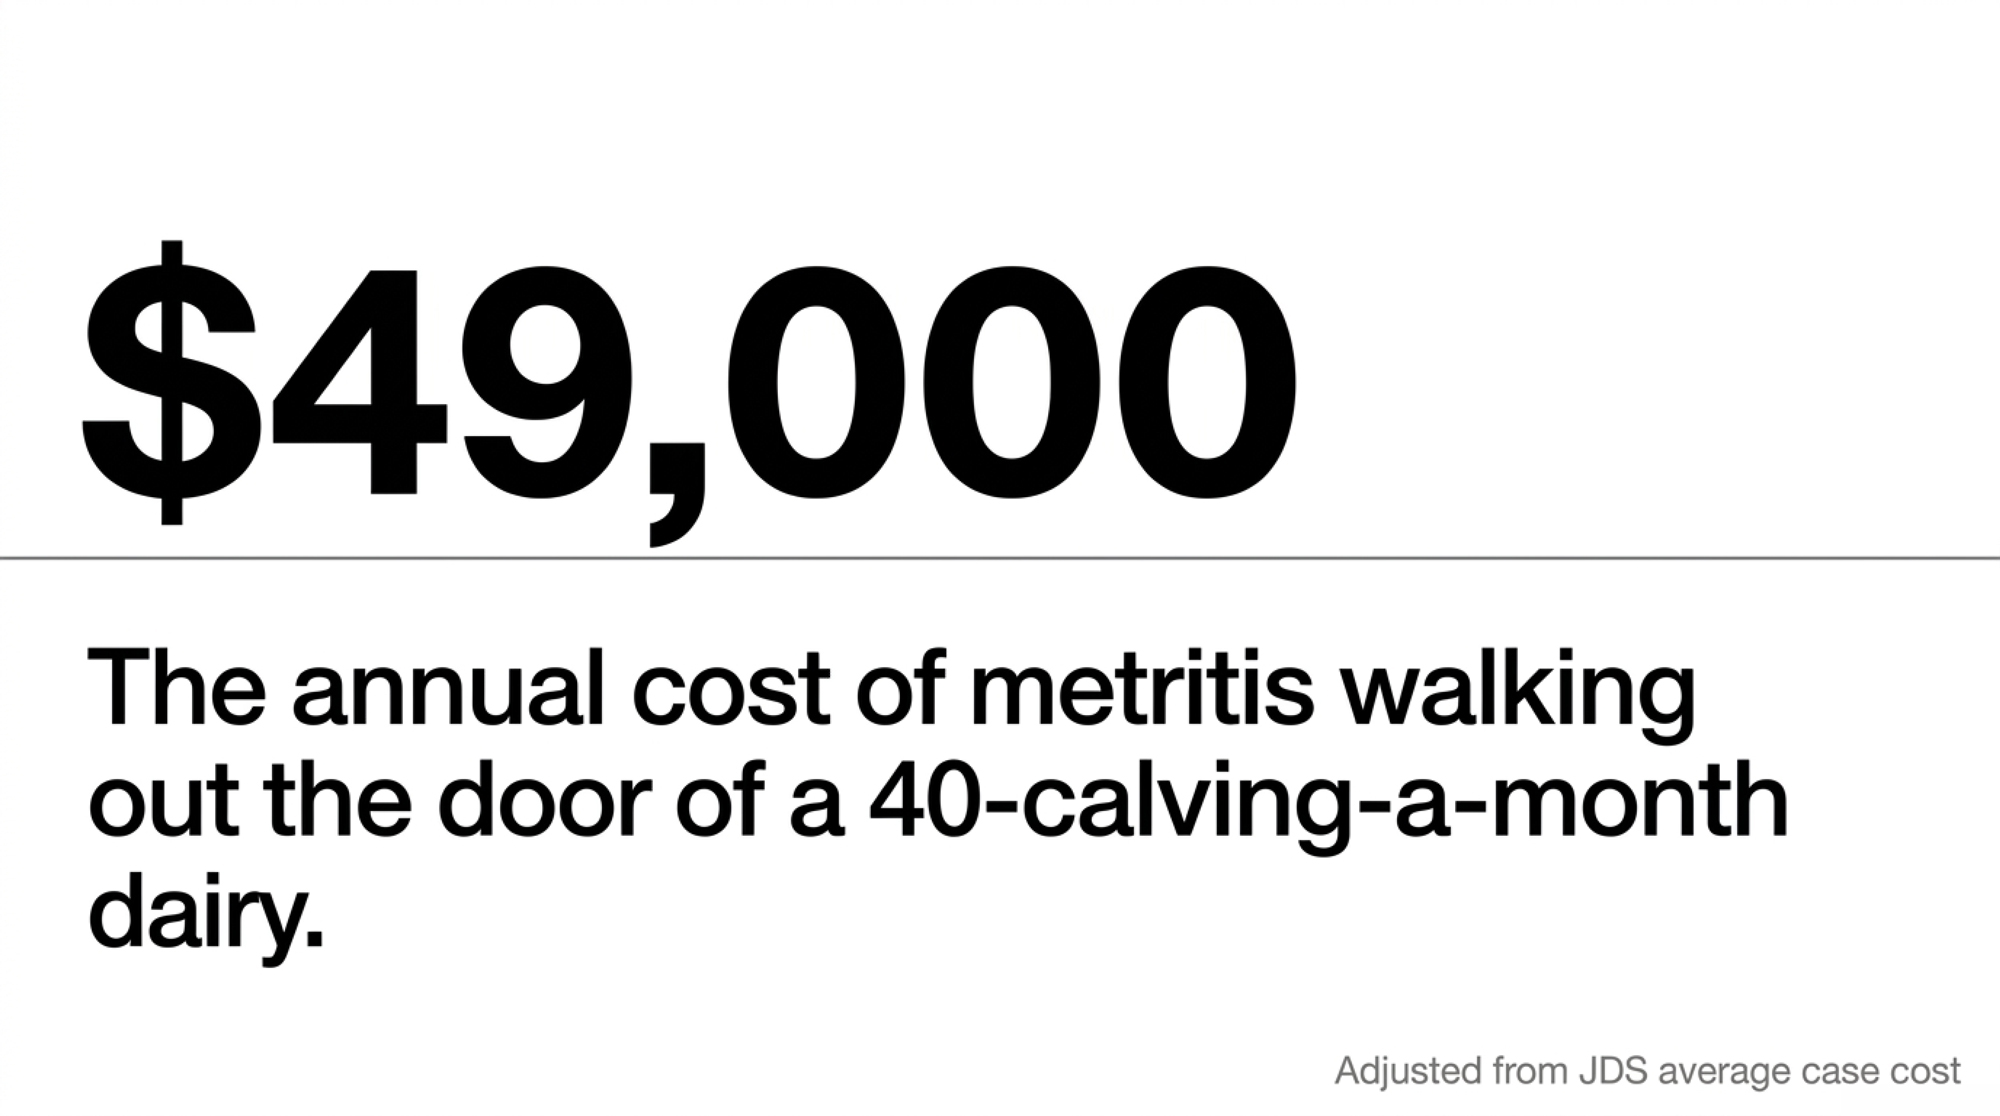
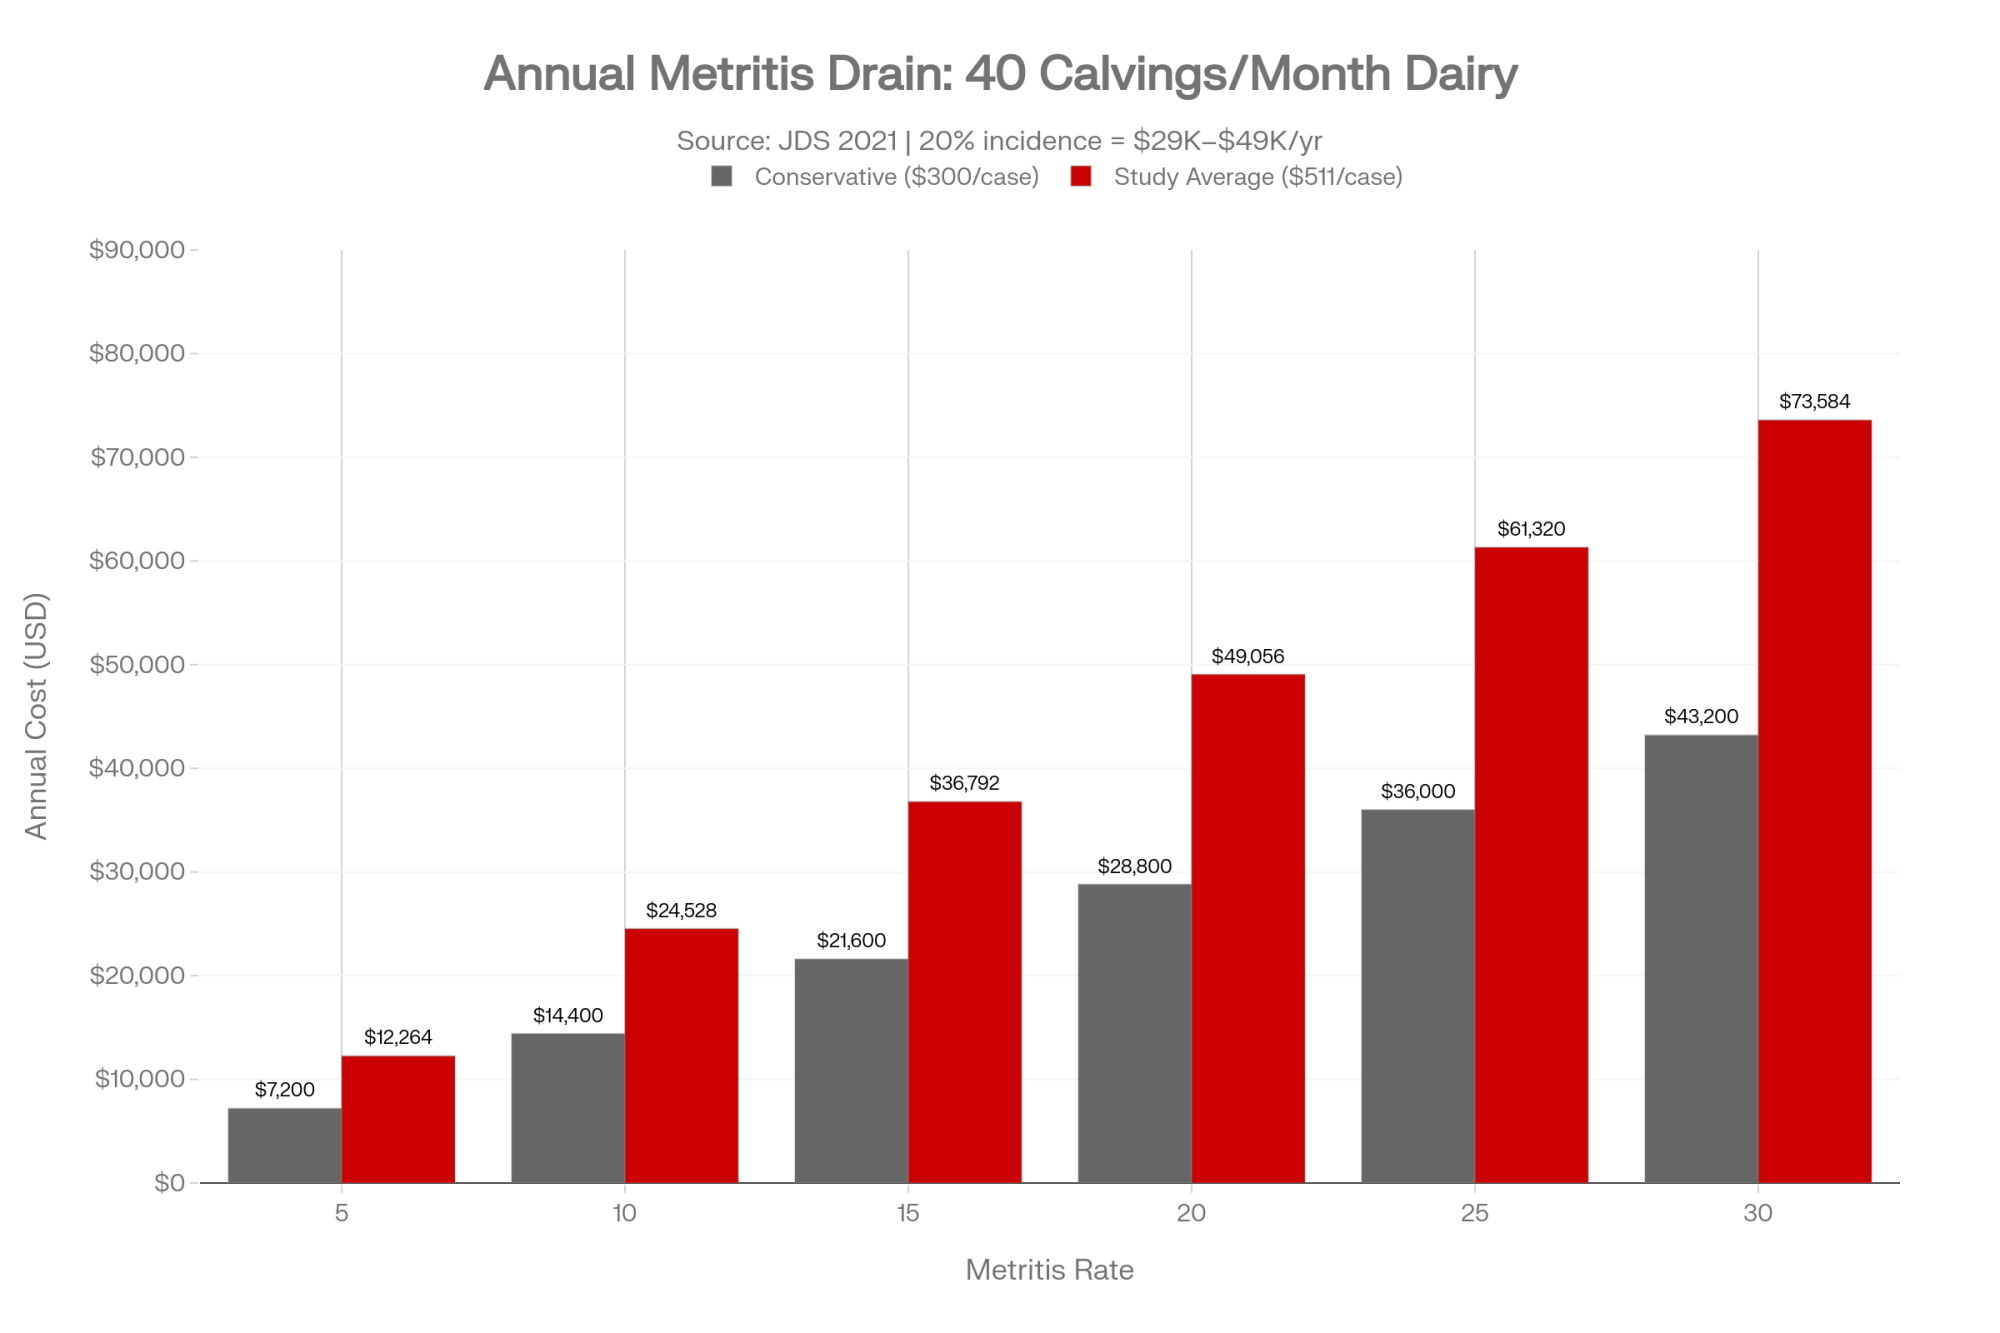
Run it on your own barn: Say you average 40 calvings a month and metritis runs at 20% — realistic for a lot of herds. That’s 8 cases a month. At the conservative end, $300 a case, that’s about $2,400 walking out the door every month, and closer to $4,000 at the study’s $511 average. Over a year, that’s $29,000 to $49,000 on metritis alone — before you count the ketosis sitting right next to it.
The ugly part is that most of those losses were visible in the data weeks before you felt them in the tank. The system recorded the rumination drop. The fresh list showed the cows that never got going. The question isn’t “do we have the data?” It’s “will we look at it every week?”
| KPI | Target / Benchmark | Common “Normal” Excuse | Farm Blindness Red Flag |
|---|---|---|---|
| Metritis rate (% of calvings) | < 10% | “We’re around 15–20%, same as everyone” | Exceeds 20%; cases unlogged or misdefined |
| Clinical ketosis rate | < 5% | “A few cases a month is just transition” | > 8%; subclinical not screened |
| 60-DIM cull/death rate | < 5–8% | “We had a rough stretch” | Persistent > 10%; no root-cause review |
| Week-4 milk: 2nd-lact vs. 1st-lact | 2nd lact ≥ 1st lact | “Our second-calvers always lag a bit” | 2nd lact consistently 5+ lbs below heifers |
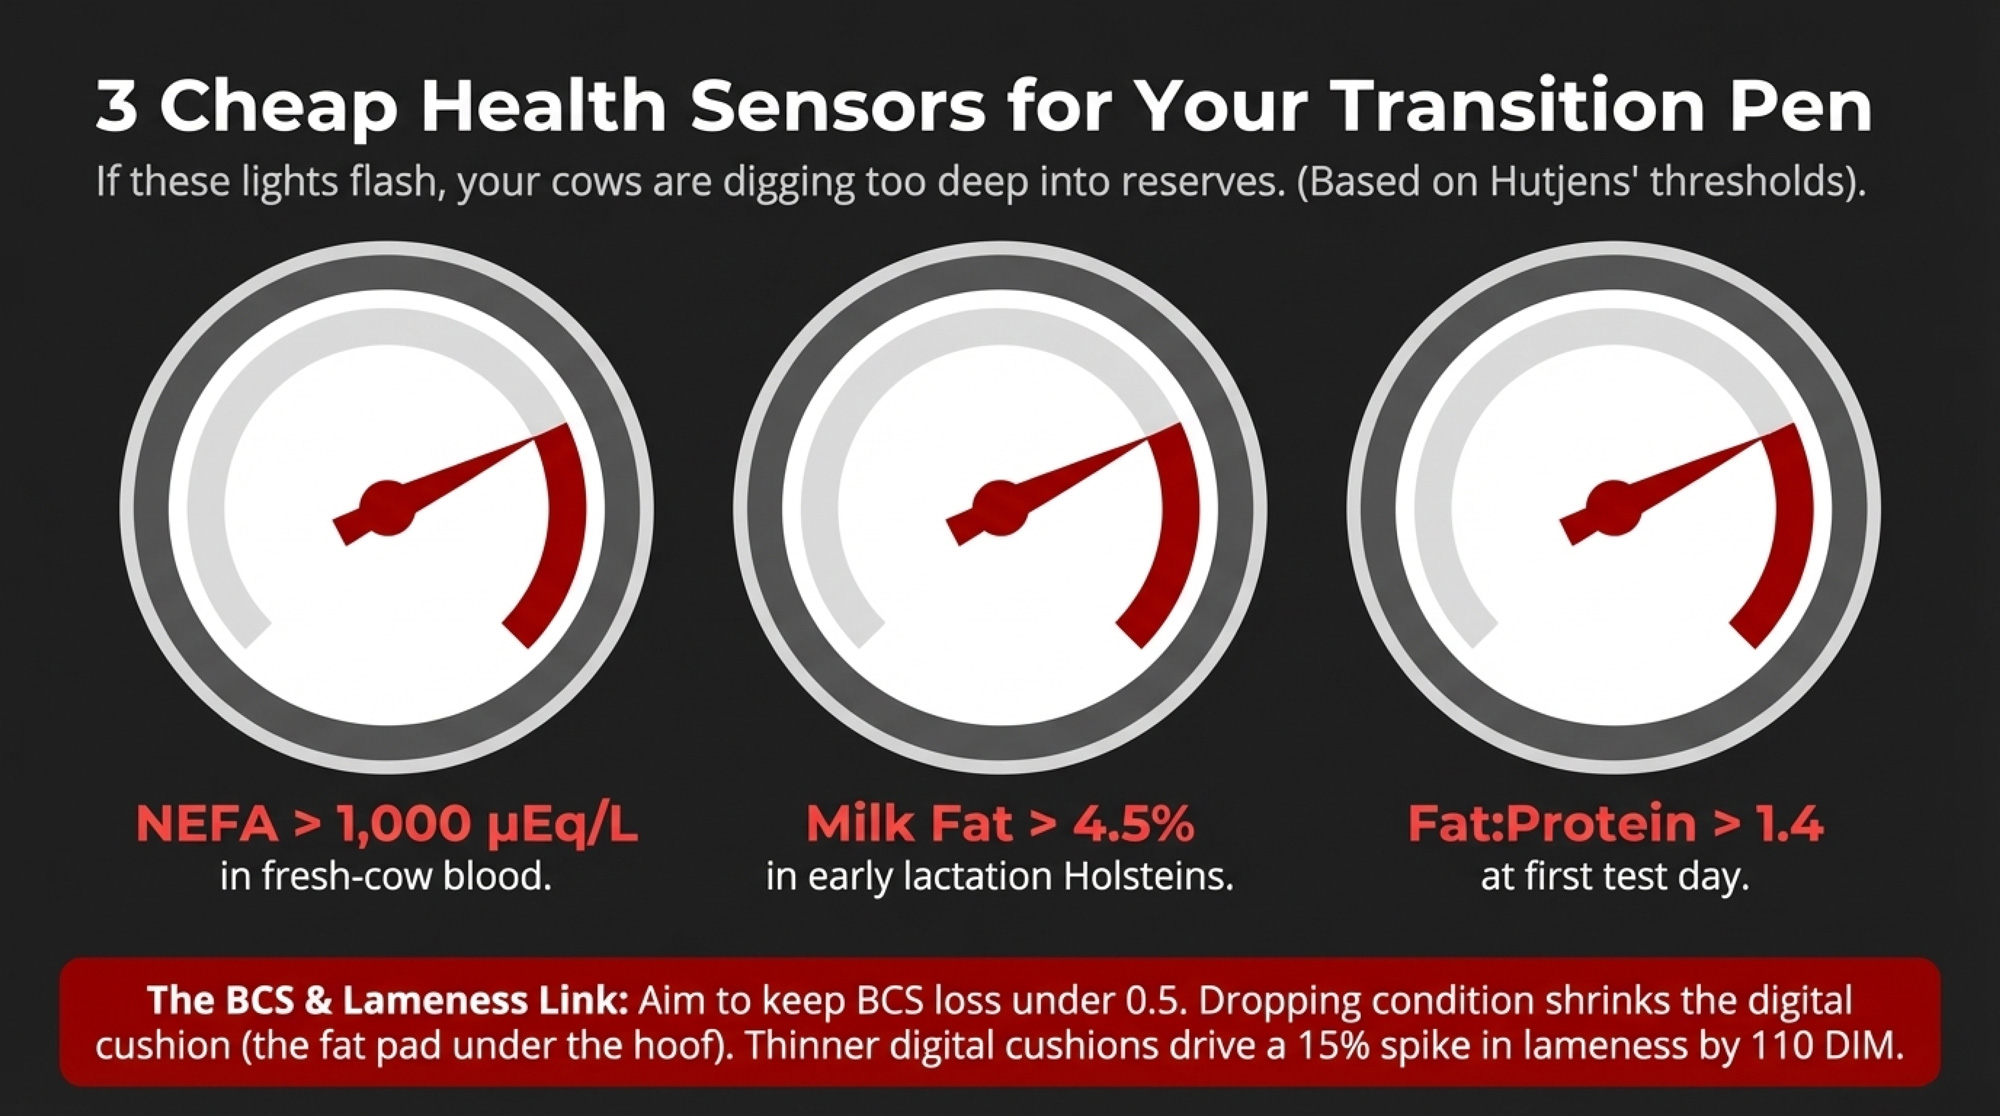
| BCS at dry-off | 3.0–3.25 (5-pt scale) | “She looked fine going in” | Cows routinely entering dry at 3.75+ |
| Close-up pen stocking density | ≤ 100% of headlocks | “We’re a bit tight but it’s temporary” | Chronically > 120%; no action on fresh list |
| Alert response time (activity/rum) | Same-day, logged with action | “Someone checks it when they have time” | Alerts accumulate unread over 48+ hours |
| Disease cases per 100 calvings (first 21 DIM) | < 15 combined | “It’s seasonal / the bull / the weather” | Stable elevated rate with no protocol change |
Why your second-calf cows quietly underperform
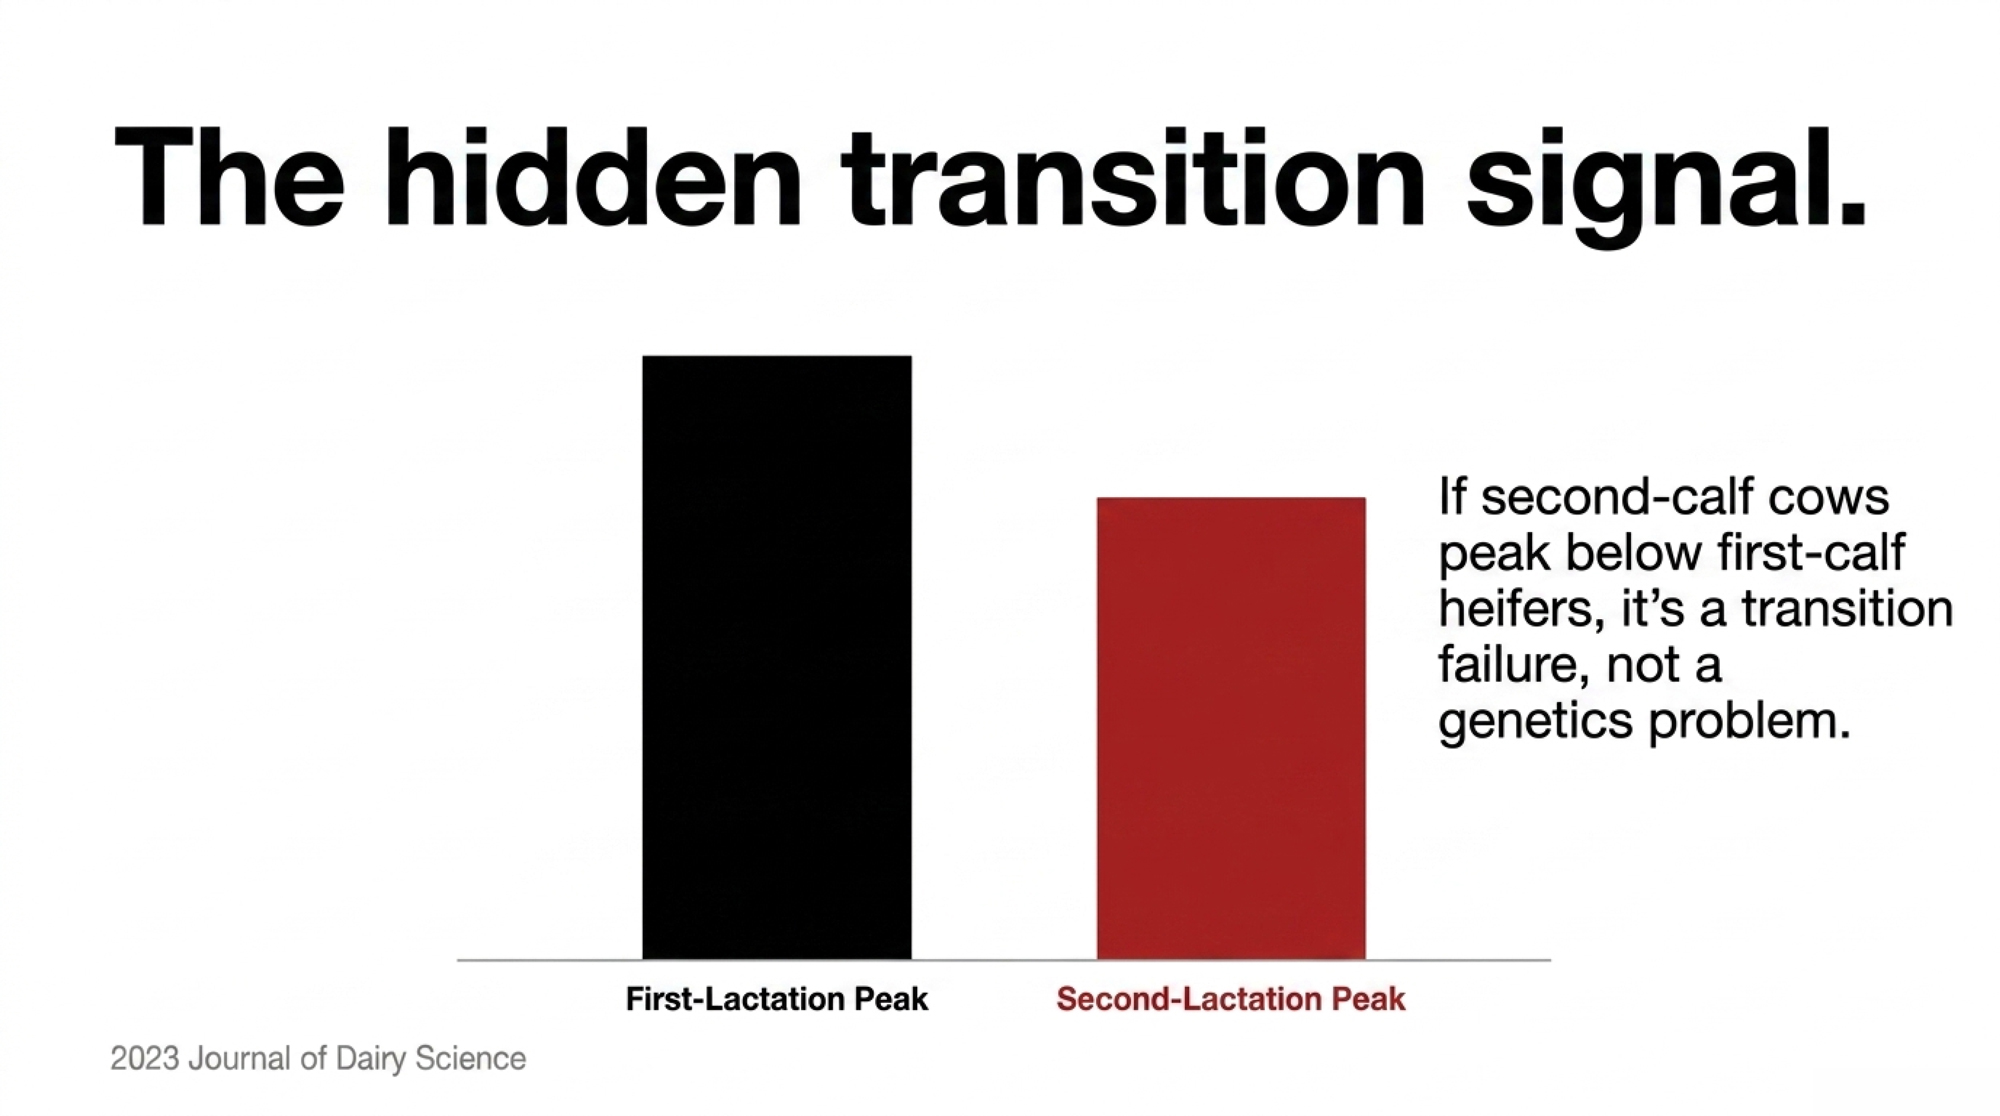
If you want to catch these leaks early, you have to know where to look. On many mid‑size dairies, the most expensive leak hides in plain sight within one group: your second‑calf cows.
Next time you pull week‑four milk by parity, watch for second‑lactation cows peaking under your first‑calf group. It’s common, it’s costly, and it’s almost always a transition story, not a genetics one.
The physiology backs that up. A 2023 Journal of Dairy Science study following cows through their first and second calvings found second‑calving cows ran lower circulating insulin and IGF‑1 through transition and posted a lower early peak than expected. Plain version: a cow’s second freshening is metabolically harder than her first, and she leans harder on body reserves to get going. If she walked into the dry pen too fat, sat in a crowded close‑up group, or carried a subclinical ketosis nobody caught, that second start gets stunted. And the milk she doesn’t make in those first weeks never fully comes back.
This is exactly the kind of trend that hides inside a herd average. Lump all the cows together, and the tank looks fine. Split it by parity, and a soft second‑lactation curve jumps off the page — and now it’s a problem you can do something about, before she’s three months in and the lactation’s already lost.
The dry pen sets the table — are you reading it?
If the milking string is where transition problems show up, the dry pen is where most of them get built. Two numbers carry most of the weight: body condition at dry‑off and calving, and how long cows actually sit dry.
On body condition, the extension consensus is tight. Ontario’s scoring guide targets a BCS of 3.0 to 3.25 at both dry‑off and calving on the 5‑point scale, with no cow swinging more than about 0.5 to 0.75 between stages. Cows calving over‑conditioned — say 3.75 and up — eat less right when they need energy most, mobilize more fat, and face a higher risk of ketosis and a slower start. A practical rule many good herds use: flag any cow heading toward dry‑off at BCS 3.75 or higher, because she’s telling you the late‑lactation ration let her get fat on your dime.
Dry‑period length is the other lever, and the data is blunt. Roughly 60 days dry still maximizes next‑lactation yield across parities, and cows pushed to very short or no dry periods can give meaningfully less milk the following lactation. Shortened dry periods of around 40 days have a real research case — better pre‑fresh intake and faster rumen recovery — but they’re a deliberate strategy, not an accident. The trap on most mid‑size farms isn’t the planned 40‑day program. It’s the cow who drifts to 80 days dry because nobody flagged her, gets over‑conditioned doing nothing, then calves into trouble. That’s a recording problem wearing a nutrition costume.
What actually makes the habit stick?
Knowing you should read the numbers and actually doing it every week are two different animals. The farms that make that Monday ritual non‑negotiable don’t get there by accident.
It usually starts with pain, not inspiration. Few operators develop discipline just by reading an article. Most build it after something hurts enough that they can’t shrug it off — a run of fresh‑cow losses, a pregnancy‑rate slide that took three months to surface, a vet pointing at a trend and saying “this has been building for weeks.” Those moments crack farm blindness open. You can blame the market, or you can decide you’re not getting blindsided like that again.
Someone has to own the numbers by name. “The manager reviews the data” doesn’t survive a busy week. A named person, a set time, and a clear next step does: the transition report gets pulled every Monday before 8 a.m., and anything off target goes to the vet by noon. On mid‑size herds, the owner’s already wearing a dozen hats, so if Monday’s review belongs to “management,” it’s the first thing to vanish when a calf gets sick, or a pump fails. Put a name on it — even if it’s your own — and ownership stops floating in the air.
The review has to drive a decision within the same week. If data goes into a report and nothing changes, recording discipline rots fast. People watch their entries disappear into a screen that never answers back. The farms that keep people recording make sure something visible happens: the employee who logged three metritis cases sees them on the vet report and hears the conversation that follows. Record → review → decide → adjust. Stretch that loop over months, and the ritual dies.
Start with a small, sharp win. The fastest way to kill a new habit is to make it too big. The profitable operator doesn’t open with a twelve‑KPI dashboard. He starts with two or three numbers he already half has that carry obvious benchmarks, and that’ll show a trend within a month. Week‑four milk by parity is a perfect first pick — the test‑day data’s already there; it just needs to be broken out by lactation group. Once that habit’s solid, add the next metric. The structure grows out of something that works, not a wish list.
Pull the advisory team inside the ritual. On many farms, the vet and nutritionist only see data when they show up. The operations that make Monday stick send the week’s transition numbers out ahead of the visit, so the conversation opens with “here’s what we’re seeing — here are our questions.” An outside audience changes how the numbers feel. You prepare differently when you know someone else will see the trend before they walk the pen.
What This Means for Your Operation
- If your transition problems feel like bad luck instead of a pattern, assume you’re flying blind. The data to prove it is probably already in your software, days ahead of the next sick cow.
- If your second‑calf cows peak below your first‑calf heifers, look at the dry pen and the close‑up ration before you blame the bull. That gap is a transition signal, not a genetic one, and it’s fixable.
- If no one on your farm can say, “I pull this report every Monday,” then no one owns the numbers.Ownership is what turns an unread alert into an action.
- If recording disease feels like paperwork that goes nowhere, the problem isn’t your staff — it’s the broken loop from record to decision. Close it, and the entries start to matter again.
- If you’ve bought technology faster than you’ve built discipline, expect the next cheque to feel good and change nothing. The gear is rarely the variable.
- Do this within 30 days: pull three numbers for the last 60–90 days — percent of cows gone by 60 DIM (culled or dead), week‑four milk split by first/second/third‑plus lactation, and metritis‑plus‑ketosis cases in the first 21 DIM per 100 calvings. They’re already in your herd software, milk‑recording reports, or vet records. If you can’t pull them cleanly, that’s your first finding.
Key Takeaways
- If you can’t name the person who reads the transition report each week, fix that before you spend another dollar on hardware.
- If a number looks wrong — 60‑day exits too high, second‑lactation cows lagging, disease higher than you thought — take that specific figure to your vet or nutritionist and ask “why” this month.
- If your system “isn’t working,” check the human loop before you replace the gear; the alert that fired and nobody read is the real failure.
- If you’re starting from scratch, start with three numbers and one Monday — not a dashboard you’ll abandon by spring.
The math doesn’t care whether you look at it. So pull those three numbers tomorrow, before the barn takes over the day. If you don’t like what you see, that uncomfortable feeling is the point — the only real question left is whether you’ll keep choosing events over processes, or finally make the Monday review as non‑negotiable as feeding. Which one are you this week?
Editor’s Note: The operators described in this piece are composites, modeled from patterns common on mid-size North American and UK dairies rather than single real farms. The research cited is real and sourced.
Run Your Numbers
Herd Health ROI Calculator — This article says early detection cuts culling and replacement cost; the calculator puts a dollar figure on it. Plug in your herd size, culling rate, and mastitis cases to see what those fresh-cow losses are costing you now — and what closing the record-review gap is actually worth per cow.
Complete references and supporting documentation are available upon request by contacting the editorial team at editor@thebullvine.com.
Learn More
- Your Fresh Cow Problems Started 6 Weeks Ago: The $70K Dry Period Fix — Arms you with a concrete roadmap to suppress fresh-cow metritis and ketosis rates below 20% by shifting your operational attention upstream into a negative DCAD and strict space-controlled dry pen protocol.
- The Six-Figure Execution Leak Happening on Most Dairies: Broken Protocols, Heifer Costs, and Dairy‑Beef Checks — Dismantles the hidden operational habits drain by linking human execution errors—like incorrect sire entry or multi-dose sync shot failures—directly to a permanent $480 lost opportunity cost per stall.
- $19.14 Costs vs. $18.95 Milk: Is Your Barn Tech Paying the Difference?— Delivers a zero-capital, 30-day hardware audit strategy designed to capture up to $45,000 annually by activating the unutilized rumination alert modules and automated sort gates you already own.
 The Sunday Read Dairy Professionals Don’t Skip.
 The Sunday Read Dairy Professionals Don’t Skip.
Every week, thousands of producers, breeders, and industry insiders open Bullvine Weekly for genetics insights, market shifts, and profit strategies they won’t find anywhere else. One email. Five minutes. Smarter decisions all week.