


Dairy farm economics in 2026 comes down to one hard truth: if you don’t understand how pricing reforms, quota shifts, labour costs and risk tools feed your margin math, you’re betting the farm blind. This page walks straight into that reality and puts numbers to it.
You’re not reading a policy recap. You’re getting a field-tested economics map built for commercial dairies on both sides of the border. We’ll decode the 2025 FMMO reforms, the Canadian protein pivot and quota values, IOFC and NCOP benchmarks, DMC and DRP payouts, beef‑on‑dairy as a “hidden” safety net, robotic milking ROI and the tax rules that make or break succession. Along the way we’ll keep the focus where it belongs: practical decisions that move your 2026 milk cheque and long‑term equity, not theory. If you care about dairy farm economics and staying in the game to 2030, you’re in the right place.

Key 2026 Dairy Farm Economics Takeaways
- 2026 is a structural reset year, not just a price cycle. The 2025 FMMO modernization, Canada’s protein pivot and the 2026 CUSMA review collide into one big economics test.
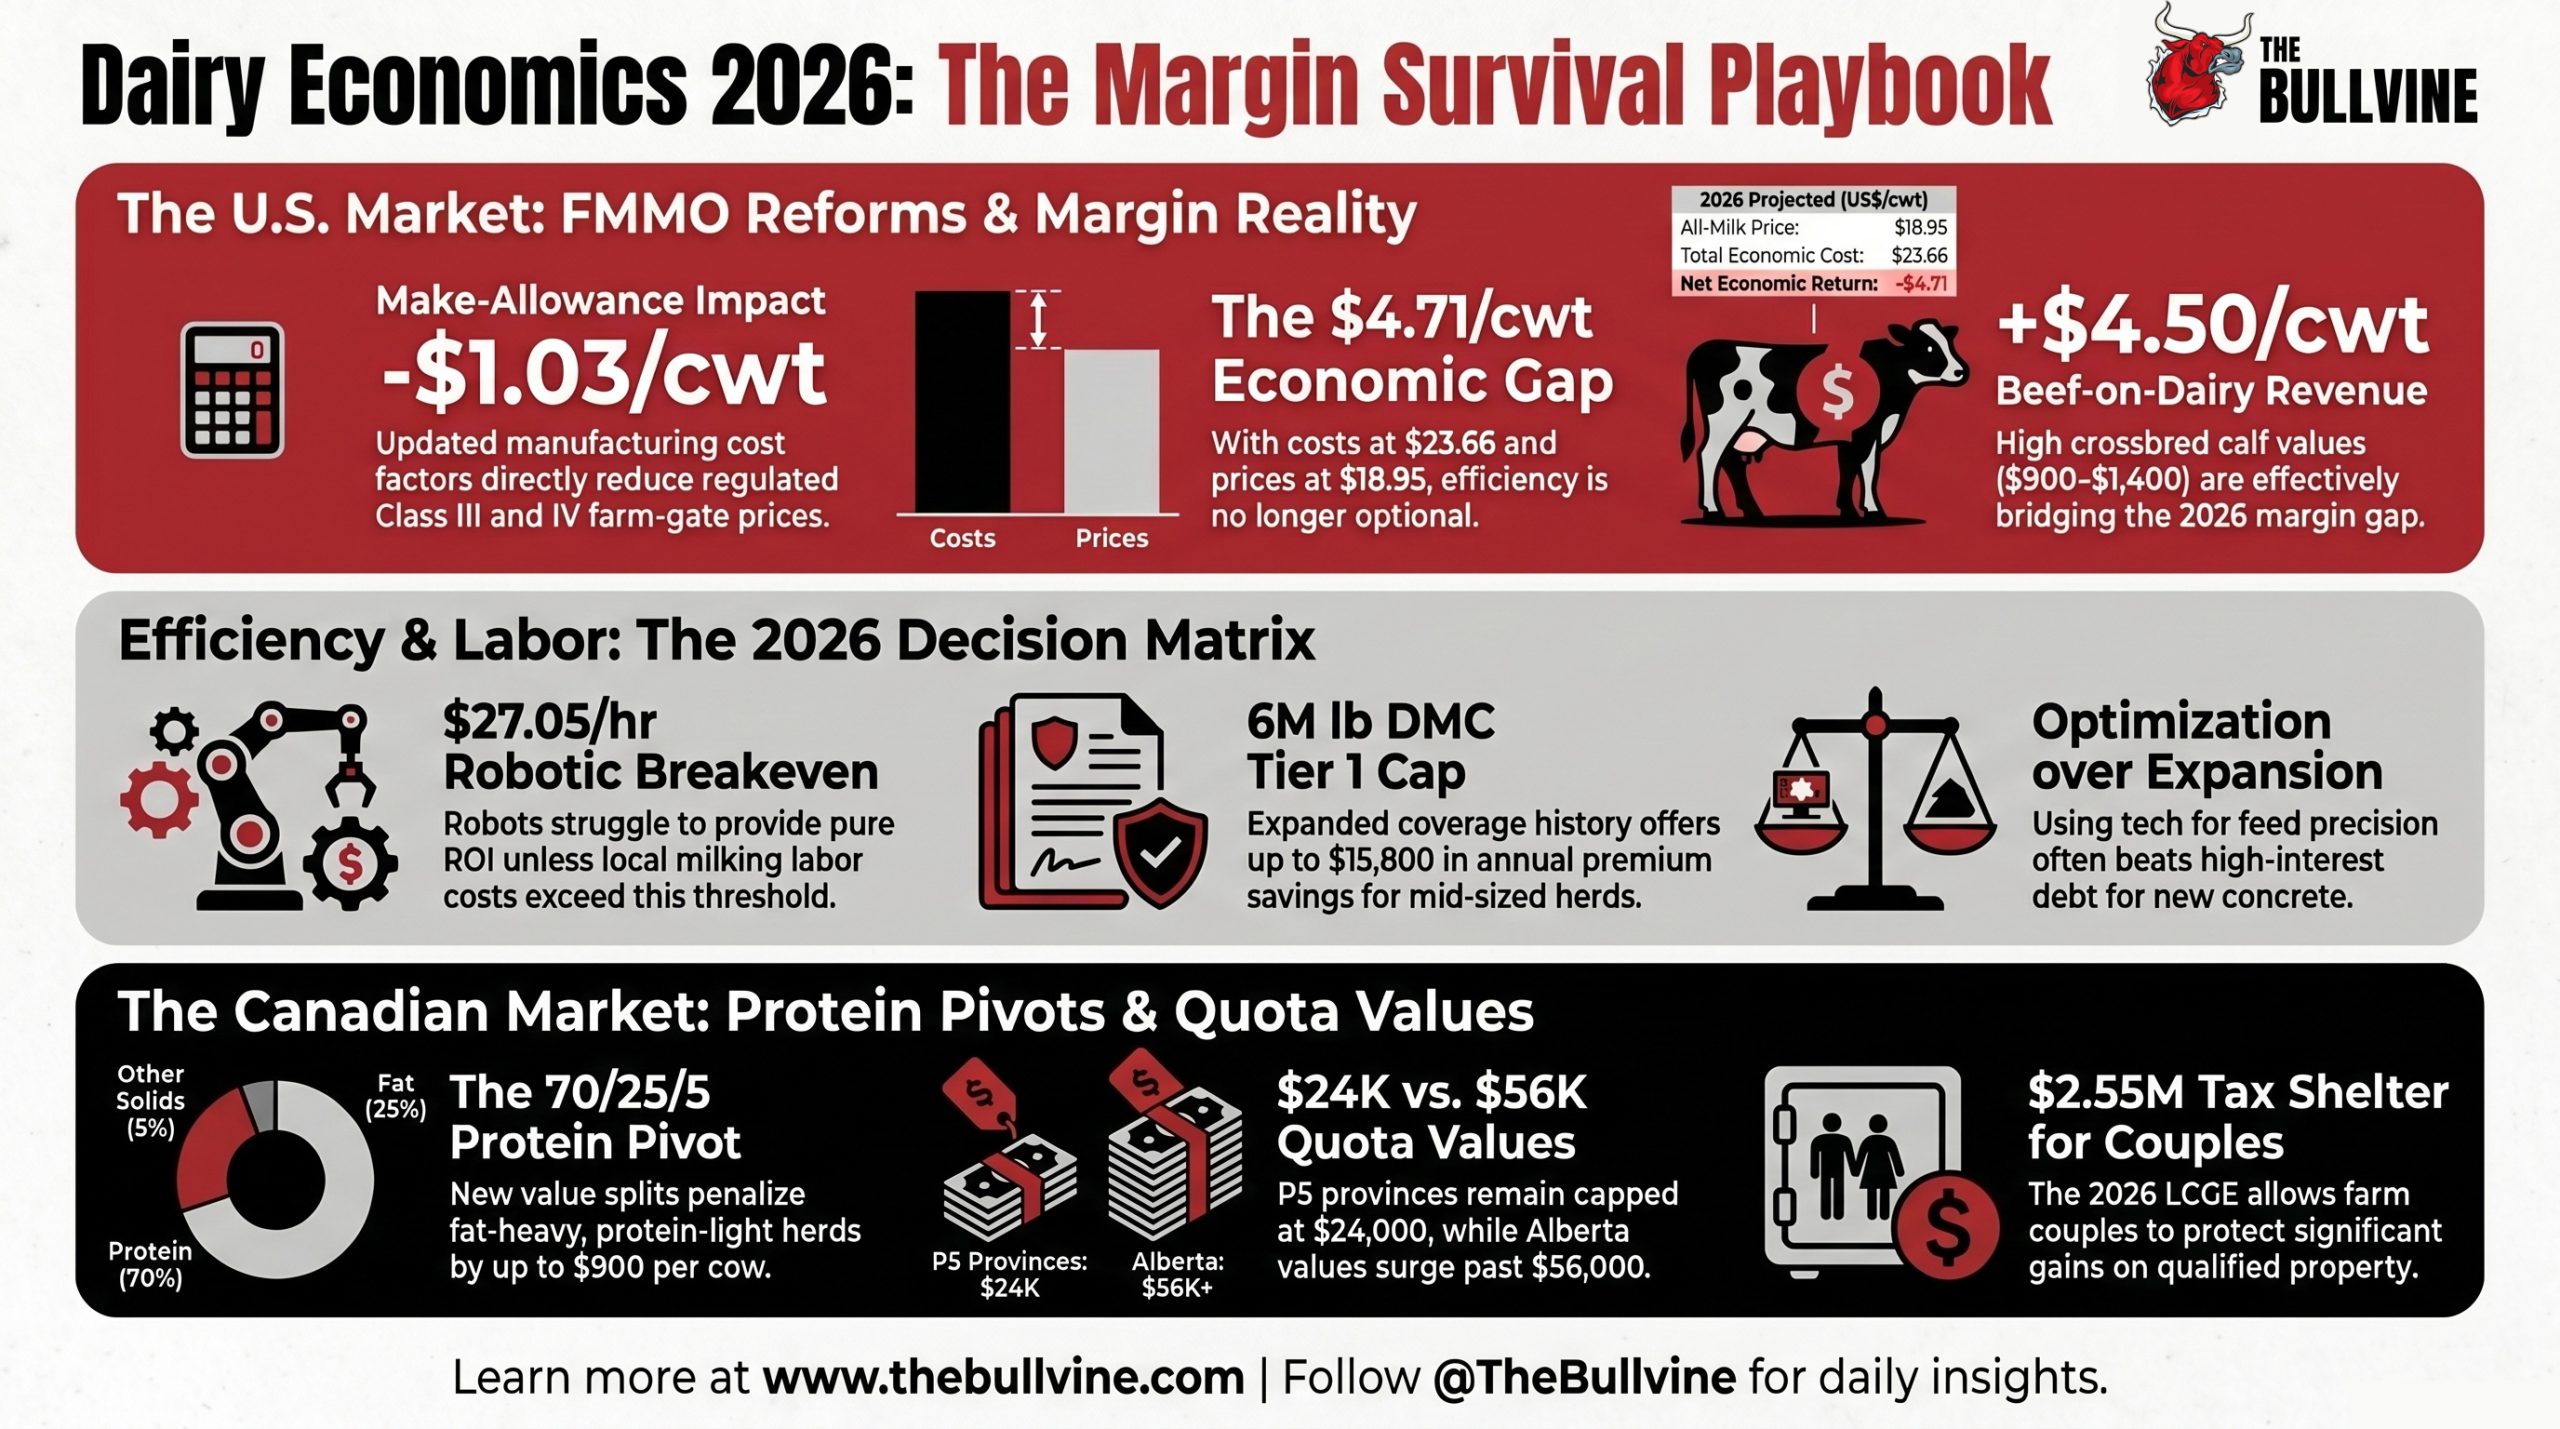
- Make-allowance increases on cheese, butter, NFDM and dry whey cut regulated U.S. Class III and IV prices by roughly US$0.90–$1.03/cwt versus 2019–2023 levels.
- The Canadian Dairy Commission raised the farmgate price 2.33% on 1 February 2026 using its National Pricing Formula, after a small decrease in 2025.
- Western Milk Pool moved to a 70/25/5 value split (fat/protein/other solids) and P5 adopted SNF:BF ratio targets, hitting fat‑heavy, protein‑light herds hardest.
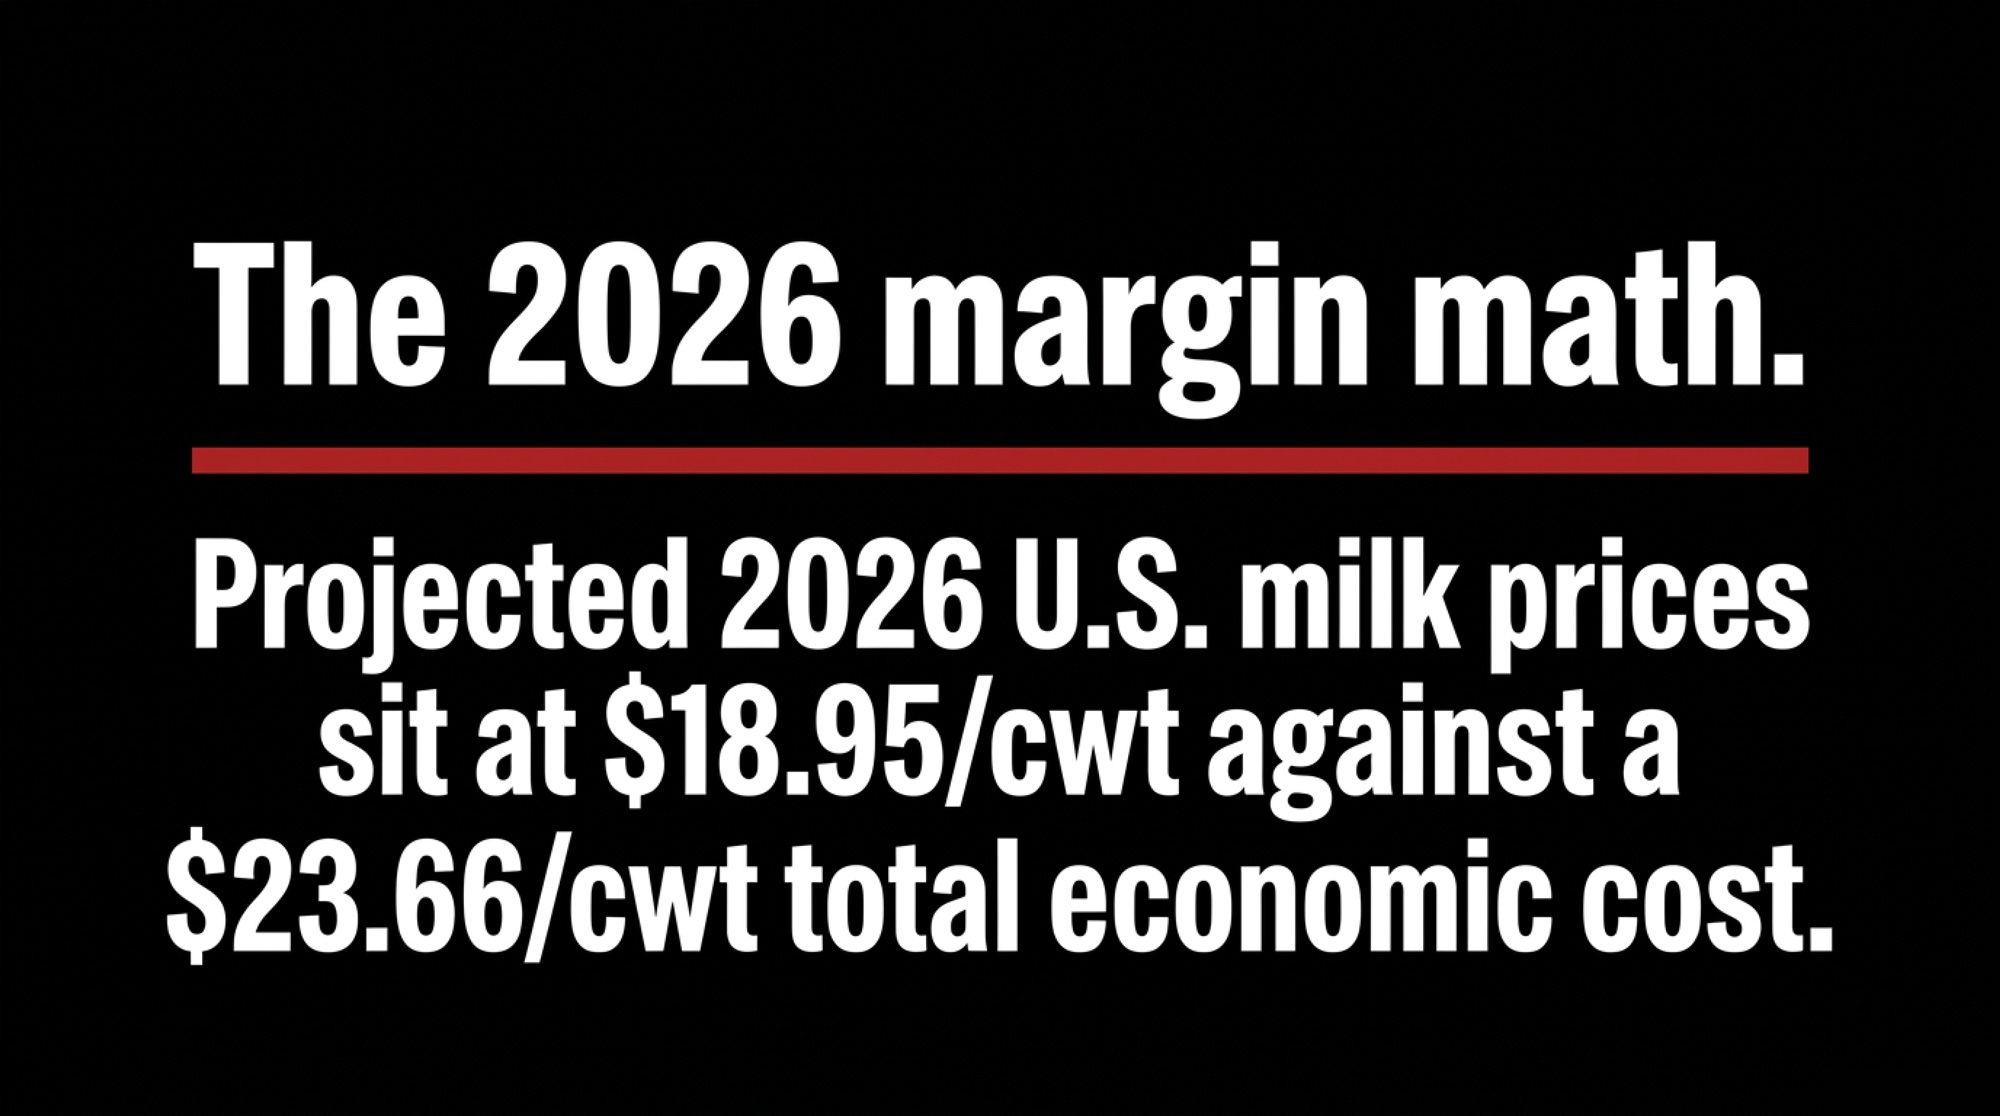
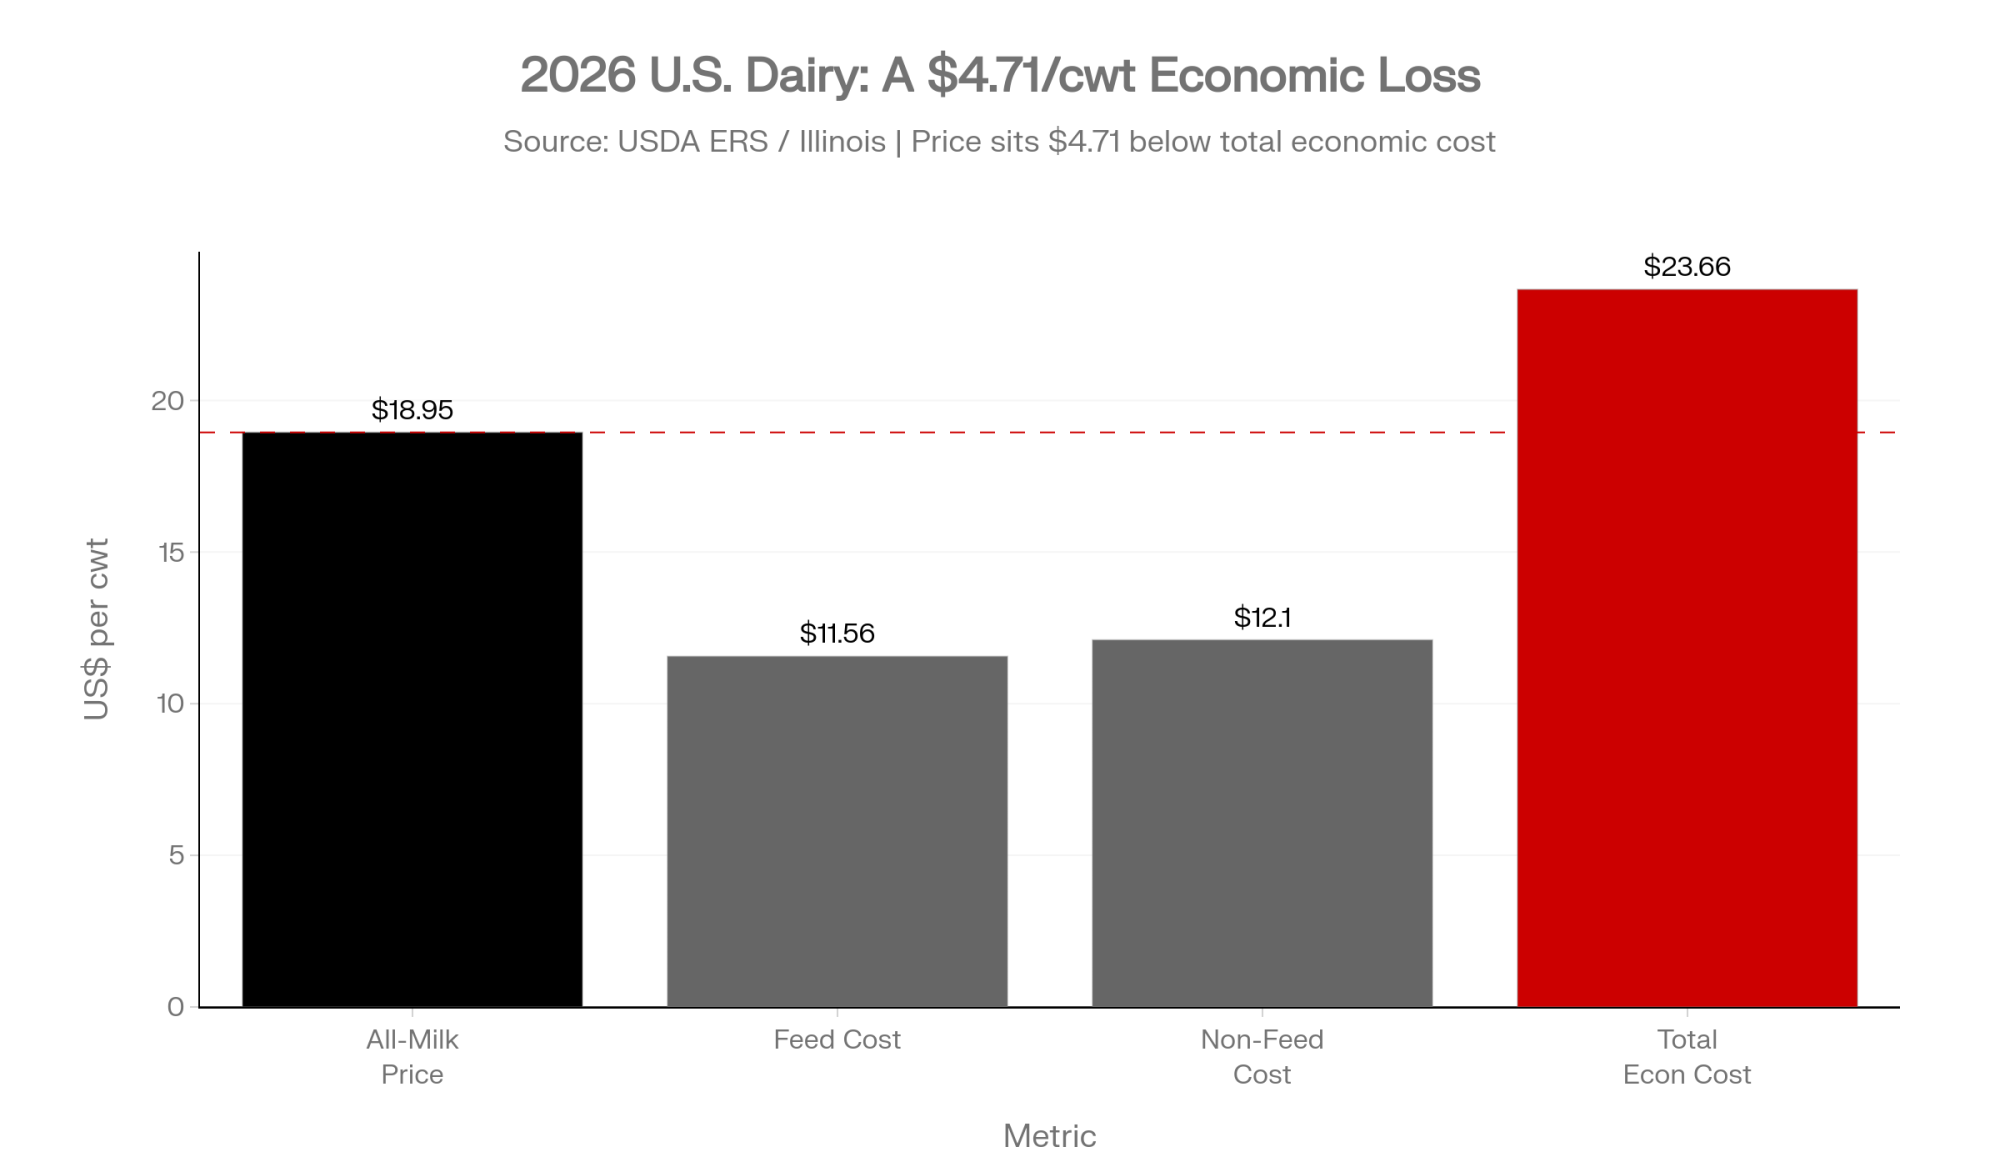
- U.S. total economic cost hangs around US$23.56–$23.66/cwt while projected all‑milk is just US$18.95/cwt, implying an economic loss of US$4.71/cwt.
- Beef‑on‑dairy calves are adding roughly US$4.00–$4.50/cwt in revenue for many herds, quietly covering margin gaps.
- Canadian LCGE and U.S. Section 2032A still blunt tax on transfer, but 2026 estate tax and CUSMA timelines are a flashing yellow light.
U.S. Dairy Milk Pricing: 2025 FMMO Reforms & Economics
Here’s the thing: if you’re milking in the States and haven’t updated your mental model since before 2025, your milk cheque story is outdated.
How the 2025 FMMO Modernization Changed Milk Pricing
The 1 June 2025 FMMO final rule is the most significant reset of U.S. milk pricing in two decades. It targeted three pressure points: make allowances, component standards and the Class I mover.
Make allowances: the quiet margin leak
Make allowances are the fixed manufacturing-cost factors embedded in Class III and IV formulas. They hadn’t moved since 2008, even as energy, stainless and labour costs climbed.
In 2026, new make allowances (actual) look like this:
| Product | Pre‑2025 make allowance ($/lb) | 2026 make allowance ($/lb) | % increase |
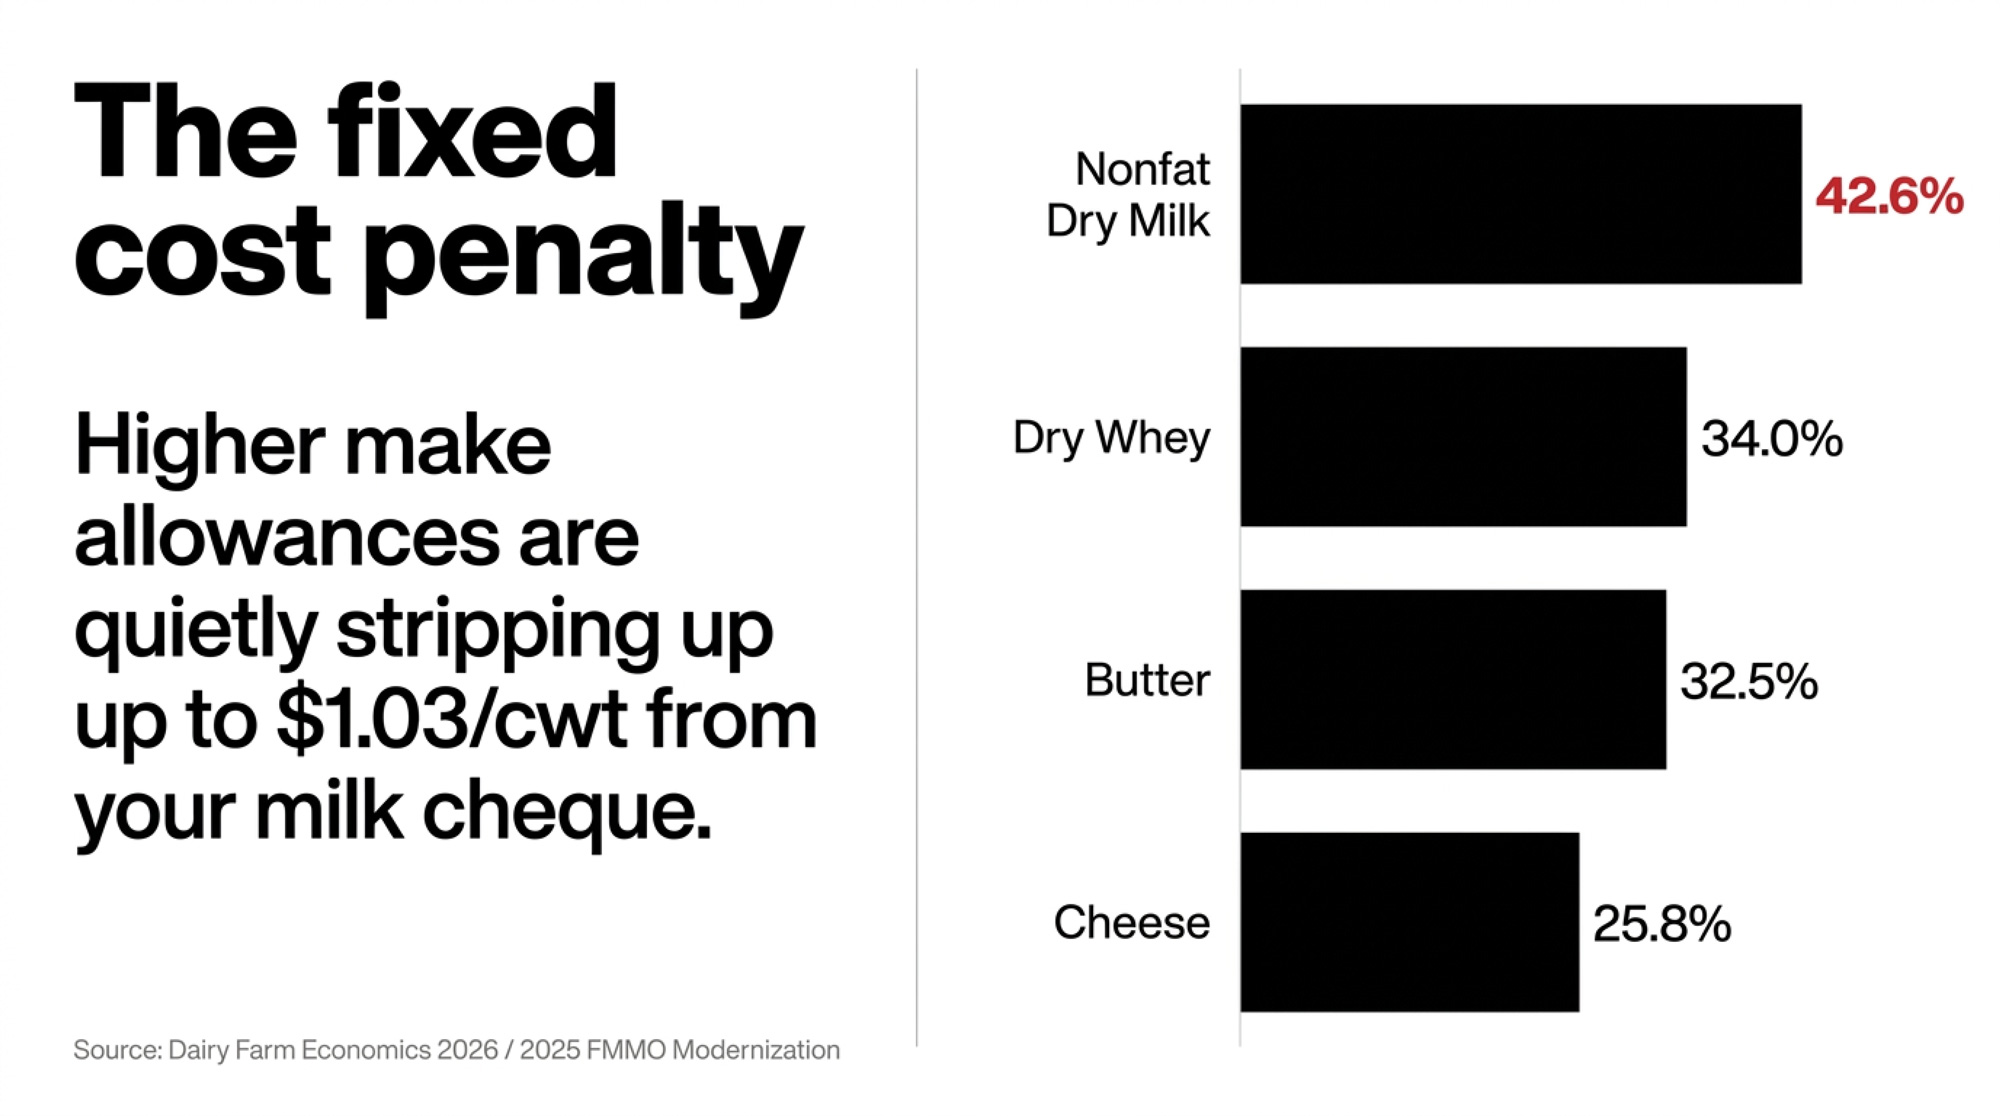
| Cheese | 0.2003 | 0.2519 | 25.8% |
| Butter | 0.1715 | 0.2272 | 32.5% |
| NFDM | 0.1678 | 0.2393 | 42.6% |
| Dry whey | 0.1991 | 0.2668 | 34.0% |
Because these allowances are subtracted from wholesale product prices in the formulas, each bump is a direct hit to farm‑gate value. Work by dairy economists like Stephenson and Mitchell shows that if these allowances had been in place from 2019–2023, average Class III would’ve dropped about US$0.90/cwt and Class IV by US$1.03/cwt.
That discount was the “price” of keeping processors in the pool instead of pushing them to de‑pool when regulated minimums exceeded true margins.
“Higher make allowances didn’t ‘create’ cost pressure – they finally put it on paper and handed the bill to the farm side.”
Component composition updates: your cows are bailing you out
To offset part of that hit, USDA updated the standard composition factors in the pricing formulas from 2000-era values to something closer to your actual tank.
| Component | 2000–2024 standard (%) | 2026 standard (%) (actual) |
| Protein | 3.1 | 3.3 |
| Other solids | 5.9 | 6.0 |
| Nonfat solids | 9.0 | 9.3 |
Those denser solids, effective 1 December 2025, add roughly US$0.60–$0.70/cwt to the Class I skim price. The butterfat recovery factor in the Class III formula also bumped from 90% to 91% to reflect modern cheese plant efficiency.
Net-net: genetics and nutrition have quietly created “richer” milk that cushions some of the make‑allowance damage.
Class I mover: back to “higher‑of”
The 2018 Farm Bill’s “average‑of plus US$0.74” Class I mover cost producers heavily whenever Class III and IV diverged, especially during COVID cheese buying. The 2025 reforms restored the “higher‑of” formula: Class I skim is now based on the higher of advanced Class III or IV.
Extended shelf‑life (ESL) products get a carve‑out: they sit on an average‑of mover with a 24‑month rolling adjuster and 12‑month lag, acknowledging their different marketing profile.
This matters because it puts fluid milk back at the top of the value ladder and reduces ugly negative Producer Price Differentials (PPDs) that showed up when Class III ran away from the blend.
PPDs and de‑pooling risk in 2026
PPDs measure the difference between the pool’s total value and what you’ve already been paid for components. When make allowances were too low, processors were effectively forced to overpay relative to product value, so they de‑pooled, hammering PPDs into the red.
With the 2026 structure, incentives to de‑pool are lower, so more milk stays regulated. That usually means a steadier, if slightly lower, base price. For most farms, consistent cash beats lottery-ticket spikes.
Canadian Dairy Farm Economics: Supply Management & Quota
Let’s switch barns. North of the line, economics are all about quota, the CDC’s pricing formula and the protein pivot.
CDC National Pricing Formula and the 2026 increase
The Canadian Dairy Commission sets the national farmgate price using the National Pricing Formula. It weights 50% on cost of production (COP) and 50% on the Consumer Price Index (CPI).
For 1 February 2026, CDC implemented a 2.33% farmgate increase after a year where the price had actually dipped slightly thanks to productivity gains and lower inputs in 2025. The 2026 bump is tied to sharp labour cost increases and climate-driven feed volatility.
The 70/25/5 protein pivot
The big structural change is not the headline price. It’s the value split inside the litre.
By 2025 the system had a butterfat surplus and a protein deficit. Demand for high‑protein products like yoghurt and cottage cheese exploded – cottage cheese alone was up 32% in 2025.
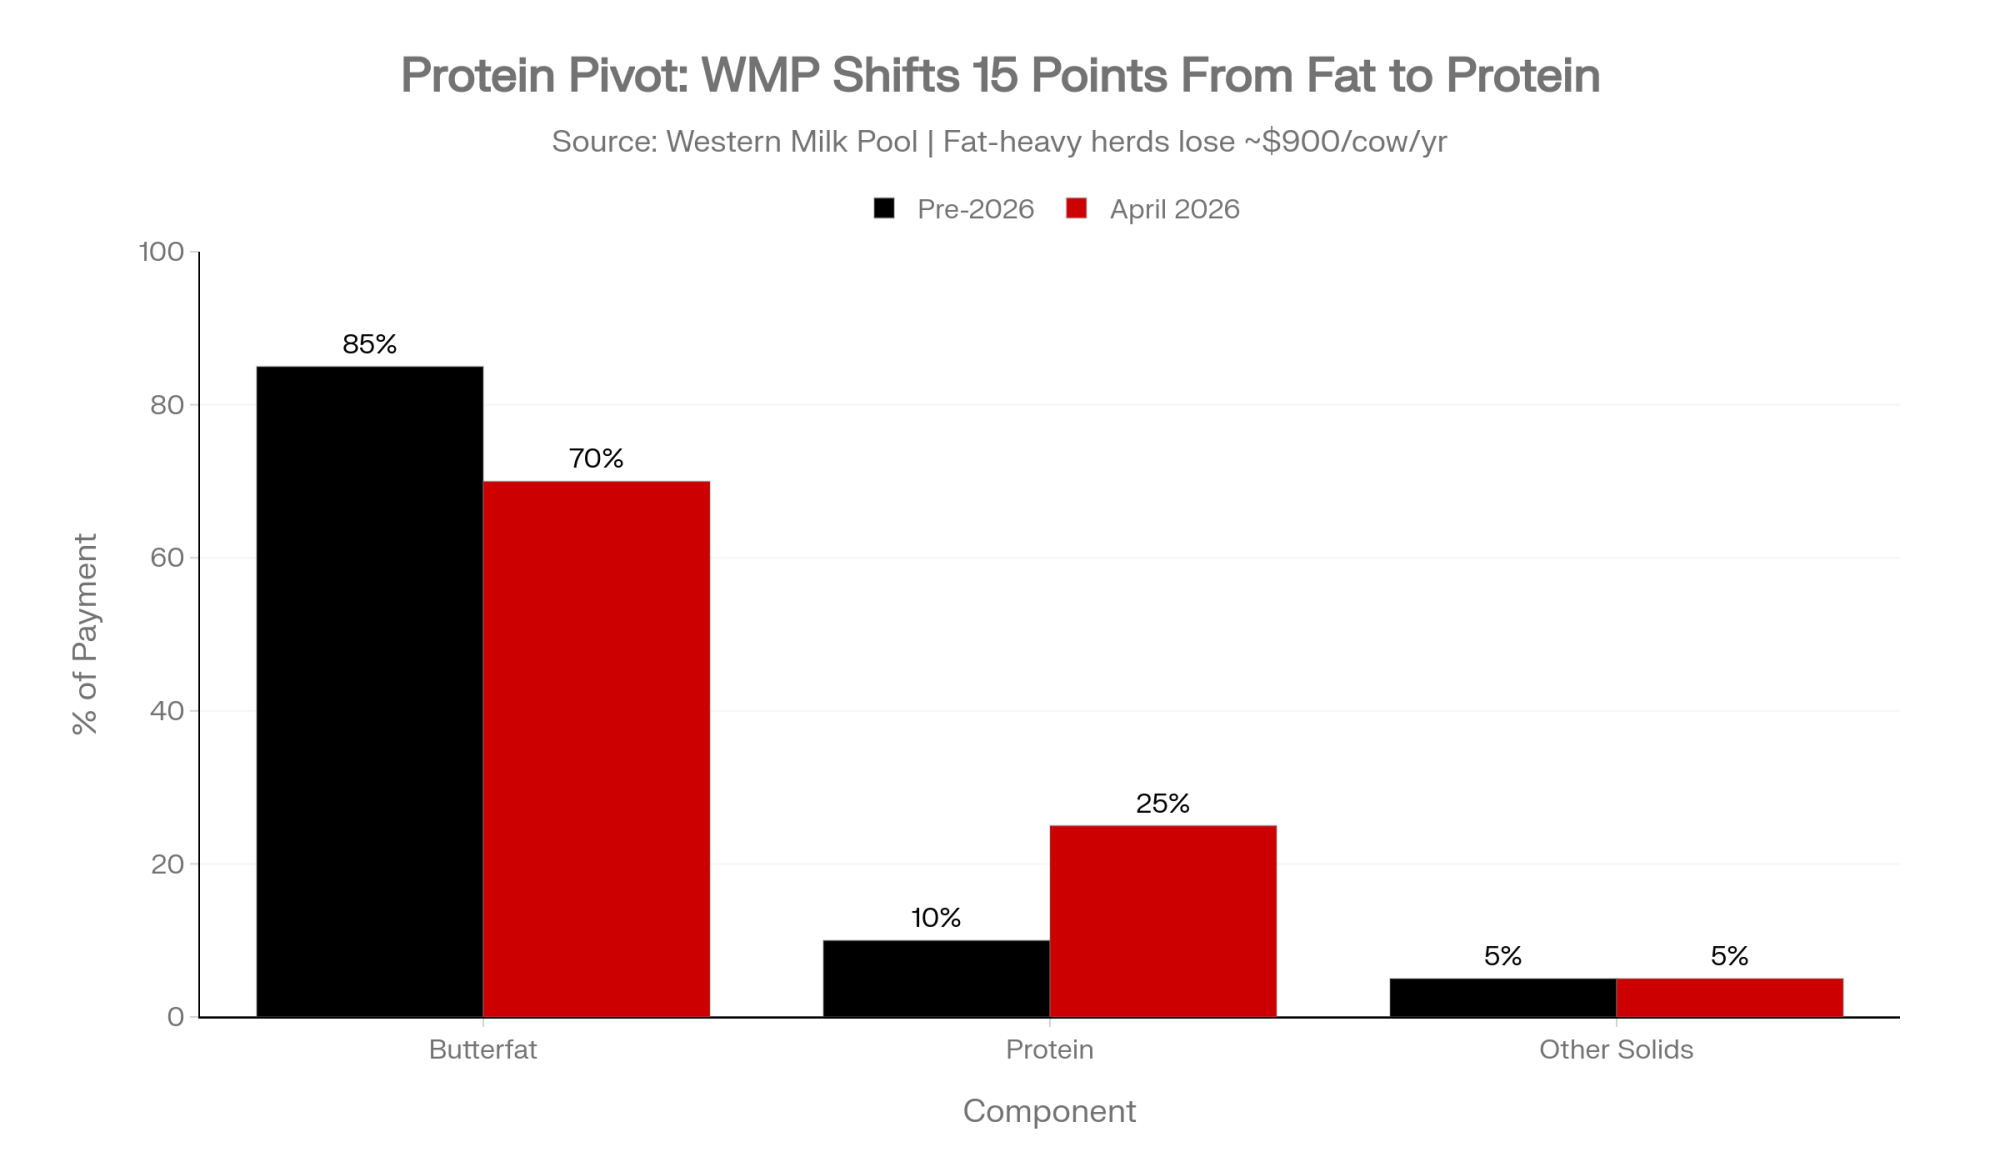
So from 1 April 2026, Western Milk Pool (WMP) producer payments moved roughly from 85% fat / 10% protein / 5% other solids to 70% fat / 25% protein / 5% other solids. In P5, boards layered in a tiered structure that rewards an SNF:BF ratio of at least 2.14.
Here’s how the WMP ratio shift pencils out:
| Component | Pre‑2026 WMP ratio | April 1, 2026 WMP ratio (actual) | Impact per kg quota (P5) |
| Butterfat | 85% | 70% | −$1.80 |
| Protein | 10% | 25% | +$2.00 |
| Other sol. | 5% | 5% | Neutral |
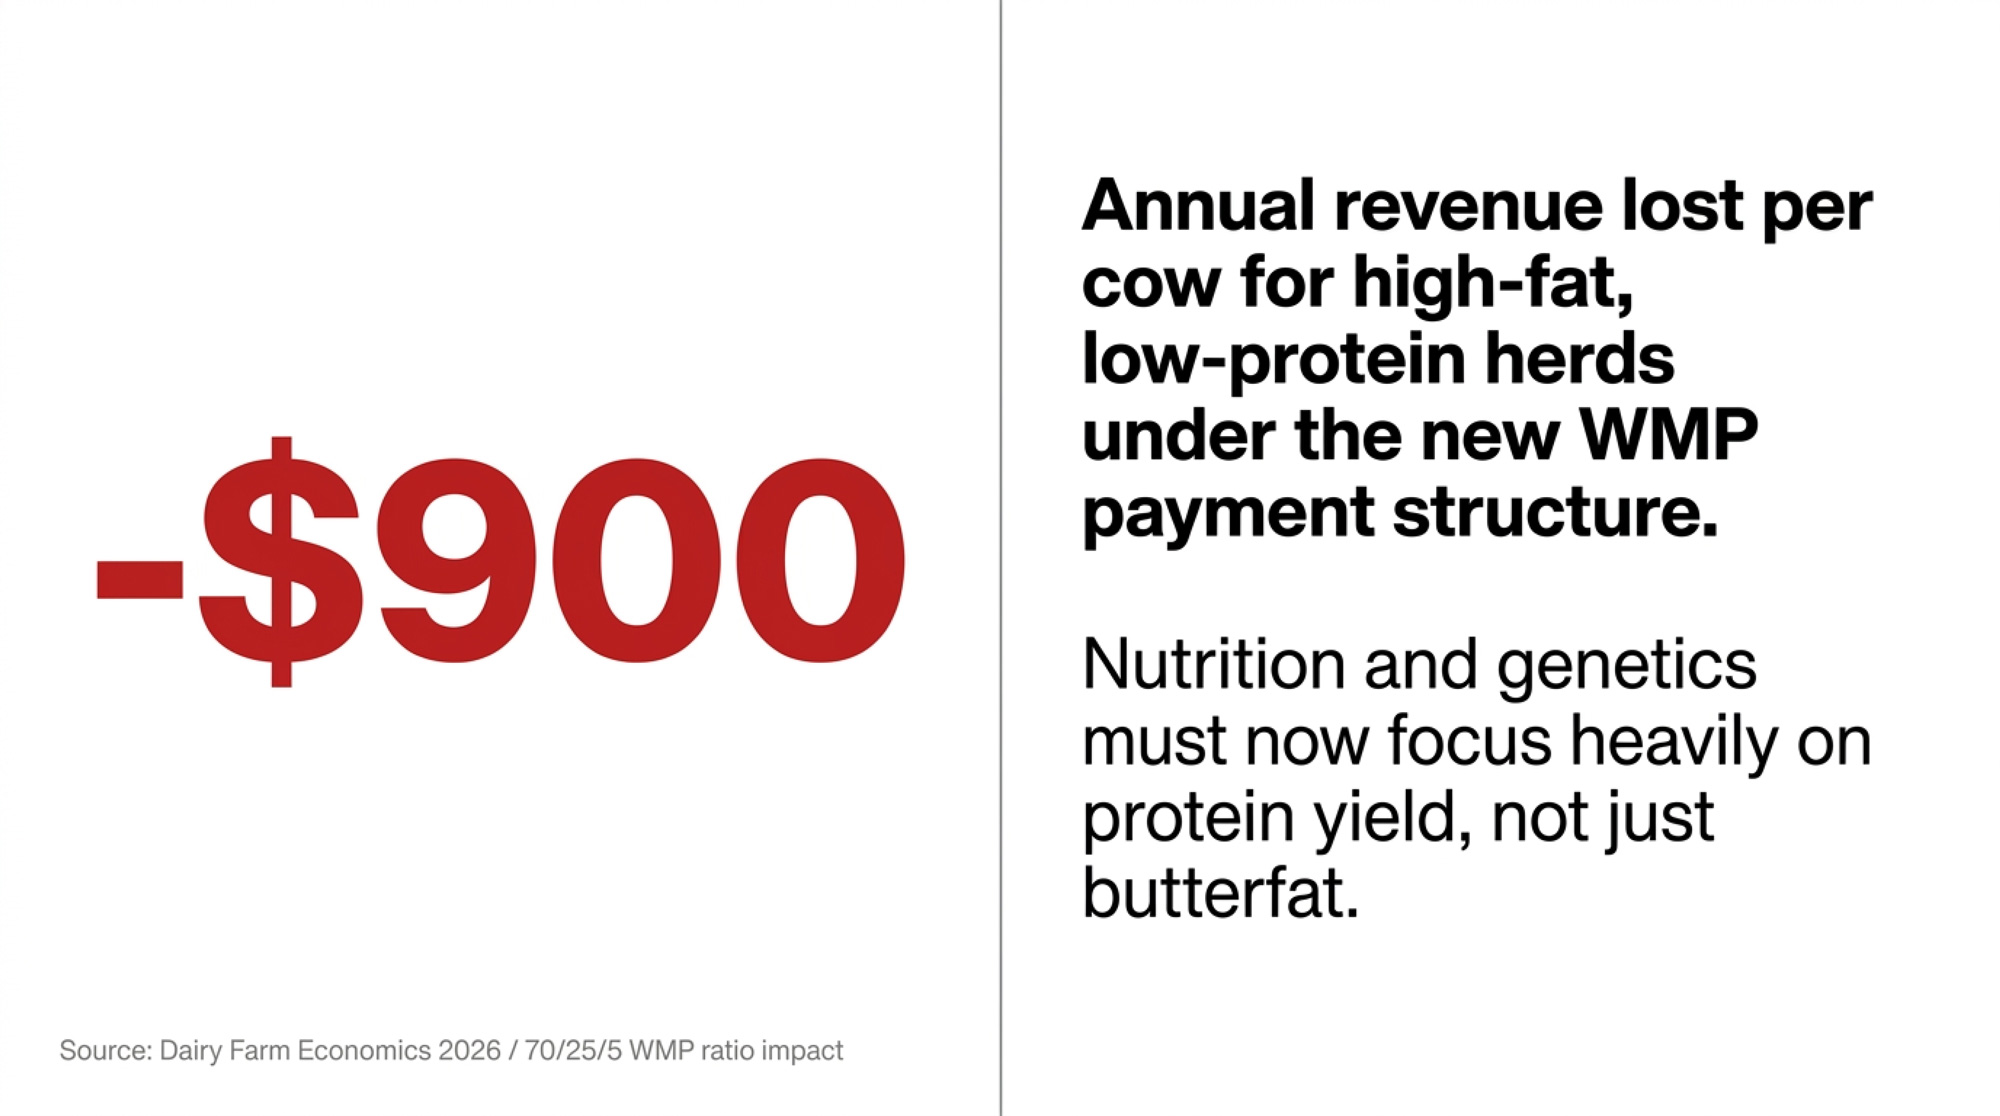
For a 100‑cow, high‑fat (4.6%), low‑protein (3.1%) herd, this re‑weighting can strip $80,000–$100,000 per year, or roughly $900 per cow. The only realistic response is nutrition (e.g., rumen‑protected amino acids) plus genetics focused on Protein Yield, not just butterfat.
Quota values and provincial trends in 2026
Quota is still the biggest line on Canadian dairy balance sheets.
- P5 provinces hold a $24,000/kg BF cap. Ontario and Quebec sit there in 2025 and February 2026.
- WMP provinces run market-driven exchanges, and values are on a tear.
Sample values:
| Province | Aug 2025 quota value ($/kg BF) | Feb 2026 quota value ($/kg BF, modelled) |
| Ontario | 24,000 (actual) | 24,000 (capped) |
| Quebec | 24,000 (actual) | 24,000 (capped) |
| Alberta | 55,305 (actual) | 56,200 (projected) |
| British Col. | 35,500 (actual) | 37,000 (projected) |
| Manitoba | 47,800 (actual) | 48,500 (projected) |
In WMP, scarcity plus aggressive large‑herd expansion, especially in Alberta, has pushed quota toward double Eastern values. Lenders are watching quota‑to‑debt ratios closely because 2026 interest costs are still way above the last decade, even with expected rate cuts.
Cost of Production, IOFC and NCOP Benchmarks
Honestly, this is where survivability gets real. Price you can’t control. Cost structure you can.
U.S. cost of production and the 2026 squeeze
University of Illinois and USDA ERS data tell a pretty blunt story: milk prices rebounded a bit in 2024–2025, but 2026 all‑milk is forecast lower as cow numbers and per‑cow production climb.
| Metric (US$/cwt) | 2024 actual (Illinois) | 2025 forecast (IL) | 2026 projected (US) |
| All‑milk price | 21.63 | 20.15 | 18.95 |
| Feed cost | 11.64 | 11.56 | 11.56 |
| Non‑feed cost | 11.92 | 11.91 | 12.10 |
| Total econ. cost | 23.56 | 23.47 | 23.66 |
| Net econ. return | −1.93 | −3.32 | −4.71 |
Income over feed cost (IOFC) for 2026 is projected around US$11.40/cwt. That’s “workable but unforgiving” territory – there’s no room for sloppy feed shrink, bad cull timing or under‑utilised facilities.
In 2024, the average Illinois dairy lost about US$409 per cow on a full economic basis once you include depreciation and opportunity cost. With softer 2026 prices, that economic loss widens unless you’re an outlier on efficiency.
Canadian benchmarks: management excellence and scale
Lactanet’s 2025 Management Benchmarks show how Canadian scale and cow performance translate into milk value.
| Province | Milk value ($/cow/year) | Standard milk (kg/cow/day) | Median herd size |
| British Col. | 10,930 | 38.0 | 151 |
| Alberta | 10,673 | 40.2 | 115 |
| Ontario | 10,206 | 39.0 | 70 |
| Quebec | 10,239 | 40.1 | 72 |
| PEI | 10,476 | 35.8 | 60 |
BC and Alberta herds generally push higher daily yields and milk value per cow, using scale and management to offset steeper land and quota costs. Quebec quietly wins on longevity, with 46.6% of cows in their 3rd+ lactation, lowering replacements per cwt.
“In 2026, NCOP – not just IOFC – is the margin lever separating the survivors from the for‑sale listings.”
Dairy Risk Management: DMC, DRP, Futures and Beef-on-Dairy
You’re not getting financing in 2026 without a risk plan your lender believes. Let’s walk through the big tools.
Dairy Margin Coverage (DMC): the Tier 1 bump
DMC is still the backbone safety net for U.S. producers. In 2026 USDA raised Tier 1 coverage from 5 million to 6 million lb of production history.
For a 300‑cow herd shipping 7.2 million lb, that shift drops 1 million lb from expensive Tier 2 (US$1.81/cwt) into cheap Tier 1 (US$0.15/cwt). That’s about US$15,800/year in premium savings.
In 2024 margins were mostly strong, but by late 2025 things softened. A projected December 2025 margin of US$9.19triggers about US$0.31/cwt at the US$9.50 coverage level. With the 2026 all‑milk forecast at US$18.95, margins are expected to frequently test that US$9.50 trigger.
Dairy Revenue Protection (DRP) and futures
For herds over the 6M lb Tier 1 ceiling, DRP and CME futures are doing more of the heavy lifting.
You’re essentially insuring quarterly revenue (price × yield) using Class or Component Pricing. A snapshot of 2026 futures:
| Month 2026 | Class III futures ($/cwt, actual May ’26) | Class IV futures ($/cwt, modelled) |
| June | 17.35 | 18.50 |
| September | 18.75 | 19.20 |
| December | 18.16 | 18.80 |
The play most advisers like: “average into” coverage and lock in 30–50% of expected production when futures sit above long‑run averages (~US$18 for Class III). Basis contracts – where you fix basis against CME and float flat price – are picking up as regional freight and plant capacity shift basis around.
Beef-on-dairy as a hidden safety net
Maybe the most under‑appreciated 2026 risk tool is the beef‑on‑dairy cheque.
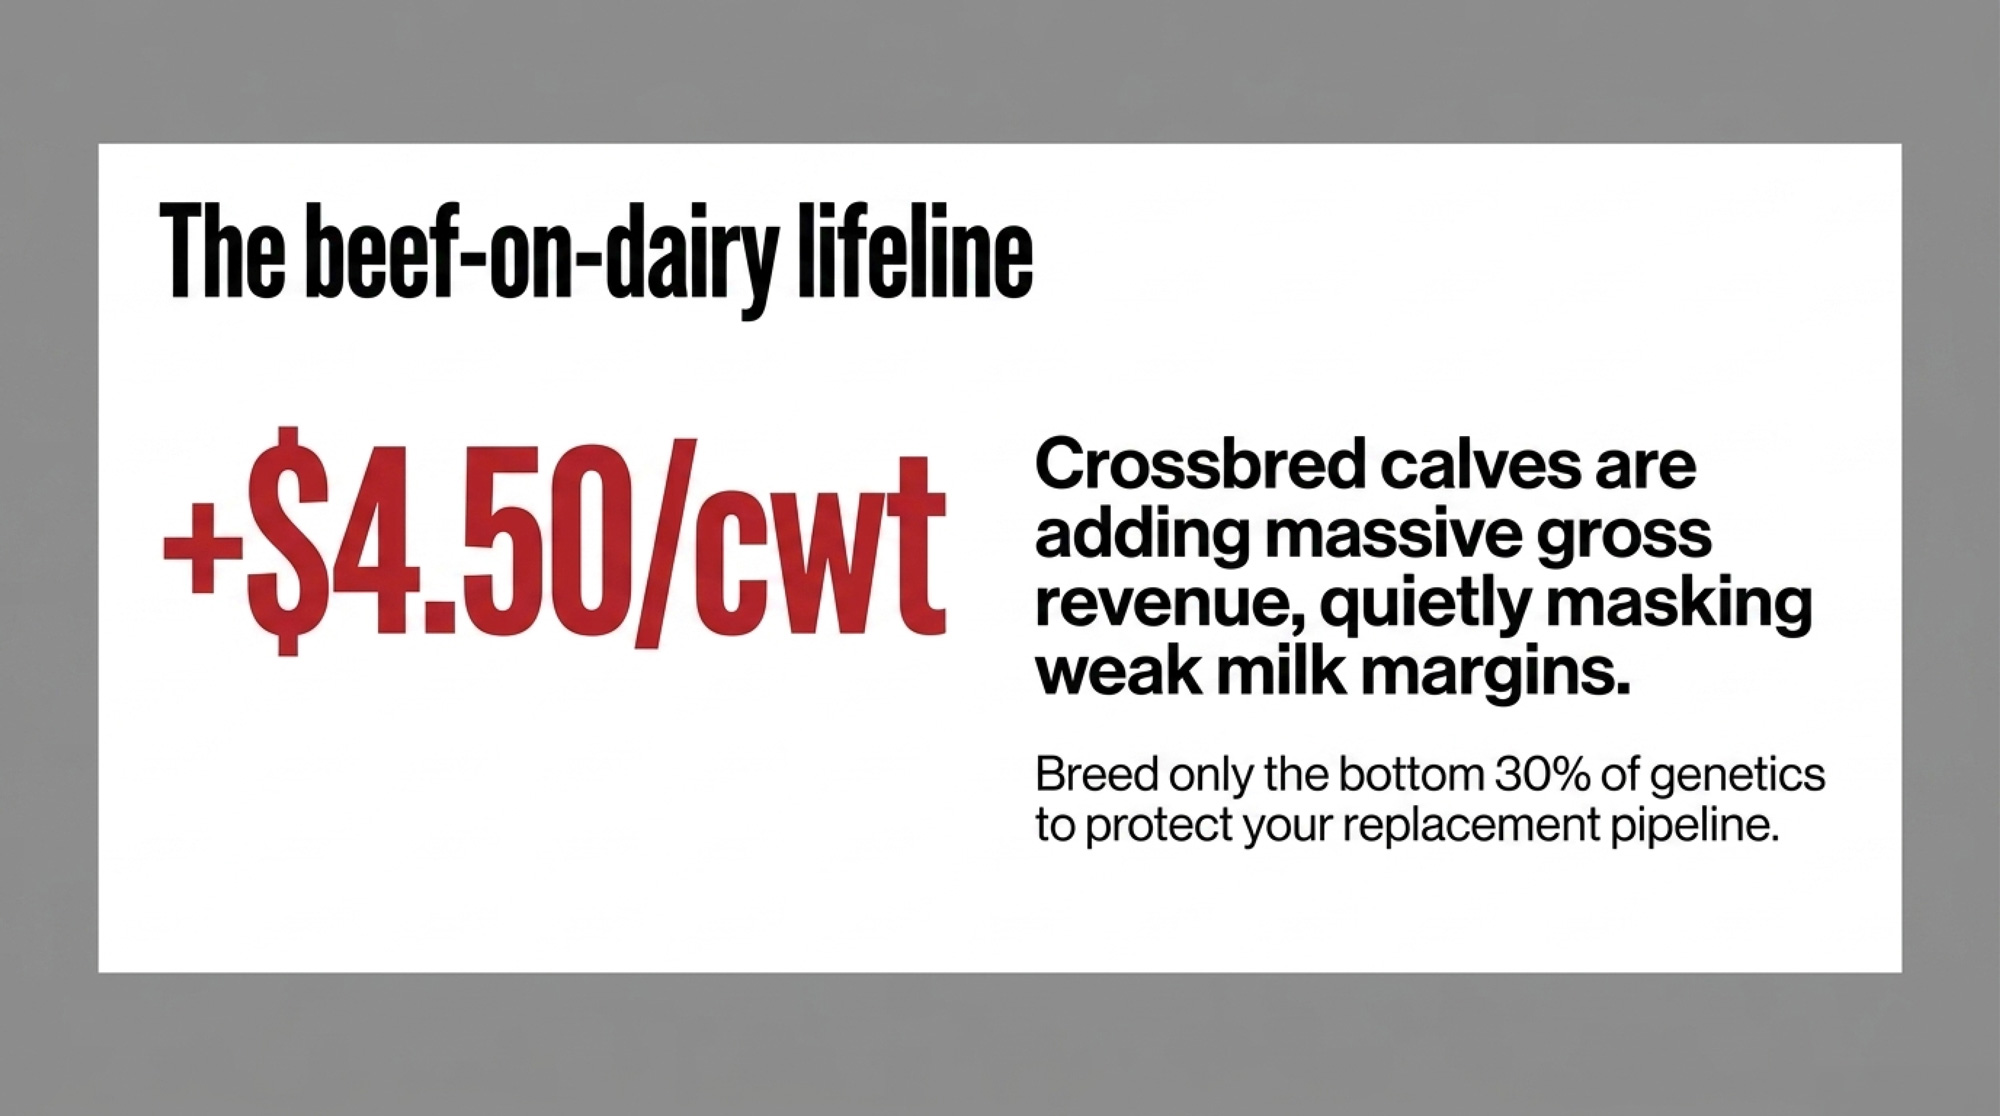
With the U.S. beef cow herd at its smallest since 1951, crossbred calves are bringing US$900–$1,400/head. For many herds that’s effectively adding US$4.00–$4.50/cwt to the revenue side of the ledger.
That’s fantastic – but it’s not free money. High beef value is keeping genetically weaker cows in the barn longer, propping up milk supply and capping price gains. The smart play is to use beef semen on the bottom 20–30% of your genetics, not the whole herd, so you don’t starve your replacement pipeline in a market where heifers are at a 20‑year low and over US$3,000/head.
Labour Economics and Robotic Milking ROI
The reality is simple: labour is your biggest controllable wild card in 2026.
Wage inflation: AEWR and TFWP pressure
AEWR and TFWP rates have climbed to levels where “just hire another milker” isn’t cheap at all.
Sample 2026 wages:
| Region | 2026 wage ($/hr, actual/projected) | Program |
| California | 19.97 | AEWR (US) |
| Wisconsin | 18.15 | AEWR (US) |
| New York | 18.83 | AEWR (US) |
| Ontario | 17.60 | TFWP (CAN) |
| Alberta | 18.34 | TFWP (CAN) |
New U.S. DOL rules bring tiered AEWRs by skill; Skill Level 2 (3+ months experience) often sits in the US$17–$20/hr band for dairy jobs.
Robotic milking ROI: scale and labour cost decide
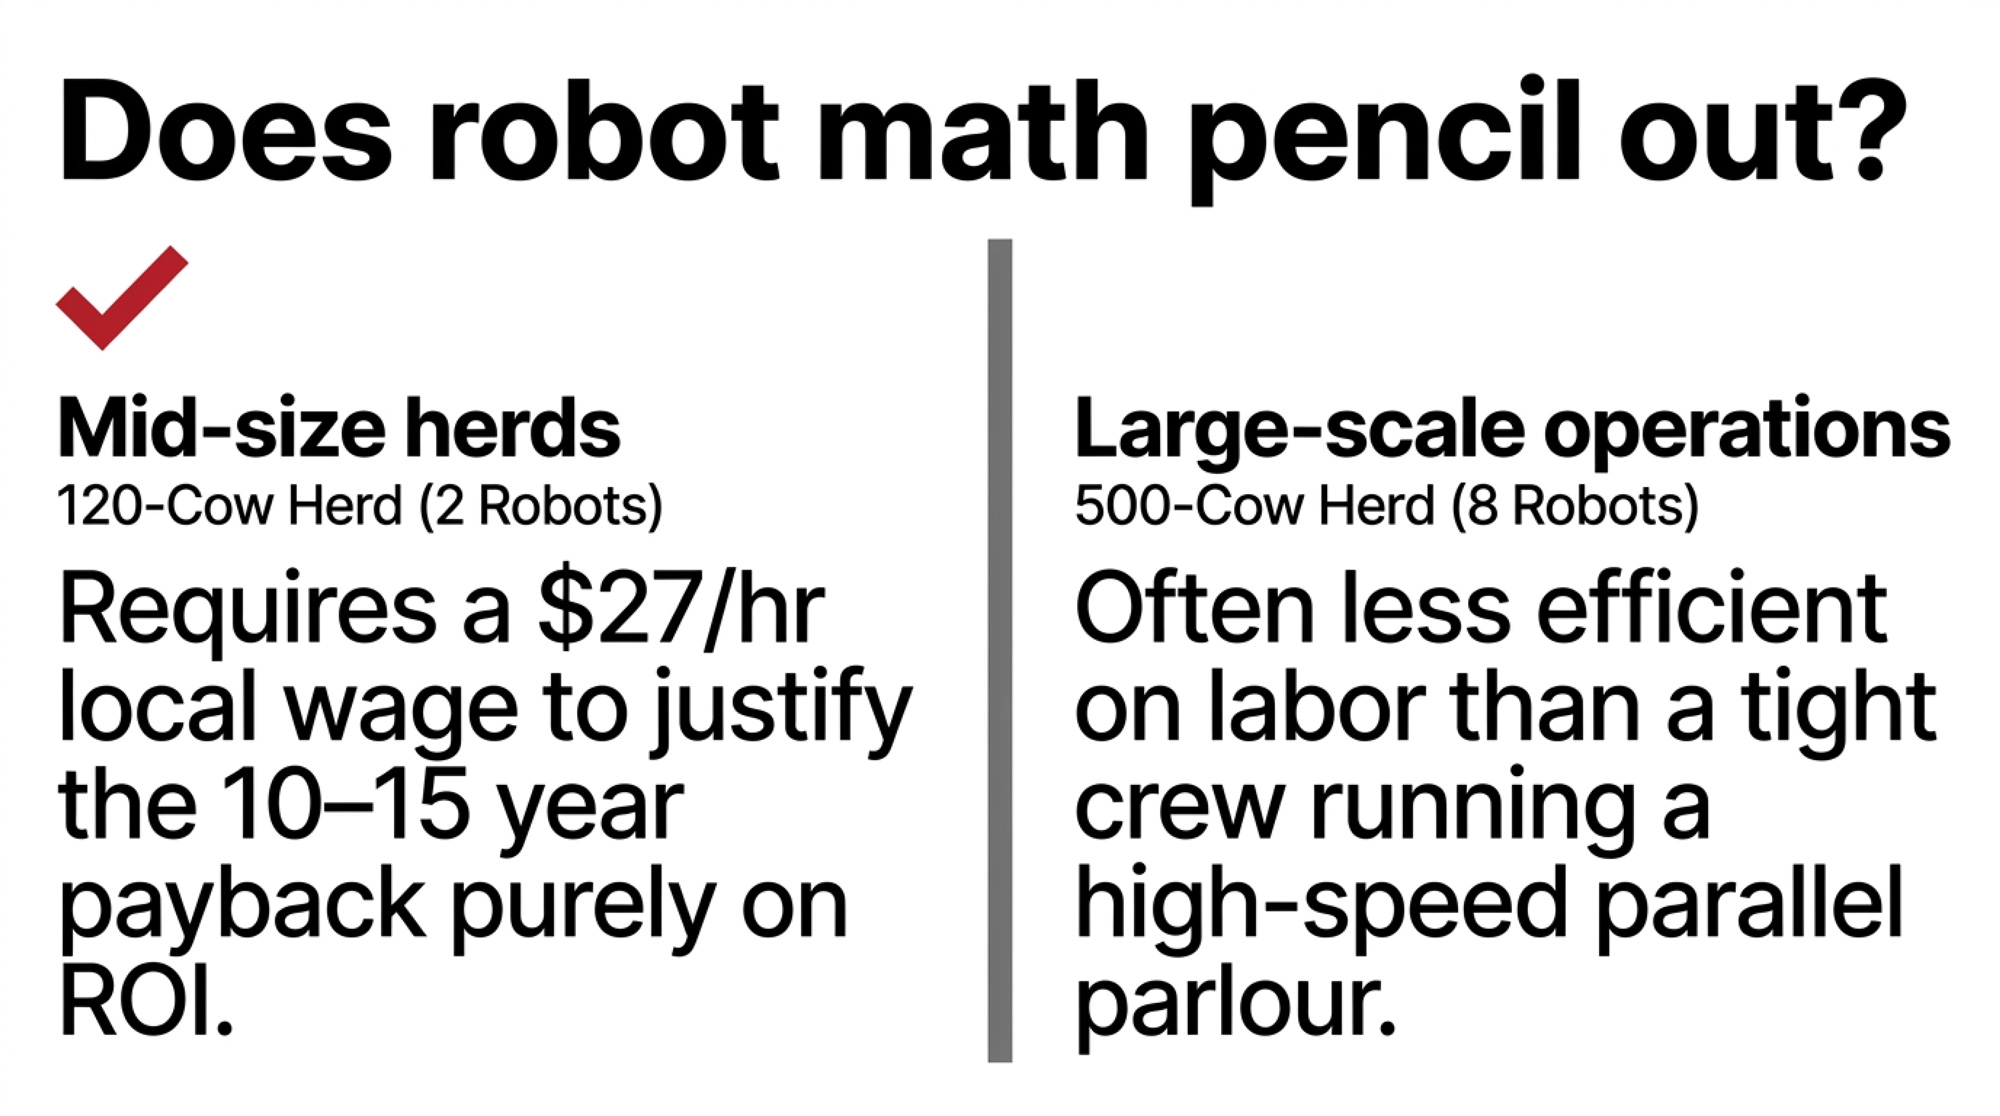
University of Wisconsin and Minnesota work puts the robotic breakeven around US$27.05/hr milking labour. Below that, robots struggle to pay strictly on dollars; above that, the math turns.
| Herd Size | 120 Cows (2 robots) | 180–400 Cows (3–4 robots) | 500 Cows (8 robots) |
| Capital investment | US$400K–500K | US$600K–1.2M | US$1.6–2.0M |
| Production bump | 5–17% (from 2x) | 5–17% | Marginal vs. parlour |
| Breakeven labour | ~US$27.05/hr | ~US$27.05/hr | Often fails vs. rotary |
| Payback (with bump) | 10–15 years | 7–12 years | Rarely pencils |
| Payback (no bump) | 16–33 years | 12–20 years | N/A |
| Verdict | Lifestyle buy, thin ROI | Sweet spot | High-speed parlour wins |
120‑cow herd (2 robots)
- Investment: US$400,000–$500,000
- Production bump: 5–17% if moving from 2x milking
- Payback: 10–15 years with production jump; 16–33 years without
- Net benefit: improved quality of life and labour reliability, but thin pure‑ROI case unless your local wage is very high
500‑cow herd (8 robots)
- Investment: US$1.6–$2.0M
- Reality: often less efficient than a high‑speed parlour with a tight crew
- Takeaway: at 500+ cows, a high‑efficiency rotary or parallel parlour with some automation generally beats individual boxes on ROI
The sweet spot for box robots is roughly 180–400 cows, where three to four units can meaningfully reduce labour positions without bringing big‑operation complexity.
Farm Succession, Tax Rules and Transfer Strategies
Margins are tight, owners are aging, and the tax clock is ticking. That’s a dangerous combo if you’re not planning.
Canadian Lifetime Capital Gains Exemption (LCGE)
LCGE remains the single most powerful tax tool for Canadian farm families. Effective 25 June 2024 the limit rose to $1.25M, with indexation resuming in 2026 for qualified farm property (QFFP). For 2026, that effectively means about $1.275M per person.
In practice: each spouse can use their LCGE, so a couple can shelter roughly $2.55M of gains on land, buildings or shares that qualify. Often you’ll see share‑sale structures in corporations to fully use each person’s exemption.
U.S. Section 2032A and the 2026 estate exclusion sunset
On the U.S. side, the focus is special‑use valuation and the impending rollback of the basic exclusion.
Section 2032A lets qualifying farm real estate be valued at its current ag use, not highest and best use. For 2026, the maximum reduction is US$1,460,000 in estate value.
At the same time, today’s roughly US$13.99M basic exclusion is set to sunset back to about US$5M (inflation‑indexed) in 2026. That’s why tools like 2032A, FLPs/LLCs and well‑drafted buy‑sell agreements are moving from “nice to have” to essential.
Succession experts like Al Mussell are pushing phased buyouts: the next generation finances the purchase of revenue‑producing assets (herd, quota) first, while renting land and buildings until final transfer. That protects mom and dad’s equity while letting the kids build their own.
Three Financial Scenarios: Expand, Optimize, or Exit
Here’s where we stop talking theory and put the 2026 dairy farm economics into scenarios. All three are modelled, not prescriptions, using the report’s numbers.
| Decision Lever | A: Expand to 750 cows | B: Strategic Exit | C: Optimize at 300 cows |
| Capital outlay | US$3.5–5.0M | $0 | ~US$150K |
| Labour cost target | ~US$2.50/cwt | N/A | ~US$3.10/cwt |
| All-milk assumption | US$18.95/cwt | N/A (dispersal) | US$18.95/cwt |
| Beef-on-dairy add | Limited (replacement needs) | US$1,300/head final cull | +US$4.25/cwt (bottom 30%) |
| Interest rate exposure | 6.5–7.0% on $3.5M+ | None | Minimal |
| Payback window | 10–15+ years | Immediate | 3–5 years |
| Risk stack | DMC + DRP + CME maxed | Dispersal timing | DMC Tier 1 6M lb + DRP |
Scenario A: Expansion to ~750 cows
- Capital: US$3.5–$5.0M for barn, parlour/robots, heifers.
- All‑milk price: US$18.95 projected.
- Labour cost target: ~US$2.50/cwt with scale.
- Risk stack: maxed DMC, DRP and CME positions.
Assumptions include US$11B of new regional processing capacity to secure a milk home and interest rates at 6.5–7.0%. High‑risk, high‑scale: works only if you can truly get your total economic cost into the high teens and believe prices will beat 2026 projections over your payback window.
Scenario B: Strategic exit
- Capital investment: $0 – focus is liquidation.
- Beef‑on‑dairy calf value: US$1,300/head on final crossbreds.
- Replacement heifers: tight supply at 20‑year lows and $3,000+ per head supports strong dispersal prices.
This path assumes you time an orderly exit into a firm cull and replacement market, preserve equity and step off the treadmill before the estate tax and interest‑rate environment shift further.
Scenario C: Status-quo optimization (roughly 300 cows)
- Capital: roughly US$150k for tech (activity monitors, feed precision).
- All‑milk: US$18.95.
- Labour cost per cwt: targeting ~US$3.10 with automation.
- Beef‑on‑dairy: bottom 30% of genetics only, adding ~US$4.25/cwt.
- Risk stack: full DMC Tier 1 with 6M lb cap plus DRP and basis locks on a slice of volume.
Five‑year outcome: debt‑free stability and better cashflow, but limited equity growth without some form of scale or diversification.
FREQUENTLY ASKED QUESTIONS
How did the 2025 FMMO make-allowance changes affect my milk price?
They raised cheese, butter, NFDM and dry whey make allowances 25–43%, which are subtracted in Class III and IV formulas. Economists estimate this cut Class III by about US$0.90/cwt and Class IV by US$1.03/cwt over 2019–2023 conditions.
What is a good IOFC for a U.S. dairy in 2026?
Projections put 2026 income over feed cost around US$11.40/cwt. That’s considered “workable but unforgiving.” Below that, even efficient herds struggle to cover non‑feed costs and debt service without eroding equity.
How much revenue does beef-on-dairy add per cwt right now?
With crossbred calves bringing roughly US$900–$1,400 per head in 2026, many herds are effectively adding US$4.00–$4.50/cwt to gross revenue. It’s a big help, but it can mask weak milk margins if you’re not careful.
Is robotic milking profitable for a 120-cow herd?
It can be, but only under the right conditions. At 120 cows, a two‑robot setup usually needs very high labour costs (around US$27/hr) and a solid production bump to get payback under 15 years. For cheaper labour, the ROI weakens.
Should I expand or stay put with 300 cows in 2026?
Expansion only pencils if you can pull total cost into the sub‑US$20/cwt range and believe milk prices will beat the US$18.95 projection. Many 300‑cow herds are better off optimizing NCOP, beef‑on‑dairy and risk tools before betting millions on new concrete.
How is Canadian quota valued in 2026 across provinces?
P5 provinces like Ontario and Quebec are capped at $24,000/kg BF. Alberta sits around $55,305/kg in August 2025 with projections to $56,200 by February 2026, while BC is in the mid‑$30,000s per kg and rising.
What is the Canadian 2026 LCGE limit for farm property?
The Lifetime Capital Gains Exemption for qualified farm property sits around $1.275M per individual in 2026 after a 2024 increase and resumed indexation. Couples can potentially shelter around $2.55M in gains on eligible assets.
How does the 2026 DMC Tier 1 change help my 300-cow U.S. farm?
By raising Tier 1 from 5M to 6M lb, it shifts 1M lb of coverage from higher Tier 2 premiums to cheaper Tier 1. For a 300‑cow herd shipping 7.2M lb, that’s about US$15,800/year in premium savings at typical coverage levels.
What SNF:BF ratio should Ontario and P5 producers aim for now?
Boards are targeting a solids‑non‑fat to butterfat ratio of at least 2.14 to maintain current milk‑cheque levels. High‑fat, low‑protein herds below that ratio are seeing significant revenue penalties under the 2026 payment structures.
What happens if CUSMA isn’t renewed in 2026?
If the agreement isn’t renewed, it won’t automatically roll forward for another 16 years. Instead, annual reviews would happen until potential termination in 2036, injecting a decade of uncertainty into both U.S. and Canadian dairy trade flows.
 The Sunday Read Dairy Professionals Don’t Skip.
 The Sunday Read Dairy Professionals Don’t Skip.
Every week, thousands of producers, breeders, and industry insiders open Bullvine Weekly for genetics insights, market shifts, and profit strategies they won’t find anywhere else. One email. Five minutes. Smarter decisions all week.
