Dairy breeders alert: The 2025 genetic base change reveals hidden inbreeding impacts reshaping PTA values and herd futures.
EXECUTIVE SUMMARY: The April 2025 genetic base update exposes how surging Holstein inbreeding silently distorts PTA adjustments, with proven bulls like Seagull-Bay Supersire-ET showing smaller-than-expected milk drops due to shifting Expected Future Inbreeding (EFI) calculations. As the Holstein population’s average relatedness spikes, EFI adjustments now account for 18% of PTA changes, requiring breeders to prioritize genomic relationship management. Delayed updates for calving traits until August 2025 add complexity, while breed-specific impacts highlight Holsteins’ 404 NM$ drop—double other breeds. Strategic herd management must now balance genetic progress with inbreeding mitigation through EFI monitoring and targeted mating programs.
KEY TAKEAWAYS:
EFI’s Hidden Power: Every 1% EFI increase costs 64 lbs milk yield, reshaping PTAs more aggressively in Holsteins than other breeds.
Supersire Shock Example: A 135-lb “missing” milk PTA drop reveals how population-wide inbreeding dilutes individual bull penalties.
Holstein Crisis: 2020-born base herds show 9.4% EFI (vs. 7.5% in 2015), accelerating inbreeding depression in evaluations.
Calving Trait Delay: Phenotypic calculation issues push key updates to August 2025, requiring interim breeding adjustments.
Survival Strategy: Focus on EFI-adjusted NM$, utilize low-relationship genomic sires, and implement mating software to curb profit erosion.
The April 2025 genetic base change isn’t just another spreadsheet update—it’s a genetic reckoning that demands immediate attention from every serious dairy producer. While the headline numbers show significant PTA drops across breeds, the real story lies in how increasing Holstein inbreeding is silently reshaping genetic evaluations and potentially threatening your herd’s future profitability.
The Genetic Time Bomb: Why Your Top Bulls Defy Expectations
When the Council on Dairy Cattle Breeding (CDCB) announced the 2025 base change, most Holstein breeders expected a uniform 752-pound drop in milk PTAs across their animals. Yet something unexpected happened: many proven bulls showed smaller decreases than anticipated.
Take Seagull-Bay Supersire-ET (007HO11351), for example. His milk PTA decreased from 978 to 361 pounds—a drop of only 617 pounds instead of the expected 752. This 135-pound “missing” decrease isn’t a calculation error—it’s a warning sign that inbreeding dynamics are changing rapidly in the Holstein population.
The Base Change Reality Check:
Holstein milk PTAs dropped by 752 pounds on average
Fat and protein PTAs decreased by 44 and 29 pounds respectively
Net Merit (NM$) values plummeted by $404
Jersey and Brown Swiss breeds experienced smaller adjustments
The magnitude of these changes reflects both genetic progress made between 2015 and 2020 and shifting inbreeding patterns that are reshaping how genetic evaluations work.
EFI Exposed: The Silent Profit Killer in Your Breeding Program
At the heart of this genetic puzzle is a measurement called Expected Future Inbreeding (EFI), which has been used to adjust PTAs since 2008. Think of EFI as your bull’s genetic shadow—the darker it looms over the herd; the more milk profits evaporate in future generations.
EFI measures how closely related an animal is to the current female population. When a bull is mated randomly to the breed, EFI predicts the level of inbreeding expected in the offspring. This matters because inbreeding depression has real economic consequences:
Inbreeding’s Hidden Cost Per 1% Increase:
Milk yield: 63.9 pounds reduction
Net Merit (NM$): $25 decrease
Fat yield: 1.18-1.70 kg decrease
Protein yield: 0.90-1.45 kg decrease
Calving interval: 0.19-0.34 days longer
The CDCB adjusts PTAs using a formula that accounts for an animal’s EFI relative to the base population: PTAEFI = PTA0 + b(EFI − EFIbase). This adjustment helps predict the true genetic merit an animal will transmit when accounting for inbreeding depression.
The Holstein Relationship Crisis
What’s changed dramatically between the 2015 and 2020 base populations is the average level of relatedness among animals. The Holstein breed has experienced a rapid increase in relationships among young animals, driven largely by the intensive use of genomically-tested elite sires.
In Supersire’s case, his inbreeding adjustment changed from -441 to -310 pounds between December 2024 and April 2025. This occurred because while his individual EFI remained relatively stable (13.5% to 13.6%), the base population’s average EFI jumped from 7.5% to 9.4%.
This increasing relatedness in the Holstein population means:
The new base population (2020-born cows) is significantly more inbred than the previous base
The difference between an individual bull’s EFI and the population average has narrowed
Inbreeding adjustments are now smaller relative to the base population
Breed Differences: Not All Breeds Face Equal Challenges
The impact of inbreeding on genetic evaluations varies considerably across breeds:
Breed
Milk (lbs)
Fat (lbs)
Protein (lbs)
NM$
Holstein
752
44
29
$404
Jersey
355
16
14
$179
Brown Swiss
381
9
14
$130
These differences reflect both the genetic progress made within each breed and the varying levels of inbreeding. Holsteins show the most dramatic adjustments, highlighting the more intensive selection and higher inbreeding rates in this population.
Calving Traits: The Delayed Update
While most traits have transitioned to the new genetic base, calving traits (Daughter Calving Ease, Sire Calving Ease, Daughter Stillbirth, and Sire Stillbirth) will maintain their current base until August 2025. This temporary delay resulted from unexpected issues when applying base updates to these phenotypically scaled traits.
This exception means that until August, these traits will continue to be evaluated against the 2015 base population, though new phenotypic data received since December will still be incorporated into evaluations.
Your Strategic Action Plan
The 2025 genetic base change demands a complete reassessment of breeding strategies. Here’s how to adapt:
1. Recalibrate Selection Thresholds
Previous benchmarks for selecting AI sires need upward revision. If you previously selected bulls with +2000 NM$ you might now look for $1600 NM$ bulls given the base change.
2. Focus on Rankings, Not Absolute Values
The relative ranking of animals remains more important than their absolute PTA values. Compare animals within the same evaluation run rather than fixating on specific PTA thresholds.
3. Implement Inbreeding Management
With Holstein inbreeding accelerating, consider:
Monitoring EFI values when selecting sires
Utilizing outcross sires with lower relationships to the general population
Implementing mating programs that optimize for both genetic gain and inbreeding control
4. Prepare for the August Calving Trait Update
Remember that calving traits will maintain their current base until August 2025, requiring another adjustment to selection criteria later this year.
The Bottom Line
The 2025 genetic base change reveals both remarkable progress and new challenges for dairy breeders. The increasing rate of inbreeding in Holsteins has amplified the effect of PTA adjustments, creating a situation where genetic evaluations reflect not just advancement but also changing population relationships.
By understanding how EFI influences genetic evaluations and implementing strategies to manage inbreeding while maintaining genetic progress, you can navigate this genetic reset to enhance your herd’s potential and profitability in the years ahead.
Remember: Genetic progress without inbreeding control is like milking three-legged cows—eventually, the whole operation crashes.
Join over 30,000 successful dairy professionals who rely on Bullvine Daily for their competitive edge. Delivered directly to your inbox each week, our exclusive industry insights help you make smarter decisions while saving precious hours every week. Never miss critical updates on milk production trends, breakthrough technologies, and profit-boosting strategies that top producers are already implementing. Subscribe now to transform your dairy operation’s efficiency and profitability—your future success is just one click away.
Holstein fertility is surging globally! Discover how the US, Germany, and Canada use wildly different strategies—and why genomics is their secret weapon.
From the 60s through to the early 2000s, cow production increased enormously though the fertility of the Holstein cow declined alarmingly. Two decades ago, selection for fertility traits was established, and with the assistance of genomics, has started to reverse that downward trend in fertility. Here we examine how the US, Germany, and Canada evaluate fertility traits – with each taking a distinctly different approach to achieve the same goal.
US Shakes Up Fertility Index: Why CCR Now Holds Equal Power to DPR
In the United States, four fertility traits form the backbone of genetic evaluations provided by the CDCB. The most familiar to breeders is Daughter Pregnancy Rate (DPR), which predicts the likelihood of a non-pregnant cow becoming pregnant during each 21-day period. The others are Cow Conception Rate (CCR), measuring a lactating cow’s ability to conceive at each service, Heifer Conception Rate (HCR), assessing conception in maiden heifers, and Early First Calving (EFC), indicating the age at first calving.
When the US Holstein Association presents genetic evaluations, it combines these four traits into a Fertility Index (FI). As of August 2024, they use the formula: FI = (0.4 × DPR) + (0.4 × CCR) + (0.1 × HCR) + (0.1 × EFC). This represents a dramatic shift from the previous formula which placed dominant emphasis on DPR: FI (previous) = (0.7 × DPR) + (0.1 × CCR) + (0.1 × HCR) + (0.1 × EFC).
Why did the US demote DPR after 20 years as the fertility gold standard?
“The new 40-40 weighting of DPR and CCR isn’t just a math change – it’s a survival strategy. Farms can’t afford to wait for late-blooming cows in today’s high-cost environment.”
– CDCB Spokesperson, 2024 Base Update Report
The industry discovered a critical flaw: DPR doesn’t accurately account for voluntary waiting periods (VWP) – the time farmers intentionally wait after calving before breeding cows. This creates bias, as cows in herds with longer VWPs appear less fertile even if they conceive quickly once bred. By elevating CCR to equal status with DPR, the index now places greater emphasis on a cow’s fundamental ability to conceive when she is bred, regardless of when that breeding occurs after calving.
The Bottom Line: Forget DPR dominance – the new Fertility Index forces breeders to prioritize cows that get pregnant NOW, not just eventually.
Germany’s Fertility Focus: 90% of Their Index Hinges on One Critical Trait
Germany takes a dramatically different approach with its RZR (Reproduction) index. Unlike the US with its four published traits, Germany’s RZR consists of five different traits but places a staggering 90% of the index weight on conception traits.
The German system evaluates:
Calving to first insemination (10% of RZR)
Non-Return Rate in heifers
Non-Return Rate in cows
First to successful insemination in heifers
First to successful insemination in cows
The four conception rate traits collectively account for 90% of the RZR, with specific weightings of 7.5% for heifer non-return rate, 37.5% for cow non-return rate, 7.5% for first-to-successful insemination in heifers, and 37.5% for first-to-successful insemination in cows.
What’s particularly telling about Germany’s approach is the decreasing importance of RZR within their overall Total Merit Index (RZG). This shift reflects Germany’s growing emphasis on health traits through their RZhealth index, which now incorporates various reproductive health disorders.
“We don’t just breed for conception – we breed cows that recover. A healthy uterus today means three more lactations tomorrow.”
German Holstein Association, 2025 RZG Guidelines
Health is the new fertility: German breeders now treat uterine health as critical as conception rates, recognizing that a healthy cow is inherently more likely to exhibit good fertility.
Canada’s Secret Weapon: The Multi-Trait Approach That Goes Beyond Conception
Canada employs the most comprehensive approach of the three nations, using a sophisticated multi-trait reproductive performance model that includes both calving-ease and fertility. When you look at Daughter Fertility on a Canadian genetic evaluation, it’s an index comprised of 6 different fertility traits.
The Canadian Daughter Fertility index incorporates:
11% Age at first service
16% Non-Return rate in heifers
8% First service to conception in heifers
15% Calving to first service
34% Non-Return rate in cows
16% First service to conception in cows
What makes Canada’s approach unique is that these 6 fertility traits are just some of the 16 traits evaluated using their multi-trait reproductive performance model. This comprehensive approach acknowledges that calving-ease impacts fertility, and data from associated traits can improve accuracy and reliability.
Canada’s secret weapon? Gestation Length. While not directly used in the Daughter Fertility index, gestation length affects calving-ease, which impacts fertility. Longer gestation periods are associated with larger calves creating more calving problems, which can lead to retained placenta and longer recovery times.
“Gestation length is the silent fertility trait. Optimize it, and you solve calving ease, stillbirths, and cow recovery in one move.”
Canadian Dairy Network Geneticist, 2024 Reproductive Model Analysis
By incorporating this data, Canada improves the accuracy of their fertility traits without explicitly selecting for gestation length.
While the US and Germany spar over conception metrics, Canada’s playing a different game entirely – and their secret weapon isn’t even a fertility trait.
The Global Fertility Revolution: Different Paths, Similar Success
What’s more valuable: A cow that conceives fast or one that stays pregnant? Three countries have very different answers – yet all are seeing positive results.
Despite their different approaches, all three nations are experiencing genetic improvements in fertility traits. The US has seen a reversal of previous declines in fertility, with improved pregnancy rates and fewer inseminations required per conception. Germany has observed improvements in daughter fertility metrics among top Holstein bulls. Canada’s analysis shows they’ve avoided the steep fertility decline seen in other dairy nations.
Global Fertility Index Comparison
Country
Key Metric
Top Weighted Trait
Economic Focus
US
Fertility Index (FI)
CCR (40%)
Lactating cow ROI
Germany
RZR
Conception Rate (90%)
Herd turnover speed
Canada
Daughter Fertility Index
Cow NRR (34%)
Lifetime pregnancy success
Source: Compiled from Holstein Association USA and CDCB reports
This shared success stems from:
Strategic Integration: All three countries have incorporated fertility into comprehensive breeding programs alongside production traits.
Advanced Selection Tools: Multi-trait indices like Net Merit (US), RZG (Germany), and LPI (Canada) allow breeders to select for balanced genetic improvement.
Genomic Revolution: Genomic evaluations provide more accurate assessments of fertility potential at younger ages, accelerating genetic progress.
“Genomics cut 5 years off fertility gains. What took decades with DPR, we’ve achieved in half a generation with CCR-focused genomics.”
While Germany obsesses over conception rates (90% weighting!), Canada’s focus on pregnancy durability (34% cow NRR) proves there’s more than one path to profit.
For Canadian herds, the difference between using bulls in the top 10% for Daughter Fertility versus average bulls translates to a 5% improvement in heifer non-return rates and a remarkable 12% improvement in cow non-return rates. This means significantly fewer repeat breedings and more pregnancies established on first service.
“Switching to CCR-focused bulls slashed our conception costs by 18%. The days of ‘milk first, fertility later’ are over.”
Wisconsin Dairy Producer, 2024 Holstein USA Survey
The Future of Fertility Selection: 3 Essential Strategies for Dairy Breeders
The fertility index war isn’t academic – it’s a survival toolkit. Breed for yesterday’s traits, and you’ll bankrupt tomorrow’s herd.
As these evaluation systems continue to evolve, breeders should:
Audit sires’ CCR proofs: With CCR now equal to DPR in the US index, this trait demands your attention.
Compare heifer/cow NRRs: Germany’s heavy emphasis on non-return rates highlights their importance.
Demand genomic data on gestation length: Canada’s approach shows the value of this associated trait.
Are you still chasing DPR? You’re betting on a trait the USDA itself admits is flawed. The most successful breeders will understand how each country’s approach can inform their breeding decisions, creating more balanced, efficient, and profitable Holstein cows.
The fertility revolution proves what forward-thinking breeders have known all along: a cow that can’t reproduce efficiently will never be truly profitable, no matter how much milk she gives.
Key Takeaways:
US Strategy: The 2024 Fertility Index now weights CCR and DPR equally (40% each), prioritizing cows that conceive now over long-term predictions.
Germany’s Shift: Reduced emphasis on fertility (RZR index) reflects a pivot toward holistic cow health as the foundation of reproductive success.
Canada’s Edge: Gestation length—not officially a fertility trait—enhances accuracy in their model, cutting calving complications and boosting pregnancy durability.
Global Trend: All three countries report rising fertility rates, proving genomics and tailored indices can overcome low-heritability challenges.
Profit Impact: Top Canadian sires improve cow non-return rates by 12%, while US herds using CCR-focused bulls save $18,000/year on breeding costs.
Executive Summary:
Despite differing methodologies, the US, Germany, and Canada are all achieving genetic gains in Holstein fertility through strategic trait prioritization. The US shifted focus to Cow Conception Rate (CCR) in its Fertility Index to counter Daughter Pregnancy Rate (DPR) flaws, Germany prioritizes conception rates but now balances fertility with health traits, and Canada leverages non-return rates and gestation length in a multi-trait model. Genomics accelerates progress across all three nations, proving diverse approaches can coexist successfully. These innovations help reverse decades of fertility decline while maintaining milk production gains.
Join over 30,000 successful dairy professionals who rely on Bullvine Daily for their competitive edge. Delivered directly to your inbox each week, our exclusive industry insights help you make smarter decisions while saving precious hours every week. Never miss critical updates on milk production trends, breakthrough technologies, and profit-boosting strategies that top producers are already implementing. Subscribe now to transform your dairy operation’s efficiency and profitability—your future success is just one click away.
Historic US genetic base shift meets global polled revolution in April 2025 Holstein rankings – discover new leaders reshaping dairy genetics.
The April 2025 genetic evaluations for Holstein cattle have arrived, revealing significant movements across major dairy breeding nations. These latest rankings showcase remarkable genetic progress, with several standout performers emerging across genomic and proven categories. Balance remains a key theme, with top bulls demonstrating impressive credentials for production, health, and conformation traits, while reliability enhancements provide breeders with greater confidence in their selection decisions.
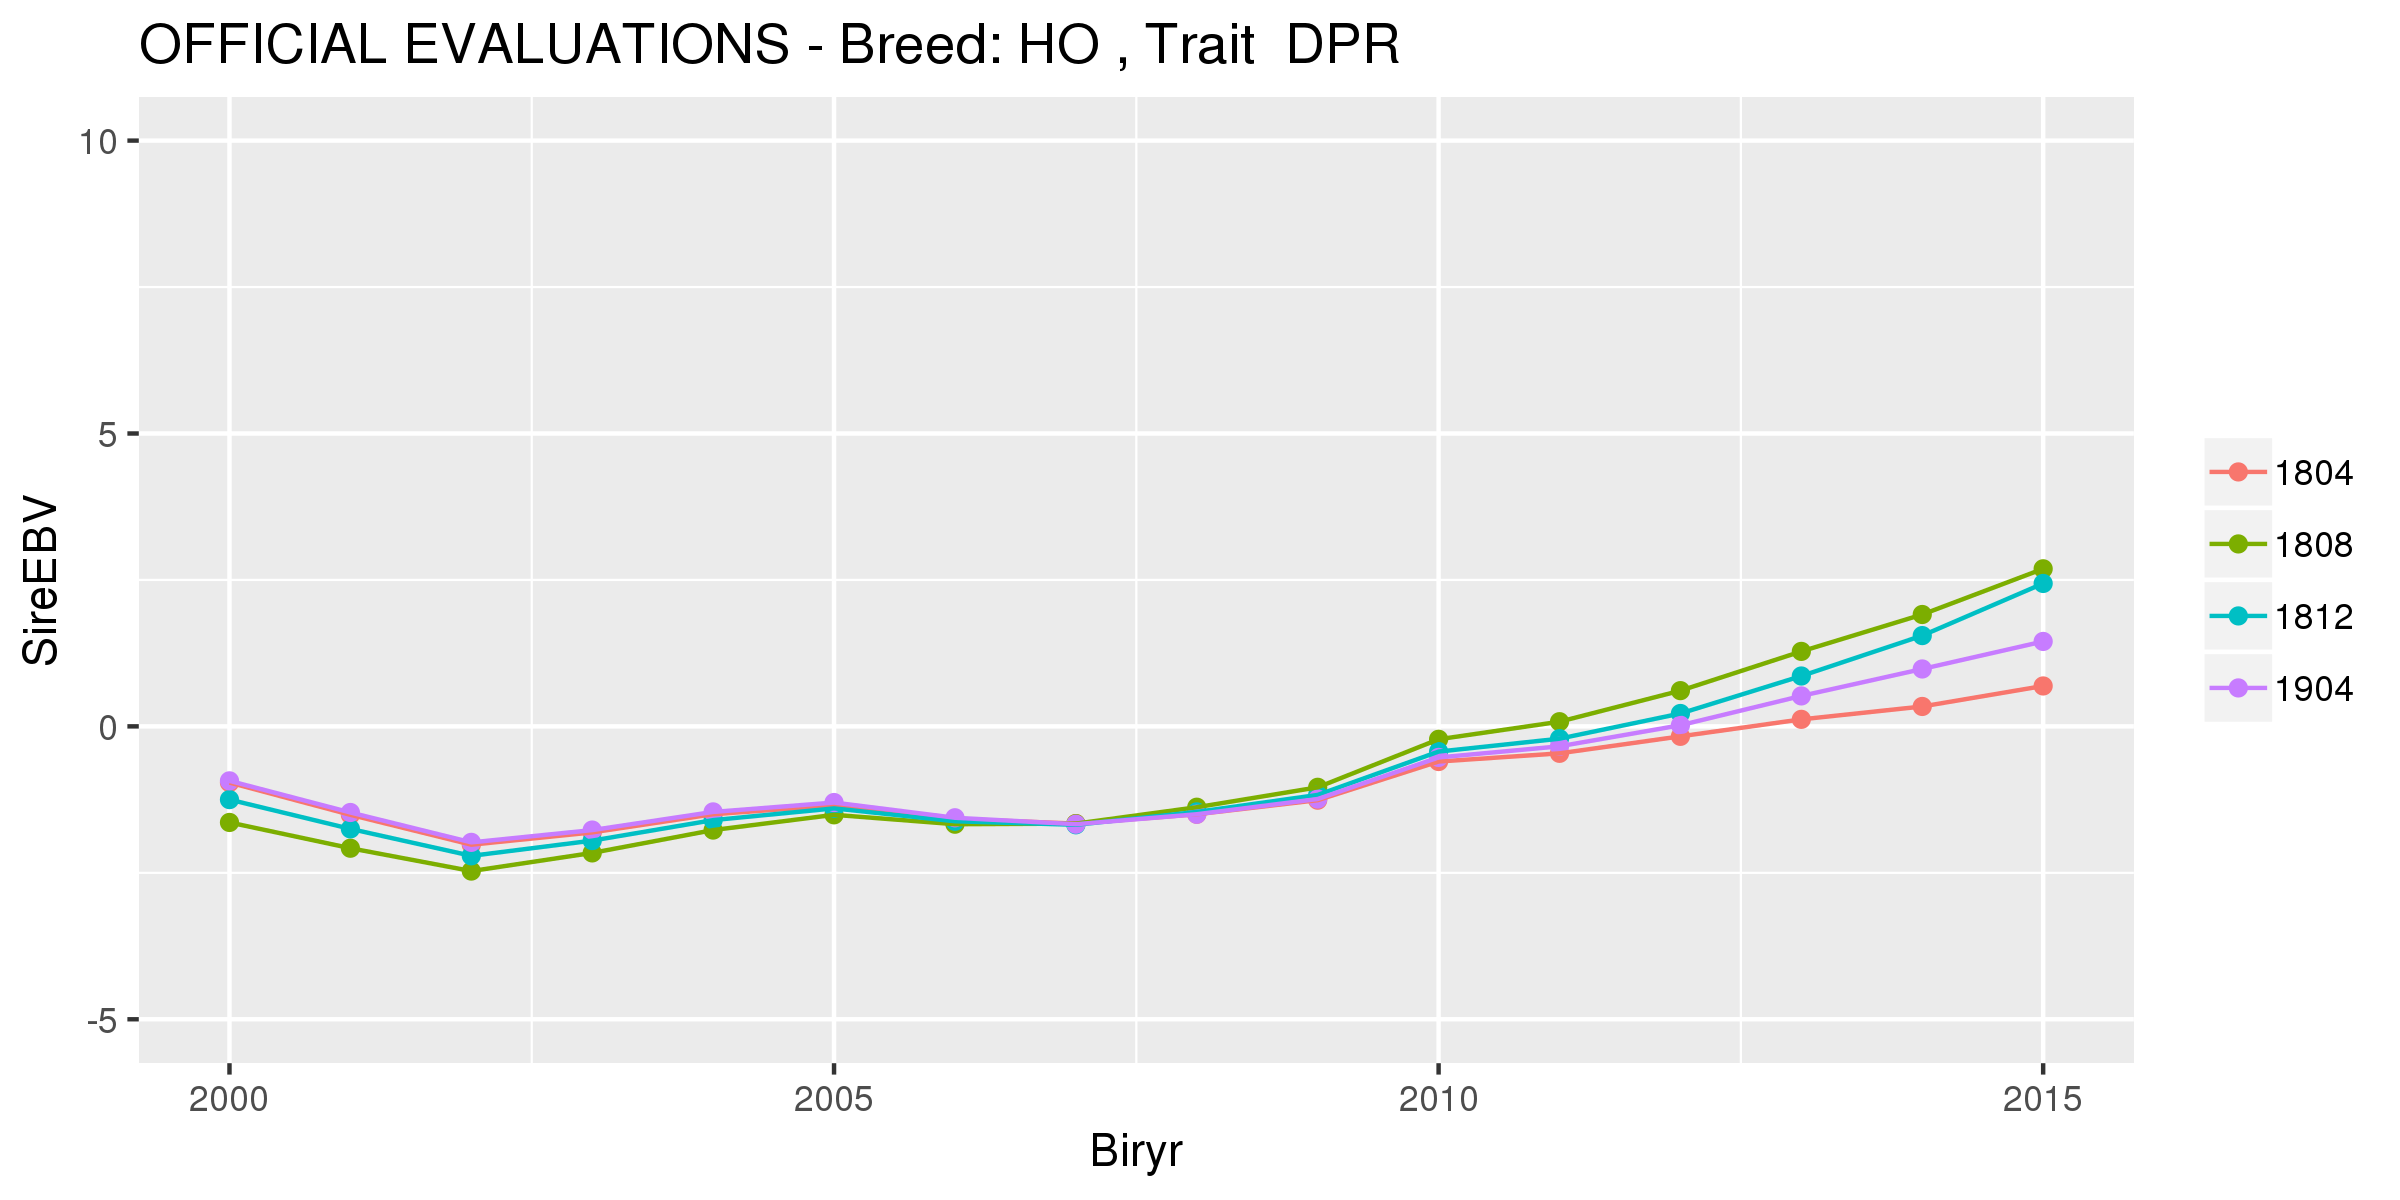
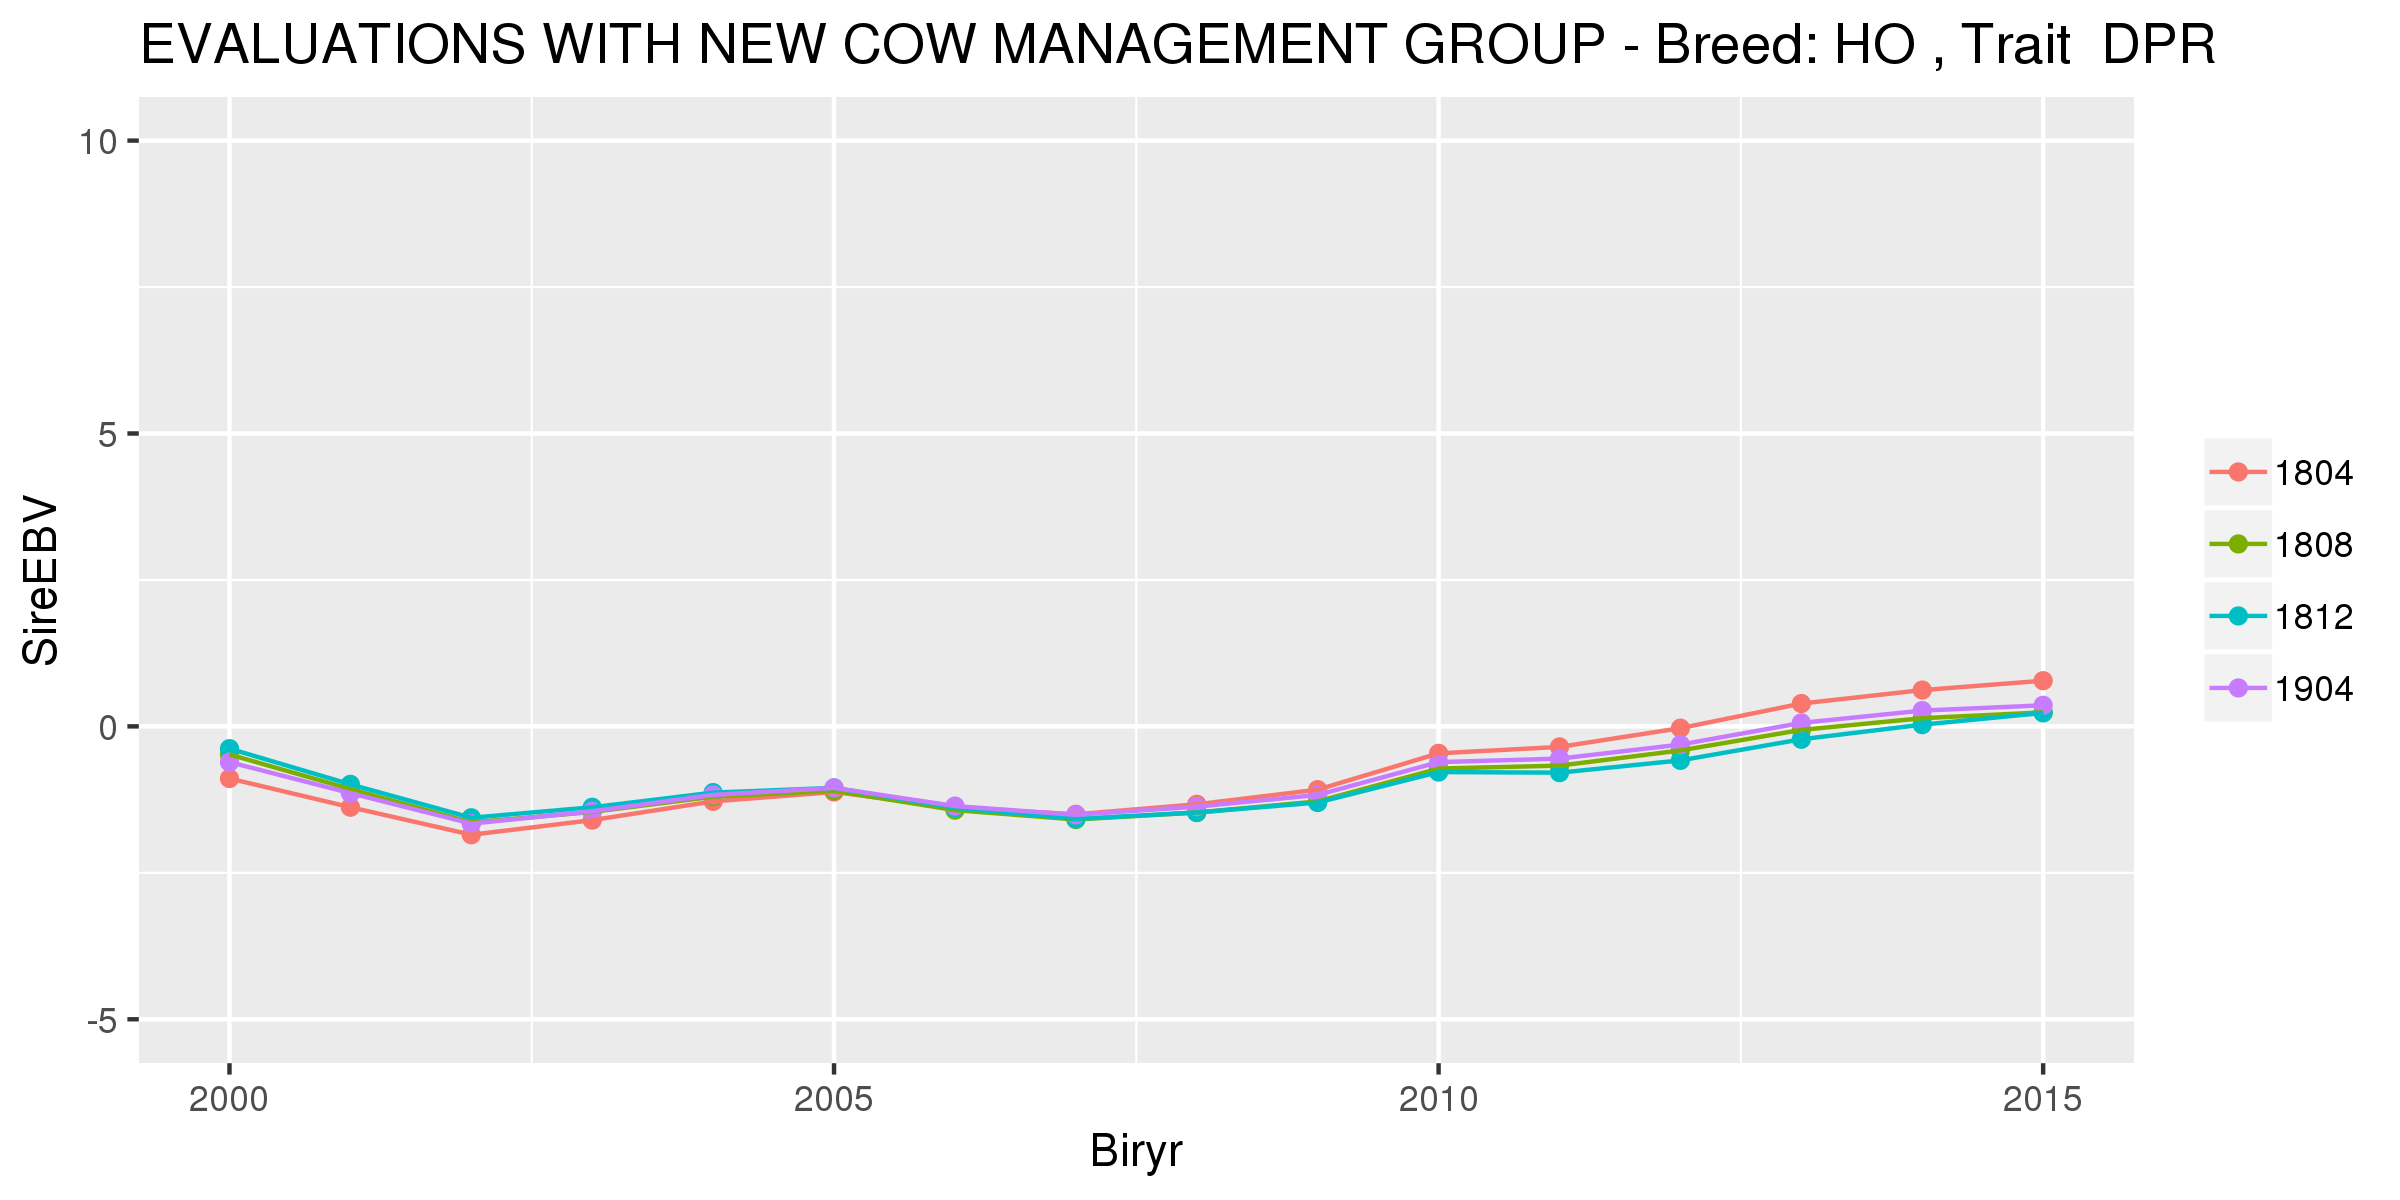
US Holstein Evaluations: Historic Genetic Base Change Reshapes the Landscape
The April 2025 US Holstein evaluations represent a watershed moment in dairy genetics with the implementation of the most significant genetic base change in history. This five-year recalibration has reset values to 2020-born cows, resulting in dramatic numerical shifts across all trait categories while generally maintaining the relative positions of elite bulls.
These changes are substantial, with production PTAs for Holsteins decreasing by approximately 750 lbs of milk, 45 lbs of fat, and 30 lbs of protein. Despite these numerical reductions, elite bulls like GENOSOURCE CAPTAIN maintain their dominant positions through relative genetic merit rather than absolute values.
RIPCORD leads with an impressive 3537 TPI in the genomic TPI rankings, maintaining his December 2024 #1 position. He’s followed closely by newcomers ABAY (3526) and JZ (3506), with DARTH VADR (3504) and WATCHMAN (3499) rounding out the top five. These elite bulls showcase exceptional genetic balance across production, health, and conformation traits.
DARTH VADR tops the Net Merit rankings at $1270 for commercial producers focused on profitability, followed by RIPCORD ($1239) and ENDURANCE ($1222). These economic powerhouses combine exceptional production with strong health traits, demonstrating that the new economic indices prioritize component values and longevity.
The base change has also highlighted the impact of accelerated inbreeding, with Holstein PTA shifts amplified by 28% higher inbreeding rates since 2015. This raises important considerations for genetic diversity management as breeders navigate the new evaluation landscape.
One notable aspect of the April evaluations is that calving traits remain in flux until August, pending recalculations. Breeders are advised to avoid major decisions in this category until the fall update provides more stable data.
The Red & White segment continues its rapid advancement with several bulls exceeding 3200 TPI. Papaya-Red leads with a TPI of 3285 and exceptional type values, followed by Morris-Red (3216 TPI) and Pegasus-Red (3162 TPI), demonstrating that colored genetics no longer require sacrificing genetic merit.
For breeders navigating these changes, the key recommendation is to focus on relative rankings rather than absolute numbers, recalibrate selection thresholds to account for the base change and maintain a balanced approach to trait selection that aligns with specific breeding objectives.
Canadian Evaluations Showcase Balanced Genetic Progress
The Canadian April 2025 evaluations reveal impressive gains across genomic and daughter-proven Holstein sire lists. OCD MONKEY leads the GLPI Genomic Bulls list with an outstanding GLPI of 4079, showcasing exceptional production traits (+1267 kg Milk, +134 kg Fat, +74 kg Protein) alongside strong conformation scores (Mammary System +11, Dairy Strength +12).
PROGENESIS IMPULSE follows closely at 4078 GLPI, excelling particularly in fat production (+132 kg) and daughter fertility. The top five are rounded out by ADAWAY BEYOND FITNESS (4062), OCD MILAN (4059), and PROGENESIS MELNIK (4038), all demonstrating the balanced breeding approach favored in the Canadian system.
On the daughter-proven side, S-S-I PR RENEGADE maintains his dominance with an LPI of 3850, supported by outstanding production (+1154 kg Milk, +98 kg Fat, +67 kg Protein) and impressive feet and legs (+14). Data from 1509 daughters across 457 herds bolster his reliability.
The conformation-focused lists reveal WALNUTLAWN PG BRIGHTSTAR leading the Genomic Bulls with an exceptional score of +20, while BLONDIN ENERGY tops the daughter-proven conformation specialists with a score of +17, excelling particularly in the mammary system (+13) and feet and legs (+13).
Notable newcomers include FRAHOLME VEC TRITON-PP, ranking 30th with a GLPI of 3952. This polled sire offers exceptional production credentials (+940 kg Milk, +105 kg Fat, +63 kg Protein) and impressive component deviations (+0.58% fat and +0.25% protein).
Canadian breeders have multiple options for genetic improvement across all trait categories. The April evaluations demonstrate the industry’s continued commitment to balanced genetic progress that enhances production efficiency and cow longevity.
German Holstein Evaluations Revolutionized by Single-Step Method
The April 2025 German Holstein evaluations introduce a fundamental shift in breeding value estimation by implementing the Single-Step method. This approach represents a significant advancement over the previous multi-step methodology, processing all available information simultaneously for more accurate genetic predictions.
In the Black & White genomic rankings, Picard’ son Pennywise tops the list with an impressive +165 RZG, showing a notable 4-point improvement since December. Real Syn’ son Rise Up follows closely at +164 RZG, with several outstanding bulls sharing third position at +162 RZG: Pirelli, Argentum, Pick Up, Alaska, Vino P *RC, and Topchamp.
The Red & White genomic rankings showcase the growing influence of polled genetics, with Cardiff P leading at +162 RZG. Three exceptional sires, Maksim P, Schach, and Malaga Red, share the second position at +161 RZG, further demonstrating the competitive performance of polled genetics.
Ginger continues to lead with 148 RZG among proven sires, showing a 3-point improvement from December. The top five proven sires all demonstrated positive movement, including Safari Red (142 RZG, +2), Ghost Red (140 RZG, +2), Sandro P (140 RZG, +1), and Symbol Red (139 RZG, +2).
Dr. Christin Schmidtmann from Vit explains the significance: “The switch to Single-Step is a significant step forward for German Holstein breeding and enables even better breeding for high-production and healthy dairy cows.” This enhanced reliability translates to more stable breeding values, more accurate predictions for functional traits, and more significant potential for genetic progress at both herd and population levels.
The Swiss Holstein evaluations for April 2025 reveal substantial movement among both proven and genomic sires. In the proven rankings, since December evaluations, Sous-Moron BOSTON has emerged as the standout performer with a remarkable +80-point jump in the Total Performance Index (TPI). His combination of production efficiency and improved daughter fertility makes him an ideal choice for commercial operations focused on profitability.
Cookiecutter HADLEY continues to impress with his exceptional longevity transmission, climbing three positions while demonstrating improved protein components. His daughters’ performance confirms his ability to produce productive cows even in challenging commercial environments. Swissgen ENRICO and EMPIRE have also made notable advances, with ENRICO distinguished by superior protein transmission (+70 TPI points since December) and EMPIRE showing remarkable improvements in health trait indexes.
The genomic young sire list witnessed even more dramatic shifts, with TGD-Holstein BEAUTYMAN debuting near the top. This young sire combines elite production potential with exceptional conformation scores that have caught the attention of progressive breeders. Several sons of Cookiecutter HADLEY have also entered the genomic rankings, suggesting his genetic influence will extend well into the next generation.
The April 2025 Swiss evaluations highlight several key trends: increased focus on longevity, enhanced protein efficiency, advancements in udder health, and a more balanced breeding approach than in previous years. These genetic advancements align perfectly with the industry’s sustainability goals. Swiss Holstein Association officials note that cows with enhanced longevity, improved health, and efficient production represent the ideal profile for environmentally conscious dairy production.
Several consistent patterns are emerging in the April 2025 evaluations across multiple countries. The balanced breeding approach continues to gain momentum globally, with elite bulls demonstrating impressive credentials that span production, conformation, and functional traits.
Polled genetics are making remarkable inroads into the highest rankings worldwide. In Canada, polled sires like FRAHOLME VEC TRITON-PP have entered elite genomic lists, offering exceptional production credentials (+940 kg Milk, +105 kg Fat, +63 kg Protein) alongside impressive component deviations (+0.58% fat and +0.25% protein). Similarly, Germany’s Red & White genomic rankings are now dominated by polled genetics, with Cardiff P leading at +162 RZG and other polled sires like Maksim P sharing second position at +161 RZG.
Enhanced reliability in genomic evaluations represents another global advancement, with Germany’s implementation of the Single-Step method representing a revolutionary change in breeding value estimation. This approach simultaneously processes all available information—pedigree, phenotypes, and genotypes—in one comprehensive calculation, delivering substantial improvements in reliability, particularly for functional traits where increases of up to 14% are expected.
Health and fitness traits continue to receive increased emphasis across all evaluation systems. Top bulls worldwide demonstrate improved metrics for daughter fertility, productive life, and udder health, reflecting the industry’s recognition that longevity and health directly impact lifetime profitability.
First, the balanced breeding focus continues to gain momentum across all evaluation systems. Top bulls worldwide demonstrate strong credentials in production, conformation, and health traits, reflecting the industry’s movement away from single-trait selection toward a more holistic approach.
Second, polled genetics have achieved elite status across multiple countries. These welfare-friendly genetics allow breeders to incorporate polled traits without sacrificing genetic progress in economically essential characteristics, as evidenced by the performance of bulls like Cardiff P in Germany and FRAHOLME VEC TRITON-PP in Canada.
Third, health and longevity traits remain critical selection criteria worldwide. Enhanced focus on fitness traits is evident across all evaluation systems, with top bulls demonstrating improved metrics for daughter fertility, productive life, and udder health. This reflects the industry’s recognition that longevity directly impacts lifetime profitability.
Fourth, production efficiency increasingly emphasizes components rather than volume alone. Bulls combining high component yields with positive deviations are particularly valued, reflecting the industry’s focus on component-based payment systems. Swiss evaluations especially highlight improved protein percentages as a priority, with top bulls demonstrating the ability to transmit enhanced components without sacrificing volume.
Finally, enhanced reliability improves confidence in breeding decisions. Advancements in evaluation methodologies, particularly Germany’s Single-Step approach, deliver more reliable breeding values that enable more precise selection decisions. This is especially valuable for functional traits that traditionally had lower reliability values.
Conclusion
The April 2025 global Holstein evaluations demonstrate remarkable genetic progress across multiple countries and trait categories. The consistency in breeding goals across nations reflects the global dairy industry’s shared commitment to developing more efficient, healthy, and profitable cows.
For progressive dairy breeders, these evaluations offer numerous opportunities to enhance herd genetics across multiple trait categories. The balance between production, conformation, and health traits evident in top bulls provides options for addressing specific herd needs while maintaining progress in overall genetic merit.
As reliability continues to improve and polled, genetics reach elite status; breeders have greater confidence than ever in their selection decisions. The continued genetic advancement demonstrated in these April 2025 evaluations highlights the global dairy industry’s commitment to breeding more sustainable, efficient, and profitable cows for future generations. Key Takeaways:
US base change resets expectations: -750 lb milk PTAs demand focus on relative rankings over absolute values.
Polled genetics reach elite status: Top Canadian/German bulls prove welfare traits no longer sacrifice performance.
Germany’s Single-Step revolution: 14% reliability gains for health traits redefine precision breeding.
Balanced breeding dominates: Leading sires globally combine production merit with improved fertility and longevity.
Commercial sustainability focus: Swiss evaluations prioritize protein efficiency and udder health for eco-conscious herds.
Executive Summary:
The April 2025 global Holstein evaluations reveal transformative shifts across key breeding nations. The US implemented its largest-ever genetic base adjustment, recalibrating PTAs while maintaining elite bulls’ dominance. Canada showcased balanced progress through sires excelling in production, conformation, and fertility. Germany introduced a groundbreaking Single-Step evaluation method, boosting reliability for health traits. Switzerland saw dramatic TPI jumps for commercial-focused sires, while polled genetics broke into elite tiers globally. Advancements in genomic reliability and emphasis on longevity-driven breeding underscore a unified industry push toward sustainable, efficient cows.
Join over 30,000 successful dairy professionals who rely on Bullvine Daily for their competitive edge. Delivered directly to your inbox each week, our exclusive industry insights help you make smarter decisions while saving precious hours every week. Never miss critical updates on milk production trends, breakthrough technologies, and profit-boosting strategies that top producers are already implementing. Subscribe now to transform your dairy operation’s efficiency and profitability—your future success is just one click away.
Two thousand twenty-five genetic base shifts are most substantial for the Holsteins. Calving traits delayed amid inbreeding surge – what it means for your herd’s future.
EXECUTIVE SUMMARY: The 2025 U.S. genetic base change reveals accelerated progress but new complexities, with Holsteins facing amplified inbreeding impacts on PTAs. While most traits now reflect 2020-born cows, calving trait updates remain delayed until August due to calculation anomalies. Breed-specific adjustments demand revised selection strategies, particularly for semen use decisions. Updated Lifetime Net Merit indices reflect shifting market realities, while enhanced reliability calculations improve non-Holstein-type evaluations. This reset demands immediate breeder action to maintain genetic momentum.
KEY TAKEAWAYS:
Base Change Magnitude: The largest adjustment in years reflects a 5-year genetic leap, requiring recalibration of PTA benchmarks
Calving Traits On Hold: Phenotypic calculation quirks delay updates until August 2025 despite other traits going live
Economic Index Overhaul: NM$ revisions align with current milk prices and feed costs, altering sire rankings
Strategic Imperative: Breeders must reassess sexed/beef semen use criteria to capitalize on new genetic realities
The April 2025 U.S. genetic base change represents one of the most significant updates in recent years, reflecting unprecedented genetic progress in dairy cattle over the past five years. As the base shifts from cows born in 2015 to those born in 2020, dairy producers will need to recalibrate their genetic selection strategies. The final values reveal substantial changes across breeds, with adjustments to PTA values, breeding indices, and reference populations. Notably, calving traits have been temporarily excluded due to unexpected results when applying the base change calculations, with updates for these traits postponed until August 2025 following further investigation. The accelerated genetic progress demonstrated by this base change, combined with increasing inbreeding rates, especially in Holsteins, signals both positive advancement and new challenges for dairy breeders.
Table 1: Value of the genetic change between cows born in 2020 and cows born in 2015.
The U.S. genetic base update is a routine recalibration every five years to align selection tools with the current dairy herd’s genetic capabilities. Beginning April 1, 2025, the genetic evaluations produced by the Council on Dairy Cattle Breeding (CDCB) will shift their reference point from cows born in 2015 to those born in 2020. This shift resets the baseline against which all animals are measured, ensuring that genetic evaluations remain relevant in a rapidly improving population.
Every dairy animal with genetic evaluations based on CDCB and Holstein USA data is compared to this breed population average, known as the base. Traits are measured as Predicted Transmitting Abilities (PTAs) relative to this established baseline. As genetic progress continually advances, this five-year recalibration provides dairy producers with an accurate point of comparison, essentially serving as a genetic report card that demonstrates progress compared to the previous generation.
The 2025 base change is particularly notable because it’s larger than previous adjustments, directly reflecting the industry’s accelerated genetic progress in the preceding five years. Genomic evaluations and advanced reproductive technologies, including sexed semen, embryo transfer, and in-vitro fertilization, primarily drive this acceleration.
Key Adjustments and Their Implications
The genetic base change involves complex adjustments beyond measuring the genetic difference between cow populations from different years. After determining the genetic difference between cows born in 2020 and those born in 2015, inbreeding and heterosis adjustments are applied, significantly impacting the final PTA values.
In the Holstein breed particularly, the increasing rate of inbreeding over the five years has amplified the effect of these adjustments on PTA values. This means the numerical shifts in genetic evaluations reflect genetic advancement and changing population dynamics. Understanding these nuances is critical for correctly interpreting the new genetic evaluations for dairy producers.
Along with the base change, the Lifetime Net Merit (NM$) index is being revised, including updates to Cheese, Fluid, and Grazing Merit. This 2025 revision adjusts methods for estimating trait values and updates numerous income and cost variables, such as milk prices, feed requirements, and reproductive options. Such revisions ensure that selection indices reflect current economic realities and production objectives.
Breed-Specific Impacts
The magnitude of the base change adjustments varies considerably across breeds, reflecting different rates of genetic progress. These differential impacts underscore the importance of breed-specific genetic selection strategies. Dairy producers must adjust their selection thresholds accordingly, particularly when deciding which cows to breed with sexed semen versus beef semen.
Calving Traits: A Notable Exception
A significant aspect of the 2025 base change is the decision to maintain calving traits in their current base. The calving traits—Daughter Calving Ease, Sire Calving Ease, Daughter Stillbirth, and Sire Stillbirth—represent a unique category in which genetic evaluations are reported on an observed (phenotypic) scale, meaning both genetic and phenotypic bases must be updated during a base change.
Unexpected results emerged when these base updates were applied for the April evaluation. Due to the timing of this discovery, the CDCB decided to maintain calving traits using the same genetic and phenotypic bases used to calculate them in December 2024. This decision ensures reliability while allowing time for further investigation. The CDCB expects to update the bases for calving traits in August 2025 after completing a thorough analysis.
This temporary maintenance of the previous base for calving traits will not impact other characteristics in the genetic evaluations. New phenotypic data received since December will still be incorporated, ensuring the evaluations remain current despite using the previous base.
Updates to Reference Populations and Calculation Methods
Breed Base Representation Changes
In addition to the core base change, April 2025 brings significant updates to the Breed Base Representation (BBR) reference population. These updates implement refined business rules for selecting purebred bulls, made possible by increasing the availability of genotyped animals and advancements in data quality, methodologies, and technology.
The BBR reference population will now be selected from genotyped, progeny-tested bulls with at least 10 enrolled daughters (excluding bulls with status codes C and N), complete pedigrees, and are classified as purebred within each breed of evaluation. When rounded to the nearest integer, a purebred bull must have a pedigree-based heterosis value ≤ 1%.
These changes will affect the percentage of animals receiving new BBR values differently across breeds—from approximately 25% in Ayrshire to only about 1% in Holstein. Generally, the new methodology will decrease BBR values across breeds, as it improves the detection of animals with non-purebred ancestors.
Type Trait Reliability Calculations
For non-Holstein breeds, April 2025 brings a significant methodological update to type trait reliability calculations. Historically, while PTAs for type evaluations have been derived from a multiple-trait model, reliabilities were calculated using a single-trait model. The growing volume of appraisal data has prompted the alignment of both processes to follow the multiple-trait methodology.
As a result, traditional PTAs will remain unchanged. Still, reliabilities for most traits will increase, particularly those with limited data, which will now benefit from genetic correlations with other characteristics. Genomic PTAs will see more noticeable impacts as reliability adjustments affect SNP solutions and weighting factors in final calculations.
Strategic Implications for Dairy Producers
The 2025 base change presents dairy producers with a significant opportunity to reassess their genetic improvement strategies. With genetic progress accelerating, an effective selection strategy becomes increasingly crucial. Selection indices like Herd Health Profit Dollars® (HHP$®) provide efficient approaches to simultaneous improvement across multiple traits.
The adjustments coming in April mean producers will likely need to recalibrate their selection thresholds for A.I. sires and adjust criteria for determining which cows are bred to beef or sexed semen. This recalibration process is essential to maintain genetic progress and ensure that genetic selection decisions align with updated evaluations.
While potentially disruptive in the short term, the magnitude of this base change ultimately reflects the industry’s success in accelerating genetic improvement. It signals that dairy producers are making faster genetic progress than ever, necessitating corresponding evolution in genetic evaluation systems to maintain their accuracy and relevance.
Conclusion
The 2025 U.S. genetic base change represents both remarkable progress and an opportunity for strategic realignment. The substantial shifts in genetic evaluations across breeds demonstrate the dairy industry’s success in accelerating genetic improvement through advanced technologies and selection practices. While the adjustment process may temporarily disrupt established selection thresholds, it ultimately provides dairy producers with more accurate tools for genetic selection.
The special handling of calving traits highlights the complexity of genetic evaluation systems and the importance of maintaining evaluation integrity even when unexpected challenges arise. Meanwhile, the updates to reference populations and calculation methodologies further refine the precision of genetic evaluations.
This base change is a milestone for dairy producers, marking five years of genetic advancement and prompting them to reevaluate selection strategies to ensure continued progress. By understanding these changes and adjusting breeding decisions accordingly, producers can leverage this base change to enhance their herds’ genetic potential and profitability in the years ahead.
Join over 30,000 successful dairy professionals who rely on Bullvine Daily for their competitive edge. Delivered directly to your inbox each week, our exclusive industry insights help you make smarter decisions while saving precious hours every week. Never miss critical updates on milk production trends, breakthrough technologies, and profit-boosting strategies that top producers are already implementing. Subscribe now to transform your dairy operation’s efficiency and profitability—your future success is just one click away.
April 2025 genetic updates reveal game-changing tools for more brilliant herd breeding—discover how to boost profits and sustainability now.
EXECUTIVE SUMMARY: Lactanet’s April 2025 genetic evaluations deliver seismic shifts in breeding strategy. With Holstein milk bases jumping +89kg and Pro$ now laser-focused on lifetime profitability, farmers face critical decisions: chase balanced traits (LPI) or prioritize revenue (Pro$)? The overhauled Lifetime Performance Index splits into six subindexes—including Environmental Impact—while Pro$ adopts rolling economic averages to stabilize rankings. Expect 5-year gains of +534kg milk from LPI bulls and 0.21cm teat length differences between sires. The bottom line? Your breeding choices today will define herd performance through 2030.
Key Takeaways:
Base changes reflect rapid genetic progress: Holstein milk yield benchmarks rose +89kg—what was average in 2024 now lags.
LPI vs. Pro$ divergence: LPI drives conformation/environmental gains; Pro$ targets milk revenue with a 95% correlation but different trait emphases.
Predictable outcomes: Expect a +42kg fat yield in 5 years using LPI bulls—translating to ~$126 extra/cow annually at current prices.
Sustainability meets profit: Pro$’s slight positive link to methane efficiency (+0.07) proves eco-goals needn’t sacrifice profitability.
Interpretation tables = actionable insights: A +5 Udder Depth proof means daughters score 0.36 points higher, which is critical for parlor efficiency.
The latest genetic evaluation updates from Lactanet bring significant changes that will impact your breeding program decisions. As the genetic landscape continues to evolve at breakneck speed, understanding these updates is crucial for staying competitive in today’s challenging dairy environment.
Base Change Adjustments Reveal Genetic Progress
The genetic base for expressing evaluations shifts annually, and the April 2025 update showcases impressive genetic progress across breeds. Holstein breeders will notice the most substantial changes, with base adjustments of +89kg for milk, +5.7 kilograms of fat, and +4.7 kilograms of protein. These aren’t just numbers on a page – they represent the relentless genetic improvement our industry has achieved.
Jersey and Ayrshire breeds also show remarkable progress, with milk base increases of +81kg and +94kg, respectively. These adjustments mean that what was “average” last year is now below average – a stark reminder that standing still in your breeding program means falling behind!
What This Means On Your Farm
When you receive your April proofs, remember that base changes affect how animal evaluations are expressed. A bull with the same genetic merit from December to April may show slightly lower values simply because the base has increased. This doesn’t mean the bull is worse – the entire population has improved.
For Holstein breeders, the +0.66 base change for Conformation is particularly noteworthy, indicating substantial improvement in overall type. Somatic Cell Score shows significant base increases across all breeds, reflecting industry-wide progress in udder health.
The New LPI: Modernized For Today’s Dairy Industry
Lactanet has overhauled the Lifetime Performance Index (LPI), replacing mathematical formulas with visual aids that make selection decisions more intuitive. The Holstein LPI now features six subindexes:
Production Index (PI)
Longevity & Type Index (LTI)
Health & Welfare Index (HWI)
Reproduction Index (RI)
Milkability Index (MI)
Environmental Impact Index (EI)
Each subindex is published independently and included in the overall LPI, giving you unprecedented flexibility to fine-tune your breeding program.
Expected Genetic Responses That Matter
What’s revolutionary about the LPI update is the inclusion of expected 5-year genetic responses. When selecting for Holstein LPI, you can expect concrete genetic gains over the next five years: +534kg milk, +42kg fat, and +28kg protein. For conformation traits, expect approximately three EBV points progress for each of Conformation, Mammary System, and Feet & Legs.
These aren’t theoretical projections – they’re practical outcomes you can expect to see in your herd using LPI as your selection criterion.
Pro$: Laser-Focused on Lifetime Profitability
For farms focused primarily on milk revenue, Pro$ remains the go-to selection index. The April 2025 update introduces a rolling five-year average of economic values, reducing year-to-year fluctuations that previously caused significant shifts in animal rankings.
Pro$ calculations reflect current economic realities based on cows born from 2008-2018, depending on breed[3]. For Holsteins, the average cow over 6 years of age produced 25,590kg of milk, 1,027kg of fat, and 845kg of protein – with rearing costs averaging $4,063.
High Correlations With Production Traits
Pro$ shows robust correlations with fat and protein yield across all breeds. For Holsteins, the correlation is 0.79 for fat and 0.78 for protein, meaning selection for Pro$ will drive substantial genetic progress for these economically important traits.
Particularly intriguing is Pro$’s positive correlation with both Methane Efficiency (0.07) and Feed Efficiency (-0.05)[3], suggesting that selection for profitability can simultaneously benefit environmental sustainability.
LPI vs Pro$: Which Drives Your Breeding Goals?
While LPI and Pro$ share a 95% correlation, they emphasize different traits. Understanding these differences is crucial for aligning your genetic selection with your farm’s goals.
Selecting heavily for LPI will accelerate genetic gain for:
Both indexes will deliver similar fat and protein composition improvements, daughter fertility, and disease resistance traits.
Practical Bull Selection Tools
The updated Sire Proof Interpretation Tables provide a concrete way to understand what bull proofs mean for your future herd. For example, a Holstein bull with a +5 proof for Udder Depth would be expected to have daughters averaging 0.36 points higher on the linear scale than daughters of a bull with zero proof.
For measurable traits like Teat Length, this translates to an actual physical difference—daughters of a bull with +5 proof for this trait would have teats 0.21cm longer than daughters of a “0” bull.
Making These Updates Work For Your Herd
As we integrate these April 2025 genetic evaluation updates into breeding decisions, consider these action steps:
Reassess your breeding goals – Has your focus shifted more toward production, conformation, or health traits? Your answer should determine whether LPI or Pro$ better aligns with your objectives.
Understand the correlations – Even if you don’t directly select certain traits, knowing the correlations with your chosen index helps predict your genetic progress.
Look beyond the numbers – The 5-year expected genetic responses provide a real-world perspective on what these genetic evaluations mean for your future herd.
Utilize the sire interpretation tables – When selecting bulls, use these tables to understand their proofs for their daughters’ actual performance in your barn.
The April 2025 genetic evaluation updates represent powerful new tools for dairy farmers committed to genetic improvement. Whether your focus is overall performance, profit, or specific trait improvement, these updated indexes and interpretation guides give you more precise selection power than ever before.
Future Outlook
With these sophisticated genetic selection tools now available, dairy producers can make more informed breeding decisions tailored to their specific goals. Including environmental traits like Methane Efficiency in both indexes reflects the industry’s growing focus on sustainability and productivity.
As genetic progress continues to accelerate, staying informed about these evaluation updates and understanding how to apply them will be increasingly crucial for maintaining a competitive edge in the global dairy industry. The future belongs to those who can effectively translate these genetic evaluations into practical breeding decisions that drive their herds and bottom lines forward.
Join over 30,000 successful dairy professionals who rely on Bullvine Daily for their competitive edge. Delivered directly to your inbox each week, our exclusive industry insights help you make smarter decisions while saving precious hours every week. Never miss critical updates on milk production trends, breakthrough technologies, and profit-boosting strategies that top producers are already implementing. Subscribe now to transform your dairy operation’s efficiency and profitability—your future success is just one click away.
AI crushes tradition: BANNs boost dairy genetics accuracy by 5%+. Will your herd lead or bleed?
EXECUTIVE SUMMARY: A groundbreaking AI model called Biologically Annotated Neural Networks (BANNs) is revolutionizing dairy genetics, outperforming traditional methods like GBLUP and BayesB by up to 7.46% accuracy in key traits such as mastitis resistance and milk yield. By analyzing DNA in 100kb “genomic neighborhoods,” BANNs capture complex gene interactions that linear models miss. While the tech promises massive gains—like 14% fewer mastitis cases per herd—it risks overfitting and demands heavy computing power. Industry giants like CRV and ABS Global are already racing to adopt it, but experts warn farmers to balance AI’s power with genetic diversity. The question isn’t if to adopt BANNs, but how fast before competitors leave you behind.
KEY TAKEAWAYS:
5% Accuracy Edge: BANNs outperform GBLUP/BayesB in milk yield, mastitis resistance, and conformation.
DNA Neighborhoods: 100kb genomic windows reveal hidden gene interactions traditional models ignore.
Risks vs. Rewards: Overfitting threatens genetic diversity; compute costs may strain small farms.
Industry Arms Race: CRV and ABS Global are piloting BANN integrations by 2025–2026.
Farmer Action Plan: Demand transparent AI tools and diversify breeding to hedge risks.
Dairy genetics just took a quantum leap forward. A groundbreaking study published in the Journal of Animal Science and Biotechnology(2024) reveals that Biologically Annotated Neural Networks (BANNs) outperform traditional genomic prediction models like GBLUP and BayesB by up to 7.46% accuracy in key traits such as milk yield and mastitis resistance. This isn’t incremental progress—it’s a seismic shift in how we understand cattle DNA. With over 6,500 Chinese Holsteins analyzed (sharing 78% of SNPs with North American herds per CDCB’s 2024 genomic survey), the findings have immediate relevance for dairy operations worldwide. As Dr. Li Chen, lead researcher, starkly notes: “We’ve been using oversimplified models for decades. BANNs force us to confront the messy reality of how genes actually interact.”
Why 100kb Windows Are Changing the Game
At the heart of BANNs’ success is their unique approach to genomic analysis: dividing the genome into 100kb windows (100,000 DNA base pair segments). Unlike traditional gene-based models that treat genes as isolated units, this method mimics biology’s complexity by analyzing how SNPs interact across functional genomic neighborhoods.
The results speak for themselves. For milk yield, BANN_100kb achieved a 7.46% accuracy boost over GBLUP, while mastitis resistance predictions jumped 4.2%—a critical gain given that mastitis costs the U.S. dairy industry over $2 billion annually (USDA, 2023).
This breakthrough matters because it finally bridges the gap between statistical models and biological reality. As the study shows, BANNs capture non-additive genetic effects—synergies and antagonisms between genes that linear models ignore. For instance, a SNP influencing milk yield might only show its full effect when paired with another SNP 50kb away. Traditional methods miss these interactions; BANNs exploit them.
PIP = Posterior Inclusion Probability (measure of genetic influence)
The Risks Lurking Behind the 5% Advantage
While the accuracy gains are undeniable, the study issues stark warnings. BANNs’ ability to model complex interactions comes with a catch: overfitting. The AI may prioritize short-term prediction accuracy at the expense of long-term genetic diversity, potentially creating herds optimized for today’s traits but vulnerable to tomorrow’s challenges. Researchers explicitly caution against applying BANNs to breeds like Jerseys without further validation, as the model was trained exclusively on Holstein data.
Industry experts echo these concerns. Dr. Chad Dechow, a dairy geneticist at Penn State, warns: “A 5% accuracy gain only matters if it translates to real-world ROI. Farmers need solutions they can trust, not black-box algorithms”. Computational demands also pose hurdles—BANNs require 2.8x more processing power than GBLUP, which could strain smaller farms or AI providers slow to upgrade infrastructure.
How the Industry Is Responding
Major players are already mobilizing. CRV announced plans to trial BANN-integrated indexes by late 2025, while ABS Global emphasizes a hybrid approach: “AI should enhance breeder expertise, not replace it”. Meanwhile, the CDCB hints at U.S. evaluations rolling out by 2026, pending further validation.
These developments signal a critical juncture. Brian Van Doormaal, Chief Services Officer at Lactanet and architect of Canada’s genomic evaluation system, emphasizes practicality: “Dairying is a difficult business. Farmers need solutions that deliver clear ROI, not just technological hype”.
For dairy farmers, the stakes are clear. A 14% reduction in mastitis cases could save thousands annually—money that flows directly to the bottom line.
Your Path Forward in the BANN Era
For dairy professionals, the message is clear: complacency is riskier than change. Start by grilling genetics providers about their BANN adoption timelines—CRV’s public commitment sets a benchmark others must match. Diversify breeding strategies by pairing BANN-selected bulls with proven sires, creating a genetic safety net against overfitting pitfalls. Most crucially, demand plain-English explanations of how these models work. The era of blindly trusting genomic predictions is over; the winners will be those who marry AI’s power with human wisdom.
The Bottom Line
BANNs aren’t a distant promise—they’re rewriting dairy genetics today. Farmers who dismiss this 5% gap risk obsolescence, while early adopters could secure generational advantages. As the Journal of Animal Science and Biotechnology team concludes: “This isn’t an evolution. It’s a revolution.” The question isn’t whether you’ll join—it’s how quickly you’ll turn this disruption into profit.
Learn more:
Longevity: The Hidden Profit Center In Your Barn Explore how breeding for longevity—like the record-breaking Canadian Milking Shorthorn with 100,000kg lifetime milk—reduces replacement costs and maximizes ROI, aligning with BANNs’ potential to enhance genetic durability.
AI vs. Breeders: Who Really Drives Genetic Progress? Dive into the debate over AI’s role in modern breeding, featuring insights from top geneticists on balancing cutting-edge tools like BANNs with traditional breeder expertise.
Join over 30,000 successful dairy professionals who rely on Bullvine Daily for their competitive edge. Delivered directly to your inbox each week, our exclusive industry insights help you make smarter decisions while saving precious hours every week. Never miss critical updates on milk production trends, breakthrough technologies, and profit-boosting strategies that top producers are already implementing. Subscribe now to transform your dairy operation’s efficiency and profitability—your future success is just one click away.
Sick of treating calf scours? New genetic tool slashes disease rates by 44%! Discover how selecting the right bulls could revolutionize your dairy farm’s health and profits.
EXECUTIVE SUMMARY: Lactanet Canada is set to launch a game-changing Calf Health Index for Holstein breeders in August 2025. This innovative genetic tool allows farmers to select bulls whose daughters show significantly improved resistance to diarrhea and respiratory diseases in calves. Based on extensive data analysis from over 78,000 heifers, the index reveals dramatic differences between top and bottom-ranked bulls, with potential to reduce disease rates by up to 44%. The index will be expressed as Relative Breeding Values (RBVs) and integrated into Canada’s Lifetime Performance Index by 2026. With nearly 3,000 bulls already evaluated, this breakthrough promises to transform calf health management, reduce treatment costs, and boost long-term profitability for dairy operations.
KEY TAKEAWAYS:
New Calf Health Index debuts August 2025, focusing on diarrhea (0-60 days) and respiratory problems (0-180 days) in Holstein calves
Top-ranked bulls produce daughters with up to 44% fewer cases of diarrhea compared to bottom-ranked bulls
Index combines genetic data with economic analysis to maximize impact on farm profitability
Will be incorporated into Canada’s Lifetime Performance Index by April 2026, reflecting industry shift towards health and sustainability traits
Offers potential to significantly reduce treatment costs and improve lifetime productivity of dairy cattle
You know those endless battles with calf scours and pneumonia that keep us up at night? Well, I just learned about a genetic solution coming our way, and honestly, I can’t wait to tell you all about it. Lactanet Canada is launching a brand-new Calf Health Index for Holsteins this August (2025). I was chatting with some folks in the industry last week, and they’re buzzing about this. It’s a genetic tool that helps us select bulls whose daughters are naturally more resistant to diarrhea and respiratory problems in calves.
Think about it – what if you could cut your calf treatment costs by making smarter breeding decisions? That’s precisely what this index promises.
The Science Behind It (Don’t Worry, I’ll Keep It Simple!)
Lactanet didn’t just come up with this idea out of thin air. They’ve analyzed nearly 89,000 health records from over 78,000 heifers across more than 1,200 Canadian farms. Data nerds like me find this stuff fascinating—they looked at records from 2007 through December 2024!
What they found confirms what we’ve all experienced in our barns: about 19.5% of calves deal with respiratory issues, while 21.1% battle diarrhea. Those numbers match pretty closely with what I’ve seen over the years.
But here’s where it gets exciting. Check out this table showing the difference between the top and bottom bulls:
Trait
Bull Group
RBV Values
% of Healthy Calves
Average
SD
Min
Max
Average
SD
Min
Max
Respiratory
Top 10
116
1.9
114
119
86
10.4
61
100
Respiratory
Bottom 10
83
1.7
80
85
64
15.2
26
81
Diarrhea
Top 10
114
0.6
113
115
95
5.9
86
100
Diarrhea
Bottom 10
82
2.1
78
84
51
13.6
33
68
When I saw these numbers, my jaw dropped. The top bulls for diarrhea resistance produced daughters with 95% healthy calves, while the bottom bulls’ daughters were healthy only 51% of the time. That’s cutting your disease rates in half by picking the right genetics!
What’s In It For Your Farm?
You might wonder, “Okay, but what does this mean for my operation?” Great question!
Here’s the deal: if you’re using bulls with an RBV below 90 (that’s their Relative Breeding Value), their daughters are 1.8 times more likely to get diarrhea and 1.3 times more likely to get respiratory disease compared to daughters of bulls with an RBV above 110.
And we all know these diseases aren’t just a short-term headache. Calves that get sick often produce less milk in their first lactation and have fertility problems, too. It’s like a gift that keeps giving – in the worst way possible!
How They Built This Thing
The new index puts more weight on diarrhea (70%) than respiratory problems (30%). At first, I thought that seemed odd, but it makes perfect sense when you understand their reasoning. Diarrhea often leads to respiratory problems later on, so if you can prevent the first domino from falling, you might avoid the whole cascade.
Genetic science is pretty cool, too. Even though the heritability isn’t super high (5.4% for respiratory problems and 4.4% for diarrhea), there’s a strong genetic correlation of 0.53 between the two traits. This means for you and me that when we select one trait, we’re making progress on the other one, too. Talk about efficiency!
Parameter
Respiratory Problems
Diarrhea
Heritability
5.4%
4.4%
Genetic Correlation
0.53
0.53
Putting This to Work in Your Breeding Program
When the index rolls out this August, it’ll use the standard RBV system with a mean of 100 and a standard deviation of 5. Any bull above 100 is better than average for disease resistance. Simple enough?
The good news is there are already 2,974 bulls with official evaluations, so you’ll have plenty of options. And with a reliability of about 84.6%, you can trust these numbers aren’t just guesswork.
I’m already talking to my genetic advisor about how we’ll incorporate this into our breeding decisions. You might want to do the same – get ahead of the curve!
Where This Fits in the Big Picture
Lactanet isn’t stopping with just releasing this index. They plan to incorporate it into the Health & Welfare subindex of the Lifetime Performance Index (LPI) by April 2026. This is part of the industry’s more significant shift toward breeding for health and sustainability, not just milk production.
I’ve been in this business for years, and I’ve seen many new indexes come and go. But this one? It’s going to stick. It addresses a real pain point for producers while also helping us show consumers that we’re serious about animal welfare. Win-win!
Join over 30,000 successful dairy professionals who rely on Bullvine Daily for their competitive edge. Delivered directly to your inbox each week, our exclusive industry insights help you make smarter decisions while saving precious hours every week. Never miss critical updates on milk production trends, breakthrough technologies, and profit-boosting strategies that top producers are already implementing. Subscribe now to transform your dairy operation’s efficiency and profitability—your future success is just one click away.
Canada’s dairy genetics are about to be shaken up. Is your herd ready for the LPI revolution coming in April 2025? Find out who wins and who loses.
EXECUTIVE SUMMARY: Canada’s Lifetime Performance Index (LPI) is undergoing a major overhaul, set to launch in April 2025. This modernization introduces six new subindexes, including an innovative Environmental Impact Index for Holsteins. The changes aim to address drift in the current formula and align genetic selection with sustainability goals. Producers can expect a significant reranking of bulls, with some top sires potentially dropping over 150 LPI points. Lactanet has released an LPI Estimator tool to help breeders navigate the transition. The new system promises a more transparent, trait-focused selection that balances production with health, longevity, and environmental efficiency.
KEY TAKEAWAYS:
The modernized LPI introduces six subindexes: Production, Longevity & Type, Health & Welfare, Reproduction, Milkability, and Environmental Impact.
Genetic rankings will shift dramatically, with only 74% of the top 50 proven Holstein sires maintaining their status.
Producers can now preview how their animals will rank under the new system using an Excel-based LPI Estimator tool.
The Environmental Impact Index, currently for Holsteins only, signals a strong industry commitment to sustainability.
Breeders should review their genetic strategies to align with the new framework before the April 2025 implementation.
Implementing the modernized Lifetime Performance Index (LPI) on April 1, 2025, will mark an important milestone for the Canadian dairy industry. This significant update to Canada’s premier selection index represents the culmination of a thoughtful two-year development process, transforming the index from a mathematical formula to a transparent, trait-focused framework that aligns with contemporary sustainability goals and production realities.
Understanding these upcoming changes allows dairy producers making breeding decisions today to adapt and optimize their genetic selection strategies before the official launch date.
Why Your Current Genetic Strategy Needs Updating
The path to modernization began in October 2023, when producer Wayne Dickieson of Prince Edward Island noted during an industry session that the existing LPI formula no longer respected its intended emphasis ratios. Subsequent Lactanet analysis confirmed his observation—the current system had gradually drifted to a 49:34:17 distribution (Production:Durability: Health & Fertility) rather than the intended 40:40:20 balance.
“This mathematical drift created an unintended bias in selection toward production traits at the expense of durability and health,” explains Brian Van Doormaal, Lactanet’s Chief Services Officer. “The modernization addresses this fundamental issue by standardizing each subindex to a common scale before applying weights, preventing future drift and ensuring the index delivers its promised emphasis.”
This discovery initiated a comprehensive reevaluation of the entire LPI framework, guided by four primary objectives:
Expanding beyond the three current components to incorporate sustainability traits
Eliminating the mathematical formula approach to improve transparency
Creating official subindexes to be published alone and combined in LPI
Clarifying relative emphasis on traits while focusing on expected responses for key correlated traits
Breaking Down the Six Revolutionary Subindexes Reshaping Dairy Selection
The modernized LPI replaces the three-component structure with six distinct subindexes, each focusing on specific trait clusters with economic and functional significance. For Holsteins, these receive precise weightings: Production Index (40%), Longevity & Type Index (32%), Health & Welfare Index (8%), Reproduction Index (10%), Milkability Index (5%), and Environmental Impact Index (5%).
Table 1: Lifetime Performance Index (LPI) Subindex Weightings by Breed (%)
Subindex
Holstein
Jersey
Ayrshire
Brown Swiss
Guernsey
Milking Shorthorn
Canadienne
Production Index (PI)
40
40
40
45
40
45
40
Longevity & Type Index (LTI)
32
30
32
30
32
30
35
Health & Welfare Index (HWI)
8
10
8
8
8
5
5
Reproduction Index (RI)
10
10
10
12
10
10
10
Milkability Index (MI)
5
10
10
5
10
10
10
Environmental Impact Index (EI)
5
–
–
–
–
–
–
Each subindex will be standardized to a Relative Breeding Value (RBV) scale with an average of 500 and a standard deviation of 100—an important innovation that prevents the mathematical drift affecting the previous formula. This standardization ensures the intended trait emphases remain stable over time, creating a more reliable and predictable selection tool.
Production Index (PI): The Economic Foundation
While maintaining its position as the cornerstone of economic selection, the PI introduces refinements that reflect long-term market realities rather than short-term price fluctuations. Holsteins’ fat-to-protein ratio is fixed at 60:40, prioritizing fat yield while maintaining adequate protein emphasis. This approach reflects butterfat’s stable economic value in the current and projected marketplace.
Jersey cattle place a greater emphasis on fat production than on protein than Holsteins (50% fat emphasis versus 40% protein), honoring the breed’s traditional strength in butterfat-rich product markets. Across all breeds, the focus remains on absolute yields rather than compositional percentages, ensuring selection drives increased production efficiency per animal.
Longevity & Type Index (LTI): Building Cows That Last
This subindex merges direct longevity measurements with conformational attributes contributing to extended productive life. A notable shift includes reducing emphasis on Dairy Strength from 10% to 5% while increasing focus on Feet and legs to 33% in Holsteins. The Mammary System receives significant weight (37% in Holsteins), reflecting its critical importance to functional productivity and udder health throughout lactation.
Table 2: Longevity & Type Index (LTI) Composition by Breed (%)
Trait
Holstein
Jersey
Ayrshire
Brown Swiss
Guernsey
Milking Shorthorn
Canadienne
Herd Life
20
20
40
40
34
26
20
Mammary System
37
40
38
32
32
42
55
Feet & Legs
33
40
22
16
24
28
25
Dairy Strength
5
–
–
–
10
4
–
Rump
5
–
–
12
–
–
–
Breed-specific adaptations maintain the uniqueness of each population—Ayrshires place 40% emphasis on Herd Life directly. In comparison, Canadienne cattle allocate 55% of the LTI to the Mammary System, reflecting the breed’s traditional excellence in udder traits.
Health & Welfare Index (HWI): Science-Based Disease Resistance
The HWI integrates disease resistance traits using a scientifically derived economic weighting system developed through consultation with AbacusBio. The Holstein formula incorporates Mastitis Resistance (47%), Metabolic Disease Resistance (27%), Hoof Health (21%), and Cystic Ovaries (5%), with weightings determined through rigorous analysis of heritability, disease prevalence, and treatment costs.
This science-based approach ensures that selection emphasis aligns with the economic impact of each health challenge, maximizing the return on genetic investment in disease resistance. Including Hoof Health within this index—previously part of the Durability component—creates a more logical organization of health-related traits.
Reproduction Index (RI): Focusing on Fertility
The RI dedicates a dedicated focus to fertility, with 90% emphasis on Daughter Fertility and 10% on Daughter Calving Ability across all breeds. This thoughtful prioritization of reproductive efficiency acknowledges its critical role in lifetime productivity and farm profitability.
The consistent 90:10 weighting across breeds reflects the universal importance of fertility regardless of breed specialization, clearly signaling to breeders the value of reproductive traits in all production systems.
Milkability Index (MI): Labor Efficiency in the Parlor
This innovative addition to the LPI framework addresses an increasingly important dimension of dairy operation—labor efficiency and milking system compatibility. For Holsteins, it incorporates Milking Speed (25%), Milking Temperament (18%), Udder Floor (-6%, with negative values being desirable), Udder Depth (15%), and Teat Length (36%).
Table 3: Milkability Index (MI) Composition by Breed (%)
Trait
Holstein
Jersey
Ayrshire
Brown Swiss
Guernsey
Milking Shorthorn
Canadienne
Milking Speed
25
20
30
25
30
30
25
Temperament
18
20
20
18
15
15
18
Udder Depth
15
15
10
15
30
15
15
Udder Floor
-6
-10
-6
-6
-5
-6
-6
Teat Length
36
35
34
36
20
34
36
Including this index reflects the increasing automation of milking systems and the economic significance of efficient milk harvesting. Negative weights for traits like Udder Floor indicate selection toward more desirable values for these traits (higher udders with less pronounced floor), requiring careful interpretation by breeders.
Environmental Impact Index (EI): Breeding for Sustainability
Exclusive to Holsteins initially, this forward-looking index combines Feed Efficiency (25%), Methane Efficiency (37%), and Body Maintenance Requirement (38%). Its introduction signals the industry’s commitment to sustainability objectives and positions Canadian genetics advantageously in climate-conscious dairy production.
The EI represents the most forward-looking aspect of the modernized LPI. It aligns genetic selection with Dairy Farmers of Canada’s goal of net-zero greenhouse gas emissions by 2050. The decision to restrict this index to Holsteins initially reflects limitations on data availability for other breeds, but it establishes a framework that can expand as research progresses.
Winners and Losers: How Your Herd’s Genetics Will Be Reranked
The transition to the modernized LPI will lead to a noticeable reranking of genetic merit. An analysis of December 2024 evaluations reveals that changes in Holstein LPI values can exceed ±300 points in some cases. Among the top 50 proven Holstein sires, 74% remain in the top 50 under the new system, with an average change of +12.6 LPI points (maximum increase of 172, maximum decrease of 189).
Table 4: Impact of Modernized LPI on Holstein Genetic Rankings
Category
Average LPI Change
Maximum Increase
Maximum Decrease
% Remaining in Top Group
Top 50 Proven Sires
+12.6
+172
-189
74%
Top 100 Proven Sires
+9.4
+176
-194
75%
Top 50 Genomic Bulls
-2.6
+152
-124
56%
Top 100 Genomic Bulls
+4.7
+152
-157
67%
Top 50 GLPI Cows
+18.1
+125
-171
68%
Top 100 GLPI Cows
+21.9
+150
-171
64%
Genomically-tested animals show more significant variability, with only 56% of the top 50 genomic bulls maintaining their top 50 status under the new system. This suggests that early adaptation may offer opportunities to identify previously undervalued genetics that excel in newly emphasized traits.
The impact varies by breed—Jersey-proven sires show an average decrease of 39.3 LPI points among the top 50 bulls, with 90% maintaining their top 50 status. Ayrshires see an average reduction of 16.2 points among top sires, with 94% remaining in the top 50.
Table 5: Examples of Significant Changes in Holstein Proven Sire Rankings
Name
Current Rank
Current LPI
New Rank
New LPI
Change
Notable Traits
SIEMERS RENEGADE ROZLINE-ET
8
3670
2
3831
+161
High MI (594), Strong EI (609)
CO-OP ALTABOOYAH-ET
7
3690
54
3518
-172
Lower EI (435)
SILVERRIDGE V EINSTEIN
12
3628
27
3616
-12
Exceptional HWI (718)
OCD MILAN-ET
3
3845
1
3997
+152
Strong LTI (771), High HWI (712)
Navigating the Transition: Tools You Can Use Today
To facilitate this transition, Lactanet has developed and publicly released an Excel-based LPI Estimator tool (available since February 12, 2025) that calculates modernized LPI values based on current genetic evaluations. This tool allows producers and industry professionals to preview how their animals will be valued under the new system and make informed breeding decisions accordingly.
The estimator accepts manual input of 21 trait values for individual animals or can process data files for companies receiving weekly updates from Lactanet. Each subindex receives a percentile rank alongside its RBV value, providing immediate context for an animal’s standing relative to the population.
For forward-thinking breeders, this tool creates an opportunity to identify valuable genetics before the April implementation—potentially acquiring animals that will appreciate in ranking once the new system takes effect.
Identify breeding stock excelling in newly emphasized traits, particularly those involving health, reproduction, and environmental efficiency
Review current genetic strategies against the new subindex framework, adjusting emphasis areas to align with operational priorities.
Use the LPI Estimator to evaluate current and potential breeding stock under the new system.
Consider prioritizing Pro$ or LPI based on specific operation goals and market positioning.
From a practical standpoint, standardizing subindexes to a standard scale (Average=500, SD=100) will improve clarity regarding an animal’s genetic profile. A bull at the 90th percentile for the Health & Welfare Index (HWI around 628) offers meaningful disease resistance compared to population averages, regardless of its ranking in other categories.
The inclusion of the Environmental Impact Index positions Canadian genetics advantageously in an increasingly sustainability-conscious global market. As carbon pricing mechanisms evolve and consumers seek climate-friendly products, genetics that reduce methane emissions while maintaining production efficiency may offer additional value domestically and internationally.
Looking Forward: Breeding for Tomorrow’s Market Realities
The modernized LPI significantly enhances Canada’s genetic evaluation system. By expanding beyond traditional production and conformation traits to embrace health, fertility, labor efficiency, and environmental impact, Lactanet has created a selection framework aligned with the multifaceted challenges of modern dairy operations.
Canadian producers now have the opportunity to familiarize themselves with this new genetic landscape before implementation. Those who study the new subindexes, utilize the LPI Estimator tool and thoughtfully adjust breeding strategies will be well-positioned to thrive in an industry increasingly defined by efficiency, sustainability, and animal welfare excellence.
As April 1, 2025, approaches, the Canadian dairy industry continues its tradition of genetic innovation. The modernized LPI provides a robust framework for selecting genetics that will perform successfully in tomorrow’s dairy farms’ economic, social, and environmental contexts.
Join over 30,000 successful dairy professionals who rely on Bullvine Daily for their competitive edge. Delivered directly to your inbox each week, our exclusive industry insights help you make smarter decisions while saving precious hours every week. Never miss critical updates on milk production trends, breakthrough technologies, and profit-boosting strategies that top producers are already implementing. Subscribe now to transform your dairy operation’s efficiency and profitability—your future success is just one click away.
Get ready for a genetic shake-up, dairy farmers! The U.S. is about to hit the reset button on cattle evaluations. Come April 2025, those impressive PTA numbers you’ve been eyeing? They’re in for a makeover. But don’t panic—it’s not a downgrade; it’s an upgrade. Let’s dive into what this means for your herd’s future.
Summary
The U.S. dairy industry is poised for a significant genetic recalibration on April 1, 2025, as the Council on Dairy Cattle Breeding (CDCB) implements a dual update to lifetime merit indices and genetic evaluations. This change will reset the genetic base to cows born in 2020, resulting in lower Predicted Transmitting Ability (PTA) values across breeds. For instance, Holstein PTAs are expected to decrease by about 750 lbs for milk, 45 lbs for fat, and 30 lbs for protein. Simultaneously, the Net Merit $ (NM$) index will be revised to emphasize butterfat production, feed efficiency, and cow livability, reflecting current market demands and sustainability concerns. While these changes may initially seem drastic, they aim to provide breeders with more accurate and economically relevant selection tools. The update accounts for rapid genetic progress in the dairy industry and aligns evaluations with contemporary economic and environmental pressures, ultimately guiding producers toward more profitable and sustainable breeding decisions.
Key Takeaways
Genetic base change occurs on April 1, 2025, resetting to cows born in 2020
PTA values will decrease across all breeds:
Holstein: -750 lbs milk, -45 lbs fat, -30 lbs protein
Jersey: -380 lbs milk, -20 lbs fat, -15 lbs protein
Ayrshire: -550 lbs milk, -28 lbs fat, -18 lbs protein
Net Merit $ (NM$) index revised with:
Increased emphasis on butterfat (+13% weighting)
Greater focus on feed efficiency (41% higher combined impact)
Doubled weighting for cow livability
A strong correlation (0.992) between old and new NM$ rankings
Changes reflect faster genetic progress and align with current economic and sustainability pressures
Future updates may include rumen microbiome PTAs and methane emission indexes by 2028
Breeding strategies should prioritize component ratios and feed efficiency for future profitability
The U.S. dairy industry will undergo its most significant genetic recalibration in decades on April 1, 2025, as the Council on Dairy Cattle Breeding (CDCB) implements simultaneous updates to lifetime merit indices and shifts all genetic evaluations to a 2020-born cow base. This dual adjustment—the first combined overhaul since 2015—aims to reflect 28% faster genetic progress in key traits while aligning economic weightings with today’s $7.20/cwt milk markets and sustainability pressures.
The Mechanics of Change
Resetting the Genetic Compass
Every five years, CDCB adjusts its genetic evaluations to account for industry progress—comparable to upgrading a smartphone’s operating system to handle new apps. The 2025 shift compares all animals against cows born in 2020 rather than 2015, creating these projected PTA adjustments:
Trait
Holstein
Jersey
Ayrshire
Milk (lbs)
-750
-380
-550
Fat (lbs)
-45
-20
-28
Protein (lbs)
-30
-15
-18
Source: CDCB Preliminary Estimates 2025
“Think of it like resetting an odometer after driving 100,000 miles,” explains Dr. John Cole, USDA-AGIL research lead. “The numbers get smaller, but the vehicle’s capability hasn’t changed.”
Merit Index Overhaul
The revised Net Merit $ (NM$) formula now prioritizes:
Leverage Feed Savings: Each 1-point FSAV improvement now saves $18/cow/year
Prioritize Component Ratios: Target 3.7:1 fat-to-protein for cheese operations
“This isn’t your grandfather’s genetic game. The bull that wins in 2025 needs to be part economist, part environmentalist,”
Market Realities
Butterfat Focus: 82% of 2024 milk checks came from fat components vs. 68% in 2015
Feed Costs: Represent 58% of operational expenses, up from 49% pre-pandemic
Sustainability Pressures: Methane metrics slated for 2028 evaluations
“Dairies surviving the next decade will be those treating feed efficiency as seriously as mastitis control,” warns UW-Madison economist Dr. Mark Stephenson.
Stability Amidst Change
While PTAs drop numerically, CDCB reports:
0.992 correlation between old/new NM$ rankings
Top 100 Holstein bulls maintain relative positions
Cheese Merit $ (CM$) adjustments favor Jerseys (+7% index stability)
“It’s like everyone’s GPS recalculating simultaneously—you’ll reach the destination, just with updated traffic data,” assures CDCB technical director João Dürr.
Looking Ahead
The 2025 reset paves the way for:
Rumen Microbiome PTAs (2028): Linking microbial profiles to feed conversion
Heat Tolerance Updates: Critical as 73% of U.S. counties face higher heat stress days
Conclusion
April’s genetic overhaul serves as both a progress report and crystal ball—validating two decades of genomic advances while redirecting selection pressure toward tomorrow’s profitability drivers. As dairy economist Chris Wolf notes, “The cows we’ll milk in 2035 are being designed today through these evaluations.” Producers who realign breeding strategies with NM$ 2025’s economic reality—where every 1 lb of fat equals 2.3 lbs of protein in revenue—position themselves to thrive in dairy’s next era.
Bullvine Daily is your essential e-zine for staying ahead in the dairy industry. With over 30,000 subscribers, we bring you the week’s top news, helping you manage tasks efficiently. Stay informed about milk production, tech adoption, and more, so you can concentrate on your dairy operations.
Net Merit 2025 is set to revolutionize dairy breeding. Launching April 1, 2025, this updated index emphasizes butterfat, feed efficiency, and cow longevity. Discover how these changes could boost your herd’s profitability and shape the future of dairy farming. Are you ready for the next generation of genetics?
Summary:
The Council on Dairy Cattle Breeding (CDCB) is set to launch Net Merit 2025 on April 1, 2025, introducing significant updates to the genetic selection index for dairy farmers. This revision adjusts trait emphases to reflect current market trends and production realities, with notable changes including increased butterfat production, a greater focus on feed efficiency, and more weight on cow and heifer livability. The update aims to improve cow profitability over generations by combining economic values for 12 individual traits and five composite subindexes into a single value. While the changes are substantial, the high correlation between the 2025 and 2021 indexes suggests stability in genetic evaluations. Dairy farmers are encouraged to consider these updates in their long-term breeding strategies, considering that the index may not perfectly reflect individual farm conditions. Additional specialized indices are available for specific production systems, offering farmers flexibility in aligning genetic selection with their particular market and operational needs.
Key Takeaways:
The Council on Dairy Cattle Breeding (CDCB) will release Net Merit 2025 to enhance dairy genetic selection based on current market trends.
The updated index emphasizes butterfat production and livability while de-emphasizing protein to align with economic changes.
Specialized indices, such as Cheese Merit, Fluid Merit, and Grazing Merit, help tailor genetic selection to various production systems.
Net Merit provides a long-term strategy for improving dairy cow profitability, emphasizing trends of economically vital traits.
Farmers are encouraged to stay informed through USDA resources and industry workshops to incorporate Net Merit into breeding decisions optimally.
The Council on Dairy Cattle Breeding (CDCB) will introduce Net Merit 2025, which includes updated genetic selection methods for dairy farmers, on April 1, 2025. This update revises genetic selection for dairy farmers nationwide and adjusts trait emphasis to reflect current market trends and production realities.
What is Net Merit?
The Lifetime Net Merit (NM$) index ranks dairy animals based on their combined genetic merit for economically important traits. Net Merit 2025 introduces innovative methods for evaluating traits and economic factors in dairy animals.
Dr. Paul VanRaden, a Research Geneticist at USDA, highlights Net Merit 2025 as a strategic response to the evolving dairy industry. The update integrates recent economic data and research to assist farmers in breeding more profitable cows.
NM$ combines values of particular traits and subindexes to improve the profitability of cows over multiple generations.
The Evolution of Net Merit
First published in 1994 by the USDA’s Animal Improvement Programs Laboratory, Net Merit has been routinely updated at three—to four-year intervals. The index weights are based on an economic model that considers incomes and expenses over a dairy cow’s lifetime, using data from public sources when possible.
Net Merit 2025 is the result of extensive collaboration. The process included:
Initial drafting by USDA’s Animal Genomics and Improvement Laboratory (AGIL) in the summer of 2024
Public discussion at the CDCB Industry Meeting during World Dairy Expo
Presentation to university experts at the S-1096 Multistate Research Project meeting
Review by CDCB’s Genetic Evaluation Methods and Producer Advisory Committees
Final approval by the CDCB Board of Directors in December 2024
Key Changes in Net Merit 2025
Comparison of Trait Weights
The following table shows the expected relative value of economically rooted weights of traits in the revised April 2025 Net Merit $ formula, compared to weights in the current formula:
Trait
Current NM$
April 2025 NM$
Protein
19.6%
13.0%
Fat
28.6%
31.8%
Feed Saved
12.0%
17.8%
Productive Life
11.0%
8.0%
Cow Livability
7.0%
8.0%
Udder Composite
7.0%
7.0%
Fertility
6.8%
6.8%
Heifer Livability
1.3%
2.0%
The 2025 revision includes significant changes:
Butterfat Emphasis: The emphasis on butterfat production has increased, aligning with recent price trends. The weight of fat in NM$ has risen from 28.6 to 31.8.
Protein De-emphasis: The weight for protein decreased from 19.6 to 13.
Livability Focus: Greater emphasis on cow and heifer livability, reflecting higher cull cow and heifer calf prices.
Feed Efficiency: More negative emphasis on Body Weight Composite and greater focus on Residual Feed Intake to address feed costs.
Minimal Reranking: The 2025 and 2021 NM$ indexes show a high correlation of 0.992 for young Holstein bulls and 0.981 for recent progeny-tested bulls, indicating stability in genetic evaluations.
Customized Selection Indices
In addition to NM$, CDCB offers three more indices customized for specific dairy operations: Cheese Merit (CM$), Fluid Merit (FM$), and Grazing Merit (GM$).
Cheese Merit (CM$): Tailored for cheese producers, this index emphasizes protein and somatic cell score.
Fluid Merit (FM$): Designed for fluid milk producers, focusing on milk volume and butterfat.
Grazing Merit (GM$): Optimized for pasture-based systems, prioritizing fertility and adaptability.
These specialized indices allow farmers to align genetic selection with their specific market and production system.
Applying Net Merit to Your Farm
While Net Merit is a valuable tool, it may not comprehensively capture each farm’s conditions. Therefore, it is recommended that farmers prioritize evaluating the genetic progress trends for traits most vital to their operations.
“Rather than focus on one number or another, it’s more helpful to look at the big picture,” suggests VanRaden. “USDA provides the expected genetic progress in each trait from selection on NM$, and it’s better to see if the trends for the traits most important to you are in the desired direction.”
Long-Term Strategy for Herd Improvement
Farmers should adopt a long-term perspective when considering Net Merit 2025 to achieve sustainable improvements in their herds. The index has been designed to improve cow profitability over the generations, requiring patience and consistent application.
Staying Informed
For the latest information on Net Merit and its applications:
Review USDA AGIL’s technical document detailing Net Merit calculations.
Watch Paul VanRaden’s PowerPoint presentation, which summarizes changes and provides examples of how genetic values affect a cow’s lifetime profit.
Engage with industry workshops and webinars to stay updated on genetic selection strategies.
Conclusion: Embracing the Future of Dairy Genetics
Net Merit 2025 signifies the dairy industry’s dedication to advancement, efficiency, and sustainability beyond an index update. Embracing these tools and staying informed about industry developments can empower dairy farmers to succeed in a constantly evolving market.
Looking ahead, farmers should actively engage with and adapt to these modifications. How do you plan to incorporate Net Merit 2025 into your breeding decisions? Share your thoughts and join the conversation shaping the future of dairy farming.
Learn the main differences between DPR and CCR in dairy cow fertility. How can these measures improve your herd’s breeding success and profits?
Think about dairy farming as solving a puzzle, where you want high milk production and healthy cow fertility. In the 1990s, breeders focused more on milk fat and protein, but this caused fertility problems. Cows had longer gaps between giving birth, which resulted in reduced productivity and profit. Today, we aim for balance, and tools like the Daughter Pregnancy Rate (DPR) and Cow Conception Rate (CCR) help us understand fertility better. However, it can be challenging to determine the appropriate times to use these tools and to distinguish between their unique functions. This article allows farmers to balance producing milk and keeping cows healthy to earn more money.
The Evolution of Dairy Cow Fertility Metrics
In the 1990s, the dairy industry focused on increasing milk production by selecting cows with higher milk fat and protein. However, this emphasis led to problems as cows became less fertile and required more time to conceive. By the early 2000s, a shift in strategy was necessary to address these fertility issues.
Year
Average Milk Production (lbs/cow/year)
% Improvement in Milk Production
Average Fertility Rate (%)
% Change in Fertility Rate
1990
16,000
45
2000
18,500
15.63%
42
-6.67%
2010
20,000
8.11%
39
-7.14%
2020
23,000
15.00%
36
-7.69%
The introduction of the Daughter Pregnancy Rate (DPR) in 2003 offered a solution. The DPR predicts how frequently cows become pregnant every 21 days, enabling farmers to select bulls that produce more fertile daughters without compromising milk yield. In 2010, the Cow Conception Rate (CCR) was introduced to measure how likely cows are to conceive after insemination, allowing for more informed breeding decisions and improved herd health.
Implementing DPR and CCR addressed the fertility challenges of the 1990s, resulting in healthier and more profitable dairy herds.
Delving Into Daughter Pregnancy Rate (DPR)
Daughter Pregnancy Rate (DPR) is a key measure in the dairy industry used to evaluate the fertility potential of dairy cows. It shows the percentage of non-pregnant cows that get pregnant every 21 days. This helps predict how well future daughters of a bull will become pregnant compared to the average.
DPR calculation includes:
Tracking ‘days open’ is the time from calving until a cow gets pregnant again.
Considering the waiting period after calving, this data can be turned into a pregnancy rate with a formula.
Looking at up to five lactations across different cows for a broad view.
Suppose the Predicted Transmitting Ability (PTA) for the pregnancy rate increases by 1%. In that case, it lowers ‘days open’ by four, showing potential genetic progress.
DPR is important for farmers who want to make their herd better over time. It’s included in key selection tools like Net Merit (NM$), Total Performance Index (TPI), and Jersey Performance Index (JPI). A study by the University of Wisconsin-Madison showed that raising DPR by 1% could make an average of $35 more per cow yearly.
However, DPR has its downsides. Its heritability is only 4%, meaning environment and management have a significant impact. Because of this, genetic progress is slower. Also, calculating the data needed for DPR can be challenging for some farmers.
The Precision of Cow Conception Rate
The Cow Conception Rate (CCR) is essential in dairy farming because it shows how well a cow can get pregnant. Unlike broader fertility measures, it measures how many inseminations lead to a confirmed pregnancy. This specific focus makes CCR valuable for checking if artificial insemination is working on farms. Its calculation is simple: it looks at the percentage of cows pregnant after being inseminated. This precise measure helps farmers evaluate their breeding plans quickly. Good CCR means fewer inseminations, which cuts costs and helps maintain steady calving, leading to regular milk production. This improves a cow’s overall productivity over its lifespan, showcasing the economic significance of CCR.
Nevertheless, the Cow Conception Rate (CCR) presents challenges. It can be affected by factors like the cow’s health, semen quality, and the timing of insemination. These factors mean that CCR might not always be accurate, so farmers should consider them when interpreting CCR data. However, when used carefully, CCR helps improve dairy farming, supports genetic advancements, and promotes better breeding practices.
Cow Conception Rate (CCR) has even lower heritability, 1-2%. This means it’s even more affected by outside factors like breeding methods and cow health. Changing this trait with genetics alone is hard. Still, DPR and CCR are critical to improving the whole herd. Knowing how these traits are passed down helps farmers pick the right breeding goals and improve how they care for their cows to boost fertility.
Contrasting DPR and CCR
The Daughter Pregnancy Rate (DPR) and Cow Conception Rate (CCR) are critical for understanding dairy cows’ fertility. They measure different things, which affects how they are used.
Aspect
Daughter Pregnancy Rate (DPR)
Cow Conception Rate (CCR)
Timeframe
Examine a cow for 21 days to determine whether she becomes pregnant.
Examines each breeding attempt to decide whether or not it was successful.
Scope
It covers overall herd fertility, including how well cows are detected in heat and inseminated.
It focuses on whether each insemination results in pregnancy.
Genetic Influence
More about long-term genetic improvement focusing on genetics.
About the immediate outcome and is more affected by factors like how well cows are managed.
Data Requirements
Requires extensive data, such as calving dates and the number of pregnant cows.
It is more straightforward, requiring only information on whether inseminations worked.
Practical Applications
It is excellent for long-term planning to improve cow genetics and reduce the time between calvings, helping keep cows healthy and farms profitable.
It helps with quick decisions about breeding and shows how well an AI program is working, ensuring constant milk production.
Farmers use the Daughter Pregnancy Rate (DPR) and Cow Conception Rate (CCR) to help with breeding goals. Choosing bulls with high DPR scores improves herd fertility and encourages cows to give birth more often. This is usually combined with traits like milk production and disease resistance, which helps with herd health and long-term success.
CCR shows how well cows get pregnant after insemination, which helps determine whether the expensive semen works. Watching CCR also helps plan when to breed cows, reduce the time without calves, and identify any food or health problems to increase productivity.
Why Only Using Positive DPR Sires May Not Be The Best Strategy
Only bulls with a good Daughter Pregnancy Rate (DPR) might not be the best way to make cows more fertile. That’s because many things affect how well cows can have calves. First, DPR isn’t very reliable because only a tiny part, about 4%, comes from genetics. Weather, food, and care matter more for cows with calves. Also, sometimes bulls with good DPR might not be as good at producing milk, so it’s better to balance these traits for healthy cows.
If you focus only on DPR, you could miss other vital traits like the Heifer Conception Rate (HCR) and Cow Conception Rate (CCR). These measures help understand how well cows can get pregnant. Plus, only thinking about genetics skips over essential factors like how cows are fed and cared for every day. Improving these areas can often boost how well cows reproduce faster and more effectively than just looking at their genes.
Another major problem with the Daughter Pregnancy Rate (DPR) is that it doesn’t account for the time farmers let cows rest before breeding, known as the voluntary waiting period (VWP). For example, suppose a farm lets high milk-producing cows wait longer before breeding. In that case, these delays can make their fertility look worse in the DPR calculations. This happened with the bull Lionel, whose daughters have a low DPR of -4.4 but a better Cow Conception Rate (CCR) of -0.3. Lionel’s daughters produce much milk, so owners let them keep milking longer before breeding them. Even though they get pregnant quickly once bred, the DPR unfairly lowers their fertility score because it doesn’t take this waiting time into account. Unlike DPR, CCR focuses on whether cows get pregnant, not when they are bred. Reflecting the shift from DPR to CCR, Holstein USA has reduced DPR’s importance from 0.4 to 0.1 and increased CCR’s from 0.1 to 0.4 in their fertility index.
Embracing the Comprehensive Daughter Fertility Index
Farmers might consider using the Daughter Fertility Index (DFI) instead. DFI looks at more than just DPR, including calving ease and how often cows get pregnant, giving a better overview of a cow’s ability to reproduce. This helps farmers make better breeding choices, looking at the cow’s genetic traits and how well she fits into farm operations.
In many places, the Daughter Fertility Index (DFI) is key for judging a bull’s daughter’s reproduction ability. DFI includes:
Daughter Pregnancy Rate (DPR): Measures how many cows get pregnant every 21 days, showing long-term fertility.
Heifer Conception Rate (HCR): How likely young cows are to get pregnant when first bred.
Cow Conception Rate (CCR): Examines how often adult cows get pregnant after breeding.
Metric
Contribution to Profitability
Daughter Pregnancy Rate (DPR)
Reduces days open, leading to more consistent milk production cycles and lower reproductive costs, enhancing long-term genetic improvement.
Cow Conception Rate (CCR)
Focuses on immediate pregnancy success, reducing insemination costs, optimizing calving intervals, and improving short-term financial margins.
Daughter Fertility Index (DFI)
Combines genetic evaluations to target comprehensive fertility improvements, effectively balancing reproduction with production demands to maximize profit.
Looking at these factors, DFI gives a fuller picture of a bull’s daughters’ fertility, helping farmers make smart farm breeding decisions.
Harnessing Technology
The future of dairy farming is changing with new technology. Tools like automated activity trackers help farmers determine the best time to breed cows by watching their move. This helps make more cows pregnant, improving the Cow Conception Rate (CCR). For instance, devices like CowManager or Allflex watch how cows move and eat, helping farmers know when to breed. This can make CCR better by up to 10% in some cases. One tool, the SCR Heatime system, uses rumination and movement tracking to find the best times for breeding, potentially raising pregnancy rates by up to 15%.
Additionally, AI-powered imaging systems give detailed insights into cows’ health. They help find health problems early, making the herd healthier and more fertile. For example, some farms use AI systems that combine this tracking data with other scores to improve breeding choices, potentially boosting overall herd fertility by up to 20%.
Data analytics platforms are essential for managing herds. They help farmers understand large amounts of data and predict health and reproductive performance. Reducing open days or when a cow isn’t pregnant can improve the Daughter’s Pregnancy Rate (DPR).
Using data helps make dairy farms more efficient and profitable. These new tools allow for better choices, leading the way to the future of farming as we approach 2025 and beyond.
Leveraging DPR and CCR for Enhanced Herd Management
In today’s dairy farming, using the Daughter Pregnancy Rate (DPR) and the Cow Conception Rate (CCR) helps improve herd management and make more money. Here’s how they can help:
Use DPR for Future Improvement: Choose bulls with high DPR scores to slowly improve your herd’s fertility. This can help cows get pregnant faster and shorten the time they don’t produce milk.
Apply CCR for Fast Results: Focus on CCR to speed up breeding decisions. This ensures that cows get pregnant on time and continue producing milk efficiently.
Leverage the Daughter Fertility Index (DFI): The DFI is an overall measure that includes genetic and environmental factors and can boost reproductive performance and sustainability.
Adopt New Technologies: Use advanced tools like health monitors and AI systems for real-time updates on cows’ health and fertility. These tools let you act quickly to fix any problems.
Review and Change Plans: Always review and change your breeding plans to accommodate your farm’s changing needs and market conditions.
Using DPR and CCR data to improve your breeding program, you can boost your herd’s fertility, productivity, and long-term gains, ensuring success on your farm. Start by checking your current metrics and getting advice from a breeding expert to make a customized plan for your herd.
The Bottom Line
We’ve discussed two essential ways to measure fertility in dairy cows: Daughter Pregnancy Rate (DPR) and Cow Conception Rate (CCR). These are helpful tools for dairy farmers who want to get the most out of their cows, both now and in the future. Knowing when and how to use DPR and CCR helps farmers make smart choices that fit their needs.
The main idea here is about picking the right ways to improve how cows reproduce. As farming changes, mixing old methods with new technology is essential. Doing so can lead to a better and more prosperous future. This approach is like standing at a crossroads, choosing between old practices and the latest technology.
It’s time for dairy farmers to look at their plans for breeding cows. Using what they’ve learned can help them make better choices. Imagine a future where every cow is used to its full potential and every choice is based on data. Are you ready to solve the final piece of this puzzle and revolutionize your herd’s potential?
Key Takeaways:
Daughter Pregnancy Rate (DPR) and Cow Conception Rate (CCR) are critical fertility metrics in dairy cattle breeding. Each provides unique insights into herd reproductive performance.
DPR evaluates long-term fertility and genetic improvement but is criticized for its instability due to calculation methods based on herd management variables rather than direct breeding outcomes.
CCR offers a more immediate assessment of a cow’s conception success, making it a practical tool for evaluating breeding effectiveness and managing costs in dairy operations.
The shift from primarily focusing on milk production to integrating fertility metrics like DPR and CCR is crucial for enhancing the profitability and sustainability of dairy farming.
Technological advancements in reproductive analytics are reshaping the dairy industry, offering farmers new tools to optimize reproductive strategies and overall herd management.
Farmers must balance DPR and CCR based on their specific operational goals. DPR favors long-term genetic strategies, while CCR addresses immediate breeding outcomes.
Summary:
The article looks at two essential tools in dairy farming: Daughter Pregnancy Rate (DPR) and Cow Conception Rate (CCR). These help farmers decide how to breed cows for better fertility and milk production. In the past, dairy farming focused too much on milk, which hurt fertility. DPR helps understand long-term fertility, while CCR shows how likely a cow is to get pregnant now. New technology like activity trackers and AI can help make dairy farms more productive and sustainable. But be careful with DPR; it’s not perfect. DPR and CCR can help farmers make smart decisions to improve their farms.
Bullvine Daily is your essential e-zine for staying ahead in the dairy industry. With over 30,000 subscribers, we bring you the week’s top news, helping you manage tasks efficiently. Stay informed about milk production, tech adoption, and more, so you can concentrate on your dairy operations.
See how CDCB’s 2025 updates can boost your dairy herd’s profits. Are you ready to improve feed efficiency and fertility?
Summary:
Prepare for significant changes in dairy farming! The Council on Dairy Cattle Breeding (CDCB) is set to update genetic evaluations in April 2025, with revisions to lifetime merit indices like Net Merit $, Cheese Merit $, Fluid Merit $, and Grazing Merit $, and a new genetic base focusing on cows born in 2020. These upgrades aim to improve feed efficiency, milk pricing, and fertility, boosting profitability and efficiency for dairy farmers. With genetic diversity monitored for sustainable growth, these changes reflect current economic environments and promise a bright future for herd management and farm earnings.
The Council on Dairy Cattle Breeding (CDCB) is preparing for significant changes in April 2025. They will Two significant updates will be implemented in the April 2025 dairy genetic evaluations published by the Council on Dairy Cattle Breeding (CDCB) – a revision to the lifetime merit indices and a genetic base change. The CDCB Board of Directors approved these revisions at their December 18, 2024 meeting.
On April 1, 2025, dairy producers will receive genetic evaluations for Lifetime Net Merit $ (NM$), Lifetime Cheese Merit $ (CM$), Lifetime Fluid Merit $ (FM$), and Lifetime Grazing Merit $ (GM$) built on new economic weights and an updated genetic base. The lifetime merit indices promote a balance of traits to maximize dairy cow profitability. These CDCB indices – produced in partnership with USDA-ARS Animal Genomics and Improvement Laboratory – estimate the difference in lifetime profit that each animal is expected to transmit to its progeny, expressed in U.S. dollars.
As the primary genetic selection index in the U.S., Net Merit $ ranks dairy animals on their combined genetic merit for nearly 40 economically important traits. All animals who receive a genetic evaluation from CDCB, the national genetic evaluation center in the U.S., receive merit index values alongside genetic evaluations for 49 individual selection traits and composites based on tens of millions of records stored in the National Cooperator Database.
The lifetime merit indices are updated periodically to reflect new traits, new research and current dairy market data. The April 2025 revision includes adjustments to the weights placed on individual traits and composite indices due to changes in the economic values of traits. Most notable is the enhanced commitment to dairy cattle genetic improvement and profitability through feed efficiency, component-based milk pricing, and fertility. The following table shows the expected relative value of economically rooted weights of traits in the revised April 2025 Net Merit $ formula, compared to weights in the current formula. Calculations show a 0.992 correlation, indicating little reranking expected of most animals.
Trait Name
Current(August 2021)
April 2025
Change
Milk
0.3
3.2
2.9
Fat
28.6
31.8
3.2
Protein
19.6
13
¯ 6.6
Somatic Cell Score
-2.8
-2.6
¯ 0.2
Productive Life
15.9
13
¯ 2.9
Livability
4.4
5.9
1.5
Heifer Livability
0.5
0.8
0.3
Health $
1.4
1.5
0.1
Udder Composite $
3.4
1.3
¯ 2.1
Body Weight Composite $
-9.4
-11
1.6
Foot and Leg Composite $
0.4
0.4
¾
Calving Ability $
2.9
3.3
1.4
Daughter Pregnancy Rate
4.1
2.1
¯ 2.0
Cow Conception Rate
1.0
1.8
0.8
Heifer Conception Rate
0.4
0.5
0.1
Early First Calving
1.2
1
¯ 0.2
Residual Feed Intake
-4.8
-6.8
2.0
Additional information on the lifetime merit indices update will be shared with industry organizations and dairy producers in early 2025 at uscdcb.com and through the CDCB Connection e-newsletter. A technical document from USDA-AGIL will be available in early January.
Genetic Base Change in April
These merit index values, along with the 49 individual selection traits and composites produced by CDCB, will be expressed on an updated genetic base relative to dairy cows born in 2020. In the U.S., this update occurs every five years to best align selection tools with the current dairy herd. Final base change values will be shared with the April 2025 evaluation release. As producers define breeding strategies for 2025, they can expect changes in predicted transmitting ability (PTA) values similar to these preliminary estimations.
Trait Name
Units
Brown Swiss
Holstein
Jersey
Milk
Pounds
350
750
400
Fat
Pounds
10
45
20
Protein
Pounds
15
30
15
Somatic Cell Score
Log base 2 units
0
-0.1
0
Productive Life
Months
1
2.5
1.5
Livability
%
0.5
0.5
0.5
Mastitis
%
-0.2
0.75
-1
Daughter Pregnancy Rate
%
-0.6
-0.2
-0.4
Cow Conception Rate
%
-0.5
0.5
0
Heifer Conception Rate
%
0.1
1
1.5
Early First Calving
Days
0.5
2
2
Residual Feed Intake
Pounds
–
-40
–
Final Score
0.2
0.6*
0.6
*Holstein type traits are calculated by Holstein Association USA. This estimation was provided by HAUSA. Holstein Final Score was updated in this table on 1/3/2024, as the number in the original post was inverted.
Since 2013, the Council on Dairy Cattle Breeding has been responsible for publishing genetic evaluations, stewarding the National Cooperator Database, and providing national dairy performance benchmarks. CDCB works in conjunction with the USDA-ARS Animal Genomics and Improvement Laboratory to research new genetic methodologies, selection traits, and tools for reporting genetic conditions.
Bullvine Daily is your essential e-zine for staying ahead in the dairy industry. With over 30,000 subscribers, we bring you the week’s top news, helping you manage tasks efficiently. Stay informed about milk production, tech adoption, and more, so you can concentrate on your dairy operations.
Investigate leukosis in Canadian Holsteins. Can genetics boost resistance and herd health? Find insights and solutions now.
Summary:
Enzootic bovine leukosis, caused by the bovine leukemia virus, is a significant issue for Canadian dairy farmers, with 77% of herds affected. Traditional management and culling strategies have been insufficient, making genetic selection a promising solution. By analyzing milk ELISA test records, researchers found genetic markers linked to leukosis resistance, paving the way for breeding programs that enhance herd resilience. This genetic approach aligns with essential traits and provides a sustainable method to boost herd health and productivity. Farmers could reduce the hidden costs of leukosis by focusing on genetic resistance, leading to healthier herds and better milk production. Identifying 28 significant SNPs on chromosome 23, the study suggests including leukosis resistance in national genetic evaluations, marking a crucial step toward addressing health challenges in dairy farming.
Key Takeaways:
Leukosis is prevalent in approximately 77% of Canadian dairy herds, with 39% of cows testing positive.
Leukosis negatively impacts milk production and overall herd health, leading to significant economic losses for dairy farmers.
Genetic selection shows promise as a viable strategy to enhance resistance to leukosis, with moderate heritability estimates.
Incorporating genomic information increases the reliability of breeding values for leukosis resistance, aiding in more effective selection processes.
Several genetic markers on chromosome 23 have been identified, potentially linking to leukosis resistance in Holstein cattle.
Selection for leukosis resistance may positively influence other economically important traits, enhancing overall dairy herd performance.
Implementing genetic insights alongside management practices can provide a comprehensive approach to controlling leukosis in dairy herds.
It may come as a surprise that 77% of Canadian Holstein herds have enzootic bovine leukosis. Cows with leukosis make less milk, have weaker immune systems, and have lower birth rates, which hurt farm profits. However, this ongoing disease does not have to stop dairy farms from doing well and staying in business. This article talks about a study of leukosis in Canada. (Estimation of genetic parameters and genome-wide association study for enzootic bovine leukosis resistance in Canadian Holstein cattle) This shows how learning more about cattle genetics, like finding genetic markers for leukosis resistance, can directly help direct breeding strategies to make cows more resistant to the disease. Implementing breeding solutions for leukosis resistance could lead to substantial and successful Canadian dairy farms, which would be a welcome sign of hope in the face of this disease’s challenges. We’ll discuss the study of common leukosis, how it affects farm income, and how making cattle stronger might work.
Leukosis in Canadian Dairy Farming: The Urgent Need for Effective Management and Control
The Silent Threat: Enzootic Bovine Leukosis in Canadian Holstein HerdsThe bovine leukemia virus (BLV) causes enzootic bovine leukosis, also called leukosis, a long-term disease in cattle. It gets into already infected blood cells and stays there for life. Symptoms include making less milk, having a weaker immune system, and sometimes getting lymphoma tumors.
In the 1980s, 40% of dairy herds in North America had leukosis. By 2015, that number had risen to 90%. Cattle can’t stay healthy without treatment or a vaccine, which can lower their productivity and make it harder for them to have babies—farms with cows that have BLV make 2.5% to 3.0% less milk, which costs money.
The Financial Toll of Leukosis: A Call for Genetic Strategies in Canadian Dairy Farming
Leukosis: The Invisible Yet Costly Threat to Dairy Herds
Leukosis has a significant effect on milk production, fertility, and the health of the dairy herd. When cows test positive, they make 18.3 kg less milk and 1.23 kg less fat each lactation. A rise in somatic cells by 17,000 cells/mL is another sign that the udder might be sick. As infected cows have more days off and need to breed more often, their fertility goes down. This makes managing the herd more difficult. Leukosis-positive cows are killed early because they are less productive and have health problems, which is bad for the herd’s health. Bartlett et al. (2013) state that these cows are 23% more likely to be killed. Leukosis costs herds between 12 and 19 thousand Canadian dollars annually because it lowers milk production and makes management more expensive. This research shows how vital genetic selection is for reducing the financial effects of leukosis, making herds more resilient, and ensuring that dairy farms will be around for a long time.
Genetic Selection: A Promising Future for Combatting Leukosis in Dairy HerdsA study looking into ways to make Canadian Holstein cattle more resistant to leukosis shows that genetics could help control this disease. The study used a simple model to find that resistance to leukosis has a heritability score of 0.10. This means that we can improve genetic factors by selective breeding.
If you leave out the somatic cell score (SCS), there are strong links between leukosis resistance and other essential traits. This makes genetic selection a promising option. Adding resistance to leukosis to national genetic tests would be possible, improving her health and productivity. Using these genetic markers in breeding is like building a resistance shield that protects the whole herd. Over time, this will slowly lower the number of animals that get leukosis.
Genomics and family history together have made it easier to choose cattle. Newer methods, genomic-enhanced breeding values (GEBVs), are more accurate than old ones. Because of this higher level of accuracy, it is wise to include leukosis resistance in national selection indices. This method gives the dairy industry the power to lower the number of cases of leukosis and the money it loses.
Unlocking Leukosis Resistance: Genetic Markers in Canadian Holstein Cattle
The genome-wide association study (GWAS) on Canadian Holstein cows sought to identify genetic markers linked to leukosis resistance. It discovered 28 significant SNPs on chromosome 23. It drew attention to the DDR1 gene, which may impact cell growth and the progression of leukosis.
The study also found that the TUBB gene is close to essential SNPs that may affect how easily the bovine leukemia virus (BLV) can infect animals, as it does with retroviruses.
These findings allow us to make breeding programs more resistant to leukosis. Through brilliant selection, this will improve herd health and productivity.
Harnessing Genetic Insights: Bridging Leukosis Resistance and Economic Traits in Dairy Farming
The study found strong connections between resistance to leukosis and important traits dairy farmers should have. Between 0.40 and 0.46, there was a moderately positive link between milk production traits and leukosis resistance. Breeding cows to be resistant to leukosis helps them fight the disease and produces more milk, which is good for dairy farmers.
On the other hand, a 0.26 correlation between somatic cell score (SCS) and cow health was not positive. This means it is essential to carefully breed to improve cow health while lowering the number of leukosis cases.
A 0.33 correlation with herd longevity shows that cows resistant to leukosis tend to live longer and keep giving birth. If you work on resistance, you can keep cows longer and make your herds more sustainable.
This positive relationship also suggests that prioritizing leukosis resistance in breeding practices can improve breeding success and help keep herds healthy and productive over time. This could mean your dairy farm doesn’t have to cull as many cows. The link to Canada’s national indexes, such as LPI and Pro$, suggests that breeding for resistance to leukosis may already be a part of some breeding methods.
These genetic links show that leukosis resistance should be added to national genetic tests. This change could make herds healthier, more productive, and more profitable. It could also make cows less likely to contract the virus and strengthen dairy cattle over time.
Embracing Genetics: A Strategic Approach to Combat Leukosis in Dairy Herds
Farmers can tackle leukosis in dairy herds using genetics effectively. Here’s an easier way to bring genetic approaches into your daily practices:
Regular testing, such as ELISA tests, is crucial to understanding the prevalence of leukosis in your cows, enabling informed decision-making.
Using genomic tests can identify cows with strong resistance to leukosis, which is crucial for minimizing the disease’s impact.
Combine Genetics and Management: Use genetic selection and actions like keeping new animals separate and cleaning equipment.
Think Ahead for Breeding: Pick bulls resistant to leukosis and work with breeding services for the best results.
Use Up-to-Date Tools: Keep up with the latest genetic tools and indices for informed breeding decisions.
Monitor Continuously: Keep track of leukosis rates and cow health, adjusting your strategies as needed.
Increase Profits: Investing in genetic resistance can reduce culling and boost milk production, leading to better profits.
Now’s your chance to lead the way in leukosis resistance, building a sustainable future for dairy farming, where you can improve your herd’s health and output.
The Bottom Line
The results of this study show that 77% of Canadian Holstein herds have leukosis. This can harm the herd’s health and milk production, harming the economy. That being said, there is some good news: breeding for genetic resistance could help. To help in the future, genetic resistance to leukosis could be based on traits passed down and linked to good economic benefits.
It might be a good idea for dairy farmers to add genetic resistance to their herds’ management plans. By making this change, dairy farmers can effectively control leukosis, increase production, and make more money. We want your thoughts, actions, and questions about genetic ways to treat leukosis. Talk to others about these ideas and figure out how they can help your farm.
Bullvine Daily is your essential e-zine for staying ahead in the dairy industry. With over 30,000 subscribers, we bring you the week’s top news, helping you manage tasks efficiently. Stay informed about milk production, tech adoption, and more, so you can concentrate on your dairy operations.
See how Lactanet’s LPI changes will transform dairy breeding in 2025. Is your farm ready?
Summary:
Lactanet Canada is poised to launch its modernized Lifetime Performance Index (LPI) formula in April 2025, bringing a significant shift to genetic evaluation for dairy breeds. This overhaul follows comprehensive industry consultations to help producers, breeders, and A.I. companies meet their breeding objectives. Notably, the updated LPI introduces groundbreaking features such as up to six breed-specific subindexes and the Milkability Index (MI) to enhance milking efficiency. For Holsteins, the newly added Environmental Impact Index (EI) emphasizes sustainability, marking a commitment to environmentally conscious practices. With a striking 98.5% correlation to the current LPI for Holsteins, these changes are poised to advance genetic selection while potentially reranking top-performing cattle. According to Brian Van Doormaal, Lactanet’s Chief Services Officer, expanding new trait evaluations in Canada necessitates this modernization of the respected LPI, steering the dairy industry toward enhanced genetic selection strategies and a profitable, sustainable future.
Key Takeaways:
The LPI formula, used since 1991, has been modernized to include up to six subindexes for more precise genetic assessment.
The Milkability Index is a new addition focusing on milking efficiency across all breeds.
The Holstein breed introduces the Environmental Impact Index, emphasizing environmental sustainability traits.
Breed-specific consultations determined the relative weightings of subindexes to cater to distinct genetic goals.
Bulls, cows, and heifers may experience reranking despite a 98.5% correlation with the current LPI in Holsteins.
Implementing the new formula aims to support breeders, producers, and A.I. companies in meeting their genetic objectives.
With the updated LPI, Canada aims to remain a leader in genetic evaluation and dairy breeding.
The world of dairy farming is about to see a significant change with the upcoming LPI formula from Lactanet, launching in April 2025. This update could create a new norm in genetic selection by introducing up to six subindexes that change how we evaluate animal genetics in dairy. Imagine it like a powerful engine—this new LPI formula is set to have a significant impact, with special subindexes for each breed’s traits, such as the Milkability and Environmental Impact Indexes. This change aims to guide the industry toward a future where milking efficiency and sustainability are key to helping dairy farming progress.
The Evolution of a Genetic Benchmark: LPI Through the Ages
Since its inception in 1991, the Lifetime Performance Index (LPI) has been a pivotal tool for dairy farmers, breeders, and geneticists in Canada. Initially focusing on genetic traits like milk production, butterfat, and protein, the LPI has evolved to incorporate new traits that align with modern dairy performance and sustainability concepts. This evolution, which now focuses on animal health, fertility, and lifespan, underscores the LPI’s role in advancing productivity and sustainability in the industry.
The 2025 LPI update addresses specific needs and advances in genetic research, noting that the old framework had limits when facing today’s challenges. Issues like climate change, the push for sustainable practices, and innovations in genetic assessment needed a big update. The industry’s ability to adapt and evolve in these challenges is a testament to its resilience and forward-thinking approach. The main goal was to widen the evaluation of traits to include things like milking efficiency and environmental impact, giving a complete picture of an animal’s genetic abilities. Adding subindexes, the updated LPI offers detailed insights into specific areas like Milkability and Environmental Sustainability, promoting targeted breeding and selection strategies.
Another aim of the updated LPI is to make genetic evaluations easier for dairy farmers and breeders to understand. With up to six subindexes, the formula simplifies assessing an animal’s strengths. It helps breeders make decisions that align with business and environmental goals. This action shows Lactanet’s dedication to helping dairy farmers make wise, informed choices that meet economic and ecological objectives.
A New Era of Genetic Evaluation: The Precision Revolution with Lactanet’s LPI
The new LPI formula dramatically changes how we evaluate dairy breeds, setting a new level of accuracy in breeding choices. This update introduces six new subindexes, each aiming for a detailed approach to judging the genetic value of dairy cattle. Each subindex has been fine-tuned to show specific traits and goals, giving breeders clear and helpful information. This precision in the new LPI formula instills confidence in breeders, knowing that their breeding decisions are based on accurate and detailed information.
These new subindexes are essential because they allow producers to focus on specific traits, targeting different parts of dairy production. This detailed information helps producers design their breeding plans more effectively, aiming for outcomes that match the industry’s current needs. Lactanet makes it easier to understand each index by providing a standard scale, which helps breeders see where an animal is strong and where it can improve.
The Milkability Index (MI) and the Environmental Impact Index (EI) are significant parts of the LPI update. The MI, which applies to all breeds, focuses on traits that improve milking efficiency. This can lower labor costs and make operations more efficient, giving breeders an edge by allowing them to focus on cattle that do well in this area.
For Holsteins, the Environmental Impact Index highlights the increasing focus on sustainability in the dairy industry. With traits that support environmental care, this index helps breeders choose cattle that reduce their herd’s impact on the planet. It supports the industry’s move toward environmental friendliness and allows breeders to meet consumer demands for sustainable dairy products.
These indices offer a smart way to address economic and environmental issues through precise genetic selection. The modernized LPI formula isn’t just an upgrade; it’s a sharp tool that fits today’s breeding methods, continuing LPI’s legacy of supporting a strong and sustainable dairy industry.
Crafting Custom Genetic Pathways: A Breed-Specific Approach to Modern LPI
The updated LPI formula is not a one-size-fits-all solution. It is meticulously customized to suit each dairy breed’s unique traits and needs. This customization is achieved through in-depth discussions with breed associations, ensuring the new formula aligns with each breed’s specific breeding goals and industry needs. This approach acknowledges that certain traits, such as higher milk production for one breed, may be less significant for another, which might prioritize traits like longevity or environmental adaptability.
Setting the subindexes involves teams from Lactanet and breed associations across the country. These discussions help us understand each breed’s essential traits and genetic goals. For example, all agreed that the Milkability Index (MI) is vital. Still, its influence varies with different breeds based on milking practices and herd management goals. Also, the Environmental Impact Index (EI), added to Holsteins, shows a commitment to sustainability in line with the breed’s global breeding directions.
The LPI subindexes for each breed needed to be carefully balanced. This balance required examining past data, industry trends, and each breed’s genetic profile. Intense discussions with breed representatives helped us balance traditional values and new ideas in genetic evaluation.
Shifting Paradigms: Embracing Sustainability with the Environmental Impact Index
The new Environmental Impact Index (EI) marks an essential change in Holstein breeding by focusing on sustainability traits. This new subindex shows a growing awareness of how farming affects the environment, aiming to lower the industry’s carbon footprint through careful breeding choices. For breeders, this means reconsidering what traits to focus on in their breeding plans. The EI will change the rankings of top bulls, cows, and heifers by highlighting their genetic ability to have a positive environmental impact.
With the EI now part of the updated LPI formula, breeders should balance traditional traits with those that support sustainable farming. Traits that improve environmental efficiency, like better feed conversion and lower methane emissions, will influence an animal’s genetic value more strongly. As a result, breeders might notice a shift in rankings, with animals previously top-ranked for traits like milk yield and fat content moving down. Animals with strong environmental traits could increase their ranks, showing their broader value to breeders.
This change in rankings is not just for show; it leads to fundamental shifts in breeding strategies. Breeders must adjust their practices to meet consumers’ and regulators’ growing expectations for environmentally friendly farming. Breeders can stay competitive and relevant in a rapidly changing market by prioritizing animals that score well on the EI.
The EI guides those planning their herds’ futures, encouraging long-term sustainability. It encourages genetic progress in productivity and environmental care, pushing breeders to rethink what makes an ‘elite’ herd. This shift points to a more comprehensive approach to genetic evaluation, recognizing the key role of sustainable practices in the future of dairy farming.
Resonating Ripples: The Industry Reacts to Modernized LPI Formula
The news about the updated LPI formula has created a buzz in the dairy industry among breeders, producers, and AI companies. Brian Van Doormaal, Lactanet’s Chief Services Officer, is hopeful about what’s coming: “Adding new traits to the LPI matches the industry’s move towards being more efficient and sustainable. We aim to improve genetic selection tools for better profits and sustainability in dairy farming.”
The new subindexes in the LPI allow breeders to tailor breeding programs more accurately. Breeders can zero in on the traits that best match their goals by breaking down the LPI into specific subindexes. This allows for more detailed genetic progress, helping them achieve the desired traits in their herds.
Producers can expect improved herd performance and efficiency. The Milkability Index is fascinating. It promises to boost milking efficiency, which is crucial for making more money in dairy farming. This aligns with the industry’s push to improve production and lower costs.
AI companies are likely to see significant advantages. They can improve their site selection and marketing plans with more detailed data from the updated LPI. This allows them to offer better genetic solutions to their clients, leading to more substantial farm outcomes. The hope is that these changes will result in smarter decisions and better genetic gains throughout the industry.
Unlocking Potential: Navigating the Waters of Lactanet’s Modernized LPI Formula
Introducing Lactanet’s new LPI formula for dairy farmers is more than just a shuffle of numbers—it’s a chance to change breeding strategies and farm management. Adapting to this new formula means planning and changing operations for better profitability and sustainability.
Get to Know the New Subindexes: Learn about the six new subindexes, especially the Milkability Index (MI) and the Environmental Impact Index (EI). Each subindex details traits that can help your farm become more efficient and sustainable. Focus on indexes that align with your farm’s goals, like improving milking efficiency and reducing environmental impact.
Customize Your Breeding Programs: Adding new subindexes to your breeding programs means rethinking your current goals. Check how your current herd performs against these indexes. Find traits that need improvement and choose strong sires and dams in those areas. Use data to make genetic choices that improve herd performance with the new LPI.
Plan for the Future: With sustainability in mind, the new LPI formula encourages setting long-term genetic goals. Create breeding strategies that help your farm become more environmentally sustainable. Choosing for the EI can create offspring with a smaller environmental footprint, matching regulations and consumer expectations for sustainable dairy production.
Measure and Update Your Strategies: Track the results of these genetic choices on farm performance, such as milk yield and feed efficiency. Use what you learn to update and improve your breeding strategy over time. The goal is to keep improving genetics to increase productivity without sacrificing sustainability.
In conclusion, while getting used to the new LPI formula takes effort, the benefits of efficiency and sustainability can be significant. By smartly using these tools, farmers can strengthen their competitive edge and contribute positively to the broader agricultural landscape.
Navigating the Uncharted: Embracing Change with Lactanet’s LPI Overhaul
The introduction of Lactanet’s updated LPI formula marks a new phase for choosing dairy genetics. However, getting used to these changes may be challenging. Understanding the new subindexes might be challenging initially, causing some confusion for producers and breeders. Are you ready to face this and take advantage of the new possibilities?
The focus on the Environmental Impact Index for Holsteins raises questions about balancing productivity and eco-friendliness. While this is a positive move toward greener practices, how will it affect your breeding goals? It would be best to assess how these changes fit your current plans and what adjustments you need to make to stay on top.
Another point to consider is how different weightings for breeds might cause issues. Some breeds might benefit more, which could lead to disagreements among breeders. As part of this community, it’s essential to keep rethinking your plans with these changes in mind. Will these benefits be worth any initial challenges to your breeding program?
The launch of the updated LPI formula in April 2025 will get a range of responses, from excitement to doubt. It’s key for people in the industry to be active during this time. How will you ensure you and your team have the knowledge and tools to use this new way of genetic evaluation? Consider these points carefully to get the best impact on your business and keep your firm position in the market.
The Bottom Line
Launching Lactanet’s modernized LPI formula in April 2025 marks an essential milestone in dairy genetic evaluation. Focusing on key subindexes like the Milkability Index and the Environmental Impact Index, this formula provides a more straightforward way to choose genetics suited to the unique needs of different breeds. The teamwork shown in the breed-specific discussions makes sure the new LPI aligns with the practical goals of dairy producers and stakeholders. The strong industry support highlights that such innovation is essential, promising stability and progress. As we look ahead, we must ask ourselves: Are we ready to use these new tools to change the future of dairy breeding, boosting sustainability and productivity? Updating the LPI is not just about selection—it’s about creating new possibilities and advancements in the dairy industry.
Bullvine Daily is your essential e-zine for staying ahead in the dairy industry. With over 30,000 subscribers, we bring you the week’s top news, helping you manage tasks efficiently. Stay informed about milk production, tech adoption, and more, so you can concentrate on your dairy operations.
Unlock the U.S. genetic system. Make smarter breeding choices and improve your herd’s productivity. Ready?
Understanding the U.S. genetic system empowers you to make better breeding decisions. This knowledge can boost your herd’s production and profitability. Learning to read sire summaries helps you choose the best breeding options, leading to better efficiency and profits. Tools like Breeding Value and Predicted Transmitting Ability predict how well an animal will perform. Having reliable data makes breeding decisions easier. Essential organizations like CDCB and Holstein USA play a significant role in genetic testing. Knowing what they do can help you make smart choices with confidence.
Deciphering Genetics: Breeding Value vs. Predicted Transmitting Ability (PTA)
Understanding the Basics: First, let’s break down the difference between Breeding Value and Predicted Transmitting Ability (PTA). Breeding Value is about an animal’s potential in a breeding plan for traits like milk or protein. Conversely, PTA is about what that animal will likely pass on to its offspring.
The Power of Data: Fueling Genetic Advancement in Dairy Farming
Data is the key to growth in dairy farming. The U.S. uses data from different farms and regions to support its genetic assessment system. Your help in collecting this data is vital for building reliable Predicted Transmitting Abilities (PTAs). These PTAs guide breeding decisions and can significantly boost your herd’s performance. Be proud of your essential role in this progress.
The accuracy of these genetic predictions depends on the amount and variety of data we gather. More data means more precise and helpful genetic insights, which allows farmers to make wise choices, leading to healthier, more productive animals and a more successful dairy business.
This approach is led by organizations like the Council on Dairy Cattle Breeding (CDCB) and Holstein USA. They work hard behind the scenes to collect and study vast amounts of genetic data. Their work ensures that genetic studies are detailed and reflect the conditions faced by dairy herds across the country.
Strong data systems in these organizations form the foundation of the U.S. dairy genetic framework. This team effort demonstrates how data is essential for genetic progress and keeps U.S. dairy competitive worldwide.
The Dynamic Duo: How CDCB and Holstein USA Lead Dairy Genetics
When studying dairy genetics, it is essential to know the roles of the Council on Dairy Cattle Breeding. CDCB gathers and reviews data about milk production and health traits, which form the basis of its genetic evaluations and indexes.
On the other hand, the Holstein Association USA concentrates on type and conformation traits. It handles classification evaluations that help breeders understand their herds’ physical traits, such as udder shape, leg formation, body size, and other key type characteristics.
Together, CDCB and Holstein USA work to create comprehensive indexes like the Total Performance Index (TPI) and Net Merit (NM$). The TPI combines productivity, health, and type traits into one measure, helping farmers track genetic improvements and make informed breeding decisions. The NM$ assesses a bull’s worth based on lifetime earnings, considering production, lifespan, and health traits. These tools help farmers choose sires to boost their herd’s productivity and lifespan.
Unlocking Genetic Potential: The Role of PTAs and STAs in Herd Optimization
Understanding traits and their effects is key for dairy farmers who aim to boost their herd’s genetic potential. PTAs are listed as STAs, which makes it easier to compare traits. Traits like milk yield, fat, and protein significantly affect profit. On the other hand, traits like Udder Composite and Feet & Legs Composite are crucial for a cow’s longevity and functionality. Farmers can use this information to make smarter breeding choices.
Proven Versus Genomic Young Bulls: Crafting a Balanced Genetic Strategy
When selecting genetics for your herd, it’s essential to understand the difference between proven bulls and young genomic bulls. Proven bulls have daughter data, which makes their ratings more reliable. This data helps us make better breeding choices.
Conversely, young genomic bulls offer a glimpse into future potential. Although they have less reliability due to a lack of daughter performance data, they can speed up genetic gains. We evaluate these bulls based on genetic predictions, suggesting how they might perform over time.
By mixing the two, dairy farmers can have the reliability of experienced bulls and the fresh potential of young genomic bulls. This approach enables a flexible breeding strategy, ensuring steady production and continuous genetic improvement.
Genetic Innovations: Charting a Sustainable Future for Dairy Farming
The future of genetic selection is exciting. Genetic assessments now include new traits like feed efficiency and methane reduction. These traits can make your dairy business more profitable and eco-friendly. They hold great potential for the future of dairy farming and offer new opportunities.
Your Guide to Identifying the Ideal Sire for Your Herd
Identify the Sire: Take note of the bull’s registration name, number, and percent registered Holstein ancestry (%RHA). This information is generally included at the beginning of the report and is used to identify the bull accurately.
Check Genetic Status and Codes: Examine the genetic codes for specified conditions, such as BLAD, CVM, or Brachyspina. Note whether the bull is free of these or any other problems. This will allow you to prevent possible health concerns in your herd.
Review Parentage Details: Examine the pedigrees, including TPI values, categorization scores, and genetic codes for the father and mother. This will provide a more complete picture of the genetic pool from which the Sire originated.
Evaluate Production Traits: Inspect the PTAs for Milk, Fat, and Protein. These values reflect what the father will likely pass on regarding milk output and components to his progeny. Compare his statistics to his parents’ and the herd’s averages.
Analyze Reliability Scores: Note each attribute’s percentage R (reliability). A higher dependability percentage indicates that the genetic assessment is more trustworthy and based on more evidence.
Understand Health Traits: Examine the health attribute PTAs, including Productive Life (P.L.), Somatic Cell Score (SCS), Sire Calving Ease (SCE), and Daughter Calving Ease (DCE). These characteristics are critical for lifespan, mastitis resistance, and calving ease.
Explore Fertility Indexes: Consider composite measures such as Net Merit (NM$), Cheese Merit (CM$), and Fertility Index. These scores integrate many attributes to estimate the bull’s potential influence on profitability and fecundity.
Review Type and Conformation Traits: Attention the PTA Type (PTAT) and linear trait STAs. These scores indicate the type and conformation qualities, such as udder conformation, feet, and leg quality, which are critical for functioning and lifespan.
Check Distribution of Daughters: Consider the amount and distribution of daughters utilized in the bull’s appraisal. A diversified and large sample size makes assessments more trustworthy across various environmental situations.
Cross-Check Ownership Information: Finally, validate the controller, breeder, and owner information. This information aids in determining the source and availability of the Sire’s genetics for purchase or consultation.
Glossary of Key Terms in Dairy Genetics
Allele: One of two or more gene variants found at a specific chromosomal location.
Chromosome: Chromosomes are structures inside cells that carry DNA and numerous genes; calves have 30 pairs.
Genotype: A single organism’s genetic makeup often refers to particular genes or alleles.
Phenotype: Observable physical qualities of an organism that are influenced by genetics and the environment.
Homozygous: Having two identical alleles for a particular gene or genes.
Heterozygous: Having two distinct alleles for a specific gene or genes.
Predicted Transmitting Ability (PTA): An estimate of a characteristic that a parent will pass on to children.
Sire: A male father of an animal.
Dam: The female parent of an animal.
Linear Composite Indexes: A single numerical value is obtained by combining measurements of numerous related qualities.
Somatic Cell Score (SCS): A mastitis indicator; lower scores are preferred as they imply reduced somatic cell count.
Productive Life (P.L.): The number of months a cow is estimated to be fruitful in a herd.
Net Merit (NM$): A selection index that measures the projected lifetime earnings of an animal.
Genomics is the comprehensive study of an organism’s genes (genome), providing extensive genetic information.
Standard Transmitting Ability (STA): Genetic assessments for characteristics are stated on a standardized scale to allow for comparison.
Inbreeding: Mating between people who are genetically closely related.
Outcrossing: Mating unrelated individuals within the same breed increases genetic diversity.
Haplotypes: Allele combinations at several chromosomal locations that are inherited together.
Embryo Transfer (E.T.): This reproductive technique allows breeders to have several children from a superior mother.
In Vitro Fertilization (IVF): A method in which egg cells are fertilized by sperm outside of the animal’s body, often employed in combination with E.T.
Dairy Herd Information Association (DHIA): Organizations that use standardized testing protocols to give genetic and managerial information.
Council on Dairy Cattle Breeding (CDCB): A company that gathers and analyzes data to provide genetic assessments for dairy cattle.
Holstein Association USA: This is the largest dairy cow breed association in the United States, renowned for its comprehensive genetic examinations and services.
Sire Summary, A publication including genetic assessments of numerous bulls available for breeding.
Proven Sire: a bull that has recorded genetic assessments derived from data and the performance of its daughters.
Genomic Young Bull: a young bull with genetic assessments primarily based on genomic data instead of progeny performance.
Frequently Asked Questions About the U.S. Genetic System
What is the primary difference between Breeding Value and Predicted Transmitting Ability (PTA)?
Breeding value is the overall genetic potential of an animal for a specific trait. Predicted Transmitting Ability (PTA), however, indicates the genetic traits an animal will pass on to its offspring. PTA is half the breeding value because offspring inherit only half of their parent’s genes.
How reliable are the PTAs in predicting an animal’s future performance?
PTAs can be reliable, especially when a lot of data, including genetic details and offspring performance, is used. The reliability ranges from 68% to 99%, and a higher percentage means greater confidence in the prediction.
How do CDCB and Holstein USA data contribute to the TPI and Net Merit indexes?
Holstein USA provides type and conformation stats, while the Council on Dairy Cattle Breeding (CDCB) provides productivity and health data. Both are key for creating indices like TPI and Net Merit, which are crucial for assessing genetic progress and making smart breeding decisions.
Why is the reliability of genomic young bulls generally lower than that of proven bulls?
Genomic young bulls have a 68-73% reliability rate. This is because their evaluations rely mostly on genetic testing and parental averages. Proven bulls, however, are over 90% reliable. Their scores include real-world data from the actual performance of their daughters.
What factors influence the development of genetic formulas and indexes?
Changes in breeding goals, market demands, and economic values impact genetic formulas and indexes. These formulas are updated regularly to reflect industry trends, such as the value of milk components or new health traits like feed efficiency and methane reduction, ensuring they stay relevant to the industry.
Why is collecting phenotypic data still crucial in the genomics era?
Phenotypic data, like production records and categorization scores, are vital because they verify and enhance genetic predictions. More solid data sets boost the accuracy and reliability of genetic assessments, aiding better selection decisions.
Can use a proven bulls guarantee superior genetic outcomes?
Selecting a proven bull with high reliability increases the chances of obtaining the desired genes. However, the overall breeding plan, including the matching traits of the dam, must also be considered. Successful genetic improvement requires both careful selection and variety in breeding decisions.
How does the U.S. Genetic System ensure the accuracy of genetic evaluations?
The U.S. Genetic System ensures precise and reliable genetic evaluations using data from millions of cows. It employs advanced statistical models and receives continuous updates from organizations like CDCB and Holstein USA.
What is the significance of Somatic Cell Score (SCS) in genetic evaluations?
The Somatic Cell Score (SCS) helps show how well a cow can resist mastitis. A lower SCS means less mastitis, lower treatment costs, better udder health, and higher milk quality.
The Bottom Line
Discovering the secrets of the U.S. genetic system will allow you to make wise, statistically-based choices for your dairy herd. Understanding the functions of CDCB and Holstein USA, the need for PTAs and STAs, and the advantages of both proven and genomic young bulls will help you maximize your breeding program for sustainability and output. Are you thus ready to raise the caliber of your dairy operation?
Key Takeaways:
Understanding the difference between breeding value and predicted transmitting ability (PTA) is crucial for informed breeding decisions.
The U.S. Genetic System relies on comprehensive data collection from CDCB and Holstein USA to create reliable genetic evaluations.
PTAs provide a robust estimate of an animal’s potential to transmit specific traits to offspring, aiding in herd optimization.
Reliability in genetic evaluations increases with the volume of data collected from daughters, making proven bulls generally more reliable than genomic young bulls.
Genetic advancements and innovations, such as genomics and ecofeed indexes, are shaping the future sustainability and efficiency of dairy farming.
Phenotypic data remains essential to validate genetic predictions and ensure accuracy in the genomics era.
Dairy farmers should leverage high-reliability PTAs, data analytics, and diverse genetic strategies to achieve optimal herd performance and profitability.
Regular review of genetic evaluations and the use of top-ranking sires can help make significant genetic advancements in dairy herds.
Summary:
As the cornerstone of dairy farming, genetic selection can significantly influence herd performance and profitability. This article illuminates the intricacies of the U.S. Genetic System, offering insights into data-driven decisions to optimize breeding outcomes. We delve into Breeding Value vs. Predicted Transmitting Ability (PTA), examine the roles of the Council on Dairy Cattle Breeding (CDCB) and Holstein USA, and explore how technology and data collection shape future dairy genetics. Emphasizing the significance of TPI and Net Merit indices, this discussion underscores the balance of proven and genomic young bulls, the importance of phenotypic data collection, and the aim for sustainability and output in dairy herd management.
Bullvine Daily is your essential e-zine for staying ahead in the dairy industry. With over 30,000 subscribers, we bring you the week’s top news, helping you manage tasks efficiently. Stay informed about milk production, tech adoption, and more, so you can concentrate on your dairy operations.
Who gets to decide the future of dairy breeding? Understand the challenges and opportunities in shaping tomorrow’s selection programs.
Envision a future where dairy farming is revolutionized by precision and efficiency, with every cow’s genetic makeup optimized for maximum yield and health. This future, driven by the powerful genetic selection tool, has already begun to transform dairy breeding. It has doubled the rate of genetic improvements and refined valuable livestock traits. As we step into this scientific era, we must ponder: ‘What are we breeding for, and who truly makes these decisions?’ The answers to these questions hold the key to the future of dairy farming, influencing economic viability and ethical responsibility.
From Cows to Code: The Genetic Revolution in Dairy Breeding
Significant scientific breakthroughs and practical advancements have marked the evolution of dairy breeding programs, each contributing to the enhanced genetic potential of livestock populations. Initially, genetic selection laid the groundwork for these developments. Farmers and breeders relied heavily on observable traits such as milk production, fat content, and pedigree records to make informed breeding decisions. This form of traditional selective breeding focused on optimizing certain economic traits, primarily targeting yield improvements.
However, as scientific understanding evolved, so did the techniques used in breeding programs. The mid-to-late 20th century witnessed a pivotal shift with the introduction of computed selection indices. These indices allowed for a more refined approach by integrating multiple traits into a singular measure of breeding value. Yet, progress during this period was still relatively slow, constrained by the time-intensive nature of gathering and interpreting phenotypic data.
The transition to genomic selection marked a revolutionary phase in dairy breeding. By focusing on an animal’s DNA, breeders began to predict breeding values with greater precision and much faster. This leap was facilitated by advancements in genomic technologies, which allowed for the high-throughput sequencing of cattle genomes. Genomic selection bypassed many limitations of the traditional methods, significantly shortening the generation interval and doubling the rate of genetic gain in some livestock populations. As a result, dairy herds saw improvements not only in productivity but also in traits related to health, fertility, and longevity.
These advancements underscore the significant role that genetic and genomic selections have played in enhancing the quality and efficiency of dairy livestock. They have transformed breeding programs from artful practice to sophisticated science, propelling the industry forward and setting the stage for future innovations that promise even more significant gains.
The Power Players Behind Dairy Genetics: Steering the Future of American Dairy Farming
The intricate world of dairy farming in the United States is guided by several key participants who influence selection decisions and breeding objectives. At the forefront is the United States Department of Agriculture (USDA), with its Animal Genomics and Improvement Laboratory playing a pivotal role in crafting the indices that shape the future of dairy breeding. This laboratory collaborates with the Council on Dairy Cattle Breeding (CDCB), an essential body that operates the national genetic evaluation system and maintains a comprehensive cooperator database.
The CDCB’s board is a coalition of representatives from pivotal industry organizations, including the National Dairy Herd Information Association (NDHIA), Dairy Records Processing Centers, the National Association of Animal Breeders, and the Purebred Dairy Cattle Associations (PDCA). These institutions act as conduits for innovation and development in dairy cattle breeding through their valuable input in developing selection criteria and objectives.
Breeding companies, notably ST, GENEX, and Zoetis, bring a competitive spirit. They publish their indices incorporating standard CDCB evaluations and proprietary traits. Their role extends beyond mere evaluation to actively shaping market demand with innovative selection tools that sometimes lack transparent review, raising questions about their added value or potential marketing motives.
Dairy farmers, the end-users of these breeding advancements, wield significant influence over these indices through their adoption—or rejection—of the tools. Their perception of the indices’ value, informed by their unique economic and operational environments, can drive the evolution of these tools. While some may adhere to national indices like the net merit dollars (NM$), others might opt for customized solutions that align with their specific production goals, reflecting the diversity within the dairy farming community and their crucial role in shaping the future of dairy breeding.
Together, these stakeholders form a dynamic network that drives the continual advancement of breeding programs, adapting them to meet modern demands and improving the genetic quality of dairy herds nationwide. Their collaboration ensures that long-standing traditions and innovative advancements shape the future of dairy genetics, making each stakeholder an integral part of this dynamic process.
The Tug of War in Dairy Genetic Selection: Balancing Economics, Environment, and Innovation
Updating selection indices, like the Net Merit Dollars (NM$) index, involves complexities beyond simple calculations. Each trait within an index holds a specific weight, reflecting its importance based on economic returns and genetic potential. Deciding which traits to include or exclude is a hotbed of debate. Stakeholders ranging from geneticists to dairy farmers must reach a consensus, a task that is far from straightforward. This process involves diverse objectives and perspectives, leading to a challenging consensus-building exercise.
The economic environment, which can shift abruptly due to fluctuations in market demand or feed costs, directly influences these decisions. Such economic changes can alter the perceived value of traits overnight. For instance, a sudden rise in feed costs might elevate the importance of feed efficiency traits, prompting a reevaluation of their weights in the index. Similarly, environmental factors, including climate-related challenges, dictate the emergence of traits like heat stress tolerance, pressing stakeholders to reconsider their traditional standings in the selection hierarchy.
The dynamism of genetic advancement and external pressures necessitates frequent reevaluation of indices. Yet, every update involves complex predictions about future conditions and requires balancing between immediate industry needs and long-term genetic improvement goals. As these factors interplay, the task remains a deliberate dance of negotiation, scientific inquiry, and prediction that continuously tests the resilience and adaptability of dairy breeding programs.
Tech-Driven Transformation: From Traditional Farms to Smart Dairies
In the ever-evolving landscape of dairy farming, integrating new technologies holds immense potential to revolutionize data collection and utilization in selection decisions. Sensor-based systems and high-throughput phenotyping are two frontrunners in this technological race. They promise enhanced accuracy and real-time insights that could significantly improve breeding programs, sparking excitement about the future of dairy farming.
Sensor-based systems are beginning to permeate dairy operations, continuously monitoring farm environments and individual animal health metrics. These technologies enable farmers to gather rich datasets on parameters such as feed intake, movement patterns, and milk composition without constant human supervision. Such detailed information provides a clearer picture of each cow’s performance, which is invaluable for making informed selection and breeding decisions. Real-time data collection means potential issues can be identified and addressed swiftly, potentially reducing health costs and improving overall herd productivity.
High-throughput phenotyping, on the other hand, expands on traditional methods by allowing the measurement of multiple traits via automated systems. This technology can swiftly and efficiently capture phenotypic data, offering scientists and breeders a broader set of traits to evaluate genetic merit. The scale at which data can be collected through high-throughput phenotyping allows for a more comprehensive understanding of genetic influences on various performance traits, supporting the development of more robust selection indices.
However, these technologies’ promise comes with challenges. A significant hurdle is the need for more standardization. With numerous proprietary data systems, standardized protocols are urgently needed to ensure data consistency across different systems and farms. Without standardization, data reliability for genetic evaluations remains questionable, potentially undermining the precision of selection decisions.
Validation is another critical challenge that must be addressed. As innovations continue to emerge, the assumptions upon which they operate need rigorous scientific validation. This ensures that the data collected genuinely reflects biological realities and provides a solid foundation for decision-making. The risk of basing selections on inaccurate or misleading data remains high without validation.
Furthermore, seamless data integration into existing genetic evaluation systems is not enough. The current infrastructure must evolve to accommodate new data streams effectively. This might involve developing new software tools or altering existing frameworks to handle data’s increased volume and complexity. Ensuring seamless integration requires collaboration across sectors, from tech developers to dairy farmers. It fosters an environment where data can flow unimpeded and be put to its best use.
Embracing these technologies with careful attention to their associated challenges can lead to significant advancements in dairy breeding programs. By harnessing the power of cutting-edge technology while addressing standardization, validation, and integration issues, the industry can move towards more precise, efficient, and sustainable selection decisions.
Preserving Genetic Diversity: The Unsung Hero in Sustainable Dairy Breeding
One of the critical concerns surrounding dairy cattle breeding today is the potential reduction in genetic diversity that can arise from intense selection pressures and the widespread use of selection indices. The drive to optimize specific traits, such as milk production efficiency or disease resistance, through these indices can inadvertently narrow the genetic pool. This is mainly due to the focus on a limited number of high-performing genotypes, often resulting in the overuse of popular sires with optimal index scores.
The genetic narrowing risks compromising the long-term resilience and adaptability of cattle populations. When selection is heavily concentrated on specific traits, it may inadvertently cause a decline in genetic variability, reducing the breed’s ability to adapt to changing environments or emerging health threats. Such a focus can lead to inbreeding, where genetic diversity diminishes, leading to potential increases in health issues or reduced fertility, further complicating breeding programs.
Despite these concerns, strategies can be employed to maintain genetic diversity while still achieving genetic gains. These strategies involve a balanced approach to selection:
Diverse Breeding Strategies: Breeders can implement selection methods emphasizing a broader set of traits rather than just a few high-value characteristics, thus ensuring a diverse gene pool.
Use of Genetic Tools: Tools such as genomic selection can be optimized to assess the genetic diversity of potential breeding candidates, discouraging over-reliance on a narrow genetic group.
Rotational Breeding Programs: Introducing rotational or cross-breeding programs can enhance genetic diversity by utilizing diverse genetic lines in the breeding process.
Conservation Initiatives: Establishing gene banks and conducting regular assessments of genetic diversity within breeding populations can help conserve genetic material that may be useful in the future.
Regulatory Oversight: National breeding programs could enforce guidelines that limit the genetic concentration from a few sires, promoting a more even distribution of genetic material.
By implementing these strategies, dairy breeders can work towards a robust genetic framework that supports the immediate economic needs and future adaptability of dairy cattle. This careful management ensures the industry’s sustainability and resilience, safeguarding against the risks posed by genetic uniformity.
The New Frontiers of Dairy Genetics: Embracing Complexity for a Sustainable Future
The landscape of genetic selection in the U.S. dairy sector is poised for significant transformation, steered by technological advancements and evolving farm needs. The future promises an expanded repertoire of traits in selection indices, acknowledging both the economic and environmental challenges of modern dairy farming. The potential inclusion of traits like feed efficiency, resilience to environmental stresses, and even novel health traits will cater to the increasing need for sustainable production practices. While these additions enhance the genetic toolbox, they complicate decision-making due to potential trade-offs between trait reliability and economic impact.
Moreover, the possibility of breed-specific indices looms large on the horizon. A one-size-fits-all approach becomes increasingly untenable, with varying traits prioritized differently across breeds. Breed-specific indices could provide a more refined picture, allowing for optimized selection that respects each breed’s unique strengths and production environments. While technically challenging, this shift could catalyze more precise breeding strategies, maximizing genetic gains across diverse farming operations.
Concurrently, the emergence of customized indices tailored to individual farm demands offers a promising avenue for personalized breeding decisions. As farms vary in size, management style, and market focus, a bespoke approach to selection indices would allow producers to align genetic goals with their specific operational and economic contexts. This customization empowers farmers by integrating their unique priorities—whether enhanced milk production, improved animal health, or efficiency gains—within a genetic framework that reflects their singular needs.
In sum, the future of U.S. selection indices in the dairy industry will likely include a blend of broader trait inclusion, breed-specific customization, and farm-tailored solutions. These adaptations promise to enhance genetic selection’s precision, relevance, and impact, supporting a robust and sustainable dairy sector that meets tomorrow’s dynamic challenges.
Melding Milk and Mother Nature: The Crucial Role of Environment in Dairy Genetics
The landscape of dairy breeding is shifting as the need to incorporate environmental effects into genetic evaluations becomes increasingly apparent. In a rapidly evolving agricultural world, factors affecting performance are not solely genetic. The environment is crucial in shaping breeding programs’ potential and outcomes. This understanding opens new avenues for enhancing selection accuracy and ensuring sustainable dairy farming.
By considering environmental effects, farmers can gain a more holistic view of how their cows might perform under specific farm conditions. These effects, divided into permanent aspects like geographic location and variable ones such as seasonal changes in feed, help build a comprehensive picture of dairy cow potential. Recognizing that genotype-by-environment interactions can influence traits as much as genetic merit alone allows farmers to tailor breeding strategies to their unique settings.
The quest to decode these interactions holds promise. As sensors and data collection technologies develop, capturing detailed environmental data becomes feasible. Feeding regimens, housing conditions, and health interventions can be factored into genetic predictions. Such precision in understanding the cow’s interactions with its environment enhances selection accuracy. It can lead to meaningful improvements in health, productivity, and efficiency.
Moreover, acknowledging these interactions fosters a breeding philosophy sensitive to productivity and sustainability. It supports resilience against climate challenges and encourages practices that align with environmental goals. Ultimately, incorporating this dual focus of genetics and environment in dairy breeding could be the key to a future where dairy farming meets both economic demands and ecological responsibilities.
Data: The Lifeblood of Dairy Genetic Progress
The flow and integrity of data play a pivotal role in shaping the future of genetic evaluations in the intricate tapestry of dairy breeding. Managing and integrating diverse data sources to create a unified, reliable system offers immense opportunities.
Firstly, with the advent of sensor-based and innovative farming technologies, data influx has increased exponentially. These technologies promise to harness real-time data, providing an unprecedented view of animal genetics and farm operations. The potential to improve breeding precision, optimize feed efficiency, and enhance animal health through this data is vast. By tapping into this reservoir of information, farmers and researchers can develop more effective breeding strategies that account for genetic potential and environmental variables.
However, with these opportunities come significant challenges. Key among these is data ownership. Many modern systems store data in proprietary formats, creating data silos and raising questions about who truly owns the data generated on farms. This lack of clarity can lead to data access and use restrictions, which inhibits collaborative research and development efforts. Ensuring farmers have autonomy over their data while respecting the proprietary technologies in use is a delicate balancing act.
Quality certification also poses a substantial challenge. Unlike traditional data sources with established protocols, many newer technologies operate without standardized validation. This lack of certification can lead to consistency in data quality, making it difficult to ensure accuracy across large, integrated datasets. Organizations like the NDHIA in the United States serve as gatekeepers, ensuring lab measurements are precise and calculations correct, but expanding such oversight to new technologies remains a hurdle.
National databases are indispensable in supporting genetic evaluations. They act as centralized repositories of validated data, facilitating comprehensive analyses that underpin genetic improvement programs. These databases must be continually updated to incorporate new data types and technologies. They also need robust governance structures to manage data contributions from multiple sources while ensuring privacy and security.
In conclusion, while considerable opportunities exist to leverage diverse data sources for dairy breeding advancements, addressing ownership dilemmas, achieving data certification, and reinforcing national databases are crucial. These efforts will ensure that genetic evaluations remain reliable, actionable, and beneficial to all stakeholders in the dairy industry.
The Bottom Line
The future of dairy breeding hinges on integrating complex genetic advancements with traditional agricultural wisdom while balancing the economic, environmental, and technological facets that define modern farming. Throughout this examination, we have delved into the mechanisms and challenges underscoring today’s breeding programs—from the evolving role of selection indices to the adoption of technology-driven phenotyping and the delicate dance of maintaining genetic diversity. At the core of these endeavors lies a critical need for a cohesive strategy—one where dairy farmers, scientists, commercial entities, and regulatory bodies work hand in hand to forge paths that benefit the entire industry.
As we reflect on the pressing themes of accountability, innovation, and sustainability, it becomes evident that genetic evaluations should support individual farms and act as a shared resource, accessible and beneficial to all. Readers are encouraged to ponder the far-reaching consequences of breeding choices, recognizing that while genetics offers unprecedented tools for enhancement, it also demands responsible stewardship. Ultimately, our collective success will be determined by our ability to harmonize data, technology, and practical farming experience, ensuring a prosperous and sustainable future for dairy farming worldwide.
Summary:
The dairy industry is on the brink of a technological revolution, with genetic advancements and technological integration becoming pivotal in shaping the future of selection decisions and breeding programs. These changes are driven by complex factors such as economics, genetic diversity, and environmental impacts. Key players, like the USDA and companies such as Zoetis, are steering these advancements, with breeding companies like ST and Zoetis publishing indices that dairy farmers influence through their adoption or rejection. The process involves updating indices to reflect traits’ economic returns and genetic potential, influenced by market demands, feed costs, and environmental challenges like heat stress. As genetic advancements accelerate, frequently reevaluating these indices becomes necessary, balancing short-term needs with long-term genetic goals. Innovative technologies, such as sensor-based systems, offer transformative potential for data collection, enhancing decision-making in dairy genetics.
Key Takeaways:
The evolution of selection indices in the dairy industry highlights a shift from focusing solely on yield traits to incorporating health, fertility, and sustainability.
Technological advancements like sensor-based systems enable continuous data collection on farm environments and animal performance.
There is an ongoing debate about the role of commercial indices and proprietary tools versus traditional selection indices, emphasizing transparency and validation.
Increased trait complexity requires indices to potentially break down into subindices, allowing farmers to focus on particular areas of interest like health or productivity.
Breeders face pressures related to maintaining genetic diversity within the Holstein breed amidst rapid gains in genetic selection.
Future indices must adapt to account for differing needs across breeds and individual farm operations, moving towards customized, farm-specific solutions.
The dairy industry’s success hinges on treating genetic evaluations as a collective resource while accommodating individual farmer choices.
Expansion in data sources poses challenges regarding standardization, certification, and ownership, necessitating robust frameworks for data integration and use.
Bullvine Daily is your essential e-zine for staying ahead in the dairy industry. With over 30,000 subscribers, we bring you the week’s top news, helping you manage tasks efficiently. Stay informed about milk production, tech adoption, and more, so you can concentrate on your dairy operations.
Check out the December 2024 CDCB Evaluations. Learn about updates on RFI, NM$ trends, and Brown Swiss evaluations. Keep up to date.
Summary:
The December 2024 CDCB evaluations introduce significant advancements in dairy cattle genetics, focusing on precision and transparency. Updates include an increased protein coefficient for Residual Feed Intake (RFI), aligning with the Nutrient Requirements of Dairy Cattle and impacting only 16 animals with changes greater than 1. The strategic exclusion of certain crossbred animals stabilizes Net Merit Dollars (NM$) trends, resulting in breed-specific evaluations reflective of true genetic potential. The integration of international evaluations for Brown Swiss Rear Teat Placement enhances genomic predictions. The new ‘Powered by CDCB’ logo reinforces data integrity and transparency, providing farmers with reliable evaluations for informed breeding strategies, thereby optimizing herd productivity and profitability.
Key Takeaways:
The updated protein coefficient in Residual Feed Intake (RFI) calculations aligns with modern industry standards, ensuring more accurate evaluations.
Excluding crossbred animals from Net Merit $ (NM$) trends offers a clearer and more stable evaluation for breed-specific trends, especially for Ayrshire and Milking Shorthorn.
Incorporation of international data for Brown Swiss Rear Teat Placement enhances the precision and global relevance of evaluations.
The introduction of the ‘Powered by CDCB’ logo aims to increase transparency and confidence in genetic evaluations by highlighting their independent and data-driven origins.
CDCB’s dedication to high-quality data collection and analysis supports the reputation of U.S. genetic evaluations as a global benchmark.
As the dairy industry braces for transformation, the December 2024 CDCB evaluations emerge as a beacon of progress, illuminating pathways for more precise genetic predictions. These updates are not just routine markers; they signify a profound evolution essential for dairy farmers and industry professionals. At the core of this year’s evaluations are the adapted calculations for Residual Feed Intake, the integration of international data for Brown Swiss traits, and the strategic exclusion of certain crossbreds in Net Merit $ trends. “The impact of these evaluations on genetic progress is like a domino effect – improving one element can redefine breeding strategies nationwide,” commented Paul VanRaden. These changes collectively influence breeding decisions that can ripple through the entire industry. For those seeking to navigate the intricate landscape of genetic evaluations, the implications of these updates are expansive, demanding attention and action. Understanding the nuances of these updates is critical, as they align with contemporary nutritional standards and enhance the reliability of genetic evaluations on a global scale. Dairy professionals who grasp these developments position themselves at the forefront of a competitive market, armed with the knowledge to make informed, innovative breeding decisions.
Refining Precision: A Closer Look at the Updated RFI Protein Coefficient
The updated calculation for Residual Feed Intake (RFI) reflects an increased protein coefficient in determining milk energy content, from 5.63 to 5.85. This subtle adjustment aligns with the Nutrient Requirements of Dairy Cattle, ensuring accuracy by adhering to the latest industry standards. Although this revision might appear minor, its impact on genetic evaluations is significant—it enhances precision without drastically altering results. The comparison between original and updated protein coefficients yielded a correlation of over 0.999 in Predicted Transmitting Abilities, demonstrating minimal disruption, with only 16 animals experiencing a change more significant than 1 in their evaluations. Such updates are crucial because they maintain the integrity and relevance of genetic evaluations amid evolving nutritional guidelines. By ensuring genetic evaluations reflect current nutritional realities, dairy producers can rely on them for informed decision-making in breeding and management strategies, reinforcing the evaluations’ utility and credibility.
Paving the Way for Purity: The Strategic Exclusion of Crossbred Animals in NM$ Trends
In removing crossbred animals from the Net Merit Dollars (NM$) trends, the CDCB has marked a significant shift toward more stable and accurate breed-specific evaluations. The exclusion focuses on animals with uncertain genetic backgrounds, which have often muddled the NM$ trends, creating inconsistencies in understanding breed performance. By clearly defining a cutoff heterosis value of 50%, this adjustment ensures that only animals with verified genetic purity contribute to the trend analysis.
The decision has yielded promising results for breeds like Ayrshire and Milking Shorthorn. The August 2024 test run highlighted a notably steadier NM$ trend for these breeds, demonstrating a newfound reliability for dairy farmers focused on genetic precision. This consistency means that farmers can make more informed decisions, relying on evaluations that reflect the true genetic potential of individual breeds without the distortion caused by crossbred influences.
The implications for dairy farmers are profound. As the industry gravitates towards precision agriculture, having access to accurate breed-specific data becomes crucial for breeding strategies and economic planning. It empowers farmers to make breeding decisions based on dependable evaluations that align closely with their herd’s genetic goals. This change could foster renewed confidence in the CDCB’s evaluations, urging more farm operations to base their decision-making on data that genuinely reflects breed integrity and potential productivity.
Global Integration for Precision: Elevating Brown Swiss Evaluations
The integration of international evaluations for Brown Swiss Rear Teat Placement marks a significant advancement in the accuracy and reliability of genetic assessments within the breed. Including international data allows for a broader scope of genetic information, ensuring that evaluations are nationally and globally aligned. This approach enhances the precision of genomic predictions, making them more comprehensive and reflective of worldwide genetic diversity.
Incorporating international data into the U.S. evaluation process underlines the benefits of cooperative data sharing and standardization, fostering improvements in overall trait evaluation results. This integration ensures that bull and cow evaluations are enriched with Multi-country Assessment Coefficient (MACE) evaluations when international Predicted Transmitting Abilities (PTA) reliabilities surpass domestic figures. Thus, producers receive a robust dataset that reinforces confidence in breeding decisions.
Moreover, correcting format flaws in the Jersey breed evaluations highlights the CDCB’s commitment to precision and accuracy. Flaws in the formatting of the bulls’ files, which previously hindered the proper implementation of MACE-based Rear Teat Placement and type composites, have now been rectified. This ensures that the information used for Jersey cattle is current, accurate, and in line with international standards, leading to more reliable data for breeders to act upon.
A Mark of Integrity: Unveiling the ‘Powered by CDCB’ Logo
The unveiling of the Powered by CDCB logo signifies a pivotal moment for the U.S. dairy sector, as it underscores a commitment to transparency in genetic evaluations. This emblem guarantees that the genetic data utilized in breeding and managerial decisions is sourced from an objective and independent process. The assurance comes from the CDCB’s stewardship of the National Cooperator Database, where unbiased data offers producers a reassuring degree of reliability.
By incorporating this mark, the CDCB reinforces the integrity of its evaluations, much like the impact of the REAL® Seal on dairy products. As João Dürr, the CEO of CDCB, eloquently puts it, the mark connects producers with the quality and objective nature of the genetic information they trust. The ‘Powered by CDCB’ logo is also a beacon of the collaborative industry effort that strengthens the services and results associated with the CDCB’s work. This initiative is pivotal in ensuring that producers receive comprehensive and credible genetic evaluations and recognize the quality assurance embedded within the data cultivated through contributions by their herds.
The Bottom Line
The December 2024 CDCB evaluations herald pivotal advancements in dairy cattle genetics. From recalibrating the RFI protein coefficient to strategically excluding crossbred animals in NM$ trends, these changes reflect a commitment to precision and purity. The integration of international data for Brown Swiss evaluations marks a new era in global collaboration, while the ‘Powered by CDCB’ mark enhances transparency and trust.
These developments offer dairy farmers and industry professionals substantial opportunities to refine breeding strategies and management practices. Stakeholders can elevate herd productivity and profitability by aligning with these enhanced evaluation metrics.
We encourage you to delve deeper into these updates and consider their potential impacts on your operations. For comprehensive guidance and support, explore additional resources and industry insights by visiting the social media channels at www.uscdcb.com and the Council on Dairy Cattle Breeding.
Bullvine Daily is your essential e-zine for staying ahead in the dairy industry. With over 30,000 subscribers, we bring you the week’s top news, helping you manage tasks efficiently. Stay informed about milk production, tech adoption, and more, so you can concentrate on your dairy operations.
Are milk components driving your profits? Focus on the right metrics and unlock your herd’s potential now.
The race to fill the milk tank has long dominated the dairy discourse, but a seismic shift is underway. Today, the stakes aren’t just in how full that tank gets but in the quality of the liquid it holds. Could this be the revolution the dairy industry never saw coming? Let’s dive deeper into how focusing on milk’s innate treasures—its butterfat and protein—could redefine success for dairy farmers everywhere.
The Evolution of Dairy: From Quantity to Quality
The landscape of dairy farming has undergone a profound transformation, echoing the rapid pace of technological and genetic advancements. Historically, the primary focus was on maximizing milk volume, with little regard for the composition or the components of the milk produced. This approach treated cows as mere ‘milk-producing machines’ focused on sheer output. However, as markets and consumer demands evolved, the emphasis gradually shifted toward the quality and components of milk, specifically its butterfat and protein content.
Year
Overall Production Change (%)
Butterfat Change (%)
Protein Change (%)
2017
2.1
1.3
1.4
2018
2.5
1.4
1.5
2019
2.7
1.5
1.6
2020
2.4
1.6
1.7
2021
2.3
1.8
1.9
2022
2.0
2.0
2.1
2023
1.9
2.3
2.2
Genetic advancements have played a pivotal role in this transformation, offering a beacon of hope for the future of dairy farming. The advent of genomics has been a game changer, allowing for far more precise genetic selection. Through mapping and understanding the bovine genome, dairy farmers can now select specific traits that enhance the quality of milk components rather than just quantity. This has led to the development of cows that are more efficient ‘component-producing machines.’ Today’s desired component levels have surpassed what producers aimed for two decades ago, signaling a promising future for the industry.
Moreover, the introduction of sexed semen technology has been revolutionary. By enabling dairy farmers to selectively breed females with superior genetics, this technology accelerates the improvement of a herd’s genetic profile. Used effectively, sexed semen quickly elevates a herd’s genetic quality, as it effectively minimizes the reproduction of cows with lesser advantageous traits. Geiger’s work underscores how this, combined with genomics, has propelled the industry forward.
These tools have collectively enabled dairy farming to progress towards more efficient milk production and a more strategic focus on milk components. As the industry continues to evolve, integrating these technologies promises further enhancements in dairy productivity and profitability, setting new benchmarks for quality in milk production. Such innovation challenges us to consider the future trajectory of dairy farming and how these advancements will continue to shape the industry. What could be next on the horizon?
Genetic Correlations: Navigating the New Landscape of Dairy Farming
Genetic correlations, which represent the relationships between traits crucial when making informed breeding decisions, are a fundamental cornerstone in understanding both the past and future trajectory of dairy farming. In simpler terms, they are like the connections between different traits in cows that farmers need to consider when breeding. In a landscape that has evolved dramatically over recent decades, these correlations have shifted, providing opportunities and challenges for the industry.
Trait Pair
Correlation
Milk Production (PTAM) and Fat (PTAF)
0.00
Health Traits (Longevity, Fertility, Disease Resistance)
Strong Correlation
Conformation Traits
High Correlation
Overall Conformation (PTAT) – Net Merit
-0.44
Net Merit and TPI
0.44
Body Weight Composite (BWC) and Strength
0.95
Body Weight Composite (BWC) – Net Merit
-0.56
Strength – Net Merit
-0.52
Historically, dairy farming focused predominantly on optimizing milk volume. However, the changes in trait relationships have redirected focus towards milk components like butterfat and protein. Changes in genetic correlations underpin this shift. For instance, the relationship between breeding for milk yield (PTAM) and fat volume (PTAF) has been notably disrupted. Where once there might have been a modest interplay between these traits, they now exhibit almost zero correlation. This detachment incentivizes farmers to prioritize breeding for component percentages to enhance milk quality rather than quantity.
Another striking deviation is between Net Merit, an index that measures the overall economic value of a cow, and TPI, an index that measures a cow’s genetic potential for producing milk, fat, and protein. Historically, these two indexes correlated closely at over 0.80 but have now split to 0.44. This reflects a broader shift within the industry towards evaluating individual traits that contribute to economic returns. As these indexes deviate, breeding strategies must be adapted to maintain economic viability while managing genetic diversity.
The implications of these exceptions for breeding strategies are profound. Farmers are now challenged to adopt a more tailored approach, focusing less on traditional metrics and more on the specific genetic attributes that will enhance the efficiency and profitability of their herds. The emphasis is increasingly on balance—ensuring that other beneficial characteristics are not inadvertently diminished in pursuit of one trait. This nuanced understanding of genetic correlations allows the industry to sustain current production and explore innovations in milk component enhancement.
Milk’s Hidden Treasure: Why Butterfat and Protein Are the Real MVPs
In today’s dairy industry, the value of milk components, rather than just the raw volume of milk, captures the spotlight. Why? Because butterfat and protein are the moneymakers, not the water content that bulks up milk production statistics. These components are essential for the dairy products that dominate our market shelves.
Consider this: U.S. milk production has risen 16.2% since 2011, but the component growth tells a more compelling story. Protein content surged by 22.9%, and butterfat saw an impressive increase of 28.9% by 2023. These figures demonstrate a significant shift towards higher-yielding component production, driven by advancements in genetic selection and improved herd management.
Year
Fluid Milk Production (%)
Butterfat Production (%)
Protein Production (%)
Cheese Yield (per 100 lbs of milk)
2010
100%
100%
100%
10 lbs
2023
116.2%
128.9%
122.9%
11 lbs
Why does this matter economically? Over 80% of U.S. milk is destined for manufactured dairy products such as cheese, butter, and yogurt. Each of these products relies heavily on milk components. The rise in butterfat and protein directly impacts cheese production, for example. In 2010, 100 pounds of milk produced just over 10 pounds of cheese. Fast forward to 2023, and that same 100 pounds, thanks to higher component yields, delivers nearly 11 pounds of cheese.
The implications are clear. By focusing on component growth, dairy farmers are not only optimizing their production but also enhancing the economic value of their output. This strategic shift aligns with market demands as consumers favor nutrient-dense dairy products. So next time you think about boosting production, remember it’s not just about the gallons. It’s about the goldmine inside every drop, and the potential for increased profitability that comes with it.
Navigating the Challenges of Component-Focused Dairy Production
As we delve into the evolving dynamics of dairy production, it’s important to acknowledge that the pivot toward enhancing milk components is not without its challenges. One such challenge is the unintended impact on cow strength and overall efficiency. Breeders who maximize component yields might inadvertently select cows with traits compromising physical robustness. The correlation between body weight composite (BWC) and cow strength is significant, and a narrower perspective on genetic selection may overlook crucial physical attributes. This can lead to reduced cow strength, a scenario no farmer desires. Understanding these challenges is the first step towards finding solutions and ensuring the sustainability of the industry.
Furthermore, the shift towards increased efficiency in milk production could lead to a potential trade-off between cow vitality and durability. As dairy systems strive for optimal component production, the intricate balance between physical capacity and milk output becomes even more critical.
Refine genetic evaluations to navigate these complexities. Accurate metrics are crucial in preventing the dilution of essential traits like strength and robustness. This calls for a departure from traditional estimates and a movement towards incorporating actual body weight measurements into genetic assessments. Relying solely on linear trait predictions can be as speculative as estimating milk yield by sight. Embracing tangible measurements ensures more precise evaluations and helps balance component efficiency and cow health.
These challenges underscore the importance of a comprehensive approach to genetic selection, one that does not just chase numbers but also values the holistic nature of dairy cattle. By adopting improved practices, we can harness the opportunities presented by component-focused strategies while safeguarding our herds’ structural and functional integrity.
Beyond the Gallons: Embracing the True Value of Dairy Production
It’s no longer enough to measure milk production by volume. While historically valuable, the USDA’s Milk Production reports now need to capture modern dairy output’s true essence fully. Why? Because the liquid volume of milk is just one part of the story. The magic lies in the components—those precious pounds of butterfat and protein that have surged in importance.
For decades, these reports were the gold standard, the one-stop shop for anyone wanting to understand trends in milk production. However, as the milk composition evolves, so must our reporting methods. Milk today isn’t just about how much is produced; it’s about what it’s made of. Yet, as it stands, the USDA reports are like a story with missing pages. Essential details about the richness and value of the milk are glossed over.
The urgency for updated reporting is not a minor issue; it’s central to understanding the industry’s dynamics. Recent trends—where component growth has outpaced volume—have left us relying on data that doesn’t tell the whole story. Such insights could inform better decision-making at numerous levels, from farm operations to policy development. A revised reporting framework could bridge this gap, providing a dual lens on volume and component growth. This would offer a more nuanced picture of how well dairy production aligns with market demands.
Imagine reports that delve into the intricacies of components, giving producers data that matters. Producers could benchmark their herds’ component production directly against industry standards, finding immediate areas for improvement. Processors, too, would benefit from a clearer understanding of the potential yield from their milk supply in terms of cheese, butter, and other manufactured products.
The time has come for an upgrade, not just to conform to a changing industry but to lead it with insights that drive progress. Let’s push for milk production reports that not only count gallons but also account for the cream of the crop.
The Bottom Line
The shift in focus from sheer milk volume to milk components like butterfat and protein marks a significant evolution in dairy farming. These elements are not merely byproducts but the driving force behind many lucrative dairy products. As U.S. milk production on a liquid basis declines, the growth in milk components underscores the shift towards quality over quantity. The remarkable improvements in genetic selection and the use of new breeding technologies like genomics and sexed semen have made these strides possible. Dairy farmers should contemplate how these transformations impact their current practices. Leveraging such advancements can lead to significant gains in production efficiency and profitability.
It’s time to rethink your approach: Are you maximizing the potential of your herd’s genetic makeup? How can you integrate the latest breeding technologies to enhance component yields? Engage with this new perspective and explore ways to align your operations with these industry insights. Don’t keep this conversation to yourself; share your thoughts and experiences in the comments below, or spread the word by sharing this article with your fellow dairy professionals.
Key Takeaways:
The shift from milk volume to component production has significantly changed dairy farming goals and outcomes.
Technological advancements like genomics and sexed semen have propelled genetic progress and increased component yields.
Genetic correlations have revealed changes in trait relationships, influencing breeding strategies.
Despite historical trends, the current focus is on butterfat and protein, which drive the dairy industry’s economic value.
Indexes like Net Merit and TPI are evolving, affecting breeding choices and herd management decisions.
Producers should consider actual body weights over linear traits for an accurate assessment of maintenance costs.
Understanding the true value of milk components versus volume is crucial as over 80% of production supports manufactured dairy products.
Summary:
The world of dairy farming is witnessing a substantial shift from prioritizing milk volume to valuing milk components like butterfat and protein. Advances in genetic selection and technologies such as sexed semen have turned cows into efficient “component-producing machines,” revolutionizing dairy production. This transformation underscores the importance of understanding genetic correlations to better navigate the evolving landscape of dairy farming. With over 80% of U.S. milk used in manufactured products, the emphasis on milk components over sheer volume becomes clearer. This evolution prompts farmers to adopt a tailored approach, thereby aligning production with market demands. However, it also brings challenges, such as potential impacts on cow strength and efficiency. Recognizing these dynamics calls for a revised reporting framework, offering insights into the growth of both volume and components.
Bullvine Daily is your essential e-zine for staying ahead in the dairy industry. With over 30,000 subscribers, we bring you the week’s top news, helping you manage tasks efficiently. Stay informed about milk production, tech adoption, and more, so you can concentrate on your dairy operations.
Explore the April 2025 LPI update to enhance your farm’s sustainability and genetic gains. Ready to thrive?
Summary:
The dairy breeding landscape is poised for a significant shift, with the Lifetime Performance Index (LPI) ‘s modernization in April 2025. This revamped formula intends to align with current industry goals such as sustainability and profitability. Highlighted at recent GEB and industry meetings, the new LPI will feature six sub-indexes focusing on production, longevity, health, reproduction, and environmental impact. It also includes an environmental impact index targeting methane efficiency and body maintenance. These changes are designed to enhance the genetic gains in dairy herds, supporting the sector’s commitment to achieving net-zero greenhouse gas emissions by 2050 and inviting dairy farmers to integrate economic viability with environmental responsibility.
Key Takeaways:
The modernized LPI formula will integrate sustainability as a critical component, reflecting industry shifts towards reducing greenhouse gas emissions.
Official subindexes, each focusing on specific traits and expectations, will be introduced, including production, longevity, health and welfare, and environmental impact.
Breed-specific weights and traits have been recommended, varying among Holsteins, Jerseys, and Ayrshires to optimize genetic gains and align with specific breed goals.
Maintaining a 60/40 fat-to-protein yield ratio has been recommended for Holsteins, ensuring consistent genetic progress while adapting to economic and environmental factors.
The introduction of the Environmental Impact subindex highlights a global initiative to measure and improve the carbon footprint of dairy operations.
Revisions to the LPI formula anticipate changes in sire rankings, with a correlation to the current formula near 97%, slightly affecting the order of top bulls.
The sustainability focus aligns with broader industry objectives to reach net-zero greenhouse gas emissions by 2050.
The new LPI system provides tools like a personalized LPI, allowing users to adjust trait emphasis and align selection with individual priorities.
In April 2025, the new Lifetime Performance Index (LPI) formula will alter how we evaluate and choose dairy cattle, ushering in an exciting period of innovation and advancement in dairy farming. This revised LPI formula is intended to speed and improve breeding choices while including critical sustainability aspects, resulting in a paradigm change toward environmentally responsible dairy production. But how does this affect the regular dairy farmer and the environment? Let us go into the specifics.
“The introduction of sustainability into the LPI marks a pivotal moment for the industry, echoing global trends towards greener farming practices.”
Are you prepared for a dramatic transition in the dairy industry? In April 2025, the new Lifetime Performance Index (LPI) formula will alter how we evaluate and choose dairy cattle, ushering in an exciting period of innovation and advancement in dairy farming. This revised LPI formula is intended to speed and improve breeding choices while including critical sustainability aspects, resulting in a paradigm change toward environmentally responsible dairy production. But how does this affect the regular dairy farmer and the environment? Let us go into the specifics.
Inclusion of Environmental Impact: The new LPI introduces an official subindex for environmental impact, integrating traits that reflect a cow’s carbon footprint.
Enhanced Genetic Progress: The modernized formula promises faster genetic gains by incorporating genomic selection and other technological advancements.
Focus on Health and Longevity: With subindices dedicated to health and Welfare, the LPI encourages breeding for resilience and longevity, crucial factors in a sustainable dairy future.
Understanding and harnessing these improvements will be critical for dairy farmers and industry experts. The new LPI formula is more than a tool; it represents a bridge to a more sustainable, resilient, and productive future for dairy farmers. Let us embrace change and pave the way to a greener future.
Charting a New Course: Unveiling the Reimagined Lifetime Performance Index
The Lifetime Performance Index (LPI) has long been a dairy industry standard, offering a complete statistic for assessing the genetic value of dairy cattle. Its significance is critical because it helps farmers and breeders make educated choices to improve productivity, profitability, and overall herd genetics. Historically, the LPI combined several features, often classified into three essential components: production, durability, and health attributes. These components were carefully chosen to match the demands of dairy operations, assuring a focus on milk output, lifespan, and health, propelling the industry’s genetic advancement.
However, as the world of dairy farming develops, so do the technologies we utilize. The upgrading of the LPI indicates a trend toward more nuanced and sophisticated approaches, taking into account advances in genetic research and industrial concerns such as sustainability. This transformation is more than just cosmetic; it is based on the reality of modern dairy production, where concerns about environmental impact and animal welfare are increasingly impacting operational decisions.
Subindexes are a crucial feature in the new LPI system. They use a more targeted approach, breaking the LPI into particular focal areas, including health and Welfare, reproduction, and environmental impact. Each subindex reflects a set of qualities that, when aggregated, contribute to the overall breeding objectives. This modular approach improves clarity and accuracy in choices. It enables a more adaptable and forward-thinking approach to herd management, connecting genetic selection closely with present and future industry needs.
Embracing Sustainability: The New Era of Dairy Genetics Begins!
Beginning in April 2025, the Lifetime Performance Index (LPI) will undergo a dramatic overhaul, making it more relevant and practical for today’s dairy sector concerns. The main goal of this update is to include sustainability as a critical component of the LPI formula. This project is consistent with worldwide initiatives to lessen the environmental effects of dairy production and targets farmers who are more concerned with sustainable methods.
Moving away from the complicated mathematical formulas of the past, the revised LPI seeks to ease comprehension and implementation. This modification is intended to make the LPI more accessible and intuitive for farmers and industry experts, ensuring that essential advice is not lost in translation.
The addition of official subindexes is another big step forward. These subindexes will now be released individually, focusing on specific performance areas. This segmentation provides a more accurate view of how each component contributes to the total LPI.
Among the new subindexes are:
Production – emphasizing yield and efficiency improvements.
Longevity and Type – focusing on the physical traits that affect a cow’s lifespan and productivity.
Health and Welfare – prioritizing disease resistance and overall cow well-being.
Reproduction – aimed at optimizing fertility and calving success.
Milkability – enhancing the ease and efficiency of milk extraction.
Environmental Impact (EI) – a new addition targeting reducing carbon footprint and enhancing sustainability.
Each subindex indicates an area where dairy producers may monitor progress and make more informed choices to improve efficiency and sustainability. Together, these LPI improvements give a complete, user-friendly way to evaluate dairy cattle, ushering in a future in which data-driven sustainability is promoted and embedded at the heart of industry measurements.
Optimizing Yields: Balancing Milk, Fat, and Protein
Production: This subindex focuses on yield qualities, namely milk, fat, and protein. The goal is to balance these components while reflecting the dairy market’s pricing mechanisms and solid compositions. Increased concentration of fat and protein yields is required for more significant genetic gain. This subindex has historically held substantial weight in the LPI, with expected development quantified in kilos of milk, fat, and protein over five years.
Longevity and Type: This subindex focuses on features such as herd life, conformation, and feet and legs to improve dairy cows’ durability and functionality. Removing the focus on dairy strength corresponds with retaining moderate-sized cows, which supports the environmental impact goals. This ensures that the cows stay healthy and productive throughout their lives, adding to the overall efficiency of dairy operations.
Health and Welfare: This subindex’s key features include resistance to mastitis, metabolic illnesses, hoof health, and reproduction issues. It emphasizes animal health by concentrating on common illnesses and disorders to reduce treatment costs and increase heritability. This subindex helps to improve cows’ well-being, which is critical for sustainable dairy production.
Reproduction: This subindex focuses on female fertility features such as daughter fertility and calving ability, including calving ease and calf survival. The goal is to strengthen the herd’s reproductive capacity, resulting in increased pregnancy rates and improved calving outcomes. This directly impacts the herd’s production and efficiency, an essential factor in the LPI.
Milkability: This subindex focuses on milking speed, temperament, and udder shape. It considers milking efficiency, convenience of use, and cow temperament important for animal welfare and farm management. The subindex hopes to enhance dairy production’s operational elements by addressing these characteristics.
Environmental Impact: This new subindex, a pioneering method, incorporates feed efficiency, methane emissions, and body maintenance needs. It demonstrates the industry’s commitment to achieving net-zero greenhouse gas emissions. This subindex covers environmental issues and is expected to play a crucial role in repositioning the LPI for a more sustainable dairy industry.
Pioneering Green Pastures: Driving Dairy’s Sustainable Revolution
The dairy industry’s unshakable commitment to achieving net-zero greenhouse gas emissions by 2050 marks a key milestone in our shared path toward sustainability. As environmental stewards, we realize the importance of this program, which connects with national and global initiatives to reduce climate change consequences. The updated Lifetime Performance Index (LPI) model is created to strengthen this commitment by incorporating sustainability into the heart of dairy genetics.
Genetic selection emerges as a significant tool in this new LPI formula, providing a way to improve features that directly benefit environmental efficiency. By including additional components, such as methane efficiency and feed intake, into the LPI, we provide dairy producers with the genetic insights they need to improve their herds’ carbon impact. These features increase productivity and result in more efficient cows that use less feed to produce the same output, reducing waste and emissions.
This method is based on the concept that genetic enhancements are permanent and cumulative, affecting each subsequent generation more deeply. As dairy herds expand, choosing features that promote environmental sustainability becomes essential to the breeding plan. The LPI acts as a guiding parameter, allowing farmers to make choices that combine economic viability and environmental responsibility, eventually propelling the sector toward its lofty net-zero targets.
Redefining Genetic Progress: Unveiling Key Advances in Dairy Breeding
The newly developed LPI formula, planned to be implemented in April 2025, is projected to accelerate significant genetic gains, with a refined focus on different qualities critical to contemporary dairy production. The anticipated genetic benefits, especially in milk production and health, are predicted to be significant. For Holsteins, the rebalanced focus predicts a yearly genetic gain of 511 kilos in milk output and a 39-kilogram rise in fat and 27 kilograms in protein over the following five years. These increases outperform previous indices, strategically matching current dairy industry needs and genetic potential.
Regarding reproductive performance and health, the LPI framework strongly focuses 70% on daughter fertility and 94% on association, resulting in a two-point increase in RBV and a two-point improvement in calving ability over a half-decade. Such concentrated selection emphasizes the long-term enhancement of reproductive qualities, a significant predictor of herd health.
The environmental impact index (EI), a new component of the LPI, represents a trend toward sustainability. The EI index, built on empirical findings, is designed to precisely target methane efficiency (37% correlation) and body maintenance needs (38% correlation). Consequently, the bovine carbon footprint is reduced overall, furthering the goal of net zero emissions by 2050. However, the original 7% weight in EI resulted in specific unfavorable correlations; modifications to 12% show that strategic realignment may overcome these downsides and ensure a positive trajectory in environmental stewardship.
Across breeds, the new LPI guarantees that the change in weighting, albeit minor, is consistent with current sectors’ needs and breed-specific traits. Whether positioned to enhance production metrics or strengthen resilience via health and environmental indices, this formula encourages a forward-thinking genetic selection approach that embraces the twin mission of productivity and sustainability.
Forging the Future: Transformative Shifts in Dairy Industry Dynamics
Updating the Lifetime Performance Index (LPI) methodology has essential consequences for dairy farmers and industry experts. It will redefine breeding choices, farm management, and competitive dynamics in the business. This new LPI formula elevates dairy production to the forefront of environmental management by including sustainability parameters with standard performance measurements. As we investigate these consequences, we must explore how these factors interact to shape the future of dairy farming.
The redesigned LPI adds dimensions to breeding choices for dairy producers by emphasizing productivity qualities above those related to environmental impact and animal welfare. This comprehensive approach involves changing breeding practices, pushing farmers to consider long-term genetic benefits to sustainability and production efficiency. By providing a better picture of a cow’s entire effect, the revised LPI enables farmers to make educated choices that line with economic and environmental objectives, possibly increasing profitability via greater efficiency and lower environmental footprints.
Similarly, agricultural management approaches will have to adjust. With a greater emphasis on sustainability, producers may need to include techniques that improve feed efficiency and reduce methane emissions, matching their operations with the features currently highlighted in the LPI. This transition supports a more sustainable dairy production model, necessitating investments in new technology and changing herd management practices to realize the advantages of the new breeding priority.
The competitive environment of the dairy business is about to change when the LPI revisions take effect. Companies that provide genetic and farm management solutions must develop and modify their offerings to help farmers navigate this shift, emphasizing services and products that correspond with the new LPI emphasis. This drive for sustainability may increase market rivalry as firms compete to provide the most effective solutions for achieving the upgraded index’s updated breeding and management standards.
The reform of the LPI formula marks a watershed moment for the dairy sector, challenging established assumptions and opening the road for a more sustainable, efficient, and competitive future. As these developments occur, dairy farmers and industry experts will play essential roles in determining the sector’s future, harnessing new insights and technologies to flourish in this changing terrain.
The Bottom Line
Modernizing the Lifetime Performance Index (LPI) is essential for more sustainable and profitable dairy production. This improved recipe will likely boost production while addressing environmental concerns by incorporating new indices and data-driven insights into breeding procedures. The changes in weighting across several genetic traits are intended to improve overall herd performance, offering a complete framework for measuring dairy yield.
The advantages of this contemporary approach are clear. It provides dairy producers a more straightforward approach to optimizing their herds for productivity and environmental sustainability. This strategy is consistent with the more considerable effort for net-zero emissions, thereby establishing the dairy sector as a pioneer in sustainable agriculture.
How will you embrace these developments as the dairy business evolves to keep your farm competitive and sustainable in an ever-changing marketplace? Now is the moment to become involved with these breakthroughs by attending forthcoming industry workshops, researching the abundance of materials accessible via Lactanet, and thinking about how these innovations might be applied to your agricultural methods to ensure future success.
Bullvine Daily is your essential e-zine for staying ahead in the dairy industry. With over 30,000 subscribers, we bring you the week’s top news, helping you manage tasks efficiently. Stay informed about milk production, tech adoption, and more, so you can concentrate on your dairy operations.
Find out how Canadian dairy farmers can lower Crampy in cows. Get the latest data, genetic insights, and future strategies to boost herd health.
Summary: Crampy, also known as Bovine Spastic Syndrome, increasingly concerns Canadian dairy farmers due to its progressive neuromuscular symptoms. Lactanet’s data collection initiative aimed to provide a clearer picture of its prevalence and explore genomic evaluations for mitigation. Their analysis, involving 2,807 Crampy cases from 801 herds, revealed that genetic selection could significantly reduce its occurrence. With the heritability of Crampy estimated at 6.8%, prioritizing top-rated sires can lower the risk. Gabriella Condello’s M.Sc. thesis highlighted that Crampy primarily affects cattle between two and seven years old, with a higher incidence in younger age groups. The study emphasizes the need for ongoing data collection to refine genetic evaluations and develop effective control strategies.
Crampy affects Canadian dairy cows as a neuromuscular disorder, primarily in the hind limbs.
Lactanet’s data collection received 2,807 Crampy cases from 801 herds, aiding research.
Genomic evaluations suggest genetic selection can reduce Crampy prevalence.
Heritability of Crampy is estimated at 6.8%, indicating a genetic component.
Crampy affects cows mainly between two and seven years of age, with severe cases often seen in younger cattle.
Ongoing data collection and genotyping are crucial to improving genetic evaluations and mitigation strategies.
Canadian dairy producers are growing concerned about crampy cows, often known as Bovine Spastic Syndrome. Imagine spending years nurturing a healthy herd only to have your cows suffer devastating neuromuscular disorders out of the blue. Wouldn’t it be frustrating to watch your carefully controlled herd’s health deteriorating? You’re not alone in feeling this way. Crampy doesn’t just afflict cows. It affects milk production, raises veterinary expenses, and may result in significant losses. Are you willing to let these obstacles eat your profitability and peace of mind? Let’s examine why this problem is growing more widespread and what you can do about it. The answers may surprise you and, more importantly, provide a path ahead.
Unpacking Crampy: What Dairy Farmers Need to Know
So, what precisely is Crampy/Bovine Spastic Syndrome? It is a degenerative neuromuscular illness that mainly affects cattle between two and seven years old. The signs are pretty obvious: spastic spasms in the muscles of one or both hindlimbs, which spread to the back and finally the whole body. You may see your cattle shivering, straining against the neck rail as they rise, or exhibiting indications of lameness even though they can still walk with total weight.
Is it now being diagnosed as Crampy? This is when things become challenging. The course of symptoms might vary greatly, making it difficult to determine the underlying reason. This cannot be diagnosed quickly or early, complicating management and therapy options.
To complicate matters further, there’s Paresis, a similar disorder to Crampy. However, Paresis usually appears in younger animals and affects just one hindlimb. You’ll notice a “pegged leg” look rather than the trembling associated with Crampy.
Understanding these distinctions allows us to understand the broad picture when both illnesses impact herds with overlapping age groups. Crampy often affects older cattle, while Paresis affects younger ones. Both illnesses provide diagnostic hurdles and need individualized treatment options.
Lactanet’s Blitz: Farmers Rally to Combat Crampy with Data
Lactanet’s data-collecting blitz was critical in combating Crampy. This program aimed to collect thorough information on the occurrence of Crampy and Paresis in Canadian dairy herds. The blitz ran from September 2021 to April 2022, providing a limited window for gathering critical information.
During this time, dairy producers nationwide reacted enthusiastically, reporting data on 2,807 Crampy instances and 219 Paresis cases from 801 dairy herds. This excellent engagement demonstrated the dairy community’s dedication to tackling this neuromuscular condition.
The efforts of dairy producers were significant. Their willingness to offer thorough information aided the first estimate of Crampy’s prevalence and paved the way for future genetic screening methods. These activities are critical in furthering our knowledge of Crampy and finding measures to limit its effect, eventually benefiting the health and production of dairy herds throughout the country.
Digging Deep: How Detailed Data Matching and Genetic Research Could Be the Game-Changer for Crampy Control
To determine the true incidence of Crampy in the Canadian dairy sector, Lactanet methodically linked acquired data from dairy herds to herdbook-registered herd mates. This means they checked each affected cow’s information against the official records of their farm colleagues. This was critical for accurately presenting the herd’s overall health state and ensuring that the study was valid.
This extensive data was then given to the University of Guelph for further analysis. Gabriella Condello’s M.Sc. thesis focused on estimating the occurrence of cramps on Canadian dairy farms and investigating their genetics.
First, the researchers reviewed the cases to see how common Crampy was across different herds. With this baseline established, the next step was to investigate the genetic data. The idea was to see whether specific genes rendered cows more prone to Crampy. The thesis attempted to examine the possibility of gene selection as a feasible strategy for reducing Crampy’s occurrence in herds.
Age Matters: Unveiling the Alarming Spike in Severe Crampy Cases Among Younger Cattle
According to current data collecting, Crampy affects cattle of varied ages, with a maximum age of 12 years. However, most instances occur in the lower age groups, particularly between the ages of two and seven. Many cases have been detected among these cattle, with younger animals showing a specific surge in severity. Specifically, 566 severe Crampy instances were observed at younger ages, emphasizing the need for early detection and management techniques in afflicted herds.
Genetic Selection: Your Key to Combating Crampy in Dairy Herds
Extensive data analysis revealed that Crampy’s genetic component has the potential to minimize its occurrence. We reduced the overlap between Crampy and Paresis instances by concentrating on cows aged three or older with neuromuscular disease indications. This filtering yielded 1,952 Holstein cows, giving a solid dataset for further analysis.
Crampy’s average within-herd prevalence rate was determined to be 4.7%. This value changes amongst herds, indicating the role of genetics and environmental influences. Crampy has a heritability of 6.8%, highlighting the role of genetic selection in alleviating the ailment.
An essential part of this research was determining the association between sire estimated breeding values (EBVs) and the occurrence of Crampy in their daughters. Daughters of low-rated sires were shown to be 3.2 times more likely to acquire Crampy than sons of high-rated fathers. This association indicates that choosing against sires with greater Crampy frequencies may dramatically lower its prevalence, demonstrating the importance of genetic assessment and selection in long-term genetic improvement.
Why Prioritizing Genetics Could Be Your Best Move Against Crampy
The research presents numerous essential insights for the dairy business. First, Crampy’s average within-herd incidence rate is estimated at 4.7%, implying genetic and environmental factors. Crampy’s heritability was determined to be 6.8%, showing a high potential for genetic selection. Furthermore, daughters of low-rated sires are 3.2 times more likely to develop Crampy, emphasizing the need to focus on top-ranked sires to minimize prevalence rates.
These data indicate that targeting low-rated sires might benefit genetic improvement. Furthermore, the research discovered large genomic areas related to Crampy, demonstrating that numerous genes regulate it. This opens the path for genetic selection as a powerful tool to combat Crampy.
However, more data collecting is required before a nationwide genetic assessment system can be created. Implement a nationwide plan to monitor Crampy symptoms in nursing cows throughout time. Both afflicted and unaffected cows should be genotyped to improve the accuracy of future genomic assessment systems. To fully utilize the promise of genetic and genomic technologies in the fight against Crampy, the dairy sector must engage in a cost-effective, ongoing data-gathering effort.
The Bottom Line
As the dairy sector deals with Crampy, a planned, continuing nationwide data-gathering approach centered on lactating cows during milk recording is critical. Genotyping afflicted and unaffected cows will improve genomic assessments and the precision of genetic selection. The Canadian dairy sector must develop a cost-effective method for identifying Crampy cows over time, assuring sustainability and efficacy, resulting in healthier herds and more resilient dairy operations.
Are you curious about how the August CDCB updates will impact your herd? Learn what changes in yield traits and heifer livability mean for your farm’s future.
Summary: Have you been keeping up with the latest updates in dairy farming evaluations? August 2024 brought significant changes to the CDCB evaluations, impacting everything from yield traits like Milk, Fat, and Protein to Heifer Livability. Are you curious about how these updates could affect your herd? These changes are designed to make evaluations more accurate and reflective of current herd conditions: the introduction of the 305-AA standard for yield measurement, significant shifts in PTAs for different breeds, updated Heifer Livability values, and new SNP List and BBR reference population updates affecting crossbred evaluations. Understanding these changes can offer invaluable insights for making more informed breeding decisions. The 305-AA standardization uses a 36-month average age for yield data, improving PTAs for Holsteins but not for Jerseys. These improvements aim to enhance the precision and accuracy of genetic tests, allowing dairy producers to make better-informed choices about their herd’s future. The latest SNP and BBR updates have resulted in variations that could financially impact dairy farms with crossbred animals. Are you interested in how this might play out for you? Keep reading to gain more insights.
August 2024 updates in CDCB evaluations introduce significant changes affecting Milk, Fat, Protein, and Heifer Livability traits.
The 305-AA standardized yield measurement now uses a 36-month average age, which impacts Predicted Transmitting Abilities (PTAs).
Holsteins observed an increase in PTAs for Milk, Fat, and Protein, while Jerseys saw a decline.
Updated Heifer Livability values reflect two years of additional data, enhancing reliability.
SNP List and BBR reference population updates bring notable changes for crossbred animal evaluations.
These changes aim to provide more accurate and contemporary genetic assessments to aid in better breeding decisions.
Have you ever wondered how the newest genetic evaluation updates may affect your herd? Or what would these upgrades imply for your future breeding decisions? If you answered yes, you’ve come to the correct spot. This August, the Council on Dairy Cattle Breeding (CDCB) announced several significant modifications in genetic assessments that would impact the dairy farming environment. We’re discussing new standards like the 305-AA yield measurement, Heifer Livability updates, SNP list revisions, and Breed Base Representation (BBR) values. These may seem complex, but stay with me—understanding them might be a game changer for your farm. These adjustments are more than modest modifications; they significantly influence the parameters you use to make essential breeding and management choices. I’ll review each one, from how Holsteins are increasing in milk, fat, and protein to why Jersey PTAs are declining.
You’ll also learn about the rippling effects on qualities such as Productive Life and Cow Livability. The August 2024 genetic examinations resulted in momentous developments that might change how you see your herd’s genetic potential. This is important because, let’s face it, keeping on top of genetic examinations will improve your herd’s production and, ultimately, your bottom line and open up new possibilities for growth and improvement on your farm. Intrigued? Let’s dig in and see what these changes imply for you and your farm.
The August 2024 CDCB Evaluations Brought Several Noteworthy Updates. Let’s Break Them Down:
The August 2024 CDCB evaluations brought several noteworthy updates. Let’s break them down:
305-AA Standardized Yield Measurement: This revision establishes a new standard for yield records, moving from 305-ME mature equivalent to a 36-month average age. It also revises age, parity, and season adjustment factors. This standardization is more precise in capturing environmental variables and is breed-specific.
Heifer Livability: The revised Heifer Livability ratings incorporate two years’ worth of lost data and additional editing criteria tailored to herd circumstances. This increases dependability and influences linked qualities such as Productive Life (PL) and Cow Livability (LIV).
SNP List and BBR Reference Population Updates: These changes include a new SNP list and a BBR reference population update, affecting purebred and crossbred animals’ status and genetic assessments. This modification has raised assessment variability, particularly in hybrid animals genotyped at low density or with incomplete pedigrees.
Why the 305-AA Change Matters for Your Dairy Farm’s Future
The launch of 305-AA has sparked interest among dairy producers. This is a gradual change but a substantial shift in how yield data are standardized. So, what precisely is 305-AA? Essentially, it is a technique of standardizing yield data that uses a 36-month average age rather than the older 305-ME (mature equivalent). This implies that the new approach considers the average age, parity, and seasonal modifications for five climatic areas in the United States. These improvements are intended to provide a more realistic picture of environmental variances. It is also breed-specific; therefore, the influence varies according to the breed.
Why does this matter? Accurate yield data is critical for making educated breeding and herd management choices. The new changes consider more specific environmental characteristics, providing a more precise evaluation customized to each breed.
Let’s get specific. For Holsteins, the 305-AA modification improved the Predicted Transmitting Ability (PTA) for Milk, Fat, and Protein. This has resulted in a minor increase in the Lifetime Net Merit $ (NM$) index, which typically ranges from +10 to +15 NM$, depending on whether we’re talking genetic or proven bull groupings. This is a welcome improvement for anyone interested in Holsteins.
On the other hand, the Jerseys have not fared well. Their PTAs for milk, fat, and protein decreased significantly—by around 100, -6, and -6 pounds, respectively. As a result, their NM$ index declined by an average of -70 to -50 NM$. Jersey breeders may be concerned about the long-term economic worth of their herds. Understanding the reasons for these changes in the Jersey breed is essential, as they can influence future breeding decisions.
You may ask why these adjustments were made. The fundamental goal is to improve the precision and accuracy of genetic tests, allowing you to make more informed choices about the future of your herd. While the change may be difficult for certain breeds, notably Jerseys, the ultimate objective is to use more accurate data to increase productivity and profitability. This reassurance should give you the confidence to make the best decisions for your herd.
Spotlight on Heifer Livability: Unpacking the CDCB Updates
The most recent CDCB revisions concentrate on heifer longevity values. Incorporating two years’ worth of previously overlooked data has resulted in larger-than-usual adjustments. Consider this: all of those missed records are suddenly coming into play! This change contributes to a better picture of heifer longevity, boosting animal dependability.
But that is not all. New editing criteria also focus more on herd circumstances. Although this is a modest change, it has a significant effect. Dairy producers like you can make better choices with more thorough and accurate data.
These Heifer Livability alterations also affect linked attributes. Productive Life (PL) indicates a minor average reduction of roughly -0.2. Cow Livability (LIV) is also indirectly impacted. How does this affect your day-to-day operations? Reliable data allows you to trust these assessments, knowing that the figures you’re looking at are more realistic representations of your herds.
SNP List and BBR Updates: What’s the Impact on Your Crossbred Animals?
The newest upgrades to the SNP list and BBR reference population have resulted in significant modifications. What’s fascinating is how these updates affect crossbred animals and the variation in their judgments. The reduced SNP list provides a more focused view of genetic markers, resulting in more accurate statistics.
However, increased accuracy leads to more considerable variability in crossbred assessments. Animals genotyped at low density or with inadequate pedigrees are especially vulnerable. In these circumstances, variations in BBR levels may substantially impact whether they are purebred or mixed. This directly affects the final Predicted Transmitting Abilities (PTAs) for crossbred animals, resulting in a wider variety of assessment outcomes.
The haplotype status has also changed due to the SNP list update. Specifically, changes to HH6 (the sixth Holstein haplotype regulating fertility) and JNS (Jersey Neuropathy with Splayed Forelimbs) have been improved to integrate more direct data. This implies that your herd’s genetic assessments are more accurate than ever. Be prepared for unexpected changes in particular animal ranks, but rest assured that you are now equipped with the most precise information to adapt to these changes.
Picture This: You’re Making Breeding Decisions and Planning for the Future of Your Herd
The most recent revisions to the CDCB assessments might be game-changers. How, you ask? Let’s dig in.
First, the new standardized yield measurement, 305-AA, significantly impacts yield attributes. An increase in Predicted Transmitting Ability (PTA) for Milk, Fat, and Protein may lead you to consider breeding Holsteins. “The slight upward trend of about +10 to +15 NM$ depending on the bull group can improve your herd’s overall productivity,” says industry expert Paul VanRaden [source]. In contrast, the significant fall in PTAs may cause you to rethink utilizing Jerseys for yield-based objectives for Jersey cattle.
The latest revisions to Heifer Livability include larger-than-usual modifications due to incorporating two years’ worth of missing information. This may influence your judgment on which heifers to keep or cull. Since Productive Life (PL) declined by an average of -0.2, you may choose heifers with higher livability ratings to maintain a more productive and long-living herd.
These modifications may have a financial impact on your income sources. For example, the new SNP list and BBR reference population updates may induce heterogeneity in crossbred animal assessments, particularly for those genotyped at low density or with incomplete pedigrees. If your farm uses mixed animals, you should reconsider the economic sustainability of retaining or growing this segment of your herd.
Consider the implications of HH6 and JNS haplotype status updates. With these new genetic insights, choosing animals that test negative for certain illnesses may become a priority, affecting your financial plans. Jay Megonigal emphasizes the need for rigorous herd management, citing recent studies that show high relationships between changes.
What’s the bottom line? These updates need dynamic changes to breeding techniques, herd management, and financial estimates. As a dairy farmer, remaining knowledgeable and adaptable is critical for adjusting to changing requirements and maintaining a healthy enterprise.
The Bottom Line
To wrap it up, the August 2024 CDCB evaluations have introduced significant changes essential for your farm’s sustainability and profitability. These adjustments can impact your herd’s genetic evaluations and overall performance, from the 305-AA standardized yield measurement to Heifer Livability, SNP lists, and BBR values updates. Staying informed about these updates can help you navigate the changes and plan effective breeding decisions. So, how will you adapt to these new evaluations to ensure your herd’s success? Keeping a close eye on these evaluations and understanding their implications can give you a competitive edge. Remember, your proactive approach could mean the difference between thriving and just getting by.
Learn about the new Holstein genetic evaluations for August 2024 and see how they’ll boost your farm’s fertility and productivity. Don’t miss out.
Come August 2024, the Holstein Association USA is shaking things up with an updated Fertility Index, rolled out alongside the official genetic evaluations. This game-changing move follows a recommendation from the Genetic Advancement Committee and has received the green light from the HAUSA Board of Directors.
The revamped Fertility Index brings together multiple reproductive components into a unified measure, including:
The ability to conceive as a maiden heifer
The ability to conceive as a lactating cow
The cow’s overall ability to resume cycling, show heat, conceive, and sustain a pregnancy
The new Fertility Index formula is:
FI = (0.4 x Daughter Pregnancy Rate) + (0.4 x Cow Conception Rate) + (0.1 x Heifer Conception Rate) + (0.1 x Early First Calving)
Significantly, this update involves a shift in weightings: The Daughter Pregnancy Rate has been scaled down from 0.7 to 0.4, while the Cow Conception Rate sees an increase from 0.1 to 0.4. This revamped Fertility Index is a crucial element of the Holstein Association USA’s Total Performance Index® (TPI®), a cornerstone for breeding decisions aimed at maximizing profit, efficiency, and fertility.
By focusing on TPI, dairy farmers can dramatically improve their bottom lines; the genetic excellence expressed by these high-TPI cows isn’t just a short-term advantage—it’s a legacy for future generations.
Discover how Lactanet’s updated Lifetime Performance Index will enhance dairy cow genetics by focusing on greenhouse gas reduction and milkability. Ready for the change?
The Lifetime Performance Index (LPI) is a pivotal tool in the Canadian dairy industry, aiding producers in breeding top-quality cows. It evaluates various traits like production, health, and fertility to help farmers enhance their herds. As Lactanet gears up to update the LPI early next year, the changes will refine trait weightings, add new subindexes, and introduce a sustainability element. This aims to improve focus on reducing greenhouse gas emissions and enhancing milkability, providing a more comprehensive tool for breeders while maintaining its trusted reliability.
As Brian Van Doormaal, Chief Services Officer at Lactanet, points out, “The expected response is relatively high when you breed for these traits.” His expertise in the field adds credibility to the information, keeping the reader engaged.
Navigating Genetic Selection: Leveraging the LPI to Cultivate Optimal Dairy Herds
The Lifetime Performance Index (LPI) is a critical tool for dairy producers, enabling precise and foresighted breeding of high-quality cows. Integrating traits like production, health, fertility, and longevity, the LPI provides a comprehensive genetic potential assessment. This holistic approach aids in identifying top performers and making informed breeding decisions tailored to producers’ specific goals, reinforcing the importance of the LPI in the dairy industry.
One of the LPI’s key strengths is its ability to evaluate traits directly impacting milk production and cow health. Producers can select cows excelling in these areas by analyzing milk yield, fat content, and protein levels, enhancing overall herd productivity. Simultaneously, health and fertility traits are meticulously evaluated, enabling the breeding of robust, resilient cows capable of maintaining peak performance.
Moreover, the LPI’s detailed sub-indexes for specific traits, such as reproduction and health & welfare, allow producers to focus on particular areas of interest. Whether improving calving ability, reducing disease incidence, or enhancing milking speed and temperament, the LPI provides targeted insights for meaningful genetic improvements. The LPI is a strategic guide that helps dairy producers navigate genetic selection complexities to achieve a balanced and optimized herd.
Modernizing the Framework: Enhancing the LPI for Contemporary Dairy Farming
The proposed changes to the Lifetime Performance Index (LPI) involve significant updates aimed at modernizing its framework to better reflect current priorities in dairy farming. The Health and Fertility group will be divided into two distinct subgroups: Reproduction, which now includes calving and daughter calving abilities, and Health and Welfare. A new Milkability subgroup will incorporate traits such as milking speed and temperament, which were not previously part of the LPI.
Another significant update is the inclusion of the Environmental Impact subindex, which initially focused on Holsteins due to available data. This subindex evaluates feed and methane efficiency, addressing the need to reduce greenhouse gas emissions. This change highlights Lactanet’s commitment to sustainability by considering how traits like body maintenance, which correlates with a cow’s stature and environmental footprint, impact feed energy usage.
These enhancements refine how breeders can utilize the LPI, offering precise tools for selecting traits that align with production, health, sustainability, and overall herd improvement. Despite these adjustments, the new LPI is expected to closely resemble its predecessor, retaining a 98% correlation with the current index.
Subtle Shifts, Significant Impact: Van Doormaal on the Continuity and Enhanced Precision of the Modernized LPI
Brian Van Doormaal, Chief Services Officer for Lactanet, emphasizes the subtle changes in the modernized LPI and their alignment with producers’ objectives. “It’s not the relative weighting that determines how much of an impact breeding for these traits could have,” Van Doormaal explained during the Open Industry Session webinar. “It’s your expected response when you breed for these traits. And in these cases, the expected response is relatively high.”
Van Doormaal underscores that the modifications will not compromise producers’ ability to concentrate on specific traits. He asserts, “When all the numbers are crunched, and the newly introduced traits are brought into the index, the list of top-rated bulls in the categories will remain largely unchanged today.”
He reassures that the anticipated consistency in top performers reflects the robustness of the current system. “What I believe we’ll be looking at next April is an LPI that will be 98 percent correlated with today’s LPI,” he noted. This continuity alleviates concerns among breeders about potential disruptions or strategic shifts.
Moreover, Van Doormaal points to the high expected response rates from breeding for the newly emphasized traits. This outcome is rooted in rigorous data analysis and the integration of new genetic discoveries, enhancing the predictability and efficiency of the breeding process. Thus, while the LPI evolves to include modern considerations, its core principles and effectiveness as a breeding tool remain steadfast.
Collaborative Consultations: Tailoring the LPI to Breed-Specific Genetic Goals
The consultation process between Lactanet and breed-specific organizations has been extensive and collaborative. Since Brian Van Doormaal’s initial proposal in October 2023, Lactanet engaged with Holstein, Ayrshire, Jersey, and Guernsey representatives to refine the modernized Lifetime Performance Index (LPI). Significant discussions focused on fat versus protein weightings, which vary by breed. For example, Holsteins may prioritize protein due to market demands, while other breeds may emphasize fat based on their production systems or consumer preferences. These consultations highlighted the diverse breed-specific goals within the LPI framework. Additionally, Holsteins addressed reproductive health issues like cystic ovaries, whereas Jerseys focused on balancing durability and production. This collaborative dialogue has been crucial in tailoring the LPI to meet the unique genetic goals of each breed.
Refined Genetic Insights: Expanding to Six Sub-Groups for Comprehensive Dairy Cow Evaluation
The new index will expand from four to six sub-groups of genetic traits, providing a more nuanced evaluation of dairy cow genetics. The existing Health and Fertility category will now be split into Reproduction and Health and Welfare sub-groups. This change includes specific traits like calving and daughter calving ability, offering a more detailed picture of reproductive performance.
Introducing the Milkability subgroup will also incorporate milking speed and temperament, which were previously not part of the LPI. By focusing on these practical traits, the modernized LPI aims to provide producers with more comprehensive and actionable genetic information.
Green Genes: Embedding Environmental Impact into Holistic Dairy Cow Selection
The Environmental Impact subindex marks a pivotal moment in genetic selection, highlighting the need for sustainable dairy farming. This subindex, initially for Holsteins, focuses on feed and methane efficiency to reduce the environmental footprint. Extensive data from Holsteins allows for a robust assessment of these traits. This subindex includes body maintenance, linking a cow’s size with its energy use. More giant cows need more energy for maintenance, affecting milk production. Integrating body maintenance ensures a holistic approach, combining efficiency in milk production with environmental responsibility.
Streamlined Insights: The Refined and Accessible LPI for Informed Breeding Decisions
Modernizing the Lifetime Performance Index (LPI) aims to refine metrics and enhance communication with dairy producers. The updated LPI offers a clearer understanding of a cow’s performance by reconfiguring existing genetic traits into six sub-groups. These subindexes – including Reproduction, Health and Welfare, Milkability, and Environmental Impact – provide specialized insights to guide targeted breeding strategies. For example, breeders looking to enhance milking speed and cow temperament can focus on the Milkability subgroup. Similarly, those interested in sustainability can reference the Environmental Impact subindex for feed and methane efficiency metrics. This structure allows each component to serve as a detailed genetic evaluation tool, aligning with specific breeding goals and operational realities.
Anticipated Outcomes: A Nuanced Yet Stable Transition for Dairy Producers
The revamped Lifetime Performance Index (LPI) promises a smooth transition for dairy producers. Integrating new traits like milk ability and environmental impact with existing core attributes, the modernized LPI offers a comprehensive cow evaluation. Van Doormaal highlights a 98 percent correlation with the current LPI, ensuring minimal changes in top-rated bulls and maintaining confidence in breeding decisions.
Precision in Breeding: Leveraging Relative Breeding Values for Clear Genetic Insights
Each sub-index evaluation will be presented as a “relative breeding value” (RBV), clearly measuring a bull’s genetic potential. The breed average is 500 with a standard deviation of ±100, standardizing trait evaluations for more straightforward interpretation. For instance, Lactanet’s analysis of Canadian Holstein bulls showed that 38.7% had RBVs between 450 and 550, 24% ranged from 350 to 450, and 25% fell between 550 and 650. This RBV system simplifies genetic evaluations and empowers breeders with breed-specific insights.
The Bottom Line
The modernized LPI represents a strategic evolution in dairy cow genetic evaluation, balancing productivity with enhanced health, welfare, and environmental sustainability. The revised LPI offers a more comprehensive tool for breeders by adding traits like calving ability and ecological impact. Consultations have ensured breed-specific needs, such as addressing cystic ovaries in Holsteins, are considered. Introducing relative breeding values makes the LPI user-friendly and effective for informed decisions. This new framework supports continuous herd improvement and aligns with the industry’s goal of reducing greenhouse gas emissions. As Brian Van Doormaal noted, while rankings may remain unchanged, the updated index promises greater precision and relevance, marking a step forward for the Canadian dairy industry.
Key Takeaways:
Emphasis on reducing greenhouse gas emissions with a new Environmental Impact subindex, including feed efficiency and methane efficiency, available initially for Holsteins due to data availability.
Division of the Health and Fertility group into separate Reproduction and Health and Welfare sub-groups, adding traits like calving ability and daughter calving ability.
Introduction of the Milkability subgroup to encompass milking speed and temperament traits, enhancing cow manageability in dairy operations.
Body Maintenance is included in the Environmental Impact subindex to factor in the environmental cost of maintaining a cow’s condition relative to its milk production capacity.
The modernized LPI aims to remain highly correlated with the current index, ensuring continuity while incorporating new traits.
Lactanet’s consultations with breed-specific organizations ensure the updated LPI will account for the unique genetic goals and concerns of different dairy breeds.
The updated LPI framework will streamline use, presenting evaluations as relative breeding values based on a standardized breed average, facilitating easier decision-making for breeders.
Summary:
The proposed modernization of the Lifetime Performance Index (LPI) by Lactanet aims to refine genetic selection for Canadian dairy cows by introducing new sub-groups and traits, emphasizing sustainability through reduced greenhouse gas emissions and enhanced milkability, and maintaining breed-specific goals. Brian Van Doormaal assures that these changes will not impede the core utility of the LPI for breeding high-quality cows, with the expected outcome being a closely correlated index to today’s LPI. Detailed consultations and analyses reveal that while nuanced adjustments will provide more precise breeding values, the top genetic performers will largely remain consistent.
Discover the latest updates in genetic evaluations from CDCB and USDA AGIL. How will the new 305-AA yield measurement and Constructed IDs impact your herd?
CDCB and USDA Animal Genomics and Improvement Laboratory (AGIL) implemented essential changes to improve genetic assessment accuracy on August 13, 2024. This paper underlines these critical developments and their advantages for the dairy sector. Supported by USDA AGIL’s innovative genomics research, CDCB is well-known for its exact genetic assessments. Among other improvements, the adoption of Constructed IDs and 305-AA standardized yield measurement highlights their dedication to precision and innovation, increasing the dairy industry’s output and sustainability.
CDCB and USDA AGIL Introduce the New Standardized Yield Measurement Known as 305-AA
In a step meant to transform dairy genetics, the USDA AGIL and CDCB have unveiled the new standardized yield measurement known as 305-AA. This much-awaited change departs significantly from the mature equivalent (ME) standard, effective since 1935. Standardized yield records now benchmark the average age of 36 months or 305-AA. Inspired by current studies, this adjustment marks a methodological turn to reflect a more contemporary dairy environment.
The new 305-AA yield assessment replaces changes relied upon over the last 30 years and incorporates updated age, parity, and season parameters. The recalibrated changes seek to permit fair phenotypic comparisons among cows of various ages, sexes, and calving seasons. The main objective is to evaluate dairy performance under many settings and management strategies.
One significant modification is adjusting herd averages to approach real yields. Under the former ME method, breed-specific yield projections varied by around 10 percent higher than actual yields. Effective June 12, 2024, the estimates of the 305-AA yield become available via CDCB’s WebConnect for animal and data searches. Moreover, the officially adopted, on August 13, 2024, new 305-AA changes are entirely included in the CDCB genetic examinations.
Table 1. The ratio of mature equivalent to 36-month equivalent milk, fat, and protein yields from 1994 or recent data
Breed
1994 Factor
ME / 36-month SD ratio in recent data
Milk
Fat
Protein
Ayrshire
1.10
1.092
1.076
1.067
Brown Swiss
1.15
1.156
1.150
1.142
Guernsey
1.05
1.043
1.009
1.013
Holstein
1.10
1.082
1.081
1.059
Jersey
1.10
1.079
1.063
1.064
Milking Shorthorn
1.15
1.110
1.100
1.090
This move from 305-ME to 305-AA offers a perceptive analogy. Recent data shows that standardized yields calculated from the 1994 ME factors are routinely more significant than those adjusted to the 36-month equivalent. This change marks a reassessment of yield projections to more closely reflect the contemporary dairy environment and current dairy animal performance.
A vital component of this shift is the modification in standard deviation (SD) “ME / 36-month” ratios, usually seen to be somewhat greater in earlier data than in recent changes. These little variations indicate calibrating output estimations to fit modern dairy production methods and genetic developments.
For predicted transmitting abilities (PTAs), these changes have significant ramifications. Updated ratios closer to 1.08 for Holsteins (HO) and Jerseys (JE) and generally more tiny numbers for fat and protein point to a minor scaling or base adjustment in PTA values. These changes assist representative assessments of dairy cow genetics, improving the validity and applicability of these measures according to contemporary industry requirements. Thus, a sophisticated, data-driven approach to genetic studies helps the dairy industry by promoting informed breeding and management choices.
Enhancing Precision: Modern Dairy Environments and Refined Seasonal Adjustments
Recent data analysis has improved seasonal adjustments to reflect the effect on lactation yields of the changing dairy environment. Modern architecture and construction methods have lessened the seasonal impact on yields, hence stressing improvements in dairy settings. The revised approach reveals minor variations by estimating seasonal impacts within five separate climatic zones defined by average state climate scores. This change emphasizes the advantages of better dairy conditions, lessening the need for significant seasonal changes and more accurate genetic tests. This method guarantees lactation yields are assessed in a framework that fairly represents current environmental and management circumstances using region-specific modifications, enabling more precise and fair comparisons of dairy output.
Robust Validation: Testing New Factors Across Decades of Lactation Records
The new parameters were tested rigorously using 101.5 million milk, 100.5 million fat, and 81.2 million protein lactation data from 1960 to 2022. The validation focused on the relationships of Predicted Transmitting Ability (PTAs) for proven bulls born after 2000. Results were rather good, with correlations of 0.999 for Holsteins, above 0.99 for Jerseys and Guernseys, and somewhat lower, ranging from 0.981 to 0.984, for Brown Swiss and Milking Shorthorns. These strong connections underscore the dependability of the new elements. The study also observed minor changes in genetic trends: a decline for Brown Swiss and Jerseys and a rise for Guernseys. These revelations help us better evaluate our genes, guaranteeing justice and ongoing development.
Revolutionizing Genetics: The Full Integration of Constructed IDs into the CDCB Database
When fully adopted by August 2024, Constructed IDs represent a significant turning point for CDCB. Targeting partial pedigrees, particularly for animals without maternal ancestry information, this invention launched in mid-2023 and ends in July 2024. Constructed IDs link approximately 3.2 million animals in the National Cooperator Database to newly discovered relatives, developed by significant research by USDA AGIL using over a decade of genetic technology experience.
This improvement increases the dependability and accuracy of genetic tests. The worldwide influence is significant given these complex interactions across the closely linked U.S. dairy community. More precise breeding choices help directly impacted and related animals to improve their genetic quality and raise U.S. assessments. Designed IDs strengthen the genetic bases for further development by filling critical pedigree gaps.
Refined Criteria and Data Integration: Elevating Heifer Livability Evaluations for Improved Genetic Precision
Recent improvements in heifer liability (HLV) show how committed the USDA AGIL and CDCB are to accuracy and dependability in genetic assessments. Fundamental changes exclude recent heifer fatalities from 2022–24 and rectify previously missed data resulting from changes in cow termination codes. These wholly integrated reports improve HLV assessments immediately. Improving the speed and depth of evaluations is a crucial modification that calls for a minimum of 1 percent mortality loss annually for the data of a herd to be legitimate. Faster adaptability to evolving reporting methods made possible by this change from cumulative to yearly criteria guarantees current herd health dynamics are faithfully captured. These improvements have generally resulted in a significant increase in the dependability of HLV assessments, particularly for bulls with daughters in the most recent data sets, generating more robust genetic predictions for offspring and informed breeding choices.
Pioneering Genetic Insights: Brown Swiss Rear Teat Placement (RTP) Evaluation
A significant turning point in dairy cow breeding is the introduction of the conventional and genomic assessment for Brown Swiss Rear Teat Placement (RTP). Using about 15,000 assessments from January 2024, CDCB and USDA AGIL accurately calculated the RTP parameters. On the 50-point linear scale, about 80 percent of the evaluations lie between 25 and 35 points. Heritability for RTP is 0.21, somewhat similar to front teat placement at 0.22; repeatability is 0.33.
Ranges for Rear Teat Placement in Brown Swiss
Predicted Transmitting Abilities (PTA)
Reliabilities
Males
-2.4 to 3.1
0 to 98%
Females
-3.7 to 2.9
0 to 79%
For bulls with reliabilities between 0 and 98% and for women between 0 and 79%, the PTA values for RTP in Brown Swiss are -2.4 to 3.1 and -3.7 to 2.9, respectively. This assessment uses exact measures and rigorous statistical techniques and emphasizes genetic heterogeneity within the breed.
Breeding choices depend on this thorough assessment, which helps farmers choose ideal RTP characteristics, enhancing herd quality and production. Driven by reliable, data-based conclusions, the August 2024 release of these assessments marks a new chapter in Brown Swiss genetics.
Refined Precision: Streamlining Genetic Markers for Enhanced Genomic Predictions
Effective August 2024, the genetic marker update improved the SNPs used in genomic predictions, lowering the list from 78,964 to 69,200. This exact choosing approach removed low call rates, poor genotyping quality, minor allele frequencies, and markers with minimal effects. The X chromosome’s length allowed all SNPs to be maintained there. This update improved efficiency by helping to reduce processing time and storage usage by 12%. About 74% of the deleted SNPs originated from high-density chips.
Five other gene tests—HH7 and Slick, among others—were also included in the update. Confirming the low effect on trait averages and standard deviations, preliminary studies revealed a roughly 99.6% correlation between genomic predictions from the old and new SNP lists. For animals with less dense genotypes or partial pedigrees, this recalibration improves the accuracy of genetic assessments.
Incorporating Genomic Advancements: Annual Breed Base Representation (BBR) Updates
Accurate genetic evaluations depend on annual Breed Base Representation (BBR) revisions. This update, set for August, guarantees that the most relevant genetic markers are included in BBR calculations. Consistent with past upgrades, a test run based on February 2024 data confirmed the stability and strength of the new SNP set. The CDCB maintains BBR calculations at the forefront of genetic assessment by including this improved SNP set, giving dairy farmers the most reliable data for informed breeding choices.
Integrating Cutting-Edge Gene Test Data: Enhancing Haplotype Calculations for Holstein HH6 and Jersey JNS
A significant step forward in genetic assessments is combining Holstein Haplotypes 6 (HH6) and Jersey Neuropathy with Splayed Forelimbs (JNS) direct gene test data into haplotype calculations. By providing thorough gene test results to CDCB, Neogen and the American Jersey Cattle Association (AJCA) have been instrumental in this process. More exact haplotype estimations have come from including these direct gene tests in imputation procedures. Test runs greatly increase performance, Particularly for animals with gene test results and their offspring. This integration improves genetic prediction accuracy and emphasizes the need for cooperation in enhancing dairy cow genes.
The Bottom Line
Incorporating innovative modifications to maximize yield metrics, genetic evaluations, and pedigree correctness, the August 2024 genetic assessments signal a turning point in dairy herd management. These advances improve the dependability and accuracy of tests. While improved seasonal and parity corrections reflect current conditions, the new 305-AA standardizes yield measures for fair comparisons. We designed IDs to decrease pedigree gaps, improving assessments and criteria for Heifer Livability (HLV) and rear teat placement for Brown Swiss. Simplified genetic markers and combined genomic advances such as HH6 and JNS gene testing further improve assessment accuracy. These developments provide consistent data for farmers, enhancing the general health and output of dairy cows. Supported by a thorough study, the August 2024 assessments mark a significant breakthrough and inspire manufacturers to use these innovative approaches for more sustainability and efficiency.
Key Takeaways:
The 305-AA standardized yield records, adjusted to 36 months, replace the previous mature equivalent (ME) adjustments.
Implemented new factors enable fairer phenotypic comparisons across cows of different ages, parities, and seasons.
Seasonal adjustments are now estimated within regional climate zones, reflecting improved management and housing reducing environmental impact on yields.
Implementation of Constructed IDs enhances pedigree completeness and genetic evaluation accuracy.
Heifer Livability (HLV) evaluations refined through revised modeling and data integrations, particularly focusing on recent years’ reports.
Brown Swiss Rear Teat Placement (RTP) evaluations introduced, offering significant genetic insights with traditional and genomic evaluations.
Reduction of SNPs from 78,964 to 69,200 for streamlined genomic predictions, enhancing processing time and accuracy.
Annual BBR updates incorporate the new set of SNP markers, ensuring consistency and precision in breed representation.
Direct gene tests for Holstein HH6 and Jersey JNS now included in haplotype calculations, improving prediction accuracy.
Summary:
The CDCB and USDA Animal Genomics and Improvement Laboratory (AGIL) have introduced a new standardized yield measurement, 305-AA, on August 13, 2024. This change allows fair comparisons among cows of various ages, sexes, and calving seasons. The revised approach estimates seasonal impacts within five separate climatic zones. Robust validation of the new parameters was conducted using 101.5 million milk, 100.5 million fat, and 81.2 million protein lactation data from 1960 to 2022. Results showed good correlations for Holsteins, Jerseys, Guernseys, Brown Swiss, and Milking Shorthorns. The August 2024 genetic assessments represent a significant turning point in dairy herd management, enhancing the dependability and accuracy of genetic tests. Constructed IDs link approximately 3.2 million animals in the National Cooperator Database to newly discovered relatives, improving genetic quality and raising U.S. assessments.
Explore the transformative power of AI, robotics, and genomics in dairy cattle breeding. How can these innovative technologies and scientific breakthroughs redefine breeding strategies for the future?
Imagine a world where dairy cattle breeding is no longer an art form but a reliable science. Genomics has revolutionized dairy farming, allowing farmers to make informed decisions by identifying desirable traits at a genetic level. However, the complexities of large datasets often hinder the full potential of these insights. Enter Artificial Intelligence (AI), a transformative technology set to redefine dairy cattle breeding. By integrating AI with genomics, farmers can optimize breeding strategies to enhance productivity and ensure cattle health and well-being. This data-driven approach replaces intuition with precision and predictive analytics.
The fusion of AI and genomics unlocks the unseen genetic potential of herds, driving efficiency like never before. In this evolving landscape, machine learning, deep learning, robotics, and fuzzy logic become essential tools, revolutionizing genetic strategies in dairy farming. Dairy farmers who adopt these technologies can achieve greater production efficiency and breed healthier, more resilient cattle suited to changing environmental conditions.
The Genomic Revolution in Dairy Cattle Breeding
Genomics has revolutionized dairy cattle breeding by making the process more efficient and predictable. Breeders can accurately identify and select desirable traits such as increased milk production and better disease resistance through genomic selection.
By analyzing genomes, researchers pinpoint genetic markers linked to desired traits, enabling early predictions of an animal’s potential. For instance, markers for higher milk yields help breeders choose cattle likely to produce more milk, while markers for disease resistance lead to healthier livestock, reducing veterinary costs.
This genomic revolution surpasses traditional methods that rely on observable traits and pedigrees. Leveraging vast genetic data, breeders directly link genotype to phenotype, enhancing breeding precision and accelerating genetic progress by reducing generation intervals.
The implementation of genomic selection has significantly increased the rate of genetic gain in dairy cattle. Traits such as milk production, fertility, and health have seen doubled or even tripled annual genetic gains, attributable to identifying superior animals at a younger age.
Genomic selection also enhances the accuracy of breeding values. By integrating genomic information, breeders make more precise predictions of genetic merit, leading to reliable selection decisions and quicker dissemination of desirable traits.
Economically, increased genetic gain translates to improved productivity, better animal health, and higher profitability for dairy farmers. Enhanced genetic potential contributes to efficient milk production, reduced veterinary costs, and sustainability.
However, challenges persist, such as limited genomic datasets and initial costs for genomic technologies, which can be prohibitive for smaller operations. Continuous data collection and analysis improvements are essential to overcome these limitations, fostering a more sustainable and productive dairy industry.
Harnessing AI: A New Horizon for Dairy Farming
Artificial intelligence (AI) simulates human intelligence in machines, enabling them to recognize patterns, make decisions, and predict outcomes. AI includes multiple subfields, such as machine learning, deep learning, and natural language processing, each driving the progress of intelligent systems.
AI significantly benefits dairy farmers by enhancing productivity, efficiency, and animal welfare. Farmers gain deeper insights into their herds, optimize breeding programs, and improve overall farm management through AI. This technology quickly processes enormous data sets, manually delivering actionable, unachievable insights.
A key AI advantage in dairy farming is its ability to predict and monitor cattle health. Machine learning algorithms process data from sensors and wearables to detect early signs of illness or stress, allowing timely intervention to prevent disease outbreaks. This proactive approach improves animal welfare, reduces veterinary costs, and boosts milk production.
AI also streamlines farm operations by automating routine tasks. AI-driven robotics handle milking, feeding, and cleaning, cutting labor costs and freeing farmers for strategic activities. These systems operate with high precision and consistency, ensuring optimal milking and feeding times, increasing milk production, and enhancing animal health.
AI is transformative for dairy farming, offering benefits like improved herd management, enhanced breeding programs, and automation of labor-intensive tasks. This technological advancement boosts productivity, profitability, and sustainability while promoting animal welfare in the dairy industry.
AI-Powered Genetic Evaluations: The Future of Dairy Cattle Breeding
Artificial Intelligence (AI) is poised to transform dairy cattle genetic evaluations. It leverages machine learning to analyze extensive datasets that include genetic information, phenotypic traits, and environmental variables. These advanced models reveal intricate patterns within the data, resulting in significantly more accurate predictions of genetic merit and breeding values, refining selection decisions and strategies.
Deep learning, a specialized branch of machine learning, substantially enhances genetic evaluations. With algorithms like neural networks, deep learning processes enormous volumes of data and detects nuanced, non-linear relationships that traditional methods frequently miss. These sophisticated models incorporate various data types, including genomic sequences, to accurately forecast traits such as milk yield, disease resistance, and fertility.
Furthermore, AI fosters the integration of genomic data into breeding programs. AI identifies genes and genetic markers associated with desirable traits by concurrently analyzing genomic and phenotypic data. This genomic selection accelerates genetic progress by enabling earlier selection of animals, thus reducing the generation interval.
AI systems are robust and adaptive, continuously learning from new data to ensure that genetic evaluations remain precise over time. This continuous learning capacity contributes to sustainable and efficient breeding programs. Incorporating environmental and management factors through AI further refines the accuracy of genetic evaluations. By considering aspects such as diet, housing, and health management, AI effectively isolates the genetic components of traits, leading to more precise breeding value estimates.
Fuzzy logic, another facet of AI, addresses the inherent uncertainty and variability in genetic evaluations. It models complex biological processes to make informed decisions based on incomplete information. This is crucial in dairy cattle breeding, where multiple genetic and environmental interactions influence trait expression.
AI-driven evaluations also enable the development of customized breeding strategies tailored to specific herd goals and conditions. By analyzing herds’ genetic and phenotypic profiles, AI recommends optimal breeding plans that consider factors such as inbreeding, genetic diversity, and economic returns.
In conclusion, the application of AI in genetic evaluations is set to revolutionize dairy cattle breeding strategies. By harnessing machine learning, deep learning, and fuzzy logic, breeders can achieve more accurate, efficient, and sustainable genetic improvements, enhancing the productivity and health of dairy cattle.
AI-Driven Dairy Cattle Type Classification: The Confluence of Machine Learning, Robotics, and Fuzzy Logic
Implementing artificial intelligence (AI) in dairy cattle classification aims to revolutionize the industry by deploying machine learning algorithms to decipher vast datasets. AI can identify intricate patterns that differentiate types with remarkable precision by training models on both visual inputs and physical attributes of cattle.
Regarding deep learning, Convolutional Neural Networks (CNNs) represent a pinnacle of technological advancement in this domain. These networks detect and analyze visual features in cattle images, such as body conformation and udder development, thereby enabling precise classification based on these characteristics.
Integrating diverse data sources, including genomic information and milk yield records, further enriches the AI’s classification capabilities. By combining phenotypic and genotypic data, AI offers a holistic view of genetic potential and health, paving the way for well-informed breeding decisions.
Robotic technology can significantly enhance the accuracy and efficiency of cattle classification processes. Automated systems equipped with cameras and sensors gather real-time data, enabling AI models to perform immediate classifications, thereby minimizing reliance on manual inspections and reducing human error.
Fuzzy logic adds another layer of sophistication by managing the inherent uncertainties within biological data. This technology allows AI to make more nuanced decisions by catering to natural animal trait variations, resulting in more flexible and accurate classifications.
The confluence of AI, deep learning, robotics, and fuzzy logic in dairy cattle classification heralds a new era of precision, efficiency, and data-driven breeding strategies. This synergistic approach not only boosts productivity but also enhances the sustainability of dairy farming.
Augmenting Genetic Advancement through Robotics: Automating Precision and Elevating Genomic Accuracy
Robotics is pivotal in genetic advancement, automating and optimizing phenotypic data collection. High-precision robots can monitor and record real-time health and productivity metrics like milk yield and behavior. This is crucial for accurate genomic predictions and training AI models to identify desirable traits.
When combined with AI, robotics can enhance the speed and accuracy of genetic selection. AI algorithms analyze data collected by robots, identifying patterns and correlations often missed by humans. This enables a more precise selection of breeding pairs and accelerates the development of superior dairy cattle.
Robotics ensures consistent and reliable data collection, which is vital for genomic studies. While human error can skew results, robots perform repetitive tasks with high precision, ensuring data accuracy and consistency.
Incorporating robotics improves animal welfare, a critical factor in genetic advancement. Robots more accurately monitor cattle health, allowing early detection of issues and ensuring only healthy animals are selected for breeding, thereby enhancing overall genetic quality.
The integration of robotics with genomics and AI supports precision farming techniques. Robots with advanced sensors gather detailed environmental and physiological data, enabling more effective breeding strategies and ensuring genetic advancements are viable in real-world conditions.
Robotics also streamlines genetic testing and manipulation. Automated systems handle DNA tasks with incredible speed and accuracy, reducing time and cost and making advanced genomic techniques feasible on a larger scale.
Using robotics, AI, and genomics fosters sustainable dairy farming. Optimized breeding strategies produce cattle that are efficient in feed conversion and milk production, reducing the environmental footprint and aligning with global sustainability efforts.
The Horizon for Dairy Cattle Breeding Gleams with Promise
The horizon for dairy cattle breeding gleams with promise, as integrating advanced technologies like machine learning and robotics offers unmatched opportunities for genetic enhancement. AI-powered genetic evaluations predict a future where precision breeding programs focus on efficiency, disease resistance, animal welfare, and adaptability. This melding of tech and biology marks a new era where each cow’s genetic potential is mapped and harnessed for optimized output and sustainability.
However, this path isn’t without challenges. Ethical issues, especially concerning genetic manipulation and animal welfare, demand robust frameworks for responsible implementation. The vast data from advanced breeding programs pose privacy risks, necessitating stringent cybersecurity measures and regulations.
Additionally, the complexity of modern breeding technology highlights the need for farmer education and training. Farmers must navigate a landscape filled with new terms and machinery. Structured educational and hands-on training programs are crucial to bridge this knowledge gap and ensure all stakeholders benefit from these innovations.
While AI, genomics, and robotics promise to transform dairy cattle breeding, their proper potential hinges on conscientious implementation. Addressing ethical concerns, safeguarding data, and equipping farmers with the right skills will drive a productive, moral, and resilient dairy industry forward.
The Bottom Line
The emergence of machine learning, deep learning, robotics, and fuzzy logic, coupled with the groundbreaking advancements in genomics, promises to reshape dairy cattle breeding strategies fundamentally. Throughout this article, we have examined how the integration of cutting-edge technologies, such as AI-powered genetic evaluations and robotics, is heralding a new era in dairy farming. We’ve discussed how AI significantly enhances genetic predictions, delivering unprecedented precision and efficiency. Furthermore, the synergy of robotics and precision farming facilitates the automation of pivotal breeding tasks, thereby improving the accuracy of genomic evaluations. Synthesizing this information, it becomes evident that the fusion of AI and genomics represents a revolutionary shift in dairy cattle breeding. These advancements elevate our capabilities, from boosting genetic quality to optimizing animal welfare and farm productivity. Looking ahead, the potential of these innovations is vast, foreshadowing a future where dairy farming is more efficient, sustainable, and responsive to cattle’s genetic and health requisites. The convergence of artificial intelligence with genomic science is not just the future of dairy breeding—it is a transformative stride towards a more sophisticated, responsible, and prosperous dairy industry.
Key Takeaways:
Artificial Intelligence and genomics are transforming dairy cattle breeding strategies, ushering in a new era of precision and efficiency.
Machine learning and deep learning algorithms enhance the accuracy of genetic evaluations, empowering farmers to make data-driven decisions.
Integration of robotics in dairy farming automates complex tasks, thereby increasing productivity and improving the well-being of the cattle.
Fuzzy logic systems contribute to better decision-making processes by handling uncertainties and providing adaptable solutions in variable conditions.
The intersection of AI, robotics, and genomic research promises to elevate genetic gains and bolster the sustainability of dairy farming.
Continuous innovation and refinement in technology and breeding programs are crucial for adapting to industry changes and maintaining competitive advantage.
A comprehensive understanding of consumer perceptions and effective communication strategies is vital for the successful implementation of advanced technologies in dairy systems.
Investing in precision livestock farming (PLF) systems necessitates thorough consideration of the types of technologies, data management methods, and AI-driven data interpretation mechanisms.
The rapid growth of genomic evaluation programs, as evidenced by advancements in the United States, highlights the potential for global improvements in dairy cattle breeding.
Summary:
Dairy cattle breeding has evolved significantly with genomics, enabling farmers to make informed decisions by identifying desirable traits at a genetic level. However, the complexities of large datasets often hinder the full potential of these insights. Artificial Intelligence (AI) is set to redefine dairy cattle breeding by integrating AI with genomics, allowing farmers to optimize breeding strategies to enhance productivity and ensure cattle health and well-being. This data-driven approach replaces intuition with precision and predictive analytics. Machine learning, deep learning, robotics, and fuzzy logic are essential tools in this evolving landscape, revolutionizing genetic strategies in dairy farming. Genetic revolution surpasses traditional methods by enabling accurate identification and selection of desirable traits, such as increased milk production and better disease resistance. However, challenges persist, such as limited genomic datasets and initial costs for genomic technologies. Continuous data collection and analysis improvements are essential for a more sustainable and productive dairy industry.
Uncover the critical variations in dairy cattle genetic assessments for conformation and PTAT between Canada and the USA. What implications do these standards hold for breeding practices?
For breeders aiming to produce the next World Dairy Expo Champion or an EX-97 cow, utilizing the American PTAT or the Canadian Conformation index is not just an option—they are essential tools in your breeding arsenal. While both PTAT and Conformation indices are invaluable, they are not interchangeable. This article will explore the distinctions between Canadian and American genetic evaluations for conformation and PTAT, shedding light on how each system functions and what sets them apart.
The Evolution of Genetic Evaluation Systems in Dairy Cattle: A Tale of Two Nations
The historical trajectory of genetic evaluation systems in dairy cattle within Canada and the USA signifies an evolution of both countries’ dairy industries. Originally hinging on fundamental pedigree analysis, these systems have dramatically advanced with cutting-edge genetic technology and data analytics. Canada launched its first formal genetic evaluation for dairy cattle in the mid-20th century, focusing on production traits. By the 1970s, Canadian dairy scientists incorporated type traits, utilizing linear classification systems to quantify conformation characteristics. This method allowed breeders to objectively evaluate and select superior dairy cattle based on body and udder traits.
In parallel, the USA advanced from essential herd records to sophisticated evaluations, incorporating production and type traits by the 1980s. A key milestone was the establishment of Predicted Transmitting Ability (PTAT), revolutionizing how type traits were genetically assessed. PTAT provided a standardized measure allowing breeders to predict genetic merit regarding conformation, facilitating more informed breeding decisions.
The 1990s and early 2000s marked a crucial phase with genomic evaluations. Canada and the USA swiftly integrated genomic data, increasing accuracy and efficiency. Genomic selection enabled early identification of desirable traits, accelerating genetic progress and enhancing herd quality. Collaborative efforts between Canadian and American dairy geneticists have recently refined methodologies, incorporating advanced statistical models and extensive phenotype databases.
Today, the genetic evaluation systems in both nations reflect a blend of historical advancements and modern innovations. Conformation and PTAT assessments are entrenched in a framework valuing genetic merit for production, longevity, health, and robustness, ensuring dairy cattle improvement remains responsive to the industry’s evolving demands.
Dairy Cattle Conformation in Canada: An Intricate Evaluation Framework
Genetic evaluations for dairy cattle conformation in Canada meticulously examine a comprehensive set of traits. Key characteristics like stature, chest width, body depth, angularity, rump angle, and leg traits are assessed to ensure aesthetic appeal and functional efficiency, particularly for durability and productivity.
Mammary system traits, including udder depth, teat length, and placement, are critical for milking efficiency and udder health. Feet and leg conformation, which is vital for mobility and longevity, is also evaluated.
In Canada, conformation blends individual traits like udder attachment and teat placement into a single index. Each trait is scored meticulously, providing a detailed evaluation of an animal’s overall conformation. This approach helps breeders make informed decisions, improving dairy cattle’s genetic quality and functional efficiency. Integrating these traits into one index highlights the importance of a balanced dairy cow. Traits such as udder conformation, feet, leg health, and overall robustness work together to enhance performance and longevity in a herd.
The Canadian Dairy Network (CDN) spearheads this complex evaluation process. Utilizing advanced genetic methodologies, the CDN integrates phenotypic data with genetic models to offer accurate breeding values. This scientific approach strengthens the genetic quality of the Canadian dairy herd.
Supporting organizations, such as Lactanet and Holstein Canada, play crucial roles. Lactanet provides comprehensive herd management services, including conformation assessments. Holstein Canada sets standards and trains classifiers for consistent on-farm evaluations. These organizations form a network dedicated to enhancing the genetic standards of dairy cattle through diligent conformation evaluations, supporting breeders in informed selection decisions, and maintaining Canada’s reputation for producing world-class dairy cattle.
PTAT and Comprehensive Type Evaluation in the United States: A Framework for Genetic Excellence
In the United States, dairy cattle conformation evaluation hinges on the Predicted Transmitting Ability for Type (PTAT) and a detailed type evaluation system. Unlike Canada, where conformation is a composite index of individual traits, PTAT in the United States is calculated based on the final classification score about herd mates. PTAT assesses an animal’s genetic potential to pass on type traits to its offspring, focusing on various aspects of physical structure, such as stature, body depth, and udder conformation. Critical traits include:
Stature: The height of the animal at the shoulders and hips.
Udder Depth: The distance from the udder floor to the hock affects milk production efficiency.
Body Depth: The depth of the ribcage, indicating overall body capacity.
Foot Angle: The angle and structure of the foot influence mobility and longevity.
Rear Leg Side View: The curvature of the rear legs when viewed from the side.
These traits are meticulously recorded and analyzed for a robust genetic evaluation. Under the USDA, the Council on Dairy Cattle Breeding (CDCB) leads the effort in collecting, analyzing, and sharing genetic and genomic evaluations. Their extensive nationwide database, sourced from dairy farms, provides comprehensive genetic insights.
Breed-specific organizations like the Holstein Association USA and the American Jersey Cattle Association (AJCA) refine evaluations for specific breeds. They collaborate with the CDCB to ensure accurate and relevant assessments, offer educational resources to breeders, and promote best practices in genetic selection. This collaborative framework ensures that U.S. dairy farmers have access to cutting-edge genetic information, enhancing the genetic merit of dairy herds and advancing dairy cattle breeding nationwide.
Unified Yet Diverse: Genetic Indices Shaping Dairy Excellence in North America
For decades, significant efforts have been undertaken to harmonize the evaluation of type traits and the classification programs generating the requisite data for genetic evaluations on an international scale. While substantial progress has been achieved, occasional surprises still emerge. These unforeseen developments typically pertain not to production traits but to type and management traits.
In Canada, Conformation is quantified on a scale where each standard deviation equals five points. Conversely, the United States expresses PTAT in standard deviations. Consequently, a confirmation score of 5 in Canada generally corresponds to a PTAT score of 1 in the U.S. However, assuming a direct equivalence between a PTAT of 1 and a Conformation score of 5 can be misleading. Lactanet in Canada recently conducted an extensive study comparing over 4,000 bulls with daughters and genetic proofs in both countries to elucidate this. The correlation between the TPI and LPI was notably high at 0.93. Interestingly, the correlation between Canada’s Pro$ and the TPI was even higher, reaching 0.95. As anticipated, production traits demonstrated strong correlations, with Milk at 0.93, Fat at 0.97, and Protein at 0.95, given that production can be measured objectively. However, the variations were more pronounced when evaluating the type of health and management traits.
Type Indexes
The correlation between PTAT in the United States and Conformation in Canada is 0.76. In the United States, the direct contribution of type to the Total Performance Index (TPI) emerges from three primary sources: the PTAT (8%), the udder composite (11%), and the feet & leg composite (6%). In Canada, these components are called Conformation, Mammary System, and Feet & Legs, respectively. A crucial point to understand is that these are composite indices composed of various individual traits within each category, and each nation applies a distinctive formula to weight these traits. Consequently, the differing weightings lead to modestly lower correlations for udders (0.80) and feet & legs (0.65). It’s also essential to recognize that both composites are adjusted in each country to be independent of stature. This adjustment allows for the specific selection of udder or leg improvements without inadvertently promoting increased stature.
Mammary System
Among the mammary system traits, evaluations of Udder Depth (0.95), Teat Length (0.94), Rear Teat Placement (0.90), Fore Teat Placement (0.87), and Fore Attachment (0.93) exhibit remarkable consistency between Canada and the United States. Nevertheless, a divergent perspective emerges with Median Suspensory (0.73), Rear Udder Height (0.78), and Rear Udder Width (0.66), which display significantly lower correlations. This disparity suggests that traits such as rear udder height, rear udder width, and suspensory ligament are appraised with varying degrees of emphasis and interpretation in each country.
Feet and Legs
Feet and legs exhibit a moderate correlation of 0.65 between Canada and the United States. Examining specific traits within this category, the rear leg side view reveals a high correlation of 0.91, indicating substantial similarity between the countries. However, the rear leg rear view (0.76) and foot angle (0.73) diverge more significantly. A noteworthy distinction lies in the traits recorded: while foot angle is commonly observed globally, Canada also measures heel depth. The rationale behind this difference stems from the susceptibility of foot angle to recent hoof trimming, a variable that does not affect heel depth.
The overarching objective of selecting for superior feet and legs is to mitigate lameness and enhance longevity. In Canada, the mammary system exhibits a 0.25 correlation with herd life, slightly higher than the composite feet and legs score of 0.22. Yet, individual traits within this composite tell a different story. Foot angle shows a negative correlation with longevity at -0.16, whereas heel depth, boasting a positive correlation of +0.20, stands out prominently. This raises a pertinent question: why is heel depth not universally recorded over foot angle?
Further analysis of specific traits reveals minimal impact on longevity. The rear leg side view holds a correlation of -0.08, the rear leg rear view is 0.03, locomotion is 0.05, and bone quality is a mere -0.01. Given these negligible impacts, particularly bone quality in its current linear measurement, it might be worth exploring its assessment as a medial optimum trait, balancing frailty and coarseness.
Additionally, Canada uniquely records front legs, correlating with her life at 0.18, second only to heel depth. In the broader context of overall frame traits, stature maintains a high concordance at 0.97 between both countries. In contrast, body depth (0.71) and chest width (expressed as strength in US evaluations, 0.69) have lower correlations, highlighting regional differences in evaluation emphasis.
The Bottom Line
Examining genetic evaluations for dairy cattle conformation and type in Canada and the USA reveals distinctive approaches and converging goals, underlining the importance of tailored yet comprehensive systems. We’ve explored the evolution of genetic frameworks in both nations, highlighting Canada’s detailed evaluations and the USA’s focus on PTAT and holistic type assessment. From composite traits to specific evaluations of mammary systems and feet and legs, each country aims to boost genetic excellence in dairy cattle.
As these systems continue to adapt to scientific advancements and industry needs, the goal remains to develop a robust, genetically superior dairy cattle population capable of thriving in diverse environments. This endeavor highlights the critical intersection of genetic science, industry priorities, and animal welfare, shaping the future of dairy cattle breeding. While methods may differ, the objective is shared: achieving dairy excellence through rigorous and innovative genetic evaluations that benefit producers, consumers, and cattle. Collaborations and continual improvements ensure North America stays at the forefront of dairy cattle genetics, leading global dairy production.
Key Takeaways:
The genetic evaluation systems for dairy cattle conformation in Canada and the USA have evolved with distinct methodologies, reflecting different priorities and breeding goals.
Canada emphasizes an intricate evaluation framework that assesses a variety of composite traits, ensuring a comprehensive understanding of a cow’s overall physical attributes.
In the USA, PTAT (Predicted Transmitting Ability for Type) serves as a crucial metric, further supported by detailed evaluations of specific type traits to drive genetic excellence.
Both nations utilize genetic indices that consider multiple aspects of conformation, significantly contributing to the genetic advancement and overall quality of dairy cattle.
Feet and legs, as well as mammary systems, are critical areas of focus in both Canadian and American evaluation systems, reflecting their importance in dairy cattle productivity and longevity.
The integration of scientific research and technological advancements has been instrumental in refining genetic evaluations, as referenced by numerous studies and scholarly articles.
Summary:
Genetic evaluation systems in dairy cattle in Canada and the USA have evolved through historical advancements and modern innovations. Canada introduced its first formal genetic evaluation in the mid-20th century, focusing on production traits. By the 1970s, Canadian dairy scientists integrated type traits and linear classification systems to quantify conformation characteristics, allowing breeders to objectively evaluate and select superior cattle. The USA advanced from essential herd records to sophisticated evaluations by the 1980s, with the establishment of Predicted Transmitting Ability (PTAT). The 1990s and early 2000s saw a crucial phase with genomic evaluations, integrating genomic data to increase accuracy and efficiency. Today, genetic evaluation systems in both countries value genetic merit for production, longevity, health, and robustness. Supporting organizations like Lactanet and Holstein Canada play crucial roles in enhancing genetic standards and maintaining Canada’s reputation for producing world-class dairy cattle.
Explore the transformative potential of machine learning in dairy farming. Can artificial intelligence refine behavior predictions and boost efficiency in your dairy operations?
The potential of machine learning developments to transform genetic predictions using massive datasets and advanced algorithms is a reason for optimism. This transformation can significantly improve cow well-being and simplify dairy running. By rapidly processing enormous amounts of data, machine learning provides insights often lost by more conventional approaches. Incorporating artificial intelligence and machine learning into genetic prediction can lead to a more robust and productive herd, advancing animal welfare and farm profitability.
A recent Journal of Dairy Science study compared traditional genomic methods with advanced deep learning algorithms to predict milking refusals (MREF) and milking failures (MFAIL) in North AmericanHolstein cows. This research reveals how these technologies could improve the precision of genetic prediction for cattle behavioral features.
Breaking the Mold: Traditional Genomic Methods vs. Deep Learning
Reliable tools in dairy cow breeding have included traditional genomic prediction techniques like BLUP (Best Linear Unbiased Prediction) and its genomic equivalent, GBLUP. These techniques, which have been used for decades, estimate breeding values using genetic markers. They presume linear genetic effects, which could not fairly depict complicated gene interactions. Additionally challenging with big datasets and needing a lot of processing capability are BLUP and GBLUP.
One fresh direction is provided by deep learning. Unlike conventional techniques, algorithms like convolutional neural networks (CNN) and multiple-layer perceptron (MLP) shine at identifying intricate patterns in big datasets. Their ability to replicate nonlinear connections between genetic markers should raise forecasting accuracy. However, deep learning requires significant computing resources and knowledge, restricting its general use.
Diving Deep: Evaluating Advanced Genomic Prediction for Dairy Cow Behavior
The primary aim of this study was to evaluate how well traditional genomic prediction methods stack up against advanced deep learning algorithms in predicting milking refusals (MREF) and milking failures (MFAIL) in North American Holstein cows. With over 1.9 million daily records from nearly 4,500 genotyped cows collected by 36 automatic milking systems, our mission was to determine which methods provide the most accurate genomic predictions. We focused on four methods: Bayesian LASSO, multiple layer perceptron (MLP), convolutional neural network (CNN), and GBLUP.
Data collection involved gathering daily records from nearly 4,500 genotyped Holstein cows using 36 automatic milking systems, also known as milking robots. This amounted to over 1.9 million records. Rigorous quality control measures were employed to ensure data integrity, resulting in a refined dataset of 57,600 SNPs. These practices were vital in excluding erroneous records and retaining high-quality genomic information for precise predictive modeling.
Four genomic prediction methods were employed, each with unique mechanisms:
Bayesian Least Absolute Shrinkage and Selection Operator (LASSO): This method uses a Bayesian framework to perform variable selection and regularization, enhancing prediction accuracy by shrinking less significant coefficients. Implemented in Python using Keras and TensorFlow, Bayesian LASSO is adept at handling high-dimensional genomic data.
Multiple Layer Perceptron (MLP): A type of artificial neural network, MLP consists of multiple layers designed to model complex relationships within the data. This deep learning model is executed with Keras and TensorFlow and excels at capturing nonlinear interactions among genomic markers.
Convolutional Neural Network (CNN): Known for detecting spatial hierarchies in data, CNN uses convolutional layers to identify and learn essential patterns. This method, also implemented with Keras and TensorFlow, processes genomic sequences to extract meaningful features influencing behavioral traits.
Genomic Best Linear Unbiased Prediction (GBLUP): A traditional approach in genetic evaluations, GBLUP combines genomic information with phenotypic data using a linear mixed model. Implemented with the BLUPF90+ programs, GBLUP is less computationally intensive than deep learning methods, albeit slightly less accurate in some contexts.
A Deep Dive into Predictive Accuracy: Traditional vs. Deep Learning Methods for Holstein Cow Behaviors
Analysis of genomic prediction methods for North American Holstein cows offered intriguing insights. A comparison of traditional and deep learning methods focuses on two behavioral traits: milking refusals (MREF) and milking failures (MFAIL). Here’s the accuracy (mean square error) for each:
Bayesian LASSO: 0.34 (0.08) for MREF, 0.27 (0.08) for MFAIL
Multiple Layer Perceptron (MLP): 0.36 (0.09) for MREF, 0.32 (0.09) for MFAIL
Convolutional Neural Network (CNN): 0.37 (0.08) for MREF, 0.30 (0.09) for MFAIL
GBLUP: 0.35 (0.09) for MREF, 0.31 (0.09) for MFAIL
Although MLP and CNN showed slightly higher accuracy than GBLUP, these methods are more computationally demanding. More research is needed to determine their feasibility in large-scale breeding programs.
Paving the Way for Future Dairy Practices: Deep Learning in Genomic Prediction
The promise of deep learning approaches in the genetic prediction of behavioral characteristics in North American Holstein cattle is underlined in this work. Deep learning models such as the Multi-Layer Perceptron (MLP) and Convolutional Neural Network (CNN) showed somewhat better accuracies in estimating milking refusals (MREF) and milking failures (MFAIL) than conventional approaches such as GBLUP—this rise in forecast accuracy results in better breeding choices and more efficiency in dairy businesses.
Still, the advantages come with some problematic drawbacks. Deep learning techniques require significant computing resources and knowledge, which would only be possible for larger farms or companies. Moreover, with specific understanding, these intricate models might be more accessible for farm managers to understand and use.
Another critical concern is the pragmatic implementation of these cutting-edge techniques. Usually requiring extensive genotype data, deep learning models find it challenging to handle nongenotyped individuals, limiting their flexibility and general relevance in different dairy farming environments.
Although deep learning methods show great potential, their acceptance has to be carefully evaluated against the logistical and practical reality of dairy production. Future studies should focus on these computational and pragmatic issues to effectively include cutting-edge solutions in regular dairy operations and optimize the advantages of technology development.
Bridging the Tech Divide: Practical Steps for Implementing Genomic Prediction and Machine Learning in Dairy Farming
Integrating genomic prediction and machine learning into dairy farm operations may initially seem daunting. Still, it can significantly enhance herd management and productivity with the right approach and resources. Here are some practical steps and tools to get you started:
Educate and Train: Begin by educating yourself and your team about the basics of genomic prediction and machine learning. University extension programs, online courses, and industry seminars can provide valuable knowledge.
Invest in Data Collection Systems: Accurate data collection is vital. Consider investing in automatic milking systems (AMS) and IoT devices that collect detailed behavioral and production data. Brands such as DairyComp, DeLaval, and Lely offer robust systems for dairy farms.
Use Genomic Testing Services: Engage with genomic testing services that can provide detailed genetic profiles of your herd. Many AI companies offer DNA testing kits and genomic analysis for dairy cattle.
Leverage Software Solutions: Use software solutions to analyze the data collected and provide actionable insights. Programs such as Valacta and ICBF offer comprehensive genetic evaluation and management tools.
Collaborate with Researchers: Contact local agricultural universities or research institutions conducting genomic prediction and machine learning studies. Collaborative projects can provide access to cutting-edge technologies and the latest findings in the field.
Pilot Small Projects: Start with small-scale projects to test the effectiveness of these technologies on your farm. Monitor the outcomes closely and scale up gradually based on the results. This approach minimizes risks and helps you understand the practical aspects of implementation.
By taking these steps, dairy farmers can begin harnessing the power of genomic prediction and machine learning, paving the way for more personalized and efficient herd management. Integrating these advanced technologies promises to transform dairy farming into a more precise and productive endeavor.
The Bottom Line
Investigating genomic prediction techniques has shown deep learning algorithms’ potential and present limits against conventional approaches. According to the research, deep learning models such as CNN and MLP are more accurate in forecasting cow behavioral features like milking refusals and failures. However, their actual use in large-scale dairy production still needs to be discovered. The intricacy and computing requirements of these cutting-edge techniques hinder their general acceptance.
Here are some key takeaways:
Deep learning methods offer slightly better accuracy than traditional approaches.
Traditional methods like GBLUP are still valuable due to their lower computational needs and broader applicability.
More research is needed to see if deep learning can be practically implemented in real-world dairy breeding programs.
In summary, continued research is crucial. We can better understand their potential to revolutionize dairy breeding at scale by refining deep learning techniques and addressing their limits.
Adopting new technologies in genomic prediction guarantees better accuracy and ensures these approaches are valuable and practical. The balance of these elements will determine the direction of dairy farming towards effective and sustained breeding campaigns. We urge industry players, academics, and dairy producers to fund more studies. Including modern technologies in dairy farming may change methods and propel the sector toward more production and efficiency.
Key Takeaways:
Traditional genomic prediction methods like GBLUP remain robust but show slightly lower predictive accuracy compared to deep learning approaches.
Deep learning methods, specifically CNNs and MLPs, demonstrate modestly higher accuracy for predicting cow behavioral traits such as milking refusals and milking failures.
MLP methods exhibit less reranking of top-selected individuals compared to other methods, suggesting better consistency in selection.
Despite their promise, deep learning techniques require significant computational resources, limiting their immediate practicality for large-scale operations.
Further research is essential to assess the practical application of deep learning methods in routine dairy cattle breeding programs.
Summary:
Machine learning has the potential to revolutionize genetic predictions in dairy farming by using massive datasets and advanced algorithms. A study compared traditional genomic methods with deep learning algorithms to predict milking refusals and failures in North American Holstein cows. Traditional genomic methods like BLUP and GBLUP are reliable but require significant computing resources and knowledge. Deep learning algorithms like CNN and MLP show promise in genetic prediction of behavioral characteristics in North American Holstein cattle. However, deep learning requires significant computing resources and knowledge, which would only be possible for larger farms or companies. Additionally, deep learning models struggle to handle nongenotyped individuals, limiting their flexibility and relevance in different dairy farming environments. Integrating genomic prediction and machine learning into dairy farm operations can significantly enhance herd management and productivity. Practical steps to get started include educating and training, investing in data collection systems, using genomic testing services, leveraging software solutions, collaborating with researchers, and piloting small projects. More research is needed to understand the potential of deep learning techniques to revolutionize dairy breeding at scale.
Learn how Lactanet’s new Lifetime Performance Index will boost sustainability and milkability for Canadian dairy cows by April 2025. Are you prepared for the changes?
Envision a dairy sector where efficient cows produce large amounts of milk, contributing to environmental sustainability. Leading genetic testing and data management for dairy cows in Canada, Lactanet is scheduled to update the Lifetime Performance Index (LPI) by April 2025. This upgrade, with its focus on lowering greenhouse gas emissions and raising ‘milkability,’ promises to match productivity to environmental responsibility, instilling hope for a more sustainable future.
Brian Van Doormaal, chief services officer at Lactanet, says, “It’s not the relative weighting that determines how much of an impact breeding for these traits could have.” “This is the expected reaction you get from breeding for these qualities.”
The revised LPI will include new criteria to improve environmental impact and cow behavior. These developments acknowledge that the overall well-being of cattle and sustainable techniques will determine the direction of dairy farming.
Modernizing the Cornerstone: Enhancing the Lifetime Performance Index (LPI) for a Sustainable Future
Integrating productivity, health, and reproductive characteristics into a single statistic, the Lifetime Performance Index (LPI), has been vital in the Canadian dairy sector. This all-encompassing strategy helps dairy farmers make wise breeding selections by guiding balanced genetic advancements. The LPI ensures general herd production and sustainability by addressing many qualities, preventing overemphasizing any area.
Beyond individual farms, the LPI increases national and global competitiveness by matching industry norms and consumer expectations with breeding goals. This backs up objectives of environmental sustainability, animal welfare, and profitability.
The changing dairy farming environment and the need to handle fresh issues, including environmental implications, drive the suggested LPI changes, including methane emissions and feed efficiency features that fit present ecological targets. Improving characteristics linked to milking speed and temperament satisfies the increasing need for operational effectiveness.
Improved genetic research and data allow more accurate and representative LPI updates. Working with Lactanet and genetic enhancement companies guarantees the index stays relevant across several breeds.
The modifications seek to modernize the LPI, maintaining its value for breeders as they solve current problems and apply fresh scientific discoveries. This strategy will help maintain the Canadian dairy sector’s reputation for quality and inventiveness.
Steering Genetic Excellence: Brian Van Doormaal’s Consultative Leadership
Under the leadership of Brian Van Doormaal, Lactanet’s chief services officer, the consultation process integral to creating the updated LPI is in progress. He has been instrumental in these conversations, ensuring the new LPI structure addresses the diverse genetic aims of various dairy breeds. For Holstein, Ayrshire, Jersey, and Guernsey breeds, he has fostered open communication between Lactanet and genetic improvement groups, emphasizing the importance of their contributions.
Van Doormaal started a thorough consultation by bringing the suggested improvements before the Open Industry Session in October 2023. This prepared the ground for in-depth conversations spanning many months that explored subtleties like the relative weighting of fat against protein in the LPI’s breeding objectives. Every breed has diverse genetic traits and performance criteria, which Van Doormaal has deftly negotiated, bringing various goals and viewpoints.
The updated LPI seeks to capture significant variations between breed-specific genetic targets using this thorough consultation approach. Through close interaction with breed-specific organizations, Van Doormaal guarantees the revised LPI is thorough and catered to every breed’s unique requirements, reflecting an agreement among industry players.
Refining Genetic Precision: Tailoring the Updated LPI to Address Breed-Specific Goals
The revised LPI seeks to meet every dairy breed’s genetic requirements and problems, guaranteeing customized breeding plans for Holstein, Ayrshire, Jersey, and Guernsey cows.
For Holsteins, health concerns, including cystic ovaries and increasing production efficiency, take the front stage. Achieving high milk output without sacrificing health still depends on balancing fat against protein.
Ayrshire breeders prioritize strong milk production and toughness. Given the breed’s usual milk composition, they usually prefer milk solids over protein.
Finding a balance between lifespan and high output is essential for Jerseys. The breed’s abundant butterfat milk prioritizes fat weighing to satisfy market needs.
Guernseys mainly aims to raise milk quality through improved sustainability and health. Discussions on fat vs. protein weightings seek to encourage both, hence preserving the breed’s commercial advantage.
The breed-specific variations emphasize the need for a tailored LPI that addresses each breed’s strengths and problems.
Revolutionizing Genetic Assessment: Expanding the LPI to Enhance Dairy Cow Traits and Sustainability
The current modernization of the Lifetime Performance Index (LPI) marks significant progress in assessing genetic features, raising the index from four to six sub-groups. With an eye on production efficiency and animal welfare, this more precise approach seeks to enhance the breeding and assessment of desired traits in dairy cows.
The updated LPI will separate the present Health and Fertility category into Reproduction and Health and Welfare. While Health and Welfare will focus on general health measures, this move includes important qualities like calving capacity and daughter calving ability under Reproduction.
The new Milkability sub-group—which will now include milking speed and temperamental characteristics—also adds significantly. These qualities directly affect labor efficiency and animal handling; their inclusion addresses a hitherto unknown element of dairy management inside the LPI.
Finally, to address mounting environmental issues, the LPI will incorporate a new Environmental Impact subindex, which was first designed for Holsteins. Reflecting the dairy sector’s emphasis on lowering its environmental impact, this subindex will concentrate on feed and methane efficiency. Research has underlined the critical influence of body maintenance on ecological sustainability, thereby supporting its inclusion.
These modifications improve the LPI’s accuracy and usefulness by matching it with contemporary breeding objectives and ensuring that genetic selection promotes dairy sector sustainability and output.
Pioneering Sustainability: Introducing the Environmental Impact Subindex
As part of its commitment to dairy sector sustainability, the new Environmental Impact subindex is a crucial addition to the revised LPI. This subindex rates body upkeep, methane efficiency, and feed economy, among other essential factors. By measuring a cow’s capacity to turn grain into milk, it helps determine its feed efficiency, thereby reducing its environmental impact. Targeting the decrease of methane emissions per unit of milk produced, methane efficiency addresses a significant contribution to greenhouse gasses. The inclusion of body maintenance in the index underscores the industry’s recognition of its critical influence on ecological sustainability, providing reassurance about its commitment to environmental responsibility.
Since there is enough data for Holsteins, this subindex consists only of them. The subindex will probably be enlarged to cover more breeds as more data about them becomes accessible.
Integrating Behavioral Efficiency: The Pivotal Role of Milkability in Modern Dairy Operations
The new Milkability subindex, which combines previously missing milking speed and temperamental qualities, is one noticeable improvement in the revised Lifetime Performance Index (LPI). These qualities depend on maximizing dairy operations and improving animal care. The subindex lets breeders increase labor efficiency and general herd management by considering milking speed. Faster milking of cows saves time and lessens stress for farm workers and animals, improving the surroundings.
Moreover, temperament is crucial as it influences handling and integration into automated milking systems. Calm, cooperative cows enable the effective running of these devices, reducing injuries and improving milk let-downs. Including temperamental features thus emphasizes the significance of animal behavior in contemporary dairy production and promotes methods that increase output and animal welfare.
Transforming Genetic Insights: Lactanet’s Ambitious Approach to an Intuitive Lifetime Performance Index (LPI)
Lactanet seeks to simplify the Lifetime Performance Index (LPI), increasing its availability and usefulness for breeders. Creating subindices for every collection of genetic features helps the index to become modular and facilitates the concentration on specific features. This method guides breeders through complex genetic material.
The aim is to increase LPI usefulness by using assessments as “relative breeding values,” standardized with a breed average of 500 and a standard deviation of plus or minus 100. This clarity helps to simplify the comparison of the genetic potential of animals within a breed, therefore supporting wise decision-making.
Other subindices, like milk ability and environmental impact, provide more accuracy in genetic improvement. This lets breeders concentrate on specific operational targets, including milking speed or calving capacity.
Ultimately, the updated LPI will be a flexible instrument enabling breeders to maximize their breeding campaigns to satisfy different objectives and goals. This guarantees that the LPI is indispensable for genetic selection in Canadian dairy production.
Embracing Stability and Progress: The Path Forward with the Modernized Lifetime Performance Index (LPI)
A more exacting breeding method is envisaged as the dairy sector prepares for the revised Lifetime Performance Index (LPI) in April 2025. Existing breeding plans will not be disturbed much, with a 98 percent correlation to the present LPI, guaranteeing continuity and dependability. This consistency will help maintain the top-rated bull ranks substantially unaltered. Breeders will have a constant instrument to balance productivity, health, sustainability, and genetics while improving dairy cow features.
The Bottom Line
Optimizing dairy performance and environmental impact will be much advanced with the forthcoming change of the Lifetime Performance Index (LPI) for Canadian dairy cows. The revised LPI set for April 2025 will include additional sub-groups, including Reproduction, Health and Welfare, Milkability, and Environmental Impact, along with improved breed-specific choices and changed trait weighting. Dividing the Health and Fertility categories will help to represent objectives such as milking speed and calving capacity more accurately.
Given data availability, the new Environmental Impact subindex targets greenhouse gas reductions for Holsteins via feed and methane efficiency features. This complements more general sustainability objectives in dairy production. Milking speed and temperament are necessary for effective operations and will be part of the Milkability subgroup.
These developments under Brian Van Doormaal guarantee farmers a scientifically solid and valuable tool. The 98% correlation with the present LPI emphasizes how these improvements improve rather than alter the current system. Maintaining genetic quality, the redesigned LPI seeks to help Canadian dairy producers create more lucrative, environmentally friendly, and efficient herds.
Key Takeaways:
The new LPI will emphasize reducing greenhouse gas emissions and enhancing “milkability.”
The index will expand from four to six sub-groups of genetic traits.
Health and Fertility will be split into Reproduction and Health and Welfare.
A new Milkability subgroup will include milking speed and temperament traits.
Environmental Impact subindex will focus initially on Holsteins, utilizing feed and methane efficiency data.
Body Maintenance will also be part of the Environmental Impact subindex, linking cow stature to environmental impact.
The updated LPI aims to simplify usage, with each component group serving as its own subindex.
Evaluations will present relative breeding values, set against a breed average with clear standard deviations.
The new LPI is expected to be 98 percent correlated with the current index, maintaining continuity in top-rated bulls.
Summary:
Lactanet, a Canadian genetic testing and data management company, is set to update its Lifetime Performance Index (LPI) by April 2025 to align productivity with environmental responsibility and improve cow behavior. The LPI integrates productivity, health, and reproductive characteristics into a single statistic, helping dairy farmers make wise breeding selections and guiding balanced genetic advancements. The proposed changes include methane emissions, feed efficiency features, and improvements linked to milking speed and temperament. The updated LPI will separate the Health and Fertility category into Reproduction and Health and Welfare, including important qualities like calving capacity and daughter calving ability. This flexible instrument will enable breeders to maximize their breeding campaigns to satisfy different objectives and goals, making it indispensable for genetic selection in Canadian dairy production.
Learn how errors in pedigrees affect the genetic evaluations. Do these errors distort breeding values and validation statistics? Discover more.
Accurate pedigrees are crucial for genetic evaluations, forming the backbone for understanding relatedness among individuals and guiding breeding decisions. They are vital for estimating breeding values, identifying superior genes, and enhancing livestock quality.
However, pedigree errors, like misidentified parents or incorrect lineage records, are surprisingly common. These seemingly minor inaccuracies can have significant consequences, distorting the robustness of genetic models and leading to potentially detrimental breeding recommendations.
These errors act as random exchanges, making individuals seem more or less related than they are.
The single-step model, a promising solution, directly integrates genomic data into genetic evaluations. This method surpasses traditional models by providing greater accuracy through the combination of pedigree and genomic information, offering a comprehensive view of genetic potential.
Using the single-step model, we examine how pedigree errors affect genetic evaluations. We’ll focus on the correlation between actual breeding values (TBV) and estimated breeding values (EBV) and the implications of these errors for validation studies with forward prediction. Understanding and addressing these errors is vital for robust genetic assessments.
Pedigree Errors: An Often Overlooked but Critically Significant Issue
Though often neglected, pedigree errors are critically significant as they misrepresent an animal’s genetic ancestry, leading to erroneous assumptions regarding genetic relationships. These errors can manifest in various ways, from incorrect parent recording to data entry mistakes.
Familiar sources of pedigree errors include:
Misidentification of parents: Errors during breeding or registration processes can lead to incorrect sire or dam recordings.
Recording mistakes: Clerical errors during data entry can misassign parents or offspring.
Multiple sires: The presence of numerous potential sires without genetic testing can cause uncertainties in pedigree records.
Errors in artificial insemination records: Mistakes in recording insemination details can significantly skew pedigree accuracy.
Previous research indicates that pedigree errors undermine genetic evaluations and impact breeding decisions. Traditional methods like the Animal Model or Parental Best Linear Unbiased Prediction (PBLUP), which often exclude genomic data, are particularly susceptible. These errors bias breeding values and hinder selection accuracy, making animals appear better or worse than they indeed are, thus distorting genetic evaluations and selection indices.
Studies have shown that even a 5% error rate can reduce the accuracy of estimated breeding values (EBVs) by about 10%. Minor errors can also inflate early predictions in forward prediction models, creating a false sense of genetic progress.
Traditionally, research focused on pedigree-based genetic evaluations, highlighting the detrimental effects of pedigree errors. This underscores the importance of the current investigation, which integrates genomic data to mitigate the negative impacts seen in traditional models. Looking ahead, future research should be inspired to refine methods that can detect and rectify pedigree errors, paving the way for more accurate genetic assessments.
Enhancing Breeding Precision Through Genomic Integration: An In-Depth Analysis
This study, published in the Journal of Dairy Science, examined the impact of pedigree errors on genetic evaluations that incorporate both traditional and genomic information. These errors can significantly affect the accuracy of these evaluations, which are vital for breeding decisions. By understanding the influence of incorrect pedigree information, we can enhance precision, allowing farmers to make more informed breeding choices and ultimately improve their herds.
This study analyzed the pedigrees and genetic data of 361,980 Fleckvieh cattle, with detailed genetic information on 25,950. This dataset provided a robust foundation to examine how errors in records might influence our findings.
We simulated actual breeding values (TBV) and phenotypes by integrating genetic and environmental factors, with an assumed heritability of 25%. This approach ensured that our simulated data closely resembled real-life scenarios.
Next, we examined the effect of pedigree errors on genetic evaluations using conventional (non-genomic) and single-step (genomic) models. We compared results using the correct pedigree against scenarios with 5%, 10%, and 20% incorrect records created by randomly reassigning sires to non-genotyped cows to replicate common recording mistakes.
Pedigree Errors: The Unseen Threat to Genetic Evaluation Integrity and Breeding Decisions
Our study reveals the practical implications of pedigree errors on genetic evaluations of cattle, particularly the link between True Breeding Values (TBV) and Estimated Breeding Values (EBV). As errors increase, this link weakens, impacting the reliability of genetic evaluations. This finding underscores the importance of accurate pedigree records in making informed breeding decisions.
Along with this weak link came less variation in the predictions. This means pedigree errors made bulls look more similar in genetic quality than they are. This is much more obvious in bulls that have sired many calves, where such errors make it challenging to tell which bulls are the best. This blending effect in bulls with many offspring suggests that the system can’t differentiate well between high and low-quality bulls, potentially messing up your selection decisions.
On the flip side, pedigree errors were not as damaging for young bulls that haven’t sired any calves yet. This happens because genetic evaluations for these young ones rely more on their DNA data than their offspring’s performance. This helps to buffer against the mistakes in their pedigree records.
Moreover, in scenarios where future performance predictions are made, the errors in bulls with progeny tended to blow up early predictions. This makes early decisions potentially misleading and off-track. Thus, correcting pedigree errors is critical to keep genetic evaluations trustworthy and accurate, ensuring early predictions and overall breeding strategies stay on point.
Mitigating Pedigree Errors: Safeguarding the Future of Genetic Evaluations
Understanding how pedigree errors impact genetic evaluations is crucial for dairy farmers. These errors, stemming from incorrect family tree data, lead to inaccurate breeding values (EBV) and poor selection decisions.
As pedigree errors rise, the standard deviation of EBVs diminishes, making related animals, especially progeny-tested bulls, appear more alike than they are. This issue is less severe for younger animals but significantly affects bulls with many offspring.
Reduced variation from pedigree errors causes overly optimistic early predictions, disrupting breeding programs. Inaccurate pedigrees weaken genetic evaluations, compromising effective selection. Ensuring accurate pedigrees through verification and genomic corrections is vital for precise EBV predictions, enhancing breeding programs, and strengthening your dairy herd.
The Bottom Line
When errors infiltrate cattle pedigrees, they severely disrupt genetic evaluations. A high frequency of mistakes weakens the correlation between a bull’s actual breeding value (TBV) and the estimated breeding value (EBV), reducing prediction reliability and consistency. This issue is particularly pronounced in progeny-tested bulls, where incorrect sire assignments inflate perceived similarities among bulls, skewing early predictions and undermining validation statistics.
Maintaining precise pedigrees is fundamental for robust genetic evaluations. Accurate lineage information ensures the integrity of family relationships and sustains reliable breeding decisions. Implementing stringent checks, improving record-keeping, and leveraging advanced DNA testing are essential to minimize pedigree errors. DNA parentage tests significantly reduce the risk of misrecording sire-dam pairs.
Future research should focus on refining methods to detect and rectify pedigree errors, assessing their impact across breeds, and seamlessly integrating genetic data into evaluation models. This approach will enhance the accuracy of genetic evaluations, ultimately fostering more reliable and efficient breeding programs.
Key Takeaways:
Pedigree errors, including misidentified parents and incorrect lineage records, undermine the assumptions about relatedness in genetic evaluation models.
The integration of genomic data using a single-step model enhances the precision of genetic evaluations, despite the presence of pedigree errors.
Incorrect pedigrees lead to lower correlations between true breeding values (TBV) and estimated breeding values (EBV), particularly affecting progeny-tested bulls.
Pedigree errors result in less variation among predictions, making genetically distinct animals appear more similar.
In forward prediction validation scenarios, pedigree errors can cause an apparent inflation in the accuracy of early predictions for young animals.
Implementation of stringent checks and advanced DNA testing can minimize pedigree errors, ensuring more robust genetic evaluations.
Future research should focus on developing better methods for detecting and correcting pedigree errors to further enhance the accuracy and reliability of genetic evaluation models.
Summary: Accurate pedigrees are crucial for genetic evaluations, guiding breeding decisions and estimating breeding values. However, pedigree errors, such as misidentified parents or incorrect lineage records, can distort the robustness of genetic models and lead to detrimental breeding recommendations. A single-step model that integrates genomic data into genetic evaluations provides greater accuracy by examining the correlation between actual breeding values (TBV) and estimated breeding values (EBV). Traditional methods like the Animal Model or Parental Best Linear Unbiased Prediction (PBLUP) are particularly susceptible to these errors. Studies have shown that even a 5% error rate can reduce the accuracy of estimated breeding values (EBVs) by about 10%. Maintaining precise pedigrees is essential for robust genetic evaluations, and implementing stringent checks, improving record-keeping, and leveraging advanced DNA testing are essential to minimize pedigree errors. Future research should focus on refining methods to detect and rectify pedigree errors, assessing their impact across breeds, and seamlessly integrating genetic data into evaluation models to enhance genetic evaluation accuracy and foster more reliable and efficient breeding programs.
Learn how the new 305-AA yield estimates affect dairy farming. Ready for changes in genetic evaluations and milk yield predictions?
Significant changes are coming for dairy farmers in the U.S. Starting mid-June, the old 305-ME (Mature Equivalent) yield estimate will be replaced by the new 305-AA (Average Age) standard. This isn’t just an update but a significant improvement reflecting modern dairy practices and environmental factors, providing better tools for herd management and breeding decisions.
Mark your calendars: On June 12, 305-AA yield estimates will debut in CDCB’s WebConnect data queries. By August 2024, they will be fully integrated into CDCB’s genetic evaluations. This change is based on extensive research and data analysis by USDA AGIL and CDCB, which examined over 100 million milk yield records.
The industry needs updated tools to make accurate, fair comparisons among cows. This transition and the new 305-AA are based on a 2023 USDA AGIL and CDCB study analyzing millions of milk yield records.
What does this mean for you? Moving to 305-AA aligns yield estimates with current insights on age, lactation length, climate, and other factors affecting milk production. This leads to more precise and fair comparisons among cows, helping optimize your herd’s performance.
Stay tuned as we dive deeper into the 305-AA transition, its impact on genetic evaluations, breed-specific changes, and what to expect moving forward.
The New Age of Yield Estimation: Introducing 305-AA
305-AA stands for 305-Average Age. It’s the new method for accurately comparing dairy cows of different ages, climates, and calving seasons. This tool estimates a cow’s lactation corrected to a standard age of 36 months using partial yield measurements from milk tests. It’s a robust update reflecting modern dairy practices.
A New Era in Dairy Production Efficiency
The shift from 305-ME to 305-AA is a game-changer for the dairy industry. For nearly 30 years, the 305-ME system couldn’t keep up with cow management and genetic advances. But now, the new 305-AA model brings us up to speed, leveraging recent insights into age, climate, and lactation variables for a more accurate milk yield estimate.
A 2023 study by USDA AGIL and CDCB, analyzing over 100 million milk yield records, showed how outdated the old system was. The new 305-AA promises better decision-making tools, boosting both productivity and fairness in the industry.
What 305-AA Means for Different Dairy Breeds
The transition to 305-AA will affect different dairy breeds in unique ways. Changes will be minimal for Holsteins, as their data heavily influenced the 1994 adjustments. This means Holstein farmers won’t see minor shifts in their yield estimates or genetic evaluations.
Non-Holstein breeds will see more significant updates due to more precise, breed-specific adjustments. Ayrshires will experience stable PTAs with a slight increase in milk, fat, and protein yields, especially for younger males. Brown Swiss will see slightly higher overall yield PTAs for younger cows, with older animals maintaining stability.
Guernseys will find that younger males show an increase, while older cows might see a slight decline in their milk, fat, and protein PTAs. Jersey cows will have a noticeable decrease in yield PTAs for younger males, but older males will benefit from an increase in their evaluations.
This recalibration means that farmers focusing on non-Holstein breeds can expect more tailored and accurate yield estimates. These changes pave the way for better breed management and selection strategies in the future.
The Ripple Effects of 305-AA on Breed-Specific PTAs
The shift to 305-AA adjustments will have varied impacts on Predicted Transmitting Abilities (PTAs) across different dairy breeds. Each breed will experience unique changes for more breed-specific and accurate assessments.
Ayrshire: PTAs will stay stable, with younger males seeing a slight increase in milk, fat, and protein yields.
Brown Swiss: Young animals will see a slight increase in yield PTAs, while older animals remain stable.
Guernsey: Younger males will experience an increase in milk, fat, and protein PTAs, while older males may see a decrease.
Holstein: Young males will get a boost in yield PTAs, and older animals will have more stable measurements.
Jersey: Younger males will see a decrease in yield PTAs, while older males will experience an increase.
Coming Soon: 305-AA Data Goes Live on CDCB WebConnect and Genetic Evaluations.
Starting June 12, 2024, you’ll see the new 305-AA yield estimates in CDCB’s WebConnect queries. This kicks off the move to 305-AA.
By August 2024, 305-AA will be fully integrated into CDCB genetic evaluations. Phenotypic updates in the triannual evaluations will adopt the new method, affecting PTAs and indices like Net Merit $.
Rest Easy: July Evaluations to Continue Uninterrupted; August Brings Enhanced Accuracy with 305-AA
Rest easy; switching to 305-AA won’t affect July’s monthly evaluations. Your data will still follow the old 305-ME adjustments for now. However, with the triannual update from August 13, 2024, all evaluations will feature the new 305-AA data, giving you the most accurate yield estimates for your dairy herd.
The Bottom Line
The switch to 305-AA is a big step forward. It uses the latest research and a massive database for more accurate milk yield estimates. This change reflects how dairy management and cow biology have evolved over the last 30 years. With 305-AA, comparing cows—no matter their age, breed, or conditions—is now fairer and more scientific.
Key Takeaways:
The transition from 305-ME to 305-AA is set to bring significant advancements in yield estimation for U.S. dairy farmers. Here are some key takeaways:
Effective date: 305-AA will be officially implemented starting June 12.
Modern alignment: This change reflects current management practices and environmental factors.
Updated research: Based on a 2023 study examining over 100 million milk yield records.
Breed-specific adjustments: Non-Holstein breeds will see more significant changes due to more precise data.
Impact on PTAs: Different breeds will experience unique effects on their Predicted Transmitting Abilities (PTAs).
Genetic evaluations: The 305-AA adjustments will appear in CDCB genetic evaluations starting August 2024.
Uninterrupted evaluations: The July monthly evaluations will not be affected by this change.
Summary: Starting mid-June, the old 305-ME yield estimate will be replaced by the new 305-AA standard, reflecting modern dairy practices and environmental factors. This transition aligns yield estimates with current insights on age, lactation length, climate, and other factors affecting milk production, leading to more precise and fair comparisons among cows. The new 305-AA model is based on extensive research and data analysis by USDA AGIL and CDCB, which examined over 100 million milk yield records. The industry needs updated tools to make accurate, fair comparisons among cows. The transition will affect different dairy breeds in unique ways, with Holstein farmers not seeing minor shifts in their yield estimates or genetic evaluations, while non-Holstein breeds will see more significant updates due to more precise, breed-specific adjustments. Ayrshires will experience stable Predicted Transmitting Abilities (PTAs), Brown Swiss will see slightly higher overall yield PTAs for younger cows, and Guardeys will show an increase in milk, fat, and protein PTAs.
Discover how metafounders enhance genomic predictions in Uruguayan dairy cattle. Can these methods improve your herd’s genetic progress and productivity? Find out now.
Genetic improvement is not just a concept but the foundation of advancing dairy cattle herds, especially in smaller countries like Uruguay. These nations heavily rely on foreign genetics to enhance their herds, aiming to increase productivity, improve health traits, and boost resilience. However, this reliance on imported genetic material presents its own challenges, particularly regarding the unique genetic landscapes of these countries and the complexities of establishing accurate pedigrees and breeding values.
While beneficial, integrating foreign genetics into domestic herds demands meticulous modeling and evaluation. This task is not to be taken lightly, as it is crucial to ensure unbiased and accurate breeding predictions.
Let’s delve into the complex world of genetic Improvement in Uruguayan Dairy Farming. This world can often feel like a maze. We’ll explore the challenges unknown parent groups pose and the solutions we’ve developed to navigate this maze effectively. In Uruguay, the issue is compounded by a dependency on unknown parent groups (UPG), which include foreign sires with untraceable ancestries. These UPGs can introduce biases in genomic estimated breeding values (GEBV), complicating the task of selecting the best animals for breeding. Understanding how these foreign genetics interact with local populations and how to model them effectively is crucial for sustainable genetic improvement in small countries.
Genomic predictions have revolutionized dairy farming by enabling a more accurate selection of animals with desirable traits. They harness the power of DNA information, predicting an animal’s genetic potential with higher precision. This is particularly important in small countries like Uruguay, which rely heavily on imported foreign genetics.
In traditional genetic evaluations, an animal’s pedigree provides crucial information. However, dealing with Unknown Parent Groups (UPG) is a common challenge. UPG represents animals whose ancestors are unknown, which can lead to prediction biases. Here’s where Metafounders (MF) come into play. Metafounders are hypothetical ancestors that can be used to represent genetic relationships better and improve the accuracy of genetic evaluations when dealing with unknown pedigree data.
Now, let’s break down the methodologies involved:
BLUP (Best Linear Unbiased Prediction) is a statistical method for predicting breeding values based on pedigrees and performance data. It has been the cornerstone of genetic evaluations for decades. However, BLUP does not consider genomic information directly.
Conversely, ssGBLUP (Single-Step Genomic BLUP) incorporates pedigree and genomic data, offering more precise genetic evaluations. This method corrects for biases and provides a more accurate prediction of an animal’s genetic potential by combining traditional pedigree information with genomic information.
Your understanding of these concepts is not just crucial; it’s empowering. It enables you to make informed decisions in dairy farming, helping you select the best breeding animals and improve your herd’s productivity and genetic quality. This knowledge puts you in a position of strength in genetic improvement.
Navigating Genetic Evaluation for Uruguay’s Dairy Herds: The Foreign Influence Challenge
Uruguay’s small dairy populations face unique challenges regarding genetic evaluation. One significant hurdle is the substantial influence of foreign genetics. For countries that rely heavily on imported genetics, like Uruguay, integrating unknown parent groups (UPG) becomes crucial. These groups account for the genetic contributions of foreign sires whose pedigrees might be incomplete or partially unknown. However, incorporating UPG into genomic evaluations is not without its pitfalls.
One of the primary challenges involves potential biases in the genomic estimated breeding values (GEBV). These biases can emerge from inaccuracies in modeling the UPG. Different models, such as using UPG alone or combining UPG with metafounders (MF), aim to tackle these biases, but their efficacy can vary. The research found that while both approaches performed well, using bounded linear regression to establish base allele population frequencies (MFbounded) was superior in predicting GEBV. However, even the best models exhibited some biases, particularly affecting the earliest generations, whose origins were not entirely understood.
Additionally, the evaluations showed another layer of complexity with overdispersion issues, primarily in validation bulls. This means that the spread of predicted values was broader than expected, making GEBV predictions less precise. Interestingly, while biases were present across all models for bulls, in cows, they were only a problem when using UPG in traditional BLUP (best linear unbiased prediction) methods.
In summary, while Uruguay’s small dairy populations face technical challenges in accurate genetic evaluation, overcoming these issues can lead to significant benefits. Addressing these challenges is critical for farmers to make informed breeding decisions, ultimately enhancing the genetic progress of their herds. With the right strategies and tools, the future of genetic improvement in dairy cattle herds in Uruguay is promising.
Metafounders vs. Unknown Parent Groups: Navigating Genetic Evaluations in Dairy Farming
In genomic evaluations, meta founders (MF) and unknown parent groups (UPG) offer a nuanced approach to understanding genetic progress, particularly in regions heavily influenced by foreign genetics like Uruguay.
UPG: A Traditional PillarUnknown Parent Groups (UPG) have long been a cornerstone in pedigree-based evaluations. Upgrading animals with unknown parents into categories based on specific criteria—like birth year or country of origin—UPG helps mitigate bias caused by missing pedigree data. While this approach has been valuable, it has limitations, mainly when used in genomic models. The disadvantages are evident: it often leads to bias in genomic estimated breeding values (GEBV). It can result in overdispersion, particularly in populations where foreign genetic material plays a significant role.
MF: A Modern SolutionMetafounders (MF), on the other hand, offer a more advanced solution. By utilizing base allele population frequencies, MF can provide a more accurate portrayal of genetic relationships. The MFbounded estimator, in particular, has shown promising results, outperforming UPG by reducing bias and improving GEBV predictions. The robustness of MF allows for better handling of genetic diversity. It can adapt more effectively to the specific genetic background of the population. However, it’s worth noting that some bias still exists, the origins of which still need to be fully understood.
Why MF Might Be BetterThe primary advantage of MF over UPG is the enhancement in the accuracy and reliability of GEBV predictions. While UPG groups animals based on broad categories, MF takes a more granular approach by factoring in allele frequencies, offering a nuanced understanding of genetic inheritances. This makes MF a better option, especially for countries like Uruguay, where foreign genetics play a pivotal role in dairy farming. By reducing the bias and improving prediction accuracy, MF can significantly enhance genetic evaluations, providing dairy farmers with more reliable data to make informed breeding decisions.
In summary, while UPG and MF have their place in genomic evaluations, MF offers a modern, more accurate alternative that better aligns with the complexities of contemporary dairy farming genetics.
Precision in Genomic Predictions: Exploring the Gamma Matrix with MFbounded and MFrobust
In our quest to enhance the genetic evaluation systems for Uruguayan Holsteins, we delved into estimating the gamma matrix (γ) with precision. Two distinct approaches were taken: MFbounded and MFrobust. These methods essentially shape how we group and assess the influence of unknown parent groups (UPG) within our dairy population.
MFbounded Approach: This method utilizes base allele population frequencies determined by bounded linear regression. By defining these base frequencies, we could estimate γ efficiently, ensuring it echoes the actual genetic variances from our dairy herd’s population. This bounded approach allows for a more restrained estimation process that caters closely to real-world data characteristics.
MFrobust Approach: Conversely, the MFrobust method uses a generalized, robust design for the gamma matrix by applying two distinct values: one for the diagonal and another for the off-diagonal elements of γ. This dual-parameter setup aims to capture a broader range of variances and covariances, making the γ estimation more versatile but potentially less centered on actual population specifics.
Both approaches were implemented within the Uruguayan Holstein population to compare their efficacy in generating reliable Genomic Estimated Breeding Values (GEBV). While both methods performed adequately, the MFbounded technique emerged as the preferred choice due to its higher precision and closer alignment with the population’s genetic structure. However, some residual bias remained, indicating that further refinement might be necessary.
Critical Insights for Dairy Farmers: Choosing the Right Genomic Prediction Model
In sum, the study found that both gamma (Γ) estimators, MFbounded and MFrobust, produced reliable genomic estimated breeding values (GEBV) for dairy cattle. However, MFbounded emerged as the superior option due to its slightly better performance. Adopting the MFbounded approach could lead to more precise breeding predictions for dairy farmers.
Interestingly, the study did reveal some biases. While these biases were observed across all models for validation bulls, they only appeared with Unknown Parent Groups (UPG) in the traditional Best Linear Unbiased Prediction (BLUP) model when validating cows. Overdispersion was a common issue, notably in validation bulls, suggesting that there might be occasional overestimates or underestimates in GEBV predictions.
A crucial takeaway for you, as a dairy farmer, is that the single-step genomic BLUP (ssGBLUP) model generally provides more accurate predictions compared to the traditional BLUP method. This could lead to improved breeding strategies and better herd management, enhancing genetic progress and overall productivity in your dairy operations.
Empowering Uruguay’s Dairy Farmers: The Metafounder Edge in Genomic Evaluations
The findings of this study have significant implications for dairy farmers in Uruguay. Adopting metafounders (MF) in your herd’s genetic evaluations can significantly enhance the accuracy of genomic predictions. Unlike traditional methods that might introduce bias or offer less reliable data, MF provides a more robust framework for accounting for unknown parent groups (UPG). This means you’re getting more apparent, more accurate genetic profiles of your cattle, even when their parentage isn’t fully known.
Improved accuracy in genomic predictions translates directly to better genetic improvement. With a more precise understanding of your cattle’s genetic worth, you can make smarter breeding decisions, leading to a more substantial, more productive herd over time. Leveraging the MFbounded approach, which has shown the best performance in the study, can help minimize bias and enhance the reliability of your genetic evaluations. This ultimately means healthier cattle, higher milk yields, and greater profitability for your dairy farm.
The Bottom Line
Accurate genomic predictions are fundamental for the continual improvement of dairy cattle. They help farmers make informed breeding decisions, ultimately boosting productivity and ensuring the vitality of their herds. Adopting metafounders (MF) in genetic evaluations offers a clear advantage, demonstrating more reliable and precise breeding values than traditional methods. By embracing MF, you can reduce bias and increase the accuracy of genetic predictions, leading to more robust and productive dairy operations.
As a dairy farmer in Uruguay, integrating MF into your genetic evaluation toolkit could be a game-changer. Not only does it account for complex genetic backgrounds and foreign genetics, but it also aids in navigating the challenges posed by unknown parent groups. So, consider leveraging this advanced approach in your breeding programs. The investment in accurate genomic predictions today will pay vital dividends in the health, efficiency, and profitability of your dairy farm tomorrow.
Key Takeaways:
Genetic improvement in small countries like Uruguay relies heavily on foreign genetics.
Considering unknown parent groups (UPG) for foreign sires is crucial to avoid bias in genomic estimated breeding values (GEBV).
Using metafounders (MF) can help model genetic progress more accurately than traditional UPG methods.
The MFbounded approach, which uses base allele population frequencies, produces the best GEBV predictions despite some minor biases.
Significant overdispersion was noted, especially in validation bulls, across all genomic prediction models tested.
Single-step genomic BLUP (ssGBLUP) models provide better prediction accuracy than traditional BLUP models.
Summary:
Genetic improvement is crucial for dairy cattle herds, especially in smaller countries like Uruguay, where they heavily rely on foreign genetics to increase productivity, improve health traits, and boost resilience. However, integrating foreign genetics into domestic herds requires meticulous modeling and evaluation to ensure unbiased and accurate breeding predictions. In Uruguay, the issue is compounded by a dependency on unknown parent groups (UPG), which can introduce biases in genomic estimated breeding values (GEBV), complicating the task of selecting the best animals for breeding.
Genomic predictions have revolutionized dairy farming by enabling more accurate selection of animals with desirable traits. Traditional genetic evaluations, such as BLUP and ssGBLUP, are often complicated by UPG. Metafounders (MF) have been adopted to represent genetic relationships better and improve the accuracy of genetic evaluations when dealing with unknown pedigree data. However, some bias still exists, which the origins of which need to be fully understood.
Explore the impact of pedigree errors on genetic evaluations in cattle breeding. How do these mistakes skew validation studies and influence breeding choices? Learn more here.
In the world of cattle breeding, precision is paramount. Yet, a single misstep in pedigree records can set off a chain reaction of errors. Consider the shock of discovering that a prized lineage is flawed due to a simple record-keeping mistake. This isn’t just a minor blip—it can throw the entire genetic evaluation process into disarray, distorting results and sowing seeds of doubt in breeding programs.
Pedigree errors, such as incorrect parentage, can significantly impact breeding. They distort the perceived relatedness of individuals, misguiding selection and reducing efficiency. Accurate pedigree information is essential to:
Ensure the integrity of breeding values
Maintain genetic diversity
Maximize desirable traits
Reliable pedigree records are the backbone of genetic evaluations, guiding everything from daily management to long-term breeding strategies. With accurate data, the advanced predictions of models like the single-step model retain their power.
“Pedigree errors are like silent assassins, stealthily undermining the foundation of trust and accuracy in cattle breeding,” a renowned geneticist warned.
This post explores the impact of pedigree errors using accurate Fleckvieh cattle data. We’ll reveal how minor discrepancies can compromise predictions and breeding outcomes by examining various scenarios with erroneous records. Join us in understanding the importance of accurate pedigree information and learning how to protect the genetic legacy of future cattle generations.
Understanding Pedigree Errors in Cattle Breeding
Type of Pedigree Error
Approximate Error Rate
Incorrect Sire Assignment
5% – 20%
Incorrect Dam Assignment
1% – 5%
Missing Parent Information
10% – 15%
Recording Errors
2% – 10%
Pedigrees, the family trees of cattle, play a crucial role in breeding decisions by mapping out lineage and ensuring breeders make informed choices. However, pedigree errors can disrupt these evaluations, leading to inaccurate Estimated Breeding Values (EBV) and misjudging an animal’s genetic potential.
Studies show that pedigree errors have serious consequences. Before genomic data, these errors caused misguided evaluations. With the integration of genomic information, it’s essential to understand how these inaccuracies affect modern genetic evaluations using the single-step model.
Research on Fleckvieh cattle, using a dataset of 361,980 pedigrees and 25,950 genotypes, revealed the impact of pedigree errors. Researchers simulated True Breeding Values (TBV) and phenotypes with a heritability of 0.25 to measure the mistakes at 5%, 10%, and 20% levels in conventional and single-step models.
The results were precise: higher rates of pedigree errors reduced the correlation between TBV and EBV and lowered prediction variability. These errors acted like random exchanges of daughters among bulls, masking actual genetic differences. This effect was more evident in progeny-tested bulls than in young selection candidates.
In forward prediction scenarios, pedigree errors caused an apparent inflation of early predictions, misleading breeders. This confirms that correcting pedigree errors is essential for reliable genetic evaluations and better breeding decisions.
Accurate pedigree records are vital; they are the lifeblood of breeders, enabling precise genetic evaluations and promoting genetic progress. With genomic data integrated into assessments, maintaining accurate pedigrees becomes even more critical, marking a new era in precision cattle breeding. Your role in this process is invaluable.
The Role of Pedigrees in Genetic Evaluations
Pedigrees are essential in livestock breeding, serving as the recorded lineage of animals. Accurate pedigrees predict an individual’s genetic potential by tracing inherited traits. However, errors in these pedigrees can lead to significant misinterpretations in genetic evaluations.
When pedigree errors occur, they disrupt the assumptions about genetic relationships among individuals. This misrepresentation can distort breeding program outcomes, affecting the accuracy of estimated breeding values (EBVs) and genetic gain, especially in genomic evaluations that combine pedigree and molecular data.
The single-step model, which integrates pedigree and genomic information, aims for more precise genetic predictions. Yet, pedigree errors can still undermine its efficacy. Even a tiny percentage of incorrect records, such as misattributing sires, can skew data and forecasts, as shown in studies on traits like carcass quality.
Correcting and verifying pedigrees are not just crucial, they are a constant battle in genetic evaluations. Many breeding programs invest in algorithms and DNA testing to correct these errors. Despite these efforts, eliminating pedigree errors remains challenging, requiring constant vigilance and improved data collection methods. Your dedication to this cause is essential.
The impact of pedigree errors can vary. In progeny-tested animals, reliance on offspring data means errors can significantly reduce genetic prediction variation. This results in progeny appearing more genetically similar, leading to inflated early predictions and potentially overestimating genetic merit.
Understanding and mitigating the impact of pedigree errors is an ongoing priority in animal breeding. With continued research and improved methodologies, the accuracy of genetic evaluations is expected to be enhanced, supporting future livestock improvement.
Why Accuracy Matters: The Impact of Pedigree Errors
When errors are embedded in pedigrees, the accuracy of estimated breeding values (EBVs) takes a significant hit. These mistakes distort animal genetic relationships, leading breeders astray and ultimately hindering genetic improvement. Our study showed that as pedigree errors increased from 5% to 20%, the correlation between actual breeding values (TBVs) and EBVs dropped markedly. This reduction means predicting an animal’s genetic potential becomes less reliable, complicating efforts to enhance desirable traits.
These errors also affect validation studies, especially in forward prediction scenarios. We observed a 5-6 percentage points decrease in validation reliabilities with incorrect pedigrees. Errors randomize genetic ties within the herd, particularly when wrong sires are assigned to non-genotyped females. This randomization causes less variation in animals with progeny, inflating early predictions and skewing perceived genetic accuracy.
The broader impact of these inaccuracies on breeding strategies is profound. Misjudged animals can lead to poor mating decisions, reducing genetic progress over generations. This is especially critical for traits like carcass quality in cattle, where our data showed that EBV accuracy and heritability estimates suffer due to pedigree errors. These findings highlight the need for stringent pedigree validation and the use of genomic data to counteract the adverse effects of erroneous records.
Decoding Pedigree Errors: Causes and Consequences
Pedigree errors can seriously disrupt genetic evaluations. These errors often arise from misidentifications or incomplete records, which are common in large-scale cattle breeding. One frequent issue is sire misidentification, where the recorded sire isn’t the biological father. This can result from human error or accidental mismatching during the breeding process.
The consequences of such errors are significant, leading to a decline in the accuracy of estimated breeding values (EBV). Distorted pedigree information skews genetic relationships, making animals appear more genetically similar than they are. This perceived homogenization reduces genetic variation, which is essential for accurate selection and breeding decisions. Higher rates of pedigree errors correlate with lower standard deviations in breeding value predictions, indicating a contraction in perceived genetic diversity.
Progeny-tested bulls are particularly affected compared to young selection candidates. Bulls with progeny show more pronounced decreases in EBV variability due to repeated errors over generations. This false sense of similarity among bulls levels the playing field, erroneously elevating or undervaluing their breeding values. Consequently, pedigree errors deflate the precision of genetic evaluations and disrupt validation processes.
In forward prediction validation scenarios, early predictions can appear inflated due to artificial genetic uniformity caused by pedigree errors. As animals mature and their progeny are evaluated, the true magnitude of these errors becomes evident. The initial over-inflation of genetic merit misleads breeding success perceptions, disillusions breeders, and complicates breeding strategies.
Two primary methods introduce pedigree errors: wrong sire information (WSI) and missing parent information (MPI). WSI introduces errors by randomly assigning incorrect sires, while MPI omits parental data. Each method misrepresents familial links, distorting the genetic blueprint and affecting the entire pedigree mapping and evaluation process.
Pedigree errors pose a multifaceted challenge in cattle breeding, impacting genetic evaluations and breeding progress. Recognizing and mitigating these errors is crucial for maintaining genetic predictions’ integrity and advancing cattle genetics. Advocating for stringent data verification and integrating genomic information to cross-verify pedigrees is essential to ensure accurate and reliable breeding data.
The Domino Effect: How Pedigree Errors Skew Genetic Predictions
Pedigree errors do more than misclassify animals; they ripple through genetic evaluation systems, distorting the entire breeding program. Accurate familial relationships are crucial, especially in single-step models where misassigned pedigrees lead to biased genetic merit estimations. The models need to know which animals share genetic backgrounds to predict breeding values accurately.
Interestingly, the impact of these errors varies with the animal’s reproductive status. Bulls with many offspring show a steep drop in the correlation between actual breeding values (TBV) and estimated breeding values (EBV) as errors increase. This is because incorrect sire assignments make offspring appear more genetically similar than they are, blurring the distinction between different bulls and misleading breeders.
Young candidates without progeny are less affected since their evaluations rely more on their genomic data than offspring records. However, they aren’t immune; indirect links to erroneous pedigrees still introduce biases.
Worryingly, pedigree errors can inflate early predictions in validation studies. When inaccuracies create undue uniformity among progeny-tested bulls, initial predictions for young candidates may seem overly favorable, misleading breeders. Given that forward prediction is vital for breeding strategies, maintaining accuracy in these predictions is critical to long-term success.
Therefore, meticulous pedigree recording and validation are crucial. As genetic evaluations increasingly incorporate genomic data, pedigree integrity remains essential for accuracy. Continuous improvement in pedigree accuracy and robust genomic integration will enhance genetic assessment, leading to a more productive and genetically superior livestock population.
Strategies for Minimizing Pedigree Errors
Dealing with pedigree errors demands an intelligent strategy. Here are some essential methods to reduce these errors and improve genetic evaluations:
DNA Testing for Parentage Verification: DNA testing ensures accurate parentage records by verifying true lineage through genetic markers, thus minimizing incorrect identifications.
Regular Audits of Pedigree Records: Routine audits help spot and fix discrepancies before they spread through the breeding program, ensuring data consistency and accuracy.
Breeder Education on Proper Pedigree Management: Educating breeders on meticulous record-keeping and the impacts of pedigree errors is essential. Training should cover best practices, data management tools, and the effects of mistakes on genetic evaluations.
Importance of Validation Studies in Ensuring Data Accuracy
Validation studies are crucial in ensuring the accuracy of genetic data in livestock breeding. These studies cross-reference pedigrees with genetic markers, making them essential for detecting and correcting errors that could undermine genetic evaluations.
The role of validation studies extends to identifying anomalies that could distort genetic predictions. Forward prediction validation, for example, shows how pedigree errors can inflate early predictions, emphasizing the need for precise validation. When validation reliabilities decrease due to higher error rates, the integrity of genetic assessments is compromised, leading to poor breeding decisions.
Collaboration between breed associations and researchers is vital to address these challenges. Breed associations’ extensive records and practical insights, combined with researchers’ technical expertise, can improve data validation methods. This partnership not only corrects existing inaccuracies but also strengthens breeding programs against future errors, ensuring a solid genetic foundation for the livestock industry.
The Bottom Line
In conclusion, pedigree errors can seriously distort genetic evaluations. Mistaken relatedness assumptions reduce the correlation between actual breeding values (TBV) and estimated breeding values (EBV). For progeny-tested bulls, this leads to decreased prediction variation and inflated early predictions, undermining reliability in validation studies.
Accurate pedigree records are crucial for reliable genetic evaluations in cattle breeding. They empower breeders to make informed selection decisions, which is essential for genetic progress and sustainable breeding goals.
Call to Action: Breeders should prioritize accurate pedigree records. Implement robust tracking systems and verify pedigree information routinely. This ensures reliable genetic evaluations, enhancing the success and sustainability of cattle breeding programs.
Key Takeaways:
Pedigree errors incorrectly assume the genetic relationships between individuals, thus affecting the quality and reliability of genetic evaluation models.
The single-step model, which combines pedigree and genomic data, is highly susceptible to even small percentages of incorrect records, leading to skewed data and forecasts.
Errors in pedigrees cause a decrease in the correlation between true breeding values (TBVs) and estimated breeding values (EBVs), complicating selection and breeding programs.
The impact of these errors is more pronounced in progeny-tested bulls compared to young selection candidates without progeny.
Forward prediction validation studies reveal an apparent inflation of early genetic predictions due to decreased variation caused by pedigree errors.
Mitigating pedigree errors requires persistent effort, improved data collection methods, and continuous research to enhance genetic evaluation accuracy.
Summary: Pedigree errors, such as incorrect parentage, can significantly affect cattle breeding by distorting the perceived relatedness of individuals, misguiding selection, and reducing efficiency. Accurate pedigree information is crucial for maintaining genetic diversity and maximizing desirable traits. These errors disrupt assumptions about genetic relationships among individuals, distorting breeding program outcomes and affecting the accuracy of estimated breeding values (EBVs) and genetic gain. The single-step model, which integrates pedigree and molecular data, aims for more precise genetic predictions, but even a small percentage of incorrect records can skew data and forecasts. Correcting and verifying pedigrees is a constant battle in genetic evaluations, requiring constant vigilance and improved data collection methods. Understanding and mitigating pedigree errors is an ongoing priority in animal breeding, with continued research and improved methodologies expected to enhance genetic evaluation accuracy and support future livestock improvement.
Unlike any other country, Direct Genomic Values (DGV) have been published in Canada for genotyped animals as part of its genomic evaluation system. The intent of doing so was to provide producers and industry personnel a better insight into the “black box” of genomic evaluations when they were first introduced in 2009. Ten years later, as of the December 2019 release, DGV will no longer be published or included in any outgoing data files associated with Canadian genetic evaluations. Some breeders have expressed their disagreement with this decision and misunderstanding continues to be propagated. This article provides further clarification regarding the decision to no longer publish DGV.
What Information Contributes to An Animal’s Genetic Evaluation?
After genomics was first introduced in Canada in 2009, Canadian Dairy Network (CDN) and industry partners launched an extensive education effort to help everyone better understand how the animal’s DNA analysis contributed to its genetic evaluation, resulting in the increased accuracy. The information in Figure 1 was regularly used as part of this educational campaign.
Every young calf born in Canada and registered in the breed association herd book, whether it’s a heifer or bull, receives a Parent Average for each trait as its first official genetic evaluation, labelled as a PA. This estimate of its genetic potential is simply based on a formula that averages the genetic evaluation of its recorded parents. In this sense, each animal’s pedigree serves as the first source of information for its genetic evaluation.
As a heifer calf ages and becomes a cow after first calving, her own performance data contributes to her genetic evaluation, labelled as an EBV (Estimated Breeding Value). Performance data can include production data recorded through milk recording, classification data recorded by Holstein Canada and any other data that contributes to genetic evaluations for the various functional traits (i.e. health traits, fertility, longevity, etc.). Including a cow’s own performance data to her genetic evaluation adds significant accuracy over and above the accuracy of its Parent Average from pedigree alone. For cows that eventually have daughters old enough to have their own performance data, this also contributes to their genetic evaluation as a dam and further increases its accuracy.
For young bulls that enter A.I. and end up with many daughters with performance data, they end up reaching progeny proven status with an evaluation that is also labelled as an EBV. While sires don’t have any of their own performance data included for dairy cattle traits, progeny proofs for sires end up with higher levels of accuracy (i.e.: Reliability) compared to cows, with their own data and with their daughter data, simply because of the volume of daughters that are included.
The significant difference that genomics has offered is the ability to genotype an animal at any stage of its life and have an analysis of its own DNA contribute to the estimate of its genetic potential. Doing so gives an increased accuracy of the resulting genetic evaluation with the greatest benefit occurring for young animals that otherwise would only have a Parent Average based on pedigree data alone. In Figure 1, adding the contribution from the animal’s DNA is represented in red text and the resulting evaluation labels add the letter “G” to become either a GPA (for young animals) or a GEBV (for cows and progeny proven sires).
What is DGV and Why Stop Publication?
As shown in Figure 1, genotyping an animal means that an analysis of its DNA can contribute to the estimation of its genetic potential, which adds significant accuracy to that evaluation. After introducing genomic evaluations in 2009, CDN coined the term “Direct Genomic Value”, or DGV, to represent this new source of contribution to genetic evaluations. The terminology of Direct Genomic Value later became widespread around the world in the area of dairy cattle improvement. The decision by CDN to publish DGV for each genotyped animal was simply to help everyone understand how genomics works. The specific DGVs were not meant to be considered as an animal’s genetic evaluation and were never promoted to be used as a tool for selection or mating.
Direct Genomic Values (DGV) are an intermediate step in the calculation of each animal’s most accurate genetic evaluation and serve as one of various sources of information that contribute to each animal’s estimate of genetic potential.
As an intermediate step in the process of estimating each animal’s most accurate genetic evaluation, it turns out that DGV are also not expressed on the same scale as the official evaluations of GPA. The most elite animals of the breed have DGV that have a range that is higher than that for official GPA. For this reason, it seems that various breeders and some A.I. organizations started to pay special attention to DGV and, on occasion, market their animals based on these higher values.
Once the Genetic Evaluation Board (GEB) of CDN, which includes breeders nominated by breed associations and other industry partners, announced its recommendation to the Board of Directors to no longer publish DGV, some of those breeders and A.I. companies that were marketing animals based on DGV made their opposition public and well known. As a consequence, senior staff at CDN and Holstein Canada met with some of the most vocal advocates of keeping DGV to listen to them and hear their perspectives on how DGV was important to their genetic selection and mating decisions. Following extensive additional research into each of those perspectives presented to CDN and Holstein Canada, there remains no scientific evidence available that demonstrates that DGV provides any more information for good selection and mating decisions compared to using the official value of GPA. It is based on this scientific evidence that the GEB and the Board of Directors of both CDN and Lactanet Canada have supported the direction to no longer publish Direct Genomic Values effective the December 2019 genetic evaluation release.
Since the initial research regarding the relative accuracy of Direct Genomic Values for selection decisions was openly presented in April 2018, there has much input from and consultation with producers as well as various breed associations, all of which was considered by the GEB when making the recommendation to no longer publish DGV as well as by the CDN and Lactanet Boards of Directors.
What About Transparency and Data Ownership?
The decision to no longer publish DGV does not reflect the position of CDN, or now Lactanet, as it relates to transparency of information and data ownership. The calculation of genetic and genomic evaluations is complex and uses advanced methods and models that involve several steps and sources of data contribution. In addition to the contributions for domestic animals represented in Figure 1, there is also the use of data from international sources such as Interbull, CDCB in the United States and cow evaluations received from other countries. The genetic evaluation details on a trait by trait basis that are available via the former CDN web site, and the future Lactanet web site, are made available to help everyone understand the main traits presented on each animal’s Genetic Evaluation Summary page.
In terms of data ownership, Lactanet and other industry partners recognize that the raw data collected on dairy farms across the country belongs to the dairy producer. Milk recording, classification, health recording, breeding data… all what is recorded and paid for by the producer belongs to them. Even for genotyping, the use of the DNA sample provided by the producer, and the resulting genotype received from the laboratory, is treated seriously by Holstein Canada, CDN and now Lactanet Canada. The role and challenge of the various industry organizations is to take that raw data from the farm and transform it into valuable information for herd management decisions. For genetic selection and mating decisions, the official genetic evaluation for genotyped animals, either GPA or GEBV, is the most accurate and valuable genetic decision tool, and not the intermediate value of DGV.
Author: Brian Van Doormaal, Chief Services Officer, Lactanet Canada
By Ezequiel Nicolazzi (CDCB), George Wiggans (CDCB), Leigh Walton (CDCB) and Paul VanRaden (USDA-ARS-AGIL)
Two important updates will be implemented in the crossbred evaluations in December 2019:
Change in F1’s threshold for the breed of evaluation to be the breed of the ID: Since the introduction of crossbred evaluations in April 2019, Breed Base Representation (BBR) is instrumental in determining the breed of evaluation of all animals. Until now, for F1 animals, the breed code of the animal ID determined the breed of evaluation even if the BBR value is only the second highest value if the 2 highest BBR breeds are in the range of 45-55% and the second breed is less than 10% from the first breed.
Effective with the December 2019 evaluation, the simplified rule will maintain the breed of the ID if its BBR is higher than 40%. In that case an animal with HO ID, will maintain the HO breed of evaluation if its HO BBR is higher than 40%. This change currently impacts less than 500 animals in
the evaluation.
Change in calculation of reliabilities for crossbred animals: The calculations of reliability (REL) and the inbreeding of future progeny (EFI) rely on the relationship between the animal and the predictor population. Since crossbred animals do not have a predictor population for PTA (purebred SNP effects are blended in based on BBR values), their reliability and EFI estimates have previously been obtained using a multi-breed reference population. This strategy results in nearly 30% lower
reliabilities for animals with BBR<90 compared to animals with BBR>90. A further concern was that crossbred animals with stronger links to the reference population (e.g. BBR close to the 90 threshold)
receive similar reliabilities than animals having a mixed-breed genetic makeup (e.g. F1’s, or animals with contributions from more than 2 breeds).
Effective December 2019, following a full review of the methodology and results, the most connected purebred reference population of each crossbred animal (determined by the breed of evaluation used) will be used instead. In addition, a differential weighting of the traditional and genomic
components will be applied, by giving more weight on the traditional component for animals with traditional reliability above 30% (animals with phenotypes). These changes make it even more
important to emphasize that genomic evaluations on crossbred animals are useful for animals being bred to animals of the same breed of evaluation (e.g. going towards “purity”), whereas are not an advisable tool for animals in a rotational crossbreeding program.
As expected, no effect will be observed on purebred animals, whereas reliabilities and PTAs of crossbred animals will be impacted. (Note that reliabilities are used to weight the traditional and genomic components of an evaluation.) The greatest changes will be observed on animals with BBR
close to the 90% threshold, as their reliabilities will be the ones mostly changing (upwards) with this new strategy. Reliabilities will be more closely linked to the BBR distribution, as animals having more purebred composition will receive a reliability and PTA estimates similar (with differences in weighting, obviously) to a purebred animal. Considering that animals with BBR close to the 90% threshold have most of their SNP effects based on that same breed on which relationships are obtained from, this change makes reliability estimates more accurate.
Correction to use of foreign fertility evaluations
By Ezequiel Nicolazzi (CDCB), Leigh Walton (CDCB) and Paul VanRaden (USDA-ARS-AGIL)
When extending the MACE information to include Mastitis into the evaluation in August 2019, an incorrect trait order when comparing reliabilities caused MACE fertility evaluations to be used incorrectly for some bulls. This resulted in more differences between traditional and genomic evaluations than expected, which mainly affected highly-reliable Holstein bulls and animals related to them. Test results on the error repair indicate the divergence between traditional and genomic PTAs for these bulls should be resolved and is expected to result in slightly different genomic PTAs propagating throughout the population, due to better SNP estimates.
We thank Ryan Starkenburg (ABS) for identifying the misalignment and the industry review committees for providing feedback.
It was ten years ago, in August 2009, that genomic evaluations were first officially published in Canada. This started with the Holstein breed but the same technology was later also applied in the Jersey, Ayrshire, Brown Swiss and Guernsey breeds. Let’s take a quick look at how genomics has changed dairy cattle selection, its impact on genetic improvement and contemplate what’s next on the horizon.
Bull Selection and Usage
Almost immediately when genomics was introduced, the A.I. companies around the world were seemingly forced to embrace it. Given the intense competition between organizations, as soon as any had decided to aggressively use genomic selection, they needed to as well to stay in business. The science showed that genomics was not a “fade” and technology had advanced to a point where DNA could finally be used for genetic selection in dairy cattle. The biggest advantage that genomics provided to A.I. companies, was the increased accuracy of genetic information available prior to making any bull purchasing decisions. Also, genomics allowed for the use of younger sires and dams as the parents of the next generation of young bulls, without much sacrifice in accuracy. Together, this translated to an unprecedented annual rate of increase in the average genetic merit of young bulls entering A.I. throughout North America, which now exceeds 120 LPI points and $200 Pro$ per year. With such a continuous year over year boost in the genetic makeup of genomic young sires offered through A.I. companies, these bulls now represent two-thirds of the total semen market share in Canada.
Increased Genetic Progress
A direct and very significant outcome of having genomic evaluations for the past ten years is the impact on the increased rate of genetic progress. Figure 1 shows this impact very clearly since the steady rate of annual gain before genomics, which was 46 LPI points and $79 Pro$ per year, suddenly switched after 2009. During the past five years, the average rate of genetic gain has increased by 2.2 fold, reaching 102 LPI points and $180 Pro$ annually. The dashed lines since 2009 in Figure 1 reflect the expected genetic progress that would have been achieved for both LPI and Pro$ in Canadian Holsteins if genomics had not been introduced.
Of equal, or perhaps even greater, importance than these realized gains for LPI and Pro$ is the impact that genomics has had on genetic progress achieved for individual traits as shown in Figure 2. The first key point to notice is that positive genetic gain is now being realized for all of the major production, conformation and functional traits in addition to Pro$, LPI and its three components. Before genomics, in addition to losing ground for Daughter Fertility, Persistency, Milking Temperament and the Health & Fertility component of LPI, very little genetic progress was being made for other traits including Fat and Protein Deviations, Milking Speed, Daughter Calving Ability and Metabolic Disease Resistance. For all of the other eleven traits in Figure 2, the average rate of genetic gain realized with genomics has increased two-fold. The truly amazing outcome now known is that genomics provides an unprecedented opportunity to realize selection objectives for lower heritability traits even if they have negative genetic correlations with traits of moderate or higher heritability.
Figure 1: Rate of Genetic Progress Achieved in Canadian Holsteins With Genomics
Figure 2: Genetic Gain Achieved in Canadian Holstein During the Past 5 Years Compared to 5 Years Before the Introduction of Genomics
Genotyping Adoption
Over the past ten years, over 3.2 million genotypes have now been accumulated in the genetic evaluation database at Lactanet. This includes genotypes from animals all over the world, mainly the United States, since it was agreed at the onset that both countries would share all dairy cattle genotypes. Figure 3 shows the evolution in the number of genotyped Canadian-born Holstein females since 2008. After an initial gradual growth period a level of plateau was seemingly reached during the years from 2015 to 2017. For various reasons, one of which was a 27% reduction in the cost of heifer genotyping in Canada, the adoption of female genotyping in Holsteins jumped to over 37,000 in 2018 and activity so far this year leads to a projected volume of 53,000 females for 2019. Figure 4 shows the similar information with genotyping adoption rates expressed in terms of the percentage of females registered by Holstein Canada by year of birth. This figure shows that the market penetration for heifer genotyping reached the 12% mark for registered Holsteins born in 2018.
Figure 3: Number of Canadian-Born Holstein Females Genotyped per Year
Figure 4: Adoption of Heifer Genotyping by Year of Birth for Registered Holsteins in Canada
A Crystal Ball
The implementation of genomic evaluations and the use of genomic selection have only just started to impact dairy cattle improvement strategies in Canada and globally. Given the experience with genomic selection over the past ten years, looking into a crystal ball towards the future, one can expect to see the following over the next ten years:
The introduction of a vast array of new traits of economic and social importance, most of which have not yet even been considered by dairy producers
Increased use of sexed semen, in-vitro fertilization and other advanced reproductive technologies, which also promote the increased use of beef semen to breed dairy cows
Use of DNA genotypes for improved selection strategies balancing genetic gain with maintenance of genetic diversity, including the use of genome-based mating programs
A significant restructuring and consolidation of the A.I. sector, leading to a handful of larger, multi-national breeding companies
Significant value-added benefits from DNA genotyping including automated parentage discovery and recording as well as traceability of dairy animals and food products
Needless to say, we are still at the tip of the iceberg when it comes to the impact that genomics and DNA genotypes will ultimately have on the dairy cattle industry.
Over the last couple of years, the noticeable seasonal fluctuation in trends in fertility traits has been difficult to understand. In particular, a large percentage of young bulls either increased or decreased, depending on the season of the triannual run (April, August, or December). It is no surprise that when bulls’ evaluations increase, it makes a lot of breeders happy. In contrast, when Predicted Transmitting Abilities decrease, many folks are disappointed. Understandably, producers hate to see bulls they’ve been using decline as it appears that their previous selection of service bulls was not optimum. These perceptions of the changes are unwarranted if it turns out the increases or decreases observed were due to shortcomings in the evaluations, i.e., changes occurred simply because the estimation procedures did not account for season appropriately. A key concern is that users may lose confidence in the usefulness of the results provided.
The good news is that after a complete revision of the fertility evaluations, which included several improvements over the last couple of years, the scientists at AGIL and CDCB have uncovered the reasons that caused seasonal fluctuations. The primary reason was that the seasonal grouping was derived previously from the heifers’ breeding dates instead of cows’ breeding dates. The less-than-exciting news is now that the issue has been discovered and rectified, there will be changes coming one more time, in the August 2019 run.
In order to understand the impact the revisions proposed (new seasonal grouping) would have on the stability of future evaluations, CDCB reran the past 4 evaluations using the revised seasonal groups. The results are shown below for daughter pregnancy rate (DPR) in Holstein. Trends from the same four runs were examined for cow conception rate (CCR) and heifer conception rate (HCR) as well, and also for Jerseys. Comparison of trends in the four official runs (Figure 1) and trends from improved seasonal grouping runs (Figure 2) gave reviewers’ confidence that this lingering problem is now resolved.
Figure 1:
Figure 2:
The results are extremely encouraging because almost all the seasonal variation disappeared when the model changes were applied. The seasonal variability observed in runs previously published (OFFICIAL) was gone in the test runs (TEST) using the revised procedure. These research runs give us confidence that the change introduced in the upcoming August 2019 evaluation will no longer produce the seasonal fluctuation experienced in the last couple of years. The actual changes in Predicted Transmitting Abilities (PTA) for the top 100 NM$ bulls in the previous evaluation are shown in Table 1 for 2 breeds.
Table 1. Changes in PTAs in fertility traits of Holsteins and Jerseys between the April 2019 and August 2019 runs
Fertility trait
Active AI Holstein bulls
Genomic Holstein bulls
Active AI Jersey bulls
Genomic Jersey bulls
DPR
-0.68
-0.99
-0.50
-0.61
CCR
-1.71
-2.36
-1.63
-1.72
HCR
-0.13
-0.47
-0.22
-0.33
There were a couple of other minor changes implemented that were obvious improvements that had little impact on the evaluations. For example, cow lactations initiated with an abortion were removed so they no longer biased Early First Calving (EFC). Abortions were previously entering that EFC calculation. Since the incidence of these cases was extremely low, the impact of this new edit is negligible on a population framework but could change EFC on single animals slightly.
In summary, the introduction of the new “stability package” will result in lower values for recent bulls, affecting most fertility traits. The table shows the changes for heifer conception rate (HCR), cow conception rate (CCR), and daughter pregnancy rate (DPR) that will be observed in the August run in comparison to the April 2019 evaluations. These changes will produce fertility evaluations that are considerably more accurate in future evaluations. We want to acknowledge the exceptional efforts of Paul VanRaden and Jana Hutchison for the research investigation to uncover causes of undesirable changes occurring and to Jay Megonigal for rerunning four consecutive test evaluations to confirm that improvements were incoming.
The Genetic Evaluation Board of CDN met on Wednesday, February 13, 2019 at the Holiday Inn in Guelph, Ontario following an Open Industry Session held the previous day. The following is a summary of the discussions and recommendations from the GEB, which will be considered by the Canadian Dairy Network (CDN) Board of Directors at its next meeting scheduled for March 7, 2019.
Brian Anderson from Athlone Farms was re-elected as Chairman of the Genetic Evaluation Board for 2019.
The GEB recommended that CDN proceed with the planned implementation of an updated Pro$ formula for the Holstein and Jersey breeds as well as the first introduction of Pro$ for Ayrshires, effective the April 2019 genetic evaluation release. Specific changes associated with the new Pro$ formula include:
Updated economic values for revenue based on current milk pricing across Canada.
Updated economic values on the expense side of the profit equation, which now include the cost of extra inseminations associated with poor reproduction as well as different daily maintenance costs based on each cow`s estimated relative body size
More accumulated cow lifetime profitability data since Pro$ was originally developed in2015.
A Pro$ formula for Jerseys based on cow lifetime profitability data specific to that breed.
In addition, the GEB recommended that CDN implement automated procedures to develop and introduce an updated Pro$ formula annually for each breed, including an annual update to the genetic base used to express published Pro$ values.
In conjunction with the update of the Pro$ formula, the GEB also recommended that CDN update the LPI formula in each breed, effective April 2019, based on the discussions held with the respective breed associations. Although all details of the updated LPI formula will be published separately by CDN, the key changes include:
For all breeds, an increased weight on fat such that it is at least equal to or greater than the weight on protein within the Production component, to reflect national changes in milk pricing in recent years
Changes to the Durability component in Holsteins by including Hoof Health alongside Feet & Legs as well as Rump
For Ayrshire, with the introduction of Pro$, the LPI formula will shift the relative emphasis on the three components to 46% Production, 32% Durability and 22% Health & Fertility, instead of the current 50:31:19, and also adjust the relative weights on the various traits within each of the three components
The Jersey LPI formula will increase emphasis on the Health & Fertility component relative to Production and Durability, and incorporate some adjustments within each of the three components including the removal of Dairy Strength from Durability
The LPI formula for the other coloured breeds will reflect current breed goals and the desired rate of genetic progress for key traits of importance
In terms of future plans for genetic and genomic evaluation services, the GEB discussed and supported the strategy outlined by CDN to develop and introduce evaluations for additional traits including cystic ovaries, metritis and retained placenta, with April 2020 as the target release date, as well as feed efficiency with a target date of August 2020.
The GEB discussed results from the ongoing work at CDN to develop an improved genetic and genomic evaluation model for calving performance traits, namely calving ease and calf survival. Based on the most recent analyses conducted by CDN, the GEB supported the current direction of implementing a single step genomic evaluation system, with a possible implementation date of December 2019 or April 2020. Results from genomic validation testing and final recommendations associated with the new calving performance system will be presented at the next Open Industry Session in October 2019.
Given the current direction of industry partners to introduce new DHI service options to allow for the remote collection of on-farm production data electronically, without visiting the farm, the GEB discussed how such data could ultimately be included for genetic evaluation. It is expected that the inclusion of milk weights on each data collection date can easily be incorporated into the current Test Day Model used by CDN for production traits. The use of fat and protein components analysis from in-line sensors may also be possible. When discussing how resulting cow evaluations would be published and labelled, the GEB recommended that CDN examine the possibility of making publicly available all cow evaluations based on their own production data, including such evaluations that may completely be based on unsupervised and/or non-verified data. This topic will be openly discussed with industry partners and presented at Open Industry Sessions in the future.
Another topic discussed by the GEB that is of broad interest to Canadian producers, breeders and industry partners is the current and future emphasis placed on stature, especially in the Holstein breed. In general, the GEB supports the recent changes implemented by Holstein Canada related to the assessment of stature and how it contributes to Dairy Strength and consequently to overall Final Score for Conformation. While such changes have an immediate impact on classification results, the GEB recognizes that they take several years of classification data before impacting genetic evaluations. For this reason, the GEB recommended that CDN examine the possibility of moving to composite indexes for the calculation and publication of genetic evaluations for Conformation, Mammary System, Feet & Legs, Dairy Strength and Rump. An expected advantage of this approach is the establishment of composite indexes that reflect the desired direction of selection for traits of intermediate optimums such as Stature, Rear Legs Side View, Teat Length and others. To allow for broad industry discussion and input on this topic, CDN will include it on the agenda for the Open Industry Sessions planned for October 2019 and March/April 2020.
CDN continues to be closely involved in the international effort to address the potential downward bias of progeny proven sires resulting from genomic pre-selection applied by A.I. organizations prior to purchasing genomic young sires. Given the complexity of this issue, any advancement in methods and models to account for this effect is expected to take time.
Following an industry request, the GEB discussed the current policy implemented by CDCB in the United States associated with the availability to CDN of haplotype results for genotyped animals. As a consequence, the GEB recommended that CDN initiate further discussions with CDCB to find a solution such that CDN is able to provide haplotype results for all genotyped animals.
The next Open Industry Session is scheduled to take place on Wednesday, October 9, 2019 in St. Hyacinthe, Québec with the Genetic Evaluation Board meeting the following day.If there are any questions, concerns or comments regarding the recommendations of the Genetic Evaluation Board, as outlined in this summary, please feel free to contact committee members listed at http://www.cdn.ca/committees-geb.php or by contacting Brian Van Doormaal directly at Canadian Dairy Network
There is no doubt that the arrival of genomics in Canada ten years ago has had a major impact on the entire dairy industry. It can be argued, however, that no segment of the industry has been more affected than the A.I. sector. In order to survive the competitive environment of that business, both nationally and internationally, A.I. companies needed to embrace and adapt to a new genetic selection scheme based on genomic selection. Canadian Dairy Network (CDN) recently looked at what has changed in terms of young bulls that were actively marketed to Canadian dairy producers in the years before the arrival of genomics (i.e.: 2004 to 2009) compared to those marketed in Canada more recently.
Figure 1 shows that the total number of young Holstein bulls with semen sold in Canada has not significantly changed since 2004, averaging 445. That said, genomic evaluations make it easier for A.I. companies to market young bulls internationally, which means there are several more players offering genomic young bulls to Canadian producers. Figure 1 also shows the increasing percentage of those bulls in A.I. that resulted from embryo transfer or manipulation such as embryo splitting, which now surpasses 90%. This trend generally reflects the parallel increased adoption of new reproductive technologies such as in vitro fertilization (IVF). A reality of the new selection scheme based on genomics is the huge shift towards the use of young animals as parents of potential young bulls for entry into A.I. This shift results from the significant gains in accuracy of genetic evaluations for young bulls and heifers due to genomics.
While the change towards the youngest parents possible and high selection intensity for A.I. purchases may be criticized by some, Figures 2 and 3 show the positive impact in terms of the average genetic merit of young Holstein bulls marketed in Canada since 2004 for LPI and Pro$, respectively. Prior to genomics, the average increase in LPI for young bulls with semen released between 2004 to 2009 was 84 points per year. For the most recent complete 5-year period from 2012 to 2017, this increased significantly to average 121 LPI points per year. For Pro$, these same averages were $142 and $206 annually, as shown in Figure 3. This means that genomic young bulls released this year are expected to increase the average lifetime profit of their daughters by more than $200 compared to daughters of young bulls released a year earlier.
The race among A.I. companies to identify, purchase and offer to producers the highest genomic young bulls possible has also led to the adoption of strategies that put greater control in the hands of such companies. Essentially all leading A.I. organizations globally have implemented business plans that include the ownership of elite females, based on genomics, which serve as a primary source for producing the next generation of elite genomic young bulls. In Canada, the five A.I. companies with the largest market shares all now have their own female multiplier herds and associated breeder prefixes including “Progenesis” for Semex Alliance, “S-S-I” for Select Sires, “Peak” for Alta Genetics, “Denovo” and “ABS” for ABS Global and “Co-op” for Genex/CRI.
The recent CDN analysis also examined the breeder prefix of the young Holstein bulls with semen released in Canada from 2004 to 2017. On average, there were over 220 breeder prefixes represented among those bulls with semen marketed in Canada. Of these, two-thirds of the breeders provided only one bull during any given year and an average of 40 breeders were able to provide three or more bulls to A.I. that were marketed in Canada. In any given year, there were a handful of breeders that contributed at least 10 bulls that were offered in Canada. Figure 4 shows the trend in the percentage of young bulls marketed in Canada that were sourced from the ten most frequent prefixes within each year of semen release. This proportion ranged between 19% and 28% for all years from 2004 to 2014 but has increased since then to 47.9% for genomic young bulls marketed in Canada in 2017. This means that roughly half of all bulls entering A.I. for use by Canadian producers have been sourced from ten breeder prefixes. The main reason for this concentration of bulls sourced from fewer breeder prefixes is the introduction of female breeding programs by major A.I. companies in addition to contractual arrangements between A.I. organizations and specific breeders.
Summary
Genomic selection has significantly changed the design and structure of the typical genetic improvement scheme for dairy cattle. Traditional young sire incentive programs have been replaced by strong demand for young sire semen to a point where it represents nearly 70% of the market share. The increased accuracy of evaluations for young males and heifers has moved sire selection schemes towards genomic testing for screening so that only the most elite are purchased for entry into A.I. In addition, the increased adoption of reproductive technologies such as IVF has significantly reduced the average age of the dams of young bull entries into A.I. The competitiveness of the A.I. sector globally has moved such global companies to strategies whereby they own their own females to have a greater control on sourcing the next generation of elite genomic young bulls. In the end, this all translates to higher quality young sires offered to Canadian producers, which translates into faster rates of genetic progress for the breed.
Author:
Brian Van Doormaal, General Manager, CDN
Lynsay Beavers, Industry Liaison, CDN
2019 will mark Canada’s 10th anniversary of the introduction of official genomic evaluations. When they were first introduced by Canadian Dairy Network (CDN) in August 2009 for Holsteins, there was much hesitation and questioning about whether the technology was real and useful or just hype. Today, we know the truth and, as a consequence, breeds with genomic evaluations have rapidly increased the rate of genetic progress for essentially all traits.
Basically, genomic selection added another source of data to the genetic evaluation systems at CDN. In addition to performance data and pedigree information, DNA became a new source of data for each genotyped animal. To improve the understanding of how this new source of data was being used to produce published genomic evaluations, CDN decided to make Direct Genomic Values (DGV) public. In recent months, there has been much discussion about the intent of CDN to no longer publish DGV. The strong interest and passion of Canadian breeders was clearly heard. For this reason, the CDN Board decided to delay the implementation of the GEB recommendation to be effective December 2019. Let’s take a closer look at why CDN will be moving forward with this direction.
What is Genomic Parent Average (GPA)?
For genotyped animals, there are three main sources of information that contribute to its official genomic evaluation. These include the animal’s Parent Average (PA), any performance data (i.e.: such as lactation, classification, mastitis, fertility, etc. data) recorded on the animal and/or its progeny, and the DGV estimated from the animal’s DNA. For young bulls and heifers, since no performance data exists, they receive a Genomic Parent Average (GPA), which combines its PA and its DGV into the single official genomic evaluation published by CDN, as shown in Figure 1.
Figure 1: Combining Parent Average (PA) and Direct Genomic Value (DGV) into the Official Genomic Parent Average (GPA)
Scale Differences
Since PA is simply the average of the evaluations for the animal’s sire and dam, the range for PA can never be wider than it is for evaluations of bulls and cows old enough to be parents. Looking at Conformation as an example, the highest active sire in A.I. currently has a rating of +20, while the highest proven sire is +16 and the highest breeding age female born in Canada is +18. This means that it is impossible for Canadian-bred animals to have a PA higher than +19. Looking at DGV for Conformation, however, the highest bulls are at +22. This higher scale for DGV attracts extra attention to these values for marketing purposes. However due to their different scales, DGV cannot be directly compared to GPA values. Further, since GPA results from a blending of PA and DGV, the most elite animals of the breed will almost always have a DGV higher than GPA.
Animal Rankings
Even though the scales for GPA and DGV are not exactly the same, the rankings for top animals of greatest interest for selection are essentially identical. In fact, regardless of the trait looked at (i.e.: LPI, Pro$, Conformation, etc.), over 90% of the highest genomic bulls would be the same if ranked by GPA versus DGV. In this sense, DGV does not help identify the most elite animals for selection and mating compared to using GPA alone.
Prediction of Future Genetic Evaluations
In discussion with some breeders, there was the impression that DGV helped to better identify those genomic young bulls that would end up with the highest proofs once their progeny were milk recorded and type classified. This was the basis for the initial analysis conducted by CDN geneticists earlier this year. The most appropriate way to assess this question is to look at sires that currently have an official progeny proof and see whether their GPA or DGV four years ago, when they were a genomic young sire in A.I., best predicted their current results. The results of the analysis were clear. While GPA is not a perfect predictor of a young bull’s future progeny proof, using DGV was consistently a poorer predictor. This can be explained by the fact that DGVs tend to be higher than GPA for elite genomic young bulls so a higher degree of over prediction is expected compared to GPA.
The same question can also be asked for females. Does DGV for genotyped heifers provide a better prediction than GPA of their future performance as a lactating cow in the herd? CDN conducted a specific analysis to examine this question within several herds. In the end, there was no practical difference in the correlation between GPA or DGV for heifers with their resulting 305-day lactation yields and classification scores during first lactation.
Looking at the Difference of DGV Versus GPA
Another strategy used by some breeders when assessing high end genomic bulls for semen purchase decisions has been to look at the difference of DGV minus GPA. The belief here has been that preference should be given to select genomic bulls for which the superiority of DGV over GPA is the highest. The CDN analysis looked at this hypothesis by focussing on the Top 100 GPA LPI genomic bulls in 2013, all of which now have an official progeny proof in 2018. The 25 genomic bulls with the highest difference of DGV minus GPA were compared to the 25 bulls with the lowest DGV superiority and results are presented in Figure 2. The 25 bulls with the biggest difference had an average DGV LPI of 3190 and an average GPA LPI of 3027. As expected, this difference was much less at only 60 LPI points (i.e.: 3075 minus 3015) for the other group of 25 genomic bulls in 2013. Once proven, however, it was the 25 bulls with DGV and GPA being closest together that ended up with the higher average LPI, at 2929 compared to 2827 for the 25 bulls with the biggest difference of DGV minus GPA. This overall result stemmed from the fact that the bulls with the biggest difference had significantly lower Parent Average (PA) for LPI at 2622 points, compared to 2773 for the bulls for which DGV and GPA were quite similar.
Figure 2: Comparison of Average LPI Values for Two Groups of Genomic Bulls Among Top 100 for GPA LPI Based on the Degree of Difference Between DGV and GPA
Breeding for the Next Generation of Extreme Animals
Breeders aiming to produce young bulls for potential entry into A.I. and/or elite females for marketing and embryo sales tend to have navigated to using DGV as an important sire selection tool. The goal from this strategy is to use genomic bulls with the highest DGV for any given trait to increase the chance of producing progeny that also have an extreme DGV in the breed. CDN recently designed and conducted an analysis to assess this strategy compared to using GPA for achieving the same objective. The conclusion from this study was that DGV was not superior to GPA in terms of identifying extreme genomic sires that will have higher chances of producing extreme progeny.
Path Forward
Based on all scientific analysis conducted, no evidence has been found to show that DGV provides any information for improved sire selection and/or mating decisions, compared to using the official GPA itself. Based on these results, the Genetic Evaluation Board (GEB) of CDN approved a recommendation to no longer publish DGV in the future. In terms of implementation of this recommendation, the CDN Board of Directors decided to delay it until December 2019. In the meantime, CDN will work with the various breed associations and A.I. organizations to prepare and deliver an industry-wide communication plan related to this direction.
Author:
Brian Van Doormaal, General Manager, CDN
Lynsay Beavers, Industry Liaison, CDN
Canadian Dairy Network (CDN) held an Open Industry Session on Wednesday, October 24, 2018 at the St. Hyacinthe Congress Centre, which was followed, as usual, by a meeting of the Genetic Evaluation Board (GEB) the following day. The following is a summary of the discussions and recommendations resulting from that GEB meeting held the next day, which will be considered by the CDN Board of Directors for approval at its meeting on December 10, 2018.
Following a comprehensive presentation related to the publication of Direct Genomic Values (DGV) and a lengthy discussion period during the Open Industry Session, the GEB members continued discussions during its meeting the following day. A summary of those discussions has been circulated by CDN in a separate document and is available upon request. In the end, given the technical nature of the GEB mandate, as an advisory committee to the CDN Board of Directors, the GEB felt there was no science-based reason to change the direction of its original recommendation made last April for CDN to no longer publish DGV for any animals or make them available in any data files. Consideration of non-technical points on this topic and an implementation plan fall within the responsibility of the CDN Board of Directors.
The GEB discussed some final details associated with the transition of Somatic Cell Score expression to the Relative Breeding Value (RBV) scale used for all other functional traits, to be effective December 2018. As a consequence the GEB made the following recommendations:
That evaluations for the Mastitis Resistance (MR) index be labelled as official when the evaluation for Somatic Cell Score meets the minimum criteria for official status.
That CDN develop a Cow Genetic Evaluation Details page on its web site for providing genetic evaluations for traits with official status that do not otherwise appear on the animal’s Genetic Evaluation Summary page.
That CDN examine the use of single step methodology for calculating Clinical Mastitis genomic evaluations for possible implementation in the future. This approach is expected to increase the accuracy compared to current genomic evaluations and/or allow CDN to expand the availability of this trait to other breeds.
That CDN assess the current range of bull evaluations for Mastitis Resistance in the Ayrshire and Jersey breeds and consider making any required modifications given that these breeds do not have genomic evaluations for Clinical Mastitis, which is the case for Holstein.
Also effective December 2018 are official genetic and genomic evaluations for additional hoof health traits in Holsteins, over and above Digital Dermatitis that was introduced in December 2017. On this topic, the GEB made the following recommendations:
That Holstein breed evaluations for eight hoof lesions, namely Digital Dermatitis (DD), Interdigital Dermatitis (ID), Heel Horn Erosion (HHE), Sole Ulcer (SU), Toe Ulcer (TU), White Line Lesion (WL), Sole Hemorrhage (SH) and Interdigital Hyperplasia (IH), be added to the “Health” page linked to each sire’s Genetic Evaluation Details page.
That the proposed formula for combining evaluations for the eight lesions into a single Hoof Health (HH) index be approved for implementation by CDN.
That CDN continue its effort towards the development of a national strategy to have more hoof health data collected from herds across Canada with the aim of increasing the accuracy of genomic evaluations in Holsteins as well as expanding the availability of these traits to other breeds where possible.
Given the intent of CDN to introduce updated formula for Pro$ and LPI in April 2019, the GEB reviewed the results of analysis conducted to date and made the following recommendations:
Following discussions with Ayrshire Canada, the Pro$ index will be introduced in the Ayrshire breed in addition to the Holstein and Jersey breeds.
That that genetic base used for Pro$ be defined such that published values are easily comparable over time and the units of expression reflect the expected difference in daughter profitability in dollar terms.
That CDN continue the ongoing research effort to account for different maintenance costs according to a cow’s body size when developing the updated Pro$ formula. To achieve this goal in a sustainable manner for the longer term, the industry should develop a national strategy for collecting body weight data on a routine basis.
That the Hoof Health (HH) index to be introduced in December 2018 be added in April 2019 to the Durability component of the Holstein LPI formula, along with Feet & Legs, in an effort to improve both the resistance to hoof lesions as well as mobility.
That CDN continue the consultation process with breed associations to assess options of different LPI formula and present recommendations at the next Open Industry Session planned for February 2019.The GEB reviewed the results of work at CDN examining options for improving genetic and genomic evaluations for calving performance traits, namely calving ease and calf survival. Supporting the direction of this ongoing research effort, the GEB recommended the following:
That CDN verify that calvings resulting from reproductive technologies such as embryo transfer, where the dam giving birth to the calf is not the same as the genetic dam, be excluded from genetic evaluation calculations for calving performance.
Given that both Canada and United States are reviewing their current calving performance evaluation systems, that CDN and CDCB have technical discussions to improve the correlation of bull proofs for calving traits between the two countries.
With the increased accuracy from genomics to evaluate Direct Herd Life based on actual daughter survival data, the GEB discussed the value of continuing to also estimate an Indirect Herd Life evaluation based on a prediction formula that combines evaluations for several traits. After considering different options, the GEB recommended that CDN conduct an analysis to examine the impact of removing Indirect Herd Life as a predictor trait of daughter survival that is combined with Direct Herd Life to derive the officially published evaluations for Herd Life. Results of such an analysis will be presented at one or both of the Open Industry Sessions and GEB meetings to be held in 2019.
The GEB discussed two topics related to the registration status and/or purity level of Jersey
animals displayed on the CDN web site, with the following recommendations:
That CDN implement an automated check based on pedigree information available for A.I. sires such that only sires whose daughters qualify for herdbook registration by Jersey Canada can be designated as having “Active” status for semen marketed in Canada.
In response to correspondence received from Jersey Canada, that CDN examine ways to increase the visibility of purity levels and/or Breed Base Representation (BBR) values calculated by CDCB, especially for genomic young sires and heifers.
The next Open Industry Session will be held on Tuesday, February 12, 2019 at the Holiday Inn in Guelph, Ontario, with the Genetic Evaluation Board meeting the following day.
To provide the best experiences, we use technologies like cookies to store and/or access device information. Consenting to these technologies will allow us to process data such as browsing behavior or unique IDs on this site. Not consenting or withdrawing consent, may adversely affect certain features and functions.
Functional
Always active
The technical storage or access is strictly necessary for the legitimate purpose of enabling the use of a specific service explicitly requested by the subscriber or user, or for the sole purpose of carrying out the transmission of a communication over an electronic communications network.
Preferences
The technical storage or access is necessary for the legitimate purpose of storing preferences that are not requested by the subscriber or user.
Statistics
The technical storage or access that is used exclusively for statistical purposes.The technical storage or access that is used exclusively for anonymous statistical purposes. Without a subpoena, voluntary compliance on the part of your Internet Service Provider, or additional records from a third party, information stored or retrieved for this purpose alone cannot usually be used to identify you.
Marketing
The technical storage or access is required to create user profiles to send advertising, or to track the user on a website or across several websites for similar marketing purposes.


 Join the Revolution!
 Join the Revolution!
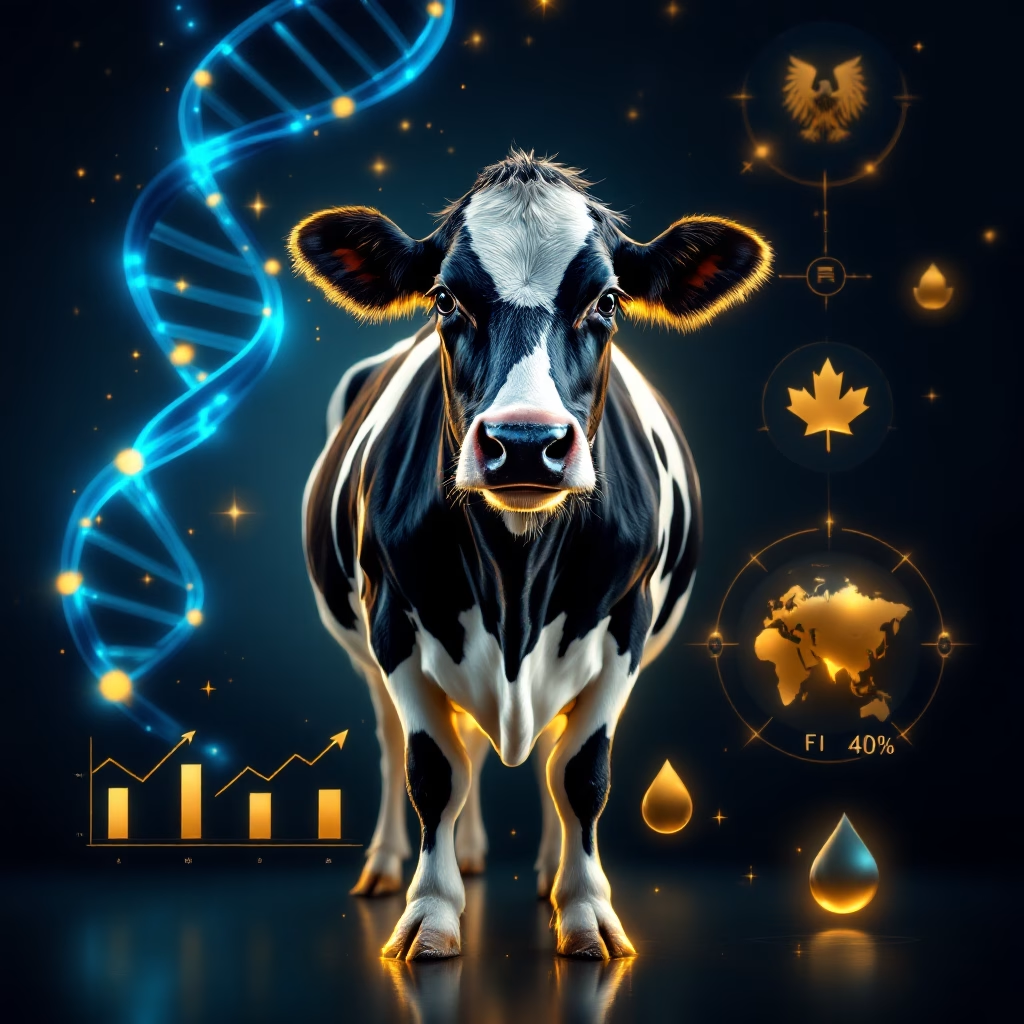

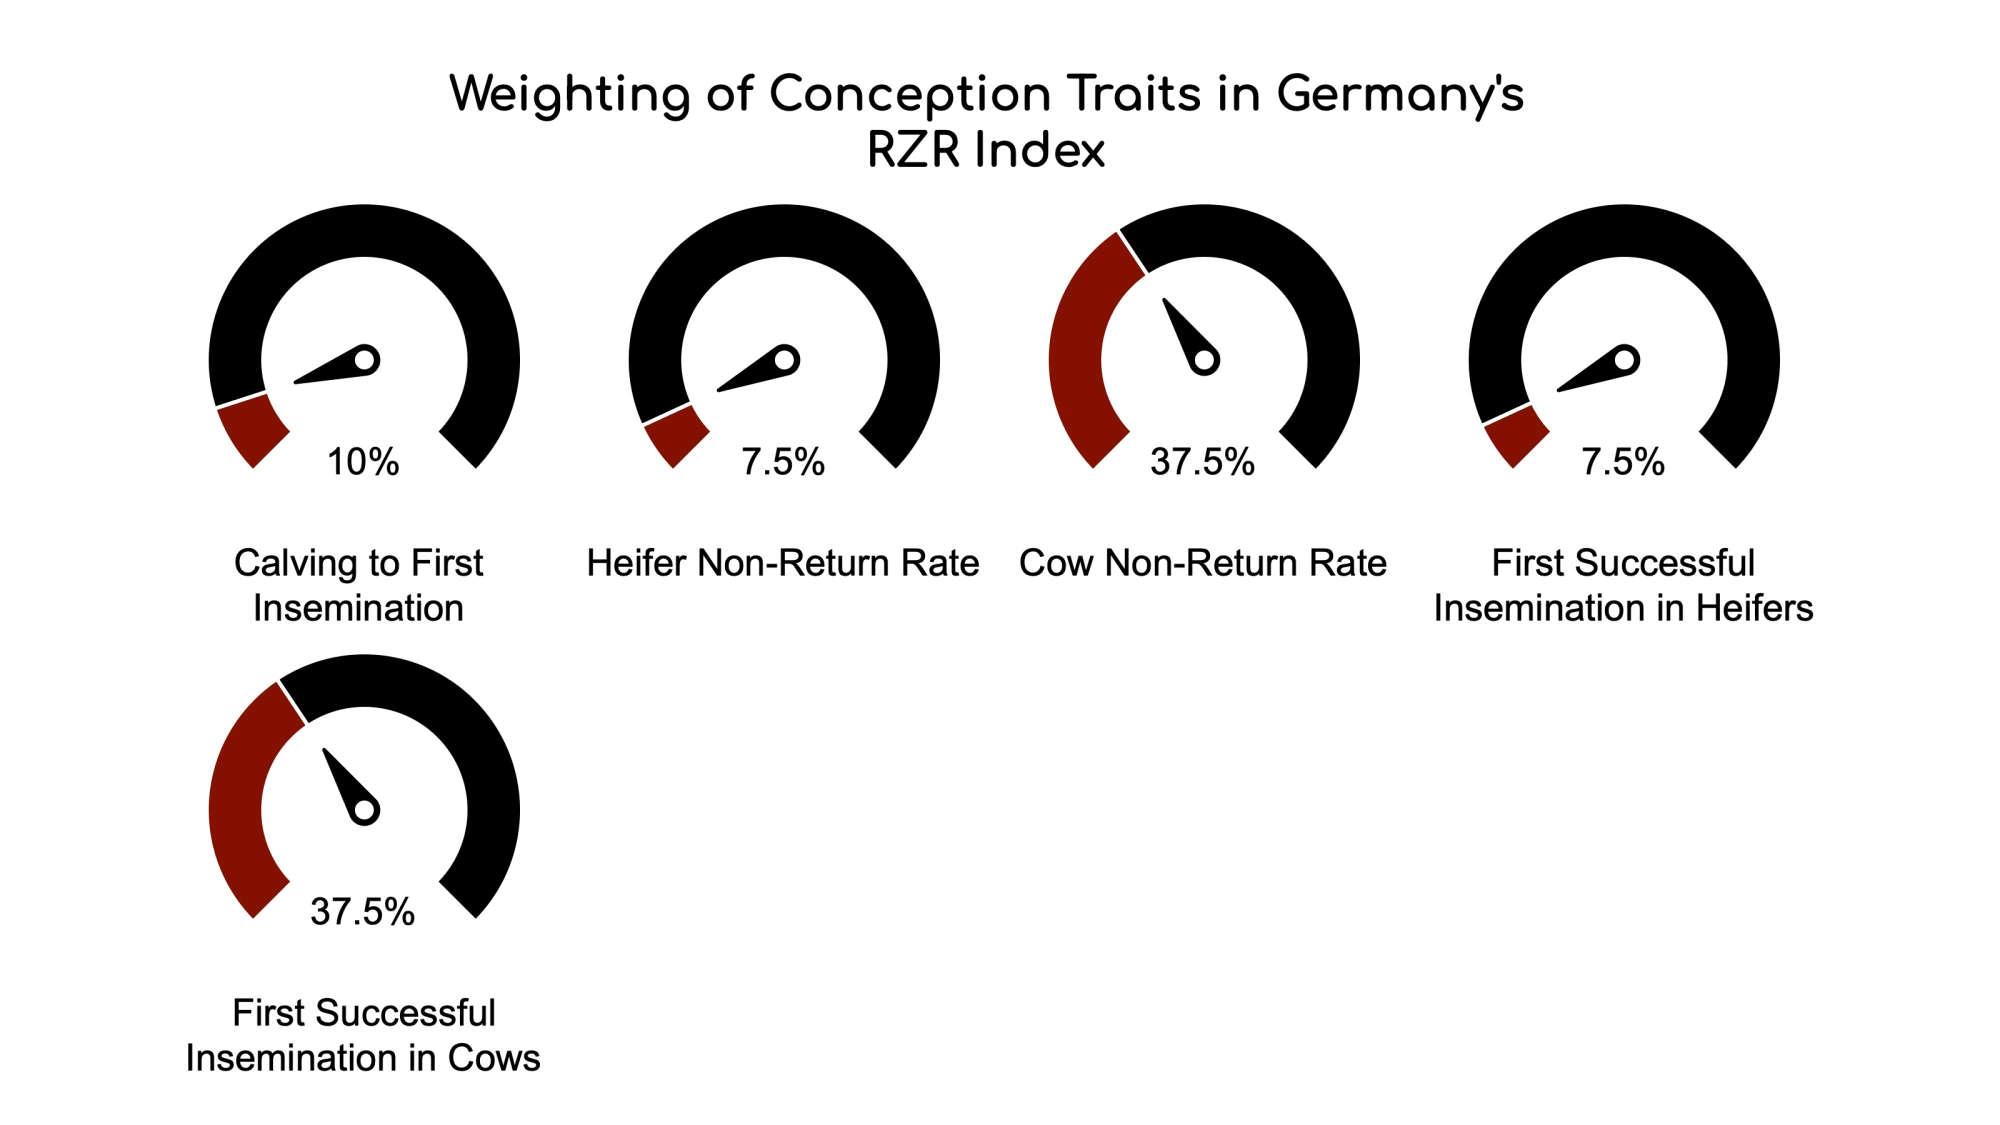

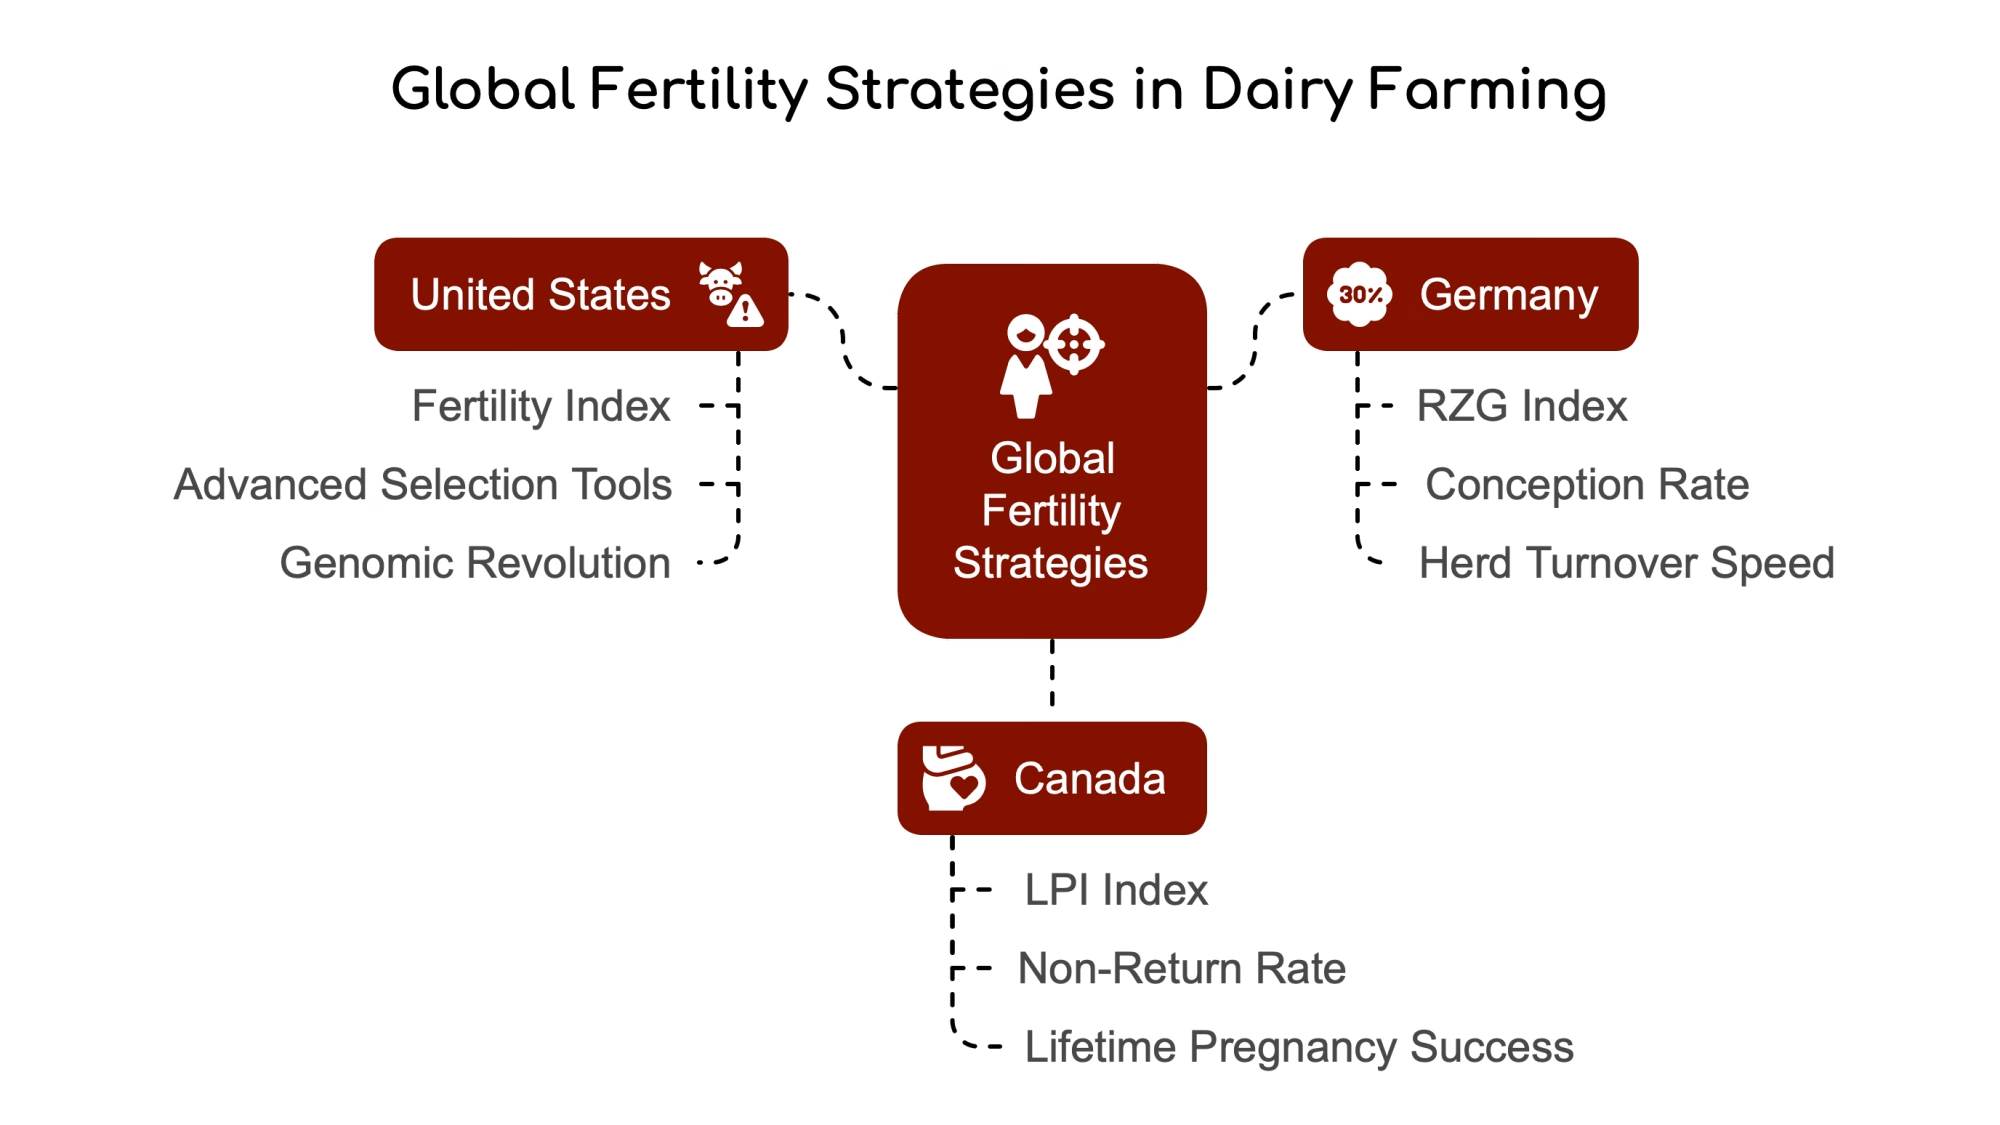
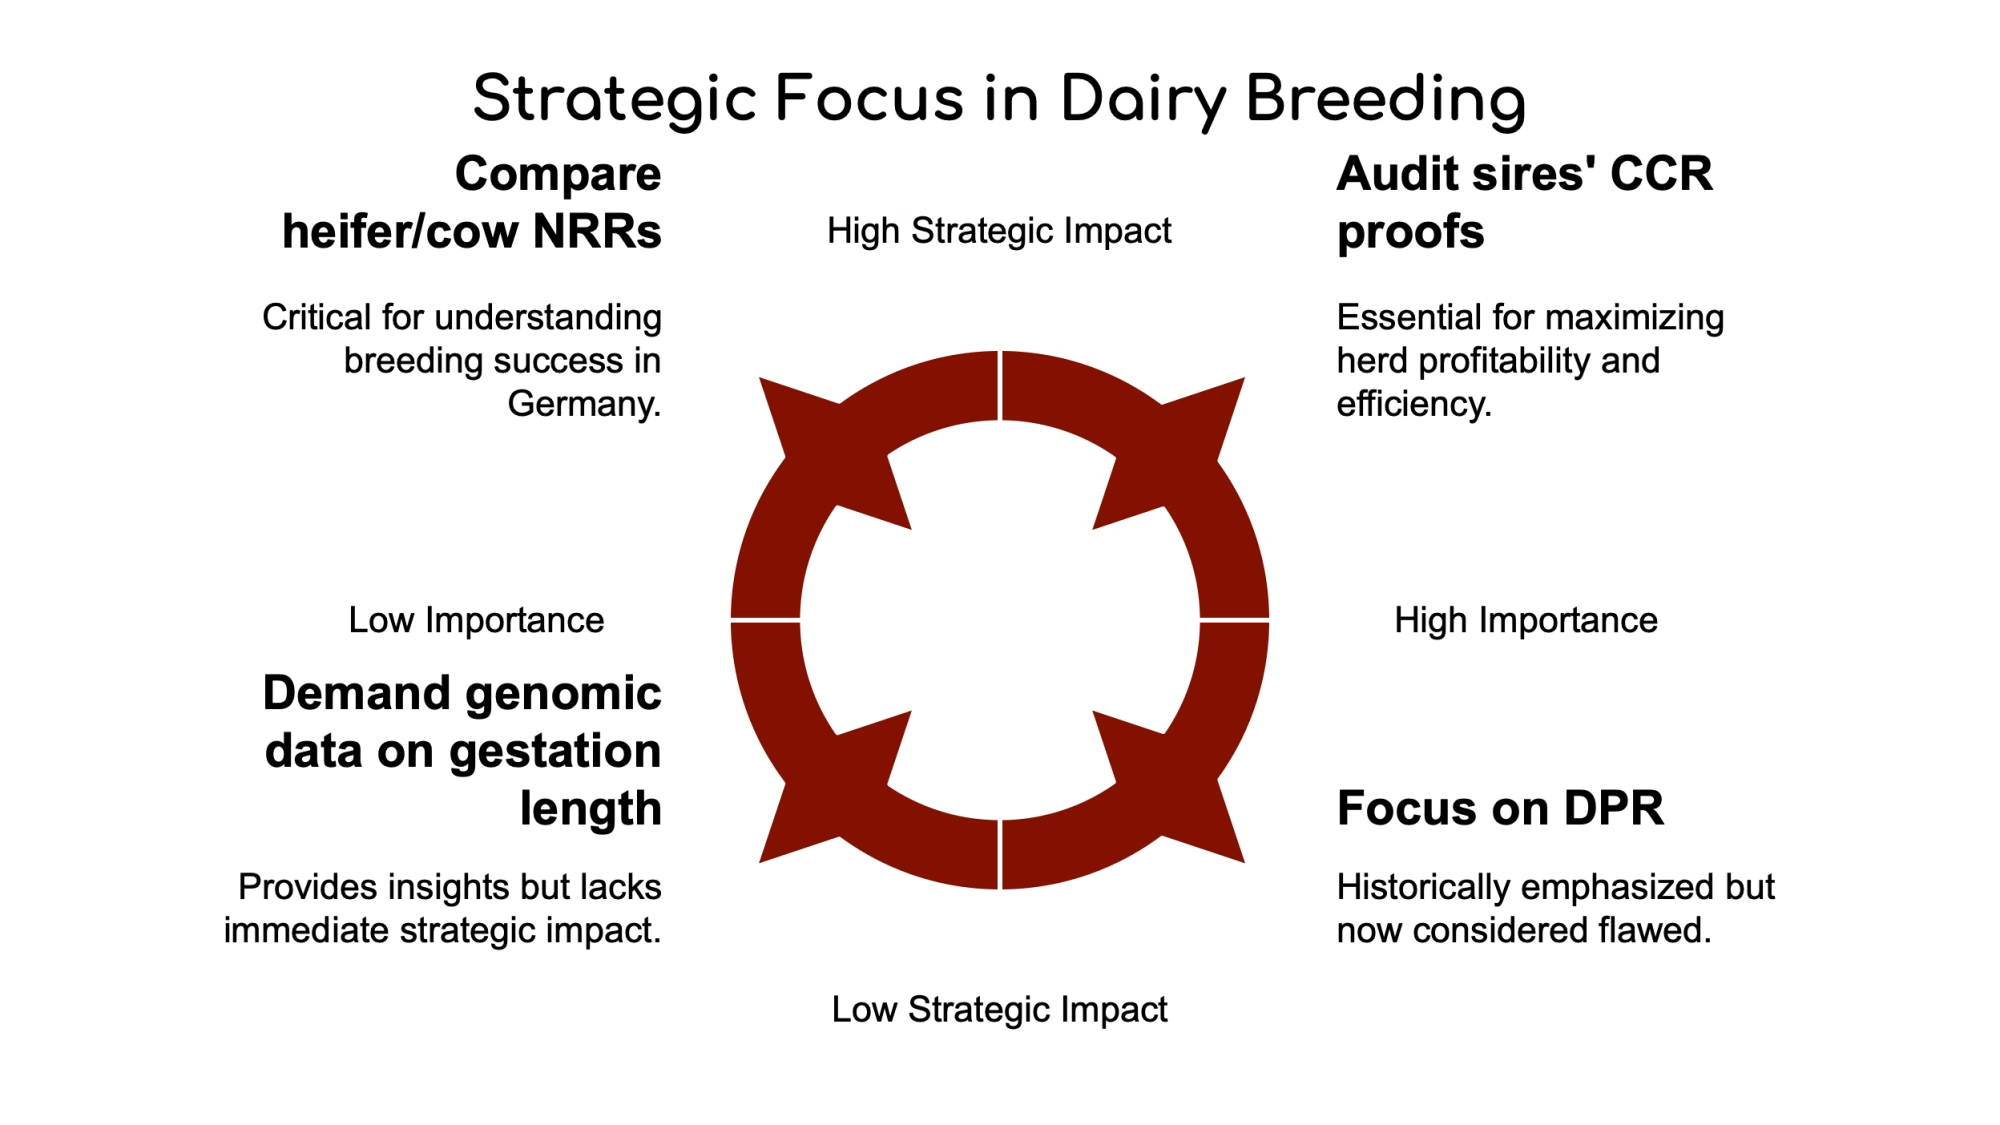


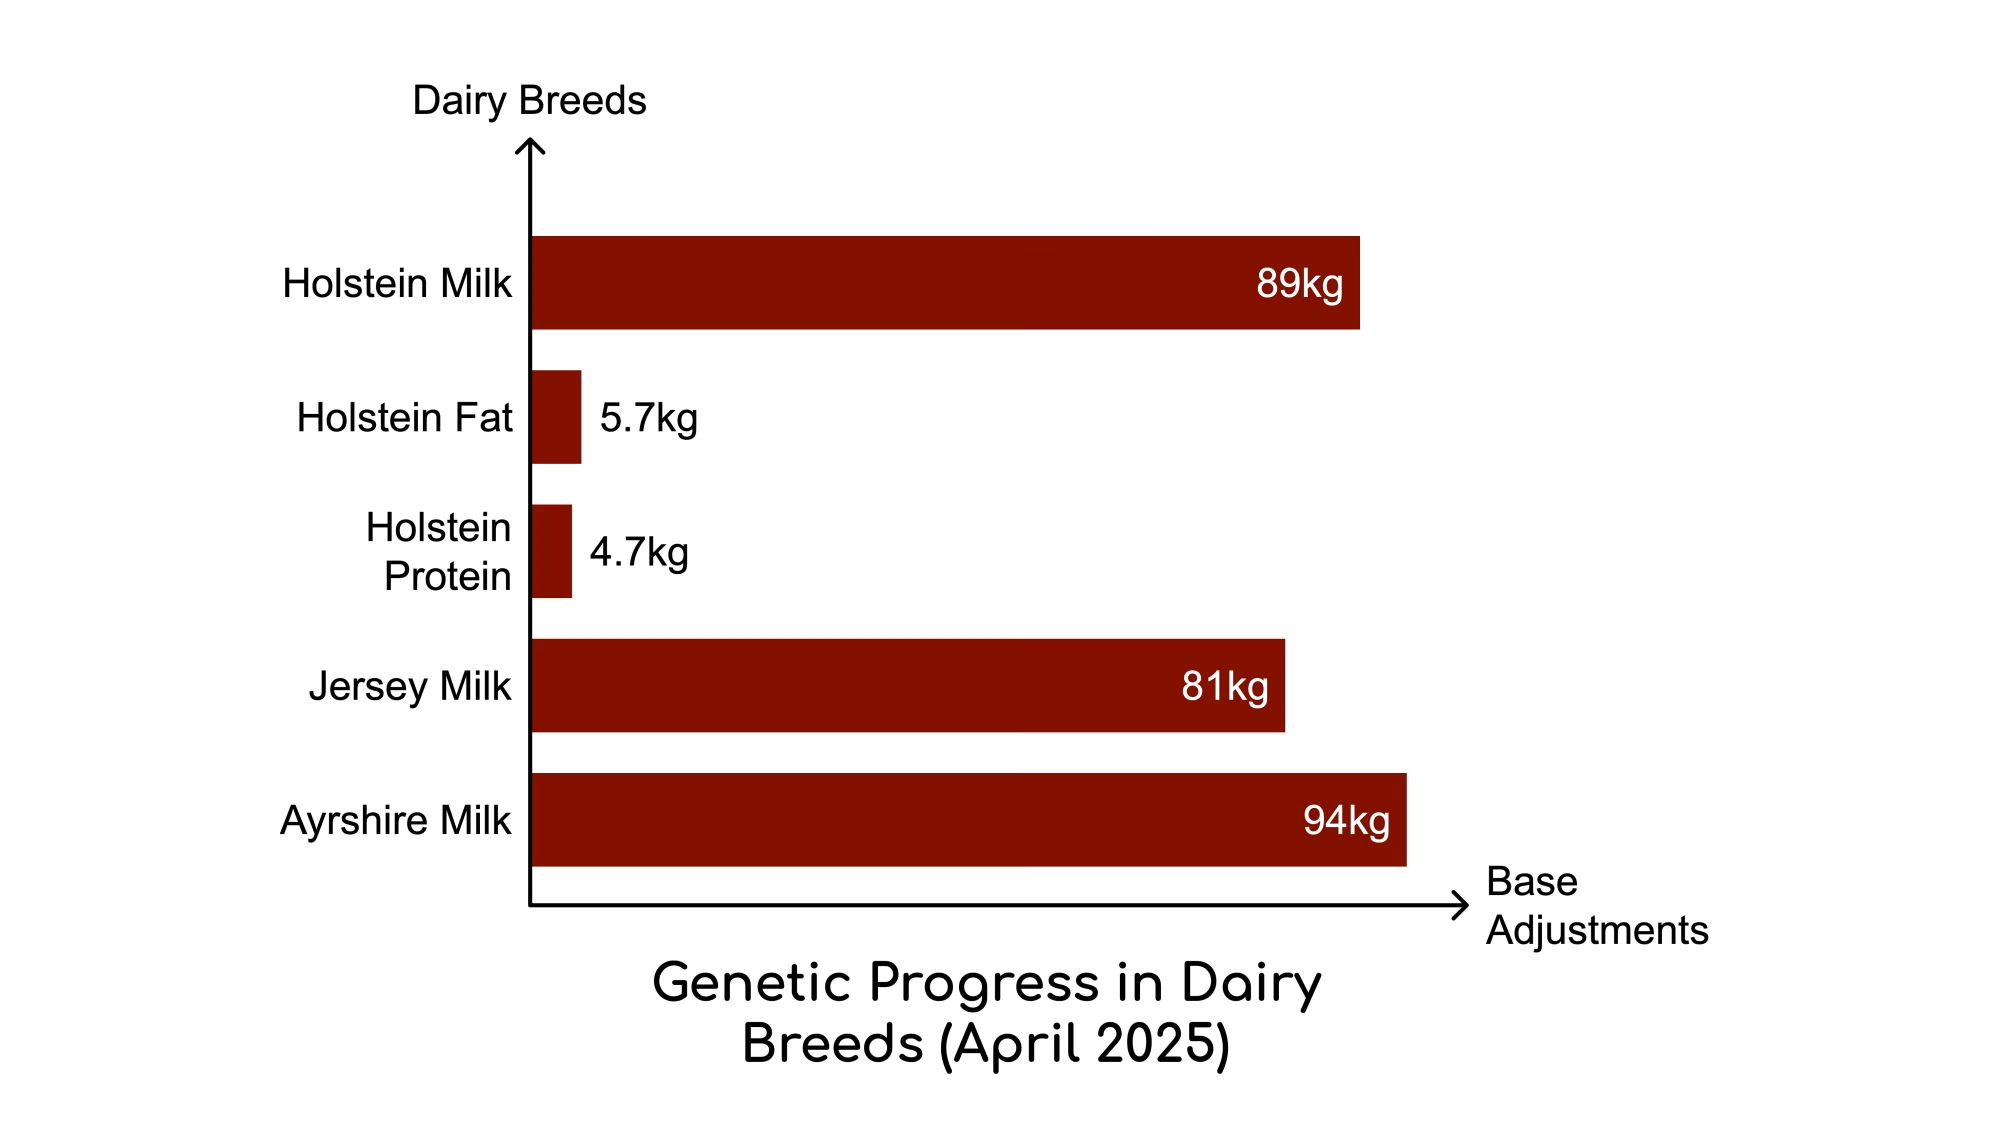
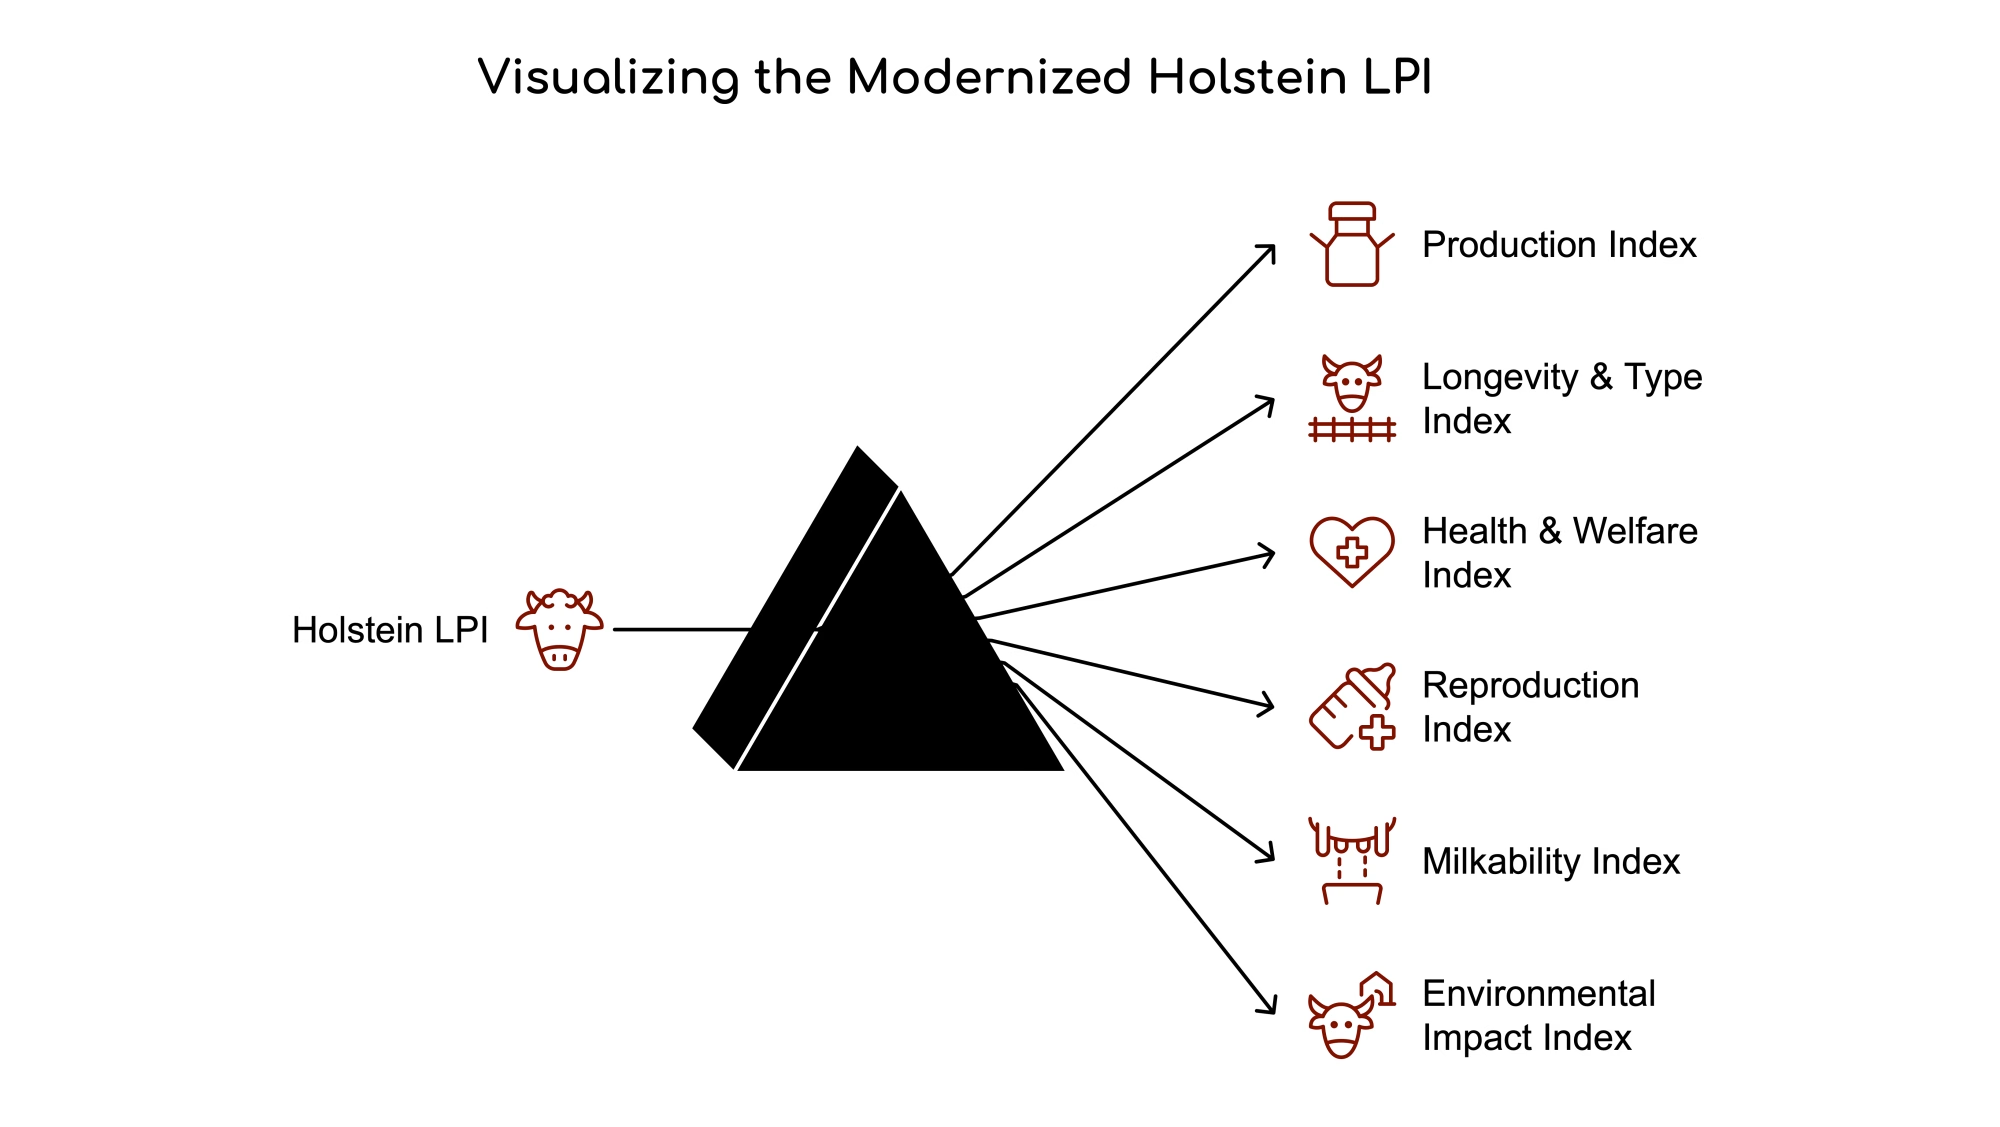
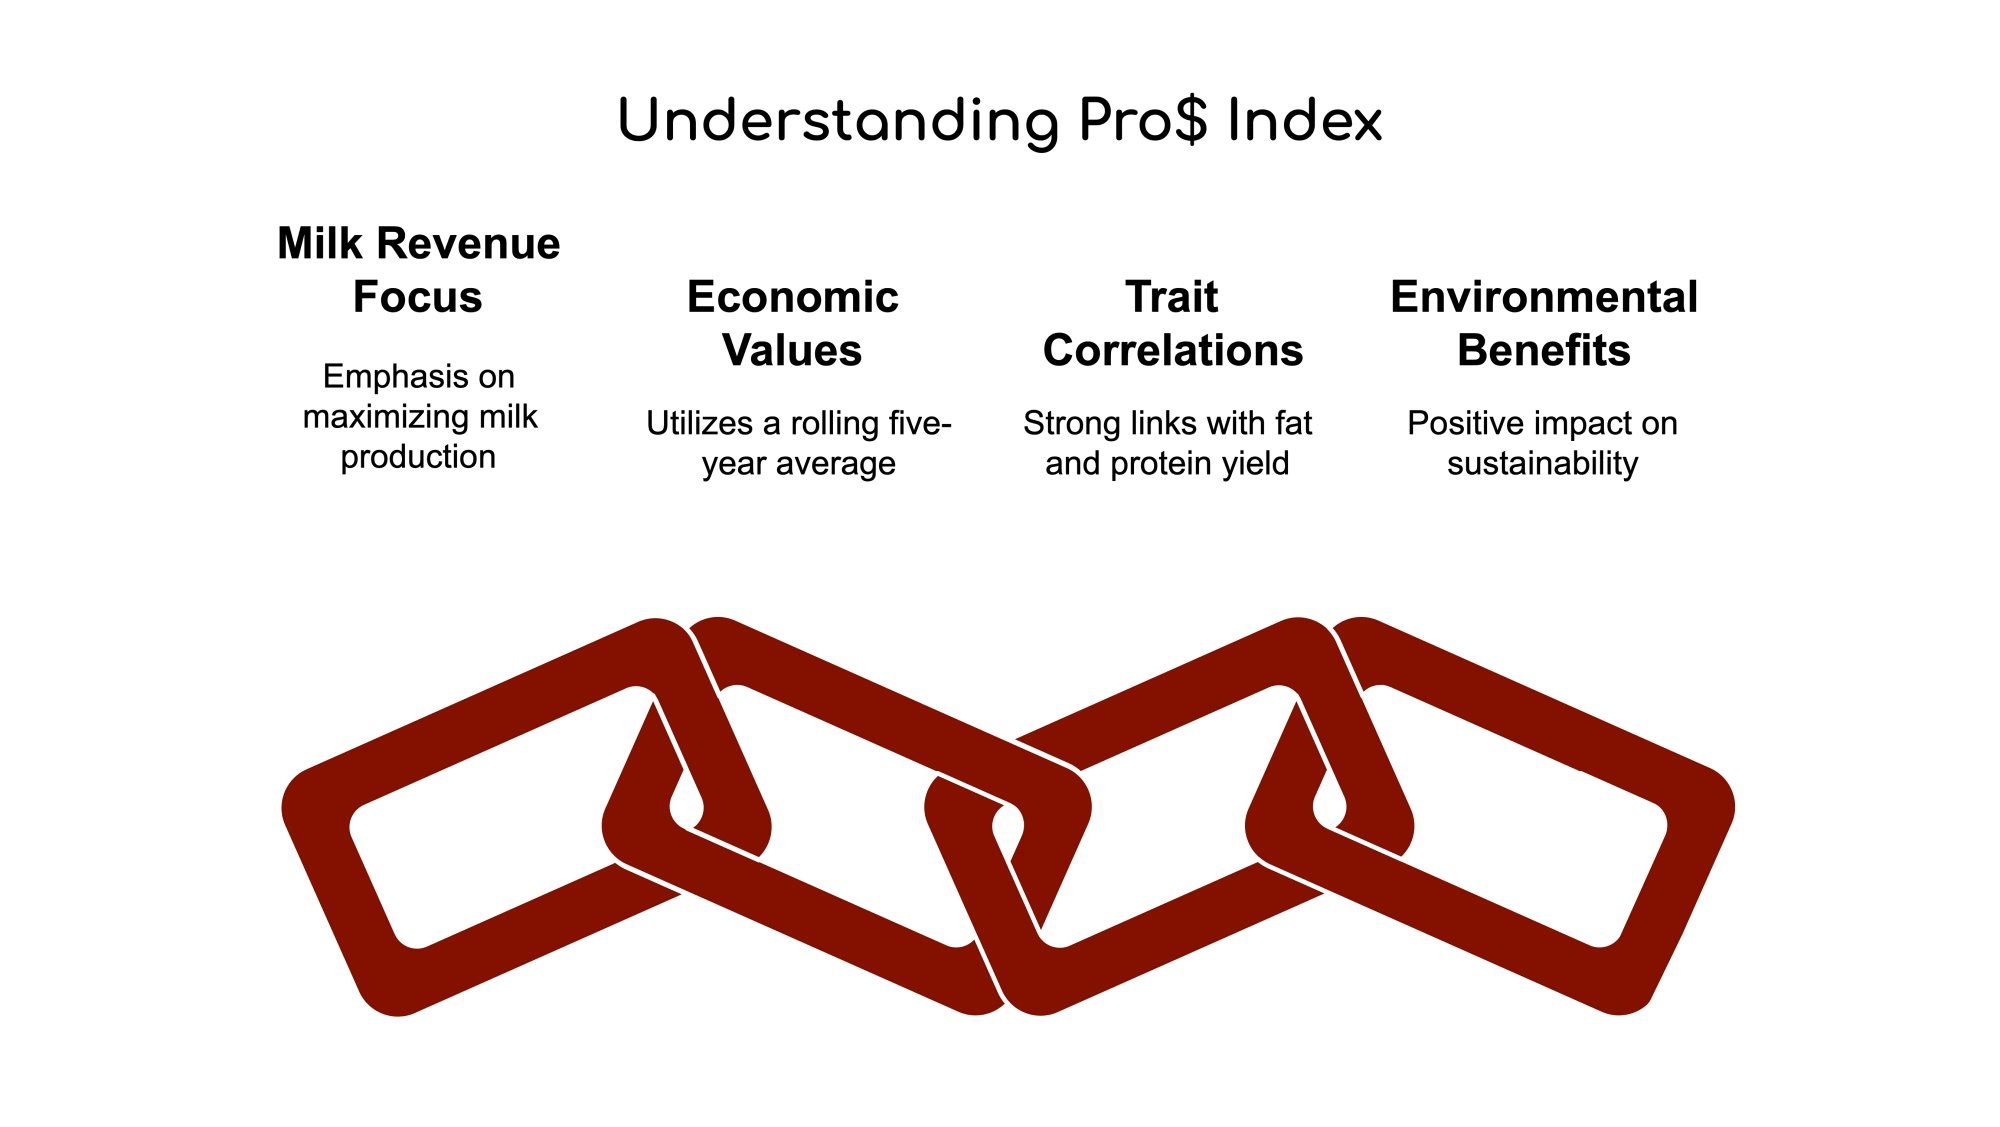

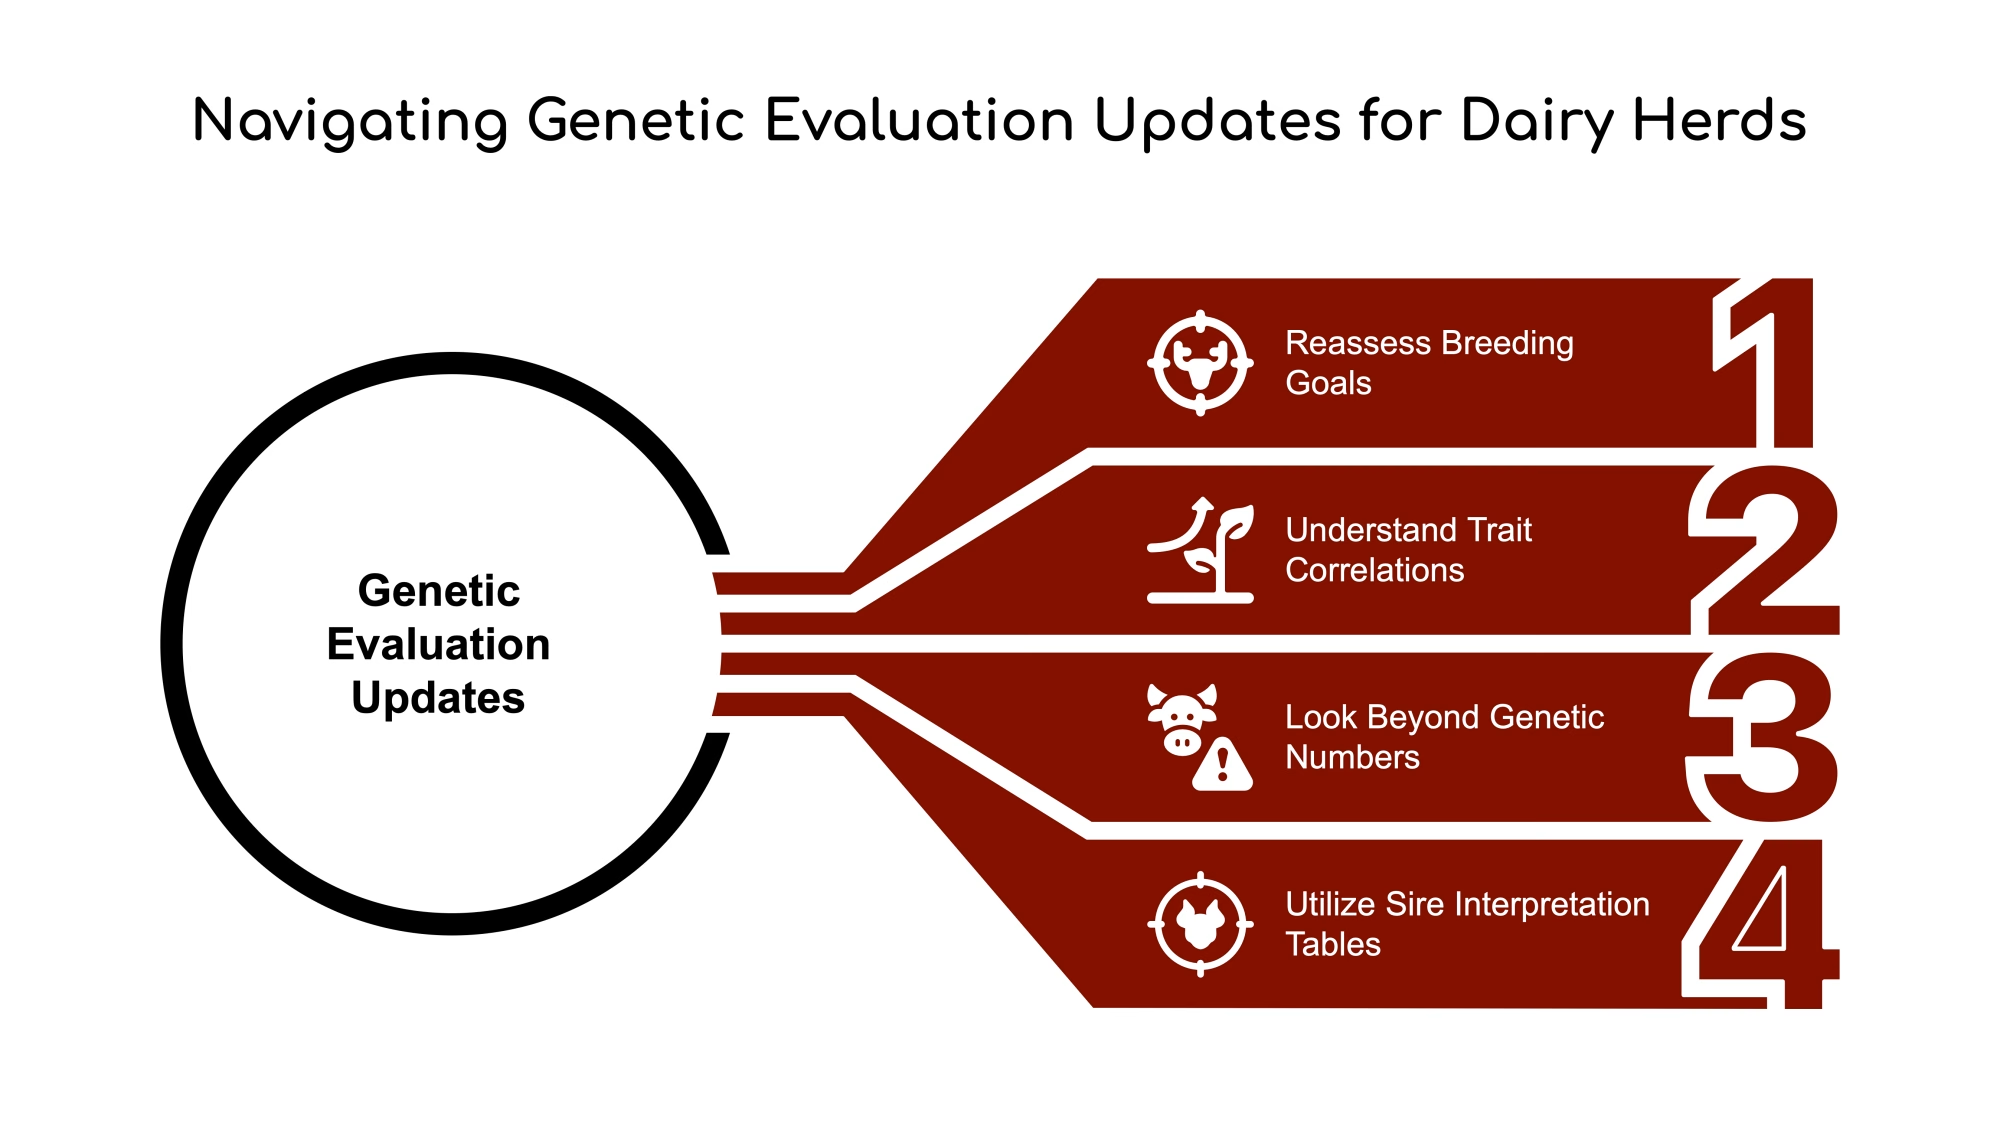
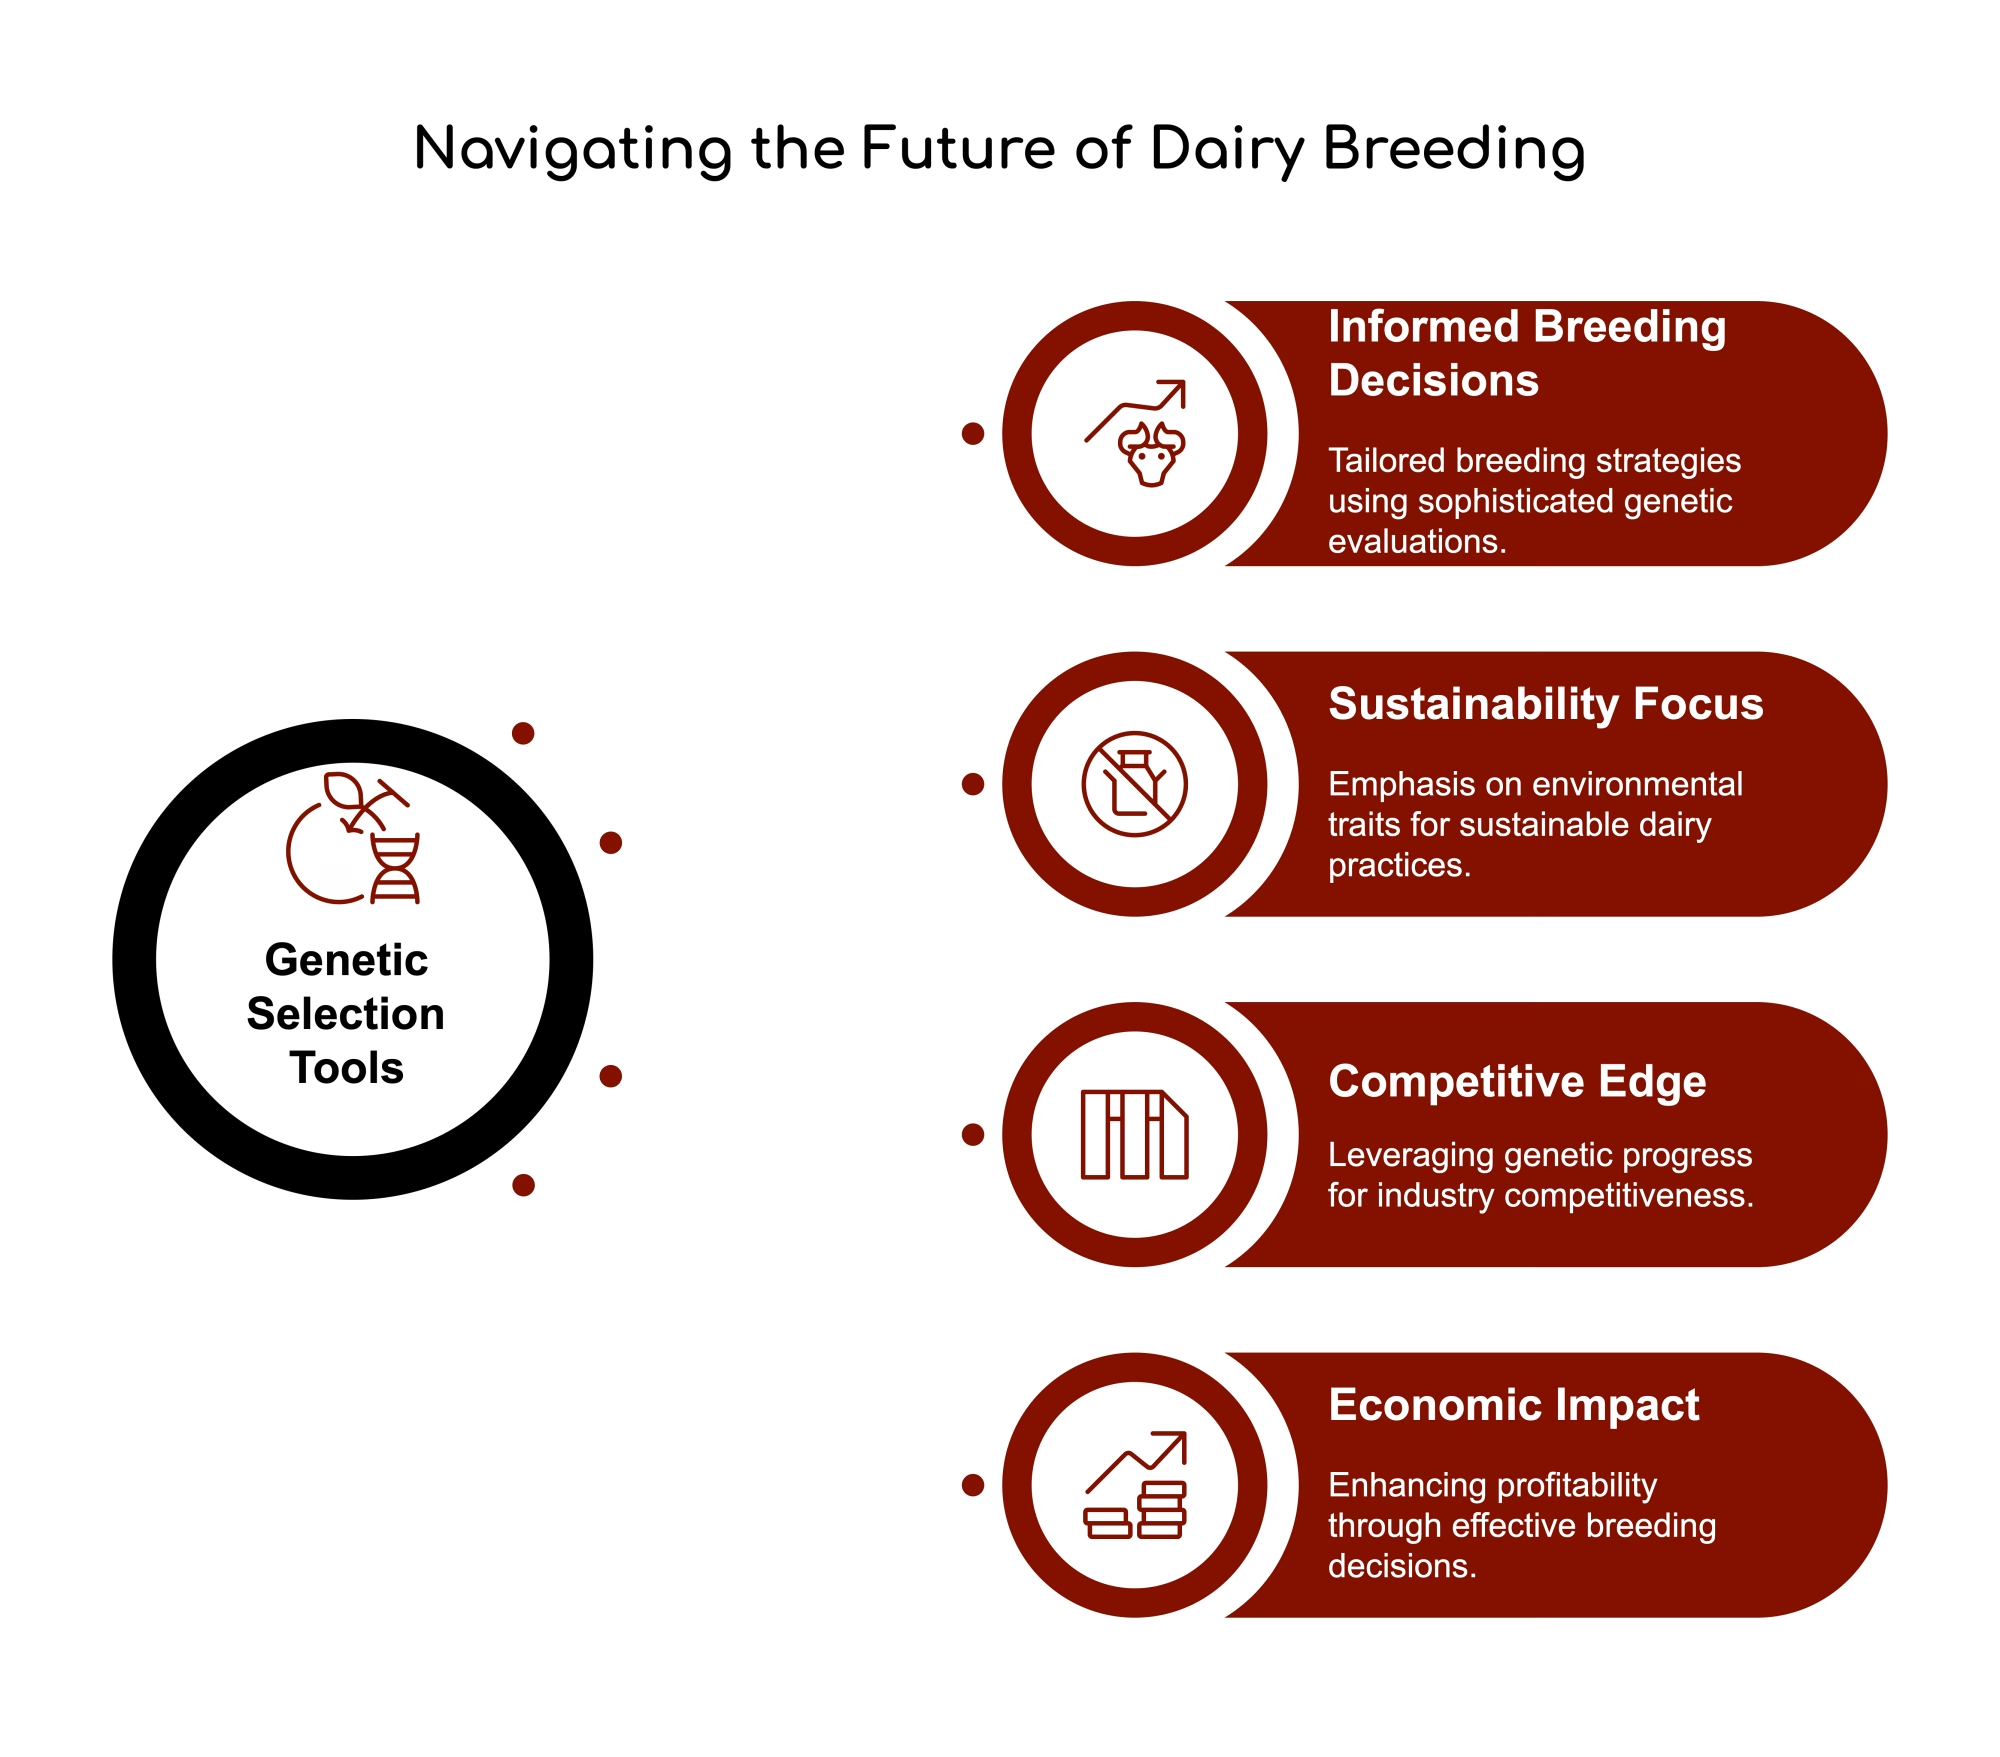

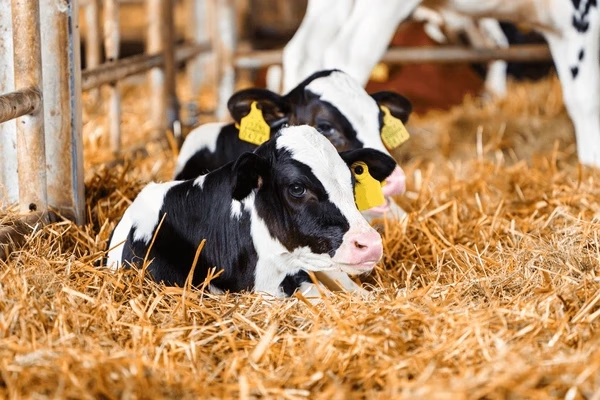

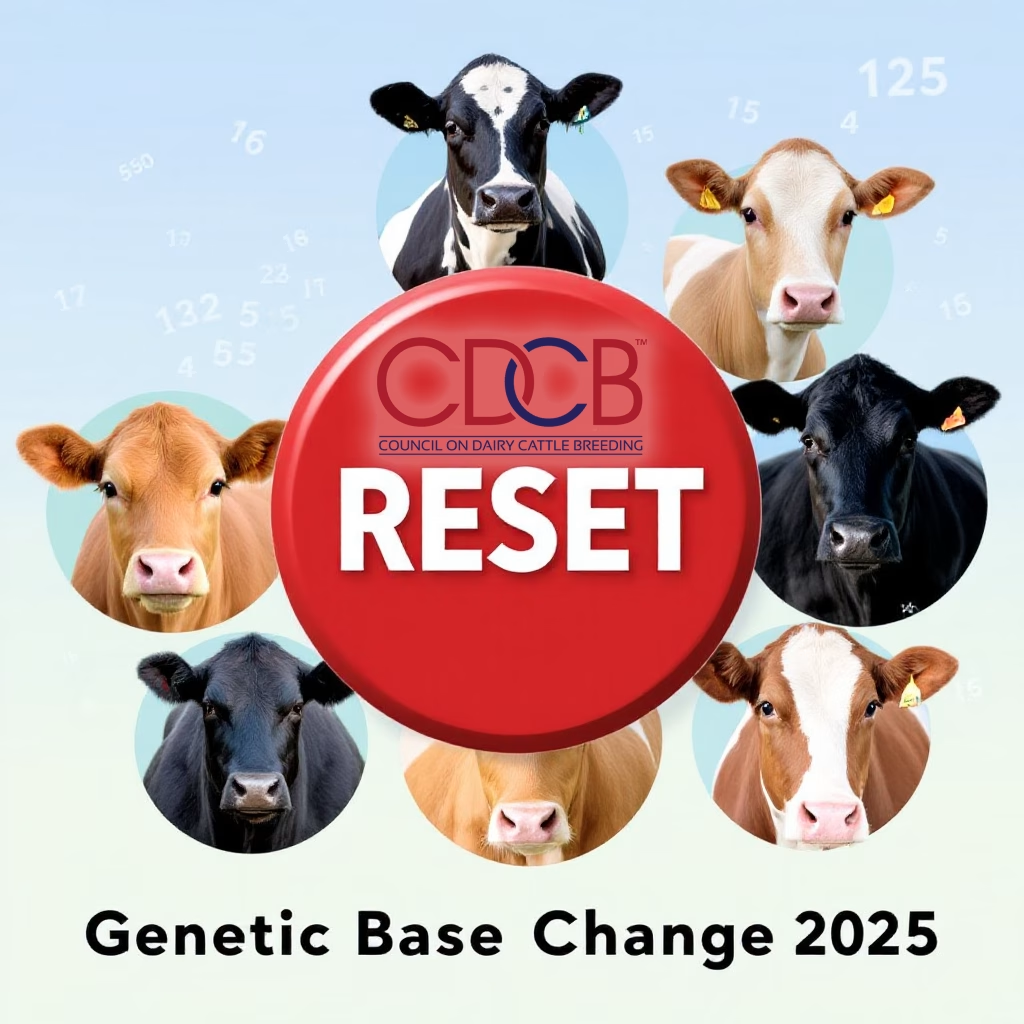
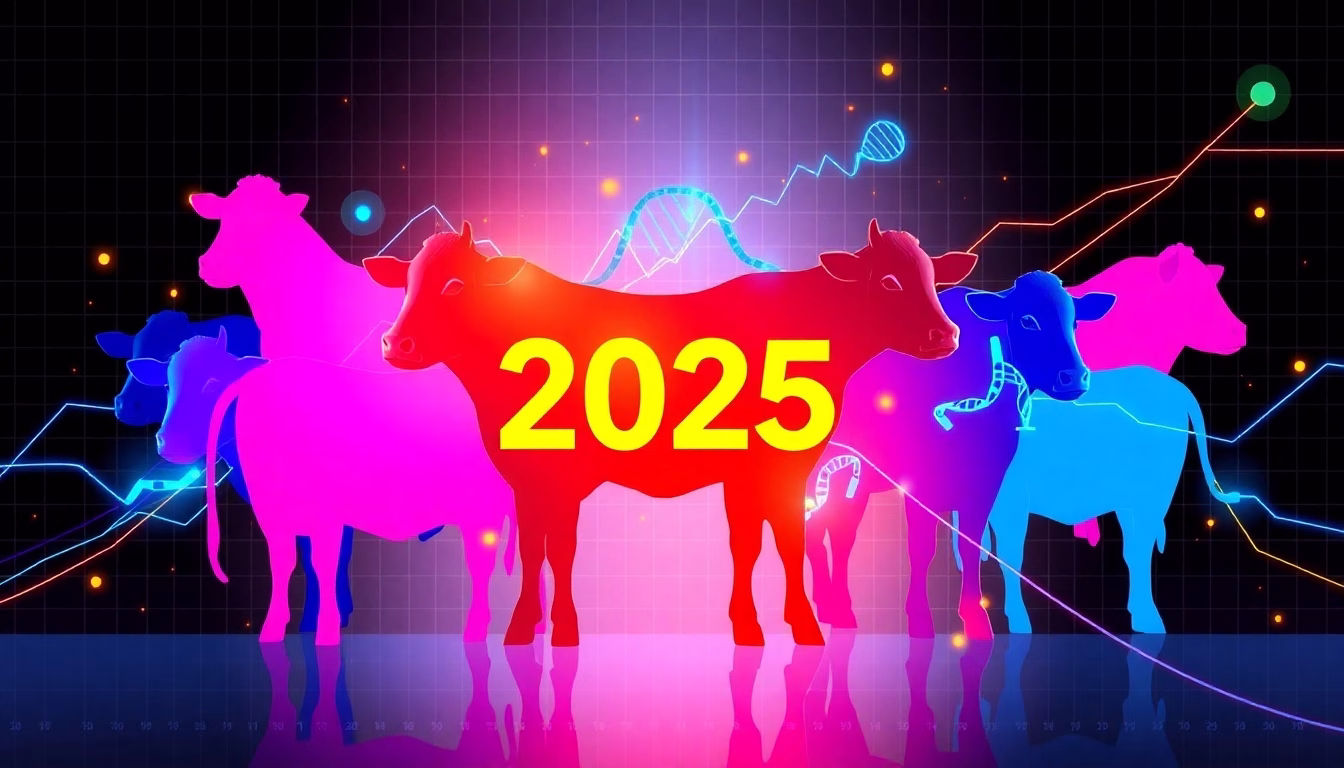


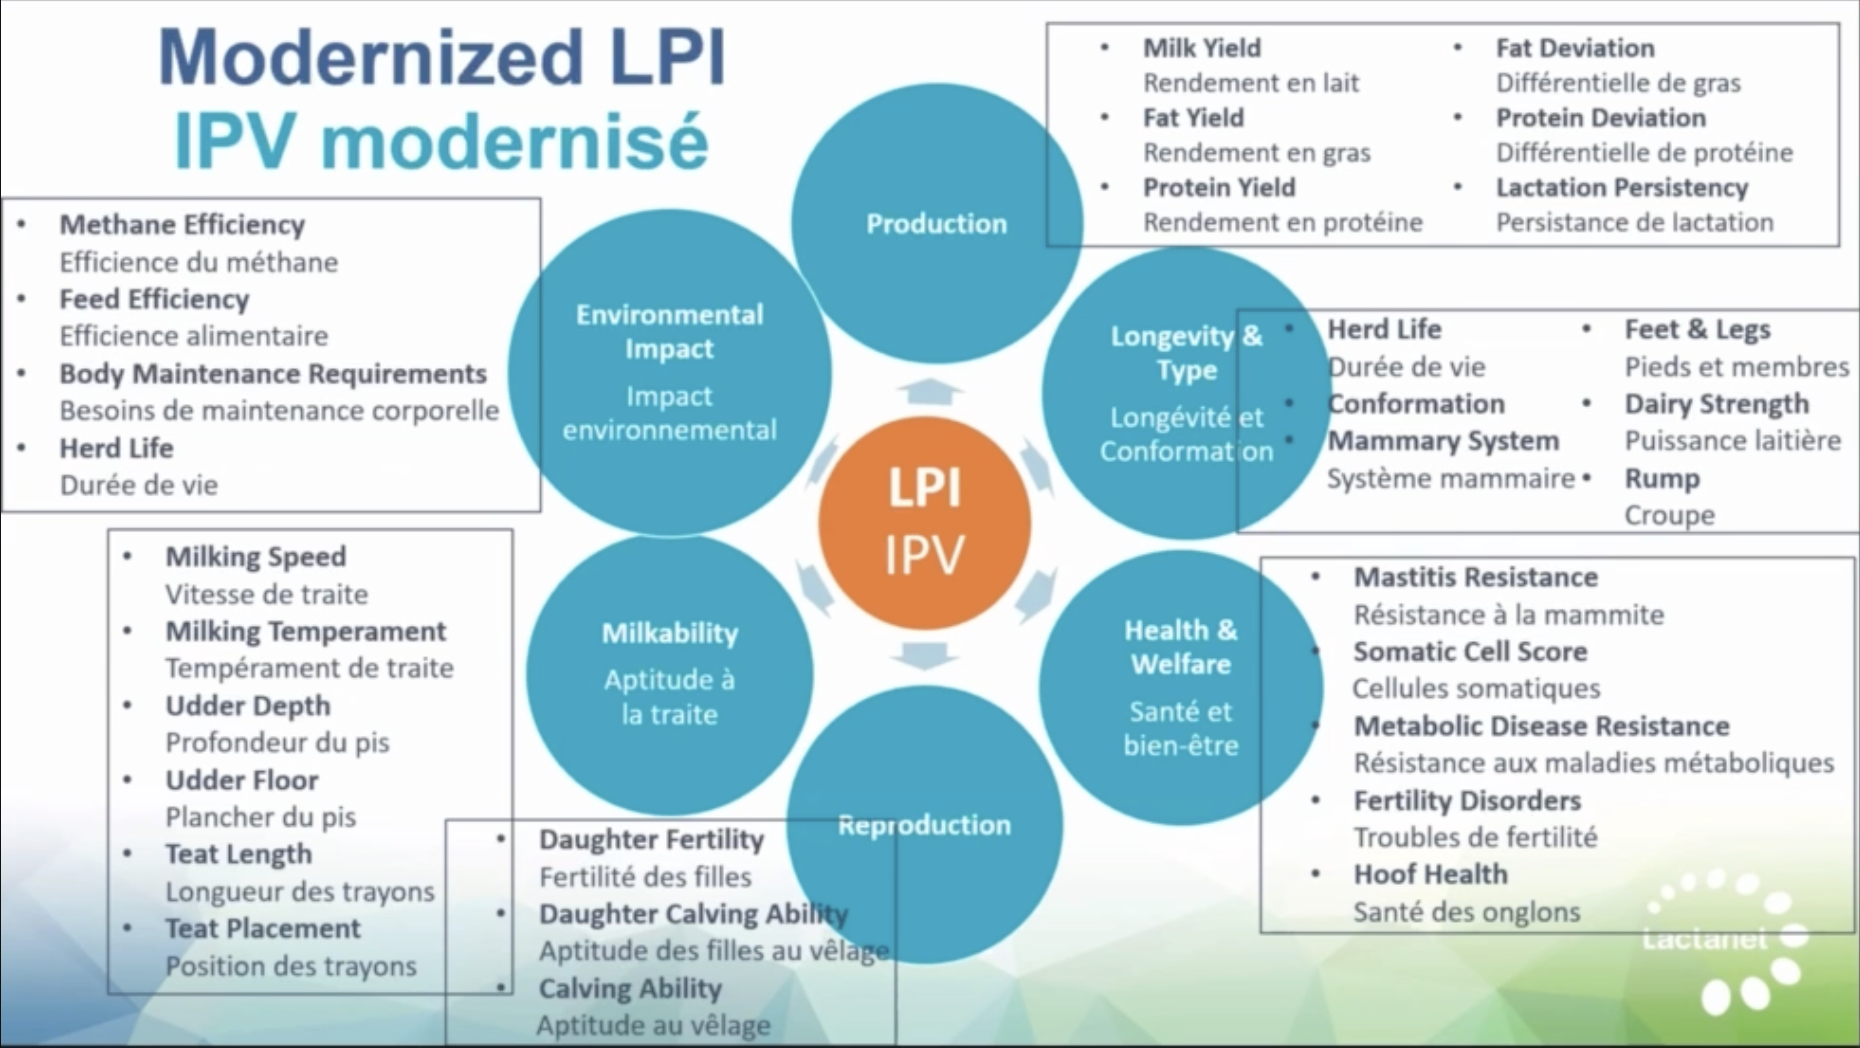


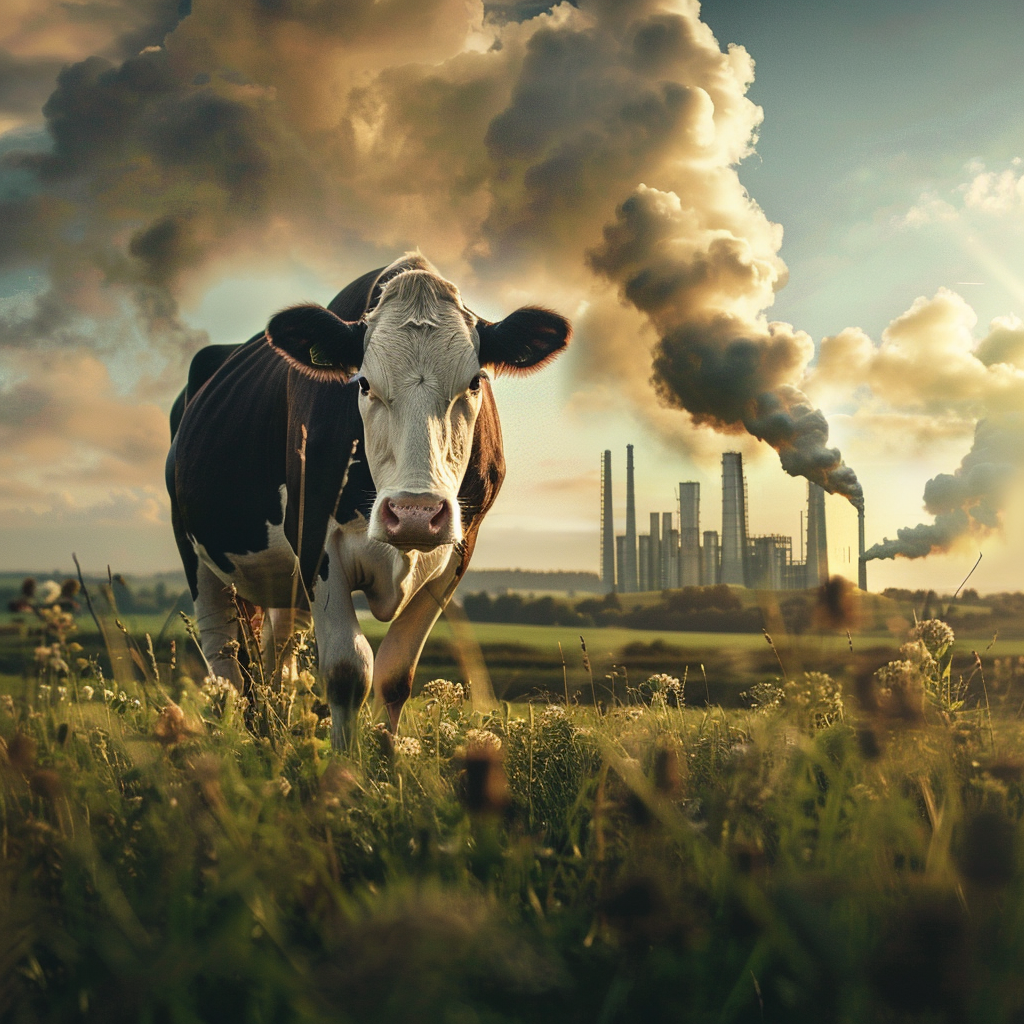


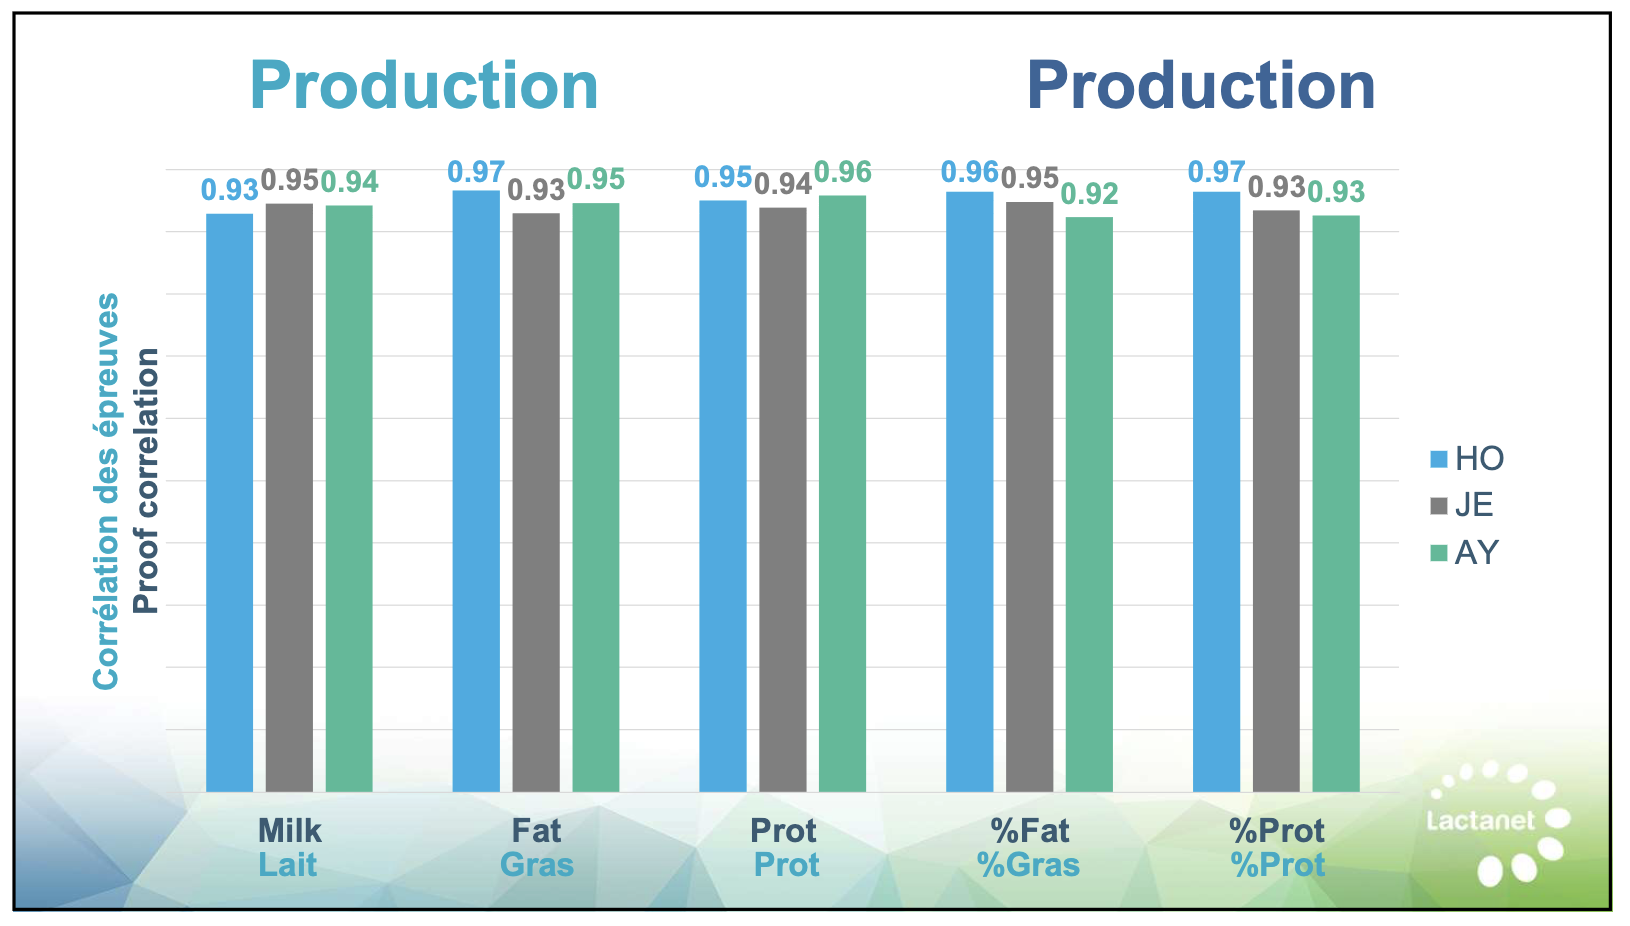

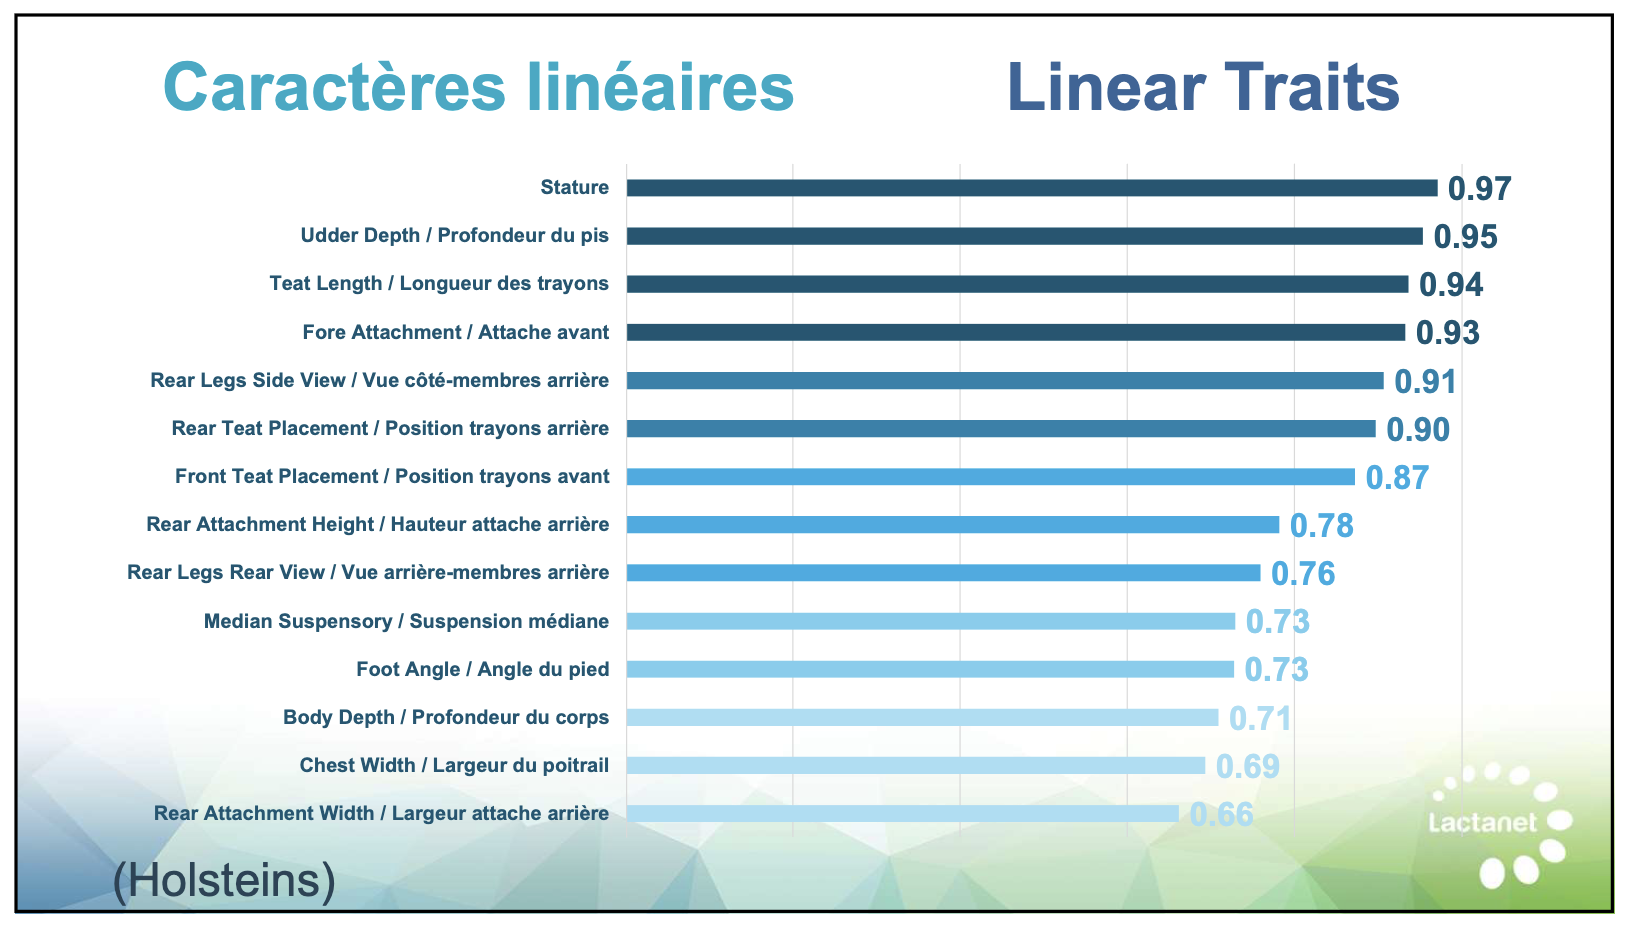

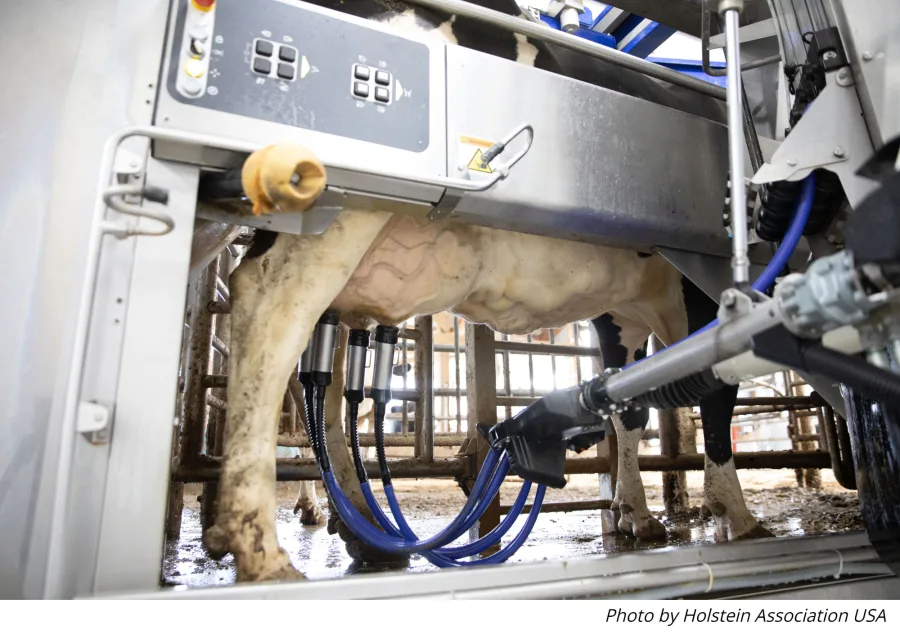


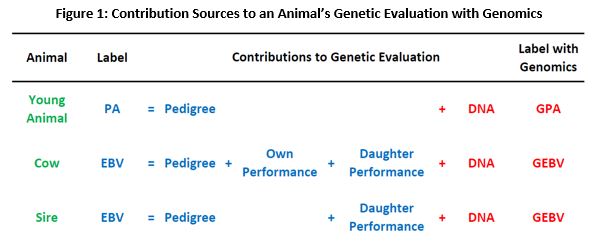
 It was ten years ago, in August 2009, that genomic evaluations were first officially published in Canada. This started with the Holstein breed but the same technology was later also applied in the Jersey, Ayrshire, Brown Swiss and Guernsey breeds. Let’s take a quick look at how genomics has changed dairy cattle selection, its impact on genetic improvement and contemplate what’s next on the horizon.