


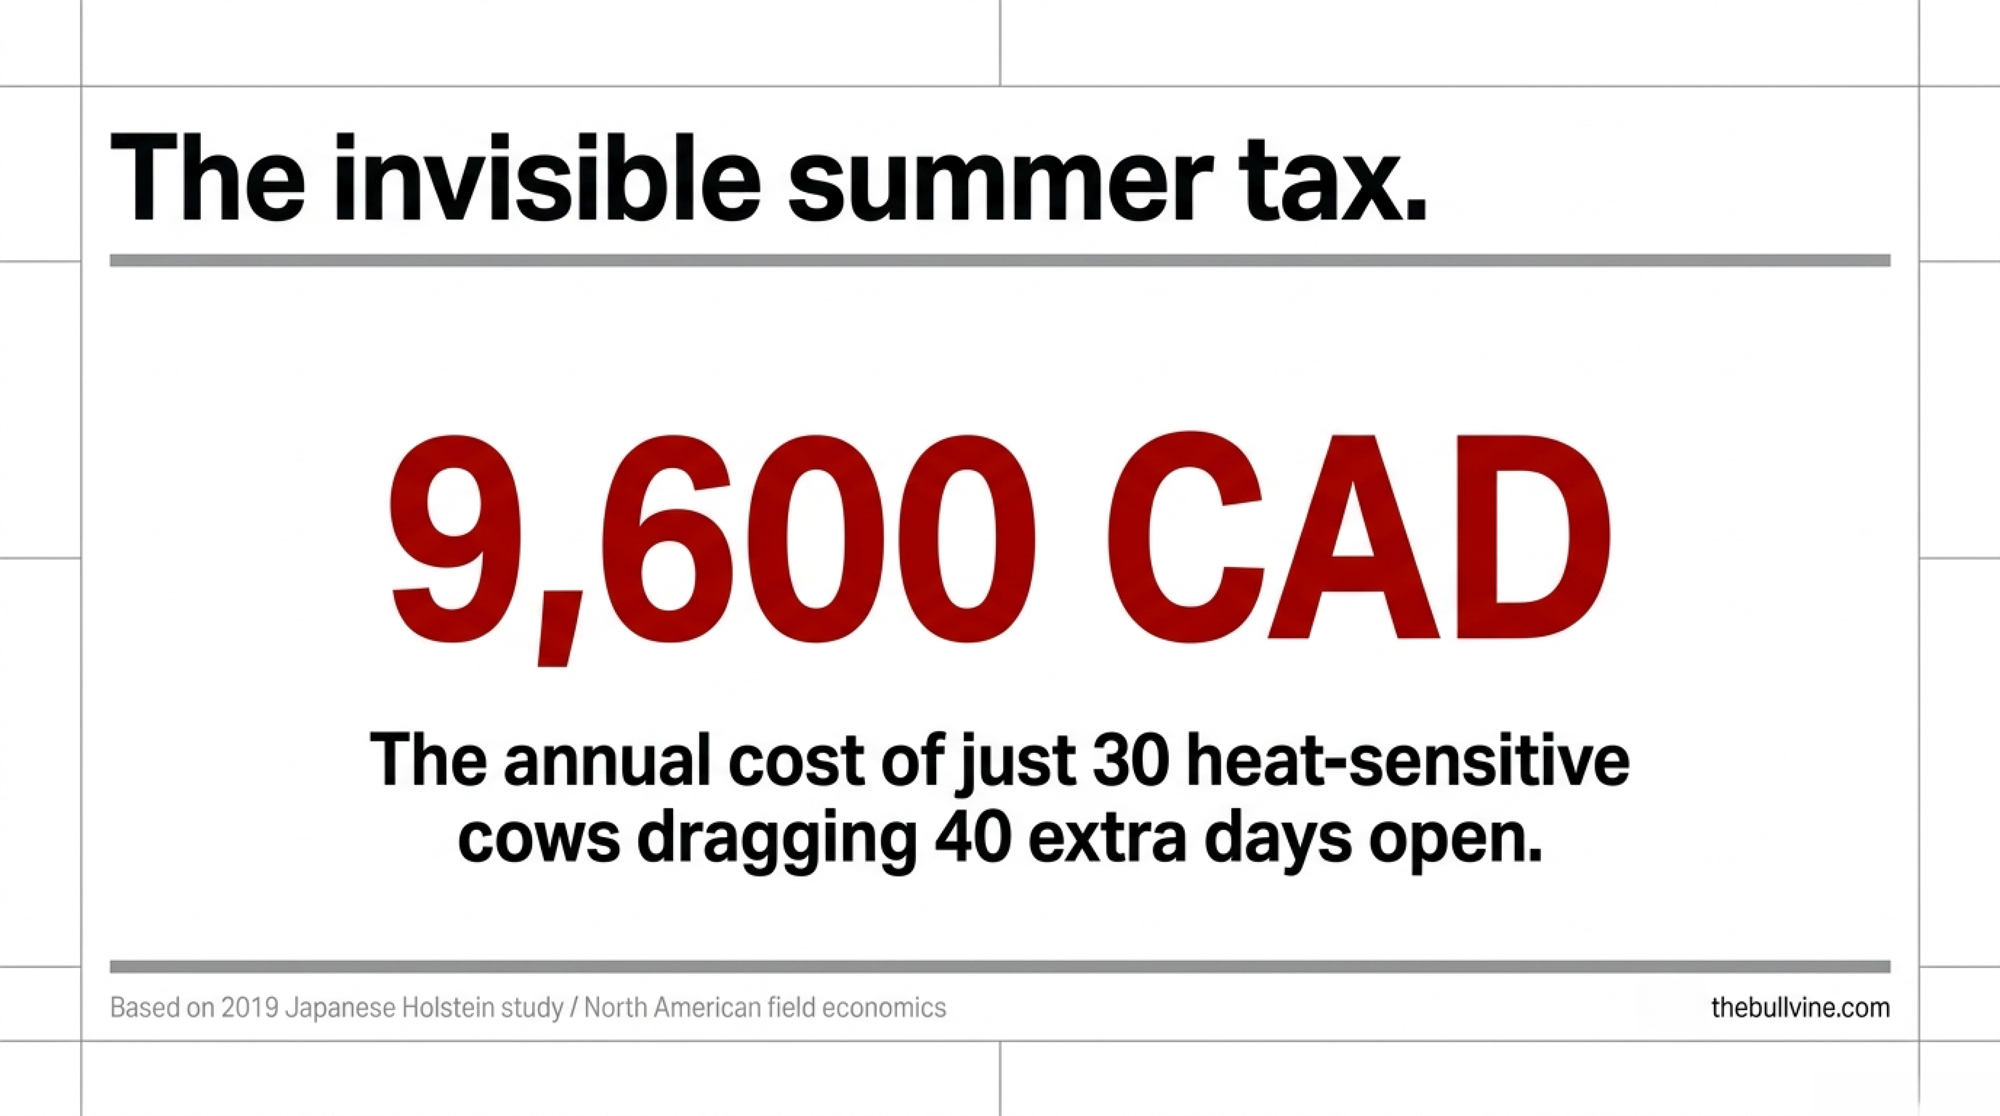
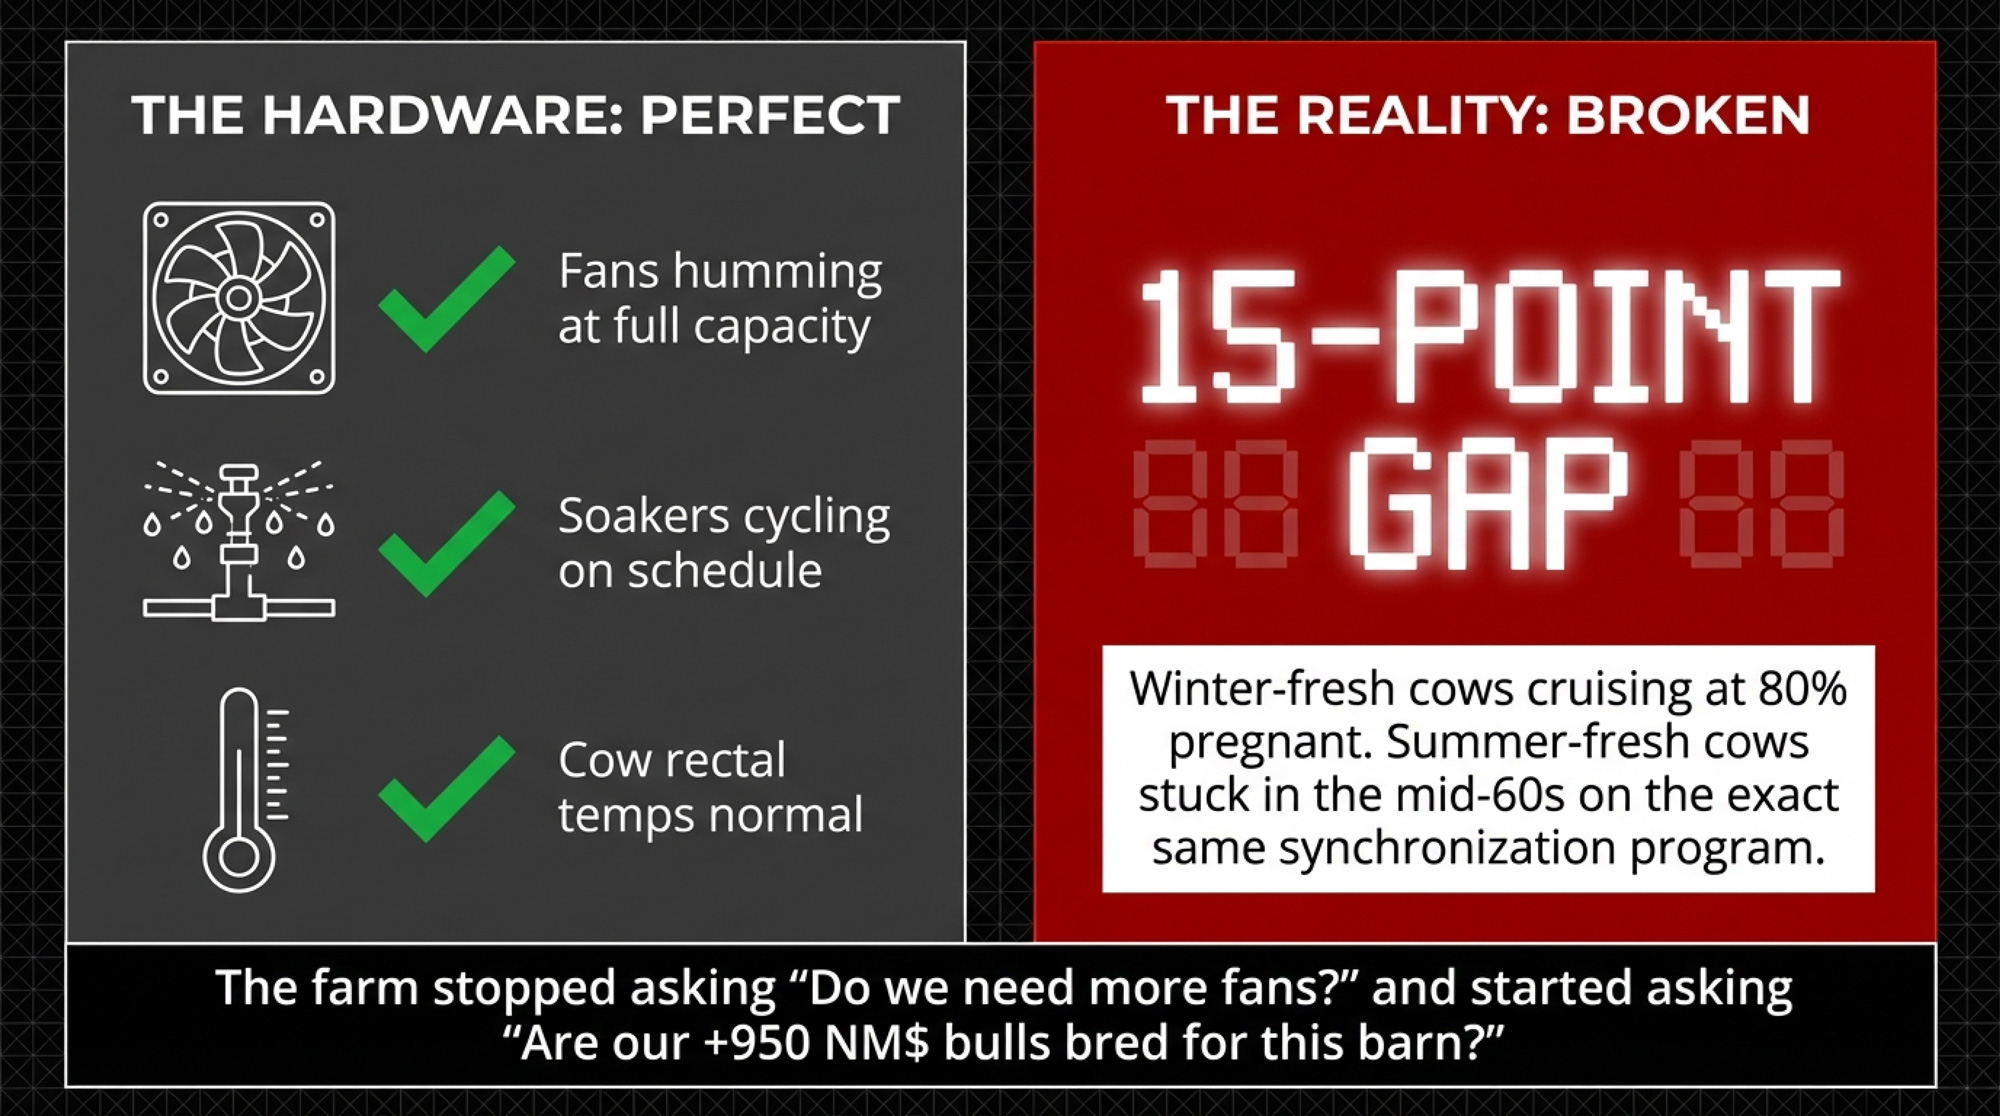
At THI 60, some cow families keep breeding and some melt—same barn, same ration, same fans. That second group is quietly running your days open up 40 and costing 200–320 CAD a head.
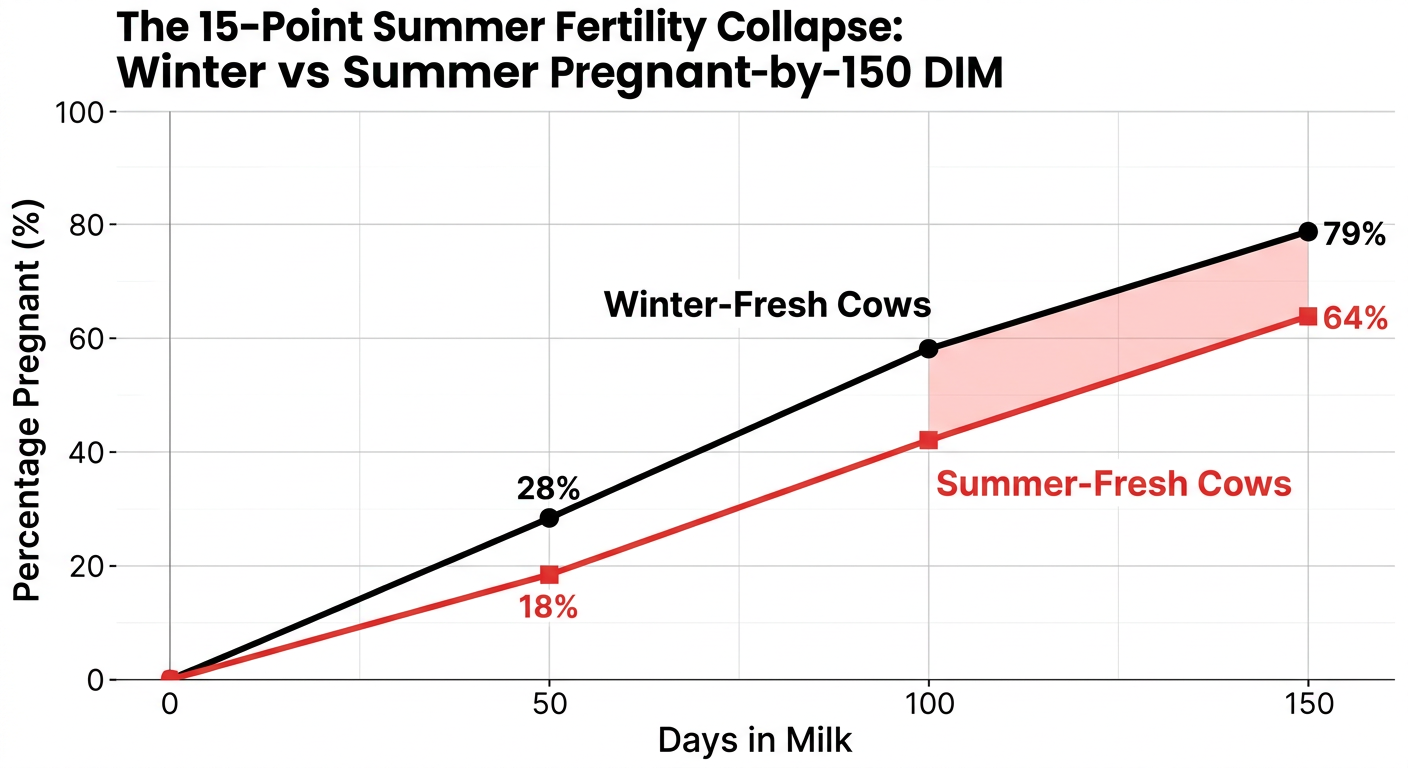
Executive Summary: Once the temperature-humidity index hits about 60, fertility starts bleeding—well before the 68-to-72 milk-loss threshold most cooling triggers are set to. Here’s the part hardware won’t fix: the loss isn’t even across the barn. Some cow families keep cycling and conceiving through July; the melters crash—piling up extra services, dragging days open out by weeks, and dominating the summer cull and recheck lists even after you’ve maxed out fans and soakers. Run the math and it stings: at roughly 5–8 CAD per extra day open, 40 lost days runs 200–320 CAD a head, and if just 30 cows in a 200-cow herd carry that pattern every summer, you’re looking at 6,000–9,600 CAD a year before the wasted semen straws and vet rechecks. The fix is genetic, and you already own the tools—sort three to five years of June-through-September breedings by cow family in DairyComp, flip the bottom 15–20% of summer-fragile lines to beef semen, and screen replacement heifers for heat resilience before economic index. None of it rescues this July; it changes the daughters you freshen in 2028. If you’ve spent on cooling and conception still craters every summer, this is the lever you haven’t pulled yet.
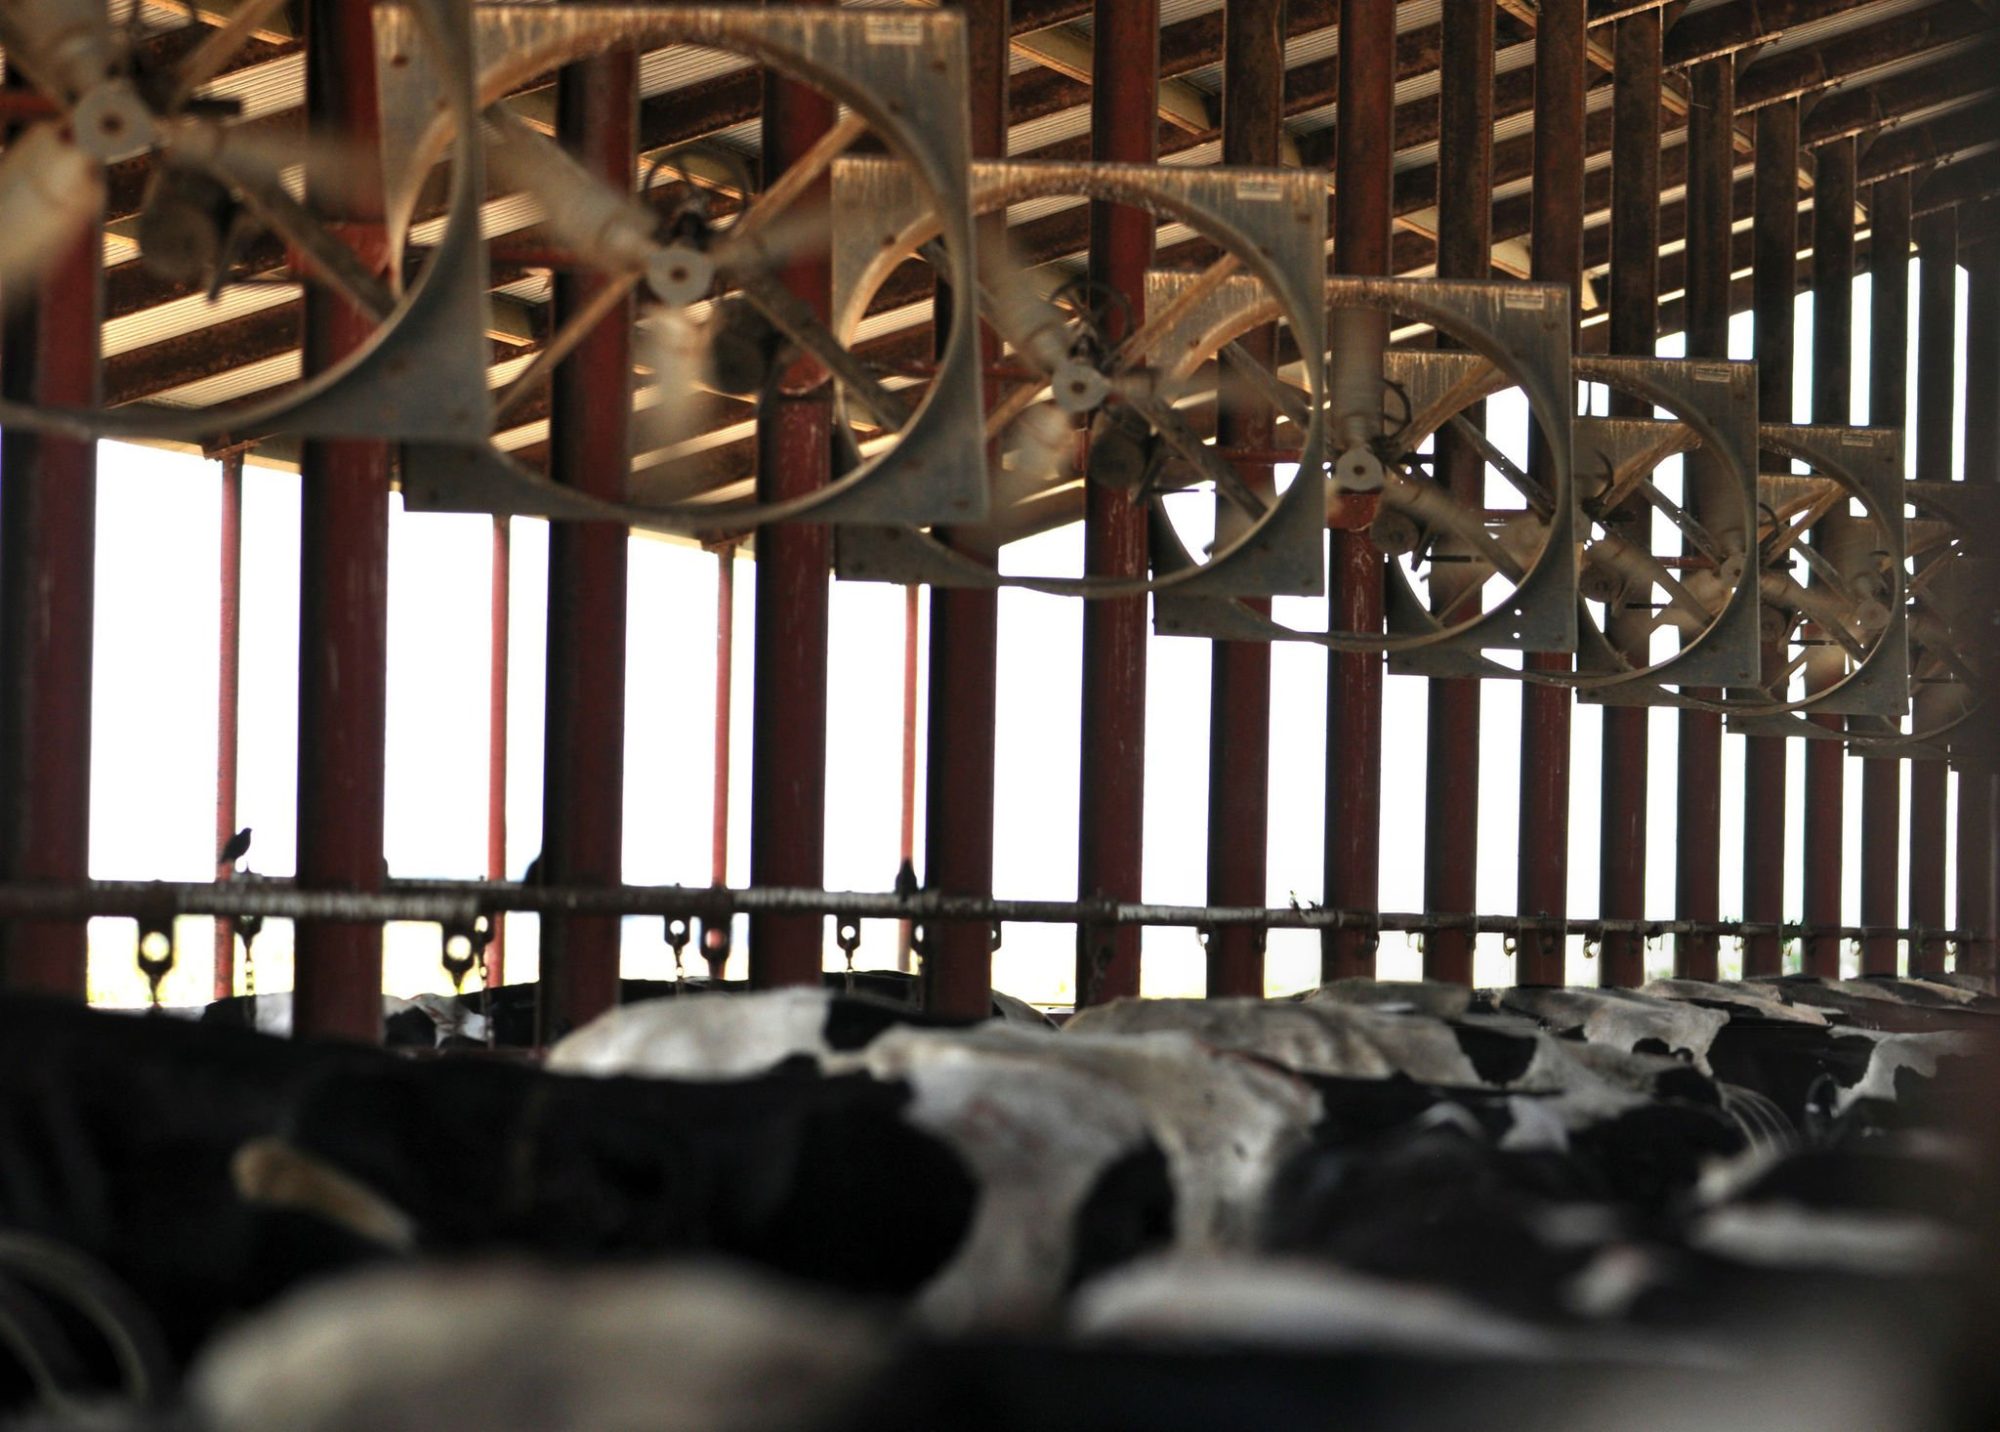
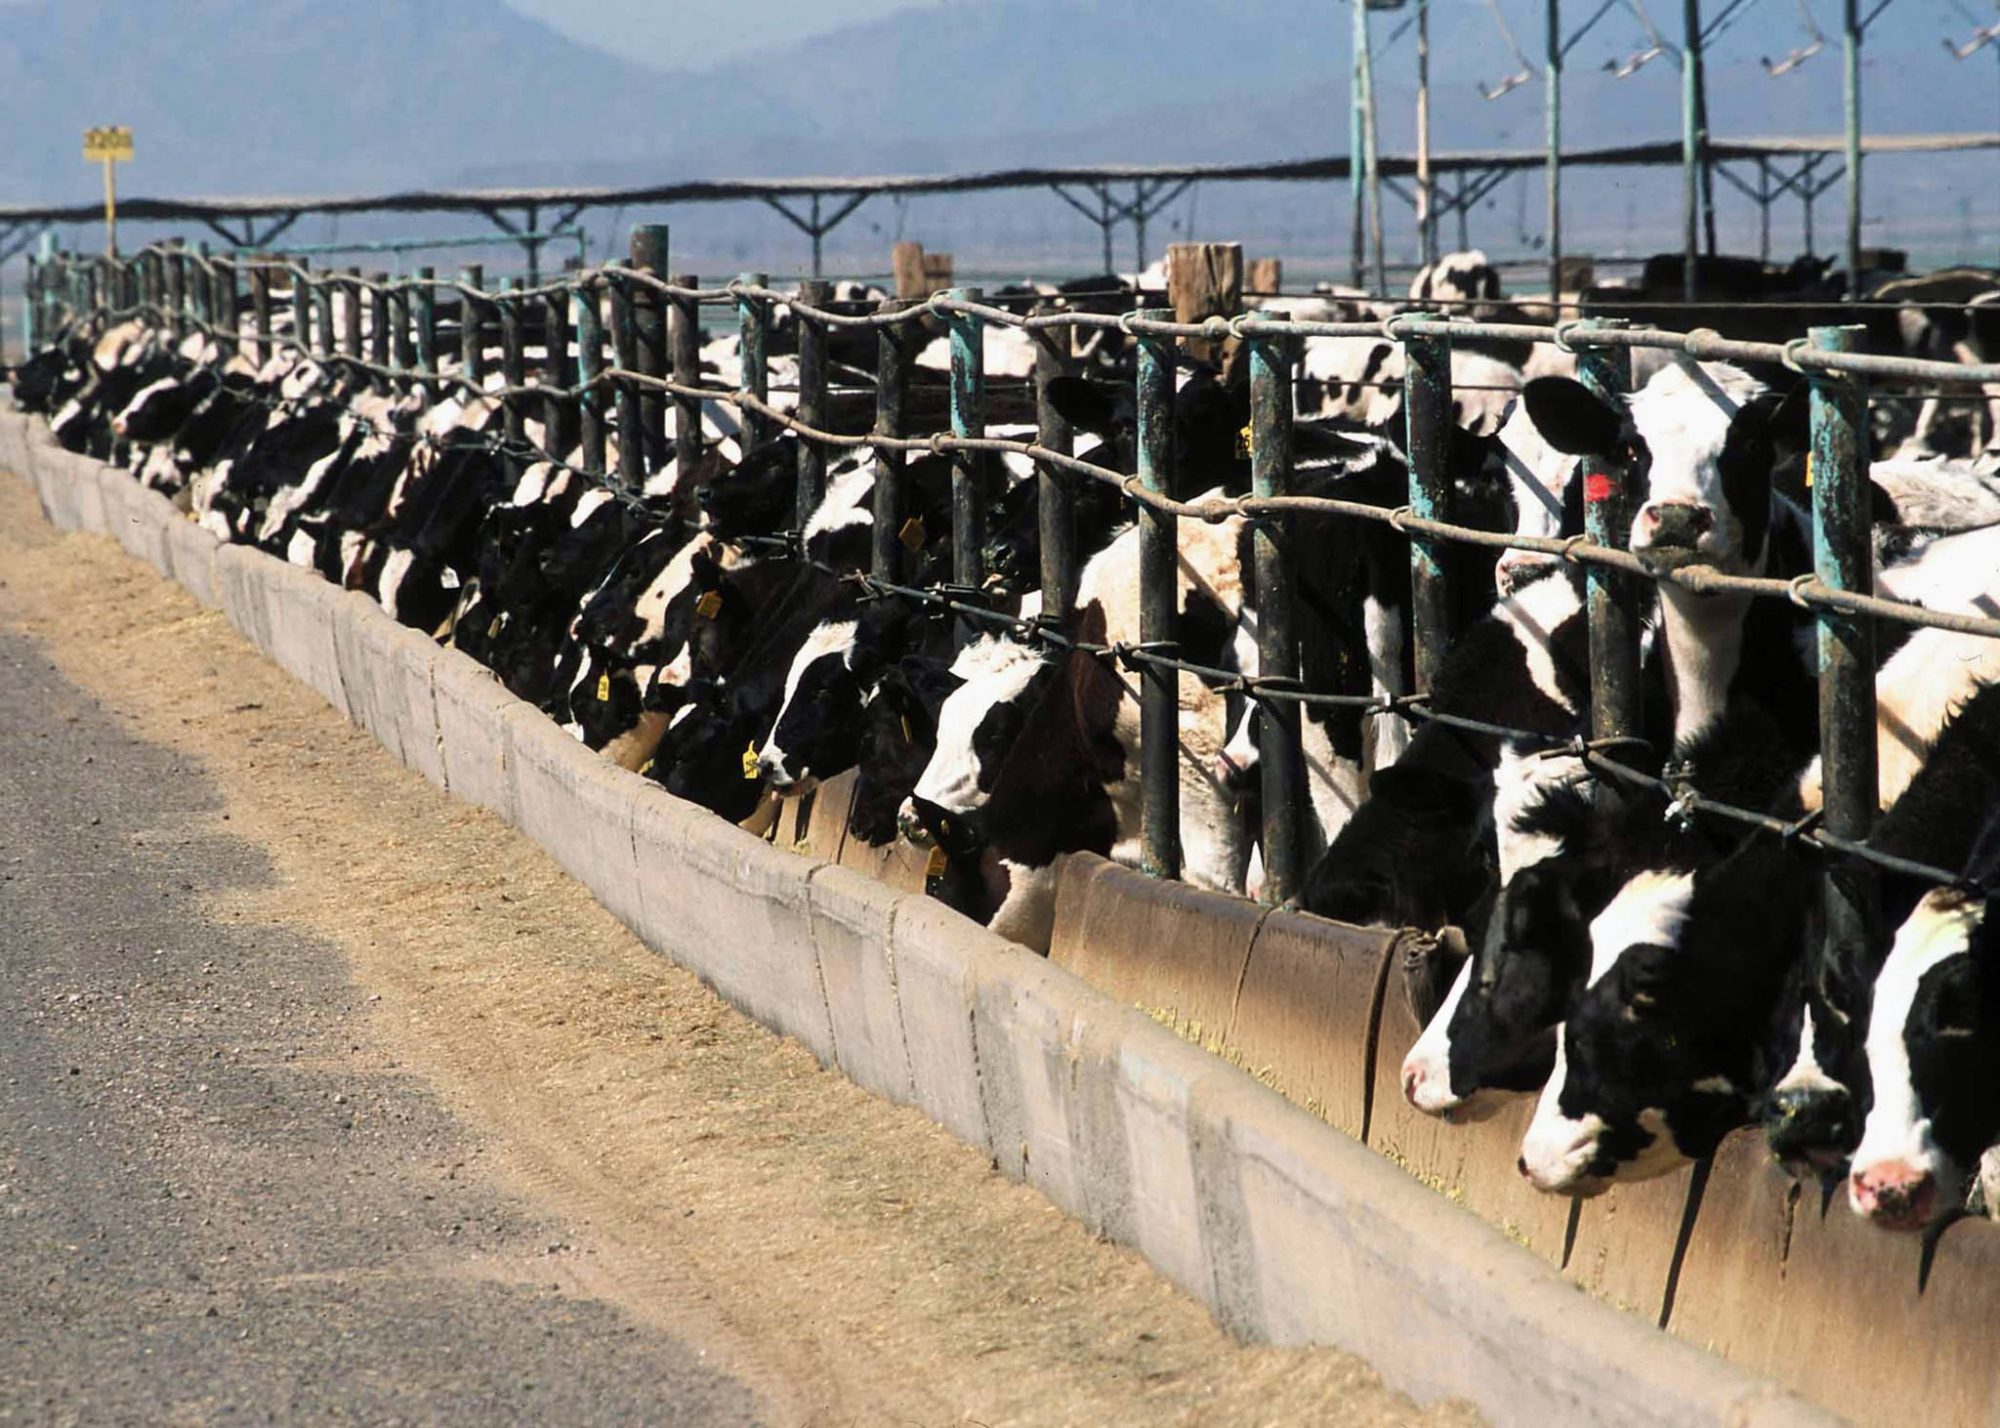
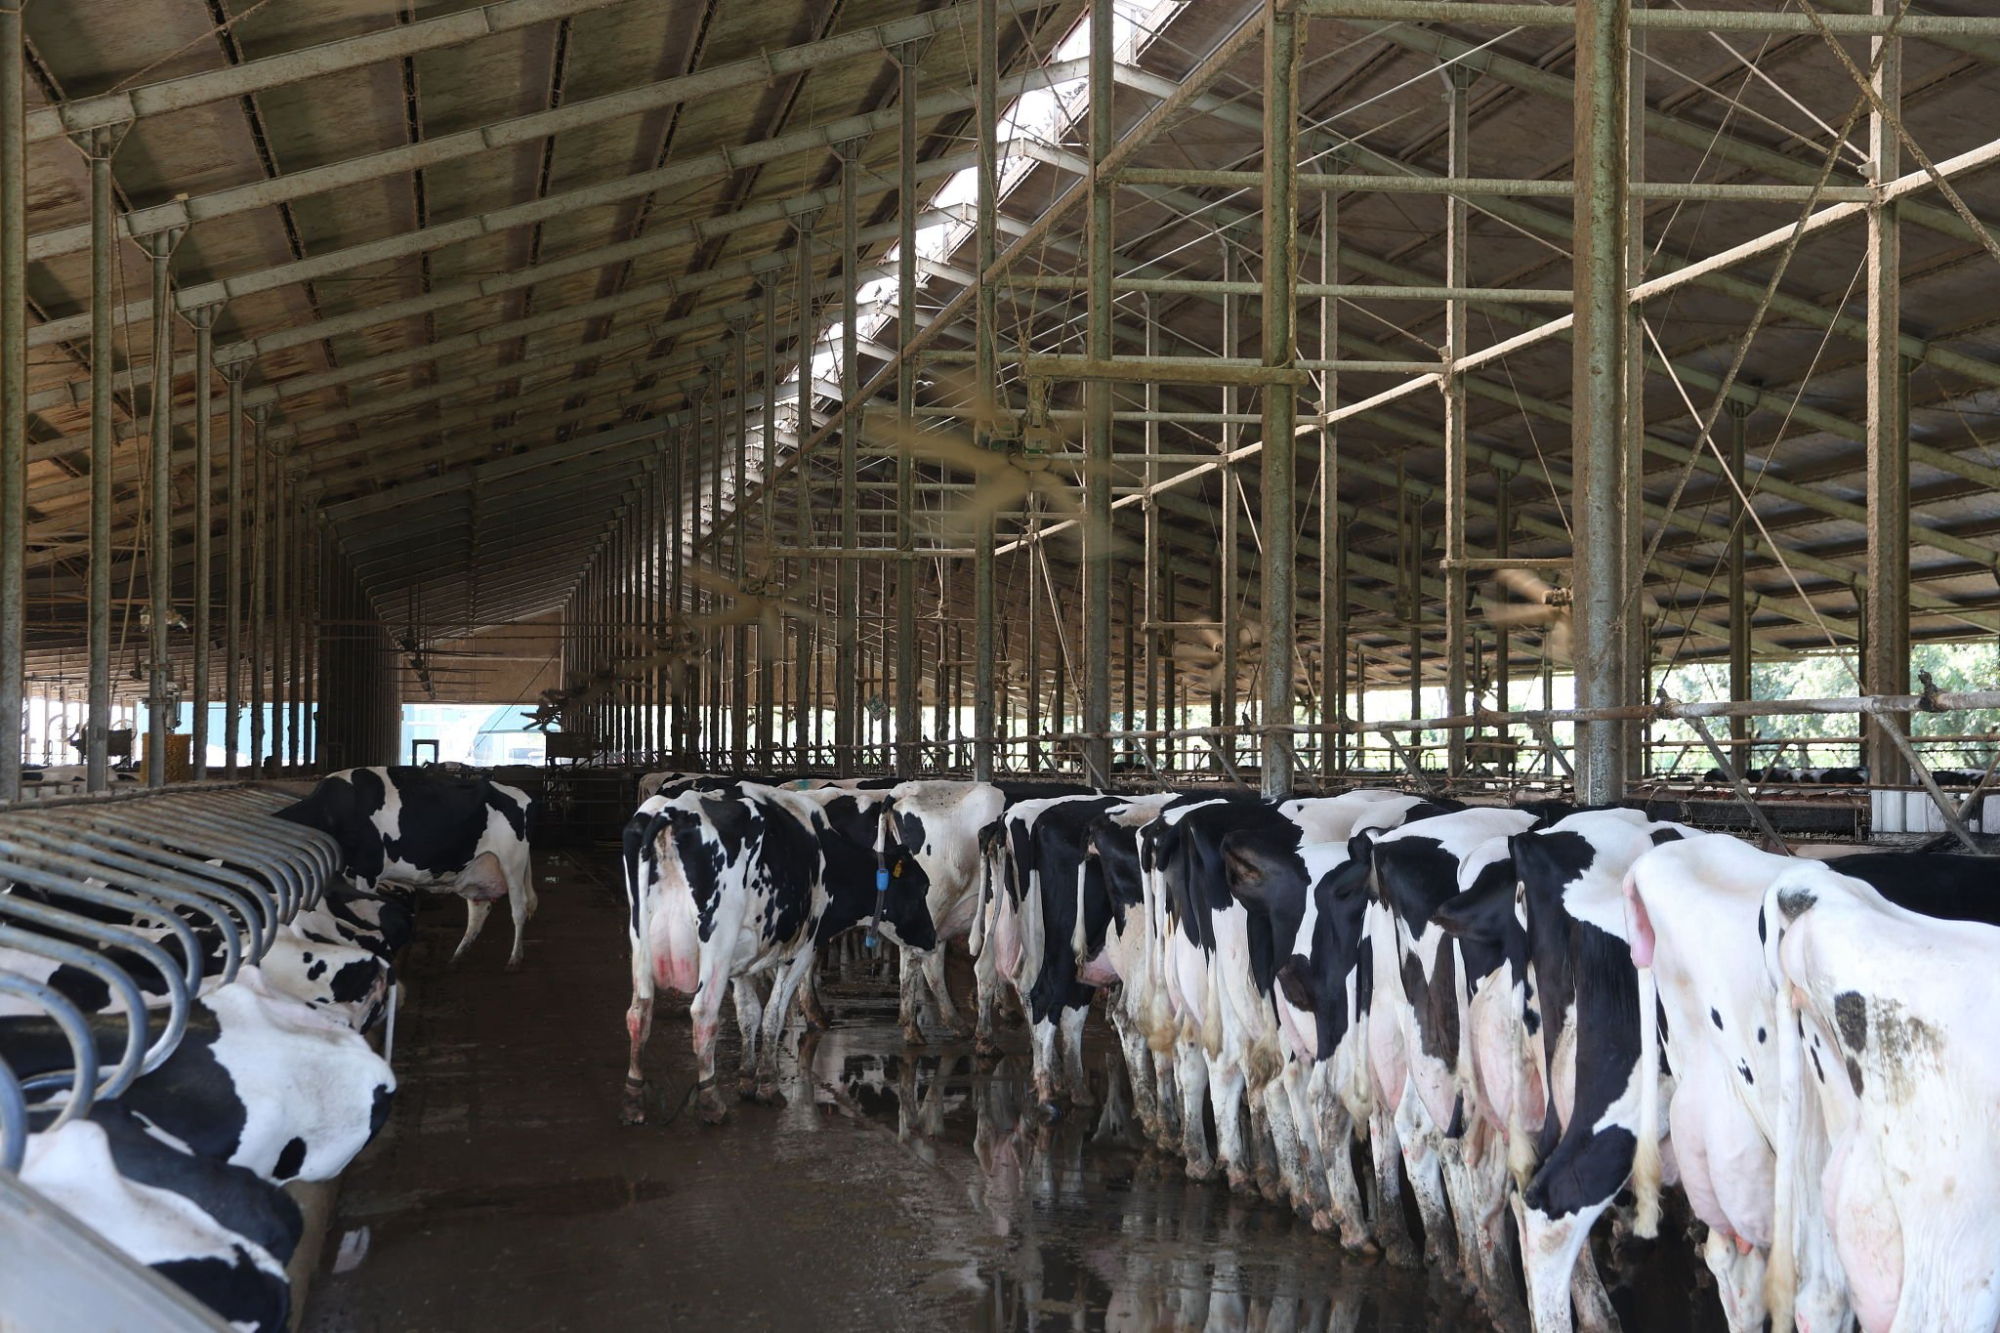
It’s a composite scene, based on how this plays out on many farms. The fans are running. Soakers click on and off in rhythm. Steam hangs in the feed lane, and the cows look about as comfortable as Holsteins get on a humid July afternoon. A herd owner walks the high group, stops at a tall cow giving 90 pounds, and says he can’t afford to cull her.
But his summer breeding record says otherwise. Year after year, once the temperature-humidity index reaches about 60, conception drops sharply—and the heat-stress damage doesn’t fall evenly across the barn. Some cow families keep breeding. Others fall apart. The cooling money is already spent. And it still isn’t enough, because the weak point isn’t just airflow. It’s genetics.
What’s Really at Stake When THI Hits 60?
Spring can make any herd look smarter than it is. Body condition holds, first cut is moving, and reproduction finally looks the way the protocol sheet promised. Then the air turns sticky, THI sits in the 60s for a few days, and the picture shifts.
You see it fast enough in the reports: conception slides through June to September, days open stretch, and health problems like mastitis, metritis, and lameness start stacking up after the first real heat run. Graph three to five years of records, and you can watch the operation slide from profit mode into damage control as THI climbs from the 50s into the 60s and 70s.
That part isn’t breaking news. The sharper question is this: what happens when you sort the same summer data by sire line or cow family?
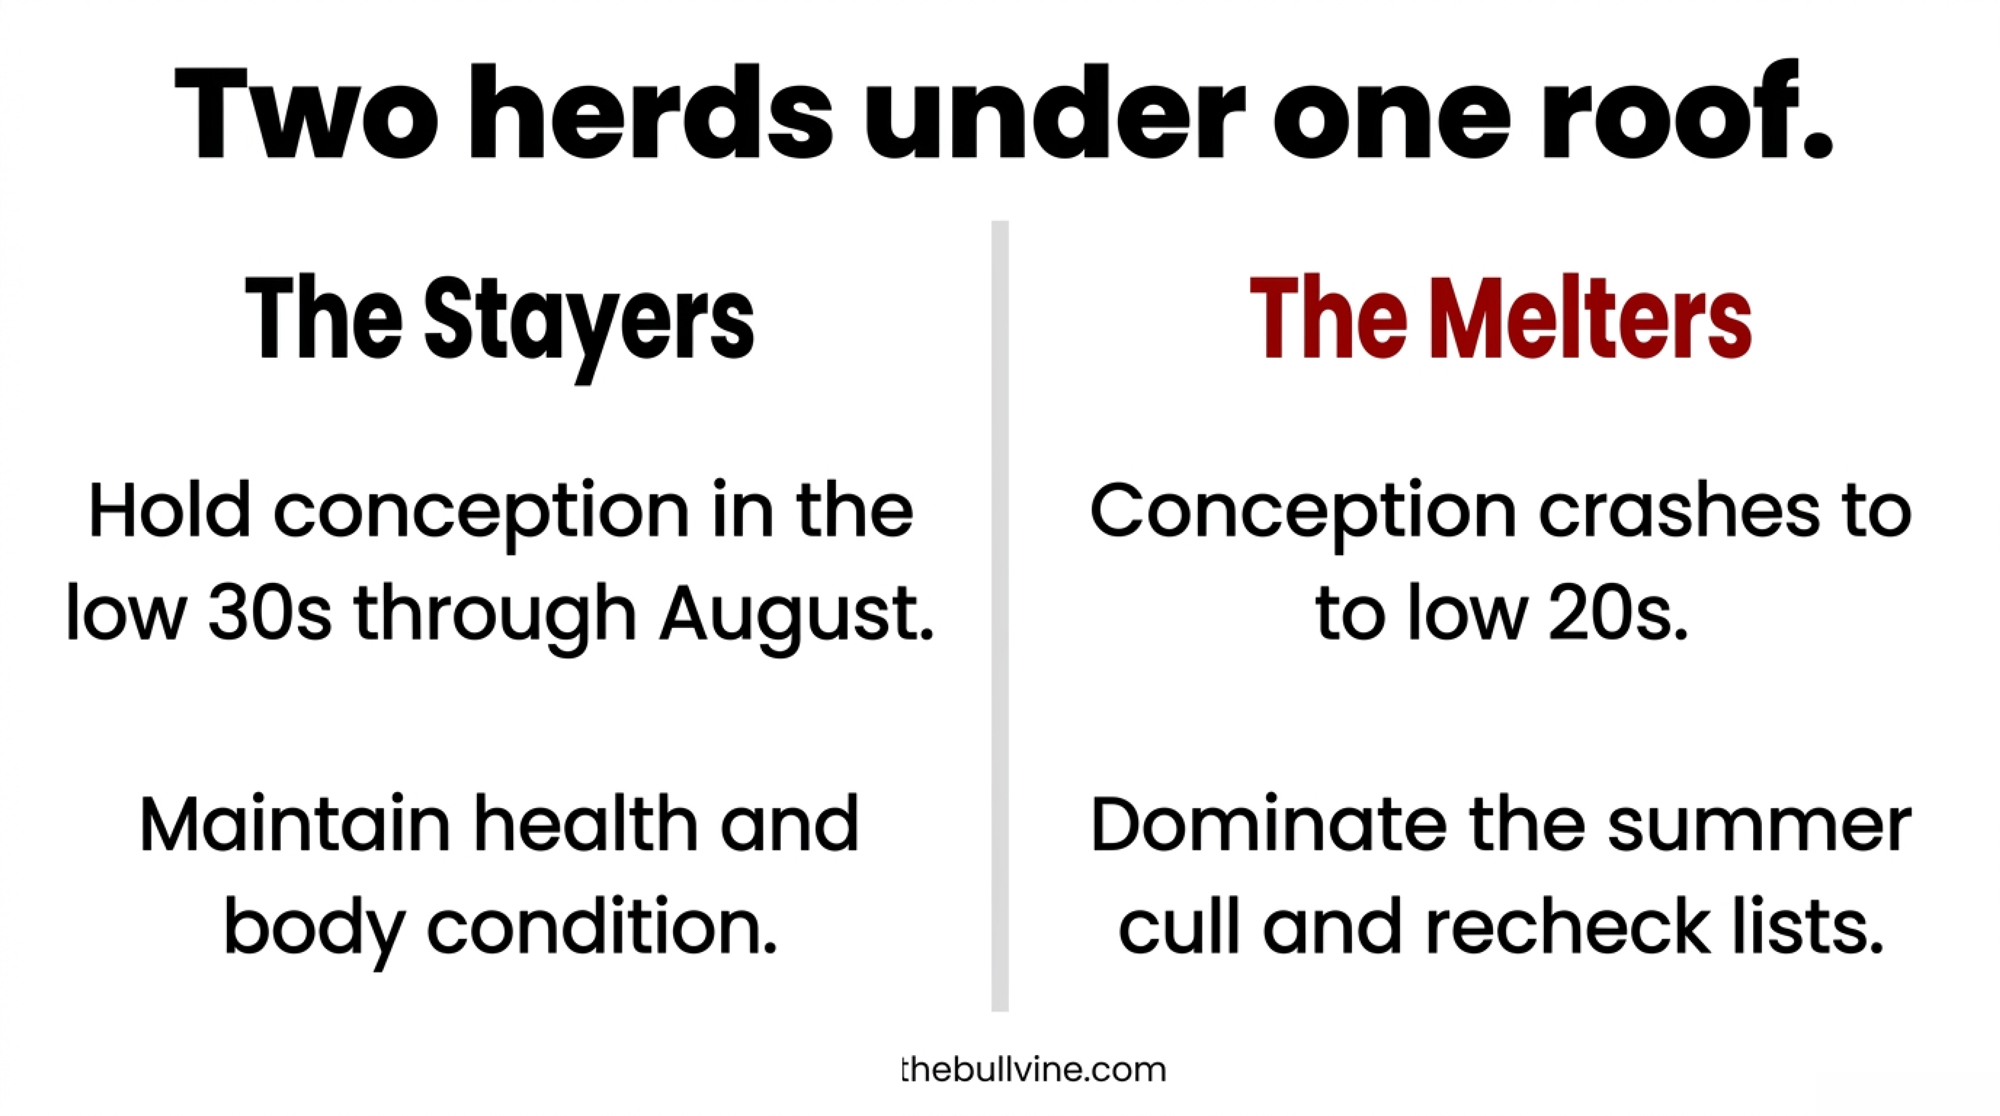
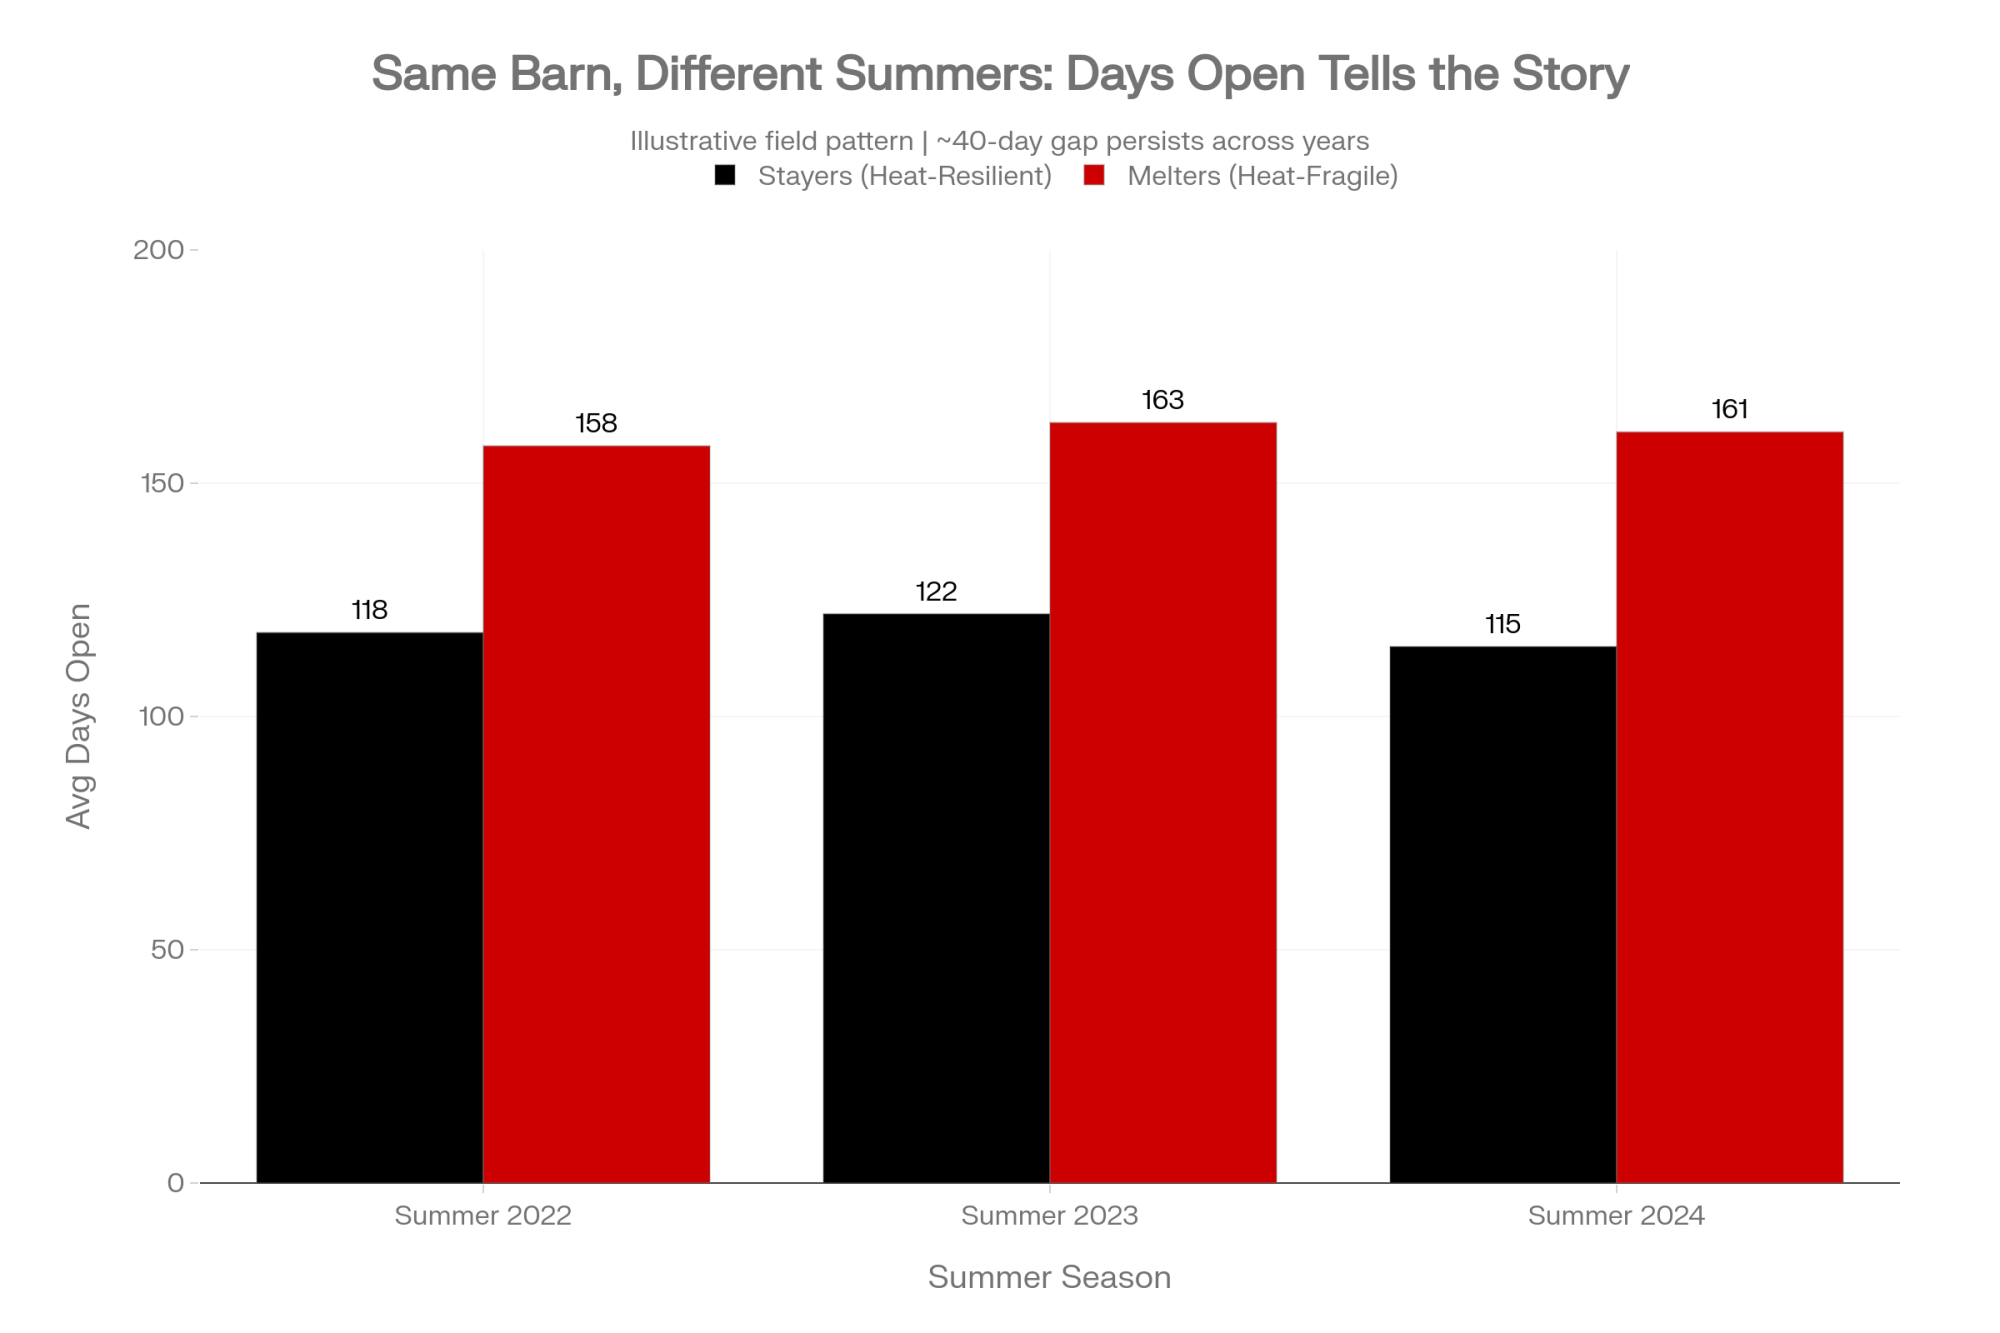
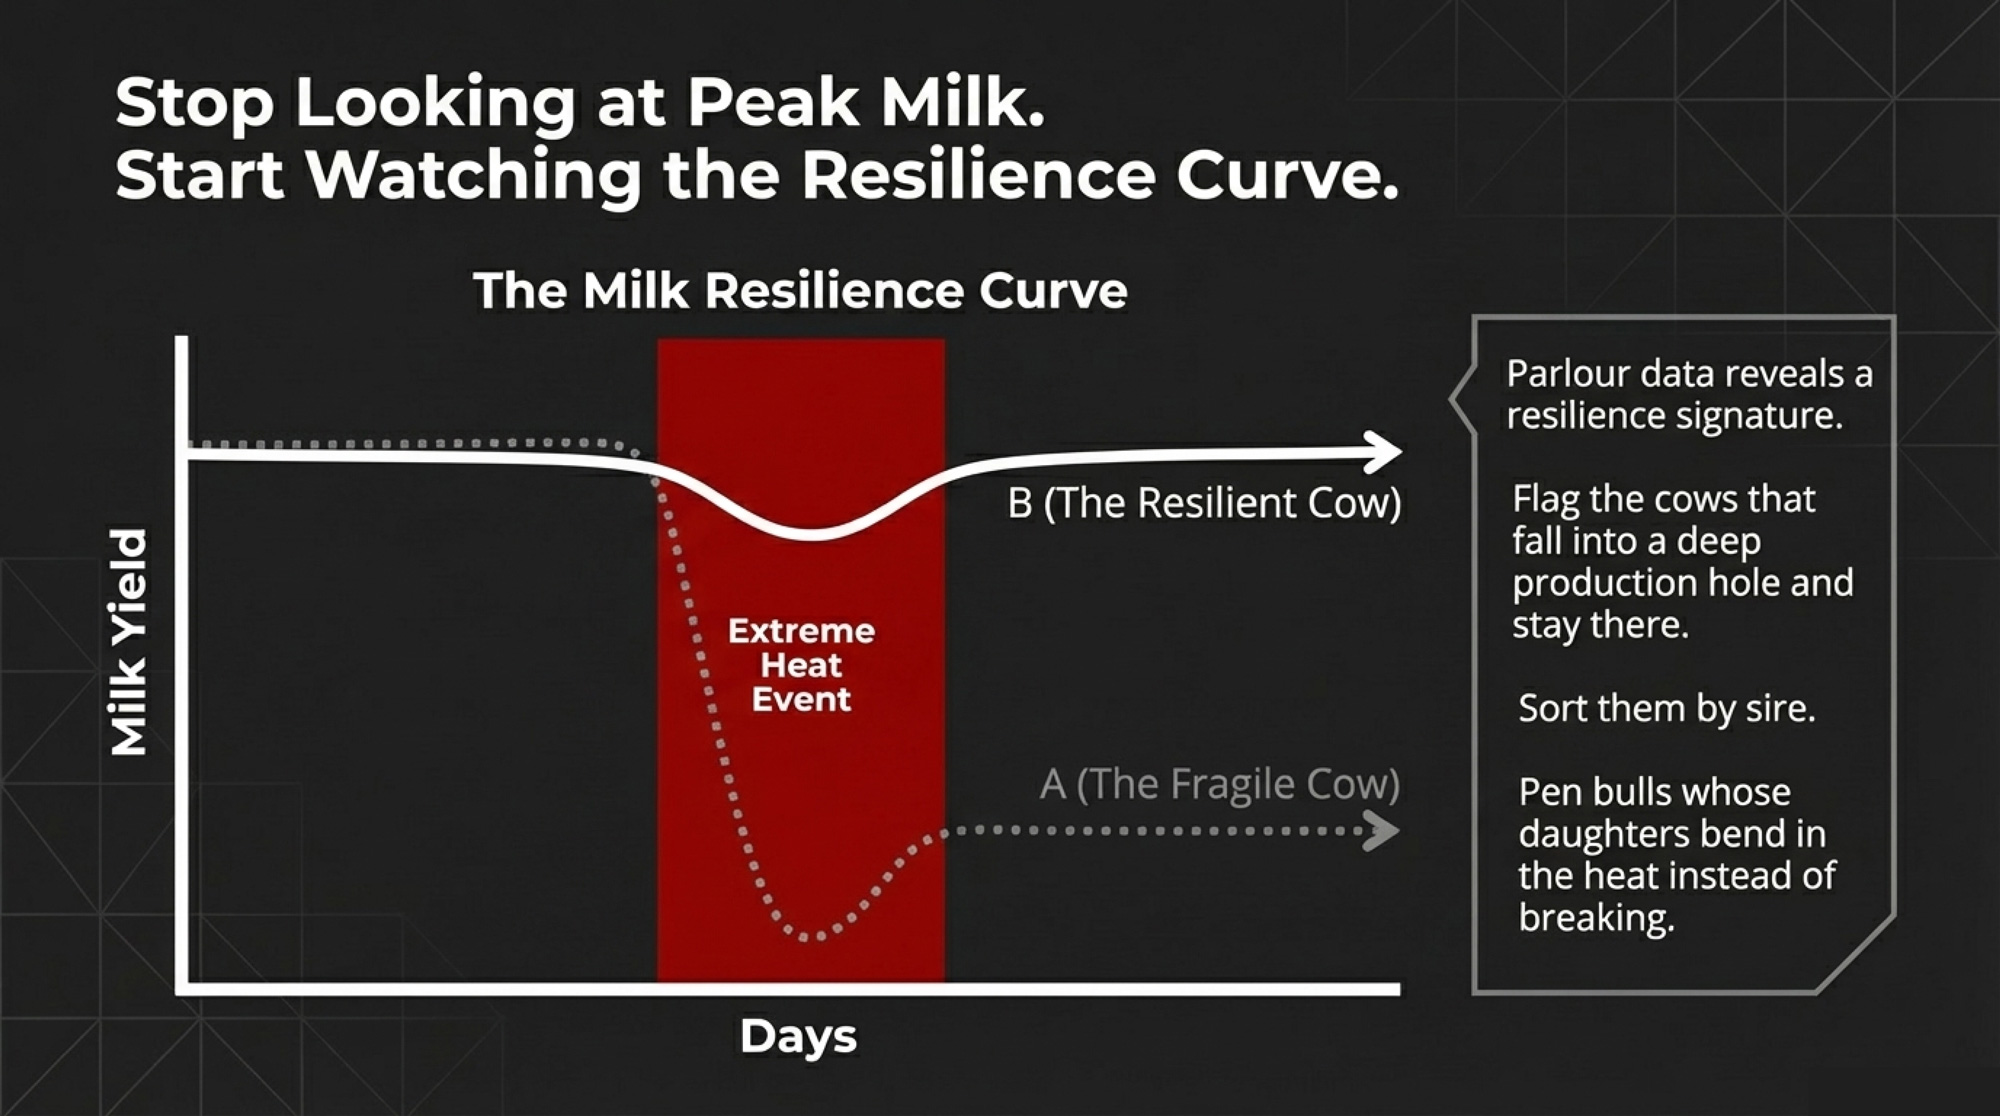
In real herd terms, two different “herds” can be standing under the same roof. One group—the stayers—gives up a little fertility but stays functional. The other—the melters—loses far more ground in the same THI band, then dominates the summer cull list, the recheck list, and the hospital pen. Same barn. Same ration. Same breeding crew. Different cows.
Why THI 60, Not 68?
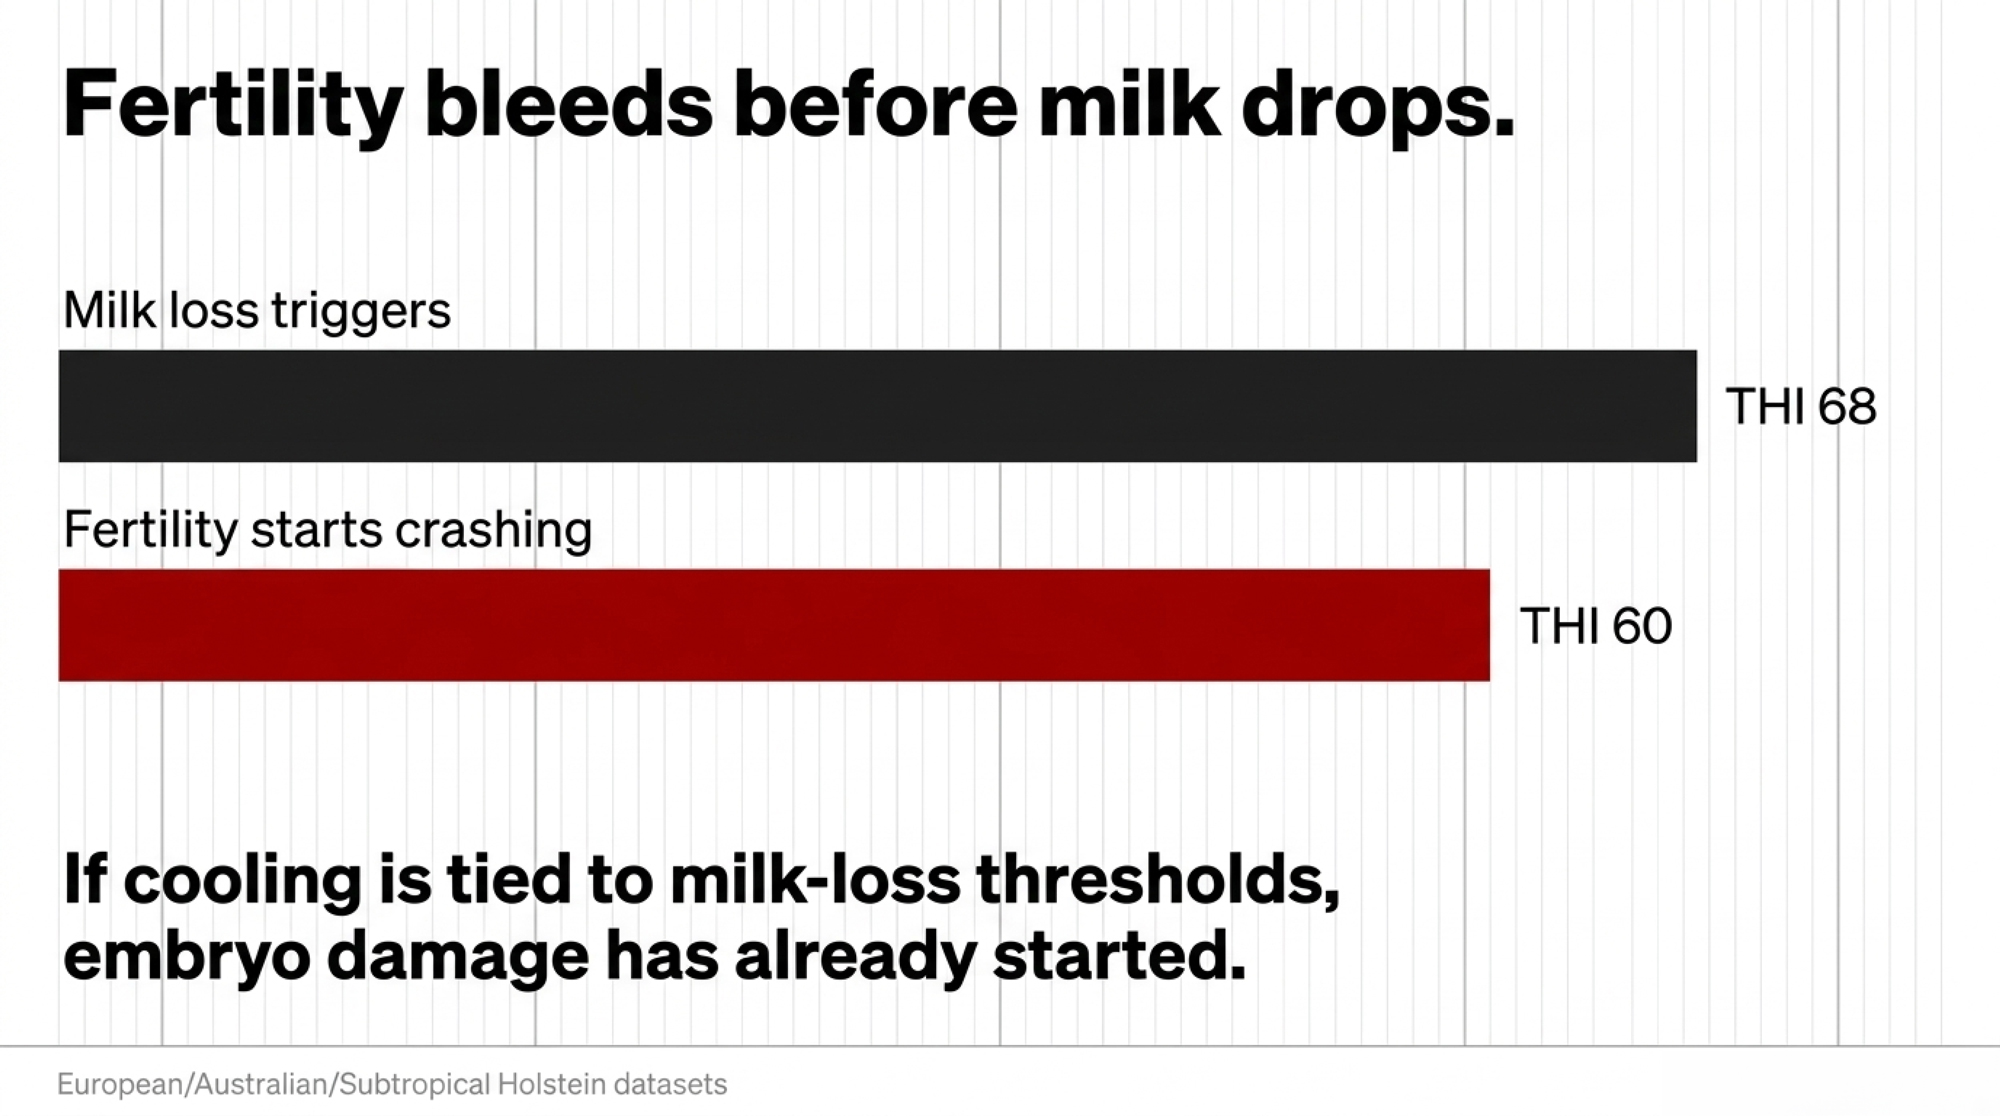
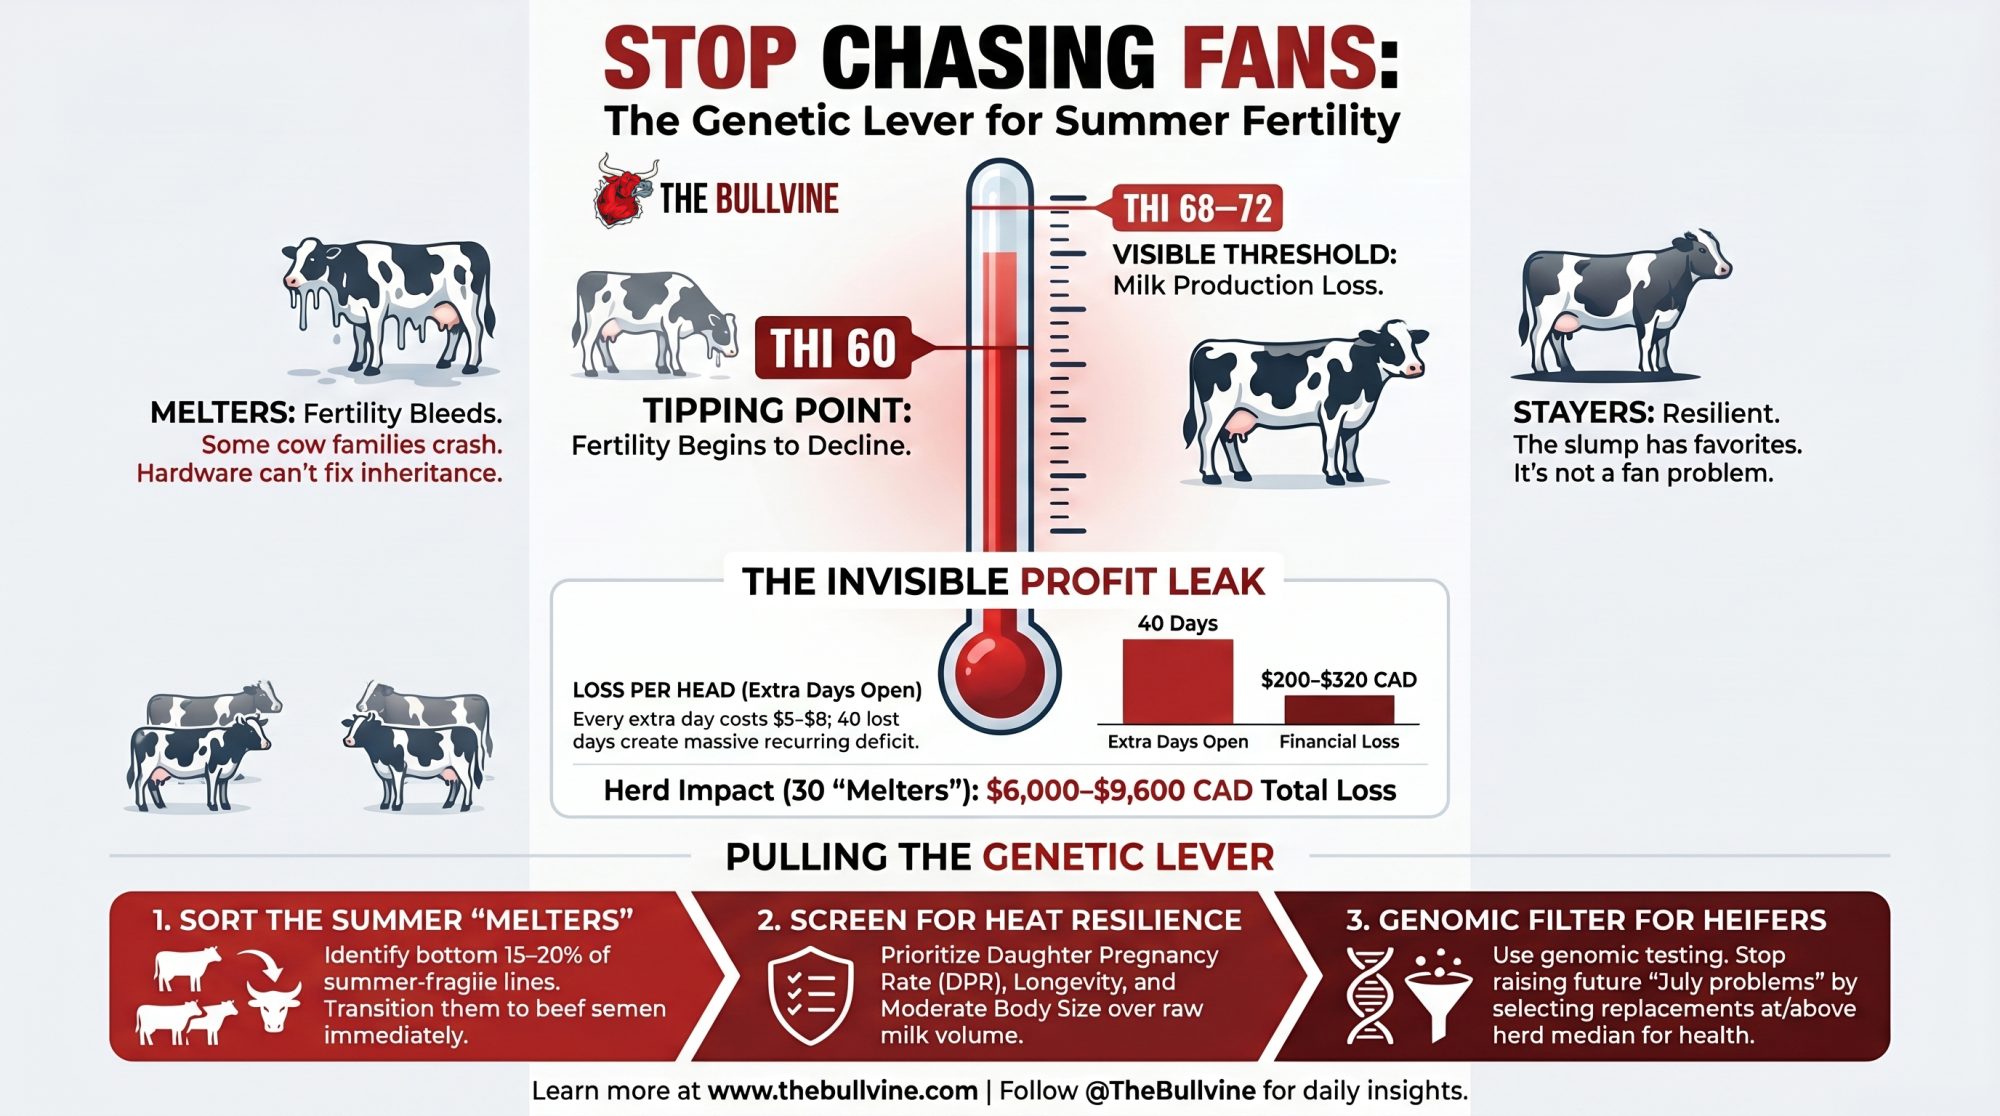
For years, the working number was 68 to 72—the point where milk yield visibly drops and most cooling triggers are set. Fertility tells a different story. It starts bleeding earlier.
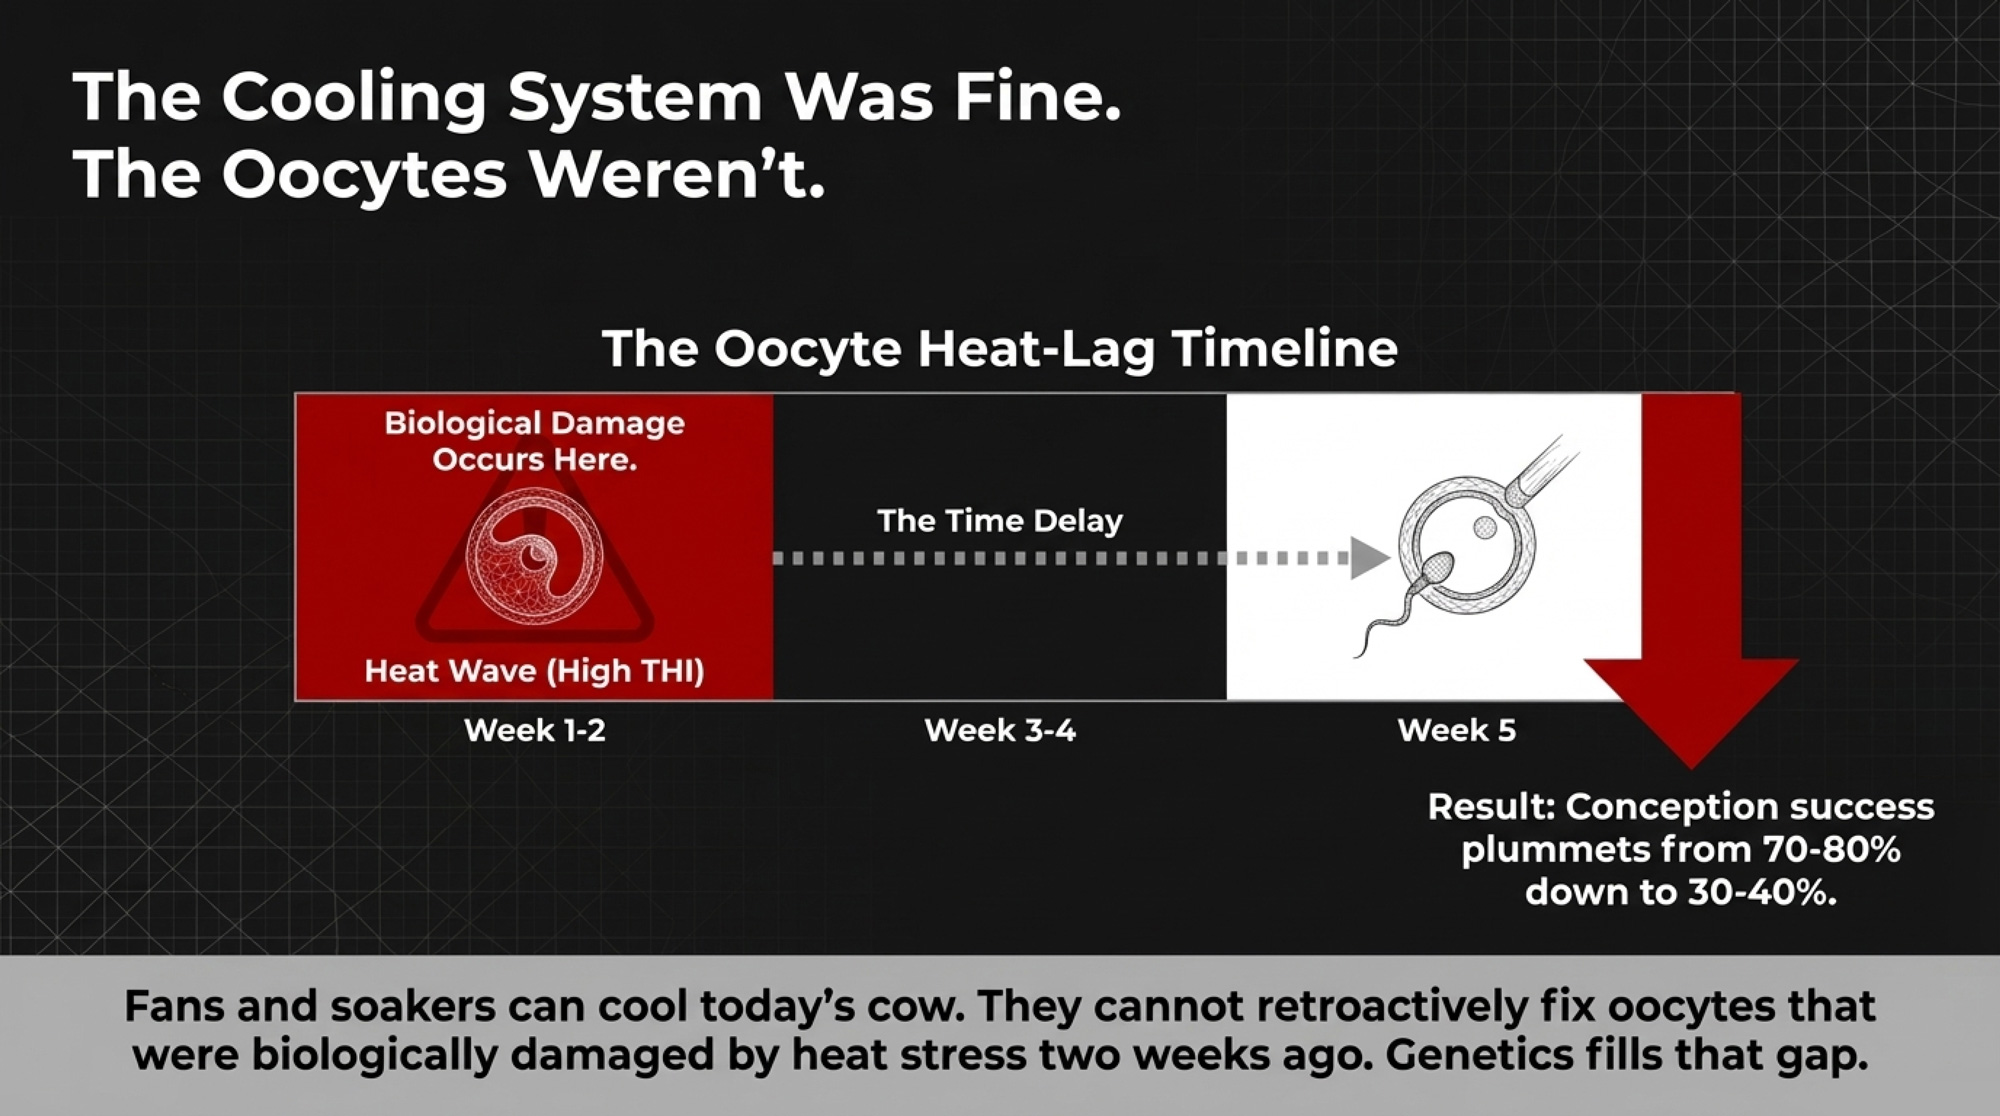
Across Holstein datasets from Europe, Australia, and subtropical regions, researchers have found fertility traits weakening below the old 68-to-72 rule of thumb—often around 60 or lower. Recent barn-level coverage pegs the same early onset, with heat effects on production showing up near 68°F THI and fertility taking hits sooner. The mechanism isn’t mysterious: the developing egg and the early embryo are heat-sensitive in windows that open before a cow looks visibly stressed, which is why a “mild” stretch of weather still shows up six weeks later as an empty cow.
So the practical takeaway is blunt. If your cooling trigger is set to the milk-loss threshold, your fertility losses started before the fans ramped up. The genetic gap between heat-tough and heat-fragile cows shows up while the weather still feels merely uncomfortable rather than dangerous.
How the Melters Give Themselves Away
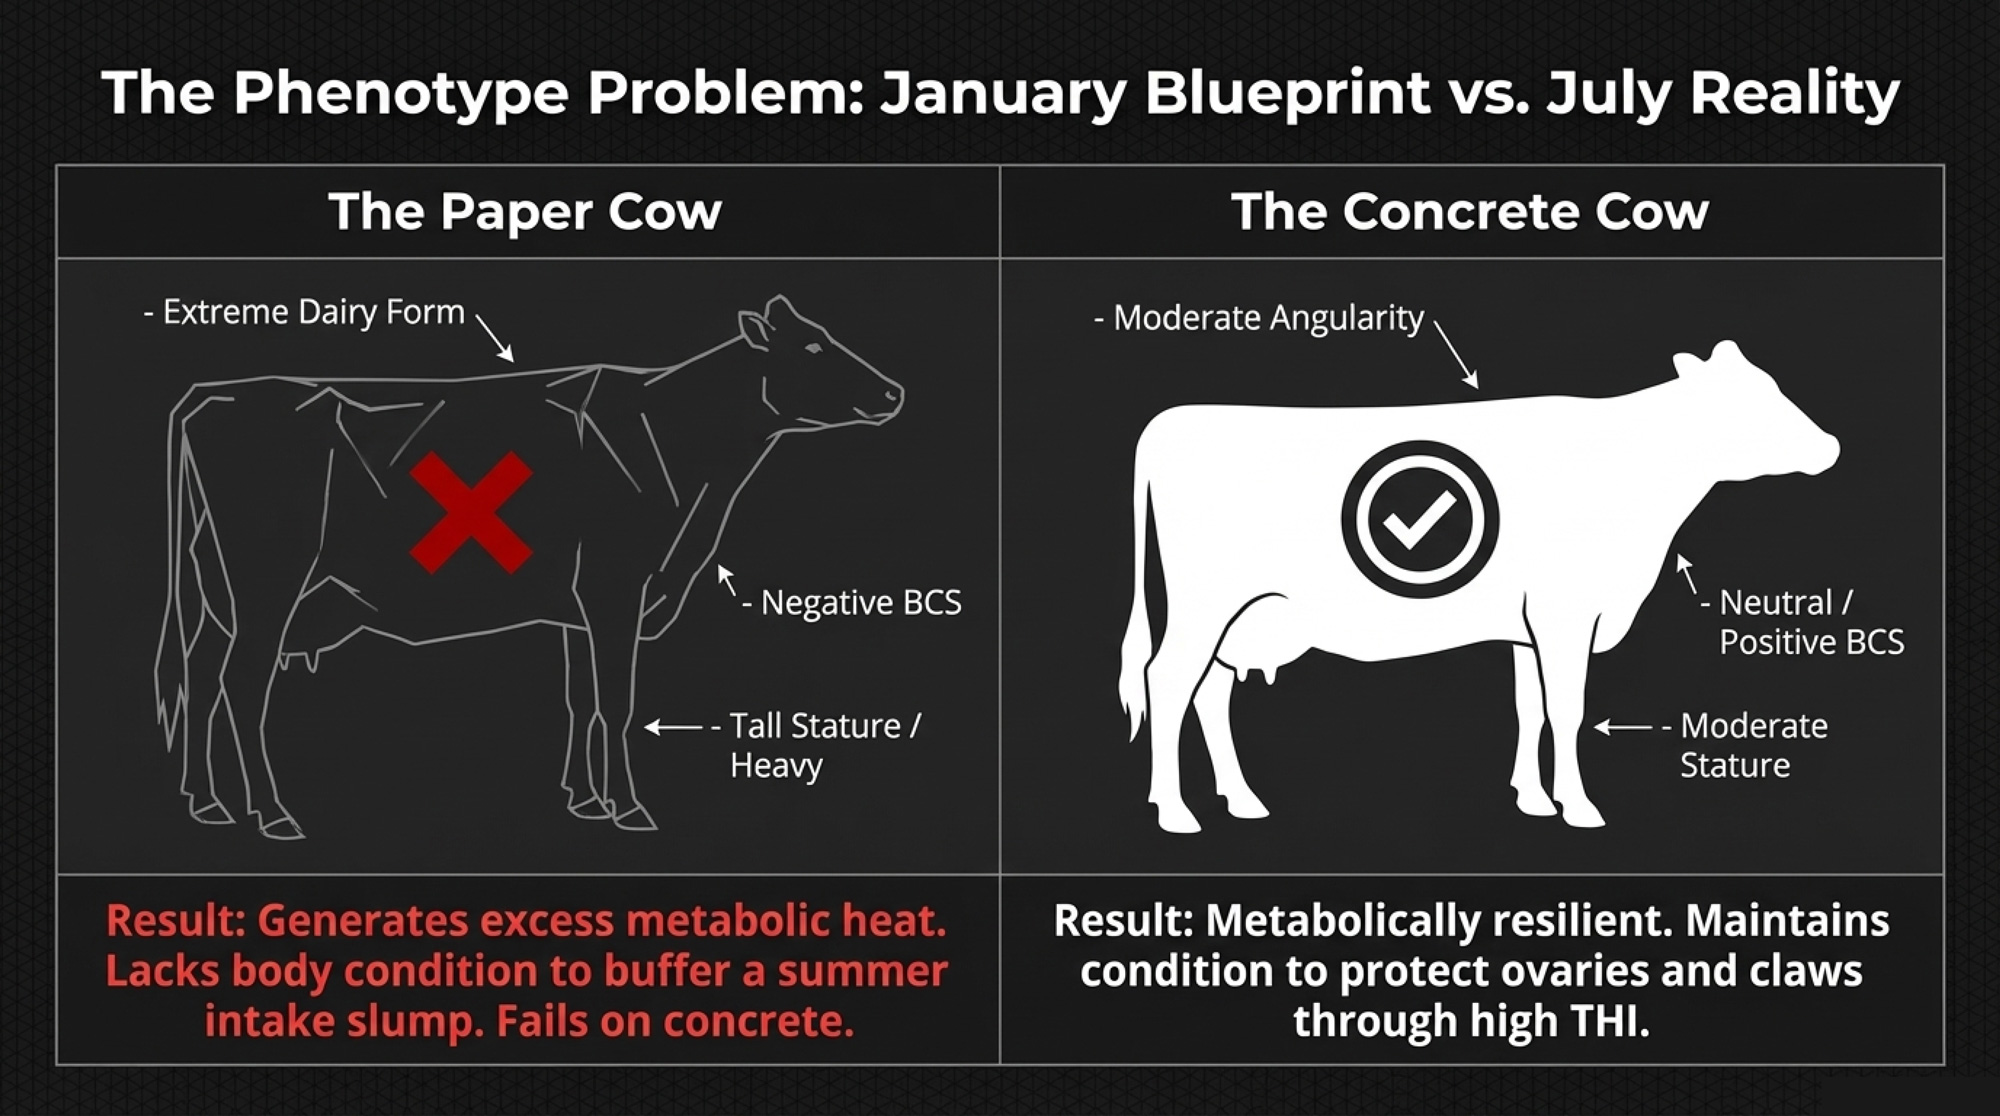
Go back to that 90-pound cow. On a cool April morning, she looks like the right kind. Big frame. Big appetite. The kind that makes a herd owner feel better about his feed bill. Then July shows up and starts asking different questions.
Advisors working with heat-sensitive herds describe a pattern that keeps repeating in high-yield families:
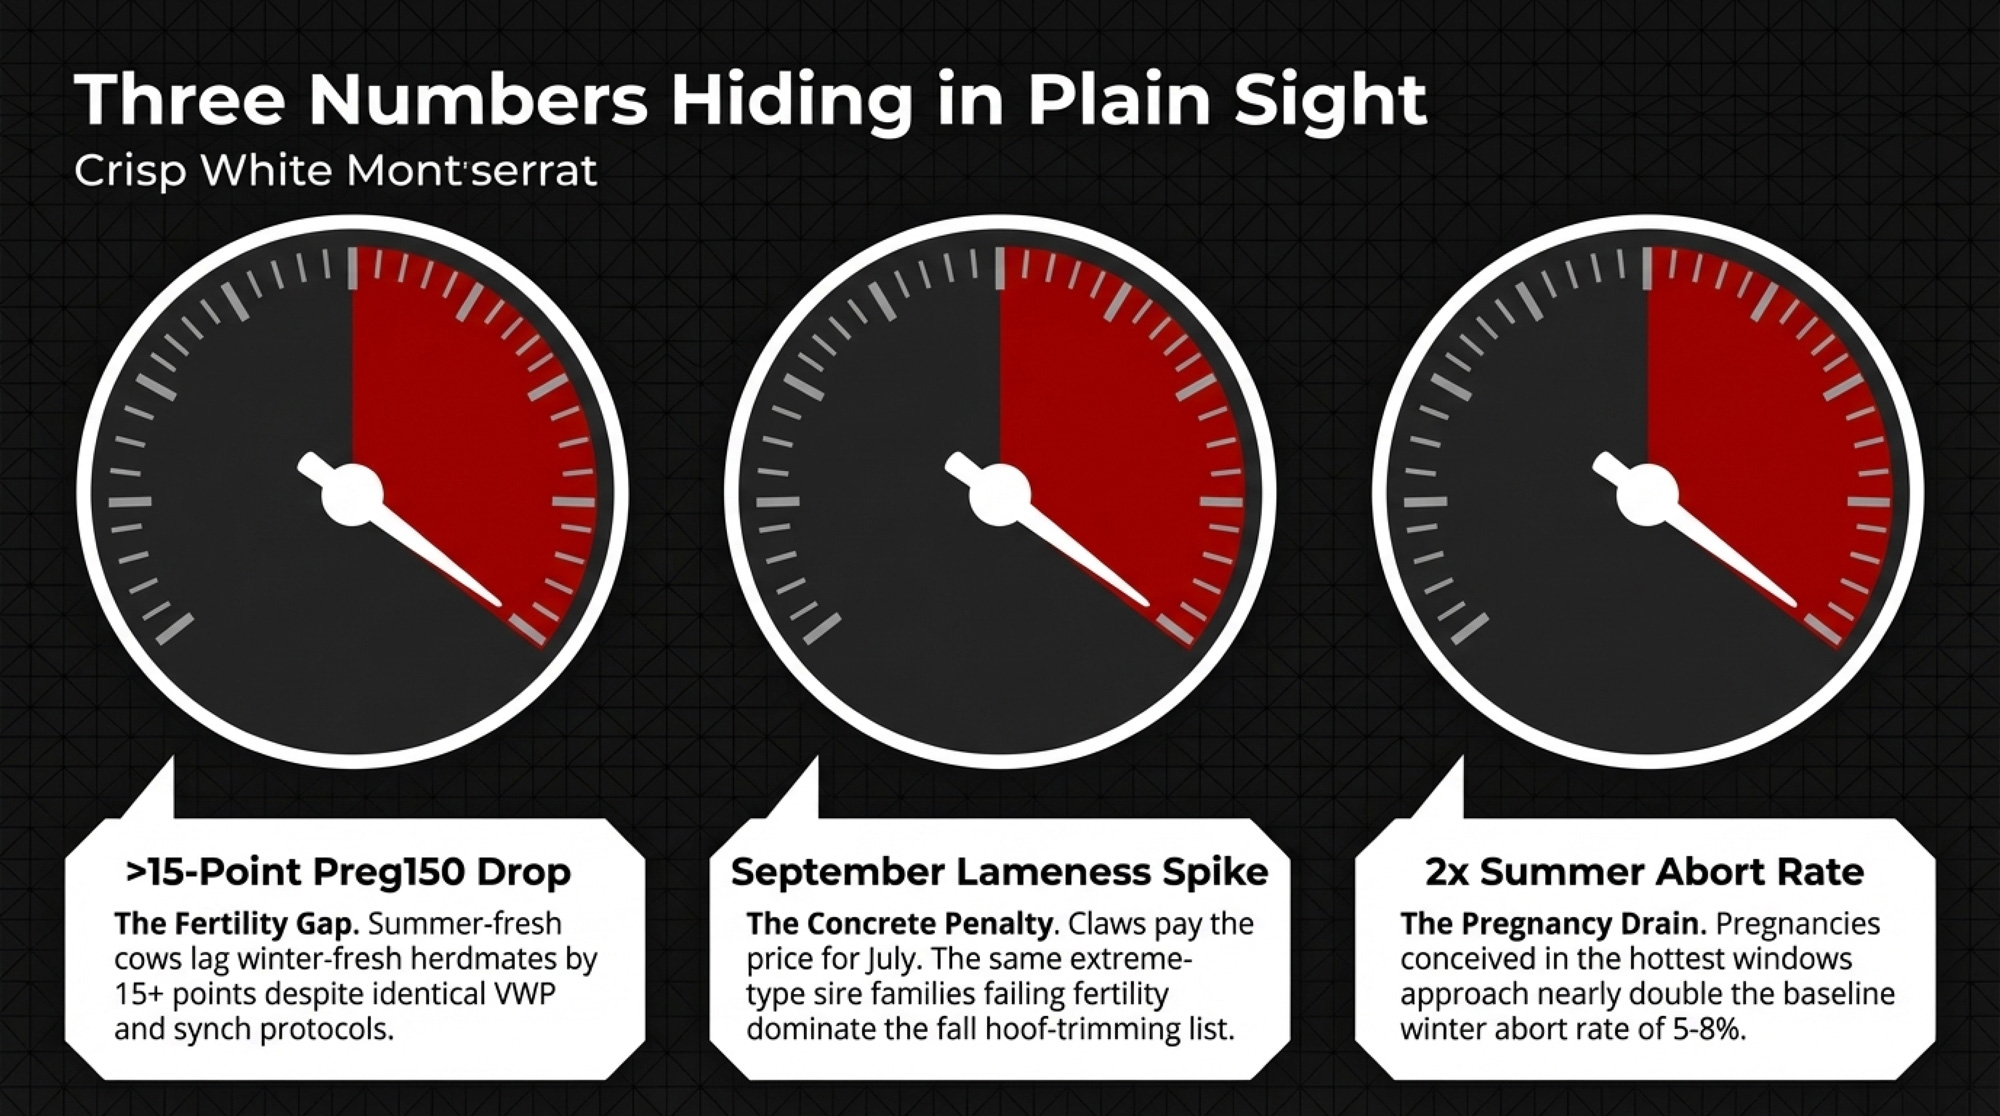
- Lower summer conception: In the THI 60-to-70 window, some families can run 10 to 15 points behind more-resilient lines within the same herd, advisors report.
- More days open: Those same cows often drag several extra weeks compared with the stayers standing beside them.
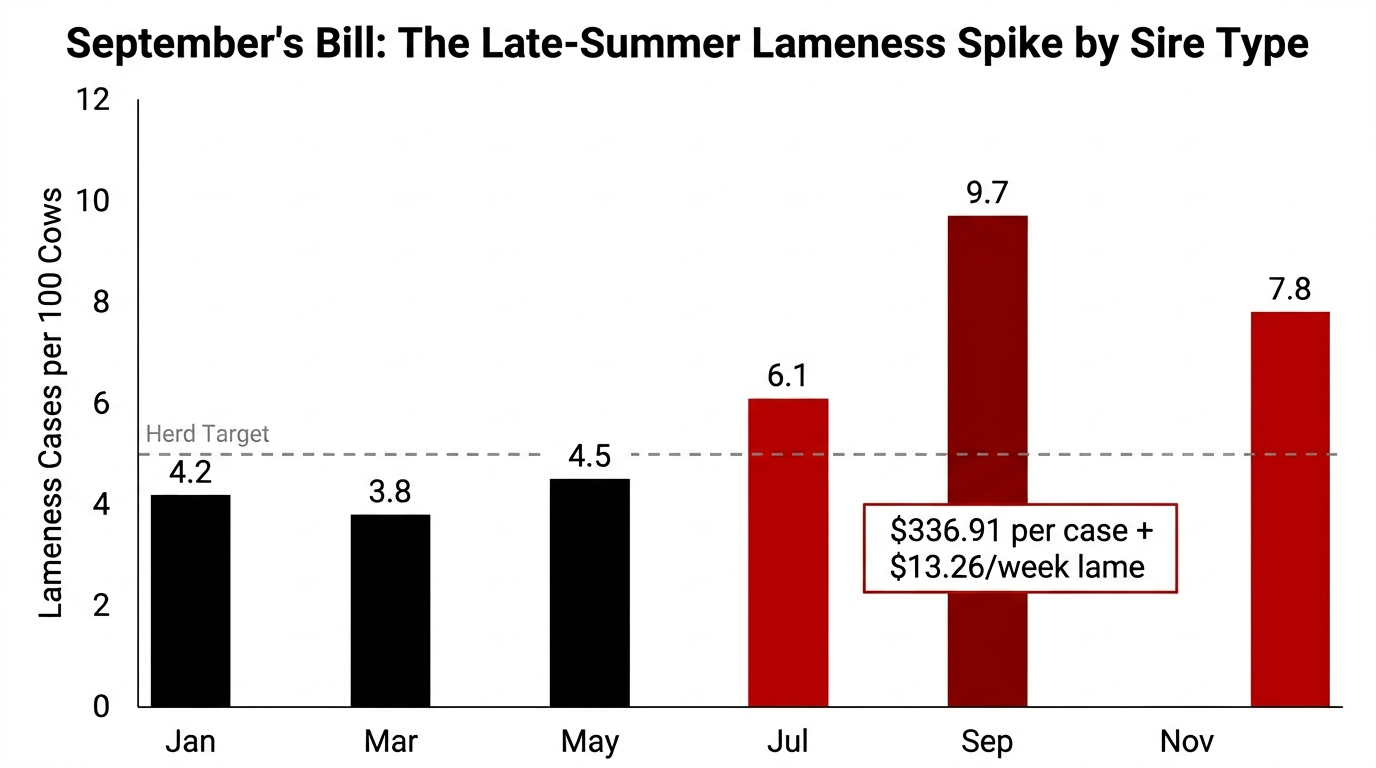
- More post-heat wreckage: Mastitis, displaced abomasum, and lameness show up more often after sustained heat events.
| Metric | Heat-Resilient Families (Stayers) | Heat-Fragile Families (Melters) | Warning Level |
|---|---|---|---|
| Cool-season conception rate | 35–38% | 34–37% | Normal |
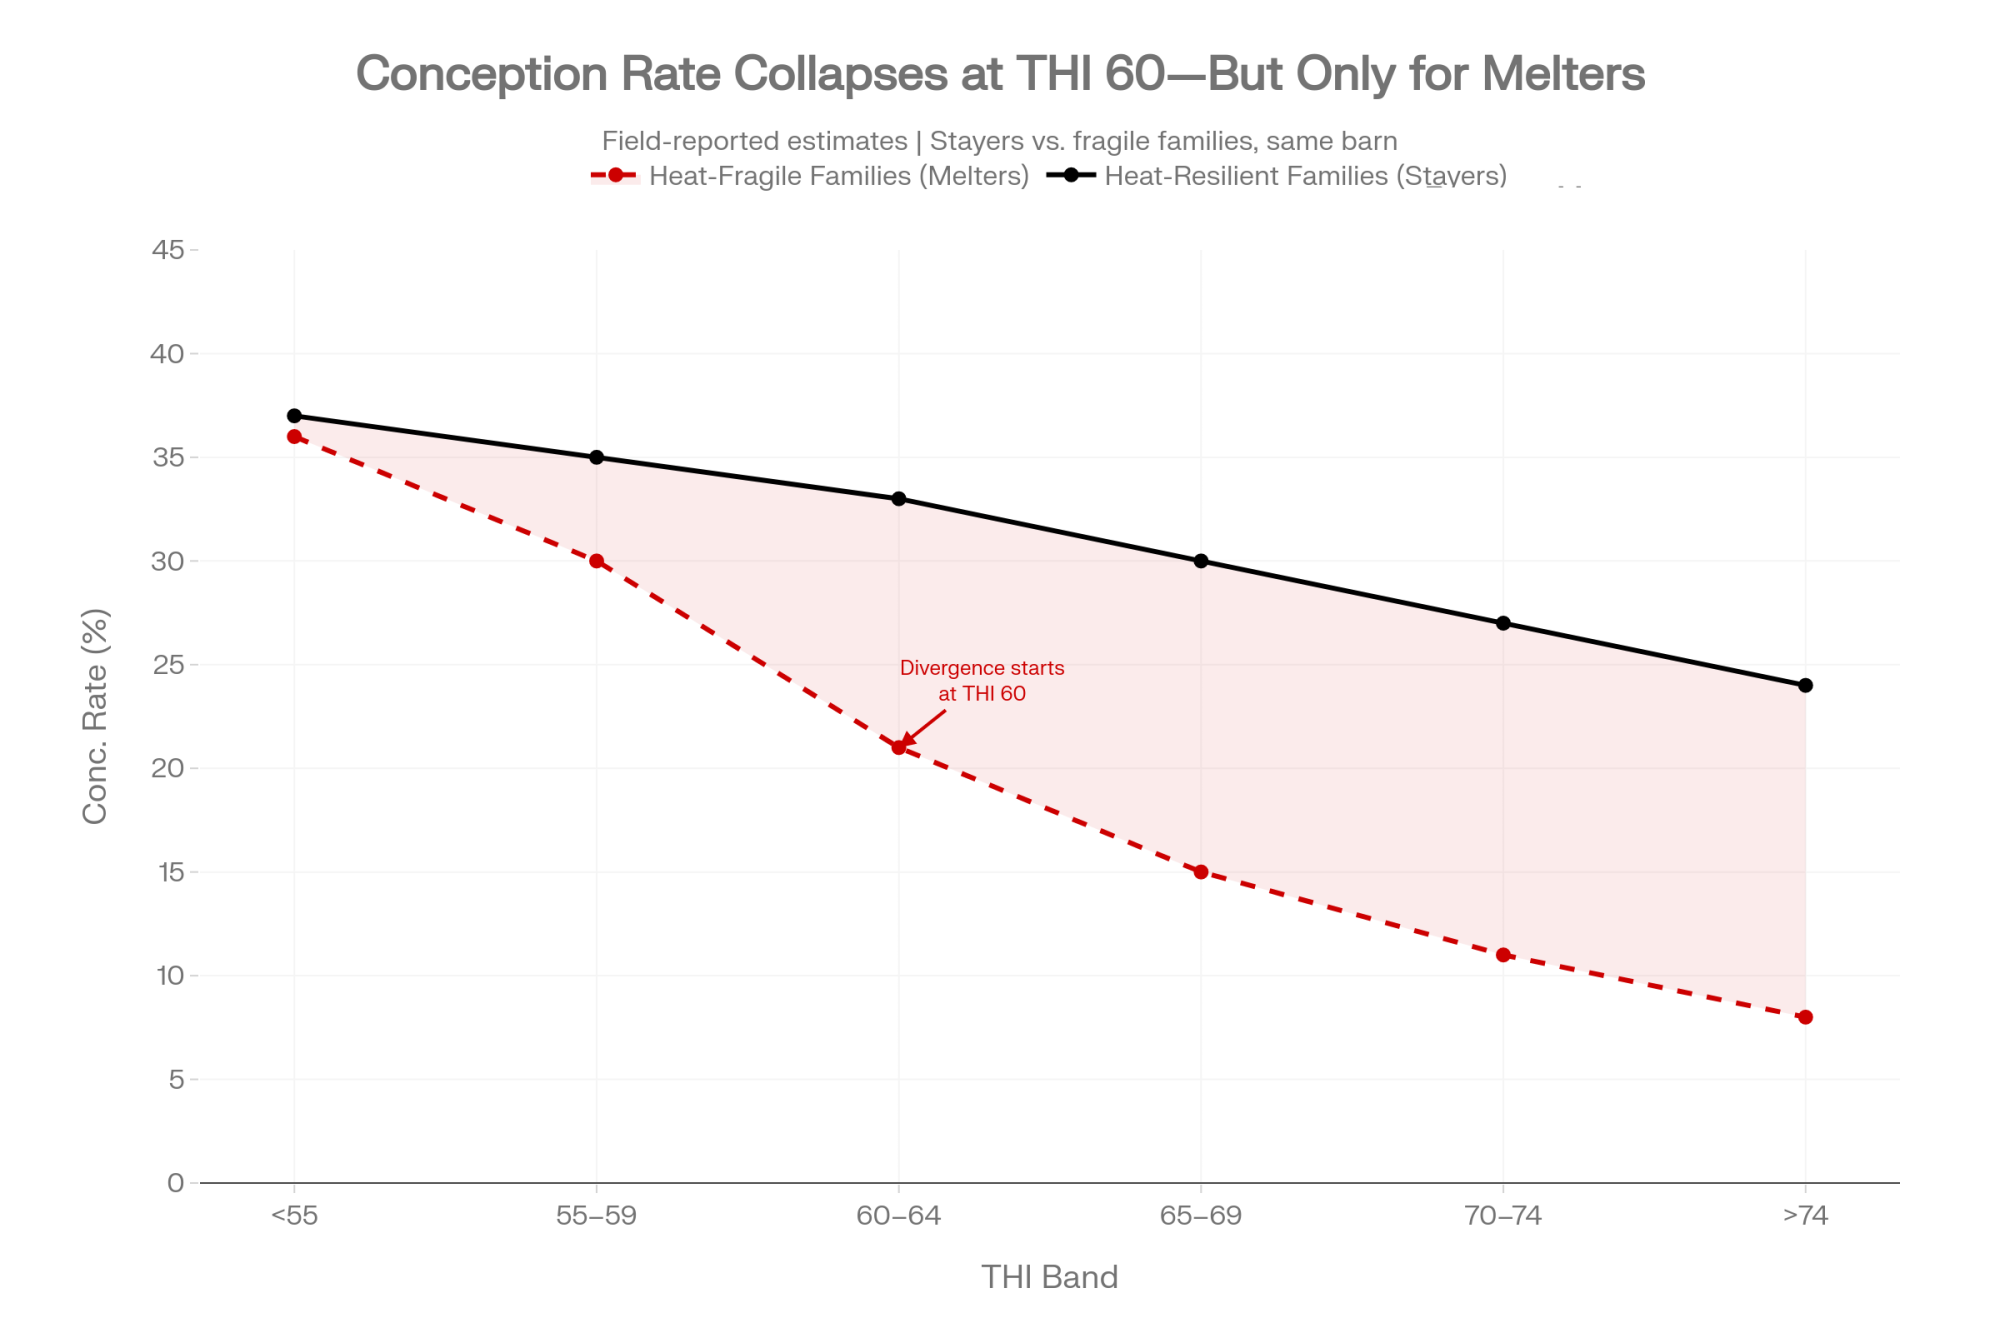
| Summer (THI 60–70) conception | 30–33% | 18–22% | 🔴 Critical |
| Extra days open vs. cool-season | +5–10 days | +35–45 days | 🔴 Critical |
| Services per conception (summer) | 1.8–2.2 | 3.0–4.5+ | 🔴 Critical |
| Post-heat health events (mastitis, DA, lameness) | Low–moderate | High; repeat offenders | 🔴 Critical |
| Summer cull / recheck list presence | Occasional | Dominates list | 🔴 Critical |
| Cool → summer conception drop | <5 points | 10–15+ points | 🔴 Actionable threshold |
| Per-cow annual summer cost (40 days open) | ~$50–100 CAD | $200–320 CAD | 🔴 Critical |
When you sort by family rather than by the whole herd, the picture gets cleaner. Advisors describe cool-weather conception in the high 30s for some herds, with the most heat-sensitive families dropping into the low 20s at mid-60s THI while steadier families hold closer to the low 30s. Treat those as field observations, not a published dataset—the direction matches the heat-stress research, but the exact spread will vary by herd.
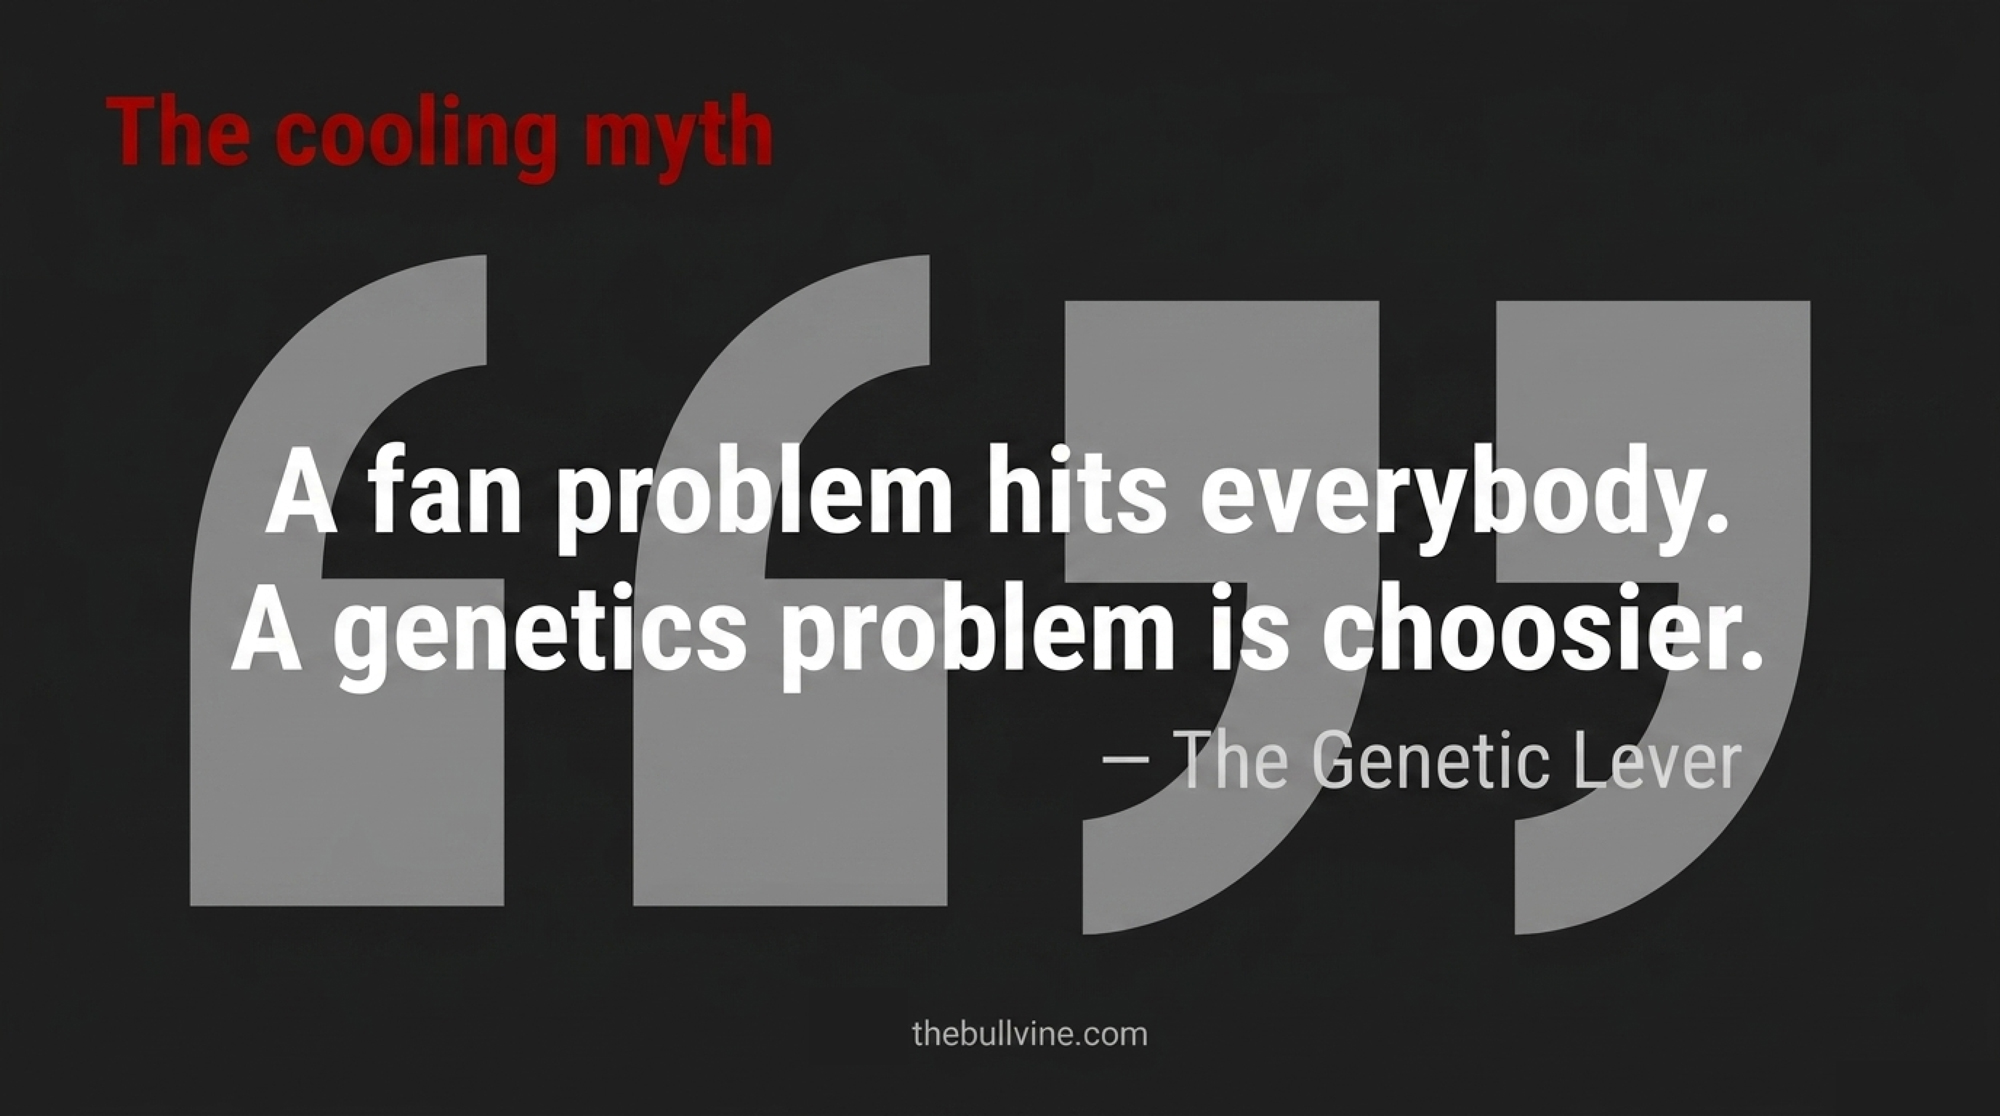
Here’s the tell that separates a genetics problem from a management one. Bad ventilation in the summer hammers everybody. The whole high group slides together, the fresh pen backs up, and the slump tracks the weather. A genetics problem is choosier. The same registration prefixes, the same maternal lines, show up open and rechecked while their pen-mates—same air, same water, same TMR—keep cycling and conceiving.
When the slump has favorites, you’re not looking at a fan that quit. You’re looking at inheritance. Melter families tend to reappear in the same ugly categories—open, repeat breeder, multiple health hits after heat—even when barns upgrade cooling or change protocols. At some point, that’s not bad luck. That’s an inherited weakness you’re choosing to keep breeding.
What Genetics Are Hiding in Your Summer Reports
Most herds already own the tools to start changing this. They just use them in the wrong order.
Too often, breeders start with Net Merit, TPI, Pro$, or LPI and then take a glance at fertility as a secondary screen. For heat resilience, flip that order. Filter first for the traits that predict summer survival. Then let your total merit index sort what’s left.
A heat-friendlier sire profile usually looks like this:
- Positive fertility signal: Clearly favorable Daughter Pregnancy Rate or equivalent, not simply “acceptable.” Under heat load, even modest genetic differences in fertility show up larger.
- Longevity and health behind it: Positive productive life or herd life, plus better-than-average udder health, metabolic disease, and lameness signals. Those traits earn their keep when cows are already carrying heat.
- Moderate body size: Neutral to slightly negative size and stature, backed by sound feet and legs. Bigger cows produce more metabolic heat and shed it harder in humid conditions.
On the female side, genomic testing is where this gets practical, and it deserves more than a footnote.
How Genomic Testing Changes the Replacement Math
Parent averages are a guess. For low-heritability traits like fertility, that guess is especially soft—a daughter of a high-DPR bull and a fragile dam could land anywhere. Genomic testing tightens the guess by reading the calf’s own genotype, and the reliability gain on fertility, productive life, health, and size is exactly where it matters most for heat work.
Here’s the practical move. When test results come back, stop treating every heifer as an automatic keeper. Rank them on a heat-resilience screen first—fertility, productive life, health, moderate size—and only then sort by your economic index. The heifers that clear both bars are the ones you breed to sexed semen and build depth from. The bottom slice, the ones soft on fertility and health with high-stature signals, are your beef-cross candidates regardless of how their milk proof reads.
There’s a cost-control angle too. Testing isn’t free, but a herd that’s already retaining too many heifers is paying to raise its own future July problems. Aiming the genomic screen at heat resilience turns a sunk testing cost into a culling-and-mating decision you’d otherwise make blind. Even without a tidy national heat-tolerance index, this beats guessing from pedigree on the exact traits that crack under heat.
How to Spot Heat-Stress Infertility in Your Own Breeding Records
None of this works if the data stays locked in whole-herd averages. The good news: you don’t need new software. Tools like DairyComp and PCDART already break reproduction down by service sire and date—DairyComp’s BREDSUM summary has long been used by consultants to rank conception and pregnancy rate by sire.
Start with a date filter. Flag every service bred between June 1 and September 30 across the last three to five years—that’s your heat-window cohort. Wisconsin extension has even published the DairyComp commands for spotting heat-stress fingerprints in milk, components, and reproduction records, so the workflow isn’t exotic. Then run conception rate and days open two ways: once by sire, once by maternal line or cow-family group.
The split that matters is the gap. Look at each family’s summer conception against its own cool-weather number, not just the herd average.
Walking One Cow Family Through Three Summers
Picture how this reads on screen once the cohort is built. Take a single maternal line—call it the family behind your 90-pound cow—and pull its bred-to-conception record across three summers next to a steadier line in the same barn.
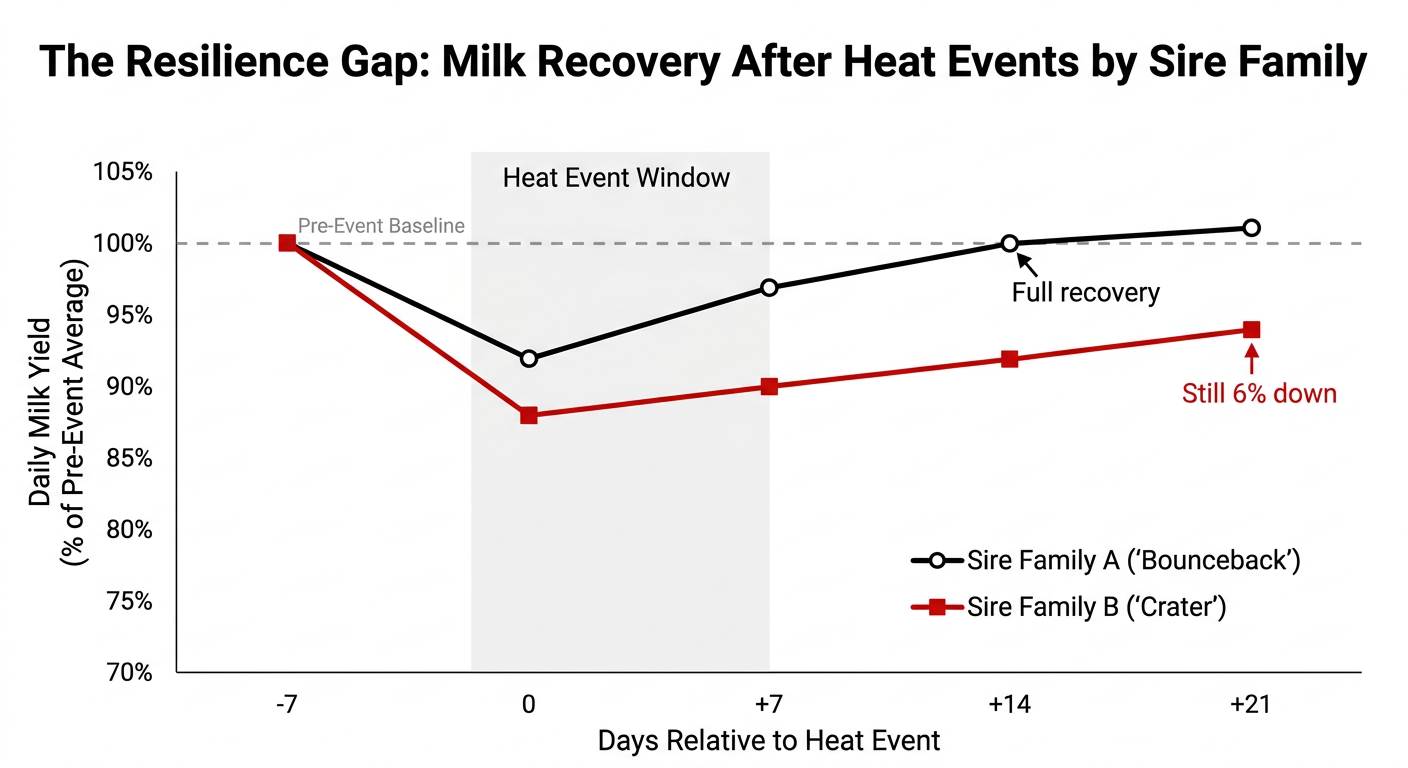
The fragile line shows a familiar shape: cool-season services convert fine, then June-through-September conception sags, three or more services per conception pile up on the same cow IDs, and days open on that line run weeks past the steady family standing in the next pen. Do it for three summers running and the pattern either holds or it doesn’t—that’s the whole point of the exercise. A family that runs 35% in spring and 33% in August is holding. A family that runs 36% in spring and 21% in August is melting, and it’s that second number quietly steering your cull list and your recheck sheet.
One caution before you act on the sort. Low-heritability fertility traits are noisy, and a single hot summer on a handful of cows isn’t a verdict. You want a repeated pattern—the same lines collapsing across multiple summers—before you start retiring genetics. One bad August is weather. Three is a trend.
Does the Barn Math Actually Hold Up?
Yes—and it’s worth being honest about where the numbers come from.
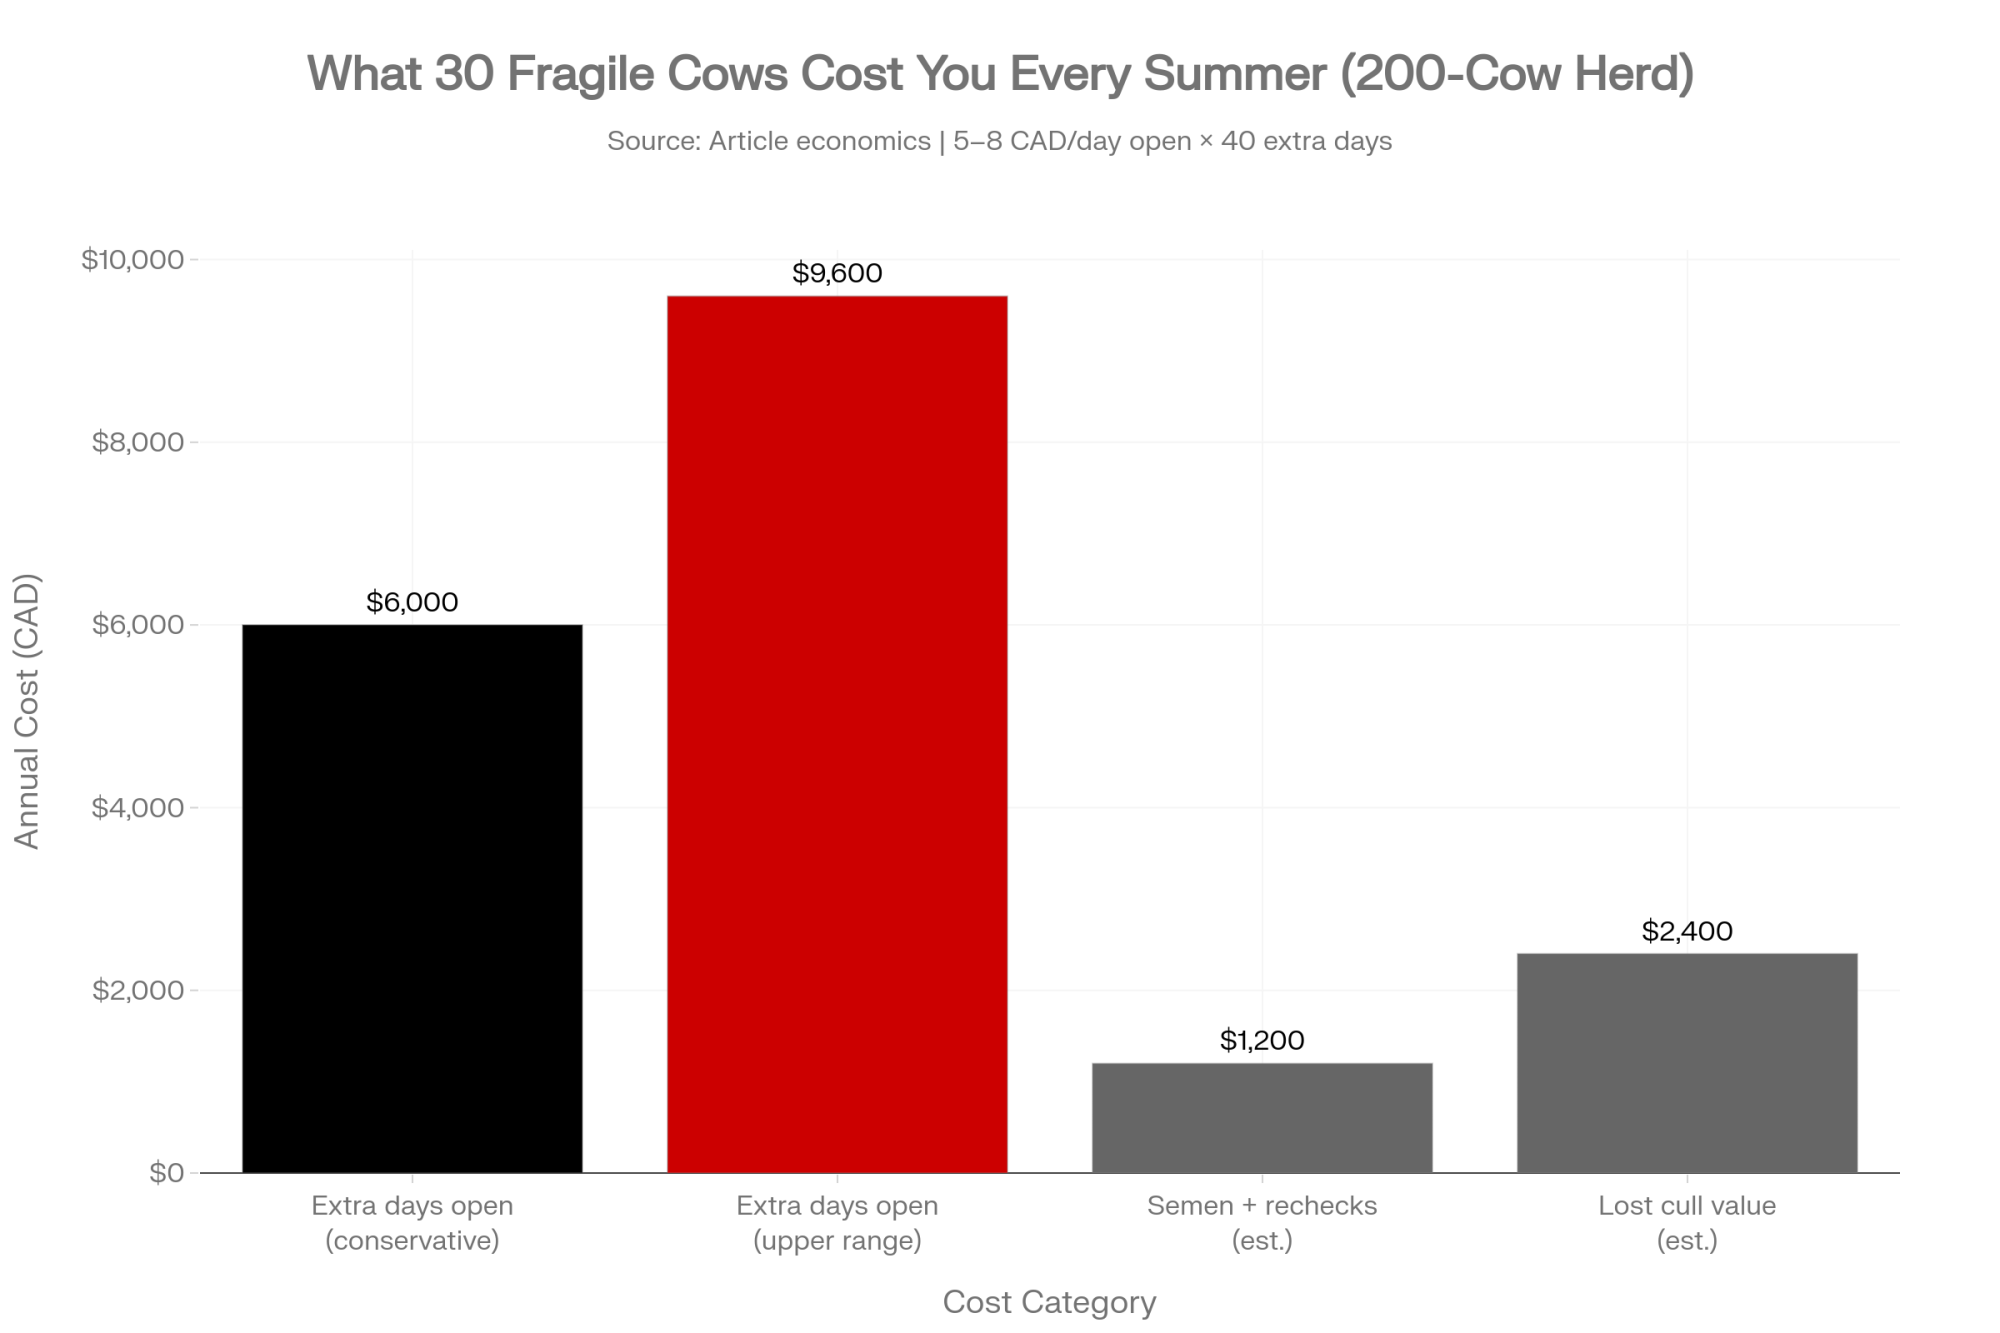
A 2019 Japanese Holstein study estimated the economic value of days open at 399 to 857 yen per day, depending on region and scenario. That’s the original published figure. At the 2019 average exchange rate of about 0.0122 CAD per yen, that works out to roughly 5 to 10 Canadian dollars per extra day open—call it 5 to 8 CAD as a conservative working range.
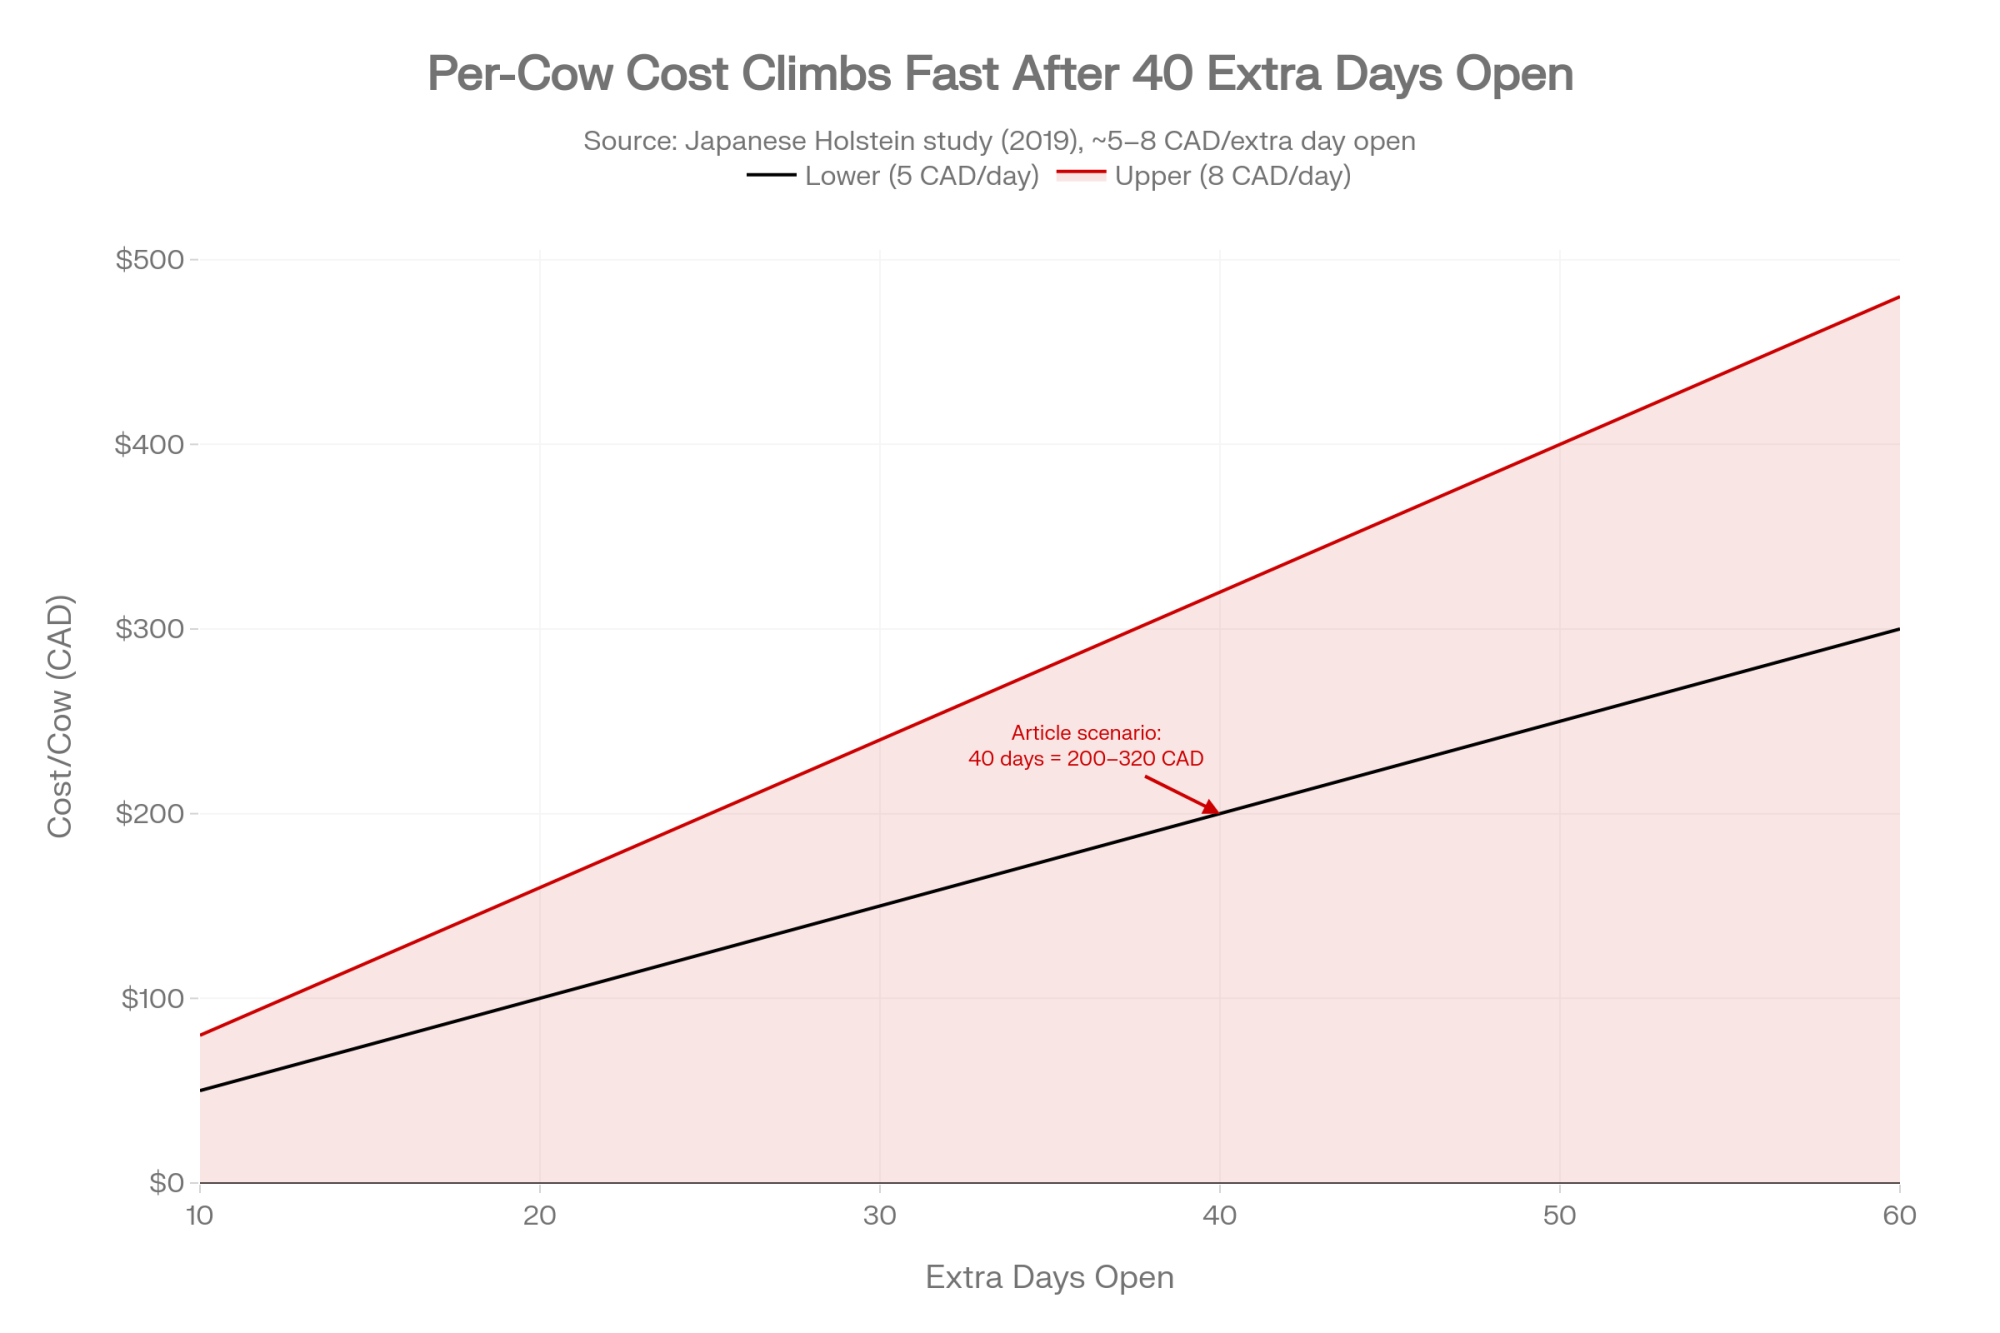
Walk it through one cow. Say a melter-family member tacks on 40 extra days open during a hot season—not a stretch when conception in that line drops into the low 20s. At the conservative end, that’s 40 × 5 CAD = 200 CAD. At the upper end, 40 × 8 CAD = 320 CAD. Now scale it as a what-if: if just 30 cows in a 200-cow herd carried that pattern every summer, the drag would land somewhere around 6,000 to 9,600 CAD a year—before you count the extra semen straws, the vet rechecks, and the higher odds those cows leave on a cull truck. That’s a recurring line item hiding inside “we had a tough summer.”
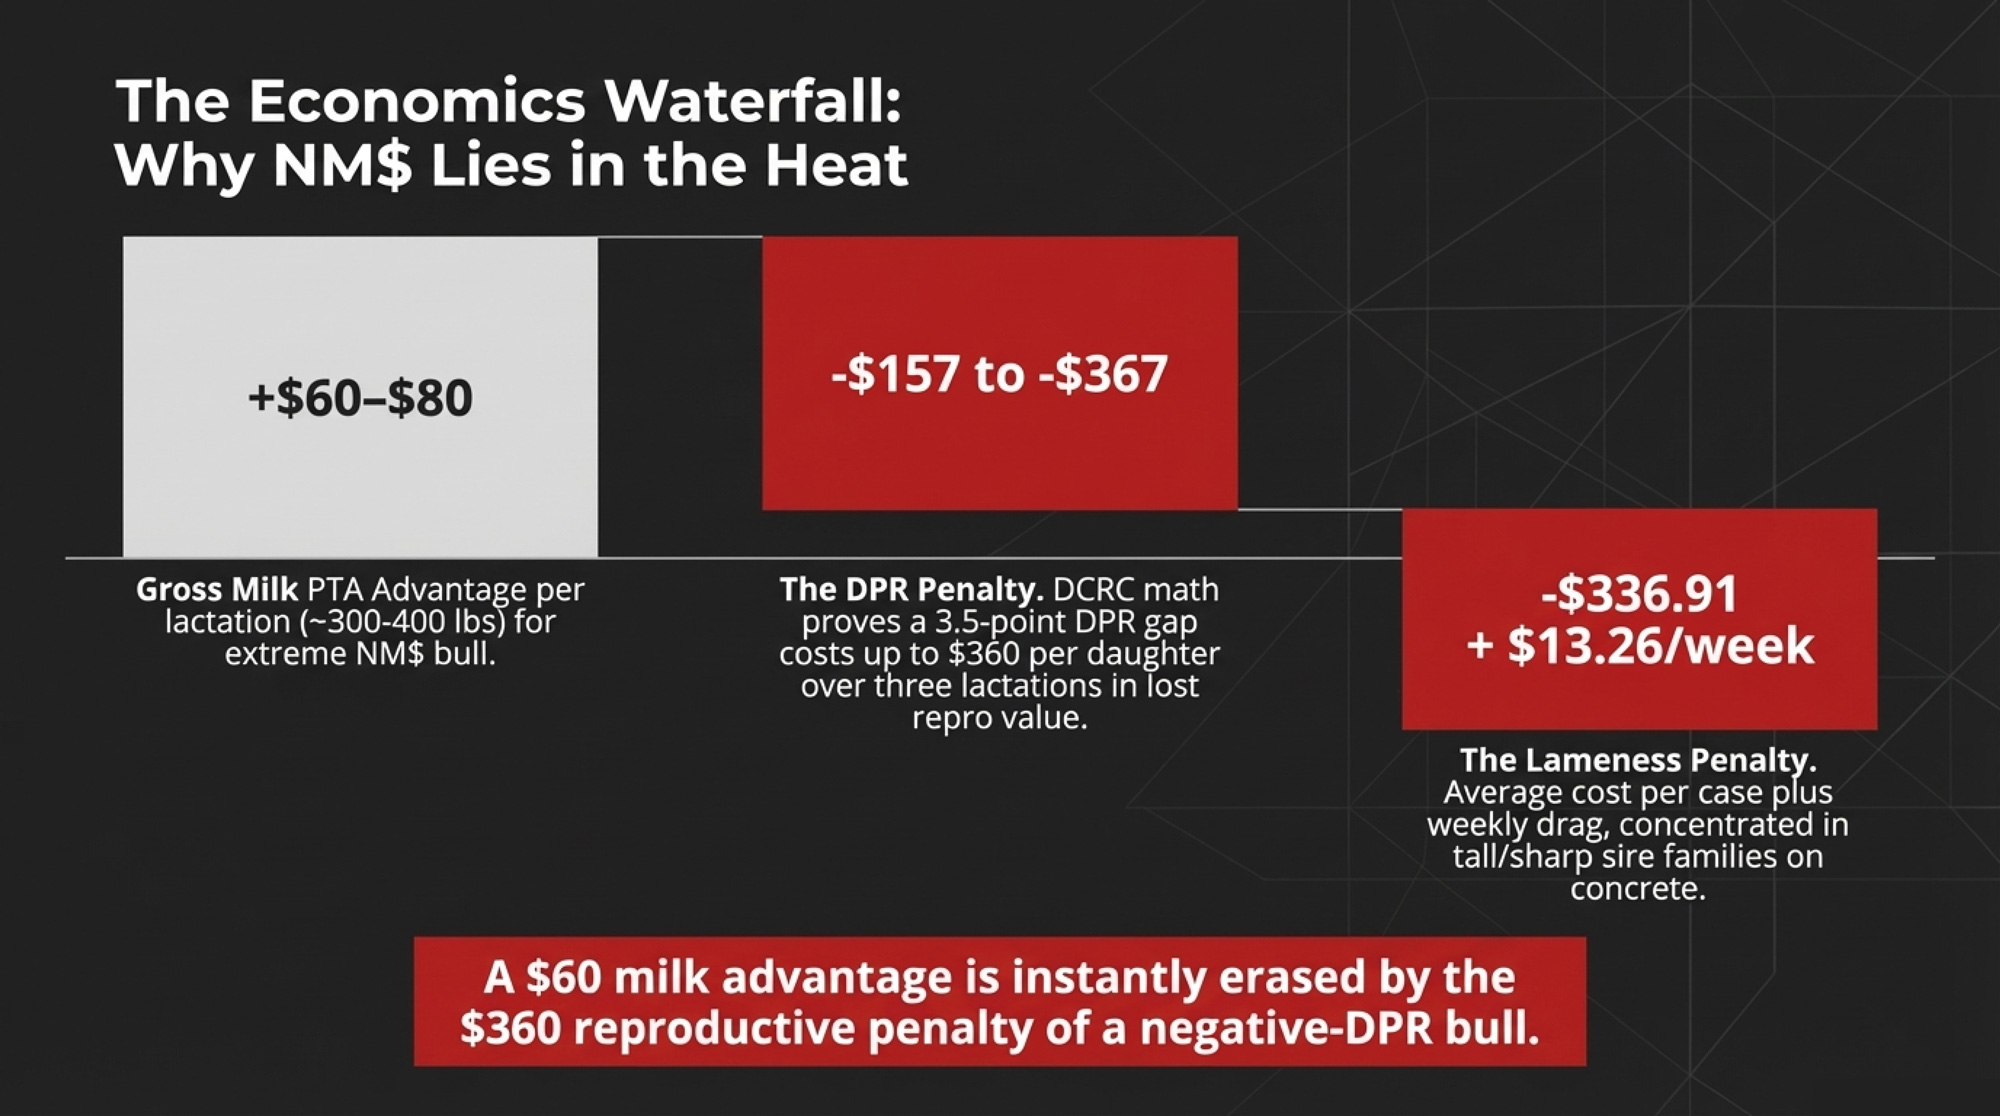
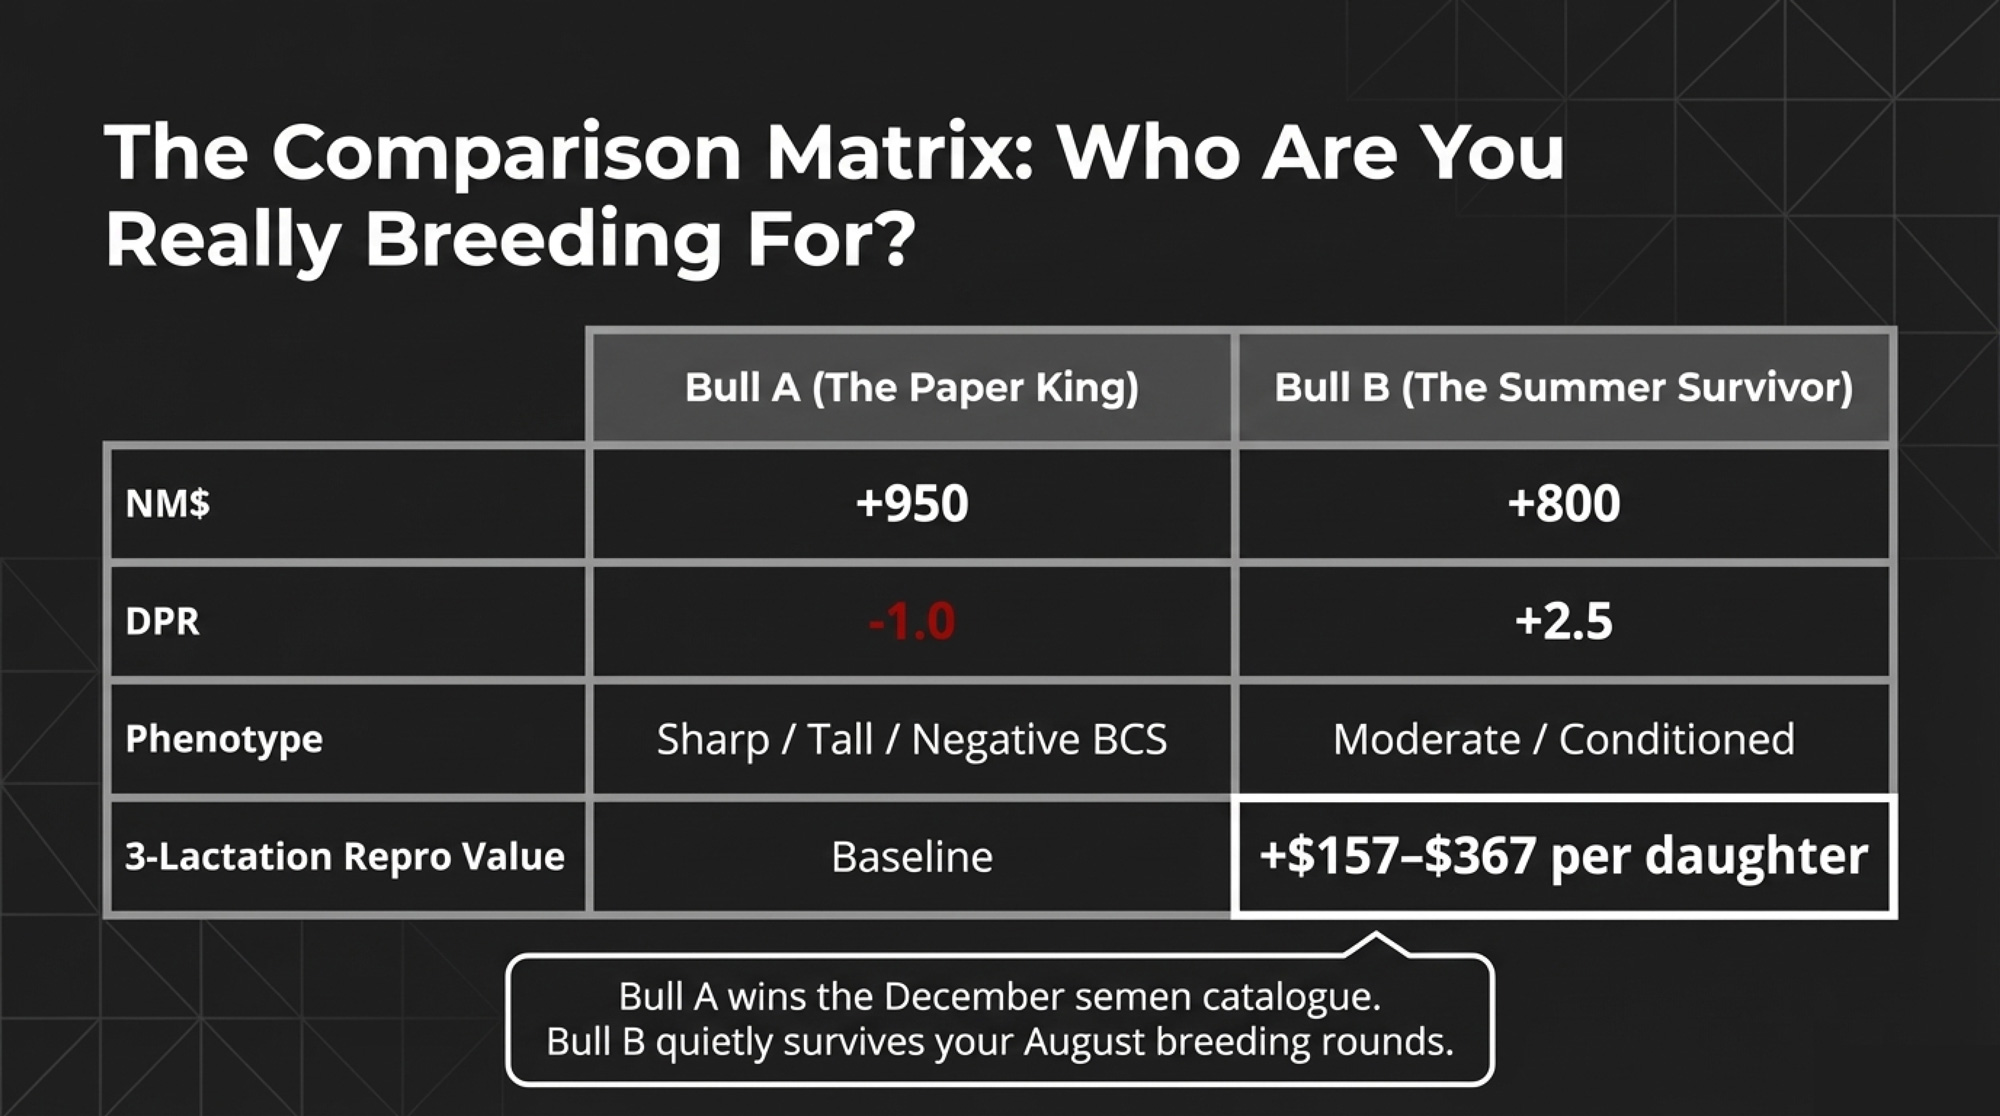
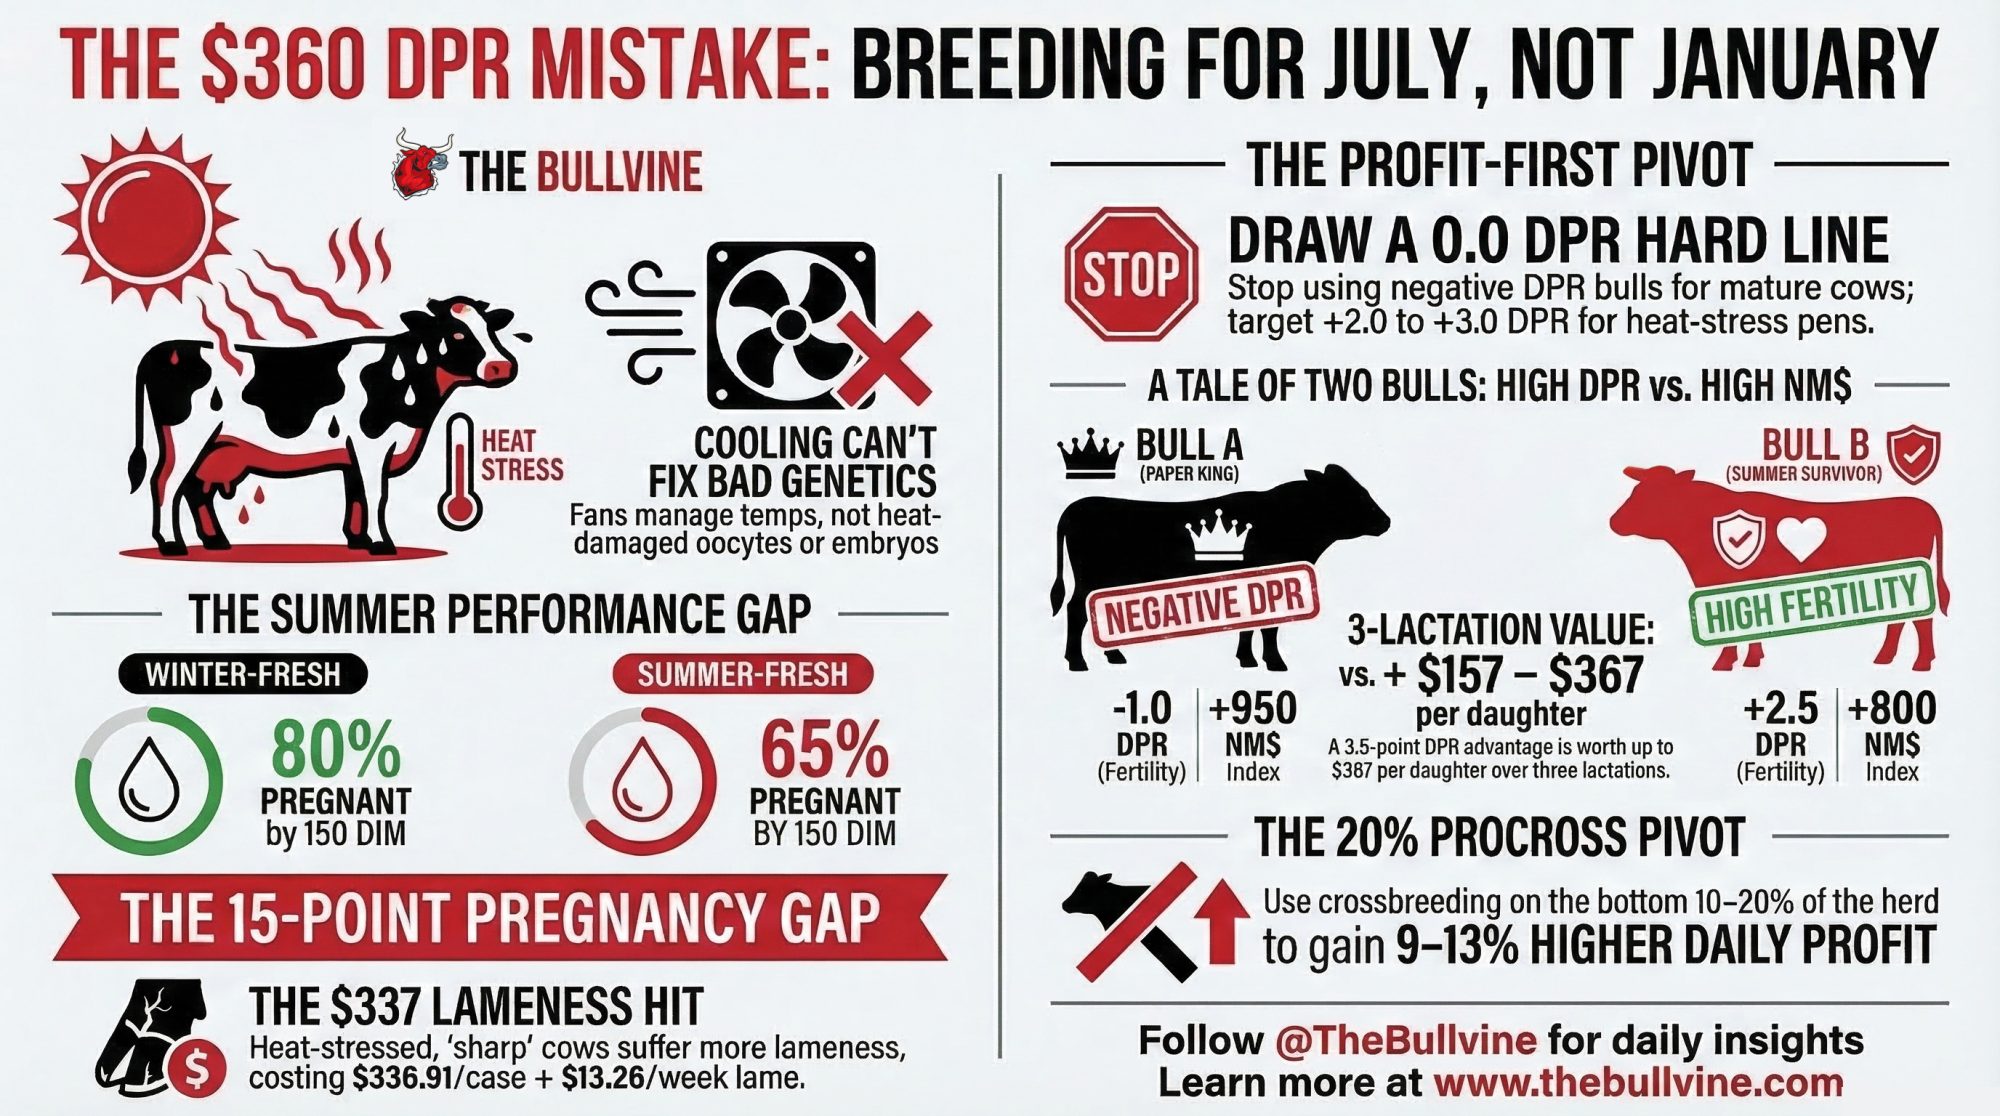
North American field economics land in the same zone. In Bullvine’s March 2026 analysis of Arizona heat-stress economics, a 3.5-point DPR gap worked out to roughly $157 to $367 per daughter over three lactations, using DCRC/Fetrow figures—often enough to beat a 150-point NM$ advantage once heat-driven days open and culls hit the ledger. So the Japanese figure isn’t an outlier. It’s a reasonable, conservative read on a cost that quietly repeats in the same families, season after season.
And there’s a bigger reason to care. Net Merit modeling and field analyses have repeatedly shown that better fertility and longevity often return more lifetime profit than chasing a little more milk from cows that don’t stay problem-free. The trade-off isn’t “milk versus nothing.” It’s usually “a little less peak versus fewer summer losses.”
Four Paths That Actually Change the Herd
There’s no perfect answer here. Herd size, replacement pressure, data quality, and appetite for short-term pain all matter. But there are four realistic ways to start.
Path 1: The One-Rule-Tonight Plan
Best fit: You’ve already invested in decent cooling and want to stop making the problem worse this breeding season.
Pull three to five years of records. Sort conception and days open for services bred June through September—or in the THI 60-to-70 range—by sire and by cow family.
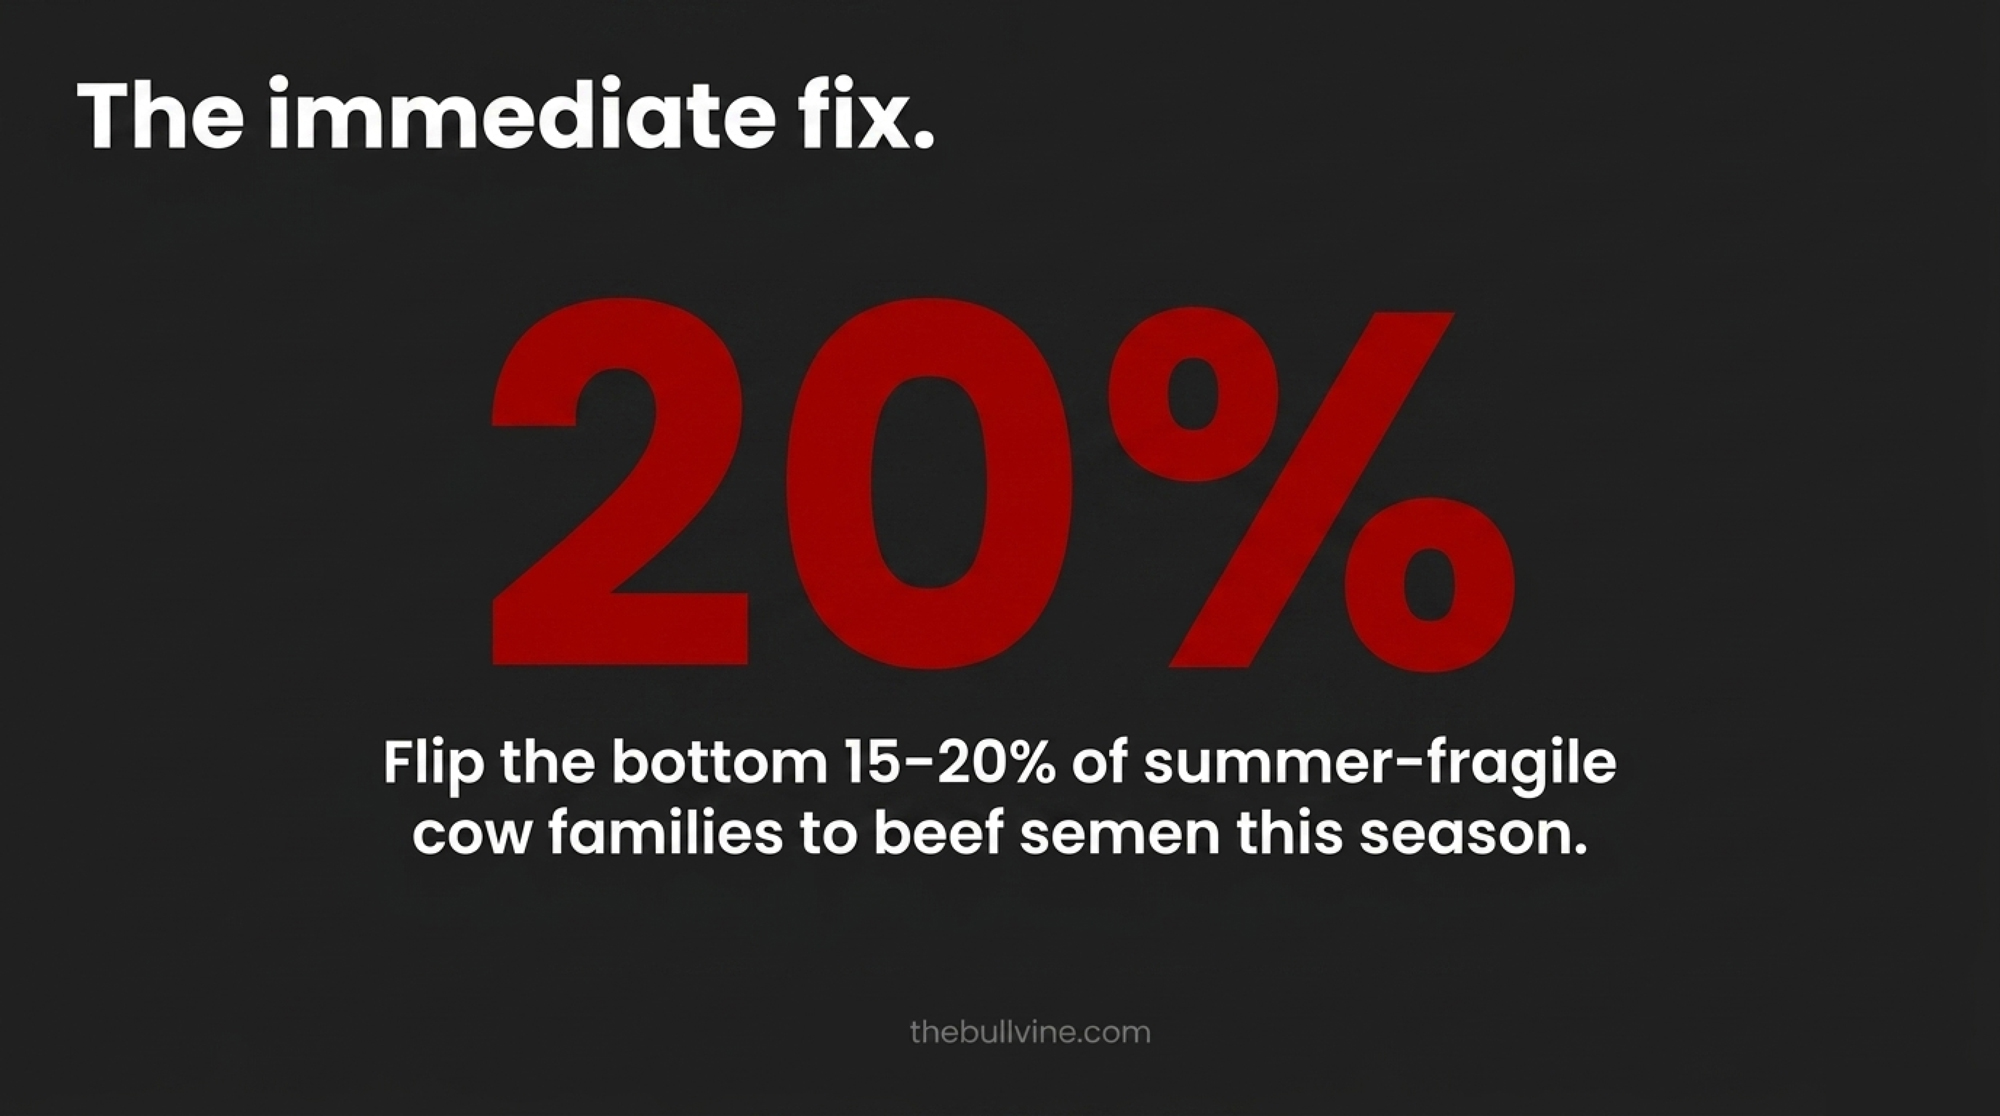
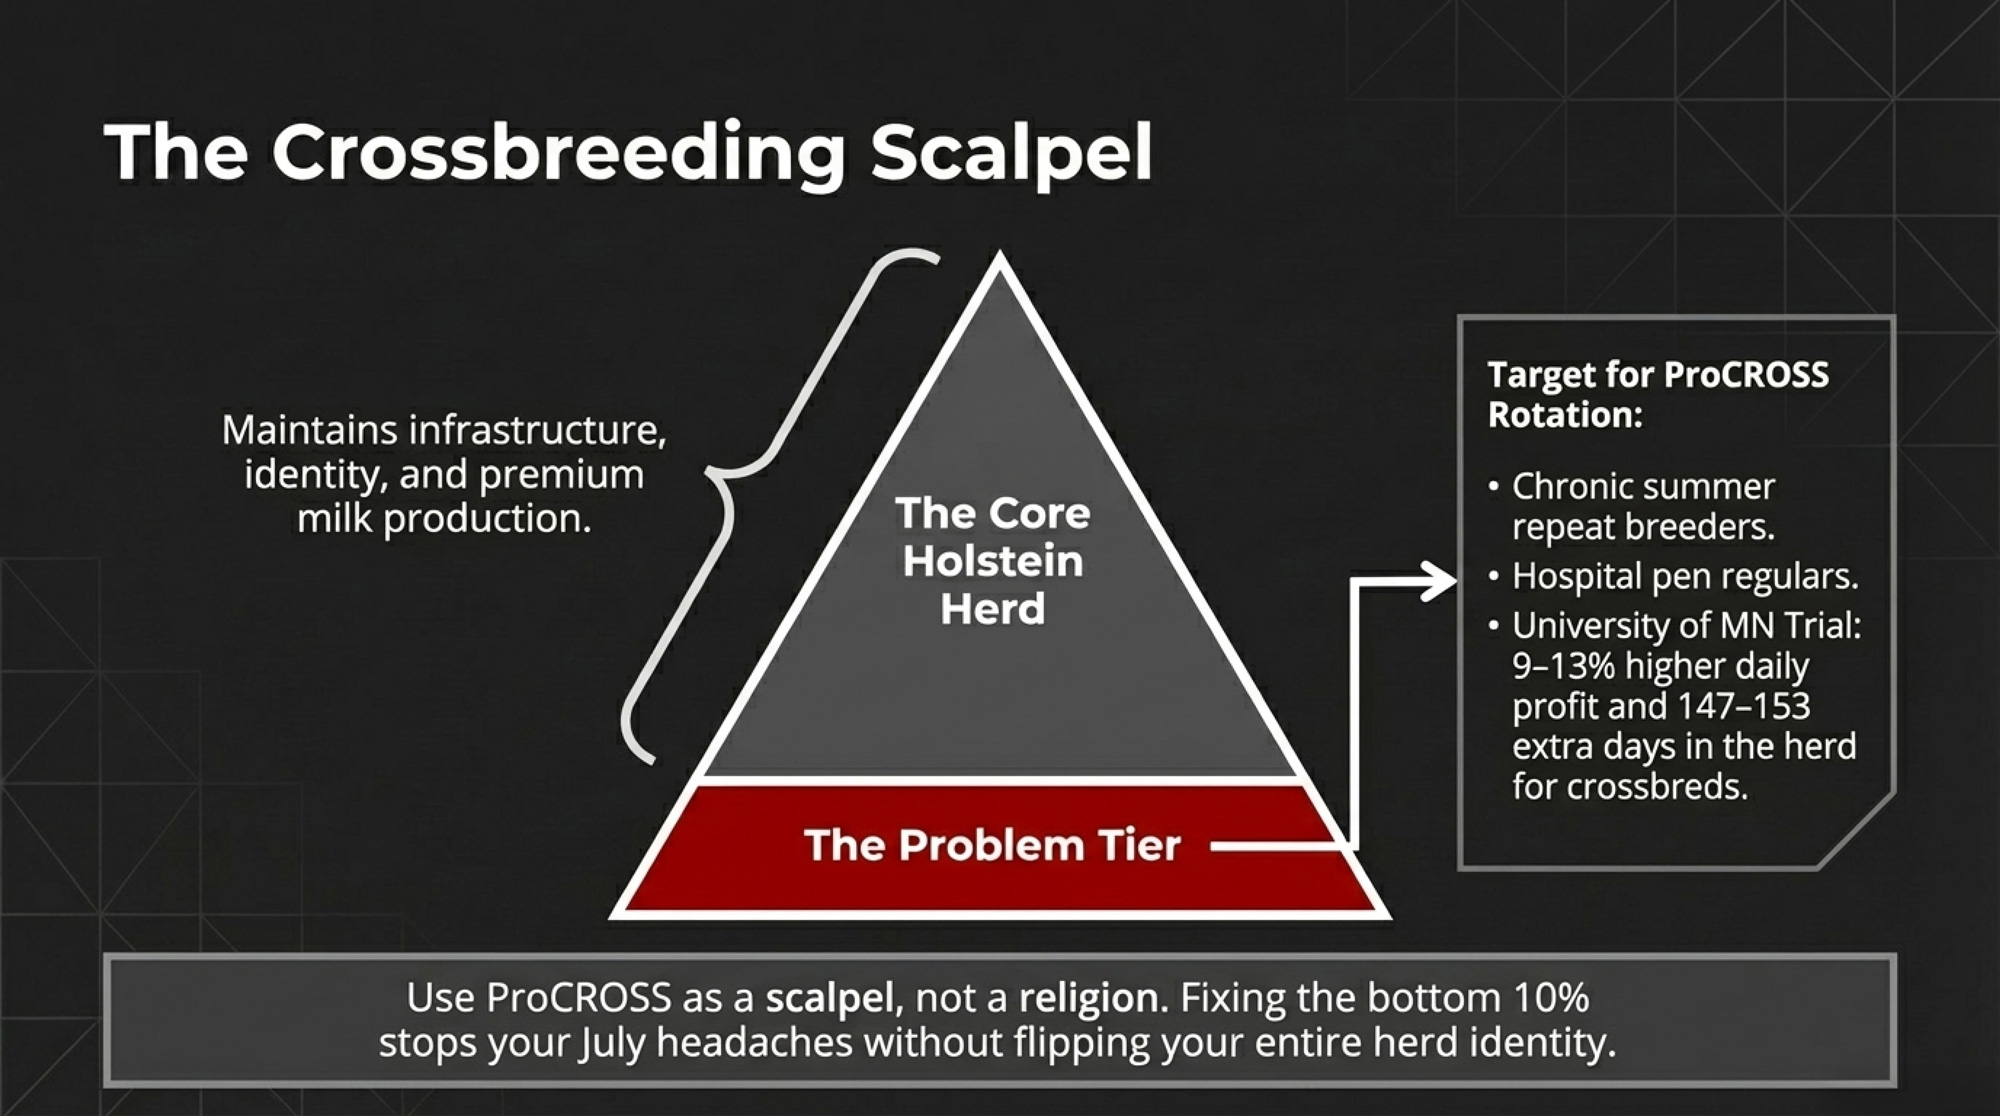
Then draw a hard line under the bottom 15 to 20 percent of families for summer fertility. Those cows get beef semen only. No dairy replacements from them this year. At the same time, push your best fertility-and-health sires, ideally with moderate stature, onto the families that held together.
What it fixes: It stops fragile genetics from quietly filling your heifer pens. What it can hurt: If replacement numbers are already tight and you don’t tighten sexed-semen use on your better families, you can come up short on heifers. Do this within 30 days: Pull the last three to five summers of breeding records, rank families by summer conception, and decide which lines go beef-only now. That won’t rescue this July. It can absolutely change the calves you freshen in 2028.
Path 2: The Genomic Replacement Filter
Best fit: You’re already genomic-testing heifers, or you’re close to it.
Once results arrive, stop acting like every heifer deserves the same future. For heat resilience, keeper heifers should sit at or above herd median for fertility, productive life, and health, without extreme stature or body-weight signals. After that, sort by your preferred economic index.
What it fixes: It keeps you from raising the next batch of beautifully bred summer disappointments. What it can hurt:Get too aggressive too fast, and you can tighten your replacement pipeline before your better families have built depth.
Path 3: The Hot-Pens-First Sire List
Best fit: You can pinpoint where heat hits hardest—fresh pens, high group, specific barns—and you track breeding by pen.
Build a tighter sire list just for those groups. Every bull on it clears your fertility, productive life, health, and moderate-size thresholds. And where your evaluation system offers THI-slope or heat-tolerance breeding values, use them.
What it fixes: It matches your toughest environments with daughters more likely to hold together. What it can hurt:Genetics won’t save a pen with poor airflow, weak water access, or cooling that’s failing in plain sight.
Path 4: The Full Three-Year Reset
Best fit: Heat stress is a recurring profit problem in your region, and you’re ready to let data make the uncomfortable calls.
- Year 1 — Triage: Pull three to five years of summer data, identify stayers and melters at THI 60 to 70, and flip the worst families to beef only.
- Year 2 — Aim replacements harder: Genomic-test heifers, keep only those at or above herd median in fertility, productive life, and health with moderate size, and rebuild your sire list around bulls whose daughters actually held up through summer.
- Year 3 — Tighten the cull gate: Move repeat offenders up the list—especially cows from fragile families that have now shown the same summer pattern twice.
Advisors who’ve watched herds follow that kind of plan describe a familiar payoff. Summer fertility still dips. But the crater shrinks, and the spread between the best and worst families tightens as more resilient cows make up the milking string. That’s the real outcome. Not a miracle. Not a silver bullet. Just a different herd.
Quick Comparison: Which Path Fits Your Barn?
| Path | Best For | Key Action | Payoff Timeline | Main Risk |
|---|---|---|---|---|
| 1. One-Rule-Tonight | Cooling done; act this season | Beef semen on bottom 15–20% of summer families | Calves freshening ~2028 | Heifer shortfall if sexed semen not tightened |
| 2. Genomic Filter | Already testing or near-ready | Screen heifers for fertility, PL, health before economic index | Next replacement group | Pipeline tightens too fast |
| 3. Hot-Pens-First Sires | Breed by pen; know your hot spots | Dedicated sire list cleared for fertility + moderate size | Current-year matings | Won’t fix broken cooling infrastructure |
| 4. Three-Year Reset | Recurring regional heat problem | Year 1: triage; Year 2: aim replacements; Year 3: tighten cull gate | Milking string by Year 3 | Needs multi-year data discipline |
What This Means for Your Operation
Use this like a working audit, not a sermon. Each line is a decision you can make in the next breeding cycle.
- Pull three to five years of summer breedings and sort by family. If the same lines keep collapsing at THI 60 to 70 while others hold closer to cool-weather performance, treat it as a selection issue—not just a facilities issue.
- Check which bulls you’re still using in your hardest pens. If your hottest groups are still getting high-milk, low-fertility, taller sires, you may be breeding more July problems on purpose.
- Audit your replacement policy. Are you keeping heifers because they’re balanced for fertility, productive life, and health—or because their milk proof looks good enough to keep the peace?
- Set a cull threshold for repeat summer offenders. Two summers running with clearly extended days open, or three or more services per conception in the June-to-September window, is a defensible line in the sand.
- Split your reports by THI band, not just by month. Even a simple under-60 versus over-60 comparison can tell you whether your cooling trigger is set too late.
- Decide where the next dollar works harder. Another hardware purchase might help. But on some farms, stopping replacements from the worst 15 to 20 percent of summer families changes more than the next fan line does.
Key Takeaways
- If you’ve already spent on cooling and conception still crashes every July, the next lever is genetic: stop making daughters from families that melt at THI 60, and concentrate your best semen on the families that don’t.
- If the summer slump has favorites—the same maternal lines open while their pen-mates conceive—treat it as inheritance, not airflow. A fan problem hits everybody; a genetics problem is choosier.
- If certain families lose far more ground in the THI 60-to-70 range while others stay near their cool-weather baseline, that’s a repeatable signal worth breeding around—but confirm it across multiple summers before retiring genetics.
- If you genomic-test, screen heat resilience before economic index, so a strong milk proof can’t sneak a fragile heifer past the gate.
- If you flip the bottom 15 to 20 percent of summer-fragile families to beef semen now and protect replacements from the stayers, you start changing your heifer pipeline without culling a single cow today.
The cows that matter most in your breeding plan aren’t the ones that impress you in April. They’re the ones you still trust in late July. Three summers from now, your barn will be full of daughters from the decisions you’re making this breeding season. Are they built for your climate—or are you still breeding April heroes that can’t cash a summer milk cheque?
Run Your Numbers
Pregnancy Rate Economics Calculator — This article says your melter families are dragging days open up 40 and bleeding 200–320 CAD a head. Put a real number on it: the calculator translates days-open savings, extra pregnancies, and cull impact into net annual ROI for your herd before you change a single breeding decision.
Complete references and supporting documentation are available upon request by contacting the editorial team at editor@thebullvine.com.
Learn More
- Is Genomic Testing Worth the Investment? — Arms you with a definitive cost-benefit framework to measure the real-world dollar return of heifer genomic screening versus the overhead of blind-raising replacements that risk crashing during peak summer stress.
- The Shift to Beef: Maximizing the Value of Lower Tier Cows — Breaks down tactical mating frameworks to aggressively capitalize on beef-on-dairy strategies, transforming your herd’s underlying “melter” family liability into immediate, premium-earning feeder calf cash flow.
- Breeding for the Future: Why Reproductive Longevity Trumps Peak Milk — Exposes the hidden financial drain of chasing high-fluid-milk sires, proving why shifting selection criteria toward sustainable daughter pregnancy rates and extended herd life consistently secures greater lifetime margin per stall.
 The Sunday Read Dairy Professionals Don’t Skip.
 The Sunday Read Dairy Professionals Don’t Skip.
Every week, thousands of producers, breeders, and industry insiders open Bullvine Weekly for genetics insights, market shifts, and profit strategies they won’t find anywhere else. One email. Five minutes. Smarter decisions all week.


 Join the Revolution!


