










Both barns run 60 cows a box. One prints money; one’s bled cash for six years. Same headcount, opposite milk cheque — and kg/min saw it coming long before the tank did.
Executive Summary: Real North American robot barns average 50.5 cows per box — not the 66–70 your dealer quotes — and two barns running the same 60 head can land on opposite sides of profitable, depending on milk per minute of box time, not headcount. USDA’s ERR-356 (McFadden & Raff, Jan. 2026) settled the big question — box robots lift net returns 13%, about $3.15/cwt — but that’s a long-run number: Iowa State’s Tranel models roughly seven years of negative cash flow first, near $8,776/year in one case. Push a box from 60 toward 70 and the fetch list is what breaks first — herds jump from a healthy ~4% fetched toward 8%-plus, involuntary milkings climb, and efficiency slides from the 1.86 kg/min average toward the 1.4 struggle zone while cows-per-robot still reads fine. The other blindside is maintenance: cheap early, then 25% of farms five years in report topping $15,000 per robot per year. And the buy only pencils as an economic decision if your fully loaded milking labour clears about $27/hr — below that, it’s a lifestyle and labour-risk purchase, which is a fair reason as long as you call it what it is. If you’re weighing a first robot or a second box on a 60–500-cow herd, the number that decides your payback isn’t on the spec sheet — it’s the kg/min line and the fetch report you’re probably not watching yet.
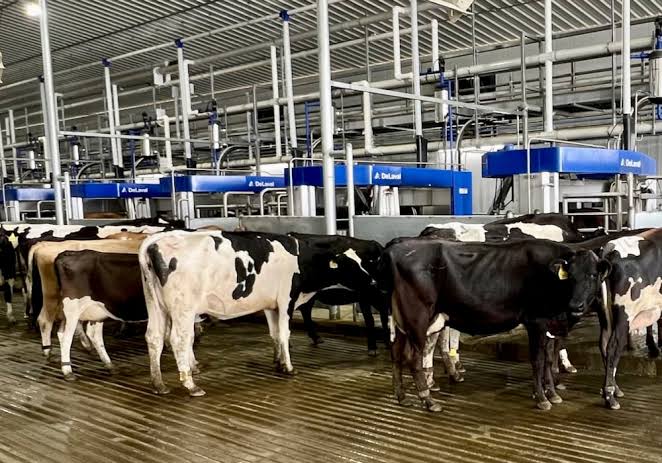
Rated capacities cited here are manufacturers’ published specifications; profit-maximizing capacity reflects The Bullvine’s analysis of independent field data.
A herd owner stands in a new robot barn at 6 a.m., watching the arm swing under a fresh cow. The dealer’s quote — based on the manufacturer’s rated capacity — put this box at 66–70 cows per robot. The University of Wisconsin’s Dairyland Initiative says design for 55. That ten-to-fifteen-cow spread isn’t a rounding error. It’s the difference between a robot that clears its debt and one that quietly breaks the farm’s cash flow while the machine keeps humming like nothing’s wrong.
Here’s the part nobody prints in the brochure. You can hit the dealer’s number — 60, even 65 cows per box — and still be bleeding. And cows-per-robot, the one figure everybody quotes, gives you no signal that anything’s gone sideways.
What’s Really at Stake
USDA’s Economic Research Service settled one argument in January 2026. Its ERR-356 report — the first national profitability estimate of its kind — found that box robots raise dairy net returns by 13% relative to non-adopters, worth about $3.15 per hundredweight on average once farm and operator differences are accounted for (McFadden and Raff, USDA ERS, ERR-356, U.S. national, Jan. 2026). Robots pay. That’s no longer up for debate.
But “pay” is a long-run word. Iowa State economist Larry Tranel’s cash-flow modeling shows the same robots can run hard negative for roughly seven years before the math turns — one modeled case sits near negative $8,776 per year during that stretch (Tranel, Iowa State Extension, cash-flow scenario). So you can be economically right and cash-flow wrong at the same time, for most of a decade.
The farms that make it through that valley aren’t the ones who bought the shiniest box. They’re the ones who asked three questions the sales sheet skips: the repair bill they can’t see yet, what crowding actually costs, and their real breakeven labour wage. If you run 60 to 500 cows and you’re weighing a first robot — or a second box — this is your decision.
Where Does “70 Cows Per Robot” Even Come From?
The brochure number isn’t a lie. It’s a throughput equation with no cow behaviour in it.
UW Dairyland walks through the math (thedairylandinitiative.vetmed.wisc.edu, 2025): 22 hours of daily uptime, a 7-minute average box visit, 2.8 milkings per cow per day. After wash and idle time, that’s roughly 1,230 usable box-minutes — about 176 milkings a day, or 63 cows per robot. Trim the visit toward 6 minutes and the same math pushes into the low-to-mid 70s. That’s how “70-plus cows per robot” starts sounding feasible, as Bullvine’s tech-ROI work put it (thebullvine.com, Jan. 2026).
Then biology walks in. Cows don’t spread visits evenly across 22 hours — they bunch around dawn and dusk and go quiet at midday and 2 a.m. (Fuchs et al., Frontiers in Animal Science, Germany, 2022). You can’t bank the slack from the dead hours against the morning rush. So Dairyland’s real recommendation isn’t 63. It’s design for 55 cows per robot, and Lactanet’s facilities guidance lands in the same place: scientific sources favour roughly 55 to 60 cows per robot regardless of the traffic system (Solano, Lactanet, Canada, 2024). Even Lely’s own onboarding guidance tells new owners to start around 50 to 60 and split the group into subgroups (Lely North America, 2024).
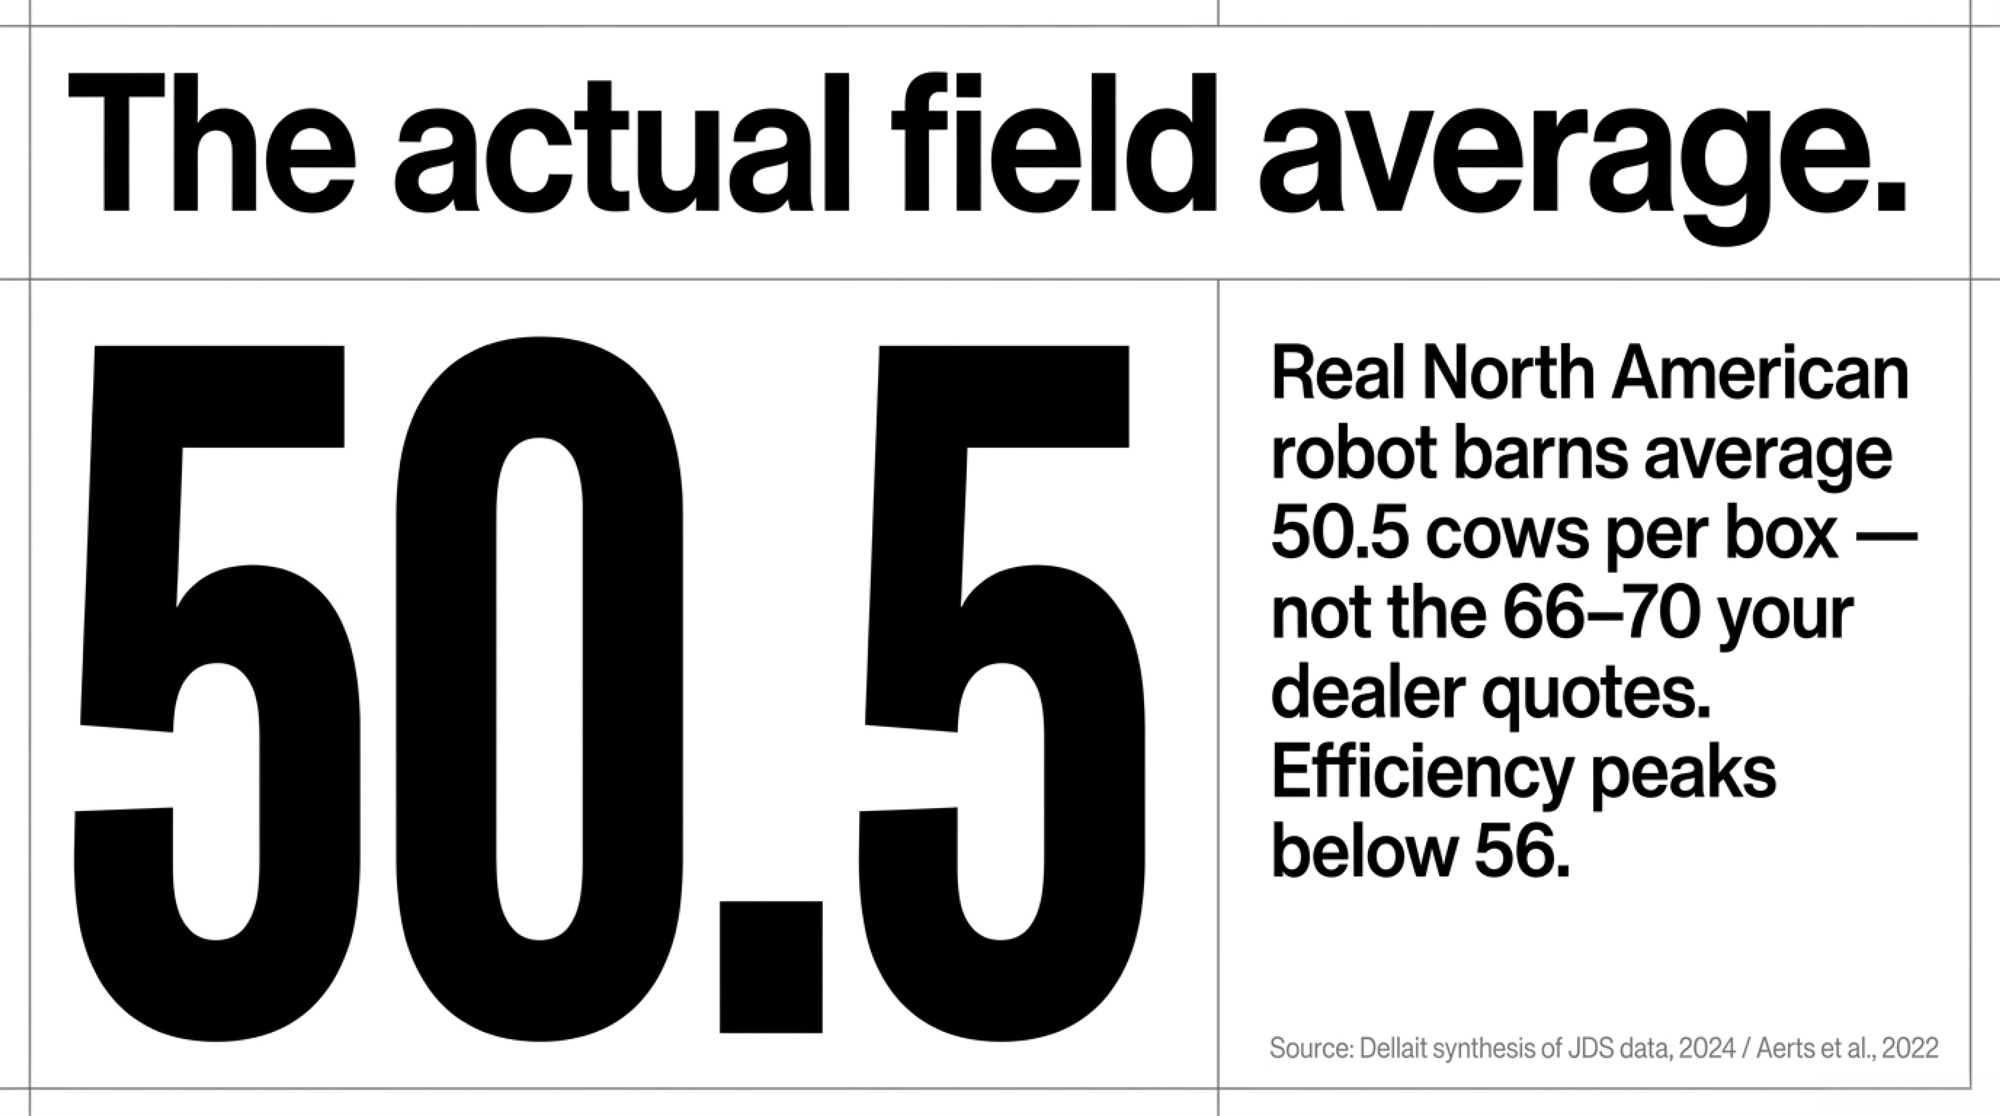
A North American field synthesis by the consultancy Dellait, drawing on published Journal of Dairy Science data, puts real barns at an average of 50.5 cows per robot, 2.9 milkings per day, and 6.8-minute visits (Dellait, North America, 2024). The formula says 63 to the low 70s. The barns say 50 to 55. Those missing cows fell into the gap between a straight line and rush hour.
The Numbers Worth Clipping
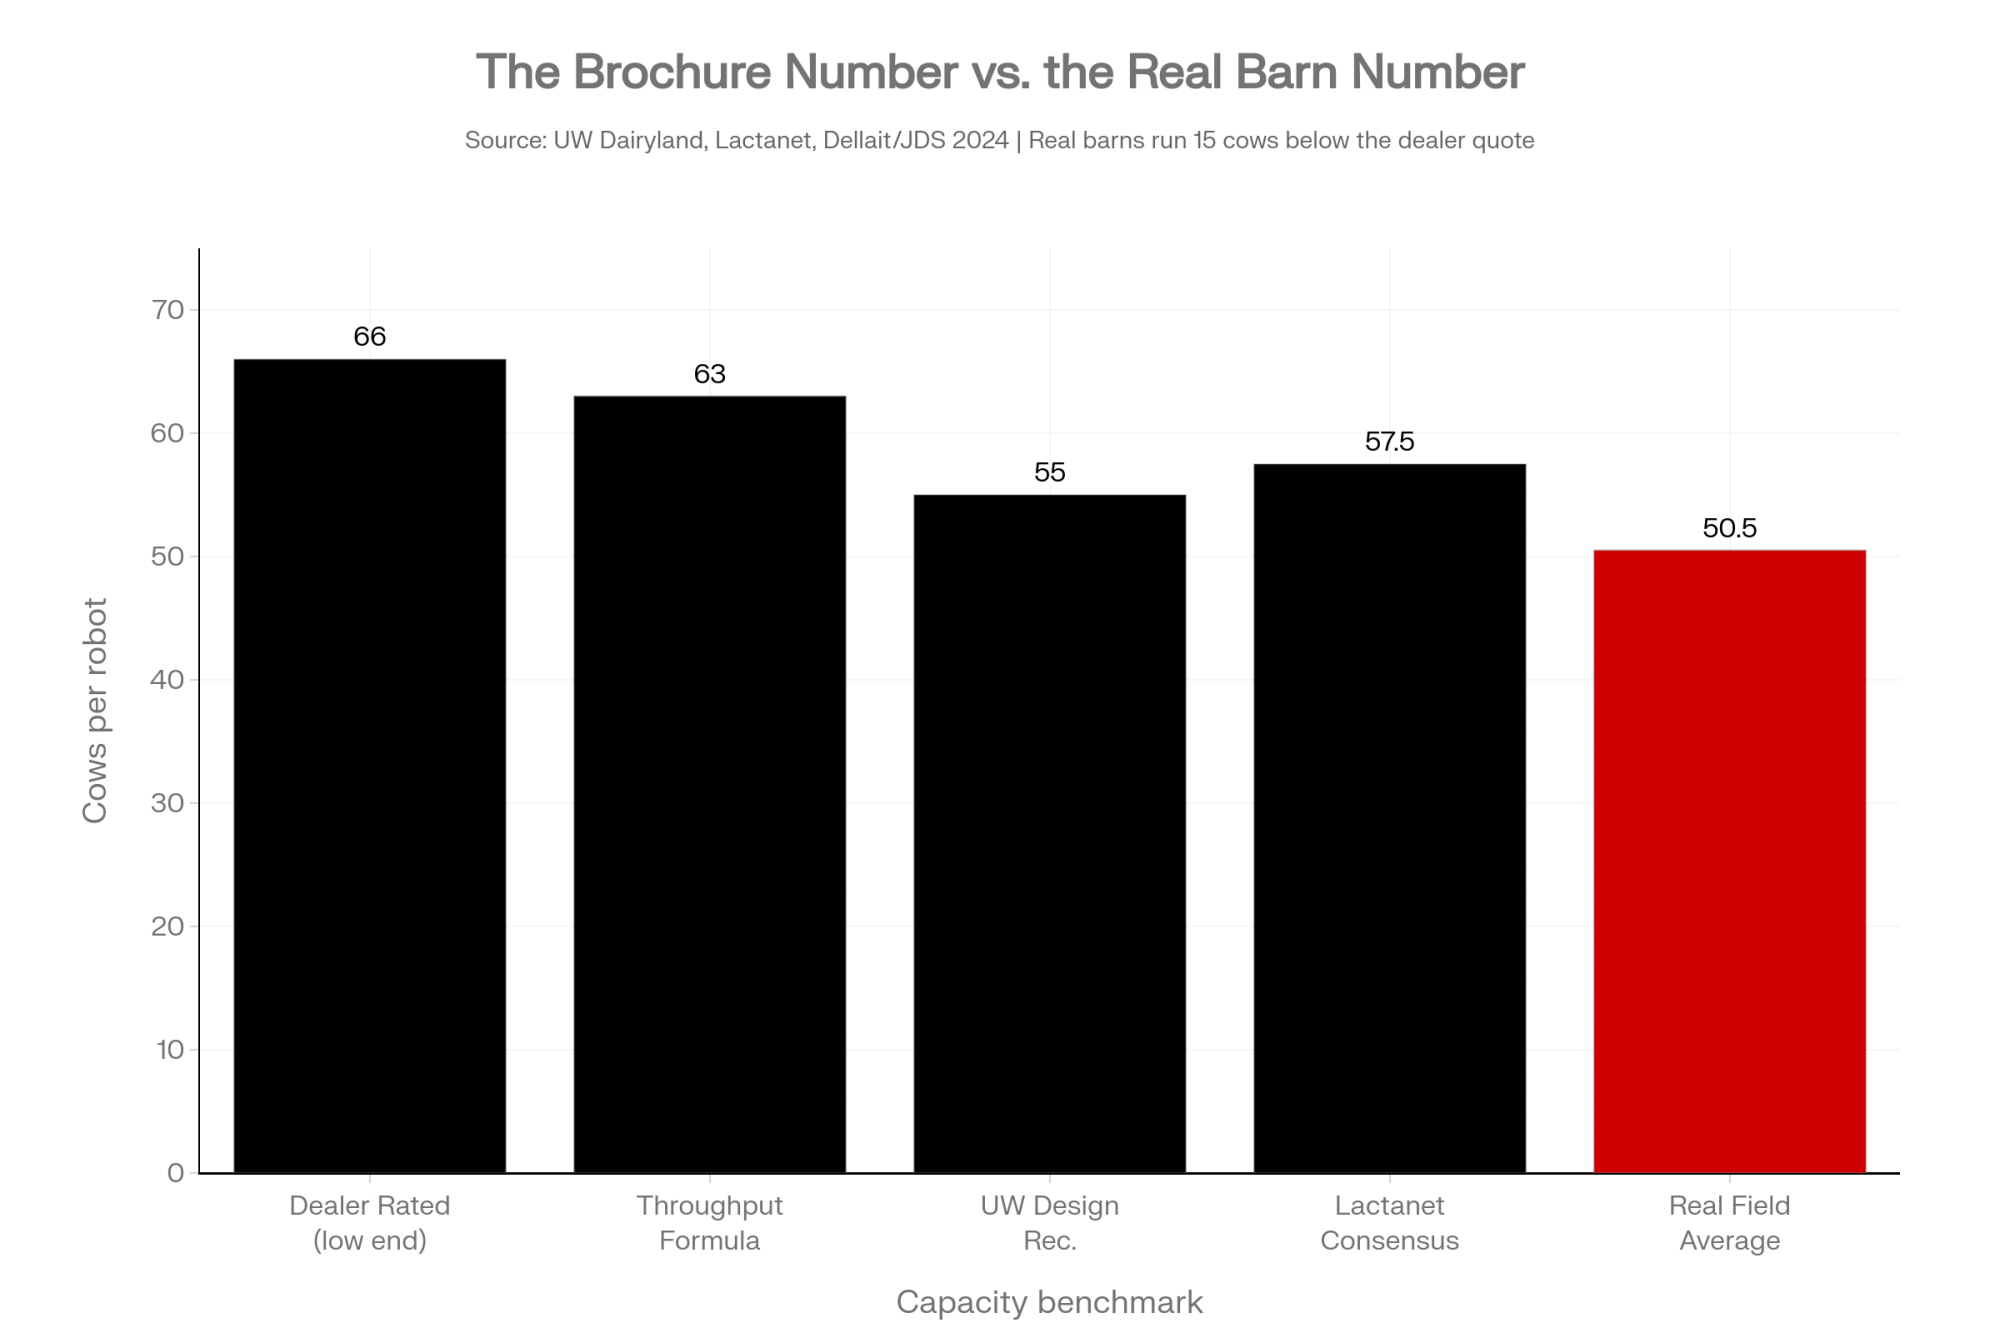
Here’s the whole argument on one page — brochure math against what real barns deliver, plus the efficiency and traffic thresholds that tell you when a box is overloaded.
| Metric | Benchmark | Source |
| Rated capacity (dealer quote) | 66–70 cows/robot | Manufacturer specs / UW Dairyland, 2025 |
| Throughput-formula capacity | ~63 cows/robot (low-70s at 6-min visits) | UW Dairyland, 2025 |
| Design recommendation | 55 cows/robot | UW Dairyland, 2025 |
| Scientific-source consensus | 55–60 cows/robot, any traffic system | Solano, Lactanet, Canada, 2024 |
| Real-world field average | 50.5 cows/robot; 2.9 milkings/day; 6.8-min visits | Dellait synthesis of JDS data, 2024 |
| Peak-efficiency occupancy | Below 56 cows/robot | Aerts et al., Animals, 2022 |
| Robot efficiency — average | 1.86 kg milk/min of box time | ICAR Tech. Series No. 26, 2022 |
| Robot efficiency — struggle zone | ~1.4 kg/min | ICAR / Lactanet, 2022 |
| Robot efficiency — peak (below 56 cows) | 2.01 kg/min | Aerts et al., 2022 |
| Fetch rate — healthy average | ~4% of herd/robot/day (~50 min/robot/day) | UW Extension, King et al., 2020 |
| Fetch rate — overload flag | 8.1% fetched, 10.4% involuntary milkings | Dellait synthesis, 2024 |
| Usable milking minutes | ~1,180 min/robot/day | Lactanet, Canada, 2022 |
The Biological Tax: What Breaks First When You Push From 60 to 70
Two barns can both run 60 cows per box. One’s printing money. One’s bleeding out. Cows-per-robot makes them look identical — which is exactly why leaning on it is dangerous. The number that tells them apart is milk per minute of box time.
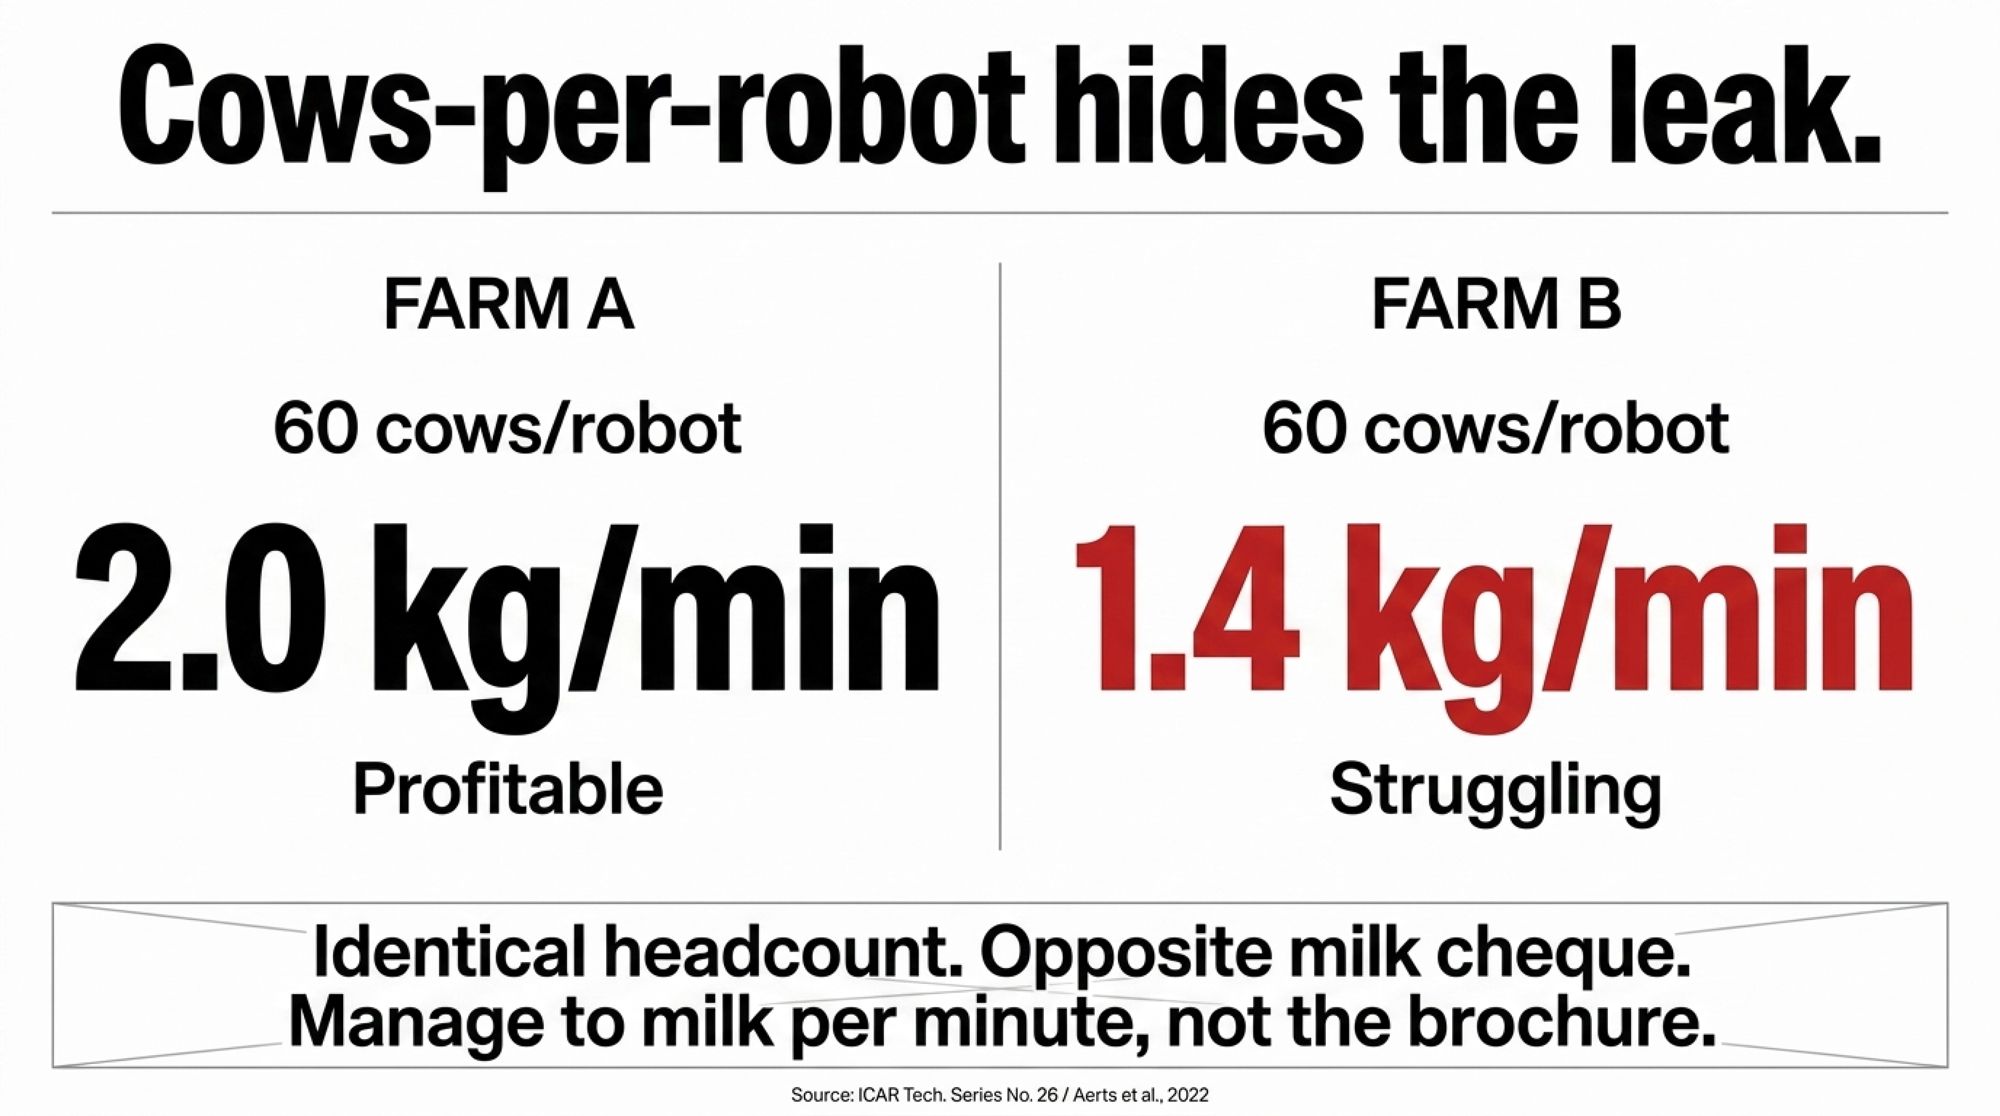
| Metric | Profitable Barn | Struggling Barn |
|---|---|---|
| Cows per robot | 60 | 60 |
| Milking efficiency (kg/min) | 2.0 | 1.4 |
| Fetch rate (% herd/day) | ~4% | 8.1% |
| Involuntary milkings | Low | 10.4% |
| Daily milk yield vs. ceiling case | On target | ~236 kg/day short |
| Cash flow status | Profitable | Negative for years |
Lactanet defines robot efficiency as kilograms of milk per minute produced by the robot, including both the prep and milking phases (Lactanet, Canada, 2022). ICAR’s technical work out of Montreal benchmarks the average operation at 1.86 kg of milk per minute of box time; farms drifting toward roughly 1.4 kg/min tend to struggle regardless of their headcount (ICAR Technical Series No. 26, Fadul-Pacheco et al., 2022; via thebullvine.com, Dec. 2025). Picture two barns. The strong one runs cows at 2.0 kg/min. The slow leak sits at 1.4. Same 60 cows, same box — but the 1.4 barn is handing back milking time it can’t get back. Lactanet’s tool shows about 1,180 usable milking minutes per robot per day; lift the herd-average efficiency from 1.80 to 2.0 kg/min and the same box yields about 236 kg more milk a day— the ceiling case, and only if the whole group actually moves, not a handful of fast cows (Lactanet, Canada, 2022).
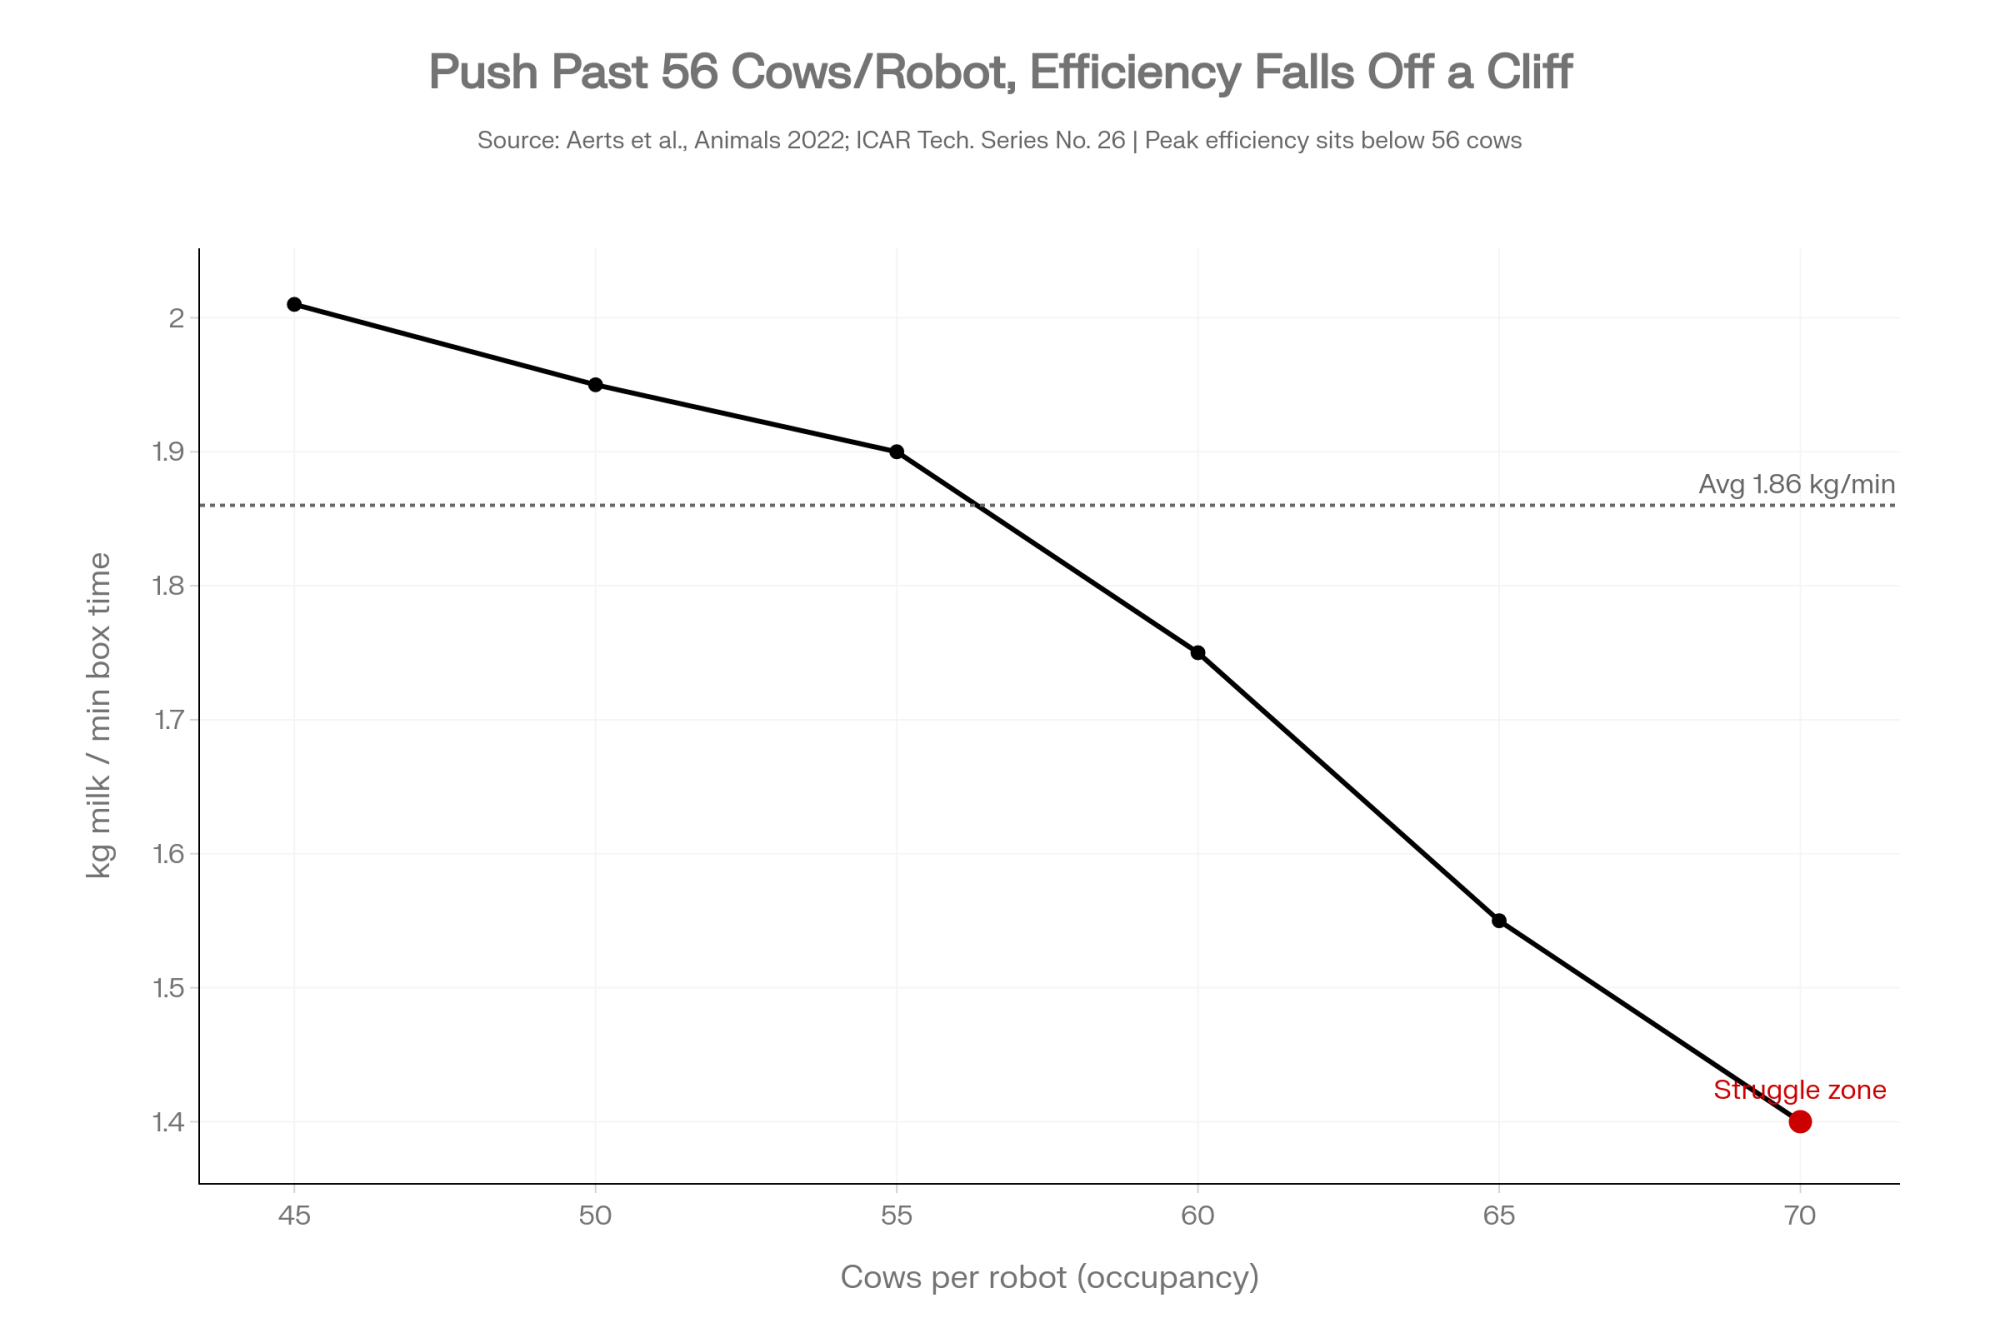
Kg/min quietly folds in everything headcount ignores: milking speed, udder conformation, temperament, congestion, and the fetch list. There’s even a hard threshold buried in the research. A decision-tree analysis of AMS herds found the highest efficiency — 2.01 kg/min — came from robots running occupancy below 56 cows; efficiency measurably softened above that line (Aerts et al., Animals, 2022). The 55- to 56-cow ceiling keeps showing up from different directions.
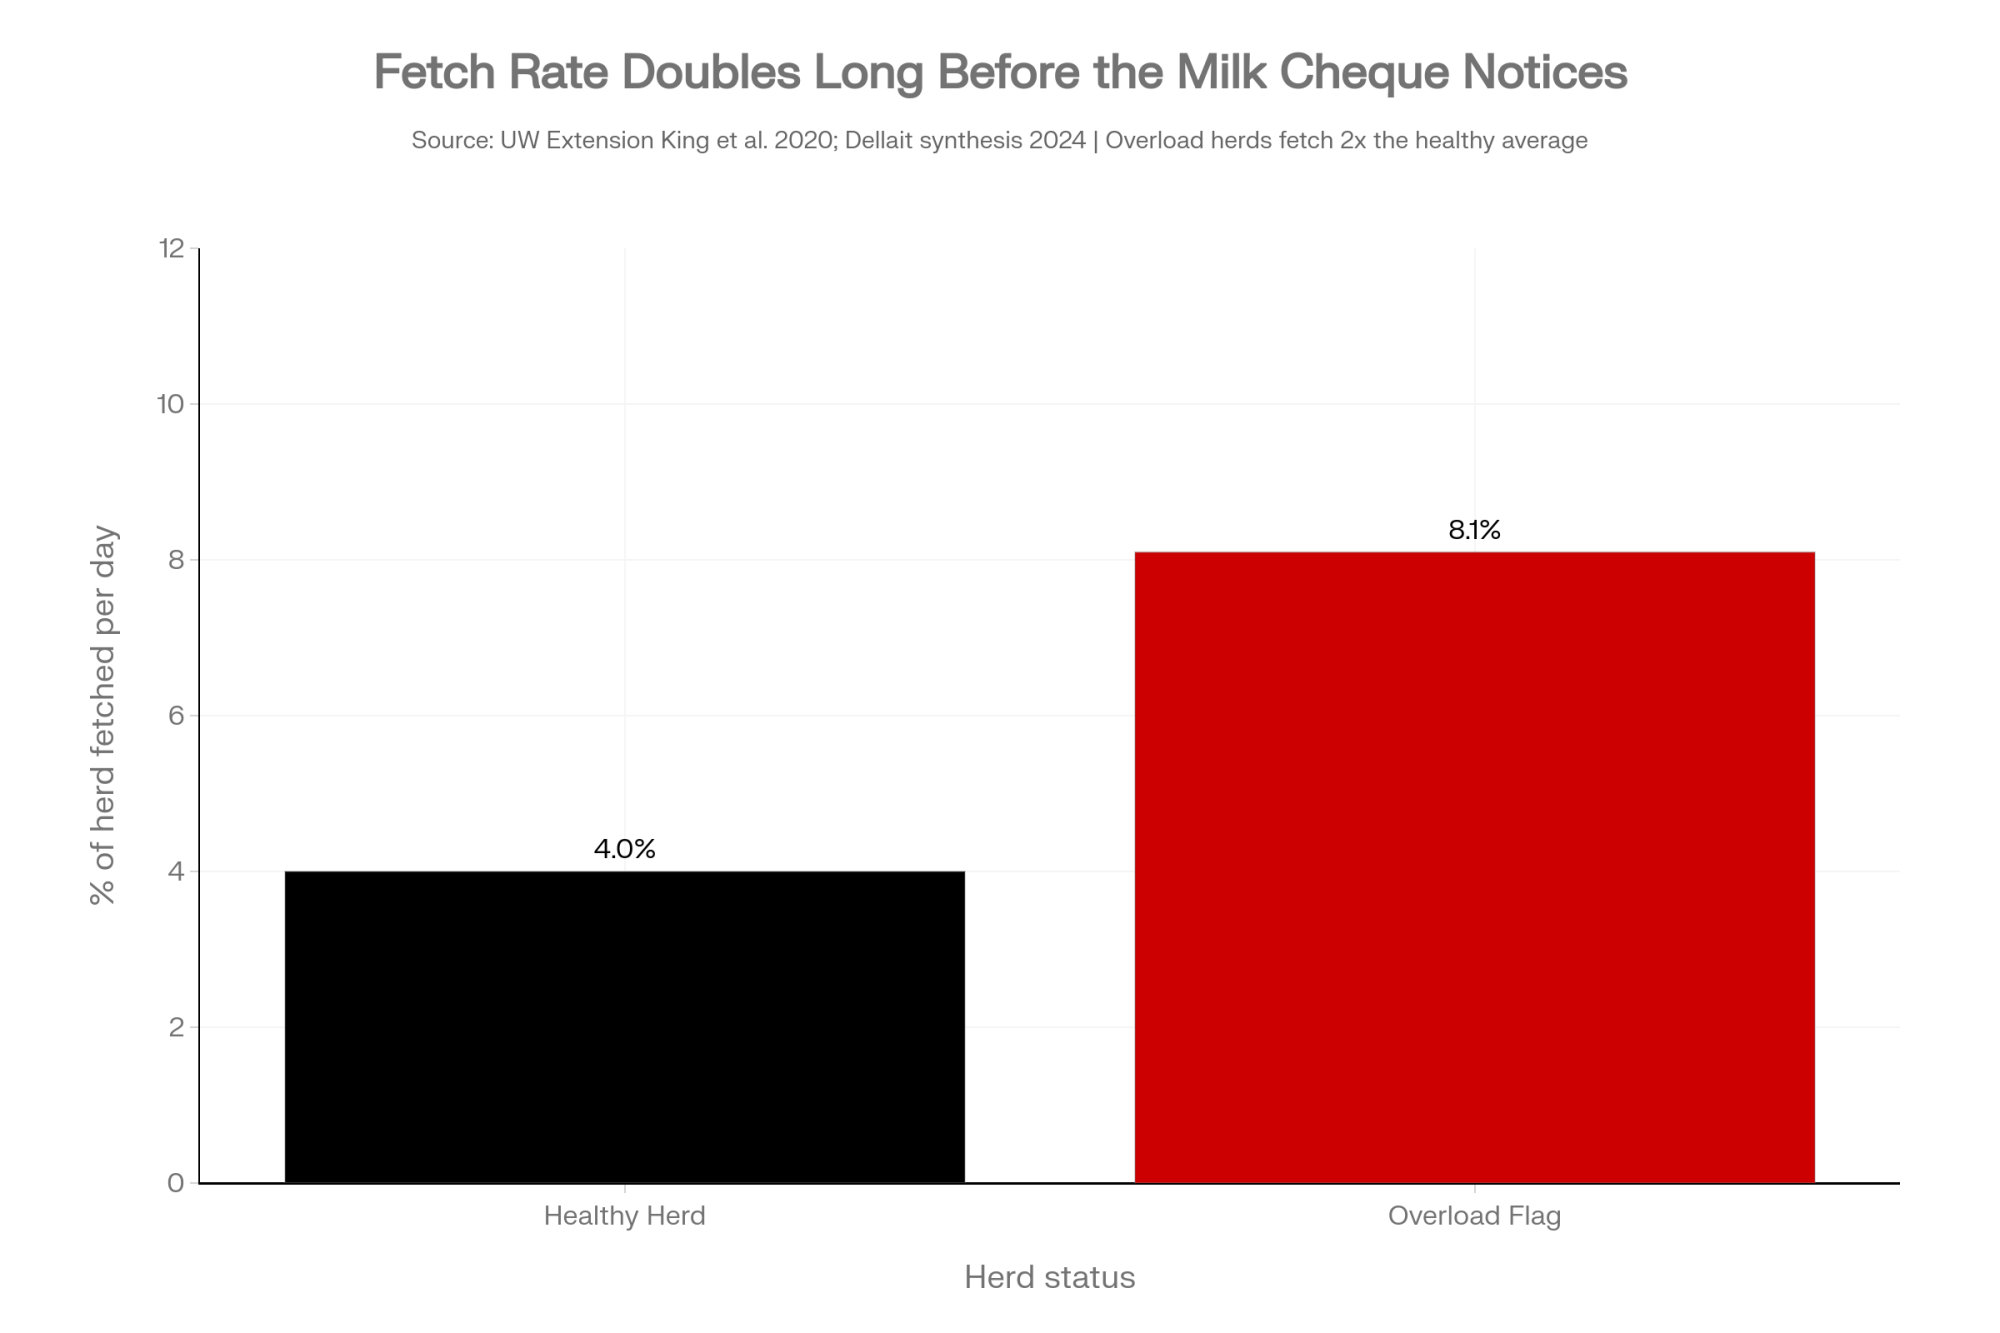
Crowd a barn from 60 to 70, and the first casualty isn’t the milk cheque. It’s cow traffic. The fetch list grows first. AMS herds fetch about 4% of the herd per robot per day on average, and producers report burning roughly 50 minutes per robot per day chasing them (UW Extension, King et al., 2020). Crowding pours fuel on that: for about every 13-percentage-point jump in free-stall stocking density, cows were 1.6 times more likely to need fetching (King et al., 2020). A Canadian survey of 43 herds found producers fetching 14.6 ± 10.4% of cows at least once a day — a range wide enough to tell you how hard management and stocking swing the number (Rodenburg, Journal of Dairy Science, 2017).
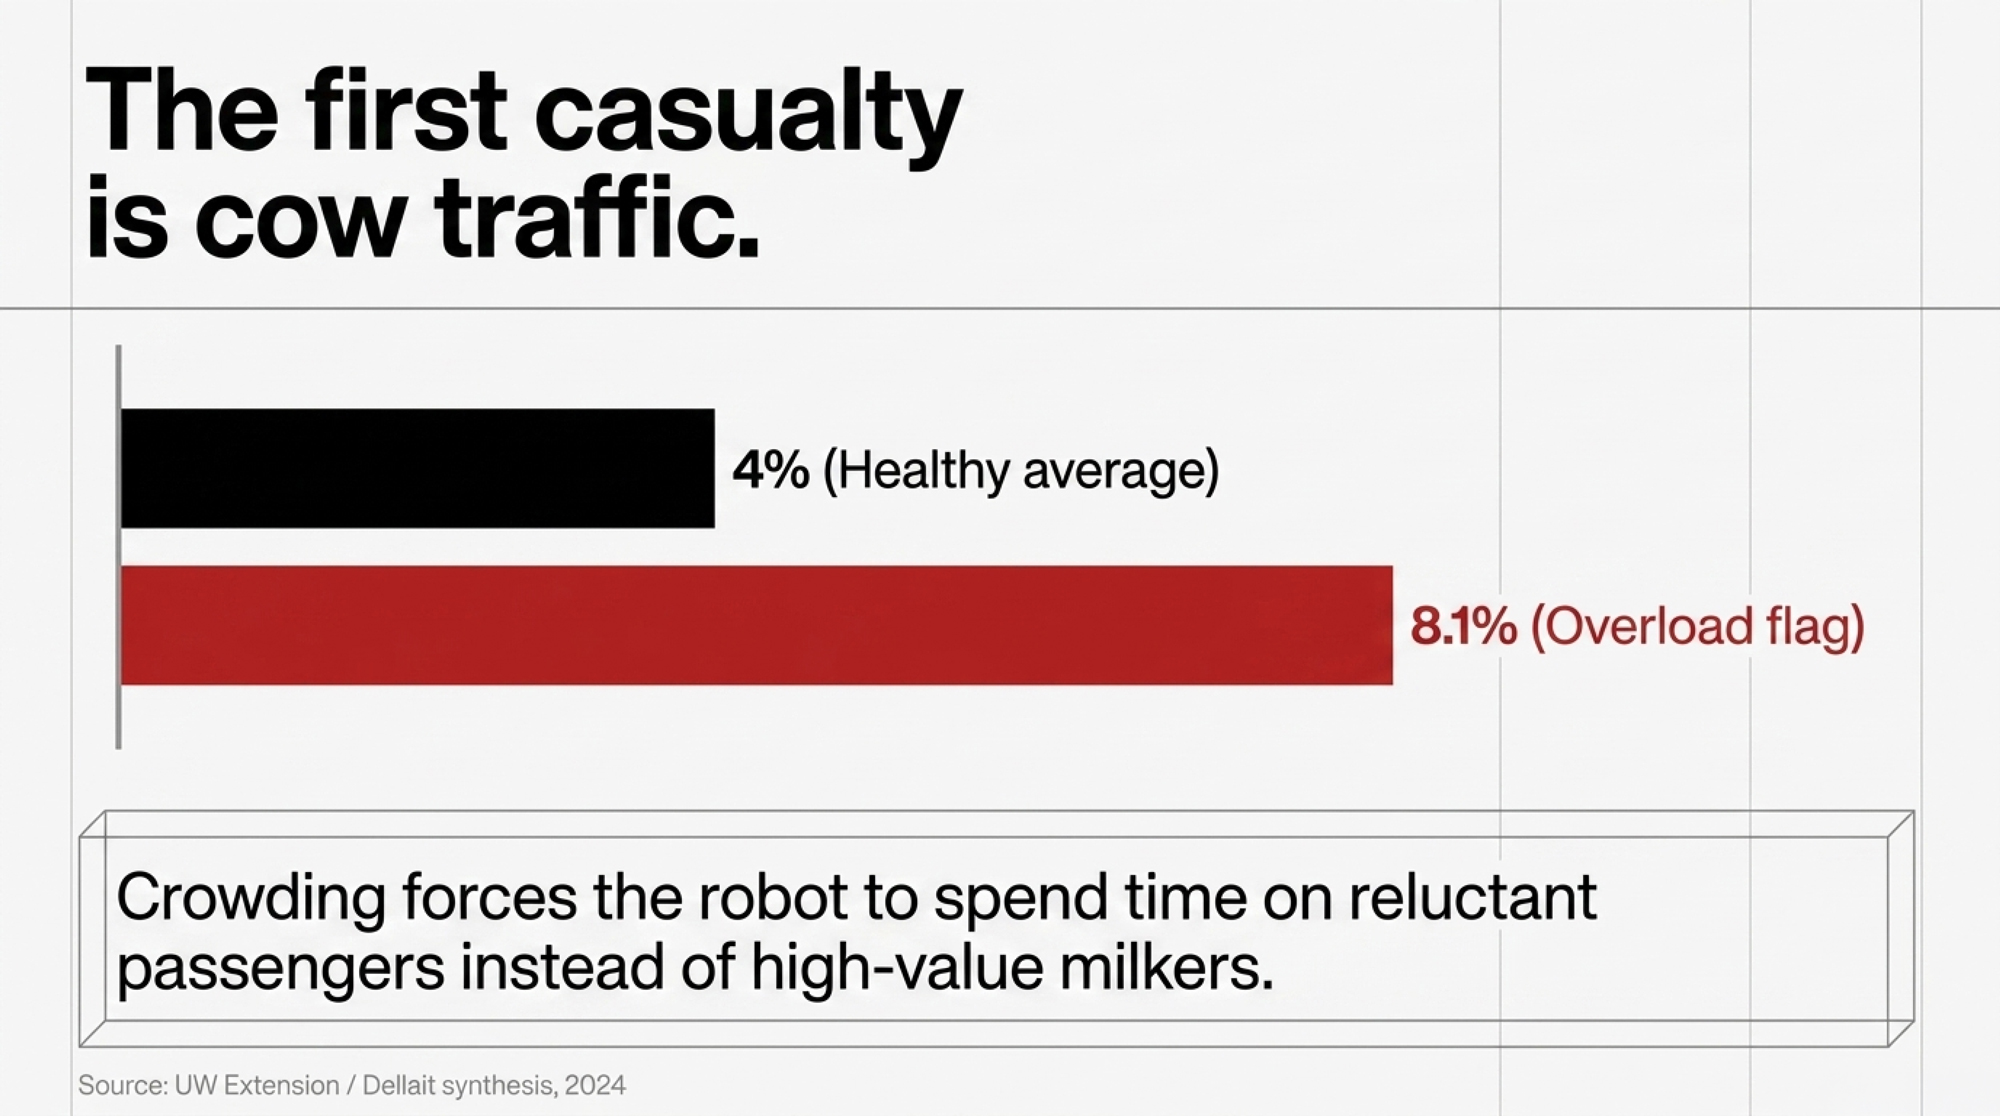
The cows that stop showing up on their own aren’t random. Lame cows, fresh heifers still learning the box, and subordinate animals in a crowded pen get squeezed out first — which is exactly why Tranel’s barn-design work insists on an exit alley so submissive cows can leave without getting pinned by boss cows (Tranel, Iowa State). So the robot spends more minutes on reluctant passengers and fewer on your high-value milkers. In the data, that shows up months before the tank notices: fetch percentage creeps up, involuntary milkings climb, and kg/min slides from 1.86 toward 1.4. One of the pooled datasets in the Dellait synthesis already flags herds sitting at 8.1% fetched cows and 10.4% involuntary milkings — double the 4% ideal (Dellait, 2024). The data’s been telling the story for months by the time the milk cheque catches up.
The Financial Reality: Maintenance and the Breakeven Wage
Push the crowding story into dollars, and it stops being abstract fast.
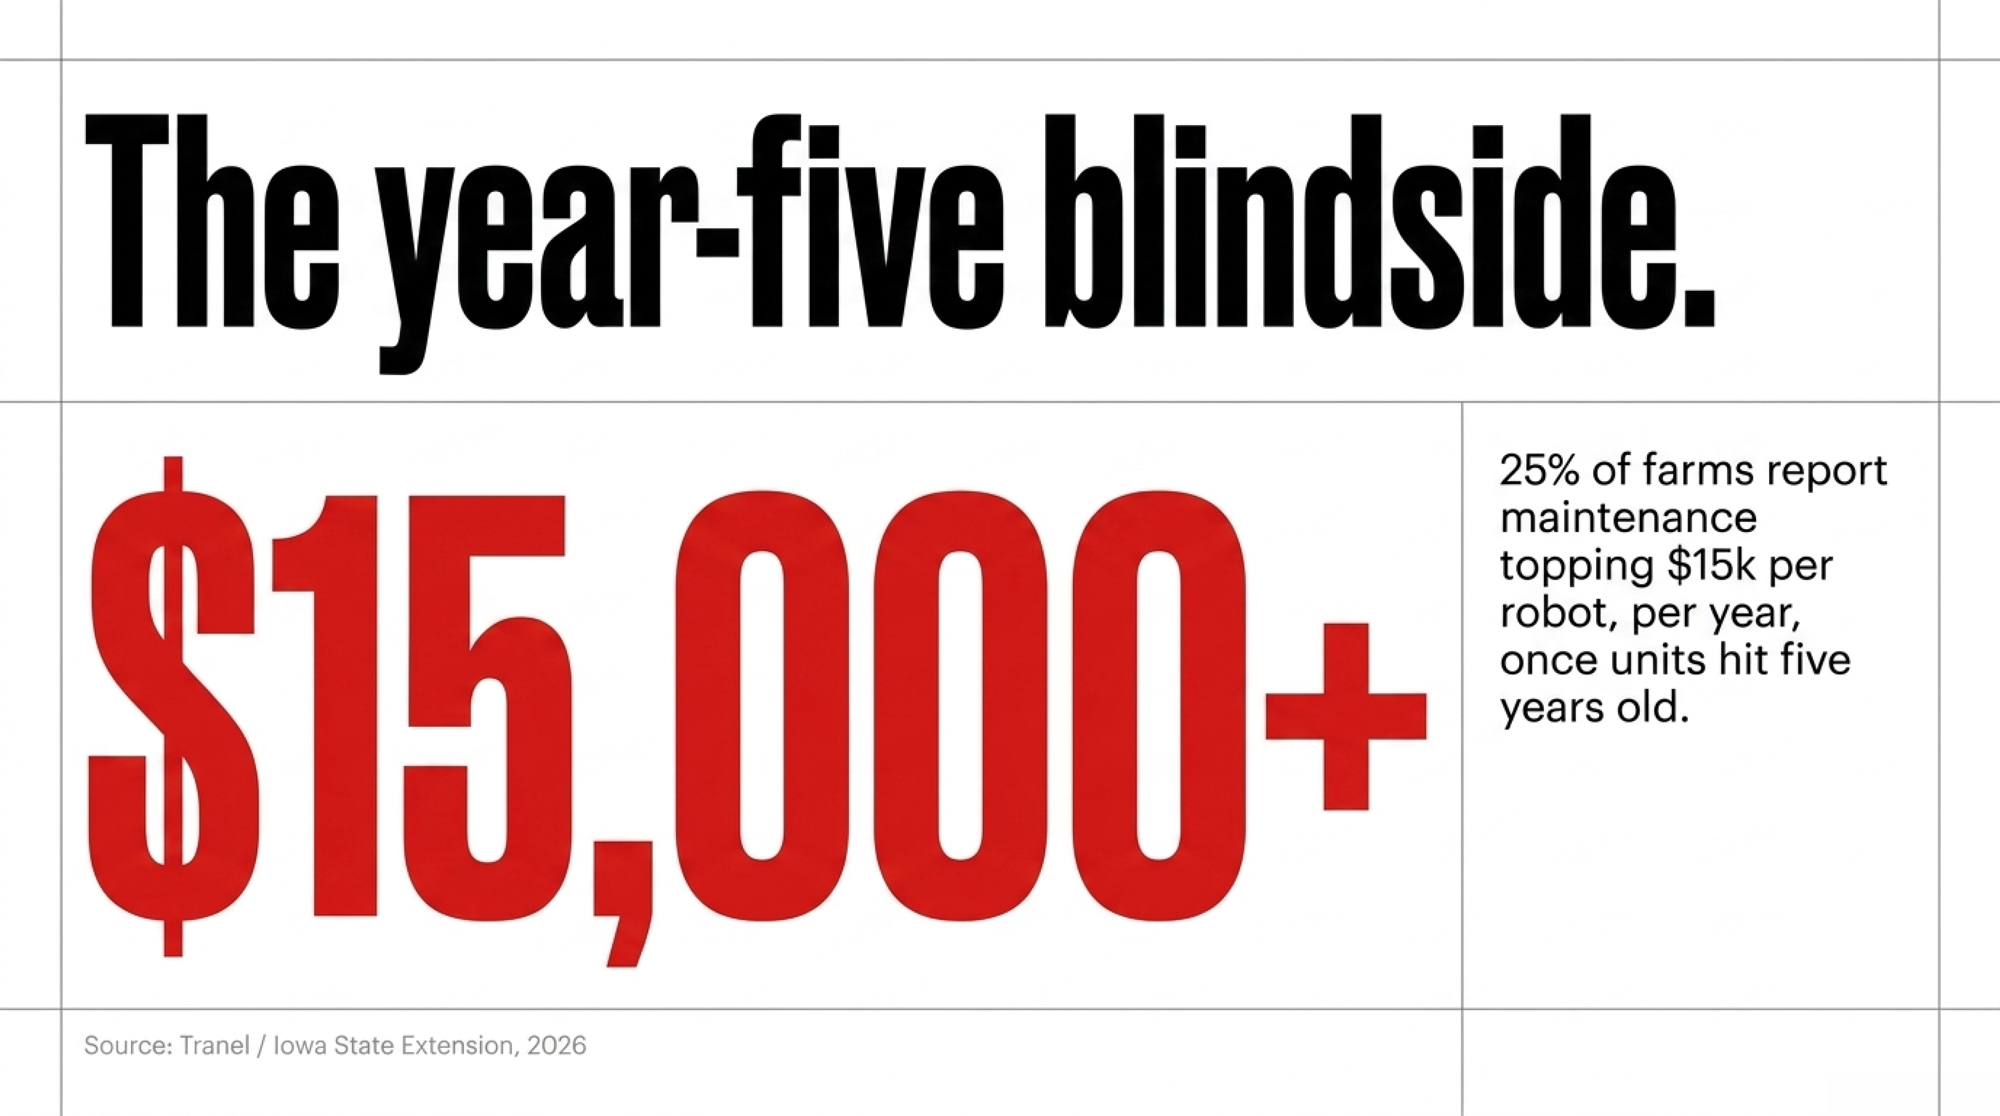
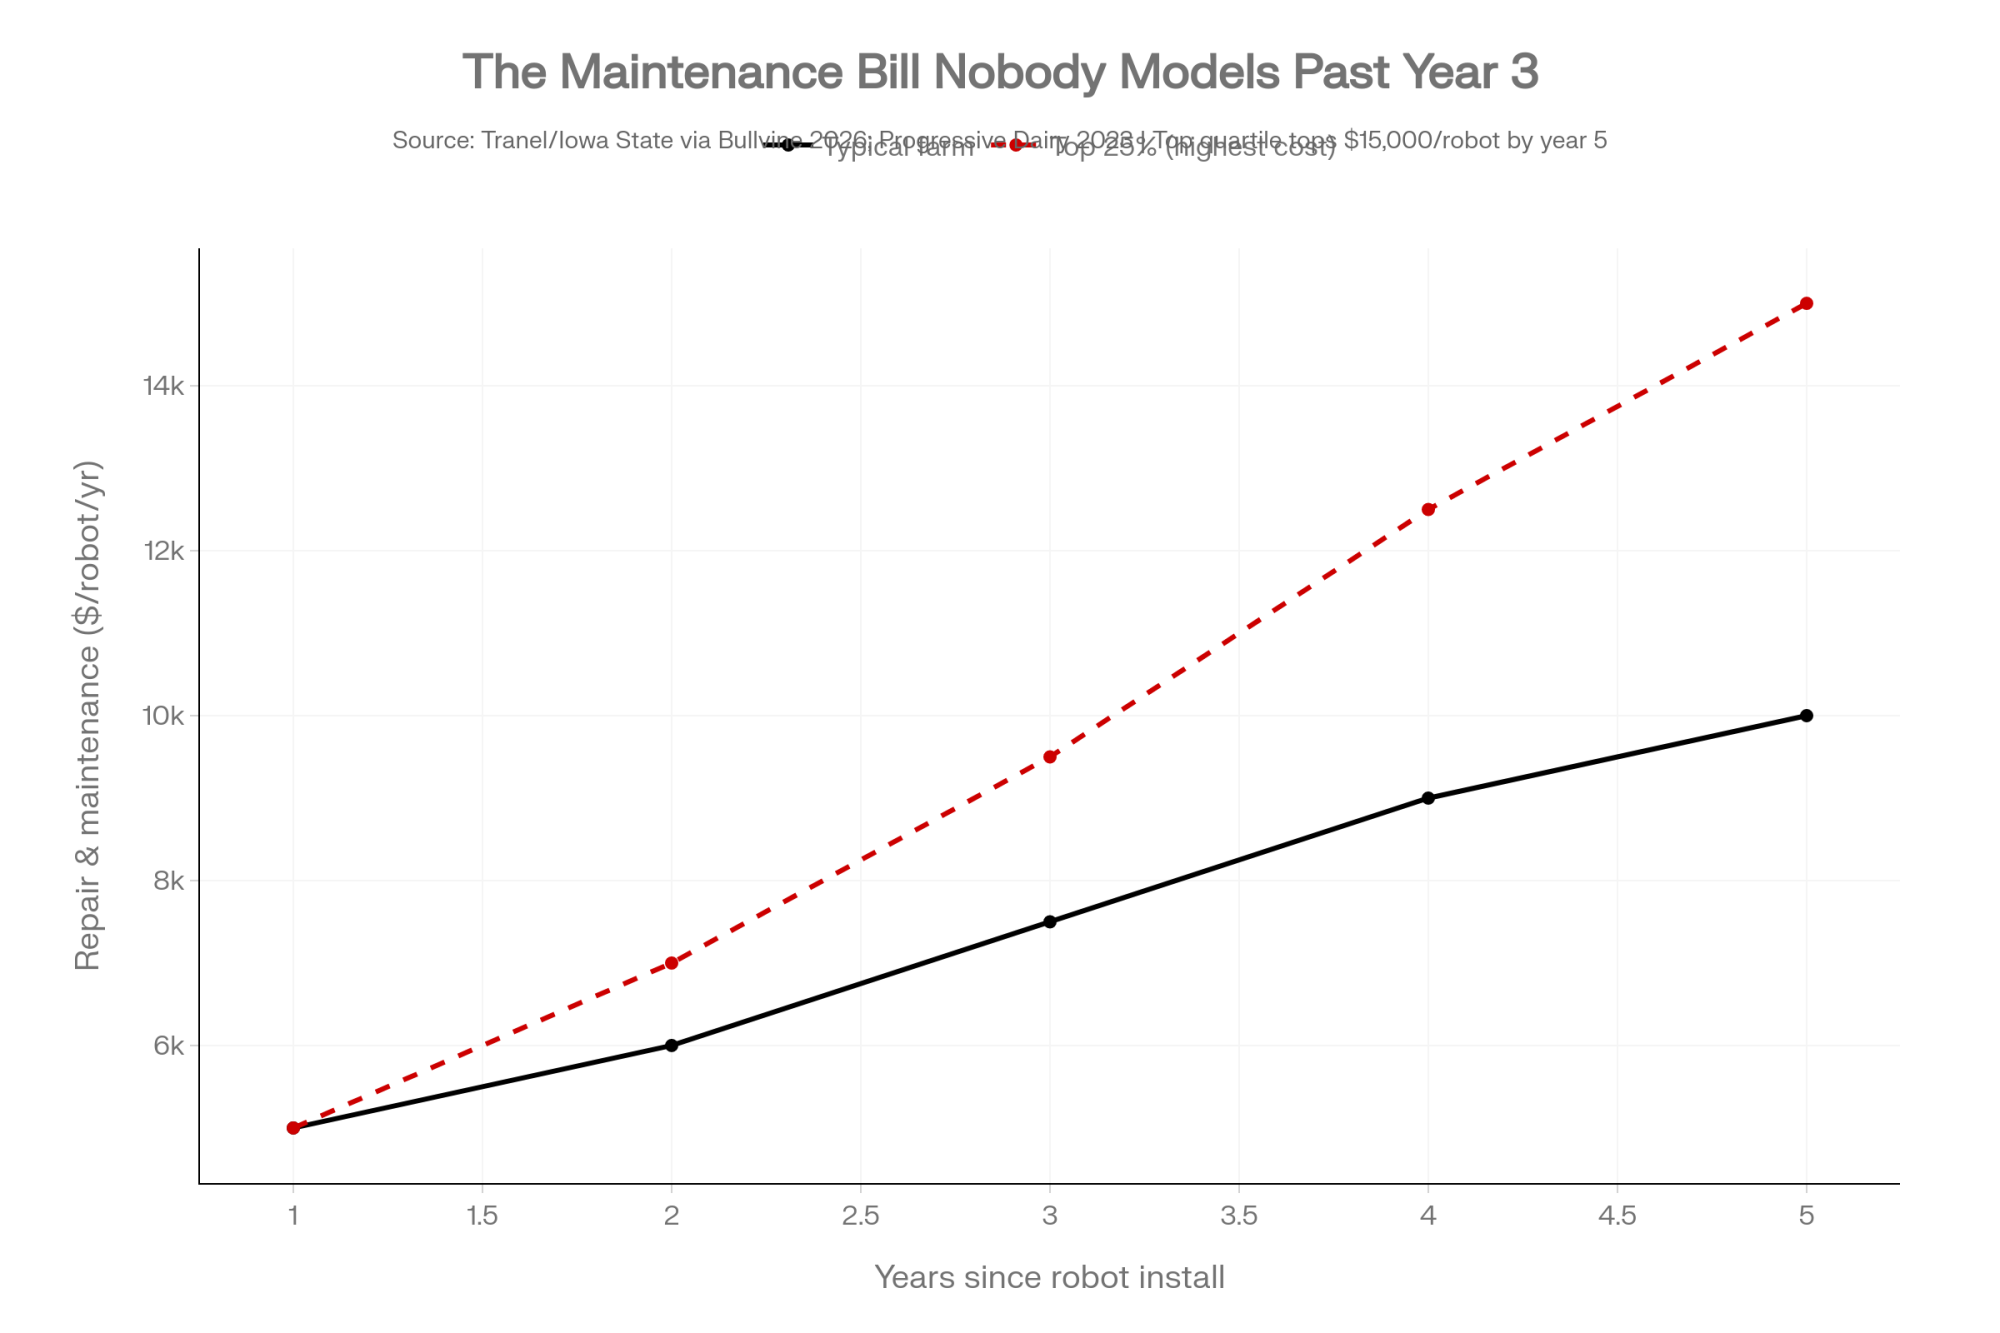
That maintenance bill is where farms get blindsided. Early on, repairs and maintenance run around $5,000 per robot per year; as the units age, that climbs toward $10,000, and among farms running robots five years or more, 25% reported maintenance topping $15,000 per robot per year — a few blew past $25,000 (Tranel/Iowa State, via thebullvine.com, Feb. 2026). Independent advisers put combined annual services at $16,000 to $24,000 per box once repairs and supplies are folded in (Progressive Dairy, U.S., 2023). A farm three years in right now is sitting two years short of a bill it may never have modeled.
Then there’s the wage question — the one that quietly separates a lifestyle buy from an economic one. University of Minnesota’s Jim Salfer modeled parlour versus robot over 20 years and found they break even only when you value milking labour at $27.05 per hour (Salfer, UMN Extension, U.S., 2018). Nudge the assumptions and the number moves: 2 lb less milk with the robot plus 1% wage inflation pushes breakeven to $32.30/hr; equal production with 3% wage inflation drops it to $22.91/hr. That model is from 2018, though — with today’s higher farm wages, the real breakeven likely sits higher still, which tilts the math further toward the robot, not away from it.
So here’s the barn-math moment worth sitting with. If your fully loaded milking labour — wages, payroll taxes, benefits, housing, turnover — is closer to $18/hr than $27, the parlour wins on pure cash. The robot isn’t beaten. It’s telling you it’s a lifestyle and labour-risk purchase first, an ROI purchase second. That’s a legitimate reason to buy one. But the math has to be honest about what it’s actually solving. UW’s own Transition Budgeter case — 120 cows, two robots, a 5% milk bump, labour at $20/hr, robots costed at a market install range near $200,000 a box — pencils to a breakeven wage of just $14.77/hr on the tool’s default milk-price and amortization assumptions, proof the picture flips fast once scale and a real production gain show up (Cabrera, UW Extension, 2026).
Options and Trade-Offs for Your Operation
Where you land depends on your barn, your feet-and-legs, and your tolerance for a long cash-flow hole:
- Stock to 55–60 and protect kg/min. Best for high-producing Holstein herds where box time is already tight. What it demands: the discipline to leave rated capacity on the table. Where it backfires: rarely — the only real cost is the cows you choose not to add.
- Push to 62–65 with elite cow flow. Only for well-designed barns — sound feet, good bedding, two robots per pen, a real exit alley for submissive cows. What it demands: constant watch on fetch rate and refusals. Where it backfires: the first heat wave or lameness spike stresses traffic, and your subordinate cows fall off the visit schedule first.
- Add a box instead of cows. For herds already past 62 per robot with fetch rate climbing and per-cow milk softening. What it demands: capital, and the equity to sit in the seven-year cash-flow hole. Where it backfires: if you can’t carry the valley, that 13% upside stays academic.
Your Go/No-Go Checklist
Before you sign — or before you add cows to a box you already own — run your own numbers against these. Each one is a decision, not a talking point:
- Labour wage. Is your fully loaded labour cost above $27/hr, or did you only count the cash wage? Above it, the robot pencils as an economic buy. Below it, you’re buying lifestyle and labour-risk cover — a fair reason, but call it what it is.
- Maintenance runway. Have you budgeted $15,000-plus per robot for years five onward — not just the cheap honeymoon years?
- Fetch rate. Is it tracking near the 4% average King’s survey reports, or has it drifted well past that? If it’s climbing, do you know exactly which cows keep landing on the list?
- The metric you manage to. Are you watching kg/min or cows per robot? One hides the leak; the other exposes it. If your kg/min is sliding toward the 1.4 struggle zone, stop adding cows.
- Crowding call. Planning to stock at 65–70 to speed up payback? Model what happens to per-cow milk when fetch doubles toward that 8% overload mark first — then decide whether the next move is more cows or another box.
- Cash-flow stamina. Do you have the equity to sit through roughly seven years of negative cash flow before the ERR-356 upside lands?
- This month: pull your robot’s last 30 days of reports and write down three numbers — cows per robot, fetch percentage, and kg/min. That’s your baseline. Everything above measures against it.
The robot will almost certainly pay — on USDA’s timeline, not the dealer’s. The real question was never which brand goes in the barn. It’s whether you’ll read the fetch list and the kg/min line the way you read a milk cheque, and act on them while they’re still a warning instead of a loss. So before you sign for a box rated at 70: what’s your honest number — and are you building the barn around it, or around the brochure?
Key Takeaways
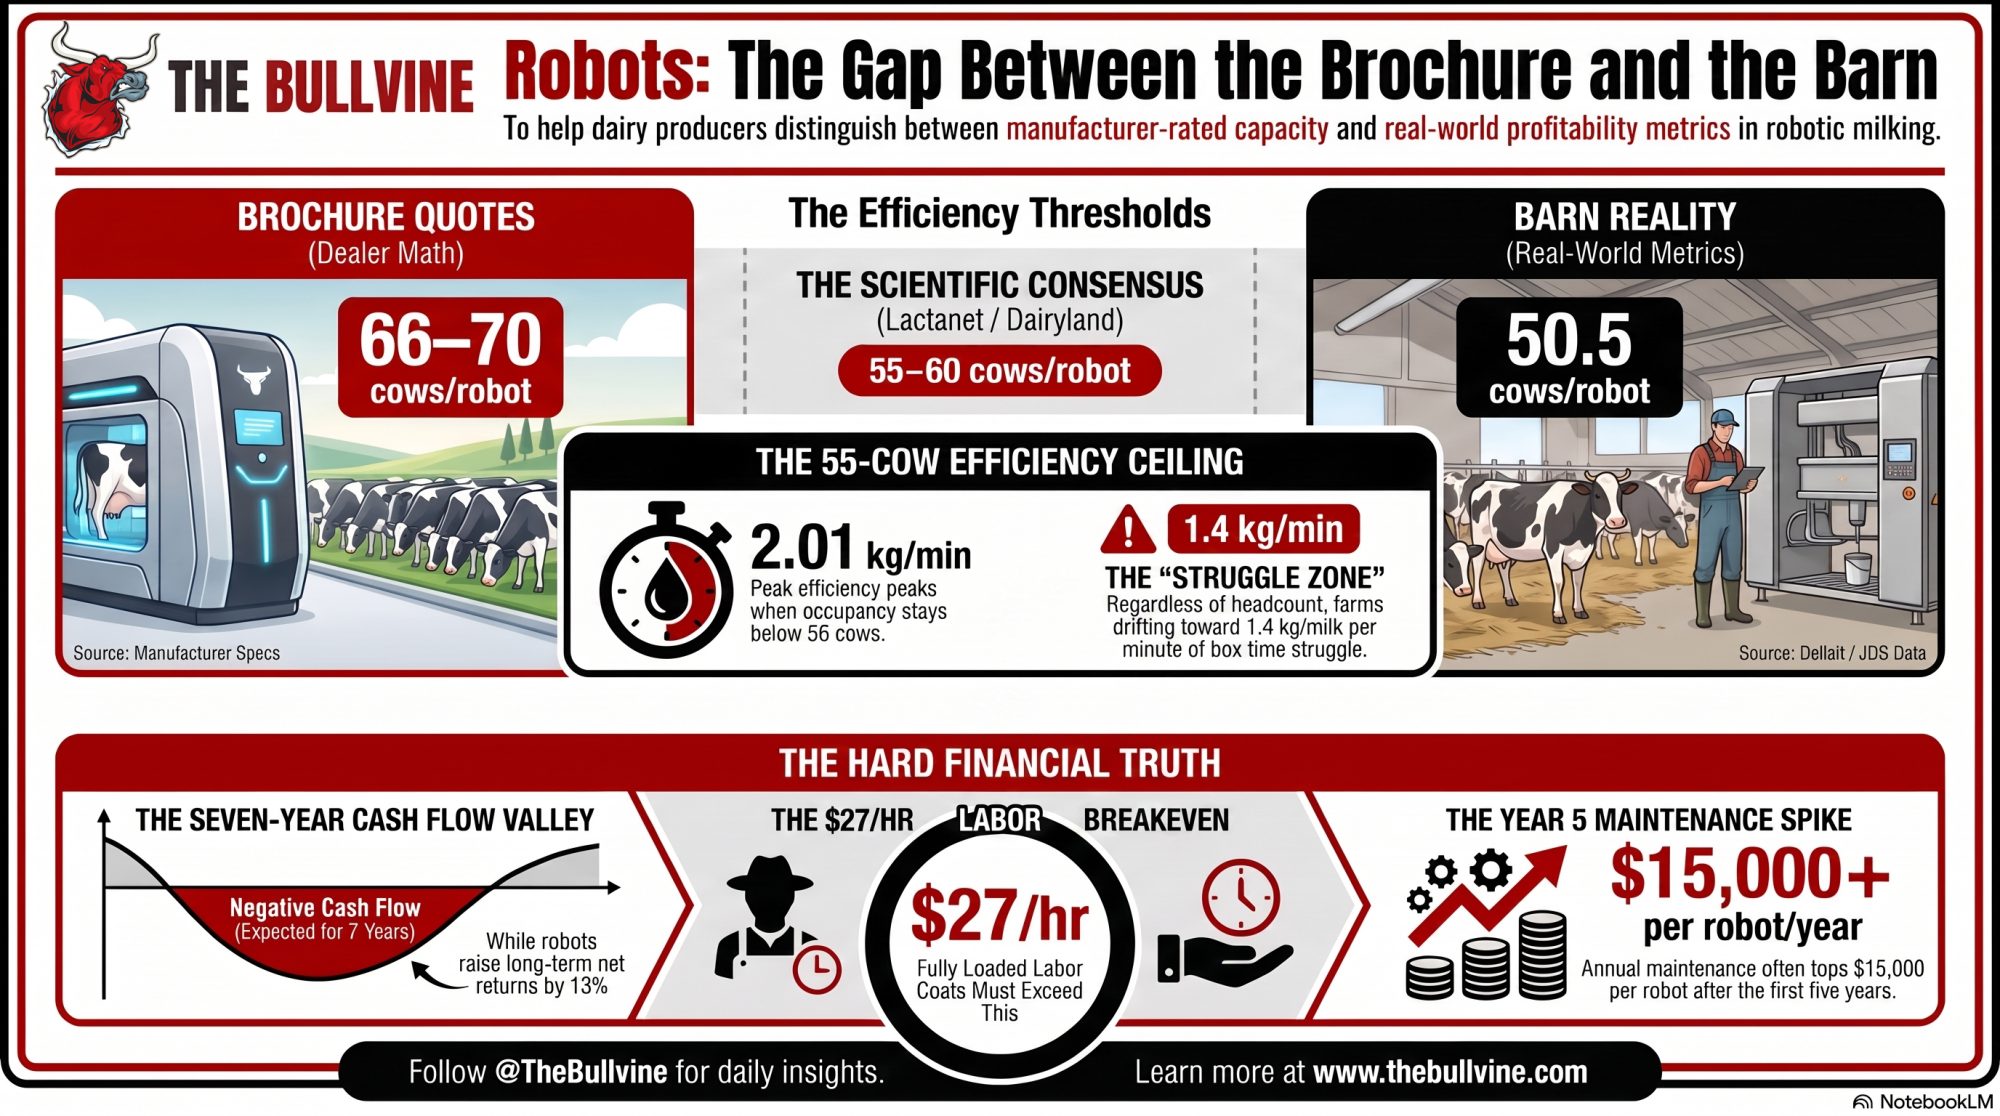
- Cows-per-robot is a vanity number. Two barns at 60 can split on profit, so manage to kg/min and the fetch list instead — if efficiency is sliding toward 1.4, stop adding cows.
- Rated capacity is the dealer’s number; profitable capacity is closer to 55. Real North American barns average 50.5 cows per robot, and efficiency peaks below 56.
- USDA’s ERR-356 says robots pay — about 13% higher net returns — but on a long timeline. Budget for roughly seven negative cash-flow years and a $15,000-plus per-robot maintenance bill from year five on.
- Know your real breakeven wage. Above ~$27/hr fully loaded, the robot pencils as an economic buy; below that, you’re buying lifestyle and labour cover — a fair reason, but call it what it is.
Complete references and supporting documentation are available upon request by contacting the editorial team at editor@thebullvine.com.
Learn More
- Dairy Technology 2026: Robotics, Sensors, AI and Real-World ROI — Dismantles standard automation claims with concrete operating cost brackets, providing real-world 10-year total cost of ownership models across single-unit and large-herd robotic setups.
- The $3,800 Heifer Problem: How Smart Dairies Are Adapting When Beef Premiums Don’t Cover Replacement Costs — Reveals how soaring replacement costs are forcing herds to recalibrate breeding ratios, protecting future heifer pipelines when robot stocking limits cap total cow capacity.
- 42% Heritability: The Milking Speed Breakthrough That Fixes Your Labor Problem — Delivers genetic screening thresholds for milking speed, showing how selecting for optimal box-time throughput directly lifts milk per minute and reduces fetch list length.
 The Sunday Read Dairy Professionals Don’t Skip.
 The Sunday Read Dairy Professionals Don’t Skip.
Every week, thousands of producers, breeders, and industry insiders open Bullvine Weekly for genetics insights, market shifts, and profit strategies they won’t find anywhere else. One email. Five minutes. Smarter decisions all week.




