


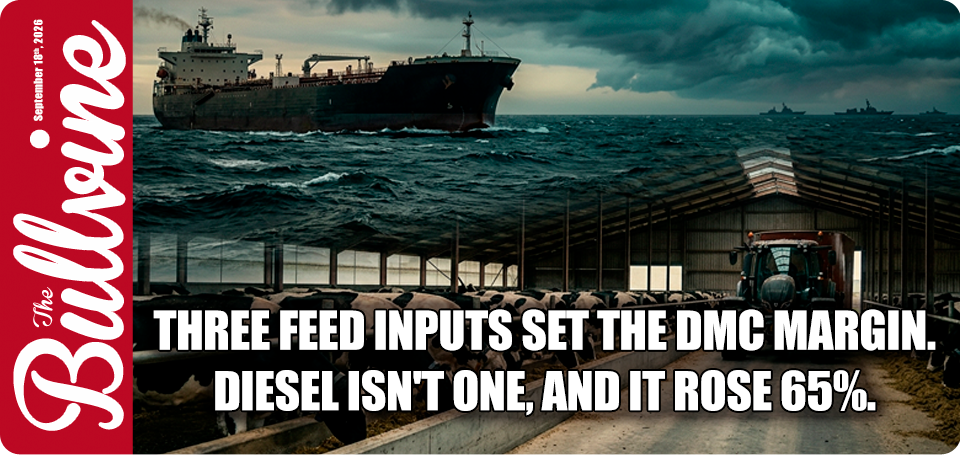





Eight primary documents, one modeled 500-cow herd, and a correction to our own March numbers.
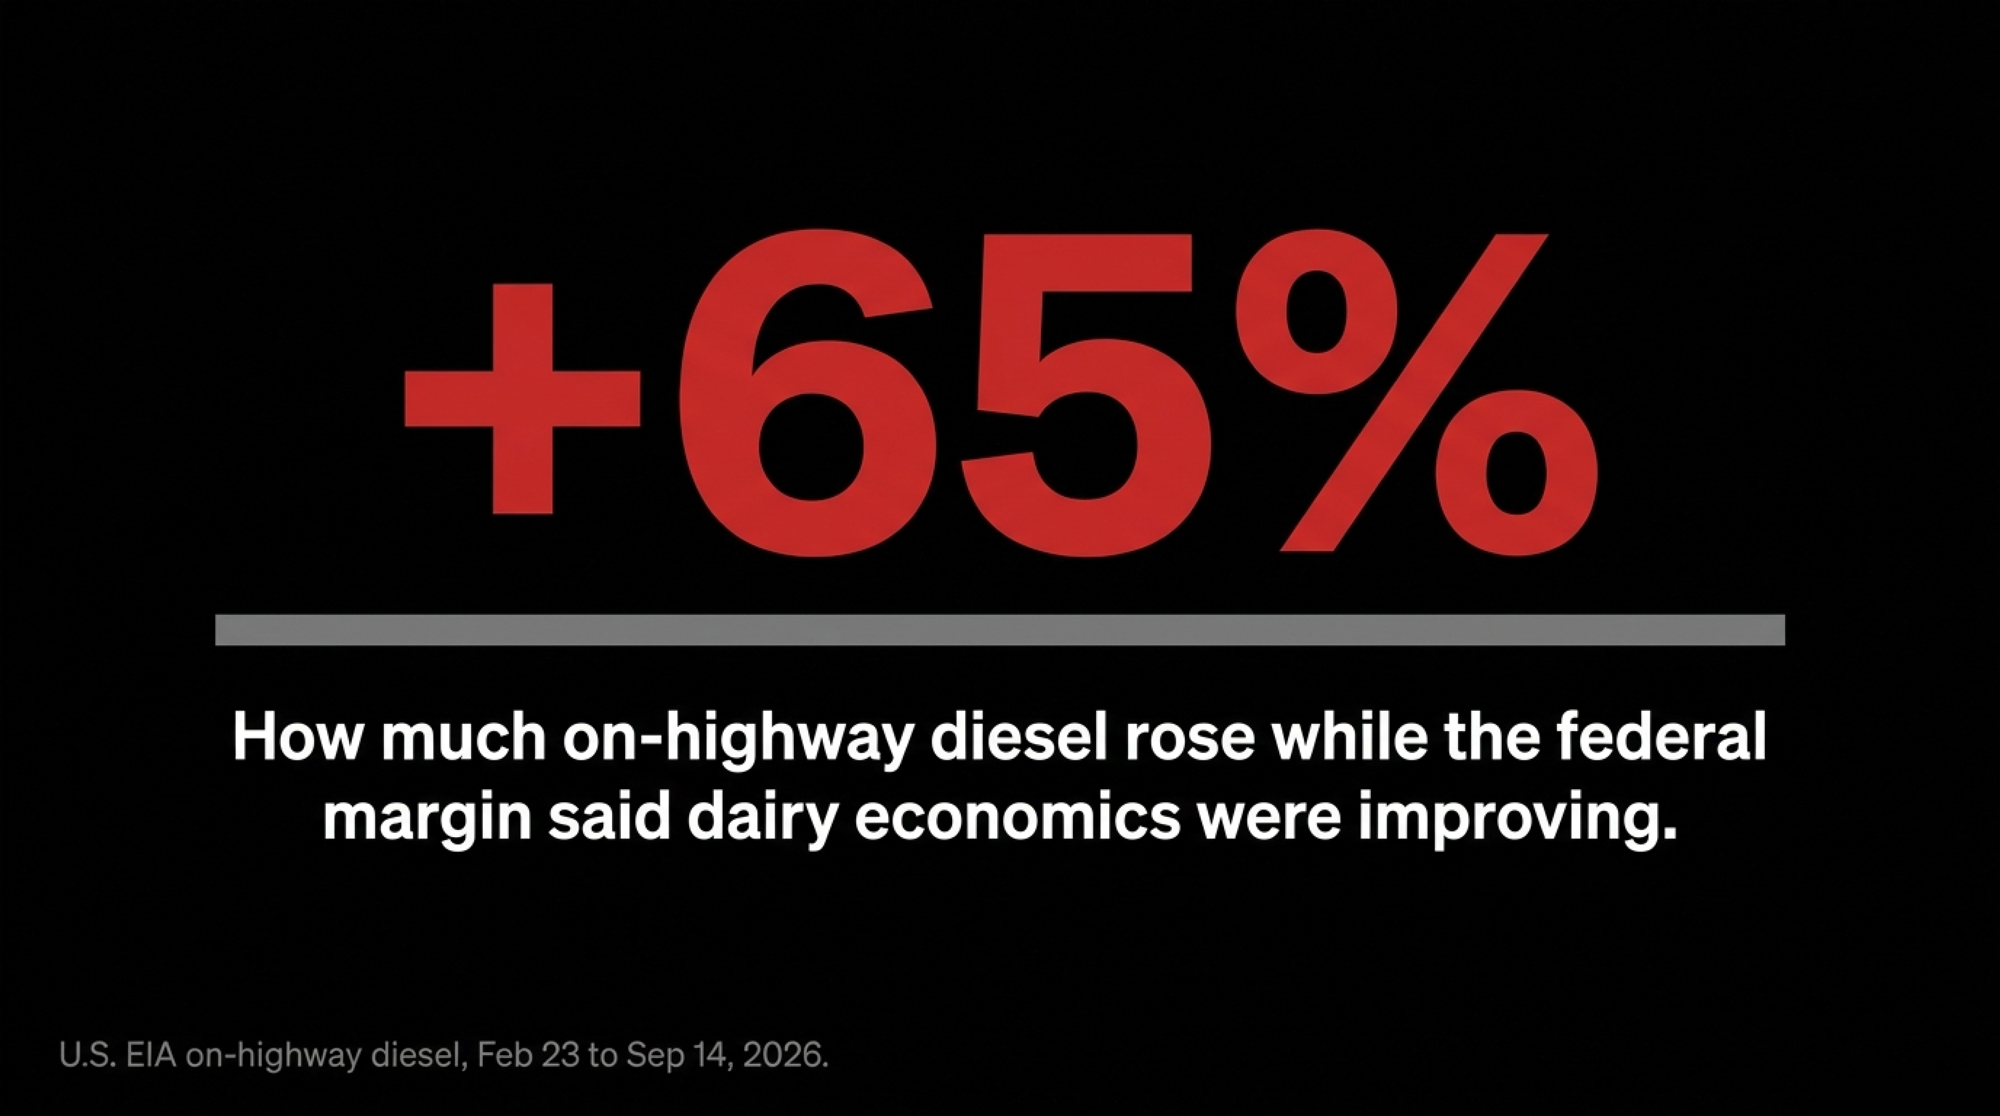
Two federal series, same year. One says the margin improved. The other says the fuel bill got away.
| Period | Start | End | Change | |
| USDA FSA — DMC margin | Jan to Jun 2026 | $7.81/cwt | $10.88/cwt | +$3.07 · +39.3% |
| U.S. EIA — on-highway diesel | Feb 23 to Sep 14 2026 | $3.809/gal | $6.285/gal | +$2.476 · +65.0% |
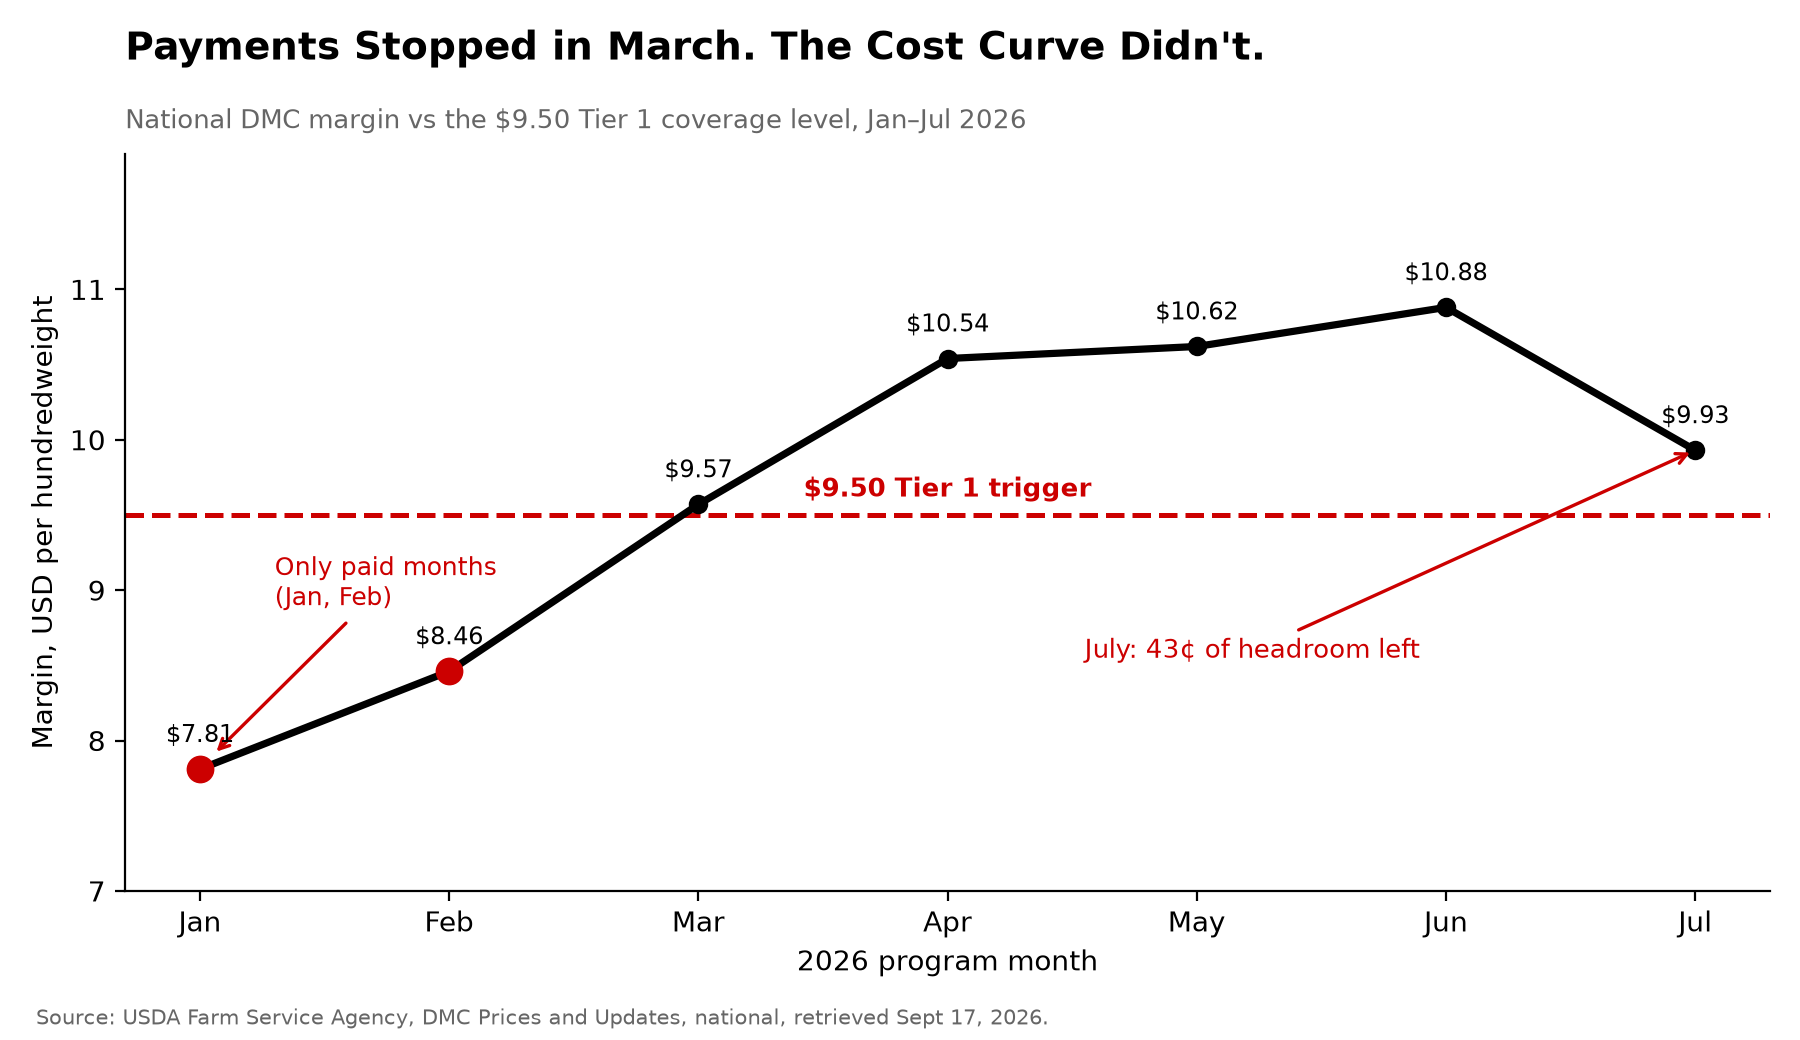
January’s $7.81 margin triggered a $1.69/cwt indemnity at the $9.50 Tier 1 level. By June the margin reached $10.88, and the payments had been off for four months.
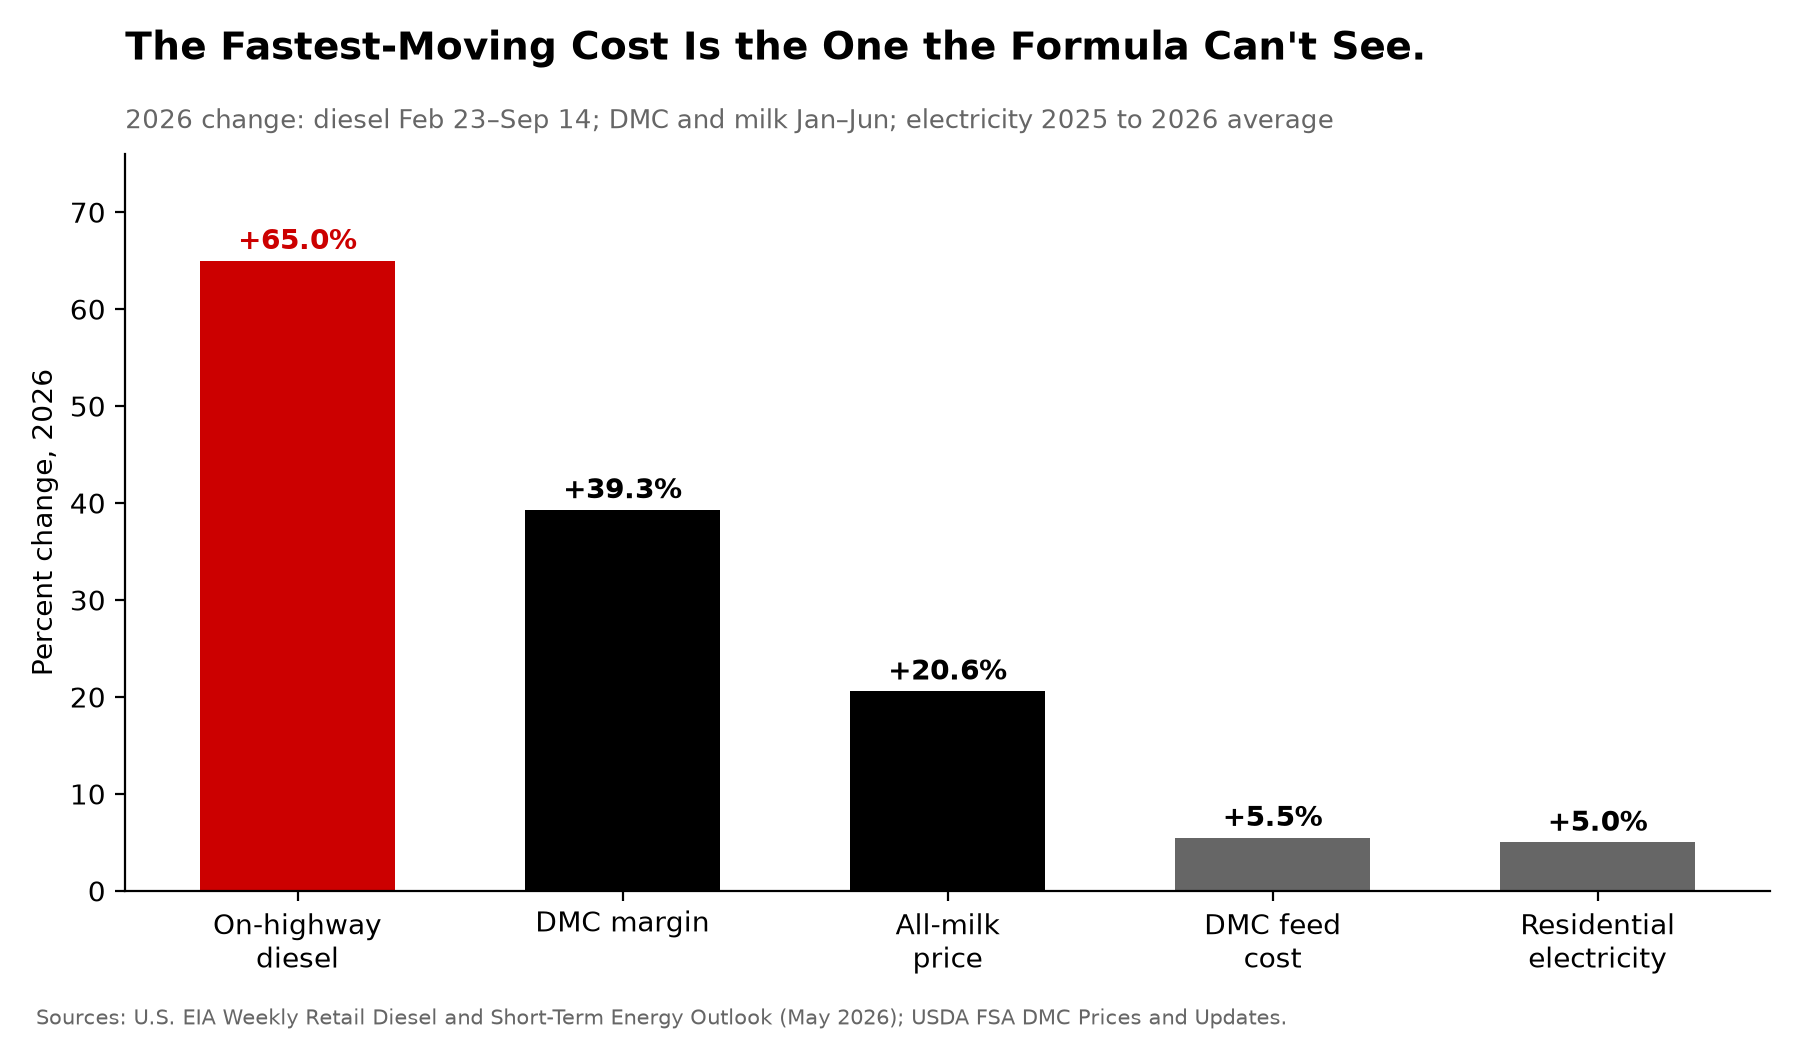
Diesel isn’t in the formula. Run it on a modeled 500-cow herd growing its own forage, and one excluded cost line comes to $31,980 against $4,317.50 net from the program. What follows is Bullvine’s own join of the two series, with the ERS cost line that sits between them.
What the FSA documents establish
Go to FSA’s own Prices and Updates table, not the trade-press recap of it. It publishes every input and output of the calculation, month by month. Notice DMC-99 confirms January’s result independently, along with the February 27 payment release.
How the program works. DMC pays when the margin between the national all-milk price and average feed cost falls below a coverage level the producer elects. Coverage runs from $4.00 to $9.50 per hundredweight in fifty-cent steps, on 5% to 95% of established production history. Tier 1 covers the first 6 million pounds in 2026, with production history based on the highest of 2021, 2022, or 2023. Tier 2 handles anything above that and isn’t offered above the $8.00 level, which means every herd over 6 million pounds is uninsurable at the coverage level Tier 1 herds buy. Payments are calculated monthly on one-twelfth of covered production history, so no two enrolled farms get the same dollars from the same national margin.
Premium at $9.50 in Tier 1 is $0.1500/cwt. Catastrophic coverage at $4.00 carries no premium beyond the $100 annual administrative fee, and FSA waives that fee for limited resource, beginning, socially disadvantaged, and veteran producers. The 2026 enrollment period closed February 26. The One Big Beautiful Bill Act reauthorized DMC through 2031, and as of September 18, FSA hadn’t announced the 2027 window. Treat any indemnity as taxable farm income and settle the reporting treatment with your accountant before you book it against a 2026 expense.
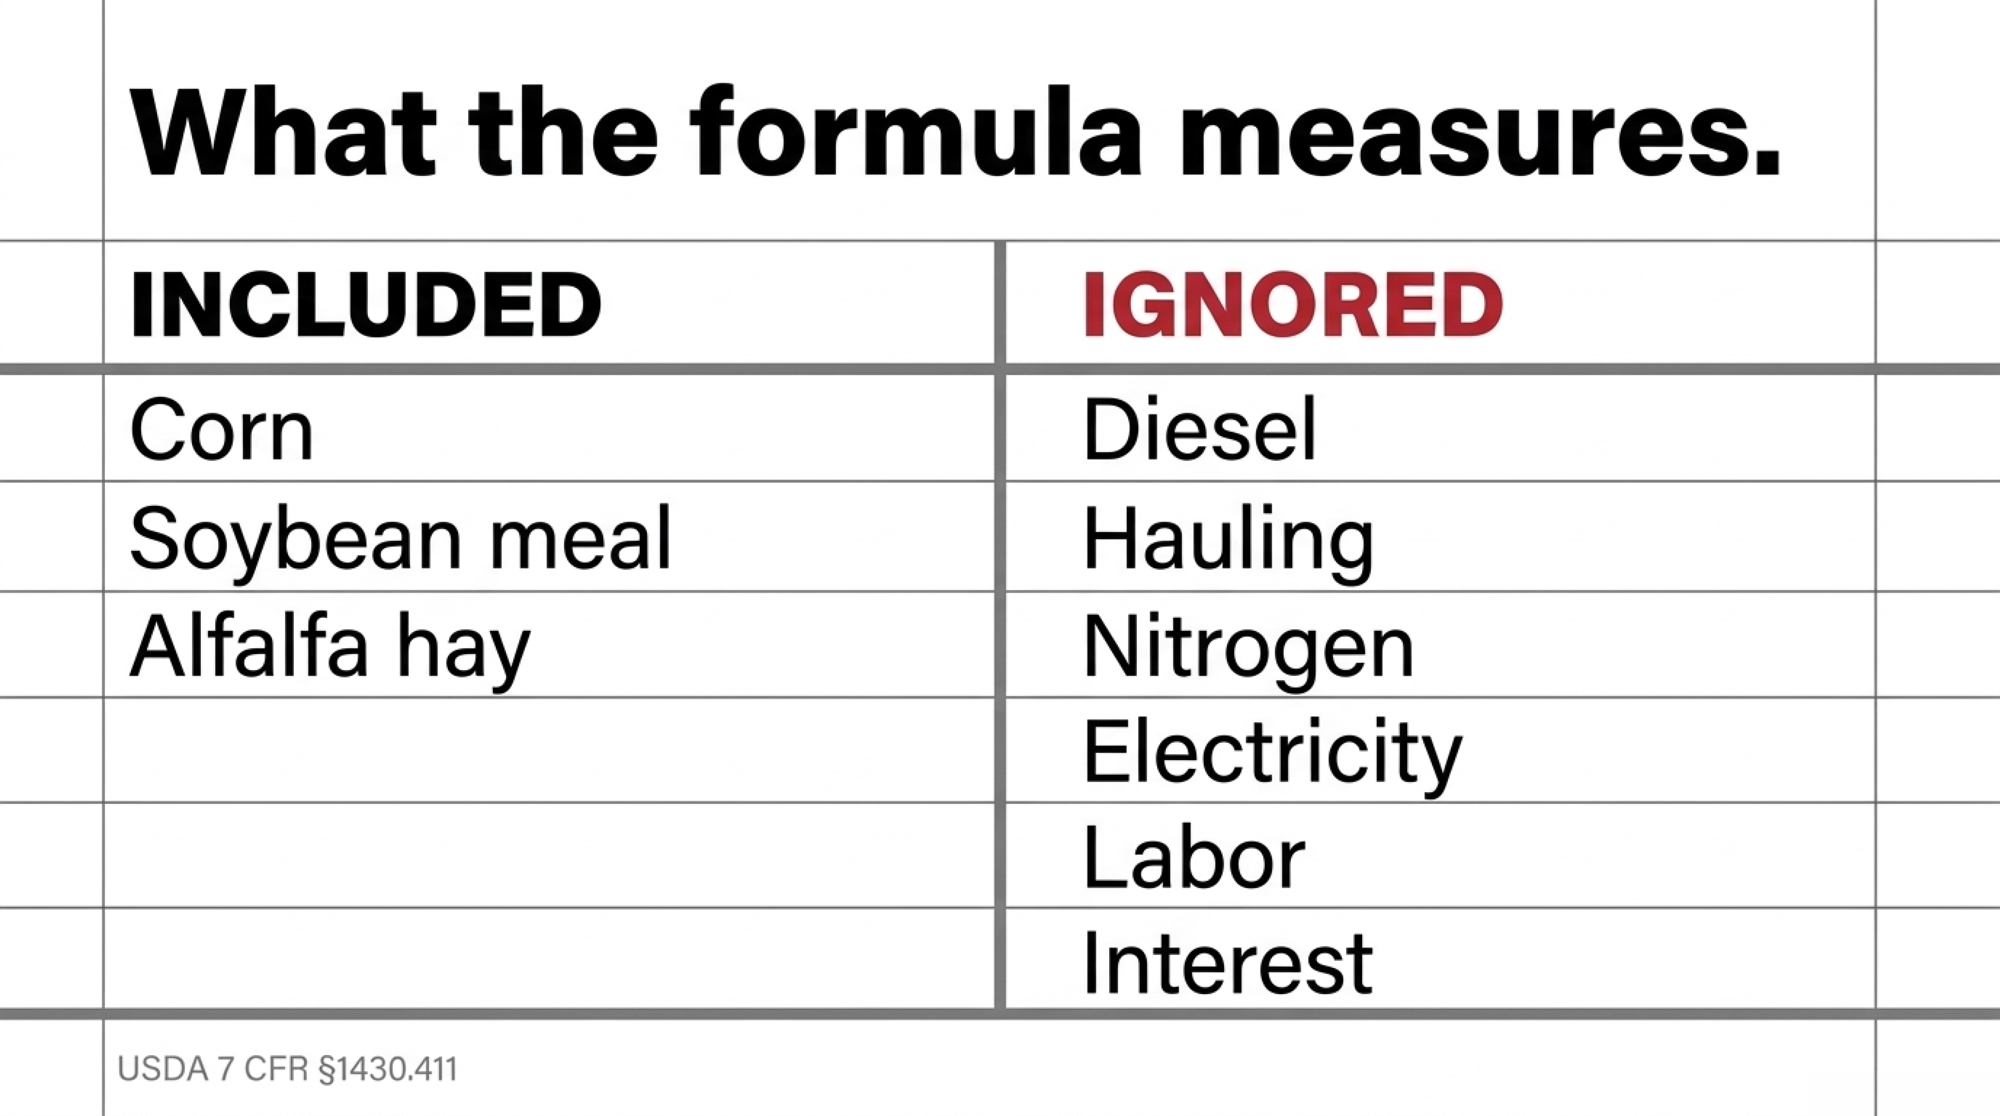
How the feed number is built. The formula sits in 7 CFR §1430.411, and it’s short enough to read in one sitting. National average feed cost per hundredweight of milk is three products added together: 1.0728 multiplied by the price of corn per bushel, plus 0.00735 multiplied by the price of soybean meal per ton, plus 0.0137 multiplied by the price of alfalfa hay per ton. The regulation sets the hay price as the full-month U.S. price received for high-quality alfalfa, which it defines as premium and supreme grades, from USDA NASS’s monthly Agricultural Prices.
Read it as a recipe. To make 100 pounds of milk, the formula assumes 60.08 pounds of corn at a 56-pound bushel, 14.70 pounds of soybean meal and 27.40 pounds of alfalfa hay, all at national averages. That’s 102.18 pounds of feed as fed. No line for diesel, hauling, nitrogen, electricity, labor, or interest.
| Cost line | Formula coefficient | Assumed per 100 lb milk | 2026 movement |
|---|---|---|---|
| Corn | 1.0728 × $/bu | 60.08 lb (56-lb bu) | Eased into June |
| Soybean meal | 0.00735 × $/ton | 14.70 lb | Eased into June |
| Alfalfa hay (premium & supreme) | 0.0137 × $/ton | 27.40 lb | Included in +5.5% feed line |
| Diesel | None | 0 | +65.0% |
| Hauling & marketing deductions | None | 0 | Netted out of all-milk before it enters |
| Nitrogen fertilizer | None | 0 | Urea benchmark +80% Feb→Apr |
| Electricity | None | 0 | ~+5.0% |
| Labor and interest | None | 0 | Not measured in the formula |
University of Minnesota Extension put it plainly during 2026 enrollment: the margin is calculated “by a predetermined USDA formula that is the same nationwide and is not determined by your dairy farm’s margin.”
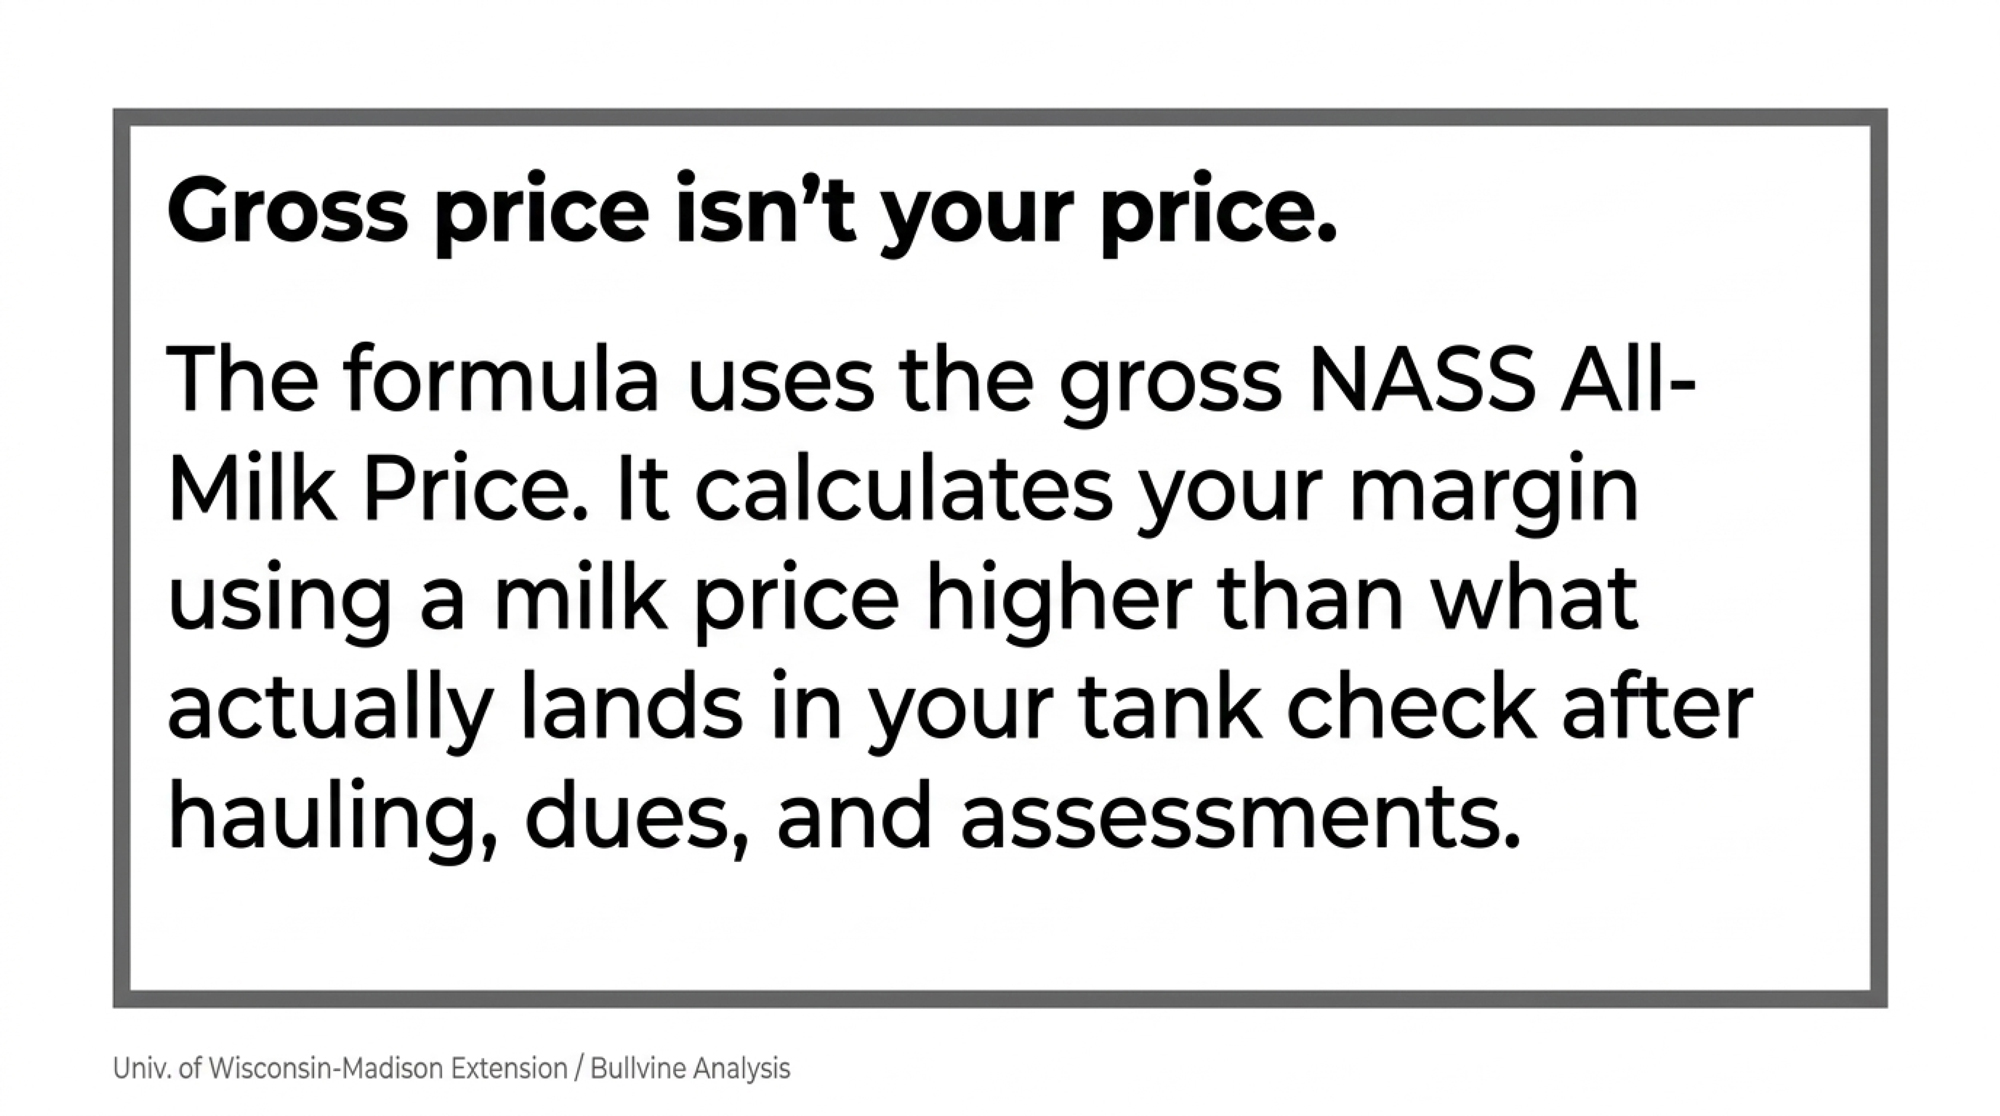
The revenue side has its own gap. University of Wisconsin–Madison Extension noted in August that the formula uses the NASS All-Milk Price, a gross figure collected before hauling, cooperative dues, marketing assessments, and promotion deductions. The margin is built from a milk price above what lands in the tank check and a feed cost that excludes most of what it takes to make the feed.
That’s the boundary the program was built with. What the document settles is what gets measured, not whether anyone oversold it.
What our own spring coverage got wrong, and what that shows
Bullvine’s spring analysis of Hormuz and dairy input costs ran its model on $4.16 diesel. That was our scenario input at the time, not a market forecast, and the EIA weekly series has since printed $6.285. We were $2.13 low.
The direction was right, and the magnitude was off by half. A cost input can double the gap between a farm’s budget and its invoices inside two quarters while the federal margin that farm watches moves the other way.
We’re labeling that March page’s $4.16 diesel and $18.95 milk forecast as March 2026 scenario inputs before this piece links to it.
Is the DMC margin still tracking your margin in 2026?
FSA’s published series for the 2026 program year. National, USD per hundredweight, retrieved September 17. The all-milk price underlying it comes from USDA NASS and is subject to revision. FSA hadn’t published August as of that retrieval.
| Month, 2026 | All-milk | Feed cost | Margin | Tier 1 indemnity at $9.50 |
| January | $17.50 | $9.69 | $7.81 | $1.69/cwt |
| February | $18.30 | $9.84 | $8.46 | $1.04/cwt |
| March | $19.70 | $10.13 | $9.57 | none |
| April | $20.80 | $10.26 | $10.54 | none |
| May | $21.30 | $10.68 | $10.62 | none |
| June | $21.10 | $10.22 | $10.88 | none |
| July | $20.30 | $10.37 | $9.93 | none |
Six consecutive monthly increases from January through June, then a $0.95 retreat in July that left the margin 43 cents above the trigger. Six points in one direction clears the four-point test comfortably. March was the first month of the program year above $9.50, and the payments stopped there.
The milk price did the lifting. Across January to June, all-milk rose $3.60/cwt while the feed calculation rose $0.53. June ran the other way: all-milk eased from $21.30 to $21.10 while feed fell from $10.68 to $10.22, so cheaper corn and soybean meal carried that month. June’s $10.88 sat $1.38 above the trigger, the widest gap of the program year so far.
April shows how fast the switch flips. All-milk jumped $1.10, from $19.70 to $20.80, pushing the margin to $10.54 and generating no payment at any coverage level for a second straight month.
The forecast record is its own small story. Penn State Extension’s January 21 enrollment article, working from projections then available, put the 2026 full-year average margin at $8.84/cwt. Bullvine calculation: the seven published months average $9.69/cwt, $0.85 higher. Anyone who budgeted off January’s outlook has been carrying a better milk price than expected and a fuel bill the January outlook didn’t include.
Against the longer record, 2026 isn’t an outlier. A University of Wisconsin–Madison Extension review of 84 months from 2019 through 2025 found an average margin of $9.48/cwt, with 39 of those months below $9.50. The same team’s August 2026 read is the sentence worth pinning above the desk: feed costs were elevated, but milk prices kept pace through most of the run, so the formula margin compressed less than producers’ on-farm costs did.
Running the Numbers: the modeled 500-cow scorecard
Modeled 500-cow herd at 24,000 lb, 120,000 cwt shipped, forage grown on-farm, 95% coverage, Tier 1 at $9.50.This is a model, not a farm’s books. No named farm, no invoices, no milk statements.
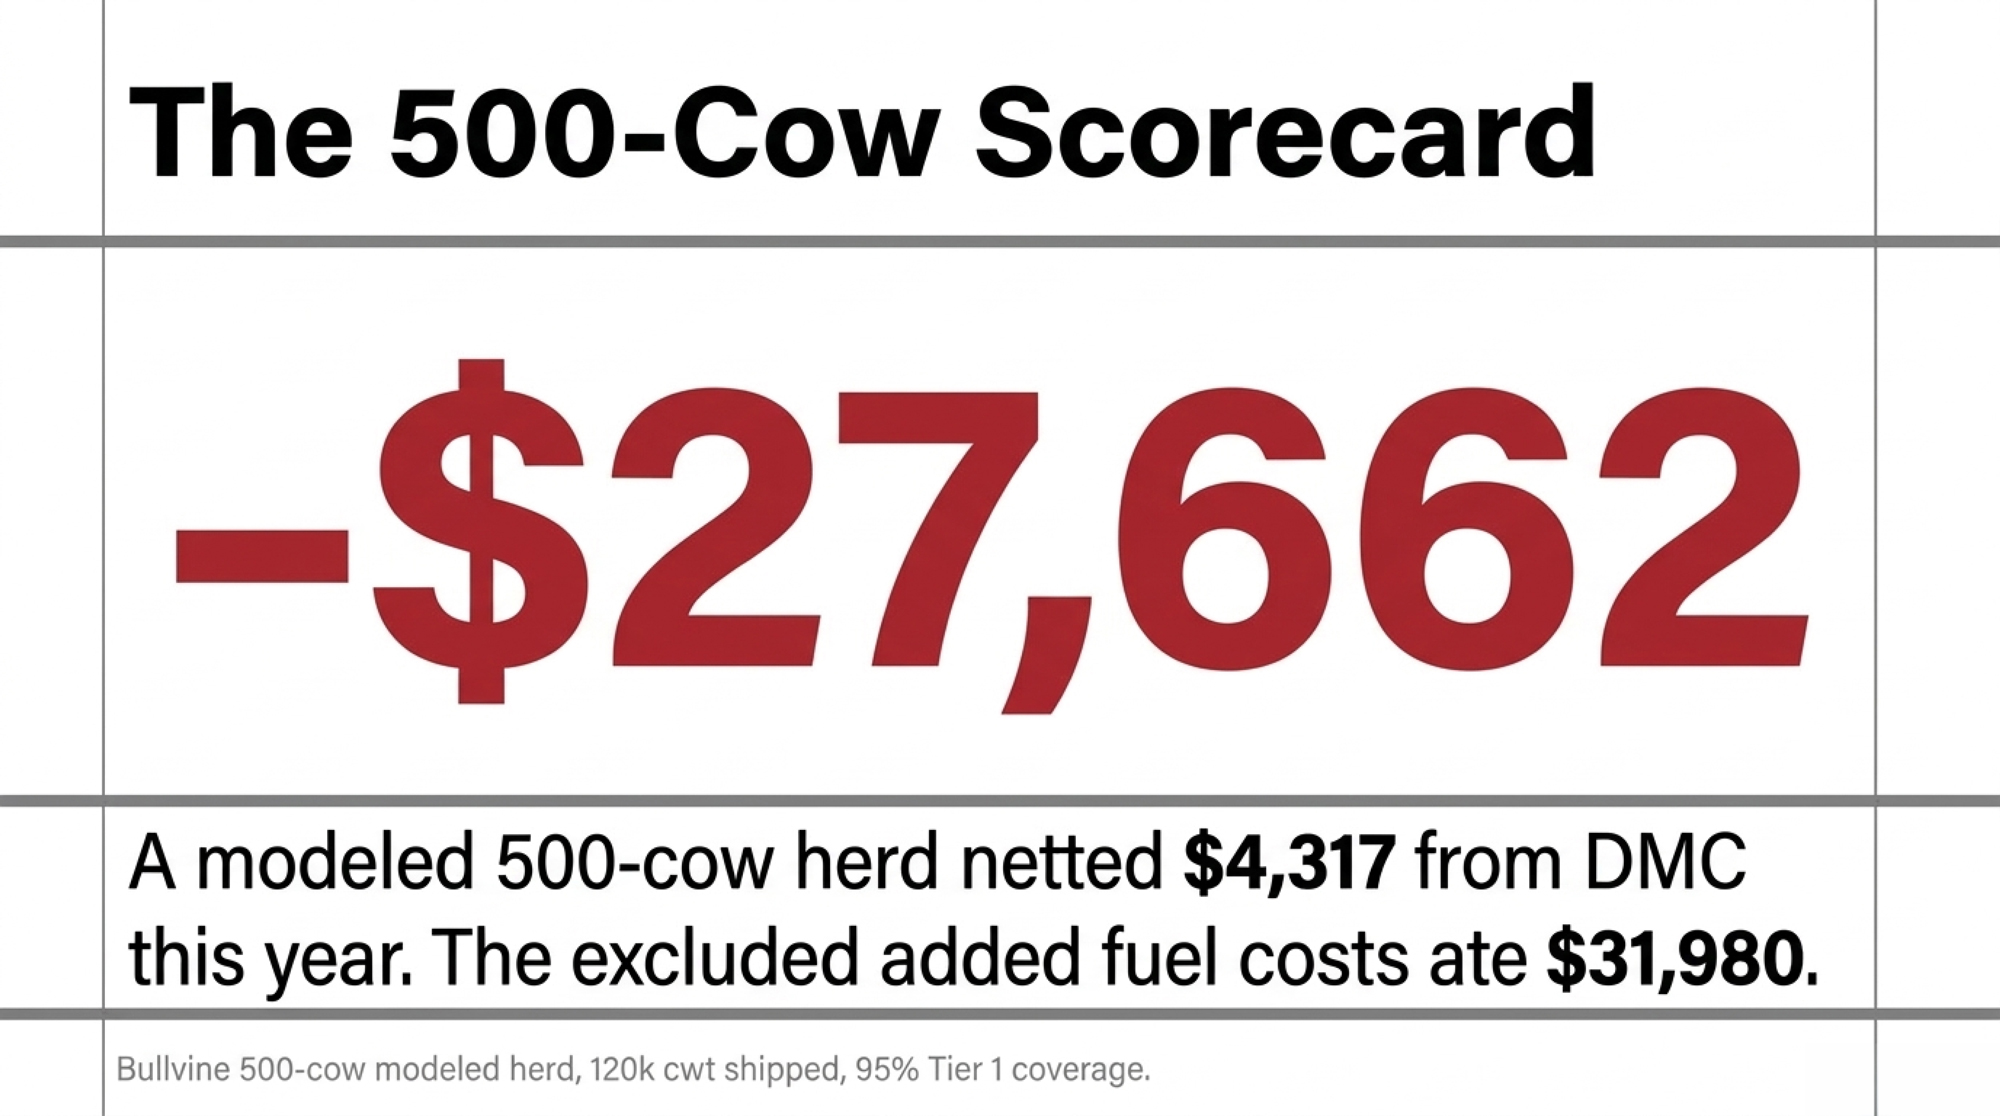
| 500-cow model | Financial value | Basis and constraint |
| DMC net indemnity received | +$4,317.50 | $12,967.50 on 57,000 covered cwt (Jan and Feb below trigger), less $8,550 premium and the $100 fee |
| Conservative added fuel cost | −$31,980.00 | 120,000 cwt whole-herd exposure, 50% fuel share of the $0.82/cwt ERS line, moved by +65.0% |
| Net operational gap | −$27,662.50 | 7.4 to 1 excluded-cost-to-payout deficit |
At the 25% six-year lock-in discount, the program side improves to $6,455.00, and the gap narrows to $25,525.00. At 60% and 70% fuel shares, the added cost runs $38,376 and $44,772.
Published evidence:
- January margin $7.81/cwt, February $8.46/cwt — USDA Farm Service Agency, DMC Prices and Updates, national, USD, retrieved September 17, 2026
- Tier 1 first 6 million lb; $0.1500/cwt premium at $9.50; $100 annual administrative fee — USDA FSA, DMC fact sheet and premium schedule, January 2026, in force
- Diesel $3.809/gal February 23 to $6.285/gal September 14, 2026, up 65.0% — U.S. Energy Information Administration, Weekly Retail Gasoline and Diesel Prices, U.S. national, on-highway
- Fuel, lube and electricity combined, $0.82 per hundredweight sold, Southern Seaboard region, no size breakout, 2025 estimate — USDA Economic Research Service, Milk Cost of Production, regional estimates, row read directly off the ERS dataset. This is an operating-cost line item, not ERS full economic cost, which imputes owned land and unpaid family labor and can run 40% or more above a farmer’s cash cost
Bullvine math, program side: 6,000,000 lb × 95% = 57,000 cwt/yr, or 4,750 cwt/month. January ($9.50 − $7.81) × 4,750 = $8,027.50. February ($9.50 − $8.46) × 4,750 = $4,940.00. Premium $0.15 × 57,000 = $8,550.00.
Bullvine math, fuel side: $0.82 × 50% = $0.410/cwt baseline. $0.410 × 65.0% = $0.2665/cwt added. $0.2665 × 120,000 = $31,980. Figures computed before rounding.
Why the on-highway price is the conservative input
Two objections land on this calculation from anyone who buys dyed fuel by the transport load. Both cut in the article’s favor, and here’s the arithmetic.
Off-road diesel is cheaper in absolute terms, not in percentage terms. IRS Publication 510 puts the federal tax on diesel at $0.244 per gallon, and only the $0.001 leaking-underground-storage-tank levy applies to dyed diesel, so the federal differential is $0.243 before state fuel taxes that also don’t apply and vary by state. On-farm and off-highway business use are listed as nontaxable uses. The farm tank price therefore sits below the EIA retail number all year.
But the exemption is a fixed amount per gallon, not a discount rate. Take an illustrative $0.40 off both ends of the EIA move, and $3.409 becomes $5.885 — a 72.6% increase, not 65.0%. The tax-free base is smaller, so the same cents-per-gallon jump is a larger percentage. Using the on-highway percentage understates what the dyed-fuel buyer absorbed.
Electricity sits in the same ERS bucket and moved nowhere near 65%. EIA’s May 2026 Short-Term Energy Outlook has U.S. residential electricity averaging 18.2 cents per kilowatt-hour in 2026 against 17.30 cents in 2025, which EIA describes as a nearly 5% increase. That’s why the conservative case assumes petroleum fuel and lube are only half the $0.82 line. Applying 65% to the whole bucket would treat a 5% electricity move as a 65% one.
Why the next four months matter more than the last seven
July’s margin sat 43 cents above the trigger. The Center for Dairy Excellence, a Pennsylvania industry organization, projected in its June 30 market review that all-milk would fall to $19.43 in August before recovering to $21.11 by December, with feed costs climbing from $9.32 in June to $9.60 in December.
Milk down and feed up is what walks the national margin back toward $9.50. Every operation enrolled at that level is about to find out whether the program switches back on in the same months its diesel bill is still running above February. The two have no mechanical connection.
Two links in the chain stay unevidenced here. How much of the 2026 diesel move traces to the Gulf conflict rather than refinery, inventory, and demand factors is not established. Neither is whether higher fertilizer costs have already moved into 2027 corn, meal and hay bids, which would put part of this shock inside the formula and turn the signal around again.
Nitrogen or potash: which line does the 2027 fertilizer call hinge on?
Nitrogen, and it isn’t close. The Food and Agriculture Organization put the affected Gulf region at roughly one-third of globally traded urea and one-fifth of ammonia. The World Bank reported the urea benchmark above US$850 per metric ton in April, 80% above February. Its 2026 forecast for muriate of potash is a rise of about 12%.
Potash rides a different supply chain. The U.S. Geological Survey reports Canada supplied 79% of U.S. potash imports across 2021 through 2024, with Russia at 12% and Israel at 3%. Freight and energy costs still travel. The chokepoint doesn’t.
If you’re pricing one nutrient hard this fall, price the nitrogen. And if your hauling deduction moved this year too, that’s the same diesel showing up in a second line the formula can’t see.
The 90-day playbook for herds enrolled at $9.50
30 days.
Put your actual monthly operating margin per cwt beside FSA’s published margin for the same month, twelve months back. Net milk revenue after hauling and deductions, minus accrual-adjusted feed, minus defined non-feed operating costs. Requires twelve milk statements and twelve months of expense detail. If you don’t have twelve, run six, or pull four quarters from your accountant’s working papers. The shorter series will diagnose a divergence, but it won’t set a band you can trust. Threshold: if the two moved opposite directions in two consecutive months, the national margin has stopped working as your proxy. Sharper trigger if you carry term debt: if your lender’s own debt-service coverage calculation has sat below its covenant floor for three consecutive quarters, this goes to the front of the list, because you no longer have room to absorb a gap you haven’t measured. Backfires if you use check-book cash flow, where a January tank fill reads as a January cost.
Put a name and a monthly due date on that reconciliation. Requires a decision, not a purchase. Threshold: if nobody owns it by month-end, it won’t happen. Watch for it drifting to whoever is least equipped to produce it.
Compute your own mailbox-to-all-milk gap from six consecutive checks, then set it against the right published number. Net pay divided by cwt shipped, compared with your own federal order’s monthly uniform price or producer price differential, not the national all-milk figure, which is collected gross and averaged across every order. Requires six milk statements and your market administrator’s monthly report. Threshold: whatever your six-month gap is, that’s a second basis you carry on top of the first, and it belongs in the same worksheet. Backfires if you benchmark against a national number and conclude your handler is the problem when the order is.
90 days.
Price 2027 nitrogen in dollars per pound of actual N, delivered and applied, netting out a current manure analysis. Requires written dealer quotes with expiry dates, your acres, and a nutrient plan. Threshold: act when a quote’s expiry falls inside your cash-flow window, not on a calendar rule. Backfires by converting price risk into prepay, storage, and counterparty risk.
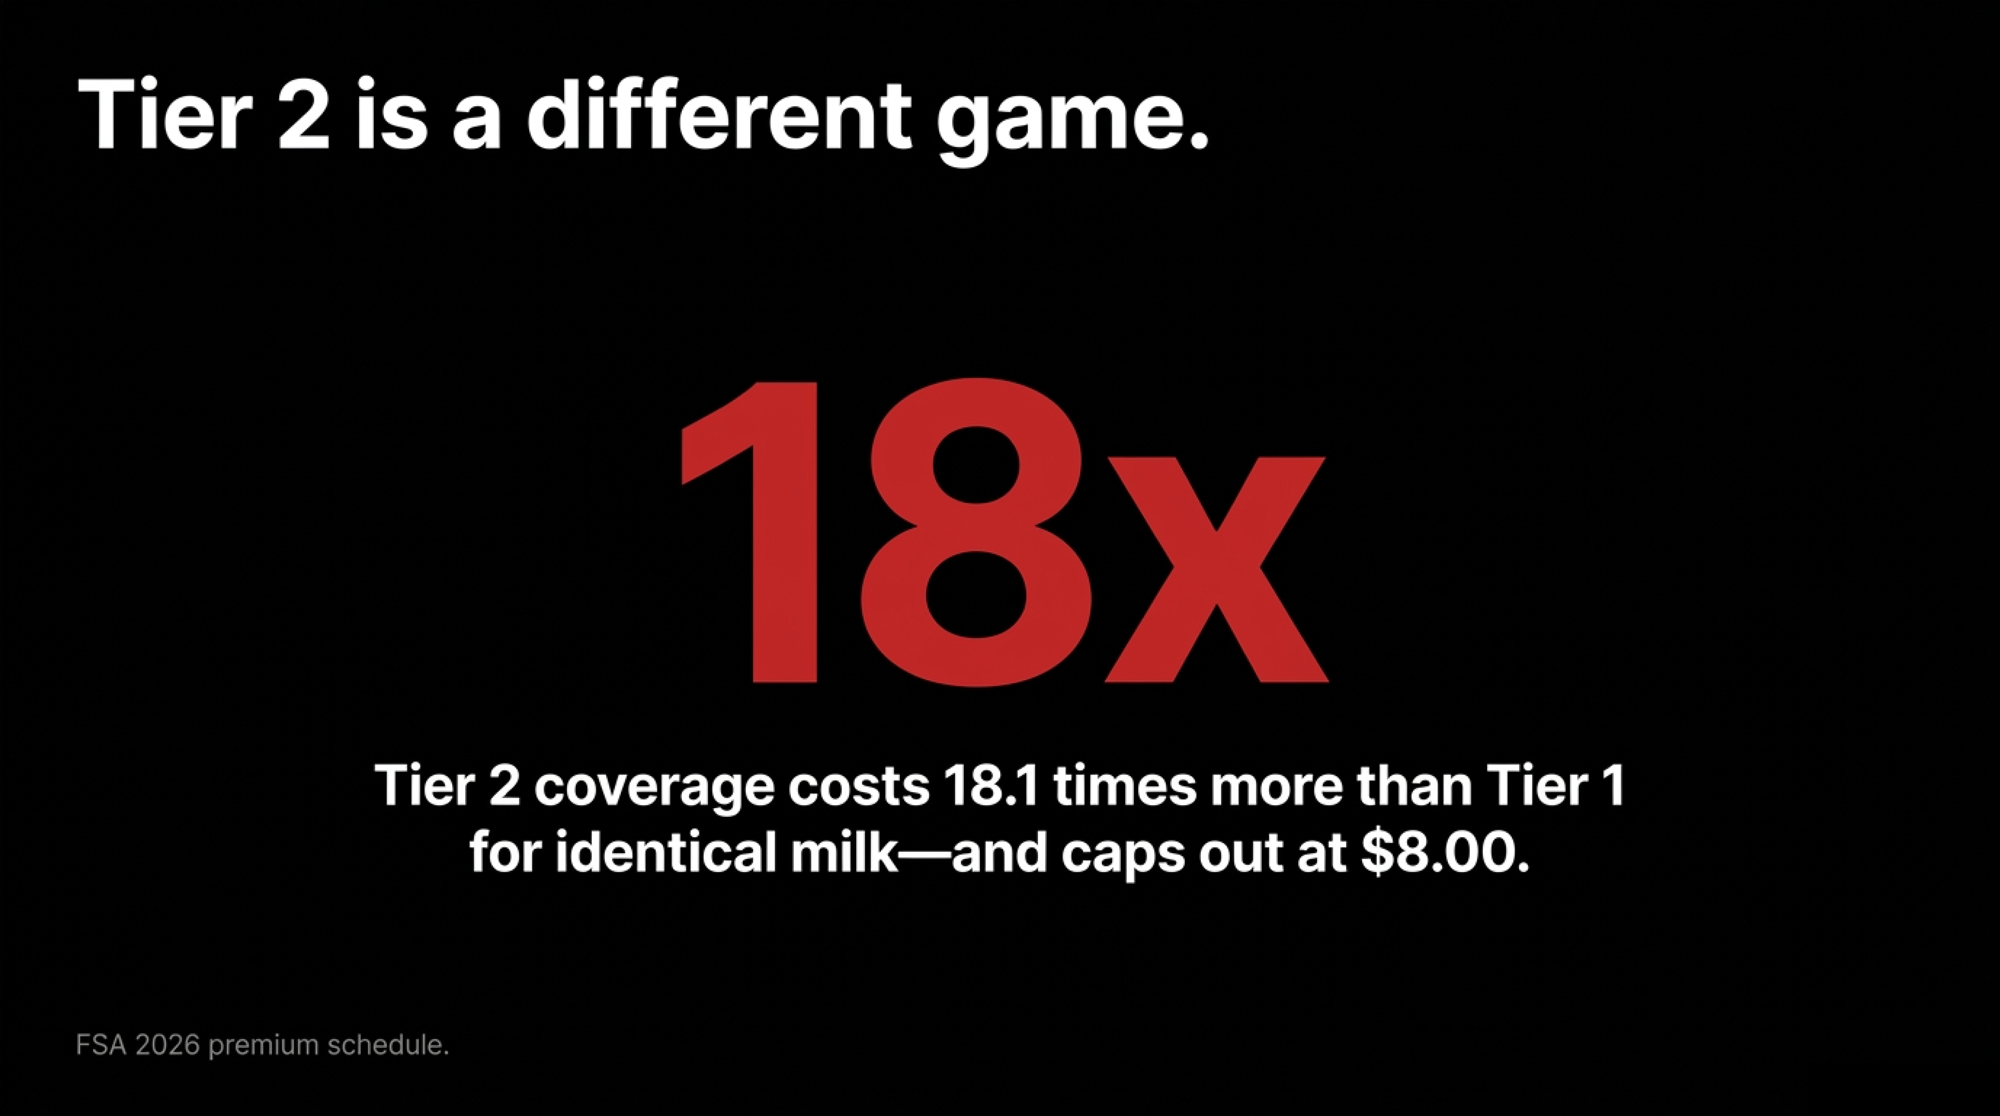
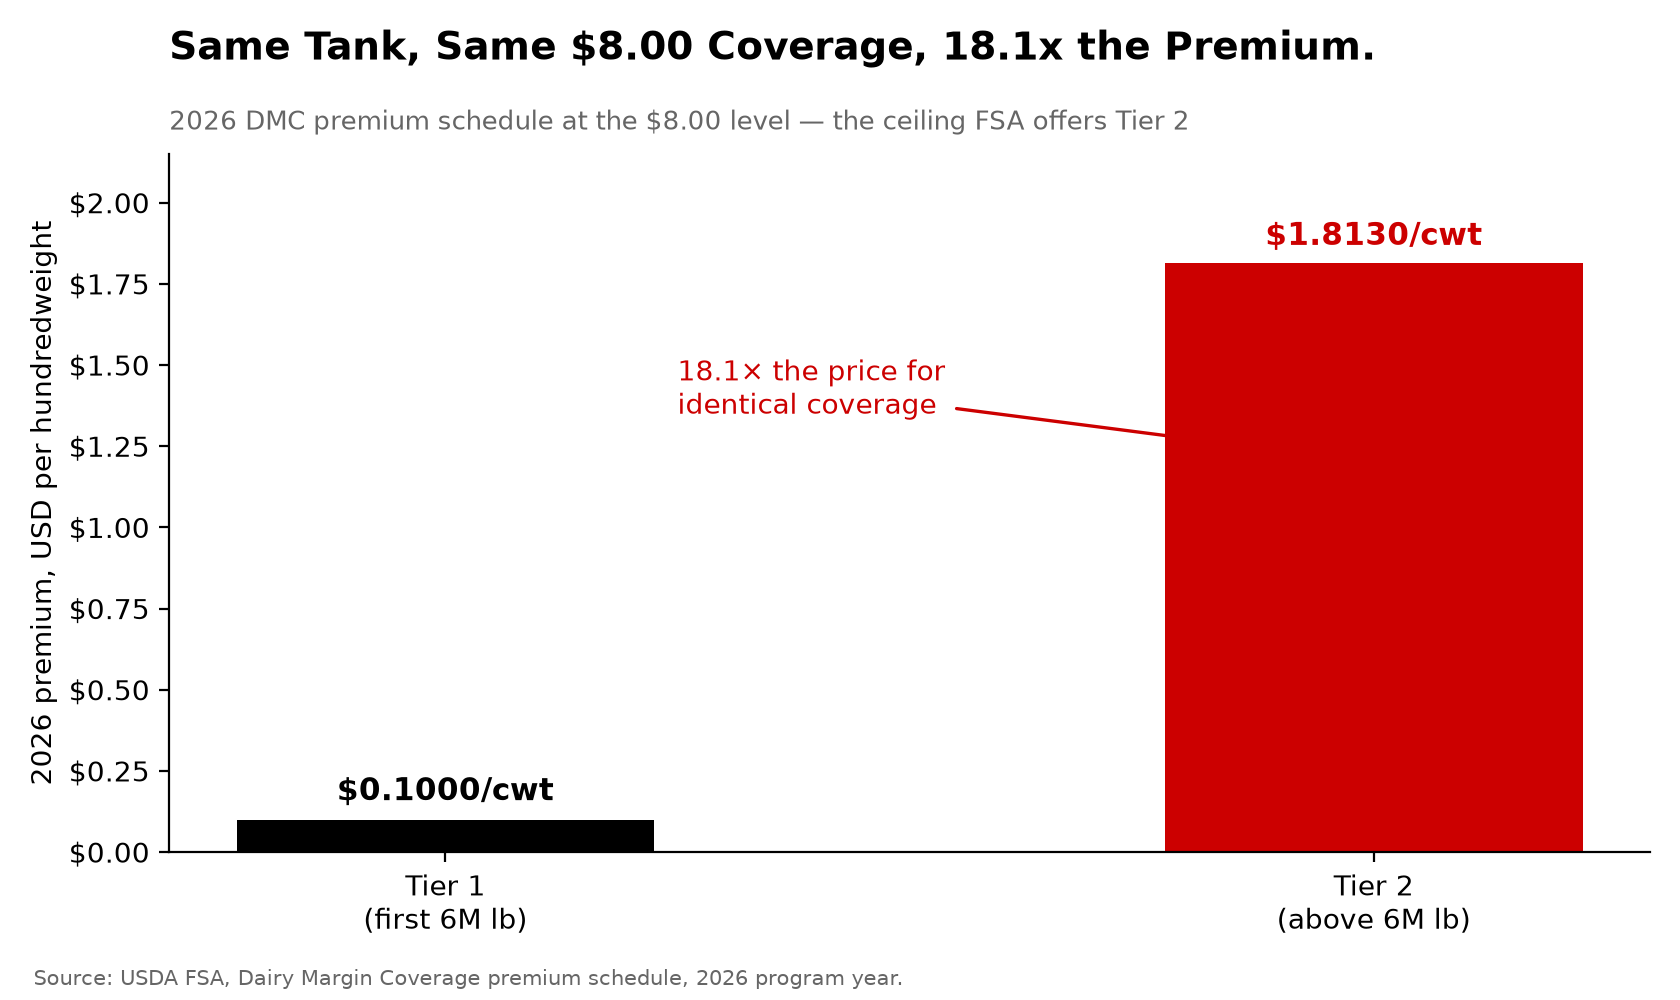
Decide what job Tier 2 is doing. At the $8.00 level, FSA’s 2026 premium schedule sets Tier 1 at $0.1000/cwt and Tier 2 at $1.8130. That’s 18.1 times the price for identical coverage on milk from the same tank, and $8.00 is the ceiling. Threshold: under three months of fixed-cost runway, Tier 2 is survival coverage. Over six months, it’s a resizing conversation with your lender. Requires your accessible cash and your true monthly fixed costs, not an estimate. Our full breakdown of the Tier 2 premium election runs the 84-month version of that math.
Get your 2027 forage acres costed at current nitrogen prices before you finalize the cropping plan. Requires the dealer quotes above plus your agronomist’s rates. Threshold: if homegrown feed is still carried at last year’s fertilizer cost, your breakeven is wrong and so is every margin you calculate off it.
365 days.
Write a trigger for the farm-versus-DMC gap. A dollar limit and a direction limit, each with an attached action. Requires 36 to 60 months of matched data to set the band honestly, which is the real reason to start the reconciliation now. Opportunity signal: current fertilizer benchmarks point toward higher 2027 feed replacement costs, and if that moves into corn, meal and hay bids, the formula starts seeing part of this shock. Coverage economics at $9.50 improve for whoever kept the matched series current and can prove where their own margin sat.
Key Takeaways
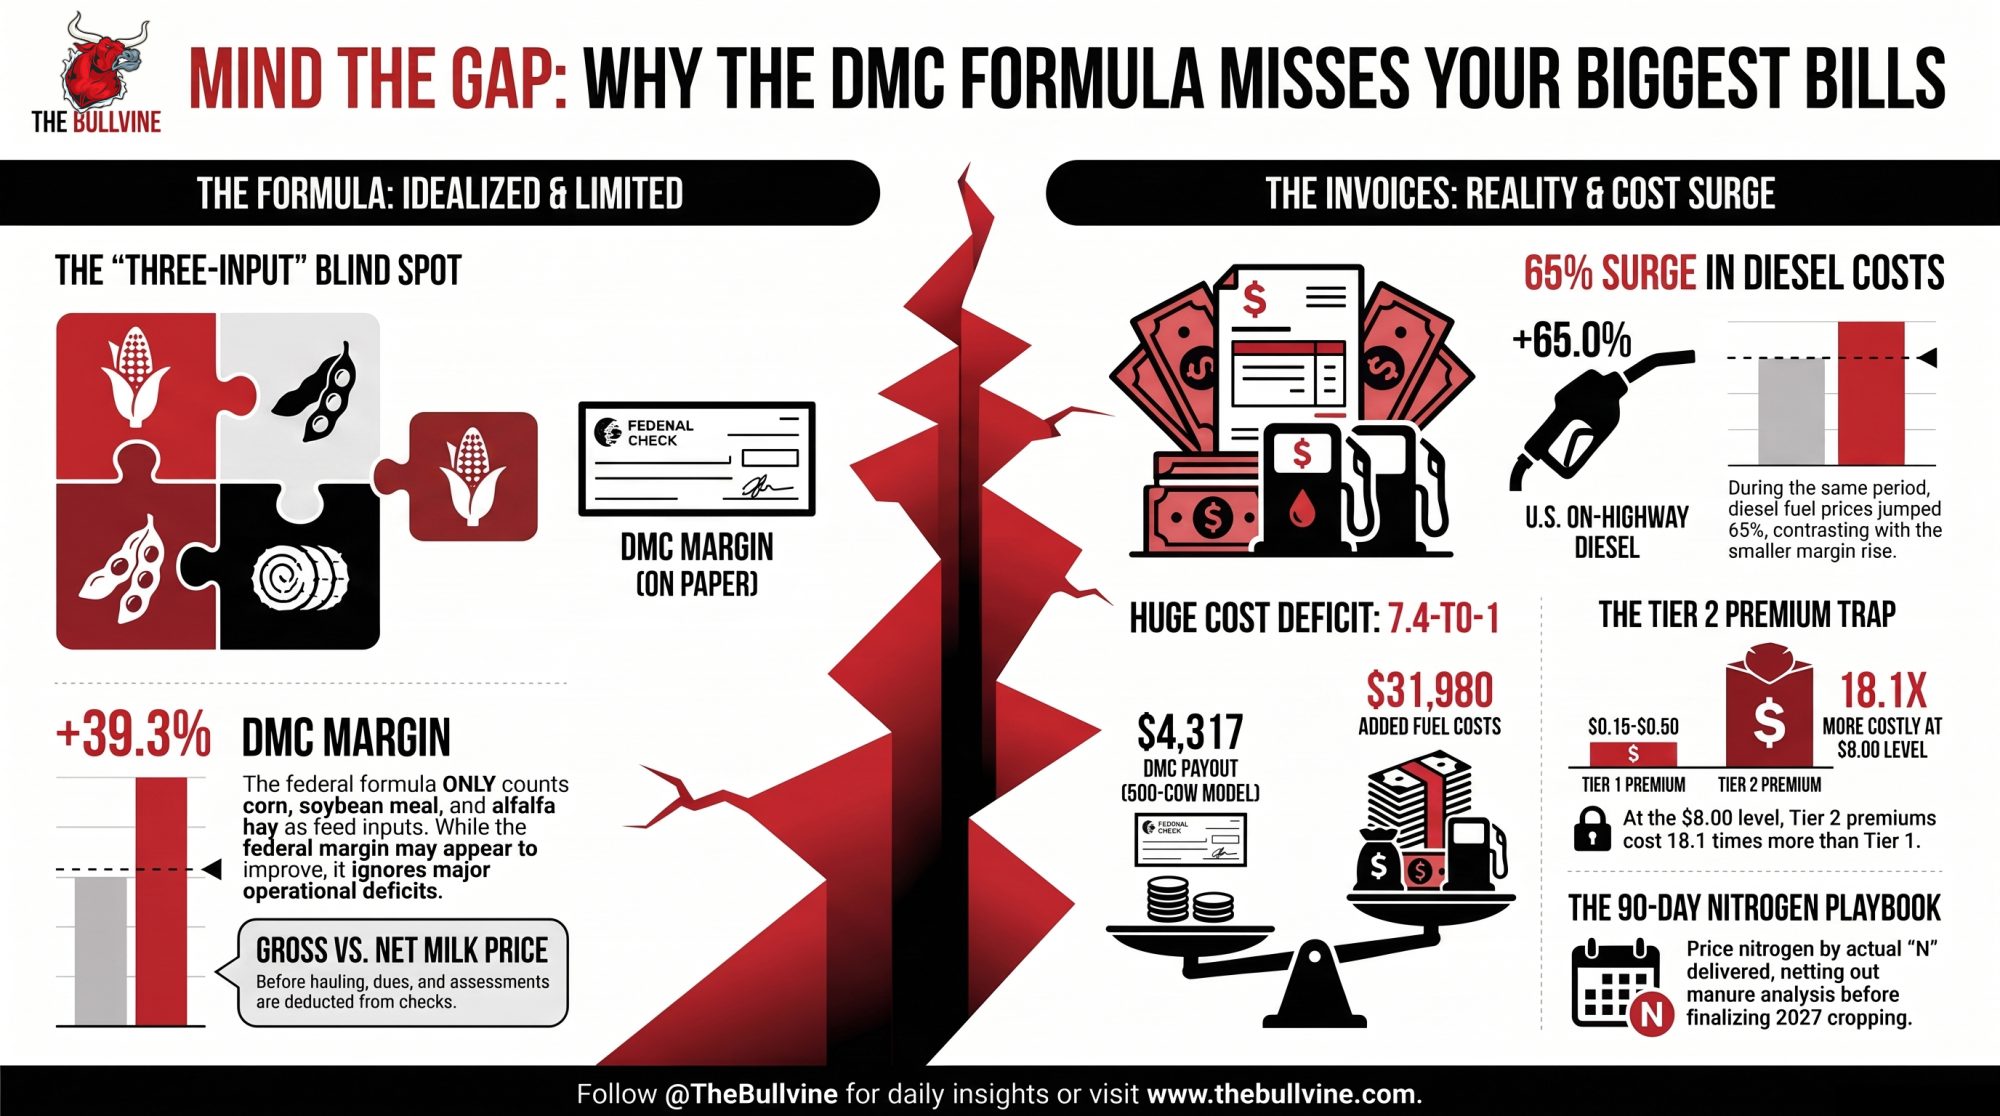
- FSA’s margin formula recognizes three feed inputs — corn, soybean meal and alfalfa hay, per 7 CFR §1430.411. Diesel, hauling, nitrogen, electricity, labor, and interest aren’t in it, and never were.
- On a modeled 500-cow herd, one excluded cost line ran $31,980 against $4,317.50 net from the program to date in 2026. Different denominators, and only one of them shows up on your invoices.
- The all-milk price feeding that formula is collected gross, before hauling, dues, assessments, and promotion, so the margin is built from a milk price above what lands in your tank check.
- FSA doesn’t offer Tier 2 above $8.00, so every herd over 6 million pounds is locked out of the $9.50 level Tier 1 herds buy. At $8.00, Tier 2 costs 18.1 times Tier 1 for identical coverage.

Two statements, one check
The trade-off isn’t whether to carry DMC at fifteen cents. It’s whether you keep reading a national milk-over-feed number as a verdict on your own business while the costs it excludes move faster than the ones it includes.
So pull your January 2026 milk statement and your July 2026 statement. Net pay divided by cwt shipped, both months. Set them beside FSA’s published margins, $7.81 and $9.93. If the federal number improved more than yours did, what does your own expense ledger say moved in the gap?
Audit Your Herd: DMC Safety Net vs. Uncovered Fuel Deficit
Plug in your production history, actual cow numbers, and local forage baseline to test if 2026 DMC payments bridged your fuel bill.
Methodology and limitations
All dollar figures are USD unless otherwise noted.
Sources. DMC margin, all-milk price, and feed cost figures come from USDA Farm Service Agency’s DMC Prices and Updates table, 2026 program year, retrieved September 17, 2026, national scope. The all-milk price underlying that table originates with USDA NASS and is subject to revision; it’s collected gross, before hauling, cooperative dues, marketing assessments, and promotion deductions. The feed formula and the premium-and-supreme alfalfa pricing basis are stated in 7 CFR §1430.411. Diesel prices come from the U.S. Energy Information Administration’s weekly retail on-highway series, U.S. national, February 23 and September 14, 2026. Federal diesel tax rates and the dyed-fuel treatment come from IRS Publication 510 (rev. 12/2025); the statutory exemption sits at 26 U.S.C. §4082. Electricity prices come from EIA’s Short-Term Energy Outlook, May 2026 edition.
The fuel line. Fuel, lube, and electricity combined, from USDA Economic Research Service’s Milk Cost of Production regional estimates (2025), Southern Seaboard region, no size breakout, based on the 2021 ARMS survey updated annually for price changes. It’s an operating-cost line item, not ERS full economic cost. The Southern Seaboard is the higher of the two regions we pulled, so these figures are not a national low; a lower-cost region produces a smaller number. We’re not publishing a second regional case because the second row wasn’t confirmed in this pass, and one verified input beats two where one is an estimate.
The model and its limits. The 500-cow calculation assumes forage grown on-farm; a dairy buying all its feed carries almost no field diesel, and its exposure sits in the hauling deduction and the delivered feed price instead. Substitute your own gallons before you use any figure here. The program side counts only the two months below trigger, so it’s complete for 2026 to date, while the fuel side annualizes the current price gap and therefore overstates a partial-year exposure. The program net is earned on 57,000 covered cwt against fuel spread over 120,000 shipped cwt, two different denominators reported side by side rather than netted into a single rate. No hauling, fertilizer, or electricity increase is added, which avoids double counting against either the ERS line or the DMC feed formula. The fuel-and-lube share of the ERS line is an assumption, varied across three cases, with the lowest used in every headline figure. The $0.40 per gallon used in the off-road comparison is illustrative, not a market quote. National averages may not reflect your region, herd size, management system, debt position, or market access.
If your own numbers differ, send them. We publish producer data and case studies, and we correct factual errors visibly at the top of the article rather than editing silently. Corrections and data: editor@thebullvine.com
Learn More
- Feed Cost Reality Check: How Smart Dairy Operators Can Lock in $200+ Per Cow Savings While Markets Stay Predictable — Arms you with immediate procurement tactics, exploiting alternative protein substitutions like canola meal to slash diet costs by 14.4% and capture $180 to $220 per cow in annual ration savings.
- The $4/cwt Your Milk Check Is Missing – And What’s Actually Working to Get It Back — Exposes how make allowance hikes and regional basis spreads siphon $4/cwt from mailbox deposits, mapping long-term positioning around component premiums and beef-on-dairy sire selection through the 2027 margin cycle.
- Feed Center Revolution: Why Your Current Design Is Costing Your Dairy Six Figures Annually — Dismantles outdated commodity storage assumptions, showing how precision traffic design, dust capture, and automated mixing cut feed shrink from 6.5% to 2% to recoup over $100,000 monthly.
 The Sunday Read Dairy Professionals Don’t Skip.
 The Sunday Read Dairy Professionals Don’t Skip.
Every week, thousands of producers, breeders, and industry insiders open Bullvine Weekly for genetics insights, market shifts, and profit strategies they won’t find anywhere else. One email. Five minutes. Smarter decisions all week.




