







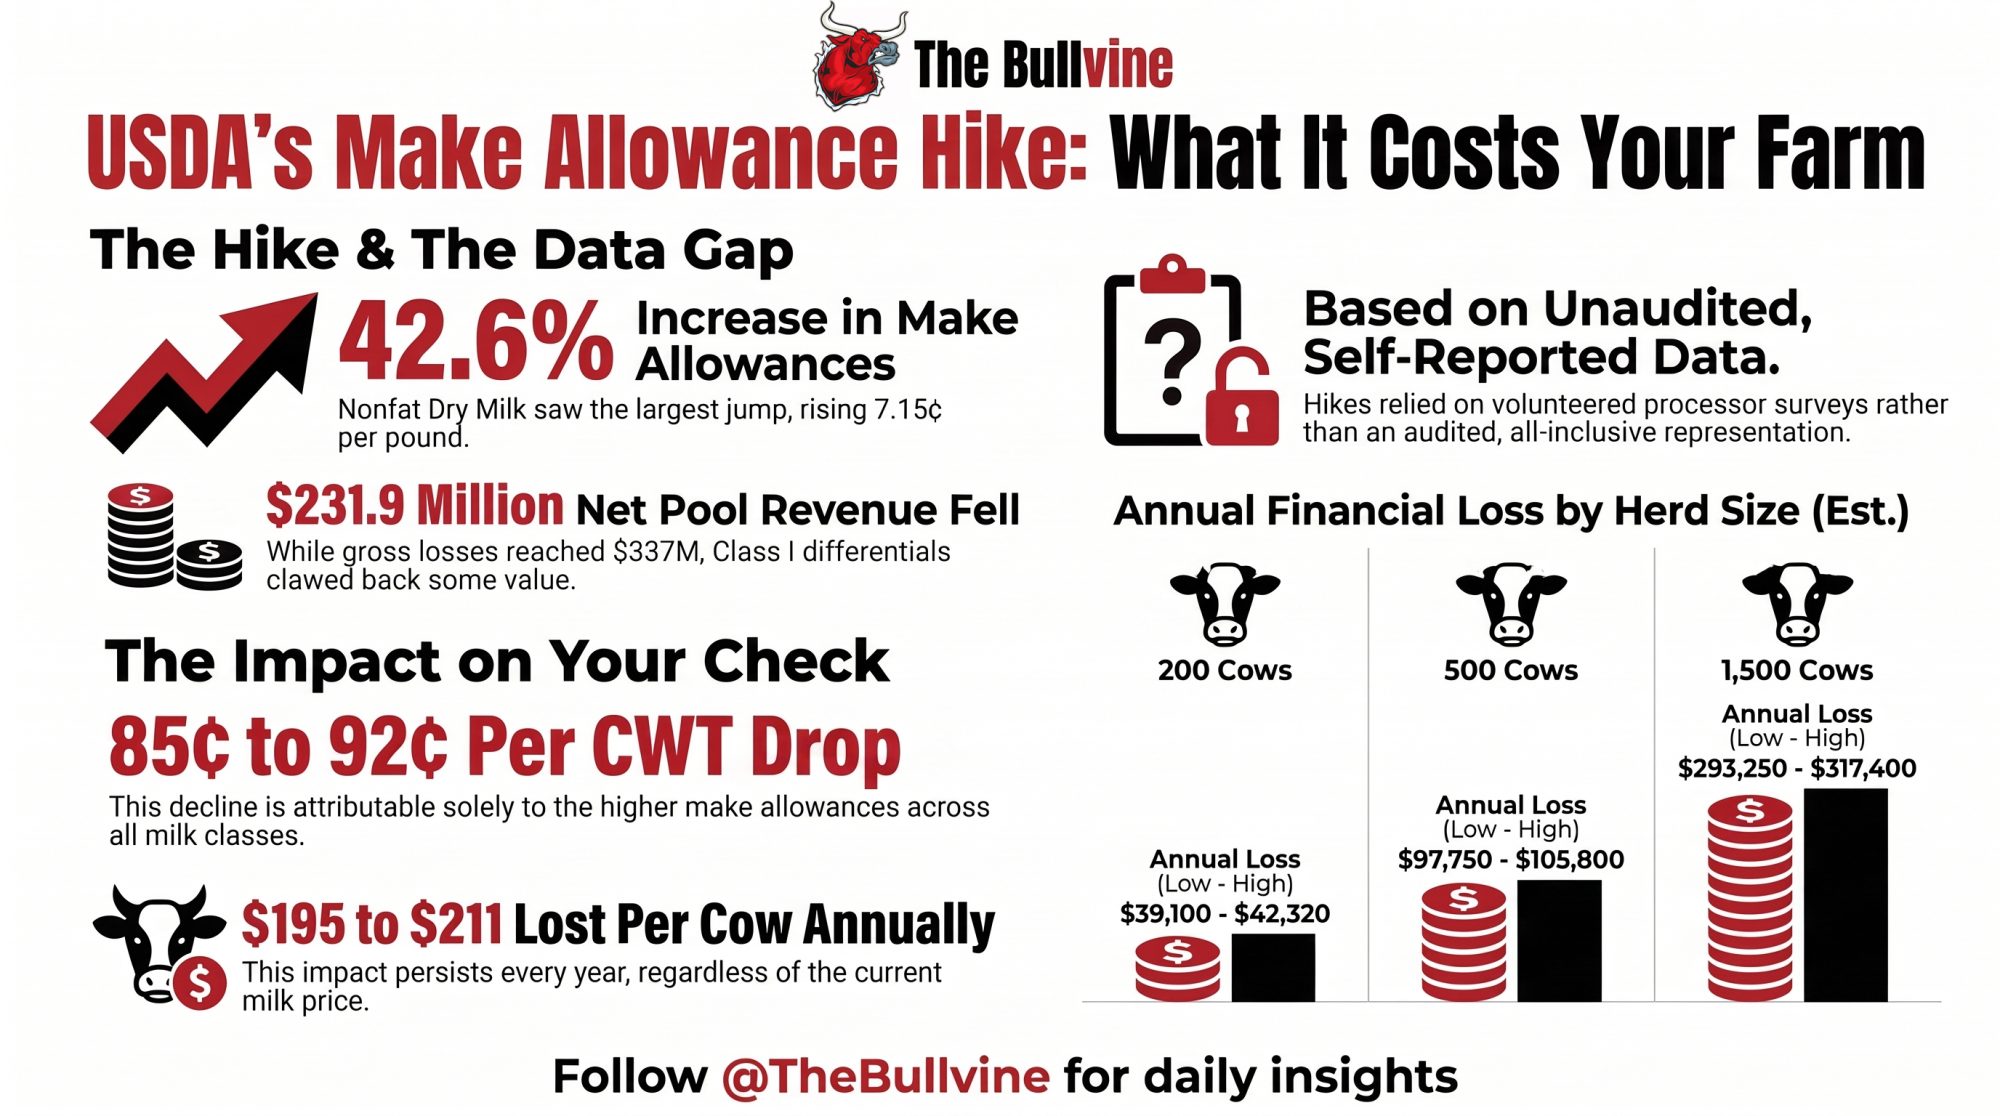
7.15 cents a pound. That’s what USDA added to the nonfat dry milk make allowance on cost data processors volunteered. On 500 cows, our math puts it at $97,750 to $105,800 a year — every year, at any milk price.
USDA raised all four FMMO make allowances effective June 1, 2025, and its own economic impact analysis states the plain version: those allowances had been “set in 2008 and determined using two surveys.” The decision raised them to $0.2519 per pound for cheese, $0.2272 for butter, $0.2393 for nonfat dry milk, and $0.2668 for dry whey.
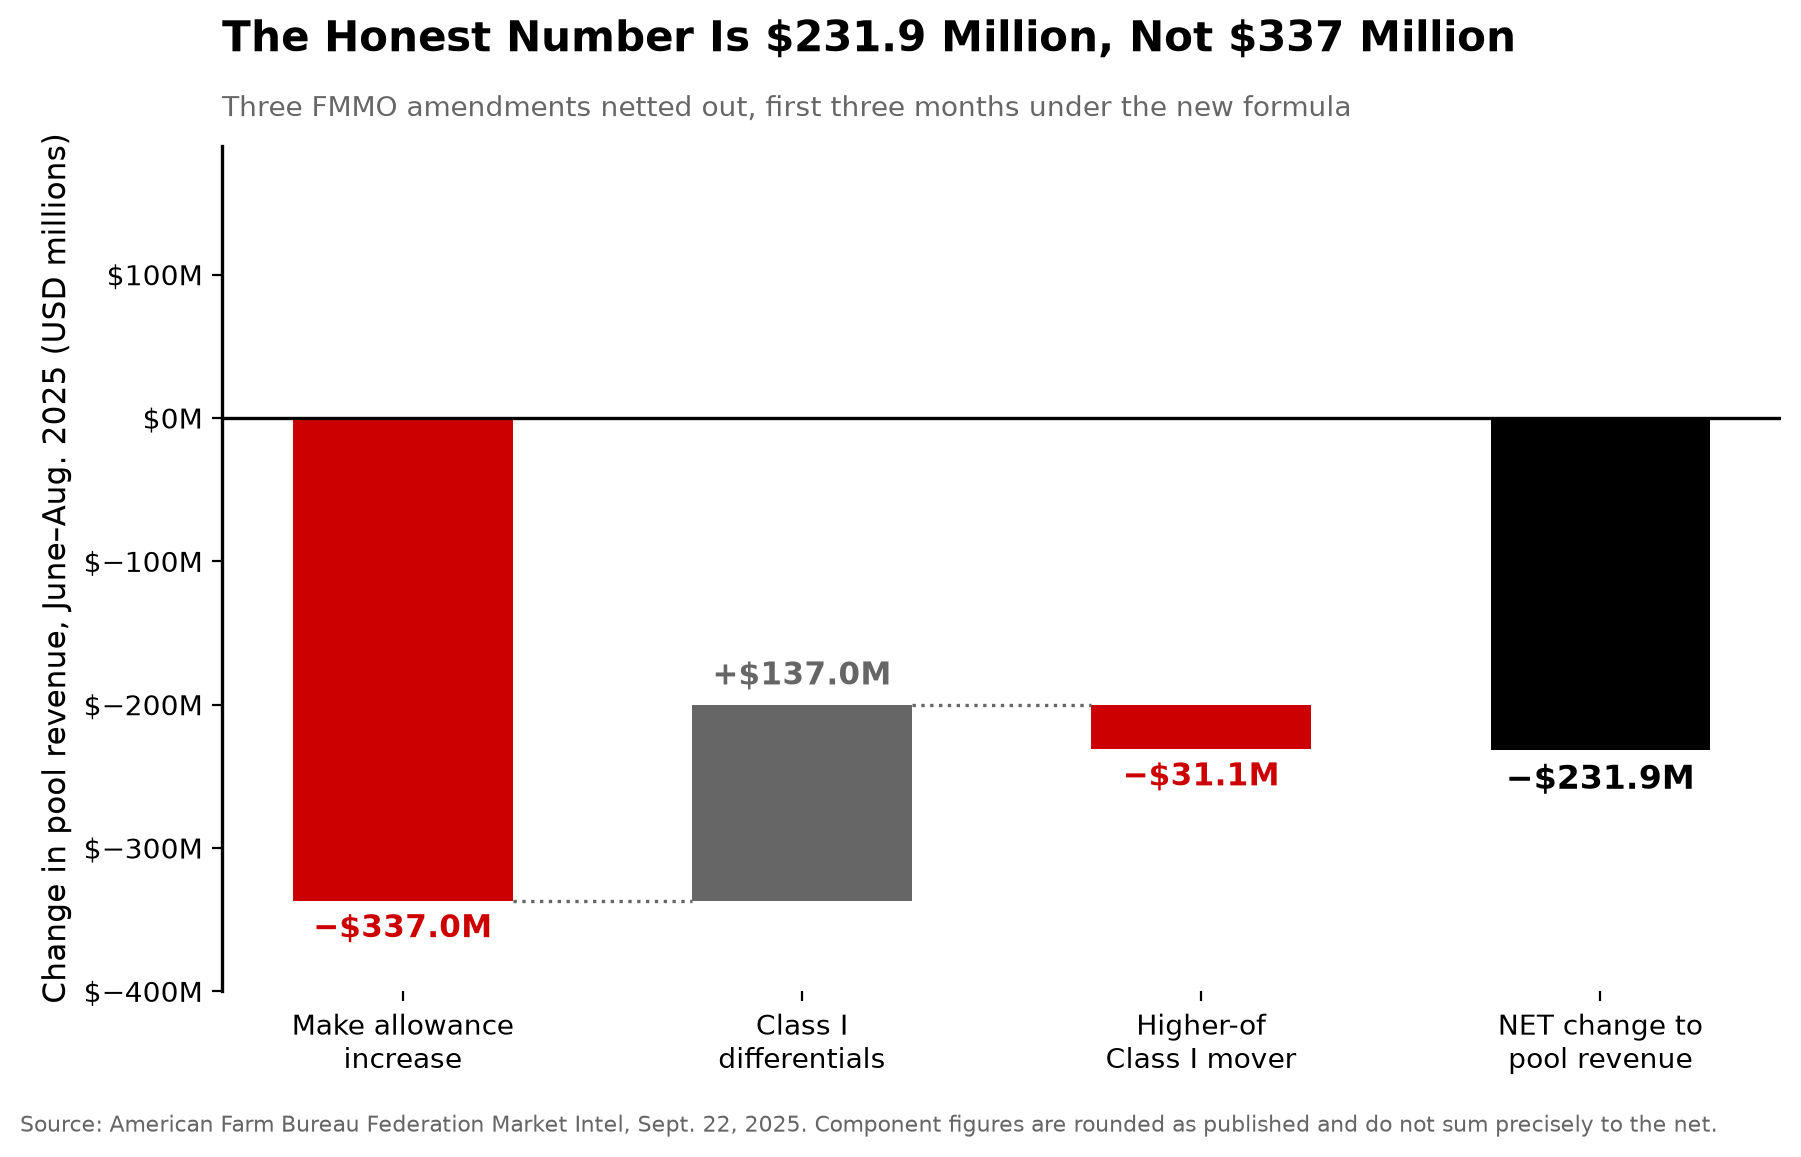
The American Farm Bureau Federation then measured the result. Across the first three months, Class I prices fell 89 cents per hundredweight, Class II 85 cents, Class III 92 cents, and Class IV 85 cents — a 4–5% drop “attributable solely to higher make allowances,” totaling $337 million in lost pool revenue.
Here’s what should sit uncomfortably with anyone whose milk was voted in those referenda. Farm Bureau’s review states USDA set those numbers using “a self-selected sample of self-reported manufacturers’ cost data, not an all-inclusive, audited representation of all processors.”
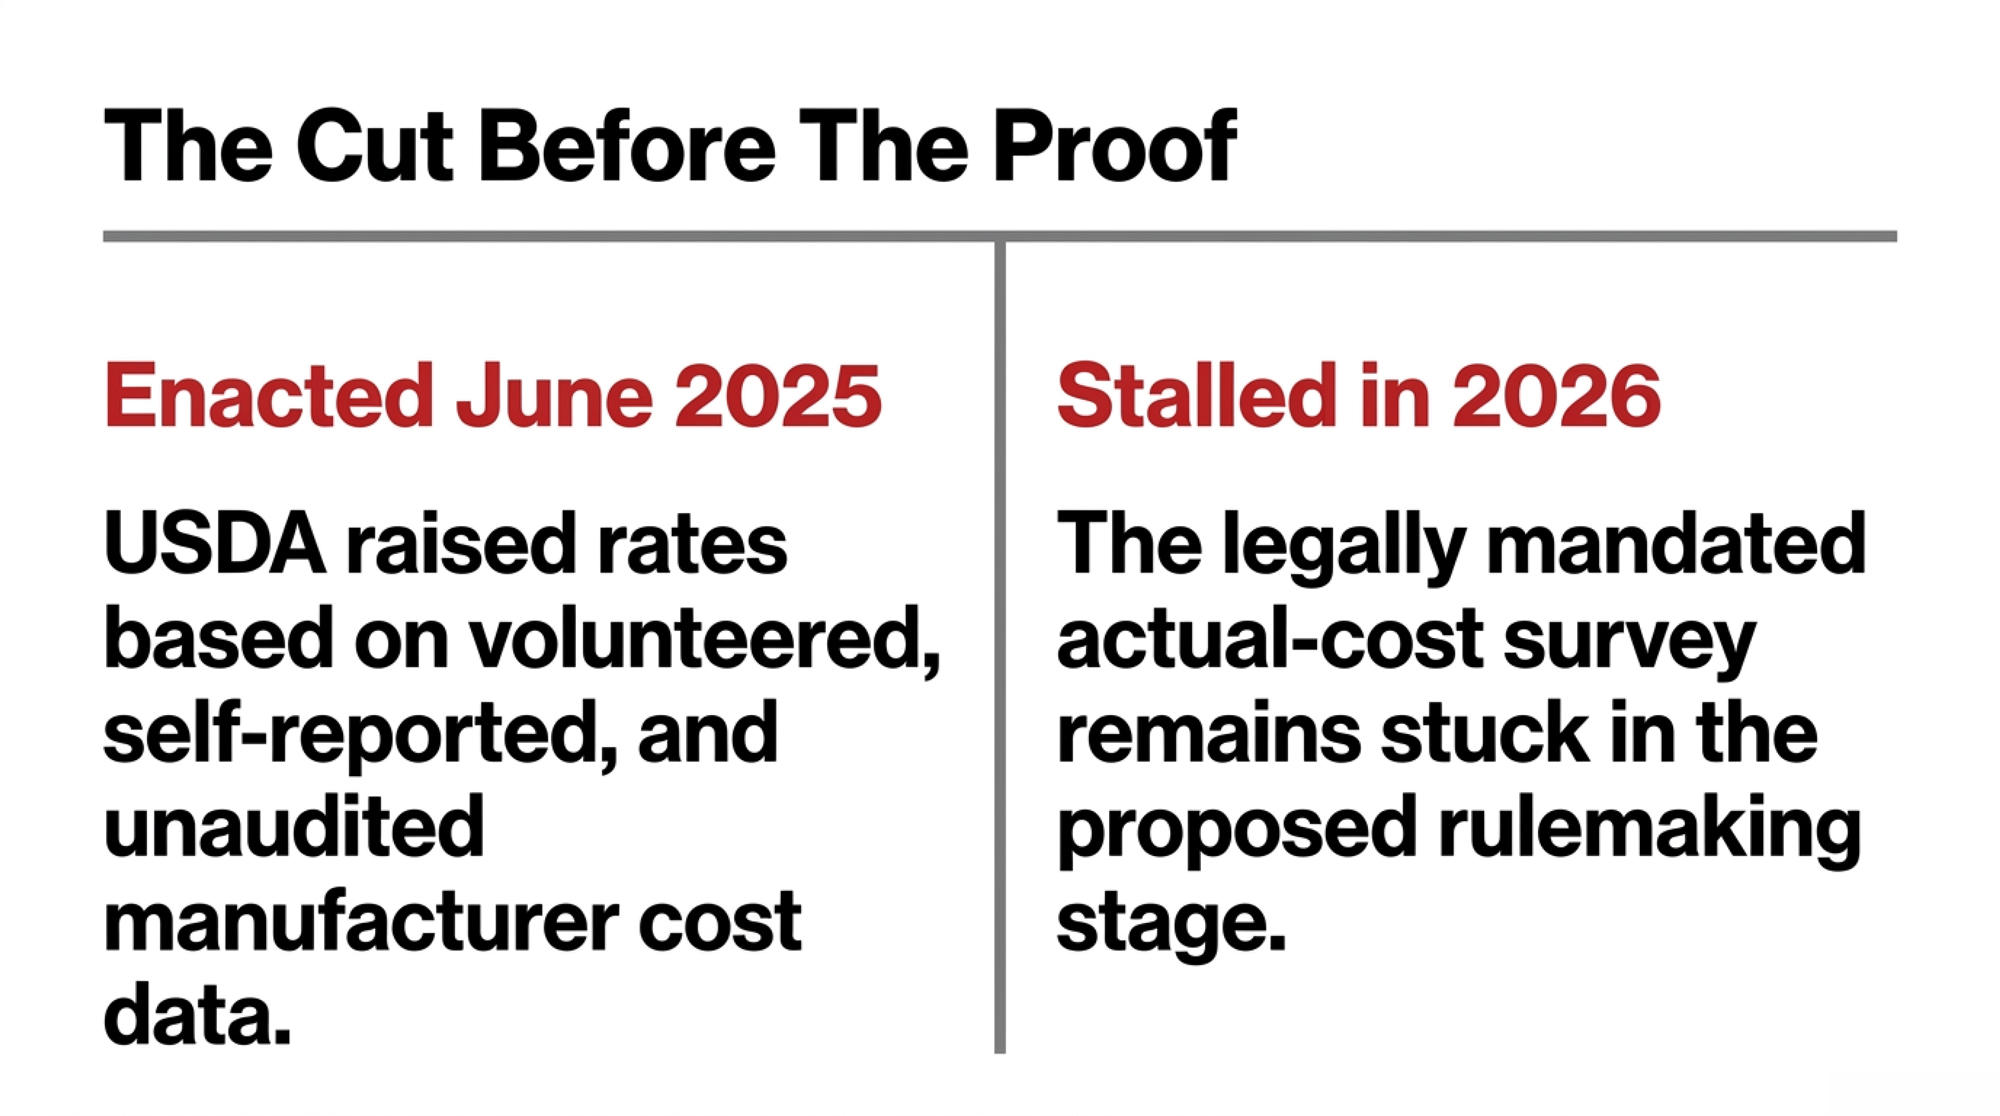
The audited version was meant to follow. The One Big Beautiful Bill Act of 2025 requires USDA to survey processors’ actual manufacturing costs for cheese, butter, and nonfat dry milk. As of today, USDA’s program page for that survey lists one document: an Advance Notice of Proposed Rulemaking issued Feb. 27, 2026. Not a proposed rule. Not a survey.
What USDA Changed, and by How Much
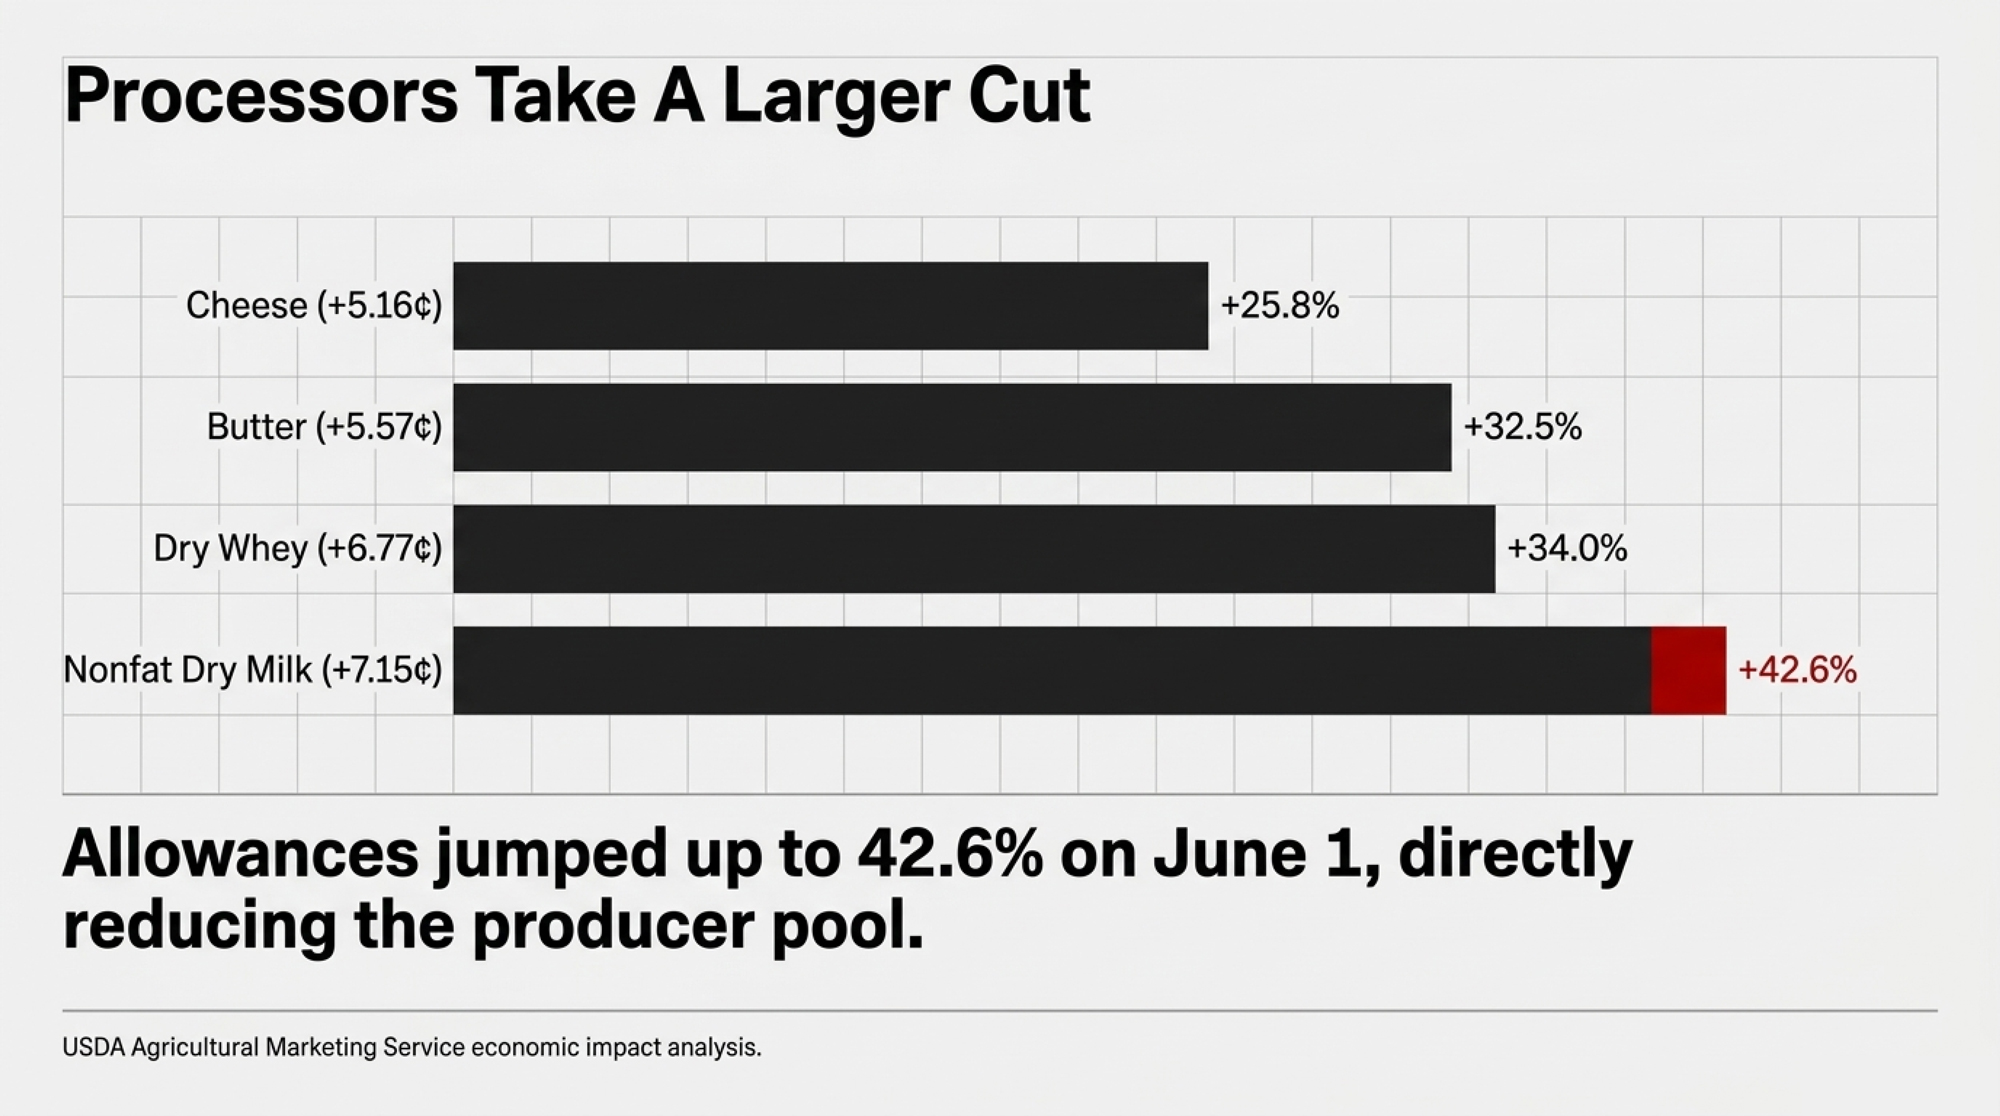
| Product | Set in 2008 | June 1, 2025 | Change | Increase |
| Cheese | $0.2003 | $0.2519 | +5.16¢ | 25.8% |
| Butter | $0.1715 | $0.2272 | +5.57¢ | 32.5% |
| Nonfat dry milk | $0.1678 | $0.2393 | +7.15¢ | 42.6% |
| Dry whey | $0.1991 | $0.2668 | +6.77¢ | 34.0% |
All values per pound, USD, national scope, all 11 orders. Source: USDA Agricultural Marketing Service economic impact analysis, Class III and IV pricing decisions. Percentage change is a Bullvine calculation on those figures. Increase is the change in the allowance itself, not the effect on milk price — for that, see the per-class declines above.
A make allowance is what USDA subtracts from each product’s wholesale price before calculating what your Class III and IV milk is worth. Raise it, and less value reaches the producer pool. The whey line works differently again — a dozen companies’ reported sales set the survey price that drives your other-solids line, a mechanism worth understanding on its own.
This is a U.S. Federal Order mechanism. Canadian producers have no direct equivalent under supply management, though the fight over whether processor cost data gets audited is the part that travels.
What Does the Change Cost at Your Herd Size?
One detail in Farm Bureau’s numbers matters more than the headline. Every class landed inside the same narrow band — Class II and IV at 85 cents, Class I at 89, Class III at 92. Your blend price dropped by roughly the same amount whether you ship into cheese, powder, or fluid. Utilization changes the mix, not the magnitude.
| Class | Price decline (¢/cwt) | Annual impact, 500 cows @ 230 cwt | What ships here |
|---|---|---|---|
| Class I (fluid) | 89¢ | $102,350 | Bottled milk |
| Class II (soft) | 85¢ | $97,750 | Yogurt, ice cream, cream |
| Class III (cheese) | 92¢ | $105,800 | Cheese and dry whey |
| Class IV (butter/powder) | 85¢ | $97,750 | Butter, nonfat dry milk |
Running the Numbers — Bullvine calculation
Published evidence: AFBF measured per-class declines of 85–92¢/cwt attributable solely to the make-allowance change. Market Intel, Sept. 22, 2025, U.S. national scope, USD.
Stated Bullvine assumption: 230 cwt shipped per cow per year. Ours, not sourced — substitute your rolling herd average.
Method: cows × 230 cwt × per-cwt decline. Low uses 85 cents (the Class II/IV figure); high uses 92 cents (Class III).
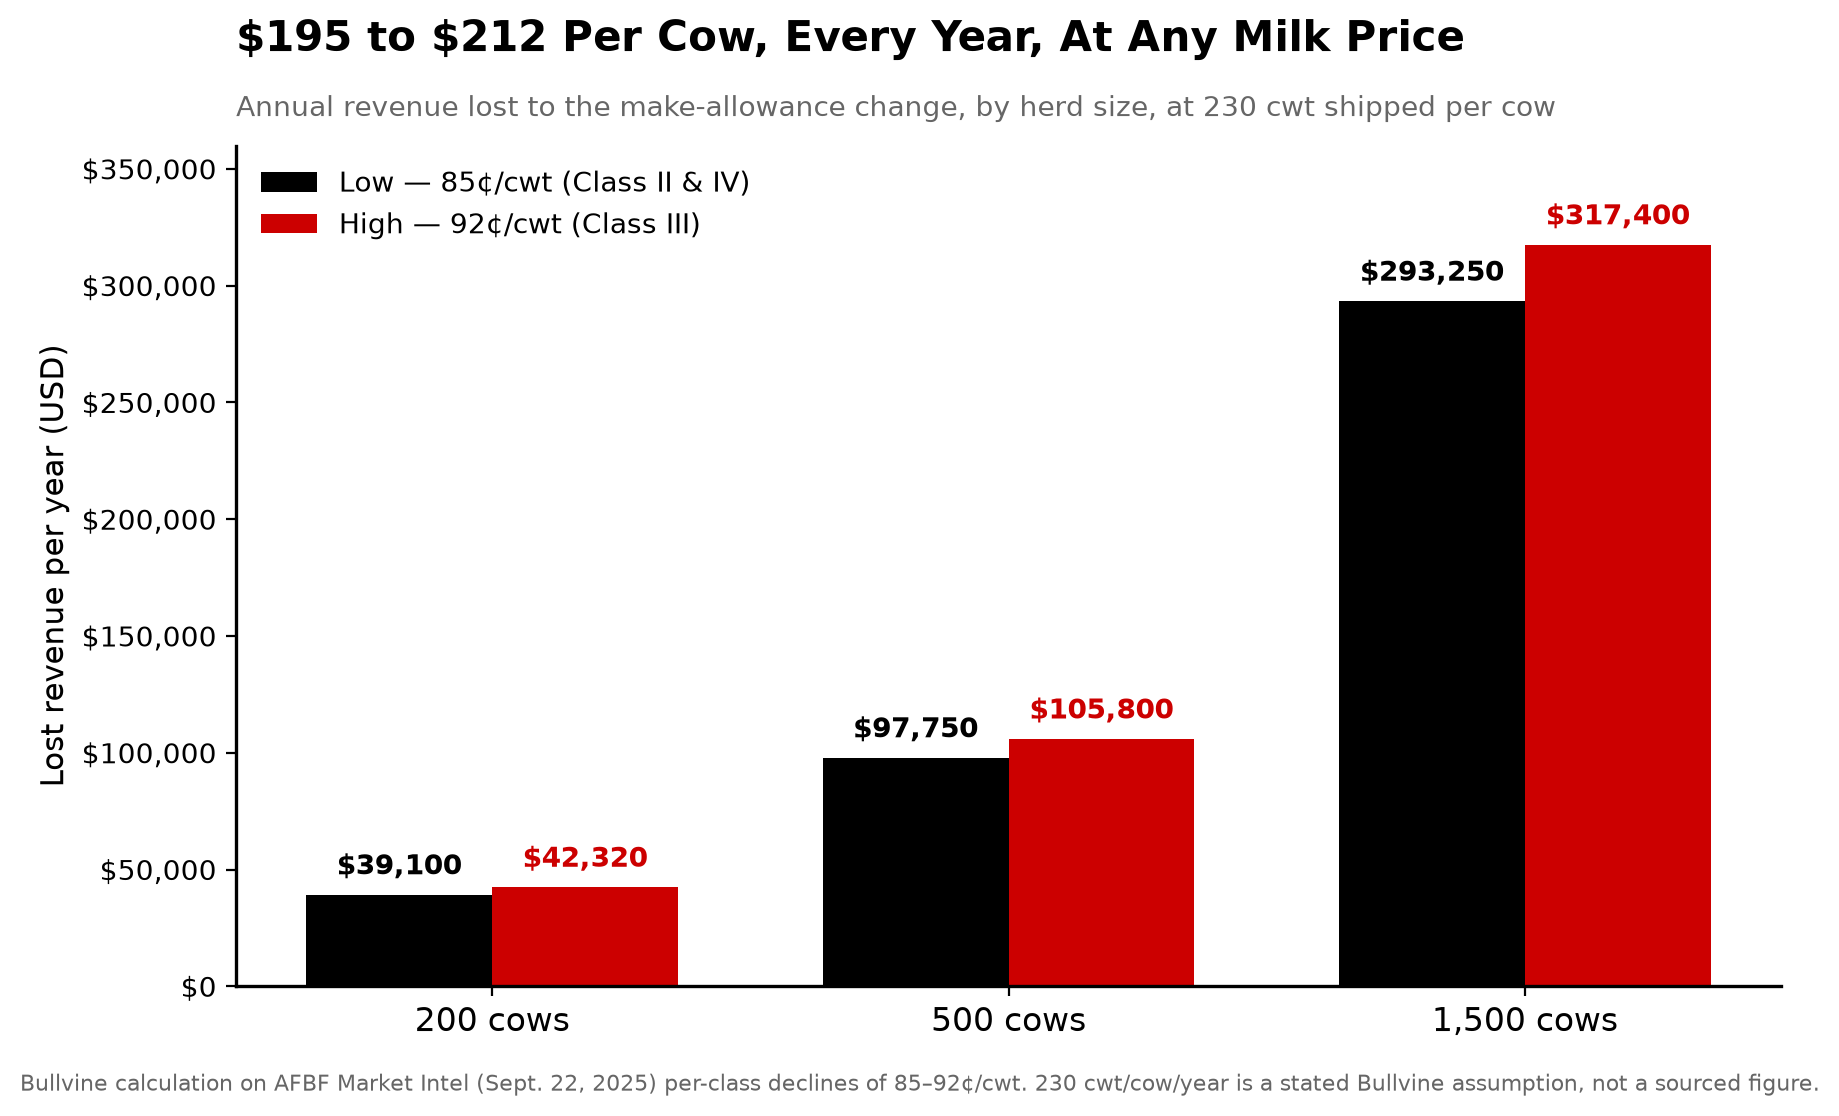
| Herd | Annual cwt | Low (85¢) | High (92¢) |
| 200 cows | 46,000 | $39,100 | $42,320 |
| 500 cows | 115,000 | $97,750 | $105,800 |
| 1,500 cows | 345,000 | $293,250 | $317,400 |
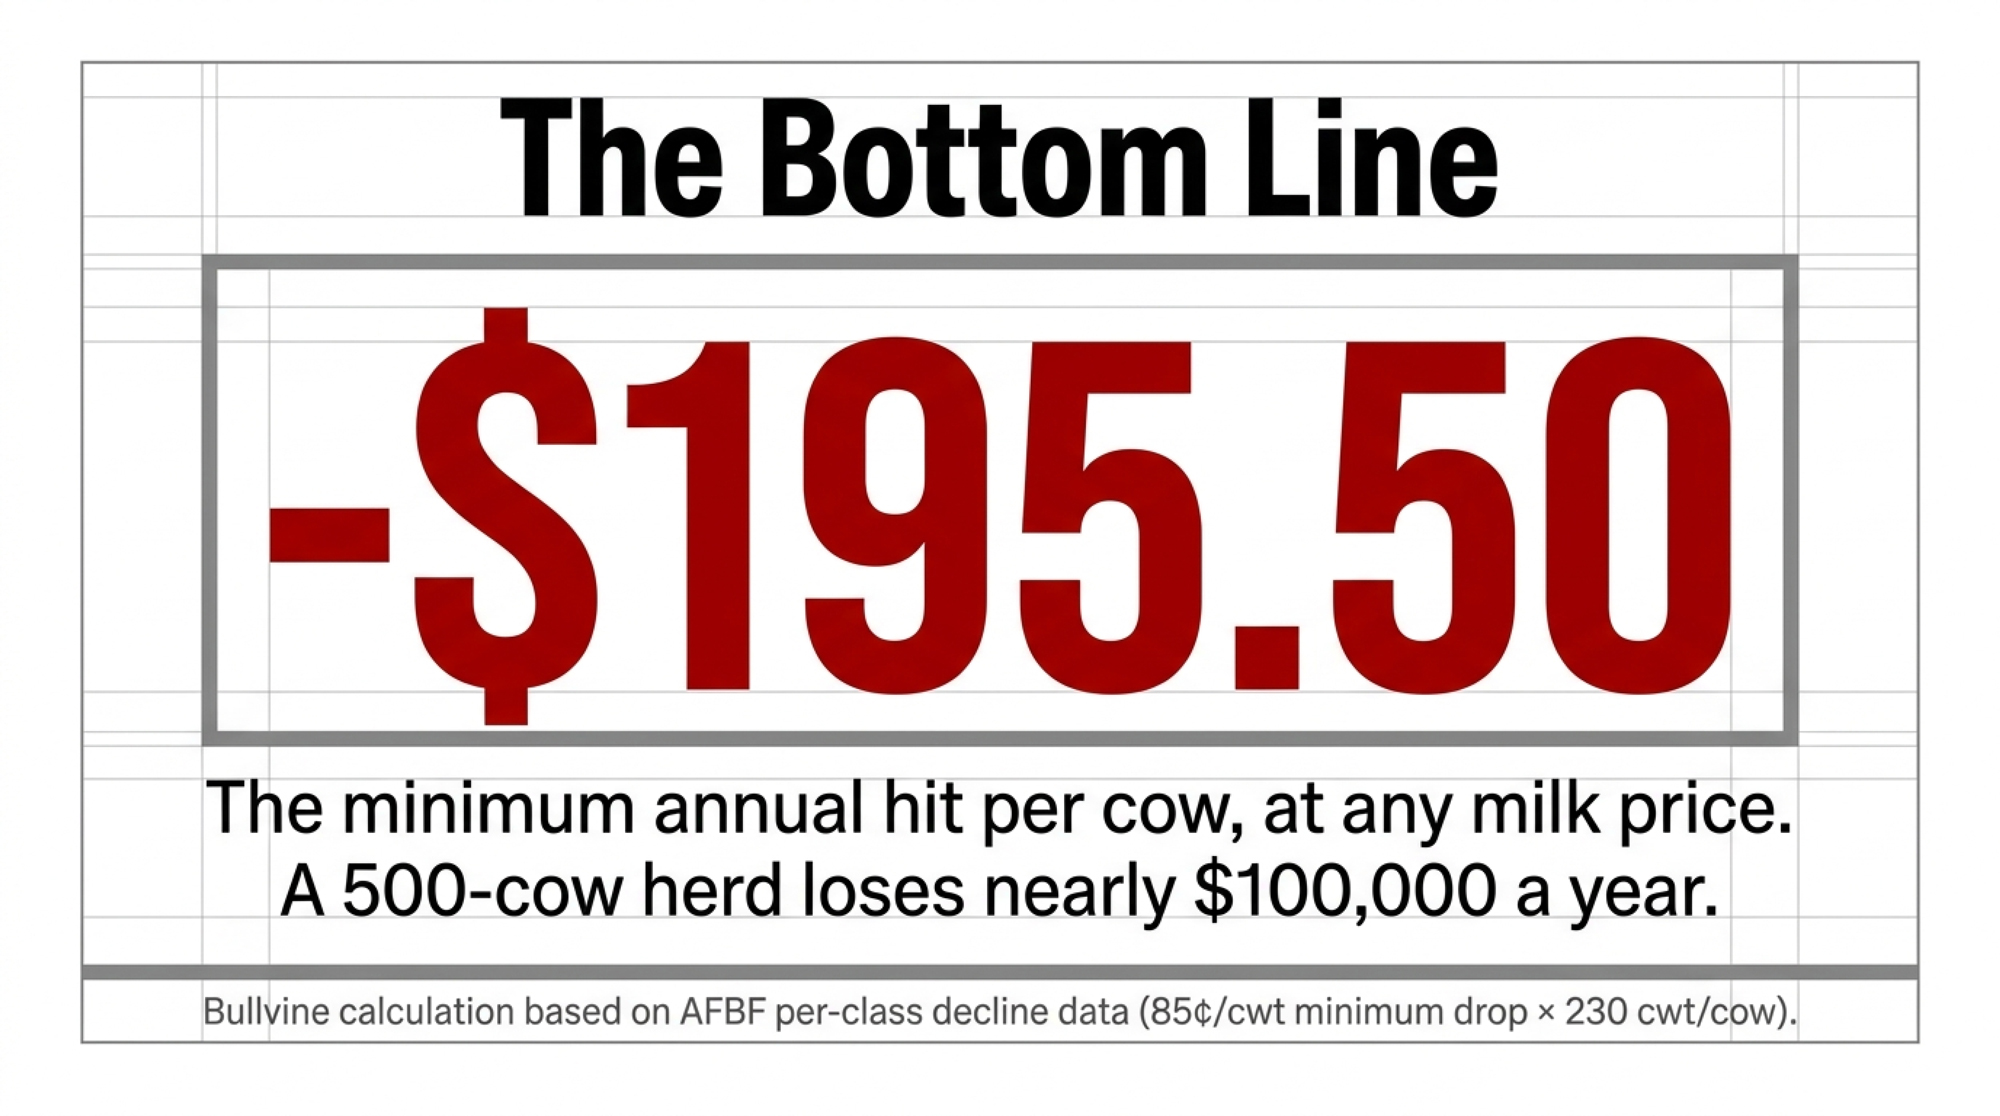
Per cow: $195.50 to $211.60 every year, at any milk price. The 500-cow line runs 500 × 230 = 115,000 cwt, then 115,000 × $0.85 = $97,750.
Budget off the low column. Where a verified figure is a range, the conservative end is the honest one.
“Both sides of this argument want the survey. Only one side already got its number.”
What Came Back the Other Way
Most coverage of this fight stops at the $337 million. It shouldn’t, because the same AFBF analysis prices the offsets and they’re real.
Class I differentials rose in most counties, averaging +$1.24/cwt nationally and adding an estimated $137 million to pool values across June through August — led by the Northeast at $34 million and the Mideast at $30 million. Farm Bureau’s regional breakdown shows the mismatch plainly. California and the Upper Midwest absorbed the largest allowance losses at $55 million and $64 million, and gained only $6 to $8 million each.
The return to the higher-of Class I mover subtracted $31.1 million over the same period, though AFBF notes that the formula proves its worth in volatile markets rather than calm ones.
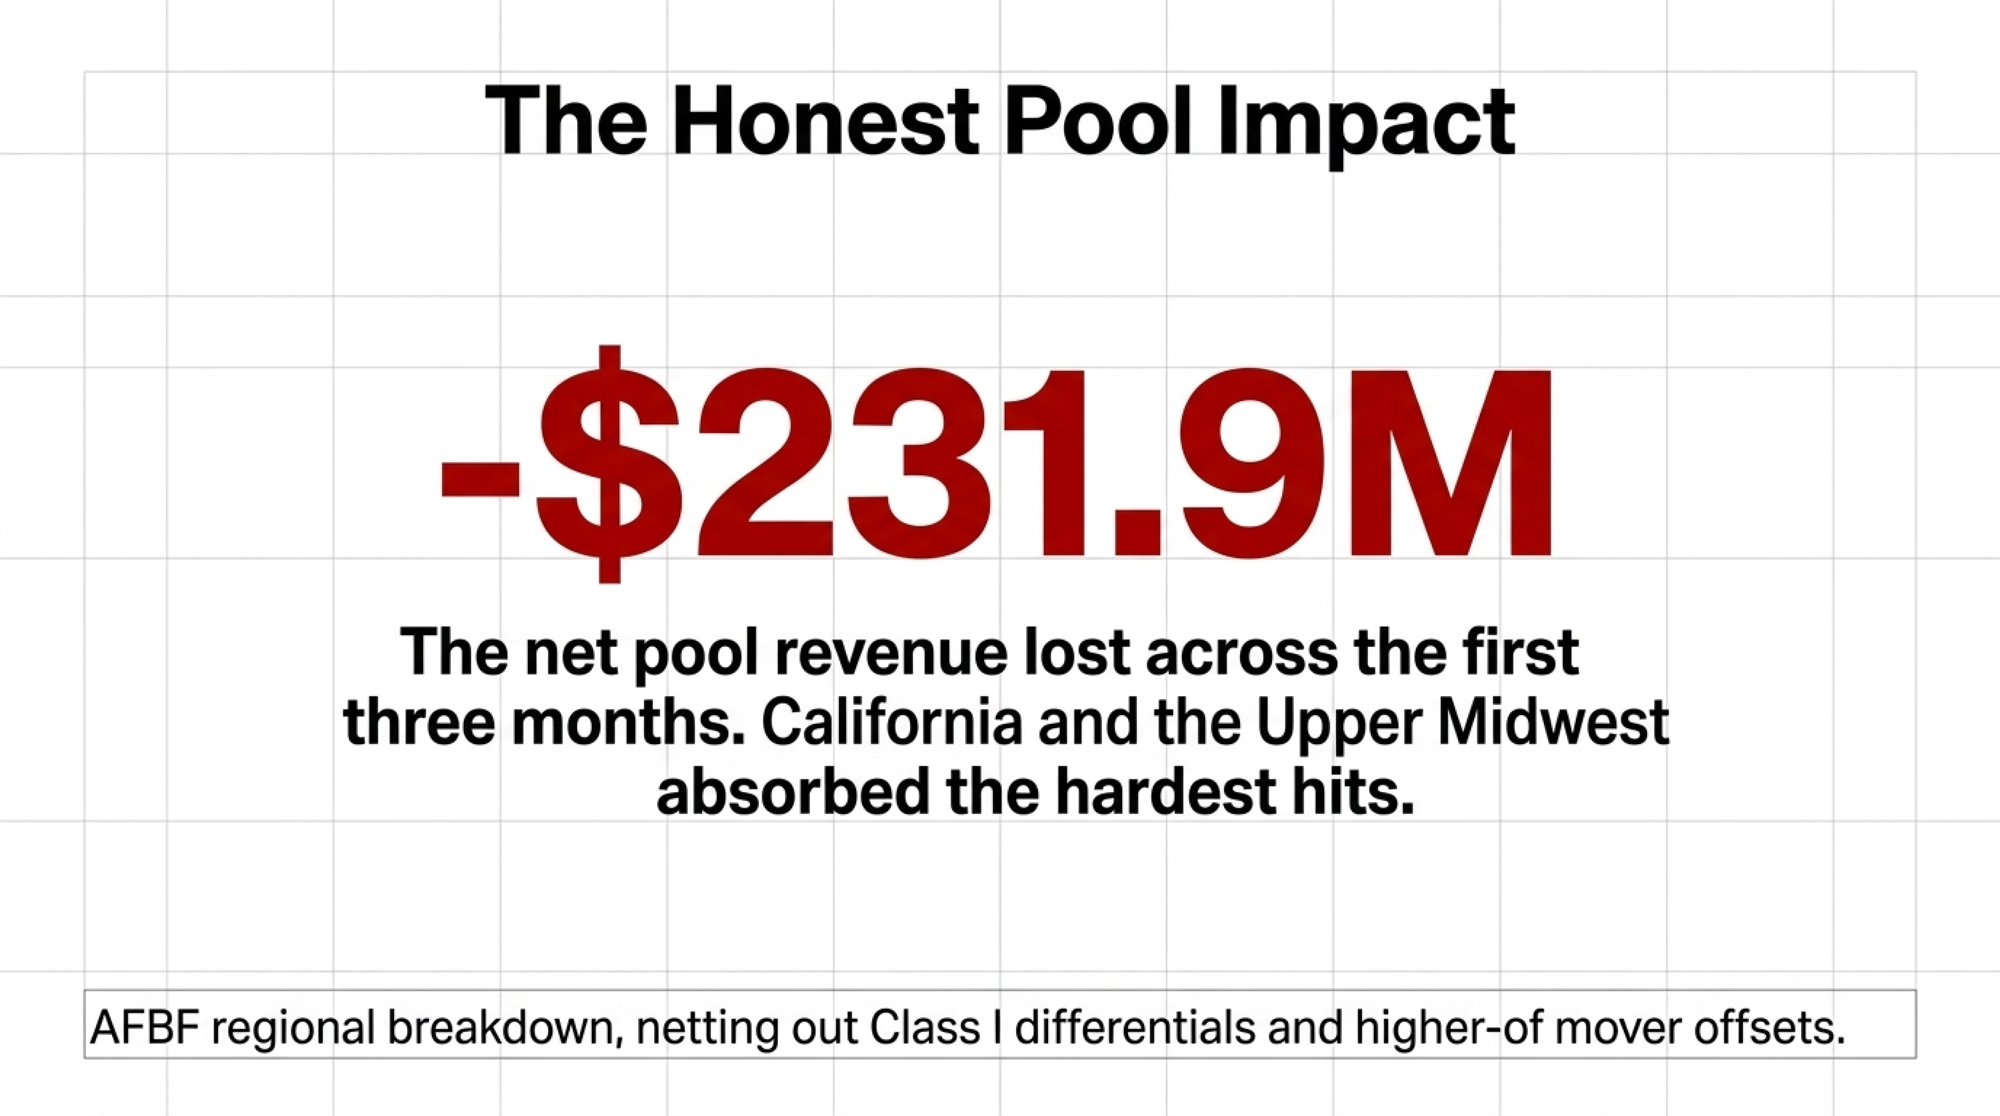
Net all three amendments together and pool revenues fell $231.9 million in the first three months, not $337 million. Use the net figure in a boardroom. The gross number is true, and the net number is harder to dismiss. (Farm Bureau’s component figures are rounded as published, so they won’t sum precisely to the net.)
One offset arrived later than the rest. The allowance increase took effect June 1, 2025. Updated milk composition factors — the change recognizing the components you actually ship — followed on Dec. 1, six months behind, and AFBF estimates that change adds roughly $200 million a year to pool value while the interval cost producers about $100 million.
Why Did the Cut Come Before the Proof?
The processors’ underlying case was legitimate. Those allowances had sat unchanged since 2008, and converting milk into cheese takes labor, cultures, energy, testing, and packaging that all cost more than they did then. The National Milk Producers Federation, which represents dairy cooperatives, filed the proposal and testified that USDA should “provide an interim increase to alleviate the acute problems and disorderly market conditions created by the current, clearly insufficient make allowances.”
Harder to defend is the sequence. USDA set the numbers on volunteered, unaudited data, and Congress authorized the audited survey afterward. The ANPRM’s comment window ran 30 days and closed March 30, 2026. The American Dairy Coalition asked for an extension, arguing 30 days was insufficient for a rulemaking that directly determines regulated milk values.
The road back is longer than most producers assume. AFBF is explicit that even once survey data exists, any adjustment to make allowances “would still require a full hearing process before USDA to implement.” Survey rulemaking, then the survey, then the report, then a hearing.
| Date | Step | Status as of Sept. 15, 2026 |
|---|---|---|
| June 1, 2025 | All four FMMO make allowances raised (25.8%–42.6%) | In force — money moved |
| July 2025 | One Big Beautiful Bill Act requires audited processor cost survey | Enacted |
| Dec. 1, 2025 | Updated milk composition factors take effect | In force, six months late |
| Feb. 27, 2026 | Advance Notice of Proposed Rulemaking issued | Only document on USDA’s survey page |
| Mar. 30, 2026 | 30-day comment window closes; extension requested | Closed; no extension reflected |
| Still ahead | Proposed rule → survey → report → full USDA hearing | Not started |
AFBF economist Danny Munch told Brownfield the law is meant “to justify the nearly dollar-a-hundredweight make allowance deductions.” Fifteen months after the deduction took effect, that justification sits at the notice stage.
Worth noting: NMPF isn’t defending the absence of audited data. The association calls mandatory biennial plant-cost studies “a key component of NMPF’s Federal Milk Marketing Order modernization proposal,” and President and CEO Gregg Doud has publicly backed legislation requiring them. Both sides of this argument want the survey. Only one side already got its number.
Who Actually Cast Your Ballot?
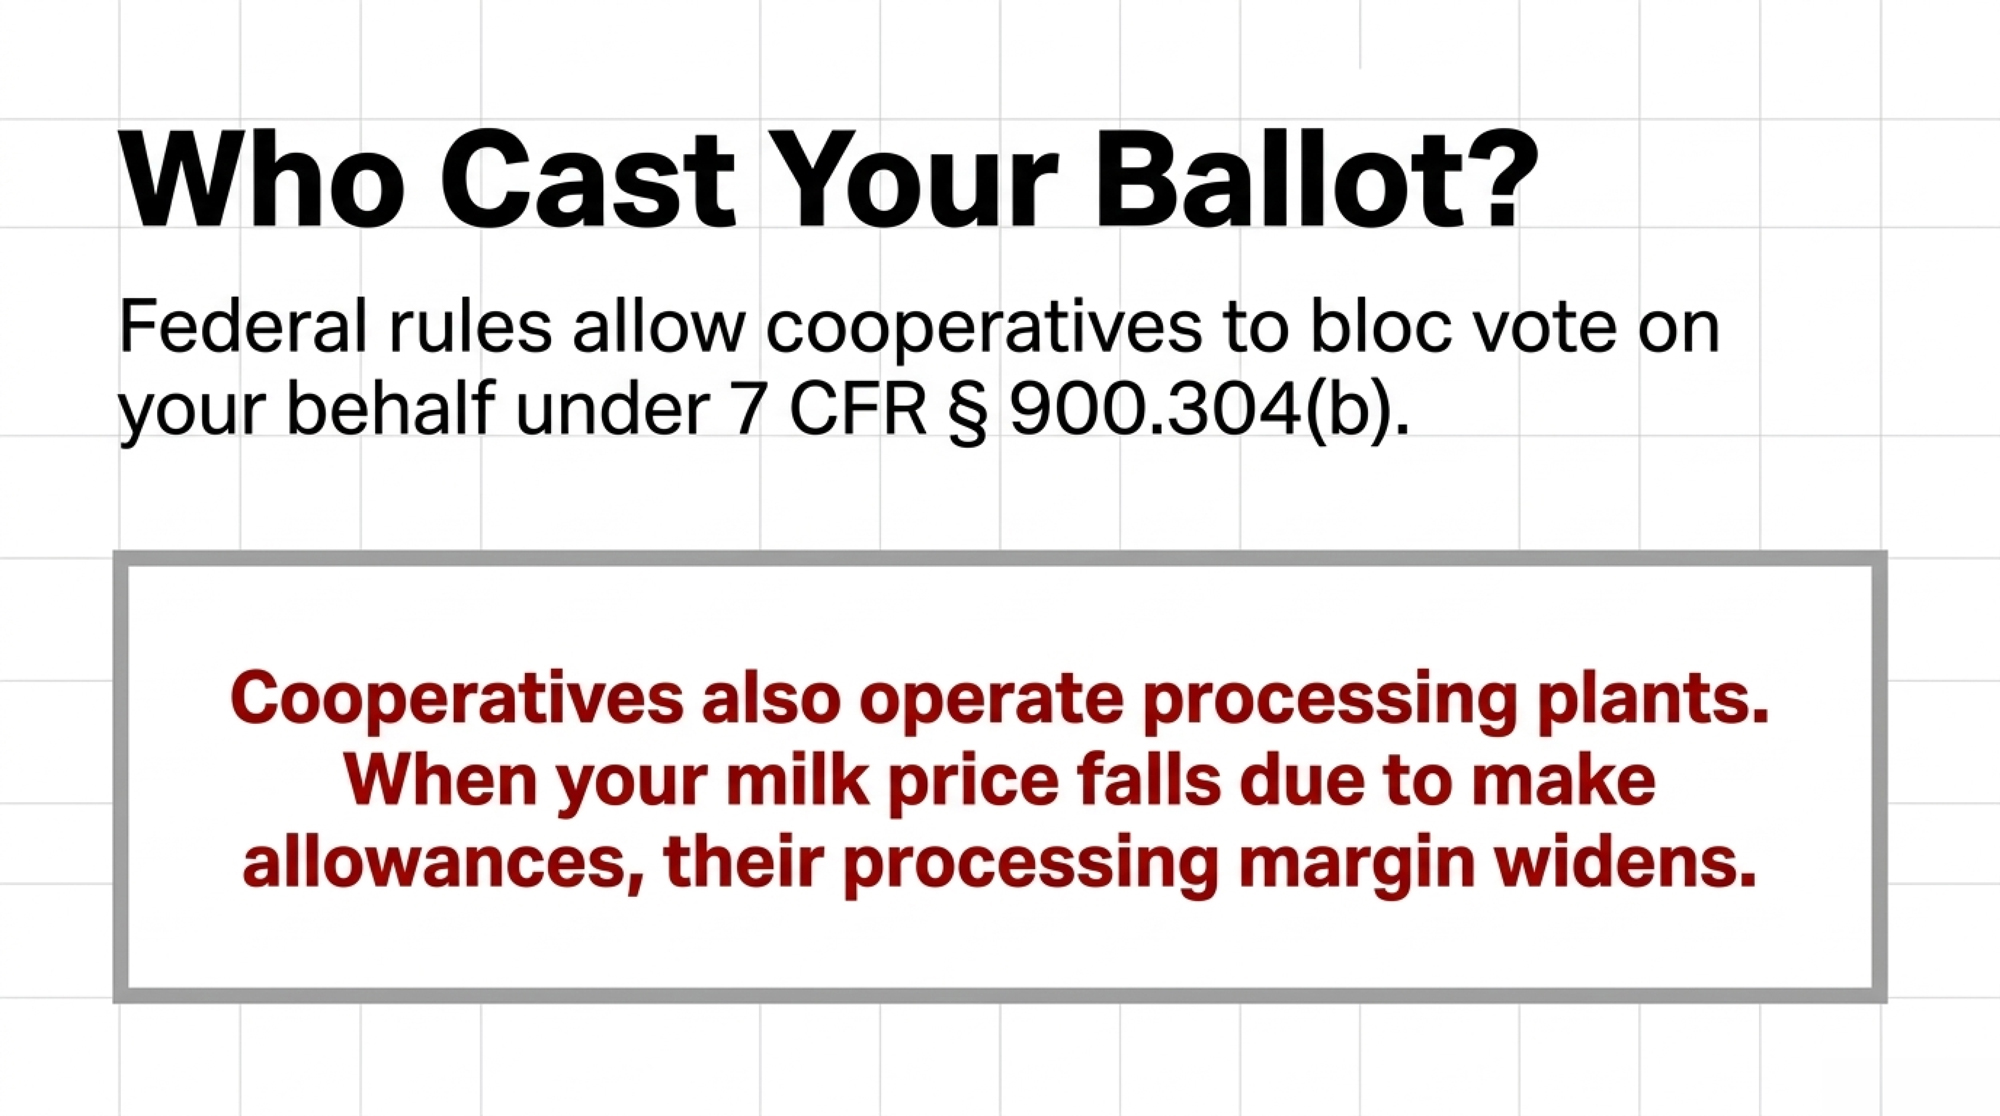
Federal referendum procedure is specific. Under 7 CFR § 900.304(a), “each producer shall be entitled to only one vote,” and under § 900.304(c), voting “by proxy or agent” is not permitted.
Then comes subsection (b). Except as provided in section 8c(5)(B) of the Act, “any cooperative association eligible under § 900.302 may, if it elects to do so, vote and cast one ballot for producers who are members of, stockholders in, or under contract with, such cooperative association.” The board votes your milk.
There’s a detail in that same subsection worth knowing. A cooperative casting a bloc ballot “shall submit, with its ballot, a certified copy of the resolution authorizing the casting of the ballot.” That resolution exists. It’s dated, and it records what your organization decided on your behalf.
Which matters because the cooperative model puts one organization on both sides of this formula. Cooperatives market their members’ milk and, in many cases, operate the plants that buy pooled milk. As your marketing agent, the organization wants a higher milk price. As a plant operator, it does better when that price falls.
Nobody outside those boardrooms can say whether a particular cooperative’s processing margin widened at members’ expense. The per-cwt margin figure a member would need isn’t broken out in publicly available cooperative reporting. A processing margin isn’t improper, and no cooperative has been shown to have acted against its members’ interests. The open question is whether member-owners can see how, or whether, the benefit returns.
If you’ve never seen a ballot for an order you ship into, that’s not an oversight — it’s how bloc voting decided this for you.
The Playbook
30 days — find your own number. Set one milk check from before June 2025 beside one from after, and isolate the blend-price gap after backing out obvious market movement. Requires: two statements, twenty minutes. Threshold: a residual gap near 85–92¢/cwt is the allowance, not the market. Backfire: components and utilization moved too, so don’t credit the whole delta to the formula.
30 days — ask for the resolution. If your cooperative bloc voted, request the certified copy of the board resolution that authorized the ballot. Section 900.304(b) required one to be filed. Requires: one written request. Threshold: if the resolution records no member-communication step before the vote, that’s your governance question for the annual meeting. Backfire: expect it framed as routine, because legally it was. Ask anyway.
30 days — red flag on debt service. Run the low-column figure for your herd size through your coverage ratio. Requires: your lender’s DSCR method, not yours. Threshold: DSCR under 1.2 for three consecutive months on the lender’s calculation moves this to the top of the list. Backfire: don’t stack it on a breakeven that already absorbed lower 2025 class prices; that double-counts.
90 days — check the composition-factor line. The updated factors took effect Dec. 1, 2025 and should be adding value to your solids. Requires: a post-December statement and your component tests. Threshold: if you can’t find the change reflected anywhere, have your field rep walk the line items. Backfire: the gain is smaller than the allowance loss, so finding it doesn’t make you whole.
90 days — price your components elsewhere. Ask a smaller cooperative or an independent what they’d pay. Requires: a second buyer within haul distance. Threshold: a spread that survives freight and contract terms. Backfire:hauling, volume commitments, and exit terms can erase it. Run the full pay-price comparison before you call anyone.
365 days — get into the survey rulemaking. The opportunity is real: an audited cost survey is the first mechanism that could push allowances down rather than up, and AFBF calls it “a critical step toward grounding future make allowance decisions in verifiable data.” Requires: docket monitoring at regulations.gov and willingness to submit your own cost reality. Threshold: comment the day a proposed rule publishes. Backfire: survey, then report, then a full hearing — position for the next cycle, not this one.
Where the Organic Suits Fit — and Where They Don’t
On April 28, 2026, members of the Coalition for Organic Dairy Exemption — Aurora Organic Dairy, Horizon Organic, and CROPP Cooperative/Organic Valley — filed three federal lawsuits challenging their required participation in the FMMO program as unconstitutional. Aurora and Horizon filed in the District of Colorado; CROPP filed in the Western District of Wisconsin. Seven Organic Valley farmer-members filed a separate class-action takings claim seeking compensation for six years of marketing-order payments.
Read the remedy. The coalition seeks exemption from pooling, not the dismantling of the orders and not a rollback of make allowances. Nothing has been ruled on the merits. The grievance rhymes; the legal theory doesn’t transfer, and a conventional producer has no organic-specific pooling claim. For the filings and what a pooling exemption would mean at the farm level, see the $19.89 risk on your farm.
Check Before Your Next Statement
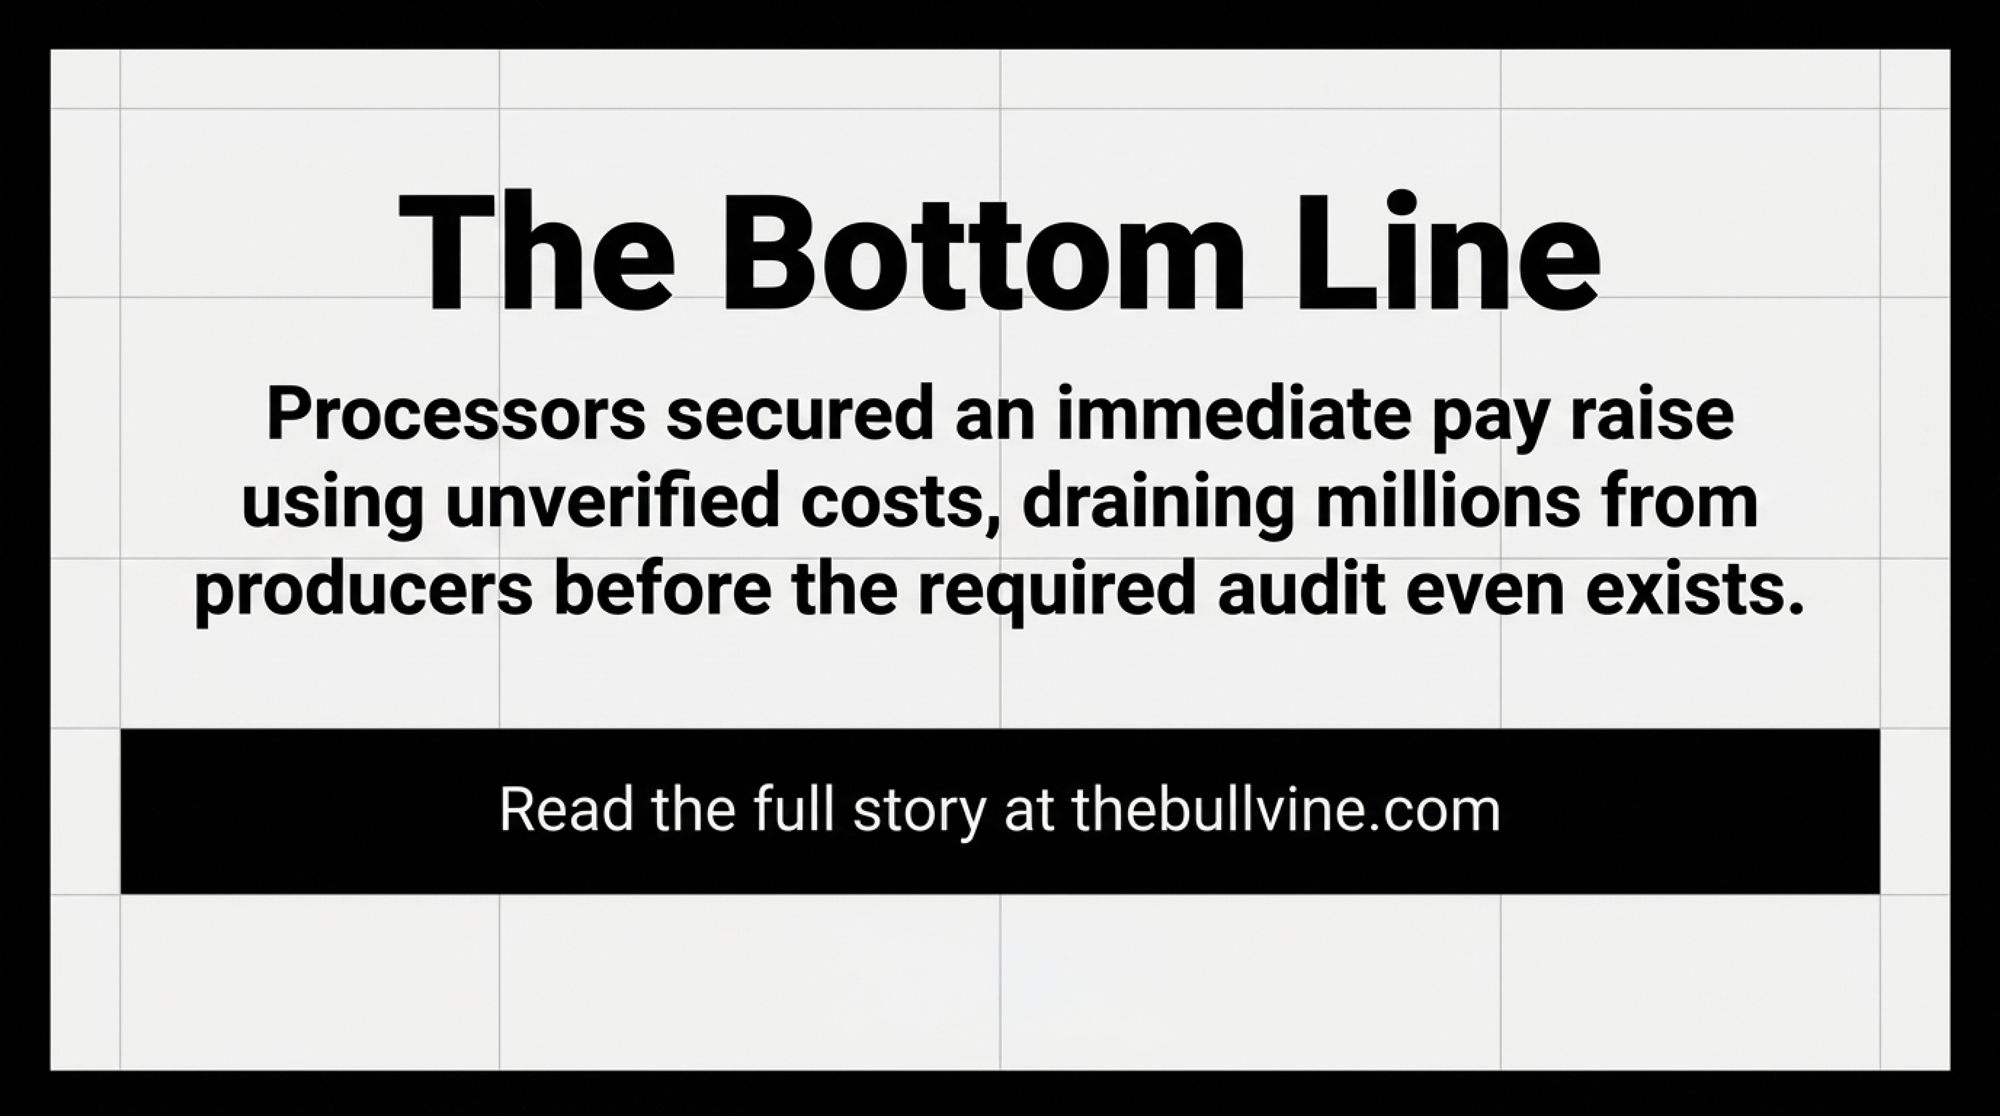
The trade-off sits in USDA’s own documents. Processors got increases of 25.8% to 42.6% built on a self-selected sample, producers absorbed a $231.9 million net pool reduction plus a six-month wait for their own offset, and the survey that both AFBF and NMPF say should ground these numbers hasn’t reached a proposed rule fifteen months on.
So pull your two statements this week. Then ask your cooperative for the certified resolution that authorized your ballot — what does it say the board decided on your behalf?
Key Takeaways
- USDA lifted the nonfat dry milk make allowance 7.15 cents a pound, a 42.6% increase, on what AFBF calls a self-selected sample of self-reported processor costs. The audited survey it was meant to rest on still hasn’t made it into a proposed rule.
- At 230 cwt per cow per year, AFBF’s measured 85–92¢/cwt decline works out to $39,100–$42,320 on 200 cows, $97,750–$105,800 on 500, and $293,250–$317,400 on 1,500. Budget the low column.
- The honest pool figure is $231.9 million net, not the $337 million everyone quotes. Class I differentials and the higher-of mover clawed some back, but California and the Upper Midwest lost most and gained least.
- Both AFBF and NMPF want the audited cost survey. Only one side already got its number, and any correction runs through a full USDA hearing after the survey exists.
Run Your Numbers
Dairy Farm Corridor Score Calculator — This article gives you the national make-allowance number. The Corridor Score adds the part that differs by location: your state’s attrition zone and your hauling cost per cwt, then shows total structural drag as a share of gross milk revenue. Red, Yellow, or Green before you talk to your co-op.
Learn More
- Protein Will Drive Your 2026 Milk Check: Are Your Components Still Built for the Butterfat Era? — Arms you with actionable ration and breeding adjustments to hit the 0.80 protein-to-fat ratio cheese plants demand, turning lagging solids into higher mailbox revenue before processor penalties bite.
- $19.85 Milk: Your Base Year Decides If You Can Grow Into It — Exposes how cooperative fixed-base rules penalize uncommitted barn expansions, warning that stagnant nominal prices shave up to $204,765 in real purchasing power across a 400-cow herd by 2030.
- Margin Squeeze: Dairy Farms Face Tightening Profits as Milk Prices Tumble — Breaks down tactical cash flow diversions during sub-$18 benchmark pricing, revealing how capitalizing on $145/cwt cull markets and beef-on-dairy premiums offsets 20% to 30% of gross milk check losses.
 The Sunday Read Dairy Professionals Don’t Skip.
 The Sunday Read Dairy Professionals Don’t Skip.
Every week, thousands of producers, breeders, and industry insiders open Bullvine Weekly for genetics insights, market shifts, and profit strategies they won’t find anywhere else. One email. Five minutes. Smarter decisions all week.
