







$128,320 a year on 1,000 cows, and 35 cents a cow a day you don’t get back. The first U.S. dairy methane credit ever sold came off a different product entirely — and the difference is the contract.
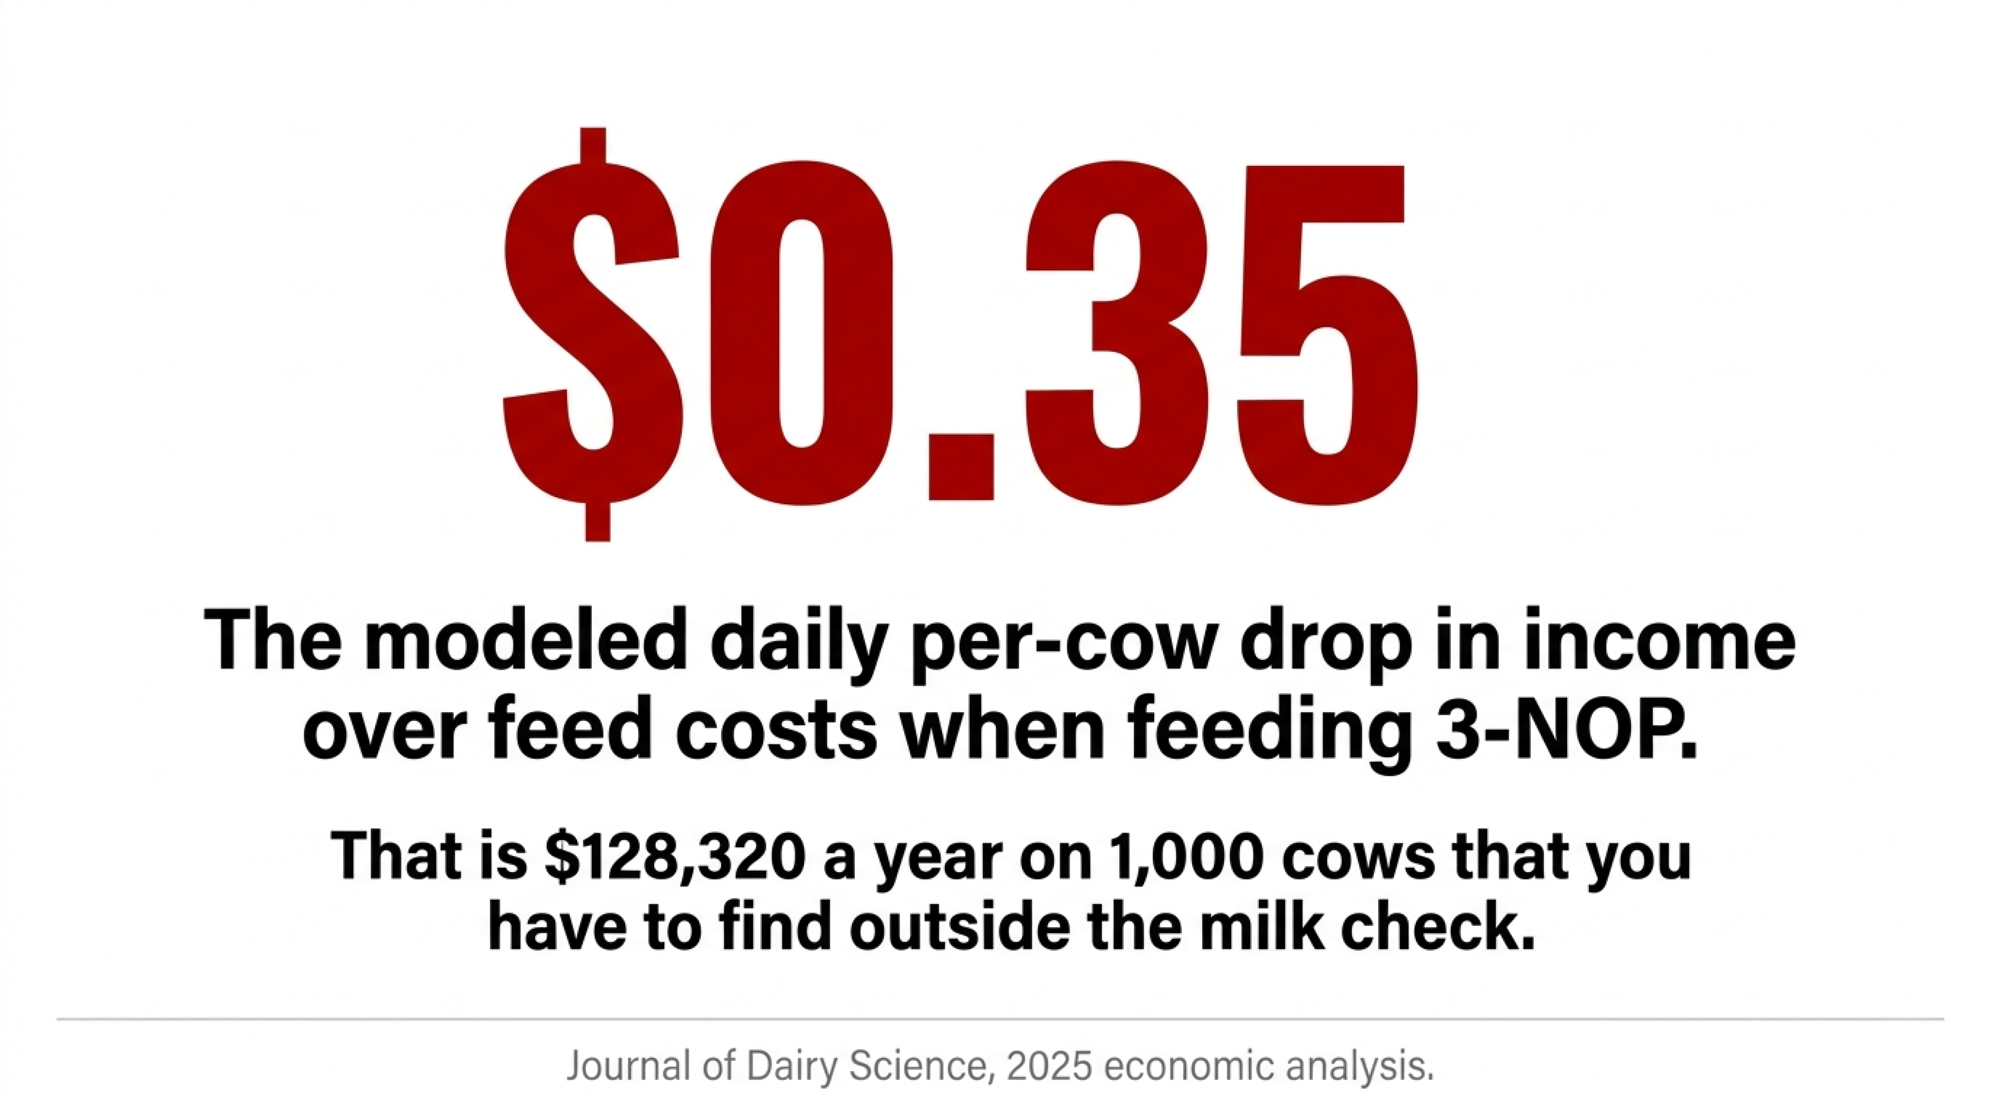
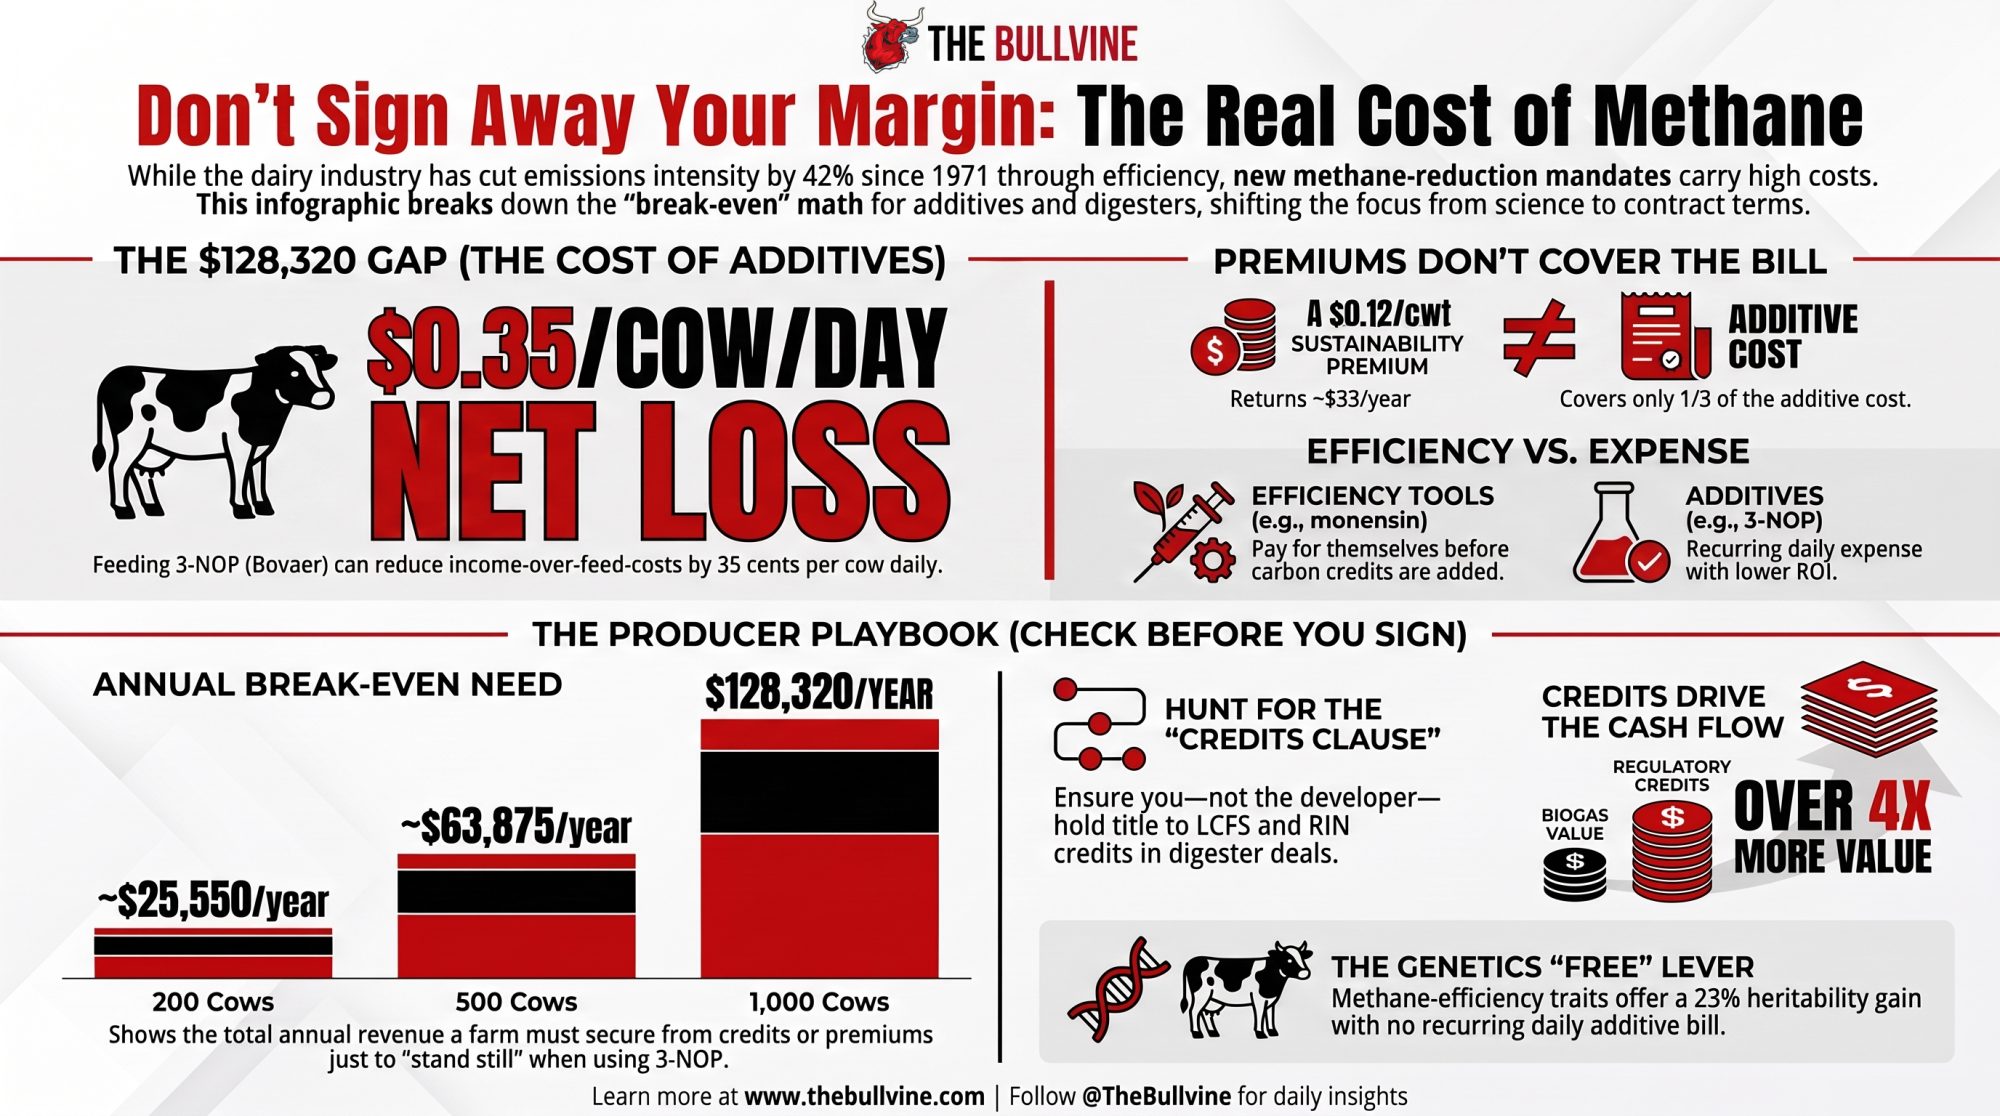
Start with the number that belongs on every whiteboard in every barn office. A 2025 economic analysis in the Journal of Dairy Science modeled a 1,000-cow dairy feeding 3-nitrooxypropanol, the methane additive sold as Bovaer and made by DSM-Firmenich. Feeding it cut income over feed costs by roughly $0.35 per cow per day, which on that herd works out to about $128,320 a year the farm has to find somewhere other than the milk check . That’s not a worst case. That’s the modeled outcome.
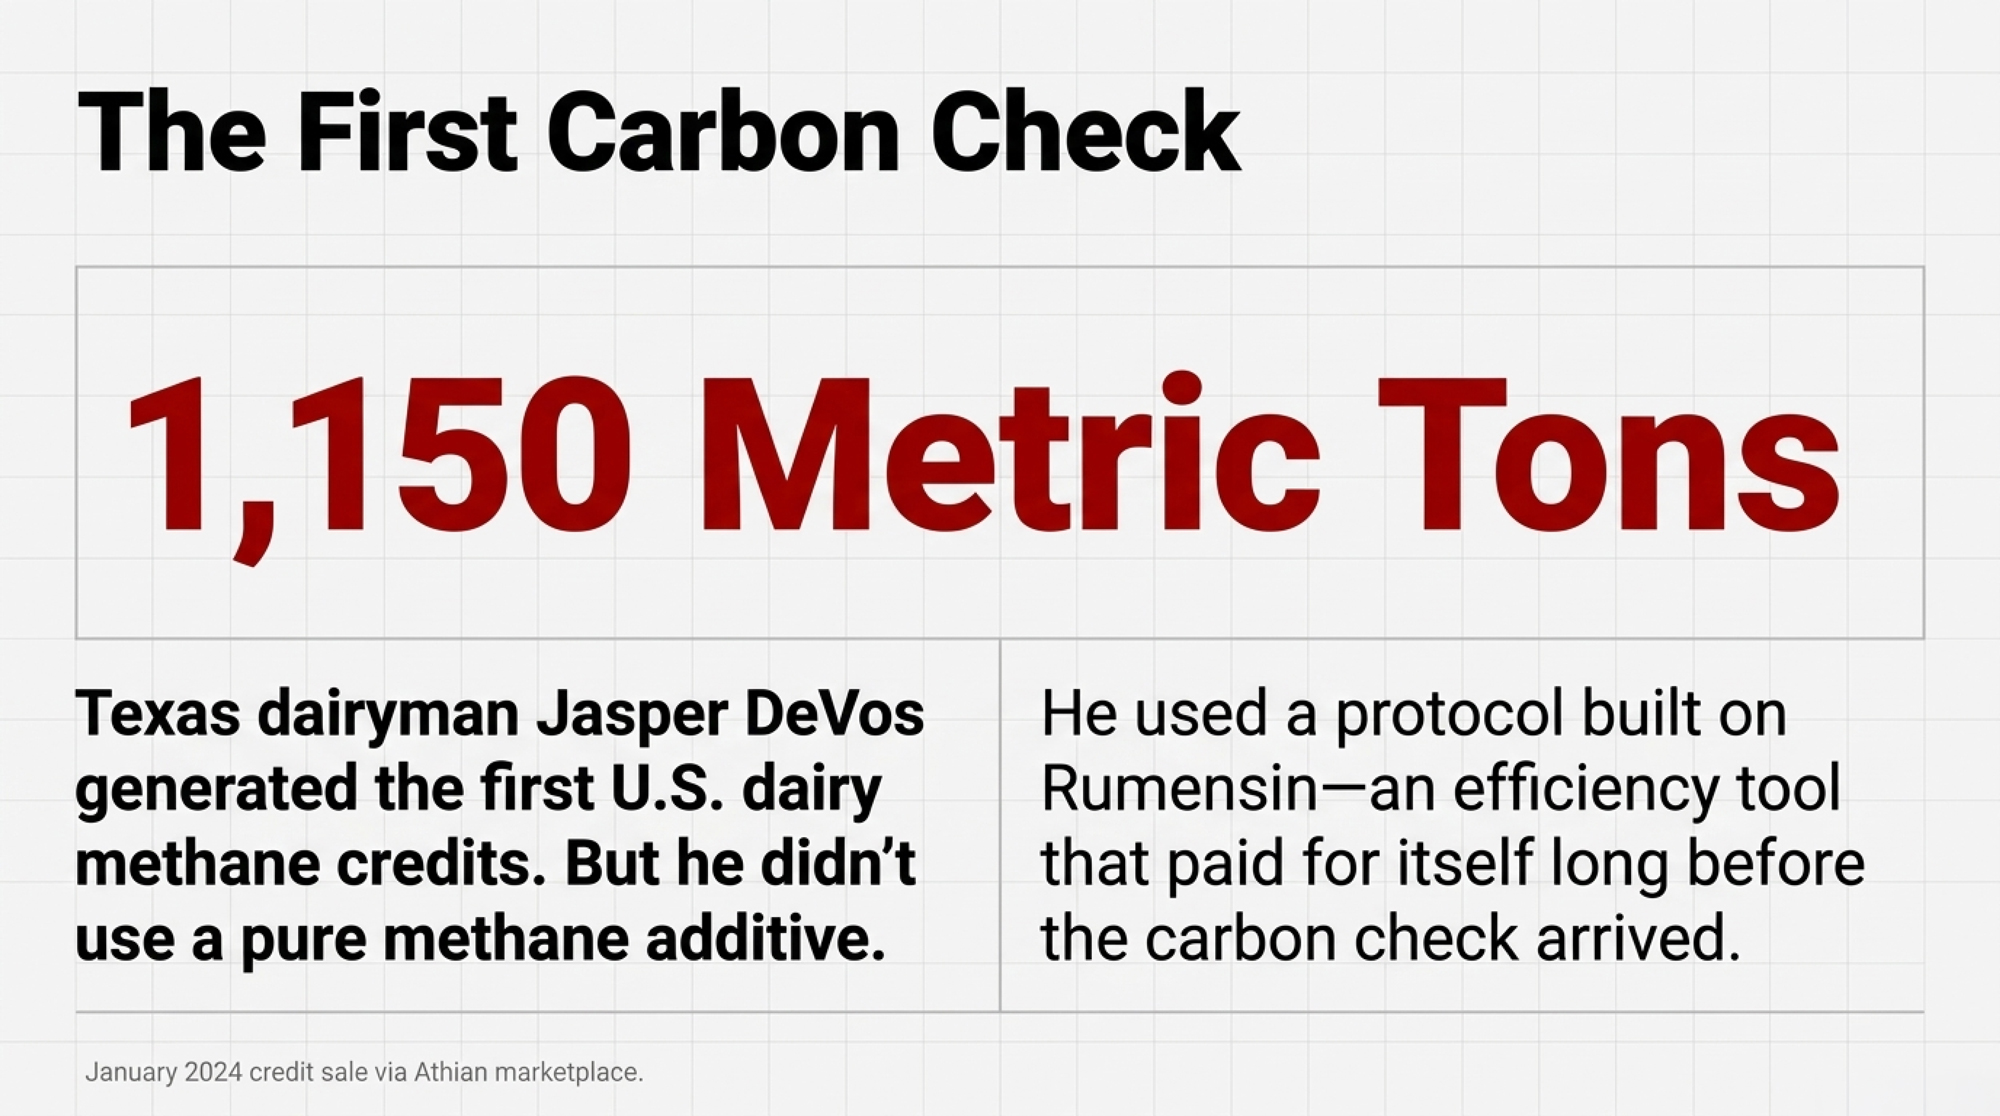
Now set it beside what happened the first time an American dairy farmer got paid for methane. In January 2024, Texas dairyman Jasper DeVos generated nearly 1,150 metric tons of verified carbon credits, the first sale of its kind in the U.S. livestock market, purchased by Dairy Farmers of America through a marketplace called Athian . Here’s the detail most coverage flattened: DeVos used Athian’s first accepted protocol, built on Rumensin, Elanco’s monensin product, FDA-approved to improve milk production efficiency and cut roughly half a metric ton of CO₂e per cow per year, depending on the herd’s animals and management .
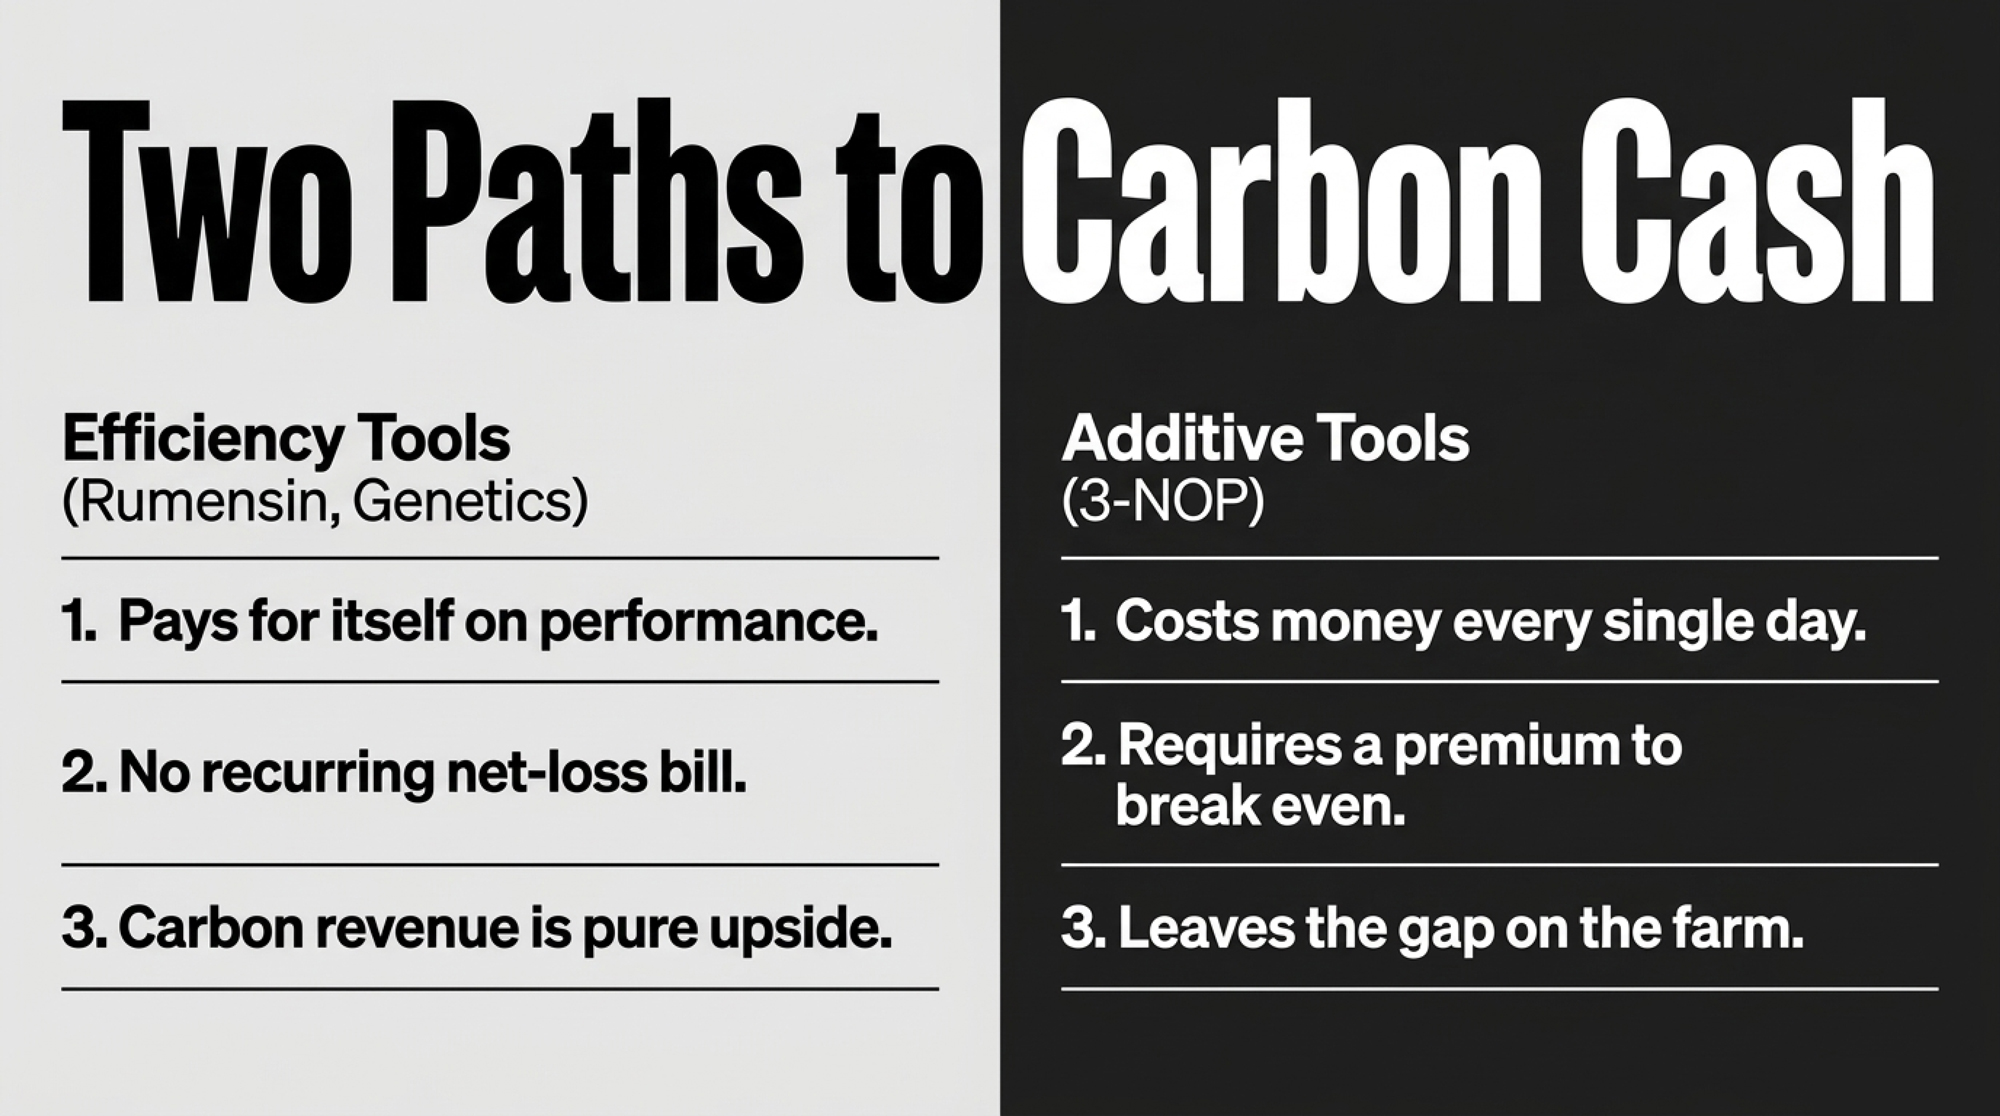
Read those two paragraphs together and you’ve got the hinge of dairy’s next twenty years. The first farmer paid for methane reduction used a tool that improves feed efficiency — it was already earning its keep before the carbon check showed up. The tool the whole industry is now being pitched costs money every day and doesn’t. So the question was never whether you can cut methane. It’s who pays when the cut doesn’t pay for itself, and that’s a contract question headed for your desk.
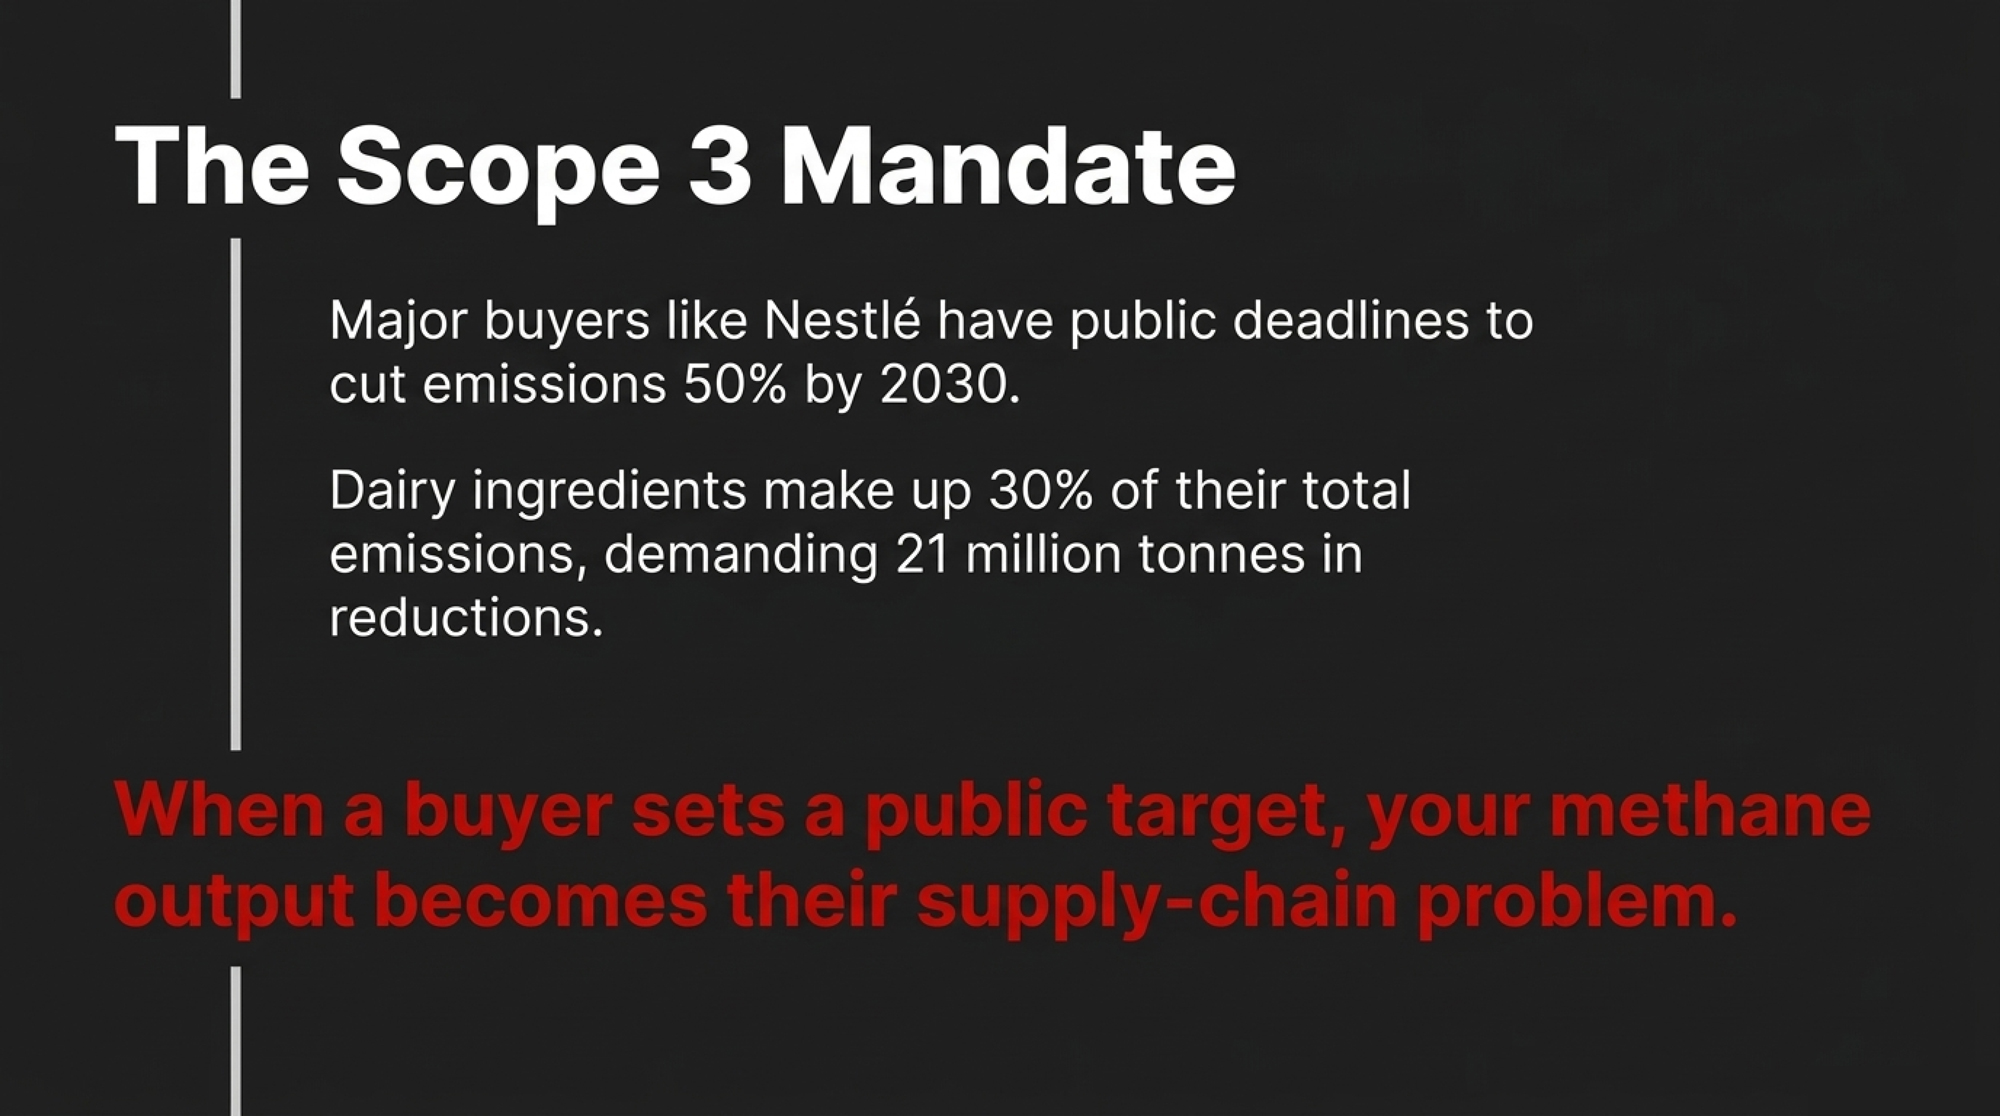
Why now, in 2026? Because the buyers at the other end of your milk have public deadlines. Nestlé, one of the largest dairy purchasers on the planet, has committed to cutting greenhouse gas emissions 50% by 2030 against a 2018 baseline and reaching net zero by 2050, with roughly 95% of its footprint sitting in Scope 3 . Dairy and livestock ingredients are its single largest Scope 3 source at about 30% of total emissions, and its roadmap targets 21 million tonnes of reductions from that category by 2030 . When a buyer that size sets a public target that depends on farm-level methane cuts, the cost of achieving those cuts becomes a supply-chain question. Producers are part of that chain.
The win nobody outside the barn talks about
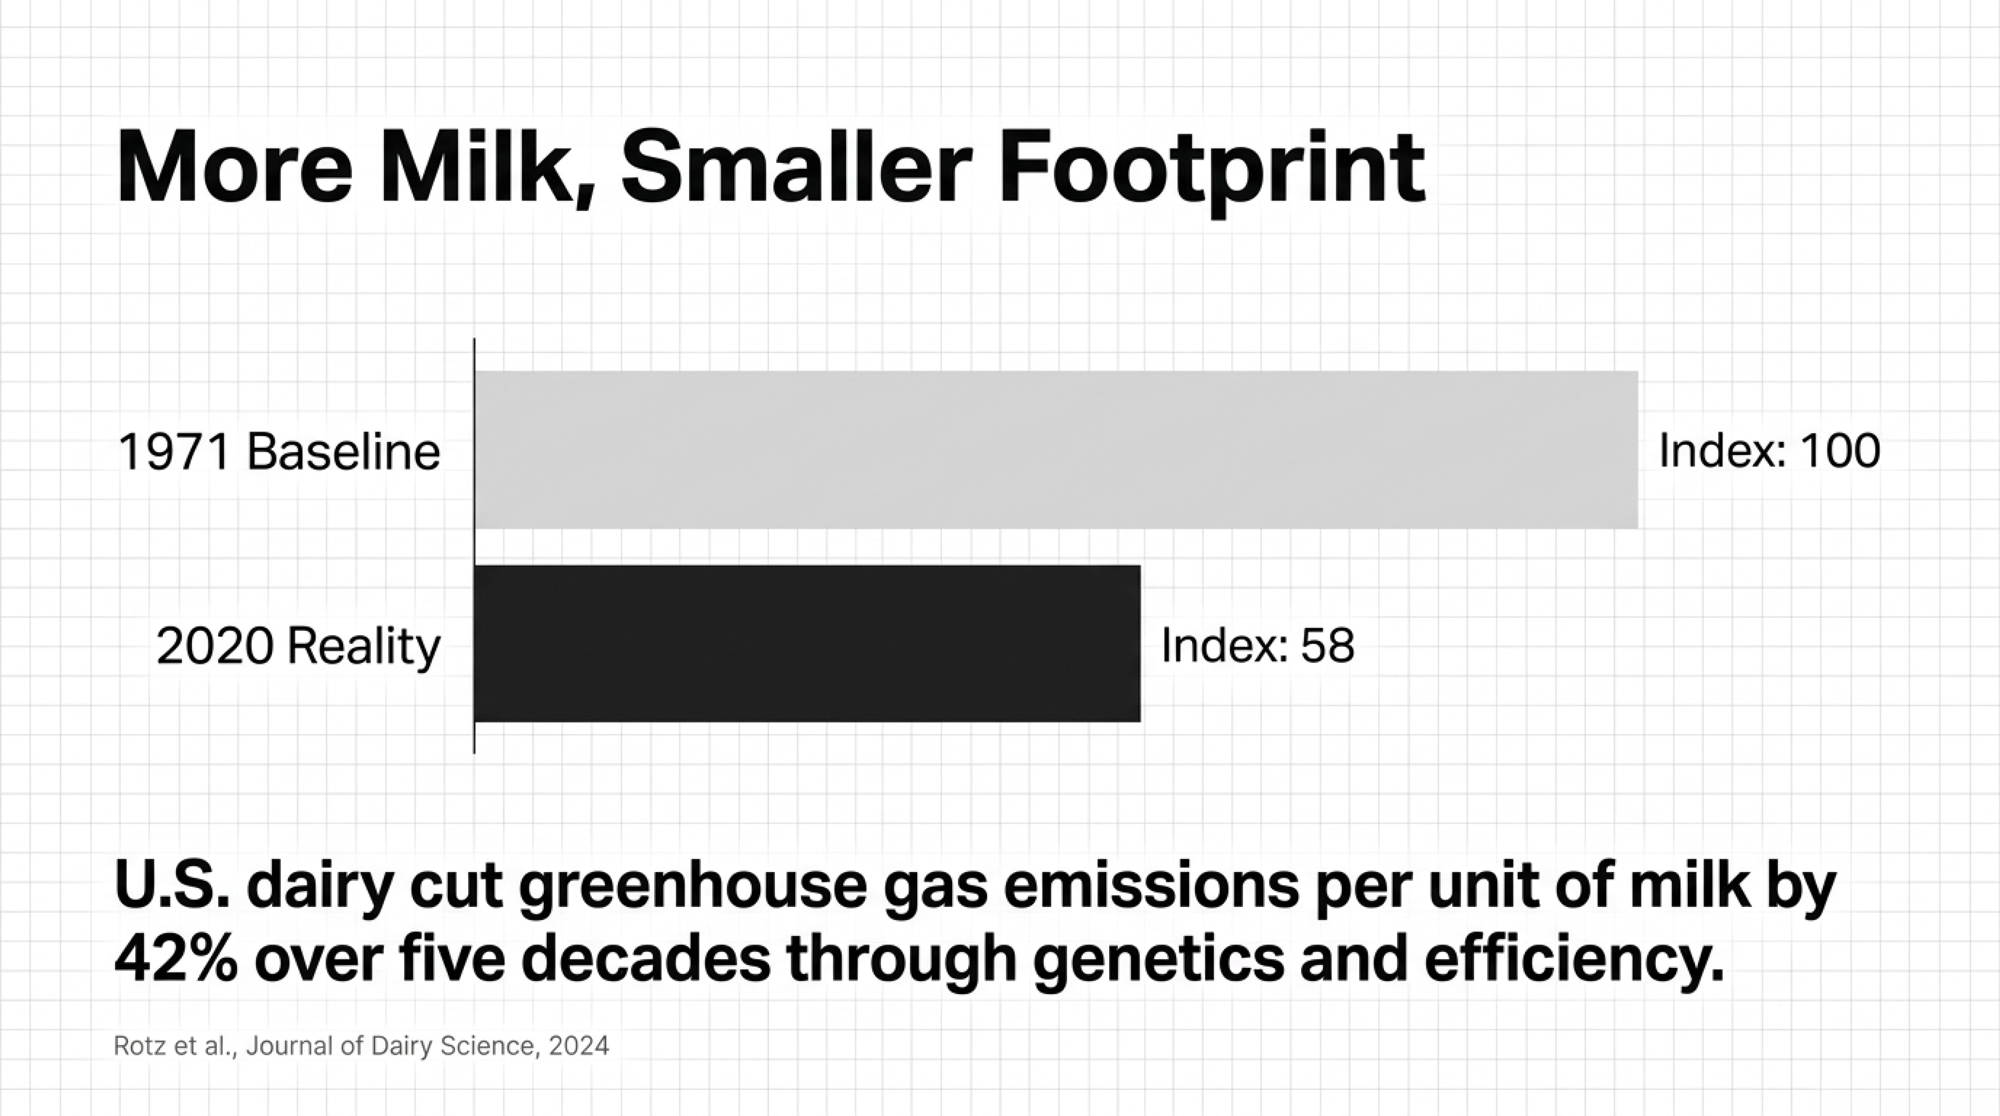
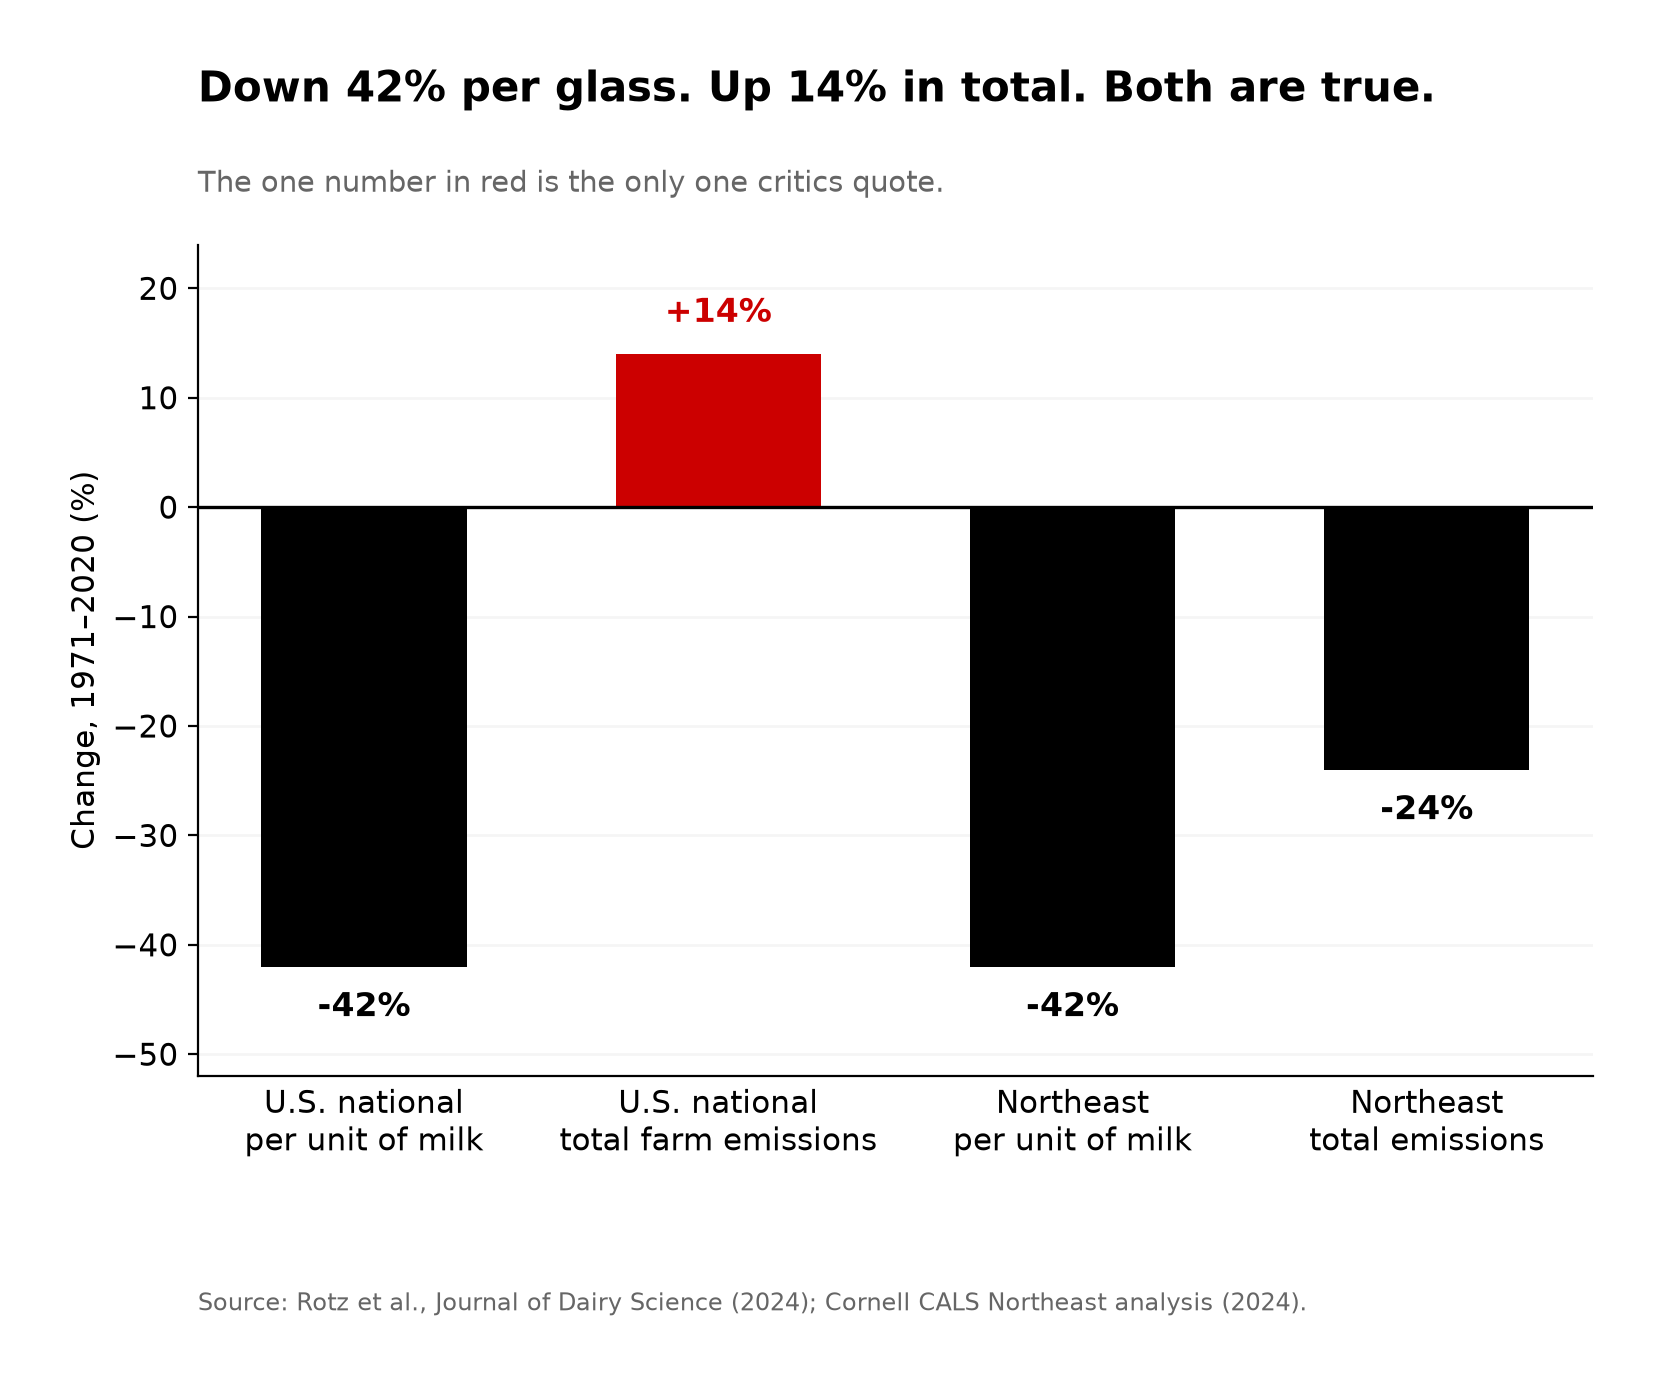
Here’s the part that should make you stand up straighter. Between 1971 and 2020, U.S. dairy farms cut greenhouse gas emissions per unit of milk by 42% while milking about 20% fewer cows and producing roughly twice the milk. That isn’t a marketing line. It’s peer-reviewed work from Rotz and colleagues in the Journal of Dairy Science, 2024 .
The rest of that study holds up just as well: fossil energy use per unit of milk down 54%, water-use intensity down 28%, and modeled nitrogen and phosphorus runoff per unit of milk down between 27% and 51%. Cornell’s Northeast analysis lands in the same place, with milk carbon intensity down 42% across the same span and absolute emissions in that region down 24% .
So why does your kid come home from school saying cows are bad for the planet? Because the public conversation never got the memo. Two research teams, one national and one regional, landed within a point of each other on intensity.
Why “per glass” and “in total” are both true
This is the line that won’t fit on a bumper sticker. Total emissions from all U.S. dairy farms still rose about 14% across those five decades, because total production climbed and a good share of it moved west into dry regions that lean hard on irrigation. Per glass, way down. In total, up. Both real.
Why does that matter to you? Because a critic reaches for the 14% and a checkoff ad reaches for the 42%, and if you can’t hold both in one breath you sound like you’re hiding something. You’re not. The footprint of each glass fell while the country drank more of it, which is productivity, not a cover-up. The Northeast figure is your best friend in that argument: in that region, absolute emissions came down 24% while intensity fell 42%. Regional stories differ, and saying so out loud is what makes you credible.
What drove the per-glass gains wasn’t a trick, and it wasn’t hormones. USDA’s Economic Research Service reported in February 2026 that the share of milk sales from farms using bovine somatotropin fell from 35% in 2000 to 2% by 2021 . The progress came from genetics, nutrition, reproduction, and management. More milk out of every cow, every acre, every gallon of diesel, and it paid for itself on the way. That’s exactly what DeVos’s credit was built on: Rumensin improves production efficiency, and the methane reduction rode along with it. The old deal, with a carbon check stapled on. The next round breaks it.
What does feeding 3-NOP actually cost you?
The science isn’t the problem. A meta-analysis in the Journal of Dairy Science found 3-NOP reduced methane production, yield, and intensity by 30.9% to 32.7% at an average dose of 70.5 mg/kg of dry matter . Van Gastelen and colleagues followed Holstein-Friesians over a full lactation and reported 21% lower daily methane, 20% lower methane yield, and 27% lower methane intensity, with a positive effect on production characteristics — Journal of Dairy Science, volume 107, 2024. It works.
The economics are the problem, and two different numbers get confused here. Bovaer’s price has been reported in trade coverage at roughly $0.30–$0.40 per cow per day, or about $93–$105 per cow per year on a lactating-cow basis . Separately, the 2025 JDS analysis found a net income-over-feed-cost decline of about $0.35 per cow per day, driven substantially by reduced feed intake and milk yield in the trials modeled . Similar-looking figures, different metrics. The second one matters because it’s what lands on your bottom line after the production response.
Read that twice before you sign anything. You’re not simply buying a feed additive — you’re absorbing a modeled production effect. Trial results vary, and some studies report no significant yield penalty, which is precisely why you run the number against your own herd instead of against a brochure.
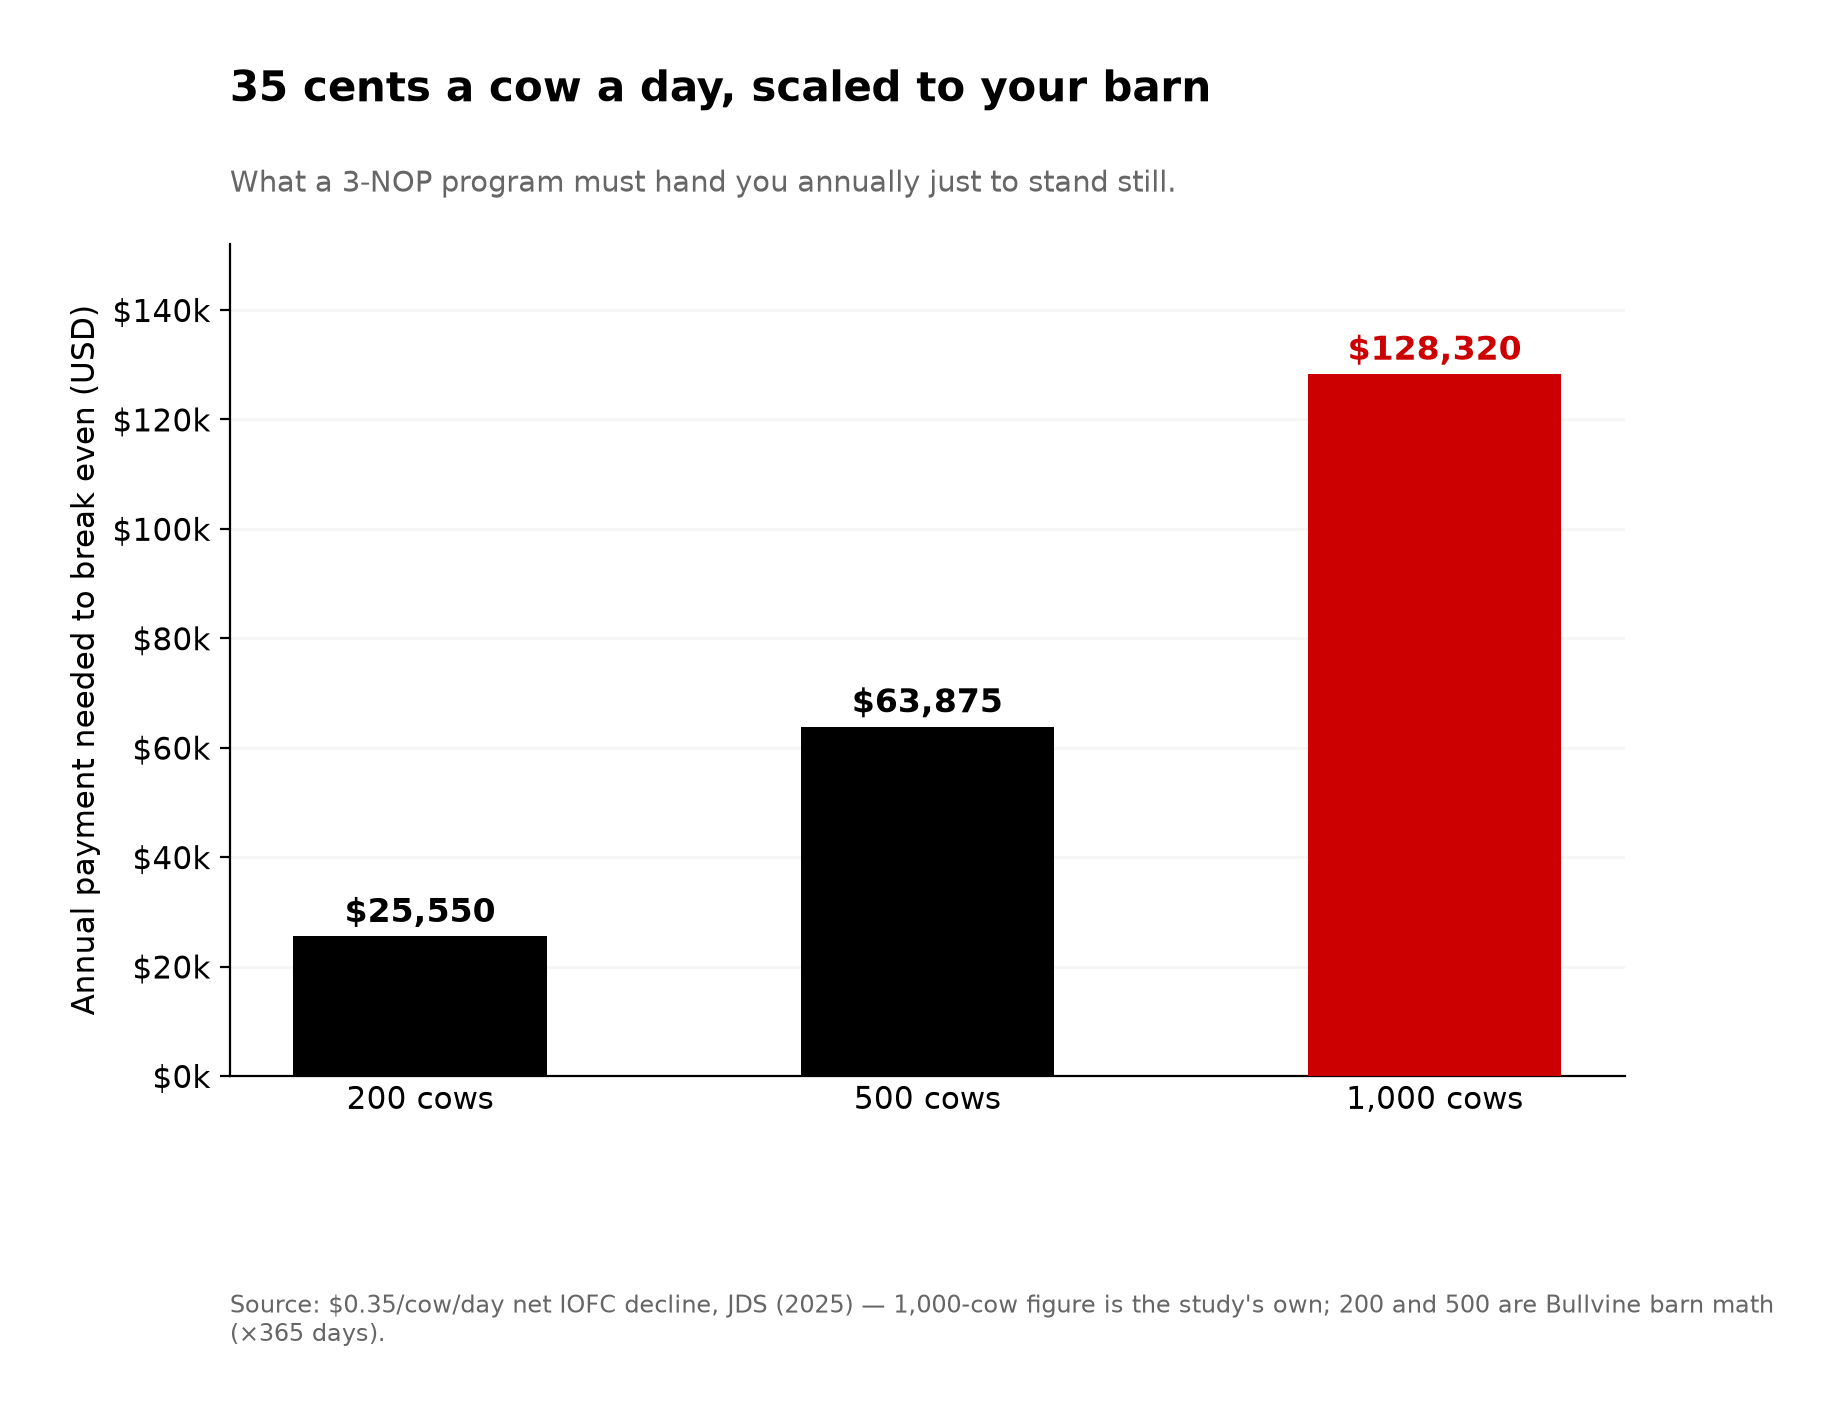
So run it. At the published $0.35 per cow per day net decline, here’s what your operation needs handed to it annually to stand still, applying that figure across herd scale:
| Herd size | Break-even need at $0.35/cow/day |
| 200 cows | ~$25,550/yr |
| 500 cows | ~$63,875/yr |
| 1,000 cows | ~$128,320/yr |
Table note: the 1,000-cow figure is the JDS-modeled annual shortfall, the study’s own number. The 200- and 500-cow rows are Bullvine’s barn math, scaling the published $0.35/cow/day across 365 days, giving $25,550 and $63,875. A straight-line 1,000-cow calculation returns $127,750, fractionally under the study’s $128,320; that difference is in the model, not a typo.
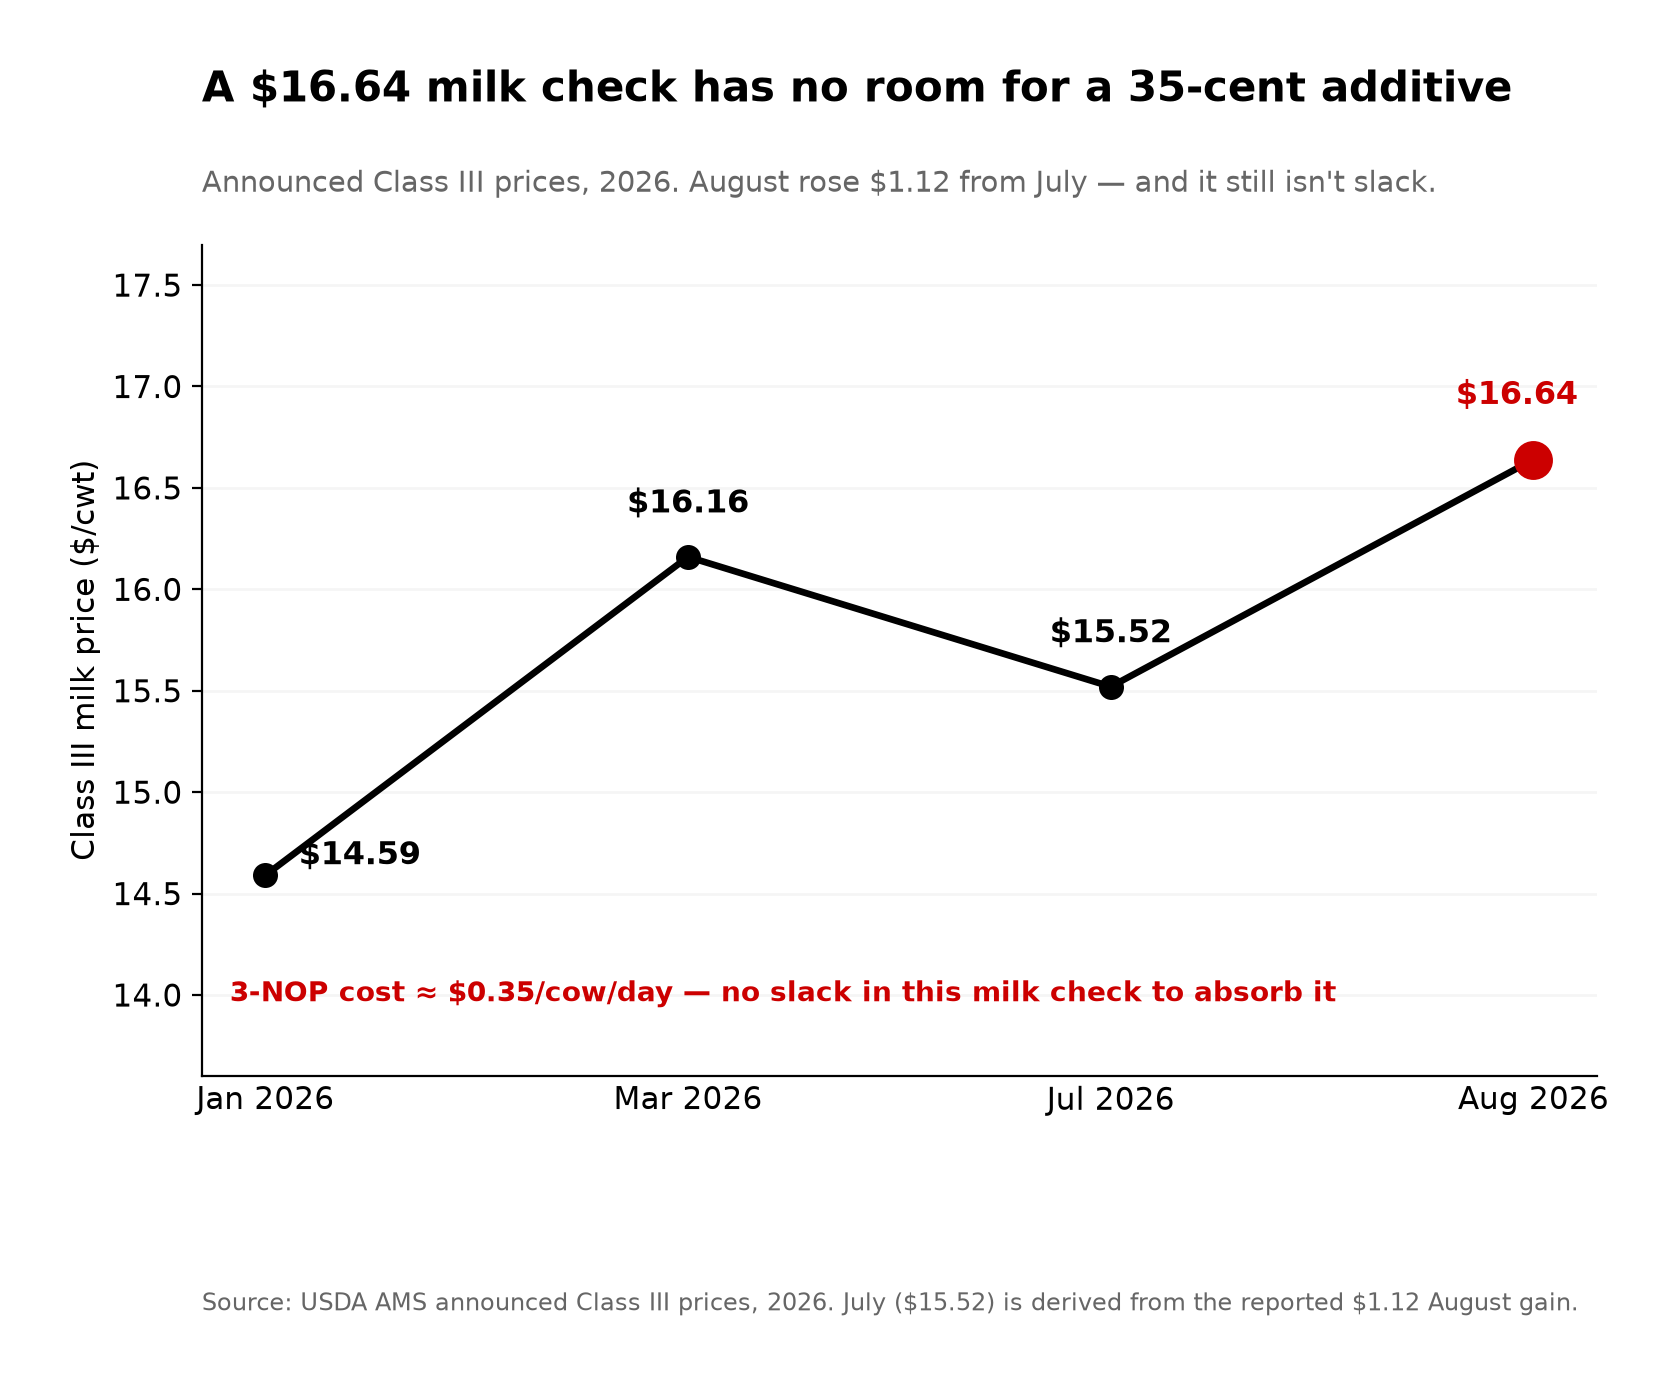
That money comes from a credit, a premium, or a buyer’s check. It isn’t coming from more milk in the tank. USDA AMS put the announced August 2026 Class III price at $16.64/cwt, up $1.12 from July , and Class III opened this year at $14.59 in January before working up through $16.16 in March . There’s no slack in that milk check to quietly absorb 35 cents a cow a day.
On the premium side, the arithmetic is thinner than the pitch. A $0.12/cwt sustainability premium on a 75-lb cow returns only about $33 per cow per year, and Elanco has publicly projected carbon-market returns around $20 per cow per year on top of that — which against a $93–$105 additive bill still leaves a gap of roughly $40–$73 per cow . We’ve walked that contract math clause by clause in the $73-a-cow gap hiding in your 2027 Bovaer contract.
| Line item | Per cow / year | Per 1,000-cow herd | Source |
|---|---|---|---|
| Bovaer additive cost | −$93 to −$105 | −$93,000 to −$105,000 | Trade-reported price, $0.30–$0.40/cow/day |
| $0.12/cwt sustainability premium (75-lb cow) | +$33 | +$33,000 | Bullvine barn math |
| Elanco projected carbon-market return | +$20 | +$20,000 | Elanco public projection |
| Net gap left on the farm | −$40 to −$73 | −$40,000 to −$73,000 | Bullvine calculation |
| Modeled net IOFC decline (separate metric) | −$128 | −$128,320 | JDS 2025 economic analysis |
Who actually keeps the carbon money?
The money is large. It just mostly isn’t yours.
Start with what a digester costs to build, because the regulator publishes its own arithmetic. CARB sets out the cost formulas it uses for dairy manure digesters in Appendix F of its Short-Lived Climate Pollutant Reduction Strategy, and the ICCT’s 2023 California renewable natural gas outlook applied them: capital expense scaling with herd size, operations and maintenance at 6% of capital, pipeline at $200,000 a mile, biogas upgrading at $8 per MCF, and a $2 million interconnection fee on a single-farm project against $5.5 million on a centralized one, plus $250,000 a truck where the gas has to move by road. theicct
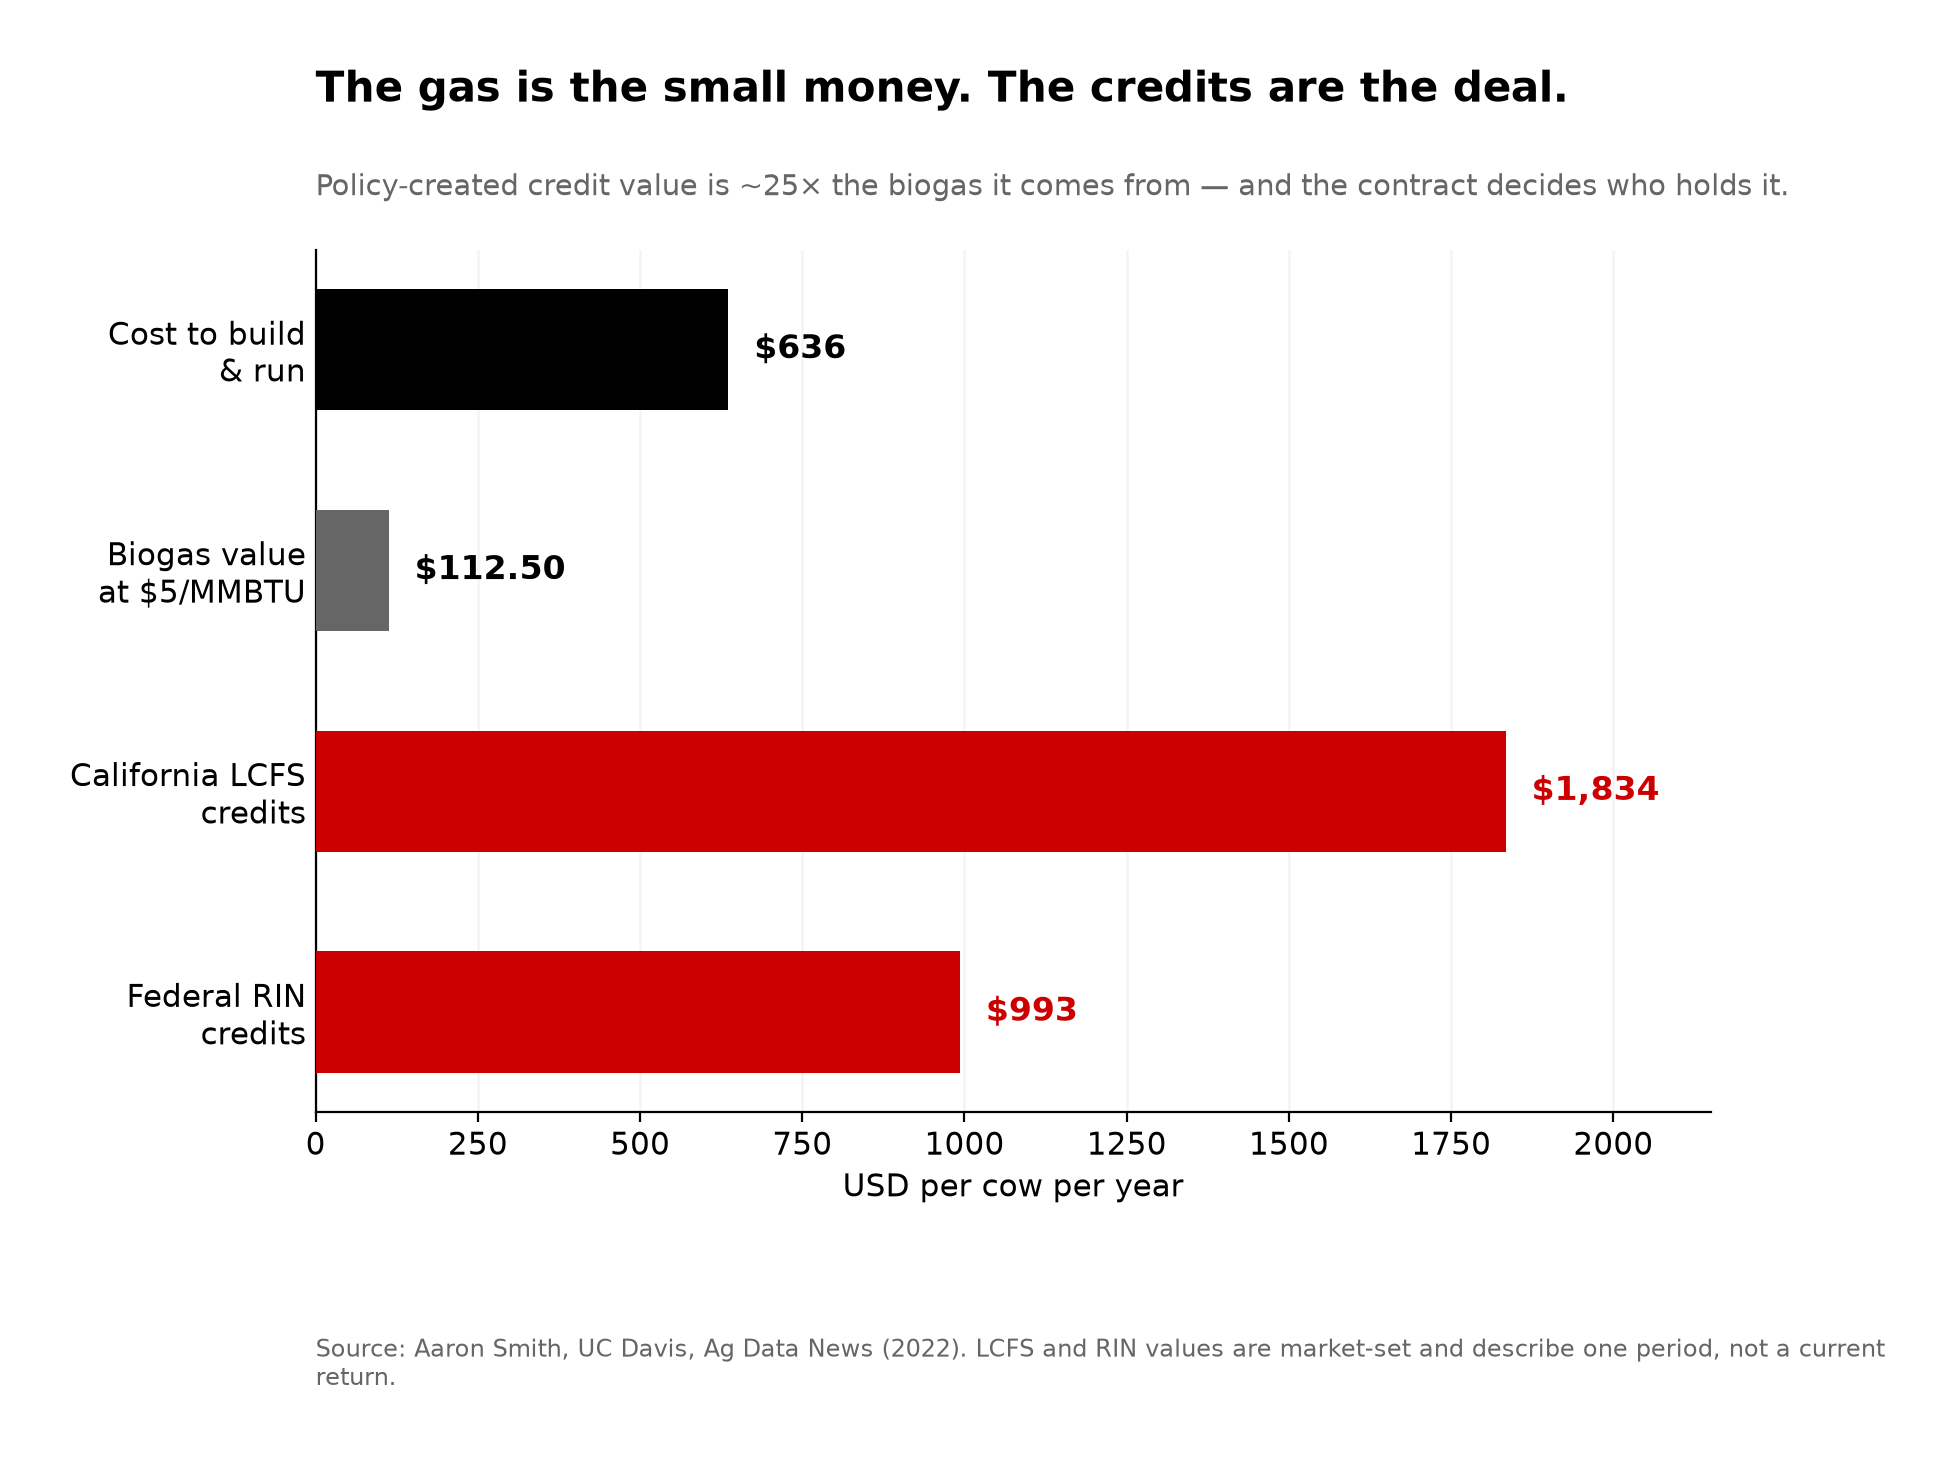
Now the per-cow view. UC Davis agricultural economist Aaron Smith, in a 2022 analysis, put a digester at roughly 22.5 MMBTU of biogas per cow per year at a cost of about $636 per cow, operating cost plus capital amortized over ten years, with the gas worth about $112.50 per cow at $5/MMBTU . On the gas alone, you’d never build it.
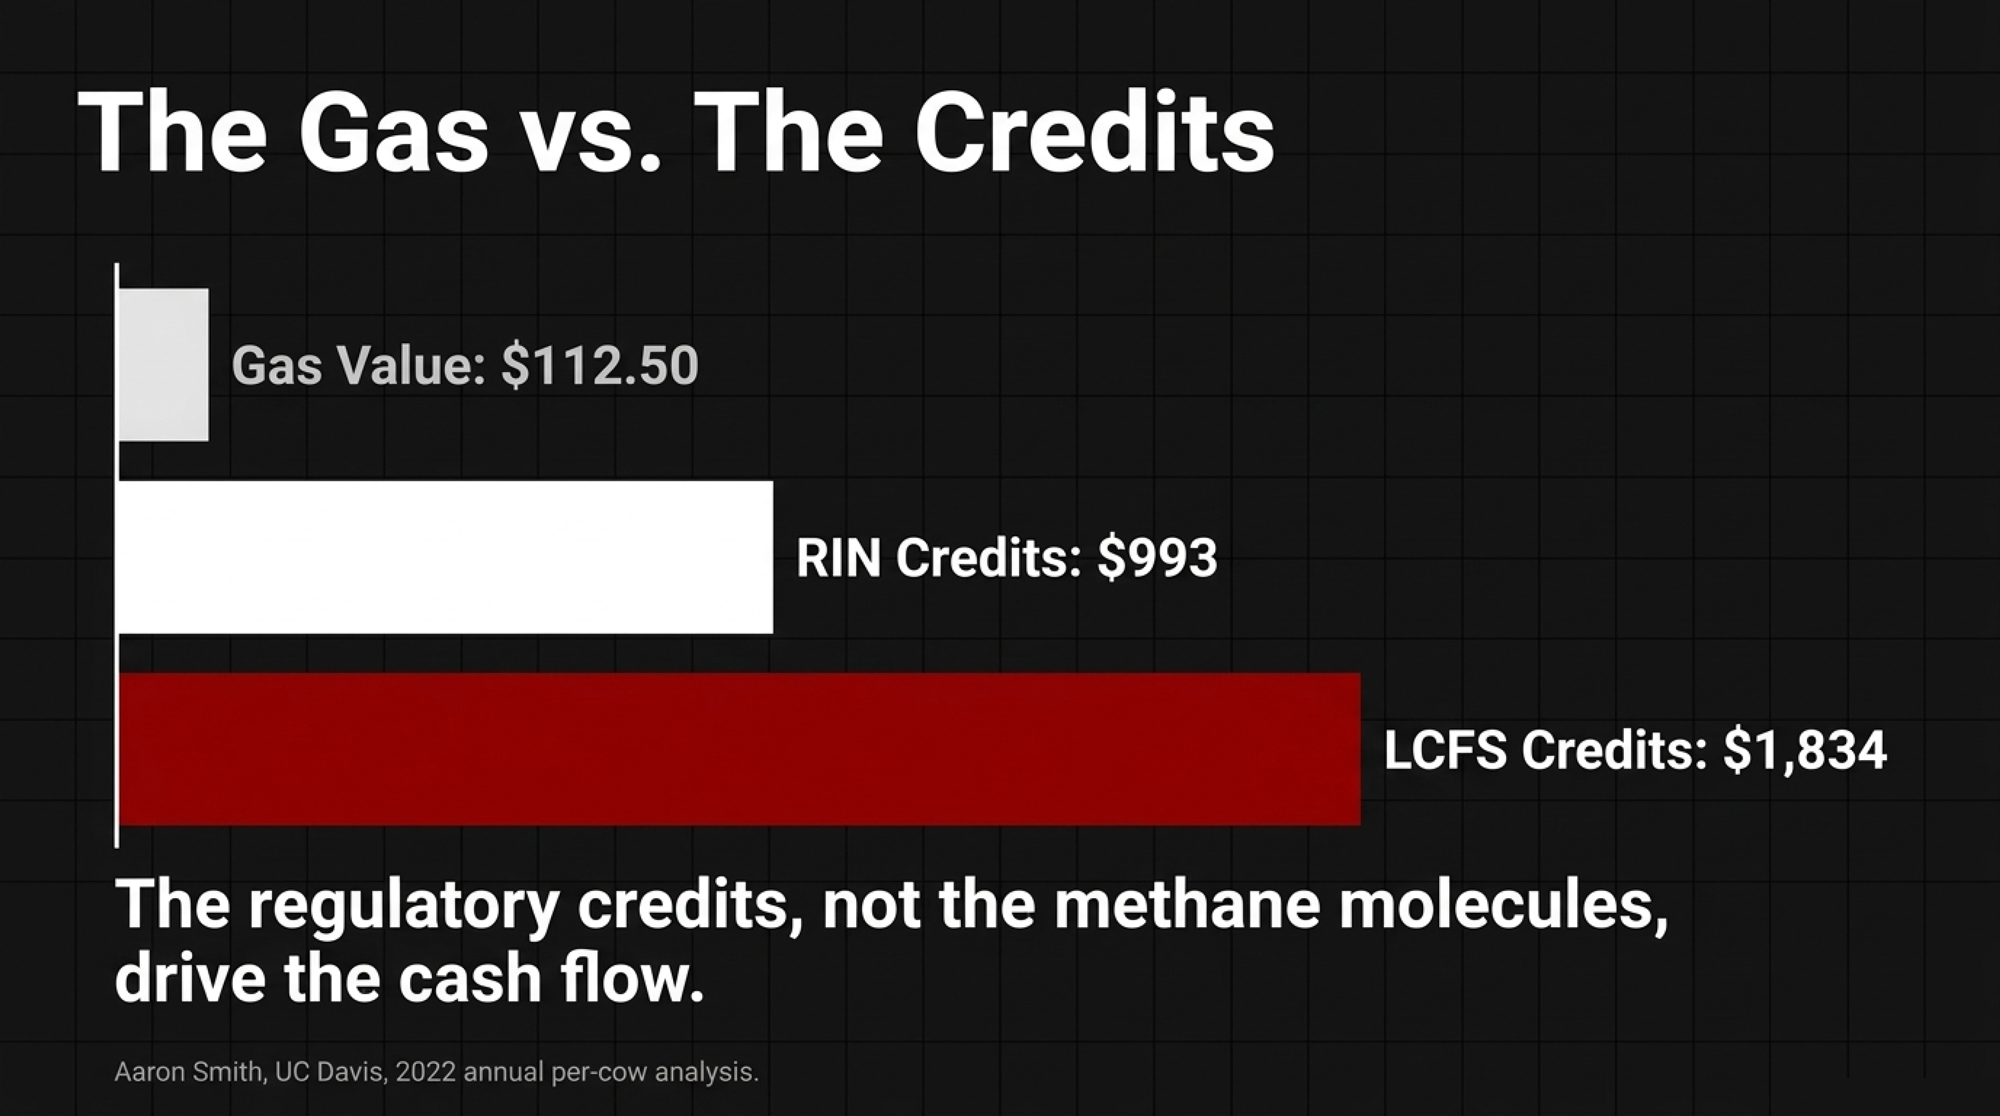
Then come the credits. Smith calculated that the same cow’s biogas earns approximately $1,834 per cow in California Low Carbon Fuel Standard credits and another $993 per cow in federal Renewable Identification Numbers, about $2,827 per cow in policy-created value . That’s more than four times the value of the gas. Don’t read it as a guaranteed margin on a deal you’re offered today: LCFS and RIN credits are market-set instruments, their value moves with program rules and market conditions, and Smith’s figure is a snapshot of one period rather than a fixed return . What doesn’t move is the underlying dynamic — the regulatory credits, not the methane molecules, drive the cash flow. A 2025 Terrain Ag analysis found the fuel is typically the smallest share of the revenue stream, which is the same finding from the lender’s side of the table .
Project scale tells the same story. Writing in October 2024, Smith reported that data provided to CARB put a typical 2023-built digester on a 2,500-cow dairy at $8.6 million to construct, about $1.2 million a year amortized over a decade, and roughly $1.1 million a year to operate, against gas sales of approximately $230,000 at 2023 city-gate prices. Net operating cost before credits: about $870,000 a year, plus another $500,000 if the gas has to be trucked. Over the first ten years he puts the net cost of building and running a digester at $2,730 to $3,380 per ton of methane abated, and notes that California grants can cover up to half of capital costs. agdatanews.substack
None of that credit stream is hypothetical. LCFS credit generation from manure digester projects has grown roughly 1,000% since 2020 and has produced more than a billion dollars’ worth of credits. California has put about $214 million of state money into 131 dairy digester projects in the San Joaquin Valley alone, and CARB’s own August 2024 dairy sector workshop draws its project data from CDFA’s grant records, EPA AgSTAR, and verified LCFS and cap-and-trade filings. sciencedirect
So the decisive question on any digester deal isn’t whether the project pencils. The question is who holds the credits, and the contracts are written on that point. Guidance published for developers in Biomass Magazine in 2022 advises that the agreement should state the developer owns all rights to the environmental credits, tax credits, and similar benefits arising from the project; lenders and offtakers want clean title in the project entity. Compeer Financial’s 2025 producer guidance puts it plainly: understanding the fine print is crucial . DeVos got a check because his tool earned on performance first, and the carbon was upside. Digester operators sit on top of substantial public subsidy value and mostly don’t hold title to it. The difference isn’t the science. It’s the contract. Our earlier breakdown of a larger covered-lagoon project runs in $1,130 per cow, $128 back.
When does a methane tool actually pencil?
The decision rule is simple even when the answer isn’t. A methane tool pencils only when the outside payment reliably clears the break-even gap and stays cleared after the marketplace or developer takes its share.
| Lever | Recurring cost to you | Who keeps the created value | Proven payout to a farmer? | Time to effect |
|---|---|---|---|---|
| Rumensin / monensin (efficiency + credits) | None — earns on feed efficiency | Farmer held the credit | Yes — 1,150 t sold, Jan 2024, DFA via Athian | Immediate |
| 3-NOP / Bovaer | −$0.35/cow/day net IOFC($128,320 per 1,000 cows) | Depends entirely on the premium clause | No banked U.S. dairy credit to date | Immediate, ~31% methane cut |
| Manure digester | $636/cow/year to build and run | Developer-side templates assign LCFS, RINs and tax credits to the project entity | Gas only: ~$112.50/cow vs ~$2,827/cow in credits | Multi-year build, 10-year amortisation |
| Methane Efficiency genetics (Lactanet) | $0 on DHI-enrolled females | Farmer — it’s in the herd | No credit protocol yet; 23% heritability, >70% reliability | 5–7 years to herd-level expression |
- For 3-NOP: you need a locked premium above $0.35 per cow per day net, roughly $25,550 a year on 200 cows and $128,320 on 1,000. A $0.12/cwt premium returning $33 a cow doesn’t reach it. A handshake or a one-year pilot price is not a floor.
- For a digester: ask who holds the LCFS credits and the RINs before you ask anything else, and ask it again about any state grant that covered construction. That clause decides whether the project is your asset or your neighbor’s.
- For an efficiency tool that also earns credits: a different question entirely. If the product pays its own way on performance, the Rumensin case, carbon revenue is upside rather than justification.
- For genetics: the one lever with no recurring bill. Lactanet’s Methane Efficiency trait runs 23% heritability with better than 70% reliability on genotyped young animals and costs nothing extra on DHI-enrolled females, though herd-level expression takes five to seven years.
What can you do before the contract hits your desk?
Plenty, and most of it is free. The highest-value move isn’t financial: get the story straight before a reporter, a neighbor, or your kid’s teacher gets it wrong for you. A 2025 Dairy MAX consumer survey found that consumers see farmers as the most trusted source of information on dairy sustainability . Use that standing before somebody else fills the silence.
The second move is to treat every carbon pitch as a contract problem, not a science problem. The science on 3-NOP is settled enough at roughly 31% methane reduction. The open question is who keeps the value when it works. For the genetics side of that answer, see why methane-efficiency breeding beats Bovaer’s $73 gap.
The Producer Playbook: What to Do Before Signing
- Run 35 cents a cow a day against any additive offer before you sign — $25,550 a year on 200 cows, $128,320 on 1,000. If the premium doesn’t clear that with margin, the answer is no.
- Check what the premium actually pays. A $0.12/cwt sustainability premium returns about $33 a cow a year, roughly a third of a $93–$105 additive bill. That’s why the gap keeps landing on the farm.
- On a digester, find the credits clause before you read anything else. The regulatory credits, not the gas, carry the cash flow, and developer-side contract templates assign them to the project entity.
- Ask what the grant paid for. California grants can cover up to half of digester capital cost, and who took that money shapes who owns the output.
- Copy the model that actually worked. The only U.S. dairy methane credit ever banked came off Elanco’s Rumensin protocol, not Bovaer: a tool already paying for itself on feed efficiency, with carbon as upside.
DeVos got a check because his tool worked twice, once on efficiency and once on carbon. Most farms won’t get that deal. So where does your operation sit right now: positioned to get paid for the methane you’re being asked to cut, or about to absorb the cost alone?
That splits hard by herd size and region. We’re building the full cost-per-cow model — 3-NOP, digesters, and carbon programs by herd size and region — in next week’s Bullvine Weekly.
Methodology Note: Long-term greenhouse-gas, energy, water, and nutrient figures come from Rotz et al., Journal of Dairy Science (2024), a national U.S. life-cycle assessment comparing 1971 with 2020. These are national averages and will not match every region or operation. Northeast figures are from Cornell CALS reporting on the same body of work. The 3-NOP economics ($0.35/cow/day income-over-feed-cost decline; $128,320/year on a modeled 1,000-cow herd) are from a 2025 JDS economic analysis in which the decline reflected reduced feed intake and milk yield in the trials modeled; individual herd results will differ with feed cost, component values, and dose, and the published figure is a single modeled central value rather than a range. Bovaer’s reported price of $0.30–$0.40/cow/day and $93–$105/cow/year is a separate figure from that net IOFC decline and should not be read as the same number. The 200- and 500-cow rows are Bullvine’s barn math scaling the published per-cow figure across 365 days. Methane-reduction efficacy of 30.9–32.7% at 70.5 mg/kg dry matter is from a JDS meta-analysis; the full-lactation figures of 21%, 20%, and 27% are van Gastelen et al., JDS volume 107 (2024). Jasper DeVos’s January 2024 credit sale used Athian’s first accepted protocol, based on Elanco’s Rumensin (monensin); Bovaer/3-NOP is a DSM-Firmenich product and was not the tool used in that sale. Digester cost formulas are CARB’s own, published in Appendix F of its Short-Lived Climate Pollutant Reduction Strategy and applied in the ICCT’s May 2023 California renewable natural gas outlook. Digester per-cow figures — $636 cost, $112.50 gas value at $5/MMBTU, $1,834 LCFS, and $993 RIN credit value — are Aaron Smith’s 2022 calculations at UC Davis; LCFS and RIN credit values are market-set and move with program rules and market conditions, so those per-cow figures describe one period rather than a current return. Project-scale figures and the $2,730–$3,380 per ton abated range are Smith’s October 2024 analysis, published at the Energy Institute at Haas and Ag Data News, drawing on data provided to the California Air Resources Board; Bullvine has not obtained individual project submissions. LCFS credit growth and cumulative credit value for manure digester projects are from peer-reviewed analysis of CARB program data; the $214 million across 131 San Joaquin Valley projects is CDFA data as cited in peer-reviewed work. CARB’s August 2024 dairy sector workshop presentation identifies its project data sources as CDFA’s Dairy Digester Research and Development Program records, EPA AgSTAR, and verified LCFS and cap-and-trade filings. Contract-structure findings are from 2022 Biomass Magazine developer guidance, a 2025 Terrain Ag/American AgCredit analysis, and Compeer Financial’s 2025 producer guidance. Class III at $16.64/cwt is the USDA AMS announced August 2026 price. Bovine somatotropin figures are from USDA Economic Research Service, February 2026. Methane Efficiency heritability and reliability figures are from Lactanet. Nestlé’s targets are from its published Net Zero Roadmap. Currency pass completed September 14, 2026. Dollar figures are USD. We welcome producer numbers and corrections.
Learn More
- The Bovaer Warning: How Denmark’s Methane Mandate Went from Law to Crisis in 6 Weeks — Arms you with a defensive herd-monitoring framework after 1,400 Danish dairies faced health issues on mandated additives, showing why you must test on 10–20% of cows with clear exit triggers before broad adoption.
- The $73-a-Cow Gap Hiding in Your 2027 Bovaer Contract — Follows the money on processor sustainability clauses where a $0.12/cwt premium leaves up to $73 per cow in unfunded annual bills, mapping how to pair insetting with genetic indexes to defend margins.
- Alberto Dairy’s $640K Worm Bet: Who Actually Gets Paid on a BioFiltro Deal? — Dismantles alternative manure vendor models by analyzing vermifiltration economics, revealing how vendor-held climate attributes shift capital risk to the barn while export contracts determine whether whole-farm nitrogen drops 4% or 38%.
 The Sunday Read Dairy Professionals Don’t Skip.
 The Sunday Read Dairy Professionals Don’t Skip.
Every week, thousands of producers, breeders, and industry insiders open Bullvine Weekly for genetics insights, market shifts, and profit strategies they won’t find anywhere else. One email. Five minutes. Smarter decisions all week.
