










Nordic Holstein female coancestry climbed from 0.02% to 0.39% per year while pedigree inbreeding looked harmless. Coancestry is next generation’s inbreeding — and your current mating report only shows you one of them.
You’re placing a semen order off the August 2026 GTPI list. You take four bulls, spread across the top ten, figuring that spread covers you. Odds are three of them are sons of Ocd Thorson Ripcord-ET — he sired seven of that top ten, and eight of the top ten for Net Merit $, per The Bullvine’s analysis of that run.
Go one generation further back and it gets tighter, not looser. One great-granddam sits behind seven bulls across those two lists.
A proposal circulating in European trade press argues North American studs should voluntarily set aside index thresholds for roughly 5% of young-sire intake, so European-origin sires get a shot they wouldn’t otherwise get. It’s pointing at something real. But it picks the wrong criterion — and the evidence for that runs through a Nordic population where female coancestry climbed nearly twentyfold across the genomic-selection transition, while the pedigree analysis of the same herd found nothing wrong at all.
Holstein Is Climbing at Twice the Rate of Everything Else
Lactanet’s Inbreeding Update – August 2025, authored by Brian Van Doormaal, put Canadian Holstein heifers born in 2024 at 9.99% average pedigree inbreeding. Highest of the four major breeds — ahead of Jersey at 7.56%, Brown Swiss at 7.10% and Ayrshire at 6.89%.
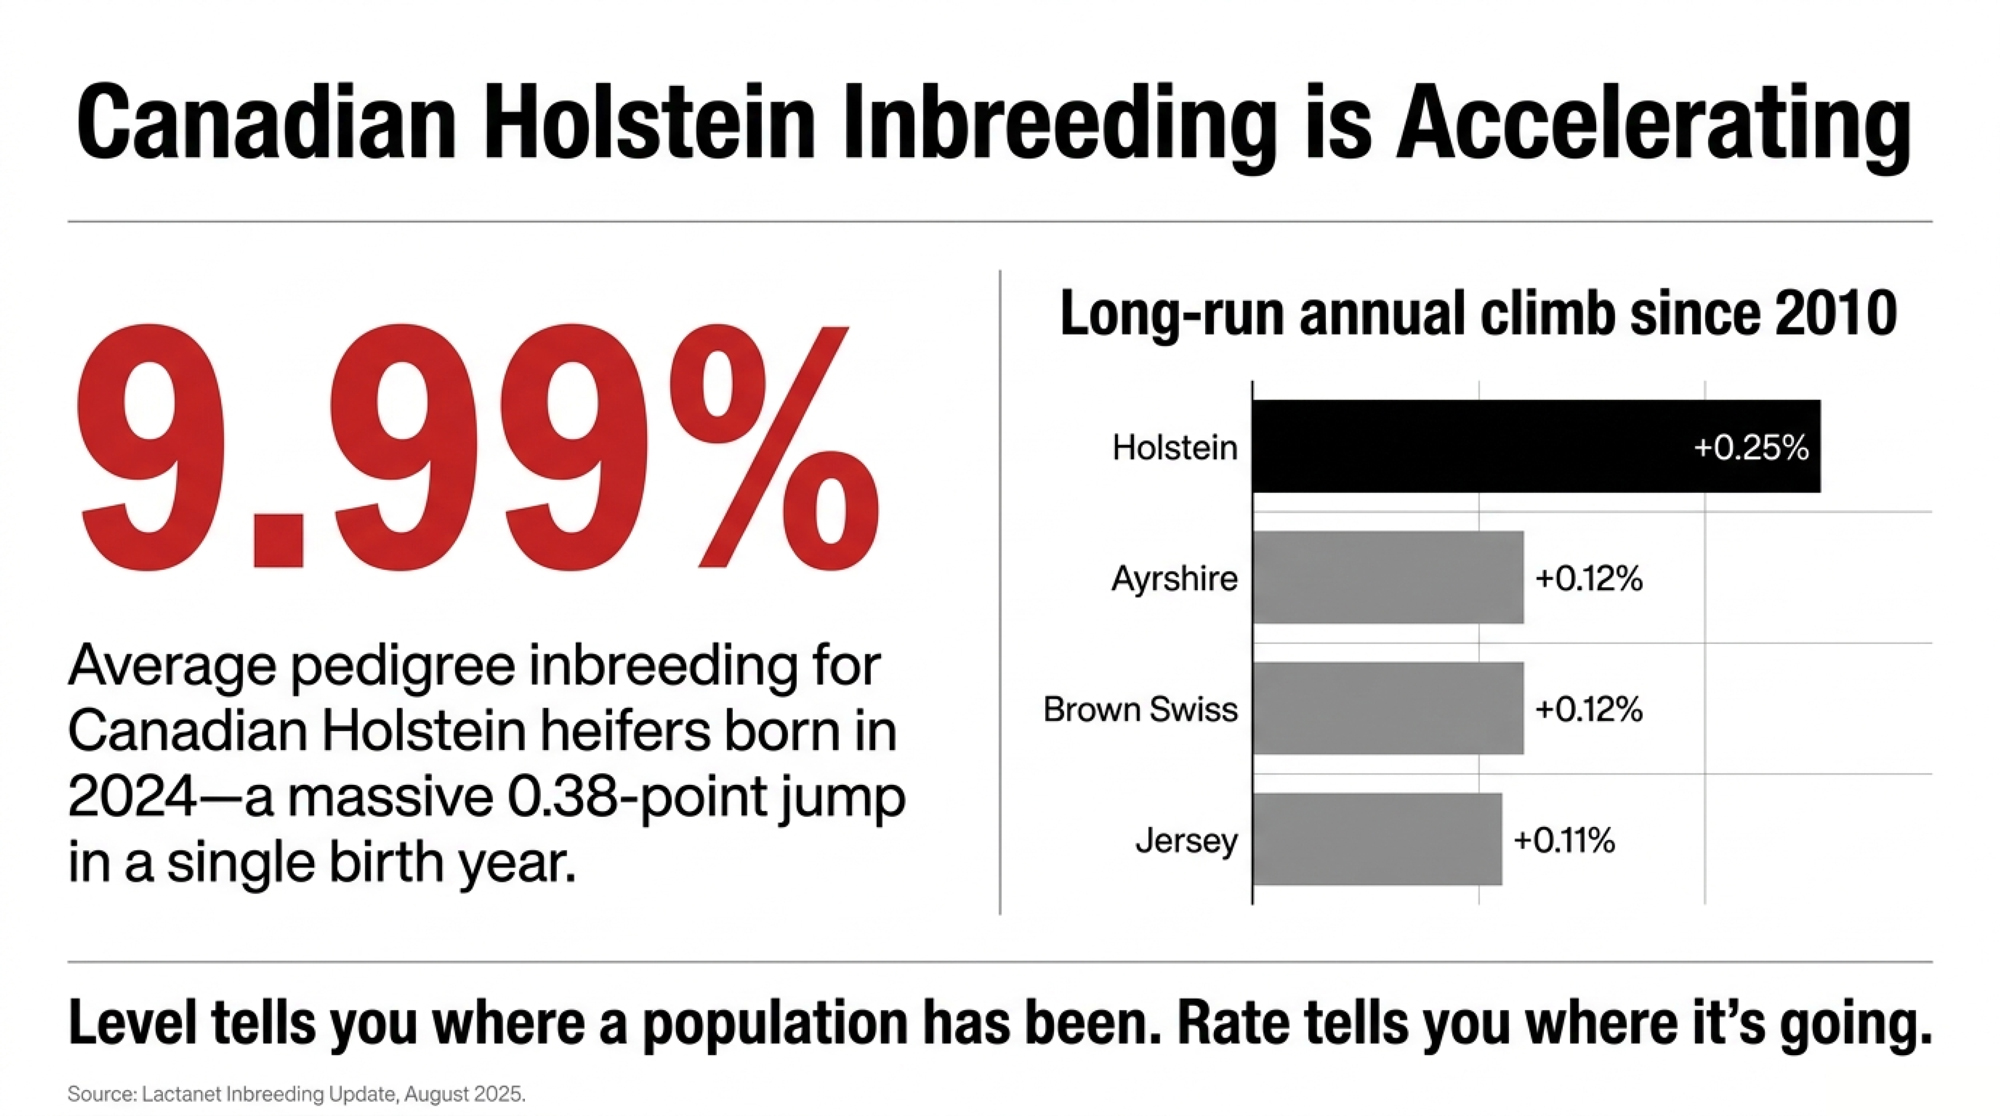
That 9.99% is up from 9.61% for heifers born in 2023. A 0.38-point jump in a single birth year, against a long-run trend of +0.25%. The climb isn’t just continuing. It steepened.
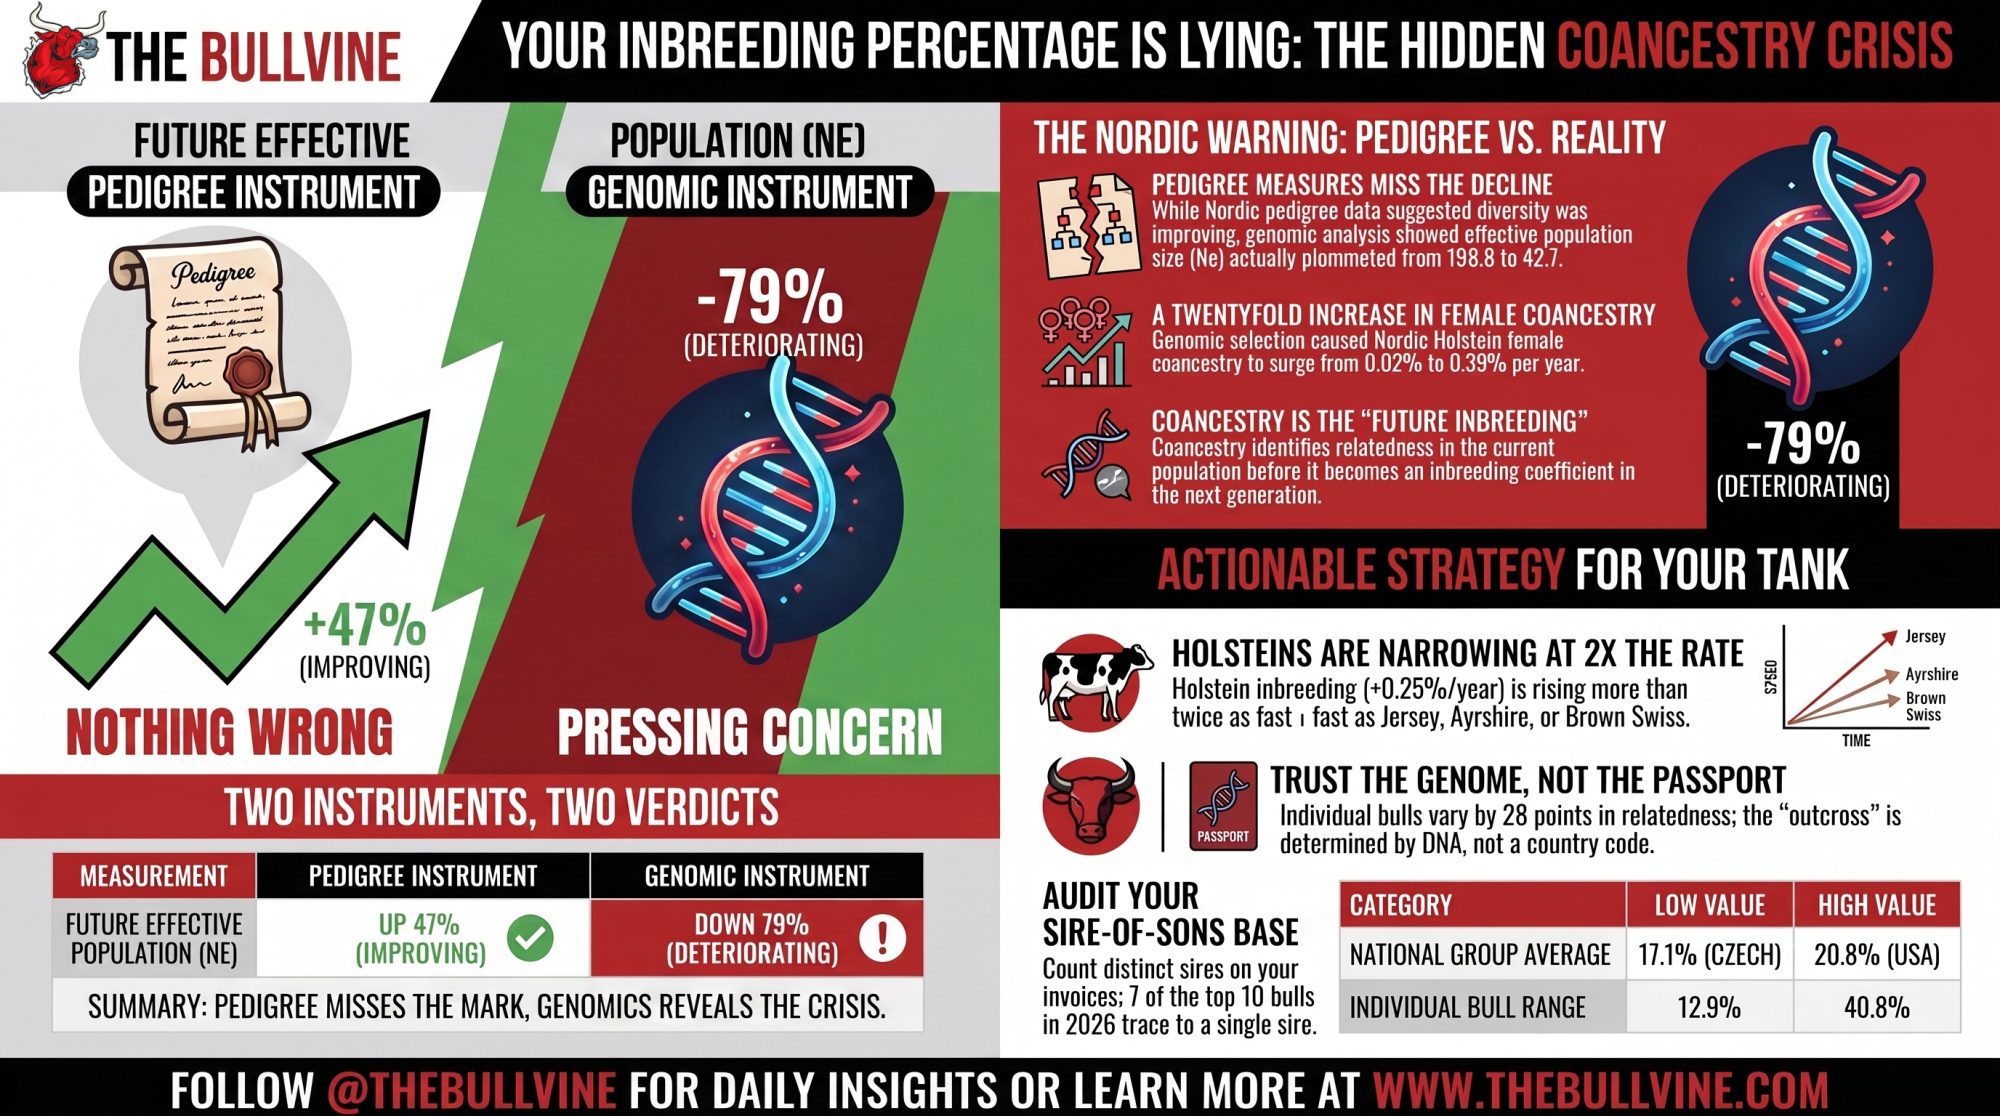
The rate is the number that should bother you. For females born since 2010, Jersey has averaged +0.11% per year, Ayrshire and Brown Swiss +0.12%, and Holstein +0.25%. Better than double.
Worth noting what that rate does and doesn’t tell you. Canadienne actually carries the highest average inbreeding of any Canadian dairy breed at 10.33% — but its rate of increase since 2010 is the lowest of the group at +0.09% per year. High level, slow climb. Holstein is the reverse. Level tells you where a population has been. Rate tells you where it’s going. Hold that distinction, because the whole argument in this piece turns on a version of it.
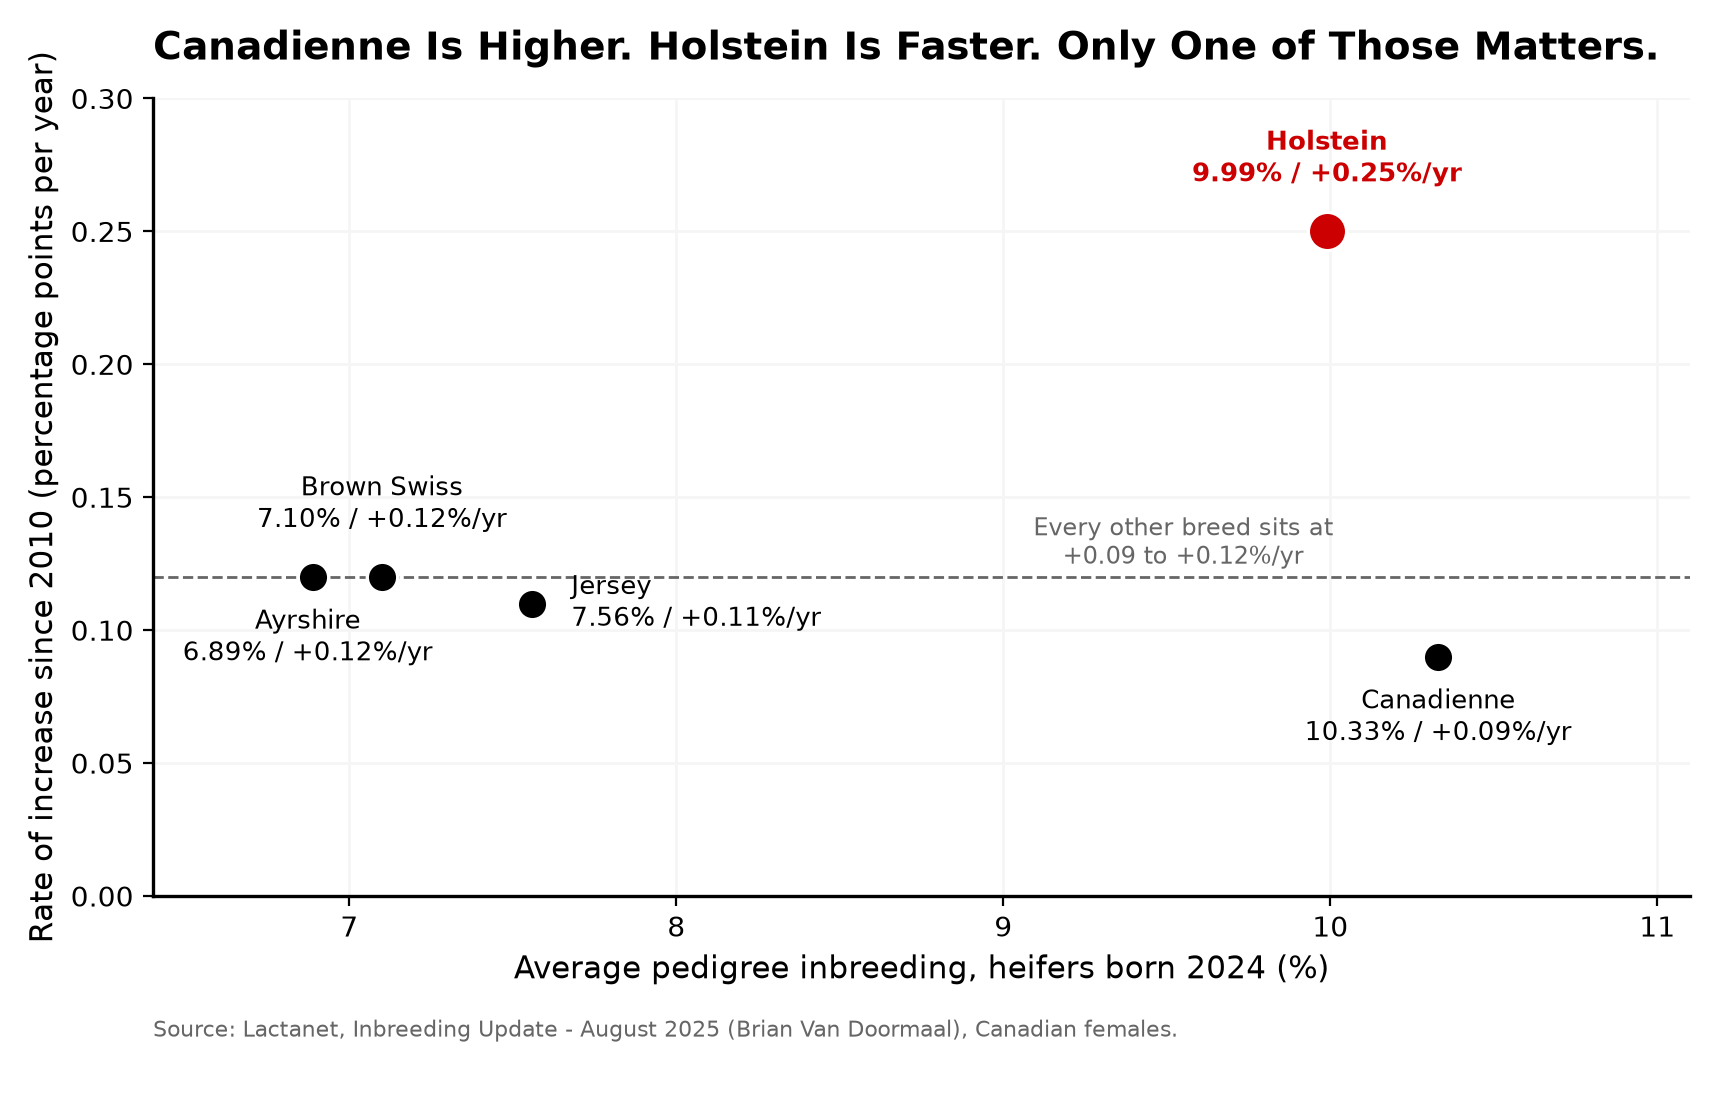
Four breeds. One country. One evaluation system. The same genomic tools sitting on the shelf for every one of them. Holstein moving twice as fast as the others. Whatever’s driving that, it isn’t a shortage of foreign germplasm — Jersey and Ayrshire breeders in Canada aren’t running set-asides either. (See our companion breakdown: What 9.99% Inbreeding Costs in a Herd Under 50 Cows.)
The Nordic Result Everybody Quotes
At the 2022 World Congress on Genetics Applied to Livestock Production, Tenhunen, Thomasen, Sørensen, Aamand, Berg and Kargo — Aarhus University, VikingGenetics and Nordic Cattle Genetic Evaluations — presented pedigree analysis on 372,955 Nordic Holstein females born January 2016 through November 2018, traced back an average of 12.4 generations.
One term you need before the table. Effective population size — Ne — is the number of breeding animals a population behaves like genetically. Not how many cows exist; how many genuinely independent lines are contributing. A breed with two million cows can run an Ne under 50. The lower it goes, the faster relatedness accumulates. Future Ne is the same idea projected forward off coancestry: where the population is heading if current mating patterns hold. That second number is the one that matters most here.
Their finding travelled fast, and you can see why:
| Birth Cohort | Period | ΔF (per yr) | ΔC (per yr) | Generation Interval | Ne | Expected Future Ne |
| 2007–2010 | Pre-genomics | 0.0016 | 0.0018 | 4.86 yr | 68 | 59 |
| 2011–2014 | Transition | 0.0017 | 0.0014 | 4.08 yr | 71 | 88 |
| 2015–2018 | Genomic era | 0.0016 | 0.0018 | 3.17 yr | 104 | 87 |
Annual inbreeding rate flat at 0.0016 before and after. Generation interval collapsing from 4.86 years to 3.17. Effective population size apparently rising by half again, and expected future Ne improving from 59 to 87. The authors reported they could not detect any increase in inbreeding or coancestry, contrary to what had been published for Dutch, French and Canadian Holstein.
Two things to hold onto before you bank that. WCGALP proceedings are conference papers, not peer-reviewed journal articles. And the analysis ran on pedigree data.
Then the Same Team Ran It With Genomics
Tenhunen, Thomasen, Sørensen, Berg and Kargo published a follow-up in the Journal of Dairy Science — 2024 Aug;107(8):5897–5912, doi 10.3168/jds.2023-24553 — covering Nordic Jersey and Nordic Holstein, comparing pedigree and genomic measures of inbreeding and coancestry before and after genomic selection, split across females, bulls and approved AI sires. It’s open access, so you can read it yourself.
Nordic Holstein went the other way.
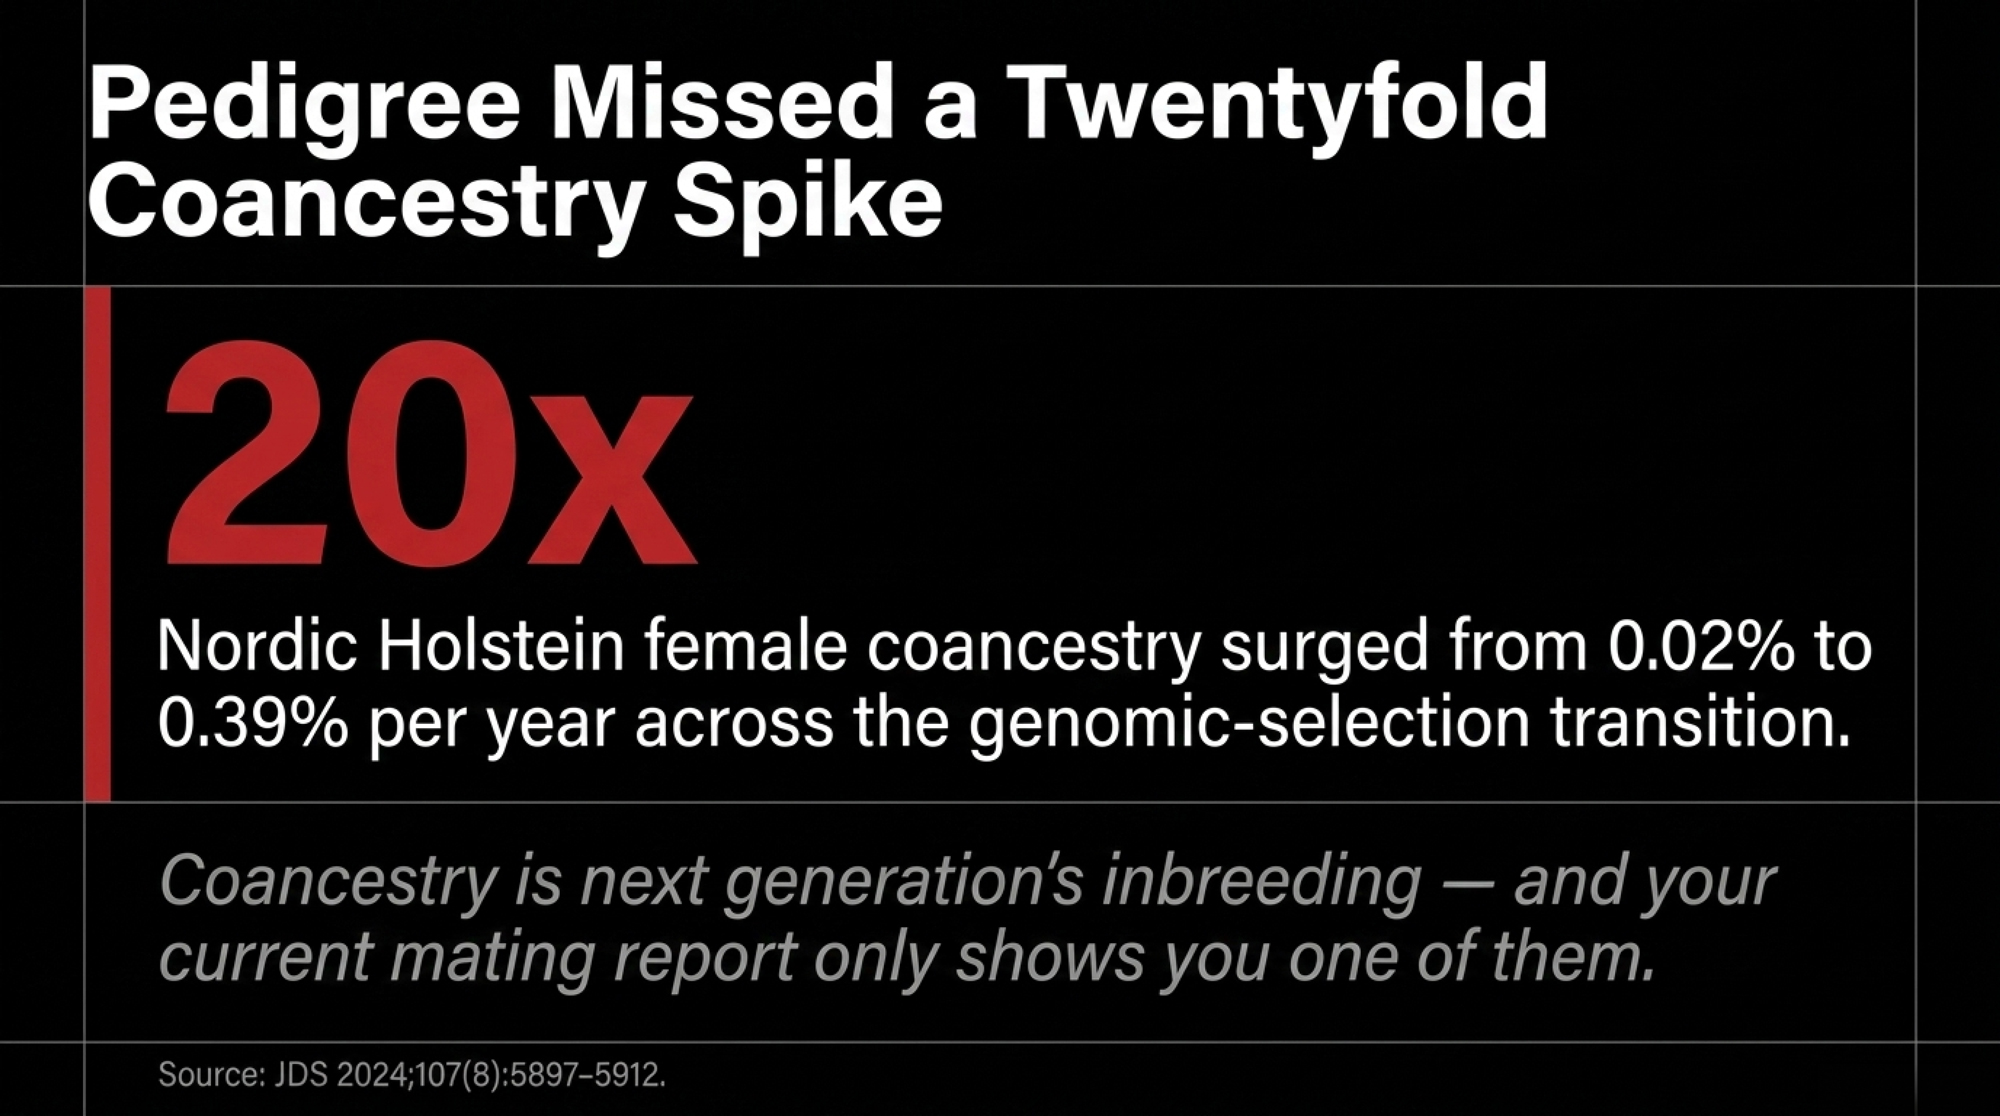
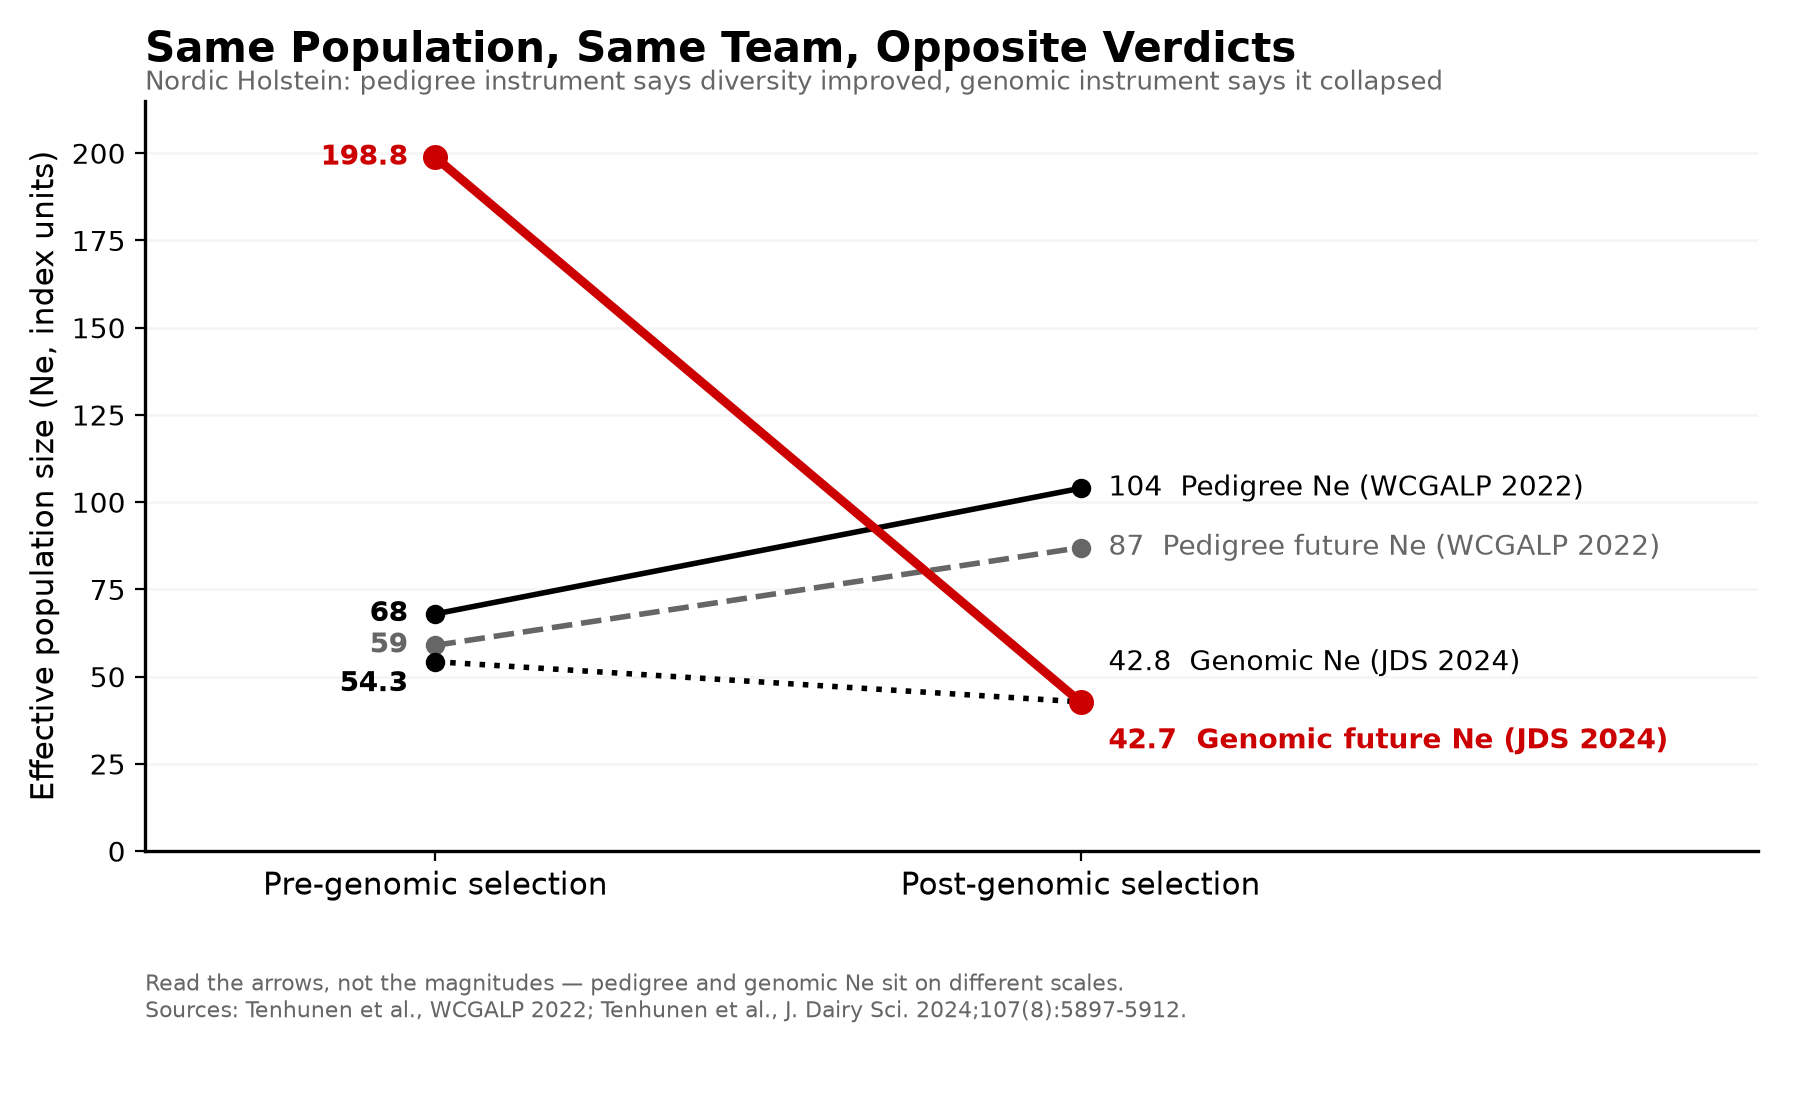
On the genomic measures, effective population size fell from 54.3 before genomic selection to 42.8 after. Future effective population size, the coancestry-derived figure, fell from 198.8 to 42.7 across the same transition.Coancestry rate rose across every Holstein animal group, with the female population surging from 0.02% to 0.39% per year. Yearly ΔF rose for most groups in both breeds.
Two Instruments, Two Verdicts
| Measure (source) | Pre-GS | Post-GS | What it says |
|---|---|---|---|
| Pedigree Ne — WCGALP 2022 | 68 | 104 | Up 53% — diversity improving |
| Pedigree expected future Ne — WCGALP 2022 | 59 | 87 | Up 47% — future looks safe |
| Genomic Ne — JDS 2024 | 54.3 | 42.8 | Down 21% — base narrowing |
| Genomic future Ne — JDS 2024 | 198.8 | 42.7 | Down 79% — the warning |
| Female coancestry rate, Holstein — JDS 2024 | 0.02%/yr | 0.39%/yr | ~20x — next generation’s inbreeding |
| Genomic future Ne, Nordic Jersey — JDS 2024 | 40.7 | 57.2 | Up 41% — same program, opposite result |
Read that table across the rows, not down the columns. These are not four readings of one quantity. Pedigree Ne and genomic Ne are computed on different scales and cannot be compared to each other by size — 68 is not “bigger than” 54.3 in any meaningful sense. What’s comparable is the arrow. The pedigree instrument said the population was opening up. The genomic instrument, run by the same team on the same population, said it was closing down. Row two and row four are the same conceptual quantity — where the population is headed — measured two ways, pointing opposite directions.
Nordic Jersey, measured the same way over the same transition, went the opposite direction from Holstein: Ne essentially stable, and future Ne improving from 40.7 to 57.2. Same program, same country, same analysis — different outcome by breed.
The authors’ summary is blunt. Genomic methods detect differences between populations and changes in ΔF and ΔC more efficiently than pedigree methods. Genomic selection produced positive coancestry outcomes in Jersey and the opposite in Holstein. Nordic Holstein “faces more pressing concerns,” and the findings “underscore the necessity of genomic control of inbreeding and coancestry with strategic changes to the Nordic breeding schemes.”
So Which Analysis Do You Believe?
The genomic one. That’s not a close call, and it’s the position the research team itself takes.
Be precise about what disagrees here. The two studies don’t offer competing readings of a single number — they used different instruments on the same population and reached opposite conclusions about the direction of travel. Pedigree analysis found diversity holding or improving. Genomic analysis found it deteriorating. One of those instruments missed something.
Pedigree inbreeding measures expected relatedness from recorded ancestry. Genomic measures capture what actually got transmitted — including relatedness that pedigree can’t see because it predates the recorded generations or runs through paths the herdbook doesn’t connect. When the two disagree, the genome is the ground truth and the pedigree is the estimate.
There’s real signal in the 2022 work that survives, and the 2024 paper confirms part of it. Generation interval genuinely fell — across every animal cohort in both breeds, more sharply in males than females. Bulls and AI sires in both breeds showed reduced generational ΔF. Nordic Holstein AI sires were the single group showing a slight decrease in yearly ΔF. The male side of the program did something right.
The Female Side Is Where It Came Apart
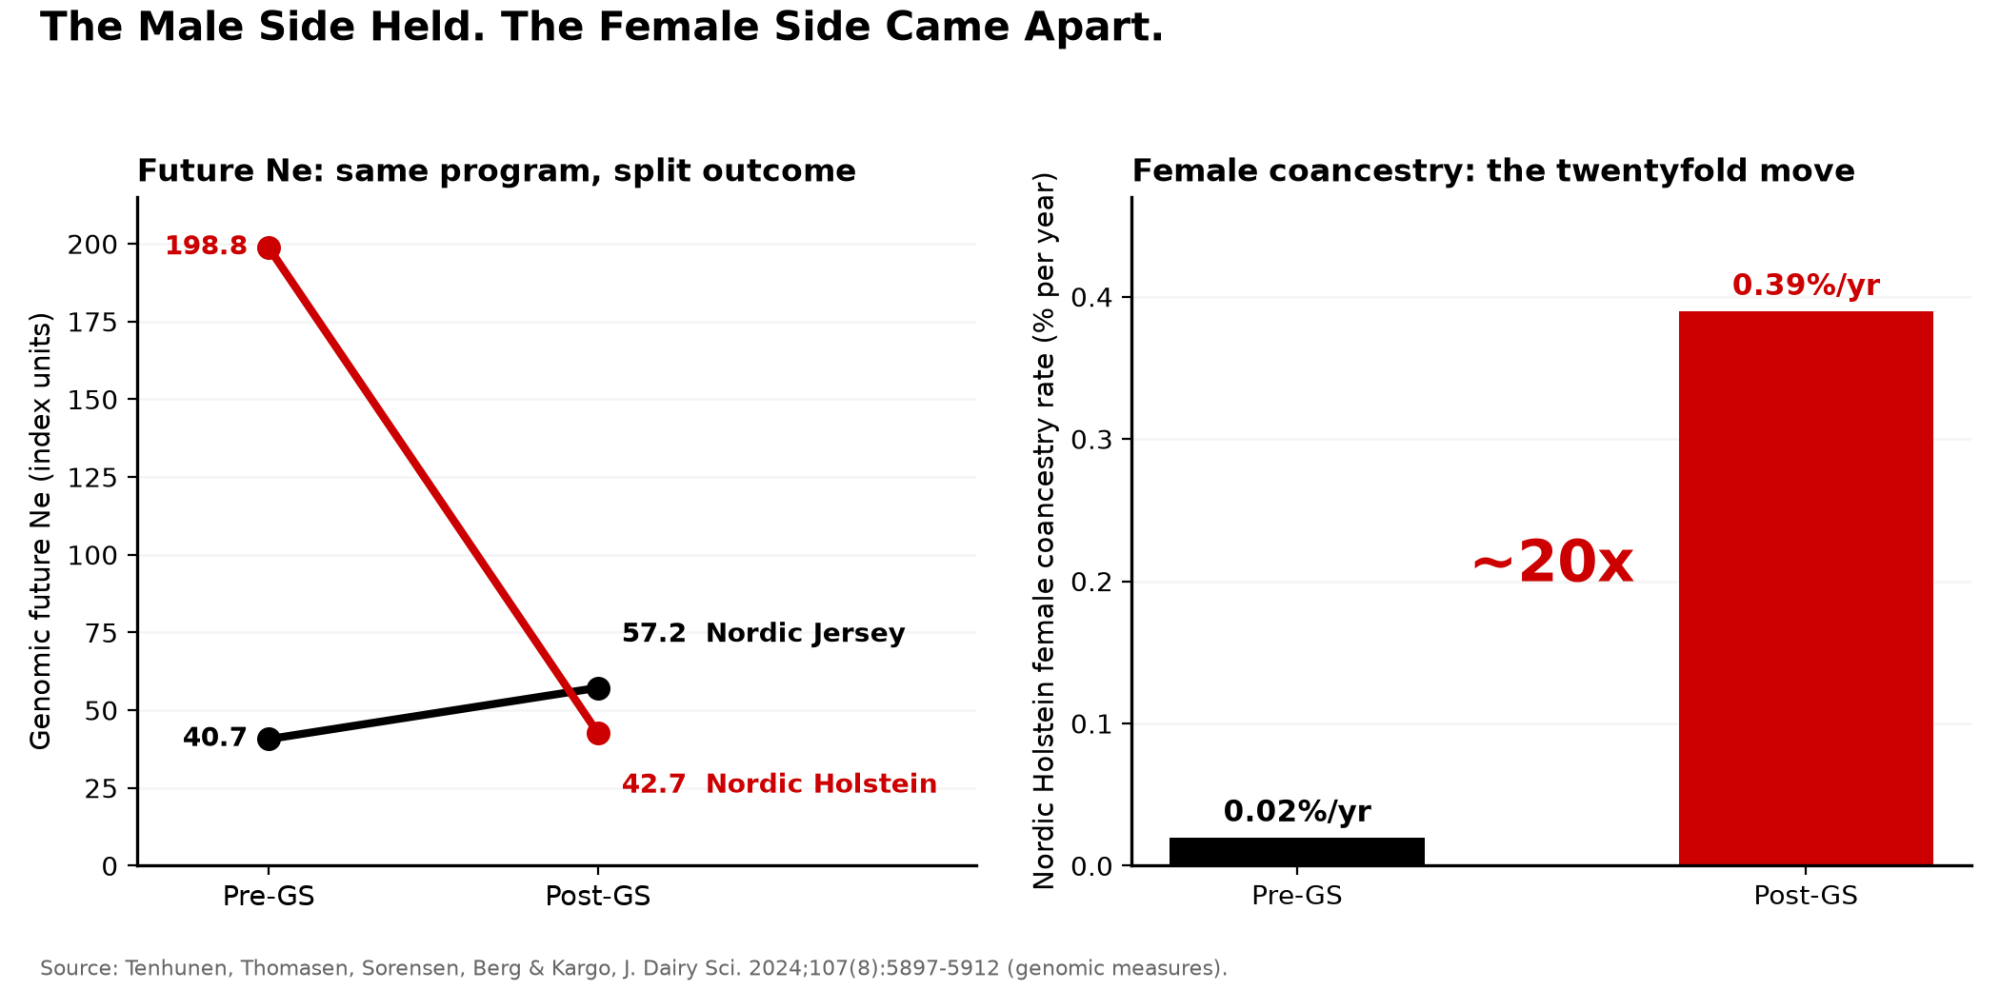
Female groups in both breeds showed a negative Ne trend while males were neutral or positive, and Holstein female coancestry climbed nearly twentyfold. A shorter generation interval spun the flywheel faster without widening the base underneath it.
Why the female side specifically? The 2024 paper doesn’t assign a cause, so what follows is inference from how the program is built — but the timing is hard to ignore.
Nordic genomic selection reached full implementation in 2014, the year females were included in the reference populations. Once you can rank a heifer at birth, the elite female pool stops being defined by proven performance across a lactation and starts being defined by a score available on day one. The same top-ranked heifers then get used, repeatedly, as donors. VikingGenetics program material published in 2017 described roughly 10,000 genomic tests on females annually, about 450 heifers contracted for flushing, and some 4,000 embryos produced per year. Its embryo program moves top heifer candidates to a donor station at five to eight months old for flushing or IVF. The stated aim is as many offspring as possible from the top NTM animals.
Note where 2017 sits. It falls inside the 2015–2018 birth cohort the Nordic analysis treats as the genomic era — so those figures describe the program during exactly the window where the coancestry rise shows up.
That is a deliberate and effective design for genetic gain. It is also, by construction, a narrowing of the female base — more calves from fewer dams, selected earlier, on a score that correlates strongly across close relatives. The male side of the program spread its risk across a wider set of sires. The female side concentrated.
One honest caveat in Nordic Holstein’s favour: the authors note ΔF there remains modest compared with what’s been observed in other Holstein populations. Nordic isn’t the cautionary tale. It’s the well-run program whose coancestry problem only became visible when the better instrument came out.
What the Authors Say to Do About It
This is the part that matters for your tank. The 2024 paper’s own conclusion points at mating strategy: analysis of the coancestry data hints at the potential to decrease future inbreeding through informed mating.
In practice that means the coancestry figures identify which pairings will compound relatedness before you make them, rather than showing up as an inbreeding coefficient on a calf that’s already on the ground.
Not passports. Measured relatedness. That’s a selection lever, and it’s the one a herd actually controls — which is a different thing from the supply question the set-aside raises. Hold that distinction; it matters in a minute.
Which is exactly what a Guelph-led team built the tool for.
Somebody Already Built That Tool
Makanjuola, Obari, Condello, Miglior, Maltecca, Cole, Schenkel and Baes — through the Centre for Genomic Improvement of Livestock at Guelph, with Lactanet, NC State, CDCB and Florida — published in the Interbull journal on November 17, 2025.
They pulled Lactanet data: 168,995 genotyped animals, a 616,258-animal pedigree, 8,491 bulls born 2000–2023, and 131,139 cows born 2010–2024. Pedigree completeness above 99%, maximum depth 30 generations. The reference population was active cows and heifers in milk recording with no left-herd date as of the April 2024 test day.
Then they measured how much DNA each bull actually shares with that live Canadian cow population — expected from pedigree (R-value), and realized from genotypes (GR-value).
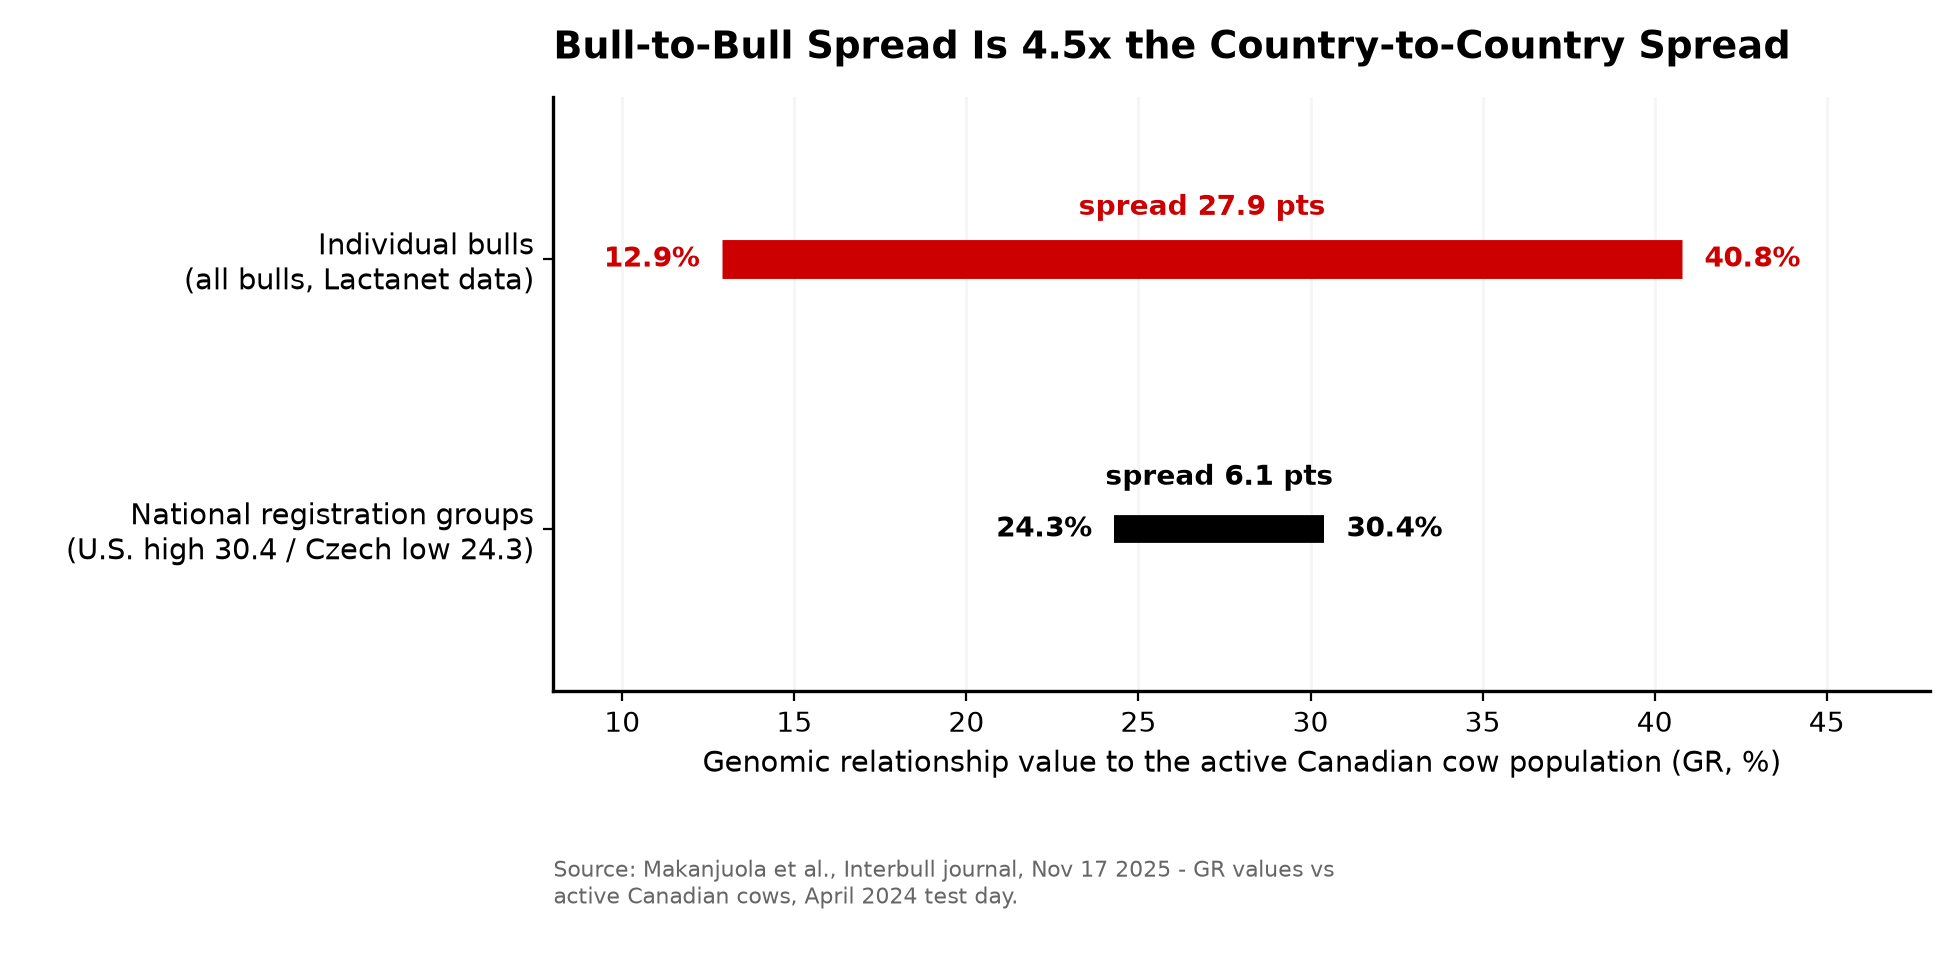
Across all bulls, R-value ran from 9.3% to 26.5%. GR-value ran from 12.9% to 40.8%. Bulls with United States registration codes came in highest at 20.8% and 30.4%. Bulls registered in the Czech Republic came in lowest, at 17.1% and 24.3%.
Doesn’t the Czech Result Prove the European Case?
Give the set-aside argument its due first, because it raises something a relationship-value screen cannot answer on its own.
Funnel width versus screening precision. You can’t run a GR value on a bull nobody collected. Screening works on the population that already exists — bulls that got sampled, genotyped and entered into an accessible database. The set-aside is about who gets into that population in the first place. Those are two levers on two different parts of the pipeline, and a narrow funnel upstream caps what any downstream screen can possibly find. Widen the funnel and you widen the range of relationship values available to select from. The two are complementary, not competing.
Grant all of that, and the criterion still doesn’t hold.
Read what the Guelph authors actually recommend: select sires with low average relationship values to a defined reference population, as a mating strategy, to reduce or hold inbreeding at acceptable levels while preserving genetic diversity. That’s a relationship-value screen, not a passport screen — and the same logic applies to what you let into the funnel as to what you pick out of it.
The Czech figure isn’t a case for Czech genetics. A Czech-registered bull ranks low here because of how Canadian breeding history ran, not because of where he was born. Run the same math against a different national herd and the order shifts.
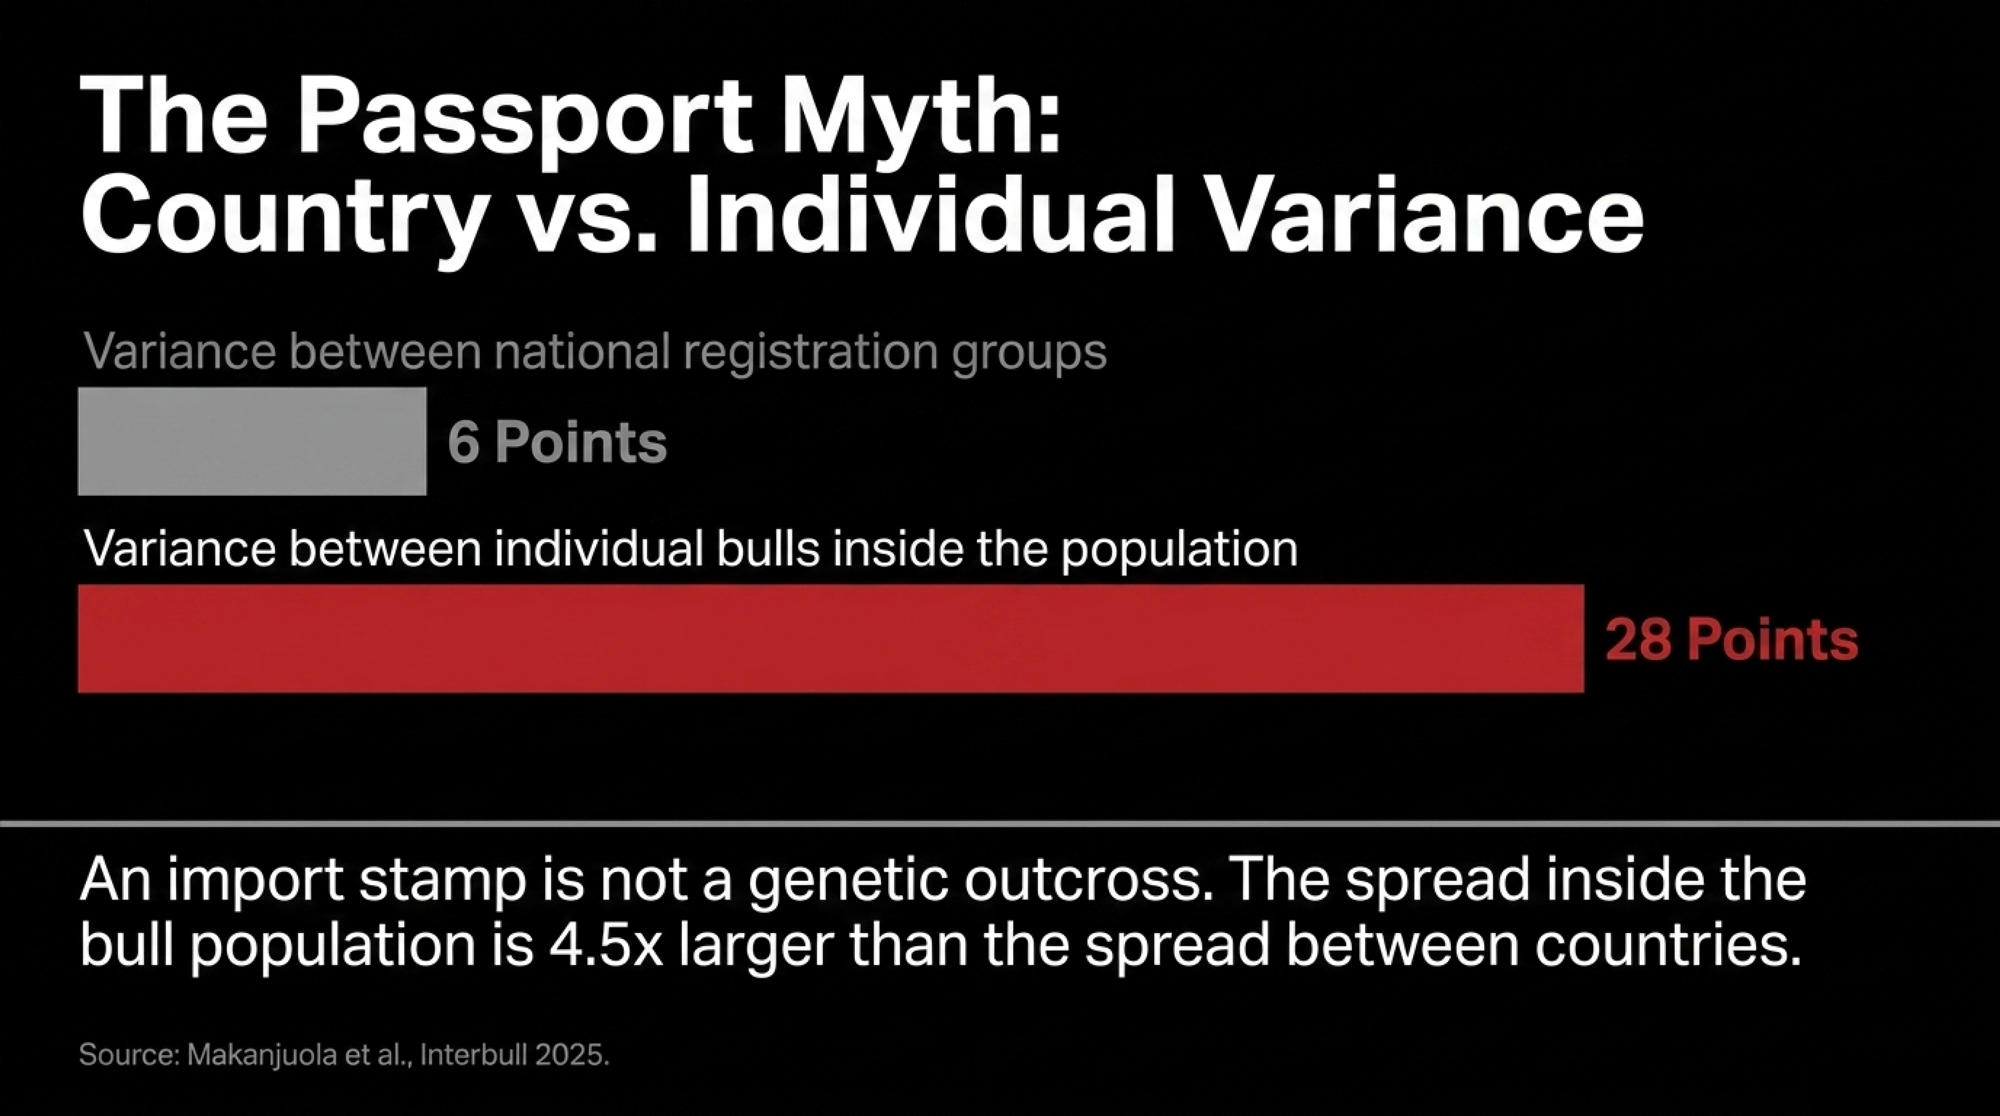
And look at the size of the gaps. Between the highest and lowest national groups: about 6 points on the genomic measure. Between individual bulls: nearly 28. The spread inside the bull population is roughly four and a half times the spread between countries. So if you’re going to reserve intake slots — and there’s a real argument you should — reserve them for bulls with low measured relatedness to your reference population, whatever their registration code. A 5% carve-out sorted by passport captures the 6-point axis and leaves the 28-point axis untouched. (Related reading: Genomic Future Inbreeding Shows Relatedness That Pedigree Misses.)
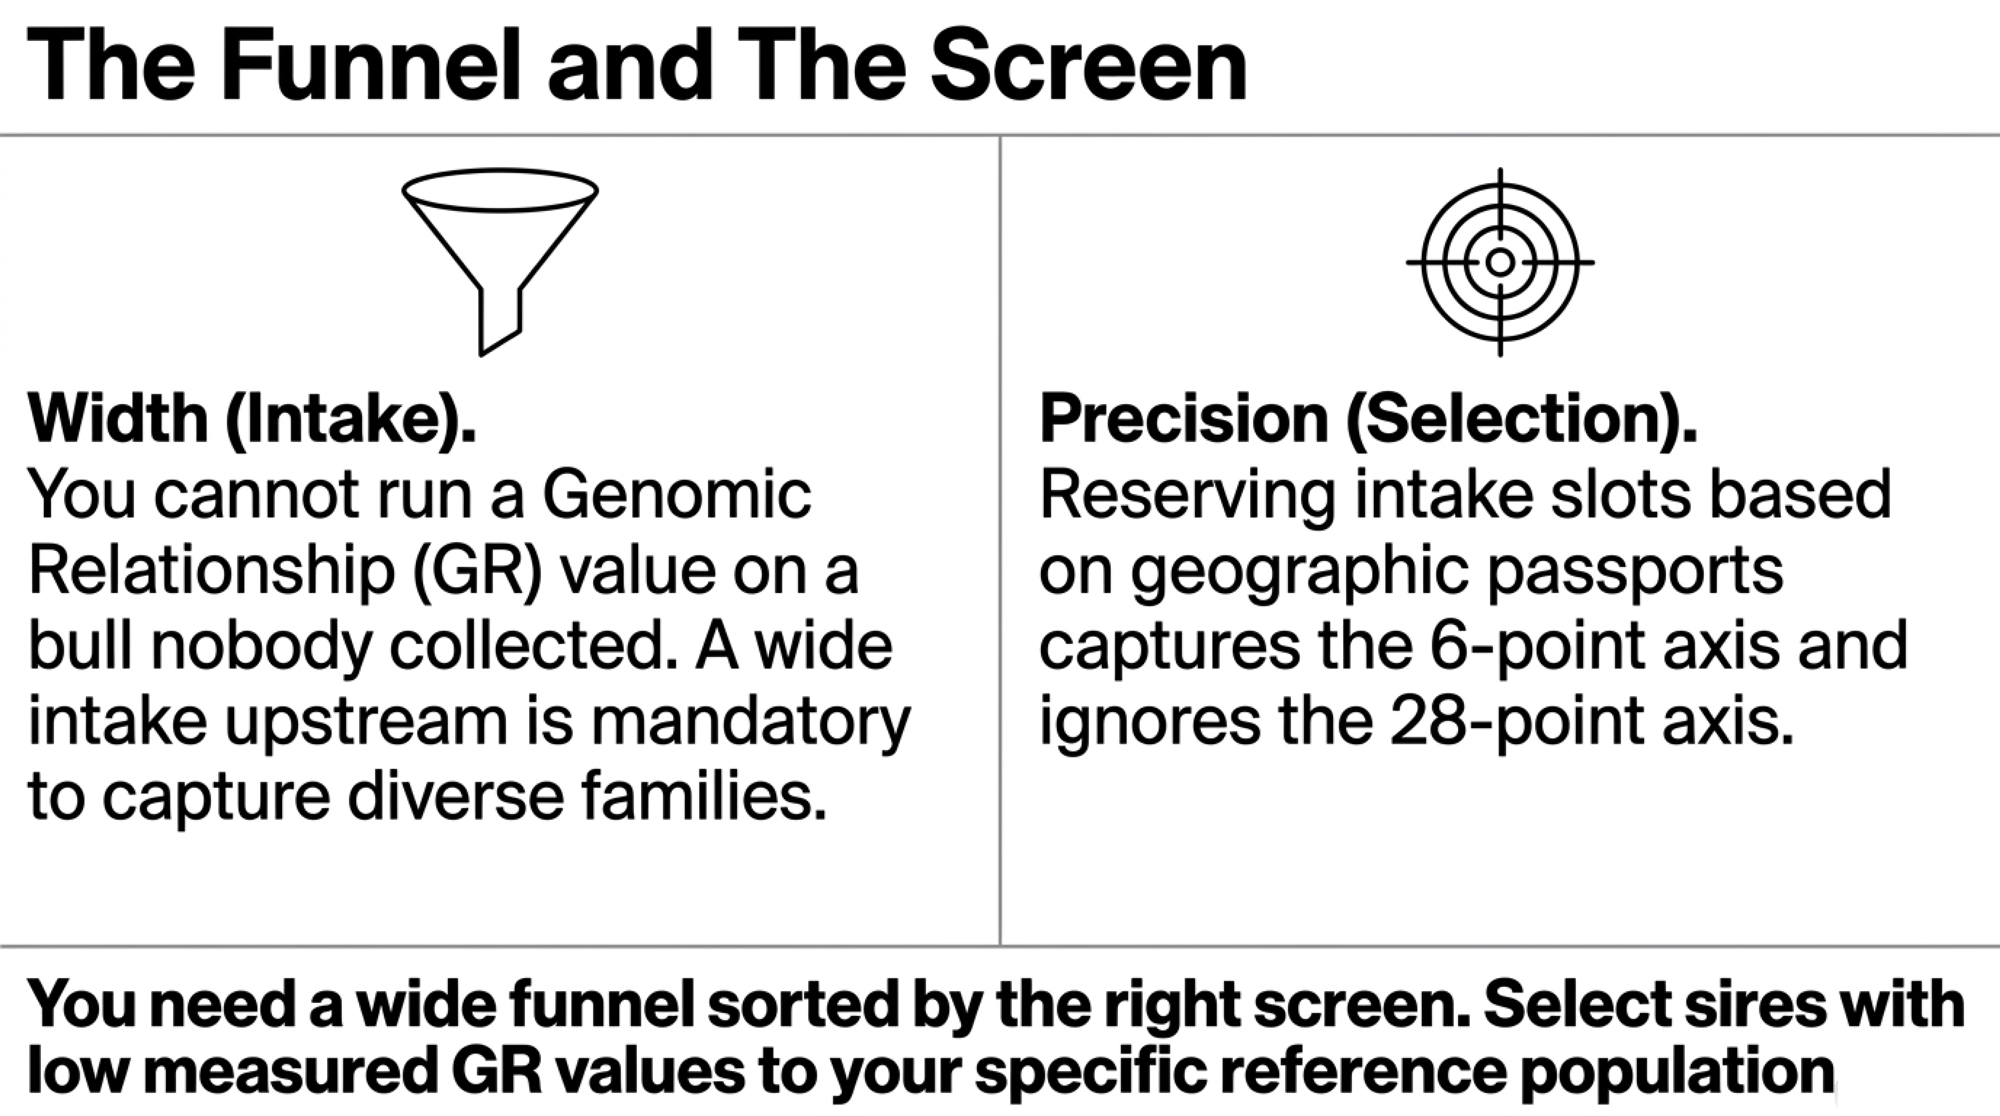
One catch: what the Guelph team published is a method, not a product. Someone still has to run it against your reference population and put the number in front of you. Ask your supplier whether they can — and notice what the answer tells you.
The Number That Isn’t Published Anywhere
The set-aside argument runs on the European-origin bulls that worked. What it doesn’t include is how many got sampled in North America over the same decades and never made a second lineup.
Studs have modelled sampling attrition since at least 1992, when Lohuis published on probability of success and predicted returns for progeny-test sires in the Journal of Dairy Science. Without that denominator broken out by origin, the case rests entirely on the sires that succeeded. Any group of bulls looks strong when only the successes get counted.
Industry Transparency Note: A review of public materials from CDCB, Lactanet, Holstein Association USA and NAAB found no published sire-sampling attrition data broken out by country of origin. That data is held by individual AI companies rather than evaluation bodies, and no association standard or regulatory requirement currently calls for it to be published.
Try to Price the Set-Aside
Meyer et al. (Journal of Dairy Science, 2001) described 1990s U.S. conditions with over 600 new young sires available annually. Five percent of that 1990s figure is about 30 bulls a year across the whole industry — and genomic-era intake is almost certainly lower than 600, which would shrink the number further.
Thirty bulls is small and checkable. It’s also where the math stops. No current published figure exists for genomic-era sampling volume, and no stud has published a per-bull cost breakdown running from acquisition through housing, genomic testing, collection and marketing to a usable proof.
Meanwhile the spread from Net Merit $ #1 to #10 in the August 2026 run is $47 per animal — roughly $4,700 across 100 daughters — per The Bullvine’s analysis of that run. That’s a PTA differential, not money in the tank, but it’s a number the industry can put a decimal on. What it costs to widen the funnel by thirty bulls isn’t published anywhere. (Full run detail: The August 2026 Lists, Bull by Bull.)
The One Historical Case Worth Citing
Carol Prelude Mtoto gets invoked constantly as proof that European testing unlocks genetics North America would have missed. His sire line traces to Ronnybrook Prelude, a Canadian-registered sire confirmed in Holstein Canada’s animal information records. Mtoto’s Italian proving history appears in two independent published accounts rather than a primary herdbook entry, so treat the detail accordingly.
What the case actually shows is a North American pedigree that got its shot in Italy. That’s a story about somebody widening the funnel for an unproven pedigree — which is the set-aside argument’s strongest instinct, and it has nothing to do with where the genetics came from. One case isn’t a pattern either way, and building a procurement policy on it would repeat the same shortcut. (Background: The Full Mtoto Story.)
One Study Nobody Reopened
Powell, Sanders and Norman at USDA’s Animal Improvement Programs Laboratory examined May 2005 Interbull evaluations using Holstein full-brother families — 24,611 bulls for yield traits (Journal of Dairy Science, July 2008, 91(7):2885–92). Bulls from Australia, Germany, Great Britain and Japan showed greater EBV for milk yield than their own full brothers evaluated in the United States, on all countries’ scales. Causes were reported as unknown, and eighteen years on, nobody has replicated it with genomic-era data.
Nilforooshan’s 2022 JDS invited review found that bulls proven in more than one country are “highly selected and a biased representation of the national sire populations.” Sallam et al. (2022) found MACE may not fully account for genotype-by-environment interactions. Neither quantifies direction or magnitude for sires entering North America.
Tie that back to your order. A foreign proof can read differently on a North American scale for reasons that have nothing to do with the bull’s genes — selection bias in which bulls got exported and evaluated abroad, genotype-by-environment effects the conversion may not fully absorb, and in the 2008 case something nobody has identified in eighteen years of trying. None of that makes foreign-tested bulls better or worse than domestic ones. It makes their index numbers harder to read with confidence. Which is one more argument for buying on measured relatedness to your own cow population, where the number means the same thing no matter which country ran the evaluation. An import stamp is not a genetic outcross, and a foreign index is not a like-for-like comparison.
What This Means for Your Operation
| What you’re buying on | The number | What it actually means |
|---|---|---|
| Top 10 GTPI bulls sired by Ocd Thorson Ripcord-ET | 7 of 10 | Four picks off the list, three likely half-brothers |
| Top 10 Net Merit $ bulls sired by Ripcord | 8 of 10 | Switching index does not switch families |
| Bulls tracing to one shared great-granddam | 7 across both lists | One generation back it tightens, not loosens |
| Net Merit $ spread, #1 to #10 | $47/animal (~$4,700 per 100 daughters) | A PTA differential, not cash in the tank |
| Reliability: genomic young sires vs daughter-proven | 65–82% vs 84–99% | On contract heifers, reliability is the decision |
| Canadian Holstein average inbreeding, 2023 → 2024 heifers | 9.61% → 9.99% (+0.38 pt in one year) | Steeper than its own +0.25%/yr long-run rate |
Trust genomic relatedness over pedigree relatedness
Nordic Holstein’s pedigree analysis reported no deterioration. The genomic analysis, from the same team, put future Ne at 42.7 after genomic selection. If your herd manages diversity off pedigree inbreeding alone, you’re reading the estimate instead of the measurement.
Audit your sire-of-sons base
Pull the last twelve months of semen invoices. List sire and maternal grandsire for every straw, then count the distinct sires of sons. Seven of ten top GTPI bulls in the August 2026 run traced to one sire — buy four off that list without checking and the odds say three are half-brothers. Vendor diversity is not family diversity.
Ask for genomic relationship values
Request GR values benchmarked against your national or herd reference base rather than trusting outcross claims on a catalogue page. Individual bulls in the Guelph study spanned 12.9% to 40.8% — roughly four and a half times the spread between the highest and lowest national registration groups. The method exists. Ask who’s willing to run it.
Ask about the funnel too, not just the screen
Screening only works on bulls somebody collected. If your supplier’s young-sire intake is narrow, no amount of GR filtering on the survivors fixes it. Ask how many bulls enter their program each year and how many distinct families those bulls come from — then ask what the relationship-value spread looks like across that intake.
Watch your own donor concentration
The Nordic female result is a warning that applies at herd level. If you’re flushing or aspirating, count how many distinct dams produced your last two calf crops. Genomic pre-selection makes it easy to keep going back to the same three heifers because the score says so. That’s how a female base narrows without anyone deciding to narrow it.
Don’t mistake a shorter generation interval for progress
Nordic Holstein cut generation interval across every cohort and still lost ground on coancestry, because the female side kept drawing on related lines. Faster turnover only expands the effective population if the parents come from genuinely different families.
Watch coancestry, not just inbreeding
Nordic Holstein female coancestry went from 0.02% to 0.39% per year while inbreeding stayed modest. Coancestry is next generation’s inbreeding. Your current inbreeding percentage won’t warn you.
Treat reliability as the decision on contract heifers
Genomic bulls in the August 2026 run carried 65–82% reliability against 84–99% for daughter-proven sires. On heifers you’re committing, that spread is the choice, not the index.
Don’t compare indexes across systems
TPI, LPI, NVI, RZG and gPFT are non-comparable without an explicit MACE-conversion caveat — and treat any foreign-tested proof as carrying an open country-of-testing question, because the 2008 full-brother finding was never revisited.
Key Takeaways
- If you’re managing diversity off pedigree inbreeding alone, you’re using the instrument that found nothing wrong with Nordic Holstein. In the next 30 days, run the invoice audit above and ask your supplier for genomic relationship values against your national reference base.
- Funnel width and screening precision are different problems, and you need both. A narrow intake caps what any screen can find; a wide intake sorted by the wrong criterion wastes the width.
- Canadian Holstein went from 9.61% to 9.99% average inbreeding in one birth year — a steeper jump than its own +0.25% long-run rate, and better than double the pace of Jersey, Ayrshire and Brown Swiss.
- Same program, same country, same genomic analysis: Nordic Jersey’s future Ne improved from 40.7 to 57.2 across the genomic-selection transition while Holstein’s fell from 198.8 to 42.7. This isn’t an argument about genomics as a technology — it’s about how a breed’s female base gets used.
- If one bull sits at 30.4% genomic relatedness to your reference population and another at 24.3%, the second one is your outcross — whatever flag is on the catalogue page.
- If your coancestry rate is climbing while your inbreeding percentage looks stable, that’s the Nordic Holstein pattern, and it resolves into inbreeding one generation later.
- Ask your stud how many foreign-origin sires they’ve sampled and how many made a second lineup. Whether that number is even available is worth knowing before your next order.
Interbull got built because fragmentation carried a cost the whole industry felt. InterGenomics got built because accuracy had a shared incentive. CDCB publishes its base-change methodology because everybody’s numbers depend on it. Sire attrition data sits at a different level — held by individual companies, with no standard calling for it. Meanwhile the Nordic team went back with a better instrument and published a result that undercut its own earlier finding, and a Guelph-led group has already built the measurement that answers the selection half of the question — and tells you what a wider funnel should be screening for. So the question isn’t whether North America needs European semen. It’s whether anybody’s going to ask their supplier for a relationship value — and whether they’ll get one. What’s yours?
Genetic evaluation figures are from the August 2026 CDCB/Holstein Association USA run. Relationship values are from Makanjuola et al., Interbull journal, November 17, 2025, calculated against the active Canadian cow population as of the April 2024 test day. Inbreeding figures are Canadian, from Lactanet’s Inbreeding Update – August 2025 (Brian Van Doormaal), covering heifers born in 2023 and 2024. Nordic pedigree figures are from Tenhunen et al., WCGALP 2022 conference proceedings; Nordic genomic figures are from Tenhunen, Thomasen, Sørensen, Berg and Kargo, Journal of Dairy Science 2024;107(8):5897–5912, doi 10.3168/jds.2023-24553, open access — all Nordic Ne and future Ne values quoted from that paper are genomic measures compared before and after the genomic-selection transition. Pedigree and genomic Ne are computed on different scales and are not directly comparable by magnitude. Embryo-program figures are from VikingGenetics program material published in 2017, plus its current embryo program description; the 2024 paper does not assign a cause for the female coancestry trend, and the connection drawn here is The Bullvine’s inference. Both Nordic studies cover Denmark, Finland and Sweden. Analysis and conclusions are The Bullvine’s.
Learn More
- What 9.99% Inbreeding Costs in a Herd Under 50 Cows — Translates Canadian Holstein’s climb to 9.99% inbreeding into immediate bottom-line impact, calculating exact lifetime margin losses per stall and exposing hidden costs in calf mortality, conception delays, and involuntary culling.
- The August 2026 Proof Run: What Your Semen Tank Is Actually Buying — Dismantles the latest GTPI and Net Merit $ lists across major studs, arming commercial breeders with a three-to-five-year procurement roadmap to protect production gain while avoiding family bottlenecks.
- Genomic Future Inbreeding: Why Pedigree Outcrosses Are Often an Illusion — Exposes why pedigree-based mating packages miss deep shared ancestral blocks tracing to foundation sires, proving why genomic relationship screening delivers true diversity where traditional herdbook paperwork fails.
The Sunday Read Dairy Professionals Don’t Skip.

Every week, thousands of producers, breeders, and industry insiders open Bullvine Weekly for genetics insights, market shifts, and profit strategies they won’t find anywhere else. One email. Five minutes. Smarter decisions all week.
