


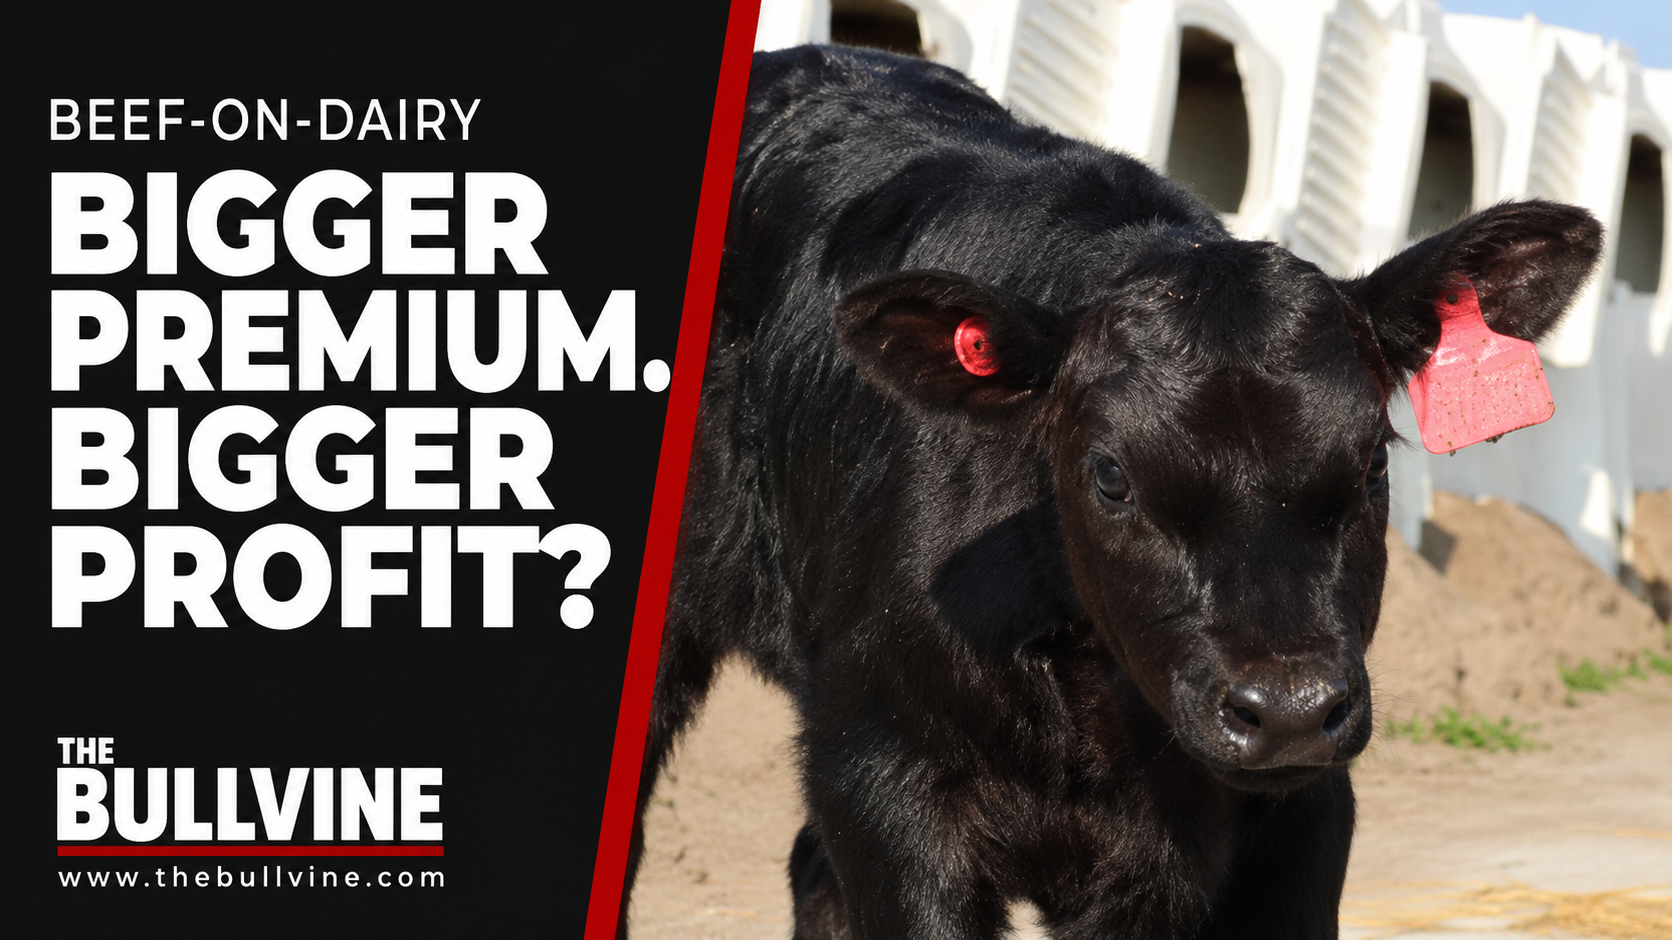




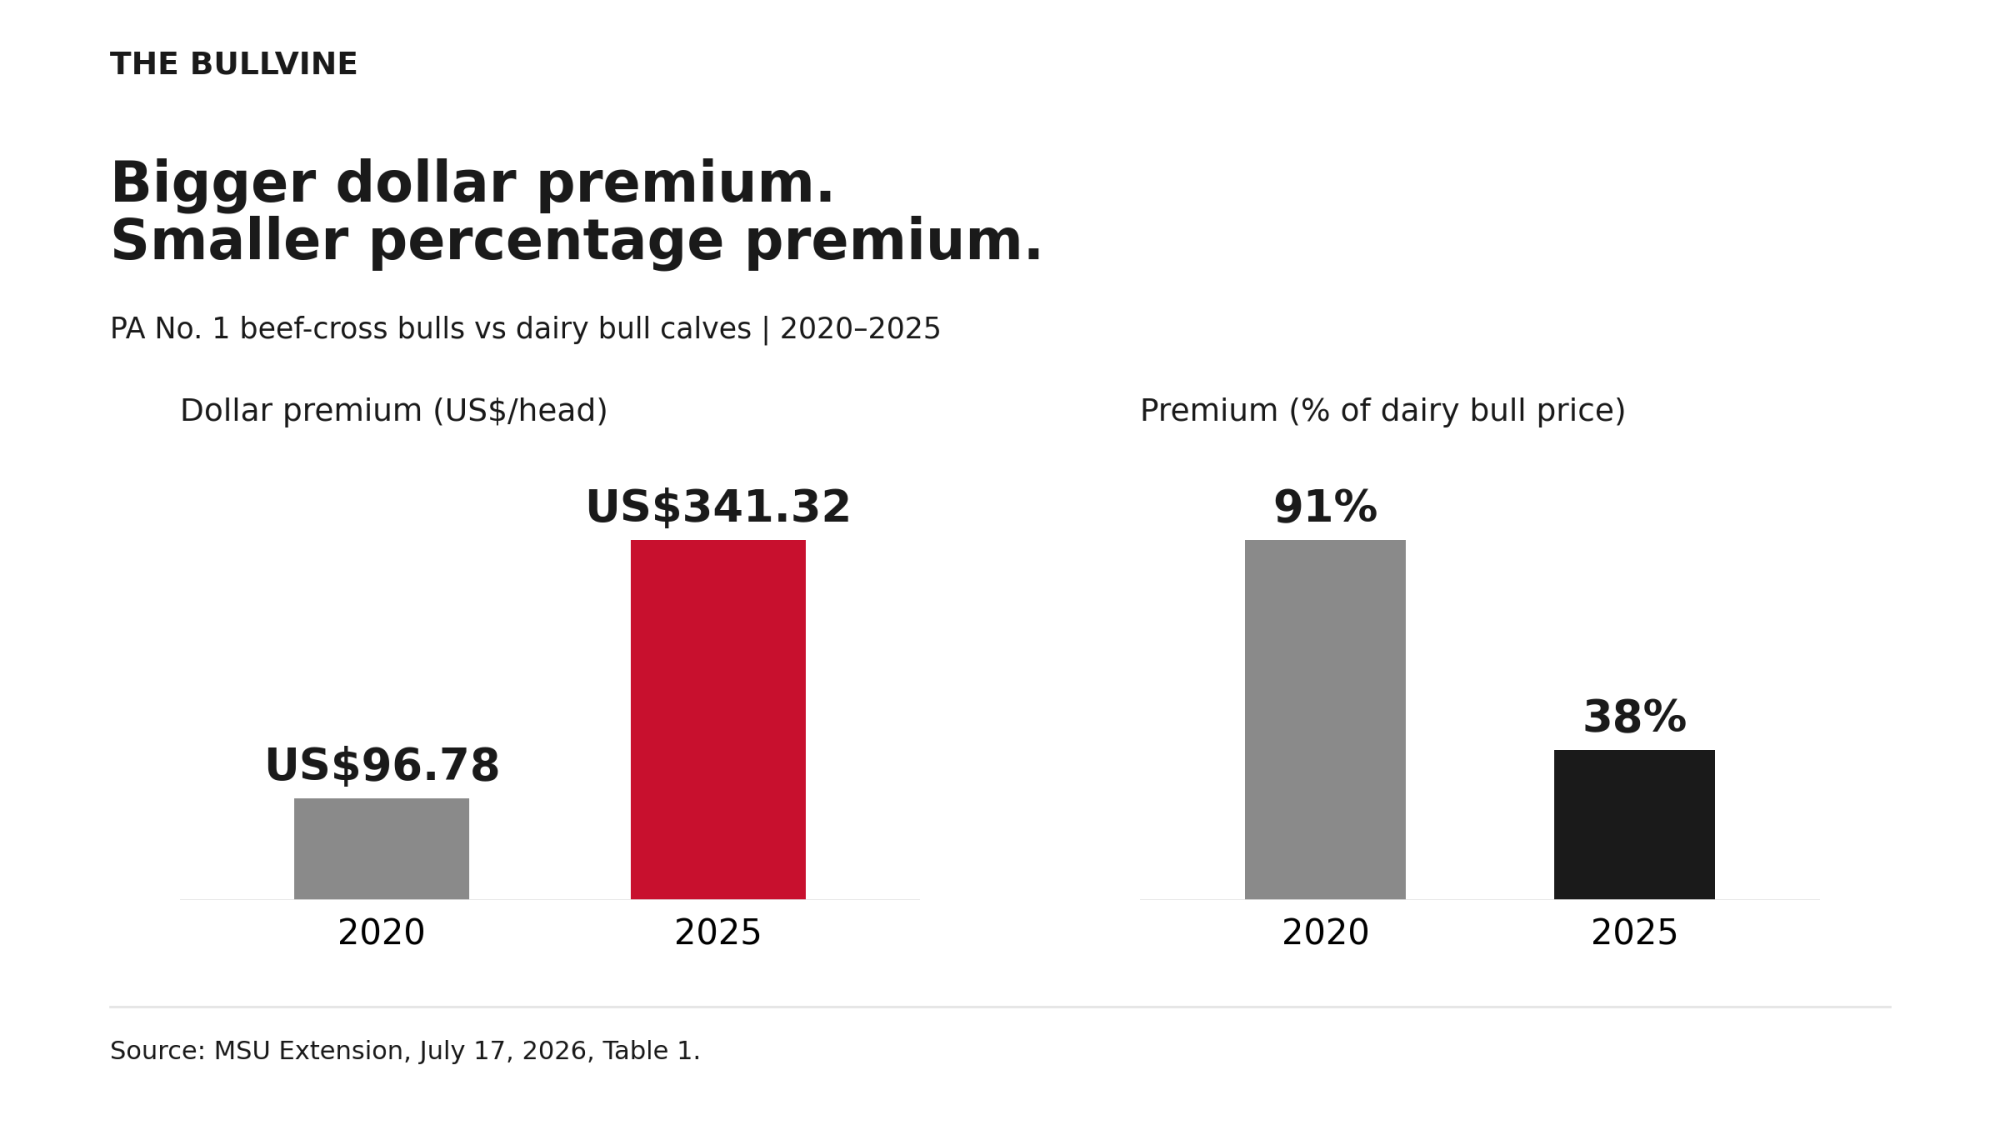
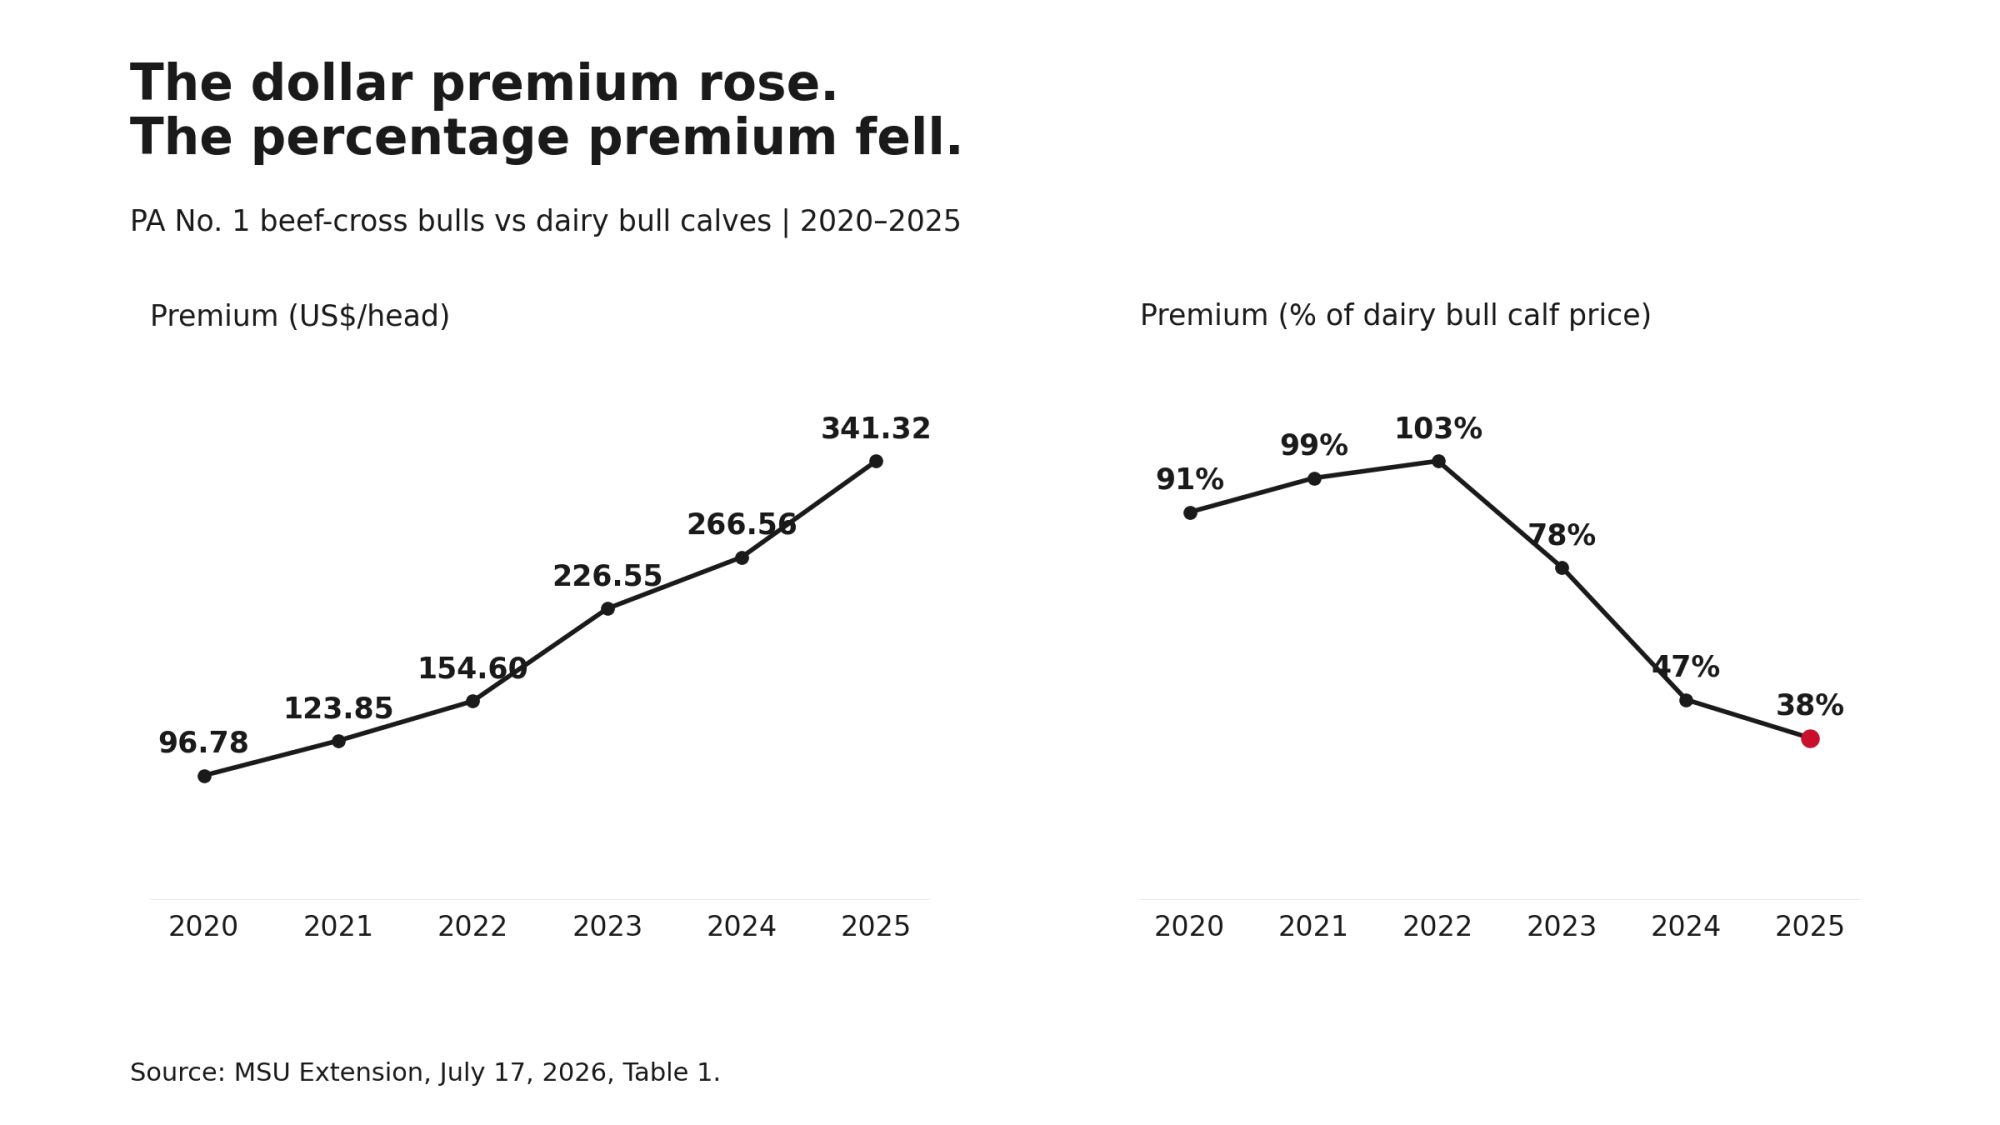
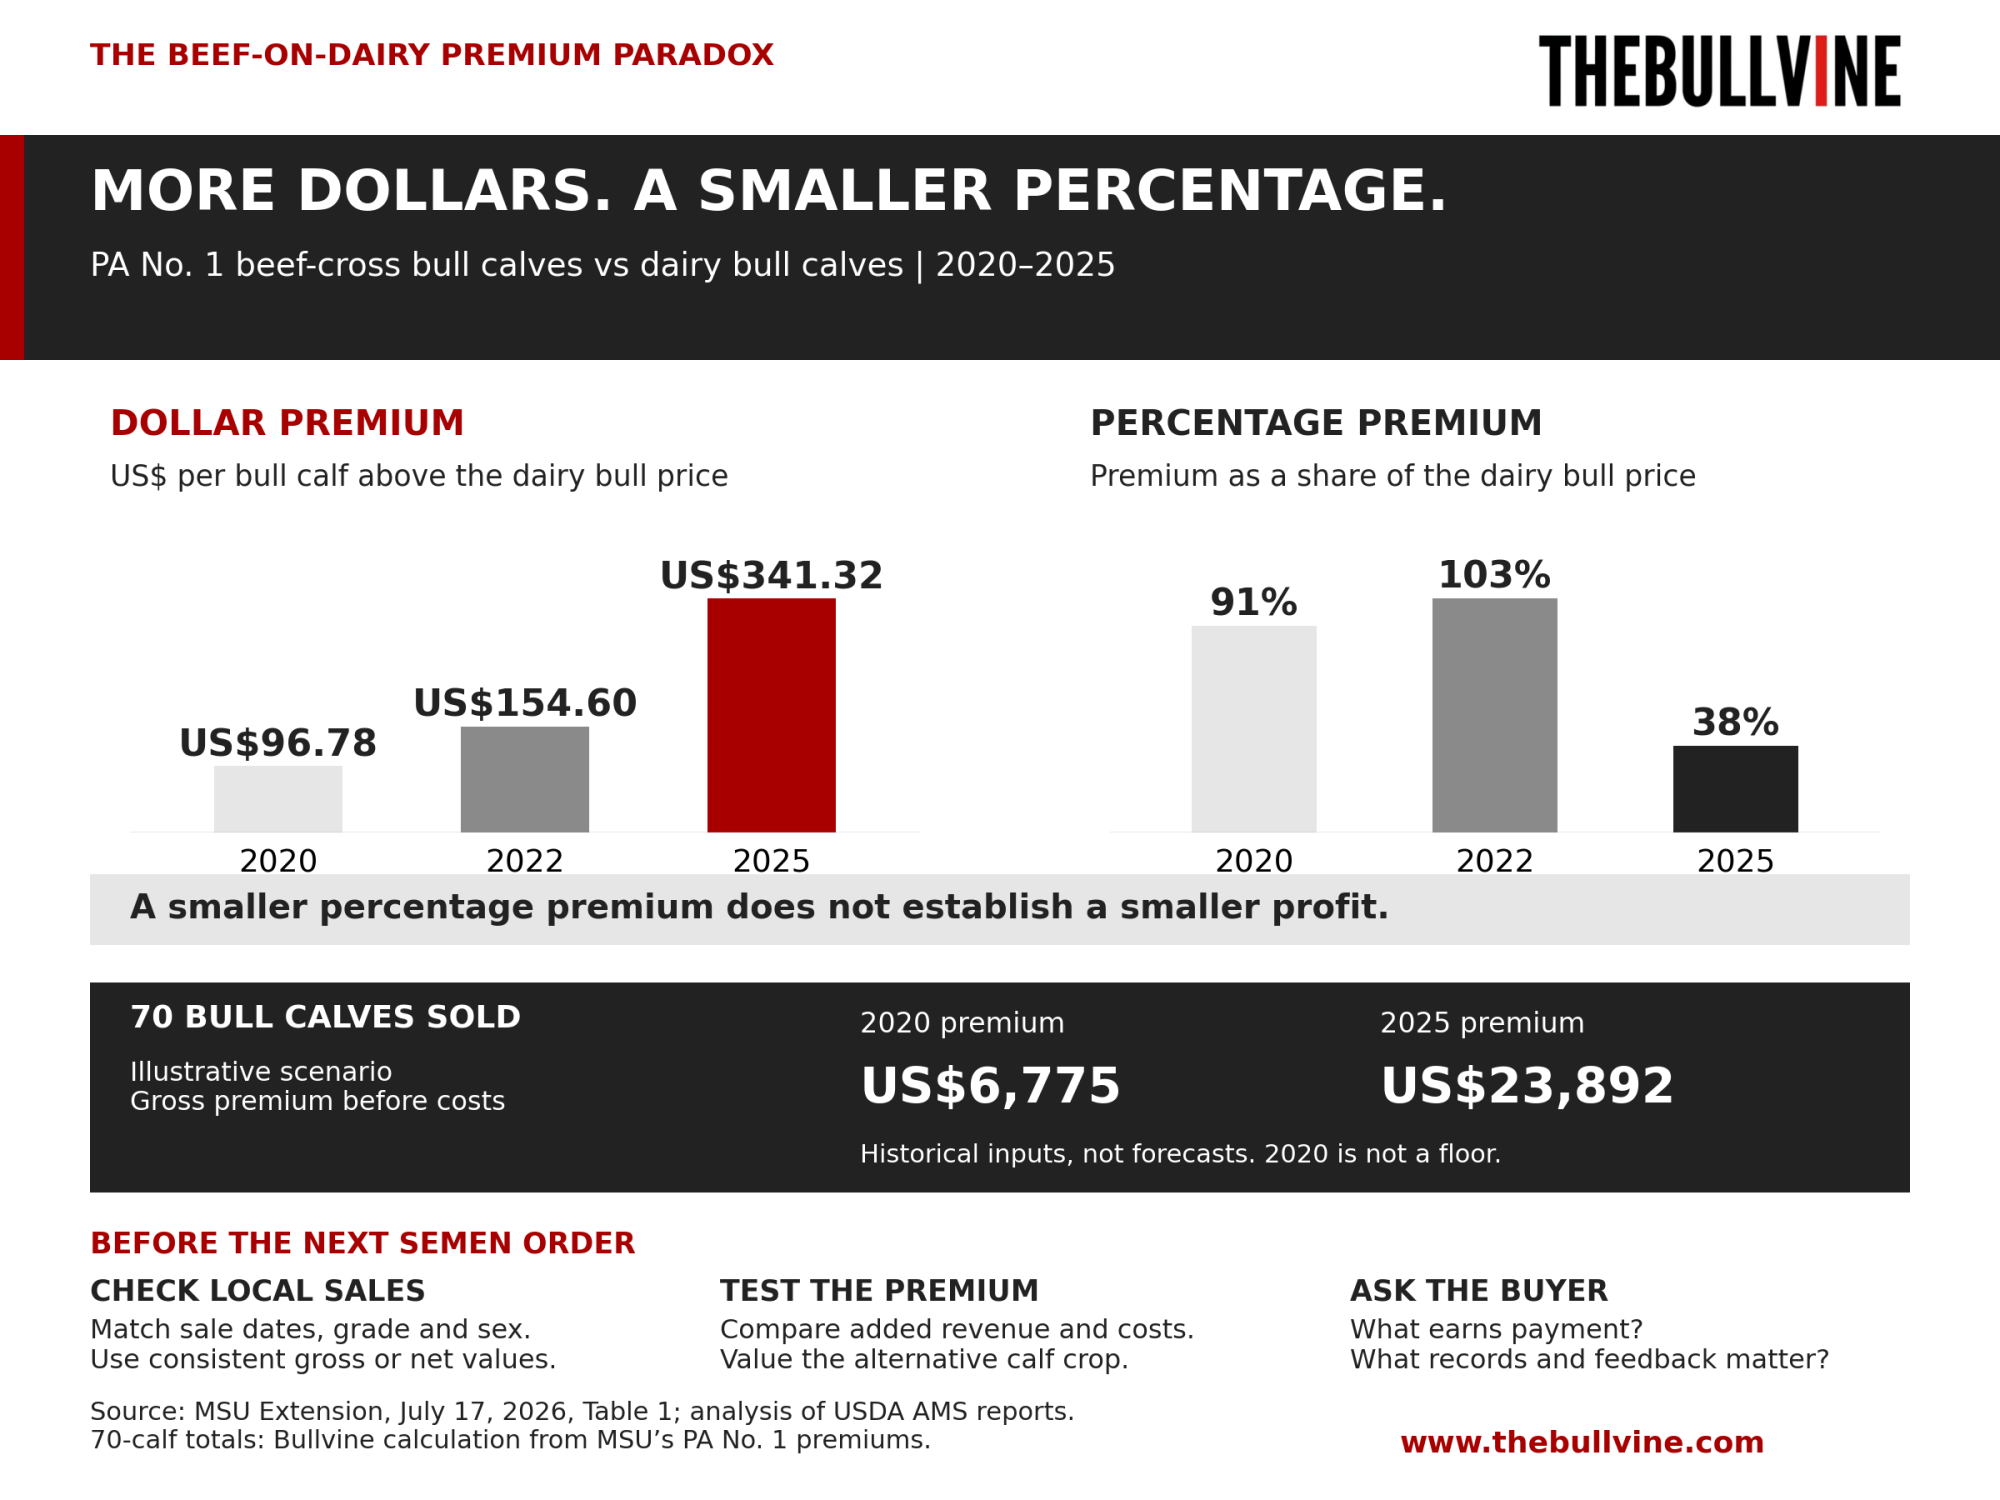
Pennsylvania No. 1 beef-cross bull calves brought US$341.32 over dairy bull calves in 2025, up from US$96.78. The percentage fell from 91% to 38%. Bigger check, smaller ratio. Now run your costs.
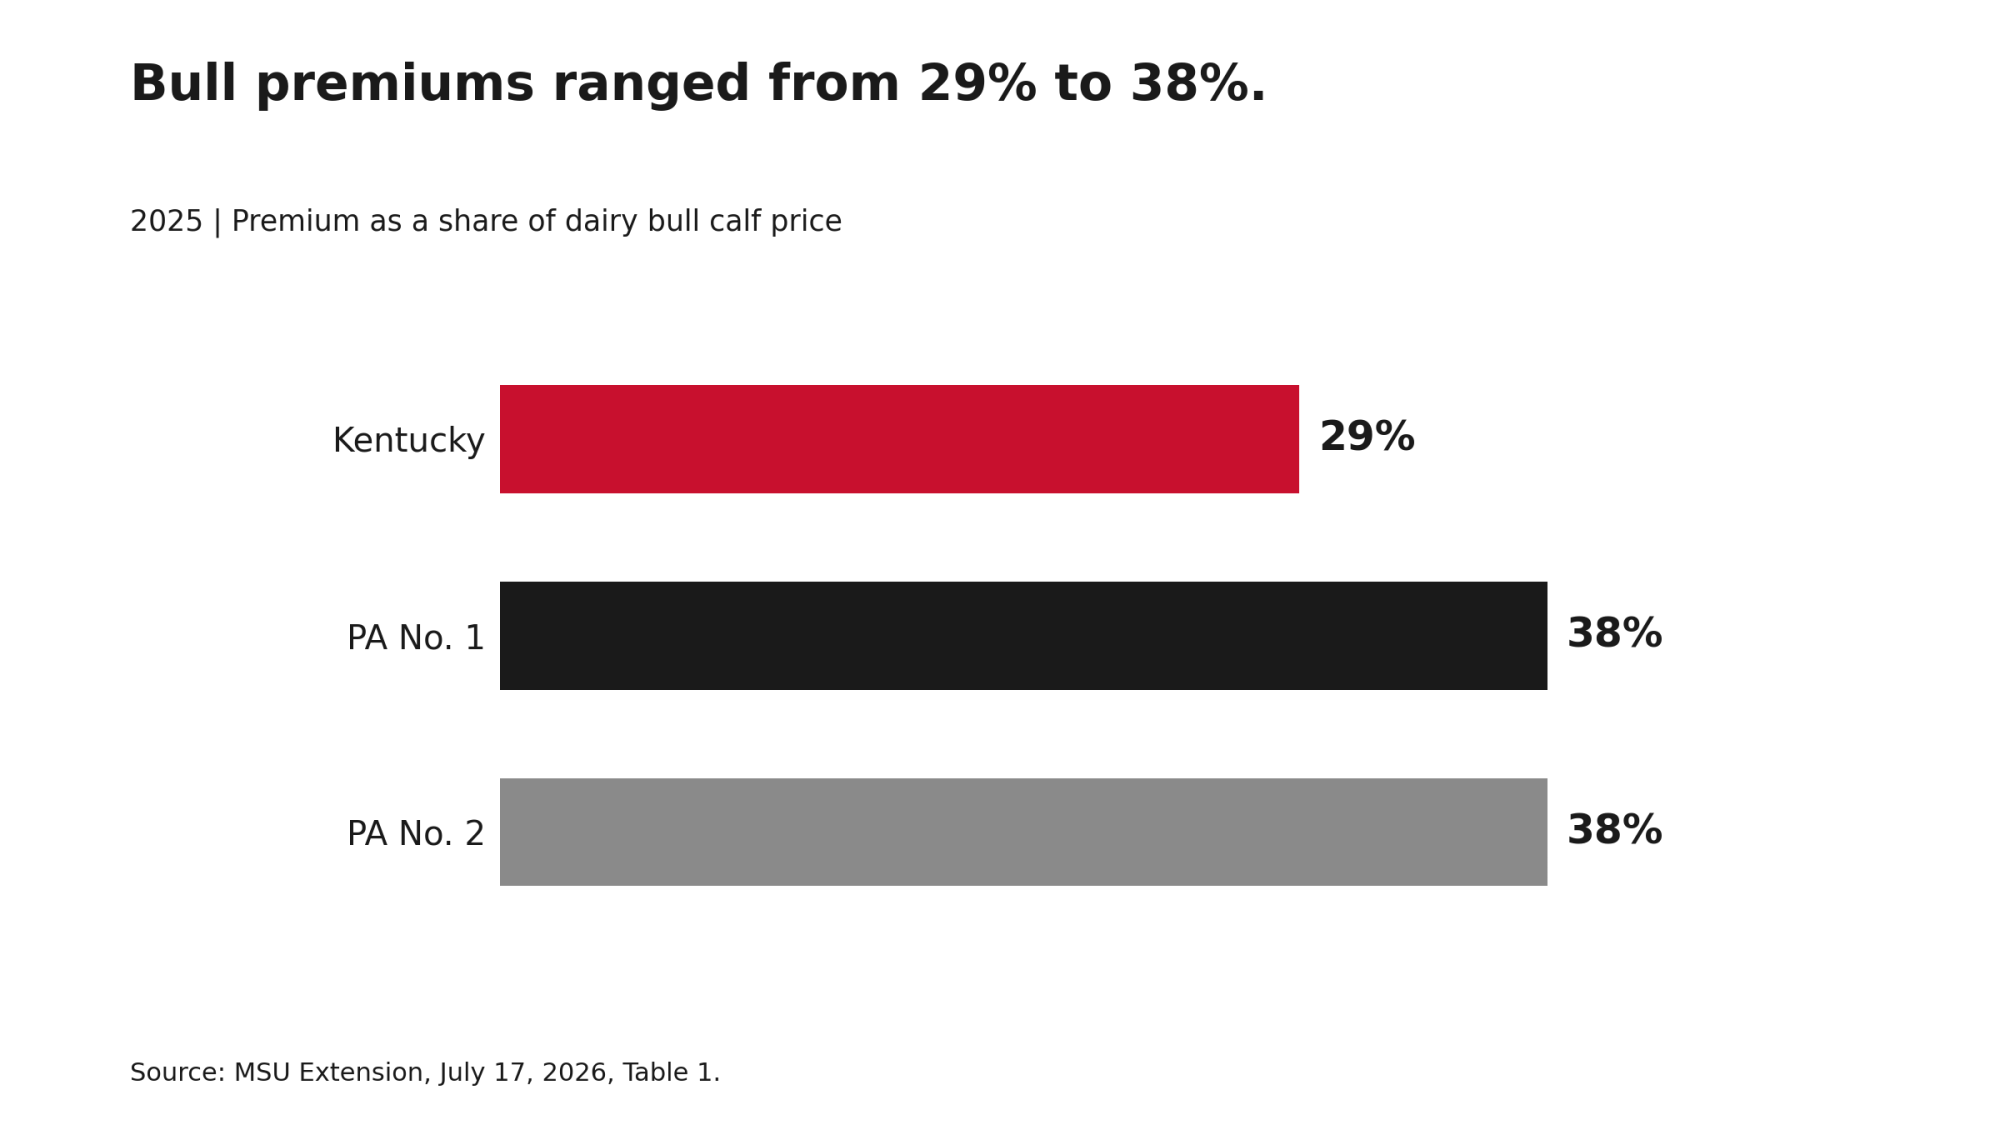
Michigan State University Extension’s Jerad Jaborek and MSU agricultural economist Jaime Luke worked through 67 months of USDA auction prices from Smiths Grove, Kentucky, and New Holland, Pennsylvania, mid-2020 through 2025. From the first year to the last, every sale series showed the same split. Beef-cross bull calves earned bigger dollar premiums over dairy bull calves and smaller percentage premiums. By 2025, the percentage ranged from 29% to 38% across the three sales.
A smaller percentage premium doesn’t necessarily mean beef semen became less profitable. The dollar premium increased. Whether the breeding decision paid better depends on the added costs and the value of the alternative calf.
A budget built on the 2020–2021 percentage premiums, 91% and 99% at Pennsylvania No. 1, overstates the relative edge. A budget built on 2025 dollar premiums is a bet on 2025 calf prices. Luke and Jaborek published the full study, including year-by-year price details, in the August 2026 issue of Applied Animal Science (read the study).
What the Auction Data Shows
MSU built quantity-weighted average prices from three recurring USDA Agricultural Marketing Service (AMS) reports: the Farmers Regional Livestock Glasgow Dairy Auction in Smiths Grove, Kentucky, and the Monday and Thursday New Holland Livestock cattle auctions in New Holland, Pennsylvania. MSU’s Pennsylvania figures cover the Number 1 and Number 2 grades AMS assigns under the U.S. Grade Standards for Feeder Cattle. (MSU Extension article).
| Year | Kentucky (US$/head) | Kentucky (%) | PA No. 1 (US$/head) | PA No. 1 (%) | PA No. 2 (US$/head) | PA No. 2 (%) |
| 2020 | 141.37 | 282 | 96.78 | 91 | 71.64 | 92 |
| 2021 | 135.22 | 250 | 123.85 | 99 | 98.48 | 102 |
| 2022 | 70.36 | 56 | 154.60 | 103 | 101.00 | 80 |
| 2023 | 80.38 | 43 | 226.55 | 78 | 201.18 | 83 |
| 2024 | 138.93 | 32 | 266.56 | 47 | 277.51 | 57 |
| 2025 | 218.28 | 29 | 341.32 | 38 | 306.35 | 38 |
Beef-dairy cross bull calf premium over dairy bull calves. Source: MSU Extension, July 17, 2026, Table 1: “Mean differences between quantity-weighted average beef-dairy cross bull and dairy bull calf price by sale, grade and year.”
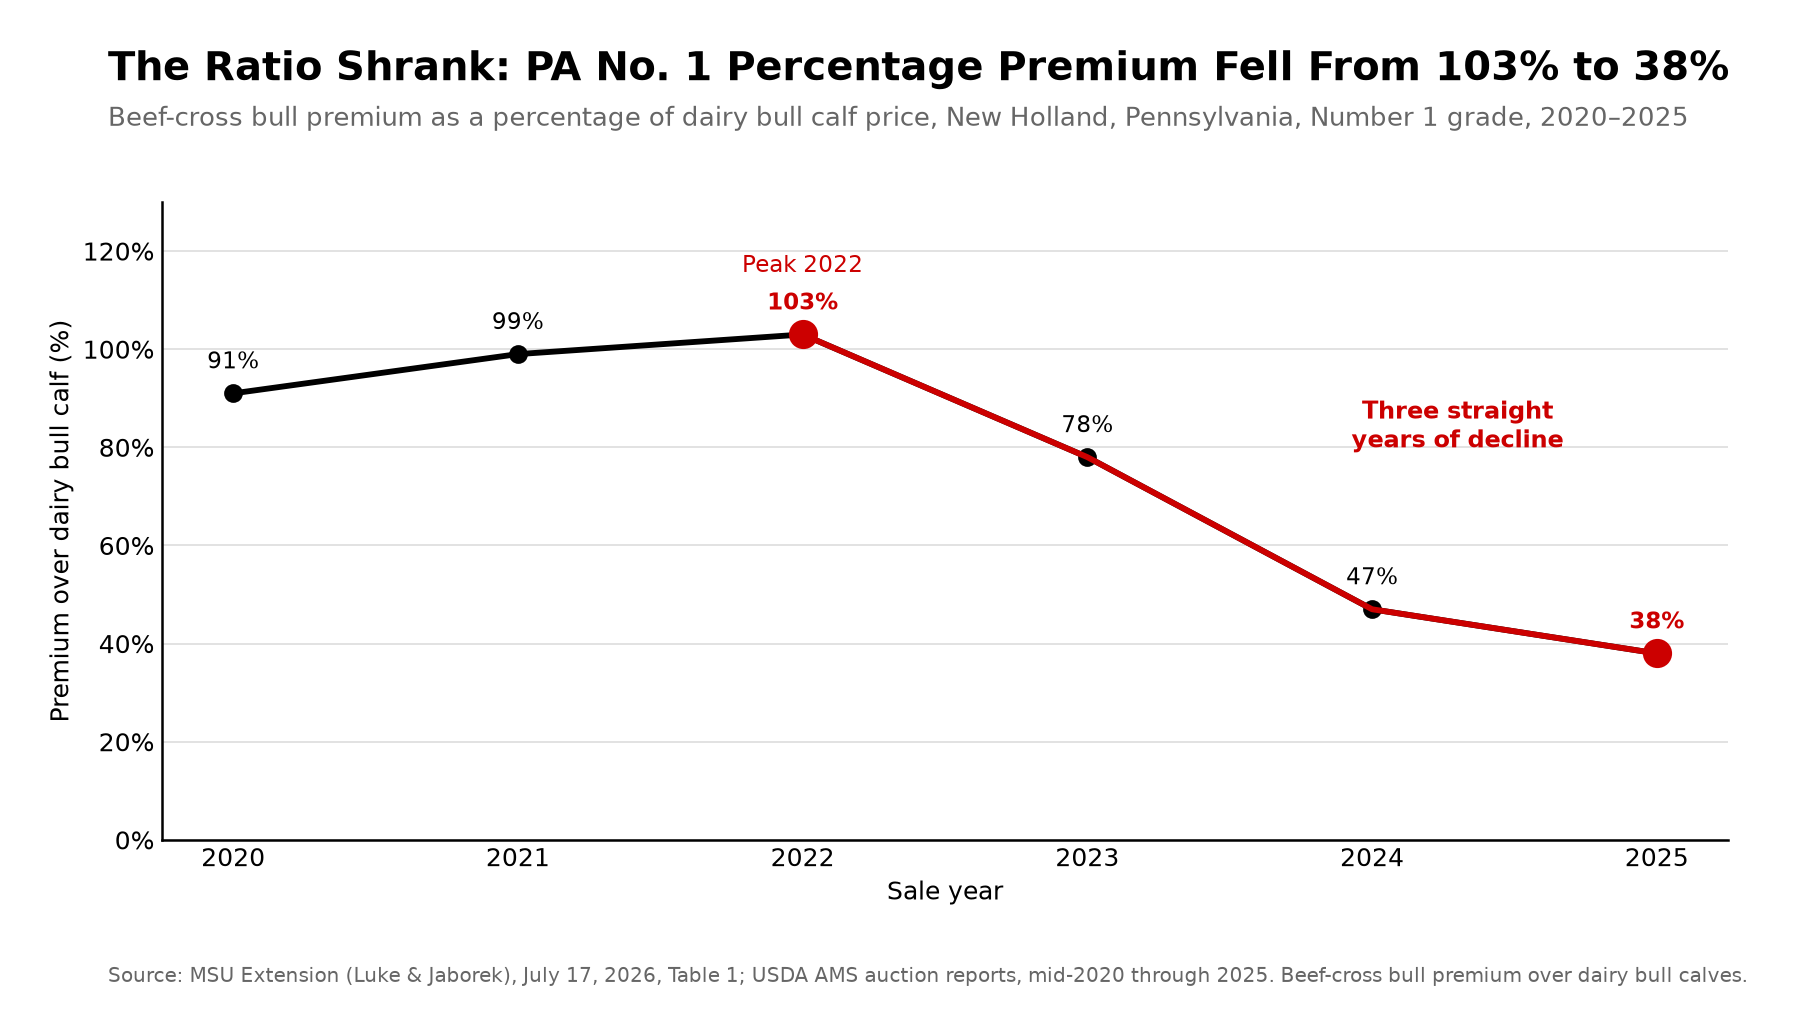
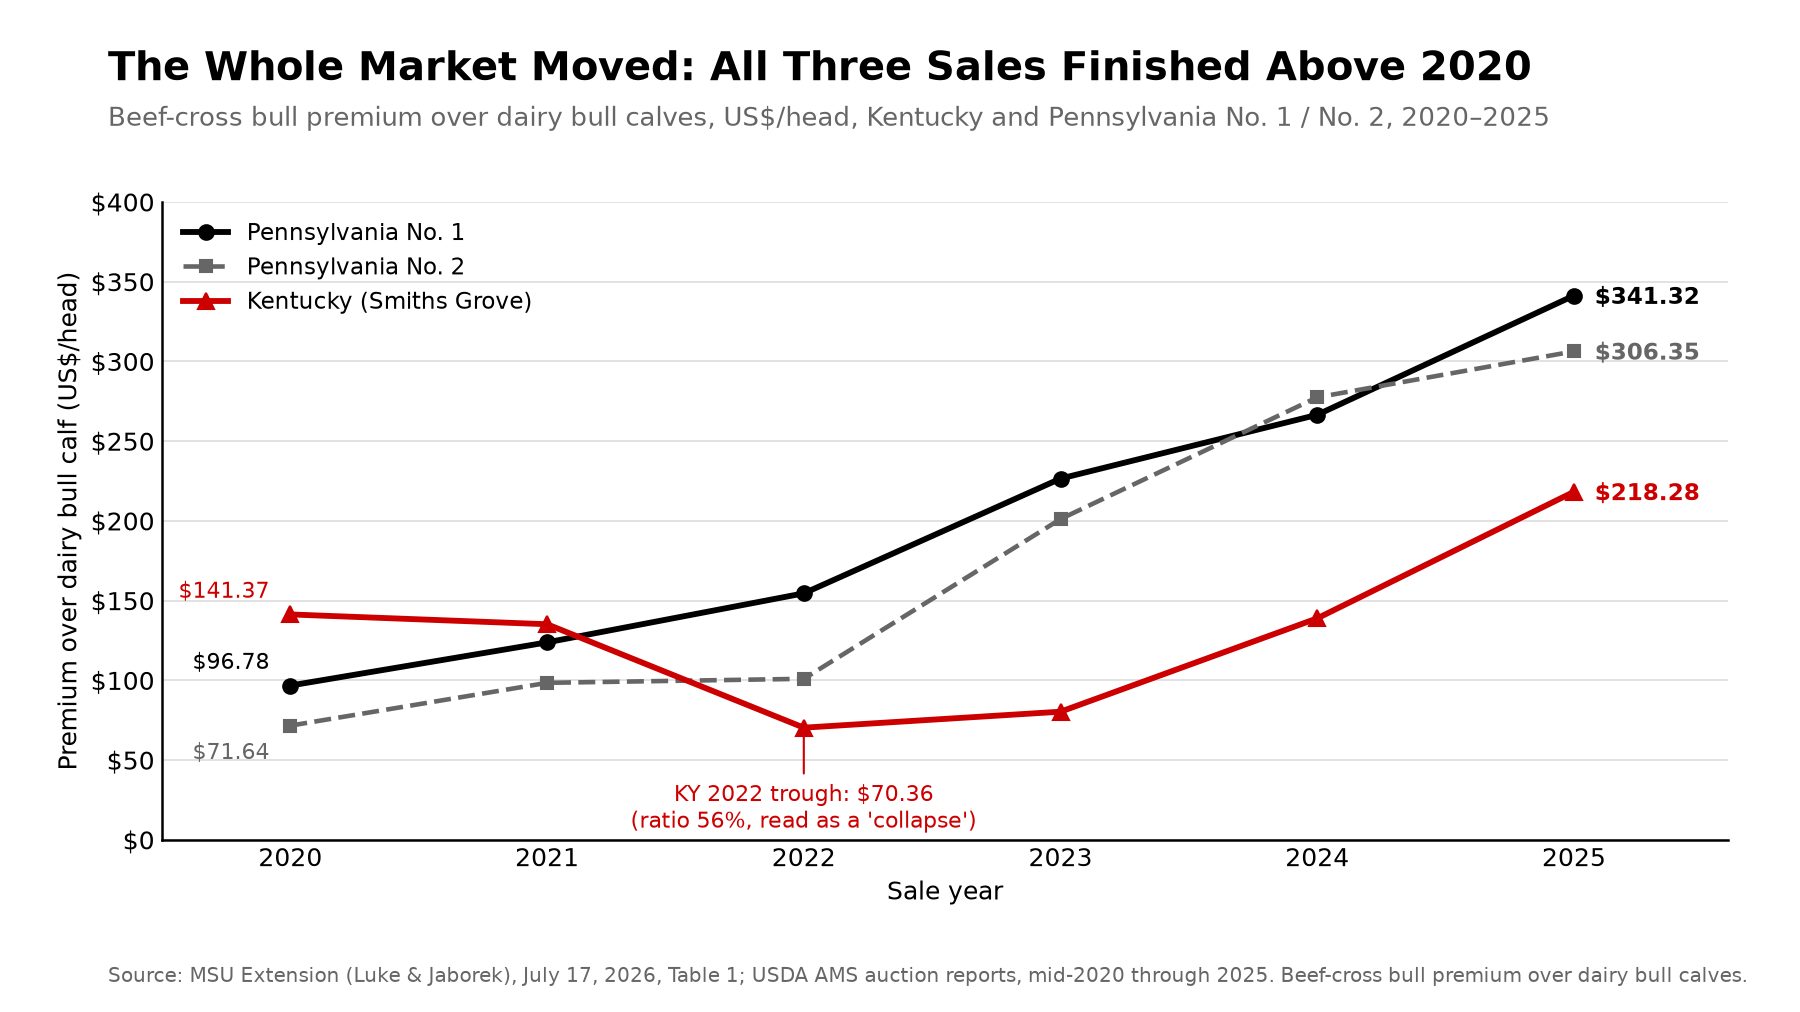
Pennsylvania No. 1’s percentage premium peaked at 103% in 2022, then fell three straight years to 38%. Kentucky’s percentage fell every year, from 282% to 29%. Its dollar premium dropped to US$70.36 in 2022, then finished at US$218.28, above the US$141.37 it started at. Anyone budgeting on the percentage would have read Kentucky as a collapse. By 2025, the check said otherwise.
Heifer premiums moved the same way. At Pennsylvania No. 1, the beef-cross heifer premium over dairy bull calves rose from US$88.92 to US$291.89 while the percentage fell from 82% to 32%. In 2025, it was 17% in Kentucky and 24% for Pennsylvania No. 2.
MSU’s explanation is that the whole market moved: “the prices garnered for all animals entering the beef supply chain are greater today than they were at the beginning of the decade.” MSU ties the climb partly to a U.S. beef cow inventory at “its lowest level since the early 1960s,” with strong beef demand on top, which made calves entering the beef supply chain “a hot commodity.” Bullvine’s New Holland beef-cross calf report tracks what the same barn paid on Oct. 5.
What the Study Can’t Measure
MSU says the extra value of beef-cross calves “could be captured by greater average daily gain and fewer days on feed” before feedlot entry, and that the calves “may achieve better carcass grades.” Those are expectations, not findings.
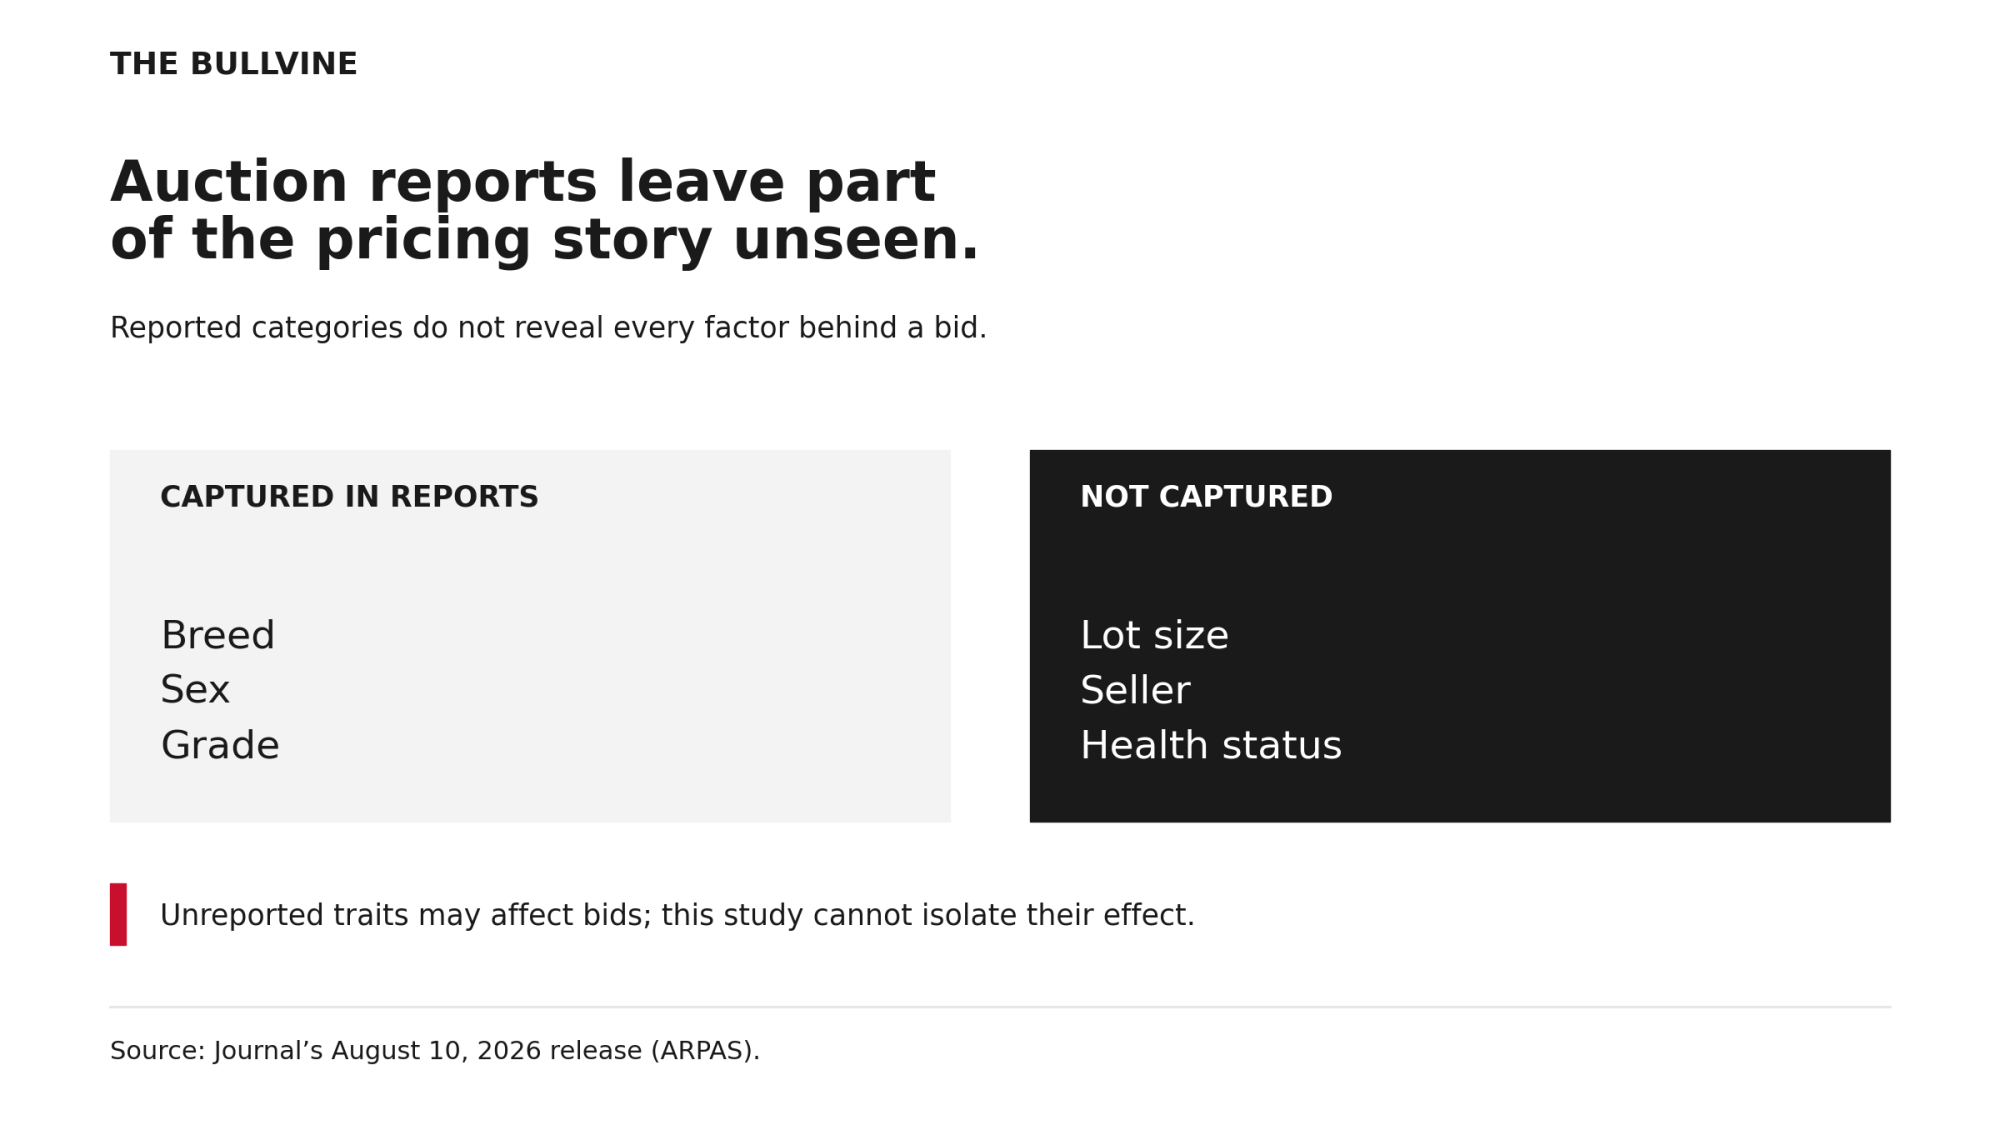
The authors say in the journal’s August 10 release that the reports capture breed, sex, and grade “but nothing about lot size, seller, or health status, all of which shape pricing,” and that some weeks are missing entirely. So the published data cannot isolate what buyers paid for. Unreported traits may well earn money, but this study can’t measure their effect.
MSU also warns that when beef cow inventory numbers increase, beef-dairy cross calves “could be positioned to take a larger relative drop in prices as compared to beef calves because buyers will have the ability to be more selective in the animals they purchase.” That warning measures beef-cross calves against beef calves. The tables measure them against dairy bull calves. It isn’t a forecast for the premium over dairy bull calves. The relative premium shrank from 2020 to 2025, and future markets could move calf prices and the premium in either direction.
Running the Numbers: 70 Beef-Cross Bull Calves
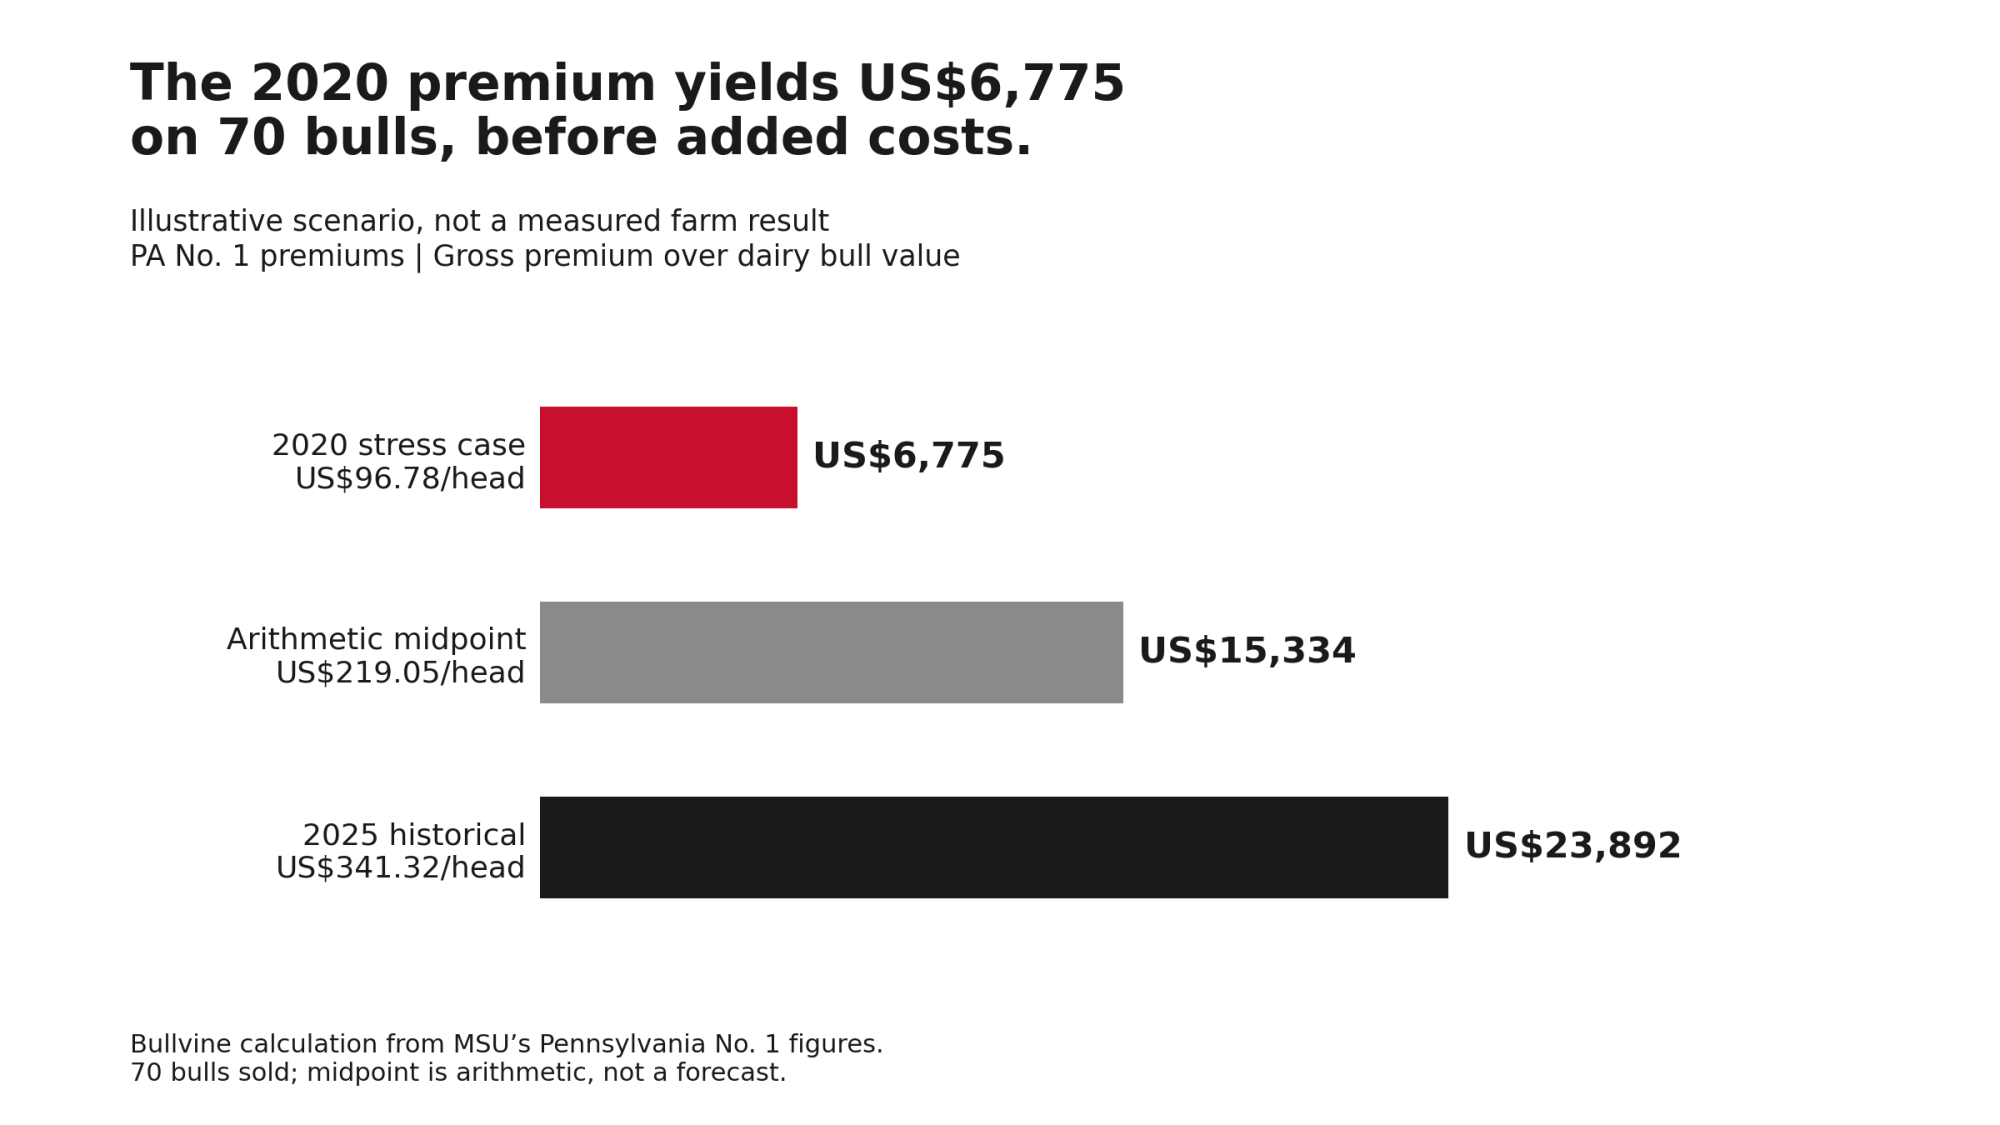
The 70 bull calves here are an illustration. The premiums are MSU’s Pennsylvania No. 1 figures; the totals are Bullvine’s.
| Scenario | Premium per bull calf | Gross premium on 70 bull calves |
| 2025 historical premium | US$341.32 | US$23,892 |
| Illustrative arithmetic midpoint | US$219.05 | US$15,334 |
| 2020 historical premium stress case | US$96.78 | US$6,775 |
Bullvine calculation. Gross premium over dairy bull calf value, before added costs. The midpoint is arithmetic, not an expected outcome. 2020 is a historical stress case, not a floor.
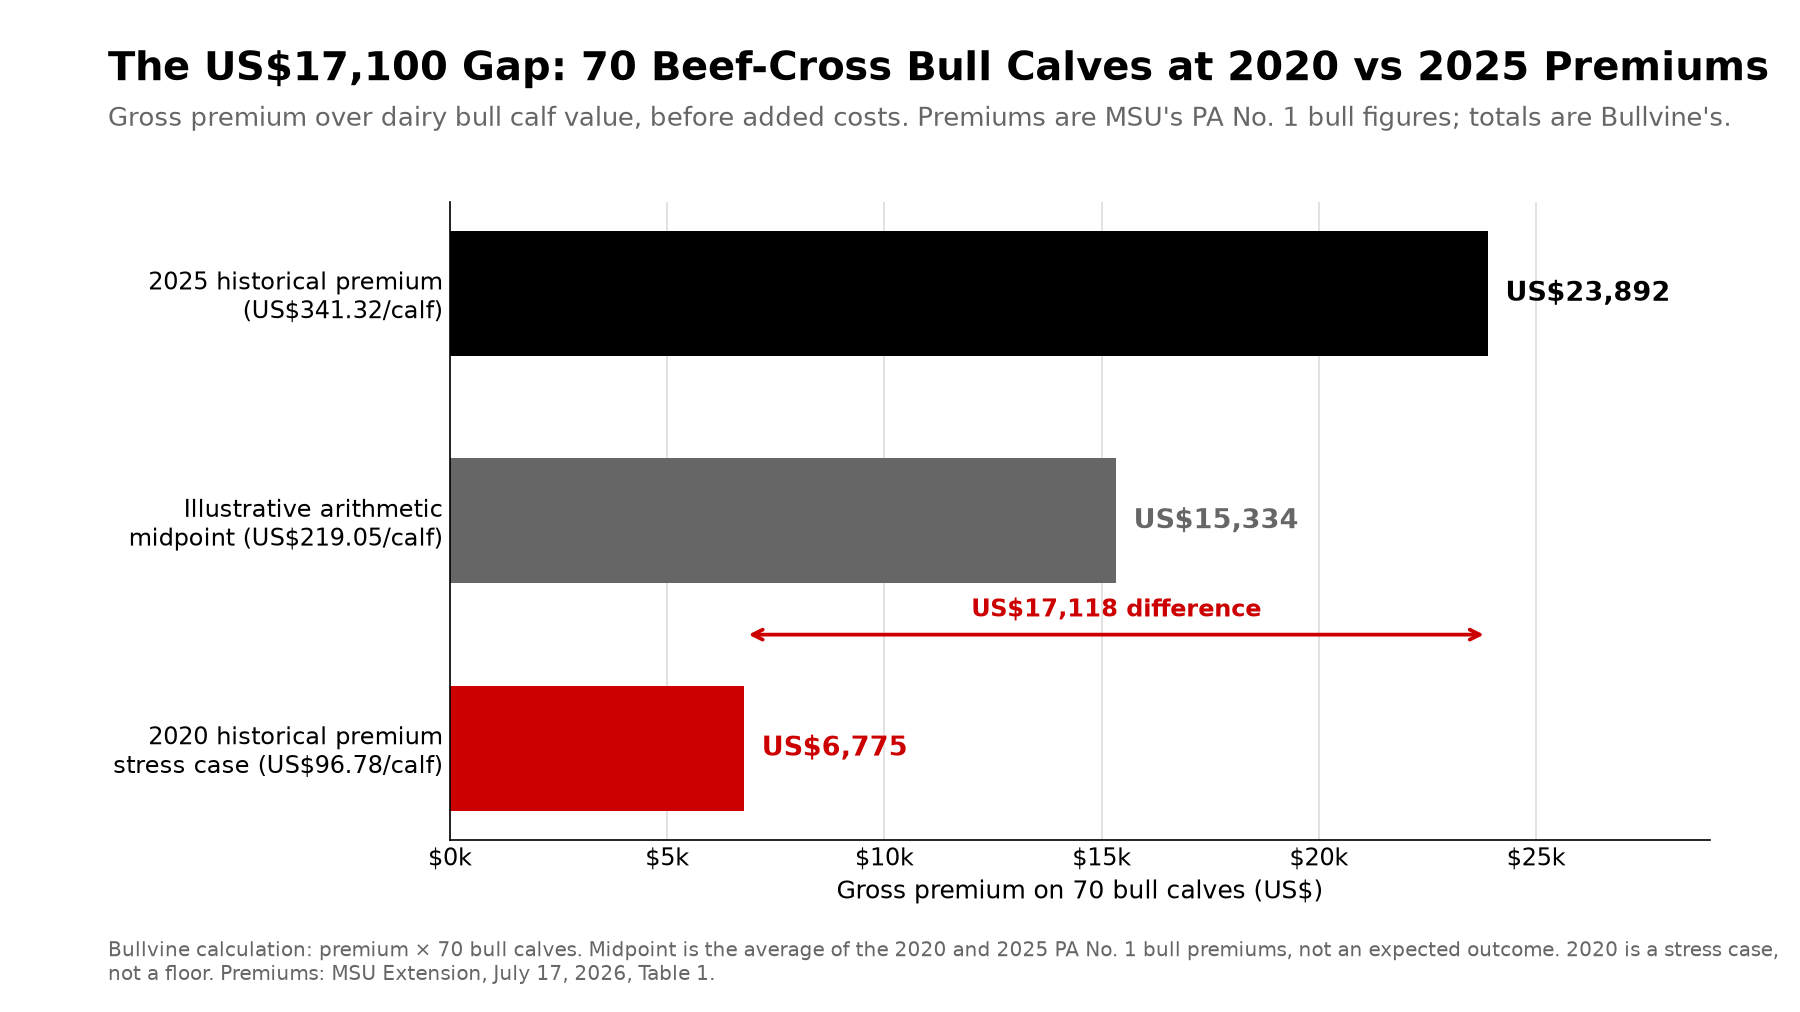
The 2020 stress case generates about US$6,800 in gross premium before added costs. The 2025 case generates about US$17,100 more (US$17,118, calculated before rounding). A beef program that only covers its costs at the 2025 number is carrying 2025 calf prices on its back.
A breeding-program decision also needs revenue from both sexes, the calves the alternative semen strategy would produce, semen use and conception differences, survival and saleability, replacement requirements, and incremental costs.
At Pennsylvania No. 1, a 50:50 mix of beef-cross bulls and heifers works out to about US$92.85 of gross premium per beef-sired calf sold at 2020 levels and about US$316.61 at 2025 levels (Bullvine calculation from MSU Tables 1–2). Set that against your added cost per beef-sired calf sold, extra straws included if conception differs. MSU measures the heifer premium against dairy bull calves too. If the alternative to a beef-sired heifer is a dairy replacement you need, value that calf instead.
| Added cost per beef-sired calf sold (illustrative) | Net at 2020 premium (US$92.85 gross) | Net at 2025 premium (US$316.61 gross) | Spread between cases |
| US$50 | US$42.85 | US$266.61 | US$223.76 |
| US$100 | −US$7.15 | US$216.61 | US$223.76 |
| US$150 | −US$57.15 | US$166.61 | US$223.76 |
| US$200 | −US$107.15 | US$116.61 | US$223.76 |
What to Ask Your Calf Buyer
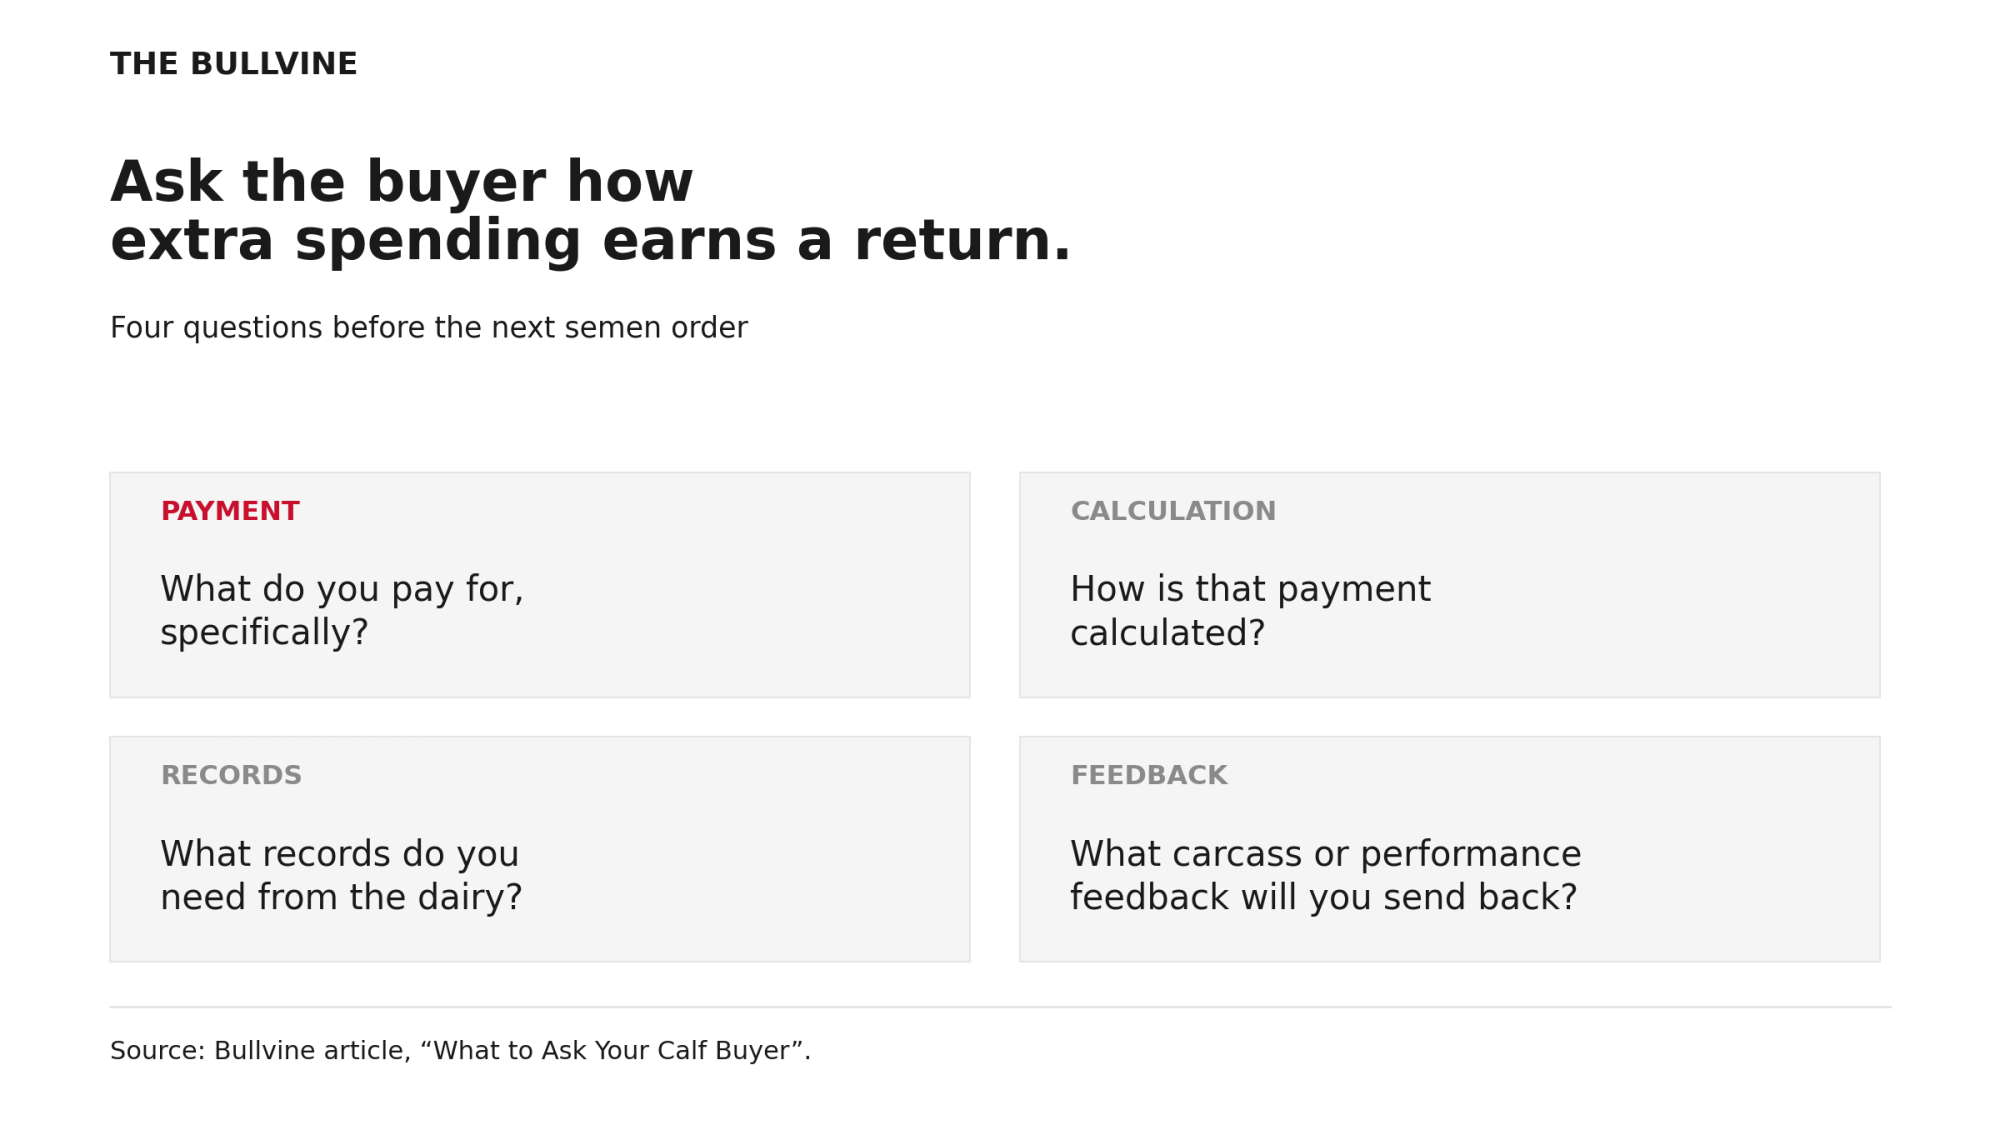
Auction sales and specification-based arrangements aren’t either-or; a herd can use both. Either way, put four questions to the buyer:
- What do you pay for, specifically?
- How is that payment calculated?
- What records do you need from the dairy?
- What carcass or performance feedback will you send back?
A written price mechanism shows a buyer pays for something. It isn’t the only proof that spending has value, and it isn’t enough by itself, because the payment still has to cover the cost and the rejection risk. For any extra expense, ask what evidence shows it improves your return through this buyer.
Keep essential care out of that test. Colostrum and calving management pay through calf health, survival and growth whether or not a buyer itemizes them. The test is for optional, buyer-specific items like certification, testing, documentation or a premium terminal-trait straw. Judge each on its total benefit, avoided losses included, and weigh it against what a beef straw costs you in replacement value.
Playbook
This week: gather settlements and pick a fair comparison.
- Pull 12 months of calf settlements and calculate your beef-cross premium over dairy bull calves in dollars and percent, split by sex.
- Compare like with like: similar sale dates and locations; comparable sex, weight, age and grade; settlement values that are consistently gross or consistently net; and your own history in the same channel.
- If you sell few dairy bull calves, use a matched local benchmark, such as the same week’s market report for your sale. Setting annual beef-cross receipts against an unmatched annual dairy calf average mixes up market timing with the breeding premium.
- Small samples and wide price swings limit how much any comparison can tell you.
Before the next semen order: run the scenarios.
- Review incremental costs per beef-sired calf sold, conception differences and replacement needs.
- Run both sexes at the 2020 and 2025 premium levels above.
- Weigh calving ease. Difficult calvings can raise costs and losses.
Over the next calf-sales cycle: track what pays.
- Record which sires and which buyer arrangements produced which settlements.
- Check whether the extra spending improved realized returns through that buyer.
More from Bullvine’s beef-on-dairy coverage.
Beef-on-Dairy Margin Stress Test
Plug in your local auction prices and herd data to calculate your actual premium over dairy bull calves.
Premium per Head
Gross Herd Premium
Net Program Advantage
Methodology Note
Published inputs: MSU Extension, “Premiums for beef-dairy cross calves shrinking in percentage terms” (Luke and Jaborek), July 17, 2026, Tables 1–2. These are mean differences between quantity-weighted average prices from three USDA AMS reports, mid-2020 through 2025. The full study is Applied Animal Science 42(4), August 2026, DOI 10.15232/aas.2026-02804. Data limitations are from the journal’s August 10, 2026 release.
Bullvine calculations: Scenario totals are premium × 70 bull calves. The midpoint is the average of the 2020 and 2025 PA No. 1 bull premiums. The two-sex figure is the mean of the PA No. 1 bull and heifer premiums for the same year.
Limits: three sale series in two states. Your region, grade, buyer or channel may differ.
Complete references and supporting documentation are available upon request by contacting the editorial team at editor@thebullvine.com.
Learn More
- Beef-on-Dairy Calf Profit: The $150 Leak Killing Your Premium — Arms you with the metrics to protect your crossbred margins. By auditing serum total protein and weaning average daily gains, you can plug management leaks that quietly erase $150 per head before the feedlot discounts your next load.
- $3010 Per Heifer. 800000 Short. Your Beef-on-Dairy Bill Is Due. — Breaks down the devastating replacement deficit threatening your long-term viability. As springing heifers top $3,000, overusing beef semen wipes out auction premiums. Learn how a 35% turnover rate leaves you scrambling for expensive replacements across a two-year timeline.
- Stop Breeding by Color: Genomics, Heat Stress and Beef‑on‑Dairy Math That Can Add Over $4/cwt to Holstein Margins — Dismantles visual breeding myths by pairing $40 genomic tests with precise beef-on-dairy tiering. This aggressive strategy helps you capture over $4.00/cwt in added milk margin while ensuring every dollar spent rearing goes exclusively to high-merit dairy replacements.
The Sunday Read Dairy Professionals Don’t Skip.

Every week, thousands of producers, breeders, and industry insiders open Bullvine Weekly for genetics insights, market shifts, and profit strategies they won’t find anywhere else. One email. Five minutes. Smarter decisions all week.