







STgenetics co-founder and CEO Juan Moreno told World Dairy Expo that the most efficient 30% of animals eat 15% less feed than the least efficient 30%. Here’s what that variation means for breeding decisions, and which numbers to compare before your next sire order.
Juan F. Moreno grew up on his family’s Brown Swiss dairy in Colombia. It milked about 60 cows. When he came to Ohio State, the university barn he worked in had 60 or 70. “In both places, I knew every cow by name. I knew who her sire was,” he told the room at the geneSTream™ Experience at World Dairy Expo on October 1, 2026.
Moreno earned a dairy science degree at Ohio State in 1988 and a master’s in reproductive physiology at Texas A&M, and he co-founded Sexing Technologies with partner Maurice Rosenstein. World Dairy Expo named him its 2025 International Person of the Year, and today he’s CEO of STgenetics, which hosted the session.
His message was about getting back to the cow he knew by name. “We went from individual animal care over the last 30 years to group animal care,” he said. Genetics and sensors, in his view, bring the individual cow back. Feed efficiency is where he made the economic case.
Disclosure: STgenetics advertises on The Bullvine website and did not commission or pay for this article. All dollar figures are U.S. dollars.
The 15% Gap
Feed is “60 to 65% of all the expenses” on a dairy or in a feedlot, Moreno said. STgenetics built EcoFeed, its feed-efficiency index, on progeny testing of females for residual feed intake. Citing UC Davis work, Moreno said that in “a population of a thousand animals,” the best 30% eat 15% less feed than the worst 30%, drink 21% less water and produce 15% less methane. Bullvine hasn’t identified the published dataset behind those combined figures. “That’s the same thing as having my money in a bank at 15% interest,” he said.
That spread is what selection works on. A sire choice can shift the expected average of the next generation, so the budget question is how far a given bull moves it.
The bank line shows how big Moreno thinks the opportunity is. A feed saving isn’t interest, though, and the 15% isn’t a measured return on a semen purchase. A sire-order budget runs on five inputs:
- Additional spending: any semen premium and, for herds not already doing it, genomic testing.
- Expected change in daughter performance from the bulls you choose.
- How many animals express that change. Rearing savings apply to the heifers those matings produce; lactation savings apply only to the replacements that enter the milking herd.
- Timing and duration. STgenetics publishes EcoFeed heifer, covering “the growing or rearing phase of life,” and EcoFeed cow, covering “her lactations” (STgenetics). Savings can occur while a heifer grows and again once she calves, if the predicted difference shows up.
- Other costs and trait differences that come with the bulls chosen.
What 10 EcoFeed Points Mean
“10 points of eco feed is one pound of dry matter savings,” Jocelyn Johnson, STgenetics’ Livestock Sustainability Manager, told the session (livestream, 1:46:02). A herd that improves its EcoFeed by 10 points, she said, gets “a pound saved per day per female on their farm.”
That conversion describes the animal herself. ST’s current explanation illustrates it with females: “a female with a score of 120 is expected to consume 3 pounds (DM) less per day than a female with an EcoFeed® score of 90” (STgenetics, 2022). An earlier ST explanation describes females and bulls in different terms. ST states that “EcoFeed® scores are breeding values,” and for a female, to see what she can pass on, “you can divide that number by 2.” A bull’s score is set from his daughters, with 110 meaning progeny that eat 1 lb less than expected, as-fed (STgenetics, 2020). The EcoFeed page of Cogent UK, whose parent company is STgenetics, also describes 10 bull points in terms of his offspring’s intake.
Because none of those pages shows how a current sire score and a current cow score combine into an expected daughter—or whether both sit on the exact same dry-matter scale—you can’t safely calculate across them from public sheets alone. A female’s score predicts her own intake. A sire’s score is described through what he transmits. Before pricing bulls, ask ST or your adviser for one worked example: using the current EcoFeed cow scale, what expected daughter score and daily dry-matter difference follow from a sire scored 120 and a dam scored 100? Ask for each bull’s reliability too, which neither ST page lists.
The US$58,000 Question: Gross Savings vs. Cash Flow Reality
On stage, Johnson put the herd-level result at “$50,000 a year,” pricing that saved pound at 19 cents across a 305-day lactation and a 1,000-cow herd. “I say it’s essentially money being left on the table if you’re not selecting for it,” she said.
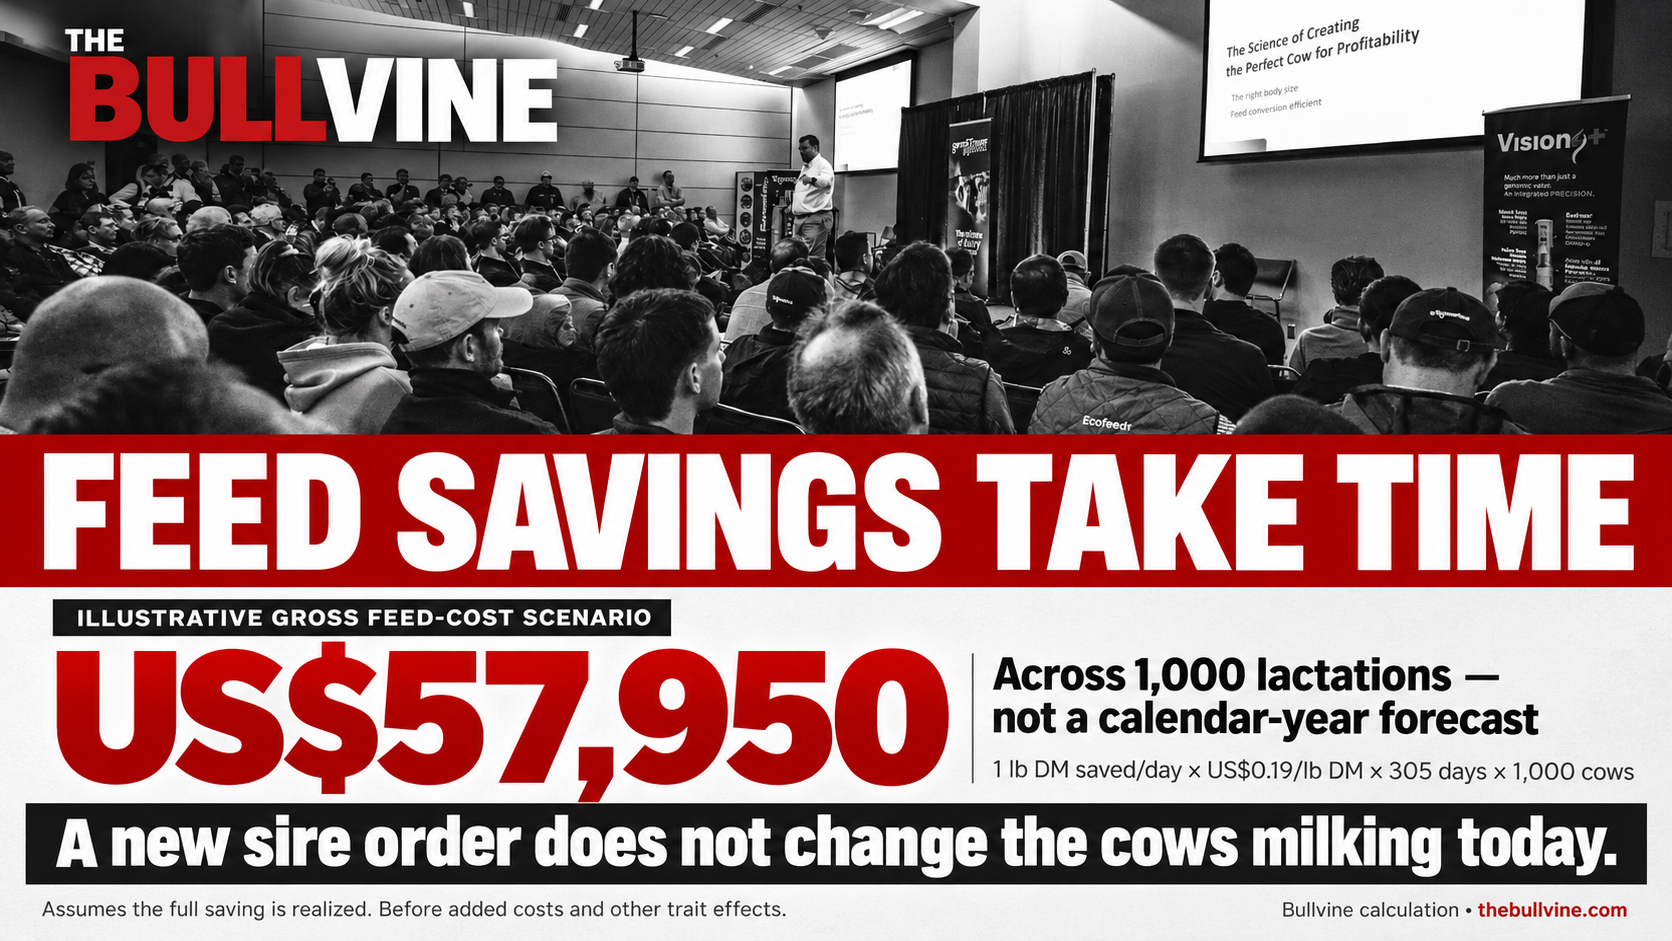
Multiplying those exact numbers out—assuming $0.19 per pound of dry matter, since the presentation didn’t specify dry matter or as-fed—puts the figure at $57,950 (about $58,000): 1 lb × $0.19 × 305 days × 1,000 cows. Three boundaries apply:
- It assumes a realized 1-lb daily difference in every one of those cows for the full lactation.
- It covers 1,000 specified lactations, not a herd’s calendar year.
- It’s gross feed-cost value, before semen premiums, genomic testing and any change in components or other traits.
The harder question is when that saving reaches the farm’s cash flow. A new sire order doesn’t change the appetite of a single cow at the bunk today. The timeline runs in sequence: first the pregnancy, then the daughter’s own rearing. Penn State Extension recommends Holstein heifers calve at 22 to 24 months of age, and that clock starts at her birth, not at the semen purchase. Only then does she eat a lactating ration, and lifting a whole milking herd takes years of matings.
Feed Saved: Pricing the Gap Between Two Bulls
CDCB’s Feed Saved is a separate evaluation from EcoFeed, so this example isn’t a conversion of EcoFeed points. It shows how to compare two sires in published PTA units. Feed Saved is a Holstein predicted transmitting ability (PTA) in pounds of dry matter per lactation. It combines body weight composite with residual feed intake, the gap between what a cow eats and what she’d be expected to eat for her milk energy, metabolic body weight and change in body weight (CDCB). Higher Feed Saved is better.
Two hypothetical Holstein bulls on the same basis, at the same assumed price:
| Metric | Bull A | Bull B | Gap (B minus A) |
|---|---|---|---|
| Feed Saved PTA (lb DM per lactation) | +200 | +500 | +300 |
| Gross feed value per daughter per lactation at $0.19/lb | $38 | $95 | $57 |
| Gross value across 100 daughters, one lactation | $3,800 | $9,500 | $5,700 |
| Average reliability if a young genomic bull | 28% | 28% | Low confidence |
| Average reliability if a progeny-tested bull | 38% | 38% | Still under 40% |
| Already counted in NM$? | RFI yes (since Aug 2021) | RFI yes (since Aug 2021) | Don’t double count |
That $57 is an expected average across Bull B’s daughters against Bull A’s, assuming comparable matings and management, before semen cost and other traits. Check what your index already counts: CDCB keeps Feed Saved out of Net Merit $ “so as not to ‘double count’ Body Weight Composite,” and residual feed intake has been in Net Merit $ for Holsteins since August 2021. CDCB’s published expected reliabilities for Feed Saved are 28% for young genomic bulls and 38% for progeny-tested bulls.
The Evidence Behind EcoFeed
Four pieces of evidence sit behind EcoFeed. Each answers a different question, and none of them prices a semen order.
| Evidence | What it reports | What this source does not establish |
| Moreno’s reported 15% feed comparison | As Moreno described it: best 30% vs. worst 30% in “a population of a thousand animals,” citing UC Davis work | The underlying study sample, or how far one bull shifts his daughters’ average |
| 12.6–15.4% lower estimated methane | Modeled emissions of high- vs. low-EcoFeed heifers | Direct methane measurements on the 5,441 study heifers |
| 2.73% / 8.2% lower lifetime feed (modeled) | Modeled scenarios of 1 and 3 standard deviations of genetic improvement, with no modeled impact on productivity | What your herd’s actual rate of genetic change will deliver |
| About 1.6 lb/day less intake | One high- and one low-EcoFeed pen on a 13,000-cow dairy; dry matter or as-fed, and cow or heifer score, not stated | Whether the difference came from genetics rather than pen and management effects |
The methane work. The 2021 Journal of Animal Science abstract, by UC Davis’s Ermias Kebreab with STgenetics co-authors including Johnson, estimated the heifers’ methane from models “based on dietary information and feed intake.” The models were checked against “an independent dataset containing 458 individual-animal methane production measurements,” but the abstract reports no direct methane measurements on the 5,441 study heifers.
The lifetime model. The 2026 Journal of Dairy Science paper, funded by STgenetics with UC Davis and company authors, modeled specified genetic scenarios (one and three standard deviations of improvement in genomic residual feed intake breeding values), not a particular semen order. A standard deviation is roughly the typical distance of an animal from the average.
The farm test. Johnson described a 2025 comparison on a 13,000-cow dairy (livestream, 1:47:05). The farm already selected for EcoFeed but ran its own test “without our input,” she said, because the owners “wanted to see if we were full of BS or not.” From “a lot of first lactation, early lactation females,” they built two pens of 200, one high-EcoFeed and one low, averaging 108 and 94, and measured daily intake at pen level alongside daily milk production. Johnson said the pens were “identical to every other genetic trait. No difference in net merit, no difference in fat, protein, fertility.”
Johnson said the 14-point gap predicted 1.4 lb less intake a day. After 12 weeks, she said, the high pen ate about 1.6 lb less per cow per day “with no difference in milk production” (livestream, 1:50:03), which she called “essentially the exact expectation.” She also noted days when “one pen got milked later than another” (livestream, 1:50:48). The owners “felt convinced” and kept selecting for EcoFeed.
Because she didn’t state whether that 1.6-lb intake difference was dry matter or as-fed—or whether the pen averages used EcoFeed cow or heifer scores—there is no way to reconcile the field result with the 1.4-lb prediction like for like. The owners’ decision to keep selecting is their judgment, not independent confirmation. With one pen per group, the comparison can’t isolate genetics from pen and management effects without more design detail. A herd that wants its own answer should plan the comparison with its nutritionist or adviser, using replicated pens or a crossover where that’s feasible.
On pasture. Asked from the floor whether EcoFeed holds for grazing cattle, Moreno said, “There’s not a lot of data,” though the limited data show “a positive correlation” when comparing animals on TMR and on grass (livestream, 1:18:42).
Moreno’s Management Message

If feed efficiency goes into the next sire order, weigh it alongside production, health and fertility, not in place of them. Moreno put mastitis heritability at 0.03, close to CDCB’s 3.1% for resistance to clinical mastitis (CDCB), and called fertility and longevity “low heritability… 99% environment.” For a herd with a mastitis problem, his first stop is the barn: “go take care of your bedding,” then the teat dip and the milking-parlor cleaning list.
He was just as clear that genetics still matters: “I’m not saying that you shouldn’t put attention to fertility genetically speaking or locomotion.” Heritability is the share of variation associated with additive genetic differences in a given population and environment. It doesn’t divide an individual cow’s case into genetic and management percentages, and on its own it doesn’t determine how large or valuable selection gains will be. In CDCB’s example, daughters of a Holstein bull with a mastitis-resistance (MAST) PTA of −4.0 percentage points are expected to have twice as many cases as daughters of a bull at +3.0. CDCB’s current heritability for daughter pregnancy rate, revised in 2026, is 2.9%, and CDCB describes progress as “gradual but cumulative over time” (CDCB).
So management and selection run together. A farm doesn’t need to finish fixing the barn before choosing sires with healthier daughters.
Three numbers get mixed up here:
- Heritability describes a trait in a population.
- Reliability describes confidence in one animal’s prediction. CDCB’s published expected average for young genomic bulls is 49% for mastitis resistance.
- Economic weight is the value an index assigns to a unit of improvement.
Calves and the Cows You Keep
Moreno said 3,000- to 4,000-cow U.S. herds that culled 35% a year and a half ago now cull 17%. “Only thing that changed was that black calf. It changed the management decision.” The cow with short teats or a high cell count “gets to live another day because she’s carrying a $1,500 calf in her belly.” He didn’t name the herds or show records on what caused the change.
That creates a direct tension for genetic progress on feed efficiency. In a stable-size herd that’s otherwise comparable, keeping more older cows and raising fewer dairy replacements turns over the milking string more slowly, which delays how fast EcoFeed or Feed Saved genetics reach the lactating pens. Expansion, purchased replacements and differences in replacement merit can change that. And slower genetic turnover doesn’t, by itself, make keeping a profitable cow the wrong call; the goal is whole-herd profit.
Whether to carry a given cow to calving depends on the expected calf value and time to calving, her ongoing margin, her health and pregnancy-loss risk, her cull value and the cost of a replacement. Keeping her until she calves is a different decision from keeping her another lactation.
Before Your Next Sire Order
| Herd objective | Evaluation or record to consult | Question to ask |
| Lower feed cost | STgenetics EcoFeed heifer and cow; CDCB Feed Saved | What expected daughter difference in daily dry-matter intake separates the actual bulls I’m choosing between, on which life-stage evaluation, and how reliable is each figure? |
| Fewer mastitis cases | CDCB resistance to mastitis, alongside SCS | Where does this bull rank on both, and how reliable is his figure? |
| Better fertility | CDCB daughter pregnancy rate (2026 basis) | How much weight does my index give it? |
| Feed efficiency on pasture | EcoFeed | Have you seen data from grazing herds, or only TMR-based figures? |
| Replacement inventory | Your dairy and beef-on-dairy breeding plan | How many dairy-sired heifers does the herd need, and how soon do you want new feed-efficiency genetics in the milking pens? |
Back to the Named Cow
Sensors are the other half of his route back to the individual cow. STgenetics’ Farmfit bolus, Moreno said, sits in the reticulum, logs temperature around the clock and tracks movement on six axes.
Early in the session he asked, “what if we could get back to individual animal care?” To him, that means knowing each cow the way he knew the 60 on his father’s dairy. A genetic evaluation predicts a calf’s genetic potential before she’s born. Read for what each number actually compares, it’s one more way to know her.

Complete references and supporting documentation are available upon request by contacting the editorial team at editor@thebullvine.com.
Learn More
- $585 a Straw: What Every Beef Service Really Costs Your Next Heifer — Arms you with a barn-level Pipeline Index audit showing how $3,100 springing heifers turn extra beef matings into a $585 net replacement drain, directly pricing the heifer-turnover tension Moreno flagged.
- Bred for Fat, Paying for Protein: The $180,000 Trap Locked into Western Cheese Herds Until 2029 — Dismantles the 2025 Net Merit butterfat tilt, revealing how biological lag locks a 500-cow herd out of $66,000 to $128,500 in annual protein revenue unless you reset sire thresholds now.
- Methane Breeding Values: NZ’s Bull-Proxy Just Failed — Exposes why methane reductions measured in growing yearlings vanished once those daughters freshened onto lactating rations, delivering a strict 30-day checklist to separate validated cow phenotypes from young-animal proxies.
The Sunday Read Dairy Professionals Don’t Skip.

Every week, thousands of producers, breeders, and industry insiders open Bullvine Weekly for genetics insights, market shifts, and profit strategies they won’t find anywhere else. One email. Five minutes. Smarter decisions all week.