






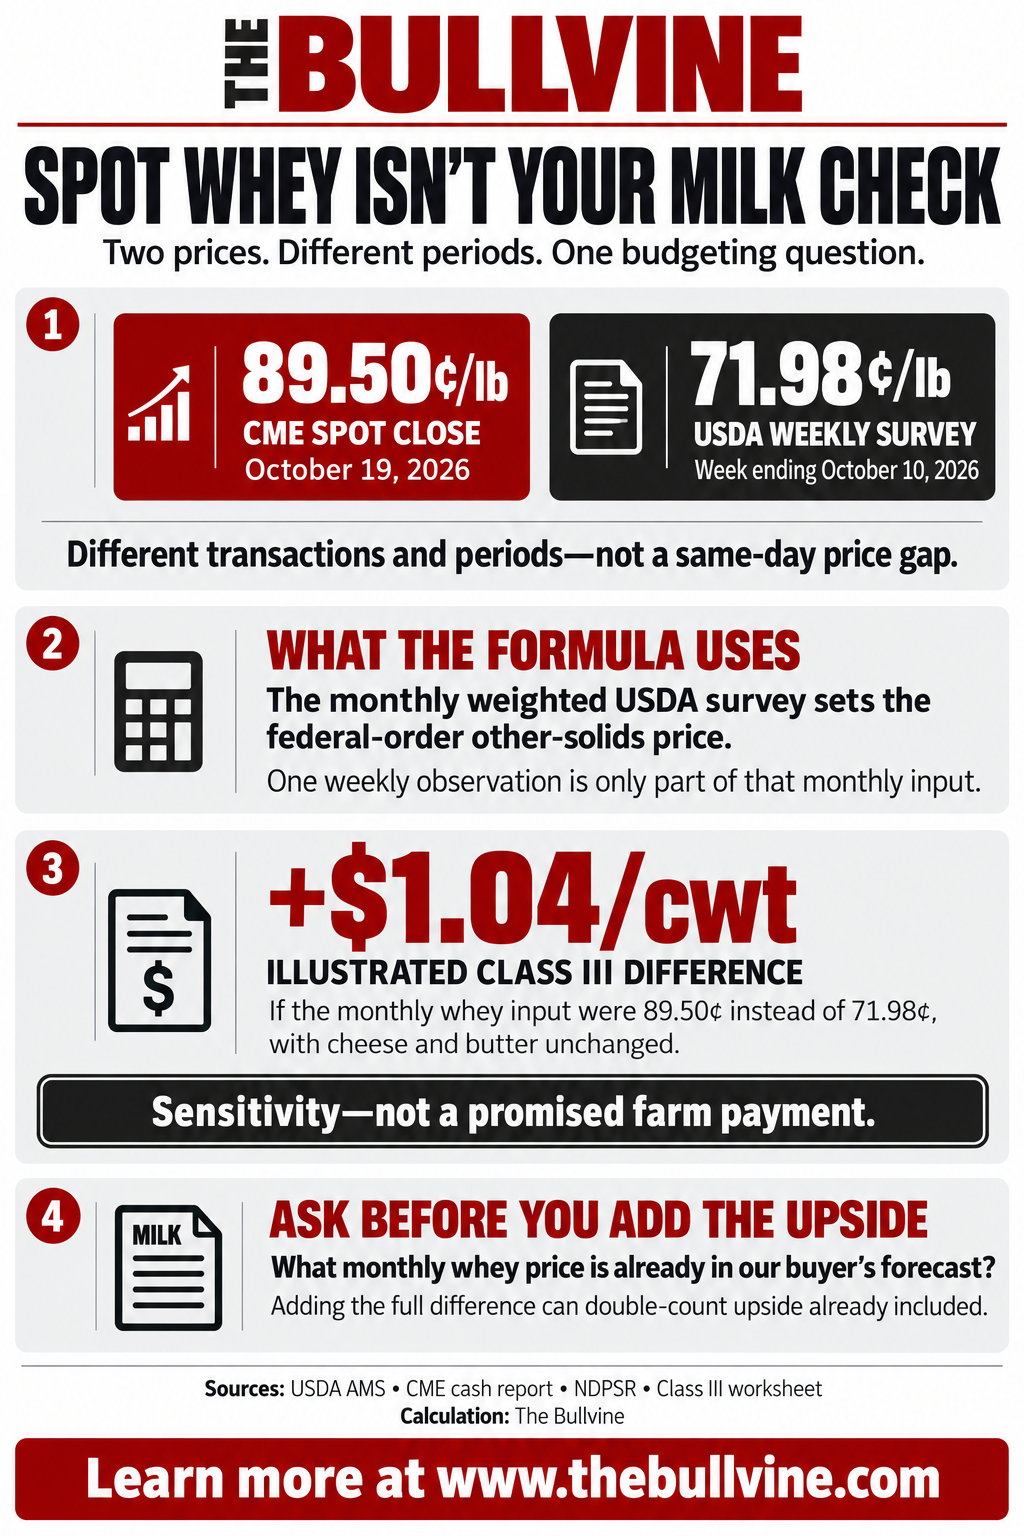
CME dry whey closed at 89.5¢ on October 19. USDA’s latest weekly survey reported 71.98¢. The monthly weighted survey—not the spot close—sets the federal-order other-solids price.
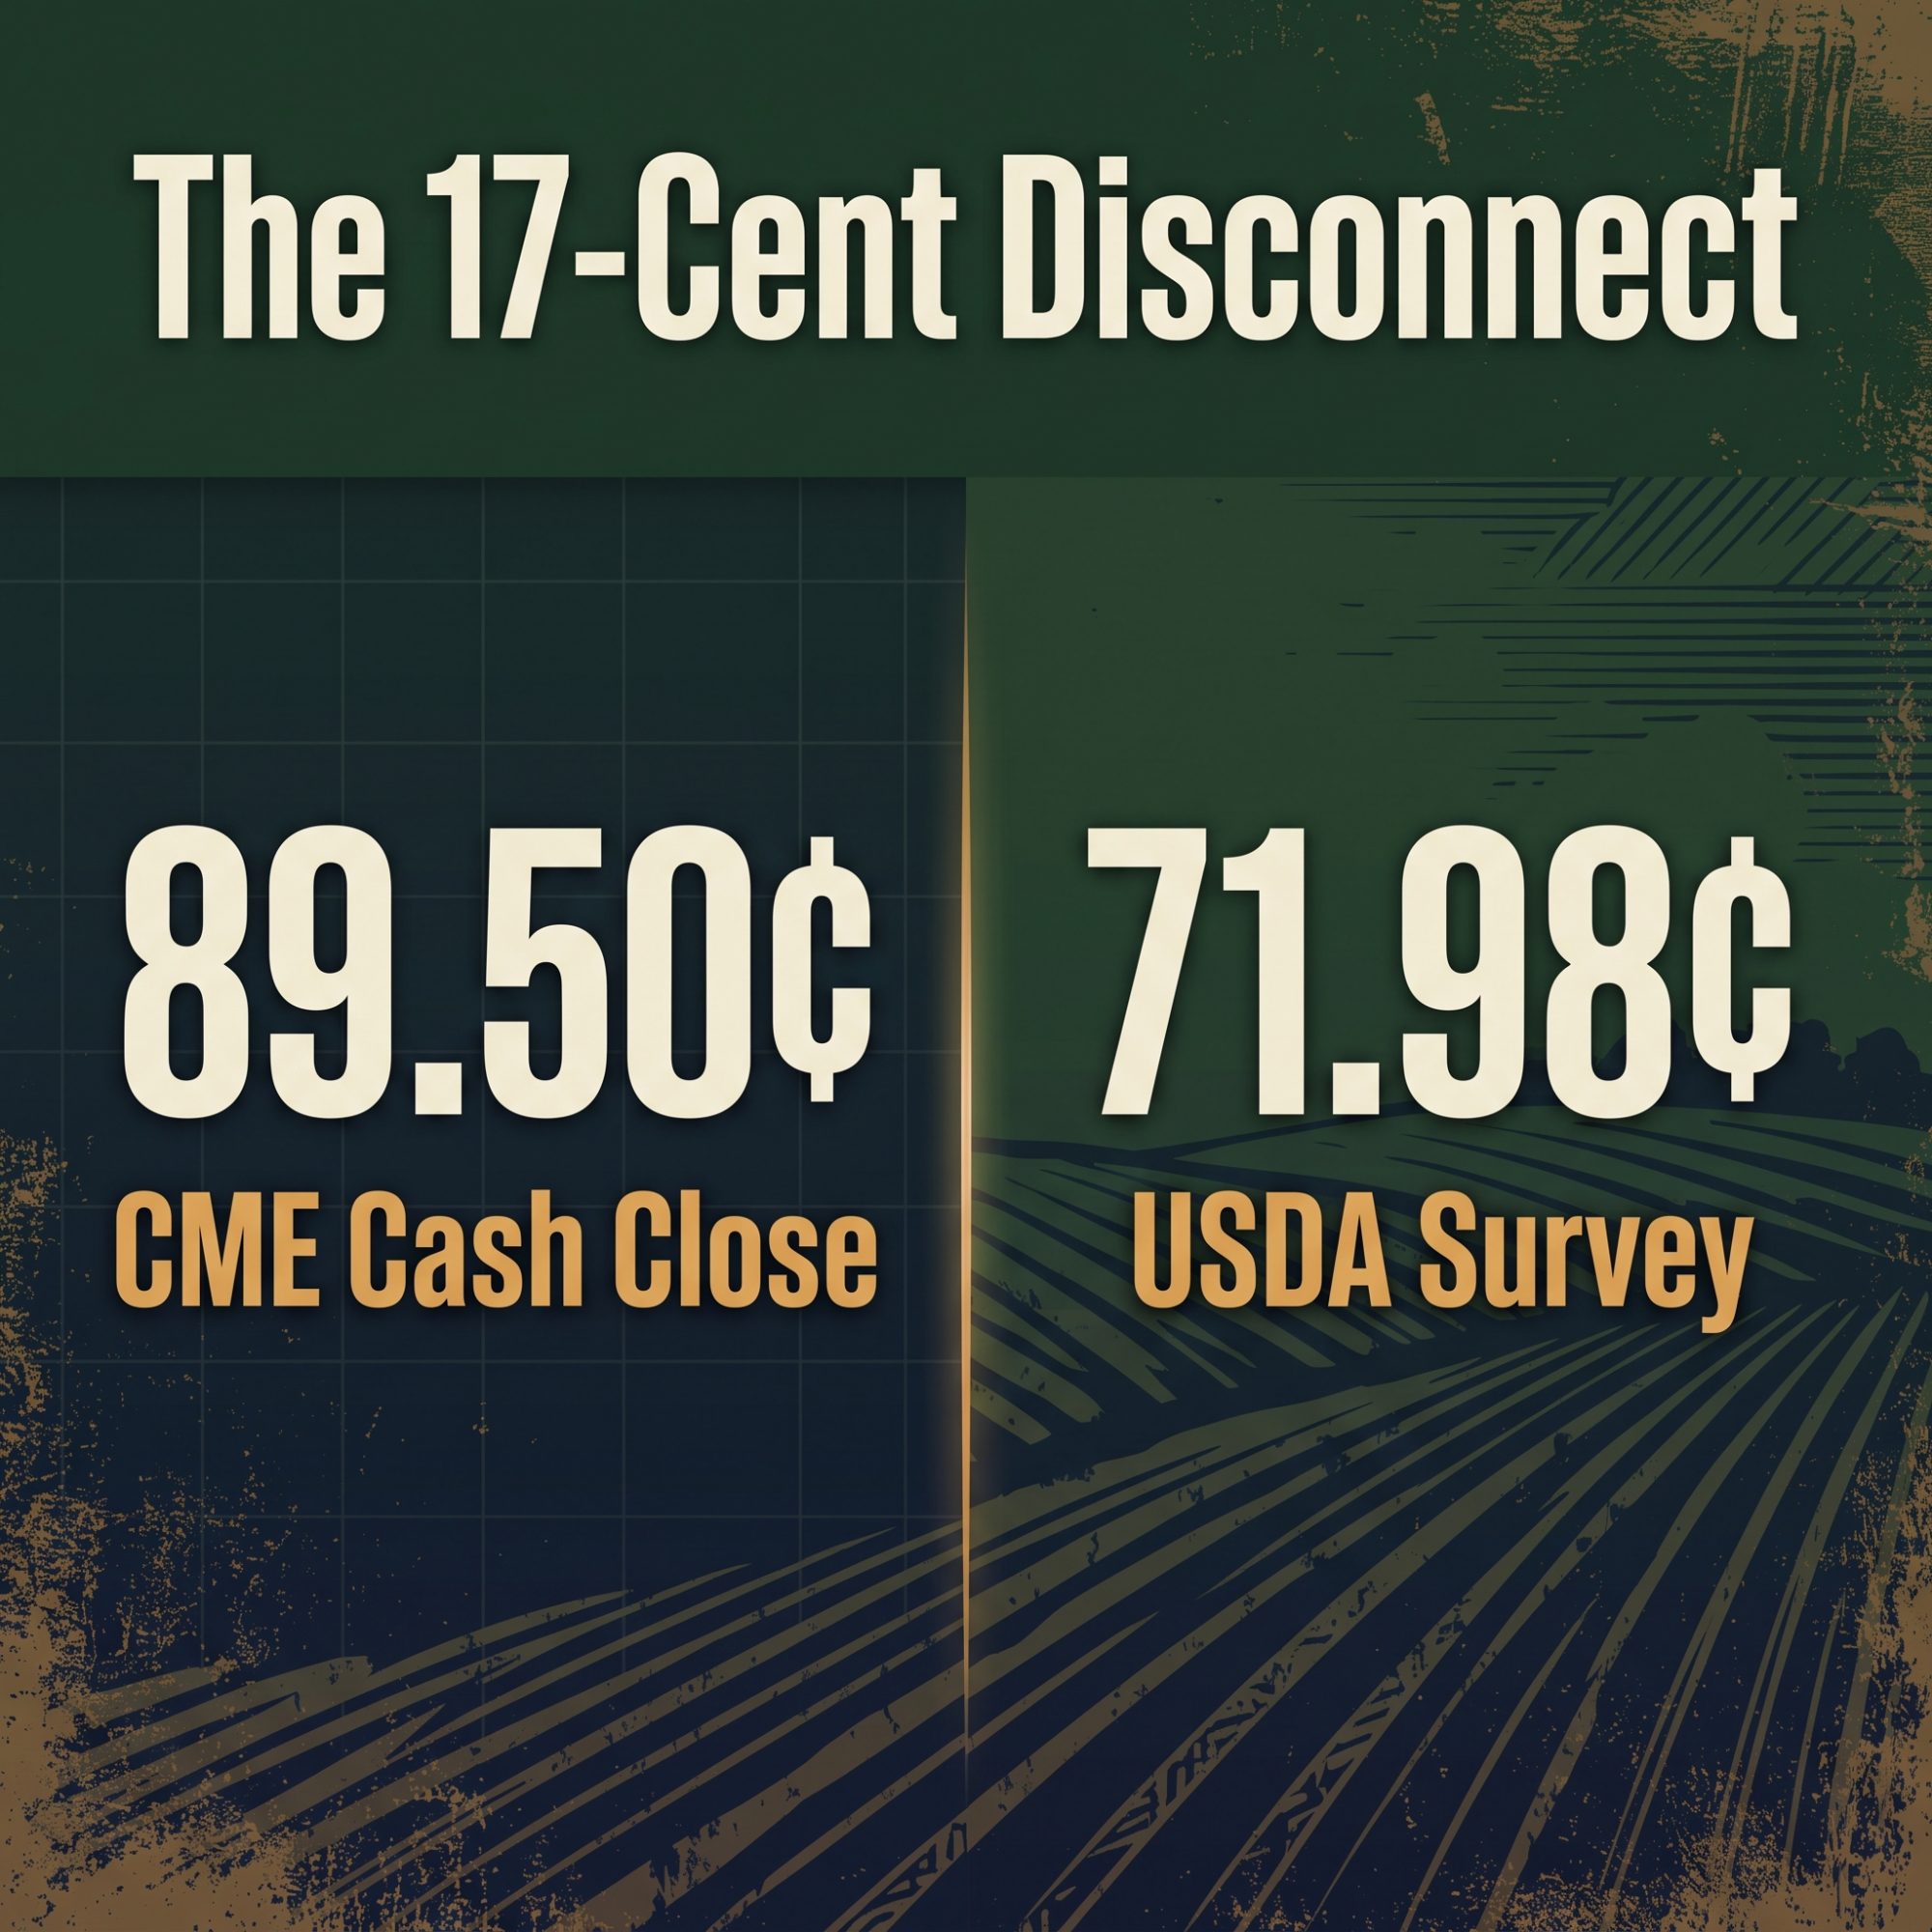
Both references cover Extra Grade dry whey, but they measure different transactions over different periods. Run both through USDA’s current Class III math and the distance is about $1.04 per hundredweight. That is Bullvine’s calculation, not a USDA price, and it is a sensitivity, not a payment. It belongs in the scenario column of the budget until the survey says otherwise.
Three markets, different pressures
The U.S. Dairy Export Council’s August trade analysis splits the protein story in two. Low-protein whey exports rose 25%. High-protein whey exports, the WPC80+ class, fell 21%, and USDEC attributed that fall to limited exportable supply.
The 25% was not dry whey alone. USDEC’s low-protein category bundles dry whey, low-protein whey protein concentrate and modified whey, and all three grew. Canada and Southeast Asia took most of the increase.
Milk protein concentrate exports rose 36% to 5,225 metric tons. USDEC’s read is that protein-fortified product makers turned to MPC because of the WPC80+ supply and price situation. That is USDEC’s interpretation, not a count of who reformulated.
| Export category | Year-over-year volume change | What the category covers | USDEC’s reported context |
|---|---|---|---|
| Low-protein whey | +25% | Dry whey, low-protein whey concentrate, and modified whey | All three classifications grew; Canada and Southeast Asia drove most of the increase |
| High-protein whey, WPC80+ | −21% | USDEC’s high-protein whey grouping | Limited exportable supply constrained shipments |
| Milk protein concentrate, MPC | +36% | Milk protein concentrate exports | USDEC suggested manufacturers were turning toward MPC given WPC80+ supply and pricing |
| Nonfat dry milk / skim milk powder | −19% | Combined NFDM and SMP exports | Elevated U.S. prices and limited exportable supply weighed on shipments |
So August supports two things at once: stronger overseas demand for lower-protein whey, and tight export availability of high-protein ingredients. It does not support one shortage across everything with “protein” on the bag.
USDA counted 75.1 million pounds of dry whey production in August, up 8.2% on the year. Stocks sat at 61.3 million pounds, 21.6% above August 2025 and 10.4% below July. Heavier than last year, drawing down from last month, and neither figure measures what was uncommitted in October. A record spot close and a 21.6% stock build can both be true. What the stocks number kills is the story that the country ran short of whey.
| USDA measure | August 2026 (million lb) | Change from August 2025 | Change from July 2026 |
|---|---|---|---|
| Total dry whey production | 75.1 | +8.2% | −7.4% |
| Total dry whey manufacturers’ stocks | 61.3 | +21.6% | −10.4% |
| Nonfat dry milk production, human use | 132.2 | +9.6% | −19.9% |
| Nonfat dry milk manufacturers’ stocks, human use | 216.3 | −3.6% | −7.1% |
NFDM already shows resistance
Nonfat dry milk is a different tension. Production rose 9.6% to 132.2 million pounds in August while manufacturers’ stocks fell 7.1% from July and 3.6% from a year earlier, to 216.3 million pounds. Output up, inventory down: that is the tighter-market reading, and it holds.
Skim milk powder production, though, fell 33.1% on the year. USDA counts NFDM and SMP separately; USDEC’s export category combines them. Read either one without the other and you get the wrong number.
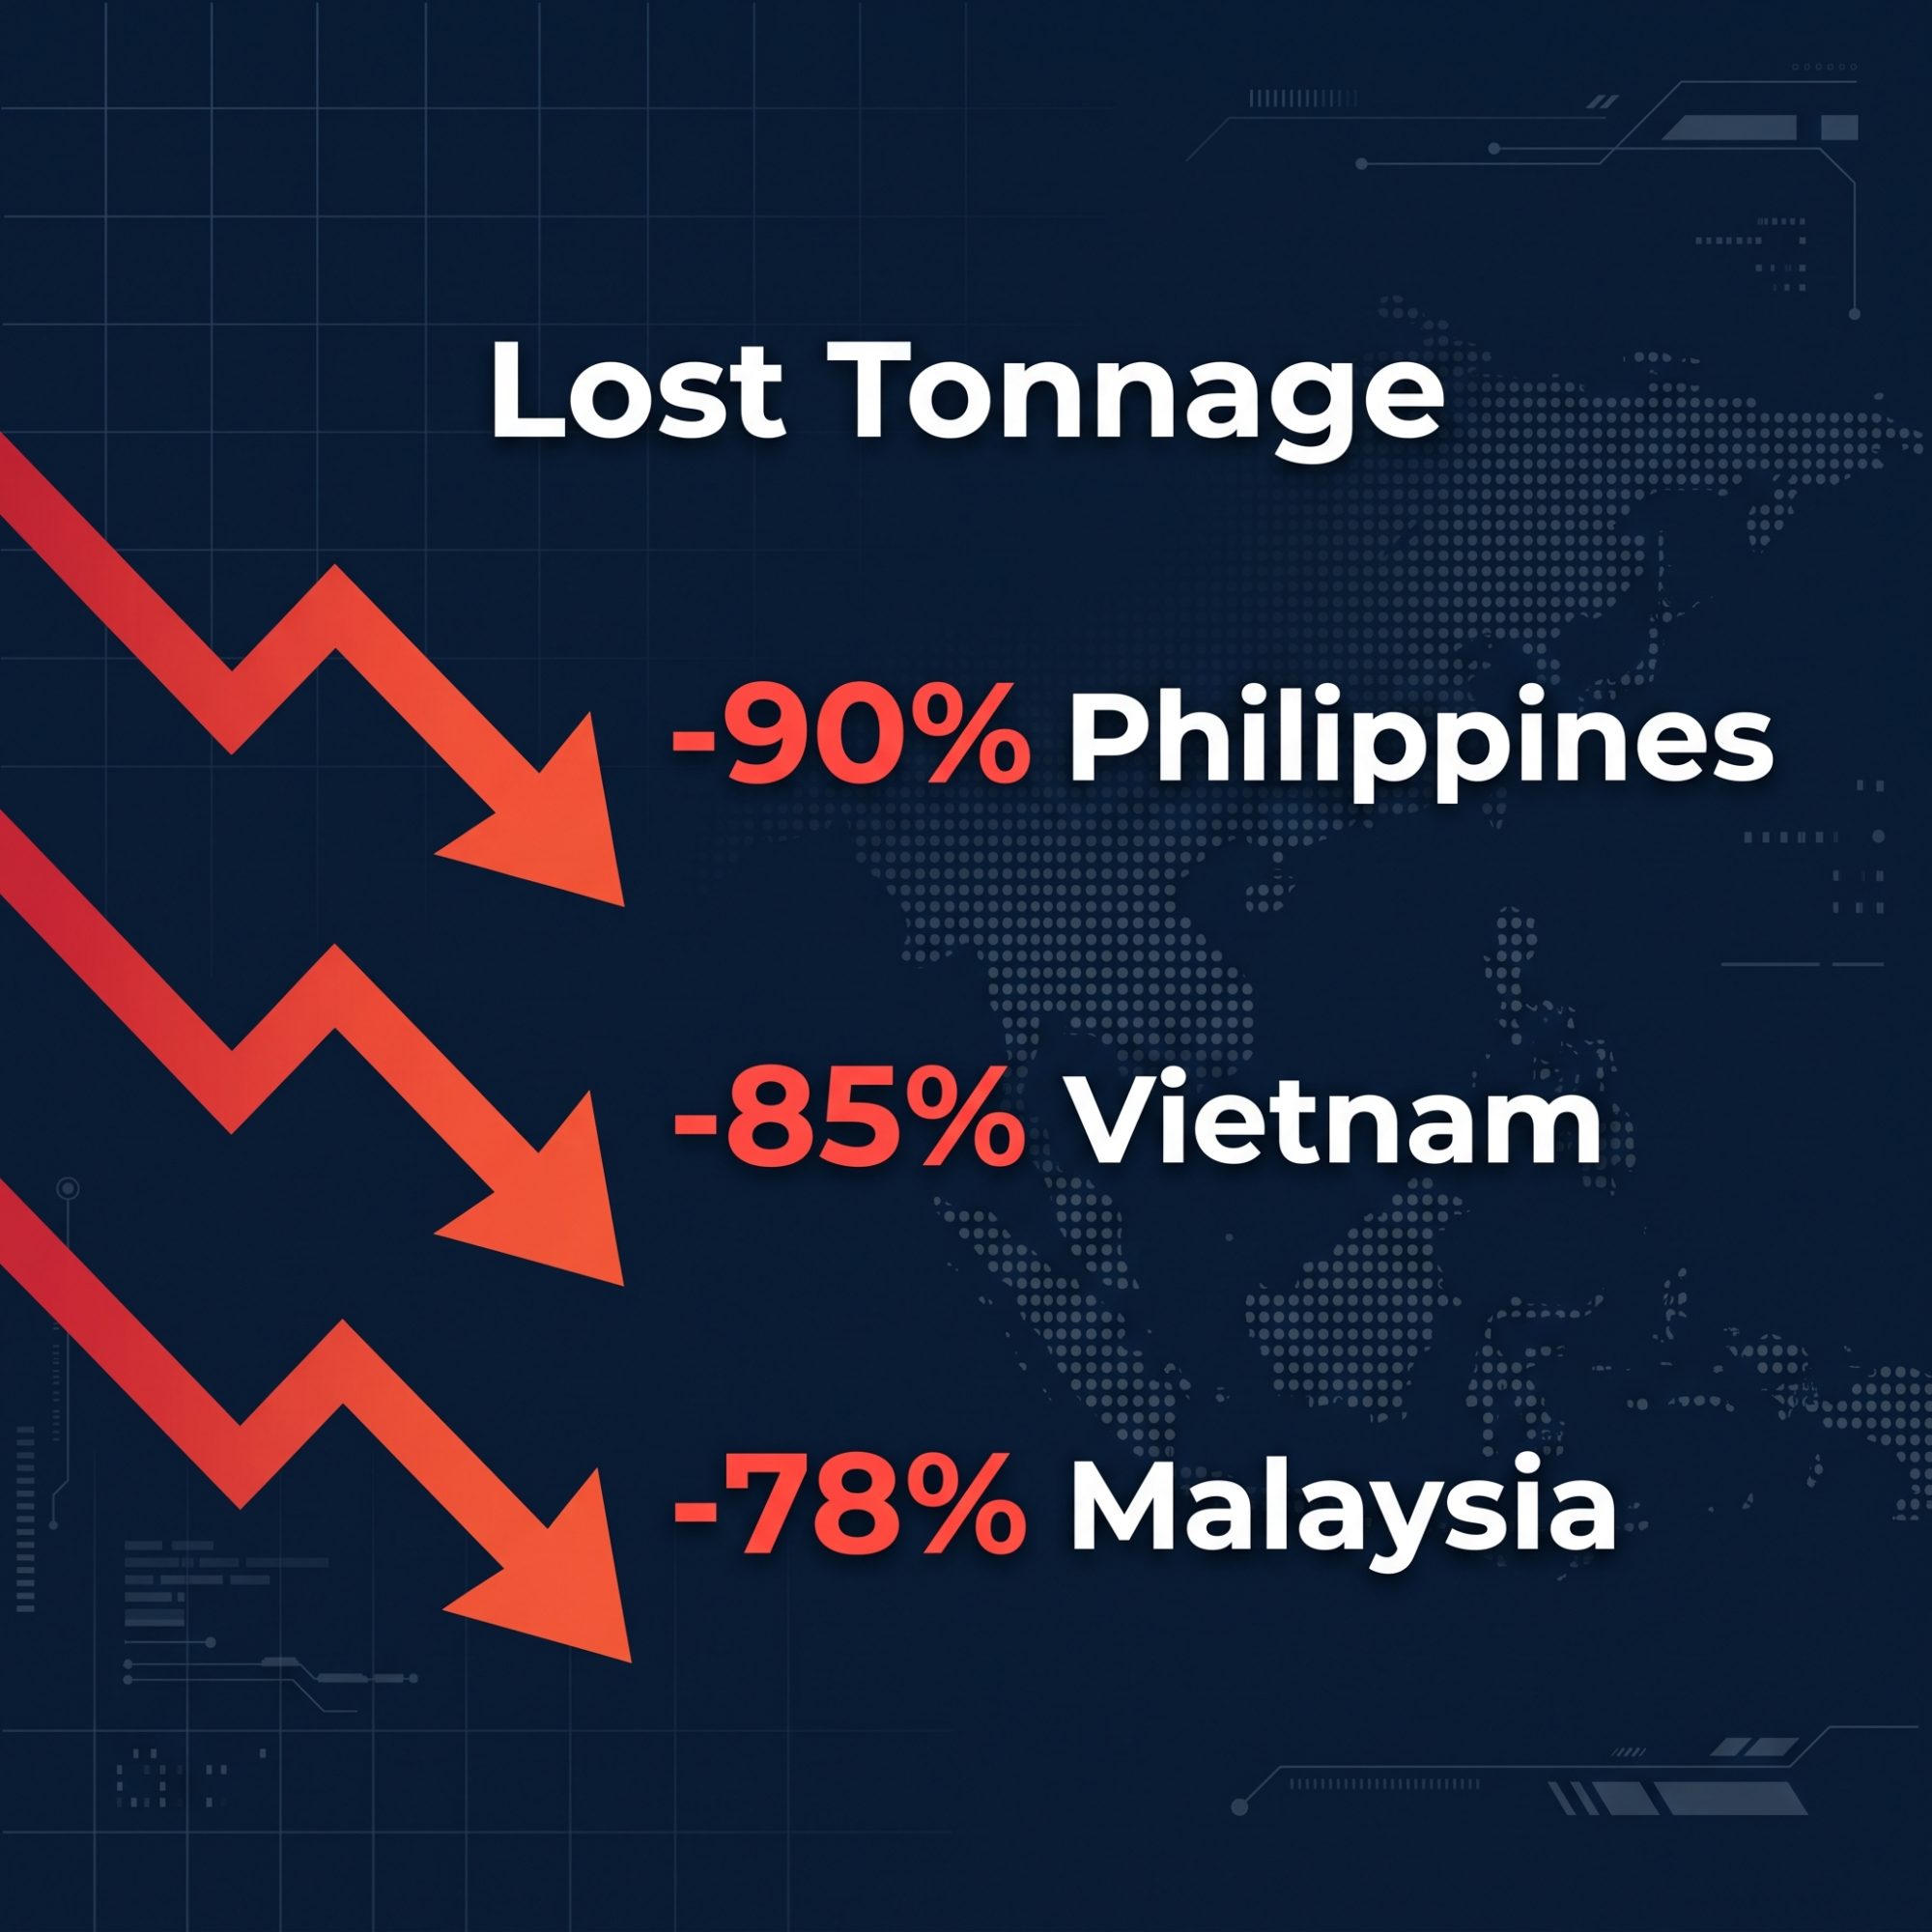
USDEC put August NFDM/SMP exports down 19%, blaming limited exportable supply and high U.S. prices. Southeast Asian buyers went to New Zealand and the EU instead. U.S. shipments to the Philippines fell 90%, Vietnam 85%, Malaysia 78%.
Tight inventory at home and lost tonnage abroad can run together for months. The 90% drop to the Philippines is the number to carry into the next export release, because it shows up in the price only after the business is already gone.
What reaches the milk check
The 71.98¢ is USDA’s October 15 National Dairy Products Sales Report, week ending October 10. The 89.50¢ is CME’s October 19 cash close. Different markets, different weeks. Neither a same-day discount nor a catch-up payment owed.
Federal-order component prices use weighted product prices from four or five weeks of USDA’s sales survey, not the latest CME close. Dry whey sets the other-solids price. The Class III protein formula uses cheddar cheese prices and a butterfat adjustment; it does not directly use whey-protein ingredient prices. A run in whey protein ingredient prices does not land on the protein line of a federal-order milk statement.
Bullvine’s whey-to-check test
USDA’s other-solids formula subtracts a 26.68-cent make allowance from the surveyed dry-whey price and applies a 1.03 yield factor. Standardized Class III carries 6.0 pounds of other solids per hundredweight of skim and a 0.965 skim-to-milk conversion.
The table below is Bullvine’s calculation on those USDA factors, with cheese and butter inputs held still. Low, central and high are reference cases, not probabilities, and none of them is an announced price.
| Documented reference | Whey price (¢/lb) | Calculated other-solids price ($/lb) | Other-solids contribution to standardized Class III ($/cwt) |
|---|---|---|---|
| USDA survey: week ending Sept. 12, 2026 | 66.21 | $0.4072 | $2.36 |
| USDA survey: week ending Oct. 3, 2026 | 68.14 | $0.4270 | $2.47 |
| USDA survey: week ending Oct. 10, 2026 | 71.98 | $0.4666 | $2.70 |
| CME spot illustration: Oct. 19, 2026 | 89.50 | $0.6470 | $3.75 |
Subtract $0.2668 from the whey reference, multiply by 1.03, then by 6.0 and 0.965.
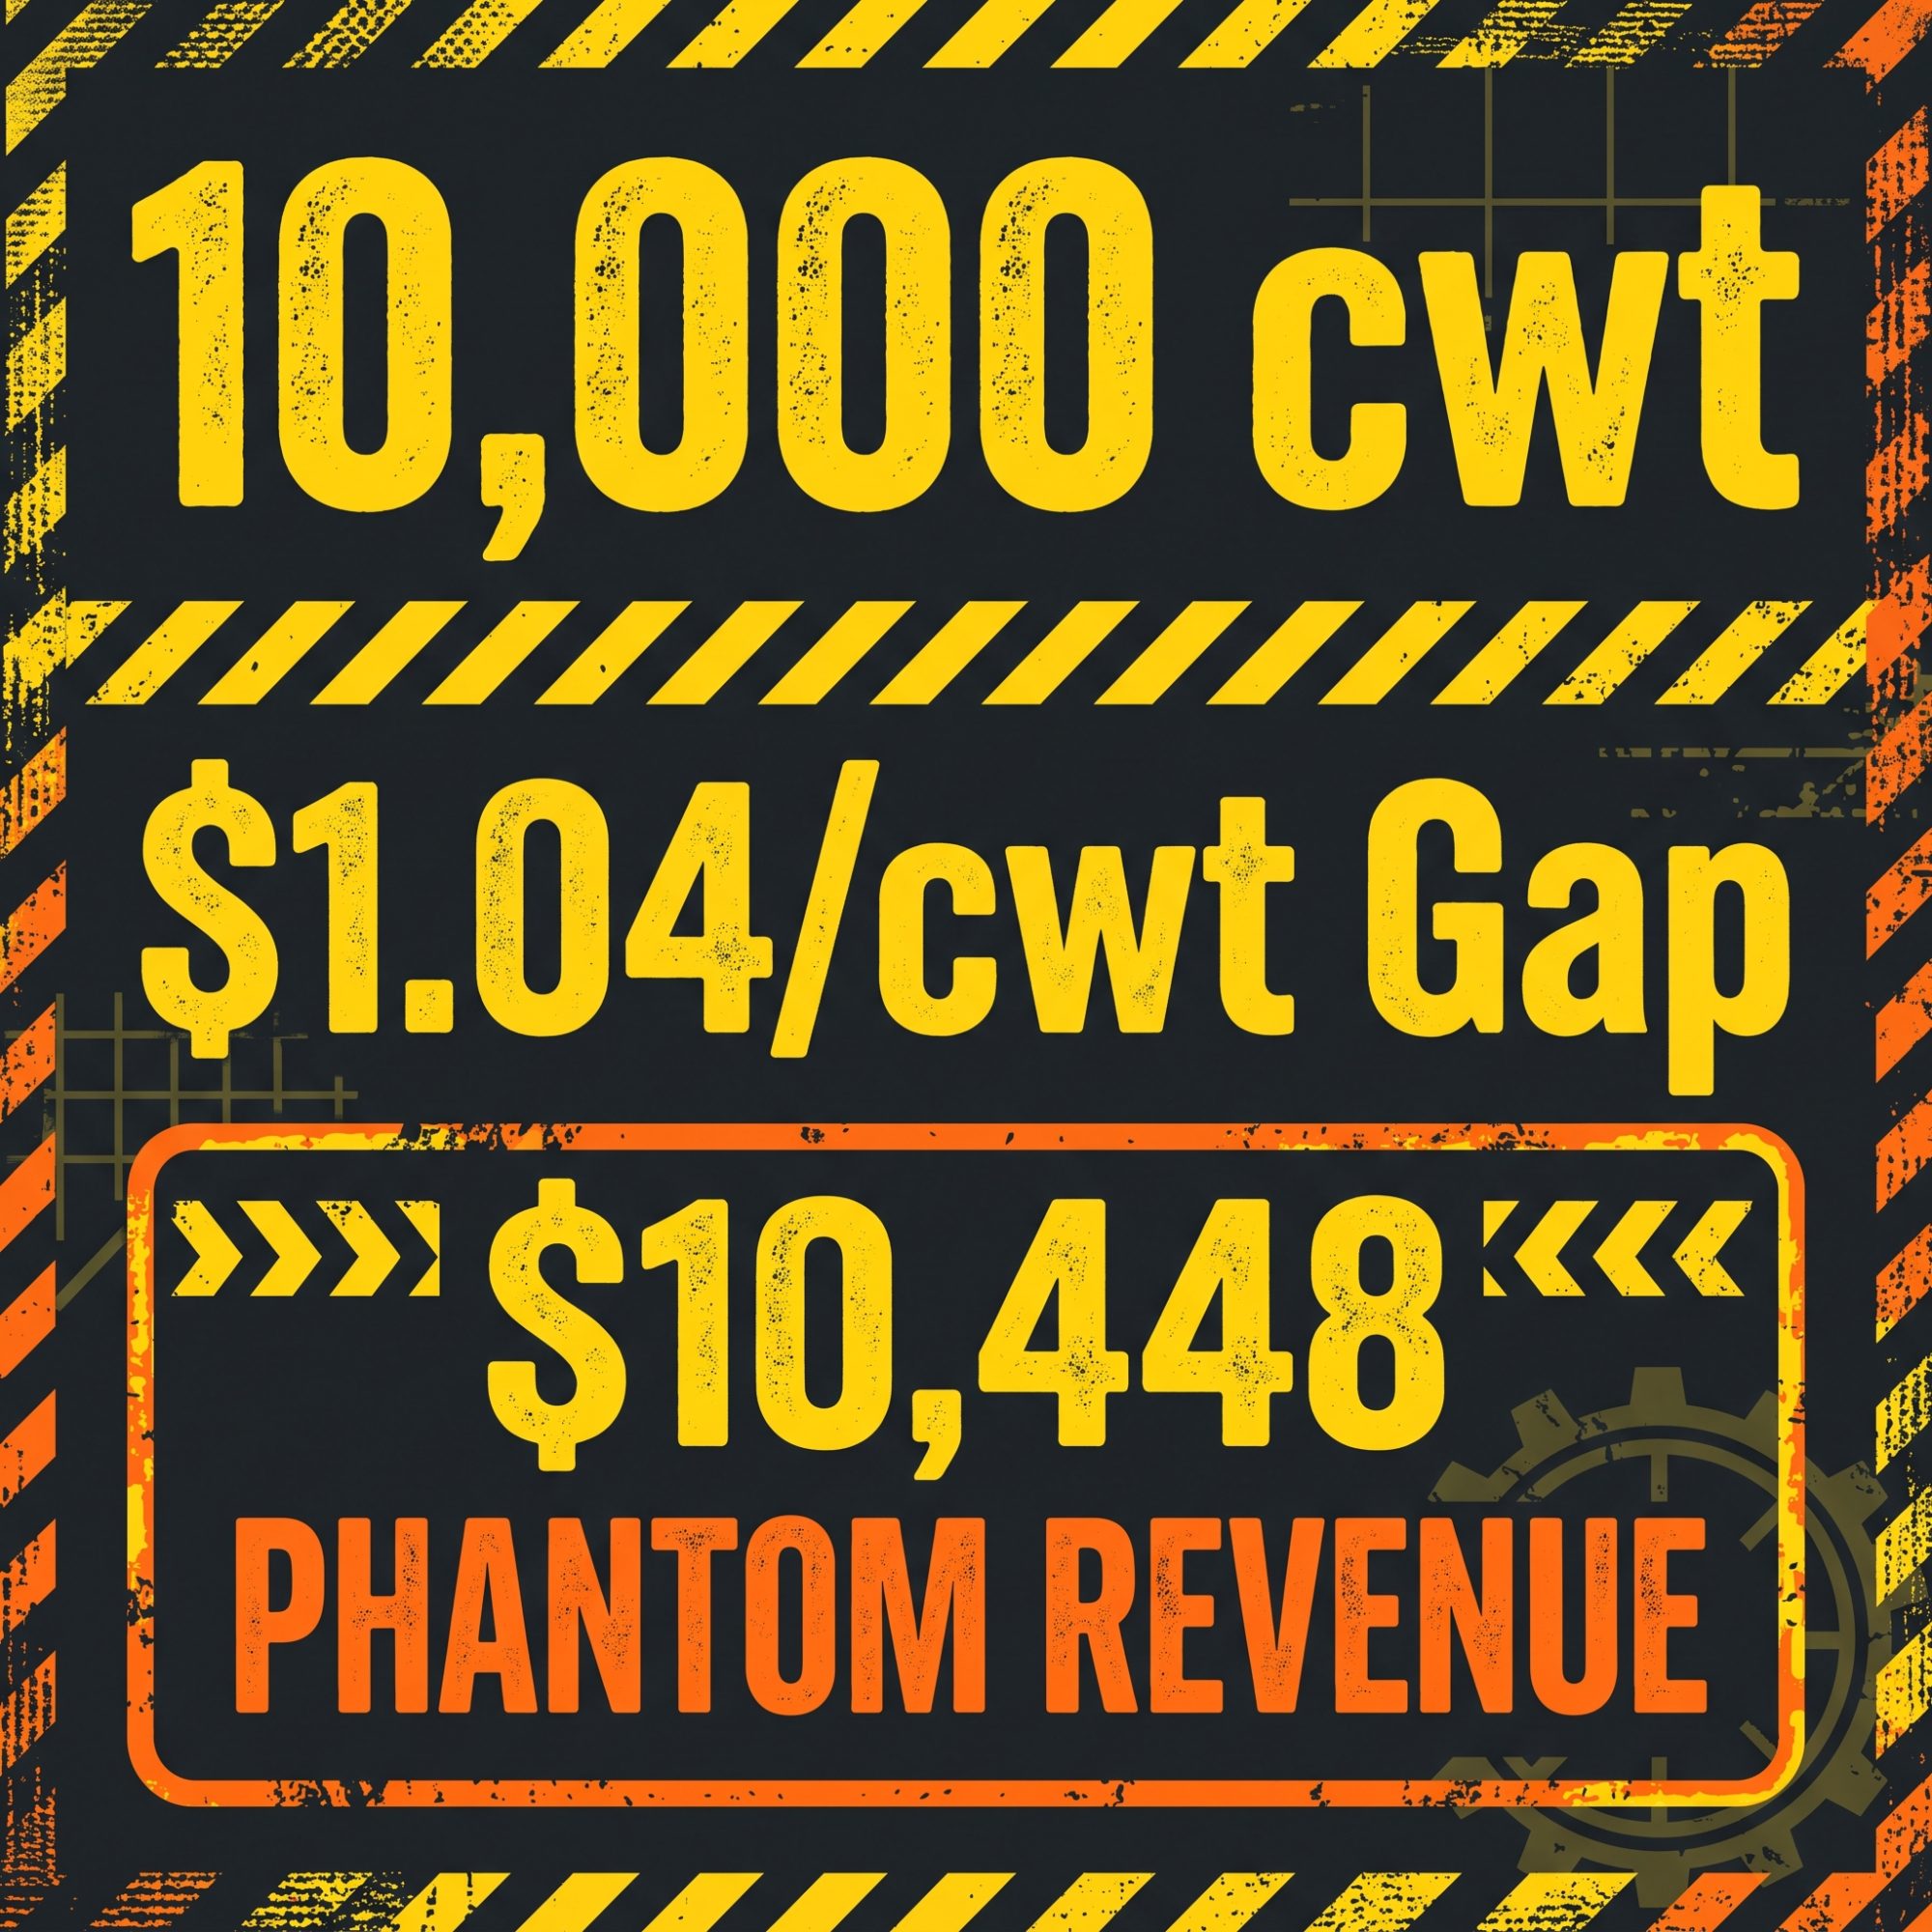
Central to high is $1.04/cwt with everything else frozen. On an assumed 10,000 cwt a month, one-for-one exposure is about $10,448. The high case only enters the regulated calculation if prices like it show up in the monthly USDA survey. A CME close on its own does not get there.
Butter and cheese still matter
Butter output ran 6.3% above a year earlier in August; total cheese was up 1.4%. In the same October 15 sales report that moved whey and NFDM higher, surveyed butter and cheddar fell on the week.
Class III still prices protein off cheese and carries butterfat; Class IV carries nonfat solids and butterfat. With 6.3% more butter in the system, a whey rally lifts one line on the statement and leaves the others to their own markets. In the latest weekly survey, stronger whey coincided with weaker butter and cheddar prices. The overall Class III result depends on all those inputs.
What this means for your operation
- Isolate spot prices in your budget. Any line built on 89.5¢ whey is a spot-reference scenario. The surveyed price is the one already in the monthly formula.
- Stress-test your exposure. It is a stress test, not an expected gain. Ask the buyer how class utilization, component tests and payment terms change it at your farm, and whether their forecast already includes stronger whey. If it does, adding $1.04 counts it twice.
- Check your break-even reality. If scheduled costs only clear under the high case, the operation is running on a price the survey has not recorded yet.
- Date the reference points. August’s 61.3 million pounds of dry whey stocks, 216.3 million pounds of NFDM stocks and 25% low-protein whey export growth are the numbers to check against the next USDA and USDEC releases.
The full $1.04/cwt illustration requires a monthly weighted whey price of 89.5¢. Before budgeting that upside, establish how much is already in the buyer’s forecast and how any additional change would reach your check.
Whey Gap Stress-Test Calculator
Calculate your farm’s exact financial exposure to the spread between CME spot whey prices and USDA surveyed prices.