





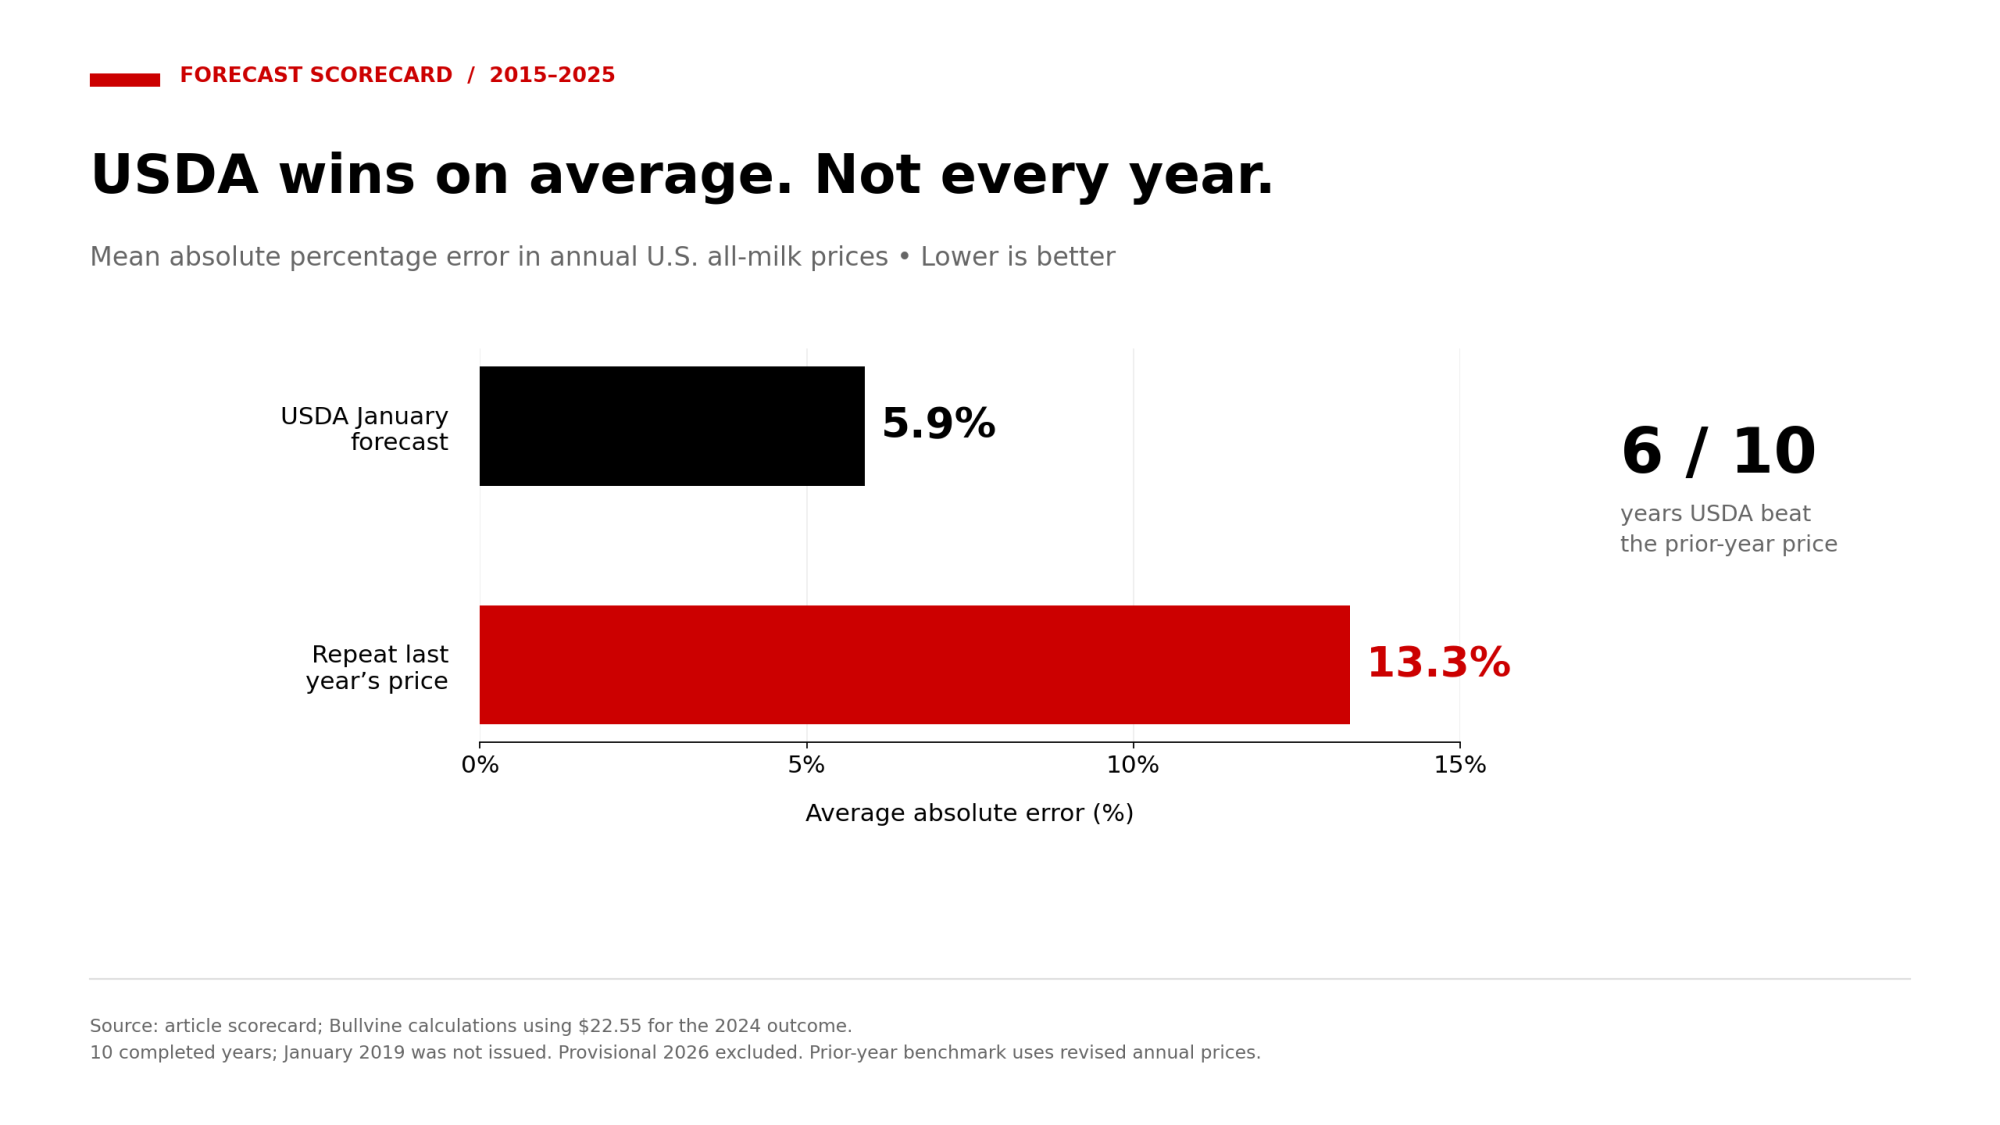
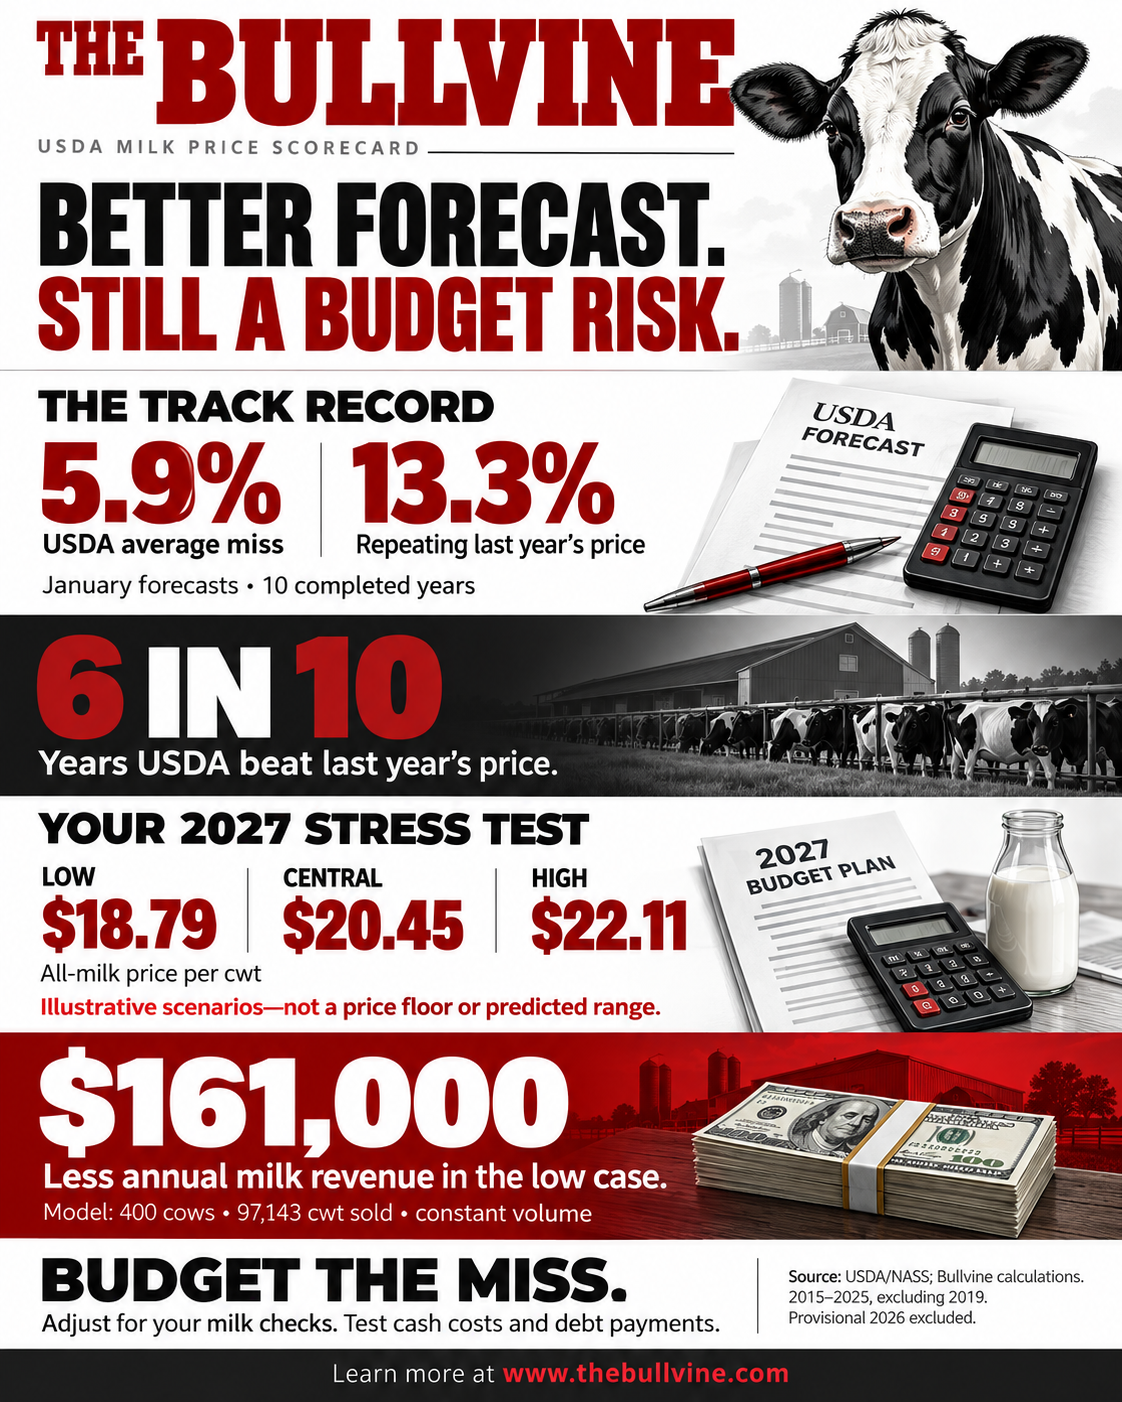
From 2015 through 2025, USDA’s January all-milk forecast missed by 5.9% on average and beat a repeat of last year’s price in 6 of 10 years. Applied to USDA’s $20.45 forecast for 2027, that record gives an $18.79–$22.11 stress test. It’s an illustration, not a proven range.
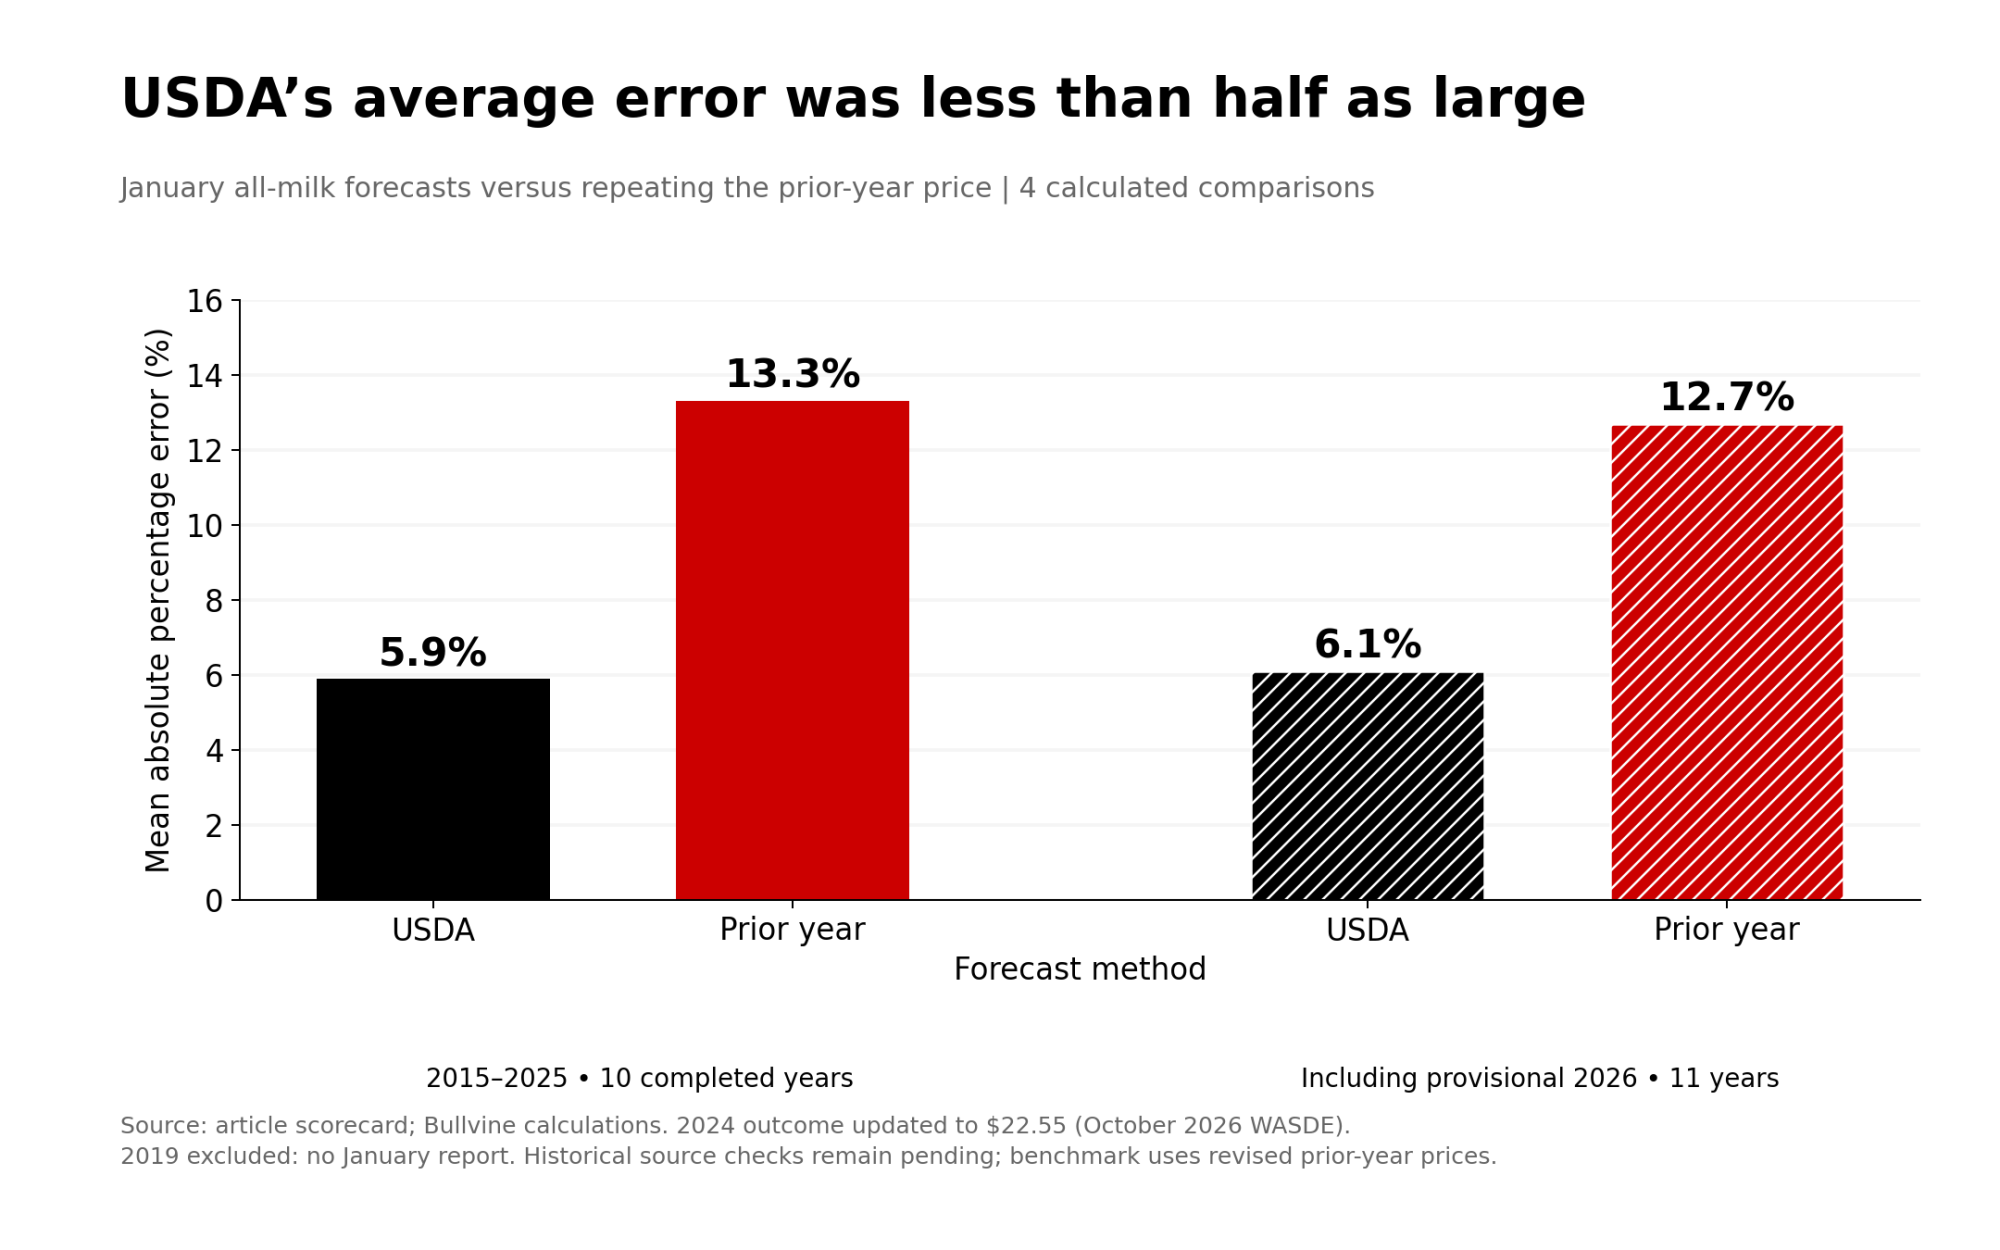
USDA’s January all-milk forecast was the better bet from 2015 through 2025. It missed the year’s price by 5.9% on average; reusing last year’s price missed by 13.3%. USDA was closer in 6 of 10 years.
Closer isn’t the same as close. USDA’s January number finished $2.74/cwt below the 2022 outcome and $2.61 below 2024. A point forecast doesn’t show how wide the outcomes run, and that’s what your budget has to carry.
Forecasting milk prices is hard. The question for a 2027 budget isn’t whether USDA gets it right. It’s how wrong you plan for it to be.
How did we score USDA?
We took the all-milk forecast from each January WASDE, the release most budgets get built on, and compared it with the year’s annual price. There was no January 2019 report, which leaves 10 completed years.
The benchmark is simply the previous year’s price. It’s retrospective: we used today’s figure, not the one USDA had each January. 2026 isn’t over, so it gets its own row.
| Year | Jan. forecast | Outcome | USDA miss | Last year’s price | Its miss | Closer |
| 2015 | $18.15 | $17.12† | $1.03 | $23.97† | $6.85 | USDA |
| 2016 | $15.75† | $16.30† | $0.55 | $17.12† | $0.82 | USDA |
| 2017 | $18.00† | $17.65† | $0.35 | $16.30† | $1.35 | USDA |
| 2018 | $16.20† | $16.18† | $0.02 | $17.65† | $1.47 | USDA |
| 2020 | $19.25† | $18.24† | $1.01 | $18.63† | $0.39 | Last year |
| 2021 | $17.65† | $18.53† | $0.88 | $18.24† | $0.29 | Last year |
| 2022 | $22.60† | $25.34† | $2.74 | $18.53† | $6.81 | USDA |
| 2023 | $21.60 | $20.34† | $1.26 | $25.34† | $5.00 | USDA |
| 2024 | $20.00 | $22.61† | $2.61 | $20.34† | $2.27 | Last year |
| 2025 | $23.05 | $21.18 | $1.87 | $22.61† | $1.43 | Last year |
| 2026 (provisional) | $18.25 | $19.90 est. | $1.65 | $21.18 | $1.28 | Last year |
Forecasts come from each January WASDE; 2015–2018 use the midpoint of USDA’s published range. The 2025 outcome is the Oct. 9, 2026 WASDE estimate, and 2026 is provisional
Add provisional 2026 and USDA’s average miss rises to 6.1%, and last year’s price picks up a fifth win in 11. The core finding holds either way.
What does this comparison show?
USDA was too high 6 times and too low 4, and its average signed miss was 12 cents/cwt below the outcome. The direction counts came out nearly even. That doesn’t make bias negligible, because a small average can hide big misses that cancel out.
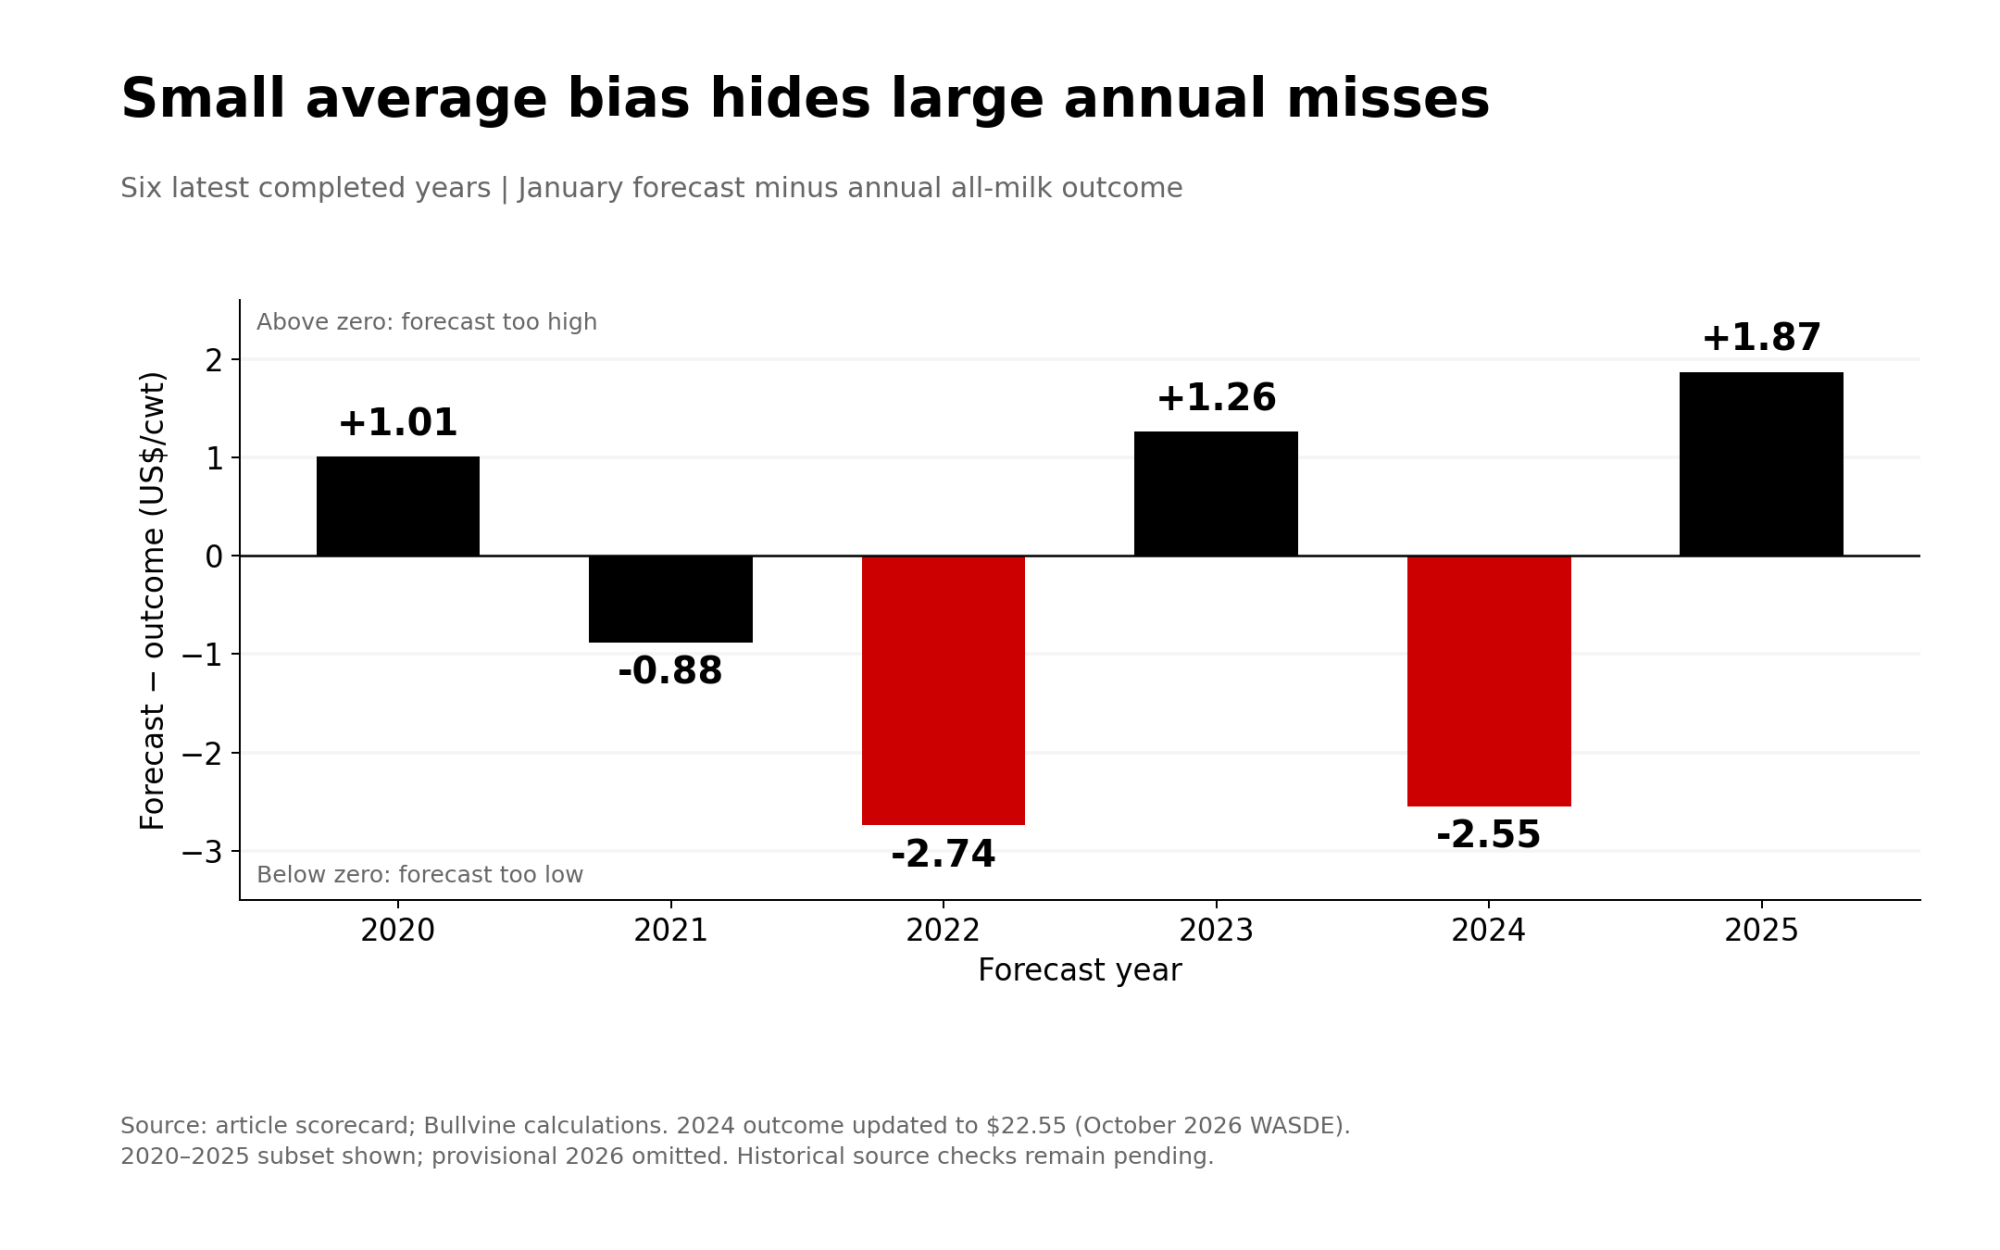
The two biggest misses, 2022 and 2024, were both too low. Two years isn’t enough to call a lean.
This comparison shows USDA is the better central estimate. It doesn’t tell you your mailbox price, your components or your basis. All-milk is a national blend across four classes, and your milk check isn’t.
Why did the 2027 forecast move?
USDA’s Oct. 9 WASDE lowered its 2027 cheese and butter price forecasts and raised nonfat dry milk and whey. In ERS’s Oct. 16 outlook, Class III came down 20 cents to $16.90/cwt, while Class IV went up $1.35 to $18.90.
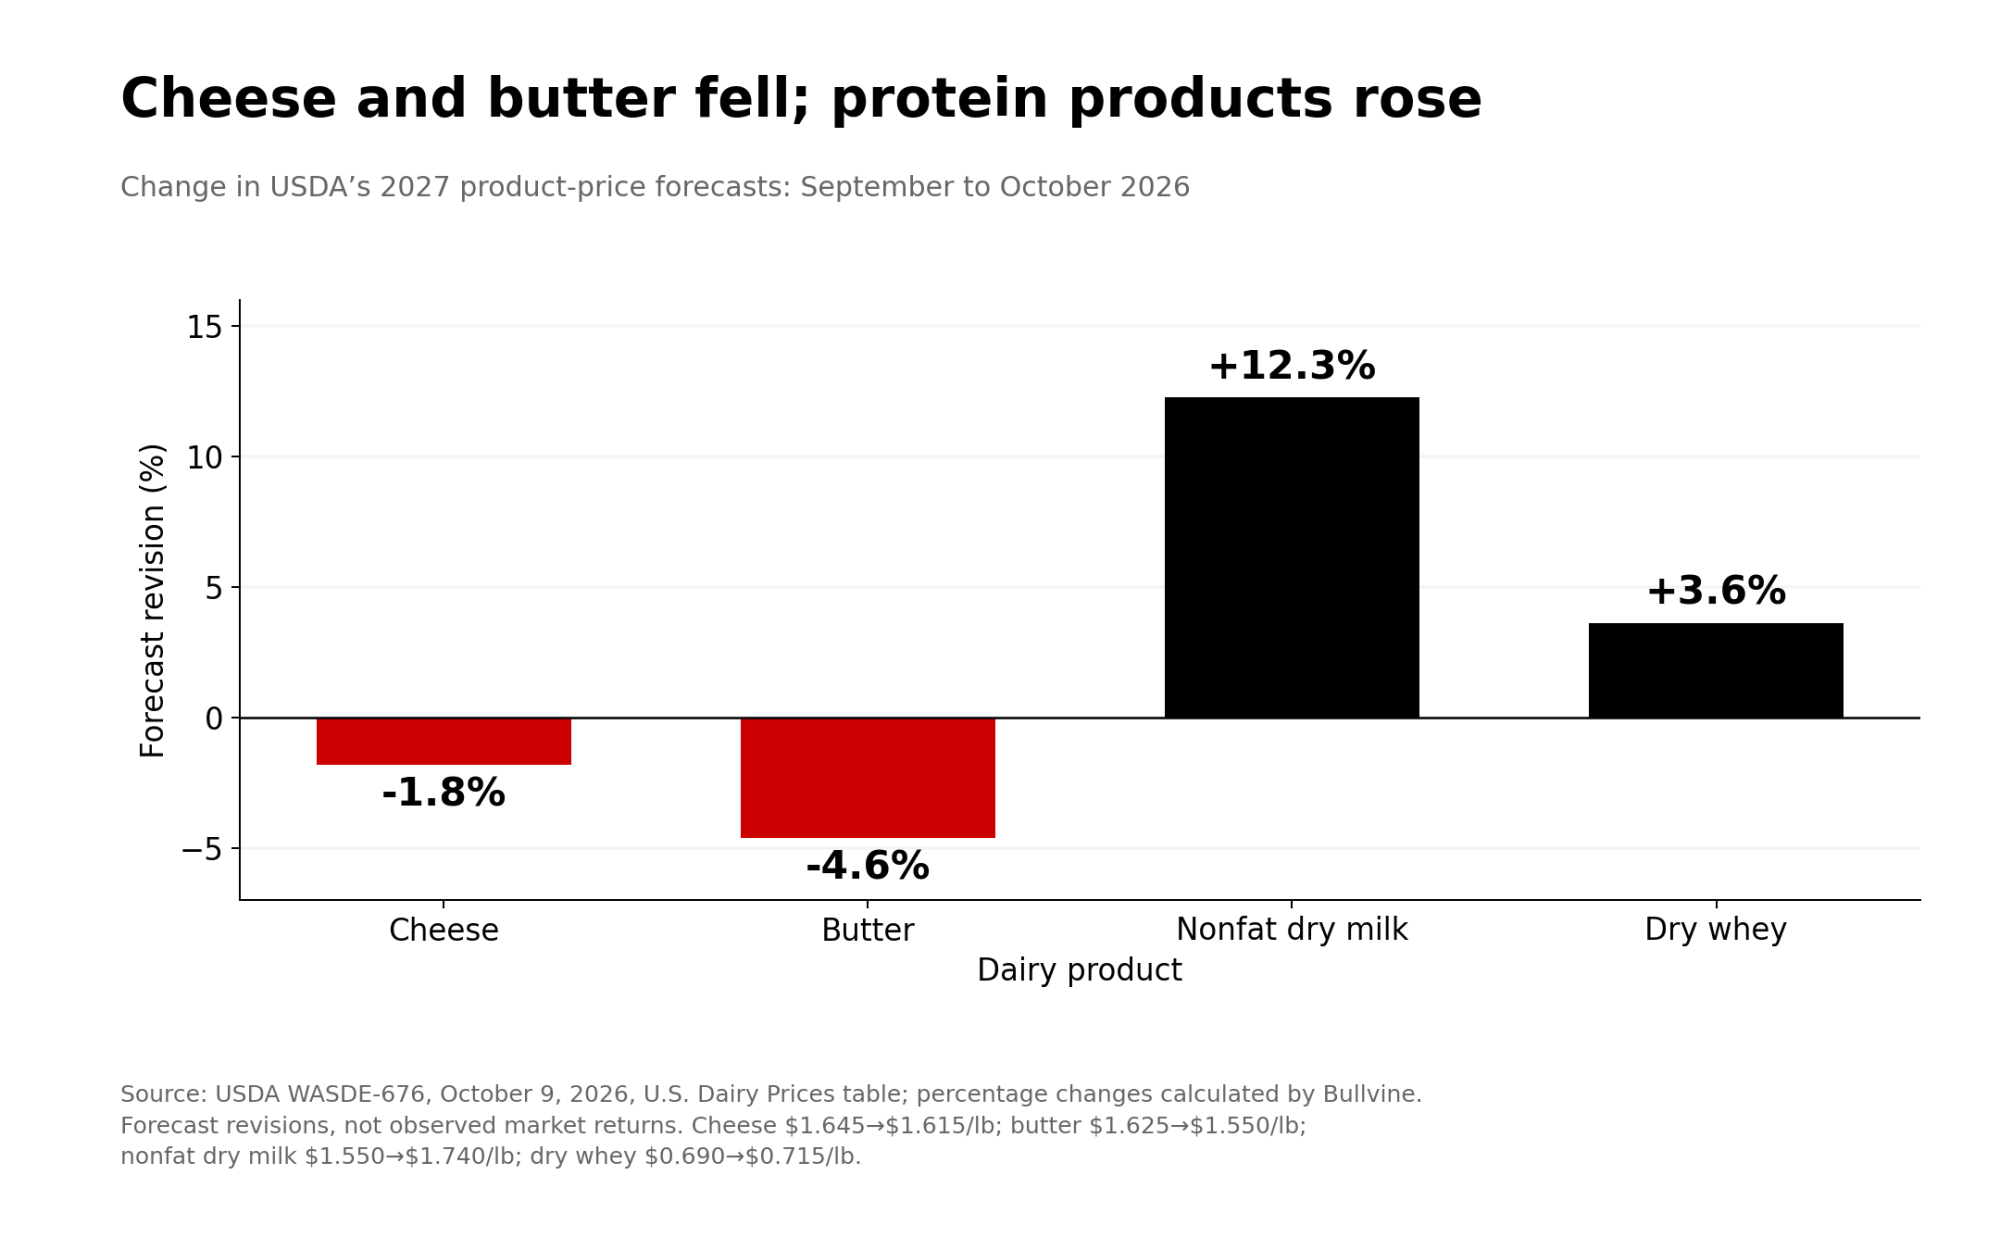
All-milk rose 65 cents to $20.45. Those are USDA’s stated reasons and numbers. The split shows cheese and powders moving in opposite directions, but it doesn’t by itself explain where all-milk lands.
What range should a 2027 budget test?
We measured each January miss as a share of what USDA forecast, so you can apply it straight to a new forecast. Then we took the smallest plus-or-minus range that would have held at least 8 of the 10 completed years. That’s 8.11%.
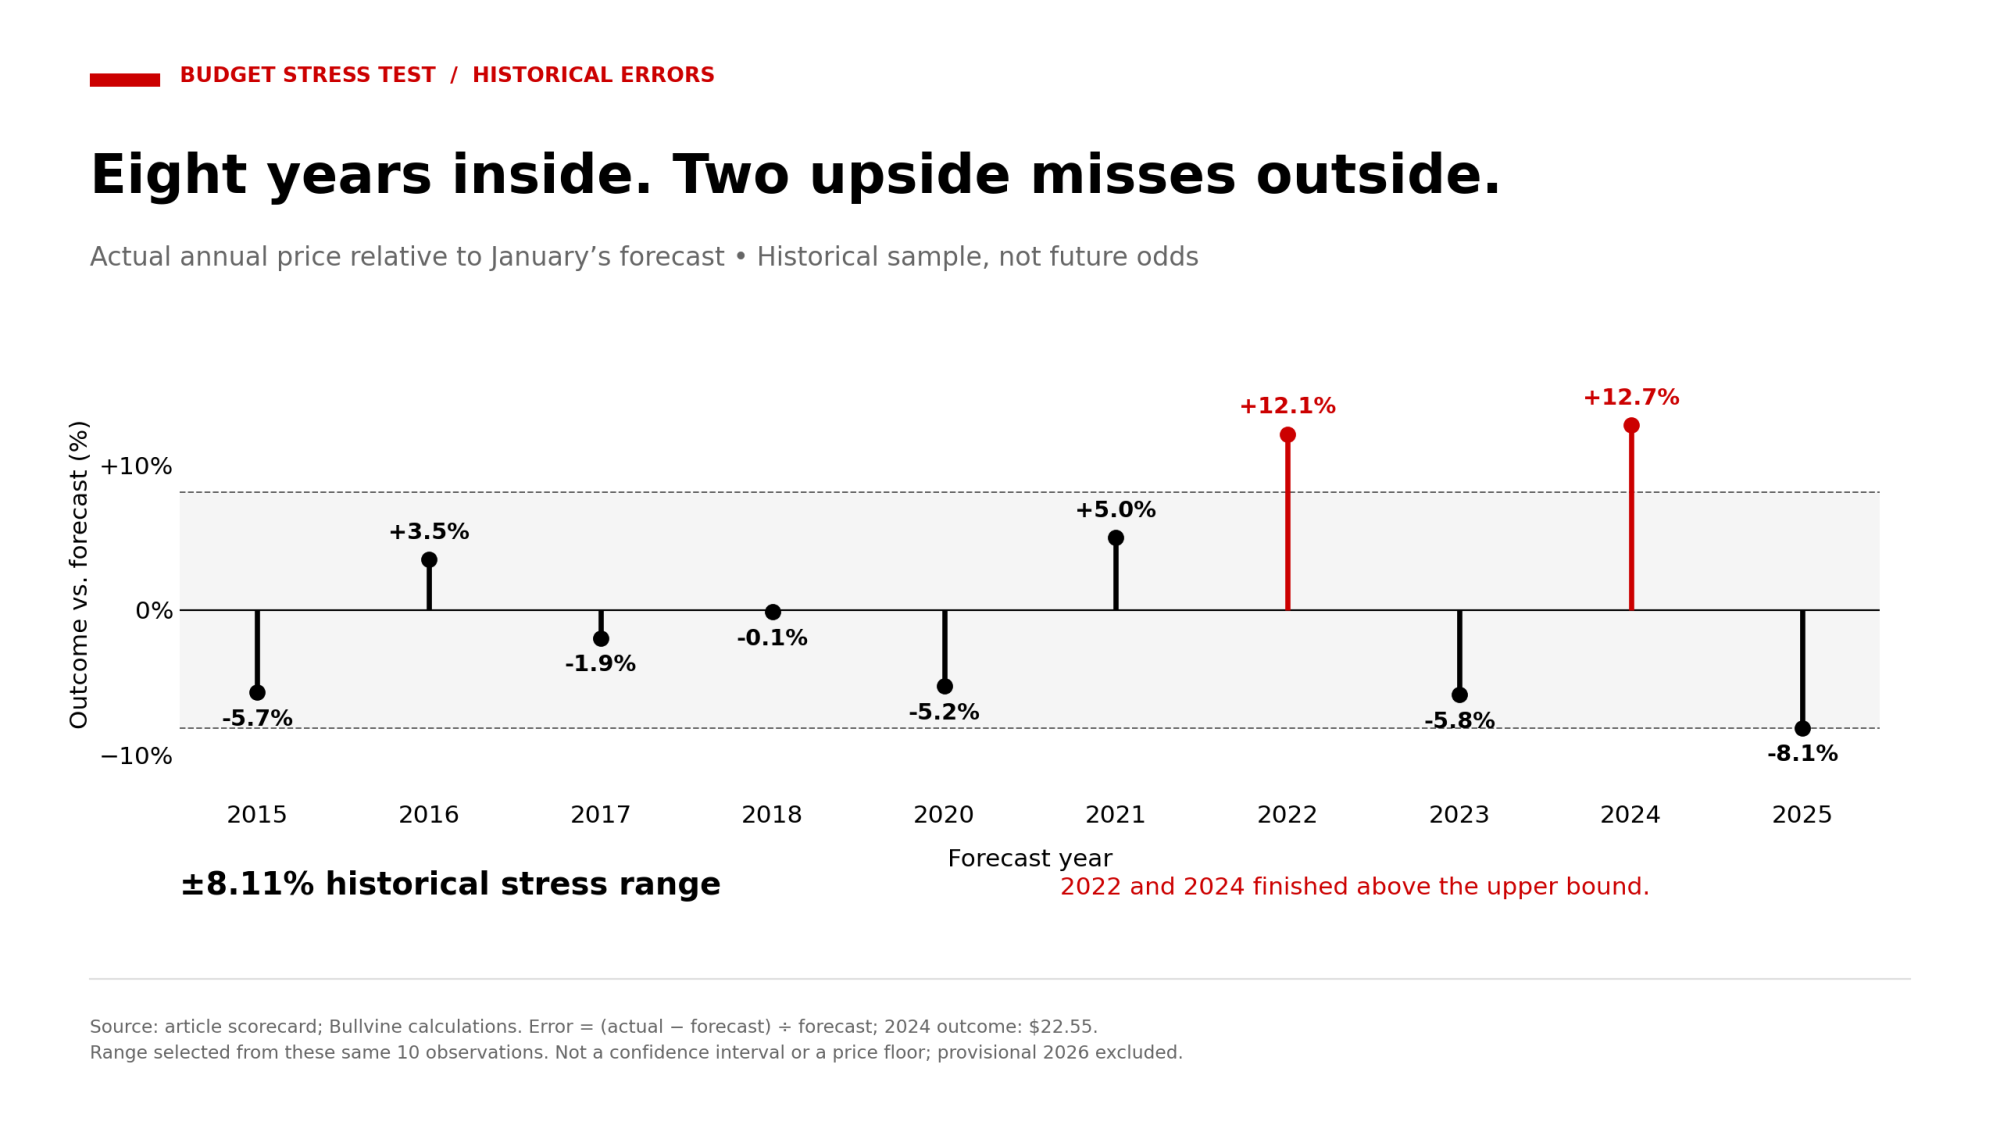
Eighty percent is our editorial choice, not a statistical guarantee. With 10 years, one observation moves the answer. Add provisional 2026 and the range becomes 9.04%.
There’s a second limit. Our history covers January forecasts for the year already underway. USDA’s $20.45 for 2027 is an October forecast made before the year starts, working further out with less information. We haven’t measured how much that matters.
So treat the range as a stress test, not proven protection. The low case isn’t a floor, and outcomes can land outside it.
Running the Numbers
USDA forecasts 2027 all-milk at $20.45/cwt, and NASS reports 24,390 lb per cow for 2025. Our model herd is 400 cows selling about 97,140 cwt at the national marketed share, paid national all-milk.

| Scenario | Price ($/cwt) | Revenue | vs. USDA case |
| Low stress | $18.79 | about $1.83 million | about −$161,000 |
| USDA central | $20.45 | about $1.99 million | — |
| High stress | $22.11 | about $2.15 million | about +$161,000 |
All revenue figures are Bullvine calculations; exact figures are in the supporting table.
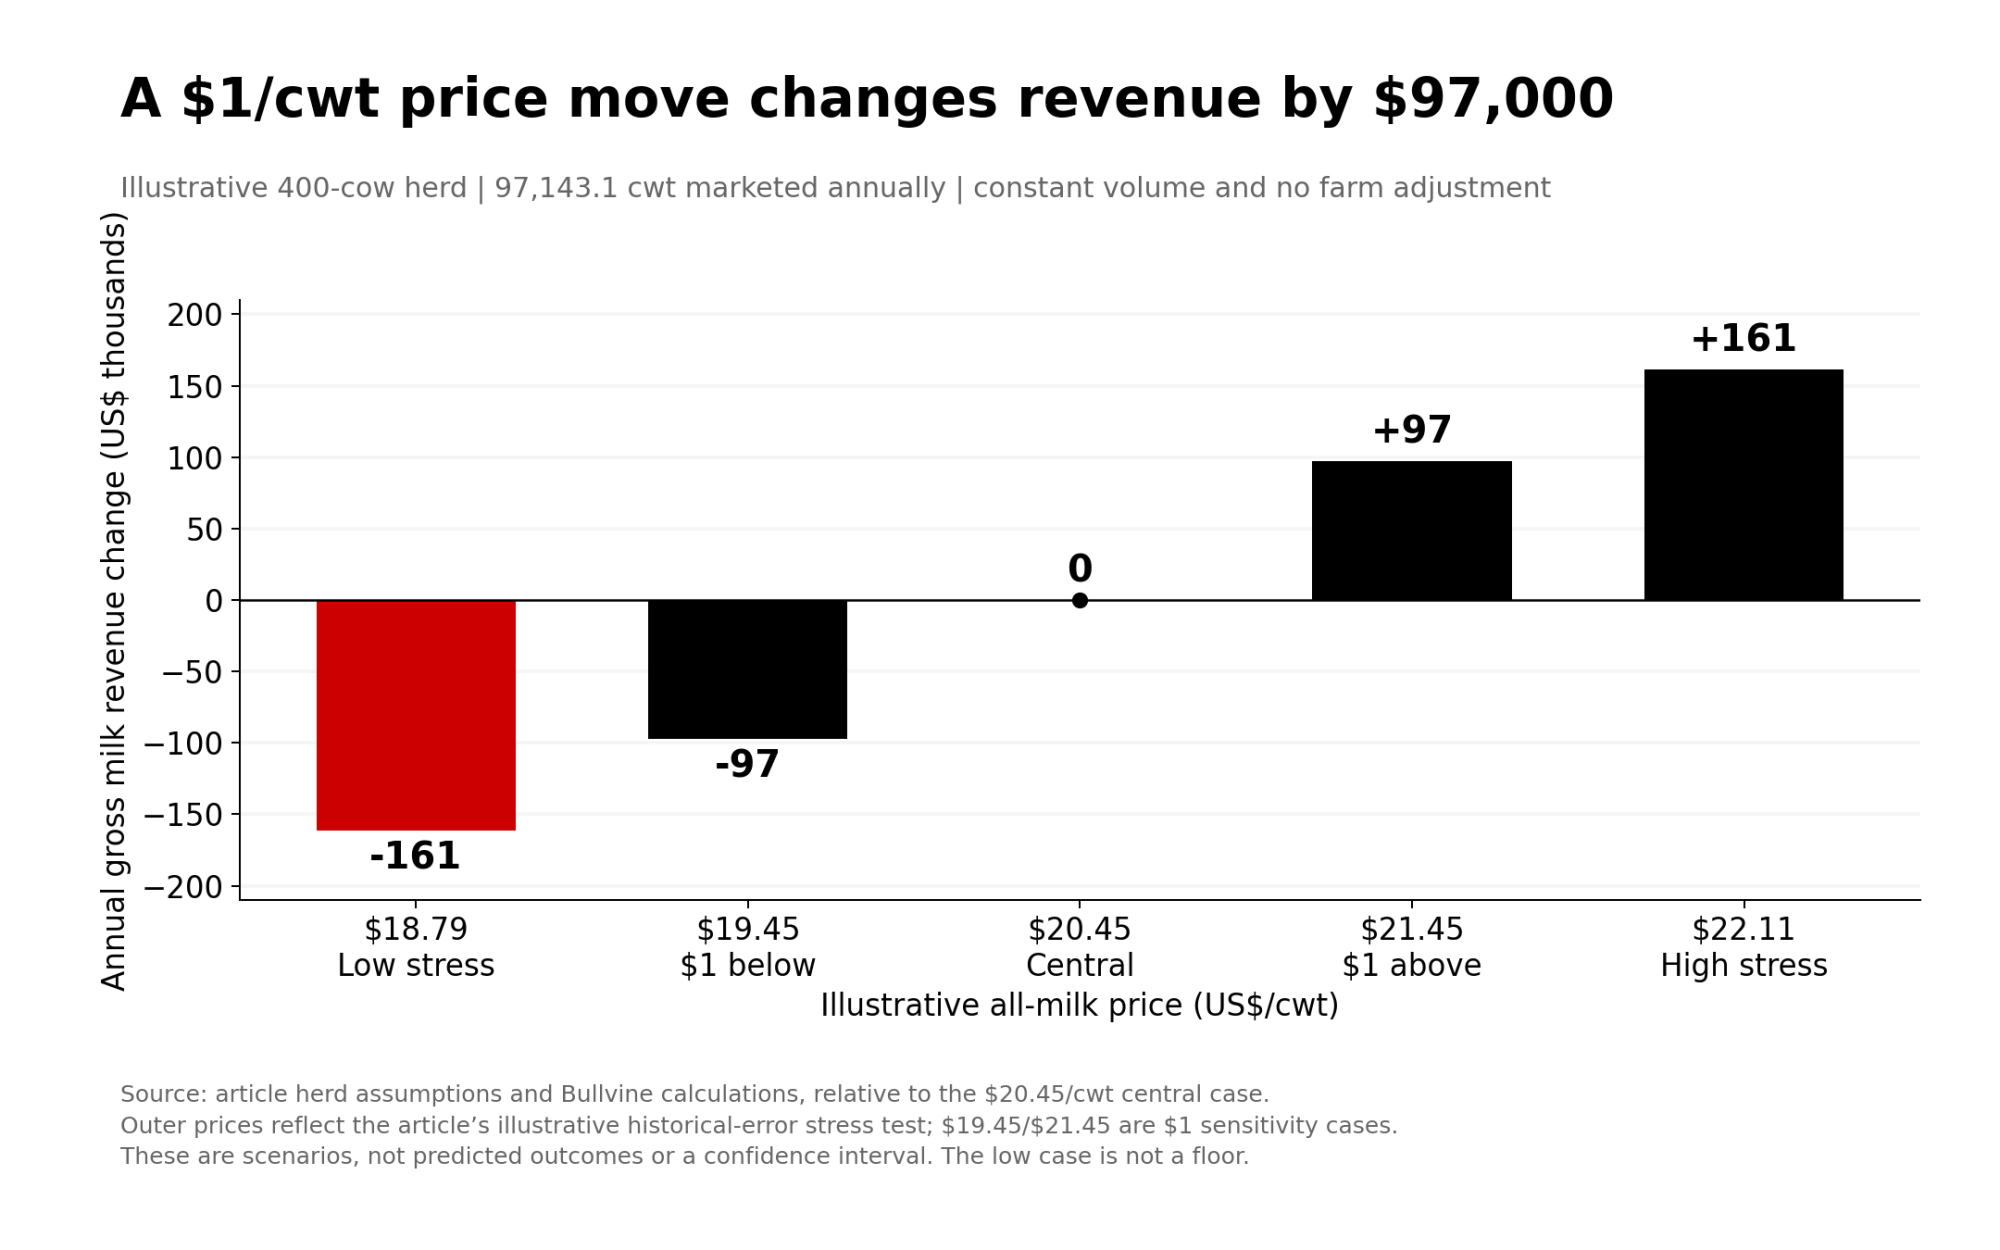
Now repeat 2025’s January miss on that herd. USDA’s $23.05 came in $1.87/cwt too high, a budget hole of about $182,000.
DMC: a constant-feed-cost illustration August 2026’s national DMC margin was $9.34/cwt: $19.80 all-milk minus $10.46 feed cost. Hold that one month’s feed cost and drop all-milk to the $18.79 stress case, and the gap is $8.33.
That isn’t a payment estimate or a break-even. DMC pays monthly, at the coverage level you elect, from $4.00 to $9.50/cwt. Tier I covers up to 6 million pounds of your established production history, which is your highest marketings from 2021, 2022 or 2023, not your 2027 output. Enrollment for 2027 closes Dec. 18, 2026.
What should you decide, and when?
| Timing | Action |
| This week | Rebuild 2027 scenarios using expected milk sales and a farm-specific price adjustment from your own milk-check history |
| Before finalizing the 2027 operating line | Review the downside cash-flow case and written borrowing triggers with your lender. USDA updates its forecast Nov. 10 and Dec. 10 |
| Before applicable enrollment and contracting deadlines | Weigh available coverage and contract terms against your exposure. DMC 2027 enrollment closes Dec. 18, 2026 |
| Monthly through 2027 | Update expected revenue, feed costs, shipments and coverage after each WASDE |
Use a stress-test price to start a contracting conversation, not as the contract target. National all-milk isn’t a contract you can buy. Compare actual quotes: which price components they cover (Class III, Class IV, butterfat or protein), how much volume you’re confident you’ll ship, and what cash you need each month.
The number check: does the downside case work with conservative, documented component and basis assumptions, without counting on unusual cattle-sale income?
Methodology Note
The forecast is each January WASDE’s annual U.S. all-milk projection, using the midpoint where USDA gave a range. The outcome is USDA’s annual all-milk price. 2025 uses the Oct. 9, 2026 WASDE estimate; 2026 is provisional and reported separately. There’s no 2019 entry because no January report was issued.
MAPE is the average miss as a share of the actual price, and signed error is forecast minus actual. The benchmark is the prior year’s price as revised today, so it’s retrospective.
The stress test measures each miss as a share of the forecast. It’s the smallest symmetric range that held at least 80% of completed years (8 of 10, ±8.11%). That’s an editorial choice. It isn’t validated for October forecasts, and it isn’t a floor. Sales volume uses NASS’s unrounded marketed share (230.668 ÷ 231.658 billion lb). All errors, ranges and herd figures are Bullvine calculations.
Run Your Numbers
Dairy Profit Projector — USDA’s $20.45 is a national number. This calculator works from your own herd, Class III and mailbox basis and returns your breakeven milk price and 12-month margin. Then use its sensitivity grid to see what a lower milk price does to your margin before your lender meeting.
Complete references and supporting documentation are available upon request by contacting the editorial team at editor@thebullvine.com.
Learn More
- Same Cows, $15,000 Apart: Class III Milk Price, DRP, and Your Spring 2026 Risk Plan — Lock in your basis adjustments before buying downside protection. Breaking down the spread between national class prices and actual milk checks arms you with the exact formulas needed to execute a Dairy Revenue Protection strategy that actually pays out.
- More Milk, Fewer Farms, $250K at Risk: The 2026 Numbers Every Dairy Needs to Run — Structural industry shifts demand aggressive budget testing over the next three years. Mapping consolidation trends against rising output exposes why status-quo revenue models fail, forcing operations to stress-test their long-term equity rather than just surviving month-to-month cash flow.
- The High Cost of Cheap Dairy Margin Coverage — Stop treating Tier 2 DMC pounds as automatic cheap insurance. Calculating the true premium load against historical payout probabilities dismantles the assumption that maximum coverage always wins, revealing exactly when to walk away from subsidized safety nets.
The Sunday Read Dairy Professionals Don’t Skip.

Every week, thousands of producers, breeders, and industry insiders open Bullvine Weekly for genetics insights, market shifts, and profit strategies they won’t find anywhere else. One email. Five minutes. Smarter decisions all week.