






Before you tighten an alert threshold or price a sort gate, match the fresh-cow list to the herd’s diagnosis records.
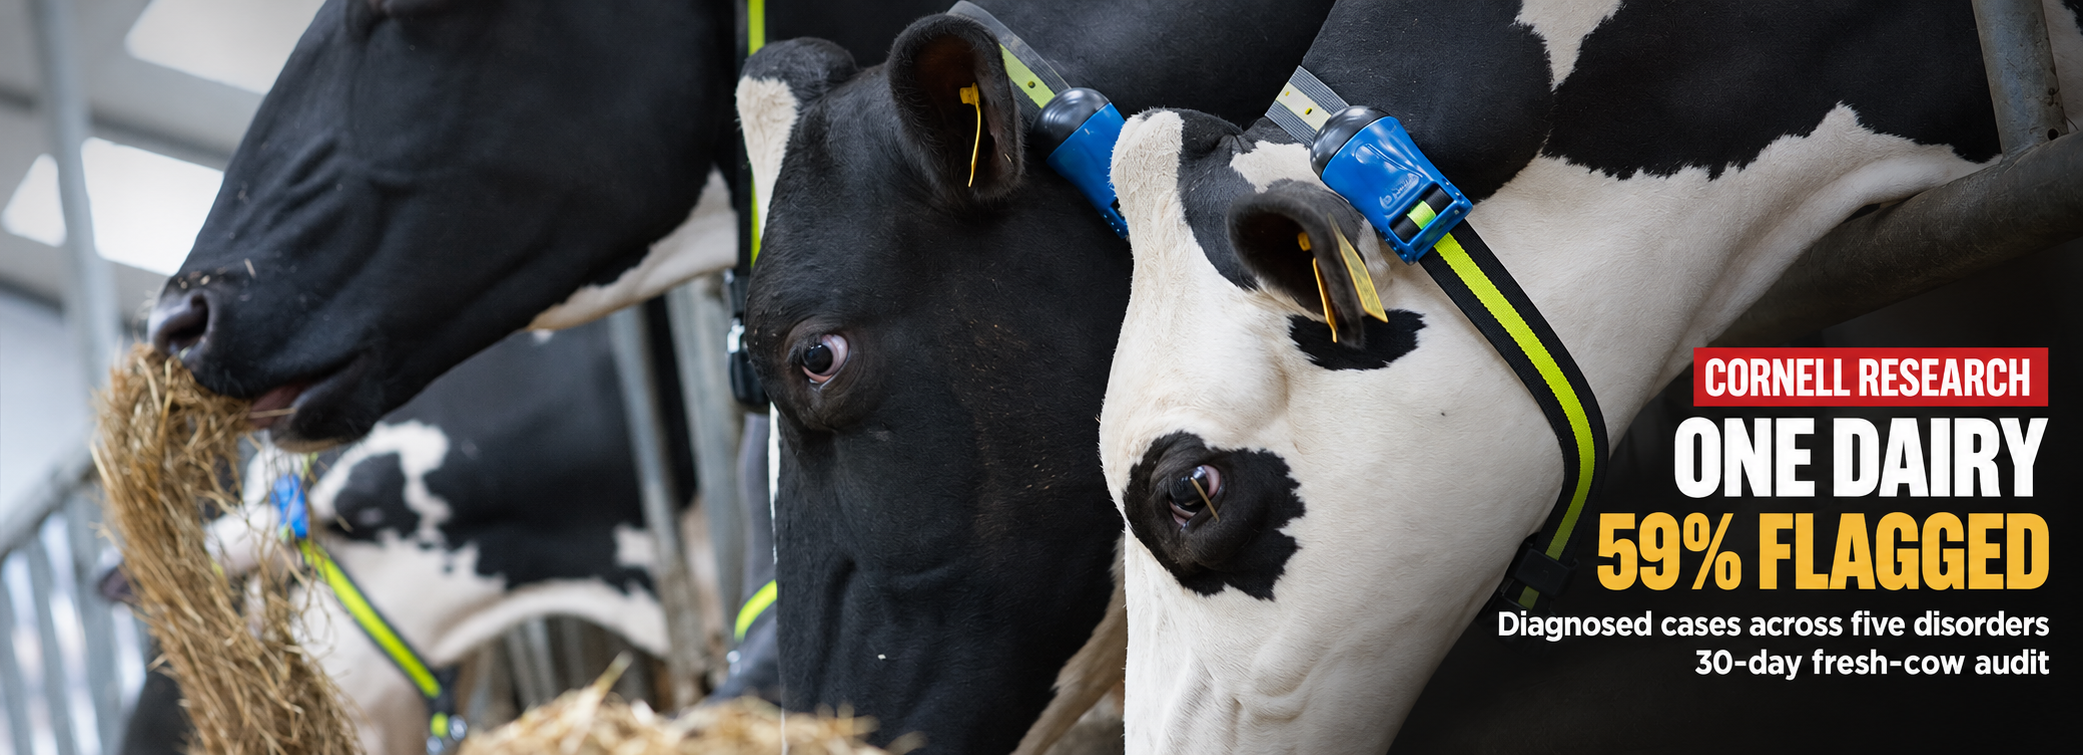
In a 2016 Cornell trial at one New York dairy, researchers fitted rumination and activity neck tags on 1,121 Holsteins. Across five disorders (displaced abomasum, ketosis, indigestion, mastitis and metritis), the system flagged 59% of diagnosed cases.
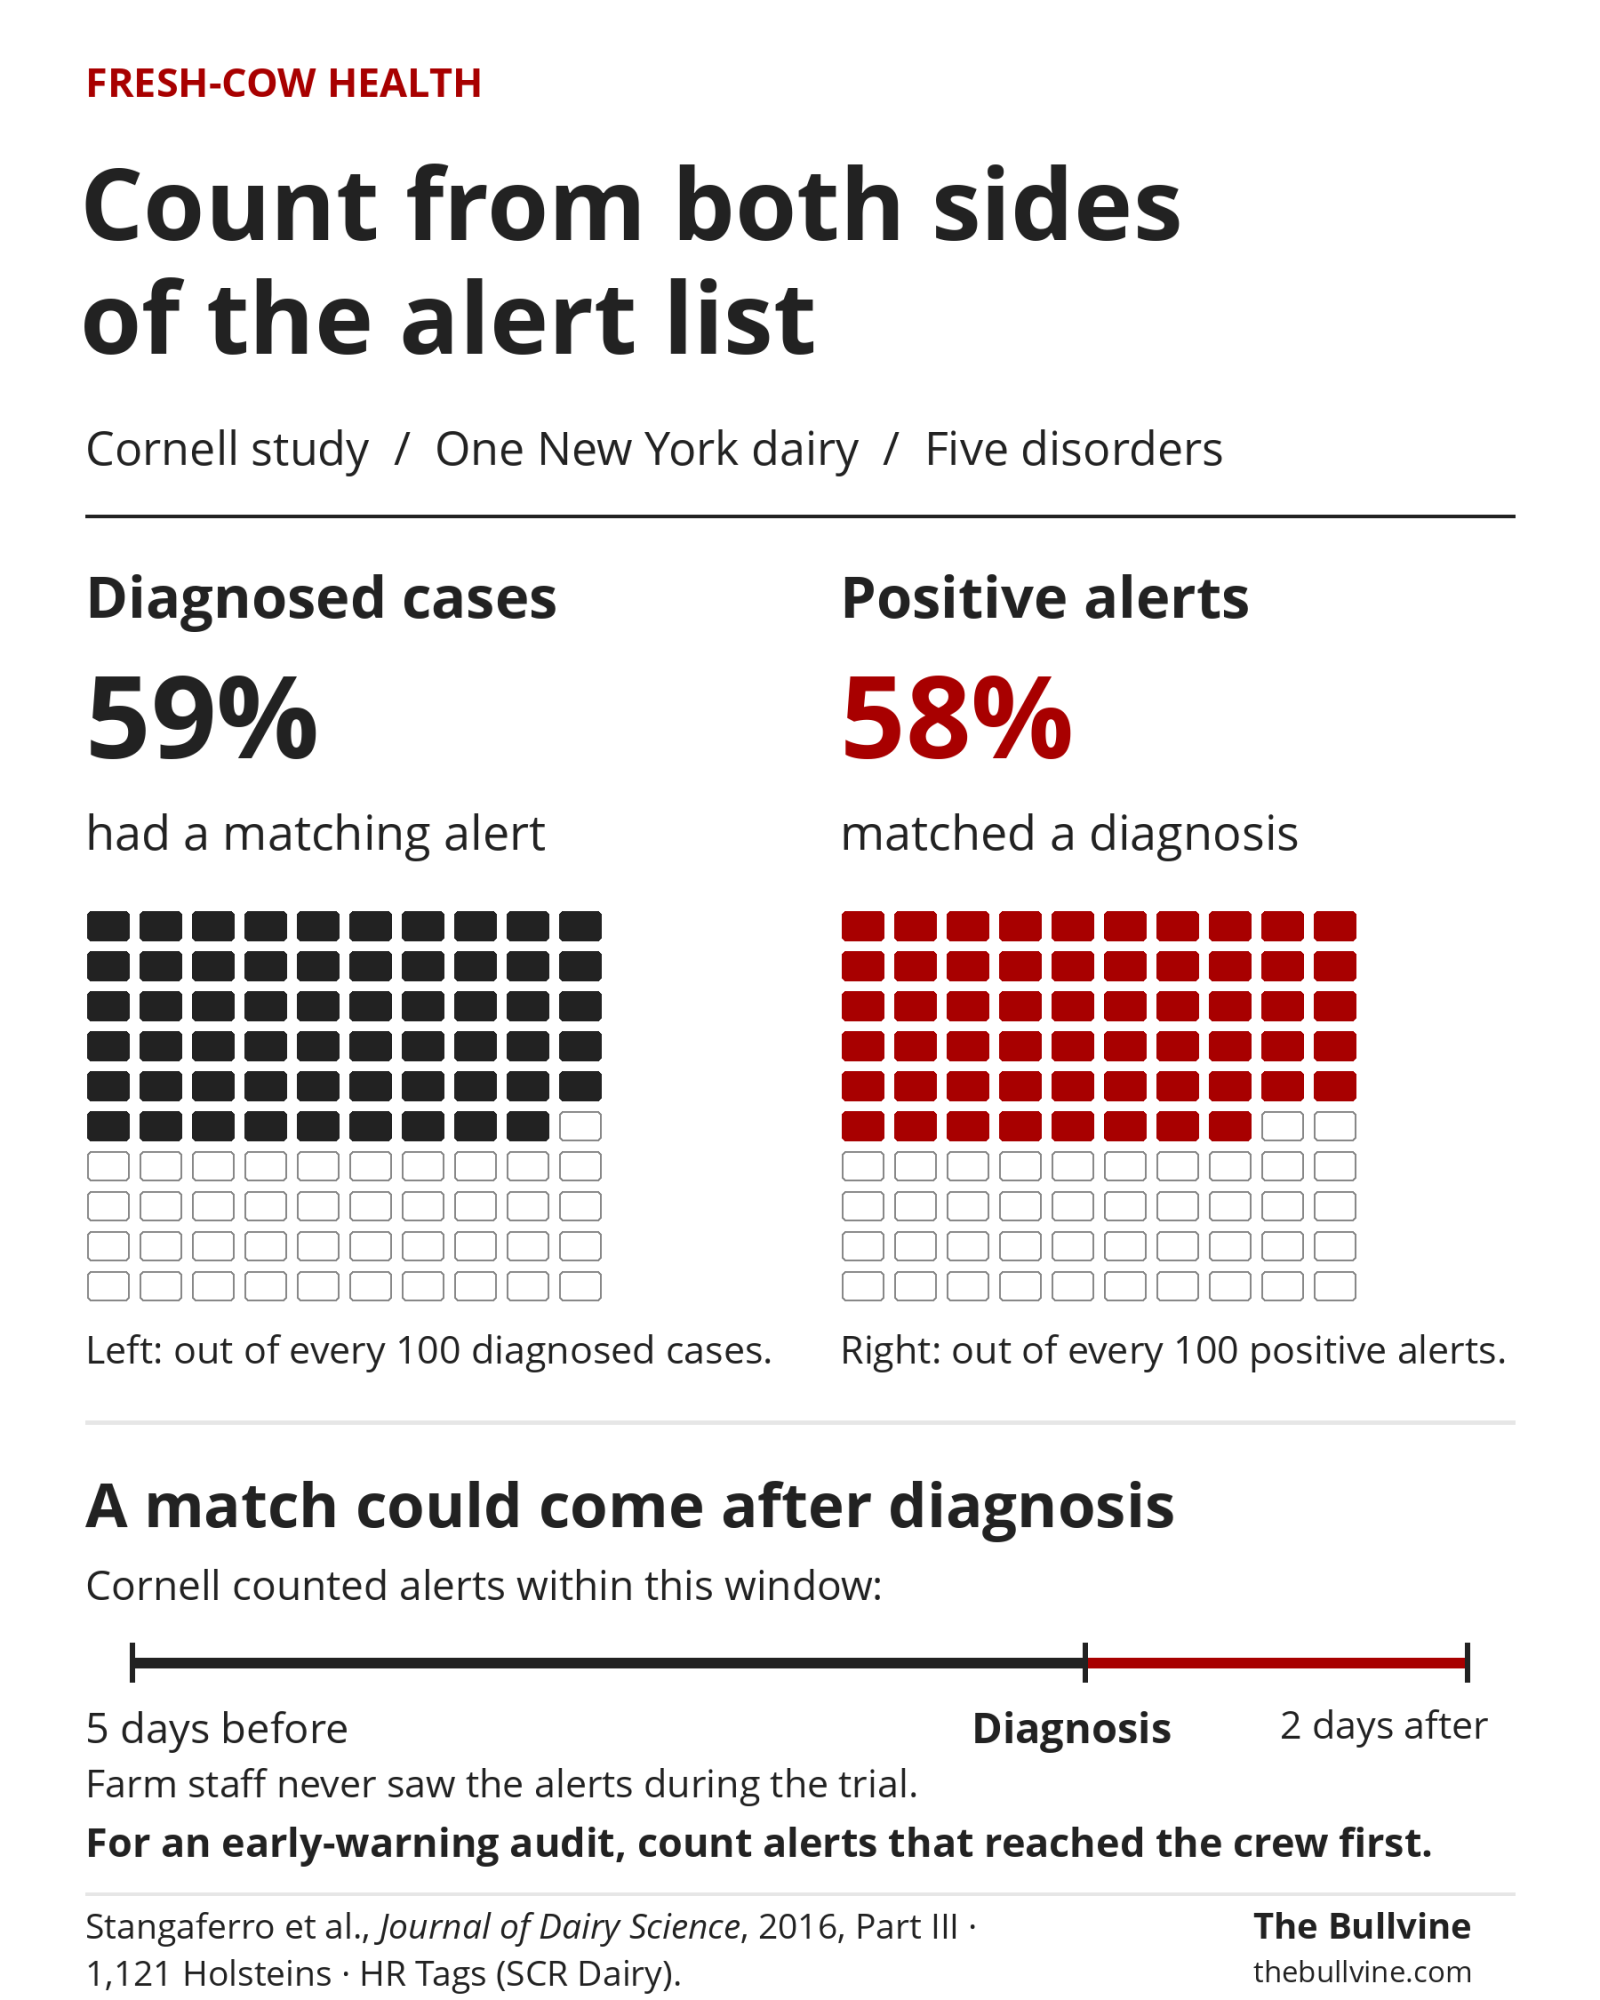
Cornell’s positive predictive value was 58%. Roughly four in ten alerts did not match one of those five diagnoses under Cornell’s rules, even with a window running from five days before diagnosis to two days after. In the 1,080 cows analyzed for metabolic and digestive disorders, the tags flagged 40 of 41 cows diagnosed with a displaced abomasum (DA). Among those 40, the first alert came three days before diagnosis on average.
The crew never saw those alerts. Cornell kept the reports from farm staff, who examined every fresh cow daily from 1 to 10 days in milk (DIM) under written case definitions. Cornell’s numbers measure the tags against a careful exam program. A crew working from the list was never tested. On your farm, two counts decide whether the list is worth walking: how many flagged cows turn out sick, and how many sick cows never make the list.
| Cornell study group | Share of diagnosed cases flagged |
|---|---|
| Displaced abomasum | 98% (40 of 41) |
| Ketosis | 91% (49 of 54) |
| Metritis alone | 53% |
| All five disorders combined | 59% |
Source: Stangaferro et al., 2016, Parts I and III. “Flagged” includes an alert from five days before diagnosis through two days after; it does not mean every flagged case received advance warning. “Metritis alone” is the subgroup without another disorder, not all metritis cases.
What’s really at stake
In a 2012 study, McArt, Nydam and Oetzel tested 1,717 cows on 4 freestall herds, 2 in New York and 2 in Wisconsin. They found 43.2% had subclinical ketosis between 3 and 16 DIM. First positive tests peaked at 5 DIM. The median time from the first positive test to the first negative was five days.
A 2015 Cornell model, co-authored by Michael Overton, then with Elanco, estimated the component cost of hyperketonemia at US\$117 per case, including milk and reproductive losses. The estimate rose to US\$289 when the researchers included attributable DA and metritis costs.
Bullvine calculation: per 100 calvings a year, that 43.2% incidence means roughly 43 subclinical cases and about US\$5,050 in component costs at US\$117 a case (a 2015 estimate). At an assumed 1,800 calvings a year (1,800 × 43.2% = about 778 cases), the estimated burden is about US\$91,000 a year. Treat that as disease load. The cost model included clinical cases as well, and neither study measured what an alert system could save.
When did Kentucky crews use the alert list?
Elizabeth Eckelkamp’s 2018 University of Kentucky dissertation followed 4 Kentucky dairies for a year using neck and leg accelerometers. An alert fired when behavior dropped 30% or more below a cow’s 10-day average. Producers were more likely to use alerts on weekdays, when the list held 20 or fewer names and when flagged cows were within 60 DIM. The longer the system ran, the less they used it.
Sensitivity ranged from 12% to 48%, so even at its best the system missed more than half of diagnosed disease events. Kentucky counted drops in individual behaviors, while Cornell combined rumination and activity into one health score, so the Kentucky study’s value here is when crews checked their lists. Eckelkamp linked the high number of false positives to the lack of usefulness producers reported. A shorter list would still have left sick cows for the crew to find.
How it plays out in the barn
Before you tighten a threshold to get below 20 names, check which diagnosed cows your current list already misses. Count the cows eligible for an alert first. At 1,800 calvings a year, the model herd averages 4.93 calvings a day, or about 104 cows across the 21-day 0–20 DIM window (Bullvine calculation). If 40 names show up one morning, separate new alerts from repeats before blaming the threshold.
In the Cornell table, ketosis ran at 91% and metritis alone at 53%, a spread one herd average hides. Check your own list by disorder. Give each alert an owner, log who checked her and what they found, and keep routine fresh-cow rounds running while you test any threshold change.
When a milk-component alert earns a blood check
In a 2015 Florida study of 158 cows tested at 8–30 DIM, 69 had an in-line milk fat-to-protein ratio above 1.42. The study did not cover day 5, when first positive blood tests peaked in McArt’s four herds. Blood testing confirmed subclinical ketosis in 22 of those 69. The ratio picked up 22 of the 24 blood-positive cows, but treating every cow above the cutoff would also have selected 47 that tested negative. The Florida authors noted that neither the in-line analyzer nor the cowside blood meter is a gold-standard test.
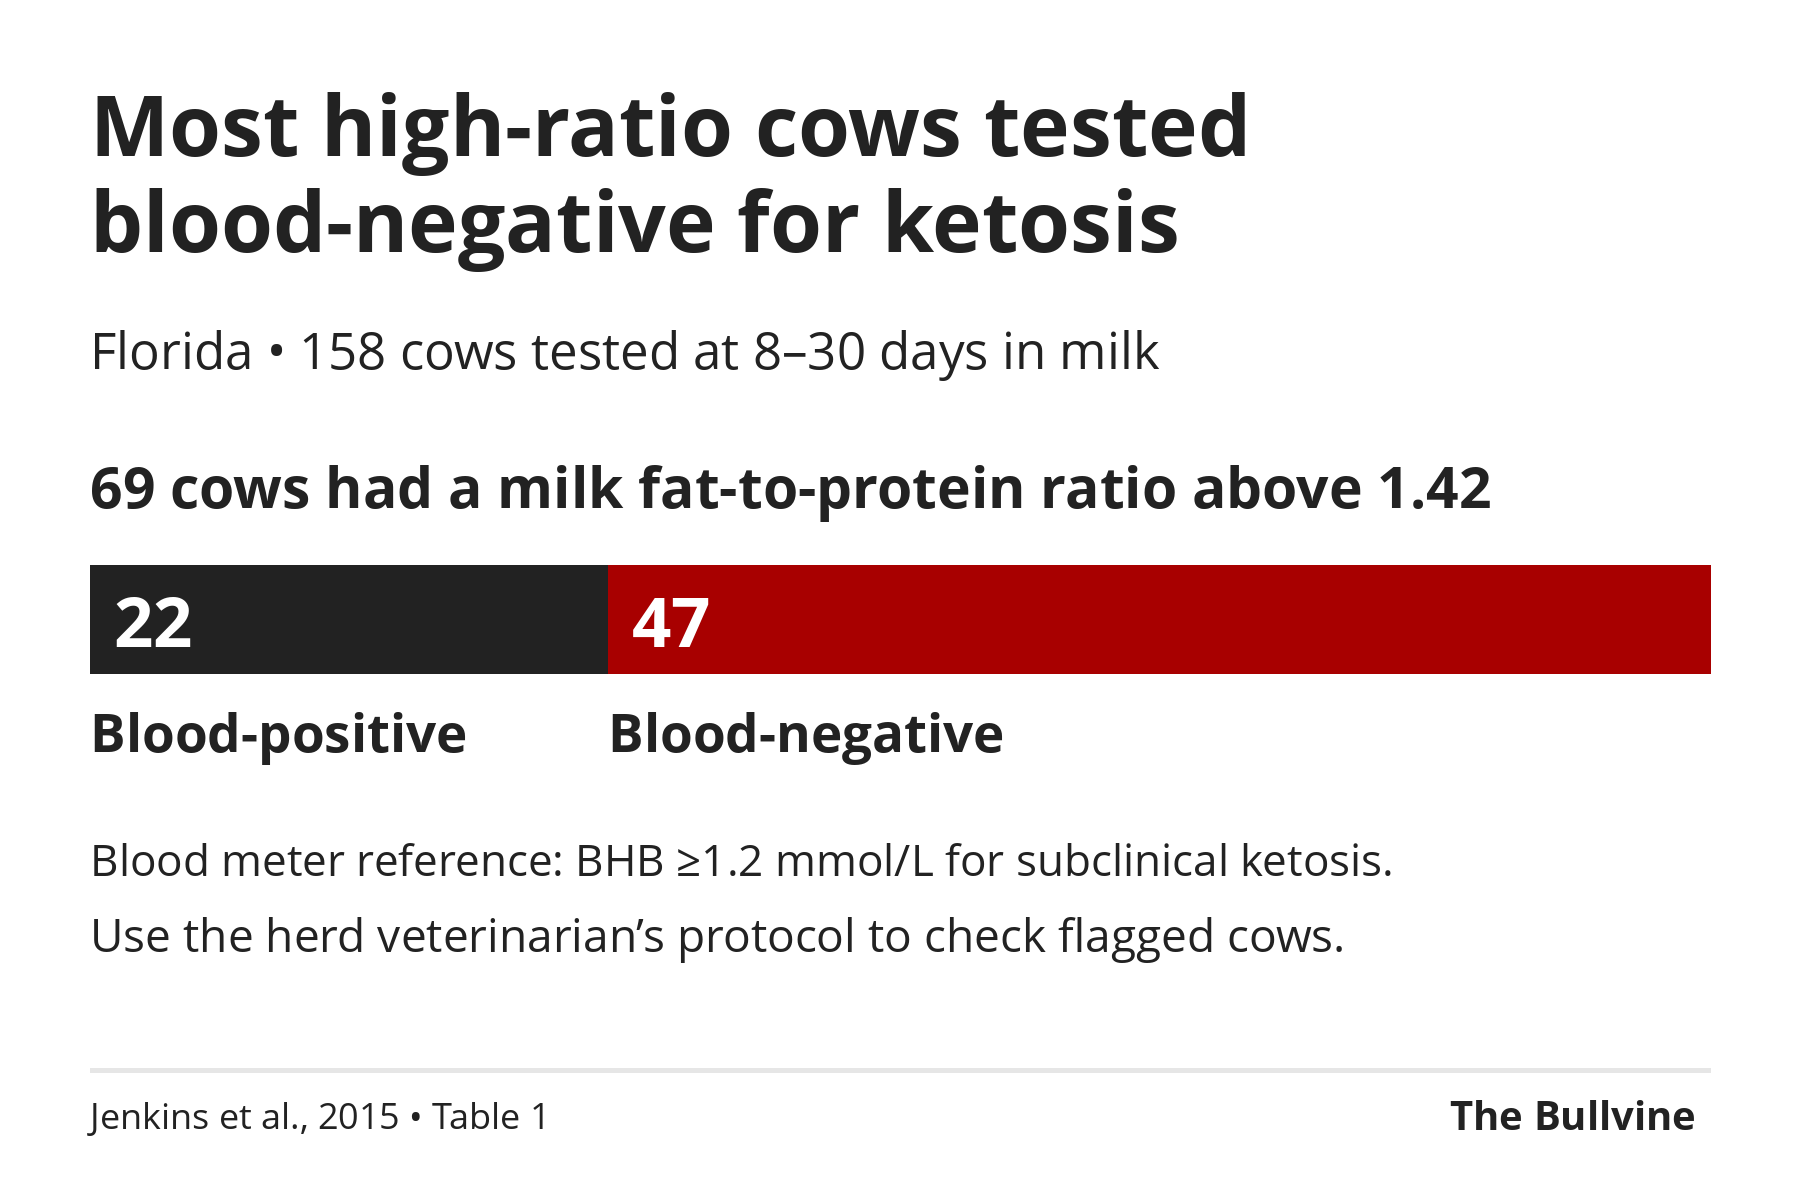
On the Florida numbers, a high ratio earns a blood test, not a treatment. Take the flagged cow’s number to the fresh pen, and use the herd veterinarian’s exam and blood-testing protocol to decide what she needs.
How many cow-hours could a sort gate save?
If your crew locks a whole pen to reach the cows on the list, time one morning from lockup to release.
Barn math (Bullvine calculation): a 250-cow pen locked for 60 minutes so the crew can reach 25 cows from the list costs 250 cow-hours of restraint, or 10 cow-hours for every cow needed. If the gate sorts all 25 target cows correctly, the other 225 go back to feed and stalls. Time how long the sorted cows wait before they return.
In a 2008 UK experiment, cows deprived of feeding and lying for four hours showed a milk decline of about 2 L (4.5 lb) a day for three days only when their feet were also trimmed, followed by higher yields over the next two days. Deprivation alone produced no detected milk loss. A 2001 Kansas State trial found no increase in milk or feed intake when headlocks were removed for cows already trained to use them. Neither trial tested a sort gate. Record crew minutes and cow-hours under each setup, and compare the installed price with the labor savings your crew can use.
Bullvine Barn Calculator
Should you audit your alert list or buy a gate?
Enter your fresh-pen lockup and alert numbers to see your restraint cost, ketosis load, and next step in under 60 seconds.
Audit your alert list before pricing a sort gate
Daily lockup restraint
250.0 cow-hrs
Fresh pen (0–20 DIM)
104 cows
Est. subclinical ketosis load
US$90,979 / yr
Your alert list vs. university benchmarks (%)
Illustrative estimate based on your inputs and Stangaferro et al. (2016), McArt et al. (2012, 2015) and Eckelkamp (2018). Not financial advice. Bullvine calculation.
How we calculate this
- Daily lockup restraint (cow-hours): Pen size locked × (Lockup minutes ÷ 60). Restraint per target cow = Daily lockup cow-hours ÷ Target cows on list.
- Net cow-hours saved by sorting: Daily lockup cow-hours − [Target cows × (Sort-pen wait minutes ÷ 60)]. Cows returned immediately = Pen size − Target cows.
- Fresh pen (0–20 DIM, 21 days): (Annual calvings ÷ 365) × 21 days.
- Estimated subclinical ketosis load: Annual calvings × 43.2% incidence (McArt et al., 2012) × US$117 component cost per case in 2015 dollars (McArt et al., 2015; total cost with attributable DA and metritis was US$289).
- Verdict bands: “Audit alert list first” if morning list exceeds 20 names (Eckelkamp, 2018), confirmed-alert rate is below 58% (Cornell PPV), or diagnosed cases flagged is below 53% (Cornell metritis-alone sensitivity). When the list meets all three benchmarks, lockup burden of 10 or more cow-hours per target cow flags “Evaluate a sort gate”; below 10 flags “Hold on hardware — track crew time.”
Get weekly dairy management math, herd-health audits, and sire analysis straight from The Bullvine.
Subscribe to The BullvineOptions and trade-offs for your operation
| Path | When it fits | What it needs | Risk |
|---|---|---|---|
| Audit existing thresholds | Sensors are in, but the crew ignores or picks through the list | 30 days of alert and diagnosis records to start | Too tight and you miss early cases; check the cases that didn’t make the list |
| Add in-line components | You can check component flags against fresh-cow blood results | Compatible equipment and a herd testing protocol | A high ratio alone can flag blood-negative cows |
| Add a sort gate | Daily lockups to reach a few cows; labor is tight | A trusted list, reliable tag reads, room for a holding pen | A loose list sends the wrong cows |
The audit comes first because both purchases depend on the list it measures. If checks are going unfinished, find out whether the crew is losing time on repeat alerts or on catching cows. Repeat alerts point to the list. Catching time points to the handling route.
How to run the 30-day barn audit
Before day one, agree with the herd veterinarian on which disorders count, what confirms a case and how many days to watch a flagged cow. Save each morning’s alert list beside the diagnosis log for the same pen. Keep one row per cow per episode, group repeat alerts on the same row, and record when the alert first reached the crew and when the cow was diagnosed. Leave a normal first exam open until the watch window closes.
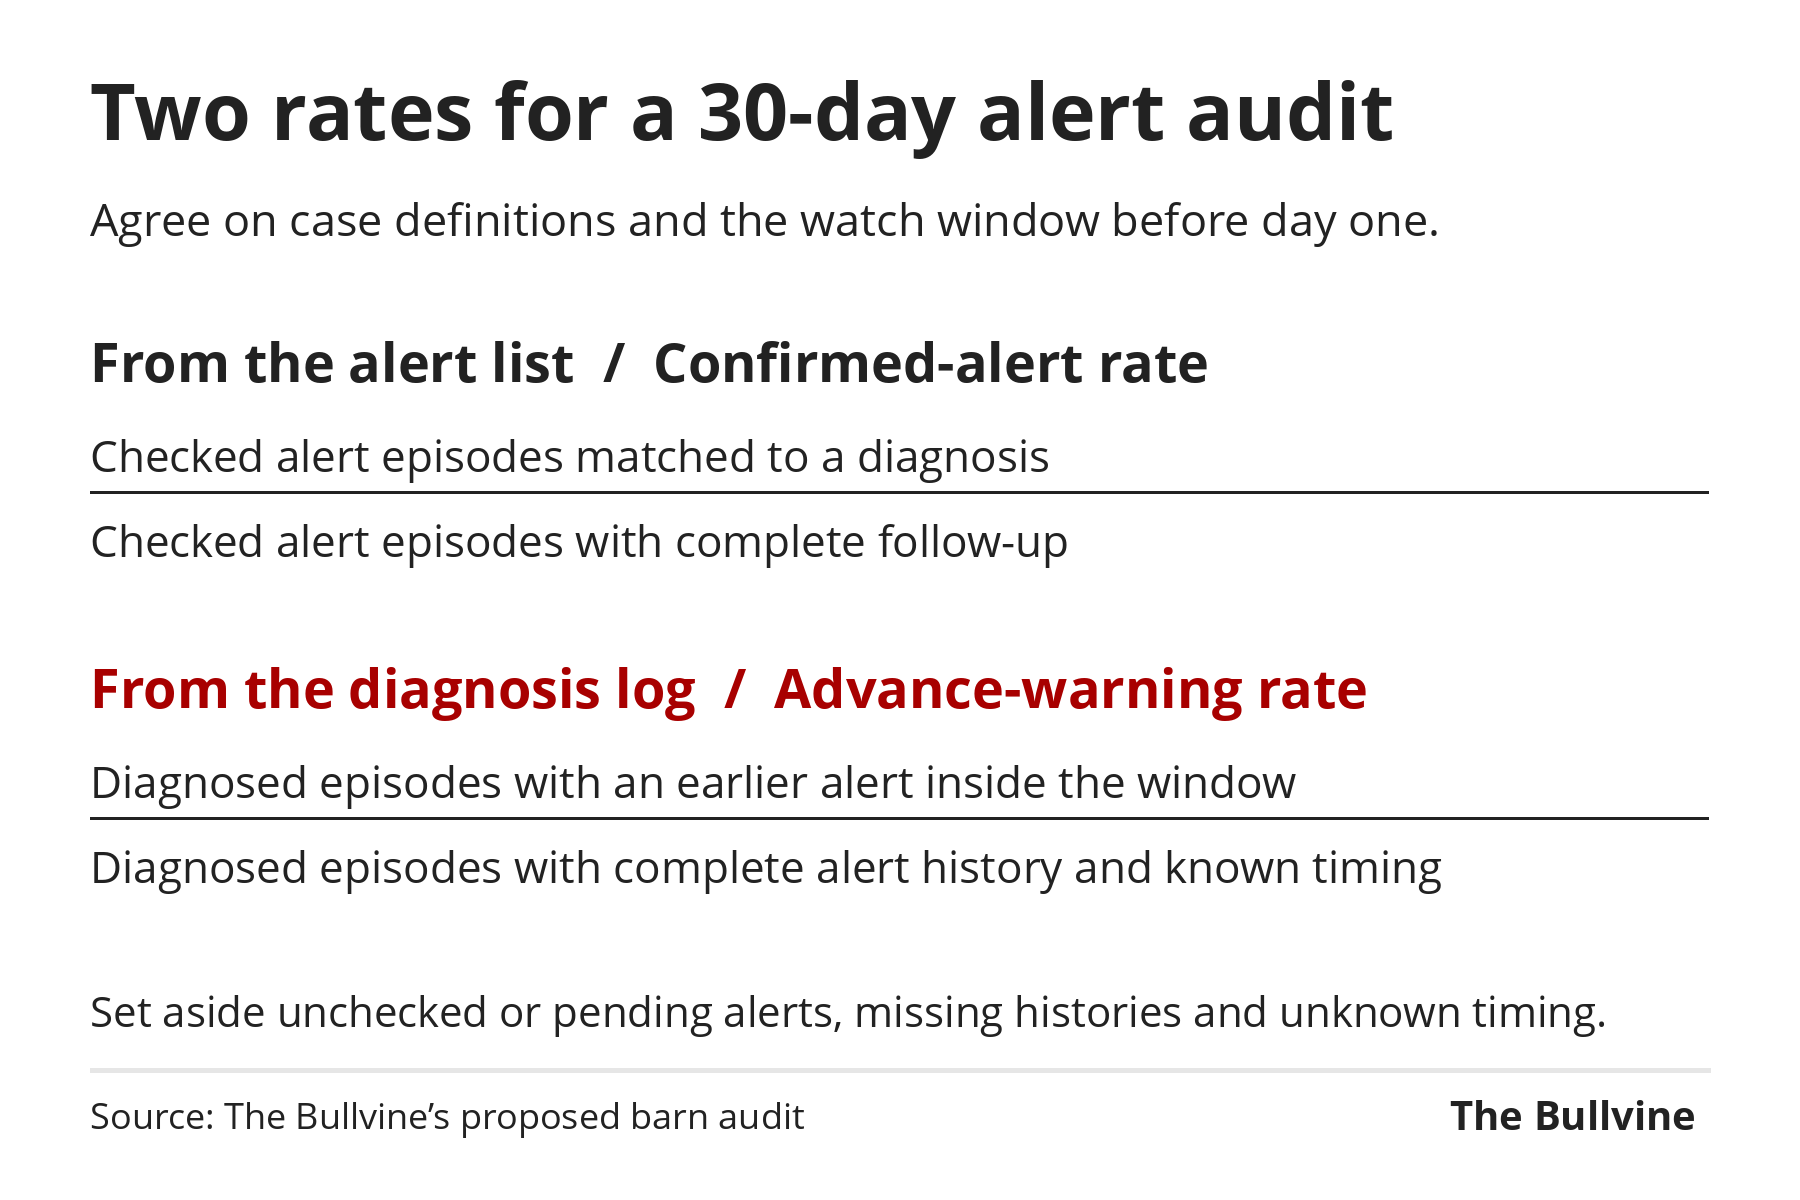
At day 30, pull two numbers and write the raw episode counts beside both percentages:
- Confirmed-alert rate: checked alert episodes that matched a diagnosis ÷ all checked episodes with complete follow-up. List unchecked alerts and late-month episodes still inside the watch window separately.
- Advance-warning rate: diagnosed episodes that appeared on the morning list before the crew recorded them, inside the watch window ÷ diagnosed episodes with complete alert history and enough timing information to tell whether an alert came first. Report missing histories and unknown timing separately. Cornell’s 59% included alerts up to two days after diagnosis, so judge the herd against its own baseline.
Before you tighten the threshold, pull the diagnosed cases that never appeared on the list, then the alerts nobody checked. The first group shows which diagnosed cases your alert list missed. The second shows where to ask what got in the way.
If only a few cases turn up in 30 days, keep the raw counts and extend the audit before changing the threshold. If a threshold changes, repeat the audit with the same definitions and fresh-cow rounds. Compare completed checks, missed diagnosed cases and time spent per shift.
For a gate comparison, multiply cows held by average hours held under each setup. In the 250-cow example, subtract the 25 sorted cows’ total holding time from 250 cow-hours. Record crew minutes separately before asking for a quote.
For a first system, ask the dealer for both the share of alerts matched to a diagnosis and the share of diagnosed cases flagged before the crew found them, and how repeats and unchecked cows were counted.
The audit fits freestall herds already running activity or rumination tags and logging diagnoses consistently. In a tiestall barn, skip the sort-gate math and use the two rates to see whether the tags catch cases before the crew does. Where diagnosis entry gets skipped, the audit can’t count the sick cows the list missed, so fix the diagnosis log first.
Sources and assumptions
- The model herd has 1,800 cows and about 1,800 calvings a year (our assumption).
- Subclinical ketosis incidence of 43.2% is from McArt et al., 2012.
- Cost per case of US\$117 (component) and US\$289 (total) is from McArt et al., 2015.
- The fresh window is 0–20 DIM (21 days) at 4.93 calvings a day.
- The lockup example assumes a 250-cow pen, 25 target cows and a 60-minute lockup.
- The 2 L to 4.5 lb conversion is ours, using milk at about 1.03 kg/L.
- Cornell’s metabolic and digestive disorders study (Table 2) reports both the case counts and rounded percentages for DA and ketosis; its companion papers report mastitis, metritis and performance across all five disorders.
- The tags in the Cornell study were HR Tags made by SCR Dairy.
- The 30-day audit period is a proposed Bullvine protocol.
Learn More
- The $500 Transition Gap: Why Your Neighbor’s Fresh Cows May Outperform Yours by Next Winter — Breaks down how shifting from blanket fresh-cow checks to tiered risk protocols cuts 60-day disease by 25–30%, recovers 500–1,000 pounds of milk per prevented case, and nets $200–$500 per cow once your alert list identifies who needs help.
- −$8,776 a Year for Seven Years: The Real Cash-Flow Curve Behind Your Dairy’s Robot Note — Before scaling labor-saving hardware beyond sort gates, follow the money on why robotic milking debt ($2.60–$3.99/cwt) outruns $1.50/cwt labor savings for seven years—while a $50,000 sensor-hybrid setup delivers a 114% five-year ROI.
- AI Eyes on Your Herd: Why Automated Lameness Detection Is Revolutionizing Dairy Farming — Gain a 23-day head start on lameness beyond neck-tag alerts: overhead 2D cameras deliver $13–$99/cow annually at 81–86% vet agreement, while exposing a familiar blind spot—missing 74–88% of lame first-lactation heifers.
The Sunday Read Dairy Professionals Don’t Skip.

Every week, thousands of producers, breeders, and industry insiders open Bullvine Weekly for genetics insights, market shifts, and profit strategies they won’t find anywhere else. One email. Five minutes. Smarter decisions all week.