Archive for Policy, Markets & Industry

Ontario’s One Open 2028 Dairy Position Starts at C$480,000 in Quota

One 2028 organic position is open in Ontario, closing September 30. Minimum buy-in: 20 kg of quota at C$480,000, plus roughly C$168,000 of your own equity at 65% LTV. The rest are on hold.
Ontario dairy quota

Dairy Farmers of Ontario publishes a 160-kilogram annual new-entrant pool and a 20 kg match per applicant, and never prints the quotient: a ceiling of eight assisted entrants a year. Set that against a net reduction of 34 farms in DFO’s own last two annual reports and the program’s theoretical capacity works out to one match per 4.25 farms off the reported count. Eight is our arithmetic, not a DFO statistic — it has surfaced publicly once, when Farmers Forum reported in August 2023 that DFO would loan 160 kilograms that year “divided between eight successful new-entrant applicants.” In a normal intake year, eight was the working allocation rather than a theoretical limit.
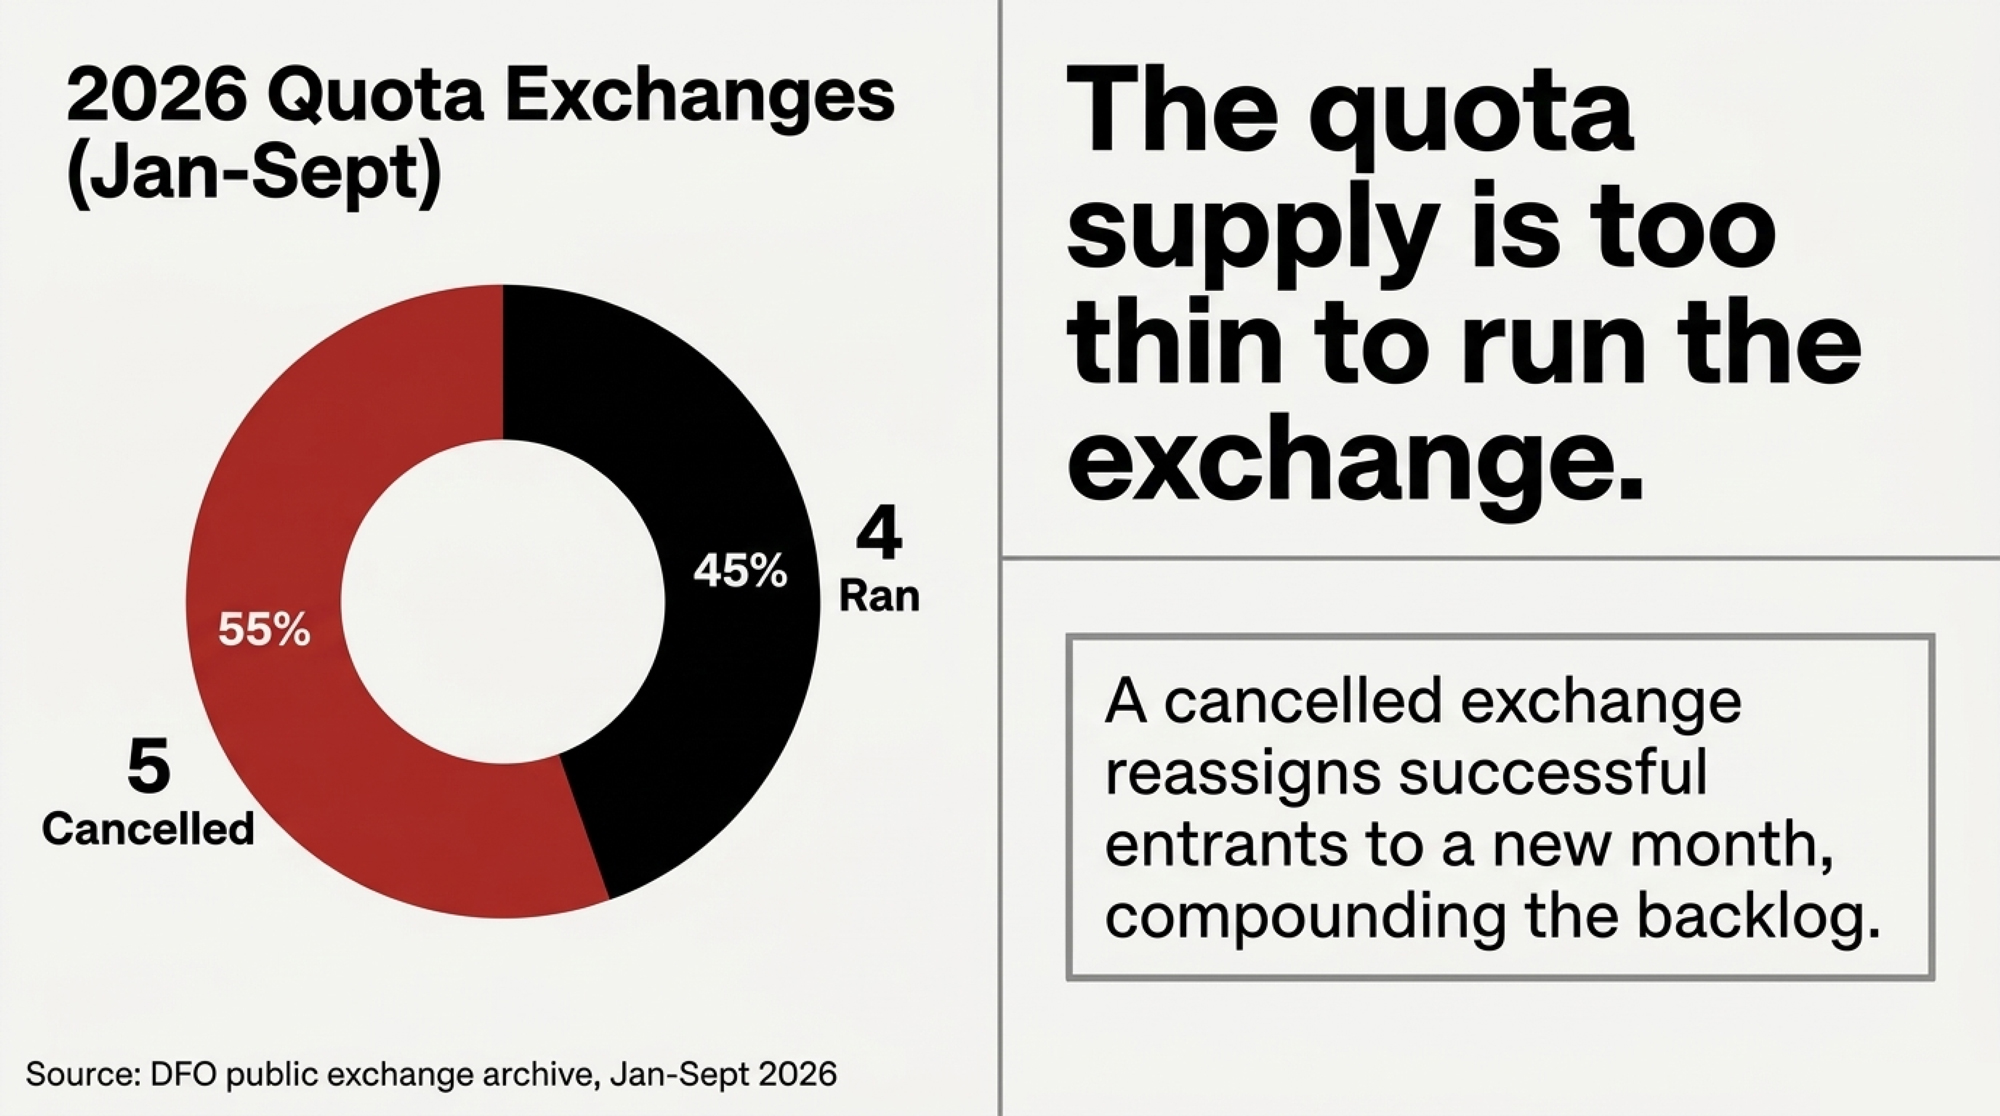
Now most of that capacity is unavailable. Citing cancelled quota exchanges and the number of New Producer Program and NEQAP applicants already carrying priority access into the 2026 and 2027 exchanges, DFO deferred the application period for the balance of the 2028 positions. One organic slot remains open until September 30; the rest are on hold with no published end date. The hold provides “an opportunity for the current backlog of successful applicants with priority access to the quota exchange to be cleared through the next several months,” according to DFO’s July 30 notice, which still carried it at 12:04 p.m. on September 15.

What DFO’s Policy Book Actually Commits To

The primary sources are DFO’s Quota and Milk Transportation Policies (revised June 1, 2026), the 2028 Organic NEQAP application (revised July 2026), and DFO’s own exchange summaries and twelve-month exchange archive. All were downloaded from new.milk.org.

Clause 1 reads: “The P5 makes available up to 160 kg of quota per year for the NEQAP in Ontario.” Clause 20 gives successful applicants priority access to buy 20 to 30 kilograms on an assigned exchange. Clause 25 commits DFO to allocate 20 kilograms to each successful applicant, subject to DFO issuing a licence and approving an order to issue quota.

One wording conflict is worth naming. DFO’s July 30 web notice states 160 kilograms flat and calls the 20 kilograms a match, while the policy book says “up to.” This article uses the policy book’s conservative reading. We put that question to DFO on September 15 with a September 22 deadline, along with the rest of what follows, and had no response as of publication.

On hold is not cancelled. The Board said it would revisit the decision in fall 2026, and it has published no end date.

DFO is Ontario’s delegated authority for marketing cow’s milk and a producer-funded board. Its policy documents are controlling primary records. Its characterization of its own program is an interested party’s characterization.

Why Can’t a Selected New Entrant Get Quota Off the Exchange?

Five of the nine Ontario quota exchanges scheduled from January through September 2026 were cancelled: February, April, May, July and August. Four ran in January, March, June and September. All nine outcomes are recorded in DFO’s public exchange archive.

August shows the constraint in one document. DFO’s summary for that exchange, printed August 4, records two new entrants receiving assistance in the exchange and 0.00 kilograms acquired. It records 25,756.66 kilograms in accepted bids from 1,864 producers against 167.79 kilograms offered by 21 sellers, and DFO’s own note explains the cancellation: “There was 167.79 kg for sale, but 186.20 kg was required to run the first allotment round.” Clause 24 cancels a new entrant’s bid when volume can’t cover 0.1 kilogram to every other successful buyer, and a cancelled exchange reassigns that entrant to a new month.

September ran, and ran thin. DFO’s summary records 511.38 kilograms sold and transferred against 25,596.34 kilograms in accepted bids from 1,852 producers, at the C$24,000-per-kilogram cap. Two NEQAP participants used priority access to acquire a combined 55 kilograms. Two entrants got nothing in August, and two got 55 kilograms in September — the deferral and the clearance, one month apart, both in DFO’s own documents.

DFO exchange monthExchange outcomeQuota offered / transferredAccepted bids and buyersNEQAP outcome
August 2026Cancelled167.79 kg offered25,756.66 kg accepted bids from 1,864 producersTwo participants received assistance but acquired 0.00 kg
August cancellation thresholdFirst allotment could not open167.79 kg available186.20 kg required to run the first allotment roundPriority access could not overcome insufficient supply
September 2026Ran at C$24,000/kg cap511.38 kg sold and transferred25,596.34 kg accepted bids from 1,852 producersTwo NEQAP participants acquired 55 kg combined
January–September 2026Five of nine exchanges cancelledFour exchanges ranExchange access was intermittent, not continuousBacklog clearance depends on months that actually run

Cancellations have run through three consecutive fiscal years: three in 2024, four in 2025, five through the first nine months of 2026. Three annual data points are not a trend, and this piece won’t call it one. It is enough to say quota supply has been thin enough to cancel exchanges in each of those years.

The C$24,000 figure is DFO’s administrative price cap on the Ontario exchange. It is not a class price, not a futures quotation, and not a spot commodity print.

Run the Capital Math Before You Call Your Lender

Running the Numbers — Bullvine calculation. Ontario, September 2026, Canadian dollars. Quota measured in kg butterfat per day.

Published sources

  • Annual Ontario pool: up to 160 kg (DFO policy book, rev. June 1, 2026, clause 1)
  • Match per successful applicant: 20 kg (same, clause 25)
  • Own quota the 2028 entrant must acquire: 20 to 30 kg (clause 20; 2028 application, rev. July 2026)
  • September 2026 exchange price: C$24,000/kg, the administrative cap (DFO exchange summary, printed September 2, 2026)
  • Recovery from year 11: 0.1 kg per month, maximum 1.2 kg per 12-month period, term not exceeding 28 years for 2021-onward applicants (clauses 31 and 35)
  • Ontario average composition, May 2026 single month: 4.3035 kg butterfat per hectolitre (Milk Producer, Dairynomics, July 2026 issue)

Stated assumptions, not DFO figures

  • Butterfat per cow per day: low 1.20 kg · central 1.35 kg · high 1.50 kg, used only to scale quota into cows
  • The June 2028 exchange clears at the same C$24,000 cap, which cannot be known today

The Bullvine model

The ceiling: 160 ÷ 20 = 8 equal matches per year.

CaseOwn quota purchasedQuota capitalTotal quota after the 20 kg matchDaily shipment at 4.3035 kg BF/hL, May 2026Cows at 1.20 / 1.35 / 1.50 kg BF
Minimum20 kgC$480,00040 kg9.3 hL, about 929 L33 / 30 / 27
Midpoint25 kgC$600,00045 kg10.5 hL, about 1,046 L38 / 33 / 30
Maximum30 kgC$720,00050 kg11.6 hL, about 1,162 L42 / 37 / 33

The conservative number is C$480,000, and that is what belongs in a lender meeting. It buys quota and nothing else: no land, cows, replacements, buildings, parlour, organic certification, feed inventory, professional fees, or working capital. If you want the fuller picture of what a startup dairy enterprise absorbs, the real math on one operation’s buildsets the scale.

One precision point on what that money buys. Under Section A clause 5, DFO calculates the saleable and non-saleable split administratively, and the non-saleable percentage moves — 0.000% on the May 2026 summary, 2.000% on August’s. Kilograms purchased and kilograms you can later resell are not automatically the same number.
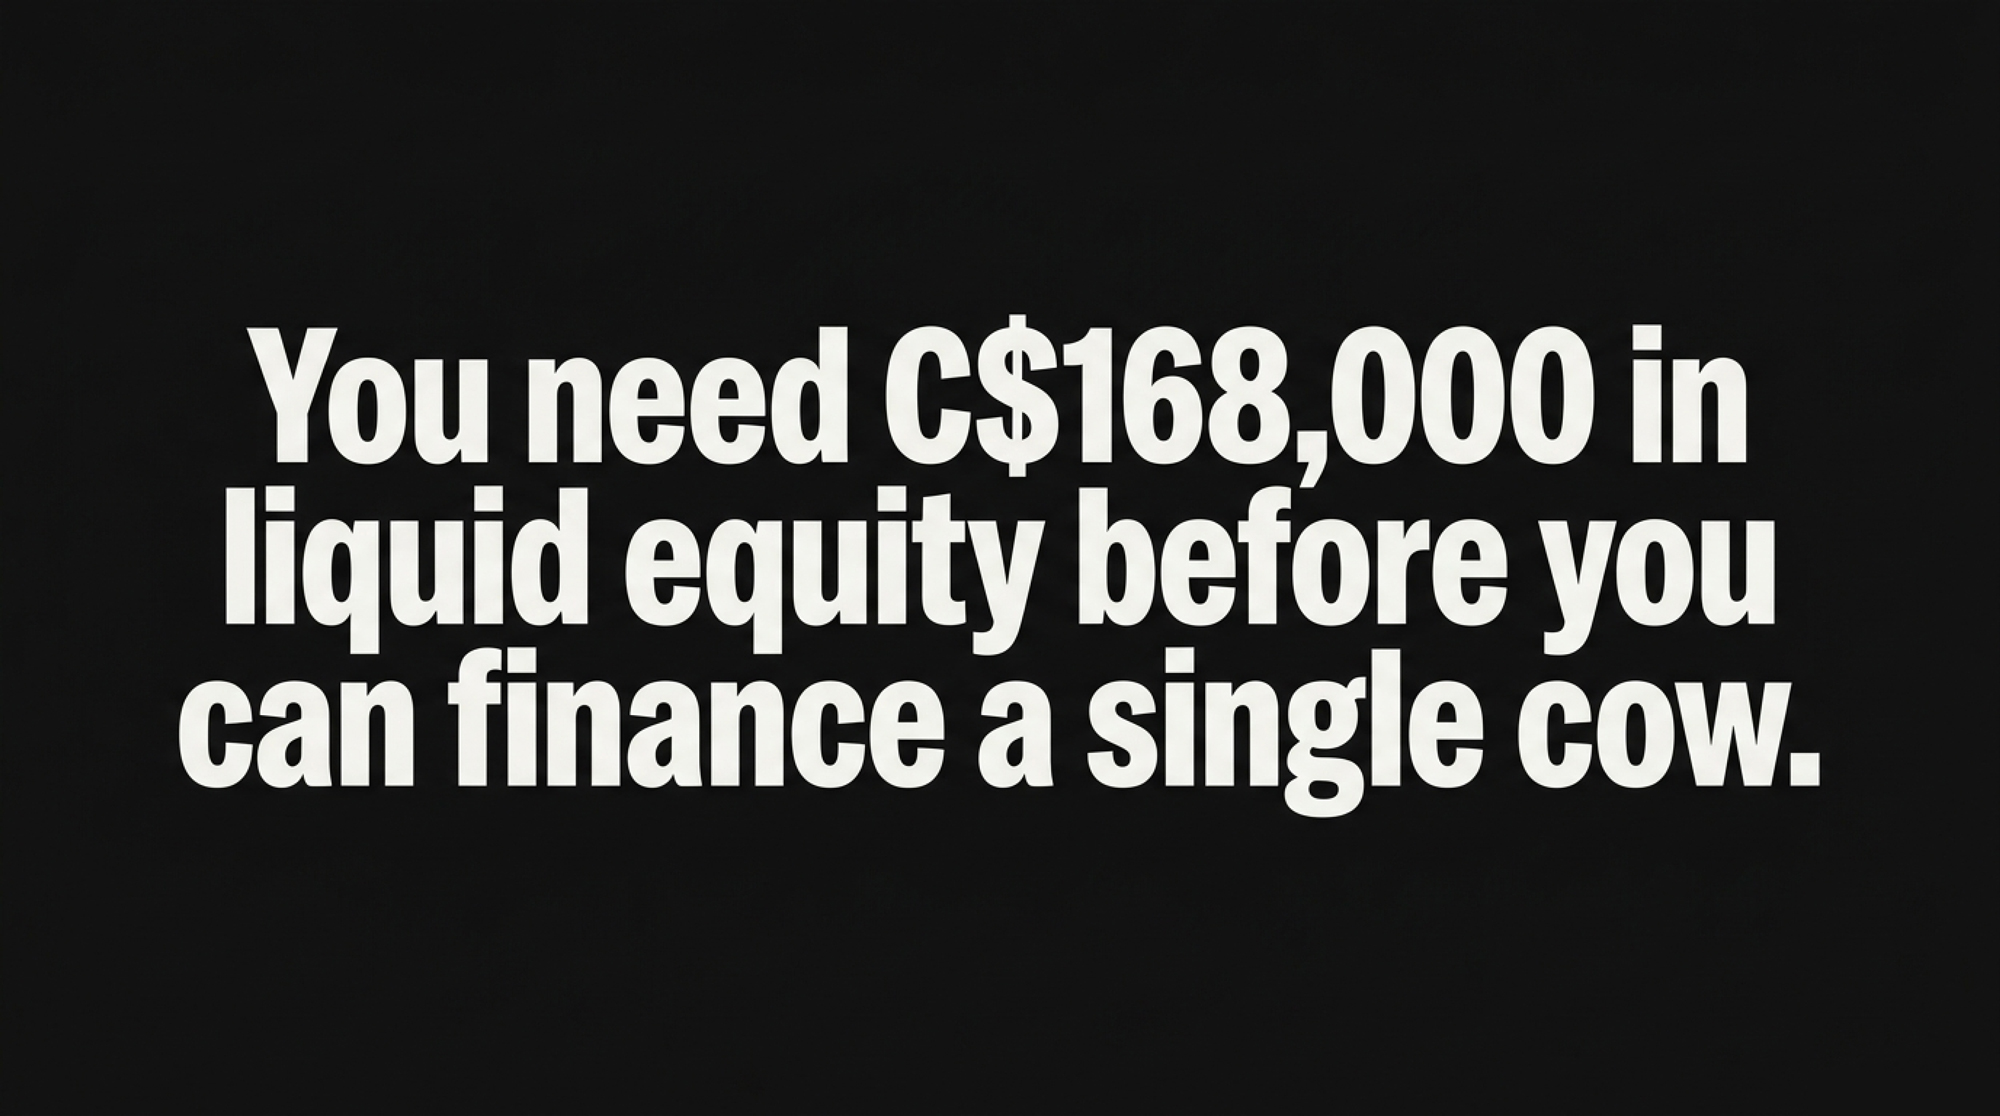
Then there is the equity behind the loan. Published commentary from Creek Road Financial, a mortgage brokerage rather than a lender, puts loan-to-value on Ontario quota at 60% to 75% against 10-to-15-year terms. Treat it as market commentary rather than underwriting policy, and note that DFO’s exchange cap has stood at C$24,000 per kilogram on every 2026 summary reviewed here. Your lender’s stated number governs. Applied to the minimum purchase:

  • At 75% LTV: C$480,000 × 25% = C$120,000 equity on quota alone
  • At 65% LTV: C$480,000 × 35% = C$168,000 equity
  • At 60% LTV: C$480,000 × 40% = C$192,000 equity

That is equity against quota before a single cow arrives, which is why the application demands signed lender letters with no appraisal contingency. Our own modelling on financed Ontario quota put each newly financed kilogram at roughly C$586 a year cash-flow negative at 6%, and that arithmetic applies to an entrant’s purchased kilograms the way it applies to anyone else’s.
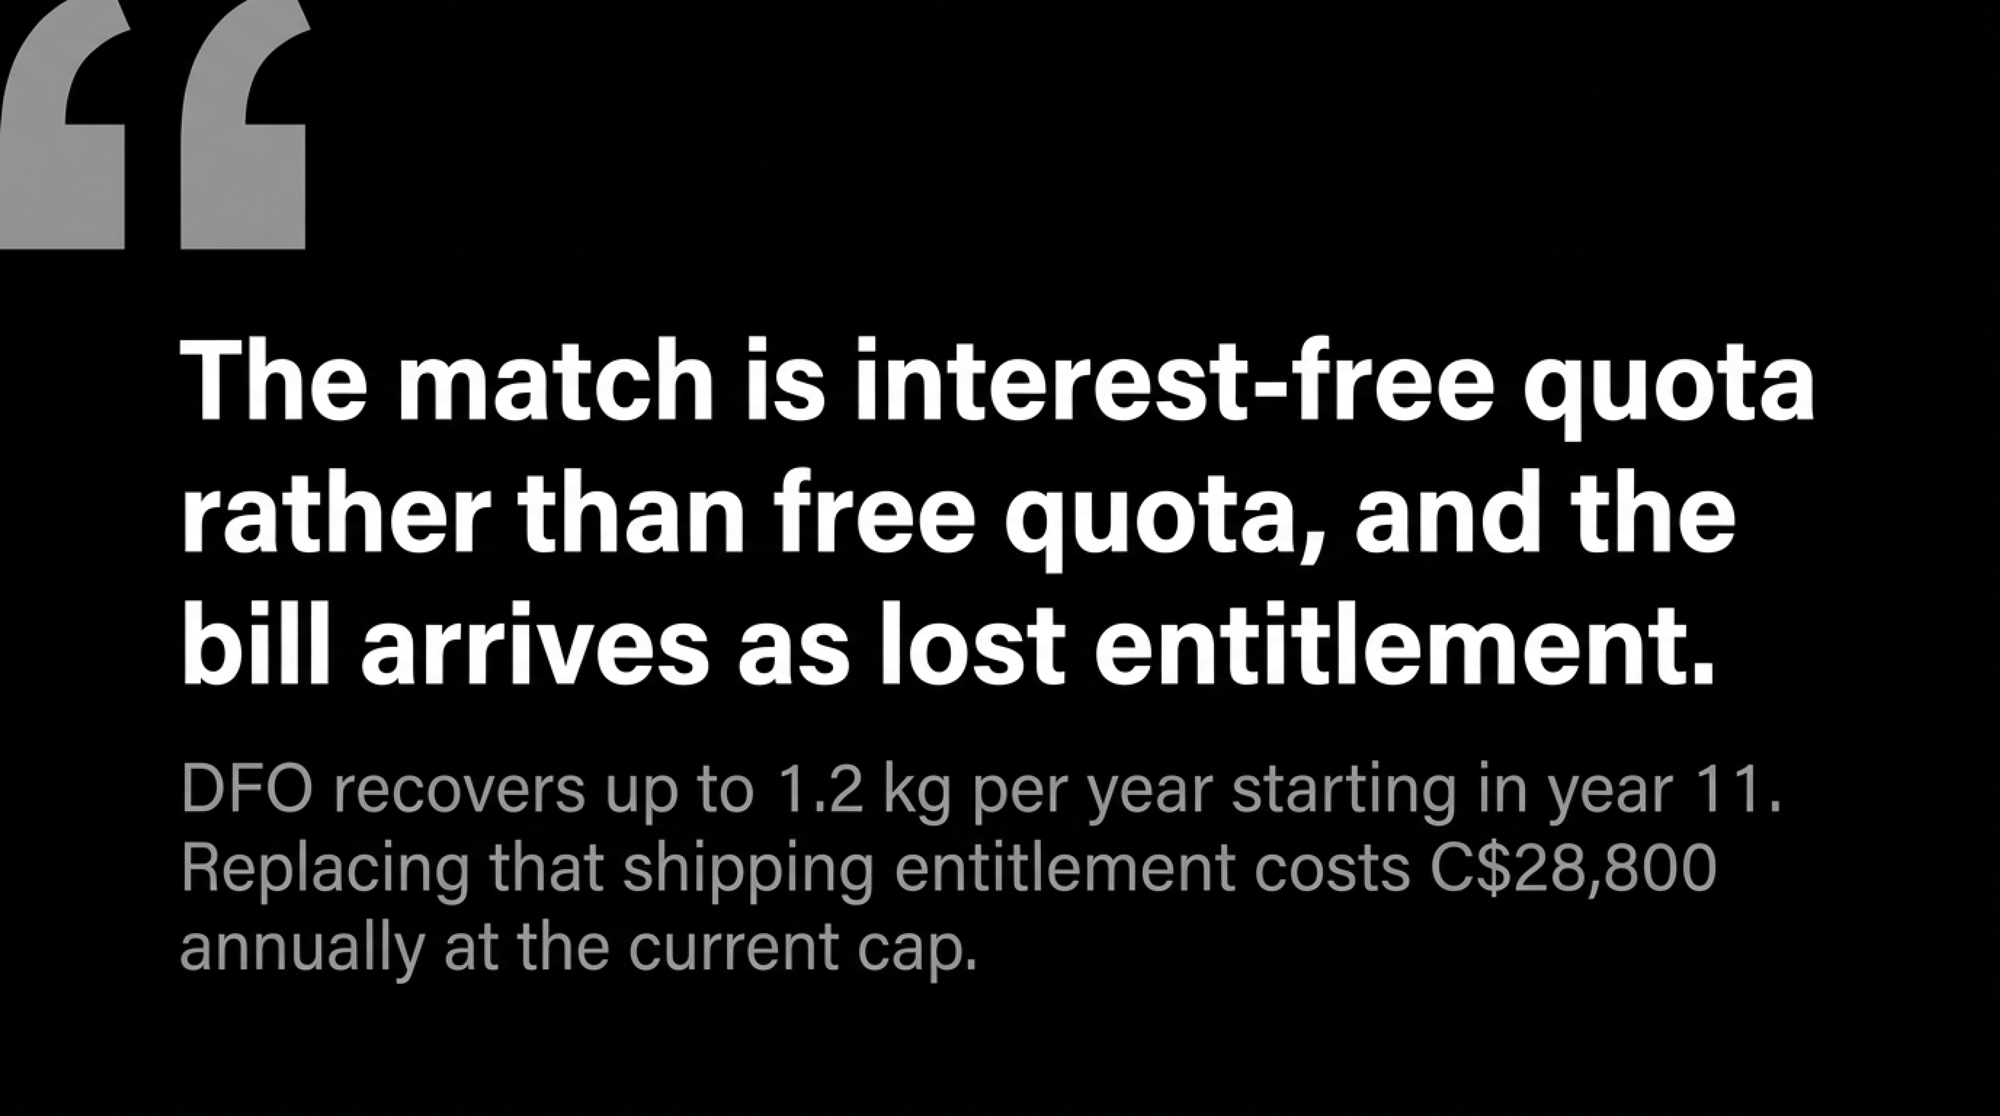
Now price the match itself. From year 11, DFO recovers up to 1.2 kg per 12-month period. On our arithmetic, replacing 1.2 kg of shipping entitlement at the September cap costs C$28,800 a year, and 20 ÷ 1.2 puts full recovery 16.7 yearsout from the year-11 anniversary, landing inside the 28-year maximum term for post-2021 applicants. The match is interest-free quota rather than free quota, and the bill arrives as lost entitlement starting in year 11.

No double counting: the 20 kg match sits outside the capital and equity columns because the entrant never buys it.

Check the County List Before Paying an Accountant

Location disqualifies more applicants than financing does, and it costs nothing to check first. DFO’s application names the eligible area precisely: Glengarry, Prescott, Russell, Carleton, Dundas, Stormont, Frontenac, Grenville, Lanark, Leeds, Renfrew, Hastings, Lennox & Addington, Northumberland, Prince Edward, Peterborough, Kawartha Lakes, Durham, Wellington, Waterloo, Grey, Bruce, Huron, Perth, Oxford, Middlesex, Elgin, Lambton and Wentworth, plus the Dufferin townships of Amaranth, East Luther and East Garafraxa, and the part of Brant County north of Highway 403.

Miss the 16-month conversion window and DFO orders the acquired quota sold and recovers the match. That is the sharpest consequence in the document, and it sits behind three disclosed commitments: begin marketing within six months of the initial allotment, ship all milk as organic within 16 months, then keep shipping organic for at least five years.

Your lender gets no security from the 20 kilograms DFO supplies. Clause 38 states assistance quota “is not transferrable and cannot be encumbered,” which is why the application demands the two financing rules that decide who can file at all: a certified-accountant-prepared or reviewed 10-year plan, and signed lender letters stating principal and term with no appraisal contingency.

A lottery can end a qualified application, and DFO owes you no explanation when it does. An independent third party determines which applications meet the criteria; priority goes to applicants who have never held a licence in another Canadian supply-managed sector, and where qualified applications outnumber positions, the third party draws. Beginning with the 2027 intake, DFO’s posted policy moves application and selection two years ahead of production.

What the Farm Count Says About Eight Matches

DFO reported 3,187 Ontario dairy farms in its 2024 annual report and 3,153 in its 2024-25 report, published February 2026. The 34-farm difference is a net reduction in the reported count, not 34 documented exits, because DFO publishes no licence reconciliation setting cancellations against new licences issued. That distinction is why the ratio in the lead is a capacity comparison rather than a replacement rate, and why the direction of that count is the real backdrop to any new-entrant program.

For scale outside supply management, USDA’s National Agricultural Statistics Service put licensed U.S. herds at an annual average of 23,609 in 2025, down 1,036 from 2024 on initial estimates — a different country under a different regulator, and no part of the Ontario arithmetic.

Now the finding that survives every caveat. DFO’s 2024-25 annual report says 133 producers entered through NEQAP from March 2010 to October 2025, “with approximately 92 per cent remaining in the industry.” Two paragraphs later, the same report describes the New Producer Program differently: 156 producers used it, and 135 are currently shipping milk. One program gets a hard operational count, the other an approximate share. The 2022 report did the same thing, pairing 110 NEQAP entrants and approximately six per cent exiting against 146 NPP users and 132 currently shipping.

Run those cumulative totals, and NEQAP looks like it has been doing its job. 110 over 152 months annualizes to 8.68. The 23 added between October 2022 and October 2025 annualizes to 7.67. Both sit close to the eight-match ceiling, and Farmers Forum’s 2023 report of eight applicants points the same way. This is not an indictment of the program’s history.

What no public document supports is a claim about right now. No cohort table shows applicants qualified, applicants selected, entrants who acquired quota, licences issued, first shipments, still shipping, and the months between each step. Without that denominator, nobody outside DFO can tell whether the 2026 backlog is delay or attrition. We asked DFO for the cohort figures and for the definitions behind “entered the industry,” “remaining in the industry,” and “currently shipping milk” on September 15, with a September 22 deadline, and had no response as of publication. The absence of the cohort table is the finding.
Work the 30/90/365 Playbook

30 Days — Before September 30

Verify the farm location.

  • Action: Check the parcel against the county and township list above, then download the application from DFO’s 2028 program page. Our companion checklist tracks all three sections, the eligibility screen and the post-selection commitments in one page.
  • Requirement: The county, and in Dufferin or Brant, the township or the Highway 403 position.
  • Threshold: Pull the property tax bill and read the municipality off it rather than working from memory. If the parcel sits in Dufferin, confirm it falls in Amaranth, East Luther, or East Garafraxa specifically. If it sits in Brant, confirm on the survey that it lies north of Highway 403. Outside the list, stop before spending on professional fees.
  • Risk: An ineligible location burns an accountant’s fee and a lender letter for nothing.

Lock the financing letter.

  • Action: Get the lender letter written with the principal and term stated and no appraisal contingency, and ask for the quota loan-to-value in writing.
  • Requirement: The 10-year plan in the lender’s hands first.
  • Threshold: Read the letter for two things: a principal amount in numbers and a term in years. On our arithmetic, a 65% LTV puts roughly C$168,000 of your own equity against the minimum purchase before you own a cow. If that equity isn’t identified and liquid, the file isn’t ready to send.
  • Risk: A conditional letter reads as a rejected package.

Submit the complete package.

  • Action: File by registered mail to 6780 Campobello Road, Mississauga, Ontario L5N 2L8, or by email to neqap@milk.org.
  • Requirement: All three sections — application form, accountant-reviewed 10-year plan, signed lender letters — in one submission.
  • Threshold: Lay the three sections out and confirm each carries a signature and a date. The accountant’s letter has to verify the plan is legitimate and that the business can generate a profit on the stated assumptions; if it only confirms the numbers were reviewed, it doesn’t meet the requirement. If all three aren’t finished 72 hours out, treat the intake as missed.
  • Risk: DFO doesn’t accept late or incomplete packages.

90 Days — Structural

Test the organic conversion timeline.

  • Action: Model the 16-month conversion against your certifier’s calendar, not the application’s.
  • Requirement: Certifier confirmation, plus an organic feed plan covering projected mature inventory.
  • Threshold: Two tests, both yours to run this month. If your certifier won’t put a projected certification date in writing, the 16-month clock is unbudgeted. If your certified or transitioning acreage can’t feed the projected mature inventory on paper, the application fails its own test before DFO reads it.
  • Risk: Missing 16 months triggers a forced quota sale plus recovery of the match.

Price the recovery schedule into the plan.

  • Action: Write DFO’s take-back into the back half of the 10-year plan. On our arithmetic, 1.2 kg a year at the September cap is C$28,800 of lost entitlement annually, running 16.7 years from the year-11 anniversary.
  • Requirement: Your own butterfat per cow, not the 1.35 kg assumption used above.
  • Threshold: Find the year-11 anniversary date. If you already hold assistance, it’s on your schedule. If you’re applying, count ten years forward from your projected June 2028 allotment date and mark the month — then check whether your plan says anything at all about that year.
  • Risk: A plan that stops at year 10 understates what the match actually costs.

365 Days — Positioning

If you’re outside the eligible area or shipping conventional.

  • Action: Track DFO’s 2028 program page for the Board’s decision rather than forcing an application through a screen it can’t pass.
  • Requirement: Nothing but attention until the Board rules.
  • Threshold: Check the “last updated” date on the program page monthly. If it moves, re-read the geography clause and the position count before assuming anything about your own eligibility — the July 30 revision changed both.
  • Opportunity signal: The 2027 intake moves application and selection two years ahead of production under DFO’s posted policy, buying a longer runway to assemble financing. Build the accountant-reviewed plan now and file into a calmer queue.
  • Risk: The hold has no published end date, so plan for the position not opening.

If you’re planning an exit rather than an entry.

  • Action: Time your exchange sale against months that actually run.
  • Requirement: Your current quota holding and saleable split from your last DFO confirmation.
  • Threshold: Before you set an offer price, read the saleable and non-saleable split off that confirmation — the non-saleable percentage moved from 0.000% in May to 2.000% in August, and only the saleable portion sells. Five cancellations in nine months, and 25,756.66 kilograms of accepted bids against 167.79 offered in the August that never ran.
  • Risk: A thin cap-priced market with a queue ahead of you means the timing is not yours to choose.

Eight matches a year against a reported farm count that fell by a net 34 is the trade-off this program lives inside, and priority access changes nothing in a month when the exchange has 167.79 kilograms to sell and needs 186.20 to open. Pull your last DFO exchange confirmation and your assistance schedule if you hold one, then check two lines: kilograms you own outright, and the anniversary date when recovery begins. Under clause 35, a transaction that drops a post-2021 entrant’s own quota below 20 kilograms costs the entire 20 kg of assistance.

Key Takeaways

  • Eight assisted entrants a year is a Bullvine calculation from DFO’s published 160 kg pool and 20 kg match — DFO prints both inputs and never the quotient, and the ratio against a net 34-farm decline is the number to remember.
  • Priority access only helps in a month when the exchange actually runs. Five of nine 2026 exchanges were cancelled, and August’s summary shows two selected entrants acquiring 0.00 kg.
  • DFO’s annual report gives the New Producer Program a hard count — 135 of 156 currently shipping — while NEQAP gets “approximately 92 per cent remaining.” Without a cohort table, nobody outside DFO can tell whether the 2026 backlog is delay or attrition.

Ontario NEQAP Capital & Cash-Flow Stress Tester

Model quota debt, required cash equity, cow requirements, and DFO’s Year-11 recovery clawback under the C$24,000 cap.

NEQAP Clause 20 requires 20 to 30 kg
Typical broker/bank range: 60% – 75%
Estimated annual debt service factor
Quota Purchase Outlay $480,000 At C$24,000/kg regulatory cap
Required Upfront Equity $168,000 Borrowing: $312,000
Total Day-1 Herd Production 30 Cows 40 kg total quota (~929 L/day)
Year 11 Recovery Drag -$28,800 / yr Replacement cost of 1.2 kg take-back/yr

Methodology Note. The eight-match ceiling divides DFO’s published annual pool of up to 160 kg by the 20 kg allocated per successful applicant under clause 25 of the Quota and Milk Transportation Policies revised June 1, 2026. Capital figures multiply the 20- to 30-kg purchase requirement by the C$24,000/kg cap recorded in DFO’s September 2026 exchange summary, printed September 2, 2026. The C$28,800 annual figure and the 16.7-year recovery period are Bullvine calculations from the 1.2 kg per 12-month take-back in clause 31. Cow counts apply stated butterfat assumptions of 1.20, 1.35, and 1.50 kg per cow per day, which are Bullvine assumptions and not DFO figures. Litre equivalents use Ontario’s May 2026 average composition of 4.3035 kg butterfat per hectolitre from Milk Producer, Dairynomics, July 2026 issue — a single month, not an annual average. Equity figures apply loan-to-value percentages published as market commentary by a mortgage brokerage, not underwriting policy from any lender. The farm-count comparison uses DFO’s own reported totals and measures net change, not gross licence exits, which DFO does not publish. Limits: these are Ontario figures under Ontario policy, the June 2028 exchange price cannot be known in September 2026, and provincial averages may not reflect your operation.

Learn More

The Sunday Read Dairy Professionals Don’t Skip.

Every week, thousands of producers, breeders, and industry insiders open Bullvine Weekly for genetics insights, market shifts, and profit strategies they won’t find anywhere else. One email. Five minutes. Smarter decisions all week.
NewsSubscribe
First
Last
Consent

USDA Raised Make Allowances Up to 42.6% on Self-Reported Processor Costs

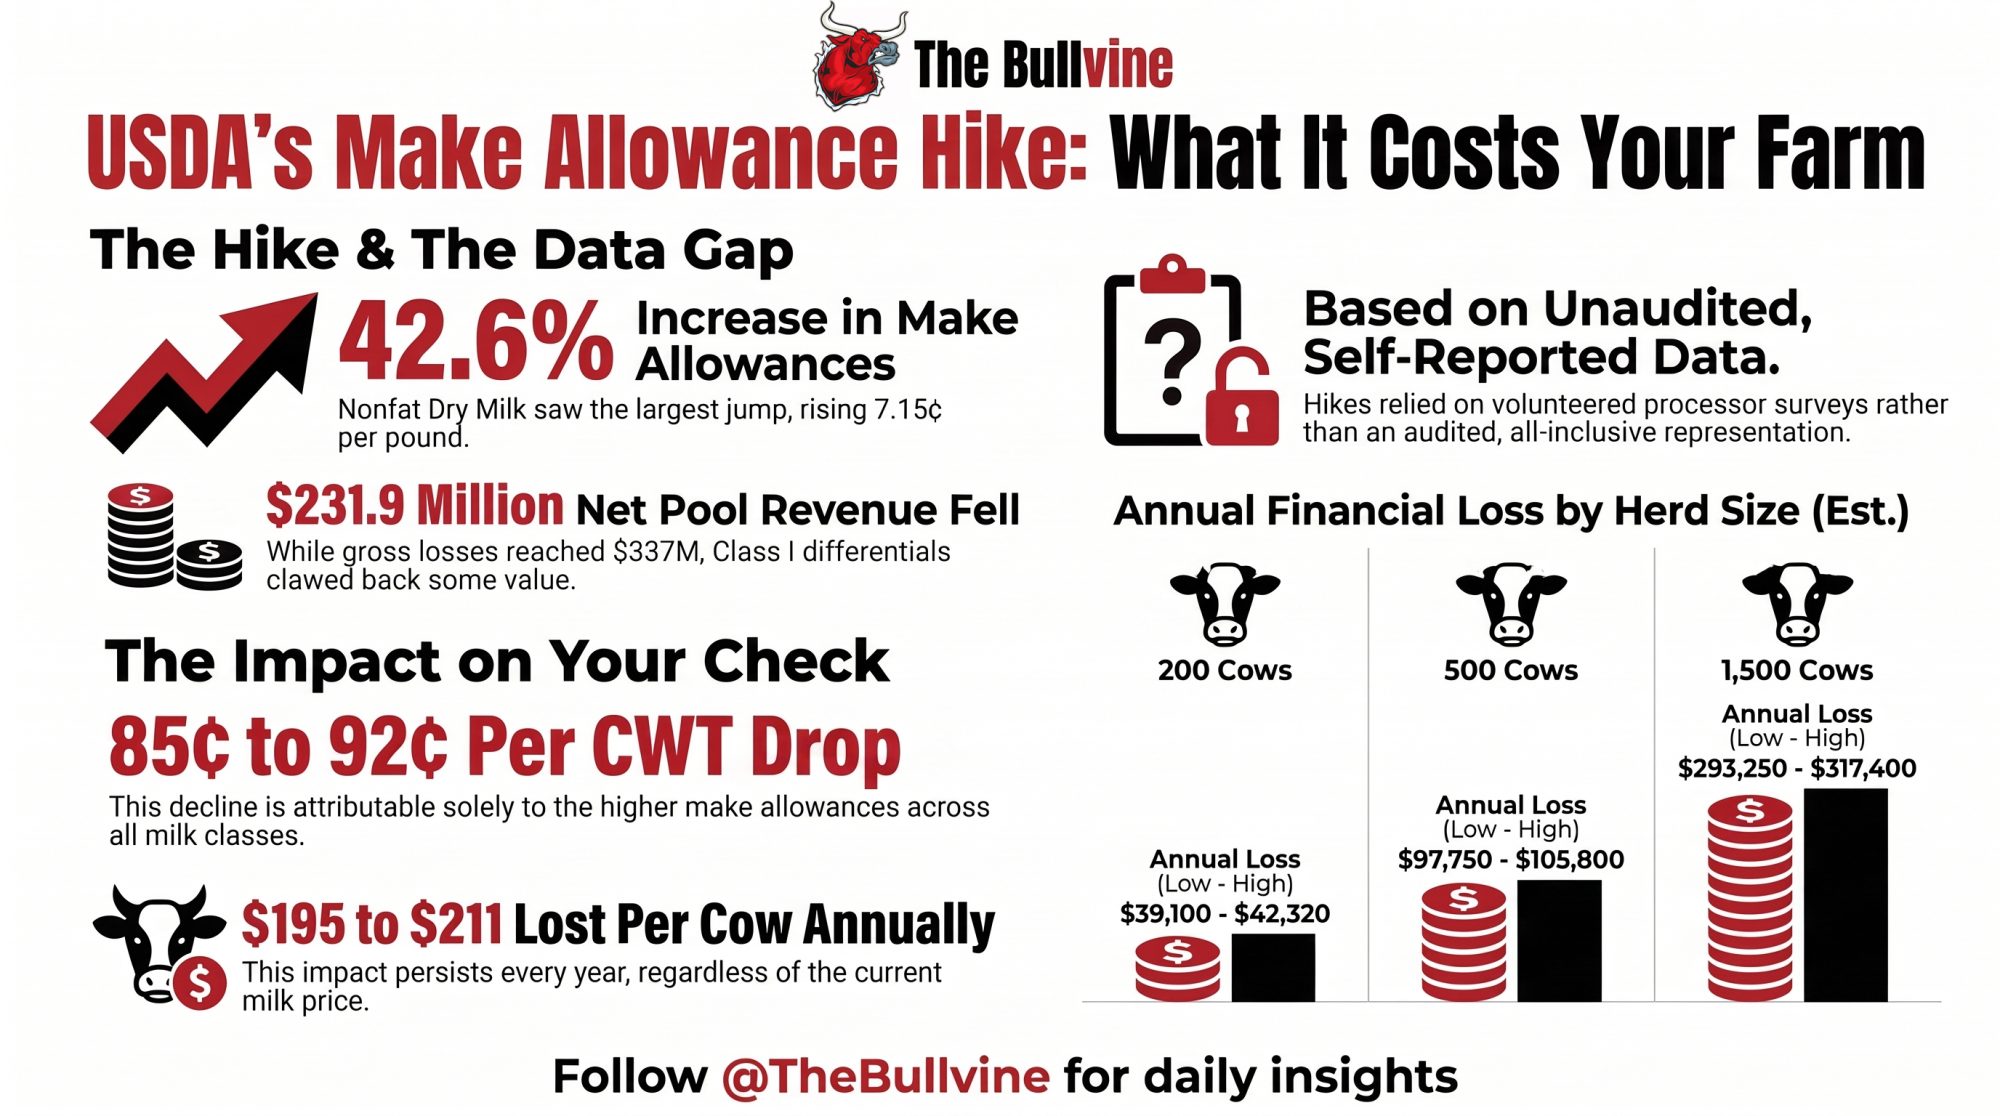
7.15 cents a pound. That’s what USDA added to the nonfat dry milk make allowance on cost data processors volunteered. On 500 cows, our math puts it at $97,750 to $105,800 a year — every year, at any milk price.

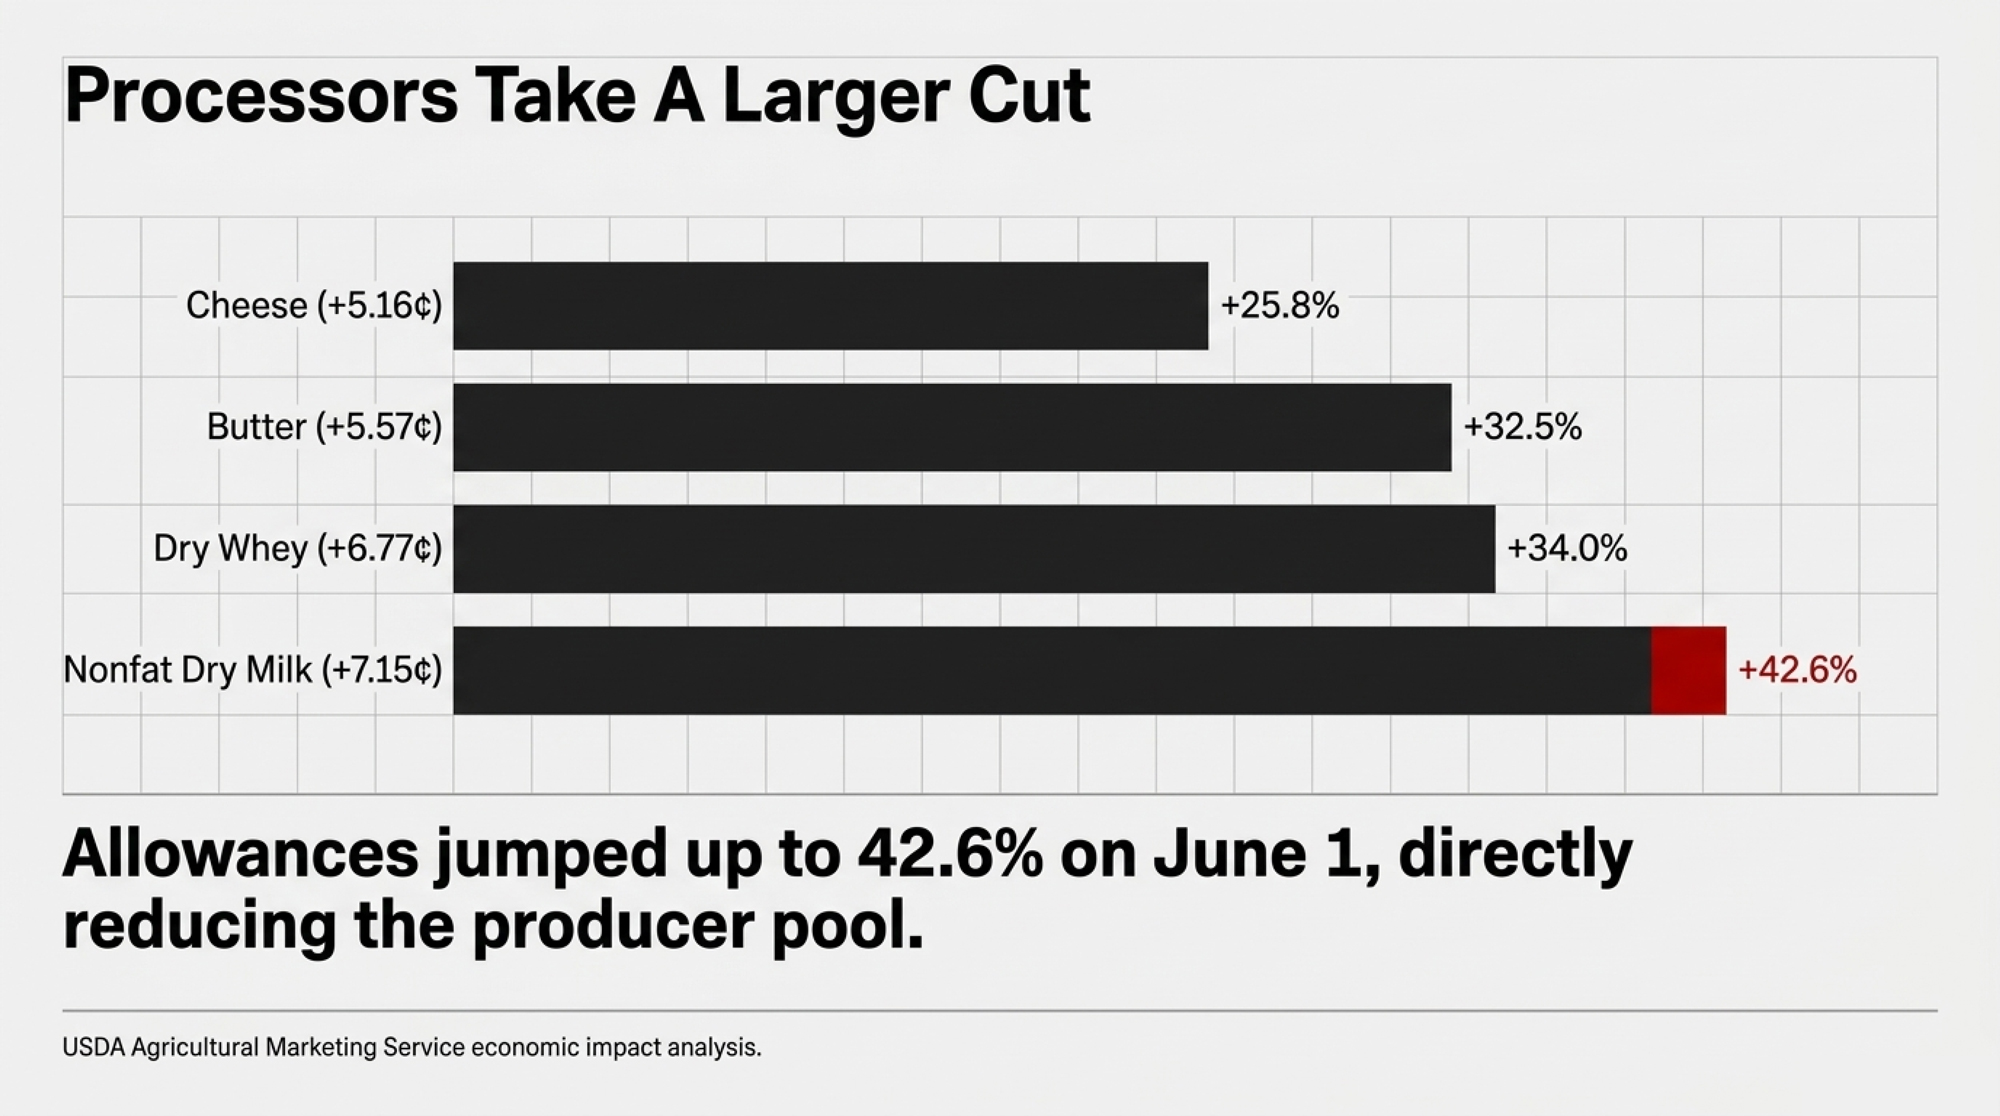
USDA raised all four FMMO make allowances effective June 1, 2025, and its own economic impact analysis states the plain version: those allowances had been “set in 2008 and determined using two surveys.” The decision raised them to $0.2519 per pound for cheese, $0.2272 for butter, $0.2393 for nonfat dry milk, and $0.2668 for dry whey.

The American Farm Bureau Federation then measured the result. Across the first three months, Class I prices fell 89 cents per hundredweight, Class II 85 cents, Class III 92 cents, and Class IV 85 cents — a 4–5% drop “attributable solely to higher make allowances,” totaling $337 million in lost pool revenue.

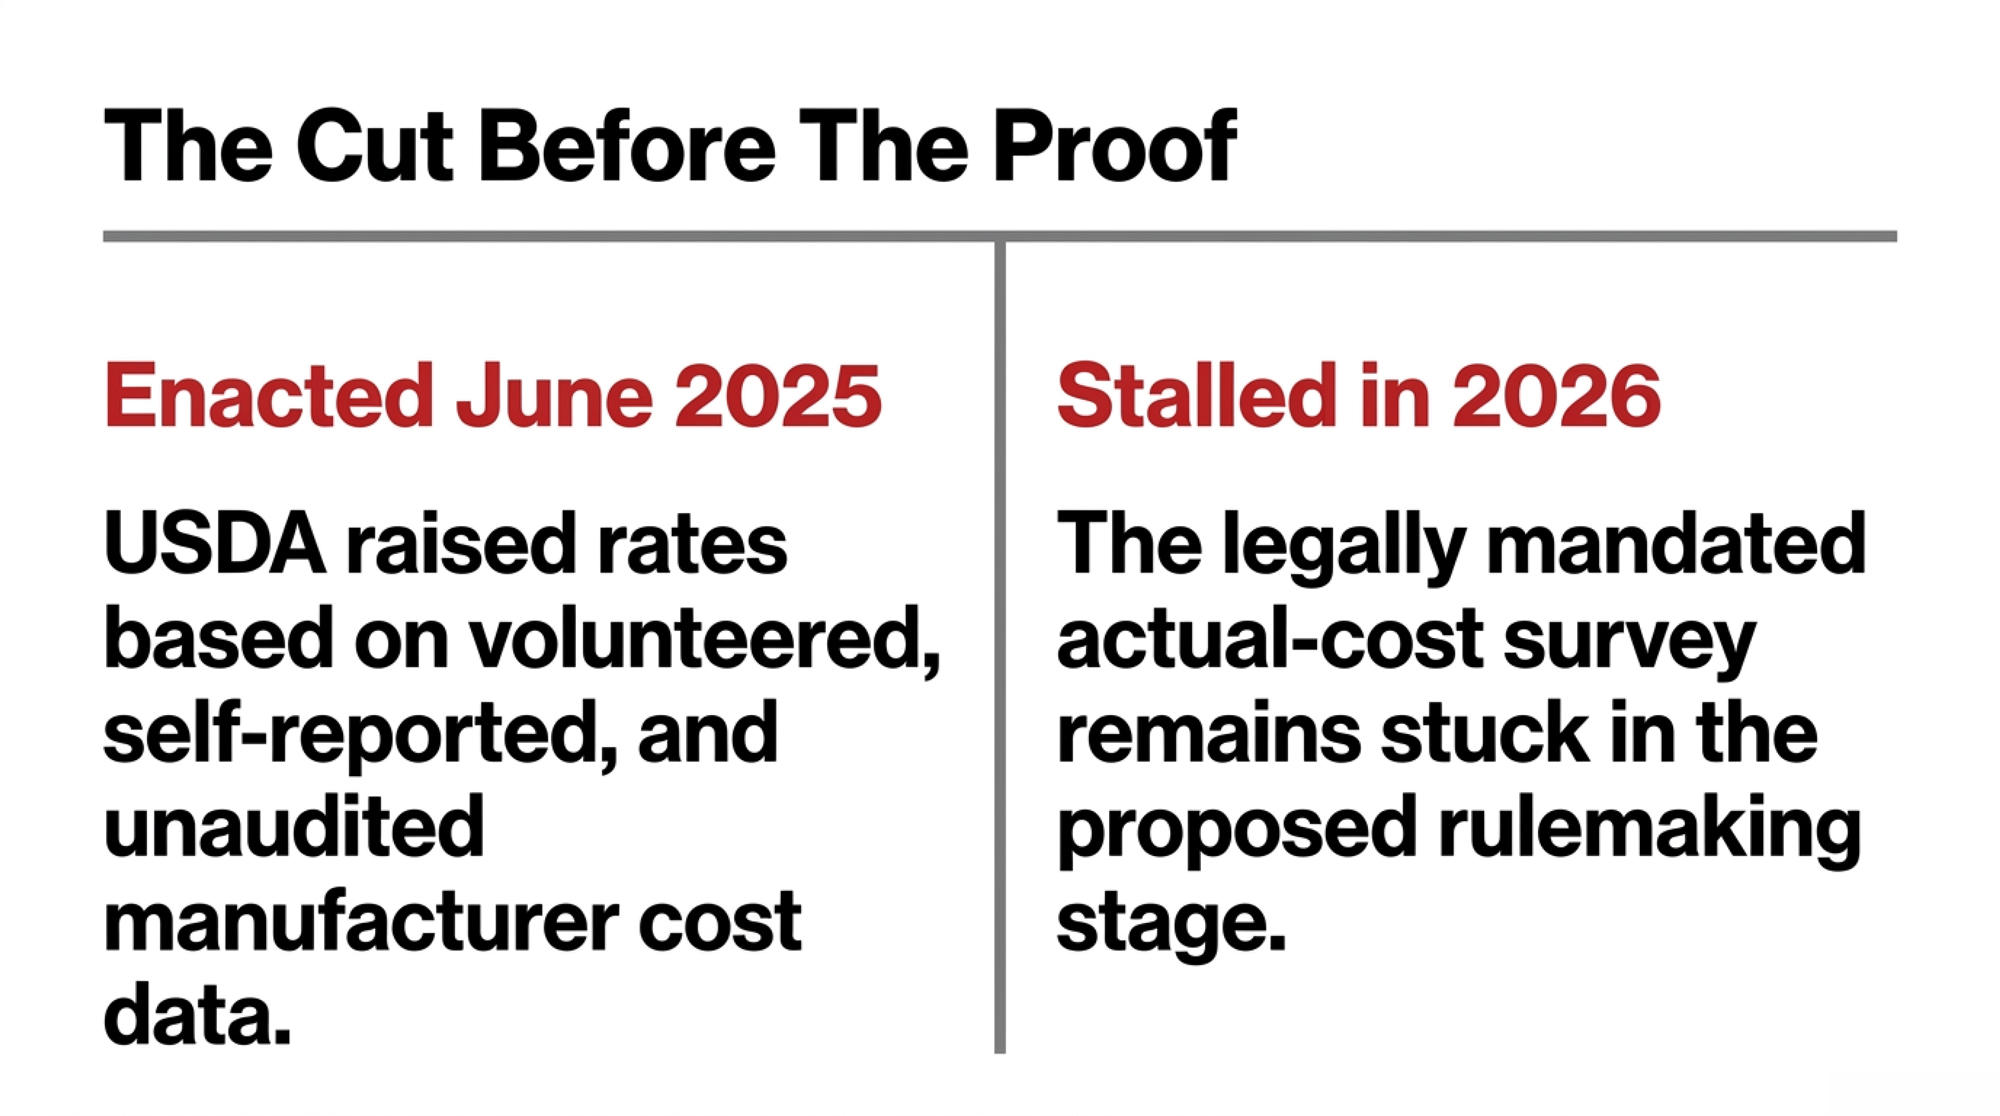
Here’s what should sit uncomfortably with anyone whose milk was voted in those referenda. Farm Bureau’s review states USDA set those numbers using “a self-selected sample of self-reported manufacturers’ cost data, not an all-inclusive, audited representation of all processors.”

The audited version was meant to follow. The One Big Beautiful Bill Act of 2025 requires USDA to survey processors’ actual manufacturing costs for cheese, butter, and nonfat dry milk. As of today, USDA’s program page for that survey lists one document: an Advance Notice of Proposed Rulemaking issued Feb. 27, 2026. Not a proposed rule. Not a survey.

What USDA Changed, and by How Much

ProductSet in 2008June 1, 2025ChangeIncrease
Cheese$0.2003$0.2519+5.16¢25.8%
Butter$0.1715$0.2272+5.57¢32.5%
Nonfat dry milk$0.1678$0.2393+7.15¢42.6%
Dry whey$0.1991$0.2668+6.77¢34.0%

All values per pound, USD, national scope, all 11 orders. Source: USDA Agricultural Marketing Service economic impact analysis, Class III and IV pricing decisions. Percentage change is a Bullvine calculation on those figures. Increase is the change in the allowance itself, not the effect on milk price — for that, see the per-class declines above.

A make allowance is what USDA subtracts from each product’s wholesale price before calculating what your Class III and IV milk is worth. Raise it, and less value reaches the producer pool. The whey line works differently again — a dozen companies’ reported sales set the survey price that drives your other-solids line, a mechanism worth understanding on its own.

This is a U.S. Federal Order mechanism. Canadian producers have no direct equivalent under supply management, though the fight over whether processor cost data gets audited is the part that travels.

What Does the Change Cost at Your Herd Size?

One detail in Farm Bureau’s numbers matters more than the headline. Every class landed inside the same narrow band — Class II and IV at 85 cents, Class I at 89, Class III at 92. Your blend price dropped by roughly the same amount whether you ship into cheese, powder, or fluid. Utilization changes the mix, not the magnitude.

ClassPrice decline (¢/cwt)Annual impact, 500 cows @ 230 cwtWhat ships here
Class I (fluid)89¢$102,350Bottled milk
Class II (soft)85¢$97,750Yogurt, ice cream, cream
Class III (cheese)92¢$105,800Cheese and dry whey
Class IV (butter/powder)85¢$97,750Butter, nonfat dry milk

Running the Numbers — Bullvine calculation

Published evidence: AFBF measured per-class declines of 85–92¢/cwt attributable solely to the make-allowance change. Market Intel, Sept. 22, 2025, U.S. national scope, USD.

Stated Bullvine assumption: 230 cwt shipped per cow per year. Ours, not sourced — substitute your rolling herd average.

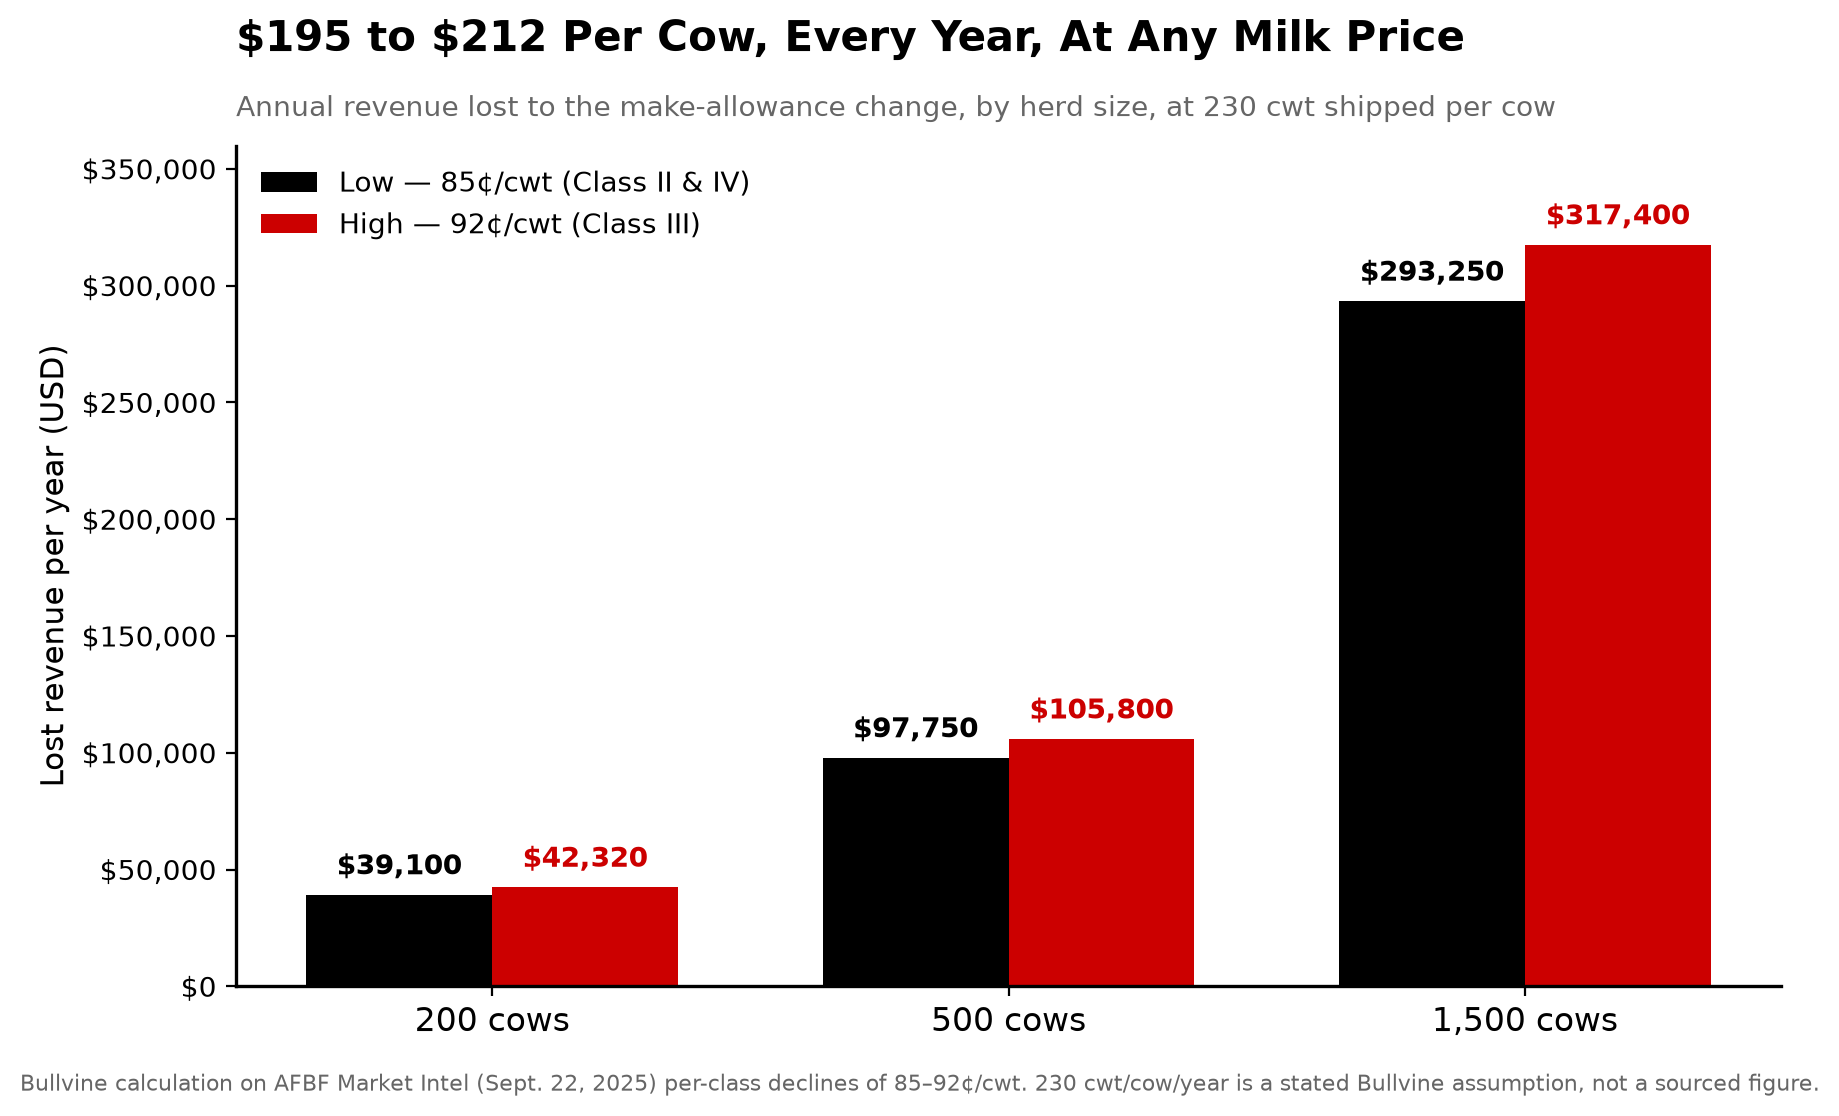
Method: cows × 230 cwt × per-cwt decline. Low uses 85 cents (the Class II/IV figure); high uses 92 cents (Class III).

HerdAnnual cwtLow (85¢)High (92¢)
200 cows46,000$39,100$42,320
500 cows115,000$97,750$105,800
1,500 cows345,000$293,250$317,400

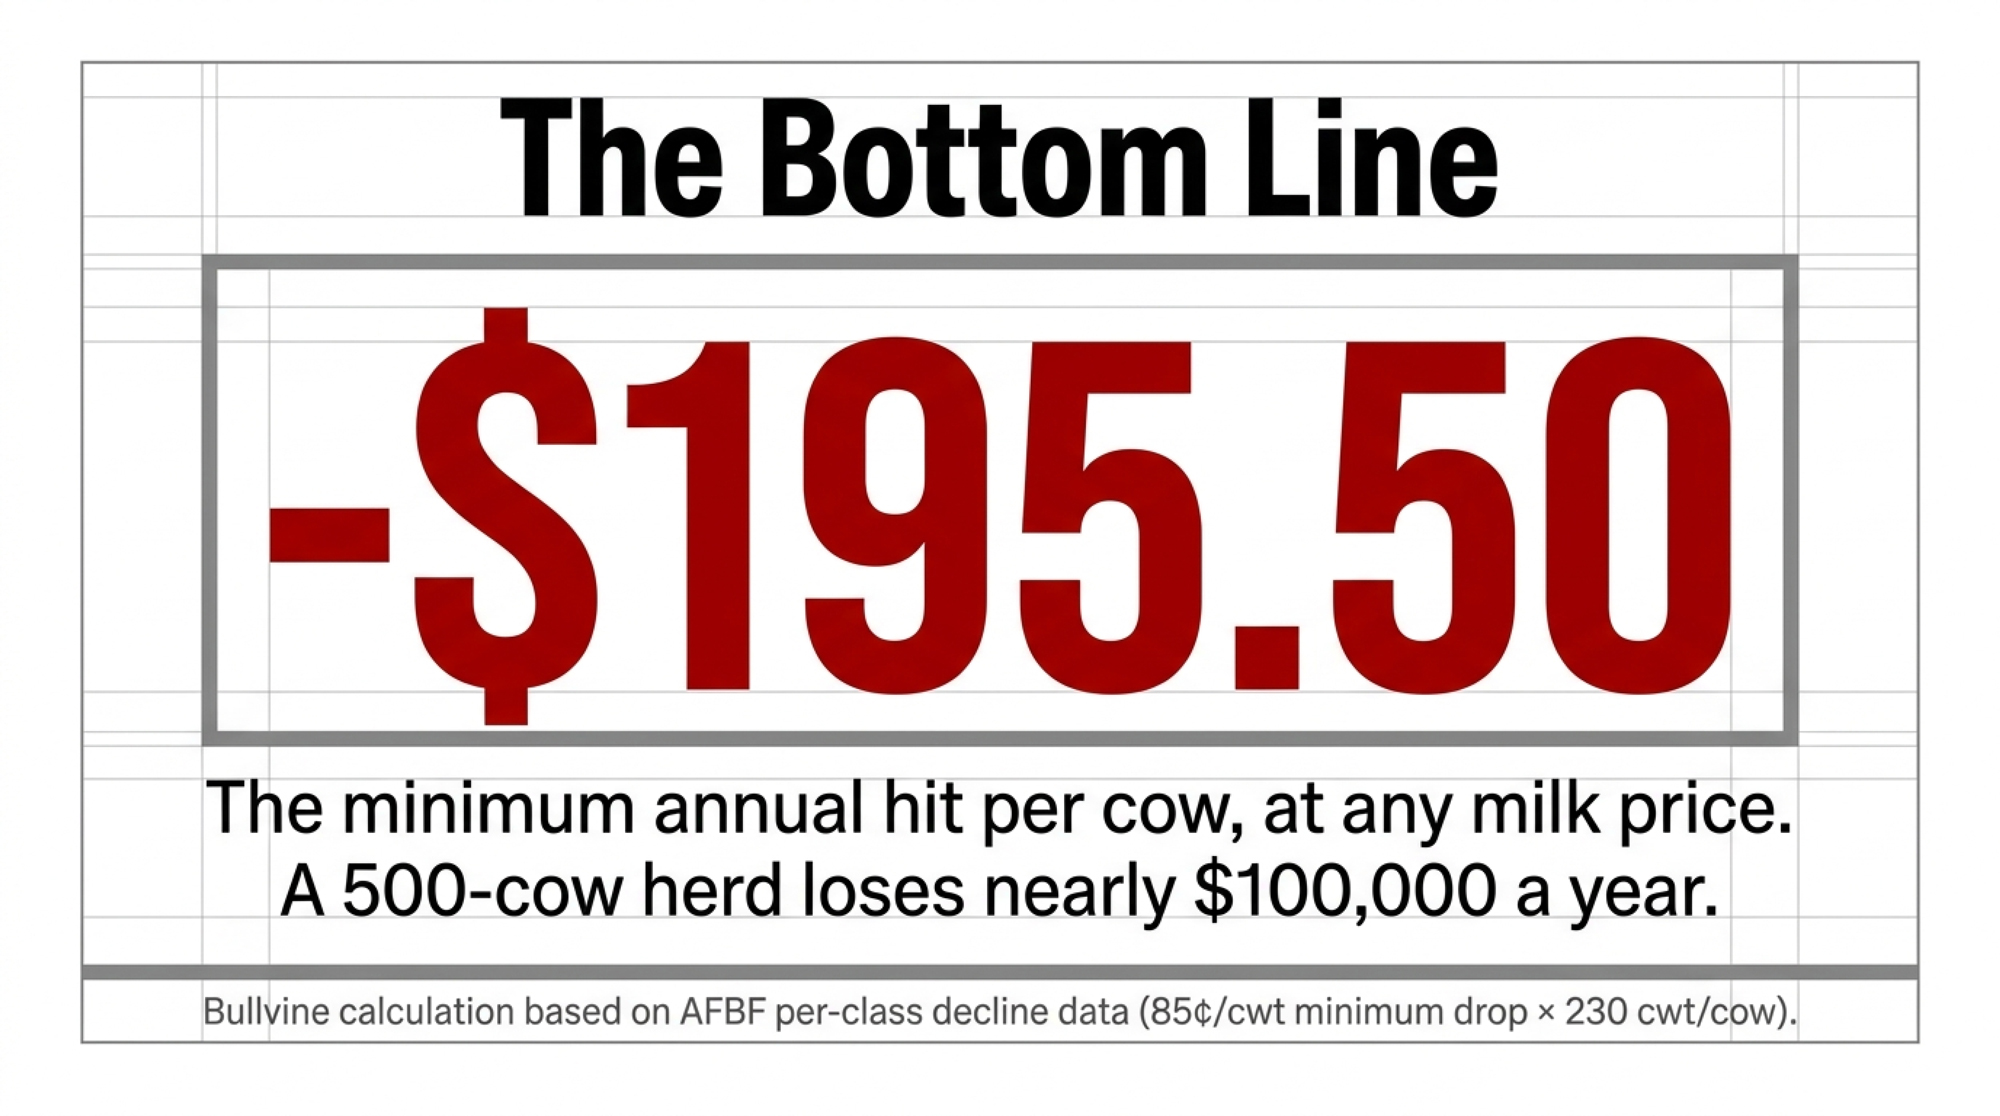
Per cow: $195.50 to $211.60 every year, at any milk price. The 500-cow line runs 500 × 230 = 115,000 cwt, then 115,000 × $0.85 = $97,750.

Budget off the low column. Where a verified figure is a range, the conservative end is the honest one.

“Both sides of this argument want the survey. Only one side already got its number.”

What Came Back the Other Way

Most coverage of this fight stops at the $337 million. It shouldn’t, because the same AFBF analysis prices the offsets and they’re real.

Class I differentials rose in most counties, averaging +$1.24/cwt nationally and adding an estimated $137 million to pool values across June through August — led by the Northeast at $34 million and the Mideast at $30 million. Farm Bureau’s regional breakdown shows the mismatch plainly. California and the Upper Midwest absorbed the largest allowance losses at $55 million and $64 million, and gained only $6 to $8 million each.

The return to the higher-of Class I mover subtracted $31.1 million over the same period, though AFBF notes that the formula proves its worth in volatile markets rather than calm ones.

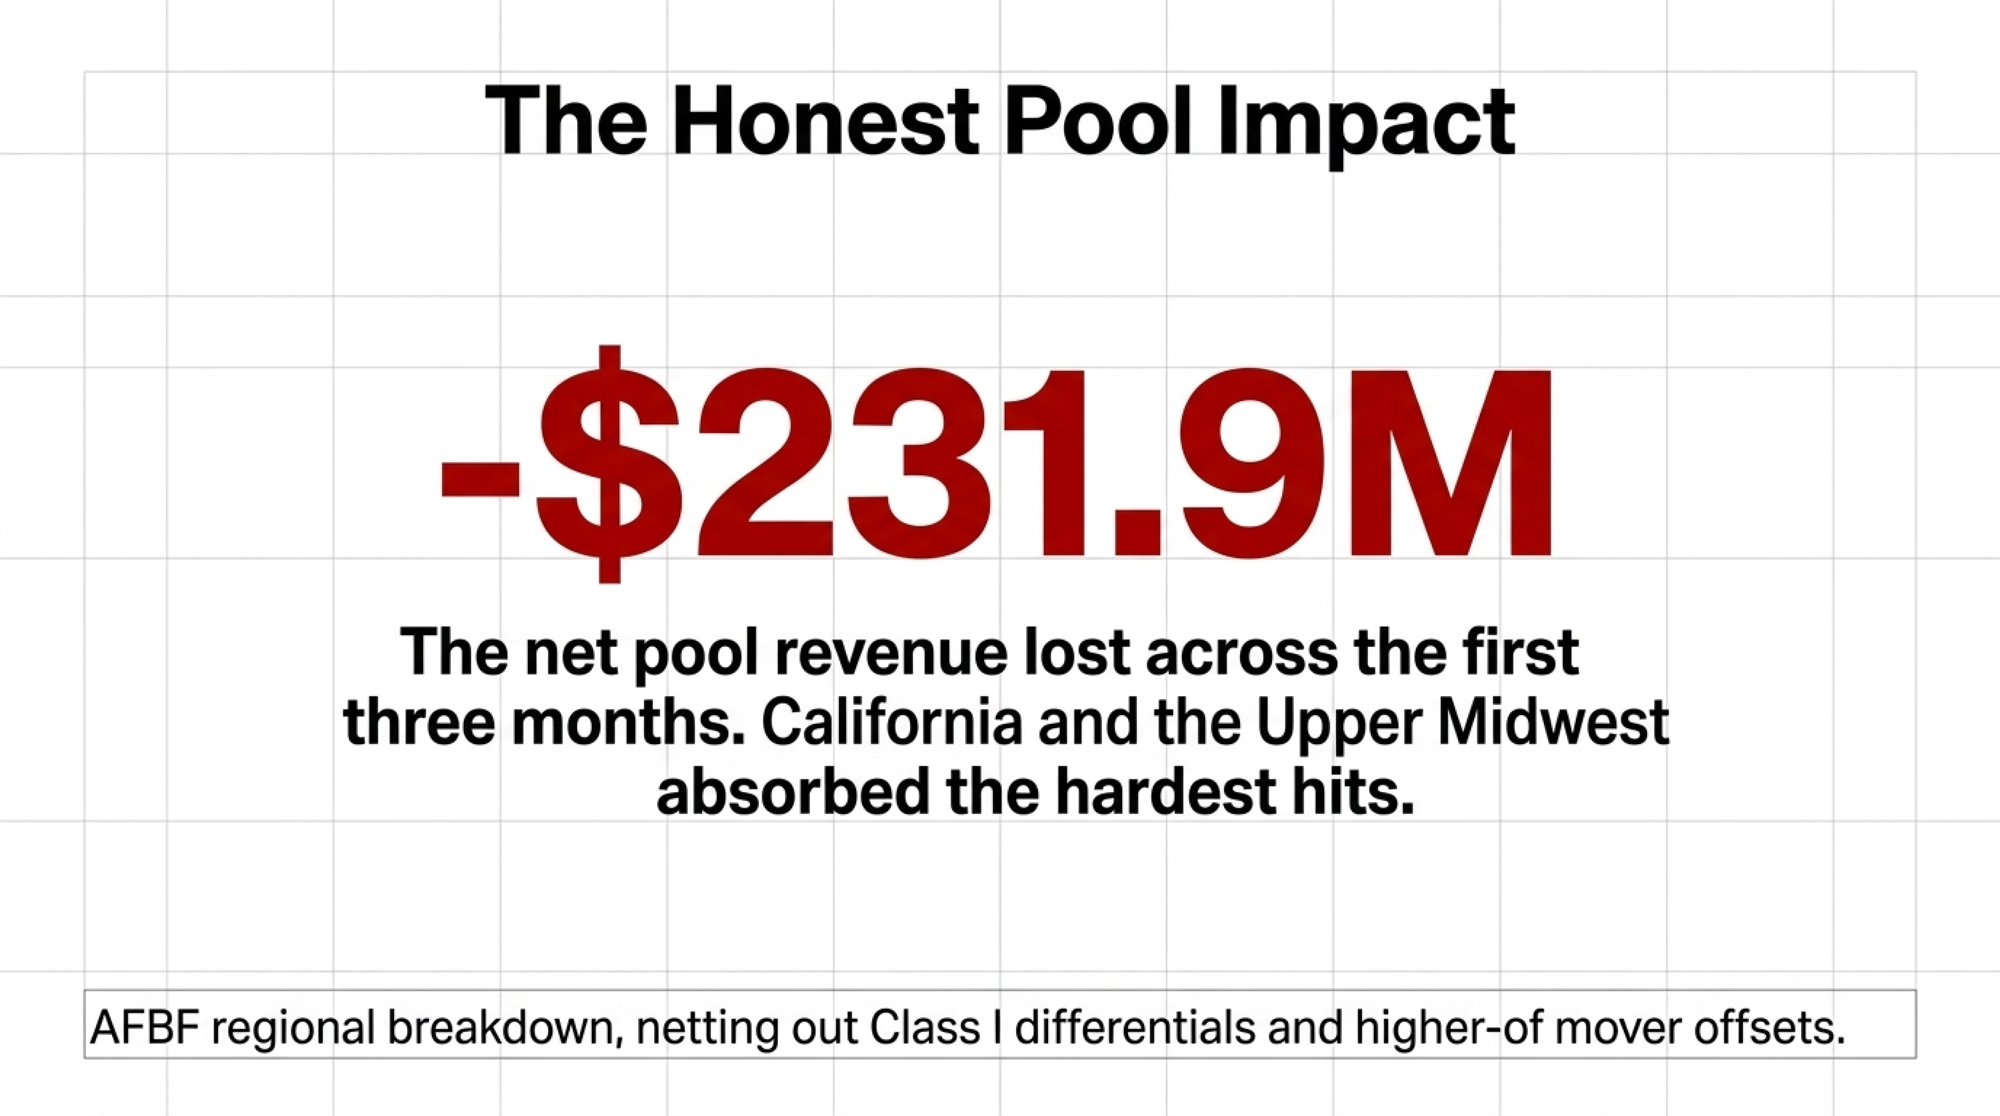
Net all three amendments together and pool revenues fell $231.9 million in the first three months, not $337 million. Use the net figure in a boardroom. The gross number is true, and the net number is harder to dismiss. (Farm Bureau’s component figures are rounded as published, so they won’t sum precisely to the net.)

One offset arrived later than the rest. The allowance increase took effect June 1, 2025. Updated milk composition factors — the change recognizing the components you actually ship — followed on Dec. 1, six months behind, and AFBF estimates that change adds roughly $200 million a year to pool value while the interval cost producers about $100 million.

Why Did the Cut Come Before the Proof?

The processors’ underlying case was legitimate. Those allowances had sat unchanged since 2008, and converting milk into cheese takes labor, cultures, energy, testing, and packaging that all cost more than they did then. The National Milk Producers Federation, which represents dairy cooperatives, filed the proposal and testified that USDA should “provide an interim increase to alleviate the acute problems and disorderly market conditions created by the current, clearly insufficient make allowances.”

Harder to defend is the sequence. USDA set the numbers on volunteered, unaudited data, and Congress authorized the audited survey afterward. The ANPRM’s comment window ran 30 days and closed March 30, 2026. The American Dairy Coalition asked for an extension, arguing 30 days was insufficient for a rulemaking that directly determines regulated milk values.

The road back is longer than most producers assume. AFBF is explicit that even once survey data exists, any adjustment to make allowances “would still require a full hearing process before USDA to implement.” Survey rulemaking, then the survey, then the report, then a hearing.

DateStepStatus as of Sept. 15, 2026
June 1, 2025All four FMMO make allowances raised (25.8%–42.6%)In force — money moved
July 2025One Big Beautiful Bill Act requires audited processor cost surveyEnacted
Dec. 1, 2025Updated milk composition factors take effectIn force, six months late
Feb. 27, 2026Advance Notice of Proposed Rulemaking issuedOnly document on USDA’s survey page
Mar. 30, 202630-day comment window closes; extension requestedClosed; no extension reflected
Still aheadProposed rule → survey → report → full USDA hearingNot started

AFBF economist Danny Munch told Brownfield the law is meant “to justify the nearly dollar-a-hundredweight make allowance deductions.” Fifteen months after the deduction took effect, that justification sits at the notice stage.

Worth noting: NMPF isn’t defending the absence of audited data. The association calls mandatory biennial plant-cost studies “a key component of NMPF’s Federal Milk Marketing Order modernization proposal,” and President and CEO Gregg Doud has publicly backed legislation requiring them. Both sides of this argument want the survey. Only one side already got its number.

Who Actually Cast Your Ballot?

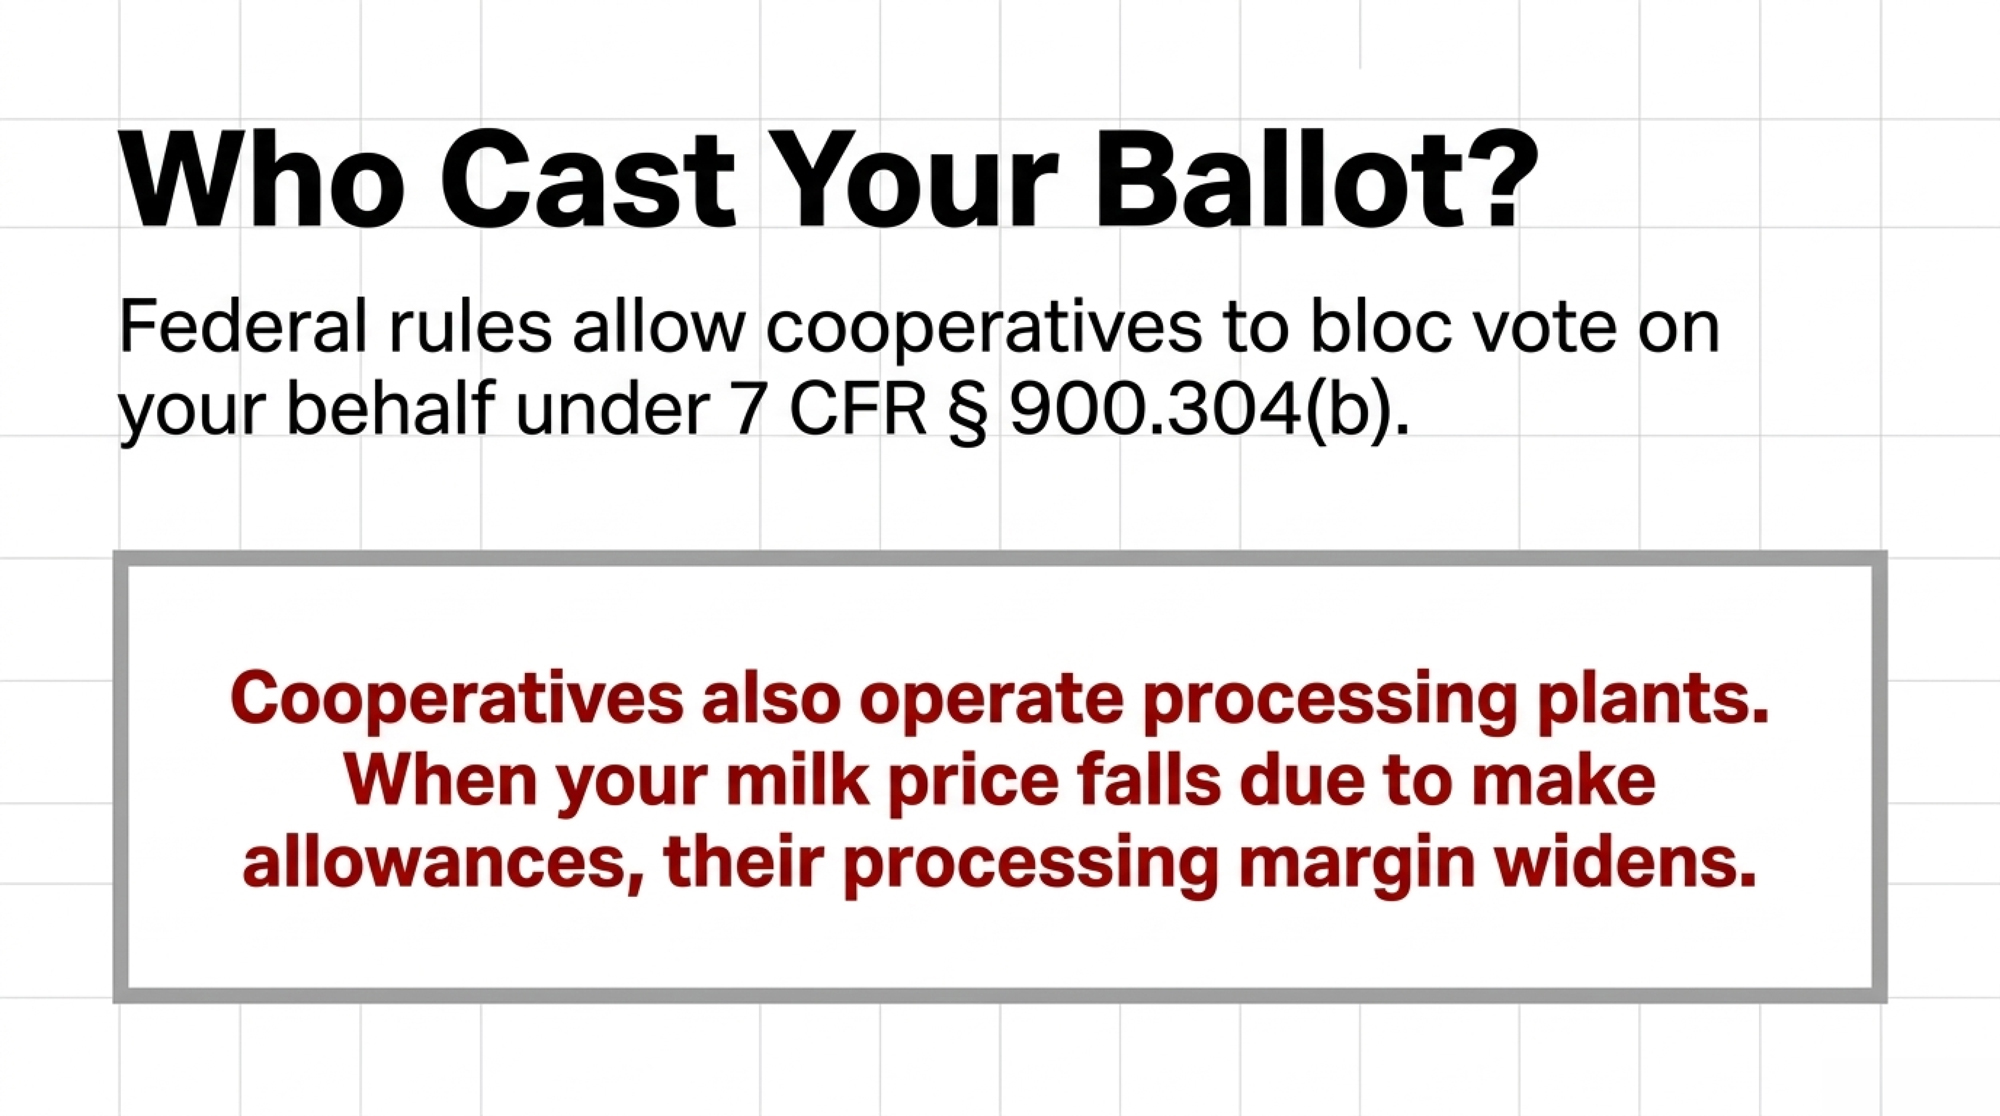
Federal referendum procedure is specific. Under 7 CFR § 900.304(a), “each producer shall be entitled to only one vote,” and under § 900.304(c), voting “by proxy or agent” is not permitted.

Then comes subsection (b). Except as provided in section 8c(5)(B) of the Act, “any cooperative association eligible under § 900.302 may, if it elects to do so, vote and cast one ballot for producers who are members of, stockholders in, or under contract with, such cooperative association.” The board votes your milk.

There’s a detail in that same subsection worth knowing. A cooperative casting a bloc ballot “shall submit, with its ballot, a certified copy of the resolution authorizing the casting of the ballot.” That resolution exists. It’s dated, and it records what your organization decided on your behalf.

Which matters because the cooperative model puts one organization on both sides of this formula. Cooperatives market their members’ milk and, in many cases, operate the plants that buy pooled milk. As your marketing agent, the organization wants a higher milk price. As a plant operator, it does better when that price falls.

Nobody outside those boardrooms can say whether a particular cooperative’s processing margin widened at members’ expense. The per-cwt margin figure a member would need isn’t broken out in publicly available cooperative reporting. A processing margin isn’t improper, and no cooperative has been shown to have acted against its members’ interests. The open question is whether member-owners can see how, or whether, the benefit returns.

If you’ve never seen a ballot for an order you ship into, that’s not an oversight — it’s how bloc voting decided this for you.

The Playbook

30 days — find your own number. Set one milk check from before June 2025 beside one from after, and isolate the blend-price gap after backing out obvious market movement. Requires: two statements, twenty minutes. Threshold: a residual gap near 85–92¢/cwt is the allowance, not the market. Backfire: components and utilization moved too, so don’t credit the whole delta to the formula.

30 days — ask for the resolution. If your cooperative bloc voted, request the certified copy of the board resolution that authorized the ballot. Section 900.304(b) required one to be filed. Requires: one written request. Threshold: if the resolution records no member-communication step before the vote, that’s your governance question for the annual meeting. Backfire: expect it framed as routine, because legally it was. Ask anyway.

30 days — red flag on debt service. Run the low-column figure for your herd size through your coverage ratio. Requires: your lender’s DSCR method, not yours. Threshold: DSCR under 1.2 for three consecutive months on the lender’s calculation moves this to the top of the list. Backfire: don’t stack it on a breakeven that already absorbed lower 2025 class prices; that double-counts.

90 days — check the composition-factor line. The updated factors took effect Dec. 1, 2025 and should be adding value to your solids. Requires: a post-December statement and your component tests. Threshold: if you can’t find the change reflected anywhere, have your field rep walk the line items. Backfire: the gain is smaller than the allowance loss, so finding it doesn’t make you whole.

90 days — price your components elsewhere. Ask a smaller cooperative or an independent what they’d pay. Requires: a second buyer within haul distance. Threshold: a spread that survives freight and contract terms. Backfire:hauling, volume commitments, and exit terms can erase it. Run the full pay-price comparison before you call anyone.

365 days — get into the survey rulemaking. The opportunity is real: an audited cost survey is the first mechanism that could push allowances down rather than up, and AFBF calls it “a critical step toward grounding future make allowance decisions in verifiable data.” Requires: docket monitoring at regulations.gov and willingness to submit your own cost reality. Threshold: comment the day a proposed rule publishes. Backfire: survey, then report, then a full hearing — position for the next cycle, not this one.

Where the Organic Suits Fit — and Where They Don’t

On April 28, 2026, members of the Coalition for Organic Dairy Exemption — Aurora Organic Dairy, Horizon Organic, and CROPP Cooperative/Organic Valley — filed three federal lawsuits challenging their required participation in the FMMO program as unconstitutional. Aurora and Horizon filed in the District of Colorado; CROPP filed in the Western District of Wisconsin. Seven Organic Valley farmer-members filed a separate class-action takings claim seeking compensation for six years of marketing-order payments.

Read the remedy. The coalition seeks exemption from pooling, not the dismantling of the orders and not a rollback of make allowances. Nothing has been ruled on the merits. The grievance rhymes; the legal theory doesn’t transfer, and a conventional producer has no organic-specific pooling claim. For the filings and what a pooling exemption would mean at the farm level, see the $19.89 risk on your farm.

Check Before Your Next Statement

The trade-off sits in USDA’s own documents. Processors got increases of 25.8% to 42.6% built on a self-selected sample, producers absorbed a $231.9 million net pool reduction plus a six-month wait for their own offset, and the survey that both AFBF and NMPF say should ground these numbers hasn’t reached a proposed rule fifteen months on.

So pull your two statements this week. Then ask your cooperative for the certified resolution that authorized your ballot — what does it say the board decided on your behalf?

Key Takeaways

  • USDA lifted the nonfat dry milk make allowance 7.15 cents a pound, a 42.6% increase, on what AFBF calls a self-selected sample of self-reported processor costs. The audited survey it was meant to rest on still hasn’t made it into a proposed rule.
  • At 230 cwt per cow per year, AFBF’s measured 85–92¢/cwt decline works out to $39,100–$42,320 on 200 cows, $97,750–$105,800 on 500, and $293,250–$317,400 on 1,500. Budget the low column.
  • The honest pool figure is $231.9 million net, not the $337 million everyone quotes. Class I differentials and the higher-of mover clawed some back, but California and the Upper Midwest lost most and gained least.
  • Both AFBF and NMPF want the audited cost survey. Only one side already got its number, and any correction runs through a full USDA hearing after the survey exists.

Run Your Numbers

Dairy Farm Corridor Score Calculator — This article gives you the national make-allowance number. The Corridor Score adds the part that differs by location: your state’s attrition zone and your hauling cost per cwt, then shows total structural drag as a share of gross milk revenue. Red, Yellow, or Green before you talk to your co-op.

Learn More

The Sunday Read Dairy Professionals Don’t Skip.

Every week, thousands of producers, breeders, and industry insiders open Bullvine Weekly for genetics insights, market shifts, and profit strategies they won’t find anywhere else. One email. Five minutes. Smarter decisions all week.
NewsSubscribe
First
Last
Consent

The Whey Ban Cuts Supply. Twelve Companies Decide If Your Check Moves.

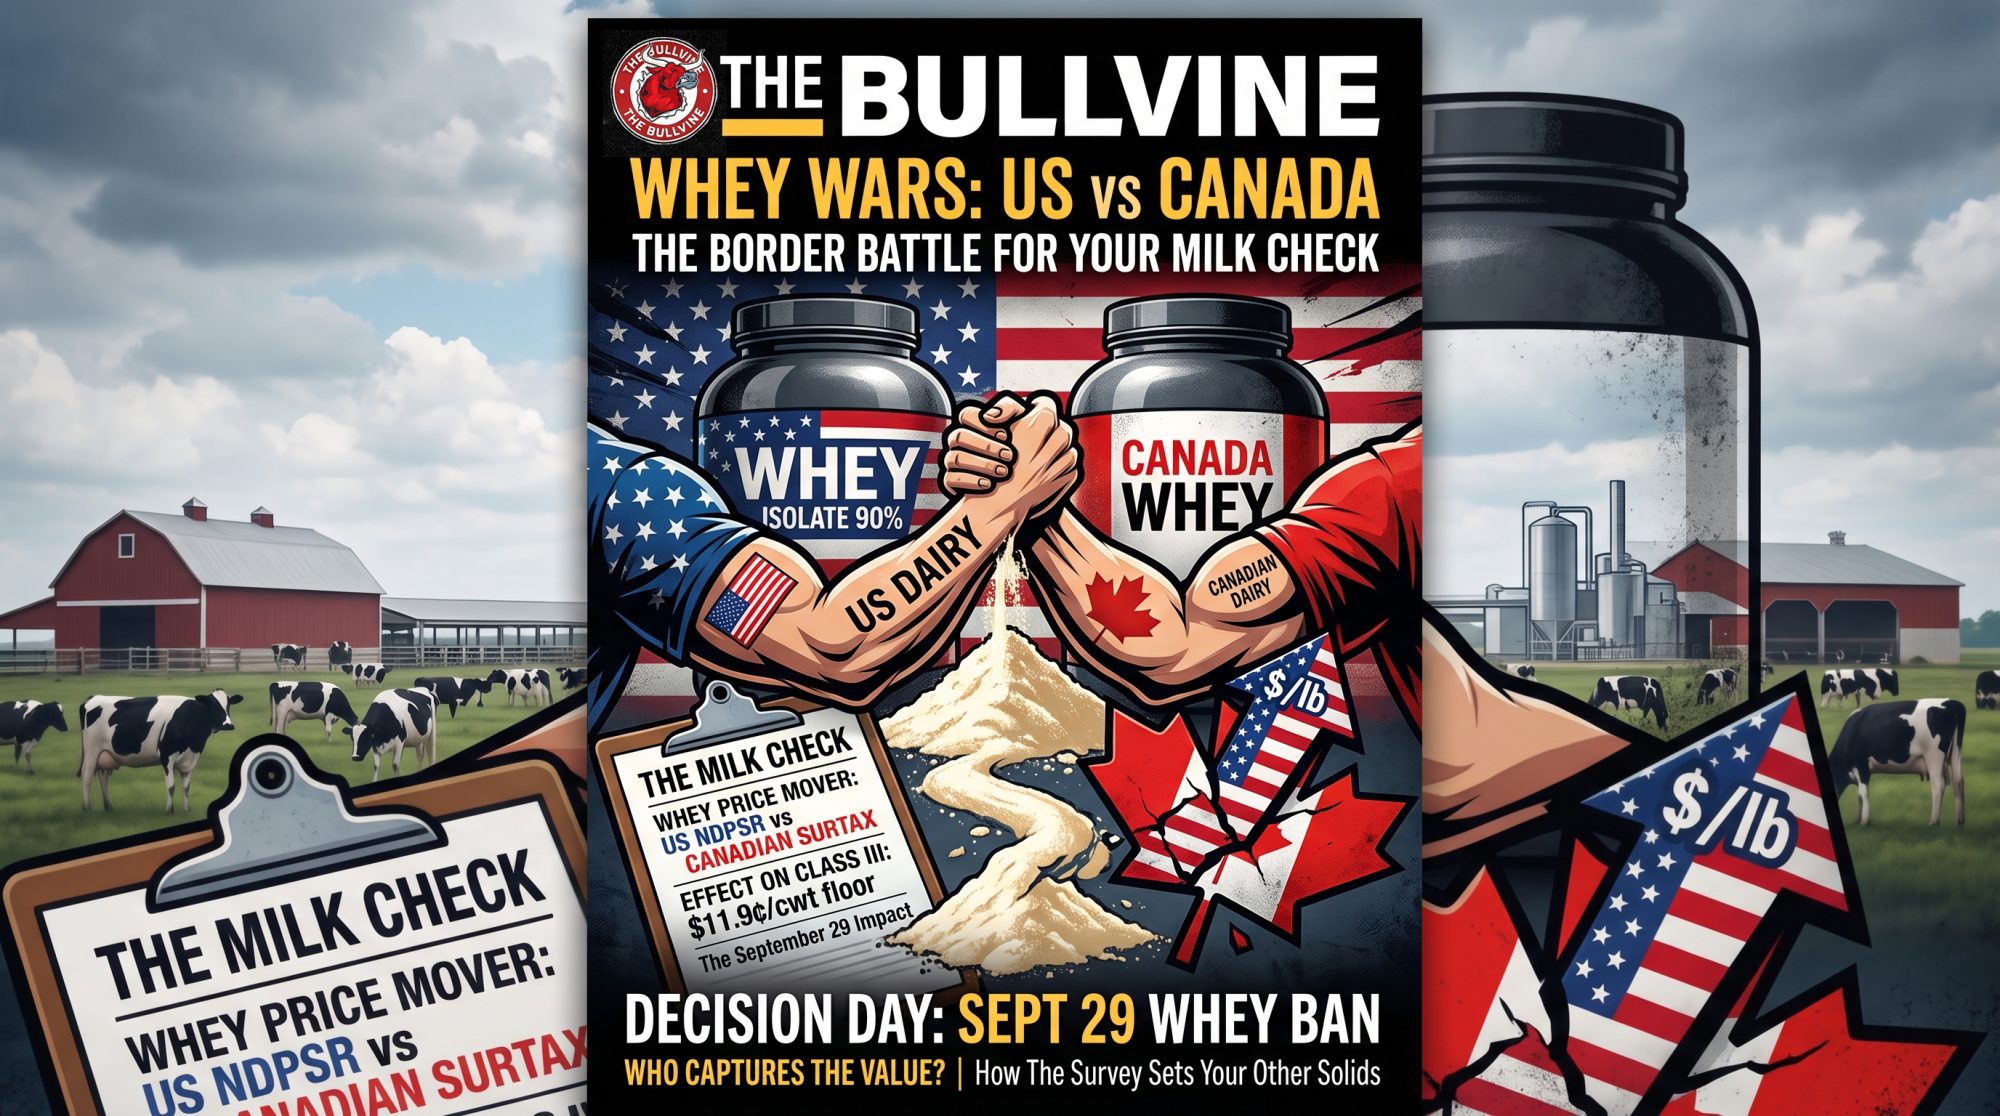
Twelve companies reported 8.2 million pounds of dry whey last week. That survey — not the CME — sets your other-solids line. Eight Canadian lines close Sept. 29. Our floor case: 11.9¢/cwt.

Canada whey import ban

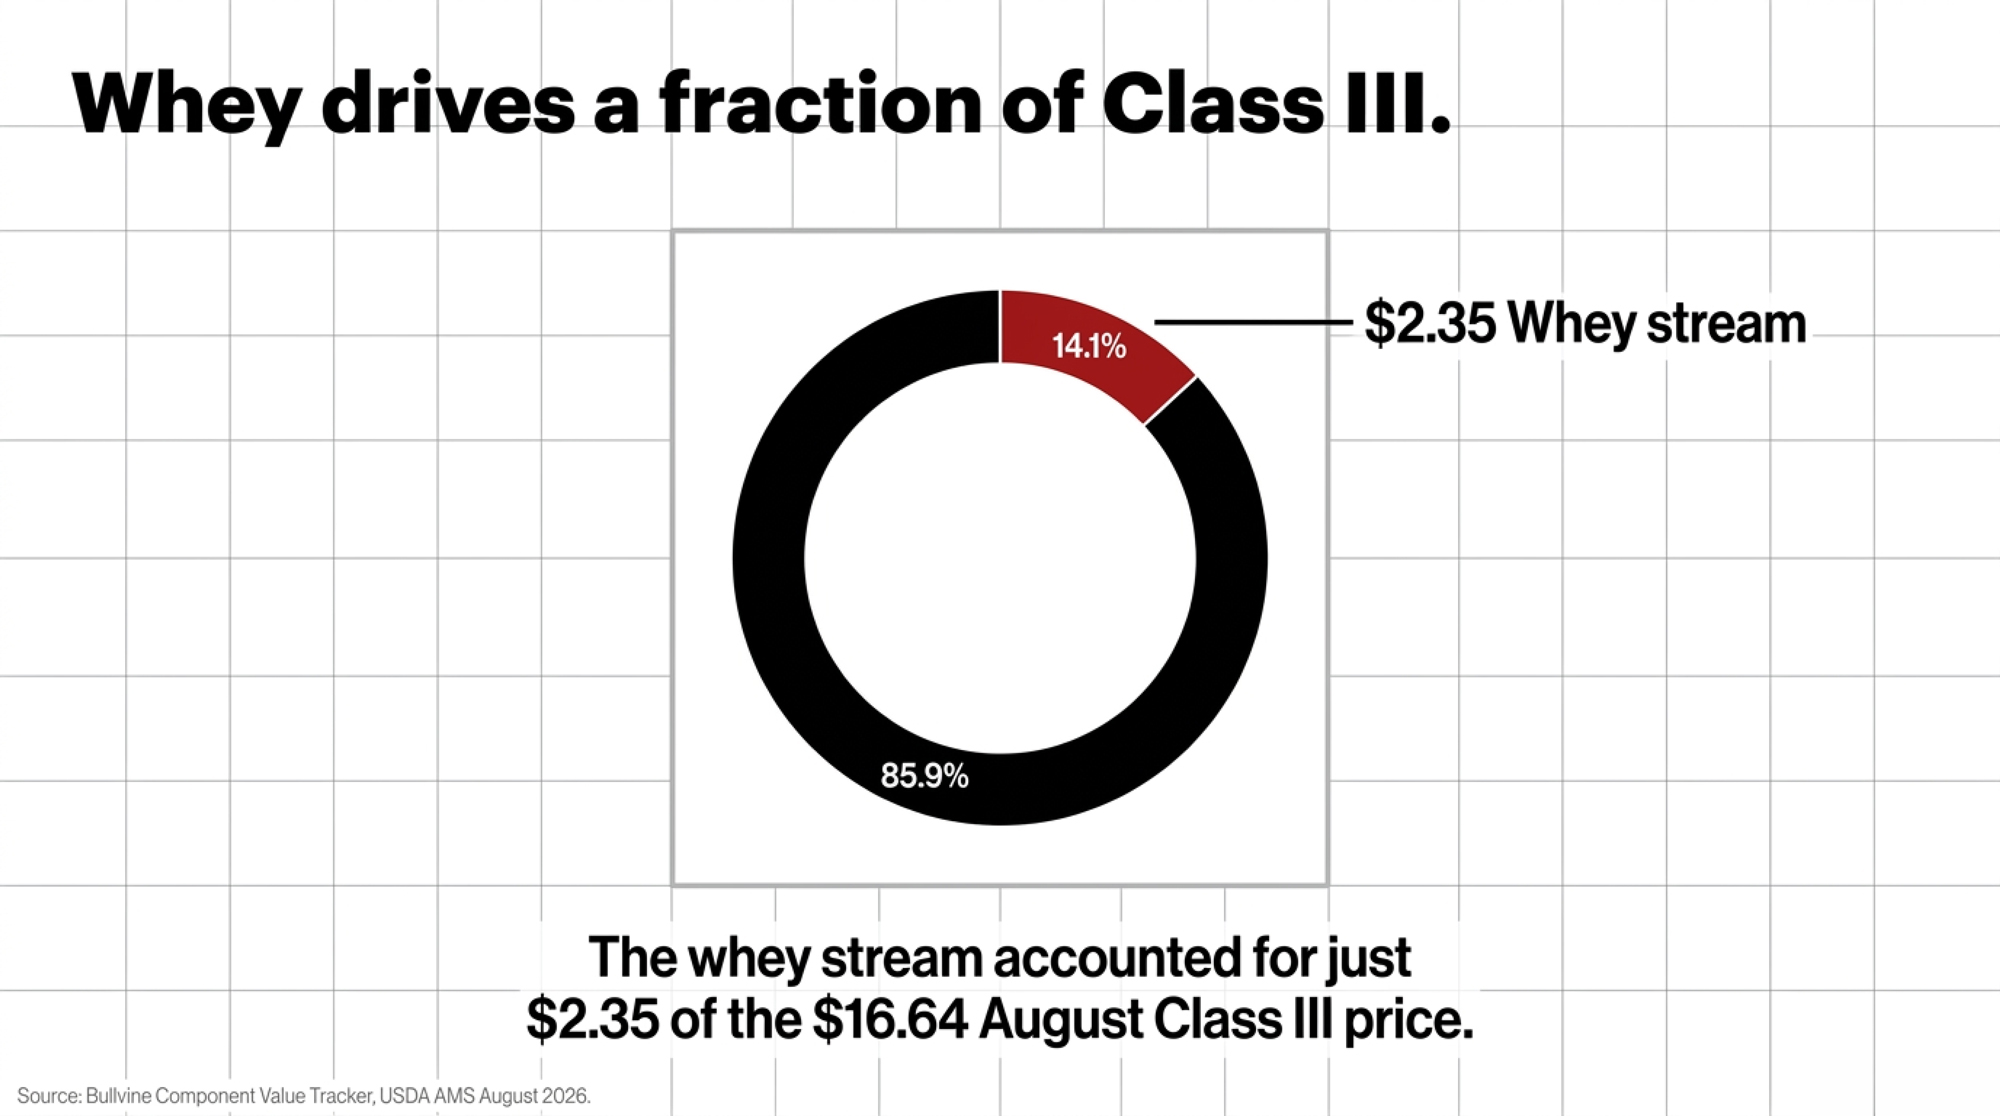
The Canada whey import ban 2026 excludes eight Canadian whey and modified-whey HTSUS lines under Proclamation 11062, effective 12:01 a.m. Eastern on September 29, closing a channel that carried $35.04 million in 2025. USDA’s formula moves Class III 5.96 cents for every penny of dry whey, and Bullvine’s Component Value Tracker isolates the whey stream at $2.35 of the $16.64 August Class III price — 14.1%. Across three substitution cases, the Q4 range runs 11.9 to 59.6 cents per hundredweight, $2,802 to $14,014 on a 400-cow model. Herds in the four skim-fat orders have no other-solids line to read. Substitution behavior remains unmodeled.

Eight tariff lines, $35.04 million of 2025 trade, one USDA survey covering 8.2 million pounds a week across twelve reporting companies. That’s the whole path from the Oval Office to your milk check.

President Trump signed Proclamation 11062 on September 8, 2026. The Office of the Federal Register published it on September 14 as FR Doc. 2026-18836, Volume 91, Number 176, pages 58319–58323. It excludes certain Canadian products from importation into the United States, effective for goods imported on or after 12:01 a.m. Eastern Time on September 29, 2026.

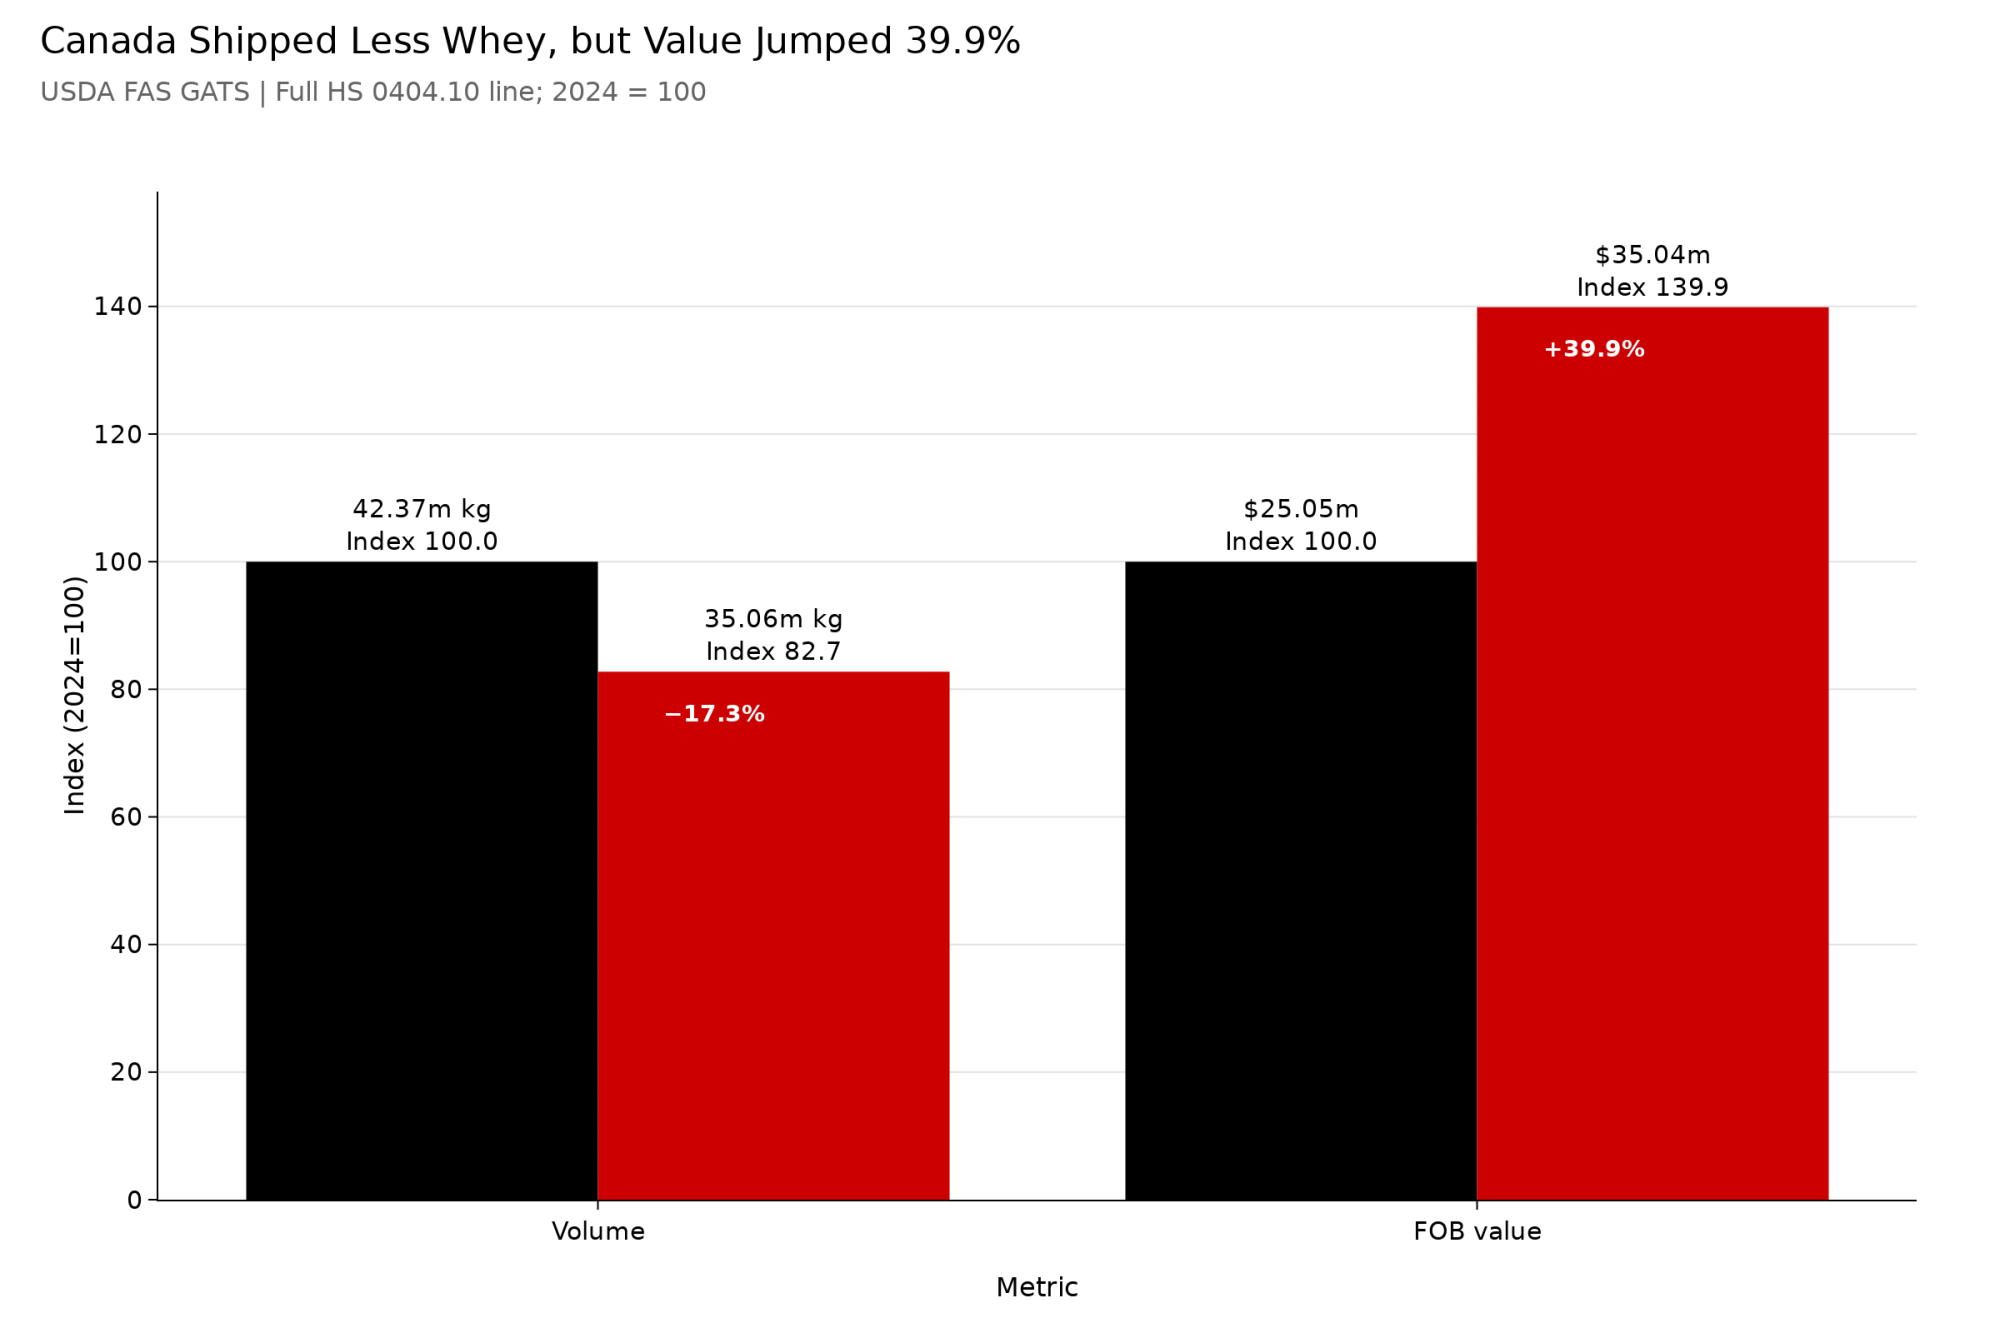
This is the first U.S. dairy action this cycle aimed at one component stream rather than a duty rate. Canada shipped $35.04 million FOB of HS 0404.10 whey and modified whey to the United States in calendar 2025, on 35.06 million kilograms, per USDA Foreign Agricultural Service GATS, which sources U.S. import records from the U.S. Census Bureau. The 2024 comparison was $25.05 million on 42.37 million kilograms, so value rose $9.99 million, or 39.9%, while volume fell 7.31 million kilograms, or 17.3%.

That $35.04 million covers the full HS 0404.10 line. The prohibition covers eight eight-digit classifications inside it, so the excluded subtotal is a portion of that figure rather than all of it.

The document sets no whey price, names no processor, and obliges nobody to pass a cent to a farm.

What does the Canada whey import ban 2026 actually cover?

Annex I lists HTSUS 0404.10.05 (whey protein concentrates), 0404.10.08, 0404.10.11 and 0404.10.15 (modified whey), 0404.10.20 (fluid whey), and 0404.10.48, 0404.10.50 and 0404.10.90 (dried whey). Certain invert and cane molasses ride in the same proclamation, along with non-alcoholic beer under HTSUS 2202.91.00, and neither is a dairy line.

Whey protein isolate normally entering under HTSUS heading 3502.20 is not listed. The U.S. Dairy Export Council, the export promotion body funded through Dairy Management Inc., told the U.S. International Trade Commission in Section 332 prehearing testimony dated July 15, 2025 that HS 0404.10 generally captures dry whey, permeates, and lower-protein concentrates, while high-protein products commonly classify under 3502.20. Check the annex against what your plant competes with before assuming coverage.

The chronology matters for anyone holding Canadian product. Proclamation 11047 of July 20, 2026 imposed additional 50% ad valorem duties on certain Canadian dairy products effective August 19. Proclamation 11056 of August 18 suspended the duties for three days after Canada expressed a commitment to remove the measures at issue. Proclamation 11062 recites that Canada reneged on that commitment on August 21. The suspension lapsed at 12:01 a.m. Eastern on August 22, and the duties took effect.

Proclamation 11062 builds on that duty rather than replacing it. Paragraph 2 provides that products subject to the ban which were imported but not yet entered for consumption, or withdrawn from warehouse for consumption, before September 29 remain subject to the 50% duty rate established by Proclamation 11047.

There is a companion document, and it’s the one to read if you buy Canadian inputs. Paragraph 3 of Proclamation 11062 points to a separate Proclamation of September 8, 2026 — Modifying the Scope of Products of Canada Subject to the Additional Duties Imposed to Offset Canadian Discrimination Against the Commerce of the United States With Respect to Dairy. Two scope-modification proclamations were published in the same Federal Register issue, FR Docs 2026-18838 and 2026-18839, covering alcoholic beverages and motor vehicles; the second took effect at 12:01 a.m. Eastern on September 15. Bullvine did not locate the dairy scope proclamation in that issue. Until it surfaces, the annex setting which Canadian dairy inputs carry the 50% duty is a document nobody outside the administration has read.

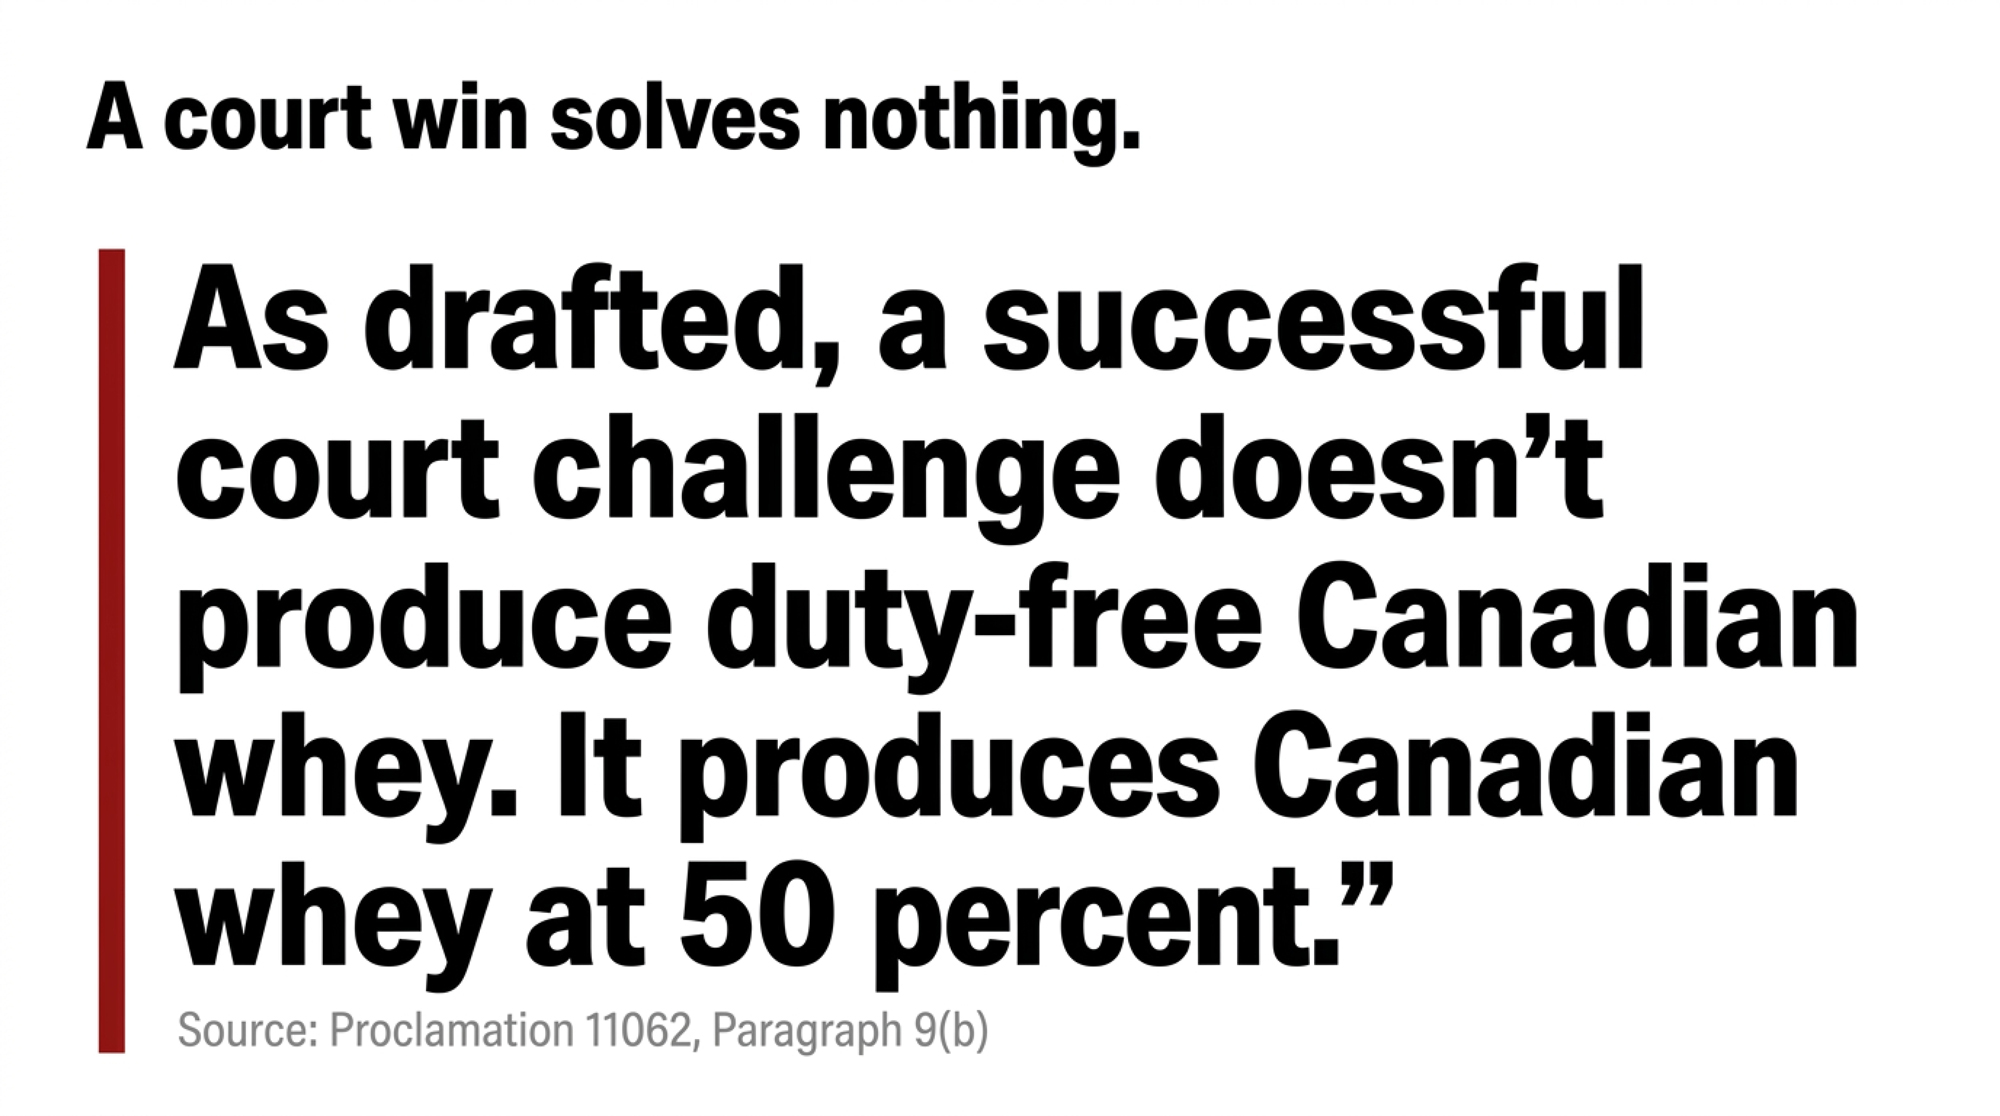
One clause deserves attention before anyone assumes litigation solves this. Paragraph 9(b) provides that if the import ban is invalidated in whole or in part as to any import, the 50% duty imposed in Proclamation 11047 applies to that import instead. As drafted, a successful court challenge doesn’t produce duty-free Canadian whey. It produces Canadian whey at 50%.

Paragraph 5 authorizes the CBP Commissioner, in consultation with Treasury, Commerce, and USTR, to issue rules and guidance. Paragraph 6 authorizes the Commissioner to make any technical or ministerial correction to the Annex through Federal Register notice so that the eight-line list can move. CBP issued CSMS #69851916 on September 11 covering the alcohol and motor vehicle scope changes. No CBP guidance specific to the dairy import ban had been located as of 1:30 p.m. Eastern Time on September 14, which leaves in-transit handling, foreign-trade-zone treatment, and entry mechanics open with 15 days to run. No legal challenge to the Section 338 dairy actions had been located as of the same check.

Which whey price actually lands in your milk check?

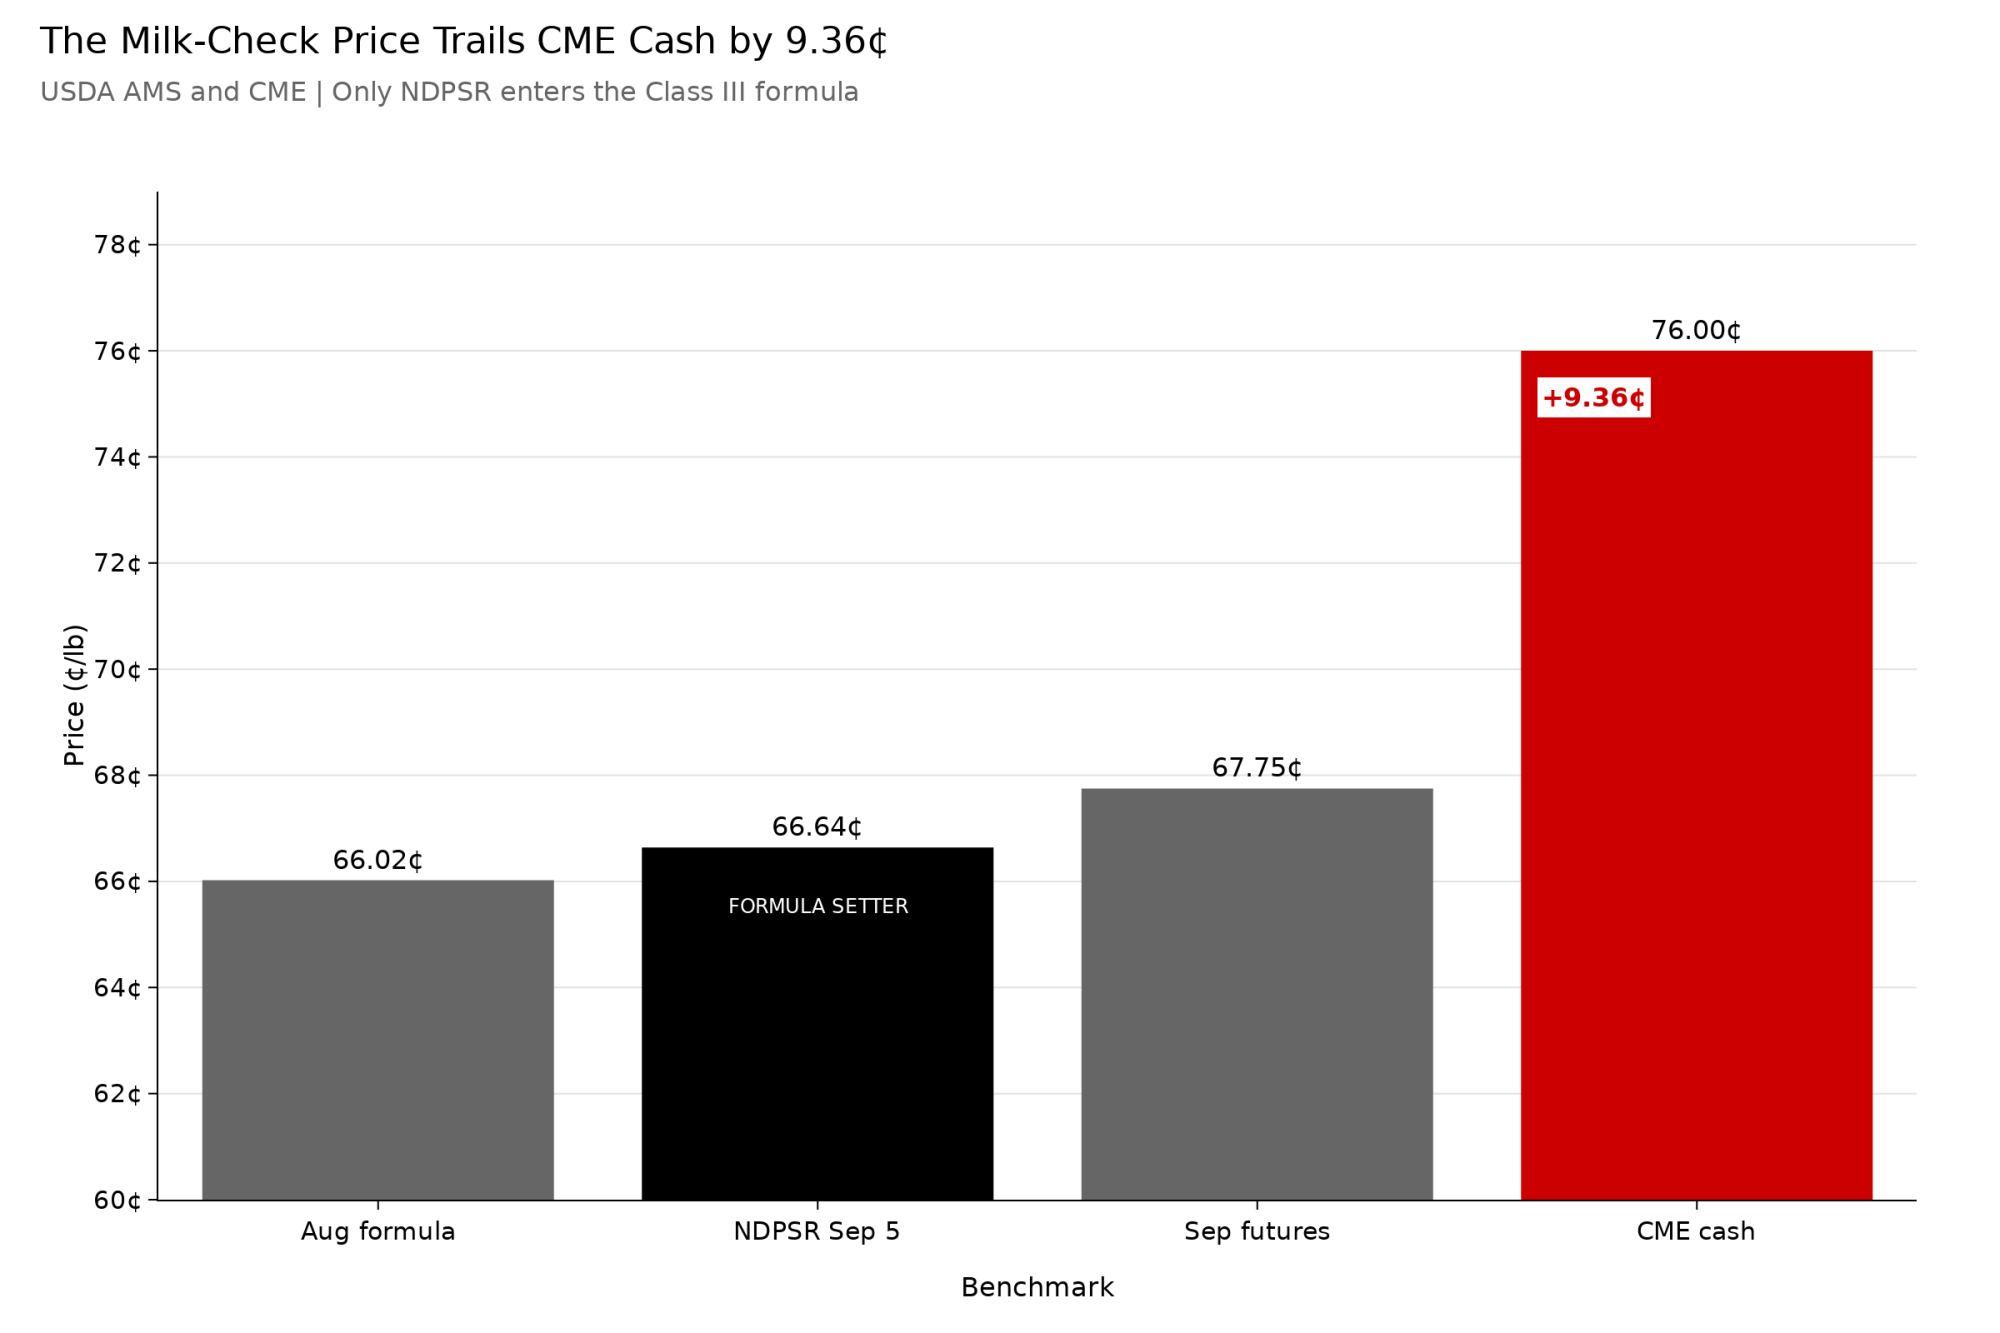
Three whey numbers printed in the same week, spread across more than nine cents. One of them touches the Class III formula.

Whey metric / benchmarkLevelMechanism and function
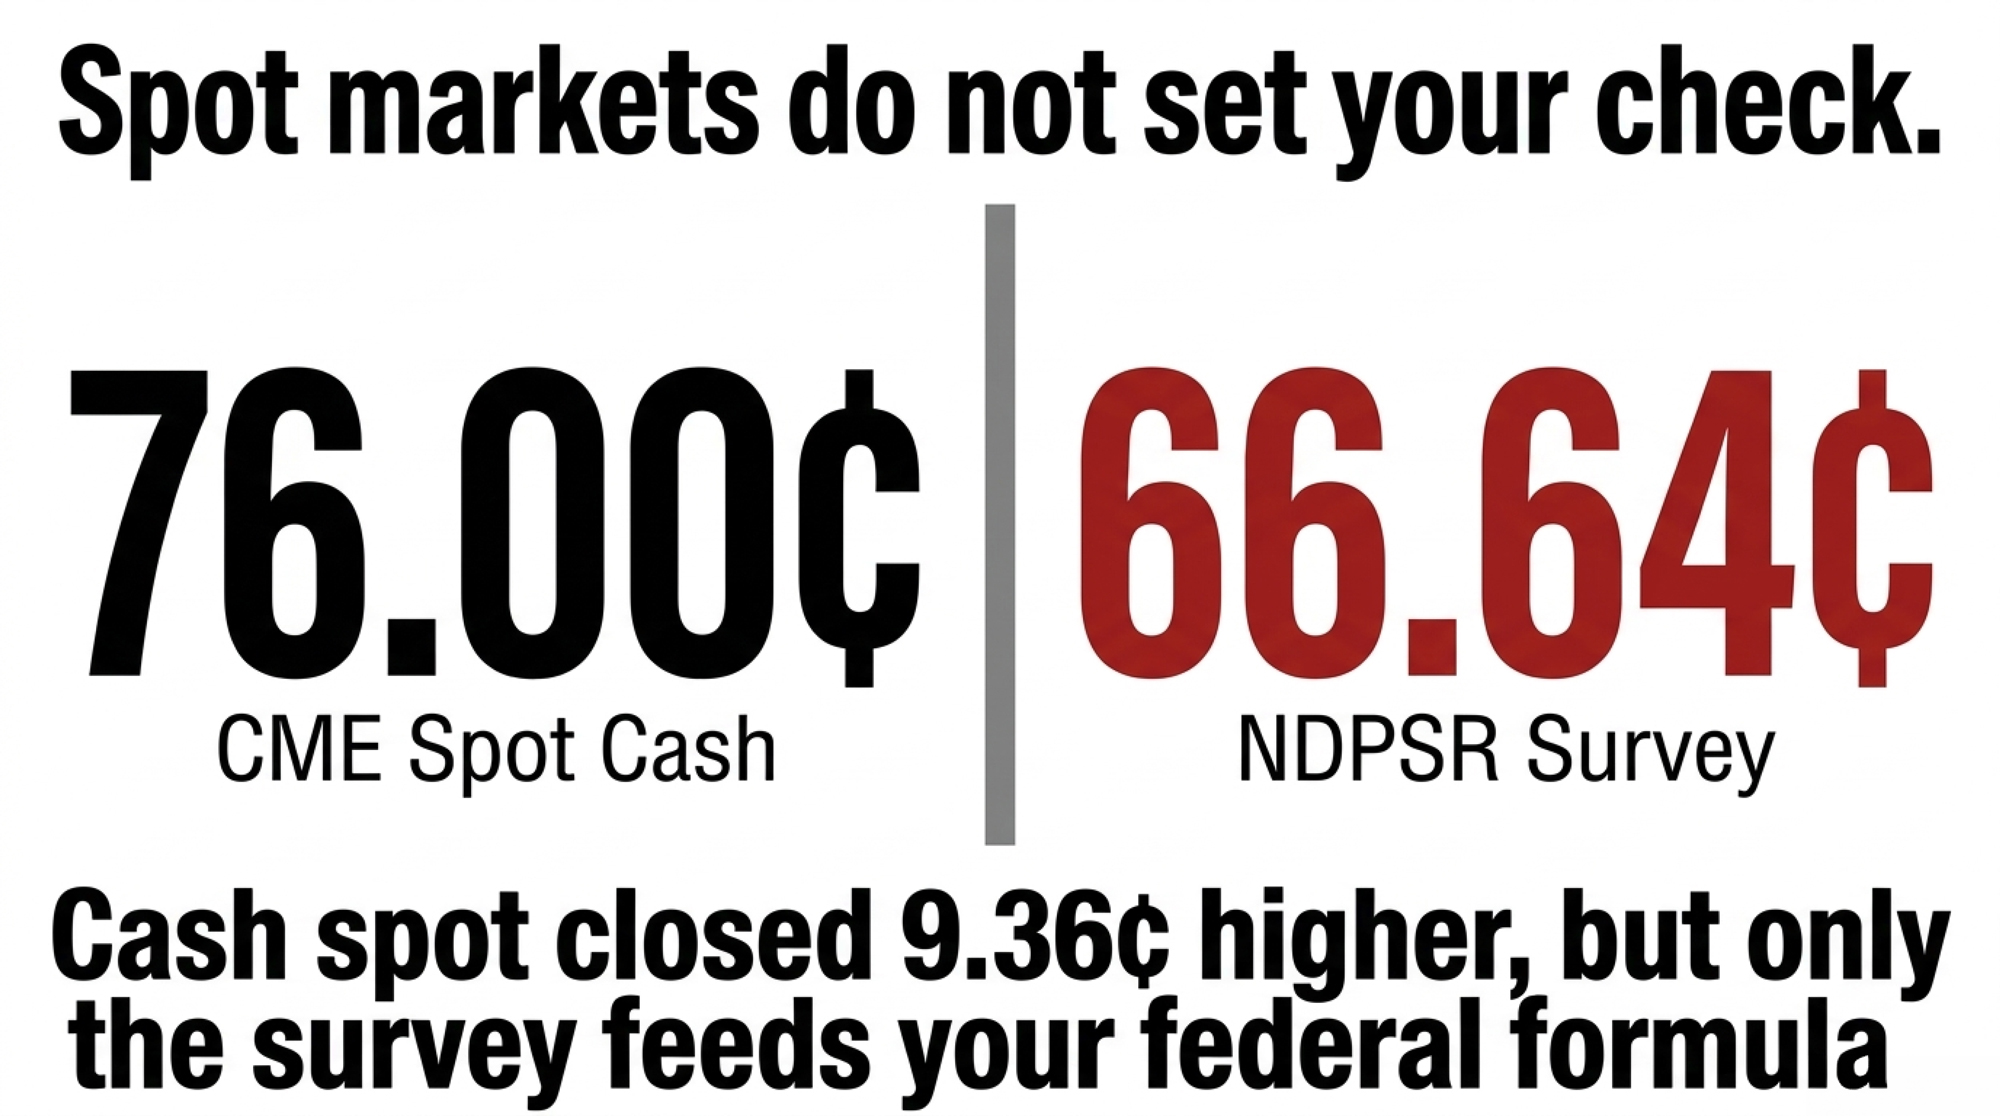
USDA NDPSR weighted average, U.S. national, week ending Sept 5, 202666.64¢/lbFormula survey used directly in FMMO Class III pricing
CME dry whey futures, September contract, Sept 10, 2026 close67.75¢/lbForward risk-transfer contract; not a settled class price
CME cash spot dry whey, Sept 11, 2026 close76.00¢/lbSpot cash exchange on light trading; 9.36¢ over NDPSR

Sources: USDA Agricultural Marketing Service, National Dairy Products Sales Report released September 10, 2026, U.S. national; USDA AMS Dairy Market News Weekly Report, Volume 93 Report 37, week of September 7–11, 2026.

USDA’s own market contacts flagged the gap. Central-region contacts told Dairy Market News that “while CME prices for dry whey have been trending higher, these movements are not reflective of broader market conditions.” Eastern contacts described CME spot trading as light. The cash market closed 9.36 cents above the survey that sets your other-solids price and 8.25 cents above the September futures contract.

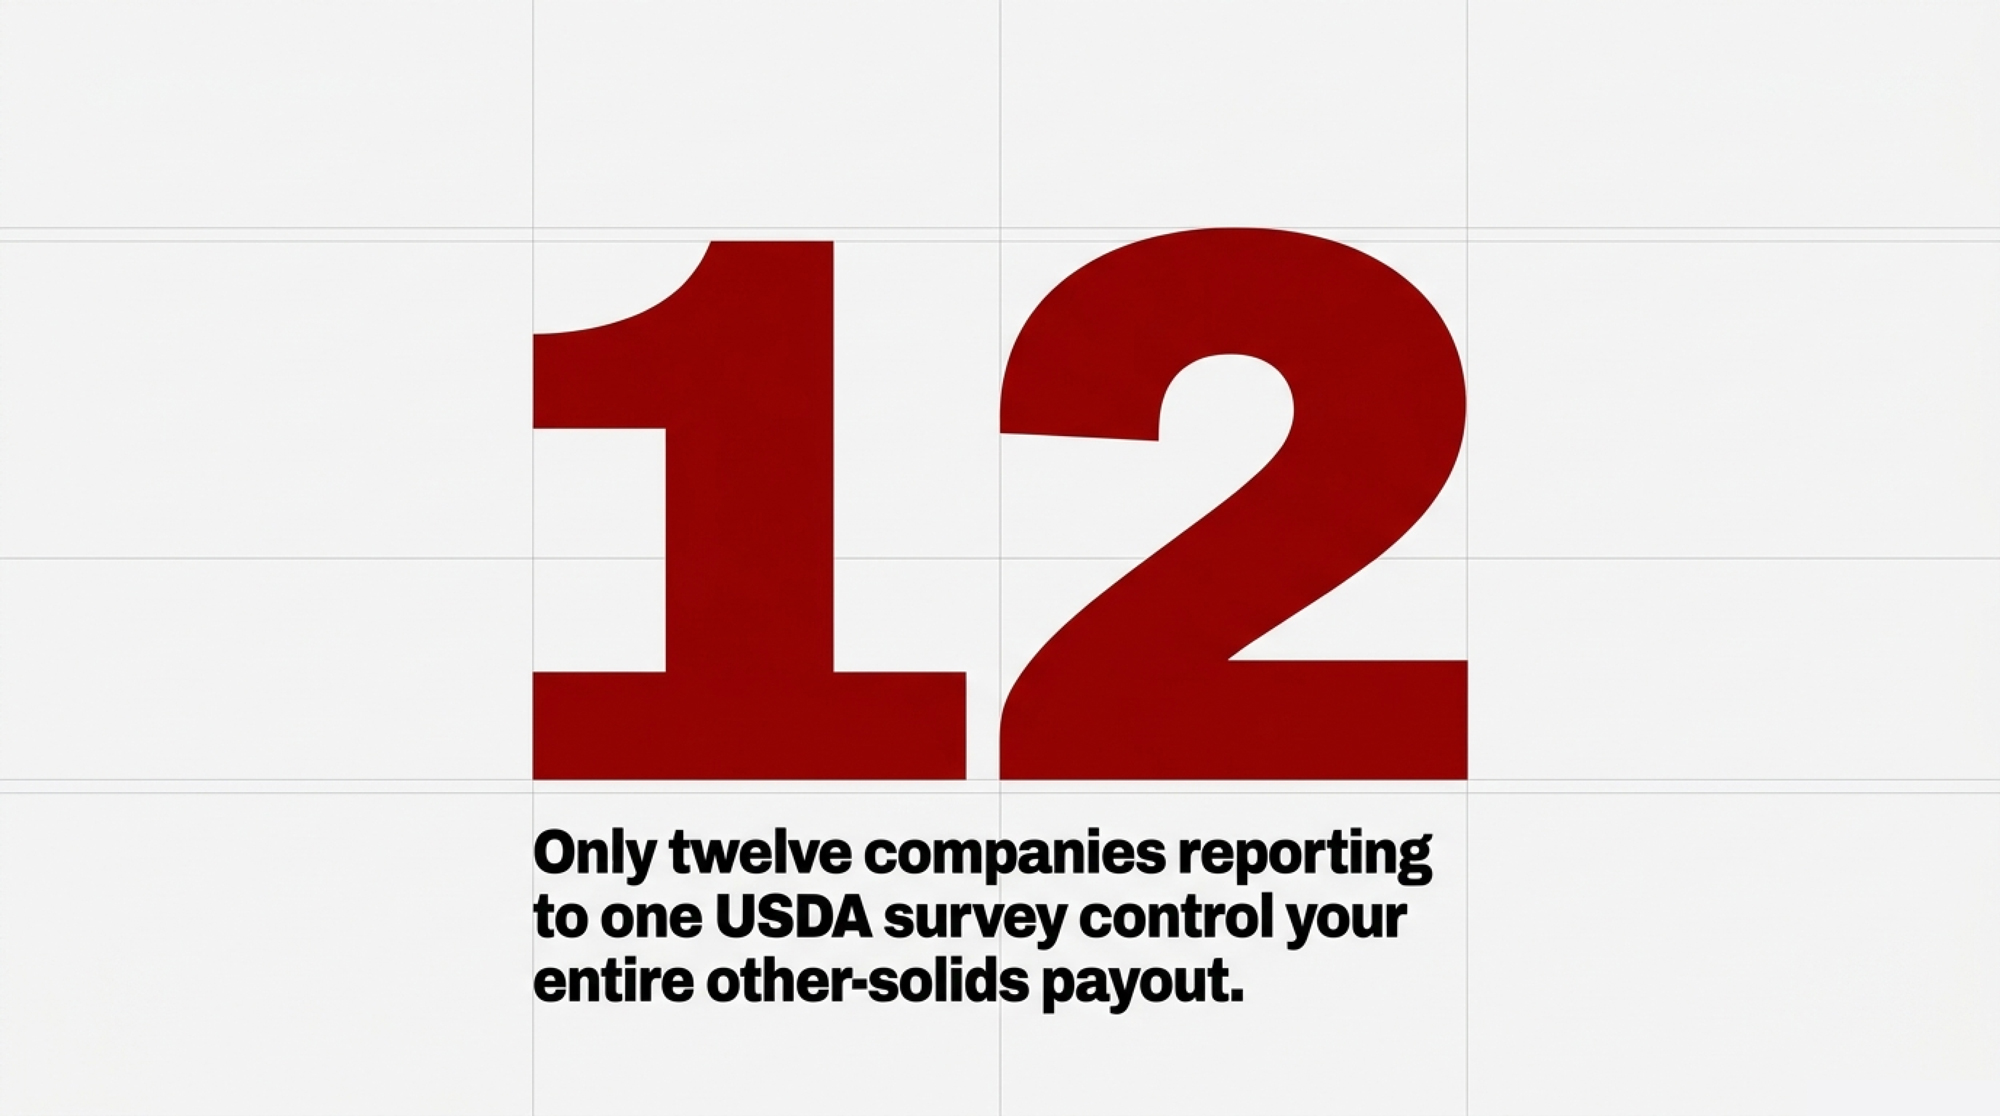
The survey is narrow by design. USDA’s September 2 release recorded 12 entities reporting dry whey, and the September 10 release covered 8,220,923 pounds of qualifying Extra Grade sales for the week ending September 5. Manufacturers selling under 1 million pounds a year are exempt under 7 CFR Part 1170.

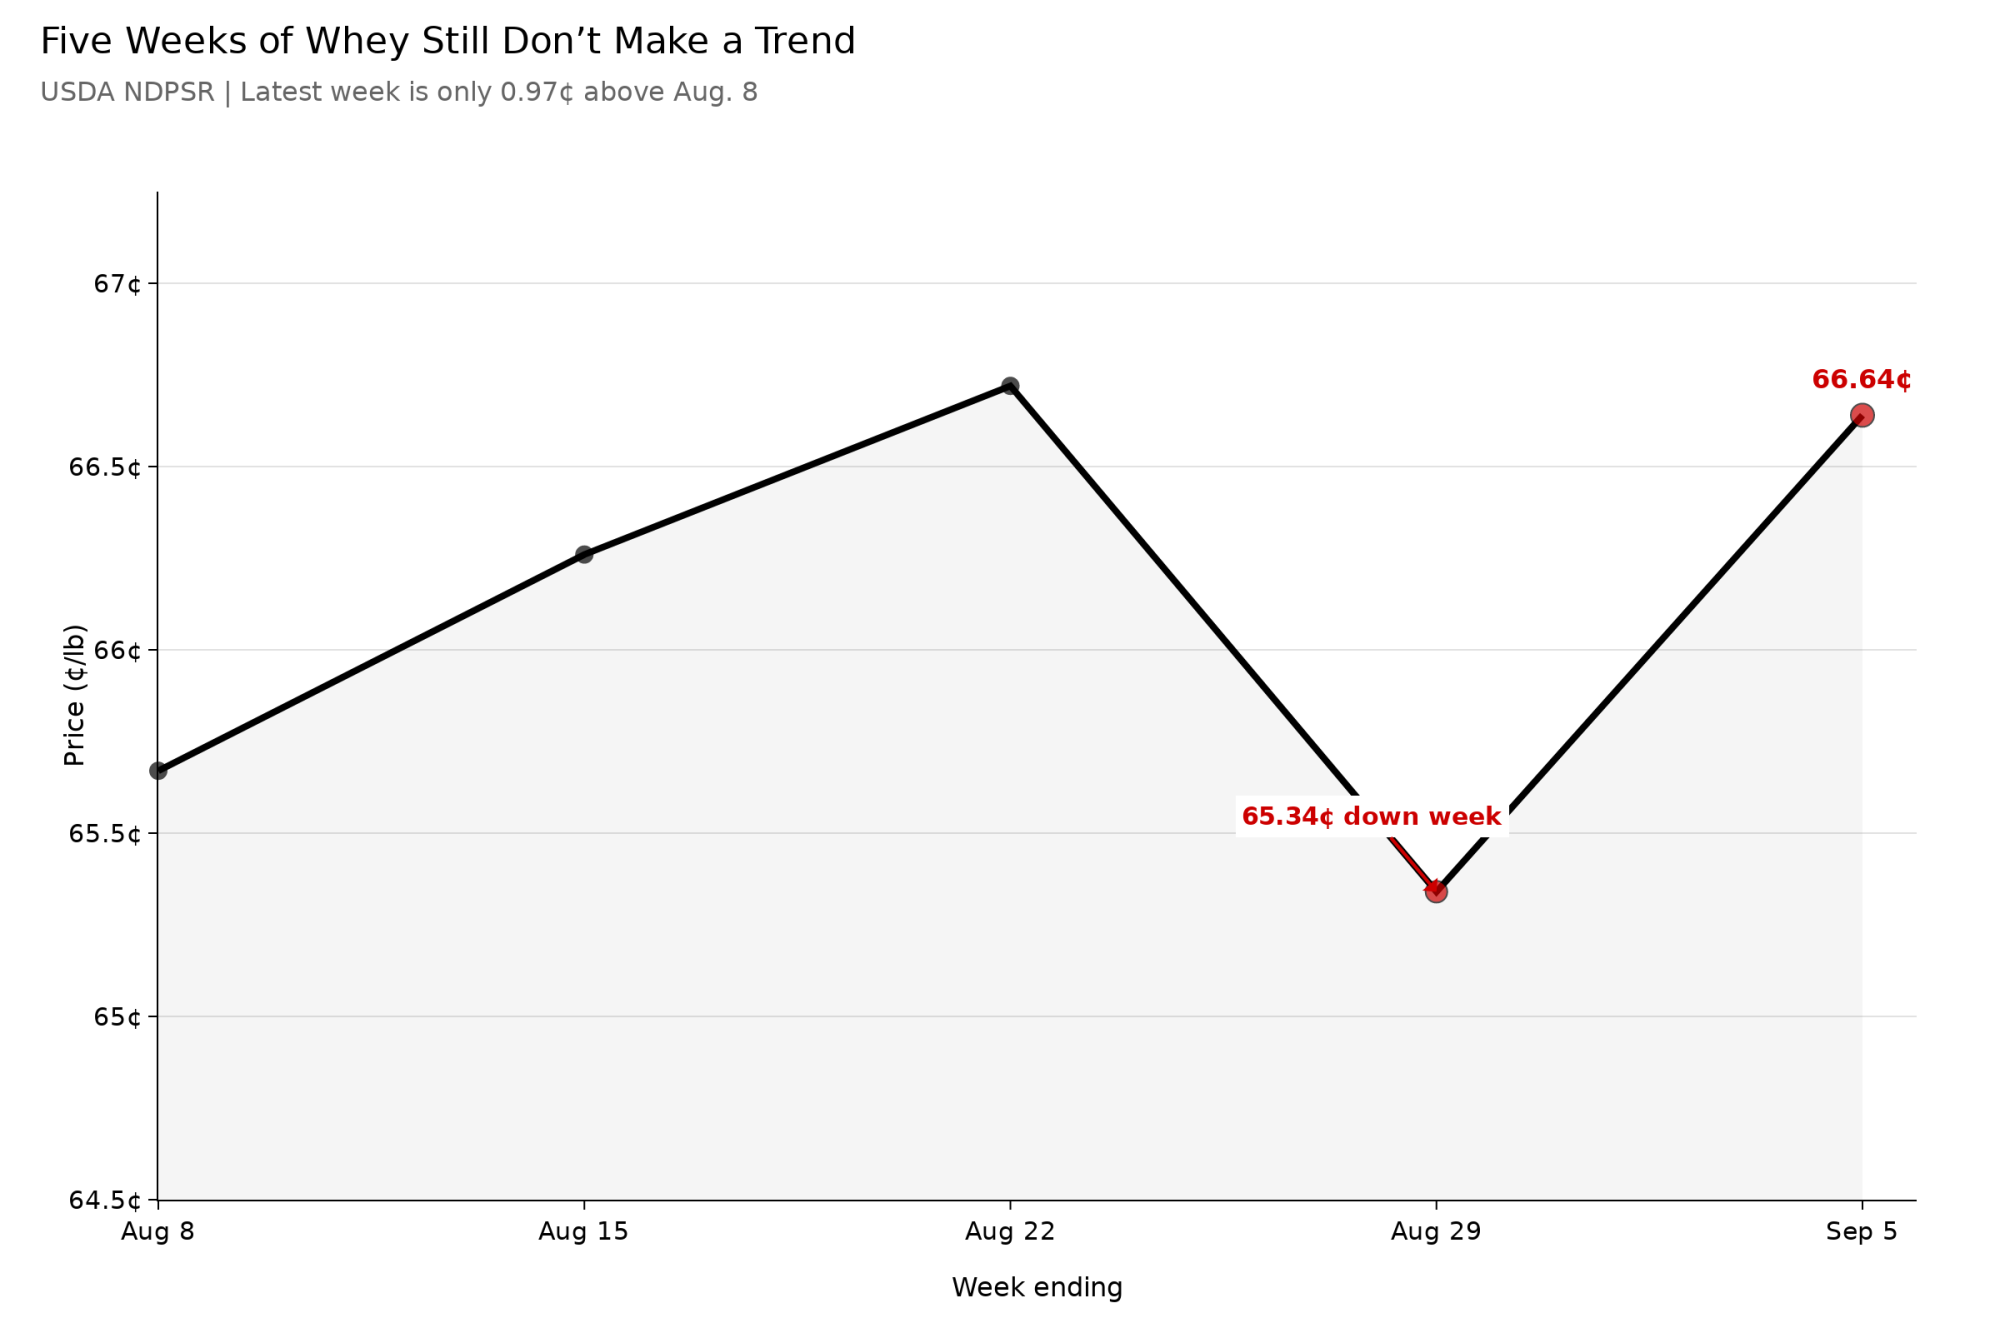
Five weeks of that survey read 65.67¢, 66.26¢, 66.72¢, 65.34¢ and 66.64¢. Up 0.97 cents, or 1.5%, with a down week inside it. Four consecutive moves in one direction make a trend, and this isn’t one.

Running the Numbers

Bullvine calculation — Component Value Tracker reading, whey stream inside Class III

Published evidence. USDA Agricultural Marketing Service announced August 2026 Class III at $16.64/cwt, dry whey at $0.6602/lb and other solids at $0.4052/lb for the U.S. Federal Milk Marketing Orders. The formula is Other Solids Price = (Dry Whey − 0.2668) × 1.03, with 6.0 pounds of other solids in the Class III skim value and a 0.965 conversion.

Bullvine math — the whey stream’s share of the August price:

(0.6602 − 0.2668) × 1.03 × 6.0 × 0.965 = $2.35/cwt, which is 14.1% of $16.64.

Bullvine math — the sensitivity:

1¢/lb on dry whey × 1.03 × 6.0 × 0.965 = 5.96¢/cwt on Class III, cheese and butterfat held constant.

Stated assumptions. Three cases. The replacement shares and the price moves are Bullvine stress assumptions, not forecasts, and every dollar figure is rounded down.

ScenarioCanadian supply replacedDry whey moveClass III impactQ4 gross value, 400-cow model
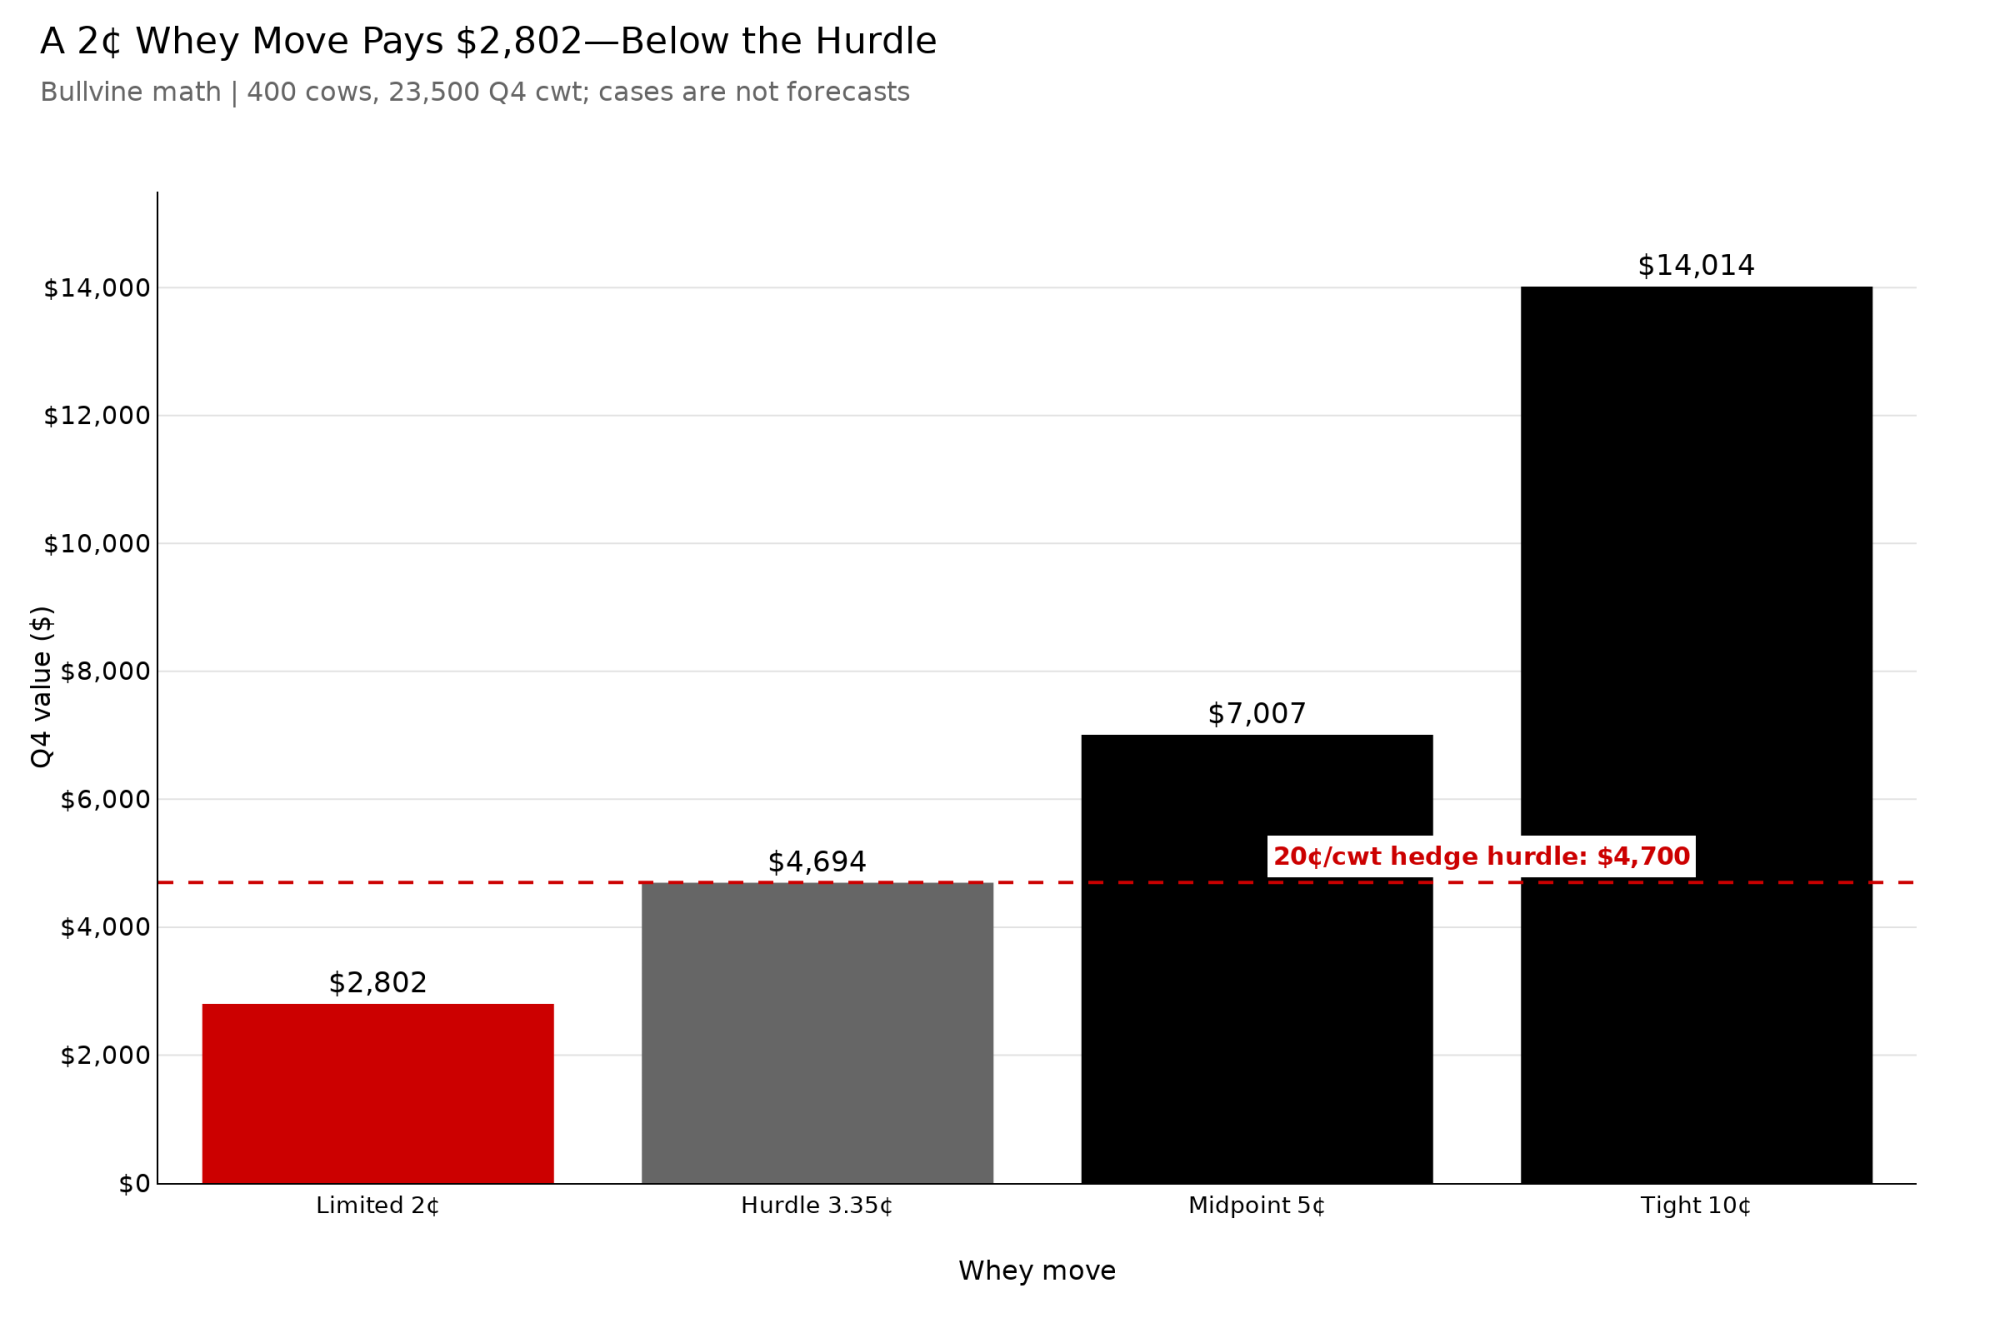
Limited transmission75% from other origins or stocks+2¢/lb+$0.119/cwt+$2,802
Midpoint sensitivity50% replaced+5¢/lb+$0.298/cwt+$7,007
Tight substitution25% replaced, severe deficit+10¢/lb+$0.596/cwt+$14,014

Scope. 400 cows, 235 cwt shipped per cow per year, Q4 volume 400 × 235 ÷ 4 = 23,500 cwt, USD, U.S. national formula basis. Gross Class III-equivalent value before PPD, basis, utilization, over-order premiums, hauling, and contract pass-through.

Who actually captures it? Seven federal orders use multiple-component pricing and four use skim-fat pricing. In a skim-fat order, there’s no other-solids line on your statement to read, because the whey value arrives inside the skim price, and you’ll need the plant to show you where it went. A herd already locked into a fixed-price Q4 contract captures none of this, whatever the whey market does. On a leveraged balance sheet, $7,007 of Q4 upside is a covenant conversation rather than a windfall.

Methodology note 1 — the utilization disconnect

USDA reported Class III at 58% of all-market utilization for July 2026, on 12.8 billion pounds of federally pooled producer milk, with a weighted average statistical uniform price of $19.18/cwt.

The other 42% was pooled under Class I, II, and IV formulas, none of which carries an other-solids line. For those producers, the dry whey mover reaches the check through the pool and the uniform price rather than as a component payment.

Class I is the exception, and it doesn’t apply this month. The base Class I skim price takes the higher of the advanced Class III or Class IV skim pricing factor, and the Class III factor is built partly on other solids. For September 2026, USDA put the advanced Class III skim factor at $11.76, and the Class IV factor at $12.16, so Class IV is the mover and whey isn’t feeding Class I at all. Flip those two, and it does.

Methodology note 2 — the high-protein creaming effect

U.S. whey protein concentrate production at 25.0 to 89.9% protein ran 40.128 million pounds in July 2026, with manufacturer stocks of 45.198 million pounds, per USDA National Agricultural Statistics Service, Dairy Products, released September 3, 2026.

The problem is where that stream goes. Dairy Market News contacts in the East reported processors “directing whey streams toward higher-protein derivatives, particularly WPC 80%, keeping traditional dry whey output secondary,” while Western contacts said availability is not improving because of competition from higher-value whey products. Some production has shifted from WPC 80% toward whey protein isolate, and contacts expect more of that in Q4.

Look at the gap driving it. In the week of September 7–11, national ranges ran WPC 34% at $2.05 to $2.90 per pound, WPC 80% in the low-to-mid $11s to mid-$12s, and WPI from $14 to the mid-to-upper $14s. Our read: a commodity dry whey price in the 60s isn’t pulling solids back from returns like that, which means a stronger survey price won’t automatically produce more of the product USDA surveys. It’s the same wedge we traced in April, when $11/lb whey showed up as 69¢ on the milk check.

Methodology note 3 — the weight-equivalence trap

Canada’s 2025 shipments equal roughly 77.3 million pounds across all of HS 0404.10, or about 6.4 million pounds a month.

That total mixes WPC, modified whey, fluid whey, and dried whey. It cannot be set one-for-one against Extra Grade dry whey powder, and it cannot enter a dry-whey formula pound for pound. Anyone dividing 77.3 million pounds into U.S. production to get a percentage is comparing two different products.

What breaks this

Substitution behavior is the largest uncertainty and it is not modeled. If buyers requalify European or Oceania suppliers, draw on the 45.198 million pounds of WPC stocks, or reformulate onto milk protein concentrate, residual demand on U.S. dry whey shrinks toward zero. No public dataset establishes an elasticity between a covered Canadian classification and the NDPSR survey price. Western manufacturers told Dairy Market News that evolving global trade conditions “are not expected to affect current fourth-quarter contracts.”

What does the three-stage ledger actually add up to?

It doesn’t add up, and that’s the finding. Three Bullvine numbers now sit on one page measuring three different things on two different bases, and summing them would be wrong.

In August, this publication priced the whole access fight at a nickel — roughly 5¢/cwt, about $1,175 on the 400-cow Q4 model. Unresolved opportunity, not a booked loss.

On September 8, we put the retaliation exposure at $51 to $90 a cow annually, based on 256 cwt shipped per cow per year. On the 235 cwt basis used throughout this piece, the same $0.20–$0.35/cwt range gives $47–$82 per cow, or $4,700–$8,225 across 23,500 Q4 cwt.

Leonard Polzin, dairy markets and policy outreach specialist at the University of Wisconsin–Madison Division of Extension, published that $0.20–$0.35/cwt anchor the same day for a sustained Canada-only action, inside a wider $0.10–$0.50 planning range, and flagged the anchor as possibly high. His framing carries: the two actions pull U.S. prices in opposite directions, and the net is not determined.

Canada’s United States Surtax Order (2026), P.C. 2026-0785 of September 4, applies 50% to listed U.S. whey, milk-protein, and powder classifications and 25% to listed cheese lines, in force since September 8. Canada’s Department of Finance announced the measures on August 25, framing them as covering $27.6 billion in U.S. imports to match the American tariffs on an equivalent value of Canadian goods. A co-op selling whey ingredients north pays the surtax on those classifications while its domestic ingredient desk may see the opposite effect.

The administration’s position is on the record. U.S. Trade Representative Jamieson Greer issued a statement on September 8 framing the action as a response to Canada’s continued retaliation. Section 338 of the Tariff Act of 1930 caps additional duties at 50% ad valorem and separately authorizes the President to exclude articles from importation where the discrimination is maintained or increased — the two-step this package follows.

IDFA, which represents dairy processors and ingredient manufacturers, took a different line the next day. “In response to the President’s Executive Order banning whey and modified whey imports from Canada effective Sept. 29th, IDFA reiterates its strong support for resolving long-standing U.S. dairy trade concerns through meaningful negotiations,” the association said. One technical note: the controlling instrument is a presidential proclamation, not an executive order, which matters to anyone tracking the legal authority or the litigation risk.

NMPF, which represents dairy cooperatives and their farmer members, supported the July 20 decision to impose the 50% dairy duties. No NMPF statement specific to Proclamation 11062 had been located as of midday September 14.

The asymmetry drives the decision. Canada’s surtax is in force and working on U.S. export returns now, while the September 29 offset is not in force, not measured, and conditional on substitution, survey transmission, and plant-level pass-through.

The 90-Day Playbook for Herds Shipping Class III Milk

This week

  • Ask your customs broker to locate the September 8 dairy scope-modification proclamation if your co-op buys any Canadian dairy input. It’s referenced in paragraph 3 of 11062 and was not published alongside the alcohol and motor-vehicle versions on September 14. Trigger: any Canadian dairy input on the purchase ledger. Backfire: it’s a duty document, not a ban document — don’t conflate the instruments or their dates.

Next 30 days

  • Identify your order type. Multiple-component pricing means an itemized “other solids” line on your statement. Skim-fat pricing means the whey value is submerged inside the skim price and only the plant can show you where it went. Trigger: if you can’t find the line, the co-op call moves to the top. Backfire: a plant premium can mask a weak pooled price — read the total.
  • Put the question straight to your director. Does our plant sell Extra Grade dry whey into the NDPSR survey, or does our whey stream go into WPC, isolate, or permeate that the survey never sees? Trigger: “stronger whey markets are good for members” is a non-answer — credit the ban at zero and escalate. Backfire: ask for the payment mechanism, not customer contracts.
  • Price your Q4 basis against the strip. CME Class III futures closed at $16.14 for October and $16.40 for November on September 10, 2026, with dry whey futures at 69.00¢ and 71.475¢ for the same months, per USDA AMS Dairy Market News. Trigger: break-even above the strip plus your basis means the decision is about the floor, not the ban. Backfire: futures are not the announced class price.

90 days

  • Run the hedge threshold on your own numbers. If an option-based floor costs 20¢/cwt more than a fixed-price sale, the required move is 0.20 ÷ (1.03 × 6.0 × 0.965) = 3.35¢/lb of dry whey. Trigger: the 2¢ case doesn’t clear it; the 5¢ case does. Backfire: basis and PPD can absorb the whole modeled gain.
  • Get the patronage and equity-redemption policy in writing. Written request to the board secretary. Trigger:if you hold allocated equity and can’t state the redemption schedule, that number is bigger than 30 cents per hundredweight. Backfire: balance-sheet value is a legitimate answer — make them say so explicitly.

Budget rule and 365-day watch

  • Pencil in $0.00. Do not raise Q4 forward margin projections until the NDPSR dry whey survey prints four consecutive weekly gains. One week is noise; the five weeks to September 5 included a down week.
  • Watch the volume line, not just the price. Opportunity signal: qualifying sales dropping below the 7.25–9.79 million pound band recorded in those five weeks while the price climbs is the substitution bridge showing up in the data — that’s when you price the next hedge, not when you add cows. Backfire: lighter dry whey output can come from thinner cheese runs or plants chasing WPC 80 and WPI margins, neither of which is Canada-related.

What this looks like on your own paper

Open your last settlement, find the other-solids pounds and the rate you were paid, and multiply the rate difference by your Q4 hundredweight. You now have your own version of the $2,802-to-$14,014 band on your components rather than a model’s.

Then go looking for the line where a co-op processing margin would show up. Monthly pay price, cash patronage, allocated equity, or nothing you can point to — make your district director name which one before September 29. Until somebody does, the right number for this in your Q4 budget is zero.

Key Takeaways

  • Eight HTSUS whey lines close at 12:01 a.m. Eastern September 29 under Proclamation 11062, but the whey stream is only $2.35 of the $16.64 August Class III price — 14.1% — so the ceiling on this is smaller than the $35.04 million trade figure suggests.
  • Three whey prices ran within nine cents of each other in the same week, and only the NDPSR survey at 66.64¢ feeds the Class III formula. CME cash closed 9.36¢ above it on light trading.
  • If an option floor costs 20¢/cwt more than a fixed-price sale, dry whey has to move 3.35¢/lb before that trade pays. The 2-cent case doesn’t clear it.
  • Paragraph 9(b) snaps invalidated imports back to the 50% duty under Proclamation 11047. As drafted, winning in court doesn’t get anyone duty-free Canadian whey.

Run Your Numbers

Component Value Tracker — This piece runs the whey stream on a 400-cow model. Put your own herd size, daily milk, and other-solids test in and see what the same 2¢-to-10¢ dry whey range is worth on your check, not ours. Print the summary before you price Q4.

Learn More

The Sunday Read Dairy Professionals Don’t Skip.

Every week, thousands of producers, breeders, and industry insiders open Bullvine Weekly for genetics insights, market shifts, and profit strategies they won’t find anywhere else. One email. Five minutes. Smarter decisions all week.
NewsSubscribe
First
Last
Consent

The Access Fight Is Worth 5¢. Class III Already Took 64¢.

Canada’s dairy tariffs land September 8: what the fight is actually worth on your herd — and what already cost you four times more

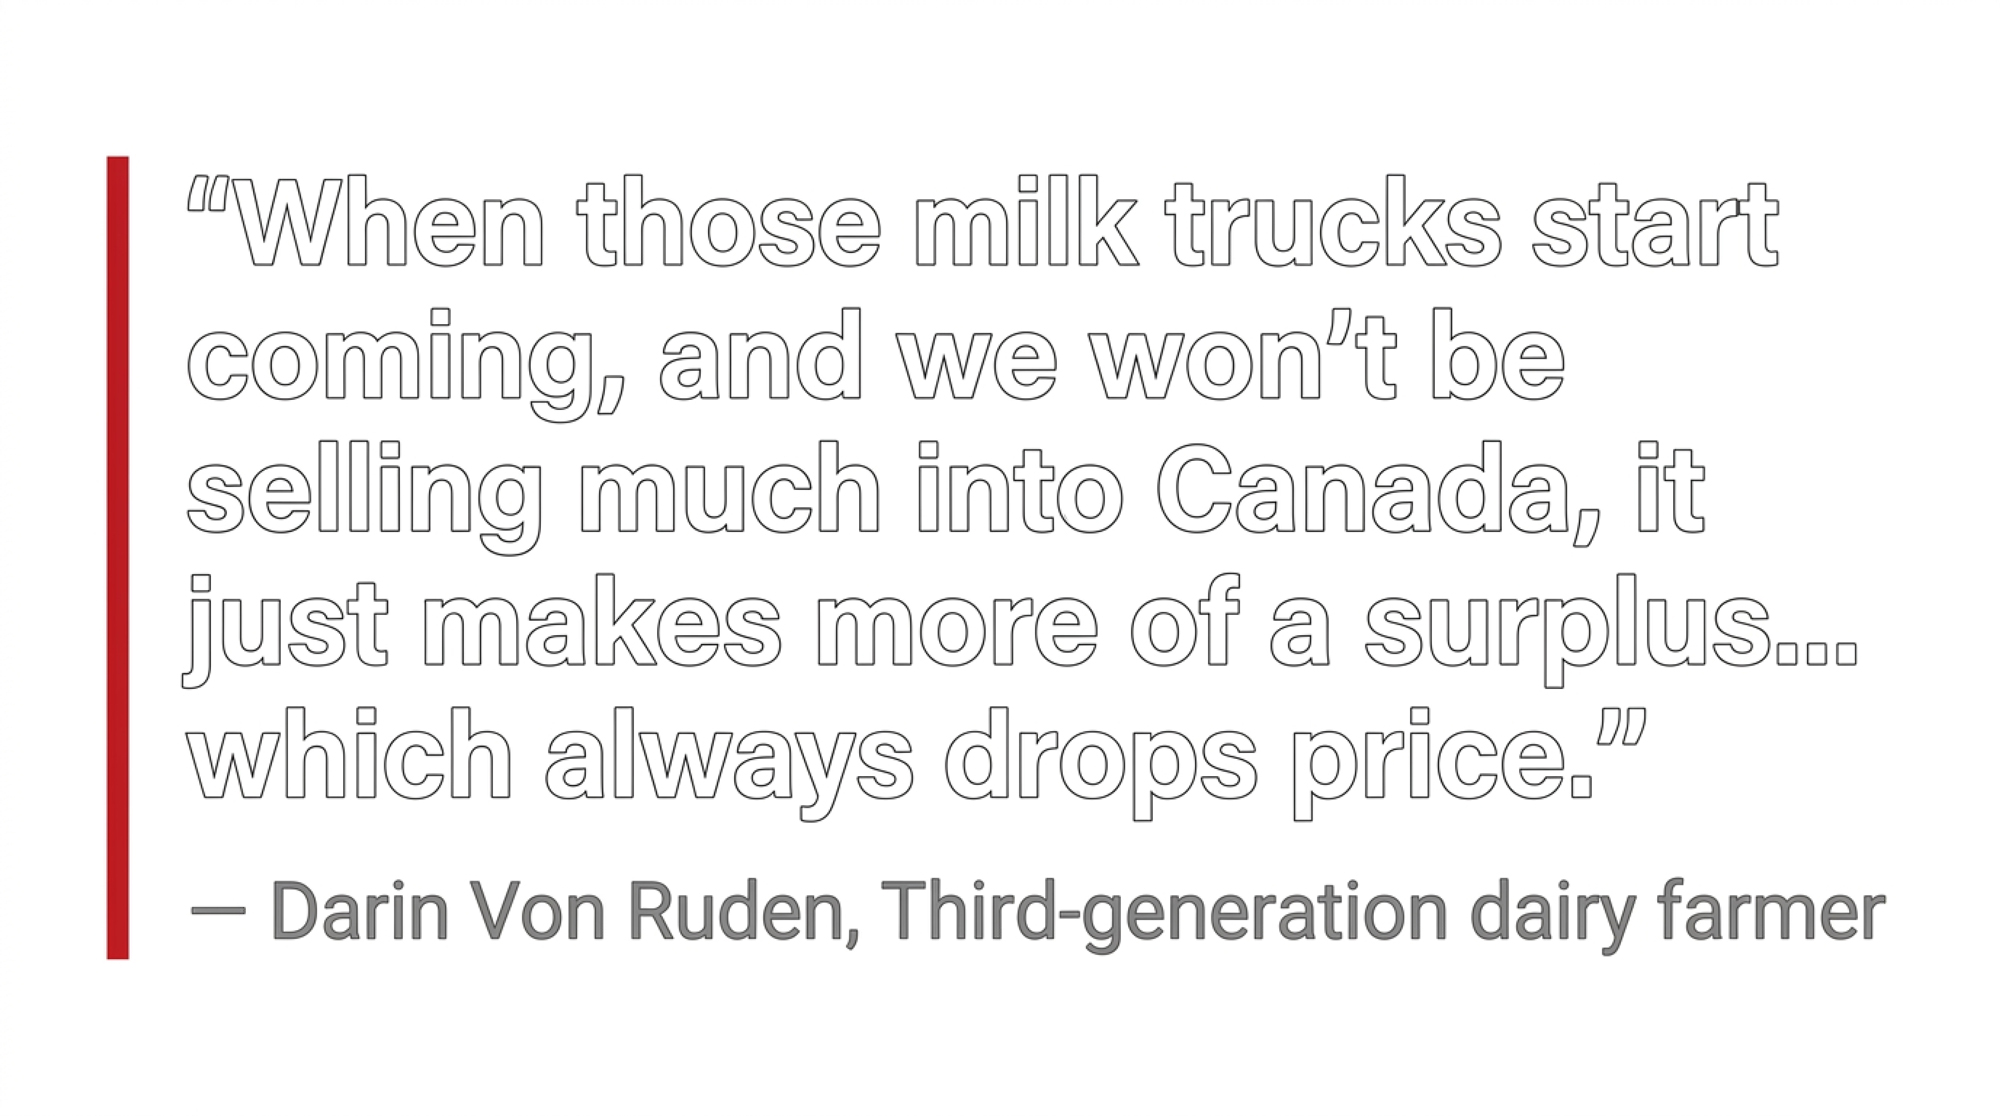
Darin Von Ruden is a third-generation dairy farmer near Westby, Wisconsin, and president of the Wisconsin Farmers Union, a producer advocacy group. On August 25, he told WEAU what he’s watching for, and it wasn’t the tariff itself. “A month from now, six weeks from now, when those milk trucks start coming, and we’re hit with that probability that we won’t be selling much dairy product into Canada, just makes more of a surplus in the United States, which always drops price.”

Surplus. That’s the mechanism, and it’s the part the trade headlines keep skipping. Canada’s counter-tariffs on U.S. dairy take effect at 12:01 a.m. on September 8, 2026 — 50% on milk and cream powders, whey and milk protein concentrates, casein; 25% on cheese and curd. And the Canadian market access the U.S. is fighting to open? Smaller than the headlines suggest.

What Actually Got Signed, and What It Covers

Three things stacked up this summer, and they don’t mean what the coverage implied.

The USMCA hit its first mandatory joint review on July 1, 2026, under Article 34.7. USTR Ambassador Jamieson Greer said the U.S. “did not agree to renew the USMCA in its current form.” That reads as the deal died. It didn’t — the agreement stays fully in force, with annual reviews now running through 2036, per White & Case’s client alert dated July 1, 2026. Nothing about your milk cheque changed that day.

On July 20, three proclamations followed under Section 338 of the Tariff Act of 1930. Proclamation 11047 is the dairy one, adding 50% duties on Canadian dairy ingredients — milk and cream powders, whey, milk protein concentrate, casein, lactose. Not retail milk. Not the cheese in a grocery cooler. Inputs. Those went live August 22 after a three-day delay, once talks in Washington collapsed on August 21.

Canada’s answer, published by the Department of Finance and updated August 26, matches dollar for dollar across $27.6 billion in U.S. goods — dairy alongside steel, appliances, agricultural equipment, pulp and paper, and electronics. The dairy lines are specific: HS 0402 milk and cream powders at 50%, HS 0404 whey and whey protein concentrate at 50%, HS 3501 casein at 50%, HS 3502.20 milk albumin and whey protein concentrates at 50%, HS 3504 milk protein substances at 50%, and every named cheese category under HS 0406 at 25% — cheddar, mozzarella, brie, gouda, parmesan, provolone, havarti, Swiss, gruyère, camembert, romano. Both within and over access commitment, on every one of them.

HS codeProductSurtaxWho feels it first
0402Milk and cream powders50%Powder plants and co-op marketing arms
0404Whey and whey protein concentrate50%Cheese-plant whey streams, ingredient buyers
0406All named cheeses (cheddar, mozzarella, gouda, Swiss)25%Cheese exporters — Canada’s largest U.S. dairy line
3501 / 3502.20Casein; milk albumin, whey protein concentrates50%Ingredient processors on both sides of the line
3504Milk protein substances50%MPC and protein-blend manufacturers
Not listedSemen, embryos, livestock geneticsNoneConfirm your own HS codes with a customs broker

How Much Is the Access Fight Actually Worth to You?

Here’s the math, assumptions on the table, because the number only means something if you can check it against your own herd.

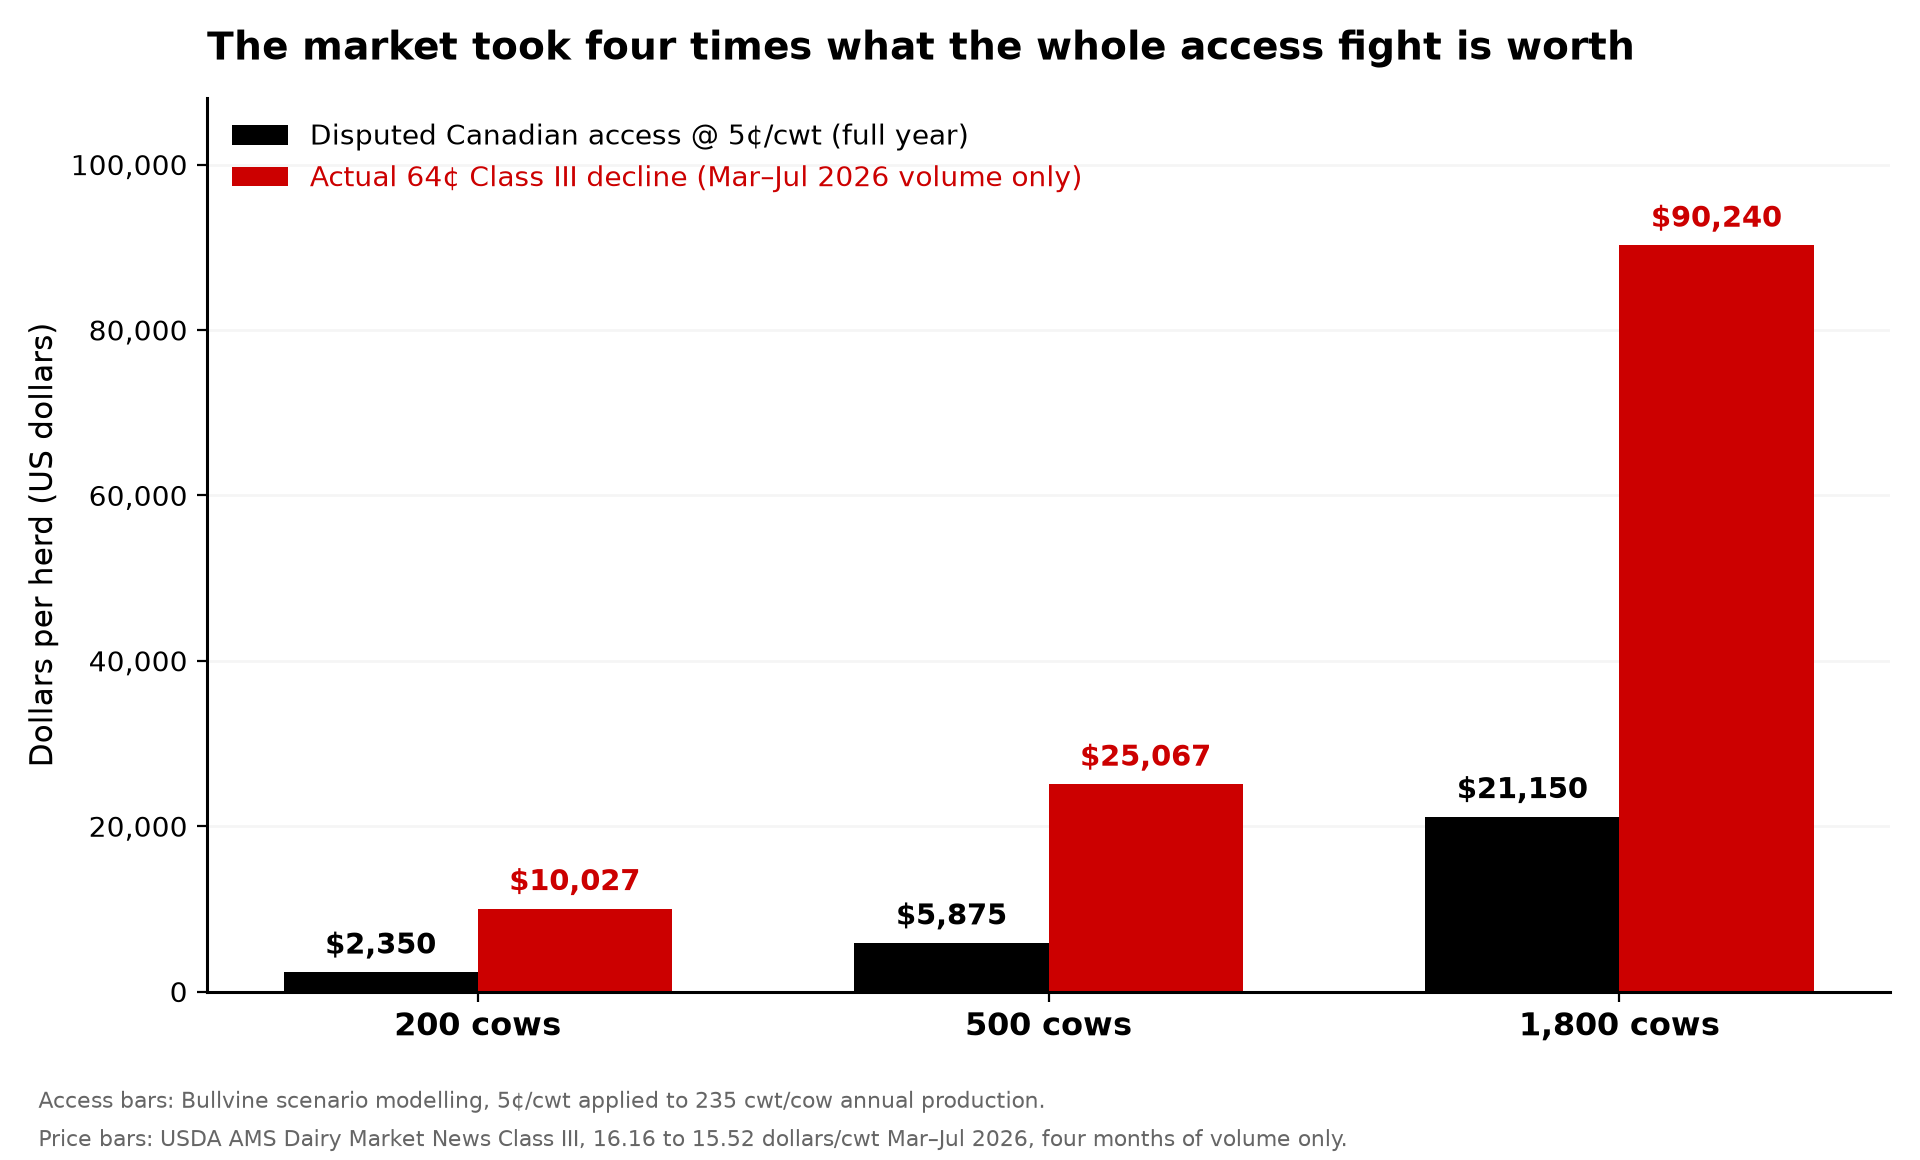
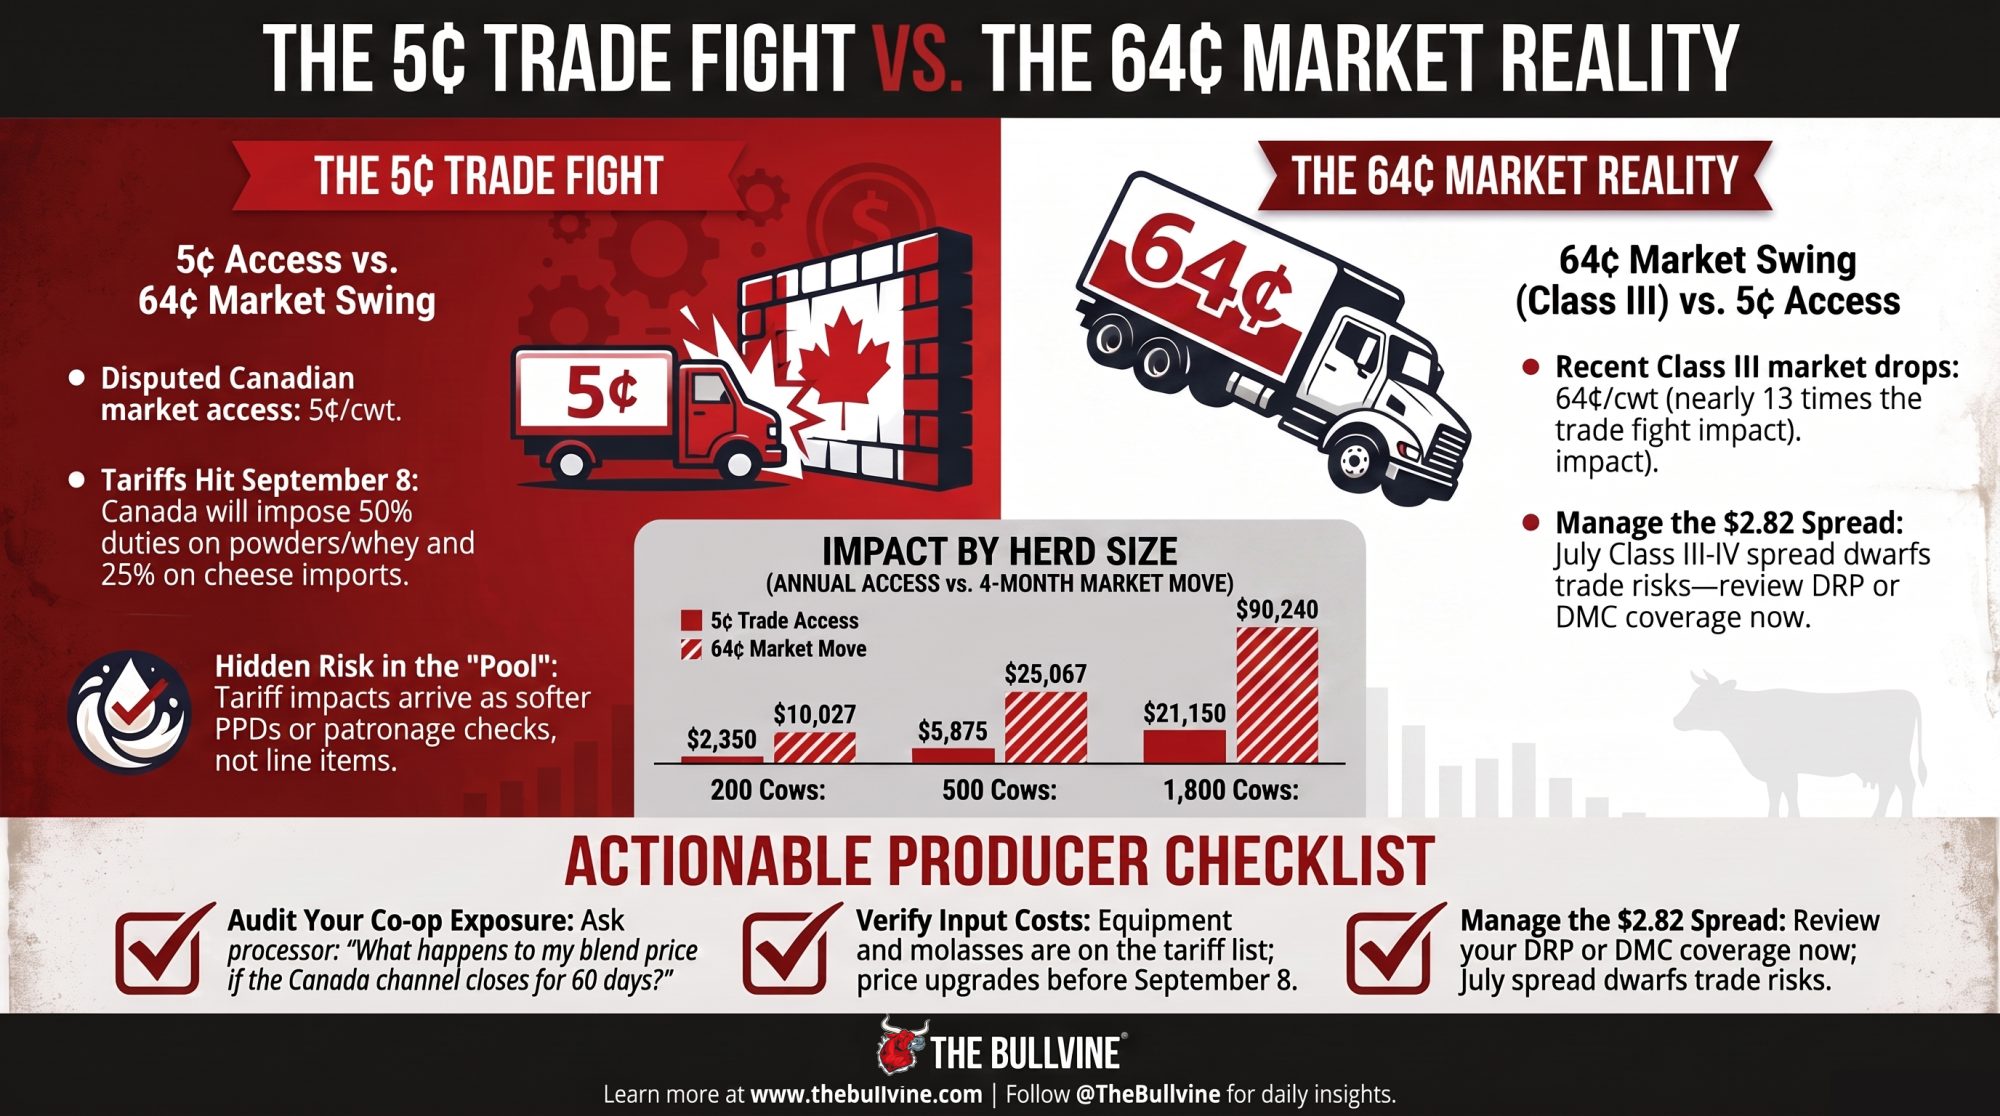
Using USDA Foreign Agricultural Service trade data, The Bullvine’s own scenario modelling puts the value of fully enforcing the disputed Canadian dairy access at roughly 5¢/cwt nationally. Model your herd at 235 cwt per cow annually — that’s our stated assumption, roughly 23,500 lbs, and you should substitute your own rolling herd average. Then set the disputed access beside what Class III actually did between March and July of this year: $16.16/cwt down to $15.52, a 64¢ drop over four months, per USDA AMS Dairy Market News.

Herd sizeAnnual productionAccess @ 5¢/cwt (year)Actual 64¢ Class III move (4 months)
200 cows47,000 cwt$2,350$10,027 on 15,667 cwt
500 cows117,500 cwt$5,875$25,067 on 39,167 cwt
1,800 cows423,000 cwt$21,150$90,240 on 141,000 cwt
Per cwt235 cwt/cow assumed$0.05$0.64 — 12.8x the access value

Access column: 5¢/cwt Bullvine scenario modelling applied to annual production at 235 cwt/cow. Price column: the actual 64¢ Class III decline applied to four months of production only — matching the window the price move covers, not annualized. Assumes even monthly production; real herds swing seasonally.

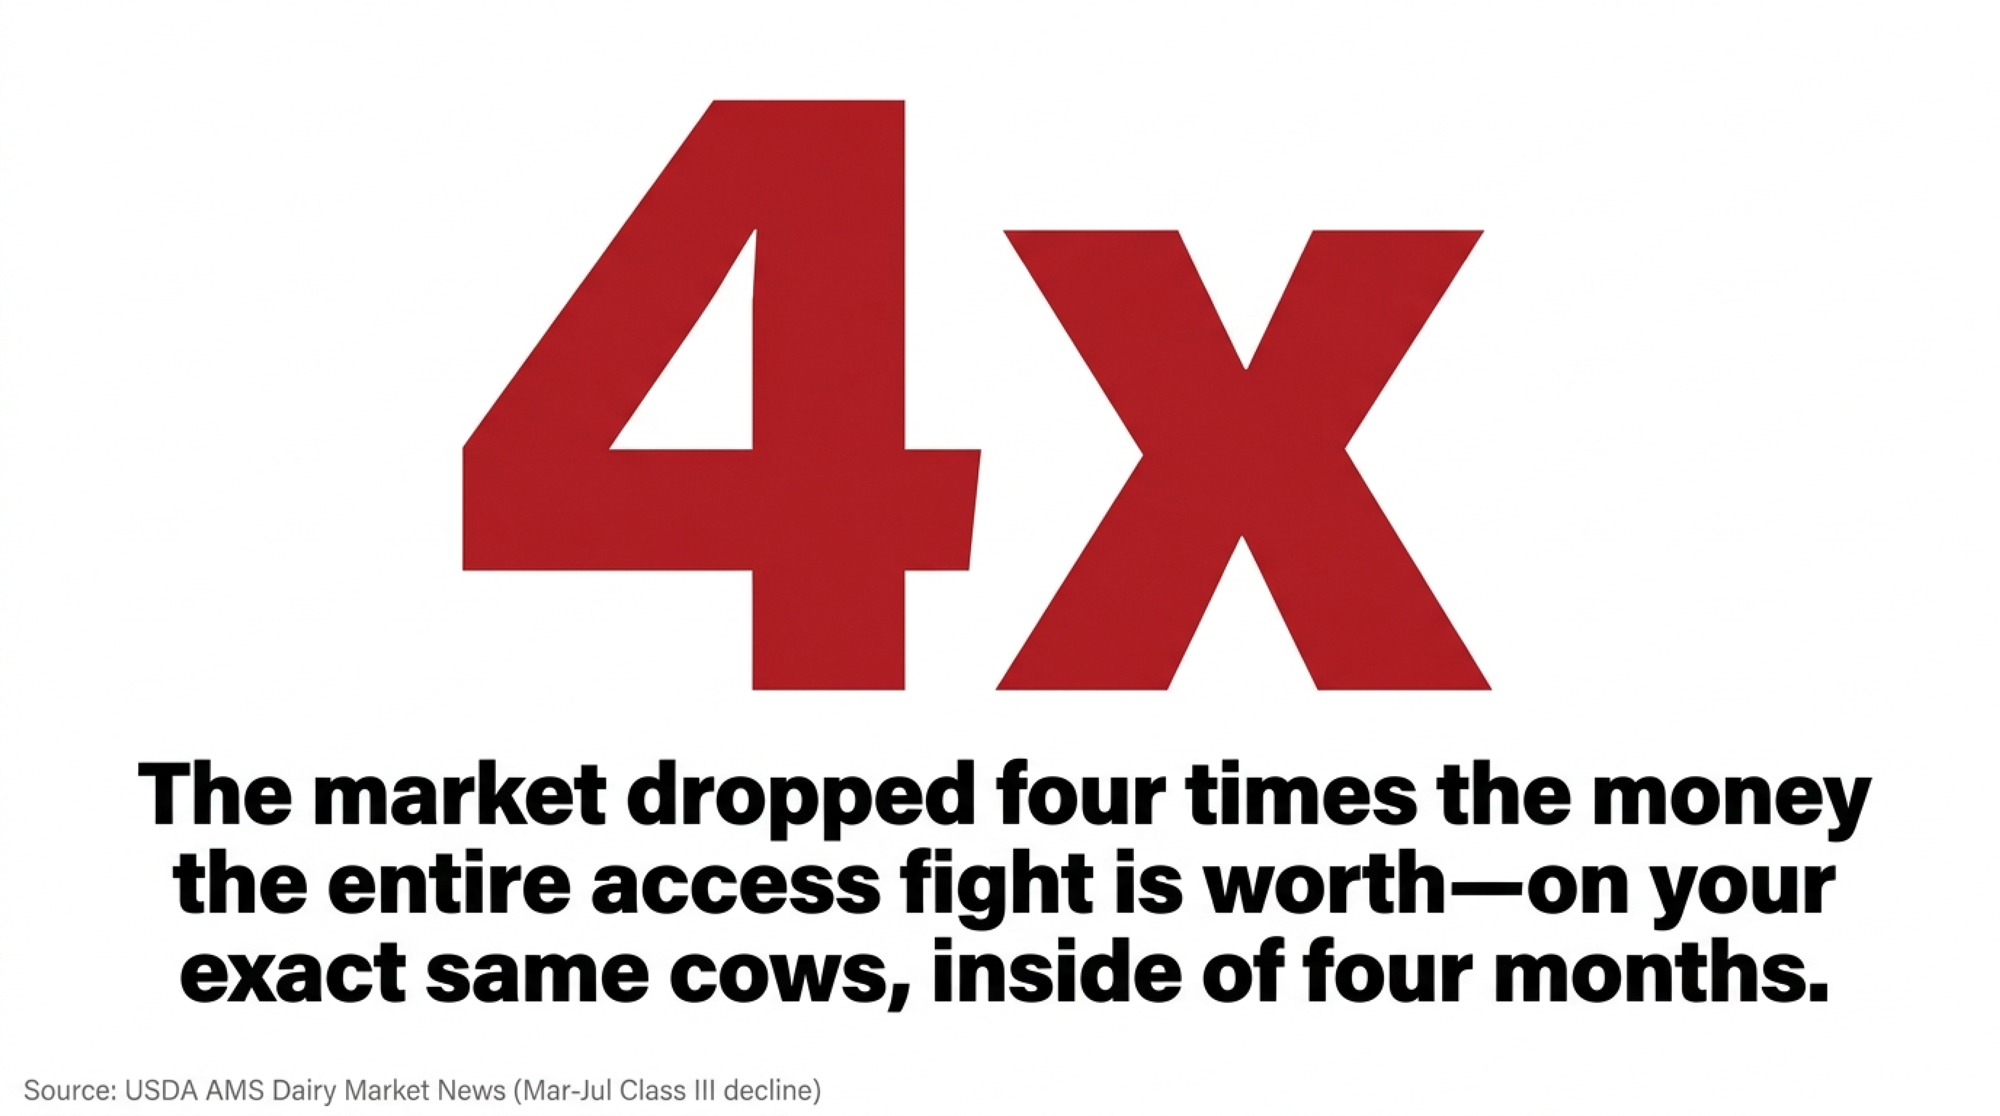
Read across any row. The market moved more than four times the money the entire access fight is worth, on the same cows, inside four months. Where does your breakeven sit right now? For most operations, the honest answer has very little to do with Canada.

That 5¢ figure is a scenario, not a published USDA number. We built it, and we’re labelling it. No government agency or land-grant university publishes a per-cwt dollar figure for unrealized USMCA dairy access, which is exactly why the number carries its label every time it appears.

One Law and One Clause Nobody’s Pricing In

Two structural facts explain why this won’t resolve the way the rhetoric implies.

The first is a statute. Bill C-282 — amending the Department of Foreign Affairs, Trade and Development Act — received Royal Assent June 26, 2025, per Parliament of Canada’s LEGISinfo record. It bars Canada’s Foreign Affairs Minister from committing to expand supply-managed dairy quotas or cut over-quota tariffs in trade negotiations. That’s not a posture a government softens under pressure. It’s a law Parliament would have to unwrite. U.S. producers waiting for Canadian negotiators to cave eventually are waiting on a law to change, not a mind.

The second is the retailer clause, and it’s the part that gets lost in the political coverage. Under Canada’s CETA agreement with the European Union, EU cheese enters through a retailer-eligible quota of roughly 16 to 17.7 million kilograms, per Global Affairs Canada’s TRQ notice. Under USMCA, U.S. cheese quota goes to processors and distributors — retailers excluded. The Globe and Mail reported July 20, 2026, that this asymmetry appears in Proclamation 11047’s own stated rationale. That gap is the actual legal complaint underneath the politics.

Access featureU.S. cheese under USMCAEU cheese under CETAWhy it matters at farm level
Eligible channelProcessors and distributors onlyRetailer-eligible quotaRetail shelf access decides whether volume moves
Quota volume6,250 t (2025) to 7,113 t by Year 19About 16 to 17.7 million kgThe EU pool dwarfs the U.S. cheese TRQ
Over-quota tariffAbout 245% MFNPreferential under CETA245% is a wall, not a price
Fill performanceCheese ran 83% in 2024Not directly comparableAll-category fill near 42% in 2022–23 — ask which product
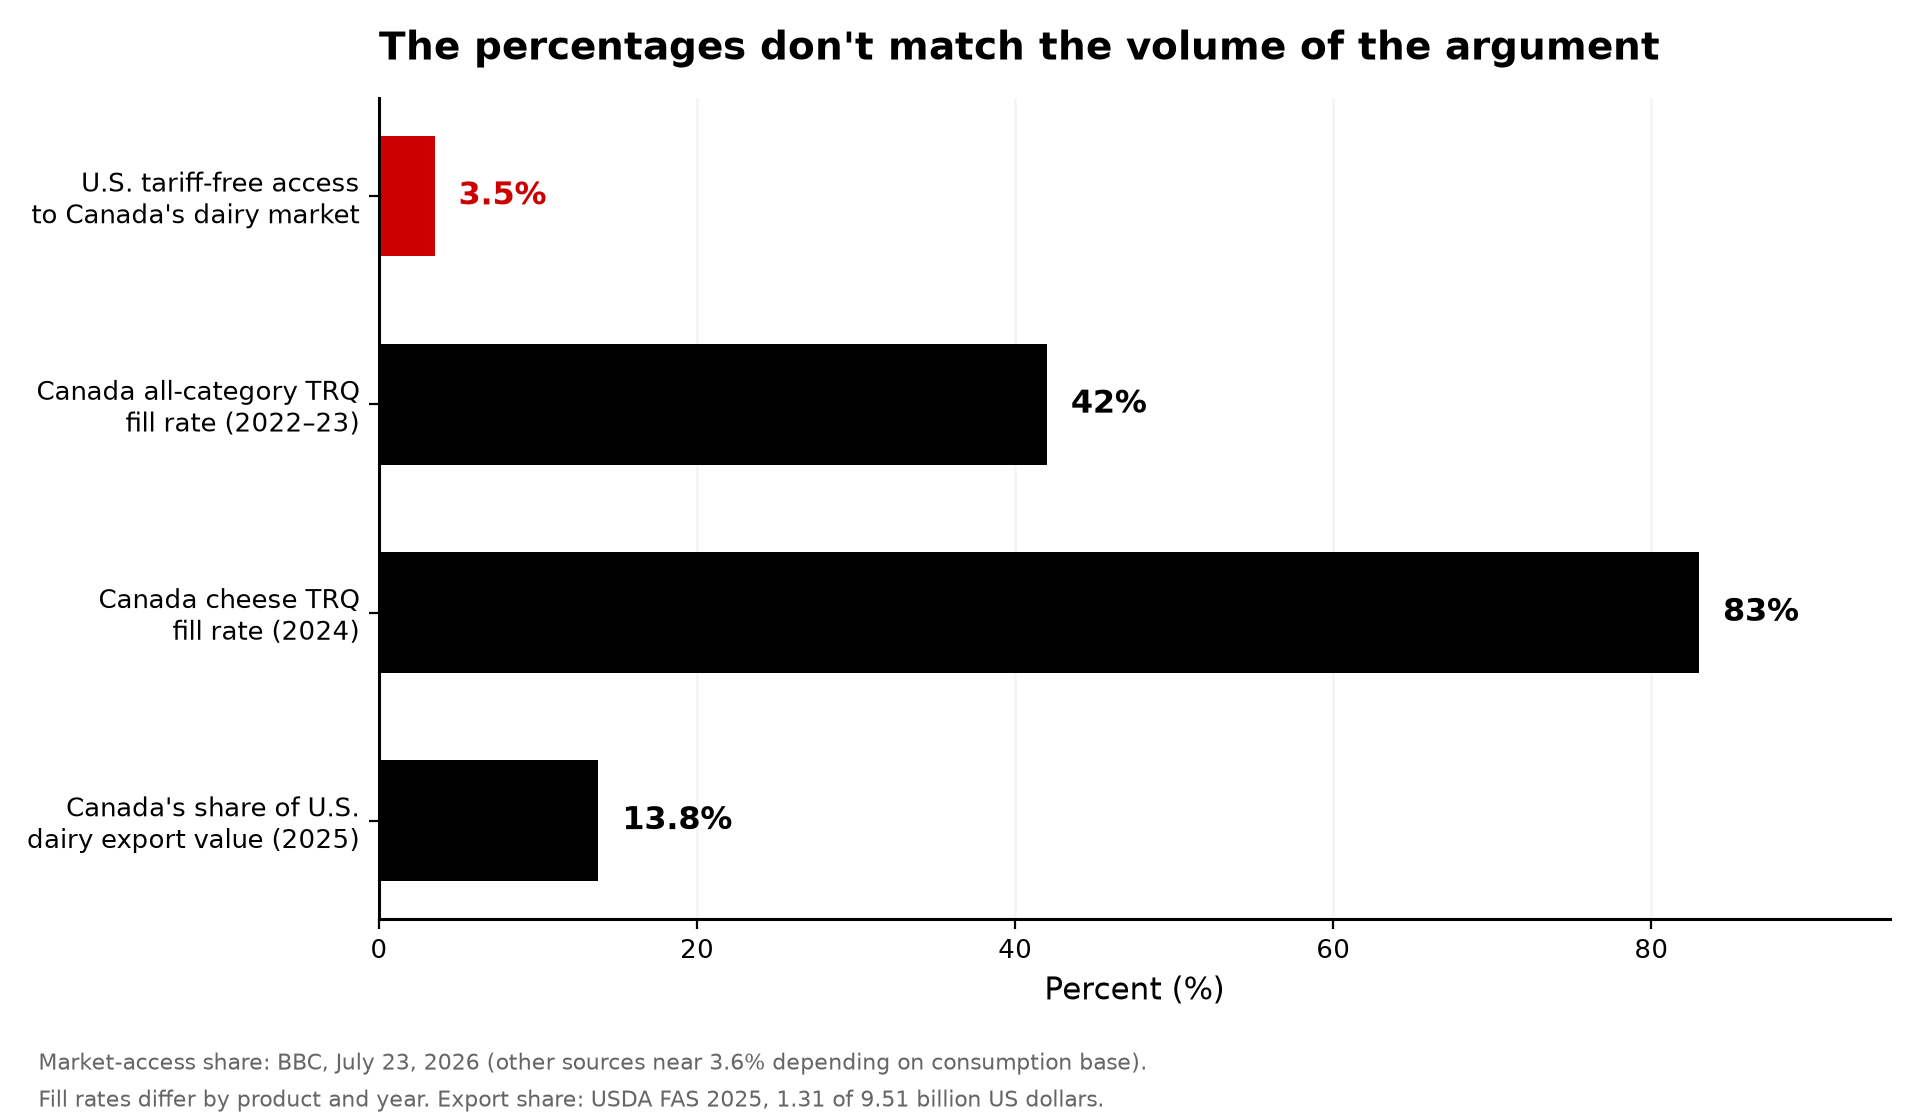
Total market accessAbout 3.5% of Canada’s marketLarger and retail-facingThe whole fight is over a sliver

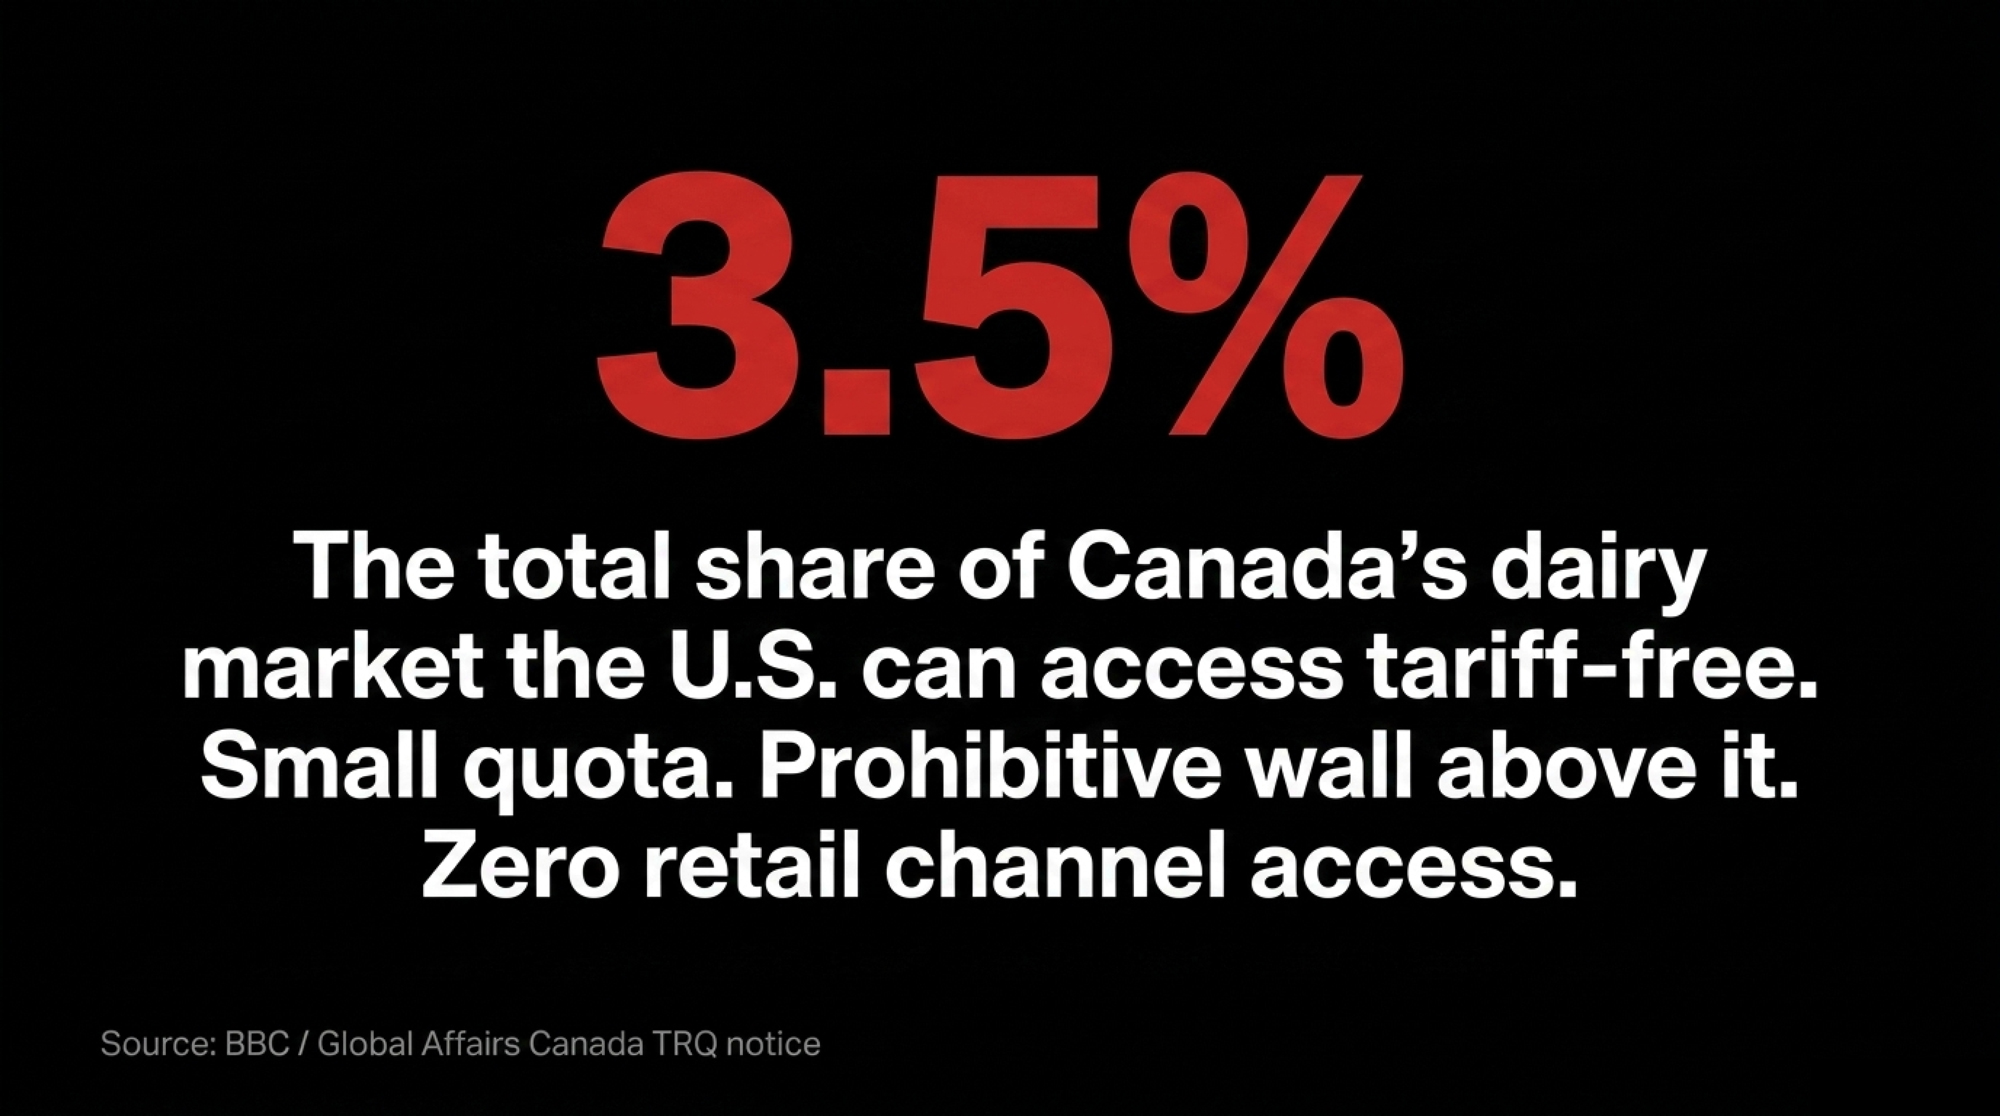
Scale tells you the rest. UW-Madison Extension puts the 2025 USMCA cheese TRQ for U.S. exports at 6,250 metric tonnes, rising to 7,113 tonnes by Year 19, with an over-quota MFN rate near 245%. BBC reported July 23, 2026, that U.S. producers hold tariff-free access to about 3.5% of Canada’s market — other sources put it nearer 3.6%, depending on the consumption base used. Small quota, prohibitive wall above it, no retail channel. That’s the architecture, and it also explains why you’ll see Canadian fill rates quoted two contradictory ways: cheese ran 83% in 2024, while the all-category average sat near 42% in 2022–23. Both real. Different products.

Is Your Real Risk Even Visible in Your Milk Cheque?

Probably not, and that’s the part worth sitting with.

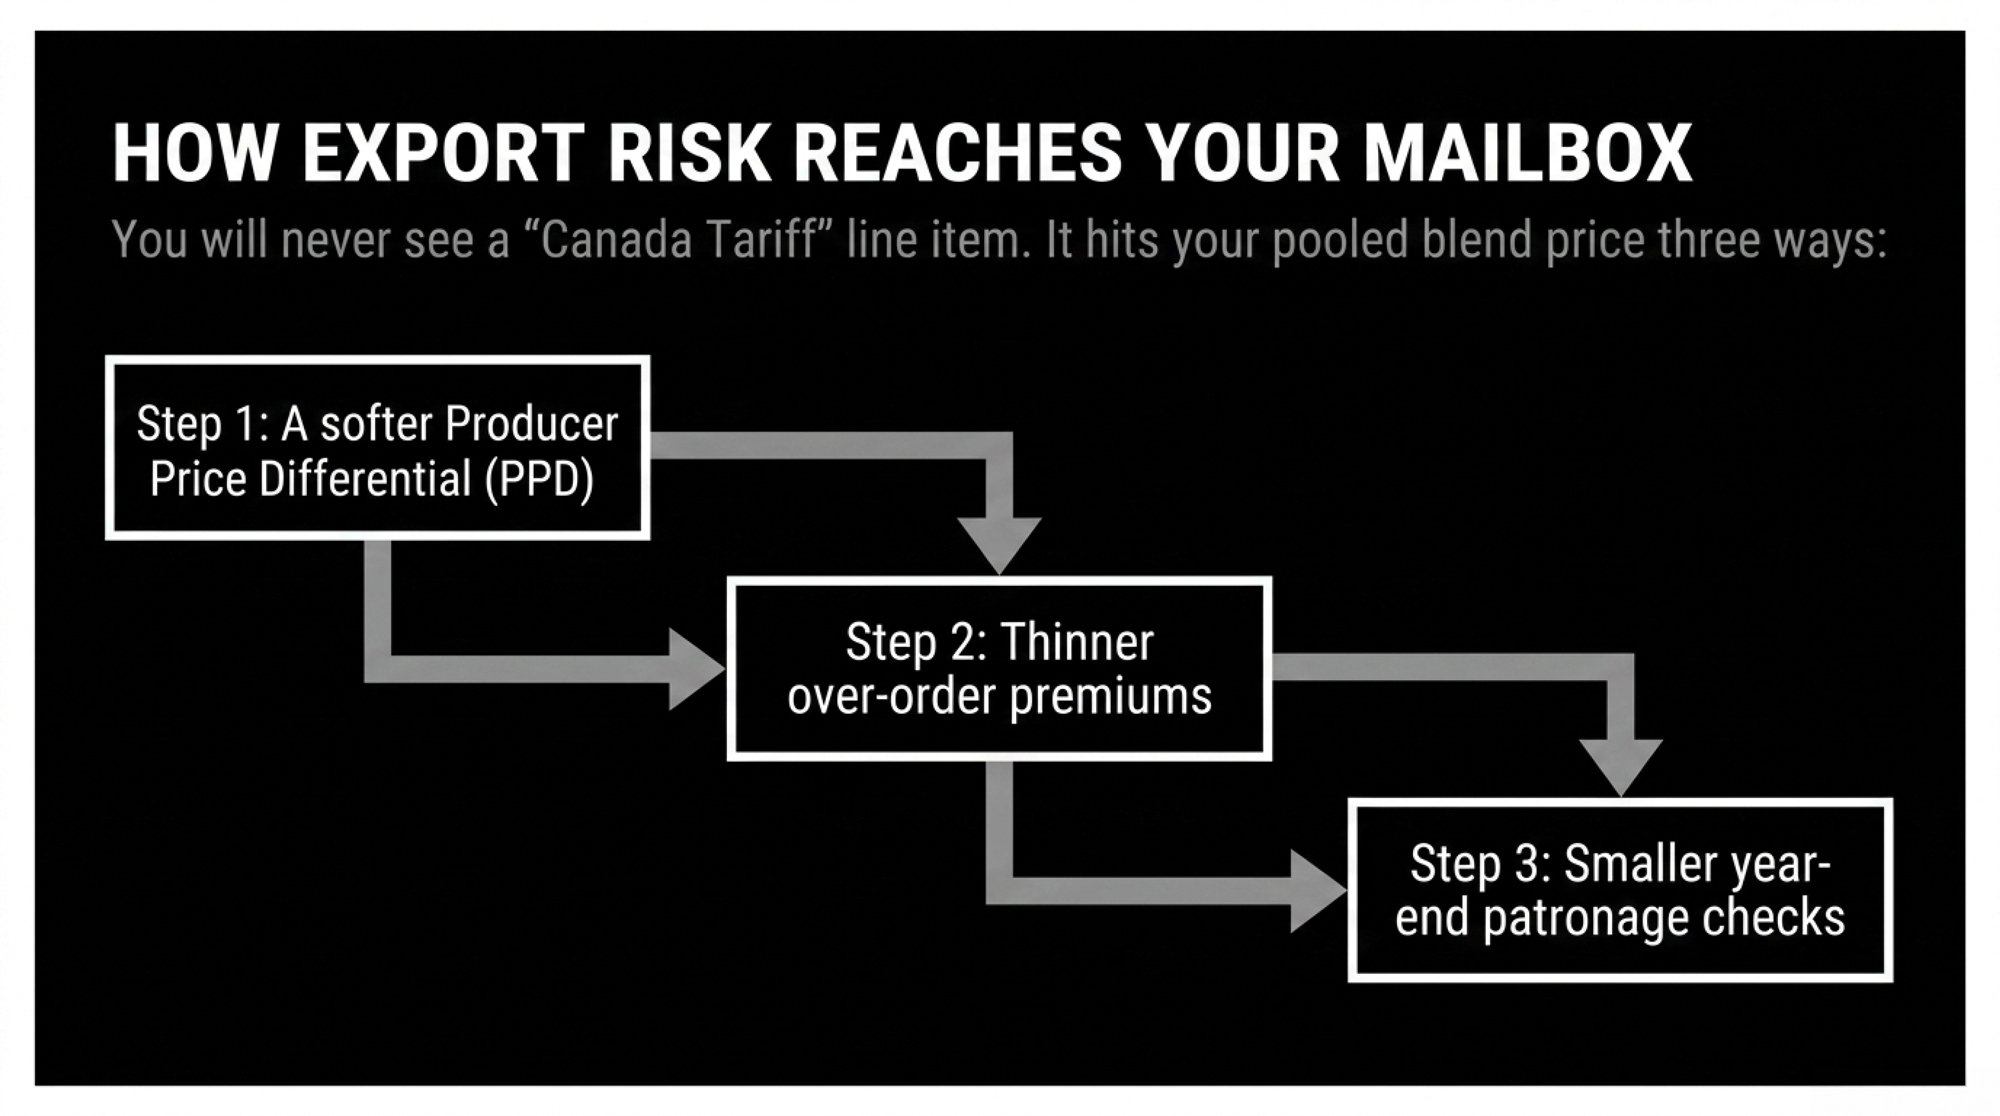
Most U.S. milk moves through Federal Milk Marketing Order pooling before it reaches a processor. Your cheque reflects Class I–IV utilization in your marketing order — not where the finished cheese or powder eventually sells. Export exposure lives downstream, at the plant or the co-op’s marketing arm. So your milk cheque is pooled. Your risk isn’t.

Here’s how that risk actually reaches your mailbox. You won’t see a line item that says “Canada tariff.” If your co-op takes a margin hit on powder or cheese it was moving north, that shows up in the blend — a softer Producer Price Differential, thinner over-order premiums, or a smaller patronage cheque at year-end. Same money, three degrees of separation, no label on it.

So ask your co-op or processor three things: how much of what you ship gets exported, how much of that goes to Canada, and what happens to your blend price if that channel closes for sixty days. No public dataset breaks this down at the plant level — we looked. That information sits in member communications, not government data, which means the only way to get it is to ask.

Options and Trade-Offs for Farmers

Pull the Finance Canada list and check your purchase orders—within 30 days. The document is public, free, and specific down to the tariff item. If you’re a Canadian producer buying U.S. cane molasses (HS 1703.10, 50%), polyethylene sacks and bags (HS 3923.21.90, 50%), or milk-protein inputs, it tells you exactly what changes on September 8. Costs you an hour and your purchase records. Here’s the part worth knowing: goods already in transit to Canada on September 8 are exempt, so what matters isn’t when you ordered — it’s whether the truck crosses before the clock runs out.

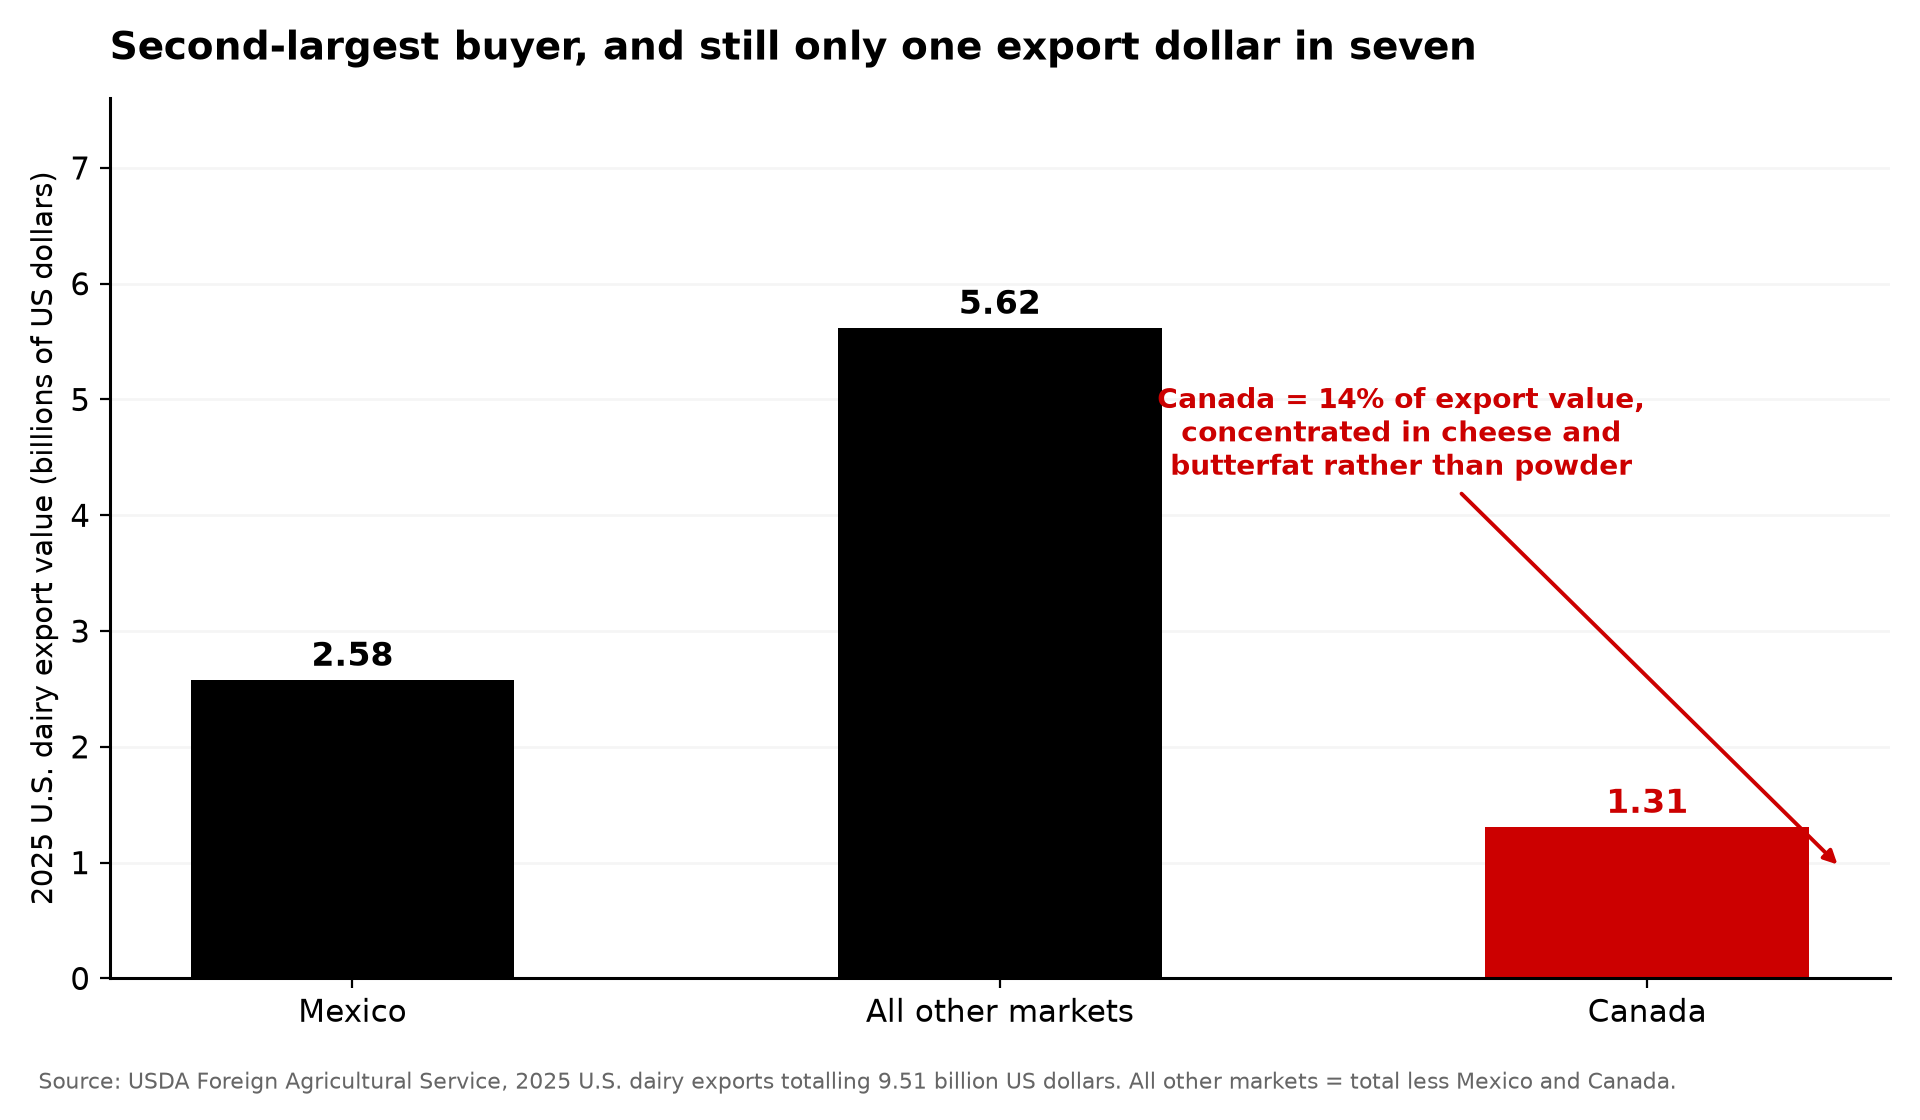
Quantify your Canada exposure before you react. Canada took $1.31 billion in U.S. dairy exports in 2025 out of $9.51 billion total, per USDA FAS — roughly 14%, second behind Mexico at $2.58 billion on the same dataset. Agriculture and Agri-Food Canada figures reported by the Western Producer on May 4, 2026 put butterfat and cheese at approximately CA$500 million of the CA$1.06 billion Canada recorded. So this concentrates in cheese and butterfat channels rather than spreading evenly across the industry. The catch is the pooling problem above — your own exposure isn’t visible in your own cheque.

The Class III–IV spread ran $2.82/cwt in July 2026, which is the real argument for reviewing your DRP or DMC coverage. That volatility already dwarfs anything this dispute realistically moves. It’s also the argument against buying coverage in a panic — a conversation with your risk advisor beats a reaction to a headline. Where this path fails: coverage priced off a news cycle tends to cost more than it protects. And the squeeze runs both directions on a farm, which is the part Von Ruden put plainly: “It’s a double edged sword that farmers deal with all the time, knowing that our price is lower, but going to the grocery store, buying milk, cheese, butter, ice cream, and having to pay more for it than we did two months ago.”

Agricultural equipment is on Canada’s list, so if you’ve got a parlour upgrade or a mixer order pending, price it against September 8 before you sign. That’s the tighter clock of the two cross-border paths. Genetics look clearer — semen, embryos, and livestock genetics don’t appear anywhere in Canada’s surtax list, and Proclamation 11047 covers dairy ingredient lines rather than breeding stock. But get your customs broker to confirm your specific HS codes instead of assuming the exemption covers your product.

Key Takeaways

For U.S. producers — export exposure and risk

  • If you don’t know your co-op’s Canada-export share, that’s a phone call this week, not a headline to react to.
  • If your co-op moves powder or cheese north, ask specifically what a sixty-day closure does to your blend price — the hit arrives as a softer PPD or a thinner patronage cheque, never as a tariff line item.
  • If your annual cwt × 5¢ comes to less than one Class III swing on your own herd, the access fight isn’t where your margin is going. Look somewhere else.
  • If you haven’t looked at DRP or DMC since spring, the $2.82/cwt Class III–IV spread in July is the reason to — not the tariff.

For Canadian producers — inputs and equipment

  • If you buy any U.S. inputs, check your next 60 days of purchase orders against the Finance Canada list before September 8.
  • If an order is already moving, find out whether it crosses before September 8 — goods in transit that day are exempt, so the shipping date, not the order date, is what counts.
  • If you’ve got a parlour upgrade or mixer order pending, price it against the September 8 date before you sign. Agricultural equipment is on the list.
  • If you’re financing quota in Ontario or Quebec at the capped CA$24,000/kg BF, this dispute isn’t what moves that number — provincial cap policy and pooled revenue are.

For both sides of the line

  • If someone quotes you a single Canadian quota fill rate, ask which product category and which year before you act. Cheese ran 83% in 2024; the all-category average was near 42% in 2022–23.
  • If you ship genetics either direction, get your customs broker to confirm your HS codes rather than assuming the exemption holds for your specific product.

Structural decline arguments make for good op-eds and bad forward contracts. The C.D. Howe Institute — which advocates market liberalization in its published policy work, so read it as a position rather than neutral data — argued in April 2026 that Canada’s supply management will eventually disappear on economic grounds. No source attaches a date to that. The next USMCA joint review is 2027. That’s the only clock in this story with an actual number on it.

Von Ruden is watching milk trucks, not press conferences. That’s the right instinct, and it points to the two numbers worth chasing this week — neither of them a tariff rate. What share of your co-op’s volume actually goes to Canada, and where does your rolling herd breakeven sit today? Stop trading on trade-war headlines and get both. We’re running the full per-cwt model by herd size and province, with assumption tables visible, in next week’s Bullvine Weekly — that’s where the barn math lives.

THE BULLVINE BARN MATH TOOL

Custom Herd Exposure Calculator

See what the 5¢/cwt Canadian market access fight is worth on your herd vs. your actual Class III price exposure.

cows
lbs/yr
$/cwt
$/cwt
Annual Canadian Access Value (@ $0.05/cwt)
$5,875
On 117,500 total annual cwt
4-Month Market Move (@ $0.64/cwt)
$25,067
On 39,167 cwt (4-mo window)
⚡
The Bottom Line: Your 4-month Class III market volatility is 4.3x larger than what the entire 12-month cross-border trade dispute moves on your cows.

Complete references and supporting documentation are available upon request by contacting the editorial team at editor@thebullvine.com.

Learn More

The Sunday Read Dairy Professionals Don’t Skip.

Every week, thousands of producers, breeders, and industry insiders open Bullvine Weekly for genetics insights, market shifts, and profit strategies they won’t find anywhere else. One email. Five minutes. Smarter decisions all week.
NewsSubscribe
First
Last
Consent

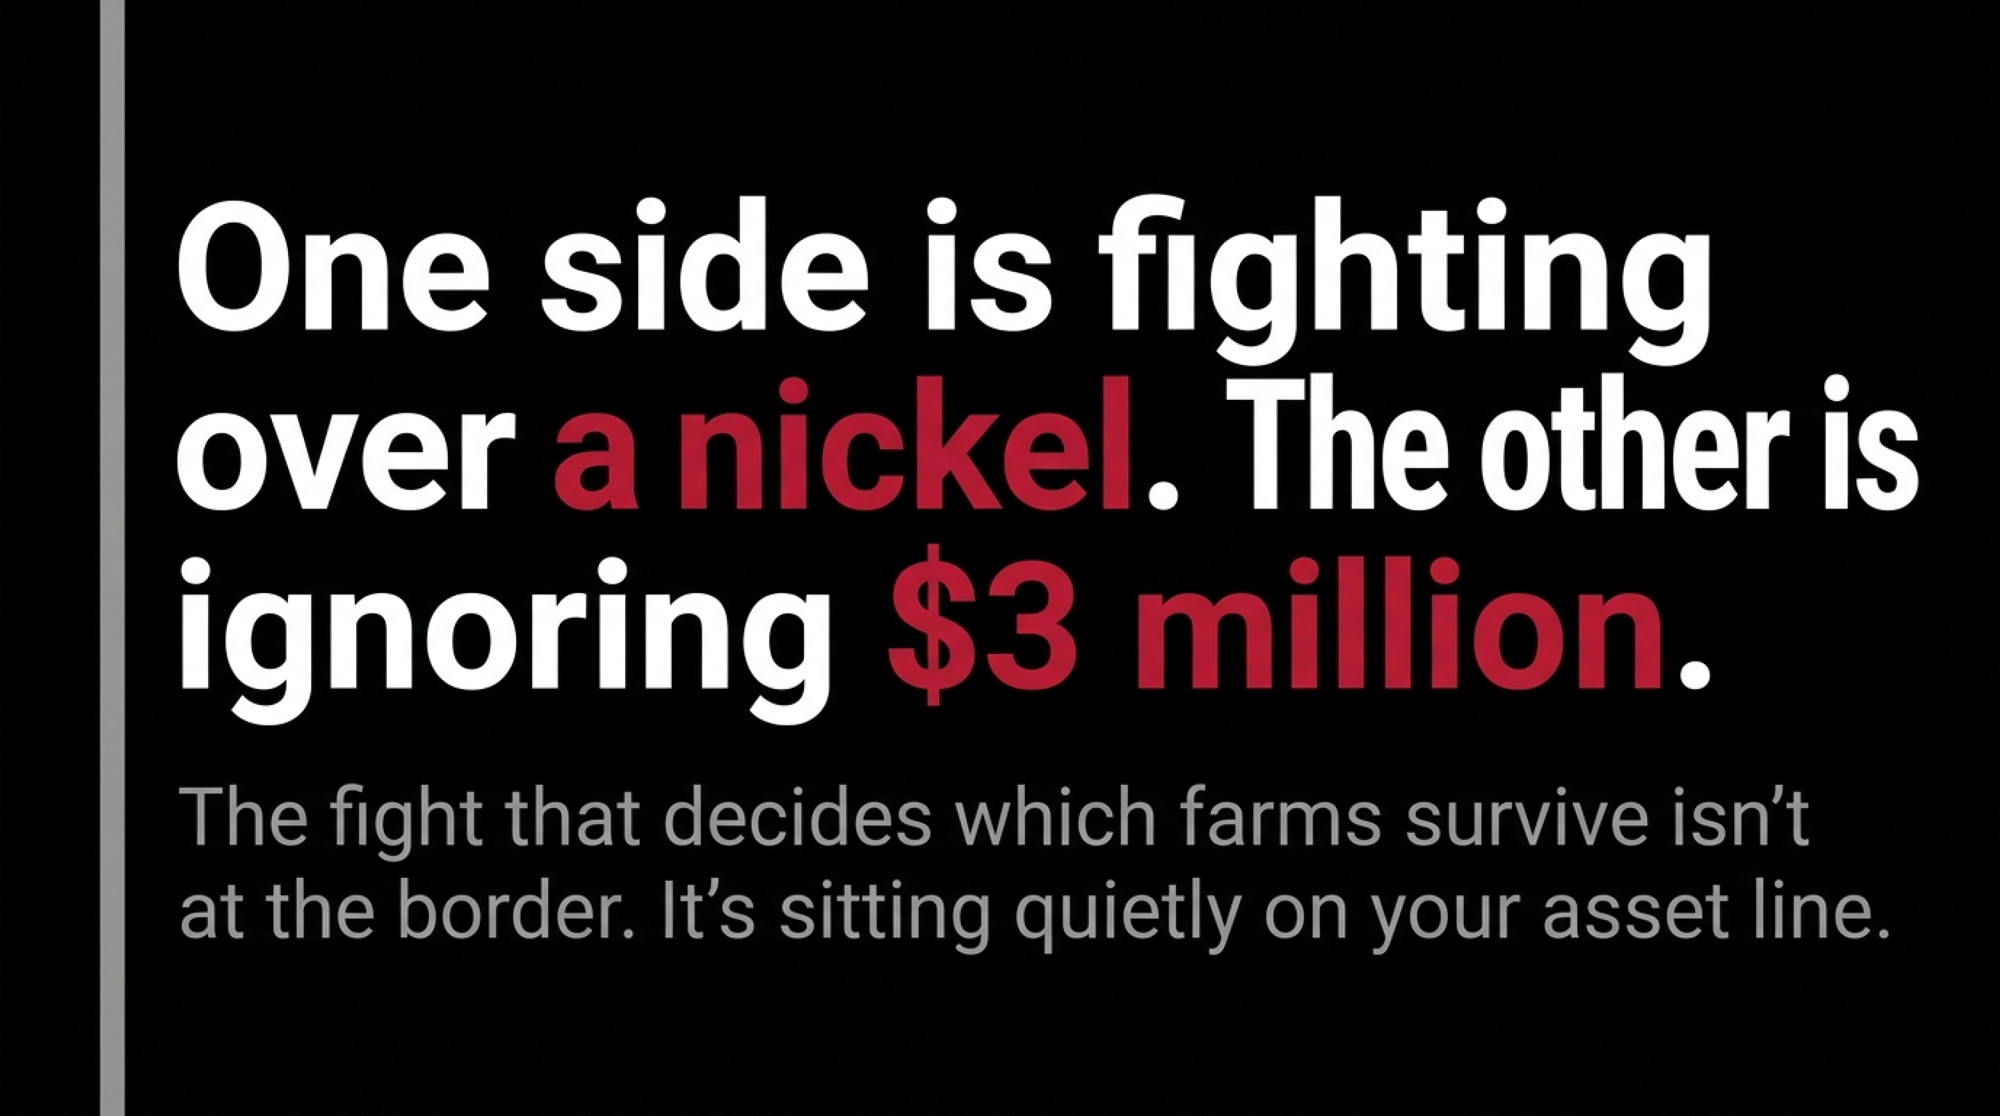
Canada vs. USA: The Dairy Border War Where One Side’s Fighting Over a Nickel and the Other’s Ignoring $3 Million

The CUSMA review lit the fuse on July 1, 2026 — but the fight that decides which farms survive isn’t at the border. It’s a nickel per cwt versus a 15% quota drop that quietly turns a bankable 55% balance sheet into 60.4% — and wipes out CA$300K in equity.

Picture two farms — composites, but built from real numbers. A 150-cow operation in Wisconsin, watching Washington rail against Canada “stealing billions” in dairy trade, thinking: finally, somebody’s fighting for us. And a 100-cow farm in Ontario, watching Ottawa hold the line with a brand-new law protecting supply management, thinking: our system won. Both proud. Both patriotic. Both watching the wrong battle while the real risk sits quietly on their own asset line.

Neither farm is a single real operation — they stand in for thousands on each side of the line. But the numbers behind them are real, and they’re the numbers the July 1 CUSMA review dragged into the open. Not a border war over milk. A question about which system leaves its farmers more exposed when the fighting drags on. So let’s put both flags on the table and settle it. Who’s actually winning? And who’s lying to themselves harder?

The “Cliff” That Wasn’t

First, kill the headline that had everyone reaching for the fireworks and the pitchforks. CUSMA didn’t die July 1. The deal runs a 16-year term to July 1, 2036, and July 1, 2026 was a scheduled joint review under Article 34.7 — a checkpoint, not a guillotine. Canada’s chief trade negotiator Janice Charette has framed the review the same way — a checkpoint rather than a cliff. The Bank of Canada’s April 2026 report flagged the review as a significant risk but maintained its base case that the core of the agreement will remain in effect. 

But here’s what should worry both camps. If the three countries don’t sign a full extension, CUSMA slips into annual joint reviews — potentially every single year until 2036. Farm Credit Canada’s read: the grievances won’t be settled come July, so tariffs and uncertainty drag on through 2026 and into 2027. 

So this isn’t one battle. It’s a ten-year war of attrition. Which makes the only question that matters this: who’s actually exposed when the clock keeps resetting?

Team USA’s Case — And the Gut-Punch Underneath It

Fly the stars and stripes for a minute, because the American producer has a real grievance. USMCA promised US dairy roughly US$200 million a year in new tariff-free access to Canada. Canadian fill rates have run near 42%, meaning more than half of the promised access goes unused — an estimated US$116 million a year left on the table. And in 2024, a CUSMA dispute panel again took up how Canada allocates its dairy import quotas — the core of a years-long fight over whether Ottawa is honoring the deal it signed. That’s not nothing. That’s a deal Canada signed and then, in the US view, quietly boxed shut. 

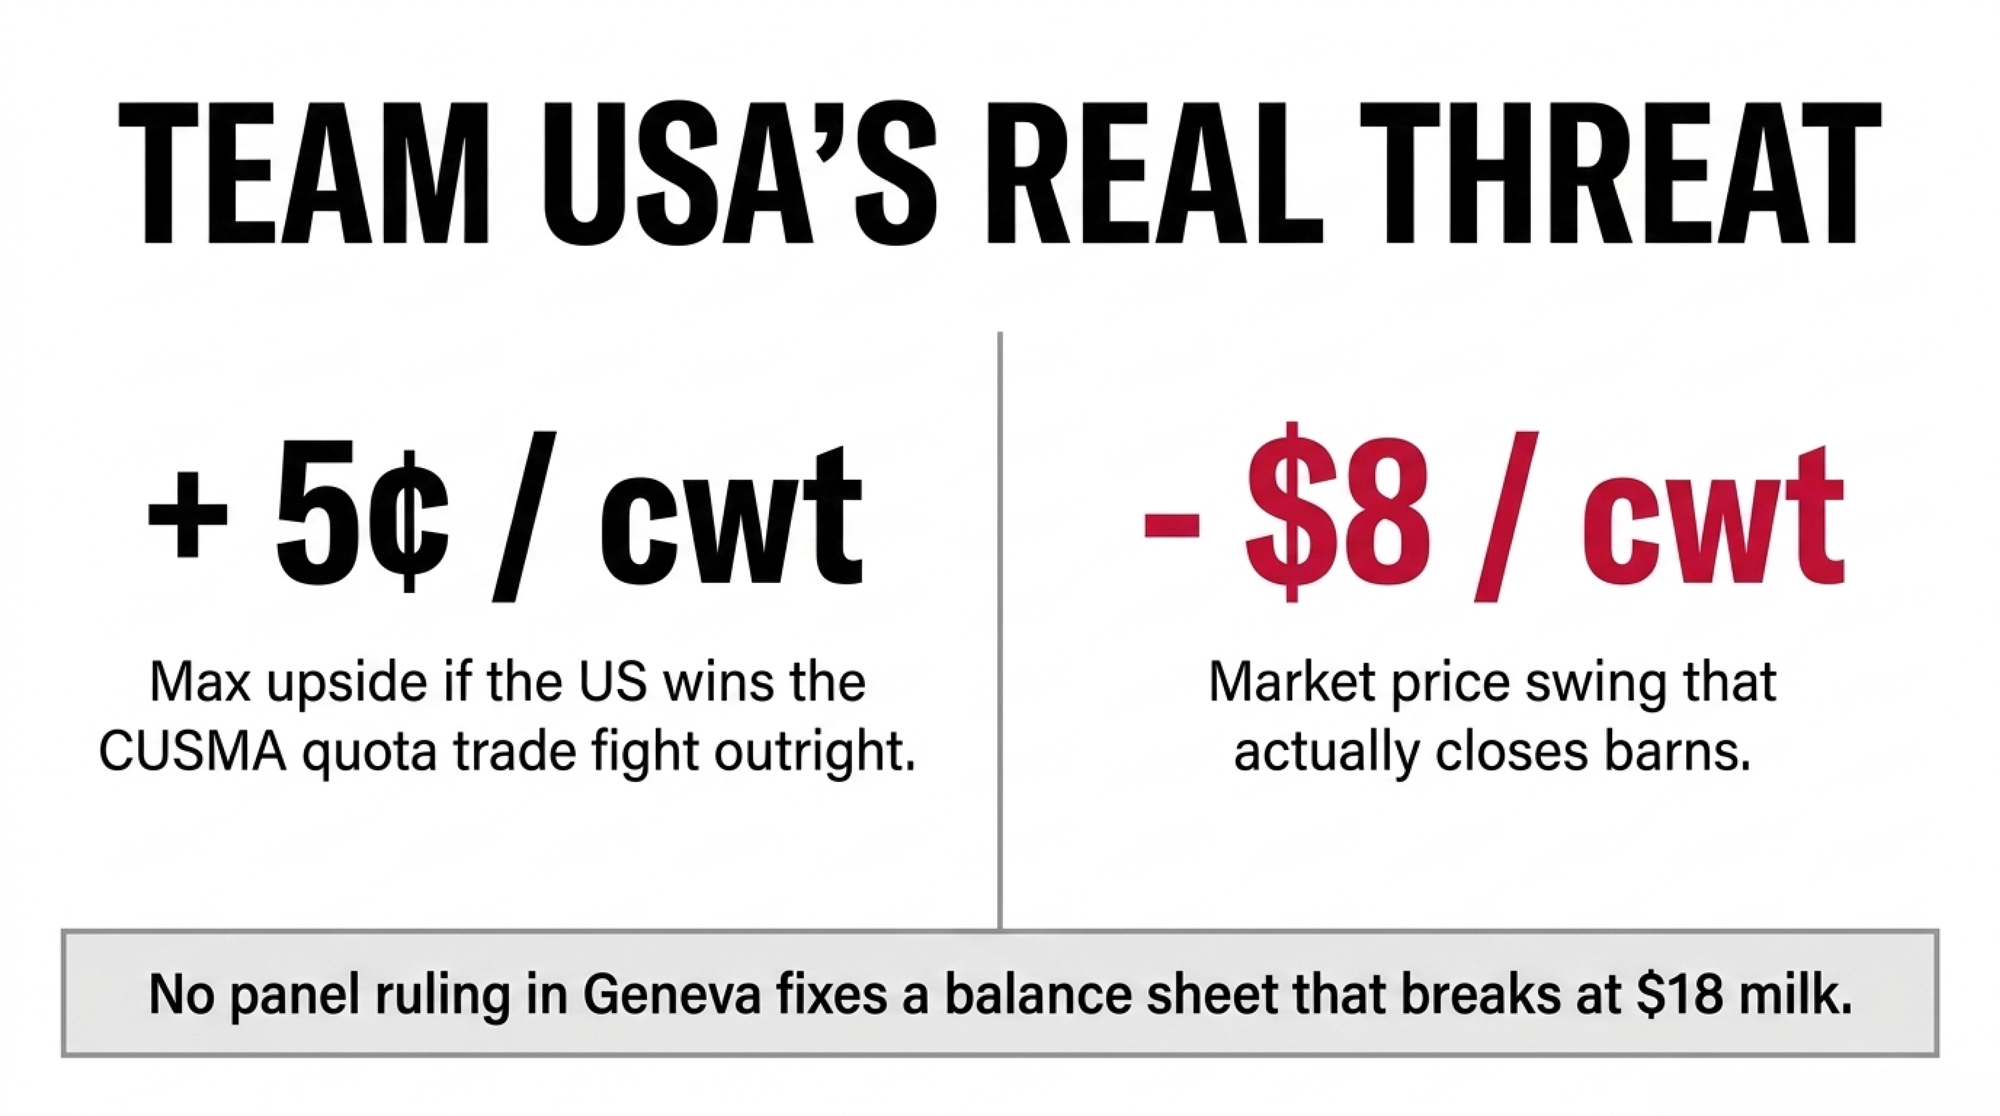
Now the gut-punch. Spread that whole fight across US milk production, and it works out to about five cents per hundredweight. On a 150-cow herd shipping roughly 24,000 lb per cow a year — call it 36,000 cwt — that’s around US$1,800. Real money, sure. Call it a month of feed. But it won’t move the needle on a farm that’s bleeding from somewhere else. 

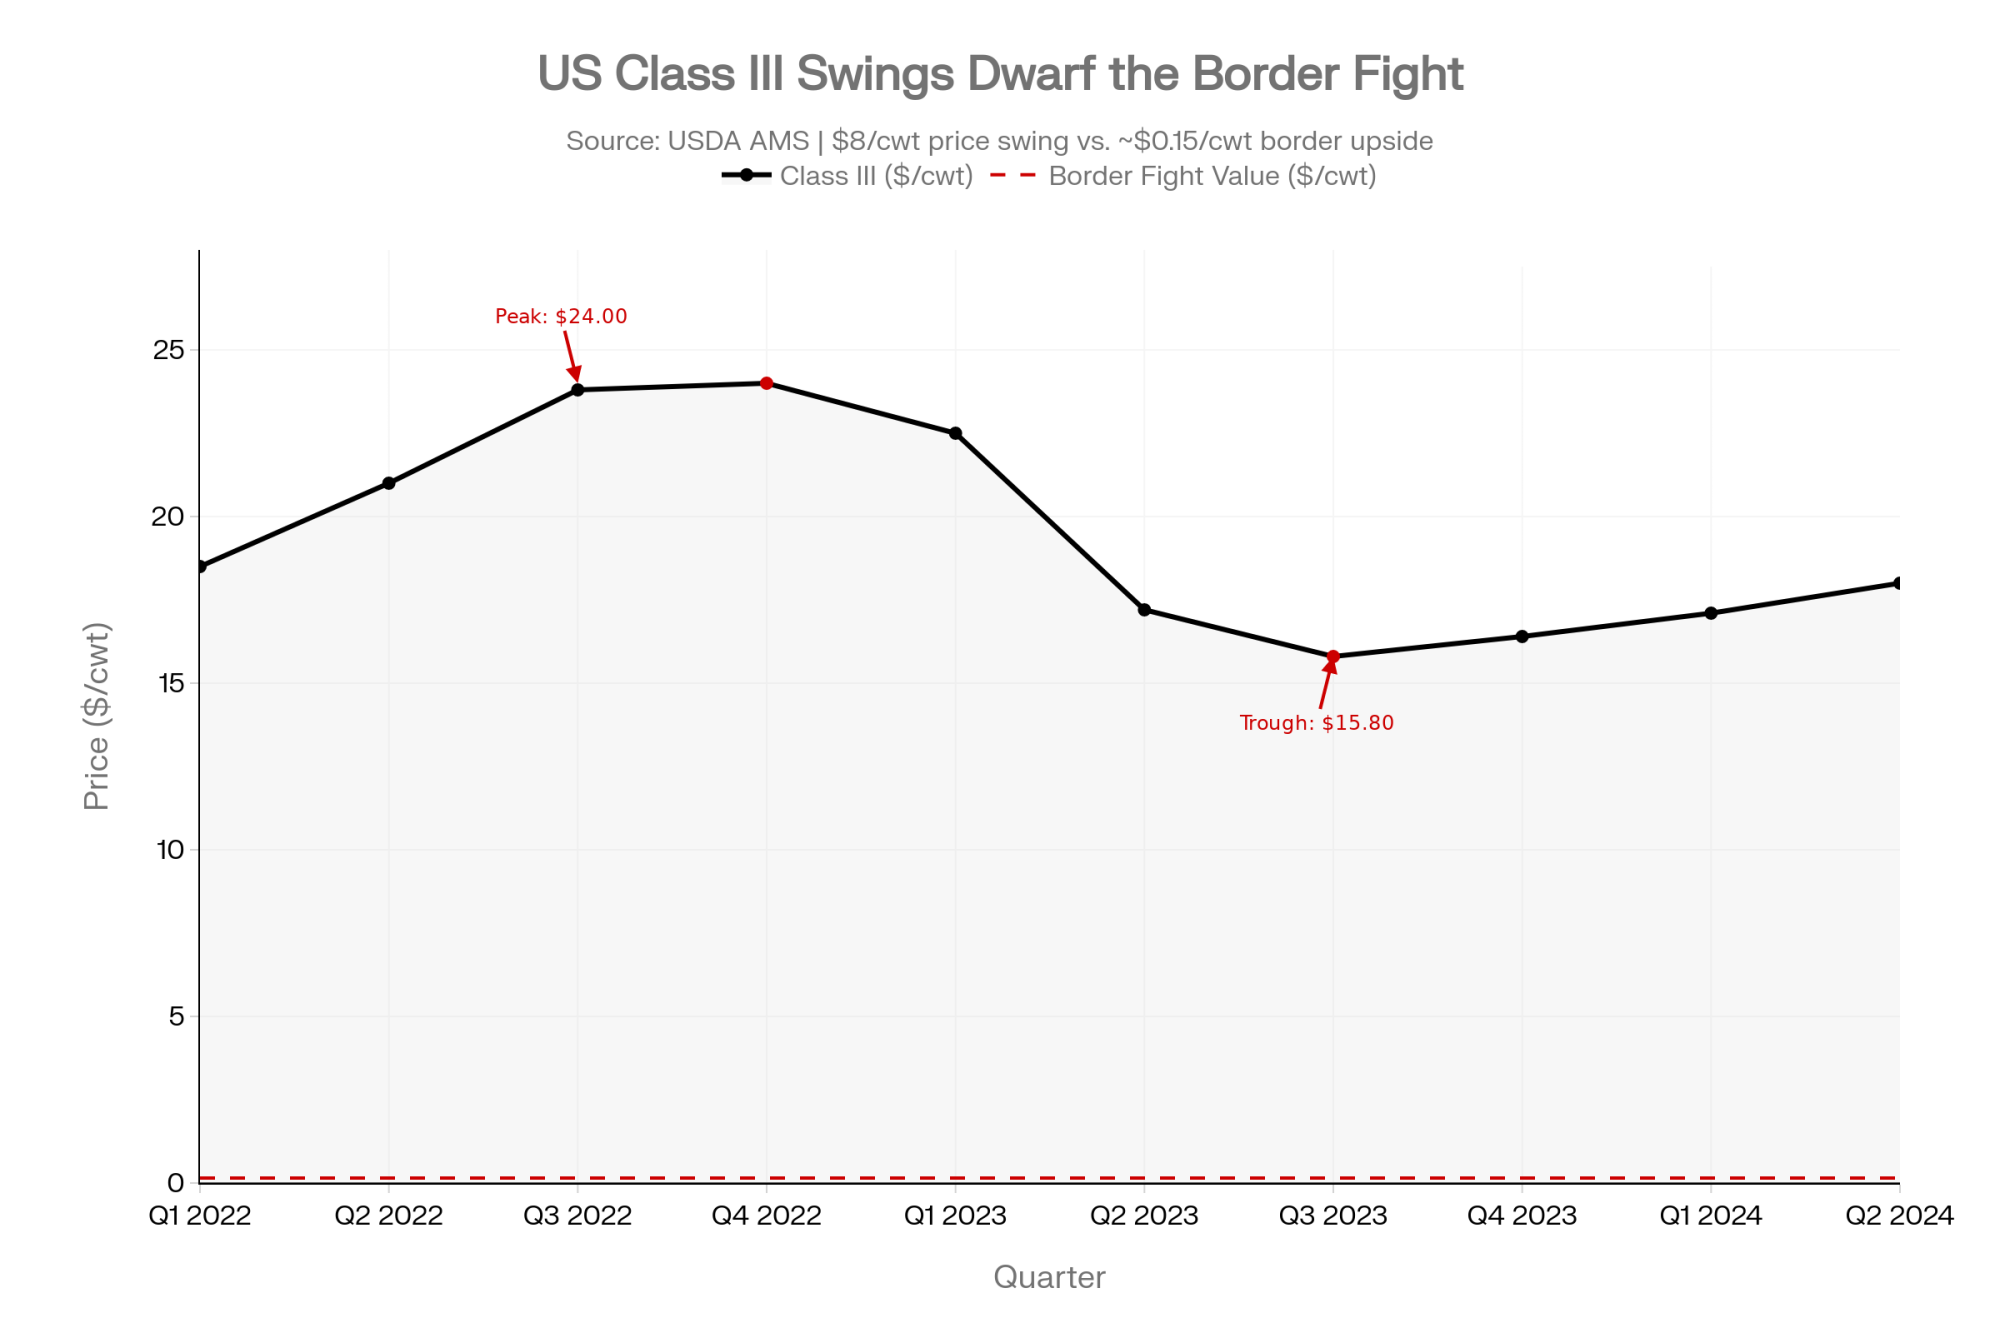
And somewhere else is where American farms actually bleed. US milk prices swing hard — Class III ran near US$24/cwt in mid-2022 and slid to around US$16 by 2023. That’s a US$8 swing per hundredweight, dozens of times larger than the entire border fight — a different order of risk entirely. 

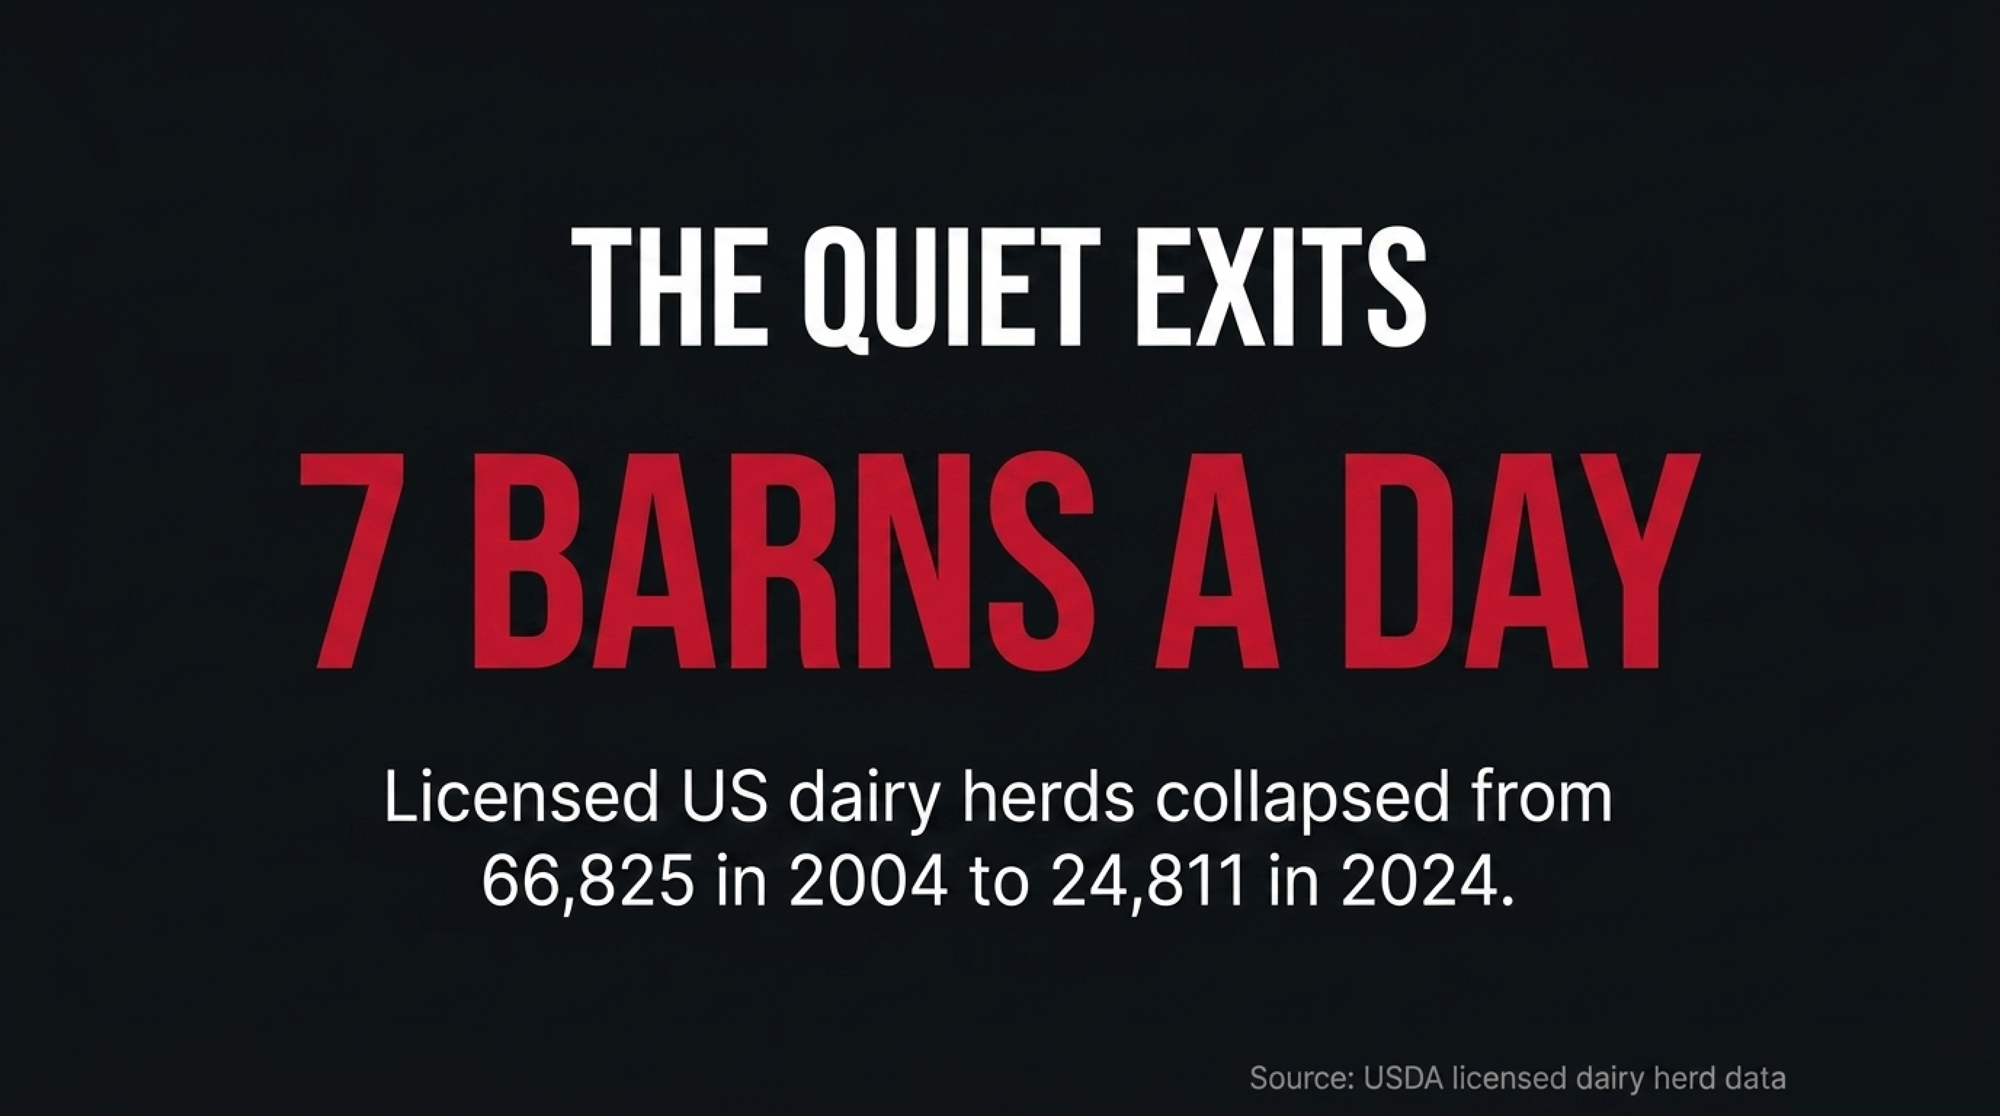
Licensed US dairy herds have collapsed from 66,825 in 2004 to 24,811 in 2024 — roughly 2,500 to 2,800 exits a year lately. About seven barns a day. 

The border fight is the loud war. The price cycle is the quiet one that actually closes those barns — and no panel ruling in Geneva fixes a debt-service coverage ratio that breaks at US$18 milk.

What Does the Border Fight Actually Change on a US Milk Cheque?

Not much — and that’s the whole point. Say the US wins the TRQ fight outright and Canada fills every basket tomorrow. The most credible estimates put the upside at five to fifteen cents per hundredweight spread across US production. On that same 150-cow farm — the same 36,000 cwt, just at 15¢ instead of a nickel — the top of the range is roughly US$5,400 a year. A nice cheque. Not a strategy. 

Line that up against what the price cycle already does to the same farm. A US$8/cwt swing on that milk is the difference between a comfortable year and a call to the lender. So if you’re American, the honest question isn’t whether Ottawa plays fair. It’s whether your operation clears its debt service when Class III drops back toward US$16 — the number that’s actually been closing seven barns a day. The border is the fight you can watch. Your DSCR is the fight you can win. 

Why Aren’t More US Farms Using the Tools Built for Exactly This?

Here’s the frustrating part. The federal programs designed to blunt that US$8 swing already exist — and plenty of farms leave them on the shelf. Dairy Margin Coverage pays out when the national milk-feed margin falls below the coverage level you buy, and Dairy Revenue Protection lets you lock a floor under your quarterly milk revenue. Neither is a handout, and neither is complicated once you’ve run it once. 

The catch producers cite is cost and paperwork — premiums due when margins look fine, forms that feel like busywork in a good year. That’s exactly the wrong time to judge them. And the program’s most affordable coverage tier is built for the family-scale operation — it applies to a base slice of your production history, which, for a herd the size of that 150-cow Wisconsin farm, covers all of its milk at essentially the cheapest rate. If that’s your farm and you’re not enrolled, you’re leaving your best-fit risk tool on the shelf while arguing about a nickel at the border. 

Team Canada’s Case — And Its Own Gut-Punch

Now raise the Maple Leaf. The Canadian producer’s pitch is stability, and the numbers back it. Supply management delivers a steadier milk cheque, and Ottawa just made it law that nobody can trade it away. Bill C-202 received Royal Assent on June 26, 2025, replacing an earlier version that died when Parliament was prorogued. The trade minister now legally can’t raise import quotas or cut over-quota tariffs on dairy, poultry, or eggs. That’s settled law now, not a proposal — which is what makes the “off the table” framing real. Fortress sealed. Flag planted. 

Here’s the gut-punch for Team Canada. That protected system runs on quota — and quota is where the real exposure hides. Farm Credit Canada’s 2026 report pegs mid-size quota holdings near CA$2.5 million, at CA$24,000 to CA$27,000 per kilogram of butterfat. Our 100-cow Ontario example runs a bit higher — about CA$3 million in quota — which is where the barn math below starts. Either way, it’s the biggest asset on the balance sheet. And it’s not a commodity price you can hedge — it’s a value that exists only because the political system says it does. 

That system’s already been chipped away three times.

CETA, CPTPP, and CUSMA combined opened access equal to about 8.4% of national milk production. Ottawa’s answer each time: up to CA$4.8 billion in compensation to producers, plus CA$497.5 million to processors. 

Concede a slice, pay the compensation, declare the fortress intact. The new law even hints at the fear underneath it. If quota value were truly bulletproof, you wouldn’t need a statute swearing you’ll never trade it away.

Could Quota Values Actually Re-Rate — Or Is That Fear Talking?

Fair question. Nobody’s predicting a crash, and no lender or ag-economics body has published a model calling for one. But you don’t need a crash to feel it — you need a slow squeeze, and the pieces for one are already on the board. Three trade deals have opened access equal to about 8.4% of production, and C-202 has removed dairy as a bargaining chip for the next round. Each concession moves more foreign product inside the fence; the guarantee behind your quota gets a little thinner each time. 

Here’s why that matters for the price of a kilogram of butterfat. Quota holds its CA$24,000-to-CA$27,000/kg value because the system guarantees you a buyer at a set return. Weaken that guarantee — more import share, a thinner effective utilization rate — and the asset starts to look less bulletproof to the next buyer, and to your lender. Provincial boards cap how fast quota prices can move, which slows any re-rate but doesn’t put a floor under the underlying value. And with Ottawa’s only remaining tool being the compensation cheque, the political durability of quota value sits dead center of the next decade. The data on exactly how past concessions moved quota values is thin — but the direction of the pressure isn’t in dispute. 

How Much Would a 15% Quota Drop Actually Cost Your Equity?

Here’s the barn math that should make a Canadian producer put down the flag and pick up a calculator. Take that 100-cow Ontario farm: CA$5.0 million in assets, CA$3 million of it quota, CA$2.75 million in debt, CA$2.25 million in equity. Debt sits at about 55% of assets — comfortable, bankable, nothing a lender blinks at. 

Now knock 15% off the quota. CA$3.0 million becomes CA$2.55 million. Same cows. Same milk. Same components. But equity drops to CA$1.80 million, and debt climbs to roughly 60.4% of assets — the kind of shift that moves a farm from a routine renewal to a sit-down with the bank. A 10-to-20% haircut on that CA$3 million is a CA$300,000 to CA$600,000 hit to your equity, with zero warning on the milk cheque. 

And here’s the part that makes it personal: that same cut lands differently depending on where your leverage sits. A farm that paid its quota down over the years absorbs the hit and stays comfortably bankable. A farm that expanded recently at peak quota prices — far more debt against the same asset — can get pushed from a routine renewal into a hard conversation with the lender. Same milk cheque. Same haircut. Wildly different phone call. The question isn’t whether quota drops. It’s where your leverage sits when it does — which is exactly what the 30-day stress-test below is built to tell you.

So Who’s Actually Winning the Border War?

Depends on which risk scares you more. Here’s the honest scoreboard, side by side.

Risk Dimension🇺🇸 Team USA (150-cow Wisconsin)🇨🇦 Team Canada (100-cow Ontario)
Milk Price StabilityVolatile — US$8/cwt swings in a single yearRegulated, formula-based — predictable
The Trade Fight’s Real Value~5–15¢/cwt upside if US wins outright8.4% of production already conceded
Annual Impact on 150/100-cow Farm~US$1,800–$5,400/year max gainQuota re-rate risk: CA$300K–$600K equity
Debt-to-Asset at RiskDependent on milk price / DSCR55% → 60.4% on a 15% quota drop
Biggest Structural ThreatPrice cycle + ~2,500–2,800 farm exits/yrQuota value linked to political system
Freedom to Grow / ExportHigh — open market, export upsideCapped — C-202 seals dairy as non-tradeable
Government Risk BackstopDMC, DRP — voluntary, no price floorCA$4.8B in compensation paid to date
What Producers Are WatchingOttawa’s TRQ fill ratesWashington’s tariff threats
What They Should Be WatchingTheir DSCR at US$18 milkTheir D/A ratio after a quota haircut

Read it straight, and nobody sweeps. On price stability, Canada wins — no argument. On scale, export upside, and freedom to grow, the US wins. But on the risk each side refuses to look at? It’s a tie in the worst way. The American’s chasing a rounding error at the border while the price cycle eats his neighbors. The Canadian’s sleeping on a six-figure asset he’s never once stress-tested. Both flags flying. Both fighting the wrong battle.

Is Your Farm Watching the Wrong Border?

The instinct on both sides is to watch the other country. Americans watch Ottawa’s “unfair” quota walls. Canadians watch Washington’s “400% tariff” soundbites and Trump’s threats. But for the US producer, the milk cheque barely moves either way — the real war is a debt-service coverage ratio nobody’s tested against the next price dip. And for the Canadian producer, Washington’s mood is a sideshow. The variable that could reset your net worth is whether quota values hold through ten years of annual reviews. Everyone’s watching the border. The risk is in the barn.

Options and Trade-Offs: Your Move by Border

Panic isn’t the point. Nobody can put a probability on a quota re-rate, and no lender or ag-economics body has published a formal model predicting one. Most farms on both sides have rehearsed the wrong risk. Here’s the playlist — Canadian balance-sheet homework first, then the American risk-management moves.

If you farm in Canada:

Farm SizeQuota Value (Baseline)Equity (Baseline)D/A (Baseline)–10% Quota Drop–15% Quota Drop–20% Quota Drop
60-cow (Starter)CA$1.8MCA$1.0M~55%–CA$180K → 58.9%–CA$270K → 61.3%–CA$360K → 63.8%
100-cow (Mid-size)CA$3.0MCA$2.25M~55%–CA$300K → 58.2%–CA$450K → 60.4%–CA$600K → 62.5%
200-cow (Large)CA$6.0MCA$4.5M~55%–CA$600K → 57.8%–CA$900K → 59.7%–CA$1.2M → 61.6%
  1. Run the haircut stress-test yourself — within 30 days. Take your current quota value, cut it 10%, 15%, and 20%, and recalculate your debt-to-asset ratio and loan-to-value.
    1. When it makes sense: any farm carrying quota as major collateral.
    1. What it takes: an afternoon and your last balance sheet.
    1. The risk of skipping it: you learn where your covenants sit from your lender, not from yourself.
  2. Ask your lender their own haircut assumptions. Your bank or FCC may already discount the quota internally when sizing up your position.
    1. When it makes sense: before your next operating-line renewal.
    1. What it takes: one direct conversation.
    1. The payoff: you find out if the bank already values your equity lower than you do.

If you farm in the US:

  • Treat the TRQ fight as gravy, not a plan. Even a fully “fixed” quota system moves you five to fifteen cents per cwt. 
    • The real levers: your DSCR, and whether you’re actually enrolled in DMC and DRP.
    • The limit: no ruling in Geneva saves a balance sheet that breaks at US$18 milk. 
  • Check your risk-management coverage before the next sign-up window. DMC and DRP are built to blunt exactly the price swings that close barns, and the most affordable coverage favors family-scale herds. 
    • When it makes sense: any herd exposed to margin collapse — which is all of them.
    • What it takes: a sign-up window and premiums paid even when margins look fine.
    • The trade-off: small guaranteed cost now versus an uncovered margin collapse later.

For both sides:

  • Grow margin before volume. For Canadians, C-202 walls off big export-driven growth, so the edge is cost per litre and better components. For Americans, chasing volume into a price trough is how good herds go under.
    • The Canadian catch: financed quota at around 6% interest already bleeds cash on a negative carry, so buying more into a possible re-rate stacks the risk. 

Key Takeaways

  • If quota is your largest asset and a 15% cut pushes your debt-to-asset ratio past your lender’s comfort zone, you’ve found your real exposure — not the one on the news.
  • If you bought quota recently at peak values with high leverage, you’ve got the thinnest equity cushion to absorb a re-rate. Model it before your next renewal.
  • If you’re American and your DSCR can’t survive a US$18 milk year, fix that before you spend one more minute on a TRQ fight worth about 5¢/cwt. 
  • If you’re not enrolled in DMC or DRP, you’re leaving the tools built for exactly these price swings unused — check your coverage before the next sign-up window. 
  • If you see dairy compensation getting reframed as “temporary” or “transitional” in Canada, or risk-tool cuts moving through a US Farm Bill, that’s your signal the ground is shifting under your system.

The border war makes for great fireworks on both sides. But the fight that decides whether your farm will still be standing in ten years isn’t happening in Washington or Ottawa. It’s happening on your own balance sheet — and most operations on both sides of the line have never run the numbers.

So pick your battle, but pick the right one. If you’re American, would your farm survive the next price crash without a single Canadian container crossing the border? And if you’re Canadian, if your quota value dropped 15% tomorrow, would your lender notice before you did? We’re breaking down the full head-to-head — the quota-haircut model by herd size beside the US risk-tool playbook — in an upcoming Bullvine deep-dive. That’s where the real numbers live, for both flags.

The Bullvine Balance Sheet Stress-Tester

Stop watching the news. Run your actual numbers below.

Learn More

The Sunday Read Dairy Professionals Don’t Skip.

Every week, thousands of producers, breeders, and industry insiders open Bullvine Weekly for genetics insights, market shifts, and profit strategies they won’t find anywhere else. One email. Five minutes. Smarter decisions all week.
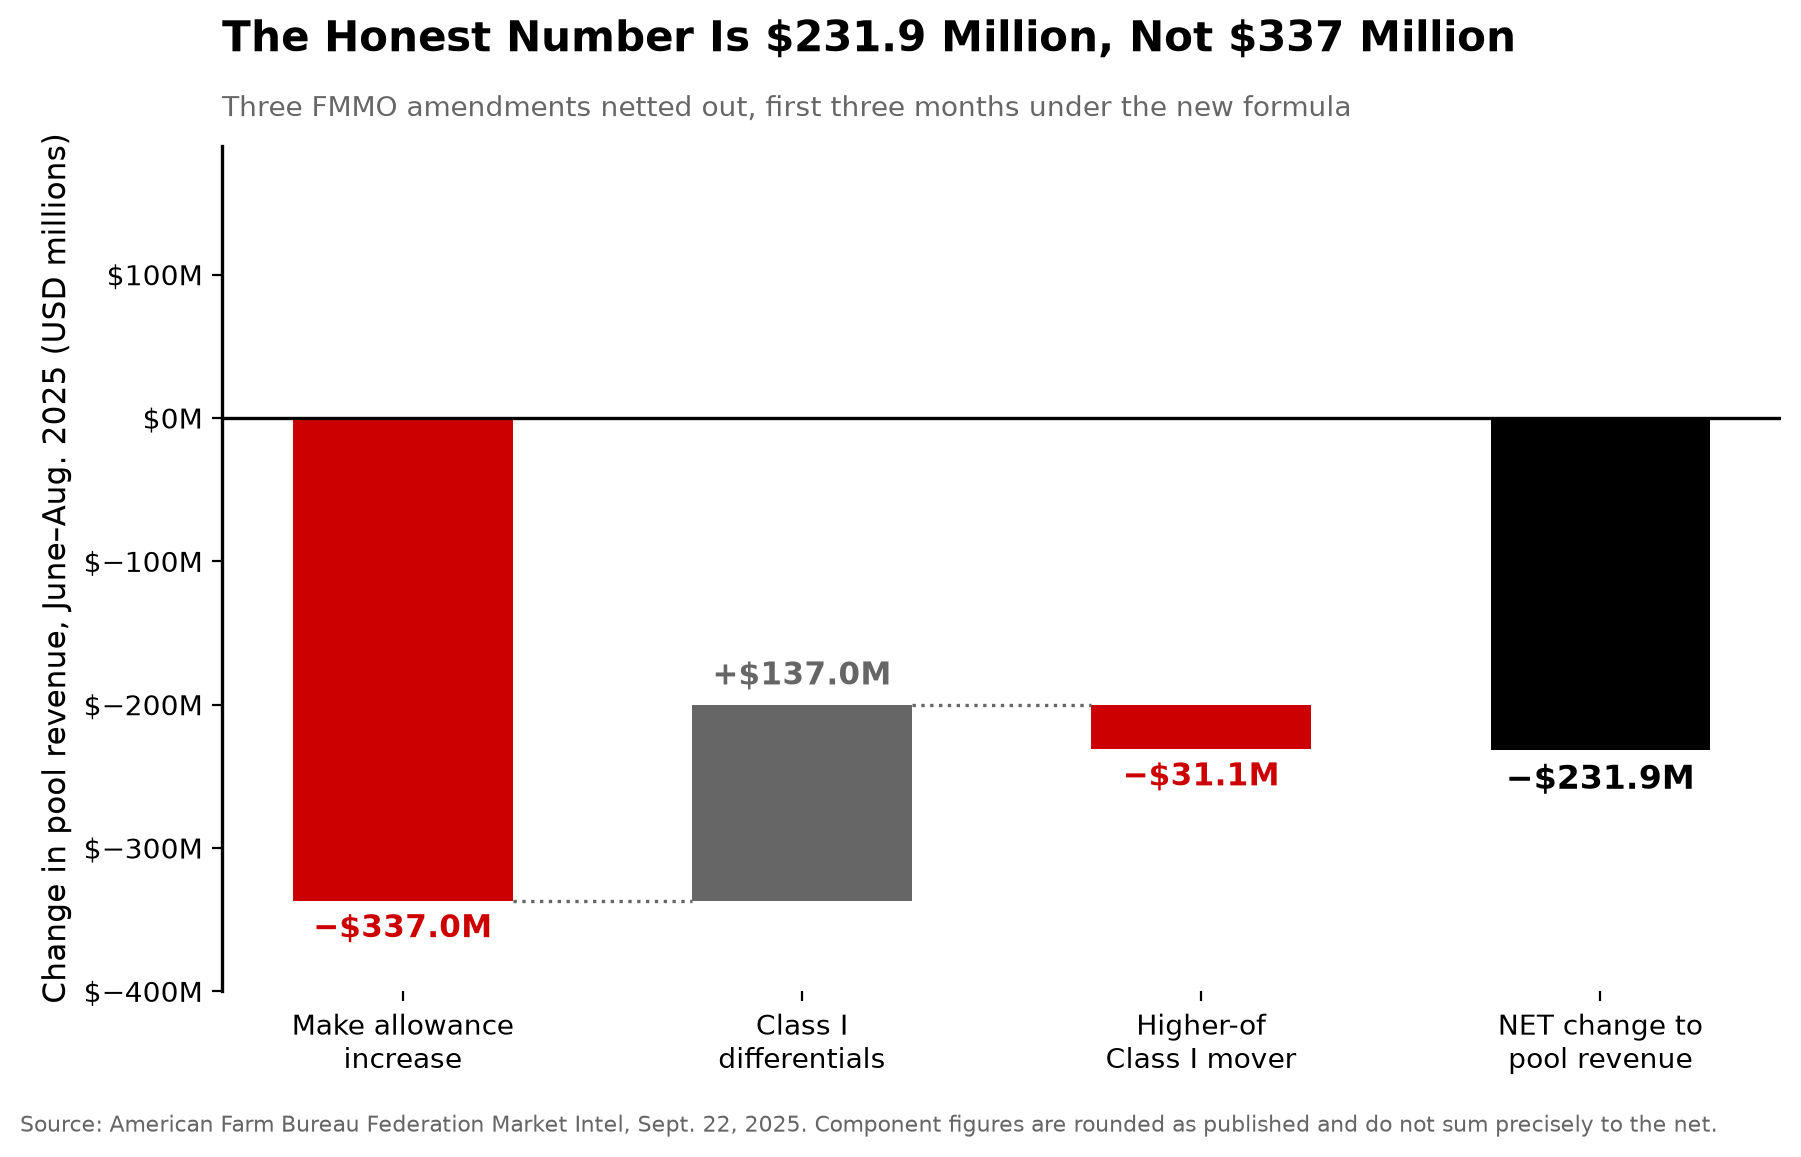
NewsSubscribe
First
Last
Consent
Send this to a friend