







Two numbers, $200M apart, for the same program. Meanwhile, $1.00/hL of retention runs $5,243 a year on an average Ontario farm — and nobody outside the co-op can tell you which way it’s moving.
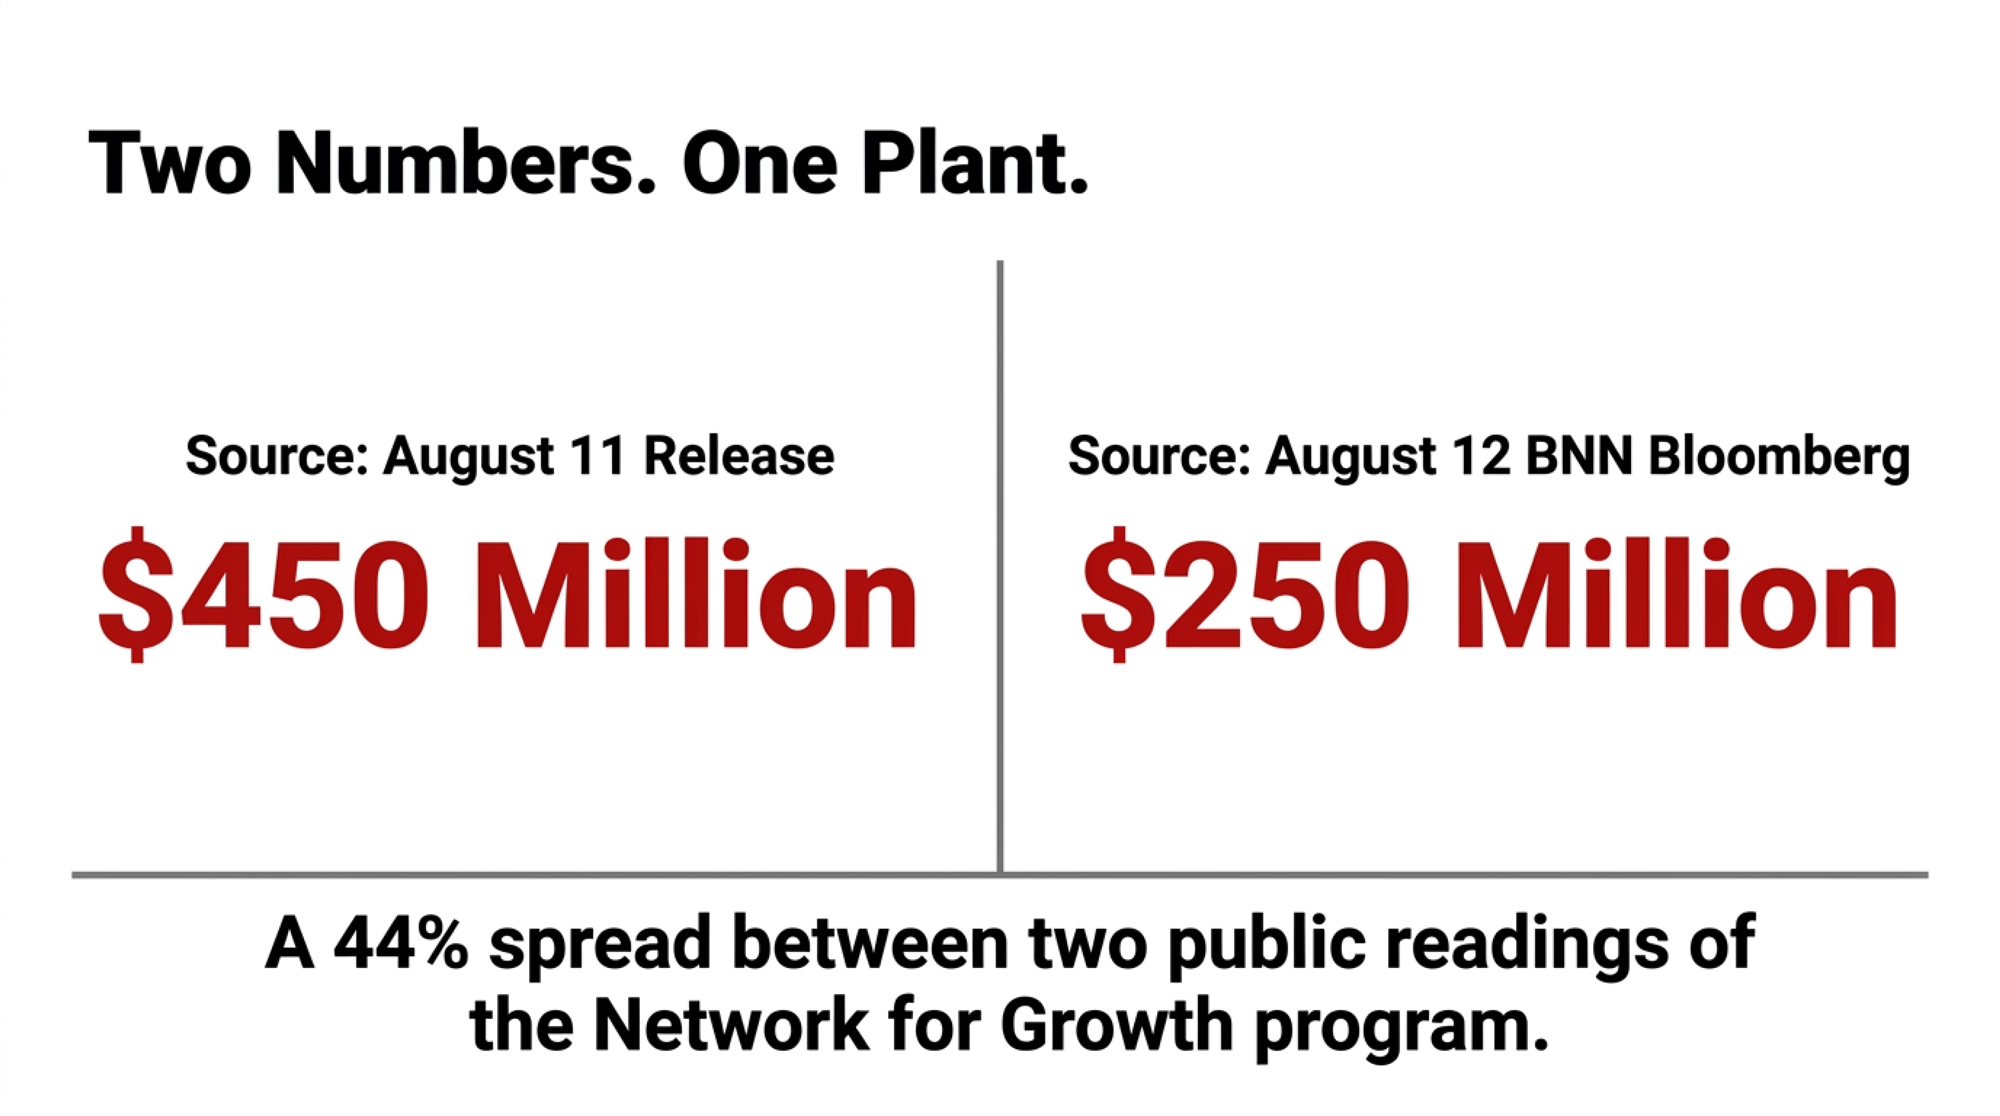
Gay Lea’s own release calls it an approximately $450 million program. Two days later, on BNN Bloomberg, the number was $250 million — and neither figure has been reconciled.
| Source | Date | Figure Cited | Context |
|---|---|---|---|
| Gay Lea press release | Aug 11, 2026 | $450 million | Described as approximate program total, Network for Growth |
| BNN Bloomberg (host, on air) | Aug 12, 2026 | $250 million | Stated live, uncommented and unreconciled |
| Public record reconciliation | As of Aug 13, 2026 | Not reconciled | No public source clarifies which figure is operative |
| Confirmed first tranche | Aug 11, 2026 | $200 million+ | The only figure both sources agree exceeds this floor |
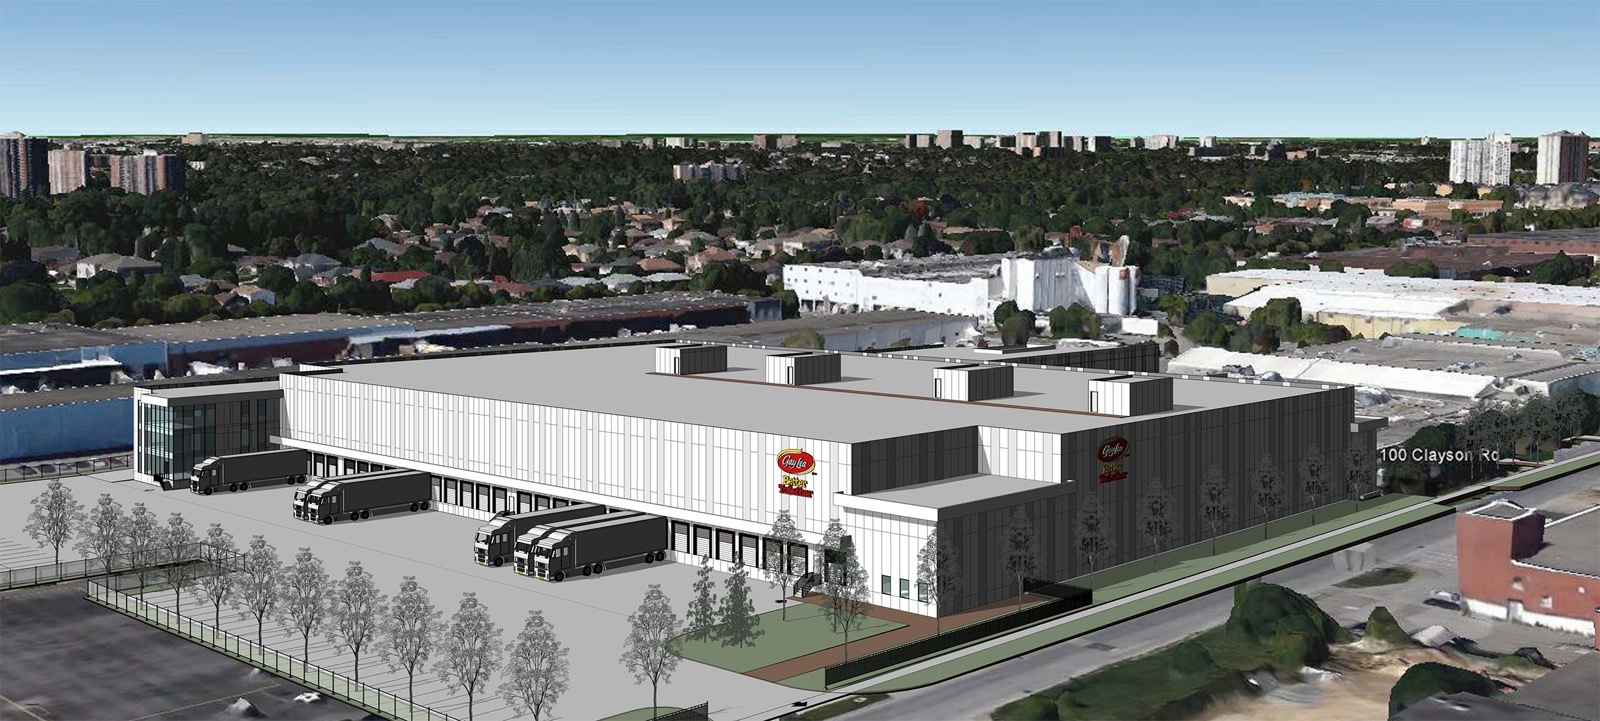
The co-op committed more than $200 million on August 11, 2026 to expand its Clayson Road plant in Toronto, described as the first milestone in a multi-year program named Network for Growth. About 1,200 farmer-members across Ontario and Manitoba own the business making that commitment. Co-op capital of that size comes off the balance sheet somewhere, and no public source breaks out how much comes from retained patronage, how much from debt, and how much from government.
The Category Bet Underneath the Capital
Three straight years of accelerating volume
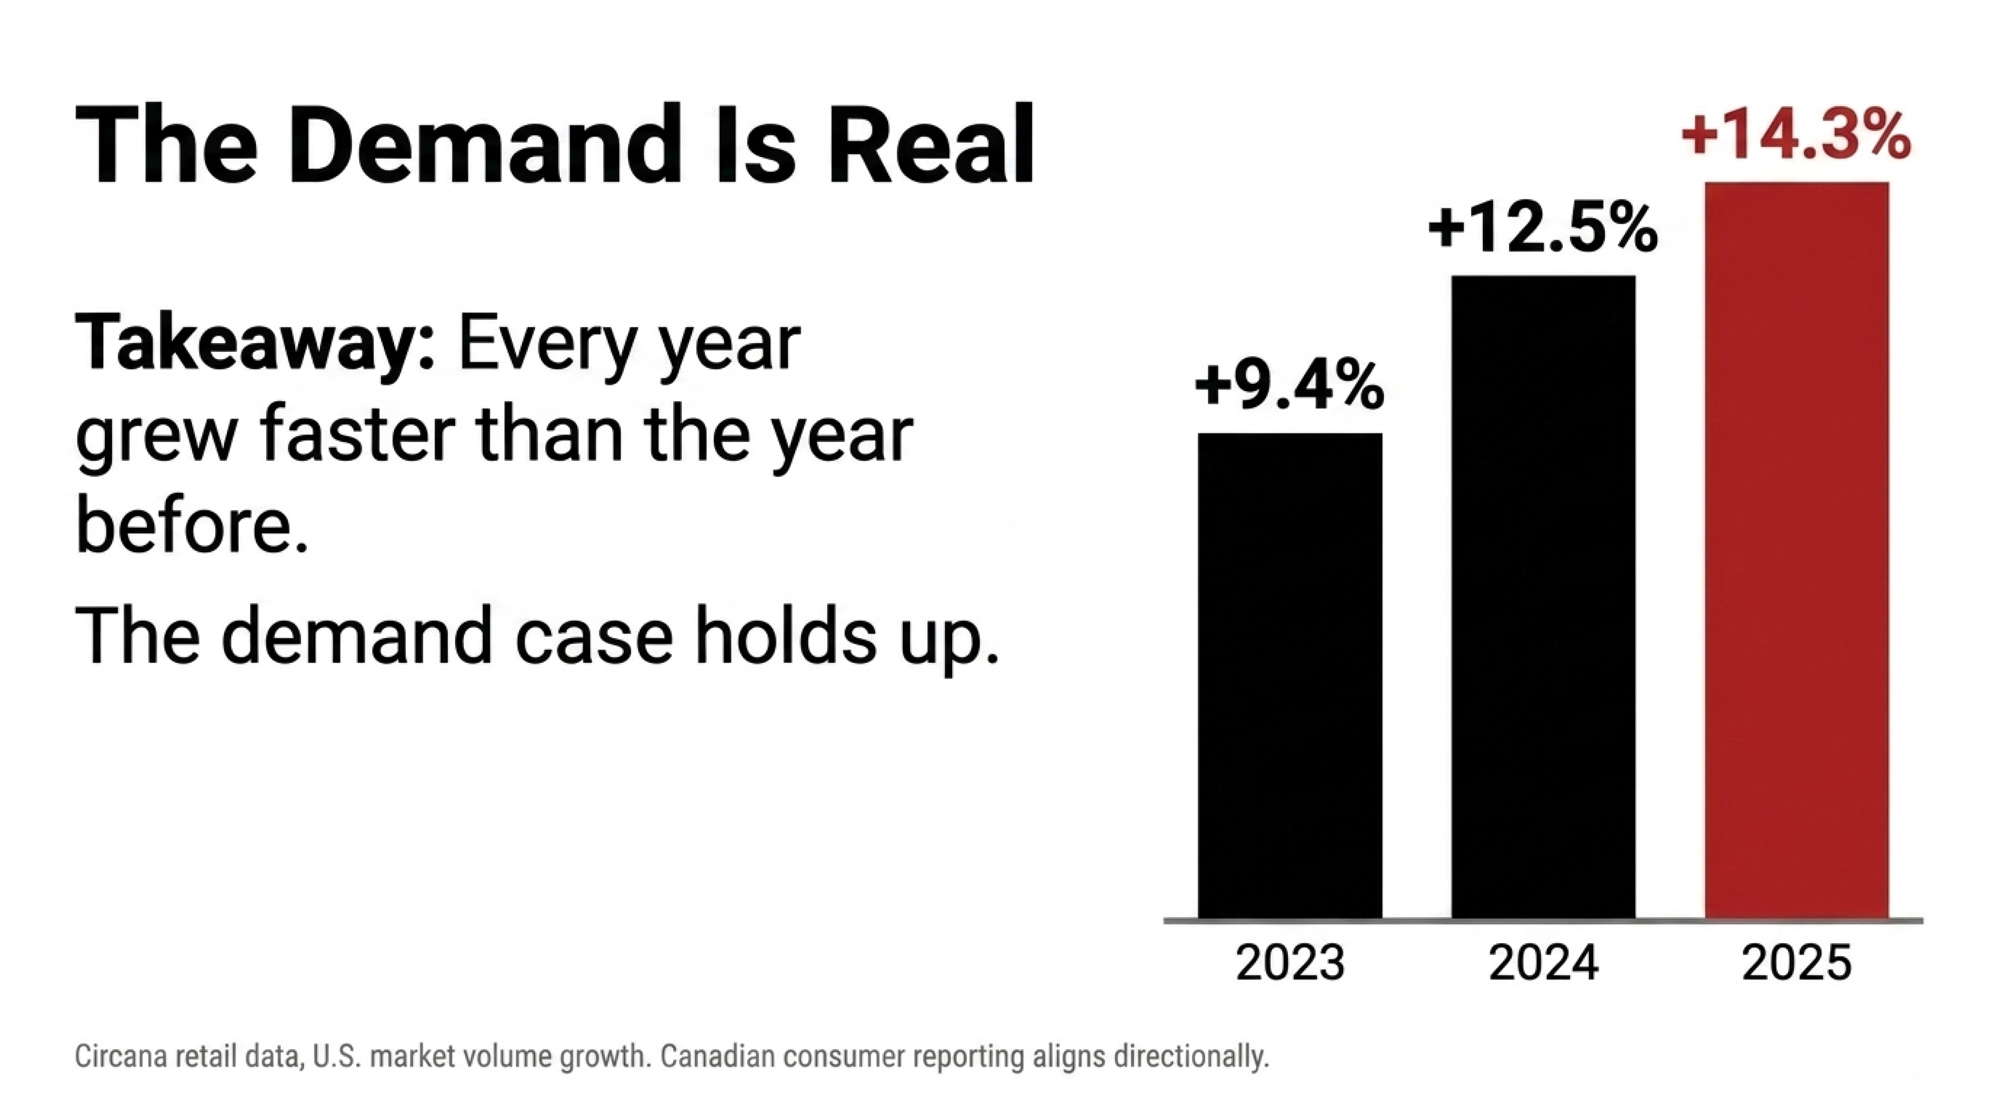
Circana retail data shows U.S. cottage cheese bottoming out in 2022 at 534.6 million pints, then climbing:
- 2023: +9.4%
- 2024: +12.5%
- 2025: +14.3%, reaching 746.6 million pints
Each year faster than the one before. U.S. retail sales cleared $2 billion in 2025, up 19.2% in dollars and 13.9% in volume, following roughly 17% dollar growth in the 52 weeks ending December 1, 2024.
Canada moved harder
Gay Lea’s own read matches the U.S. trajectory. President and CEO Suzanna Dalrymple, speaking to BNN Bloomberg on August 12, 2026, put category growth in “double digits over the last several years” and described Canadians “incorporating cottage cheese into their breakfast, lunch, dinner, and snacks.”
Canadian consumer reporting from Chatelaine (April 2026) and CBC News Windsor (May 2026) puts the increase near 30% year over year, with empty shelves in major markets. Both cite retail and industry commentary rather than a StatCan or Nielsen Canada series — directional, not precise.
The demand case holds up. That was never the part a patron needed clarified.
Where Co-op Capital Actually Comes From
The mechanism
Cooperatives fund processing investment primarily through retained patronage refunds and preferred stock, per USDA Rural Development’s guidance on patronage refunds. The co-op calculates what it earned on your milk, keeps a share to build with, and credits it to your equity account for redemption on the co-op’s timetable.
The trade-off, on the record
The U.S. Government Accountability Office stated it plainly in its 2019 report on dairy cooperative consolidation:
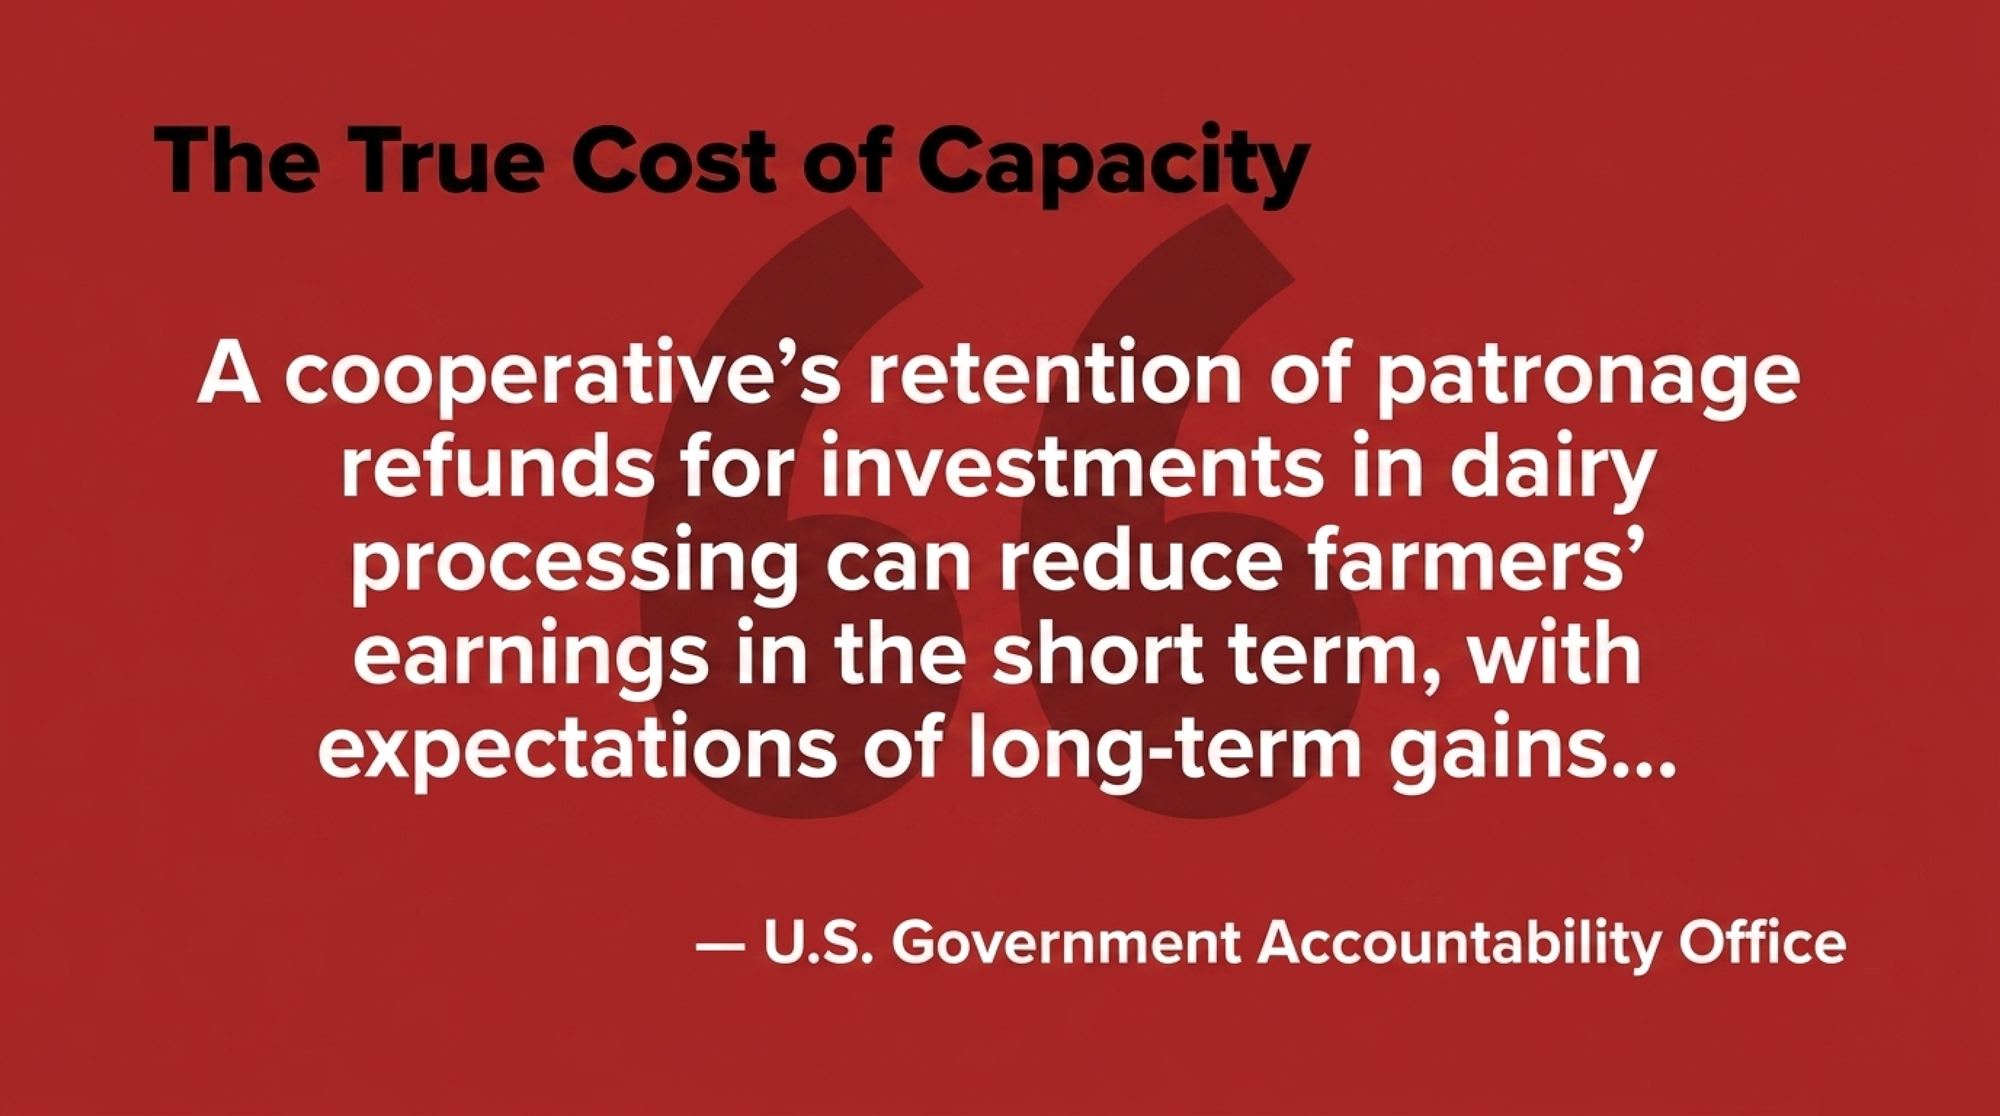
“A cooperative’s retention of patronage refunds for investments in dairy processing can reduce farmers’ earnings in the short term, with expectations of long-term gains when the cooperative undertakes investments that may increase earnings.”
Both sources are American and describe an accounting mechanism common to co-ops on either side of the border. Canadian retention rules differ in ways that may be material rather than technical — some Canadian frameworks permit retaining a substantially higher share of declared refunds than typical U.S. practice, and Gay Lea’s own bylaw provisions aren’t public. Treat the mechanism as portable and the percentages as not.
Where your milk lands in Ontario’s class system also shapes what a retention point costs you. Pull your own component detail before modelling off any provincial average.
Running the Numbers
The program figure has appeared two ways — and it changes the math
Gay Lea’s August 11 release and the trade coverage that followed put Network for Growth at approximately $450 million. In the August 12 BNN Bloomberg interview, the host referred to the program as $250 million; the figure went uncommented on air. Both readings sit on the public record.
That’s not a rounding issue. Run both:
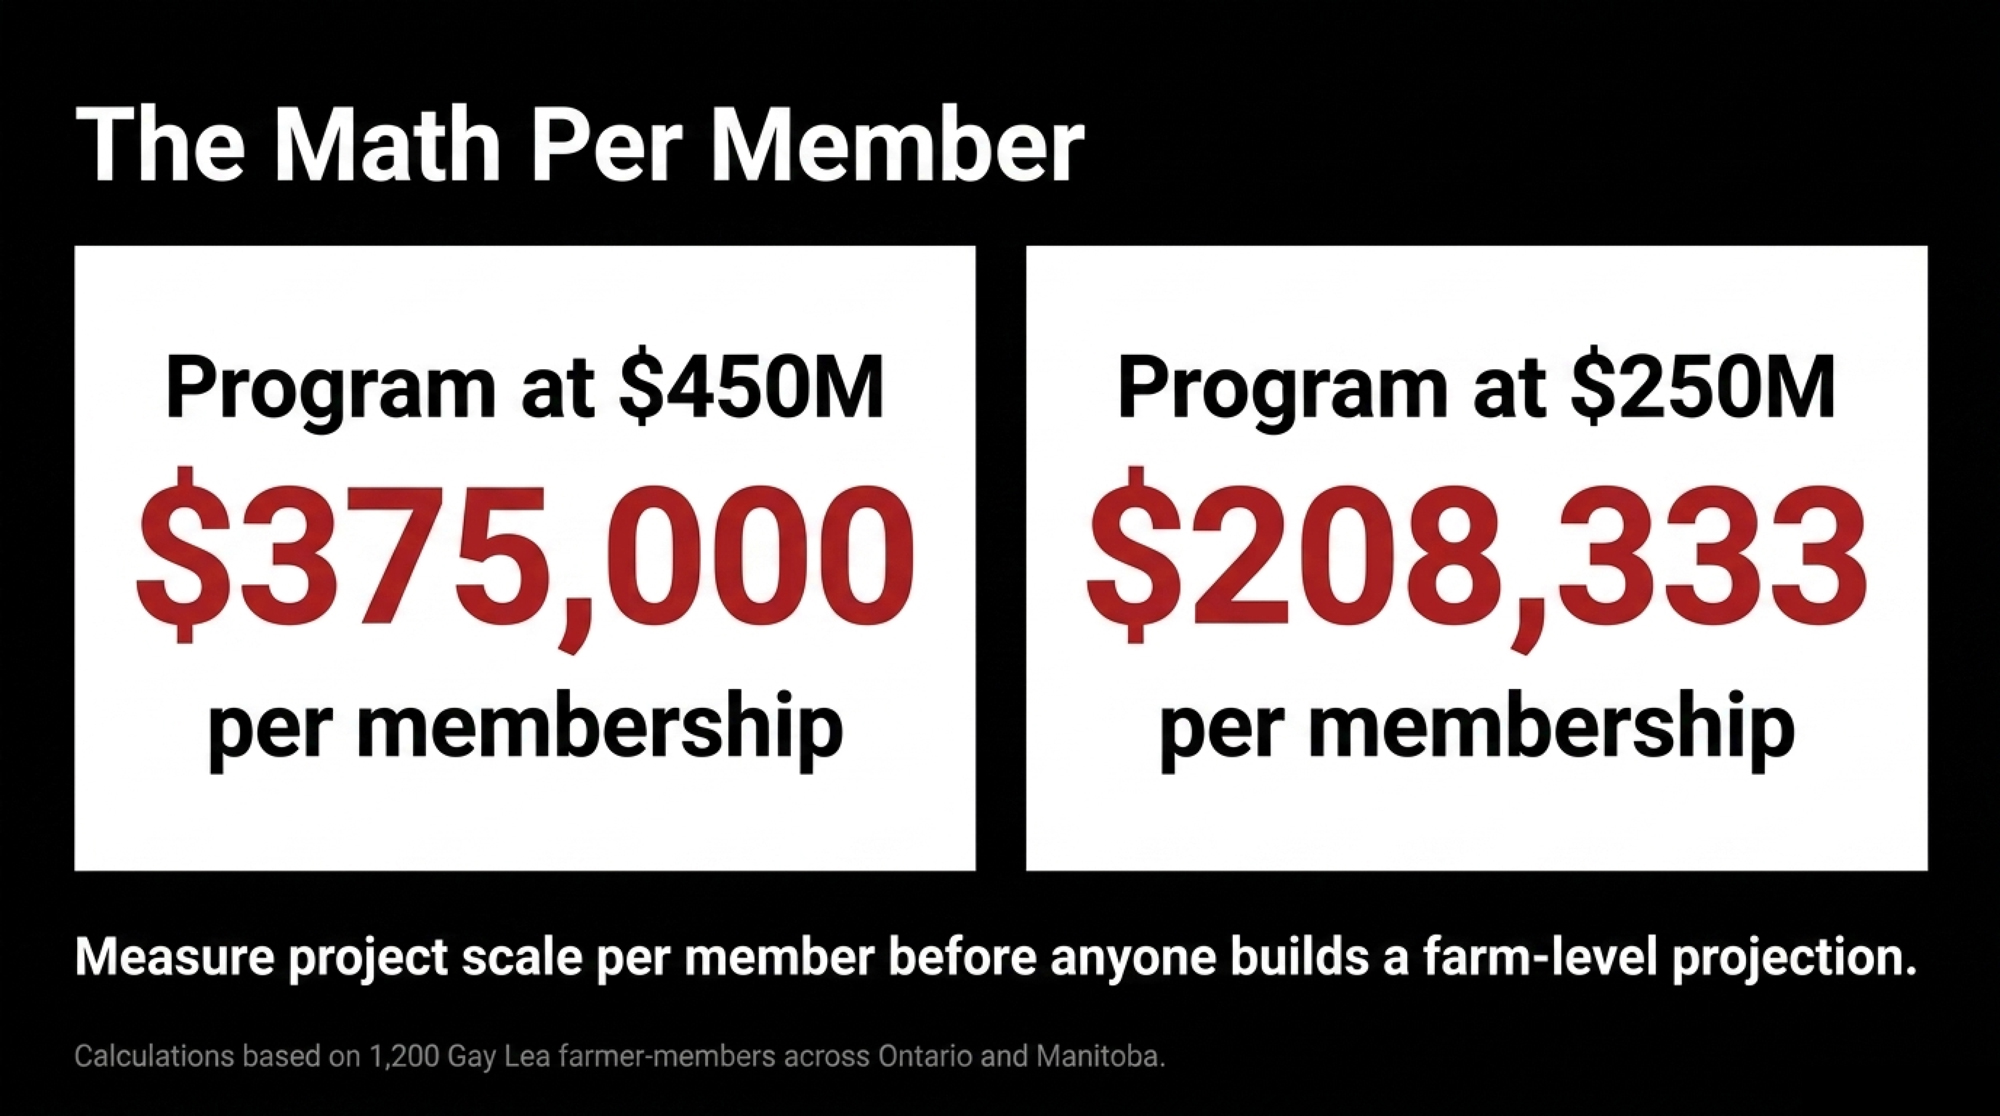
| Scenario | Program total | ÷ 1,200 members | Per membership |
| First tranche only | $200M+ | $200,000,000 ÷ 1,200 | $166,667 |
| Program at $450M | $450M | $450,000,000 ÷ 1,200 | $375,000 |
| Program at $250M | $250M | $250,000,000 ÷ 1,200 | $208,333 |
A 44% spread between the two program readings. Before anyone builds a projection off either figure, confirm which one the co-op is working from.
Read all three correctly. They measure project scale per member — not retained equity, not a deduction, not an exposure estimate. Retained patronage depends on what the co-op earns on your milk, not on what a project costs. A build financed 60% by debt produces nowhere near $375,000 per member in retention.
What a retention shift costs, by volume
Assumptions: Ontario average milk sold per farm of 524,341 litres (~5,243 hL) from the Ontario Dairy Farm Accounting Project’s 2022 annual report, and producer returns of $89.48/hL at Ontario average composition from Dairy Farmers of Ontario’s 2022 annual report. Both boards publish annually — pull the current year before you plan on these. Larger-volume rows scale the provincial per-farm average proportionally.
| Annual volume | Gross milk revenue | +$1.00/hL | +$2.00/hL | One month of gross |
| 5,243 hL (provincial avg) | ~$469,000 | $5,243 | $10,486 | ~$39,100 |
| 15,000 hL | ~$1.34M | $15,000 | $30,000 | ~$111,900 |
| 25,000 hL | ~$2.24M | $25,000 | $50,000 | ~$186,400 |
Run your own hL against your own $/hL. The arithmetic is one line, and your numbers beat any provincial average.
The number that’s actually yours
- Pull your last three patronage statements.
- Record the retained-versus-cash split on each — in dollars and as a percentage.
- Line the three years up side by side.
That trend is your real signal. Rising retention across two consecutive years while cash patronage falls is a cash-flow planning item. Rising retention in a strong earnings year may mean nothing at all, which is why you read absolute dollars alongside the percentage.
Leverage changes the calculus too. A farm carrying heavy term debt feels a retention shift in its operating line immediately. A debt-free operation absorbs the same shift as deferred equity.
What Producers Outside the Co-op Should Take From This
The GAO flagged a second effect in the same report, and non-patrons should read it as a shipping decision rather than a policy note. Increased market access from a co-op’s processing investment, the report found, “may result in higher earnings for farmers in the cooperative while potentially reducing market access for farmers outside of the cooperative.”
Dalrymple told BNN Bloomberg the Toronto facilities take milk “every day… from the dairy farmers of Ontario.” A patron is funding capacity that will absorb their protein. A non-patron watches a competitor’s outlet grow while carrying none of the build cost — and gaining none of the access.
You take on equity exposure and market access together, or you decline both. Neither side of that trade is obviously the winner.
Is There Public Money in This Build?
What DIIF allows
Canada’s Dairy Innovation and Investment Fund was built to co-fund this class of expansion. Per the Canadian Dairy Commission’s applicant guide:
- Non-repayable contributions up to 33% of eligible costs
- 25% for construction specifically
- Capped at $75 million per project
- Ontario allocated $127 million of the $333 million national pool
No public record indicates Gay Lea has applied for or received DIIF funding for Clayson Road.
The precedent at this exact site
The Government of Canada’s Grants and Contributions database carries agreement 062-2020-2021-Q1-00441: a $10 million FedDev Ontario Business Scale-Up contribution, running June 12, 2018 to September 30, 2020, for equipment acquisition and building expansion across four facilities — Teeswater, Guelph, Hamilton, and Clayson. That agreement closed nearly six years before this announcement.
It sat inside a larger package announced jointly by the co-op and the federal government at Teeswater on July 24, 2019, with then-Agriculture Minister Marie-Claude Bibeau present:
- $10 million — FedDev Ontario, processing equipment
- $6.9 million — AAFC Dairy Processing Investment Fund, waste-reduction work
- $16.9 million total, with roughly 13 skilled positions created and 50 maintained
The FedDev component in the grants database is the same $10 million inside that $16.9 million package — one program, publicly announced, and separately logged in Ottawa’s statutory disclosure database, which publishes contribution records regardless of what recipients announce.
Gay Lea has form on multi-year capital programs, too. In November 2016, the co-op announced $140 million over four years for a nutraceutical-grade dairy ingredients business, with a $60 million first phase at Teeswater starting in early 2017.
| Financing Source | Publicly Confirmed? | Amount / Status | Note |
|---|---|---|---|
| Retained patronage refunds | Mechanism confirmed, amount not disclosed | Unknown split | Standard co-op practice per USDA guidance |
| Debt | Not disclosed | Unknown | No public breakdown of leverage on this build |
| DIIF (federal co-funding) | No application on record | $0 confirmed | Program allows up to 33% of eligible costs, capped at $75M |
| FedDev Ontario (2018 precedent, same site) | Confirmed, closed | $10 million | Agreement ran 2018–2020, unrelated to current build |
| AAFC Dairy Processing Investment Fund (2019 precedent) | Confirmed, closed | $6.9 million | Part of a separate $16.9M package announced jointly with Ottawa |
The pattern worth noting: when federal money has been part of a Gay Lea plant project, it came with a joint announcement and a dollar figure attached. On the current program, no equivalent announcement has appeared.
It’s early in a build that runs to 2028. Terms may not be final. Public co-investment may not be part of this one at all. Each of those stops being a question the moment somebody asks.
Is Fixed-Price or Cost-Plus the Question Nobody Asked?
On a nine-figure build, that single contract distinction sets whether member equity exposure has a ceiling or floats with the project. Fixed-price caps it. Cost-plus doesn’t.
Asked on BNN Bloomberg whether anything could affect the 2028 timeline, Dalrymple said: “Nothing that would be different from any other construction build, but we’ve got a great team working on it, and we expect it to be on time and on budget.”
That’s a confidence statement about outcomes, not a disclosure of contract structure — and they aren’t the same thing. On budget against a fixed price means the price holds. On budget against cost-plus means the estimate held, which is a different promise with a different owner of the overrun risk.
No public source states which structure governs Clayson Road, and capital projects routinely don’t publish contract terms. Members hold the equity here, though, and whether a co-op discloses those terms is governed by its own bylaws and by Ontario co-operative law. Check your membership agreement rather than assuming either way.
Ask it while the build is still in front of you. Once the plant is running, the terms are settled.
Is Your Shipping Decision Now a Category Decision?
One 60-day window shows where dairy capital thinks the margin lives:
| Company | Commitment | Read |
| Lactalis Canada | $900M+ across 19 sites | Multi-category, investor-owned |
| Gay Lea | $200M+ | Cottage cheese |
| Bongards’ Creameries | $135M | Process cheese |
| Dairy Farmers of America | St. Albans, VT idled Aug 17 | Fluid milk exit |
Bongards adds 180 million pounds of annual capacity, with construction starting Q4 2026 and commercial operations expected in early 2028. DFA’s idling costs roughly 80 jobs — and the hauling bill lands on the farms around it, not on the processor. Lactalis Canada’s program includes $42 million at Winchester, Ontario, with a $16.4 million milk receiving bay.
Three co-op or co-op-adjacent entities. Three category-specific calls. One quarter. And Lactalis — investor-owned, no member equity in play — reading the same categories the same way.
If you’ve never pressed your processor on what your milk actually becomes, that’s the gap Same Milk, Different Payday was built to close. For the American version of the same squeeze, the $11 billion gap runs those numbers.
The 30/90/365-Day Playbook
30 Days — Urgent Checks
1. Chart your retention split across three years
- Do: Pull three years of patronage statements; record the retained-versus-cash split in dollars and percentages.
- Requires: Statements, twenty minutes
- Trigger: Retained share up in each of the last two years while cash patronage fell
- Watch for: Retention climbs in strong earnings years too — read absolute dollars before concluding anything
2. Submit three financing questions in writing
- Do: Email your board asking for the patronage/debt/government split, the contract structure, and whether a member-approved cost cap exists.
- Requires: An email
- Trigger: None — do it regardless
- Watch for: “Not finalized” is legitimate this early in a build. Asking now sets the expectation that it gets answered later.
3. Ask which program figure is operative
- Do: Request written confirmation of the Network for Growth total
- Requires: One line in the same email as #2
- Trigger: The $200M spread between the public readings
- Watch for: Both figures may be accurate under different definitions — one could be net of a component the other includes. Ask what’s in and out, not just the number
90 Days — Structural Adjustments
4. Model exposure against your actual volume
- Do: Work your real hL through the retention scenarios with your accountant, not the even-split figures
- Requires: Three years of statements, your hL shipped, your CPA, about an hour
- Threshold: Projected retention exceeding one month of gross milk revenue belongs in operating-line planning — roughly $39,100 at 5,243 hL, $111,900 at 15,000 hL
- Watch for: You’re modelling against an undisclosed financing mix and an unreconciled program total. Build a range; revisit when the co-op discloses
5. Read your supply agreement’s term before you model anything
- Do: Check whether you’re on a multi-year supply commitment or shipping year-to-year
- Requires: Your membership and supply documents
- Threshold: A patron locked into a multi-year agreement through 2028 carries retention exposure across the full build; a year-to-year shipper has an exit that a long-term commitment doesn’t
- Watch for: Exit optionality isn’t free — leaving a co-op mid-build can trigger equity redemption on the co-op’s timetable, not yours
6. Get the equity redemption schedule in writing
- Do: Request the revolving period from your board or corporate secretary
- Requires: Persistence
- Threshold: Know the period in years, not in “eventually”
- Watch for: Boards can revise redemption schedules under financial pressure. A stated schedule isn’t a contract
365 Days — Strategic Positioning
7. Track the competitive response
- Do: Monitor Saputo, and Lactalis for cottage-cheese capacity announcements
- Opportunity signal: A competitor move within twelve months means companies with zero member equity at risk are independently confirming the demand read
- Current status: Nothing announced as of mid-August 2026
- Watch for: Silence has three readings — the category is too small for their portfolios, they’re already at capacity, or something unannounced is in motion. The public record doesn’t distinguish among them
8. Watch the supply-management file alongside the capital file
- Do: Track whether Ottawa concedes on supply management in U.S. trade talks. Dalrymple’s public position is that Gay Lea is “focused on what we can control,” describing trade disruption to date as minimal because the Canadian system is built around domestic supply
- Trigger: A concrete concession affecting Class allocations changes the demand assumptions under any protein-category build
- Watch for: Trade rumours aren’t announced policy. Wait for the latter
9. Stress-test the demand curve
- Do: Build your long-range plan on a range, not a point estimate
- The data: Three consecutive Circana years at 9.4%, 12.5%, 14.3%. No defensible ceiling estimate exists
- Watch for: Commercial forecasters put long-range U.S. growth anywhere from 3.5% to 6.2% annually into the early 2030s, and their absolute market-size estimates disagree by orders of magnitude
What This Means for Your Operation
If you’re a Gay Lea patron: you’re on the short-term-cost side of the GAO’s trade-off until Clayson Road commissions in 2028. That’s the structure working as designed. The open question is whether you can see the terms while you’re inside them.
If you’re a non-patron Ontario producer: the GAO’s market-access finding says this build shifts your competitive position without asking for your permission or your capital. Watch the capacity announcements as pricing intelligence.
If you’re a U.S. producer: Bongards committed $135 million to process cheese in the same week DFA idled a fluid plant. The disclosure question travels. Ask your board what share of the last capital project came from retained patronage versus debt versus a state or federal program, then watch whether anyone can answer without checking.
The Question Worth Putting in Writing
Short-term equity for long-term position is a legitimate trade. It built most of the processing capacity your milk already moves through, and Gay Lea’s demand read is well-supported by three years of Circana volume data and by what its own CEO is saying publicly.
But a $200 million spread between two public statements of the same program’s size gets resolved in a sentence, once somebody asks for it.
So pull the statements. What did your co-op retain from your cheque in each of the last three years, and can anyone at your next annual meeting tell you what it bought?
Key Takeaways
- Two public figures for the same program, $200M apart, swing project scale per member from $208,333 to $375,000 — ask which number your board is working from before this year’s retention rate gets set.
- Retained patronage funds this build before anyone sees a return. At $1.00/hL, that’s $5,243 a year on 5,243 hL, $15,000 on 15,000 hL, and you can’t estimate it from outside because the financing mix isn’t public.
- Pull three years of patronage statements and chart the retained-versus-cash split. Rising retention two years running while cash drops is a cash-flow item; rising retention in a strong earnings year might be nothing.
- Fixed-price or cost-plus decides whether your exposure has a ceiling. On a build that runs to 2028, the answer is worth having in writing now rather than reconstructing later.
Based on public documents, trade coverage, and broadcast interviews available as of August 13, 2026.
Learn More
- Milk Hauling: The Hidden Cost Sucking $0.40 to $2.50/cwt from Your Milk Check — Arms you with contract auditing strategies to catch shifting deductions before they erode margins, exposing how regional plant closures quietly transfer transportation liabilities directly back to your milk check.
- Same Milk, Different Payday: How Your Processor’s Product Mix Shapes Your Future — Breaks down the exact spread between fluid bottlers and value-added cheese makers, showing why aligning your herd’s component yield with your buyer’s manufacturing profile dictates your five-year farm valuation.
- The $11 Billion Gap: Where Processing Investment Meets Producer Reality — Follows the money across massive North American plant construction cycles, revealing why expanded processing capacity rarely trickles down to farm-gate premiums without member-enforced equity safeguards and transparent payout formulas.
 The Sunday Read Dairy Professionals Don’t Skip.
 The Sunday Read Dairy Professionals Don’t Skip.
Every week, thousands of producers, breeders, and industry insiders open Bullvine Weekly for genetics insights, market shifts, and profit strategies they won’t find anywhere else. One email. Five minutes. Smarter decisions all week.
