











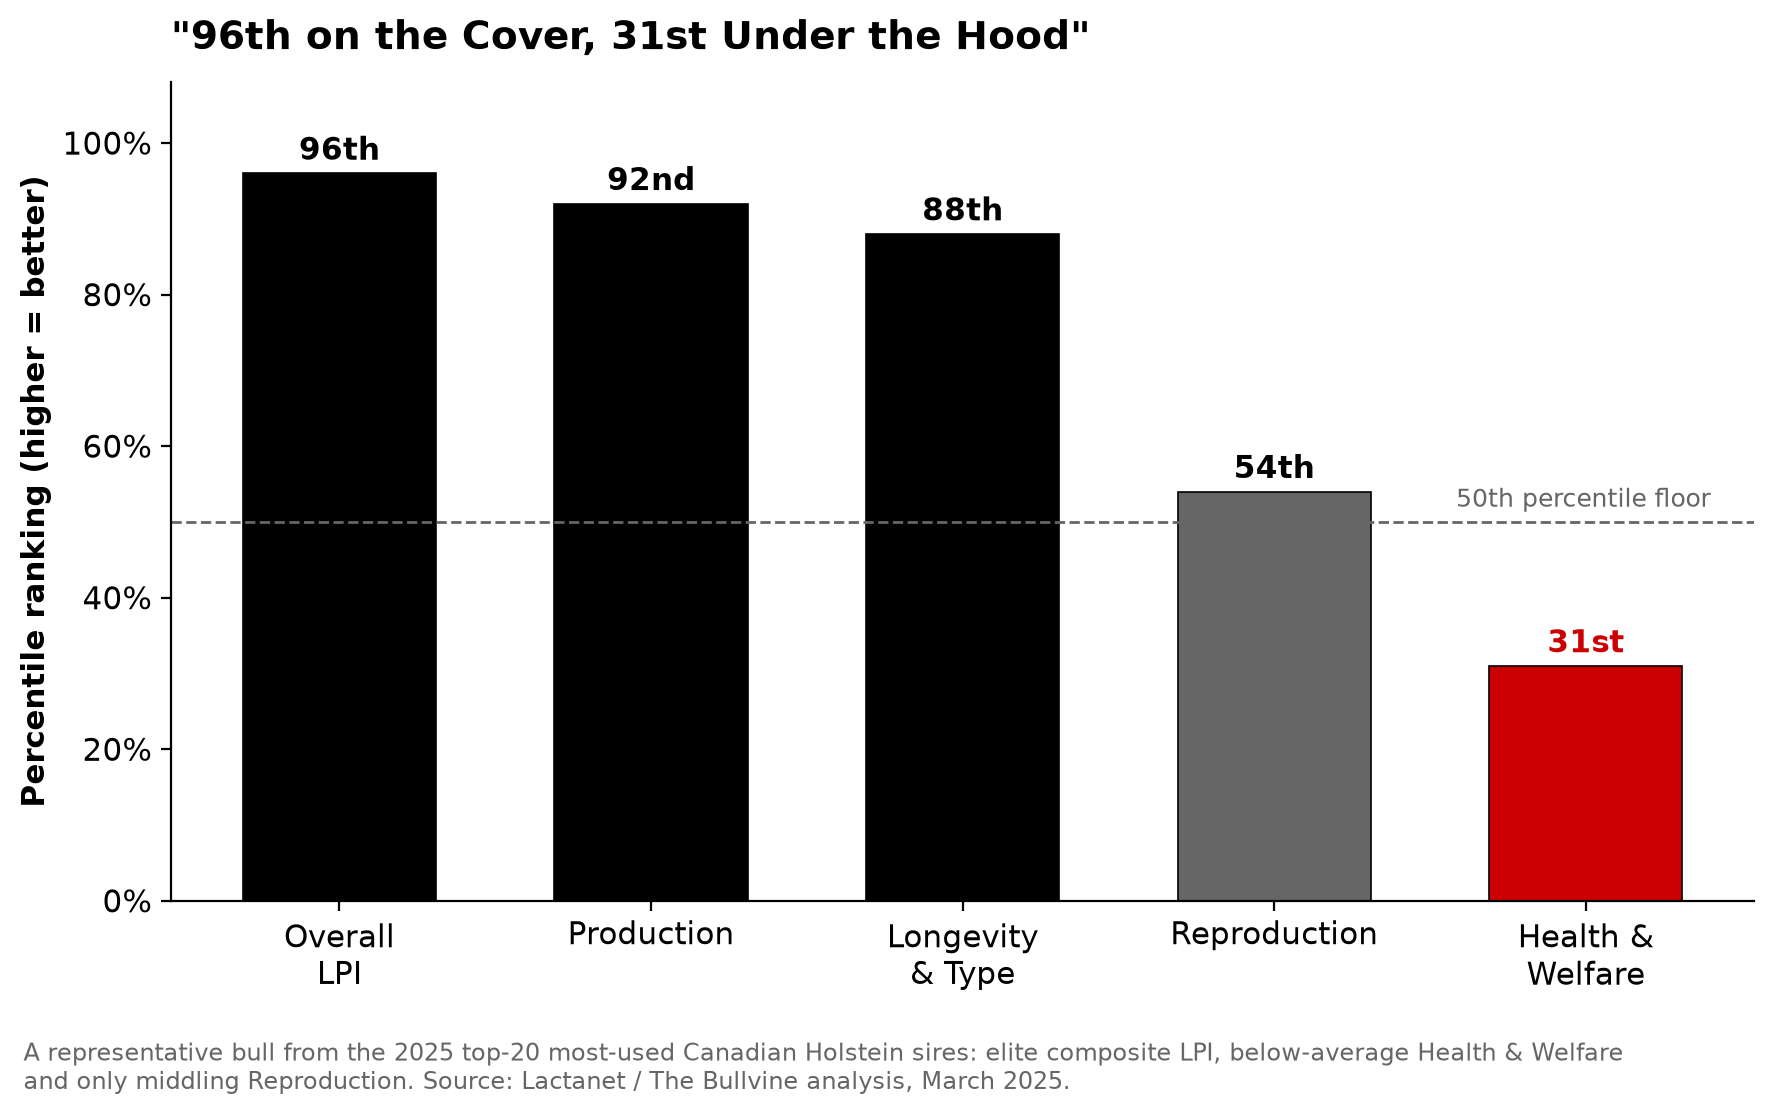
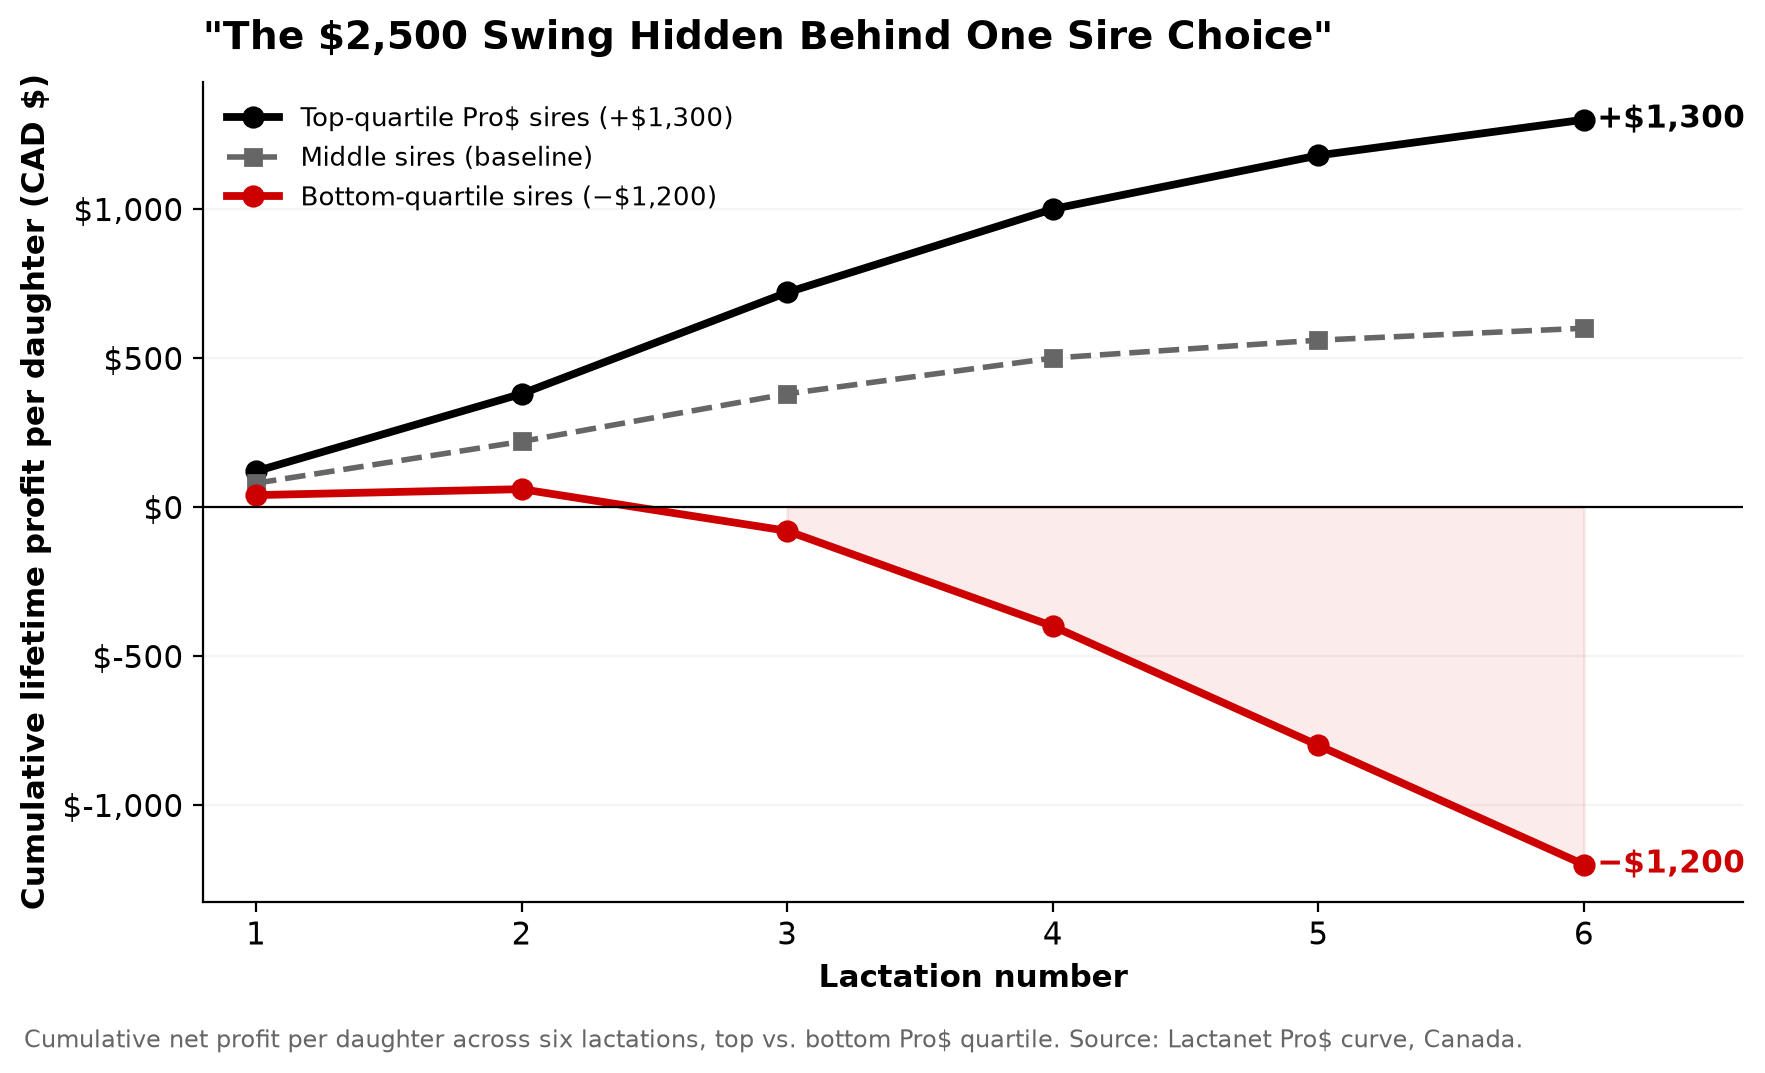
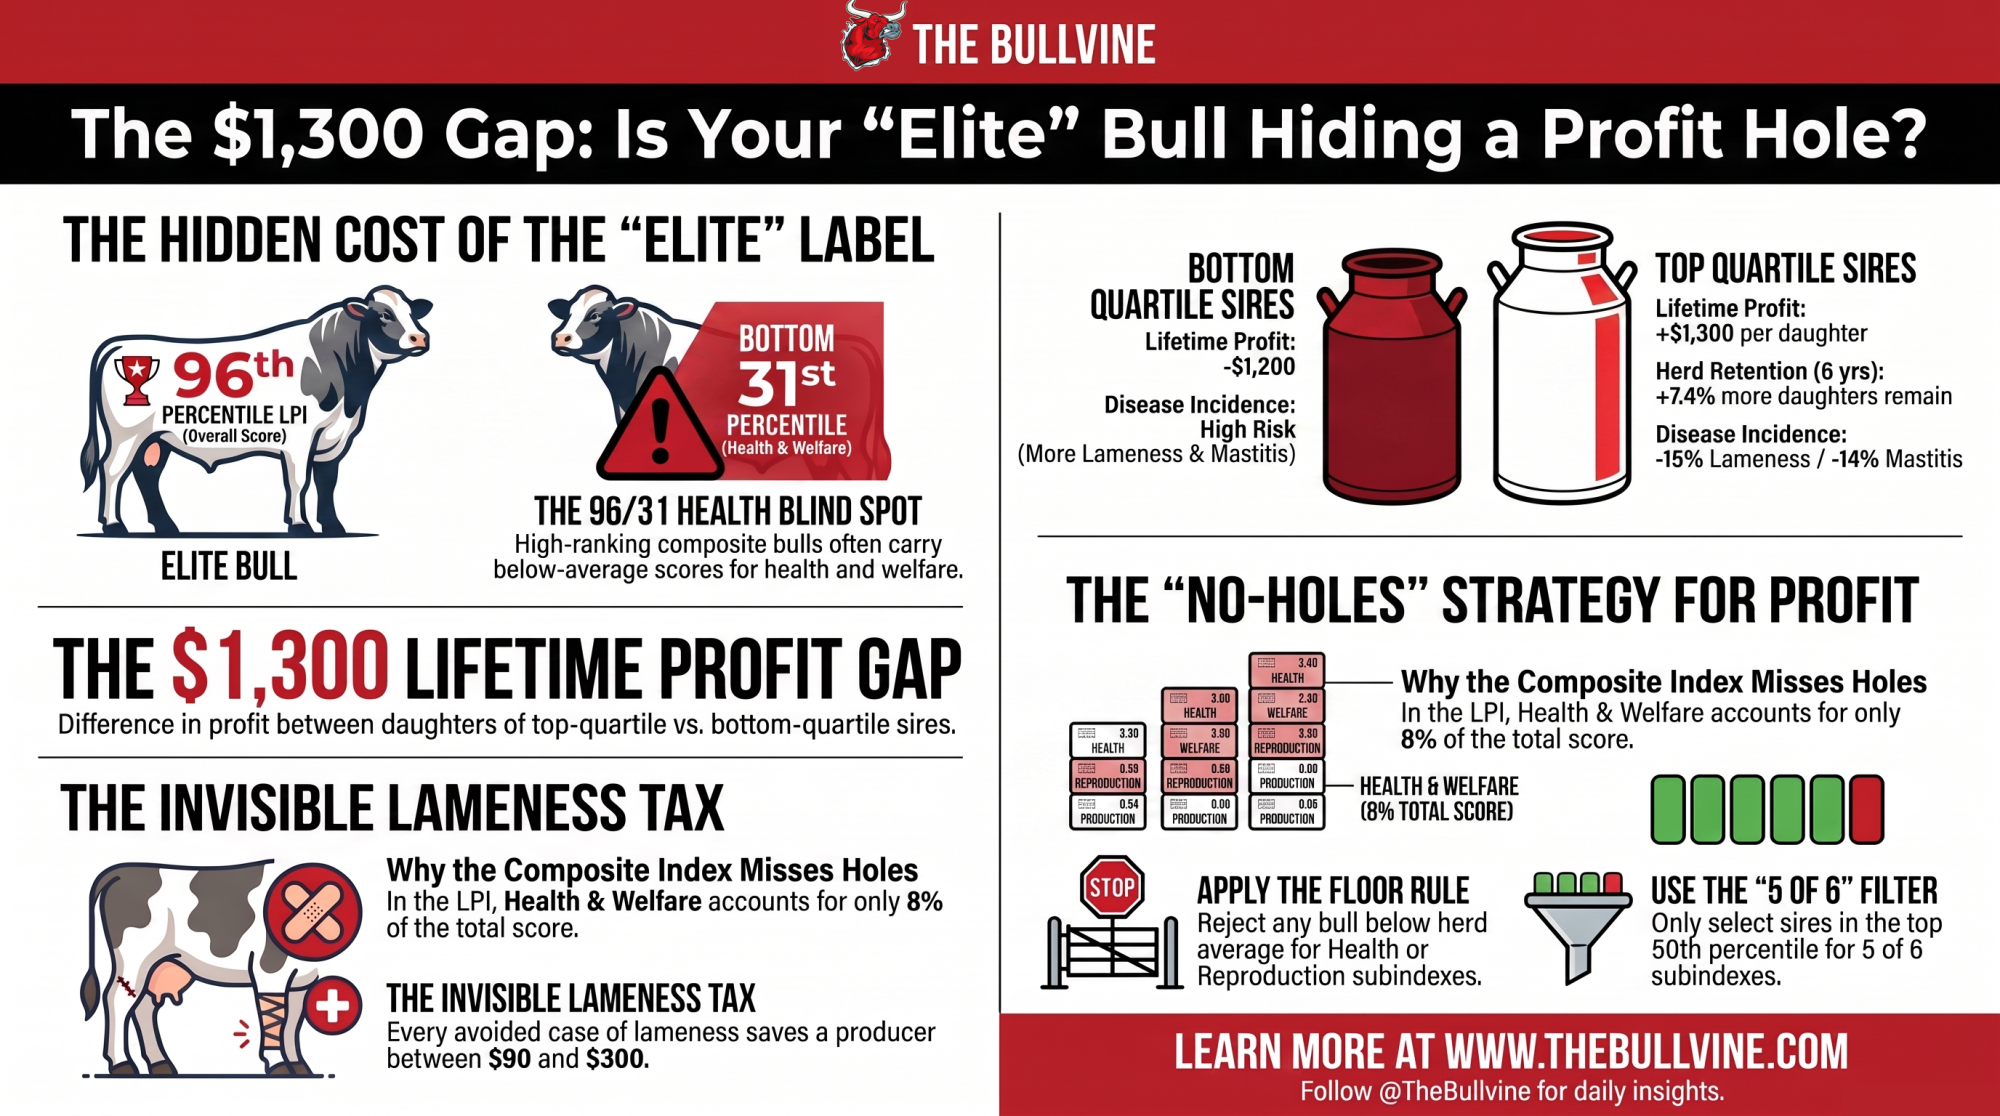
A 96th-percentile LPI bull can rank 31st for health — costing up to $1,300 a daughter in lifetime profit. Here is how taking two minutes with subindexes prevents a multi-generation mistake.
Back in 1970, for my Masters at Guelph under Ted Burnside, I built an index called the Production Dollar Difference Guide (PDDG). The idea was simple enough to fit on one line: measure, in real dollars, how much more profit a bull’s daughters would return over a lactation than an average cow. It became Canada’s first composite sire ranking index, and the profit thinking behind it is the same thinking that eventually produced today’s Pro$. But the arithmetic started earlier than any thesis — it started at my kitchen table, with a pencil and a stack of milk records from Huntsdale, asking which cows actually paid the bills and which bulls made more of them.
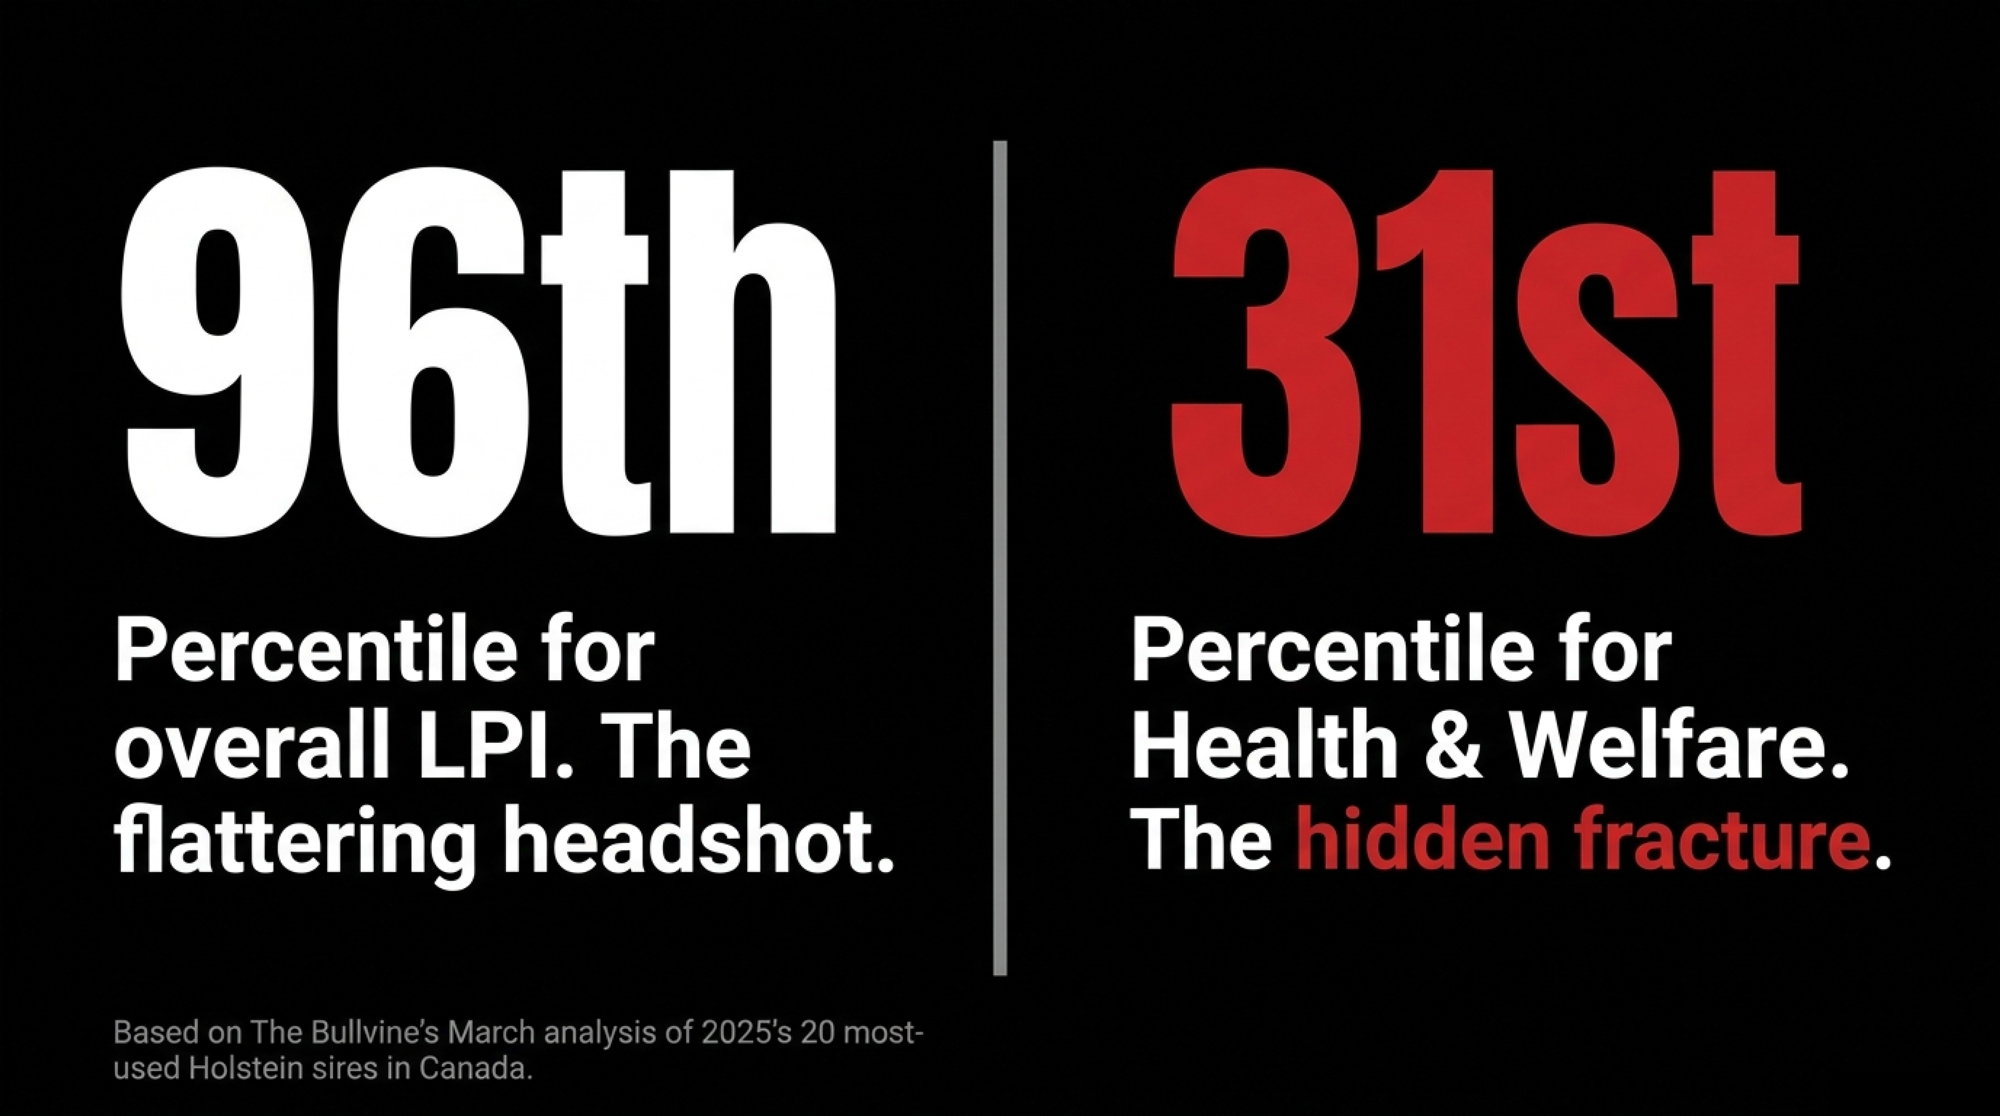
Fifty-six years later, the industry has finally built the machinery to answer that question at scale — six published subindexes including wellness, welfare and reproduction indexes that use lifetime profit curves. And most producers still aren’t using them. They circle the big composite number instead. That number has a blind spot, and it has a face now: when The Bullvine ran Canada’s 2025 20 most-used Holstein sires against Lactanet’s new subindexes this past March, it found bulls sitting at the 96th percentile for overall LPI yet only the 31st percentile for Health & Welfare— a pattern our analysis links to sires behind roughly a quarter of the registered calves born in 2025. That’s our own analysis, not a wire story. If you’re picking sires this month, give me two minutes before you circle a name.
The Core Problem: A Headshot, Not a Scan
For years, “#1” meant something clean. Top 10 TPI or LPI was a badge, and everybody knew what it stood for. That clarity has quietly frayed — not through anybody’s bad faith, but because there are now a dozen ways to be number one. TPI and NM$ anchor U.S. proofs, LPI and Pro$ run Canada, and Zoetis owns DWP$, a proprietary index built to estimate genetic potential for lifetime profit. When every stud keeps its own leaderboard, a bull can honestly be “#1” on a definition narrow enough to flatter him. And when the whole industry circles the same few names, the bill comes due in a different column — 99.84% of Holstein A.I. bulls now trace to just two fathers.
So why does the composite miss the health hole? Because it’s doing exactly what it was built to do — averaging. A bull can post huge components and functional type, ride those into a 96th-percentile LPI, and carry a below-average health score that barely dents the total. The number isn’t lying to you. It just isn’t telling you where the soft spot sits.
“The composite index is a flattering headshot — one number, easy to post, easy to sell. The subindexes are the MRI scan that shows exactly where the joint is failing.”
Lactanet even built a tool called pLPI that lets any producer log in, re-weight the six subindexes to match the herd’s own priorities and read the result beside the official LPI. It’s been live since April 2025. Most producers have never opened it.
Which Index Comes From Where?
The alphabet soup is less confusing once you sort the tools by who runs them and what they’re built to do. Rank animals on your public national index first, then read the health, welfare and fertility details underneath before a private or personalized index ever breaks a tie.
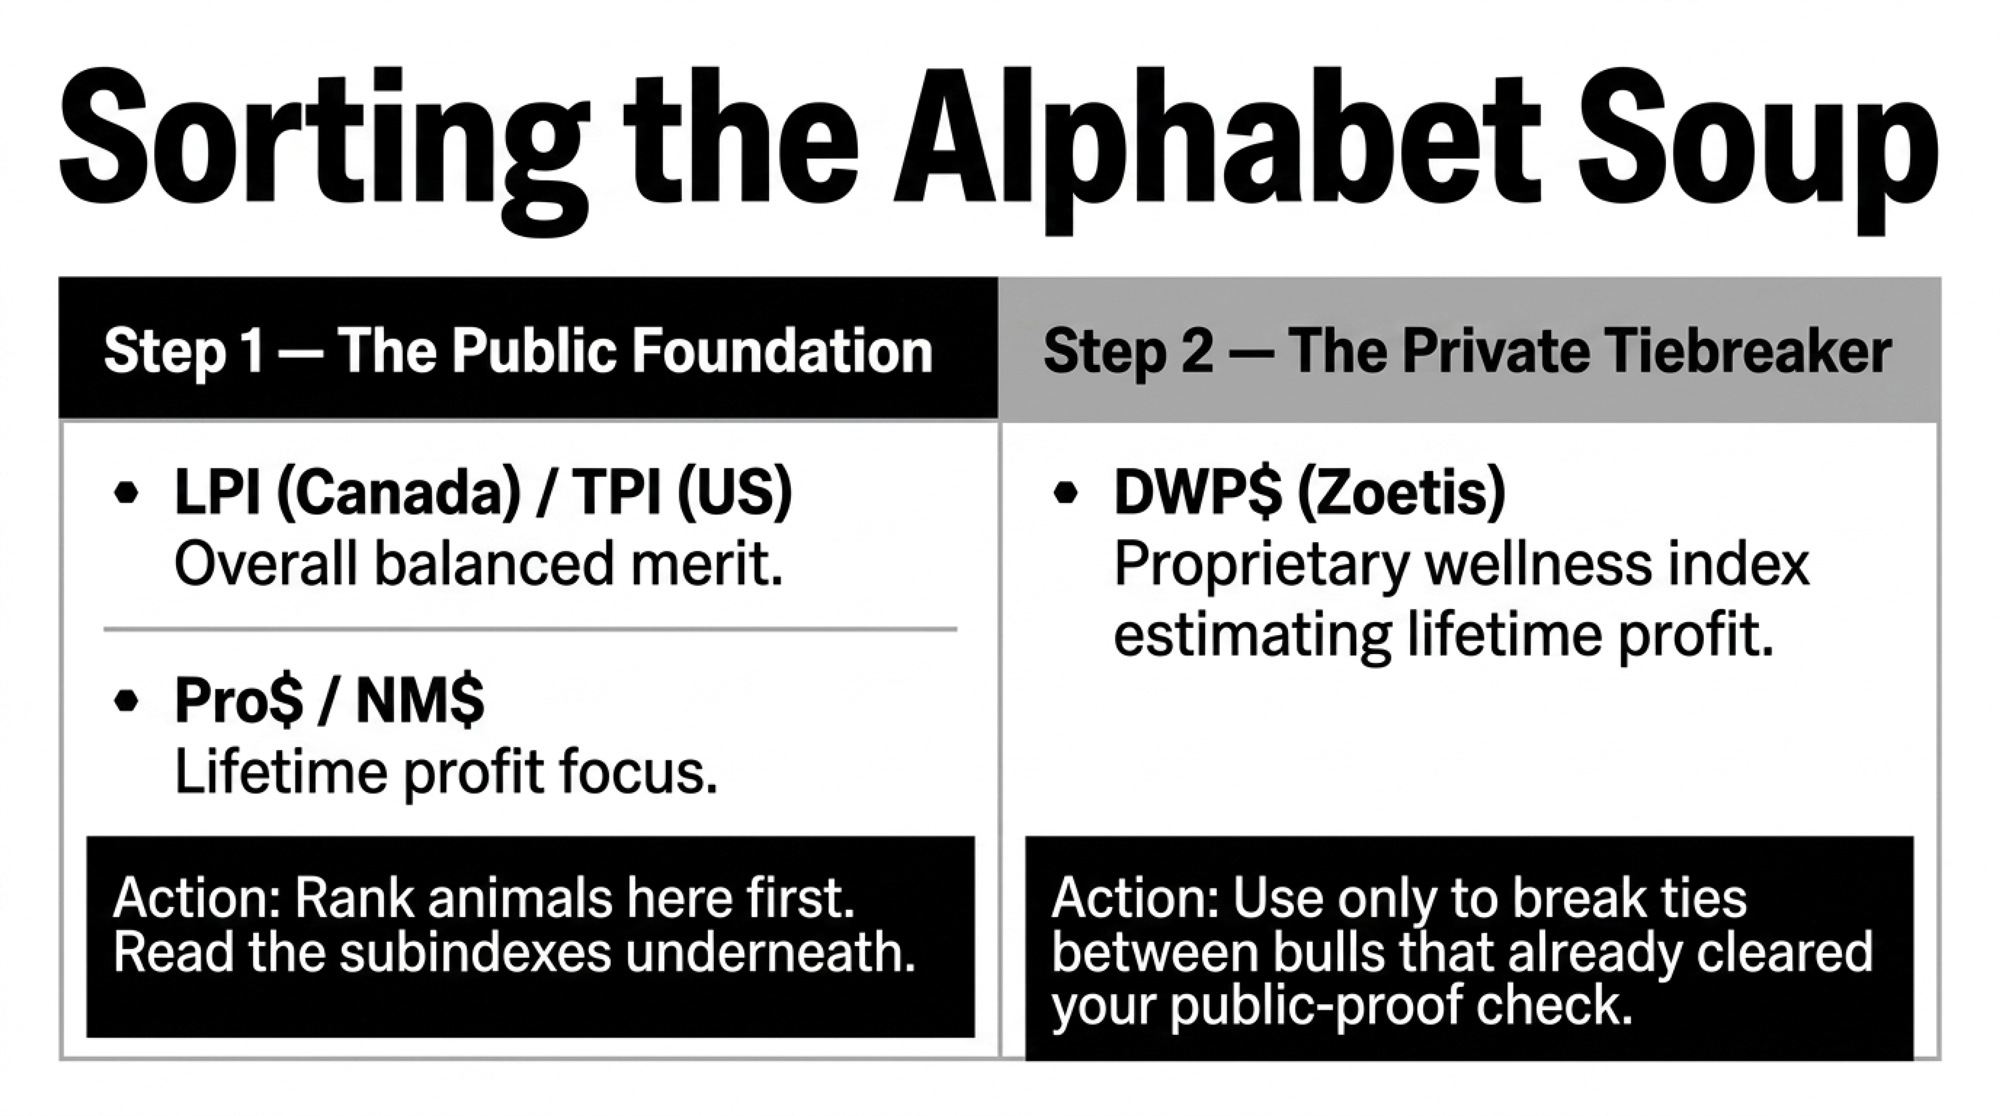
| Index | Who runs it | Region | What it is |
| LPI | Lactanet | Canada | Overall merit, now split into six readable subindexes |
| Pro$ | Lactanet | Canada | Lifetime-profit focus ($); the direct heir to the 1970 PDDG logic |
| TPI | Holstein Association USA | US | A balanced index across production, health, and type |
| NM$ | USDA / CDCB | US | Ranks animals on combined merit for economically important traits; expected lifetime profit ($) |
| DWP$ | Zoetis (proprietary) | US | Multi-trait wellness index estimating genetic potential for lifetime profit ($); a tiebreaker after the public-proof check |
The Hard Math: Top Quartile vs. Bottom
A high-index total merit bull doesn’t fail loudly. His daughters look terrific on paper and freshen fine. Then, a couple of lactations in, they start showing up on the lists nobody wants — the lame pen, the mastitis log, the breeding sheet with too many open cows. The composite averaged his strength and his weakness into one tidy number, and weighting in a weakness doesn’t erase it. It just hides it until your cull list does the accounting for you.
Here’s what the published data says that gap is worth. Read the source column carefully: the retention and profit figures come from Lactanet’s Canadian Pro$ curve, while the disease figures come from a US DWP$ validation across five herds. Two countries, same story.
| Metric / Risk Area | Bottom Quartile | Top Quartile | Bottom-Line Impact | Source |
| Herd retention at 6 years | Baseline | +7.4% more daughters remain | +$1,300 lifetime profit per daughter (bottom sires: −$1,200) | Pro$, Canada |
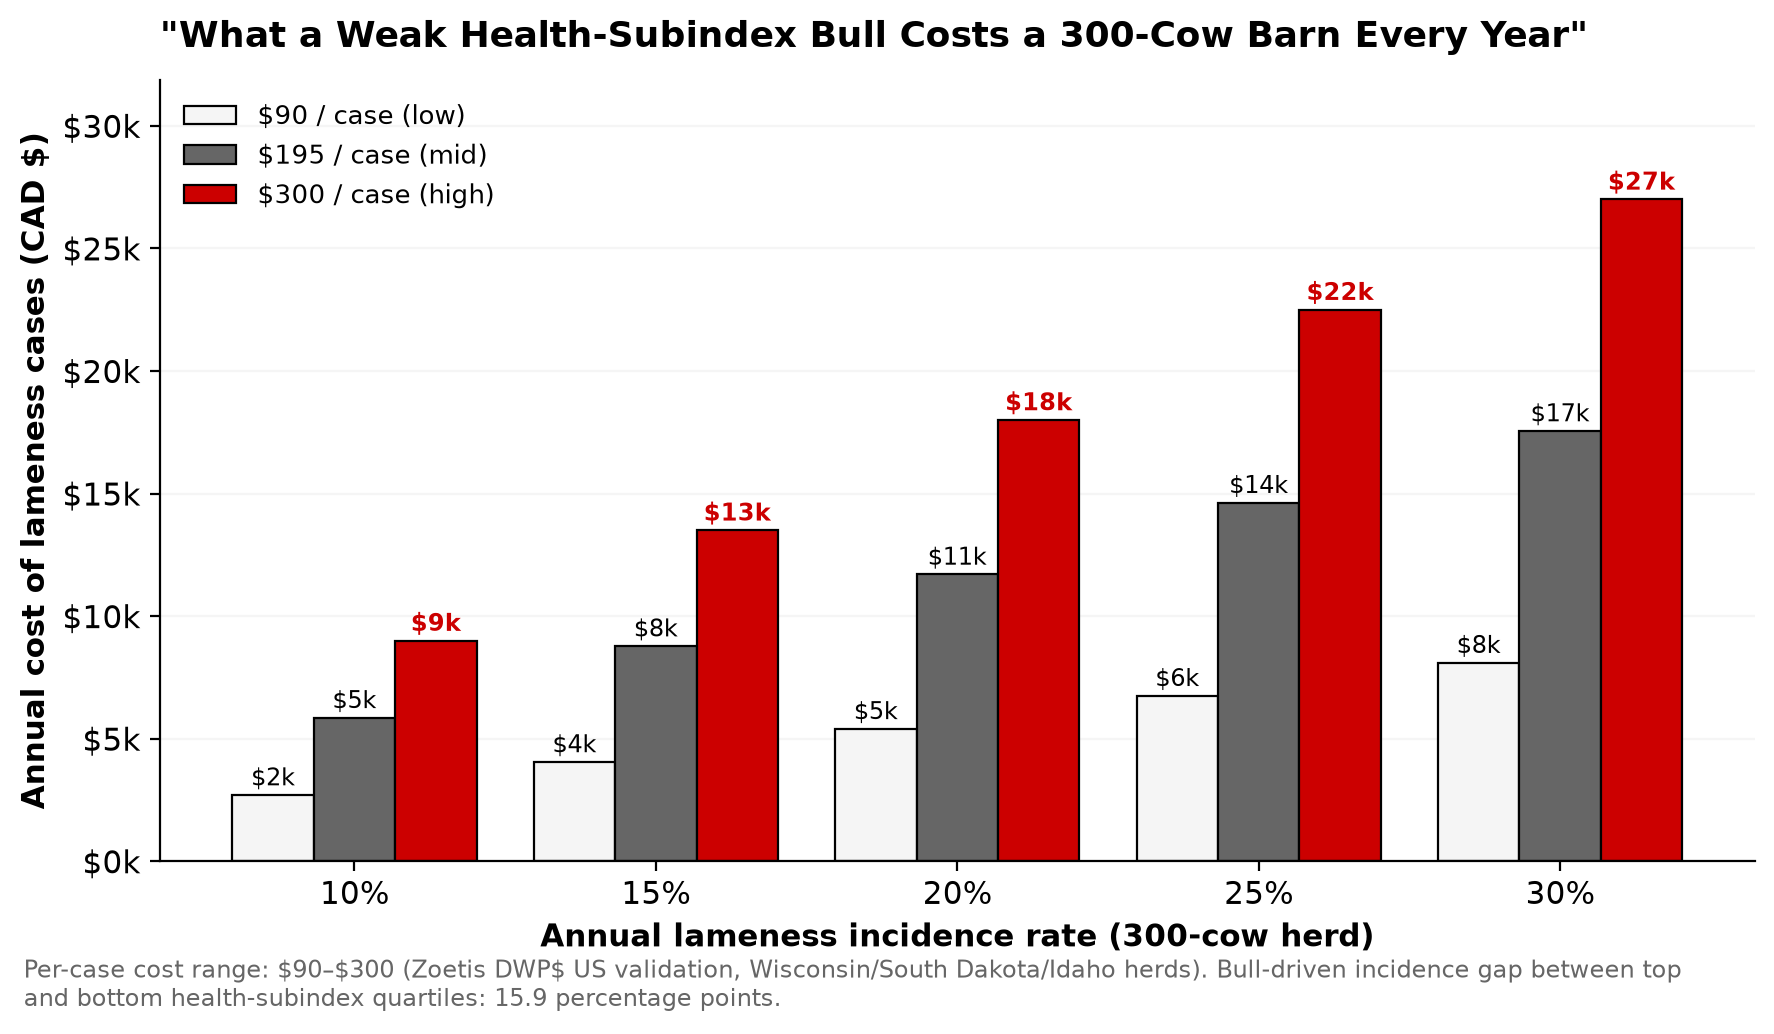
| Lameness incidence | High | −15.9 percentage points | $90–$300 saved per case avoided | DWP$ US validation |
| Mastitis incidence | High | −14.9 percentage points | Fewer treatments and less dumped milk; +$811 lifetime profit overall | DWP$ US validation |
Retention and profit figures: Lactanet Pro$ (Canada). Disease figures: Zoetis DWP$ validation across five US herds in Wisconsin, South Dakota, and Idaho.
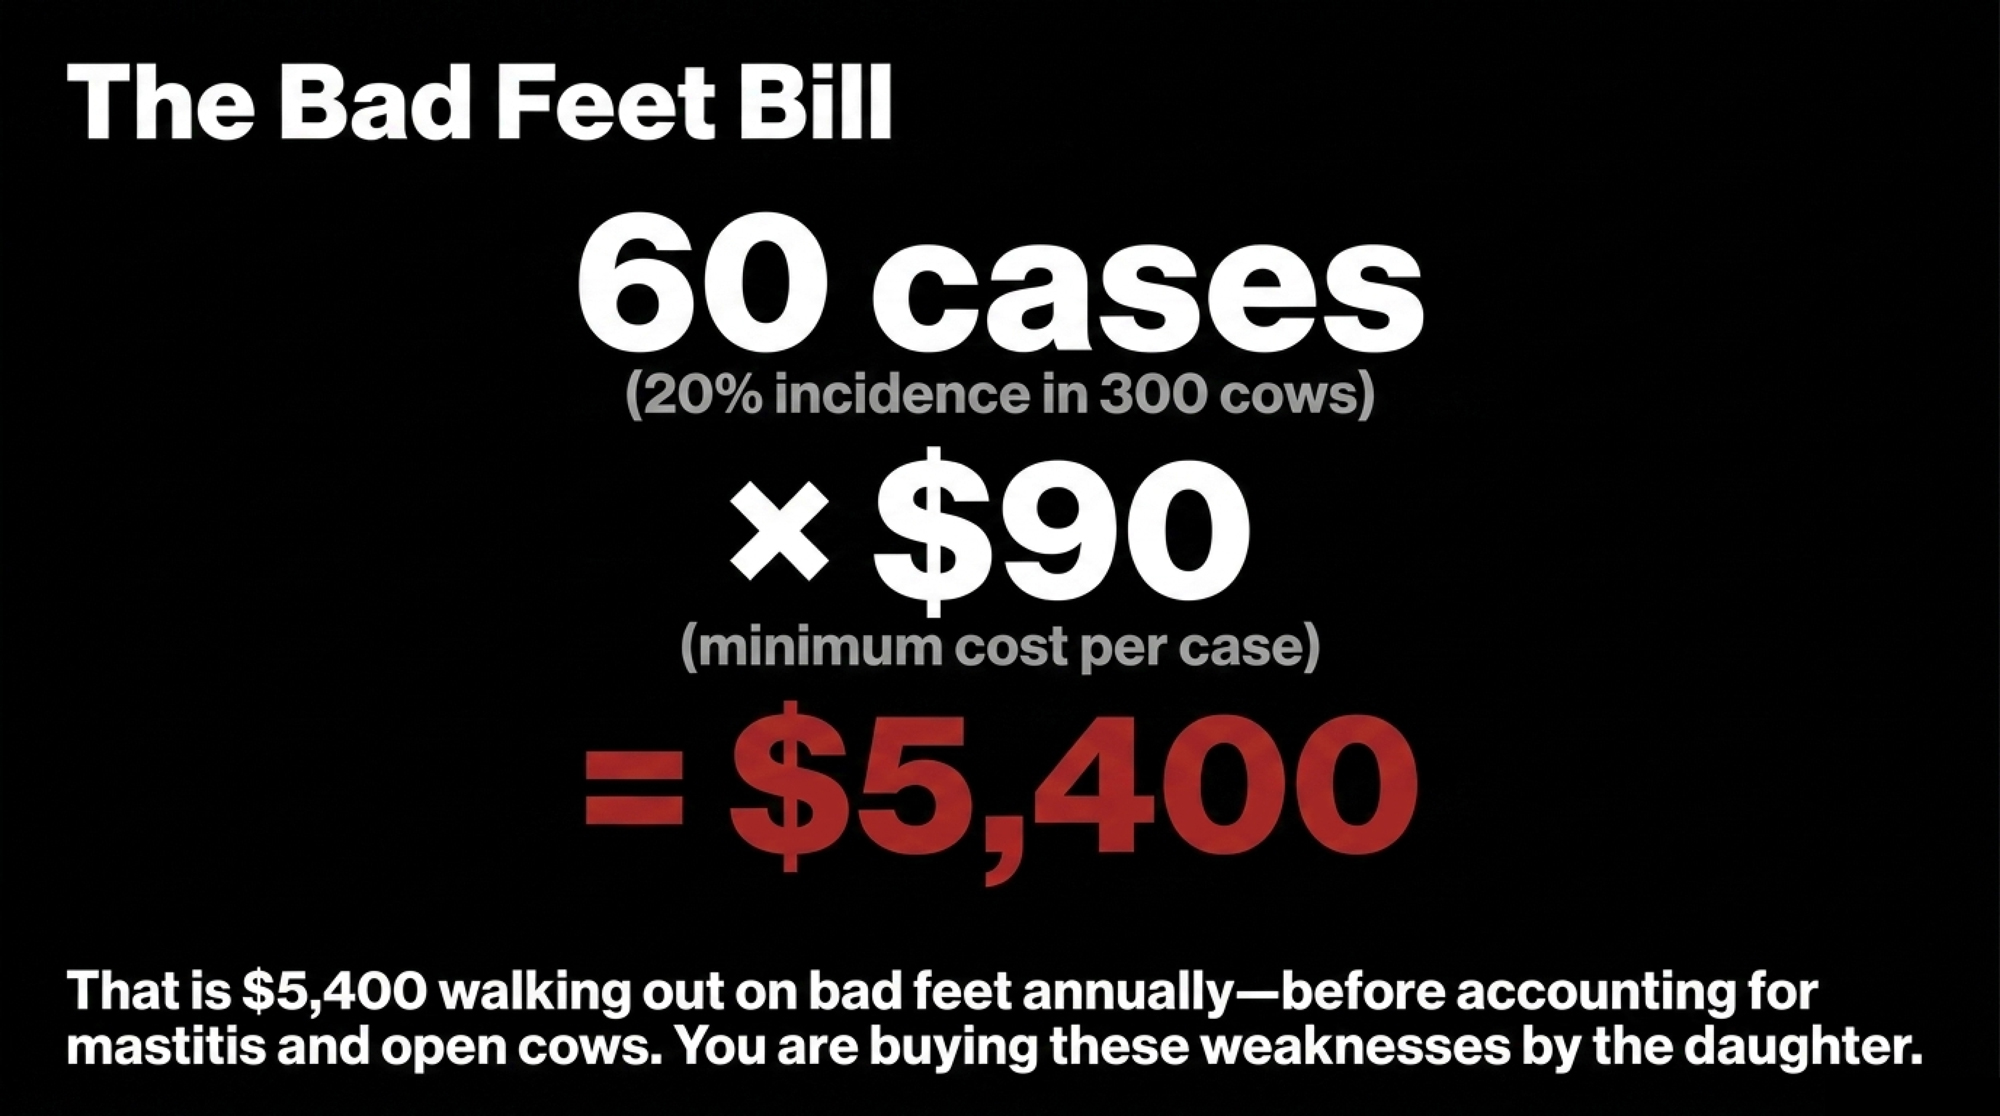
Now run it on your own barn. Take a 300-cow herd with 20% lameness incidence — 60 cases a year. Even at the low $90 figure, that’s $5,400 walking out on bad feet annually, before the mastitis and open cows that tend to travel with weak health genetics. Buy those weaknesses in through a bull, and you’re buying them by the daughters, year after year. If you want to put your own incidence and treatment costs against that, run them through our Health ROI Calculator before your next proof day.
The LPI Weighting Dilemma
The reason the composite can hide a hole is right there in the math. Here’s how modern Holstein LPI is built — and the two changes that landed in April’s proof round:
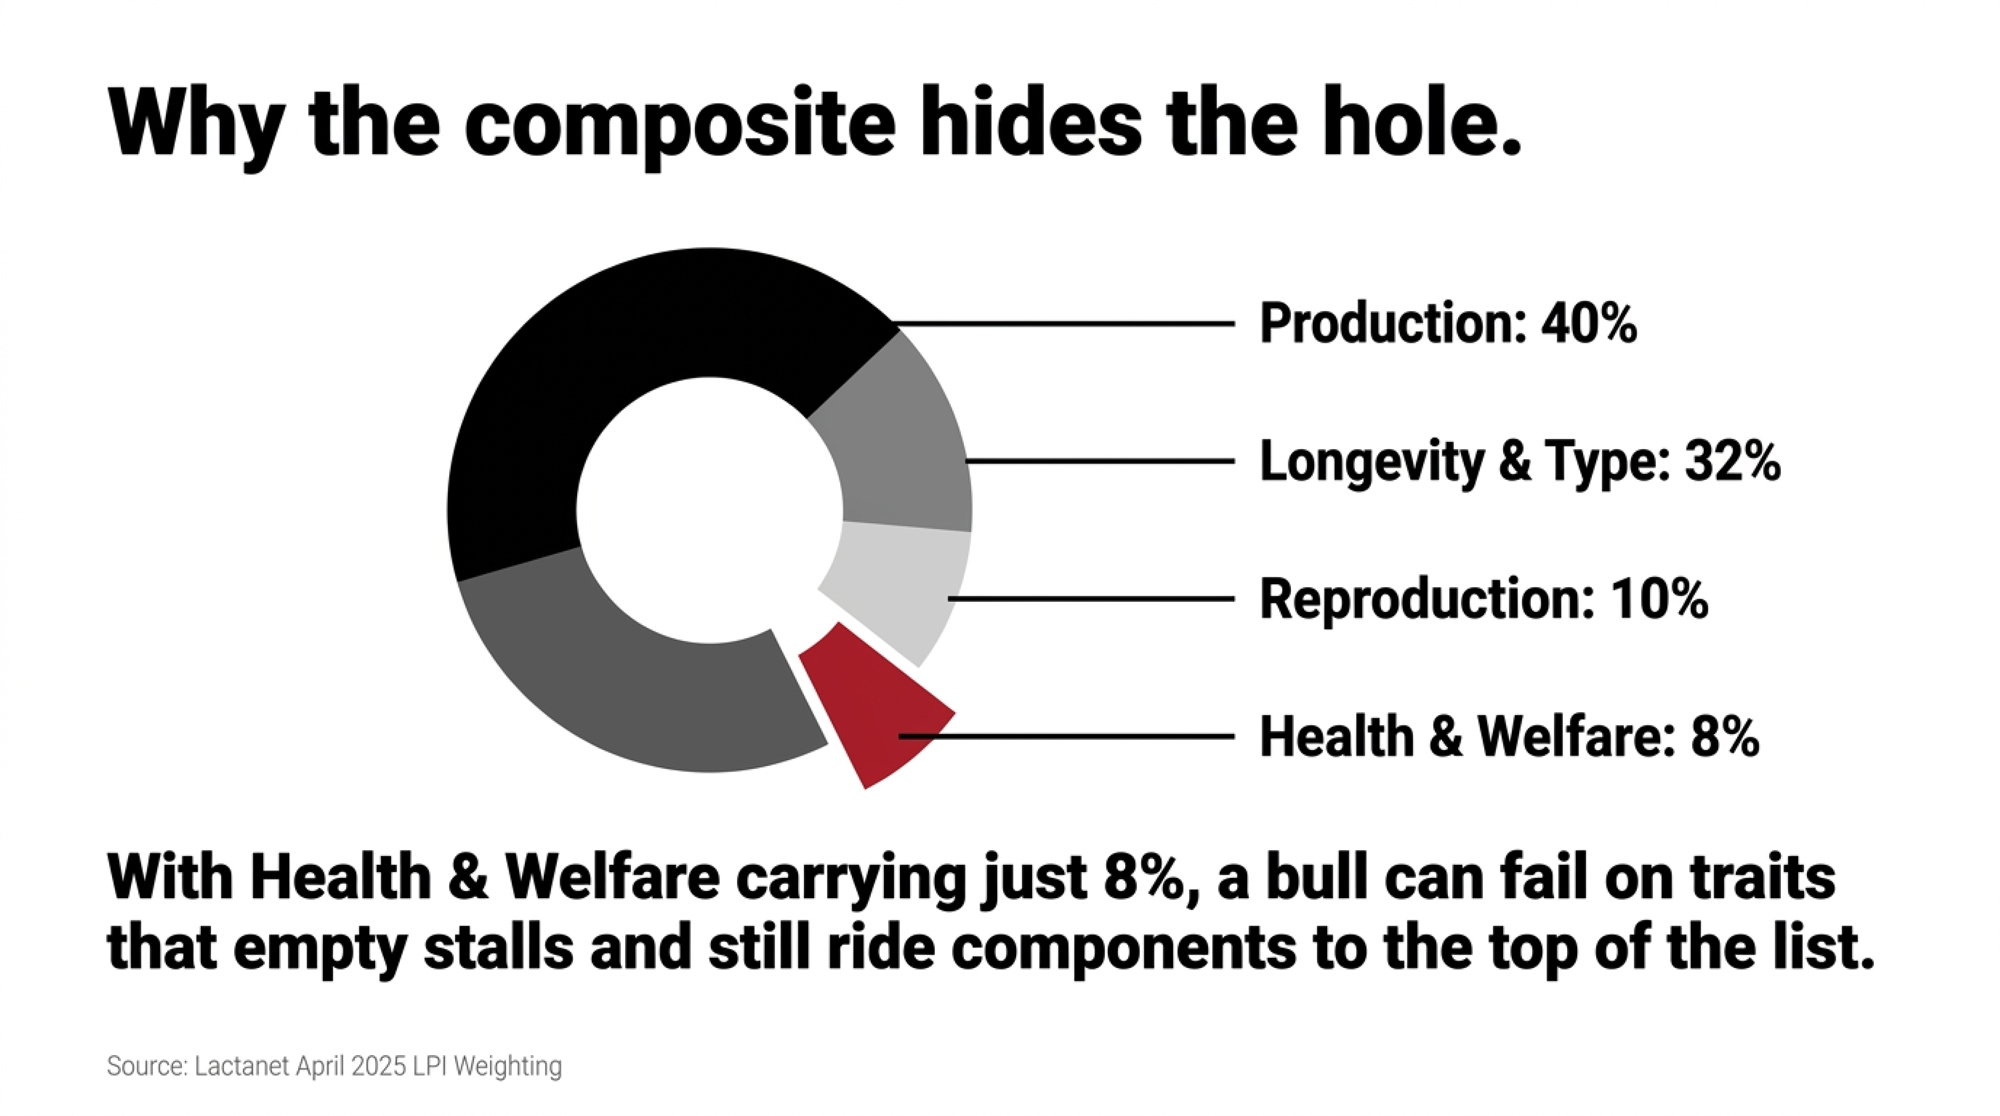
- Production — 40%. Shifted this past April from 60% fat / 40% protein to 40% fat / 60% protein.
- Longevity & Type — 32%.
- Reproduction — 10%.
- Health & Welfare — 8%. Got sharper in April: Calf Health added at 30% weight, Mastitis Resistance at 40%, Hoof Health at 11%.
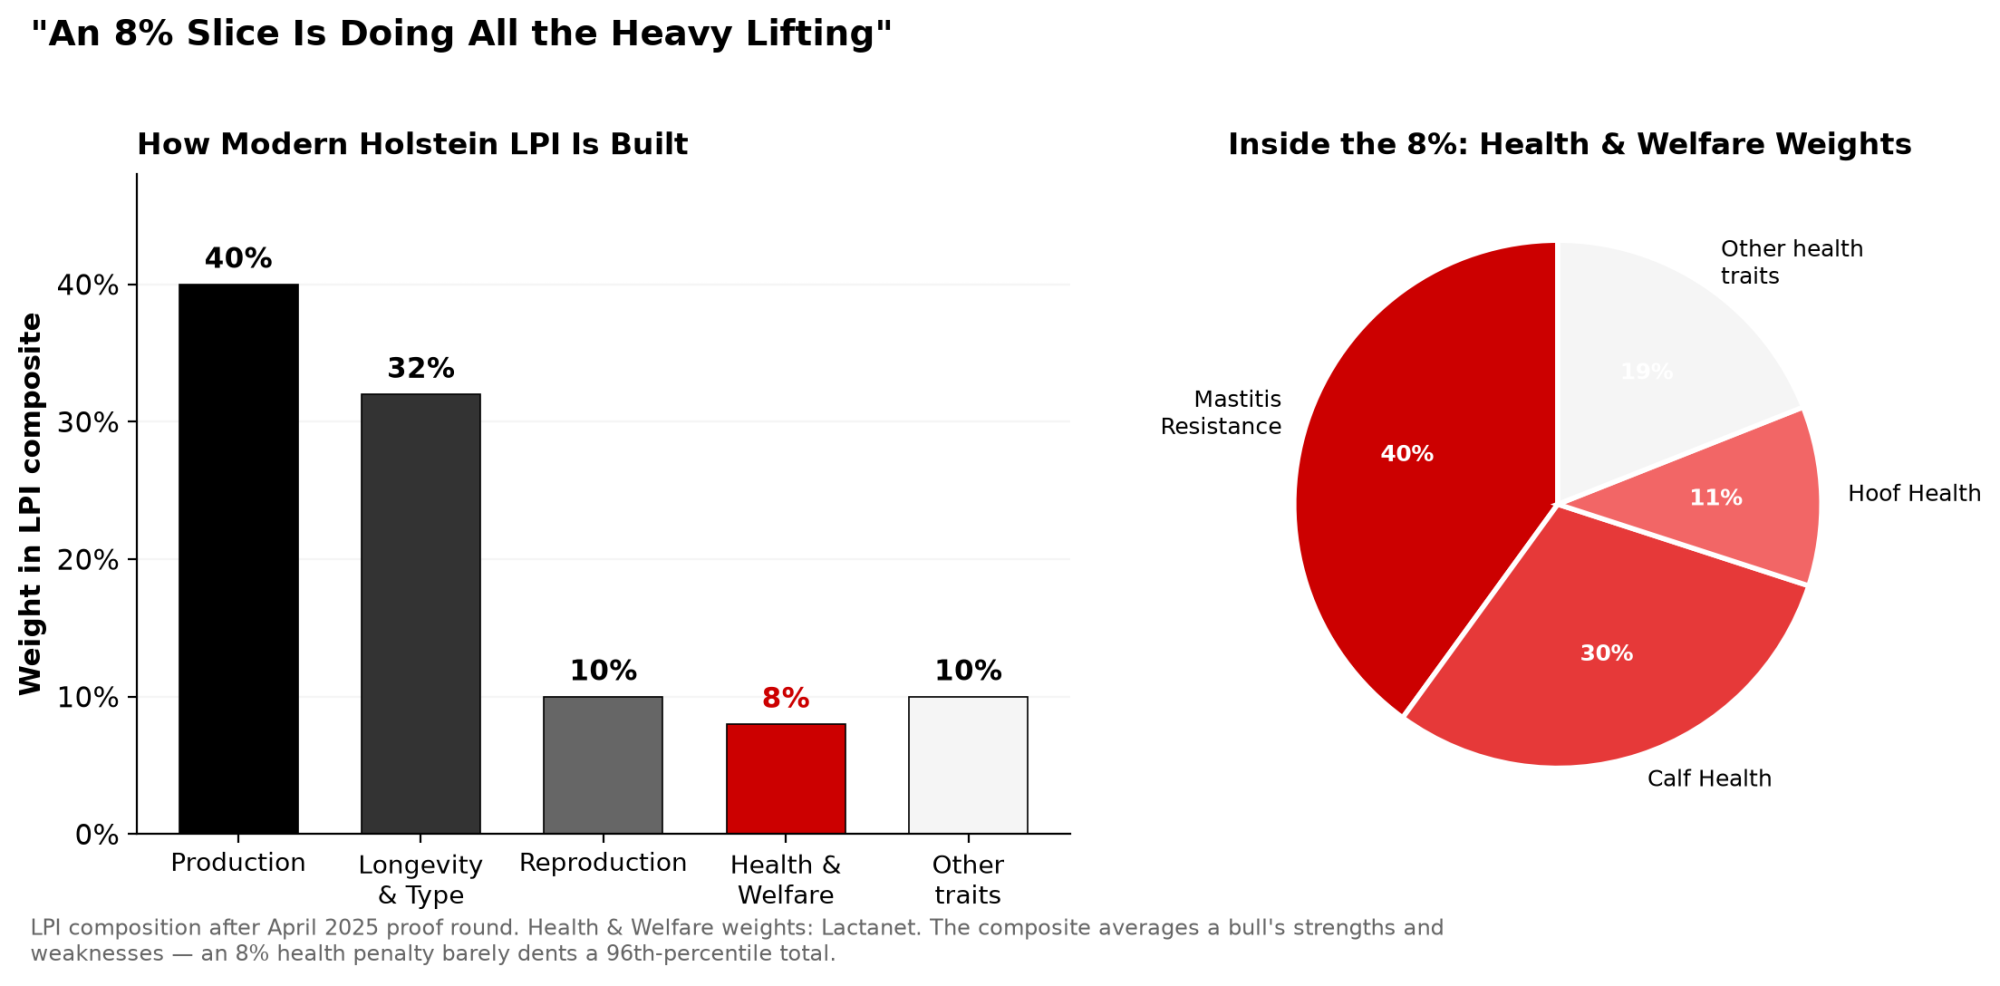
Read that stack plainly. With Health & Welfare carrying just 8% of the total, a bull can be well below average on the traits that empty stalls and still ride his components to a 96th-percentile LPI. That’s the whole blind spot in one line. It’s the same arithmetic behind the 9.99% Holstein inbreeding bill — are you breeding for profit, or just for index points?
What I’d Do With The Six Subindexes Today
I’d welcome them — because they’re the Production Dollar Difference Guide with better arithmetic. My 1970 thesis argued that the way to lift genetic progress was to sample far more young sires each year and let the proven ones rise; at the peak of young sire sampling, Canada was testing over 500 A.I. young dairy bulls annually on that logic. That shield at Huntsdale wasn’t won chasing the hottest bull of the month. It came from breeding cows that lasted, bred back, kept milking and threw enough surplus breeding stock to sell. Holstein Canada recognized the prefix with a Master Breeder Shield in 1984.
Holding a direction takes nerve, mind you. Plenty of bulls get written off early and prove the room wrong — they called Mogul’s heifers fat, and then came the million doses. The point isn’t to avoid every bull with a critic. It’s to avoid the bull with a hole you can already see on the page.
The through-line to today is simple. A sire stack built the way I built one isn’t a shopping list of favorites — it’s a direction you hold across generations, layering balanced bulls so longevity, fertility, and functional type compound while production keeps climbing. The subindexes make that direction visible on a screen instead of in a shoebox of milk records. My rule hasn’t changed in over fifty years: trust the system, improve the system, and use it to produce a continually better product.
How Much Does Chasing the #1 Bull Actually Cost You?
Map it to your own herd, and it stops being abstract. If your “elite” sire’s daughters run even one extra lameness case per ten cows over their productive lives, that’s roughly $900 to $3,000 per hundred daughters at Wisconsin’s cost range. Set that against the $1,300-per-daughter profit swing Pro$ documents between top and middle sires, and the composite-chasing decision starts looking expensive in a column the sire catalog never shows you. The exciting bull isn’t free. You pay for him later, in vet bills and empty stalls.
Is Your Herd’s Genetic Strategy Already a Step Behind?
Here’s a fair gut check, no judgment attached: when did you last look at a bull’s Health & Welfare or Reproduction subindex before you bought him? If the honest answer is “never” or “the rep handles that,” you’re in the same boat as thousands of good producers — the difference is that the tool to do better has been sitting on Lactanet’s site since April 2025. The herds that’ll be ahead in five years won’t be the ones with the flashiest catalog. They’ll be the ones whose cull lists got boring because the same problems stopped showing up.
The Rules for Farmers: The “No-Holes” Strategy
You don’t need a consultant or a spreadsheet to close this gap. You need a filter and the nerve to hold to it. Three moves, in order.
1. The Floor Rule — do this within 30 days. Before you circle any bull, check his Health & Welfare and Reproduction subindexes (or Pro$/DWP$ if that’s your system). Below your herd average on either? He doesn’t become a main sire for your herd — no matter how big his composite index. Costs two minutes. The catch: you’ll pass on some exciting bulls, and that stings.
2. The “No-Holes” Filter — clear 5 of 6. Use only sires that clear at least five of the six LPI Subindexes above the 50th percentile — above average almost everywhere. Best when you’re breeding replacements you plan to keep. The catch: your shortlist gets shorter and a little boring. Boring is the point. It’s about genetics for profit.
3. The Multi-Gen Stack — build for consistency. Sequence balanced bulls across generations so the good traits compound — the PDDG logic in modern dress. The catch: it’s slow to show, and it means ignoring the monthly “new #1” noise sire. With the Production subindex reweighted in April, a written direction keeps you steady when the index itself moves under you.
And use private indexes as a tiebreaker, not a verdict. DWP$ and the like are useful for breaking ties after the public-proof check — not for overruling a hole you can already see.
The Rep Checklist: Four Questions Before You Buy
- Where does this bull sit for Health & Welfare and Reproduction — not just overall merit?
- How many of his six subindexes are above the 50th percentile?
- Which of my cows would you actually mate him to, and why?
- If I lined up your top three picks by health and fertility instead of by total merit index, would the order change?
Key Takeaways
- If you’ve never checked a sire’s Health & Welfare or Reproduction subindex, do it this proof run — a 96th-percentile LPI bull can sit at the 31st for health.
- If a bull falls below your herd average on health or fertility, keep him off your main-sire list regardless of composite rank.
- If you’re keeping your own replacements, run the five-of-six-above-50th filter on your current catalog or in-tank group and count how many “elite” bulls survive it.
- If lameness is creeping up, do the math yourself: $90–$300 a case times your incidence times your daughter count.
- If you’ve never opened Lactanet’s pLPI tool, log in once and re-weight the six subindexes to your herd’s real priorities.
- If a rep leads with a private index like DWP$, use it to break ties after the public-proof check — not to overrule a visible hole.

So, here’s the question I’ll leave you with for your next proof day: are you picking bulls your future self won’t have to fix — or bulls that look elite tonight and quietly fill your cull list in 2030? Pull your last three sire purchases and check their health and fertility subindexes. You might be pleasantly surprised. You might not.
If you want the deeper cut — how the no-holes filter reshapes a real 20-sire shortlist, one subindex at a time — that’s the breakdown we’re running next in Bullvine Weekly. That’s where the real numbers live.
Sire Health & Hold-to-Proof Cost Simulator
Calculate your herd’s financial exposure to high-index sires with weak health subindexes
Run Your Numbers
Health ROI Calculator — The article puts lameness at $90–$300 a case. This tool turns your own incidence, treatment costs, and herd size into a dollar figure, so you can see what a sire’s health hole is actually worth before you circle a name.
Learn More
- The 10 Commandments of Dairy Farming: Expert Tips for Sustainable Success — Delivers direct operational metrics to audit your herd’s transition cow protocols, reduce involuntary culling rates, and protect milk check margins before small health leaks turn into costly herd-wide losses.
- The McCarty Magic: How a Family Farm Became the Dairy Industry’s Brightest Star — Breaks down the long-term capital strategy behind scaling farm infrastructure, securing direct processor contracts, and structuring multi-generational risk protection to insulate high-volume dairy operations against severe commodity price swings.
- Bull in a China Shop: How Juan Moreno Turned the Dairy World Upside Down — Follows the money on sexed semen technology and commercial genomic sorting, detailing how aggressive reproductive disruption reshaped AI economics and opened massive new margin streams through targeted beef-on-dairy breeding strategies.
 The Sunday Read Dairy Professionals Don’t Skip.
 The Sunday Read Dairy Professionals Don’t Skip.
Every week, thousands of producers, breeders, and industry insiders open Bullvine Weekly for genetics insights, market shifts, and profit strategies they won’t find anywhere else. One email. Five minutes. Smarter decisions all week.




