


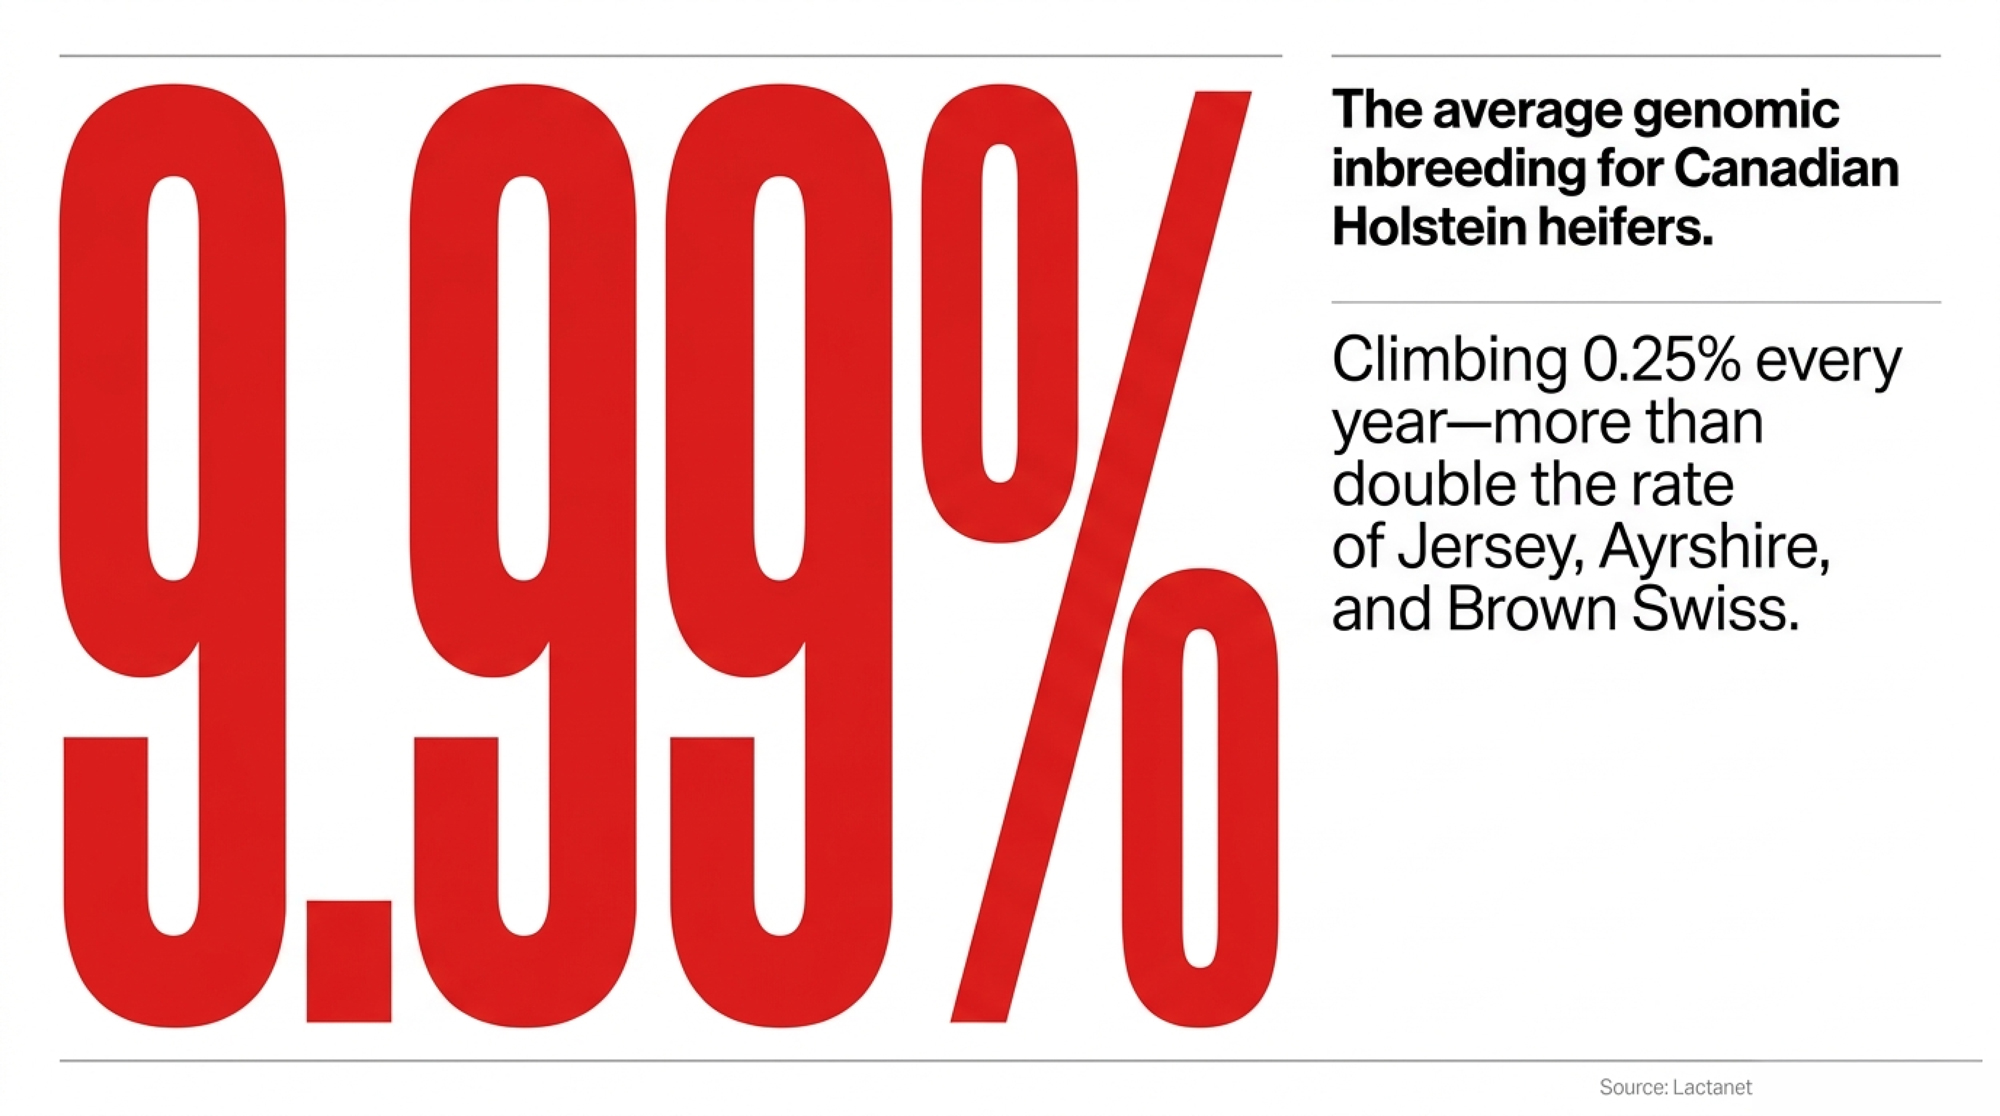
Lactanet just clocked Canadian Holstein heifers at 9.99% inbreeding — climbing 0.25% a year, more than double Jersey. On 1,500 cows, that’s a modeled $180–250K hit. The fix? A toggle most mating programs ship loose.
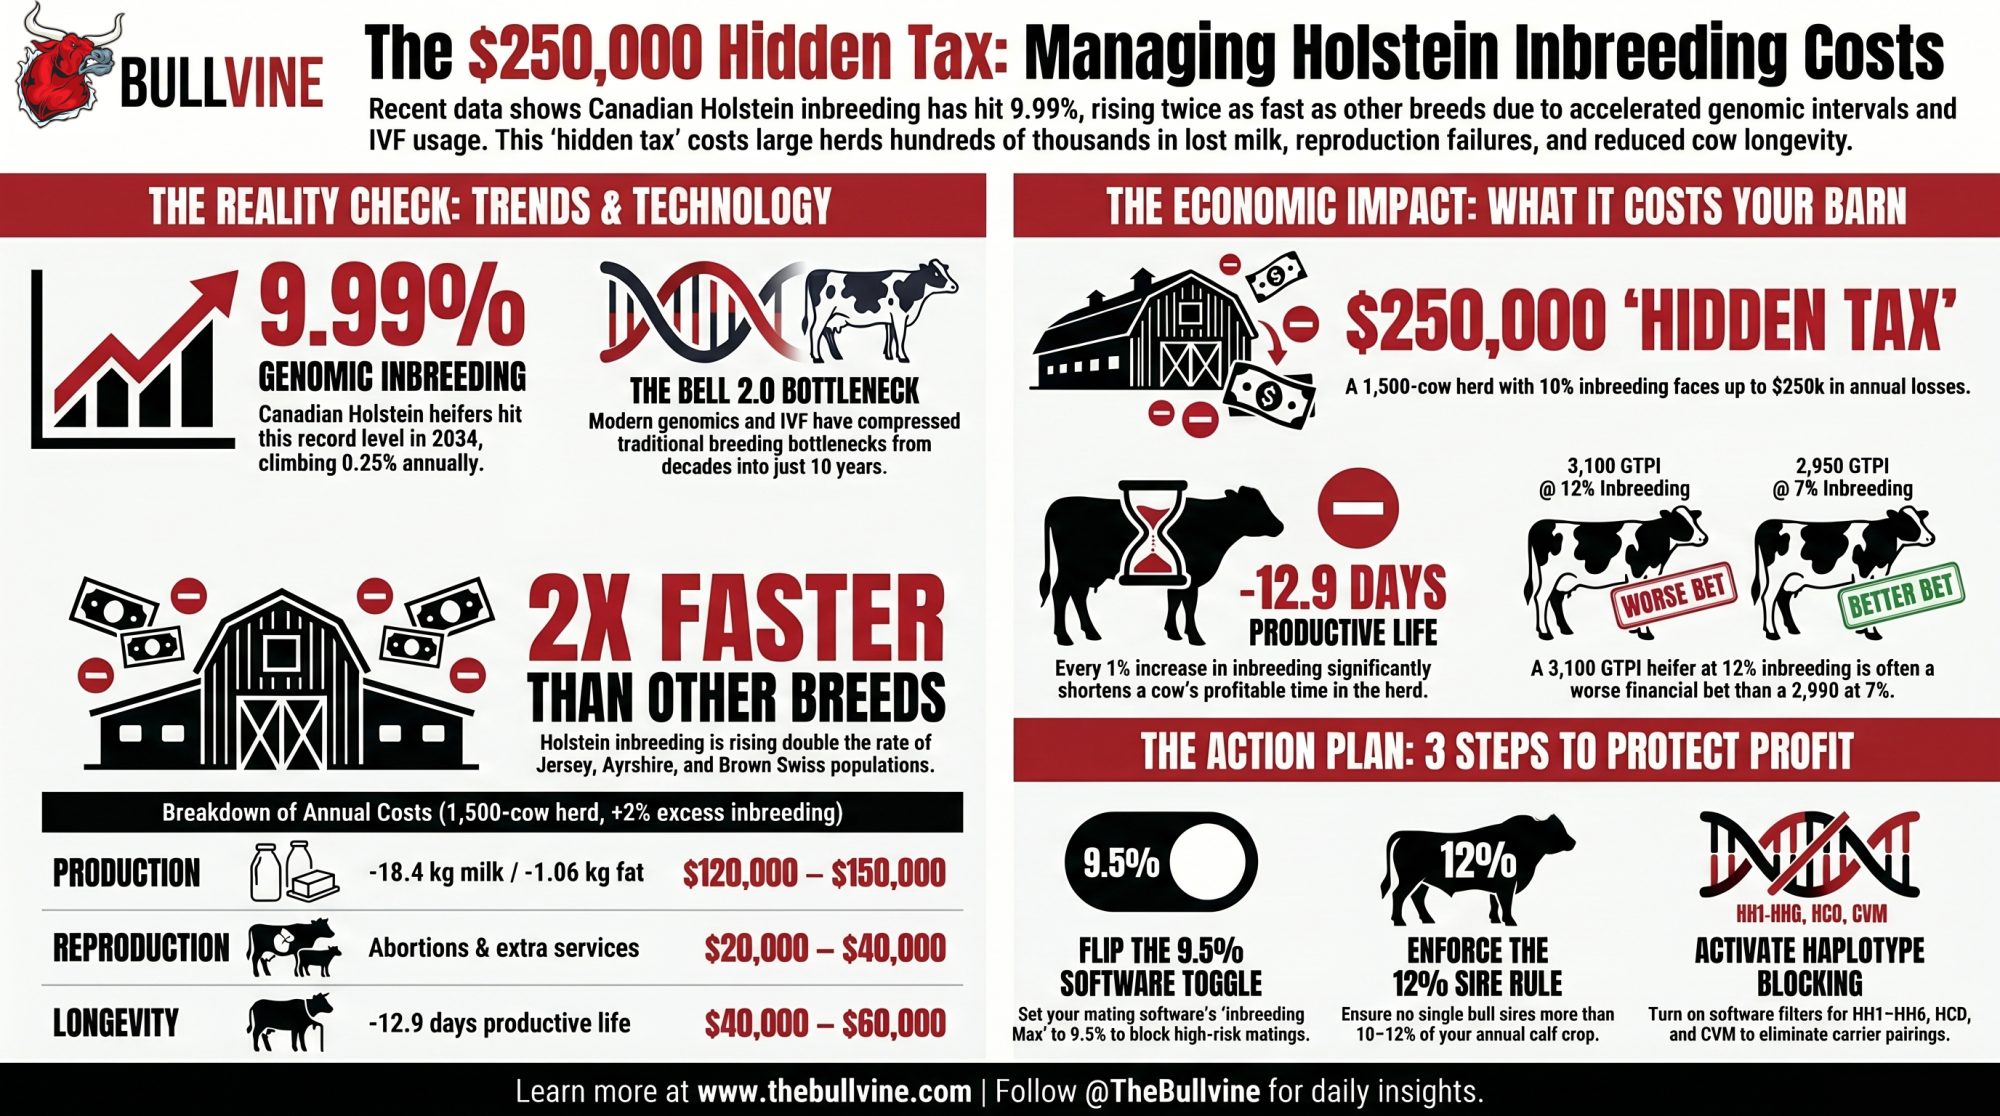
Executive Summary: Lactanet’s August 2025 update clocked Canadian Holstein heifers born in 2024 at 9.99% genomic inbreeding, climbing 0.25% a year — more than double Jersey, Brown Swiss, and Ayrshire. Push the Cassell (1999) and CDN (2008) coefficients through a 1,500‑cow Holstein herd running 10% heifer inbreeding instead of 7–8%, and the modeled annual drag lands at $180,000–$250,000 in lost milk, extra abortions and services, and shorter productive life. Genomics didn’t fix the Chief/Elevation bottleneck — it cut sire generation intervals from 6.8 years to under 3 and put O‑Man at 13% relationship to the breed in one cycle. IVF now multiplies it from the other side: a 3,100 GTPI heifer at 12% inbreeding is a worse financial bet than a 2,950 at 7%, and most herds have never audited the gap. The highest‑leverage fix is a 30‑minute job — drop your mating software’s Inbreeding Max toggle to 9.5%, turn on HH1–HH6 / HCD / CVM blocking, cap any single sire at 10–12% of the calf crop, and screen IVF donors under 9%. Hold that discipline three years and the modeled recovery on a 1,500‑cow herd runs $150,000–$300,000 a year once the new cohort cycles through. Read the full piece if your last semen order went in without anyone in the room being able to quote your herd’s inbreeding number.
Composite scenario: the southwestern Ontario manager in this story is a synthesis of patterns showing up in well‑run 1,500‑cow Holstein herds. The herd numbers are illustrative; the inbreeding‑depression math and Lactanet data behind them are real.
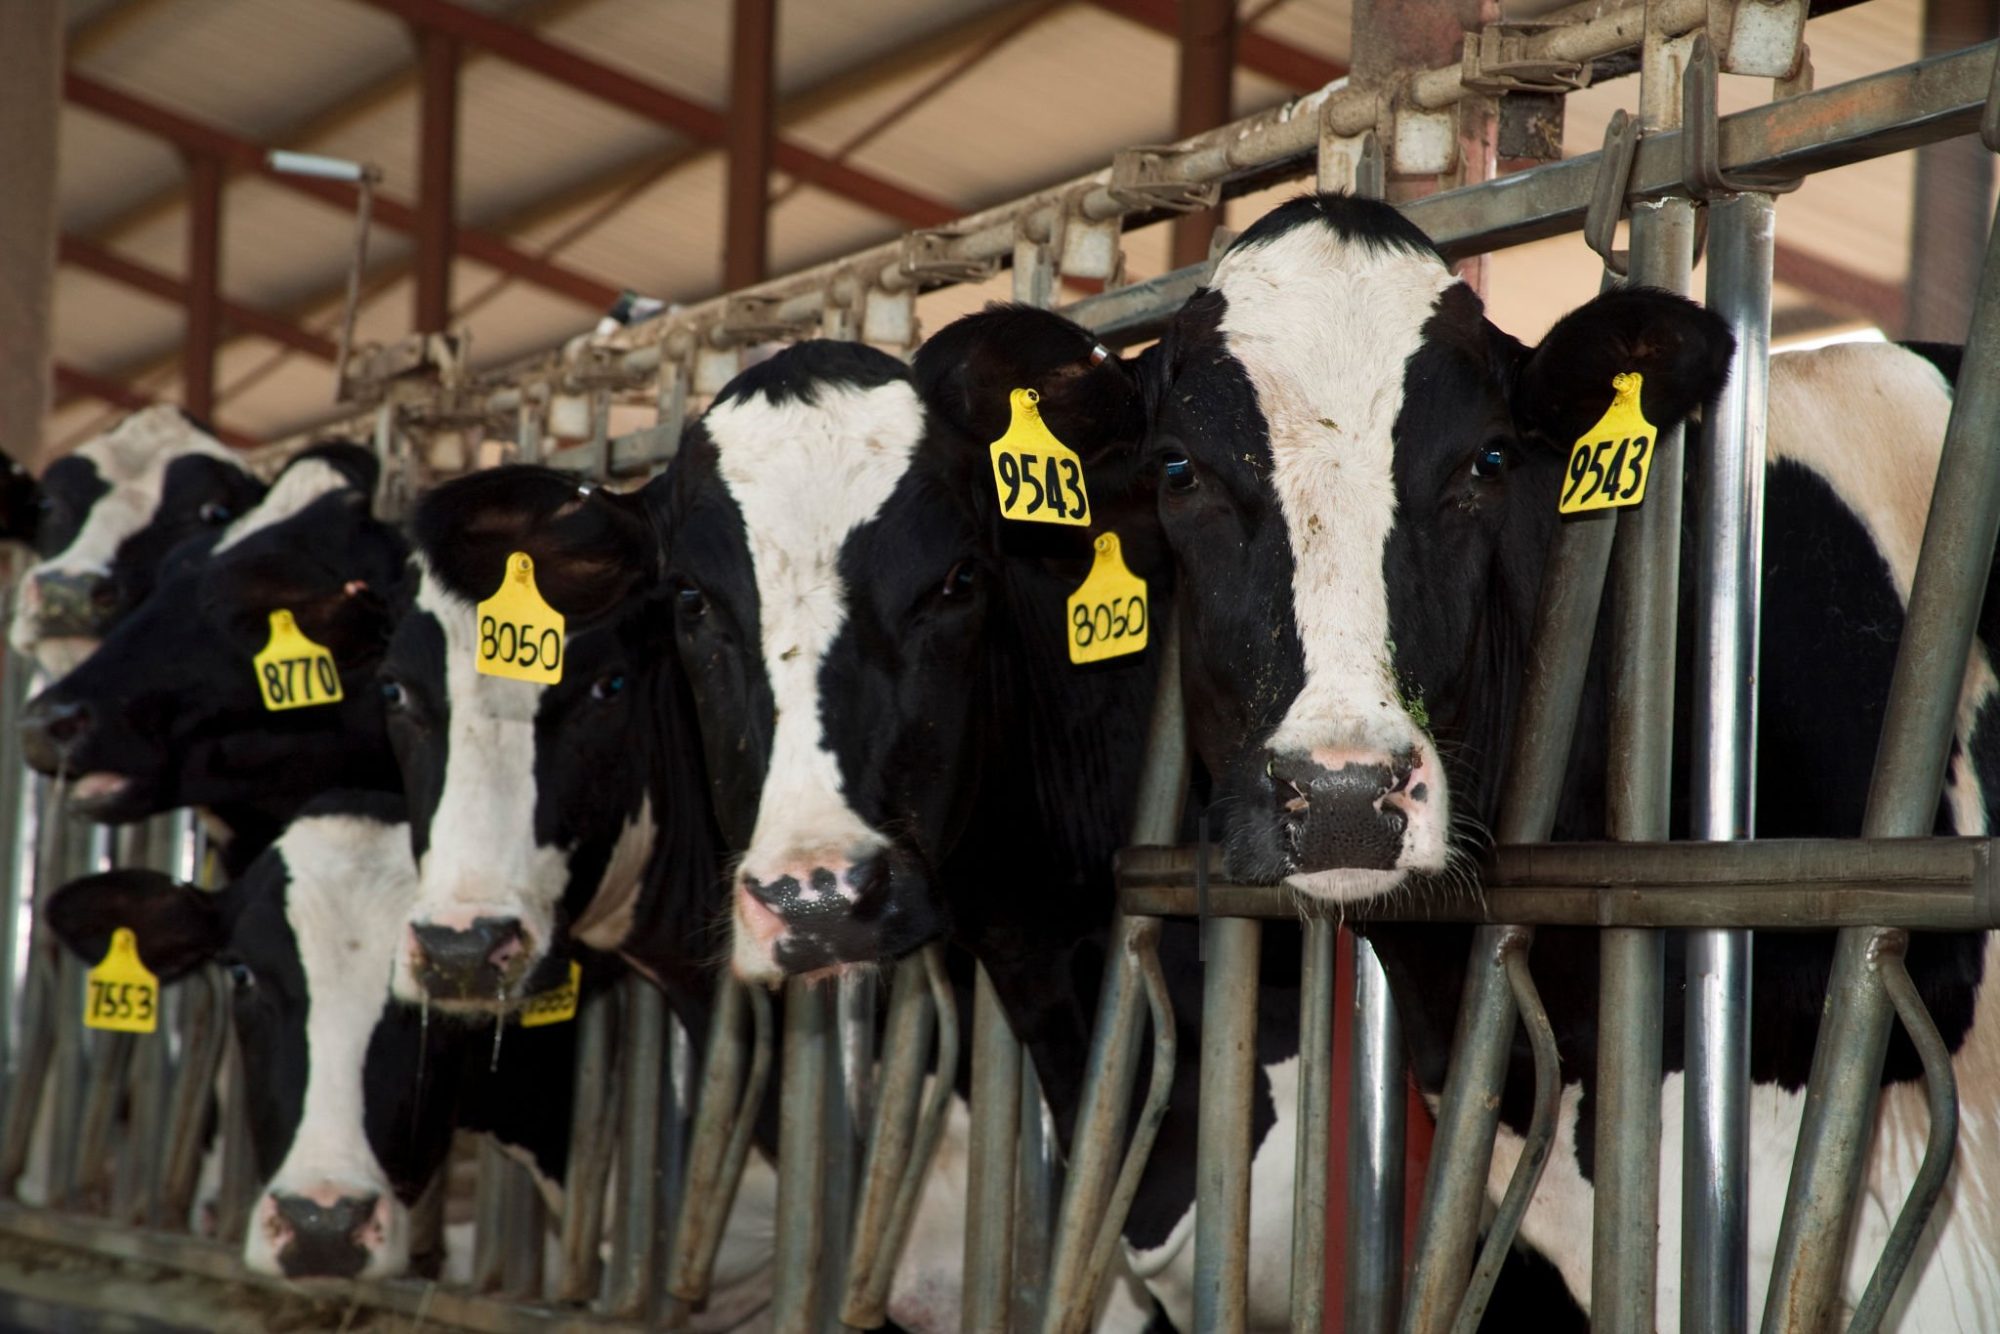
Picture a breeding manager on a 1,500‑cow Holstein operation in southwestern Ontario, pulling a report he’d never bothered with before: average genomic inbreeding on his 0–12‑month heifers. The number lands at 10.3%.
On paper, everything looked right. Seven years of buying top‑5% genomic sires, flushing the best young donors through IVF, pushing NM$ higher with every proof run. Every proof sheet and semen invoice said elite genetics.
That 10.3% told a different story. Mapped against the kind of repro records most large herds keep — conception by sire group, mid‑term abortions, second‑calf cull reasons — the pattern jumps off the page in herd after herd. The tightest, most “elite” matings are also the worst performers in the breeding barn.
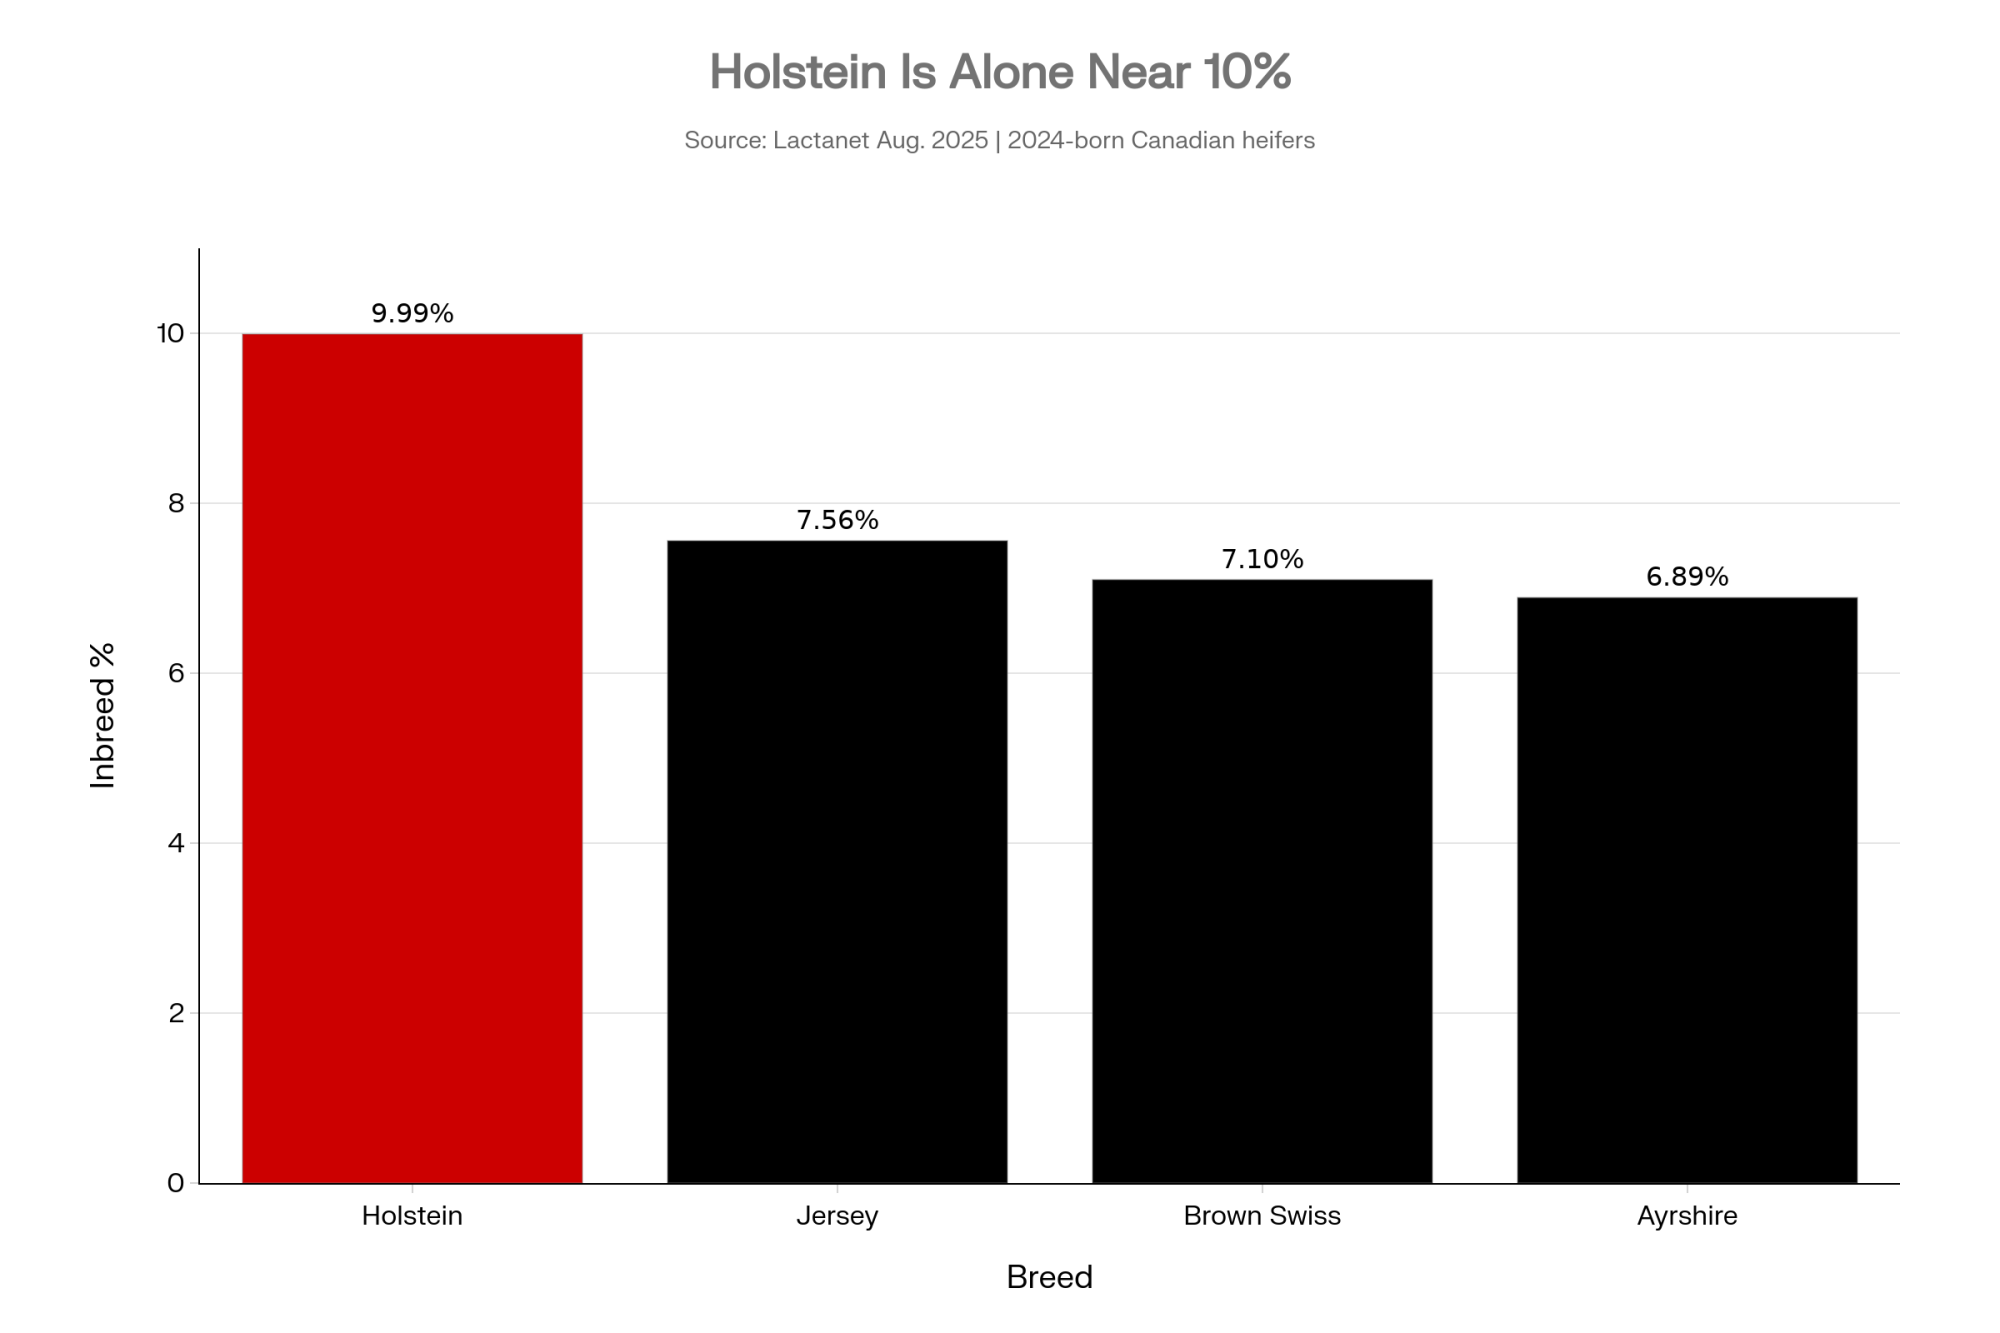
He isn’t an outlier, and the herd average isn’t either. Lactanet’s August 2025 inbreeding update put Canadian Holstein heifers born in 2024 at 9.99% genomic inbreeding — ahead of Jersey (7.56%), Brown Swiss (7.10%) and Ayrshire (6.89%). And Holstein is climbing at +0.25% per year since 2010, more than double the rate of Jersey (+0.11%), Ayrshire (+0.12%) and Brown Swiss (+0.12%) over the same window. If your herd has been leaning on the same handful of hot genomic sires and IVF donors, your number likely looks a lot like that 10.3%.
The Original Trap Took Decades. This One Took 10 Years.
The first Holstein bottleneck is familiar history, even if it rarely comes up when we’re picking bulls.
Pawnee Farm Arlinda Chief, born in 1962, now shows up in roughly 14% of the global Holstein genome. Round Oak Rag Apple Elevation, born in 1965, sits around 15.2%. To‑Mar Blackstar has climbed higher still at about 15.8%relationship to the breed.
Those bulls and their sons drove enormous gains. The collective milk production impact of the Chief/Elevation era has been estimated in the tens of billions of dollars over the late 20th and early 21st centuries.
But Chief carried the APAF1 nonsense mutation we now call HH1. Published estimates tie that single mutation to roughly 525,000 mid‑term abortions worldwide over 35 years at about $800 per fetus — in the $420–450 millionrange in lost calves, vet time, and milk that never got made.
Run the math and the ratio still works out heavily in favour of the production gain. That’s why HH1 rode along undetected for so long. The upside hit every milk cheque. The downside hid in vet invoices, open‑cow lists, and “unexplained” pregnancy failures nobody connected to pedigree.
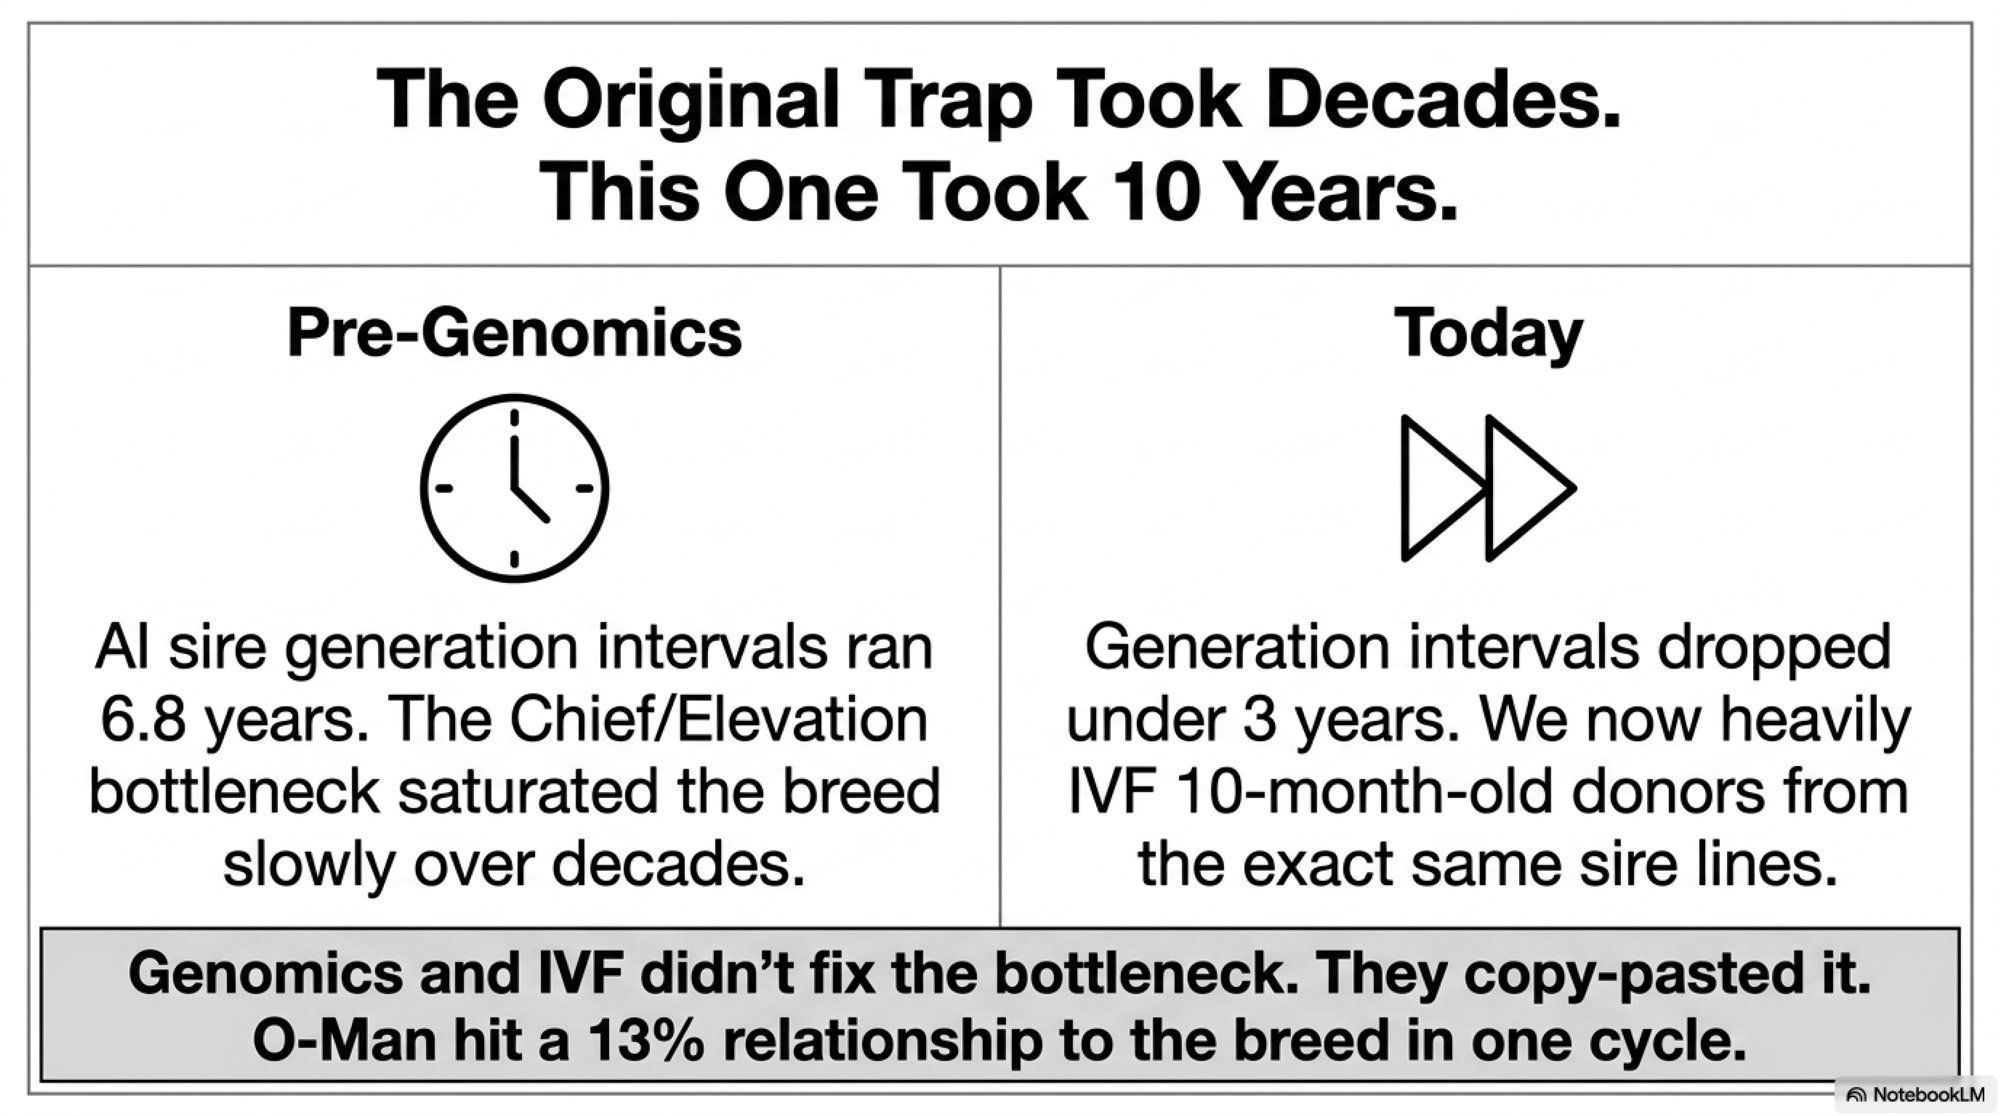
Back then, AI sire generation intervals ran close to 6.8 years. Chief and Elevation’s DNA took decades to saturate the breed.
Genomics changed the pace. Published US Holstein data show AI sire generation intervals dropping from about 6.8 years pre‑genomics to under 3 years afterward. Fewer young bulls now sire a larger share of the next generation, and they’re more closely related to each other than at any point in Holstein history. O‑Bee Manfred Justice — O‑Man — is the clearest example: roughly 13% relationship to the Holstein population, approaching Chief and Elevation territory in essentially one genomic generation.
IVF made the new bottleneck two‑sided. In North America, IVF embryo production has surpassed conventional flushing, and many programs collect embryos from donors well before their first calving, sometimes starting around 10 months of age. Both sides of the pedigree are tightening at once. Effective population size (Ne) for Holsteins — how genetically diverse the breed actually behaves, regardless of the millions of cows on the ground — has been estimated between 74 and 171 across recent multi‑country studies (Salehi et al., 2025, Veterinary Medicine and Science). For a global population this big, that’s conservation‑biology territory.
What Does 2% Extra Inbreeding Actually Cost in Your Barn?
Virginia Tech’s benchmark inbreeding work (Cassell, 1999) put the lifetime economic loss at roughly $22–24 per cowfor every 1% increase in inbreeding — in 1999 dollars, with current impact likely higher once you adjust for today’s milk price, replacement costs, and inflation.
The Canadian Dairy Network’s “Quantifying Inbreeding Depression” analysis (Van Doormaal, 2008) sits behind the trait‑level numbers most breeders use today: per 1% inbreeding, roughly 18.4 kg less milk (about 41 lb), 1.06 kg less fat (about 2.3 lb), 0.53 kg less protein (about 1.2 lb), and 12.9 days less productive life across Holsteins.
Stack those coefficients across multiple lactations on a 1,500‑cow herd whose replacement heifers average 10% inbreeding instead of 7–8%, and the modeled annual drag looks like this:
The Silent Drag: Modeled Annual Cost of +2% Inbreeding in a 1,500‑Cow Holstein Herd
| Cost bucket | Impact per +1% inbreeding | Modeled +2% herd impact | Why it matters |
| Production | −18.4 kg milk; −1.06 kg fat | $120,000–$150,000/year | Biggest visible drag, but still usually blamed on feed or transition management |
| Reproduction | More abortions, extra services, longer days open | $20,000–$40,000/year | Shows up as “random” pregnancy loss and repeat-breeder noise |
| Longevity | −12.9 days productive life | $40,000–$60,000/year | Pushes more cows out before they pay back rearing cost |
| Total | Hidden inbreeding tax | $180,000–$250,000/year | Large enough to beat many bull-list index gains |
| Recovery target | Remove 2 excess points over time | $150,000–$300,000/year | Frames the 9.5% cap as a cash-flow decision, not a genetics lecture |
Modeled example built from Cassell (Virginia Tech, 1999) and CDN/Lactanet trait coefficients (Van Doormaal, 2008). Production line assumes ~200 lb less milk and proportional fat across the productive life of the affected cohort at current component returns. Reproduction line assumes 10–30 extra mid‑term abortions at $800–1,200 each plus added services and days open. Longevity line assumes 20–30 extra annual replacements at $1,800–2,200 each. Not an audited herd P&L.
A composite back‑of‑the‑barn version using realistic 1,500‑cow abortion counts, repro spend, and milk price lands squarely in the middle of that range. The lesson sitting underneath it: too many managers spend years arguing over 20 points of NM$ on the bull lineup while ignoring a cost roughly three times larger.
IVF: Your Best Tool or Your Fastest Bottleneck?
IVF and OPU are powerful when they multiply diversity and merit together. They’re brutal when they copy and paste a bottleneck.
Walk through the pattern that’s playing out on farms right now.
A donor heifer is 10 months old, top 2% on NM$, and already sitting at 9.5–10% genomic inbreeding because the same popular sire lines built both sides of her pedigree. She looks like the obvious IVF candidate. The program mates her to the same handful of high‑index sires already in heavy use across the herd. Over the next year, she produces 20–40 embryos.
If nobody has checked her inbreeding or her relationship to those sires, a big chunk of those embryos will sit in the 10–12% expected‑inbreeding range. If haplotype blocking isn’t turned on, some of those combinations can be carrier × carrier for HH1–HH6 or HCD.
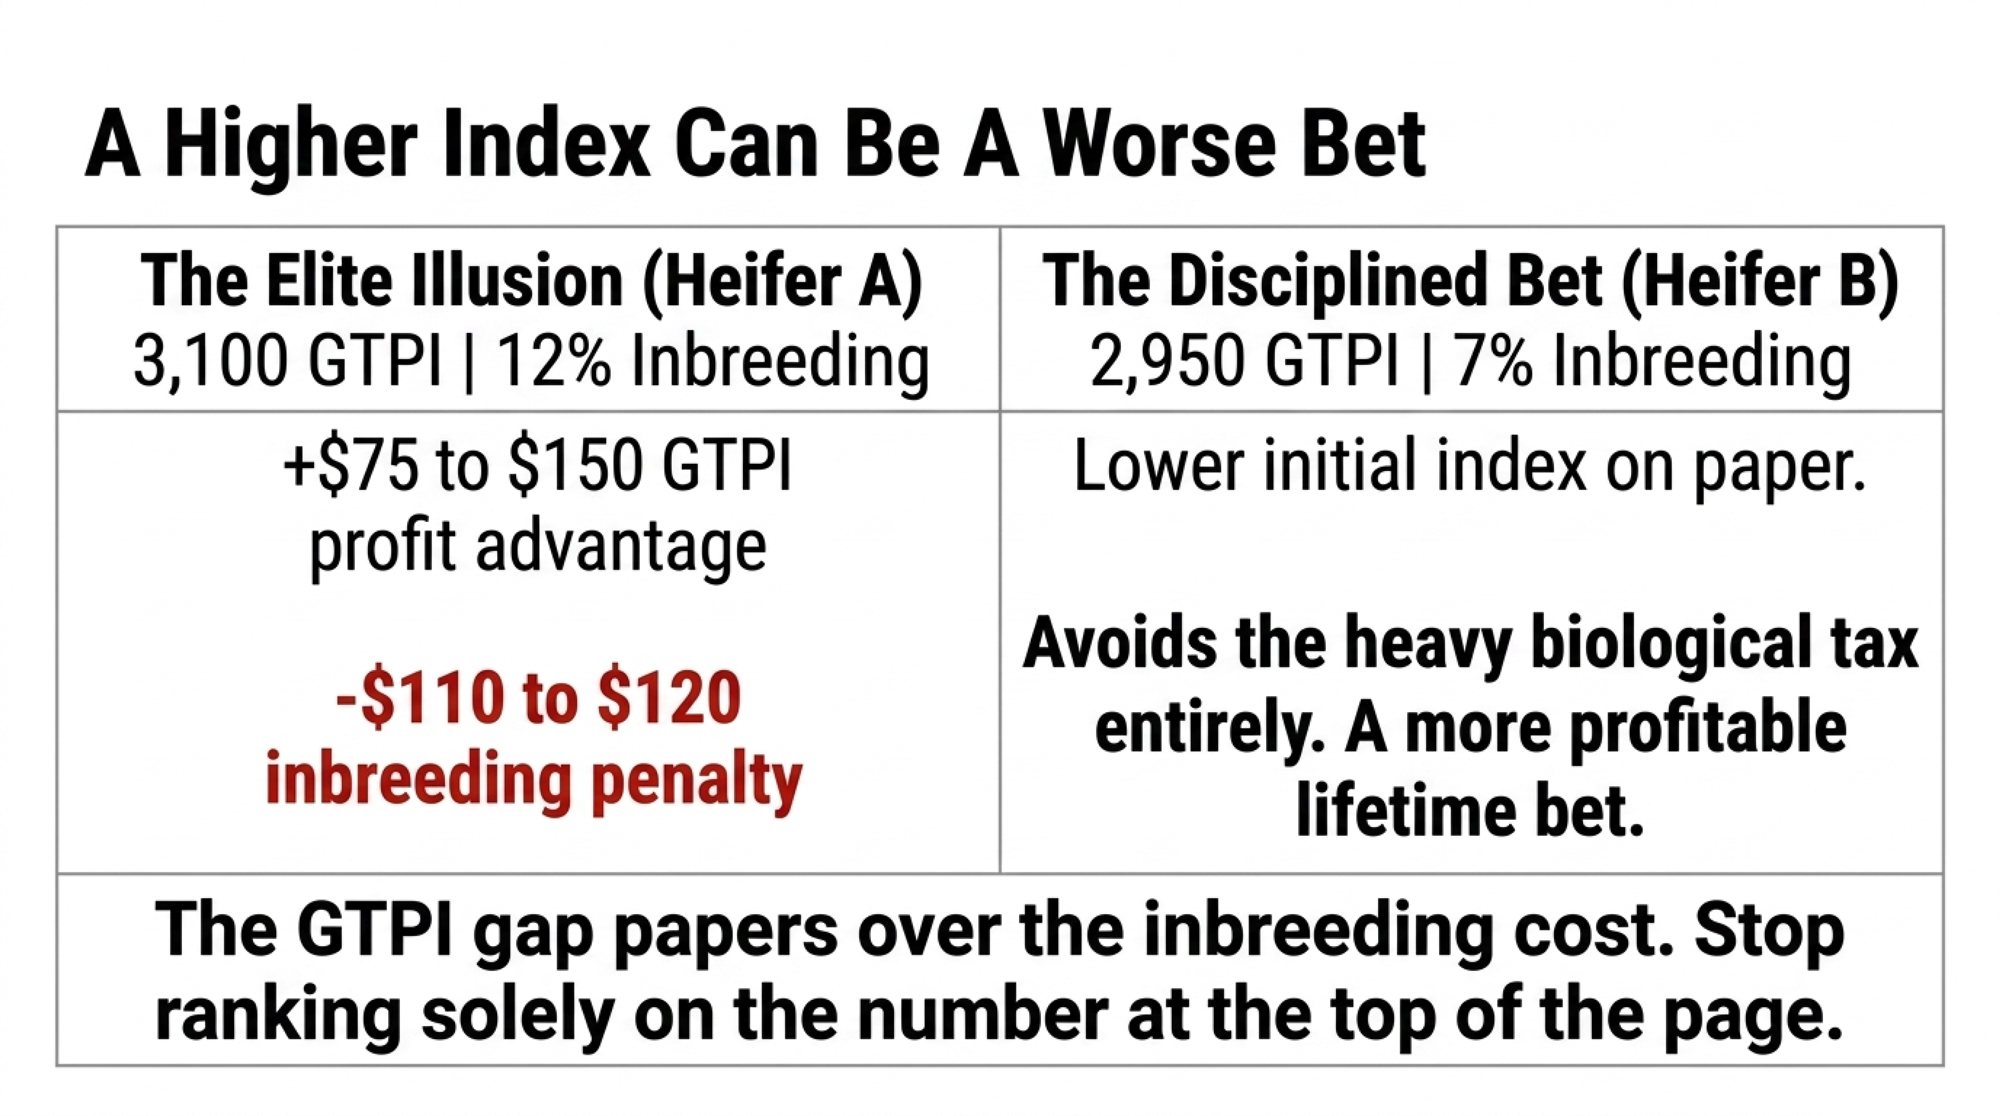
Here’s the trap: the GTPI or NM$ number at the top of the genomic report is so high it papers over the inbreeding coefficient sitting two columns to the right. A 3,100 GTPI heifer with 12% inbreeding can be a worse financial betthan a 2,950 GTPI heifer with 7% inbreeding. Run the math: the 150‑point GTPI gap is worth roughly $75–$150 in lifetime profit on most index conversions. The 5‑point inbreeding gap costs $110–120 in Cassell’s framework. Stop ranking on the number at the top of the page.
Fast‑forward two years. Those IVF daughters hit the fresh pen with impressive genomic proofs and a frustrating pattern: slightly worse conception, a few more transition events, a tendency for some to leave before their third lactation. On paper, they’re the future of the herd. In the parlour, they’re not quite paying their rent.
Feed gets blamed. Housing gets blamed. The IVF lab gets blamed. The unglamorous answer is often simpler: the program multiplied a bottleneck.
Here’s a fast way to check. Pull average genomic inbreeding on your IVF‑bred heifers born in the last 12 months, then the same number on your conventionally bred group. If the IVF calves are running 1–2 points higher — and in herds that haven’t audited this, they often are — your highest‑cost genetics program is working against your longevity and repro numbers. At Cassell’s $22–24 per 1% per cow per lifetime, even a 1‑point gap across 200 IVF‑bred replacements adds up to roughly $4,400–4,800 in modeled lifetime drag before those heifers ever calve.
Who Gets Paid — and Who Holds the Bill?
AI companies earn margin on every straw, and the business model rewards concentration: when a small number of high‑index bulls move large volumes of doses, marketing, proof rollouts, and rep activity tend to follow. That’s how the industry has worked for decades.
Most AI reps are paid in significant part on volume and market share. You’re paid on margin and longevity. Those incentives don’t always pull in the same direction.
You need cows pregnant on time, healthy through transition, and milking through three or more lactations. Every mid‑term abortion, every repeat breeder, every second‑calf cow that crashes and leaves early — those costs hit your P&L, not your stud’s.
Layered across the inbreeding‑depression literature — Cassell at Virginia Tech, CDN/Lactanet’s quantification work, and later reviews — the lifetime economic loss at today’s Holstein inbreeding levels lands in roughly the $200–400 per cow range. That’s not one paper. It’s a range that keeps showing up when you stack the milk, fat, longevity, fertility, and health hits together.
Many reps work hard to steer breeders toward responsible matings, and several companies have invested in better relationship and expected‑inbreeding tools inside their mating programs. The critique here is of the default incentive structure, not of any individual rep or company. But the structural reality remains: it’s still not the default view in most catalogs, and relationship data rarely leads the conversation when a rep arrives with a bull list sorted by NM$, TPI and Pro$.
The studs monetise concentration. The herd absorbs the long tail of it — in abortions, repro costs, and replacements.
Can a 9.5% Cap and 20 Sires Really Change Anything?
This is where the composite Ontario manager’s playbook gets useful — because it tracks closely with what disciplined large herds are actually doing right now.
After seeing a 10.3% heifer inbreeding report, the move isn’t to scrap the genetics program. The move is three specific changes, committed to for at least three years.
First, turn on a mating‑level inbreeding cap. Most software already calculates expected inbreeding on proposed matings, but in many installs we’ve reviewed the default sits well above the threshold most large Holstein herds need today. Move the toggle to 9.5% and make it a hard rule: no mating allowed if the resulting calf’s expected inbreeding exceeds that threshold. The program simply blocks those proposals. Some go‑to sires suddenly disappear as options on certain cows. That stings — but the cap isn’t banning bulls, it’s banning bad matings.
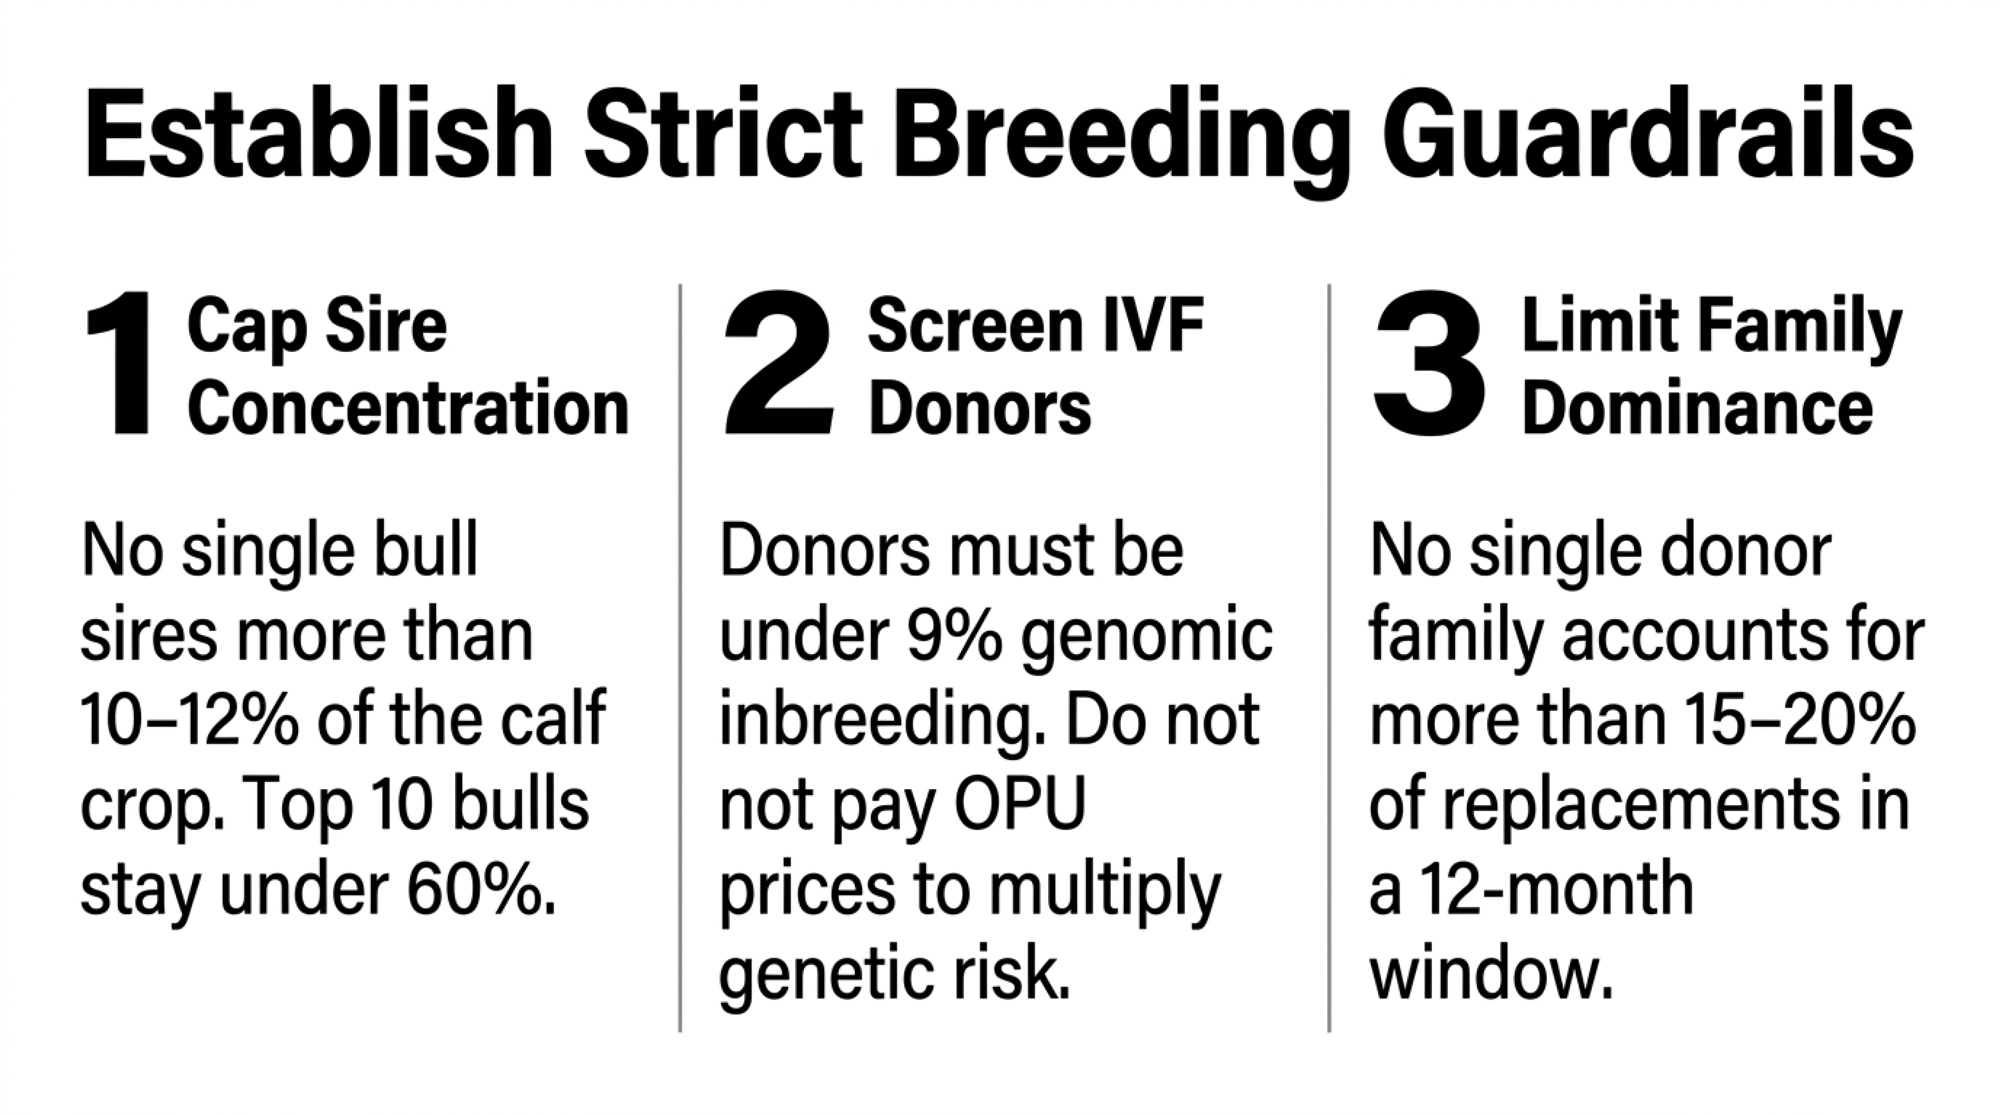
Second, enforce a sire‑use rule. No single bull sires more than 10–12% of the calf crop in a calendar year. The top 10 bulls, collectively, stay under 60% of the calves. That forces sire groups drawn from genuinely different sire stacks — not eight sons of the same bull with different prefixes.
Third, put IVF under guardrails. Donors under 9% genomic inbreeding. Every potential sire screened for relationship to that specific donor. No donor family accounts for more than 15–20% of replacement heifers in any 12‑month window.
Sit down with your vet and accountant and agree on farm‑specific numbers for the cost of a mid‑term abortion, an extra service, and the rearing cost per replacement. Those three numbers turn the inbreeding conversation from interesting genetics talk into a line on the cash flow.
Within 90 days of switching on the 9.5% cap and tightening IVF, the breeding tech notices something simple: fewer ugly proposed matings, fewer repeated carrier pairings, and fewer head‑scratching combinations on problem cows.
How Long Before You See It in the Barn?
The payoff doesn’t arrive all at once, and it doesn’t show up first on the milk sheet.
Managers who implement this kind of package — 9.5% cap, sire diversity, IVF guardrails, haplotype blocking — describe a three‑phase timeline.
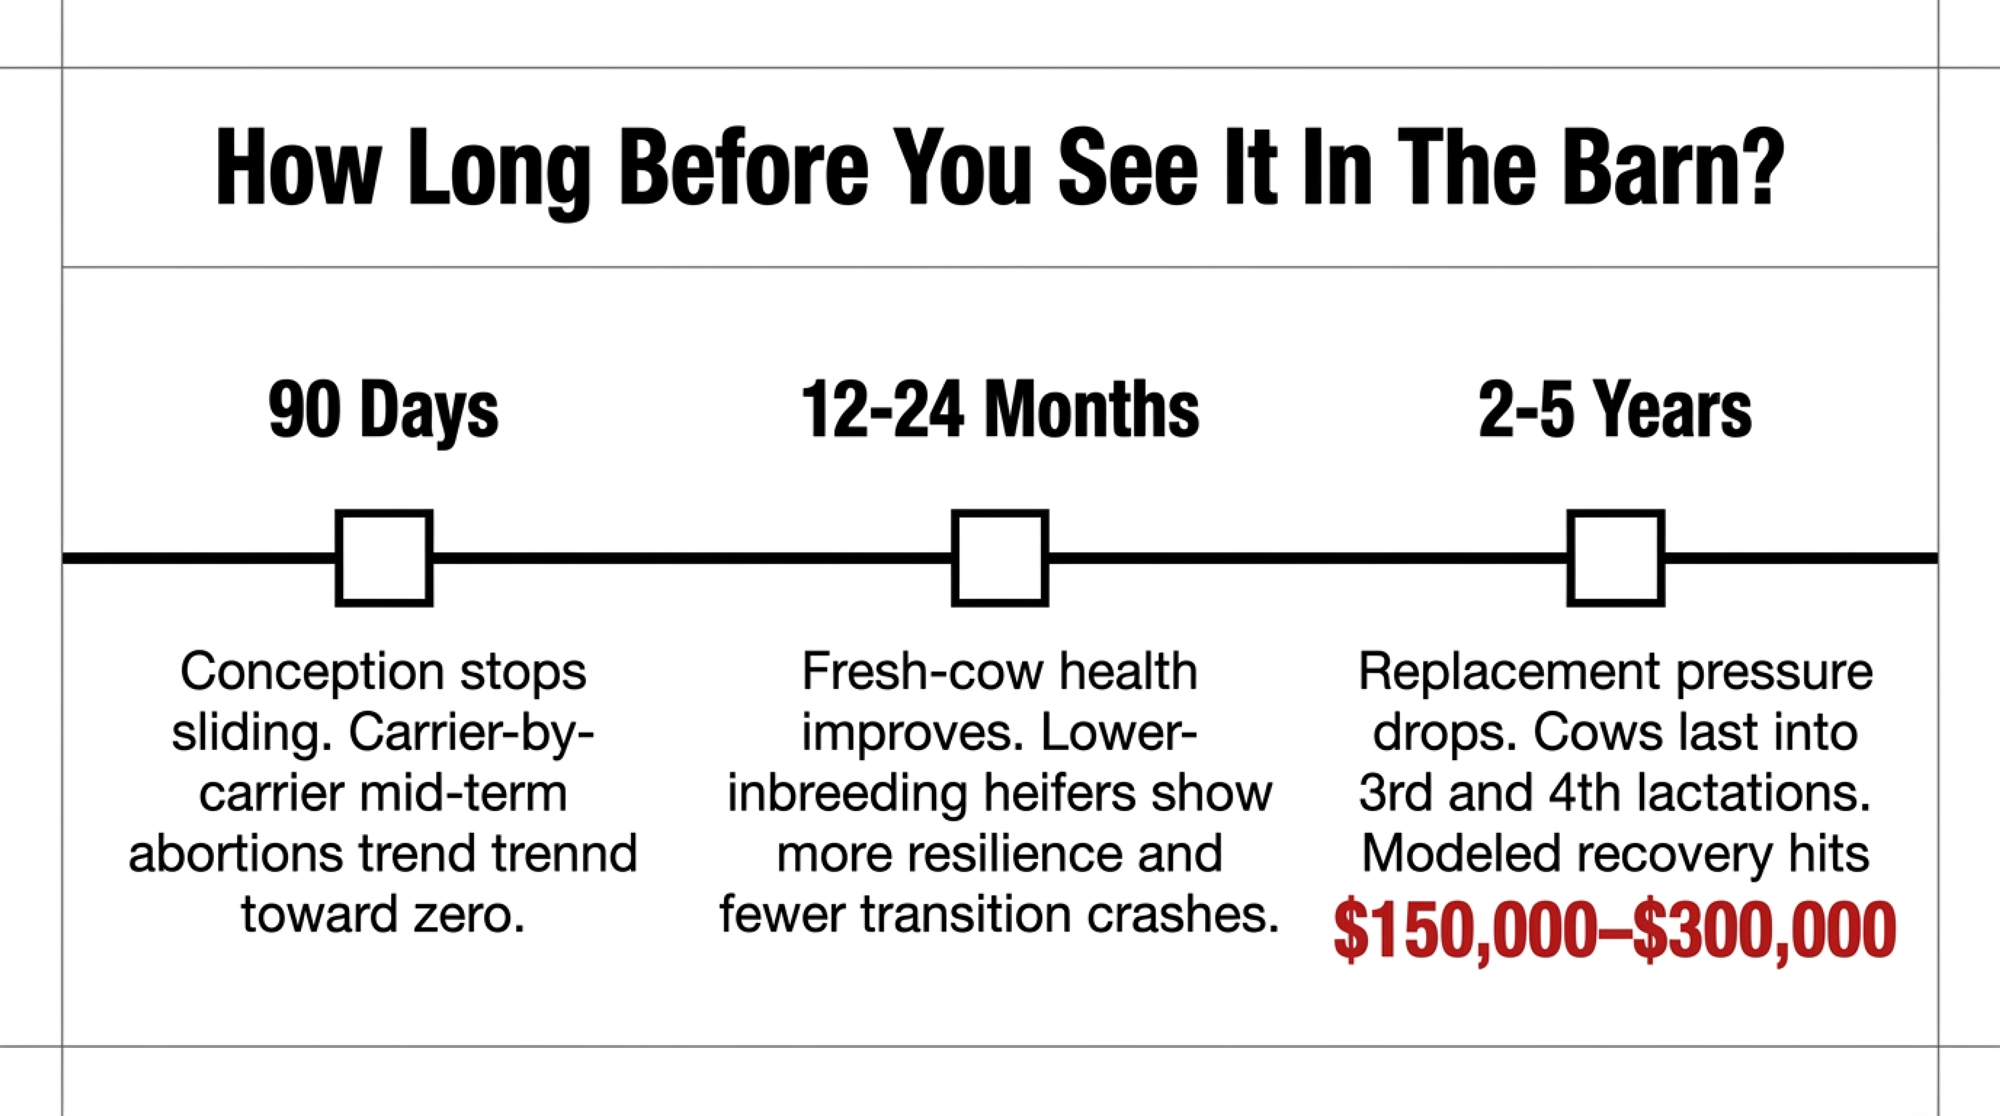
0–12 months: repro and abortions. Within about 90 days, conception rates stop sliding and, in many herds, start ticking up. The worst inbreeding‑driven matings are out of the pool. Turn on recessive haplotype blocking (HH1–HH6, HCD, CVM) and carrier × carrier matings drop to zero as soon as the new rules are in place. Within one gestation length — roughly 9–10 months — mid‑term abortions linked to those combinations trend toward zero.
12–24 months: fresh‑cow health. The first “new‑protocol” heifers calve in. Lower‑inbreeding heifers tend to show fewer transition issues and more resilience through the first 60 days in milk. It’s not dramatic — but classify your fresh cows by inbreeding band and the differences usually jump off the page. Fewer crash‑and‑burn second‑calf cows show up on the cull list.
2–5 years: lifetime profit and replacement pressure. By year 3, lifetime economics begin to shift. More cows last into third and fourth lactations. Replacement rate comes down because you’re not culling as many cows for fertility and health before they’ve paid off their rearing cost. Over a 5‑year window, a herd that holds this discipline is positioned to pull average heifer inbreeding from around 10% closer to 7–8%. Run Cassell’s and CDN’s coefficients in the opposite direction and the modeled annual recovery from eliminating 2 points of excess inbreeding in a 1,500‑cow herd falls in the $150,000–300,000 range once the full replacement cohort has cycled under the new rules.
None of that is a guarantee. Weather, management, feed, and markets all move the needle too. But change nothing about inbreeding and sire concentration and your numbers will keep drifting in the same direction as the national curve.
What This Means for Your Operation
- Can you quote your heifer‑crop average inbreeding right now? If not, that’s your first ask before the next semen order. It’s the quickest read on whether the last five years of bull decisions are building resilience or quietly eroding it.
- Pull conception and abortion numbers by inbreeding band. Compare cows over 10% to those under 8%. Gaps of several points in conception rate or higher abortion rate in the more inbred group are real money on the table.
- Ask your semen rep a different question next time: “What’s this bull’s relationship to my herd?” If they can’t answer, push for expected inbreeding and relationship reports alongside index rankings.
- Stop ranking by GTPI/NM$ alone. Sort your bull short list by expected inbreeding against your specific cow before you order semen. A 150‑point GTPI gap can be cheaper than a 4‑point inbreeding gap on the wrong cow.
- Put inbreeding on the same quarterly dashboard as pregnancy rate, SCC, and cull rate. If it’s not a KPI, it won’t get managed.
The 30‑Day Action Plan: Flip the Toggle Most People Miss
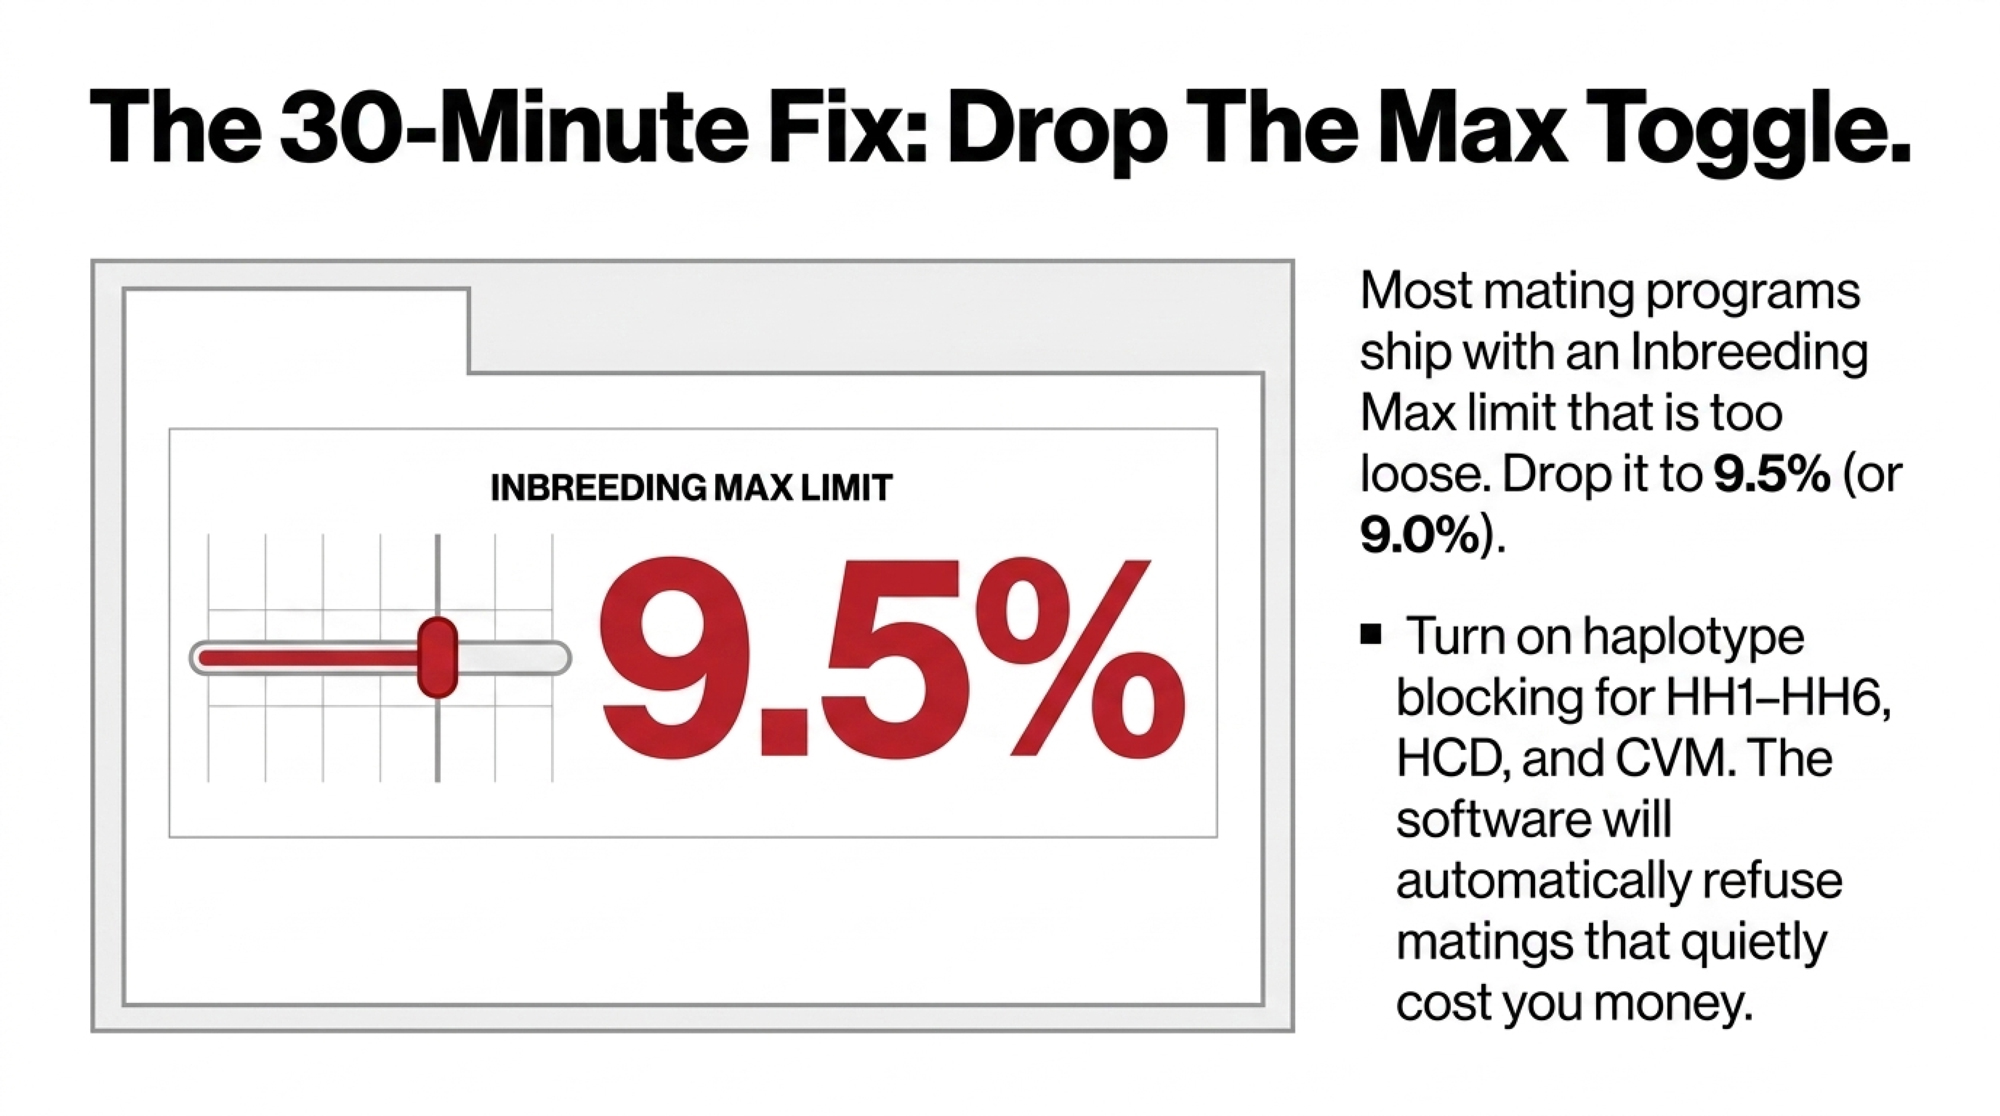
Most mating software — DairyComp, Lactanet’s mating module, and the major AI‑company mating programs — ships with an Inbreeding Max or Expected Inbreeding Limit toggle. In many installs we’ve reviewed, that default sits well above the threshold most modern Holstein herds actually need — high enough that it rarely blocks anything. The single highest‑leverage move you can make this month is to drop it to 9.0% or 9.5% and let the software start refusing the matings that are quietly costing you money.
- Week 1: Log into your mating program. Find the Inbreeding Max / Expected Inbreeding setting. Move it to 9.5% (9.0% if your herd average is already under 8%). Turn on haplotype blocking for HH1–HH6, HCD, and CVM while you’re in there.
- Week 2: Pull the average genomic inbreeding on your 0–12‑month heifer crop and on your most recent IVF cohort. Compare them. If IVF is higher, run the audit.
- Week 3: Re‑run your active sire list against the new cap. Identify the bulls that suddenly aren’t usable on big chunks of the herd and source 2–4 genuine outcross alternatives.
- Week 4: Sit down with your vet and accountant. Lock in your farm’s per‑abortion cost, per‑extra‑service cost, and rearing cost per replacement. Add inbreeding to your quarterly KPI dashboard.
Key Takeaways
- If your 0–12‑month Holstein heifers average 9% or higher genomic inbreeding, run a 9.5% mating cap and a 15–20‑sire rotation — don’t just chase the top of the proof list. The cap is available in most major mating programs. The default is usually too loose. Turn it down.
- A 3,100 GTPI heifer with 12% inbreeding can be a worse financial bet than a 2,950 GTPI heifer with 7% inbreeding. Stop ranking your short list on index alone.
- If your IVF calves are your most inbred group, you’re paying OPU/IVF prices to multiply genetic risk. Tighten donor and sire relationship guardrails before the next flush cycle.
- If nobody in your breeding conversation — not you, not your consultant, not your rep — can quote your herd’s inbreeding band and sire concentration, you’re flying blind on a six‑figure line item.
The industry built the original Chief/Elevation bottleneck by accident over decades. Genomics and IVF can rebuild Bell 2.0 in under ten years — quietly, across thousands of herds at once. The science to manage it is already loaded in your mating software and genomic reports. The only real question is whether your next breeding meeting starts with your herd’s inbreeding number — or with the first page of the semen catalog.
Complete references and supporting documentation are available upon request by contacting the editorial team at editor@thebullvine.com.
Learn More
- The $8,100 Gamble on Missy, 198 Dragged Genes, and the 20-Year Breeding Blind Spot Hiding in Your Herd— Mastering the barn math on fast-turnover herds reveals how a 4% inbreeding drag silently wipes out $5,070 in genomic milk gains. Arm yourself with a clear diagnostic to stop leaking profit through hidden fertility failures.
- TPI 2026’s $17500 Protein Trap: Breeding Holsteins for a Protein Market That Doesn’t Exist — Your next component check relies on understanding the April 2026 formula shift that artificially rewards protein ratios over total fat output. Follow the money to see why chasing new index leaders could build a mismatched herd.
- 9.99% Inbreeding and Rising: How Blondin Sires Turned a Holstein Bottleneck into 75% Growth — Claw back lost reproductive margin using the exact outcross blueprint one high-growth program deployed to bypass the North American AI bottleneck. This strategy reveals how to integrate European cooperative sires without sacrificing elite production potential.
 The Sunday Read Dairy Professionals Don’t Skip.
 The Sunday Read Dairy Professionals Don’t Skip.
Every week, thousands of producers, breeders, and industry insiders open Bullvine Weekly for genetics insights, market shifts, and profit strategies they won’t find anywhere else. One email. Five minutes. Smarter decisions all week.
