Archive for Genetics & Breeding

Frazz Lionel Reads -3.1 DPR and +0.4 CCR. Both Are Right.

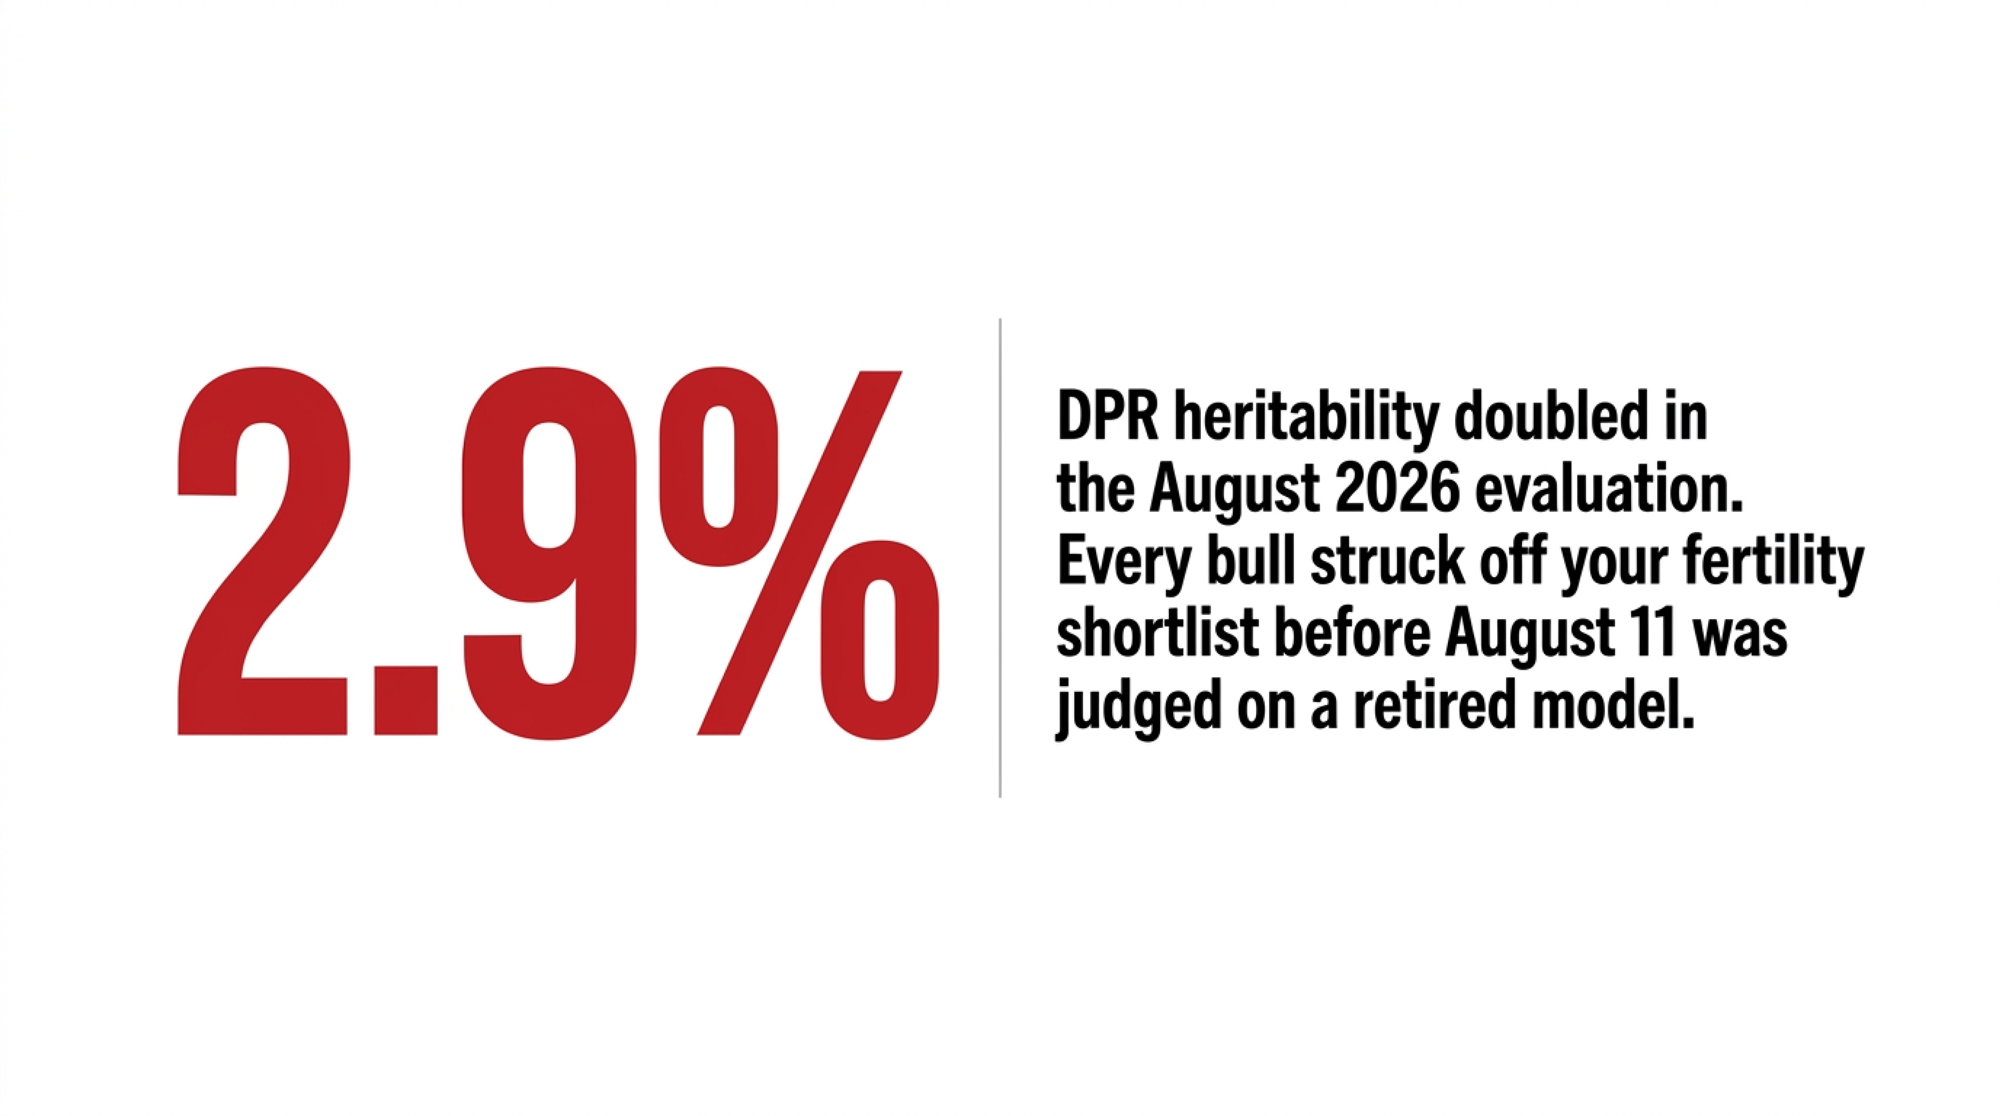
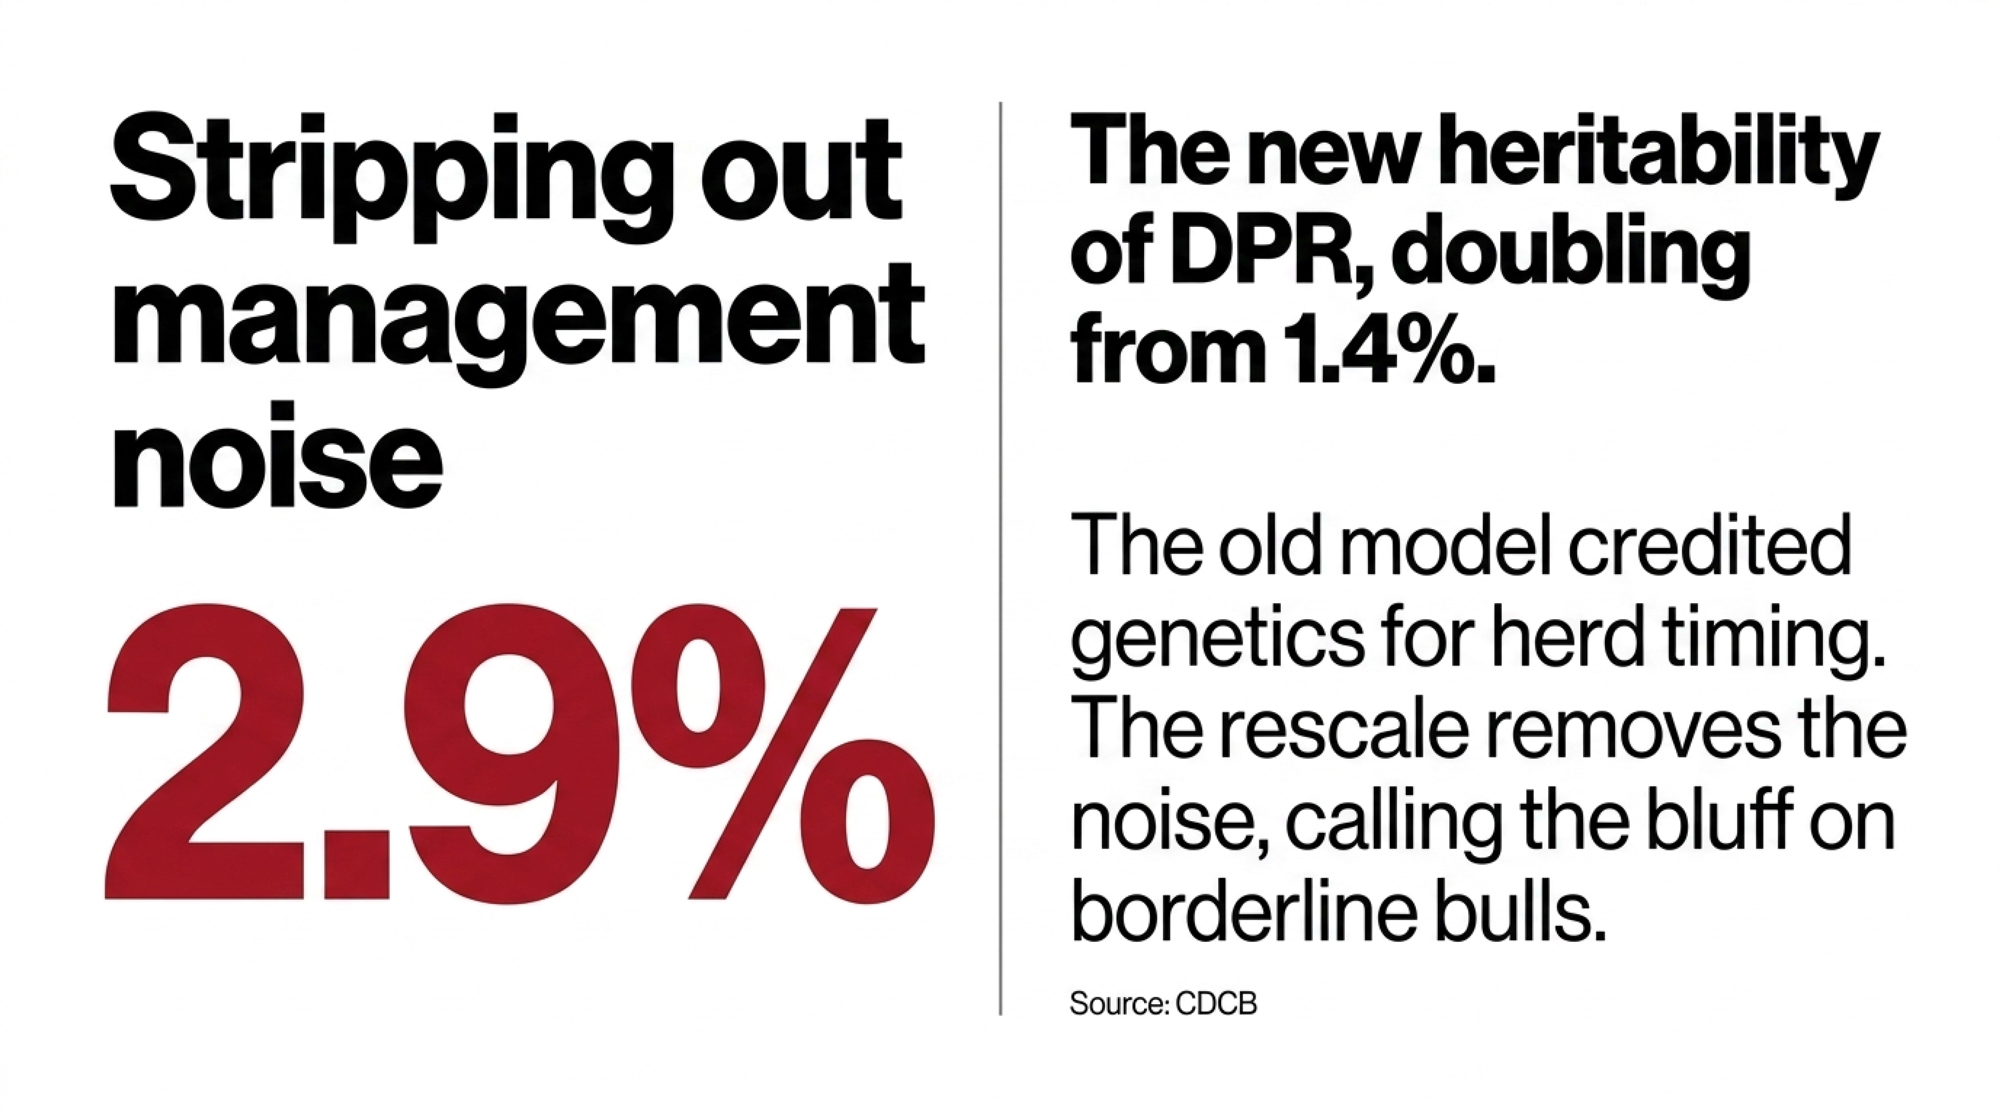
Every bull struck off a fertility shortlist before August 11 was judged on a model CDCB has now retired — and on a heritability half its current value.

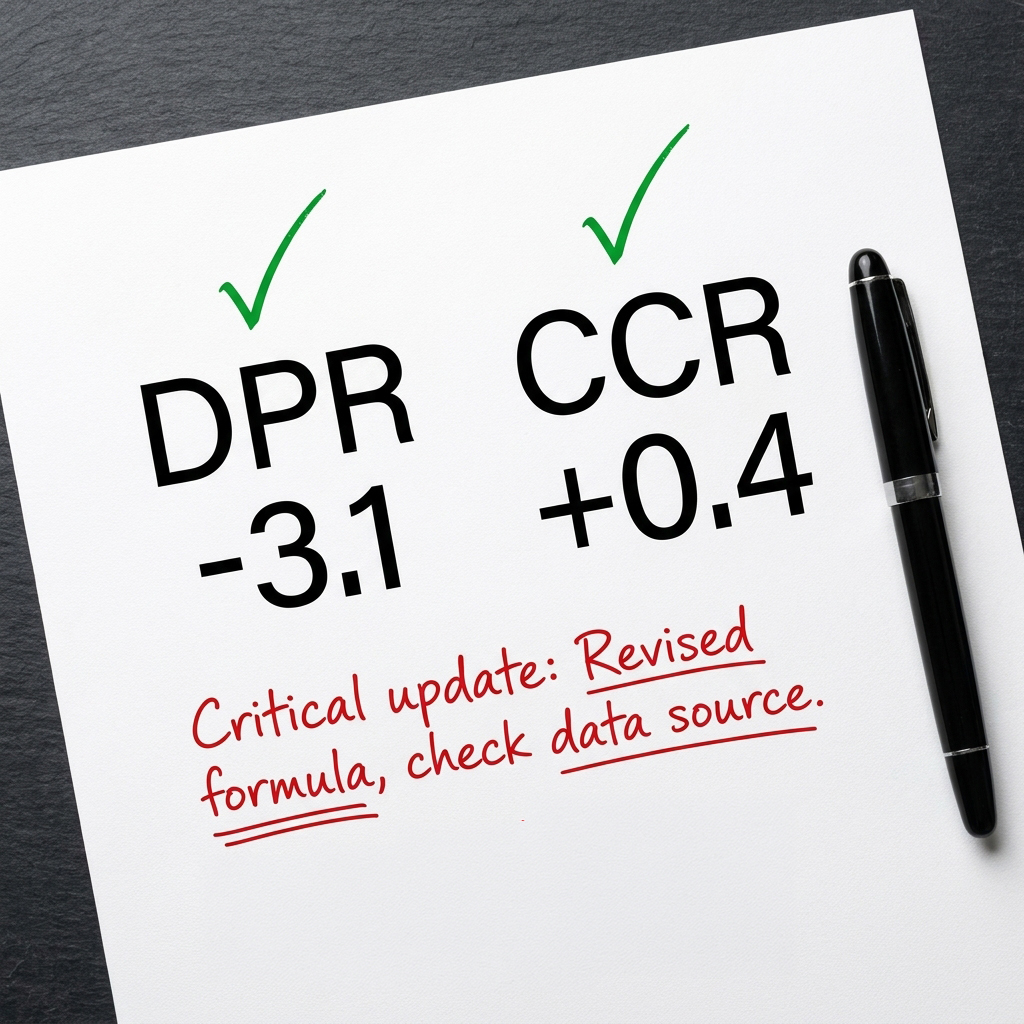
Executive Summary: MR T-SPRUCE FRAZZ LIONEL-ET (007HO14454) reads -3.1 DPR against +0.4 CCR on CDCB’s August 2026 run, both at 99% reliability, and the two figures measure different things rather than contradicting each other. August’s rebuild lifted DPR heritability from 1.4% to 2.9%. Bullvine’s calculation goes further: his published Fertility Index of -0.5 computes to -1.56 under Holstein Association USA’s pre-August-2024 weights — about a point of index from a committee vote, on identical daughter data. His fertility PTAs rest on 17,368 daughters, not the 30,490 behind his milk proof.
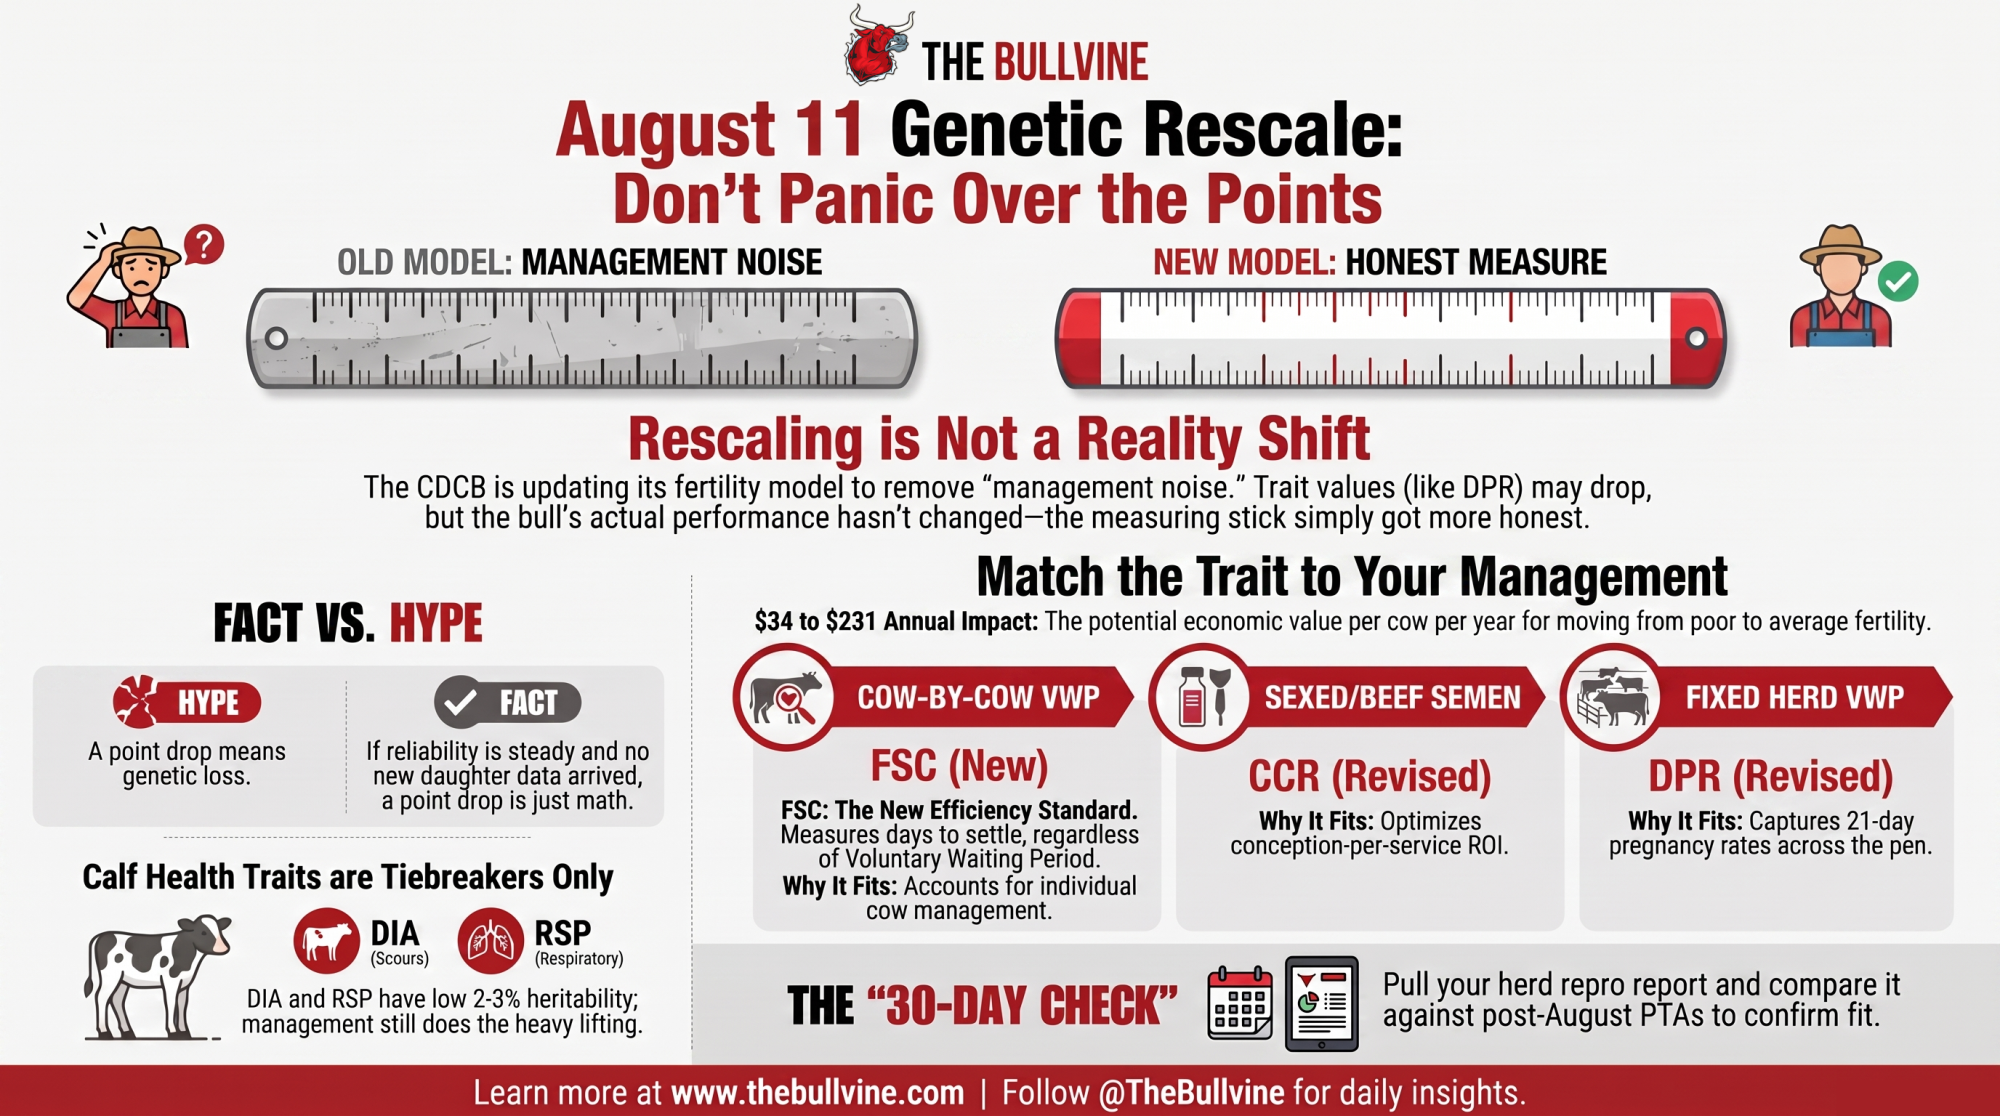
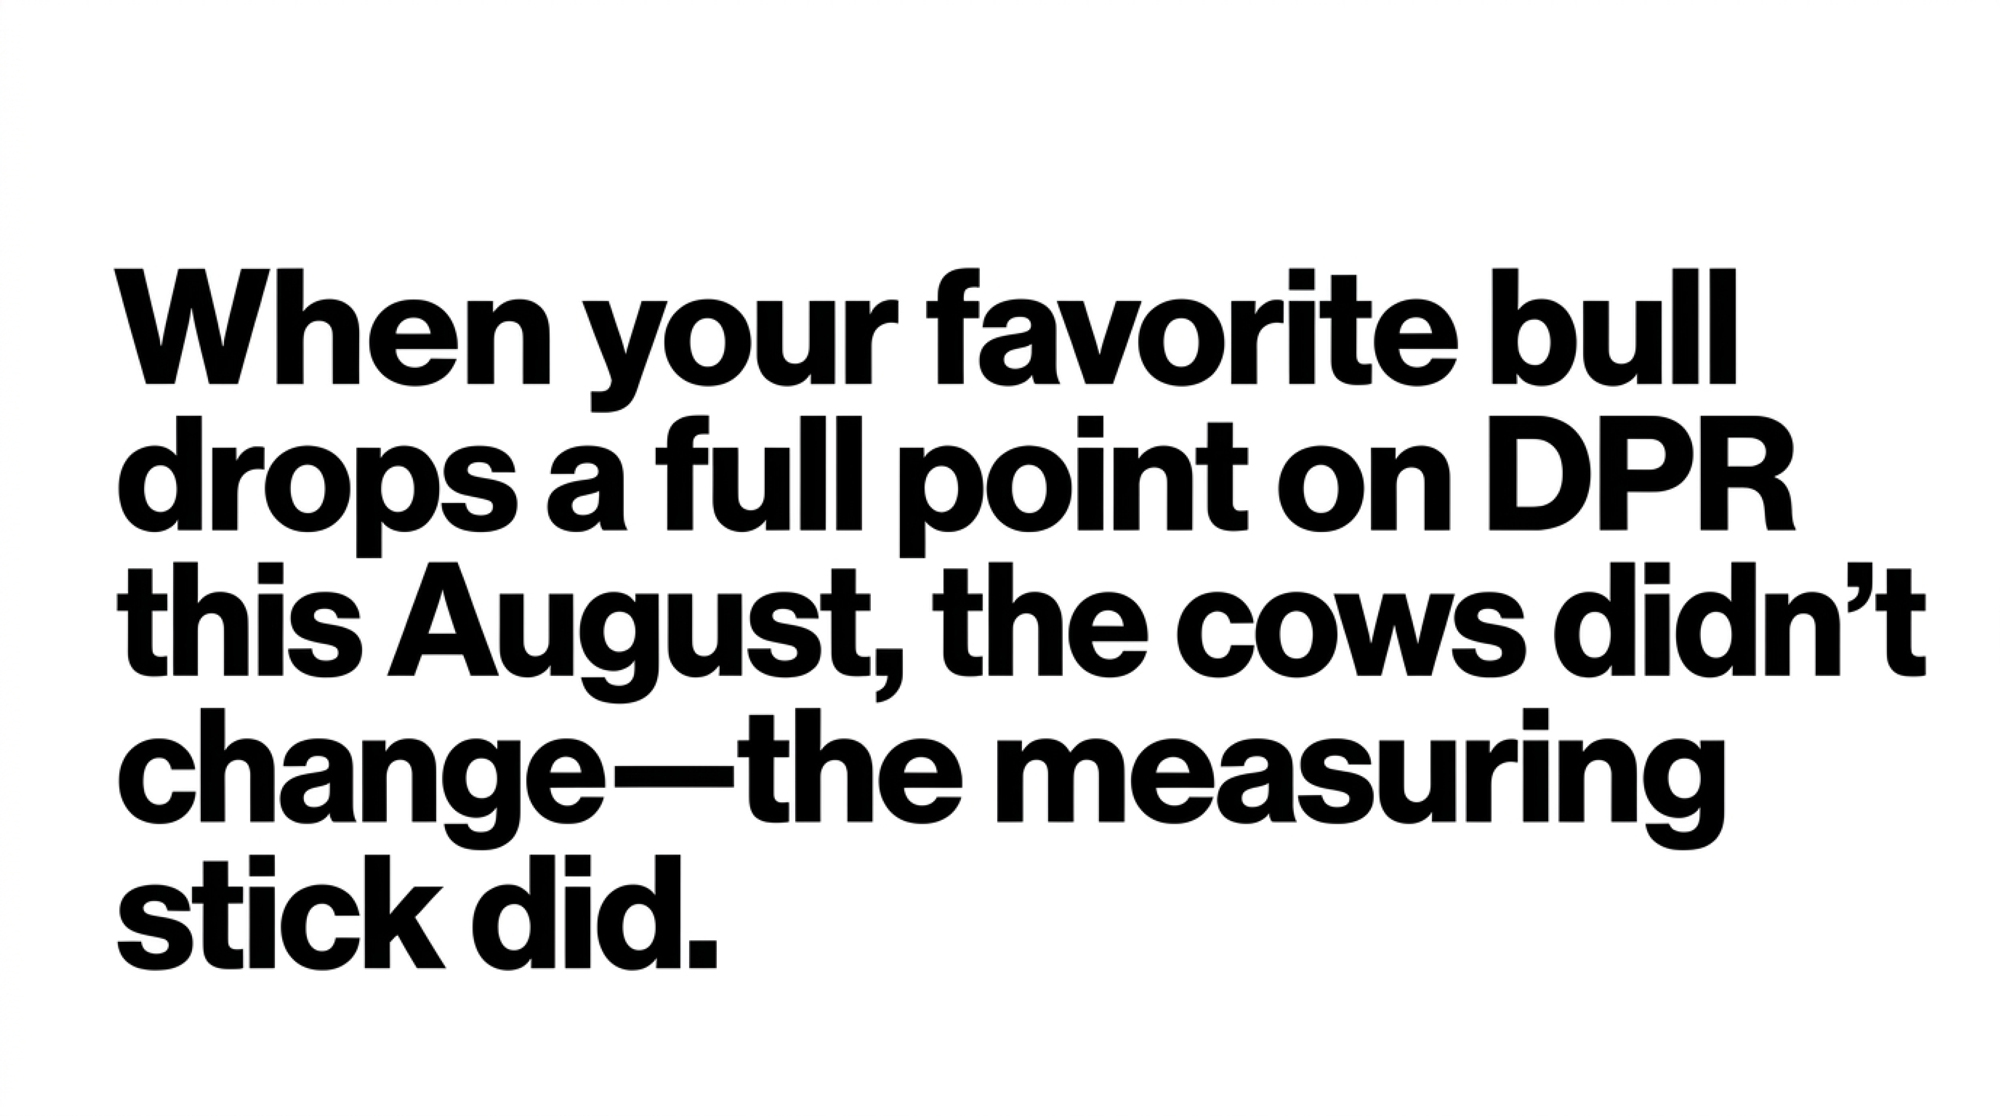
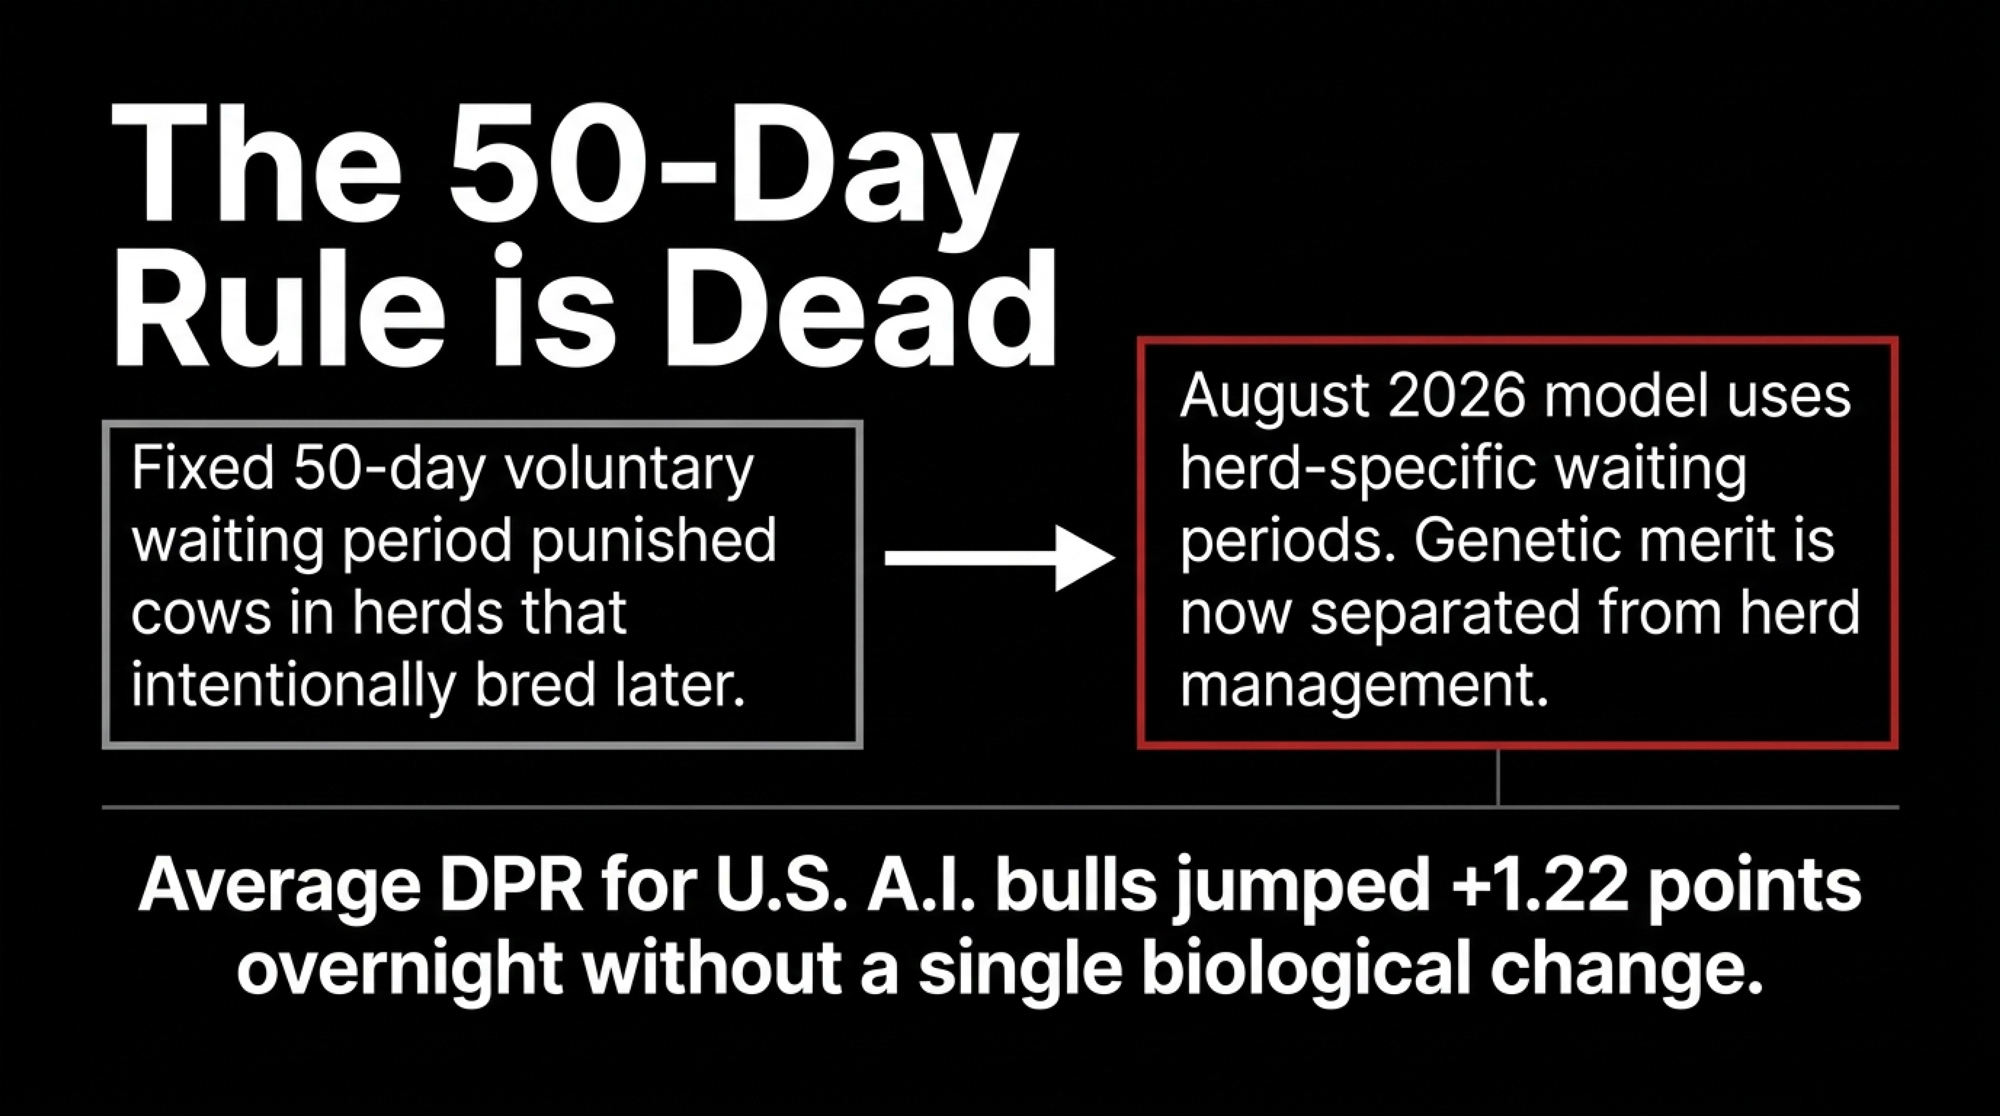
On the August 2026 run, released August 11, CDCB rebuilt every reproductive trait in the U.S. national evaluation. For U.S. Holstein bulls holding April 2026 A.I. status, average Daughter Pregnancy Rate moved +1.22 points in a single run, and nothing biological happened to a single one of them in those four months.

The other three revised traits moved too:

  • Average Cow Conception Rate rose +1.38
  • Average Heifer Conception Rate slipped -0.14
  • Average Early First Calving shifted -0.27 days

Those figures cover that specific population of bulls, not every Holstein in the herdbook.

A claim has been circulating that fertility PTAs have become unreadable, built on a bull quoted at -4.4 DPR against just -0.3 CCR. We can’t source that claim to a named account or a dated post, so we aren’t treating it as evidence — but the numbers in it don’t match any official run we could locate, and neither do older distributor sheets. They disagree in different directions. We’re reporting that as a gap rather than guessing at how it happened.
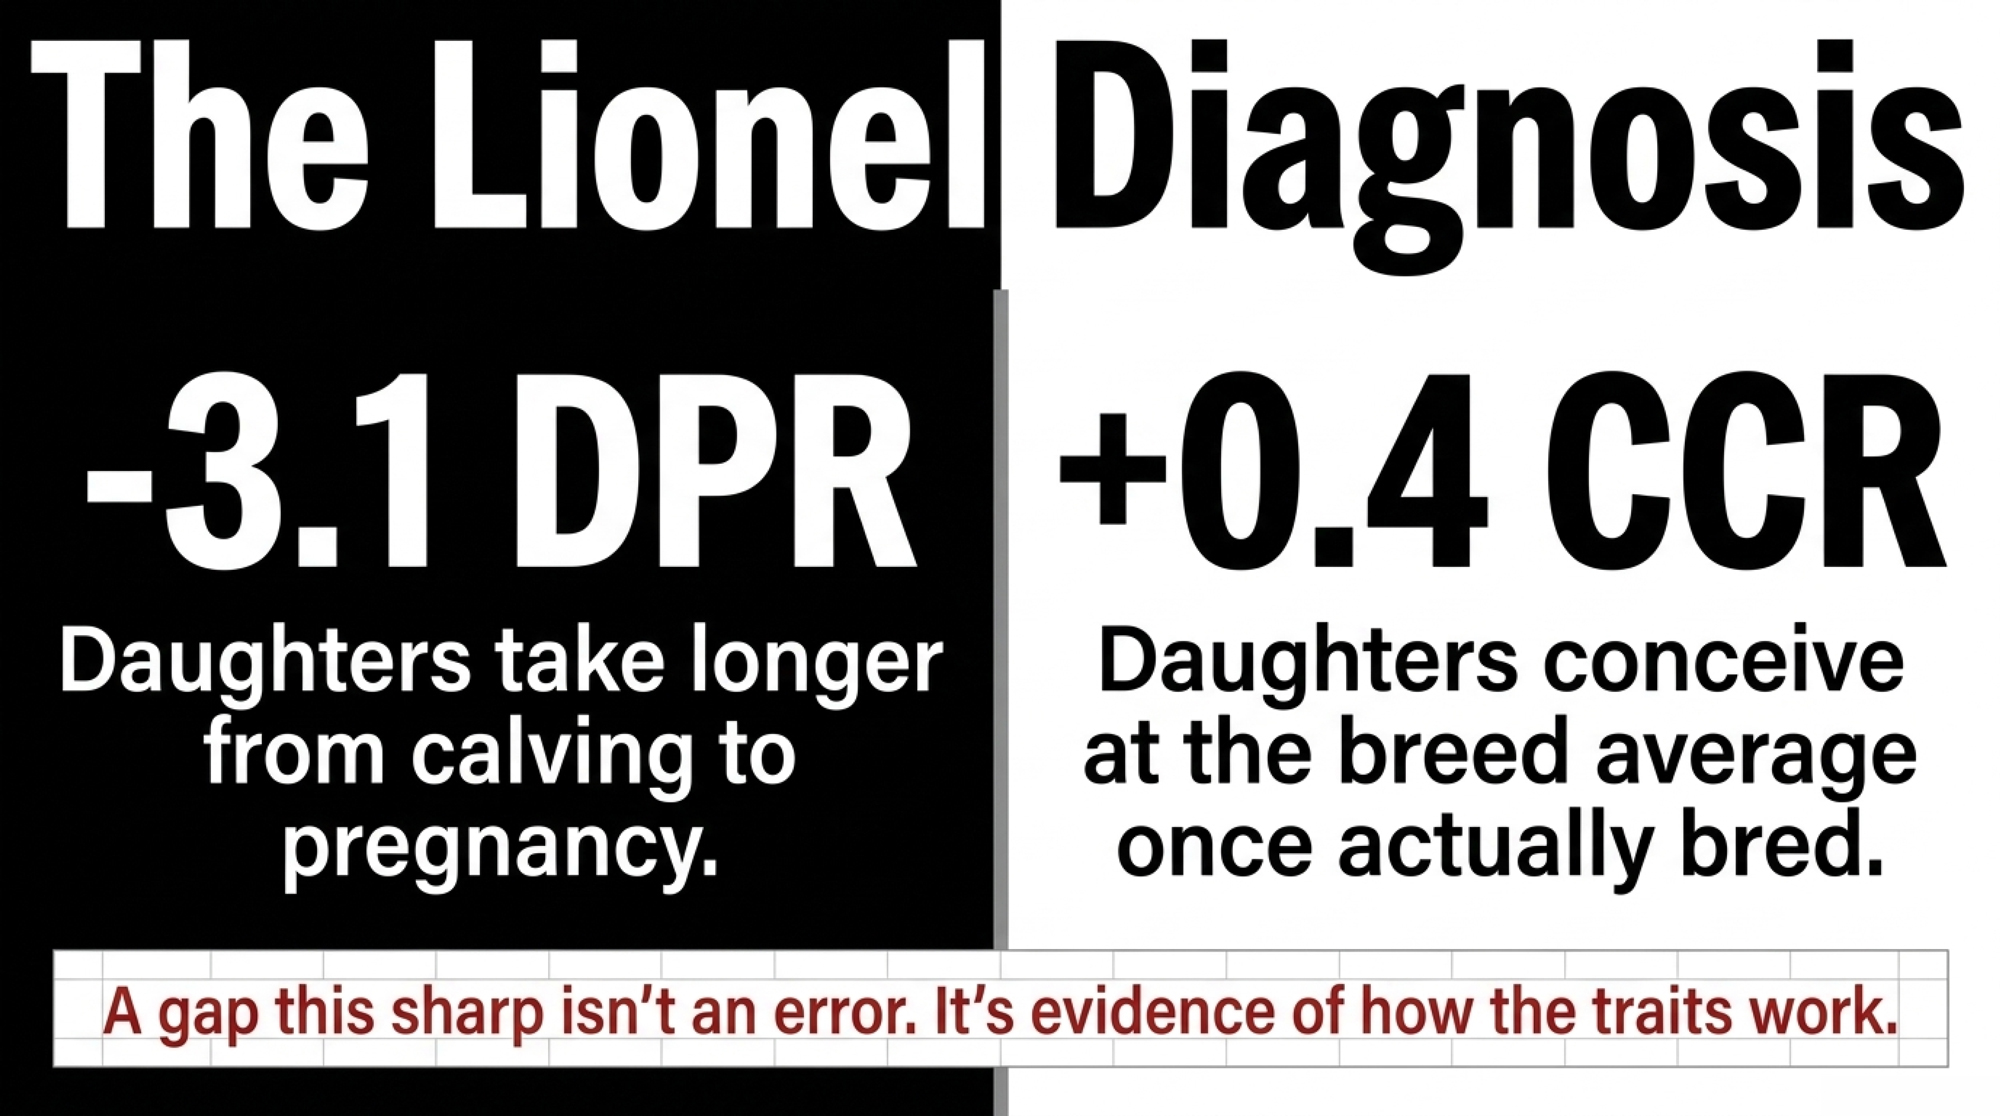
The underlying logic traveled because it sounds airtight. If one number calls a bull’s daughters a fertility disaster while the other calls them ordinary, one of those numbers is lying. Neither is, and a fertility PTA quoted without its trait name and its run date is a rumor with a decimal point.

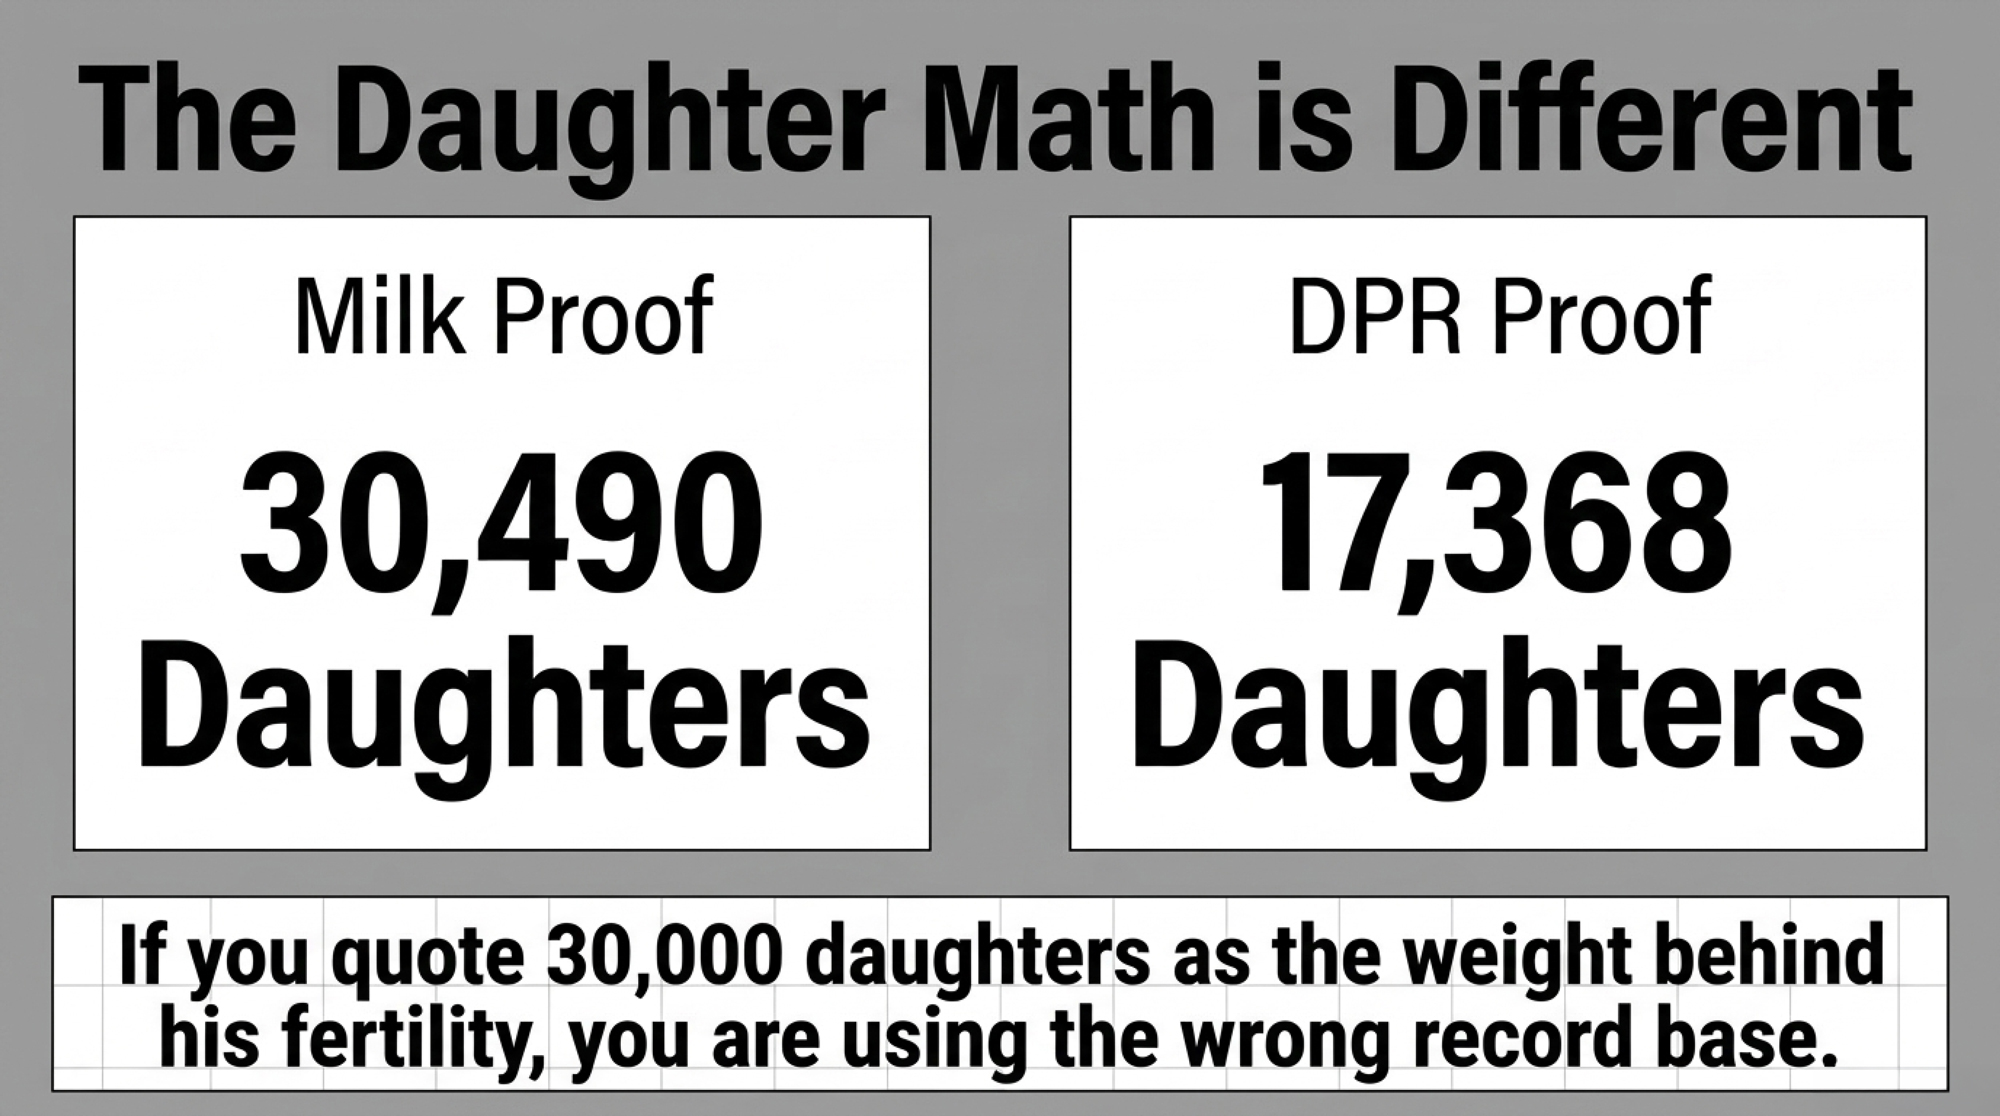
His DPR sits on 17,368 daughters, not 30,490
CDCB WebConnect, Run August 2026, animal HO840003142490309, NAAB code 007HO14454. Born 22 May 2017. Current status: A, control stud 7. Pedigree completeness 100%; sire and dam both genotyped.
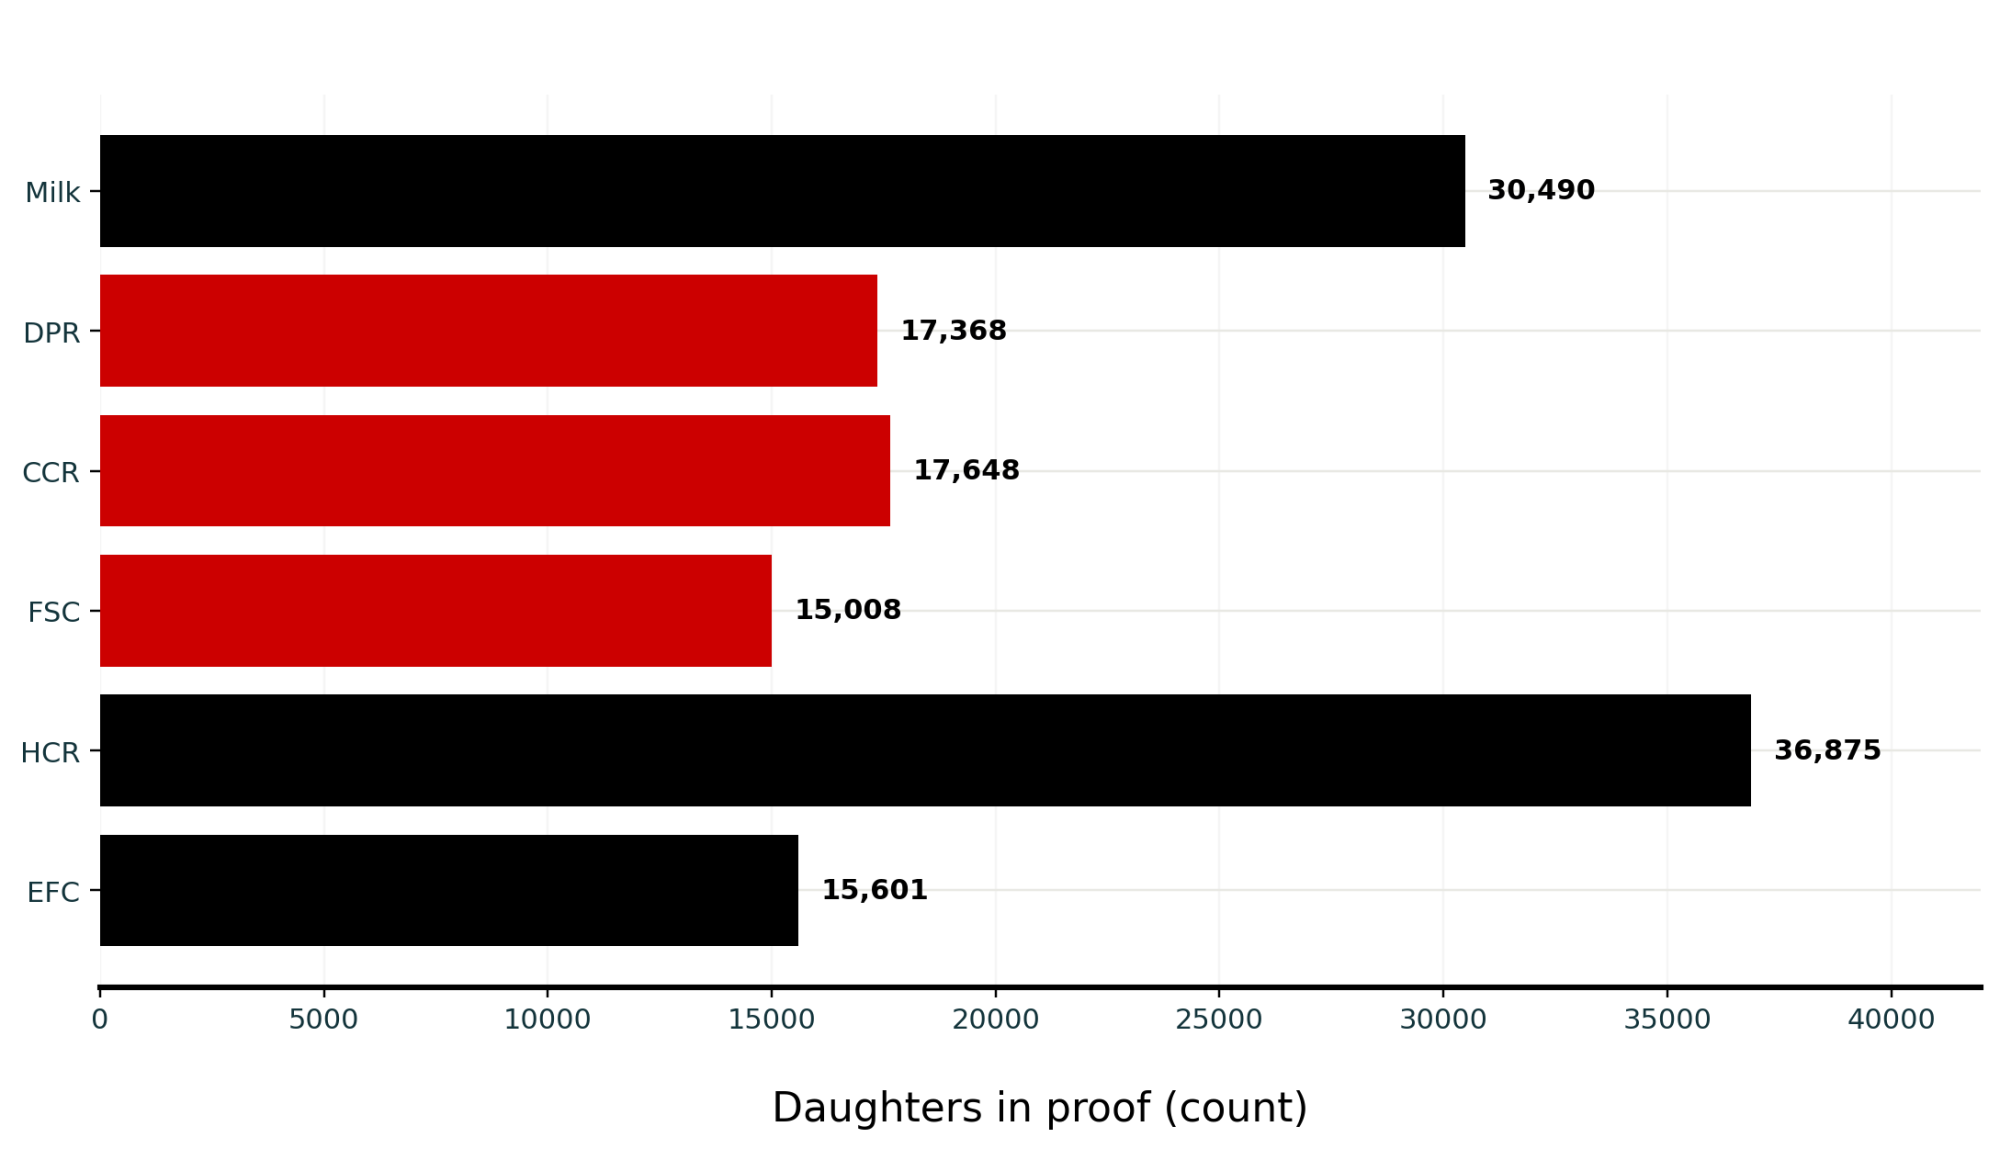
TraitPTAReliabilityDaughtersHerds
Milk+2,566 lbs99%30,4901,666
Daughter Pregnancy Rate-3.199%17,368940
Cow Conception Rate+0.499%17,6481,126
First Service to Conception-2.1 days99%15,008481
Heifer Conception Rate+1.199%36,8751,701
Early First Calving+4.6 days99%15,601502
Sire Conception Rate-0.398%12,230 breedings

Source: CDCB WebConnect, U.S. national evaluation, August 2026 run.

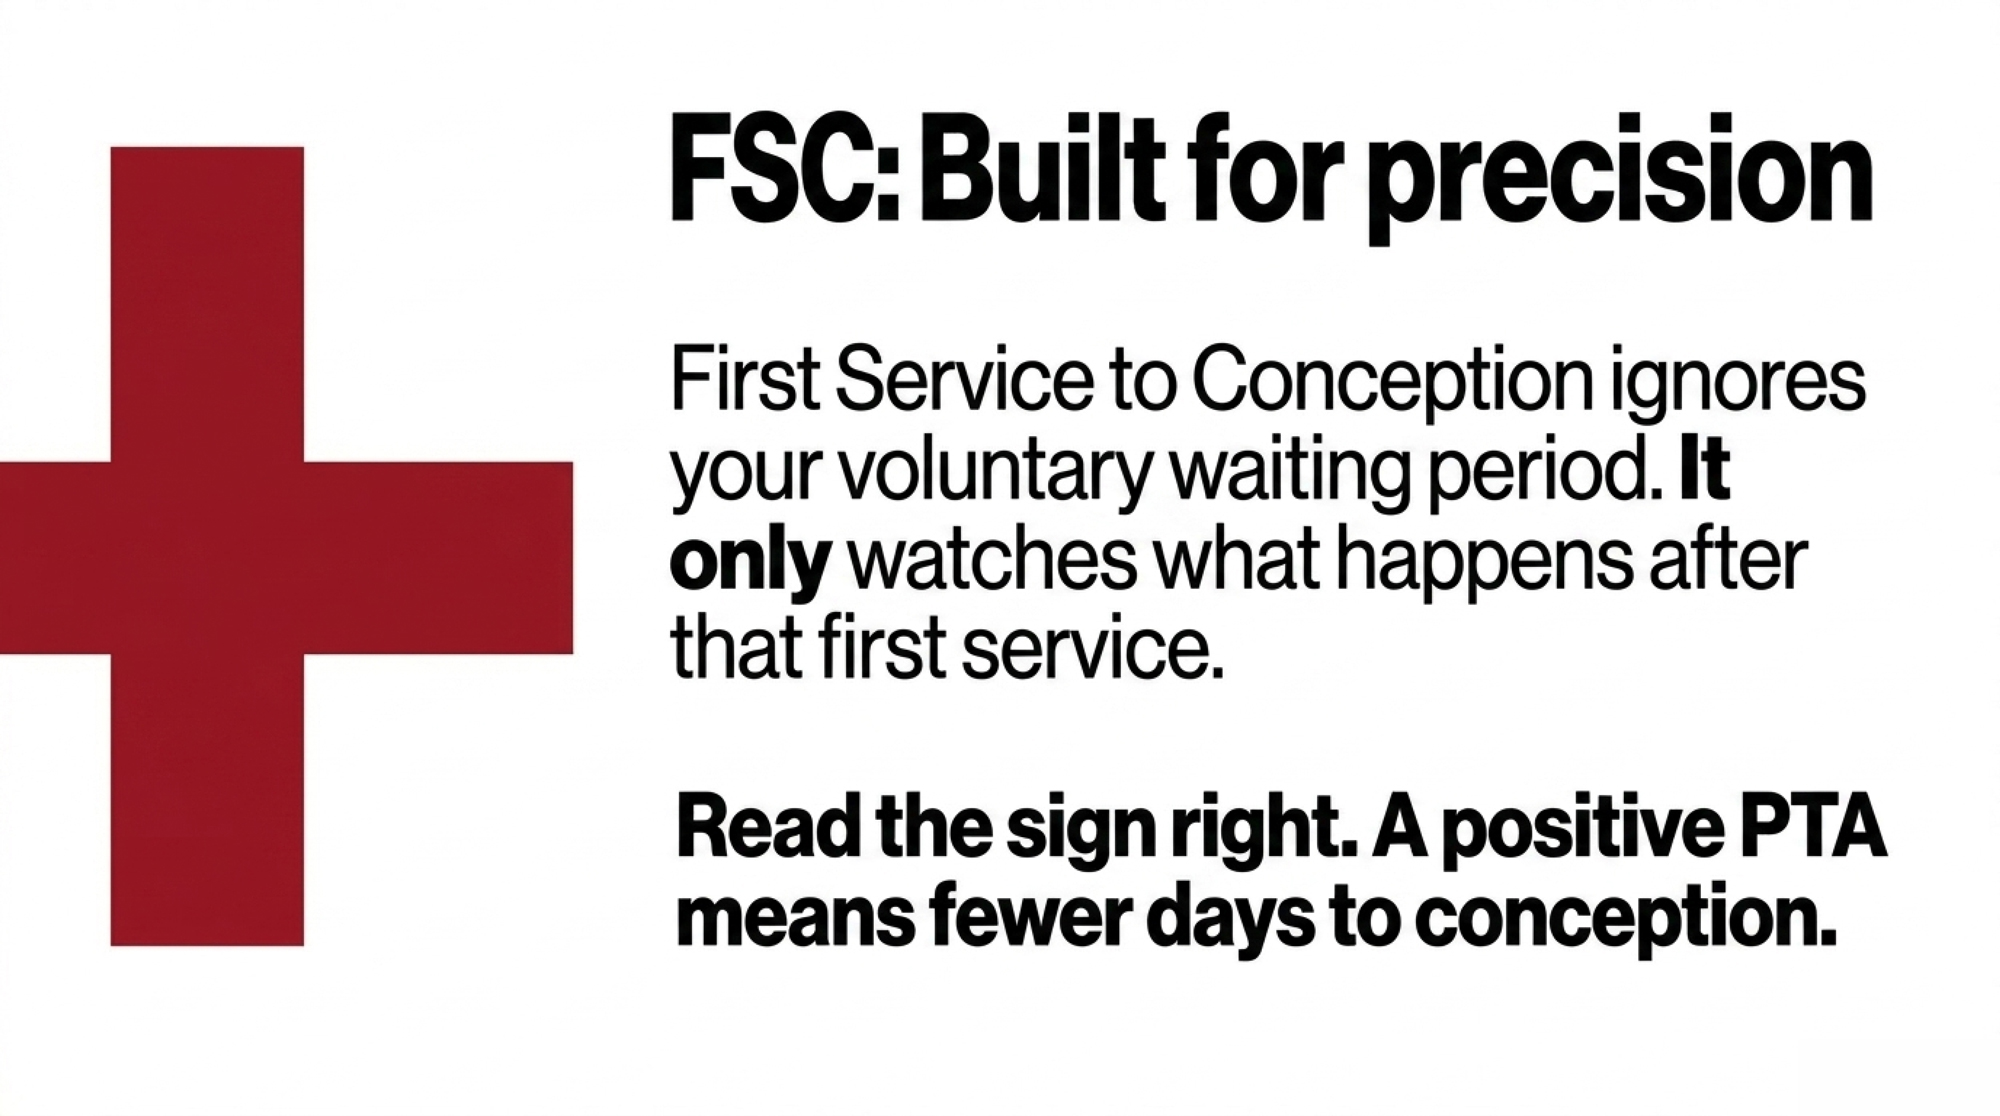
Read the FSC row carefully. CDCB multiplies the day count by -1 before publishing it, so a positive First Service to Conception PTA means fewer days to conception and is the favorable direction. LIONEL’s -2.1 is therefore the unfavorable side: his daughters take about two days longer from first service to a settled pregnancy than breed base. Two days against a Holstein FSC breed mean of 55.6 days, published in CDCB’s May 2026 reproductive-traits summary. Anyone who reads that minus sign as “shorter interval” has it backward.

With that straight, read across. His daughters conceive at roughly the breed-base rate once they’re actually bred, which is the +0.4 CCR. And they still land 3.1 points below base on the full trip from calving to pregnancy. Three traits, three different questions, one animal.

TraitWhat it measuresUnit and favorable directionLIONEL August 2026 PTARecord base
Daughter Pregnancy Rate (DPR)The full route from calving to established pregnancyPercentage points; higher is favorable-3.117,368 daughters; 940 herds
Cow Conception Rate (CCR)Probability that a service results in conceptionPercentage points; higher is favorable+0.417,648 daughters; 1,126 herds
First Service to Conception (FSC)Days from first breeding to conception, separated from voluntary-waiting-period timingDays; positive means fewer days and is favorable-2.1 days15,008 daughters; 481 herds
Sire Conception Rate (SCR)The service sire’s own semen fertility—not daughter fertilityPercentage points; higher is favorable-0.312,230 breedings

Notice what the daughter column does to the usual shorthand. The 30,490 figure is his milk proof. His DPR rests on 17,368 daughters in 940 herds, his CCR on 17,648 in 1,126, his FSC on 15,008 in 481 — all at 99% reliability, all still enormous, and all a different record base than production. The heifer trait runs higher at 36,875 because heifer records are counted on their own terms. If you’ve been quoting “30,490 daughters” as the weight behind his fertility, that’s the wrong number.

His main traits carry the source code M, for MACE, and his daughters sit in fifteen countries. Counting yield records, 25,432 are in the United States, 1,463 in Italy and 857 in Poland, with the rest spread across twelve more countries from Japan to New Zealand. A single herd holds 5,474 of them.

Two splits, and one of them is bigger

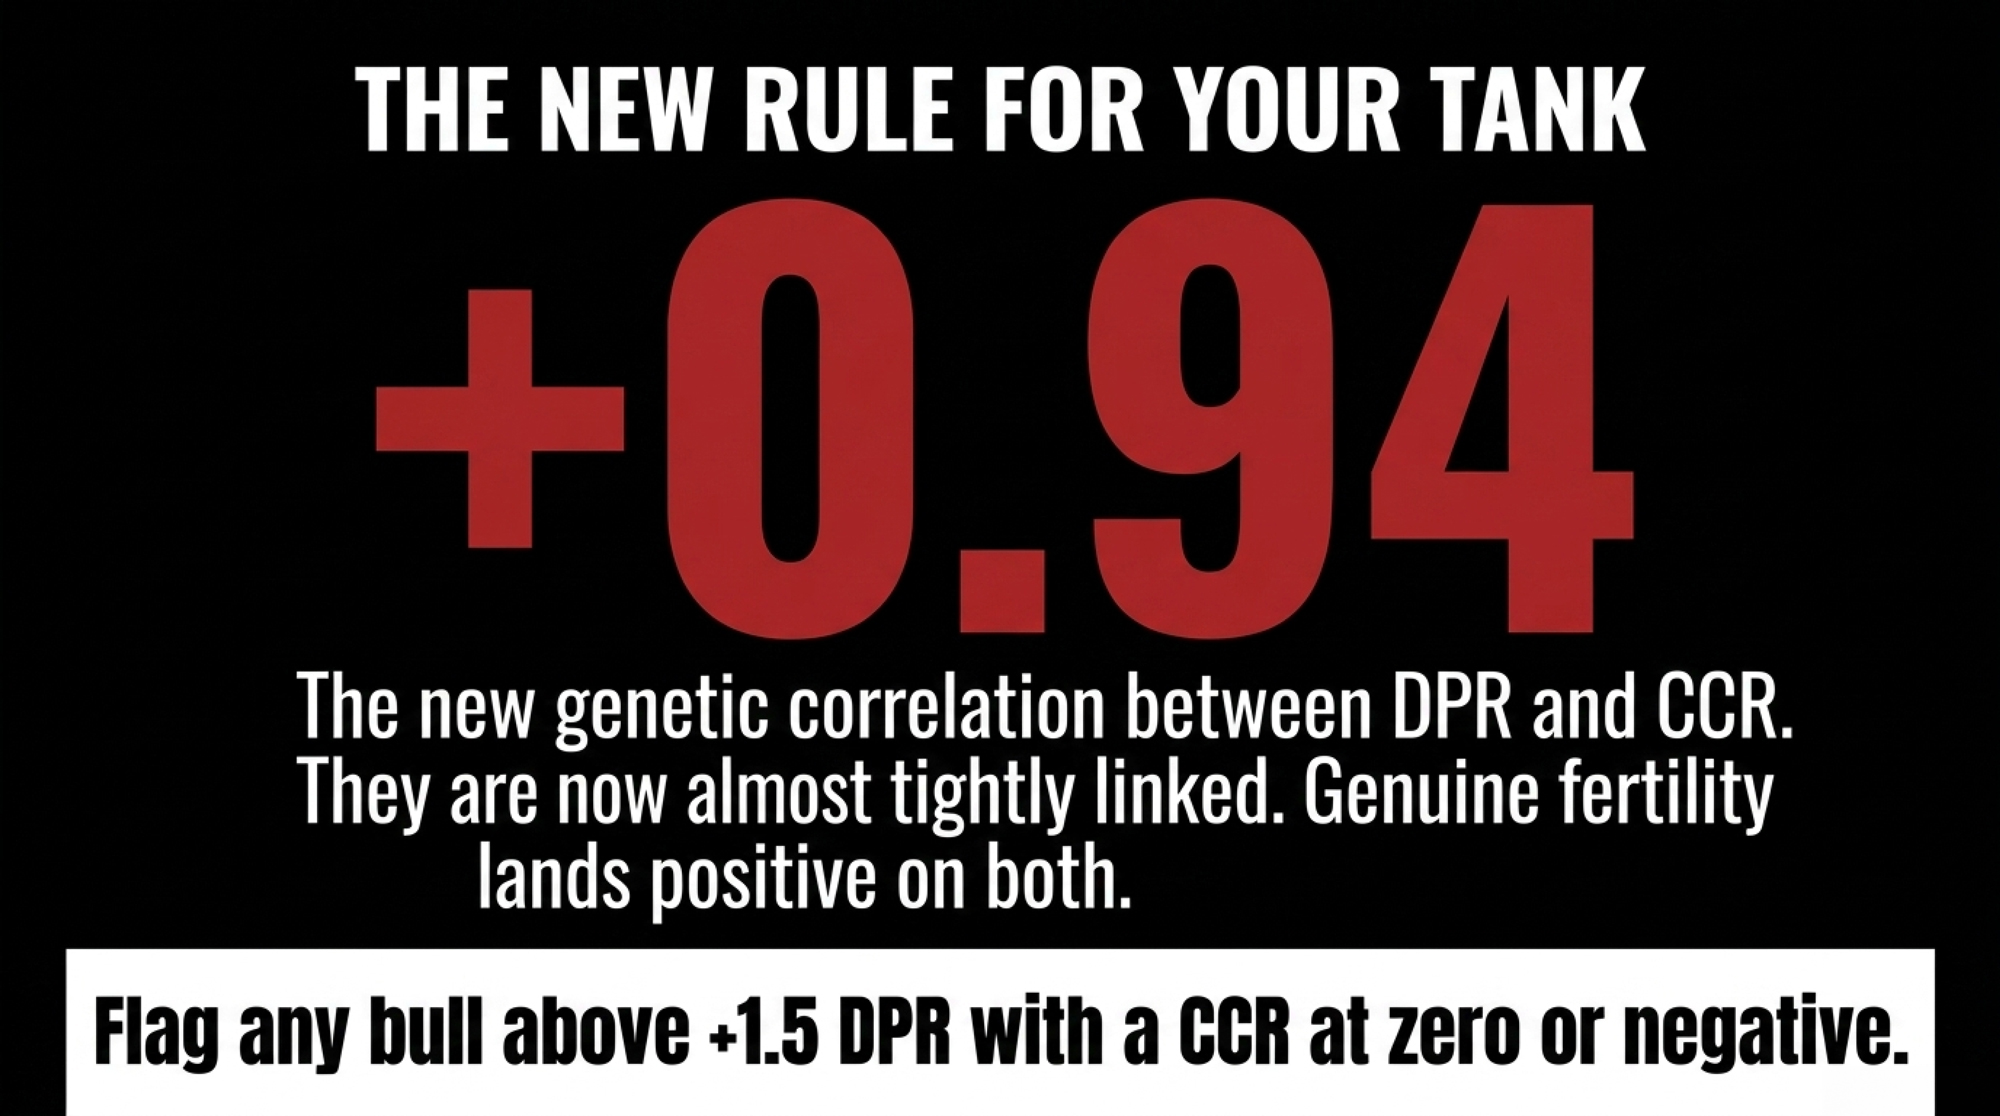
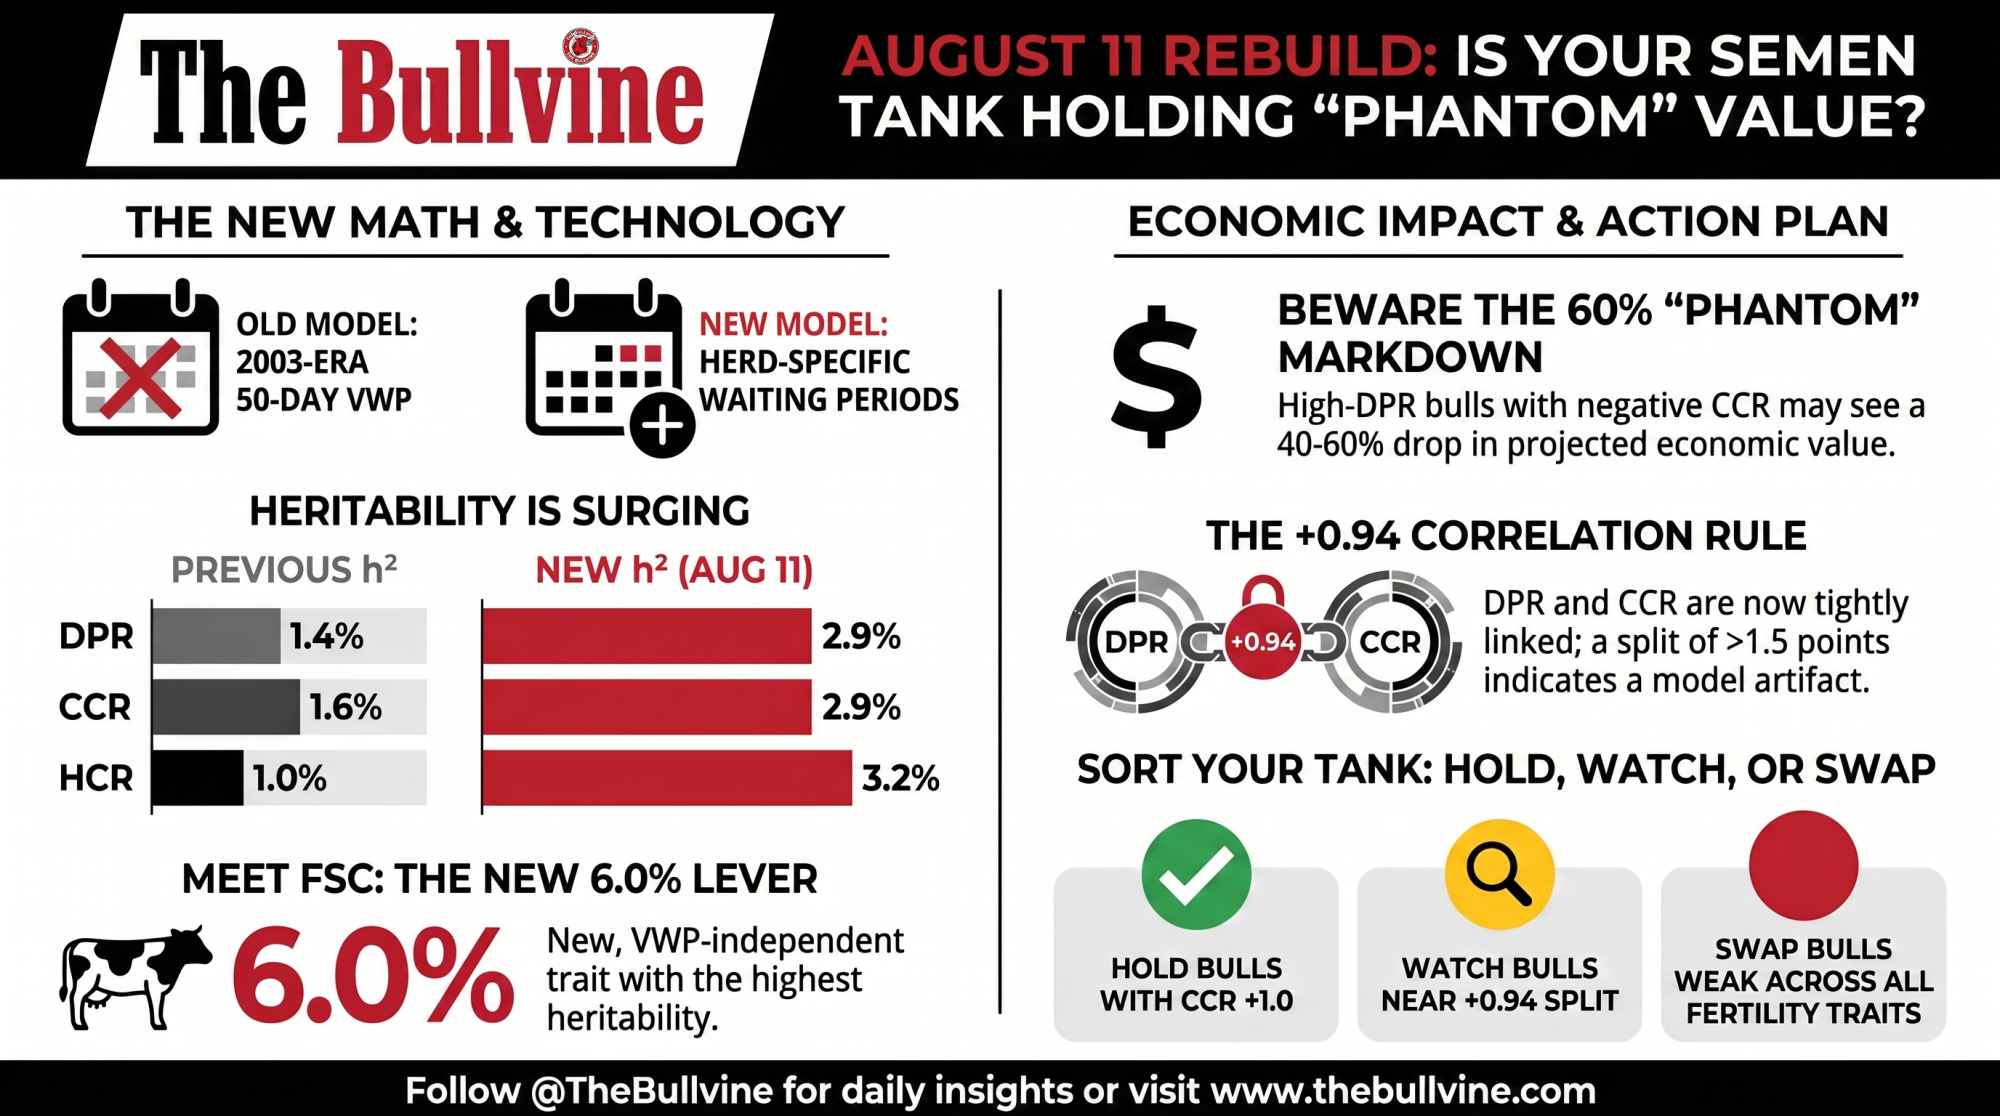
The revised models tightened the relationships between these traits, and CDCB published the before-and-after: DPR to CCR moved from +0.86 to +0.94, and DPR to the new FSC sits at +0.96. A peer-reviewed analysis of the VWP rebuild puts CCR to FSC at about +0.97. Across the population, these traits now move close to lockstep.

So LIONEL at -3.1 DPR and +0.4 CCR is unusual, and CDCB says so on the record: a gap that sharp “is not seen often,” though the organization confirmed an individual bull’s PTAs for the two traits can move separately. We’re still not calling him a statistical outlier — that word needs the residual spread around a +0.94 correlation, and CDCB has not published the trait standard deviations required to compute it. We asked. They didn’t supply them.

CDCB gave us the reading to use when the numbers split. DPR measures how quickly a cow becomes pregnant again after calving. CCR measures her ability to conceive when she’s inseminated. FSC measures the interval from first insemination to the insemination that establishes the pregnancy. A cow can conceive well once bred and still take a long time to get pregnant because breeding started late or the opportunities were spread further apart; another can be bred promptly and need several services. Read a pronounced DPR–CCR gap, CDCB said, as information about which component of reproduction is driving that bull’s profile — not as evidence one evaluation is wrong. All three together carry considerably more biological context than any one.

Now the part the argument keeps missing, and the part CDCB did not address. His CCR and FSC disagree more sharply than his DPR and CCR do, under a tighter correlation — slightly above base for conception rate, below base for days to conception, on two traits correlating around +0.97. We asked about DPR versus CCR and got a clear answer. The CCR–FSC gap remains unexplained on the record. Three things account for most of it without anyone’s proof being wrong:

  • The traits don’t share a record base. FSC rests on 15,008 daughters in 481 herds; CCR on 17,648 in 1,126. Different herds, different management, different breeding protocols.
  • FSC starts the clock at first insemination, which by construction makes it independent of when the herd chose to start breeding. That’s our reading of the trait definition, not a CDCB statement.
  • The units aren’t comparable. CCR is expressed in percentage points, FSC in days. Eyeballing +0.4 against -2.1 and calling it a contradiction is comparing two different rulers.

That’s the honest read: the traits are behaving, and the apparent contradictions on this bull’s page are mostly artifacts of base, units, and herd mix.

Production sits on the other side of the ledger: +2,566 Milk, +107 Fat, +65 Protein, CFP +172, TPI +3145, NM$ +760 at 94% reliability, and 83rd percentile for Net Merit. The circulating version described him as “almost +3,200 lbs of Milk,” accurate on an earlier run, before the April 2025 base change reset the scale. Same bull, same daughters, different yardstick.

So where does this bull actually fit?

The verdict, before the methodology. LIONEL is a production sire with a documented fertility cost, and that cost is now measured on a better model than the one that condemned him.

He fits herds already breeding cows on time — insemination risk at or above 60%, median first service inside the voluntary waiting period plus one 21-day cycle — whose income is driven by yield and components rather than by days open. At +2,566 Milk, +107 Fat, +65 Protein, and 83rd percentile Net Merit on 99% reliability, he is paid for in the tank, and a -3.1 DPR spread across a capped share of the breeding is a trade many operations should take deliberately.

He doesn’t fit herds where pregnancy per AI is the verified bottleneck, herds already carrying a low-DPR cow base, or any mating where the female has no current genomic evaluation to correct against. Cap him rather than ban him: a defined percentage of the herd, written down, with the cow families excluded rather than left to chance. His -0.3 SCR at 98% reliability on 12,230 breedings also means his own semen sits a hair below the average A.I. bull at getting cows pregnant, so don’t load him into a season you’re already fighting.

Which of those two herds you are is a records question, not a genetics question. The three-gate diagnostic further down settles it in about twenty minutes.

What CDCB changed on August 11

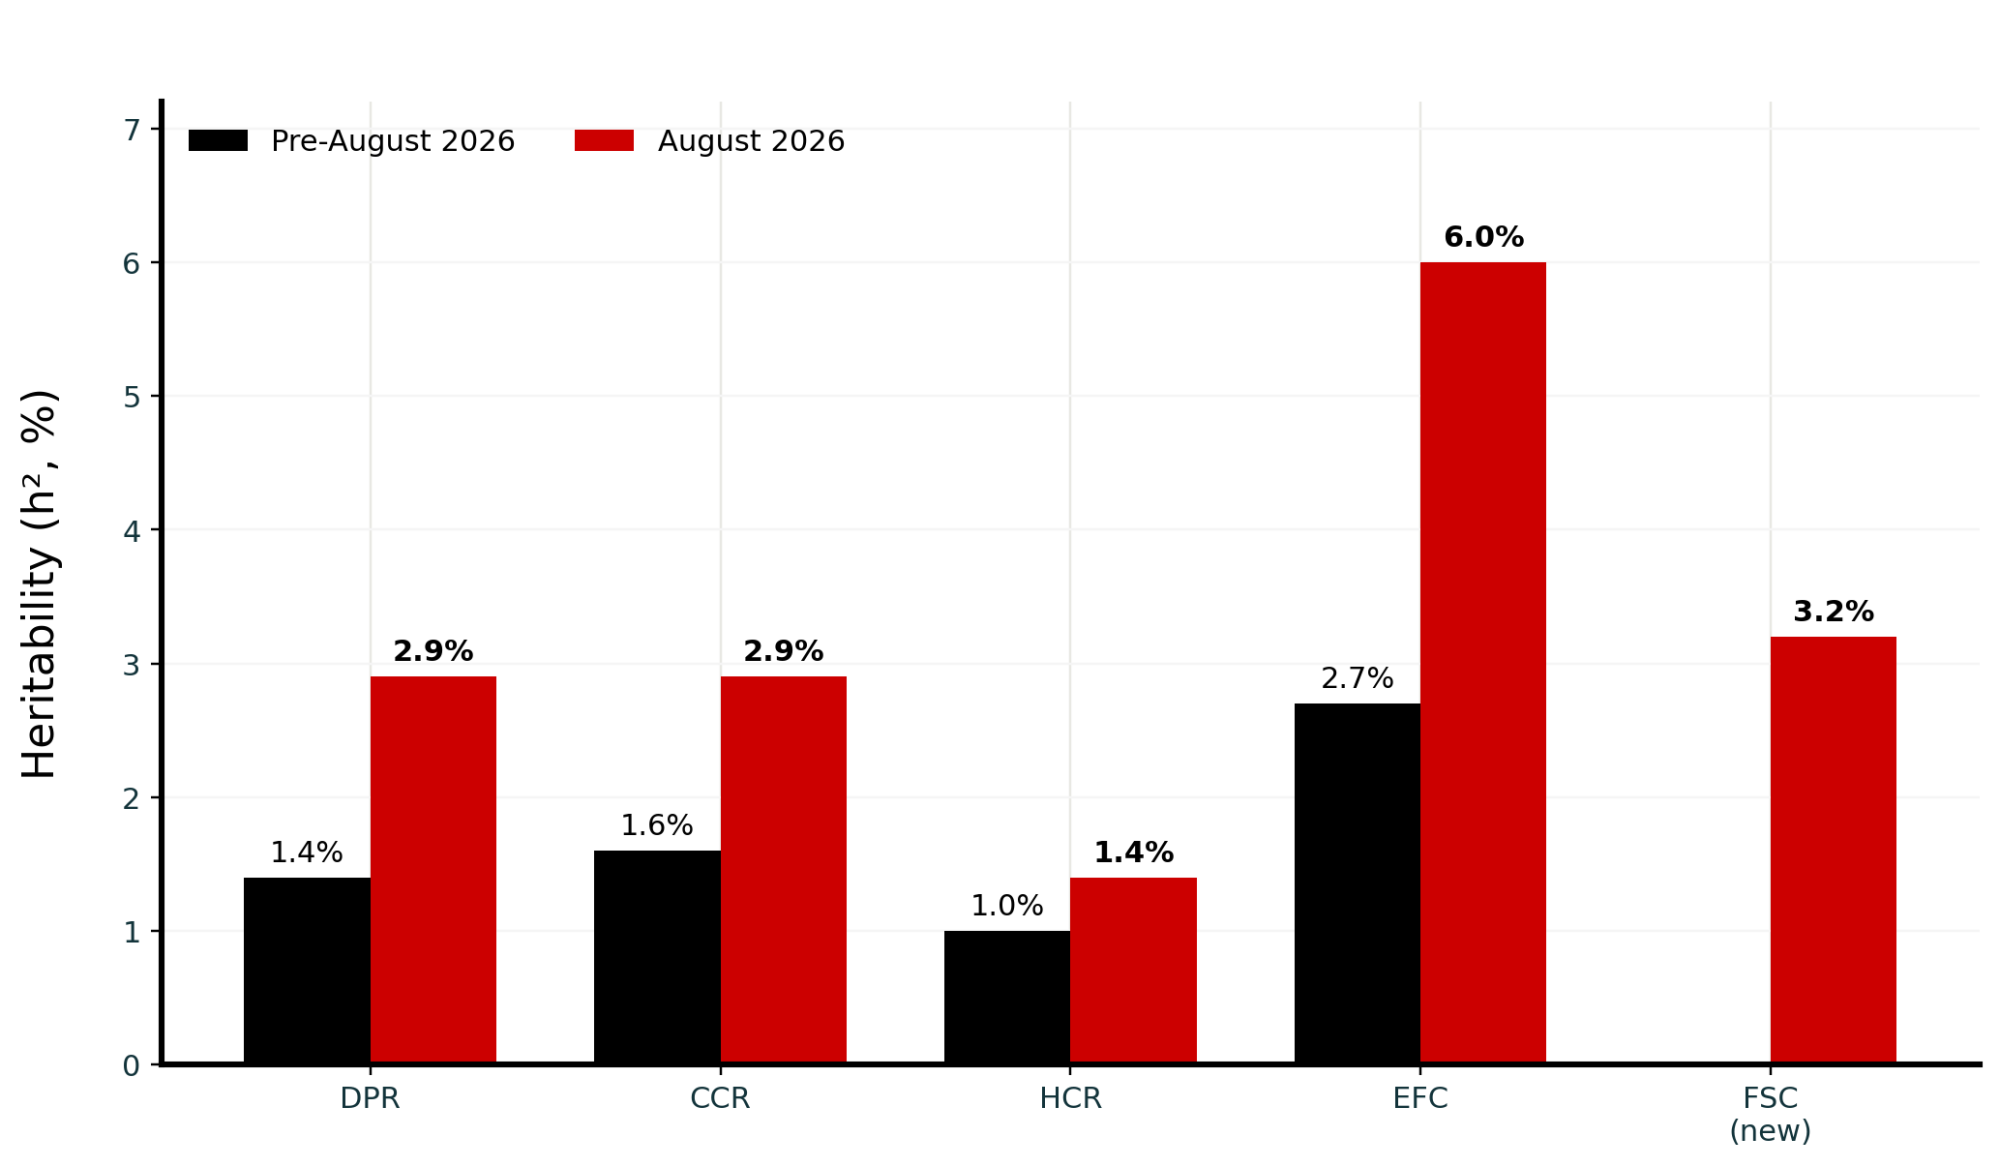
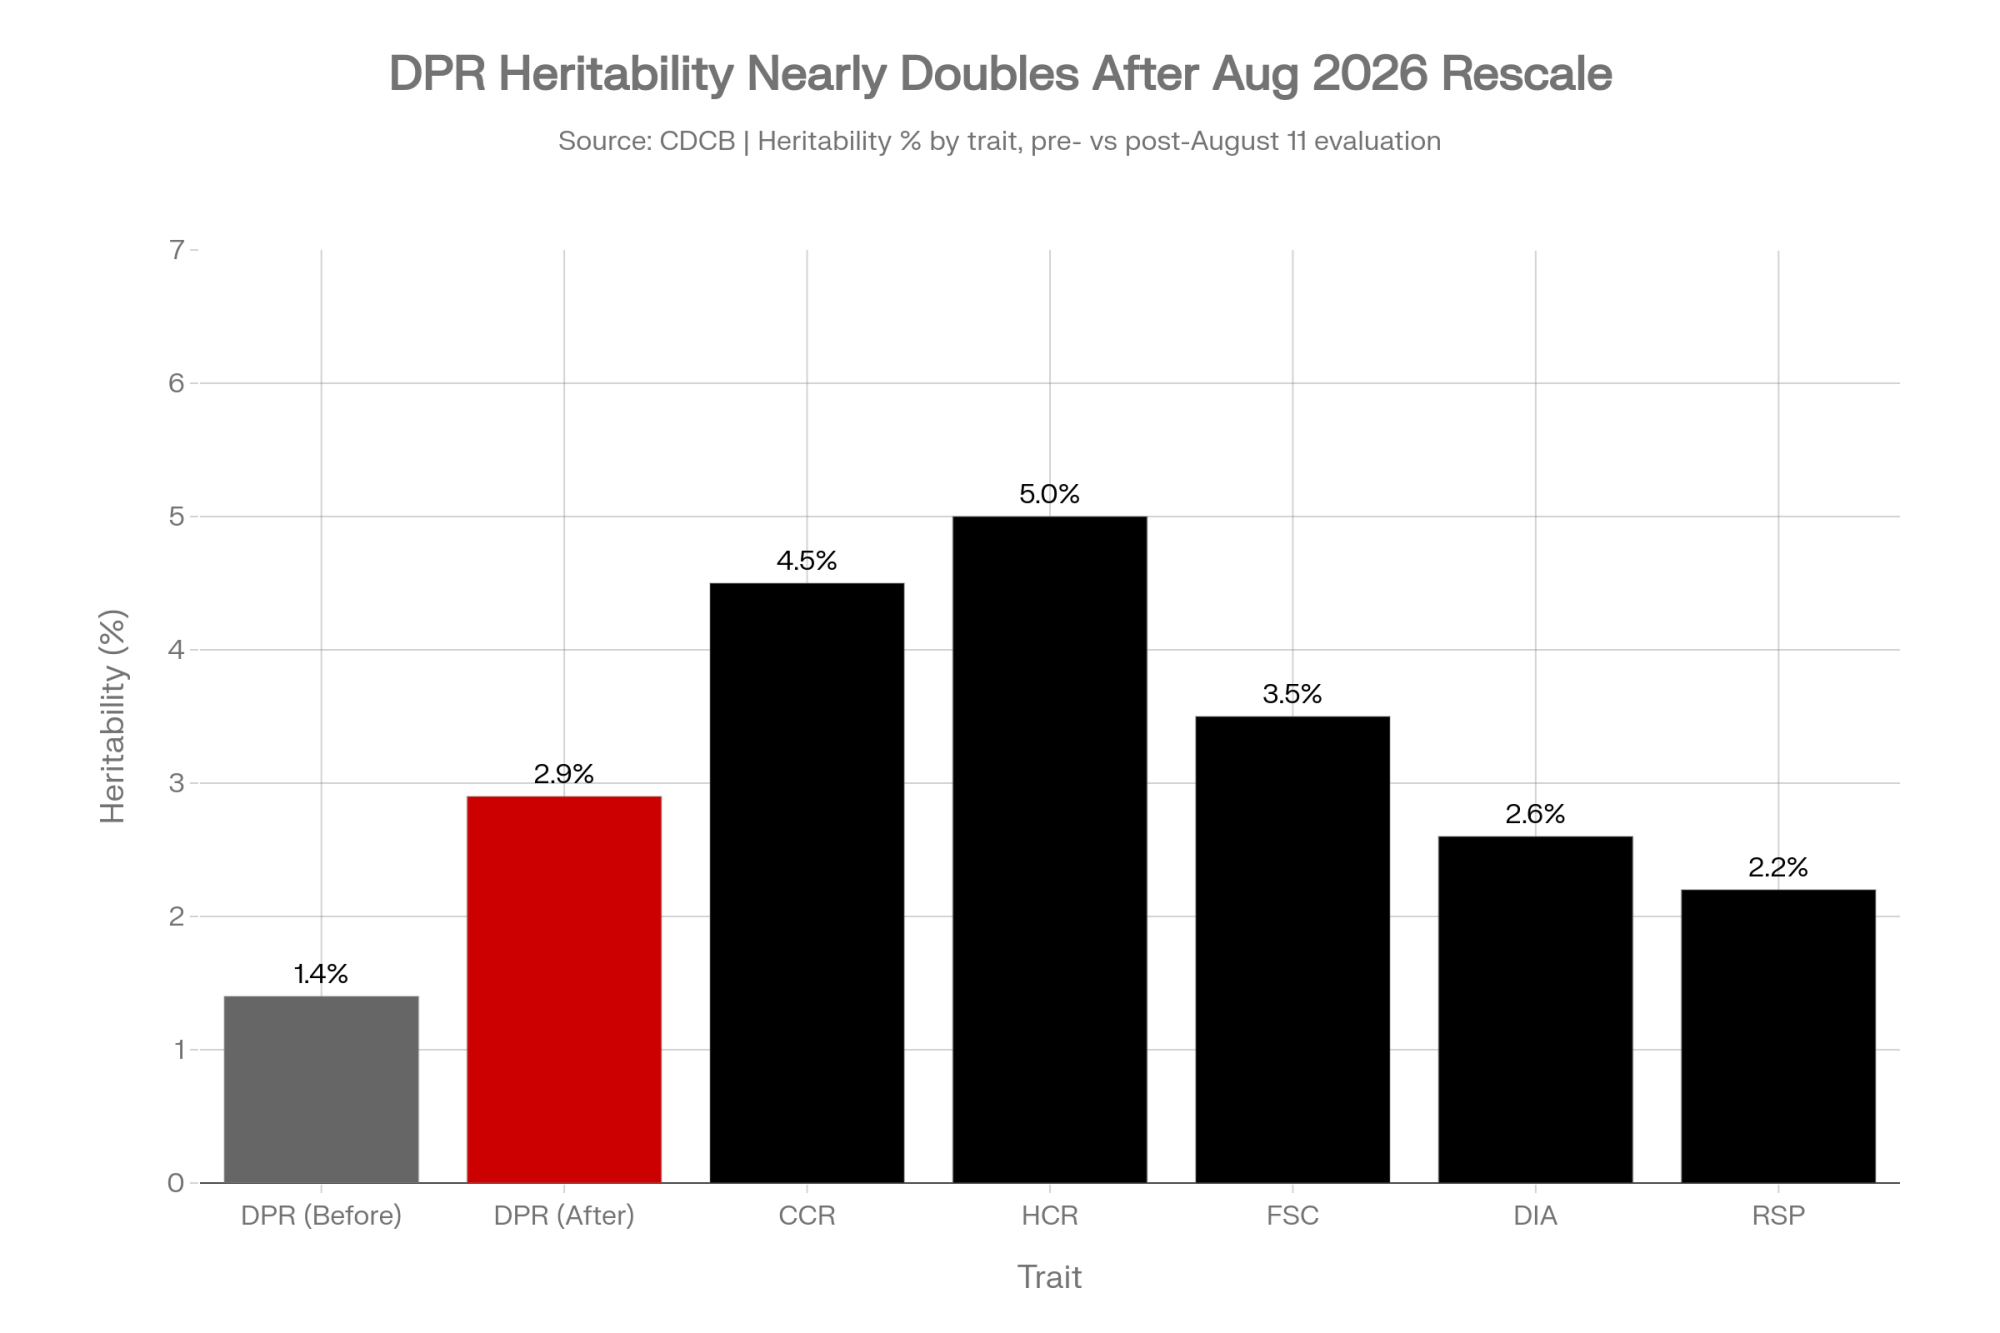
The revisions moved every reproductive heritability, most of them substantially.
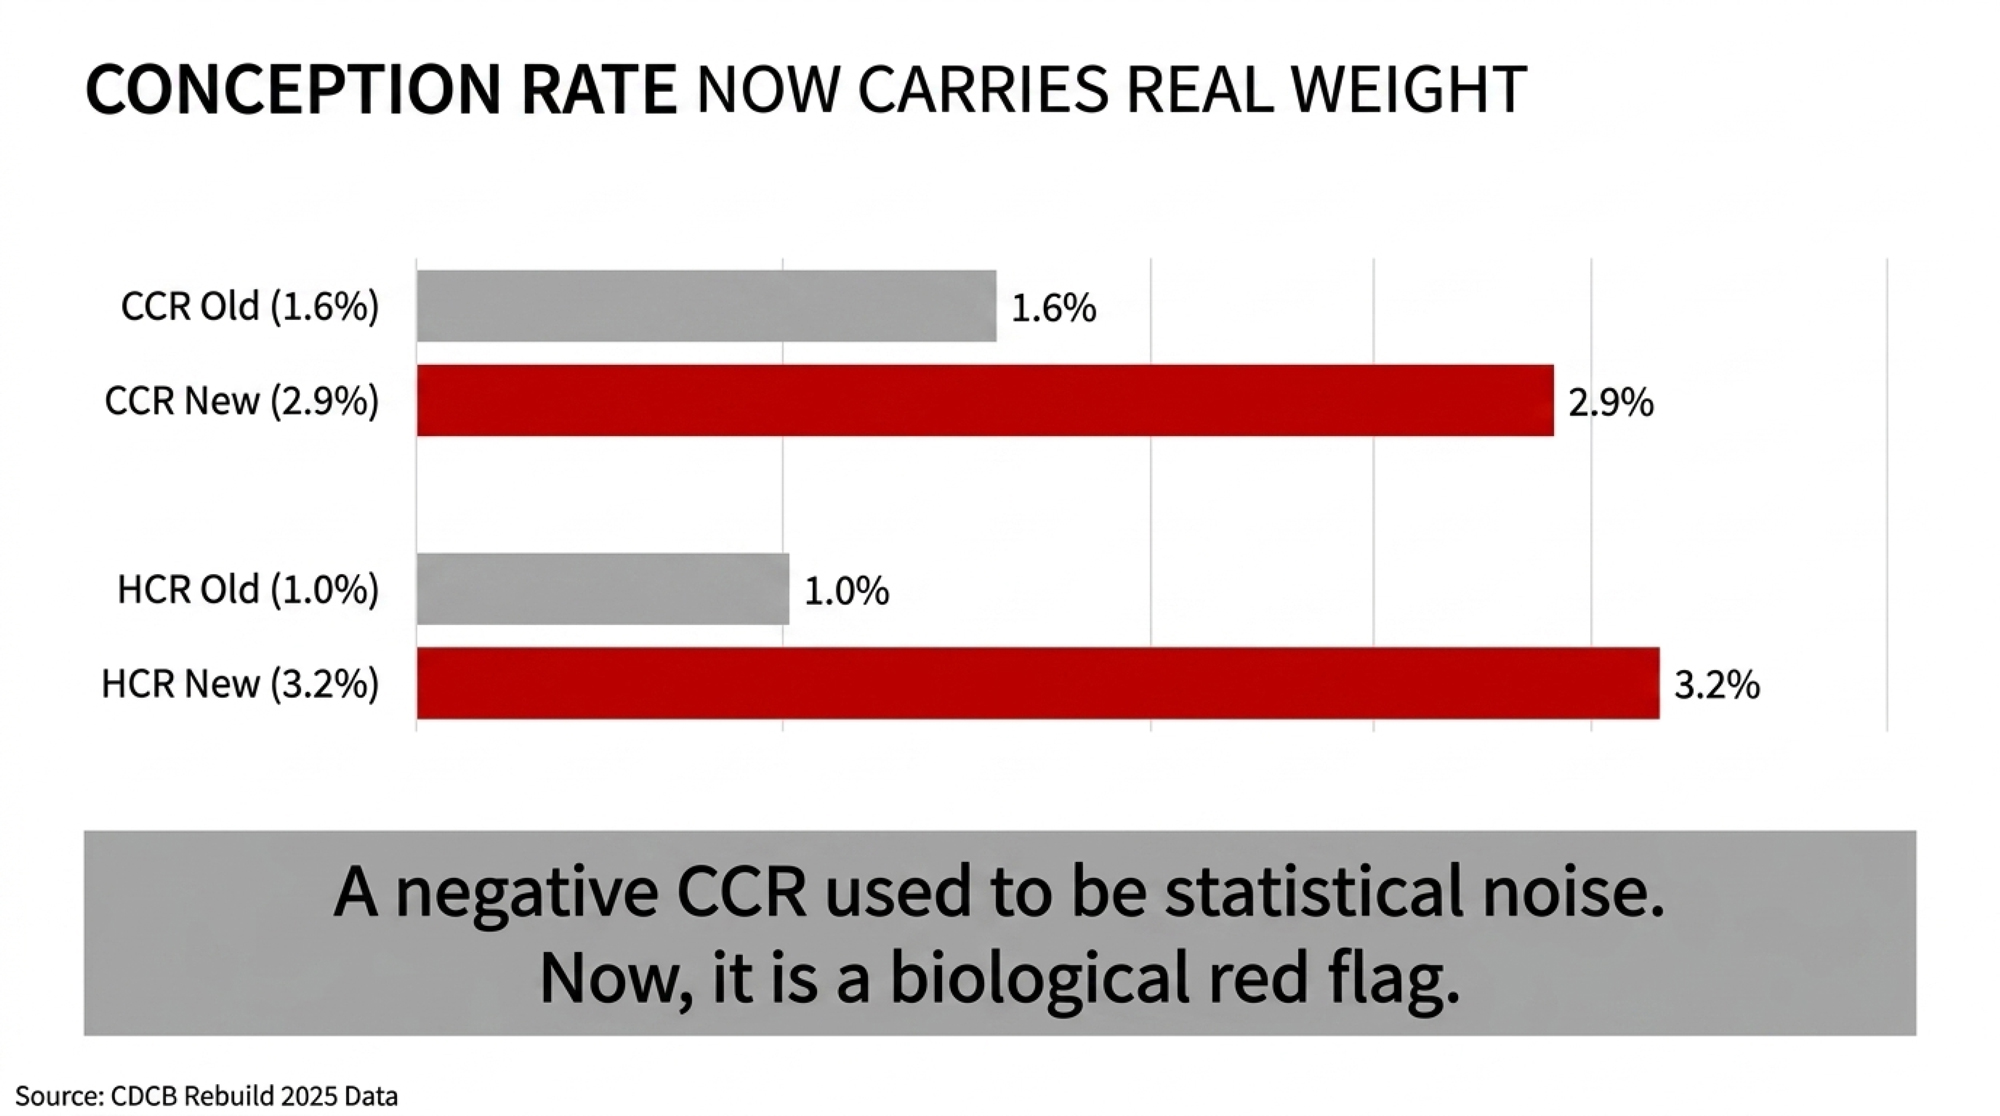
TraitOld h²Aug 2026 h²Primary model update
Daughter Pregnancy Rate (DPR)1.4%2.9%Fixed 50-day VWP replaced with herd-level, lactation-group-specific values
Cow Conception Rate (CCR)1.6%2.9%Adds service sire breed, short cycling, and days-in-milk at first insemination
Heifer Conception Rate (HCR)1.0%1.4%Adds service sire breed and short cycling
Early First Calving (EFC)2.7%6.0%Recalculated on a single-trait model, with new cow performance data
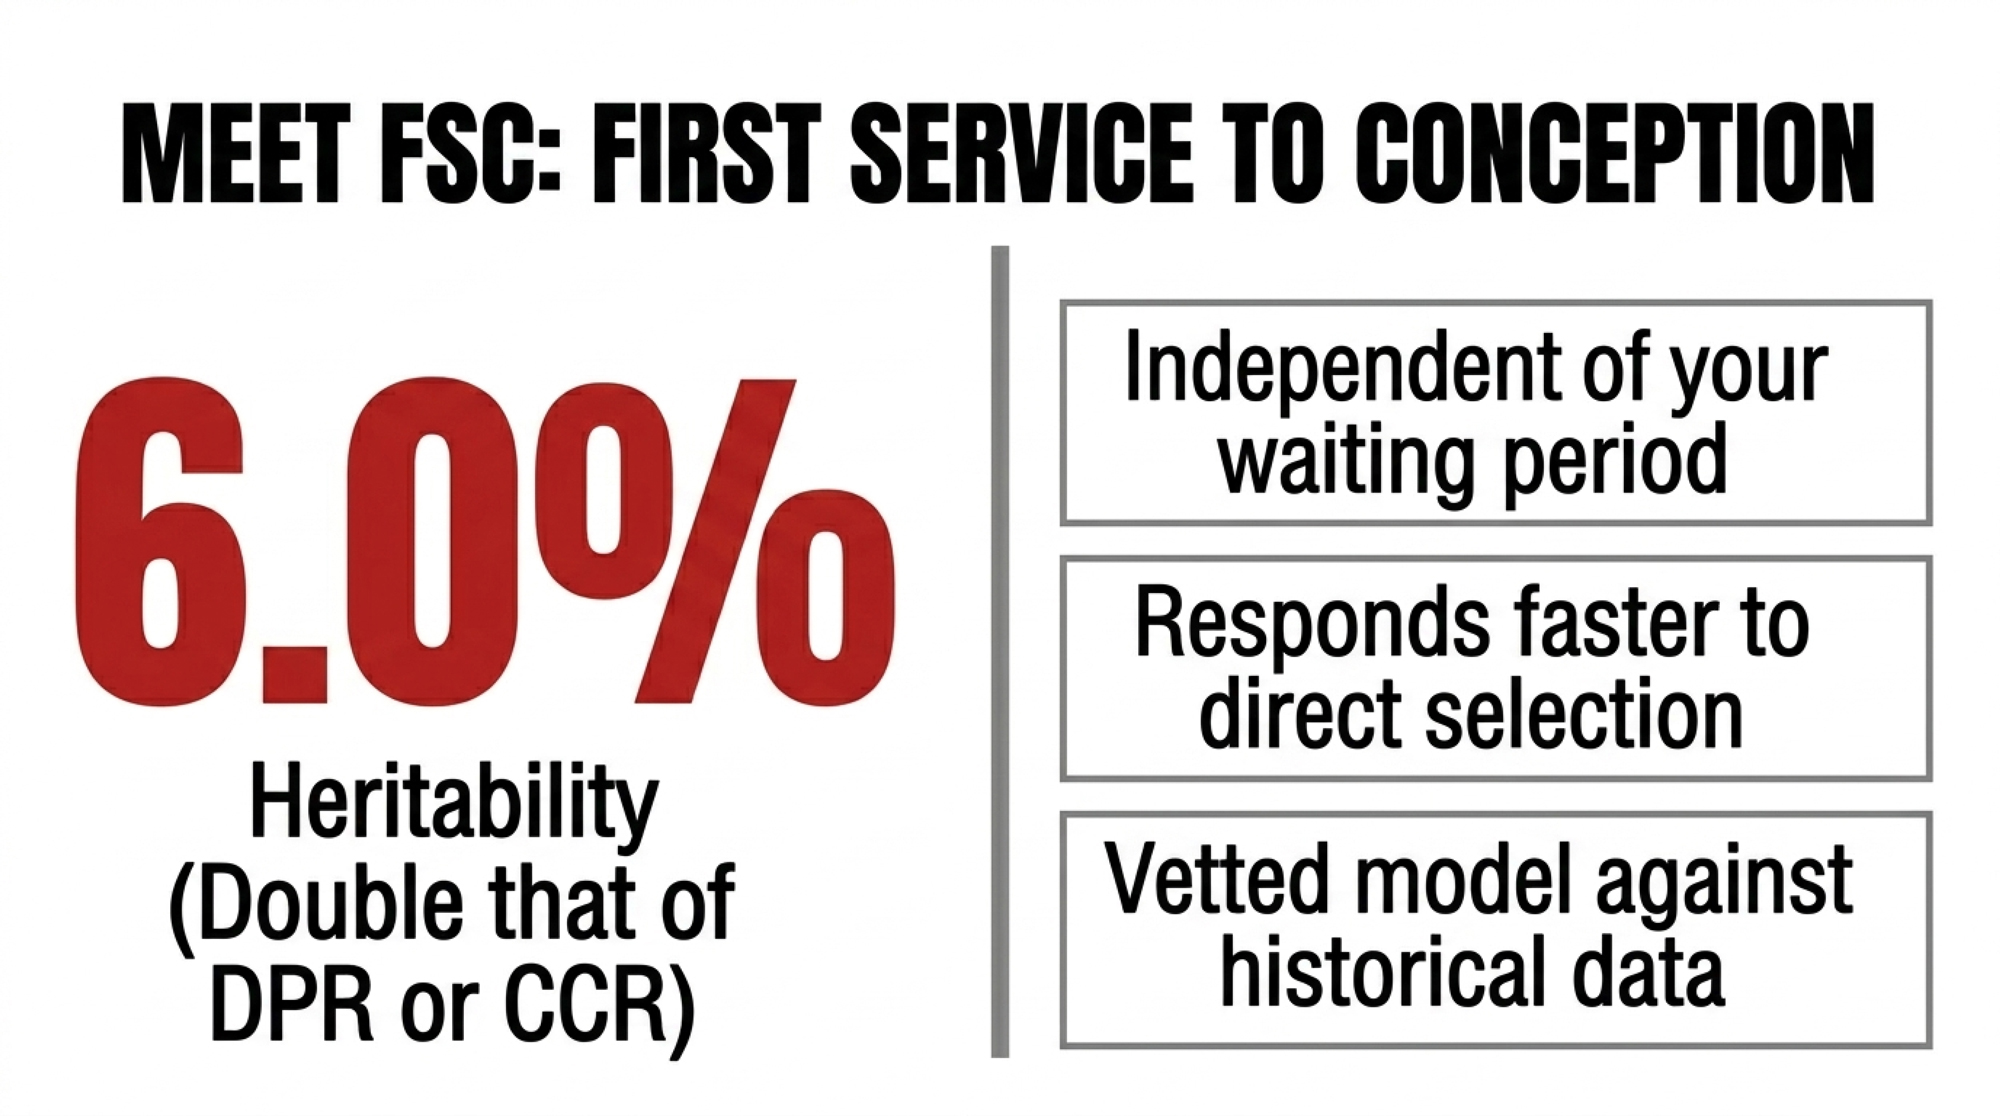
First Service to Conception (FSC)New trait3.2%Interval from first insemination to the insemination that establishes pregnancy, capped at 200 days, set to 230 if she never conceives

Source: CDCB, Reintroducing Reproductive Performance Traits, May 2026, and CDCB’s August 2026 Evaluation Recap.

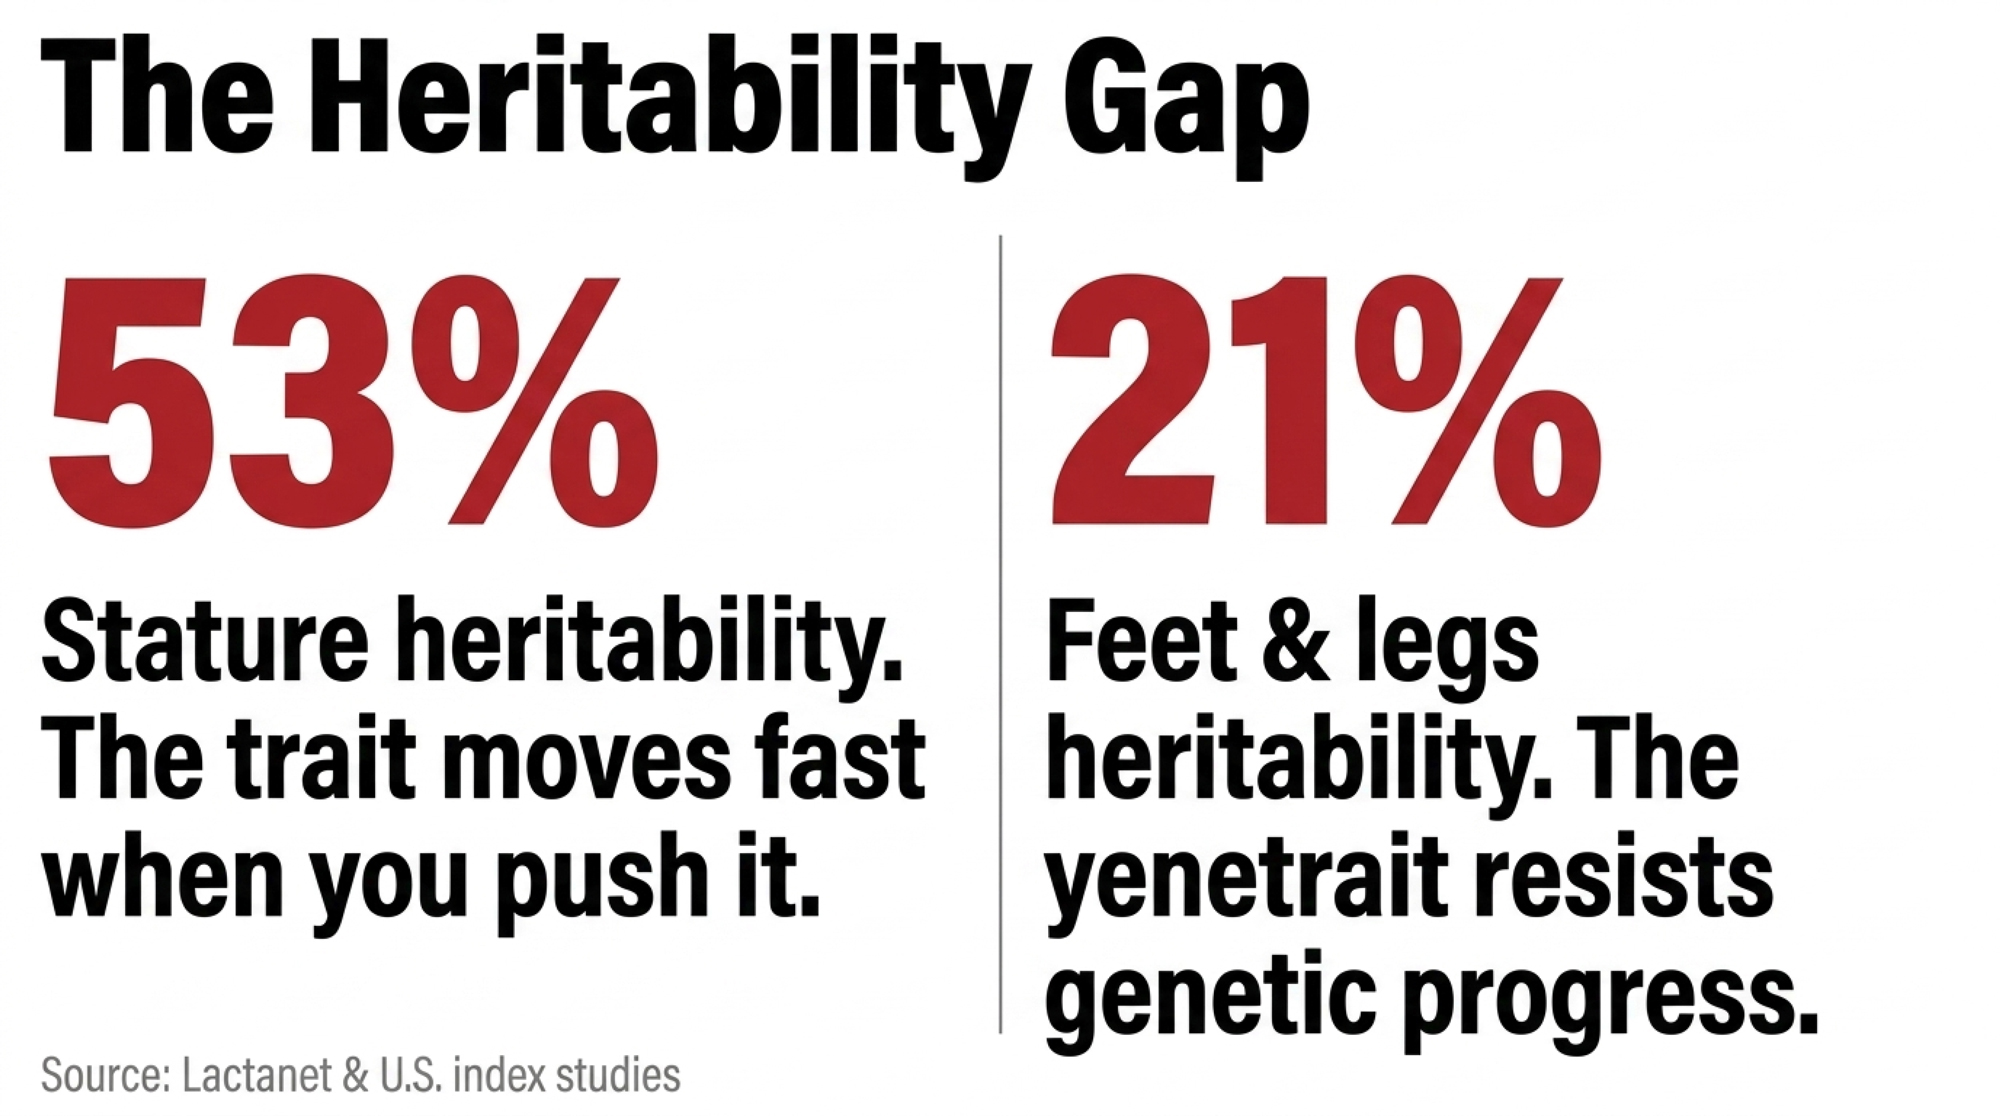
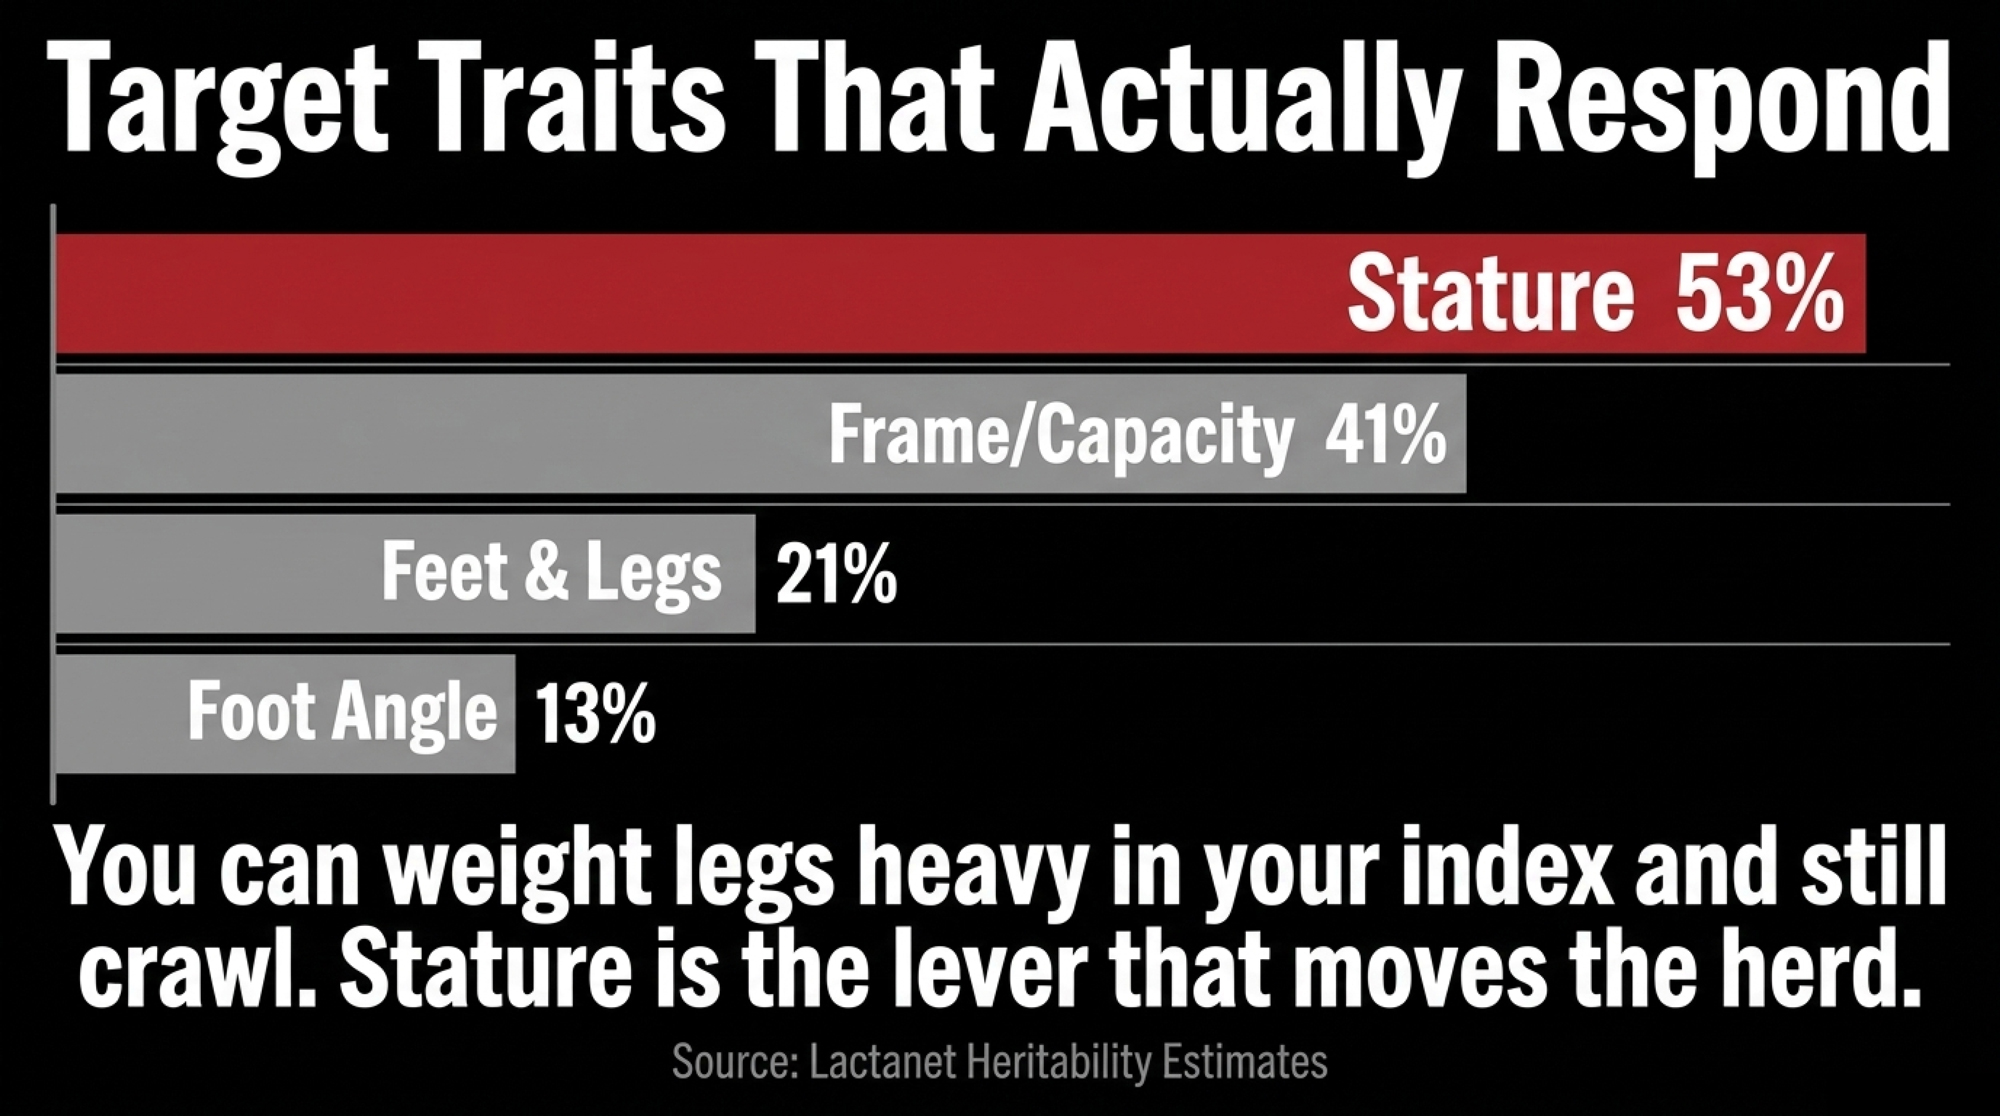
Still low-heritability traits, all of them. But a CCR figure now carries roughly twice the genetic signal it did in April.

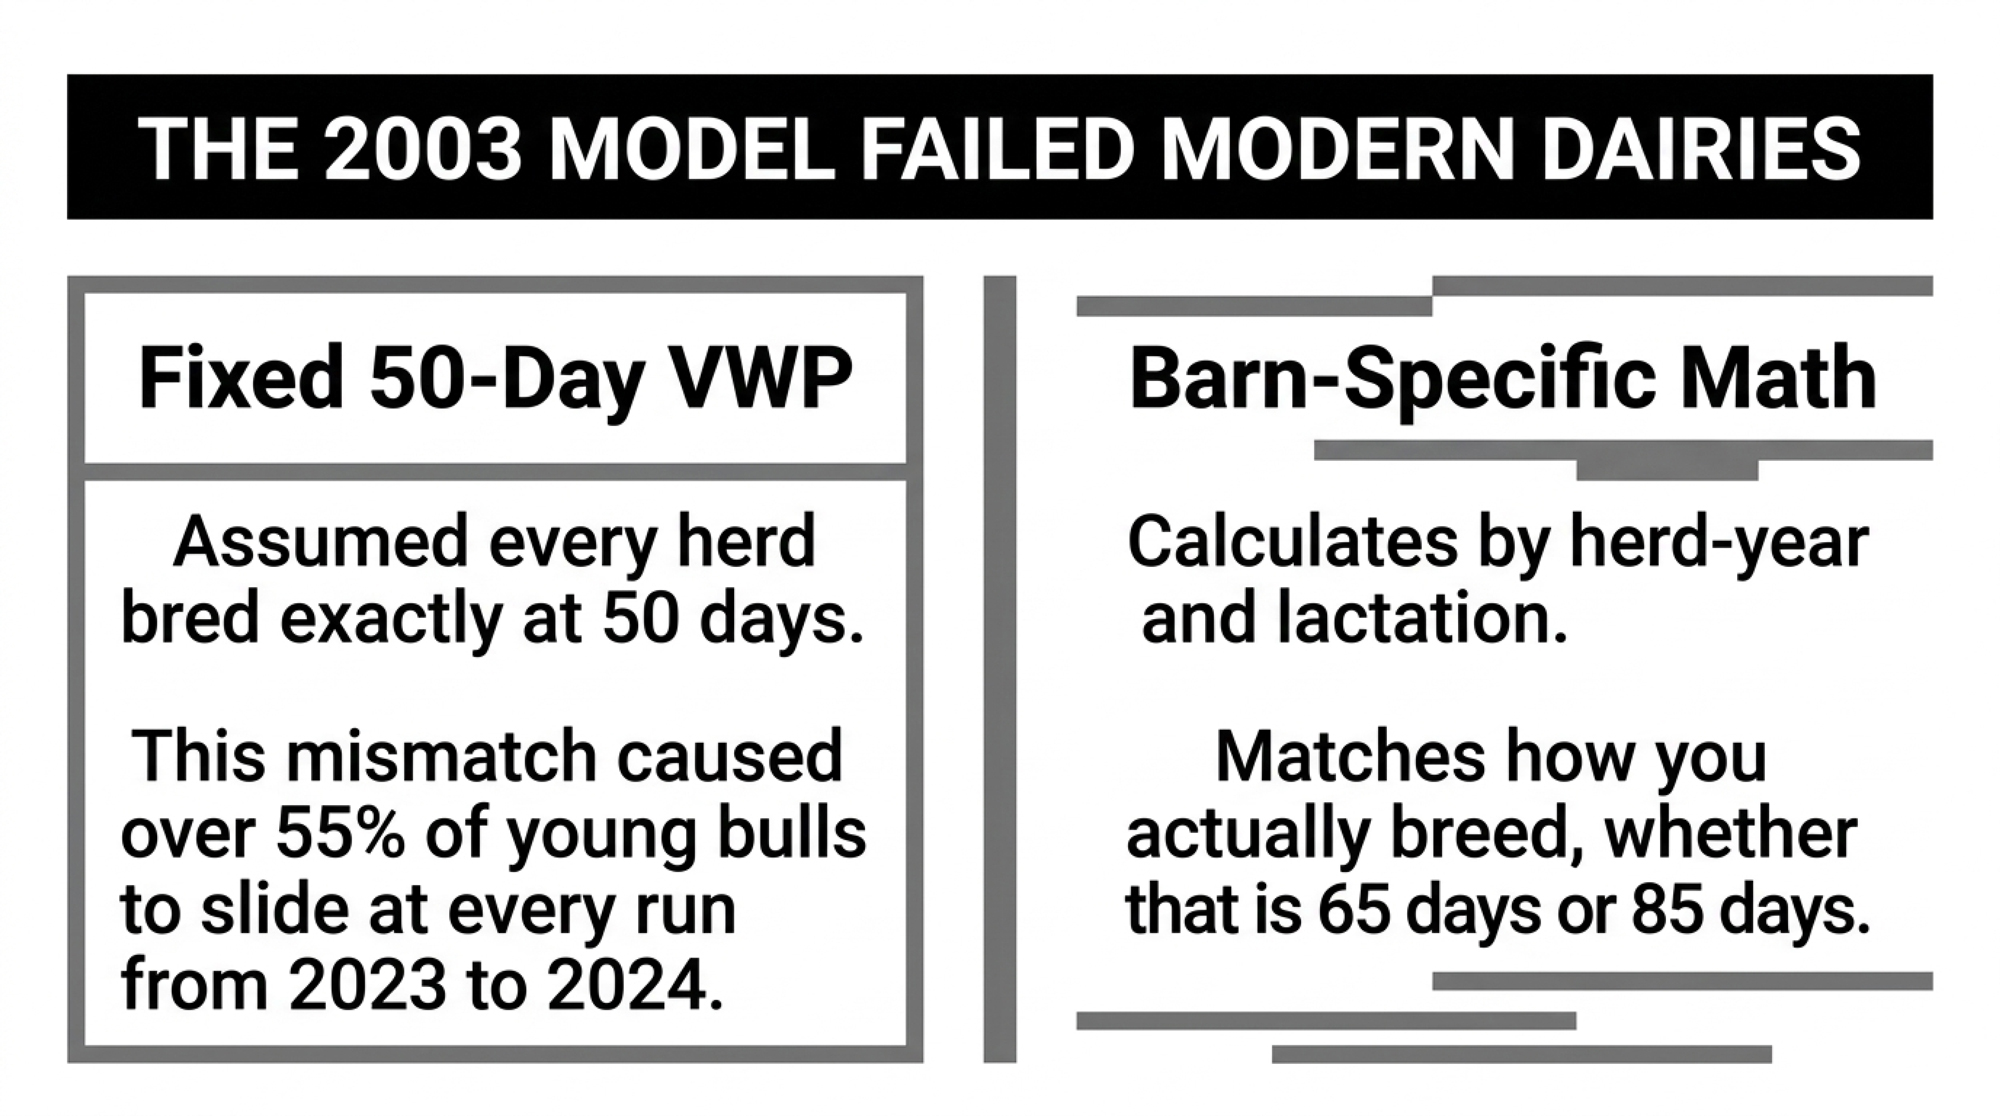
In the U.S. national evaluation, DPR has run since its 2003 introduction on a fixed 50-day voluntary waiting period with a 20-day grace period. The model hasn’t sat frozen for 23 years — in December 2014, a USDA and CDCB team replaced the single-trait evaluation reported since 2003 with a multi-trait version built on pregnancy observations at 21-day intervals between 50 and 250 days in milk.

But the fixed VWP survived that rebuild. It survived synchronization protocols, activity collars, sexed and beef semen, and herds that now set the breeding date one cow at a time. CDCB told The Bullvine the review was about whether the model’s assumptions still matched contemporary management. If a herd intentionally begins breeding later, the organization said, those additional days “should not automatically be interpreted in the same way as additional days open resulting from poorer reproductive performance.” The variable VWP “gives the model a better representation of when cows in that management group actually become eligible for breeding.”

One clarification kills a misreading before it spreads. There is no separate bull PTA for each VWP length. CDCB was explicit: the change is not meant to produce a different genetic value for a bull depending on whether he’s used in a 50-, 70- or 90-day herd. His PTA remains an estimate of genetic merit across the national population.

We also asked how large the legacy confounding was, and whether validation ran stratified by herd VWP length. CDCB provided neither a figure nor a description of stratified validation. The direction of the fix is documented; the magnitude isn’t, and we’re reporting that rather than filling it.

What we said would happen, and what did. When we covered this change in advance, our read was that the fix would land hardest on herds running long voluntary waiting periods — cows credited as slow to settle when the herd had chosen to breed them later. The realized population average moved +1.22 points of DPR for bulls at April 2026 A.I. status, upward as expected, and the herd-level VWP substitution is the mechanism CDCB names.

One correction to how we framed it, now on the record. The gain doesn’t accrue to herds — it accrues to bulls whose daughter records came from those herds. CDCB confirmed there is no per-VWP-length PTA, so a 90-day operation does not read a different number for the same bull than a 50-day operation does. The direction held. The magnitude by herd type is unverified, and CDCB didn’t supply it.

One more edit matters for anyone buying young bulls. Daughter data no longer enters DPR, CCR, or FSC until the daughter turns 36 months, which stops early-reporting bias from inflating a young sire’s first crop. That’s why LIONEL’s 99% fertility reliabilities on 17,368 daughters are worth what they’re worth, and a 70-to-75% genomic prediction on zero daughters isn’t the same animal.

One committee decision is worth about a point of his Fertility Index

Holstein Association USA reweighted its Fertility Index effective with the August 2024 evaluations: DPR from 0.7 down to 0.4, CCR from 0.1 up to 0.4, HCR and EFC steady at 0.1 each, as published in the TPI formula. Recommended by the association’s Genetic Advancement Committee, approved by its board. Equal weighting, not replacement — worth knowing, because the circulating claim had DPR cut to 0.1 and CCR raised to 0.4, two years off and a weight adrift. Fertility Index is a HAUSA product and a component of TPI; the PTAs feeding it come from CDCB.

Now put a number on what that decision does to one animal.

Bullvine calculation. Published evidence: LIONEL’s CDCB summary sheet for August 2026 lists his Fertility Index at -0.5, and his August 2026 PTAs are DPR -3.1, CCR +0.4, HCR +1.1, EFC +4.6. Stated assumption: FI is a weighted sum of those four traits, as published in the TPI formula.

FormulaWeights (DPR / CCR / HCR / EFC)LIONEL computes to
Current, since August 20240.4 / 0.4 / 0.1 / 0.1-0.51 (published: -0.5)
Pre-August 20240.7 / 0.1 / 0.1 / 0.1-1.56

Bullvine math on identical PTAs. The current-weights row reproduces the published value to rounding, which confirms the method on this animal — one animal, so treat the method as validated at n=1 until we run it across a wider set of bulls. The gap between the two rows is roughly one full point of Fertility Index on identical daughter data, produced by a committee vote rather than by anything a cow did.

One clarification, because this figure will travel. The -1.56 is a counterfactual: it’s what he computes to under the retired weights using his August 2026 PTAs. It is not what his Fertility Index actually read in July 2024, which was calculated on different PTAs and a different base.

So a bull’s fertility standing depends as much on when you look at it as on what his daughters do. For scale, CDCB puts DPR’s relative emphasis in Net Merit at 2.1%, and says the August revisions don’t change that emphasis at all.

Re-read the bulls you already cut

Every negative-DPR bull struck off a list before August 11 was judged on the fixed 50-day model, and on a DPR that carried half the heritability it does now. LIONEL moved to -3.1 without changing a daughter, and the average for U.S. bulls at April 2026 A.I. status moved +1.22 in the same run — so the list is stale, not just the numbers on it.

There’s a date on this, and it splits into two horizons:

  • Inside 30 days. Pull the three herd numbers below, re-run your rejected list against the August figures, and place what you need on this run.
  • Inside 90 days. The next official CDCB triannual lands December 1, 2026. Anything you’re planning for winter breeding gets built on that run, not this one.

One clean decision window, then every figure here moves.

Which fertility question is your herd actually failing?

None of this belongs on an order sheet until you know which gate your cows lose time at. Work them in order — each one rules out the next.

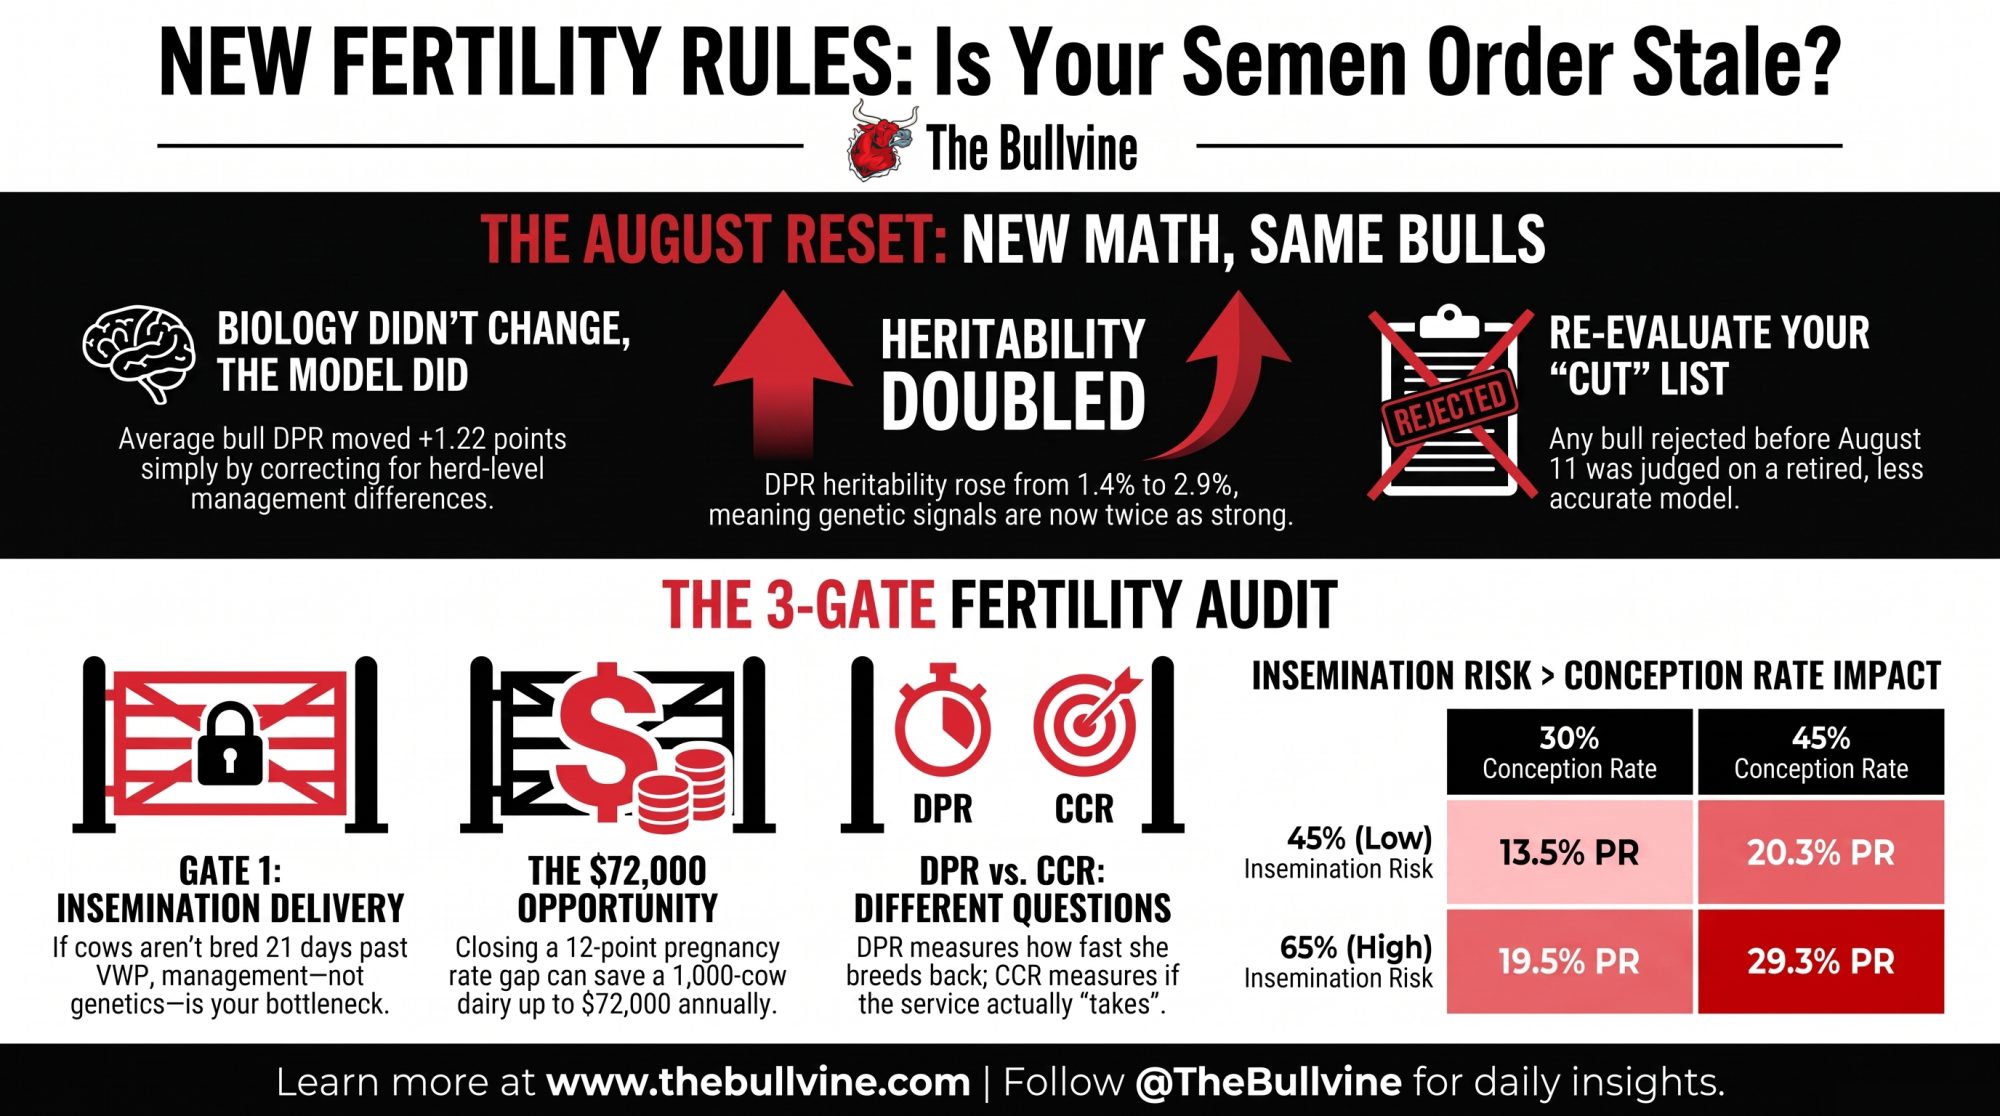
Gate 1 — Insemination delivery. Pull median DIM at first service and 21-day insemination risk, trailing 12 months, split by parity. If cows are first bred more than 21 days past your recorded VWP, you’ve lost a full reproductive cycle before genetics enters the picture. Look upstream at enrollment, heat detection, synchronization compliance, fresh-cow eligibility, and deliberate exceptions. No semen purchase fixes this gate.

Gate 2 — Conception efficiency. Pull pregnancy per AI, split by first versus later service, parity, season, semen type, and technician. If cows are served on time and still don’t settle, this is where CCR and FSC earn their place on the order sheet — and it only becomes a genetic decision when the female side carries a current genomic evaluation.

Gate 3 — Pregnancy maintenance and semen fertility. Two separate checks. Read the service sire’s own SCR, which measures his semen rather than his daughters. And confirm pregnancies twice, with enough gap between checks to separate a conception failure from a loss after a viable embryo was confirmed — the 2022 fetal-loss analysis below used detection at around 42 days of gestation as its dividing line.

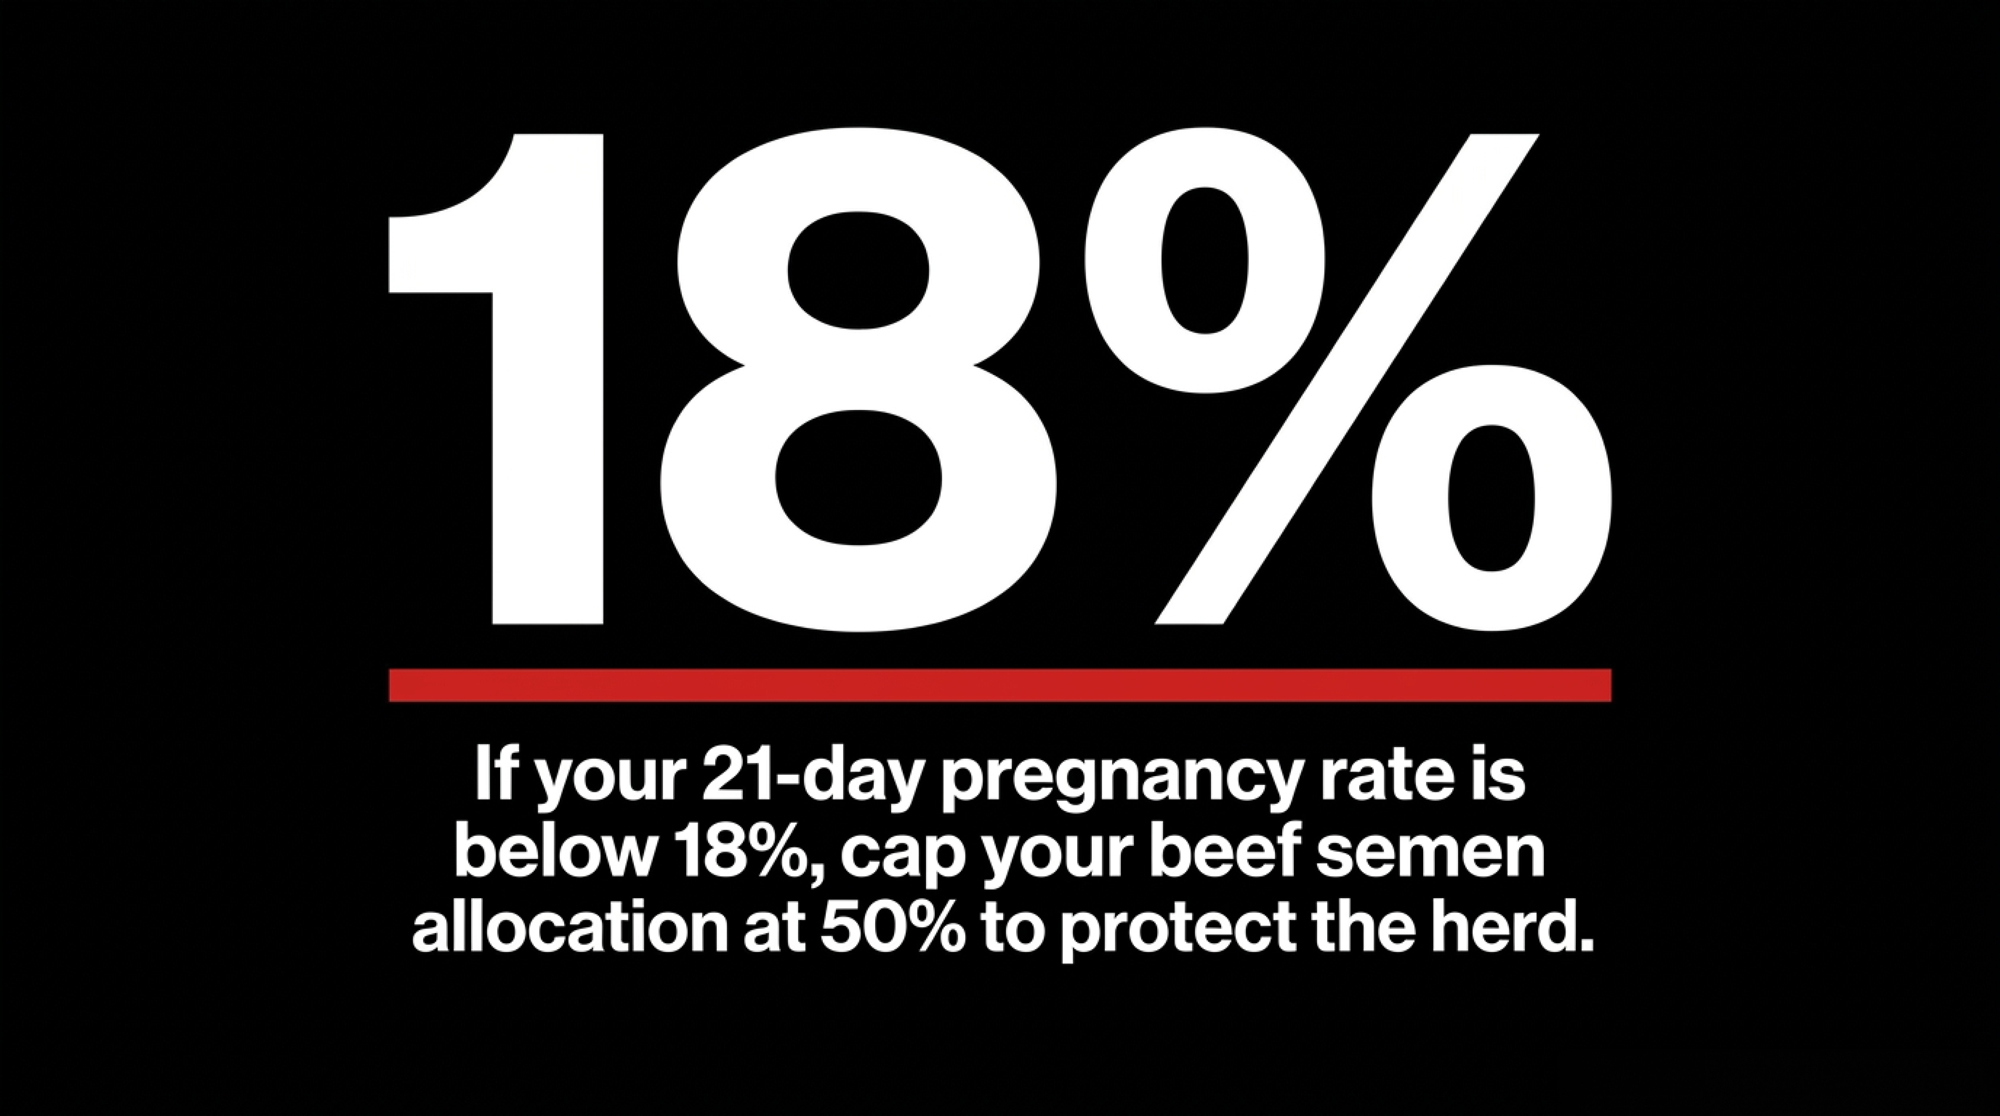
Bullvine calculation. Illustrative inputs, not one farm’s books: VWP 70 days, median first service 91 DIM, insemination risk 45%, pregnancy per AI 40%. Insemination risk times pregnancy per AI gives roughly an 18% 21-day pregnancy rate.

Published context: Lauber, Cabrera and Fricke at the University of Wisconsin–Madison modeled a 1,000-cow U.S. herd and classified 21-day pregnancy rate as low at 20%, below average at 25%, average at 30%, above average at 35%, high at 40% (Journal of Dairy Science 109:452–468, 2026). Those are modeled scenario bands, not observed averages. Our illustrative herd computes below the low band.

Here’s the whole grid so you can find your own square rather than ours. Each cell is a 21-day pregnancy rate; insemination risk across the top, pregnancy per AI down the side:
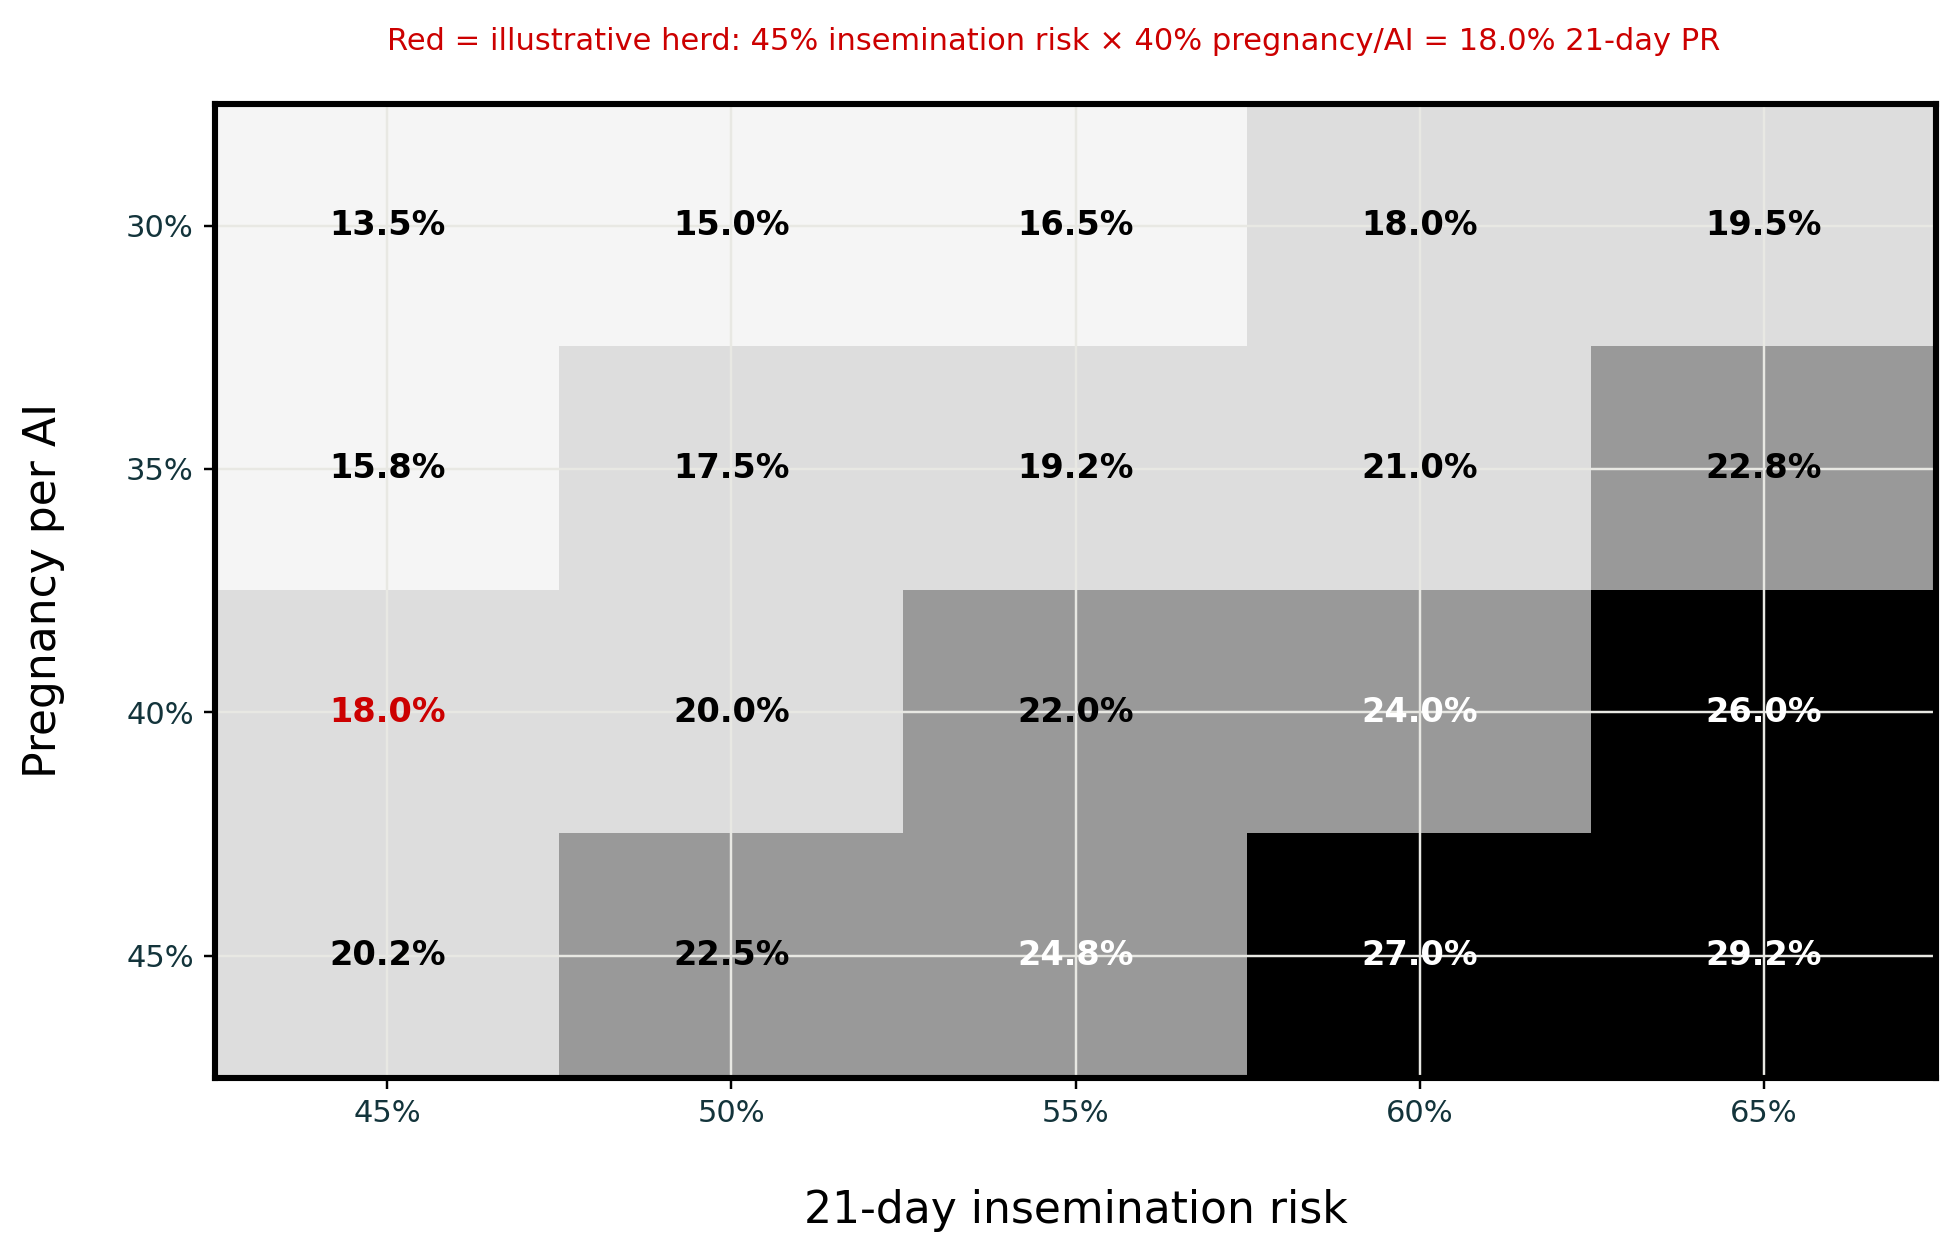
Preg/AI ↓ · Insem. risk →45%50%55%60%65%
30%13.515.016.518.019.5
35%15.817.519.321.022.8
40%18.020.022.024.026.0
45%20.322.524.827.029.3

Bullvine calculation. 21-day PR approximated as insemination risk × pregnancy per AI.

Read it across a row, and the point lands hard. At 40% conception, moving insemination risk from 45% to 65% buys eight points of pregnancy rate. Moving conception from 30% to 45% at a fixed 45% insemination risk buys under seven. The multiplication is an approximation — VWP definitions, pregnancy-check timing, loss and software eligibility rules all pull a real report off the simple product — but the ranking of the two levers survives every cell in the table.

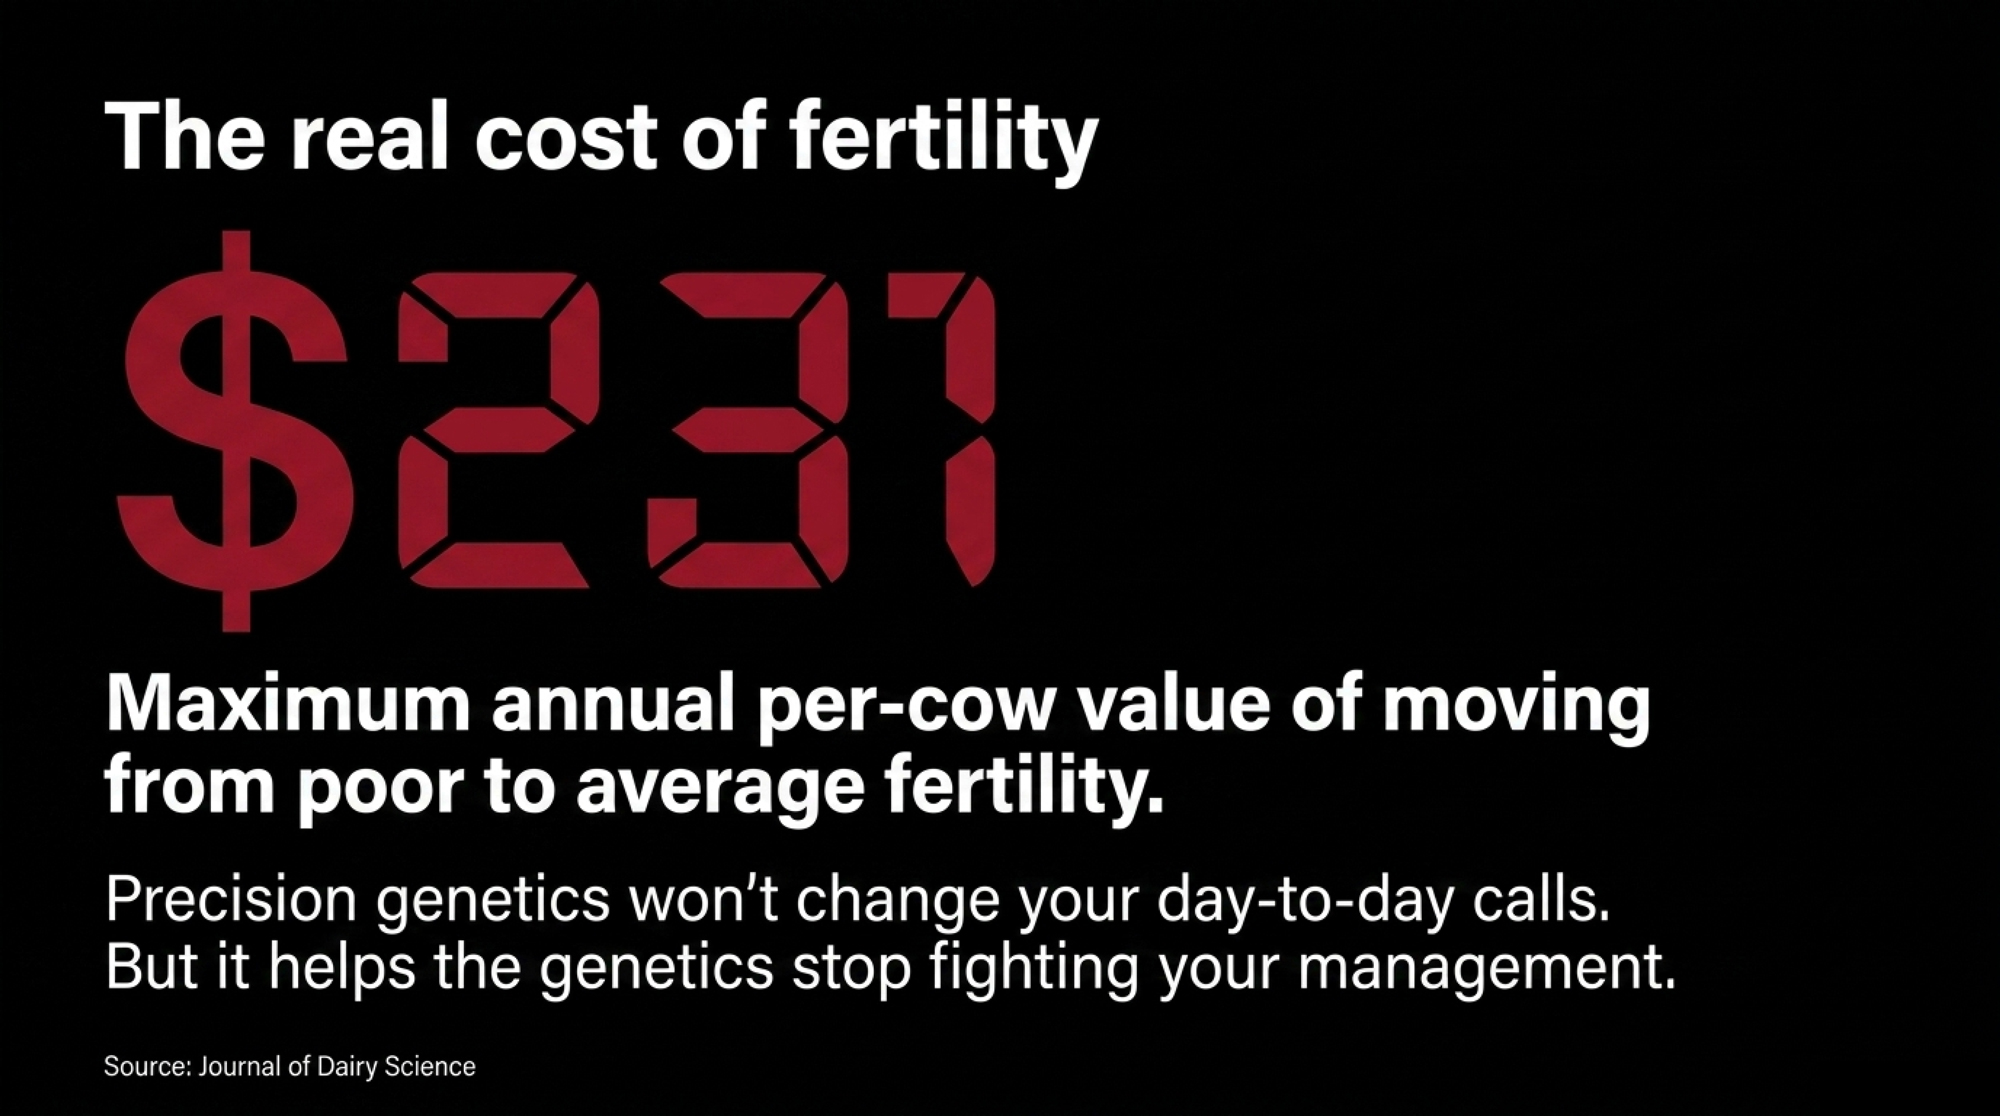
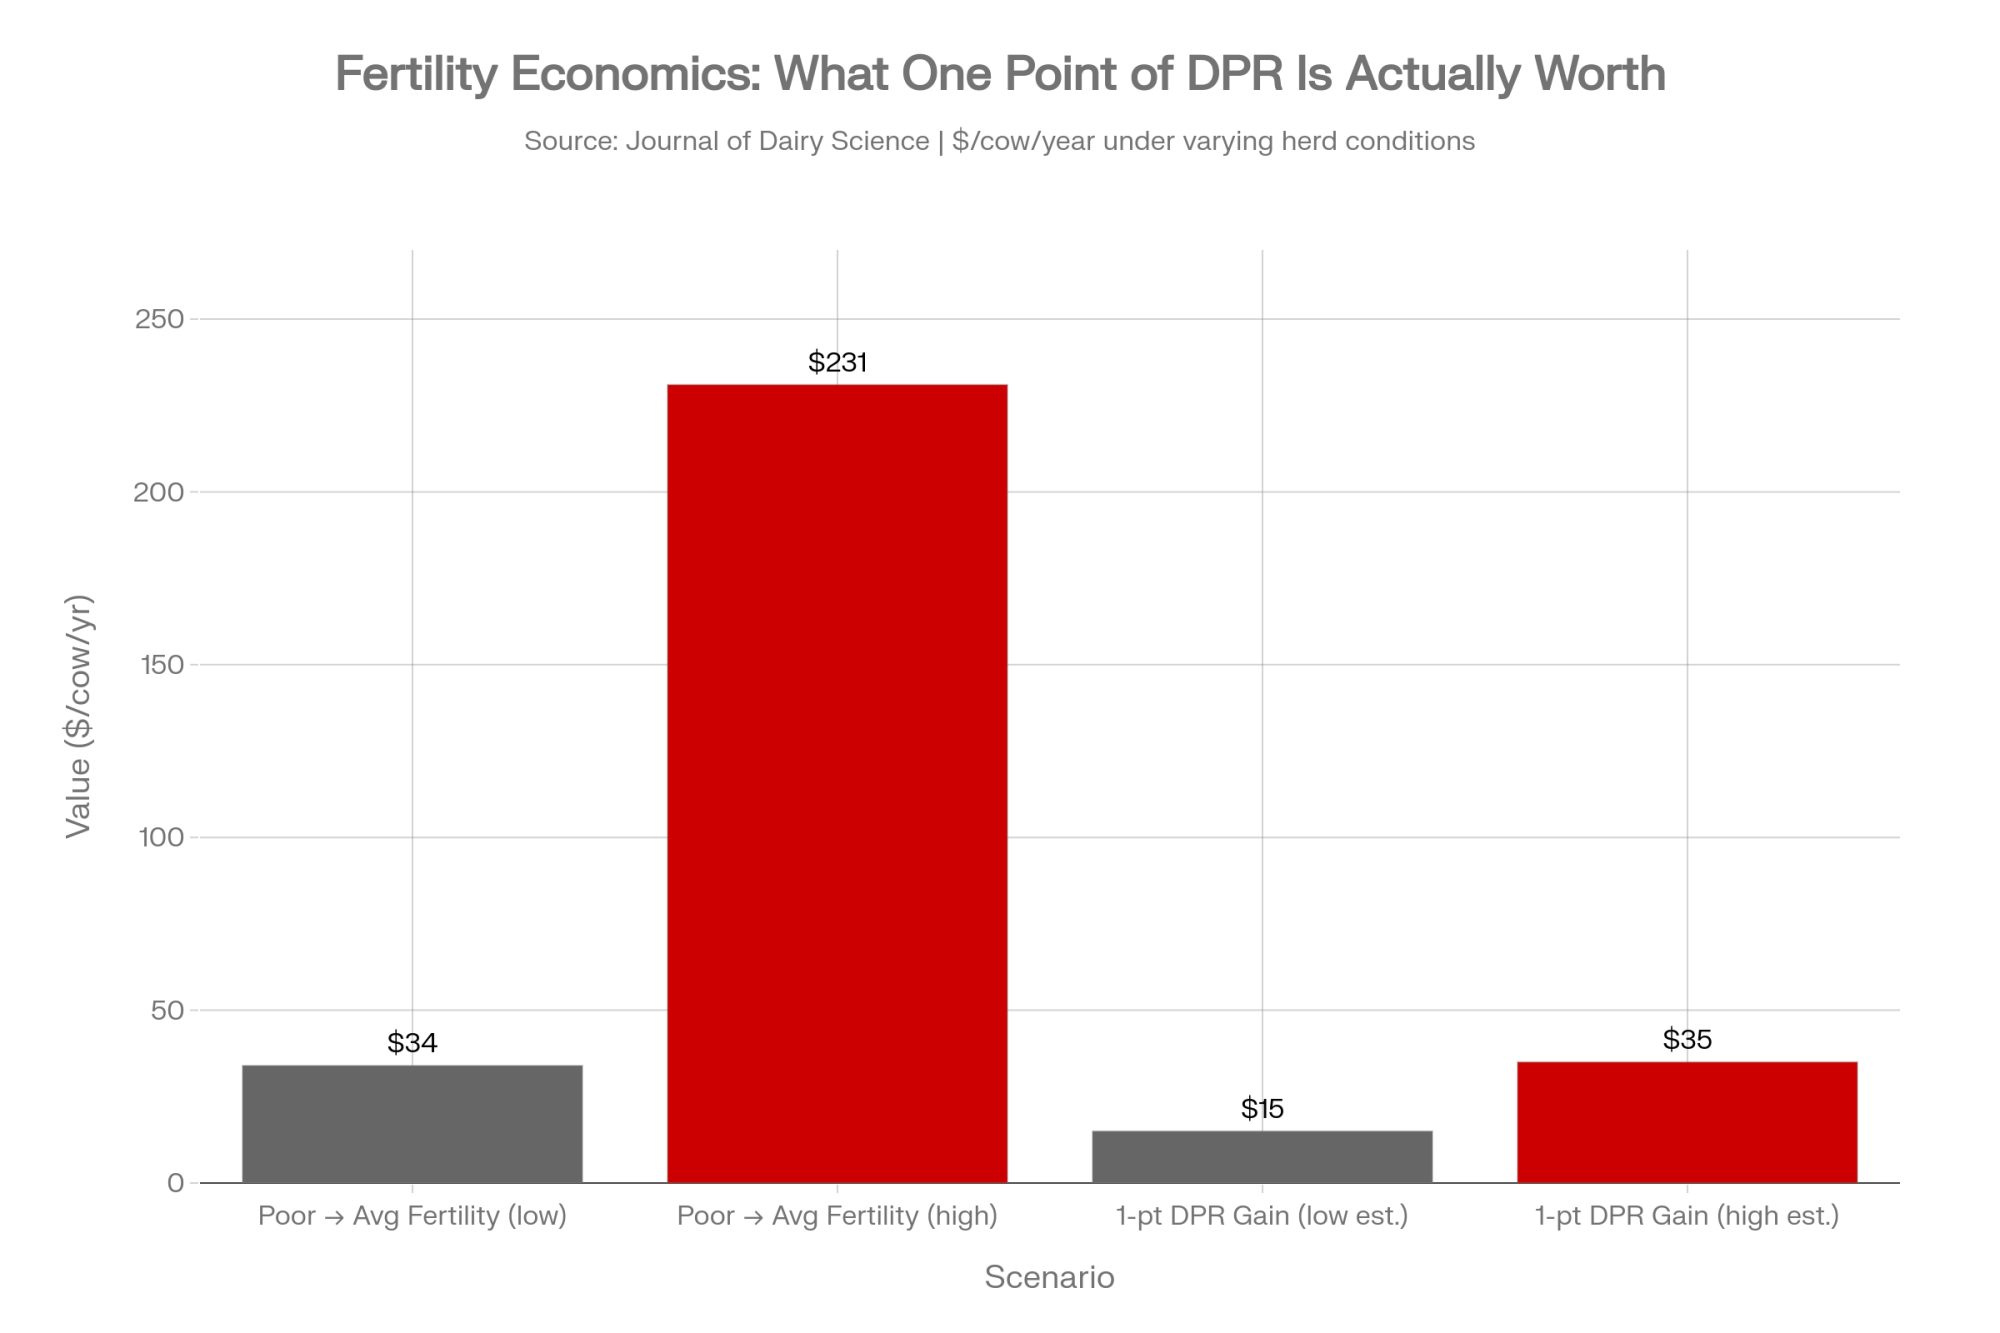
Now the money, and note what can and can’t be priced. Nobody can convert a DPR point into dollars directly; CDCB derives DPR from days open, but a genetic PTA point and a herd-level pregnancy-rate point are different units and not interchangeable. What you can price is the herd-level gap. Lauber and colleagues modeled net return at $3 to $6 per cow per year for each one-percentage-point gain in 21-day PR on conventional semen, $2 to $7 on sexed-plus-beef, at a 170-day insemination eligibility period, with the value higher when you start from a lower rate.
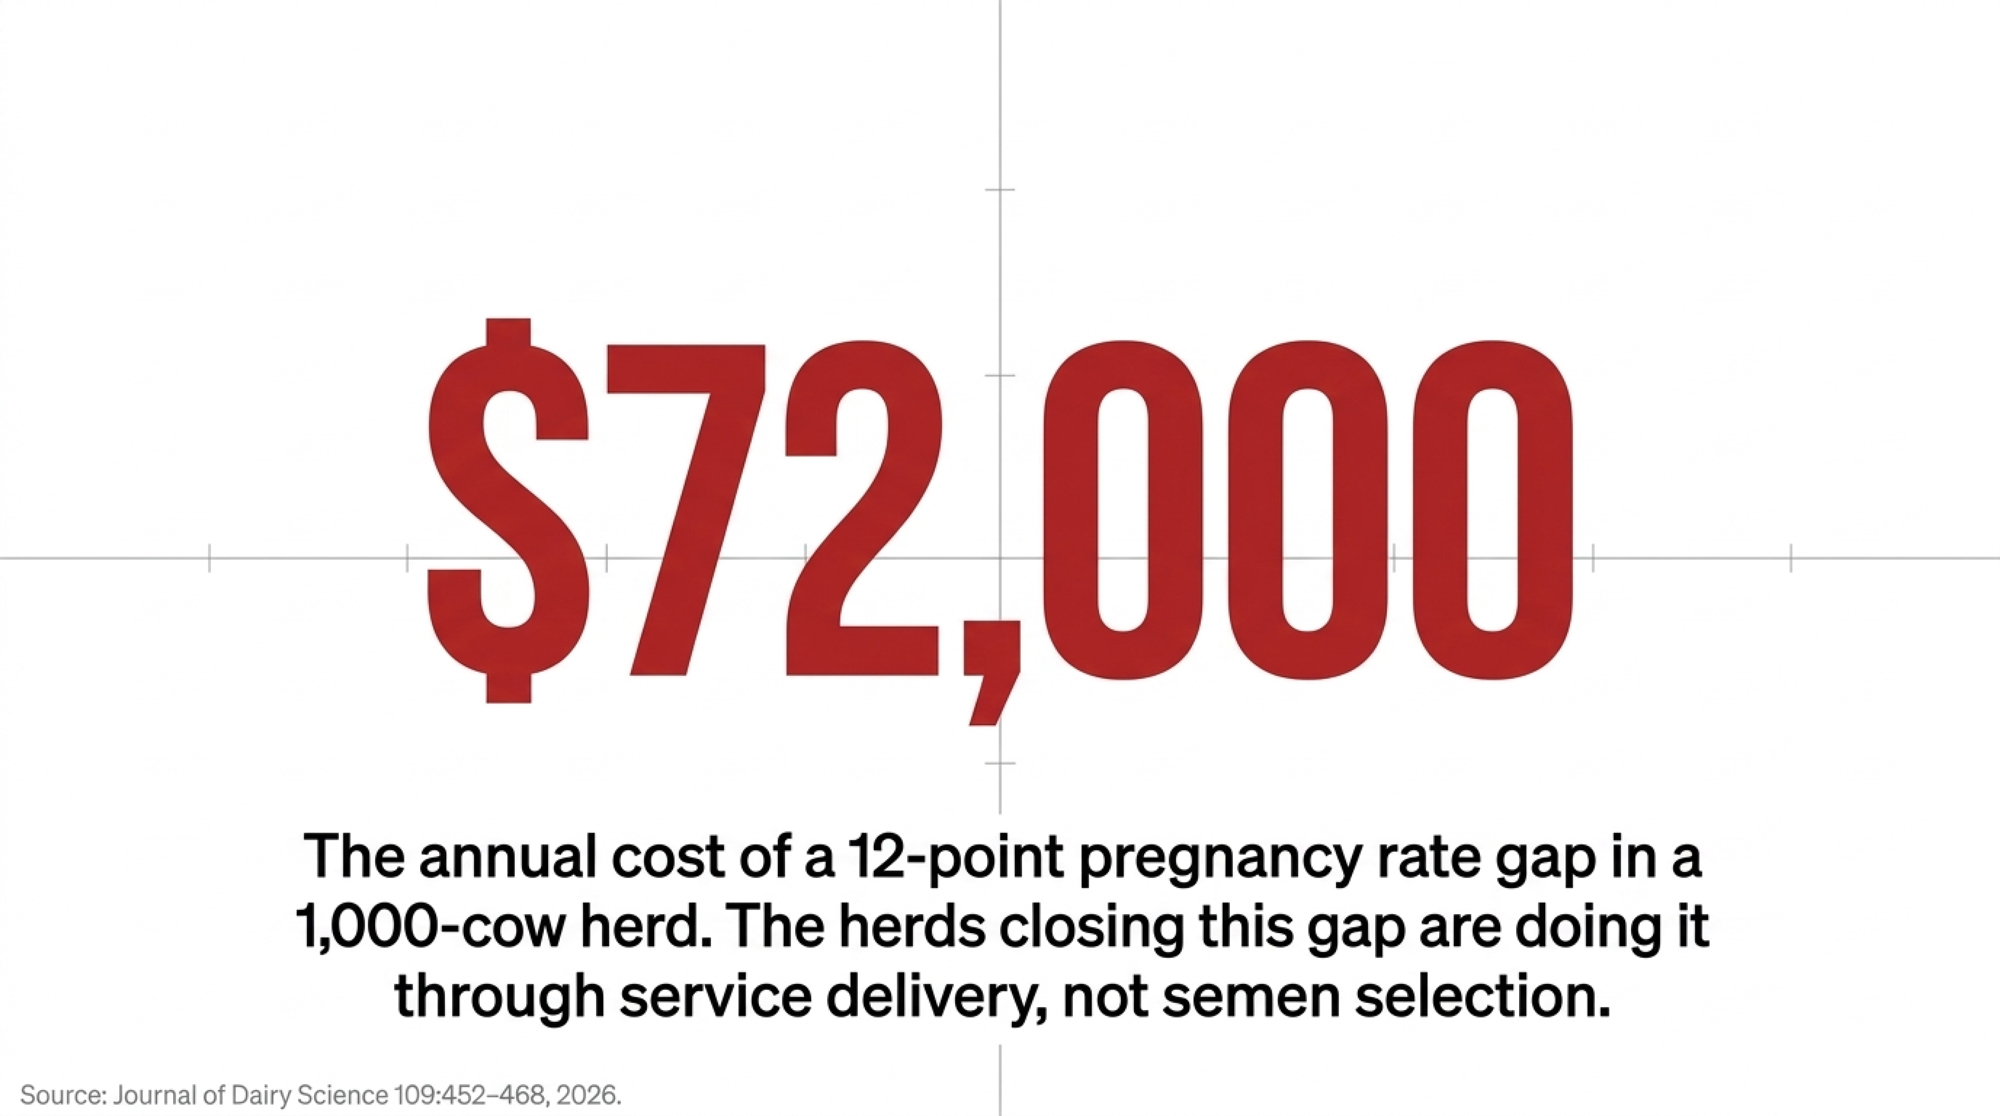
Our illustrative herd sits at 18% against the 30% average band — a 12-point gap. At $3 to $6 a point, that’s $36 to $72 per cow per year, or $36,000 to $72,000 on a 1,000-cow dairy. Most of it is sitting in Gate 1. Our earlier two-herd analysis priced a six-point gain at $18 to $36 per cow per year using the same inputs, and the herds that closed it did so on service delivery, not semen selection.

That herd breeds cows a full 21-day cycle past its own stated waiting period and serves fewer than half its eligible cows per cycle. Conception at 40% isn’t the bottleneck, and no semen order fixes it.

What does a positive DPR with a negative CCR mean for a mating?

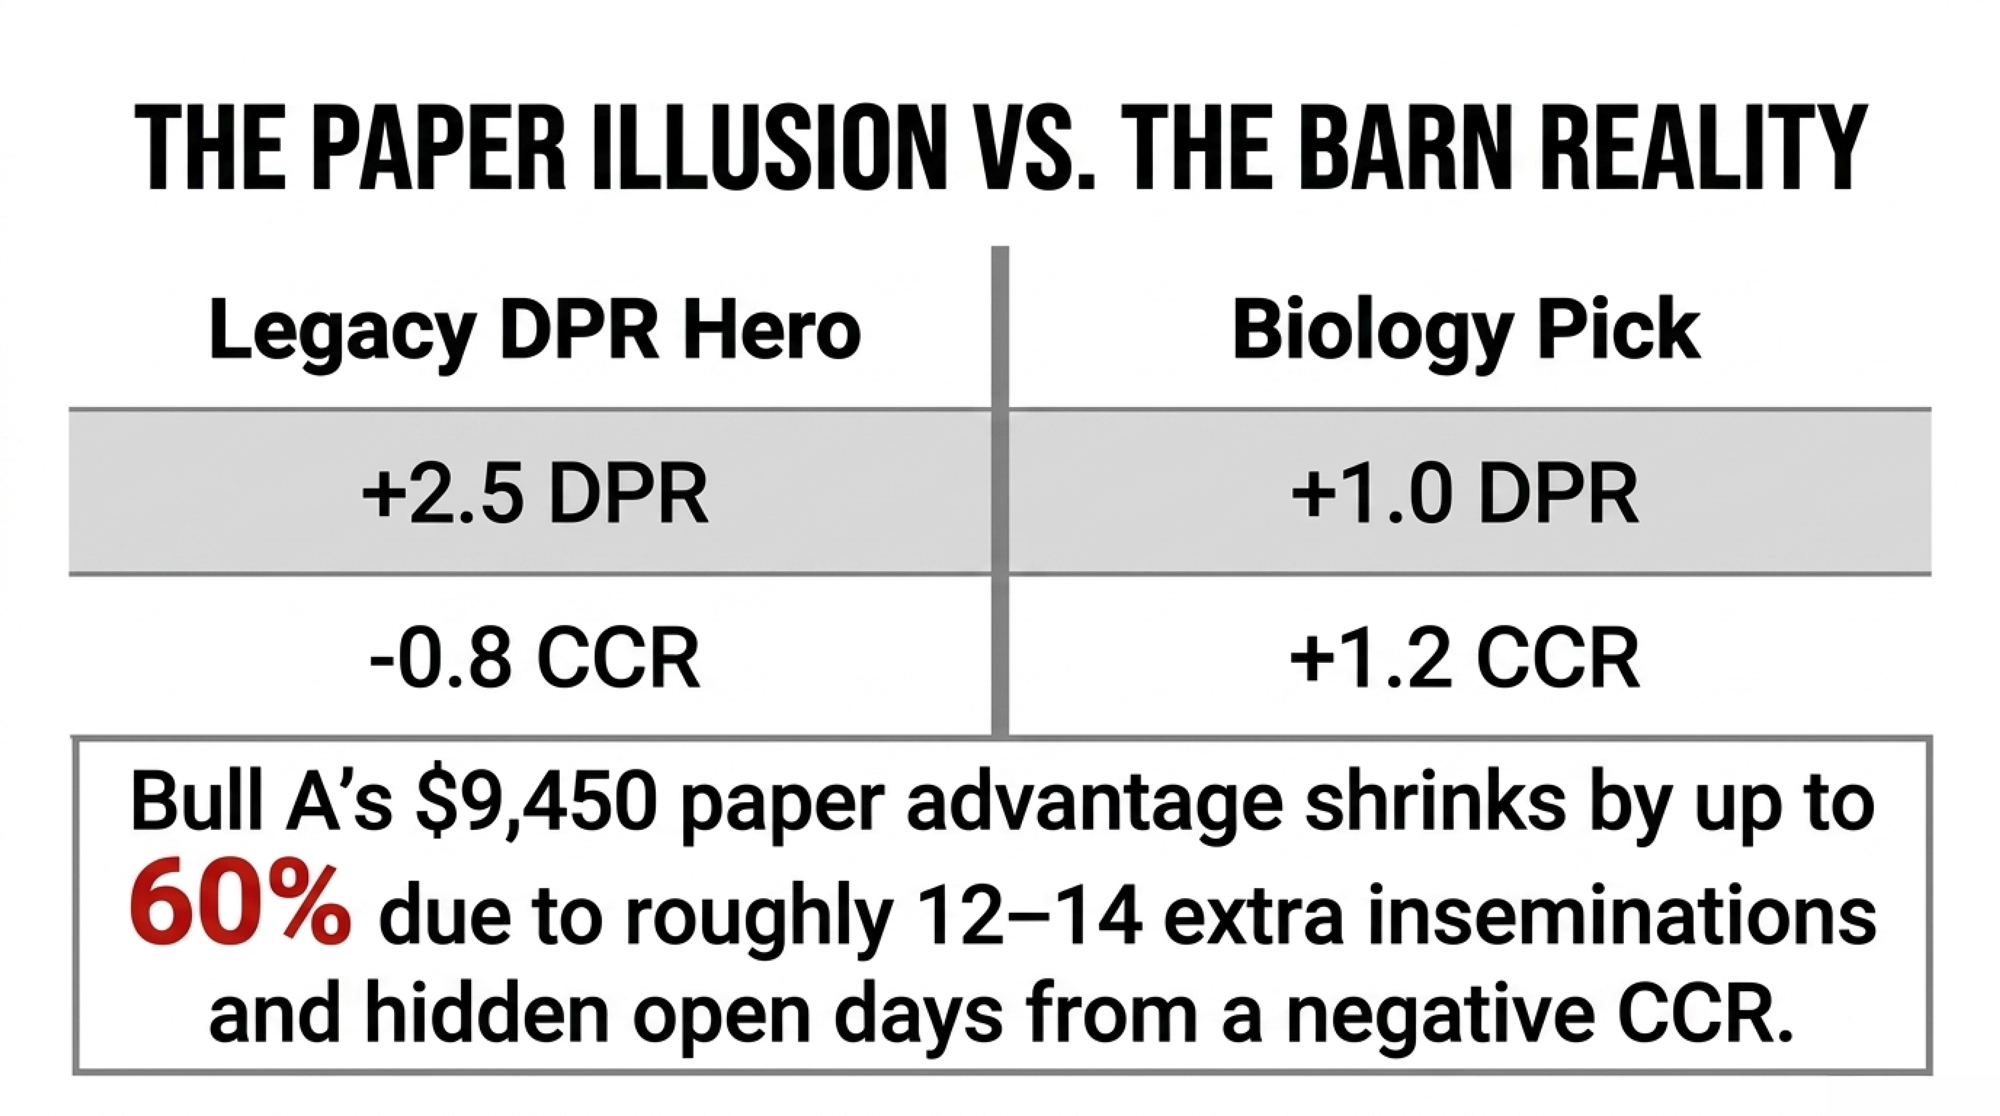
If conception per AI is your verified weak gate, a below-base CCR bull doesn’t become acceptable because his DPR looks fine. The two traits aren’t offsetting forces on one scale, and the decision is limit, mate, or remove.

“Mate selectively” sounds the most precise and demands the most. It only works when the female side carries a current genomic evaluation for the trait you’re correcting. Raw conception history isn’t that. At 2.9% heritability, CCR carries real but modest genetic signal, so a cow family that “always catches” may be telling you about your protocol, your season, or your breeding technician rather than her genetics. Without female data, treat the bull as negative CCR and cap his use — that’s the honest version.

And run the mating screen separately from the fertility read. LIONEL’s own inbreeding reads 10.7% on pedigree and 11.2% genomic, with expected future inbreeding at 12.1% and 12.4% and his daughters averaging 8.4%.

None of these three traits confirms a calf

DPR, CCR, and FSC all measure the route to pregnancy. None confirms a calf.

A 2022 Journal of Dairy Science analysis by Sigdel, Bisinotto and Peñagaricano examined records from 24,476 heifers, 20,805 first-lactation cows and 14,027 later-lactation cows at a single U.S. commercial Holstein herd in Florida between 2001 and 2019. It put fetal-loss heritability at 3.4% in first lactation and 7.4% in later lactations on the observable scale, and defined fetal loss as a pregnancy lost after a viable embryo was detected around 42 days of gestation.

Their conclusion: fetal loss is equal to or more heritable than the female fertility traits already in the national evaluation. That gap isn’t closing soon, and we asked directly. CDCB’s current research priority sits with the upcoming move to single-step evaluations and ongoing work on hoof health and mobility. The organization says there is “always interest” in better characterizing female reproductive performance, including portions of the cycle the current traits don’t represent, but named nothing in development. So build the next two proof cycles on the assumption that pregnancy maintenance stays a management problem, not a selectable trait.

Two more gaps, and LIONEL shows one. His Sire Conception Rate reads -0.3 at 98% reliability on 12,230 breedings, while his daughters’ conception reads just above base. Daughter fertility and semen fertility are different jobs on the same page.

No fertility PTA screens the mating itself either. Cole, Null and Van Raden at USDA’s Animal Genomics and Improvement Laboratory costed 18 recessive disorders across the Ayrshire, Brown Swiss, Holstein and Jersey populations at US$10.7 million a year in lost fertility and perinatal calf death, $7.5 million of it in Holsteins. Their point was that the money is avoidable by choosing mate pairs that can’t produce an affected embryo (Journal of Dairy Science 99(9):7274–7288, 2016, on a 9-million-head U.S. national herd).

What This Means for Your Operation

Eight audit steps, in the order we’d run them.

  1. Date-stamp every fertility figure on your order sheet. Any PTA without a trait name and a run date beside it gets re-pulled from the current run before you commit units. Figures quoted off a pre-August scale are not comparable to figures quoted off this one.
  2. Learn the FSC sign convention before you use the trait. Positive means fewer days to conception. A negative FSC PTA is the unfavorable direction, which is the opposite of what a days figure normally implies.
  3. Identify your herd’s specific fertility gate before you order semen. Run Gates 1 through 3 above and write down which one failed. Order against that gate, not against a general impression that fertility is poor.
  4. Find your square in the grid and price the gap. Multiply your insemination risk by your pregnancy per AI, compare against the 30% average band, and put $3 to $6 per point per cow per year on the difference. That number tells you how much management is worth before genetics gets a vote.
  5. Check the record base behind each bull’s fertility PTA, not his milk proof. His milk proof and his DPR proof don’t rest on the same daughters — compare the rows in the table above before you treat a headline daughter count as fertility evidence.
  6. Re-run the bulls you rejected on fertility before August 11. That shortlist was scored on the retired 50-day model and on heritabilities roughly half their current values. Open the current run beside the old list and reinstate anything that moved.
  7. Verify female-side data before you plan any corrective mating. A below-base CCR bull is only correctable where the cow carries a current genomic evaluation for that trait. Without it, cap his use and record why.
  8. Add SCR and haplotype compatibility to the order checklist. Daughter fertility and semen fertility are separate reads, and no fertility PTA screens the mating pair for recessives.

LIONEL’s August 2026 proof reads -3.1 DPR and 83rd percentile Net Merit at the same time, on 17,368 fertility daughters across fifteen countries. That’s a real trade, and both sides of it are published, which means the decision was never whether the bull is good. It’s whether your records can tell you which gate your cows lose time at — because that answer, not his DPR, determines whether he belongs on your order sheet, and you have until December 1 to find it.
Key Takeaways

  • LIONEL’s published Fertility Index of -0.5 computes to -1.56 under Holstein USA’s pre-August-2024 weights on the same PTAs — a point of index from a committee vote, not a daughter. A counterfactual, not his 2024 value.
  • DPR heritability doubled in August, from 1.4% to 2.9%, and CCR from 1.6% to 2.9%. If you wrote off a CCR figure as noise back in April, it’s carrying twice the genetic signal now.
  • Our grid puts an 18% herd 12 points under the 30% average band — $36 to $72 per cow per year at Lauber’s $3 to $6 a point. Almost all of it is insemination delivery, not semen.
  • Every figure here expires December 1, when the next CDCB triannual lands. Order on the August run within 30 days, and build winter breeding on December’s.

Methodology Note. Genetic evaluations reference the August 11, 2026 triannual run from the Council on Dairy Cattle Breeding on the U.S. national base, with reliability stated for every figure. LIONEL’s trait values, daughter and herd counts, breeding count, merit figures, status, and inbreeding come from CDCB’s WebConnect record for HO840003142490309 (007HO14454), Run August 2026, cross-checked against his CDCB summary sheet and Holstein Association USA type summary for the same run. His Fertility Index of -0.5 is printed on that summary sheet and independently reproduced by our own calculation using the published TPI formula weights; Holstein Association USA calculates the Fertility Index using CDCB inputs, and we validated our reproduction on this animal only. Heritabilities, the DPR–CCR and DPR–FSC correlations, breed means, and the FSC sign convention come from CDCB’s Reintroducing Reproductive Performance Traits summary and FSC trait page, published May 2026; the CCR–FSC correlation of approximately +0.97 comes from the peer-reviewed analysis of voluntary waiting period adjustment in U.S. herds, Journal of Dairy Science, September 2026. Trait-level model changes and average PTA shifts come from CDCB’s Early First Calving trait page and its August 2026 Evaluation Recap. The 21-day pregnancy rate bands and the $3-to-$6 per-point net return come from Lauber, Cabrera, and Fricke, Journal of Dairy Science 109:452–468, 2026, modeled on a 1,000-cow herd at a 170-day insemination eligibility period; they are modeled scenario values, not observed averages, and the dollar figures are net return per cow per year excluding the cost of achieving the gain. The pregnancy-rate grid is a Bullvine calculation on the stated approximation and uses illustrative inputs, not any farm’s records. We requested the trait standard deviations needed to quantify residual spread around the revised correlations; CDCB responded to our questions on September 18, 2026 but did not provide them, and this article does not claim outlier status without them. His main traits carry MACE source coding, meaning daughter records from multiple countries contribute; country counts cited are yield records. Dollar figures are USD. U.S. evaluations are not directly comparable to Canadian, EU, New Zealand, or Australian systems. Limitations: national averages, breed means and modeled bands may not reflect your region, herd size, management system or breeding program, and every figure here moves at the December 1, 2026 run. If your herd records tell a different story, send them — we publish producer data and case studies. Corrections: posted visibly at the top of the article. Contact editor@thebullvine.com.

CDCB was approached by email on September 17, 2026, with questions on the scale of legacy management confounding in the DPR model, how to read a sharp DPR–CCR divergence, and whether a pregnancy-maintenance trait is in development. CDCB responded on September 18, 2026. At the organization’s request, the answers are attributed to CDCB rather than to an individual spokesperson. CDCB did not provide a figure for the magnitude of the legacy confounding, did not describe validation stratified by herd VWP length, and did not supply the trait standard deviations we requested.

Learn More

The Sunday Read Dairy Professionals Don’t Skip.

Every week, thousands of producers, breeders, and industry insiders open Bullvine Weekly for genetics insights, market shifts, and profit strategies they won’t find anywhere else. One email. Five minutes. Smarter decisions all week.
NewsSubscribe
First
Last
Consent

9,860 First-Lactation VGs. Three Stress Tests. One Undisputed Winner.

Every first-lactation VG score in Canada for a year — 9,860 head, 46 bulls ranked. Then we tried three ways to break the leaders. Detective held every time. Sidekick got zero from 102 VG-dam daughters.

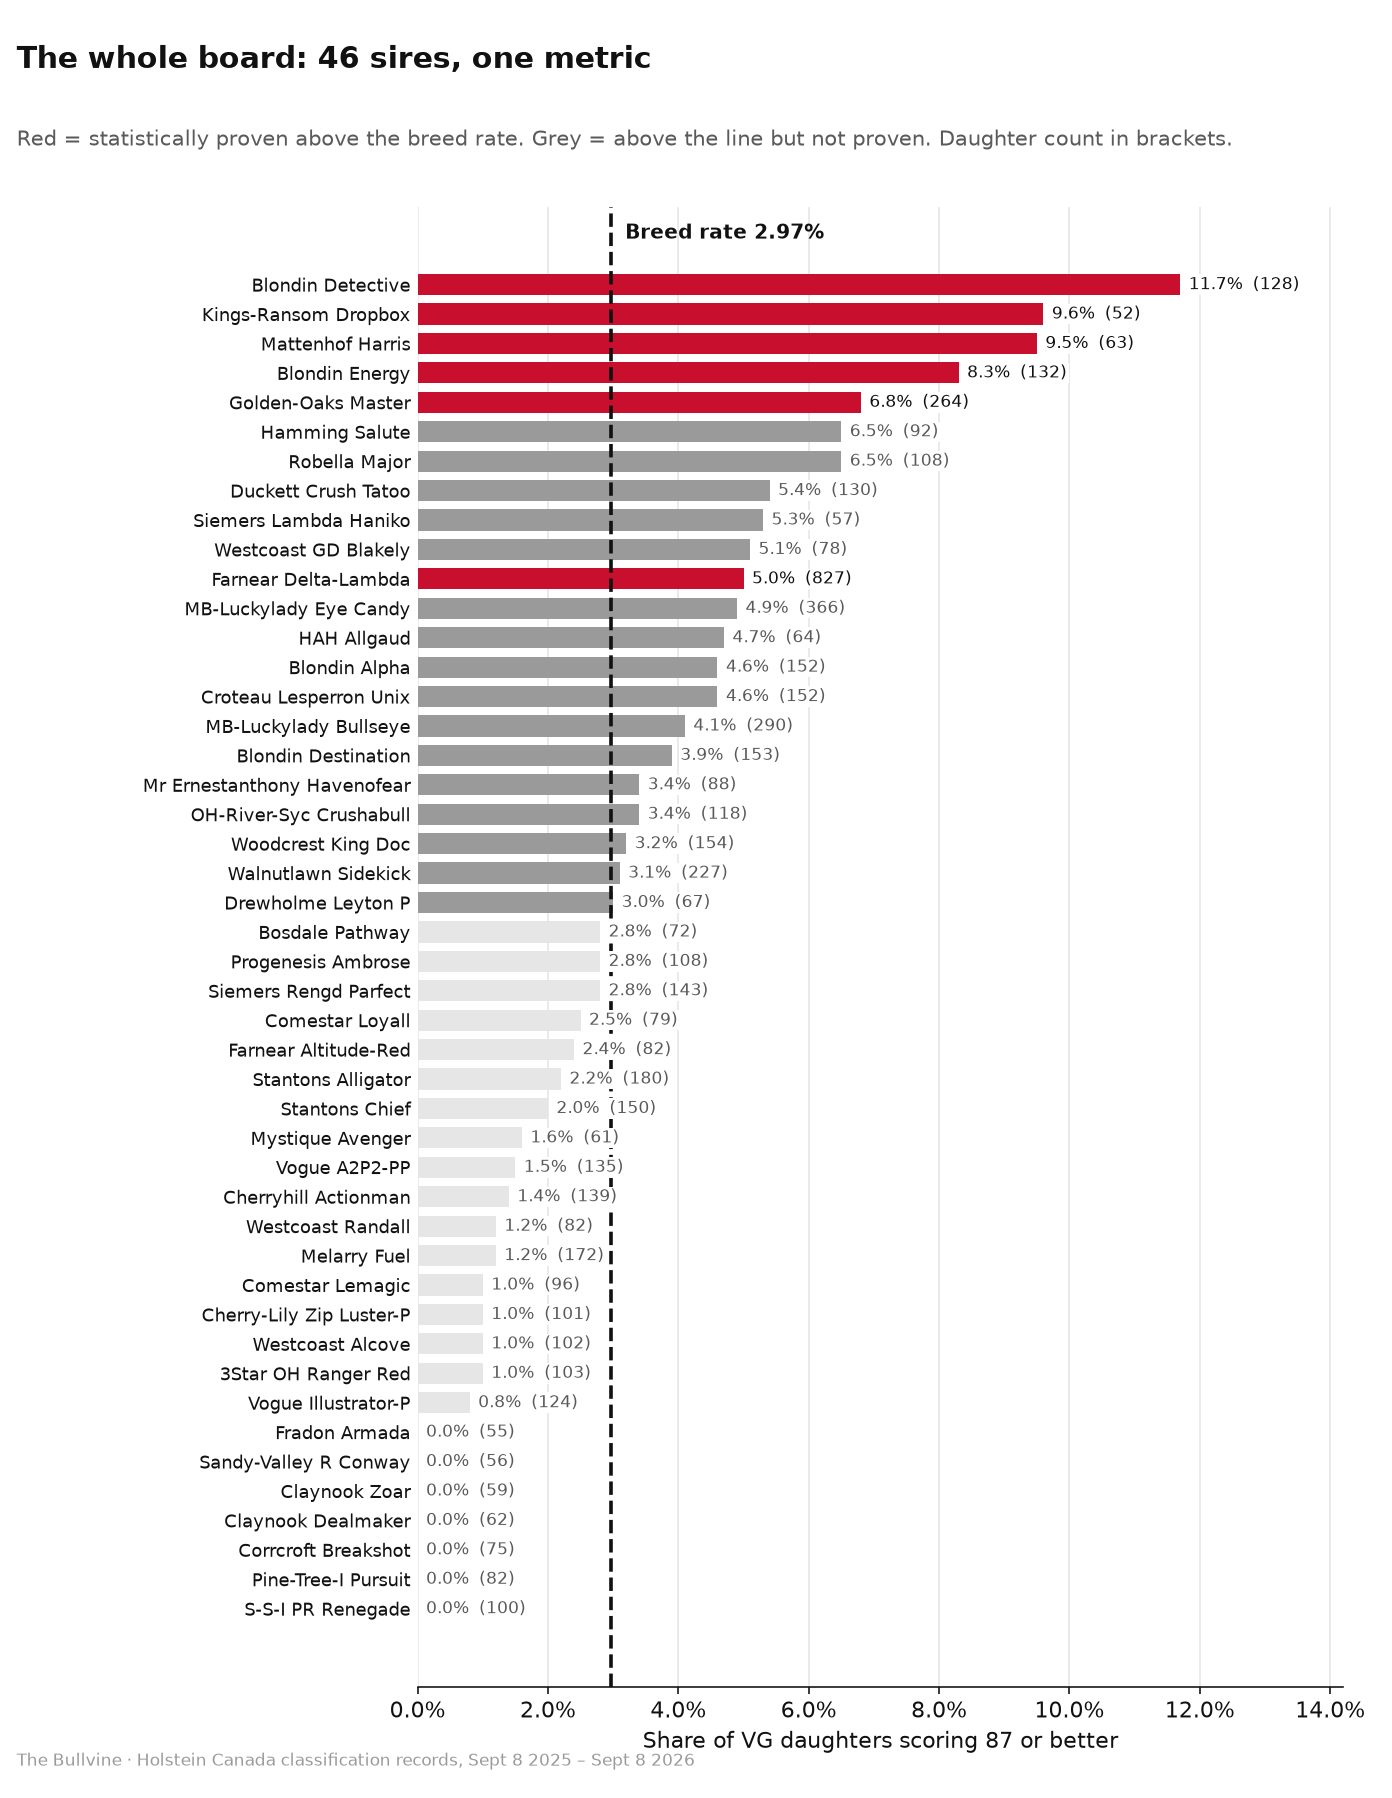
Blondin Detective. Fifteen of his 128 VG first-lactation daughters classified 87 or better this year — 11.7%, against a national rate of 2.97%. Take the ten biggest show herds out and he still holds 9.57%.

The short version: 46 bulls ranked on 9,860 first-lactation VG scores. Six beat the breed rate by enough to prove it. Then we stripped out the ten biggest show barns, levelled the field by dam score, and demanded the same performance in both halves of the year. Blondin Detective passed all three. Nobody else did. Then we checked the whole board against Holstein Canada’s August 2026 official proofs — and found that the trait that predicts a top-end two-year-old isn’t the one being sold.

Every breeder has had the barn argument at a show. Is that bull truly stamping the elite ones, or does he just have thousands of milking daughters padding his counts?

Touting raw numbers of 87-point two-year-olds is a semen-sales metric, not an efficiency metric. So we pulled all 9,860 first-lactation Very Good scores Holstein Canada recorded over the past twelve months, opened 3,756 complete family trees by hand across the 46 major sires, and then put the leaders through three stress tests:

  1. Strip out the top ten show barns.
  2. Level the field by dam score — EX versus VG.
  3. Demand it twice, in both halves of the same year.

One sire passed every test without flinching: Blondin Detective. Meanwhile some of the most-used type names in the country stumbled the moment the show halter came off.

What we’re measuring — and what we’re not

Understanding the metric. This study measures the VG Conversion Efficiency Ratio: of a bull’s first-lactation daughters that scored Very Good, what share reached VG-87 or VG-88. It does not look at daughters scoring Good Plus or lower, and it does not replace a multi-trait genetic evaluation like LPI or TPI, which account for contemporaries, herd management and production. It answers one question and one only: when a bull makes a good one, how often does he make an exceptional one?

That distinction matters, and any stud whose bull lands badly on this board will raise it — correctly — so let’s put it up front.

The denominator here is VG daughters, not total classified daughters. Take a hypothetical: Sire A gets 20% of his heifers to VG and converts 10% of those to 87+. Sire B gets 75% of his heifers to VG and converts 5%. Per straw used, Sire B is producing more elite two-year-olds — even though Sire A wins on this board. Conversion efficiency inside the VG class and absolute probability across all daughters are two different questions, and this dataset can only answer the first one.

Breed-wide, that VG Conversion Efficiency Ratio is 2.97%. About one in thirty-four. That’s the bar.

The six that clear the bar

The last column asks one thing: is this bull’s edge big enough, on enough daughters, to rule out luck? A small edge takes a lot of daughters to prove. A big edge takes fewer. And checking forty-six bulls at once will always throw up a fluke or two, so the bar allows for it. Provenmeans we’d argue the number with the bull’s owner and not blink. A dash means he might be exactly that good — there just aren’t enough daughters on the ground yet to say.

SireVG dtrs86+87+RateCould really beProven?
Blondin Detective12842.2%1511.7%6.1–17.3Proven
Kings-Ransom Dropbox5225.0%59.6%1.6–17.6Proven
Mattenhof Harris6331.7%69.5%2.3–16.8Proven
Blondin Energy13234.8%118.3%3.6–13.0Proven
Golden-Oaks Master26434.1%186.8%3.8–9.9Proven
Farnear Delta-Lambda82731.9%415.0%3.5–6.4Proven

The “could really be” column is the humbling one. Dropbox shows 9.6%. On 52 daughters his real number is somewhere between 1.6% and 17.6%. Only more daughters will narrow that. Anybody quoting you a rate without telling you how many daughters it came off is selling semen.

One bull under the 50-daughter cutoff is worth watching: Blondin Driven, 4 of 25 at 87+ — too few head to say anything yet, but the best feet-and-legs average of any sire in this dataset. Ask me again next year.

The middle of the board

Anything between about 3% and 6.5% here could just be the breed rate having a good year. Salute and Major both show 6.5% and I’d like to believe it — but on 92 and 108 daughters, that’s a lead, not a fact.

The five strongest of the middle:

SireVG dtrs86+87+RateCould really be
Robella Major10832.4%76.5%1.8–11.1
Hamming Salute9227.2%66.5%1.5–11.6
Duckett Crush Tatoo13033.8%75.4%1.5–9.3
Siemers Lambda Haniko5731.6%35.3%0.0–11.1
Westcoast GD Blakely7821.8%45.1%0.2–10.0
SireVG dtrs86+87+RateCould really be
MB-Luckylady Eye Candy36629.2%184.9%2.7–7.1
HAH Allgaud6426.6%34.7%0.0–9.9
Croteau Lesperron Unix15223.7%74.6%1.3–7.9
Blondin Alpha15226.3%74.6%1.3–7.9
MB-Luckylady Bullseye29025.9%124.1%1.8–6.4
Blondin Destination15324.8%63.9%0.8–7.0
OH-River-Syc Crushabull11827.1%43.4%0.1–6.7
Mr Ernestanthony Havenofear8821.6%33.4%0.0–7.2
Woodcrest King Doc15422.1%53.2%0.4–6.0
Walnutlawn Sidekick22730.8%73.1%0.8–5.3
Drewholme Leyton P6719.4%23.0%0.0–7.1
Siemers Rengd Parfect14314.0%42.8%0.1–5.5
Progenesis Ambrose10837.0%32.8%0.0–5.9
Bosdale Pathway7218.1%22.8%0.0–6.6
Comestar Loyall7927.8%22.5%0.0–6.0
Farnear Altitude-Red8230.5%22.4%0.0–5.8
Stantons Alligator18029.4%42.2%0.1–4.4
Stantons Chief15022.7%32.0%0.0–4.2
Mystique Avenger6118.0%11.6%0.0–4.8
Vogue A2P2-PP13510.4%21.5%0.0–3.5
Cherryhill Actionman13921.6%21.4%0.0–3.4
Melarry Fuel17223.3%21.2%0.0–2.8
Westcoast Randall8217.1%11.2%0.0–3.6

And the five lowest that still produced an 87:

SireVG dtrs86+87+RateCould really be
3Star OH Ranger Red10315.5%11.0%0.0–2.9
Westcoast Alcove1028.8%11.0%0.0–2.9
Cherry-Lily Zip Luster-P10113.9%11.0%0.0–2.9
Comestar Lemagic9613.5%11.0%0.0–3.1
Vogue Illustrator-P12421.0%10.8%0.0–2.4

Zero for the year

Seven bulls put 50 or more VG daughters through classification and produced no 87s at all.

Context matters. Several of these sires were sampled hard for commercial profitability, milk solids and health traits rather than show type. Semex introduced Pine-Tree-I Pursuit as Canada’s number one new-release sire for both GLPI and Pro$, later publishing him at +3649 GLPI, +$3,173 Pro$, and +8 Conformation (1.66 PTAT). A bull built and sold to that spec is not being bought to make an 87-point two-year-old. The absence of high scores here reflects breeding intent and buyer intent, not commercial failure. We did not obtain current published proofs for all seven and are not characterising the other six beyond what this dataset shows.

SireVG dtrs86+87+
S-S-I PR Renegade10012.0%0
Pine-Tree-I Pursuit829.8%0
Corrcroft Breakshot7512.0%0
Claynook Dealmaker6214.5%0
Claynook Zoar5916.9%0
Sandy-Valley R Conway563.6%0
Fradon Armada5512.7%0

That’s 489 VG daughters between them. At the breed rate you’d expect 14 or 15 at 87. They got none — and Renegade, Pursuit and Dealmaker each classified 30-plus daughters in both halves of the year without one in either half.

The claim is narrow and it’s worth repeating: if you were after a big score on a two-year-old, these seven didn’t deliver it this year, at these daughter numbers, in these herds. Conway is the one I’d look at twice on type either way — only 3.6% of his VG daughters even reached 86, lowest figure on the whole board.

About Delta-Lambda

He’s the reason a lot of breeders will argue with this whole metric, so let’s deal with him now.

He sired 41 of the country’s 293 top scorers, and second place has 18. He also had 827 VG daughters classify this year — one in every twelve VG-first cows in Canada.

Divide it out and he converts at 5.0%. Against the breed at 2.97%, that’s genuinely good, and on 827 daughters it’s about as solid a number as exists in this business. Against the twenty leading type sires as a group — 5.17% — he’s exactly par.

Both are true at once, and that’s the trap. Counting a bull’s 87s measures how much semen he sold. He passed away in 2023 with over 11,000 daughters on the ground (The Bullvine), so what we’re watching is the long tail of the biggest type-sire run this country has seen.

Hold onto his 5.0%. It doesn’t survive the first test unchanged.

Then we tried to break it

A ranking like that has three obvious ways to be wrong. So we ran all three at the numbers.

Test one: take the show herds out

The fair objection to any classification analysis is that it measures barns, not bulls. The big show herds feed a two-year-old right, grow her properly and have her looking her best on classification day. If a bull sold heavily into those herds, his rate rides along.

The concentration is real. Among the 293 top scorers, counting every listed owner: Ferme Blondin, Saint-Placide, QC is on 21 of them. Blondin Sires, same village, on 14.Hamming Holsteins (Vernon, BC) and Westcoast Holsteins (Chilliwack, BC), 8 each. Beckridge, Quality Farms and Weeksdale, 7 each. Stanton Bros (Ilderton, ON), Kingsway Farms (Hastings, ON) and T & L Cattle, 6 each. Provincially, Quebec makes 40% of the country’s VG-first two-year-olds and 44% of the 87s; BC converts at 3.89%, Quebec 3.31%, Ontario 2.53%, Alberta 1.64%. PEI tops the table at 5.32% off 188 head, thin enough that one strong herd moves it.

Those herds have earned their reputations — we’ve profiled Ferme Blondin and Blondin Siresbefore. But if you milk 60 in a tie stall, their results aren’t your results.

So we pulled every cow owned by those ten herds — 184 head — and re-ranked what was left. The baseline drops from 5.17% to 4.28%, which tells you how much those barns carry on their own.

SireAll herdsShow herds removedWhat happened
Mattenhof Harris9.52% (63)9.68% (62)held — and took over first
Blondin Detective11.72% (128)9.57% (115)held, still more than double the baseline
Duckett Crush Tatoo5.38% (130)5.51% (127)held
Robella Major6.48% (108)6.00% (100)mostly held
Golden-Oaks Master6.82% (264)5.58% (251)slipped
Hamming Salute6.52% (92)5.33% (75)slipped
Blondin Energy8.33% (132)5.83% (120)dropped hard
Farnear Delta-Lambda4.96% (827)3.67% (791)dropped hard
MB-Luckylady Eye Candy4.92% (366)3.49% (344)dropped
Stantons Alligator2.22% (180)2.26% (177)unchanged

That reshuffles the top. Harris and Detective don’t need the big barns. Harris actually goes up. Energy loses a third of his edge the moment those herds come out, and so does Delta-Lambda — there’s the answer to the question we left hanging.

It isn’t an accusation against anybody. It’s the honest arithmetic of where a bull’s semen landed. But it’s the size of effect the sceptics always claimed, and now it’s measured instead of argued.

Test two: give every bull the same cows

Second objection: the good bulls get put on the good cows. Of course Detective looks strong if he’s used on the best families in the country.

So we split every sire’s daughters by what the dam herself classified, and compared like with like.

Read this table as a snapshot, not a proof line. Subgroups under 50 head per dam tier are observational. Robella Major sits on 34 EX-dam daughters and 49 VG-dam daughters — one animal moving either way swings his rate 2.5 to 3.0 points. Only Delta-Lambda, Eye Candy, Master, Bullseye and Sidekick carry 50-plus head in both tiers.

SireOut of EX damsOut of VG damsRead
Blondin Detective4/44 = 9.09%10/72 = 13.89%upgrades the cow
Blondin Energy4/49 = 8.16%7/63 = 11.11%upgrades the cow
Robella Major2/34 = 5.88%4/49 = 8.16%upgrades the cow — thin sample
Golden-Oaks Master10/131 = 7.63%7/105 = 6.67%same either way
Farnear Delta-Lambda23/397 = 5.79%17/311 = 5.47%same either way
Duckett Crush Tatoo4/60 = 6.67%2/47 = 4.26%wants the better cow
Woodcrest King Doc4/54 = 7.41%1/74 = 1.35%wants the better cow
Walnutlawn Sidekick7/97 = 7.22%0/102 = 0.00%needs an EX cow, full stop

There’s a whole mating philosophy in that table — and note that the two strongest lines in it, Sidekick and Delta-Lambda, are also the two with the biggest samples.

Detective and Energy are upgraders. Put them on a plain VG cow and they still find you an 87 — Detective actually does it more often on VG dams than on Excellent ones. That’s the bull for the good-not-great family you’re trying to move forward.

Sidekick is the opposite, and it’s stark. Ninety-seven daughters out of Excellent dams gave seven 87s. One hundred and two daughters out of VG dams gave zero. Both groups are big enough to mean something. He doesn’t build a cow; he finishes one that’s already there.

King Doc reads the same way — 7.41% out of EX dams, 1.35% out of VG.

And look at what they were handed. Across all 3,756 animals the dam mix is dead even — 1,582 came out of Excellent dams, 1,581 out of VG. So 44% each way, and that’s the baseline for what a bull’s book looks like.

Detective’s is the most VG-heavy of any proven sire on the board. Seventy-two of his daughters came out of VG dams against 44 out of Excellent ones — 57% where the breed sits at 44%. He isn’t riding a book of elite cows. He’s got more plain ones behind him than almost anybody in the top six, and he still converts at 11.7%.

SireOut of EX damsOut of VG damsVG share87+ rate
Blondin Detective447256.7%11.7%
Blondin Energy496349.2%8.3%
Walnutlawn Sidekick9710247.2%3.1%
Golden-Oaks Master13110540.9%6.8%
Farnear Delta-Lambda39731140.0%5.0%
Stantons Alligator1036436.8%2.2%

Alligator is the mirror image. Fifty-nine percent Excellent dams — the most elite book of any bull with 50 or more VG daughters — and a 2.2% conversion rate. Best cows on the board, worst result off them.

And at the very top it barely matters. Of the 293 cows that scored 87 or 88, 48.6% came out of Excellent dams against that 44.4% baseline. A four-point tilt. Being out of an Excellent dam helps. It is nowhere near the sorting factor most of us assume it is.

Test three: did they do it twice?

Third objection, and the one that catches most single-season rankings: one hot classification round in one big herd can carry a bull’s whole year.

So we split the twelve months in half and scored every bull twice, on separate daughters.

SireFirst six monthsSecond six monthsVerdict
Blondin Detective10.29% (68)12.70% (63)delivered in both halves
Blondin Energy4.69% (64)11.43% (70)climbing hard
Golden-Oaks Master6.14% (114)7.14% (154)steady
Duckett Crush Tatoo4.60% (87)6.12% (49)steady
Farnear Delta-Lambda4.09% (416)5.52% (435)steady, average both times
Walnutlawn Sidekick1.60% (125)4.63% (108)improving off a low base
Blondin Destination4.95% (101)1.82% (55)fading
Stantons Chief3.45% (87)0.00% (67)fading
MB-Luckylady Bullseye6.47% (139)1.96% (153)collapsed
Westcoast GD Blakely7.14% (42)2.56% (39)collapsed
Drewholme Leyton P5.88% (34)0.00% (35)collapsed

Note: half-year totals may sum slightly higher than the 12-month unique totals — a cow classified in both rounds counts once in each half, but only once across the year.

Bullseye is the cautionary tale. He was running 6.47% at the halfway mark — the kind of number that sells semen — then came in at 1.96% on 153 daughters in the second half. Same bull, same year. Buy him on a six-month number and you bought a mirage. Half-year groups are small and noisy, so don’t over-read any single line; the point is which bulls are steady, not which one moved most.

And the bull left standing

Blondin Detective is the only sire in Canada that passed all three tests. He clears the statistical bar on the full board. He holds with the big show herds stripped out. He converts better on ordinary VG cows than on Excellent ones. And he did it in both halves of the year, on separate sets of daughters.

Harris is right behind him and arguably cleaner on the herd test, on 63 daughters instead of 128. Energy is the most exciting bull on the board and the one with the biggest question mark — a superb second half, and a third of his edge gone without the show herds.

Then we checked it against the official proof

Three tests down, and every one of them was ours — our metric, our data handling, our judgement calls. So here’s the fourth check, and it isn’t ours at all: does Holstein Canada’s own genetic evaluation reach the same conclusions?

We pulled the August 2026 CAN-GEBV conformation proof for every bull that matters here, straight off the individual AIS records. If you want a refresher on how those figures are built and what the percentile ranks mean, we’ve written the cheat sheet.

SireRel.Classified dtrsConformationMammaryFeet & LegsOur conversion
Blondin Driven93%117+16 (99%)+6 (88%)+19 (99%)16.0% (25 dtrs)
Blondin Detective95%319+16 (99%)+10 (96%)+17 (99%)11.7%
Kings-Ransom Dropbox95%311+9 (95%)+7 (91%)+7 (90%)9.6%
Mattenhof Harris94%224+20 (99%)+18 (99%)+11 (98%)9.5%
Blondin Energy97%768+15 (99%)+12 (98%)+13 (99%)8.3%
Golden-Oaks Master98%1,463+13 (98%)+11 (98%)+6 (87%)6.8%
Robella Major94%+17 (99%)+11 (98%)+11 (98%)6.5%
Hamming Salute92%+13 (98%)+11 (98%)+2 (65%)6.5%
Duckett Crush Tatoo99%1,572+12 (98%)+9 (95%)+7 (90%)5.4%
Farnear Delta-Lambda99%11,128+12 (98%)+8 (93%)+11 (98%)5.0%
MB-Luckylady Eye Candy98%1,219+15 (99%)+11 (98%)+12 (98%)4.9%
MB-Luckylady Bullseye98%1,574+9 (95%)+4 (77%)+6 (87%)4.1%
Woodcrest King Doc99%8,089+6 (87%)+4 (77%)+3 (72%)3.2%
Walnutlawn Sidekick99%7,949+13 (98%)+12 (98%)+2 (65%)3.1%
Progenesis Ambrose94%188+14 (99%)+8 (93%)+11 (98%)2.8%
Stantons Alligator99%7,220+11 (97%)+9 (95%)+10 (97%)2.2%
Stantons Chief99%7,443+8 (93%)+7 (91%)+2 (65%)2.0%

Rank those bulls by their official Conformation rating, then rank them by our conversion rate, and the two lists agree about half the time. That’s reassuring — the daughter scores aren’t telling a different story from the national evaluation.

But split the proof into its parts and something jumps out.

Rank them on Feet & Legs and the agreement barely drops. Rank them on Mammary System and it disappears into noise. Run it properly and only two of the five conformation measures clear the significance bar for a set this size — the Conformation composite and Feet & Legs. Mammary, Rump and Dairy Strength don’t. Statistically, they tell you nothing about which bull makes an 87.

Look at the top of the table. Driven is +19 on Feet & Legs. Detective is +17. Both 99th percentile. They’re the two highest converters in the country.

Now look at the bottom. Sidekick carries a +13 Conformation proof — 98th percentile — with Feet & Legs at +2, the 65th. He converts at 3.1%. Stantons Chief is the same shape: +2 legs, 2.0% conversion. King Doc is weak everywhere and converts at 3.2%.

Progenesis Ambrose is the sharpest disagreement on the board. A +14 Conformation proof at the 99th percentile, +11 on legs — and 2.8% conversion, below breed average, with the second-highest 86+ rate of any bull we measured. His proof says elite. His daughters say nice, not exceptional.

And then there’s the number that should stop anybody who thinks a published proof settles this.

Braedale Goldwyn’s own conformation proof is +2 — the 65th percentile — off 36,899 classified daughters at 99% reliability. That’s a middling type bull by the national evaluation. He is also, on our data, the most productive maternal grandsire in the country at 16.2%.

A proof measures what a bull’s own daughters are. It doesn’t measure what those daughters go on to breed. That’s the entire argument of the next two sections.

Look at what’s behind the ones that are working

This is the part that made me sit back.

SireBornHis sireHis damHis maternal grandsire
Blondin Detective2021Stantons AlligatorVG-86-2YROH-River-Syc Crushabull
Kings-Ransom Dropbox2020AOT HighjumpEX-96-2EClaynook Casper
Mattenhof Harris2021Farnear Delta-LambdaVG-85-2YRDuckett Crush Tatoo
Blondin Energy2020Siemers Lambda HanikoVG-86-2YRWalnutlawn Solomon
Golden-Oaks Master2017Dymentholm Mr Apples AvalancheEX-90-4YRVal-Bisson Doorman
Hamming Salute2022Mystique AvengerEX-93-2EStantons Chief
Robella Major2021Farnear Delta-LambdaEX-91Walnutlawn Sidekick
Blondin Driven2021Brabantdale AlleyoopVG-85-2YRWalnutlawn Sidekick
Farnear Delta-Lambda2015Mr Mogul Delta 1427EX-91-5YRAmighetti Numero Uno

They’re young. Every bull converting over 6% was born 2017 or later; five are 2020 or newer. Delta-Lambda was born in 2015. If your mating program runs on a list from three years ago, it’s running on the wrong generation.

And look who’s behind them. Detective is an Alligator son. Major and Driven are both out of Sidekick daughters. Salute is out of a Stantons Chief daughter, Master out of a Doormandaughter, Energy out of a Solomon daughter.

Delta-Lambda is behind them too — as a grandfather, not as a competitor. Harris and Major are both direct Delta-Lambda sons. Energy is by Siemers Lambda Haniko, himself a Delta-Lambda son. Three of the bulls now out-converting him carry his name one generation up. That’s what 11,128 classified daughters buys you: not the best conversion rate in the country, but the paternal side of the bulls that have it.

Half of them also came out of an Excellent cow — Dropbox out of an EX-96, Salute out of an EX-93, Major EX-91, Master EX-90. Whatever the ad says about the bull, somebody bred a very good cow first. Which is its own argument for the brood cows that built the breed.

Now flip the pedigree around

Same 3,756 head, counted this time by maternal grandsire — the bull who sired the dam. Average inside this group: 5.17%.

Sire of the damGranddaughters87+RateProven?
Braedale Goldwyn37616.2%Proven
Col DG Crushtime32412.5%borderline
Golden-Oaks Master26311.5%
Blondin Legend28310.7%
Stantons Alligator133139.8%Proven
Duckett Crush Tatoo3239.4%
Maple-Downs-I G W Atwood3339.1%
Walnutlawn Sidekick177158.5%borderline
Farnear Delta-Lambda155127.7%
Val-Bisson Doorman202136.4%
Stantons Chief15196.0%
Croteau Lesperron Unix217125.5%
Woodcrest King Doc9644.2%
LIRR Drew Dempsey6822.9%

Put that beside the sire board and there it is.

Stantons Alligator: 2.2% as a sire. 9.8% as a grandsire. Same bull, one generation apart, on 180 daughters and 133 granddaughters. And he’s one of the few bulls whose rate doesn’t move at all when you strip the show herds out, so that 2.2% is genuinely him.

Sidekick does the same thing — 3.1% as a sire, 8.5% as a grandsire, on 227 and 177.

Sitting on top of the maternal list: Braedale Goldwyn at 16.2%. Born January 3, 2000. Classified GP-84 himself.

His own August 2026 conformation proof is +2, the 65th percentile, off 36,899 classified daughters at 99% reliability. The best maternal grandsire in Canada is, by the national evaluation, an average type bull.

Read Goldwyn’s number carefully, though. A Goldwyn daughter still breeding in 2025–26 is, by definition, a survivor from a bull whose daughters have been culled for twenty years. The ones left are sitting in deep, protected maternal lines that have had generations of deliberate high-type matings laid on top of them. That 16.2% measures Goldwyn’s transmitting ability and two decades of selection on the cows carrying his name — and this dataset can’t separate the two. It’s still the most striking number on the board. It just isn’t a clean read on the bull alone.

Now go back to that pedigree table. Alligator sired the best young bull in Canada. Sidekick is the grandsire of two more. Chief, Doorman and Solomon each sit behind one. The bulls that look ordinary on their own daughter sheet are the ones building the sires that are getting it done.

The 86 machines: high conformation, low conversion

SireVG dtrs86+87+
Progenesis Ambrose10837.0%2.8%
Walnutlawn Sidekick22730.8%3.1%
Stantons Alligator18029.4%2.2%
Farnear Altitude-Red8230.5%2.4%

Ambrose puts 37% of his VG daughters at 86 or better — second-best on the whole board, behind only Detective — and converts to the top end at 2.8%, below breed average. He fills your barn with really nice 86-point two-year-olds and rarely gives you the one.

Milking for herd average, that’s a heck of a bull. Trying to breed the heifer that leads your string, it’s a different product. Two jobs. One number won’t measure both.

Polled and Red: the name-designated gap

Uncomfortable, so let’s put it up — with the caveat attached, not buried.

GroupVG-first cows86+87+Rate
Polled-name-designated sires (93 bulls)94217.0%121.27%
Red-name-designated sires (70 bulls)54119.4%81.48%
Everything else8,40923.0%2743.26%

These groups are sorted by registered-name designation — the -P, -PP and RED suffixes — not by a full genotype audit of all 834 sires. That matters, because a name suffix and a genetic test code aren’t the same thing.

So we spot-checked it against Holstein Canada’s own codes, which appear on every AIS record: POC (polled carrier), POS (homozygous polled), POF (tested polled-free), and coat colour as R&W or B&W with RDC for red carriers.

Where we hold those codes, the name-sorting held up. Nine polled-named sires, covering 536 of the group’s 942 daughters — 57% — all came back POC or POS: Vogue A2P2-PP (POS), Vogue Illustrator-P (POC), Cherry-Lily Zip Luster-P (POC), Drewholme Leyton P (POC), Vogue Impact-P (POC), Drewholme Logic PP (POS) and others. Six red-named sires covering 257 of 541 red-group daughters — 48% — all came back R&W. Among every sire whose code we hold, exactly one carried polled genetics without a polled suffix, and none was coded R&W without RED in the name.

That’s a spot-check, not a full audit. Call the finding directional: polled-designated daughters are reaching the top end at less than half the rate of everybody else across 942 head, and the biggest polled-named sires say the same thing alone — Vogue A2P2-PP, 135 VG daughters, two at 87 and only 10.4% at 86+.

Two more honest caveats. Polled bulls skew younger with smaller daughter groups, which drags a top-end rate down by itself. And this is type at the extreme — no production, no health, no polled premium at the calf sale.

If the type gap on polled has closed, it hasn’t closed at the top of the Canadian score sheet yet.

Feet and legs: the trait nobody’s buying

Canadian classification weights it Mammary 42%, Feet & Legs 28%, Dairy Strength 20%, Rump 10%.

Of the 293 cows at 87 and 88: 273 scored 87 or better on mammary. Only 147 — barely half — scored 87 or better on feet and legs. Feet and legs was the weakest of the four sections on 42% of all 3,756 head, when chance says 25%.

Look at how differently the two sections behave inside that top group. Mammary acts like a floor: not one of the 293 scored below 85 on it, and 290 of them were 86 or better. Feet and legs acts like a spread — it runs from 83 all the way to 91 inside that same group of cows, and it sits below the cow’s own mammary score on 178 of the 293. Across all 3,756 animals, feet and legs averages 0.83 of a point lower than mammary on the very same cows.

So mammary is the prerequisite and feet and legs is the bottleneck. She isn’t in the conversation without the udder; she doesn’t get out of the 85s without the legs. That fits what breeders have always said about classifiers grading legs harder than udders on a young cow — though that’s our reading of the spread, not a published rule.

All of which is before you count what those legs are worth in her third lactation, which we’ve been through elsewhere.

And you can see it on the bulls, twice over. In their daughters: the five sires averaging 85.0 or better on feet and legs are Driven (85.96), Energy, Detective, Alpha and Dropbox — three of them top-six converters, and Driven would be first on the board if he had the daughters to qualify. And in their proofs: F&L rating tracks top-end conversion almost as closely as the whole Conformation composite does, while Mammary System barely tracks it at all.

The bulls getting it done are, mostly, the bulls fixing the thing everybody buys last.

What about the magic cross?

I went looking for it. Genuinely expected to find it.

We tested 147 sire-on-grandsire combinations with five or more daughters. Three came back looking special: Eye Candy on King Doc dams (3 of 16), Bullseye on Alligator dams (4 of 28), Destination on Delta-Lambda dams (2 of 12).

Here’s the problem. Check 147 combinations and roughly seven will look special by pure chance. We found three — fewer than random noise would have handed us. That includes the most-repeated cross in the country, Delta-Lambda on Sidekick dams: 64 head, 9.4% against his 5.0%, still inside the range of luck.

So no. The magic nick isn’t in this data. What’s real is the bull, the maternal line, and — as test two showed — the match between a bull and the kind of cow you’re putting him on.

The nine at 88

CowSire × grandsireDamMSF&LDSRP
Craila Memory BlackoutBlondin Memory × Delta-LambdaVG-86-3YR88879091
Desperle Chalou Delta LambdaDelta-Lambda × SidekickEX-9089879088
Earincliffe Unix DestinyUnix × Mystique AvengerVG-89-2YR88879088
Eastriver Lambda Life 38Delta-Lambda × Claynook BaroloVG-86-2YR88898790
Fraeland Beckridge Energy BrieBlondin Energy × SidekickVG-87-2YR89878990
Karnview Harris ReflexMattenhof Harris × AlligatorVG-86-2YR91878990
Maifield Lambda MoniqueDelta-Lambda × Val-Bisson DoormanEX-90-2E89869188
Milibro Enzo RoselianzaWilt Enzo × Duckett Crush TatooEX-93-4E89908690
Walnutlawn Bullseye SadieBullseye × AlligatorVG-87-4YR89889087

Three Delta-Lambdas — out of 827 daughters. One Harris, one Energy — out of 63 and 132. Sidekick twice as grandsire, Alligator twice. Not one of the nine came out of a GP cow.

So what do you do with all this?

Detective is the bull of the year, and it isn’t close. Only sire to pass all three tests.

Match the bull to the cow you actually have. Detective and Energy upgrade a plain VG cow. Sidekick and King Doc need her to already be Excellent — Sidekick got seven 87s out of 97 EX-dam daughters and zero out of 102 VG-dam daughters. Same bull. Different cow. Completely different outcome.

Don’t judge a bull only on his own daughters. Alligator converts at 2.2% and sired the best young bull in Canada. Sidekick converts at 3.1% and is behind two more. If you’ve got Alligator or Sidekick daughters in the barn, you’re sitting on a maternal group other people are paying for.

Read the legs line on the proof, not the composite. Detective is +17 on Feet & Legs and Driven is +19, both 99th percentile — the two best converters in the country. Sidekick carries a 98th-percentile Conformation proof with legs at the 65th, and converts at 3.1%. The composite hides exactly the trait that decides an 87.

Ask how many daughters, and ask for two seasons. Twenty-two of the 46 bulls beat the breed average. Six beat it by enough to prove it. And Bullseye beat it at the halfway mark before falling to 1.96%.

And remember what this metric is. It’s conversion efficiency inside the VG class. A bull who gets three-quarters of his heifers to VG in the first place may hand you more elite two-year-olds per straw than a bull who ranks above him here. Read this board next to a real proof, not instead of one.

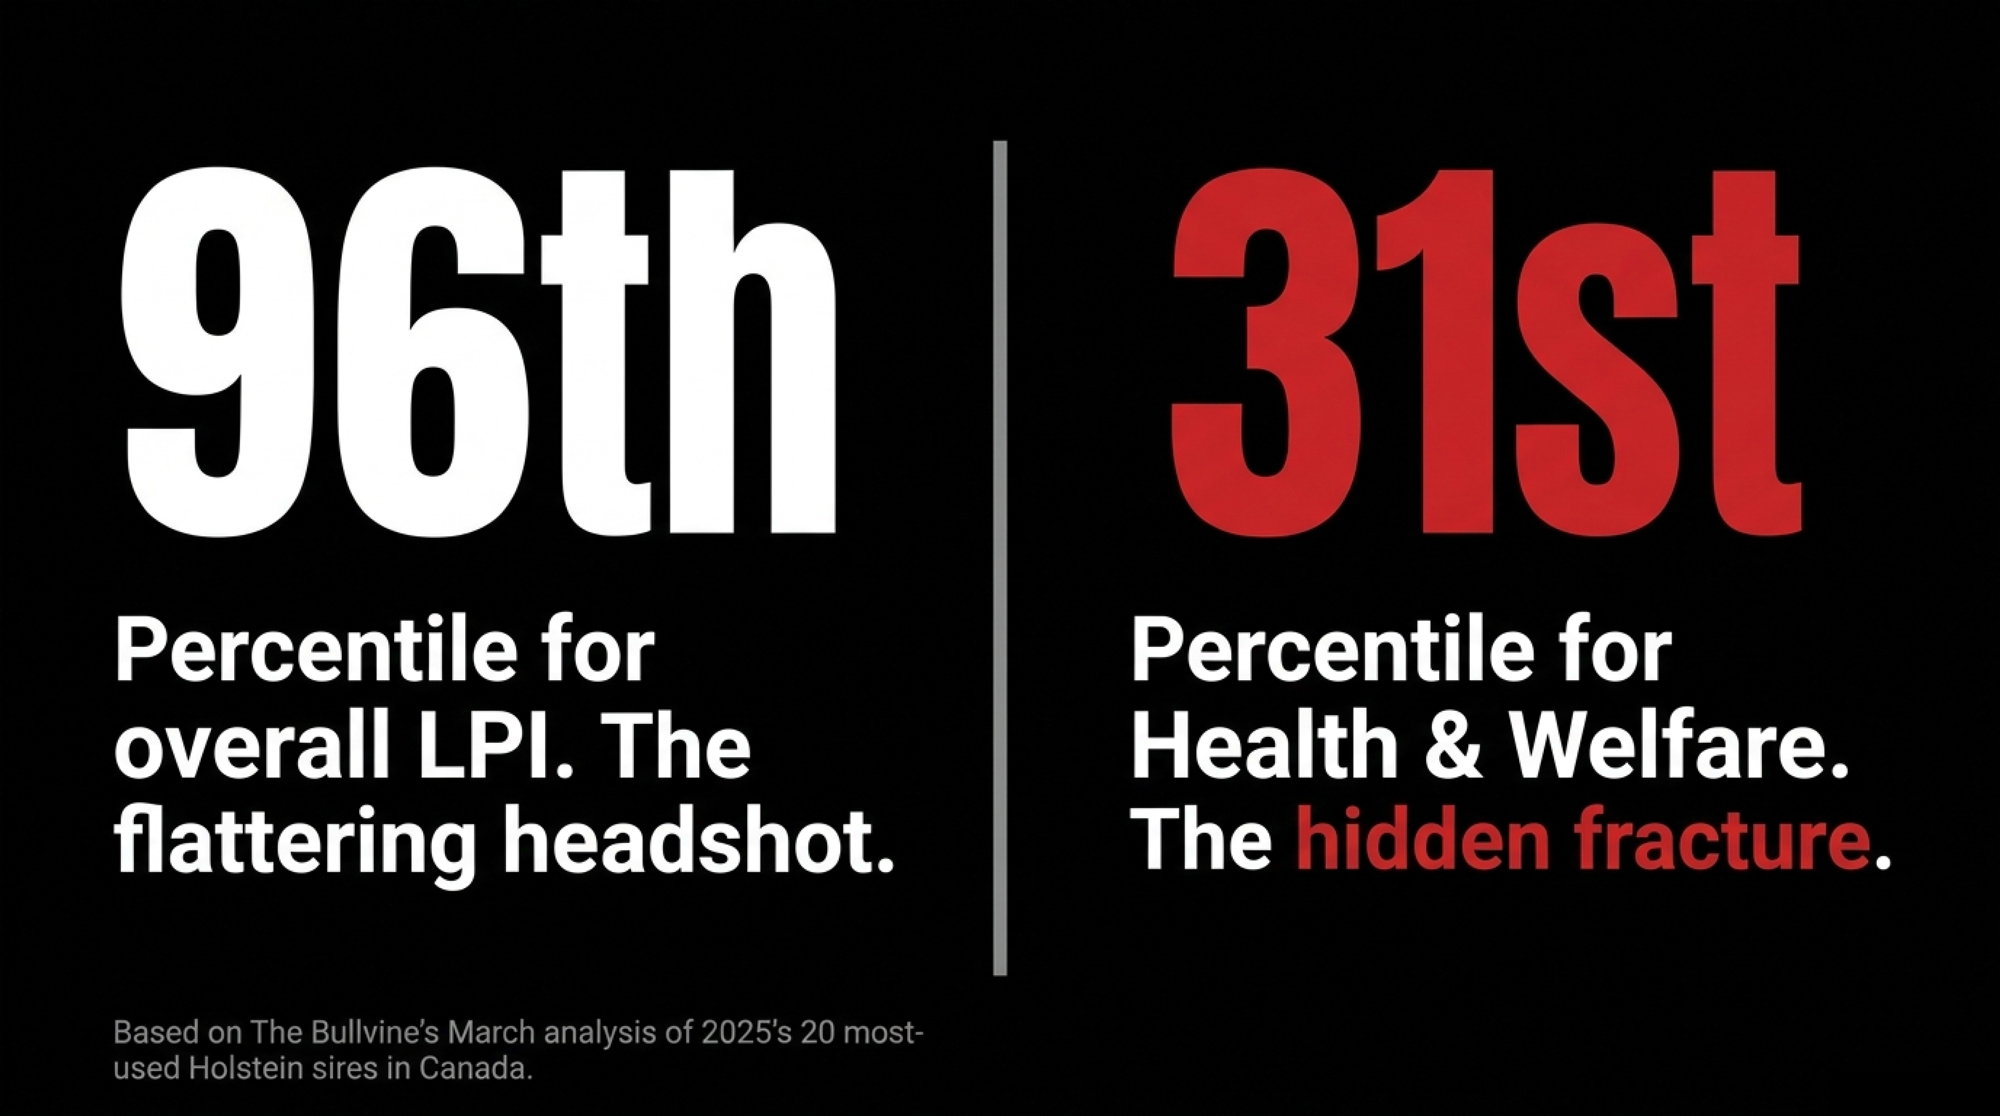
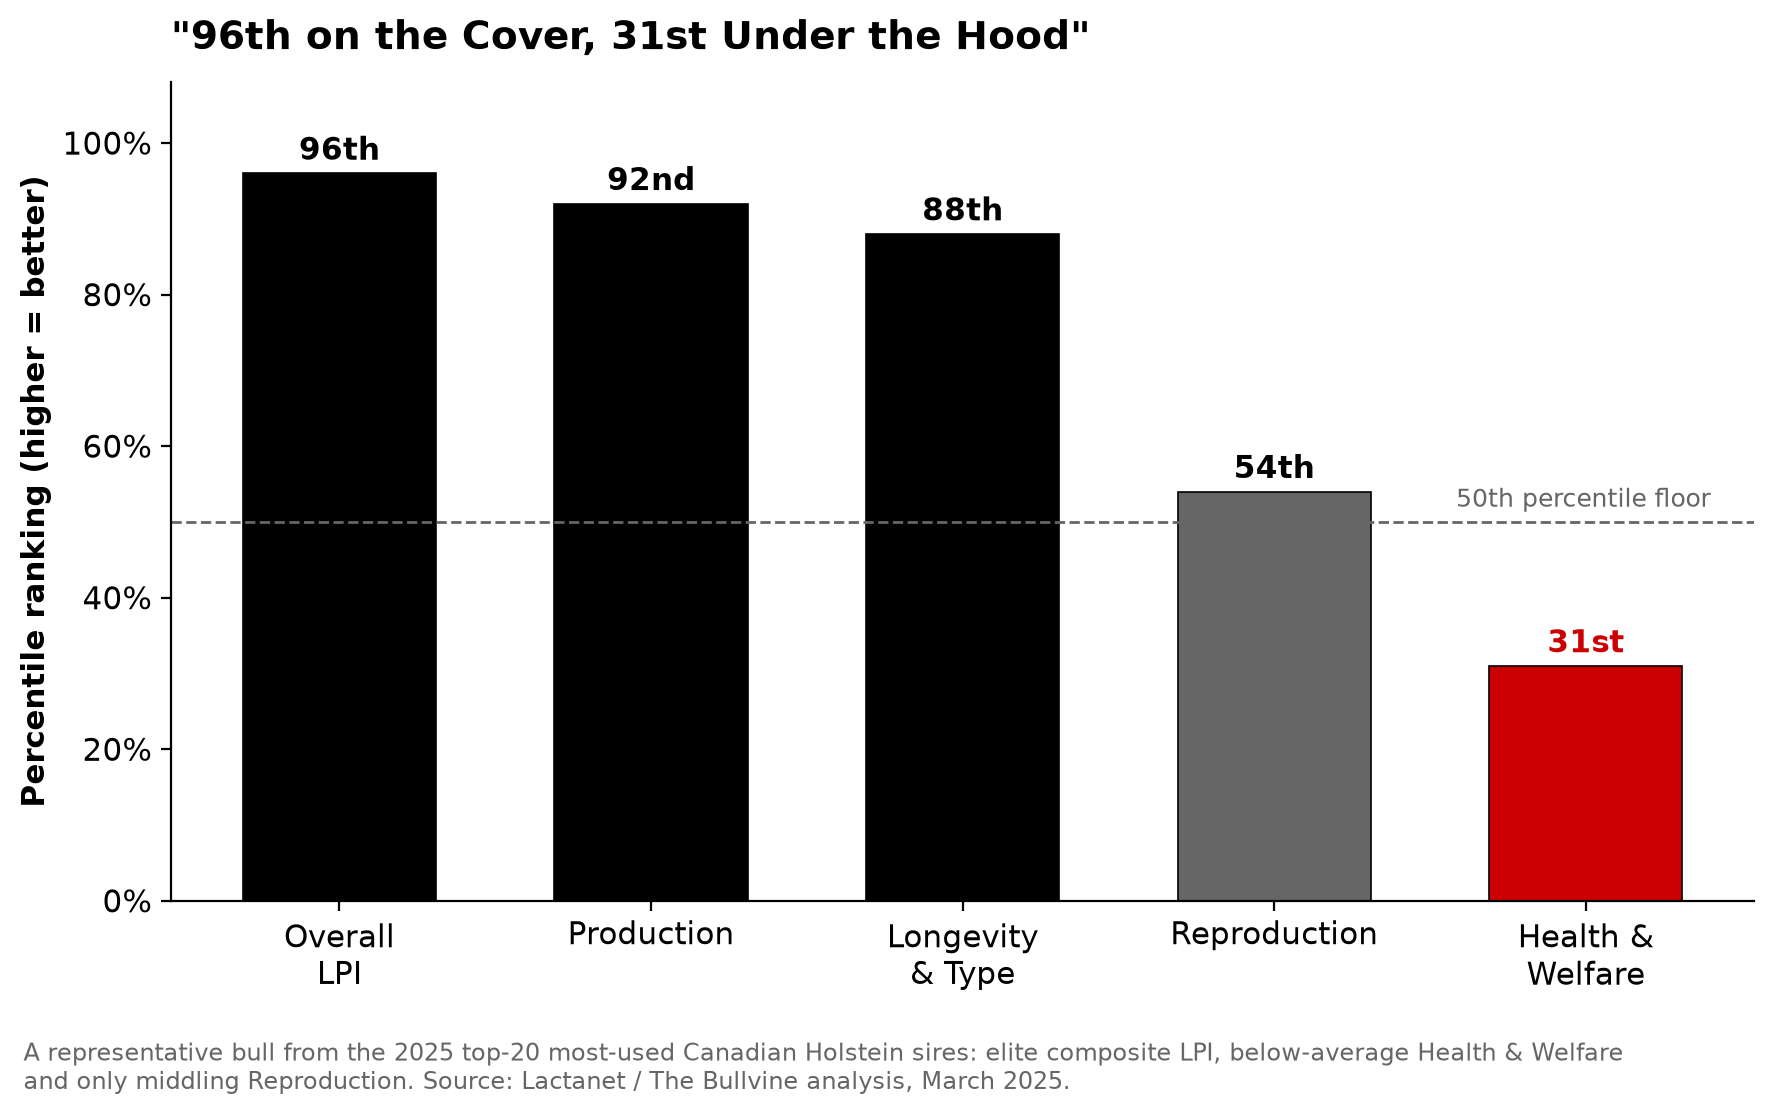
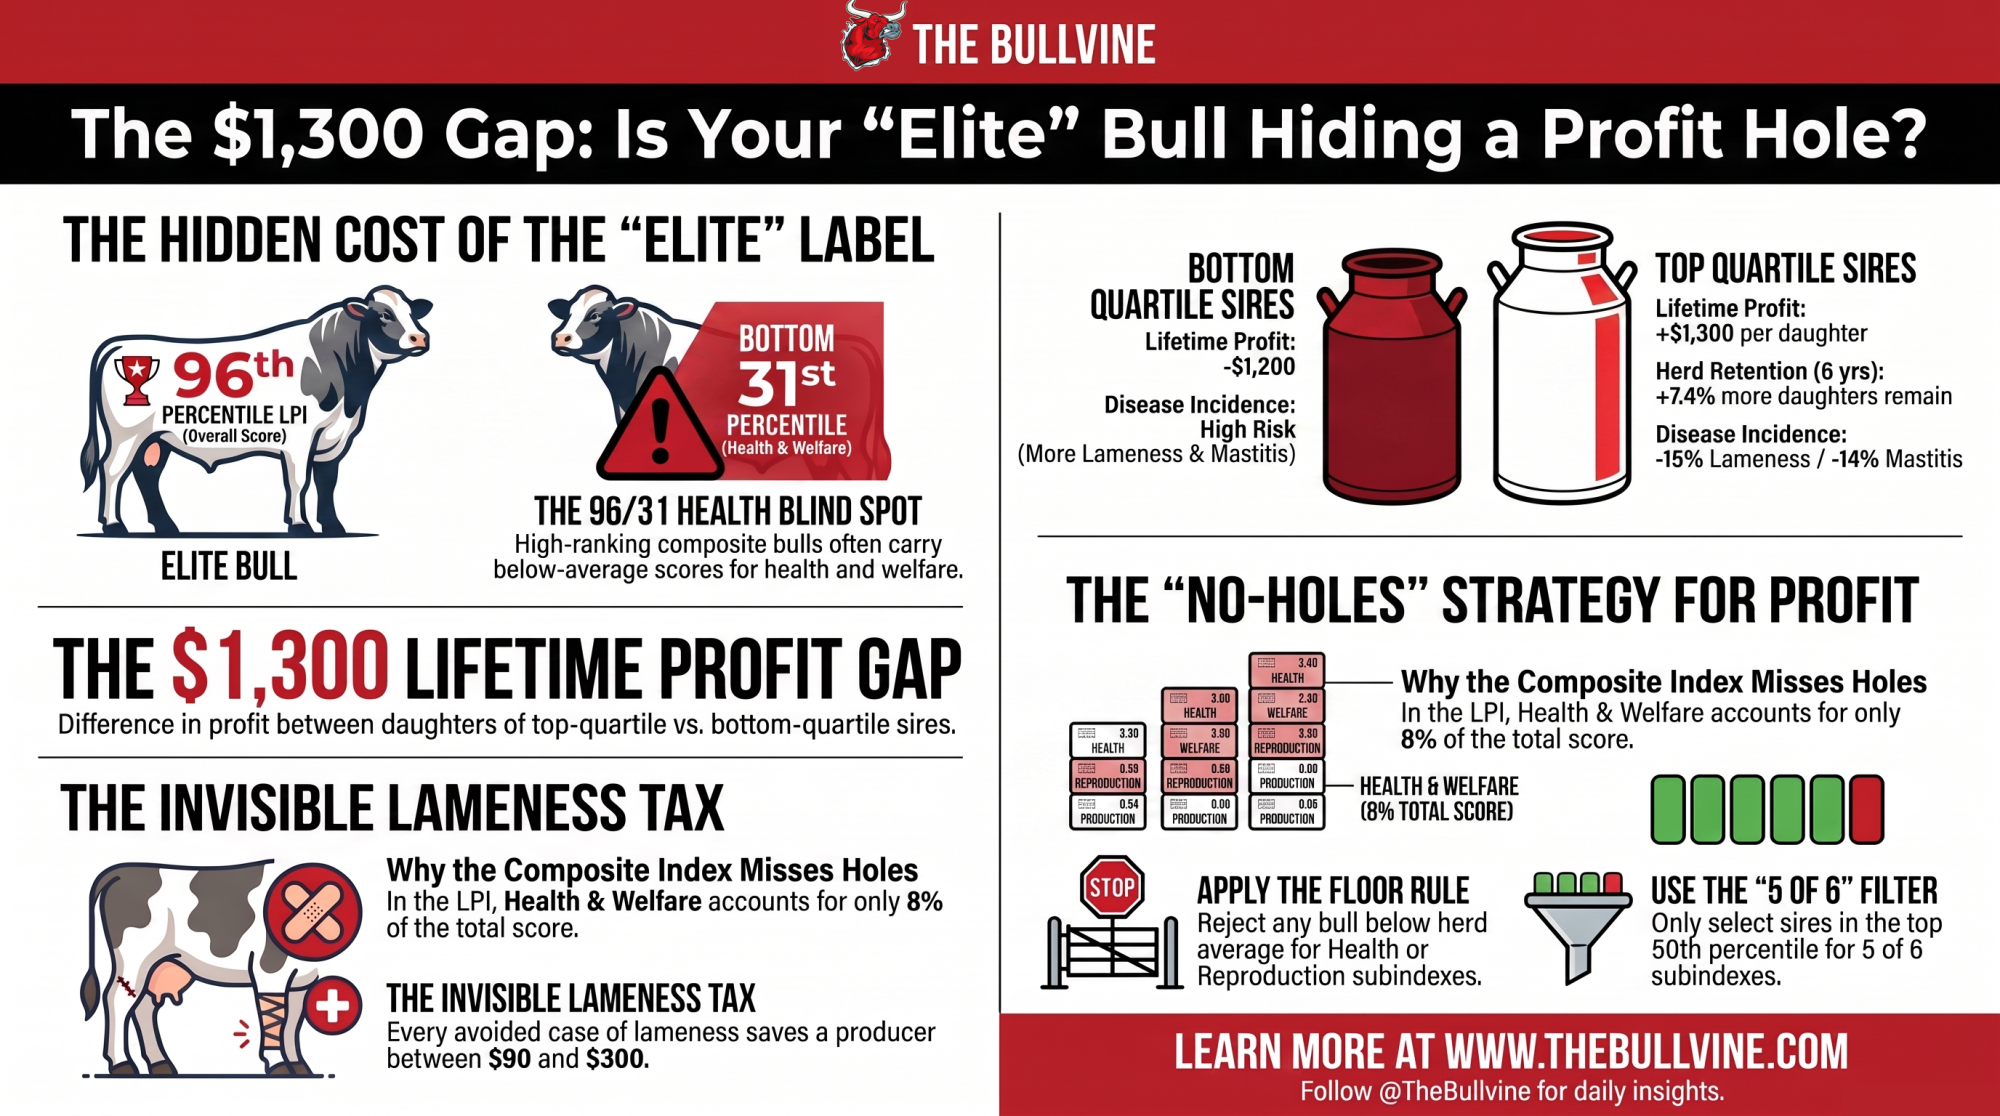
And keep type in its place. Our own look at Canada’s twenty most-used Holstein sires found them averaging the 96th percentile for LPI and the 31st percentile for reproduction, at 11.9% inbreeding (The Bullvine, March 2026). A barn full of 87-point two-year-olds that won’t settle isn’t a breeding program. Make the type call after the fertility and health call, not before it.

That’s the board, the three tests, and the proof check. Six bulls beat the breed rate on the numbers. One beat every attempt we made to break him.

So — which bull on this board would you defend? We have the figures on all 834 sires. Name one in the comments and we’ll pull his card.

Quick answers

  • Which Holstein sire produces the most VG 87 two-year-olds in Canada? By raw count, Farnear Delta-Lambda — 41 of the country’s 293 top scorers in the twelve months to September 8, 2026. By conversion efficiency, Blondin Detective, who converted 11.7% of his VG daughters to 87 or better against a breed average of 2.97%.
  • What percentage of VG first-lactation cows score 87 or better? 2.97%. Of 9,860 females receiving a first-time VG score in Canada over the twelve months to September 8, 2026, 284 scored 87 and nine scored 88.
  • Does the maternal grandsire affect classification score? On this evidence, more than most breeders price in. Stantons Alligator daughters produced 87-point granddaughters at 9.8% while Alligator’s own daughters converted at 2.2%. Braedale Goldwyn, himself only GP-84, is the top maternal grandsire at 16.2% — though that figure carries twenty years of maternal selection inside it.
  • Does a high Conformation proof mean a bull will make 87-point two-year-olds? Only partly. Ranking bulls by August 2026 CAN-GEBV Conformation and by their VG conversion rate produces broadly similar lists, but the Feet & Legs figure tracks conversion nearly as well as the whole composite while Mammary System barely does. Progenesis Ambrose holds a +14 Conformation proof at the 99th percentile and converts at 2.8%, below breed average.
  • Which trait decides whether a two-year-old scores 87? Feet and legs. Mammary is close to a precondition — 273 of the 293 top cows had 87 or better there — while only 147 reached 87 on feet and legs, the section carrying 28% of the Canadian scorecard.

How we did it

Where the numbers come from. Holstein Canada’s public Top Classifying Cows report, “VG 1st” setting, visit dates September 8, 2025 to September 8, 2026, pulled September 8, 2026 (holstein.ca). Pedigrees, birth dates, dam scores, genetic and coat-colour codes and section scores from individual Holstein Canada Animal Inquiry Service records (portal.holstein.ca).

Counting rules. The report returned 11,226 owner rows and 10,190 animal-score records. Co-owned cows appear once per owner, and 327 cows were classified more than once inside the window. Every figure is built on unique animals at their highest score: 9,860 head, 834 sires. Breakdown: 85 (7,666), 86 (1,901), 87 (284), 88 (9). The herd counts in Test One are the one place we count owner listings instead of animals, and say so.

The metric. VG Conversion Efficiency Ratio = share of a bull’s VG first-lactation daughters that scored 87 or better. Breed baseline 2.97% (293 of 9,860). This is conditioned on the daughter having classified VG — it is a within-VG efficiency measure, not an absolute probability across all a bull’s daughters, and a sire with a higher share of heifers reaching VG in the first place may produce more elite two-year-olds per straw than his position here suggests. The 5.17% figure in the maternal-grandsire, cross and stress-test sections is the rate inside the twenty-leading-sire group those tables are drawn from — a tougher benchmark, kept separate throughout.

The three tests. Test one removes every cow whose listed owners include any of the ten herds appearing most often among the 293 top scorers (184 cows) and re-computes on what remains; that table’s baseline is 4.28%, not 5.17%. Test two splits each sire’s daughters by the dam’s own final classification (EX or VG), for sires with at least 30 daughters in both tiers — subgroups under 50 head per tier are observational snapshots, not established proof lines, and only Delta-Lambda, Eye Candy, Master, Bullseye and Sidekick carry 50-plus in both. Test three splits the twelve months into September 8, 2025 – March 8, 2026 and March 9 – September 8, 2026, computing each half independently at unique-animal level, for sires with 30 or more daughters in both halves; half-year movements are consistency checks, not trends.

Polled and red classification. Groups were assembled from registered-name designations (-P, -PP, RED), then spot-checked against Holstein Canada’s AIS genetic and coat-colour fields (POC / POS / POF; R&W / RDC / RDF). Codes were available for nine polled-named sires covering 57% of that group’s daughters and six red-named sires covering 48% of the red group’s daughters; every one matched its name designation. Exactly one sire in our code set carried polled genetics without a polled suffix. A full genotype audit of all 834 sires was notperformed, so these are name-designated groups and the finding is directional.

Official proofs. Conformation ratings, section ratings, percentile ranks, reliability figures and classified-daughter counts are the August 2026 CAN-GEBV evaluation as published on each bull’s Holstein Canada AIS Genetics record, read individually. Agreement between proof rankings and conversion rankings is measured with Spearman rank correlation across the 17 bulls we hold both figures for: Conformation +0.54, Feet & Legs +0.50, Mammary System +0.19, Dairy Strength +0.02, Rump +0.12. With 17 pairs, the 5% significance threshold sits at roughly ±0.48. Conformation (+0.54) and Feet & Legs (+0.50) clear it; Mammary System (+0.19), Rump (+0.12) and Dairy Strength (+0.02) do not, and are effectively indistinguishable from zero. Seventeen bulls is still a small set — treat the ordering as a signal, not a settled result. Robella Major’s and Hamming Salute’s classified-daughter counts were not displayed on their records and are shown as dashes.

Statistics. “Could really be” is a 95% normal-approximation confidence interval. Each sire is compared against the rest of the population with a two-sided two-proportion z-test. The “Proven?” column applies a Benjamini-Hochberg false-discovery correction across all 46 sires; the same logic applied to the 147 crosses kills every one of them. Bulls with zero 87s have no valid interval. The three stress tests are descriptive comparisons, not significance tests — the sub-groups are too small, and we’ve said so rather than dressing them up.

What this is not. The report lists only cows that classified VG, so daughters scoring GP or lower are invisible and this is not a daughter proof and not a genetic evaluation. A bull with 300 VG and 700 GP daughters looks identical here to one with 300 VG and 50 GP. There’s no reliability figure, no contemporary-herd adjustment, and no correction for the fact that semen doesn’t land randomly across herds. Classification is round-based and regional. On age: a 200-record sample found 179 scored 2-YR, 14 3-YR and 7 1-YR — a two-year-old population, but not purely. Twelve months is one window. National figures may not match your region, your barn or your management.

Corrections. We publish them. If you have a figure that doesn’t match what’s here — especially your own herd’s — send it and we’ll check it against the source records.

Disclosure. No bull, stud, owner or breeder named here had anything to do with this analysis, saw it before publication, or paid The Bullvine a cent. Every number came out of Holstein Canada’s public records.

Learn More

Every Tuesday Dann Brady Throws Out Bulls He Likes. One of Them Wasn’t Logic PP

The screen kills bulls the team genuinely wants. It also produced Canada’s #1 Newly Proven GLPI sire — and a 70-head sale that cleared at €6,729.

Dann Brady is the guy who says the industry spent twenty years telling breeders not to bother looking: “Ah, you’re busy, Mr. Dairyman, don’t worry about it. We’ll make the mating for you with our computer.”
His answer: “That’s not the way we were raised.”

Nicolas Lalande answered the question in French, and the translation landed harder than the original.

He’s looking for bulls without holes.

Not the highest bull on Tuesday’s genomic list. A balanced one — and Lalande put a ceiling on how much imbalance he’ll accept: one weakness. That’s it. Stack a sire’s weak trait onto a cow’s weak trait and you’ve bred a daughter with a hard ceiling on production, on herd life, or both.

Logic PP is what survives that screen. Homozygous polled, Conformation 16 at 93% reliability, full classified and milk-recorded maternal line behind him — and in August, Canada’s #1 Newly Proven GLPI sire, #3 overall. Plenty of bulls Dann Brady liked more on paper never made the list because their second dam was a blank.

On August 29, 2026, on the eve of the Welcome to Wilcor Sale in Lower Saxony, that screening rule was put under the spotlight. The next day, 70 head averaged €6,729 to buyers across seven countries. The money was in the ring, but the engine was in the semen tank.

Every Tuesday, the Same Disappointment

The catalogue and the gavel, minutes before the ring opened. August 29, 2026, 18:30, at Wilcor Holsteins in Warmsen — Blondin Sires listed as Hauptsponsor, online bidding live through GeneticsSale. Cord Hormann’s name is pencilled on the cover in his own hand. Seventy lots. Two operations. One screening rule underneath all of it.

Ferme Blondin milks 250 Holsteins in a sand-bedded freestall at St-Placide, Quebec, farms close to 2,000 acres, and carries roughly 1,000 head all told. They flush five to eight donors every Thursday. Brady does the matings. And roughly ten years ago he kept hitting the same wall.

“We couldn’t find the pedigrees that we wanted to use,” he said. “They didn’t have the full pedigrees, they didn’t have the classification or milk recording.”

Genomics was accelerating at the time, and Blondin was — still is — a believer in it. The technology wasn’t the problem. The problem was that high-genomic young sires kept arriving without classified, milk-recorded dams behind them. So Brady and the Lalandes built their own stud. Health testing, collection, bull housing, the regulatory paperwork. None of which any of them had done before.

“There was a lot to learn,” Brady said.

Tuesday is genomic day at Blondin, and a decade in, it still produces the same frustration on repeat: a bull the team genuinely likes, then a pedigree check that turns up an unclassified dam or an unrecorded second dam.

“That’s actually the hardest thing we do every week,” Brady said. The payoff, in his telling, is more reliability and more structure than studs that accept bulls with incomplete maternal records — a distinction that separates studs building from verified cow families from those buying genomic numbers off the weekly list.

Thirty Cows, Twelve Excellent, and the Same Filter

Cord Hormann of Wilcor Holsteins isn’t running a big program. He milks around thirty cows on 70 hectares at Warmsen — twelve Excellent, fourteen Very Good, nothing below that. (Read more: Rising to Excellence: The Remarkable Journey of Cord Hormann and Wilcor Holsteins)

That’s the whole herd. And it arrived at Brady’s standard independently.

Hormann credits a mentor, Rolf Klöcker, with shaping the approach — deep pedigrees, generations of highly classified dams, serious milk behind them.

“Components are important too, but it’s the families, and it always comes back,” Hormann said.

When he started buying embryos overseas, he bought only out of full pedigrees with no holes, mostly EX-90-and-above dams. Holstein International profiled Wilcor in 2022 as one of the best addresses for conformation in Germany, built on cows like Wiesenfeld Austrias Magic Talent EX-92, Curtat Shottle Benzouka EX-93, and Le Moal Lheros Elaniss EX-94 — a profile that predates the Blondin partnership, which matters when weighing how independently the two operations landed in the same place. Blondin Sires now co-owns Wilcor’s show string.

The banners came regardless. Wilcor O’Kaliber Louella took both Grand Champion and Intermediate Champion at the 52nd Schau der Besten in Verden this past February, under the joint Wilcor / Blondin banner. Stablemate Wilcor Chief O’Katy stood Reserve — after winning the whole show the year before, at the 51st, on February 27, 2025.

Cord Hormann takes the Grand Champion trophy for Wilcor Chief O’Katy at the 51st Schau der Besten, Verden, February 27, 2025 — a globe wrapped in the flags of competing nations, handed over under Masterrind’s banner. Twelve months later O’Katy stood Reserve at the 52nd while stablemate Wilcor O’Kaliber Louella took Grand and Intermediate. Both out of thirty cows on 70 hectares.

Two Grand Champion banners in two years, out of a 30-cow barn.

Dann Brady’s view from the block, reading pedigrees at Warmsen the way he did years ago at the After Show Sales. A packed tent, an animal on the shavings, and buyers from seven countries who’d come to look at maternal lines. Seventy lots went through here. Not one went home.

Can You Really Cap a Bull at One Weakness?

Back to Lalande’s rule, because there’s a mechanism underneath it that’s easy to miss.

“The bulls need to have some strengths, and the strengths are really important,” he said. “But the weak points of every cow is what limits her from producing more, from living longer.”

The logic is subtractive, not additive. A cow strong in a given trait can carry a sire who’s merely neutral there. Put his weakness on top of hers in the same trait, though, and the daughter inherits the ceiling. So Lalande caps candidates at one weakness — then places that weakness deliberately, against an area where the cow is already strong.

Simon Lalande, working the pens at Wilcor the afternoon before the sale, with the catalog open, gives every animal a careful look and an honest evaluation.

He layers a second filter on top: prioritize highly heritable traits, because those are the ones a sire actually transmits. Chasing a low-heritability trait through sire selection is a slow way to be disappointed.

The clearest example sits in Blondin’s own barn. They breed Salute to Detective and Detective to Salute, because each bull covers what the other lacks. Reciprocal matings, arranged around complementary gaps.

Two or Three Traits. Then Stop.

Arnold Grings, a breeder watching from Luxembourg, asked how show enthusiasm survives as farms consolidate and labour gets thin. Brady’s answer had almost nothing to do with shows.

“It’s not rocket science,” he said. “We try and pick two or three traits we want to improve and that’s it.” No magic formula, in his framing, is going to fix ten things on a cow in a single breeding — the genetics have to come together, and too many small targets never match up.

Then he named what he thinks went wrong across the industry. “People were starting to get confused with all the mating programs and all of the new indexes and this trait and that trait. And for us, we just brought it back to being simple.”

Brady’s characterization of the pitch breeders heard for years: don’t worry about it, we’ll make the mating for you with the computer. In his reading, that convenience cost breeders the habit of looking hard at the bulls they were using. “That’s not the way we were raised.”

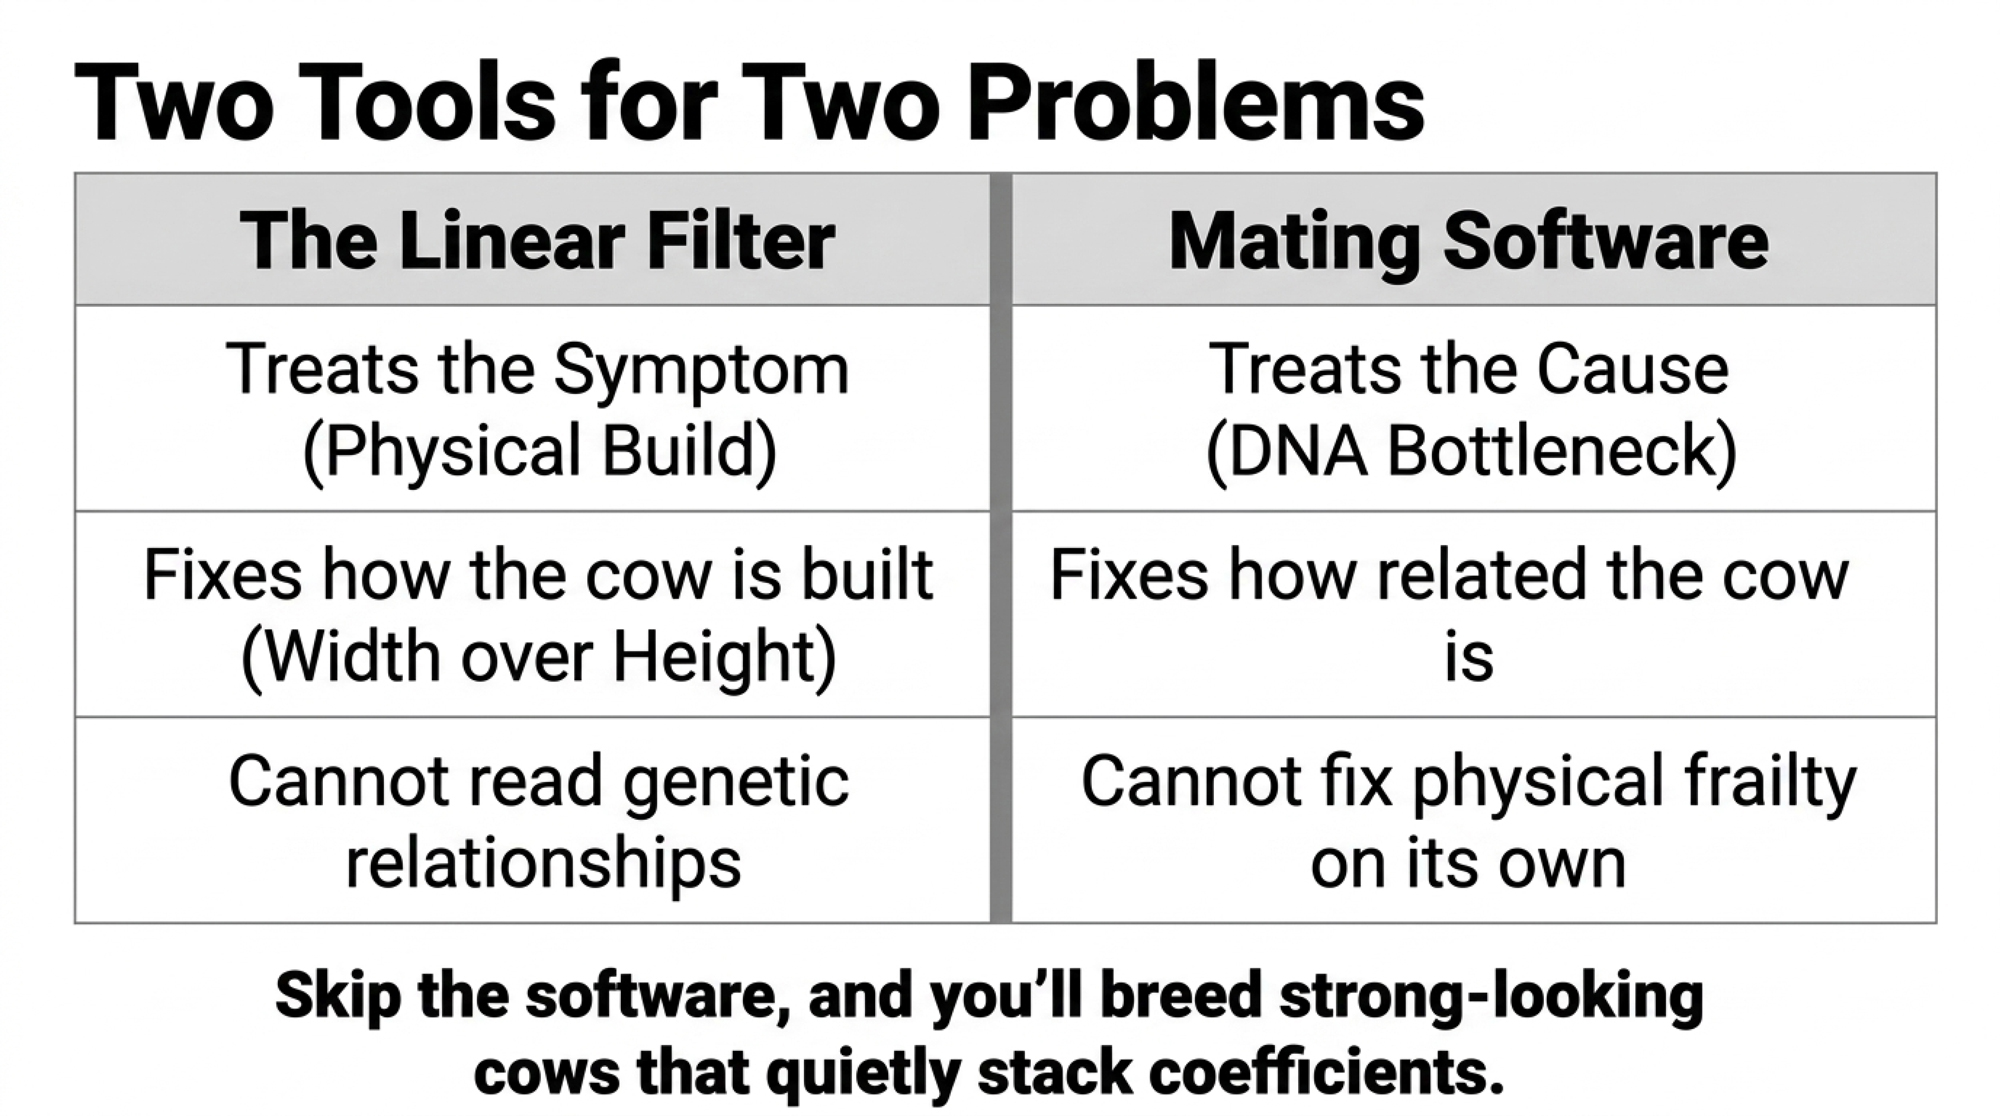
It’s an argument that directly challenges the algorithmic, corrective-mating software major studs have sold for the better part of two decades — and Brady co-owns a stud that benefits when breeders pick their own bulls. But whether driven by stud philosophy or commercial pragmatism, the genetic reality holds: selection pressure diluted across ten traits moves none of them.

Setting the sale order at Ferme Blondin, done the way Blondin does everything else: in a room, out loud, with the pages spread across the table. Eight people, one laptop, and a lot of pointing at photographs. The Thursday mating calls happen the same way — Brady, Nicolas, Carscadden and whoever else is around, on five to eight donors at a time. “It’s always the biggest decision of the week,” Simon Lalande says. There’s no software in this photo.

They Milk 250. They Show 15.

Brady spent more energy correcting one thing than anything else: the idea that Blondin is a show operation with a semen business attached.

They milk 250 cows. They take 10 or 15 to a show in a given year.

“Shows are just cows that have been washed and clipped up and look good,” he said. “The reason they look good is because we design them that way so they can live a long time and produce a lot of milk. That’s the idea of a show cow.”

Simon Lalande tied it to payroll. “First, we are milking cows every day. We make our living milking cows. We have lots of employees at the farm and we need to be able to pay them.”

Which produces a trait list that reads more like a freestall survival checklist than a show catalogue:

TraitWhy it’s on the list
Correct feet and leg setNot too straight, not too sickled — a bad leg doesn’t last on concrete
Wide chestPower to push into a full bunk and walk to the parlour twice a day
Rump angleThe trait Brady says other studs quietly ignored
UdderBuilt to milk through several lactations, not one

On rump angle he didn’t hedge: “There was so many high rump angle bulls at that time. We just didn’t use them.” Go through the Blondin list, he said, and you’ll find very few bulls even a little high in the rump — and none that are really high. Canada’s classification system tracks the trait closely, and Blondin leans on that.

Simon Lalande’s version of the whole philosophy fits in one line: solid frame, good udder, good legs, more lactations, more profit.

What a Half-Lactation Is Actually Worth

Lalande made the longevity-to-profit argument on air but never put a number on it. So here it is as a scenario — not a measured result. Substitute your own herd life and heifer cost and the shape holds.

  • Baseline: 250 cows at 2.8 lactations = 89 replacements a year.
  • Target: 250 cows at 3.3 lactations = 76 replacements a year.
  • Net: 13 fewer heifers needed, roughly $27,000 saved annually at $2,000 a head.

The half-lactation gain is my estimate, not a Blondin claim — nothing in the broadcast ties their trait targets to a specific herd-life figure. And the model leaves something out: fewer replacements also means fewer surplus heifers to sell. If you’re moving heifers into a strong market, net the two against each other before you bank the number.

But it explains why a stud known for type keeps talking about feet, legs, and udders instead of banners.

Robots Are Rewriting the List Right Now

The pressure Blondin watches hardest isn’t the show ring. It’s labour.

“There’s just not enough workers anymore,” Brady said. A large share of Canadian herds have gone to robots — he declined to put a percentage on it, and this article won’t invent one.

The effect on sire selection is concrete. Blondin now watches daughter fertility, milking speed, and teat placement closely. Brady noted that every robot-focused breeder seems to weight a slightly different udder trait — teat placement for some, teat length for others, reverse teat angle for others still. He gave the Canadian evaluation system specific credit for adapting to those traits.

Here’s the version with a deadline attached. If a robot conversion is inside 24 months, pull the milking speed and teat placement values on every sire currently in your tank before your next semen order goes in — call it the next 30 days. Drop anything below breed average on either trait. The cows milking in your box three years from now are the ones you’re breeding this quarter, and no retrofit fixes a teat you bred into the wrong place.

Elite Type Is Wearability in Show Leather

Here’s where the show ring and the milk cheque stop being separate arguments.

Every trait on Blondin’s freestall list is a durability trait. Correct legs, wide chest, an udder built for multiple lactations — those are the same characteristics a judge rewards, described in commercial terms. A cow that scores well is a cow built to still be functional in her fourth lactation, and Nicolas Lalande put the money on that directly.

On a large operation, breeding for type isn’t a hobby line item. It’s a second revenue stream. Cows that last longer produce more sellable calves, and with North American beef-cross calf prices at levels he described as the highest he’s seen, every extra pregnancy out of a functional older cow is margin — a beef-cross calf into a strong market, or an embryo contract on a female whose record is now long enough to sell.

Lot 15, written in ballpoint. Blondin Salute Shatter VG-87 as a two-year-old with an 89-point mammary, third Winter 2-Yr-Old at Quebec Spring Show 2026 and fourth at ON Spring Discovery — and 101 ovocytes with 62 embryos already on her record. Dann Brady marked the price on his own catalogue page: $200,000, the top of Blondin’s own summer sale.

Which is why the cow families come next. They aren’t nostalgia. They’re the accumulated evidence of which lines stay functional long enough to keep paying.

Eight Generations, and One Trip to an Anniversary Show

Both operations argued that families outperform individual animals. Both had receipts, and Simon Lalande’s went personal.

His father was a good farmer and a good milk producer with no purebreds at all. But he took one trip to a Holstein Canada anniversary event and came home with a Warden-sired female from the Supra family. Lalande bred her to Starbuck, kept building on her, and that line has produced for him ever since. It’s the family he’s most attached to — alongside the Barbies, the Jasmines, and the Apples the operation has invested in since.

“Very rare that you’re going to be disappointed when you invest money in a great cow family,” he said. “Sometimes you can fail in one generation, but then the generation after, it comes back.”

There’s a longer arc behind that. Ferme Blondin has been farmed by the Lalande family since 1672 — eight generations — and the herd carried two Master Breeder shields as of 2016. Nicolas is Simon’s son and a co-owner of Blondin Sires alongside his father and Brady, stud code 799. So when Simon describes his own father’s single purchase and Nicolas talks about cow families, that’s four generations of the same decision compounding.

O Katy of Wilcor Holsteins stands triumphantly amid a shower of confetti after being named Grand Champion at the prestigious 51st Schau der Besten in Verden, Germany. Her exceptional dairy strength, balanced frame, and remarkable udder quality caught the judge's eye, continuing breeder Cord Hormann's legacy of excellence. This victory marks a remarkable achievement for the German breeding program that emphasizes quality over quantity, proving that with patience, attention to detail, and commitment to deep cow families, championship results are possible regardless of herd size.

O Katy of Wilcor Holsteins stands triumphantly amid a shower of confetti after being named Grand Champion at the prestigious 51st Schau der Besten in Verden, Germany. Her exceptional dairy strength, balanced frame, and remarkable udder quality caught the judge’s eye, continuing breeder Cord Hormann’s legacy of excellence. This victory marks a remarkable achievement for the German breeding program that emphasizes quality over quantity, proving that with patience, attention to detail, and commitment to deep cow families, championship results are possible regardless of herd size.

Hormann’s version runs on a different clock. O Katy descends from O’Kalibra, the Swiss cow he bought embryos from before her show career took off. That purchase produced exactly one pregnancy: a red-carrier daughter who went on to market a string of high-priced calves. A great-granddaughter of that line became O Katy — a chain Hormann traced himself on air.

Louella traces to a Brittany cow family, and Hormann bought her grand dam in France. Same profile — deep pedigree, strong udders, high production and classification across generations. She was a two-year-old when Simon Lalande first saw her. This past February she took Grand and Intermediate Champion at Verden.

Lalande bought into both cows after seeing them in person, at the show where O Katy took her first Grand Championship. He was there with Brian Carscadden. “I could see in Simone’s [Simon Lalande’s] face when he spotted the cow that he likes her quite a bit,” Hormann said — his read of the moment. Lalande did buy in, on both.

Nicolas Lalande added a wrinkle worth filing away: the less famous pedigrees are often where the value hides. Blondin only ships embryos overseas out of donors they’re confident will produce — so a dam you don’t recognize in a European catalogue frequently signals an outstanding calf rather than a weak one.

That held up on sale night. Four Blondin-prefix lots landed in the top fifteen: Blondin Lambda Lacey at €13,500 to Luxembourg, Blondin Triton Deloria P at €11,000, Blondin Triton Della P at €10,400, and Blondin Armour Sunset at €9,700, the last three all to German buyers.

Two operations, one crew: the Wilcor and Blondin teams on the shavings at Warmsen after the third Welcome to Wilcor Sale, August 29, 2026. Seventy head averaged €6,729, twelve embryos averaged €1,600, and the offering cleared 100% — Mattenhof Hanna Hinge topping the night at €20,000. The animal in the middle is the whole argument: a heifer the screen let through.

Why Brady Doesn’t Expect One Red Bull to Lead

The red-and-white question drew the most candid answers of the night, and the verdict was uncomfortable.

There is no proven red bull the industry agrees on. Brady put it flatly: “There’s no proven Red Bull that people want to use.” Earlier in the same answer he’d framed the timeline — the next three years in the red, as he described them, are going to be really difficult, with breeders scattering across several sires instead of converging on one.

Simon Lalande’s solution is to refuse the trade-off entirely. He’ll breed a red cow to a black bull when the black bull offers more of what he wants, accept the red-carrier heifer, and come back to red the following generation.

“We love red, but I’m not ready to sacrifice the quality,” he said. “Every generation, you need to get what you like.”

Over the past 12 to 14 months the operation has put significant money into red and red-carrier females — his words, no figure disclosed — because it sees demand outrunning supply. The market backed the read hard. Wilcor AM Audacious Miracle Red made €15,000 to Great Britain, second-highest of the night, and Jacobs Altitude Shake Hands Red made €13,000, also to a British buyer.

One of the partners made the point that red bulls used to clear a higher bar at home: his father wouldn’t let him use one unless it matched the black and whites, and back then there weren’t many that did.

Brady also named the contradiction keeping the red market stuck. Breeders ask for something new, then refuse it because they don’t recognize the sire. “You’re only gonna get something new if we try to use something outside of our normal everyday bulls.”

Their Own Bull List, Held Against Their Own Rules

The rules are testable, and twelve days before the sale the August 2026 Canadian run tested them.

Blondin posted the results on August 17, 2026: Logic PP became the #1 Newly Proven GLPI sire and #3 overall, and Major jumped for both Conformation and Milk to become the #1 Available bull. Both claims check out against the stud’s own proof-day announcement.

BullConformationRankingVerified against
Logic PP16 (93% reliability)#1 Newly Proven GLPI, #3 overallPublished August 2026 GEBV; Blondin proof-day announcement
MajorIncreased on both Conformation and Milk#1 Available bull for ConformationBlondin proof-day announcement, August 17, 2026

Logic’s full published August 2026 GEBV: Conformation 16 at 93% reliability, Mammary System 11, Feet & Legs 12, Dairy Strength 7.

The rest of the lineup came up on the broadcast in functional terms rather than as verified figures, and that’s how they’re presented here:

  • Triton — the operation’s next-generation reference sire. A Logic son, described by the partners as combining high type with high index, which is the pairing Blondin has been chasing.
  • Detective and Salute — bred reciprocally. Salute goes to Detective, Detective goes to Salute, because each bull covers what the other lacks. This is the one-weakness rule executed in the barn rather than explained on a whiteboard.
  • Jacob Spear — a Triton son tracing back to Shakira. Brady flagged him twice, unprompted, as not available. Young, unreleased, and worth watching rather than ordering.

Figures and descriptions for these three come from the August 28, 2026 broadcast and have not been checked against a published evaluation.

Here’s the context the partners didn’t mention, and it works in their favour. Logic didn’t just climb the August list — the mountain moved underneath him. Lactanet adjusted the Holstein LPI Production subindex from 60% Fat / 40% Protein to 40% Fat / 60% Protein for the April 2026 release, a change the organization said would rerank top bulls toward higher-protein sires. That rewarded balanced, component-focused bulls over raw liquid volume, which validates exactly what Blondin had been breeding for. Read the ranking accordingly: it’s a real result under the current formula, and any comparison against a pre-April number is a comparison across two different formulas.

Logic remains the clearest proof of concept for the components argument. Lower milk volume, strong combined fat and protein, homozygous polled, Conformation 16 — a bull built for a component-based milk cheque, as Nicolas Lalande framed it. Brady called it “a unicorn kind of package.” He traces to Drewholme Lambda Leysure P VG-88 out of the Drewholme herd at Gowanstown, Ontario.

Drewholme Lambda Leysure P EX 3*, the dam behind Logic PP — grazing at Gowanstown, Ontario, udder still hanging like that as a mature cow. Classified, milk-recorded, three-star brood cow. This is the second-generation record Brady’s Tuesday screen is looking for, and the reason Logic cleared it while flashier bulls didn’t.

Triton’s record at the sale makes the point about balance. Both Blondin Triton lots in the top fifteen carried the P — polled cattle sitting comfortably inside the top eleven of an international type sale, which is not where polled genetics sat five years ago.

Genomics is doing something else Blondin didn’t expect: surfacing genuinely new pedigrees. A California-bred Parfect daughter the team calls Silver Elite has produced what Brady described as the #15 heifer in the world on LPI, well over 4,100, plus bulls at +16, +17, and +18 type. “She’s a complete package, but she’s a totally new pedigree,” he said. “Something that we’ve been trying to find, and we found her.”

For scale on that number: Canada’s August 2026 GPA LPI run put Stantons Overhaul-P at #1 with +4140, and nine of the top ten were new to the list since April. A heifer over +4,100 sits genuinely near the top of a list that turns over hard every run.

How Much Is a Classified Dam Actually Worth?

The filter produced a #1 GLPI sire and a sold-out sale. It’s still worth knowing exactly what part of that is statistics and what part is marketability.

Lactanet ran the numbers on the question. Across 275 Canadian-born bulls, those with a classified dam received a Conformation evaluation with a reliability 1.3 percentage points higher than bulls whose dams weren’t classified. Seventy-seven percent against seventy-six. Both groups picked up the same roughly 34.5-point gain from genomics.

One-point-three points. That’s the measured statistical premium on a classified dam, for Conformation, in that dataset.

So the filter isn’t buying Brady the reliability gulf the pitch might imply. Holstein Canada is clear that a genotype gets added to whatever information already exists rather than replacing it — parents, performance, progeny, DNA, four sources stacking up — and reliability climbs as information accumulates. Genomics did the heavy lifting: Lactanet reports average LPI reliability in young Holstein animals jumping 37 points, from 41% to 78%, once genomic evaluation arrived. A classified dam adds a rounding error on top of that.

What the full pedigree really buys is different, and Brady’s own behaviour shows it. He’s flushing five to eight donors a week and selling embryos into Europe. In that business, a dam with classification and milk records is verifiable to a buyer — a heifer in a German catalogue whose grandam is EX and milk-recorded sells differently than one whose second dam is a blank. The filter is about marketability and confidence as much as it’s about statistics.

That’s not a knock on the rule. It’s the reason to apply it where it pays instead of treating it as an article of faith.

Thirty Cows and Twenty Snapchats

One more piece of advice, aimed at breeders rather than herds.

Brady’s read is that plenty of breeders have good cattle at home and talk themselves out of it. “A lot of people have really good cows at home and they see the top ones and they think, ‘Oh, they’re not good enough.’ But part of breeding is being excited for what you have and then trying to improve on that.”

Hormann is the argument for that position. Thirty cows, 70 hectares, two Grand Champion banners at Verden in two years.

The channel rebuilding that enthusiasm isn’t the ring, in Brady’s telling. It’s the phone. He wakes up to 20 or 30 Snapchat and Facebook messages from breeders sending photos of daughters by Blondin bulls.

Dann Brady and Johnathon Honcoop at ringside during Le Suprême Laitier. Honcoop joined Blondin recently to help with marketing — which in this business means being at the rail, phone in hand, watching cattle with the person who reads the pedigrees. Brady’s mornings start with 20 or 30 Snapchat and Facebook messages from breeders sending photos of daughters. Somebody has to answer them.

“Farming is a very lonely occupation,” he said. His read on why social media matters: everybody loves cows regardless of country, there are fewer farmers every year, and at least the ones still going can share the experience.

The Blondin crew with the top seller from their own summer sale at St-Placide — Dann Brady, Brian Carscadden, and the Lalandes among them, alongside a heifer whose pedigree cleared the same Tuesday screen. Nine people in the frame for one animal. That’s the part the mating software can’t replicate.

Nicolas Lalande pointed at his own father — Simon, sitting beside him — as the counterexample to the too-busy excuse. Roughly 90 employees across the group, and the man still walks the barn to look at cows.

The Thursday mating calls aren’t one man’s either. Brady, Nicolas, Carscadden and others all weigh in on five to eight donors. “It’s always the biggest decision of the week,” Simon said. Then, deadpan: “If the calf turns out, he made the decision. If it’s a really bad calf, then I made the decision.”

What This Means for Your Operation

  • Screen the pedigree before the index — but know what you’re buying. Lactanet’s figure is 1.3 percentage points of Conformation reliability for a classified dam. What you’re really paying for is verifiability to a buyer and confidence in the maternal line, so apply the filter hardest where you’re selling animals or embryos rather than treating it as an article of faith everywhere.
  • Cap candidates at one weakness, then decide where it lands. Below breed average on more than one of your herd’s problem traits, he’s out. His single weakness should sit where your cows are already strong — that’s Detective-to-Salute logic applied to your own barn.
  • Pull the current LPI rank, not the one you remember. April 2026 moved the Production subindex from 60F:40P to 40F:60P and reranked the top of the list toward higher-protein sires. Comparing a bull’s rank today against a pre-April number means comparing two different formulas.
  • Name two or three priority traits in writing before your next order. Everything else becomes a tiebreaker instead of a criterion. Ten priorities is the same as none — selection pressure spread that thin moves nothing.
  • If robots are inside 24 months, screen milking speed and teat placement this month. Drop anything below breed average on either. Three-year lag between the semen decision and the animal standing in the box, and no retrofit fixes a teat you bred into the wrong place.
  • Count the fourth and fifth lactation as revenue, not sentiment. Every extra pregnancy out of a functional older cow is a beef-cross calf into a strong market or an embryo contract on a female with a long enough record to sell.
  • On reds, plan a three-year scatter rather than waiting for consensus. There’s no proven red bull the industry agrees on and Brady doesn’t expect one soon. Budget for multiple red-carrier sires, and take the black-bull generation when the black bull is genuinely better. The sale ring says the premium is real — a Red went second-highest at €15,000.
  • Judge a cow family across generations, not on one disappointing daughter. And price a family purchase as a five-to-ten-year position, because that’s what Hormann’s O’Kalibra embryos turned out to be: one pregnancy, then a great-granddaughter with a Verden banner.
  • Stop treating herd size as the constraint. Hormann runs 30 cows and sold 70 head into seven countries. The filter doesn’t scale with the barn.

Simon Lalande’s father wasn’t a purebred breeder. He took one trip, bought one Warden daughter out of the Supra family, and four generations later the family still farms ground their name has worked since 1672. Cord Hormann milks thirty cows in a Lower Saxony farmyard and has put two Grand Champions on the coloured shavings at Verden in two years.

Neither of those required scale. Both required deciding what you’re actually selecting for, then holding the line when a flashier number shows up on genomic day.

So what’s the one weakness you’ve been breeding into your herd without meaning to?

Learn More

The Sunday Read Dairy Professionals Don’t Skip.

Every week, thousands of producers, breeders, and industry insiders open Bullvine Weekly for genetics insights, market shifts, and profit strategies they won’t find anywhere else. One email. Five minutes. Smarter decisions all week.
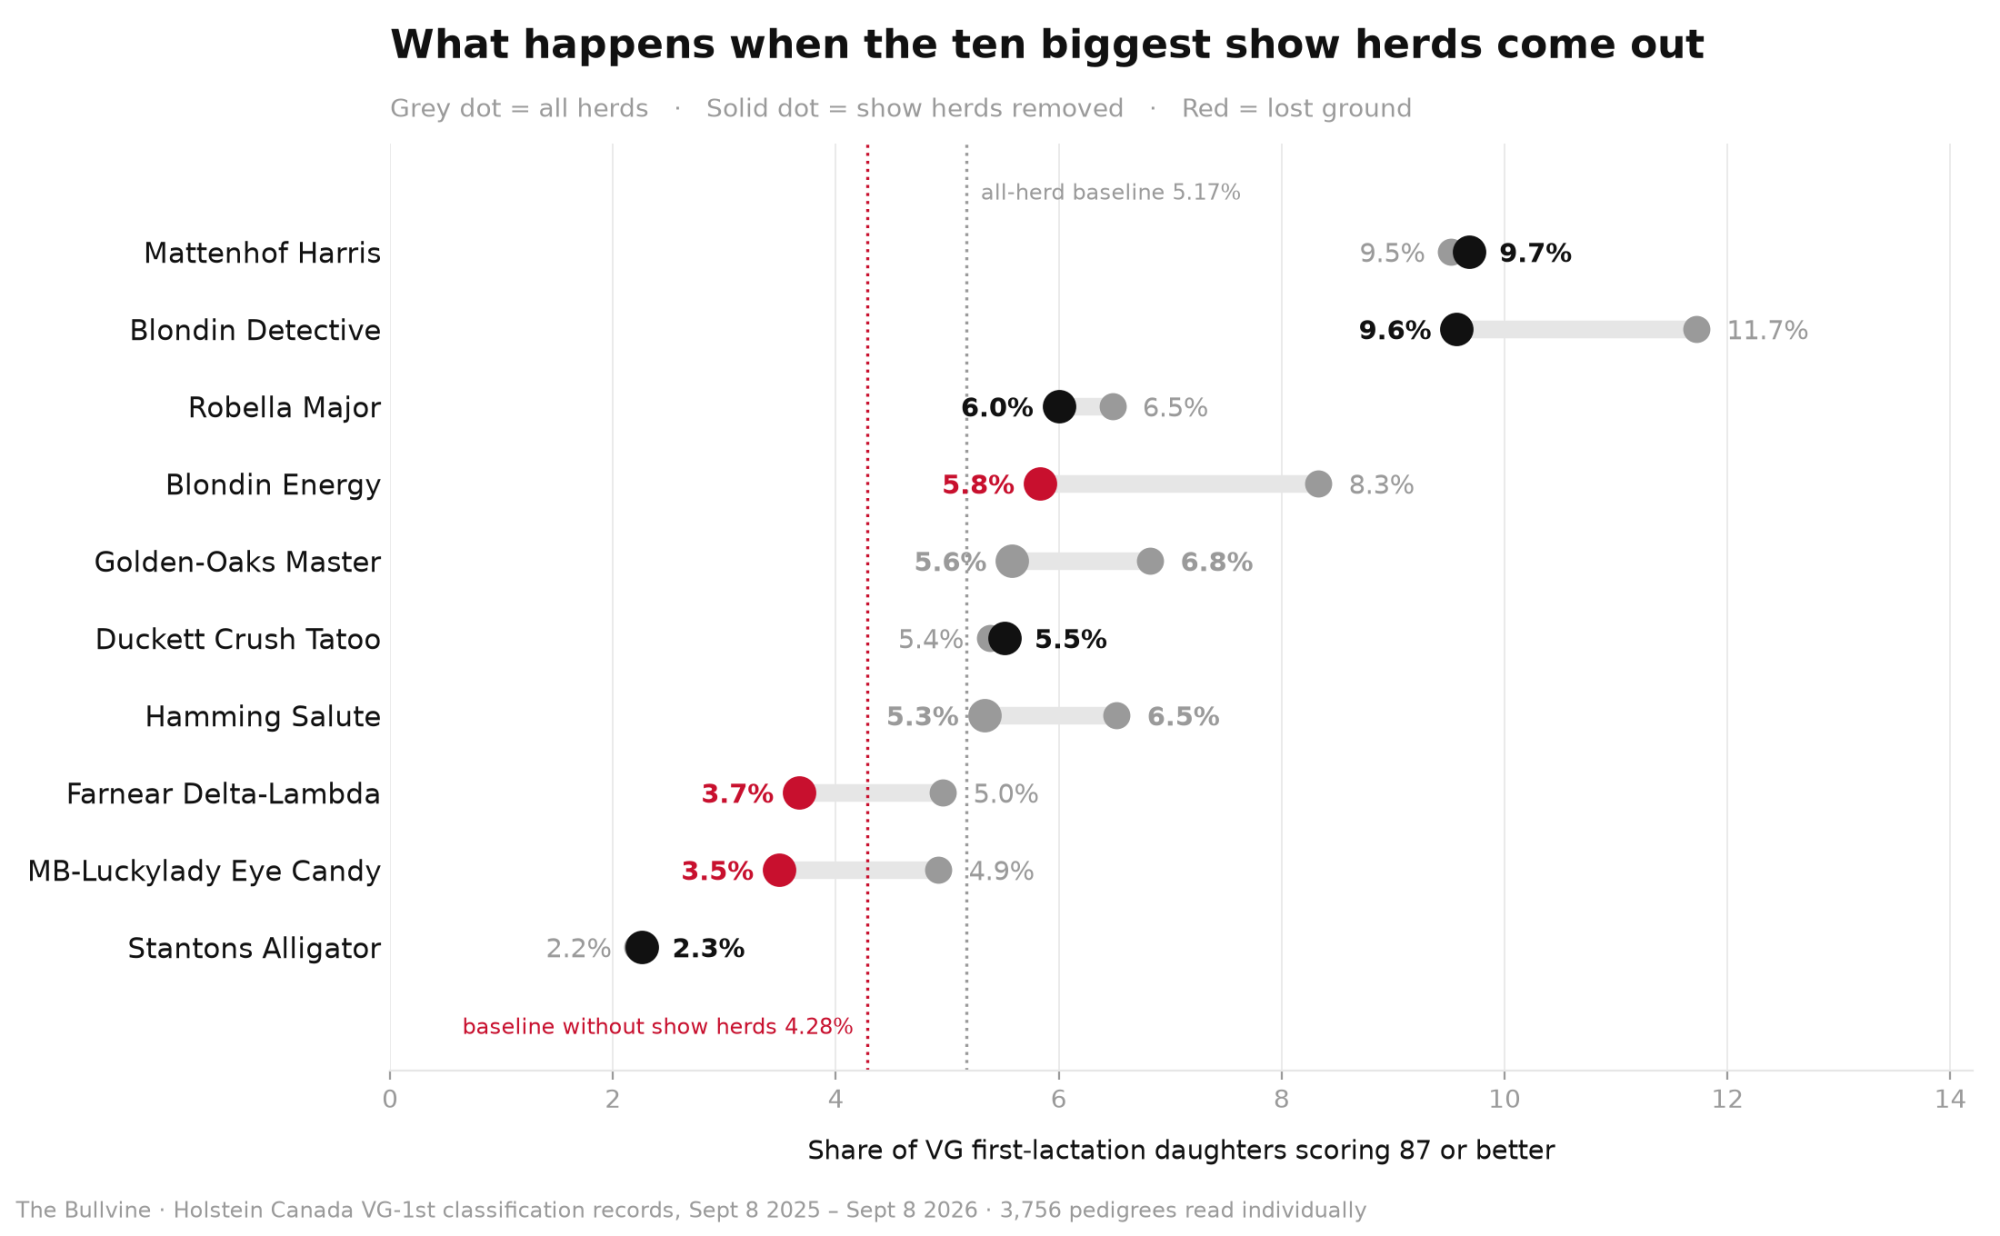
NewsSubscribe
First
Last
Consent

You Paid for 415 Kilos of Genetic Gain. Inbreeding Kept 143 of Them.

Italian researchers tracked 27,735 Holsteins for five years. The breed earned 415 kilos of genetic gain per lactation. Inbreeding took 143 back. Do you know your own herd’s number?

Executive Summary: Ablondi’s Parma team measured the same 27,735 Holsteins twice, and pedigree said 7% inbred while the genome said 16% — with the milk loss tracking the bigger number, 61 kg per point against 44. That gap matters to anyone genomic-testing females and still running matings off pedigree EFI, because you’re managing to the instrument that reads low. Across 2015 to 2020 the Italian Holstein banked 415 kg of genetic gain per lactation and inbreeding depression took 143 of it back, though the authors are careful to say the breed still kept 272 kg net; the worry is the trajectory, not a bill already due. Run Pryce’s scaling on your own operation — 0.4 to 0.6% of your rolling herd average per point of inbreeding — and a decade at the U.S. rate of 0.36 points a year costs a 12,000 kg herd 170 to 260 kg per cow, per lactation. North American Holstein’s genomic-era effective population size sits somewhere between 24 and 42, and even the optimistic end is under the FAO’s critical threshold of 50. Four major studs built internal elite-female programs between 2008 and 2015, only Select Sires has published a sourcing split, and none of the eight organizations we contacted responded — so nobody outside those companies can say where your next bull came from. The tools that fixed this in the 2000s are still available; the open question is whether anyone uses them at a 2.2-year generation interval, and whether you’ve ever seen your own two numbers side by side.

Michela Ablondi’s team at the University of Parma did something most inbreeding studies skip. They measured the same 27,735 Holstein cows twice.

Once on pedigree — the way most mating programs still calculate it, working back through recorded ancestors. Once on genome, marker by marker across 84,443 SNPs. Pedigree came back at 7% average inbreeding. The genome came back at 16%.

Then they checked which number the cows agreed with. Each 1% rise in pedigree inbreeding cost 44 kg (97 lbs) of 305-day milk. Each 1% rise in genomic inbreeding cost 61 kg — 134 lbs. Same animals, same lactations, and the depression tracked the bigger figure.

That’s the part worth sitting with, because Lactanet’s August 2025 figures put average inbreeding for Canadian Holstein heifers born in 2024 at 9.99%, climbing about a quarter point a year on a pedigree basis. If pedigree is the instrument reading low, then the number most producers are watching is not the number doing the damage.

Two Instruments, Same Cows, One Reads Low

The correlation between the two measures came in at 0.65. Related, nowhere near interchangeable. The reason matters: pedigree can’t see Mendelian sampling, and it’s only as good as the records behind it. Ablondi’s group had 24 generations to work with and a complete generation equivalent of 10.6 — deep by any standard — and pedigree still read less than half what the genome showed.

Your own two numbers won’t be 7 and 16 exactly. Ablondi’s herds had unusually complete records, and the size of your gap depends on your pedigree depth and how much recent breeding runs back through the same bulls. What won’t change is which direction the error runs. Pedigree reads low, every time.

Ablondi’s group also split inbreeding by age. Runs of homozygosity longer than 8 Mb — the fingerprint of recent inbreeding — carried the negative effect across every trait. Pryce and colleagues found the same thing in Australia a decade earlier with 8,853 Holsteins and 4,138 Jerseys: ROH over 3 Mb cut milk yield and captured recent inbreeding independently of overall homozygosity. Two teams, two continents, ten years apart. Recent inbreeding is what hurts.

In the U.S., Steyn and colleagues documented the annual increase accelerating from 0.11 percentage points a year between 2000 and 2008 to 0.36 between 2013 and 2021, working from CDCB data in the Journal of Dairy Science in 2022. Three continents, same direction.

The 143 Kilos You Paid For and Didn’t Keep

Now the cost at breed scale. Between 2015 and 2020, the Italian Holstein’s pedigree inbreeding climbed 2.35%. Realized genetic progress for milk came in at +415 kg (915 lbs) per lactation.

Inbreeding depression took back 143 kg — 315 lbs. That’s 34.5% of the gain.

Be precise about what that means, because the authors are. Their own conclusion is that “the realized genetic progress has so far successfully counterbalanced the negative effect of inbreeding” for milk yield. The breed kept 272 kg net. Progress didn’t stop, and anyone telling you the Holstein is going backwards isn’t reading the paper.

What worries Ablondi’s group is the trajectory. The tax compounds, it lands on fitness traits this study didn’t even measure, and inbreeding is projected to climb faster in the generations ahead. Run the same arithmetic on the pedigree measure and you get a smaller bill — 103 kg, 24.9%. Two instruments, two answers again, and only one of them is telling you what your matings actually cost.

Compare the extremes and it gets uglier. Moving from the 5th-lowest to the 95th-highest inbreeding percentile cost 263 kg (580 lbs) per lactation on pedigree — 2.4% of the herd average — and 561 kg, 1,237 lbs, on genomics, or 5.2% of the herd’s 10,836 kg (23,890 lbs) average. Fat dropped 1.31 kg and protein 2.45 kg on the genomic measure.

What nobody can measure is which bulls are driving it, because no public database records where an AI sire came from.

Below the Line Where Fitness Erodes

The FAO puts the critical effective population size at 50. Not 50 cows in a barn — 50 in the genetic sense, the number of breeding animals that would produce the inbreeding rate you’re actually seeing.

Makanjuola and colleagues measured it for North American Holstein and Jersey using Canadian Dairy Network records on 676,594 Holsteins, publishing in the Journal of Dairy Science in 2020. Across 1990 to 2018, Holstein Ne came in at 66 on pedigree and 43 to 46 on genomic measures. Jersey held up better at 64 to 85.

Narrow to the genomic-selection era and the rate of inbreeding per generation climbs to between 1.19% and 2.06%, depending on the measure. That puts Holstein Ne somewhere between 24 and 42.

Which is why you’ll never see an honest single number here. Pedigree and genomic measures disagree on the rate of inbreeding per generation by nearly a factor of two, so North American Holstein Ne isn’t a dot — it’s a corridor running from 24 to 42, and both ends sit under the FAO line. Same argument as the 7-versus-16 gap, one level up.

Behind it sits a generation-interval collapse. Holstein sires of bulls averaged 8.08 years in 1990 and 2.32 by 2016 — a 71% reduction. Guinan and colleagues documented the same trajectory in U.S. data on the sire-of-bulls pathway, 7.1 years down to 2.2.

Nordic populations get held up as the counterexample, and the picture is genuinely mixed. Tenhunen and colleagues found Nordic Holstein Ne falling from 54.3 before genomic selection to 42.8 after, with future Ne dropping from 198.8 to 42.7 and female coancestry rising from 0.02% to 0.39%. Their conclusion: Nordic Holstein “faces more pressing concerns.”

But read that comparison carefully. At 42.8, Nordic Holstein sits at the optimistic end of North America’s 24-to-42 corridor — better than the pessimistic read, roughly level with the generous one. Methods and study periods differ between the two papers, so treat it as directional, not a scoreboard. Nordic Jersey held essentially flat at 29.4 before and 30.3 after.

Against the FAO line the pattern is blunt. North American Holstein on genomic measures, Nordic Holstein, and Nordic Jersey all sit below 50. North American Jersey is the only measured population that clears it.

Can Anyone Tell You Where Your Next Bull Came From?

Not from anything published.

Every major stud runs an internal elite-female program now, and most say so openly. Select Sires launched ART in 2008, targeting Holsteins “genetically unique compared to those found in the general population.” Alta started PEAK in 2012 as its genetics development arm during a restructuring built around genomics, and PEAK joined URUS when that holding company formed in October 2018 — PEAK’s own materials date the entity to 2018. Semex founded Progenesis in 2013, calling it “Semex’s industry-leading internal dairy breeding program.” ABS Global shipped its first commercial units from an elite female nucleus herd in 2015.

Look at the dates. 2008, 2012, 2013, 2015 — every major stud built an internal elite-female program inside a seven-year window, and that window opens the year before USDA-AIPL published the first official U.S. genomic evaluations in January 2009. Four companies didn’t independently arrive at the same structure by coincidence. They read the same new tool the same way.

Four programs. One published split.

Select Sires puts roughly 40% of the Holstein bulls it samples each year as ART graduates, with 60% acquired from producers across the U.S. and Canada. That figure appeared in a January 2024 company post, and ART program manager Mark Kerndt repeated it on the record in a July 2025 Select Sires podcast, describing an internal female donor program running since 2008 and transferring roughly 15,000 IVF embryos a year. Two independent company sources, one of them a named executive speaking on tape.

Credit where it’s owed. That’s the only proportional sourcing figure any of the four has put in public, nobody made them do it, and it’s now better documented than anything else in this section. ABS, Semex and PEAK describe their programs without quantifying what share of released sires come through them — which leaves the one company that disclosed as the only one whose disclosure can be picked apart.

Semex says the Progenesis team “continues to add bloodlines that diversify the program.” That sentence is the whole problem in miniature. It’s substantive, it’s checkable in principle, and it’s unverifiable from outside. Semex may be entirely right. Nobody outside Semex can confirm it.

Past what companies volunteer, the trail goes cold. NAAB’s Semen Sales Report tracks units by breed and category, and we found no field recording origin. CDCB publishes proof runs and reliability figures on every sampled bull in the U.S. system, and we located no public output sorting sires by nucleus, contracted, or open-market origin.

The Counterweight Nobody Expected

Here’s what complicates everything above.

United Sires — NAAB codes 596 and 796, registered with NAAB in February 2024 — is an independent breeder partnership with no ownership tie to any of the majors. By The Bullvine’s count of Holstein Association USA’s top 200 TPI genomic young bulls — 85% genomic reliability minimum, from the CDCB run published April 7, 2026 — it holds 30 of them, 15%. That’s third behind Select Sires’ 59 (29.5%) and Semex’s 40 (20%), and ahead of ABS at 12, Alta at 11, GENEX at 9 and CRV at 8.

We’re citing April rather than the August 2026 run on purpose. April is when Holstein Association USA changed the TPI formula, shifting production weights from 19% protein and 19% fat to 24% protein and 14% fat, and it’s the snapshot that isolates what that change did to the standings. Bulls moved as much as 125 points in either direction without a single new daughter. Same bulls, same daughters, different instrument — the third time in this article that swapping the measuring tool has swapped the answer. Holstein Association USA has since published an August 2026 list, and the shares will have shifted some with it; treat the April figures as the post-formula-change baseline rather than today’s standings.

So whatever’s happening to the independent breeder, “shut out” doesn’t cover it. The pipeline is concentrating and a two-year-old breeder-owned partnership just took 15% of the top of the list. Both are true. Neither reconciles without the origin data nobody publishes — if the nucleus programs are as dominant as their scale implies, United Sires shouldn’t rank where it does.

Worth knowing what the modelling said before any of this got built. Dekkers and Shook, at Wisconsin-Madison, modelled nucleus schemes for commercial AI firms in the Journal of Dairy Science in 1990 (73:1920). Their finding, replicated since and echoed in Roden’s 1994 review: opening a nucleus raises both the intensity and the accuracy of female selection, and open systems deliver a higher rate of genetic gain than closed ones. They also found closed schemes could stay competitive at large nucleus sizes — so the easy version, closed bad and open good, is only half right. Design matters more than the label, which is exactly why the design should be public.

What It Costs, Country by Country

Four populations have been measured for inbreeding depression. Every one is negative:

StudyPopulationPer 1% inbreeding increase
Ablondi et al. 2023Italian Holstein, 27,735 cows−61 kg 305-day milk (ROH); −44 kg (pedigree)
Doekes et al. 2019Dutch Holstein-Friesian, 38,792 first-parity cows−36.25 kg (ROH); −37.95 kg (pedigree); −48.07 kg (genomic relationship)
Bjelland et al. 2013U.S. Holstein, University of Wisconsin−20 kg 205-day milk (ROH); −47 kg (genomic relationship); −53 kg (percent homozygosity)
Pryce et al. 2014Australian Holstein and Jersey, 12,991 genotyped cows−0.4% to −0.6% of phenotypic mean for milk, fat and protein

Figures as published. Multiply kg by 2.205 for pounds — 61 kg is 134 lbs, 36.25 kg is 80 lbs, 20 kg is 44 lbs.

Pryce’s framing is the one to run on your own operation, because it scales to whatever you produce. At 0.4 to 0.6% of the mean per 1% of inbreeding, a decade at the U.S. rate — 0.36 points a year, 3.6 points total — costs 1.4% to 2.2% of your herd average. On a 12,000 kg (26,455 lbs) herd, that’s 170 to 260 kg — 375 to 573 lbs — per cow, per lactation.

Ablondi’s team costed it in terms their readers feel immediately. Eighty percent of Italian milk goes into cheese, so they priced the loss in Parmigiano Reggiano — the country’s second-largest PDO consortium, 160,097 tonnes in 2022. Between the most and least inbred 5% of cows, the difference came to over half a wheel per cow per lactation on pedigree and more than a full wheel on genomics. Roughly €310 and €600 — about $360 and $700 USD, or $495 and $960 CAD, at 24-month-aged prices.

Pryce’s group mapped the damage to specific regions, finding stretches that cost up to 260 L of milk and 12.5 days of calving interval when fully homozygous. Ablondi’s team saw the same chromosome by chromosome — 16 of 29 autosomes carried a measurable hit to milk yield, with BTA14 the worst at −3.53 kg per 1% of homozygosity on that chromosome alone.

Bjelland’s U.S. work adds a cost that usually gets filed under calving management: stillbirths rose 0.25% for bull calves and 0.20% for heifer calves per 1% increase in inbreeding.

Doekes explains why recent matings matter most. New inbreeding — alleles identical-by-descent for the first time — cost 2.42 kg (5.3 lbs) of fat per 1%. Ancestral inbreeding cost essentially nothing, +0.03 kg. The damage lives in the matings you’re making right now.

The Tools You’re Probably Underusing

ToolWhat It MeasuresData Basis
CDCB Expected Future Inbreeding (EFI)Population-level inbreeding impactPedigree relationship to heifers born in the past 48 months; adjusts PTA accordingly
Genomic Future Inbreeding (GFI)True genomic relationshipDirect DNA marker overlap; consistently higher and more realistic than EFI
Lactanet Inbreeding CalculatorMating-specific inbreeding and parent averagePedigree-based; flags haplotypes and genetic conditions (LactanetGen.ca)

The EFI-versus-GFI choice isn’t academic. Makanjuola’s team found the correlation between pedigree and genomic inbreeding in Holsteins weakening materially across the period they studied — pedigree is getting worse at tracking reality, not better. Pryce’s conclusion was blunt: genomic measures can replace pedigree for estimating depression, using either the genomic relationship matrix diagonal or the proportion of homozygous SNPs.

Genomic-testing your females and then mating off pedigree inbreeding means managing to the number that understates the problem. That’s the whole finding, in one sentence.

One stud has published constraint evidence. C. Sun and colleagues at STgenetics presented Chromosomal Mating at ADSA in 2019 — a linear-programming system built on CDCB genomic relationship files covering 5,731 bulls and more than 1.3 million females, against a pedigree database of over 5 million animals. They reported average progeny predicted producing value up 17% and inbreeding down 30% against random mating.

Their design choice is the interesting part. Rather than setting a hard inbreeding ceiling, the system prices inbreeding as an economic penalty inside the optimization — a defensible way to handle a variable nobody has set a herd-level limit for. It’s also a company-authored conference abstract, seven years old and not independently validated, which is how you should read it.

Two Ways to Buy Pedigree Distance

One route stays inside the breed, and there’s a working example of it in Quebec. Blondin Sires — NAAB code 799, owned by Simon Lalande, Dann Brady and Nicolas Lalande — grew its share of Canadian sire usage from 2.8% in 2022 to 4.9% in 2023, a 75% jump in one year per Lactanet market data reported by The Bullvine in February 2026. The pitch is separation from the mainstream stack while staying Holstein; they prioritize proven performance in both conformation and productio, and use different sires than those targeting the top TPI or NM$ lists.

Be sure to check out our article with Dann Brady and team on their breeding strategy tomorrow. 

United Sires’ 15% share of the top 200 says there’s more room in that lane than the concentration story implies. The trade-off is real, though: independent-sourced bulls may carry lower reliability figures, and you’re still drawing from a gene pool whose effective size sits under the FAO line.

Going across breeds has a decade of peer-reviewed production data behind it. VikingGenetics’ ProCROSS rotates VikingHolstein, VikingRed and Coopex Montbéliarde, and a ten-year University of Minnesota study led by Les Hansen with Amy Hazel and Brad Heins measured it in high-performance Minnesota herds. ProCROSS cows returned 33% more lifetime profit and more daily profit — 13% for two-breed crosses, 9% for three-breed. Forty-one percent reached a fourth lactation against 21% of the Holsteins.

They also stayed 147 days longer, though Hansen’s own conference presentation of the combined two- and three-breed groups puts that at 153. Conception rate to first service in second and third lactation ran 45% against the Holsteins’ 35% — 1.9 services instead of 2.4. Health treatment costs came in 23% lower for two-breed crossbreds and 17% lower for three-breed across their lifetimes, with cull value 16% higher.

What does all that do to income over feed cost? Shonka-Martin and colleagues published twice in the Journal of Dairy Science in 2019, and the numbers favour the crossbreds. First-lactation crossbreds ate 2,807 kg (6,189 lbs) of dry matter over 4 to 150 days in milk against the Holsteins’ 2,948 kg (6,499 lbs) — about 5% less — with a further 6.5% reduction later while producing the same fat plus protein. Income over feed cost ran $0.34 to $0.60 higher per cow per day.

Read the inbreeding claim carefully, though. VikingGenetics’ ProCROSS material tells producers there are “no worries about inbreeding,” and for the crossbred animal in front of you that’s essentially right — heterosis does the work. It doesn’t mean the source populations are exempt. “No worries” is marketing shorthand, and the company’s own researchers documented real pressure on those source populations. They documented it in a peer-reviewed journal, which is the opposite of hiding it.

The component question depends entirely on your basis, and this is where a lot of crossbreeding arguments go sideways. On a single 305-day lactation, crossbreds produced less fat plus protein than purebred Holsteins in the Minnesota work — 24 kg (53 lbs) less for Montbéliarde crosses, 29 kg (64 lbs) less for Scandinavian Red. Across a lifetime the picture flips: daily fat plus protein ran 1% higher for two-breed crossbreds and 1% lower for three-breed, because they stuck around long enough to make it up. A rotation is also a multi-year commitment you can’t reverse next season, and crossbred replacements are harder to move if you sell breeding stock.

Then weigh all of it against a replacement market that punishes mistakes. USDA put the U.S. national average for milk cows sold as dairy herd replacements at $3,130 per head in April 2026, up from $2,980 in January and $2,860 a year earlier — 5% on the quarter, 9% on the year. USDA NASS put milk replacement heifer inventory at 3.90 million headon January 1, 2026, down slightly from the prior year. Fixing a genetic misstep costs more than it did two years ago, which argues for care in both directions.

Your Pre-Breeding Action Checklist

  • Pull your inbreeding report in the next 30 days. Run your last three years of sire selections through the Lactanet Inbreeding Calculator or your CDCB-linked mating program and count how many trace to a shared maternal grandsire. A few hours of records work, no new spend, before breeding starts.
  • Run both measures on the same animals, then move your matings to the genomic one. Ablondi’s cows read 7% on pedigree and 16% on genomics, and the depression tracked the bigger figure — 61 kg per point against 44. If you’ve never seen your own two numbers side by side, you don’t know which one your program has been deciding from.
  • If more than two of your last ten sire picks share a maternal grandsire, raise it with your mating consultant. Editorial rule of thumb, not a published standard — no threshold defines “too much overlap” at herd level, so you’re setting a baseline rather than measuring against one.
  • Check whether your TPI cutoff still means what it meant last year. The April 2026 formula change moved bulls up to 125 points without new daughter data. If your program screens on a fixed threshold, some sires dropped off your list on arithmetic alone.
  • Run Pryce’s scaling on your own rolling herd average — 0.4 to 0.6% per point of inbreeding, rather than borrowing an Italian or Dutch figure measured on a different population. At the U.S. rate, a decade costs a 12,000 kg herd 170 to 260 kg per cow per lactation. Multiply your own average by 1.4% to 2.2% to get your version.
  • Ask your supplier for its sourcing split at proof-run specificity, then log the answer or the non-answer. Not proof of anything on its own — but a pattern across several suppliers should shape how much of your lineup comes from one place. Select Sires has published 40% and put an executive on tape saying it; the others haven’t.
  • Before you compare any crossbreeding numbers, establish the basis. Single-lactation and lifetime daily figures point opposite directions on components: 24 to 29 kg less fat plus protein in one lactation, 1% more across a lifetime. Quoting one while meaning the other is the most common way that pitch gets made.
  • Price stillbirth rate as an inbreeding cost, not a calving-management line item. Bjelland’s work puts it in the first column.

Between 2000 and 2009 the industry drove Holstein rate of inbreeding down to 0.37% per generation and pushed Ne up to roughly 135, using optimum contribution selection, expected future inbreeding, and publicly posted relationship values. Those tools worked. Then genomic selection outran them, and they’re still sitting there unused at scale.

The measurement problem is the cheaper of the two fixes. Nobody has to build an origin database or rewrite an index for you to run both numbers on your own females and see which one your matings have been following. Ablondi’s team needed 84,443 markers and 939 herds to prove it at breed scale. You need an afternoon and a report you’re already paying for. The question is whether you’ll like what it says — and whether you’d breed differently if someone finally published where those bulls came from.

Run Your Numbers

Genomic Testing ROI Calculator — This article says pedigree reads low and only genomics shows the real number. The calculator prices what testing is worth on your farm, and flags the families where inbreeding risk needs tighter control. Run the conservative scenario first.

Methodology note: The 7% and 16% figures in this article’s headline are the pedigree and genomic inbreeding averages for Ablondi’s Italian Holstein population and are not presented as a universal read on any individual herd; the size of the divergence depends on pedigree completeness and recent breeding patterns. Nucleus program descriptions and dates are self-reported or from trade media: Select Sires ART (company history page, January 4, 2024 blog post, and a July 2025 Select Sires podcast interview with ART program manager Mark Kerndt, in which the roughly 40% figure refers to bulls sampled each year); PEAK (2012 program start, though official as PEAK in 2018); Semex Progenesis (company pages, founded 2013); ABS Global (company history, first commercial units 2015). USDA-AIPL published the first official U.S. genomic evaluations in January 2009; CDCB assumed responsibility for U.S. genetic evaluations in 2013. Only Select Sires has published a proportional sourcing split. 

Stud-share counts are The Bullvine’s own independent count of the Holstein Association USA Top 200 TPI Genomic Young Bulls list, April 2026 (85% genomic reliability minimum), drawn from the CDCB run published April 7, 2026, with stud assignment by the official NAAB marketing codes table. The April run is cited rather than a later one because Holstein Association USA implemented a TPI formula change in that run, moving production weights from 19% PTA Protein and 19% PTA Fat to 24% PTA Protein and 14% PTA Fat; individual bulls moved up to 125 TPI points with no new daughter data, so April 2026 shares are not comparable to earlier runs and represent the first post-change snapshot. An August 2026 list has since been published and current shares will differ. United Sires, LLC (NAAB 596/796) registered with NAAB on February 8, 2024. Blondin Sires Inc. (NAAB 799, St. Placide, Quebec) is owned by Simon Lalande, Dann Brady and Nicolas Lalande. 

Italian figures: Ablondi, M., A. Summer, G. Stocco, R. Finocchiaro, J.-T. van Kaam, M. Cassandro, C. Dadousis, A. Sabbioni and C. Cipolat-Gotet, Journal of Animal Science 101:skad382 (2023), doi:10.1093/jas/skad382 — 27,735 cows, 939 herds, 84,443 autosomal SNPs, 24 generations of pedigree depth. The 2.35% five-year rate is drawn from Ablondi et al. (2022) and the +415 kg realized progress from ANAFIBJ (2023). Three co-authors are affiliated with ANAFIBJ, which supplied the data and part-funded the work; the authors declare no conflicts of interest. The Parmigiano Reggiano comparison appears in Results and Discussion, using 24-month-aged wheel prices per CLAL (2022), and reflects the difference between the most and least inbred 5% of cows — not a typical per-cow loss. USD and CAD equivalents are editorial conversions at approximately €1 = $1.16 USD and €1 = $1.60 CAD as of September 3, 2026; because the underlying euro figure derives from 2022 cheese prices, the conversion is indicative of present-day value rather than a 2022 dollar equivalent.

Other depression studies use different lactation bases and are not directly interchangeable. Doekes, H.P. et al., Genetics Selection Evolution 51:54 (2019), doi:10.1186/s12711-019-0497-z. Bjelland, D.W., K.A. Weigel, N. Vukasinovic and J.D. Nkrumah, Journal of Dairy Science 96(7):4697–4706 (2013), doi:10.3168/jds.2012-6435 — 205-day, not 305-day. Pryce, J.E., M. Haile-Mariam, M.E. Goddard and B.J. Hayes, Genetics Selection Evolution 46:71 (2014), doi:10.1186/s12711-014-0071-7.

North American population figures: Makanjuola, B.O. et al., Journal of Dairy Science (2020), doi:10.3168/jds.2019-18013 — 676,594 Holstein and 304,676 Jersey pedigree records from the Canadian Dairy Network. Genomic-era Ne is derived from the paper’s reported 1.19–2.06% rate of inbreeding per generation using Ne = 1/(2ΔF), which is why it is reported here as a range rather than a point estimate; an earlier ADSA abstract from the same group reported 30 to 48, differing from the published paper. FAO critical Ne of 50 cited therein (FAO, 2015). Nordic figures: Tenhunen, S., J.R. Thomasen, L.P. Sørensen, P. Berg and M. Kargo, Journal of Dairy Science 107(8):5897–5912 (2024), doi:10.3168/jds.2023-24553; four of five authors are affiliated with VikingGenetics, and the study is open access and peer-reviewed. Methods and periods differ between Makanjuola and Tenhunen, so comparisons are directional.

Generation interval: Guinan, F.L. et al., Journal of Dairy Science 106(2):1110–1129 (2023), doi:10.3168/jds.2022-22205, with corrigendum; figures are for the sire-of-bulls pathway. García-Ruiz et al., PNAS 113(28) (2016), independently found that interval falling from roughly 7 years to under 2.5 between 1975 and 2015. U.S. inbreeding rates: Steyn, Y. et al., Journal of Dairy Science 105(12):9810–9821 (2022), doi:10.3168/jds.2022-22143, citing CDCB (2021).

Crossbreeding: ten-year University of Minnesota study of high-performance Minnesota herds led by L.B. Hansen with A.R. Hazel and B.J. Heins, published 2019. Single-lactation 305-day and lifetime daily component figures use different bases and are reported separately above. Shonka-Martin, B.N., A.R. Hazel, B.J. Heins and L.B. Hansen, Journal of Dairy Science 102:871–882 (2019), doi:10.3168/jds.2018-15318; and Shonka-Martin, B.N., B.J. Heins and L.B. Hansen, Journal of Dairy Science 102:3661–3673 (2019), doi:10.3168/jds.2018-15682. See also Hazel, A.R., B.J. Heins and L.B. Hansen, Journal of Dairy Science (2020). VikingGenetics’ “no worries about inbreeding” statement is a company marketing claim, not independently verified.

Mating programs: Sun, C., S. Westberry, D. Kendall and D. Castellani (STgenetics, Navasota, TX), ADSA Annual Meeting 2019, Abstract #365 — company-authored, not independently validated. Nucleus modelling: Dekkers and Shook, J. Dairy Sci. 73:1920 (1990). Replacement price: USDA, April 2026, U.S. national average with significant regional variation. Heifer inventory: USDA NASS Cattle, released January 30, 2026.

Learn More

The Sunday Read Dairy Professionals Don’t Skip.

Every week, thousands of producers, breeders, and industry insiders open Bullvine Weekly for genetics insights, market shifts, and profit strategies they won’t find anywhere else. One email. Five minutes. Smarter decisions all week.
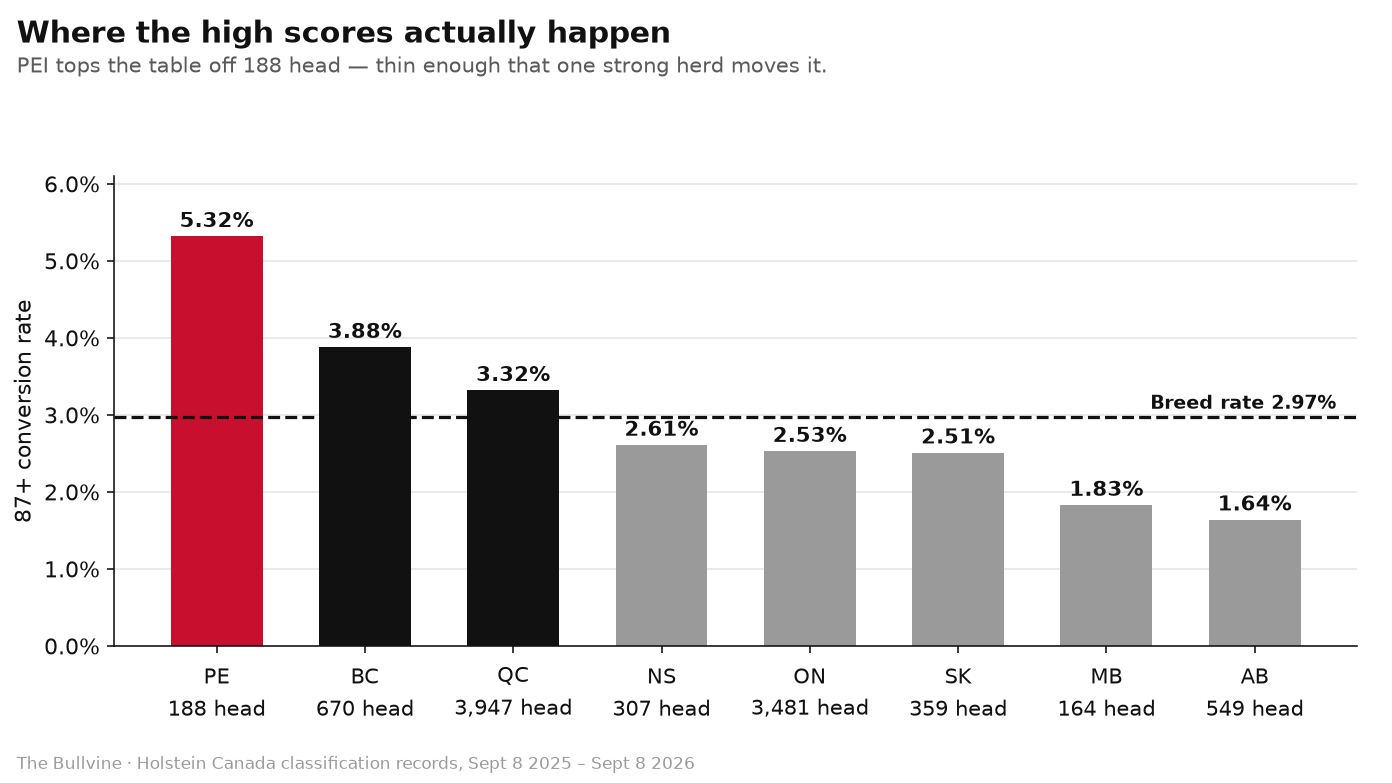
NewsSubscribe
First
Last
Consent

Nordic Holstein Coancestry Rose Twentyfold. Your Inbreeding Percentage Won’t Show You.

Nordic Holstein female coancestry climbed from 0.02% to 0.39% per year while pedigree inbreeding looked harmless. Coancestry is next generation’s inbreeding — and your current mating report only shows you one of them.

You’re placing a semen order off the August 2026 GTPI list. You take four bulls, spread across the top ten, figuring that spread covers you. Odds are three of them are sons of Ocd Thorson Ripcord-ET — he sired seven of that top ten, and eight of the top ten for Net Merit $, per The Bullvine’s analysis of that run.

Go one generation further back and it gets tighter, not looser. One great-granddam sits behind seven bulls across those two lists.

A proposal circulating in European trade press argues North American studs should voluntarily set aside index thresholds for roughly 5% of young-sire intake, so European-origin sires get a shot they wouldn’t otherwise get. It’s pointing at something real. But it picks the wrong criterion — and the evidence for that runs through a Nordic population where female coancestry climbed nearly twentyfold across the genomic-selection transition, while the pedigree analysis of the same herd found nothing wrong at all.

Holstein Is Climbing at Twice the Rate of Everything Else

Lactanet’s Inbreeding Update – August 2025, authored by Brian Van Doormaal, put Canadian Holstein heifers born in 2024 at 9.99% average pedigree inbreeding. Highest of the four major breeds — ahead of Jersey at 7.56%, Brown Swiss at 7.10% and Ayrshire at 6.89%.

That 9.99% is up from 9.61% for heifers born in 2023. A 0.38-point jump in a single birth year, against a long-run trend of +0.25%. The climb isn’t just continuing. It steepened.

The rate is the number that should bother you. For females born since 2010, Jersey has averaged +0.11% per year, Ayrshire and Brown Swiss +0.12%, and Holstein +0.25%. Better than double.

Worth noting what that rate does and doesn’t tell you. Canadienne actually carries the highest average inbreeding of any Canadian dairy breed at 10.33% — but its rate of increase since 2010 is the lowest of the group at +0.09% per year. High level, slow climb. Holstein is the reverse. Level tells you where a population has been. Rate tells you where it’s going. Hold that distinction, because the whole argument in this piece turns on a version of it.

Four breeds. One country. One evaluation system. The same genomic tools sitting on the shelf for every one of them. Holstein moving twice as fast as the others. Whatever’s driving that, it isn’t a shortage of foreign germplasm — Jersey and Ayrshire breeders in Canada aren’t running set-asides either. (See our companion breakdown: What 9.99% Inbreeding Costs in a Herd Under 50 Cows.)

The Nordic Result Everybody Quotes

At the 2022 World Congress on Genetics Applied to Livestock Production, Tenhunen, Thomasen, Sørensen, Aamand, Berg and Kargo — Aarhus University, VikingGenetics and Nordic Cattle Genetic Evaluations — presented pedigree analysis on 372,955 Nordic Holstein females born January 2016 through November 2018, traced back an average of 12.4 generations.

One term you need before the table. Effective population size — Ne — is the number of breeding animals a population behaves like genetically. Not how many cows exist; how many genuinely independent lines are contributing. A breed with two million cows can run an Ne under 50. The lower it goes, the faster relatedness accumulates. Future Ne is the same idea projected forward off coancestry: where the population is heading if current mating patterns hold. That second number is the one that matters most here.

Their finding travelled fast, and you can see why:

Birth CohortPeriodΔF (per yr)ΔC (per yr)Generation IntervalNeExpected Future Ne
2007–2010Pre-genomics0.00160.00184.86 yr6859
2011–2014Transition0.00170.00144.08 yr7188
2015–2018Genomic era0.00160.00183.17 yr10487

Annual inbreeding rate flat at 0.0016 before and after. Generation interval collapsing from 4.86 years to 3.17. Effective population size apparently rising by half again, and expected future Ne improving from 59 to 87. The authors reported they could not detect any increase in inbreeding or coancestry, contrary to what had been published for Dutch, French and Canadian Holstein.

Two things to hold onto before you bank that. WCGALP proceedings are conference papers, not peer-reviewed journal articles. And the analysis ran on pedigree data.

Then the Same Team Ran It With Genomics

Tenhunen, Thomasen, Sørensen, Berg and Kargo published a follow-up in the Journal of Dairy Science — 2024 Aug;107(8):5897–5912, doi 10.3168/jds.2023-24553 — covering Nordic Jersey and Nordic Holstein, comparing pedigree and genomic measures of inbreeding and coancestry before and after genomic selection, split across females, bulls and approved AI sires. It’s open access, so you can read it yourself.

Nordic Holstein went the other way.

On the genomic measures, effective population size fell from 54.3 before genomic selection to 42.8 after. Future effective population size, the coancestry-derived figure, fell from 198.8 to 42.7 across the same transition.Coancestry rate rose across every Holstein animal group, with the female population surging from 0.02% to 0.39% per year. Yearly ΔF rose for most groups in both breeds.

Two Instruments, Two Verdicts

Measure (source)Pre-GSPost-GSWhat it says
Pedigree Ne — WCGALP 202268104Up 53% — diversity improving
Pedigree expected future Ne — WCGALP 20225987Up 47% — future looks safe
Genomic Ne — JDS 202454.342.8Down 21% — base narrowing
Genomic future Ne — JDS 2024198.842.7Down 79% — the warning
Female coancestry rate, Holstein — JDS 20240.02%/yr0.39%/yr~20x — next generation’s inbreeding
Genomic future Ne, Nordic Jersey — JDS 202440.757.2Up 41% — same program, opposite result

Read that table across the rows, not down the columns. These are not four readings of one quantity. Pedigree Ne and genomic Ne are computed on different scales and cannot be compared to each other by size — 68 is not “bigger than” 54.3 in any meaningful sense. What’s comparable is the arrow. The pedigree instrument said the population was opening up. The genomic instrument, run by the same team on the same population, said it was closing down. Row two and row four are the same conceptual quantity — where the population is headed — measured two ways, pointing opposite directions.

Nordic Jersey, measured the same way over the same transition, went the opposite direction from Holstein: Ne essentially stable, and future Ne improving from 40.7 to 57.2. Same program, same country, same analysis — different outcome by breed.

The authors’ summary is blunt. Genomic methods detect differences between populations and changes in ΔF and ΔC more efficiently than pedigree methods. Genomic selection produced positive coancestry outcomes in Jersey and the opposite in Holstein. Nordic Holstein “faces more pressing concerns,” and the findings “underscore the necessity of genomic control of inbreeding and coancestry with strategic changes to the Nordic breeding schemes.”

So Which Analysis Do You Believe?

The genomic one. That’s not a close call, and it’s the position the research team itself takes.

Be precise about what disagrees here. The two studies don’t offer competing readings of a single number — they used different instruments on the same population and reached opposite conclusions about the direction of travel. Pedigree analysis found diversity holding or improving. Genomic analysis found it deteriorating. One of those instruments missed something.

Pedigree inbreeding measures expected relatedness from recorded ancestry. Genomic measures capture what actually got transmitted — including relatedness that pedigree can’t see because it predates the recorded generations or runs through paths the herdbook doesn’t connect. When the two disagree, the genome is the ground truth and the pedigree is the estimate.

There’s real signal in the 2022 work that survives, and the 2024 paper confirms part of it. Generation interval genuinely fell — across every animal cohort in both breeds, more sharply in males than females. Bulls and AI sires in both breeds showed reduced generational ΔF. Nordic Holstein AI sires were the single group showing a slight decrease in yearly ΔF. The male side of the program did something right.

The Female Side Is Where It Came Apart

Female groups in both breeds showed a negative Ne trend while males were neutral or positive, and Holstein female coancestry climbed nearly twentyfold. A shorter generation interval spun the flywheel faster without widening the base underneath it.

Why the female side specifically? The 2024 paper doesn’t assign a cause, so what follows is inference from how the program is built — but the timing is hard to ignore.

Nordic genomic selection reached full implementation in 2014, the year females were included in the reference populations. Once you can rank a heifer at birth, the elite female pool stops being defined by proven performance across a lactation and starts being defined by a score available on day one. The same top-ranked heifers then get used, repeatedly, as donors. VikingGenetics program material published in 2017 described roughly 10,000 genomic tests on females annually, about 450 heifers contracted for flushing, and some 4,000 embryos produced per year. Its embryo program moves top heifer candidates to a donor station at five to eight months old for flushing or IVF. The stated aim is as many offspring as possible from the top NTM animals.

Note where 2017 sits. It falls inside the 2015–2018 birth cohort the Nordic analysis treats as the genomic era — so those figures describe the program during exactly the window where the coancestry rise shows up.

That is a deliberate and effective design for genetic gain. It is also, by construction, a narrowing of the female base — more calves from fewer dams, selected earlier, on a score that correlates strongly across close relatives. The male side of the program spread its risk across a wider set of sires. The female side concentrated.

One honest caveat in Nordic Holstein’s favour: the authors note ΔF there remains modest compared with what’s been observed in other Holstein populations. Nordic isn’t the cautionary tale. It’s the well-run program whose coancestry problem only became visible when the better instrument came out.

What the Authors Say to Do About It

This is the part that matters for your tank. The 2024 paper’s own conclusion points at mating strategy: analysis of the coancestry data hints at the potential to decrease future inbreeding through informed mating.

In practice that means the coancestry figures identify which pairings will compound relatedness before you make them, rather than showing up as an inbreeding coefficient on a calf that’s already on the ground.

Not passports. Measured relatedness. That’s a selection lever, and it’s the one a herd actually controls — which is a different thing from the supply question the set-aside raises. Hold that distinction; it matters in a minute.

Which is exactly what a Guelph-led team built the tool for.

Somebody Already Built That Tool

Makanjuola, Obari, Condello, Miglior, Maltecca, Cole, Schenkel and Baes — through the Centre for Genomic Improvement of Livestock at Guelph, with Lactanet, NC State, CDCB and Florida — published in the Interbull journal on November 17, 2025.

They pulled Lactanet data: 168,995 genotyped animals, a 616,258-animal pedigree, 8,491 bulls born 2000–2023, and 131,139 cows born 2010–2024. Pedigree completeness above 99%, maximum depth 30 generations. The reference population was active cows and heifers in milk recording with no left-herd date as of the April 2024 test day.

Then they measured how much DNA each bull actually shares with that live Canadian cow population — expected from pedigree (R-value), and realized from genotypes (GR-value).

Across all bulls, R-value ran from 9.3% to 26.5%. GR-value ran from 12.9% to 40.8%. Bulls with United States registration codes came in highest at 20.8% and 30.4%. Bulls registered in the Czech Republic came in lowest, at 17.1% and 24.3%.

Doesn’t the Czech Result Prove the European Case?

Give the set-aside argument its due first, because it raises something a relationship-value screen cannot answer on its own.

Funnel width versus screening precision. You can’t run a GR value on a bull nobody collected. Screening works on the population that already exists — bulls that got sampled, genotyped and entered into an accessible database. The set-aside is about who gets into that population in the first place. Those are two levers on two different parts of the pipeline, and a narrow funnel upstream caps what any downstream screen can possibly find. Widen the funnel and you widen the range of relationship values available to select from. The two are complementary, not competing.

Grant all of that, and the criterion still doesn’t hold.

Read what the Guelph authors actually recommend: select sires with low average relationship values to a defined reference population, as a mating strategy, to reduce or hold inbreeding at acceptable levels while preserving genetic diversity. That’s a relationship-value screen, not a passport screen — and the same logic applies to what you let into the funnel as to what you pick out of it.

The Czech figure isn’t a case for Czech genetics. A Czech-registered bull ranks low here because of how Canadian breeding history ran, not because of where he was born. Run the same math against a different national herd and the order shifts.

And look at the size of the gaps. Between the highest and lowest national groups: about 6 points on the genomic measure. Between individual bulls: nearly 28. The spread inside the bull population is roughly four and a half times the spread between countries. So if you’re going to reserve intake slots — and there’s a real argument you should — reserve them for bulls with low measured relatedness to your reference population, whatever their registration code. A 5% carve-out sorted by passport captures the 6-point axis and leaves the 28-point axis untouched. (Related reading: Genomic Future Inbreeding Shows Relatedness That Pedigree Misses.)

One catch: what the Guelph team published is a method, not a product. Someone still has to run it against your reference population and put the number in front of you. Ask your supplier whether they can — and notice what the answer tells you.

The Number That Isn’t Published Anywhere

The set-aside argument runs on the European-origin bulls that worked. What it doesn’t include is how many got sampled in North America over the same decades and never made a second lineup.

Studs have modelled sampling attrition since at least 1992, when Lohuis published on probability of success and predicted returns for progeny-test sires in the Journal of Dairy Science. Without that denominator broken out by origin, the case rests entirely on the sires that succeeded. Any group of bulls looks strong when only the successes get counted.

Industry Transparency Note: A review of public materials from CDCB, Lactanet, Holstein Association USA and NAAB found no published sire-sampling attrition data broken out by country of origin. That data is held by individual AI companies rather than evaluation bodies, and no association standard or regulatory requirement currently calls for it to be published.

Try to Price the Set-Aside

Meyer et al. (Journal of Dairy Science, 2001) described 1990s U.S. conditions with over 600 new young sires available annually. Five percent of that 1990s figure is about 30 bulls a year across the whole industry — and genomic-era intake is almost certainly lower than 600, which would shrink the number further.

Thirty bulls is small and checkable. It’s also where the math stops. No current published figure exists for genomic-era sampling volume, and no stud has published a per-bull cost breakdown running from acquisition through housing, genomic testing, collection and marketing to a usable proof.

Meanwhile the spread from Net Merit $ #1 to #10 in the August 2026 run is $47 per animal — roughly $4,700 across 100 daughters — per The Bullvine’s analysis of that run. That’s a PTA differential, not money in the tank, but it’s a number the industry can put a decimal on. What it costs to widen the funnel by thirty bulls isn’t published anywhere. (Full run detail: The August 2026 Lists, Bull by Bull.)

The One Historical Case Worth Citing

Carol Prelude Mtoto gets invoked constantly as proof that European testing unlocks genetics North America would have missed. His sire line traces to Ronnybrook Prelude, a Canadian-registered sire confirmed in Holstein Canada’s animal information records. Mtoto’s Italian proving history appears in two independent published accounts rather than a primary herdbook entry, so treat the detail accordingly.

What the case actually shows is a North American pedigree that got its shot in Italy. That’s a story about somebody widening the funnel for an unproven pedigree — which is the set-aside argument’s strongest instinct, and it has nothing to do with where the genetics came from. One case isn’t a pattern either way, and building a procurement policy on it would repeat the same shortcut. (Background: The Full Mtoto Story.)

One Study Nobody Reopened

Powell, Sanders and Norman at USDA’s Animal Improvement Programs Laboratory examined May 2005 Interbull evaluations using Holstein full-brother families — 24,611 bulls for yield traits (Journal of Dairy Science, July 2008, 91(7):2885–92). Bulls from Australia, Germany, Great Britain and Japan showed greater EBV for milk yield than their own full brothers evaluated in the United States, on all countries’ scales. Causes were reported as unknown, and eighteen years on, nobody has replicated it with genomic-era data.

Nilforooshan’s 2022 JDS invited review found that bulls proven in more than one country are “highly selected and a biased representation of the national sire populations.” Sallam et al. (2022) found MACE may not fully account for genotype-by-environment interactions. Neither quantifies direction or magnitude for sires entering North America.

Tie that back to your order. A foreign proof can read differently on a North American scale for reasons that have nothing to do with the bull’s genes — selection bias in which bulls got exported and evaluated abroad, genotype-by-environment effects the conversion may not fully absorb, and in the 2008 case something nobody has identified in eighteen years of trying. None of that makes foreign-tested bulls better or worse than domestic ones. It makes their index numbers harder to read with confidence. Which is one more argument for buying on measured relatedness to your own cow population, where the number means the same thing no matter which country ran the evaluation. An import stamp is not a genetic outcross, and a foreign index is not a like-for-like comparison.

What This Means for Your Operation

What you’re buying onThe numberWhat it actually means
Top 10 GTPI bulls sired by Ocd Thorson Ripcord-ET7 of 10Four picks off the list, three likely half-brothers
Top 10 Net Merit $ bulls sired by Ripcord8 of 10Switching index does not switch families
Bulls tracing to one shared great-granddam7 across both listsOne generation back it tightens, not loosens
Net Merit $ spread, #1 to #10$47/animal (~$4,700 per 100 daughters)A PTA differential, not cash in the tank
Reliability: genomic young sires vs daughter-proven65–82% vs 84–99%On contract heifers, reliability is the decision
Canadian Holstein average inbreeding, 2023 → 2024 heifers9.61% → 9.99% (+0.38 pt in one year)Steeper than its own +0.25%/yr long-run rate

Trust genomic relatedness over pedigree relatedness

Nordic Holstein’s pedigree analysis reported no deterioration. The genomic analysis, from the same team, put future Ne at 42.7 after genomic selection. If your herd manages diversity off pedigree inbreeding alone, you’re reading the estimate instead of the measurement.

Audit your sire-of-sons base

Pull the last twelve months of semen invoices. List sire and maternal grandsire for every straw, then count the distinct sires of sons. Seven of ten top GTPI bulls in the August 2026 run traced to one sire — buy four off that list without checking and the odds say three are half-brothers. Vendor diversity is not family diversity.

Ask for genomic relationship values

Request GR values benchmarked against your national or herd reference base rather than trusting outcross claims on a catalogue page. Individual bulls in the Guelph study spanned 12.9% to 40.8% — roughly four and a half times the spread between the highest and lowest national registration groups. The method exists. Ask who’s willing to run it.

Ask about the funnel too, not just the screen

Screening only works on bulls somebody collected. If your supplier’s young-sire intake is narrow, no amount of GR filtering on the survivors fixes it. Ask how many bulls enter their program each year and how many distinct families those bulls come from — then ask what the relationship-value spread looks like across that intake.

Watch your own donor concentration

The Nordic female result is a warning that applies at herd level. If you’re flushing or aspirating, count how many distinct dams produced your last two calf crops. Genomic pre-selection makes it easy to keep going back to the same three heifers because the score says so. That’s how a female base narrows without anyone deciding to narrow it.

Don’t mistake a shorter generation interval for progress

Nordic Holstein cut generation interval across every cohort and still lost ground on coancestry, because the female side kept drawing on related lines. Faster turnover only expands the effective population if the parents come from genuinely different families.

Watch coancestry, not just inbreeding

Nordic Holstein female coancestry went from 0.02% to 0.39% per year while inbreeding stayed modest. Coancestry is next generation’s inbreeding. Your current inbreeding percentage won’t warn you.

Treat reliability as the decision on contract heifers

Genomic bulls in the August 2026 run carried 65–82% reliability against 84–99% for daughter-proven sires. On heifers you’re committing, that spread is the choice, not the index.

Don’t compare indexes across systems

TPI, LPI, NVI, RZG and gPFT are non-comparable without an explicit MACE-conversion caveat — and treat any foreign-tested proof as carrying an open country-of-testing question, because the 2008 full-brother finding was never revisited.

Key Takeaways

  • If you’re managing diversity off pedigree inbreeding alone, you’re using the instrument that found nothing wrong with Nordic Holstein. In the next 30 days, run the invoice audit above and ask your supplier for genomic relationship values against your national reference base.
  • Funnel width and screening precision are different problems, and you need both. A narrow intake caps what any screen can find; a wide intake sorted by the wrong criterion wastes the width.
  • Canadian Holstein went from 9.61% to 9.99% average inbreeding in one birth year — a steeper jump than its own +0.25% long-run rate, and better than double the pace of Jersey, Ayrshire and Brown Swiss.
  • Same program, same country, same genomic analysis: Nordic Jersey’s future Ne improved from 40.7 to 57.2 across the genomic-selection transition while Holstein’s fell from 198.8 to 42.7. This isn’t an argument about genomics as a technology — it’s about how a breed’s female base gets used.
  • If one bull sits at 30.4% genomic relatedness to your reference population and another at 24.3%, the second one is your outcross — whatever flag is on the catalogue page.
  • If your coancestry rate is climbing while your inbreeding percentage looks stable, that’s the Nordic Holstein pattern, and it resolves into inbreeding one generation later.
  • Ask your stud how many foreign-origin sires they’ve sampled and how many made a second lineup. Whether that number is even available is worth knowing before your next order.

Interbull got built because fragmentation carried a cost the whole industry felt. InterGenomics got built because accuracy had a shared incentive. CDCB publishes its base-change methodology because everybody’s numbers depend on it. Sire attrition data sits at a different level — held by individual companies, with no standard calling for it. Meanwhile the Nordic team went back with a better instrument and published a result that undercut its own earlier finding, and a Guelph-led group has already built the measurement that answers the selection half of the question — and tells you what a wider funnel should be screening for. So the question isn’t whether North America needs European semen. It’s whether anybody’s going to ask their supplier for a relationship value — and whether they’ll get one. What’s yours?

Genetic evaluation figures are from the August 2026 CDCB/Holstein Association USA run. Relationship values are from Makanjuola et al., Interbull journal, November 17, 2025, calculated against the active Canadian cow population as of the April 2024 test day. Inbreeding figures are Canadian, from Lactanet’s Inbreeding Update – August 2025 (Brian Van Doormaal), covering heifers born in 2023 and 2024. Nordic pedigree figures are from Tenhunen et al., WCGALP 2022 conference proceedings; Nordic genomic figures are from Tenhunen, Thomasen, Sørensen, Berg and Kargo, Journal of Dairy Science 2024;107(8):5897–5912, doi 10.3168/jds.2023-24553, open access — all Nordic Ne and future Ne values quoted from that paper are genomic measures compared before and after the genomic-selection transition. Pedigree and genomic Ne are computed on different scales and are not directly comparable by magnitude. Embryo-program figures are from VikingGenetics program material published in 2017, plus its current embryo program description; the 2024 paper does not assign a cause for the female coancestry trend, and the connection drawn here is The Bullvine’s inference. Both Nordic studies cover Denmark, Finland and Sweden. Analysis and conclusions are The Bullvine’s.

Learn More

The Sunday Read Dairy Professionals Don’t Skip.

Every week, thousands of producers, breeders, and industry insiders open Bullvine Weekly for genetics insights, market shifts, and profit strategies they won’t find anywhere else. One email. Five minutes. Smarter decisions all week.
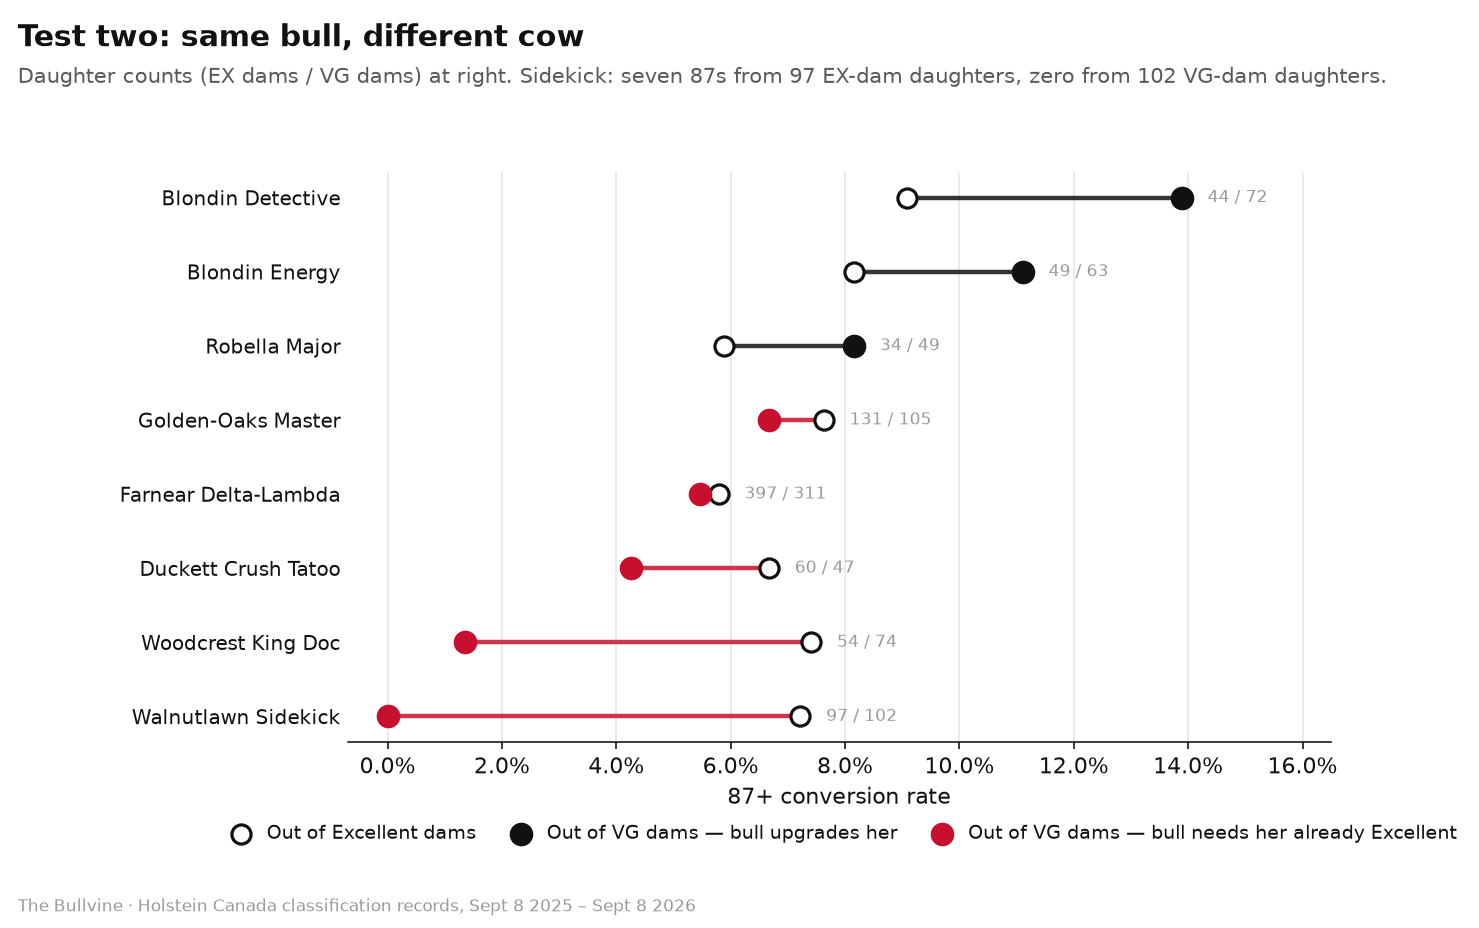
NewsSubscribe
First
Last
Consent

The Ripcord Risk: Correcting the Genetic Blind Spot in Legs

Seven of the ten highest-GTPI bulls in the U.S. share one father. Every one is positive on udders, negative on feet and legs. Feet and legs correlate −0.11 with TPI — your ranking won’t flag it.

EXECUTIVE SUMMARY:

  • What happened: Seven of the ten highest-GTPI bulls in the August 12, 2026 U.S. run trace to one father — Ocd Thorson Ripcord-ET — and eight of the top ten on Net Merit $. Every one of those GTPI sons carries a positive Udder Composite alongside a negative Feet & Legs Composite.
  • Why your ranking won’t catch it: In Holstein Association USA’s own August matrix, FLC correlates −0.11 with TPI across 630,295 females born in 2020. That’s not a formula that penalizes legs. It’s a formula that can’t see them. And legs are the slowest thing in the barn to fix — Lactanet puts Holstein Feet & Legs heritability at 13% and Foot Angle at 7%, below the .10 threshold Holstein USA itself says you need for meaningful progress, against stature at 46%.
  • What it costs, and what to do: At $336.91 per clinical lameness case, a 200-cow herd running 20% incidence pays $13,476 a year; one at the 29.5% published median pays $19,878 — a $6,400 swing on the same milk check. The new Holstein Conformation Composite is the first index in years that weights legs heavily, and it correlates just 0.64 with PTAT, which itself runs −0.54 against Livability in that cohort. Before your next semen order, add one column: pull FLC on every straw and note where Ripcord shows up as sire or maternal grandsire.
Feet and Legs Composite

Open the August 12, 2026 evaluation, pull the U.S. GTPI top ten, and check the sires. Seven of those bulls trace to one father: Ocd Thorson Ripcord-ET. On the Net Merit $ top ten, it’s eight of ten.

Now look at their type numbers. The Ripcord sons in that GTPI top ten show a consistent pattern in our review of the August run — positive Udder Composite alongside negative Feet & Legs Composite. Individual values vary, so pull each bull’s own UDC and FLC rather than trusting the pattern. But the direction is the direction, seven times over.

That’s not a popular-sire story. Holsteins have had those for sixty years. That’s one pedigree holding 70 to 80 percent of the top of the U.S. Holstein registry while the trait group most likely to shorten a cow’s stay sits in the same place on all of them.

Why Won’t the Index Catch This?

Because feet and legs barely register in it.

In the correlation matrix Dr. Jason Graham and Dr. Sam Comstock published for the August run — females born 2020, n = 630,295 — Feet & Legs Composite correlates −0.11 with TPI. Call it zero. A bull’s leg composite tells you essentially nothing about where he’ll rank.

Holstein Association USA publishes UDC and FLC separately on every bull, so both numbers sit on every proof sheet you pull. They don’t move a TPI ranking in either direction. A breeder sorting on GTPI or Net Merit sees production, health, and fertility shift the number — and sees nothing from the trait group that decides how many of those daughters are still walking sound at 30 months.

What HCC Actually Rewards

The same run published the Holstein Conformation Composite for every animal in the HAUSA database, and April-to-August scores correlate at 0.99 across 4,055 animals. The calculation is stable out of the gate.

Graham and Comstock pulled the top 25 HCC bulls and averaged all 18 linear traits. Rear Legs Rear View averages +1.61 — the strongest trait in the whole profile. Feet & Legs Score: +1.33. Foot Angle: +0.86. Stature? −0.42. These aren’t tall bulls. They’re better-assembled ones.

That’s the design working as intended. HCC scores each linear trait against a functional optimum and penalizes deviation in either direction. Traditional type evaluation rewards extremes; HCC docks them. Rump angle averages +0.25 across that group, body depth +0.14, rump width +0.52 — near the middle, none pushed.

Across those 25 bulls, HCC runs 2.58 to 3.08 and averages 2.73. PTAT across the same animals averages just 1.43. Same bulls, more than a full point of disagreement between the two scores.

MetricHCC (Holstein Conformation Composite)PTAT (Traditional Type)What it means
Average score, top 25 bulls2.731.43Same bulls score a full point apart
Rear Legs Rear View (avg deviation)+1.61Not separately weightedHCC’s single strongest trait
Correlation with Livability−0.07 (essentially none)−0.54PTAT selection tracks with cows leaving sooner
Correlation with Productive LifeNot published in this run−0.38Same pattern, second metric
Correlation with Feet & Legs Composite+0.57+0.64Both “see” legs; TPI (−0.11) doesn’t
Correlation between HCC and PTAT0.640.64Related, not interchangeable

The Longevity Number Worth Arguing With

In that 630,295-female cohort, PTAT correlates −0.54 with Livability and −0.38 with Productive Life. HCC correlates a milder −0.18, and essentially nothing at −0.07.

Cows bred for higher PTAT left the herd sooner. Graham and Comstock flag the caveat themselves — correlations shift with the population you sample. Fair enough. But the direction holds in both their bull-list work and their cow-level matrix, and the two composites correlate just 0.64 with each other. Related. Not interchangeable.

Feet & Legs Composite correlates +0.57 with HCC and +0.64 with PTAT. Both type composites see legs. TPI doesn’t.

The Barn Math on a Leg Decision

Legs build slowly and erode fast, and the heritability numbers are worse than most breeders assume. Lactanet’s April 2025 heritability table puts Holstein Feet & Legs at 13% and Foot Angle at just 7% — against stature at 46% and rump angle at 41%. Rear Legs Rear View, the trait topping the HCC profile, sits at 11%. Locomotion is 5%.

Holstein Association USA puts the threshold plainly on its Linear Type Evaluations page: “It is difficult to make much genetic progress through selection and mating unless a trait has a heritability of .10 or higher.”

Foot Angle doesn’t clear that bar. Feet & Legs barely does. Stature clears it by a factor of four. You can move udder in a mating cycle. Legs take generations — exactly the wrong shape of problem to inherit from seven bulls at once.

So price the downside. The average clinical lameness case runs $336.91, climbing $13.26 for every additional week a cow stays lame, per Robcis and colleagues in the Journal of Dairy Science.

Two scenarios on a 200-cow herd. At a conservative 20% annual incidence — 40 cases, $13,476 a year. At the 29.5% median cow-level prevalence found across the published literature — 59 affected cows and roughly $19,878, though prevalence and annual case count aren’t the same measure. Either way, the gap between those two herds runs about $6,400 a year, and genetics is one of the levers moving you between them.

Lameness accounted for 9.1% of the total U.S. cull rate in the 2018 USDA/NAHMS survey, with injuries adding 3.5%. That puts locomotion third among involuntary culling reasons, behind infertility at 23.3% and mastitis at 18.6%.

The Part That Costs Labor, Not Just Dollars

Treatment cost is the easy number. The harder one is what a low-FLC group does to your routine.

Two or three hoof trimmings during first lactation improve hoof health in early second lactation — and improve survival into that second lactation. Read that alongside the heritability math and the shape of the problem changes. A group of daughters with weaker feet and legs doesn’t just generate treatment invoices. It generates trim appointments, restraint time, and labor you’d budgeted somewhere else.

The disease genetics are thinner still. Finnish work on 24,685 Holstein cows found hoof disorder heritabilities running from 0.02 for sole hemorrhage and heel horn erosion up to 0.13 for digital dermatitis, with feet and leg conformation traits landing between 0.10 and 0.19. Most genetic correlations between hoof disorders and conformation traits came in low and statistically indistinguishable from zero — meaning conformation is a proxy for hoof health, not a substitute.

Worth knowing how the composite was built. Both the Udder Composite and the Feet & Legs Composite carry a −0.20 weight on stature, documented by Holstein Association USA, so breeders can improve udders and legs “without making their cows taller.” Someone anticipated this exact trade decades ago and engineered against it inside the composites. The index doesn’t carry that logic upward into TPI.

The Fertility Correction Was the Dress Rehearsal

Here’s why this run should make you uneasy about more than feet and legs.

The August evaluation rewrote the fertility scale, and Fertility Index carried 69% of all TPI movement — roughly seven times the next-largest trait. Males in the top 10% for DPR dropped 9.08 PTA points. April-to-August male ranking correlation for DPR came in at 0.31, against 0.93 for Heifer Conception Rate. An April DPR ranking told you almost nothing about an August one.

That’s what it looks like when a component of the index gets recalibrated after two decades of use. Nothing about the old number was hidden — it was published, it moved the index, breeders used it. Then CDCB changed how DPR accounts for the voluntary waiting period, and TPI moved for all 12.6 million evaluated females at once: top-decile animals up, everything below them down.

Now apply that to legs. Feet and legs aren’t mismeasured — they’re barely visible, at −0.11 against TPI. Different failure, same exposure. The fertility correction arrived as a scale change breeders could see in a single run. A locomotion correction, if it comes, arrives as culls — three years after the mating decision, spread across a herd, with nothing in the index to have warned you.

Why Index Moves Punish Concentrated Pedigrees Hardest

We’ve watched this pattern before, and the numbers are on record.

Our five-year tracking of 401 elite genomic Holstein bulls from April 2020 through their December 2025 proofs found the retained bulls dropped an average of 42.5 TPI points — most of it from base changes and formula rewrites, not failed biology. Correlations between 2020 genomic predictions and 2025 proven results held strong on core traits: 0.81 for PTAT, 0.76 for fat, 0.71 for protein. The DNA didn’t change its mind. The formula did.

The bulls that crashed hardest shared a profile: over-predicted type stacked on thin functional traits. Homecoming lost 414 TPI points with PTAT dropping 0.87. Supercharge lost 396, including a 2.32-point PTAT collapse from +1.18 to −1.14. Sire lines heavy on Legacy and Heroic up top, with Delta on the maternal side, were over-represented in that group.

Concentration amplifies whatever the formula decides to reward or ignore. When 70 to 80 percent of a top-ten list traces to one sire, and they all sit weak in the same trait group, you don’t have seven independent bets. You have one bet placed seven times.

Fertility is where that already bites hardest. Annual genetic gain outruns inbreeding depression for every index trait except one — daughter pregnancy rate, running a net loss of 0.02 PTA units per year, on figures calculated before this run’s revision. Holstein heifers born in 2024 averaged 9.99% inbreeding per Lactanet Canada’s August 2025 update — a Canadian figure, not a U.S. one, and up from 9.61% the year before.

Looking for an Outcross

Concentration this deep makes clean pedigrees worth hunting, and the August lists offer one credible candidate near the top.

Genosource Jaco-ET sits at #8 GTPI at +3608 with 82% reliability, no daughters yet, and he was the biggest riser in the top ten at +128. Under the new 36-month rule holding daughter data out of DPR, CCR, and FSC, a bull like Jaco has no fertility daughter records feeding his numbers — so weight him on production confidence, not fertility confidence.

Whether he’s a genuine outcross for your herd depends on your own pedigree stack. That’s a check to run against the HAUSA database with your straw inventory in front of you, not something a proof sheet answers for you.

The honest read: with one sire behind 70 to 80 percent of the top ten, options up there are thin, and the ones that exist come with compromises — no daughters, limited status, or family overlap you’ll need to verify yourself.

Three Paths, and What Each One Costs

ApproachWorks best forWhat it costsWhere it backfires
Add FLC as its own spreadsheet column with a floorAny herd ranking primarily on TPI/NM$~1 hour of spreadsheet work; occasionally a lower GTPI pickSetting the floor at zero cuts most of the current top 10
Select on HCC for longevity-focused herdsHerds culling heavily on feet, legs, udder breakdownLower PTAT, lower show-ring ceilingExpecting fast results — 13% heritability is a 3-generation play
Place one deliberate outcross sire in the rotationHerds where a third+ of active straws trace to RipcordReal compromise — top candidates near GTPI top 10 also carry limitationsSwapping one concentration risk for another unverified one
  • Pull FLC as its own column and set a floor. Works for any herd ranking on index. Costs an hour of spreadsheet work and occasionally a lower GTPI on the bull you pick. Backfires if you set the floor at zero — you’ll cut most of the top ten and forfeit real production merit. Set it against your herd’s actual leg problem, not an arbitrary line.
  • Use HCC where longevity is the goal. Works for herds culling heavily on feet, legs, and udder breakdown rather than by choice. Costs you a lower PTAT and a lower show ceiling sometimes. Backfires if you expect speed — at 13% heritability on Feet & Legs this is a three-generation play, not a first-crop answer.
  • Place one deliberate outcross in the lineup. Works where a third or more of active straws trace to Ripcord. Costs real compromise, because the candidates near the top all carry one. Backfires if you swap one concentration for another, so verify the pedigree yourself before you commit.

The Action Checklist

Do this in the next 30 days:

  1. Put your April and August proofs side by side for every sire in your active lineup. Sort by TPI change. Flag any bull whose drop is more than double his cohort’s — that short list, not the full drop list, is where re-evaluation belongs.
  2. Add an FLC column to that same sheet. If you rank on TPI or NM$ alone, feet and legs are not currently in your decision. The index correlates −0.11 with FLC. Add the column or accept that you’re not selecting on it.
  3. Note sire and maternal grandsire on every straw. Where Ripcord appears, pull each bull’s individual FLC rather than judging by pedigree — the pattern is directional, the numbers are what you breed to.
  4. Cap single-sire exposure. No one bull on more than 12 to 15 percent of your matings, and build the team from at least eight unrelated sires. That’s the same discipline North Florida Holsteins applied when it capped how much any single bull could influence the herd.
  5. Locomotion-score your herd this quarter. Published prevalence spans 2.6% to 63.7% across studies, so the breed average tells you nothing about your barn — and the difference between 20% and 29.5% on 200 cows is roughly $6,400 a year.

Nobody built TPI to ignore feet and legs. It worked out that way — a composite weighting production, health, and fertility, with a trait group that washes out to −0.11 in the arithmetic. And nothing about that arithmetic changes on its own: at 13% heritability on Feet & Legs and 7% on Foot Angle, you can buy udder in one mating cycle and spend three generations paying it back. The 2029 version of this decision won’t arrive as a scale change you can see in a proof run. It arrives as culls and trim appointments. HCC is the first tool in a while that puts legs back in the conversation with real weight behind it. So before your next semen order, the question isn’t which bull ranks highest. It’s which column you’re adding to the spreadsheet first.

Learn More

The Sunday Read Dairy Professionals Don’t Skip.

Every week, thousands of producers, breeders, and industry insiders open Bullvine Weekly for genetics insights, market shifts, and profit strategies they won’t find anywhere else. One email. Five minutes. Smarter decisions all week.
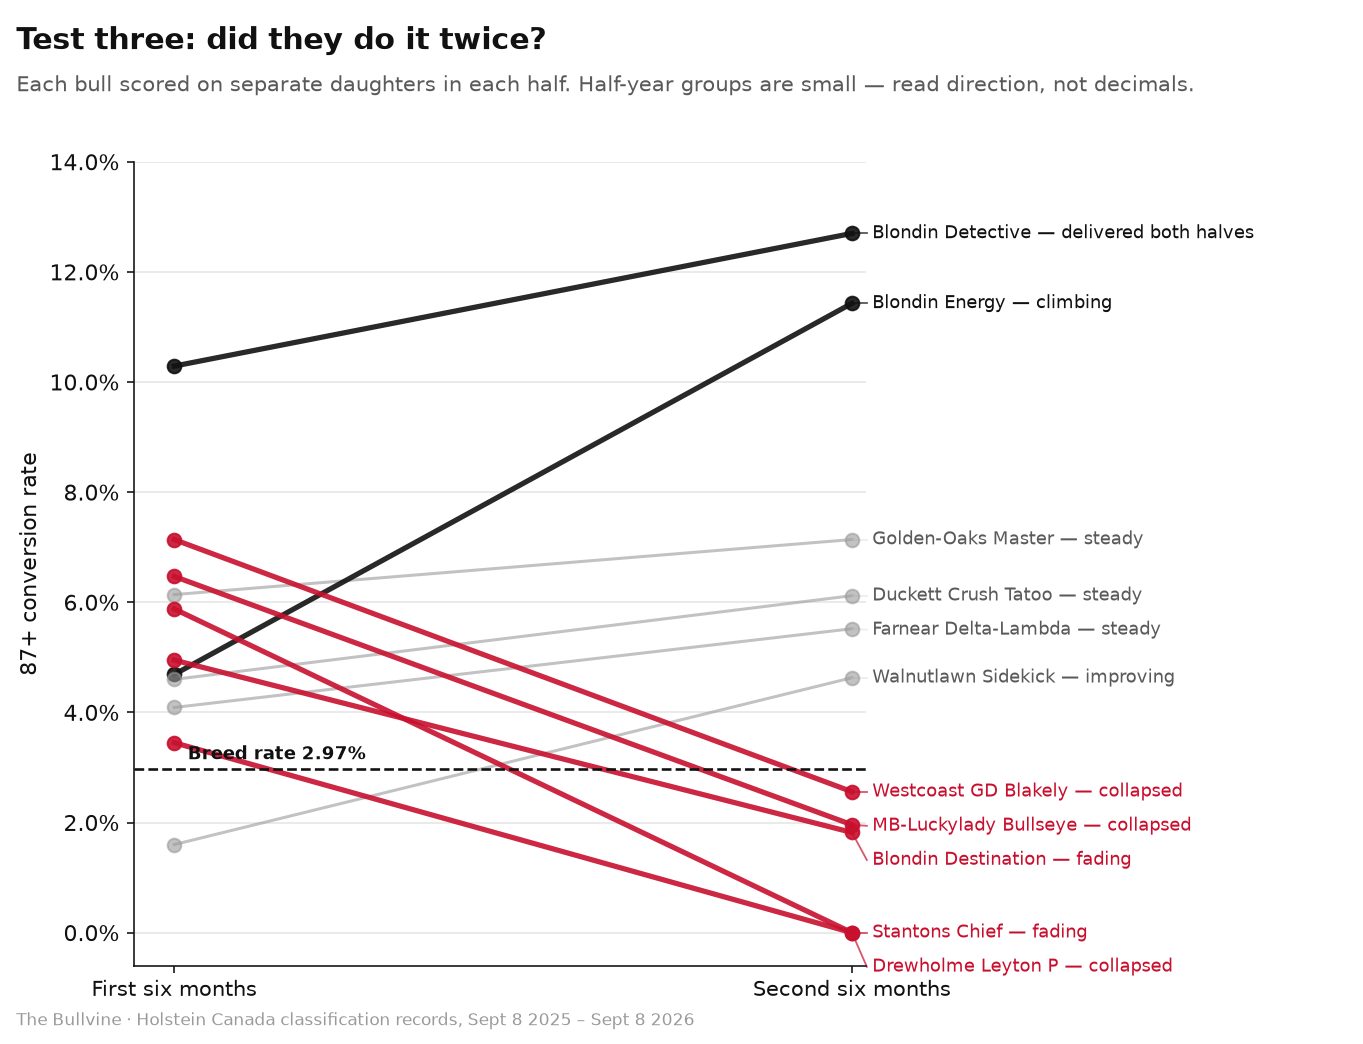
NewsSubscribe
First
Last
Consent

Stature Predicts Your Feed Bill at 0.63. It Predicts Profit at 0.06.

Two decimals, two decades of peer-reviewed data. Stature tracks what your cows eat at 0.52–0.63 and what they earn at 0.06 — and CDCB just priced the spread at 1,682 pounds of dry matter.

EXECUTIVE SUMMARY:

  • The Feed Spread: CDCB’s Feed Saved evaluations show a 1,682-lb dry matter spread per lactation between top and bottom Holstein sires. At $0.11–$0.15/lb DM, that’s $185 to $252 per cow — or $14,000 to $22,000 in Year 1 on a 250-cow herd once you apply it to the replacement group.
  • The Policy Squeeze: Holstein Association USA now docks Final Score up to 3.45 points for 70-inch cows (May 2026), while CDCB raised Feed Saved to 17.8% of Net Merit (April 2025). Two separate organisations, thirteen months apart, no evidence of coordination.
  • The Selection Reality: Feed Saved reliability averages 28% on young genomic sires versus 38% on proven bulls — use it to weed out extremes, not to split hairs. And if you’re capping stature expecting longevity to follow, Productive Life heritability sits at 0.05–0.13.
  • Same milk. Different feed bill. And nothing on your monthly milk statement will ever tell you which side of that 1,682-pound dry matter spread your herd landed on.
  • That range is current, too. CDCB’s August 2026 evaluation update introduced three new traits and revised four female reproductive traits, but left Feed Saved untouched.

Two Changes, Seventeen Months Apart, Pointing Opposite Ways

On December 1, 2024, Holstein Association USA threw out its stature linear scale. The old 51-to-61-inch range became 55 to 65 inches, five points per inch. Behind it was a 2023 cow-measurement project that found the breed had physically outgrown the old ruler.

Seventeen months later, the same organization started docking height. From the May 2026 classification run forward, 60 inches is the ideal, and every inch above it costs Final Score — taken out of Front End and Capacity, which is 15% of the score.

  • 60 inches — breed standard ideal, no deduction
  • 61 inches — −0.15 points
  • 65 inches — −1.20 points
  • 68 inches — −2.55 points
  • 70 inches — −3.45 points

Source: Holstein Association USA, Spring 2026 Pulse

Widen the scale, then penalise what you made room for. It reads like whiplash.

It isn’t, quite. December was a ruler problem. The association’s rationale: cows were bunching at the top of the old 61-inch ceiling, leaving classifiers little room to separate them, and their measurements showed the scale no longer matched the population. Under the new one, 60 inches reads as 25 and 65 reads as 50. Nothing got punished. Tall cows just got measured honestly.

May 2026 is a different instrument, and the association was explicit about why. The sliding scale “defines a breed standard for ideal stature for the first time” and is “designed to discourage extreme stature in the Holstein breed, while continuing to reward cows that combine balance, strength and functional correctness.” Both changes came from recommendations by the association’s Conformation Advisory Committee and Genetic Advancement Committee.

The Change That Didn’t Get a Headline

Underneath both, on its own track, CDCB revised Net Merit effective April 1, 2025.

Net Merit Weighting Shift — Effective April 1, 2025

TraitBeforeAfter
Fat28.6%31.8%
Protein19.6%13.0%
Feed Saved (combined)12.0%17.8%
Body Weight CompositeIncluded in Feed Saved bundleEconomic weight more negative — CDCB states the direction; no standalone percentage published

Source: CDCB, “Introducing Net Merit 2025,” January 30, 2025. Board approval December 18, 2024.

No classification-run headline for that one. It just quietly reweighted the index a lot of sire lists get built on.

Careful what you read into the timing, though. CDCB and Holstein Association USA are separate organisations with separate boards and separate review cycles. Holstein Association USA’s published rationale for the stature penalty cites breed standards and functional correctness — not feed costs or Net Merit. And CDCB’s revision arrived without any public cross-reference to classification policy either. Thirteen months between CDCB’s April 2025 index change and Holstein USA’s May 2026 classification change isn’t evidence they were coordinating. Both could be downstream of the same peer-reviewed literature, which has been sitting in the Journal of Dairy Science since at least 2010.

What 1,682 Pounds Actually Costs

Here’s the barn math, and read the assumptions, because this isn’t a published finding. It’s CDCB’s spread times a feed cost, and it’s arithmetic you can check.

University of Wisconsin Extension’s feed-efficiency worked example prices dry matter at $0.15 per pound against milk revenue of $0.21 per pound. Toghiani et al. priced U.S. Holstein rations at $12 per 100 Mcal NEL and $73 per 100 kg metabolizable protein — near $0.109 per pound on a typical lactating ration. Call the working range $0.11 to $0.15, and know your own forage and ration costs can land outside it either way.

Financial Sensitivity Breakdown

ScenarioLow feed cost ($0.11/lb DM)High feed cost ($0.15/lb DM)
Per cow, per lactation$185.02$252.30
100-cow herd, outer bound$18,502/yr$25,230/yr
250-cow herd, outer bound$46,255/yr$63,075/yr
500-cow herd, outer bound$92,510/yr$126,150/yr

Bullvine calculation: 1,682 lb DM spread × feed cost. Herd figures are outer bounds only — they assume every cow descends from either the best or worst Feed Saved sire available. At a 30–35% replacement rate, you’d need roughly three years of one-directional mating to approach even half of it. A realistic first-year target is the per-cow figure applied to that year’s replacement group: on 250 cows, roughly 75–88 head, or $14,000–$22,000 depending on feed cost.

Across all genotyped animals, the range is tighter: −738 to +613 pounds, with an average PTA of about 10 pounds saved, per USDA-ARS. Use the wider bull range when you’re shopping. Use the narrower one when you’re setting herd expectations.

And here’s the part that should nag at you. On 250 cows, the gap between a $0.11 feed cost and a $0.15 one is roughly $17,000 a year all by itself. Same bulls. Same genetics. Your feed price moves this answer hard — and that’s a number you can’t get off a proof sheet.

Feed Cost ScenarioPer-Cow/Lactation250-Cow Herd (Outer Bound)Gap vs. Low Scenario
$0.11/lb DM (low)$185.02$46,255/yr
$0.13/lb DM (mid)$218.66$54,665/yr+$8,410
$0.15/lb DM (high)$252.30$63,075/yr+$16,820

Does the Tall Cow Actually Milk More?

This is where most stature conversations end at the rail, usually in the tall cow’s favour. The genetic data doesn’t really back it.

Schmidtmann et al. (2023), using German Holstein data, found stature’s genetic correlations with production traits ranged from 0.084 to 0.158 across milk, fat, and protein yield. Campos et al. (2015), looking across 21 linear type traits, put most yield correlations under 0.20 — stature well inside that band.

Body weight is a different animal — heavier cows do yield more, with the correlation shifting once you account for body condition. But height on its own is a weak proxy for milk.

Genetic Levers: Reality vs. Perception

TraitHeritabilityCorrelation to DMICorrelation to lifetime profitPractical takeaway
Stature0.49–0.63+0.52 to +0.63+0.06 (negligible)High genetic response — builds size and feed cost fast with virtually no profit dividend
Productive Life0.05–0.13Low / variable*High*Direct progress is slow; work it through management and correlated composite traits
Udder Depth0.31Not established*Moderate*Roughly twice as responsive as foot angle (0.08–0.15); prime lever if culling traces to udders
Feed Saved~0.14Direct negative (saves DM)High — inferred from its 17.8% Net Merit weightingReal dollars, but 28–38% reliability — separate extremes, don’t split hairs

Heritabilities and the stature correlations are sourced as follows: Vallimont et al., JDS 2010 (Pennsylvania research herd); Pérez-Cabal et al., Journal of Dairy Science, 2002 (Spanish Holstein population — a 24-year-old estimate, and the most direct one available); Kern et al. 2015 (Brazilian); Wasana et al. 2015 (Korean); Holstein Association USA Linear Type EvaluationsCanadian Dairy Network.

*Cells marked with an asterisk are directional professional assessments, not values drawn from the cited studies.

So the trait you can size up from across the yard tracks a cost you can’t see, barely tracks the profit you’re after, and only weakly tracks the milk you assumed you were buying. Nobody chose that on purpose. It’s a measurement gap that ran for decades before the tools existed to close it.

Put the heritability columns side by side and the last forty years make sense. Cow size moved fast because it was easy to select. Longevity — the thing every breeder says they want — is among the hardest traits in the barn to shift through genetics alone.

Four Paths, and What Each One Costs

PathHeritability / ReliabilityDollar ImpactBest Fit
Cap stature as a filterN/A — policy lever$0 cost, no direct gainAlmost any herd
Rank on Feed Saved + BWC28% (young) / 38% (proven)$185–$252/cow/lactationHerds chasing feed cost first
Chase longevity via udder depth0.31 h² (vs. 0.15 foot angle)Indirect, high long-termCulling problems traced to udders
Wait / hold steadyN/AOpportunity cost onlyModerate-framed, decent feed conversion herds

Path 1 — Cap stature as a filter, not a ranking trait

  • Set the ceiling near 0.0 PTA, then rank survivors on everything else
  • Fits almost any herd; costs nothing to apply
  • Limit: a ceiling buys you nothing if you then rank survivors on the same traits you always did

Path 2 — Move Feed Saved and BWC into primary ranking

  • This is where the dollars are: $185–$252 per cow per lactation across the full spread
  • Reliability caution: CDCB reports Feed Saved reliabilities averaging 28% for young genomic bulls, 38% for progeny-tested. Thin against traits you’re used to trusting, because the dry matter intake phenotype database is still small
  • Feed efficiency heritability sits near 14%
  • Practical read: separate clear extremes, don’t split hairs between two bulls three points apart. Firmer ground on progeny-tested sires

Path 3 — Chase longevity sideways

  • Direct PL selection is slow at 0.05–0.13 heritability
  • Udder depth carries 0.31 heritability against foot angle’s 0.15 — roughly twice the response for the same selection pressure
  • Lactanet’s Canadian estimates run the same direction: udder depth 0.31, foot angle 0.08
  • Best fit: herds whose culling sheet keeps pointing at udders
  • Honest caveat: no study in hand quantifies how much faster indirect selection moves Productive Life in this specific context

Path 4 — Or wait

  • Reasonable if your herd’s already moderate-framed and feed conversion is decent
  • Cost of waiting: each lactation is another cycle of Body Weight Composite drag before any correction compounds
  • Context: VikingGenetics roughly doubled Saved Feed’s weighting in its Holstein NTM index, from 6.2% to 11.4%, per the company’s own documentation. Several evaluation systems are moving in the same direction independently.

Is Your Sire List Behind, or Is the Data Just Too New?

Depends which change you mean. Net Merit’s revision took effect April 1, 2025, so it’s had four full proof runs to work through rankings. The classification penalty started with the May 2026 run — roughly three months of data as of now.

Which is why one claim circulating in trade coverage deserves a flag: that cows under 60 inches show 25% longer longevity. No primary source for it turned up in this research. No named study, no institution, no population — it appears only in secondary aggregation. Don’t build a culling threshold on it.

Use the same caution on the softer version, common in recent coverage, that the May 2026 penalty has already delivered measurable longevity or profitability gains. Three months of classification data can’t carry that, whatever direction the underlying biology points.

What This Means for Your Operation

  • Pull Feed Saved and BWC on every bull in your tank this month. If your rep quotes index totals only, ask for the component traits by name. That’s the 30-day move, and it’s one phone call.
  • Ask whether each Feed Saved figure came from a progeny-tested or young genomic bull. At 38% versus 28% reliability, that distinction should change how hard you lean on it.
  • Work out your own feed cost per pound of dry matter before using any per-cow figure here. The $185–$252 range swings entirely on that input.
  • If a bull’s stature PTA sits above 0.0, ask what you’re getting for it. Correlation to milk yield is 0.084–0.158. If the answer is “he’s just tall,” that’s not a reason.
  • If longevity is the problem, put the pressure on udder depth before foot angle. Twice the response for the same effort.
  • Treat the May 2026 penalty as policy, not proven outcome. Three months isn’t a longevity dataset.

Key Takeaways

  • If your ration runs near $0.15/lb DM, the Feed Saved spread is worth roughly $252/cow/lactation — first trait to fix. Nearer $0.11 and it’s $185, still real money, but other traits may earn the priority.
  • If you’re selecting young genomic bulls on Feed Saved, treat 28% reliability as a reason to separate extremes only.
  • If you’ve held stature because you believe it buys milk, the published correlation is 0.084–0.158. That belief is doing less work than you think.
  • If your culling problem is udders rather than feet, you’re in luck — udder depth is the more heritable trait by a factor of two.
  • If anyone quotes you a “25% longer longevity” figure for sub-60-inch cows, ask for the study. There doesn’t appear to be one.
  • If you’re changing sire strategy this fall, plan on the replacement-group figure — $14,000–$22,000 on a 250-cow herd in year one — not the upper bound.

Run It Against Your Own Records

Pull your top and bottom quartile by frame. Look at their lifetime margin across three lactations. See whether your barn agrees with Pérez-Cabal’s 0.06 or argues with it — because a Spanish population estimate from 2002 can tell you where the odds sit, but it can’t tell you what happened in your own freestalls.

That’s answerable from your records this month. So what would you do differently if the tall ones came out ahead?

Complete references and supporting documentation are available upon request by contacting the editorial team at editor@thebullvine.com.

Learn More

The Sunday Read Dairy Professionals Don’t Skip.

Every week, thousands of producers, breeders, and industry insiders open Bullvine Weekly for genetics insights, market shifts, and profit strategies they won’t find anywhere else. One email. Five minutes. Smarter decisions all week.
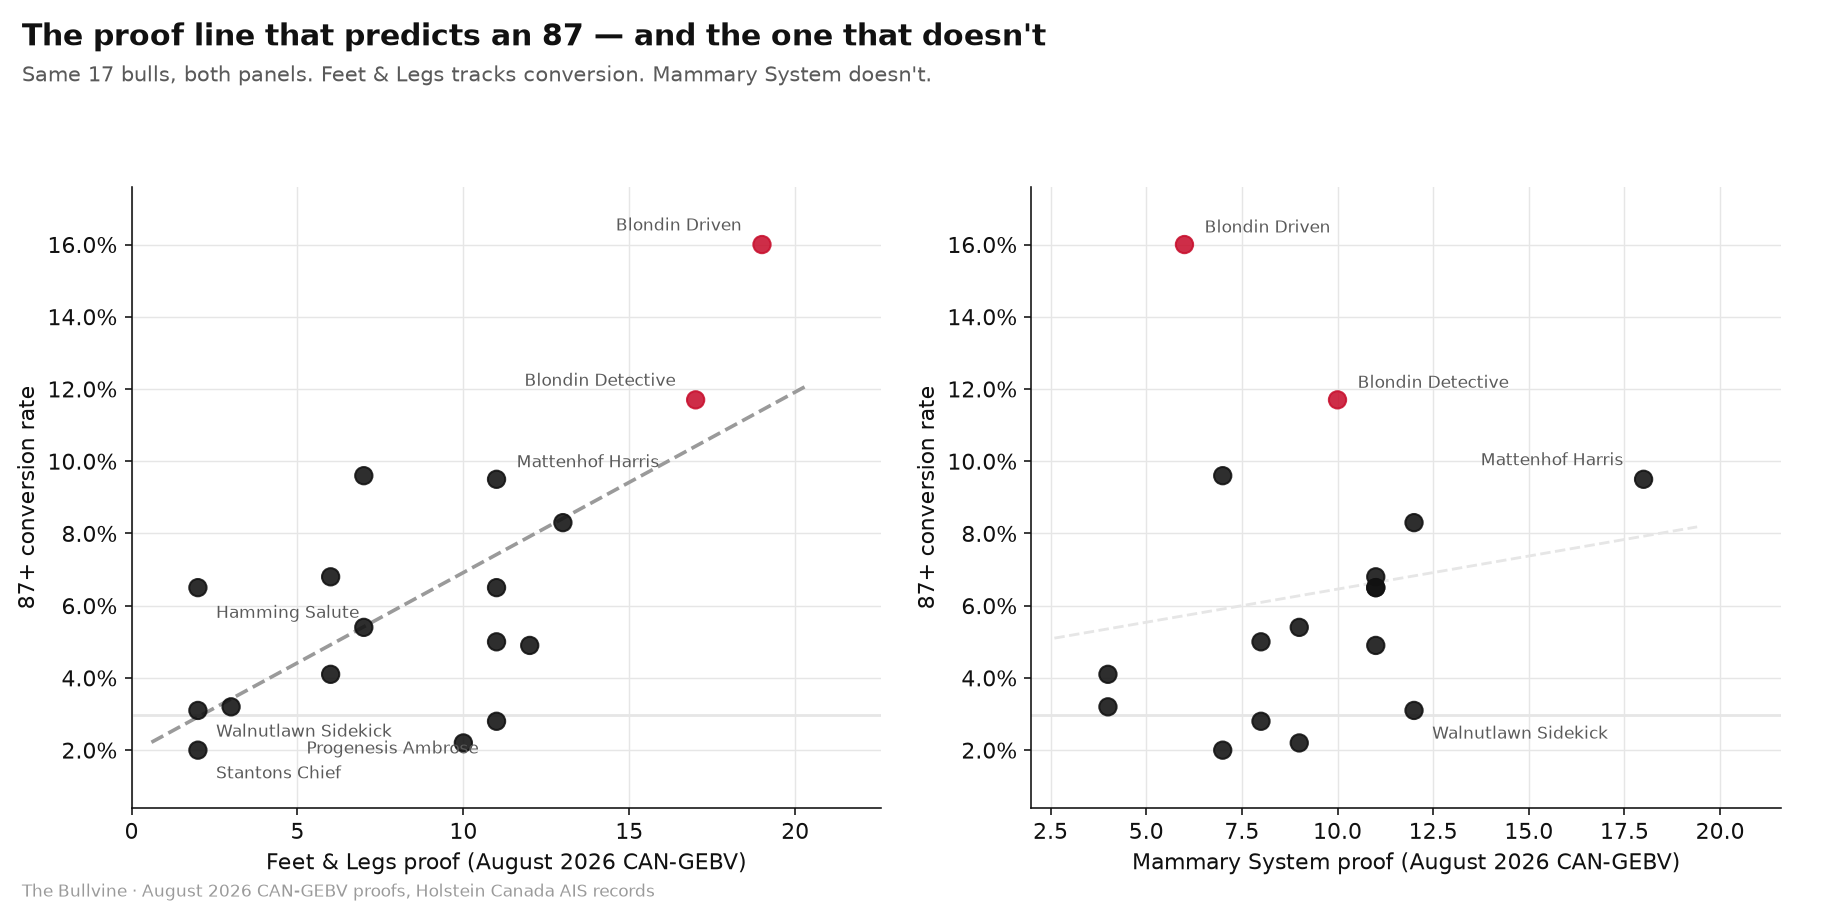
NewsSubscribe
First
Last
Consent

Holsteins Now Lose Milk at THI 69. Twenty Years Ago It Was 72.

Your cows start giving up milk three points sooner than your father’s did. That’s not the weather changing — it’s the genetics. And CDCB just skipped the one that’s costing you milk.

EXECUTIVE SUMMARY: The THI threshold where Holsteins start giving up milk has fallen from 72 to 69 in two decades — your cows quit three points sooner than the ones your father milked, and that’s genetics, not weather (Misztal, Brito & Lourenco, 2024, JDS Communications 6(3):464–468). CDCB’s August 2026 evaluations shipped three brand-new traits plus a rebuilt fertility suite, proving the system moves when it decides a problem is worth solving; heat tolerance wasn’t on the list, nine years after DataGene put it on Australian bull pages. Read on if you’re finalizing a fall sire team: you’ll get the per-cow math, the three tools that already exist and where each one bites back, and the one question to ask your provider while your August proof list is still open.

heat tolerance genetics

CDCB’s August 2026 official evaluations went live with three brand-new traits: Resistance to Respiratory Problems, Resistance to Diarrhea, and First Service to Conception. The machinery proved it can move. Yet nine years after Australia introduced Heat Tolerance, the trait costing you milk every July still isn’t on the North American bull page.

Hold that against the Australian numbers. By August 2024, one in three of Australia’s Holstein “Good Bulls” — 197 sires — already carried a Heat Tolerance breeding value of 100 or better, DataGene’s score for how well a bull’s daughters hold milk when it turns hot and sticky. Thirty-four of them scored 105 or higher. This isn’t a weather story. It’s about a blind spot in the tools you use to pick your next round of sires.

The System Moves When It Wants To

Give CDCB its due — the August round was real work. RSP and DIA came out of research on more than 768,000 respiratory disease records and over 260,000 diarrhea records pulled from the National Cooperator Database, drawing on respiratory data from calves 3 to 365 days old and diarrhea data from calves 3 to 60 days. That’s the first national selection tool aimed at calf health, and it addresses a genuine cost centre.

The fertility overhaul was just as substantial. DPR now uses a herd-level, lactation-group-specific voluntary waiting period instead of the fixed herd-wide assumption carried since the trait portfolio was built in 2003. HCR picked up service sire breed, mating type, and short cycling; CCR got a days-in-milk covariable with pre-adjustments to individual inseminations. FSC arrived as a fresh option, predicting days from first breeding to conception without VWP in the model.

So the machinery works. A trait gets studied, validated, and shipped when the industry decides the problem is worth solving. Which raises the obvious question about the one that keeps getting skipped.

The Metabolic Trap: Why Fans Aren’t Enough

Most producers reading this have already spent real money on cooling. Fans, soakers, shade over the holding pen. And the tank still drops when the mercury climbs. That’s not a cooling failure. It’s the tell that heat stress hits your herd from two directions at once — the barn and the cow’s own metabolism — and cooling only touches one of them.

Here’s the split, plain as it gets. Cooling protects cows from the barn. Heat-tolerant genetics protects them from their own metabolism. A high-producing cow makes more internal heat just by making milk. Push her genetics harder for yield without watching heat tolerance, and you’ve built an animal that starts losing milk at a lower temperature than her grandmother did.

That last part isn’t a figure of speech. Work led by Ignacy Misztal at the University of Georgia with Luiz Brito at Purdue found that the THI threshold at which Holsteins begin losing production has dropped from 72 to 69 over the past two decades (Misztal, Brito & Lourenco, 2024, JDS Communications 6(3):464–468). Your cows start suffering at lower temperatures than the cows your father milked. Heat tolerance is eroding while the infrastructure spending masks it.

DataGene’s own documentation names the mechanism: Heat Tolerance is unfavorably correlated with production. Select hard for yield alone and you tend to erode it. That’s exactly why DataGene tells producers to treat HT ABV as a filter, not a stand-alone target.

What the Heat Actually Costs — Even a Well-Cooled Herd

The numbers aren’t hypothetical, and they don’t vanish once you install fans. A 2025 study in Science Advances, tracking more than 130,000 cows over 12 years, found that one day of extreme humid heat can cut a cow’s milk up to 10%, with output still down more than 10 days later. Most of those farms already had cooling. The kicker: fans and sprinklers offset only about half the loss on moderately hot days — and less than 40% once wet-bulb temperature pushes past 24°C.

Then there’s the long tail cooling can’t reach. University of Florida research (Laporta et al., Journal of Dairy Science, 2020) showed heat stress on a dry, pregnant cow programs lower lifetime production into her daughter and even her granddaughter — animals not yet born when the damage is done.

On the cost side, USDA’s Economic Research Service (report ERR-175) estimated heat stress lowered milk value for the average U.S. dairy by about $39,000 a year — in 2010 dollars — or roughly $1.2 billion across the sector. That same report projects added losses of 0.60 to 1.35% of milk for the average dairy by 2030, hitting Southern states hardest. Blend the national figures down to the cow and heat-exposed herds land somewhere in a $300–$400 per cow, per year range once you stack lactation losses, fertility hits, and multi-generation dry-cow damage. That $300–$400 isn’t a single published stat — it’s a derived range, so treat it as a working estimate, not gospel.

Run the Barn Math on Your Own High Group

Numbers land harder when they’re your own. So walk through a modeled example — a 120-cow herd with a 30-cow high group, the kind of split most freestall operations would recognize. (Illustrative composite, not a real farm.)

USDA’s most recent published U.S. average mailbox price is February 2026 at $17.45/cwt — about 17.5¢ a pound. Say each cow in that 30-cow high group loses about 5 lbs a day across 70 hot days. That’s a middling summer, well short of the 10% single-day spikes the research documents.

The High-Group Summer Hit — 120-Cow Herd Model

30 cows × 5 lbs/day × 70 days × $0.175/lb = $1,840 in lost milk revenue

Roughly $61 a cow for a moderate 70-day run — before you account for open cows, extra SCC, or the multi-generational loss from calves gestated in a hot dry-cow pen.

For Canadian herds, run it in litres against your blend/quota price; for EU or Australian herds, run it against your local farmgate — the currency and units change, but the margin hit scales identically. Heat doesn’t read your milk cheque.

And you’re running that math in a soft market. February’s $17.45 sits well below the 2025 mailbox average of $20.41/cwt, and USDA’s August 2026 Dairy Market News lowered the 2026 all-milk forecast to $19.85/cwt. Every pound heat pulls out of the tank costs the same to lose whether prices are high or low. It just hurts more when the cheque’s already thin.

ScenarioDaily Loss/CowSeasonal Revenue Hit (30-cow group, $0.175/lb)
Moderate summer (70 hot days)5 lbs/day$1,840
Severe heat run9 lbs/day (90-lb cow, 10% drop)$3,308
Annual compounded estimate (per cow, all effects)$300–$400/cow/year (derived range, not a single published stat)

Push the daily loss toward that 10% figure and the number climbs fast. A 90-lb cow dropping 9 lbs on the worst days, across a longer heat run, is how a mild-looking summer quietly turns into the $300–$400-a-cow annual hit. The point isn’t the exact dollar. It’s that the loss is real, recurring, and partly written into the genetics you order this fall.

The Genetics Toolkit: Three Paths to Cooler Cows

The tools to breed for heat resilience are already on the shelf. They just rarely come up at breeding time — because the index everyone ranks on doesn’t score the trait. Three exist, and none is a silver bullet.

  • DataGene’s Heat Tolerance ABV (Australia, since Dec 2017): The first commercial heat-tolerance breeding value in the world. Scores a bull on how well his daughters hold milk, fat, and protein under heat and humidity load — 100 is breed average, 105 means about 5% more tolerant, and 95 means a production drop 5% worse than average.
  • Zoetis DWP$ Heat (U.S., launched April 2026): The genomic contender. Folds Fertility Heat Resilience (Z_FR) and Milk Heat Resilience (Z_MR) into the Dairy Wellness Profit Index via CLARIFIDE Plus testing.
  • Slick genetics (PRLR gene): The biological route. A single mutation in the prolactin receptor gives cows a short coat and real temperature-regulation gains — a 2025 tropical trial (JDS Communications) found Slick homozygotes out-milked heterozygote herdmates by 9% in hot months. That’s a hot-climate result, not a temperate-freestall guarantee.

Here’s where each one earns its place — and where it bites back:

ToolBest FitThe Catch
HT ABV(DataGene)Herds buying internationally proven sires48% Holstein reliability (39% Jersey); unfavorable production correlation — use a team
DWP$ Heat(Zoetis)Herds already genomic-testing replacementsProprietary; sits outside official CDCB indexes
Slick (PRLR)Hot, humid regions where cooling hits its mechanical limitNarrow carrier pool; possible trade-offs on other traits

That 48% deserves a note, because it’s the number skeptics reach for first. Per DataGene’s Fact Sheet 5, reliability sits at 48% for Holsteins and 39% for Jerseys — up from 38% for Holsteins after DataGene expanded the reference population in June 2024. An ICAR 2025 paper puts the new base at 4,947 sires and 42,419 cows at 74K SNP density. Jerseys didn’t move. It’s lower than a production proof, and DataGene says so plainly. It’s also a DNA test, not a subjective call, and it’s rising.

The Index Legacy: Why the Leaderboard Won’t Move

Fair question — why hasn’t any of this reached your bull list? The honest answer isn’t a conspiracy. It’s how the system prioritizes. Net Merit is built for stability. Producers, semen companies, and breed marketing all lean on a familiar leaderboard, and CDCB is cautious about anything that reranks bulls overnight.

But notice what August proved. CDCB’s own documentation notes that PTA ranges, means, and standard deviations shift between trait versions — a rescaling, not a change in underlying genetics — and that persistent downward trends in young-bull PTAs were among the problems that triggered the two-year review. The system absorbed that disruption because calf health and fertility were judged worth it.

Worth noting: those calf-health traits took years of work on 768,000-plus records before CDCB would ship them. Peer-reviewed heat-tolerance models for U.S. and Canadian Holsteins already exist in the Journal of Dairy Science — Misztal and Brito’s threshold work is published, indexed, and citable. The research gap isn’t the bottleneck.

Add a heat trait and the leaderboard moves again. A high-index bull selected under temperate conditions may not hold that edge under sustained summer heat load — the productivity advantage he’s priced on can shrink where heat is the limiting factor. That’s a commercial reality nobody in the sales chain is eager to spell out. The harder part isn’t the science. It’s a governance system willing to tell producers that “lifetime profit” should include what happens at 100°F.

Follow the Incentives: Who Wins When You Buy?

Follow the incentives and it gets clearer. The players pushing heat tolerance hardest are the ones who don’t sell semen. DataGene is an evaluation body funded by the Australian dairy industry — its job is to get every useful trait into producers’ hands, including the one that complicates pure-production selection. Zoetis sells genomic tests and indexes, not straws, so DWP$ Heat helps their business without cannibalizing a semen catalog.

Studs sit in a different spot, and it’s structural, not sinister. They market to the index producers actually rank on — and heat tolerance isn’t in NM$ or TPI, even after August. They’ll raise heat traits when a producer asks, or when they’ve got a specific sire to feature, and plenty do offer heat-relevant genetics. But a stud can’t bake a trait into an index it doesn’t control. So if your provider walked you through RSP, DIA, and FSC this month but never mentioned HT ABV, DWP$ Heat, or Slick, that’s not bad faith on their part — it’s a sign the upstream system isn’t prompting the conversation. The burden of asking falls on you.

What This Means for Your Operation

  • Monitor the drop. If your high-production group falls more than 8–10% in summer against a stage-of-lactation-adjusted winter baseline, do the per-cow loss math before assuming your fans have it handled.
  • Select for longevity and fertility. If you face 60-plus days above THI 68, weight Productive Life, Livability, and fertility (DPR/CCR) heavier. These correlate positively with thermotolerance, giving you indirect selection pressure while the direct tools mature — expect to give up some genetic gain elsewhere.
  • Budget for barn and biology. Six figures in tunnel ventilation won’t protect an animal whose genetics start surrendering milk at THI 69.
  • Use heat as a filter. Layer heat traits on a profit-index floor (NM$, TPI, LPI, Pro$) rather than treating them as a standalone target. At 48% reliability, a team of bulls beats betting the herd on one.
  • Target the exposure. Your highest producers and summer-calving cows carry the most heat load. Start there, not across the whole herd.
  • Read your region’s trajectory. U.S. Southeast, Southwest, Central Valley, southern Ontario, a warming EU summer — USDA ERS projects added heat-stress losses of 0.6–1.35% of U.S. milk by 2030.

Key Takeaways

  • Do this within 30 days. You’re already pulling fresh August 2026 proofs to see how RSP, DIA, FSC, and the revised DPR shook out. While that list is open, ask your provider — by trait name — what heat-tolerance data exists on those same sires: HT ABV, DWP$ Heat (Z_FR/Z_MR), Slick carrier status. If they can’t answer, that’s information too.
  • If you genomic-test replacements and farm a hot region, DWP$ Heat is the lowest-friction entry point — you’re already pulling the sample.
  • If you buy internationally proven semen, cross-reference DataGene’s free Good Bulls App for HT ABV before finalizing a fall-sire team. Thirty-four Holstein Good Bulls sat at 105 or better as of August 2024.
  • If cooling still leaves cows panting in a humid climate, Slick is worth a conversation with your rep — going in knowing the carrier pool is limited.

A heifer you breed this fall won’t hit her stride in the tank until the early 2030s — into summers hotter than the one just behind you, against a THI threshold that’s already moved three points the wrong way. CDCB showed this month that it’ll build a trait when the industry decides the cost is real. So here’s the question worth chewing on before the next order goes in: if you laid your own summer milk weights next to your winter baseline tonight, how much of that gap is your barn, and how much is your bulls? That number is the argument for the trait North America hasn’t built yet.

Run Your Numbers

Genomic Testing ROI Calculator — DWP$ Heat only reaches your herd through a CLARIFIDE Plus sample, so the heat question starts as a testing-cost question. Run your test list, heifer raising cost, and quartile spread to see whether testing pays under conservative assumptions — or only aggressive ones.

Learn More

The Sunday Read Dairy Professionals Don’t Skip.

Every week, thousands of producers, breeders, and industry insiders open Bullvine Weekly for genetics insights, market shifts, and profit strategies they won’t find anywhere else. One email. Five minutes. Smarter decisions all week.
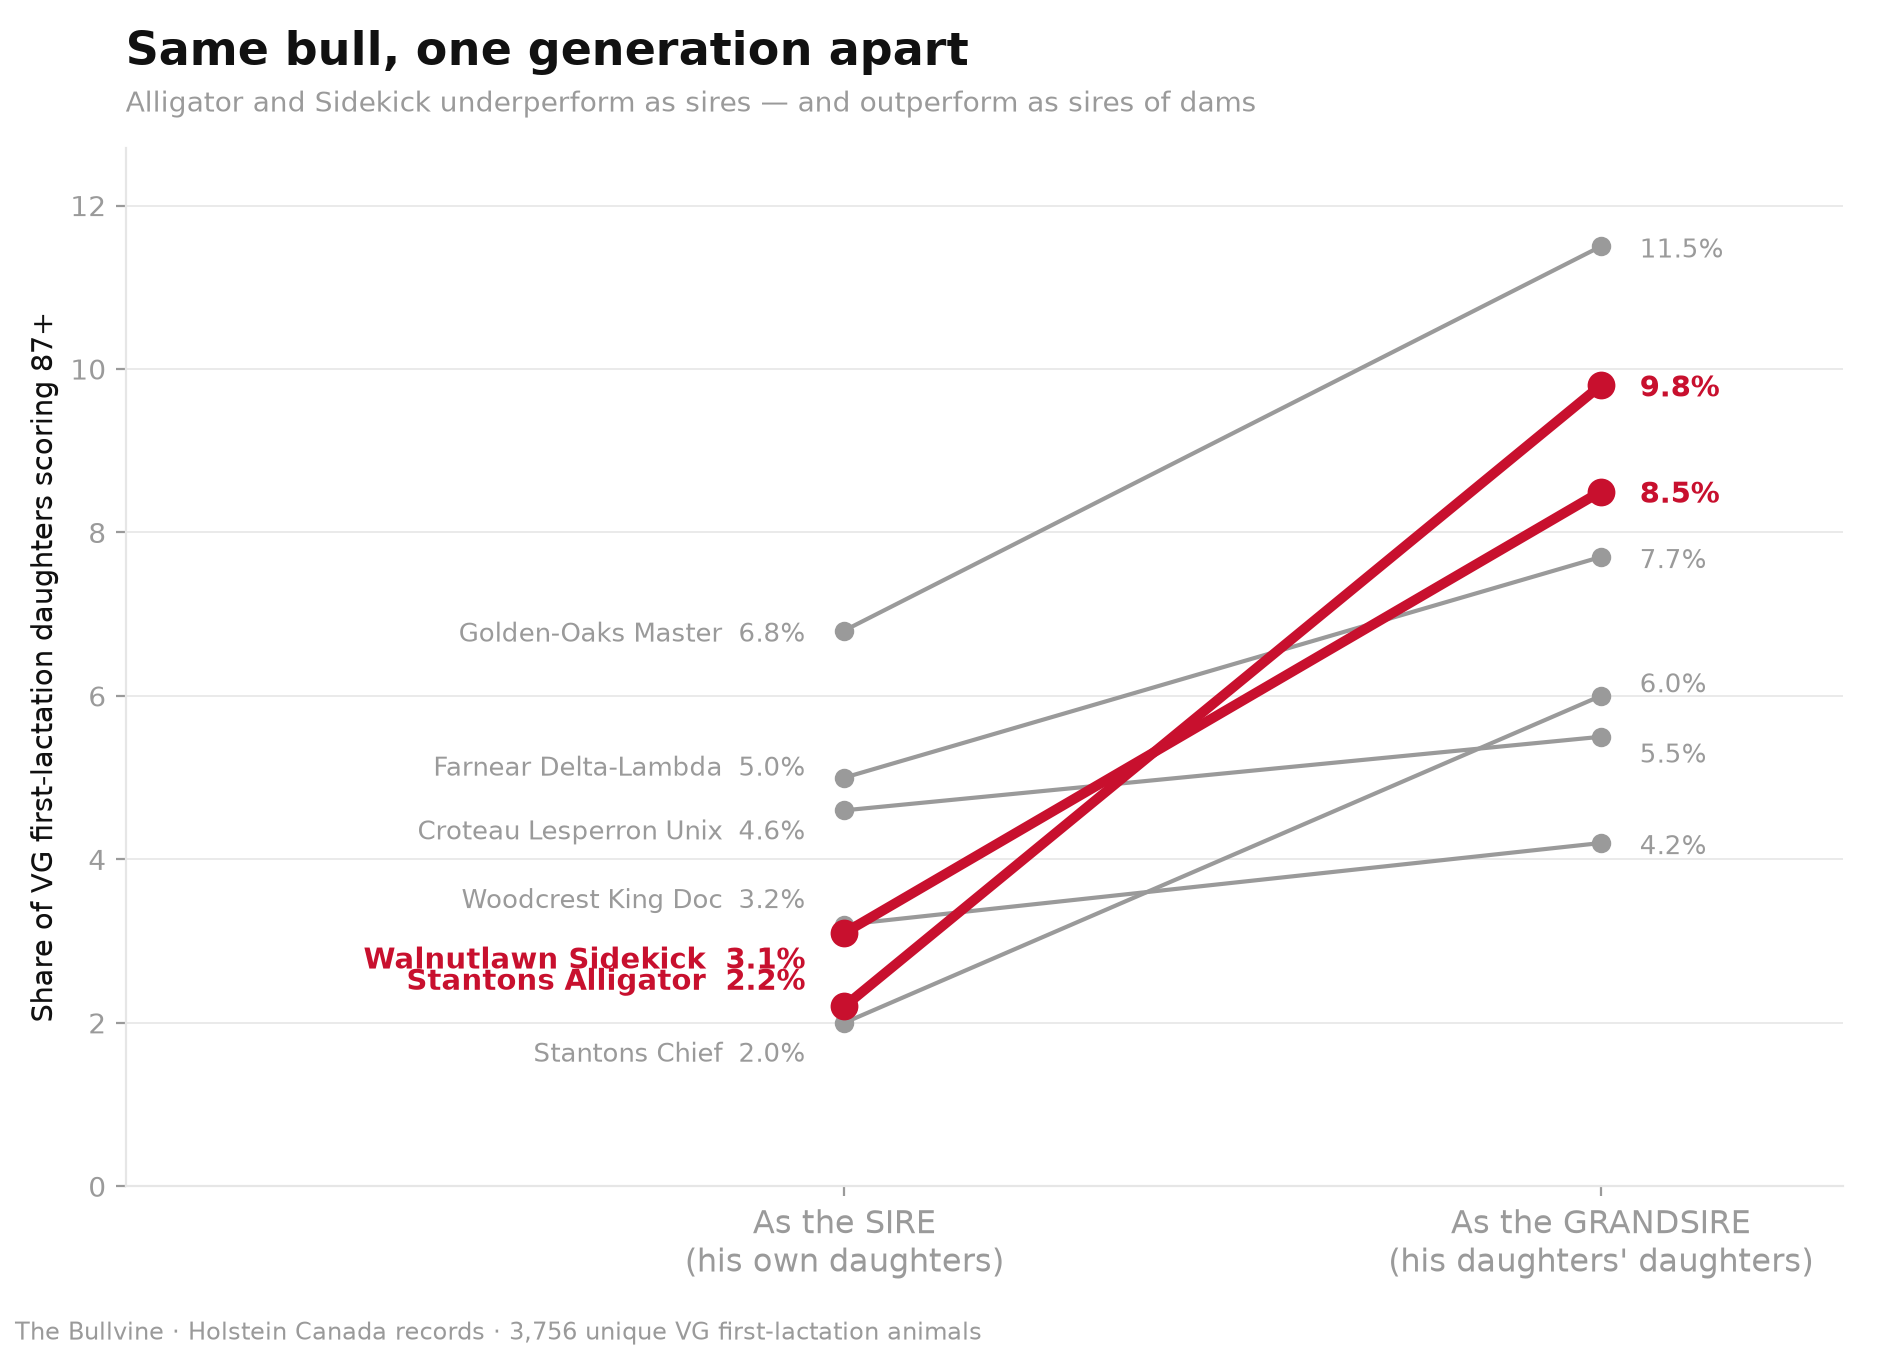
NewsSubscribe
First
Last
Consent

The $1,300 Gap Between the Bull You Want and the Bull You Should Buy

A 96th-percentile LPI bull can rank 31st for health — costing up to $1,300 a daughter in lifetime profit. Here is how taking two minutes with subindexes prevents a multi-generation mistake.

Back in 1970, for my Masters at Guelph under Ted Burnside, I built an index called the Production Dollar Difference Guide (PDDG). The idea was simple enough to fit on one line: measure, in real dollars, how much more profit a bull’s daughters would return over a lactation than an average cow. It became Canada’s first composite sire ranking index, and the profit thinking behind it is the same thinking that eventually produced today’s Pro$. But the arithmetic started earlier than any thesis — it started at my kitchen table, with a pencil and a stack of milk records from Huntsdale, asking which cows actually paid the bills and which bulls made more of them.

Fifty-six years later, the industry has finally built the machinery to answer that question at scale — six published subindexes including wellness, welfare and reproduction indexes that use lifetime profit curves. And most producers still aren’t using them. They circle the big composite number instead. That number has a blind spot, and it has a face now: when The Bullvine ran Canada’s 2025 20 most-used Holstein sires against Lactanet’s new subindexes this past March, it found bulls sitting at the 96th percentile for overall LPI yet only the 31st percentile for Health & Welfare— a pattern our analysis links to sires behind roughly a quarter of the registered calves born in 2025. That’s our own analysis, not a wire story. If you’re picking sires this month, give me two minutes before you circle a name.

The Core Problem: A Headshot, Not a Scan

For years, “#1” meant something clean. Top 10 TPI or LPI was a badge, and everybody knew what it stood for. That clarity has quietly frayed — not through anybody’s bad faith, but because there are now a dozen ways to be number one. TPI and NM$ anchor U.S. proofs, LPI and Pro$ run Canada, and Zoetis owns DWP$, a proprietary index built to estimate genetic potential for lifetime profit. When every stud keeps its own leaderboard, a bull can honestly be “#1” on a definition narrow enough to flatter him. And when the whole industry circles the same few names, the bill comes due in a different column — 99.84% of Holstein A.I. bulls now trace to just two fathers.

So why does the composite miss the health hole? Because it’s doing exactly what it was built to do — averaging. A bull can post huge components and functional type, ride those into a 96th-percentile LPI, and carry a below-average health score that barely dents the total. The number isn’t lying to you. It just isn’t telling you where the soft spot sits.

“The composite index is a flattering headshot — one number, easy to post, easy to sell. The subindexes are the MRI scan that shows exactly where the joint is failing.”

Lactanet even built a tool called pLPI that lets any producer log in, re-weight the six subindexes to match the herd’s own priorities and read the result beside the official LPI. It’s been live since April 2025. Most producers have never opened it.

Which Index Comes From Where?

The alphabet soup is less confusing once you sort the tools by who runs them and what they’re built to do. Rank animals on your public national index first, then read the health, welfare and fertility details underneath before a private or personalized index ever breaks a tie.

IndexWho runs itRegionWhat it is
LPILactanetCanadaOverall merit, now split into six readable subindexes
Pro$LactanetCanadaLifetime-profit focus ($); the direct heir to the 1970 PDDG logic
TPIHolstein Association USAUSA balanced index across production, health, and type
NM$USDA / CDCBUSRanks animals on combined merit for economically important traits; expected lifetime profit ($)
DWP$Zoetis (proprietary)USMulti-trait wellness index estimating genetic potential for lifetime profit ($); a tiebreaker after the public-proof check

The Hard Math: Top Quartile vs. Bottom

A high-index total merit bull doesn’t fail loudly. His daughters look terrific on paper and freshen fine. Then, a couple of lactations in, they start showing up on the lists nobody wants — the lame pen, the mastitis log, the breeding sheet with too many open cows. The composite averaged his strength and his weakness into one tidy number, and weighting in a weakness doesn’t erase it. It just hides it until your cull list does the accounting for you.

Here’s what the published data says that gap is worth. Read the source column carefully: the retention and profit figures come from Lactanet’s Canadian Pro$ curve, while the disease figures come from a US DWP$ validation across five herds. Two countries, same story.

Metric / Risk AreaBottom QuartileTop QuartileBottom-Line ImpactSource
Herd retention at 6 yearsBaseline+7.4% more daughters remain+$1,300 lifetime profit per daughter (bottom sires: −$1,200)Pro$, Canada
Lameness incidenceHigh−15.9 percentage points$90–$300 saved per case avoidedDWP$ US validation
Mastitis incidenceHigh−14.9 percentage pointsFewer treatments and less dumped milk; +$811 lifetime profit overallDWP$ US validation

Retention and profit figures: Lactanet Pro$ (Canada). Disease figures: Zoetis DWP$ validation across five US herds in Wisconsin, South Dakota, and Idaho.

Now run it on your own barn. Take a 300-cow herd with 20% lameness incidence — 60 cases a year. Even at the low $90 figure, that’s $5,400 walking out on bad feet annually, before the mastitis and open cows that tend to travel with weak health genetics. Buy those weaknesses in through a bull, and you’re buying them by the daughters, year after year. If you want to put your own incidence and treatment costs against that, run them through our Health ROI Calculator before your next proof day.

The LPI Weighting Dilemma

The reason the composite can hide a hole is right there in the math. Here’s how modern Holstein LPI is built — and the two changes that landed in April’s proof round:

  • Production — 40%. Shifted this past April from 60% fat / 40% protein to 40% fat / 60% protein.
  • Longevity & Type — 32%.
  • Reproduction — 10%.
  • Health & Welfare — 8%. Got sharper in April: Calf Health added at 30% weight, Mastitis Resistance at 40%, Hoof Health at 11%.

Read that stack plainly. With Health & Welfare carrying just 8% of the total, a bull can be well below average on the traits that empty stalls and still ride his components to a 96th-percentile LPI. That’s the whole blind spot in one line. It’s the same arithmetic behind the 9.99% Holstein inbreeding bill — are you breeding for profit, or just for index points?

What I’d Do With The Six Subindexes Today

I’d welcome them — because they’re the Production Dollar Difference Guide with better arithmetic. My 1970 thesis argued that the way to lift genetic progress was to sample far more young sires each year and let the proven ones rise; at the peak of young sire sampling, Canada was testing over 500 A.I. young dairy bulls annually on that logic. That shield at Huntsdale wasn’t won chasing the hottest bull of the month. It came from breeding cows that lasted, bred back, kept milking and threw enough surplus breeding stock to sell. Holstein Canada recognized the prefix with a Master Breeder Shield in 1984.

Holding a direction takes nerve, mind you. Plenty of bulls get written off early and prove the room wrong — they called Mogul’s heifers fat, and then came the million doses. The point isn’t to avoid every bull with a critic. It’s to avoid the bull with a hole you can already see on the page.

The through-line to today is simple. A sire stack built the way I built one isn’t a shopping list of favorites — it’s a direction you hold across generations, layering balanced bulls so longevity, fertility, and functional type compound while production keeps climbing. The subindexes make that direction visible on a screen instead of in a shoebox of milk records. My rule hasn’t changed in over fifty years: trust the system, improve the system, and use it to produce a continually better product.

How Much Does Chasing the #1 Bull Actually Cost You?

Map it to your own herd, and it stops being abstract. If your “elite” sire’s daughters run even one extra lameness case per ten cows over their productive lives, that’s roughly $900 to $3,000 per hundred daughters at Wisconsin’s cost range. Set that against the $1,300-per-daughter profit swing Pro$ documents between top and middle sires, and the composite-chasing decision starts looking expensive in a column the sire catalog never shows you. The exciting bull isn’t free. You pay for him later, in vet bills and empty stalls.

Is Your Herd’s Genetic Strategy Already a Step Behind?

Here’s a fair gut check, no judgment attached: when did you last look at a bull’s Health & Welfare or Reproduction subindex before you bought him? If the honest answer is “never” or “the rep handles that,” you’re in the same boat as thousands of good producers — the difference is that the tool to do better has been sitting on Lactanet’s site since April 2025. The herds that’ll be ahead in five years won’t be the ones with the flashiest catalog. They’ll be the ones whose cull lists got boring because the same problems stopped showing up.

The Rules for Farmers: The “No-Holes” Strategy

You don’t need a consultant or a spreadsheet to close this gap. You need a filter and the nerve to hold to it. Three moves, in order.

1. The Floor Rule — do this within 30 days. Before you circle any bull, check his Health & Welfare and Reproduction subindexes (or Pro$/DWP$ if that’s your system). Below your herd average on either? He doesn’t become a main sire for your herd — no matter how big his composite index. Costs two minutes. The catch: you’ll pass on some exciting bulls, and that stings.

2. The “No-Holes” Filter — clear 5 of 6. Use only sires that clear at least five of the six LPI Subindexes above the 50th percentile — above average almost everywhere. Best when you’re breeding replacements you plan to keep. The catch: your shortlist gets shorter and a little boring. Boring is the point. It’s about genetics for profit.

3. The Multi-Gen Stack — build for consistency. Sequence balanced bulls across generations so the good traits compound — the PDDG logic in modern dress. The catch: it’s slow to show, and it means ignoring the monthly “new #1” noise sire. With the Production subindex reweighted in April, a written direction keeps you steady when the index itself moves under you.

And use private indexes as a tiebreaker, not a verdict. DWP$ and the like are useful for breaking ties after the public-proof check — not for overruling a hole you can already see.

The Rep Checklist: Four Questions Before You Buy

  • Where does this bull sit for Health & Welfare and Reproduction — not just overall merit?
  • How many of his six subindexes are above the 50th percentile?
  • Which of my cows would you actually mate him to, and why?
  • If I lined up your top three picks by health and fertility instead of by total merit index, would the order change?

Key Takeaways

  • If you’ve never checked a sire’s Health & Welfare or Reproduction subindex, do it this proof run — a 96th-percentile LPI bull can sit at the 31st for health.
  • If a bull falls below your herd average on health or fertility, keep him off your main-sire list regardless of composite rank.
  • If you’re keeping your own replacements, run the five-of-six-above-50th filter on your current catalog or in-tank group and count how many “elite” bulls survive it.
  • If lameness is creeping up, do the math yourself: $90–$300 a case times your incidence times your daughter count.
  • If you’ve never opened Lactanet’s pLPI tool, log in once and re-weight the six subindexes to your herd’s real priorities.
  • If a rep leads with a private index like DWP$, use it to break ties after the public-proof check — not to overrule a visible hole.

So, here’s the question I’ll leave you with for your next proof day: are you picking bulls your future self won’t have to fix — or bulls that look elite tonight and quietly fill your cull list in 2030? Pull your last three sire purchases and check their health and fertility subindexes. You might be pleasantly surprised. You might not.

If you want the deeper cut — how the no-holes filter reshapes a real 20-sire shortlist, one subindex at a time — that’s the breakdown we’re running next in Bullvine Weekly. That’s where the real numbers live.

Sire Health & Hold-to-Proof Cost Simulator

Calculate your herd’s financial exposure to high-index sires with weak health subindexes

Annual Lameness Cost Burden: $5,400
Daughter Lifetime Pro$ Gap Impact: -$1,300 / daughter
Estimated 5-Year Genetic Exposure: $39,000

Run Your Numbers

Health ROI Calculator — The article puts lameness at $90–$300 a case. This tool turns your own incidence, treatment costs, and herd size into a dollar figure, so you can see what a sire’s health hole is actually worth before you circle a name.

Learn More

The Sunday Read Dairy Professionals Don’t Skip.

Every week, thousands of producers, breeders, and industry insiders open Bullvine Weekly for genetics insights, market shifts, and profit strategies they won’t find anywhere else. One email. Five minutes. Smarter decisions all week.
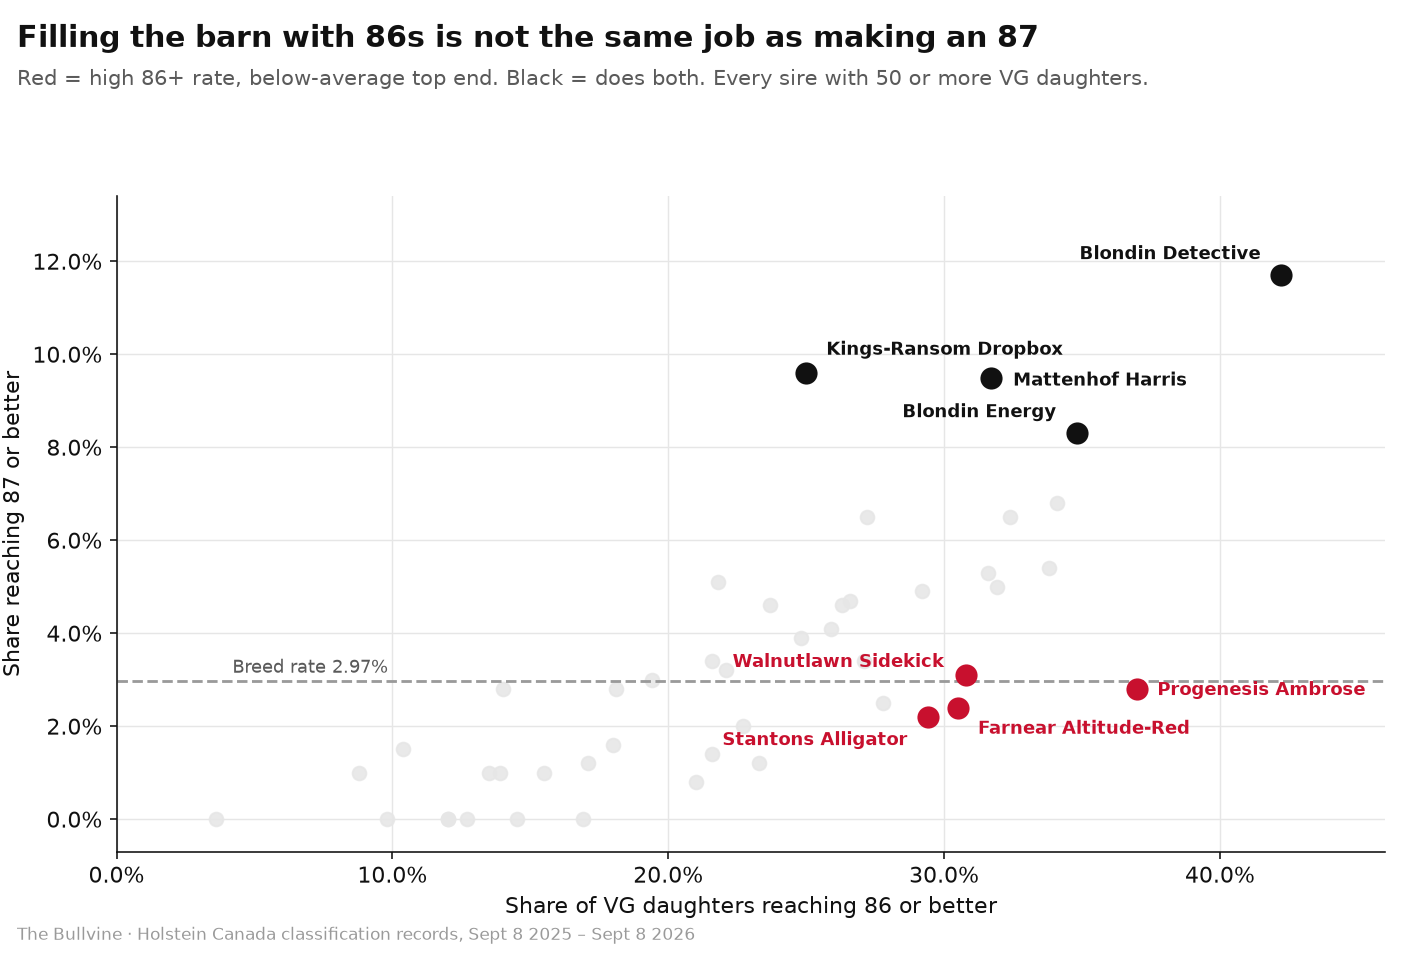
NewsSubscribe
First
Last
Consent

The $93,300 Cow Family: Why the Breeding Fight at Your Kitchen Table Is Really a Succession War

Beef-cross calves clear $575 a head over dairy bull calves — but on the cows you’d actually keep a daughter from, that premium nearly cancels out. Here’s the math that should be settling the argument.

Editor’s note: The kitchen-table scene that opens this piece is a composite, modeled from succession-research patterns and multiple multi-generation dairy operations rather than a single named farm. All statistics, dollar figures, and named organizations are sourced.

It’s February. The breeding sheets are spread across the kitchen table, and the herd’s best cow is the lightning rod — a high-component Holstein that traces back to a foundation cow your grandfather still talks about like she’s standing in the box stall. Your dad wants to flush her to a hot type bull. Your grandfather wants to know why beef-on-dairy is even in the conversation. And you’re sitting there with a milk cheque that’s tighter every month, running the math on a beef-cross calf worth $1,450 against a straight dairy bull calf worth $875.

That argument feels like it’s about genetics. It isn’t. It’s about who owns the future of the farm, and breeding is just the thing everyone’s pointing at. With 72% of U.S. herds now using beef genetics on at least part of the herd, this exact fight is playing out at thousands of kitchen tables right now. The cow is the proxy. The real stakes are who decides, who stays, and when control actually changes hands.

The Kitchen Table Math

Beef-cross calf value: ~$1,450 Dairy bull calf value: ~$875 Immediate net premium: +$575 / head Replacement opportunity cost on cows worth keeping: −$585 / service

On the cows you’d actually want a daughter from, those two numbers nearly cancel. Which is why which cows you breed beef matters more than how many.

Cow you’re breedingBeef-cross calf premiumReplacement value traded awayNet per serviceVerdict
Bottom-20% genomically verified+$575$0 (you weren’t keeping her daughter anyway)+$575Breed beef
Middle-of-herd, sound but average+$575−$585−$10Coin flip — sexed dairy still safer
Top proven family, third-lactation-plus+$575−$585−$10Sexed dairy or donor work
Any cow at beef prices below $1,580Below crossover−$585Net negativeBeef stops paying

What’s Changing and Why

For decades, legacy purebred herds ran on a clean logic. Build deep cow families, protect the prefix, chase classification and the show ring, and let the genetics business help carry the farm. That logic is cracking. Genomics flattened the premium that pedigree depth used to command, the available AI bull pool has thinned sharply, and the calf cheque quietly became one of the biggest levers a commercial herd has.

Here’s how big. A 2024 Purina survey found 80% of dairy farmers now receive a premium on beef-on-dairy calves, reporting $350 to $700 per head above straight dairy calves. The spread runs wider than any single average suggests: USDA-verified auction reports had beef-cross calves at $680–$1,160 per head at New Holland, Pennsylvania, and $680–$1,100 in Wisconsin markets, while Ontario was running near $15 a pound — roughly $1,500 for a 100-pound calf, per OMAFRA’s Christoph Wand.

And the calf cheque is only half the story. The same legacy herds most likely to protect a famous cow family are the ones most exposed when that family stumbles. The Bullvine’s March 2026 concentration analysis modeled a herd whose top genomic heifers all traced back to three cow families and put the cost of that concentration at roughly $93,300 a year against a $3,110 replacement value — close to USDA’s $3,010 national average for July 2025. That’s the figure in the headline: one modeled herd, not a universal number, but the kind of exposure that hides in plain sight when pride sets the breeding plan.

Which farms carry the most exposure? The multi-generation purebred operations. The ones with banners on the wall and a parent or grandparent still making the mating calls. For a commercial herd with no show history, the pivot to beef is arithmetic you run once and move on. For a legacy herd, every beef straw on a homebred cow family feels like a vote against who the family is.

Why the timing bites now: milk margins have been thin enough that the calf cheque stopped being pocket change and started being a line item that decides whether the year pencils. When a beef-cross calf clears four figures and the bottom-end dairy bull calf is a coin flip, a sentimental breeding policy isn’t abstract anymore. It shows up at settlement.

How This Plays Out on Real Farms

The pattern repeats across succession research and farm-press profiles, and it usually starts with a spreadsheet. The next generation comes to the table showing what the numbers actually do: one herd’s calf income line more than quadrupled when it shifted from dairy bull calves at $650 a head to beef-crosses at $1,400 — the same number of calves, roughly twice the value each, according to Bullvine 2026 margin modeling. Dad agrees, with one rule written in pen at the top of the sheet. No beef on the legacy family. Grandpa doesn’t want beef semen anywhere near a cow he still considers a bull mother, full stop.

The herds that thread this needle tend to do it structurally, not emotionally. They ring-fence the top 15–20% of proven cow families for sexed dairy semen and donor work, run balanced dairy genetics through the middle, and put beef on the genomically verified bottom 20–30% of performers. Verified — not chosen on type or intuition. One Bullvine podcast laid the gap out plainly: dairy bull calves at $875, beef-cross at $1,450, a $575 premium per head.

Now run it on your own herd. Say you milk 300 cows and you move 150 of them from dairy semen to beef at that $575 premium. That’s roughly $86,000 in additional calf income for a single breeding cycle — before you adjust for calving rate and calf losses, which trim it some. Defer the decision a year because the conversation was too hard to have, and that’s $86,000 the bank quietly notices, even if nobody at the table says it out loud.

But that premium has a mirror image, and it’s the part the enthusiasts skip. At today’s replacement values, every beef service on a viable dairy dam trades away roughly $585 in expected replacement value — putting the crossover point near $1,580 per beef calf before the swap clearly pays on a cow you’d otherwise breed dairy, per our April 2026 per-service analysis. So the premium and the opportunity cost nearly cancel on your good cows.

What Does Keeping the Wrong Cow Actually Cost?

There’s a harder cost layered underneath all of this, and Swiss researchers put a number on it. Schlebusch and colleagues, publishing in Animals in 2025, tracked 3,003 cows across 29 Swiss dairy farms over five years, comparing what farmers actually did against what a bio-economic model said they should have done. Suboptimal replacement decisions cost an average of 161 CHF per farm per month.

Decision errorCost per cow per monthCumulative cost across 29 farmsDirection of the bias
Retaining an unprofitable cow1.18 CHF3,557 CHFFarmers overestimate cull cost
Culling slightly too early0.33 CHF1,101 CHFFarmers underestimate keep cost
Ratio (keep-too-long : cull-too-early)~3.6×~3.2×The pride tax
Average replacement heifer benchmark3,123 CHF (≈ USDA $3,010)Ratio applies in North America

The direction of the error is what matters for your breeding sheet. Retaining unprofitable cows cost 1.18 CHF per cow per month, versus 0.33 CHF for culling a bit too early — roughly a three-to-one penalty for hanging on. Across all 29 farms, cows kept despite a negative cow value accounted for 3,557 CHF in cumulative losses against 1,101 CHF from premature culling. Their average replacement heifer ran 3,123 CHF, which isn’t far off North American replacement costs right now, so the ratio travels even if the currency doesn’t.

Farmers overestimate the cost of culling early and underestimate the cost of keeping too long. When the protected list is built on pride instead of performance, those losses hide inside the legacy families nobody’s willing to question. And they compound — a late-calving, low-component cow you kept for her pedigree is also a cow you bred dairy when you could’ve bred beef. You paid twice for the same sentiment.

The Mechanics Behind the Outcomes

So why is breeding the lever older generations grip the hardest? Harder than the equipment, the debt, even the herd-size decisions? Because genetics is authorship. You can hand over the tractor keys and still feel like yourself. Hand over the mating plan, and you’re admitting the herd’s story belongs to someone else now. Succession researchers call what’s changing hands here “psychological ownership” — the feeling of being tied to something you built. It’s exactly what gets cut when breeding policy shifts.

The Bullvine’s succession work names herd genetics, reproduction, and milk-quality knowledge as “intellectual capital that must be transferred alongside physical assets.” Wisconsin Extension frames the recurring tensions as fair-versus-equal, business-versus-family, and control-versus-inclusion. Breeding decisions sit right inside that control bucket. Which is why they detonate.

But here’s where the economics stop caring about feelings. A cow family earns its protected spot only if its daughters pay back what they cost to raise. Lactanet’s analysis of Canadian Holsteins found the average cow doesn’t hit breakeven until about 42 months of age — mid-second lactation. U.S. cost structures differ, so treat that as a Canadian benchmark rather than your own number. The direction holds either way: a line that consistently calves late and leaves before that point isn’t a legacy. It’s nostalgia drawing feed.

How the $93,300 Trap Actually Adds Up

Go back to that headline number. In the modeled herd, the top genomic heifers all traced to three cow families — which feels like a strength right up until it isn’t. The cost stacks three ways: inbreeding creeping up as you breed within a narrowing pool, the health and fertility liabilities riding along with it, and the replacement gamble if one of those families has a bad run at $3,110 a head.

The inbreeding piece is no longer a soft worry, though you have to be careful which number you’re reading. Genomic inbreeding in Holstein bulls ran from roughly 5.7% to 15.2% between 2010 and 2020 — a 168% jump in one decade. Pedigree-based inbreeding in Holstein heifers hit 9.99% in 2024, highest of any major breed. Those aren’t the same metric, and genomic measures always read higher than pedigree ones on the same animal: one study found a 7.74% pedigree average against 15–31% when calculated genomically. Compare like with like or you’ll scare yourself with the wrong figure.

The cost per point is well-established. Each 1% of inbreeding takes $23–$25 off lifetime Net Merit. That tracks closely with older peer-reviewed work — Cassell’s analysis put it at $22 to $24 in lifetime net income per 1%, and Smith’s 1998 lifetime-performance study found registered cows dropped $24.43 in fluid markets. A 10%-inbred cow versus a 5% one also gives up about 92 kg of milk per lactation and 65 days of productive life, per Canadian Dairy Network. On 500-cow herds, cutting inbreeding from 13% to 8% documented $75,000–$94,000 in improved lifetime cow value — $150 to $188 per cow.

That’s the part the show banner hides. Concentration looks like dominance when those families are winning. It turns fragile the moment one of them stops — and on a closed herd, one off year in a foundation line can echo for three lactations before you’ve bought your way out of it.

How Much Does Waiting One More Cycle Actually Cost?

More than most families let themselves admit. Start with the calf premium you skip, layer on the retained-cow losses, and add the fertility ground you don’t gain. A 2024 Journal of Dairy Science simulation — European modeling, so read it directionally — found that improving fertility and productive life from 2.8 to 3.8 years lifted profit by about €98 per cow-year, while enabling more beef semen use, not less. Better cows let you push more beef without gutting your replacement pipeline. Worse fertility traps you in dairy matings you can’t afford to skip.

So the deferral isn’t neutral, and it isn’t free. Picture two herds the same size, same milk price, same feed bill. One sorted its cow families by profit two years ago and has been banking the calf premium since. The other is still arguing about a single cow. By the time the second herd settles the fight, the first has a head start that didn’t come from better cows — just from an earlier decision. The math doesn’t pause for the family meeting.

Is the Cow Even the Real Argument?

Usually not. Strip the breeding fight back and it’s a stand-in for the conversation nobody wants to start: who decides, who stays, who leaves, and when authority actually transfers.

The real conversation isn’t “Angus or sexed Holstein on cow 403.” It’s bigger and harder. Who owns this place in 2032? How much income does the retiring generation actually need to walk away comfortable? Which decisions are being handed over now, not someday? And when does the older generation stop using the breeding sheet as proof they still run the farm? That talk is rare because the moment you put names, dates, and dollars on the table, you’re admitting somebody’s dream might not survive the transition. A mating plan is a far easier thing to argue about.

Here’s the quiet part. When the breeding fight keeps reigniting over the same cow, that cow usually isn’t the problem — she’s the only safe place to have a fight about everything else. Move the real questions to their own table and the genetics argument shrinks back down to what it should be: a technical decision about which straw goes in which cow.

Options and Trade-Offs for Farmers

There’s no single right split. Three paths keep showing up, and each one buys you something while costing you something else.

Option 1: Ring-Fence and Pivot (The Survivor Model)

The Play: Protect the top 15–20% of proven families with sexed dairy semen; put beef on the genomically verified bottom 20–30%.

When It Works: Operations with genuine seedstock or show equity and solid reproductive metrics.

What It Takes: Genomic testing to sort the core honestly — not by who’s got the famous prefix. Cap projected inbreeding at 6% in your sire-search filter and treat it as a brake, not a target.

The Catch: Over-concentrating replacements in too few lines risks the $93,300 exposure that March 2026 model found.

Option 2: Aggressive Beef-on-Dairy

The Play: Shift the majority of your matings to beef, keeping only enough sexed dairy service on your best cows to cover replacement needs. Treat crossbred calves as a primary revenue line, not a byproduct.

When It Works: High 21-day pregnancy rates, where local beef calf prices clear the $1,580 crossover threshold.

The Catch: Severe exposure to the replacement heifer squeeze. CoBank projected 438,844 fewer dairy heifers in 2026 versus 2025, driven by 398,925 more beef-on-dairy calves born; their June 18, 2026 update puts the combined 2025–2026 shortfall near 796,000 head, with only about 360,200 rebuilt across 2027–2028. Updated NAAB data trims the likely gap closer to 600,000 — but your replacement bill doesn’t care about the difference. Market replacements now run $3,010 average (USDA, July 2025) to $4,400 for top-quality at auction.

Option 3: Hold the Legacy Line

The Play: Maintain traditional dairy breeding, relying on classification, genetics, and replacement sales.

When It Works: Elite, recognized cow families positioned to capitalize on record replacement demand. Jeffrey-Way Holsteins built 384 Excellent cows out of essentially one cow family over forty years — so it can be done.

The Catch: That’s the upside case. The downside shows up elsewhere: shrinking seedstock margins, and line-breeding tight around a single family has run $10,000–$15,000 in voluntary culls in separate Bullvine modeling.

Do This Within the Next 30 Days

Run the maternal audit before your next semen order. Print three to four years of cows sorted by lifetime milk or lifetime margin, highlight the ones in third lactation or better with solid components and no chronic problems, then trace those cows back three maternal generations and circle the surnames that repeat. That’s your real protected core — not the one on the barn wall.

Pull your inbreeding coefficients animal by animal while you’re at it, and note whether your software is reporting pedigree or genomic values. A 6% pedigree herd average can hide replacement heifers sitting at 12%.

Key Takeaways

  • If you can’t name the maternal lines behind your top ten cows without opening the herd book, run the 30-day audit before you spend another dollar on semen or embryos.
  • If your top genomic heifers all trace to two or three families, price your exposure now — that concentration ran $93,300 a year in one modeled herd at $3,110 heifers.
  • If beef calves in your market are selling below roughly $1,580, keep beef off any cow you’d genuinely want a replacement from. At that price the $575 premium doesn’t cover the $585 in replacement value you’re trading away.
  • If any mating pushes projected inbreeding above your 6% cap, find a different bull. Every point costs $23–$25 in lifetime Net Merit, and the peer-reviewed work behind that number has been consistent for twenty-five years.
  • If you’re holding a cow because culling her feels premature, remember the Swiss ratio: keeping too long cost roughly three times what culling too early did.
  • If you’re deferring a breeding shift because the family conversation is hard, put a dollar figure on the delay — calf premium plus retained-cow losses — and bring that number to the table instead of the breeding sheet.
  • If breeding keeps triggering the same fight, stop having it in the barn. Schedule a separate succession meeting where the older generation defines the non-negotiable families and the next generation sets the performance bar those families must clear.

The question worth sitting with this week isn’t whether beef-on-dairy belongs in your herd. For most operations, some version of it already does. It’s whether your family has ever actually named, out loud and with the numbers in front of you, which cows carry the legacy and which ones carry the mortgage.

If you haven’t had that conversation, the cow is still standing in for one nobody’s brave enough to start.

Learn More

The Sunday Read Dairy Professionals Don’t Skip.

Every week, thousands of producers, breeders, and industry insiders open Bullvine Weekly for genetics insights, market shifts, and profit strategies they won’t find anywhere else. One email. Five minutes. Smarter decisions all week.
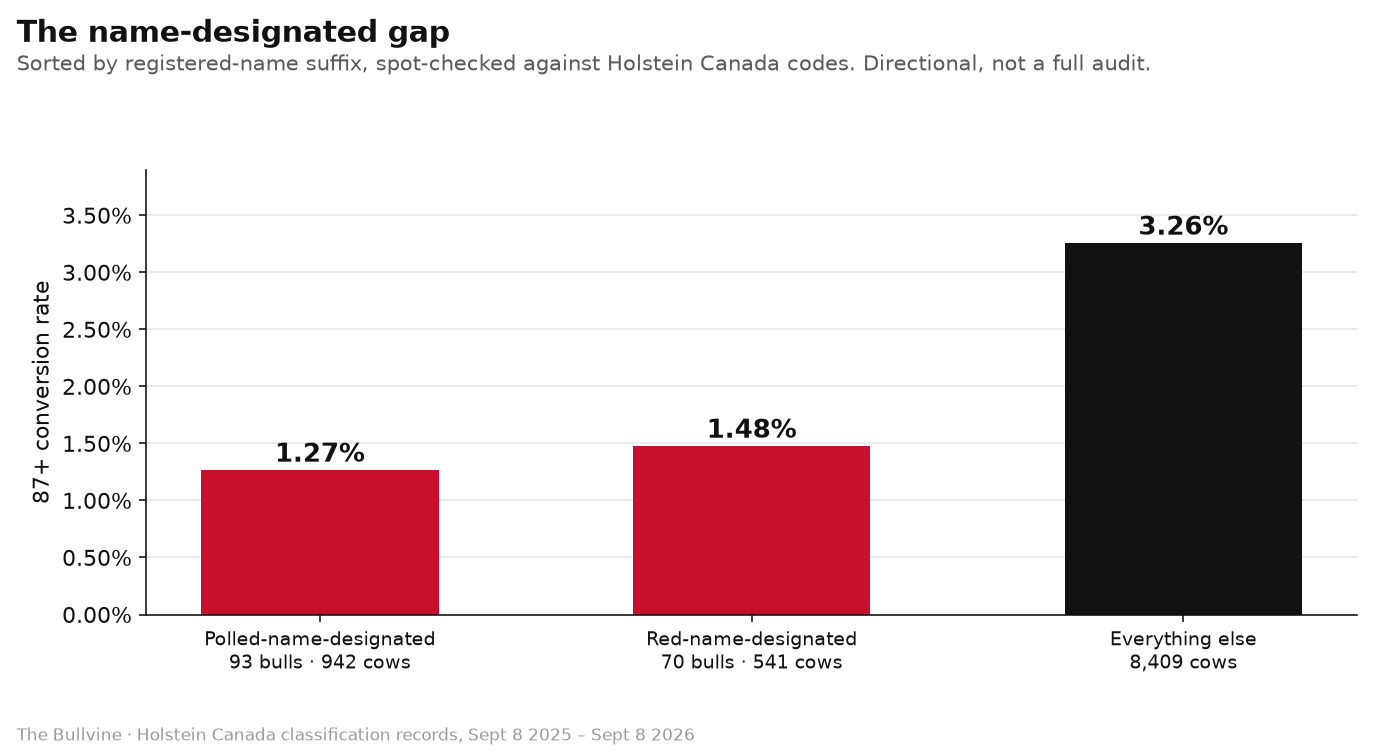
NewsSubscribe
First
Last
Consent

Holstein’s 60-Inch Rule: Why Breeders Are Backing It With 53%-vs-21% Math 

Two weeks after we broke down the May 2026 stature penalty, breeders answered back — and the sharpest reply wasn’t outrage. It was a heritability lesson.

Emeric Lebacle, a Quebec breeder, dropped it into our comment section almost as an afterthought, and it turned out to be the most important thing anyone said about Holstein’s new stature penalty. His point: stature inherits more than twice as reliably as feet and legs, so if you actually want to move a herd, you pull the lever that responds. That’s exactly what Holstein USA did in its May 2026 classification run — and if your bull lineup still leans tall, this is the number that should stop you cold.

StaturePoint deduction from Final Score
60″ and under0.00 (no penalty) 
61″−0.15 
62″−0.30 
64″−0.90 
65″−1.20 
68″−2.55 
70″−3.45 

We figured the thread would split the usual way. Show people furious, commercial people cheering. That’s not what came back.

The One Number That Explains the Whole Penalty

What came back was working breeders doing the genetics math the association never spelled out. Stature is one of the most heritable traits on the card. Feet and legs? Not close. And that gap is the whole argument.

The data backs the Lebacle, hard. Lactanet pegs stature heritability at 53% — the highest of any Holstein type trait — with frame/capacity at 41%, while the Feet & Legs major score sits at just 21% and Foot Angle drops to 13%. Holstein USA runs the same direction: U.S. studies put stature in the low-to-mid 0.4 range, and the association states flatly that “it is difficult to make much genetic progress through selection and mating unless a trait has a heritability of .10 or higher”. This isn’t a 2026 discovery, either. Cassell reported back in 1973 that “stature showed the highest heritability while estimates for udder quality, hind legs, feet… were low”. 

Keep the borders straight — Canada’s 53% and the U.S.’s low-0.4 range aren’t the same figure, but they tell the same story. Selecting hard on feet and legs is like pushing a rope. You can weight them heavy in your index and still crawl, because a 21% trait doesn’t inherit the way a 53% trait does. Stature does. So the association went after the trait that actually responds, knowing it drags a lot of correlated durability along with it.

TraitLactanet heritability (Canada)U.S. studies (Holstein USA)Selection response
Stature53% — highest of any type traitLow-to-mid 0.4 rangeFast — moves the herd
Frame / Capacity41%Comparable frame estimatesModerate
Feet & Legs (major score)21%Below statureSlow — like pushing a rope
Foot Angle13%Near the .10 floorBarely responds

Does the Penalty Punish a Good Tall Cow?

This was the loudest fear in the thread, and one farm answered it with a real classification result. A producer walked into this spring’s round braced for damage and didn’t get it. Her classifier docked stature — then handed it right back on front-end capacity and width. Her balanced cows came out neutral.

That’s one farm’s experience, not a controlled study. But it lines up with how Holstein USA actually builds its numbers. Both the Udder Composite and the Feet & Legs Composite carry a −0.20 weight on stature — on purpose, so breeders can “improve udders and feet & legs without making their cows taller”. The penalty isn’t anti-tall. It’s anti-tall-and-narrow. A wide, strong, deep-ribbed cow who happens to stand over 60 inches carries her frame, and the score shows it. The cow it’s aimed at is the narrow one riding on height alone. 

Another breeder made the same case from the skeptic’s chair. He doesn’t care how big a cow is, long as she’s got the width and strength to last — and frail, he noted, comes in every size. He’s right. And the penalty agrees with him. Height was never the disease. Height without substance is.

Is the Real Problem Height — or the Feet Nobody’s Culling?

The sharpest pushback deserves a full hearing, because it’s fair. One breeder’s argument: this penalty makes classifiers look political, and it’s aiming at the wrong target. Pull up the current top-GTPI list, he says, and look at the feet and legs on that group. Weak. Nobody’s thinning the sorry-walking bulls hard enough. So why chase height when the real durability killer is legs?

Here’s the honest answer, and it’s a “yes, and” — not a rebuttal. He’s right that top-GTPI feet and legs have slid; genomics chased production and type composites while feet and legs quietly eroded, a drift Holstein USA’s own million-cow conformation study laid bare. But the stature penalty and the feet-and-legs problem aren’t competing fixes. They’re the same fight. Height-for-height’s-sake breeding is part of what wrecked the legs in the first place — and at 53% against 21%, stature is the trait you can move fast. The lever this breeder wants pulled directly, feet and legs, responds less than half as well. So push both. Just don’t mistake the more-heritable tool for a distraction. “Watch how they walk and get up and down, not the number on the stick,” another put it — and he’s making the same point. Mobility is what matters. Height is the proxy the system can actually select on. 

The Barn-Floor Longevity File

You can argue heritability estimates all day. It’s harder to argue with a cull sheet. Several breeders volunteered the same pattern from their own alleys.

One producer runs an older freestall barn — shorter stalls, slatted floor. His read was blunt: tall cows leave earlier than short cows, so he now hunts for a minus on stature when he buys Holstein semen. That’s a breeder rewriting his own index based on what the stalls told him. Another gave the version with detail. Years back he had a cow that flirted with 70 inches — big producer, decent career, until her joints gave out. Her daughter, still tall but not as extreme, aged better and stayed athletic to the end. His verdict: somewhat-tall cows with good feet and legs generally weren’t the problem. Tall plus weak legs was. A third put it flatter — taller cows go down more, and they’re less likely to get back up.

Now put a number on “they leave earlier.” Raising a Holstein replacement to calving runs about $2,016 in confinement, and anywhere from $1,700 to $2,400 depending on your setup (Overton, Journal of Dairy Science, 2020)  — and recent land-grant figures have crept to the $2,400–$2,500 range as feed costs climbed. A cow culled a full lactation early strands a chunk of that before she’s paid you back. On a 100-cow herd, cutting five early exits a year protects roughly $10,000 in replacement investment — call it the ceiling, not the take-home, since salvage value and the milk she already shipped claw some of it back. That’s why breeders in older, shorter stalls treat a stature minus as risk management, not fashion. None of these are studies. They’re decades of watching cows come and go, and they all point where the data already does. 

Don’t Blame the Ring

Here’s where this whole conversation usually goes sideways. The show ring gets blamed for every tall, narrow, fragile Holstein in the country. That’s too easy. And it lets everyone who actually built her off the hook.

Lovhill Sidekick Kandy Cane takes Grand Champion at the Largest Dairy Show in the world— The ring is a mirror — it rewards the cow breeders, studs, and buyers chose to build. The only question that matters walking out: would she still be here in her fifth lactation?

The ring rewarded what breeders walked into it. Breed associations printed the scorecards. AI companies marketed the pedigrees. Commercial herds kept buying daughters of bulls that looked impressive at 24 months — before anyone asked how they’d hold up through three lactations. We chased bigger for 30 years, then the math caught up: big cows eat more just to exist, and the science flipped so hard the industry now docks stature and even built a whole trait, Feed Saved, to reward the opposite of what it rewarded for a generation. Same people. Opposite advice.

So don’t blame the ring. The ring is a mirror. It shows you exactly what you selected for — and the penalty is just the glass finally being honest.

The Cow That Still Stings

Then there’s the story that stopped the thread cold. A longtime breeder recalled hauling a cow to slaughter decades back — an 18-year-old downer, a small black cow, scored 88, with strength, width, and a beautiful udder. By his telling, she was among the first cows in Wisconsin to top 300,000 pounds of milk lifetime. Yet she never scored Excellent, he says, because she wasn’t tall enough. U.S. bull studs wanted nothing to do with a son of hers. That son went to Europe and did great things.

We couldn’t independently verify the record, so take it as one breeder’s memory, not documented history. But the shape of it rings true to anyone who bred cows in that era. One of the most productive cows in her state, denied the top score and shut out of the bull pipeline for a single reason — too short — back when short was the sin. The pendulum that beat her is the same one now swinging back to penalize the cows that replaced her. The trait didn’t change. The fashion did.

Options and Trade-Offs for Your Herd

The thread wasn’t just venting. Read together, your peers left a working playbook.

Your situationRecommended moveThe trade-off you acceptWarning flag
Weighting F&L hard, no progressPush stature (53%), work the cull sheet for legsLegs still improve slowly21% won’t move on its own
Older / shorter stalls, slatted floorTreat a stature minus as a featurePass on tall pedigreesTall cows leave earlier here
Want durability, no show hitBreed width, strength, capacity firstSkip flashy narrow-tall bullsBalanced tall scores neutral
Breed show-typePrice the penalty before you commitRead linear traits, not just composites64–65″ ≈ −1 Final Score point

Run the 30-day sire audit — do this before your next semen order. Pull your bull list this month. Sort by stature PTA, and on your tallest transmitters check productive life and the Feet & Legs Composite too. If you’re in older, shorter stalls on slatted floors, do what that breeder did and treat a stature minus as a feature, not a flaw. Costs you an evening. It’s the fastest way to see whether your lineup is still ordering the cow the scorecard now penalizes.

Chase substance, let height fall where it lands. Best for herds that want durability without a show hit. Select for width, strength, and capacity first — a balanced tall cow scores neutral, as that spring classification proved. The trade-off is real: you’ll pass on flashy, narrow, tall pedigrees that still photograph like a magazine cover. 

Push feet and legs directly, too — the critics earned that. Don’t let the stature debate become an excuse to ignore legs. But know the catch going in: at 21% against stature’s 53%, progress comes slow, so lean on the composite and your own cull records rather than chasing one bull’s foot-angle number. 

If you breed show-type, price the change with your eyes open. A daughter at 64–65 inches now gives back close to a full point of Final Score she’d have kept a year ago. Read the individual linear traits, not just the composites, and decide the trade honestly.

Key Takeaways

  • If you’re weighting feet and legs hard and seeing no herd progress, that’s the heritability talking. F&L sits at 21%; stature runs 53% in Canada and low-0.4 in the U.S.. Push where it moves, and work the cull sheet for the rest. 
  • If you’re scared the penalty guts a good tall cow, breed width and strength and quit worrying. Both composites carry a −0.20 stature weight by design, so capacity earns back what height docks. 
  • If you run older or shorter stalls, treat a stature minus as risk management, not heresy. At roughly $2,000 a replacement, early exits are the expensive kind of tall. 
  • If your best-ever cow would’ve been too short for Excellent a generation ago, ask what today’s fashion is costing you that you can’t see yet. Fashions reverse. Function doesn’t.

What Fashion Is Your Herd Really Built For?

The best breeders can stand in front of a gorgeous cow and still ask the only question that pays the bills on Monday morning. So walk out to your tallest, flashiest heifer — the one that photographs like progress — and ask it straight: would you want 500 more of her in the milking string? If the answer’s no, that was never the ring’s mistake. It was yours.

Pull ten of your best cows this week and run the stick next to the cull history. See which fashion your herd is actually built for. We laid out the full penalty schedule and the Net Merit math in our earlier breakdown of Holstein’s 60-inch line — this piece was your answer to it, and the reply thread isn’t closed. Keep it coming.

Hold-to-Proof Cost Simulator

Calculate the structural retention balance of your replacement pipeline

% of annual culls leaving before Lactation 3 due to frame/leg weakness

Operational Capital Impact

Annual Replacement Pipeline Requirements: 175 heifers / year
Stature-Linked Early Exits: 9 animals / year
Stranded Heifer Investment: $18,144

Formula assumes early structural exits fail to fully amortize their initial $2,016 rearing asset cost prior to third lactation. Benchmark figures adapted from Overton & Dhuyvetter, Journal of Dairy Science.

Complete references and supporting documentation are available upon request by contacting the editorial team at editor@thebullvine.com.

Learn More

The Sunday Read Dairy Professionals Don’t Skip.

Every week, thousands of producers, breeders, and industry insiders open Bullvine Weekly for genetics insights, market shifts, and profit strategies they won’t find anywhere else. One email. Five minutes. Smarter decisions all week.
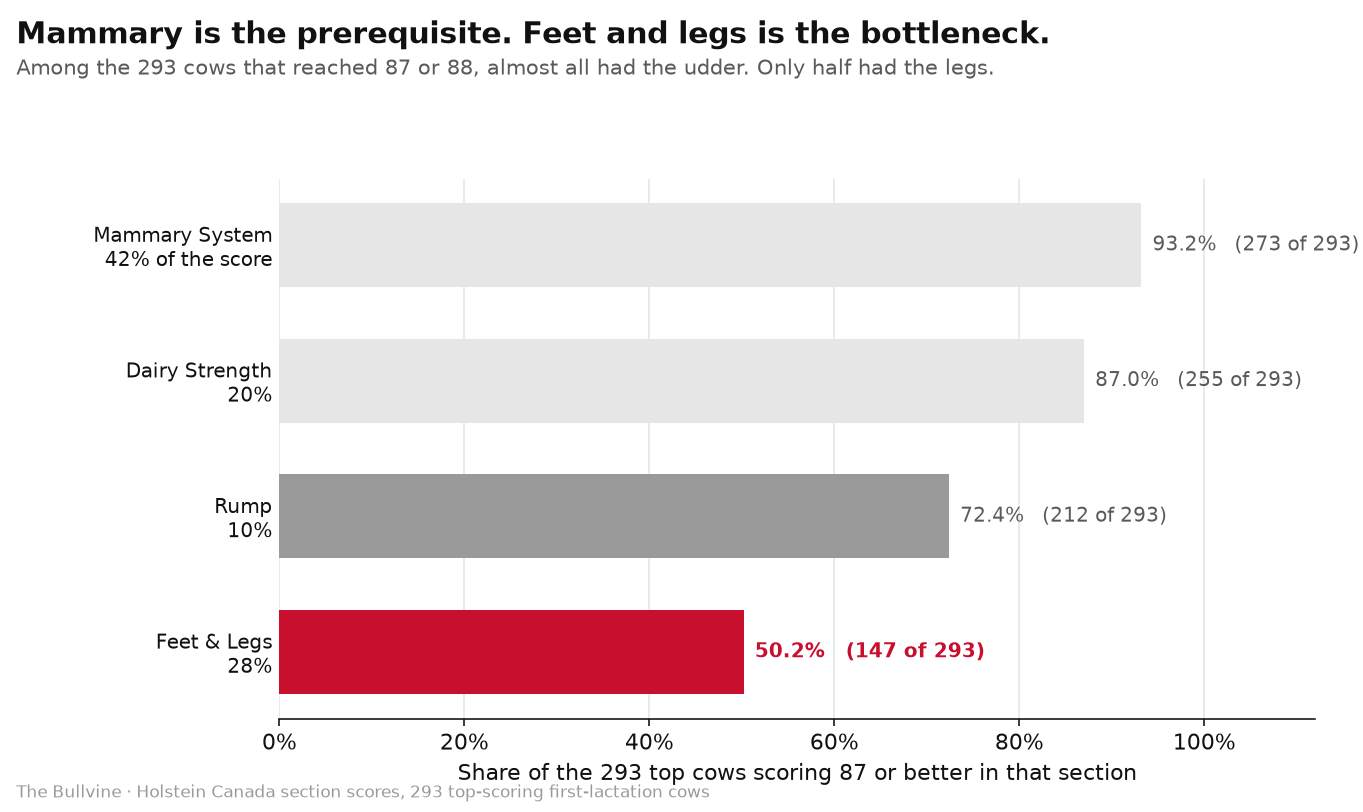
NewsSubscribe
First
Last
Consent

Why Cow Family Beats a +3000 GTPI Calf: The $12,000 Embryo Math Every Breeder Should Run

A dynasty-line heifer can out-earn a flashier genomic pick by roughly $950 to $1,600 over five years — here’s the barn math, and why the surname on your best cow’s ear tag matters more than the index on top.

Marc Comtois with Comestar Laurie Sheik VG-88-23* at World Dairy Expo, 1989 — second in her Senior 2-Year-Old class. The judge put another cow ahead of her that day. History didn’t. This is the cow that would go on to anchor 14 Semex Class EXTRA bulls and four millionaire sires — the living proof, decades before genomics, that cow family beats a flashy card.  (Read more: The Cow That Built an Empire: Comestar Laurie Sheik’s Unstoppable Genetic Legacy)

The best argument for cow family over index sheets showed up on Marc Comtois’s trailer in 1985. It was Elysa Anthony Lea EX-15*, one of Willowholme Mark Anthony’s best daughters, and the most important thing he ever bought. Bred to Puget-Sound Sheik, she produced Comestar Laurie Sheik VG-88-23* in December 1986. That one cow went on to anchor 14 Semex Class EXTRA bulls and four millionaire sires — Leader, Lee, Lheros, and Outside. That’s a maternal dynasty, fully cashed in.

Marc Comtois at the Semex Millionaire Club display, flanked by models of Lee and Leader — two of the four millionaire sires bred off Comestar Laurie Sheik. The placards tell the story in numbers: over a million doses, semen sold in 43 countries. No single index built that. One cow family did — which is exactly the case this article makes

The uncomfortable question is what’s happening in your own barn right now. You’re spending on genomic tests, elite semen, and $3,000-plus embryos without asking whether the cow family underneath those numbers can actually stay in your barn for three or four lactations. That gap between paper merit and staying power is what this piece is about.

From Bull-of-the-Month to Cow Families That Don’t Miss

Genomics promised we could skip generations of slow, patient pedigree-building. But as the index race speeds up, a paper-thin pedigree is turning into a high-maintenance luxury. Let’s look at the real math of what a shallow family costs you once the honeymoon of her first proof wears off.

The industry still runs on a four-month heartbeat — new proofs in April, August, December, fresh catalogs, a fresh list of must-use sires. CDCB’s April 2025 base change reset every TPI value in the system, moving the reference point from cows born in 2015 to those born in 2020, and the April 2026 run reshuffled the rankings again, with STgen alone holding 36% of the proven TPI top 100. By design, you’re pushed to think bulls first.

Glenridge Citation Roxy EX-97 — the American answer to the same argument. No genomic test ever scored her; her record did. Generations of Goldwyns, Atwoods, and show-ring champions trace to this one cow, proof that a great maternal line compounds value long after the index that ranked her contemporaries has been forgotten. Read more: Glenridge Citation Roxy: The Legendary “Queen of the Breed”

The cows quietly driving your margins don’t turn over every four months. Strip the brand names off the catalogs, follow the cow side, and the same surnames keep surfacing: Comestar Laurie Sheik, Snow-N-Denises Dellia and her granddaughter Regancrest-PR Barbie, Glenridge Citation Roxy. These families do what no single sire can — throw profitable daughters, generation after generation, through changes in feed cost, housing, indexes, and tools. For the wider story of how 16 years of genomics rewrote which bulls get used — and what it didn’t touch on the cow side — see The Great Holstein Shakeup.

Snow-N Denises Dellia, EX-95-2E-GMD-DOM—Walkway Chief Mark out of Snow-N Dorys Denise, with Carlin-M Ivanhoe Bell as maternal grandsire. “Tall, sharp, clean, beautifully uddered, and trouble-free,” judge Niles Wendorf called her the day she stood grand champion at the 1991 Wisconsin Spring Show. This is the cow Select Sires had passed on. (Read more: Three Gold Medal Sons From One Cow the Studs Didn’t Want)

How Does a Shallow Pedigree Actually Cost You Money?

Bring it down to two heifers walking into your parlor next spring.

Heifer A is +3.2 PTAT on a genomic-only proof. Her dam’s a GP cow with two quick lactations and not much behind her. On paper, she’s exciting. In reality, you’ve got no idea whether that maternal line survives heat, robot glitches, or your transition pen. Heifer B is +2.8 PTAT — less flashy on the sheet. But she comes from a Barbie-type line where more than 27 daughters have been scored, all but one landing VG or EX on first classification, and where the family now sits behind roughly 36% of top-tier PTAT rankings.

Regancrest-PR Barbie — the cow family that refused to be made obsolete. When genomics arrived promising to replace pedigree with a number, Barbie answered by stacking her sons and daughters at the top of the same index lists. The dynasty didn’t fight the new system. It won inside it — which is the whole point.  (Read more: When Breeding Genius Meets Perfect Timing: How Regancrest-PR Barbie Shaped the Future of Holstein Genetics)

Heifer Comparison: Dynasty vs. Shallow Pedigree

AttributeHeifer A (Shallow Pedigree)Heifer B (Dynasty Line — “Barbie/Roxy”)
Genomic PTAT+3.2 (exciting on paper)+2.8 (slightly lower index)
Maternal backingGP dam, shallow familyDeep line (27+ VG/EX maternal sisters)
Expected lifespan~1.8–2 lactations (early cull risk)3.5+ lactations (proven durability)
Parity-1 vet costs~$75+ (higher stress susceptibility)~$23–$35 (resilient, low drama)
ET/IVF viabilityHigh risk (unproven transmission)High reward (80–90% elite transmission)
5-year est. marginBaseline+$950 to +$1,600 (midpoint +$1,200)

Note: Parity-1 vet costs (Blom et al., 2023) and maternal backing reflect documented records. Expected lifespan and ET transmission rates are Bullvine illustrative estimates comparing dynasty and shallow lines — not measured population values.

Fast-forward five years. The Barbie-line heifer is far more likely to still be milking in her third or fourth lactation. Published herd-life economics — De Vries (2017, Journal of Dairy Science) on the longevity-versus-genetic-gain trade-off, and Gazzarin et al. (2025, JDS) on optimal productive lifespan — consistently show that spreading rearing cost across more lactations while banking extra peak-milk cycles adds real profit per cow. Our Bullvine analysis, built on those ranges, pegs each additional successful lactation at roughly $400 to $600 per cow, depending on your system.

Health stacks on top. A 2023 study of eight high-performance Minnesota Holstein herds (Blom et al., Animals) found parity-1 treatment costs ranging from about $23 to $75 per cow — and that’s direct vet cost only, before lost milk, discard, and breeding delays. Add it up across three or four lactations and the dynasty cow pulls clear. Our model lands the five-year cash gap between a dynasty-line heifer and an equally fancy but shallow-pedigree heifer at roughly $950 to $1,600 per head — call it $1,200 at the midpoint. Hold that in pencil. It moves with your feed cost, your milk price, and how hard you lean on ET.

On a 300-cow herd raising 40 to 50 donor-candidate heifers over a few years, that gap scales into five-figure territory. The genomic test bills you today. The shallow family bills you in year three.

Three Fingerprints a Dynasty Can’t Fake

The Comestar, Regancrest, and Roxy families don’t look alike. One leans functional type, one extreme PTAT, one fertility and herd-life. Lay their histories side by side, though, and the same fingerprints show up.

a historic moment for the Comtois family as they receive Holstein Canada’s most prestigious individual honor for Comestar Lamadona Doorman EX-94-2E 27*. The presentation marks a remarkable full-circle achievement, as Lamadona becomes the 2022 Cow of the Year exactly 27 years after her ancestor, Comestar Laurie Sheik, received the inaugural award in 1995. Standing proudly before the Holstein Canada backdrop, the family displays a commissioned portrait of this extraordinary cow who combines exceptional type (EX-94) with remarkable genetic transmission (27 brood stars). Lamadona continues the Laurie Sheik dynasty through her influence on modern breeding programs, with sons like LEMAGIC (Semex), LOYALL (Blondin Sires), LATAYO (Semex) and BARLOT (Semex) carrying her genetics forward. This moment represents not just an individual achievement, but the validation of a breeding philosophy focused on maternal lines that has shaped Holstein breeding across four decades and 51 countries worldwide.
A historic moment for the Comtois family as they receive Holstein Canada’s most prestigious individual honor for Comestar Lamadona Doorman EX-94-2E 27*. The presentation marks a remarkable full-circle achievement, as Lamadona becomes the 2022 Cow of the Year exactly 27 years after her ancestor, Comestar Laurie Sheik, received the inaugural award in 1995.

Depth, not a spike. In the Laurie Sheik family, herdbook stars stack in a way most herds never see once. Laurie Sheik carries 23 brood-cow stars, her Blackstar daughter Laura Black topped her with 24, and L Or Black earned 16. Holstein Canada named Laurie Sheik the inaugural Cow of the Year in 1995; her descendant Comestar Lamadona Doorman took the same title in 2022 — 27 years apart. That one purchase Comtois made in 1985 is still winning national hardware nearly four decades later. Not a one-hit wonder. A conveyor belt. The full story lives in The Cow That Built an Empire.

Barbie’s line runs the same pattern — dams, daughters, granddaughters carrying multiple Excellent daughters and top PTAT slots, not one freak cow surrounded by also-rans. Glenridge Citation Roxy EX-97-4E had 16 Excellent daughters, over 300 Excellent descendants, and a 30-star brood cow in Mil-R-Mor Roxette EX. Families that flat-out refuse to miss.

Volume with the same result. Dynasties don’t get judged on three daughters. Barbie produced more than 27; all but one classified VG or better on first lactation, and by 2010 she’d stacked eight Excellent and nineteen Very Good, with at least eleven daughters in the top-25 PTAT rankings. Give a family 20 to 30 daughters by different bulls and they still hit 80 to 90% of the time — that’s zero-failure transmission in barn terms. No genomic prediction fakes that.

And here’s the real separator: the results hold across different sires and different barns. In the Barbie family, Goldwyn and Shottle daughters both show the same mammary quality. In the Laurie Sheik line, Blackstar, Prelude, and Storm all threw daughters and sons that lifted herds from Quebec to Belgium to modern robot barns — at Bois Seigneur Holstein, roughly 70% of the herd traces back to her. Roxy’s descendants have milked in tie-stalls, free-stalls, and on pasture without losing their reputation for fertility and low SCC. A printout ranks a calf in a population. It can’t tell you how her granddaughters behave across 30 matings and five proof runs. That’s where dynasties live. Read the family trees in Roxy, Dellia and The Mothers Who Built the Breed.

Dynasty familyDepth (brood-cow stars / EX daughters)Volume testedRepeatability signal
Comestar Laurie Sheik23 brood stars; Laura Black 24, L Or Black 16Anchored 14 Class EXTRA bulls2 Cow-of-the-Year titles, 27 yrs apart
Regancrest-PR Barbie8 EX + 19 VG daughters by 201027+ daughters classifiedAll but 1 hit VG/EX on 1st lactation
Glenridge Citation Roxy16 EX daughters; 300+ EX descendantsMil-R-Mor Roxette = 30-star brood cowHeld type across tie-stall, free-stall, pasture
Millionaire sires producedLeader, Lee, Lheros, Outside (Laurie Sheik)Comestar Lee: 1.5M dosesSame result across Goldwyn, Shottle, Blackstar

What Does a $3,000 Embryo Really Buy You?

Here’s the flip side, and it’s the other half of our $93,300-a-year “three cow families” warning. Not the trap of leaning too hard on a handful of dynasties — the opposite mistake, ignoring proven cow families entirely.

Hand over $3,000 for an embryo and you’re not buying a guarantee. You’re playing biological telephone. Here’s how the cash actually drains:

The Cold Math on $3,000 Embryos

  • The buy-in: 4 embryos × $3,000 = $12,000 spent
  • The reality check: ~50% conception rate = 2 pregnancies
  • The coin flip: ~50% heifer rate = 1 live heifer

You just paid $12,000 for one live heifer before she drinks her first bag of colostrum — and that’s before the $3,500 to $4,000 to raise her to calving. If her donor’s a one-generation wonder, you’ve got a real shot at that $12,000 washing out early. If she’s a Roxy or a Barbie, she’s got the maternal infrastructure to back the price tag. Those conception rates aren’t guesses, either: Demetrio et al. (2020, Animal Reproduction) put in vivo pregnancy at about 51% in lactating cows and 63% in virgin heifers.

Now overlay the family. From a Barbie/Laurie/Roxy-level dynasty, family data suggests 80 to 90% of those embryo-derived daughters land in your top tier. From a high-genomic young cow with nothing behind her, that “elite” hit rate can realistically slide to 30 to 40% once health, fertility, and cull reasons pile on. Using the upper end of our earlier range — roughly $1,500, since embryo heifers are pre-selected for merit rather than average — the expected margin per $12,000 investment looks like this:

  • Dynasty donor: 0.8 × $1,500 ≈ $1,200 expected margin
  • Shallow donor: 0.4 × $1,500 ≈ $600 expected margin

Ignore maternal proof and you’ve taken a 50% haircut, purely because you never asked whether the donor’s family had proven anything past three generations of names on paper. Run 20 embryos a year in a 300-cow herd and that’s five-figure lost upside over five years — before you count the drain of watching can’t-miss heifers turn into problem cows.

How Do You Lean on Dynasties Without Breeding Yourself Into an Inbreeding Hole?

There’s a real catch. Double down on a few cow families, ignore the sire mix, and you dig an inbreeding hole fast.

Canadian Holstein heifers born in 2024 now average 9.99% inbreeding, per Lactanet’s August 2025 update — up from 9.61% the year before, and nearly double where it sat 15 years ago. The US doesn’t publish one breed-average figure, but CDCB’s base-change work tells the same story: average Expected Future Inbreeding jumped from 7.5% to 9.4% between the 2015 and 2020 cow bases. Different yardstick. Same direction.

The Inbreeding Alarm: With breed averages sitting at a historic 9.99%, doubling down on “popular” branches of a dynasty without a strict mating guardrail is genetic self-sabotage. Virginia Tech’s benchmark work (Smith et al., 1998, JDS) pegged each 1% rise in inbreeding at roughly $22 to $24 in lost lifetime net income per cow — but that’s in 1999 dollars. Inflation-adjusted and paired with newer genomic milk-loss data, real-world estimates now run about $44 to $100 per cow. And it hits exactly where dynasties are supposed to protect you: fertility, stillbirths, immune-system slack.

So you manage a dynasty like a long-term investment, not a shortcut:

  • Track inbreeding animal by animal, not just as a herd average.
  • Hold expected heifer-crop inbreeding well below the 9.99% breed average — treat whatever number you pick as a brake pedal, not a target.
  • Don’t blackball elite carrier bulls. A +3,200 GTPI carrier mated only to clear (Code 0) cows beats a +2,800 GTPI clean bull — you bank the genetics and dodge the homozygous risk.
  • Use genomic relationship data to find less-related bulls that still fit your dynasty’s type and production goals.

The full barn math on what each point of inbreeding costs is in Holstein’s $40,500 Inbreeding Bill, and the outcross-sourcing playbook is in How Blondin Sires Turned a Bottleneck into 75% Growth. You’re not giving up pedigree depth. You’re keeping inbreeding depression from erasing the exact traits that made you love the family.

Options and Trade-Offs for Farmers

Every herd sits in a different spot on the genetics curve. Three paths fit most 200- to 1,500-cow operations staring at this maternal blind spot.

The 30-Day Maternal Audit (start here). Print three to four years of cows sorted by lifetime milk or margin. Highlight the ones in third lactation or better with solid components and no chronic problems. Trace them back three maternal generations and circle the surnames that repeat. When it makes sense: any herd over ~150 cows with a few years of records. What it takes: a couple hours with herd software and a pen — no consulting fee. The limit: if your records don’t track lifetime performance well, you’ll lean on cull notes and memory as a stopgap. Even that beats flying blind. Tag those dynasty animals in your software this month, and you’ve already started changing daily decisions.

The Dynasty-First Semen Plan. Redirect the budget you already spend. Sexed, high-end semen goes to your top 20 to 30 dynasty cows and heifers first; conventional Holstein or beef goes on the rest unless one has a clear role. Cap expected inbreeding well under 9.99% on dynasty matings, and when a sire pushes those animals toward the line, swap him. When it makes sense: herds already spending real money on elite or sexed semen. The trade-off: you give up chasing every new bull and run a tighter sire list longer. As genomic evaluations put more weight on health and fertility, the smartest move won’t be overriding maternal proof — it’ll be sharpening which sires you use inside families that have already earned their spot in your barn.

The “Stop Guessing” Embryo Rule. Write one rule before the next sale catalog hits: if the donor’s family can’t show three generations of daughters with solid production, decent classification, and real herd life, you don’t write a $3,000 check. When it makes sense: any herd using ET/IVF or tempted by purchased embryos. The trade-off: you’ll walk past a hot donor with sizzling numbers and no cow-family proof, and you might miss the rare new family that would’ve panned out. You’ll dodge far more expensive disappointments. As more ET programs chase feed efficiency and sustainability, donors from proven dynasties are the ones that hit under real-world stress.

Key Takeaways

  • If you can’t name the maternal lines behind your top 10 cows without opening the herd book, run the 30-day audit before you spend another dollar on semen or embryos.
  • If a donor’s family can’t show three generations of daughters that milk, breed back, and stay out of the dead pile, don’t pay brood-cow prices for her embryos.
  • If you’re running more than 15 to 20 Holstein sires in a 300-cow herd over two or three years, you’re spreading the budget too thin — tighten the list and aim it at your top three families.
  • If your embryo-derived heifers aren’t beating your herd’s average retention to a third lactation, your program’s riding shallow families. Rebuild it around lines that have proven they stay.
  • If your herd inbreeding is creeping toward 9.99%, cap dynasty matings below that line, mate elite carriers to Code 0 cows only, and check inbreeding animal by animal — not just as a herd average.

Nobody’s arguing whether Barbie, Laurie Sheik, and Roxy created value. Four millionaire sires — with Comestar Lee alone reaching 1.5 million doses — 16 Excellent daughters in one family, a third of the elite PTAT list: that answer’s already written. The open question is whether your program is built to reward the dynasties quietly carrying your barn, or whether you’re still spending 2026 money like it’s 1998, letting catalogs call the shots instead of the surnames on your best cows’ tags.

So here’s the one to sit with before the next proof run lands in your inbox: print that three-to-four-year cow list tomorrow morning and see which three families are actually holding your barn together. Once you see it, you can’t unsee it. And when you want the full model — exactly how much extra profit per lactation a dynasty cow throws off at 200 cows versus 1,500 — that’s the deeper per-cow math we’re building next, and where Bullvine Weekly readers get it first.

Run Your Numbers

Genomic Testing ROI Calculator — Before you flush a donor or write another $3,000 embryo check, run the numbers on which animals are actually worth testing. It puts a dollar value on the spread between your best and worst genetic quartiles, flags where inbreeding risk needs tighter control, and pressure-tests whether the decision pencils under conservative assumptions — not just the aggressive ones.

Complete references and supporting documentation are available upon request by contacting the editorial team at editor@thebullvine.com.

Learn More

The Sunday Read Dairy Professionals Don’t Skip.

Every week, thousands of producers, breeders, and industry insiders open Bullvine Weekly for genetics insights, market shifts, and profit strategies they won’t find anywhere else. One email. Five minutes. Smarter decisions all week.
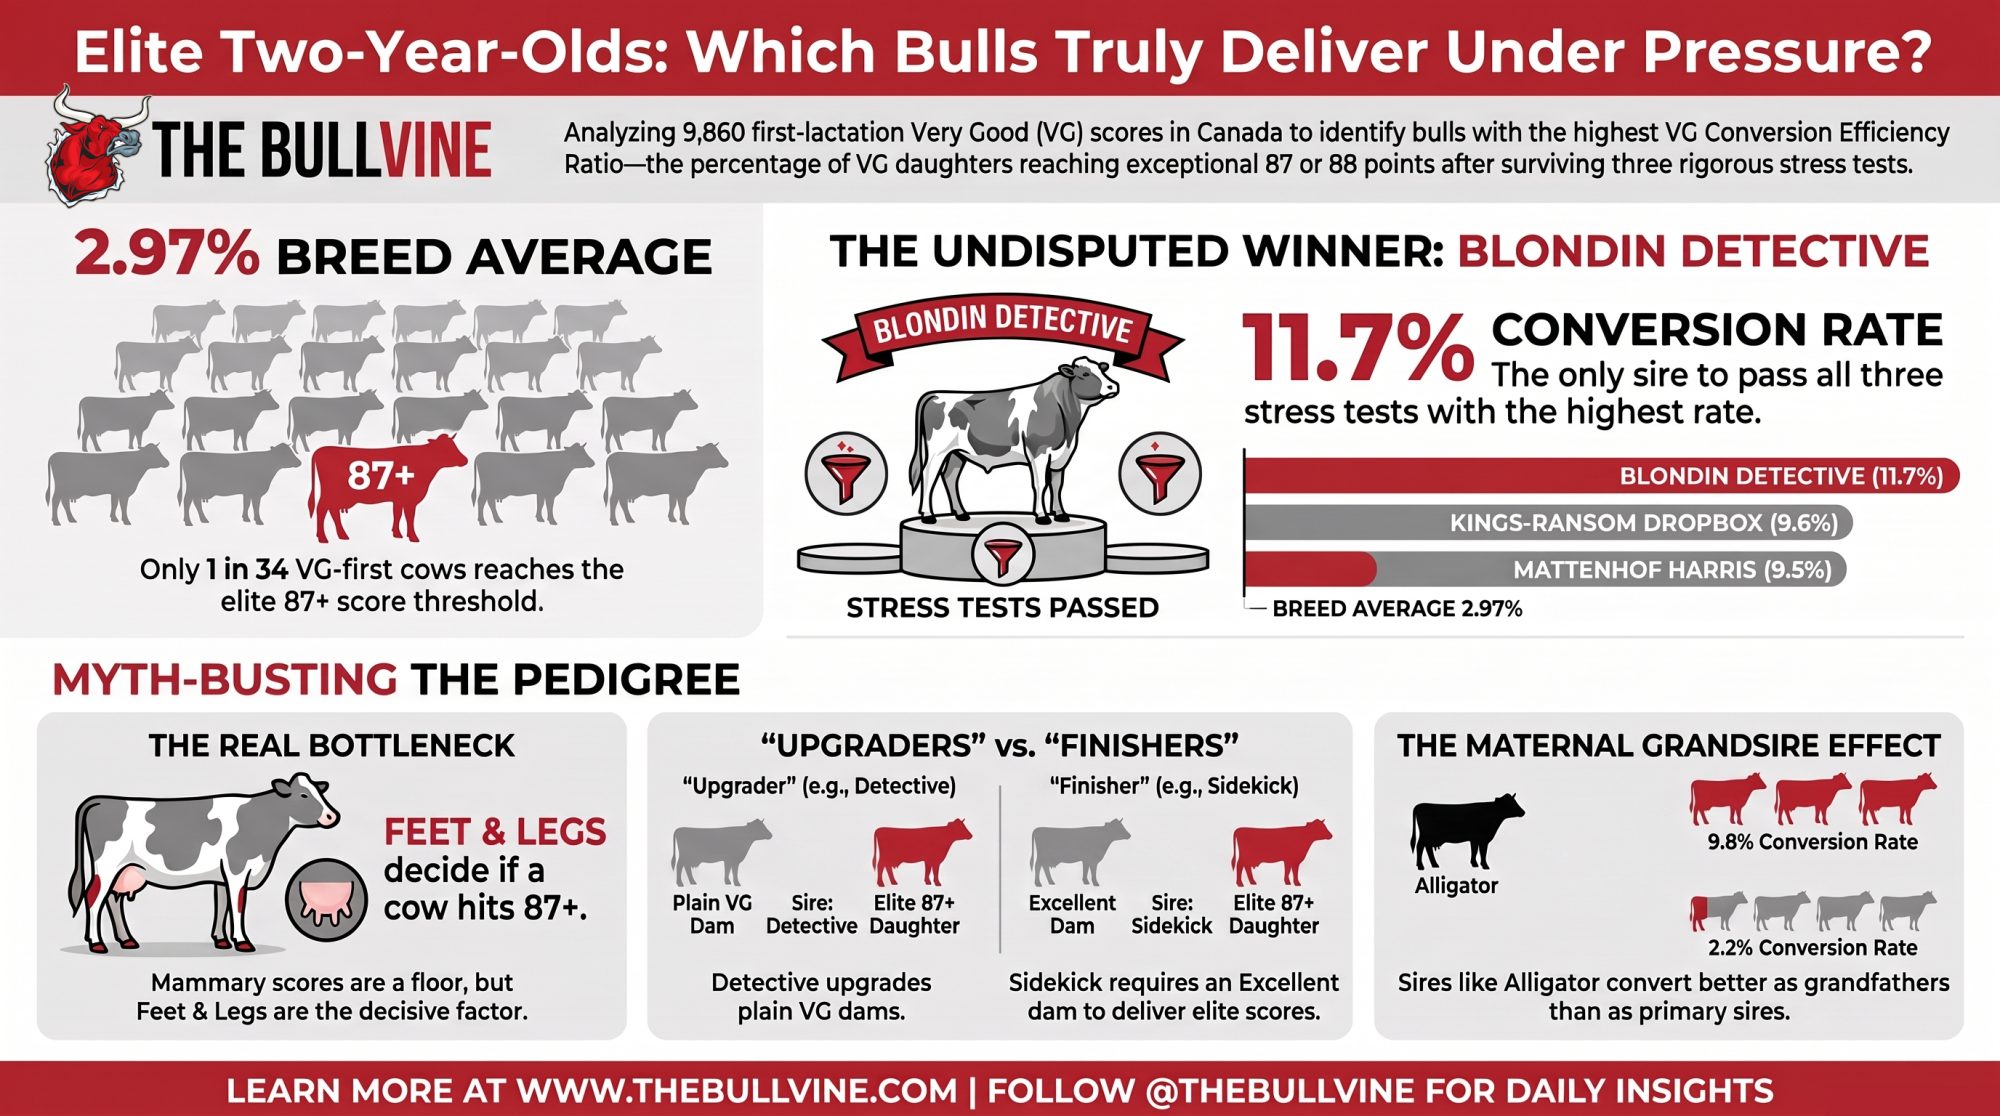
NewsSubscribe
First
Last
Consent

Dairy Strength, Not Height: The Proof Rule Hiding in Every Holstein Pedigree

Holstein heifers just crossed 9.99% inbreeding — and the drift is quietly dragging money off every cow. Here’s the one linear rule that keeps “dairy strength” from turning into expensive frailty.

O-Bee Manfred Justice-ET — look at that deep, powerful front end. That’s the strength the breed was starving for, so it bred him, his sons, and his grandsons into damn near everything. Twenty years later, the bill for all that concentration shows up as 9.99% inbreeding on the milk check.

There was a stretch, not that long ago, when you could feel smart just rattling off O-Man’s proof. O-Bee Manfred Justice-ET. Fat, protein, health traits, calving ease — the exact toolkit the breed was starving for — wrapped around type nobody bragged about. He fixed real problems. So the industry did what it always does with a bull that fixes real problems. It bred him, his sons, and his grandsons into damn near everything.

And that’s the part nobody was pricing at the time. Somebody, somewhere, is at a bull catalog this morning stacking a mating a shade more inbred than the last one. Not on purpose. It never is.

The Bull the Breed Couldn’t Stop Using

O-Man was born in 2004. By the back half of that decade his sons stacked the top of the lists — Snowman, Man-O-Man, the whole run — while O-Man himself kept climbing on health and components long after most bulls his age had faded. And his daughters became brood-cow royalty: Seagull-Bay Oman Mirror, an O-Man daughter, went on to anchor a family that threads through modern sire stacks. 

One semen order at a time, the breed wired one bull deep into nearly every pedigree. That’s not a knock on O-Man. He earned the demand. But here’s what should land differently than it would have five years ago: the bill for all that concentration is finally showing up on the milk check.

What’s Really at Stake

The problem and its price tag sit side by side. Here’s the bottleneck on the left, and the money it’s pulling off your cows on the right.

Metric / HorizonThe Current Bottleneck (2025/2026)The Invisible Economic Drag
Breed BaselineCanadian Holstein heifers average 9.99%inbreeding (Lactanet, Aug 2025)  $44 per cow, per point in lifetime drag over baseline 
AI Lineup ShrinkFemale inbreeding now climbs ~3× fasterthan the pre-genomic era (~0.3–0.4%/yr)  $60 to $100 loss per cow, per lactation in high-inbreeding herds  
Pedigree Core99.84% of active AI sires trace to just two male lines — Elevation and Chief  −92 kg milk, −65 days productive life per 5% inbreeding jump (CDN)

That 9.99% is nearly double where the breed sat 15 years ago. And it’s not a Holstein-only story — the black-and-whites lead Jersey (7.56%), Brown Swiss (7.10%), and Ayrshire in the same 2024 crop. That Canadian figure from Lactanet tracks the same direction U.S. data shows through CDCB and Holstein USA, so this isn’t a border quirk.

Who eats the cost first? The smaller and mid-size herds. USDA ERS reported in February 2026 that cost of production runs about $42.71 per hundredweight in herds under 50 cows versus $19.14 in herds over 2,000. When your breakeven’s already thin, this drift stings more.

Have You Ever Called a Cow “Too Strong”?

Inbreeding depression doesn’t knock. It’s the cow that milks fine but won’t settle. The calf that never quite thrives. The good one that leaves a lactation early. And it has a look — as inbreeding climbs, that depression tends to surface as narrow, frail cows that impress on height and wear out faster. Hold that thought. It’s the bridge between the DNA problem and the type sheet.

Ask yourself two questions standing at the pen. Have you described a cow recently as “too strong”? Have you seen cows that are “too frail”? Almost nobody says yes to the first. Everybody’s seen the second. That tells you which way the breed’s been drifting.

Here’s what a jump from 5% to 10% inbreeding costs on a single cow, every lactation, per Canadian Dairy Network:

−92 kg milk  ·  −5.3 kg fat  ·  −2.6 kg protein  ·  +1.4 days open  ·  −65 days of productive life

None of those alone ends a cow. Stack them across a whole heifer crop, though, and you’re running a herd that milks a little lighter, breeds back a little slower, and turns over a little faster than the one your neighbor built off a wider gene pool. That’s the tax. It’s quiet, it’s cumulative, and it never sends an invoice.

The Barn Math: Two Numbers That Stack

You’ll bump into two different dollar figures, and they measure different windows. Don’t let them cancel out in your head — they add.

The lifetime number comes from Virginia Tech’s VanRaden and Smith (1998), who pegged the cost at $22 to $24 per cow for every 1% of inbreeding. Adjusted for inflation to 2026 dollars, that becomes roughly $44 per cow, per point — a lifetime figure, not an annual one. Run it on a real herd: a 200-cow herd that’s drifted from 6% to 10% — four points — carries about 200 × 4 × $44 = $35,200 in lifetime drag. Money you never see leave, because it never shows up as a line item. 

The second figure is a per-year bleed, and it’s grounded in peer-reviewed production losses, not guesswork. Makanjuola and colleagues (2020) found each 1% jump in genomic inbreeding cut first-lactation 305-day milk by roughly 40–50 kg in Canadian Holsteins; Doekes et al. (2019) landed in the same range. Add lost protein, extra days open, and shorter productive life, and Bullvine’s worked barn-math lands at roughly $60 to $102 per cow, per lactation for a herd carrying about two points of excess. On a 300-cow herd, even the $60 floor is about $18,000 a year until your mating strategy changes. 

Some herds have pushed back and watched it pay. Bullvine’s coverage of the Birkstead and North Florida operations documented both farms using tighter inbreeding management — tracking coefficients on every mating, steering clear of closely related sires — to stop that per-cow leak. The peer-reviewed research prices the cost of ignoring it. The herds show what managing it looks like. 

Why the Gene Pool Keeps Shrinking

The root cause isn’t any one bull — not even O-Man. It’s a base that keeps narrowing. A Y-chromosome study of 62,897 bulls (Yue et al., 2015, Journal of Dairy Science) found virtually every active North American Holstein AI bull traces its paternal line to two grandfathers born in the 1960s: Round Oak Rag Apple Elevation and Pawnee Farm Arlinda Chief. Bullvine’s analysis of that dataset puts the figure at 99.84% — split almost evenly between the two. 

Read that again. Nearly the entire active AI Holstein population funnels back through two bulls. Every “outcross” you order is, at the male-line level, probably a cousin of the last one. That’s the bottleneck O-Man got poured into. Not the cause of it.

Genomics sped this up; it didn’t slow it down. Under progeny testing, a bull took years to prove out before he could flood the market — a brake nobody appreciated until it was gone. Now the sires of sons turn over in a fraction of that time, and female inbreeding climbs about three times faster than it did in the pre-genomic era. Faster genetic progress, thinner gene pool. Same coin, two sides. 

And the index won’t rescue you. Net Merit added Daughter Pregnancy Rate in 2003 and Feed Saved in 2021, and NM$ 2025 cut Body Weight Composite to −11% emphasis while lifting Feed Saved to 17.8%. But catch the gap: Net Merit prices size and efficiency. It carries no penalty for inbreeding. That part lives entirely in your matings and your stud’s lineup.

Two Tools for Two Different Problems

Here’s where catalog decisions go sideways. The frail, hollow cow inbreeding produces is a physical symptom. But inbreeding itself is a pedigree problem. You need two separate tools, and one won’t cover for the other.

Tool 1 — the linear filter — treats the symptom. In the U.S. linear system, Body Weight Composite weights strength three times heavier than stature — 0.72 versus 0.23. A bull who’s tall but only moderately strong is building his daughters out of height, not working power.

🛑 The 1:1 Frame Rule

If a bull’s Stature STA is higher than — or even equal to — his Strength STA, you’re paying for frame height, not working capacity. In an era of high beef-cross values on cull cows, you want a deep, powerful, wide-chested front end — not a hollow, tall cow that overshoots the stalls and breaks down early.

Tool 2 — pedigree mating software — treats the cause. The 1:1 Frame Rule can’t read relationship. Only a mating program running genomic inbreeding on each specific pairing catches the DNA bottleneck before you order semen. Run the linear filter to fix how the cow is built. Run the mating software to fix how related she is. Skip the second, and you’ll breed strong-looking cows that quietly stack coefficients.

So Where Do You Actually Find Strength?

Talk about strength long enough and it stays abstract. So here are four real, active sires, each run through both tools — the phenotype (does Strength beat Stature?) and the pedigree (how much of that narrow base is stacked in?).

S-S-I PR Renegade (250HO14134) — The Baseline.

  • Phenotype: Strength +0.96 barely edges Stature +0.94 (CDCB/Holstein, April 2026). He passes the physical test — just. 
  • Pedigree: His maternal line runs back through the Seagull-Bay Oman Mirror family, so there’s O-Man on the bottom of his pedigree. Use him with caution if your herd already runs close to the 9.99% ceiling. 

Aurora Sheepster Robo (796HO10201) — The Trap.

  • Phenotype: A genuine powerhouse — strength, milk, and teat placement in one package. 
  • Pedigree: The Renegade blood stacks in through his dam side — his MGS is Siemers Rengd Parfect, a Renegade son. For herds already deep in Renegade, that triggers immediate relationship flags on a big chunk of the cows you’d point him at. 

Dulet King (799HO112) & Peak Glowup (1HO17864) — The Alternates.

  • Phenotype: Both bring strength off a different profile — King is Alcove-sired and A2A2; Glowup leans health and components with lower milk. Pull each bull’s live linear card to confirm the strength-over-stature ratio matches your cows.
  • Pedigree: Both sit off the Renegade line, which makes them genetic relief valves — a way to add strength without stacking the same family you’re already carrying.

The point isn’t “buy these four.” It’s the method. Renegade shows how thin the strength-over-stature margin can be even on a bull everyone calls strong. Robo shows a phenotypic powerhouse can still be the wrong bull once you run the relationship test. King and Glowup show you can hunt strength off a different family — if you verify the ratio yourself. Two tools, every time.

Options and Trade-Offs for Your Operation

No single move fixes this. A few are working right now.

  • Cap inbreeding on every AI mating. Ask your mating program or rep to flag anything projected above your ceiling; many breeders aim to keep a mating under roughly 6–7%. Cheap and immediate. The catch: it protects your herd, not the breed, and you’ll pass on a hot bull now and then.
  • Run the 1:1 Frame Rule. Best for herds fighting cows that overshoot the stalls and eat more without lasting longer. Costs nothing but discipline at the catalog. Where it backfires: it’s structure, not relationship, so pair it with the inbreeding check.
  • Diversify your bull team on purpose. Makes most sense for herds with the scale to run several sire lines at once. Costs homework, and sometimes a few index points traded for lower future coancestry.
  • Lean on Net Merit for commercial goals. NM$ 2025’s Feed Saved and BWC weights point at the moderate, efficient cow the economics now reward. The limit is blunt: even flawless NM$ selection won’t manage inbreeding for you.

Three Things to Do Before You Order Semen Again

  1. Audit your tank (next 30 days). Pull your herd’s average inbreeding coefficient. If you’re hovering at or above 9.99%, set a hard mating ceiling in your software immediately — many breeders hold matings under 6–7%. 
  2. Apply the strength filter. Reject any incoming catalog sire whose Stature outpaces — or even ties — his Strength. Even Renegade’s +0.96 over +0.94 is a razor’s-edge pass. 
  3. Never let a line card substitute for software. A bull can look beautifully wide on paper and still be a first cousin to the heifer you’re trying to correct. Use linear filters to design the cow; use genomic mating tools to protect the pedigree. 

O-Man’s real lesson isn’t that he got overused. It’s that the breed only noticed after the fact — years after the semen was in the tanks and the daughters were in the barns. So walk your holding pen some morning and count honestly: how many separate families are actually standing there, and how many are the same handful wearing different names? The studs decide how wide the pipeline runs. Your call at the catalog decides how much of that bottleneck your own cows carry. Which bull are you about to order — and do you actually know how related he is to the cow he’s going on?

Key Takeaways

  • Canadian Holstein heifers hit 9.99% inbreeding — the drift costs about $44/cow per point over a lifetime, plus $60–100 per cow per lactation in the herds carrying the most of it. Pull your herd average before your next semen order.
  • Run two separate tools, because they fix two different problems: the 1:1 Frame Rule (if Stature STA beats or ties Strength STA, you’re buying height, not cow) fixes how she’s built; genomic mating software fixes how related she is. Neither covers for the other.
  • A strong bull can still be the wrong bull. Robo checks every phenotype box but stacks Renegade through his dam — and even Renegade’s own +0.96 strength over +0.94 stature is a razor-thin pass. Look off the line (King, Glowup) when your herd’s already near the ceiling.

The Invisible Invoice

Herd Inbreeding & Pedigree Bottleneck Auditor

9.9%
5.0% (Outcross) 9.9% (2026 Breed Avg) 15.0% (Severe)
6.5%
5.0% Strict 6.5% Conservative Goal 10.0% No Cap

Real-Time Financial Exposure Audit

Annual Milk Loss per Cow: 153 kg
Total Herd Annual Volume Deficit: 38,250 kg
Annual Revenue Leakage (@$0.43/kg margin): $16,448
⚠️ Invisible Operational Drain Detected
$37,400
Estimated total cumulative lifetime drag across this generation if mating strategies are not capped.
Data Matrix verified via peer-reviewed JDS literature. Source: The Bullvine

Complete references and supporting documentation are available upon request by contacting the editorial team at editor@thebullvine.com.

Learn More

  • The Shottle Legacy: A Lesson in Balance — Arms you with a masterclass in outcross selection by studying the precise sire line that resisted the O-Man onslaught, delivering a roadmap to inject structural soundness and functional width back into your stalls this week.
  • The Genomic Revolution: 15 Years Later — Exposes the long-term structural blind spots created by aggressive turnaround times in young sires, positioning your 5-year mating strategy to survive the hidden coancestry collapse that current major index formulas completely ignore.
  • Is Linebreeding Dead or Just Rebranded? — Dismantles standard catalog marketing by pulling back the curtain on modern “outcross” claims, revealing how elite operations leverage controlled relationships to lock in high-margin consistency without triggering catastrophic inbreeding depression.

The Sunday Read Dairy Professionals Don’t Skip.

Every week, thousands of producers, breeders, and industry insiders open Bullvine Weekly for genetics insights, market shifts, and profit strategies they won’t find anywhere else. One email. Five minutes. Smarter decisions all week.
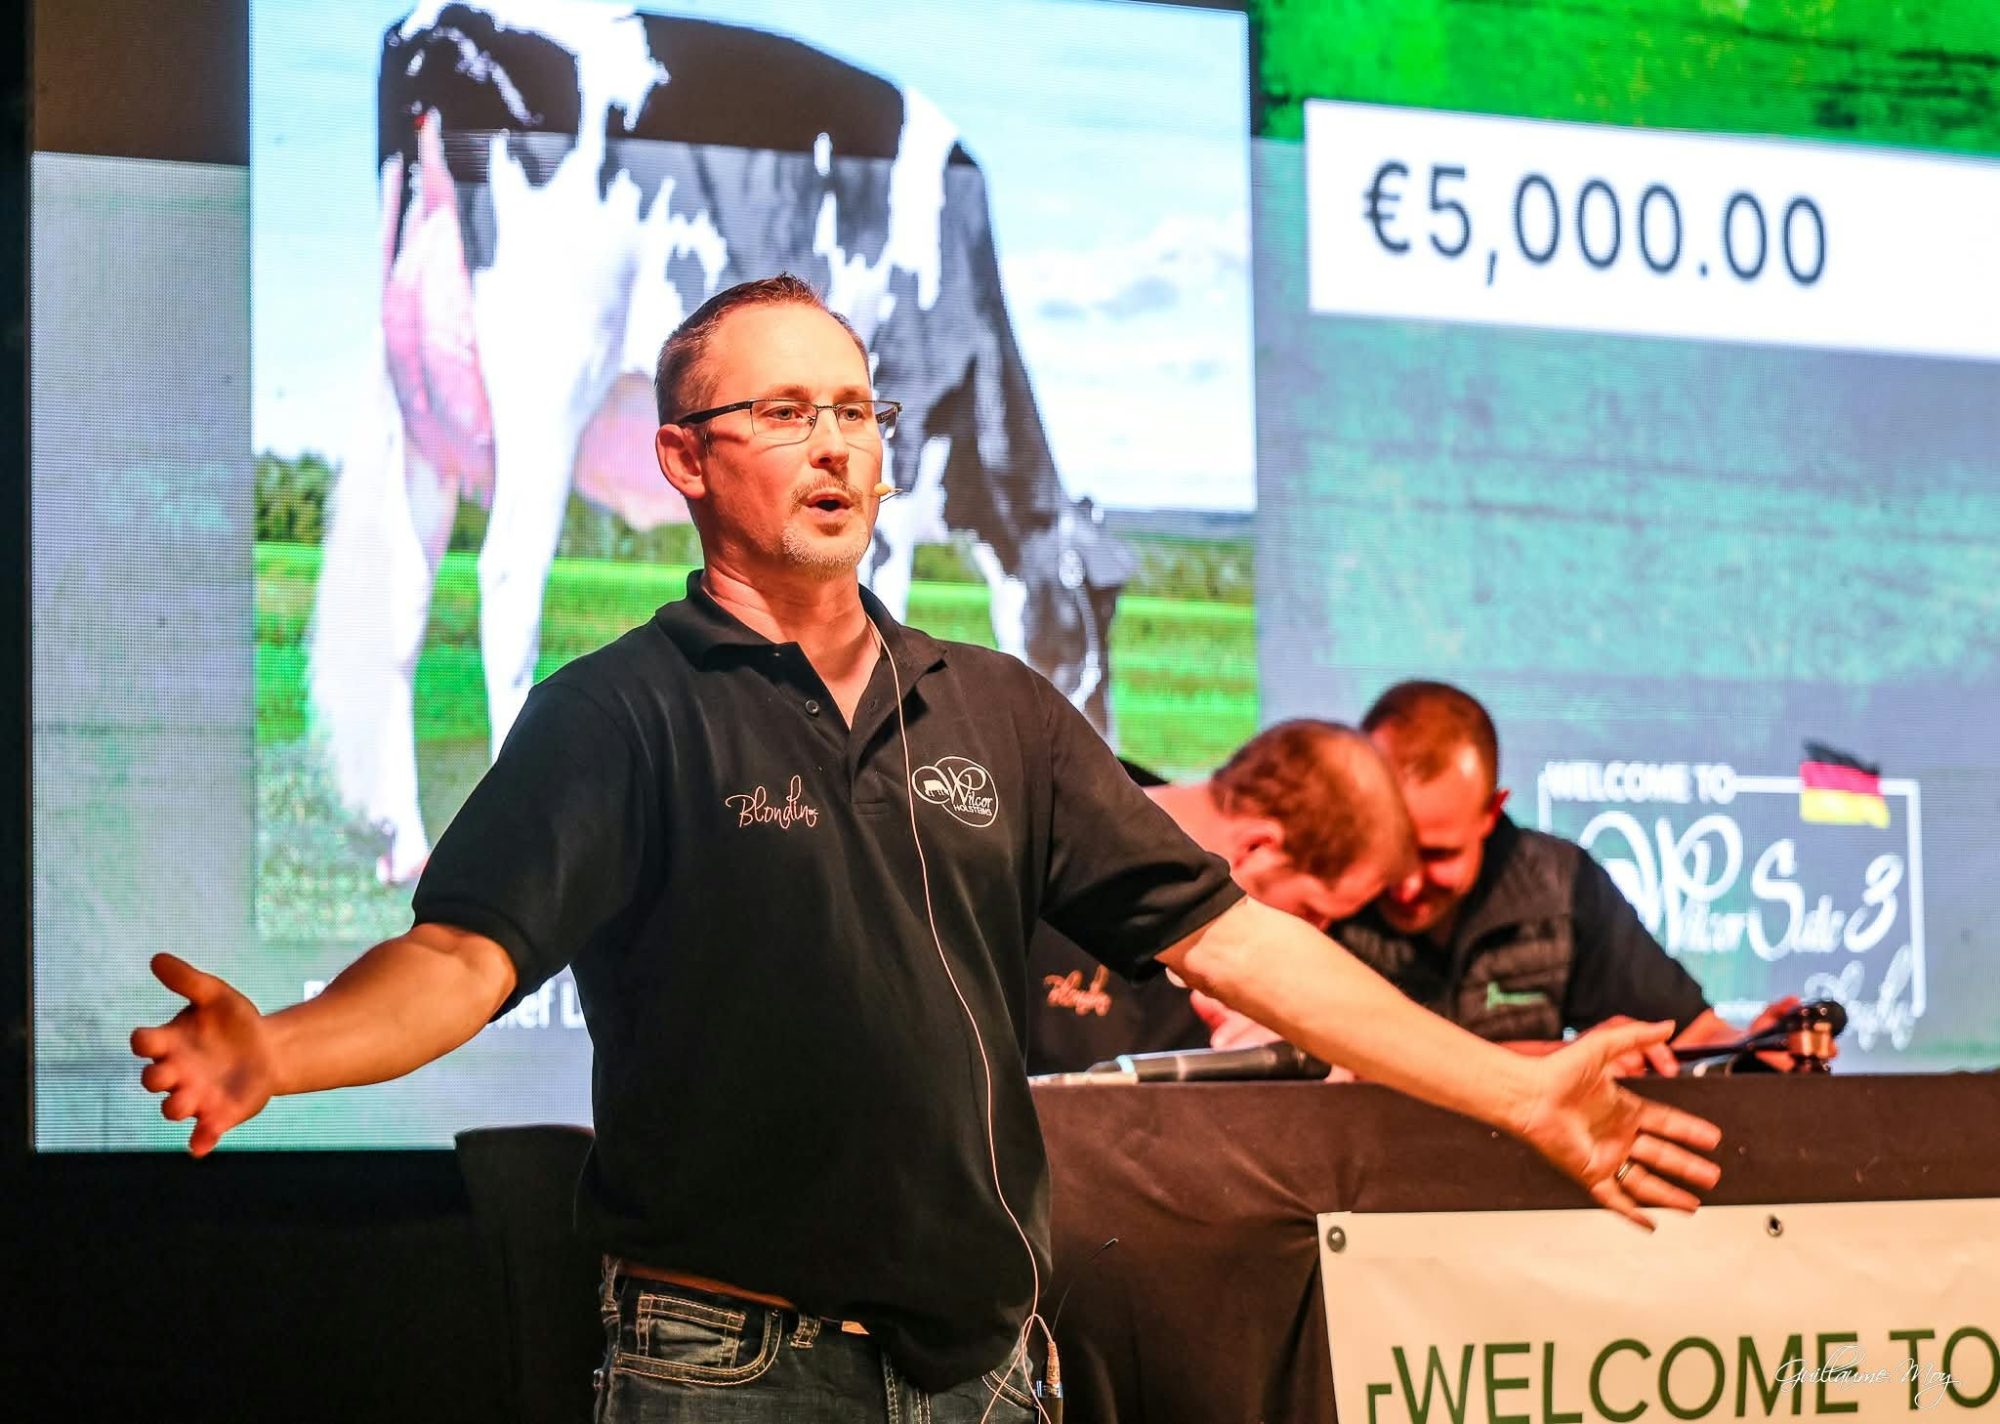
NewsSubscribe
First
Last
Consent

Stop Reordering Semen on DPR Alone — CCR Reprices August 11 (What the +0.94 Correlation Means)

DPR’s been rebuilt and CCR now carries real weight. The DPR-CCR correlation just hit +0.94 — here’s how to use it to sort your tank into hold, watch, and swap before Aug 11.

Executive Summary

On August 11, CDCB rebuilds all four female reproductive traits — DPR, CCR, HCR, and EFC — and adds three new ones, so the bull you bought this spring on DPR may reprice the morning the run lands. The fix scraps the fixed 50-day voluntary waiting period DPR has run on since 2003 and swaps in herd-year, lactation-specific waiting periods that match how you actually breed — which is why more than 55% of young bulls were sliding at every run from December 2023 to December 2024. Here’s the tool to sort your tank now: the DPR-CCR correlation jumped to +0.94, so any bull sitting above +1.5 DPR with CCR at zero or negative is a flag, not a hold. CCR heritability climbs to 2.9% and HCR more than triples to 3.2%, meaning a -0.8 CCR that used to read as noise now carries real weight. Run the barn math and a “phantom DPR advantage” worth $9,450 in projected open-day savings on a 350-cow herd can shrivel to $3,500–$5,500 once CCR reweights — a 40-to-60% markdown on the edge you thought you paid for. The further your VWP sits past 50 days, the more your numbers move, so pull your average days-to-first-service and your first-service conception by sire before August 11. 

CDCB fertility reprice

CDCB started a foundational review of its reproductive trait portfolio in 2024. The result lands August 11: Daughter Pregnancy Rate (DPR), Cow Conception Rate (CCR), Heifer Conception Rate (HCR), and Early First Calving (EFC) all get rebuilt, and a new trait — First Service to Conception (FSC) — joins them. All five run across Holstein, Jersey, Brown Swiss, Ayrshire, Guernsey, and Milking Shorthorn, for males and females alike. 

The research carries the names of CDCB’s research team — T.M. McWhorter, J.R. Graham, E. Nicolazzi, longtime USDA scientist P.M. VanRaden, A. Ling, S. Savoia, and A. Legarra. CDCB says the package touches ten separate model components at once. That’s not a quarterly tweak. It’s a two-year rebuild that ran across seven consecutive triannual evaluations for stability and passed Interbull’s international validation in January–February 2026, per CDCB. 

The core problem is older than most of the cows in your barn. Since 2003, DPR has run on a fixed 50-day voluntary waiting period with a 20-day grace period — applied to every herd in the database, no matter what that herd actually does. The industry moved on. Synchronization programs, sexed semen, beef-on-dairy, and a wide spread of VWPs — all standard now. The model stayed put. 

That mismatch dragged young-bull numbers one direction. In the legacy system, more than 55% of bulls showed constantly declining PTAs at every run from December 2023 to December 2024 — which shouldn’t happen, because fresh daughter data ought to push roughly equal numbers up and down. CDCB flagged the gap itself and built the fix: herd-year and lactation-group-specific waiting periods, calculated separately for first lactation and later lactations, that match how operations really breed. 

Every Trait Being Repriced — at a Glance

TraitOld h²New h²DirectionKey Model ChangeSire Selection Action
DPR1.4%2.9%↑ ~2×Fixed 50-day VWP → herd-year/lactation-specific VWPFlag any bull above +1.5 DPR with CCR ≤ 0
CCR1.6%2.9%↑ ~2×DIM-at-first-service covariable addedElevate from tiebreaker to primary fertility signal
HCR1.0%3.2%↑ 3×+Heritability more than triples — now a real selection leverStart weighting in replacement-heifer programs now
EFC2.7%1.4%↓ ~½Moved to single-trait modelDial back EFC emphasis if you’ve been pushing hard
FSC6.0%🆕 NewVWP-independent; measures days 1st insem. → conceptionUse as CCR crosscheck; identical genetic signal (+0.98 corr.)

Watch EFC. It runs the opposite way — heritability drops from 2.7% to 1.4%, so age-at-first-calving selection just got a touch less responsive, not more. If you’ve been pushing hard on EFC, that’s worth a second look. 

The genetic trends now line up with what producers see in the barn. Older proven bulls with big daughter counts stay stable; the young bulls stop sliding. The biology didn’t change. The model did. 

The One Number That Audits Your Tank Right Now

Here’s the tool you already have, weeks before the run.

The revised model puts the genetic correlation between DPR and CCR at +0.94, up from +0.86 — that’s per CDCB’s December 2025 test run, with the official figure confirming August 11. That’s about as tightly linked as two traits get. A bull with genuine fertility should land positive — or at least consistent — on both. When they split by more than roughly a point and a half in opposite directions, you’re probably looking at a measurement artifact, not real biology. 

So pull your top five bulls by units used since January. Write down each one’s spring DPR and CCR. Any bull above +1.5 DPR with CCR at zero or negative is your first flag. He’s not necessarily a bad bull. But his legacy DPR may have been propped up by the old waiting-period mismatch — and his CCR is about to carry more genetic weight than it used to.

That weight shift is the part producers keep underestimating. CCR heritability climbs to 2.9% from 1.6%, and HCR more than triples to 3.2% from 1.0%. DPR itself roughly doubles, 1.4% to 2.9%. Still low-heritability traits, all of them — but under the old model a -0.8 CCR was barely distinguishable from noise. Under the new one, it means something. If you’ve treated CCR as a tiebreaker rather than a trait worth weighting, this is the run that changes the math. 

The correlations also shifted underneath the headline traits. DPR-HCR jumped to +0.56 from +0.36, and CCR-HCR to +0.52 from +0.45. The new FSC trait lands tight against the others — CCR-FSC at +0.98, DPR-FSC at +0.96. Translation: FSC and CCR are almost the same genetic signal expressed two ways, one in days, one in percent. 

What Does the “Phantom Advantage” Actually Cost?

Take a 350-cow timed-AI herd. Eighty-five-day VWP, Presynch-Ovsynch, 90% service rate — 315 cows in play. This is an illustrative scenario, not a real herd’s books, and every assumption is stated so you can swap in your own.

Assumptions: $5 per day open — the top of the $3–$5 range University of Wisconsin-Madison extension work puts on each additional day open, depending on milk price and replacement cost. $25 per unit of conventional semen. 35% conception rate per service.

Two bulls. Bull A is the legacy DPR hero: DPR +2.5, CCR -0.8. Bull B is the conception-biology pick: DPR +1.0, CCR +1.2. Here’s how Bull A’s edge erodes once August reweights CCR:

MetricBull A (DPR Hero)Bull B (Conception Pick)Edge
DPR PTA+2.5+1.0Bull A +1.5 pts
CCR PTA-0.8+1.2Bull B +2.0 pts
Paper open-day savings (85-day VWP, 315 cows)+$9,450+$0 baselineBull A on paper
CCR penalty (semen + synch labor)-$325 to -$500Bull B
Hidden open-day bleed (extra services → late conception)-$2,800 to -$6,600Bull B
Net real advantage~$1,850–$5,500$0 baselineBull A shrinks 40–60%
Post-Aug 11 CCR weight↓ Risk — h² jumps 1.6→2.9%↑ StrengthensBull B
FSC signal (proxy)Likely negativeLikely positiveBull B
VerdictWatch / flag before Aug 11Hold / preferredBull B wins biology
  • The paper illusion. CDCB’s documentation confirms a DPR +1.0 PTA equals four fewer days open, per a prior USDA study — so Bull A’s 1.5-point edge reads as about six fewer days open per daughter. Six days × $5 × 315 cows = $9,450 in projected open-day savings. On paper, Bull A wins. 
  • The reality check (CCR penalty). That -0.8 CCR against Bull B’s +1.2 is a two-point swing. There’s no published point-to-services conversion, so model it yourself: call it two extra services per 100 cows per cycle. Across 315 cows over two cycles, that’s roughly 12–14 extra inseminations — about $325 in semen plus an estimated $100–$170 in synch labor.
  • The hidden bleed. Those extra services push four to six additional days open onto the cows that don’t settle. At $5/day, that’s roughly $2,800–$6,600 across the 140–220 cows most likely affected — pull the real count from your own herd’s non-conception rate.
  • The net result. The $9,450 paper advantage shrivels toward a $3,500–$5,500 net range — a markdown of roughly 40% to 60%.

Not zero. But not the bull your spring order was built around, either. If that feels familiar, it should — it’s the same trap as buying a proof on one headline number and eating the markdown later, the way three-year-old proofs averaged a $72 markdown when the daughters finally landed.

Does VWP Length Change Your Exposure? Run It at 65 Days

Now run the same comparison on a shorter-VWP herd — say 65 days, a cow-by-cow program that breeds on heat earlier. The DPR correction bites less there, because the old fixed 50-day assumption wasn’t as far from your reality to begin with. 

Bull A still loses ground on CCR — that two-point swing doesn’t care about your waiting period. But the DPR rescale moves him less, so the phantom advantage that needs erasing was smaller to start. Walk it through: at 65 days, Bull A’s legacy DPR edge might pencil at four fewer days open instead of six, trimming the paper savings to roughly $6,300 across the same 315 cows. The CCR penalty stays put at $3,200–$6,800. The net swing lands closer to break-even — Bull A and Bull B end up much nearer each other.

Here’s the rule that falls out of both scenarios: the further your actual VWP sits from that old 50-day baseline, the more August moves your DPR numbers. An 85-day herd has more correction coming than a 65-day herd. That single fact — how far your barn breeds from 50 days — is the best predictor you’ve got of how exposed your tank is. Pull your own average days-to-first-service before August 11 and you’ll know which camp you’re in. 

Buying DPR while ignoring CCR is like buying a tractor for its horsepower rating while ignoring its fuel burn per hour under a heavy load. The number was real. It just wasn’t measuring the thing you thought it was.

The New Trait Nobody Ordered — FSC

Then there’s the one nobody put on an order sheet: First Service to Conception, or FSC.

FSC measures days from a cow’s first insemination to conception, and a positive PTA means fewer days. The design choice that matters: it’s explicitly not a function of the VWP, so it reflects individual-cow management no matter when your barn starts breeding. Holstein active-AI bulls range from -24.8 to +20.7 days against a breed base of 55.60 days, per the December 2025 run. 

Its heritability is 6.0% — the highest in CDCB’s reproductive portfolio, roughly double DPR or CCR. That means it responds faster to direct selection than the traits breeders have leaned on for years. And while August 11 is the first official run to publish FSC PTAs, the trait isn’t untested science — CDCB already ran it against historical data through the December 2025 test run before releasing it, so the underlying model is vetted, not experimental. For herds running cow-by-cow waiting-period calls, FSC is closer to what DPR was always trying to be. 

The Calf-Health Pair Sharing the Stage

The two other new traits — Resistance to Respiratory Problems (RSP) and Resistance to Diarrhea (DIA) — are easy to miss in the reproductive noise, but August 11 is their debut too. They’re the first national selection tools aimed at calf respiratory disease and scours, built from the same National Cooperator Database that already feeds 50 traits and four indexes off roughly four million cows of annual data. 

If you’ve been buying calf survival indirectly through livability and management, this is the run that gives you a direct genetic lever on two of the costliest pre-weaning problems in the barn. They won’t reshuffle your sire ranking the way the reproductive rebuild will. But for herds bleeding labor and treatment cost on sick calves, they’re worth a column on the mating sheet starting now.

How the Model Decides What Counts

One underappreciated change sits in the data edits, and it explains why some young bulls will move more than others. Under the rebuild, daughter data doesn’t enter DPR, CCR, or FSC until 36 months after the cow’s birth — giving high- and low-fertility daughters time to show up closer together, instead of letting the early-calving, easy-breeding daughters set the tone. That means a young bull may need one or two extra triannual runs before his first daughters move his number. 

CDCB also tightened the edits: cows with a missing sire are dropped, records with missing calving dates or days open are removed, and contemporary groups with fewer than four observations are tossed entirely. CCR and HCR now account for service-sire breed, mating type — sexed, conventional, natural, or unknown — and short cycling, those re-breeds landing 10 to 17 days after the last service. If you run a lot of beef-on-dairy or sexed semen, that last fix is quietly aimed at you: the old model wasn’t separating those services cleanly, and the new one does. 

The Tank-Sorting Action Plan

You don’t have to wait for the run to act. You have to be ready for it. Work this as a sequence:

CategoryDPRCCRHCRYour Conception DataReorder?Notes
✅ HOLDAny+1.0 or betterNeutral to positiveTracks within 2 pts of proofYes — maintainConception biology is real; most should hold or improve Aug 11
⚠️ WATCH+1.5 or higher0 or negativeAnyBelow CCR proofNo — wait for Aug 11 runLegacy DPR may be propped by old 50-day VWP mismatch
🔴 SWAPBelow averageNegativeNegativeConsistently underperformsNo — replaceWeak across all 3 reproductive traits; production numbers don’t fix fertility
⚠️ WATCHAverageNeutral (0 to +0.5)Below averageMatches proof ±1 ptConditionalFlag for post-Aug 11 review; HCR tripling may move ranking

1. Pull barn benchmarks — this week. Extract your average days-to-first-service and your first-service conception rates by sire from your herd management software (DairyComp or equivalent). Days-to-first-service tells you how far you breed from the old 50-day baseline — the single best predictor of how much your DPR-heavy bulls will move.

2. Identify the splits — next week. Audit your top five most-used bulls. Flag any sire where the legacy DPR and CCR split by more than 1.5 points in opposite directions. If your own conception data runs consistently below a bull’s CCR proof, weight your data — that gap is your signal, not the proof.

3. Grill your stud rep — two weeks out. Call your genetic supplier. Ask exactly how their proprietary fertility flags — Select Sires’ FertilityPRO, Semex’s Repromax, and the equivalents at ABS and Alta — are shifting to account for the new CDCB weights. A rep with a real answer has done the homework.

4. Categorize your tank — by August 10. Sort your physical inventory into three piles:

  • Hold — CCR +1.0 or better, DPR consistent within a point. Conception-biology bulls; most should hold or improve through the run.
  • Watch — DPR +1.5 or higher with CCR at zero or negative. Don’t reorder until the run lands; the waiting-period correction may quietly trim that DPR lead.
  • Swap — weak across DPR, CCR, and HCR, however good the production numbers look. August doesn’t fix biology.

Two things to keep in mind as you sort. If heifer conception is eating your replacement budget, this is the run to start weighting HCR seriously — heritability more than tripling to 3.2% finally makes it a real selection lever. And don’t brace for an index reshuffle: CDCB confirms the revisions don’t change trait emphasis in the lifetime merit indexes, because those weights are economic and aren’t being updated — but any bull whose CCR correction is material still moves on the Fertility Index, which weights DPR and CCR equally. 

The run doesn’t change a single cow in your barn. It changes what you know about the bulls you’ve already paid for. The real question isn’t whether the new numbers are more accurate — by CDCB’s own validation, they are. It’s whether you’ll have your tank sorted into hold, watch, and swap before August 11, or whether you’ll be reading your mating sheet backward in September. Which pile does your heaviest-used sire fall into right now? 

Run Your Numbers

Pregnancy Rate Economics Calculator — The phantom advantage lives or dies on days open. Plug in your herd size, cost per day open, and conception rate to put a real dollar value on the CCR gap before you reorder — and pressure-test whether that high-DPR bull actually pencils in your barn.

Complete references and supporting documentation are available upon request by contacting the editorial team at editor@thebullvine.com.

Learn More

The Sunday Read Dairy Professionals Don’t Skip.

Every week, thousands of producers, breeders, and industry insiders open Bullvine Weekly for genetics insights, market shifts, and profit strategies they won’t find anywhere else. One email. Five minutes. Smarter decisions all week.

NewsSubscribe
First
Last
Consent

The 9.99% Holstein Inbreeding Bill: Are You Breeding for Profit or Just Index Points?

At 9.99% inbreeding, every extra point can quietly strip up to $44 per cow — before you even argue TPI vs Net Merit.

Lovhill Sidekick Kandy Cane takes the fist-bump and the banner — Grand Champion of the International Holstein Show at World Dairy Expo. Bred by Michael and Jessica Lovich on 72 tie-stall cows in Balgonie, Saskatchewan, and later classified EX-97, she’s living proof that a deep, functional udder and real longevity still win the ring — the same traits a narrowing gene pool is quietly pricing every breeder out of.

Michael and Jessica Lovich milk 72 cows in a tie-stall barn in Balgonie, Saskatchewan. They mostly ignore genomics. They breed off cow families and their own eye. And they’ve now bred two separate World Dairy Expo Holstein Grand Champions — Lovhill Goldwyn Katrysha in 2015 and Lovhill Sidekick Kandy Cane in 2025. They’re the first and only breeders in history to pull that off. (Read more: Lovholm Holsteins: The Only Farm to Breed 2 World Dairy Expo Holstein Champions Milks 72 Cows in Tie-Stalls)

Here’s the part that should make you pause. The herd that walked away from the index list ended up breeding the kind of functional, long-lasting cows the commercial indices are quietly moving toward anyway. They succeeded by breeding out of a broader, more diverse gene pool — the exact opposite of where the rest of the industry is rushing. And while everyone keeps arguing about show cattle versus commercial cattle versus “just use the index,” a number nobody chose keeps climbing in the background: Holstein inbreeding hit 9.99% for Canadian heifers born in 2024 — the highest of the four major breeds, ahead of Jersey at 7.56%, and up from 9.61% the year before — according to Lactanet’s August 2025 update. That number lands on all three camps at once, no matter which side of the argument you stand on.

What’s Changing and Why

For thirty years, the dairy genetics argument has had two sides. One camp says the show ring proves what a valuable cow looks like. The other says the milk cheque does. This summer a third voice got loud enough to matter: “Both of you are wasting time — just breed off the top GTPI or Net Merit list.”

All three are answering different questions, and the numbers now prove it. In April 2026, Holstein Association USA changed its TPI formula to weight protein at 24% and fat at just 14%, up from a 19/19 split. CDCB’s Net Merit 2025 revision went the opposite direction — fat at 31.8%, protein down to 13.0%, with Feed Saved climbing to a combined 17.8% and Body Weight Composite at −11%. Two flagship indices, both claiming to describe a profitable cow, now point in genuinely opposite directions on fat versus protein.

Here’s the split at a glance:

IndexPrimary FocusKey Trait Heavyweights (2025/2026 updates)Ideal Cow Profile
HAUSA TPIComponent ratio & typeProtein 24%, Fat 14%; stature penalty above 60″Balanced, moderate-sized, high-protein yielders
CDCB Net Merit (NM$)Commercial marginFat 31.8%, Protein 13.0%, Feed Saved 17.8%Shorter, highly efficient, high-butterfat producers

Then there’s the classification change most show barns are still processing. Starting with the May 2026 run, HAUSA set 60 inches as the ideal stature and applied a sliding-scale penalty for cows taller than that — shaving points off the final classification score as height climbs past the limit, so a tall, extreme-framed cow that once scored well can now come in lower on paper for the exact trait that used to help her. The official language is about normalizing size. But underneath it is a harder admission: decades of breeding taller cows collided with feed cost, stall fit, and longevity. The breed association put a measurable penalty on the exact trait the show ring spent a generation chasing.

How This Plays Out on Real Farms

The Lovich story looks like a fairy tale until you read the fine print. They sold both champions. Katrysha went south, and Kandy Cane went to Oakfield Corners Dairy in New York as a four-year-old, well before she walked into Madison as a five-year-old and later reclassified EX-97. For a lot of small tie-stall herds, selling your best cows is how the barn stays viable — the premium on an elite animal funds the operation. And their cows tend to milk well past the age most Holsteins are culled, which flips the whole economics toward longevity rather than peak yield.

The tap that started a dynasty: Lovhill Goldwyn Katrysha is confirmed Grand Champion of the International Holstein Show at World Dairy Expo 2015. Her win put a 72-cow tie-stall herd in Balgonie, Saskatchewan on the map — the first of two World Dairy Expo Grand Champions Michael and Jessica Lovich would breed off cow families and their own eye, not a genomic list, while the rest of the breed narrowed toward it.

The number that reaches every barn is inbreeding, and it carries a real bill. The Virginia Tech research pegged it at $22 to $24 in lifetime net income per cow for each 1% rise in inbreeding — but that’s in 1999 dollars. Adjust it forward on cumulative inflation alone and the same drag lands near $44 per cow per 1% today (a Bullvine CPI-based estimate — layer in higher modern milk and feed values and the case for the top of that range only gets stronger). Run the math your own way. On a 200-cow herd that lets average inbreeding drift up four points, that’s roughly $35,000 in lost lifetime net income across the herd — not index points on a page, real money bleeding out of the barn. Newer Canadian work backs the mechanism: the Canadian Dairy Network found a cow that’s 10% inbred, versus 5%, loses about 92 kg of milk, 5.3 kg of fat, and 2.6 kg of protein per lactation, adds 1.4 days open, and loses roughly 65 days of productive life. It never shows up on a semen invoice. It hides in open days, mastitis cases, and calves that don’t make it.

Metric (per lactation unless noted)5% Inbred Cow10% Inbred CowLoss at 10%
Milk yieldBaseline−92 kg−92 kg
FatBaseline−5.3 kg−5.3 kg
ProteinBaseline−2.6 kg−2.6 kg
Days openBaseline+1.4 days+1.4 days
Productive lifeBaseline−65 days−65 days

That’s why this reaches every camp. The show breeder, the Net Merit devotee, and the top-50-list herd are all pulling from an increasingly related bull population, and the compounding cost lands the same way on all of them.

The Deeper Read: For where that shrinking bull pool actually concentrates — and the USDA sires your stud may not be pushing — see Holstein’s inbreeding bill and the USDA bulls your stud isn’t selling you.

The Mechanics Behind the Outcomes

Think of it as three different experiments, not three answers to one question. Show-and-type selection asks whether breeding for conformation and classification produces cows that win and sell. The commercial camp runs a different test entirely: through Net Merit or LPI, does a cow throw the most profit under your actual costs? And the index-first crowd is betting on speed — trust the highest-ranked young bulls, shorten the generation interval, and try to outrun everyone else’s genetic gain.

None of those experiments settles the others, because each measures something different. A judge at World Dairy Expo isn’t scoring feed intake per day or days open. Net Merit ignores ring presence entirely. And the index itself isn’t neutral — it’s an editorial choice about what matters, built on national-average price assumptions that may not match your processor. So when TPI says protein and Net Merit says fat, a breeder who “just uses the index” without checking which one fits their cheque is quietly optimizing for someone else’s barn.

The inbreeding problem sits underneath all three. The top of any genomic list — GTPI or Net Merit — isn’t a random draw. It’s a tight cluster of high-relationship sires that trace back through a handful of grandsires, and the concentration is stark: research finds the vast majority of today’s Holstein AI bulls funnel back to just two ancestral sires, with a single foundation bull, Pawnee Farm Arlinda Chief, still echoing through the population decades later. Ride the list harder, and you stack that relationship faster. CDCB has confirmed its genetic base changes now include Expected Future Inbreeding (EFI) adjustments to account for future inbreeding, not just observed genetic trends — which is why individual PTAs no longer track the base change as cleanly as they once did. When the statisticians pre-discount the future, that tells you something.

How Much Does Sticking With the Wrong Index Actually Cost?

More than most herds realize, and the loss is invisible because it’s “index-approved.” A herd that keeps breeding off TPI out of habit, while getting paid on butterfat, can drift toward higher protein ratios its cheque doesn’t reward at current component prices. Bullvine’s own modeling of the 2026 TPI shift put the exposure as high as $17,500 for a mid-size herd chasing the protein signal in a fat-heavy market — a figure that depends on your herd size and your component spread, so treat it as a scenario, not a guarantee.

The mirror image is just as real. A cheese-plant herd still breeding off Net Merit’s fat signal can leave protein premiums on the table — a gap Bullvine modeled at roughly $134 per cow per lactation, or about $67,000 across 500 cows. Either way, nobody traces it back to the semen order. They blame feed, labor, the processor — everything except the objective function they never chose on purpose.

Barn SituationIndex Being UsedWhere It LeaksModeled Cost Exposure
Fat-heavy market, chasing proteinHAUSA TPI (2026)Higher protein ratios the cheque doesn’t reward~$17,500 (mid-size herd)
Cheese plant, breeding for fatCDCB Net Merit (2025)Protein premiums left on the table~$134/cow/lactation
Same, scaled to the barnCDCB Net Merit (2025)Compounded across the herd~$67,000 (500 cows)
Any herd, wrong index by habitEitherBlamed on feed, labor, processor — never the semen orderInvisible / untraced

The Deeper Read: For the full walkthrough of how the Net Merit 2025 reweighting hits your milk cheque, see our breakdown of what changed and what it costs your barn.

Is Your Herd’s Genetic Diversity Already Behind?

Maybe — and the tie-stall clock makes it more urgent for some. Canada’s updated code of practice requires that continuously tethered cows get untethered freedom of movement, with the key provisions phasing in by 2027.

Connect the dots and the three storylines turn out to be one. HAUSA’s 60-inch stature penalty isn’t an aesthetic call — it’s a structural necessity, because modern Holsteins have been outgrowing the physical dimensions of the tie-stalls and freestalls North American barns were built around. That’s the same logic driving Net Merit’s −11% Body Weight Composite: a bigger cow costs more to feed and fits the barn worse. The logic points one way — a shorter, more genetically diverse cow should fit a retrofitted stall better and carries less of the fertility and health drag that inbreeding stacks on, which is exactly what you want walking into the 2027 deadline. Head in tall and closely related, and you’re solving two problems at once, with only one of them showing up on your classification report.

Options and Trade-Offs for Farmers

Path 1: Pick your index deliberately, then match it to your pay stub. This is the 30-day move. Pull last year’s milk cheques and figure out your actual dollar-per-pound split on fat versus protein. If you’re component-heavy on butterfat, Net Merit’s 31.8% fat weighting likely fits better than TPI’s protein-heavy 2026 formula. It takes an afternoon with your statements and your rep. Skip it, and you leak margin for years while your cows look better on paper.

Path 2: Build an explicit inbreeding ceiling into your mating program. This one’s for any herd riding the top of the GTPI or Net Merit lists year after year. It means telling your mating software — or your rep — a hard limit and holding to it, even when a high-index bull is closely related to your cows. Lactanet notes the average inbreeding level today is roughly 9% and advises aiming matings below that average; its own tools flag %INB so you can screen out mates that push a calf too high. You may give up a few index points per mating. The payoff is not stacking that $22-to-$24-per-cow-per-percent bill — closer to $44 in today’s dollars — that you won’t feel for three years.

Path 3: Borrow across camps instead of picking a tribe. Take the show world’s eye for udders and legs, the commercial index’s discipline on feed efficiency and longevity, and genomic testing’s speed on sorting replacements. Works for most mid-size herds. The trap is doing it by accident — a little TPI, a little Net Merit, a little show type — and ending up with a bull battery optimized for nothing. Lovhill reached the top of the show ring twice by holding one clear standard, not by hedging across three — and that discipline is the part worth copying, whichever camp you land in.

Key Takeaways

  • If you don’t know your actual dollar-per-pound split on fat versus protein from last year’s cheques, run that number before your next semen order — it decides whether Net Merit or TPI fits your barn.
  • If your herd’s average inbreeding is at or above the 9% breed average, pull your number from your genetic-management software this month and ask your rep to project it forward before your next mating run.
  • If your cows skew tall, factor in that the May 2026 stature penalty and Net Merit’s −11% Body Weight Composite now both work against extreme size.
  • If you show and sell as part of your business model, be honest about whether your plan includes selling your best cows the way the Lovich family did — that’s what made their math work.
  • If your index “feels safe” because it’s familiar, remember the TPI and Net Merit formulas both changed in the last 18 months — familiarity isn’t the same as fit.
  • If you’re shipping to a cheese plant with a protein-to-fat ratio below 0.80, run the per-cow math on your own component prices — that’s the danger band where the wrong index quietly costs the most.

Here’s the uncomfortable question worth sitting with. The show breeder confuses a ring result with an economic verdict. The index-first herd confuses trusting the formula with running a strategy. Both outsourced their judgment — one to a judge, one to a formula — and neither stopped to ask whether the thing they trusted still fits the cows they actually need. So which one are you? And when did you last check whether the tool you rely on is optimizing for your barn, or for the average barn someone modeled years ago?

The short version: genetics is an economics question, and the only real mistake is not knowing which experiment you’re running. The longer version — the full cost-per-cow inbreeding math, broken down by herd size and index choice — is where the decisions actually get made. We’re running those numbers in next week’s Bullvine Weekly. If you want to map this to your own operation, that’s where the real math lives.

Hold-to-Proof Cost & Inbreeding Drag Simulator

Map the 2026 TPI/Net Merit formula updates and genetic drag directly to your herd’s bottom line.

200
9.5%
8.0%

Annual Inbreeding Penalty
$0
Annual Index Revenue Leak
$0
Total Invisible Annual Margin Leak
$0

Calculated using updated 2026 genetic values and modern inflationary baselines.

Complete references and supporting documentation are available upon request by contacting the editorial team at editor@thebullvine.com.

Learn More

  • Dairy Cattle Genetics Explained: TPI, NM$, GTPI and Genomics — Arms you with an immediate operational blueprint to navigate the 2026 formula divergence, showing exactly when to deploy TPI’s high-protein selection versus Net Merit’s aggressive butterfat and feed-efficiency weighting.
  • Net Merit 2025 — Exposes why national genetic indexes lag behind current marketplace realities, tracking the multi-year commodity averages that create a hidden financial mismatch between your tank’s actual value and your long-term breeding goal.
  • The Proof You Waited Three Years For Averaged a $72 Markdown — Delivers a brutal, data-driven reality check on daughter-proven strategies, demonstrating how holding famous bulls to proof stacks an expensive maintenance bill while sacrificing an entire generation of genetic velocity.

The Sunday Read Dairy Professionals Don’t Skip.

Every week, thousands of producers, breeders, and industry insiders open Bullvine Weekly for genetics insights, market shifts, and profit strategies they won’t find anywhere else. One email. Five minutes. Smarter decisions all week.
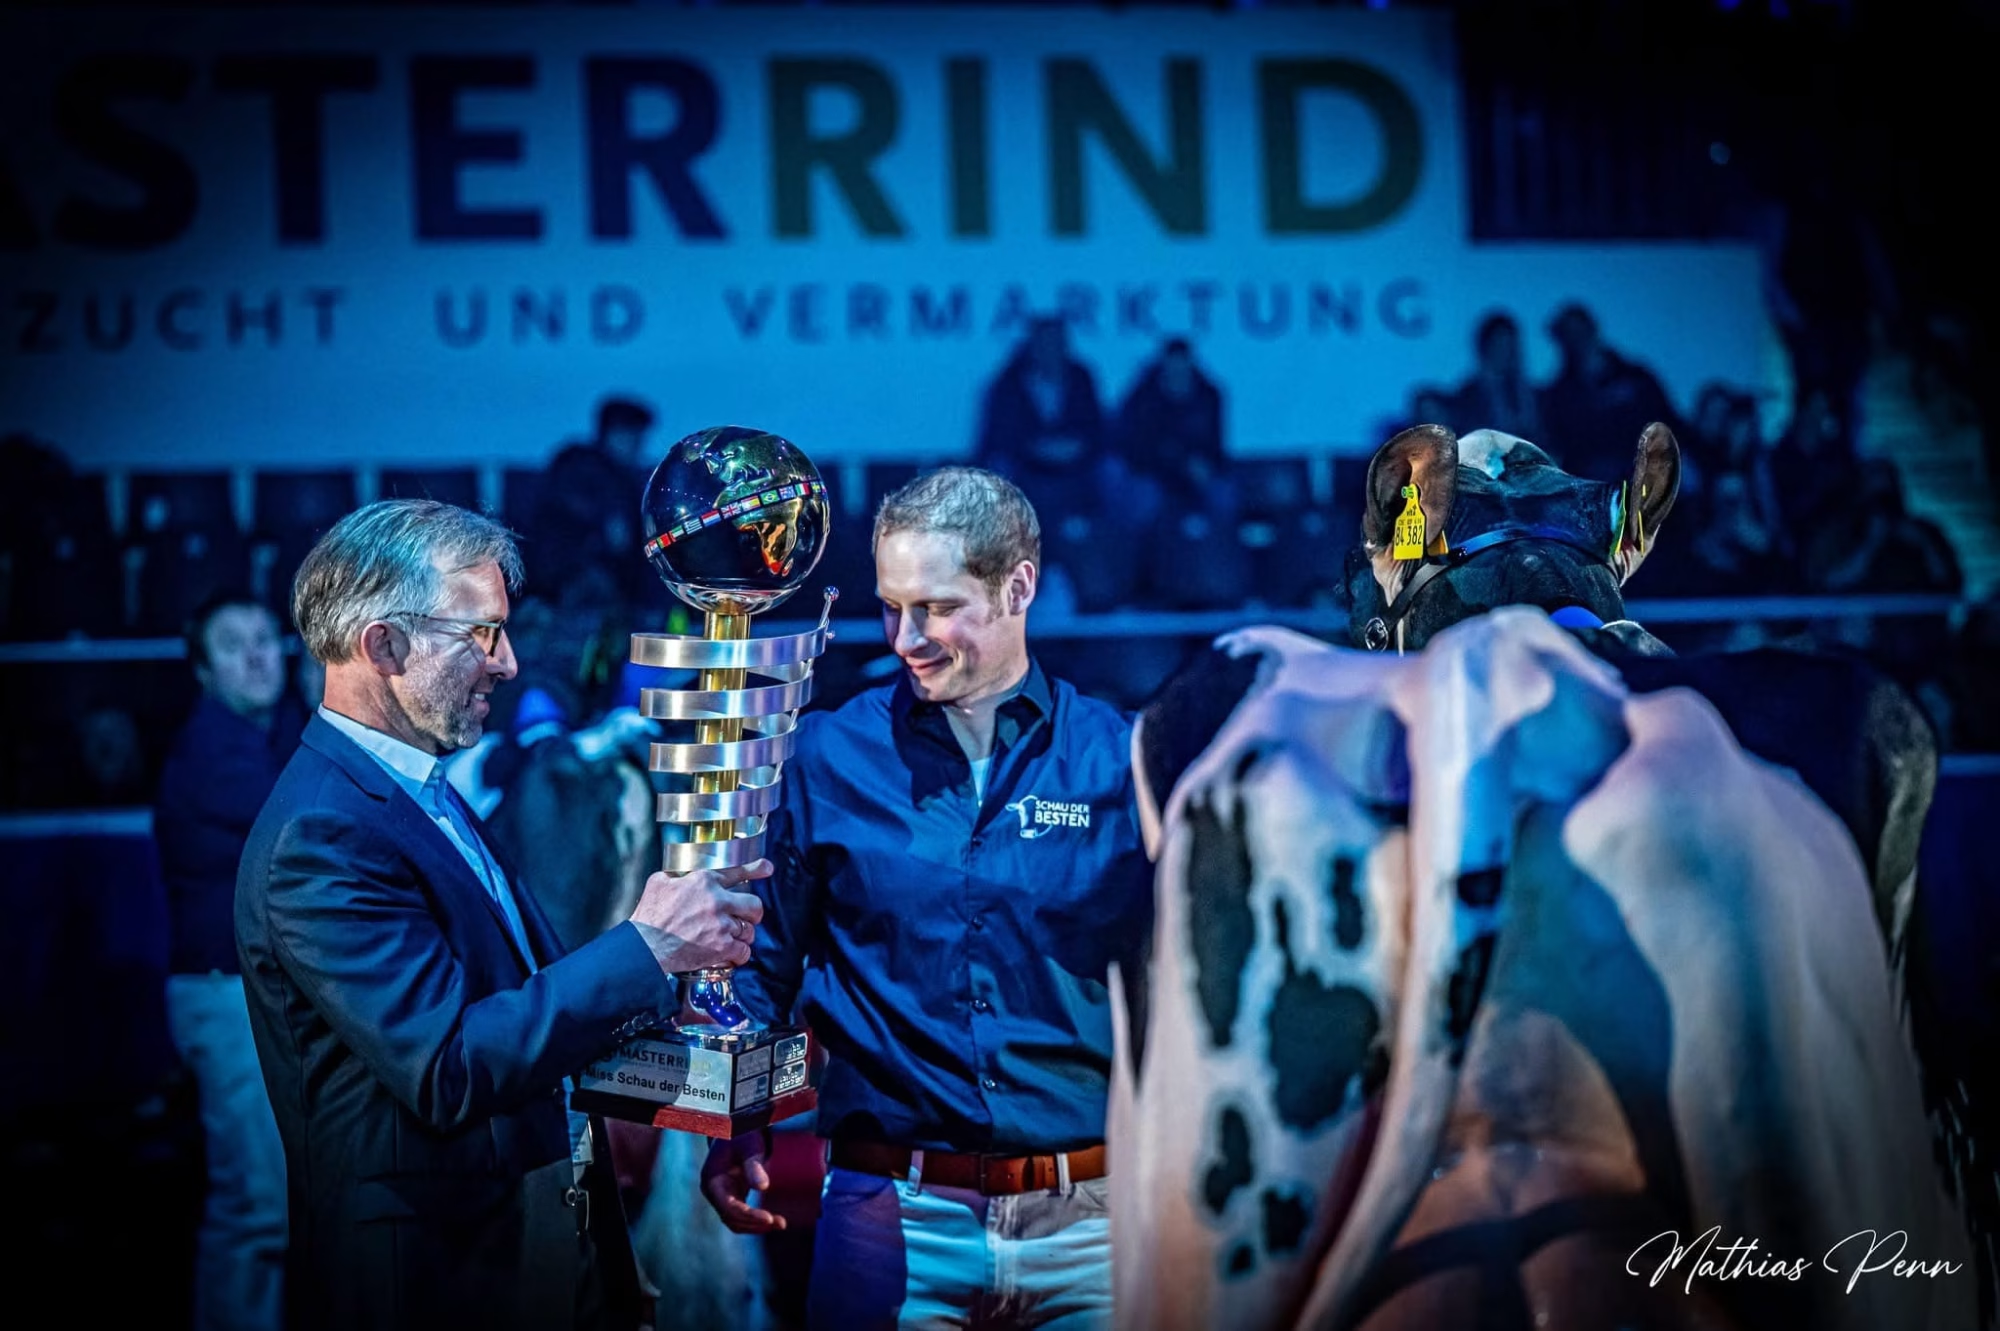
NewsSubscribe
First
Last
Consent

Navigating the CDCB August 2026 Genetic Rescale and New Fertility Traits

A full point off his DPR on August 11, same daughters, same bull. Before you swap him out: that’s CDCB rescaling the fertility stack, not a genetic verdict. Here’s how to tell — and what to do.

Executive Summary: On August 11, 2026, CDCB rescales its entire fertility stack — DPR, CCR, HCR, EFC — adds a new trait called First Service to Conception (FSC), and launches the first U.S. calf-health traits, DIA and RSP, for Holsteins and Jerseys. The catch: when your favorite bull drops a point on DPR that morning, the cows didn’t change, the measuring stick did — CDCB calls it a rescale, not a real genetic loss, so panic-culling or panic-buying off the move is a mistake. The revision finally strips management noise from the math (DPR heritability roughly doubles, from 1.4% to 2.9%), which means your fall sire list can be reshuffled even with zero new daughter data. Which fertility trait you lead on now depends on how you actually breed: revised DPR for herd-level VWP, FSC for cow-by-cow herds, CCR for the conception-per-service crowd running sexed and beef semen. The two calf-health traits are built on serious data — 260,000-plus scours records and 768,000-plus respiratory records — but at roughly 2–3% heritability and launch reliabilities in the 43–53% range, they’re tiebreakers between close bulls, not a fix for a barn that fights scours. With fertility worth somewhere around $34 to $231 per cow per year, the play before you lock fall matings is simple: pull your herd repro report against your post-August PTAs, sort your list three ways, and decide which column is yours.

CDCB August 2026 evaluation

When CDCB runs the August 11, 2026, evaluation, the first thing many breeders will see is that their favorite bull has moved. A full point off his Daughter Pregnancy Rate, maybe. Same bull, same daughters, lower number.

Here’s the thing to hang onto before you touch a single straw: the cows didn’t change. The measuring stick did. CDCB is revising its four reproductive traits, adding a fifth, and rolling out two calf-health traits in the same run — and if you read it wrong, you’ll either bench a bull that’s still doing the job or chase a new trait that can’t carry the weight you’re about to put on it.

What Actually Lands in August

Three new traits show up in the August 2026 evaluation: Resistance to Diarrhea (DIA), Resistance to Respiratory Problems (RSP), and First Service to Conception (FSC). At launch, the new traits are available for Holsteins and Jerseys. At the same time, CDCB revises the four female reproductive traits breeders already lean on — DPR, Cow Conception Rate (CCR), Heifer Conception Rate (HCR), and Early First Calving (EFC). CDCB via LinkedIn

The revision came out of a two-year foundational review that CDCB and USDA’s Animal Genomics and Improvement Laboratory began in 2024, after seasonal swings between evaluations, a steady downward drift in young-bull PTAs, and genetic trends moving in unexpected directions all pointed to a model that wasn’t keeping up with how herds actually breed. The old model assumed a fixed voluntary waiting period (VWP) for every herd and allowed management decisions to bleed into the genetic estimate. Estrus synchronization, heat-detection tech, sexed and beef semen, shifting wait periods — none of it was fully accounted for, so fertility PTAs drifted. CDCB

So when your numbers move in August, read the cause before you react. CDCB puts it plainly: the shifts in PTA ranges and averages “represent a rescaling of each trait rather than a true increase or decrease in underlying genetic variation.” Rescaling. Not your cows going backward overnight. CDCB

What Changed in Each of the Four Revised Traits

The four reproductive traits you already use didn’t just get nudged — each one was rebuilt to strip out management noise that the old model was crediting to genetics. Here’s what moved, and why:

  • DPR (Daughter Pregnancy Rate): Rebuilt to remove the fixed VWP assumption that made later-breeding herds look genetically worse. Heritability roughly doubled, from 1.4% to 2.9%, because it now captures the true genetic signal rather than herd timing. CDCB
  • CCR (Cow Conception Rate): Now built from up to the first seven inseminations in a lactation, scored 0 for a miss and 1 for a settle. Adjusted for days in milk, mating type, service-sire breed, and short cycling before becoming a conception rate. CDCB
  • HCR (Heifer Conception Rate): Revised to account for service-sire breed, mating type, and short cycling — a re-insemination 10 to 17 days after the previous breeding, which usually signals a recording artifact, not a true open heifer. For scale: the average U.S. Holstein heifer that calved in 2024 was bred 1.77 times per conception; Jerseys averaged 1.85. CDCB HCR trait sheet
  • EFC (Early First Calving): Rounds out the revised reproductive set. CDCB

The takeaway across all four: the numbers will move, but the movement is the model getting more honest about what’s genetic and what’s management — not your animals changing.

“My Best Bull Just Dropped a Point. Now What?”

Picture the morning after the run. You pull up your fall sire list, and the bull you’ve been hammering on your best cows sits a full point lower on DPR than he did in April. The urge to swap him out is real. Don’t — not yet.

Pull his April and August proofs side by side first. Check two things: did his reliability move, and is there a big new group of daughters behind the change? If reliability held steady and no major daughter data came in, that drop is almost certainly the new model recalibrating — not a verdict on his daughters. CDCB says it directly: under the old system, “some of the effects of management choices could be incorrectly attributed to genetics, which made trends for traits like DPR and CCR appear flat or even declining.” The new model strips that noise out. CDCB

The honest way to frame it — with yourself, or with a client if you’re the A.I. rep fielding the calls — is this: you weren’t wrong to trust that bull. The ground under the number moved. Your job now is to protect the matings you already planned from a knee-jerk reaction to a model update. The barn-math rule is simple. Don’t make any breeding move you wouldn’t make if the traits hadn’t changed names.

SignalLikely CauseReliability Changed?New Daughters Added?Right Call
DPR drops < 1 pt; reliability flat; no new daughtersRescaling — model correction, not geneticsNoNoLeave fall matings alone
DPR drops > 1 pt; reliability flat; no new daughtersRescaling + borderline bull losing management-propped PTANoNoRe-sort list; check CCR and FSC rank
DPR drops; reliability rises; large new daughter groupReal genetic update — new data changed the verdictYes ↑YesInvestigate daughters; consider list revision
CCR or HCR moves sharply; mating type mix changedModel now adjusts for sexed/beef semen useSlightlyPossibleConfirm your semen mix; re-weight CCR if sexed-heavy
FSC appears for first time on a bullBrand-new trait — no prior baselineNew traitNew traitSet your own threshold; use positive = fewer days
DIA or RSP moves a sire up/down significantlyLow-reliability new trait with wide confidence intervalLow (43–53%)N/AKeep in tiebreaker lane only; don’t reshuffle fertility rank

Walk Through It: How a Top-10 Sire List Reshuffles

Here’s where it gets practical. Say you’ve got a fall lineup of ten bulls you’ve already ranked on fertility, and you’re sorting them on DPR the way you always have. What does the August run do to that list? Let’s reason it through — with the assumptions stated up front, because the exact reshuffle depends on your herd’s data, not a universal answer.

The assumptions: a U.S. Holstein herd; you’ve been ranking on old-model DPR; your bulls are a mix of genomic young sires and progeny-tested bulls; and no major new daughter groups landed between April and August, so any movement is rescaling, not new information. Under those conditions, three things happen to that list.

First, the absolute DPR values compress or shift across all ten bulls at once, because the whole trait was rescaled. Your number-one bull might drop from, say, a strong positive to a slightly lower positive — but so does much of the list, so his rank may barely move. That’s the trap: a scary-looking drop in the number that doesn’t actually change his standing against his peers.

Second, the bulls whose old DPR was propped up by favorable management assumptions — daughters that happened to sit in herds breeding on a tight clock — give back more than the bulls whose fertility was a real genetic signal. Those are the ones that can slide a true rank position or two. The revised model is, in effect, calling the bluff on borderline bulls.

Third, if you re-sort that same list on the revised CCR or the new FSC instead of DPR, the order changes again — because you’re now ranking on a different question (conception per service, or days to conception) than DPR’s cycle-by-cycle pregnancy rate. A bull who looked middling on DPR can rise on FSC if his daughters settle fast once bred.

So the walkthrough lesson isn’t “your list is wrong.” It’s that you now have three legitimate ways to sort the same ten bulls, and the right one depends on how your herd actually breeds — which brings us to the decision table. If you’re still getting comfortable reading these numbers, our guide to understanding bull proofs walks through the basics first.

DPR vs. CCR vs. FSC: Which Fertility Trait Fits Your Herd

Three fertility traits, three different questions. Picking the wrong one means buying semen ranked on a question your herd doesn’t ask.

TraitWhat It MeasuresBest Herd FitData BackboneAugust MoveLead or Backup?
Revised DPRPregnancy rate per 21-day cycle; herd-level VWP assumedSingle VWP across entire penLong-standing CDCB daughter recordsRescale — read shift as model correction, not genetic newsLead for herd-VWP operations
Revised CCRConception per service; up to 7 inseminations scoredSexed and beef semen herds where conception/service drives ROIUp to 7 inseminations per lactation; adjusts for mating type, service-sire breed, short cyclingWeight up if conception per service is your economic leverLead for sexed/beef semen programs
New FSCDays from first service to conception; VWP-independentCow-by-cow programs where vet/team decides per animalBuilt independently of VWP; conception capped at 200 days, non-pregnant set to 230Move to front of sort; positive PTA = fewer days — rank high-to-low⚠️Lead for individual-cow management
EFCAge at first calving, heifer reproductive readinessHeifer development programs tracking calving timingCDCB female reproductive databaseRevised alongside DPR/CCR/HCR; read shift as rescalingSupportingtrait alongside heifer conception

The rule underneath the table: cow-by-cow VWP herds lead on FSC; herd-level VWP herds stay on the revised DPR; and herds optimizing conception per service lean on CCR. Same ten bulls, sorted three ways, and your breeding system tells you which column is yours.

FSC: A Fertility Trait Built for How You Actually Breed

For breeders who’ve run on DPR for decades, First Service to Conception is a different way of thinking about fertility. DPR predicts the share of non-pregnant cows that become pregnant in each 21-day cycle under a herd-level wait period. FSC asks something more direct: once you start breeding her, how many days does it take her to conceive?

The design feature is what makes it matter. CDCB built FSC to work independently of the wait period — it “is not a function of the VWP, which allows it to account for individual cow management independently of VWP changes.” It doesn’t care whether you breed at 50, 65, or 80 days. It watches what happens after that first service. CDCB FSC trait page

The mechanics are worth knowing before you rank bulls on it. FSC is the number of days from a cow’s first breeding to confirmed conception within a lactation. If she conceives after 200 days, her record is capped at 200; if she never conceives, it’s set to 230 days. CDCB then multiplies the day count by −1, so a positive PTA means fewer days to conception, which is the desirable direction. Read it backward, and you’ll rank your bulls upside down, so that sign convention is the one detail not to fumble. CDCB FSC trait sheet

Where does FSC earn its spot? In herds that breed cow by cow. If your vet and breeding team decide when each cow is ready — on body condition, calving history, disease, behavior — rather than running the whole pen on one clock, DPR’s herd-level assumptions never fit you cleanly.

So Should a Twenty-Year Cow-by-Cow Breeder Even Care?

Fair question. If you’ve run a tight individual-cow program for two decades with solid conception and good days-open numbers, you might look at FSC and think: I’ve done this without a trait. Why now?

Here’s the straight answer. You don’t need FSC to make your program work. You need it if you want your genetics to match the precision of your management. FSC is a filter, not a rescue. It lets you stop buying semen off numbers built for herds that breed on a herd clock, and start asking which bulls sire daughters that conceive fast in your system.

And the economics still bite, even in a well-run herd. One widely cited fertility analysis pegged the move from poor to average fertility — mostly through shorter days open — at roughly $34 to $231 per cow per year, depending on conditions, with a one-point pregnancy-rate gain worth about $15 to $35 per cow per year, much of it from fewer open days. FSC won’t change your day-to-day calls. It helps the genetics stop fighting them. Journal of Dairy Science (PubMed)

DIA and RSP: Real Data, Honest Limits

The calf-health traits are the ones most likely to get oversold, so it’s worth being precise about what they are. DIA predicts a calf’s genetic resistance to scours; RSP predicts resistance to respiratory illness. Both are built from producer-recorded health events in CDCB’s National Cooperator Database — more than 260,000 diarrhea records in calves 3 to 60 days old, and more than 768,000 respiratory disease records in animals 3 to 365 days old, across all breeds. CDCB

The honest pitch for a producer who fights scours every winter: DIA can tilt the odds, but it won’t fix a bad barn. The peer-reviewed work behind these traits, led by CDCB Senior Research Geneticist Kristen Parker Gaddis, Ph.D., put heritability around 0.026 for diarrhea and 0.022 for respiratory disease. With heritability that low, the overwhelming majority of the outcome still comes down to colostrum, bedding, ventilation, and hygiene — genetics is the thin slice, not the bulk. It moves the odds slowly, stacked on top of a management foundation, never instead of one. Journal of Dairy Science (PubMed)

MetricDIA (Resistance to Diarrhea)RSP (Resistance to Respiratory)
What It PredictsCalf genetic resistance to scoursCalf genetic resistance to pneumonia/BRD
Age Window3–60 days old3–365 days old
Records in Database260,000+ diarrhea events768,000+ respiratory events
Heritability2.6%2.2%
Launch Reliability — Genomic Sires43%45%
Launch Reliability — Progeny-Tested48%53%
Breeds Available at LaunchHolsteins and JerseysHolsteins and Jerseys
Favorable CorrelationsHeifer livability, productive lifeMastitis resistance, productive life
Management Share of Outcome~97% (colostrum, bedding, hygiene)~98% (ventilation, biosecurity, hygiene)
Right Role at the Breeding DeskTiebreaker between close bulls ✓Tiebreaker between close bulls ✓
Wrong Role at the Breeding DeskPrimary semen purchase driver“Scours fix” without barn changes ✗

Reliability at launch is moderate, right where you’d expect a brand-new health trait to land. Speaking on the Select Sires podcast, Gaddis reported Holstein DIA reliabilities of 43% for genomic sires and 48% for progeny-tested bulls, with RSP at 45% and 53% — comparable, she noted, to where the cow-health traits sat when they were first introduced. The same conversation pointed to favorable correlations with heifer livability, productive life, and mastitis resistance. The takeaway holds either way. Treat DIA and RSP as tiebreakers between otherwise similar bulls, not as the reason you buy one. 

Where the Oversell Goes Wrong

New traits are exciting, and exciting sells semen. The way this costs producers money is by treating a high-DIA bull as a fix for scours, or by reading a single dollar-index as a guarantee when a 2.6%-heritability trait sits within it.

The producer who buys that story pays twice. First, he eases off on colostrum and bedding because he figures the genes have it covered. Then, two or three winters later, his scours rate has barely moved — but his replacements are weaker on fertility or production because he traded a bigger, faster gain for a slow one. Extension guidance is consistent here: for low-heritability traits, lead with economic importance rather than novelty. The real cost of the hype isn’t the semen bill. It’s three winters of thinking the calf-health bulls will fix it while your colostrum program stays exactly where it was. 

If you’ve watched a single number quietly reshape a sire list before, this is the same trap that played out when the 2025 Net Merit cull-gate moved and when one TPI point reshuffled the polled rankings.

Your August Action Checklist

Don’t react to the run — work it. Here’s the order of operations before you lock fall matings:

  • Match the fertility trait to your breeding method. Herd-level VWP herds stay on revised DPR. Sexed- or beef-semen herds weight CCR, now adjusted for mating type, service-sire breed, and short cycling across up to seven inseminations. Cow-by-cow herds move FSC to the front of the sort.
  • Read a big PTA move before reacting. If a bull’s DPR or CCR shifted more than a point but his reliability and daughter count barely changed, that’s rescaling — not a reason to cull or panic-buy.
  • Re-sort, don’t rebuild. Run your existing fall list through DPR, CCR, and FSC. The bulls that slid on the revised model were likely propped up by management assumptions rather than genetics.
  • Get the FSC sign right. Positive PTA means fewer days to conception. Rank high-to-low on positive FSC, not the reverse.
  • Keep DIA and RSP in the tiebreaker lane. When two bulls are close on fertility, production, and type, let the calf-health PTAs decide — especially if you fight scours or pneumonia. Don’t let a 2–3% heritability trait push fertility and production down your list.
  • Don’t ease off management because you bought “health bulls.” With modest launch reliabilities and low heritability, your colostrum, ventilation, and hygiene still do the heavy lifting.
  • Do this within 30 days: pull your herd repro report and line it up against your fall sires’ post-August fertility PTAs. Confirm the bulls you’ve leaned on actually fit the fertility profile your herd shows on the ground. Costs you an hour. Saves you a season of guessing.

What This Means for Your Operation

This run isn’t a reason to redo your breeding program. It’s a reason to re-read it. The decisions below are the ones worth making in the days around August 11:

  • Decide which fertility trait is yours before you open the run. If you breed the entire pen on a single VWP, you’re a DPR herd. If you breed cow by cow, FSC is your lead. If conception per service drives your sexed- and beef-semen ROI, CCR moves up. Pick the column first, then look at the bulls.
  • Set a personal “don’t panic” threshold. Decide now that a sub-one-point fertility move with steady reliability and no new daughters is rescaling, and you won’t act on it. Write the rule down before the emotion of seeing a favorite bull slide.
  • Treat the calf-health traits as a tiebreaker, not a purchase reason. If two bulls are even on what already drives your check, let DIA or RSP break the tie — especially in a barn that fights scours or pneumonia.
  • Protect the matings you already planned. The bulls you chose in April were chosen based on real daughter performance. A renamed, rescaled number is not new information about them.
  • Ask your stud rep one question: “Did this bull move on rescaling, or on new daughters?” The answer tells you whether to care.

Key Takeaways

  • If a bull drops less than a point on DPR with flat reliability and no new daughters, then it’s rescaling — leave your matings alone.
  • If you breed cow by cow, then rank fall sires on FSC and keep DPR as your backup, not the other way around.
  • If you run sexed or beef semen, then weight the revised CCR, which now adjusts for mating type, service-sire breed, and short cycling.
  • If a high-DIA or high-RSP bull is being pitched as a scours or pneumonia fix, then push back — at 2–3% heritability, your colostrum and ventilation still do the heavy lifting.
  • If you only do one thing in the next month, pull your herd repro report and compare it against your fall sires’ post-August fertility PTAs to confirm the fit.

So before the August run, here’s the question worth sitting with: when your numbers move, will you know whether the model changed on you, or whether you actually bred a better herd? One of those is worth reacting to. The other will cost you if you treat it like news. Pull your list, sort it three ways, and decide which column is yours — because the bulls won’t have changed, but the smart way to rank them just did.

Run Your Numbers

Pregnancy Rate Economics Calculator — Before you re-rank a single sire on DPR, CCR, or FSC, run the Pregnancy Rate Economics Calculator to put a dollar value on one point of pregnancy rate in your own herd. It turns days open, extra pregnancies, and program cost into a net annual number — and flags whether your real bottleneck is heat detection or conception.

Complete references and supporting documentation are available upon request by contacting the editorial team at editor@thebullvine.com.

Learn More

  • Genetics Influence Calf Health — Arms you with statistical clarity on how genomic selection alters disease susceptibility. Reveals how managing early-life immunity via specific sire traits directly caps veterinary overhead, helping you protect calf crop viability before clinical scours outpaces your treatment protocols.
  • The GLP-1 Gold Rush: Why Dairy Protein is Pharma’s New Best Friend — Exposes the shifting consumer baseline as weight-loss pharmaceutical trends skyrocket component demand. Explains how prioritizing protein-dense milk genetics positions your herd for maximum component pricing premiums over the next three to five years as component markets completely transform.

The Sunday Read Dairy Professionals Don’t Skip.

Every week, thousands of producers, breeders, and industry insiders open Bullvine Weekly for genetics insights, market shifts, and profit strategies they won’t find anywhere else. One email. Five minutes. Smarter decisions all week.
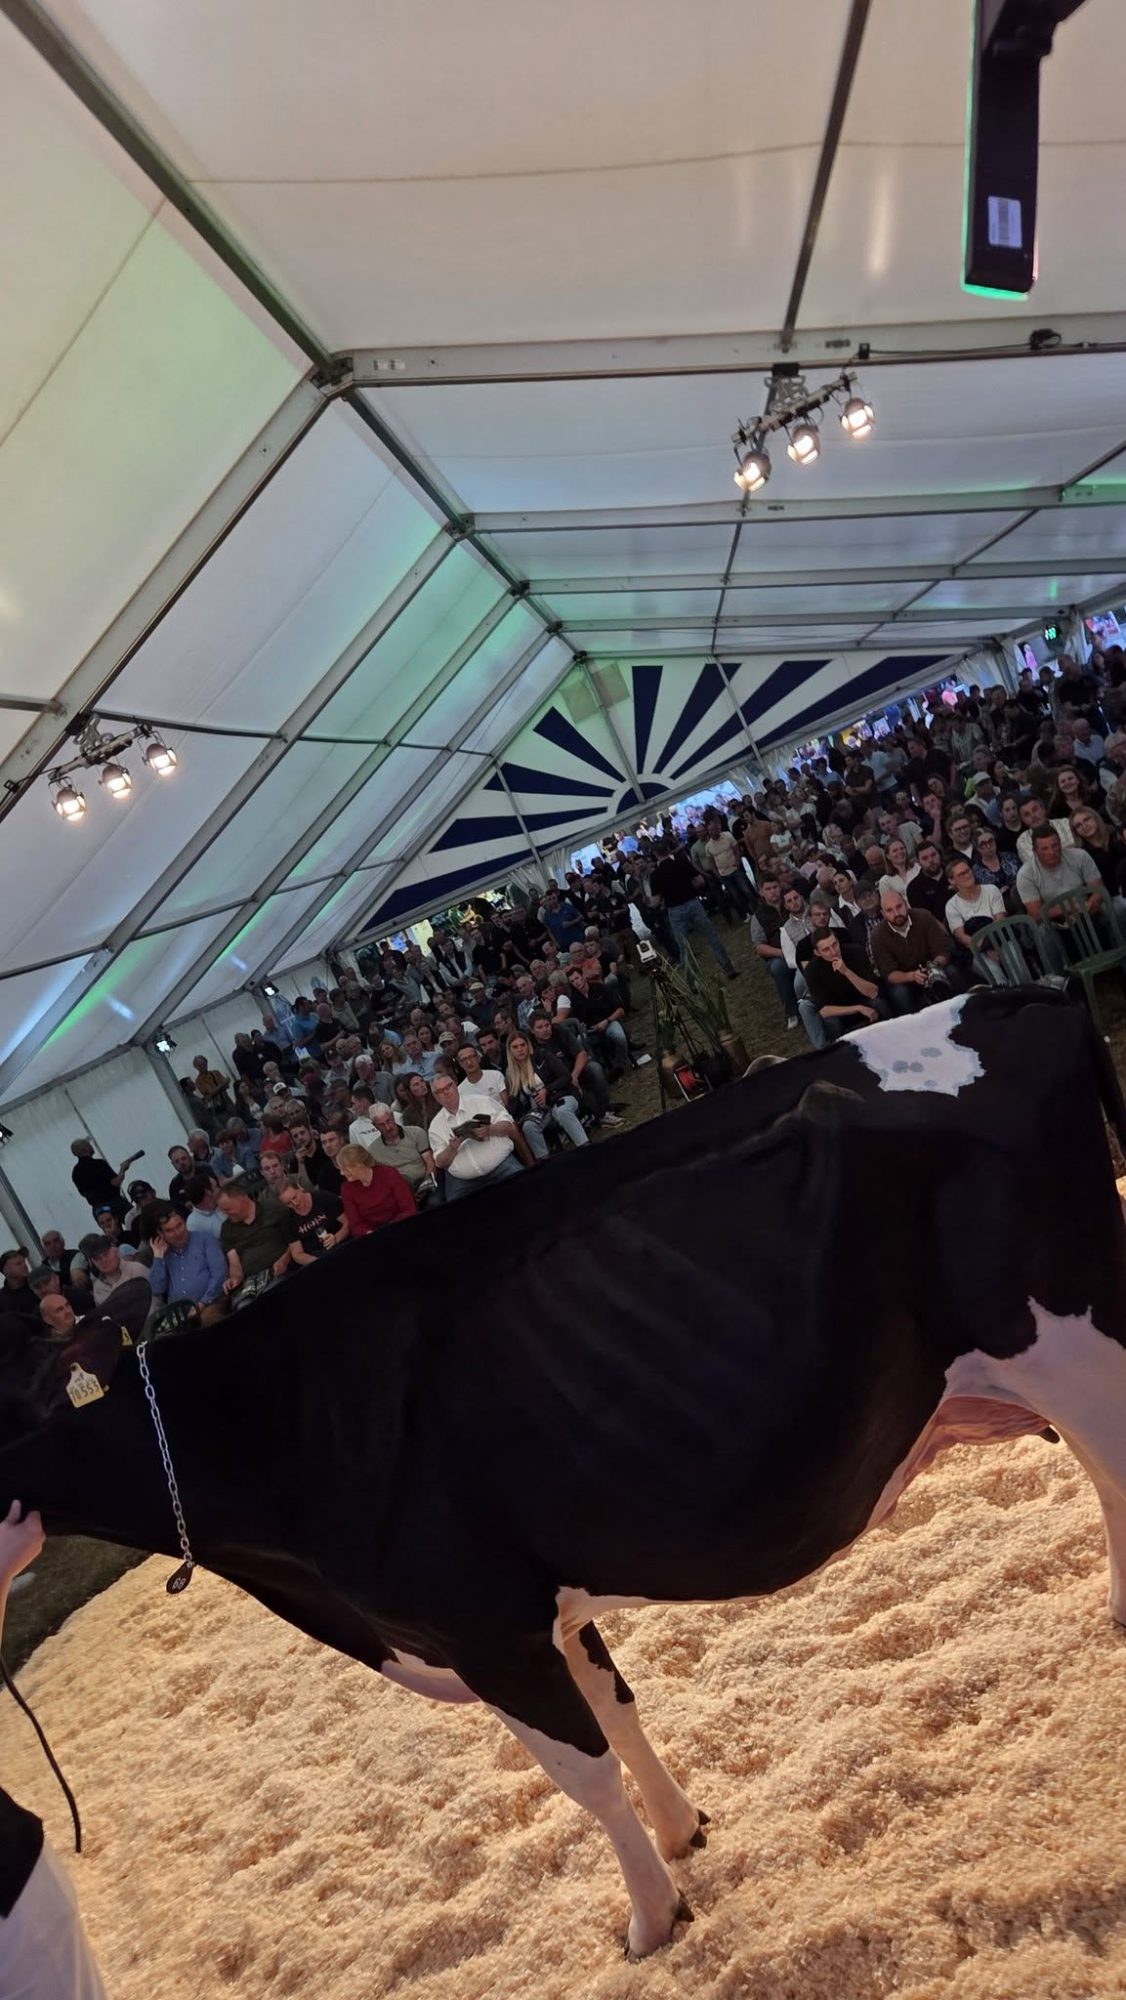
NewsSubscribe
First
Last
Consent

Producers Fight Over Bovaer. The Cheaper Fix Is on the Breeding Sheet

Bovaer can leave $73 a cow uncovered once the carbon math clears. Meanwhile, a low-methane sire costs nothing extra and compounds every generation — and it’s already on your 2026 list.

Executive Summary: A 300-cow herd feeding Bovaer is looking at $27,900 to $31,500 a year in new cost — and once the carbon return clears, the math can still leave roughly $73 a cow uncovered without a processor premium, or about $40 with one. That’s the gap nobody puts on the pitch slide, and it’s why the loud fight over feed additives is the wrong fight. The cheaper methane lever is already sitting on your 2026 sire list: Lactanet’s Methane Efficiency trait runs 23% heritability with 70%-plus reliability on genotyped young animals, costs nothing extra on DHI-enrolled females, and compounds every generation instead of renting you a cut for as long as you keep paying. The timing is the kicker — sires you use in 2026 throw heifers that milk into the early 2030s, right when 2030 buyer targets decide whether “low-methane milk” earns a premium or eats a penalty. Bovaer’s still a legitimate tool for stable TMR herds with a real premium behind it, but treat Denmark as a rollout warning: watch ration sulphur, silage timing, and transitions, because that’s where the trouble showed up. Do nothing, and you’re not playing it safe — you’re choosing to negotiate from a blank page when methane lands in your milk contract. Filter your next round of sires above 100 for Methane Efficiency without dropping your core index, and you’ve built a 2030 position for free.

methane efficiency breeding

In Denmark this past winter, farmers who’d been ordered to feed Bovaer started calling their vets about cows going off feed. One veterinarian told Farmers Forum that the additive “affected every herd” in her area. By November 2025, a SEGES Innovation survey of the country’s conventional dairy farms had drawn several hundred responses, and the majority reported a drop in milk yield — figures first surfaced in investigative reporting by Undark Magazine and Farmers Forum. That’s the methane headline scaring everybody.

Here’s the one nobody’s running. While the industry fights about a feed additive, the cheapest methane tool you own is already sitting on your 2026 sire list. And almost nobody’s calling it a methane decision.

What’s Really at Stake When the Processor Calls

When a processor rep starts talking methane commitments and premiums, the surface conversation is climate. The real conversation is risk, market access, and who ends up owning the carbon story.

The processor is trying to de-risk its Scope 3 footprint and hit a branded climate target. Danone committed in January 2023 to a 30% absolute cut in methane from its fresh milk supply by 2030, and its own Dairy Methane Action Plan reported a 25.3% reduction versus the 2020 baseline by 2024 — including a 13.9% drop in the single year from 2023 to 2024. A company moving that fast doesn’t get there without eventually sorting its suppliers. You’re on the other side of that table, working out whether the premium covers the cost — or whether you’re signing into someone else’s program economics.

One number reframes the whole exchange. The Innovation Center for U.S. Dairy’s national life cycle assessment puts U.S. dairy at roughly 2% of total U.S. greenhouse gas emissions, across every stage. Read it for what it is — a market signal, not an ecological emergency — and methane becomes something to time and negotiate, not panic over.

The Productivity Story Nobody Puts in the Pitch

Before anyone sells you the next reduction, remember how the first one happened. U.S. dairy already did the hard part, the unglamorous way.

The national herd dropped from about 25 million cows in 1950 to roughly 9 million today, while total milk output climbed. Per kilogram of milk, the greenhouse gas footprint fell by roughly half over those seventy years. None of that came from a feed additive. It came from genetics, nutrition, reproduction, and culling — the same levers you’d pull in a rough milk-price year.

So here’s the first honest move. The work that lowers methane per hundredweight is the same work that protects your margin. It’s the bedrock under any methane score or premium that shows up later, and you’d be doing it anyway.

The Denmark Caution Light — and How to Read It Right

Back to the additive everyone’s actually asking about. The peer-reviewed record on 3-NOP — the active ingredient in Bovaer — is genuinely strong. A 2025 review found that 3-NOP cuts methane by roughly 30% in dairy cattle at an average dose of around 70 mg/kg of dry matter, with no effect on milk production. A full-lactation study in the Journal of Dairy Science (van Gastelen et al., 2024, Vol. 107) followed Holstein-Friesians over a full year and reported reductions of 21% in daily methane, 20% in methane yield, and 27% in methane intensity — with a positive effect on production characteristics.

So why the alarm bells out of Europe?

Denmark mandated methane-reducing feed changes, and most farms started Bovaer around October 1, 2025. The reports were serious enough that in February 2026, the European Commission directed EFSA to reopen its safety review of Bovaer in dairy cows. In that SEGES survey, alongside the herds reporting lower yield, a comparable share reported digestive and metabolic disorders. EFSA opened a public call for data with a March 31, 2026, deadline.

The manufacturer pushes back hard, and fairly. dsm-firmenich says there’s “absolutely no evidence that Bovaer is a cause of any problems,” that the additive is almost entirely metabolized in the rumen and doesn’t show up in milk or meat, and that Elanco hasn’t seen these issues in the more than 150,000 U.S. lactating cows fed Bovaer since launch. SEGES itself flagged a statistical link between the Danish health reports and high-sulphur rations — specifically rapeseed, far more common in Danish diets than in North American TMRs.

So the honest read isn’t “Bovaer is dangerous.” It’s that nobody had ever stress-tested it this way — mandatory, all at once, into rations where farms were opening new silage and running high-sulphur diets the same week. EFSA’s earlier opinion deemed it safe at the maximum recommended level; the U.S. FDA cleared it for lactating dairy cattle in 2024; and Aarhus University’s controlled trials “showed the desired methane-reducing effect without any signs of disease.” The product stays approved in more than 70 countries at recommended doses. The Danish data is real and worth respecting. It just landed in the messiest possible rollout conditions.

FactorControlled Trials (Peer-Reviewed)Denmark Rollout (Oct 2025)
Methane reduction21–30% (JDS 2024; 2025 review)Not measured systematically
Milk yield effectNo significant impactMajority of SEGES survey farms reported drop
Health incidentsNone in controlled conditionsDigestive/metabolic disorders widely reported
Ration contextControlled, optimized TMRHigh-sulphur rapeseed diets; new silage opening same week
Sulphur interactionNot studied at scaleSEGES flagged statistical link to high-sulphur rations
Animals affectedResearch herds, managed transition“Affected every herd” (vet report, Farmers Forum)
Regulatory responseApproved in 70+ countriesEFSA reopened safety review, Feb 2026
Manufacturer positionExtensive global safety data“No evidence Bovaer is the cause” — dsm-firmenich
North American relevanceFDA cleared for U.S. lactating cows (2024)Rapeseed diets rare; risk profile lower but not zero

The lesson for a North American TMR herd is blunt. Additives don’t exist in a vacuum, and how you roll one out can matter as much as what’s in the bag.

The Math That Actually Decides It

Strip away the safety drama, and 3-NOP comes down to barn math. Bovaer runs roughly $0.30–$0.40 per cow per day. dsm-firmenich pegs the cost at about $93–$105 per cow per year on a lactating-cow basis — close to a cent per litre. The two numbers don’t line up at a glance because the annual figure reflects a lactating-cow feeding window, not a flat 365 days. Confirm the feeding-day basis your supplier is quoting before you budget. On a 300-cow herd at that annual rate, you’re staring at roughly $27,900 to $31,500 in new costs. One caveat in your favor: a new manufacturing plant in Dalry, Scotland, is projected to bring the cost down over time, so this gap should narrow.

The return side is thinner than the pitch suggests. Elanco estimates Bovaer could return “$20 or more per lactating cow per year” through voluntary carbon markets, conservation funds, or processor incentives — call it roughly $6,000 back on those same 300 cows, and remember that’s a projection, not a guarantee. The Bullvine’s own analysis found a $0.12/cwt sustainability premium recovers only about $33 per cow per year on a 75-lb cow.

Now do the arithmetic, because nobody argues with their own arithmetic. With a premium stacked on carbon ($93 cost − $20 carbon − $33 premium), you’re leaving roughly $40 per cow uncovered. With no premium at all — just the carbon return against the cost — the hole runs from about $73 per cow at the low end of the cost range, and widens if you’re paying at the top of the range. That $73 floor is the number behind this story’s headline, and it’s the scenario many producers are actually facing.

That’s the figure for the farm-office wall. Before you sign anything, ask three questions. What does it cost per cow? What am I guaranteed per cow or per hundredweight in return? And how long does the contract lock? Everything else is marketing.

Can a Sire Decision Really Be a Methane Decision?

Here’s where the slow, cheap lever lives — the one almost nobody frames this way.

Methane is heritable. Lactanet pegs the heritability of its milk-MIR-predicted methane trait at 23% (0.23), with average reliability surpassing 70% for genotyped young bulls and heifers — figures published in Lactanet’s own trait documentation and the peer-reviewed implementation paper in the Interbull Bulletin (December 2023) and JDS Communications (2024). That’s right in the range of traits like fertility, and the genetic correlation with production is weak, so you can select for lower methane without giving up milk, fat, or protein. Lactanet has also reported a slight positive correlation between its Pro$ index and Methane Efficiency, suggesting that lifetime profit and a lower methane footprint aren’t at odds.

This isn’t theoretical anymore, and it’s exactly where Canadian breeders have an edge. In April 2023, Lactanet became the first organization in the world to publish official Methane Efficiency genetic evaluations for the Holstein breed, expressed as Relative Breeding Values (RBVs) built on milk mid-infrared spectroscopy data. The trait was then folded into the modernized LPI’s new Environmental Impact subindex in April 2025. Lactanet projects genetic selection can deliver a 20–30% methane reduction by 2050 with no production penalty, and calls it “a permanent and cumulative solution.” VikingGenetics has since followed with a Nordic Methane Index, and CRV in the Netherlands with Methane Saved. If you already read proofs and rank bulls by index, you can act on this today — while operations that only consider methane a feed-bunk problem are still waiting on the next additive trial. For how the trait slots into the indexes you already use, see our breakdown of the April 2025 LPI overhaul.

This is pay-now or pay-later in one decision. The additive is rent — you cut methane only as long as you keep paying. Genetics is a purchase. You build the reduction into the animal once, the recurring cost is zero, and the gain compounds every generation.

MetricBovaer (3-NOP)Genetic Selection (Methane Efficiency RBV)
Annual cost/cow$93–$105$0 (DHI-enrolled females)
Methane reduction~30% per peer-reviewed averageProjected 20–30% by 2050
HeritabilityN/A — not heritable23% (h²) — permanent in animal
Reliability on genotyped animalsN/A>70%
Effect durationLasts only while fedCompounds every generation
Production penalty?None in controlled trialsNone — weak genetic correlation with milk
Requires stable TMR?Yes — ration-sensitiveNo — works in grazing systems
Compounds over time?No — rent modelYes — purchase model
Cost if you stop payingReturns to baseline methaneGain is permanent in progeny
2030 market positioningReady now, ongoing cash outCalves of 2026 sires milk in early 2030s

And the timeline is the part that should keep you up at night. A sire you use heavily in 2026 throws calves in 2027. Those heifers calve in 2028–2029 and milk into the early 2030s — right when 2030 buyer targets bite and “low-methane milk” is most likely to carry a premium or a penalty. Your 2026 sire decision is a 2030 market-positioning decision wearing a production hat. The calf check on the additive shows up now; the genetic position shows up exactly when the market starts paying for it.

Your next mating session, do this: pull up your genomic sheets and find the Methane Efficiency value (the RBV in Canada; watch for the equivalent line as U.S. and Nordic evaluations roll out). Screen out the high-methane tails and weight toward bulls sitting clearly above the breed average — above 100 — for Methane Efficiency, without dropping your core economic index, whether that’s Pro$, LPI, NM$, or TPI. In Canada, those values are already published free of charge for every Holstein female in your DHI herd inventory; for cows and heifers outside it, Lactanet sells the bundled Methane and Feed Efficiency evaluation at $8 per animal, with a $2 credit for type-classified herds.

Lab Coat or Barn Coat: Sorting the Rest of the Toolbox

The rest of the buzz sorts cleanly into what you can feed tomorrow, what you watch for two years out, and what you ignore until the science catches up.

ToolVerdictWhat the data showsThe catch
TanninsFeedable now, modestly2024 meta-analysis: ~10% cut in enteric methane and methane yieldOnly works at high effective doses (above ~8,000–10,000 mg/kg DM); sub-therapeutic doses do little; most robust data is from beef
Asparagopsis seaweedWatch, don’t bet~20% reduction at low inclusion, 50%+ at 1% inclusionThe biggest cut came with a milk-yield penalty (Roque et al., 2019); high cost, bromoform variability, supply and regulatory hurdles
Methane vaccineIgnore for budgetingNZ’s AgResearch targeting at least 20% reduction with no system changesOnly in-vitro antibody responses so far; no consistent live-animal methane drop; 5–10 years out

The seaweed and vaccine numbers that headline conference slides mostly come from short beef trials, in-vitro work, or aspiration — not from multi-lactation dairy data. Worth knowing. Not worth betting the barn on yet.

What This Means for Your Operation

Pick the path that fits your system, then run the check beside it before you commit a dollar.

Farm TypePrimary LeverSecondary LeverWatch Out ForMethane Cost (Year 1)
Stable TMR, processor premium3-NOP (Bovaer) + genetics filterCarbon program enrollment$40–$73/cow gap if premium doesn’t cover cost; ration sulphur$93–$105/cow
Stable TMR, no processor dealGenetics filter (Methane RBV >100)Efficiency + reproduction disciplineSigning for optics before math pencils$0 extra
Grazing / high-forage systemGenetics — only viable daily leverTannins at effective dose if set up for itDaily additives impractical without individual feeding$0 extra
All farm types — baselineCulling + reproduction + feed efficiencyMethane RBV filter on sire listDoing nothing = price taker when methane hits your contract$0 extra
  • Default path — efficiency plus genetics. Fits nearly every herd, any size. No new product spend, just discipline on reproduction, culling, and feed efficiency, plus a methane filter on the sire list. The gains are slow and won’t satisfy a processor wanting cuts this quarter — but they cost nothing extra and compound for a decade. Check: Does your mating program have a methane filter on it yet? If you’re in Canada, are you pulling the Methane Efficiency RBVs already sitting free on your DHI-enrolled females?
  • Conditional path — 3-NOP. Makes sense for stable TMR herds with a premium or carbon program that genuinely narrows the $40–$73 gap. Demands ration precision and careful transition timing. Where it backfires: signing for the optics, feeding it through silage changes, or believing in a flat 30% forever. Check: Have you run your own cost-per-cow against a guaranteed premium or credit, not a projected one? What’s written into your processor agreement, and how long does any premium lock last? If the rep pitches “30% forever,” ask for the 18-month data in a herd like yours. That dataset barely exists.
  • Stacking path — tannins, and a note for grazers. Sensible for high-forage or grazing systems already set up for tannin inputs, but only at effective doses. Check: If you graze, are you leaning on genetics? Daily additives aren’t practical for animals you don’t feed individually, which makes the sire list your main lever, not your backup.
  • The data question that cuts across all three. Are you capturing the production, intervention history, and methane intensity that a future premium will make you prove? Here’s how carbon insetting actually pays producers.

Key Takeaways

  • If you do nothing else, bank the free gains. Efficiency plus a light methane filter on your sire list costs nothing extra and compounds for a decade.
  • If a processor pitches a premium, run the gap math first — additive cost minus guaranteed return. If it leaves a $40–$73 gap per cow, or wider at the top of the cost range, don’t sign for the optics.
  • If you’re on a stable TMR and the numbers pencil, 3-NOP is a legitimate tool — but treat Denmark as a rollout warning, not a verdict: watch ration sulphur, silage timing, and transitions.
  • If you farm a grazing system, your methane plan is genetics, full stop — daily additives don’t fit animals you don’t feed individually.

The Danish farmers calling their vets didn’t get a say in how that additive landed in their bunks — the mandate decided for them. You still get the say. Doing nothing feels safe at the kitchen table tonight, but it’s still a decision: you’re choosing to be a price taker when methane lands in your milk contract, negotiating from a blank page while the neighbor walks in with a genetic trajectory and verified numbers. The cheapest move on the board costs you nothing this year and builds for a decade. So the real question isn’t whether you trust the Bovaer rep. It’s whether you’ll let your 2026 sire list do the quiet work while everyone else argues about the additive.

Run Your Numbers

Genomic Testing ROI Calculator — Before you bank on Methane Efficiency as a free lever, run the genomic numbers. The calculator pressure-tests whether testing and sorting your heifers actually pays once raising cost, quartile value spread, and beef-on-dairy outs are counted — so you know the genetic play pencils before the additive rep ever calls.

Complete references and supporting documentation are available upon request by contacting the editorial team at editor@thebullvine.com.

Learn More

The Sunday Read Dairy Professionals Don’t Skip.

Every week, thousands of producers, breeders, and industry insiders open Bullvine Weekly for genetics insights, market shifts, and profit strategies they won’t find anywhere else. One email. Five minutes. Smarter decisions all week.
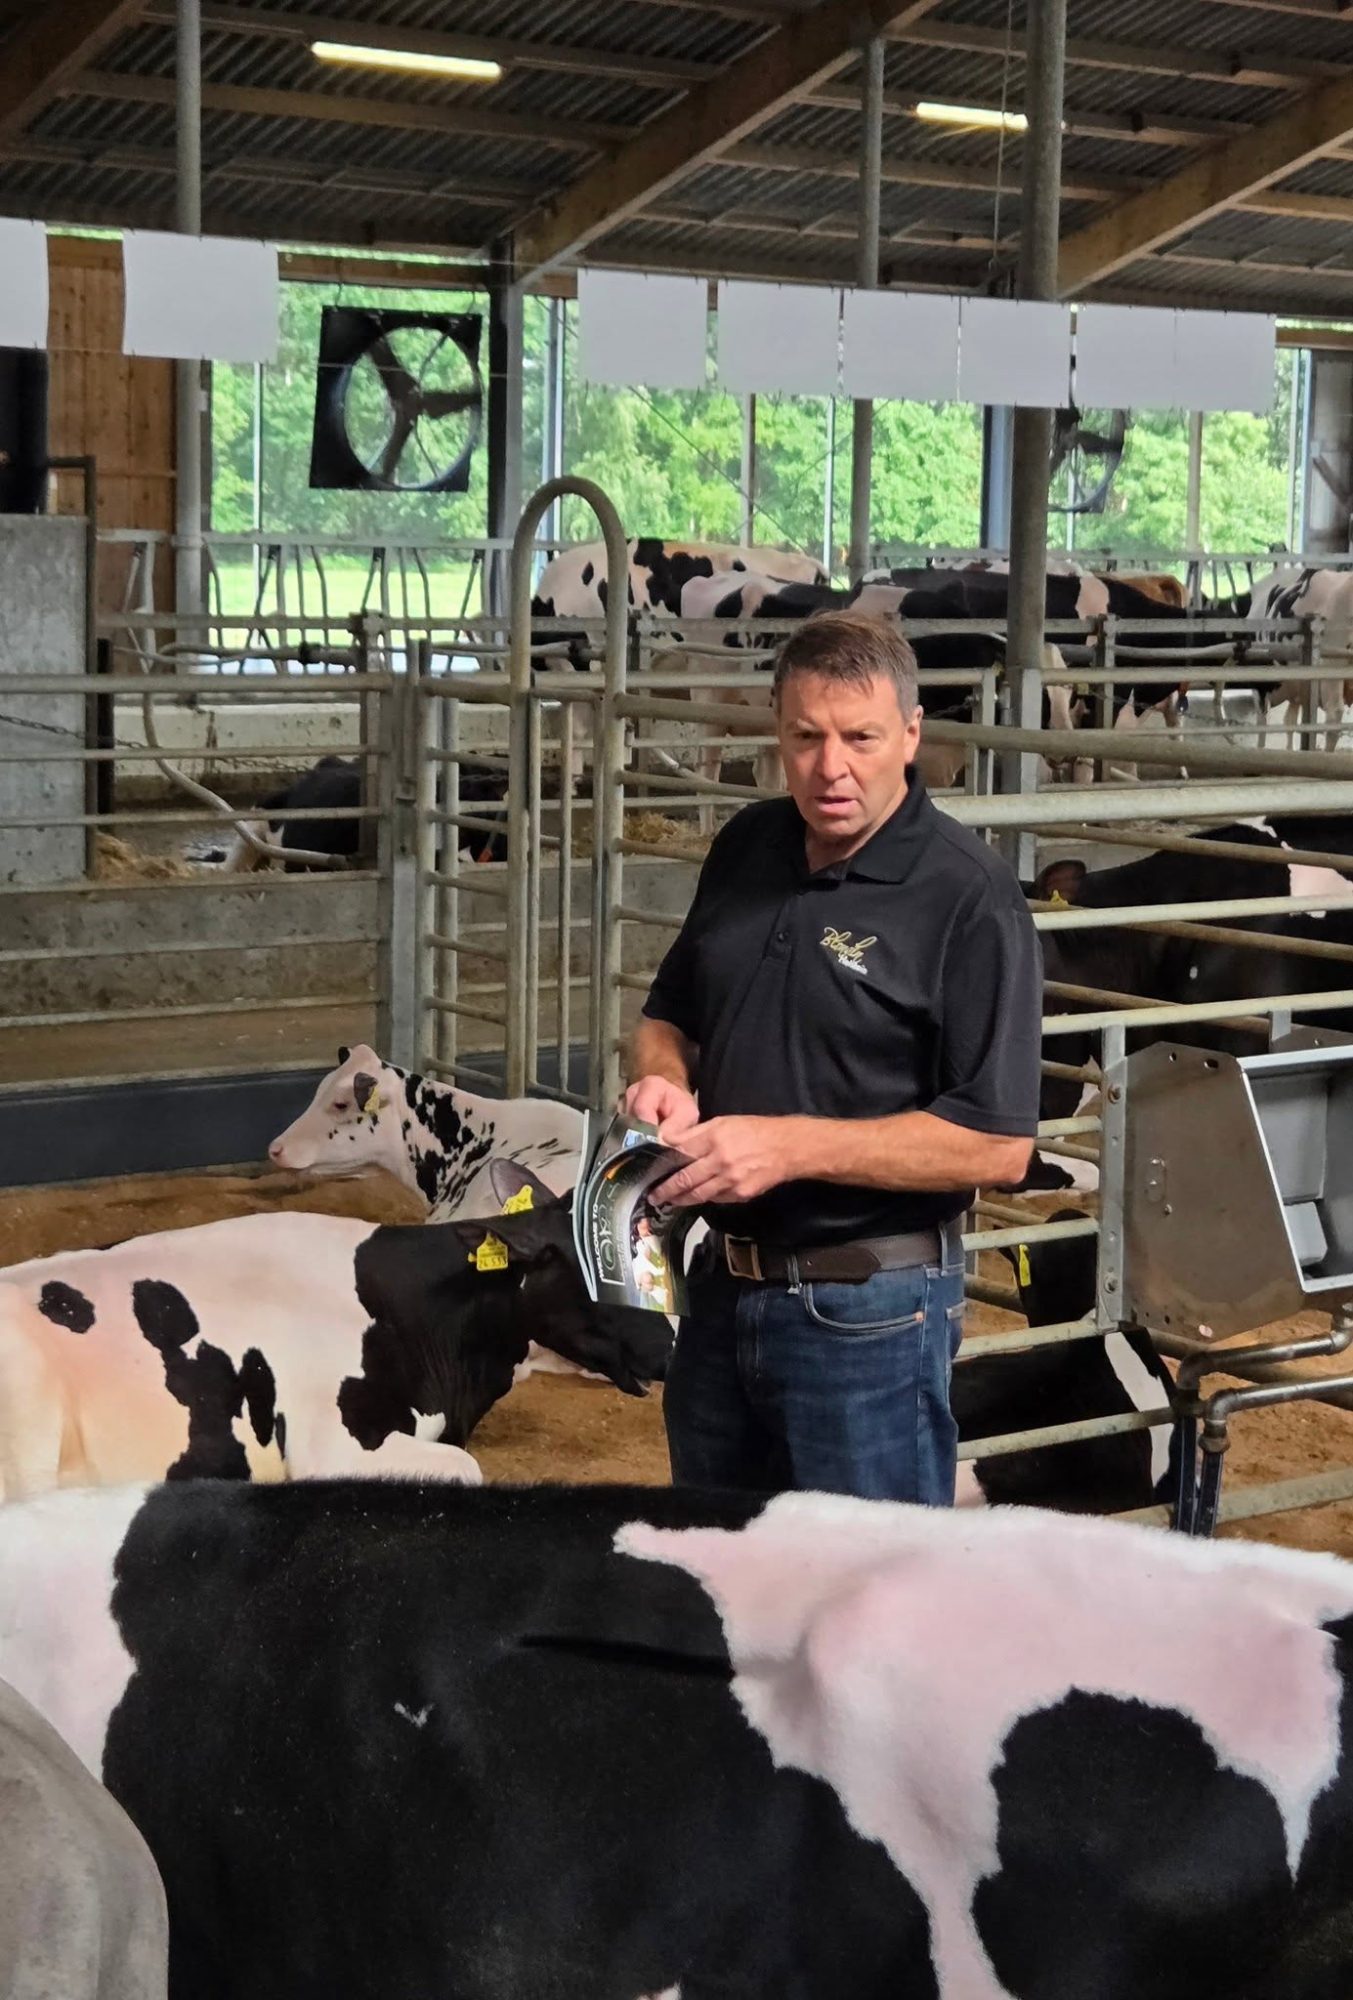
NewsSubscribe
First
Last
Consent

99.84% of Holstein AI Bulls Trace to Just Two Fathers

Two bulls born in the 1960s—Chief and Elevation—sit behind 99.84% of today’s AI sires. The gift: more milk, better udders. The bill: a 9.99% inbreeding tab now in your heifer pen.

Picture every Holstein in North America walking into one barn for Father’s Day dinner.

Millions of black-and-white cows, shoulder to shoulder, in a building the size of a county. They’ve come to toast their fathers, the way families do this time of year. And here’s the part that ought to stop you cold while you’re scraping the parlor this Sunday: almost every animal in that impossible room would be raising a glass to the same two dads.

Not two dozen. Not two hundred. Two.

Their names were Pawnee Farm Arlinda Chief and Round Oak Rag Apple Elevation. One arrived on an Indiana spring morning in 1962. The other showed up in 1965, on a modest Virginia farm nobody had heard of. Neither ever knew the other. And yet a Y-chromosome study that combed through 62,897 bulls born between 1950 and 2013 found that virtually every active North American Holstein AI bull traces its paternal line back to just these two grandfathers. The Bullvine’s own analysis of that work puts the figure at 99.84% of active AI bulls — split almost eerily down the middle, roughly half Chief and half Elevation. 

Read that number again. Ninety-nine point eight four percent. It’s as if the entire breed flipped a coin sixty years ago and has been living with the result ever since.

So, before you pour your coffee and head out to check the fresh pen, let me properly introduce you to the two dads at the head of your herd’s table. Once you know their story, you’ll never look at your milking string the same way again.

The $4,300 gamble that started a dynasty

Pawnee Farm Arlinda Chief (1962–1982). The bull behind half the breed. From a dam who sold for $4,300, Chief sired 16,000 daughters and more than two million great-granddaughters—and carried a hidden HH1 recessive that the breed wouldn’t decode for fifty years. Read more: The $4,300 Gamble That Reshaped Global Dairy Industry: The Pawnee Farm Arlinda Chief Story

Start with the elder. In a family reunion, you always start with the elder.

Here’s the thing about Chief, though — the gamble that made him happened before he ever drew breath. At the Pawnee Farm dispersal, his dam, Pawnee Farm Glenvue Beauty (EX-90), crossed the auction block and sold for $4,300. Now, picture what that meant in 1962. You could buy a new car twice over. You could put serious money down on land. Somebody stood at that ring, looked at a cow, and decided she was worth more than a house lot. 

They turned out to be right in a way nobody could have predicted.

Because Beauty’s son became a kind of one-animal continent. By the time the dust settled, Chief had produced 16,000 daughters, 500,000 granddaughters, and more than two million great-granddaughters. Stack that against the cow your grandfather was proud to own, and you start to feel the gravity of the thing. This wasn’t a good bull. This was a whole population’s worth of fatherhood compressed into one animal. 

And his daughters could milk. The proof has a name — Beecher Arlinda Ellen. In 1975, on Harold Beecher’s farm near Rochester, Indiana, Ellen completed a lactation of 55,661 pounds, the first cow in the entire Holstein breed to crack 55,000 in a single year — a world record that would stand for nearly two decades.

Here’s the part worth sitting with. Reporters came calling, the way they do when a farm makes history, and asked what magic ration he’d been feeding her. By Harold Beecher’s own account, he hadn’t done anything special at all. Think about that for a second. A humble Indiana dairyman, a world record standing in his tie-stall, and his honest answer was a shrug. He knew what every good cowman knows — you don’t feed your way to a number like that. You breed your way there. Ellen wasn’t a fluke. She was Chief’s signature, written in the milk tank.

And here’s what made Chief’s story the hard one. This was the era before genomics — no DNA test to whisper which young bull was worth sampling. You bred him, you waited, and you milked his daughters for years before the herd finally told you whether you were holding a fortune or a flop. Chief’s people waited. And the daughters kept coming back with the same verdict, herd after herd, in barns that had never heard of Pawnee Farm: more milk, again, and again. A father proves himself slowly. Chief proved himself the only way the times allowed — and the breed was never the same after the proof came in.

When sons become legends in their own right

Great fathers don’t just have great children. They have children who become great fathers themselves — and that’s where Chief’s story gets bigger than one bull.

S-W-D Valiant (EX-95 GM). One of Chief’s great sons. Born June 28, 1973, out of a VG-85 Admiral dam, Valiant took his father’s milk and added show-ring type—the kind of son who becomes a legend in his own right and keeps the family table growing. Read more: The S-W-D Valiant Story: How Genetics Promised Everything and Changed How We Think About Breeding

His most influential sons read like a roll call: Walkway Chief Mark, S-W-D Valiant, Glendell Arlinda Chief, and Milu Betty Ivanhoe Chief. Take Walkway Chief Mark. He was only ever sampled because his full brother died, and somebody needed a backup. The spare. That backup bull accounted for roughly 7% of every Holstein genome on this continent. (The Bullvine has told that whole strange, wonderful story in full in Walkway Chief Mark’s profile — it’s one of the great accidents in breeding history.) 

Seven percent. From the understudy.

Walkway Chief Mark (VG-87 GM). The spare that ran the breed. Only sampled because his full brother died and Foster Walk’s Illinois herd needed a backup, Mark went on to account for roughly 7% of every Holstein genome in North America. Select Sires later named him an Impact Sire of the Breed. The understudy nobody saw coming. Photo: Remsberg. Read more: Walkway Chief Mark: The Backup Bull Behind Seven Percent of Every Holstein Cow

A powerful father’s influence doesn’t stop with his own kids. It compounds. It ripples down through sons, and their sons, until you can’t open a modern catalog without bumping into the old man’s name a dozen times over. Chief didn’t just have a big family. He had a big family that kept having big families, branch after branch — one line eventually threading down to To-Mar Blackstar, himself one of the most heavily used bulls in breed history. Generation after generation, the table just kept getting longer, and the gambler who paid $4,300 for a cow back in 1962 kept looking smarter. 

To-Mar Blackstar. The branch that kept growing. Down one of Chief’s many lines, Blackstar became one of the most heavily used bulls in breed history—proof of how a great father’s influence doesn’t stop with his sons, but compounds, generation after generation, until you can’t open a catalog without bumping into the old man’s name. Photo: Remsberg. Read more: To-Mar Blackstar: The One-Embryo Holstein Sire Behind 15.8% of Today’s DNA – and the Genetic Debt in Your Herd

The B-team mating that produced the Bull of the Century

Round Oak Rag Apple Elevation (1965–1979). The Bull of the Century. He came from a fertility-troubled sire and a “B-team” dam nobody expected anything from—then sired over 10,000 AI sons across 45 countries and an estimated nine million descendants worldwide. The cousin’s hunch that built the barns at Select Sires. Photo: Remsberg. Read more: Round Oak Rag Apple Elevation: The Bull That Changed Everything

Now, meet the other grandfather. And get ready to be surprised, because Elevation’s beginning was the opposite of a sure thing.

Down on Round Oak Farm in the Virginia piedmont, Ronald A. Hope and his family were running a working dairy, not a genetics empire — the kind of modest operation you’d have driven past a hundred times without a second look. The mating that produced Elevation wasn’t some master plan off a proof sheet. It came from Ron Hope’s cousin, George Miller, who suggested the cross. Just a hunch, passed down within the family. Try this one. 

And honestly, on paper, you’d have shrugged and moved on. The sire, Tidy Burke Elevation, had fertility trouble. The dam, Round Oak Ivanhoe Eve, had been shuffled onto the farm’s B-team because she matured too slowly. A questionable father. An overlooked mother. A cousin’s offhand suggestion.

What walked out of that barn in 1965 changed the world. 

I don’t say that lightly. He would later be named the “Bull of the Century.” But forget the title for a second and walk into a parlor full of his daughters instead. Look up. There it is — the udder. High, wide, held tight to the body, still bolted on the way you’d want it two and three lactations after the cows around it had broken down and shipped. Watch one of those daughters walk: sound on her feet into her sixth lactation, settling back in calf as if it were nothing, walking up to milk at an age when her contemporaries were long gone. That’s what Elevation transmitted — and the remarkable thing is he transmitted it all at once: production, udder quality, mobility, fertility, and longevity, in one package, when breeders had spent generations trading one good trait away to get another.

Put numbers on it, and your cup goes down on the table. His daughters averaged about 29,500 pounds in their first lactation — roughly 15% above their contemporaries in the 1970s. And while the industry average was near 2.8 lactations per cow, Elevation’s daughters averaged 4.2. 

Do the barn math on that. Your average cow leaves after 2.8 lactations. Your neighbor’s Elevation daughters are still walking into the parlor at 4.2. Same feed bill to raise the heifer, same calving, and he’s getting roughly half again the productive life out of every replacement. That’s not a show-ring statistic. That’s a mortgage payment. For the farmer living it, the whole thing came down to a simple difference: a cow you fought all year, versus one you forgot to worry about.

A father whose children fill 45 countries

If Chief built his dynasty through a few towering sons, Elevation built his through sheer abundance.

Over 10,000 of his sons became registered AI sires. His semen was shipped to 45 countries. And his descendants — brace yourself — run an estimated 8.8 to 9 million worldwide. There are whole nations with fewer people than this one bull has grandchildren. 

Hanoverhill Starbuck (1979–1998). Elevation’s most famous son. A $2,500 calf whose semen would eventually sell for roughly $25 million, Starbuck sired over 200,000 daughters across 45 countries—and by the early 2000s, some 93% of Canadian Holsteins traced back to him. The Canadian Holstein Association called him, simply, “the Best.” Shown here at five. Photo: Jim Rose. Read more: Hanoverhill Starbuck’s DNA Dynasty: The Holstein Legend Bridging 20th-Century Breeding to Genomic Futures

The most famous of those children crossed the border into Canada and became a legend in his own right: Hanoverhill Starbuck, a $2,500 calf whose semen eventually sold for roughly $25 million. (Starbuck’s story deserves its own evening — The Bullvine has told it in full.) Through Starbuck and ten thousand other sons, Elevation became the patriarch at the head of dinner tables from Wisconsin to the Netherlands to Japan. 

Johanna Rag Apple Pabst, Grand Champion, mid-1920s. Where the family tree begins. The “Rag Apple” buried in Chief’s name and the bloodline behind Elevation’s dam both run back to this one Wisconsin bull—undefeated in 1924 and the foundation ancestor whose name still rides in pedigrees a century on. Walk far enough up the tree, and both grandfathers shake hands here. Read more: The Bull Who Changed Everything: The Johanna Rag Apple Pabst Story

And here’s a detail that ties the whole tree together. Eve — the overlooked B-team mother nobody expected anything from — traced back twenty times to a foundation cow named Johanna Rag Apple Pabst. The “Rag Apple” buried in Chief’s name comes from the same deep well. These two grandfathers, born to different farms in different decades, weren’t strangers at all. Walk far enough up the family tree, and they shake hands. The reunion was always a family affair. 

Northcroft Ella Elevation (EX-97 4E GMD DOM). Both grandfathers in one cow. Born February 26, 1974, Ella carried Elevation on top and an EX-91 Chief daughter underneath—the two bloodlines that fathered half the breed, shaking hands in a single pedigree. The reunion, made flesh. Photo: Remsberg.

Two fathers, two temperaments

Set the two old bulls down at the same table, and you’d have spotted the difference fast. They were nothing alike.

Chief was the quiet workhorse — a production sire whose genius announced itself in the milk tank, lactation after lactation, value measured in pounds and years rather than ribbons. Elevation was the showman with substance, one of the first proven bulls of the modern era who could put a daughter in the ring and fill the bulk tank. One made cows that paid. The other made cows that paid and turned heads on the colored shavings.

Elevation did something else, too — he changed the very machinery that moves genetics around the world. His semen, by one account, helped finance Select Sires and solidify it as a cooperative during its fragile early years. As his own breeder’s cousin, George Miller, put it: “It’s been said that Elevation built the barns at Sire Power and Select Sires.” 

And his fingerprints are still all over the modern toolbox. Here’s the mind-bender: by The Bullvine’s analysis, Elevation’s DNA makes up about 8.3% of the CDCB’s genomic reference population — the very dataset that modern genomic predictions are trained on. Think about that the next time a young genomic bull’s numbers flash up on your screen. The math ranking him was partly based on his own great-great-grandfather. 

The roots run deeper than you think

Speaking of walking up the tree, the story doesn’t actually start with these two.

Dr. Chad Dechow’s work shows that all the great 1960s pillars of the breed trace their male lines back to just two bulls born in the early 1880s: one called Neptune H, born in 1880, and one named Hulleman, born in 1881.

Sit with that. The Father’s Day table you’ve been picturing doesn’t have two chairs at the head — it has two chairs in this generation. Keep walking back, and the whole enormous family narrows again and again until, in the 1880s, it comes down to a pair of bulls who lived before the automobile, before the milking machine, before electricity reached most farms.

We like to think we’re steering. Our index, our matings, our careful selection — surely that puts us in the driver’s seat. And it does, a little. But we’re steering a river that’s been running in the same channel for nearly 140 years. Someday, a breeder none of us will ever meet will trace a herd back to a bull you used this week, and they’ll feel exactly the way you feel as you read these names right now. That’s the strange gift of a breed this old. You’re never just raising cattle. You’re handing something down.

The morning the numbers didn’t add up

Now comes the hard part of every honest Father’s Day — the part where you love somebody and still have to tell the truth about them.

It started, in a way, with researchers staring at a spreadsheet that made no sense.

In 2011, USDA scientists were studying haplotypes — long stretches of chromosome inherited as a single block — when they noticed something wrong on chromosome 5. A particular haplotype was common across the breed. Carriers were everywhere. By the plain arithmetic of inheritance, there should have been thousands of living animals carrying two copies of it. They went looking for those animals. There were none. Not a single one. The double-carriers weren’t dying young or growing up sickly — they were never being born at all. 

Five years later, a team led by Heather Adams with USDA’s Paul VanRaden ran the cause to ground: a single “nonsense” mutation in a gene called APAF1, a typo that truncates more than half the protein it’s supposed to build. 

One copy, and a calf is just a carrier — perfectly healthy. But breed a carrier to a carrier, which is heartbreakingly easy when half the breed descends from the same grandfather, and two copies quietly kill the embryo before it’s ever born.

They traced the haplotype straight back to Chief. And before anyone knew it was there, that single inherited flaw is estimated to have caused roughly half a million spontaneous abortions worldwide — and about $420 million in losses over 35 years. The flip side runs staggeringly in the other direction: the same researchers estimate that Chief’s beneficial genetics added about $30 billion in increased milk production. The gift and the bill, written into the same animal. 

Half a million calves conceived and quietly lost. Half a million heat checks that came up empty — a farmer standing in the barn at dusk, wondering what went wrong, never knowing the answer had been written into the breed’s most celebrated father sixty years before he was born.

That’s no reason to resent Chief. A father doesn’t choose the genes he carries. But it’s the unavoidable math of a narrow family tree: when everyone shares the same grandfather, his hidden flaws stop being rare. The good news — once the mutation had a name, breeders could test for it and breed around it, and U.S. carrier frequency fell from roughly 8% to about 2% within a few years. The defect didn’t end Chief’s legacy. It just made us smarter about how we carry it forward. 

The number landing in your heifer pen right now

Here’s where the history stops being history.

According to Lactanet’s August 2025 update, the average pedigree-based inbreeding of Canadian Holstein heifers born in 2024 hit 9.99%. Nearly ten percent. A generation ago, that figure would have set off alarms. Today it’s just Tuesday. 

That’s what two grandfathers at the head of the table eventually costs a family. Every percentage point of inbreeding chips away at fertility, at calf vigor, at the very longevity that made Elevation famous in the first place. The traits these great fathers gave us are exactly the ones a too-narrow pedigree slowly takes back. By the USDA’s measure, Dr. Dechow puts both Chief and Elevation at a genetic relationship of about 14% to the modern Holstein cow. Two bulls, wearing different hides, make up a huge chunk of your herd. (The Bullvine has run the dollars-and-cents of where this is heading in its breakdown of Holstein’s inbreeding bill.) 

Maxima de Bois Seigneur. Sixty years later, still in the room. A daughter of Stantons Chief—and a direct descendant of Pawnee Farm Arlinda Chief—Maxima stands in a Belgian farmyard as living proof that the old grandfather never left the table. Every time you see a modern cow like her, you’re looking at his influence. Photo: Guillaume Moy. Read more: From Laurie Sheik to Robotic Milking: Bois Seigneur Holstein’s Journey of Innovation

What this means for your operation

Here’s the good news in all of this: knowing the family history is exactly what lets you manage it. So you’ve met the grandfathers — what do you actually do with this on Monday morning? A few concrete things.

Run your matings through a genomic inbreeding tool, not just a pedigree check. With 99.84% of AI sires tracing to two bulls, pedigree alone hides how related your “outcross” really is. The genomic future inbreeding value tells the truth.

Check carrier status for HH1 (APAF1) before you breed a deep-Chief cow. Most catalogs list it. Avoiding carrier-to-carrier matings is the cheapest insurance you’ll ever buy against an empty calving pen.

Put a hard ceiling on expected progeny inbreeding. Many breeders aim to keep a mating under roughly 6–7%. With the Canadian average heifer already at 9.99%, every mating you pull below that line is a small win for the next generation.

Actively hunt the rare outcross lines. They exist. They’re harder to find, and they’re worth the search — the breed’s long-term fertility depends on the breeders who refuse to let the family tree narrow any further.

None of this is a knock on Chief or Elevation. You’d have made the same call any of those old breeders made — the production was real, the longevity was real, the money was real. This is simply the next chapter of stewardship: honoring what the grandfathers built while quietly widening the table for everyone who comes after.

The reunion, and what we owe the dads at the table

Come back to that impossible barn one last time.

The millions of cows. The two chairs at the head. The two old bulls who never met and yet fathered nearly all of it — one a $4,300 gamble out of Pawnee Farm, one a cousin’s hunch off a modest Virginia hillside that had no business working and changed everything anyway. Between them, they handed the dairy world more milk, better udders, longer-lasting cows, and a uniformity that built the modern industry. They also handed down a narrower gene pool and a few hidden flaws their children are still reckoning with. Both things are true. That’s what it means to inherit from a great father — the gifts and the burdens come in the same package, and the work of a lifetime is sorting out what to do with each.

So this Sunday, when somebody asks what you do for a living, tell them the truth. You’re raising the great-great-grandchildren of two bulls born in the 1960s — who themselves came down from a pair born in the 1880s — in a family reunion that has never once adjourned, and never will.

Pour a little extra in the cup. The grandfathers earned it.

Key Takeaways

  • That “outcross” bull on your mating list probably isn’t one — 99.84% of active AI sires trace to Chief or Elevation, so run matings through a genomic inbreeding tool, not just the pedigree.
  • Before you breed a deep-Chief cow, check HH1 (APAF1) carrier status on both sides; a carrier-to-carrier mating is the cheapest way to end up with an empty calving pen.
  • The traits these two gave us — milk, udders, longevity — are the same ones a narrow pedigree quietly takes back, so aim to keep expected progeny inbreeding under roughly 6–7%, against a breed-average heifer already at 9.99%. 
  • The breed’s long-term fertility depends on the breeders who hunt and use the rare outcross lines — they’re harder to find, and they’re worth the search. 

Methodology Note

This article uses several distinct measures of genetic influence that should not be conflated. The 99.84% figure is a paternal Y-chromosome lineage measure derived from Yue et al. (2015, Journal of Dairy Science 98(4):2738–2745, examining 62,897 bulls) — it describes male-line descent, not total genome share; the 99.84% / roughly-half-each breakdown is The Bullvine’s analysis of that dataset. The genetic relationship to the modern Holstein cow (~14% for both bulls) comes from Dr. Chad Dechow’s USDA-affiliated analysis, as reported in Hoard’s Dairyman. The Bullvine reports that Elevation accounts for approximately 8.3% of the CDCB genomic reference population. The HH1/APAF1 facts come from the 2011 USDA haplotype discovery (VanRaden et al., J. Dairy Sci. 94:6153–6161) and Adams et al. (2016, J. Dairy Sci. 99(8):6693–6701), which identified the causative APAF1 nonsense mutation. The estimates of roughly half a million abortions, about $420 million in losses over 35 years, and about $30 billion in beneficial milk production are reported by UC Davis (2016). The 9.99% inbreeding figure is a pedigree-based coefficient for Canadian Holstein heifers born in 2024 (Lactanet, August 2025) and may differ from U.S. CDCB genomic measures. National figures may not reflect your region or herd; verify carrier status and inbreeding values against current CDCB/Lactanet data for your own matings.

Questions, corrections, or a number you’d like us to double-check? Reach out to editor@thebullvine.com

Continue the Story

The Sunday Read Dairy Professionals Don’t Skip.

Every week, thousands of producers, breeders, and industry insiders open Bullvine Weekly for genetics insights, market shifts, and profit strategies they won’t find anywhere else. One email. Five minutes. Smarter decisions all week.

NewsSubscribe
First
Last
Consent

$9,000 in Feed Savings, $100,000 Out the Cull Gate — Read the Right Number

One barn chases $9,000 a year in feed efficiency the index rewards — and loses up to $100,000 out the cull gate it barely scores. Net Merit sees one number. Guess which.

Executive Summary: When CDCB updated Net Merit in April 2025, it effectively priced butterfat near $2.90/lb and methane at $0, pushed the fat weight to 31.8% while cutting protein to 13.0%, and bumped Feed Saved to 17.8% — but the formula re-ranked almost nothing, correlating 0.992 with the old weights for young Holstein bulls. That stability is the trap: it leans on a high-butterfat window that the market already gutted, with CME spot butter sliding from about $2.50/lb in early 2025 to roughly $1.45 by December. For a 1,200-cow, high-output Holstein herd, the bigger blind spot isn’t components — it’s culling. Chasing a genuine 3% feed-efficiency gain is worth maybe $9,000 a year, while 70–100 fewer forced culls is worth $35,000–$100,000 using de Vries-style $500–$1,000/cow modeling, and NM$ only touches that leak indirectly through PL, LIV, DPR, and SCS. Meanwhile, methane sits at $0 even as DFA, Saputo, and FrieslandCampina (already paying €2.63/100kg in sustainability premiums) move toward carbon-graded milk, and the heifers you breed today on a $0 methane value won’t hit the string until 2028–2029. The piece lays out three honest roads — trust the index, adjust it around your own cull and fertility data, or override it with Cheese Merit, EBI, or custom weights — plus a 30-day move: pull your last 12 months of culls, and if more than 70% are involuntary, your breeding goal, not just your transition pen, is the problem.

Net Merit 2025

Editor’s Note: The 1,200-cow western New York Holstein operation in this story is a composite scenario modeled on multiple high-output herds that The Bullvine has reviewed since the April 2025 Net Merit update. The barn math, cull patterns, and adviser conversations are illustrative — drawn from realistic ranges in herd records and published research, not a single farm. All program names, trait weights, researcher names, and economic figures are real and sourced.

Picture the kitchen-table breeding meeting at a 1,200-cow Holstein operation in western New York, late March. Two open laptops. A pot of coffee gone cold an hour ago. A stack of breeding sheets that keeps growing as the herdsman pulls more sire proofs off the printer. This farm is a composite — but the numbers on those sheets are real. For more than a decade, the rule here has been simple: sort by Net Merit, take the top 10 bulls, don’t overthink it.

The vet truck is now a regular fixture at the fresh pen. The hoof trimmer spends most of his day in the high groups. And the cull report shows a rate in the high-30s to low-40s, with most exits starting as a health or fertility problem in the first 60 days.

Sooner or later, somebody at the table asks the question that matters on any operation like this: what is this index actually breeding the herd for in 2030, and does that still match the cows they can keep, and the milk their buyer will want to pay for?

The April 2025 Shift: High-Fat Illusion vs. Genetic Reality

Nobody at this table thinks Net Merit is ‘bad.’ NM$ remains one of the best tools for ranking bulls on expected lifetime profit under typical U.S. conditions. The problem is the gap between the conditions Net Merit assumes and the conditions a herd like this is actually facing now — and will face when today’s calves are in their third lactation.

When the Council on Dairy Cattle Breeding rolled out the updated Net Merit weights in April 2025, the headline changes were clear:

  • The butterfat weight rose from 28.6% to 31.8%.
  • The protein weight dropped from 19.6% to 13.0%.
  • Feed Saved jumped from 12.0% to 17.8%.

Here’s what that fat-heavy tilt means for your actual milk check. The index is telling your breeding program to chase butterfat hard and ease off protein — but it’s pricing those components off lagging multi-year averages, not what your tank is worth this week. Component values swing, Class prices jump, and a fat-to-protein ratio that looked right when CDCB built the formula can flip before the semen you ordered off it ever produces a milking daughter. A static index will always lag a dynamic tank. So the question isn’t just ‘is butterfat valuable?’ — it’s ‘will it still be priced this way when these matings hit the bulk tank in 2028?’

That’s not a hypothetical. CME spot butter traded near $2.50 per pound at the start of 2025 — right in the window CDCB used to reset those weights — then slid to roughly $1.45 by December and hovered near $1.71 by June 2026 (CME via USDA AMS and trade reporting). The index doubled down on fat just as the market spent a year taking the air out of it. That’s the lag in one commodity within a single year.

Translated into pricing, the update effectively values butterfat at about $2.90 per pound and feed at roughly $0.13 per pound of dry matter, while assigning methane a value of exactly $0 in the index math. CDCB and USDA-ARS used recent rolling averages of milk prices and feed margins — drawn from the years leading into the launch — to reset those economics. Butterfat had been the star during that window, trading near the high-$2-per-pound range in many orders, while protein prices sagged. Feed costs spiked, so Feed Saved was worth more.

Methane, heat tolerance, and welfare penalties weren’t in the equation at all. The official Net Merit documentation is explicit: only traits with a direct, currently measurable impact on farm profit are priced into the index, and greenhouse-gas traits are not yet included. CDCB has stated that traits are added to NM$ only when reliable national evaluations and clear economic values exist, and that greenhouse-gas evaluations are ongoing.

One number from CDCB’s own rollout really lands: the 2021 and April 2025 NM$ indexes correlate at 0.992 for young Holstein bulls and 0.981 for recent progeny-tested bulls. In plain language, almost nothing re-ranked. The same bulls a herd would have picked three years ago still float to the top of the list today — even though the butterfat, protein, and feed markets that drove the new formula look different from when most “top 10 NM$ only” rules began.

A growing number of U.S. processors are publicly discussing scope 3 emissions and sustainability reporting, and several have signaled that future producer payments may be linked to greenhouse gas performance. Nothing on the milk cheque yet. But the direction of travel is obvious.

The Bullvine walked through how the updated formula was built in its coverage of the CDCB Net Merit update.

When the Fresh Pen Says “Enough”

The cull report from a herd like this looks a lot like what you see in many high-output Holstein freestall operations. Overall, culling has crept into the high-30s. Sort culls into two piles — voluntary (older, low-producing cows with planned exits) and involuntary (health, fertility, injury, chronic problems) — and most exits are “had to” cows, not “chose to” cows.

There’s no single “official” cost of an involuntary cull, but economic modeling summarized by Albert de Vries and others puts the loss in the $500–$1,000 per cow range when you fold in lost future milk, replacement rearing cost, and health costs. And here’s why the timing hurts so much. Lose a second-lactation cow at 45 days in milk, and you’re not losing an average cow — you’re losing her at the exact moment she’s climbing toward peak yield, the most productive stretch of her life. She never gets the chance to milk back the rearing deficit she ran up as a heifer. You ate two years of feed, labor, and opportunity cost raising her; she’s three weeks from paying it back, and she leaves on the cull trailer instead. Do that 70 to 100 times a year, and the leak isn’t a rounding error — it’s much of the problem.

Cull PatternInvoluntary ShareEstimated Annual LeakLikely Genetic SignalRecommended Action
Mostly older, low-producing cows<30% involuntaryMinimal ($5k–$15k)Program working; monitor components trendStay Path 1; re-check butterfat vs. protein pricing quarterly
Mix of health + low production40–60% involuntaryModerate ($20k–$45k)Fertility and health traits under-weightedMove to Path 2; add DPR/CCR and SCS floors
Dominated by fresh-cow disease, lameness, infertility>70% involuntaryHigh ($50k–$100k+)Breeding goal misaligned with system pressurePath 2 or 3 immediately; audit sire stack for PL, LIV, hoof health
High culls concentrated in first 60 DIM>65% involuntaryHigh + rearing cost unrecoveredTransition risk baked in geneticallyFull genetic audit; consider Nordic/EBI sires for robustness

For 1,200 cows with a cull rate near 40%, even modest improvements in involuntary culling add up fast — and they add up to a number that dwarfs anything achievable by chasing feed efficiency alone.

Where the Money Actually Sits

 Involuntary Cull LeakageFeed-Efficiency Upside
What’s being modeled1,200 cows × 40% cull rate = 480 culls/yr; 15–20% reduction in forced exits = 70–100 fewer “had to” cowsA genuine 3% improvement in feed use (genetics + management together) on 30,000 cwt shipped, at a Northeast purchased-feed cost around ~$10/cwt, consistent with recent Cornell PRO-DAIRY / Northeast Dairy Farm Summary benchmarks
Per-unit economics$500–$1,000 per involuntary cull saved (de Vries-style modeling)3% of ~$300,000 annual feed cost
Annual impact$35,000–$100,000/yr~$9,000/yr (more if your landed feed cost runs higher)
Source of the gainCows staying in the herd long enough to pay off rearing costSmaller cow size + intake efficiency in the Feed Saved PTA
Visible in the index?Indirectly via PL, LIV, DPR, SCS — all under-weighted relative to this leakDirectly via Feed Saved (17.8% weight)

🔴 The P&L Blind Spot

High-output herds are chasing roughly $9,000 a year in marginal feed-efficiency gains the index explicitly rewards — while quietly leaking up to $100,000 a year through transition wrecks and forced culls the index barely sees. One number sits on the spreadsheet your breeding program optimizes for. The other walks out on the cull trailer.

So why is a breeding goal still leaning as hard on production and Feed Saved as the national average?

“We Bred Exactly What We Asked For”

A decade of sire choices on a farm like this tells an ordinary story. The team chased high NM$ and TPI, especially big milk and components. Less weight on body condition and “middle,” more on tall and angular. They eventually bolted on Productive Life and SCS filters once the cost of mastitis and early exits became impossible to ignore.

The cows walking the freestall alleys in 2025 are the predictable result. Powerful milkers, especially in first and second lactation. But many fresh cows dive into a deep negative energy balance — the window Cornell and PRO-DAIRY transition research has long flagged as the highest-risk stretch for high-output Holsteins — that drops them right on the edge between “profitable” and “problem.”

In our reporting on transition cow disease across high-output Holstein herds, one pattern keeps surfacing: genetics now produce cows that can out-milk the ability of an operation to keep them healthy through the first 60 days. Good transition management still helps. But genetics quietly loads the dice against you before the calf is even born.

Cornell’s NYSCHAP transition-cow benchmarks draw the alarm lines in hard numbers: displaced abomasum at or above 6% (target under 3%), milk fever at or above 5% (target under 2%), retained placenta at or above 10% (target under 8%). Herds that have selected hard on production for years tend to flirt with those lines unless genetics and transition management are pulling in the same direction.

Lay health and culling patterns next to a genetic trend, and what shows up isn’t a “transition program” problem. It’s a breeding-goal problem that’s been compounding across multiple sire generations.

If you want the mechanics, The Bullvine breaks down how feed efficiency is actually measured in its primer on residual feed intake.

Net Merit: Where It Still Helps and Where It’s Blind

This isn’t “abandon NM$.” It’s knowing what Net Merit is genuinely good at for a herd like this — and where it’s blind.

Where NM$ still shines:

  • Ranks bulls for lifetime profit under average U.S. confinement herd economics, assuming FMMO-style component pricing and no carbon price.
  • Keeps obviously risky sires — very poor somatic cell, extremely low fertility, weak livability — out of the tank.
  • Provides a consistent national yardstick to compare bulls, cow families, and herds.

Where NM$ goes blind for this kind of herd:

  • Feed efficiency. The Feed Saved trait combines actual feed intake data, where available, with the body weight composite. A big slice of that PTA still comes from smaller cows, not necessarily cows that convert feed more efficiently at the same size. For a herd already pushing milk per stall hard, smaller isn’t automatically better if it means less “middle” to handle higher output.
  • Environment. Methane and other environmental externalities are valued at $0 in the NM$ formula. Any future carbon premium or deduction from a processor is invisible to the index, which leaves any herd thinking about methane efficiency or low-carbon dairy genetics working off-index.
  • How it plays in robots. Udder and teat composites that work fine in a parlor can be a headache in AMS barns. Robot herds have learned the hard way that rear teats too close together are one of the quickest ways to make a robot hate your cow. National udder composites weren’t originally built around AMS needs.
  • Responsiveness. The April 2025 update didn’t add any new traits and barely moved bull rankings overall, despite real changes in butterfat prices and feed costs. That’s a deliberate trade-off CDCB makes to keep the national index stable: changes that re-rank too many bulls or invalidate years of breeding decisions are, by design, hard to push through quickly.

For a herd with a full fresh pen, a high share of involuntary culls, and a processor warming up for sustainability scoring, NM$ is still useful — but more as a minimum standard than the steering wheel.

Trust the Index, Adjust It, or Override It?

Here’s where the kitchen-table conversation gets honest. Three roads forward. And which one you take isn’t a personality test — it’s dictated by how far your herd has drifted from the “average U.S. parlor herd” the index assumes.

Start at Path 1. The further your reality sits from that national average, the further down the line you move. Cull report still looks normal, and your processor’s quiet on carbon? Trust works. Watching involuntary culls climb, and fresh-pen disease creep toward those NYSCHAP alarm lines? You’re already past Path 1, whether you’ve admitted it or not. Running robots, grazing, or staring down a processor sustainability contract? You’re at Path 3. Find the road that matches what you’re actually living — then decide whether it still fits the next decade.

Selection PathPrimary Sort ToolKey AssumptionWhat You Give UpRed Flag Trigger
Path 1 — Trust NM$NM$ top 10–20 bullsAvg U.S. confinement economics, FMMO pricing, no carbon priceDirect control over methane, AMS udder fit, index lagInvoluntary culls >70%; fresh-pen disease at NYSCHAP alarm lines
Path 2 — Adjust Around Your DataNM$ as gatekeeper + custom minimumsYour DPR, CCR, mastitis, and hoof floors override top-end rankingSome NM$ points at top of listHigh forced-cull rate + processor starting carbon conversation
Path 3 — Override the IndexCheese Merit / EBI / NTM / custom weightsYour system (robots, grazing, OAD) differs materially from national averageSingle national ranking; smaller reference populationsRobots, grazing, processor sustainability contract, OAD milking
Methane Value in Each Path$0 (NM$)$0 (NM$)€2.63/100kg already paid in NLU.S. processor carbon premiums ~2028–2030 window

Path 1 — Trust the Index

You are here if: Your primary sire-selection rule is “sort by NM$, take the top 10–20 bulls, move on.”

What it assumes: Average U.S. confinement herd economics, FMMO-style component pricing, no carbon price, and a herd structure close to the national mean.

What you give up: Direct emphasis on the traits NM$ doesn’t price — methane, heat tolerance, AMS-specific udder design — plus any responsiveness to the gap between your milk cheque and the index’s pricing assumptions.

Honest tell: If your involuntary cull share is climbing and your fresh-pen disease rates are flirting with NYSCHAP alarm levels, “trust” is quietly costing you the leakage in the table above.

Path 2 — Adjust Around Your Own Data

You are here if: You use NM$ as a gatekeeper but layer your own minimums on top.

What it looks like in practice: A hard floor on Daughter Pregnancy Rate and Cow Conception Rate. More weight on mastitis resistance and hoof health, where credible proofs exist. A preference for bulls with real feed-intake data behind their Feed Saved PTAs, not just a smaller body weight composite. Acceptance that you’ll give up some top-end NM$ points to get cows that stay in the herd longer.

What you give up: Some short-term genetic merit on the top-line index number.

Honest tell: If your composite herd looks like the New York one in this story — full fresh pen, high involuntary culls, processor talking carbon — this is usually the right starting road.

Path 3 — Override the Index

You are here if your future system looks materially different from the “average U.S. parlor herd.”

What it looks like in practice: Cheese Merit or Grazing Merit as your primary sort instead of NM$. Irish or Nordic sires were brought in because EBI and NTM placed greater weight on fertility, pasture performance, and emissions. Or rough custom economic weights built off your own numbers — your feed costs, your culling pattern, your labor situation, and the language in your processor’s contract.

What you give up: The simplicity of a single national ranking, and reference populations that may be smaller for some traits.

Honest tell: Robots, grazing, OAD, processor sustainability scoring, or a strong components-only payment structure are all signs the override path is worth a serious look.

A composite herd like this New York operation usually lands between Path 2 and Path 3. Keep an NM$ threshold but stop insisting on only top-10 bulls. Weight health, fertility, livability, and moderate stature harder when picking sires. Hunt for bulls with credible feed-efficiency stories. And look at EBI-bred and Nordic sires with curiosity instead of writing them off as “pasture bulls from somewhere else.”

The agreement that emerges around the table is usually the same: cows that stay in the herd and pay off their rearing cost deserve more weight in the breeding goal than cows that leave after one or two rocky lactations.

What Does a Case of Ketosis Really Mean for Your Genetics?

Most of us talk about genetics and picture proofs before pens. The health patterns in your fresh pen are exactly where your index choices show up.

Take ketosis. Cornell research led by Jessica McArt and recent extension summaries put a single case of clinical ketosis in the low hundreds of dollars per cow — published estimates range from roughly $117 to over $230 per case once treatment, lost milk, reproduction delays, and added culling risk are factored in. The exact number depends on the system and prices, but it’s not trivial.

Run the example off this herd’s scale:

  • 1,200 cows, with 10% hitting some form of ketosis in early lactation. That’s 120 cases.
  • If better genetics and management together trimmed that by 20%, that’s 24 fewer cases.
  • Use a conservative blended estimate of around $150 per case to stay on the low end of published ranges, and you’re looking at about $3,600 a year back in your pocket.

You’re not retiring on that number. But stack it with fewer DAs, fewer down cows, better fertility, and a few more cows making it into third and fourth lactation, and now you’re talking real money.

Changing trait weights doesn’t magically fix everything. But the cows getting sick now are partly the product of mating decisions made 5–10 years ago. The same proofs that gave you high-octane milk can quietly raise the odds that cows tip over in a high-pressure transition program. And if the cows that stay in your herd don’t look like the cows your index rewards, your genetic goal and your business have stopped agreeing with each other.

This isn’t a “transition program” problem that showed up in 2025. It’s a long-running genetic strategy that never got updated as the economics and farm realities shifted around it.

Is Your Index Already Behind Your Processor?

The other source of tension at the table isn’t the vet bill. It’s the milk buyer.

Several large U.S. processors — Dairy Farmers of America among them, with its publicly committed net-zero greenhouse-gas goal by 2050 and ongoing scope-3 reporting, and Saputo with its publicly stated commitment to reduce absolute scope 1 and 2 emissions and to engage suppliers on scope-3 emissions by 2030 — have lined up sustainability targets that put farm-level emissions on the table. Nobody knows exactly what the premium and deduction structure will eventually look like. But at some point, a kilogram of milk from a low-footprint herd won’t be treated the same as a kilogram from a higher-footprint one.

International examples are the warning shot. In November 2022, Ireland’s Economic Breeding Index added a dedicated carbon sub-index, which ICBF and Teagasc set at a 10% weighting of the total EBI — putting a monetary value on emissions at €80 per tonne of carbon dioxide. Teagasc and ICBF data show cows bred under EBI have become measurably more carbon-efficient per kilogram of milk solids, mostly through higher fertility, better solids, and tighter calving patterns, diluting emissions per unit of output.

Now factor in the clock that makes this urgent: a dairy animal’s generation interval runs roughly 3 to 4 years. Breed off a “$0 methane value” index today, and the heifers you’re creating won’t even enter the milking string until 2028 or 2029 — and they’ll be in your herd for years after that. So if a U.S. processor lands a carbon premium or deduction by the turn of the decade, the cows facing that penalty are being conceived right now, off an index that prices their emissions at nothing. You’re not breeding for today’s milk cheque. You’re breeding for a milk cheque you can’t see yet, with a tool that pretends carbon is free.

Dutch dairy co-op FrieslandCampina already runs the real-world version of this on the milk cheque. The co-op paid out more than €245 million in sustainability premiums to member farms for 2023 — averaging €2.63 per 100 kg of farm milk — with about €190 million of that flowing through the Foqus planet sustainable-development incentive system, and the remaining €55 million-plus tied to special milk flows such as organic and PlanetProof. The exact split shifts year to year, but the principle is fixed: greenhouse-gas and sustainability performance is already cash on a Dutch milk cheque.

Index / ProgramCountryMethane / Carbon ValueFertility WeightSustainability on Milk Cheque?
Net Merit (NM$) Apr 2025USA$0~10% (DPR/CCR)No
Economic Breeding Index (EBI)Ireland€80/tonne CO₂ (10% sub-index)~38% (fertility)Indirect via EBI-linked premiums
Nordic Total Merit (NTM)Sweden/Finland/DenmarkIncluded in health/longevity cluster~15–20%Partial (national programs)
Grazing MeritUSA (alt)$0Higher DPR floorNo
FrieslandCampina FoqusNetherlandsPriced into farm sustainability scoreStandard NLYes — avg €2.63/100kg paid in 2023

The Bullvine broke down exactly how that bonus lands — and why it doesn’t always show on the cheque — inFrieslandCampina Pays €2.63/100kg Sustainability Bonus.

Net Merit still values methane at $0, even after the April 2025 update. For a herd that sells embryos or bulls, or supplies a processor already thinking in carbon accounting, that mismatch matters. If your index assumes greenhouse gases cost nothing and your buyer’s long-term plan treats them as a real liability, you’re breeding into a gap that shows up somewhere — on your milk cheque, in your access to certain programs, or in how marketable your genetics are to buyers further down the sustainability path.

For a herd like this, that’s the final nudge. Nobody wants to discover in 2030 that their genetics were perfect for a 2023 milk cheque and badly misaligned with a carbon-graded market.

For the bigger picture on the 2025 base changes, see The Bullvine’s full breakdown of CDCB’s 2025 genetic base and merit indices update.

What This Means for Your Operation

  • Pull your last 12 months of cull records and sort them into “voluntary” and “involuntary.” If more than 70% of your culls are involuntary, and infertility, lameness, mastitis, and transition disease top the list, that’s a strong sign you need more genetic emphasis on health, fertility, and robustness — not just better management.
  • Ask your genetics adviser one specific question about Feed Saved. For the bulls you’re using, how much of their Feed Saved PTA is attributable to true feed intake data versus just smaller body size? If the answer leans heavily on body weight composite, you’re mainly selecting for smaller cows, not necessarily cows that convert feed better at the same size.
  • Compare your milk cheque to the index’s pricing assumptions. Net Merit’s updated weights lean toward butterfat and protein values that reflect recent U.S. component prices, with a heavier emphasis on fat than on protein. If your market pays more aggressively for protein, or your fat price has already slid from those highs — and it slid hard through 2025 — give Cheese Merit or a custom trait profile more weight alongside NM$.
  • Look at your 5-year system plan, not just this proof run. Are robots, grazing, or alternative housing in the pipeline? Start filtering now for the traits that matter in those systems — teat placement and udder depth for robots, fertility and feet for grazing — instead of assuming the national composite will automatically produce the right cows.
  • Do one “override the index” exercise in the next 30 days. For your next semen order, deliberately pick two or three bulls that aren’t in your usual top-10 NM$ list but rank strongly for the traits your own numbers say matter most. Track their daughters separately. See whether they match the kind of herd you actually want to milk.
  • Use your own numbers to set genetic red lines. If your records show that DAs, metritis, or down cows at certain levels destroy your margin, work with your adviser to set minimum thresholds for relevant traits — not just maximum NM$ points — and stick to them.

Key Takeaways

  • If your cull report is dominated by cows you “had to” ship, that’s not just a transition management story — it’s feedback on your breeding goal. Genetics and management pull on the same rope. Adjust only one end, and the herd won’t move very far.
  • Net Merit’s updated weights make it a solid national index, but it’s built on 2021–2024 economics with zero value on methane and limited direct emphasis on the traits that keep cows in a high-pressure system. Use it as a baseline, not a blind autopilot.
  • Your own data is the best starting point for adjusting or overriding the index. The three biggest leaks in your P&L — usually involuntary culls, fresh-cow disease, and labor around “problem cows” — should drive more of your trait emphasis than they probably do today.
  • If your processor, lender, or genetics customers are already talking about sustainability and 2030 targets, your breeding program is in the sustainability business whether you like it or not. The genetics you choose now will decide whether your herd fits those programs or constantly fights them.

A herd like this, the New York composite, still looks at NM$ every proof run. The difference, once the conversation goes honestly, is that it becomes one lens, not the whole picture. The sire list bends toward cows you can keep, and toward a milk cheque your buyer is likely to be writing in 2030, not 2019.

If you laid your last ten years of sire choices next to your last 12 months of cull reasons and vet bills, would those two stories look like they came from the same farm — or is it time to redraw your genetic target?

Run Your Numbers

Herd Health ROI Calculator — This article puts the cull-gate leak at up to $100,000 a year. Plug in your own culling rate, replacement heifer cost, and mastitis incidence to see what slowing those forced exits is actually worth on your herd — before you blame the breeding goal or the transition pen.

Complete references and supporting documentation are available upon request by contacting the editorial team at editor@thebullvine.com.

Learn More

The Sunday Read Dairy Professionals Don’t Skip.

Every week, thousands of producers, breeders, and industry insiders open Bullvine Weekly for genetics insights, market shifts, and profit strategies they won’t find anywhere else. One email. Five minutes. Smarter decisions all week.
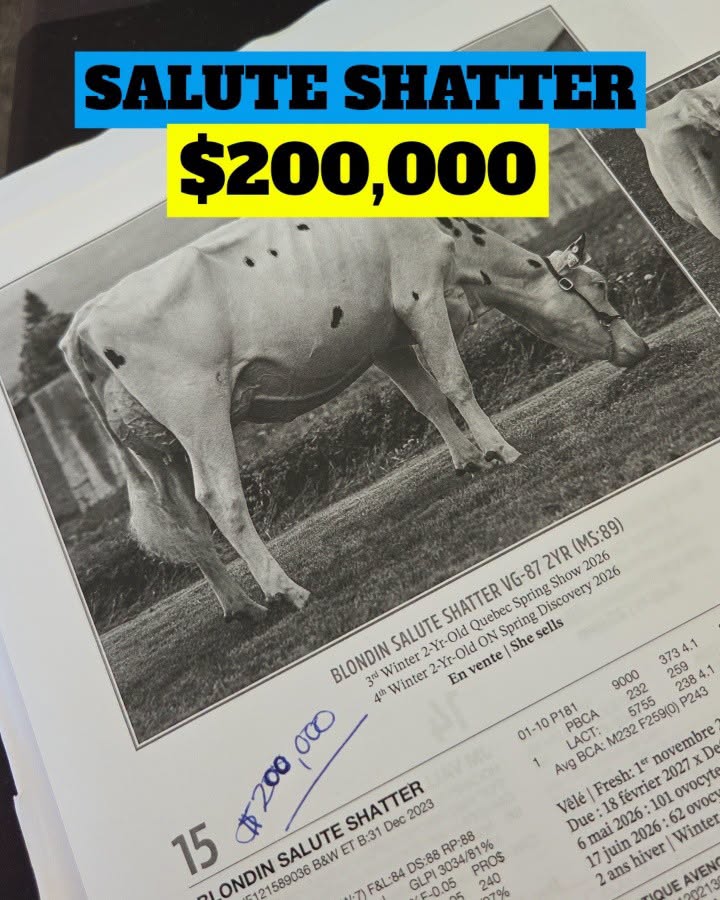
NewsSubscribe
First
Last
Consent

Falling Semen Sales Aren’t Bad News – They’re Proof You Bred Better

U.S. dairies bought 45.8M semen units in 2025, down 6% — and NAAB’s Jay Weiker says that’s a win. Fewer straws settled the same cows. Here’s what your breeding mix should do next.

Jay Weiker has spent 40 years watching how dairy farmers breed cows. So when the president of the National Association of Animal Breeders sat down with CDCB CowCast host Katie Schmidt and was asked what’s behind the latest sales figures, his answer cut counter to the usual gloom. Total U.S. semen sales fell about 6% in 2025, down to 45.8 million units, and Weiker’s read is that part of that drop is a win. Dairies are settling cows with fewer straws because they’ve gotten better at reproduction. “If you’re doing a better job, you’re actually losing some of your market if you’re an AI company,” Schmidt said on the episode. “Putting ourselves out of business,” Weiker agreed — “but keeping dairymen in business.”

There’s the tension worth your time. The same skill that tightens your conception rates is shrinking a supplier’s order book. And the mix underneath that 45.8 million — sexed, beef, conventional — tells you exactly how fast your breeding calls are reshaping the calves that hit your barn floor. Weiker’s organization isn’t guessing at these numbers, either. NAAB members produce about 95% of the semen used in the U.S. and roughly 99% of what’s exported, and they report units quarterly.

What’s Changing and Why

Start with the headline number. Weiker reported 2025 sales of 45.8 million units, down about 6% from 2024 — though 2024 itself ran roughly 4% ahead of 2023. So this isn’t a collapse. It’s a herd that held steady and is now getting bred more efficiently.

Split that 45.8 million three ways and it sharpens. Just under 17 million units sold domestically — about 37% of all dairy semen. Exports accounted for the bigger share, at roughly 28 million units, or 63%. The rest was custom collection for non-members. Here’s the part to sit up for: over the past four or five years, domestic dairy semen use has been declining, which is why exports keep climbing as a share of the total.

Who’s affected? Just about every U.S. dairy that’s sharpened its repro program — which is most of them. Weiker pointed to three forces pulling straws-per-pregnancy down: producers selecting harder for female fertility, AI companies leaning into bulls with positive daughter pregnancy rate, and steady work on semen quality through the lab and bull health. Stack those on a herd that isn’t expanding, and the result is blunt. Weiker’s phrase: “It’s just a mathematical fact.” Fewer units to settle the same cows.

How This Plays Out on Real Farms

What producers are actually buying isn’t “less breeding” — it’s smarter sorting. Gender-selected (sexed) semen is now the top-selling dairy semen type in the country. It grew by about 6% last year and accounts for 64% of dairy units sold domestically. Producers genomic-test their cows and heifers, decide which females are worth raising replacements from, and put sexed semen on exactly those animals.

The flip side is the bottom of the herd. Beef-on-dairy held constant in 2025, Weiker said, but it’s still the number-two category — beating conventional dairy semen by 2.1 million units. Feedlots want a black-hided crossbred calf, not a purebred dairy steer. So conventional dairy semen erodes from both ends: sexed on the top cows, beef on the bottom.

How fast did that shift happen? Look at the national breeding record. USDA’s data shows beef semen used on dairy cows climbed from essentially a rounding error a decade ago to more than 8 million units a year by the mid-2020s, while dairy-cow numbers barely moved. That’s not a few early adopters — that’s the herd at large rewriting its own breeding sheet inside ten years. Weiker’s “equilibrium” comment is the key tell here: producers are now backing off the gas, doing the replacement math first and only then deciding how many cows go to a beef bull.

Here’s a barn-math moment you can map to your own parlor. Take a 100-cow herd that needs about 30 replacement heifers a year. If you can cover those 30 by aiming sexed semen at your top 35–40 genomic-tested cows over the breeding season — building in conception and the roughly 90% female skew sexed semen throws — every remaining breeding is freed up for beef. And that’s where the money moved. Through early 2026, Holstein bull calves that once brought $300–$450 have been running $700–$1,000 in stronger markets, while well-bred beef-cross calves topped $1,500–$1,750 in parts of Wisconsin and cleared $1,000 in Pennsylvania — a real premium spread of roughly $200 to $700 a head depending on quality and region. Push 30 to 40 crosses through in a year instead of dairy bull calves, and you’re swinging calf revenue well into five figures on a 100-cow herd.

But the same call quietly raises the cost of the heifers you didn’t make. Replacement heifers averaged $3,010 a head in USDA’s July 2025 Agricultural Prices report — a national figure — and quality heifers have been commanding $2,500–$3,000-plus into 2026, with top genetics nearer $4,000. The calf check you cash today is also a bet on what it’ll cost to refill your parlor in two years. Weiker and Schmidt kept circling that point: the beef decision you make this month is really a replacement-pipeline decision down the road.

The Mechanics Behind the Outcomes

The whole system runs on a sorting logic that genomics has unlocked. Asked which technology surprised him most in four decades, Weiker didn’t hesitate: genomic selection. Sexed semen was “a game changer” on its own, he said, but genomics “moved the needle much more than anything else.” It’s what lets you decide, with real confidence, which females become the next generation and which get bred beef.

Keep one thing straight, because it’s easy to muddle. Genetics and immediate semen savings are two different levers. When Weiker points to AI companies pushing bulls with positive Daughter Pregnancy Rate (DPR), that’s a long-game genetic trait. It shows up years out in how your daughters settle. The drop in straws-per-pregnancy you’re seeing right now is mostly due to near-term factors: service sire fertility, semen quality, and sharper heat detection on your end. Schmidt made the same point on the episode, noting how low the heritability of female reproductive traits is — meaning management and environment drive most of what you see this season. DPR builds the herd you’ll milk in 2029. Your protocol and the bull’s fertility are what led to fewer straws in fewer cows this year.

That confidence is why conventional semen keeps sliding. Why gamble on a coin-flip Holstein calf when you can aim for a heifer from your best cow or a marketable cross from the rest? One wrinkle most producers never see: a lot of that beef semen now ships as heterospermic straws — semen from several bulls mixed in one dose. And there’s a reason it caught on specifically for beef-on-dairy. Beef-cross conception can lag your dairy semen, partly because a beef bull collected for the dairy market can have an off day — a fever weeks before collection that never shows under a microscope. Motility looks fine; conception doesn’t. Mix several bulls in one straw, and the others cover for him, pulling the group’s conception close to the best bull in the dose instead of dragging on the worst.

You give up knowing the exact sire. For a calf bound for a feedlot, most producers take that trade to claw the fertility back. There’s a real cost, though, and Schmidt named it: without a sire ID on a beef-cross calf, the industry can’t easily learn which beef bulls produce the most productive crosses. That gap doesn’t close until parent verification gets cheap enough to genomic-test calves routinely — and it isn’t there yet.

How Much Is the China Closure Costing the Export Side?

If you want the number that genuinely jolts this story, it’s not domestic — it’s China. In February 2025, China closed its market to U.S. semen. Members had shipped maybe two months’ worth, Weiker said, then nothing for the 15 months since. China had been the number-one export market by both volume and dollar value in 2024. By 2025, it dropped to number 15. If it doesn’t reopen — and there’s no sign it will — it likely won’t even make the export list in 2026.

So how did total exports hold flat anyway? The rest of the world picked up the slack. Members export to more than 120 countries, with over 40 markets each importing more than $1 million in product in 2025. The current top 10 by dollar value: the UK at number one, then Italy, Mexico, Russia, Brazil, Canada, France, Japan, Australia, and Poland. Not every China unit found a new home — but enough did to keep the total steady. That’s resourcefulness, not luck.

Why does that matter to a producer who never exports a straw? Because export demand is part of what keeps a deep bull lineup commercially viable for the studs you buy from. When a top market vanishes overnight, it changes which bulls get sampled, housed, and marketed — and Weiker noted that some members are already weighing where they physically house bulls to avoid trade barriers. The semen catalog you order from doesn’t exist in a vacuum. It’s shaped by demand from 120 countries, and right now, one big buyer just walked off the board.

Is Your Herd’s Breeding Mix Keeping Up With the Country?

Pull your breeding records and run a quick count. What share of last year’s services were sexed, beef, and conventional? Hold it against the national pattern Weiker laid out: sexed at 64% of domestic dairy units and climbing, beef holding strong and beating conventional by 2.1 million units, conventional fading. If you’re still running a heavy book of conventional dairy semen on cows you’d never raise a replacement from, you’re breeding against the grain of where the data says the value sits.

Semen TypeShare of U.S. Domestic Dairy Units2025 DirectionWhat It Signals for Your Book
Sexed (gender-selected)64%Rising (+6% in 2025)Top genomic-tested cows — your replacement engine
Beef-on-dairy~24% (beats conventional by 2.1M units)Holding steadyBottom of the herd → marketable feedlot calves
Conventional dairy~12%Declining (multi-year)Needs a real outlet — “we’ve always done it” isn’t one
All dairy semen (total)45.8M units (down ~6%)Down on better reproFewer straws settling the same cows

That doesn’t make you wrong — your costs, your heifer needs, and your feedlot outlets all factor in. But it’s a question worth asking before your next semen order, not after. Weiker’s own read: conventional will likely continue to decline, sexed will likely continue to rise, and beef-on-dairy will settle into an equilibrium once producers finish calculating how many replacements they actually need versus how many cows they can hand to a beef bull. Worth noting one quirk he flagged — overseas, the mix runs backward, with roughly two-thirds of exported dairy units still conventional and only 13% sexed, mostly down to feedlot preferences and cheaper semen abroad.

MetricU.S. DomesticExportTakeaway
Sexed share64%~13%Mirror image — home sorts hard, world doesn’t
Conventional share~12%~67%Cheaper semen + feedlot preferences abroad
Share of total units~37% (~17.0M)~63% (~28.0M)Export now carries the volume
Top market shiftn/aChina #1 (2024) → #15 (2025)Demand from 120+ countries shapes your catalog

Your 30-Day Playbook

Forget the long-range philosophizing. Here’s what to actually do this month and the trade-off for each move. Pull your breeding records and your last 12 months of calf-sale receipts before you read the table — you’ll need both.

MoveDo this in 30 daysWhen it paysThe catch
Count your real replacement need firstRun Penn State Extension’s replacement formula: herd size (milking + dry) × cull rate × (age at first calving ÷ 24) × (1 + heifer non-completion rate). Lock that number before you reorderAlways — every move below depends on it, and Weiker says beef-on-dairy equilibrium is being set by farms doing exactly this mathGuess high and you over-make heifers you can’t afford to raise; guess low and you’re bidding $3,010-plus to refill your parlor
Sexed on top, beef on the bottomMap your sexed-vs-beef split against that replacement number; sexed on your top genomic-tested cows, beef on the restWhen you’ve genomic-tested enough to know your top females cold; 64% of domestic dairy units are already sexedOver-breeding beef on viable dams trades away replacement value at $3,000-plus heifer prices
Audit the conventional bookPull what share of last year’s services were straight conventional dairy, and on which cowsOnly where you’ve got a real outlet for purebred dairy bull calves or a genuine cost caseNationally it’s a multi-year decline — “we’ve always done it” isn’t an outlet
Price heterospermic vs. single-sire beef strawsAsk your rep for both and check your beef-cross conception trendWhen your beef-cross conception’s been streaky and the calves are feedlot-boundYou lose sire ID — a real cost only if you’re building beef-on-dairy performance data

Key Takeaways

  • If conventional dairy semen still fills a big share of your book, ask what real outlet justifies it — nationally, it’s losing ground to sexed on top and beef on the bottom, and habit isn’t an outlet.
  • If you haven’t counted your exact annual replacement need lately, run the Penn State formula before your next order — the whole sexed-vs-beef ratio hangs on that one number.
  • If your beef-cross conception’s been streaky, price heterospermic against single-sire — but only accept the lost sire ID if you’re not trying to build beef-on-dairy performance data.
  • If any of your decisions touch your bull lineup or export marketing, watch China — a number-one market that went to number 15 in a year, with the rebound riding on 40-plus smaller markets, not one big buyer.

So here’s the question to carry into your next breeding meeting: does your sexed-beef-conventional split actually match the number of replacements your herd needs in 2027 — or are you breeding on last decade’s habits? Weiker’s been right about the direction for 40 years, and the direction is more sorting, not less. The farms that come out ahead are the ones that run their own ratios instead of guessing them.

Complete references and supporting documentation are available upon request by contacting the editorial team at editor@thebullvine.com.

Learn More

The Sunday Read Dairy Professionals Don’t Skip.

Every week, thousands of producers, breeders, and industry insiders open Bullvine Weekly for genetics insights, market shifts, and profit strategies they won’t find anywhere else. One email. Five minutes. Smarter decisions all week.
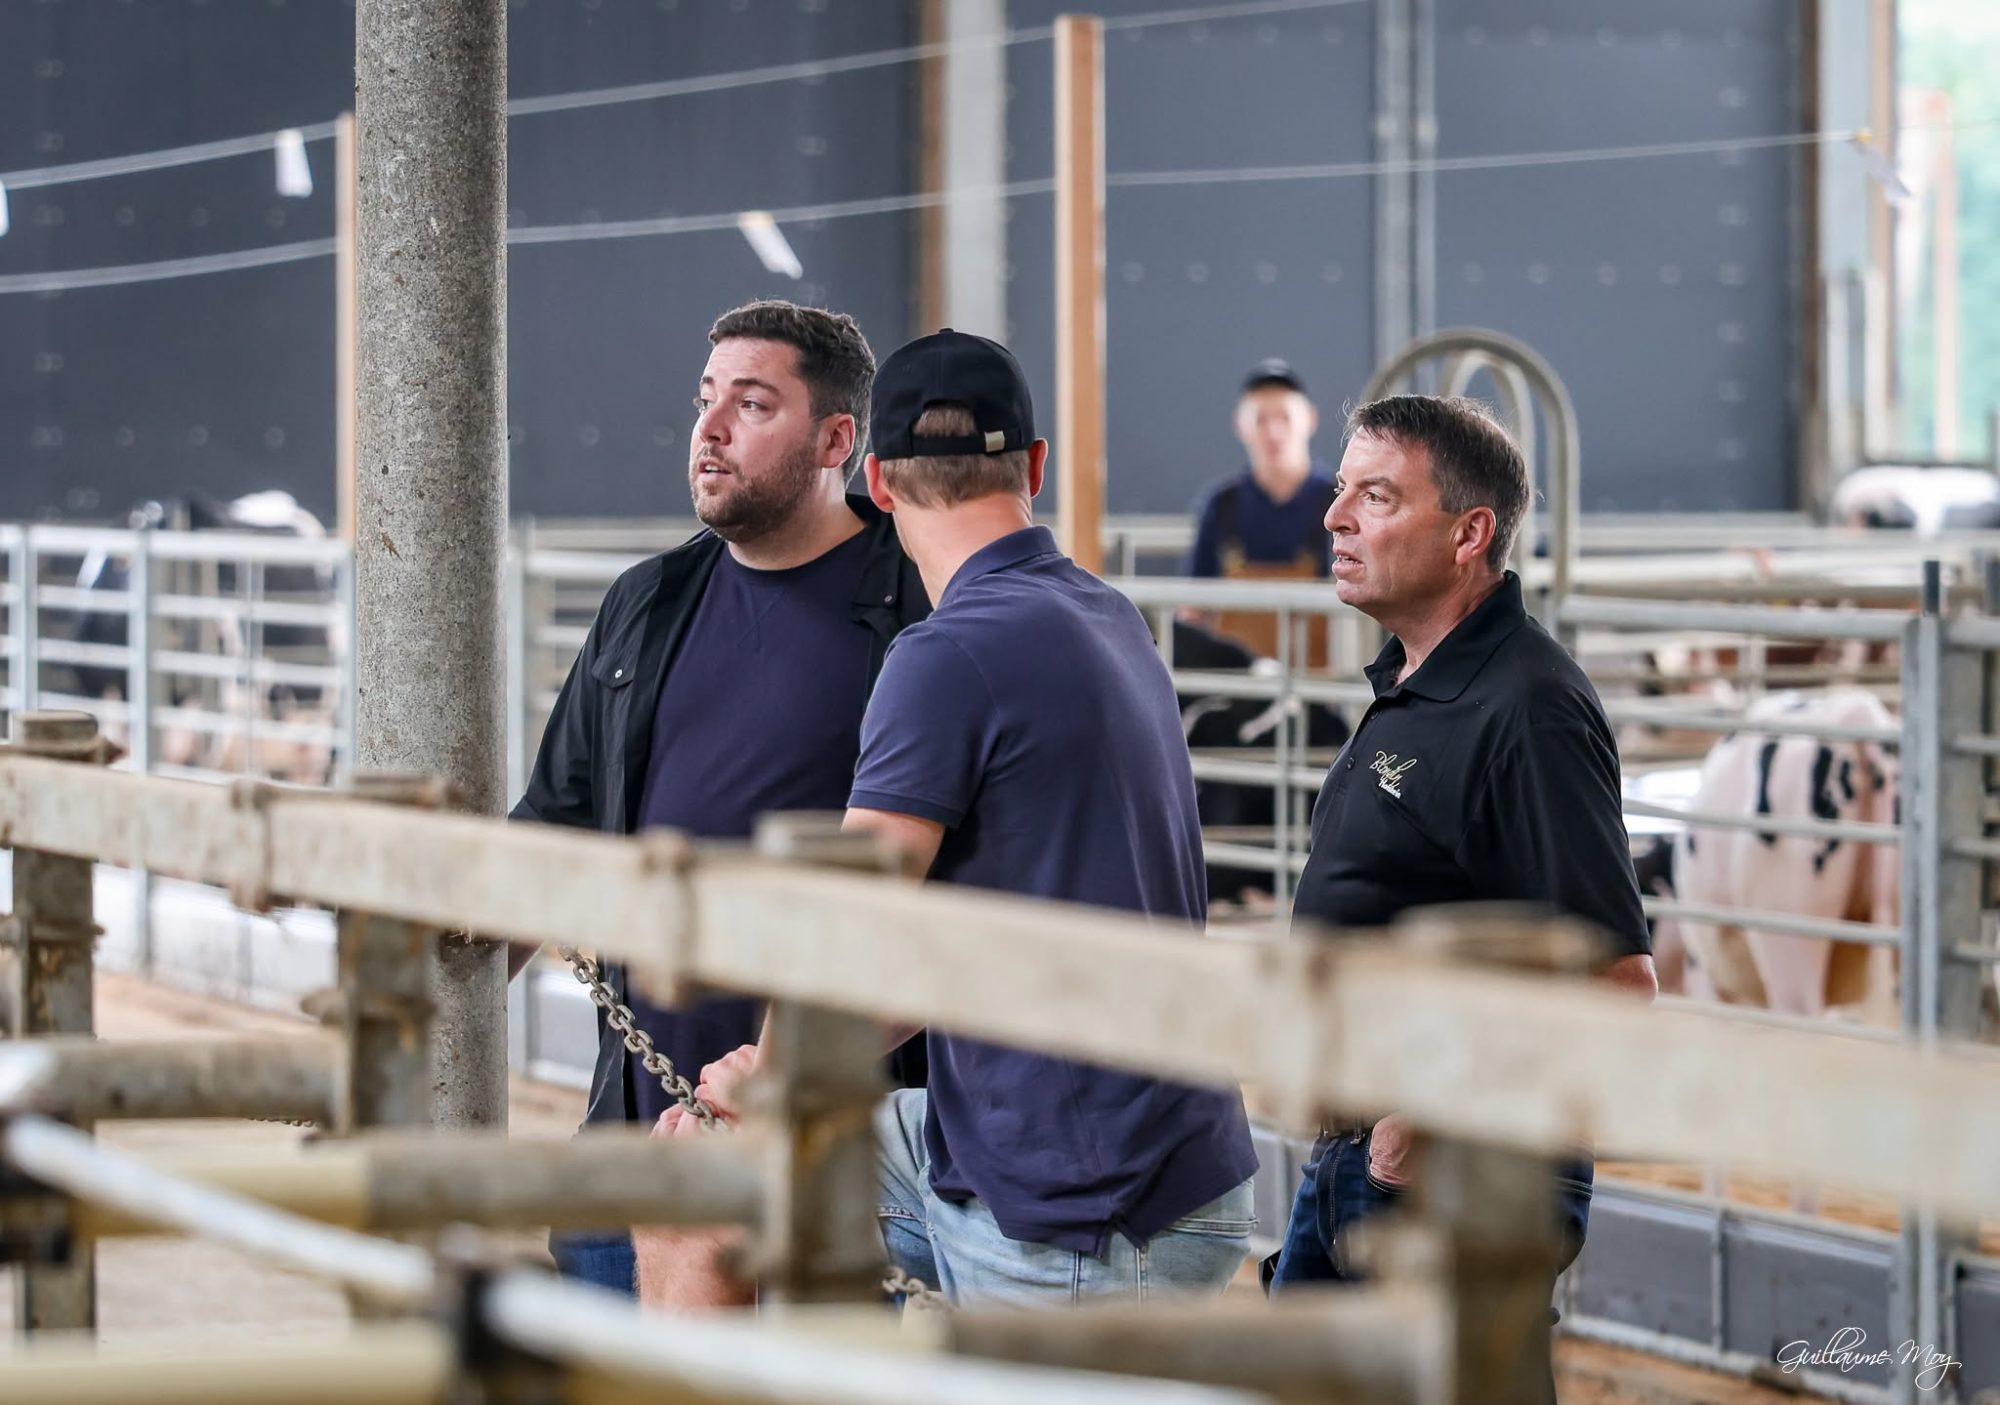
NewsSubscribe
First
Last
Consent

The Proof You Waited Three Years For Averaged a $72 Markdown

A young bull sells semen from first release to proof and beyond — he’s earning the whole time. So the only thing the wait actually buys you is the proof itself. And on average, the proof tells you less than his DNA already did.

Editor’s Note: The stud manager in the opening is a composite scenario modeled on publicly reported AI-stud practices, used to illustrate a real industry dynamic. It does not depict a specific individual.

Run the scenario at a typical mid-size AI stud in spring 2026. The manager’s got roughly 100 young bulls in the lineup, each one a genomic bet placed two or three years ago. Every one was genotyped as a calf. He already knows, to a tight reliability band, what most of them transmit — and their semen has been selling the whole time. The question isn’t whether they earn their keep; they do. The question is what he’s still paying for on the ones he holds all the way to a traditional daughter-proof. Because that wait carries a cost almost nobody puts a number on — and buys something worth less than most people assume.

Holstein International ran a tidy table on this. Fifty studs, one column, retention rates running from “less than 5%” to a flat 100%. Aberekin keeps everything. Elitest and VikingGenetics keep almost nothing. The takeaway, more or less: proven bulls still sell, philosophies differ, isn’t that interesting.

It is interesting. It’s also a snapshot dressed up as an answer.

What does the wait for a proof actually buy?

Less than you’d think — and here’s the number nobody puts on it.

Start with what the proof costs to chase. A peer-reviewed decision tool, BullVal$, published in Animals in 2023, uses an AI company’s own estimate of $30 per bull per day to cover physical maintenance — feeding, housing, and veterinary care. That $30 is one company’s published figure, not an industry average, so treat it as order of magnitude. Hold a bull from his genomic debut as a yearling until his daughters milk and a proof lands — three to four years, call it 1,200 days — and that’s roughly $36,000 in maintenance.

The carry, in one line

$30/day × 1,200 days ≈ $36,000 per bull in maintenance — running on top of, not instead of, the semen he’s selling the whole time. The doses earn; the wait is the cost.

His semen sells the entire time he stands, often at full price from first release. So the $36,000 isn’t money spent on an idle animal — it’s the overhead of running him long enough to reach a daughter-proof. Which raises the real question: what does that proof actually tell you that his genotype didn’t?

Here’s the answer, with a number on it. Virginia Tech tracked the December 2011 proofs on more than 2,400 genomic-tested Holstein bulls — bulls already marketed on their genomic predictions. When the daughters finally milked, the average daughter-proof came in $72 lower in Net Merit than the genomic figure those bulls had been sold on, and dropped nearly a month of Productive Life (Cassell, Virginia Tech / Virginia Dairy). You waited three to five years, paid the carry, and the proof’s headline news was a markdown.

That’s the trade nobody prices. As the same analysis put it, waiting to lift reliability from about 70% to about 85% is “a questionable decision on young bulls with some pretty fantastic genomic predictions.” Genomic young-sire semen often sells at a premium before a proof; the proof, on average, doesn’t add value — it regresses the bull toward the mean and sometimes docks his price just as his daughters arrive.

Proof-Chasing Overhead Simulator

Progeny Testing Carry Costs vs. Accelerated Genomic Pipelines

Pipeline Input Variables

100 bulls
10350 bulls
$30 / day
$10$60/day
1,200 days
8001,600 days
10%
5%30% select
Total maintenance overhead to reach proof
$3,600,000
Maintenance overhead while holding to proof — incurred on top of ongoing semen sales.
Amortized Burden Per Active Catalog Survivor
$360,000
The overhead penalty each successful genomic survivor must recoup to clear out the bulls culled down the road.
Pipeline Efficiency Balance Matrix High Structural Capital Drag
🔴 Overhead on bulls that don’t make the final catalog (90%) 🔵 Active Revenue Sires (10%)
Equations Formulated from Peer-Reviewed BullVal$ Financial Datasets (Animals, 2023).

Why did genomics speed up genetic gain — better predictions, or less waiting?

Less waiting. That's the part the proven-bull conversation keeps skipping.

When the U.S. moved to genomic selection, the rate of genetic progress jumped a gear. The Net Merit trend tells it plainly:

EraAnnual genetic trend (Holstein bulls, Net Merit)
Early 2000s~$13 / year
Pre-genomic (2005–2009)~$40 / year
Genomic (service since 2011)~$85 / year

That's more than double the pre-genomic pace. The published trend lines in Frontiers in Genetics spell it out, and The Bullvine has walked through this doubling before. Net Merit values shift with each base change and formula revision — the index was rebased to 2020-born cows in April 2025 — but nobody disputes the direction or the scale of the jump.

The why is where the genetics literature stops arguing. A 2024 review in the Journal of Animal Science concluded that "most of the increased genetic gain is attributed to reduced generation intervals." VanRaden's group put it plainer — genomics doubled gain "primarily through halving the generation interval," with bull-parent ages "now near the biological minimum." The landmark García-Ruiz study in PNAS measured U.S. Holstein generation intervals collapsing right after 2009.

So sit with the contradiction. The engine of modern progress is turning generations faster. The sample-and-prove model does the opposite — it deliberately slows the interval back down on the bulls it holds. A bull you keep until proof is, by definition, old by the time that proof lands. You bought a little certainty with a lot of time, and time is the one input genetics can't spare anymore. Peer-reviewed simulation work confirms the mechanism: pairing genomic selection with a sharply shorter generation interval can double the rate of gain.

"But genomic reliability is only 70%" — true, and mostly beside the point

This is the proven-bull camp's strongest card. Genomic indexes sit around 70–80% reliability, so there's roughly a 30% chance a bull transmits differently than predicted. Proven bulls hit 90–99%. Why gamble?

Fair question. But it quietly assumes every trait you care about is equally uncertain at the genomic stage. It isn't. Sort the traits, and most of the gamble evaporates:

What you're selecting forGenomic reliability todayThe real situation
Milk, fat, protein~75–82%Plenty. Genomic testing reveals ~75% of an animal's genetic potential before she ever milks.
A2A2, BB kappa-casein, β-lactoglobulin, polled, recessive haplotypes~99–100%Single-gene traits read straight off the DNA — not predictions.
Health & fertilityLowest today, climbingMore female genotypes lift accuracy every year.

On production, 80% is plenty. Milk, fat, and protein are moderately heritable — CDCB uses 15–29% for yield, with butterfat and protein around 20–25%. When you're chasing pounds of components, an 80%-reliable young sire who's three years of gain ahead beats the proven option that's three years behind. You give up a sliver of per-bull certainty and pick up a generation of population progress.

And on the traits that increasingly decide whether your milk gets sold at all, reliability isn't 70% — it's effectively 99–100%. Take BB kappa-casein, the "cheese-yield gene." Peer-reviewed work confirms the long-cited Ng-Kwai-Hang finding: milk with the BB variant shows roughly 10–40% shorter coagulation time and 20–140% greater curd firmness than AA milk, with BB delivering the highest curd firmness of any genotype. A2A2 beta-casein, beta-lactoglobulin, polled, clean haplotype status — you don't wait three years for a proof to know any of it. You know the day you genotype the bull. UW–Madison Extension reports that a quick survey of five AI stud websites turned up over 800 A2A2 Holstein bulls — "by far the most common" genotype — and says the breed "is quickly moving to be an A2A2 only breed."

Reliability is also a moving floor. Genotyping has collapsed in price — commercial dairy panels now run around $43/head, down from roughly $100 a decade ago — so genotyping every heifer calf at birth is becoming routine. That flood of female records is exactly what lifts accuracy on the health and fertility traits genomics is weakest on. Push young-bull reliability up 10 points, and the case for waiting on a proof gets thinner still.

The clearest signal isn't in the survey answers — it's in what the inventory tanks already show. Serious studs freeze deep inventory on a bull — a few thousand doses on a routine young sire, tens of thousands on the high-genomic standouts — then send the bull himself to beef. The semen sits in a tank and keeps selling; the bull doesn't keep eating. And every one is genotyped, so the DNA's on file for re-analysis as new traits get added. You never needed the live, housed bull to keep selling him — the banked doses sell whether he's standing in a stall or sitting in a freezer. The only thing the live bull adds is the maintenance bill while you wait for a proof that, on average, docks his value.

FactorHold to daughter-proofBank semen + beef the bull
Maintenance cost to reach decision~$36,000/bull (≈$30/day × 1,200 days)$0 — doses sell from the tank
What the wait adds to valueAverage −$72 Net Merit + ~0.8 mo Productive LifeNothing lost; DNA on file for re-analysis
Reliability gained~70% → ~85%Stays ~70–85% (plenty for yield)
Position on the gain curveA full generation behindA generation ahead
Single-gene / contract traitsAlready known at genotypingAlready known at genotyping

Are you keeping proven bulls for a customer who's disappearing?

Maybe. The honest core of the proven-bull case is that they "continue to sell" — and that's true and current. Cogent's December 2025 sire summary still leads with proven sires "for farmers who value consistency," and Semex still markets daughter-proven bulls at the top of its lineups. Real demand is real demand. Nobody should torch a profitable product line on theory.

There's a fair argument on the other side, too. The American Jersey Cattle Association's own Jersey Journal breed-improvement series argues that breeders have leaned too heavily on individual young sires and should use high-ranking proven bulls heavily while sampling young bulls lightly to find the next great ones. The AJCA has since backed that with hard structure — its new GenProgress sampling program, announced in late 2025, requires nominated young bulls to come from proven A.I. sires and documented maternal lines. That's disciplined sampling working as designed. The question this piece raises isn't whether to sample — it's who should carry the cost of that sampling, and whether a live, housed bull is still the cheapest way to do it when the semen can sit in a tank instead.

Then look at who that customer is becoming. U.S.-licensed dairy farms have fallen by about 45% since 2014, down to roughly 24,800, while average herd size has climbed to about 377 cows. Per the American Farm Bureau's analysis of USDA data, the largest operations now make most of the milk. The 200-to-500-cow family dairy buying a "safe" proven bull from a catalog — the exact customer this model was built for — is the segment getting squeezed hardest as consolidation grinds on. The buyer of the 2030s runs two or three times today's herd, employs a nutritionist and a geneticist, and thinks in rate-of-gain and component contracts. That buyer pays for speed, not for the privilege of waiting.

Are you still breeding to a bull that died in 2008?

Here's where this stops being a story about studs and starts being about you. The proven-bull instinct doesn't live only in semen barns — it lives in mating decisions made by breeders who reach for a name they trust rather than a plan they follow. Goldwyn. Lambda. Captain.

Braedale Goldwyn was born on January 3, 2000, and died in 2008. Chase his look in 2026, and you're linebreeding to a 26-year-old pedigree while the genomic frontier has moved three or four full generations past him. We get the romance — a favorite sire is a relationship, a genomic list is a spreadsheet. But the habit carries a bill most breeders don't see until it lands.

That bill is inbreeding. When everyone piles onto the same admired sire, the pool narrows fast:

Here's the barn-math version you can map to your own herd. A Canadian Dairy Network analysis found that cows that are 10% inbred lose about 92 kg of milk per lactation compared with cows at 5% inbreeding — roughly 18 kg, or about 40 lbs, of milk for every 1% inbreeding climbs. On a 100-cow herd, a single point of avoidable inbreeding is roughly 4,000 lbs of milk per lactation walking out the bulk tank. Keep it in proportion, though: fewer than 5% of Canadian Holsteins are even above 10% inbred. This is a real, manageable leak — not a catastrophe. (Those figures are Canadian Holstein data; the biology travels, but U.S. herds should confirm against their own evaluations.)

And the legends carry hidden debts. Goldwyn is a known carrier of Cholesterol Deficiency (HCD), a lethal recessive traced to the APOB gene. Breed unthinkingly toward his pedigree, and you stack carrier on carrier without meaning to.

Options and trade-offs

There's no single right answer here — there's the answer that fits your operation, your breed, and what your milk buyer pays for. A few honest paths:

Stud running Holstein: go all-genomic, bank deep, keep the DNA. Makes sense when production traits dominate your breeding goal, and you've got the deepest reference population on earth working for you. What it requires is the discipline to send good-looking bulls to beef once their semen is banked. The risk: you give up a legacy product line some loyal clients still want — so hold a handful to proof if a profitable market asks, but call it a niche, not your gain engine.

Stud in Jersey, Brown Swiss, or a colored breed: lean hard on genomics, but sample with intent. Same $30/day housing cost, smaller population, higher stakes per decision. The Jersey camp makes a real case for disciplined sampling to find the next proven sires — the open question is whether you need a live bull in a stall to do it, or whether banked semen and DNA-on-file get you there more cheaply. For most thin-market breeds, the cost math leans hard toward banking.

Breeder with a favorite sire: trade the scrapbook for a plan. The fix isn't a different favorite — it's not having one. Set your breeding goal first, then refresh the bull team after each proof run against it, using the best young genomics available now and managing relationships to keep inbreeding down. The cow doesn't care that the bull is famous; she cares that he's the right outcross at the right reliability for the trait you're chasing.

Do this within 30 days: before your next mating run, pull your current sire shortlist and flag any bull born before 2015 or any sire you're using mostly out of habit. Run those matings through your herd's inbreeding/outcross tool against this season's young-genomic options. If a young sire gives you equal or better merit on your priority traits with lower inbreeding, the loyalty pick is costing you — and now you can see exactly how much.

Key Takeaways

  • The bull sells the whole time he stands, so the $36,000 hold-to-proof cost buys you one thing: the proof. And Virginia Tech found the average daughter-proof came in ~$72 lower in Net Merit than the genomic prediction the bull was sold on. Bank the semen, beef the bull, keep the DNA.
  • If your breeding goal is pounds of components, an ~80% genomic young sire a generation ahead beats a 99% proven bull a generation behind. Reliability is the wrong thing to optimize when speed is what pays.
  • If a trait decides whether your milk sells — A2A2, BB kappa-casein, polled, clean haplotypes — buy it straight off the genotype today at 99–100%. There's no proof worth waiting three years for on a single-gene trait.
  • If you've used a sire born before 2015 mostly out of loyalty, price the habit: roughly 40 lbs of milk per cow per lactation for every 1% of inbreeding you stack, plus the carrier risk a famous pedigree can hide.

So, where does your bull team actually sit? Pull your last three mating runs and check how many of your top sires are genomic young bulls versus names you've trusted for years — then ask whether that ratio is a plan or a habit. If you want the full per-bull hold-cost model, the trait-by-trait reliability breakdown, and the thin-market-breed numbers worked all the way through, that's the deeper dive in The Bullvine's genetics coverage and the weekly newsletter — where this argument gets the spreadsheet it deserves.

Methodology note: The opening stud manager is a composite scenario modeled on publicly reported AI-stud practices, not a specific individual. Genomic young-sire semen is sold continuously from first release; the per-bull figure here is maintenance overhead concurrent with semen sales, not idle carry. The $30/bull/day maintenance estimate is from the peer-reviewed BullVal$ decision-support tool (Animals, 2023) — one company's figure, not an industry average — applied over a ~1,200-day hold-to-proof window; actual costs vary widely by facility, country, labor model, and bull. The proof-regression figure (average ~$72 Net Merit drop and ~0.8-month Productive Life drop from genomic prediction to daughter-proof, on December 2011 proofs of 2,400+ genomic-tested Holstein bulls) is from D. Cassell's Virginia Tech / Virginia Dairy analysis; individual bulls vary and regression direction can differ by trait and era. Genetic-trend figures (~$13/year early 2000s, ~$40/year pre-genomic, ~$85/year genomic) and the generation-interval/gain-doubling claims are drawn from the peer-reviewed sources linked throughout (PNAS — García-Ruiz et al.; a 2024 Journal of Animal Science review; Frontiers in Genetics — VanRaden; and peer-reviewed simulation work); Net Merit values shift with each base change, including the April 2025 rebasing to 2020-born cows. The inbreeding-on-milk figure (~18 kg of milk per 1% inbred, derived from a 92 kg loss between 5% and 10% inbreeding) is from the Canadian Dairy Network's "Quantifying Inbreeding Depression" analysis and reflects Canadian Holstein data; U.S. herds should confirm against their own evaluations. Kappa-casein BB cheese-yield effects (~10–40% shorter coagulation time; ~20–140% greater curd firmness vs AA, per Ng-Kwai-Hang) are reported in peer-reviewed work (Animals, 2023). Single-gene trait status (A2A2, kappa-casein, beta-lactoglobulin, polled, haplotypes) is determined by direct genotyping rather than genomic prediction reliability. The proven-bull product lines of Cogent and Semex are confirmed against the companies' own 2025 sire summaries; the disciplined-sampling argument is from the AJCA's Jersey Journal breed-improvement series and its GenProgress program; the Global Alliance housing-cost quote and the retention percentages by stud originate with Holstein International. National averages may not reflect your region, breed, or operation. Spot an error or have stud or on-farm numbers that sharpen the math? Tell us — corrections and counter-data are welcome.

Learn More

The Sunday Read Dairy Professionals Don't Skip.

Every week, thousands of producers, breeders, and industry insiders open Bullvine Weekly for genetics insights, market shifts, and profit strategies they won't find anywhere else. One email. Five minutes. Smarter decisions all week.

NewsSubscribe
First
Last
Consent

384 Excellent Cows and a Royal Grand Champion: Inside Holstein USA’s 2026 Elite Breeder Jeffrey-Way Holsteins

The Hendricksons of Belleville, Wisconsin built most of their herd off one maternal line. Holstein Association USA just named them 2026 Elite Breeders — and the family’s top cow is the reigning Royal Winter Fair Grand Champion.

The salute that says “program,” not luck: Jeffrey-Way Hard Rock Twigs, EX-96, takes Grand Champion at the 2024 Royal Winter Fair. A second-generation EX-96 off the Hendricksons’ 40-year “T” family — the banner that just helped make them Holstein USA’s 2026 Elite Breeders.

Start with the cow on top. Jeffrey-Way Hard Rock Twigs scored EX-96 and was named Grand Champion at the 2024 Royal Winter Fair — a second-generation EX-96, out of a Doorman dam, sired by Cookiecutter MD Hardrock.  She didn’t come from a checkbook or an outcross gamble. She came from a maternal line Jeff and Kate Hendrickson have been building since the early 1980s. 

That’s the story Holstein Association USA just honored, naming the Hendricksons its 2026 Elite Breeders, to be recognized at the National Holstein Convention in Orlando this June 22–25.  Roughly 90% of the Jeffrey-Way herd traces to one cow family.  This isn’t about chasing the hot bull every August. It’s a study in what concentrating a maternal line actually does to a herd over four decades — the upside, the risk, and the discipline it takes. 

Where the “T” Family Started

The line runs back generations, and it shows in the pedigrees. Look at a recent Jeffrey-Way sale lot and the dams stack up like a family tree carved in stone: Tanawood EX-95, then Tanaya EX-92, Tameka EX-94, Tranquil EX-92, and deeper still.  That’s the “T” family — a tail-female line the Hendricksons have bred forward, one daughter at a time, for 40 years. 

Where the 40-year bet still milks: Jeff and Kate Hendrickson outside the barn that carries their name in Belleville, Wisconsin. They started with Registered Holsteins as kids, built almost the whole herd off one “T” family, and never traded out of it — the discipline that just made them Holstein USA’s 2026 Elite Breeders.

Forty years ago this was a youth project. Jeff and Kate started with Registered Holsteins as kids, and the prefix grew up alongside them.  What’s striking isn’t the start — plenty of breeders begin with one good cow. It’s that they never traded out of the line. Decade after decade, as genomics arrived and proof sheets reshuffled the breed, they kept breeding back into the “T” family instead of chasing whatever topped the August run. 

That choice is the whole story. A breeder who commits to one maternal line is betting that depth beats breadth — that a family proven across generations is a safer foundation than the newest number on the list. The Hendricksons made that bet for 40 years, and the trophy case says it paid.

More Than One Branch on the Tree

Here’s the part that gets missed when people hear “90% from one family”: it isn’t 90% from one cow. A tail-female line that deep grows branches, and the Hendricksons have worked more than one. The “T” prefix is the trunk — Tanawood, Tanaya, Tameka, Tranquil — but the herd also carries a “Tina family” running through cows like Jeffrey-Way Saphire RC P EX-94 and Jeffrey-Way Mascot Tina-ET EX-91.  Same maternal foundation, different limbs. 

That branching is what keeps a concentration strategy from becoming a dead end. When you’ve got several proven sub-families inside one line, you can mate within the strength of the family without doubling up on the exact same animals every generation. It’s the difference between linebreeding and backing yourself into a corner. The Hendricksons have enough branches to keep choosing.

And it’s why a number like 384 Excellent cows is even possible off one foundation. You don’t get there by flushing a single donor over and over. You get there by building out the whole tree — Tate branch here, Tina branch there — and letting each one throw its own string of high-scoring daughters. 

A Family That Markets Itself

The “T” prefix isn’t just a pedigree anymore. It’s a brand buyers chase. This past March, Jeffrey-Way ran its first-ever public online sale through CattleClub.com — “this decision wasn’t easy,” the family wrote — offering “the best ‘T’ family members” and billing it as buyers’ first chance to get into the Twigs branch, with animals selling off the farm at N9385 Cty CC in Belleville. 

For a herd that spent 40 years keeping its best genetics in-house, opening the gate at all is a strategy shift worth noticing. You don’t sell into your own foundation lightly. The Hendricksons did it because demand finally outran what they could use themselves — when buyers are asking for a branch by name, holding everything back leaves money and reach on the table.

The depth shows up in the family’s newest stars. Jeffrey-Way Addison Sauna EX-95 is, as the farm put it, “the Holstein breed’s newest Excellent 95 scored cow” — and she’s polled and a Red Carrier, straight out of the “T” family. That matters. The Hendricksons built polled and Red genetics into a line better known for black-and-white show type, hitting two of the hottest market traits in the breed without abandoning their base. 

That optionality runs deeper than one cow. The herd has put homozygous polled and Red-carrier genetics into multiple “T” branches, so a buyer chasing polled, or Red, or just bulletproof show type can find it inside the same family.  When the breed’s priorities shift — and they always do — a line with that many doors stays marketable. The reach has gone international, too. Twigs’ descendants and embryos move through European genetics outlets, marketed as a foundation worth buying into.  When a Belleville cow family shows up in embryo catalogs across the Atlantic, that’s not luck. That’s 40 years of consistency the rest of the breed can finally see. 

Does 90% From One Family Mean an Inbreeding Wall?

It’s the first question a serious breeder asks. Concentrate a maternal line that hard and you risk stacking the bad in with the good — and breed-wide inbreeding has climbed for years as popular sire stacks narrow the gene pool. Our reporting on how one foundation sire ended up with a 15.8% relationship to the entire U.S. Holstein population shows how fast that concentration compounds. Read more: To-Mar Blackstar: The One-Embryo Holstein Sire Behind 15.8% of Today’s DNA – and the Genetic Debt in Your Herd.

The Hendricksons’ answer is in their classification record. Holstein International, profiling the herd, counted 59 Excellent cows among 109 milking — more than half the working string scored EX.  Across the herd’s history, Holstein Association USA credits Jeffrey-Way with 384 Excellent cows.  A deep cow family is the closest thing in dairy breeding to a moat: type, longevity, and components that show up generation after generation. The same one-daughter-at-a-time patience built the great franchise cow families that reshaped the modern Holstein. Read more: How Seven Franchise Cows: Roxy, Dellia, Blackrose, and Four Others Built Modern Holstein – One Daughter at a Time.

But concentration only pays when you cull as hard as you breed. A herd that holds 59 EX in the milking string is also shipping the animals that didn’t make the cut — and the discipline is in moving them, not falling in love with a pedigree. That’s the part of the Jeffrey-Way story the trophy doesn’t show. The inbreeding risk is real; the herd’s answer is that a family this deep, with this many branches, gives you enough good animals to stay selective, and modern genomic mating tools let you steer around the worst of the stacking.

The Cow That Proved It at the Royal

Twigs is where the strategy stops being theory. A second-generation EX-96 doesn’t happen by accident — it means the dam was good enough to score 96, and her daughter was good enough to match her.  That’s the line working exactly the way a concentration strategy is supposed to: each generation holding or improving on the last. 

She backed it up in the colored shavings. Twigs was named Grand Champion at the 2024 Royal Winter Fair — the kind of banner that puts a cow family on the international map and sends buyers looking for full sisters and embryos.  The Royal isn’t a county show. Winning it tells every breeder watching that this isn’t a one-good-cow operation. It’s a program. 

The Rest of the Roll Call

The family runs deep, and the cows the association named in its announcement read like a herdbook highlight reel — confirmed against breed records and the farm’s own listings: q106

  • Jeffrey-Way Hard Rock Twigs EX-96 — Grand Champion, 2024 Royal Winter Fair 
  • Jeffrey-Way Tanawood EX-95 — a 250,000-lb (≈113,000 kg) cow still milking on her 8th calf 
  • Jeffrey-Way Addison Sauna-PO-RC EX-95 — polled, Red Carrier, the breed’s newest EX-95 at scoring 
  • Jeffrey-Way Saphire RC P EX-94 — “Tina family,” more than 337,000 lb (153,000+ kg) lifetime 
  • Jeffrey-Way Format Tate-ET EX-93
  • Jeffrey-Way Tranquil-ET EX-92 and Jeffrey-Way Mascot Tina-ET EX-91
  • Jeffrey-Way Mars Tara-ET EX-90

Look at the sire prefixes — Hardrock, Addison, the polled Red & White lines coming through Saphire and Sauna. That’s a breeder reading each daughter, correcting where she needed it, and moving the herd forward across decades. No single bull built this. The cow family did, with a different sire layered on top each generation to fix what the last one left short.

What Does a 384-EX Record Actually Take?

The Hendricksons have held a spot on the Progressive Breeder’s Registry for 35 years — that part is confirmed.  Run the arithmetic: 384 Excellent cows across a span like that works out to close to one new Excellent cow a month — though the figure isn’t broken down by year, so treat it as a rough pace, not a steady cadence. 

Put it against your own barn. A solid registered herd might score a handful of cows Excellent in a good year. To hold 59 EX in a 109-cow milking string, you need cows that last — high lifetime production, low involuntary culling, and a type base that holds up to a classifier’s eye through multiple lactations.  Tanawood’s 250,000 pounds on her 8th calf, and Saphire’s 337,000-plus pounds, are the kind of numbers that make the point: this isn’t show type at the expense of the tank. 

And it pencils into milk. A million-cow classification study — the one we broke down in our Ed Bos feature — tied the functional traits classification rewards, the udders, feet and legs that keep a cow in the herd, to roughly $2,678 in extra lifetime milk revenue per cow. Read more: Ed Bos Picked the Same Traits for 50 Years. A Million-Cow Study Just Proved He Was Right — by $2,678 Per Cow.  Type and index usually pull in different directions. Doing both off one cow family — a Royal Grand Champion and a herd that more than half-classifies Excellent — is the rare trick most herds never crack. 

“It gives us a sense of pride to be recognized by this award,” Jeff Hendrickson said in the association’s announcement. “It’s a good feeling to know you’re recognized by your peers, and it provides a sense of accomplishment.” 

The Second Generation Is Already Winning

A cow family is only a legacy if someone carries it forward. The Hendricksons have that covered. The farm is now owned and operated by Jeff and Kate alongside son Brooks and Riley Hendrickson — and Brooks took a Grand Champion banner at the Royal with a four-year-old in 2024, the same show where Twigs went Grand. 

The bench runs deeper still. Trent Hendrickson has built his own operation, Trent-Way Genetics in Blanchardville, and in 2024 Holstein Association USA named him its Distinguished Young Holstein Breeder.  That’s not a participation ribbon — it’s the association’s signal that a young breeder is already building a program worth watching. And he built it on the same foundation, the “T” family genetics he grew up with, now running under a second prefix on a second farm. 

Think about what that says about the original bet. One cow family didn’t just fill one barn — it seeded two operations, in two Wisconsin towns, both winning at the Royal, with a national young-breeder award between them. Most herds spend a generation hoping the next one stays in dairy at all. The Hendricksons handed theirs a foundation deep enough to start over with. The “T” line built more than a herd. It built a bench.

What This Means for Your Operation

The Elite Breeder award goes each year to a living Holstein Association USA member, family, or partnership that’s bred outstanding animals and moved U.S. Registered Holsteins forward.  Strip away the Orlando ceremony and the Hendrickson record leaves five decisions worth weighing in your own barn. 

  • If one cow family already throws your best type and longevity, concentrate toward your strength — but pair it with a culling rule strict enough to keep the misses out of the milking string. A family becomes a moat only if you ship the misses as honestly as you keep the hits; 59 EX in a 109-cow string is a culling story as much as a breeding one. 
  • If you’re going hard on one maternal line, run an inbreeding check on every mating, not annually. That’s the difference between Jeffrey-Way’s moat and a genetic corner — genomic mating tools make it manageable, but only if you actually run them. Branches help too: the more proven sub-families you’ve got inside the line, the more room you have to mate without doubling up.
  • If you doubt classification pays, look at the milk. The functional traits it rewards — udders, feet and legs — tied to roughly $2,678 per cow in lifetime revenue in a million-cow study. 
  • If you want a family with staying power, breed in optionality. The Hendricksons put polled and Red genetics into a show-type line through Addison Sauna and Saphire, chasing emerging market traits without abandoning their base. 
  • If you’ve got genetics worth seeing, open the gate. A public sale, a Royal banner, an embryo listing overseas — visibility is how a single line earns a national, even international, audience.

If you want to put this to work in the next month, pull your own herd’s classification history and find the single cow family quietly carrying your type. Map its branches while you’re at it — which dams trace where, and where you’ve got room to mate within the family without stacking the same animals. That’s your “T” family, and you can’t build a 40-year line until you know which one you’d bet on.

Key Takeaways

  • One deep cow family can carry a whole herd, but only if you cull as hard as you breed — 59 EX in a 109-cow string is a culling record as much as a breeding one.
  • Concentration pays when the line has branches. Several proven sub-families inside one foundation give you room to mate within your strength without stacking the same animals every generation.
  • Pull your classification history this month and find the one family quietly carrying your type. Map its branches and run an inbreeding check on every mating, not just once a year.
  • Build in optionality. Layering polled and Red genetics into a show-type line, plus a public sale, is how Jeffrey-Way turned one tail-female line into national and European demand.

Forty years ago this was a youth project and a string of “T” cows. Now it’s the breed’s top breeding honor, a cow family selling off the farm, embryos moving through Europe, two generations winning at the Royal, and a Grand Champion standing on top of it all.  So here’s the question worth taking back to your barn: which cow in your herd today is the one your grandkids will be tracing back to? 

Learn More

The Sunday Read Dairy Professionals Don’t Skip.

Every week, thousands of producers, breeders, and industry insiders open Bullvine Weekly for genetics insights, market shifts, and profit strategies they won’t find anywhere else. One email. Five minutes. Smarter decisions all week.
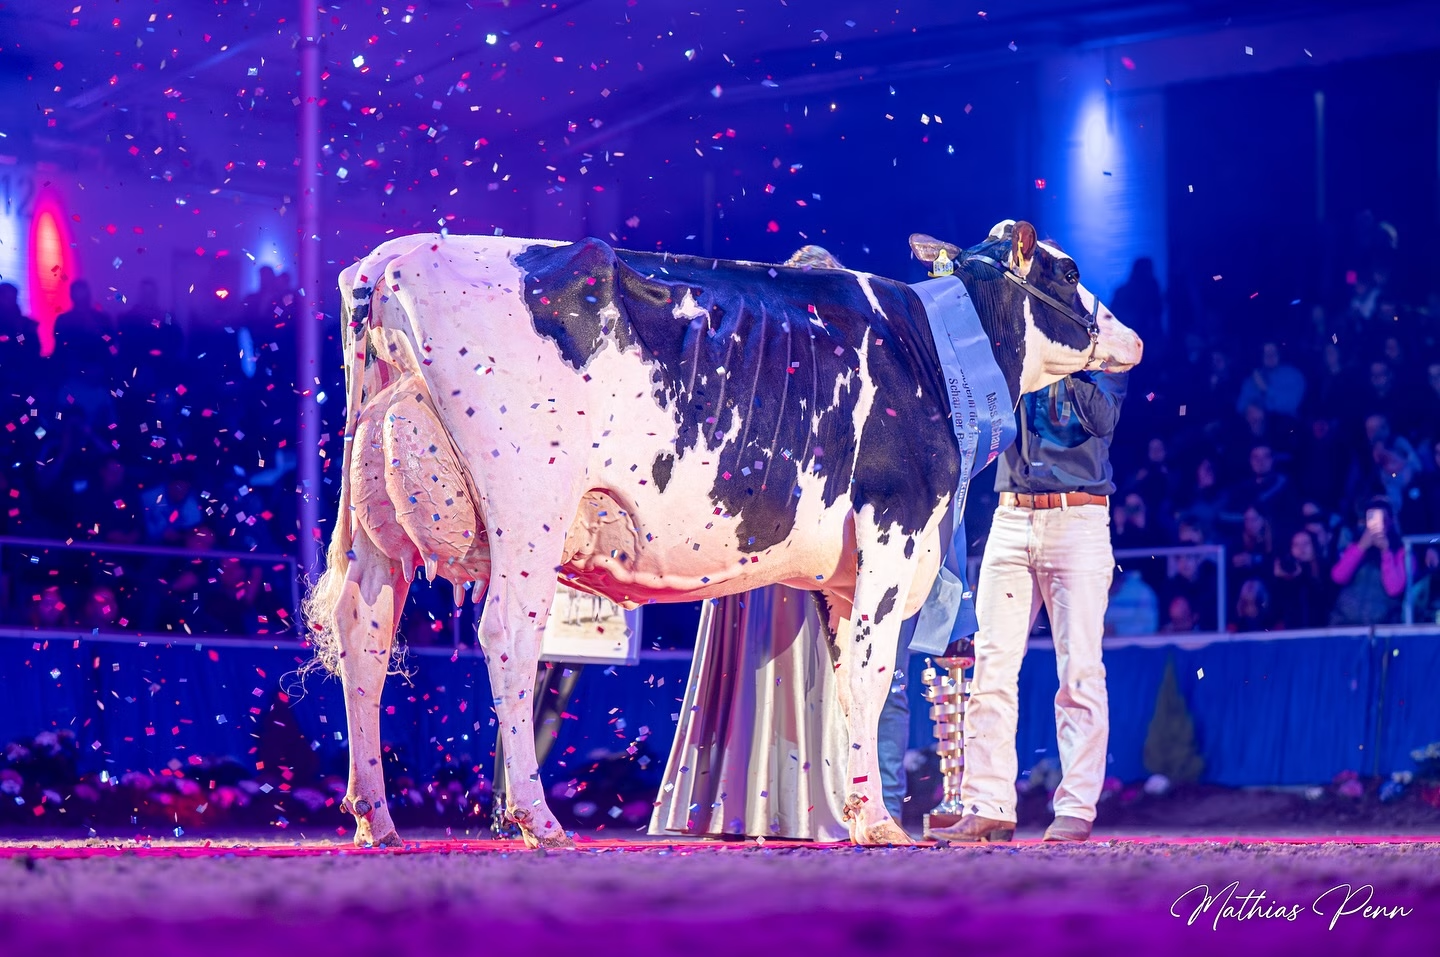
NewsSubscribe
First
Last
Consent

Beef-on-Dairy Math: $25,200 Rides on Your Semen Order 

One Panhandle dairy pulled its full-year closeout — 168 head, too much Select, almost no Prime. The gap between a +0.65 marbling bull and a bargain straw? Up to $25,200 a year.

A 480-cow Holstein operator pulls up a chair at a Texas Panhandle packer’s procurement desk, a little after dawn, and asks to see the cumulative closeout on his entire year’s beef-on-dairy crop — 168 head, twelve months of kill dates, every grading line tallied. It’s the kind of plant visit you arrange when you finally want to know what 18 months of beef semen decisions actually paid.

What’s on the screen isn’t a wreck. It’s worse, in a way. The cattle are stuck in the middle — too much Select, almost no Prime, a clutch of yield grade 4s pulling discounts. And right beside it sits a verified beef-on-dairy closeout from another dairy: heavier carcasses, higher marbling, a clean Prime/CAB column. Same plant. Same twelve months. Very different cheques. In scenarios like this, the dairy without a sire record is usually the one that bought beef bulls on price.

(Editor’s note: this 480-cow operator is a composite, representative of mid-size Panhandle herds running about 35% beef-on-dairy, built from NAAB, USDA AMS, CoBank, Premier Select Sires, and Penn State data — not a single real farm.)

Beef-on-Dairy Stopped Being a Side Hustle

The numbers behind the trend are no longer small. NAAB’s 2025 year-end report shows 8.1 million units of beef semen went into U.S. dairy herds, up from 7.9 million in 2024 — and on the national dairy cow, the semen mix now runs 43% sexed, 24% conventional, and 33% beef. CattleFax data, cited by American Farm Bureau, put crossbred calf production climbing from roughly 50,000 head in 2014 to about 3.22 million in 2024.

So the dairy barn quietly became a year-round terminal beef factory. And packers price it accordingly.

Here’s the part that’s shifting fastest: the data trail. Plants increasingly know which dairy a load came from, which sires those cattle trace to, and how the source’s earlier loads closed out. CoBank’s February 2025 Knowledge Exchange report found program-verified beef-on-dairy averaging slightly above purebred beef and well above straight dairy steers. Without that paperwork, your calves get bucketed as a generic “beef/dairy cross” — and that’s exactly where the discount lives.

The herds most exposed are the mid-size and large operations running 25–40% beef-on-dairy without verification, mixing sires by price, and assuming “Angus” on the invoice does the work. It usually doesn’t.

What Actually Drives the Spread on the Rail?

Three things move the cheque, and none are mysterious.

Sire BreedMarbling Score (USDA)Grade Outcome (typical)ADG (kg/day)Est. Extra Days on FeedGrid Risk
Red Angus × Holstein5.03Low Choice / CAB eligible1.69+3 vs. Angus🟢 Low
Angus × Holstein4.82Choice / CAB threshold1.76Baseline🟢 Low
Simmental × Holstein4.57*Select / Low Choice1.60+8🟡 Moderate
Charolais × Holstein4.30*Select1.58*+10🟡 Moderate
Limousin × Holstein4.14Select / Slight1.55+13🔴 High
Wagyu × Holstein6.50+ (est.)Prime / Upper Choice1.39+26🔴 High (DOF cost)

Marbling does the heavy lifting. The Penn State sire-breed comparison published in Translational Animal Science(Basiel et al., 2024) ran 262 beef × Holstein steers and found Red Angus × Holstein at a marbling score of 5.03 — right at the bottom of low Choice — Angus × Holstein at 4.82, brushing the Choice line, and Limousin × Holstein at 4.14, sitting in Slight territory below the threshold most grids reward. A University of Minnesota trial of 50 beef × dairy steers (Sharpe & Heins, 2025) landed the same way: Angus-sired calves marbled at 616.9, well ahead of Charolais (521.3), Simmental (547.1), and Limousin (426.9).

Limousin and Continental sires get selected for cutability and yield, not marbling — different trait priorities, different grid outcomes. None of that is a knock on those breeds. It’s just that on a Choice/Select grid, marbling is the line that pays.

Dressing percentage and feedlot efficiency follow sire breed too. Beef-on-dairy cattle still run about a point lower in dressing percentage than purebred beef — that’s structural to the dairy dam, not something a sire fixes. But average daily gain shifts with the bull. In the Penn State trial, Angus crosses gained 1.76 kg/day while Wagyu crosses gained 1.39 kg/day, needing roughly 24–26 extra days on feed. The feedlot pencils every one of those days into next year’s bid.

Verification is the third lever, and it’s the cheapest. Penn State Extension’s own marketing guidance is blunt about it: when you select beef bulls, ribeye area and frame score (5 or under for feed-efficient, moderate cattle) belong on the sheet right next to calving ease. Calves that leave without sire records and EID tags can’t prove any of it at the rail.

How Much Is the Wrong Bull Really Costing You Per Head?

The key threshold is Certified Angus Beef’s “Targeting the Brand” Marbling EPD floor of +0.65. A high-marbling Angus sire at or above that line can put the majority of his calves into Choice or better; a bargain bull at +0.30 to +0.45 leaves a far thicker tail stuck in Select.

On a typical grid — featuring a $12/cwt Choice/Select spread, a $4/cwt CAB premium, and a $15/cwt Prime premium — the distribution gap between a high-marbling sire (+0.65 EPD) and a bargain bull (+0.30 EPD) is worth $50 to $100 per head. The catch is that the Choice/Select spread is a moving target: it set a record near $38/cwt in late 2025, but USDA AMS had its weekly figure down at just $5.76/cwt at the end of May 2026. When the spread is wide, the per-head gap stretches past $150; when it’s this thin, the marbling premium narrows with it. Run your own grid before you bank any single figure.

Scale those numbers across the composite’s 168-head crop:

Grid & market conditionsPer-head revenue gapAnnual value on 168-head crop
Thin spread (~$5–6/cwt, spring 2026)$20 – $50$3,400 – $8,400
Normal Choice/Select spread (~$12/cwt)$50 – $100$8,400 – $16,800
Wide spread (Q4 2025 peak, ~$38/cwt)$150+$25,200+
Program-verified & tagged (ceiling)*$190 – $210$31,920 – $35,280

*The bottom row is a different animal from the rest. The $190–$210/head figure comes from Premier Select Sires’ April 2024 ProfitSOURCE brochure, comparing its program carcasses against non-program cattle — so these are the company’s own program results, measuring verification plus carcass uplift, not a single-bull marbling gap. We’re not aware of independent, third-party replication, so read that row as a best-case ceiling rather than a typical outcome. Other major studs run comparable verified programs — ABS Global’s Beef InFocus, for one, hand-picks beef sires on carcass performance and tags the resulting calves — so the principle, not any one brand, is the point.

So the honest range is the one in the deck: in normal-to-wide markets the defensible grid math runs $8,400–$25,200 a year on this crop, and the program-tagged ceiling pushes toward $33,000. In a thin-spread spring like this one, the gap compresses hard. Either way, it’s a grid line item already getting paid to somebody. The only open question is whether it’s getting paid to you.

A fair caveat: not every trial finds a windfall. The Minnesota study concluded that total revenue across Angus, Charolais, Hereford, Limousin, and Simmental crosses netted out statistically similar — $2,650 to $2,779/head — once carcass weight, days on feed, and yield grades balanced against each other. The spread is real, but it’s conditional. It pays out most when grids reward marbling hard, when you ship full loads, and when your alternative is genuinely bottom-tier commodity straws.

The Other Side of the Ledger Nobody Brags About

The calf cheque looks great until the replacement bill comes due.

Beef-on-dairy calves carried roughly $400–$1,000+ premiums over straight dairy calves through 2025’s strong market. On the composite’s 168 beef matings, that premium alone is real money. But then springers showed up at a historic national average near $2,870/head in late 2025, with some markets pushing toward $3,000 and beyond.

Line ItemMetric / AssumptionFigureSignal
Beef calves sold (168 head × $700 premium)35% beef share, 480-cow herd+$117,600Revenue win
Missing heifers replaced (~50 head × $2,870)Springer market, late 2025 avg−$143,500Replacement liability
Net before other costsBreak-even zone~−$25,900⚠️ Not a win
Pregnancy rate floor to run >50% beefUW Cabrera research threshold18% 21-day PRHard cap
Crossbred calf production projection (2026)CattleFax5–6M headSpringer market stays tight

Here’s the simple version of the trap. At 35% beef share, this herd is steering a big slice of its breedings away from making replacements — and University of Wisconsin work led by Dr. Victor Cabrera shows the flip side: herds holding 30%+ pregnancy rates can clear over $6,200 in net calf income a month through optimized beef-on-dairy. Push beef share too high without the repro to back it, and you trade that calf income for a replacement shortage. Below an 18% pregnancy rate, the research says cap beef allocation at 50%.

Line itemFigure (illustrative)
~50 missing heifers × $2,870 springer~$143,500 replacement liability
168 beef calves × $700 premium~$117,600 added calf revenue
Net before any other costroughly breaks even

That’s the whole point: at the wrong beef share, the calf “win” gets eaten by the replacement bill. And CattleFax projects crossbred production climbing toward 5–6 million head by 2026, so the springer market won’t loosen up to bail you out.

Is Your Breeding Sheet Already Behind the Market?

Quick gut check. Pull last year’s beef semen invoices and ask three questions: How many different bulls are on it? What’s the average Marbling EPD across them? How many calves left with sire ID and program tags?

If the honest answer is “more than five bulls, mixed carcass EPDs, no program,” your cattle are almost certainly in the bucket buyers price as generic beef-on-dairy. The fix isn’t a new system. It’s the next semen order.

What This Means for Your Operation

  • If your beef calf cheque is funding more than 60% of your projected replacement liability, the breeding sheet — not the calf market — is the lever to pull first.
  • If any beef bull on your sheet posts a Marbling EPD below +0.65, either replace him or run the math on what his Select-heavy tail costs on your buyer’s grid — remembering that in a thin-spread spring, that cost shrinks.
  • If your 21-day pregnancy rate is under 18%, cap beef allocation at 50% — the economics stop favoring more beef below that line.
  • If your calves leave without EID tags and sire records, you’re forfeiting the verification premium that tagged loads from the same dairy can already earn.
  • If your 2027 plan leans on buying replacement springers near $3,000, the cheaper fix is on this year’s semen order, not next year’s purchase ledger.
  • If you’ve never seen one of your loads grade, that’s the gap to close first — because every decision above is a guess until you do.

The Bottom Line: Your 30-Day Action Plan

If you’re running a 25–40% beef program, your next semen order shapes your 2028 bottom line. Three moves you can start this month:

  1. Audit the heifer pipeline. If your 21-day pregnancy rate is soft and beef use is above 30%, rebalance toward sexed dairy on your top cows before chasing calf prices — protect the replacements first.
  2. Capture the verification premium. Stop selling generic crossbreds. EID tags plus verified sire records let your loads be priced on what they are, not on a generic-cross discount.
  3. Test the channel. If you’ve never tracked carcass performance, ship a verified load and an unverified load through the same channel this quarter — and let the real closeout decide your genetics program.

🛑 5 Beef Bulls to Pull From Your Tank This Week

Next time your genetics rep stops by, cross these five liabilities off the order:

  • The sub-floor sires — any beef bull with a Marbling EPD below +0.65, the Certified Angus Beef “Targeting the Brand” baseline.
  • The “bargain” straws — any bull picked strictly on volume pricing rather than a verified, published carcass index.
  • The data blanks — bulls with no published Ribeye Area (REA) or Yield Grade (YG) EPDs in their breed-association database.
  • The “black-hide only” bulls — sires whose sole selling point on the sheet is coat color, with no carcass genetics behind it.
  • The unvetted clean-up crew — the cheap, unscrutinized straws quietly thrown in the bottom of the tank to catch repeat services.

Key Takeaways

  • If grids are rewarding marbling and you ship full loads, tightening to 2–3 sires above +0.65 Marbling EPD is worth roughly $50–$150/head — but in a thin-spread market like spring 2026, run your own grid before you bank it.
  • If your pregnancy rate can’t support it, capping beef share protects your 2027–28 heifer pipeline more reliably than chasing this year’s calf premium.
  • You don’t need to own the feedyard to own your data — EID tags plus sire records let your loads be priced on what they are, not on what a generic-cross discount assumes.
  • The carcass-value gap is real but conditional. One trial found similar total revenue across beef breeds, so read your own grid and load size before banking the high number.

The producer in the composite isn’t a villain. He’s the rare one who actually went to the plant and pulled the cumulative closeout — most never do, which is exactly why most never learn their breeding sheet is 18 months behind the market. The next load off your dairy is already being graded in someone’s head, whether you’ve seen the data or not. So when your next 168 head close out at the rail, what will the grading sheet say about the bulls you ordered last fall? If you’re not sure, that’s your answer.

Complete references and supporting documentation are available upon request by contacting the editorial team at editor@thebullvine.com.

Learn More

The Sunday Read Dairy Professionals Don’t Skip.

Every week, thousands of producers, breeders, and industry insiders open Bullvine Weekly for genetics insights, market shifts, and profit strategies they won’t find anywhere else. One email. Five minutes. Smarter decisions all week.
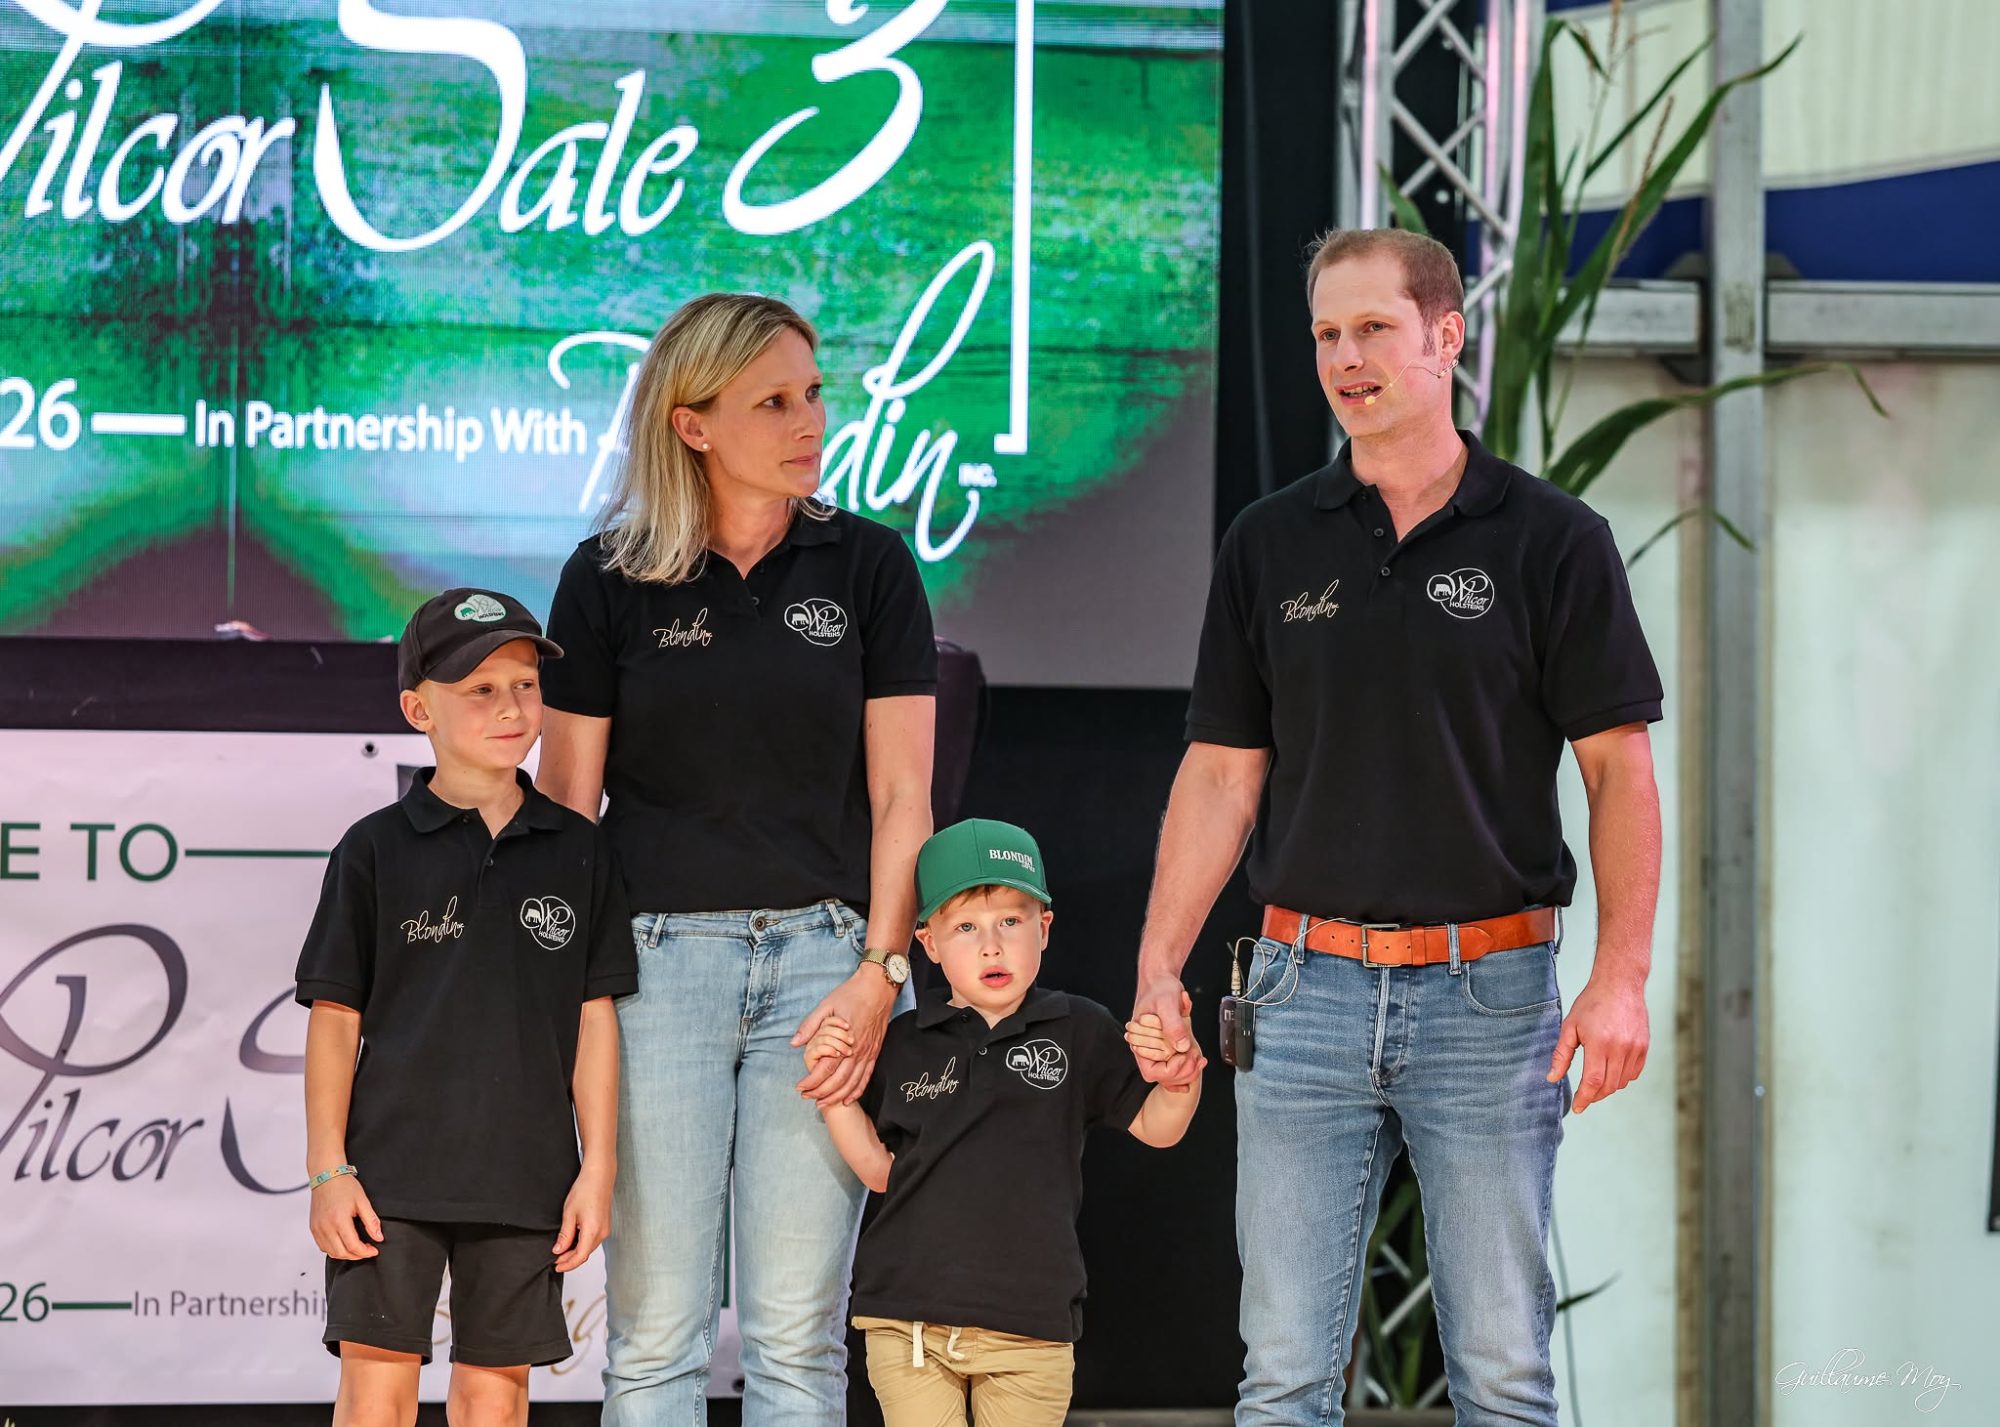
NewsSubscribe
First
Last
Consent

Polled Just Hit 3371 TPI. The Dehorning Iron Is Now a Choice, Not a Necessity.

A homozygous polled bull just sat at #1 on Canada’s August 2025 proven LPI list — ahead of every horned sire. The 15-year horn tax is gone. Is your iron still earning its keep?

At Embro, Ontario, breeder Mark Fraser keeps an 85-cow herd built around one VG-86 cow doing outsized work for the polled story. Her name is Fraholme Allday Arielle-P — a finalist for Holstein International’s 2025 Global Cow of the Year — and her homozygous polled sons Triton-PP, Apollo-PP, and Gideon-PP now sire some of the highest-ranked polled animals in Canada. A decade ago, a cow like Arielle-P would’ve been a curiosity. A novelty in a corner of the barn. Today she’s a blueprint.

And because of cows like her, the question on your operation has flipped. It used to be simple: can I afford the production hit that comes with polled? Now it’s sharper. Is the dehorning iron still earning its place in your calf protocol, or are you just heating it up out of habit?

Why did polled stop being a compromise?

For years, breeding hornless meant paying a tax — in milk, in components, or in type. Pick your loss. That trade is gone. The top polled bull on Holstein USA’s August 2025 list, DeNovo 23201 Celadon-P, sits at 3371 TPI — close enough to your best horned matings that you give up almost nothing.

The genetics behind the shift aren’t complicated, which is exactly why polled moved through herds so fast. Polled is dominant; horned is recessive. One copy of the polled allele — that’s the “P,” a heterozygous bull — and you get a hornless calf. Breed that P sire to your horned cows and the next calf crop splits roughly 50/50 polled to horned.

Two copies — “PP,” homozygous — and the math changes entirely. A PP sire bred to anything, horned cows included, throws polled calves every single time. That’s the lever every serious polled breeder is pulling. PP is how you flip a herd to hornless in one generation instead of grinding through three.

The 15-year climb out of the bargain bin

It’s worth remembering how bad the trade used to be, because that’s what makes the current numbers land. Back when genomic testing went mainstream around 2009, the polled bulls on offer were a study in compromise — pick one and you were trading away production, type, or both to get the hornless trait. Breeders who wanted polled weren’t chasing genetic merit. They were paying a horn tax and hoping the rest of the proof didn’t sink the mating.

The most-cited cautionary name was Aggravation Lawn Boy P-Red. He spread the polled trait widely through red-and-white pedigrees in the early 2010s, but breeders openly talked about working around him to avoid dragging down their other numbers — The Bullvine said as much in its own polled coverage back in 2013 and 2014. That’s the era in a sentence: polled was available, but using it cost you something real.

Later names like Mission-P — a daughter-proven polled sire that reached the +3000 LPI range in Canada — showed the gap starting to close. Polled was climbing the lists. It just wasn’t at the top yet, and almost all the progress was on the heterozygous side, where the trait is easier to carry without piling up the weaknesses that dogged the early homozygous bulls.

What changed was the math underneath. Each generation of polled-to-elite matings narrowed the gap, because breeders stopped treating polled as a separate, lesser pool and started crossing the best polled animals onto the best horned cows in the barn. Genomic selection sped that up — you could identify a high-merit polled calf at birth instead of waiting years for a proof. The trait rode along on animals that were getting genuinely good, not just hornless. By the early 2020s the homozygous bulls finally caught up, and once PP got competitive, the whole equation changed — because PP is the only version that flips a herd in one shot.

The bull who erased the penalty

If you want to know why the compromise finally died, start with one bull: Cherry-Lily Zip Luster-P. He was bred by Ron Hembury of Cherry-Lor in Pennsylvania and John Marshman of Tiger-Lily in New York, and stationed at Select Sires in Ohio. And he did something no polled bull had pulled off before — he sired daughters that could win in a heifer pen on type and still fill the bulk tank.

Holstein International reported that Select Sires sire analyst Jordan Siemers credited Luster-P with combining type and production rather than forcing a trade between them. That framing matters more than it sounds. For most of polled’s history, a breeder picked a polled bull despite his proof — to fix horns, you accepted a hole somewhere else on the sheet. Luster-P flipped that logic. You could use him on production cows to fix type, or on type cows to add production. He stopped being a compromise and started being a tool.

That’s why he sold. Select Sires says he is the highest-selling polled bull in its history, with lifetime semen sales of roughly 964,000 units — a figure the company reports and that we haven’t independently audited. His daughter base now runs north of 39,000 head. Luster-P himself is gone. But the genetics he turned loose are why the rest of this story exists.

His sons did what no polled bull had done

Here’s the part that should change how you read a proof sheet. Luster-P’s son Stantons Remover-PP went from #7 in April to #1 on Canada’s August 2025 Holstein LPI list — a homozygous polled bull topping a national proven ranking outright, ahead of every horned sire in the country. Read that again. Not a genomic prediction. Not a young-sire flier dressed up in a pedigree. A daughter-proven, homozygous polled bull sitting at the top of the list.

Vogue A2P2-PP — EX-97-5YR-CAN, +15 conformation at 99% reliability. He’s the only polled Holstein on record at EX-97 and the highest-type bull among Canada’s top 100 proven LPI sires (Select Sires Canada). Five years ago, a homozygous polled bull at this score would’ve been a typo. Now breeders mate toward him on purpose.

His other standout son, Vogue A2P2-PP, is the only polled Holstein sire on record to be classified EX-97, according to Select Sires Canada — scored EX-97-5YR-CAN with +15 conformation at 99% reliability, which makes him the highest-conformation bull among Canada’s top 100 proven LPI sires. Five years ago, a homozygous polled bull at that score would’ve been a typo. Now he’s a building block other breeders mate toward on purpose.

The numbers behind those two bulls — and the bull who sired them — read more cleanly side by side than buried in a paragraph:

BullRegion / IndexStatusDaughters
Celadon-P (P)🇺🇸 US — TPI3371 TPI, #1 polled (Aug 2025 formula)Genomic
Winstar Kvell-PP (PP)🇺🇸 US — TPI3224 TPI, top PP (Aug 2025 formula)
Stantons Remover-PP (PP)🇨🇦 Canada — LPI+3897 LPI, #1 Aug 2025; +3873, #2 Apr 2026234
Vogue A2P2-PP (PP)🇨🇦 Canada — typeEX-97-5YR-CAN, +15 conformation, 99% rel.Highest conf. in top 100 proven LPI
Cherry-Lily Zip Luster-P(P, sire)🇺🇸 US — Select Sires~964,000 units sold (co-op-reported)39,000+

Sources: Holstein Association USA Top 100 TPI Polled Bulls, Aug 2025; Eurogenes/Lactanet/Holstein International, Aug 2025 & Apr 2026; Select Sires Canada; Holstein Canada registry. US TPI figures are on the August 2025 formula — Holstein USA reweighted TPI in April 2026, so don’t line these up against post-April-2026 numbers. Indexes are not directly comparable across borders — see note below.

That’s the difference between “polled is improving” and “polled has arrived.” The improvement story has run for fifteen years. The arrival showed up on the male proven list in Canada — with daughters standing in real barns getting scored, not just genomic numbers on a screen. And Remover-PP’s slip from #1 to #2 between August and April isn’t a knock; a homozygous bull holding the top tier across multiple proof rounds is the signal that matters, not the single peak.

How fast is polled actually moving?

Look north for the clearest read. In Canada, polled genetics showed up in about 1.5% of Holsteins in 2015. By 2025 that figure hit 12.5%, according to Lactanet — better than an eightfold jump in a decade. That’s not a fad curve. That’s a structural shift in how an entire population is being bred. Nine polled bulls now rank inside Canada’s top 100 LPI.

The genetic gap that used to justify steering clear has nearly closed too. Top polled sires now average $1,108 Net Merit, and on Herd Health Profit Dollars — HHP$, Semex’s health-and-fertility measure — they sit less than $100 behind comparable horned NxGEN sires (per The Bullvine’s Semex NxGEN comparison; NxGEN is Semex’s elite proven sire program). A hundred dollars of HHP$ on a high-end mating is real, but it’s not the canyon polled breeders used to stare across.

Then there’s the data point that punctures the last emotional argument. In one Western Canadian herd, the polled cows out-milked their horned herdmates — 66.5 kg versus 65.9 kg per day, roughly 147 versus 145 lbs, per The Bullvine. One herd isn’t a population trend, and we’ll say that plainly. The sample’s too small to bank on. But it quietly kills the fear that hornless somehow means lesser — and that fear, more than any proof, is what kept the iron in the fire this long.

And that brings us back to Embro. The reason a short list of cow families now does so much of the breed’s polled heavy lifting is that bulls like Arielle-P’s son Fraholme Vec Triton-PP keep showing up at the top — Triton debuted at #30 on Canada’s genomic list at +3952 GLPI in the April 2025 run, billed by his marketers as the #1 homozygous polled bull in the breed (The Bullvine, April 2025 evaluations; Blondin Sires). That concentration is exactly the risk worth flagging now — hold the thought, because it lands in the action section.

Europe isn’t watching. It’s mandating.

Now cross the Atlantic — and watch the logic flip from choice to rule. North American breeders pick polled because the numbers finally pencil out. Parts of Europe are about to breed it because the law will require it. Follow the thread country by country, and you can see the same deadline pulling each market in the same direction.

🇩🇰 Denmark — the deadline that started it. Denmark already runs organic standards stricter than the EU baseline: routine disbudding is restricted, permitted only as a vet-performed last resort, under anesthesia, with mandatory long-term pain treatment (Friland/Danish Crown welfare standards). Holstein International reports Danish organic farms will be barred from dehorning entirely as of January 1, 2031 — the regulatory direction is independently documented via Friland and INRAE. That single date is what every other move on this list is reacting to.

🇪🇺 EU-wide — the baseline it sits on. Only about 1% of dairy farms across the EU keep polled cattle today, but the Demeter organic standard already bans dehorning and disbudding outright (INRAE EU dehorning survey, 2020). The mandate edge is organic-first, then widening — which is why a 2031 organic deadline doesn’t stay confined to organic herds for long.

🌍 VikingGenetics (Nordic) — the supply response. That 2031 wall is already reshaping a major AI cooperative’s playbook. VikingGenetics says it intends to bring 15 to 20 new high-testing polled Holstein sires online each year from 2030, aiming for a standing lineup of 20 to 25. The pipeline’s already visible: as of the May 2026 proof run, VikingGenetics lists nine polled VikingHolstein bulls, three of them homozygous — and the new #1 bull on its own gNTM list, VH Mads-P, is itself polled (heterozygous) at +47 gNTM. When the top bull on a major program’s list happens to be hornless, that’s the tell.

🇩🇪 Germany — the head start that fed the pool. Germany has run its own polled engine for years, and it predates the North American surge. The Simon-P line in particular is a backbone of German polled breeding, with homozygous sons like Sampler-PP and transmitters like Signal-P anchoring the rankings (Holstein International). German breeders leaned in earlier and harder, partly because welfare pressure on the Continent arrived earlier — so when the rest of Europe started scrambling, Germany already had genetics to export.

🇳🇱 Netherlands — the red-and-white channel. CRV’s Delta Launch-PP-Red — among the world’s first and bestselling homozygous polled red sires — now counts roughly 16,000 milking daughters across several continents (Holstein International). The red-and-white channel matters because the polled trait has historically run strong through red genetics, giving breeders of red-and-whites an even deeper hornless bench.

Why should any of this land on your radar if you ship milk in Wisconsin or Ontario? Because the genetics don’t stop at the border. When a co-op of VikingGenetics’ size builds 20-plus elite polled bulls into its standing lineup to beat a 2031 deadline, that semen flows into the North American market too. Europe forcing the issue makes your sire list deeper — whether you ever sell a drop of organic milk or not.

One caution on every number above: TPI, LPI, GLPI, NM$, NTM, and RZG aren’t directly comparable across borders without an Interbull MACE conversion. Each figure lives inside its own system. The trend is real and global; the point totals don’t translate one-to-one.

Does the dehorning iron still pay its way?

Strip away the proof sheets and here’s the on-the-ground case. Disbudding a calf, done early and well, is cheap on paper — extension estimates put hot-iron or caustic-paste disbudding at well under $5 per calf when farm staff do it, plus cents for pain control (CDQAP). Per calf, the materials aren’t what hurts.

What hurts is everything around it. The labor scheduling. The pain-management protocol your buyers increasingly expect you to document. The welfare scrutiny. The job nobody on the crew volunteers for. And the recovery window — healing from caustic paste alone can stretch up to 18 weeks in some calves (Veterinary Sciences, 2025). Research consistently flags polled genetics as the one approach that eliminates the procedure entirely: no pain, no healing window, no labor, no treatment cost.

So run it on your own scale, because the math reads differently depending on your barn. Say you raise 250 heifer calves a year. At $5 a head that’s only $1,250 in materials — but layer in the labor hours, the pain protocol, the recovery time, and a buyer audit you now have to log, and that line item stops being about $5. Now picture a 60-cow tie-stall raising maybe 30 replacements: the dollar total is smaller, but it’s likely one person doing every calf by hand, on top of milking, fieldwork, and everything else. For that operator the cost isn’t really money — it’s the morning they have to carve out for a job they dislike, on a calf that’s healing for weeks.

There’s a semen-cost angle too, and it’s worth doing on your own gun. A PP straw might run you a few dollars more than your usual horned pick — call it the price of skipping the index gap. But you’re buying out every disbudding that calf and her future daughters would have required, plus the labor and welfare paperwork attached to each one. On a heifer that stays in the herd and breeds replacements, that one-time premium amortizes across years of calves you never have to touch with an iron.

Either way, breed a PP sire and the whole job goes to zero. One mating decision, made once at the gun, against a recurring headache and a growing welfare liability. When the genetic penalty was real, the headache won every time. Now that the penalty’s gone, the headache has no defense left.

What This Means for Your Operation

You don’t need to convert the whole herd this fall. You need a deliberate position. Pick the row that matches where you are, then run the move next to it.

Your situationThe moveThe trade-off
Testing the water(start this month)Book a heterozygous (P) sire that ranks where you already breed onto a defined group of horned cows. The US Aug 2025 list runs from Celadon-P at 3371 down through dozens above 3200 TPI.Half the calf crop is hornless; you’re still dehorning the other half. A toe in the water, not the finish line.
Moving fast (one-generation flip)Use a homozygous (PP) sire like Remover-PP or A2P2-PP on a defined group. Every calf is polled, guaranteed, regardless of the dam.Give up a little top-end index — 147 TPI points between the top P (3371) and top PP (3224) on the US Aug 2025 list. In Canada, the proven gap is now under .
Selling genetics / exportingBuild PP into the matings you’d market into the EU. VikingGenetics is stacking its lineup around the 2031 shift; PP animals are positioned to carry a premium where dehorning is banned.Those are organic- and EU-specific signals — not a promise your local sale ring pays up tomorrow.
Any of the aboveSpread your polled pedigrees. VikingGenetics is screening barely-used cow families on purpose to keep diversity. Do the same at home.A short list of source families — Arielle-P’s among them — is doing most of the work, so stacking the same pedigree on every heifer imports inbreeding risk.

Your 30-day step, whatever row you’re in: pull your last three sire selections and check where the best polled bull ranked against what you actually used. That single comparison tells you how much — or how little — going polled would have cost you.

FactorHeterozygous P SireHomozygous PP Sire
Polled calves guaranteed?No — 50/50 split on horned cowsYes — 100% polled, every calf
Top US TPI (Aug 2025)3,371 (Celadon-P)3,224 (Kvell-PP)
Top CA LPI (Aug 2025)+3,897 (Remover-PP, #1 proven)
Index gap vs. top horned~9 TPI points~147 TPI points
Dehorning eliminated?Partial (50% of calves still need iron)Fully eliminated
Herd conversion speed2–3 breeding cyclesOne generation
Best use caseTesting adoption; maintaining top indexFlipping herd; exporting PP genetics
EU/export market valueModerateHigh — meets 2031 Danish organic standard
Pedigree diversity riskLowerHigher — monitor source families
Typical semen premiumMinimal$3–8/straw above comparable horned

Key Takeaways

  • If your best polled option ranks within roughly 100 points of your best horned sire — and on the current Canadian lists it does — the old “production penalty” reason to skip polled no longer holds. Re-run that comparison before you book your next round.
  • If you want hornless calves guaranteed in one generation, breed PP and accept a modest index trade — 147 TPI points between the top P and top PP bull on the US Aug 2025 list. If you’re fine flipping the herd gradually, a high-ranking P sire on horned cows gets you halfway each cycle.
  • If you export or sell genetics into the EU, treat PP as a market-access decision, not just a welfare one — Denmark’s organic dehorning rules are tightening toward a reported January 1, 2031 deadline, and the German and Dutch polled pools are deep enough to compete with on merit.
  • If you’re moving toward polled, check the pedigrees before you commit. A short list of source families is doing most of the work, so spread your matings or you’ll stack inbreeding risk into your own herd.

So where does your iron stand?

Polled isn’t the future of the Holstein breed anymore. It’s the present — sitting at 3371 TPI on the US list, topping Canada’s August 2025 proven ranking, and getting written into European law. The iron didn’t become illegal. It became optional. The genetics that made it optional are on the sire list right now, and a cow named Arielle-P in an 85-cow barn at Embro is part of the reason why.

So here’s the real question for your next mating sheet: is the dehorning iron still earning its place in your calf protocol, or are you just heating it up out of habit? If the gap between your best polled option and what you actually bred last round surprises you — and it might — that’s your answer.

Run Your Numbers

Genomic Testing ROI Calculator — Before you build PP into your matings, run the calculator to see whether testing pays on your replacement costs and culling pressure. It flags the families where inbreeding risk needs tighter control — the exact trap when a short list of polled pedigrees does most of the work.

Complete references and supporting documentation are available upon request by contacting the editorial team at editor@thebullvine.com.

Learn More

The Sunday Read Dairy Professionals Don’t Skip.

Every week, thousands of producers, breeders, and industry insiders open Bullvine Weekly for genetics insights, market shifts, and profit strategies they won’t find anywhere else. One email. Five minutes. Smarter decisions all week.
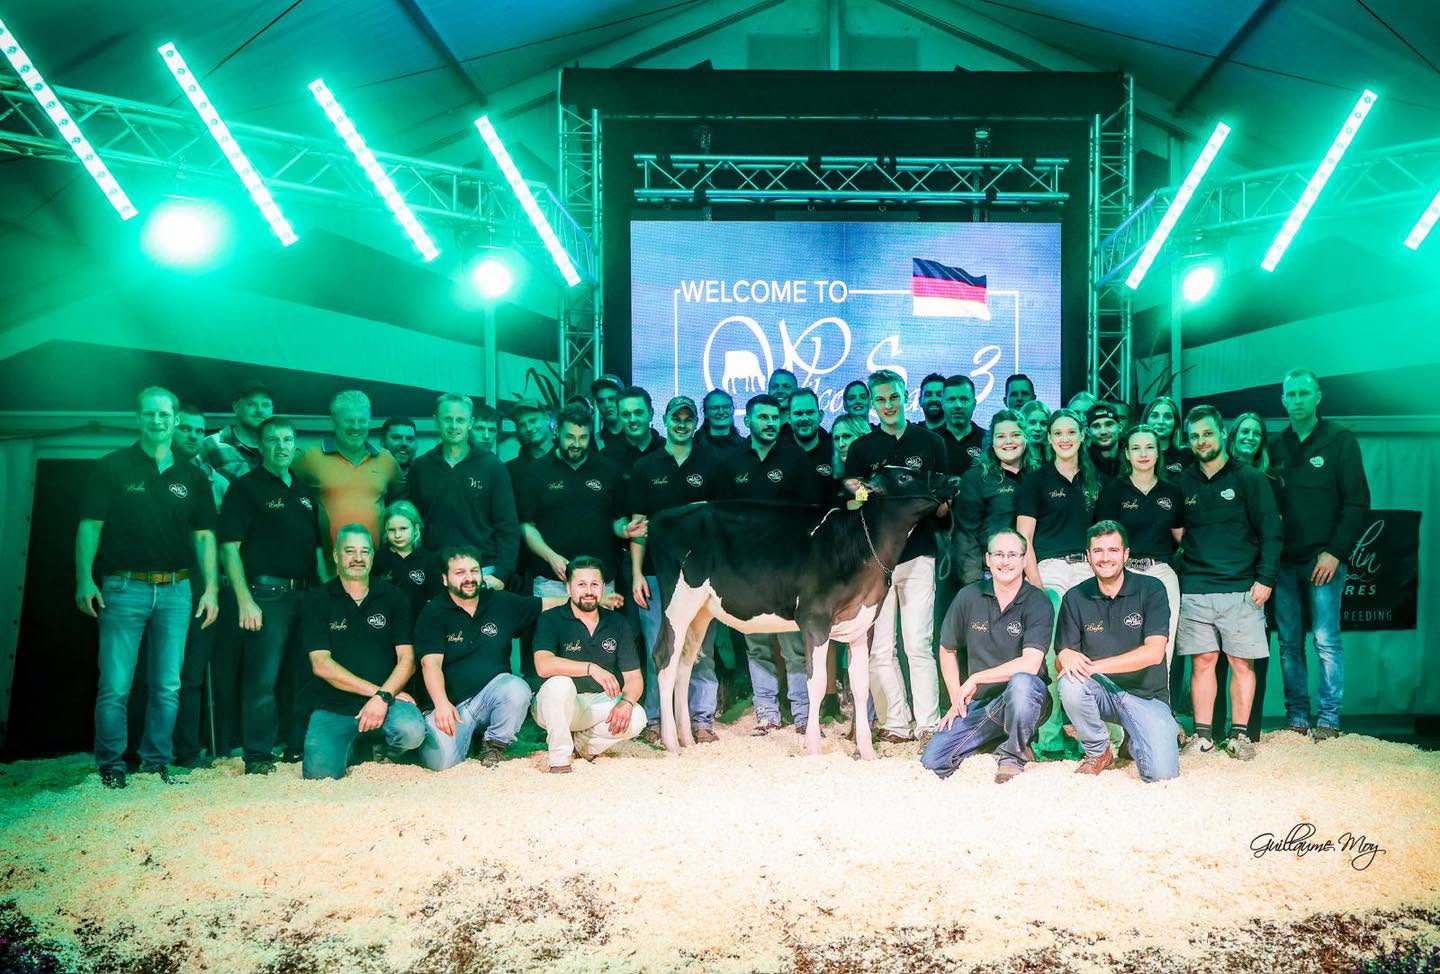
NewsSubscribe
First
Last
Consent

Sexation and the Ocean-View Covenant: The Herd That Taught the Holstein World to Trust Cow Families

Marvin Nunes was $450 over budget when Vivian elbowed him to keep bidding. That $2,450 cow — bought partly on her teacher’s pension — seeded a herd that today, more than sixty years later, traces every animal back to her and averages 12.8 generations deep. 

Ocean-View Sexation — the pitch-black Elevation son, bred in California in 1973, he couldn’t ship semen abroad — yet through his sons and embryos he stamped 96,689 daughters in the Netherlands alone, and built a herd that still traces every cow back to him.

The papers came back in January 1980, and a pitch-black Elevation son standing at ABS in Colorado stopped being just another young sire with a pretty pedigree. Ocean-View Sexation, bred from the Steps family of Marvin and Vivian Nunes, had posted the rare combination breeders were chasing in that era: significant pluses for fat percentage and strong conformation, at a time when the United States still wasn’t even calculating a protein index and when Elevation sons were flooding the market. 

Picture the dairy world he walked into. In 1980, before genomic shortcuts, before proofs moved at today’s speed, before every breeder carried a screen full of rankings in his pocket, a bull’s reputation traveled through proofs, phone calls, barn visits, semen reps, and the kind of coffee-shop talk that could make or break him. Sexation’s proof didn’t whisper. It kicked the door open. 

By September 1979, ABS had already seen enough to move him to its Colorado facilities, before his first complete index was even released. Then January came, and with it the words that would follow him for the rest of his life: “Sexation mania.” Dairy farmers across the country wanted the attractive black Elevation son who could put fat and structure into daughters with the kind of balance that made cows last. 

And the bull who stirred that national appetite was nearly trapped by geography. Because he was bred in California, Blue Tongue restrictions sharply limited the export of his semen, which meant Europe couldn’t simply use him the way American breeders did. What no one saw coming was that the restriction wouldn’t stop his influence. It would reroute it. 

That’s the Ocean-View story in miniature: a barrier becomes a doorway, a cow family outlives fashion, and one careful mating keeps echoing through Holstein pedigrees long after the bull himself is gone. 

Act I: The Family Before the Fire

To understand Sexation, you have to go back before the proof, before ABS, before the “mania.” You have to stand in a sale row in Salt Lake City in 1963, where Marvin and Vivian Nunes were studying a nearly four-year-old Burkgov daughter named Ideograph Burkgov Steps. 

In that era, a breeder’s eye still carried enormous weight. Classification visits were events, production records were studied like scripture, and a truly deep cow family could pull grown men across state lines just to see the daughters and granddaughters in the flesh. The 1963 National Convention Sale, managed by M.B. Nichols and Whitie Thomson, included seven daughters of Burkgov Inka DeKol — the famous sire tied to the polkadot pattern, born on the farm of the Utah State Industrial School. 

Steps had the goods on paper. Her dam, Ideograph Tidy Stars EX-91, had made 25,027 pounds of milk at 3.7% fat and 918 pounds of fat at twelve years old, and the maternal line ran back to Winona 6321 H.H.B., imported by W.K. Sexton of Howell, Michigan, in 1884. The sale catalog leaned hard on that pedigree — “Ross Gordon’s famous family!” — and listed Steps as a VG Burkgov daughter with a 1-11 record of 15,767 pounds of milk, 3.9% fat, and 622 pounds of fat. 

Marvin and Vivian had set their limit at $2,000. The bidding reached the line, crept to $2,100, and Marvin stopped. One can imagine the pause — the auctioneer’s chant still rolling, the cow standing there, the future of a whole herd balanced on the stubborn fact of a budget. Vivian nudged him with her elbow and told him to keep going. 

They bought her for $2,450. Part of that money came from Vivian’s teacher retirement fund. 

If you’ve ever stretched for a heifer you believed in, that detail lands right in the ribs. This wasn’t spare change. This was a schoolteacher’s security turned into cow-family capital, and history would prove it one of the great agricultural investments in the breed. 

Marvin never forgot what it bought. The most influential purchase Ocean-View ever made, he said, was Ideograph Burkgov Steps, adding, “To her we owe any success we have achieved in the registered Holstein business.” A 2017 sale-catalog account added that he’d seen the Steps family at Ross Gordon’s farm the day before the sale and remembered them as “the best group of animals from one family I have ever seen.” 

That was the dream at Ocean-View. Not a one-hit wonder, not the fashionable sire of the month — a cow family built to stand the pressure of time. 

Steps became a 2E-EX-90 Gold Medal Dam — the breed’s old mark for a proven producer of high-performing, high-classifying daughters — with a top record of 28,390 pounds of milk and 980 pounds of fat. Bred to Ida-Falls Stylemaster EX-GM, she produced Ocean-View Mistress Sonia VG-87. Sonia went to Rosafe Citation R. EX-Extra — the same great transmitter behind Glenridge Citation Roxy’s family — and the result was Ocean-View Citation Sheri VG. 

Then came the mating that lit the fuse: Sheri to Round Oak Rag Apple Elevation. Four matings, fourteen years, one family climbing toward something — and the calf born from that last cross on September 11, 1973, was Ocean-View Sexation. 

By 1981, the family had already earned the cover of the Holstein World Brood Cow Issue. The feature centered on Ocean-View Capsule Sharon EX-90, a sixth-generation Excellent descendant of Steps who made over 40,000 pounds of milk and more than 254,000 pounds lifetime. Think about what that cover meant in 1981 — no genomics, no shortcuts, just a magazine telling the breed that this California family could stamp Excellent daughters six deep. The story was already remarkable. The ink was barely dry on that cover before the family proved it was only getting started. 

Looking back, the signs were there. Elevation gave Sexation the sire power of the age, Citation R. lent the old transmitter strength, and Steps supplied the maternal depth Marvin had risked real money to secure. But nobody standing in that barn in 1973 could have guessed this calf would one day put more than 27,000 daughters into production in the United States — or that, decades on, every animal in the family’s barn would trace straight back to him.

Act II: The Bull They Couldn’t Bottle Up

Sexation didn’t enter AI through some polished rollout. He got his chance because Nor-Cal Sires needed a solid, reasonably priced young bull, and Marvin Nunes was willing to lease him. In December 1974, at just fifteen months old, Sexation was launched as a young sire by Nor-Cal, a California AI company that worked with ABS. 

He cut a striking figure — solid black where most of the breed ran broken and patchy, the kind of dark, clean-coated bull that, by all accounts, photographed like a statue and made a stud parlor go quiet when he walked through. And the rest of the story fits that quiet entrance: no fireworks, no theatrical beginning, just a good bull from a good cow family, given a shot because the pedigree made sense and the economics worked. 

The obstacles were real. He was one more Elevation son in a market already thick with Elevation sons. He was born in California, where Blue Tongue restrictions meant his semen could barely be exported. And as a sire of sons, his milk volume wasn’t strong enough to make him a runaway success in that role. 

That last point matters, because legends don’t need to be sanded smooth. Sexation wasn’t perfect. What made him matter was that his daughters worked. 

His daughters were cattle a farmer could live with. Read the 1989 Holstein World tribute and you can almost hear a herdsman nodding: he “truly transmitted the profile that corresponds to the expectations that every dairy farmer has for what a solid cow should look like,” and a Holstein International profile celebrated him the same way, as a source of females. In breeder language, that’s about as good as it gets. 

Starting in 1980, after that first index revealed the rare fat-percentage strength for an Elevation son alongside real conformation, Sexation became an ABS icon. He died in 1983 at only nine years of age, yet by then his name was secure. More than 27,000 daughters came into production in the United States. 

But the great twist — the part that still feels almost too perfect — was Europe.

Because direct semen export was restricted, European AI organizations went hunting for another route. They turned to Sexation sons born outside California or developed through embryos, and what came back is hard to believe even now. Start with Freebrook Sexation Amos, his maternal grandsire Astronaut: 70,100 daughters in the Netherlands. Then Paltzer Sexation Bert, out of an Apache-sired dam: 96,689 daughters — in one country. Dutch CRV statistics later pushed Bert’s cumulative total past 132,255. 

Read those numbers again. That’s not influence sneaking through a side door. That’s influence arriving with a crowd behind it.

And the crowd kept growing. Triosex of KI Samen — whose dam was bred to Sexation in Belgium — reached roughly 15,000 daughters across eleven countries. Orlo, imported to Germany as an embryo, became the highest-TPI Sexation son in the world in the 2023 reporting — TPI being the breed’s all-around merit index — with 2,911 daughters in Germany. Back home, Indianhead Cherokee carried the U.S. flag as the highest-TPI domestic son, with 8,694 daughters of his own. 

So Blue Tongue restricted him. And then it scattered his blood through sons, embryos, and AI programs on two continents. What was meant to contain him helped make him global. 

His female line may be the deeper story. Ked Sexation Jasmine VG became the dam of Ked Mark Justine VG-88-GMD. Justine produced Ked Juror GP-GM, and she was the grandam of Ked Outside Jeeves, who recorded 51,467 daughters and appears through Jeeves in the pedigree of the powerful Frazzled. Sexation also stands behind the Prudence family, which Holstein International connects to the modern sire Ranger-Red. Most readers won’t memorize the path from Jasmine to Justine to Juror to Jeeves to Frazzled — but that’s exactly the point. A good cow family keeps finding the next open lane. 

And here’s where the old bull reaches all the way into today. Pull up the April 2026 Top 100 lists — the PTA Type Females, the TPI Bulls — and Pam Nunes will walk you back through them name by name. Trace those modern sires back far enough, she says, and a striking share of them carry Sexation. Most run through Lew-Bro Sexation Cass; a handful — Superstition and Gold Chip among them — come instead through Juror. Follow those two lanes forward and his blood threads behind today’s heavyweights — Doorman, Doc, Lambda, Planet through Cass; Superstition and Gold Chip through Juror — often more than once in a single pedigree. Pam’s honest about the why. “Maybe today there are more bulls that can do that,” she says, “because it’s getting so inbred and crossed over. But I think it’s pretty cool.” She’s not claiming Sexation built those bulls single-handed. She’s just noticing that when you follow the breed’s best back to the foundation, his name keeps surfacing — and that’s a kind of legacy no proof sheet measures. 

Some of his daughters became stars in their own right. Mansion-Valley Niagara, a Sexation daughter, sold through the 1983 Designer Fashion Sale for $280,000 to Hilltop-Hanover Farms, later classified EX-95, and completed an age-eleven record of 48,910 pounds of milk — described in the contemporary accounts as the highest record for age in North Carolina history. 

And that was still only the beginning of what the covenant could do. Because then there was Zandra.

The Cow Who Turned a Chance Into a Legacy

“Can she walk?”

That was Marvin’s first question when Bill Kent called to say he’d just bought an Excellent cow for $1,600. The cow was Moore-Farms Valiant Smurf EX-90-GMD-DOM. She’d been scheduled to sell carrying a Sexation calf, but shortly before the sale she came back in heat — bred right back to Sexation — and the buyers got nervous. Reluctant to gamble on a cow that might not be settled, they let her go. Bill saw something different. “She’s a good one,” he told Marvin. 

He was right. After the 3,000-mile haul to California, Smurf was confirmed pregnant to that sale-day service, and the resulting calf was Moore-Farms Sexy Zandra. 

That calf — the one buyers hesitated over before she was even born — became one of the great living arguments for Sexation.

The Zandra family had started far from California, tracing to Quoque 7174 H.H.B., imported from Holland in 1884 by Wm. Koch of New York City, and it stayed in central New York for roughly seventy years before Smurf carried it west. Sexy Zandra classified EX-92-EEEEE-GMD — and produced 263,670 pounds of milk, 10,103 pounds of fat, and 8,476 pounds of protein across 3,337 days. 

In a 1996 Holstein World advertisement, Marvin and Daryl Nunes — father and son writing it together, the younger already shaping the breeding argument as much as the marketing — argued that their Sexation two-year-olds were still outperforming more modern herdmates, and that the good young cows in the herd that weren’t Sexations usually had him somewhere in their pedigrees. “Tremendous type plus volumes of production,” they wrote, “equals calf after calf and years of adding to the bottom line.” That sentence could’ve been carved over the Ocean-View barn door. 

Sexy Zandra’s greatest daughter was Ocean-View Mandel Zandra EX-95-2E-EEEEE-GMD-DOM, by Lutz-Meadows E. Mandel. E.Y. Morwick called her possibly the best all-round Mandel daughter — no small compliment, given how widely Mandel was used. She produced Ocean-View Zenith EX-GM, the Durham son proven through major AI systems, and at one point seventeen Excellent offspring of Mandel Zandra were confirmed. 

OCEAN-VIEW MANDEL ZANDRA EX-95-2E-EEEEE — that frame, that udder. E.Y. Morwick called her possibly the best all-round Mandel daughter ever; her son Zenith spread her across the U.S. while her daughters sold overseas, and one Japanese breeder kept her photo as the screen saver on his phone. (Photo: Frank Robinson)

Here’s the export theme echoing again. When the Nuneses bred Mandel Zandra back to Sunshine, she had no living daughters — and because embryos couldn’t be exported from California, the natural move was to sell them internationally only. Her son Zenith spread her in the U.S.; her daughters spread her across continents. As the family puts it, the true measure of strong breeding isn’t how cows do in your own barn — it’s how they do in someone else’s. Pam Nunes later called Mandel Zandra the easiest cow they ever had to market, and told the story of a gentleman from Japan proudly showing them his phone — the screen saver was Zandra. 

A phone screen saver. From Japan. For a cow bred out of a New York family, hauled to California through a sale-day accident, shaped by Sexation, and carried forward by Ocean-View. You couldn’t script Holstein history much better.

The Zandra line, still climbing: OCEAN-VIEW GOT THE Z FACTOR EX-92-2E EEEEE, a Doorman daughter and National Elite Performer who topped 57,130 lbs of milk as a five-year-old. She’s the eighth generation of an unbroken Zandra family averaging 90 points — her fourth dam is Mandel Zandra EX-95, her fifth dam Sexy Zandra, sired by Sexation himself. Sixty years on, the chance mating still pays out.

The Same Covenant, Tested Against Time

If Sexation proved a cow family could conquer the world through one bull, the Dixie family proved the same philosophy could outlast something harder: time itself. 

In 1975, Marvin bought Fleetridge Mona Dixie EX-92-2E, carrying a Paclamar Bootmaker heifer calf. That unborn calf became Fleetridge Bootmaker Dixie EX-90-2E-GMD. Marvin didn’t just buy a cow that day. He bought the next chapter already inside her. Mona Dixie opened the family’s historic run in 1979 when, as a ten-year-old, she produced 40,010 pounds of milk and 1,413 pounds of fat. 

Then a Dixie daughter went east. Brigeen Farms bought Ocean-View Elevation Debbie from Nunes and bred her to Valiant, and the resulting Brigeen Hanover Debra EX-91-2E set a national championship three-year-old record in 1986 with 42,910 pounds of milk and 1,882 pounds of fat. That’s the part that gets overlooked about a great cow family — it doesn’t stay home. The Nuneses sold a Dixie heifer east, a Maine breeder put a different sire on her, and the family answered just the same in someone else’s barn. A good family travels. 

Now sit with that for a moment. A three-year-old. More than 42,000 pounds of milk. Nearly 1,900 pounds of fat. And she still carried the type to score Excellent.

That wasn’t a lucky lactation. It was the middle of a chain. In November 1998, Jerland Aero Delicate EX-92-2E became the breed’s first seventh-generation Excellent, 40,000-pound cow. By 2005, the Dixie family had stretched to nine consecutive generations of Excellent, 40,000-pound females — a sequence the source material describes as unprecedented in Holstein history. 

Read that line twice, because the breeding math behind it is brutal. One Excellent 40,000-pound cow is special. Four generations is historic. Nine means the family kept answering the question over and over — through different sires, different herds, different managers, different decades, and tightening standards. No skips, no shortcuts. For a modern producer chasing longevity and lifetime efficiency, that’s not a museum piece. That’s the whole argument. 

Marvin’s Herd Then — and the Sassys Now

If Sexation was the high point of the old story, the Sassys are the high point of the new one. The same philosophy that bought a teacher’s-pension cow in 1963 is still winning on colored shavings today — and it runs through one remarkable family. 

The Sassy family is the clearest proof of the Ocean-View vision, because it blends both foundation lines into one cow: it traces straight to Sexation and Steps, while also carrying Zandra. During their era, Lindy Sheen and Mandel Zandra stood together in the show string, and visitors would ask which was the favorite. The honest answer was always the same — it was nearly impossible to choose. The Sassys carry the best of both. 

What makes the family extraordinary is how it grew. Ocean-View Zenith Sassy EX-90 was never flushed. She produced four natural daughters, the old-fashioned way, and each one founded a branch: 

  • Damion Sassy EX-95-3E — matriarch of a line that’s already produced three All-American descendants, the breed’s annual honor for the top animal in its age class nationwide. 
  • Dundee Sassy EX-93-3E — a 303,000-plus-pound lifetime producer. 
  • Sanchez Sassy EX-94-2E — a state and national fat leader, over 248,000 pounds lifetime and more than 11,000 pounds of fat. 
  • Sterling Silver EX-94-2E — Holstein USA Star of the Breed and a Junior 3-Year-Old milk record holder. 

Four sisters from one unflushed dam. Set that against a modern world of dozens of IVF siblings — this family elevated itself the slow way, naturally, and the Nuneses have leaned into it on purpose. Watch how Daryl and Pam mate this family and you see the covenant still working: faced with a herd full of choices, they keep reaching for sires carrying Sexation blood, because the family answers to those genetics. Sexy Shamma was a direct Sexation daughter; Benefit Sassy was sired by a Sexation son. More recently they’ve leaned on Diamondback and Master, both of which carry Sexation and Steps influence — natural complements to a family already proven to respond. It’s not linebreeding for its own sake. It’s protecting what already works. 

OCEAN-VIEW SHEZ A SASSY EX-94 — garlanded and still grazing, a Diamondback daughter of Damion Sassy EX-95-3E who has already topped 43,000 lbs in a lactation. She’s the dam of Ocean-View Sassin Me Back, World Dairy Expo Junior Champion and All-American — and her own maternal line runs fourteen generations of EX and VG dams straight back through Sexy Shamma to Sexation himself and, beyond him, to Ideograph Burkgov Steps.

And the family is still announcing itself. At the 2025 International Junior Holstein Show at World Dairy Expo, the Ocean-View prefix landed in the Top 10 eight times across the heifer division — double the next-closest breeder prefix at the show. The newest star is Ocean-View Sassin Me Back, a WDE Junior Champion, Jr All-American and Reserve All-American. Her pedigree carries fourteen consecutive generations of Excellent and Very Good females averaging 90 points — and Steps appears six times within her extended pedigree. Six crosses to that 1963 cow, in a champion heifer winning today. When she sold in 2024 to a partnership with Doug Brown of Iowa, she wasn’t just a stylish heifer — she was nearly eighty years of breeding decisions standing on four good legs. 

The arms fly up: Ocean-View Sassin Me Back is named Junior Champion of the World Dairy Expo Junior Show — also a winning Summer Yearling in both the Junior and Open shows and an All-American. A Diamondback daughter of Shez A Sassy, she carries fourteen generations of EX and VG dams that trace straight back through Sexation to the $2,450 cow Marvin and Vivian Nunes bought in 1963.

The Sassys aren’t alone, either. The Barbie family runs back through Juror, tying yet another Ocean-View line to that same Sexation thread. And that’s the thing about this herd — you can pick almost any branch, the Sassys, the Sheens, the Barbies, the Zandras, and follow it down to the same root. 

Different branch, same answer: OCEAN-VIEW-MA DB ALANNAH EX-92, a Diamondback daughter standing eleven generations of Excellent deep — her ten closest dams average 92 points — and already topping 44,000 lbs in a lactation. From the Annie/Arabella line rather than the Sassys, she’s co-owned with Martin Artucio of Uruguay, proof that the Ocean-View covenant still measures itself far from home.

Act III: The Sale, the Silence, and the Echo

Every great herd eventually reaches the day the trailers line up.

For Ocean-View, that day was May 2, 2012, at the home farm. The herd had grown past 600 registered Holsteins, with more than 330 of the animals in that dispersal herd classified Excellent. Dallas Burton had predicted it would be remembered as one of the few distinguishing sales in Holstein history. 

Imagine the sound of that day — the chant rolling for hours, cattle shifting in fresh bedding, old friends leaning on the gates, buyers paging through pedigrees that weren’t really pedigrees but family histories. The sale ran nine hours, and 524 lots averaged $2,742. All the cow families were represented. Steps. Dixie. Zandra. The names that built the herd, led through the ring one after another, and scattered into new barns. 

But here’s the part most folks in the seats didn’t know that day. The top seller, an EX-92 Allen daughter of Mandel Zandra known as Allen Zamora, sold for $15,200 — and the buyers were the Nuneses themselves. They had Ronnie do the bidding so no one in the crowd could tell which lots they were quietly after, and by the end of the day they’d bought back ten head to add to the ones they’d already set aside. Think about that — a family dispersing its life’s work, and slipping back into its own sale under cover to make sure the best of it came home with them. That’s not sentiment. That’s a breeder who knew exactly what those cow families were worth. 

Because a dispersal isn’t an ending — not when the genetics are real. Daryl and Pam Nunes carried the family commitment forward through Ocean View Genetics, now based in Deerfield, Wisconsin, where the core cow families kept going on a more individual scale. Their approach stayed faithful to the old lesson: keep the cows that make cows. Pam calls them the “factories” — a plain, working word that fits Ocean-View better than any polished slogan. Across the life of the prefix, 498 animals have earned the Excellent classification and 110 carry Gold Medal Dam status. Among the cows standing on the farm today, the highest lifetime producer, Ocean-View Roy Shari EX-94-5E, has milked 370,210 pounds in a lifetime. 

And then 2019 arrived, and it brought the cruelest losses and one of the proudest records in the same twelve months.

OCEAN-VIEW STERLING SILVER EX-94-2E EEEEE, a Braxton daughter who twice topped 58,000 lbs of milk in a lactation and was named a National Elite Performer and the 2019 Holstein USA Star of the Breed. The thirteenth generation of EX and VG dams tracing through Sexy Shamma to Sexation and back to Steps — she died just after the honor was announced.

That year, Ocean-View Sterling Silver EX-94-2E was named Holstein USA Star of the Breed — a National Elite Performer who’d milked past 219,000 pounds lifetime, including a record junior-three-year-old lactation of 58,330 pounds of milk, 2,419 pounds of fat, and 1,640 pounds of protein, the thirteenth generation of Excellent or Very Good dams tracing to Steps. And then, heartbreakingly, she died right after the announcement. The cow reached the summit and laid down at the top of it. 

That same year, on November 7, Marvin L. Nunes passed away at 83. He’d been honored with Holstein Association USA’s National Distinguished Breeder Award back in 2007, so he knew what he’d built. By every account he was a man who wanted no fuss for himself — but he deserved to be marked, and the symmetry of that year marks him whether he’d have wanted it or not. The man and the cow he made went out together. There’s grief in that, and there’s also a rare kind of peace in a breeder leaving behind families that still know exactly how to work. 

The thesis, standing in a pasture: OCEAN-VIEW LINED IN SILVER *RC EX-91, an Awesome-Red daughter built on fourteen straight generations of Excellent and Very Good dams averaging 91 points — three of them, top to bottom, over 50,000 lbs of milk (her at 50,700, her dam Silver Lining at 52,680, her granddam Sterling Silver at 58,330). The line runs unbroken to the twelfth dam, Ideograph Burkgov Steps — the $2,450 cow that started it all. Pam Nunes doesn’t believe there’s another cow alive who carries all of it at once.

And here’s the thing — as proud as the family is of that thirteenth-generation record, Pam will tell you it isn’t even the cow that says the most about what Ocean-View built. That distinction belongs to Ocean-View Lined in Silver *RC, an EX-91 Awesome-Red daughter out of Ocean-View Silver Lining. Her pedigree reads like the whole story compressed into a single page: fourteen generations of Excellent and Very Good dams, every one of them, averaging 91 points. Her dam, Silver Lining, scored EX-94 EEEEE. Her second dam was Sterling Silver herself. And the tower behind them runs straight down through the Sassys to the twelfth dam — Ideograph Burkgov Steps — then Tidy Stars and, fourteen deep, Twelvelms Hartog Segis EX-92. Look at the top of that pedigree and you’ll find three generations in a row over 50,000 pounds of milk: Lined in Silver at 50,700, her dam at 52,680 and again at 52,100, her second dam topping out at 58,330. Pam doesn’t believe there’s another cow alive who carries all of it at once — that kind of type, that depth, that production, stacked in one female. That’s not a record. That’s a thesis statement. 

There’s one thing about that barn that puzzles Pam in the best possible way. The Ocean-View string today is a patchwork of families that, on paper, have no business all peaking at once — Sassy, Sheen, Arabella, Heaven, Zandra, Dixie — eight distinct maternal lines averaging 12.8 generations deep, with a maternal classification score of 90.6 across the herd. “What it keeps telling me,” she’ll say, “is how different the herd is — to have SO many different cow families doing these things. And yet they all trace back to Sexation.” Then she answers her own question. “So maybe it makes sense.” That’s not a coincidence talking. That’s a covenant doing exactly what it was built to do. 

Trace Sexation forward today and you don’t have to look far. You find him through Ked Sexation Jasmine to Justine, Juror, Jeeves, and Frazzled. Behind the Prudence family tied to Ranger-Red. You find him through Lew-Bro Sexation Cass and Juror, surfacing again and again in the April 2026 Top 100 lists, behind names like Doorman, Doc, Lambda, Planet, Superstition, and Gold Chip. And you find him in the most literal way imaginable: the entire Ocean-View herd standing in Wisconsin today traces back to him, averaging 12.8 generations deep. When Pam Nunes says her champion heifer carries six crosses to Sexation, she’s not reaching for a marketing line. She’s describing the architecture of her barn. 

Here’s what Ocean-View finally proved. It didn’t change the Holstein breed by chasing the newest thing. It changed the breed by showing that deep maternal lines, functional type, production, fertility, and longevity could all be bred together — if a family was respected long enough to express it. Genomics can tell a breeder plenty, and no serious breeder today should pretend otherwise. But Ocean-View answers the older question the indexes still struggle with: will this family keep making the right kind of cow after the fashionable sire has come and gone? Marvin said it plainly — popular sires come and go every six months, but a program built on a solid foundation matters more than ever. The years proved him right. 

Ocean-View was never just a place — not Windsor, California, and not Deerfield, Wisconsin. It was a promise kept across generations: buy the cow family, trust the cow family, breed it honestly, and let time decide whether you were right.

It began with a schoolteacher’s elbow and her pension money — the budget standoff, the “Can she walk?” phone call, the ten-year-old Dixie breaking 40,000 pounds, four Sassy sisters from one unflushed dam — and more than sixty years later it was still answering, in a barn 12.8 generations deep where every cow traces to one black bull bought as a calf in 1973. Sexation gave that promise a name the world would remember; Steps, Dixie, Zandra, and the Sassys gave it roots deep enough to outlive them all. 

So the next time his blood surfaces in a modern pedigree — in a cow that milks hard, stands square, breeds back, and looks like she was built to stay — look twice. That’s the old Ocean-View lesson walking into the barn again, black and white, quiet, and permanent.

Key Takeaways

  • A restriction isn’t always a dead end. Blue Tongue kept Sexation’s semen home, but his sons and embryos rerouted that blood into 70,100 and 96,689 daughters in the Netherlands alone — and through Lew-Bro Sexation Cass and Juror, he still surfaces in today’s April 2026 Top 100 lists behind sires like Doorman, Lambda, and Planet. 
  • The Ocean-View bet was never on the fashionable sire of the month; it was on the cow family. That’s what turned a $2,450 teacher’s-pension gamble into 498 Excellent animals, 110 Gold Medal Dams, and a Junior Champion at World Dairy Expo. 
  • Great families can still be built the slow way. Zenith Sassy was never flushed, yet her four natural daughters — including Star of the Breed Sterling Silver — each founded a branch, and the line now crowns in Ocean-View Lined in Silver, fourteen generations of EX/VG dams deep. 

Learn More

The Sunday Read Dairy Professionals Don’t Skip.

Every week, thousands of producers, breeders, and industry insiders open Bullvine Weekly for genetics insights, market shifts, and profit strategies they won’t find anywhere else. One email. Five minutes. Smarter decisions all week.
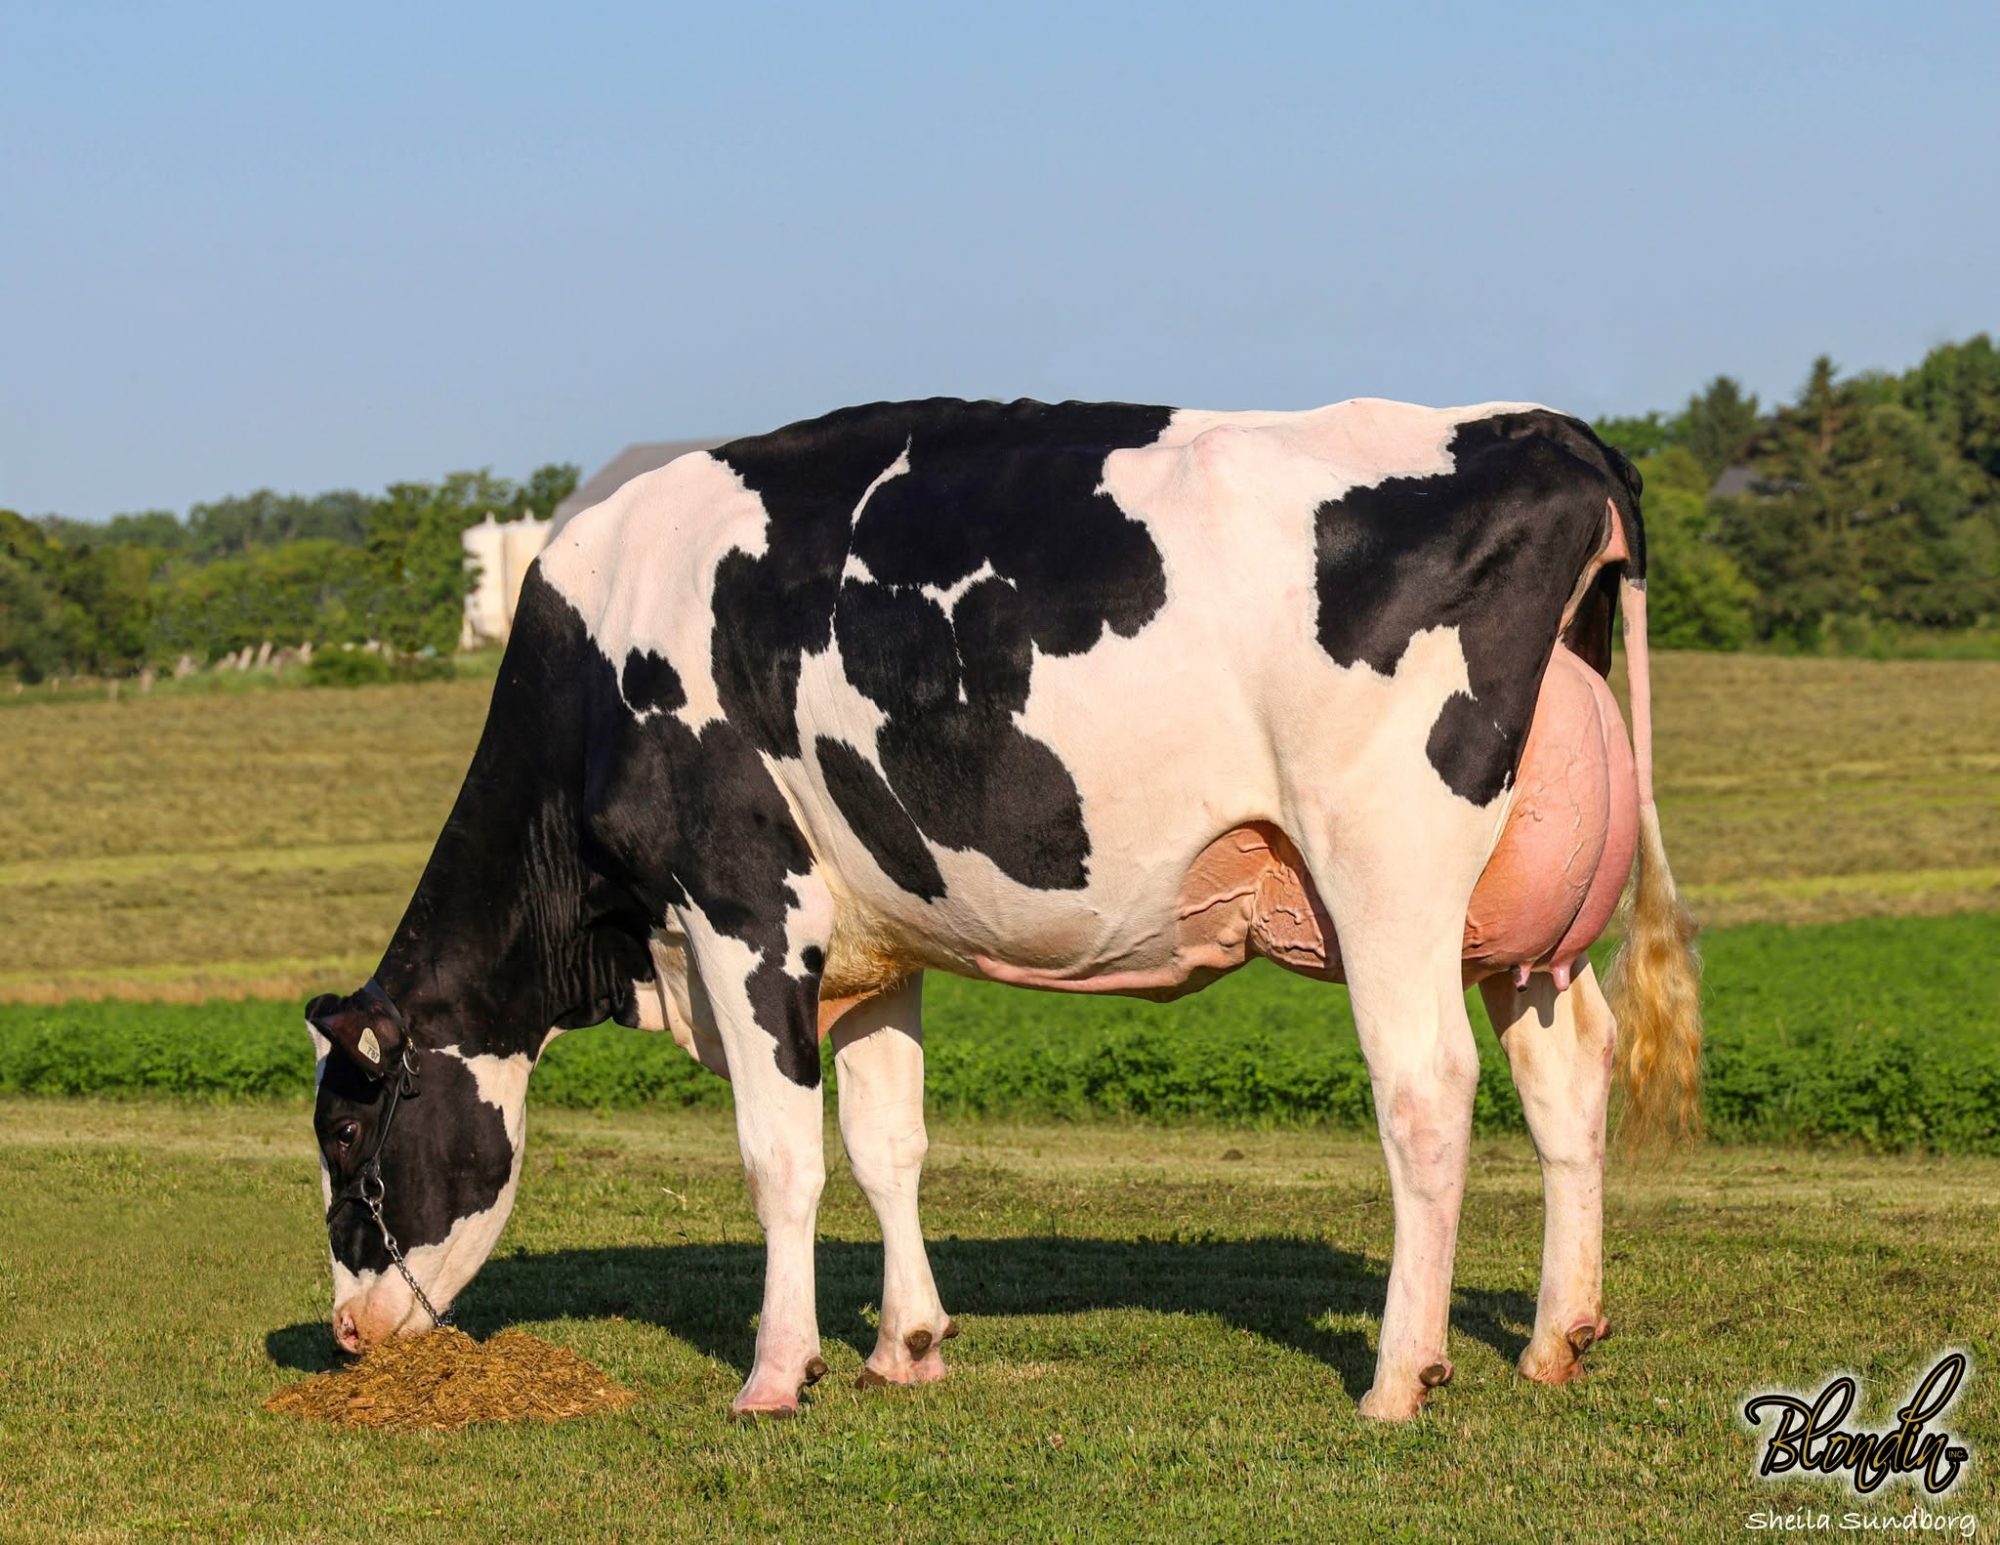
NewsSubscribe
First
Last
Consent

It’s Not Your Fans, It’s Your Genetics: Why Cows Quit Breeding at THI 60

At THI 60, some cow families keep breeding and some melt—same barn, same ration, same fans. That second group is quietly running your days open up 40 and costing 200–320 CAD a head.

Executive Summary: Once the temperature-humidity index hits about 60, fertility starts bleeding—well before the 68-to-72 milk-loss threshold most cooling triggers are set to. Here’s the part hardware won’t fix: the loss isn’t even across the barn. Some cow families keep cycling and conceiving through July; the melters crash—piling up extra services, dragging days open out by weeks, and dominating the summer cull and recheck lists even after you’ve maxed out fans and soakers. Run the math and it stings: at roughly 5–8 CAD per extra day open, 40 lost days runs 200–320 CAD a head, and if just 30 cows in a 200-cow herd carry that pattern every summer, you’re looking at 6,000–9,600 CAD a year before the wasted semen straws and vet rechecks. The fix is genetic, and you already own the tools—sort three to five years of June-through-September breedings by cow family in DairyComp, flip the bottom 15–20% of summer-fragile lines to beef semen, and screen replacement heifers for heat resilience before economic index. None of it rescues this July; it changes the daughters you freshen in 2028. If you’ve spent on cooling and conception still craters every summer, this is the lever you haven’t pulled yet.

heat stress fertility

It’s a composite scene, based on how this plays out on many farms. The fans are running. Soakers click on and off in rhythm. Steam hangs in the feed lane, and the cows look about as comfortable as Holsteins get on a humid July afternoon. A herd owner walks the high group, stops at a tall cow giving 90 pounds, and says he can’t afford to cull her.

But his summer breeding record says otherwise. Year after year, once the temperature-humidity index reaches about 60, conception drops sharply—and the heat-stress damage doesn’t fall evenly across the barn. Some cow families keep breeding. Others fall apart. The cooling money is already spent. And it still isn’t enough, because the weak point isn’t just airflow. It’s genetics.

What’s Really at Stake When THI Hits 60?

Spring can make any herd look smarter than it is. Body condition holds, first cut is moving, and reproduction finally looks the way the protocol sheet promised. Then the air turns sticky, THI sits in the 60s for a few days, and the picture shifts.

You see it fast enough in the reports: conception slides through June to September, days open stretch, and health problems like mastitis, metritis, and lameness start stacking up after the first real heat run. Graph three to five years of records, and you can watch the operation slide from profit mode into damage control as THI climbs from the 50s into the 60s and 70s.

That part isn’t breaking news. The sharper question is this: what happens when you sort the same summer data by sire line or cow family?

In real herd terms, two different “herds” can be standing under the same roof. One group—the stayers—gives up a little fertility but stays functional. The other—the melters—loses far more ground in the same THI band, then dominates the summer cull list, the recheck list, and the hospital pen. Same barn. Same ration. Same breeding crew. Different cows.

Why THI 60, Not 68?

For years, the working number was 68 to 72—the point where milk yield visibly drops and most cooling triggers are set. Fertility tells a different story. It starts bleeding earlier.

Across Holstein datasets from Europe, Australia, and subtropical regions, researchers have found fertility traits weakening below the old 68-to-72 rule of thumb—often around 60 or lower. Recent barn-level coverage pegs the same early onset, with heat effects on production showing up near 68°F THI and fertility taking hits sooner. The mechanism isn’t mysterious: the developing egg and the early embryo are heat-sensitive in windows that open before a cow looks visibly stressed, which is why a “mild” stretch of weather still shows up six weeks later as an empty cow.

So the practical takeaway is blunt. If your cooling trigger is set to the milk-loss threshold, your fertility losses started before the fans ramped up. The genetic gap between heat-tough and heat-fragile cows shows up while the weather still feels merely uncomfortable rather than dangerous.

How the Melters Give Themselves Away

Go back to that 90-pound cow. On a cool April morning, she looks like the right kind. Big frame. Big appetite. The kind that makes a herd owner feel better about his feed bill. Then July shows up and starts asking different questions.

Advisors working with heat-sensitive herds describe a pattern that keeps repeating in high-yield families:

  • Lower summer conception: In the THI 60-to-70 window, some families can run 10 to 15 points behind more-resilient lines within the same herd, advisors report.
  • More days open: Those same cows often drag several extra weeks compared with the stayers standing beside them.
  • More post-heat wreckage: Mastitis, displaced abomasum, and lameness show up more often after sustained heat events.
MetricHeat-Resilient Families (Stayers)Heat-Fragile Families (Melters)Warning Level
Cool-season conception rate35–38%34–37%Normal
Summer (THI 60–70) conception30–33%18–22%🔴 Critical
Extra days open vs. cool-season+5–10 days+35–45 days🔴 Critical
Services per conception (summer)1.8–2.23.0–4.5+🔴 Critical
Post-heat health events (mastitis, DA, lameness)Low–moderateHigh; repeat offenders🔴 Critical
Summer cull / recheck list presenceOccasionalDominates list🔴 Critical
Cool → summer conception drop<5 points10–15+ points🔴 Actionable threshold
Per-cow annual summer cost (40 days open)~$50–100 CAD$200–320 CAD🔴 Critical

When you sort by family rather than by the whole herd, the picture gets cleaner. Advisors describe cool-weather conception in the high 30s for some herds, with the most heat-sensitive families dropping into the low 20s at mid-60s THI while steadier families hold closer to the low 30s. Treat those as field observations, not a published dataset—the direction matches the heat-stress research, but the exact spread will vary by herd.

Here’s the tell that separates a genetics problem from a management one. Bad ventilation in the summer hammers everybody. The whole high group slides together, the fresh pen backs up, and the slump tracks the weather. A genetics problem is choosier. The same registration prefixes, the same maternal lines, show up open and rechecked while their pen-mates—same air, same water, same TMR—keep cycling and conceiving.

When the slump has favorites, you’re not looking at a fan that quit. You’re looking at inheritance. Melter families tend to reappear in the same ugly categories—open, repeat breeder, multiple health hits after heat—even when barns upgrade cooling or change protocols. At some point, that’s not bad luck. That’s an inherited weakness you’re choosing to keep breeding.

What Genetics Are Hiding in Your Summer Reports

Most herds already own the tools to start changing this. They just use them in the wrong order.

Too often, breeders start with Net Merit, TPI, Pro$, or LPI and then take a glance at fertility as a secondary screen. For heat resilience, flip that order. Filter first for the traits that predict summer survival. Then let your total merit index sort what’s left.

A heat-friendlier sire profile usually looks like this:

  • Positive fertility signal: Clearly favorable Daughter Pregnancy Rate or equivalent, not simply “acceptable.” Under heat load, even modest genetic differences in fertility show up larger.
  • Longevity and health behind it: Positive productive life or herd life, plus better-than-average udder health, metabolic disease, and lameness signals. Those traits earn their keep when cows are already carrying heat.
  • Moderate body size: Neutral to slightly negative size and stature, backed by sound feet and legs. Bigger cows produce more metabolic heat and shed it harder in humid conditions.

On the female side, genomic testing is where this gets practical, and it deserves more than a footnote.

How Genomic Testing Changes the Replacement Math

Parent averages are a guess. For low-heritability traits like fertility, that guess is especially soft—a daughter of a high-DPR bull and a fragile dam could land anywhere. Genomic testing tightens the guess by reading the calf’s own genotype, and the reliability gain on fertility, productive life, health, and size is exactly where it matters most for heat work.

Here’s the practical move. When test results come back, stop treating every heifer as an automatic keeper. Rank them on a heat-resilience screen first—fertility, productive life, health, moderate size—and only then sort by your economic index. The heifers that clear both bars are the ones you breed to sexed semen and build depth from. The bottom slice, the ones soft on fertility and health with high-stature signals, are your beef-cross candidates regardless of how their milk proof reads.

There’s a cost-control angle too. Testing isn’t free, but a herd that’s already retaining too many heifers is paying to raise its own future July problems. Aiming the genomic screen at heat resilience turns a sunk testing cost into a culling-and-mating decision you’d otherwise make blind. Even without a tidy national heat-tolerance index, this beats guessing from pedigree on the exact traits that crack under heat.

How to Spot Heat-Stress Infertility in Your Own Breeding Records

None of this works if the data stays locked in whole-herd averages. The good news: you don’t need new software. Tools like DairyComp and PCDART already break reproduction down by service sire and date—DairyComp’s BREDSUM summary has long been used by consultants to rank conception and pregnancy rate by sire.

Start with a date filter. Flag every service bred between June 1 and September 30 across the last three to five years—that’s your heat-window cohort. Wisconsin extension has even published the DairyComp commands for spotting heat-stress fingerprints in milk, components, and reproduction records, so the workflow isn’t exotic. Then run conception rate and days open two ways: once by sire, once by maternal line or cow-family group.

The split that matters is the gap. Look at each family’s summer conception against its own cool-weather number, not just the herd average.

Walking One Cow Family Through Three Summers

Picture how this reads on screen once the cohort is built. Take a single maternal line—call it the family behind your 90-pound cow—and pull its bred-to-conception record across three summers next to a steadier line in the same barn.

The fragile line shows a familiar shape: cool-season services convert fine, then June-through-September conception sags, three or more services per conception pile up on the same cow IDs, and days open on that line run weeks past the steady family standing in the next pen. Do it for three summers running and the pattern either holds or it doesn’t—that’s the whole point of the exercise. A family that runs 35% in spring and 33% in August is holding. A family that runs 36% in spring and 21% in August is melting, and it’s that second number quietly steering your cull list and your recheck sheet.

One caution before you act on the sort. Low-heritability fertility traits are noisy, and a single hot summer on a handful of cows isn’t a verdict. You want a repeated pattern—the same lines collapsing across multiple summers—before you start retiring genetics. One bad August is weather. Three is a trend.

Does the Barn Math Actually Hold Up?

Yes—and it’s worth being honest about where the numbers come from.

A 2019 Japanese Holstein study estimated the economic value of days open at 399 to 857 yen per day, depending on region and scenario. That’s the original published figure. At the 2019 average exchange rate of about 0.0122 CAD per yen, that works out to roughly 5 to 10 Canadian dollars per extra day open—call it 5 to 8 CAD as a conservative working range.

Walk it through one cow. Say a melter-family member tacks on 40 extra days open during a hot season—not a stretch when conception in that line drops into the low 20s. At the conservative end, that’s 40 × 5 CAD = 200 CAD. At the upper end, 40 × 8 CAD = 320 CAD. Now scale it as a what-if: if just 30 cows in a 200-cow herd carried that pattern every summer, the drag would land somewhere around 6,000 to 9,600 CAD a year—before you count the extra semen straws, the vet rechecks, and the higher odds those cows leave on a cull truck. That’s a recurring line item hiding inside “we had a tough summer.”

North American field economics land in the same zone. In Bullvine’s March 2026 analysis of Arizona heat-stress economics, a 3.5-point DPR gap worked out to roughly $157 to $367 per daughter over three lactations, using DCRC/Fetrow figures—often enough to beat a 150-point NM$ advantage once heat-driven days open and culls hit the ledger. So the Japanese figure isn’t an outlier. It’s a reasonable, conservative read on a cost that quietly repeats in the same families, season after season.

And there’s a bigger reason to care. Net Merit modeling and field analyses have repeatedly shown that better fertility and longevity often return more lifetime profit than chasing a little more milk from cows that don’t stay problem-free. The trade-off isn’t “milk versus nothing.” It’s usually “a little less peak versus fewer summer losses.”

Four Paths That Actually Change the Herd

There’s no perfect answer here. Herd size, replacement pressure, data quality, and appetite for short-term pain all matter. But there are four realistic ways to start.

Path 1: The One-Rule-Tonight Plan

Best fit: You’ve already invested in decent cooling and want to stop making the problem worse this breeding season.

Pull three to five years of records. Sort conception and days open for services bred June through September—or in the THI 60-to-70 range—by sire and by cow family.

Then draw a hard line under the bottom 15 to 20 percent of families for summer fertility. Those cows get beef semen only. No dairy replacements from them this year. At the same time, push your best fertility-and-health sires, ideally with moderate stature, onto the families that held together.

What it fixes: It stops fragile genetics from quietly filling your heifer pens. What it can hurt: If replacement numbers are already tight and you don’t tighten sexed-semen use on your better families, you can come up short on heifers. Do this within 30 days: Pull the last three to five summers of breeding records, rank families by summer conception, and decide which lines go beef-only now. That won’t rescue this July. It can absolutely change the calves you freshen in 2028.

Path 2: The Genomic Replacement Filter

Best fit: You’re already genomic-testing heifers, or you’re close to it.

Once results arrive, stop acting like every heifer deserves the same future. For heat resilience, keeper heifers should sit at or above herd median for fertility, productive life, and health, without extreme stature or body-weight signals. After that, sort by your preferred economic index.

What it fixes: It keeps you from raising the next batch of beautifully bred summer disappointments. What it can hurt:Get too aggressive too fast, and you can tighten your replacement pipeline before your better families have built depth.

Path 3: The Hot-Pens-First Sire List

Best fit: You can pinpoint where heat hits hardest—fresh pens, high group, specific barns—and you track breeding by pen.

Build a tighter sire list just for those groups. Every bull on it clears your fertility, productive life, health, and moderate-size thresholds. And where your evaluation system offers THI-slope or heat-tolerance breeding values, use them.

What it fixes: It matches your toughest environments with daughters more likely to hold together. What it can hurt:Genetics won’t save a pen with poor airflow, weak water access, or cooling that’s failing in plain sight.

Path 4: The Full Three-Year Reset

Best fit: Heat stress is a recurring profit problem in your region, and you’re ready to let data make the uncomfortable calls.

  • Year 1 — Triage: Pull three to five years of summer data, identify stayers and melters at THI 60 to 70, and flip the worst families to beef only.
  • Year 2 — Aim replacements harder: Genomic-test heifers, keep only those at or above herd median in fertility, productive life, and health with moderate size, and rebuild your sire list around bulls whose daughters actually held up through summer.
  • Year 3 — Tighten the cull gate: Move repeat offenders up the list—especially cows from fragile families that have now shown the same summer pattern twice.

Advisors who’ve watched herds follow that kind of plan describe a familiar payoff. Summer fertility still dips. But the crater shrinks, and the spread between the best and worst families tightens as more resilient cows make up the milking string. That’s the real outcome. Not a miracle. Not a silver bullet. Just a different herd.

Quick Comparison: Which Path Fits Your Barn?

PathBest ForKey ActionPayoff TimelineMain Risk
1. One-Rule-TonightCooling done; act this seasonBeef semen on bottom 15–20% of summer familiesCalves freshening ~2028Heifer shortfall if sexed semen not tightened
2. Genomic FilterAlready testing or near-readyScreen heifers for fertility, PL, health before economic indexNext replacement groupPipeline tightens too fast
3. Hot-Pens-First SiresBreed by pen; know your hot spotsDedicated sire list cleared for fertility + moderate sizeCurrent-year matingsWon’t fix broken cooling infrastructure
4. Three-Year ResetRecurring regional heat problemYear 1: triage; Year 2: aim replacements; Year 3: tighten cull gateMilking string by Year 3Needs multi-year data discipline

What This Means for Your Operation

Use this like a working audit, not a sermon. Each line is a decision you can make in the next breeding cycle.

  • Pull three to five years of summer breedings and sort by family. If the same lines keep collapsing at THI 60 to 70 while others hold closer to cool-weather performance, treat it as a selection issue—not just a facilities issue.
  • Check which bulls you’re still using in your hardest pens. If your hottest groups are still getting high-milk, low-fertility, taller sires, you may be breeding more July problems on purpose.
  • Audit your replacement policy. Are you keeping heifers because they’re balanced for fertility, productive life, and health—or because their milk proof looks good enough to keep the peace?
  • Set a cull threshold for repeat summer offenders. Two summers running with clearly extended days open, or three or more services per conception in the June-to-September window, is a defensible line in the sand.
  • Split your reports by THI band, not just by month. Even a simple under-60 versus over-60 comparison can tell you whether your cooling trigger is set too late.
  • Decide where the next dollar works harder. Another hardware purchase might help. But on some farms, stopping replacements from the worst 15 to 20 percent of summer families changes more than the next fan line does.

Key Takeaways

  • If you’ve already spent on cooling and conception still crashes every July, the next lever is genetic: stop making daughters from families that melt at THI 60, and concentrate your best semen on the families that don’t.
  • If the summer slump has favorites—the same maternal lines open while their pen-mates conceive—treat it as inheritance, not airflow. A fan problem hits everybody; a genetics problem is choosier.
  • If certain families lose far more ground in the THI 60-to-70 range while others stay near their cool-weather baseline, that’s a repeatable signal worth breeding around—but confirm it across multiple summers before retiring genetics.
  • If you genomic-test, screen heat resilience before economic index, so a strong milk proof can’t sneak a fragile heifer past the gate.
  • If you flip the bottom 15 to 20 percent of summer-fragile families to beef semen now and protect replacements from the stayers, you start changing your heifer pipeline without culling a single cow today.

The cows that matter most in your breeding plan aren’t the ones that impress you in April. They’re the ones you still trust in late July. Three summers from now, your barn will be full of daughters from the decisions you’re making this breeding season. Are they built for your climate—or are you still breeding April heroes that can’t cash a summer milk cheque?

Run Your Numbers

Pregnancy Rate Economics Calculator — This article says your melter families are dragging days open up 40 and bleeding 200–320 CAD a head. Put a real number on it: the calculator translates days-open savings, extra pregnancies, and cull impact into net annual ROI for your herd before you change a single breeding decision.

Complete references and supporting documentation are available upon request by contacting the editorial team at editor@thebullvine.com.

Learn More

  • Is Genomic Testing Worth the Investment? — Arms you with a definitive cost-benefit framework to measure the real-world dollar return of heifer genomic screening versus the overhead of blind-raising replacements that risk crashing during peak summer stress.
  • The Shift to Beef: Maximizing the Value of Lower Tier Cows — Breaks down tactical mating frameworks to aggressively capitalize on beef-on-dairy strategies, transforming your herd’s underlying “melter” family liability into immediate, premium-earning feeder calf cash flow.
  • Breeding for the Future: Why Reproductive Longevity Trumps Peak Milk — Exposes the hidden financial drain of chasing high-fluid-milk sires, proving why shifting selection criteria toward sustainable daughter pregnancy rates and extended herd life consistently secures greater lifetime margin per stall.

The Sunday Read Dairy Professionals Don’t Skip.

Every week, thousands of producers, breeders, and industry insiders open Bullvine Weekly for genetics insights, market shifts, and profit strategies they won’t find anywhere else. One email. Five minutes. Smarter decisions all week.
NewsSubscribe
First
Last
Consent

Tinder for Cows: How a Kiwi Sharemilker’s ChatGPT App Is Outbreeding the National Herd

A busted spreadsheet, a $30 ChatGPT subscription, and 400 KiwiCross cows later — one Waikato sharemilker’s mating reports are bending the national genomic trendline faster than LIC’s own tools.

Matthew Zonderop on his Matamata sharemilking block, the Kaimai Range at his back and his KiwiCross herd grazing behind him — the same 400 cows whose spreadsheet crashed one Friday night and sent him building the AI mating app now outbreeding New Zealand’s national herd.

A Spring Night in the Waikato

Picture this. You’ve seen it. You’ve lived it.

It’s 10:30 on a Friday night in early spring, two weeks out from PSM. The spring sunshine has been brightening the days, but the evenings are still cool, and the Kaimai Range out the kitchen window has gone that bruised purple colour the mountains go when the light finally drops. The rugby’s on in the background. Matthew Zonderop’s wife packed it in and went to bed an hour ago. He’s still at the kitchen table with the laptop open, because mating season’s bearing down and there are 400 KiwiCross cows out in the paddocks who don’t much care what time of night he finishes sorting them.

Five weeks of spreadsheets. Stacked on each other. Lactation data, sire IDs, somatic cell counts — and somewhere in the pile, something’s just gone pear-shaped.

The whole workbook’s lit up red. #REF! errors everywhere. And there’s Matthew, staring at it the way any of us have stared at a busted screen on a Friday night, starting to wonder if he should’ve just watched the rugby and dealt with it Saturday.

You know that feeling.

One Harmless Little Experiment

So he tried something a bit daft.

“I’d heard about ChatGPT,” he says, with the shrug of a bloke who’s told this story a few too many times now. “And I thought — well, I’ve got nothing to lose here. It’s not personal data. It’s just cow data.”

He uploaded the file.

The AI came back almost straight away. Found the problem. A spelling mistake. Fixed it. Then — and this is the part he still laughs at — tacked on a little line at the bottom: “Quite common to make this sort of error this time of night.”

Bit cheeky, really.

But here’s where it gets interesting. The file was still sitting there in the chat window, and the thing asked him a question he wasn’t ready for.

“Would you like me to continue analyzing this file?”

Two in the Morning

He said yes. Because why wouldn’t you. It was already late, the rugby was finished, the workbook was fixed — might as well see what it could do.

And what happened over the next three hours is the part that should make every breeding company exec from Hamilton to Madison sit up and pay attention.

The AI started pulling threads on its own. Sorted the lactation data. Broke out the SCC. Pulled fat and protein into their own column. Then it clocked the bull data sitting in another tab and — without being asked, mind you — offered to cross-reference it. These bulls here look like they’d match up with these cows. Want me to run it?

“I said yes,” Matthew says. “And then I just sort of stopped. Because I realised — hang on. You’ve just done what I’ve been trying to do for five weeks. In about thirty seconds.

Then a second thought hit him, sharper than the first.

And I’ve just woken a beast that every breeding company globally has played close to their chest for decades. What have I done?

It was two in the morning by the time he shut the laptop. He had to be up in a couple of hours to milk.

Look, I know. Everybody’s got their ChatGPT-just-changed-my-life story these days. I get it. But stay with me. This one’s different, and you’ll see why.

Meet the Man Behind Perfect Cow

That Friday night idea turned, over the next couple of years, into the thing Matthew now calls Perfect Cow Breeding Solutions. The “Tinder for cows” line? That was a joke he cooked up to get the Kiwi press to pay attention. Worked a treat. NZ Herald ran it. Farmers Weekly ran it. Fieldays 2025 named him a finalist in their Innovation Awards. He’s done just about every ag podcast in the country. A few thousand Kiwi cows are walking around right now with mating reports that came out of his system — most of them in the South Island, where the herds get big and the dollar decisions get real.

But here’s the bit the headlines kept glossing over.

He’s Not a Coder

Matthew isn’t some tech bloke who happened into dairy. He’s a 50-50 sharemilker at the base of a mountain range, working someone else’s ground under an arrangement you almost never see in North America. The owner provides the farm. Matthew provides the cows and the labour. They split the milk cheque down the middle. That owner, credit to them, held steady through the six months Matthew effectively disappeared into his laptop. Matthew was already known and respected around the Matamata sharemilker scene, which is probably the only reason he got the rope he needed to run with this.

As for his tech background? He’s good with Excel the way the rest of us are good with Excel. Functional. Stubborn. Suspicious of anything asking for $30 US a month out of his pocket.

He paid the $30.

Six Months of YouTube and Bad Prompts

Then he got to work in the way farmers get to work on anything — by chipping at it. YouTube tutorials after evening milking. Podcasts on in the ute while he shifted cows. Prompts copy-pasted, rewritten, rephrased, then handed back to the AI with the question can you help me ask you better questions? Bit by bit. Over six months.

“You don’t need to write code with AI,” he says. Flat as you like. “It does that for you.”

What he did need was the stuff nobody in an LIC office could give him. A Waikato sharemilker’s gut. The kind of thing that’s not written down anywhere. Why putting an American Holstein bull over a KiwiCross cow is a straight line to a shed full of expensive, oversized disappointments. Why a System 1 farm — that’s Kiwi shorthand for all-grass, no bought-in feed, running up to System 5 which is partial TMR — why the guardrails you’d use on one of those will absolutely wreck the other. Why you can’t go chasing 35 kilos of liveweight in a single generation without snapping something you didn’t even realise was load-bearing.

He had all that in his bones. He’d lived it. He just didn’t have a tool that could hold it all at once.

And honestly? Nobody does. Not a human. You try to hold 400 cows by 26 traits by eight generations of ancestry by a dozen bulls in your working memory, and you’ll crack. That’s not laziness. That’s physics.

So he built one.

How Perfect Cow Actually Works

Strip the Tinder joke off and here’s the real job.

One File. 900 Cows. Before Lunch.

A South Island farmer rings Matthew. He’s running 900 cows and he’s got a nagging suspicion last season’s matings weren’t quite right. The farmer goes into MINDA — that’s LIC’s central herd database, and here’s the punchline most North Americans haven’t clocked yet: it covers 93% of every dairy animal in the country — and he exports a CSV.

Phenotypic data. Full genomic profile. Production history. Health records. Liveweights. Every mastitis case, every uterine infection, every lame day, every lactation curve going right back to the day the cow was born. One file. Standardised. Downloadable.

Matthew gets the file. Jumps on a video call with the farmer. Twenty, thirty minutes talking through what the farmer actually wants. More solids? Better breeding back? Drop the SCC? Tighten gestation length? Protect longevity?

Twenty-Six Traits, and LIC on the Other End of the Phone

Then the system goes to work.

Cross-references the cow data against the bull catalogues Matthew has direct relationships with. Runs compatibility across 26 traits per animal. Then writes the mating report.

Here’s where the partnership with LIC matters more than people realise. When Perfect Cow proposes a bull team for a herd, Matthew runs the proposed team straight back through LIC, and they tell him very, very quickly which bulls can or can’t be used against that specific herd’s ancestry. Could he build a bull-by-bull ancestry database for every client himself — grand-sire, MGS, dam, the lot? Sure. It’s a bit more work, and frankly nobody’s asked. The LIC kinship check is fast, accurate, and built off the national pedigree. No reason to reinvent it.

A single slice of a Perfect Cow report: each dam-heifer pair scored across 26 traits — breeding worth, protein, fertility, liveweight, SCC, udder — then handed a plain-English verdict. Repeat. Use with caution. Avoid repeating. Note the “locked logic” column on the right: dam phenotype crossed with heifer genomics, governed by pasture-first rules, so the system can’t talk a farmer into going backwards.

His own 400-cow herd? About half an hour. The South Island job on 900? Done before lunch.

The old way took months. Matthew knows. He lived it. And at the end of those months, he says, there was always a quiet voice at the back of his head asking whether any of the work was really right.

“If you’ve got 400 cows and you try to do it yourself, you’re going to spend months on it. And even then — are you ever really going to be completely satisfied with the answers you came up with?”

That voice has gone quiet for the first time in his farming life.

What That Looks Like From the Other Side of the Inbox

This is the part you don’t get from a press release. You get it from the people sitting in their own kitchens, watching the report come back.

Tom B, a Perfect Cow client, put it like this:

“PCBS turned my MINDA herd data into clear, detailed results within minutes — including individual cow recommendations, potential culls, and a selective AB breeding plan tailored to my herd. It is fast, practical, and easy to use, with technical commentary that makes it a valuable sounding board for better breeding and management decisions.”

And Matthew’s wife, Carolyn Osborne, who watched the whole thing land in their kitchen on that first night:

“I was oblivious to the magic that was unfolding. By morning, Matthew came back from the shed buzzing — the AI platform had delivered results that we had been working on for 5 years. It has now, without question, won the Employee of the Month award.”

Employee of the Month. There’s the line.

The North American Translation — Sexed Semen Meets Beef-on-Dairy

Here’s the part that should prick up North American ears, given where the breeding conversation sits right now in 2026. The same multi-trait engine that sorts a 900-cow KiwiCross herd in a morning is exactly the tool a Wisconsin or Ontario operator needs to triage the sexed-semen-vs-beef-on-dairy call at the cow level. Which dams get a conventional dairy sire. Which get sexed straws. Which move to a Limousin or Angus cross.

That decision tree has dominated fresh-pen strategy for 18 months now. And hardly anybody is making it with this kind of analytical horsepower behind them. Most farms are still eyeballing it off a DHIA report.

Why the KiwiCross Is the Animal at the Centre of This

You need to understand the cow before you understand why any of this matters.

60% of a National Herd, 70 Years in the Making

The KiwiCross — roughly 60% of New Zealand’s 5.91-million-cow national herd — isn’t an accident. She’s a long, patient breeding project. Holstein-Friesian crossed to Jersey, selected continuously since the 1950s, officially trademarked as a breed by LIC back in 2005. The modern KiwiCross carries 378 kg more milk and 28.7 kg more milk solids than the foundational parental average. That’s compounding gain — exactly the kind of generational patience work North American breeders spent 50 years layering into the Holstein.

She’s middle-weight. Around 450 kilos. Fertile. Tough. Built to pick her own feed off a wet paddock 365 days a year and keep going.

And she’s exactly the cow who breaks under aggressive single-trait selection.

The Seven-Kilo Rule

“People come to me and say I want to breed bigger cows,” Matthew says. “And we go back and look at their data, their system, their location, how much feed they’re actually bringing onto the farm. And we ask — is this really going to work for your farm?”

More often than not, no.

“Bigger cows don’t necessarily mean more milk in New Zealand. There’s more to it than that. We farm outdoors.”

This is the spine of Perfect Cow. And it’s what separates Matthew’s work from the reckless techno-optimism the rest of the industry’s about to drown in. The system is built so you can’t go backwards. Traits get repaired or enhanced one small step at a time. Seven kilos of liveweight this season. Not thirty-five.

“Mating cows can go both ways,” he says. “You can repair traits, or you can enhance them. But we’ve designed the system so you’re not going to go backwards.”

She’s Not a Commodity

This is where his philosophy about the animal herself starts to show. It’s the bit I wish more breeding programmes would copy.

“We’re in an age where we’ve got extremely highly productive animals. Extremely valuable animals. We can’t treat them as a commodity the way we have in the past. Think about it — from calving to full lactation in six weeks, and then on and on, year after year, in our environment. That’s an incredible animal. We need to look after her. We need to make sure the data we’re getting from her is accurate. Because her progeny is going to affect the next generation. And the one after that.”

That’s not PR talk. That’s a man who gets up in the dark to milk 400 cows and knows exactly what it costs to replace one.

As Matthew puts it — they’re performing a Rugby World Cup Final every day. Every day.

Longevity isn’t a buzzword in his system. It’s something he built the AI to protect. And that matters more than ever in 2026, with the methane pricing conversation heating up on both sides of the Tasman and the EU already putting numbers on the table. A pasture-based system running incremental, longevity-protective genetic progress isn’t just dairy philosophy anymore. It’s climate positioning — and the smart operators know it.

The Proof Was Standing in a Paddock

You can argue philosophy all day. The cows in the paddock don’t lie.

The First Cohort on the Ground

During our conversation, about 23% of the herd — Matthew’s target replacement rate, the first full cohort bred off Perfect Cow matings — was grazing right behind his shoulder. Black-and-white, cross-coloured, smaller than a North American Holstein calf at the same age. A couple of them stretched out in the autumn sun. One or two lifted their heads at the sound of a quad bike somewhere over the ridge.

He walks that mob most days. Knows which came off which sire. And listening to him talk about them, you can hear he hasn’t quite lost the wonder of it yet.

Running the Numbers Backwards

Before those calves went off to grazing, he did something that two years ago would’ve been pure science fiction. He pulled the genomic data on every one of them. Married it to the full lifetime record of each dam — size, grand-sire, lactation history, every health event, calving dates, first-service inseminations, every mastitis case, every lameness. Cross-referenced the sire IDs. Then asked the system to tell him, in reverse, how his mating programme had actually performed.

Half an hour.

What came back was the kind of verdict no human consultant could hand you in a month. This mating worked. This one was a dud. Don’t use that bull again. This sire corrected a weakness three generations deep on the maternal side.

Genetic Gain Trends, 2015–2025: Zonderop’s herd (blue) tracked the national average (red) for years, then broke away once Perfect Cow matings took hold — closing 2025 near 280 gBW against the national herd’s roughly 205. The bending line he keeps on his laptop, made visible.

The herd genetic gain trajectory off those matings — Matthew has the chart on his laptop. The line bends.

What LIC’s Own Analysis Is Picking Up

LIC’s own analysis of Perfect Cow-mated herds is flagging something the industry needs to watch. They’re seeing lifted milk solid components and improved fertility without a matching rise in milk volume. In a pasture-based system, where every extra litre costs you in feed demand, that’s the trifecta. More solids. Better breeding back. Animals still sized for the paddock they’re standing in.

Now — the early trade-press numbers you might’ve seen thrown around, 12% faster genetic progress, 18% fewer stillbirths — Matthew treats those with the caution they deserve, and so should we. Those are early figures. Whether they hold up under further independent research is something he’d want to keep an eye on rather than bank on. The long-tail stuff, mastitis resistance, functional survival — that won’t tell its full story for another five to eight years.

Keep an eye on it. Don’t put weight on it yet.

But the genomic trajectory against the national herd is already bending the right way.

“We’re seeing the gains.”

In a country that on June 20, 2025 reset its entire genetic base cow from 2005 to 2015 — effectively declaring the average cow of a generation ago is no longer the benchmark — a line like that lands differently than it would anywhere else in the world.

The whole national herd is running.

Matthew’s herd is running faster.

What This Means If You’re Milking in Wisconsin, Ontario, or Texas

Right. So here’s the question for you if you’re reading this from a free stall in Wisconsin, a robot shed in Ontario, or a 3,000-cow operation outside Hereford.

What do you actually do with this story?

The Wrong Answer

On first read, the easy way out is this: well, New Zealand’s different. MINDA’s different. The KiwiCross is different. Good on Matthew, doesn’t apply to me.

That’s the wrong answer.

The Real Moat Is Data, Not AI

Here’s the right one. The reason Matthew pulled this off isn’t because he’s smarter than the rest of us. It’s because he had access to one standardised, exportable, farmer-owned data file covering every animal in his herd. That’s the whole advantage. That’s the entire moat New Zealand has over North American dairy in this particular race.

And we don’t have it.

We’ve got DHIA records in one place. CDCB genomic evaluations in another. Herd management software somewhere else. Parlour data sitting in a server nobody ever touches. Health records stuck on the vet’s computer. And beef-on-dairy sire data scattered across a half-dozen AI companies that — let’s be honest — don’t love the idea of sharing.

Or as Matthew himself frames it: the greatest risk to your national herd is not the farmer and their hard work on breeding. It’s the segregated platforms — the off-ramps on the genetics highway.

That’s the line. Pin it on the office wall.

Work out of the University of Wisconsin, and the Dairy Brain project in particular led by Dr. Victor Cabrera, has been making this exact case for years now. Data fragmentation is the single biggest thing holding back precision breeding on this continent. The barrier isn’t the AI. The AI is ready. The barrier is the plumbing, and it’s a political problem dressed up as a technical one.

What to Do Monday Morning

The practical takeaway for a Bullvine reader goes like this.

Audit what data you actually own. What you can export. What your breeding company controls. Ring your genetics rep on Monday and ask them, point blank, whether you can get a single clean file combining your genomic evaluations, your DHIA records, and your health events. If the answer’s no, ask why. Because the Kiwi sharemilker running mating reports for 900-cow South Island herds on a $30-a-month ChatGPT subscription is doing it with your cows’ worth of data — organised in a way you currently can’t get at.

The cows on your farm are ready. The AI is ready.

The plumbing isn’t.

Fix that, and Perfect Cow — or its North American cousin — shows up in your parlour faster than anyone on the industry side wants to admit.

The Day LIC’s Entire Exec Team Turned Up at His Kitchen Table

Which brings us to the part of the story that still makes Matthew shake his head.

The Email Nobody Expected

You’d expect LIC to have treated him as a competitive threat. A sharemilker builds a custom app that does what Customate does — their flagship mating tool — and arguably does more. Standard corporate playbook says: lawyers, cease-and-desist, sorted by Tuesday.

Instead, the email landed.

The Chief Executive wanted to come out to the farm. Brought the whole exec team. Head of Genetics. Science lead. Technology department. The people who actually write the MINDA dashboard itself. They all sat around Matthew’s kitchen table while he showed them what he’d built. His wife Carolyn poked her head in halfway through to say hello — the sort of small-farm New Zealand moment you don’t really see reproduced anywhere else in the global dairy world.

Five Minutes vs a Whole Career

“They were taken aback at the speed,” Matthew says. “I told one of them — you’ve spent your entire career researching and experimenting with genetics. And I’ve just done it in five minutes.

That’s the kind of line that could’ve ended the conversation right there. Didn’t.

“They were really enthusiastic. They said — this is really, really good. Congratulations.

Then came the question Matthew wasn’t ready for.

What can we do to help?

“I was totally unprepared for that question,” he says. “I’m not an entrepreneur. I’m a dairy farmer trying to breed the perfect cow.”

LIC now shares additional bull data with him direct, and runs the kinship checks on his proposed bull teams. Customate offered you eight traits you could weight. Perfect Cow runs the full spectrum — 26. That’s not a competitor relationship. That’s an industry to its credit recognising that a door just opened it didn’t know was there, and deciding to walk through it.

The Sharemilker Who Stopped Chasing the Farm

Something quiet has shifted for Matthew since that kitchen meeting.

The Classic Arc, Redirected

Five years ago, you’d have asked where his career was headed and he’d have given you the classic sharemilker arc. Build equity. Buy the farm. Hand something to the kids. Same story you’ve heard a hundred times, from the North Island to North Dakota.

Ask him now. Something’s different.

“My focus has moved a little bit — from farm ownership to actually creating the perfect cow. Fine-tuning the system so we’re getting profit per hectare on a 450-kilo animal doing 500 kilos of milk solids. That’d be an amazing achievement. Done all through AI, in a very short period.”

Compressing 50 Years Into 5

Short period is right. New Zealand’s legendary breeders have been building their herds for 80 years. Some of the best families trace right back to foundation cows calved before the Second World War. Those breeders are gaining fast through genomics now too — no argument there. But Matthew’s point, and you can hear the quiet wonder in his voice when he makes it, is that he’s compressing 50 years of their work into three to five.

Not because he’s better than they are.

Because the tool let him.

The Uncomfortable Truth for the Rest of the Industry

Here’s the part the industry needs to sit with for a minute.

The Moat Is Already Gone

The old moat — proprietary software, specialised consultants, centralised analytical power held by the big genetics companies — is eroding. Not in a decade. Not in five years. This quarter.

The raw material for precision breeding is data. Whoever has clean, standardised, farmer-accessible data wins. Whoever builds the tool on top of it matters less than the fact that a sharemilker can now build it himself. In a kitchen. After evening milking. On a subscription that costs less than a case of mastitis treatment.

The Cows Win Either Way

And the cows at the end of the chain — those incredible animals Matthew refuses to treat as a commodity, the ones running their own Rugby World Cup Final every day — benefit either way. Better matches. Fewer disappointing calves. Longer productive lives. Less genetic damage being repaired one generation downstream.

If you’re running a dairy in 2026 — whether it’s 60 Holsteins in a tie-stall in Wisconsin or 5,000 cows in the Texas Panhandle — the question isn’t whether AI is going to change how you breed. The question is whether the data you need is sitting somewhere you can actually get at it.

Matthew Zonderop answered that question the night he uploaded a busted spreadsheet to a chatbot at 10:30 PM while the rugby was on.

The rest of us are still figuring out where ours live.

One Mating at a Time

The Kaimais are quiet tonight. Carolyn’s asleep. And somewhere on the Waikato side of that range, a cow who hasn’t been born yet is already mapped in a report, matched to exactly the bull she was meant to meet.

Tinder for cows, maybe.

But really — something closer to what breeders have been chasing since we first started keeping records.

The perfect cow.

Or as close as a patient, stubborn, self-taught sharemilker from Matamata can get her. One mating at a time.

Key Takeaways

  • The moat was never the AI — it’s the data. Matthew pulled this off because MINDA hands him one clean, exportable file on every animal. If your DHIA, genomic, health, and parlour records live in five silos, that’s the real thing holding you back.
  • Use it to repair or build traits in increments, not to swing for the fences. Chasing 35 kg of liveweight in one generation breaks a cow; adding 7 kg a season doesn’t. The tool’s only as disciplined as the goals you set with it.
  • The sexed-semen-vs-beef-on-dairy call is exactly the kind of cow-level triage this kind of multi-trait engine is built for — and most farms are still eyeballing it off a report.
  • Don’t wait for a vendor to build this for you. Ring your genetics rep Monday and ask if you can get one combined file of your genomics, DHIA, and health data. If the answer’s no, ask why.

Learn More

  • When Your “Elite” Genetics Start Costing You Real Money — Run this audit before your next mating: every 1% bump in inbreeding quietly drains $24 per cow, and Italian genomic data pegs the milk loss at 61 kg. Arms you with the diversity checks Perfect Cow’s five-generation guardrail is built to enforce.
  • The $1,350 Replacement Advantage — Follows the money on why genomic progress at $75 Net Merit a year now makes younger cows beat your loyal third-lactation producers, and why the tech only pencils above 400 cows — the scale question every operation must answer in the next 3–5 years.
  • The Next Frontier: What’s Really Coming for Dairy Cattle Breeding (2025-2030) — Maps the CRISPR, designer-milk, and feed-efficiency breakthroughs landing by 2030, delivering $87,500–$393,750 in annual savings per 1,000 cows. Where Perfect Cow optimizes today’s bulls, this charts the traits you’ll be selecting for next.

The Sunday Read Dairy Professionals Don’t Skip.

Every week, thousands of producers, breeders, and industry insiders open Bullvine Weekly for genetics insights, market shifts, and profit strategies they won’t find anywhere else. One email. Five minutes. Smarter decisions all week.
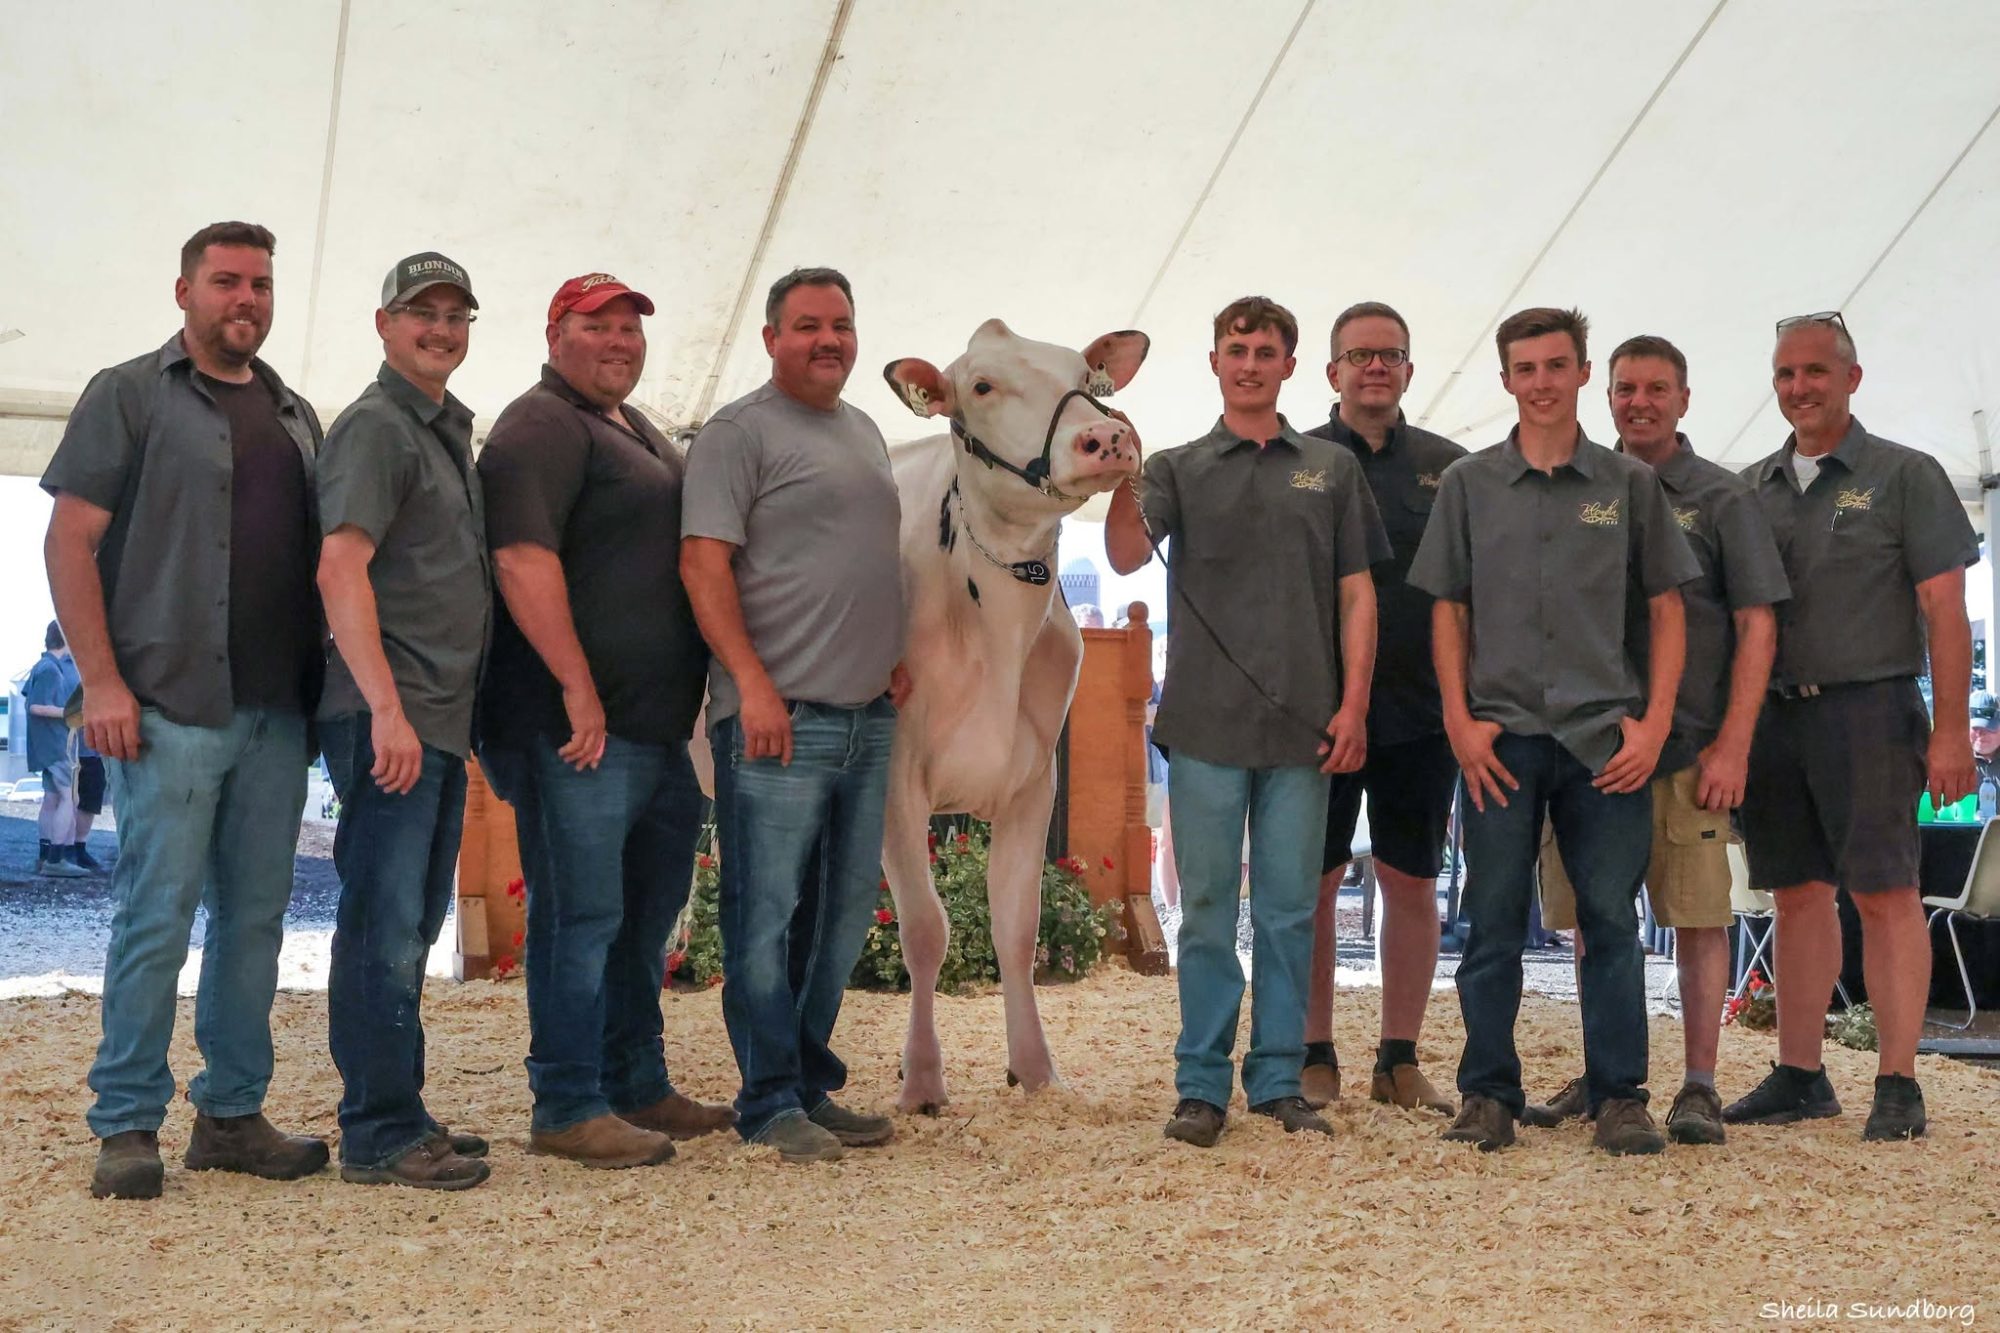
NewsSubscribe
First
Last
Consent

Roybrook in 2026: The $15,000 Cull Cheque Behind a Real Cow Family

Ormiston paid $750 for the White Cow in 1956. To do what he did on a 300‑cow Holstein herd in 2026, you’ll write a $10,000–$15,000 cull cheque — and most breeders quit before it pays.

Roy Ormiston at his Roybrook desk, “The White Cow” crest on the wall behind him and bronzes of his Roybrook bulls within arm’s reach. Every banner, plaque, and statue in this room traces back to a $750 cow he bought in a Bowmanville barn in 1956. (Photo: Patty Jones) (Read more: Roy Ormiston: The Holstein Man’s Holstein Man Who Revolutionized Modern Breeding)

Frederick Roy Ormiston handed over $750 for a five‑year‑old Holstein in a modest Bowmanville, Ontario barn in 1956. He didn’t buy a proof or chase a hot sire stack. He bought a cow that wouldn’t leave his mind: Balsam Brae Pluto Sovereign — “The White Cow.”

Telstar, Starlite, Tempo, a bronze statue in Hokkaido, and a Holstein type template that still runs through modern pedigrees all trace back to that single decision. But the part that matters to a 300‑cow Holstein cow family in 2026 isn’t the statue or the show banners. It’s the line‑breeding math behind it — the culling bills Ormiston swallowed along the way, and whether anyone with a genomic mating app and a lender looking over their shoulder can actually do the same thing now.

What’s Really on the Line When You Line‑Breed a Holstein Cow Family

Balsam Brae Pluto Sovereign — “The White Cow,” circa 1956. Roy Ormiston paid $750 for her, then bred her so tight she stamped 185,327 lbs of lifetime milk, four Peterborough Grand Championships, and six straight All‑Canadian nominations into the Roybrook line. Every cow family decision in this article starts here.

Line‑breeding is just inbreeding when it works. Ormiston said it out loud and then proved it by tightening relentlessly on one cow family until the “Roybrook Look” bred true: long, clean necks, deep open ribs, flat bone, and cows that could live on forage and still hang banners. He wasn’t chasing hybrid vigor or the bull‑of‑the‑month. He was chasing prepotency — the ability of one cow to stamp her kind no matter what you bred her to.

The Roybrook program was simple and brutal:

  • Closed herd built around The White Cow.
  • Closely related matings to concentrate her genetics.
  • Intense culling any time recessives or structural weaknesses surfaced.

The biology hasn’t changed. To make a cow family prepotent, you’ve got to stack homozygosity around an outstanding ancestor instead of spreading your bets across every hot sire in the catalog. When you do that, you’ll surface defects and weak spots you’d never see in a more outcrossed herd.

Ormiston’s tools were visual stockmanship, family memory, and a willingness to ship anything that didn’t fit the mold. He had no haplotype screens, no genomic inbreeding reports, no optimal contribution software. He just culled what broke and kept tightening around The White Cow.

You’ve got something he didn’t: the ability to see carriers and inbreeding risk before you ever load the gun. The question now isn’t “Can line‑breeding work?” Roybrook answered that. The real question is whether you’ll still do what it takes when the numbers on the screen and the numbers on the milk cheque don’t agree — for years.

What Does a “Ruthless” Culling Bill Actually Cost a 300‑Cow Herd?

Let’s put some real structure under the part everyone flinches at.

The cost of raising a Holstein heifer to first calving has pushed to roughly $2,500 to $3,000 in 2026, driven by feed inflation and the high market value of replacements, according to current dairy herd health and reproduction benchmarks. A sound 1,300–1,400 lb cull Holstein cow typically clears the bottom end of that range at salvage, and the broader revenue picture is propped up by a beef‑on‑dairy market where dairy‑beef crossbred calves are now fetching $900 to $1,400 per head and adding an estimated $4.00–$4.50 per cwt to dairy revenue across North America, per current 2026 dairy farm economics data.

Net those numbers out, and every “extra” young cow you ship as part of a line‑breeding cleanup is costing you somewhere around $1,000 to $1,500 in true replacement cost — the rearing investment minus salvage value, with crossbred‑calf revenue propping up dairy revenue alongside it.

Now scale it to something that hurts.

If you identify a weak branch inside your chosen cow family and make yourself act the way Ormiston did, you might ship 10 young cows you’d originally circled as future donors or bull dams. On this math, you’re staring at a $10,000 to $15,000 decision in that one year.

That’s just the cheque. Behind it sit two years of raising each heifer, genomic tests, sexed semen, maybe IVF bills you justified because “she’s from the right family” — and the pride hit of cutting into the cow family you’ve been bragging about.

That’s the exact point where breeders start negotiating with themselves. You’re looking at a VG‑looking first‑calf heifer from your “White Cow” family, genomics say she’s fine, and your gut knows shipping her will cost four figures plus pride. It’s very easy to say, “She just needs one more chance with a different bull.”

Ormiston didn’t have a mating app to make that choice look smarter than it really was.

When Does That Cull Bill Start Paying You Back?

The only honest reason to swallow that kind of hit is if it turns into extra productive life on the right cows and fewer replacements over time.

Heifer‑rearing economics points to a hard truth: at $2,500–$3,000 per replacement and a North American heifer inventory at a 20‑year low, every cow you keep healthy through her third lactation and beyond is worth more than she has been in a generation. Quebec’s herd data illustrates the payoff — Lactanet’s 2025 management benchmarks show 46.6% of Quebec cows in their 3rd or later lactation, leading the P5 in longevity and significantly lowering replacement cost per cwt. That’s the prize.

So what is this “ruthless” cleanup supposed to buy you? More daughters that actually make it to those third and fourth lactations. Fewer fragile cows leaving in the first two. A tighter family where the daughters look and last like the cow you fell in love with — not like a genetic coin toss.

If that plays out, the barn math shifts. Lactanet’s 2025 management benchmarks back this up region by region:

Region / MetricMedian Annual Milk Value (Per Cow)Longevity / Economic Impact
British Columbia$10,930Highest gross revenue potential per slot
Quebec$10,304P5 leader: 46.6% of cows reach 3rd+ lactation
Ontario$10,206High baseline; massive swing if mature cows drop
The Danger ZoneRetaining inferior cowsLoses $19 per cow slot annually

[EDITOR: render the Danger Zone row with a coloured highlight (warning amber) so the negative figure draws skim‑readers.]

Even modeled conservatively against feed and variable cost, every additional mature‑cow lactation you bank on a structurally sound cow keeps a meaningful share of that value on your side of the ledger — plus the $1,000–$1,500 in replacement cost you don’t have to spend on a heifer to fill her stall. Three extra cows reaching that fourth lactation translates into a five‑figure swing in your favor, on top of the avoided heifer bills.

Every herd’s inputs are different. But the structure is the point:

  • Year 0–1: You feel the culling hit. Cash leaves the account. Replacement rate spikes.
  • Years 2–3: The first cleaned‑up daughters enter the milking string. Heifer inventory stabilizes. Replacement rate starts trending down.
  • Years 3–5: Enough cows stay for that extra lactation that the math begins to catch up to the pain.

You’re often living with a two‑to‑three‑year lag between when the cull cheques clear and when any payoff shows up clearly in your own numbers. That lag is exactly where people bail out.

How Do You Know It’s the Family — and Not Just Bad Luck?

This is the knife edge. If you misread the problem, you’re not doing a Roybrook‑style cleanup. You’re just burning good cows.

A weak branch doesn’t reveal itself with one bad calf out of one mating. It shows up as consistent failure across sires, across sisters, and across time. One ugly calf out of a cow you like is noise. Three disappointing daughters out of four, from different bulls, with the same basic flaw? That’s a pattern.

You want to see that pattern survive three tests:

Sire change test. You’ve used at least two different bulls with different sire stacks on that line. The daughters still show the same structural issues — weak loin, narrow rib, coarse bone — or the same career arcs, leaving before second or third calving.

Sister comparison test. Inside your chosen family, one branch throws daughters that disappear early or never match the family type. Another branch, under the same management and similar sires, gives you cows that stand the test of time. When one sub‑branch consistently underperforms next to sisters that work, you’ve probably found the dead wood.

Management sanity check. Compare your culling patterns to pens, seasons, and management changes. If a whole age group from multiple families cratered in the year you changed transition diets, that’s a protocol problem. Once you’ve fixed the protocol, if the same branch keeps underperforming while the rest of the family stabilizes, that’s genetics talking.

Strike TestWhat to Look ForPasses = NoiseFails 3× = Pattern (Cull Branch)
Sire Change TestUse ≥2 unrelated bulls on same lineDaughters vary — different strengthsSame flaw repeats regardless of sire
Sister Comparison TestCompare daughters of this branch vs. sisters under same mgmtOne branch lags but not systematicallyOne branch consistently exits early or fails type
Management Sanity CheckCross-reference against pen, season, feed protocol changesProblem tracks a protocol change, not geneticsBranch underperforms after protocol is fixed and herd stabilizes
Strike Count Reached?Tally across all three tests0–2 failures: hold the branch, keep evaluating⚠️ 3 strikes: Demote branch. Stop flushing. Stop selling as donors.
What you DO with the cowsKeep paying milkers in commercial stringFlush, transfer, IVF — normal treatment⚠️ Milk commercially. Do NOT propagate into nucleus.

A working rule that keeps you honest without turning you into a one‑calf executioner:

Three independent strikes and that branch is out. 

Roybrook Valiant (VG‑GM) and his sire Roybrook Starlite (EX‑Extra) at United Breeders, Guelph, Ontario, May 1977. Two generations of the same tightened matings, standing side by side — the visible answer to the question every line‑breeder eventually has to ask: did the next generation hold up, or did the program quietly go backwards?

That means at least two different sires used, at least two different daughters evaluated, and the same basic structural or longevity problem showing up three times. When you hit three, you stop blaming the bull, the weather, or the classifier. You stop flushing that branch. You stop selling heifers from that line as “future donors.” You might keep milking the good ones, but you quietly demote that branch to commercial status inside your own program.

It’s ugly. But it’s also how Ormiston watched weak branches inside the Roybrook herd eliminate themselves, and tightened only on what stood up under pressure.

Build the Nucleus and Write the Rules

Here’s where your world really diverges from Ormiston’s.

You can pull up a laptop and see, in black and white, genomic inbreeding levels and runs of homozygosity on your cows, carrier status for lethal recessives and fertility‑wrecking haplotypes, and relationship coefficients between every cow and bull you’re thinking of using.

If you want to line‑breed a cow family on purpose without re‑creating the breed‑wide inbreeding mess inside your own herd, the sequence looks something like this.

Draw a hard box around your nucleus. Pick 15–20 females from the cow family you trust most — three or four generations of sound, trouble‑free cows behind them, the structural template you want, and no extreme outlier genomic inbreeding numbers. Everything else in the herd is commercial from a breeding standpoint, no matter how good they look on paper.

Roybrook Starlite EX‑Extra — the production half of the Telstar‑Starlite‑Tempo trifecta. Bred out of the same tightened Roybrook matings, Starlite’s sons and daughters pushed milk and fat yields hard enough to put Roybrook genetics on pedigrees well outside Ontario. Proof that line‑breeding for type doesn’t have to cost you the milk cheque. (Photo: Danny Weaver)

Peer note on inbreeding: Traditional pedigree charts only guess at genetic relationship percentages. Modern genomics map actual Runs of Homozygosity (ROH) — the identical DNA strands a calf actually inherited from both parents. That lets you line‑breed to an elite ancestor’s physical traits while making sure you aren’t accidentally doubling up on hidden, bad chunks of DNA elsewhere in the genome.

Write your inbreeding and defect rules before anyone opens the catalog. On paper, before the next mating season, decide: a per‑mating genomic inbreeding cap for that nucleus, a family‑level cap so your nucleus group’s average inbreeding doesn’t rocket past your herd average, and a hard “never” list for carrier‑to‑carrier matings on known lethal recessives and fertility‑wrecking haplotypes. These rules exist so that once you’re staring at a sexy cross on screen, you don’t talk yourself into it because “just this one won’t matter.”

Hand your mating program a brief, not a default. Most mating software is set up to avoid disasters and maximize index. You have to tell it to value your cow family. Tag your nucleus cows as a priority group. Ask the program to maximize their contribution over the next 5–10 years while obeying your inbreeding caps and defect rules. Let it suggest bulls that tighten on that family without stacking the same three global sires everyone else is stacking.

What the Software Can’t Do for You

Be picky about who’s allowed in the loop. For the nucleus cows, bulls are tools, not celebrities. They should be either sons or grandsons of your chosen family, or outcross‑ish bulls with rock‑solid structure and health that won’t drag you back into the sire stacks that created the Holstein bottleneck. If a bull is already heavy in the same high‑inbreeding global blood you’re trying to dilute, use him on your commercial cows, not your nucleus. If a bull doesn’t line up with your structural non‑negotiables, he doesn’t touch the nucleus, no matter how high his index sits.

Let the software manage risk — but don’t let it make the hard calls. The program can stop you from mating two carriers or creating a 14% inbreeding train wreck. It cannot cull for you. Every crop of tight‑mated calves out of the nucleus group needs a harsher eye than the rest of the herd. Any heifer that doesn’t look like the family template, shows chronic health or fertility issues early, or has structure you know won’t last gets demoted out of the nucleus, even if her genomic values look pretty. That’s where you either stay Ormiston‑honest or start lying to yourself with software.

If you run that play hard for five years and you picked the right family, you’re aiming to see two things: the nucleus daughters are more uniform and more durable than the herd average, and your whole‑herd genomic inbreeding drifts up slowly, not in a straight line to crisis levels.

Roybrook Tempo — the third leg of the Telstar‑Starlite‑Tempo trifecta and the proof that Ormiston’s program kept compounding. Tempo’s daughters and sons carried the Roybrook stamp for type, production, and longevity into herds well beyond Ontario, the trait combination that’s still the hardest thing to stack in 2026. (Photo: Jim Rose)

If you’re not seeing that, you’re not really line‑breeding a cow family. You’re just doing fancier inbreeding.

Why Most People Quit Halfway and Blame the Math

The hardest part of this isn’t the biology or the barn math. It’s the noise you’re trying to do it in.

Ormiston didn’t have proof runs every few months comparing his herd average to everybody else’s. He didn’t have an AI rep walking in with a laptop, pointing at his herd LPI, and telling him he was “leaving points on the table.” He didn’t scroll past a feed full of calves and donors from the latest “#1 genomic bull” every time he sat down for coffee. And he never had to explain to a farm partner or a lender why his average herd index was trending sideways while the neighbours’ was climbing.

You do. All of it, all the time.

There’s also a structural pressure Ormiston never faced: beef‑on‑dairy. With dairy‑beef crossbred calves bringing $900–$1,400 a head and adding $4.00–$4.50 per cwt to total farm revenue, that revenue stream is keeping genetically weaker cows in the barn longer than they should be. Producers are being told — correctly — to use beef‑on‑dairy only on the bottom 20–30% of genetics so they don’t starve a replacement pipeline already at a 20‑year low. Beef‑on‑dairy economics rewards you for keeping average cows as passive crossbred incubators. A true line‑breeding program demands the exact opposite: you must torture‑test the very cow family you are investing in, culling harder where it hurts the most. That contradiction is real, and it’s worth saying out loud.

Here’s the pattern that plays out on a lot of farms:

  • You take the pain. You ship the weak branch. Your replacement rate spikes.
  • Two years later, the first cleaned‑up daughters start calving. They look solid, but their genomic proofs aren’t anything special because the indexes still tend to weight raw volume and component numbers more heavily than structural durability and longevity.
  • Meanwhile, your neighbour’s herd average is climbing faster on paper because they’re chasing the catalog and letting the mating program manage inbreeding on autopilot. They’ve never written a five‑figure cull cheque in one shot, and their AI rep is thrilled with them.
Roybrook Telstar EX‑Extra, son of Roybrook Ace and Model Lass — and the proof that line‑breeding around The White Cow worked. Sold as a six‑month‑old at the 1964 National Sale for $25,000, Telstar went on to stamp Holstein type and production in pedigrees from Ontario to Hokkaido, where his life‑size bronze still stands. (Photo: Jim Rose)

If your only scoreboard is GTPI or LPI, your program can easily look like a failure for the first three to five years, even if the cows are quietly getting better where it matters.

Scoreboard DimensionGTPI / LPI (Industry Default)Barn-Level Line-Breeding Scoreboard
Primary metricGenomic index points (volume, components)Productive life by dam line (lactations completed)
Replacement rate signalNot trackedTracked by dam family, flagged per branch
Daughter uniformityNot assessedCore KPI — daughters should look like The White Cow
Inbreeding trackingHerd average / software defaultPer-mating cap + family cap, written in advance
Carrier risk visibilityFlagged at matingHard “never” list before catalog opens
How you look in Yr 1–3Sideways or declining averageConsistent with goals if barn KPIs move right
Beef-on-dairy interactionRewards keeping average cows in⚠️ Conflicts — pressures you NOT to cull nucleus
Time horizonNext proof run5–10 year cow family development
Ormiston would recognize it?NoYes

The breeders who get through that window aren’t magically braver. They just build a different scoreboard. They track productive life by family — which cow families actually reach 3rd, 4th, 5th lactations. They track replacement events by dam line — which families are filling the cull list for the same reasons, over and over. And they track uniformity — which groups of daughters look like clones of the cow you wanted to replicate, and which ones look like the product of a bull catalog.

If your own scoreboard starts moving in the right direction — longer productive lives, fewer “surprise” culls, tighter family type — you’ve got the feedback Ormiston had long before the milk cheque made it obvious. If you rely only on the industry’s scoreboard, you’re going to bail out right when the biology finally starts to agree with you.

What This Means for Your Operation

  • Name your core family before you name your bulls. If you can’t point to one cow family that consistently gives you daughters past third lactation, you don’t have a Roybrook candidate yet. You have a herd. Start tracking cull reasons and productive life by dam line before you try to line‑breed anything.
  • Write your inbreeding and defect guardrails before the next mating run. Decide your per‑mating genomic inbreeding cap and your “never” list for carrier‑to‑carrier matings. Put them in writing. If they’re only in your head, you’ll talk yourself into exceptions as soon as a fancy cross shows up on screen.
  • Use the three‑strikes rule on branches, not calves. Don’t condemn a branch on one bad calf. But if you see the same structural or longevity problem three times across at least two sires and two daughters, stop flushing that branch. Keep daughters in the milking herd if they pay their way, but slide that line quietly out of your nucleus.
  • Be honest about how much pain your cash flow can take. If your replacement rate is already sitting in the high‑30s and your lender’s nervous, this probably isn’t the year to pile voluntary culls for genetic reasons on top of that. Make your involuntary culling smaller and more predictable first.
  • Don’t let beef‑on‑dairy revenue talk you out of culling your nucleus. $900–$1,400 calves are a great safety net for the bottom 20–30% of your herd. They’re a terrible reason to keep a structurally weak heifer from the family you’re trying to concentrate.
  • Choose your scoreboard now, not halfway through. Decide whether you’re going to judge this experiment by your herd’s average index or by your own numbers on productive life, replacement rate, and uniformity. If you try to serve both, you’ll end up fully committed to neither.
  • In the next 30 days, do one nucleus‑level audit. Tag your top 15–20 females from the family you like best. Pull their daughters’ cull reasons and productive lives. If you don’t like what you see in that one group, you just saved yourself from line‑breeding the wrong family.

Key Takeaways

  • If you’re not prepared to ship 5–10 “almost good enough” young cows from your chosen family over the next couple of years, you’re probably not ready to run a Roybrook‑style cleanup yet.
  • If you don’t have a written per‑mating genomic inbreeding cap and a carrier‑to‑carrier “never” list, you’re not really controlling inbreeding — you’re delegating it to software defaults.
  • If you can’t show, on paper, that one cow family gives you more daughters lasting past third lactation than the rest of the herd, you don’t have a White Cow yet. Keep looking and keep tracking.
  • If your only scoreboard is GTPI or LPI, a serious line‑breeding effort is going to look like a mistake on paper for three to five years. Build a barn‑level scoreboard — productive life by family, replacement rate by dam line, and daughter uniformity — before you start.

The real question isn’t whether Ormiston’s math still works. It’s whether you’re willing to step into the same gap he did — two or three years where the bank, the catalog, the proof sheet, and that one neighbour at the coffee shop all suggest you’re wrong, while the cows quietly start proving you right. Next time you stare at your “almost” heifer from your favourite family — are you reading the report, or are you reading the cow?

Learn More

The Sunday Read Dairy Professionals Don’t Skip.

Every week, thousands of producers, breeders, and industry insiders open Bullvine Weekly for genetics insights, market shifts, and profit strategies they won’t find anywhere else. One email. Five minutes. Smarter decisions all week.
NewsSubscribe
First
Last
Consent

Closed Since 1956: 4 Master Breeder Families and a $54,665 Inbreeding Bill

Larenwood hasn’t bought a heifer since Eisenhower. Lactanet just put Holstein heifer inbreeding at 9.99% — and on a 500-cow herd, that gap models out to $54,665 a year in lost milk alone.

Chris McLaren’s breeding story doesn’t start with a catalog bull. It starts with cow families his grandfather built outside Drumbo, Ontario, beginning in 1956.

Chris McLaren in the Larenwood tie-stall outside Drumbo, Ontario — sixth generation on a farm that hasn’t bought an outside female since 1956. The udder under his hand was bred from cow families his grandfather started 70 years ago, the same maternal lines that earned Larenwood its 2019 Master Breeder shield and a multi-year run at the top of Canada’s National Herd Management Score. Photo: Holly McFarlane. Read more: The Magic Behind Larenwood Farms: How Chris McLaren is Redefining Dairy Excellence)

Larenwood Farms milks roughly 110–115 registered Holsteins off those same maternal lines today. Per Holstein Canada records, the operation ships well above the Ontario Holstein average on milk and components, with somatic cell counts well below the provincial DHI average — and has done it while keeping a closed herd for roughly 70 years. No purchased heifers. No outside cows walking in the lane.

Run a typical 500-cow Holstein herd at the 9.99% Lactanet 2024 heifer-inbreeding average against a pre-genomic 4% baseline, and the modeled milk-loss gap works out to roughly $54,665 a year under the upper-bound Doekes/Makanjuola coefficient and a Class III milk price near $16.90/cwt — a figure consistent with USDA AMS Class III monthly announcements across recent quarters. That’s before any fertility, embryo-loss or longevity drag stacks on top. It’s the bill the open-catalog model quietly hands the average herd. The four farms profiled here almost certainly carry a smaller version of it, but none publish a herd-level inbreeding figure. The point isn’t that closing the herd erases inbreeding. It’s that they’re the ones who actually know what they’re paying.

In 2019, Larenwood took home a Holstein Canada Master Breeder shield. In the mid-2010s they topped Canada’s National Herd Management Score list (then administered by CanWest DHI, now Lactanet), scoring in the high 980s out of 1,000 across multiple consecutive years. McLaren has framed the program in Semex’s published Larenwood profile as a generational match-and-improve approach — making each generation of daughters better than her mother and investing in the cow families that built the herd.

For two decades the industry pitch has been the opposite: progress comes in a tank, not a cow family. If you want to keep up, you buy what you can’t breed.

But when you dig into the numbers, there’s a different story sitting underneath.

What’s Changing and Why

The genomic era was supposed to put elite genetics in every herd. Shorter generation intervals, sharper indexes, sexed semen — any operation could tap into “the top 1%” as long as the credit line held.

Pawnee Farm Arlinda Chief (1962–1978). His sons and grandsons were used so heavily that today, more than 60 years after he was born, an estimated 14% of the Holstein genome in North America still traces directly to him — and 99.84% of active Holstein AI bulls share his Y-chromosome or Round Oak Rag Apple Elevation’s. The bottleneck this article opens with starts here. (Read more: The $4,300 Gamble That Reshaped Global Dairy Industry: The Pawnee Farm Arlinda Chief Story)

In practice, it stacked a lot of cows on a very narrow base. Pedigree analysis of active Holstein AI bulls shows the overwhelming majority — published estimates place the figure above 99% — still trace back to two foundational patriarchs. They aren’t a clean two-grandfather story. Pawnee Farm Arlinda Chief (born 1962) and Round Oak Rag Apple Elevation (born 1965) are overlapping fountainhead ancestors born three years apart, with pedigrees that thread through nearly every modern North American Holstein. More than 60 years on, Chief alone still contributes a meaningful double-digit share of the modern Holstein genome per published pedigree analyses.

Round Oak Rag Apple Elevation (1965–1979). Bred at Round Oak Farm in Virginia and proven through ABS, Elevation became the most-used Holstein sire of his era and the second pillar of the modern bottleneck — every active North American Holstein AI bull that doesn’t trace paternally to Chief traces here. Together they account for 99.84% of the breed’s active Y-chromosome. (Read more: Round Oak Rag Apple Elevation: The Bull That Changed Everything)

National inbreeding numbers climbed right alongside that concentration. Lactanet’s August 2025 update set the Canadian Holstein heifer average at 9.99%, gaining about 0.25 points per year — more than double the rate in Jersey, Ayrshire and Brown Swiss. U.S. Holstein cohorts run just under that on recent CDCB expected-future-inbreeding figures.

To be fair to the AI side: every major supplier — Semex, Select Sires, ABS, STgenetics — already offers EPI caps, haplotype blocking and outcross sire programs as part of their mating tools. The product set is there. What separates the four farms in this piece isn’t access to better software. It’s how disciplined they are about turning the right settings on and rotating the bull list with intent.

Closed herds aren’t immune to inbreeding. They use outside AI semen pulled from the same Chief-and-Elevation–descended bull pool as everyone else. The difference is how they use it — deliberate sire rotation, hard EPI caps, and a willingness to bring back outcross lines (Red Holstein, older AI sires through stored semen, European bloodlines) that most catalog-driven herds never look at twice. Run the top-20 list and you drift toward the national average. Curate the list like a closed-herd breeder does and you can hold heifer-crop inbreeding meaningfully below 9.99%.

Per Holstein Canada and Holstein USA records, four operations have built that kind of curation into multi-decade closed-female programs.

The Four Farms at a Glance

OperationRegionHerd SizeStandout NumberClosed-Herd StatusOperational Style
LarenwoodDrumbo, ON~110–115 cowsMulti-year topper of Canada’s National Herd Management ScoreClosed since 1956 (~70 yrs)Multi-generation maternal-line discipline; Master Breeder 2019
BokmaShubenacadie, NS~700 cows7-robot DeLaval systemClosed-female, expansion via homebredsRobot-flow trait selection; Master Breeder 2025
BrigeenTurner, ME580 cowsBAA 108.1, 50 EX, well above U.S. Holstein average production per Hoard’s Dairyman coverage, low five-figure SCCClosed-female-replacementTop-10 U.S. for 250+ cow herds; classification-led mating
Saintour / Ferme BarjoQuebecMid-size Quebec herdHPI 99 — 99th-percentile herd performance — sustained 16 yrs (Lactanet historical)Closed-female with selective co-ownershipGenerational improvement model; Master Breeder 2025

None are filling stalls with purchased outside females.

How This Plays Out on Real Farms

Put Larenwood beside a typical open-catalog herd of the same size and the operating model differs in ways the herdbook can document.

Per Holstein Canada’s Master Breeder citation, Larenwood’s mating program is run by Chris McLaren in collaboration with his father Grant, with multi-generation breeding records cross-referenced to classification outcomes. Holstein Canada credits the operation with maintaining its breeding direction across decades through that record discipline. They genomic test, but those numbers get read in the context of cow families they’ve watched calve, break in and finish multiple lactations.

In a 110-cow herd built mainly off a top-20 bull list, the genetics on offer are strong and the software is capable. The piece that’s harder to bottle is decades of on-farm context — which cow families pay off in which barn, and which need a different environment to perform. Some open-catalog herds carry that context internally. Many don’t.

The Bokma family on stage with their 2025 Holstein Canada Master Breeder shield — the third-generation Dutch-Canadian operation in Shubenacadie, Nova Scotia that filled seven DeLaval robots with homebred replacements rather than purchased heifers, and built the breeding program around udders, feet and temperaments suited to robot flow. (Read more: 21 Master Breeders. 16 Years Each: Holstein Canada’s 2025 Master Breeders Just Crossed the Finish Line)

Bokma takes the same closed-female logic and bolts it onto robots. Per Holstein Canada’s 2025 Master Breeder citation and DeLaval’s published case material, the Bokma family — third-generation Dutch-Canadian operators in Shubenacadie, Nova Scotia — milks roughly 700 cows through seven DeLaval robots. The expansion to seven robots was supported by homebred replacements rather than purchased heifers, with the breeding program selecting for udders, feet and temperaments suited to robot flow.

The ninth and tenth generations at Brigeen Farms in Turner, Maine — a family operation that has worked the same ground since 1777, and has grown the registered Holstein herd from about 60 cows to 580 over the last 25 years on homebred replacements. Left side, back row: Jon and Chloe Chapman of Gil-Tex Holsteins, Vivian Briggs. Front row: Kate, Alexis and Nichole Teixeira. Right side: Will Bullard, Bill Bullard, Mary Briggs, Betsy Bullard, Sydney Bullard and Steve Briggs.  Read more: From 35 Cows to a WDE Grand Champion: 4 Breeders Using Sales, Embryos & Presentation to Make Registered Holsteins Pay

Brigeen tells the long version. Per Holstein USA records and Hoard’s Dairyman trade-media coverage, the Briggs–Bullard family has farmed the Turner, Maine ground since 1777 — the operation predates the U.S. Constitution. Over the last 25 years they’ve grown from about 60 cows to 580 registered Holsteins, while building one of the top type herds in the country: BAA 108.150 EX, and a National Dairy Quality Gold Award. Per Hoard’s coverage, Betsy Bullard has run the mating program since returning to the farm in 2000 from a career with Cargill, leaning on deep maternal branches and homebred donors built up over two decades of breeding decisions. Bullard has publicly described her approach as measurement-driven, with classification scoring at the center of her breeding feedback loop.

Disclosure: Brigeen runs as a closed-female-replacement operation, not a fully closed herd. The commercial milking herd is built on homebred replacements, but per Holstein USA herdbook records and Hoard’s Dairyman coverage, the family has imported outside donor genetics for marketing and show-ring projects, kept separate from the commercial replacement pipeline.

Dominique Bard and Amélie Tremblay of Saintour / Ferme Barjo with daughters and the 2025 Maître-Éleveur (Master Breeder) plaque from Holstein Canada — a Quebec herd that has held a Herd Performance Index of 99 for 16 consecutive years, ranked #1 nationally in 2010, and earned its first Master Breeder shield in 2025 under the family motto “L’amélioration, une génération à la fois.”  (Read more: 21 Master Breeders. 16 Years Each: Holstein Canada’s 2025 Master Breeders Just Crossed the Finish Line)

At Saintour, the story is in the index. Per Holstein Canada’s 2025 Master Breeder citation and Lactanet’s historical records, the Quebec herd, operated under Ferme Barjo by Dominique Bard and Amélie Tremblay, has held a Herd Performance Index (HPI) of 99 — a 99th-percentile herd performance ranking — for 16 consecutive years, ranked #1 nationally in 2010, and earned a first Master Breeder shield in 2025. The farm’s published tagline, “L’amélioration, une génération à la fois,” captures the program in five words: improvement, one generation at a time.

Disclosure: A co-ownership model in partnership with Ferme Bard inc. lets Saintour access elite outside female genetics — a structure designed to bring in outcross blood without opening the home replacement pipeline.

The Barn Math: What 9.99% Actually Costs

Here’s the mechanism behind that $54,665 figure, run for the average open-catalog herd — not for the four named farms.

Take a 500-cow Holstein herd whose heifer crop sits near the 9.99% Lactanet August 2025 average against a pre-genomic 4% baseline. The Doekes (2018) and Makanjuola (2020) regressions estimate milk loss in the 80 to 108 lbs per cow per 305-day lactation range for every 1% increase in pedigree inbreeding. Use the upper end and the math runs:

The 500-Cow Open-Catalog Calculation

StepValueSource
Heifer-crop inbreeding9.99%Lactanet, Aug 2025
Pre-genomic baseline4.00%CDCB / Lactanet historical
Delta5.99 pointsderived
Upper-bound coefficient108 lbs / 1% / 305-day lactationDoekes 2018 / Makanjuola 2020 (JDS)
Modeled milk loss per cow~647 lbs / yrderived
Class III milk price~$16.90 / cwtUSDA AMS Class III monthly announcements, recent quarters
Loss per cow~$109derived
Loss on 500 cows~$54,665 / yrderived

Lower-bound check: Use the lower-bound coefficient (80 lbs / 1%) and the same herd loses about $40,500 a year in milk alone. Either way, you’re looking at the cost of a small pickup truck. And that’s just milk — fertility, replacement turnover and stillbirth losses sit on top.

Sensitivity note: Drop the Class III price by $1.00/cwt and the 500-cow figure shifts roughly $3,200 in either direction. The underlying milk-loss volume — 647 lbs/cow/yr at the upper-bound coefficient — is the figure that matters; the dollar tag rides whichever Class III month you anchor to at publish.

Here’s the part the four named farms get right that the average herd doesn’t: closing the gates doesn’t eliminate that tax. Curating the bull list does. A closed herd that runs the same lazy top-20 catalog can still drift toward 9.99%. A closed herd that rotates 15–20 deliberately diverse sires, caps single-sire usage at 10–12% of the calf crop, and sets a hard EPI cap below the national average tends to land below it. Per Holstein Canada Master Breeder profiles, the four farms in this piece lean hard on the second model.

That’s the genetic tax an open-catalog herd quietly pays when the relationship math gets away from it. Closed herds still pay some of it. They’re usually just the only ones in the room with a full picture of the bill.

The Mechanics Behind the Outcomes

Why do closed herds with disciplined sire rotation keep posting type and longevity numbers most open herds chase with catalog orders? Three things actually do the work, per Lactanet, CDCB and peer-reviewed literature on closed-population breeding.

Stack bulls on cow families they know. Closed herds don’t spread semen like peanut butter. They pick 15 to 20 bullsand use them deliberately across maternal lines they’ve watched for decades. Each bull is there to correct something specific — udder depth, heel depth, chest width — not just to hit a TPI or LPI target. The bull list is a multi-year working document, not a quarterly catalog refresh.

Cap inbreeding instead of just minimizing it. Most mating software defaults to “minimize inbreeding,” which sounds responsible until you read the settings. Closed herds that survive this long set hard caps on Expected Progeny Inbreeding (EPI) — typically around 9.0–9.5% — and refuse matings that cross the line. They flip the switch that blocks HH1 through HH6, HCD and CVM carrier-by-carrier matings. That’s how you avoid the bottleneck Chief built, where the HH1 mutation, before testing was widespread, has been linked in CDCB and VanRaden literature to several hundred thousand pregnancy losses globally and substantial heifer-value losses.

Run classification as a feedback loop, not a courtesy visit. In open-catalog herds, mating decisions often default to whatever the AI program suggests. In Master Breeder operations, classification day is an audit — which cows moved up, which lines stalled, what last decade’s mating decisions look like in the flesh. When Brigeen hits 108.1 BAA with 50 EX in a 580-cow herd, that’s not a fluke. It’s what happens when on-farm scoring closes the loop on every breeding decision.

A fair caveat: not every closed herd outperforms. Some hit a genetic ceiling, drift into founder bottlenecks, and stagnate without disciplined outcross rotation. The four farms in this piece are the ones who got the discipline right. The model works when you do the work.

How Much Is Your Inbreeding Actually Costing?

This is the question that drives the economics, and most herds can’t answer it.

Most operations know their rolling herd average. Fewer can tell you average pedigree inbreeding on the current heifer crop. Almost none have translated that number into dollars.

The math isn’t complicated, but you have to look at it. Under the upper-bound coefficient (108 lbs/1%), 2 percentage points of excess inbreeding — call it 10% instead of a disciplined 8% — costs roughly 160 to 216 lbs of milk per cow per year. On a 1,500-cow herd at Class III near $16.90/cwt, that lands in the $40,500 to $55,000 a year range in milk loss alone. A high-component herd capturing full butterfat and protein premiums on a strong mailbox price will see that figure run materially higher.

Then add the rest:

  • Modeled mid-term abortions and embryo losses when you stack recessive haplotypes — in the $20,000 to $40,000/year range for commercial herds at +2 points of excess inbreeding.
  • Shorter productive life forcing 20 to 30 extra replacements a year.

Replacement-cost reality check: U.S. springing-heifer values reported in USDA NASS Agricultural Prices monthly data averaged near $3,010 across mid-2025 reports, with replacement inventory at a 47-year low per the January 2025 NASS Cattle inventory report. Every extra cull that walks out the gate is now a four-figure decision, not a routine one — and that’s hitting open-catalog herds harder than it has in a generation.

Add it up — milk drag, modeled abortion and embryo losses, plus 20 to 30 net additional replacements at roughly $3,010 each — and the modeled hidden tax on a 1,500-cow herd with unmanaged inbreeding lands somewhere in the $90,000 to $180,000 a year range, depending on coefficient choice, component-price assumptions and how much of that replacement cost is already baked into your normal turnover budget. Closed herds with disciplined sire rotation typically carry a fraction of that, but not zero. The number you actually pay depends on how curated your bull list is — not whether your gates are open or shut.

You don’t have to close your herd to hate that number. You do have to know it.

Is Your Herd’s Genetic Strategy Already Behind?

This is the operational question Master Breeder herds force everyone else to answer.

If you’re picking bulls mainly off TPI or LPI lists, you’re already a step behind where these four farms operate. They aren’t ignoring the indexes — Holstein Canada and Holstein USA records show they use them as one filter among several. The real work happens in the barn and in the records.

A few honest questions:

  • Who actually owns the mating program at your place — and could they tell a stranger why, off the top of their head?
  • Do they know which cow families paid for the last parlour or the last robot?
  • When a classifier knocks a cow down a point, does that change the next bull list, or does the score just get filed?

The closed herds documented in this story share one trait: a single person, or a tight team, who can answer those questions without opening a laptop. You don’t need to copy their model. But if nobody in your operation can name the cows that built the place and the bulls that kept them around, you’re running a breeding program on autopilot — and autopilot is what the 9.99% number is built on.

Options and Trade-Offs for Farmers

Most herds won’t go fully closed. That’s fine. What matters is knowing where you sit on the spectrum and what each option actually costs.

Path 1: Stay Open, but Put a Price Tag on Inbreeding

When it makes sense: You’re growing fast, need outside females to fill stalls, or you rely on ET and IVF to sell genetics and scale replacements.

What it requires: A real handle on your herd’s inbreeding levels — pedigree and ideally genomic. At least one barn-math exercise: what does a 2-to-3-point inbreeding bump cost you in milk and replacement budget?

Risks/limits: Apply the upper-bound coefficient to a 200-to-300-cow herd at 2 points of excess inbreeding and the modeled milk-loss drag at Class III near $16.90/cwt runs roughly $5,500 to $11,000 a year before fertility, embryo-loss and replacement costs. Layer those on and the all-in modeled tax can run two to three times the milk-only figure. You’re betting ET and high-priced semen will out-earn that drag. Some herds do. Many don’t.

Path 2: Semi-Closed — Homebred Replacements, Strategic Embryos

When it makes sense: You want biosecurity and herd consistency, but you also sell embryos, show cattle, or want diversification on a few specific families.

What it requires: Treating the homebred replacement stream as sacred. Outside embryos go into clearly labeled marketing or show projects, not into the commercial replacement line. Clear rules about how many outside matings and where they fit.

Risks/limits: It’s easy to slide from “semi-closed” into “we bought three heifers this year because the numbers looked good.” You need the same record discipline as a fully closed herd, plus the stomach to say no when somebody offers you a hot heifer. Per Hoard’s Dairyman coverage and Holstein USA records, Brigeen runs this model — closed on female replacements, selective on imported embryos for marketing cows. Saintour’s Ferme Bard co-ownership model is the same idea on a smaller scale.

Path 3: Fully Closed on Females, Curated Outcross Semen

When it makes sense: You know your cow families inside out, and you’ve got a successor — or at least a willing trainee — to carry the mental load.

What it requires: A hard stop on outside heifers and cows. A deliberate 15-to-20 bull rotation with caps on how much any one sire can contribute to your calf crop, often around 10–12%, and a willingness to use Red Holstein, European outcross sires and older AI bulls through stored semen to break up the Chief stack. Classification and on-farm notes back at the center of breeding decisions.

Risks/limits: Expansion is harder. Every extra stall has to be filled with a calf you bred. Cash-flow shocks bite deeper, because slashing cow numbers in a bad year cuts into the families the whole program depends on. The upside in 2026? With springing heifers near $3,010 and inventory at a 47-year low, closed herds are insulated from the heifer market that’s choking open-catalog cash flow. Per Holstein Canada records, Larenwood lives here — no outside females since 1956, Larenwood-prefix bulls in AI distribution, a Master Breeder shield earned the slow way.

Path 4: Closed-Herd Thinking Without Closing the Gates (the 30-day move)

When it makes sense: You’re not ready to change replacement policy, but you’re done paying dumb inbreeding tax.

What it requires: Within 30 days, sit down with your genetics rep and turn on inbreeding caps and haplotype blocking — set the EPI cap around 9.0–9.5% and switch on HH1–HH6, HCD and CVM blocking before the next semen order goes in. Within 90 days, identify your top three cow families by lifetime production, classification trajectory and longevity, and decide which gets sexed semen and which gets beef. Add at least two outcross sires to your rotation — Red Holstein, European bloodlines, or older AI bulls through stored semen — to break up the Chief stack.

Risks/limits: It’s easy to tell yourself you’re “breeding like a closed herd” while still buying cows that don’t fit your barn. Without someone owning the long-term vision, the settings drift back to convenience. This is probably the best 30-day starting point for most herds — flip a few toggles, pull a couple of reports, and at least see whether you’re carrying the same $54,665-style tax the 500-cow example shows.

Key Takeaways

  • If your average heifer inbreeding is above 9.5%, assume you’re paying a five-figure annual penalty under current Doekes/Makanjuola assumptions and treat it like any other cost line — not a footnote.
  • If three or more people share bull-selection authority with no one accountable for long-term direction, you’re not set up for closed-herd thinking — even if you stop buying cows tomorrow.
  • If your mating software is set to “minimize inbreeding” rather than capped at a hard EPI threshold, you have a 30-day fix sitting in front of you. Set the cap around 9.0–9.5% and turn on HH1–HH6, HCD and CVM blocking before the next semen order.
  • If your bull list this year shares a sire grandfather across more than half your matings, you’re stacking Chief whether you can see it or not — add at least two outcross lines before the next round.
  • If you can’t name your top three cow families by lifetime contribution, stop sending their daughters to beef and start treating those lines as a 10-year asset.
  • If springing-heifer prices near $3,010 are bending your cash flow, lean harder on homebred replacements before you lean harder on the auction barn.

So which side of the $54,665 line is your herd on — and would you actually know if you didn’t run the numbers?

If Larenwood can carry a 70-year closed herd in Ontario and put Larenwood-prefix bulls into AI distribution, and if Brigeen can hit 108.1 BAA with 50 EX in a 580-cow Maine herd, the question isn’t whether the closed-herd model “wins.” It’s how curated your bull list is, how disciplined your mating caps are, and whether your operation is set up for the long mental load that goes with both. For now, the next move is yours: pull your inbreeding report and see where you sit.

Complete references and supporting documentation are available upon request by contacting the editorial team at editor@thebullvine.com.

Run Your Numbers

Genomic Testing ROI Calculator — Before you decide which heifer calves deserve a stall and which ones get a beef straw, run the Genomic Testing ROI Calculator. It puts a dollar value on testing the calf crop, sorting the bottom quartile out, and managing the inbreeding risk the $54,665 example pressure-tests for the average open-catalog herd.

Learn More

The Sunday Read Dairy Professionals Don’t Skip.

Every week, thousands of producers, breeders, and industry insiders open Bullvine Weekly for genetics insights, market shifts, and profit strategies they won’t find anywhere else. One email. Five minutes. Smarter decisions all week.
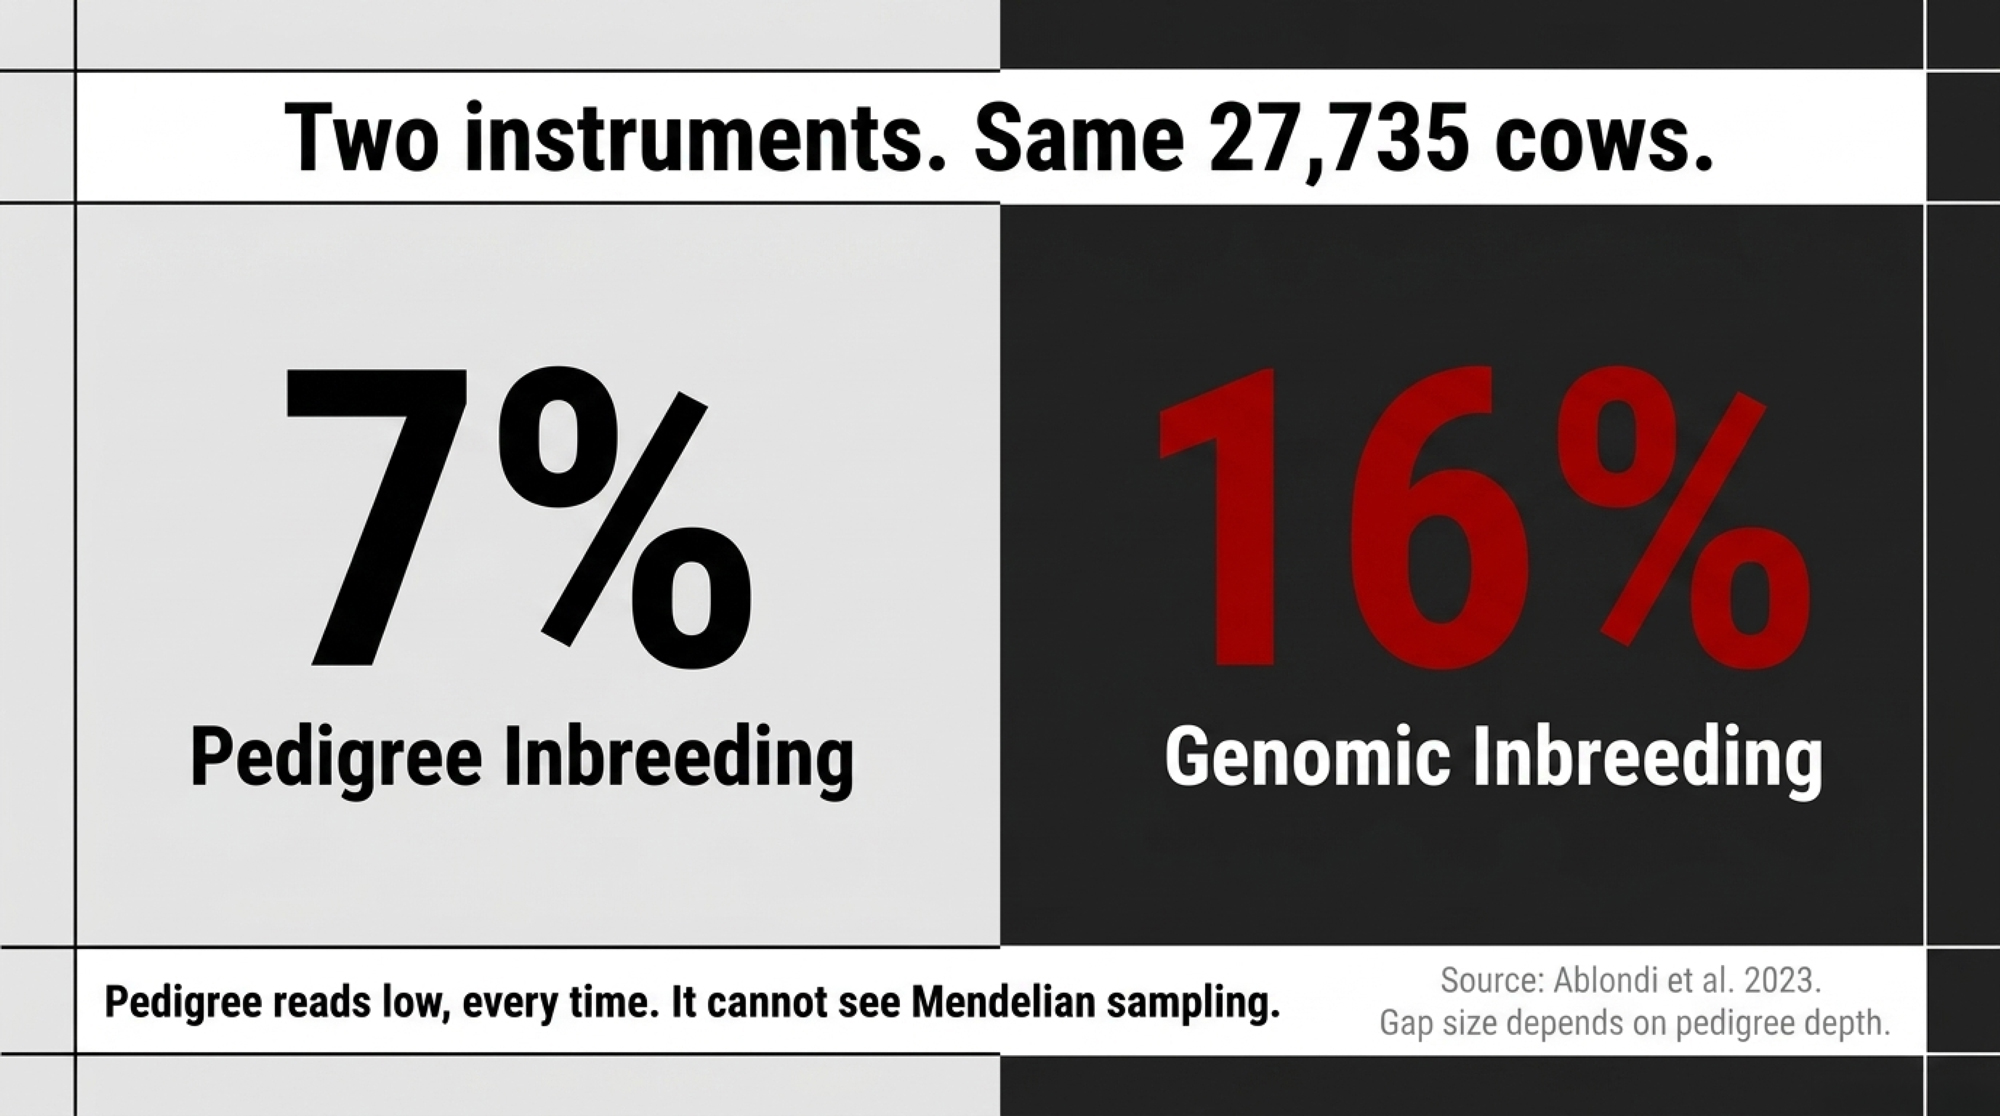
NewsSubscribe
First
Last
Consent

Holstein’s $40,500 Inbreeding Bill – and the USDA Bulls Your Stud Isn’t Selling You

99.84% of active Holstein AI bulls trace paternally to two grandfathers. Penn State proved the lineages we walked away from in the 1980s still work. So why aren’t they in your spring catalog?

Executive Summary: 99.84% of active Holstein AI bulls in North America trace paternally to two grandfathers — Pawnee Farm Arlinda Chief and Round Oak Rag Apple Elevation — and Canadian heifers born in 2024 are now averaging 9.99% pedigree inbreeding (Yue et al., 2015, J. Dairy Sci.; Lactanet, August 2025). Using the Doekes/Makanjuola loss curve of 80–108 lbs of milk per 305-day lactation per 1% inbreeding, that’s roughly $81–$110 per cow per year versus a 4% baseline at Q2 2026 Class III pricing — $40,500 to $54,700 quietly bleeding out of a 500-cow dairy every year, before fertility, SCC, and culling losses. Penn State’s Chad Dechow proved in 2020 (with USDA’s Harvey Blackburn) that bulls reconstituted from two “extinct” Y-lineages — Netherland Prince and Colantha, frozen in the USDA NAGP vault since the 1950s — produced daughters that matched modern elite contemporaries on production and beat them on fertility. Genomic ROH inbreeding runs 6–7 percentage points higher than pedigree numbers, so what shows on your DC305 report is the smaller of the two real numbers. The escape hatches exist: hard 6.25% inbreeding caps in your mating program, VikingHolstein/CRV outcross sires, Blondin’s diversity lineup, or research-channel access to the Dechow/NAGP reconstituted bulls through Select Sires and TransOva. No formal Y-lineage program has been identified at Holstein USA, NAAB, or CDCB as of publication — meaning the conversation has to start with you, this spring, before your stud finalizes the catalog. If you can’t tell your AI rep how many unique sires-of-sons sit behind the top 20 bulls in your mating plan, that’s the first phone call.

Pawnee Farm Arlinda Chief (1962–1978). His sons and grandsons were used so heavily that today, more than 60 years after he was born, an estimated 14% of the Holstein genome in North America still traces directly to him — and 99.84% of active Holstein AI bulls share his Y-chromosome or Round Oak Rag Apple Elevation’s. The bottleneck this article opens with starts here. (Read more: The $4,300 Gamble That Reshaped Global Dairy Industry: The Pawnee Farm Arlinda Chief Story)

In a USDA vault in Fort Collins, Colorado, the National Animal Germplasm Program has been holding semen straws from two Holstein bulls — Zimmerman Alstar Pilot and Cuthbert — born in the early 1950s. They carry Y-chromosome lineages, Netherland Prince and Colantha, that vanished from commercial Holstein AI roughly 40 years ago. And in 2020, Penn State’s Chad Dechow proved they still work.

Two numbers tell you why those vault straws matter to your spring 2026 semen order. 99.84% of active Holstein AI bulls in North America trace paternally to just two grandfathers, Pawnee Farm Arlinda Chief and Round Oak Rag Apple Elevation. That’s from Yue, Dechow, and colleagues’ 2015 study in the Journal of Dairy Science, which ran across 62,897 bulls. The other number: 9.99% is the average pedigree-based inbreeding coefficient of Canadian Holstein heifers born in 2024, per Lactanet’s August 2025 update. The breed is now sitting on two Y-chromosomes, and those Y-chromosomes are stacking on top of each other.

Round Oak Rag Apple Elevation (1965–1979). Bred at Round Oak Farm in Virginia and proven through ABS, Elevation became the most-used Holstein sire of his era and the second pillar of the modern bottleneck — every active North American Holstein AI bull that doesn’t trace paternally to Chief traces here. Together they account for 99.84% of the breed’s active Y-chromosome. (Read more: Round Oak Rag Apple Elevation: The Bull That Changed Everything)

Dechow, working with Wansheng Liu, Leon Specht, and USDA’s Harvey Blackburn, pulled the vault straws back into a breeding program. They mated long-frozen 1950s semen to elite modern females through IVF, raised the calves, and milked the daughters. The daughters didn’t underperform. The 2020 JDS paper reports that the resulting bulls were “above the expected level and equal to their counterparts from the current Holstein genetic base born in the same year”in production, with “high genetic merit for daughter fertility” and “high somatic cell scores.” The breed walked away from those genetics in the 1980s. Independent, peer-reviewed work says they still work.

And right now, they’re not on the page in front of you.

The Bottleneck Is Two Y-Chromosomes Wide

A third surviving Y-line, Penn State Ivanhoe Star, was holding on at 0.16% of active bulls in the 2010s. It’s effectively gone today. That leaves the entire active Holstein AI bull population — every catalog you’ll see this spring — sitting on Chief or Elevation paternally.

The 9.99% inbreeding figure is what that bottleneck does to your barn. It’s Canadian, from Lactanet’s August 2025 update on heifers born in 2024. CDCB doesn’t publish a single breed-average inbreeding number for U.S. Holsteins in the same format as Lactanet, but the trend lines CDCB does publish — plus genomic studies in commercial U.S. herds — point in the same direction as the Canadian number.

Genomic measures run higher than pedigree-based ones. Studies of commercial Holstein herds put runs-of-homozygosity inbreeding around 15–16% — roughly 6–7 percentage points above pedigree numbers. Pedigree understates what’s actually happening at the chromosome level. That gap matters when you’re trying to figure out why your fresh cows aren’t bouncing back the way they used to.

The trajectory: Lactanet’s Holstein inbreeding is climbing by about 0.38 percentage points per year in the current cohort. Project that forward at current selection intensity and the breed walks past 12% pedigree inbreeding well inside the next breeding decade.

How This Plays Out on Real Farms

You won’t see “inbreeding loss” on any single report. It shows up scattered. A few extra services per conception. Slightly higher SCC. Cows that don’t quite make it to a third lactation. Each item alone looks like ordinary herd noise. Stacked together, they’re a recurring tax.

Peer-reviewed estimates of how big the tax is land in a fairly tight range. Doekes (2019) and Makanjuola (2020) both report that roughly 80–108 lbs of milk are lost per 305-day lactation for each 1% increase in inbreeding. Ablondi (2023), using genomic ROH measurements in Italian Holsteins, estimates the loss at about 134 lbs per 1%. CDCB’s own Norman 2020 analysis sits at the lower end of the same range.

Here’s the micro barn math. Assumptions stated up front, treated as a model — not a guarantee:

  • Current average inbreeding: 9.99% (Lactanet, August 2025)
  • Pre-genomic baseline: 4.0% (typical Holstein average in the early 2000s)
  • Delta: roughly 6 percentage points
  • Loss rate: 80–108 lbs/lactation per 1% increase (Doekes/Makanjuola)
  • Class III equivalent used in this model: $16.90/cwt, in line with USDA AMS Class III price reporting in the second quarter of 2026

That works out to roughly 480–650 lbs of milk per cow per lactation, quietly missing about $81–$110 per cow per year at that price. On a 500-cow dairy, the annual drag lands in the $40,500 to $54,700 range every year, before you count extended days open, mastitis events, and early culls that come with rising homozygosity.

That’s not a number that comes up in a normal semen-order conversation. But it’s the number you’re already paying.

How Did the Catalog Get This Narrow?

The mechanics aren’t mysterious. AI was commercialized in the 1950s and 1960s. Chief and Elevation sons proved out early, got used heavily, then got used more. Their sons did the same. Generation interval dropped, IVF compressed it further, and a small group of major studs ended up controlling the majority of North American Holstein sire influence.

Every Y-chromosome lineage outside Chief and Elevation lost ground until those lines essentially disappeared from commercial AI by the late 1980s. We’ve covered the broader genetics war reshaping AI catalogs in a separate Bullvine piece worth reading alongside this one. The CDCB system handles inbreeding by adjusting PTAs. That’s mathematically correct, but in our reading, it has a quiet side effect: every five-year base change resets the zero point against the current, more inbred population. In the April 2025 base change, inbreeding adjustments accounted for roughly 18% of PTA shifts in Holsteins. That’s not a small accounting note. It’s a meaningful share of why some producers saw smaller-than-expected proof movement.

Whose surprise that is depends on which side of the kitchen table you’re sitting on. Some of the smaller-than-expected drop reflects real genetic progress. Some of it reflects the cost of inbreeding being absorbed into a new baseline. Both things are technically true. Together, they tell completely different stories.

What Did the USDA Actually Prove?

Dechow’s 2020 paper, with Liu, Specht, and Blackburn, didn’t just thaw old straws and hope. The team recovered semen from Pilot (Netherland Prince line) and Cuthbert (Colantha line), produced 15 calves through IVF using elite modern females — seven bulls and eight heifers — and tracked the daughters into lactation.

The published finding, in plain language: one generation of mating these “lost” bulls to elite modern cows produced bulls that were breed average for total economic merit, with high genetic merit for fertility and somatic cell scores, and near-average milk components. A USDA ARS follow-on project running through 2028 is now looking at the granddaughters. The project documentation puts the early result this way: “Results to date indicate that daughters’ performance was similar or exceeded daughters sired by contemporary bulls. This unexpected result seems to be caused by breaking up runs of homozygosity and therefore creating more heterozygous loci.”

That’s heterosis showing up inside a purebred program — from a Y-chromosome that’s been gone 60 years. The point isn’t that 1950s bulls are magically better. It’s that the breed currently carries enough hidden homozygosity that simply restoring lineage diversity yields a measurable bump on the very traits that have been getting harder to hold: fertility, health, and survivability. Readers who want the longer arc on how the breed got here can pair this story with our earlier piece on the four bulls that built today’s catalog.

Options and Trade-Offs for Farmers

OptionPedigree Diversity LevelExpected NM$ Trade-offBest Fit
Hard 6.25% Inbreeding Cap (mating software)Moderate improvement−3 to −5 NM$ per matingAny herd ≥ breed avg (~9–10%) inbreeding
VikingHolstein / CRV Nordic Outcross SiresHigh — ~20 unique sires-of-sons−10 to −20 NM$ vs. top domesticHerds with fertility & longevity drag
Blondin Diversity Lineup (Quebec)High maternal breadthSmall NM$ discountHerds stacking Chief/Elevation maternal lines
Dechow/NAGP Reconstituted Bulls (Select Sires / TransOva)Maximum — extinct Y-lines restoredBelow top-genomic on NM$; high fertility20–30 cow pilot herds; research-minded farms
USDA Animal-GRIN Direct RequestMaximum — full vault accessResearch-scale only; no NM$ dataUniversity or breed-org partnerships only

There’s no single playbook. There are realistic paths producers are starting to walk.

1. Tighten the inbreeding cap in your mating program — this month. Most mating software has an “expected progeny inbreeding” setting that defaults to “minimize” rather than a hard ceiling. Setting a hard cap — a common starting point in the literature is around 6.25%, going back to Weigel’s WCDS mating-program work — forces the algorithm to reject some matings rather than sort them. When it makes sense: Any herd at or above breed-average inbreeding. What it requires: A 30-minute call with whoever runs your mating program — your AI rep, your independent mating service, or your own herdsman if you run it in-house. Ask specifically whether your software supports a hard cap, not just a sort. Risks/limits: You’ll give up a few index points on individual matings. Lifetime profit math still favors the cap if the published loss curves hold.

2. Use Nordic or pedigree-diverse sires as a partial outcross. VikingGenetics builds its program around using bulls from about 20 different sires-of-sons each year, with strict caps on sons-per-sire and short marketing windows. CRV emphasizes broader pedigree breadth than is typical in North American catalogs, with explicit attention to sire-of-sons diversity. Blondin Sires in Quebec markets bulls deliberately built around outcross maternal lines — we’ve covered Blondin’s diversity-built lineup and the 75% growth that followed it in a separate piece. When it makes sense: Herds where pedigree concentration is already showing up as fertility or longevity issues. What it requires: Willingness to accept a small NM$/TPI gap for genuinely different genetics. Risks/limits: These bulls aren’t from extinct lineages. They still trace through Chief or Elevation paternally — just with broader maternal backgrounds. A partial fix, not a reset.

3. Ask your stud about access to the Dechow/NAGP reconstituted bulls. The 2020 JDS paper says explicitly: “Semen from the bulls is commercially available to facilitate Y chromosome research and efforts to restore lost genetic diversity.” Select Sires and TransOva were the industry partners on the project. That’s research-channel availability, not a routine catalog listing — and any conversation with a stud needs to start there. When it makes sense: Herds willing to run a small pilot — 20 to 30 matings — and track fertility, SCC, and survivability against a control group. What it requires: A direct conversation with someone at or above the district-rep level. These bulls aren’t in standard catalogs and may involve a research-style use agreement. Risks/limits: Access is informal. Production won’t beat your top genomic sire on paper. The upside shows up in fertility and homozygosity reduction, not in NM$.

4. Request directly through USDA’s Animal-GRIN portal. The portal at agrin.ars.usda.gov accepts germplasm requests for research, genetic-defect resolution, or diversity restoration. NAGP has released thousands of samples over more than two decades — research-scale, not retail-scale, when it makes sense: If you can partner with a university or breed organization on a documented project. What it requires: A formal application explaining the purpose. NAGP keeps a “Core Collection” of each breed that’s legally protected from commercial release. Risks/limits: Research access route, not a commercial channel. Best treated as a partnership, not a purchase.

The forward-looking signal sits inside paths 2 and 3. If a meaningful share of producers start asking studs about VikingHolstein outcross options or NAGP-derived sires this spring, the catalog you see in 2028 will look different than the one you’re holding now. If they don’t ask, it won’t.

How Much Is Your Current Catalog Costing You?

Pull your last semen invoice and your DC305 inbreeding report side by side. If your herd-average pedigree inbreeding is north of 8% and your top mating recommendations trace paternally through Shottle, Goldwyn, Planet, or O-Man within three generations — all widely used Chief or Elevation descendants — you’re stacking the same Y-chromosome on the same Y-chromosome. That doesn’t make the bulls bad. It makes the catalog narrow.

Holding the same Doekes/Makanjuola loss curve used in the headline math, knocking expected progeny inbreeding down by even two percentage points — by mixing in pedigree-diverse or minority-line sires — recaptures somewhere in the $27–$37 per cow per year range, or up to roughly $45 if you weight toward the higher Ablondi 2023 ROH-based estimate. On a 200-cow herd, that’s $5,400–$9,000 a year currently sitting on the table. The same dynamic shows up on the maternal side — the maternal-side concentration trap is where we’ve put the longer numbers on cow-family stacking.

ScenarioInbreeding LevelLoss vs. 4% BaselineCost/Cow/yr (Doekes 80 lbs/pp)Cost/Cow/yr (Ablondi ROH 134 lbs/pp)500-Cow Annual Impact
Early 2000s Holstein baseline4.0%$0$0$0
Breed average 20209.0%+5.0 pp$67.60$113.30$33,800–$56,650
Breed average 2024 (Lactanet)9.99%+5.99 pp$81.07$135.78$40,535–$67,890
Projected 2028 (+0.38 pp/yr)11.51%+7.51 pp$101.61$170.23$50,805–$85,115
After 2 pp reduction via outcross7.99%+3.99 pp$54.00$90.47$27,000–$45,235

Is Your Genetics Conversation Asking the Right Questions?

When your AI rep walks in this spring, the standard question is, “Who’s your top NM$ bull?” That’s the question the catalog is built to answer. It’s also the question that produced 9.99% inbreeding. A different conversation starts with these four:

  • What percentage of your active Holstein lineup traces paternally to bulls other than Chief or Elevation descendants?
  • How many unique sires-of-sons sit behind the top 20 bulls you’d recommend for my herd?
  • What’s the expected pedigree and genomic inbreeding of progeny under your default mating plan — and how much can you knock it down with substitutions?
  • Do you have access to any of the USDA NAGP reconstituted-lineage bulls, or to VikingHolstein/CRV outcross sires for a portion of my matings?

You may not get clean answers. The questions still do their job. They signal that the customer is evaluating offerings on dimensions beyond NM$, giving the stud a reason to surface diversity-relevant options, if any exist, in their lineup. Any reader who hasn’t already seen our coverage of the 9.99% Bell 2.0 number itself should pair that piece with this one.

The Institutional Blindspot

The trend itself isn’t being ignored. Holstein USA, the National Association of Animal Breeders, and the Council on Dairy Cattle Breeding have all published commentary or data on rising Holstein inbreeding. The gap is at the next level down: a formal initiative aimed specifically at the Y-chromosome bottleneck Yue and colleagues documented in 2015.

Based on a review of each organization’s public materials as of publication, no formal initiative specifically targeting Y-chromosome lineage concentration has been identified at any of the three. The peer-reviewed proof has existed since 2020. The freezer in Fort Collins has been running since 1999. The barn-level cost is being paid right now in fertility, SCC, and lost lactations. Whether industry institutions choose to lead on this or wait for producers to drag them into the conversation is a story this publication will keep covering — and any formal Y-lineage program announced by Holstein USA, NAAB, or CDCB after publication will be reflected in updates here.

Key Takeaways

  • If your herd’s pedigree-based inbreeding is at or above breed average (~9–10%), the modeled production drag at current milk prices is realistically $81–$110 per cow per year versus a 4% baseline — $40,500–$54,700 annually on a 500-cow dairy before you count fertility and longevity effects.
  • If you only look at pedigree inbreeding, you’re working with the smaller of the two real numbers. Genomic ROH inbreeding runs 6–7 percentage points higher. Ask whether your mating program can also report ROH or genomic future inbreeding.
  • If you haven’t set a hard cap on expected progeny inbreeding, do it this month. Start near 6.25% and watch which matings the algorithm rejects. That’s your information.
  • If your AI rep can’t answer how many unique sires-of-sons sit behind your top 20 recommendations,you’ve found a gap worth closing before you order.
  • If you’re considering a pilot with reconstituted-lineage or pedigree-diverse semen, plan it as a 20–30-cow trial with a matched control group and full health and fertility tracking. Anecdotes won’t move your operation. Recorded data will.
  • If your stud has no answer on NAGP-derived sires, VikingHolstein, CRV outcross options, or Blondin’s diversity lineup, treat that silence as a data point worth raising at your next genetics review.

What Are You Going to Do Before Spring Orders Close?

The peer-reviewed research has been sitting in the Journal of Dairy Science since 2020. The freezer in Fort Collins has been there since 1999. The 9.99% number arrived last summer. None of that changes what’s in your tank this morning. But it does change the question worth asking before your next breeding season starts: of the bulls your stud will sell you in the next 60 days, how many are doing anything genuinely different than the bulls your stud sold you five years ago — and what’s that costing you per cow, per lactation, in a market where margins are already thin?

If you want to walk the math on your own operation — herd size, current inbreeding, expected loss versus available alternatives — the per-cow and per-lactation calculator goes live in this week’s Bullvine Weekly, along with the producer-to-stud script for actually getting answers about lineage diversity. That’s where the numbers come home.

Complete references and supporting documentation are available upon request by contacting the editorial team at editor@thebullvine.com.

Learn More

The Sunday Read Dairy Professionals Don’t Skip.

Every week, thousands of producers, breeders, and industry insiders open Bullvine Weekly for genetics insights, market shifts, and profit strategies they won’t find anywhere else. One email. Five minutes. Smarter decisions all week.
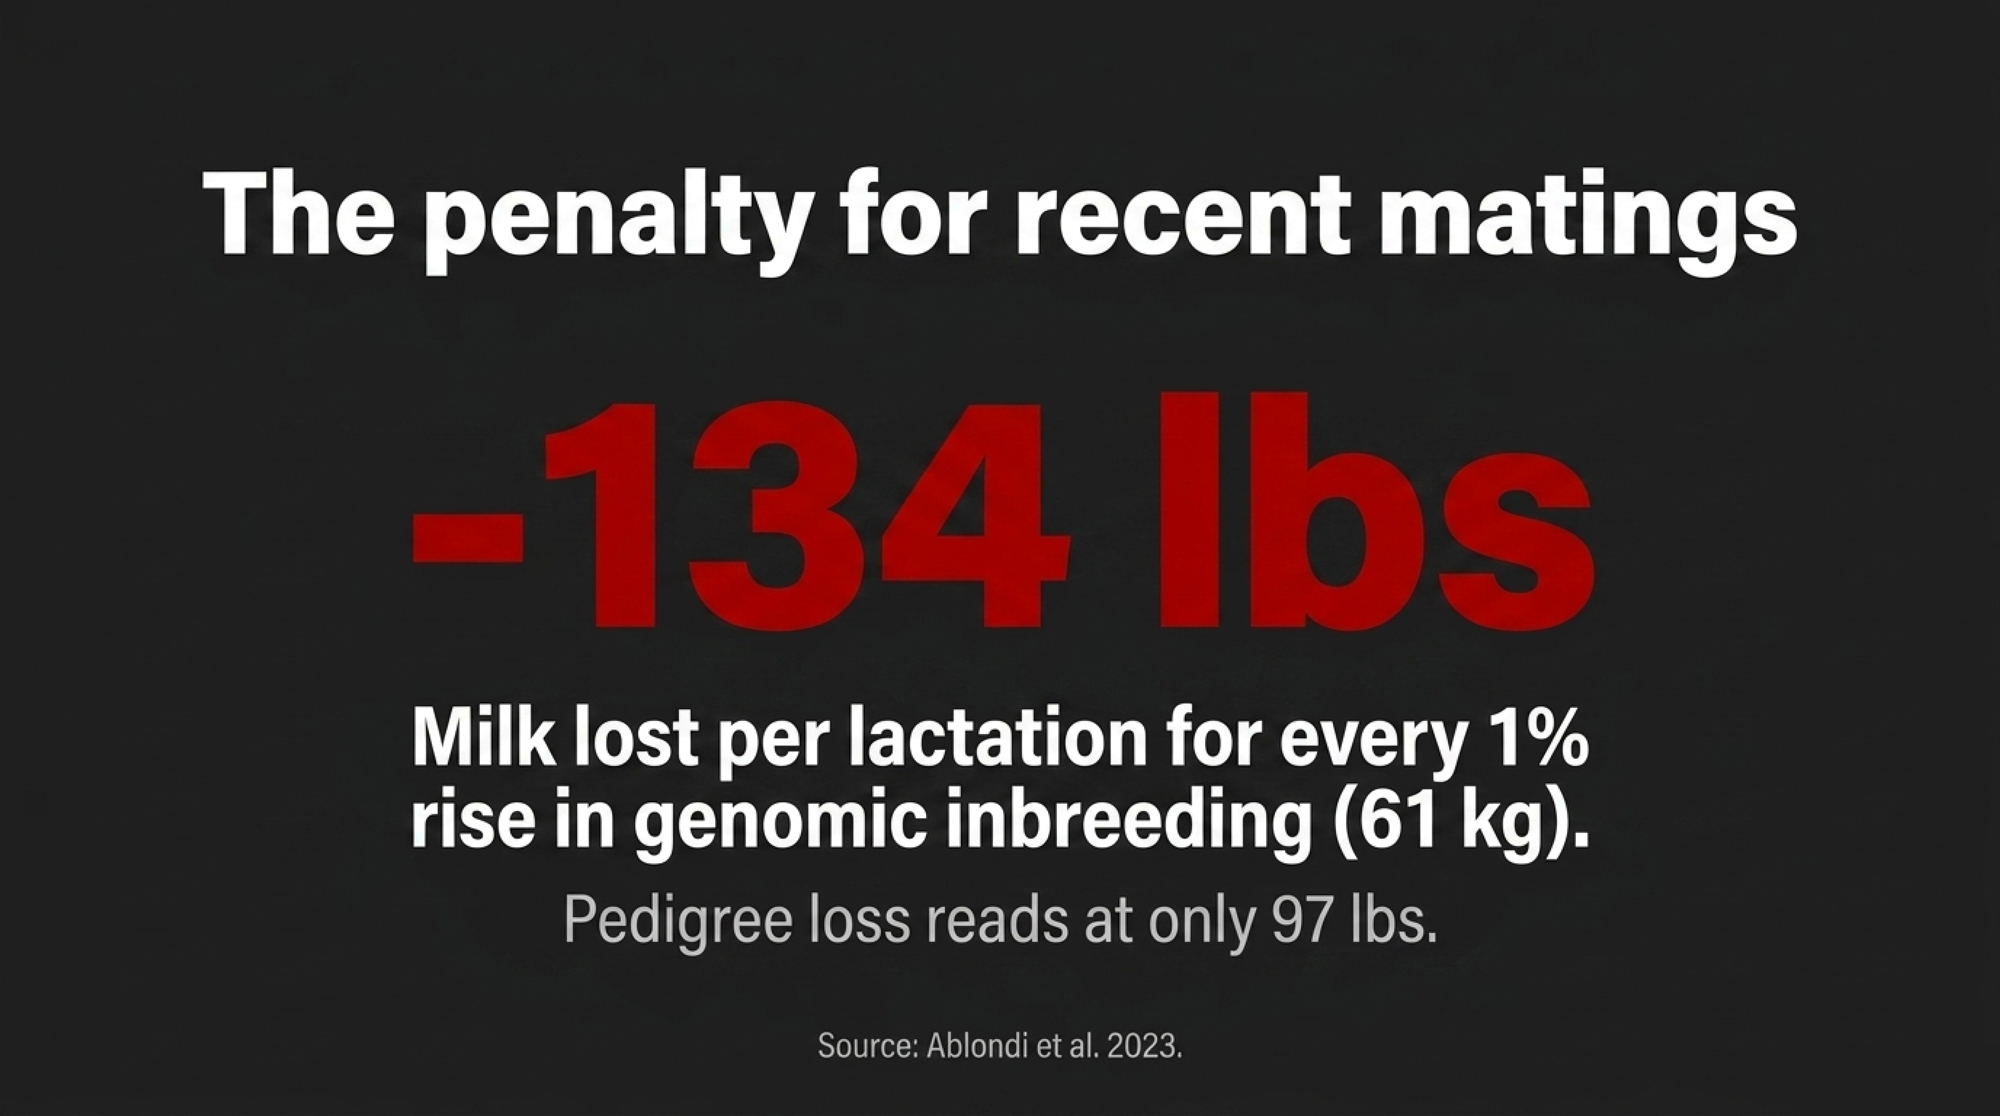
NewsSubscribe
First
Last
Consent

Holstein Inbreeding Hit 9.99%. Genomics Didn’t Fix the Chief/Elevation Trap – It Built Bell 2.0.

Lactanet just clocked Canadian Holstein heifers at 9.99% inbreeding — climbing 0.25% a year, more than double Jersey. On 1,500 cows, that’s a modeled $180–250K hit. The fix? A toggle most mating programs ship loose.

Executive Summary: Lactanet’s August 2025 update clocked Canadian Holstein heifers born in 2024 at 9.99% genomic inbreeding, climbing 0.25% a year — more than double Jersey, Brown Swiss, and Ayrshire. Push the Cassell (1999) and CDN (2008) coefficients through a 1,500‑cow Holstein herd running 10% heifer inbreeding instead of 7–8%, and the modeled annual drag lands at $180,000–$250,000 in lost milk, extra abortions and services, and shorter productive life. Genomics didn’t fix the Chief/Elevation bottleneck — it cut sire generation intervals from 6.8 years to under 3 and put O‑Man at 13% relationship to the breed in one cycle. IVF now multiplies it from the other side: a 3,100 GTPI heifer at 12% inbreeding is a worse financial bet than a 2,950 at 7%, and most herds have never audited the gap. The highest‑leverage fix is a 30‑minute job — drop your mating software’s Inbreeding Max toggle to 9.5%, turn on HH1–HH6 / HCD / CVM blocking, cap any single sire at 10–12% of the calf crop, and screen IVF donors under 9%. Hold that discipline three years and the modeled recovery on a 1,500‑cow herd runs $150,000–$300,000 a year once the new cohort cycles through. Read the full piece if your last semen order went in without anyone in the room being able to quote your herd’s inbreeding number.

Holstein inbreeding 9.99%

Composite scenario: the southwestern Ontario manager in this story is a synthesis of patterns showing up in well‑run 1,500‑cow Holstein herds. The herd numbers are illustrative; the inbreeding‑depression math and Lactanet data behind them are real.

Picture a breeding manager on a 1,500‑cow Holstein operation in southwestern Ontario, pulling a report he’d never bothered with before: average genomic inbreeding on his 0–12‑month heifers. The number lands at 10.3%.

On paper, everything looked right. Seven years of buying top‑5% genomic sires, flushing the best young donors through IVF, pushing NM$ higher with every proof run. Every proof sheet and semen invoice said elite genetics.

That 10.3% told a different story. Mapped against the kind of repro records most large herds keep — conception by sire group, mid‑term abortions, second‑calf cull reasons — the pattern jumps off the page in herd after herd. The tightest, most “elite” matings are also the worst performers in the breeding barn.

He isn’t an outlier, and the herd average isn’t either. Lactanet’s August 2025 inbreeding update put Canadian Holstein heifers born in 2024 at 9.99% genomic inbreeding — ahead of Jersey (7.56%), Brown Swiss (7.10%) and Ayrshire (6.89%). And Holstein is climbing at +0.25% per year since 2010, more than double the rate of Jersey (+0.11%), Ayrshire (+0.12%) and Brown Swiss (+0.12%) over the same window. If your herd has been leaning on the same handful of hot genomic sires and IVF donors, your number likely looks a lot like that 10.3%.

The Original Trap Took Decades. This One Took 10 Years.

The first Holstein bottleneck is familiar history, even if it rarely comes up when we’re picking bulls.

Pawnee Farm Arlinda Chief, born in 1962, now shows up in roughly 14% of the global Holstein genome. Round Oak Rag Apple Elevation, born in 1965, sits around 15.2%. To‑Mar Blackstar has climbed higher still at about 15.8%relationship to the breed.

Those bulls and their sons drove enormous gains. The collective milk production impact of the Chief/Elevation era has been estimated in the tens of billions of dollars over the late 20th and early 21st centuries.

But Chief carried the APAF1 nonsense mutation we now call HH1. Published estimates tie that single mutation to roughly 525,000 mid‑term abortions worldwide over 35 years at about $800 per fetus — in the $420–450 millionrange in lost calves, vet time, and milk that never got made.

Run the math and the ratio still works out heavily in favour of the production gain. That’s why HH1 rode along undetected for so long. The upside hit every milk cheque. The downside hid in vet invoices, open‑cow lists, and “unexplained” pregnancy failures nobody connected to pedigree.

Back then, AI sire generation intervals ran close to 6.8 years. Chief and Elevation’s DNA took decades to saturate the breed.

Genomics changed the pace. Published US Holstein data show AI sire generation intervals dropping from about 6.8 years pre‑genomics to under 3 years afterward. Fewer young bulls now sire a larger share of the next generation, and they’re more closely related to each other than at any point in Holstein history. O‑Bee Manfred Justice — O‑Man — is the clearest example: roughly 13% relationship to the Holstein population, approaching Chief and Elevation territory in essentially one genomic generation.

IVF made the new bottleneck two‑sided. In North America, IVF embryo production has surpassed conventional flushing, and many programs collect embryos from donors well before their first calving, sometimes starting around 10 months of age. Both sides of the pedigree are tightening at once. Effective population size (Ne) for Holsteins — how genetically diverse the breed actually behaves, regardless of the millions of cows on the ground — has been estimated between 74 and 171 across recent multi‑country studies (Salehi et al., 2025, Veterinary Medicine and Science). For a global population this big, that’s conservation‑biology territory.

What Does 2% Extra Inbreeding Actually Cost in Your Barn?

Virginia Tech’s benchmark inbreeding work (Cassell, 1999) put the lifetime economic loss at roughly –24 per cowfor every 1% increase in inbreeding — in 1999 dollars, with current impact likely higher once you adjust for today’s milk price, replacement costs, and inflation.

The Canadian Dairy Network’s “Quantifying Inbreeding Depression” analysis (Van Doormaal, 2008) sits behind the trait‑level numbers most breeders use today: per 1% inbreeding, roughly 18.4 kg less milk (about 41 lb), 1.06 kg less fat (about 2.3 lb), 0.53 kg less protein (about 1.2 lb), and 12.9 days less productive life across Holsteins.

Stack those coefficients across multiple lactations on a 1,500‑cow herd whose replacement heifers average 10% inbreeding instead of 7–8%, and the modeled annual drag looks like this:

The Silent Drag: Modeled Annual Cost of +2% Inbreeding in a 1,500‑Cow Holstein Herd

Cost bucketImpact per +1% inbreedingModeled +2% herd impactWhy it matters
Production−18.4 kg milk; −1.06 kg fat$120,000–$150,000/yearBiggest visible drag, but still usually blamed on feed or transition management
ReproductionMore abortions, extra services, longer days open$20,000–$40,000/yearShows up as “random” pregnancy loss and repeat-breeder noise
Longevity−12.9 days productive life$40,000–$60,000/yearPushes more cows out before they pay back rearing cost
TotalHidden inbreeding tax$180,000–$250,000/yearLarge enough to beat many bull-list index gains
Recovery targetRemove 2 excess points over time$150,000–$300,000/yearFrames the 9.5% cap as a cash-flow decision, not a genetics lecture

Modeled example built from Cassell (Virginia Tech, 1999) and CDN/Lactanet trait coefficients (Van Doormaal, 2008). Production line assumes ~200 lb less milk and proportional fat across the productive life of the affected cohort at current component returns. Reproduction line assumes 10–30 extra mid‑term abortions at $800–1,200 each plus added services and days open. Longevity line assumes 20–30 extra annual replacements at $1,800–2,200 each. Not an audited herd P&L.

A composite back‑of‑the‑barn version using realistic 1,500‑cow abortion counts, repro spend, and milk price lands squarely in the middle of that range. The lesson sitting underneath it: too many managers spend years arguing over 20 points of NM$ on the bull lineup while ignoring a cost roughly three times larger.

IVF: Your Best Tool or Your Fastest Bottleneck?

IVF and OPU are powerful when they multiply diversity and merit together. They’re brutal when they copy and paste a bottleneck.

Walk through the pattern that’s playing out on farms right now.

A donor heifer is 10 months old, top 2% on NM$, and already sitting at 9.5–10% genomic inbreeding because the same popular sire lines built both sides of her pedigree. She looks like the obvious IVF candidate. The program mates her to the same handful of high‑index sires already in heavy use across the herd. Over the next year, she produces 20–40 embryos.

If nobody has checked her inbreeding or her relationship to those sires, a big chunk of those embryos will sit in the 10–12% expected‑inbreeding range. If haplotype blocking isn’t turned on, some of those combinations can be carrier × carrier for HH1–HH6 or HCD.

Here’s the trap: the GTPI or NM$ number at the top of the genomic report is so high it papers over the inbreeding coefficient sitting two columns to the right. A 3,100 GTPI heifer with 12% inbreeding can be a worse financial betthan a 2,950 GTPI heifer with 7% inbreeding. Run the math: the 150‑point GTPI gap is worth roughly $75–$150 in lifetime profit on most index conversions. The 5‑point inbreeding gap costs $110–120 in Cassell’s framework. Stop ranking on the number at the top of the page.

Fast‑forward two years. Those IVF daughters hit the fresh pen with impressive genomic proofs and a frustrating pattern: slightly worse conception, a few more transition events, a tendency for some to leave before their third lactation. On paper, they’re the future of the herd. In the parlour, they’re not quite paying their rent.

Feed gets blamed. Housing gets blamed. The IVF lab gets blamed. The unglamorous answer is often simpler: the program multiplied a bottleneck.

Here’s a fast way to check. Pull average genomic inbreeding on your IVF‑bred heifers born in the last 12 months, then the same number on your conventionally bred group. If the IVF calves are running 1–2 points higher — and in herds that haven’t audited this, they often are — your highest‑cost genetics program is working against your longevity and repro numbers. At Cassell’s $22–24 per 1% per cow per lifetime, even a 1‑point gap across 200 IVF‑bred replacements adds up to roughly $4,400–4,800 in modeled lifetime drag before those heifers ever calve.

Who Gets Paid — and Who Holds the Bill?

AI companies earn margin on every straw, and the business model rewards concentration: when a small number of high‑index bulls move large volumes of doses, marketing, proof rollouts, and rep activity tend to follow. That’s how the industry has worked for decades.

Most AI reps are paid in significant part on volume and market share. You’re paid on margin and longevity. Those incentives don’t always pull in the same direction.

You need cows pregnant on time, healthy through transition, and milking through three or more lactations. Every mid‑term abortion, every repeat breeder, every second‑calf cow that crashes and leaves early — those costs hit your P&L, not your stud’s.

Layered across the inbreeding‑depression literature — Cassell at Virginia Tech, CDN/Lactanet’s quantification work, and later reviews — the lifetime economic loss at today’s Holstein inbreeding levels lands in roughly the 0–400 per cow range. That’s not one paper. It’s a range that keeps showing up when you stack the milk, fat, longevity, fertility, and health hits together.

Many reps work hard to steer breeders toward responsible matings, and several companies have invested in better relationship and expected‑inbreeding tools inside their mating programs. The critique here is of the default incentive structure, not of any individual rep or company. But the structural reality remains: it’s still not the default view in most catalogs, and relationship data rarely leads the conversation when a rep arrives with a bull list sorted by NM$, TPI and Pro$.

The studs monetise concentration. The herd absorbs the long tail of it — in abortions, repro costs, and replacements.

Can a 9.5% Cap and 20 Sires Really Change Anything?

This is where the composite Ontario manager’s playbook gets useful — because it tracks closely with what disciplined large herds are actually doing right now.

After seeing a 10.3% heifer inbreeding report, the move isn’t to scrap the genetics program. The move is three specific changes, committed to for at least three years.

First, turn on a mating‑level inbreeding cap. Most software already calculates expected inbreeding on proposed matings, but in many installs we’ve reviewed the default sits well above the threshold most large Holstein herds need today. Move the toggle to 9.5% and make it a hard rule: no mating allowed if the resulting calf’s expected inbreeding exceeds that threshold. The program simply blocks those proposals. Some go‑to sires suddenly disappear as options on certain cows. That stings — but the cap isn’t banning bulls, it’s banning bad matings.

Second, enforce a sire‑use rule. No single bull sires more than 10–12% of the calf crop in a calendar year. The top 10 bulls, collectively, stay under 60% of the calves. That forces sire groups drawn from genuinely different sire stacks — not eight sons of the same bull with different prefixes.

Third, put IVF under guardrails. Donors under 9% genomic inbreeding. Every potential sire screened for relationship to that specific donor. No donor family accounts for more than 15–20% of replacement heifers in any 12‑month window.

Sit down with your vet and accountant and agree on farm‑specific numbers for the cost of a mid‑term abortion, an extra service, and the rearing cost per replacement. Those three numbers turn the inbreeding conversation from interesting genetics talk into a line on the cash flow.

Within 90 days of switching on the 9.5% cap and tightening IVF, the breeding tech notices something simple: fewer ugly proposed matings, fewer repeated carrier pairings, and fewer head‑scratching combinations on problem cows.

How Long Before You See It in the Barn?

The payoff doesn’t arrive all at once, and it doesn’t show up first on the milk sheet.

Managers who implement this kind of package — 9.5% cap, sire diversity, IVF guardrails, haplotype blocking — describe a three‑phase timeline.

0–12 months: repro and abortions. Within about 90 days, conception rates stop sliding and, in many herds, start ticking up. The worst inbreeding‑driven matings are out of the pool. Turn on recessive haplotype blocking (HH1–HH6, HCD, CVM) and carrier × carrier matings drop to zero as soon as the new rules are in place. Within one gestation length — roughly 9–10 months — mid‑term abortions linked to those combinations trend toward zero.

12–24 months: fresh‑cow health. The first “new‑protocol” heifers calve in. Lower‑inbreeding heifers tend to show fewer transition issues and more resilience through the first 60 days in milk. It’s not dramatic — but classify your fresh cows by inbreeding band and the differences usually jump off the page. Fewer crash‑and‑burn second‑calf cows show up on the cull list.

2–5 years: lifetime profit and replacement pressure. By year 3, lifetime economics begin to shift. More cows last into third and fourth lactations. Replacement rate comes down because you’re not culling as many cows for fertility and health before they’ve paid off their rearing cost. Over a 5‑year window, a herd that holds this discipline is positioned to pull average heifer inbreeding from around 10% closer to 7–8%. Run Cassell’s and CDN’s coefficients in the opposite direction and the modeled annual recovery from eliminating 2 points of excess inbreeding in a 1,500‑cow herd falls in the $150,000–300,000 range once the full replacement cohort has cycled under the new rules.

None of that is a guarantee. Weather, management, feed, and markets all move the needle too. But change nothing about inbreeding and sire concentration and your numbers will keep drifting in the same direction as the national curve.

What This Means for Your Operation

  • Can you quote your heifer‑crop average inbreeding right now? If not, that’s your first ask before the next semen order. It’s the quickest read on whether the last five years of bull decisions are building resilience or quietly eroding it.
  • Pull conception and abortion numbers by inbreeding band. Compare cows over 10% to those under 8%. Gaps of several points in conception rate or higher abortion rate in the more inbred group are real money on the table.
  • Ask your semen rep a different question next time: “What’s this bull’s relationship to my herd?” If they can’t answer, push for expected inbreeding and relationship reports alongside index rankings.
  • Stop ranking by GTPI/NM$ alone. Sort your bull short list by expected inbreeding against your specific cow before you order semen. A 150‑point GTPI gap can be cheaper than a 4‑point inbreeding gap on the wrong cow.
  • Put inbreeding on the same quarterly dashboard as pregnancy rate, SCC, and cull rate. If it’s not a KPI, it won’t get managed.

The 30‑Day Action Plan: Flip the Toggle Most People Miss

Most mating software — DairyComp, Lactanet’s mating module, and the major AI‑company mating programs — ships with an Inbreeding Max or Expected Inbreeding Limit toggle. In many installs we’ve reviewed, that default sits well above the threshold most modern Holstein herds actually need — high enough that it rarely blocks anything. The single highest‑leverage move you can make this month is to drop it to 9.0% or 9.5% and let the software start refusing the matings that are quietly costing you money.

  • Week 1: Log into your mating program. Find the Inbreeding Max / Expected Inbreeding setting. Move it to 9.5% (9.0% if your herd average is already under 8%). Turn on haplotype blocking for HH1–HH6, HCD, and CVM while you’re in there.
  • Week 2: Pull the average genomic inbreeding on your 0–12‑month heifer crop and on your most recent IVF cohort. Compare them. If IVF is higher, run the audit.
  • Week 3: Re‑run your active sire list against the new cap. Identify the bulls that suddenly aren’t usable on big chunks of the herd and source 2–4 genuine outcross alternatives.
  • Week 4: Sit down with your vet and accountant. Lock in your farm’s per‑abortion cost, per‑extra‑service cost, and rearing cost per replacement. Add inbreeding to your quarterly KPI dashboard.

Key Takeaways

  • If your 0–12‑month Holstein heifers average 9% or higher genomic inbreeding, run a 9.5% mating cap and a 15–20‑sire rotation — don’t just chase the top of the proof list. The cap is available in most major mating programs. The default is usually too loose. Turn it down.
  • A 3,100 GTPI heifer with 12% inbreeding can be a worse financial bet than a 2,950 GTPI heifer with 7% inbreeding. Stop ranking your short list on index alone.
  • If your IVF calves are your most inbred group, you’re paying OPU/IVF prices to multiply genetic risk. Tighten donor and sire relationship guardrails before the next flush cycle.
  • If nobody in your breeding conversation — not you, not your consultant, not your rep — can quote your herd’s inbreeding band and sire concentration, you’re flying blind on a six‑figure line item.

The industry built the original Chief/Elevation bottleneck by accident over decades. Genomics and IVF can rebuild Bell 2.0 in under ten years — quietly, across thousands of herds at once. The science to manage it is already loaded in your mating software and genomic reports. The only real question is whether your next breeding meeting starts with your herd’s inbreeding number — or with the first page of the semen catalog.

Complete references and supporting documentation are available upon request by contacting the editorial team at editor@thebullvine.com.

Learn More

The Sunday Read Dairy Professionals Don’t Skip.

Every week, thousands of producers, breeders, and industry insiders open Bullvine Weekly for genetics insights, market shifts, and profit strategies they won’t find anywhere else. One email. Five minutes. Smarter decisions all week.
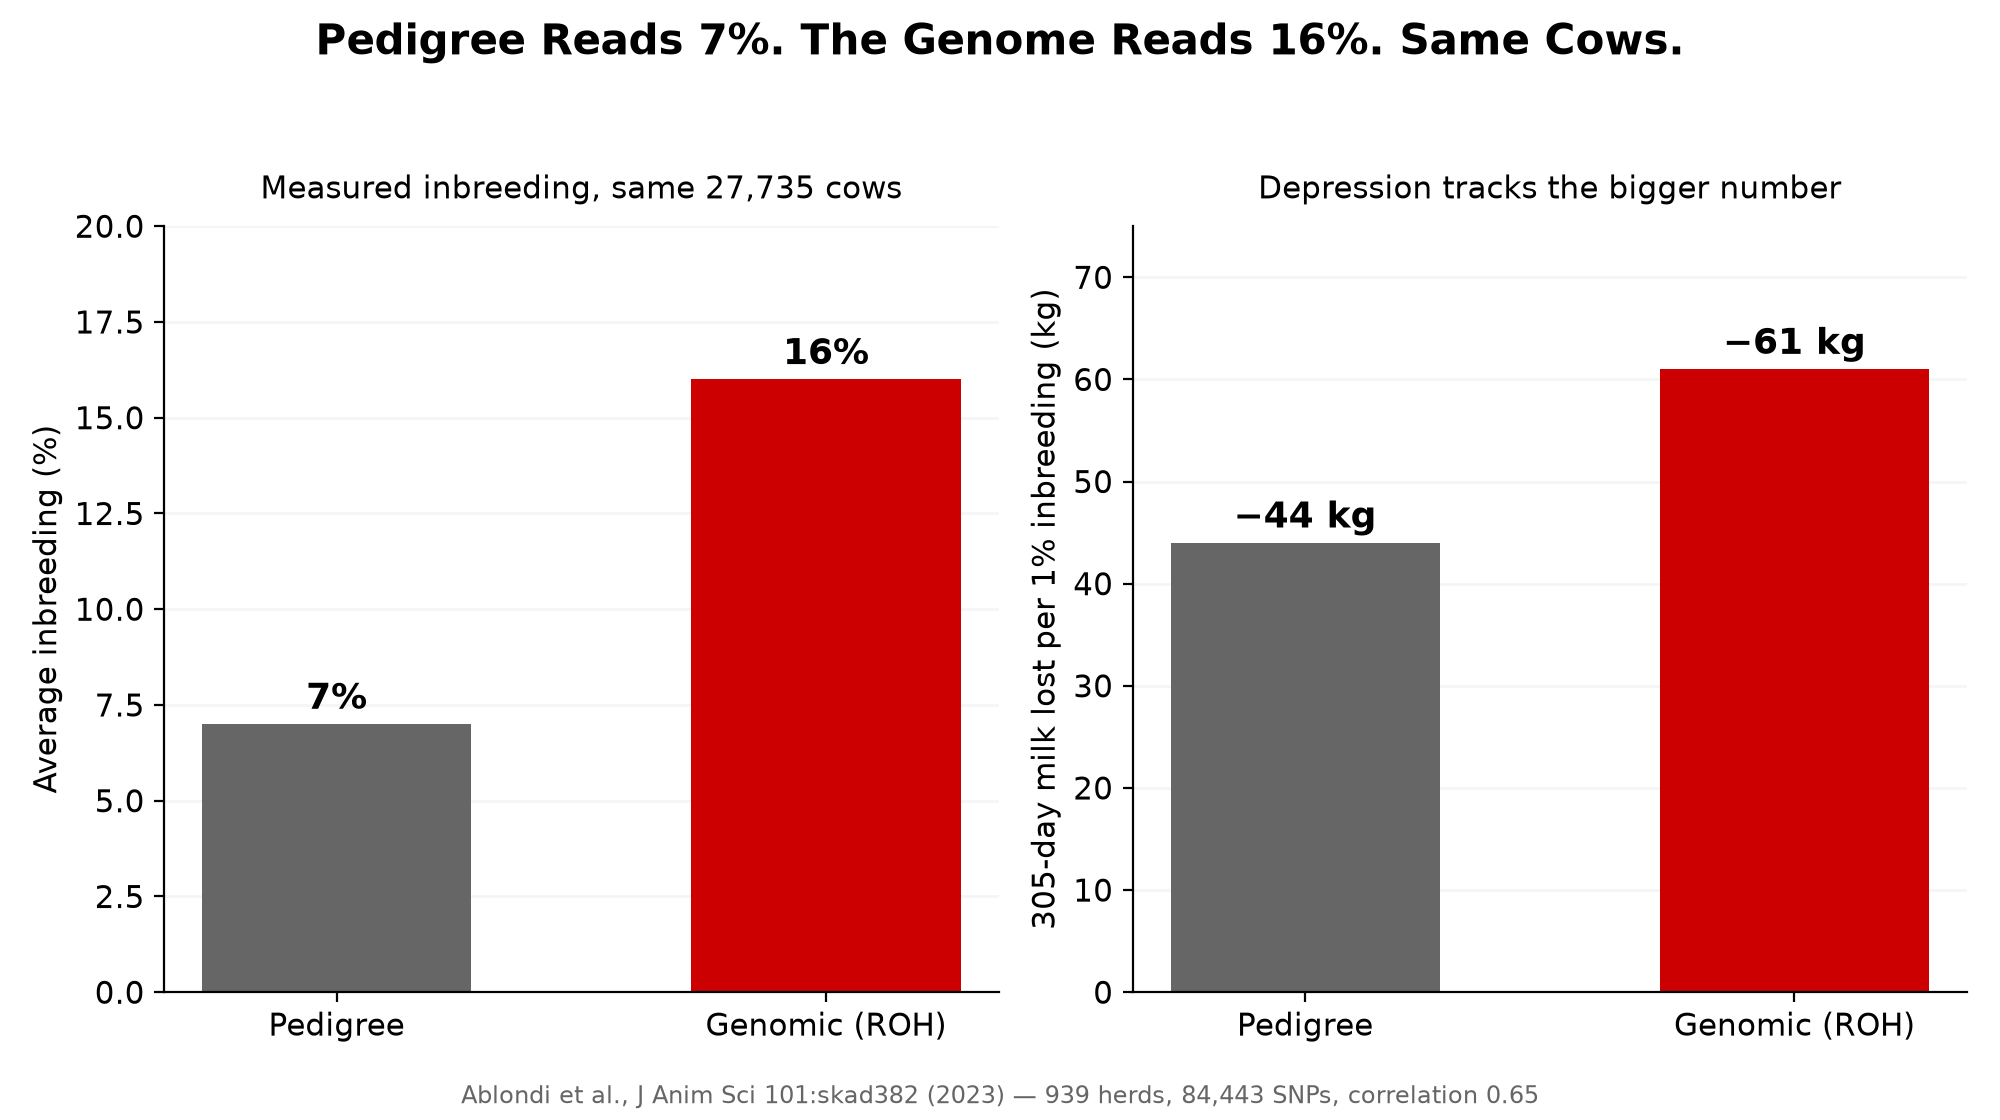
NewsSubscribe
First
Last
Consent

New Zealand Bred Years of Low-Methane Bulls. Their Daughters Didn’t Inherit a Thing.

Several hundred first-lactation daughters at Pāmu Wairakei. One full season on GreenFeed. Zero significant difference between low- and high-methane sires. The bull-proxy shortcut is done.

Executive Summary: LIC and CRV’s flagship methane breeding programme just confirmed that low-methane young bulls in New Zealand don’t pass the trait to their lactating daughters — several hundred first-lactation daughters at Pāmu Wairakei, measured one full season on GreenFeed, showed no significant difference between high- and low-emitting sires. LIC Chief Scientist Dr. Richard Spelman told Farmers Weekly (NZ) on April 30, 2026 that the trait in young bulls isn’t the same trait in a lactating cow — and the planned late-2026 NZ methane BV rollout now has to be rebuilt on lactating-cow phenotypes. The Norwegian Heringstad and Bakke paper (JDS Communications, July 2025) had already pegged the genetic correlation between bull methane and cow methane at 0.63 ± 0.22 — meaning a /straw premium across 200 services was a ,000 bet on a coin flip with the downside in your own barn. Lactanet ME (h² ~0.23, 70%+ reliability on young animals), VikingGenetics NMI (h² ~0.20, 16,000+ commercial cows), and CRV NL’s Methane Saved aren’t tarred by the result — they were built on lactating cows from day one. TPI and NM$ users have a natural shield, but private “sustainability indexes” and processor climate composites are where bull-phase numbers still hide. The single question that now separates real methane genetics from expensive guesswork: at what life stage was the reference population measured?

Lactating Holstein at GreenFeed unit during methane breeding value trial measuring per-cow emissions in first lactation

LIC Chief Scientist Dr. Richard Spelman didn’t dress it up. Speaking to Farmers Weekly (NZ) on April 30, 2026, he framed the lactation-phase result of New Zealand’s flagship methane breeding trial as a setback. The trait measured in young bulls, he told the outlet, didn’t appear to be the same trait when measured in a lactating cow.

The first-lactation daughters of LIC and CRV’s lowest-emitting young bulls had finished their measurement season at Pāmu’s Wairakei Estate, and the methane signal that had looked clean in yearling heifers was gone. Several hundred daughters. One full lactation. No significant difference between daughters of high-emitting and low-emitting sires. For breeders who’ve watched methane labels appear on sire pages since 2023, that’s the moment the bull-proxy version of the assumption broke.

The 60-Second Breakdown

  • The Goal: Measure methane in young bulls to skip the cost of phenotyping millions of milking cows.
  • The Result: Bull data didn’t match cow reality. Daughters of low-methane sires emitted no less than daughters of high-methane sires.
  • The Action: Only weight methane breeding values built on lactating-cow phenotypes. Decline anything you can’t decompose.

Why a Multi-Year Bet on Bull Methane Failed in Lactation

The New Zealand programme wasn’t a marketing exercise. It was a serious, well-funded scientific bet, built on a hypothesis that looked airtight on paper. Measure methane in young bulls cheaply, identify the lowest emitters, and push their semen across a national herd through AI — and you’d skip the brutal cost of phenotyping millions of milking cows. Lactating-cow phenotyping is structurally more expensive than bull-phase screening, which is why national programmes have rationed it carefully.

The trial cohort tells you how seriously they took it. Several hundred daughters, sired by the highest- and lowest-emitting bulls from earlier screening rounds, were measured under controlled conditions using GreenFeed methodology so feed intake and emissions could be quantified precisely. The lactation phase alone represented years of controlled measurement work on a cohort of this scale — before counting the bull screening that came earlier.

What the trial proved is uncomfortable for anyone who’s already weighted a methane number in a mating decision: the trait expressed in growing animals is not the same trait expressed in lactating cows. Per LIC’s official update on April 29, 2026 and Spelman’s comments to Farmers Weekly the following day, the cow trait sits in a different physiological space than the bull trait. The cross-stage transfer the programme was built on didn’t hold.

One caveat worth keeping front of mind. As of press, the lactation-phase result has been communicated through LIC’s official April 2026 update, statements to Farmers Weekly and Rural News Group, and the Wellington presentation. A peer-reviewed manuscript hasn’t been published yet. Sire analysts should treat the result as official communication, not yet a published paper.

What Happened When the Daughters Freshened

The yearling phase had been genuinely encouraging. Daughters of the low-methane sires were lower emitters at 8–10 months. The trait looked heritable. Transferable. Ready to commercialise. By December 2024, Dr. Lorna McNaughton was presenting milestone data at the Wellington Agricultural Climate Change Conference, and LIC was publicly describing a planned methane breeding value rollout from late 2026.

Then the daughters freshened.

Lactating cows are metabolic athletes. Dry matter intake can triple within weeks of calving, and the rumen environment they’re working with at peak lactation barely resembles the one they ran as yearlings. Take a heifer on a silage-and-grain ration with a relatively stable methanogen population, then move her onto a high-energy lactating ration and push her to 30+ litres a day. Different fermentation substrates. Different passage rates. Different methanogen archaea dominance. The genetic differences in methanogen populations or rumen morphology that distinguished a quiet yearling from a noisy one get buried under the sheer volume of fermentation needed to make milk.

Norwegian researchers Bjørg Heringstad and Katrine A. Bakke quantified the underlying problem in a July 2025 JDS Communications paper that landed almost four years after the NZ programme committed to its design. In Norwegian Red cattle, the genetic correlation between methane in young bulls and methane in lactating cows came in at 0.63 with a standard error of 0.22. Related, but not the same trait.

That number matters in a way that’s easy to miss. A correlation of 0.63 means a breeder who selected a bull two years ago expecting full methane response in his daughters is, on the expectation, capturing maybe 63 cents of every promised dollar of reduction. Factor in the standard error and the realistic range runs from roughly zero up to that 63 cents — a coin flip with a skewed downside. The NZ daughter trial landed at the bottom end of that range.

So the question stops being theoretical. If the trait you’re paying for in a young bull doesn’t fully transfer to his daughters, what does a sire catalogue page actually need to show before you weight it?

How Does a Validated Methane BV Differ From a Bull-Proxy One?

The contrast with programmes built on lactating-cow phenotypes is the part of this story that should change how you read a sire catalogue tomorrow morning.

ProgrammeReference PopulationReliabilityStatusUse in Selection?
NZ Trial (LIC / CRV)Young bulls / yearling heifers0.10Low (proxy)Failed lactation validationNo — research-grade only
Lactanet ME (Canada)MIR spectra, lactating Holsteins 120–185 DIM0.2370%+ on young animals✅ In use since Apr 2023Yes — 5–10% weighting
VikingGenetics NMISniffer data, 16,000+ lactating cows~0.20High✅ Expanded May 2026Yes — 5–10% weighting
CRV NL (Methane Saved)Residualised, lactating cow recordsPublished as RBVModerate✅ Published Aug 2025Yes — 5–10% weighting
TPI / NM$ / LPI / Pro$No direct methane componentN/AN/A✅ Natural shieldYes — no hidden bull-proxy risk

Lactanet’s Methane Efficiency RBV — a Canadian evaluation launched in April 2023 — was built from MIR milk spectra on first-lactation Holsteins between 120 and 185 days in milk. Heritability of the underlying methane prediction came in at 0.23, with genomic reliabilities for young animals reported above 70%. Lactanet has projected modest but compounding herd-level methane reductions through sustained selection on the index, with no recurring feed cost.

VikingGenetics’ Nordic Methane Index draws on automated sniffer data from over 16,000 commercial lactating cows in Denmark, Sweden, and Finland. Heritability lands around 0.20, with a projected long-term reduction of roughly 20% as the trait works through the population. CRV Netherlands published its “Methane Saved” BV in August 2025 — daily methane per cow, residualised against production, expressed as a relative breeding value. Dutch herds enrolled in CRV recording can pull a sire’s Methane Saved figure from the same evaluation system that delivers their fertility and longevity numbers.

None of these programmes carry a multi-decade track record yet, and that’s worth saying out loud. Lactanet ME has been in commercial use since April 2023. The Nordic Methane Index expanded to VikingRed and VikingJersey only in May 2026. CRV NL’s Methane Saved is nine months old. What they have is the right reference population, the right life stage, and published heritability — not a long history of audited herd-level results.

The structural difference with the NZ bull-phase work isn’t subtle. Validated lactating-cow indexes carry h² of roughly 0.20–0.23 and reliabilities above 60–70%. The NZ bull-phase work reported an early-phase heritability around 0.10. Stack a 0.10 heritability against 0.20–0.23 in the validated programmes, then run the result through an imperfect cross-stage genetic correlation, and the realistic in-herd response from a young-bull methane BV is a fraction of what a lactating-cow-built BV delivers. The NZ daughter result suggests that fraction can collapse to zero in practice.

The barn math. A breeder who paid even a $5 per-straw premium for a “low methane” young-bull index across 200 services spent $1,000 on a trait whose realistic in-herd response — based on the NZ trial — sits between zero and a modest fraction of the catalogue claim. A Canadian breeder weighting Lactanet Methane Efficiency in their selection index, by contrast, is buying into a published, evaluated trait — and avoids the kind of contract-to-cow gap that’s already shown up elsewhere in the climate genetics economy. Same selection pressure, same cost. One response is built on a validated reference population. The other isn’t.

Checklist for Your AI Rep

Before you weight any methane number on a sire page, get written answers to these three:

QuestionAcceptable AnswerRed Flag
1. Reference population life stage?“Lactating cows” — with DIM window specified“Young bulls,” “yearling heifers,” “growing animals,” or no answer
2. Published genetic correlation (r_g) between measured and lactating population?Specific published number with SE (e.g., 0.63 ± 0.22 or 1.0 if built on cows)“We assume high correlation,” vague language, or no number provided
3. Is the trait residualised — independent of milk, fat, protein?Yes, with documented residualisation methodNo residualisation; BV correlates with lower production; no documentation

A Note on Sheep, Beef, and Why Dairy Is the Outlier

Worth saying briefly, because it underlines why dairy is the harder problem: low-methane breeding still works in sheep. The Beef + Lamb New Zealand Genetics programme has measured low-methane sheep for over a decade, and the trait expresses in adult animals because measurement and production stage line up — sheep are measured at roughly the same physiological state they’re selected on. AgResearch’s beef cattle work has reported similar reasons for confidence in adult-animal measurement, though dairy is the result with the published null.

Dairy is the outlier because lactation is the outlier. Nothing else in livestock production demands the metabolic intensity of a 30-litre cow at peak. That’s the biological fact the NZ trial just made unavoidable. Per LIC’s April 29, 2026 update and supporting comments from Ag Emissions Centre Executive Director Naomi Parker to Rural News Group on May 4, 2026, the dairy programme is signalling a pivot toward measuring lactating cows directly, rather than abandoning the work.

Which Methane Number Earns a Line in Your Selection Spreadsheet?

The selection question for 2026 isn’t whether climate genetics matter. It’s which climate numbers actually deserve weight in a real mating decision.

  • Stay on profit, fertility, and feed efficiency. Use validated methane indexes only as a tie-breaker. Best for most herds in most markets. You’re not missing real genetic progress, because the validated lactating-cow indexes are already correlated with feed efficiency. Backfire risk: low.
  • Weight a validated lactating-cow index (Lactanet ME, NMI, Methane Saved) at a defensible 5–10% of your internal index, depending on confidence in your own production system’s methane phenotype. Best for herds in Canada, the Nordics, or Holland with active recording in those systems and a processor relationship that recognises the metric. Demands: discipline to keep money traits ahead of climate traits.
  • Decline any methane or “climate score” you can’t decompose. Best for herds being pitched bulls with composite sustainability scores where the supplier can’t break the number into reference population, life stage, and heritability. Backfire: you might miss a marginal real signal, but you also won’t pay for one that doesn’t express.

The U.S. and Canadian Picture: A Natural Shield, With One Catch

North American breeders selecting on TPI or NM$ in the U.S., or LPI and Pro$ in Canada, have a structural advantage in this debate that’s easy to miss. Methane isn’t currently a heavy weight in any of those base indexes. CDCB’s NM$ doesn’t carry a methane component. Holstein Association USA’s TPI doesn’t either. Lactanet’s LPI and Pro$ formulas weight production, durability, health, and fertility — Methane Efficiency is published as a separate RBV that breeders choose to layer on top, not a hidden weighting inside the headline index.

That’s a natural shield against the bull-proxy failure. A producer mating on TPI or NM$ today isn’t accidentally buying NZ-style bull-phase methane assumptions through their main index. The trap sits one layer deeper: in private-company Sustainability Indexes and processor-branded composite “climate scores” that bundle methane alongside feed efficiency, polled, and other traits. Those composites are where a bull-phase or unvalidated methane number can hide, depending on how the index is constructed. If your AI partner offers a sustainability index, ask the same three questions in the AI Rep checklist above before you weight it. If the answer is opaque, treat the composite as marketing, not selection signal.

30-day action. Pull your last 12 months of semen invoices. Mark each sire that carried any methane, sustainability, or climate label in its marketing. For each, ask the AI company in writing — was the BV built from lactating cow phenotypes or growing animals? What’s the published heritability? What’s the reliability on this bull? If you don’t get clean answers within 30 days, that’s data you can use the next time a methane premium gets pitched. NZ readers should run the same query through LIC or CRV NZ technical sales. If 90 days pass with no written answer, treat the absence as the answer.

What This Means for Your Operation

  • The single question that separates real methane genetics from expensive noise: at what life stage were the animals in the reference population measured? If the answer is young bulls or growing heifers, treat the trait as research-grade, not selection-grade.
  • Does the methane index you’re being shown have a published heritability and reliability? If not in writing, it doesn’t get a line in your selection spreadsheet.
  • Is the trait residual — independent of milk, fat, and protein? A “low methane” sire whose daughters just produce less milk isn’t solving the problem you think it’s solving.
  • If you’re entering a 2027+ carbon contract, can you point to validated lactating-cow genetics, or are you implicitly betting on the bull-based proxy approach the NZ trial just failed to validate?
  • Genetics moves at roughly 1–3% per cow per year on validated lactating-cow traits. Any contract treating a methane BV like a feed additive or digester is structuring genetics to fail an audit it was never designed to pass.
  • Feed efficiency and RFI are doing more measurable methane work in your herd today than most “climate scores.”
  • A credible NZ “version 2.0” methane BV — one built on lactating pasture cows — is several years away based on the measurement work the pivot will require. Plan accordingly.

Key Takeaways

  • If a methane BV’s reference population was measured in young bulls or yearling heifers, treat it as research-grade and don’t pay a premium. The NZ trial just spent years and a major effort proving the trait doesn’t transfer to lactation.
  • If a methane BV comes from a validated lactating-cow programme — Lactanet ME, VikingGenetics NMI, or CRV Methane Saved — it can reasonably hold a 5–10% weighting in your internal index, but only after profit, fertility, and health traits are locked in.
  • If your AI rep can’t tell you the life stage, heritability, and reliability of a methane number on a bull’s page, don’t put that number on your spreadsheet.
  • If a 2027+ carbon contract leans on genetic methane progress, ask the verifier which national evaluation system underpins the claim. Bull-phase or “composite climate score” answers are an audit risk you don’t want.
  • TPI and NM$ users have a natural shield — but private sustainability indexes are where the bull-proxy risk hides. Decompose every composite score before you weight it.

The hardest part of the New Zealand result isn’t the science. The science worked the way it’s supposed to — a plausible hypothesis, a well-designed trial, a clean negative outcome that nobody is trying to massage. The harder part is what’s still to come: a clear industry conversation with breeders who weighted those bull-phase methane numbers in mating decisions in 2023 and 2024.

So the question that lands in your barn this month isn’t whether to believe in climate genetics. It’s whether the methane number on the sire page in front of you was built from cows actually emitting methane the way your milking string emits it — or from a yearling in a research barn whose biology hadn’t yet been asked to make 30 litres a day. Which catalogue page are you about to weight?

This article draws on official LIC communications (December 2024 and April 2026), Ag Emissions Centre and DairyNZ public programme materials, peer-reviewed research from JDS Communications (July 2025), and trade-media reporting in Farmers Weekly (April 30, 2026) and Rural News Group (May 4–5, 2026). The Bullvine did not directly interview any named researcher for this piece.

Complete references and supporting documentation are available upon request by contacting the editorial team at editor@thebullvine.com.

Learn More

The Sunday Read Dairy Professionals Don’t Skip.

Every week, thousands of producers, breeders, and industry insiders open Bullvine Weekly for genetics insights, market shifts, and profit strategies they won’t find anywhere else. One email. Five minutes. Smarter decisions all week.
NewsSubscribe
First
Last
Consent

The Punjab Pivot: Why $12 Semen Is Dead in India by 2031

A senior PDFA officer called it in 2018. GADVASU signed the MOU in August 2025. By 2029, Rs 960 imported Holstein straws face Rs 200 locally proven bulls. Who modeled that?

First place at the 19th PDFA International Dairy & Agri Expo in Jagraon, February 7–9, 2026. Cows like this one are the dam pool GADVASU is drafting from — and the reason Rs 960 imported Holstein semen has a 2029 problem.

Every North American AI company still counting India as a growth market has a 2029 math problem it hasn’t solved publicly. It’s the moment local reliability meets a roughly 75% price discount. Rs 960 imported conventional semen on one side. A projected Rs 150–250 locally proven GADVASU dose on the other — The Bullvine’s projection, extrapolated from government-subsidized semen pricing and the Progressive Dairy Farmers Association of Punjab’s own 2018 “much cheaper” aspiration. GADVASU hasn’t published commercial pricing. It doesn’t need to yet.

That moment has a source document. In August 2025, PDFA signed a formal MOU with Guru Angad Dev Veterinary and Animal Sciences University — GADVASU, the Ludhiana-based agricultural university that’s been producing HF crossbred semen for years but never at commercial scale. GADVASU Vice-Chancellor JPS Gill described the objective in the language of an import substitution program, noting that high cost and irregular supply of imported semen are hindering genetic improvement at the farm level. The partnership is designed to fix that.

The Warning Shot Everyone Missed in 2018

A senior PDFA officer told ArthaImpact in 2018 exactly what would happen once the pedigree data existed. Punjab farmers, the officer said, would start selling semen to each other at much cheaper rates than the Rs 200–600 they’d been paying for imported straws since the mid-1990s. Almost nobody outside the association heard it properly.

Seven years later, that sentence reads less like an ambition and more like a timeline. The August 2025 MOU is the operational expression of the 2018 promise — elite male calves from PDFA member cows, produced into semen through GADVASU infrastructure, daughter-tested inside the same herds already winning the Jagraon Holstein show. Every structural piece the 1960s-era state programs couldn’t assemble is now in one contract.

The Death of the Export Premium

Punjab isn’t a typical Indian dairy region, and its graduation from genetics buyer to genetics seller isn’t a typical emerging market story. Milk output in the state has grown approximately 172% since 1990. Cattle population over the same period shrank 31%, per eDairy News reporting in August 2025. That arithmetic is the product of 25 years of commercial HF crossbreeding, built on imported North American semen and distributed through a private association infrastructure that operates alongside — but largely independent of — the state government AI system. Bullvine readers tracking India’s 80 million smallholder dairy base will recognize why this commercial elite lane matters so much inside a country still dominated by two-cow households.

PDFA imported its first frozen semen doses from the USA before 2010. World Wide Sires opened direct Punjab operations that year, having already moved 88,000 doses through local distributors, per Business Standard reporting in September 2010. By February 2026, ABS India and Maharashtra’s Chitale Dairy imported live Holstein bulls with TPI values exceeding 3,000 — among the highest-TPI Holstein bulls imported commercially into India on public record. ABS India currently lists bull Oscar (NAAB 29HO22333, TPI 3261, NM$ 844 per the most recent CDCB evaluation published in ABS India’s 2026 Sire Directory**)** at Rs 960 conventional and Rs 2,700 sexed. Those prices sit an order of magnitude or more above what a farmer pays for government-subsidized domestic semen — roughly 48 times for Oscar’s conventional straws and over 130 times for the sexed product versus typical Rs 20 subsidized semen.

Punjab’s commercial dairy farmers have been paying that premium willingly for a generation because the yield math worked. Until now.

How Much Does Imported Holstein Semen Actually Cost a 50-Cow Punjab Dairy?

The 2029 Math Problem is straightforward: the moment GADVASU’s first progeny-proven bulls reach commercial distribution, local reliability meets a roughly 75% price discount on conventional semen. A progressive 50-cow operation breeding 40 animals a year absorbs that shift directly on the input line.

The conventional-to-conventional savings isn’t transformational on its own. The real shift is somewhere else.

Expense CategoryCurrent (Imported)Projected (GADVASU)Savings / Impact per 50-Cow Herd
Conventional SemenRs 38,400 (@ Rs 960)Rs 8,000 (@ Rs 200)Rs 30,400/year
Sexed SemenRs 108,000 (@ Rs 2,700)Import-only through 2033Minimal near-term shift
Conception RiskHigher (U.S. proofs vs 45°C)Lower (Local daughter data)1–2 repeat services avoided
Reliability MoatU.S. CDCB infrastructureLocal PDFA member herdsLoss of import data monopoly

A TPI 3261 North American bull is evaluated for fertility on daughter records collected across U.S. commercial herds — temperate freestall environments, not 45°C Punjab heat. A GADVASU bull with daughter data generated inside PDFA member herds — same TMR formulations, same parlor routines, same ambient conditions — removes that translation risk. That’s margin that was accruing to North American genetics suppliers to begin with, and in the post-graduation market, it disappears from the value chain.

Why This Isn’t Another Government Semen Program That Won’t Scale

India has been running progeny testing programs since the 1960s. None cracked the premium commercial market, for structural reasons that have nothing to do with capability.

Government programs tested bulls from government herds, which meant the genetic ceiling was set by average-quality dams. They distributed semen through government AI networks at subsidized prices, which killed the price signal that would tell the program which bulls the market actually valued. And they struggled to generate rigorous daughter data because smallholder farmers don’t maintain structured milk recording.

The PDFA-GADVASU arrangement flips every one of those failure modes. Elite male calves will be selected from PDFA member cows — the same animals that win the Jagraon Holstein show, the ones already averaging 5,000+ litres per lactation per 2018 ArthaImpact reporting on the original PDFA pedigree plan. The PDFA has 25 years of documented farmer willingness to pay Rs 200–600 for imported premium semen, which is the demand signal telling the program what traits matter. And PDFA member farms already track yield data to justify their purchasing decisions, so the daughter records flow back into the evaluation system through commercial channels that already exist.

What remains is execution risk, not structural risk. The one worth watching: Indian progeny testing protocols require daughter records from several hundred animals per bull, distributed across multiple herds and agro-climatic zones. If PDFA’s participating farms cluster too tightly geographically, the resulting proofs could be challenged as region-specific rather than broadly applicable. That’s a known stumble point in previous Indian programs, and a real thing to monitor over the next three years.

How Fast Does Punjab’s Semen Advantage Actually Arrive?

Cattle have a roughly 9-month gestation, and a heifer reaches first calving around 24 months of age. First lactation records require another 305 days. Add the daughter-record threshold and multi-zone distribution requirement, and that sets the biological floor on how fast a proven bull can reach market. NDDB documentation describes conventional progeny testing as under a five-year cycle from calf selection to proven bull status.

Which puts the GADVASU timeline in approximate terms. Bull calf selection active now through 2026–2027. Test mating distribution 2027–2028. First daughter data and commercial proven bulls landing 2029–2031 at the earliest. Full progeny-tested domestic lineup with genomic layer operational 2032–2035.

The market compression doesn’t hit when GADVASU launches. It hits when the first Punjab-validated proven bulls arrive at roughly a fifth of imported pricing, carrying conception rate data from PDFA herds. That’s a four-to-six-year window. Whether it gets used to build the next business or to extract the last revenue from the current one depends on ownership structure — cooperatives like CRV and Semex are structured to tolerate that investment horizon, as NAAB’s record $327.6 million export year coverage makes clear about the cooperative-vs-corporate revenue divide. For publicly-traded genetics businesses answerable to quarterly reporting, in our view the organizational case is harder to build.

What Changed Between 2015 and 2025

In 2015, the Punjab government briefly proposed restricting imported semen, in a move USDA FAS reporting from August of that year framed as protecting the state AI delivery system that competed with private distributors. Ten years later, the same state government publicly backed the GADVASU genomics infrastructure underpinning the PDFA partnership.

The political economy flipped for four reasons worth studying if you’re a progressive breeder in a state that hasn’t made this transition.

Punjab’s per-cow yield gap became a government accountability problem rather than a technical observation. The national policy frame shifted toward genomics through the Rashtriya Gokul Mission, making state genetics investment a path to central matching funds rather than a standalone expense. The smallholder constituency that state semen stations were designed to serve eroded as Punjab’s dairy sector consolidated into commercial operations. And the PDFA, with a large and well-attended annual Jagraon expo and documented yield improvements across member farms, became a constituency the state government could no longer afford to work around.

That’s the playbook other Indian states will need to execute. Build the commercial network first, accumulate demonstrated results, organize the political constituency, then approach the state government for infrastructure backing. PDFA took years of steady network-building to complete that sequence. No MOU shortcuts it. Gujarat, with Amul’s cooperative scale and existing milk recording density, is the obvious candidate state to watch for the next credible replication attempt — but Amul’s smallholder orientation may cut against the elite-dam selection that makes the Punjab model work.

The Data Monopoly Is the Only Moat Left

Here’s the part most trade coverage misses. North American genetics companies aren’t just selling straws into India. They’re selling certainty — the TPI number, the NM$ number, the reliability percentage, the whole decades-long apparatus of CDCB evaluation infrastructure that makes Oscar’s TPI 3261 a credible purchase decision for a farmer 12,000 kilometres away. It’s the same data moat that underpins the broader battle for Holstein’s genetic direction in every major dairy market.

That certainty is the moat. Price was never the moat. Indian farmers have always had cheaper options; they paid Rs 960 because the data was real and the domestic equivalents weren’t.

The moment GADVASU starts generating its own certainty — Punjab-validated daughter data from PDFA herds, under local heat stress and local management — the moat evaporates. What’s left is a straw-for-straw price comparison that North American suppliers cannot win.

Which puts a question on the table that’s uncomfortable enough nobody in the industry wants to ask it out loud: are the big AI houses ready to compete on price, or are they going to keep selling U.S. daughter-proof certainty to farmers in a 45°C Punjab summer? Because those are the two options. There isn’t a third.

The 2031 Survival Checklist: Strategic Directives

Strategic Directive 1 — Commercial HF operator in Haryana, Maharashtra, or Karnataka: The replication window is approximately now through 2028. State programs launched before GADVASU’s proven bulls establish interstate market share will have a defensible position. Programs launched after 2030 will be competing against a validated Punjab reference population they can’t match on reliability. What it demands: a private farmer association with procurement scale, a university research partner willing to produce commercial semen, and elite commercial dam density sufficient for rigorous progeny testing. Chitale Dairy has the institutional capacity to anchor a Maharashtra version. Where it backfires: if your state’s smallholder-focused cooperative sector blocks the commercial elite program politically, or if your farmer base lacks the recording discipline that makes daughter data usable.

Strategic Directive 2 — Progressive breeder in UP, Rajasthan, or MP: You’ll be a buyer of Punjab genetics, not a competitor. Start positioning now to access PDFA-network semen when it reaches interstate distribution. The generational commercial HF adoption lag in these states isn’t closable on a useful timeline. This month, pull your last two lactation records and benchmark your top 10% cows against published GADVASU or NDRI crossbred HF performance data. If your best cows sit where Punjab’s middle tier sat five years ago, you’re buying Punjab genetics in 2030, not building your own.

Strategic Directive 3 — Importer of premium North American semen today: Conventional imported semen at Rs 960 is the product category most exposed to domestic substitution once GADVASU’s proven bulls reach market. Sexed semen at Rs 2,700 holds longer because the flow cytometry technology doesn’t get domestically replicated on the same timeline. Shift your import mix toward sexed product and genomic-tested young bulls with defensible Indian-condition fertility data. The elite operation running 200+ cows will always have a reason to access the top 1% of global genetics. On the pricing and quality trajectory this article describes, the case for bulk-purchasing commodity conventional imports starts to erode around 2031.

Strategic Directive 4 — ABS, CRV, Semex, ST Genetics strategist: Each of these companies operates comparable international genomic evaluation, embryo, and sexed semen programs globally. The India-specific question is how quickly the local entity activates those capabilities for Punjab-network farms. If you don’t have a local progeny or genomic partner anchored inside India by 2027, the 2029–2031 compression window will arrive with your leverage already gone. At that point, the options narrow to pricing the conventional product at domestic parity, retreating to sexed and embryo specialty, or shifting the growth narrative to the next emerging market.

A realistic caveat before you plan around this timeline. The scenario above assumes GADVASU executes on the MOU at the pace PDFA needs. Previous Indian progeny testing programs have stumbled on exactly this point. If execution slips three years, the compression window moves with it — but it doesn’t close.

What This Means for Your Operation

  • Are your replacement heifers being bred to genetics that will still command a premium in 2031, or are you paying import prices for a product category about to see domestic substitution pressure?
  • If your state has elite commercial HF herds but no PDFA equivalent, who in your region is positioned to organize one — and what’s your role in that conversation?
  • Does your current farm recording system generate data rigorous enough to contribute to a regional genomic reference population if one gets built?
  • For breeders outside Punjab: have you mapped which imported bulls are producing the best daughters under your specific management conditions, or are you buying on catalog TPI alone?
  • Is your sexed semen penetration where it should be given the shifting economics of conventional product?
  • The genetic distance between your top-tier cows and your commercial middle — wider or narrower than five years ago? That ratio determines your exposure to market-leveling genetics arriving at low prices.
  • If you’re an AI distributor or dealer in India, what does your 2031 revenue model actually look like, and have you pressure-tested it against a scenario where Punjab-proven semen is commercially available at Rs 200 per dose?

Key Takeaways

  • If you’re commercially breeding HF crossbreds outside Punjab and your state has no PDFA equivalent in motion by 2028, you’re positioned as a genetics customer — not a producer — through at least 2040. Plan your sourcing relationships accordingly.
  • If your operation currently pays Rs 900+ per conventional imported straw, assume that product category will face meaningful domestic substitution pressure by 2031. Migrate your premium spend toward sexed semen and genomic-tested young sires in the next 24 months.
  • If you’re a genetics company with India exposure, the 2026–2028 window is the one where pricing leverage and data-relationship leverage are still on your side. After GADVASU’s first proven bulls land, both compress in the same direction.
  • If you’re evaluating a state-level genetics program in Haryana, Maharashtra, or Karnataka, the non-negotiable variables are elite commercial dam density, a university production partner, and structured daughter-recording discipline. Missing any one and the program produces interesting research, not commercial competition.

The Question Sitting in Your Parlor

The comfortable read on Punjab’s story is that it’s an outlier — specific conditions, specific institutional history, not replicable in your state or your operation. That read is half-true and half-excuse. The generational lag in HF commercial crossbreeding is real biology. The PDFA network’s years of social infrastructure aren’t instantiated by decree. Those barriers are genuine.

But the policy lever that could compress the replication timeline from fifteen years to seven exists, and it’s not expensive. A national HF crossbred genomic reference population — tens of thousands of genotyped daughters across multiple states, linked to NDDB’s existing milk recording infrastructure — would make genomic pre-selection viable everywhere commercial dairy farms exist. The cost is a rounding error in the current national genetics budget. The decision to build it hasn’t been made because the political constituency organized around it hasn’t been assembled.

So the question for readers outside Punjab isn’t whether the graduation is coming. It’s whether your state’s commercial dairy sector — and your own barn within it — will be a supplier or a customer when it arrives.

Complete references and supporting documentation are available upon request by contacting the editorial team at editor@thebullvine.com.

Learn More

The Sunday Read Dairy Professionals Don’t Skip.

Every week, thousands of producers, breeders, and industry insiders open Bullvine Weekly for genetics insights, market shifts, and profit strategies they won’t find anywhere else. One email. Five minutes. Smarter decisions all week.
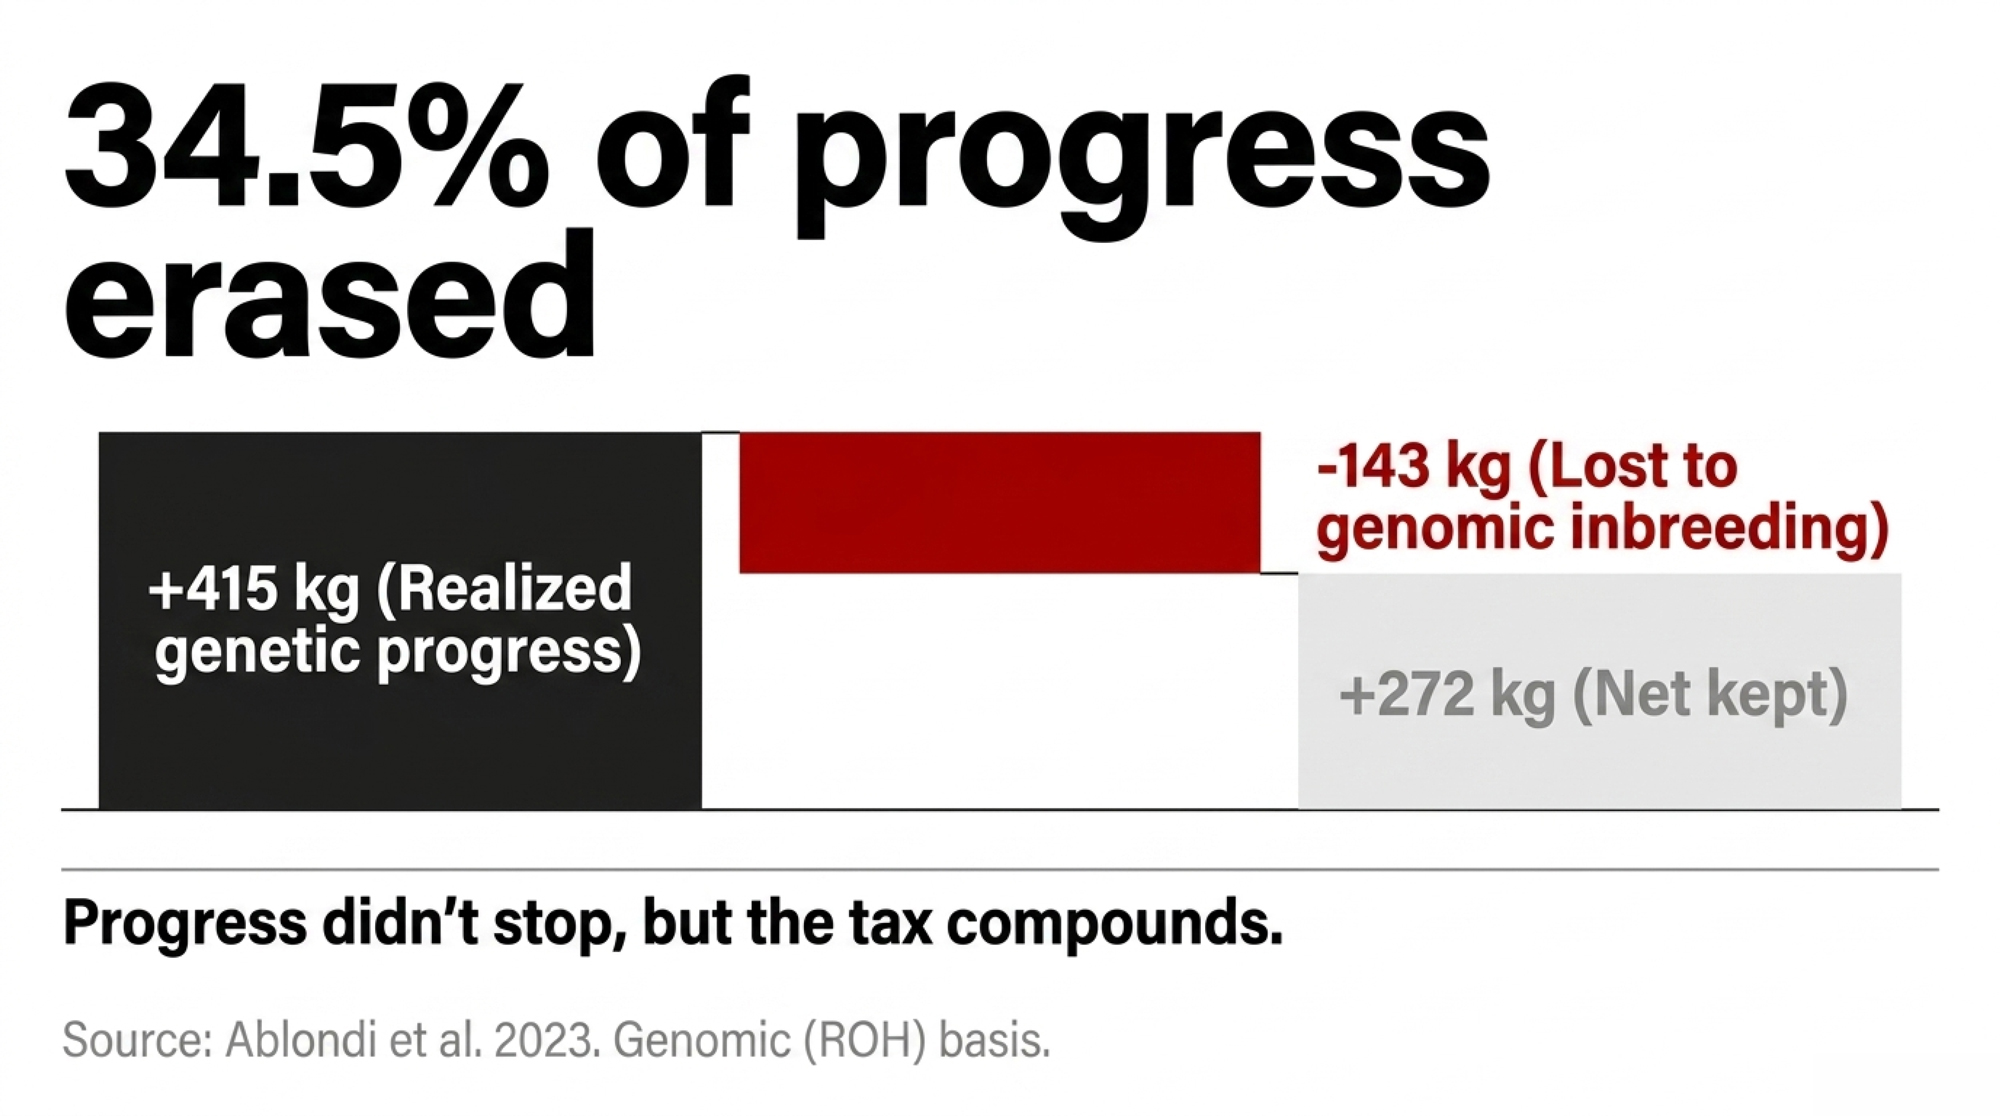
NewsSubscribe
First
Last
Consent

The $45 Holstein Genomic Test: Three Blind Spots CDCB’s April Reset Missed

April’s CDCB reset moved every Holstein PTA in your inbox. It didn’t touch the three things the $45 chip was never built to see — and one of them quietly prices every embryo you sell.

Executive Summary: CDCB’s April 2025 base change reset every Holstein PTA in your inbox, but it left three structural limits of the $45 SNP chip untouched — mitochondrial DNA, copy number variations, and Mendelian sampling. None of them show up on a commercial genomic report, and all three are quietly costing capital on heifer pens and embryo sales right now. On a 200-cow herd raising 60 replacements at Penn State’s $2,400 cost-to-first-calving, just five miscalls a year on a trait your test doesn’t actually predict is $12,000 gone — $60,000 over five years, before opportunity cost. The fix isn’t more testing; it’s Path 3, a 30-day CORREL audit matching your last two years of genomic scores to classification and 305ME records, with farm-level thresholds of ≥0.40 (trust it), 0.25–0.40 (hedge), and ≤0.25 (stop weighting). Peer-reviewed work (Wiggans et al., 2017; Kadri et al., 2014; Schutz et al., 1994) backs every limit — and a 660-kb deletion carried at 13–23% in Nordic Red is the cautionary tale Holsteins haven’t fully reckoned with. Where genomics still wins unambiguously: parentage, recessive carriers, haplotypes, and inbreeding control. Everywhere else, the breeders pricing the cow family separately from the composite index are the ones still getting paid.

Holstein genomic testing

April 2025 quietly reset U.S. dairy genetics. CDCB’s scheduled April update re-anchored Holstein production PTAs to a refreshed reference base. Every breeder’s index landed in the inbox reading differently than it had in January. No cow on the ground changed. The yardstick did.

For a commercial breeder running a cull sheet, that’s an annoyance. For a seedstock operation selling embryos, marketing young sires, or pricing flush pregnancies on composite index, it’s something else.

“The number you paid $45 a head to generate is a model output — not a measurement.”

And that model gets rebuilt on a schedule nobody in your barn controls. The April 2025 recalibration is at least visible. It lands in your inbox. The three structural limits this article is actually about don’t.

Blind SpotWhat It IsWhy the Chip Misses ItReal-World CostFix
Mitochondrial DNAMaternal genome, passed intact dam-to-daughter, no recombinationSNP chips scan nuclear DNA only; mtDNA is a separate genome entirelyProven cow families carry a production signal buyers pay a premium for — the index can’t price itPrice cow families separately from composite index; don’t treat two embryo lots as interchangeable
Copy Number Variations (CNVs)Deletions or duplications of whole DNA chunks during meiosisFlanking SNP markers stay intact; the chip reads “marker present” even when the gene is goneNordic Red: 660-kb deletion at 13–23% frequency dragged fertility down for years before discovery (Kadri et al., 2014)Run herd-level correlation audits; investigate structural variants when phenotype consistently diverges from index prediction
Mendelian Sampling VarianceThe random 50% each calf actually inherits from each parentModels predict average transmission, not which half was drawn; genomic models capture only a fraction of this varianceTwo full sisters from same elite flush can draw very different genetic hands — test can’t tell you whichUse genomics to flag the bottom quartile; walk the pens and use maternal-line depth for the middle 60%

The “Base Change” Illusion

Before the critique, the credit. Genomic testing has genuinely changed dairy breeding. Since USDA’s AIPL rolled out official U.S. genomic evaluations in January 2009, and CDCB took over in 2013, Holstein genetic gain has accelerated substantially. Sire-path generation intervals fell from roughly seven years to under three, with annual gains across yield and health picking up sharply (García-Ruiz et al., 2016). Breeders who built reputations in the 1980s and 1990s on eight-year sire turnaround are watching the same genetic ground covered in under half the time.

That part isn’t in dispute. What’s less discussed — in producer conversations, in industry press, in day-to-day mating decisions — are three structural limits built into the tool itself. They’re not defects. They’re properties of how SNP-based testing works. And they’re the reason the breeders with the deepest cow families, the ones still moving flush daughters into sale rings at premiums the composite can’t explain, don’t treat the $45 report as gospel. They treat it as one input out of three.

Is it a $45 insurance policy or a $45 gamble? Honestly, that depends on what traits you’re weighting on your cull sheet — and whether the test is actually predicting them in your herd. Most breeders have never checked.

What the SNP Chip Sees vs. What It Misses

What the $45 SNP chip capturesWhat it doesn’t
Single-letter nuclear DNA changes across ~60–80k markersMitochondrial DNA (the maternal genome, in full)
Parentage verificationStructural variants — deletions, duplications, CNVs
Recessive carrier status (haplotypes, BLAD, CVM, HH1–HH6)Which specific 50% a calf actually inherited
Inbreeding estimates via genomic relatednessIndividual Mendelian sampling variance for polygenic traits
Predicted transmitting abilities for published traitsTrait performance your herd actually delivers on those same animals

That right-hand column is the whole article.

Limit 1 — The Mitochondrial “Mother-Lode”

The first blind spot sits inside every cow in your barn and has never shown up on a commercial genomic report. It’s mitochondrial DNA — the maternal genome passed intact from dam to daughter to granddaughter. No recombination. No shuffling. No sire-side contribution.

Every commercial test on the market scans nuclear DNA. None measure mtDNA. The foundational work by Schutz et al. (1994) established that cytoplasmic line effects account for a measurable share of production variance in dairy cattle. Magnitudes vary by study, population, and trait. But the signal is real, repeatable, and outside the scope of SNP-based commercial testing. For anyone watching the pedigree world shift toward genomic superstars with thin maternal records, it’s part of the hidden economics of proven maternal lines the index can’t price.

Here’s where it walks into a mating decision you’re already making. Two embryo lots. Same sire. Identical gTPI. One donor comes from a four-generation proven maternal line — classified daughters at every step, documented production, health records that hold up. The other is a two-year-old genomic superstar with no daughters on the ground yet.

On paper, those embryos are interchangeable. They aren’t. You’re buying two different mitochondrial genomes, and every female descendant will carry that maternal lineage unchanged, forever. You can upgrade nuclear DNA every generation. You can’t breed the mtDNA out.

Think of the nuclear genome as the blueprints for the car — the engine size, the leather seats, the aerodynamics. The mitochondrial DNA is the quality of the fuel in the tank. The $45 test tells you that you’ve built a Ferrari. But if the maternal line has “low-octane” mitochondria, that Ferrari is going to underperform what the blueprints suggested. The breeders who stick to proven cow families are essentially ensuring they have a high-octane fuel supply that the genomic report isn’t even checking for.

The old-school breeders who kept flushing inside proven cow families weren’t being sentimental. They were capturing a signal the $45 test can’t see. The ones who held on to that practice while everyone else chased the newest genomic top-list are — quietly, one sale at a time — still getting paid for it.

Limit 2 — The CNV Ghost in the Machine

The second blind spot is copy number variation — and it produced one of the most documented breeding disasters in recent European dairy genetics.

SNP chips are built to detect single-letter changes in DNA. They aren’t built to see when an entire chunk of DNA has been deleted or duplicated during meiosis. When that happens inside a CNV region, the flanking markers often stay put. The test still reports “marker present.” The functional gene it was supposed to tag? Gone.

In Nordic Red cattle, researchers fine-mapping a major fertility QTL found the real culprit wasn’t a SNP — it was a 660-kb deletion on chromosome 12 that caused embryonic lethality when two carriers were mated. The deletion carried at high frequency across Nordic Red populations — roughly 13–23% of animals in some Finnish, Swedish, and Danish Red subpopulations (Kadri et al., 2014). It stayed there precisely because it was linked to markers that boosted milk yield. Selection dragged it along for the ride.

Same structural mechanics are silently taxing Holsteins today. CNV discovery work in Holsteins by Bickhart et al. (2012, and follow-on studies) has identified structural variants linked to production and health traits that standard SNP-based evaluation doesn’t fully capture. That’s before you get to the known Holstein haplotypes (HH1–HH6, HCD) that CDCB does track — which are themselves a reminder that structural and haplotype-level effects have a documented history of riding hidden inside elite pedigrees until somebody goes looking.

Picture a Nordic Red breeder in 2013, running genomic evaluations, watching conception rates erode, blaming synch protocols, heat stress, the AI tech. The answer was sitting in a structural variant the SNP chip wasn’t designed to find. If your Holstein herd has chronic hoof issues or a fertility slump that doesn’t line up with what the health indexes predicted, there’s a reasonable chance part of that gap lives in structural variation the chip can’t resolve either.

Limit 3 — The Mendelian Roulette

The third piece is the one breeders running flush programs have been complaining about for thirty years — and now have a mechanistic explanation for.

A calf inherits 50% of her DNA from each parent, but which 50% is random. For single-gene traits like polled, red factor, kappa-casein, or recessive defects, this is manageable. For polygenic traits like udder composite, feet and legs, or fertility, it’s the largest single source of individual prediction error.

Current genomic models capture only a fraction of that variance. Gains from more sophisticated methods like single-step GBLUP remain incremental for individual Mendelian sampling prediction (Mrode, 2014). The rest is noise you can’t model away.

Two full sisters from the same elite flush, with similar composite indexes, can draw very different genetic hands. The test can’t reliably tell you which drew well and which didn’t — and that matters most in the middle 60% of a heifer crop, where most keep-or-cull decisions actually live. Any breeder who’s flushed a cow twice and watched one calf become a dam of merit while her full sister never classified above GP has been living inside this reality for a career.

Can You Actually Trust the Rank?

Every genomic index is a model output. Every evaluation cycle, the reference population grows, trait weightings get revisited, and the base population resets on CDCB’s routine rotation. The April 2025 base change updated Holstein production PTAs to reflect the new reference base and revisited Net Merit $ as part of the ongoing formula review (CDCB, “Evaluation Changes, April 2025”). A breeder comparing an old index score to a current animal is comparing against a moving reference.

For young genomic bulls, peer-reviewed research has repeatedly documented meaningful re-ranking between initial genomic evaluation and daughter-proven status. Wiggans et al. (2017), reviewing the USDA genomic selection experience, documented that a measurable share of top-quintile genomic bulls drop out of the top quintile once daughter data lands. That’s not a criticism of the tool. It’s a property of predicting complex traits from limited information.

The bull that tops the April proof run is rarely the same bull that tops the December proof. If your mating plan only works when your top three sires all hold through their daughter-proven runs, your strategy has a timing problem the genomics didn’t cause but can’t fix either.

What Does This Cost on a Real Heifer Pen?

Published heifer-rearing-cost estimates from Penn State Extension put total cost to first calving in the range of $2,200–$2,600, with OMAFRA reference budgets tracking similarly. Assume $2,400 for a round-number illustration.

You run 200 cows. You raise roughly 60 replacements a year. If even five heifers a year get kept or cut on a low-reliability trait signal that isn’t actually predictive in your herd, that’s ,000 in capital tied to animals the test couldn’t validate for the trait you weighted most heavily. Over five years, straight-line, that’s $60,000 — before the opportunity cost of the better replacements you didn’t keep.

The scenario is illustrative, not prescriptive. Your rearing cost, replacement rate, and miss rate will differ. The point is the order of magnitude. For a seedstock operation selling embryos and pregnancies, the same logic runs on embryo pricing instead of rearing cost, with the miss rate showing up at the sale instead of the parlour. Different columns. Same math.

What Top Breeders Are Actually Doing

Producers are handling this three ways right now. Each works in some situations and fails in others.

Path 1: Trust the CompositePath 2: Genomics + Phenotype + Maternal LinePath 3: CORREL Audit First
Best forCommercial operations prioritizing speedPedigree operations, ET programs, seedstockAny operation before next cull round
SpeedFastSlowOne-time 30-day investment
Works best at…Extreme top & bottom of heifer cropMiddle 60% of the cropValidating which traits to trust in your own herd
Fails when…Confidence intervals overlap in the middle 60%Requires strong records infrastructureData gaps exist (no DHI, no classification)
Capital riskHigh — miscalls invisible until phenotype showsLow — family depth catches what the chip missesLow — reveals chip blind spots before capital is committed
Captures mtDNA signal?❌ No✅ YesPartial — flags divergence
Genomics rolePrimary decision toolFilter only — flags clear bottomValidation benchmark

Path 1 — Trust the composite, cull by rank. Fast, simple, defensible. Works reasonably well at the extreme top and bottom of a heifer crop, where signals converge. Fails in the middle 60%, where confidence intervals overlap. Best fit: commercial operations prioritizing speed over precision. The limit: you’ll misallocate capital on individual animals more often than the rank order suggests — and you won’t know which ones because you stopped tracking.

Path 2 — Layer genomics with phenotype and maternal-line depth. Use genomic scores to flag the bottom quartile. Walk the pens for the rest. Retain animals whose dam families have proven themselves across multiple generations — not just those with the flashiest single-generation index. Weight classification and production history alongside the number, especially for the middle of the crop. Slower, more judgment-intensive, but captures the mtDNA and maternal-line signal the test can’t see. Best fit: pedigree-focused operations, ET programs, and anyone marketing breeding stock where a buyer pays a premium for documented depth.

The breeders running Path 2 aren’t rejecting genomics. They’re using it to filter, not to decide. They trust the chip to flag what it does well — recessive carriers, parentage, the clear bottom of a heifer crop — and they trust their eyes, their records, and four generations of maternal-line data for everything the chip can’t see.

🔧 THE 30-DAY AUDIT: Path 3 — Run Your Own Herd Correlation

The single highest-leverage move any breeder can make this month.

You already own the data. It’s sitting in your DHI reports, classification files, and original genomic panels. Here’s the protocol:

  1. Pull your last two years of genomic test reports (trait-level scores, not just composite).
  2. Pull first-lactation classification scores and 305ME production records for those same animals.
  3. Match them in a spreadsheet — one row per animal, columns for predicted and actual.
  4. Run Excel’s CORREL function on each trait individually.

Read the result as a farm-level rule of thumb — not a formal statistical cutoff:

CORREL ResultSignal StrengthWhat It MeansCulling ActionMating Action
≥ 0.40✅ StrongTest is predicting this trait in your herdWeight heavily in keep/cull decisionsInclude in mating software at full reliability
0.25 – 0.40⚠️ MarginalUseful but not decisive; confirm with phenotypeUse as a tiebreaker, not a primary cut signalWeight at 50%; layer with classification and dam record
≤ 0.25🔴 WeakBarely better than guessing for your geneticsStop weighting this trait on your cull sheetRemove from mating formula; use family data instead
  • ≥ 0.40 → The test is giving you real signal in your herd. Weight it.
  • 0.25 – 0.40 → Treat the test as one input among several. Confirm with phenotype.
  • ≤ 0.25 → Barely better than guessing. Stop weighting this trait.

These are decision-support heuristics; your genetics advisor can help with borderline traits. Path 3 doesn’t replace Paths 1 or 2 — it tells you which of them to use for which trait.

What This Means for Your Operation

  • If you breed for a sale or a show ring, maternal-line depth carries a value your composite index doesn’t price. The mtDNA your cows carry doesn’t appear on any commercial genomic report. Buyers who know that pay for the cow family.
  • If your young-sire strategy depends on April’s top-five bulls still being top-ten in December, it’s a timing strategy, not a genetic one. Peer-reviewed work consistently shows meaningful re-ranking. Build your plan assuming your top sires will move.
  • If you classified, production-tested, and genomic-tested the same animals, you already own the data to validate your tool. Herd-specific correlation tells you which traits to trust, hedge, or stop weighting.
  • If your herd has a chronic problem — hoof breakdown, fertility drop, udder failure — that doesn’t line up with what the indexes predicted, assume a structural or maternal-line signal the chip can’t see is part of the gap. More testing won’t fix it. Different data will.
  • If you’re pricing embryos on composite index alone, you’re selling against the buyers who value depth and undercutting yourself against the buyers who don’t know the difference. Price the cow family separately.
  • If you’ve been tempted to drop DHI or classification to save money, run the math before you do. Every genomic prediction depends on phenotype from operations that keep recording. Drop out of the feedback loop, you degrade the tool you’re paying for.
  • Where genomics still wins, unambiguously: parentage verification, recessive carrier status, haplotype management, and inbreeding control. Lean on it aggressively there. Be more cautious with individual rankings on low-heritability traits.

Key Takeaways

  • If you haven’t matched your last two years of genomic scores to your classification and 305ME records, do it this month. One afternoon with a spreadsheet tells you which traits the test is actually predicting — before your next cull round.
  • If you’re not already archiving trait-level genomic scores at time of testing, start today. Base changes like April 2025 will otherwise obscure your validation work 18 months from now.
  • If you weight udder composite and milk yield equally on your cull sheet, but one has substantially lower published reliability in CDCB tables, you’re weighting a weaker signal as if it were stronger. Reweight.
  • If you’re pricing embryos primarily on composite, and one donor comes from a four-generation proven maternal line and the other doesn’t, the proven line is worth a premium the test price doesn’t capture. Ask about maternal line depth, not just gTPI.

The Cow Family Still Matters

Here’s the one to sit with before your next cull round or flush plan. If you matched your last two crops of genomic scores to the cows those heifers became, which traits would surprise you, and which decisions would you make differently next time?

The breeders who’ll be ahead in five years aren’t the ones buying the densest chip or chasing the flashiest flush. They’re the ones who figured out — quietly, one heifer crop at a time — which traits their genomic tool actually predicts for their genetics, and which ones it doesn’t. That knowledge isn’t on the test report. It’s on a spreadsheet they built themselves, alongside a pedigree they’ve been curating since long before genomics arrived.

Run Your Numbers

Genomic Testing ROI Calculator — Stop guessing whether your $45-per-head investment is actually paying off. This tool puts a dollar value on your testing strategy, revealing the real-world ROI of your heifer culling decisions and flagging exactly where low-reliability traits are draining your capital.

Complete references and supporting documentation are available upon request by contacting the editorial team at editor@thebullvine.com.

Learn More

The Sunday Read Dairy Professionals Don’t Skip.

Every week, thousands of producers, breeders, and industry insiders open Bullvine Weekly for genetics insights, market shifts, and profit strategies they won’t find anywhere else. One email. Five minutes. Smarter decisions all week.
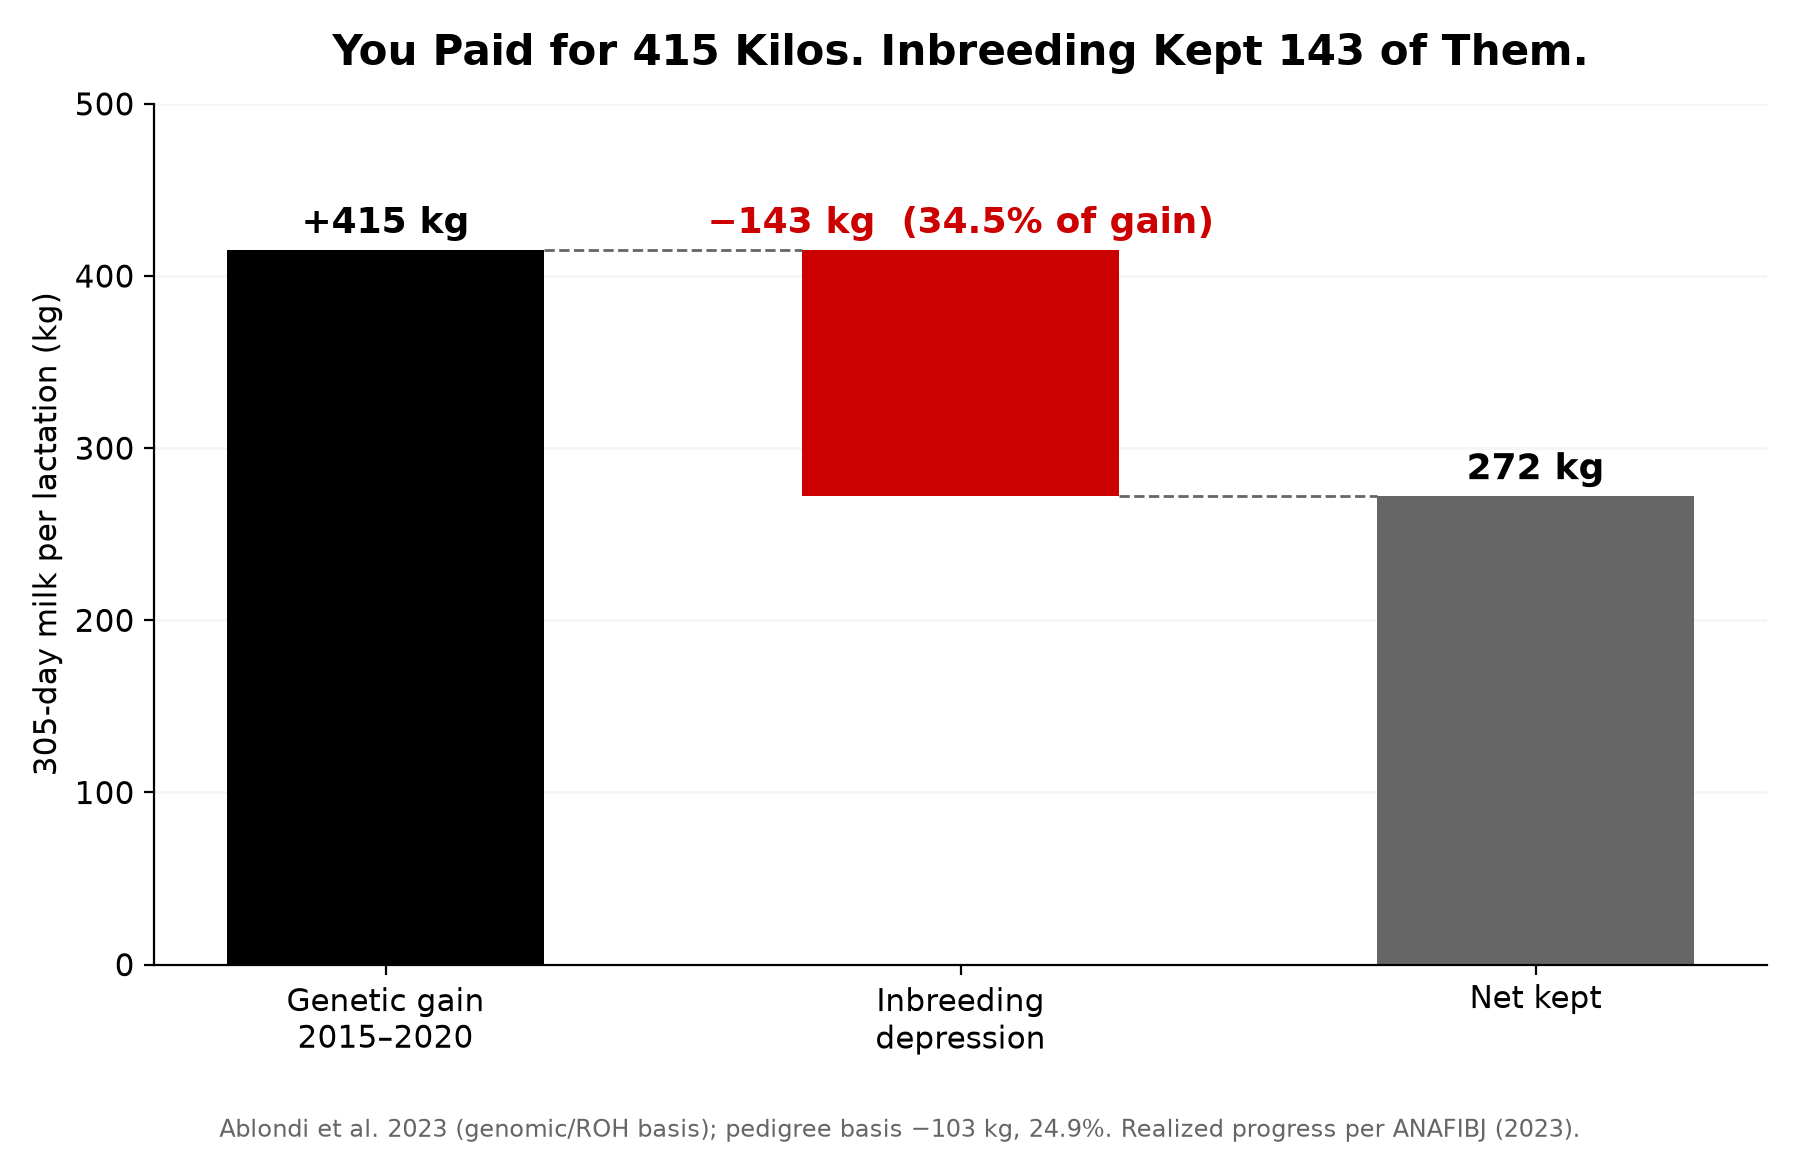
NewsSubscribe
First
Last
Consent
Send this to a friend