










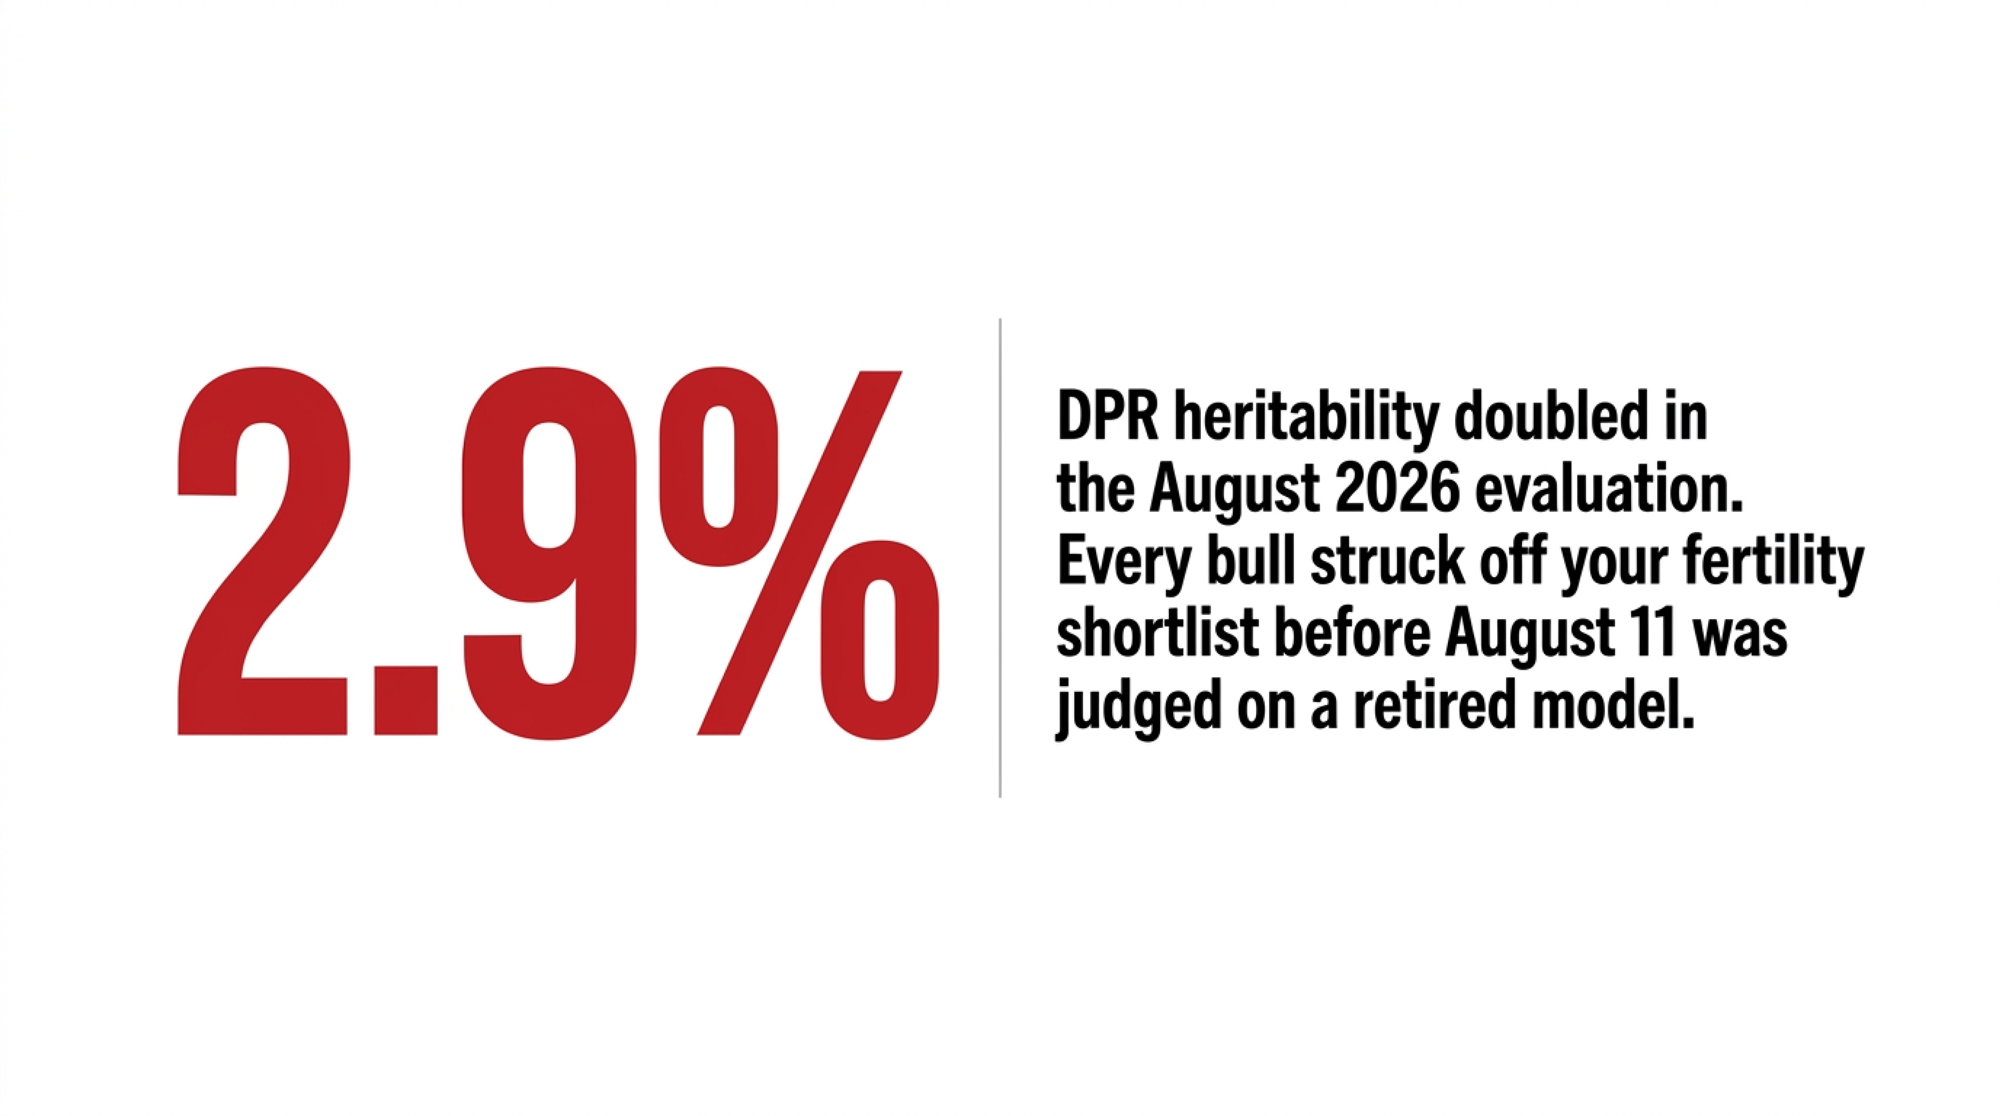
Every bull struck off a fertility shortlist before August 11 was judged on a model CDCB has now retired — and on a heritability half its current value.
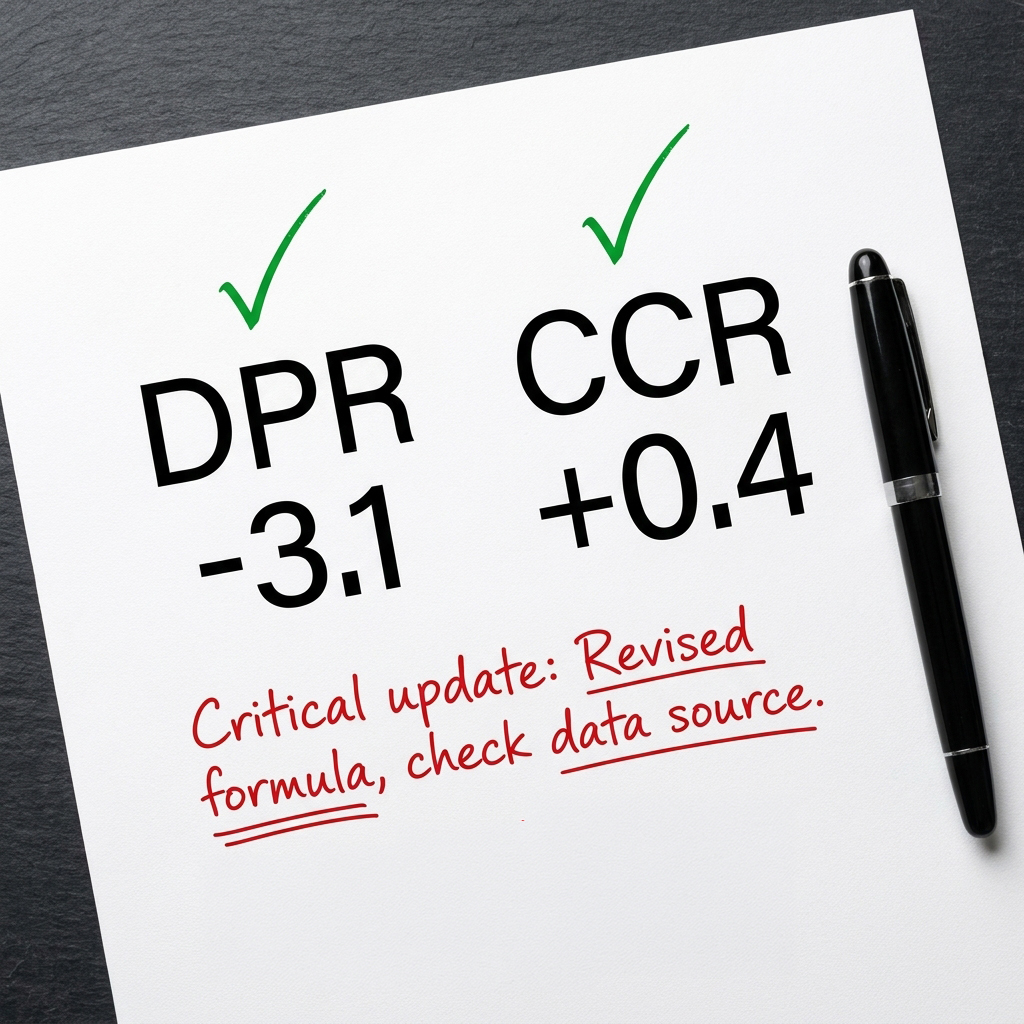
Executive Summary: MR T-SPRUCE FRAZZ LIONEL-ET (007HO14454) reads -3.1 DPR against +0.4 CCR on CDCB’s August 2026 run, both at 99% reliability, and the two figures measure different things rather than contradicting each other. August’s rebuild lifted DPR heritability from 1.4% to 2.9%. Bullvine’s calculation goes further: his published Fertility Index of -0.5 computes to -1.56 under Holstein Association USA’s pre-August-2024 weights — about a point of index from a committee vote, on identical daughter data. His fertility PTAs rest on 17,368 daughters, not the 30,490 behind his milk proof.
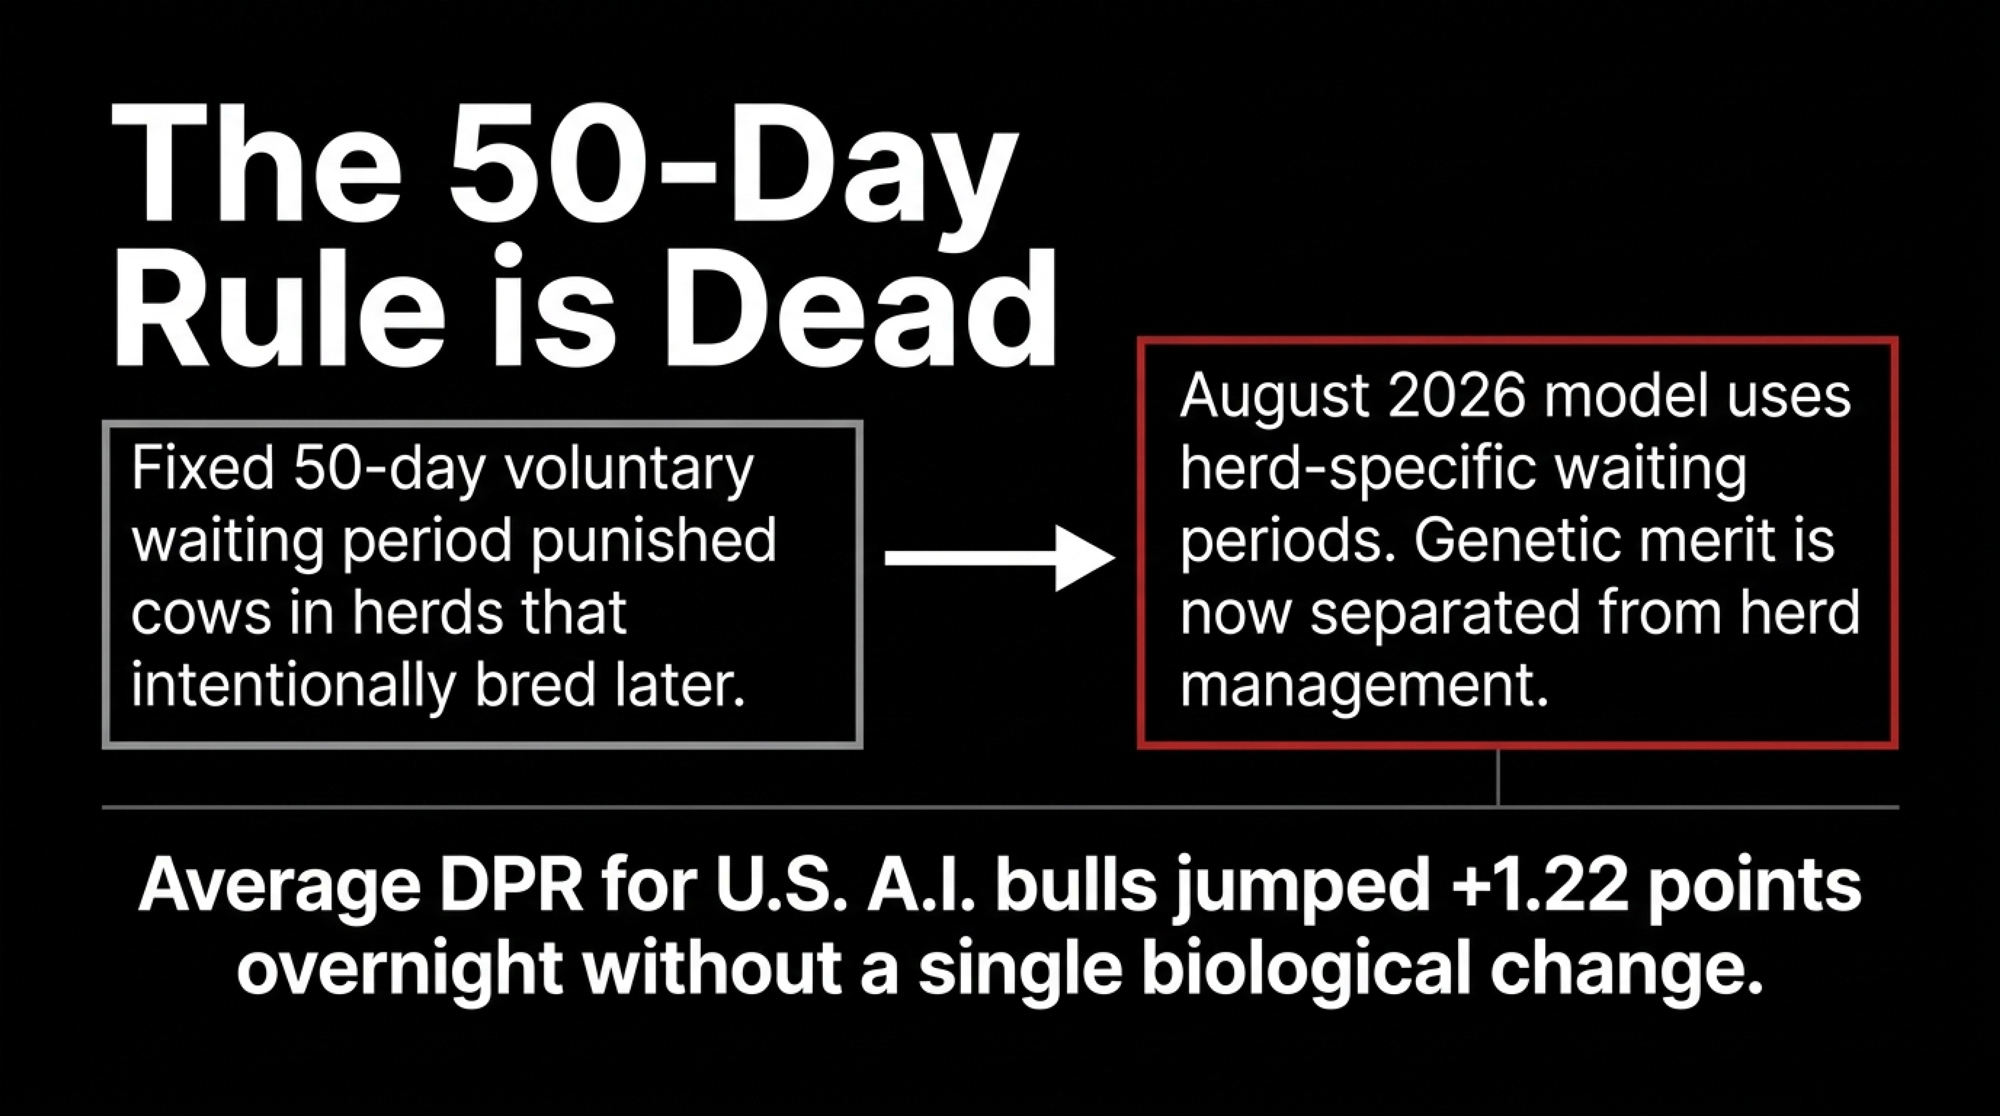
On the August 2026 run, released August 11, CDCB rebuilt every reproductive trait in the U.S. national evaluation. For U.S. Holstein bulls holding April 2026 A.I. status, average Daughter Pregnancy Rate moved +1.22 points in a single run, and nothing biological happened to a single one of them in those four months.
The other three revised traits moved too:
- Average Cow Conception Rate rose +1.38
- Average Heifer Conception Rate slipped -0.14
- Average Early First Calving shifted -0.27 days
Those figures cover that specific population of bulls, not every Holstein in the herdbook.
A claim has been circulating that fertility PTAs have become unreadable, built on a bull quoted at -4.4 DPR against just -0.3 CCR. We can’t source that claim to a named account or a dated post, so we aren’t treating it as evidence — but the numbers in it don’t match any official run we could locate, and neither do older distributor sheets. They disagree in different directions. We’re reporting that as a gap rather than guessing at how it happened.
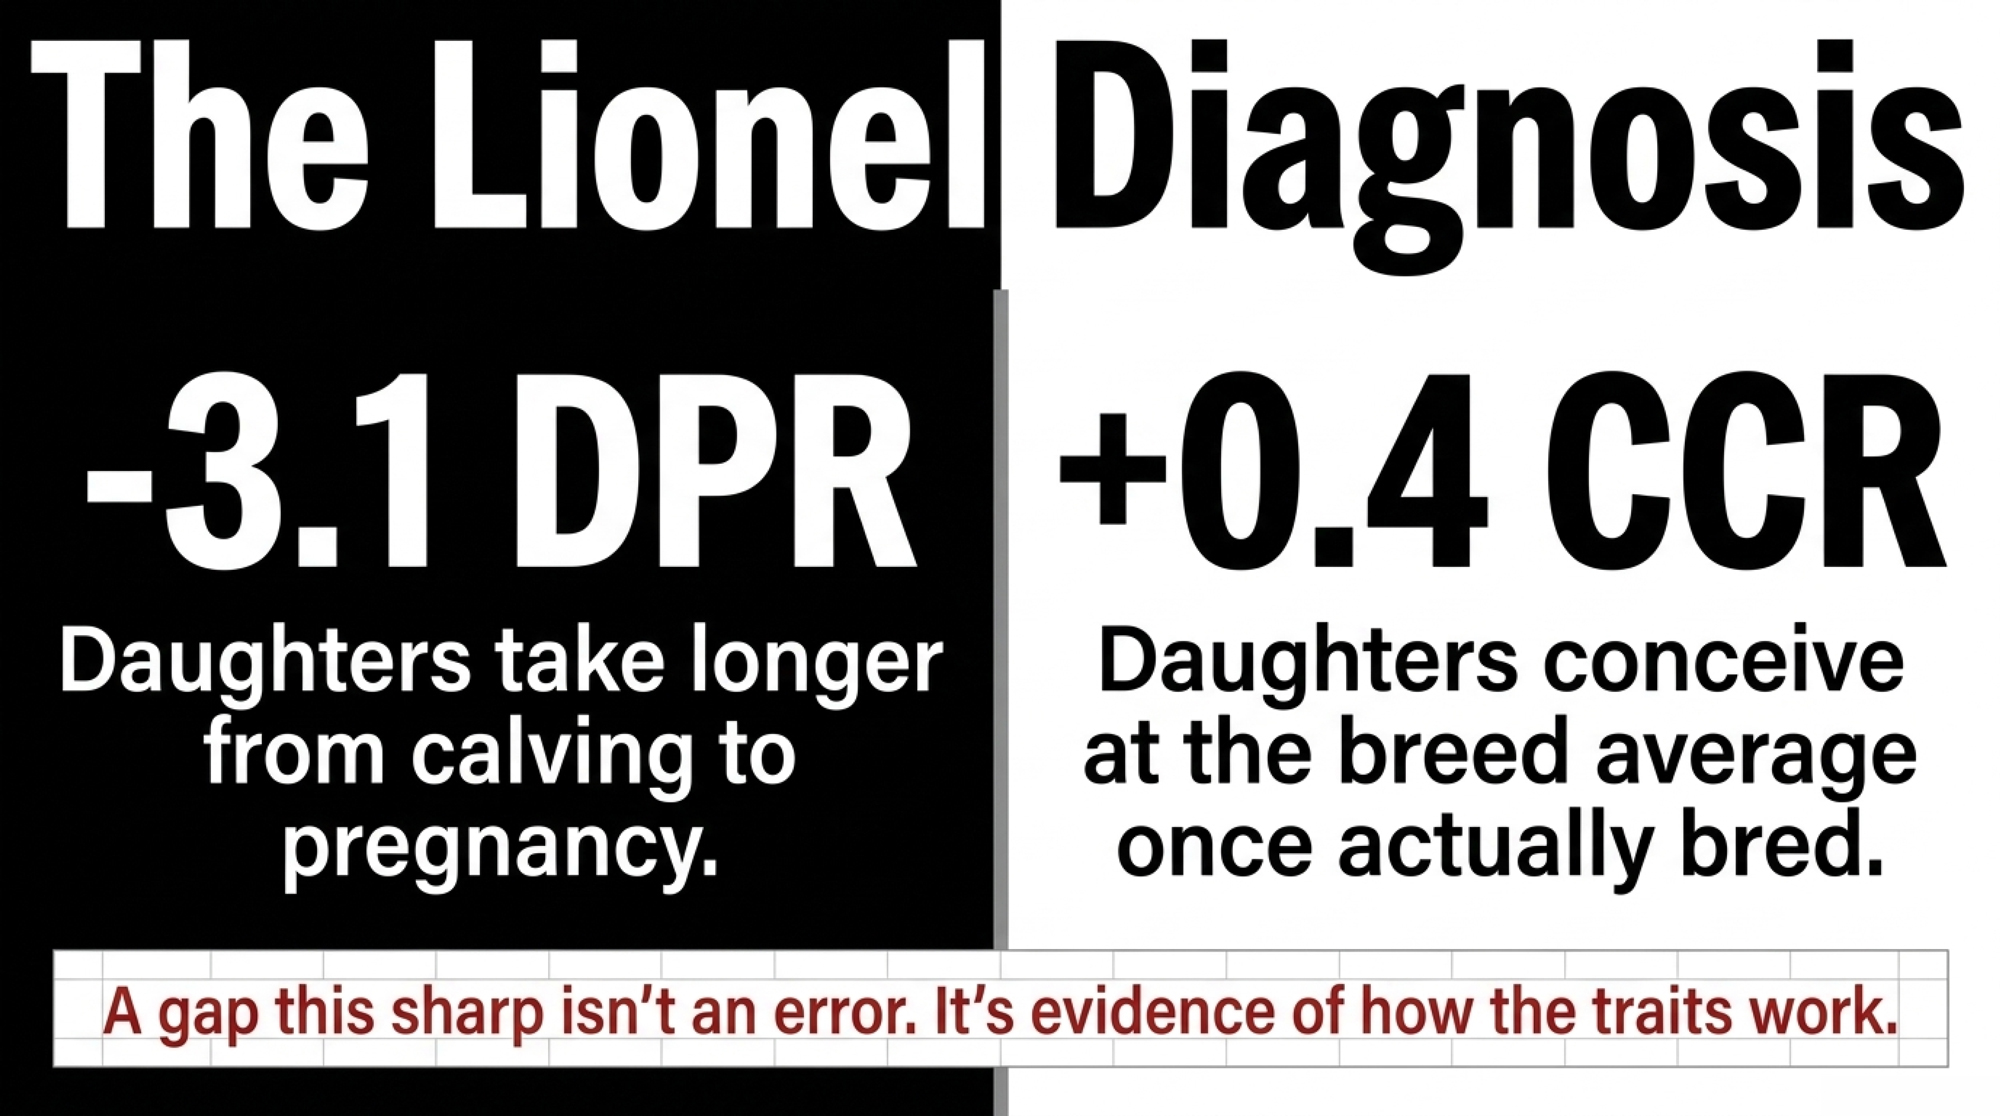
The underlying logic traveled because it sounds airtight. If one number calls a bull’s daughters a fertility disaster while the other calls them ordinary, one of those numbers is lying. Neither is, and a fertility PTA quoted without its trait name and its run date is a rumor with a decimal point.
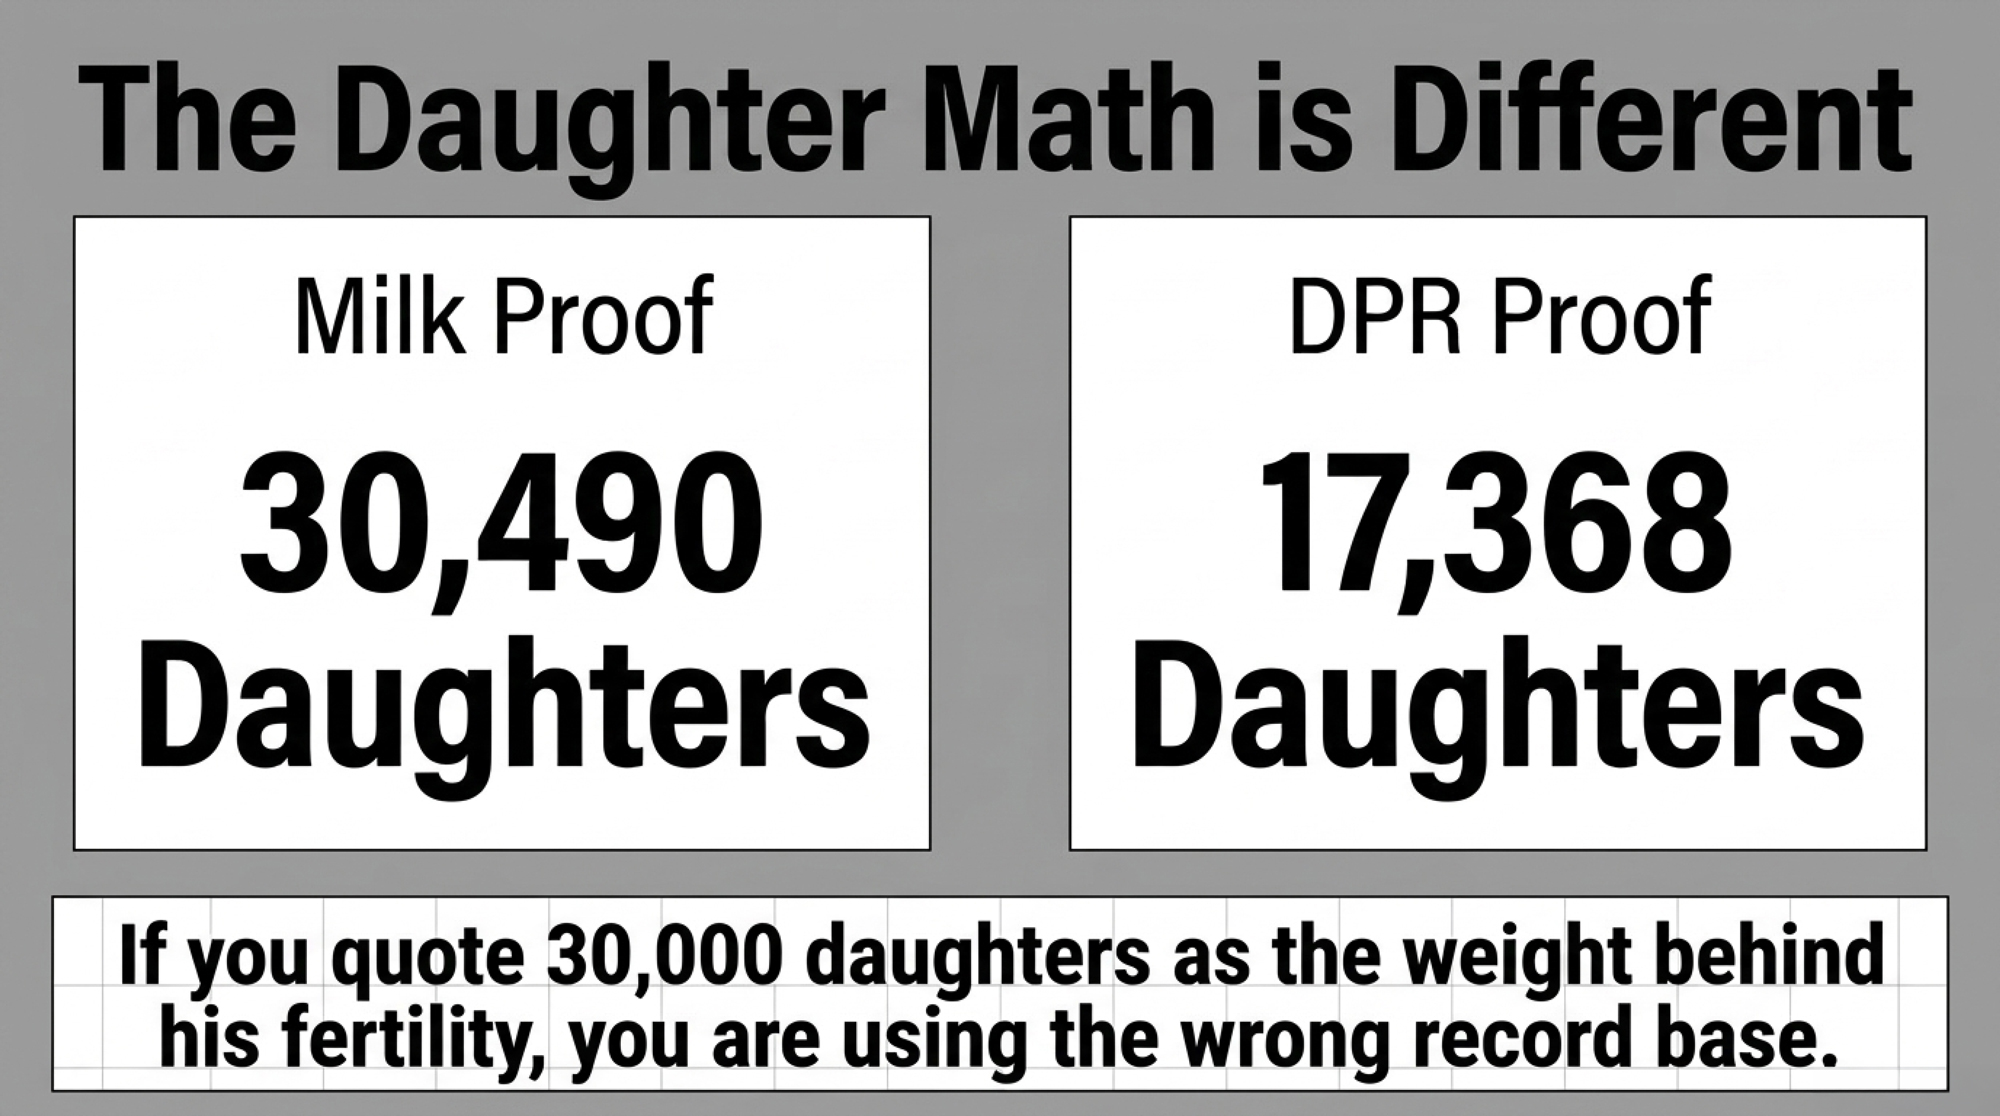
His DPR sits on 17,368 daughters, not 30,490
CDCB WebConnect, Run August 2026, animal HO840003142490309, NAAB code 007HO14454. Born 22 May 2017. Current status: A, control stud 7. Pedigree completeness 100%; sire and dam both genotyped.
| Trait | PTA | Reliability | Daughters | Herds |
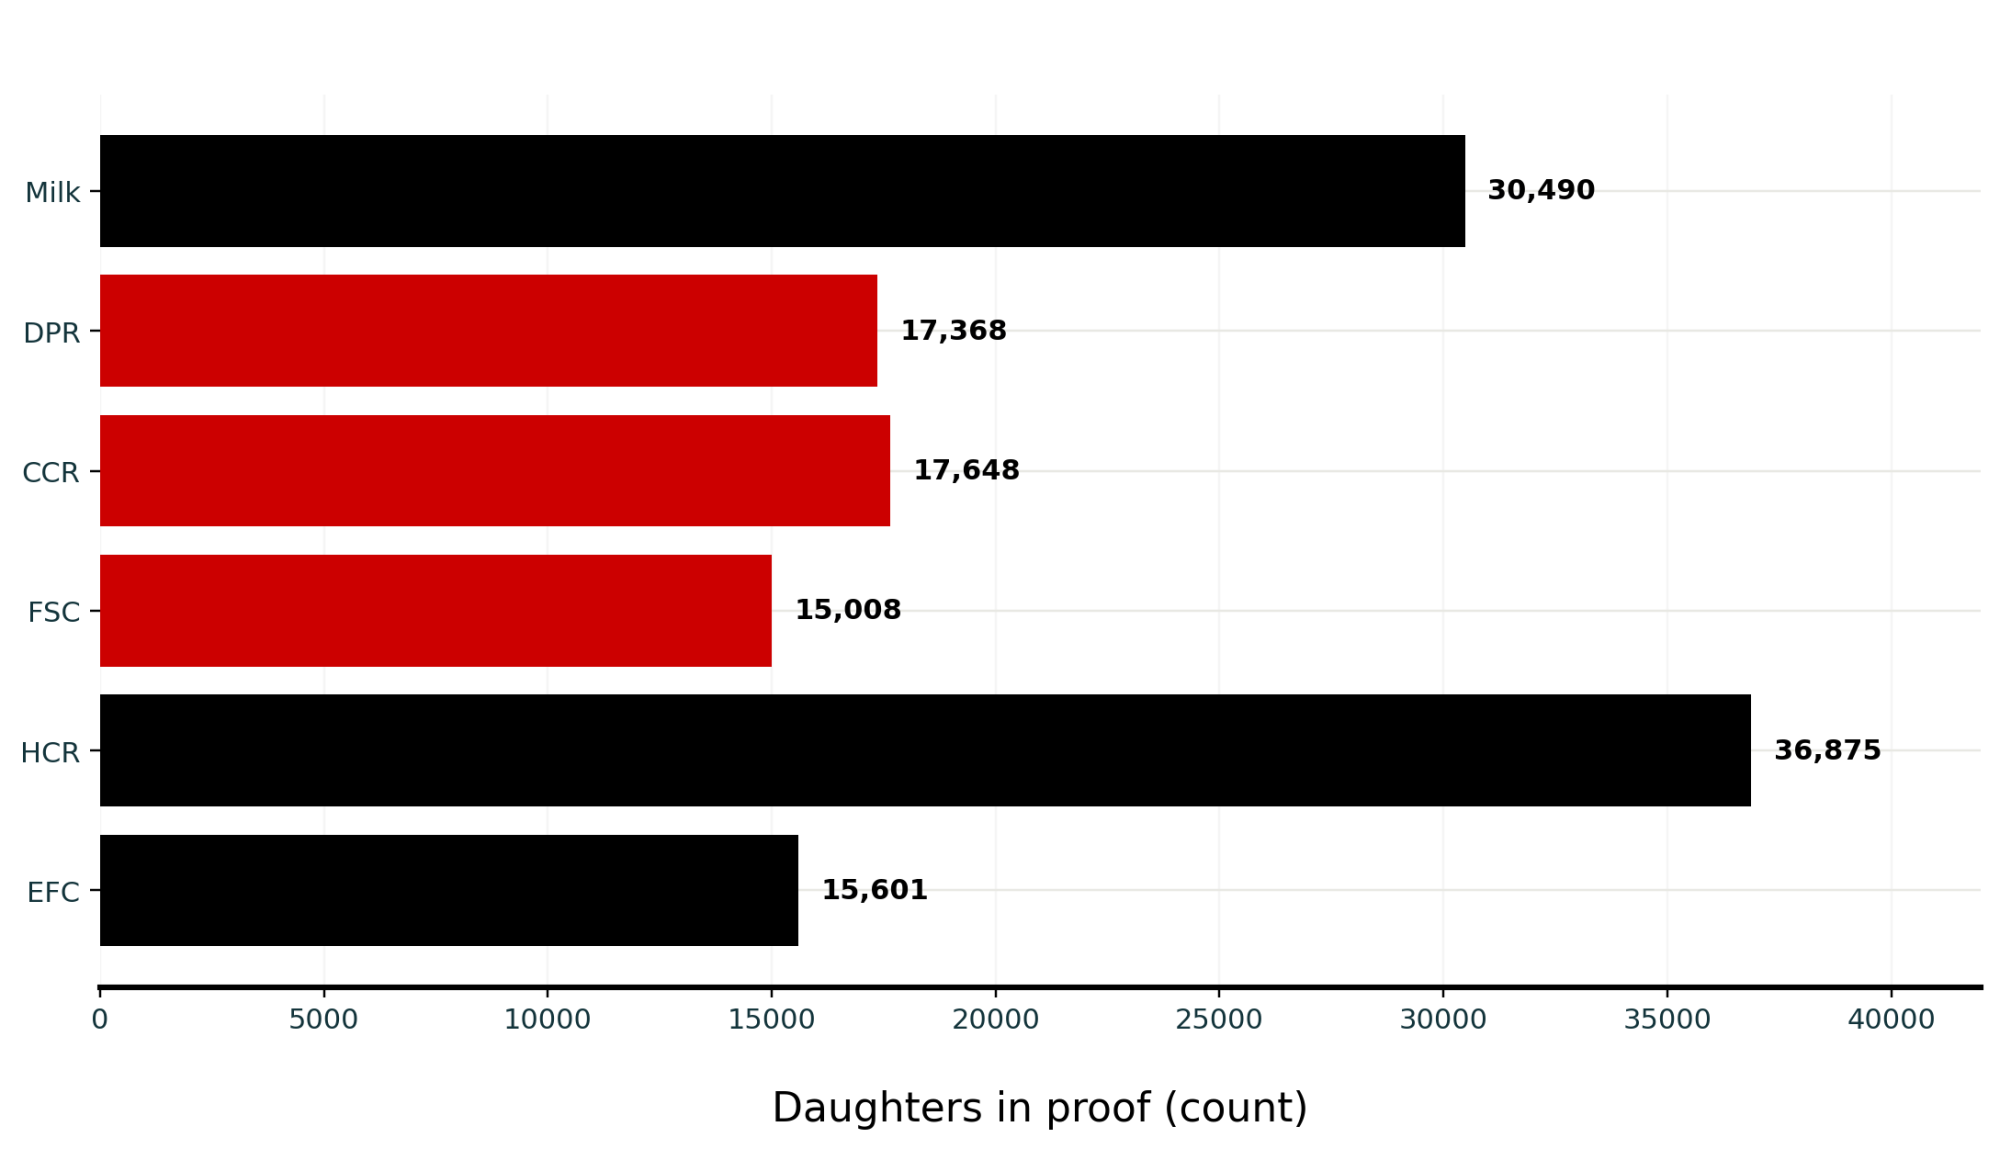
| Milk | +2,566 lbs | 99% | 30,490 | 1,666 |
| Daughter Pregnancy Rate | -3.1 | 99% | 17,368 | 940 |
| Cow Conception Rate | +0.4 | 99% | 17,648 | 1,126 |
| First Service to Conception | -2.1 days | 99% | 15,008 | 481 |
| Heifer Conception Rate | +1.1 | 99% | 36,875 | 1,701 |
| Early First Calving | +4.6 days | 99% | 15,601 | 502 |
| Sire Conception Rate | -0.3 | 98% | 12,230 breedings | — |
Source: CDCB WebConnect, U.S. national evaluation, August 2026 run.
Read the FSC row carefully. CDCB multiplies the day count by -1 before publishing it, so a positive First Service to Conception PTA means fewer days to conception and is the favorable direction. LIONEL’s -2.1 is therefore the unfavorable side: his daughters take about two days longer from first service to a settled pregnancy than breed base. Two days against a Holstein FSC breed mean of 55.6 days, published in CDCB’s May 2026 reproductive-traits summary. Anyone who reads that minus sign as “shorter interval” has it backward.
With that straight, read across. His daughters conceive at roughly the breed-base rate once they’re actually bred, which is the +0.4 CCR. And they still land 3.1 points below base on the full trip from calving to pregnancy. Three traits, three different questions, one animal.
| Trait | What it measures | Unit and favorable direction | LIONEL August 2026 PTA | Record base |
| Daughter Pregnancy Rate (DPR) | The full route from calving to established pregnancy | Percentage points; higher is favorable | -3.1 | 17,368 daughters; 940 herds |
| Cow Conception Rate (CCR) | Probability that a service results in conception | Percentage points; higher is favorable | +0.4 | 17,648 daughters; 1,126 herds |
| First Service to Conception (FSC) | Days from first breeding to conception, separated from voluntary-waiting-period timing | Days; positive means fewer days and is favorable | -2.1 days | 15,008 daughters; 481 herds |
| Sire Conception Rate (SCR) | The service sire’s own semen fertility—not daughter fertility | Percentage points; higher is favorable | -0.3 | 12,230 breedings |
Notice what the daughter column does to the usual shorthand. The 30,490 figure is his milk proof. His DPR rests on 17,368 daughters in 940 herds, his CCR on 17,648 in 1,126, his FSC on 15,008 in 481 — all at 99% reliability, all still enormous, and all a different record base than production. The heifer trait runs higher at 36,875 because heifer records are counted on their own terms. If you’ve been quoting “30,490 daughters” as the weight behind his fertility, that’s the wrong number.
His main traits carry the source code M, for MACE, and his daughters sit in fifteen countries. Counting yield records, 25,432 are in the United States, 1,463 in Italy and 857 in Poland, with the rest spread across twelve more countries from Japan to New Zealand. A single herd holds 5,474 of them.
Two splits, and one of them is bigger
The revised models tightened the relationships between these traits, and CDCB published the before-and-after: DPR to CCR moved from +0.86 to +0.94, and DPR to the new FSC sits at +0.96. A peer-reviewed analysis of the VWP rebuild puts CCR to FSC at about +0.97. Across the population, these traits now move close to lockstep.
So LIONEL at -3.1 DPR and +0.4 CCR is unusual, and CDCB says so on the record: a gap that sharp “is not seen often,” though the organization confirmed an individual bull’s PTAs for the two traits can move separately. We’re still not calling him a statistical outlier — that word needs the residual spread around a +0.94 correlation, and CDCB has not published the trait standard deviations required to compute it. We asked. They didn’t supply them.
CDCB gave us the reading to use when the numbers split. DPR measures how quickly a cow becomes pregnant again after calving. CCR measures her ability to conceive when she’s inseminated. FSC measures the interval from first insemination to the insemination that establishes the pregnancy. A cow can conceive well once bred and still take a long time to get pregnant because breeding started late or the opportunities were spread further apart; another can be bred promptly and need several services. Read a pronounced DPR–CCR gap, CDCB said, as information about which component of reproduction is driving that bull’s profile — not as evidence one evaluation is wrong. All three together carry considerably more biological context than any one.
Now the part the argument keeps missing, and the part CDCB did not address. His CCR and FSC disagree more sharply than his DPR and CCR do, under a tighter correlation — slightly above base for conception rate, below base for days to conception, on two traits correlating around +0.97. We asked about DPR versus CCR and got a clear answer. The CCR–FSC gap remains unexplained on the record. Three things account for most of it without anyone’s proof being wrong:
- The traits don’t share a record base. FSC rests on 15,008 daughters in 481 herds; CCR on 17,648 in 1,126. Different herds, different management, different breeding protocols.
- FSC starts the clock at first insemination, which by construction makes it independent of when the herd chose to start breeding. That’s our reading of the trait definition, not a CDCB statement.
- The units aren’t comparable. CCR is expressed in percentage points, FSC in days. Eyeballing +0.4 against -2.1 and calling it a contradiction is comparing two different rulers.
That’s the honest read: the traits are behaving, and the apparent contradictions on this bull’s page are mostly artifacts of base, units, and herd mix.
Production sits on the other side of the ledger: +2,566 Milk, +107 Fat, +65 Protein, CFP +172, TPI +3145, NM$ +760 at 94% reliability, and 83rd percentile for Net Merit. The circulating version described him as “almost +3,200 lbs of Milk,” accurate on an earlier run, before the April 2025 base change reset the scale. Same bull, same daughters, different yardstick.
So where does this bull actually fit?
The verdict, before the methodology. LIONEL is a production sire with a documented fertility cost, and that cost is now measured on a better model than the one that condemned him.
He fits herds already breeding cows on time — insemination risk at or above 60%, median first service inside the voluntary waiting period plus one 21-day cycle — whose income is driven by yield and components rather than by days open. At +2,566 Milk, +107 Fat, +65 Protein, and 83rd percentile Net Merit on 99% reliability, he is paid for in the tank, and a -3.1 DPR spread across a capped share of the breeding is a trade many operations should take deliberately.
He doesn’t fit herds where pregnancy per AI is the verified bottleneck, herds already carrying a low-DPR cow base, or any mating where the female has no current genomic evaluation to correct against. Cap him rather than ban him: a defined percentage of the herd, written down, with the cow families excluded rather than left to chance. His -0.3 SCR at 98% reliability on 12,230 breedings also means his own semen sits a hair below the average A.I. bull at getting cows pregnant, so don’t load him into a season you’re already fighting.
Which of those two herds you are is a records question, not a genetics question. The three-gate diagnostic further down settles it in about twenty minutes.
What CDCB changed on August 11
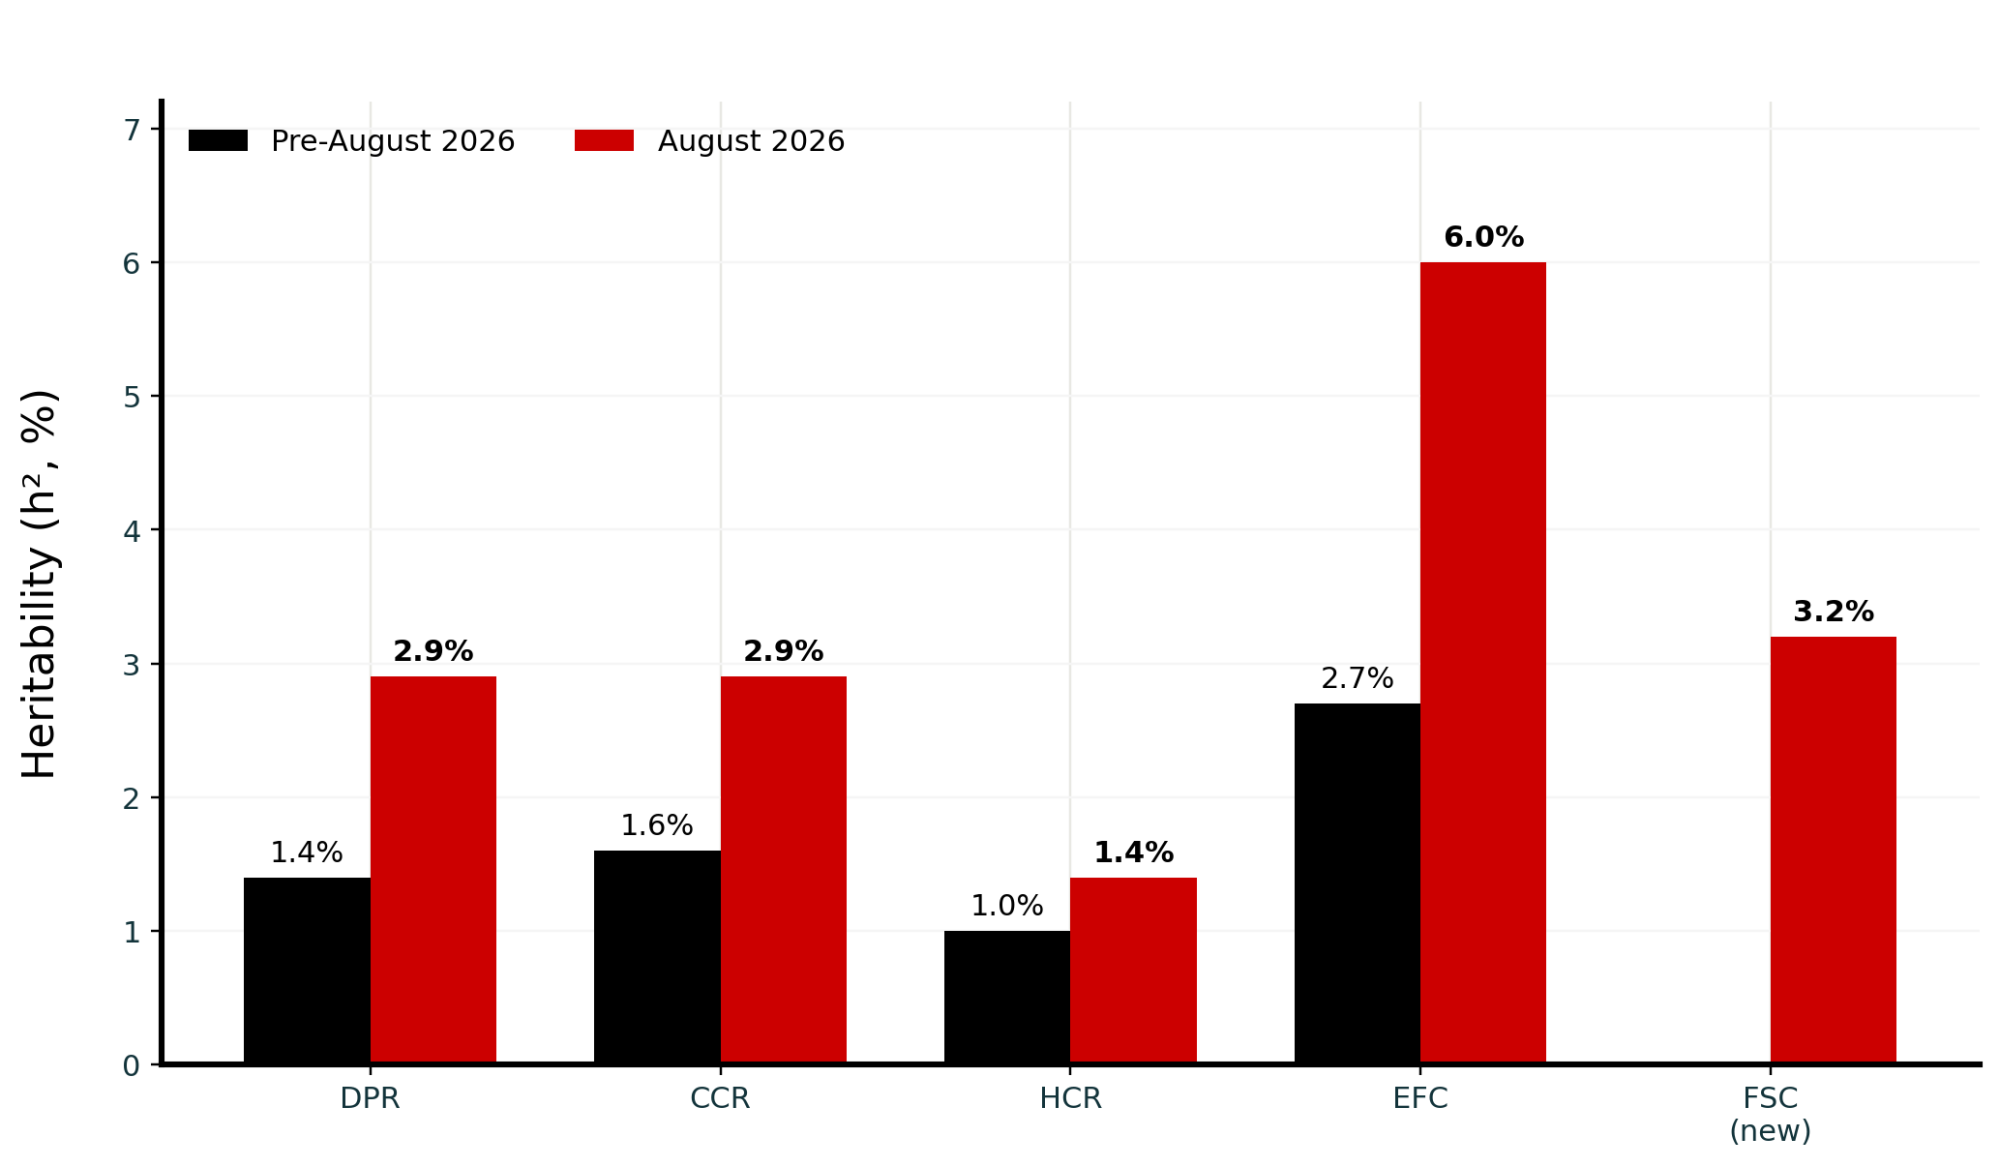
The revisions moved every reproductive heritability, most of them substantially.
| Trait | Old h² | Aug 2026 h² | Primary model update |
| Daughter Pregnancy Rate (DPR) | 1.4% | 2.9% | Fixed 50-day VWP replaced with herd-level, lactation-group-specific values |
| Cow Conception Rate (CCR) | 1.6% | 2.9% | Adds service sire breed, short cycling, and days-in-milk at first insemination |
| Heifer Conception Rate (HCR) | 1.0% | 1.4% | Adds service sire breed and short cycling |
| Early First Calving (EFC) | 2.7% | 6.0% | Recalculated on a single-trait model, with new cow performance data |
| First Service to Conception (FSC) | New trait | 3.2% | Interval from first insemination to the insemination that establishes pregnancy, capped at 200 days, set to 230 if she never conceives |
Source: CDCB, Reintroducing Reproductive Performance Traits, May 2026, and CDCB’s August 2026 Evaluation Recap.
Still low-heritability traits, all of them. But a CCR figure now carries roughly twice the genetic signal it did in April.
In the U.S. national evaluation, DPR has run since its 2003 introduction on a fixed 50-day voluntary waiting period with a 20-day grace period. The model hasn’t sat frozen for 23 years — in December 2014, a USDA and CDCB team replaced the single-trait evaluation reported since 2003 with a multi-trait version built on pregnancy observations at 21-day intervals between 50 and 250 days in milk.
But the fixed VWP survived that rebuild. It survived synchronization protocols, activity collars, sexed and beef semen, and herds that now set the breeding date one cow at a time. CDCB told The Bullvine the review was about whether the model’s assumptions still matched contemporary management. If a herd intentionally begins breeding later, the organization said, those additional days “should not automatically be interpreted in the same way as additional days open resulting from poorer reproductive performance.” The variable VWP “gives the model a better representation of when cows in that management group actually become eligible for breeding.”
One clarification kills a misreading before it spreads. There is no separate bull PTA for each VWP length. CDCB was explicit: the change is not meant to produce a different genetic value for a bull depending on whether he’s used in a 50-, 70- or 90-day herd. His PTA remains an estimate of genetic merit across the national population.
We also asked how large the legacy confounding was, and whether validation ran stratified by herd VWP length. CDCB provided neither a figure nor a description of stratified validation. The direction of the fix is documented; the magnitude isn’t, and we’re reporting that rather than filling it.
What we said would happen, and what did. When we covered this change in advance, our read was that the fix would land hardest on herds running long voluntary waiting periods — cows credited as slow to settle when the herd had chosen to breed them later. The realized population average moved +1.22 points of DPR for bulls at April 2026 A.I. status, upward as expected, and the herd-level VWP substitution is the mechanism CDCB names.
One correction to how we framed it, now on the record. The gain doesn’t accrue to herds — it accrues to bulls whose daughter records came from those herds. CDCB confirmed there is no per-VWP-length PTA, so a 90-day operation does not read a different number for the same bull than a 50-day operation does. The direction held. The magnitude by herd type is unverified, and CDCB didn’t supply it.
One more edit matters for anyone buying young bulls. Daughter data no longer enters DPR, CCR, or FSC until the daughter turns 36 months, which stops early-reporting bias from inflating a young sire’s first crop. That’s why LIONEL’s 99% fertility reliabilities on 17,368 daughters are worth what they’re worth, and a 70-to-75% genomic prediction on zero daughters isn’t the same animal.
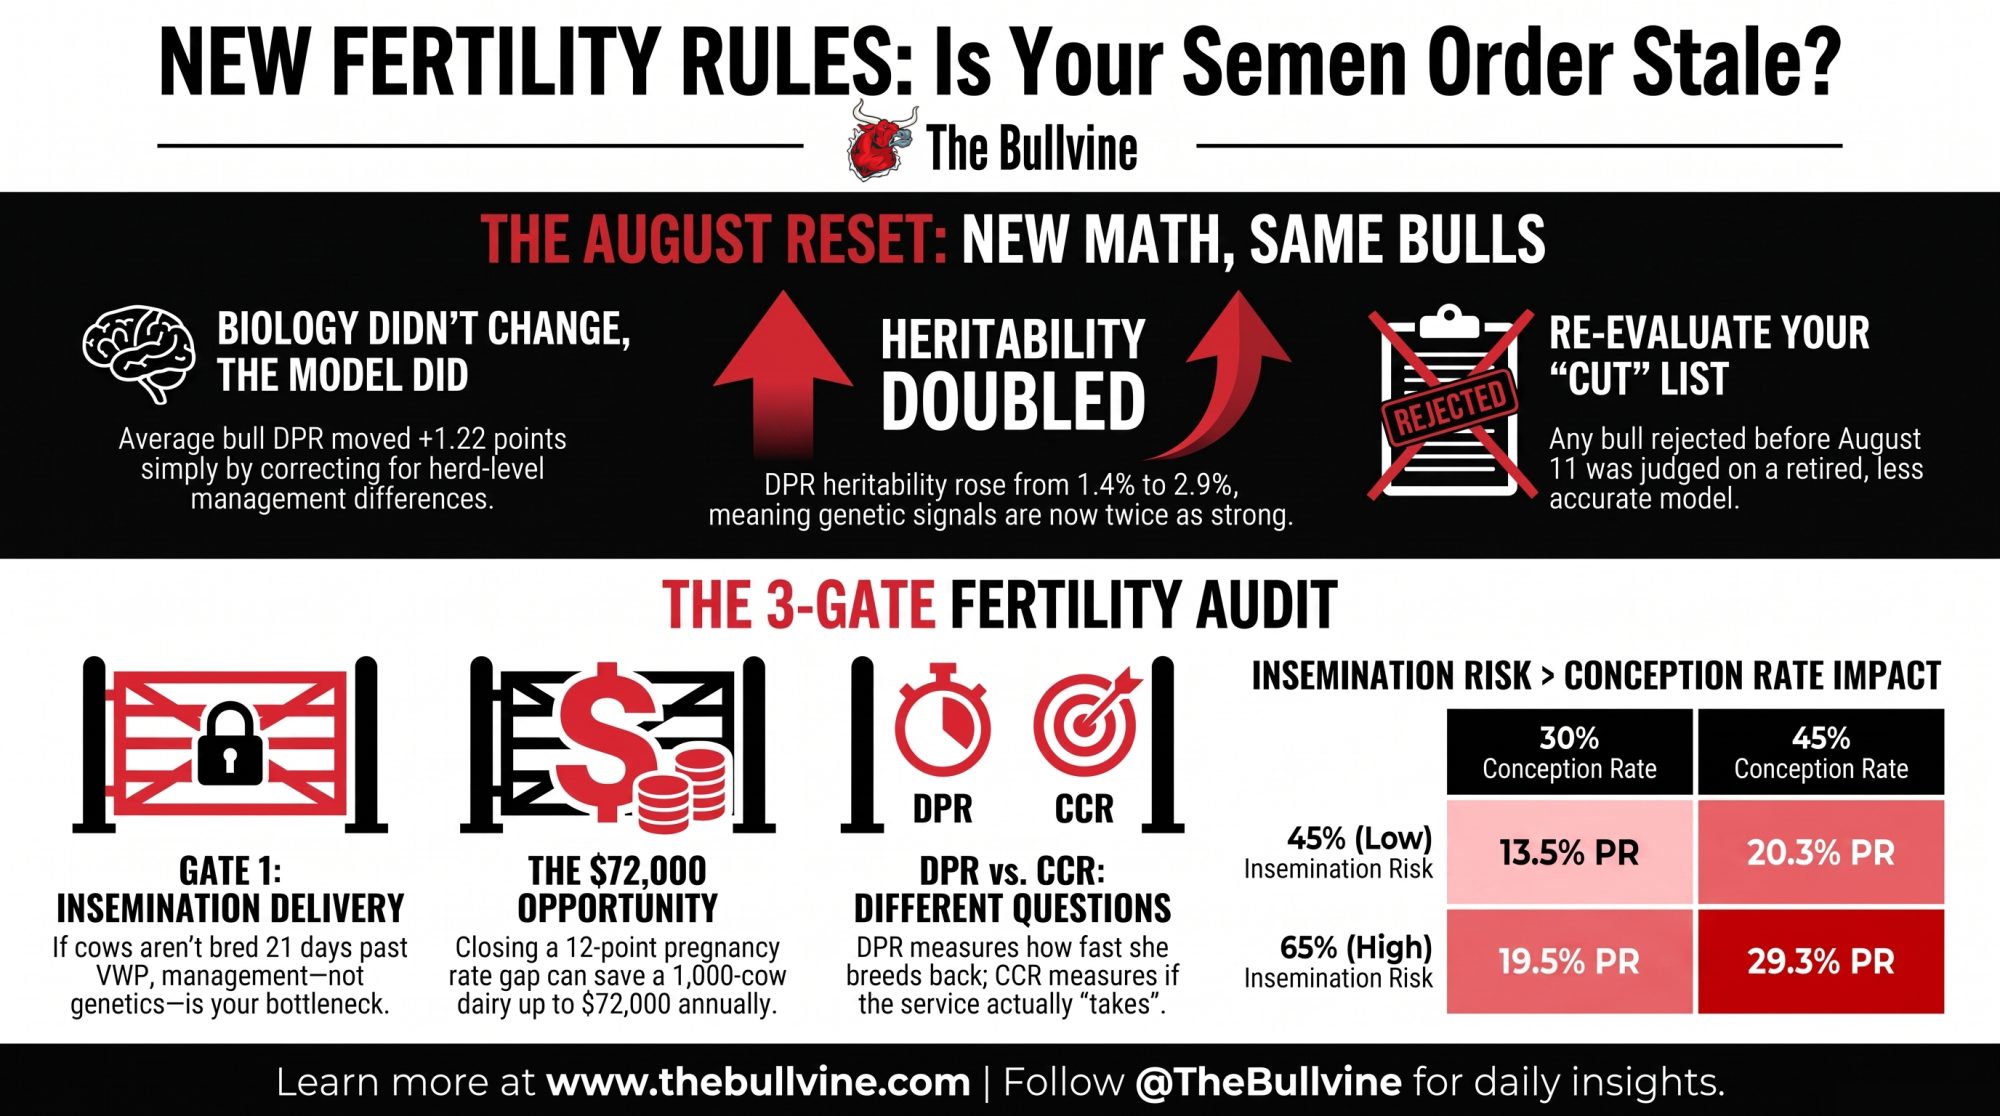
One committee decision is worth about a point of his Fertility Index
Holstein Association USA reweighted its Fertility Index effective with the August 2024 evaluations: DPR from 0.7 down to 0.4, CCR from 0.1 up to 0.4, HCR and EFC steady at 0.1 each, as published in the TPI formula. Recommended by the association’s Genetic Advancement Committee, approved by its board. Equal weighting, not replacement — worth knowing, because the circulating claim had DPR cut to 0.1 and CCR raised to 0.4, two years off and a weight adrift. Fertility Index is a HAUSA product and a component of TPI; the PTAs feeding it come from CDCB.
Now put a number on what that decision does to one animal.
Bullvine calculation. Published evidence: LIONEL’s CDCB summary sheet for August 2026 lists his Fertility Index at -0.5, and his August 2026 PTAs are DPR -3.1, CCR +0.4, HCR +1.1, EFC +4.6. Stated assumption: FI is a weighted sum of those four traits, as published in the TPI formula.
| Formula | Weights (DPR / CCR / HCR / EFC) | LIONEL computes to |
| Current, since August 2024 | 0.4 / 0.4 / 0.1 / 0.1 | -0.51 (published: -0.5) |
| Pre-August 2024 | 0.7 / 0.1 / 0.1 / 0.1 | -1.56 |
Bullvine math on identical PTAs. The current-weights row reproduces the published value to rounding, which confirms the method on this animal — one animal, so treat the method as validated at n=1 until we run it across a wider set of bulls. The gap between the two rows is roughly one full point of Fertility Index on identical daughter data, produced by a committee vote rather than by anything a cow did.
One clarification, because this figure will travel. The -1.56 is a counterfactual: it’s what he computes to under the retired weights using his August 2026 PTAs. It is not what his Fertility Index actually read in July 2024, which was calculated on different PTAs and a different base.
So a bull’s fertility standing depends as much on when you look at it as on what his daughters do. For scale, CDCB puts DPR’s relative emphasis in Net Merit at 2.1%, and says the August revisions don’t change that emphasis at all.
Re-read the bulls you already cut
Every negative-DPR bull struck off a list before August 11 was judged on the fixed 50-day model, and on a DPR that carried half the heritability it does now. LIONEL moved to -3.1 without changing a daughter, and the average for U.S. bulls at April 2026 A.I. status moved +1.22 in the same run — so the list is stale, not just the numbers on it.
There’s a date on this, and it splits into two horizons:
- Inside 30 days. Pull the three herd numbers below, re-run your rejected list against the August figures, and place what you need on this run.
- Inside 90 days. The next official CDCB triannual lands December 1, 2026. Anything you’re planning for winter breeding gets built on that run, not this one.
One clean decision window, then every figure here moves.
Which fertility question is your herd actually failing?
None of this belongs on an order sheet until you know which gate your cows lose time at. Work them in order — each one rules out the next.
Gate 1 — Insemination delivery. Pull median DIM at first service and 21-day insemination risk, trailing 12 months, split by parity. If cows are first bred more than 21 days past your recorded VWP, you’ve lost a full reproductive cycle before genetics enters the picture. Look upstream at enrollment, heat detection, synchronization compliance, fresh-cow eligibility, and deliberate exceptions. No semen purchase fixes this gate.
Gate 2 — Conception efficiency. Pull pregnancy per AI, split by first versus later service, parity, season, semen type, and technician. If cows are served on time and still don’t settle, this is where CCR and FSC earn their place on the order sheet — and it only becomes a genetic decision when the female side carries a current genomic evaluation.
Gate 3 — Pregnancy maintenance and semen fertility. Two separate checks. Read the service sire’s own SCR, which measures his semen rather than his daughters. And confirm pregnancies twice, with enough gap between checks to separate a conception failure from a loss after a viable embryo was confirmed — the 2022 fetal-loss analysis below used detection at around 42 days of gestation as its dividing line.
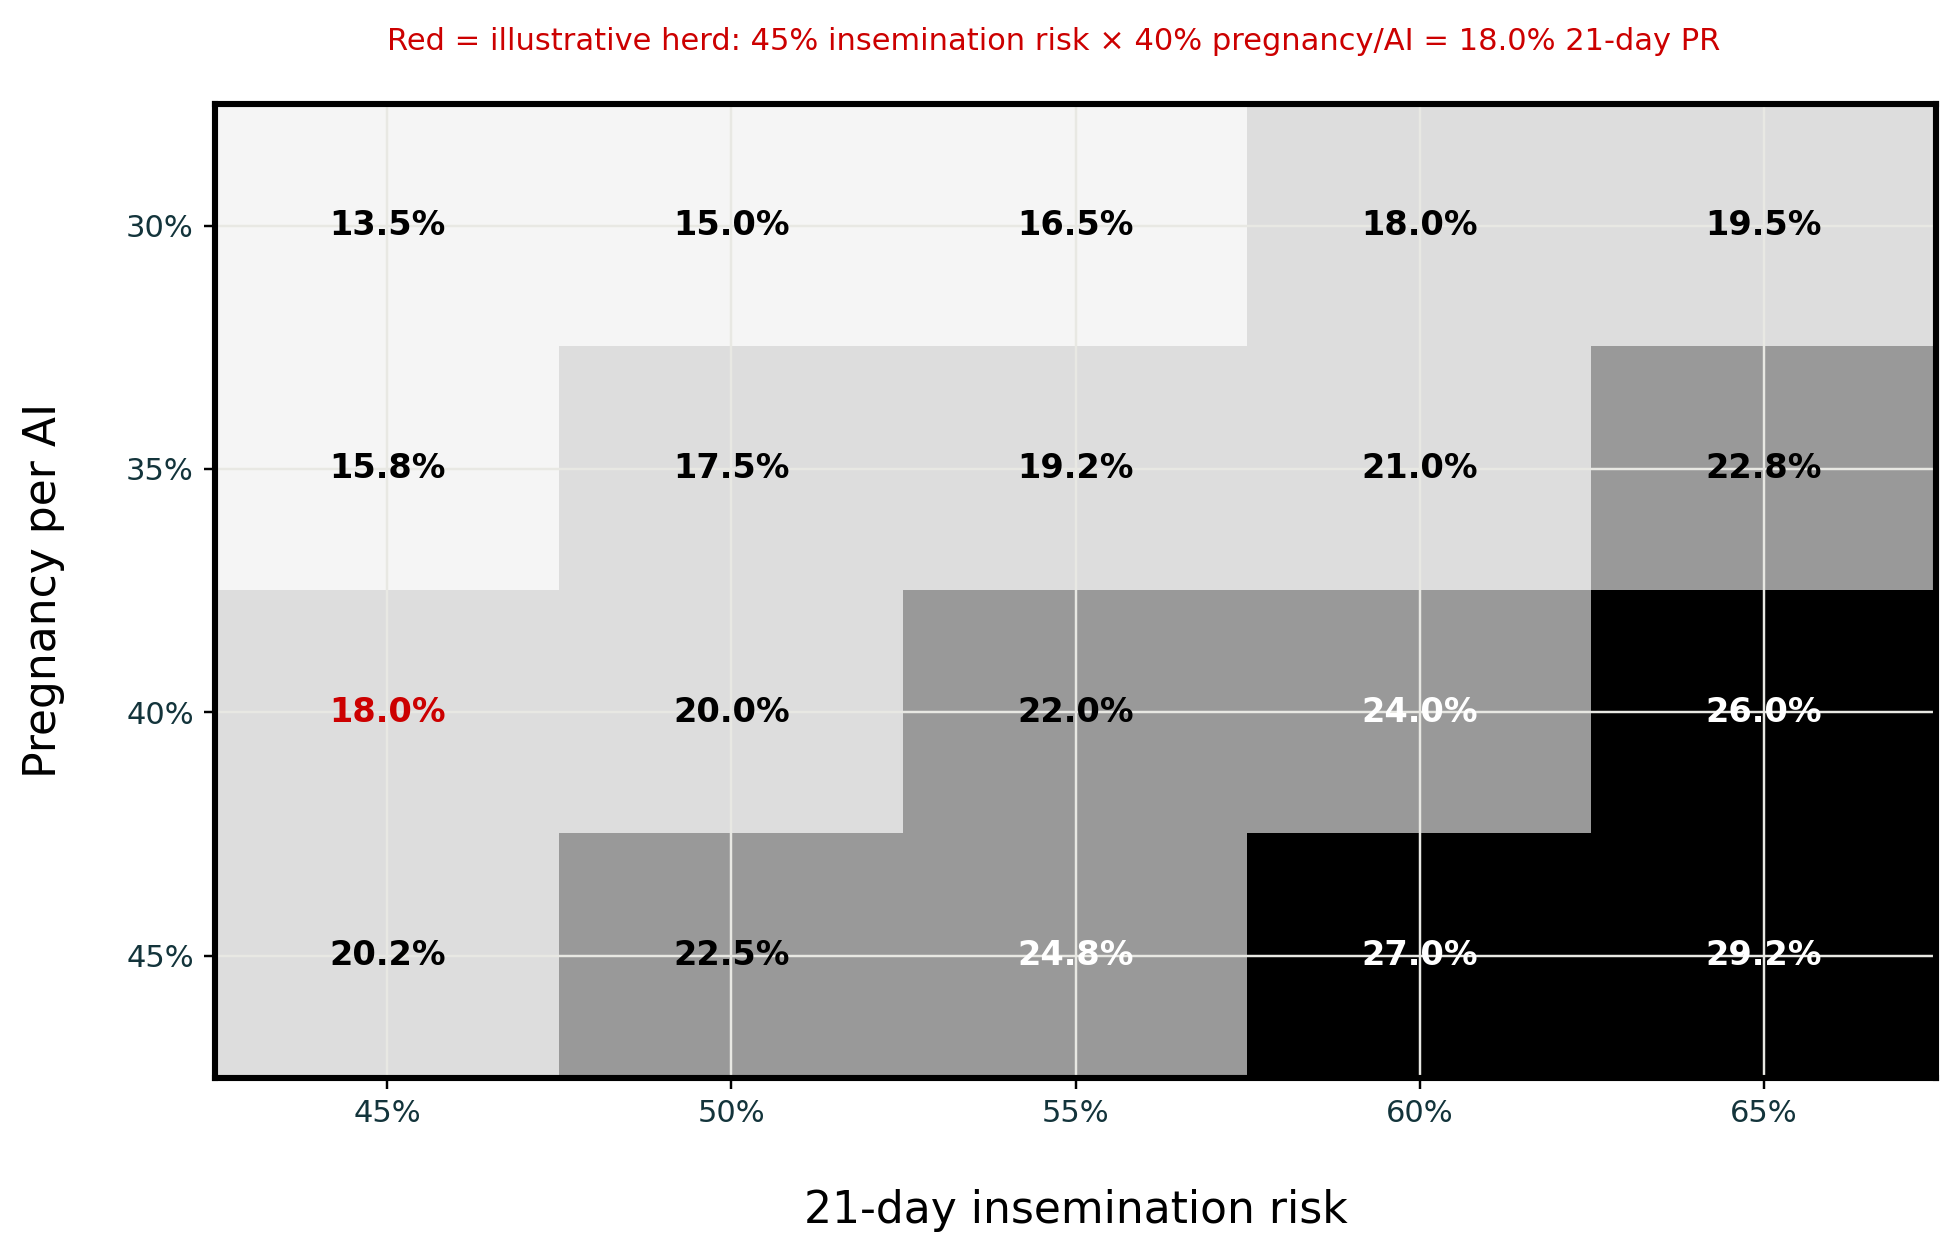
Bullvine calculation. Illustrative inputs, not one farm’s books: VWP 70 days, median first service 91 DIM, insemination risk 45%, pregnancy per AI 40%. Insemination risk times pregnancy per AI gives roughly an 18% 21-day pregnancy rate.
Published context: Lauber, Cabrera and Fricke at the University of Wisconsin–Madison modeled a 1,000-cow U.S. herd and classified 21-day pregnancy rate as low at 20%, below average at 25%, average at 30%, above average at 35%, high at 40% (Journal of Dairy Science 109:452–468, 2026). Those are modeled scenario bands, not observed averages. Our illustrative herd computes below the low band.
Here’s the whole grid so you can find your own square rather than ours. Each cell is a 21-day pregnancy rate; insemination risk across the top, pregnancy per AI down the side:
| Preg/AI ↓ · Insem. risk → | 45% | 50% | 55% | 60% | 65% |
| 30% | 13.5 | 15.0 | 16.5 | 18.0 | 19.5 |
| 35% | 15.8 | 17.5 | 19.3 | 21.0 | 22.8 |
| 40% | 18.0 | 20.0 | 22.0 | 24.0 | 26.0 |
| 45% | 20.3 | 22.5 | 24.8 | 27.0 | 29.3 |
Bullvine calculation. 21-day PR approximated as insemination risk × pregnancy per AI.
Read it across a row, and the point lands hard. At 40% conception, moving insemination risk from 45% to 65% buys eight points of pregnancy rate. Moving conception from 30% to 45% at a fixed 45% insemination risk buys under seven. The multiplication is an approximation — VWP definitions, pregnancy-check timing, loss and software eligibility rules all pull a real report off the simple product — but the ranking of the two levers survives every cell in the table.
Now the money, and note what can and can’t be priced. Nobody can convert a DPR point into dollars directly; CDCB derives DPR from days open, but a genetic PTA point and a herd-level pregnancy-rate point are different units and not interchangeable. What you can price is the herd-level gap. Lauber and colleagues modeled net return at $3 to $6 per cow per year for each one-percentage-point gain in 21-day PR on conventional semen, $2 to $7 on sexed-plus-beef, at a 170-day insemination eligibility period, with the value higher when you start from a lower rate.
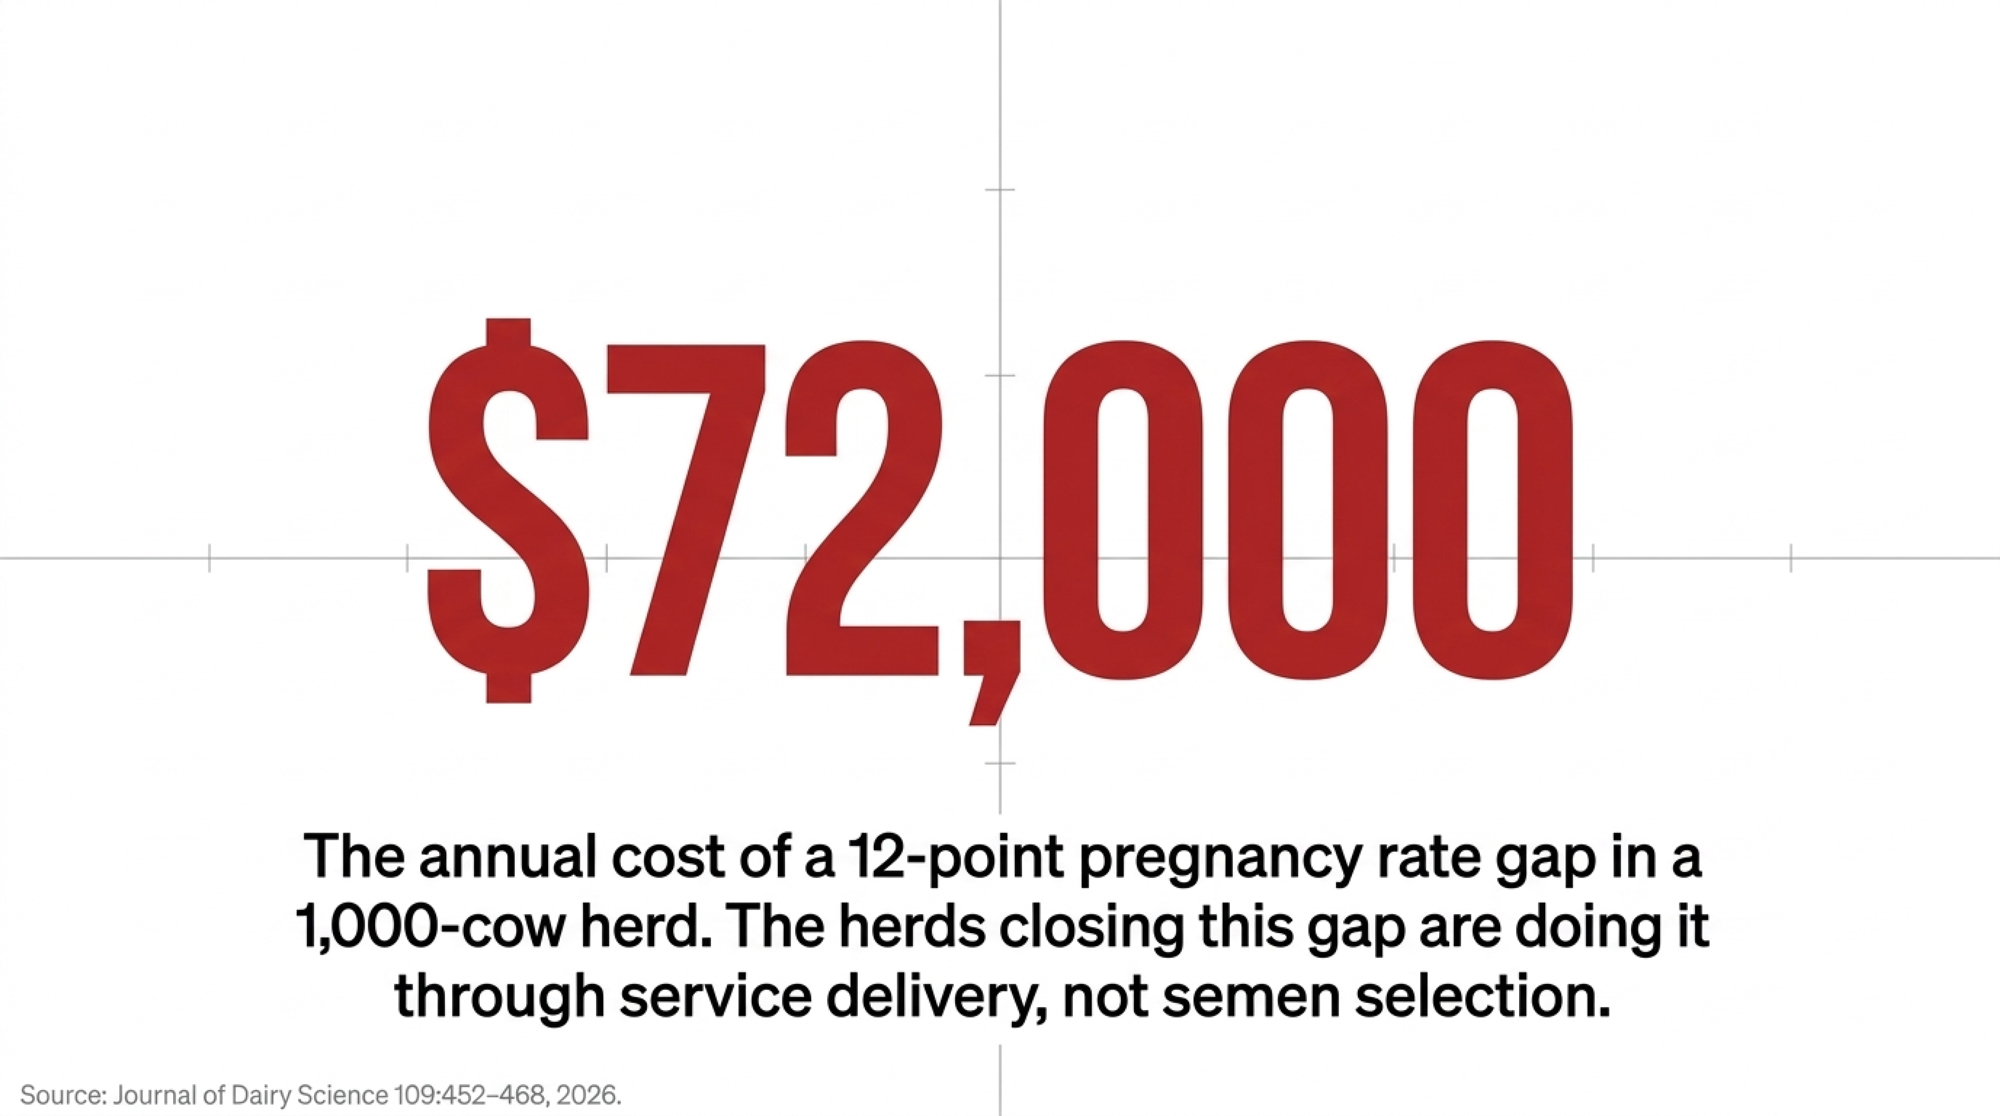
Our illustrative herd sits at 18% against the 30% average band — a 12-point gap. At $3 to $6 a point, that’s $36 to $72 per cow per year, or $36,000 to $72,000 on a 1,000-cow dairy. Most of it is sitting in Gate 1. Our earlier two-herd analysis priced a six-point gain at $18 to $36 per cow per year using the same inputs, and the herds that closed it did so on service delivery, not semen selection.
That herd breeds cows a full 21-day cycle past its own stated waiting period and serves fewer than half its eligible cows per cycle. Conception at 40% isn’t the bottleneck, and no semen order fixes it.
What does a positive DPR with a negative CCR mean for a mating?
If conception per AI is your verified weak gate, a below-base CCR bull doesn’t become acceptable because his DPR looks fine. The two traits aren’t offsetting forces on one scale, and the decision is limit, mate, or remove.
“Mate selectively” sounds the most precise and demands the most. It only works when the female side carries a current genomic evaluation for the trait you’re correcting. Raw conception history isn’t that. At 2.9% heritability, CCR carries real but modest genetic signal, so a cow family that “always catches” may be telling you about your protocol, your season, or your breeding technician rather than her genetics. Without female data, treat the bull as negative CCR and cap his use — that’s the honest version.
And run the mating screen separately from the fertility read. LIONEL’s own inbreeding reads 10.7% on pedigree and 11.2% genomic, with expected future inbreeding at 12.1% and 12.4% and his daughters averaging 8.4%.
None of these three traits confirms a calf
DPR, CCR, and FSC all measure the route to pregnancy. None confirms a calf.
A 2022 Journal of Dairy Science analysis by Sigdel, Bisinotto and Peñagaricano examined records from 24,476 heifers, 20,805 first-lactation cows and 14,027 later-lactation cows at a single U.S. commercial Holstein herd in Florida between 2001 and 2019. It put fetal-loss heritability at 3.4% in first lactation and 7.4% in later lactations on the observable scale, and defined fetal loss as a pregnancy lost after a viable embryo was detected around 42 days of gestation.
Their conclusion: fetal loss is equal to or more heritable than the female fertility traits already in the national evaluation. That gap isn’t closing soon, and we asked directly. CDCB’s current research priority sits with the upcoming move to single-step evaluations and ongoing work on hoof health and mobility. The organization says there is “always interest” in better characterizing female reproductive performance, including portions of the cycle the current traits don’t represent, but named nothing in development. So build the next two proof cycles on the assumption that pregnancy maintenance stays a management problem, not a selectable trait.
Two more gaps, and LIONEL shows one. His Sire Conception Rate reads -0.3 at 98% reliability on 12,230 breedings, while his daughters’ conception reads just above base. Daughter fertility and semen fertility are different jobs on the same page.
No fertility PTA screens the mating itself either. Cole, Null and Van Raden at USDA’s Animal Genomics and Improvement Laboratory costed 18 recessive disorders across the Ayrshire, Brown Swiss, Holstein and Jersey populations at US$10.7 million a year in lost fertility and perinatal calf death, $7.5 million of it in Holsteins. Their point was that the money is avoidable by choosing mate pairs that can’t produce an affected embryo (Journal of Dairy Science 99(9):7274–7288, 2016, on a 9-million-head U.S. national herd).
What This Means for Your Operation
Eight audit steps, in the order we’d run them.
- Date-stamp every fertility figure on your order sheet. Any PTA without a trait name and a run date beside it gets re-pulled from the current run before you commit units. Figures quoted off a pre-August scale are not comparable to figures quoted off this one.
- Learn the FSC sign convention before you use the trait. Positive means fewer days to conception. A negative FSC PTA is the unfavorable direction, which is the opposite of what a days figure normally implies.
- Identify your herd’s specific fertility gate before you order semen. Run Gates 1 through 3 above and write down which one failed. Order against that gate, not against a general impression that fertility is poor.
- Find your square in the grid and price the gap. Multiply your insemination risk by your pregnancy per AI, compare against the 30% average band, and put $3 to $6 per point per cow per year on the difference. That number tells you how much management is worth before genetics gets a vote.
- Check the record base behind each bull’s fertility PTA, not his milk proof. His milk proof and his DPR proof don’t rest on the same daughters — compare the rows in the table above before you treat a headline daughter count as fertility evidence.
- Re-run the bulls you rejected on fertility before August 11. That shortlist was scored on the retired 50-day model and on heritabilities roughly half their current values. Open the current run beside the old list and reinstate anything that moved.
- Verify female-side data before you plan any corrective mating. A below-base CCR bull is only correctable where the cow carries a current genomic evaluation for that trait. Without it, cap his use and record why.
- Add SCR and haplotype compatibility to the order checklist. Daughter fertility and semen fertility are separate reads, and no fertility PTA screens the mating pair for recessives.
LIONEL’s August 2026 proof reads -3.1 DPR and 83rd percentile Net Merit at the same time, on 17,368 fertility daughters across fifteen countries. That’s a real trade, and both sides of it are published, which means the decision was never whether the bull is good. It’s whether your records can tell you which gate your cows lose time at — because that answer, not his DPR, determines whether he belongs on your order sheet, and you have until December 1 to find it.
Key Takeaways
- LIONEL’s published Fertility Index of -0.5 computes to -1.56 under Holstein USA’s pre-August-2024 weights on the same PTAs — a point of index from a committee vote, not a daughter. A counterfactual, not his 2024 value.
- DPR heritability doubled in August, from 1.4% to 2.9%, and CCR from 1.6% to 2.9%. If you wrote off a CCR figure as noise back in April, it’s carrying twice the genetic signal now.
- Our grid puts an 18% herd 12 points under the 30% average band — $36 to $72 per cow per year at Lauber’s $3 to $6 a point. Almost all of it is insemination delivery, not semen.
- Every figure here expires December 1, when the next CDCB triannual lands. Order on the August run within 30 days, and build winter breeding on December’s.
Methodology Note. Genetic evaluations reference the August 11, 2026 triannual run from the Council on Dairy Cattle Breeding on the U.S. national base, with reliability stated for every figure. LIONEL’s trait values, daughter and herd counts, breeding count, merit figures, status, and inbreeding come from CDCB’s WebConnect record for HO840003142490309 (007HO14454), Run August 2026, cross-checked against his CDCB summary sheet and Holstein Association USA type summary for the same run. His Fertility Index of -0.5 is printed on that summary sheet and independently reproduced by our own calculation using the published TPI formula weights; Holstein Association USA calculates the Fertility Index using CDCB inputs, and we validated our reproduction on this animal only. Heritabilities, the DPR–CCR and DPR–FSC correlations, breed means, and the FSC sign convention come from CDCB’s Reintroducing Reproductive Performance Traits summary and FSC trait page, published May 2026; the CCR–FSC correlation of approximately +0.97 comes from the peer-reviewed analysis of voluntary waiting period adjustment in U.S. herds, Journal of Dairy Science, September 2026. Trait-level model changes and average PTA shifts come from CDCB’s Early First Calving trait page and its August 2026 Evaluation Recap. The 21-day pregnancy rate bands and the $3-to-$6 per-point net return come from Lauber, Cabrera, and Fricke, Journal of Dairy Science 109:452–468, 2026, modeled on a 1,000-cow herd at a 170-day insemination eligibility period; they are modeled scenario values, not observed averages, and the dollar figures are net return per cow per year excluding the cost of achieving the gain. The pregnancy-rate grid is a Bullvine calculation on the stated approximation and uses illustrative inputs, not any farm’s records. We requested the trait standard deviations needed to quantify residual spread around the revised correlations; CDCB responded to our questions on September 18, 2026 but did not provide them, and this article does not claim outlier status without them. His main traits carry MACE source coding, meaning daughter records from multiple countries contribute; country counts cited are yield records. Dollar figures are USD. U.S. evaluations are not directly comparable to Canadian, EU, New Zealand, or Australian systems. Limitations: national averages, breed means and modeled bands may not reflect your region, herd size, management system or breeding program, and every figure here moves at the December 1, 2026 run. If your herd records tell a different story, send them — we publish producer data and case studies. Corrections: posted visibly at the top of the article. Contact editor@thebullvine.com.
CDCB was approached by email on September 17, 2026, with questions on the scale of legacy management confounding in the DPR model, how to read a sharp DPR–CCR divergence, and whether a pregnancy-maintenance trait is in development. CDCB responded on September 18, 2026. At the organization’s request, the answers are attributed to CDCB rather than to an individual spokesperson. CDCB did not provide a figure for the magnitude of the legacy confounding, did not describe validation stratified by herd VWP length, and did not supply the trait standard deviations we requested.
Learn More
- 21-day pregnancy rate: two herds, opposite fixes — Diagnoses why an 18% pregnancy rate demands opposite farm fixes, arming you with the service-rate versus conception-rate breakdown needed to stop wasting semen dollars on protocol failures.
- Fertility Traits: How Different Countries Are Achieving Positive Gains — Follows the money on international selection models, revealing how U.S., German, and Canadian systems deploy non-return rates and gestation length to outmaneuver legacy Daughter Pregnancy Rate calculation traps.
- Bull Fertility in Dairy Production: Why Genetic Evaluations Matter — Dismantles the industry’s female-only genetic bias, delivering concrete genomic and semen-quality markers that expose service-sire conception drag before subfertile semen hits the tank.
 The Sunday Read Dairy Professionals Don’t Skip.
 The Sunday Read Dairy Professionals Don’t Skip.
Every week, thousands of producers, breeders, and industry insiders open Bullvine Weekly for genetics insights, market shifts, and profit strategies they won’t find anywhere else. One email. Five minutes. Smarter decisions all week.
 Join the Revolution!



