









FSA’s August margin: $9.34. In our 500-cow model, 4,750 covered cwt paid $716.68 on a 10,248-cwt tank. Run your ratio before Dec. 18.
A 95% DMC coverage election does not mean the payment calculation uses 95% of the milk an expanded herd ships today. USDA’s Farm Service Agency reports national DMC margins of $9.34 per cwt in August 2026 and $8.35 in September, both below the $9.50 coverage level. January ($7.81) and February ($8.46) also came in below it. By Bullvine’s count of FSA’s margin table, that makes four payment months at $9.50 coverage through September. Enrollment for 2027 closes December 18, 2026.
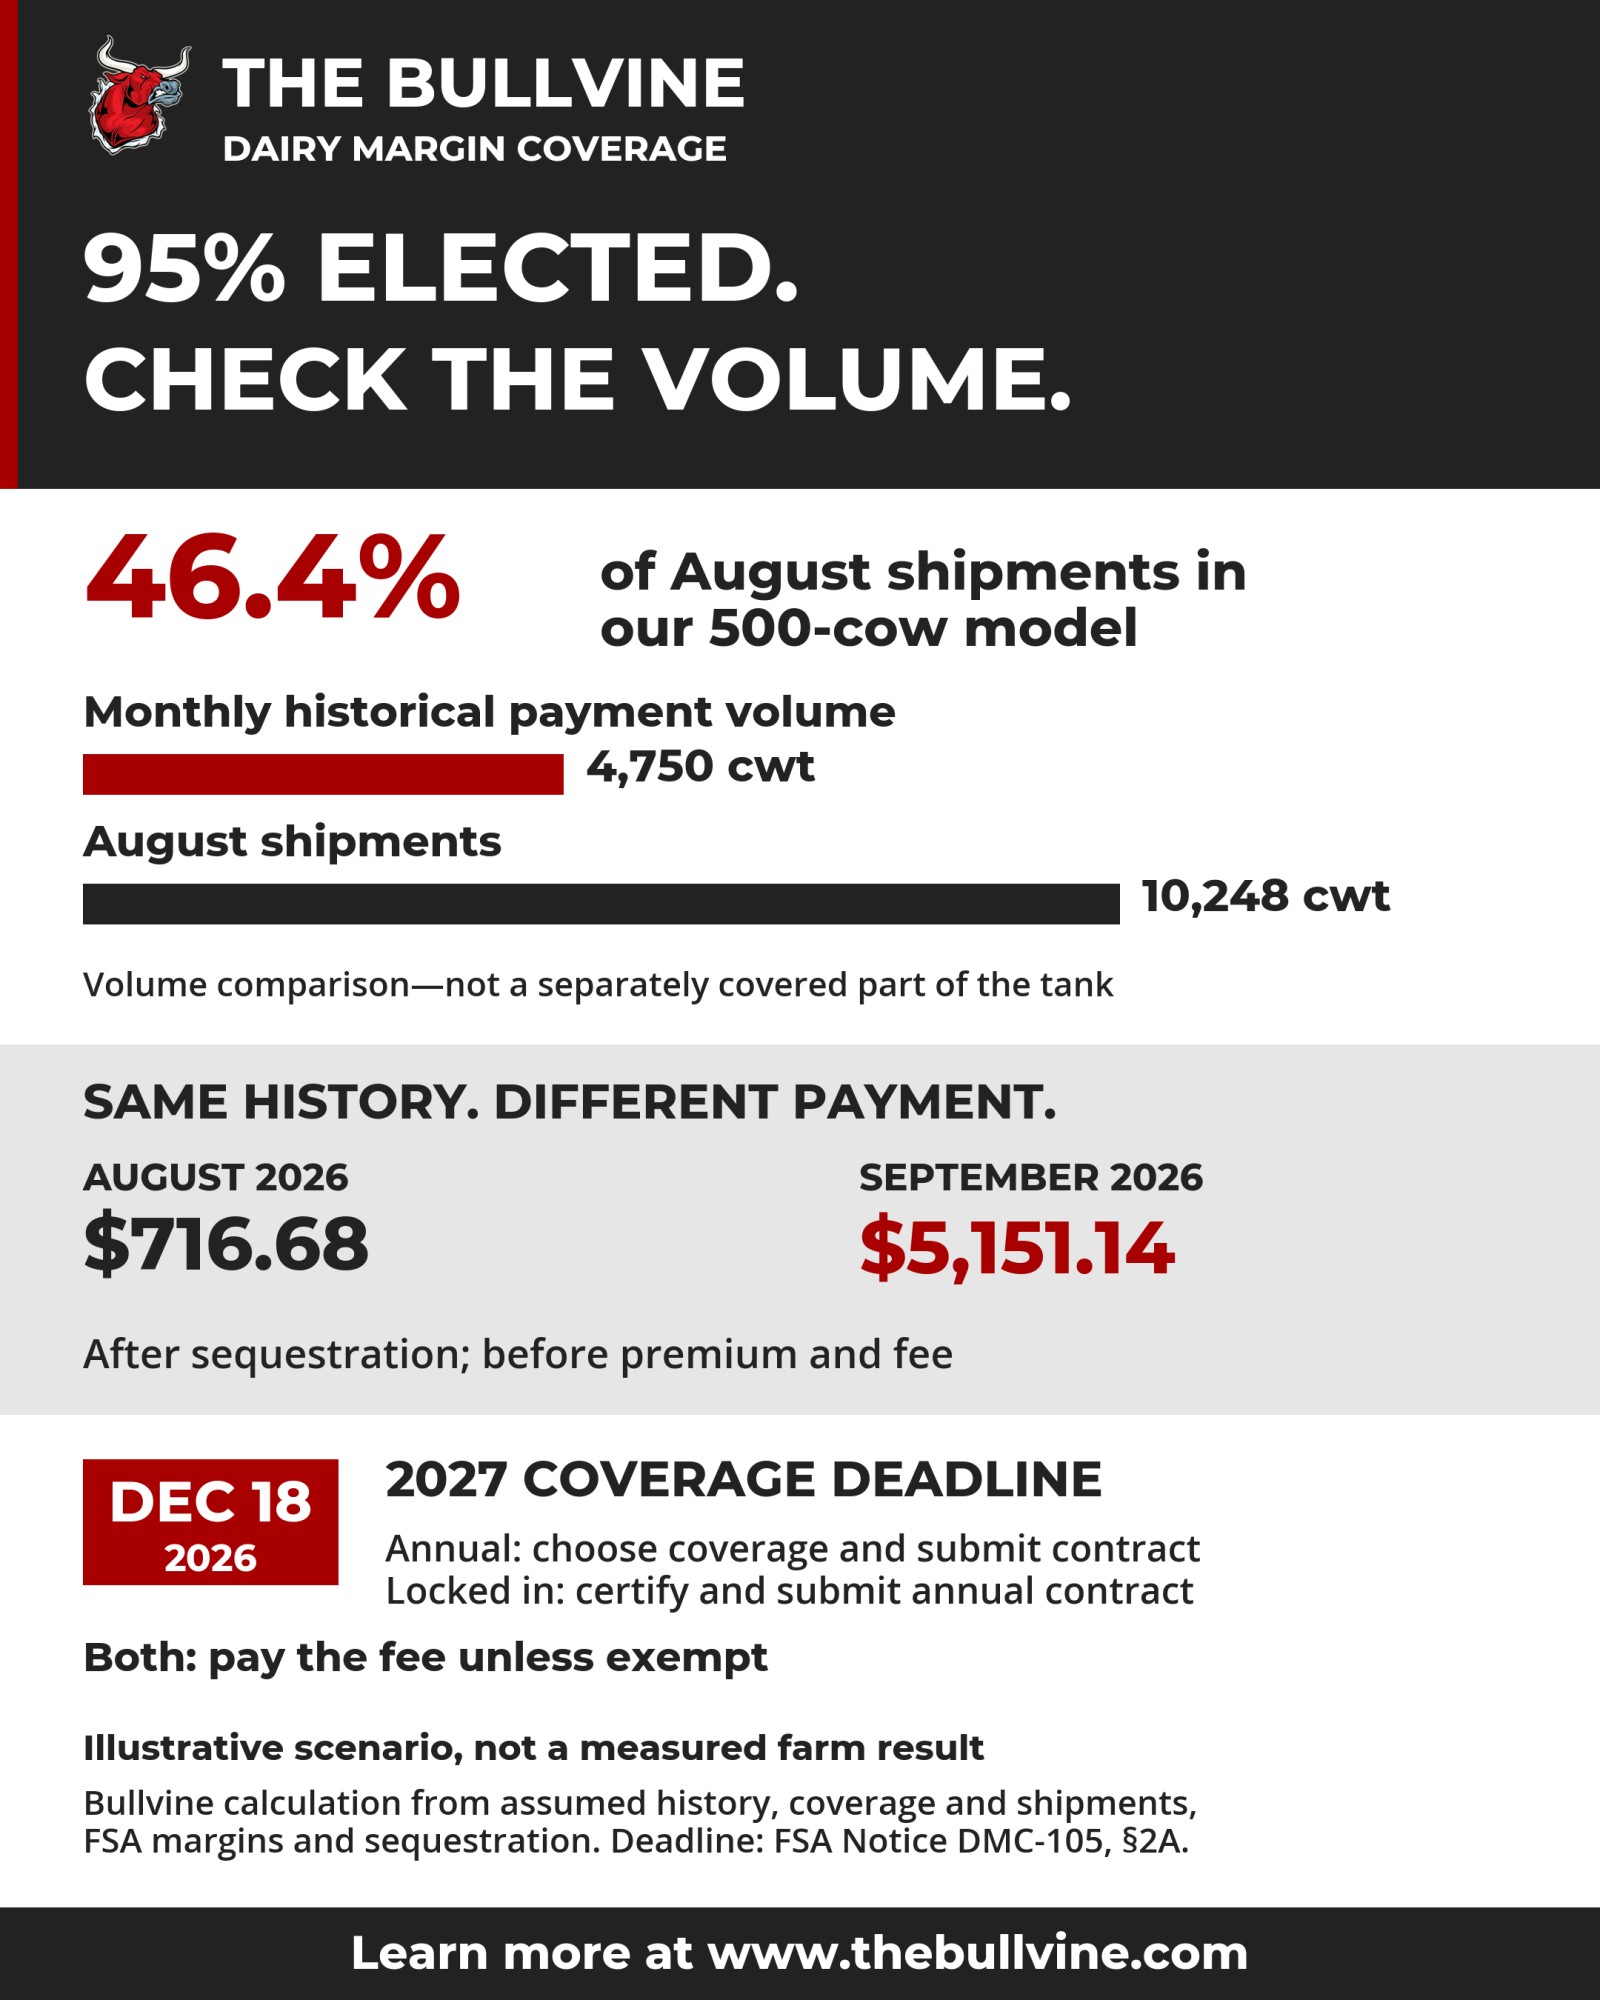
The model assumes 6.0 million lb of approved production history and 95% coverage, which works out to 4,750 cwt of monthly payment volume. The herd shipped 10,248 cwt in August, so the monthly payment volume equals 46.4% of August shipments. The payment follows historical volume, but the business spreads those dollars across what it ships now.
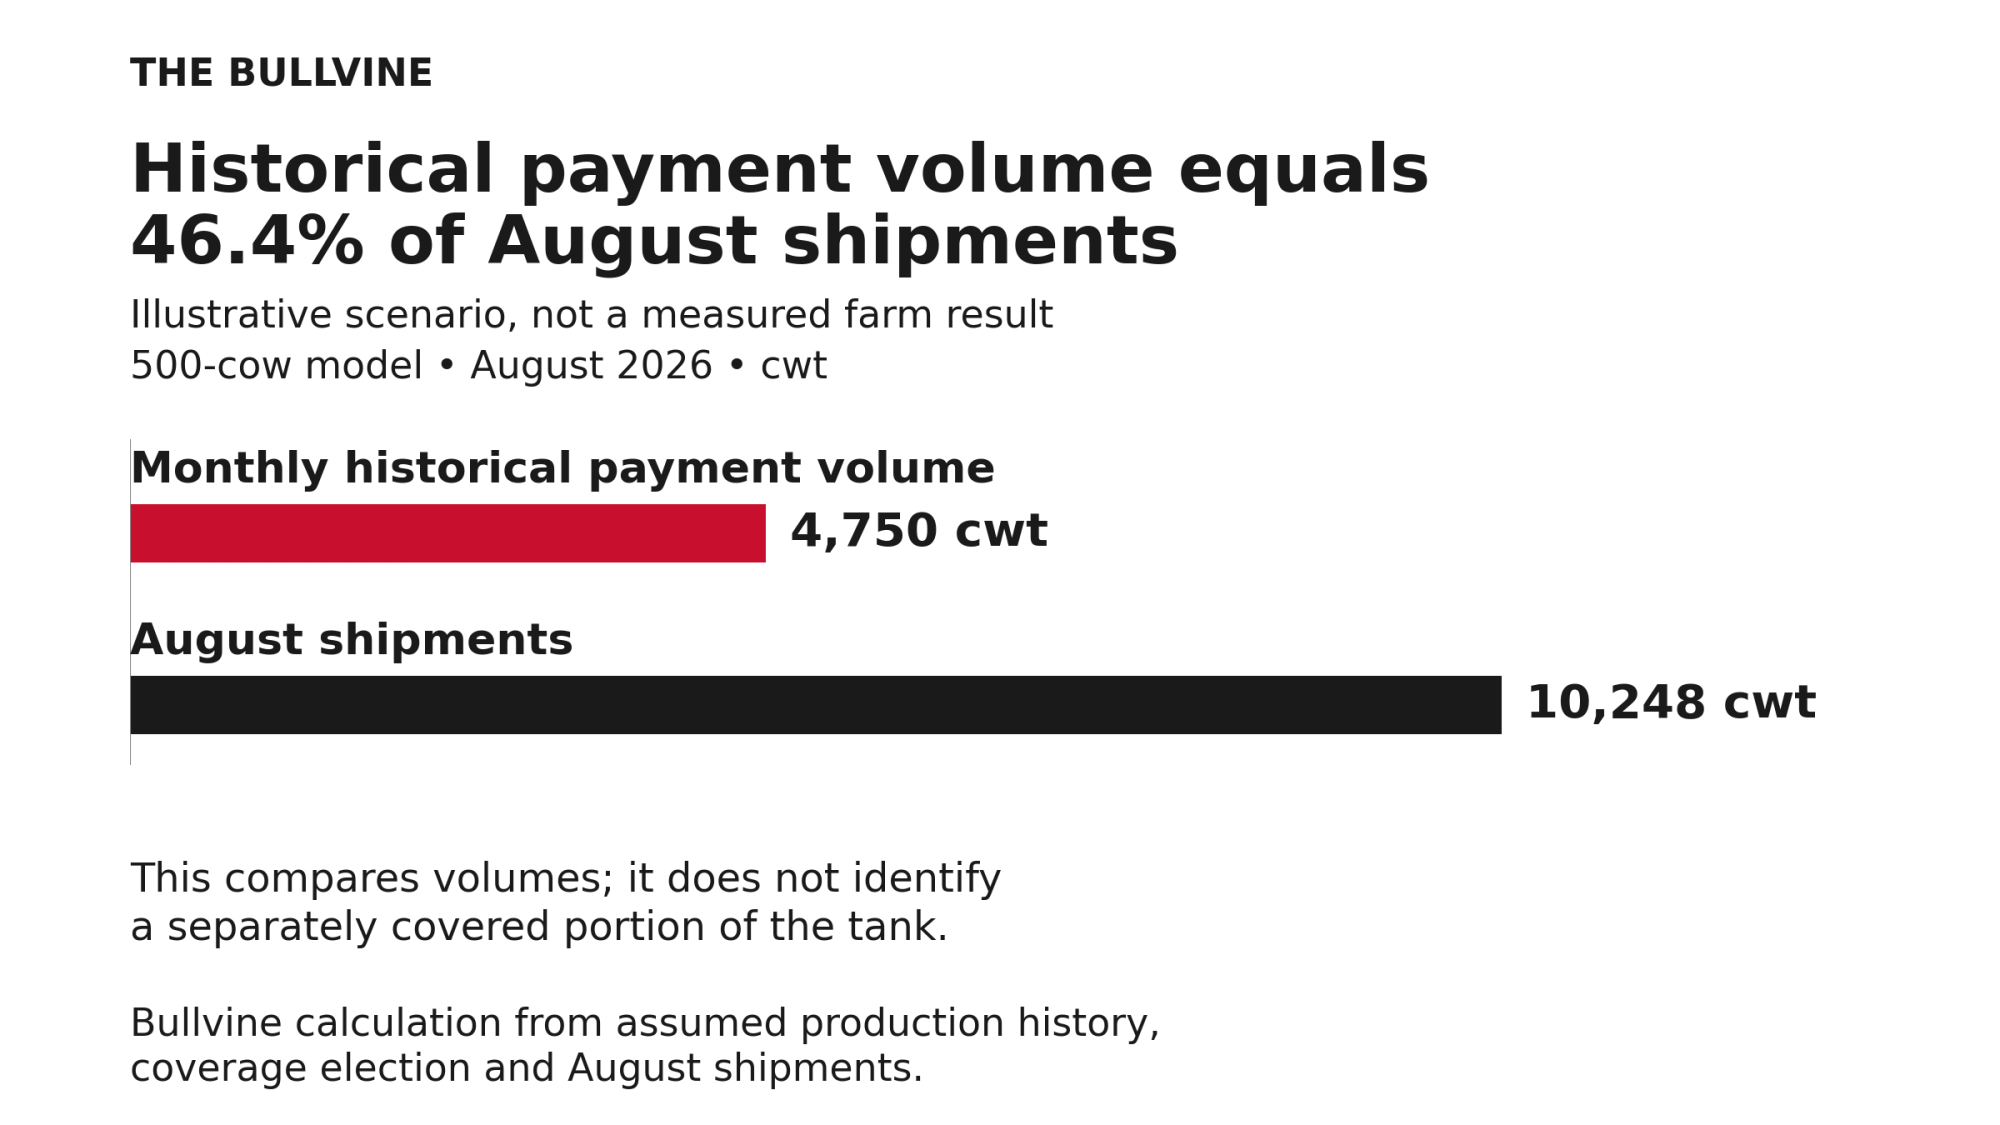
Bullvine model: Monthly historical payment volume of 4,750 cwt equals 46.4% of the herd’s 10,248 cwt shipped in August. This compares volumes; it does not identify a separately covered portion of the tank.
Why August barely covered its allocated premium
August’s 16-cent payment rate produced $716.68 on 4,750 covered cwt, after the 5.7% sequestration rate in FSA’s 2026 program notice. The allocated monthly share of this model’s $8,550 annual premium is $712.50, which leaves $4.18 before the fee. Both figures use the same historical volume, so the near-cancellation comes from August’s shallow trigger, not from herd expansion.
Expansion does its damage on a second line. Payment and premium both scale with covered history, and neither grows when shipments grow. Spread across 10,248 cwt shipped, August’s $716.68 comes to 6.99¢ per marketed cwt before premium and fee.
August beside September and the year so far
All figures in this section are Bullvine math for a modeled producer choosing coverage annually. Inputs are 4,750 covered cwt a month, an annual premium rate of $0.150 per cwt of annual covered history, and 5.7% sequestration.
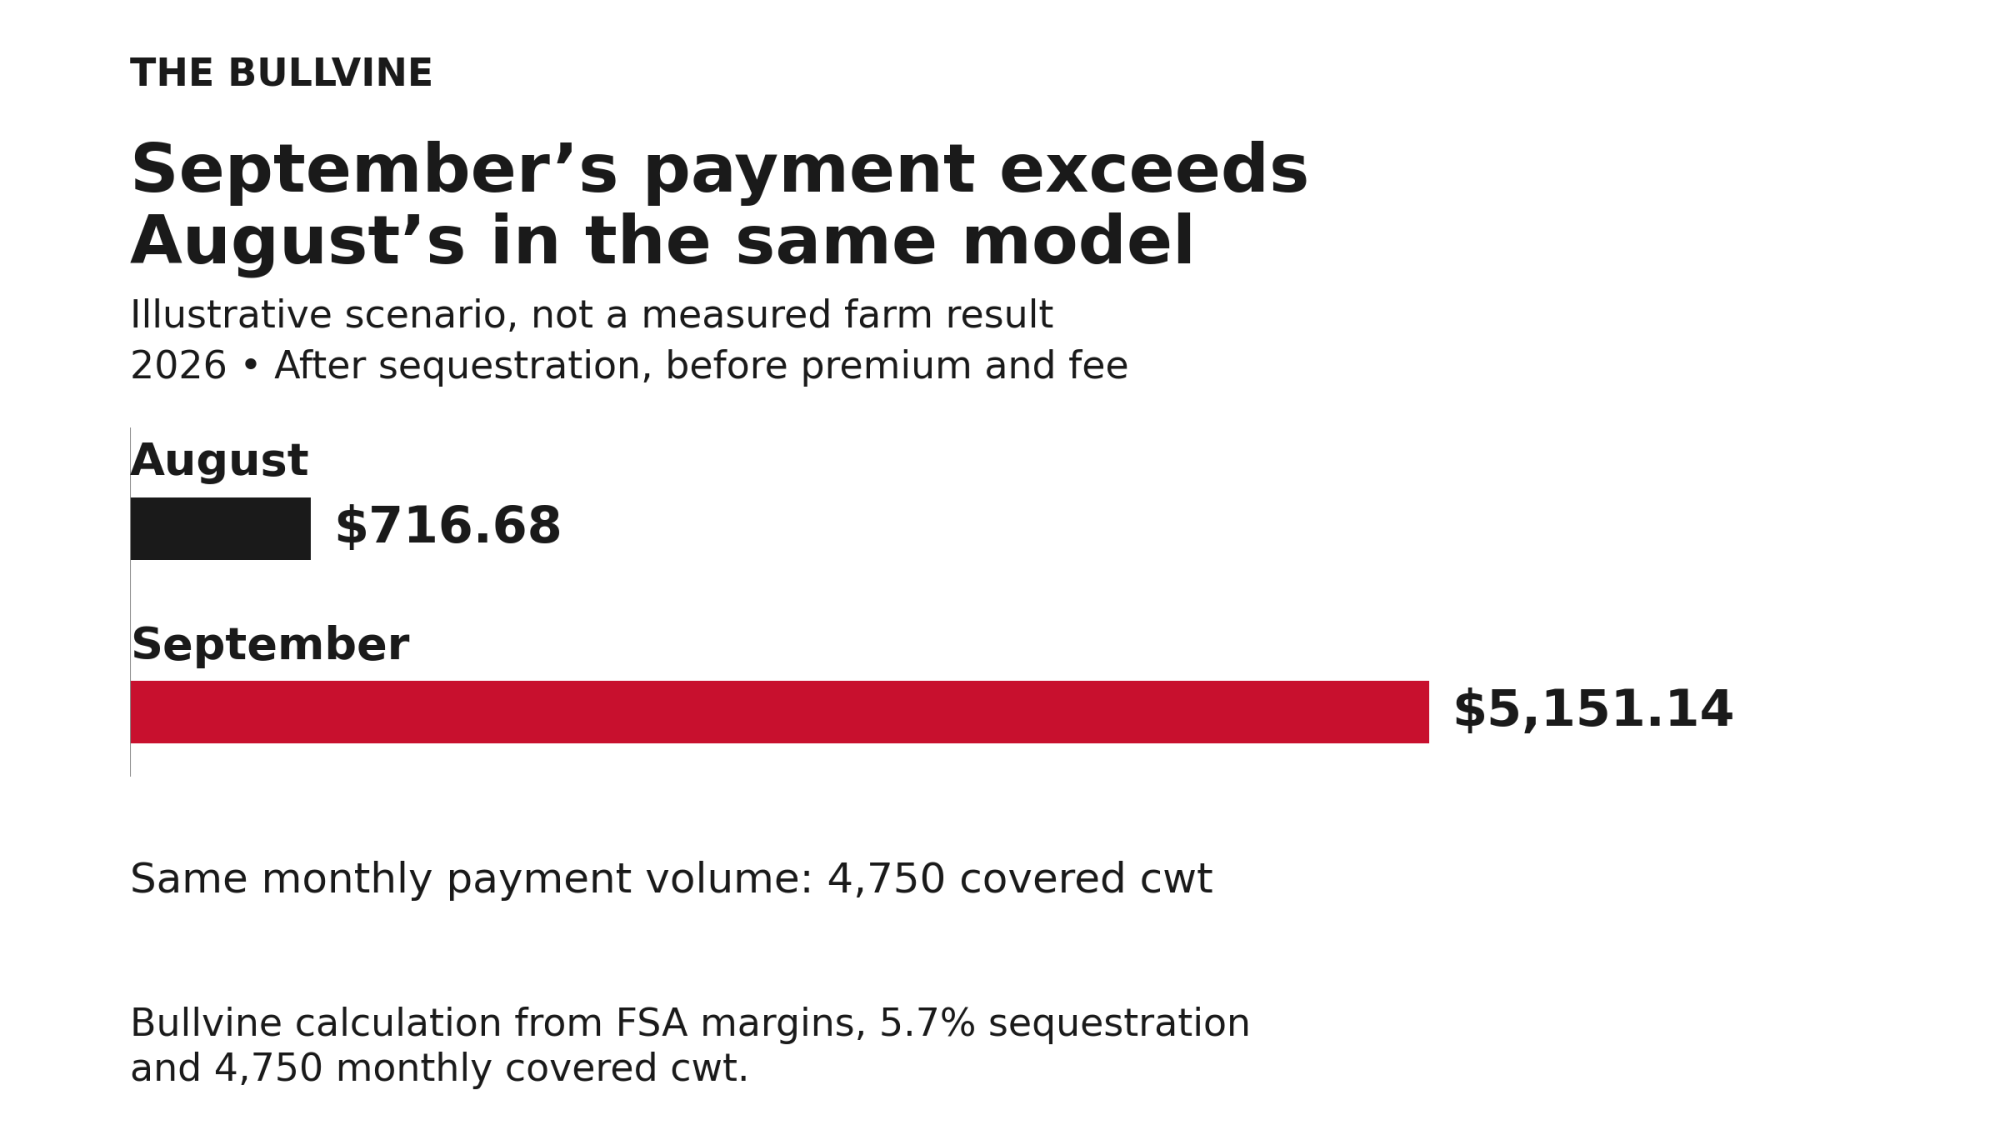
| Model calculation | August | September |
| Payment rate before sequestration | $0.16/cwt | $1.15/cwt |
| Payment after sequestration | $716.68 | $5,151.14 |
| Less allocated monthly share of annual premium | $712.50 | $712.50 |
| Payment less allocated premium, before fee | $4.18 | $4,438.64 |
September did the work August could not. Payments attributable to January–September come to $18,096.17: 4,750 monthly covered cwt × ($1.69 + $1.04 + $0.16 + $1.15) × 0.943. The four rates are January, February, August and September at $9.50 coverage. Subtracting the full $8,550 annual premium and the $100 fee leaves $9,446.17.
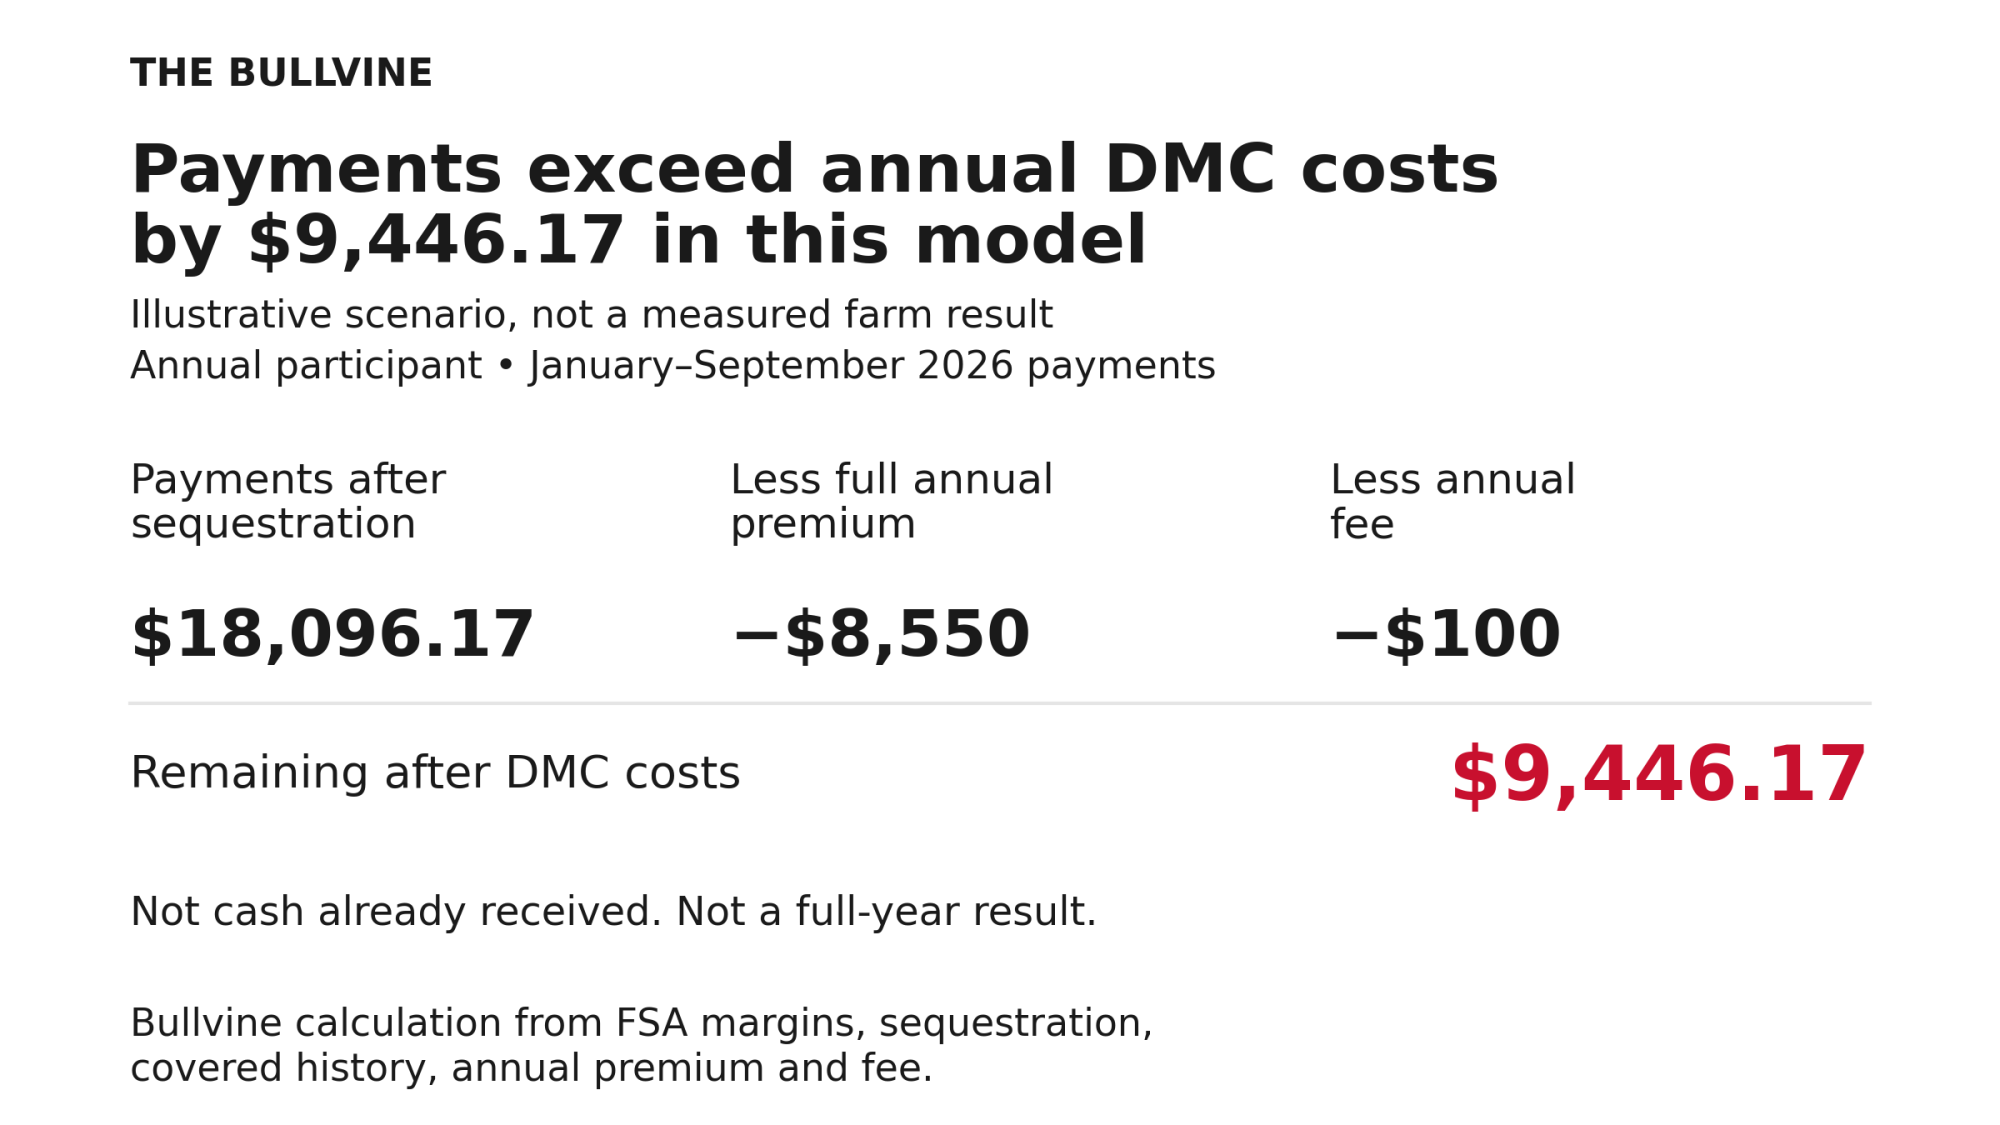
That figure is not cash already received, and it is not a full-year result. As of November 17, 2026, FSA’s published table still lists September as the latest reported margin.
The premium allocation is for comparison only and does not show when the premium was actually paid. Section 1430.407(h) has the premium paid with the coverage election, and no later than September 1 of the coverage year unless FSA specifies otherwise.
Same deadline, different decision
Annual participants choose 2027 coverage by December 18. Producers already locked in have the same deadline, but for annual certification and a contract instead.
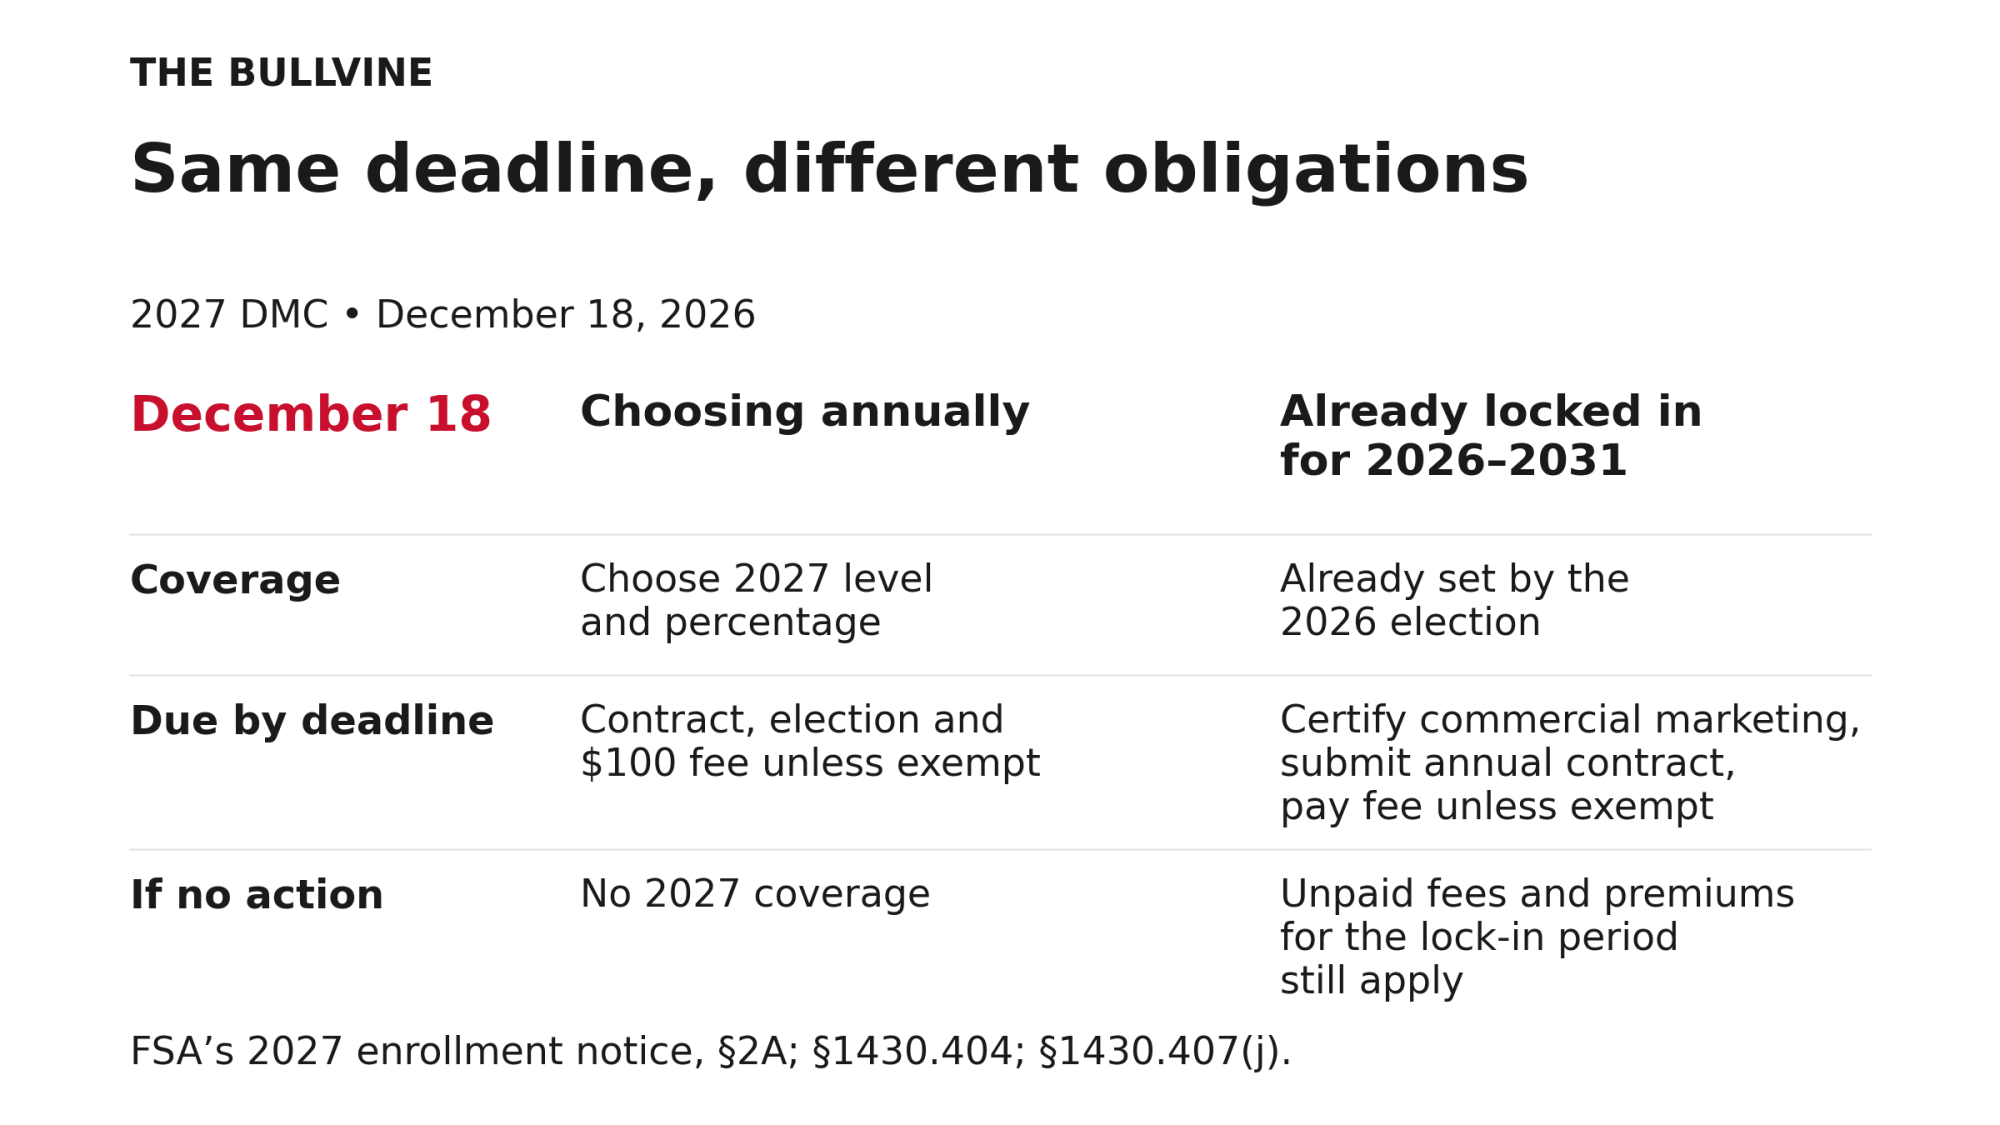
| Item | Choosing coverage annually | Already locked in for 2026–2031 |
| Coverage level and percentage | Chosen fresh for 2027; nothing carries forward | Already set by the 2026 lock-in election |
| Due by Dec. 18 | Contract, election and $100 fee unless exempt. Late contracts are not considered | Certify commercial marketing, submit the annual contract, pay the fee unless exempt |
| Premium | $0.150/covered cwt at $9.50 Tier 1 | 25% less: $0.1125/covered cwt |
| If nothing is done | No 2027 coverage | Unpaid fees and premiums for the lock-in period still apply |
Table sources:
- Annual coverage: §1430.404(e)(1)
- Deadline and late contracts: §1430.404(c)
- Locked-in coverage: §1430.407(j)
- Locked-in obligations: §1430.404(e)(2) and FSA’s 2027 enrollment notice, §2A
- Premium rates: FSA’s October 2026 fact sheet
The standard lock-in election was only open during the 2026 sign-up, with a separate exception for new operations. Existing producers choosing coverage for 2027 cannot take it now. For the trade-off locked-in producers already made, see our 2026 lock-in analysis.
How DMC sets production history
For existing operations, 2026 production history is the highest annual marketings of 2021, 2022 or 2023 (7 CFR §1430.405(a)). Adding cows does not raise it automatically. The regulation provides for transfers, successions and re-establishments. Eligible continuing operations also have one specific potential adjustment, for qualifying intergenerational transfers (§1430.405(f)).
This model assumes a large gap between historical volume and the current production rate. Annualizing August’s 10,248 cwt gives 122,976 cwt—about 2.05 times its 60,000-cwt approved history—but that is not an estimate of actual annual shipments. For an annual comparison, 95% coverage divided by annual shipments 20% above history gives 79.2%; at 50% above history, it gives 63.3%. If annual shipments equal approved history, the annual ratio is 95%. Monthly ratios can still vary with seasonality. These are Bullvine calculations.
Running the Numbers
Modeled herd: 500 cows shipping 10,248 cwt in August 2026, about 66 lb per cow per day. Approved history is 6.0M lb, with 95% coverage at $9.50, all in Tier 1. These are stated assumptions, not a real farm.
| Item | Value |
| Covered history: 6.0M lb × 95% | 57,000 cwt/year; 4,750 cwt/month |
| August margin (FSA) | $9.34/cwt |
| Payment rate: $9.50 − $9.34 | $0.16/cwt |
| Sequestration, 2026 DMC payments (FSA Notice DMC-95) | 5.7% |
| August payment: 4,750 × $0.16 × 0.943 | $716.68 |
| Annual premium: 57,000 × $0.150 (§1430.407) | $8,550 |
| Allocated monthly share of annual premium | $712.50 |
| Payment vs. allocated premium, per monthly covered cwt | $0.15088 vs. $0.15000 |
| Monthly covered volume ÷ August shipments (4,750 ÷ 10,248) | 46.35% |
| August payment ÷ August shipments | 6.99¢/cwt |
Payment less allocated premium and fee, by participant circumstance (Bullvine math):
| Participant | August | Jan–Sept payments less full annual premium and fee |
| Choosing annually, fee payable ($8.33/month allocated) | −$4.15 | $9,446.17 |
| Choosing annually, fee waived | $4.18 | $9,546.17 |
| Already locked in since 2026, fee payable | $173.97 | $11,583.67 |
| Already locked in since 2026, fee waived | $182.31 | $11,683.67 |
How much of your current tank does historical DMC actually cover?
Enter your approved history and current volume to see your true coverage ratio and effective payout per shipped hundredweight in under 60 seconds.
How we calculate this
- Covered Monthly Volume: (History lbs / 100) × Coverage % ÷ 12 months.
- Coverage Ratio: Covered Monthly Volume ÷ Current Monthly Shipments.
- Gross Payment: Covered Monthly Volume × Payment Rate × 0.943 (5.7% sequestration cut per FSA Notice DMC-99).
- Allocated Premium: Total Annual Covered cwt × $0.150 tier 1 premium (§1430.407) ÷ 12.
- Net Payment: Gross Payment minus Allocated Premium (excluding $100 admin fee).
- Payout per Shipped cwt: Gross Payment ÷ Current Monthly Shipments.
Numbers change when FSA publishes the next monthly DMC margin. Bookmark this page or get the update in The Bullvine Weekly.