








USDA counted 2.6% more milk in September, but the all milk price fell 90 cents. Holding even took about 4.6% more. Here’s the math, and a worksheet for your own settlements.
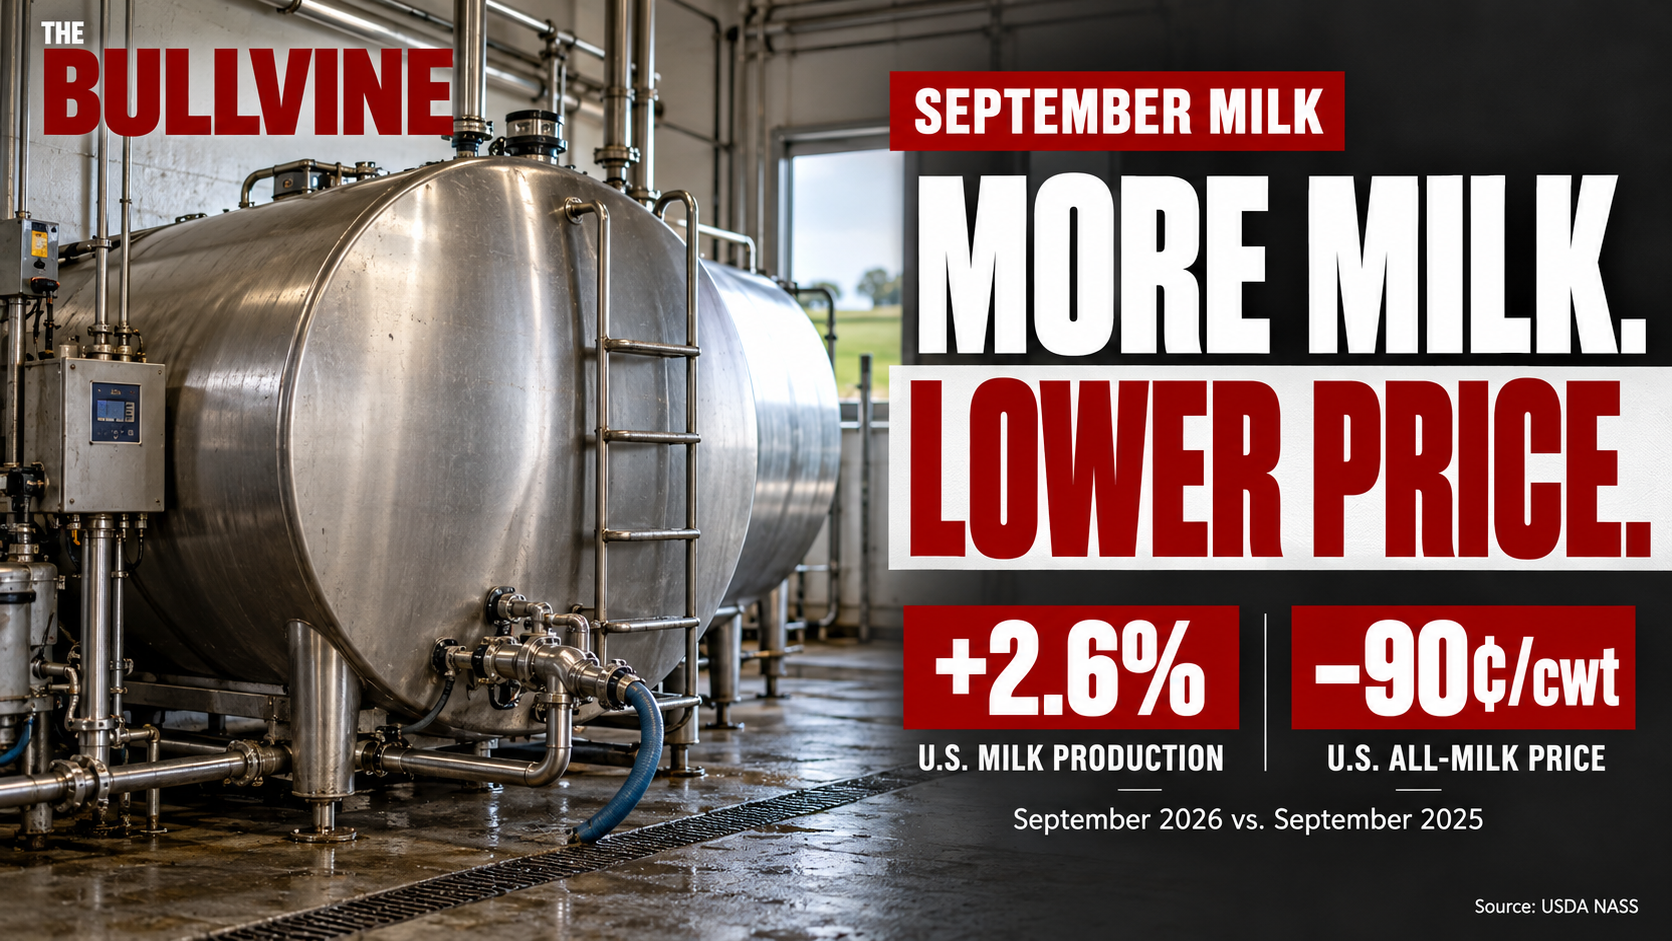
USDA’s National Agricultural Statistics Service puts September 2026 U.S. milk production at 19.443 billion pounds, up 2.6% from 18.942 billion a year earlier. Over the same months, the national all milk price slipped from $20.40 to $19.50/cwt, a 4.4% drop by Bullvine’s calculation. Multiply each year’s milk, in cwt, by that year’s price, and the total comes out 1.9% lower.
September in three numbers
- USDA NASS puts September 2026 national milk production up 2.6% from a year earlier. The all milk price fell 90 cents, to $19.50/cwt.
- By Bullvine’s math, holding the national price–volume total steady would have taken about 4.6% more milk. The total fell 1.9%.
- A farm’s own result depends on its components, premiums, deductions and marketing arrangement. The two-box worksheet below runs on both Septembers’ settlements.
More milk didn’t offset a lower all milk price
| U.S. national | September 2025 | September 2026 | Change |
| Milk production | 18.942 billion lb | 19.443 billion lb | +2.6% |
| All milk price | $20.40/cwt | $19.50/cwt | −4.4% |
| Production (cwt) × price, indexed | 100.0 | 98.1 | −1.9% |
Sources: USDA NASS, Milk Production (October 22, 2026) and Agricultural Prices (October 30, 2026). Price change and index are Bullvine calculations; this is a national comparison, not a farm settlement.
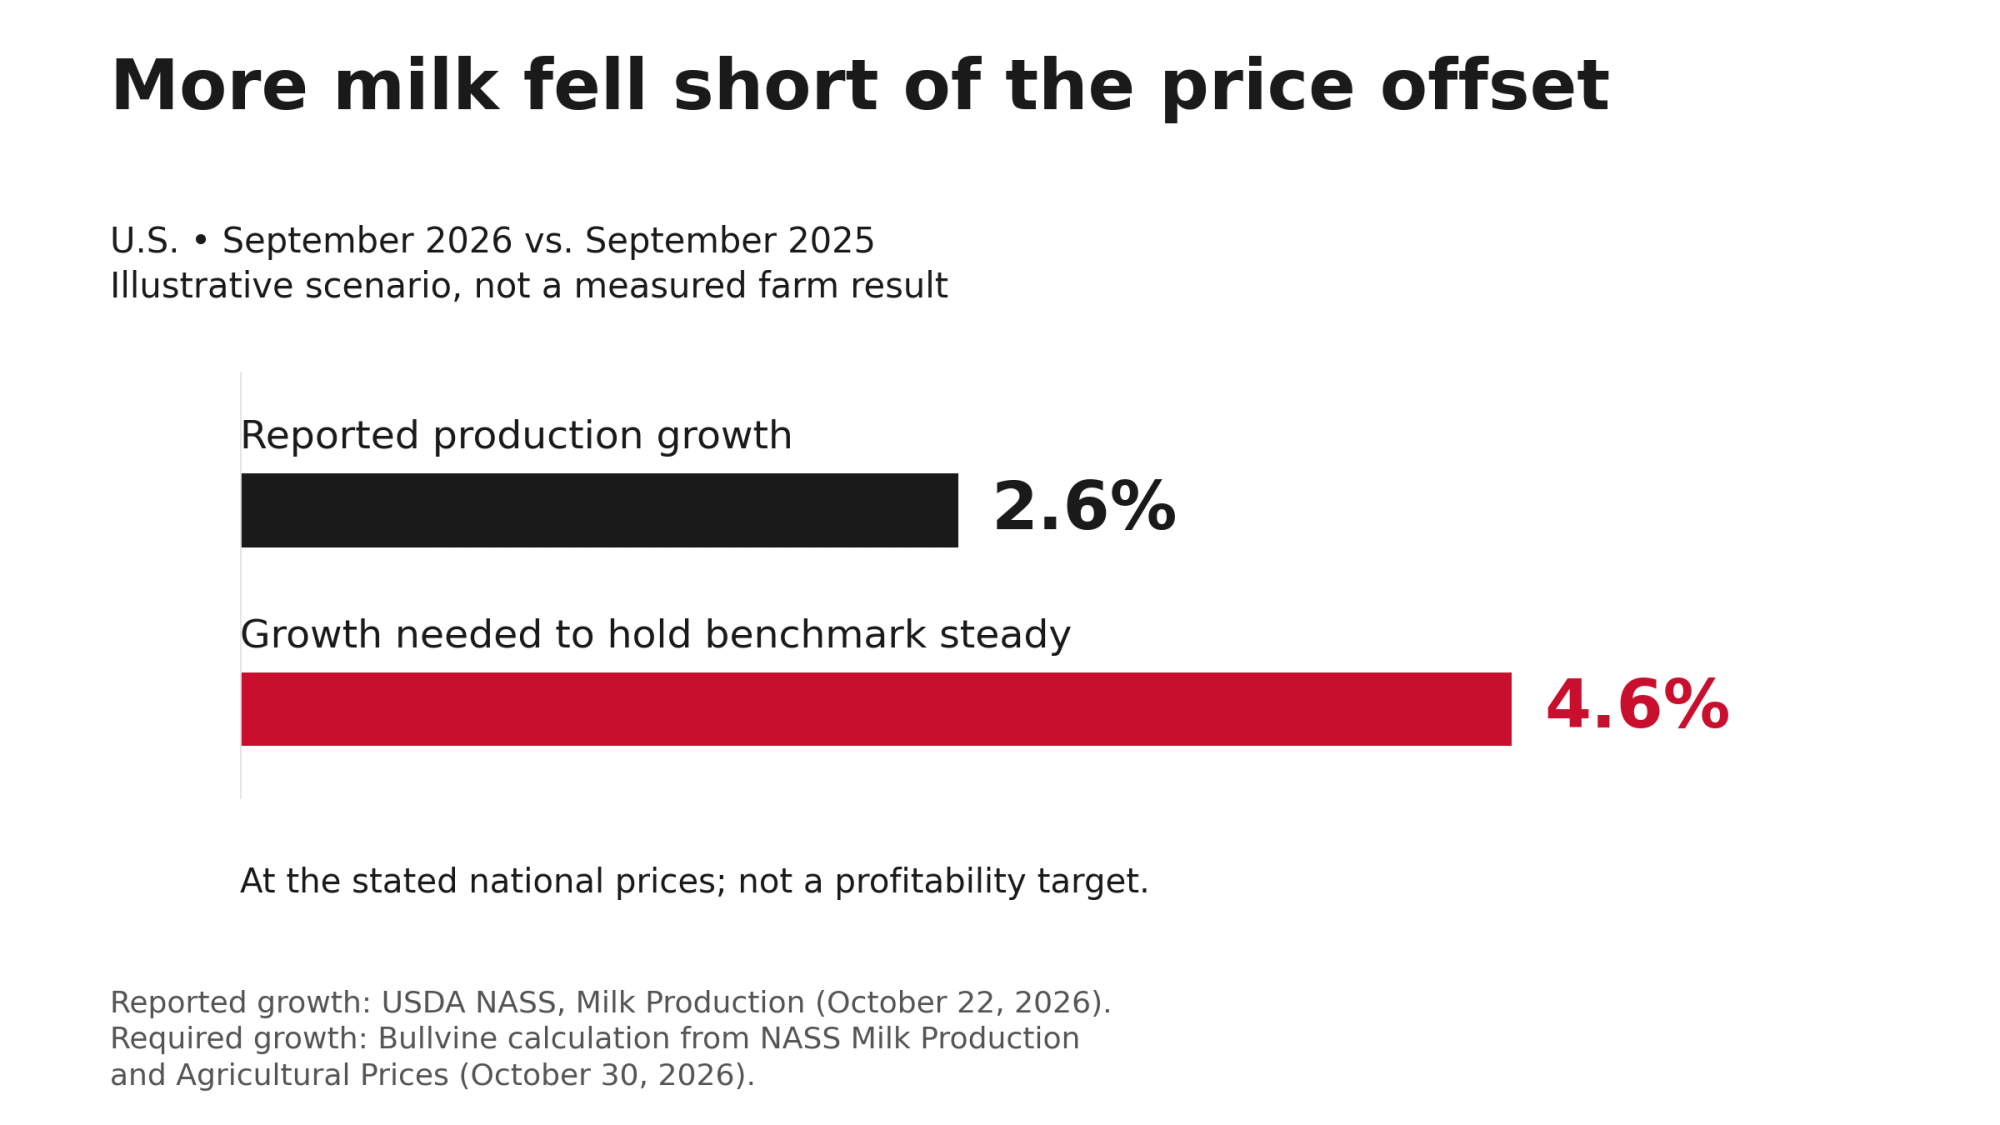
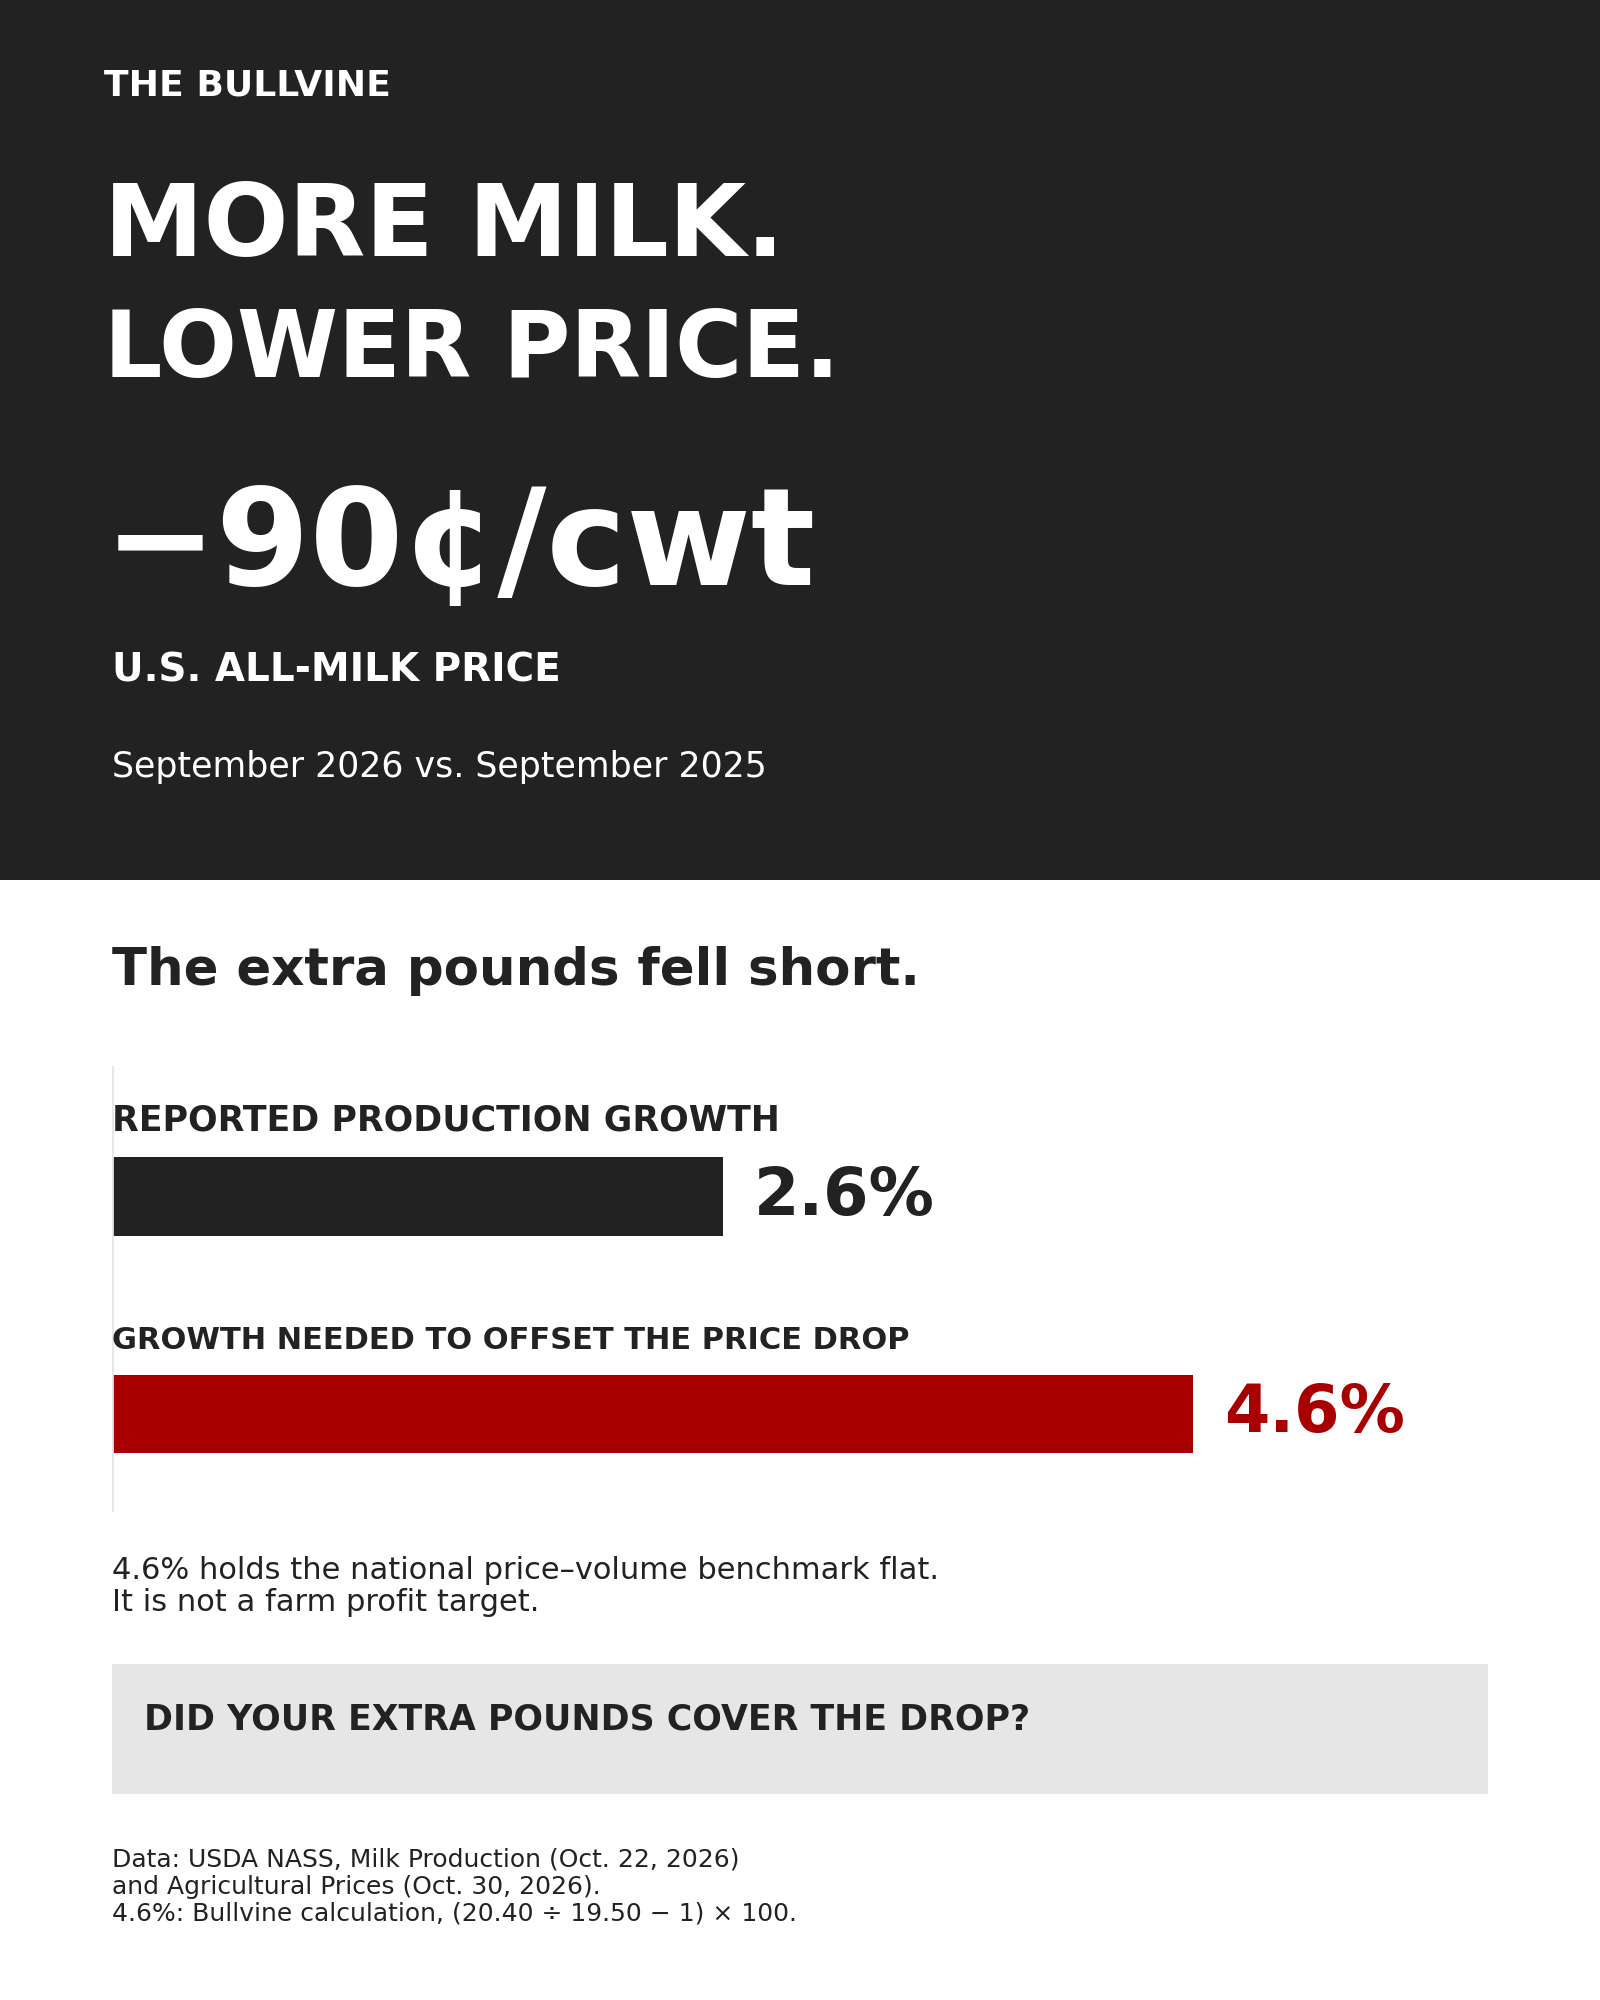
Holding the national total steady at those prices would have taken about 4.6% more milk, by Bullvine’s calculation: $20.40 divided by $19.50, minus one. NASS reported about 2.6%, so the gain covered a little more than half the distance. The 4.6% only marks where this one number stays flat; it is not a profitability target or a case for shipping more milk.
The all milk price is a gross figure. NASS reports it before deductions for items such as hauling, stop charges, advertising and promotion, and co-op dues, with premiums and discounts for quality, quantity or other reasons included and hauling subsidies excluded.
What that looks like on 1,000 cwt
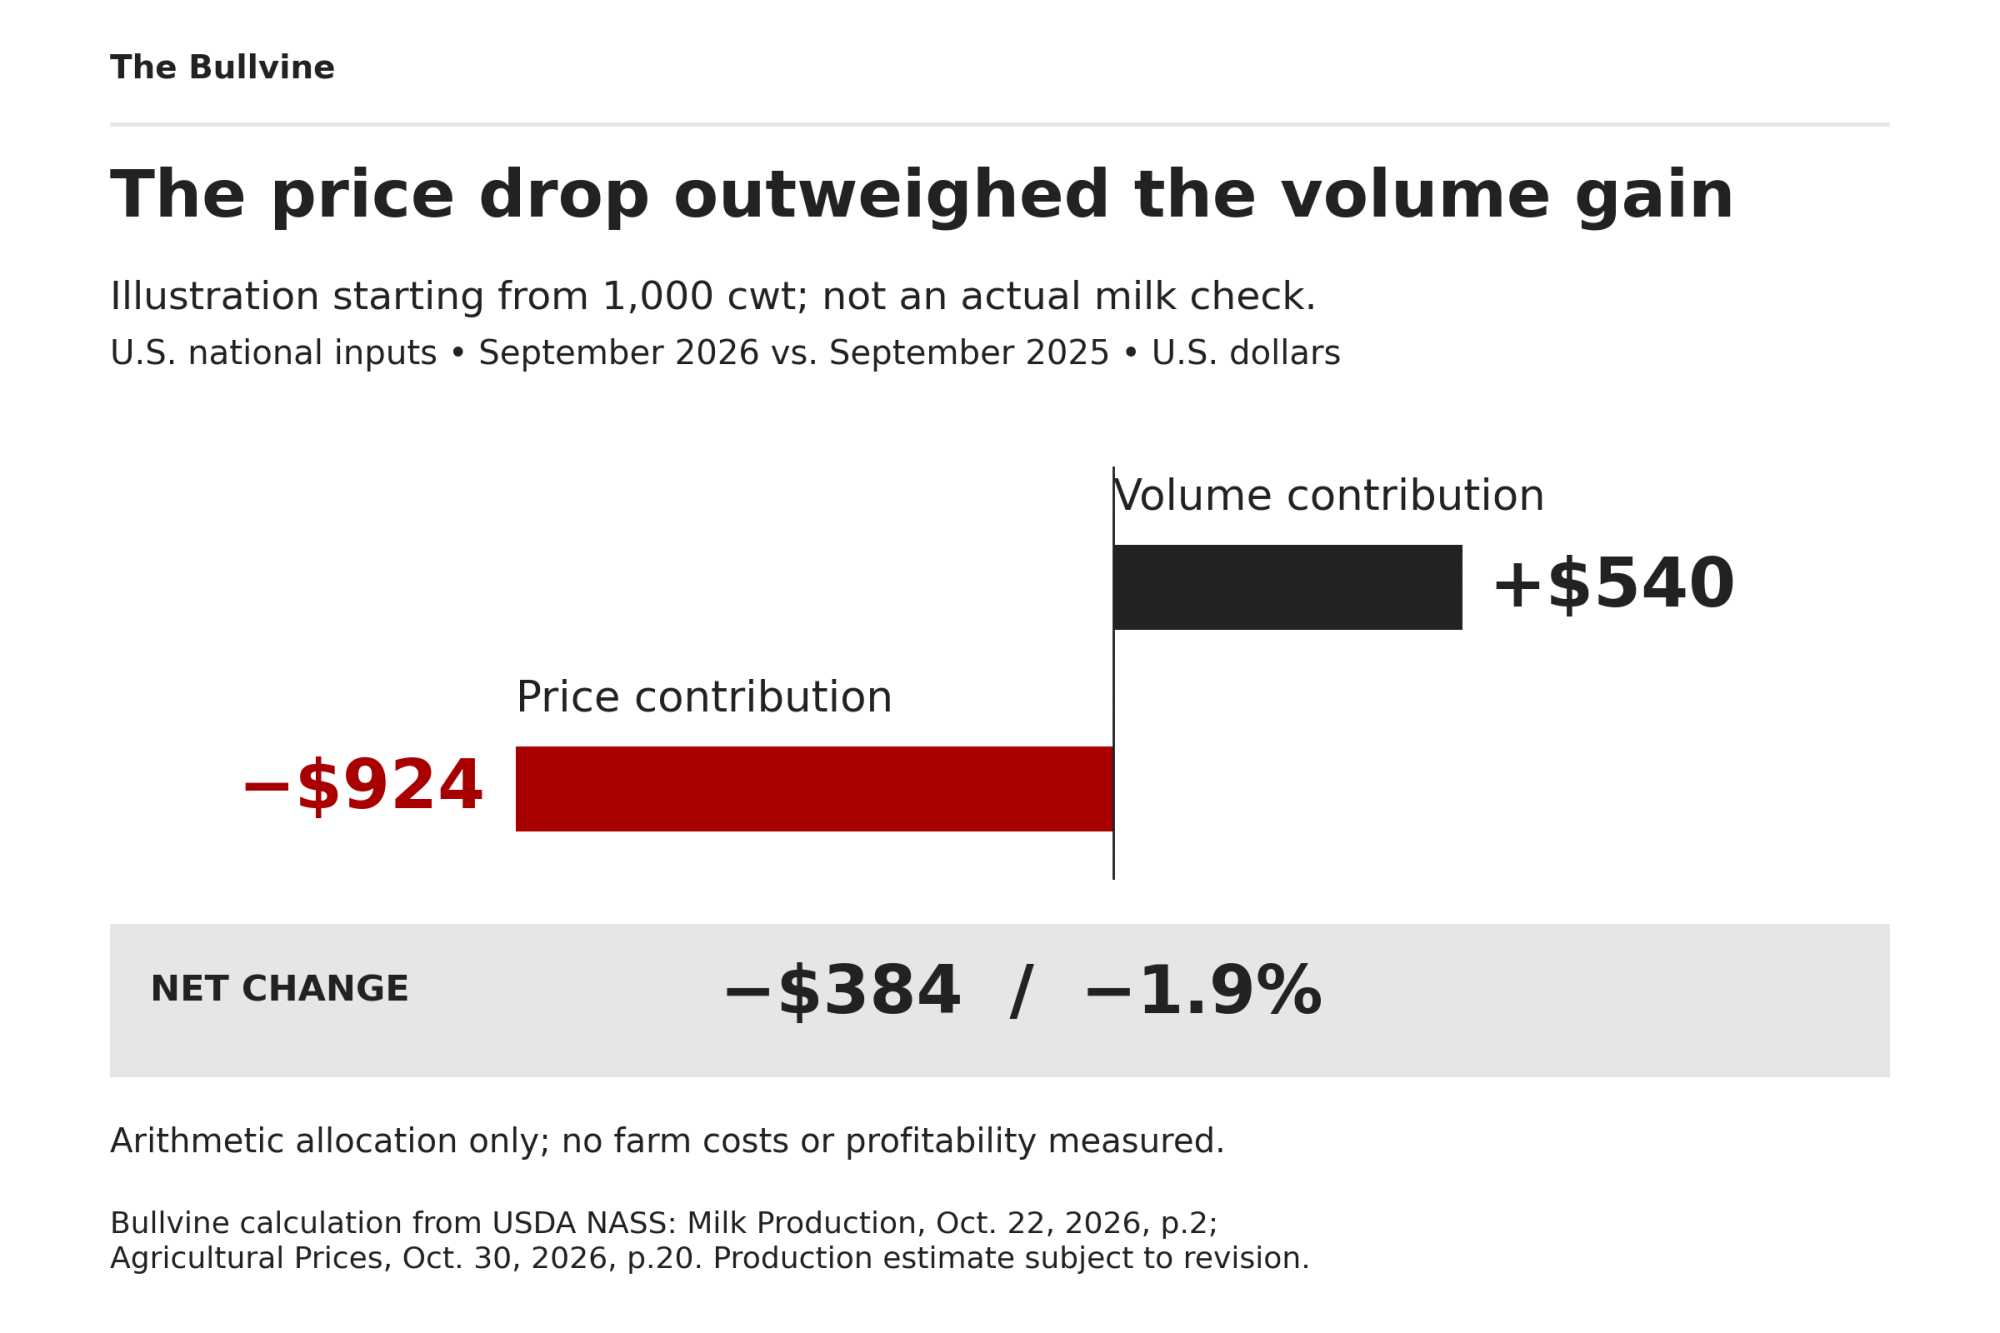
Start with 1,000 cwt shipped in September 2025 and grow it by the national 2.6%, and September 2026 lands at about 1,026 cwt. Valued at last year’s $20.40, the extra milk is worth about $540, while the 90-cent drop on every hundredweight costs about $924. That leaves the total about $384 lower, or 1.9%. The illustration runs on national prices, not anyone’s check, and it shows the split rather than why prices or production moved.
How did the farm’s own September compare?
A farm’s realized price depends on its components, premiums, deductions and marketing arrangement, so its September can land above or below the national line. The check runs on the farm’s own September settlements for both years.
Use the full-month statement totals with itemized deductions, for the same milk period each year. If the final statement already includes the advance, don’t add the advance again.
Box 1: The inputs
| Enter for each September | 2025 | 2026 |
| Marketed pounds (what the buyer settled) | ___ | ___ |
| Marketed cwt (pounds ÷ 100) | ___ | ___ |
| Gross milk-sales value for that milk period | ___ | ___ |
| Marketing deductions | ___ | ___ |
| Milk value after marketing deductions (gross − deductions), before assignments | ___ | ___ |
| Realized value per cwt (the chosen milk value ÷ marketed cwt) | ___ | ___ |
Pick one basis, gross or after deductions, and keep it for both years. Running both means two separate comparisons.
Box 2: The calculation
The example column uses the national illustration above, not a real check.
| Step | What to calculate | Example |
| Change in cwt | 2026 cwt minus 2025 cwt | 1,026.45 − 1,000 = 26.45 |
| Change in realized value | 2026 value per cwt minus 2025 value per cwt | $19.50 − $20.40 = −$0.90 |
| Volume contribution | Change in cwt × 2025 value per cwt | 26.45 × $20.40 ≈ +$540 |
| Realized-value (price) contribution | 2026 cwt × change in value per cwt | 1,026.45 × −$0.90 ≈ −$924 |
| Check the arithmetic | The two contributions should add up to the change in milk value | +$540 − $924 = −$384 ✓ |
Carry value per cwt at full precision and round only at the end. A small mismatch usually means rounding, and a bigger one points to a unit conversion, a typo or a formula slip. A clean match proves the arithmetic and nothing more, because it won’t catch the wrong month or the wrong line, so every entry still gets checked against the full statements.
When realized value moves, the component, premium and deduction lines show how much of the change came from market prices and how much from those lines.
Keep assignments out of the milk price
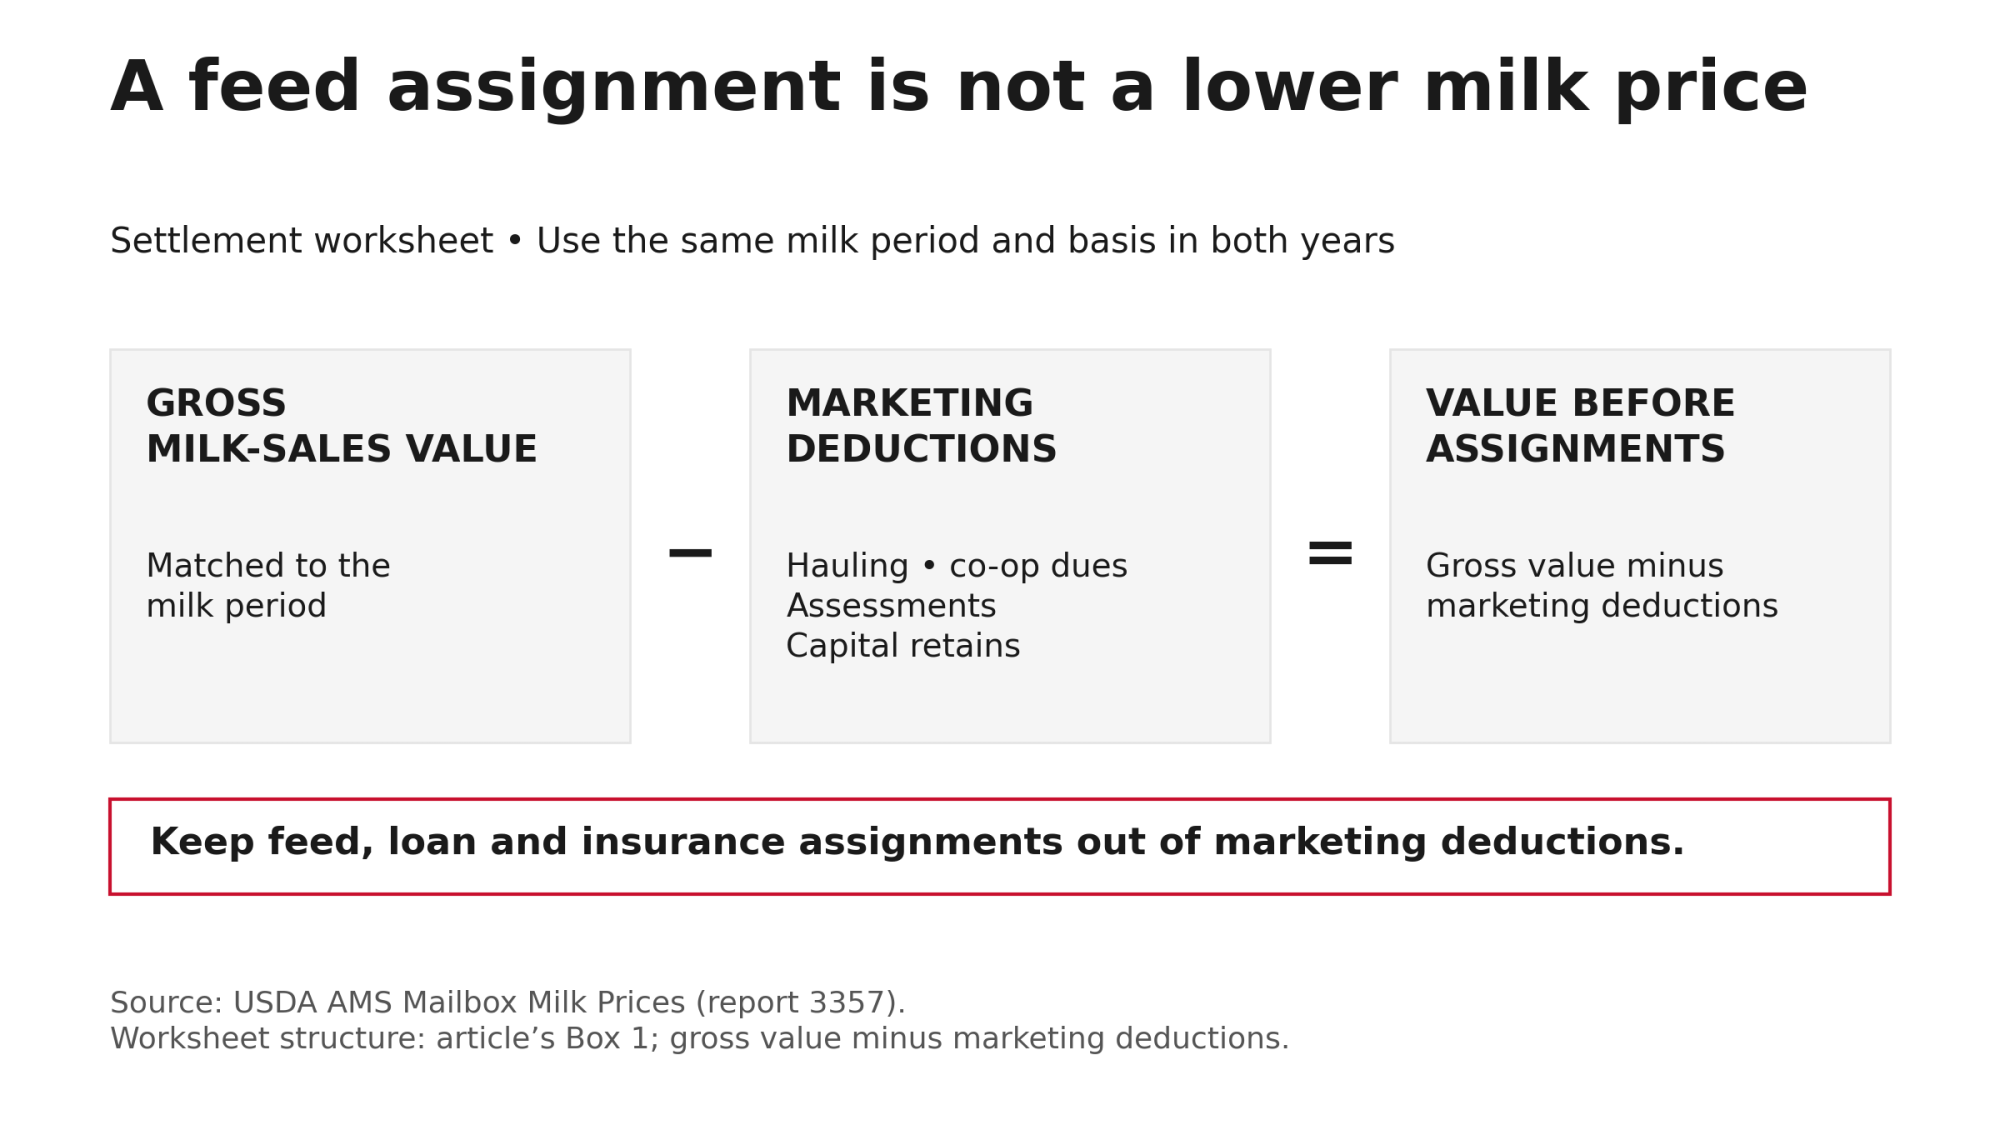
A bill paid through the check is not automatically a lower milk price. If the buyer withholds a feed bill from the September settlement, the deposit shrinks, but the bill is still a feed expense rather than a milk-marketing deduction. It stays out of Box 1’s deductions line, handled the same way in both years. USDA AMS’s mailbox-price methodology draws the same line, counting hauling, co-op dues, assessments and capital retains as marketing costs and leaving out loan, insurance and feed-mill assignments.
This worksheet compares milk-sales value. DMC’s published margin is a separate, national milk-minus-feed measure, and any DMC payments belong in a broader income or cash-flow assessment, not in this comparison.
Did the extra milk pay for itself?
The national 1.9% isn’t anybody’s milk receipts, and it says nothing about profit. The worksheet goes a step further and shows whether a farm’s added cwt offset its change in realized value. Profit takes the additional costs that came with that milk. An expansion or borrowing decision also takes capital spending, debt service and cash requirements, and any unexplained gap between the settlements and the accounts gets settled first. Nationally, September’s 2.6% more milk did not cover a 4.4% lower price, and whether it paid on any one farm sits in that farm’s cost records.
Methodology and sources: how Bullvine did the math (Details block, collapsed)
- National benchmark (Bullvine calculation): (19.443 ÷ 18.942) × (19.50 ÷ 20.40) − 1 = −1.8835%. Production change +2.6449%; price change −4.4118%. The pounds-to-cwt conversion cancels in the ratio.
- Volume needed to hold the benchmark (Bullvine calculation): 20.40 ÷ 19.50 − 1 = +4.6154%.
- 1,000-cwt illustration (Bullvine calculation):
| Step | Calculation | Result |
| Starting value | 1,000 cwt × $20.40 | $20,400.00 |
| Later quantity | 1,000 × (19.443 ÷ 18.942) | 1,026.449 cwt |
| Volume allocation | $20.40 × 26.449 cwt | +$539.56 |
| Realized-value (price) allocation | 1,026.449 cwt × −$0.90 | −$923.80 |
| Ending value | 1,026.449 cwt × $19.50 | $20,015.76 |
| Net change | Ending – starting | −$384.24 |
- Rounding: Calculations carry the unrounded production ratio. The tables display 1,026.449 cwt and 1,026.45 cwt, and the article and graphic round to whole dollars.
- Worksheet identity: change in milk value = (change in cwt × 2025 value per cwt) + (2026 cwt × change in value per cwt). This assigns the price–quantity interaction to the value term. The identity confirms the arithmetic, not the inputs or the cause.
Complete references and supporting documentation are available upon request by contacting the editorial team at editor@thebullvine.com.
Learn More
- Dairy Profit Projector — 12-Month Margin Calculator — Map out your next twelve months of whole-herd profitability using this interactive calculator. Plug in your production numbers and ration costs to instantly generate daily income over feed costs, breakeven targets, and projected net margins per hundredweight.
- USDA Slashes 2025 Milk Price Forecast By $1: What Dairy Farmers Need to Know — Washington’s $1.00 cut to the all-milk forecast strips $125,000 from the average 500-cow dairy. This breakdown exposes the flawed production signals behind the USDA’s math, delivering specific contract-blending and feed-efficiency tactics to buffer your bottom line.
- The $11 Billion Dairy Rush: Your 18-Month Window to Lock in Processor Premiums — Geographic proximity now dictates your negotiating power. This component analysis reveals why operations within 75 miles of new processing plants secure massive revenue advantages, arming you with the data to lock in premiums before early-signer leverage disappears.
The Sunday Read Dairy Professionals Don’t Skip.

Every week, thousands of producers, breeders, and industry insiders open Bullvine Weekly for genetics insights, market shifts, and profit strategies they won’t find anywhere else. One email. Five minutes. Smarter decisions all week.