






A robot can remove milking from a job description without shrinking the payroll by a single dollar. If the person who used to milk now fetches cows, responds to alarms, and reads reports, the work has just changed. A robot loan is paid in cash, and unless those freed hours completely leave your payroll, your cash flow takes the hit.
A robot can take milking off someone’s job without shrinking the payroll by a dollar. If the person who milked now fetches cows, responds to alarms, and reads reports, the farm has changed that person’s work. Whether total labor fell depends on how many hours those new tasks take. If paid hours and pay stay the same, so does the payroll. Time handed back to an unpaid owner doesn’t reduce payroll either. A robot loan is paid in cash, so cash is the test this article runs, starting with the four-robot, 240-cow University of Minnesota model.
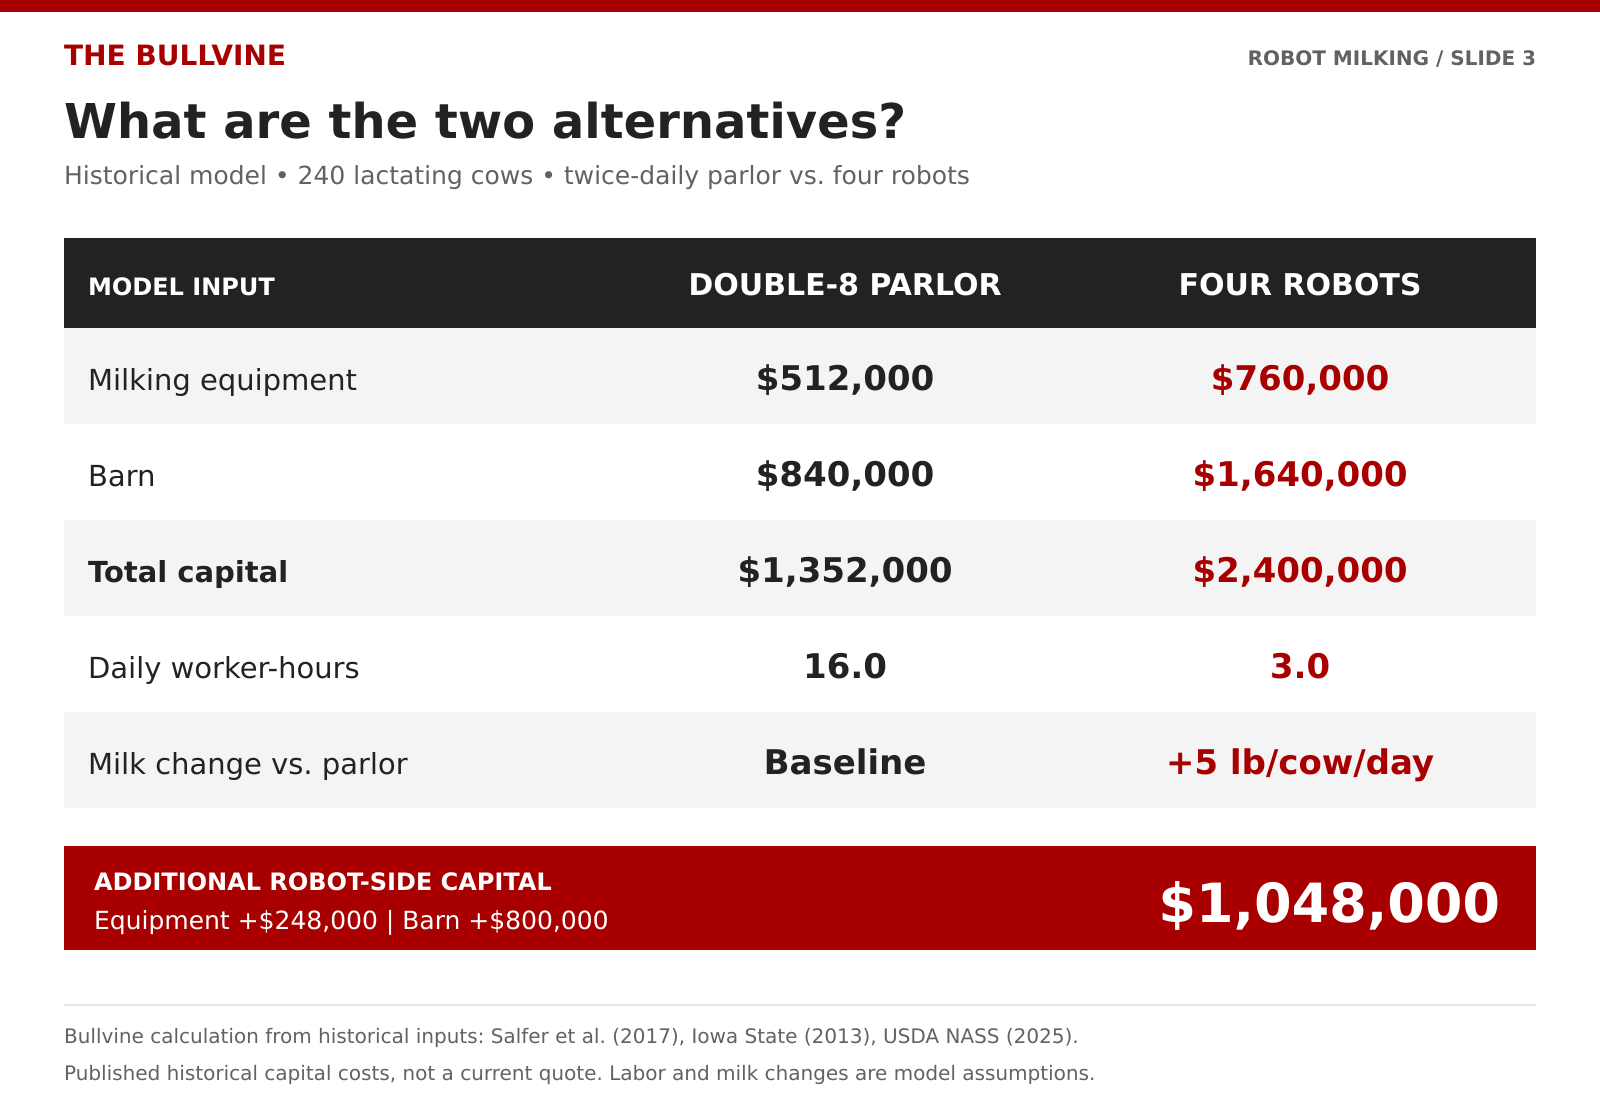
That model is a good place to see the difference. In the Minnesota model, four robots on 240 cows cut twice-daily (2×) milking labor from 16 worker-hours a day to 3.0. That frees 13.0 hours, by our subtraction. Bullvine ran a cash comparison combining inputs from that historical model with our own assumptions:
- $17/cwt milk (our assumption)
- 5 lb more milk per cow per day (a modeled increase in the Minnesota model)
- the Minnesota model’s $1.048 million capital premium, which we assume is fully financed
- no cash credit for saved management time (our default)
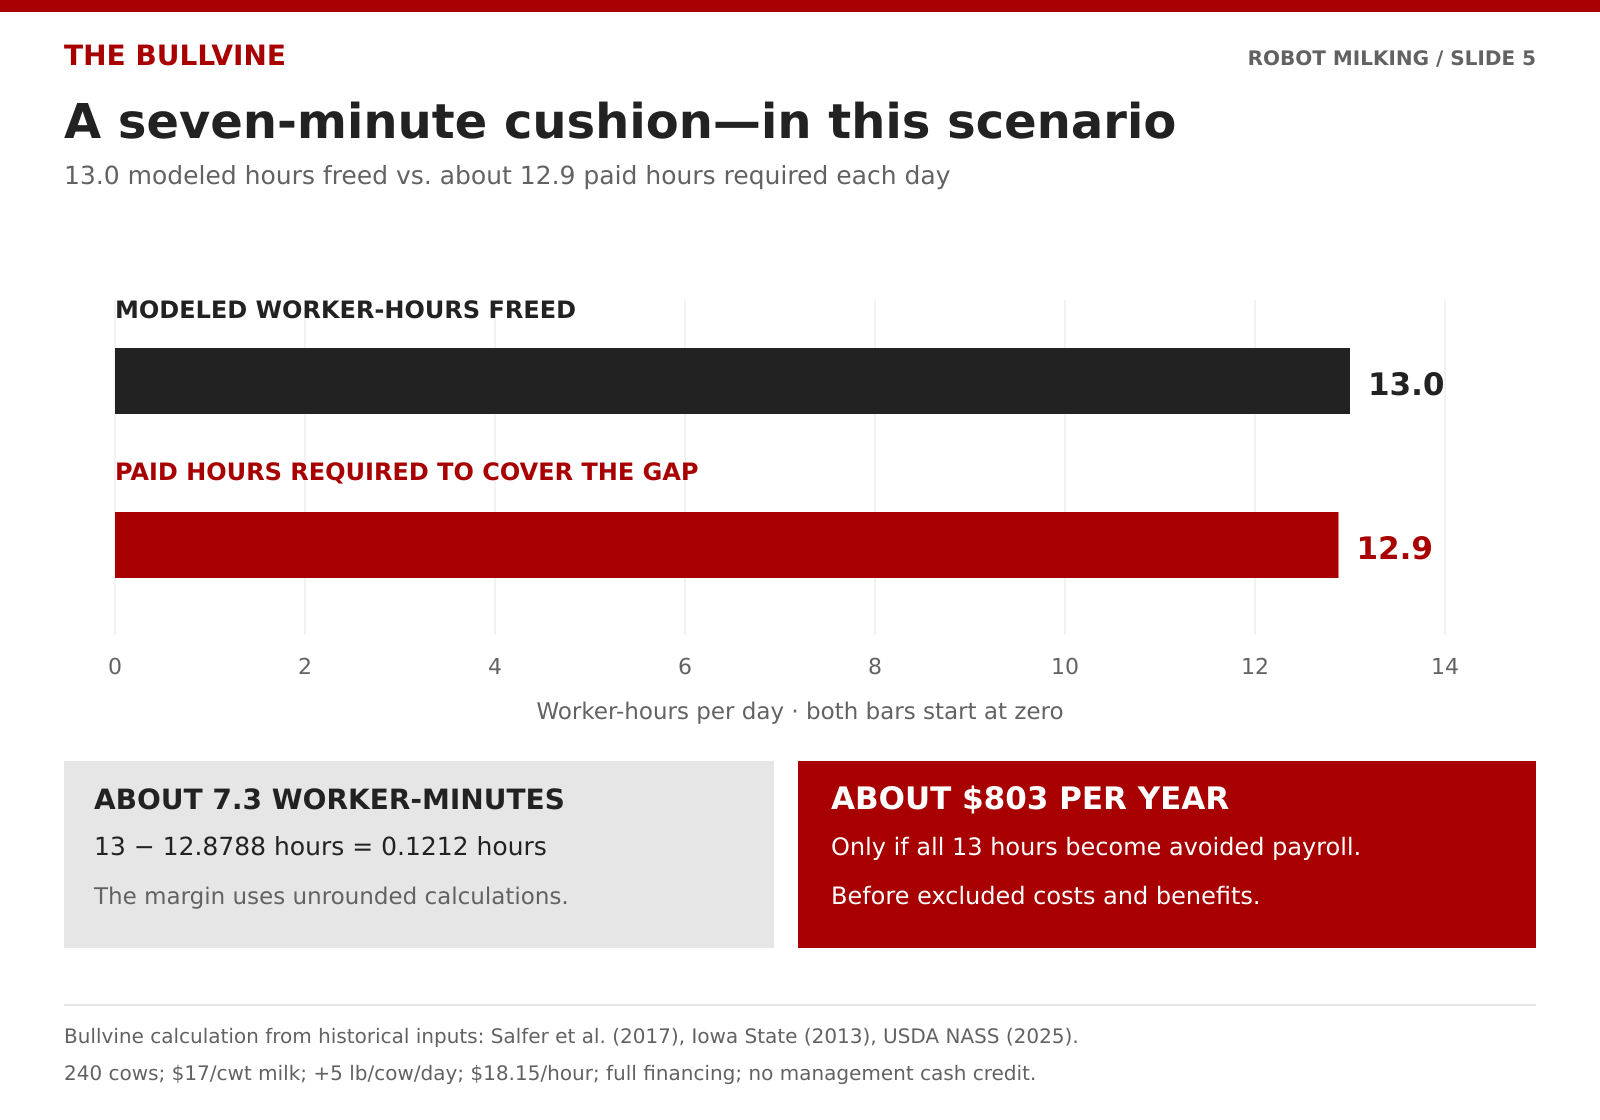
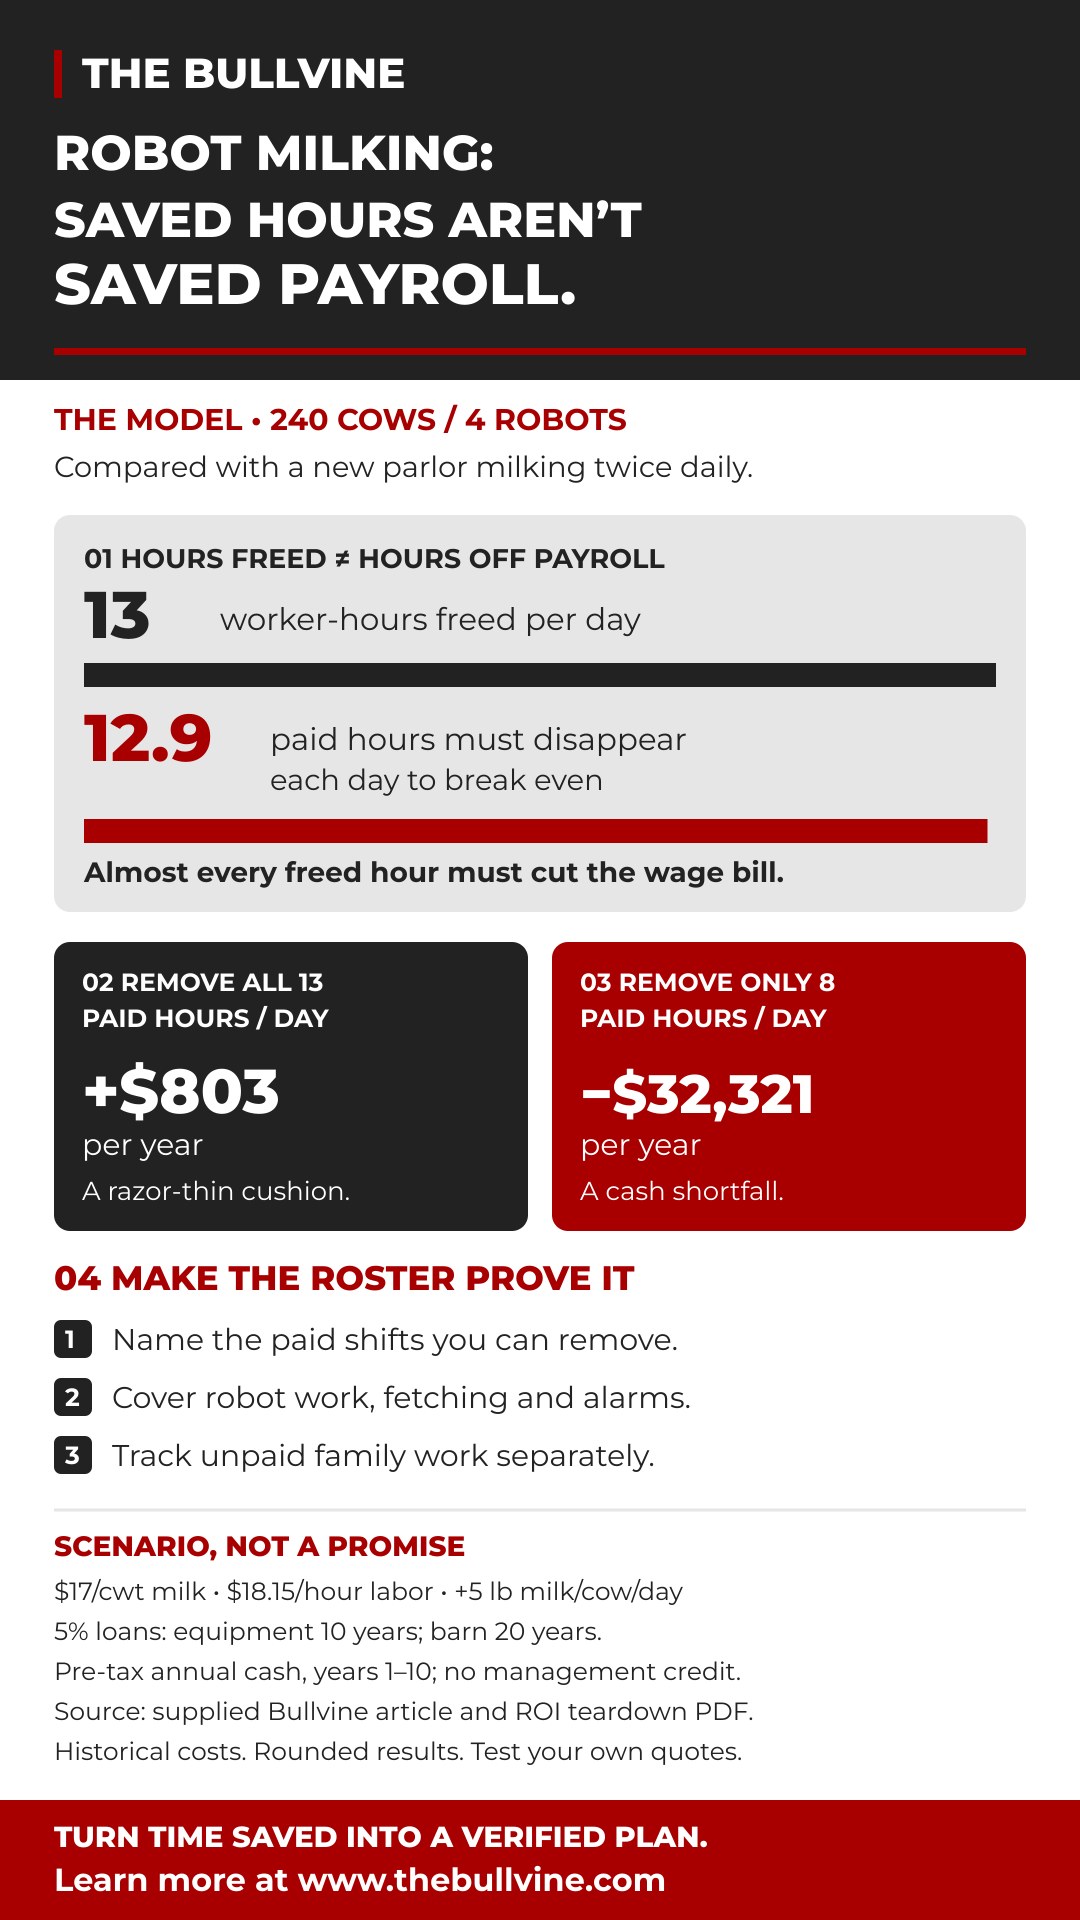
At USDA’s April 2025 livestock wage of $18.15 an hour, 12.9 of those 13.0 hours have to come off payroll to cover the added costs. If all 13 freed hours become avoided payroll, the scenario has about $803 a year left over (our math). That’s roughly seven worker-minutes a day, before the costs and benefits our cash comparison excludes.
None of this contradicts the paper. Salfer and colleagues found the 240-cow robot system more profitable than the double-8 parlor on net annual impact. That’s a 30-year, after-tax measure that assumes 1–3% wage inflation and discounts at a 3% cost of capital. Profitability over 30 years and the ability to make payments in years 1–10 are different questions. With the assumed five-pound milk gain, the wage and milk-price cases we ran against a 2× parlor need 7.7 to 14.6 hours a day to leave payroll.
What the Minnesota model assumes
The model, published in the Journal of Dairy Science in 2017, compares four robots with a double-8 parlor on a 240-cow North Central confinement dairy. It counts “only the factors that differed between milking systems.”
- Capital: robots cost $760,000 plus a $1,640,000 barn. The parlor costs $512,000 plus an $840,000 barn. The robot premium is $1.048 million.
- Labor: the parlor takes 16 worker-hours a day at 2× and 24 at three-times-daily (3×) milking, while running 8 and 12 operating hours. The robots take 3.0 worker-hours a day, covering “cleaning stalls, scraping alleys/crossovers, and fetching cows.”
- Milk: the model assumes robots gain 2.27 kg (5.0 lb, our conversion) per cow per day against 2× and lose 0.91 kg (2.0 lb) against 3×.
That 3.0-hour figure is a good-barn number. It works out to 45 minutes per box (our division). That matches the paper’s unpublished Minnesota–Wisconsin survey of “well-designed (automatic manure removal, split entry pens), well-managed, free-flow AMS barns.”
Time saved is not payroll cut
Iowa State Extension’s 2013 budget for a 144-cow robot herd shows how the two numbers come apart:
| Step | Adjustment | Running balance |
| Original partial-budget result | — | +$1,391 |
| Replace the depreciation-and-interest capital-recovery charge with loan principal and interest | −$8,776 | −$7,385 |
| Remove unpaid-labor savings | −$15,040 | −$22,425 |
Iowa State treated management time the same way. Extra records time canceled out reduced labor-management time, and the authors noted that “Both management costs are also unpaid.”
The Minnesota model credits robots with half an hour a day less management time, valued at $25 an hour. Our cash comparison gives that half-hour no cash credit by default. If a paid cost actually falls, subtract the documented annual cash saving, as long as it isn’t already counted in the payroll reduction. Avoiding the full modeled half-hour at $25 an hour is worth $4,563 a year. That would lower the central requirement from 12.9 paid hours a day to 12.2.
The wage in the denominator is the employment cost the farm actually stops paying for each hour removed. USDA NASS’s $18.15 is a national gross wage for livestock workers, not a dairy or Minnesota rate. It excludes the employer’s share of payroll taxes, plus housing and meals. A fully loaded average can overstate the savings too, because many of those costs stay as long as the worker stays.
Freed workers aren’t wasted. Salfer’s paper notes that “Low-value milking labor is often replaced by more economically valuable management labor.” That value counts here only where it produces additional cash you can defend, and only if it doesn’t double count the milk response.
Running the Numbers
Bullvine calculation: annual comparison during loan years 1–10 (2×, $17 milk, full financing, no management credit)
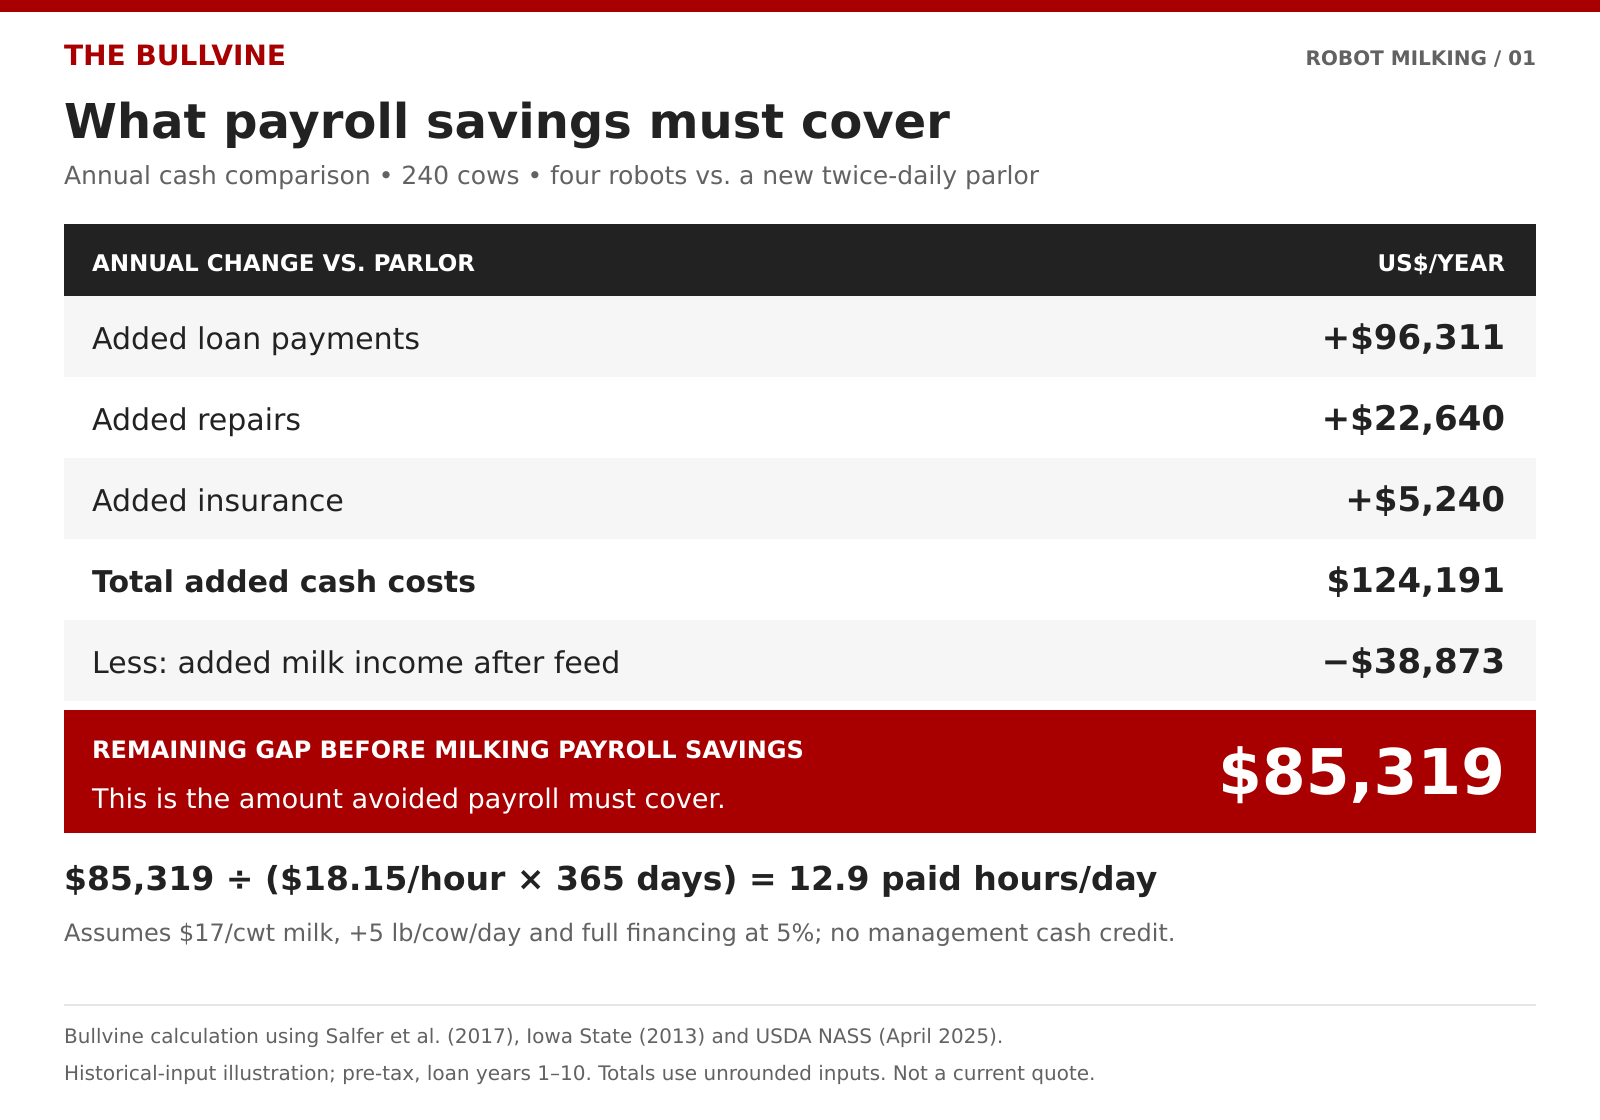
- Added debt service: $96,311 a year. Added repairs: $22,640. Added insurance: $5,240.
- Total added cash cost: $124,191 a year.
- Less extra milk margin: 4,380 cwt × $8.875 = $38,873.
- Annual incremental cash gap: $85,319, or $355 per cow.
- Paid hours that must leave payroll: $85,319 ÷ ($18.15 × 365) = 12.9 a day, against 13.0 freed.
This is a break-even on the incremental investment against the modeled parlor. It doesn’t tell you whether the whole farm can carry its debt.
Historical-input illustration: annual comparison during loan years 1–10, not a current installation estimate
Net paid hours a day that must leave payroll (no management cash credit):
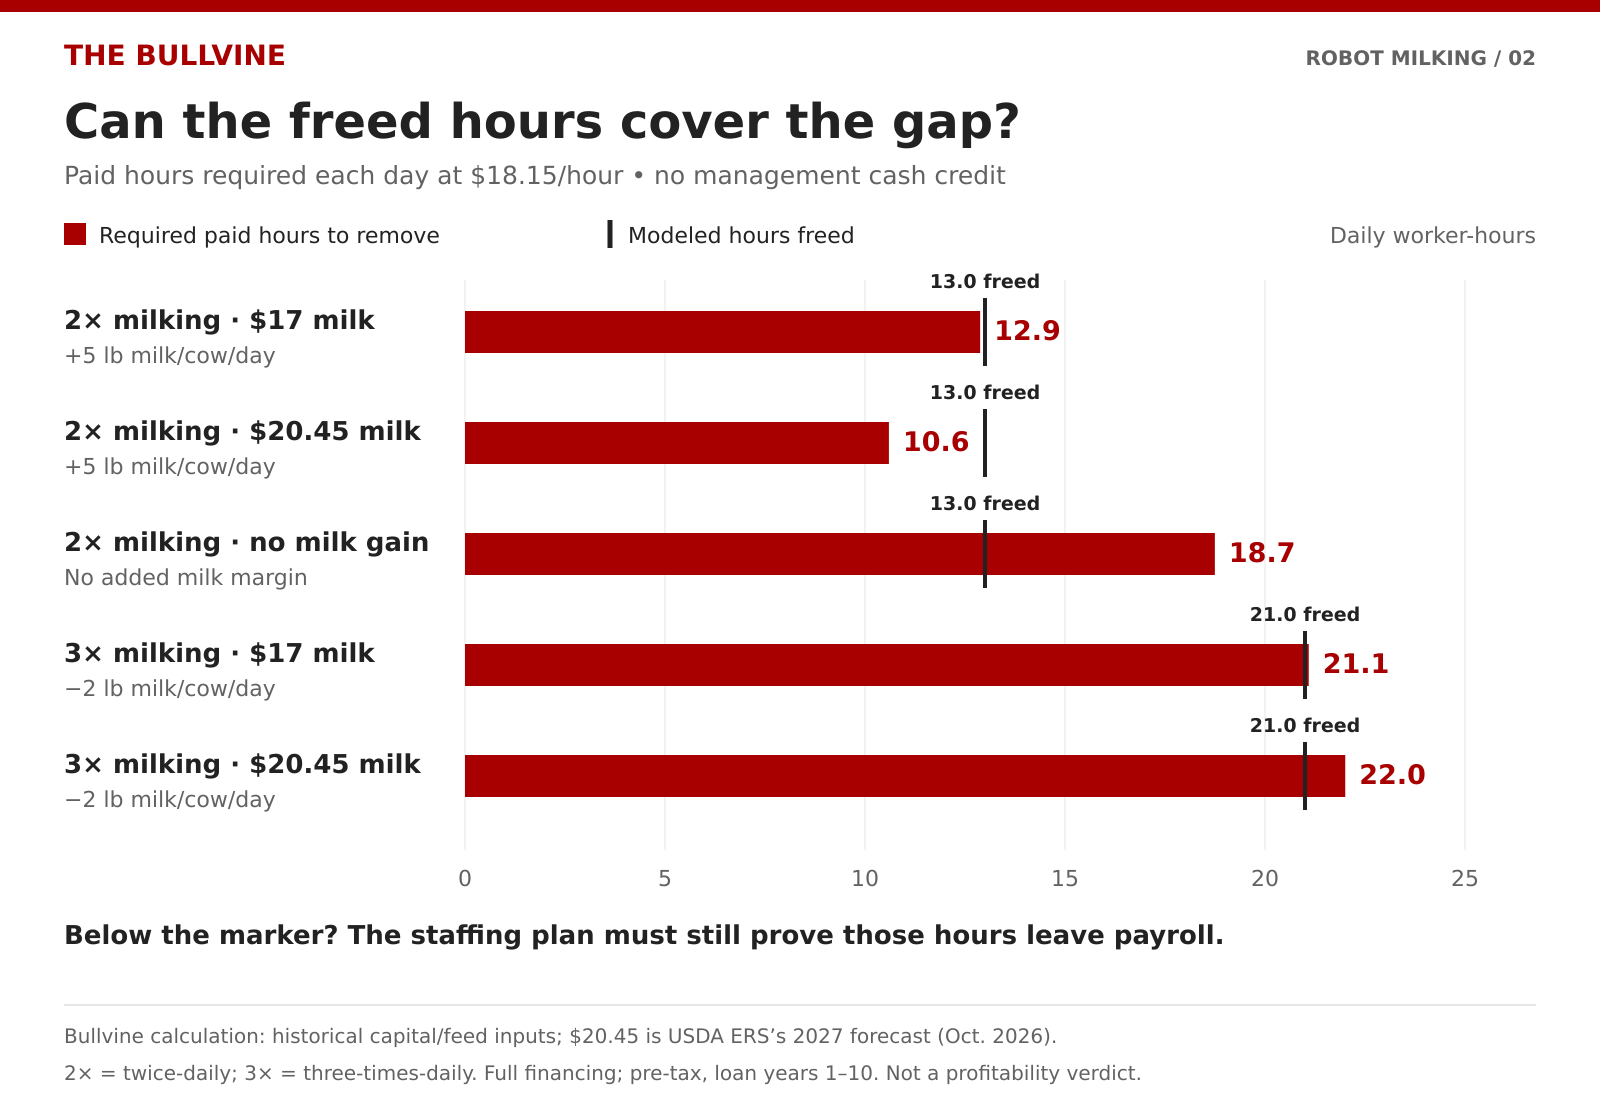
| Baseline · milk price | $16.00/h | $18.15/h | $25.00/h (illustrative) | Worker-hours freed |
| 2× · $17.00 | 14.6 ✗ | 12.9 | 9.3 | 13.0 |
| 2× · $20.45 | 12.0 | 10.6 | 7.7 | 13.0 |
| 2× · no milk gain | 21.3 ✗ | 18.7 ✗ | 13.6 ✗ | 13.0 |
| 3× · $17.00 | 23.9 ✗ | 21.1 ✗ | 15.3 | 21.0 |
| 3× · $20.45 | 25.0 ✗ | 22.0 ✗ | 16.0 | 21.0 |
✗ = exceeds the hours the Minnesota model frees up, under these assumptions. An unmarked cell meets this incremental cash test; it doesn’t make a project profitable or bankable. The central case has only about seven worker-minutes a day of headroom. The $20.45 rows use USDA ERS’s 2027 all-milk forecast, updated October 19, 2026.
Three ways the central case breaks:
- Slower robot labor: at 60 minutes per box instead of 45, the robots free 12.0 hours, not 13.0, and the 12.9-hour requirement fails.
- No milk gain: the requirement climbs to 18.7 hours.
- More capital: each extra $100,000 financed over 20 years at 5% adds $8,024 a year in debt service, about 1.2 paid hours a day. Over 10 years, it adds $12,950, about 2.0 hours. Extra insurance and repairs come on top.
Why 3× is a harder test
Against 3×, robots lose their milk advantage, so higher milk prices make their case worse. At $20.45 milk and $18.15 an hour, they’d need to remove 22.0 paid hours a day while freeing only 21.0. The paper names underused parlor capital as “one reason” its results differ by herd size. At 240 cows, the double-8 runs only 8 hours a day at 2×.
If you can’t realistically staff three milkings a day, leave 3× out of your comparison. Keeping an existing paid-off parlor is a separate investment decision. The paper ran it separately, against “a current milking system with no debt payments.”
Decision stages
Before requesting quotes. Time paid and family milking work across several representative weeks, including normal fresh-cow and staffing variation. Avoid basing it on an unusually easy or hard week.
Before comparing bids. Price the robots and a conventional option to the same barn standards, task coverage, and financing terms. Include only options you could actually staff. Get the dealer’s labor figure in writing as minutes per box per day, and confirm whether fetching and robot-area cleaning are inside it.
Before signing.
- Calculate your annual incremental cash gap. Divide it by your avoidable employment cost per hour, then by 365, to get paid hours per day.
- Build a seven-day before-and-after roster. Include relief coverage and who answers alarms outside scheduled hours.
- The roster should show paid hours removed (by name and shift), paid hours kept for fetching, cleaning, alarms, and coverage, and any work moving to unpaid family labor.
- A shorter average task day doesn’t automatically mean fewer scheduled shifts. Neither does a payroll cut that works by shifting work onto the owner.
- Re-run the gap with no milk gain, higher repairs, and slower robot labor.
- Equity lowers the loan payment, but it commits money that could have gone elsewhere.
After startup. Compare actual paid labor, milk, service costs, and the net change in feed cost against the budget. Track labor savings and payroll savings separately: labor can fall while payroll doesn’t.
Pricing flexibility and physical relief
In a 2012 survey of 53 Minnesota and Wisconsin farms cited by the paper, the top reasons for installing robots were improved lifestyle, less hired labor, and growth without more hired labor. Producers also cited “long-term concerns about health of milkers’ knees, backs, hips, and shoulders.”
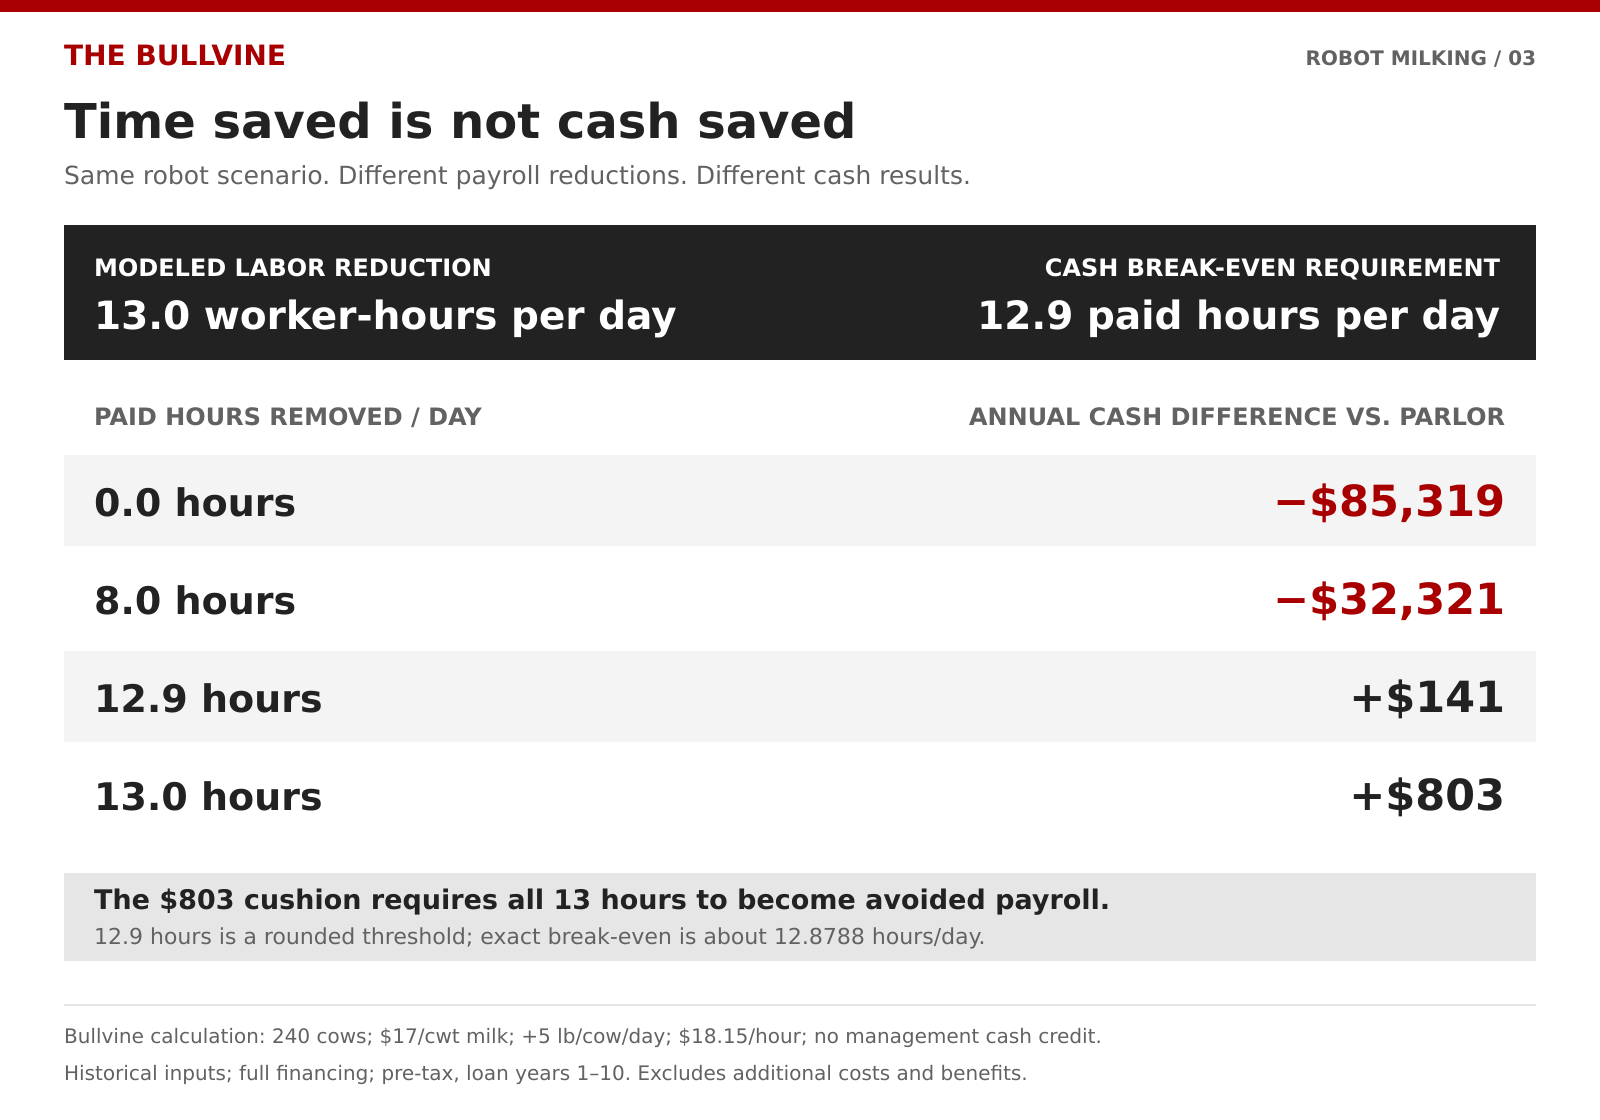
Those benefits belong in the overall investment decision, weighed separately from demonstrated cash savings. Suppose a farm can take only 8 paid hours a day off payroll at $18.15. In this scenario, that leaves an annual cash disadvantage of $32,321 relative to the modeled parlor alternative, or $135 per cow (Bullvine calculation). That figure reflects the assumptions chosen here, and it would change if excluded costs, excluded benefits, or different financing were included. It isn’t automatically the price of flexibility, and it isn’t proof that the farm can’t make its payments. The question is whether the documented benefits justify accepting less cash than the parlor. Then ask whether the rest of the farm’s cash flow can carry the difference.
What to take to the robot decision
The table shows a method, not your farm’s threshold. Your capital premium, borrowing terms, service costs, milk response, and avoidable payroll will differ. If the seven-day roster can’t show which paid hours end, the farm is buying flexibility, not payroll savings, and has to fund the difference.
For why no single break-even wage fits every herd, see our breakdown of dairy labor cost per hundredweight by herd size.
These are U.S. North Central inputs in U.S. dollars. Canadian quota economics need a separate build.
Methodology Note
Formula (Bullvine calculation): paid hours per day = (added debt service + added repairs + added insurance − milk margin − documented management cash saving) ÷ (avoidable employment cost per hour × 365). Calculations use unrounded inputs; displayed results are rounded.
Scope: an annual comparison during loan years 1–10, with inputs held fixed. It doesn’t model year-to-year changes in repairs, wages, milk prices, taxes, or transition performance.
| Item | Calculation |
| Financing | $248,000 equipment increment over 10 years and $800,000 barn increment over 20 years, both at 5%, annual amortizing payments |
| Additional annual repairs | 5% × $760,000 − 3% × $512,000 = $22,640 |
| Additional annual insurance | 0.5% × $1,048,000 = $5,240 |
| Milk margin | 240 cows × lb/cow/day change × 365 ÷ 100 × (milk price − $8.125/cwt feed) |
Feed: 0.65 lb of dry matter per lb of milk at $0.125/lb DM, or $8.125/cwt. We selected this from Iowa State’s 2013 budget (range 0.55–0.8), so it doesn’t reproduce the Minnesota calculation. As a simplifying assumption, the same marginal feed relationship applies to milk gains and losses, so the 3× case credits feed saved on lower milk.
Milk price: Bullvine assumes $17/cwt for this illustration. The paper’s Table 3 prints milk at “$7.71/kg,” which isn’t a plausible price. $17.00 ÷ 2.2046 = 7.71 hints at a unit-conversion error, but doesn’t prove the authors’ intent. The paper’s feed entry (“$0.05/kg of DM”) also looks implausible as printed.
Wages: $16.00 is the paper’s input, $18.15 is USDA NASS for April 2025, and $25.00 is illustrative only.
Excluded from this cash comparison, with the direction each would move the threshold:
- Lowers it: the depreciation and interest tax shield (possibly material at the paper’s 40% tax rate); wage inflation in later years; health and reproduction gains, if achieved and monetized.
- Raises it: robot replacement (the paper found robots needed an economic life of 13 years or more for a consistently positive net annual impact, depending on milk per cow and labor cost); extra electricity; a milk dip during transition.
- Either way: the net feed-cost difference from robot pellets. A positive difference raises the threshold; a negative one lowers it.
- Prices: capital is at the paper’s published figures. We haven’t priced a 2026 installation.
Not the paper’s NAI: the paper’s net annual impact uses a 30-year, after-tax annuity at a 3% weighted average cost of capital. This cash comparison is pre-tax for years 1–10, with Bullvine’s own milk and feed assumptions.
Learn More
- Robot ROI Reality Check – Free Dairy Robot Calculator — Arms you with a zero-BS screening tool to stress-test dealer promises against your real-world milk check. Rebuilds the payback math using a 1.4× hidden-cost multiplier, proving exactly when those freed labor hours transition into positive cash flow.
- $1 Labor or $200,000 Debt? The Robotic Milking Bet That Could Make or Break Your Dairy — Follows the money on the hidden contract risks of substituting variable hourly wages for fixed seven-figure debt. Exposes why a $4/hour pay bump hurts your balance sheet less than a 1.15× debt-service coverage ratio drop during $18 milk cycles.
- Dairy’s Bold New Frontier: How Forward-Thinking Producers Are Redefining the Industry — Dismantles the single-commodity mindset by mapping out AI health monitors, precision feeding, and methane digesters. Connects automated efficiency to broader farm resilience, delivering a blueprint that can push production efficiency while dropping staff turnover by 40%.
The Sunday Read Dairy Professionals Don’t Skip.

Every week, thousands of producers, breeders, and industry insiders open Bullvine Weekly for genetics insights, market shifts, and profit strategies they won’t find anywhere else. One email. Five minutes. Smarter decisions all week.