


Dairy cattle genetics in 2026 is the science and business of using genomic data, economic indexes, and mating strategy to produce cows that make more money, stay healthier, fit modern milk markets, and avoid the hidden drag of inbreeding, feed inefficiency, and outdated sire selection.
Here’s the thing: this page is built for people who already live in the real world of proofs, semen tanks, replacement costs, and milk cheques. The Bullvine’s angle is simple. Don’t just admire rankings. Analyse what those rankings are actually paying you.
This guide walks through the full dairy cattle genetics pipeline, from SNP chips and imputation to reliability and reference populations. It also breaks down TPI, NM$, GTPI, LPI, Pro$, PLI, ISU, and RZG, explains the 2025–2026 base change, tackles haplotypes and inbreeding, and shows where genomic testing really pencils out for commercial herds.
Key Takeaways
- Dairy cattle genetics is now driven by genomics, not slow daughter-proof cycles, and that has radically compressed the generation interval since 2009.
- TPI and NM$ are no longer pulling in the same direction on components; TPI’s 2026 protein pivot and NM$’s fat-heavy weighting create real selection tension.
- The 2025 U.S. base change reset the benchmark, so many bulls looked worse on paper without actually losing biological merit.
- Feed Saved, livability, and body weight efficiency now matter far more in modern index design than many breeders still assume.
- Genomic testing ROI depends less on the test cost and more on whether the herd actually acts on the rankings.
- Inbreeding management has shifted from pedigree avoidance to genomic relationship management using GFI and mating software.
- Emerging traits like methane efficiency, heat resilience, polled genetics, and gestation length are moving from “interesting” to commercially relevant.
What dairy cattle genetics means in 2026
Dairy cattle genetics in 2026 is no longer just about breeding for more milk. The modern job is to breed cows that fit a processor’s component market, survive longer, convert feed better, handle environmental pressure, and still work inside the labour, housing, and cash constraints of a real commercial herd.
That shift is why so many breeders are now talking less about “good bulls” and more about index philosophy. A bull can be elite on one ranking and economically awkward on another. That isn’t a flaw in the data. It’s a sign the industry is now selecting for multiple end games at once.
In practical terms, the average cow has become a moving target. The 2025–2026 base changes and formula revisions mean a sire stack that looked modern two years ago can already be trailing the market on feed efficiency, component balance, or survivability.
“Modern selection is no longer just about milk volume; it is an exercise in bulletproofing the dairy operation against feed volatility, climate stress, and shifting processor demands for component ratios.”
For commercial producers, the smartest question isn’t “Who is Number 1?” It’s “Which index best matches how this herd gets paid?” That’s the difference between buying genetics and building a breeding system.
How genomic selection works in dairy cattle
Genomic selection transformed dairy cattle genetics because it replaced the old five-year daughter-proof delay with a system that can identify elite animals at or near birth. The change started in 2009, when genomic evaluations shifted selection from slow progeny testing to DNA-driven prediction.
The pipeline starts with a biological sample, usually hair, blood, or tissue. That sample is genotyped using a SNP chip, which reads thousands of single nucleotide polymorphisms across the genome. Early systems relied on 3K and 10K chips. By 2026, the standard has shifted toward higher-density arrays and, increasingly, low-coverage whole-genome sequencing in advanced systems.
Imputation is the quiet engine behind the economics. Instead of paying for every animal at the highest density, the industry uses lower-density tests and then statistically fills in missing markers using the genomic patterns from a large reference population. The source document notes that Beagle 5.1 has become a gold-standard tool for this work and that imputation reliability rises from 0.75 to 0.87 as the reference population scales from 100 to 10,000 animals.
That reference population matters more than many people realise. The CDCB National Cooperator Database had passed 12 million genotypes by late 2025, and about 93% of those genotyped animals were female. That female-heavy population has helped rebalance prediction away from the old bull-only bias and lets genomic predictions be validated against real-life performance later on.
Why genomic reliability matters
Reliability tells you how much confidence to place in a proof. It’s not a guarantee. It’s a probability statement. Young genomic animals can rank high because the data says they should, but lower reliability means they still carry more movement risk than heavily proven sires.
Here’s the reality: commercial selection now lives in the trade-off between speed and certainty. Genomics gives access to the newest genetics fast. Proven bulls still give more confidence. Strong breeding programs use both, but they do it intentionally rather than by habit.
The next frontier: low-coverage sequencing
Low-coverage whole-genome sequencing is emerging because it pushes beyond standard marker panels. The source document reports that, with a multi-breed reference panel containing over 61.8 million SNPs, low-coverage sequencing can hit 99.6% concordance in Holsteins even at 0.1X coverage. That opens the door to better detection of structural variation and immune-related regions tied to disease resistance and metabolic stability.
- What changed since 2009: faster selection, shorter generation intervals, more female genotyping, more powerful reference populations.
- What matters now: accuracy depends on both the DNA test and the depth of the reference population behind it.
- What’s next: lower-cost sequencing and phenomics will keep pushing trait discovery into health, climate, and efficiency territory.
TPI, NM$, GTPI and the 2026 index split
If there’s one thing dairy cattle genetics readers need to get straight in 2026, it’s this: TPI and NM$ are not synonyms. They are different tools with different philosophies, and the 2026 revision cycle widened that gap.
GTPI simply means the genomic version of TPI. The formula is the same. The difference is whether the evaluation is driven mainly by genomic prediction or by daughter-proven data.
TPI in 2026: the protein pivot
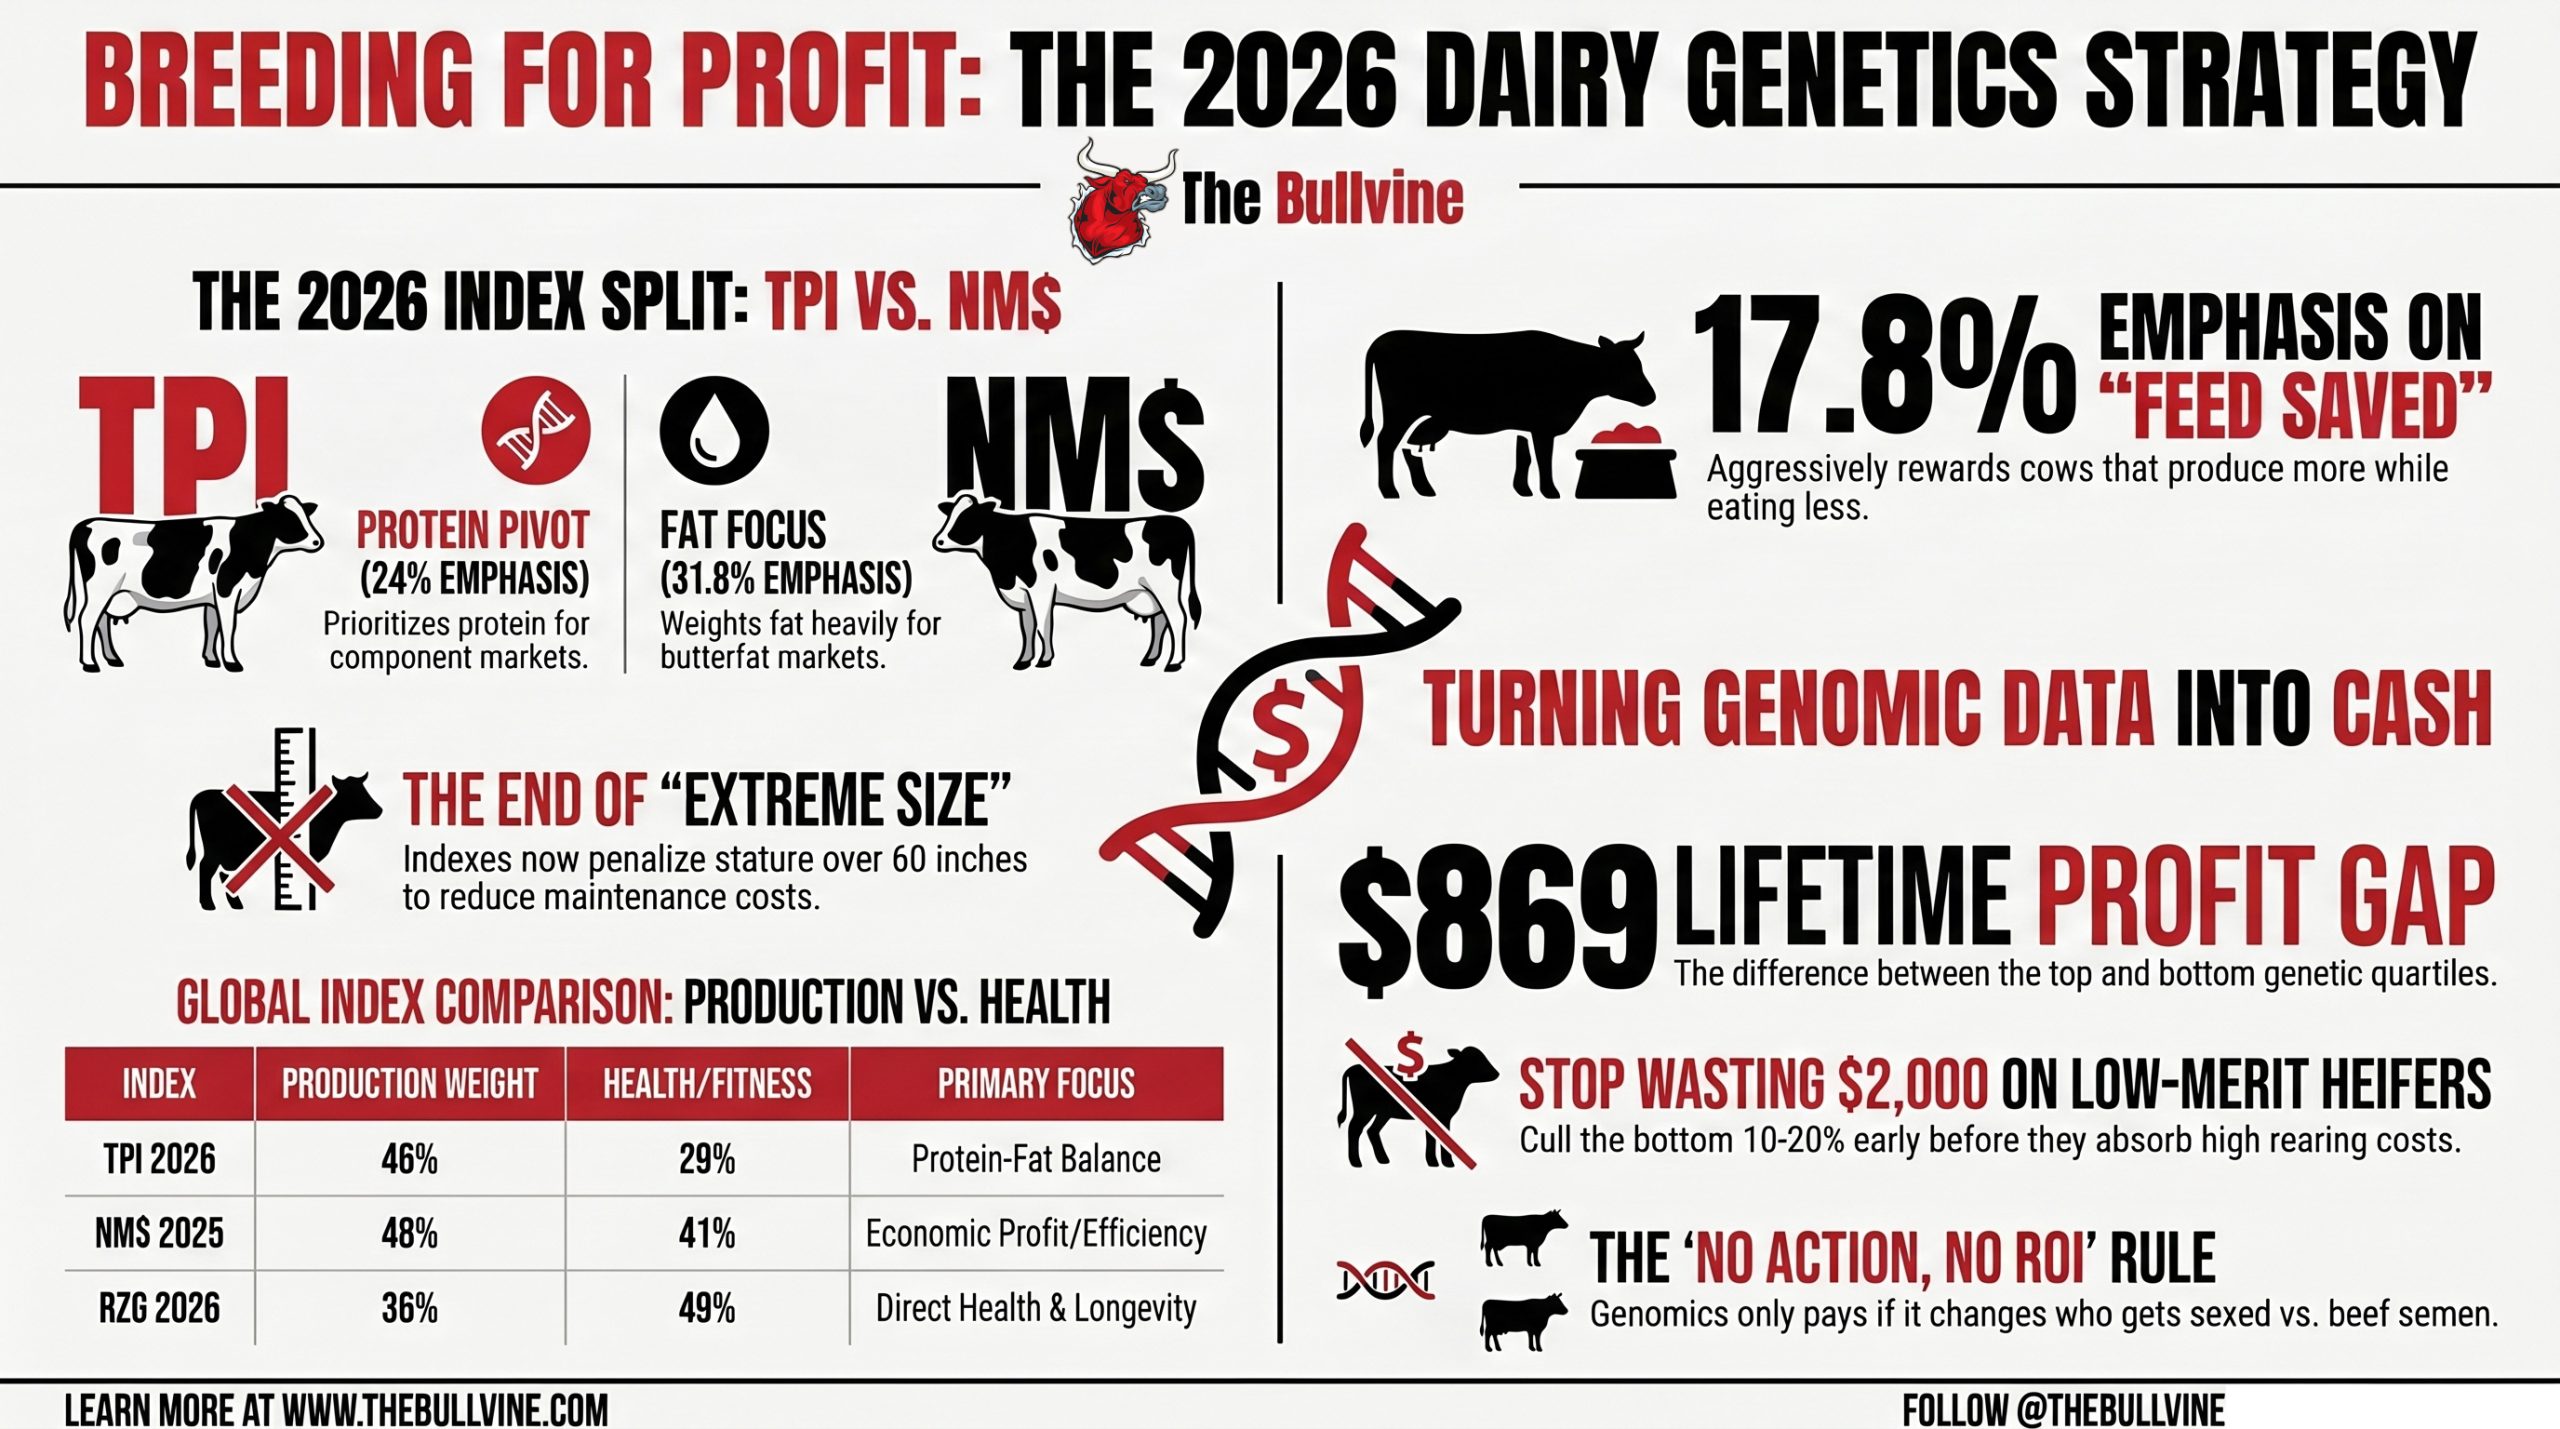
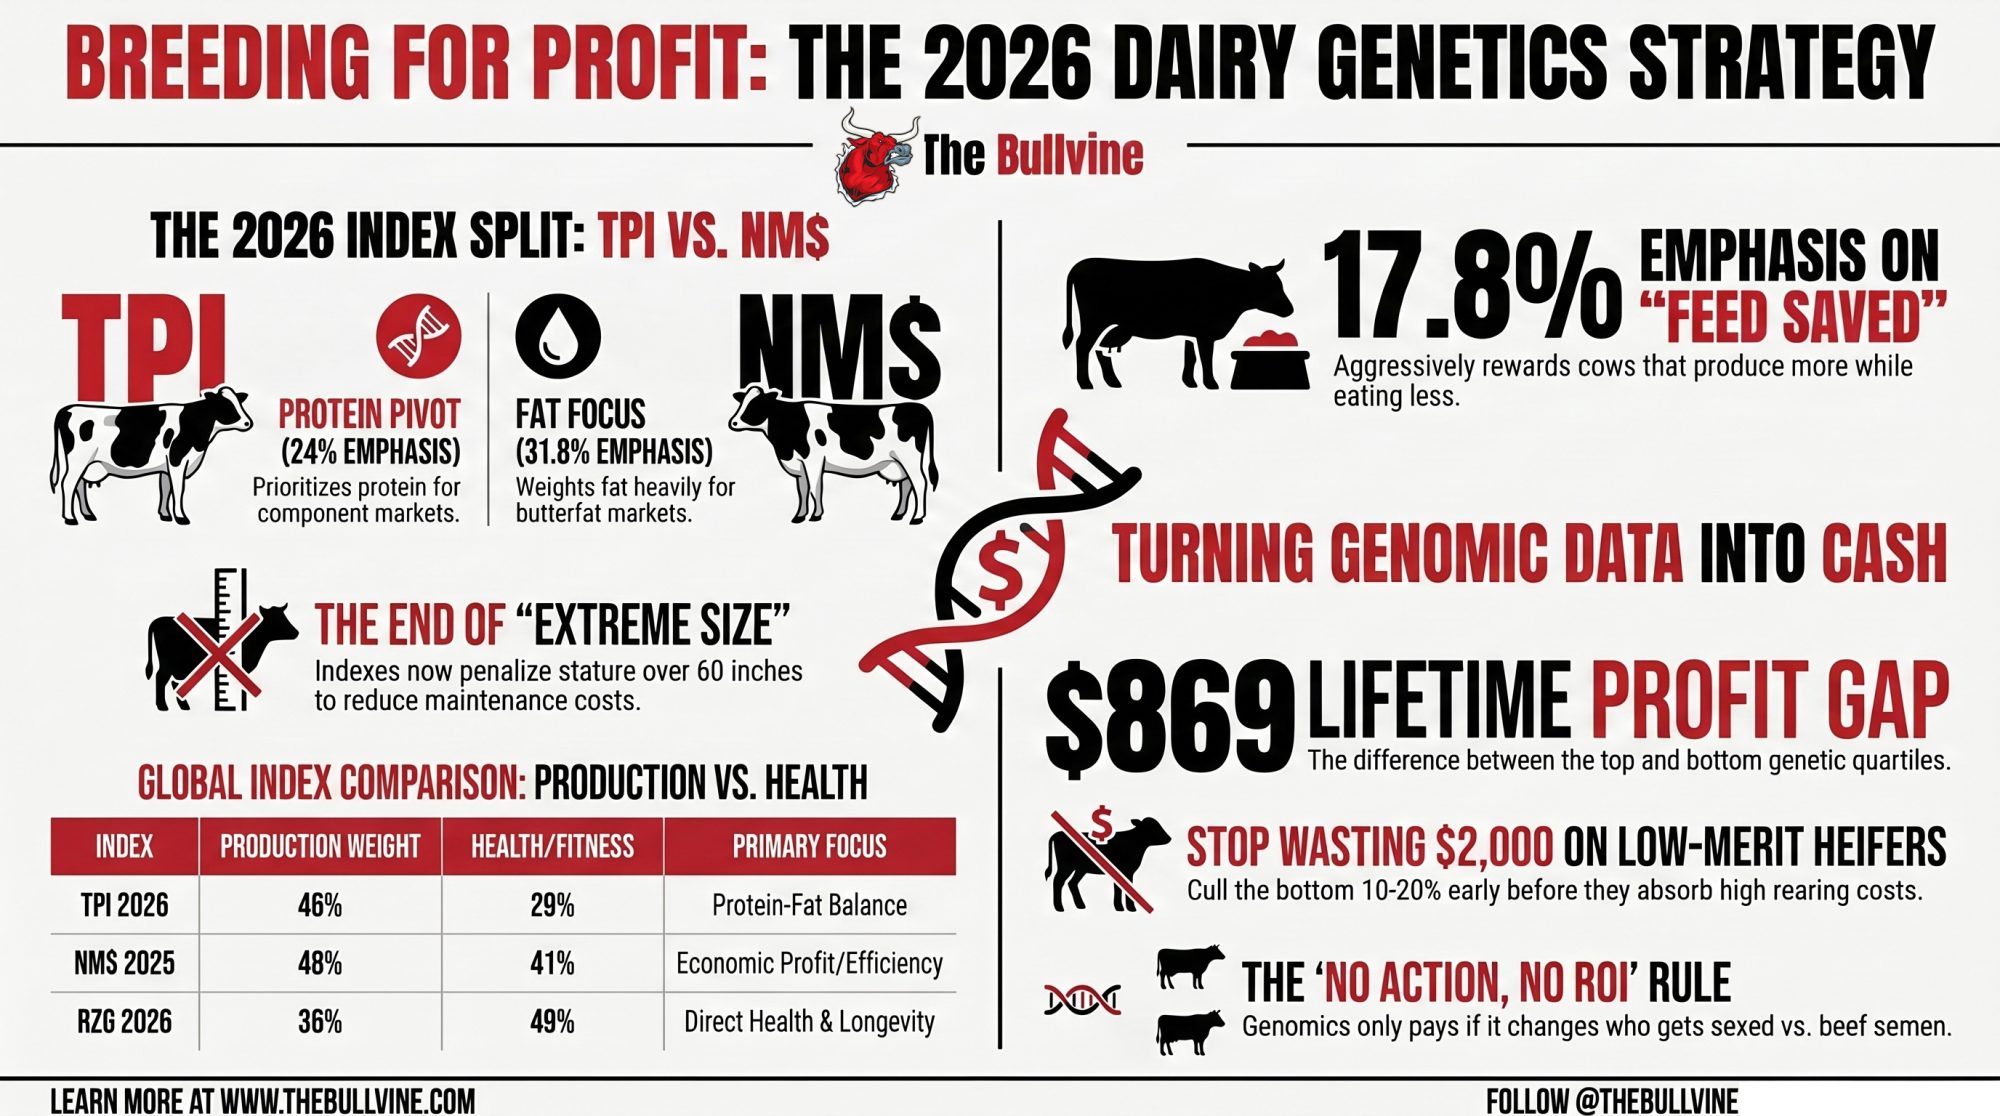
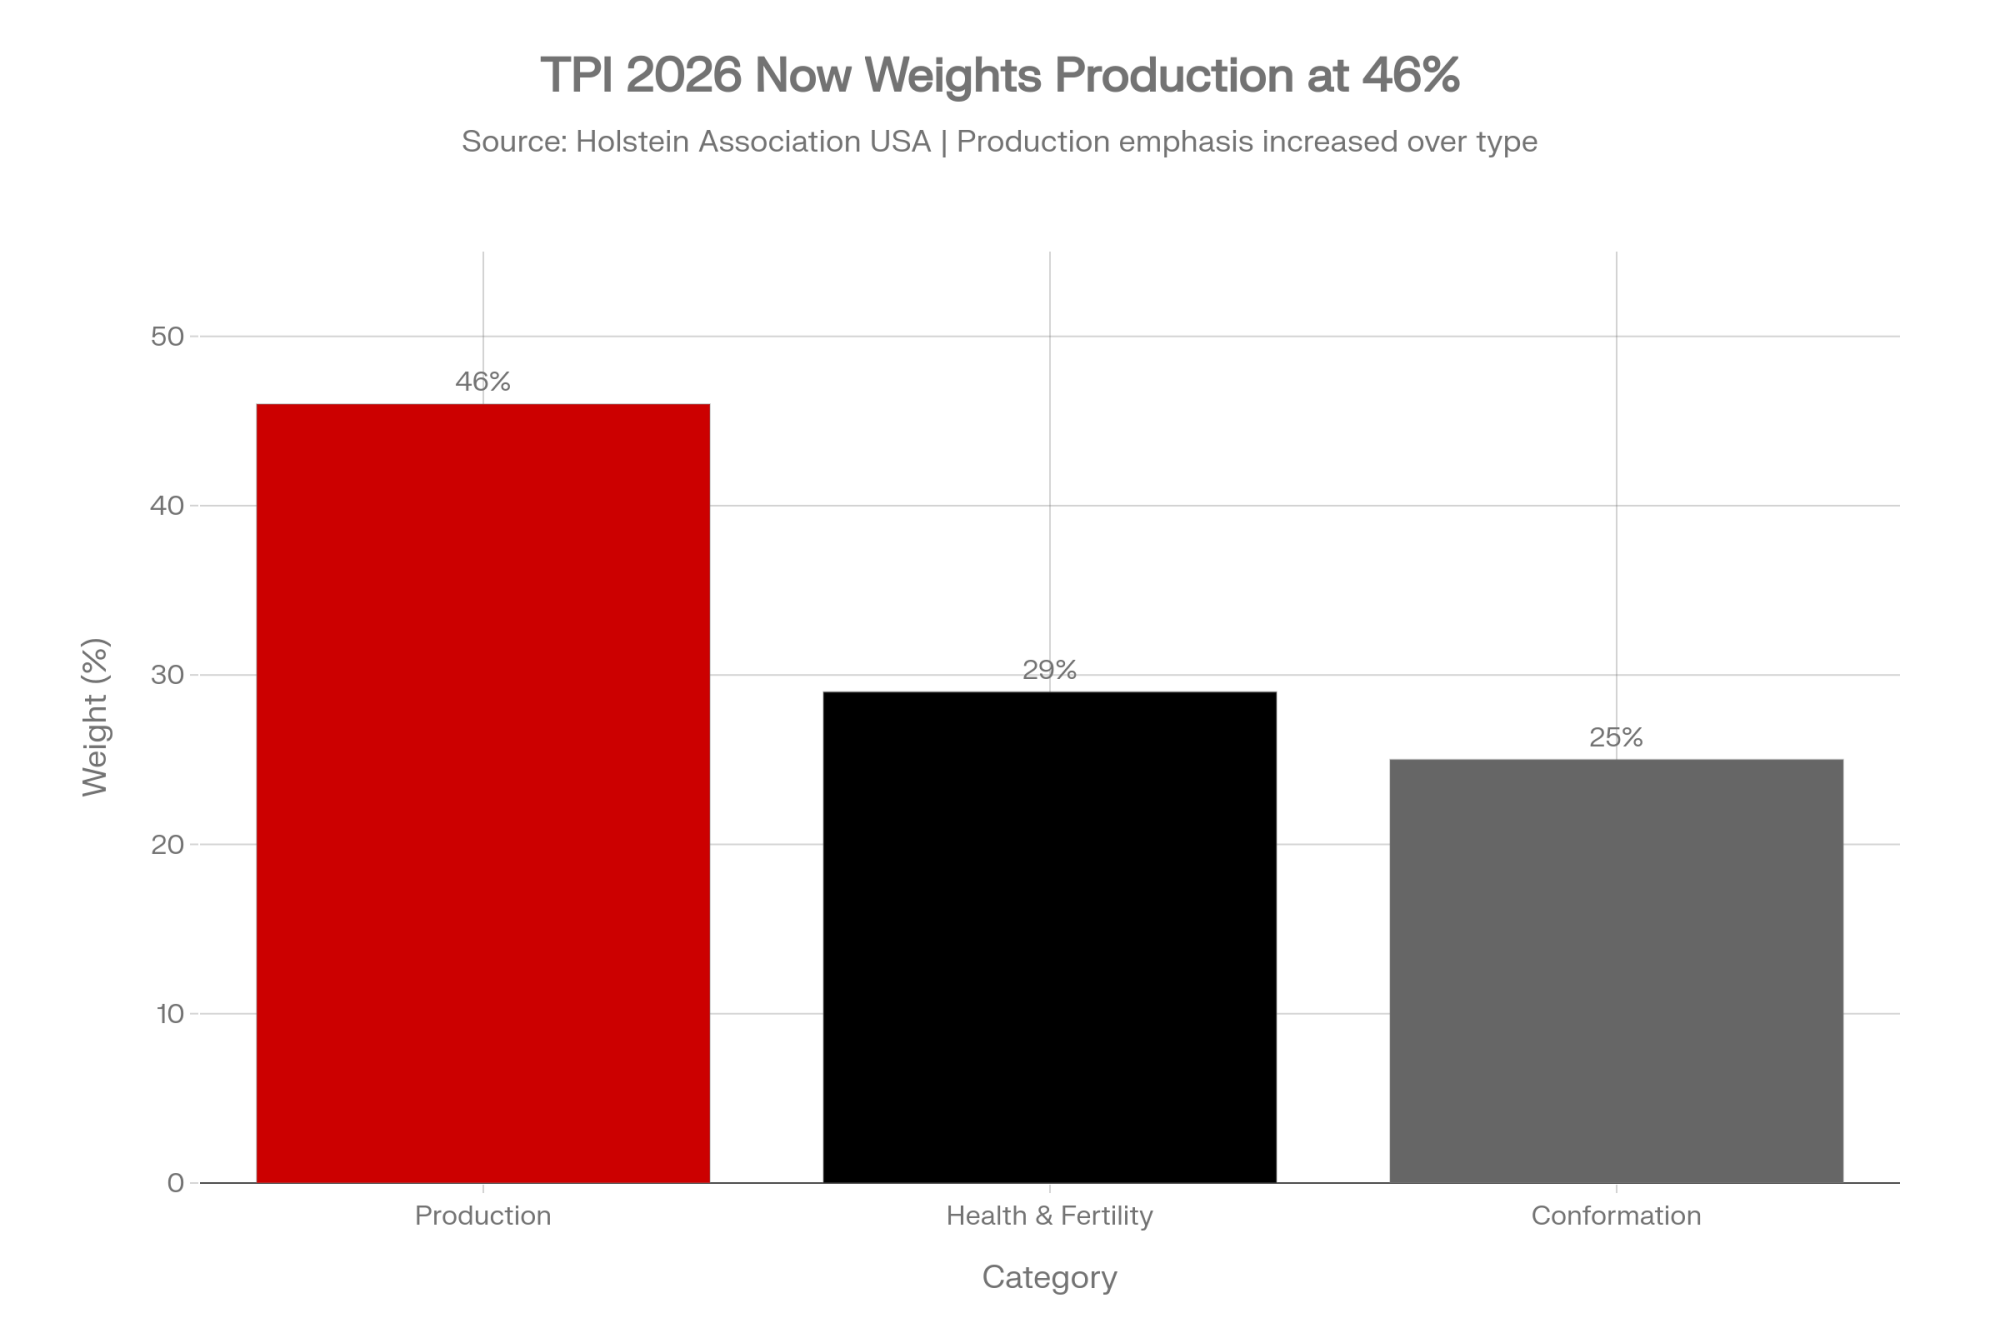
The April 2026 TPI revision increased protein weighting from 19 to 24 and cut fat from 19 to 14. That was a deliberate protein pivot by Holstein Association USA to bring protein progress back in line with market direction and breed goals. The source document reports that the correlation between the old and new TPI stayed extremely high at 0.9978, so the whole system didn’t get blown up, but elite rankings did move.
TPI 2026 is grouped into three major categories:
| TPI 2026 category | Weight | Notes |
| Production | 46 | Includes Protein 24, Fat 14, and Feed Efficiency. |
| Health & Fertility | 29 | Includes SCS, PL, HT, LIV, and FI. |
| Conformation | 25 | Includes PTAT, UDC, and FLC. |
The same source also flags the new Holstein Conformation Composite and a May 2026 stature penalty built around 60 inches as the ideal height, a big philosophical move away from chasing extreme size.
NM$ in 2025–2026: efficiency over aesthetics
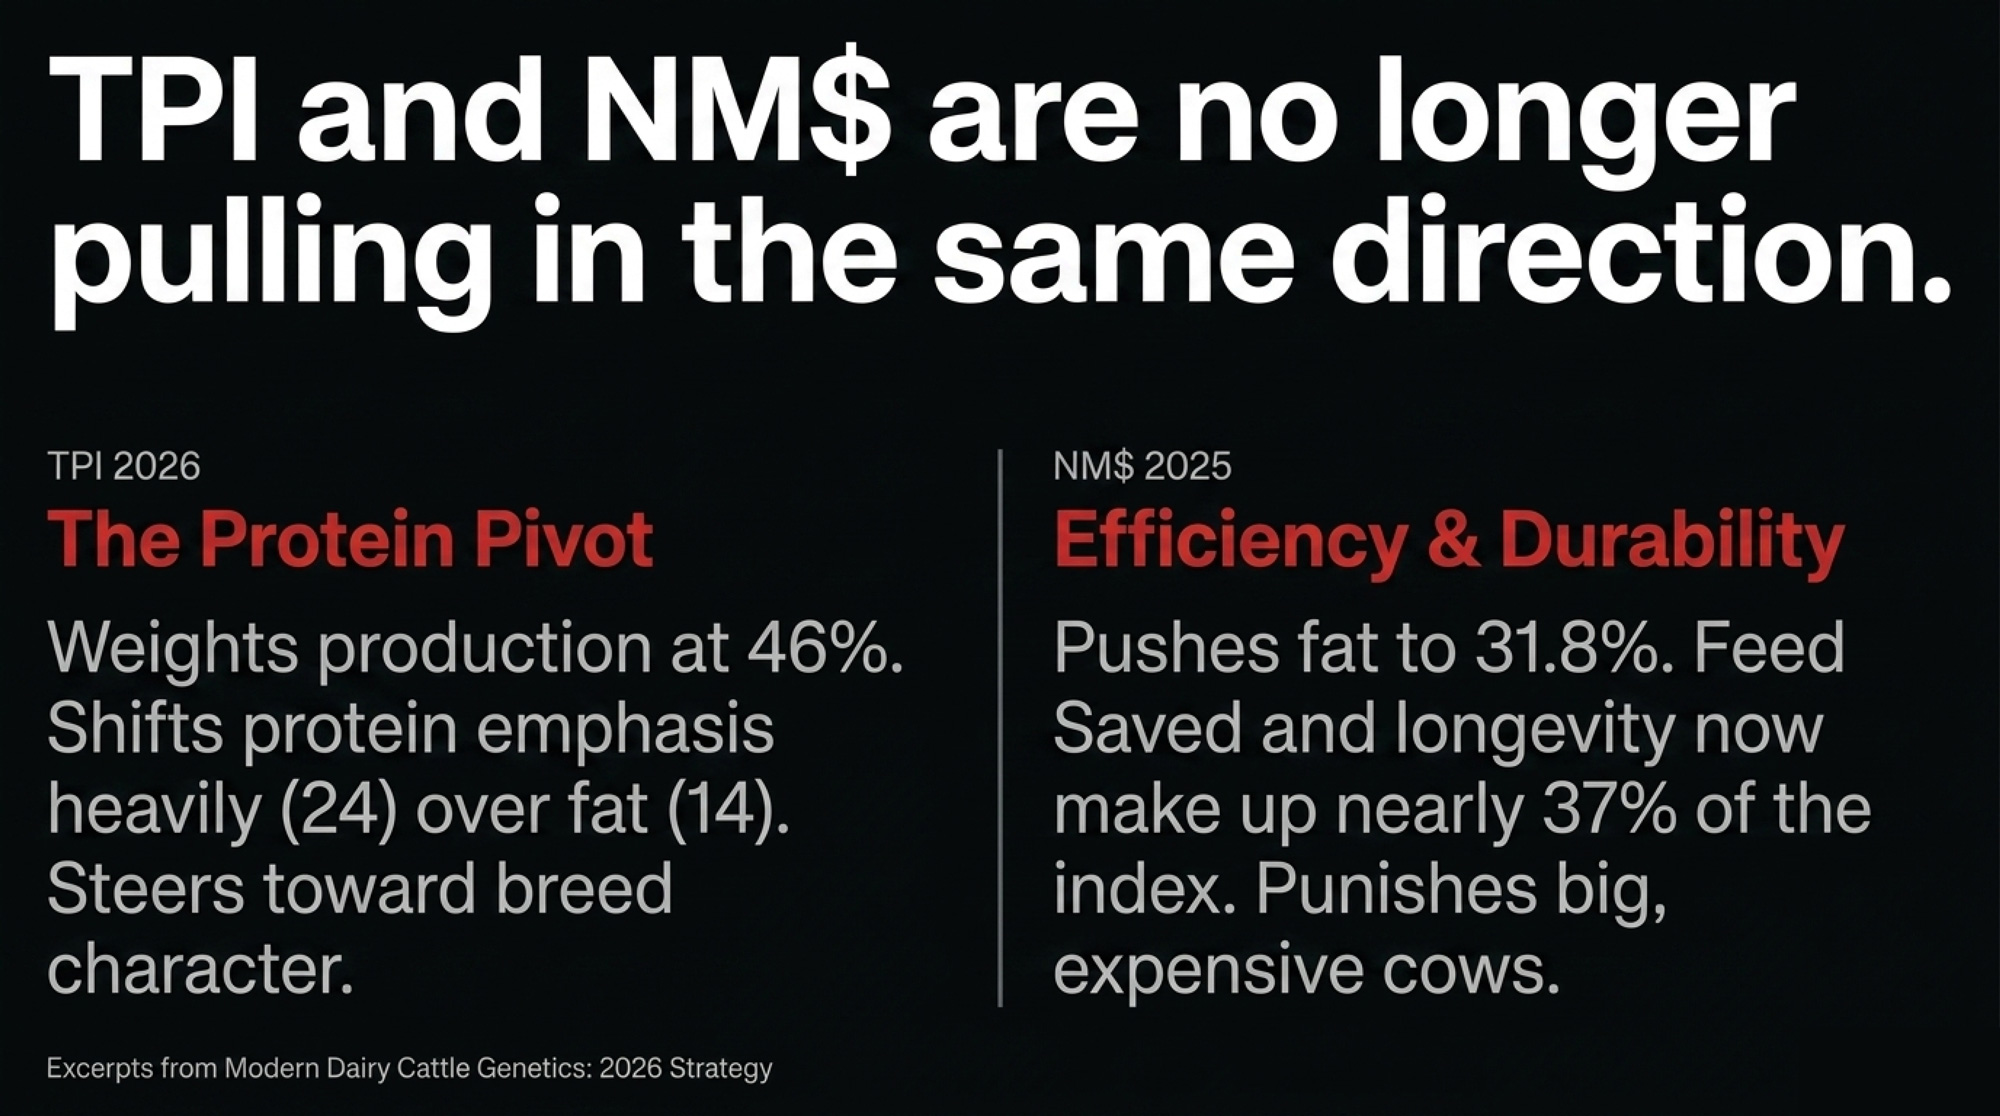
Net Merit took the opposite component direction. Its 2025 revision pushed fat to 31.8% and dropped protein to 13.0%, reflecting U.S. milk pricing where butterfat has been paying hard.
More important, honestly, is what NM$ did around efficiency and durability. Feed Saved, built from Body Weight Composite and Residual Feed Intake, now carries 17.8% of the total emphasis. Productive Life and Cow Livability together account for 18.9%, making longevity the largest non-yield complex in the index.
That tells you exactly what the modern economic signal is: moderate cows, fewer health crashes, better survival, lower maintenance costs. Dr. John Cole’s point in the source document is blunt — big cows cost more to maintain than older formulas were properly charging for.
Why the split matters on farm
A TPI-led sire stack may now steer harder toward protein and breed character. An NM$-led stack may reward fat, feed efficiency, and functional longevity more aggressively. Neither is automatically wrong. But mixing them casually is how herds end up with breeding goals they never actually chose.
2026 benchmark stat: Feed Saved now commands 17.8% of NM$, while TPI 2026 weights production at 46% and specifically shifts protein to 24 versus fat at 14.
Global dairy genetics indexes compared
North American breeders talk a lot about TPI, NM$, LPI, and Pro$, but the global picture matters because it shows how different breeding systems define “the right cow.” The source document’s comparison table makes that clear fast.
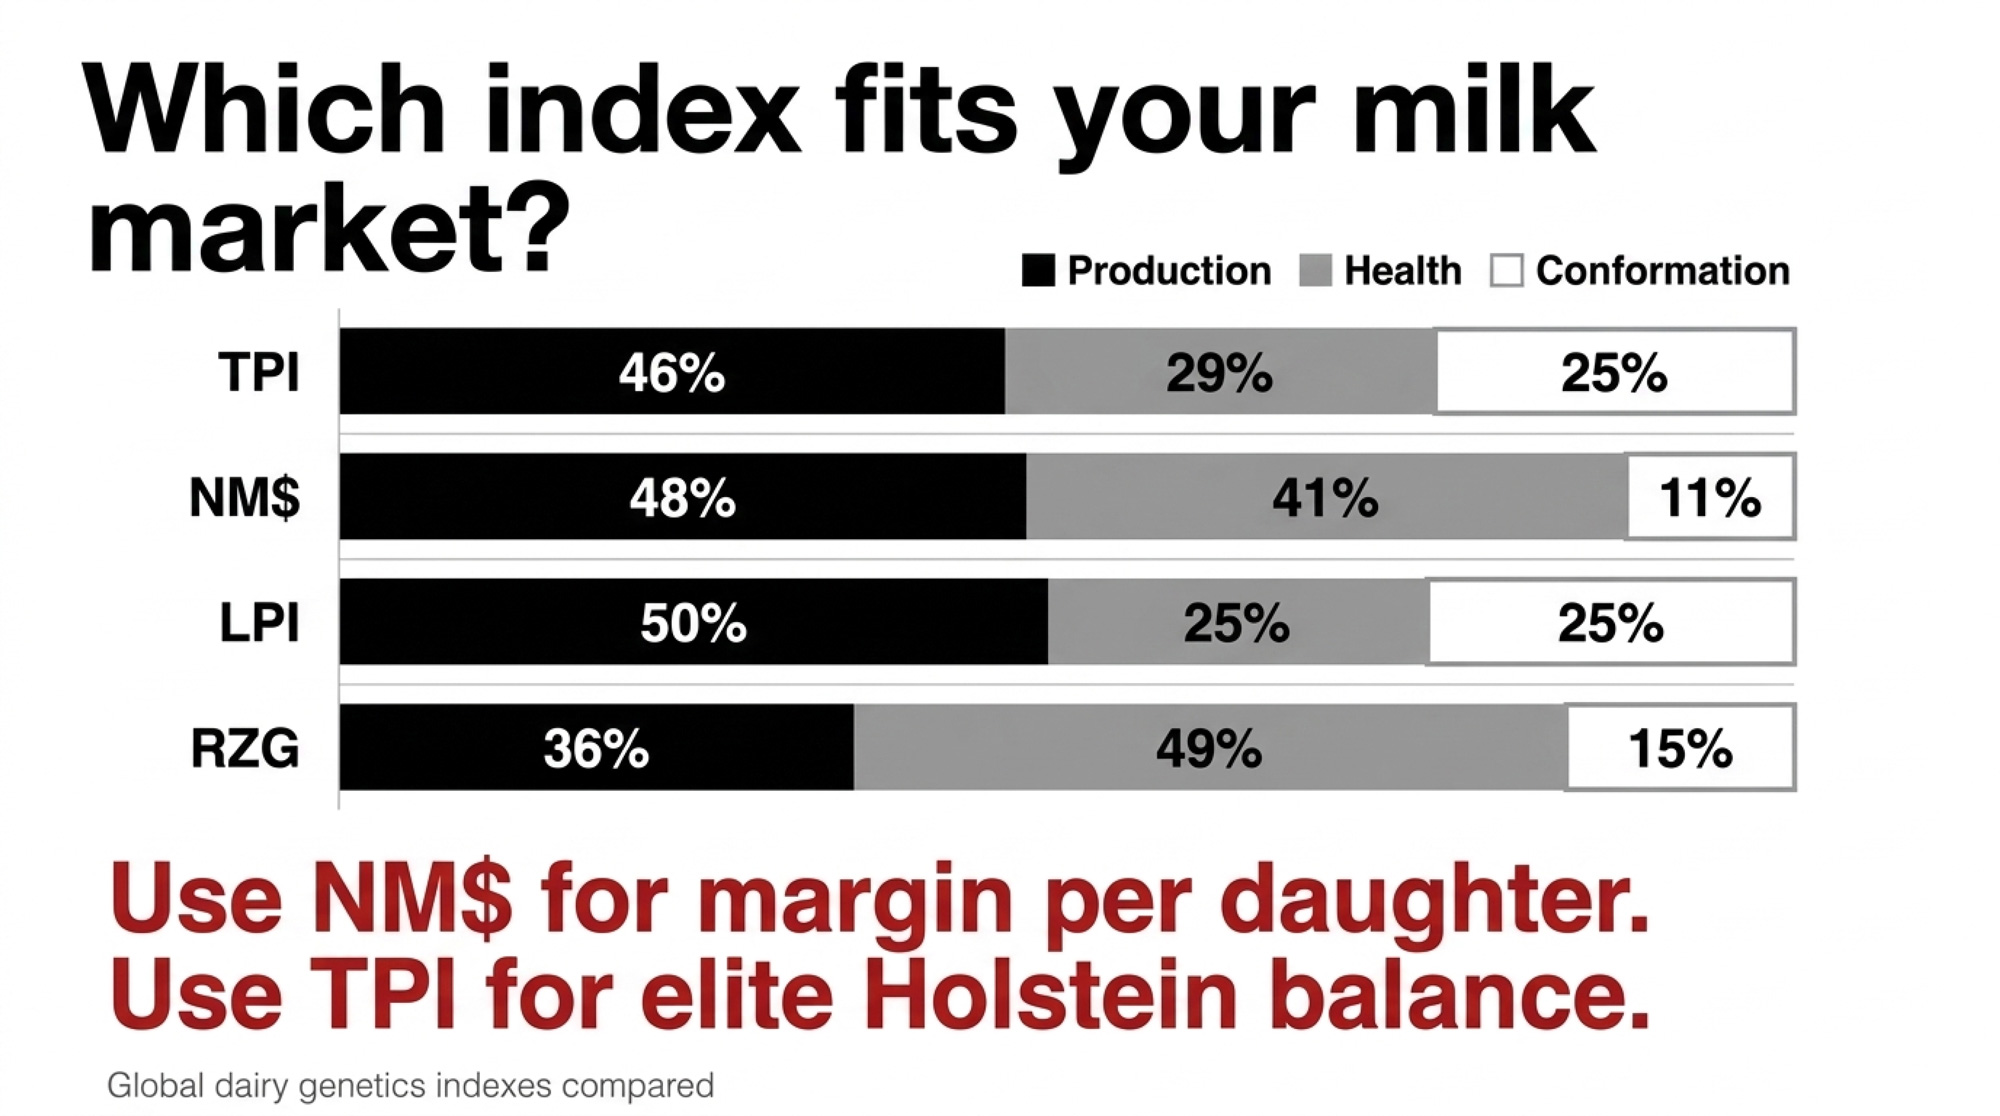
| Index | Production | Health/Fitness | Conformation | Primary focus |
| TPI 2026 | 46 | 29 | 25 | Protein-fat balance. |
| NM 2025 | 48 | 41 | 11 | Economic profit and efficiency. |
| LPI 2026 | 50 | 25 | 25 | Component yields. |
| RZG 2026 | 36 | 49 | 15 | Direct health and longevity. |
| PLI 2026 | 34 | 48 | 18 | Functional profit. |
That’s not just academic. It tells you which systems are pushing hard on commercial profitability, which are protecting robustness, and which still hold a bigger place for type and breed identity.
Canada: LPI and Pro$
Canada’s LPI remains a central breeder-facing index, but the source document also makes a strong case for treating Pro$ as the more direct commercial profit lens. It frames the 2026 Canadian system around component yield pressure and specifically notes a 40:60 fat-to-protein weighting shift inside the production emphasis.
UK and Germany: stronger functional weighting
PLI and RZG lean harder into commercial function. PLI is designed around functional profit. RZG stands out for its strong health and longevity weighting. If your herd operates in a high-cost environment where labour, replacement pressure, and robustness dominate, these systems are worth studying even if you never use them directly.
France and the broader lesson
ISU and the other European systems underline the same strategic truth: indexes are not universal truths. They are regional answers to regional economic and biological questions. The right comparison isn’t “Which index is best?” It’s “Which index fits the milk market, management style, and replacement strategy this herd is actually living with?”
- Use NM$ when margin per lifetime daughter is the main decision lens.
- Use TPI/GTPI when Holstein breed ranking and balanced elite selection still matter in your program.
- Use Pro$, PLI, RZG, or ISU comparisons when stress-testing whether your selection philosophy is too narrow.
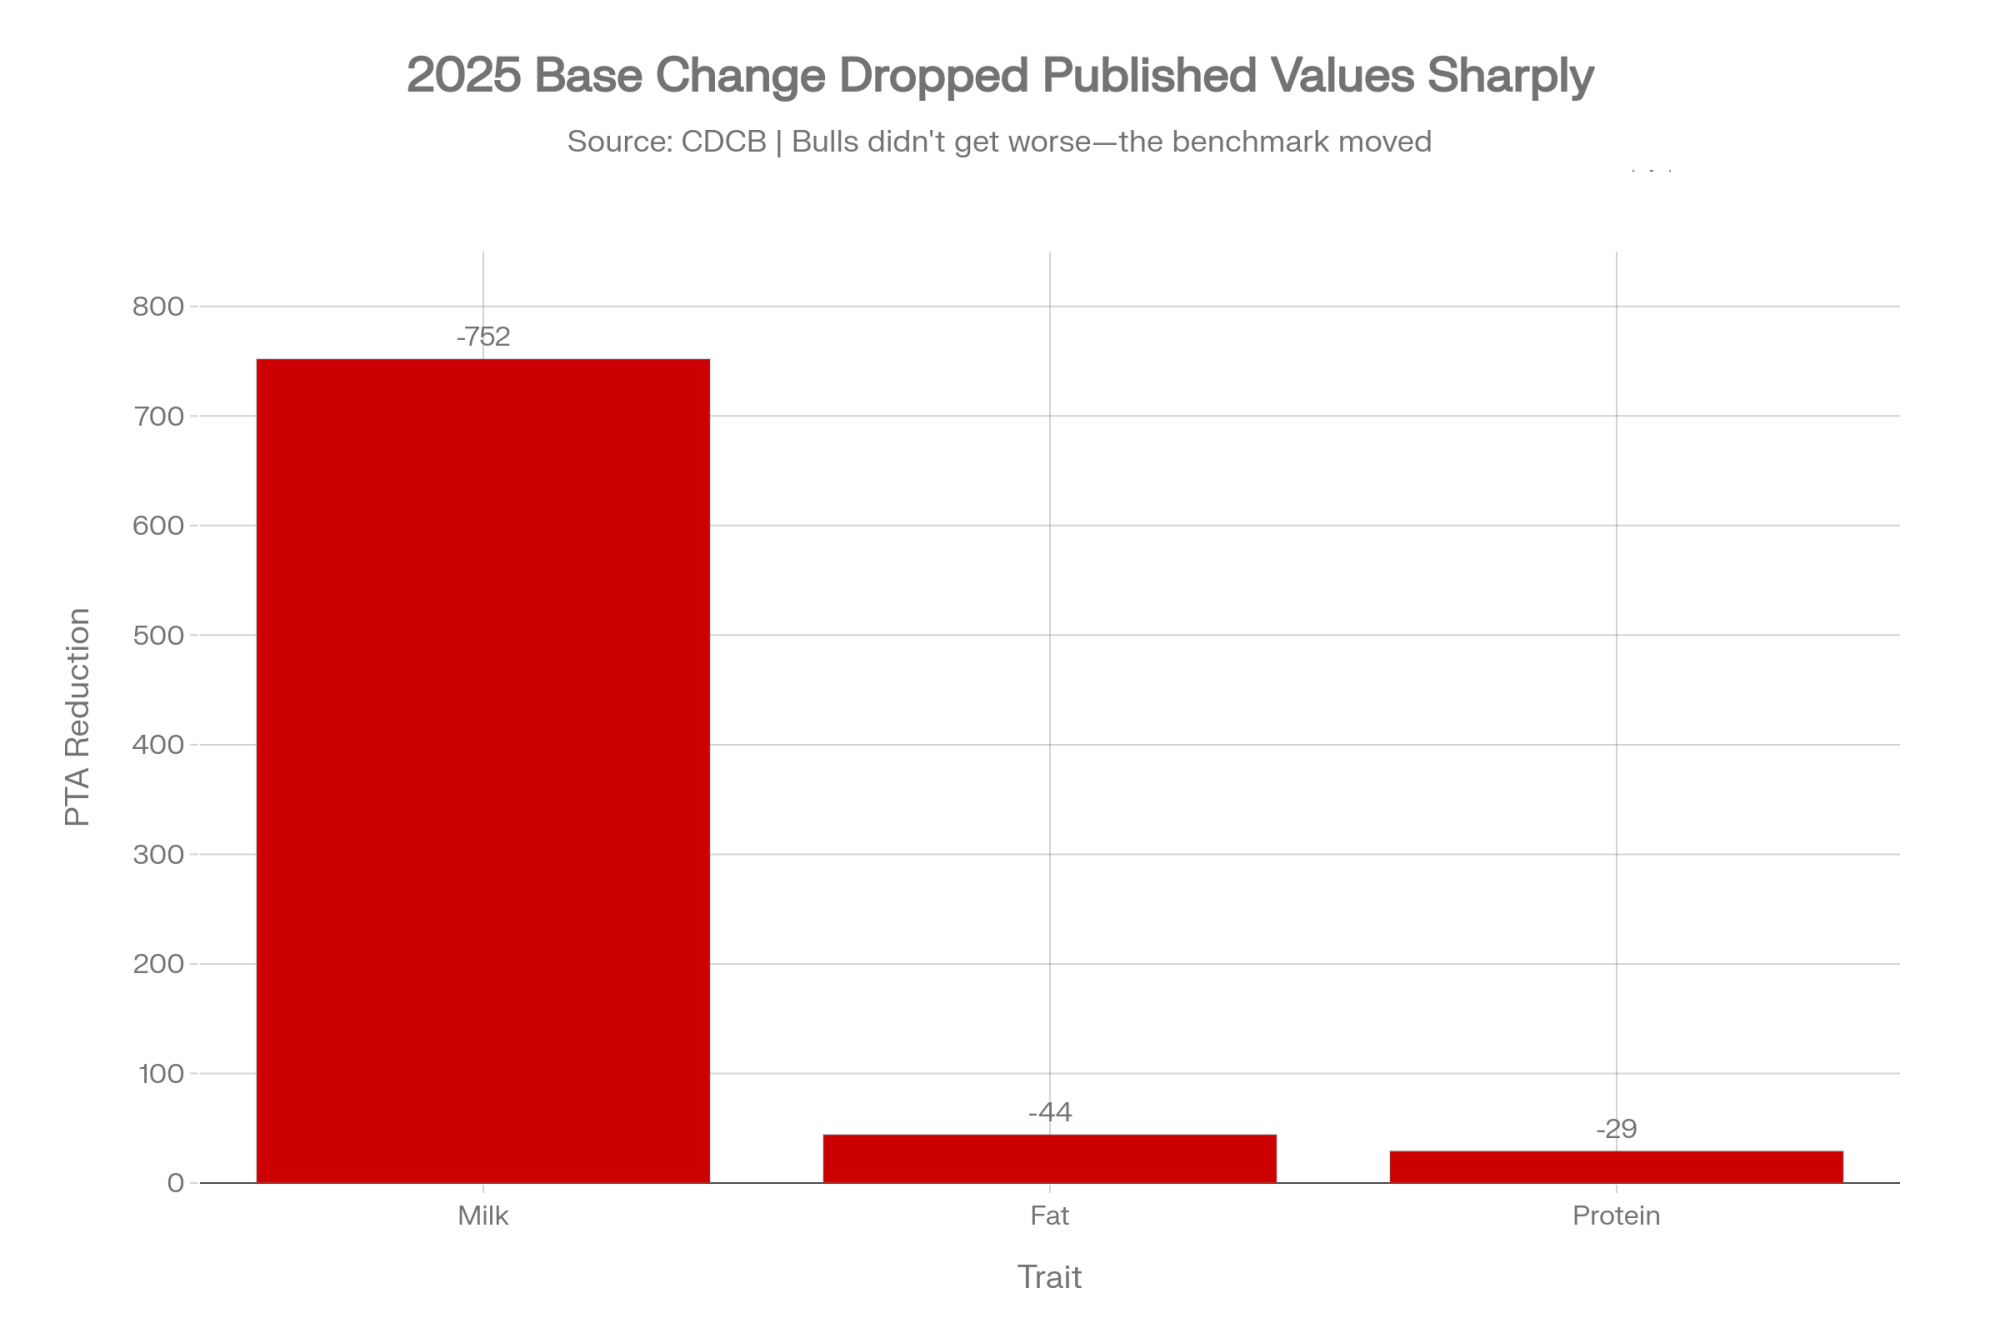
What the 2025 base change did to dairy genetics
Base changes confuse a lot of good producers because they make elite animals look like they got worse overnight. They didn’t. The benchmark moved.
In the United States, the April 2025 genetic base change shifted the zero point from cows born in 2015 to cows born in 2020. Canada updates its base annually, but the same principle applies: the average population keeps improving, so the reference point has to move with it.
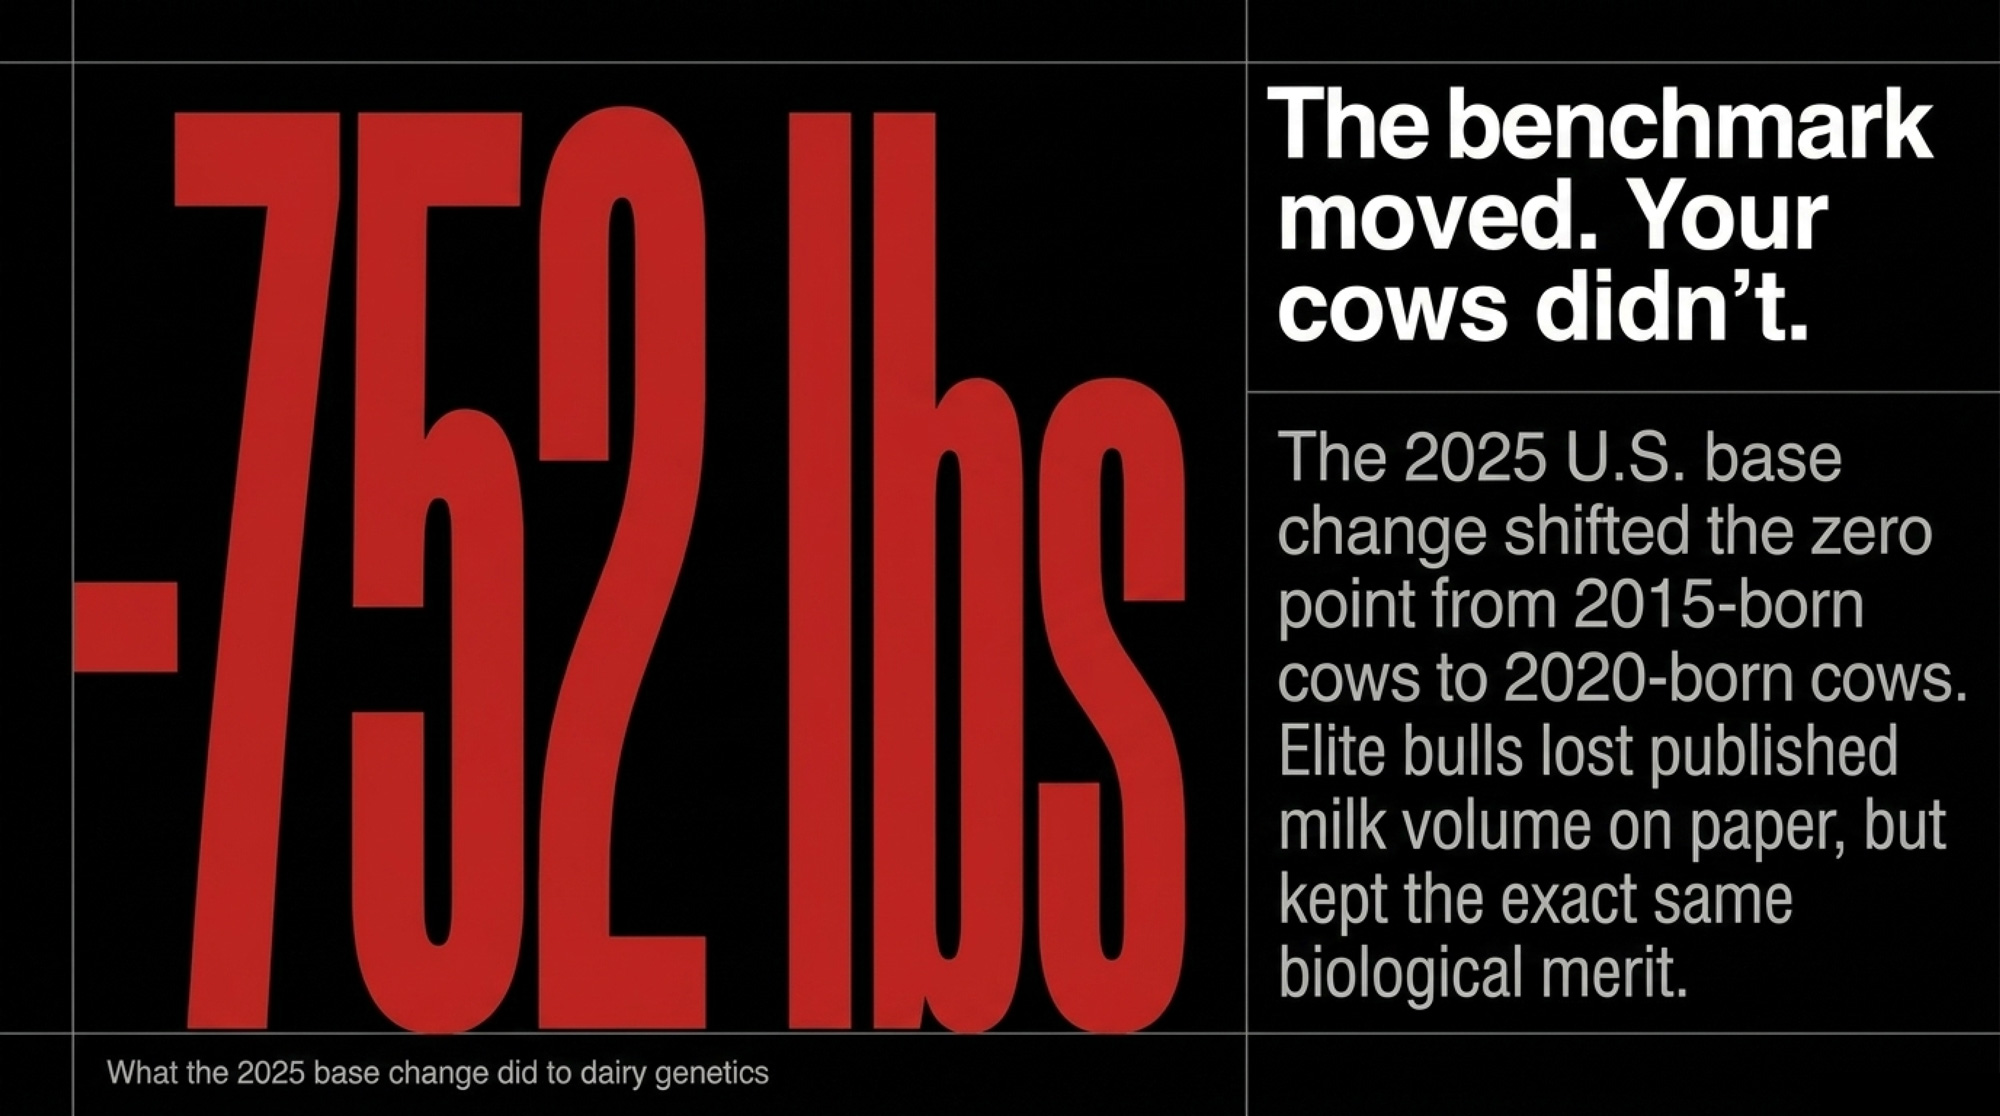
For Holsteins, the 2025 U.S. shift reduced published values by 752 pounds of milk, 44 pounds of fat, and 29 pounds of protein. That doesn’t mean the bull lost transmitting ability. It means the 2020-born cow population is that much genetically stronger than the 2015-born base.
Why selection thresholds had to change
This is where herds get into trouble. If a breeding team keeps using old “cut lines” after a base change, it can accidentally tighten selection too far or misread actual sire quality. A bull that was +1,500 milk in December 2024 might show up around +750 after the base change and still represent the same biological package.
The calving-trait wrinkle
The source document also notes an important nuance: Sire Calving Ease and Daughter Calving Ease stayed on the 2024 base until August 2025 because of unexpected recalibration results. When those traits were finally updated, Holstein calving-difficulty PTAs dropped by 0.8, reflecting both management and genetic improvement.
Inbreeding adjustment inside the reset
The base change isn’t just a production reset. It also interacts with inbreeding correction. The document notes that rising inbreeding in Holsteins is running at roughly 0.5% per year and that the base-change calculation adjusts PTAs for that accumulating drag.
Named-expert reference: The source document ties the NM$ efficiency overhaul to Dr. John Cole’s argument that the economic system had been undercharging large cows for maintenance cost.
For editors, this section deserves a quick-answer treatment high on the page because it’s perfect snippet bait and exactly the kind of question that drives AI Overview and PAA traffic.
Inbreeding, GFI and haplotype defects in dairy cattle genetics
Genomics solved one problem and intensified another. It gave the industry speed. It also made it easier to concentrate on the same elite families faster than ever.
That’s why inbreeding management in dairy cattle genetics has shifted away from simple pedigree watching and toward genomic relationship management. In 2026, the key term is GFI, or Genomic Future Inbreeding. It measures the actual genomic risk of homozygosity in future matings more accurately than a paper pedigree ever could.
Why GFI matters more now
As generation intervals collapsed under genomic selection, the industry saw inbreeding rise. The source document notes that inbreeding in Holsteins is increasing at roughly 0.5% per year and that this depresses PTAs enough to require recalibration during base changes.
That means inbreeding is no longer a side issue for pedigree purists. It’s an economic drag tied to production, fertility, and long-term sustainability.
HH1 to HH7, JH1 and BH2
Haplotype defects are stretches of DNA that can carry recessive lethal or damaging mutations. The commercial message is simple: carrier-to-carrier matings are where the pain starts.
| Haplotype Group | Breed | Primary Impact | Carrier-to-Carrier Risk | Commercial Action |
| HH1-HH4 | Holstein | Reduced conception, embryonic loss | 25% affected offspring | Screen matings, use carriers on non-carriers |
| HH5-HH6 | Holstein | Fertility loss, early embryonic death | 25% affected offspring | Mating software avoidance |
| HH7 | Holstein | Lower conception rates | 25% affected offspring | Recently identified; manage in genomic systems |
| JH1, JH2 | Jersey | Embryonic loss, fertility drag | 25% affected offspring | JH2 discontinued; causal mutation refined |
| BH2 | Brown Swiss | Stillbirth, early calf mortality | 25% affected offspring | High priority in crossbreeding programs |
| HCD | Holstein | Cholesterol Deficiency; calves die within months | 25% lethal | Severe; cull or mate carefully |
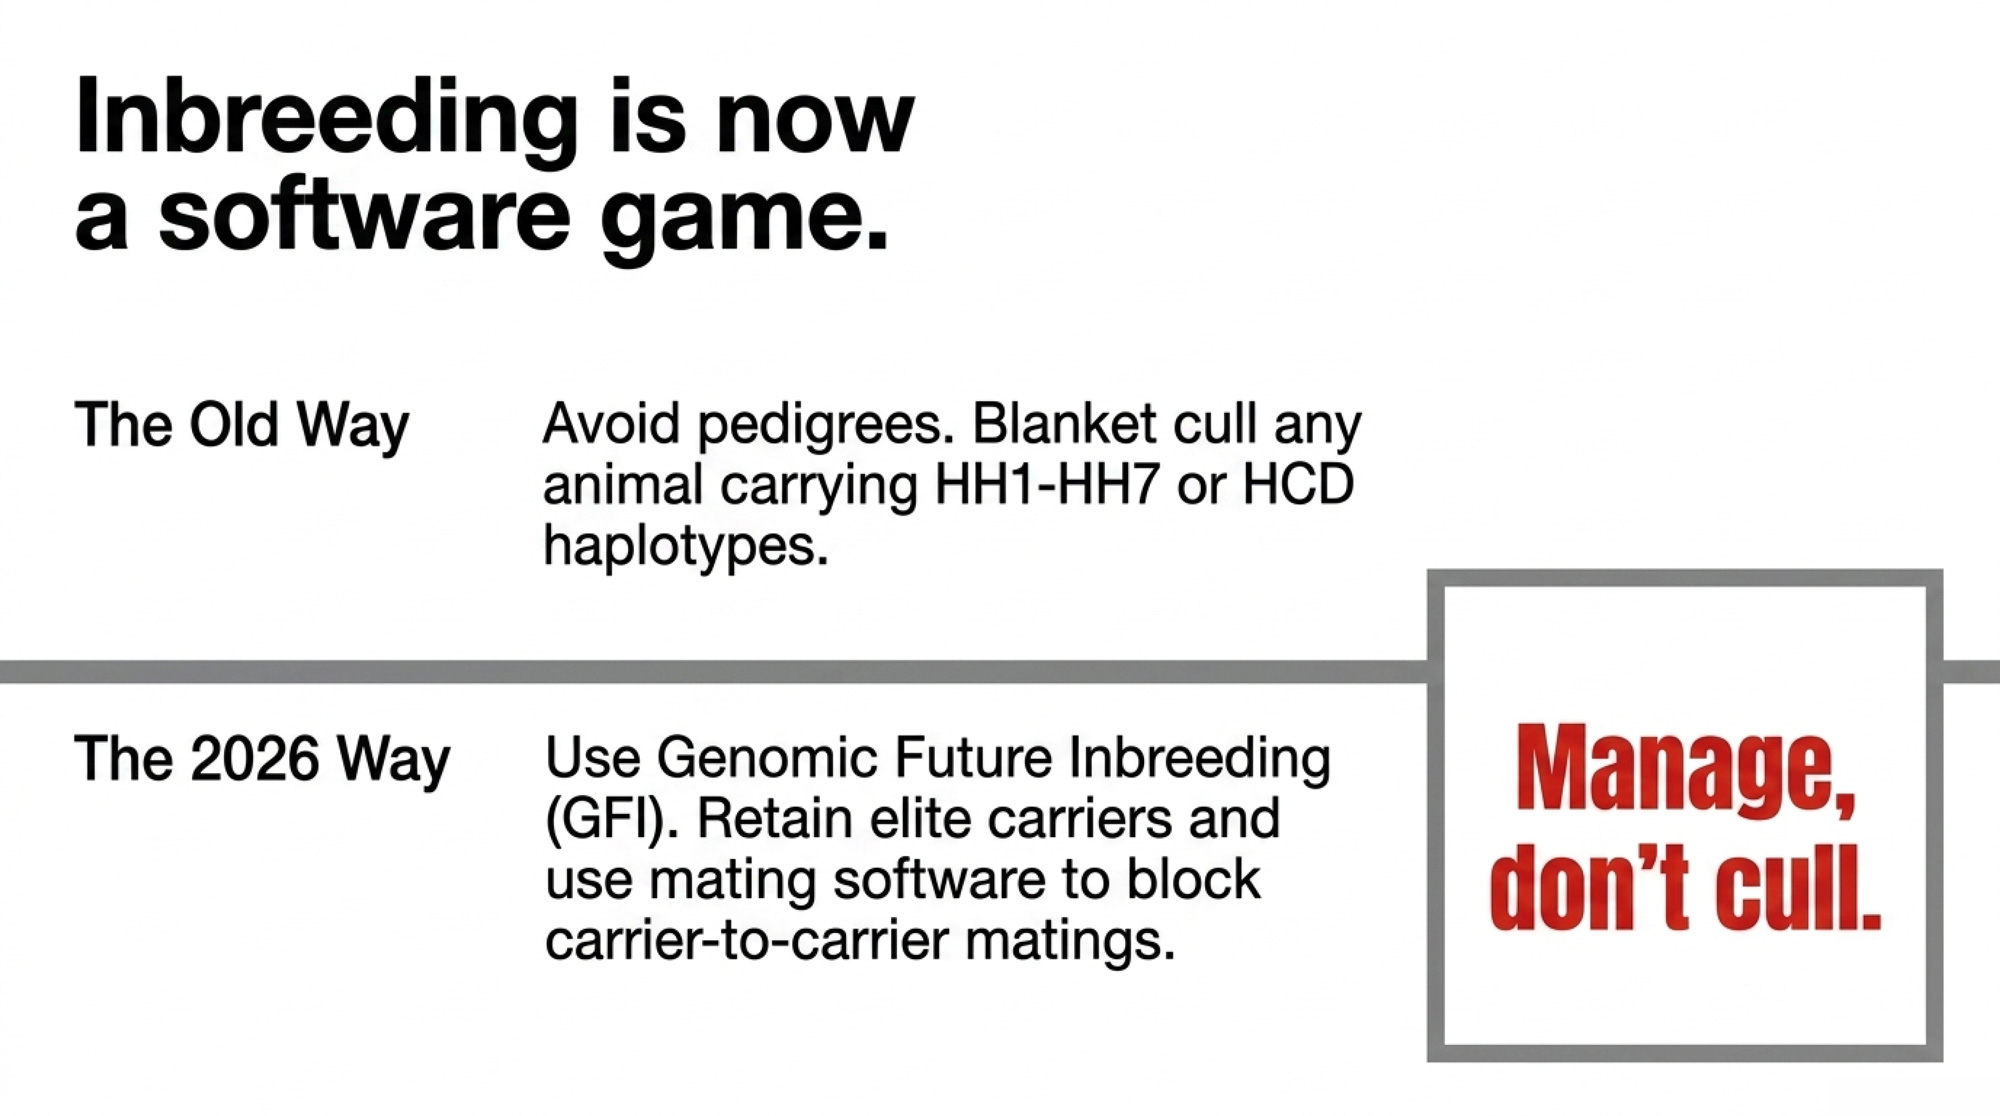
The modern strategy is manage, don’t cull. Carrier animals are not automatically worthless. Elite carriers can still be used if they are mated correctly to non-carriers, and that’s exactly what advanced mating software is built to do.
What commercial herds should do
- Genomically test females if the herd is making replacement, IVF, or aggressive beef-on-dairy decisions.
- Use mating software that screens carrier risk automatically.
- Don’t overreact to carrier status; react to carrier-by-carrier mating risk.
- Watch HCD especially carefully because the downstream calf outcome is severe.
Genomic testing ROI for commercial dairy herds
The cost of a genomic test in 2026 sits between 35 and 45 dollars per animal in the source document. That’s the easy part. The hard part is whether the herd will actually use the data to make tougher, earlier decisions.
Herds under 500 cows
For smaller herds, the document recommends a more targeted approach. Test replacement heifers, roughly 45% of the total herd, then use those results to cull the bottom 10% to 20% before they absorb about 2,000 dollars in rearing cost.
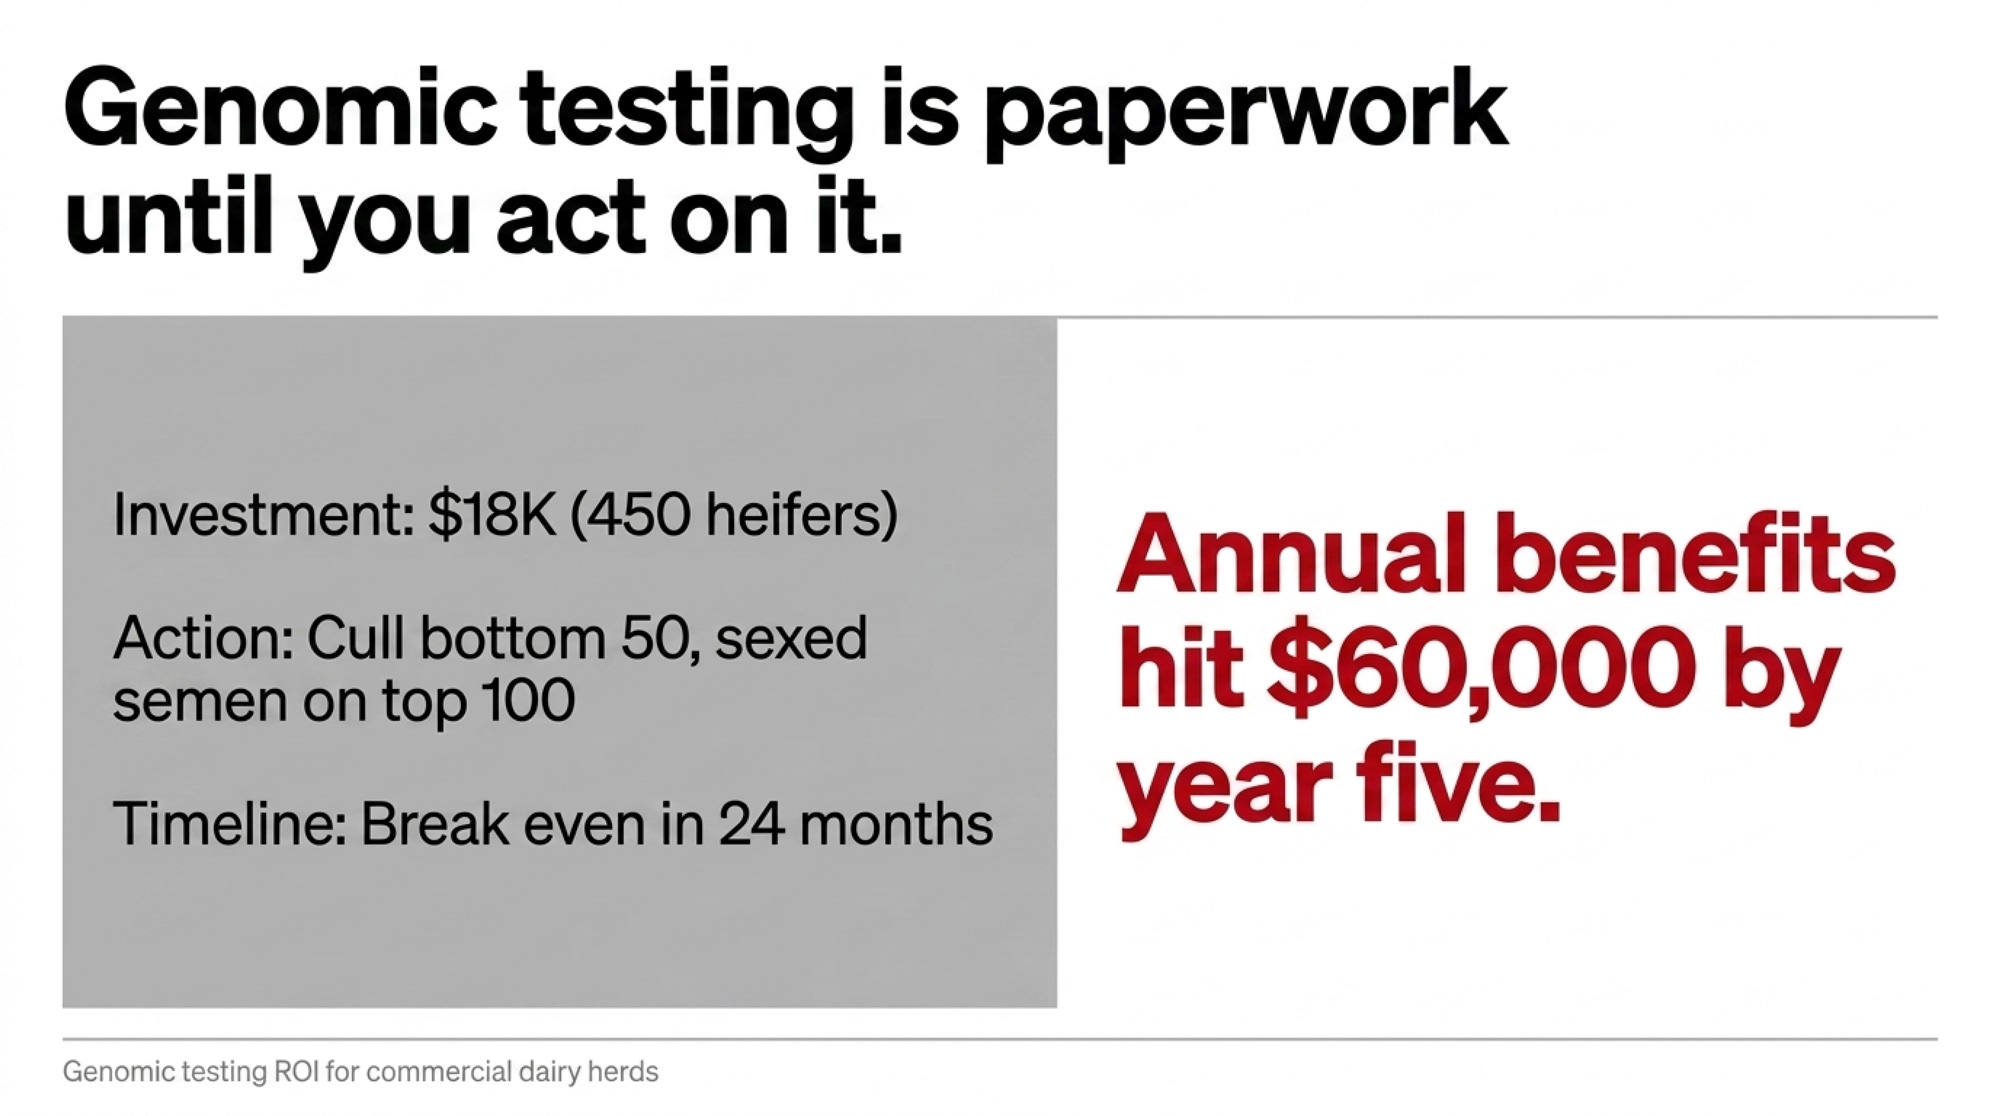
The document gives this benchmark framework:
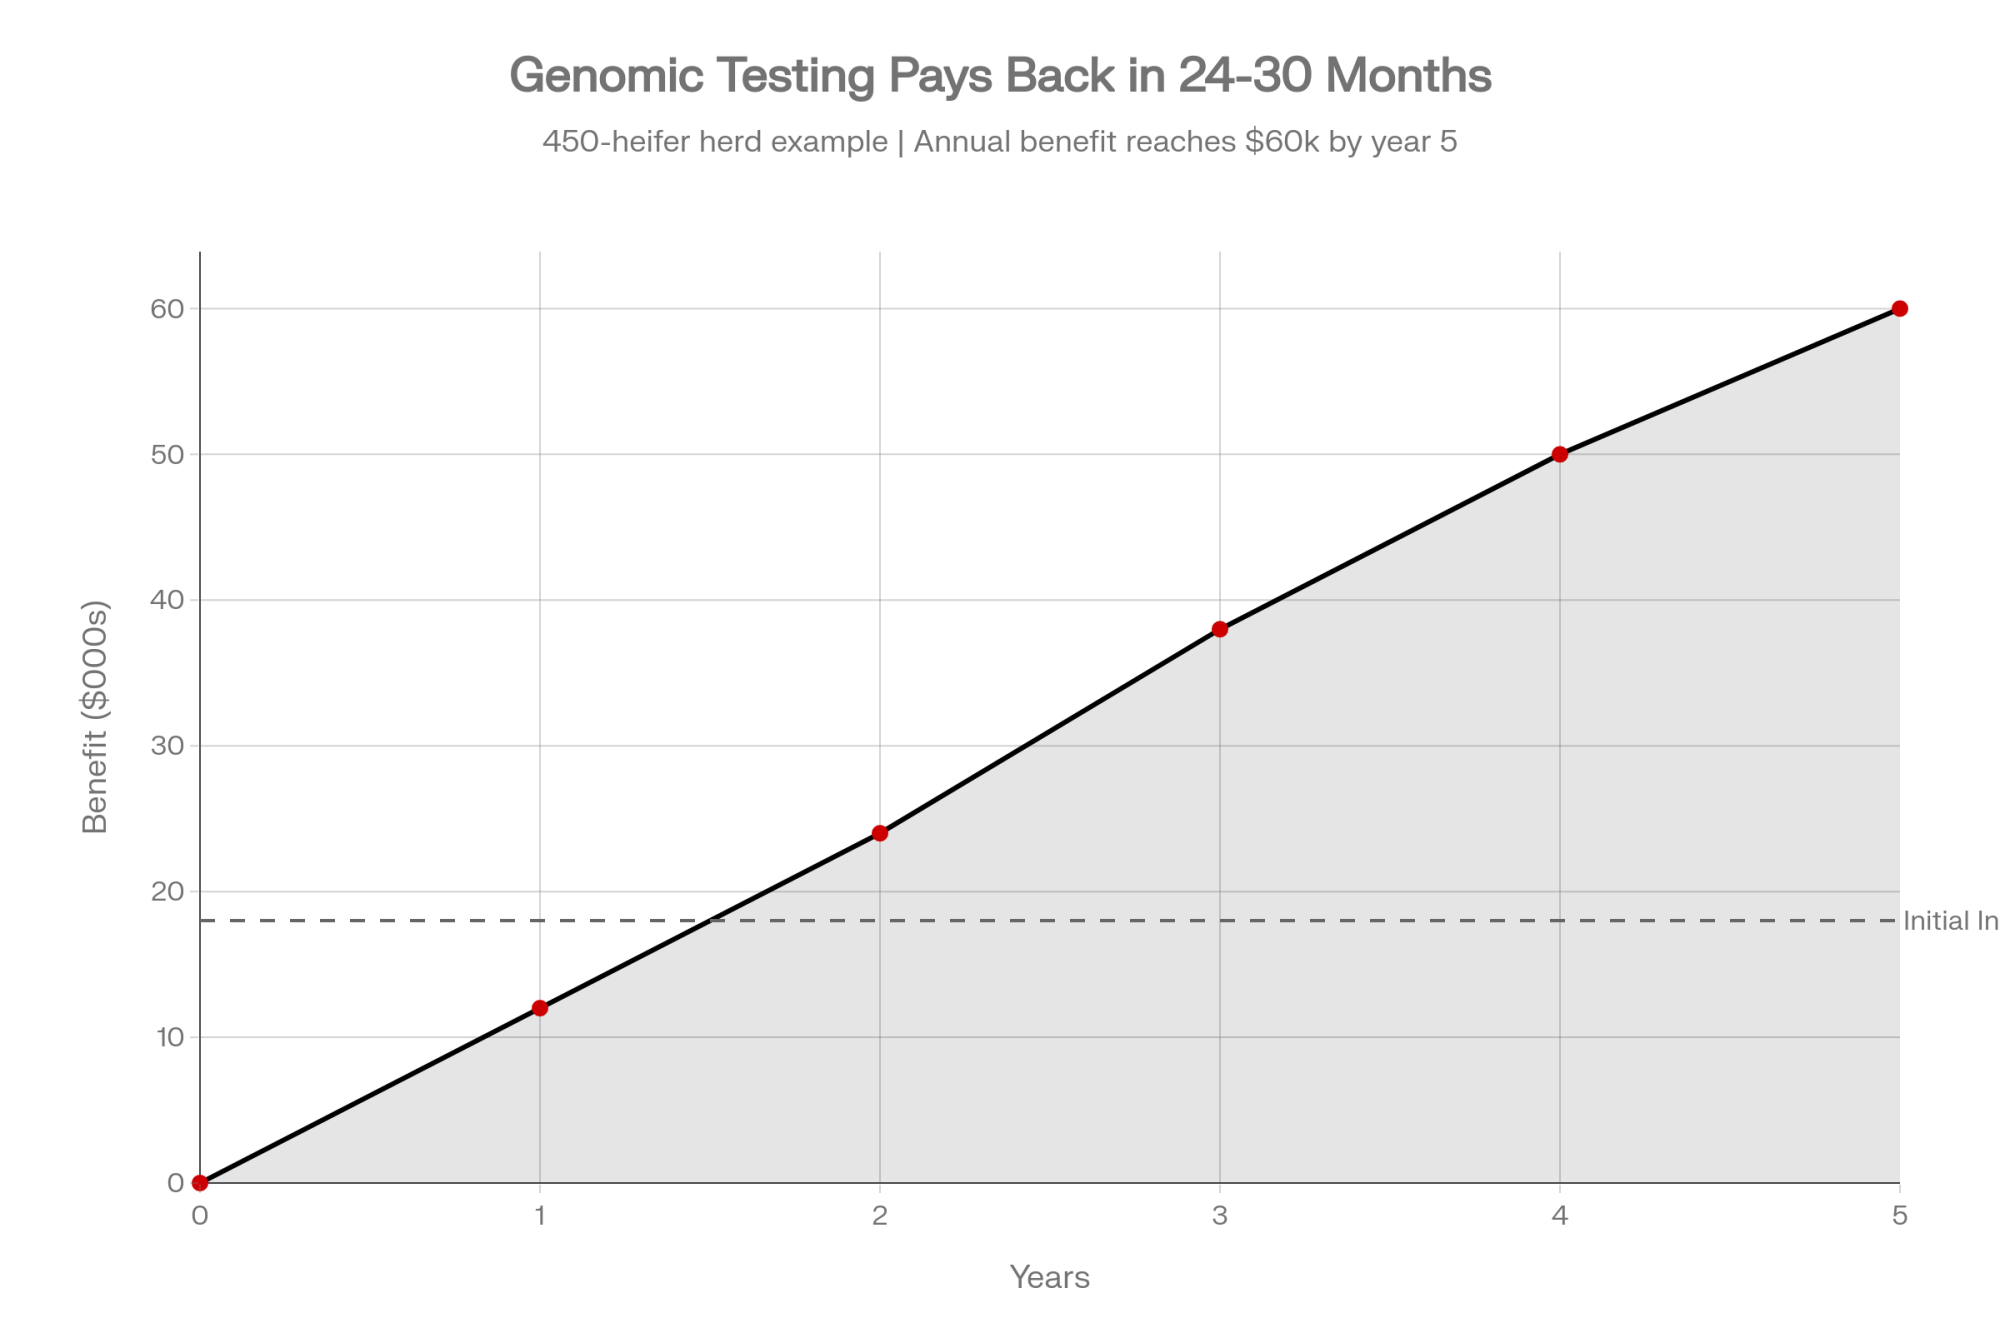
- Investment: 18,000 for 450 heifers.
- Action: Cull the bottom 50 and breed the top 100 to sexed semen.
- ROI: Breakeven in 24 to 30 months, with annual benefits reaching 60,000 by year five.
That’s not small-farm theory. That’s a decision rule. If the herd won’t sort heifers, change semen allocation, or move low-merit animals out early, the test becomes paperwork instead of strategy.
Herds over 500 cows
Larger herds can create faster payback because genomics plugs directly into beef-on-dairy, replacement pressure, and elite sexed-semen concentration. The source document uses a 1,000-animal example: 40,000 dollars invested, aggressive beef-on-dairy on the bottom half, elite sexed semen on the top 20%, and immediate cash-flow upside because a one-day-old beef-by-dairy calf is worth over 1,000 in 2026.
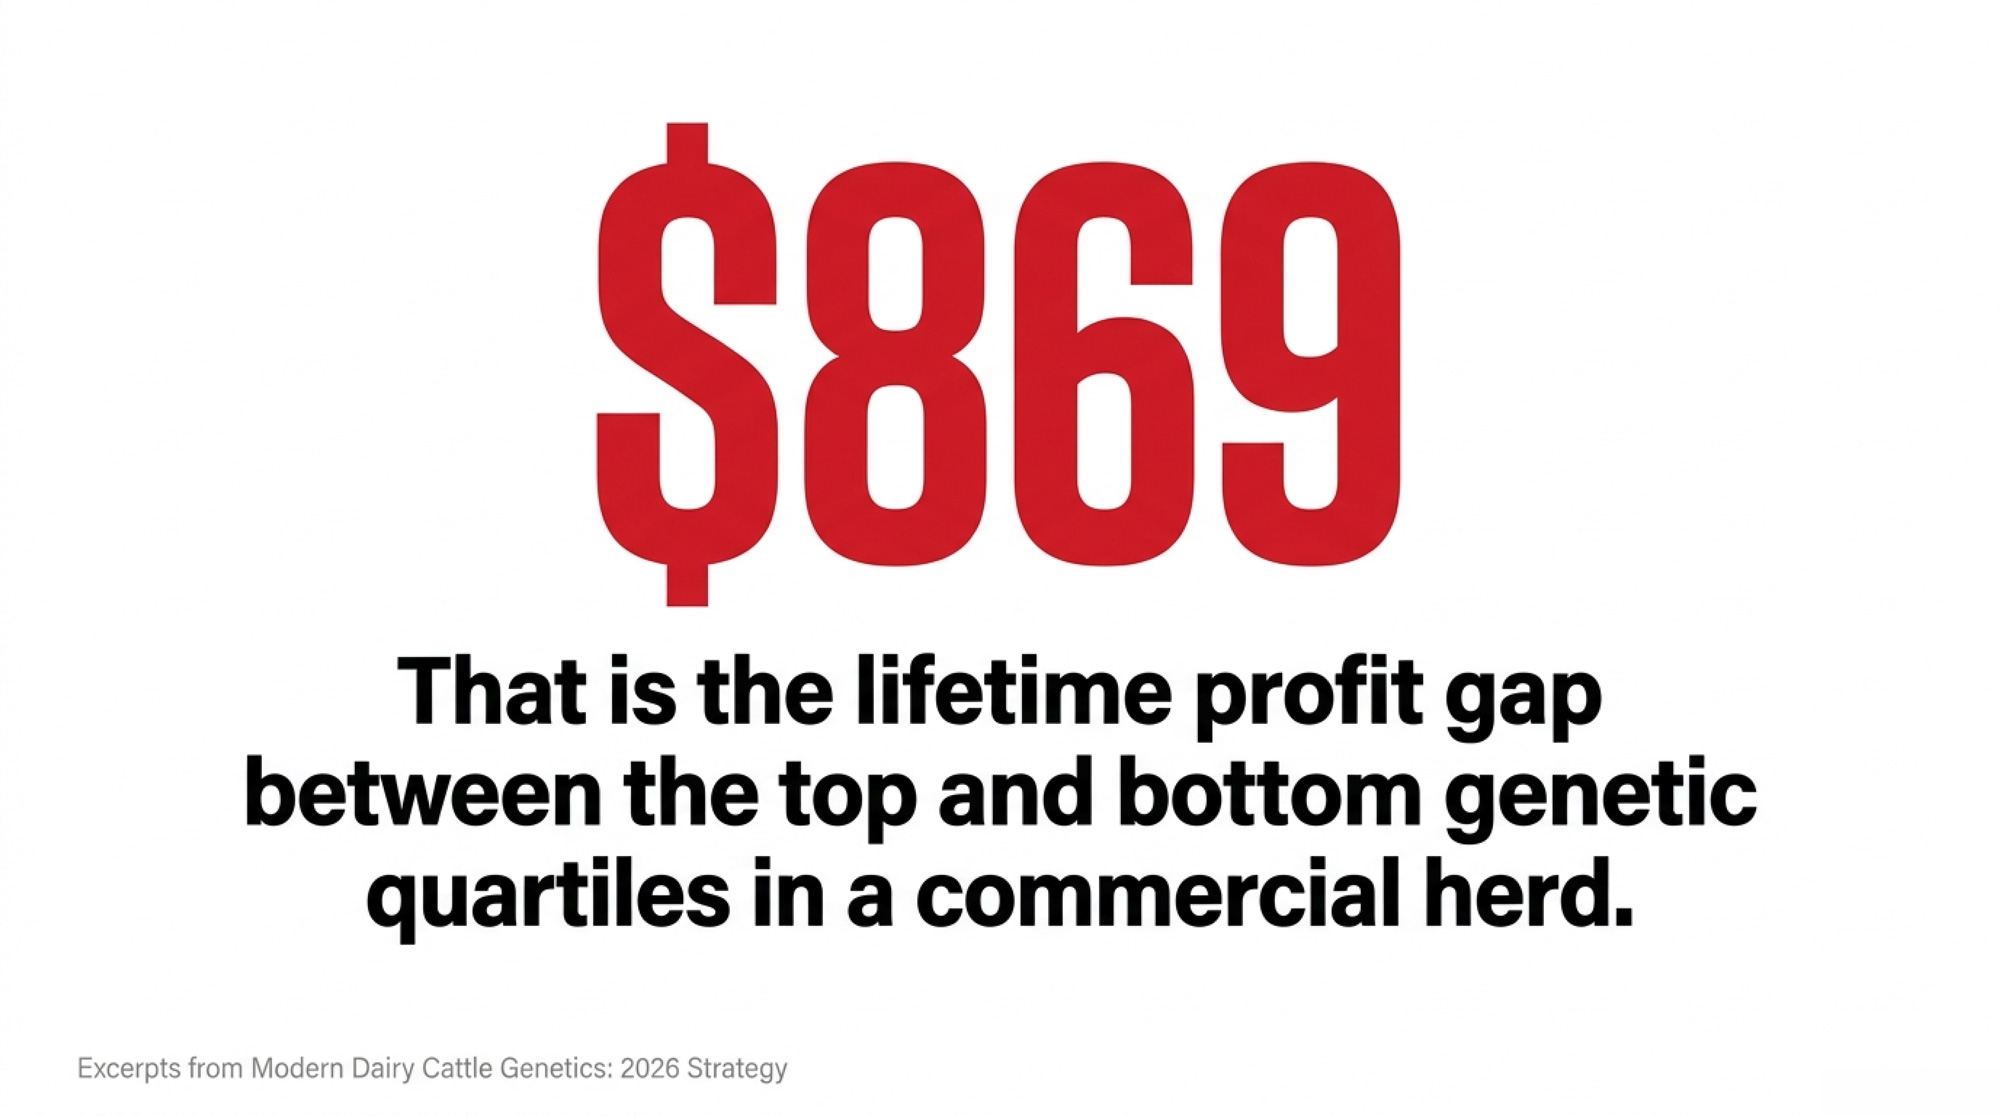
It also preserves one of the biggest profit markers in the whole piece: an 869 lifetime profit gap between the top and bottom genetic quartiles. That’s the kind of number that moves genomic testing out of the “nice to have” category.
2026 benchmark stat: The source document places genomic test cost at 35 to 45 per head and the top-versus-bottom genetic quartile profit gap at 869 over lifetime performance.
The real ROI filter
Genomic testing pays when it changes:
- which calves become replacements,
- which animals get sexed semen,
- which cows get beef semen,
- which matings are blocked for carrier risk,
- and which elite females earn the reproductive spend.
No action, no ROI. Pretty simple.
Emerging traits reshaping dairy cattle genetics
The next wave of dairy cattle genetics is being driven by traits that used to be too expensive, too hard, or too messy to measure. Now they’re moving into selection because phenomics, sensors, and larger reference datasets are making them usable.
Methane efficiency
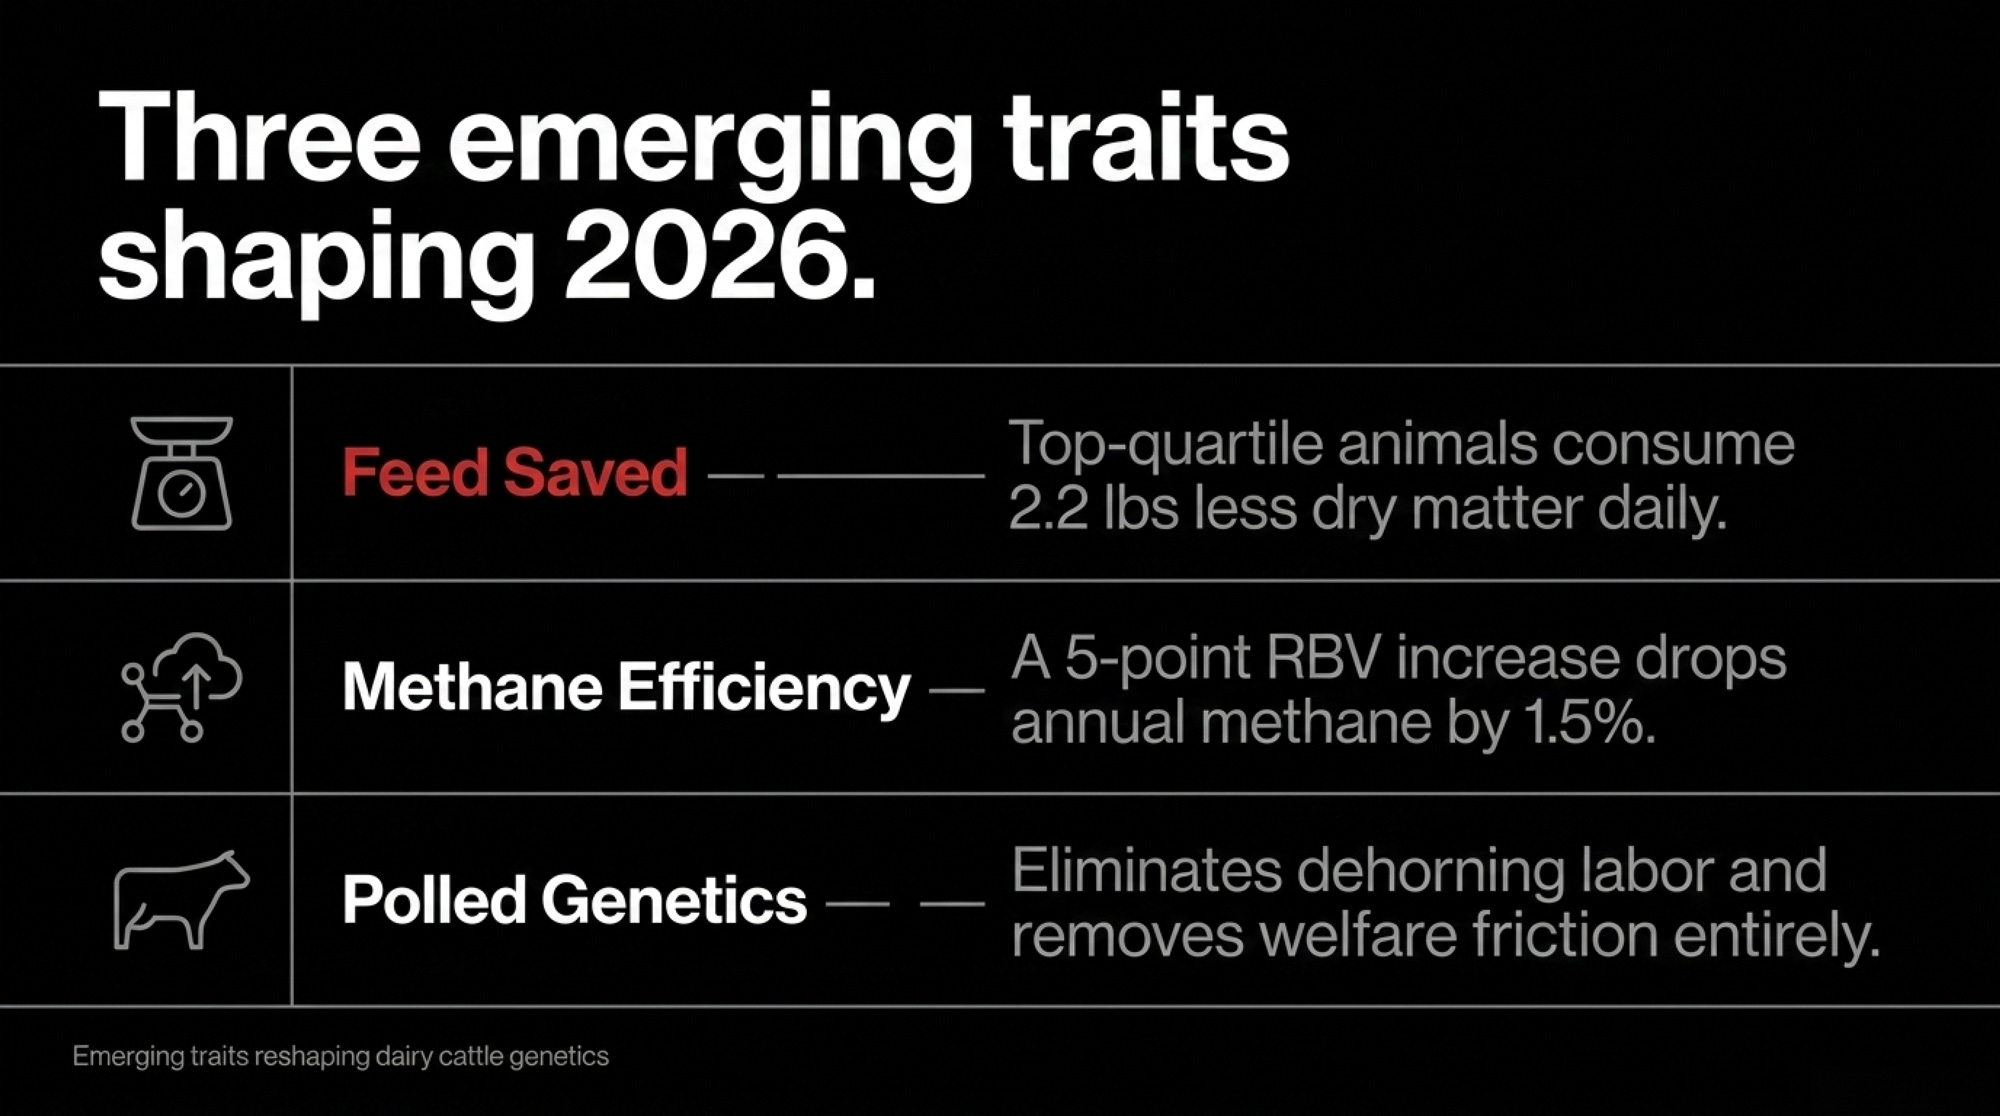
Methane efficiency has moved from conference talk to official evaluation territory in Canada and parts of Europe. The source document says Lactanet Canada and Dutch researchers have implemented methane efficiency evaluations using mid-infrared milk spectra to predict methane output, and that every 5-point increase in a sire’s Methane Efficiency RBV corresponds to a 1.5% reduction in annual methane emissions per daughter.
That matters because future milk-market access may be tied not just to production but to carbon behaviour. This is one of those traits that still sounds optional until it suddenly isn’t.
Heat resilience
Heat stress is no longer just a summer management problem. The source document highlights Zoetis Clarifide Plus heat-resilience traits, including Fertility Heat Resilience and Milk Heat Resilience, aimed at maintaining conception and milk stability as THI rises.
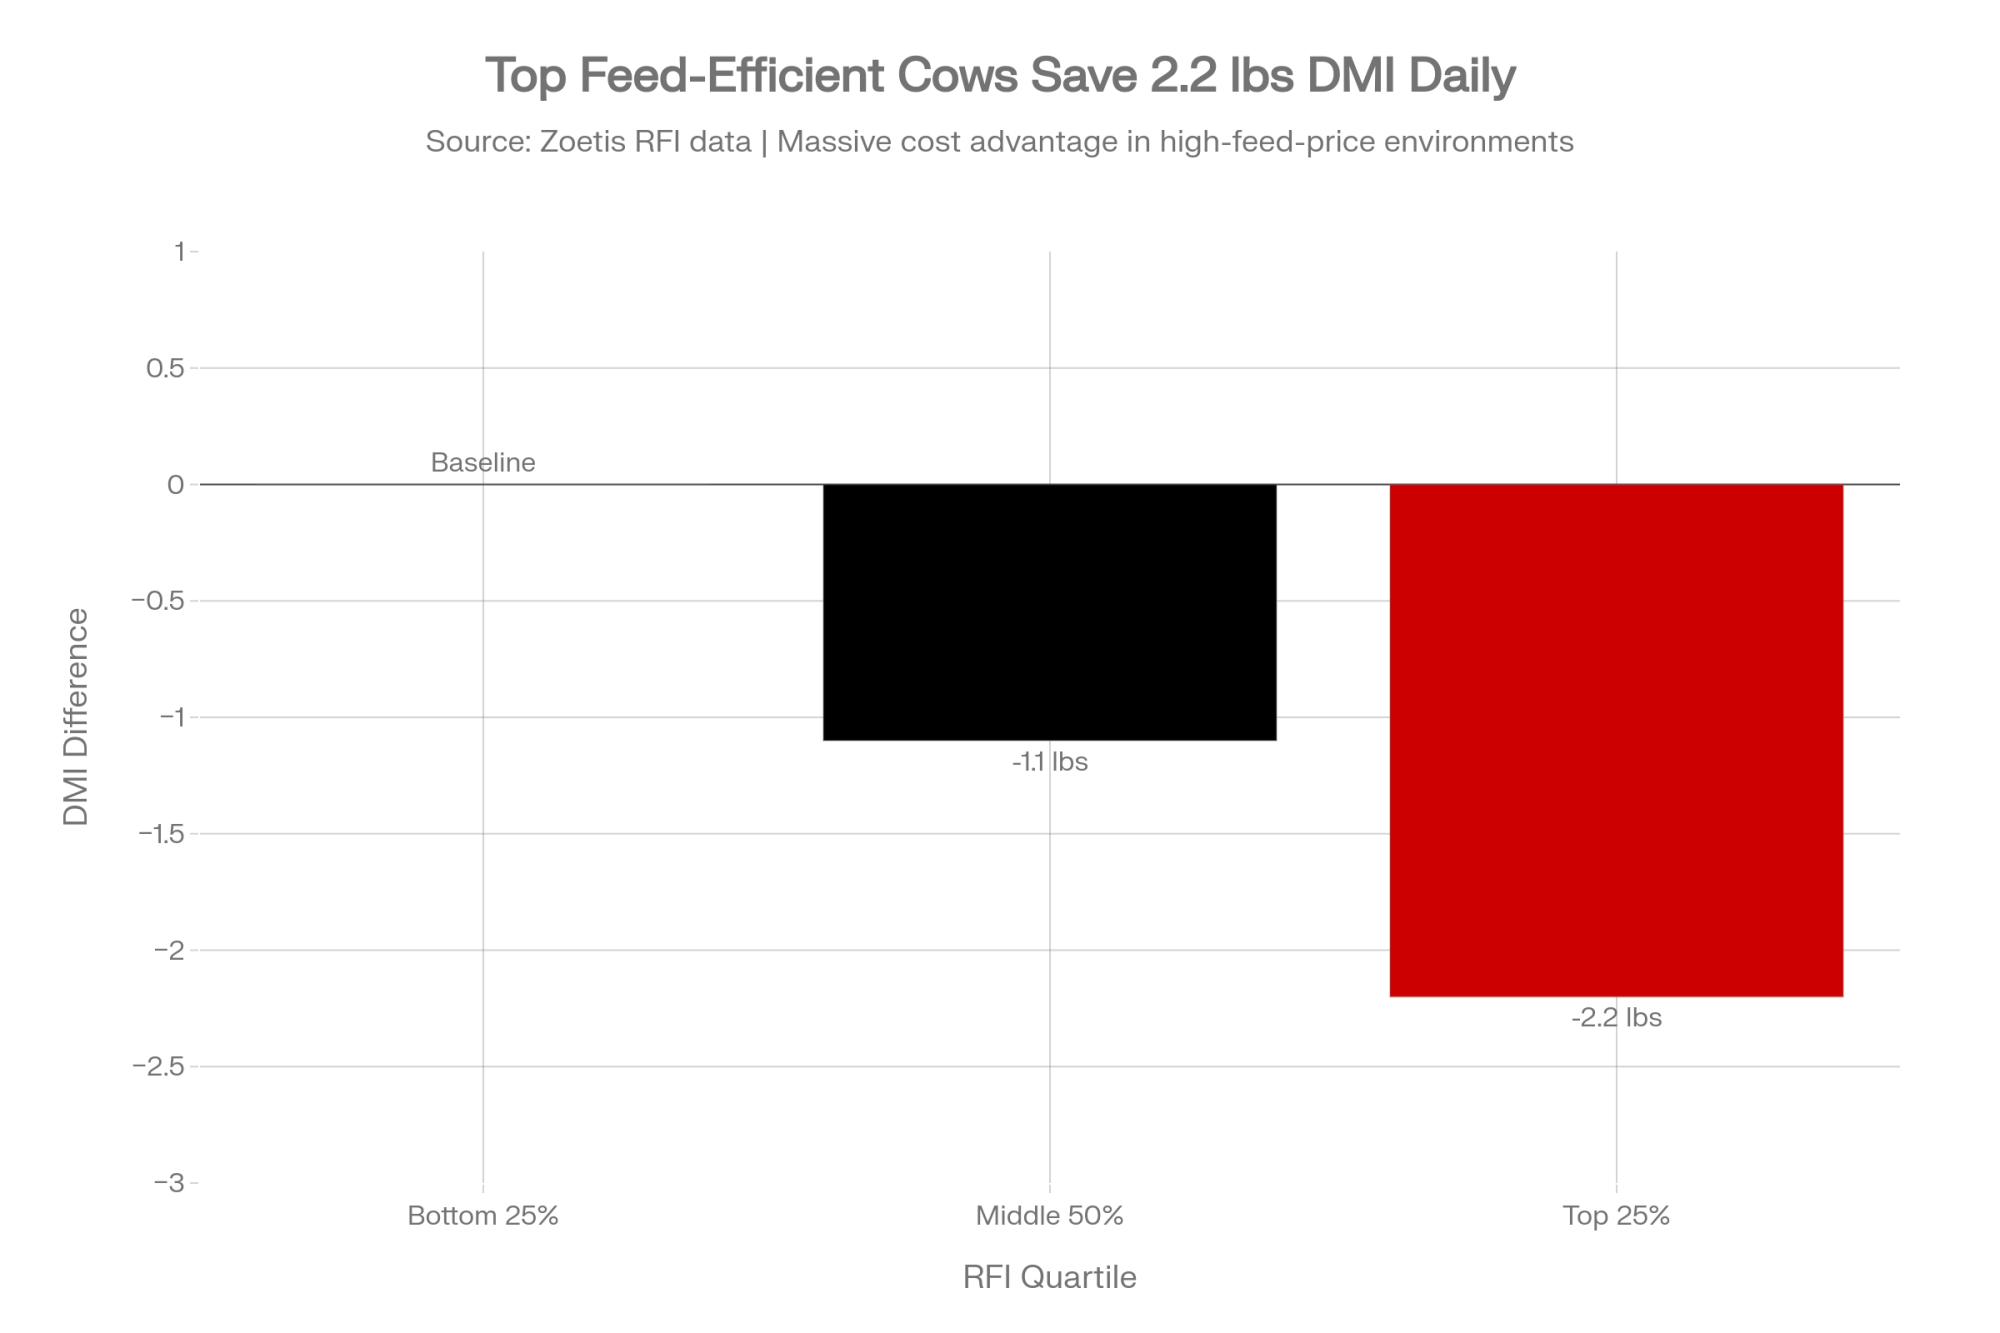
Feed Saved and RFI
Feed efficiency is probably the most economically practical emerging trait set on the page. The document notes that top-quartile animals for Zoetis residual feed intake consume 2.2 pounds less dry matter per day than peers. In a high-feed-cost system, that’s huge.
Polled genetics and gestation length
Polled genetics has moved from a niche welfare discussion into mainstream commercial selection because it can remove dehorning cost and welfare pain from the system. The document also notes that gestation length is being used to tighten calving windows and improve labour predictability in large herds.
- Methane efficiency: climate and processor relevance.
- Heat resilience: reproductive stability under stress.
- Feed efficiency: immediate cost pressure.
- Polled: welfare, labour, and market optics.
- Gestation length: tighter management control.
Breed philosophies in dairy cattle genetics
Breed indexes aren’t just formula differences. They express different biological brands.
Holstein: balanced efficiency under pressure
The Holstein message in 2026 is clear: still dominant, but being pushed to correct for years of size, maintenance cost, and narrow selection pressure. The source document frames Holstein philosophy around balanced efficiency, with TPI and NM both trying, in different ways, to produce a healthier, more moderate, more system-compatible cow.
Jersey: component density
Jerseys are still selling a component story. The source document notes that the 2026 Canadian LPI for Jerseys shifted heavily toward protein with a 33:67 fat-to-protein ratio to meet cheese-plant demand. That’s a very different market signal than a straight milk-volume chase.
Ayrshire and Brown Swiss: robustness and durability
The source document groups Ayrshire and Brown Swiss around functional feet and legs, longevity, and a trouble-free commercial profile. That’s why these breeds often stay relevant in crossbreeding and lower-input systems even when they don’t top the mainstream volume rankings.
Milking Shorthorn and Guernsey: niche sustainability
These breeds hold value through efficiency in lower-input systems, unique protein profiles, and niche positioning rather than scale dominance. They aren’t trying to win the same race on the same track.
FAQ SECTION
Frequently Asked Questions
What is the difference between TPI and NM$?
TPI is a breed-specific Holstein ranking index, while NM$ is a multi-breed economic index designed around lifetime profit. In 2026, TPI leans harder toward protein, while NM$ places heavier value on fat, feed efficiency, and longevity.
What does GTPI mean in dairy cattle genetics?
GTPI means Genomic Total Performance Index. It uses the same TPI formula, but the score is based primarily on genomic information rather than daughter-proven data. It’s essentially TPI for animals evaluated mainly through DNA prediction.
How does genomic selection work in dairy cattle?
Genomic selection uses DNA markers, usually SNPs, to predict an animal’s genetic merit early in life. Low-density genotypes can be imputed to higher density using large reference populations, which makes genomic testing more affordable and still highly useful.
What did the 2025 dairy genetic base change do?
The 2025 base change reset the comparison point to a newer cow population. In Holsteins, that reduced published values by 752 pounds of milk, 44 pounds of fat, and 29 pounds of protein, but it did not mean animals got biologically worse.
Is genomic testing worth it for commercial dairy herds?
Yes, but only if the herd acts on the information. The strongest returns come when test results are used for heifer culling, sexed-semen allocation, beef-on-dairy strategy, carrier-risk control, and elite female selection.
What is Feed Saved in dairy genetics?
Feed Saved is a feed-efficiency concept that combines maintenance cost from body size with metabolic efficiency, including residual feed intake. In current index design, it matters because it helps identify cows that produce efficiently without carrying excess maintenance cost.
What is GFI in dairy cattle breeding?
GFI stands for Genomic Future Inbreeding. It measures the likely genomic inbreeding risk of future matings and is more precise than relying on pedigree alone. It is now central to modern mating programs in elite and commercial herds.
What are HH1 to HH7 in Holstein genetics?
HH1 through HH7 are Holstein haplotype defects associated with fertility loss or reduced conception. They matter most when carrier animals are mated together, which is why modern mating software focuses on risk management rather than blanket culling.
Are polled genetics commercially relevant in 2026?
Yes. Polled genetics now carries welfare, labour, and public-perception value, and it is moving closer to mainstream commercial use as higher-ranking polled sires become available. It’s no longer just a niche breeding badge.
 The Sunday Read Dairy Professionals Don’t Skip.
 The Sunday Read Dairy Professionals Don’t Skip.
Every week, thousands of producers, breeders, and industry insiders open Bullvine Weekly for genetics insights, market shifts, and profit strategies they won’t find anywhere else. One email. Five minutes. Smarter decisions all week.
