










U.S. calf-health records rose 74.5% in two years. Milking Speed still reads only parlor meters. CDCB’s December data deadline is October 29, so here’s how to check which of your herd’s records count.
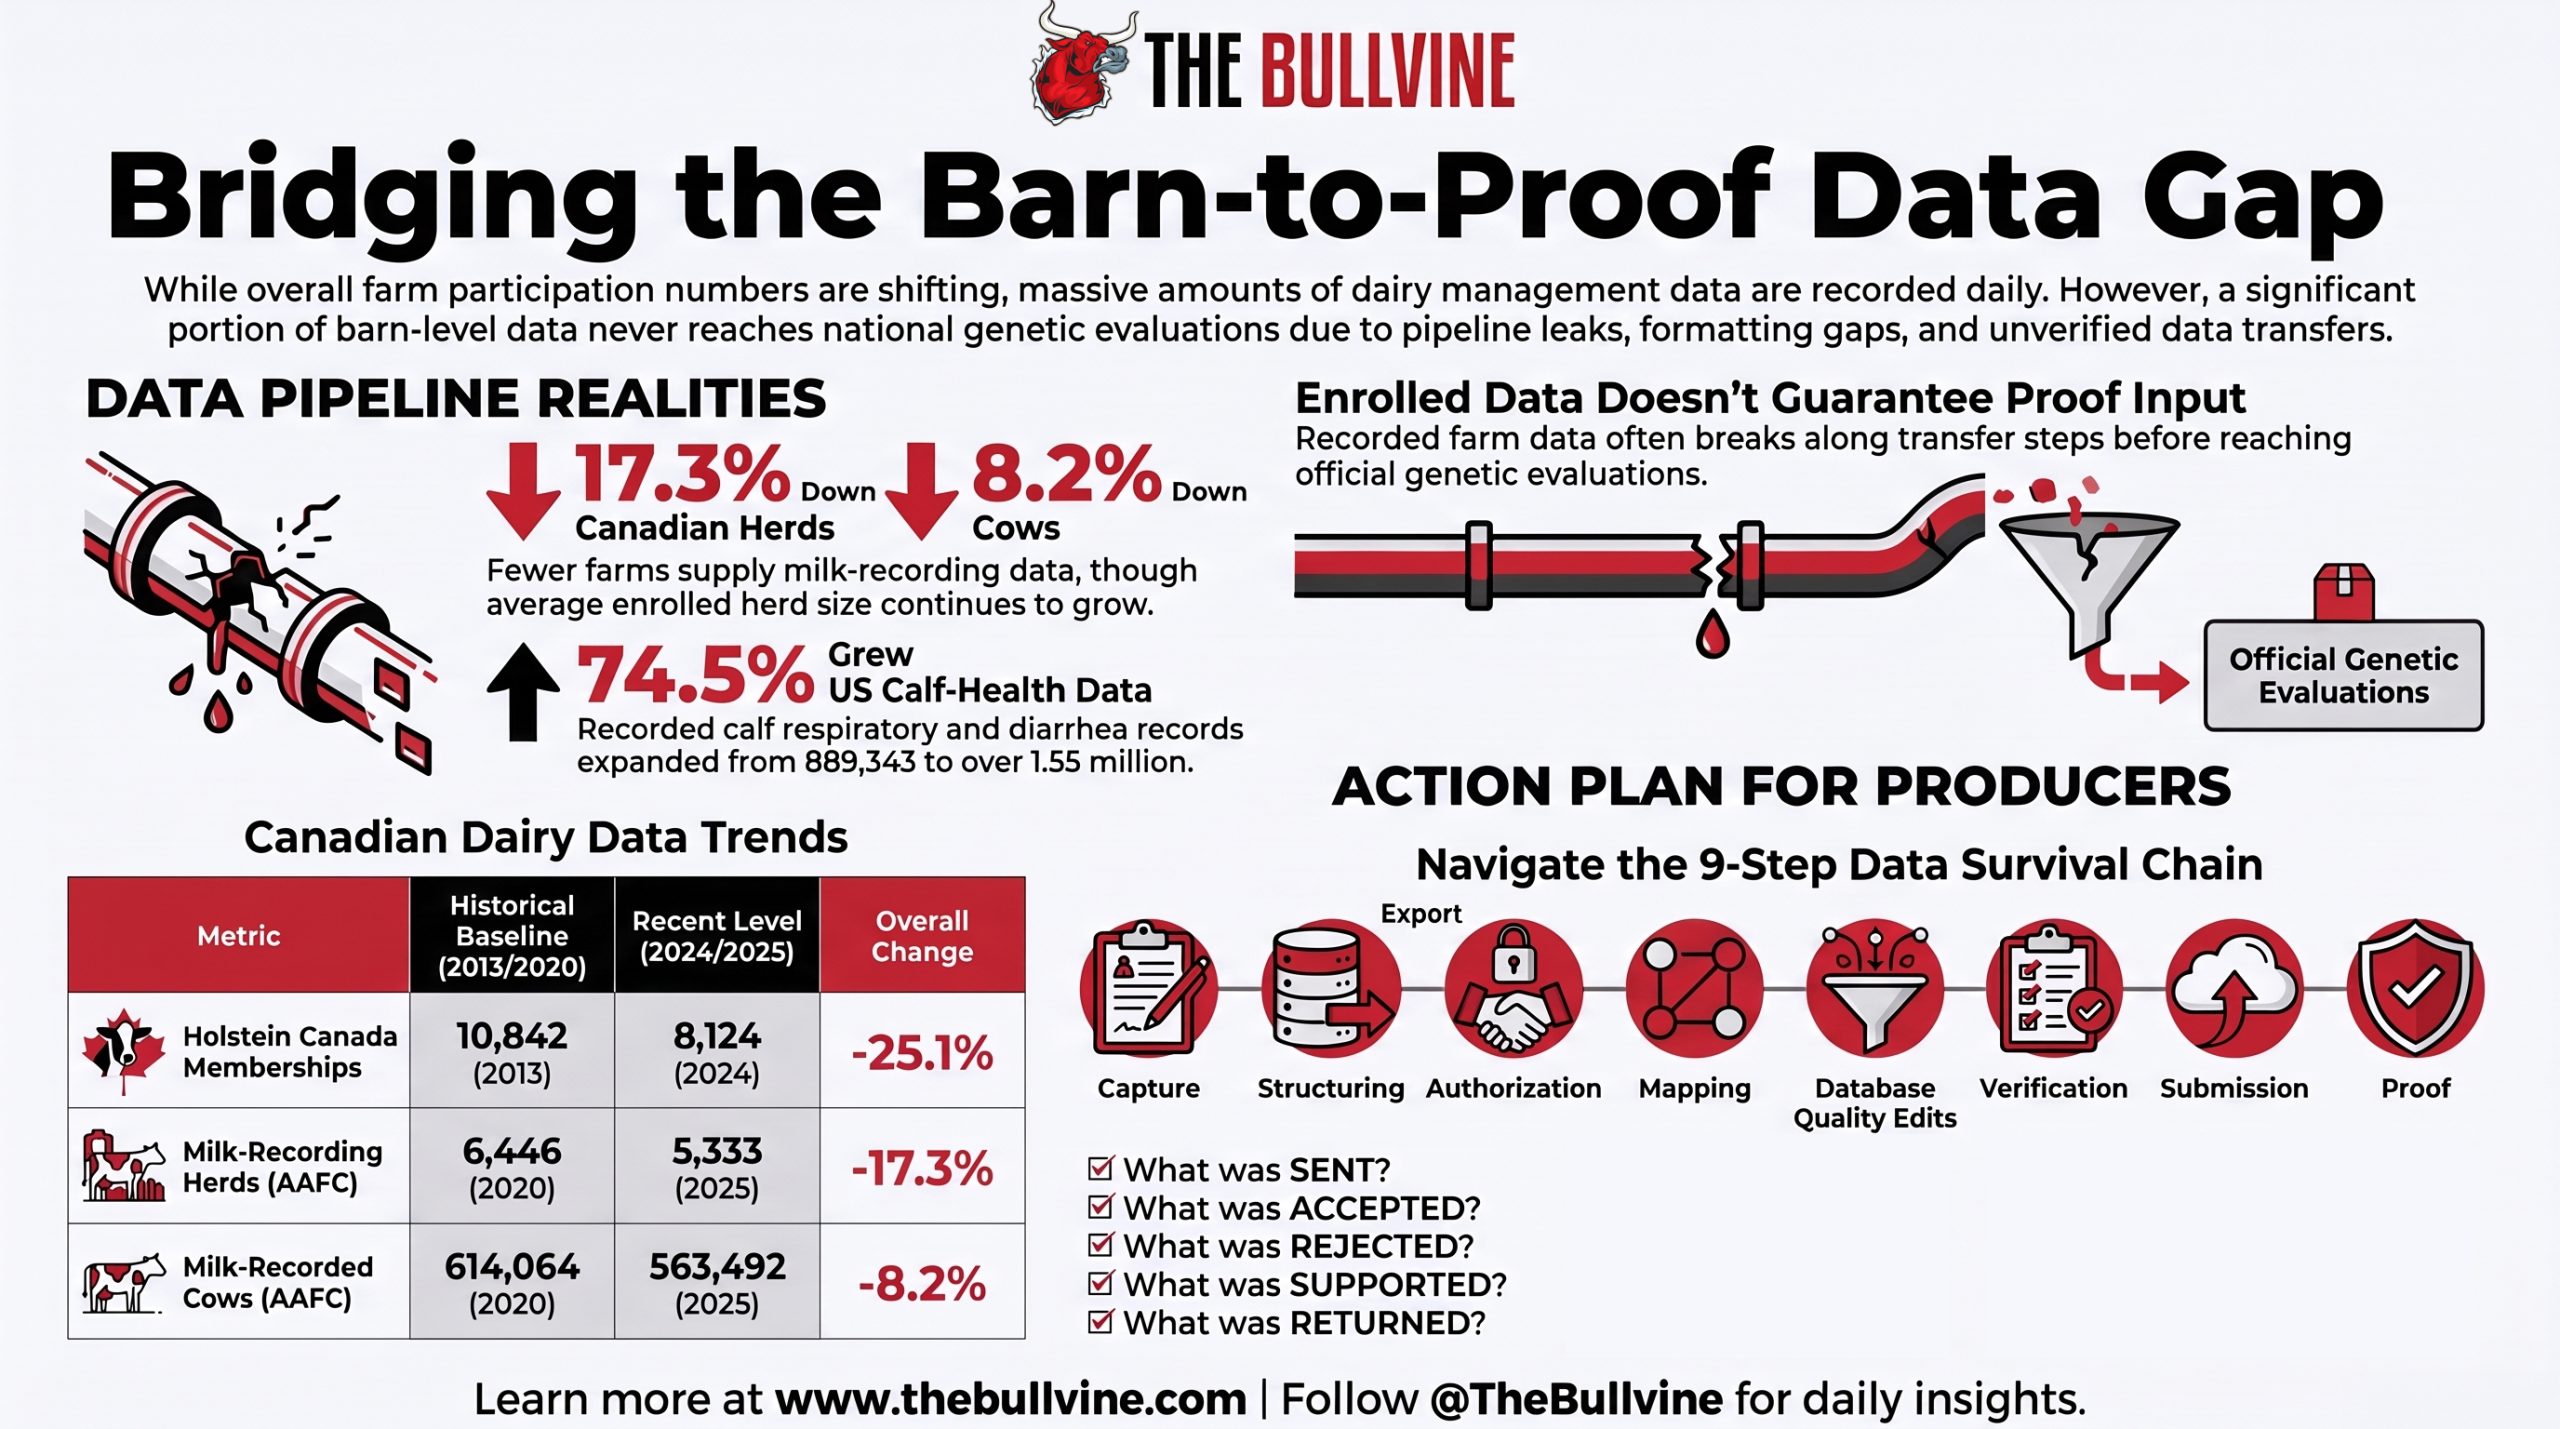
Executive Summary: Canada’s milk-recording herds fell 17.3% from 2020 to 2025 while recorded cows fell 8.2%, by our math from AAFC data. U.S. calf-health records rose 74.5% between 2024 and 2026, CDCB reports. The data aren’t vanishing, but public reporting doesn’t show which records survive the trip from barn to proof. CDCB’s Milking Speed evaluation still reads only parlor meters, and beef and sexed semen are thinning conventional fertility data. Health, reproductive, and lactation data for CDCB’s December 1 run are due October 29. Before then, ask your provider what your herd sent, what was accepted, and what it supported.
North American breeders still fill the rings at the Royal and World Dairy Expo. National evaluation runs on a quieter kind of participation: usable records moving from ordinary cows, through farm software, into public databases. Some of those streams are growing. Others are thin. And nothing public lets a breeder tell which is which.
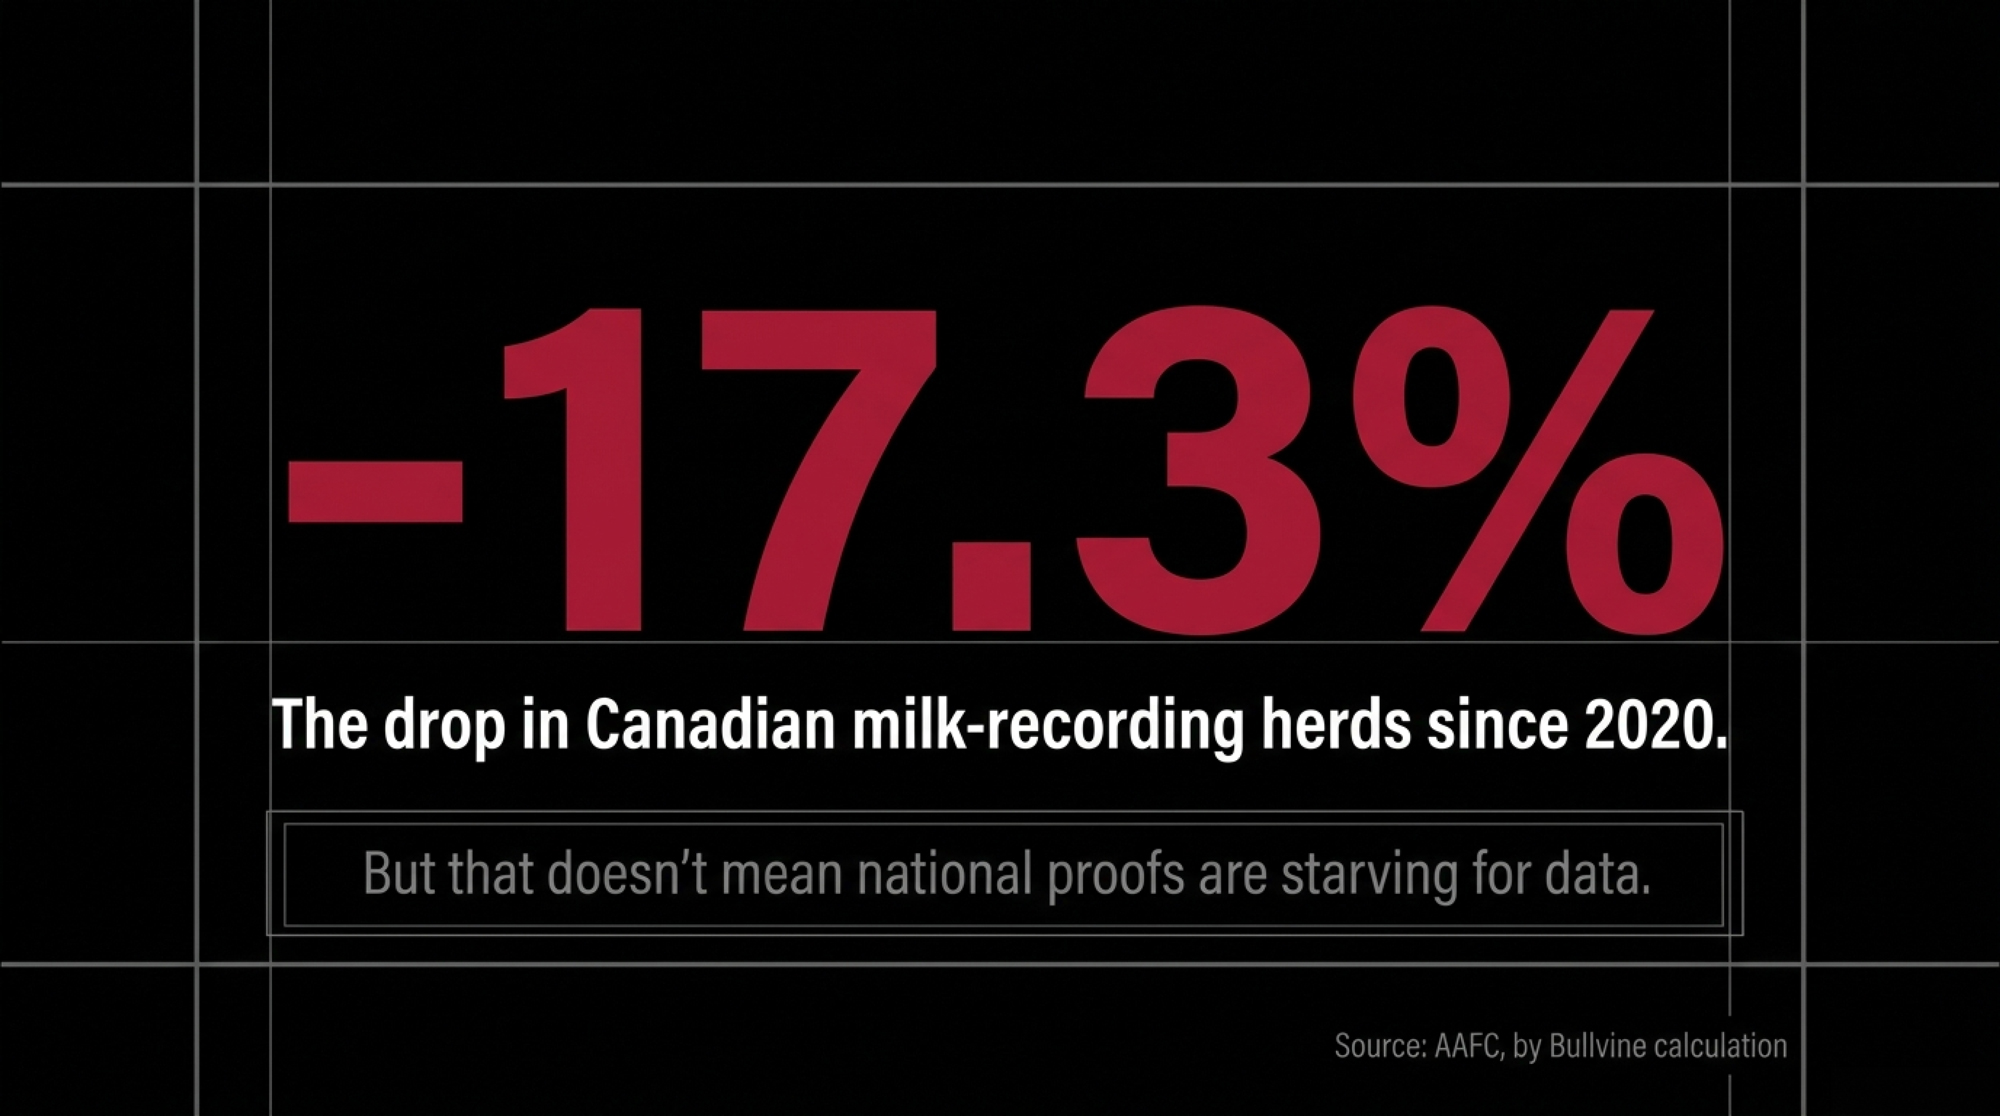
In Canada, the clearest series points both ways at once. Milk-recording herds fell 17.3% from 2020 to 2025, by our calculation from Agriculture and Agri-Food Canada data. Recorded cows fell only 8.2%. Fewer farms are sending records. Most of the cows behind them haven’t gone anywhere.
The 2025 National Black and White Holstein Show at the Royal Agricultural Winter Fair drew a record 464 head over two days, with another 129 Red and Whites behind them, according to Holstein Canada. At World Dairy Expo’s 2025 show, 1,829 owners exhibited 2,625 cattle from 37 states, seven provinces, and one Australian state.
Those numbers say something real about breeding culture. They don’t measure genetic diversity, ownership independence, or the information feeding national evaluations. Those records get entered after a fresh-cow check, a breeding, or a treatment: into a phone, into a robot terminal, or onto paper that never leaves the office.
A breeder can stand six deep at ringside and still be absent from the phenotype stream.
The question this piece asks is narrow and measurable: which records make it from the barn, through farm software and data exchange, past identity matching and quality control, into a named evaluation? And can the farm that sent them see what happened?
The Denominators Don’t Match
The first finding wasn’t a decline. It was that the decline changed depending on which row got called “participation.”
Holstein Canada’s 2013 service summary listed 10,842 memberships, 285,449 registrations, and 266,578 animals classified. Its 2024 annual report, the most recent Holstein Canada annual report reviewed for this analysis, listed 8,124 memberships, 263,149 registrations, and 235,500 animals classified, 218,577 of them Holsteins. By our calculation, over those 11 years memberships fell 25.1%, registrations 7.8%, and total classified animals 11.7%.
All three numbers hold up. None measures the same thing. A membership is a customer relationship, not necessarily a unique milking herd. Registrations count animals or transactions. Classification totals count animals across several breeds. None identifies a herd supplying production, fertility, or health phenotypes to Lactanet.
| Measure | Start | End | Change | What it counts |
| Holstein Canada memberships | 10,842 (2013) | 8,124 (2024) | −25.1% | Memberships, not necessarily unique herds |
| Holstein Canada registrations | 285,449 (2013) | 263,149 (2024) | −7.8% | Animals or registration transactions |
| Animals classified, all breeds | 266,578 (2013) | 235,500 (2024) | −11.7% | Animals receiving classification |
| Farms shipping milk | 12,007 (2014) | 9,256 (2024) | −22.9% | Milk-producing operations (AAFC) |
| Milk-recording herds | 6,446 (2020) | 5,333 (2025) | −17.3% | Herds enrolled in milk recording (AAFC) |
| Milk-recorded cows | 614,064 (2020) | 563,492 (2025) | −8.2% | Cows enrolled in milk recording (AAFC) |
Percentage changes are Bullvine calculations from the cited figures. The rows cover different periods and different populations, so they aren’t comparable rates of decline.
Milk recording comes closest to the evaluation pipeline, and it’s the one series where herds and cows can be compared over the same period from the same source. By our calculation, average recorded-herd size rose from about 95 cows to 106. Our Murray Hunt profile looked at where that herd trend leads.
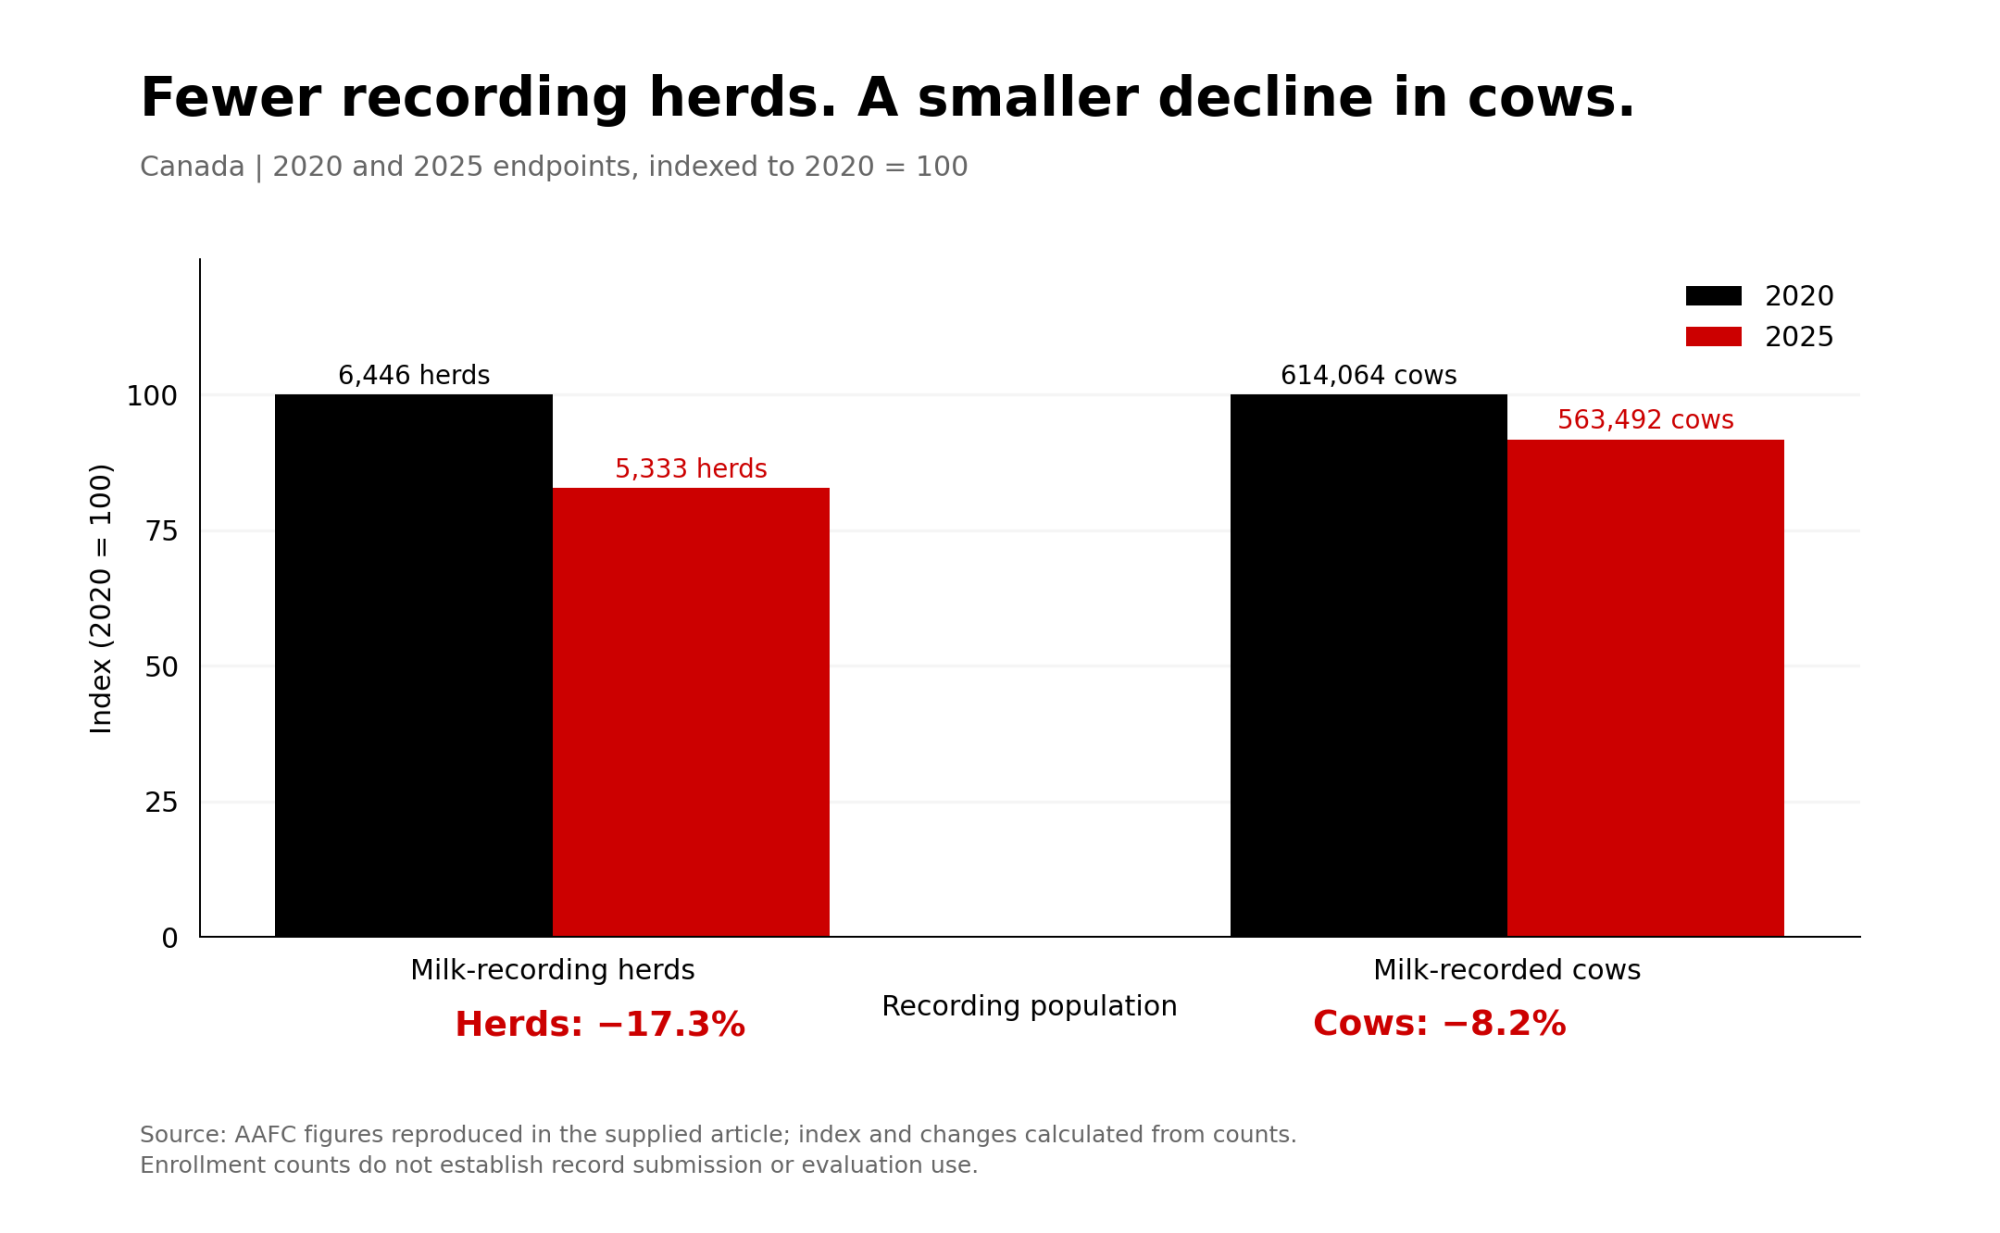
Source: Agriculture and Agri-Food Canada, Canadian Dairy Information Centre. Same source and period for both series.
So the number of cows on test held up better than the number of recording herds supplying them. That’s a structural change worth tracking. It doesn’t on its own show that evaluations are less accurate.
Enrolled Isn’t Supplying
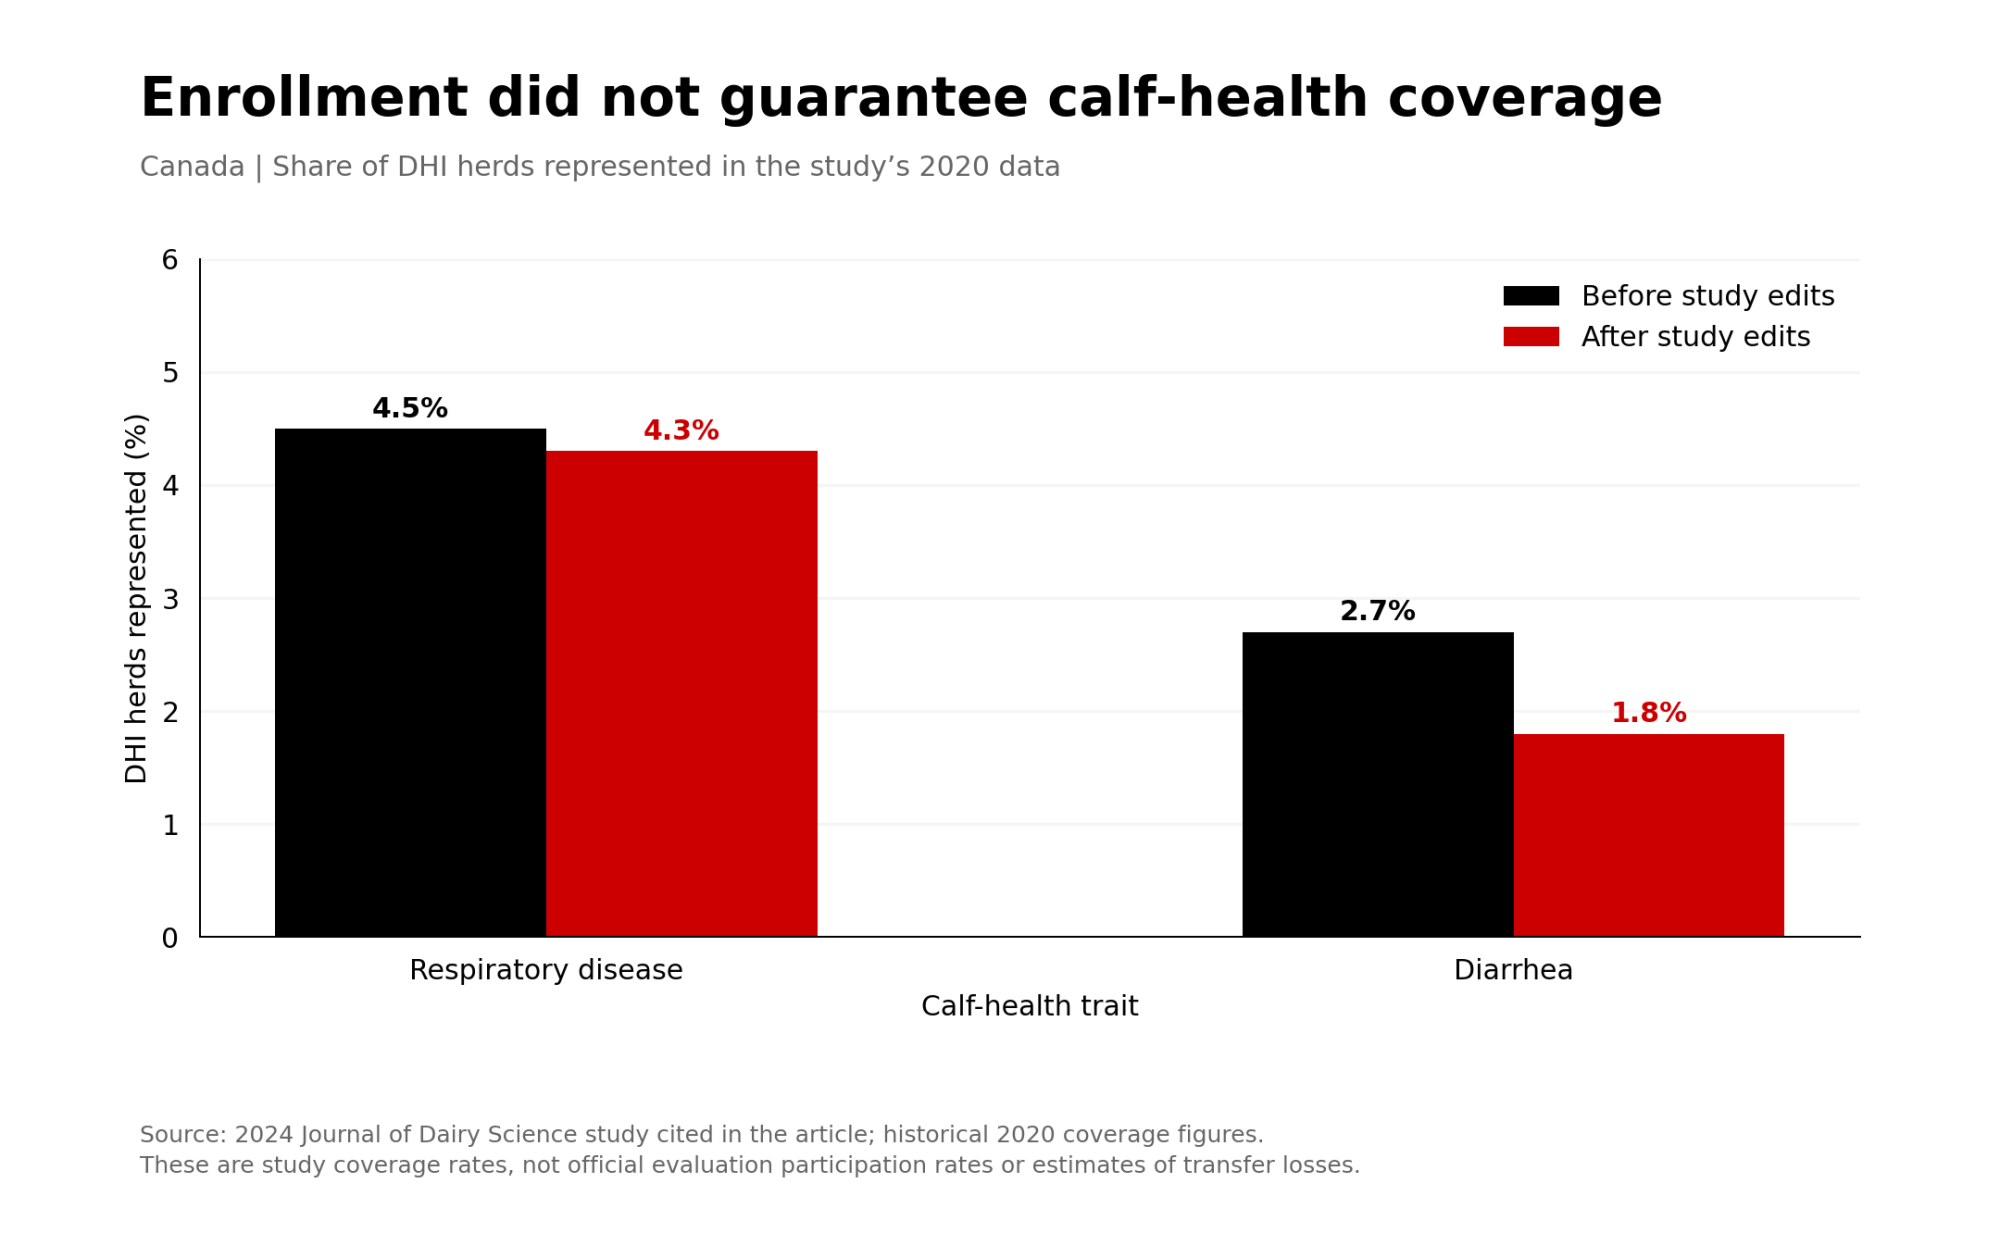
A 2024 study in the Journal of Dairy Science shows how far enrollment and supply can drift apart. In the researchers’ 2020 data, only 4.5% of Canadian DHI herds were represented in calf respiratory-disease records and 2.7% in calf diarrhea records. Those weren’t participation rates in an official national evaluation; the team was testing whether producer-recorded management data could support future ones.
Its source data held 69,695 disease events on 62,361 calves in 1,617 herds from 2006 through 2021. The researchers removed incomplete endpoint years, events outside defined age windows, and roughly 16% of records lacking sire or dam information, and required herds to show recording continuity. After those edits, DHI-herd representation went from 4.5% to 4.3% for respiratory disease and from 2.7% to 1.8% for diarrhea.
It’s tempting to call everything missing “leakage.” The evidence doesn’t support that. Each type of finding supports something different:
| Finding | What it supports |
| Few DHI herds represented in the historical study | Limited observed coverage in that dataset |
| Records excluded under documented study rules | Specific analytical exclusions, for stated reasons |
| A farm software field absent from a data exchange | A demonstrated transfer or scope gap |
| No consolidated public accounting located | A reporting gap within the material reviewed |
A herd’s absence from the calf study could reflect nonrecording, nontransmission, study scope, or something else. The coverage percentages can’t rank those causes. They show limited coverage. Full stop.
Some Datasets Are Growing
Here’s the evidence that complicates any simple “data starvation” story.
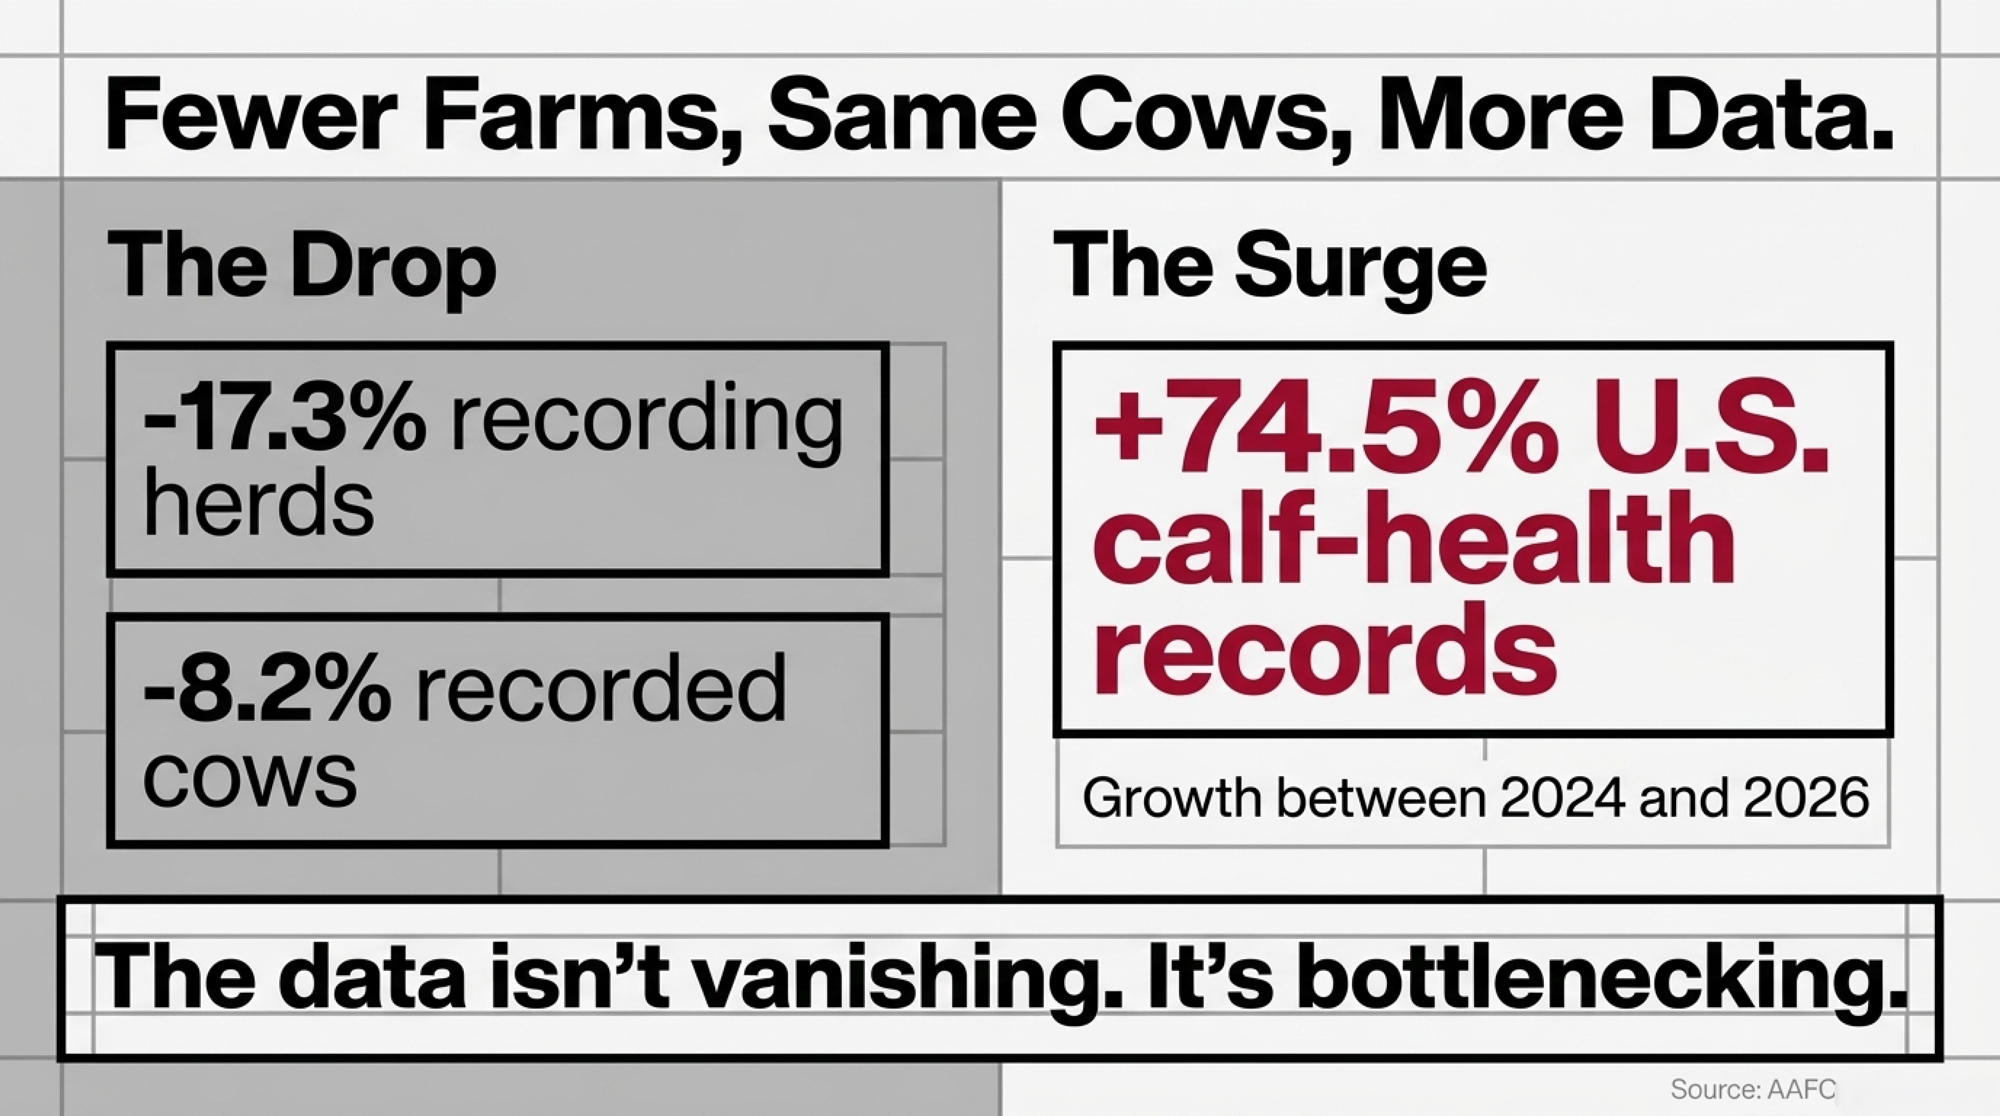
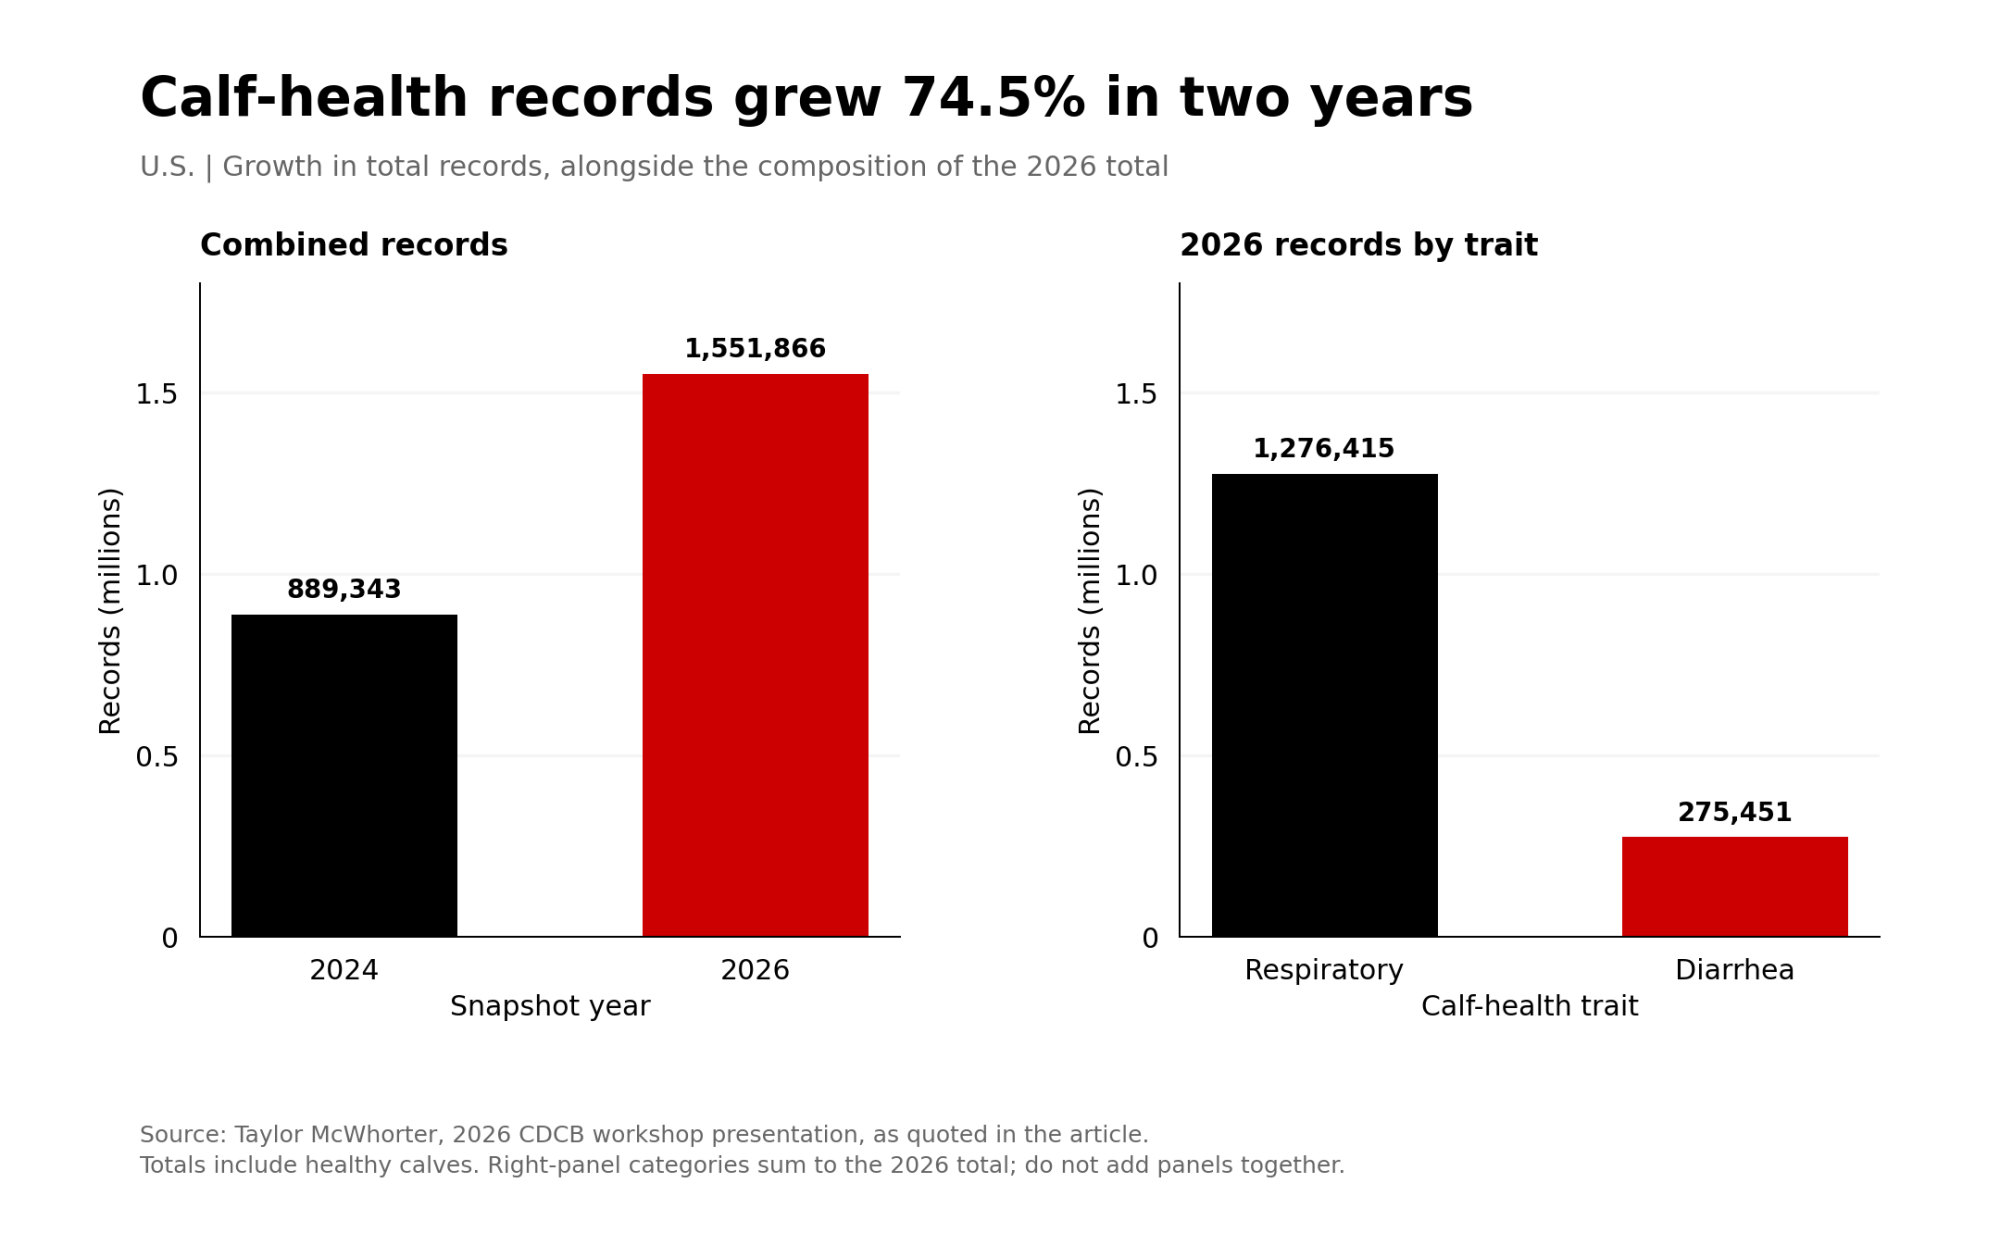
CDCB’s Dr. Taylor McWhorter, presenting at the 2026 CDCB Genomic Nominator and Laboratory Workshop, reported that combined calf diarrhea and respiratory records grew from 889,343 in 2024 to 1,551,866 in 2026, up 74.5%. Respiratory records rose 87.2%, to 1,276,415. Diarrhea records rose 32.7%, to 275,451. Those totals include healthy calves; the deck counts about 186,000 respiratory cases and 37,000 diarrhea cases inside them. Counts quoted around the May launch announcements were smaller, so check which snapshot a source is using.
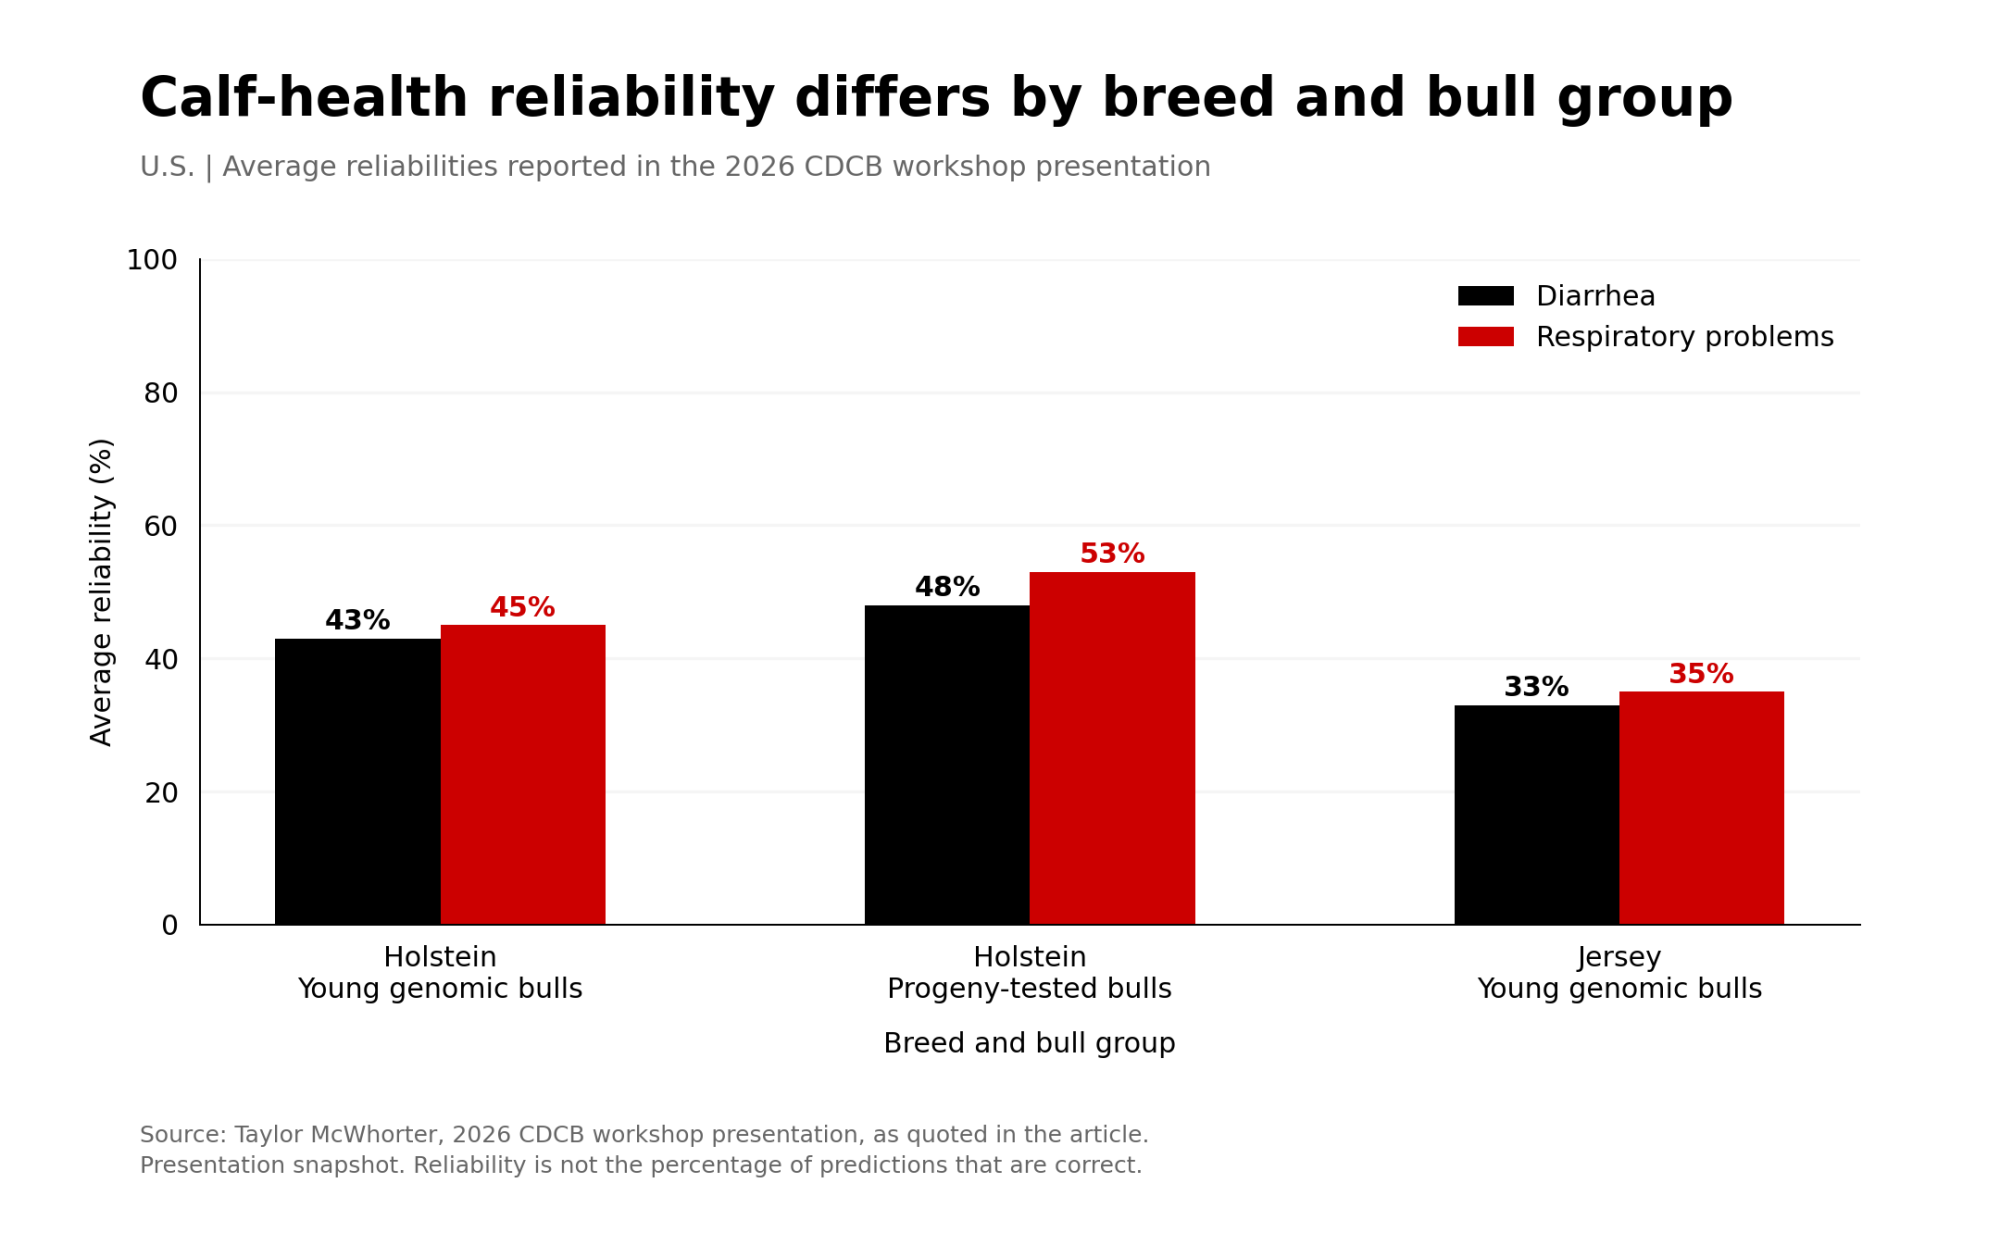
CDCB launched both traits for Holsteins and Jerseys in the August 2026 run, outside the lifetime merit indexes at launch (our run coverage has the trait-by-trait detail). Average Holstein reliabilities sit at 43% for diarrhea and 45% for respiratory problems in young genomic bulls, and 48% and 53% in progeny-tested bulls. Jerseys run lower: 33% and 35% for young genomic bulls. Those aren’t failure figures. They show useful evaluations emerging from a newer information base, and thinner ones where the population is smaller.
That growth doesn’t settle whether the data are adequate. Public reporting tracks growth for some traits. It rarely shows whether that growth comes from more herds or the same herds recording more, whether coverage across regions, herd sizes, and breeds is widening, or what any one herd’s records support.
The denominator that matters is accepted, contemporary, connected phenotypes linked to identified animals, reported by trait. CDCB reported 9,289 DHI herds with 3.79 million cows in 2025 and 3.07 million lactation records integrated into the National Cooperator Database that year. That’s impressive scale. It doesn’t show, trait by trait, what was submitted, accepted, or linked to genotyped animals.
Where the Record Stops
On any modern dairy, a robot logs each cow’s identity, yield, flow, and visit interval. Herd software holds calvings, breedings, pregnancy checks, treatments, and disposals. Activity systems track rumination and lying time. Calf feeders record intake.
Measurement isn’t the problem. The record has to survive a chain of handoffs before it becomes an evaluation phenotype: observation, structured entry, export, authorization, compatible identifiers and codes, a match to the right animal, a trait definition, and quality-control edits.
Canadian fertility research shows what one break in that chain looked like. In a 2022 Journal of Dairy Science studyusing Canadian Holstein data from 2007 to 2019, the researchers described how official fertility evaluations received insemination records through Lactanet’s Data Exchange System from AI organizations and accredited farms. Detailed breeding-protocol descriptions stored in DairyComp weren’t part of that stream during the study period.
The insemination traveled. The protocol stayed behind.
The source data contained 5,804 protocol descriptions from 1,192 herds: abbreviations, misspellings, and local shorthand for Ovsynch, timed AI, and heat detection. For classification, the researchers worked with 1,835 unique descriptions from 981 herds and evaluated machine-learning methods for sorting them into usable categories. That’s a historical finding. It doesn’t show that the same field is missing from today’s exchange, and that should be confirmed with Lactanet before anyone says so.
Health data carry a similar translation problem. A “scours” entry, a treatment record, and a drop in feeder visits may all relate to calf diarrhea. They aren’t automatically the same phenotype. An API can move the bytes. It can’t decide what the biology means.
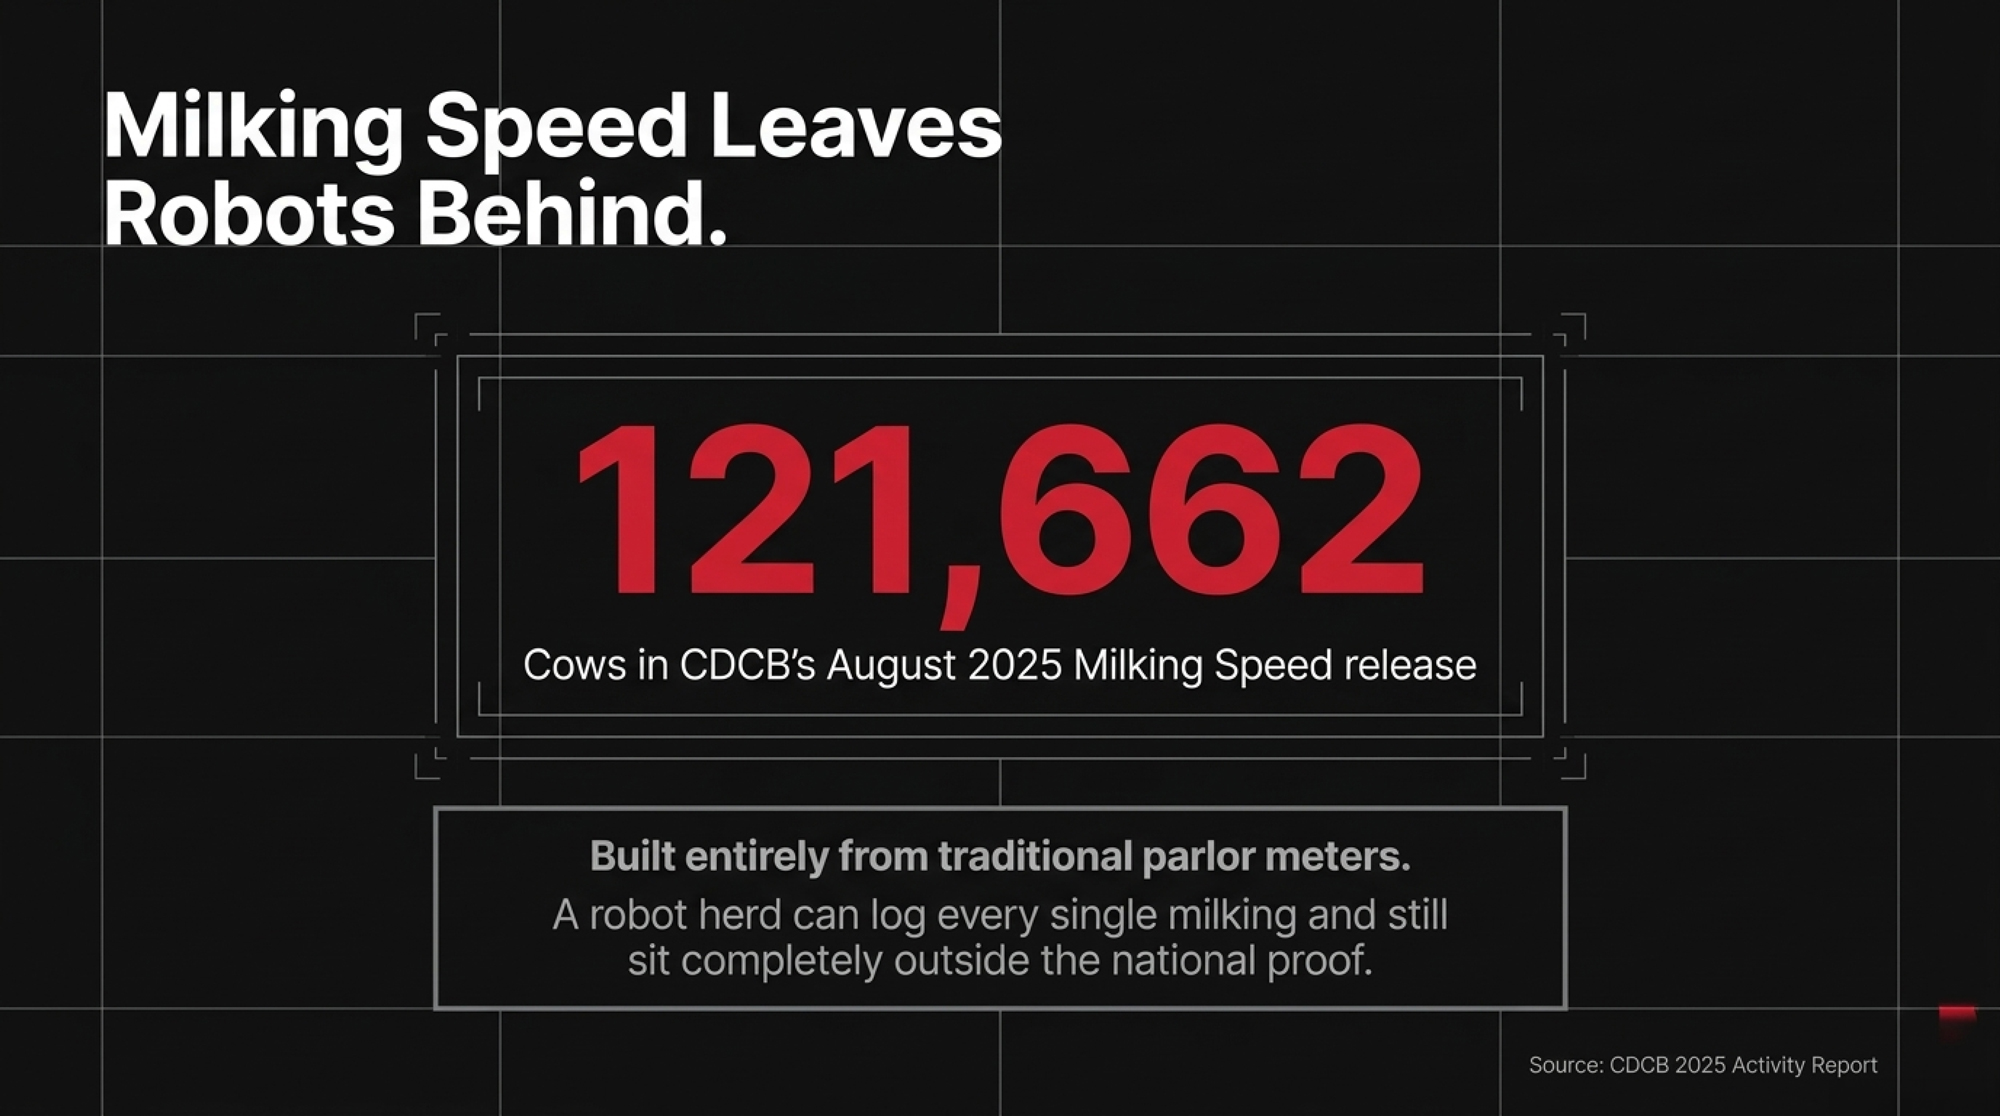
The U.S. system shows the same seams. CDCB’s 2025 Activity Report says Milking Speed, released in the August 2025 evaluations, was built from in-line meter records on 121,662 cows across 11 manufacturers. But it currently uses only traditional parlor equipment, and incorporating automatic milking system data “will be explored.” The same report’s board chair column says heavier use of beef and sexed semen has cut the volume of conventional breeding data available for fertility evaluations, and CDCB has opened a review of its fertility models in response. Our Frazz Lionel breakdown shows what August’s fertility rebuild did to one bull’s numbers.
A robot herd can log every milking and still sit outside the Milking Speed proof.
| Data stream | What’s captured | Documented scale | Where it stops (per source) |
|---|---|---|---|
| Milking Speed (U.S.) | In-line meter flow | 121,662 cows, 11 manufacturers | Parlor meters only; robot data “will be explored” |
| Robot herds (Canada) | Every milking and visit | 115,000 cows on DHI + 13,500 on eDHI; 950+ herds | Not in the U.S. Milking Speed evaluation |
| Fertility (U.S.) | Breedings | Not quantified publicly | Beef and sexed semen are thinning conventional data; CDCB model review opened |
| Breeding protocols (Canada, 2007–2019) | DairyComp protocol notes | 5,804 descriptions, 1,192 herds | Inseminations sent, protocols not sent (historical; check with Lactanet) |
| Calf health (U.S.) | Diarrhea and respiratory events | 1,551,866 records (2026), +74.5% | Growth reported; herd breadth not reported |
Robot herds aren’t a rounding error in Canada either. In its reference note on a member resolution, Lactanet says 115,000 cows in robotic milking systems use regular DHI services, another 13,500 cows are enrolled in eDHI, and most of its 950-plus robot herds receive a specialized Robot Report.
Even after a record arrives, it doesn’t flow straight into the model. Lactanet describes plausibility checks on dates, herd information, and environmental context, and records that fail can be removed. That editing is what keeps bad data from becoming a confident breeding value. Whether a farm can see that attrition on its own records is a question for its provider.
Standards for moving the data exist. ICAR’s Animal Data Exchange framework uses APIs and JSON messages to move animal, reproduction, milking, and health records from farm systems toward central databases. Lely’s third-party API documentation lists endpoints for animals, calvings, inseminations, pregnancies, dry-offs, milk visits, feeding, activity, and rumination.
An announced API proves data can be requested from a system. It doesn’t prove any field reaches a national evaluation. That takes a nine-step survival chain:
- Capture: Is the field stored?
- Structure: Is it standardized?
- Export: Is it exposed for transfer?
- Permission: Has the farm authorized its use?
- Connection: Has the receiving organization built the integration?
- Mapping: Does the field match the national phenotype definition?
- Acceptance: Does it pass the receiving database’s checks?
- Use: Does it enter a named trait in a specific evaluation run?
- Feedback: Is the farm told the record’s status and what needs fixing?
A record can pass database checks and still not enter a particular evaluation. Acceptance and use are different outcomes, and the farm deserves to know both.
Two Countries, Two Structures
Canada and the U.S. organize this differently, and the differences shape who would have to act.
Canada. Lactanet runs milk recording, national genetic evaluation, and production databases, and offers producer tools including DairyComp, Lactanet Mobile, and Ori-Automate, which moves data between automated milking systems and the milk-recording database. Policy sits with its board, which includes milk-recording organizations, Dairy Farmers of Canada, breed associations, and Semex. In December 2025, Lactanet also changed cow production evaluations so qualifying supervised and unsupervised records feed one published evaluation. That integrated structure may make coordination simpler. It doesn’t give Lactanet unilateral control over every vendor’s fields, permissions, or service agreements.
United States. CDCB manages the National Cooperator Database and calculates national evaluations, while DHI organizations and Dairy Records Processing Centers collect, standardize, and return information to farms. CDCB and National DHIA are building a Herd Portal that, according to CDCB’s 2025 Activity Report, will let a farm’s advisers check its fee code and data-use agreements. Farms pick one of three sharing codes: Code 1 keeps data between the DHI affiliate and the processing center, Code 2 sends it on to the National Cooperator Database, and Code 3 adds farm-authorized recipients. That’s step four of the survival chain, permission, written down.
The U.S. also puts a price on contribution. CDCB’s fee documentation sets genomic evaluation fees by the herd’s data contribution. A female from a herd supplying birth, yield, health, and type records evaluates for $0; birth records only, $4. Males run from $25 to $100 on the same logic. A herd genotyping 100 heifers a year saves $400 in CDCB evaluation fees by supplying full data rather than birth records alone, by our math. That’s small next to the lab and nominator bill, which these fees don’t include. CDCB recalculates fees each triannual period and doesn’t recalculate them retroactively when data arrive late.
That schedule is the freerider argument with a price tag. Any producer can use NM$, TPI, or LPI rankings and a bull evaluated partly on other herds’ health and conformation records, whether or not the farm contributes a single record. If the private return from recording looks smaller than the bill and the labor, leaving can be rational for one farm even though widespread departure could weaken the shared evaluation. That’s plausible. Whether it’s happening hasn’t been established. The public data don’t separate herds that left dairying from herds that dropped a service, how many moved to robot-only or management-only recording, why, or what phenotype volume left with them.
In 2024, the CDCB board also set up a Data Providers Incentives Task Force with a six-month mandate to review existing incentives and design a sustainable program. CDCB’s 2025 Activity Report lists it beside a Strategic Data Flow Work Session as the two 2024 initiatives aimed at phenotype supply, and records that the board approved data flow “to support upcoming trait needs” at its Denver meeting. A published incentive schedule is the next document breeders should watch for.
CDCB also documents fee lookup tools and return codes explaining nomination outcomes and fee changes. That feedback is narrower than a farm-level phenotype statement. It’s still real, and it matters.
Where the Danger Line Sits
There’s no universal herd count at which genomic evaluation fails. The threshold differs by trait, breed, and population. CDCB notes that reliable genomic evaluation needs a continuing flow of genotypes and phenotypes to refresh the reference population.
Five signals would show trouble:
- Reference renewal: contemporary phenotypes and genotypes added each year, by trait.
- Representation: whether data are concentrating in fewer regions, herd sizes, or management systems.
- Validation: falling reliability, persistent bias, or dispersion drifting from expectation in forward testing.
- Trait coverage: whether newer health and efficiency traits can reach usable reliability across breeds.
- Proof movement: whether later changes repeatedly exceed what published reliability implied.
By those measures, nothing reviewed here shows core North American Holstein production evaluations crossing a system-wide threshold. The U.S. still integrates millions of lactation records. Canada still records more than half a million cows. U.S. calf-health records grew sharply between 2024 and 2026.
Smaller breeds are more exposed. A 2022 U.S. multibreed study had validation groups of 3,278 Holstein and 471 Jersey bulls, against 107 Brown Swiss, 28 Guernsey, and 17 Ayrshire bulls, and the authors cautioned about the limited numbers.
The strongest finding isn’t that the system is collapsing. It’s that the public dashboard doesn’t show where the danger line sits.
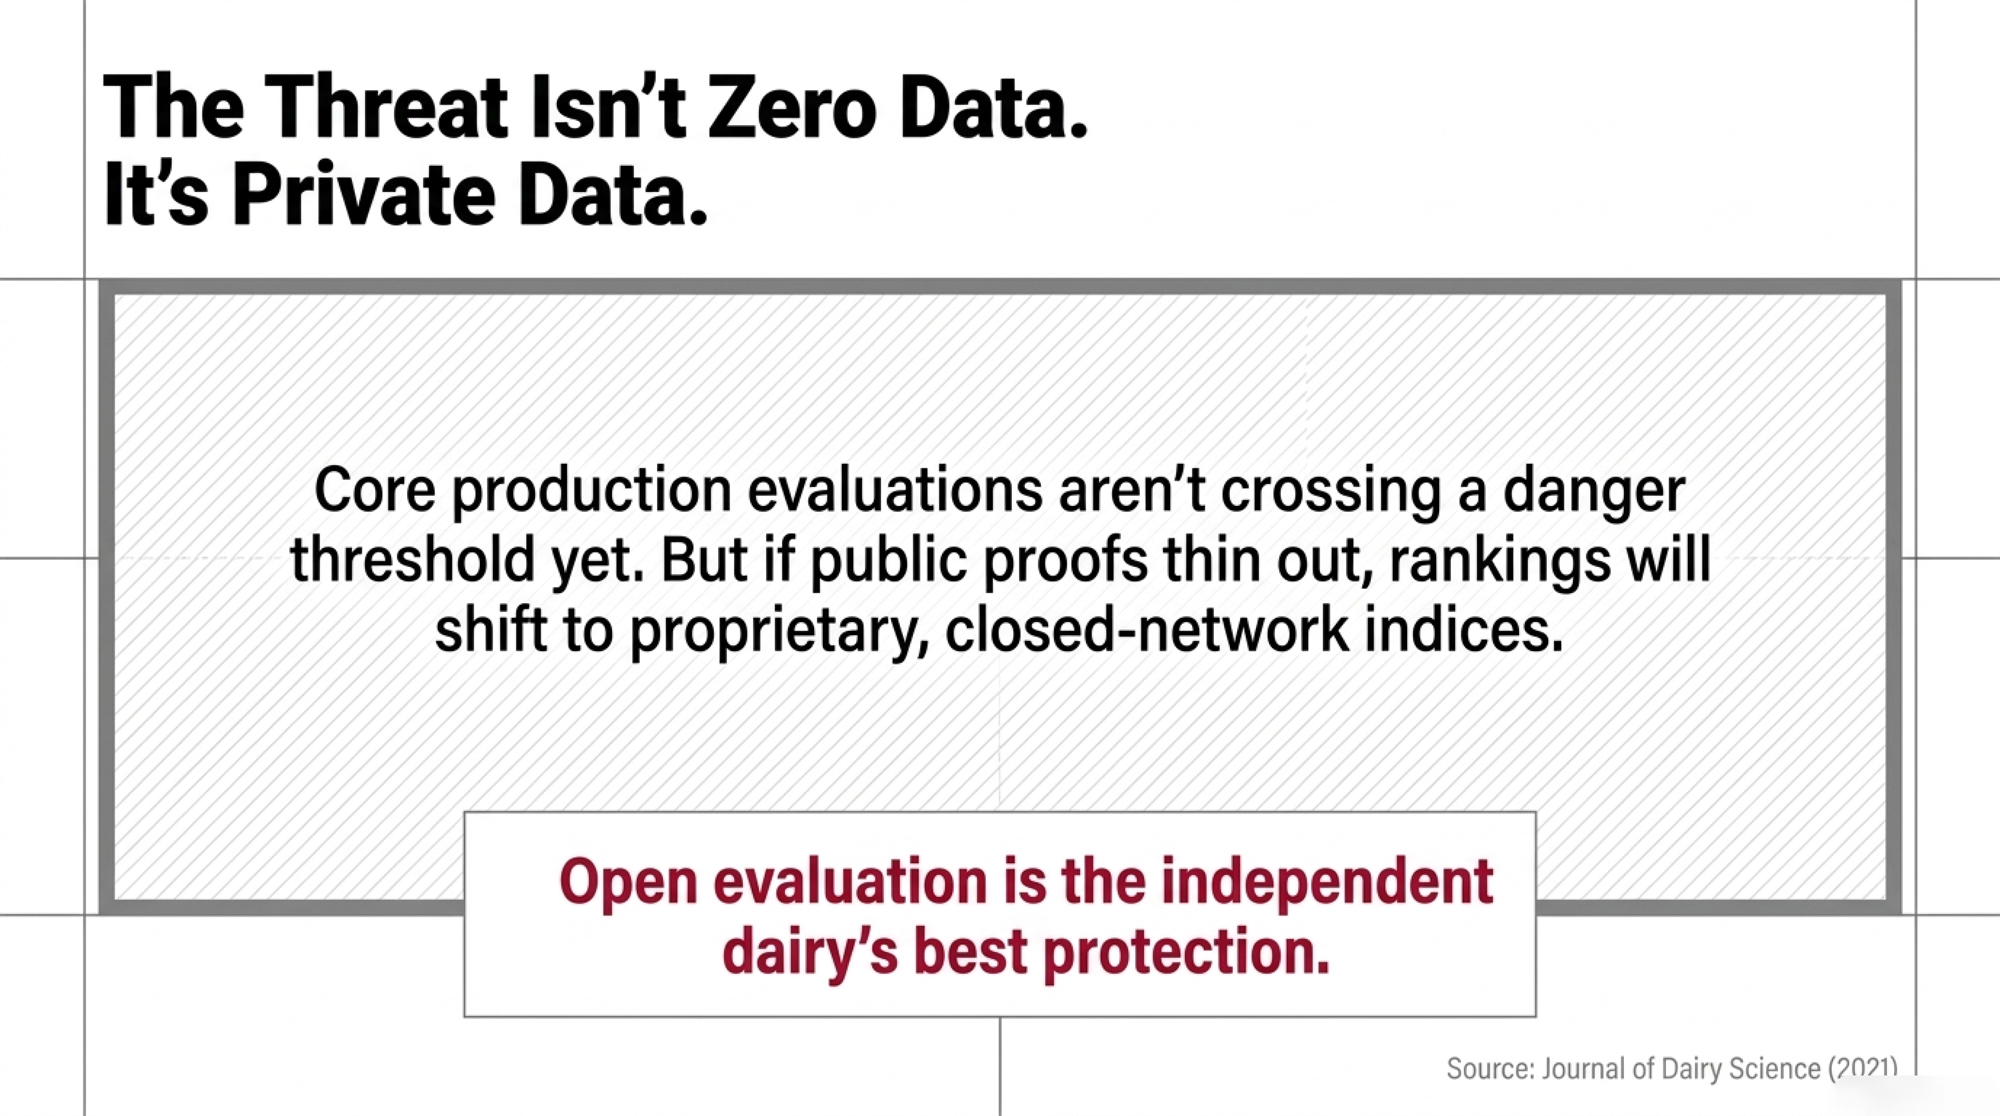
The other risk isn’t that the national system disappears. It’s that the rankings farmers actually use drift away from records anyone can review. In 2021, a Journal of Dairy Science invited review by CDCB and USDA scientists described the start of that shift: companies including GENEX and Zoetis were publishing their own indices that combined CDCB evaluations with proprietary traits. The authors warned that if producers began to question the credibility of NM$, they might turn to commercial indices from AI companies or, on larger farms, build custom ranking tools of their own.
The same review noted that line-based breeding, with tighter inbreeding inside each strain, is more common in the swine and poultry sectors. That’s the end state worth avoiding: breeding records still exist, but the reference population sits inside private networks. Dairy’s protection is open evaluation, portable data, and a public reference population broad enough that no single private network can out-predict it for the average herd.
Before October 29
The show ring will keep doing its job. The harder work happens before breakfast, in records nobody photographs.
The calendar is tight. CDCB’s 2026 evaluation schedule sets October 29 as the deadline for lactation, reproductive-event, health-event, and milking-speed data for the December official evaluations. Genomic data are due November 13, and the run releases December 1. In the U.S., go through your DHI provider, processing center, or genomic nominator. In Canada, ask Lactanet directly.
| Item | Detail | Producer implication |
|---|---|---|
| Female genomic evaluation, full data (birth, yield, health, type) | $0 | Lowest CDCB fee tier |
| Female genomic evaluation, birth records only | $4 | Highest female tier |
| Male genomic evaluation | $25–$100, by data contribution | Same contribution logic |
| 100 heifers/year, full data vs. birth only | $400 saved(Bullvine math) | Lab and nominator fees not included |
| Lactation, reproductive, health and milking-speed data due | October 29, 2026 | Late data don’t change fees retroactively |
| Genomic data due / December run release | November 13 / December 1, 2026 | Ask your DHI provider, processing center or nominator; in Canada, Lactanet |
The Five-Line Data Statement. Ask for these five answers:
- What did my herd send?
- What was accepted?
- What was rejected, and why?
- Which evaluations or benchmarks did it support?
- What did my herd get back: fee code, reports, benchmarks?
If nobody can tell you, that’s the finding.
The case for the mid-size breeding herd belongs in that statement too. It has to be made with data, not sentiment: which records, from which herds, add connections the model can’t get anywhere else. The evaluation centers already hold the data to answer that.
Tech vendors: prove it end to end at the next trade show. Skip the dashboard demo. Pick one field your system says belongs in national evaluation and show the whole route: the farm’s authorization, the connector to the recording or evaluation center, the mapping to the national trait definition, and confirmation that it was used in an evaluation run.
Not every sensor reading belongs in a national model. The ones that do should be able to prove they arrive.
Complete references and supporting documentation are available upon request by contacting the editorial team at editor@thebullvine.com.
Learn More
- Genomic Testing ROI Calculator — Eliminating the guesswork around heifer replacements pays immediate dividends. Input your herd size, cull rate, and raising costs into this interactive tool to isolate exactly what genomic testing nets your operation over a three-year financial window.
- CDCB’s 2025 Genetic Base and Merit Indices Update: Everything You Need To Know — Protect your future milk checks as PTA numbers prepare to drop across all breeds. Master the revised Net Merit $ formula’s 41% higher weight on feed efficiency and 13% butterfat bump to safely recalibrate your sire selection thresholds.
- From “Worst Dairy” to Zero Lame Cows: How CDCB’s New h² = 0.27 Trait Could Rewrite Lameness Genetics— Continuous camera monitoring delivers roughly three times the genetic leverage against lameness compared to traditional foot angle scores. Follow one test herd’s blueprint for utilizing CattleEye data to eliminate clinical cases and recover $131 per lactation.
The Sunday Read Dairy Professionals Don’t Skip.

Every week, thousands of producers, breeders, and industry insiders open Bullvine Weekly for genetics insights, market shifts, and profit strategies they won’t find anywhere else. One email. Five minutes. Smarter decisions all week.
