










560 farms ship 63.61% of Order 30’s milk, so the order average is mostly theirs. At 2025 prices, their test edge on the typical farm is worth $221 to $265 a cow. South Dakota milk out-tests them.
Executive Summary: Order 30’s August 2026 prices paid $2.8281/lb for protein and $1.5107 for butterfat, 1.87 to 1, after 2025, when the two sat within a cent. At 90 pounds a day, 0.1 point is worth $92.90 per cow per year in protein and $49.63 in fat. Bullvine’s 500-cow model breaks even on a 25-cent ration change at about +0.064 point each of fat and protein. Bullvine’s estimate from Staff Paper 26-01 data puts even the floor for a component-ranked top tenth at about 4.56% butterfat, above the 560 largest dairies’ 4.44%. Upper Midwest herds building 2027 rations should price their own tenth from 12 milk checks. Two months aren’t a trend.
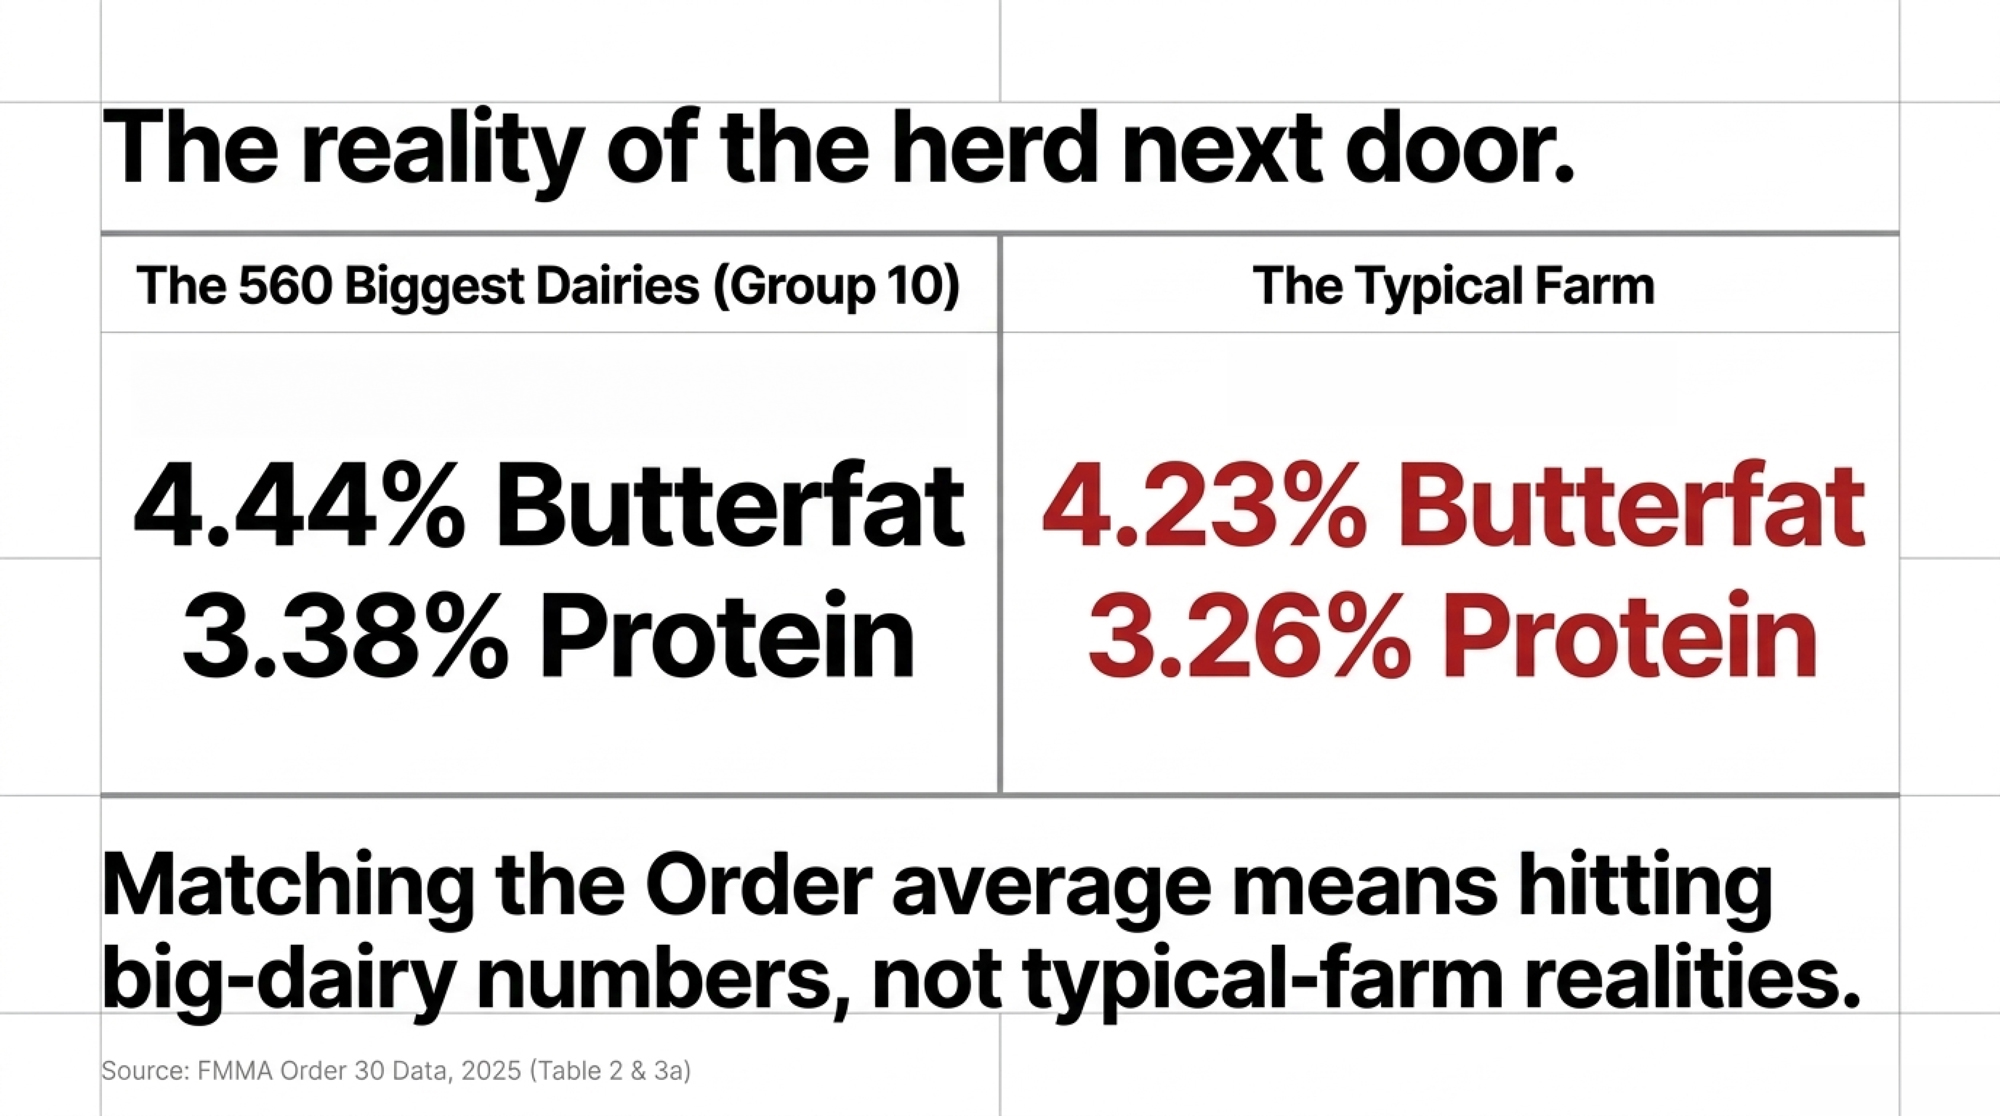
Here’s the trap. Order 30’s 2025 butterfat average was 4.37%, and 63.61% of the milk behind it came from Group 10, the order’s 560 biggest dairies. They tested 4.44% butterfat and 3.38% protein. The typical farm tested 4.23% and 3.26%, according to Staff Paper 26-01, the Upper Midwest Market Administrator’s May 2026 study of 5,599 Order 30 farms.
Bullvine calculates that gap is worth $221 to $265 per cow per year at 2025 prices and 75 to 90 pounds a day, or $180 to $216 at August 2026 prices. And the biggest farms aren’t the top component tier. On average, Order 30 milk from South Dakota, Minnesota, and Iowa tests higher.
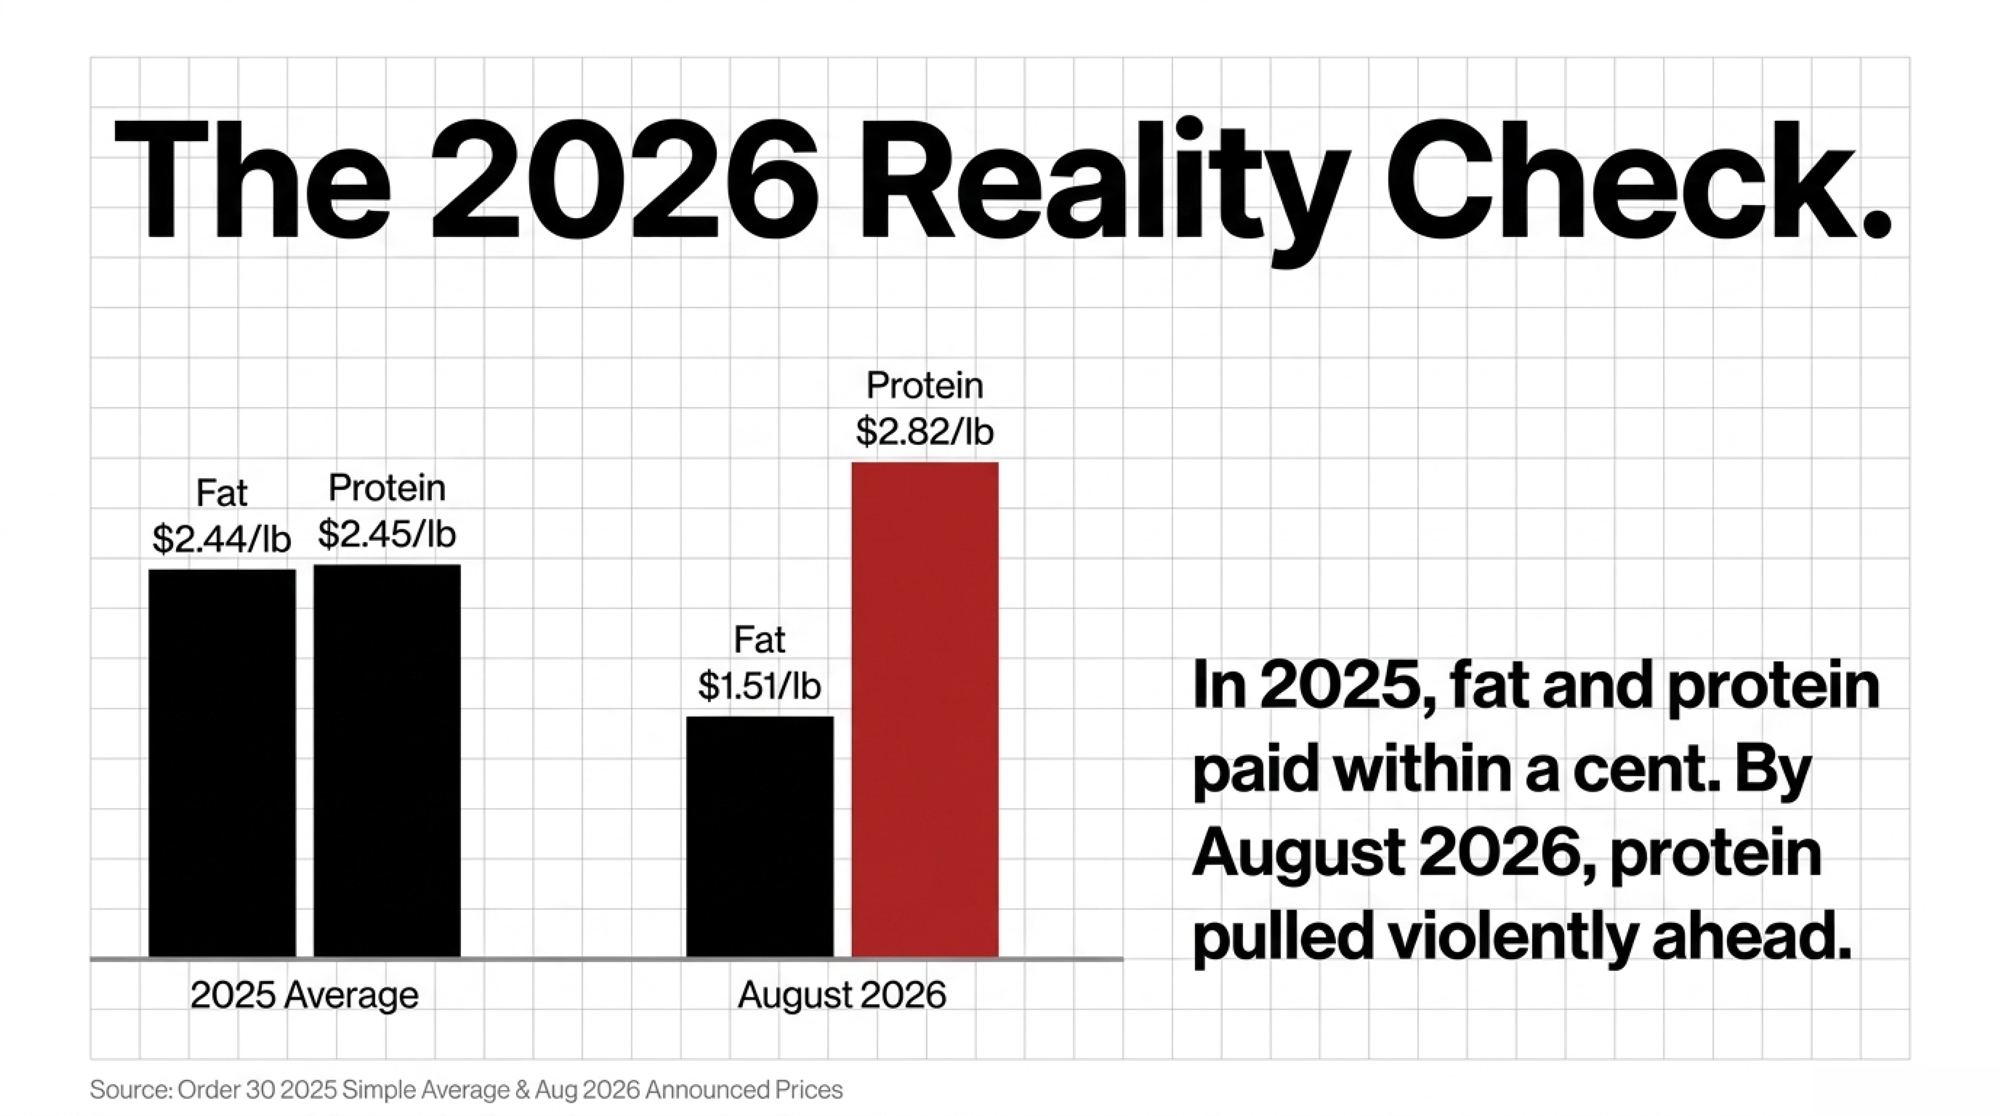
The price mix moved underneath all of it. In 2025, Order 30 paid $2.4495 a pound for protein and $2.4416 for butterfat. On September 2, Order 30 announced August 2026 prices of $2.8281 for protein and $1.5107 for butterfat. If your fall ration or 2027 sire plan still chases butterfat on 2025 prices, hit pause.
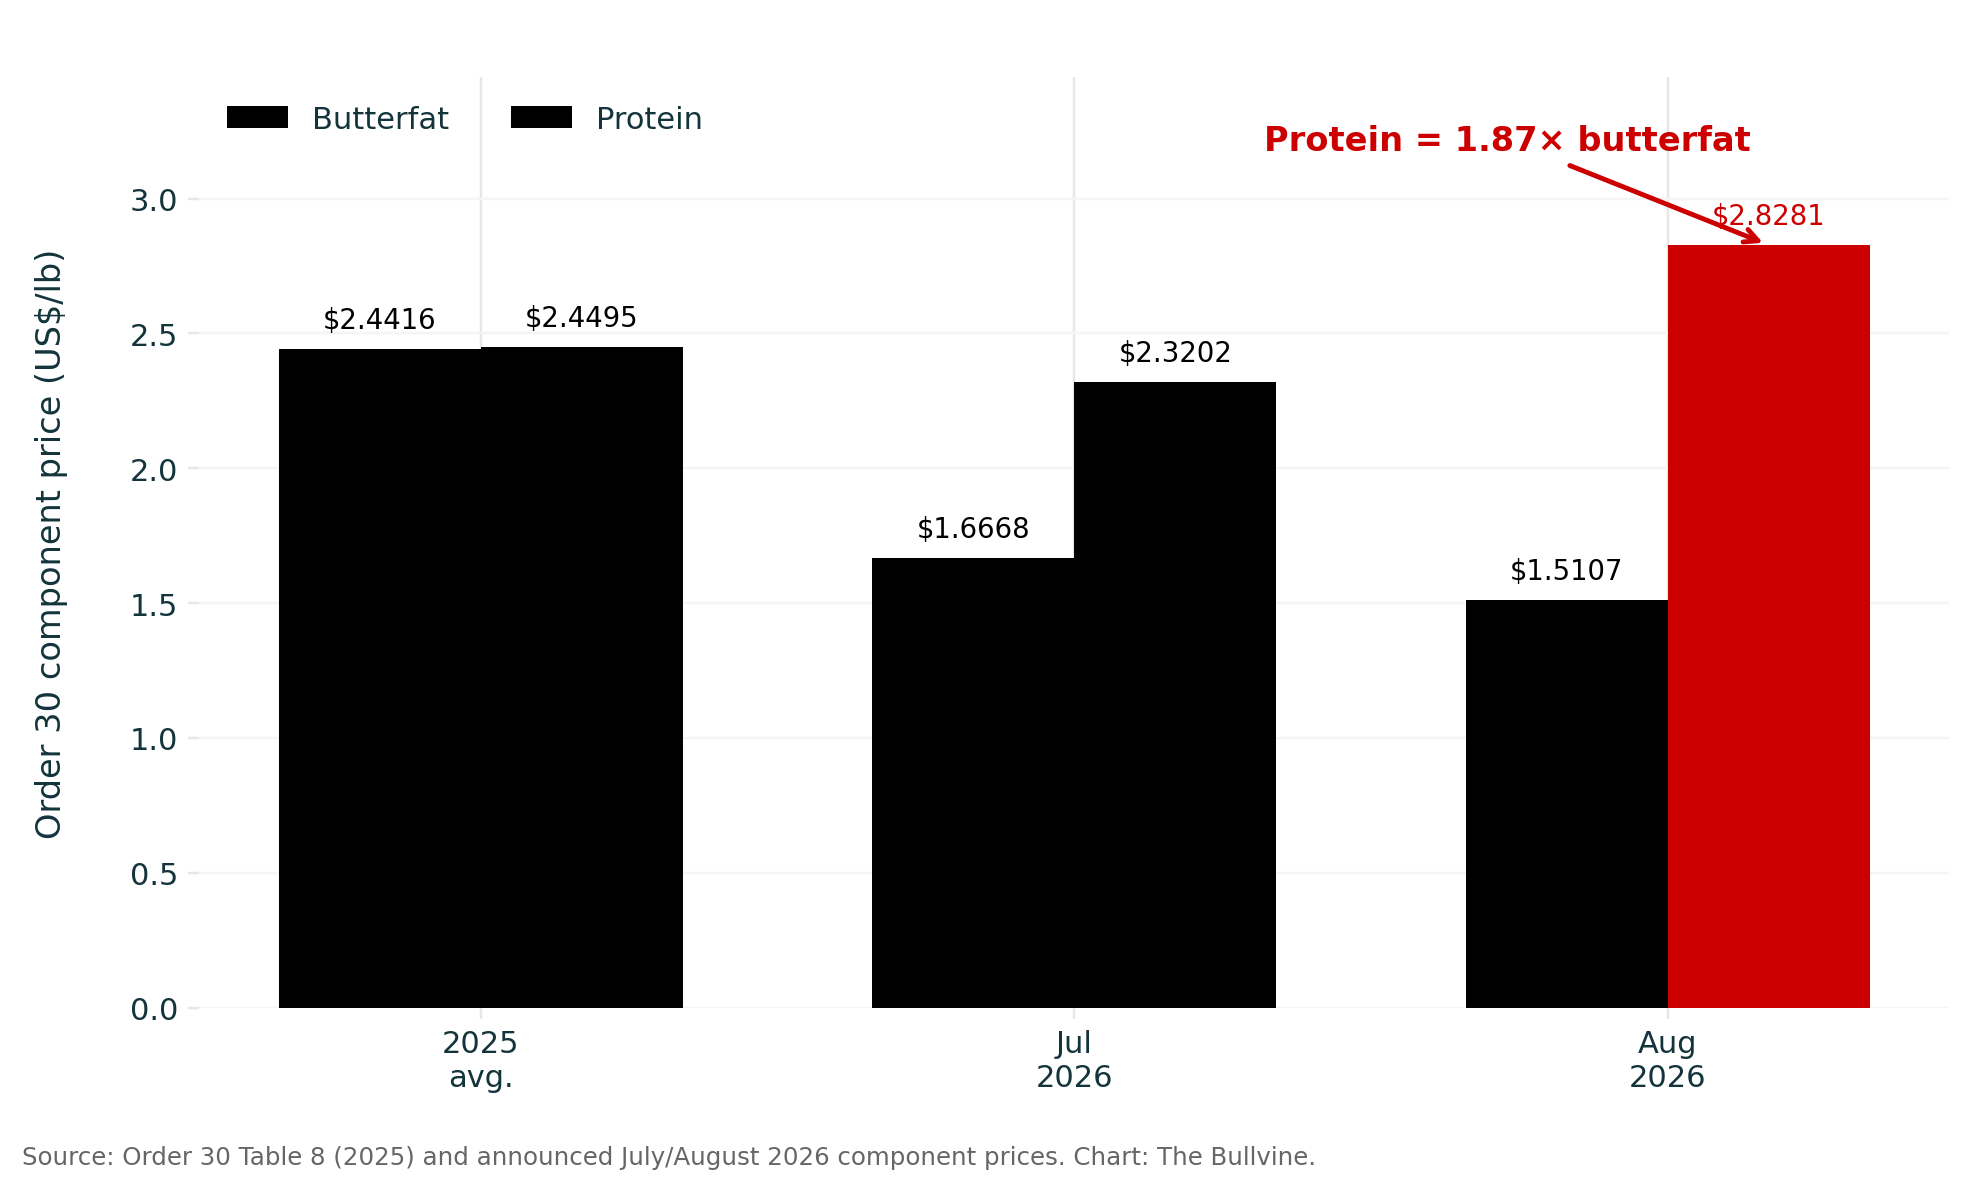
The Benchmark Trap: Use the Order Average, and You’re Comparing Your Herd to Group 10
The paper’s author, Areerat Kichkha, split the farms that shipped milk in all 12 months of 2025 into ten equal groups “based on average monthly production.” Group 10 averages 3,878,536 pounds a month, almost 154 times Group 1’s 25,192.
| Order 30 measure, 2025 | Farms | Butterfat | Protein | SCC (cells/mL) | Milk-share context |
|---|---|---|---|---|---|
| Group 1 — smallest farms | 560 | 4.16% | 3.24% | 285,000 | 25,192 lb/month average |
| Typical farm — simple average | All producers | 4.23% | 3.26% | 220,000 | Closer to the herd next door |
| Group 10 — largest farms | 560 | 4.44% | 3.38% | 166,000 | 63.61% of Order 30 milk |
| Order average — weighted by milk | 5,599 | 4.37% | 3.33% | 174,000 | Mostly shaped by Group 10 milk |
The order average is weighted by milk, and Group 10 ships 63.61% of it (Table 3b). That makes the 4.37% mostly Group 10’s own milk. The paper makes the same point about weighted averages generally: “The more numerous smaller dairies have tests more likely to be around the simple average and the fewer larger dairies are biased toward the weighted average.”
Kichkha’s simple average is closer to the herd next door. About 80% of Order 30 producers ship less than the 606,950-pound monthly average. The simple median, 4.22% butterfat and 3.24% protein, sits almost on the simple average.
The size pattern is also recent. Her summary reads: “A recent break from historical trends, started in 2022, is that the largest categories of dairies have higher component tests and milk value.” The paper doesn’t estimate how much of that comes from breed or feeding, and it covers Order 30 only.
The 2026 Reality Check: August Protein Was Worth Nearly Double Fat
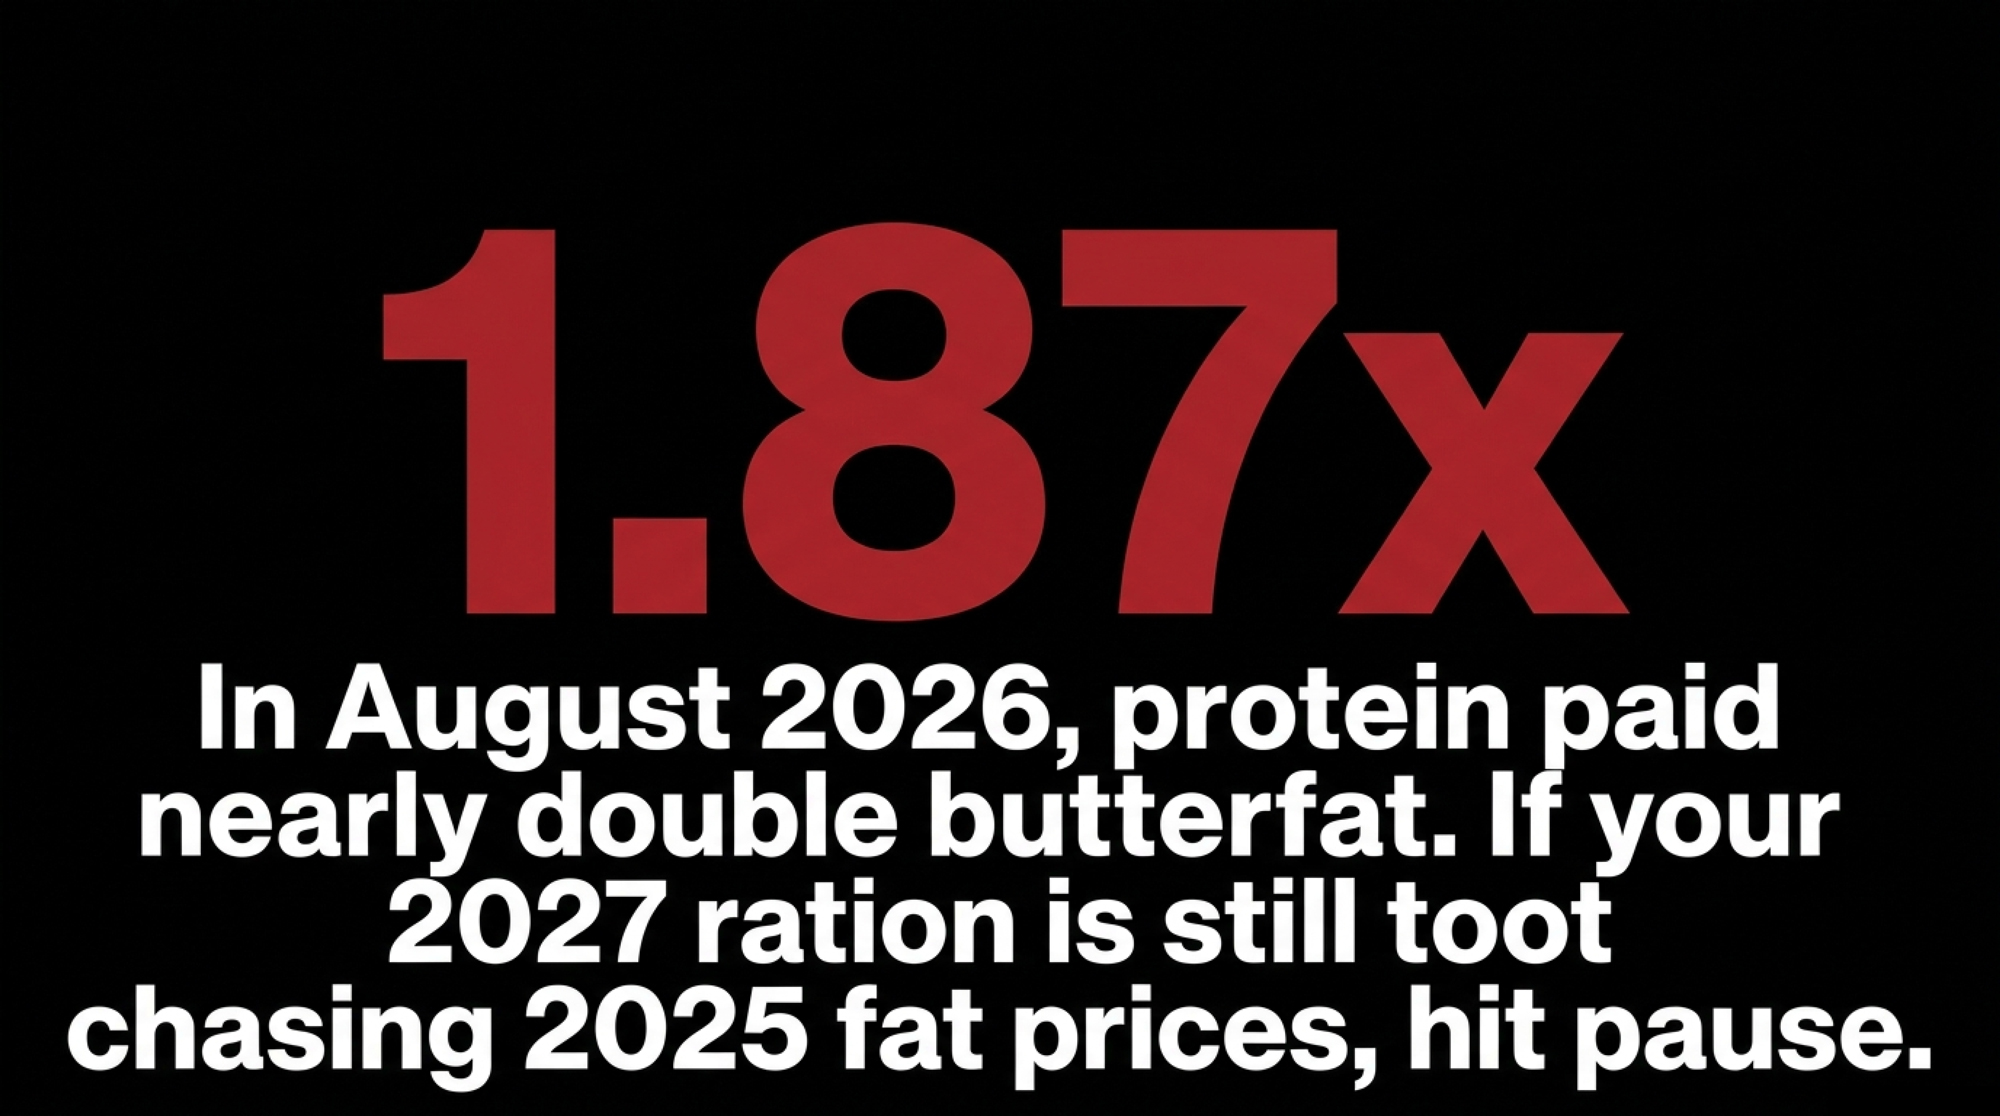
In 2025, a tenth of a point of either component was worth about the same. By July 2026, protein was worth 1.39 times as much. By August, it was 1.87 times.
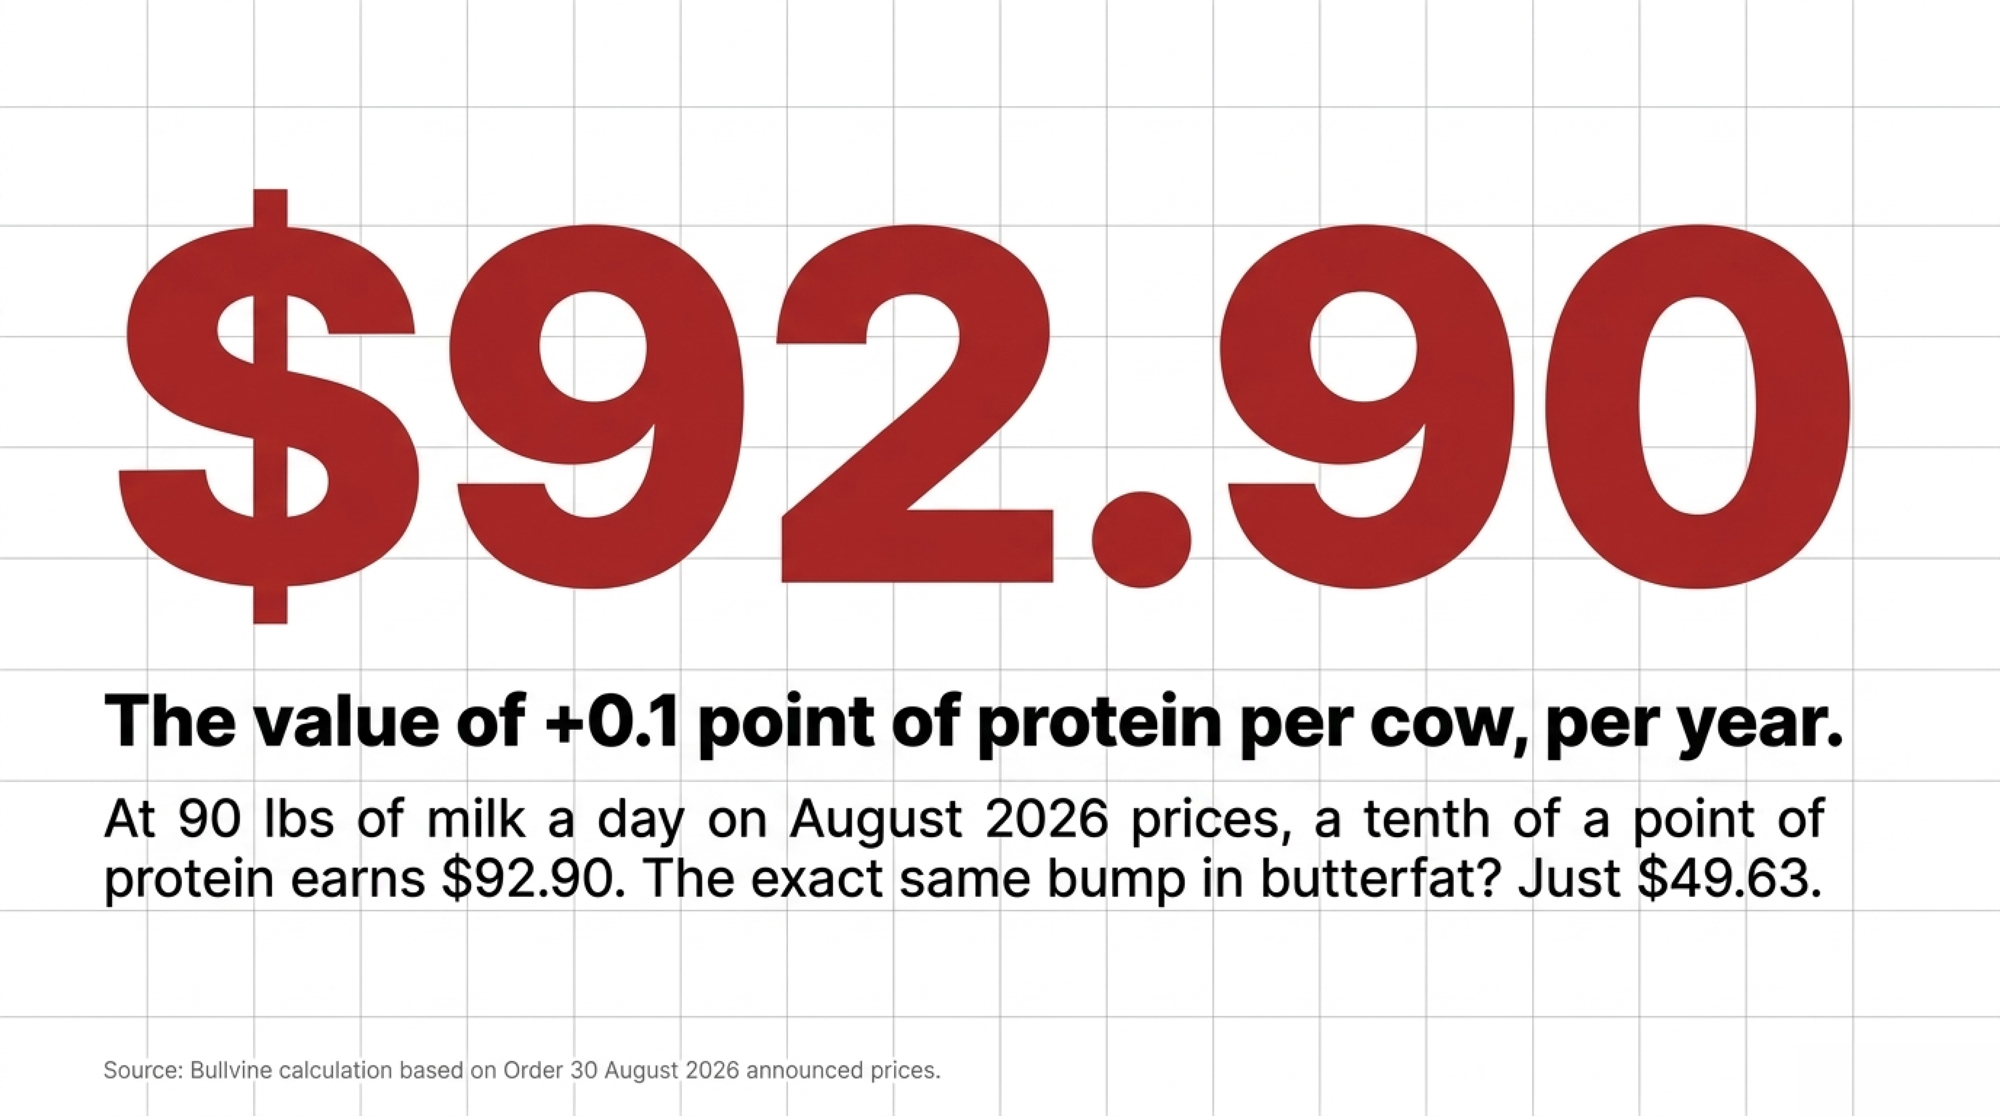
| Price basis | Butterfat | Protein | +0.1 pt butterfat | +0.1 pt protein |
| Order 30 2025 simple average (Table 8) | $2.4416/lb | $2.4495/lb | $80.21 | $80.47 |
| Order 30 July 2026 | $1.6668/lb | $2.3202/lb | $54.75 | $76.22 |
| Order 30 August 2026 (announced Sept. 2) | $1.5107/lb | $2.8281/lb | $49.63 | $92.90 |
Values are per cow per year at 90 lb/day (32,850 lb). Bullvine calculation.
The 2025 average hides the turn. Order 30’s Table 8 shows butterfat falling every month from September through December 2025 to $1.5761, and protein priced above it in each of those four months. July and August 2026 kept protein on top, but two months aren’t a trend. Don’t let your nutritionist build a 2027 ration off 2025 milk checks, and don’t rebuild it on two months of prices either. Run your own.
The formula for your herd
Value of 0.1 point = 0.001 × daily milk per cow (lb) × 365 × cows × your component price ($/lb)
Example: 500 cows at 90 lb and August’s protein price: 0.001 × 90 × 365 × 500 × $2.8281 = $46,452 a year (about $92.90 a cow).
Running the numbers: 500-cow trial
Published evidence: Order 30 2025 simple-average prices and August 2026 announced prices, above.
Stated assumptions:
- 500 cows at 90 lb/day (32,850 lb/year), same volume before and after.
- A ration change costing 25 cents per cow per day ($45,625 a year).
- Fat and protein respond equally.
Bullvine calculation:
| Response (fat and protein each) | Gross, 2025 prices | Net, 2025 prices | Gross, Aug. 2026 prices | Net, Aug. 2026 prices |
| Low: +0.05 pt | $40,168 | −$5,457 | $35,632 | −$9,993 |
| Central: +0.10 pt | $80,336 | +$34,711 | $71,265 | +$25,640 |
| High: +0.15 pt | $120,504 | +$74,879 | $106,897 | +$61,272 |
Breakeven is about +0.057 point each at 2025 prices and +0.064 at August’s. If the ration moves only one component, August prices need about +0.18 point of butterfat or +0.10 point of protein to cover the same 25 cents. That’s the number to put in front of anyone selling you a fat-only push. This is a Bullvine model. It leaves out response variation, health effects, and any change in volume.
| Component-response scenario | Response required to cover $45,625/year | Annual gross value at August 2026 prices | Editorial read |
|---|---|---|---|
| Equal fat + protein response | +0.064 pt fat and +0.064 pt protein | $45,625 | Base break-even under August’s mix |
| Protein-only response | +0.10 pt protein | $45,625 | Protein clears cost with a smaller test gain |
| Butterfat-only response | +0.18 pt butterfat | $45,625 | Red flag: almost 2× the protein-only response |
| Central equal-response trial | +0.10 pt fat and +0.10 pt protein | $71,265 gross / $25,640 net | Clears the cost—but only after measured response |
To run your own herd, use the Bullvine Component Value Tracker (March 2026 default prices)and swap in your milk-check prices. For how fast the protein-versus-fat math moved earlier this year, see The Bullvine’s earlier breakdown, The $28,614 Tenth, built on March 2026 Order 30 prices.
What is Order 30’s biggest-farm component edge worth?
Running the numbers: Group 10 vs. the typical farm
Published evidence:
- Staff Paper 26-01, Table 3a: Group 10 at 4.44% fat and 3.38% protein; Group 1 at 4.16% and 3.24%.
- Table 2 simple average: 4.23% and 3.26%.
- Table 8 2025 simple-average prices: $2.4416 butterfat and $2.4495 protein per lb.
- Order 30’s August 2026 prices: $1.5107 butterfat and $2.8281 protein per lb.
Stated assumption: equal milk per cow in both groups, at 75 or 90 lb/day (27,375 or 32,850 lb/year). The paper doesn’t report milk per cow.
Bullvine calculation: annual milk × component-test gap × component price.
| Comparison (fat / protein gap) | 2025 prices, 75 lb | 2025 prices, 90 lb | Aug. 2026 prices, 75 lb | Aug. 2026 prices, 90 lb |
| Group 10 vs. typical farm (+0.21 / +0.12 pt) | $220.83 | $264.99 | $179.75 | $215.70 |
| Group 10 vs. Group 1 (+0.28 / +0.14 pt) | $281.03 | $337.23 | $224.18 | $269.02 |
Worked example, typical farm at 90 lb and 2025 prices:
- Butterfat: 32,850 × 0.0021 = 68.985 lb, × $2.4416 = $168.43
- Protein: 32,850 × 0.0012 = 39.42 lb, × $2.4495 = $96.56
- Total: $264.99 per cow
On a 500-cow dairy, the typical-farm gap comes to $110,414 to $132,497 a year at 2025 prices, or $89,875 to $107,850 at August’s. The paper doesn’t report milk per cow, so treat these as the value of the test gap alone. They leave out PPD, premiums, deductions, and any difference in volume.
Milk from three states out-tests the 560 biggest dairies
Group 10 is a size ranking. It’s the right comparison if you want to know how the order’s largest farms test, and the wrong one if you want to know what a top-component herd looks like. Table 4 of the paper breaks out 2025 tests by state, weighted by milk.
| Order 30 milk by state, 2025 (Table 4) | Butterfat | Protein |
| South Dakota | 4.60% | 3.55% |
| Minnesota | 4.52% | 3.42% |
| Iowa | 4.47% | 3.41% |
| Group 10, 560 largest farms (Table 3a) | 4.44% | 3.38% |
| Wisconsin | 4.32% | 3.29% |
| North Dakota | 4.27% | 3.33% |
| Michigan (Upper Peninsula only) | 4.23% | 3.24% |
| Illinois | 4.17% | 3.25% |
Source: Federal Milk Market Administrator’s Office, Upper Midwest, Staff Paper 26-01 (May 2026), Tables 3a and 4. Chart: The Bullvine.
The average pound of Order 30 milk from South Dakota, Minnesota and Iowa beats the order’s 560 biggest dairies on both components. Where you farm matters, too. Take a hypothetical Wisconsin herd testing 4.40% butterfat: it beats its state’s 4.32% average by 0.08 points and still trails Group 10.
Bullvine estimate (methodology note): Kichkha describes butterfat and protein tests as “approximately normal.” If herd averages follow that shape, the top tenth of farms sits about 1.76 standard deviations above the farm average. Table 2 reports a weighted standard deviation of 0.38 points for butterfat and 0.23 for protein, and the paper says monthly tests in most producers’ milk fell within one deviation of the weighted average. Annual herd averages spread less than monthly tests, so Bullvine started from the simple farm average and ran it two ways: at the reported deviation, and at half of it as a floor.
| Measure | Group 10 | Component-ranked top tenth, floor (half SD) | Component-ranked top tenth, reported SD |
| Butterfat | 4.44% | about 4.56% | about 4.90% |
| Protein | 3.38% | about 3.46% | about 3.66% |
Group 10 lands below even the floor, by about 0.12 points of butterfat and 0.08 points of protein. Individual herds averaged anywhere from 2.51% to 6.92% butterfat in 2025. Match Group 10’s tests and you’ve matched the order’s biggest dairies, while the component leaders sit higher.
Do bigger farms get paid more per hundredweight?
In 2025, yes. At Order 30’s 2025 prices, component value averaged $21.18 per hundredweight (Table 6), and butterfat and protein made up 89.25% of it. Table 7 runs from $20.24 for herds shipping under 50,000 pounds a month to $21.78 for herds at 5 million pounds or more.
The paper doesn’t test what drives that link, and this article doesn’t either. Those values also leave out the producer price differential and any handler premiums or deductions. “Modeled gross component value” is the accurate term. Calling it a premium claims more than the calculation shows.
What this means for your operation
Within 30 days
Price your own 0.1 point. Pull 12 consecutive milk checks. From each, record:
- pounds shipped and tests
- actual component prices and PPD
- quality adjustments, premiums and deductions
Then run the formula above with your own prices. For the hauling line in those deductions, see Federal Order 30’s Hauling Number Is 16 Months Old.
You’ll need: 12 statements and DHIA test-day or co-op herd-summary data.
It’s urgent when (Bullvine operating rule): your trailing 12-month test runs at least 0.10 points below your DHIA or co-op peer group, same breed and same market.
It backfires when: you benchmark against the order’s weighted average or Group 10, both of which mostly reflect the biggest dairies. It also backfires across breeds and states, such as a Holstein herd against a Jersey-heavy average, or an Illinois herd (state average 4.17%) against South Dakota’s 4.60%.
Red flag: any benchmark that treats Group 10’s 4.44% and 3.38%, or the order average, as a top-component target, or a per-cow figure quoted as your expected return. Run it on your own statement.
Within 90 days
Trial before you commit (Bullvine trial rule). Run a 30-to-45-day baseline, then track pounds of fat and protein per cow alongside tank percentages.
You’ll need: test-day data, feed cost per cow per day, nutritionist time, and a stop date set in advance.
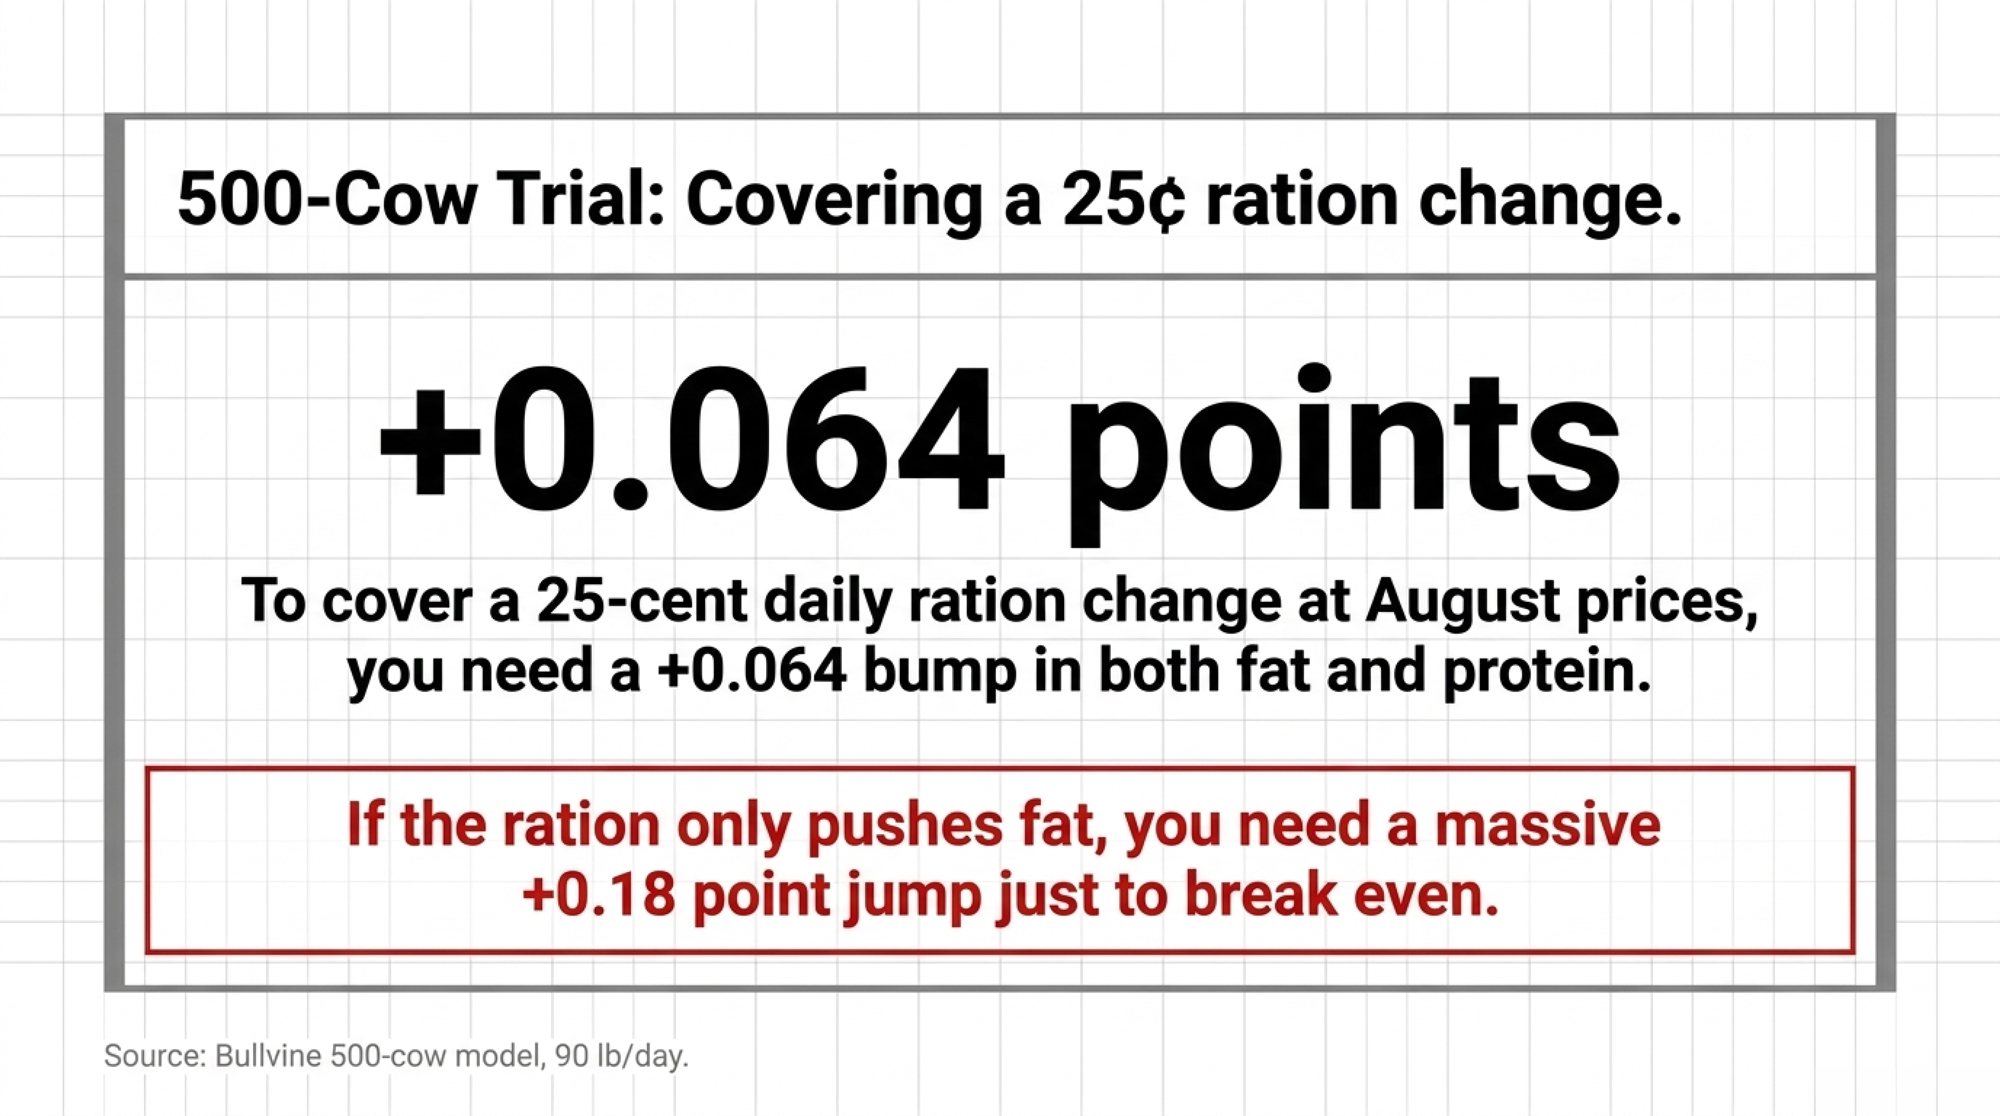
Threshold: at 25 cents per cow per day and 90 pounds, you need about +0.064 point each of fat and protein at August 2026 prices (+0.057 at 2025 averages). A fat-only response needs about +0.18 points at August prices.
It backfires when: percentages rise because volume falls. The test sheet looks better while component pounds and the check both shrink.
Re-rank your sire list. Rank bulls on economically weighted fat and protein pounds under your pricing, using the current proof run. For how the August 2026 run reshuffled the top lists after Lactanet moved its Holstein production weighting to 40:60 fat to protein, see What August 2026’s Proof Run Really Tells You About Your Semen Tank.
It’s urgent when (Bullvine operating rule): protein has been priced above butterfat on at least four consecutive monthly statements.
It backfires when: you chase component percentage on bulls with weak milk, or re-weight a breeding program on one or two months of prices.
Within 365 days
Find out what your plant pays above the Federal Order minimum. Get written answers from your co-op or processor on three points:
- How butterfat and protein are paid above the minimum.
- Whether component pounds are capped, discounted, or seasonally adjusted.
- How PPDs and handler adjustments change your net component return.
You’ll need: the 12-statement file from your 30-day check and a meeting with your field rep before 2027 budgets are set.
It’s urgent when (Bullvine operating rule): your statements show protein paid at the Order 30 minimum with no premium, and your protein test trails your DHIA peer group.
Opportunity signal: any protein premium adds to the $92.90 a tenth of a point was worth at August’s minimum price. A protein-focused ration or sire plan earns back first at a plant that pays one.
It backfires when: you budget for a protein push that the plant caps or doesn’t reward.
Don’t put any of these per-cow figures into a 2027 budget until they hold up against your prices, a measured cow response, and the full cost of getting there. Pull your August statement and answer two questions: what did you get paid per pound of protein, and whose average are you measuring your herd against?
Key Takeaways
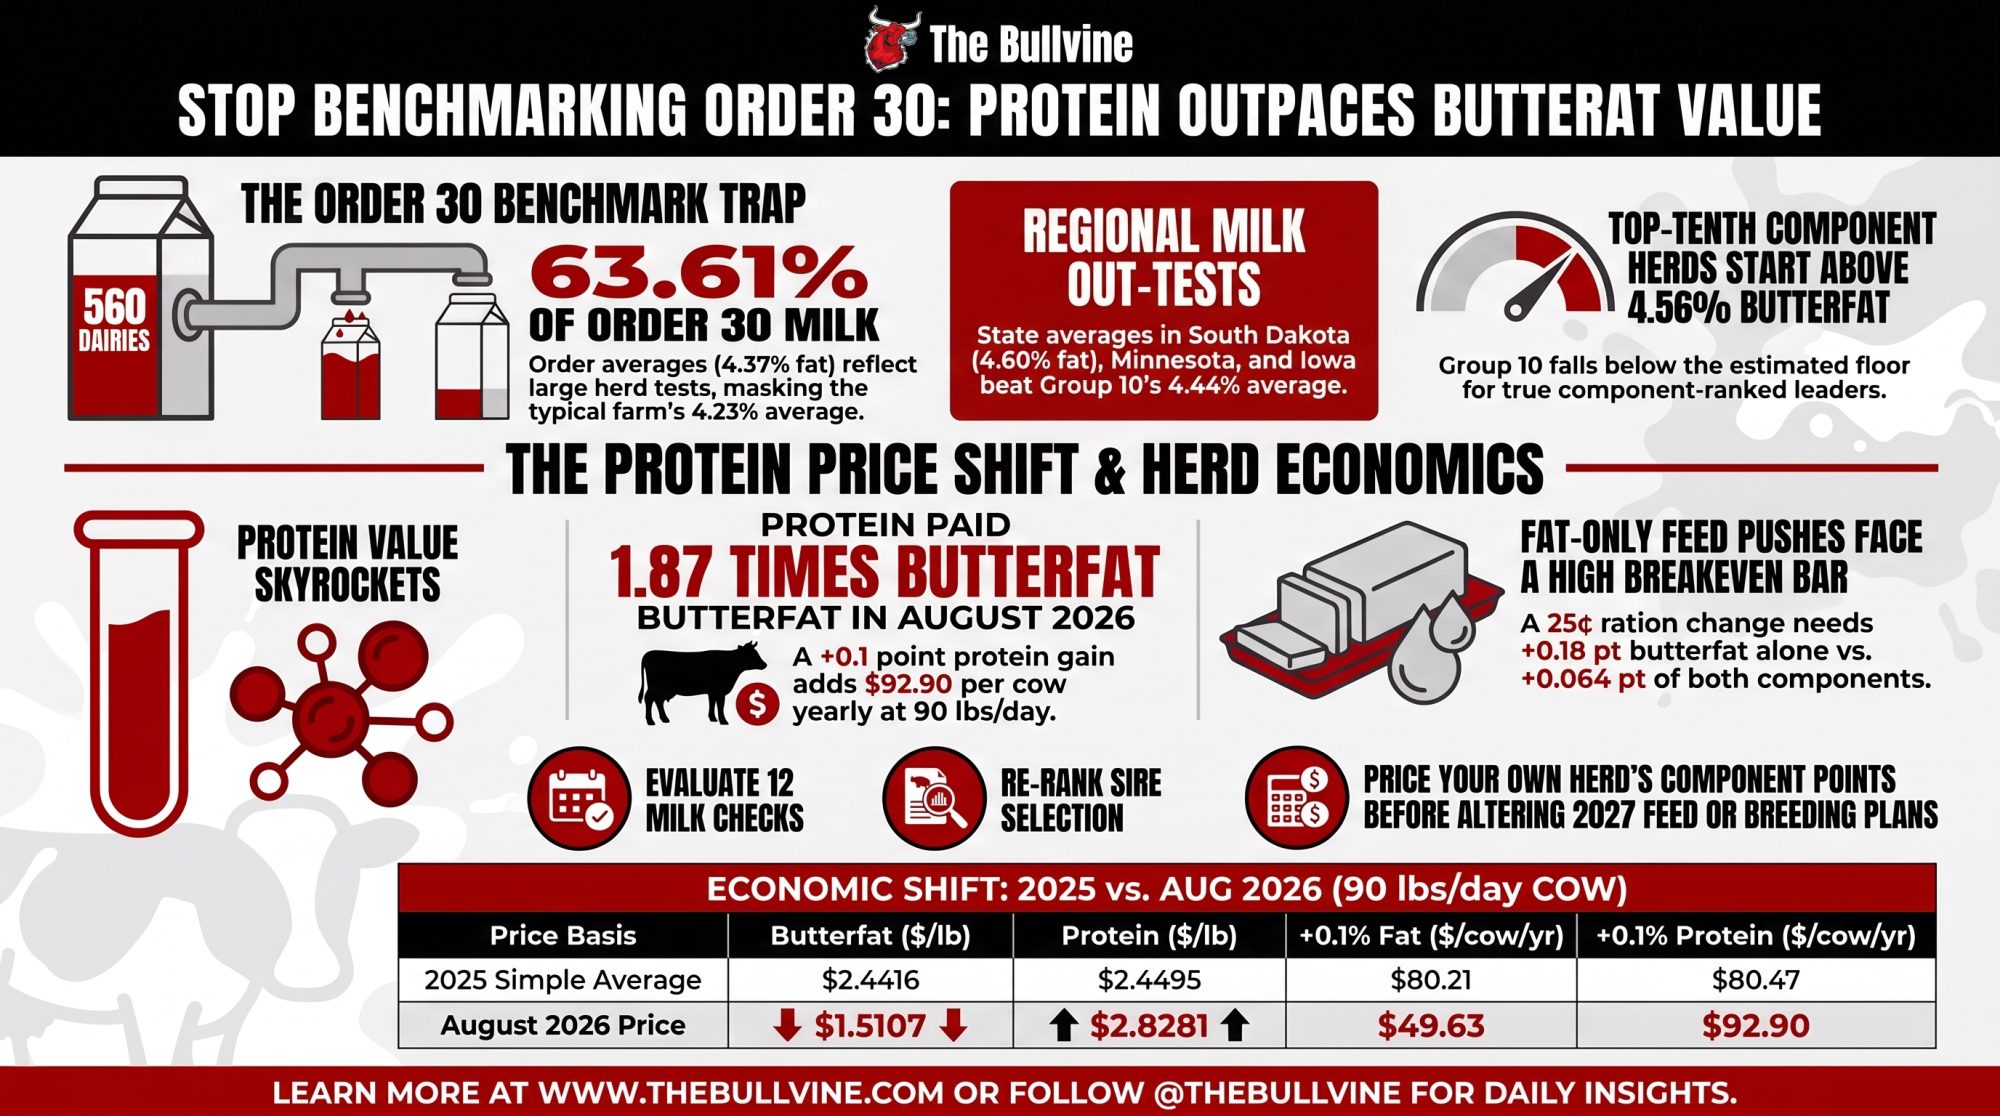
- Order 30’s 4.37% butterfat average is mostly Group 10’s milk, because those 560 farms ship 63.61% of it. The typical farm tested 4.23% butterfat and 3.26% protein, which is closer to the herd next door.
- In 2025, protein and fat paid within a cent of each other. In August 2026, protein paid 1.87 times fat, so 0.1 point was worth $92.90 a cow at 90 lb against $49.63 for fat.
- The biggest farms aren’t the top testers. On average, milk from South Dakota, Minnesota, and Iowa tests higher than Group 10’s. Group 10 also sits below Bullvine’s floor estimate for a component-ranked top tenth, about 4.56% and 3.46%.
- Bullvine values Group 10’s edge over the typical farm at $221 to $265 a cow at 2025 prices. That’s gross test value before PPD, premiums, and deductions, so don’t budget it as a return.
Herd Component Payoff & Benchmark Calculator
Price your own 0.1-point component bump, benchmark against Order 30’s top tier, and check your ration trial breakeven.
1. Your Herd Parameters
2. Milk Check Prices & Costs
Financial Impact & Benchmarks
At your entered prices and milk volume, a $0.25 ration cost requires a +0.064 pt gain in both fat and protein to break even. If the response is fat-only, you need +0.183 pt of butterfat; if protein-only, you need +0.098 pt.
| Component Gain (Both) | Gross Revenue | Feed Cost | Net Margin |
|---|
Methodology Note: Herd test data in this article comes from the Federal Milk Market Administrator’s Office, Upper Midwest Marketing Area, Staff Paper 26-01 (May 2026), based on 2025 Order 30 monthly payroll records. Component prices are Order 30’s 2025 simple averages (Table 8) and its July and August 2026 announced prices. Per-cow and per-herd figures are Bullvine calculations that assume equal milk per cow at 75 or 90 pounds a day; the paper doesn’t report milk per cow. They are modeled gross component values and exclude the producer price differential, handler premiums, and deductions. Order 30 figures may not reflect your state, breed, herd size, or milk market. Dollar figures are USD. We welcome producer feedback, corrections and case studies for future reporting. Contact: editor@thebullvine.com.
Learn More
- The $900/Cow Hit You Can’t Outbreed by April: Western Canada’s 70/25/5 Reckoning — Actionable feed interventions secure a fast 0.20% protein bump to shield your margin from the 70/25/5 pricing flip. Avoid the four-year lag of genetic selection and implement immediate transition management tactics to save $900 per cow.
- Protein Will Drive Your 2026 Milk Check: Are Your Components Still Built for the Butterfat Era? — Following the money on shifting component formulas reveals why cheese plants actively penalize fat-heavy milk. Dismantles the outdated pure-butterfat strategy and delivers a multi-year blueprint to align your herd’s genetics with tightening processor demands.
- The Proof You Waited Three Years For Averaged a $72 Markdown — Stop burning capital on traditional daughter proofs. Exposes the hidden $36,000 maintenance cost of holding sires, proving mathematically how relying on 99% reliable older bulls forfeits an entire generation of genetic advancement.
 The Sunday Read Dairy Professionals Don’t Skip.
 The Sunday Read Dairy Professionals Don’t Skip.
Every week, thousands of producers, breeders, and industry insiders open Bullvine Weekly for genetics insights, market shifts, and profit strategies they won’t find anywhere else. One email. Five minutes. Smarter decisions all week.




