










It’s renewal season. Your banker already ran your cows at $17 milk and watched the working capital run dry on a screen you’ve never seen. Have you run that number yet?
Executive Summary: Your lender has already run your herd at $17 milk for 2026–2028 — the question is whether you’ve run the same number, because the test just quietly switched from “have you always paid?” to “how many months do you last before the working capital’s gone.” That shift hits 200- to 1,000-cow operators hardest: ERS pegs 2026 all-milk near $20.70/cwt against a full economic cost close to $23.50, so a 400-cow herd is bleeding roughly $2.80/cwt — call it $300,000 a year — through equity and borrowing before basis drag even lands. Cornell’s 2023 PRO-DAIRY summary put the average farm’s debt-service coverage near 0.29, meaning a lot of dairies couldn’t fully cover payments in a decent income year, let alone at the $17 your banker is stress-testing. Sit on your hands for 18 months, and that gap runs $300K–$500K in lost margin and equity; Chapter 12 filings already jumped 46% in 2025, and Kooser Farms filed twice in six years. The FMMO make-allowance change stacks on top — 85–93¢/cwt off class prices, $337 million pulled from producer pools in 90 days — and it now pays component pounds shipped, not test percentage, so three cycles bred for high fat and low volume can quietly become a liability. The fix isn’t complicated: run your own DSCR at $17 before renewal season, check working capital per cow against the $450 line, and walk into the bank first with your numbers instead of last with a tax return and a story. If your breakeven at $17 is a number you can’t say out loud right now, that’s the thirty-minute job that changes every decision after it.
Editor’s note: The 400-cow figures below are a composite scenario, modeled from multiple mid-size U.S. dairy financials and Cornell PRO-DAIRY benchmark data — built from real numbers, not one real farm. The named farms and counselor session referenced are real and sourced. Price and cost figures reflect USDA and industry data as of June 2026.
Earlier this year, a 550-cow Wisconsin dairy sat down with a farm financial counselor and ran the same numbers their lender was about to run. Same cows, same parlor, same management that had always made the payment. What changed wasn’t the farm — it was the test the farm was being judged against. That’s the quiet shift reshaping mid-size dairy in 2026: your lender relationship stopped running on payment history and started running on a forward stress test.
Here’s the short version. Your banker isn’t really asking “have they always paid?” anymore. They’re asking how many months this business survives $17 milk before the working capital runs dry. Two very different questions. And the gap between them is exactly where 200- to 1,000-cow operators are getting caught.
What’s Actually Changing
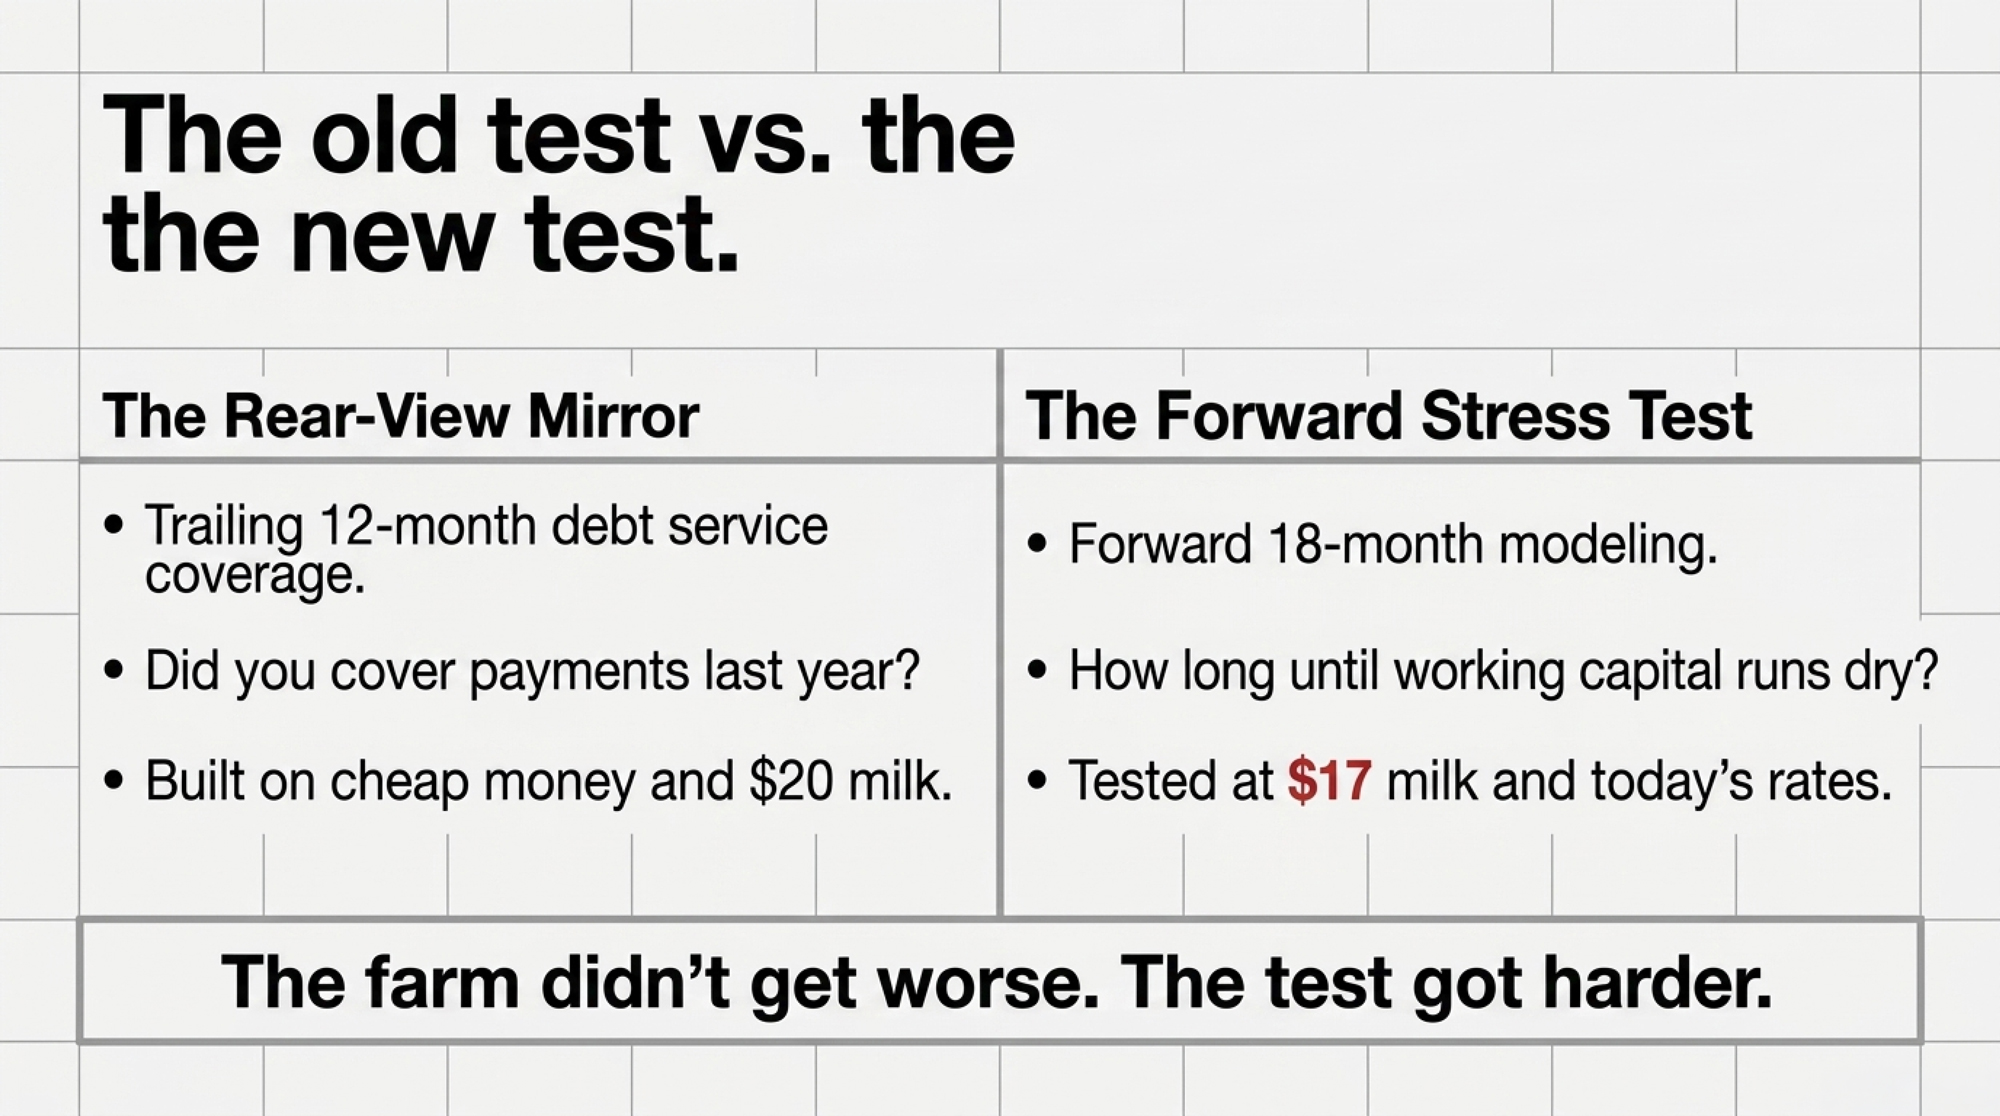
For years, ag lenders ran a trailing 12-month debt service coverage ratio. Did you cover your payments last year — yes or no? That’s not the test anymore. Lenders now model forward DSCR at lower milk prices and higher interest rates, stress-testing your cash flow against that scenario rather than the rear-view mirror. The same three-scenario drill banks run on their own books — most likely, downside, worst-case — they’re now running on your file.
DSCR is just the cash you’ve got to service debt divided by your total debt payments. Farm Credit Canada calls 1.5x healthy, 1.0–1.25x tight but manageable, and anything under 1.0x a flashing red light — the farm can’t cover payments from operations alone. Now the uncomfortable part. Cornell’s PRO-DAIRY Dairy Farm Business Summary for the 2023 business year — 127 New York farms — put the all-farm average DSCR near 0.29, with the lowest-profit group around 0.34. Many dairies couldn’t fully cover debt payments even in a decent income year.
Who’s most exposed? The middle. USDA’s Economic Research Service reports licensed U.S. dairy herds fell 63% — from 66,825 in 2004 to 24,811 in 2024 — while average herd size more than doubled. The 200- to 1,000-cow herd lands in a hard spot on the cost curve: too big to run on sentiment, too small to claim the lowest cost structure. ERS’s cost-of-production data makes the gap concrete:
Cost to make 100 lbs of milk, by herd size
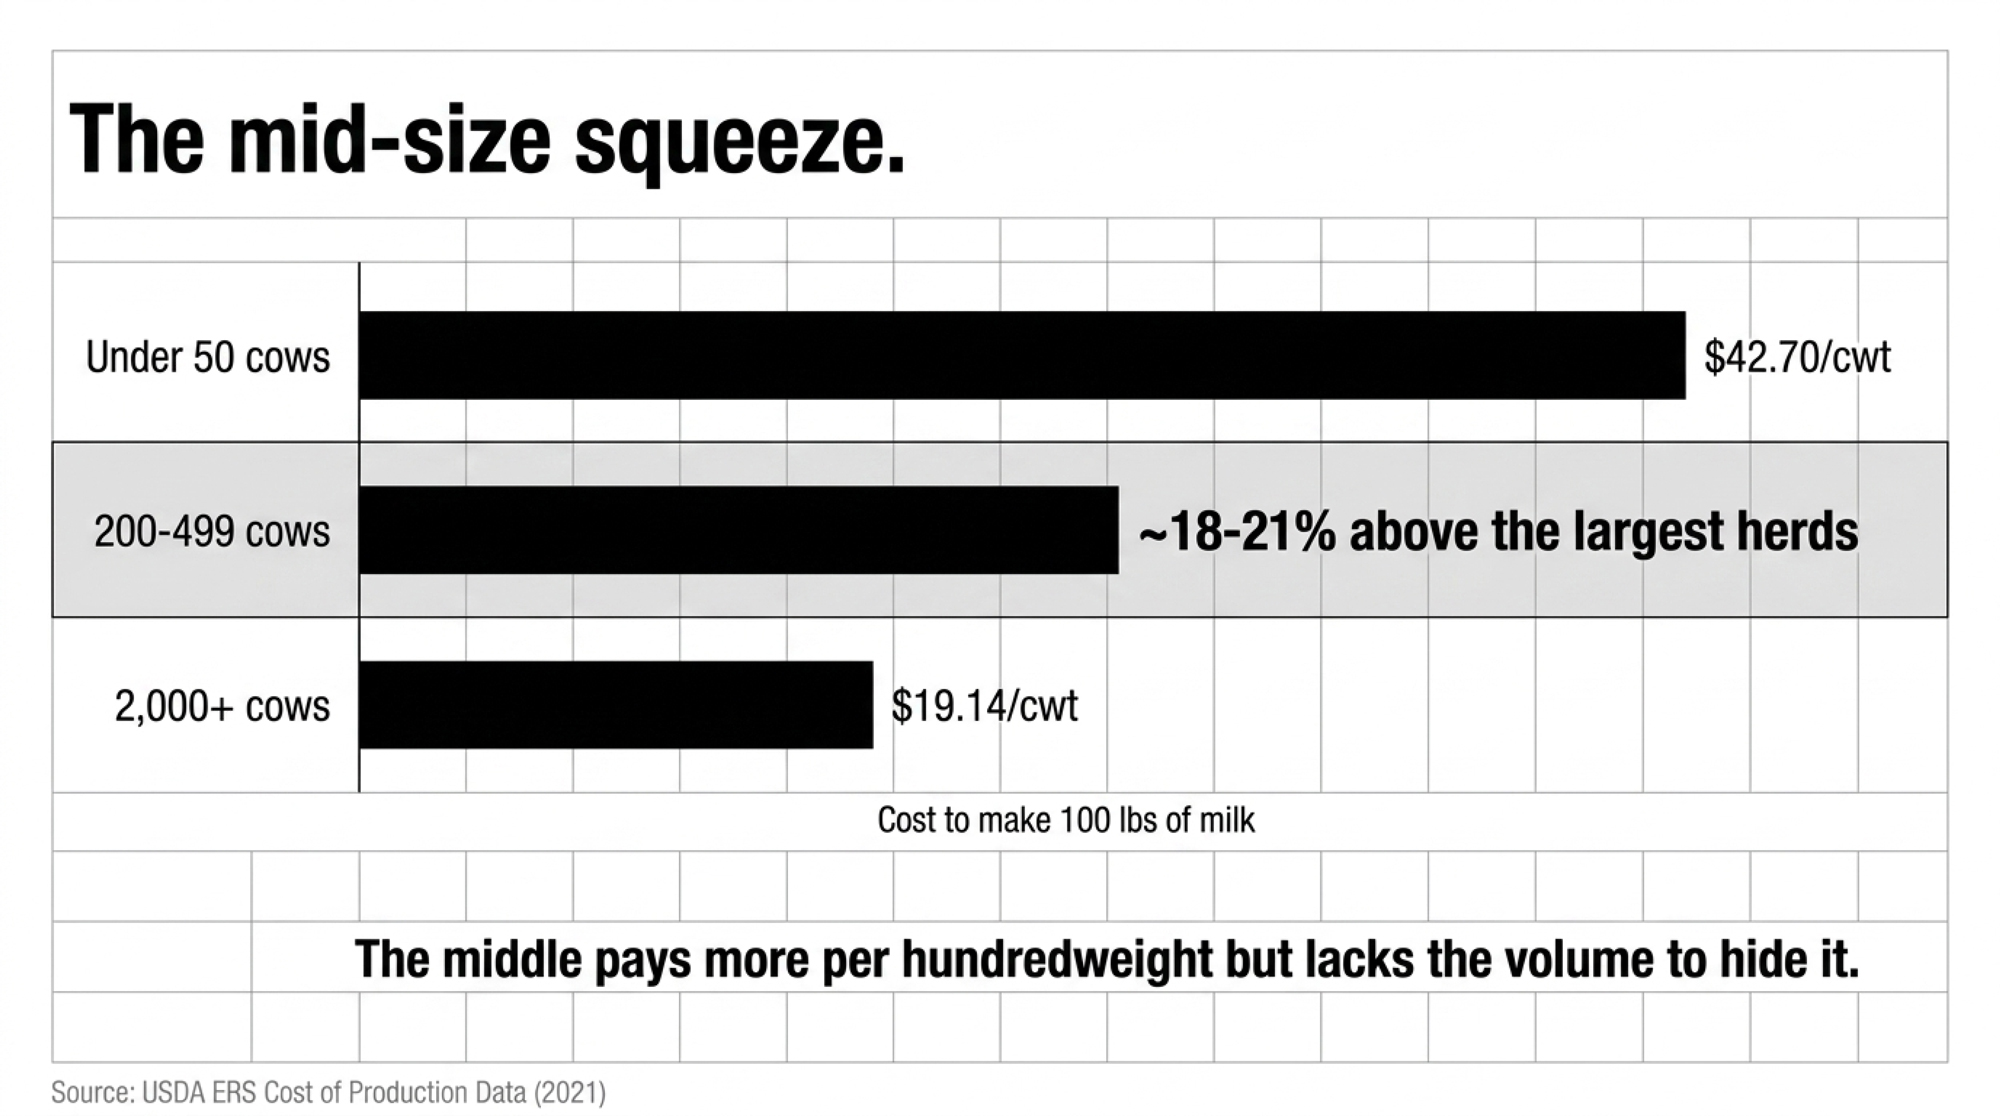
| Herd size | Cost per cwt |
| Under 50 cows | $42.70/cwt |
| 200–499 cows | ~18–21% above the largest herds |
| 2,000+ cows | $19.14/cwt |
The middle pays more per cwt than the big herds — and ships less volume to spread it over. (2021 ERS; latest full national breakdown available.)
How It Plays Out on Real Farms
Run that Wisconsin operation forward on one clean baseline. ERS’s June 2026 forecast puts 2026 all-milk at $20.70/cwt — revised down 55 cents from the month before — while full economic cost of production sits close to $23.50/cwt. That’s the number that matters: a gap of roughly $2.80/cwt between what it costs to make the milk and what the milk pays back.
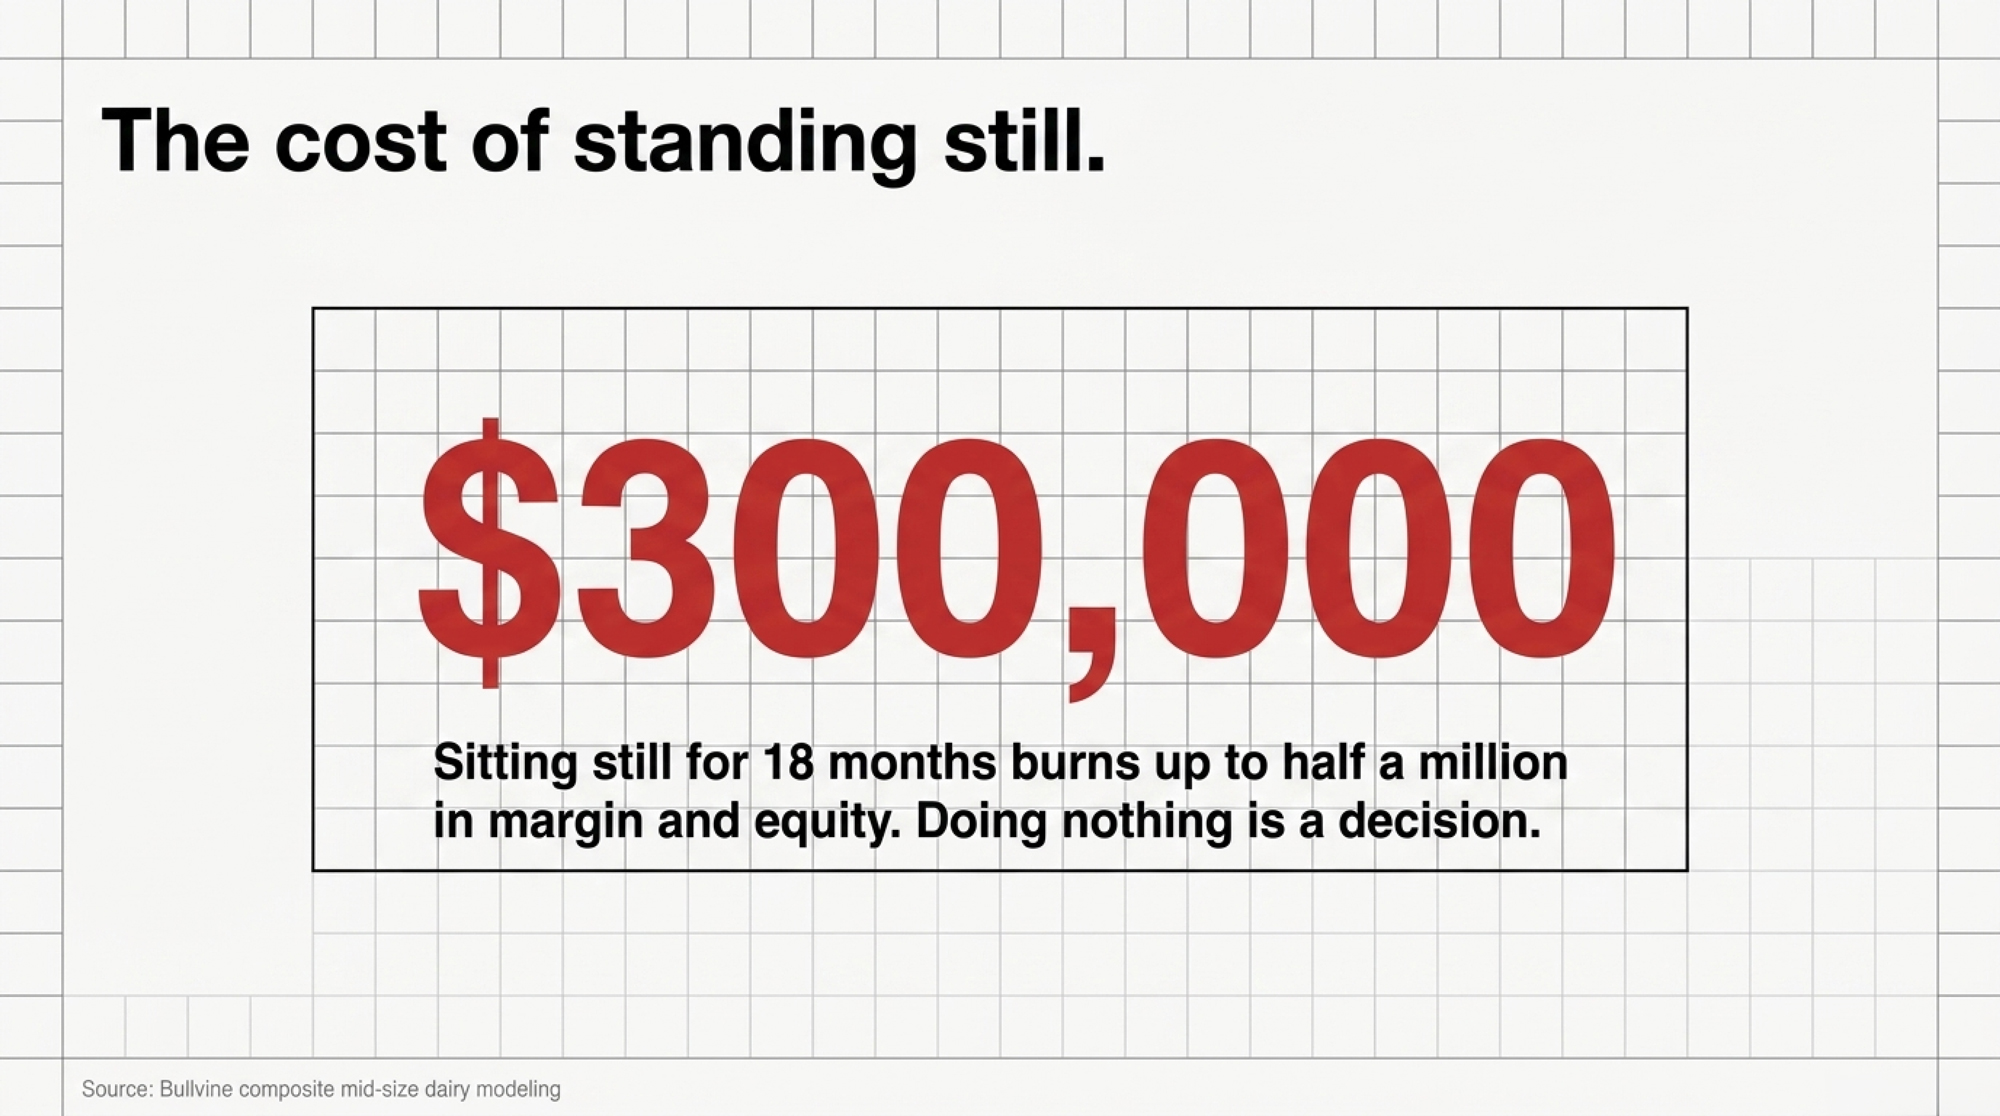
Now the barn math. A 400-cow herd at about 75 lbs/cow/day moves roughly 300 cwt a day — call it 110,000 cwt a year. Multiply that $2.80 gap across the year, and you’re absorbing better than $300,000 through equity and borrowing, unless something changes. Stretch it across 18 months of doing nothing, layer in the basis drag below, and you’re looking at $300,000 to $500,000 in lost margin and equity. Here’s how the rest of the price picture stacks up around that baseline:
The numbers your lender is working with
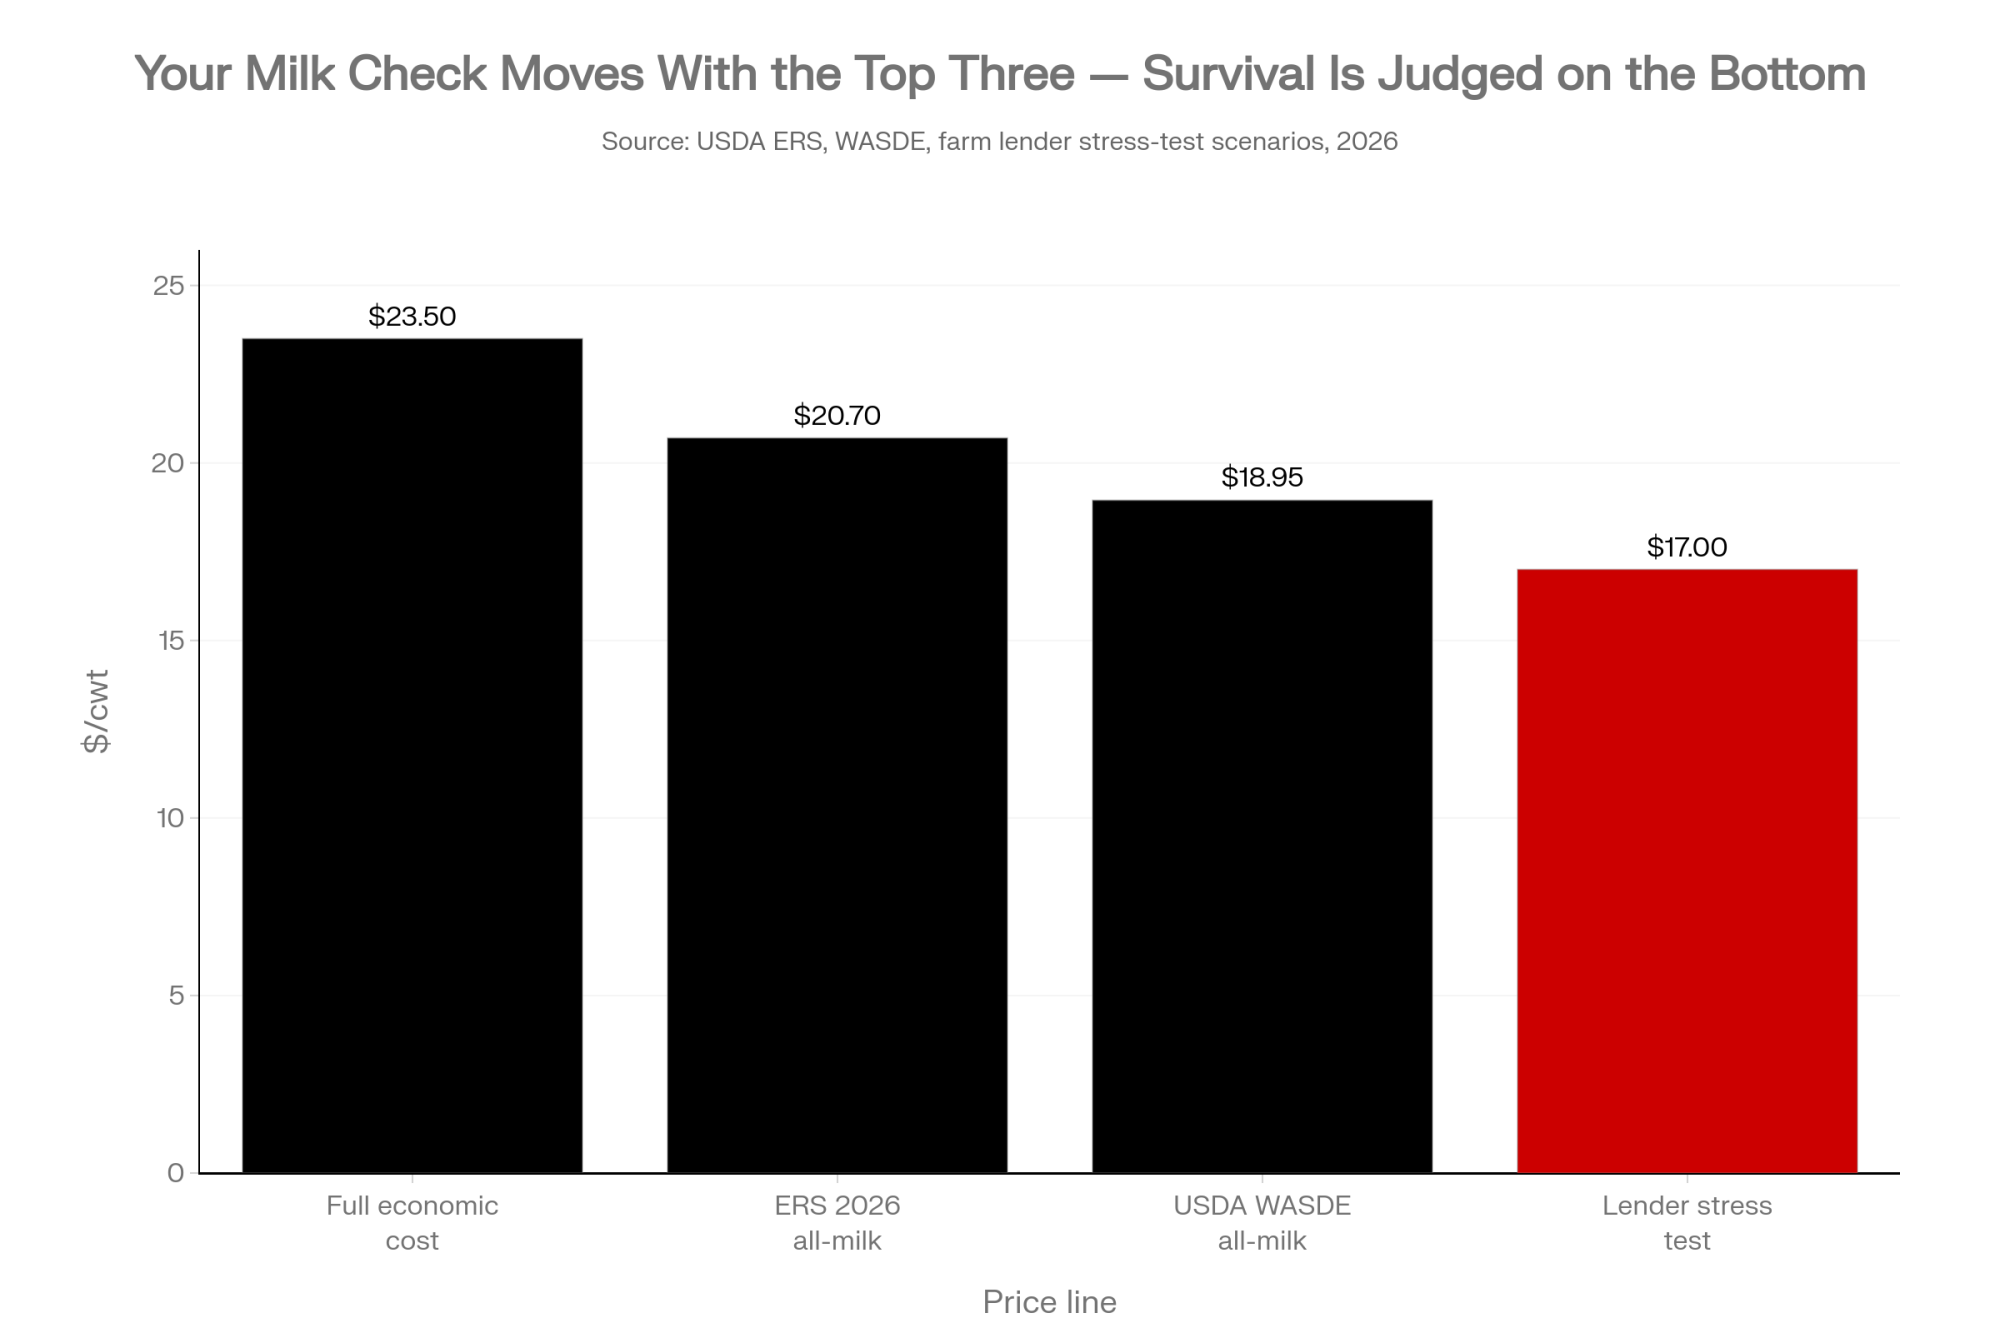
| Line | Price |
| ERS 2026 all-milk forecast | $20.70/cwt |
| Lender stress-test price | $17.00/cwt |
| USDA 2026 all-milk (Feb WASDE) | $18.95/cwt |
| Full economic cost of production | $23.50/cwt |
Your milk check moves with the top three. Your survival is judged against the $17 line.
Then it stacks. As regional milk volume grows, basis and premiums can tighten — Bullvine’s regional milk-price analysis associates this with net price differences of 40 to 60 cents/cwt in some regions.¹ On a 9,000-cwt monthly check, that’s $3,600 to $5,400 a month, or roughly $43,000 to $65,000 a year, gone before you touch a single thing on your own farm. None of it lands as one dramatic blow. Ninety cents here, fifty thousand there.
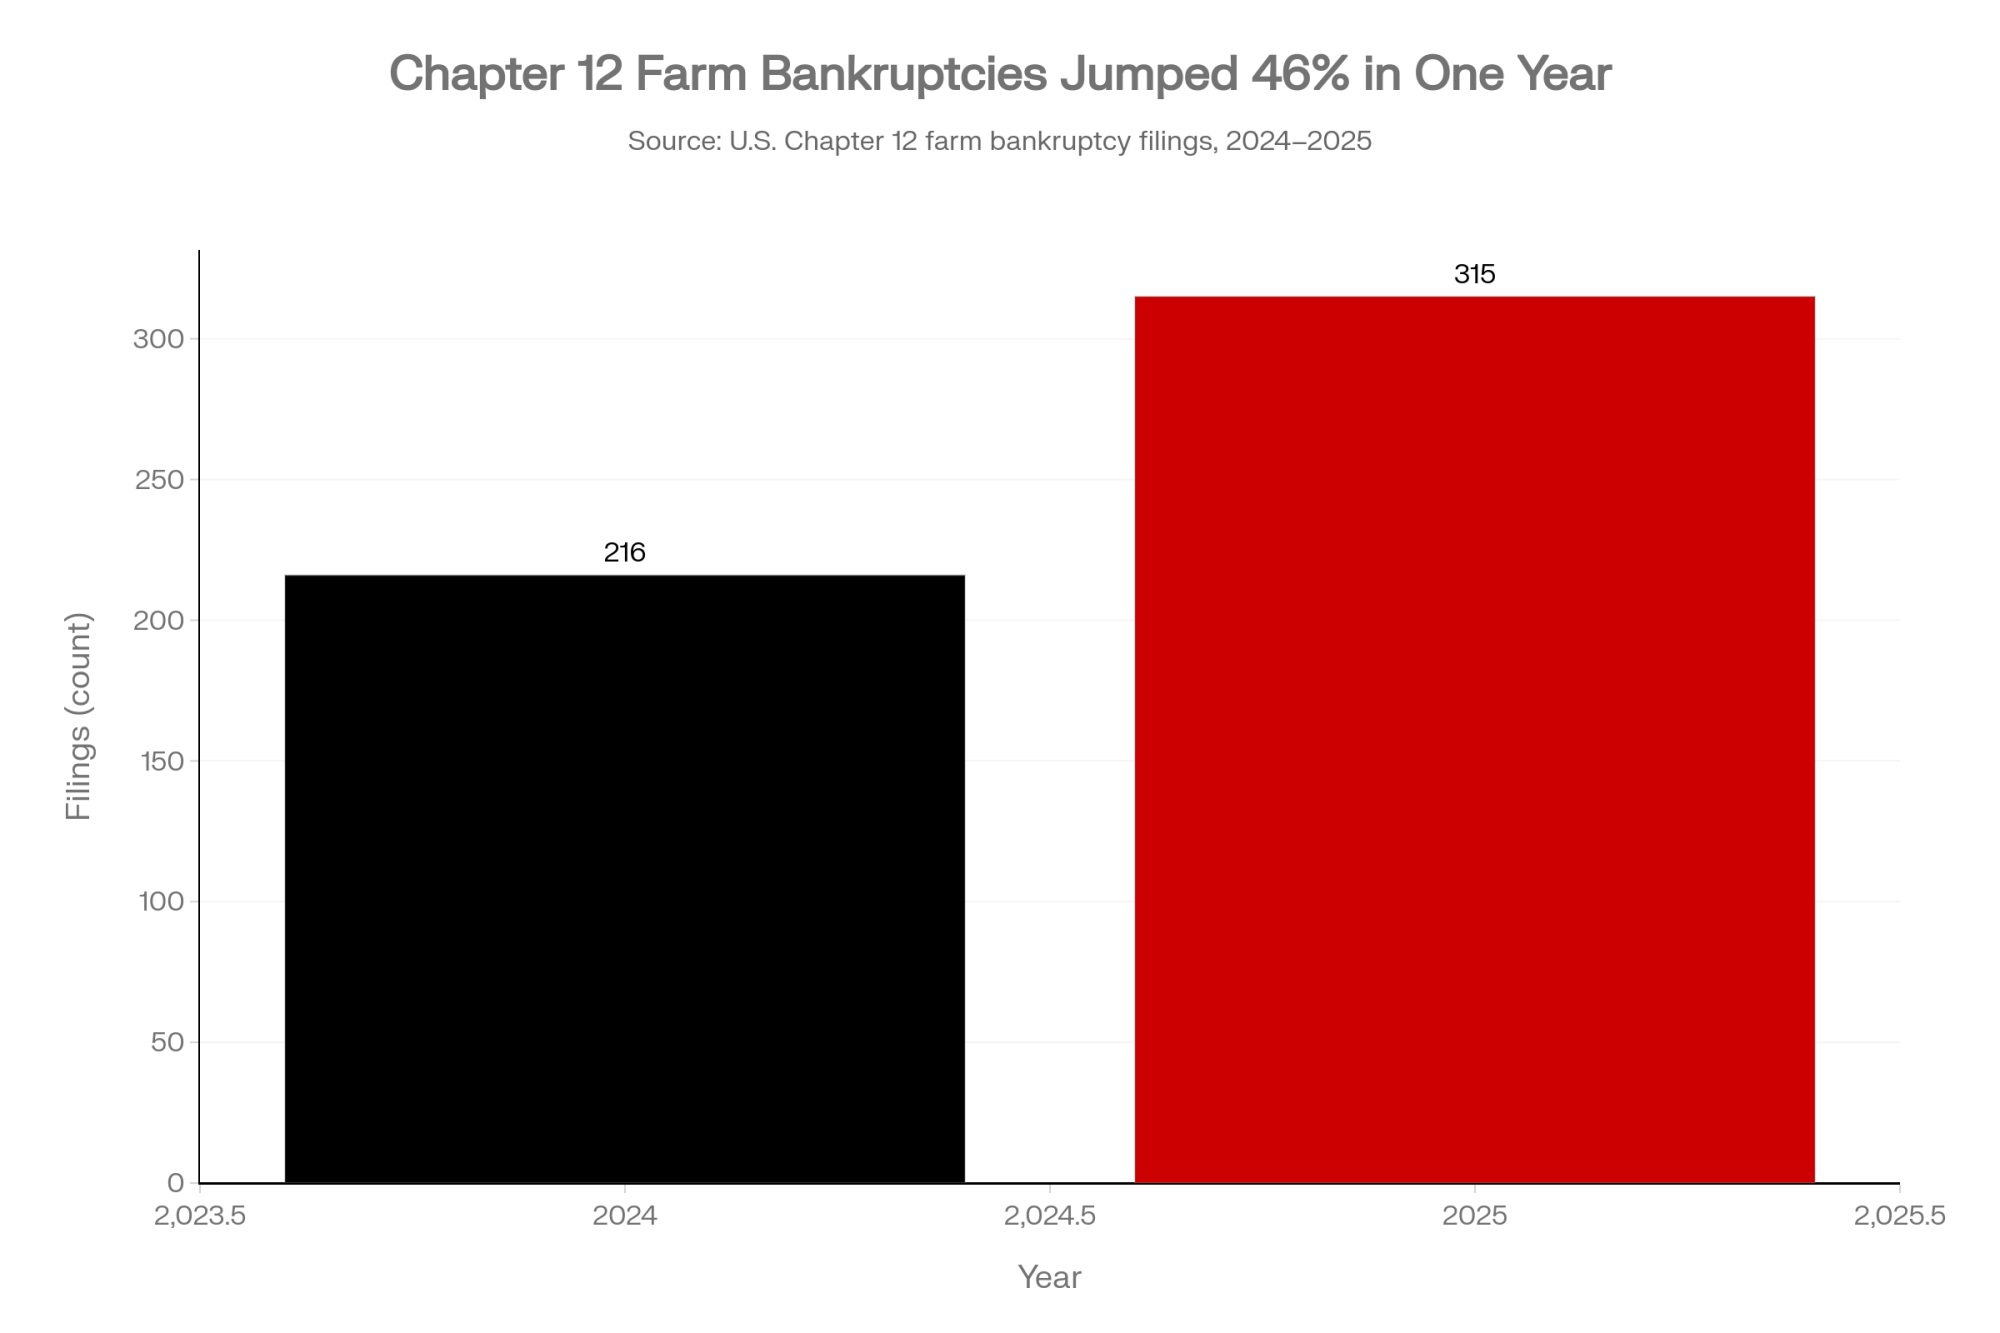
And you usually find out late. Bullvine’s reporting describes the tells — quarterly financial requests where you used to send them once a year, a new credit analyst in the room, an off-cycle appraisal, an operating line that stops expanding. The shift from partner to decision-maker happens inside the committee before anyone says it out loud in your barn. The proof it’s already happening: U.S. Chapter 12 farm bankruptcy filings hit 315 in 2025 — a 46% jump — and some operations are filing twice. Kooser Farms of Pennsylvania filed Chapter 12 in October 2025, six years after its first filing in 2019; a federal judge confirmed its second restructuring plan in February 2026.
What’s on the Committee’s Screen
So what are they actually looking at? More than character and collateral. They run your DSCR at base and stress prices — current cash flow at $18.95 milk, then at $17, sometimes $16 — plus a rate bump on any variable debt, watching for where you cross below 1.25x and 1.0x. They check working capital per cow — Compeer flags a management goal above $450/cow — as well as your operating expense ratio and debt repayment per cwt. And they read the trend lines: is equity eroding? Is liquidity shrinking year over year?
| Metric | Healthy | Warning zone | Red flag |
|---|---|---|---|
| DSCR | 1.5x+ | 1.0–1.25x | Below 1.0x |
| Working capital/cow | $450+ | $300–$450 | Below $300 |
| Debt-to-asset ratio | Under 55% | 55–70% | Above 80% |
| Operating line drawn | Under 50% | 50–80% | Above 80% |
The rate side matters more than it used to. Farm Credit Services of America projects Class III to average around $17.25/cwt in the second half of 2026, stress-tested against operating-loan rates that are well above where they were a few years ago. So a herd that penciled fine at the cheap money and $20 milk of three years back can fail the same committee’s test at today’s rates and $17 milk, with not one cow sold and not one ration changed. That’s the trap. The farm didn’t get worse. The test got harder.
None of these formulas are secret. Compeer publishes them. Farm Credit Canada explains them. Your local extension office hands them out for free. So the gap isn’t access. It’s time, identity, and a little bit of dread. You’re running a multi-million-dollar business and a hands-on farm at once, and most operators were raised to think of themselves as dairy farmers first, never the CFO. Purdue Extension has made the point that producers under financial stress tend to bury themselves in chores and put off the long-term decisions.
There’s a real cost to opening that file, too. Researchers define financial stress as the psychological strain that comes from worrying about money — for farm households it’s a measurable, front-and-center part of the work, not a footnote. The first time you run DSCR at $17 and see a number below 1.0, the story flips from “we’re tight but okay” to “this has to change.” That moment stings. It’s also the only place real decisions start. If the math feels heavier than the spreadsheet, you’re not the only one — in the U.S., the 988 Suicide & Crisis Lifeline and the Farm Aid hotline (1-800-FARM-AID) are there for exactly that pressure; in Canada, Do More Ag connects producers to the same kind of help.
How Much Does Standing Still Actually Cost?
| Scenario (400-cow herd) | Annual cost gap | 18-month cumulative cost |
|---|---|---|
| Cost-of-production gap ($2.80/cwt × 110,000 cwt) | ~$300,000 | ~$300,000–$500,000 |
| Regional basis drag (40–60¢/cwt) | ~$43,000–$65,000 | Stacks on top of above |
| Cornell PRO-DAIRY avg. DSCR (2023) | 0.29 | Can’t fully cover payments in a good year |
Freezing isn’t passive. It’s a decision to accept the status quo — and in 2026 the status quo carries a price tag. For a 400-cow herd carrying that economic-cost gap plus basis drag, doing nothing for 18 months runs comfortably into the $300,000 to $500,000 range in lost margin and equity, before you count the heifer-replacement squeeze coming down the pipe. When a producer says “we’ll ride it out,” the math usually hears “we’ll give up a quarter-million and hope the market bails us out before the lender’s spreadsheet does.”
The outlook doesn’t reward waiting, either. The University of Georgia’s 2026 outlook cited a USDA all-milk projection near $18.75/cwt, with prices expected to stay soft through much of the year. Class III futures have priced milk near $17/cwt through the third quarter of 2026. Riding it out is a bet on a bounce the current data doesn’t promise.
Is Your Breeding Strategy Already Behind the Pay Formula?
Here’s where it gets interesting for herds that chased butterfat for a decade. The FMMO make-allowance changes that took effect June 1, 2025, cut class prices roughly 85 to 93 cents/cwt and, per American Farm Bureau Federation analysis, pulled about $337 million out of producer pool values in the first 90 days. The change was adopted to reflect processors’ rising plant costs, but the skim-composition update that would have partly offset the producer side didn’t take effect until December 31, 2025 — so you absorbed the full hit before any relief showed up. Butterfat’s component value, meanwhile, slid from around $2.95/lb in January 2025 to roughly $1.45/lb a year later.
The deeper shift is in the formula logic: Net Merit $ now rewards component pounds shipped, not just test percentage. Bullvine modeled two 500-cow Upper Midwest herds on NM$ planning prices — same cow count, opposite breeding philosophy — and the spread is the part worth screenshotting:
Two 500-cow herds · same count · opposite strategy (modeled)
| Herd | Butterfat | Milk/cow | Component value |
| A — “High Test” | 4.25% | 72 lbs | baseline |
| B — “High Volume” | 4.05% | 82 lbs | ~$210,000 more per year |
Lower test, higher volume — and the pay formula now rewards exactly that. The modeled edge ranges from roughly $55,000 (fluid-heavy order) to $95,000 (manufacturing order) on a comparable component improvement.
Three breeding cycles built for high test, low volume can quietly turn into a structural disadvantage after a single formula change. There’s a fuller breakdown in our look at [what butterfat’s crash reveals about breeding into a moving market][LINK-1] — worth reading before your next sire decision.
Options and Trade-Offs
There’s no single right move. But there are a few clear paths producers are taking, each with real trade-offs.
- Run your own stress test and get to the lender first — within 30 days. Pull your last 12 months of financials and calculate DSCR and full breakeven at $17–$18 milk, including unpaid family labor and depreciation at replacement cost. Then book the meeting before renewal season books it for you. Bullvine’s reporting and Ag Proud’s stress-test guidance both find that operators who walk in with their own rolling cost-per-cwt and downside scenarios get more flexibility on terms than those who show up with a tax return and a story. The requirement is honesty. The only real risk is emotional — you have to be willing to see the number.
- Restructure debt, but only if you fix the underlying problem. Re-amortizing carry-over debt or refinancing can ease the monthly squeeze. The catch: restructuring without closing the cost gap delays your position on the curve, as Bullvine’s analysis puts it. Wisconsin Extension makes the same point a blunter way — paying down dead-weight debt and rebuilding working capital often beats the more exciting capital upgrade. It buys time, not a fix.
- Add non-correlated revenue. Lenders like income that isn’t chained to the Class III/IV roller coaster, and beef-on-dairy calves sell into the fed-cattle market, not the milk market. But lean too hard on it, and you drain a pipeline you’ll need later — replacement heifers hit a record $3,010/head in July 2025, a 164% jump, and have topped $4,000 at some auctions.
- Plan a controlled exit with equity intact. For some operators, the right call is selling on your own timeline rather than the bank’s — or filing a strategic Chapter 12 while equity remains, which works best when debt-to-asset is in the 55–70% range, and the operation can pencil after restructuring. It’s the hardest path emotionally and the cleanest one financially when DSCR is structurally broken.
What’s Stopping You From Running the Numbers Today?
If the formulas are free and the stakes are six figures, why is the 400-cow operator so often the last person to run them on themselves? Usually it isn’t ignorance. It’s that the day-to-day grind eats the hours, and there’s a quiet fear that the real cost-per-cwt sits three dollars higher than the story you’ve been telling yourself. Heavier to face than a balky parlor.
But here’s the reframe. Once you’ve seen your own math in the same light your lender is using, every other decision — breeding, expansion, exit, even who you ship to — stops being a guess and becomes a choice. That Wisconsin dairy didn’t walk out of the counselor session with better cows. It walked out knowing which months of the year actually broke even and which ones bled — the same numbers the bank was already holding.
Your 30-Day CFO Checklist
Work these in order. Each step has a trigger — a number that tells you whether to move on or stop and act. Print it, screenshot it, tape it to the office wall.
1. Run the core number. Calculate DSCR at $17 milk using this year’s feed bill and current rates. → Trigger: below 1.20x at $18.95 milk is your warning line — stop here and make it a 30-day priority. Kansas City Fed surveys already show that 60% of district lenders report lower farm income and loan repayment rates at their weakest since 2020, so the squeeze is real even as overall stress is still building.
2. Check your liquidity cushion. Pull working capital per cow and your operating-line draw. → Trigger: line more than 80% drawn, or working capital well under $450/cow? Those are the exact trend lines your committee is watching.
3. Read your leverage. Find your debt-to-asset ratio. → Trigger: past 60%, restructuring talks should already be happening; past 80%, call an ag attorney this week.
4. Re-test against the rate environment. If any debt is on variable rates, re-run the test at today’s money and $17 milk. → Trigger: the same cows fail a test that penciled three years ago? The rates moved, not the herd.
5. Audit your component strategy. Model fat and protein pounds — not test percentage — against the post-June 2025 pay formula. → Trigger: three breeding cycles of high-test, low-volume genetics? Reweigh it before your next sire pick.
6. Pressure-test your side revenue. If beef-on-dairy is propping up margin, check what it’s doing to your replacement pipeline. → Trigger: heifers north of $3,010/head mean you may be selling tomorrow’s herd to fund today’s cash flow.
So here’s the real question — not whether your lender has run these numbers, but whether you’ve seen the same spreadsheet they’re working from. Where does your breakeven actually sit at $17 milk, and how many months of it can your balance sheet absorb before something gives? The 550-cow Wisconsin dairy found out by choosing to look. Most won’t, until the committee looks for them.
Key Takeaways
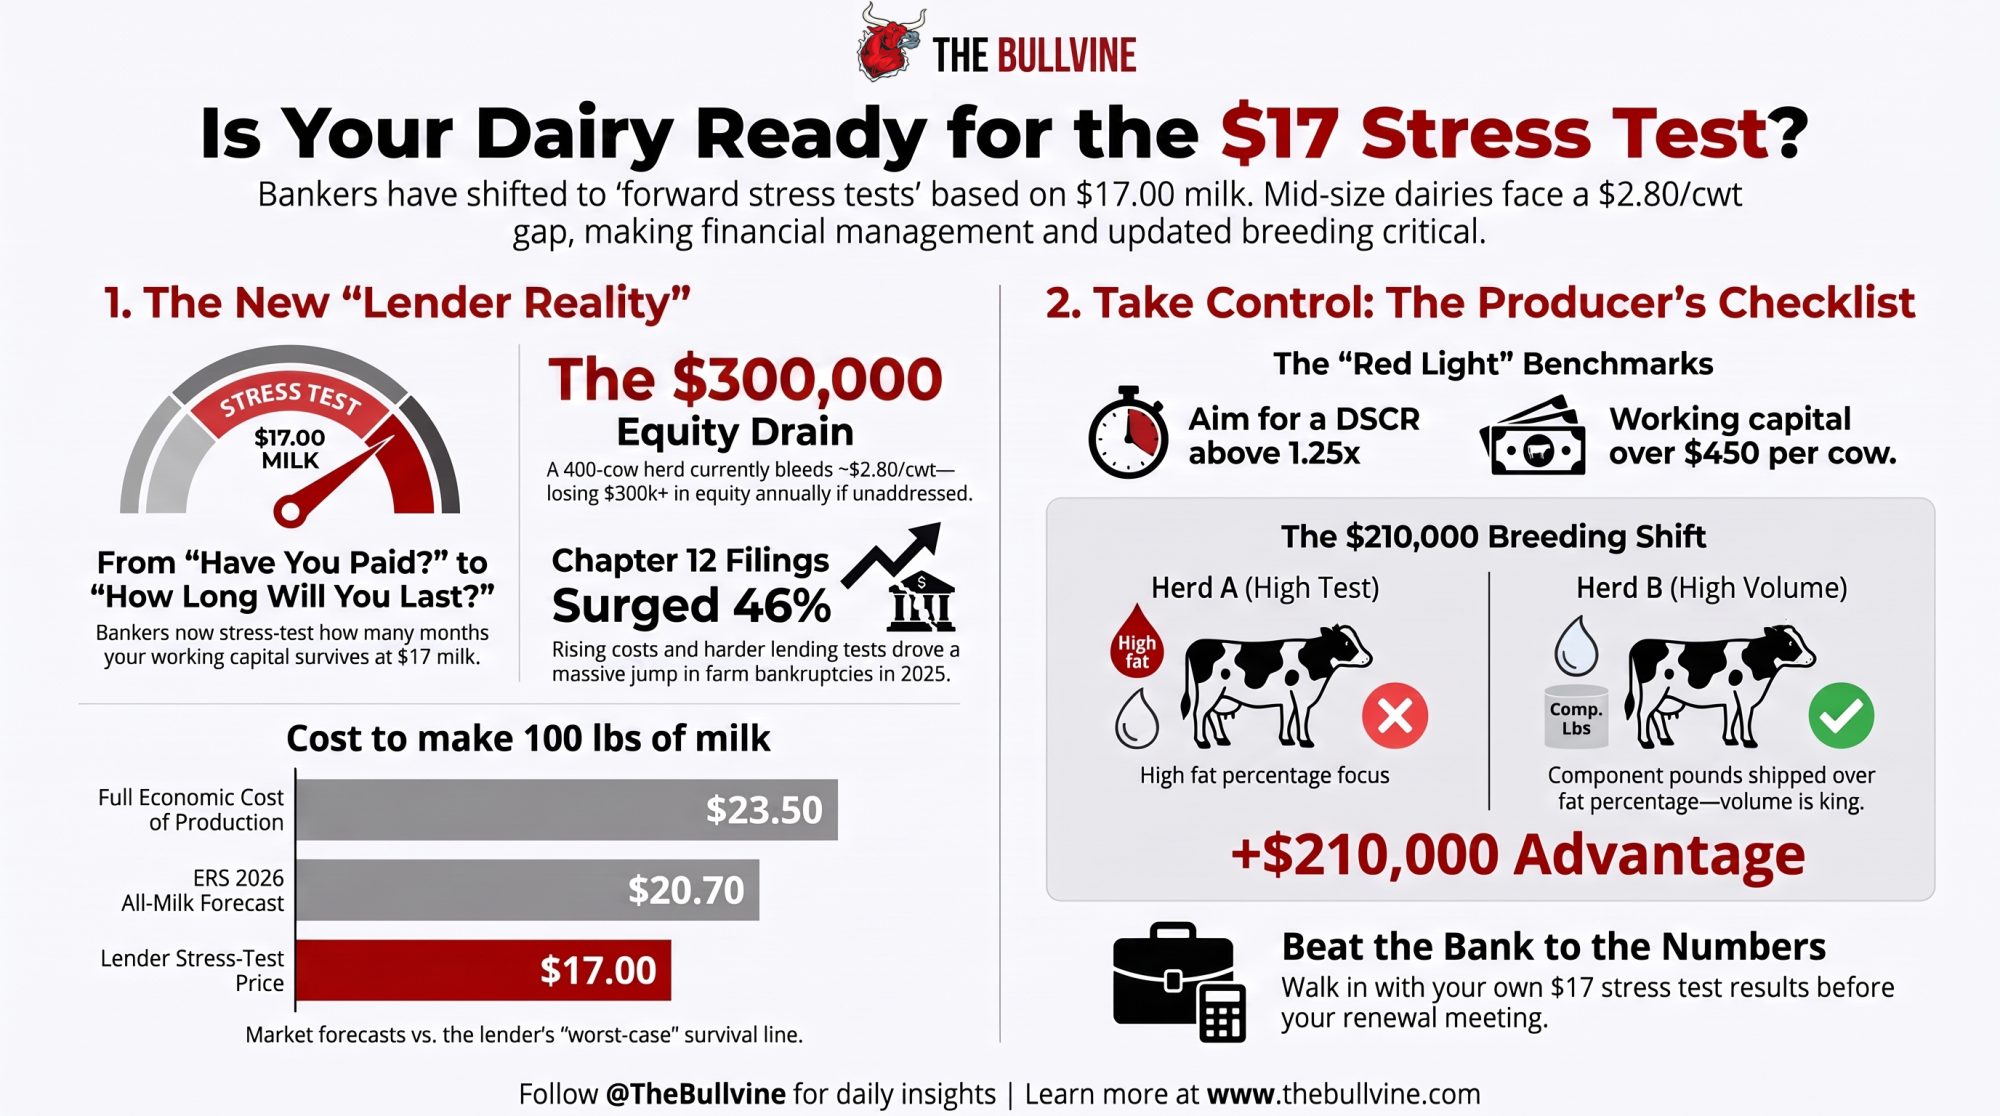
- Your lender’s already stress-testing you at $17 milk against a full cost near $23.50/cwt — run your own DSCR at $17 before renewal season, because on 400 cows that gap is roughly $300K a year through equity.
- If your DSCR comes in under 1.0 or working capital’s below $450/cow, that’s not a wait-and-see number — get to the bank first with your own math instead of last with a tax return and a story.
- The FMMO change now pays component pounds shipped, not test percentage; if you’ve bred three cycles for high fat and low volume, reweigh that before your next sire pick.
- Sitting still for 18 months runs $300K–$500K in lost margin and equity, and Chapter 12 filings jumped 46% in 2025 — riding it out is a bet on a bounce the current numbers don’t promise.
Run Your Numbers
Dairy Profit Projector — Before renewal season, run your herd at $17 milk and see your own breakeven price, IOFC per cow per day, and 12-month margin — the same math the committee’s already holding. Walk in with the number, not a tax return and a story.
Complete references and supporting documentation are available upon request by contacting the editorial team at editor@thebullvine.com.
Learn More
- The Efficiency Trap: How Mid-Sized Dairies Can Win the 18-Month Asset Race — Arms you with a protective roadmap to navigate equity erosion, mapping out how to utilize tools like structured Chapter 12 restructuring to safeguard hundreds of thousands in capital before default dictates terms.
- The 5¢ TRQ Fight vs. a $96000 Hole in Your Milk Check — Exposes why relying on political trade wins or short-term bounces cannot fix a multi-dollar structural gap on a leveraged herd, delivering a strategic framework to set a hard balance-sheet floor before equity bleeds out completely.
- TPI 2026’s $17500 Protein Trap: Breeding Holsteins for a Protein Market That Doesn’t Exist — Reveals a massive $17,500 hidden genetic penalty dragging down a standard 500-cow herd, breaking down the exact formula mismatch between outdated selection indexes and what modern federal order milk checks actually reward.
The Sunday Read Dairy Professionals Don’t Skip.

Every week, thousands of producers, breeders, and industry insiders open Bullvine Weekly for genetics insights, market shifts, and profit strategies they won’t find anywhere else. One email. Five minutes. Smarter decisions all week.
