


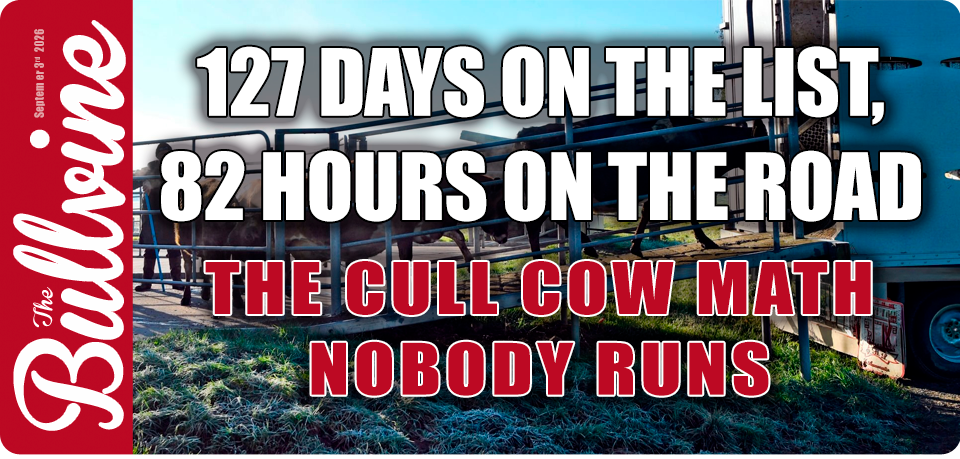








She went on the list in April at 209 days in milk. It’s September, she’s still milking, and the odds she’s thin have been climbing the whole time. UBC tracked 1,171 cows through exactly this wait. Here’s what it costs.
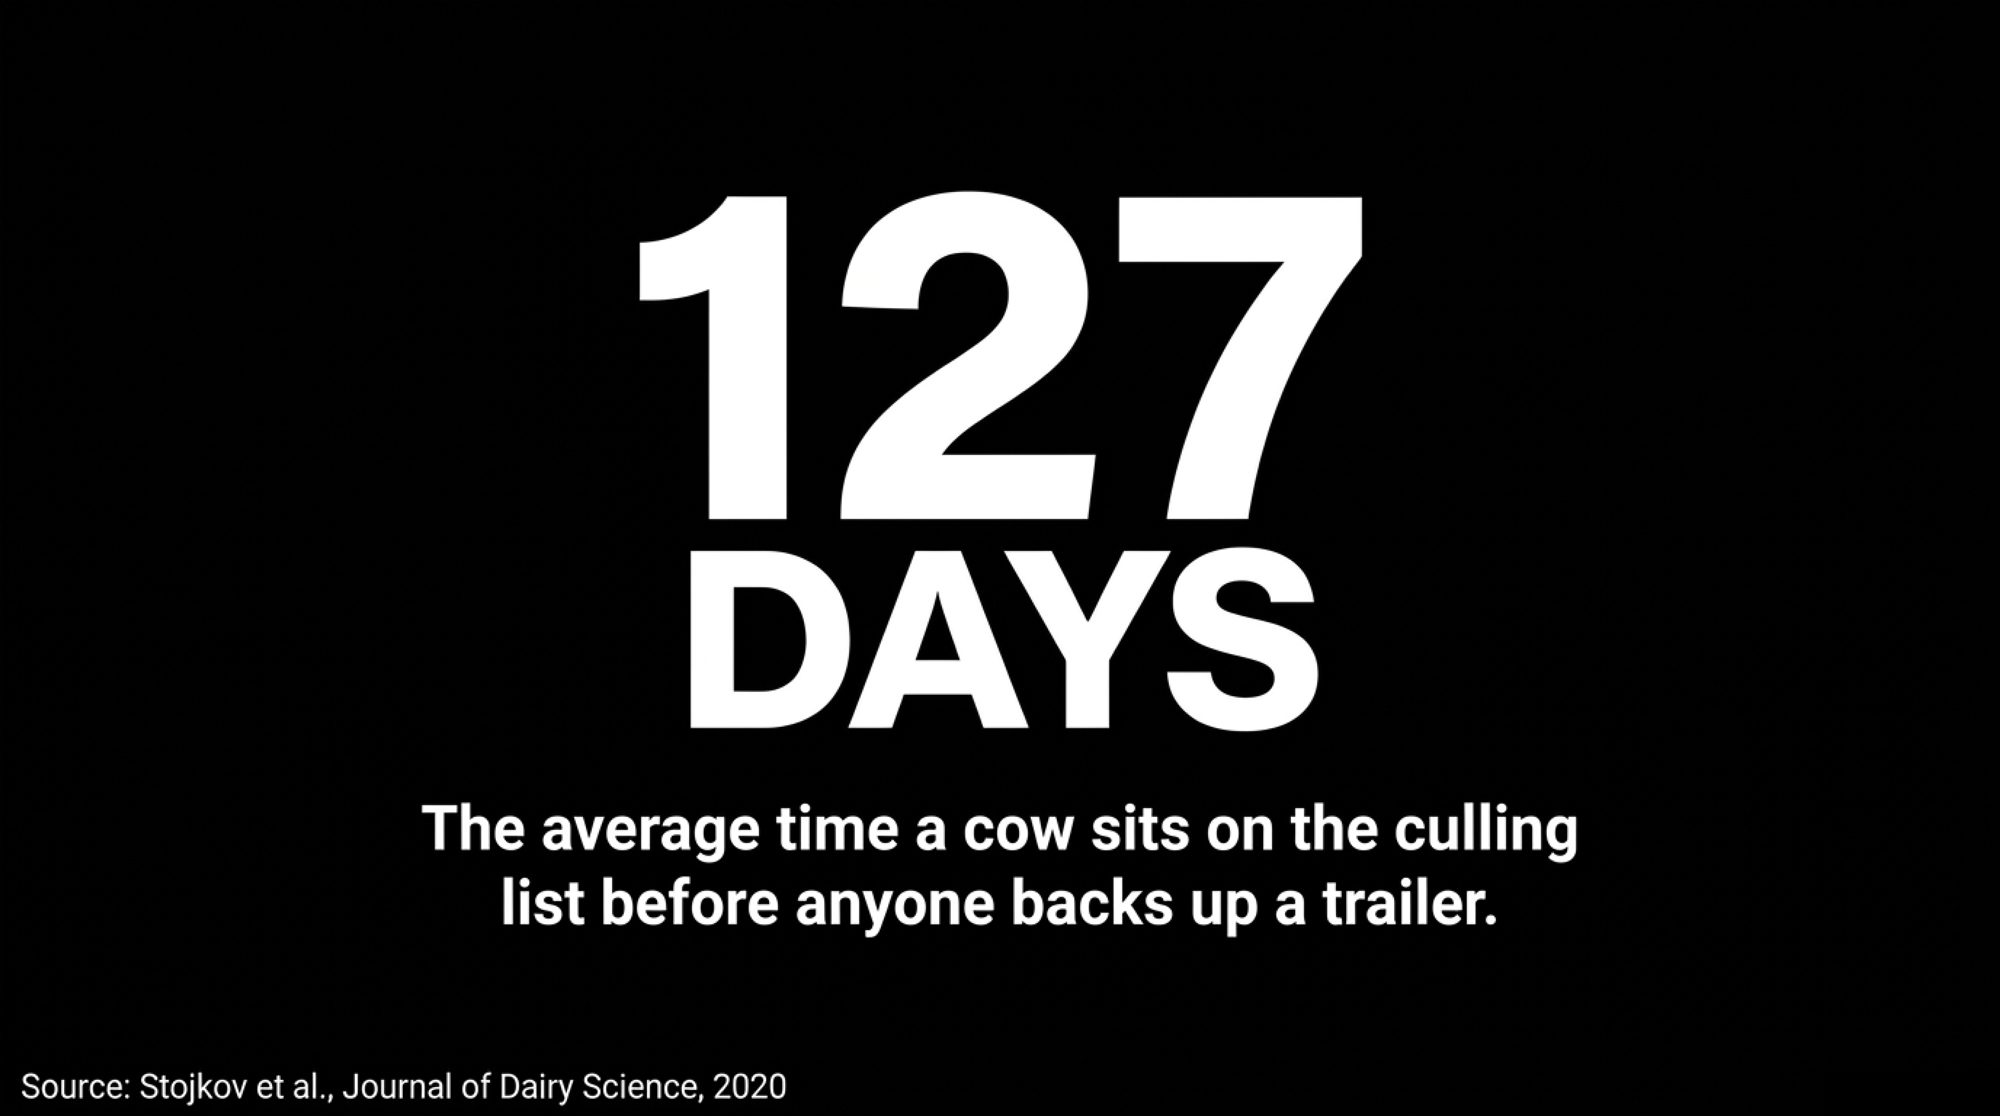
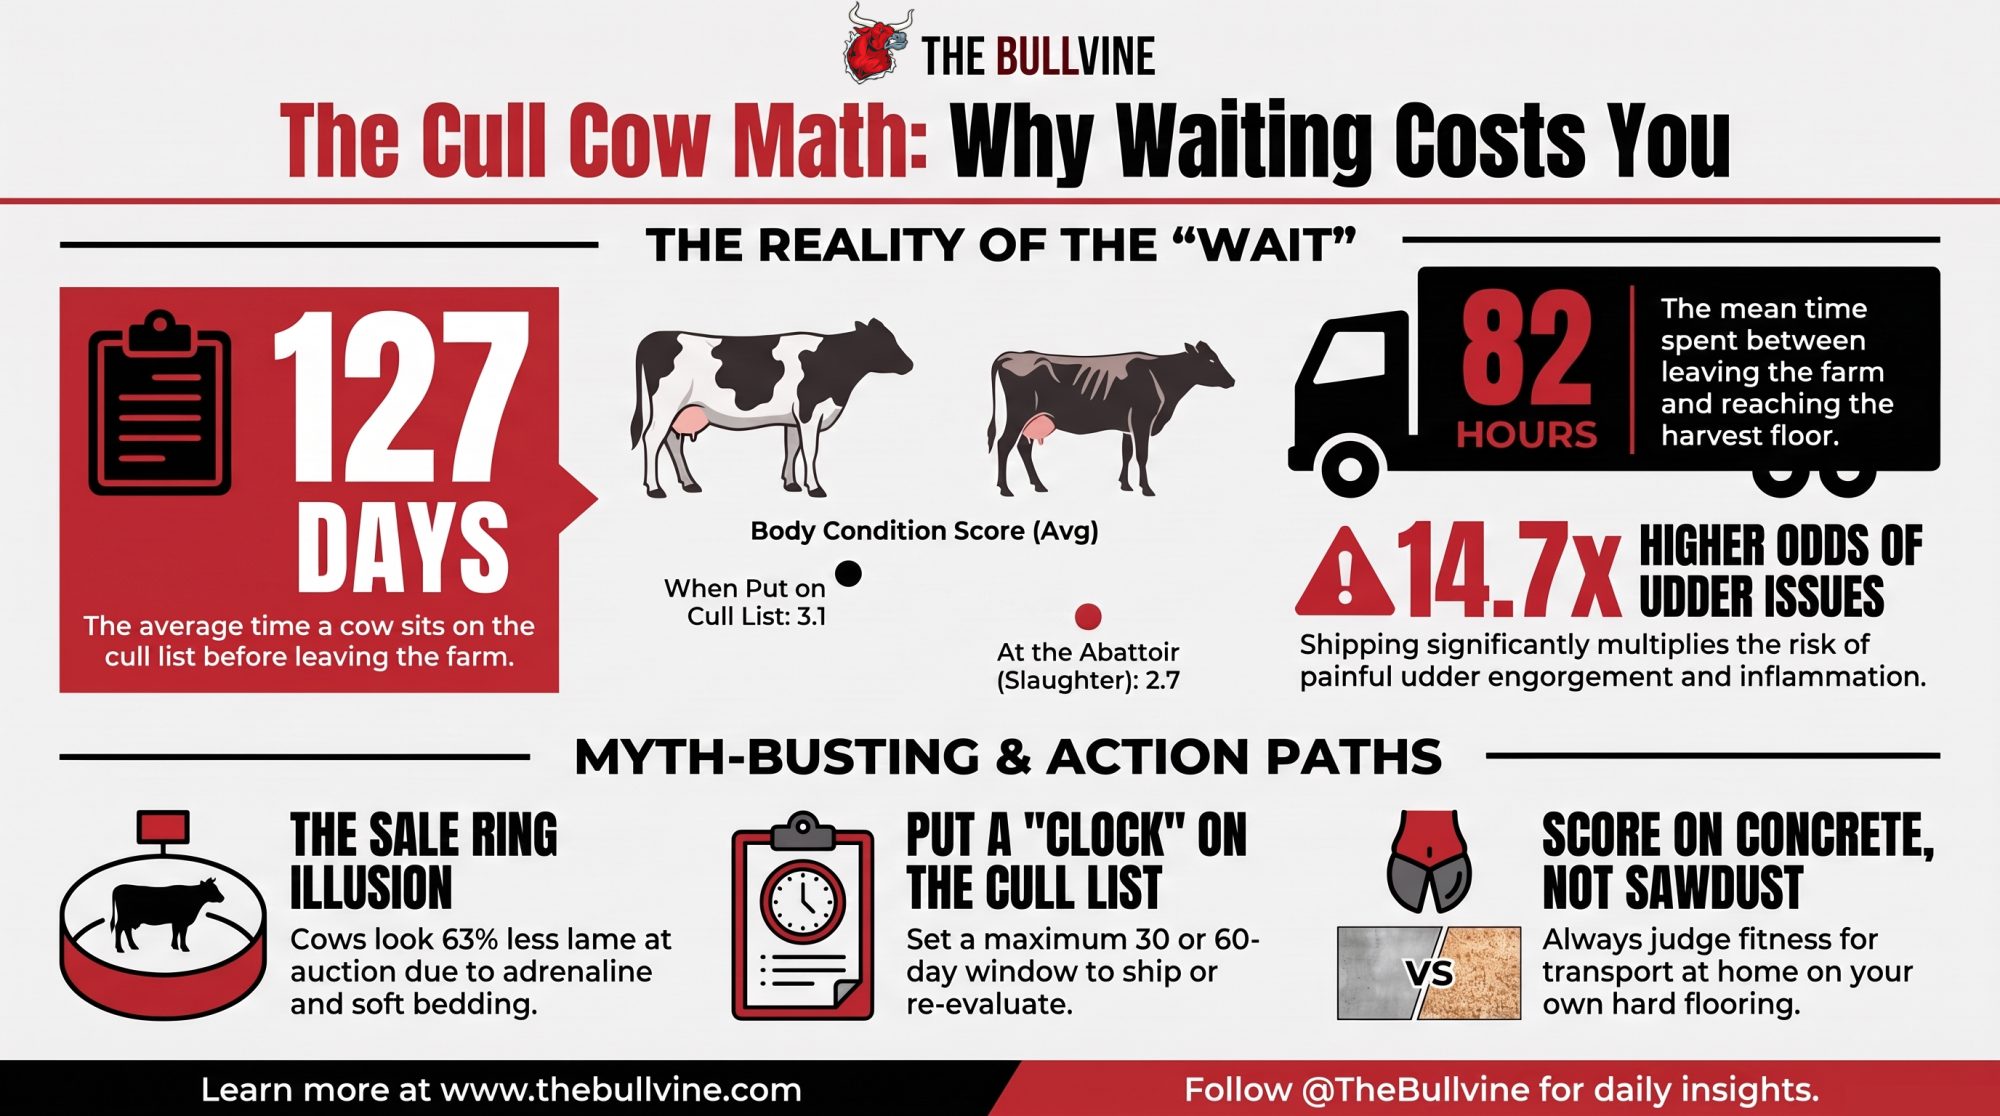
- 127 Days — Average time a cow sits on the culling list before leaving the farm
- 82 Hours — Average time she then spends in the marketing chain before harvest
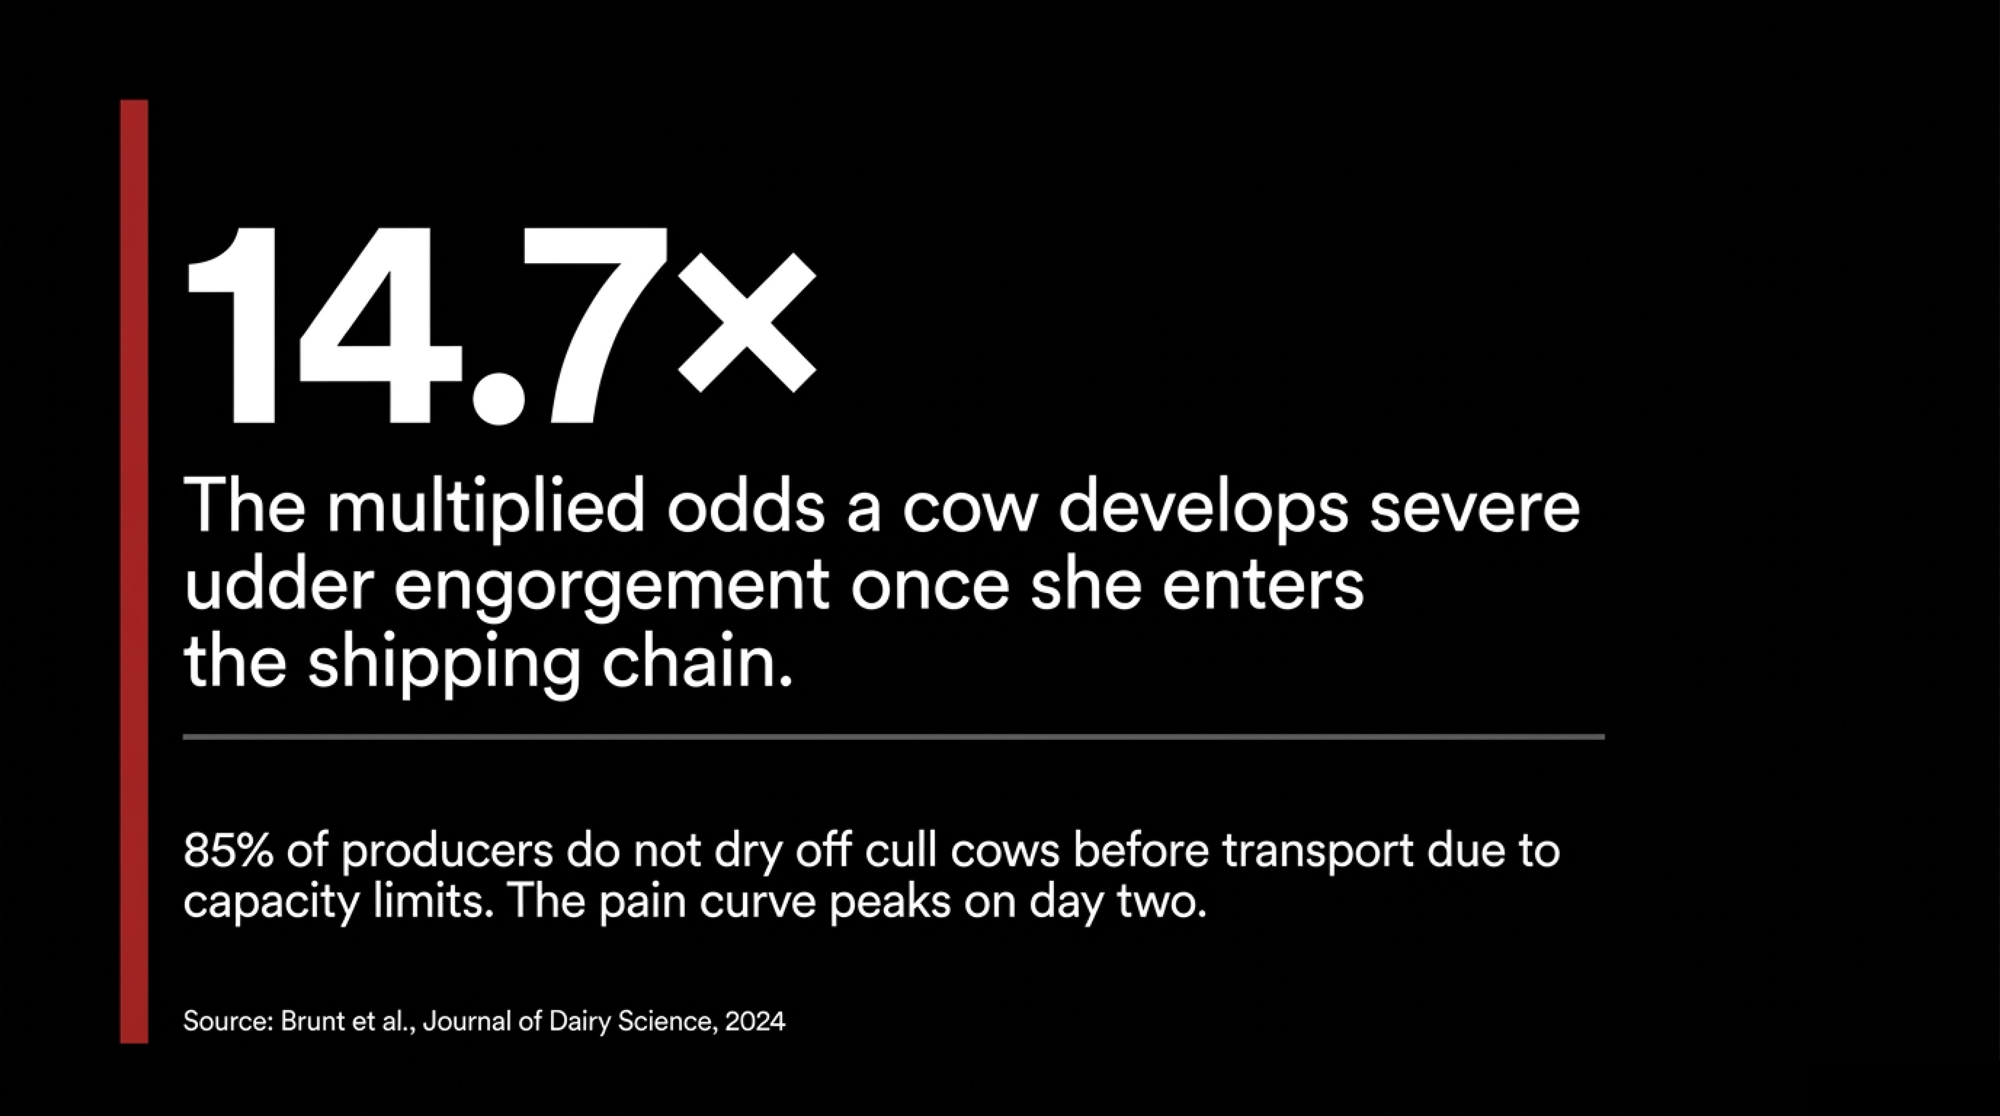
- 14.7× — Multiplied odds of udder engorgement or inflammation by the time she reaches the abattoir
Stojkov et al., Journal of Dairy Science, March 2020
An Ontario dairy farmer, describing where responsibility for a cull dairy cow ends, put it about as plainly as anyone has. Identified only as “C2” in a University of Guelph focus-group study published in Frontiers in Veterinary Science in June 2023, he told researchers: “Once it leaves the farm and goes on the truck, it is the trucker’s responsibility, and once it leaves the truck and goes to the sale ring, it is the sale ring’s responsibility. It is, in my mind, whoever has [financial] possession of the animal.”
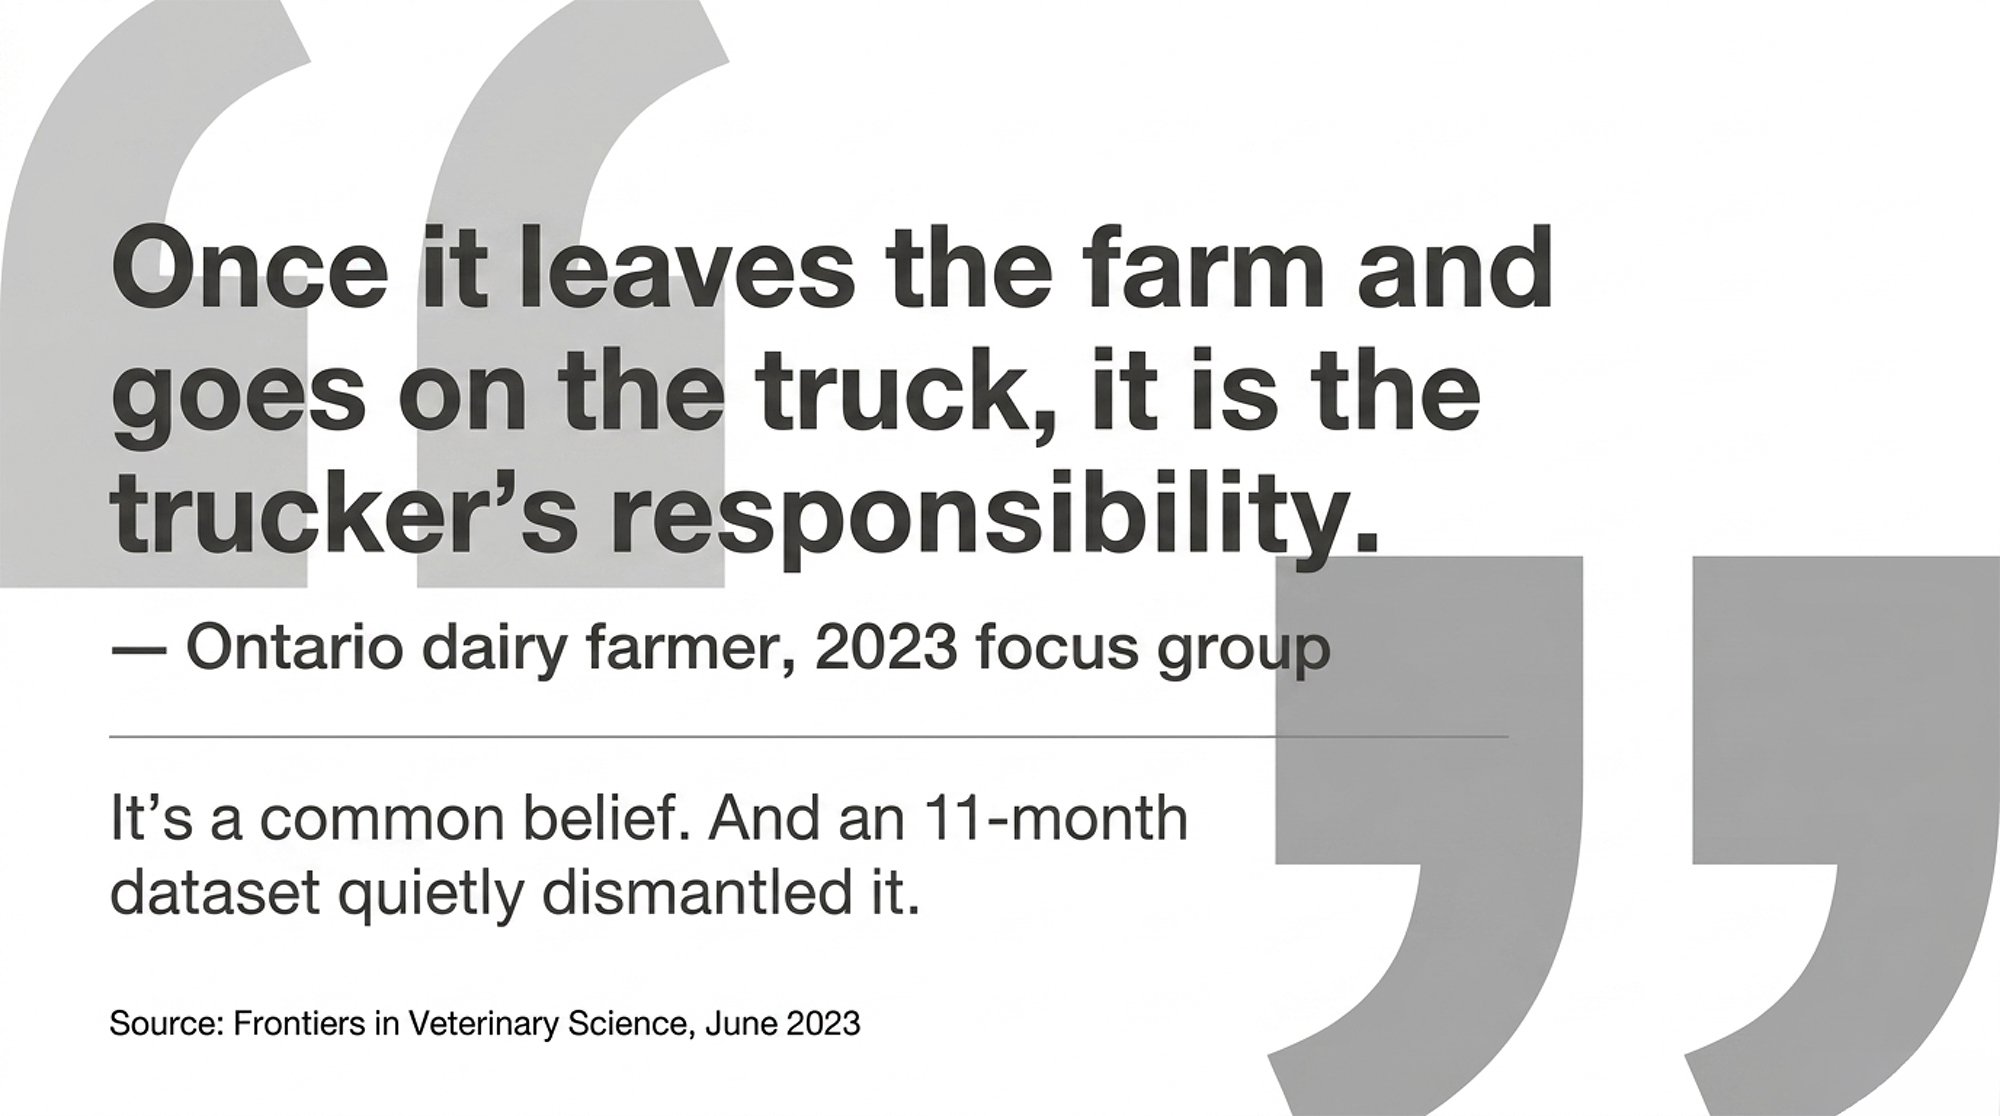
That’s a coherent position. It’s also the exact belief a British Columbia dataset spent eleven months quietly dismantling — and the dismantling starts earlier than the truck.
The 127-Day Number Nobody Talks About
Jane Stojkov, Marina von Keyserlingk and David Fraser at UBC, with Todd Duffield at Guelph, tracked 1,171 cows off 20 Fraser Valley dairy farms between May 2017 and March 2018. Herd size averaged 311 cows. More than 99% were Holstein. Every animal was scored for body condition, locomotion, and udder condition at four checkpoints: when she went on the culling list, before she left the farm, at auction, and at the abattoir.
Cows were flagged for culling at a mean of 209 days in milk, and left the farm at a mean of 273 DIM. But the span that matters isn’t the gap between those two averages — it’s how long each individual cow actually waited. The paper reports that span as its own figure, with its own standard deviation of 112 days: a mean of 127 days on the listbefore anyone backed up a trailer.
And their condition was already sliding before the trailer showed up. While cows were on the culling list, the odds of being thin or having poor fitness for transport increased. The decision to cull had been made. The shipping decision hadn’t.
The authors offer a straightforward explanation for at least part of it: demand for milk in British Columbia rose through the study’s baseline period, and increased demand appeared to lead to delayed culling — so more compromised cows went to slaughter. Body condition at removal averaged 3.1. By the slaughter plant it was 2.7.
Where Does the Damage Actually Happen?
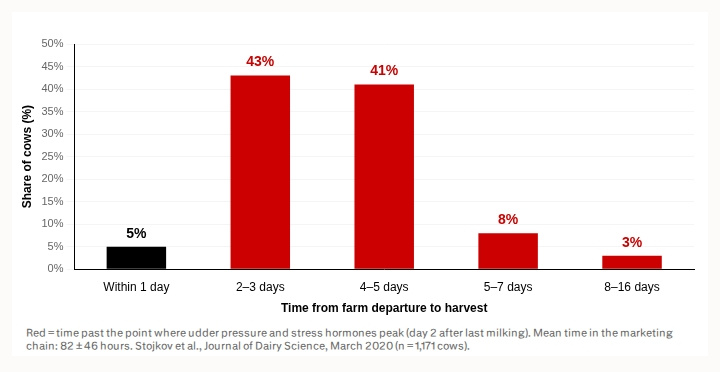
Then the trailer. Published in the Journal of Dairy Science in March 2020, the study found cows spent a mean of 82 hours — plus or minus 46 — in the marketing system before slaughter. Only 5% were slaughtered within a day of leaving the farm. Forty-three percent took two to three days, 41% took four to five, and 16 cows spent between eight and sixteen days in the system.
Three of those 1,171 cows never made it through in a saleable state. One arrived dead. Two were non-ambulatory on arrival and had to be euthanized on the spot.
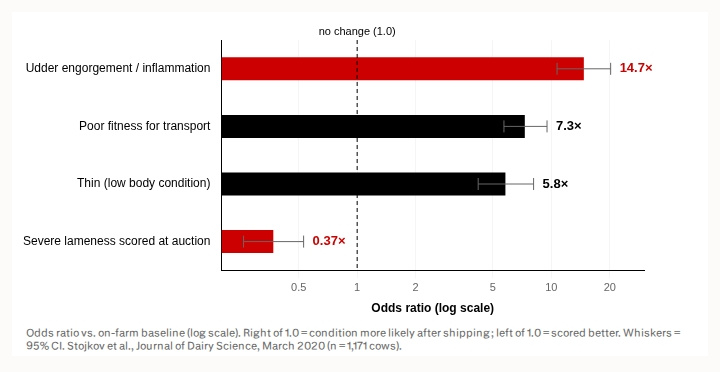
Shipping from farm to abattoir raised the odds of a cow being thin by a factor of 5.8 (95% CI 4.2–8.1), of showing udder engorgement or inflammation by 14.7 (10.7–20.2), and of poor fitness for transport by 7.3 (5.7–9.5).
Read “odds” literally. An odds ratio of 14.7 doesn’t mean 14.7 times as many cows arrive with udder problems. It means the statistical odds of that condition being present multiply by roughly fifteen once she’s shipped — a measure of how strongly shipping is associated with the problem, not a headcount.
The mechanism isn’t mysterious. At the livestock markets, cattle in presale pens got no feed and water at all; those in holding pens got water and sometimes low-quality hay. Repeated loading, offloading, and mixing with unfamiliar animals cuts intake and mobilizes body reserves. And the udder finding has a clock on it — research the authors cite shows that even cows producing only 10 to 15 kg a day develop increased udder pressure and elevated stress hormones that peak on day two after milking stops.
Not every cow carries the same risk into that chain. The same paper found a fourth-lactation-or-greater cow had 2.77 times the odds of poor fitness for transport compared with a first-lactation animal, and cows in the first 100 days in milk had 4.48 times the odds of udder engorgement compared with cows past 305 days. The mature cow culled in early lactation is the highest-risk animal you own on every axis the study measured.
And one marginal cow doesn’t only risk herself. Jake Jacobs, market manager at Equity Livestock in Bonduel, Wisconsin, puts it in trailer terms: “When one cow goes down, when you’re going down the highway, it creates a domino effect… you may only have one cow that’s in poor condition, but she goes down, you may have three to four or five other cows piled up over the top of her.”
The Cull Market Is Making This Worse
Cull prices are in record territory. Drovers reported in March 2026 that Southern Plains auction prices for 85% to 90% lean cows had climbed about $3 per cwt to $167 since the start of January, with the cow beef cutout up $19 to roughly $331 per cwt. Mississippi breaker-quality cows hit $175. Yield grade 1 cull bulls broke $200 per cwt in February at Mississippi and Georgia auctions, about $30 higher than the year before. Beef cow slaughter is down more than 20% year over year.
Dairy is pulling the other direction. Dairy cow slaughter is running 7.3% higher than last year, and Drovers expects it to stay ahead of 2025’s pace — the largest dairy cow herd since the early 1990s, meeting sharply lower milk prices. Strong calf prices, especially for beef-on-dairy calves, have helped hold that inventory up by offsetting the milk check.
So the salvage check has never looked better, and the incentive to keep a marginal cow one more week has never been stronger. Stojkov’s 127 days is what that instinct already costs — measured in a year when milk demand was rising rather than milk price falling.
| Market or barn figure | Current level | Direction | What it does to the shipping decision |
|---|---|---|---|
| 85–90% lean cows, Southern Plains | $167/cwt | +$3 since January | Salvage value rewards holding her |
| Cow beef cutout | ~$331/cwt | +$19 | Packer demand is strong |
| Beef cow slaughter | — | down >20% y/y | Beef side is retaining; dairy is the supply |
| Dairy cow slaughter | — | up 7.3% y/y | Largest dairy herd since the early 1990s meets lower milk prices |
| Gross on a 1,300 lb cow @ $180/cwt | $2,340 | — | The number producers actually see |
| Trial-reported pre-slaughter loss | $112.80/cow | ~4.8% of value | One JDS feeding trial, August 2024 — not an industry average |
The 85% Who Can’t Dry Her Off
Brunt and colleagues, publishing in the Journal of Dairy Science in 2024, found 85% of surveyed Ontario producers did not dry off culled cows before transport. Not because they hadn’t heard the recommendation. Participants named business pressures — production demands and space limitations — as what challenged their ability to dry those cows off. The same paper independently confirmed the C2 pattern: producers disagreed on whether responsibility ended once the cow left the property.
That 85% aren’t cutting corners. Brunt’s respondents described a genuine capacity problem, and a dry-off pen you don’t have isn’t a decision you can make.
But the udder number is the one that punishes the gap hardest. Fourteen-point-seven, and the pain curve peaking on day two, against a system that held better than half these cows longer than three days.
Barn math, assumptions shown
A Journal of Dairy Science feeding trial published in August 2024 reported a $112.80-per-cow economic loss under that specific pre-slaughter feeding protocol — a trial-specific figure, not an industry average. Against a $2,340 gross on a 1,300-pound cow at $180/cwt, that’s about 4.8% of the animal’s value.
Then run the number that’s actually yours. Take your annual culls, multiply by a per-cow loss figure you trust from your own kill sheets, and see what falls out. One feeding trial isn’t your operation, and a percentage isn’t a plan.
One number to handle carefully. The widely circulated $22.4 million industry bruising loss traces to Rosse, 1974, and the researchers who keep citing it say in print that it needs revisiting.
Herman’s Cow, and Why the Trip Beats the Gate
Dr. Julia Herman, the veterinarian on the Beef Quality Assurance team, walked a University of Wisconsin–Madison Division of Extension webinar audience in December 2025 through an illustrative case — her teaching example, not a documented animal. An older cow, lactation three or four. Body condition score 3 on the five-point dairy scale. Slightly lame on a rear leg.
Two hours to a consolidation point. Held overnight, where the lame leg gets a little worse, and she’s introduced to unfamiliar cattle in an unfamiliar pen. She drops a body condition score — about 100 pounds. Another four and a half hours to the plant. Total elapsed: five days, fifteen hours on a trailer, and, because she’s a dairy cow, not milked once.
Her point about destination is sharper than the arithmetic. Across the 2022 audit, the mean final transport leg ran six hours, with a maximum of 24 hours and distances past a thousand miles. Wisconsin producers are luckier than most — a couple of market cow plants sit relatively close, which isn’t true everywhere in the US. But close doesn’t mean guaranteed. From the 2016 audit: a dairy cow sold in California was harvested at a Pennsylvania plant.
Stojkov’s data says the same thing with a map. Roughly 80% of those Fraser Valley cows were slaughtered in the United States, averaging 286 km of transport. Eleven percent went to Alberta — 1,105 km. Nine percent stayed local in BC at 62 km. And during the study, one of the six participating abattoirs stopped slaughtering cattle altogether. The authors’ conclusion is unusually direct for a journal: regions with dense dairy populations need more local facilities for slaughtering cull dairy cows.
| Destination | Share of cows | Mean transport distance | Barn-level read |
|---|---|---|---|
| United States | ~80% | 286 km | Border crossing is the default, not the exception |
| Alberta | 11% | 1,105 km | Longest route, on the least-fit animals |
| Within British Columbia | 9% | 62 km | The only option that keeps her under two hours |
| Capacity change during study | — | — | One of six participating abattoirs stopped slaughtering cattle |
| US audit comparison (2016) | — | CA sale → PA plant | Sale location tells you nothing about the trip |
Jacobs sits about 25 to 30 miles from what he calls two of the biggest kill cow plants in the US, and he tells his own producers that certain cows should go from the farm straight to the slaughter facility rather than through a sale ring. His reasoning is barn-level: haul her 30 miles the wrong direction into a sale barn, and she stands on cold concrete in a building considerably colder than the milking barn she came out of, eating dry hay instead of TMR, losing energy and condition while she waits for a truck to make the 30-mile trip back to Green Bay.
He described the pattern that gets her there: a cow diagnosed with hoof rot, treated, now under a 30-day withhold. Mid-withhold, she comes up lame on another foot. Another withhold, and her condition keeps deteriorating the whole time. His question is whether day one — diagnosis day — was the day she should have gone on the truck while she was still salvageable.
A note on the language. We’ve argued before that “market cow” is the more accurate term than “cull cow” — she’s an animal with a second career and a real carcass value, and Herman makes the same point when she reminds dairy audiences these cows don’t just become ground beef. The research literature still says “cull.” The barn doesn’t have to.
Why the Sale Ring Lies About Lameness
This finding should change how you interpret anything you see at a sale barn, and it’s the most counterintuitive result in the whole study.
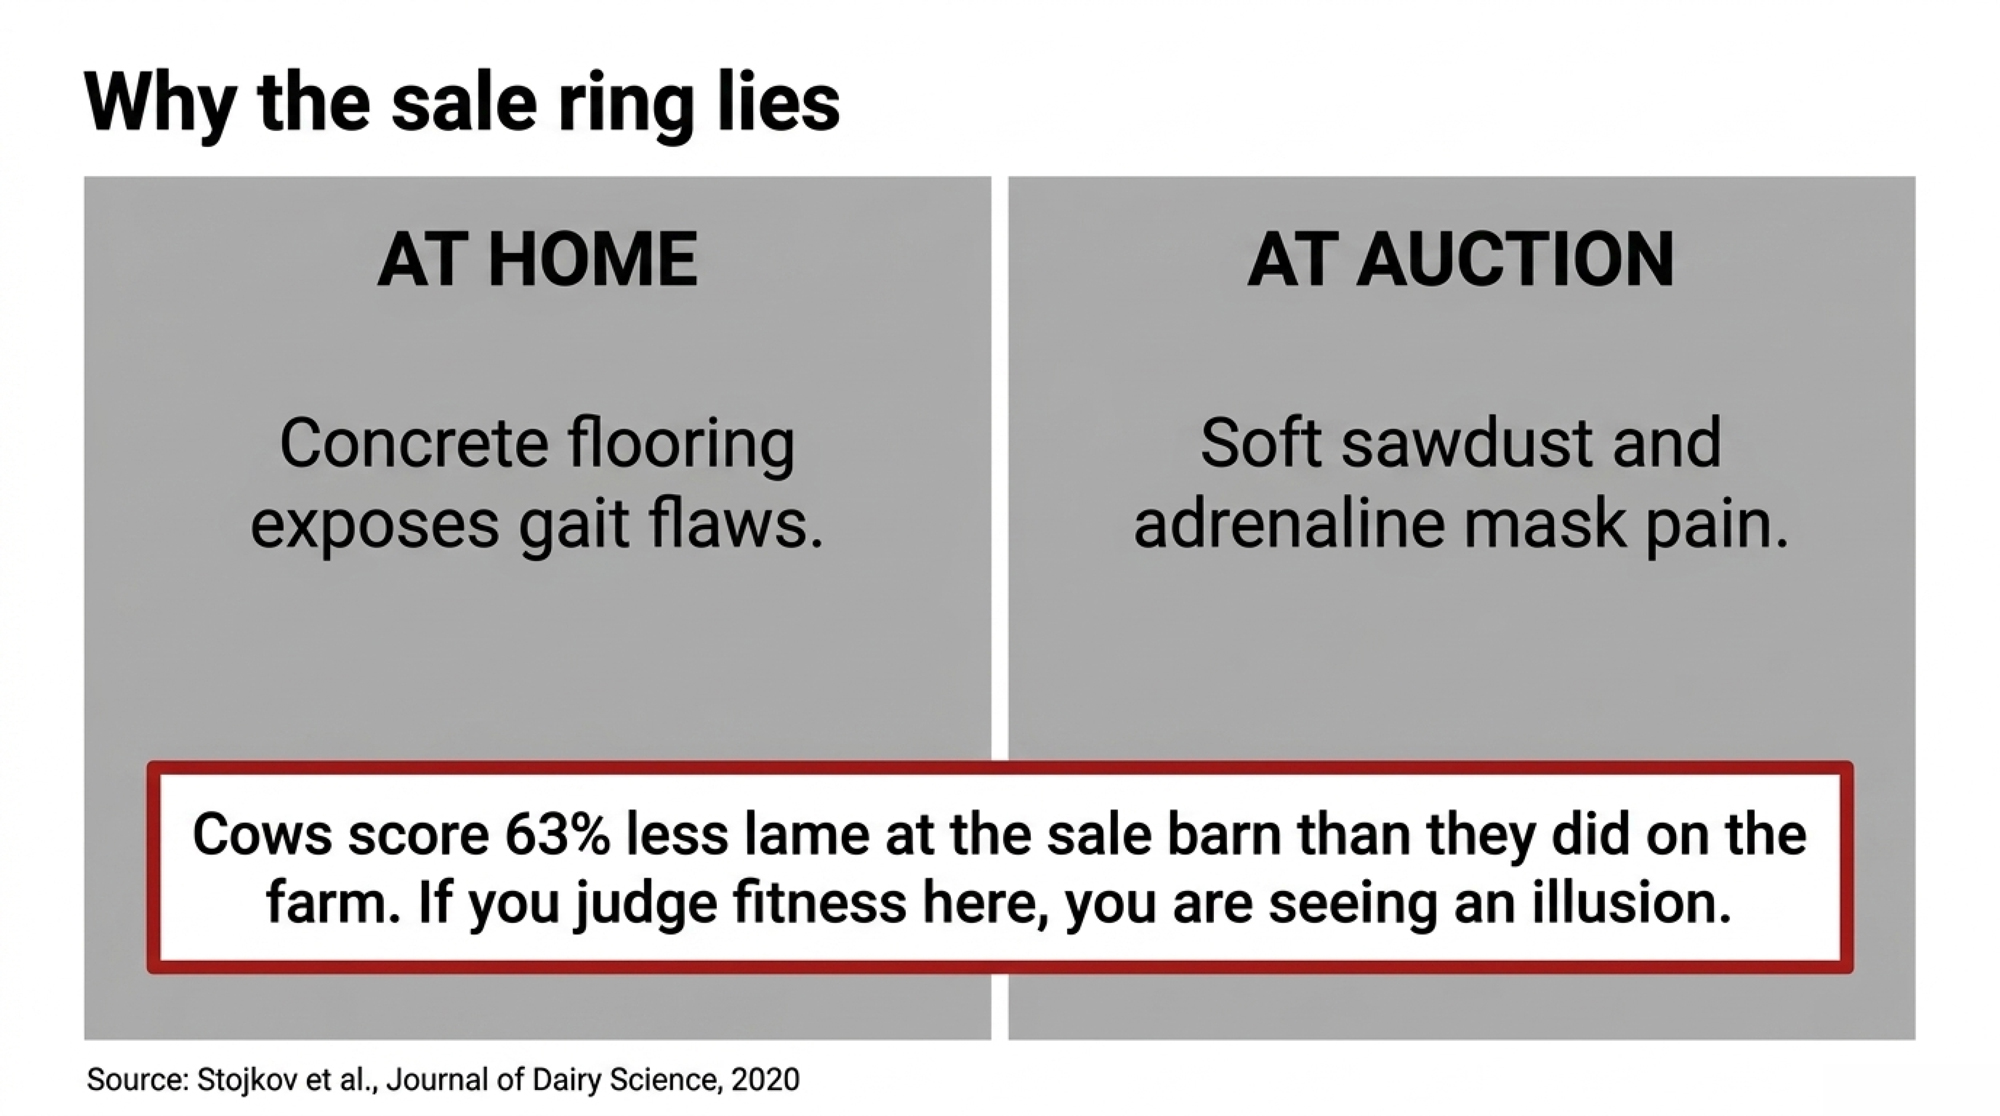
Cows scored better for locomotion at the livestock market than they had on their own farm. The odds of being scored severely lame at auction were 0.37 — a 63% reduction against the on-farm baseline.
They hadn’t improved. The authors offer two explanations, both well grounded in the lameness literature. The novel environment of a sales ring — noise, unfamiliar handlers, individual penning — distracts a cow’s attention away from the pain, which suppresses the gait abnormality you’d otherwise see. And the sawdust flooring in a sales ring is a great deal softer than the concrete she was scored on at home, which improves stride length and gait symmetry.
So if you’re judging fitness for transport by watching cows move through a ring, you’re looking at the most flattering picture that animal will present all week. Score her at home, on your concrete, before anyone loads her.
One Defect Collapsed 87%. The Other Hasn’t Budged.
The audit record is more interesting than “nothing changed,” and more damning.
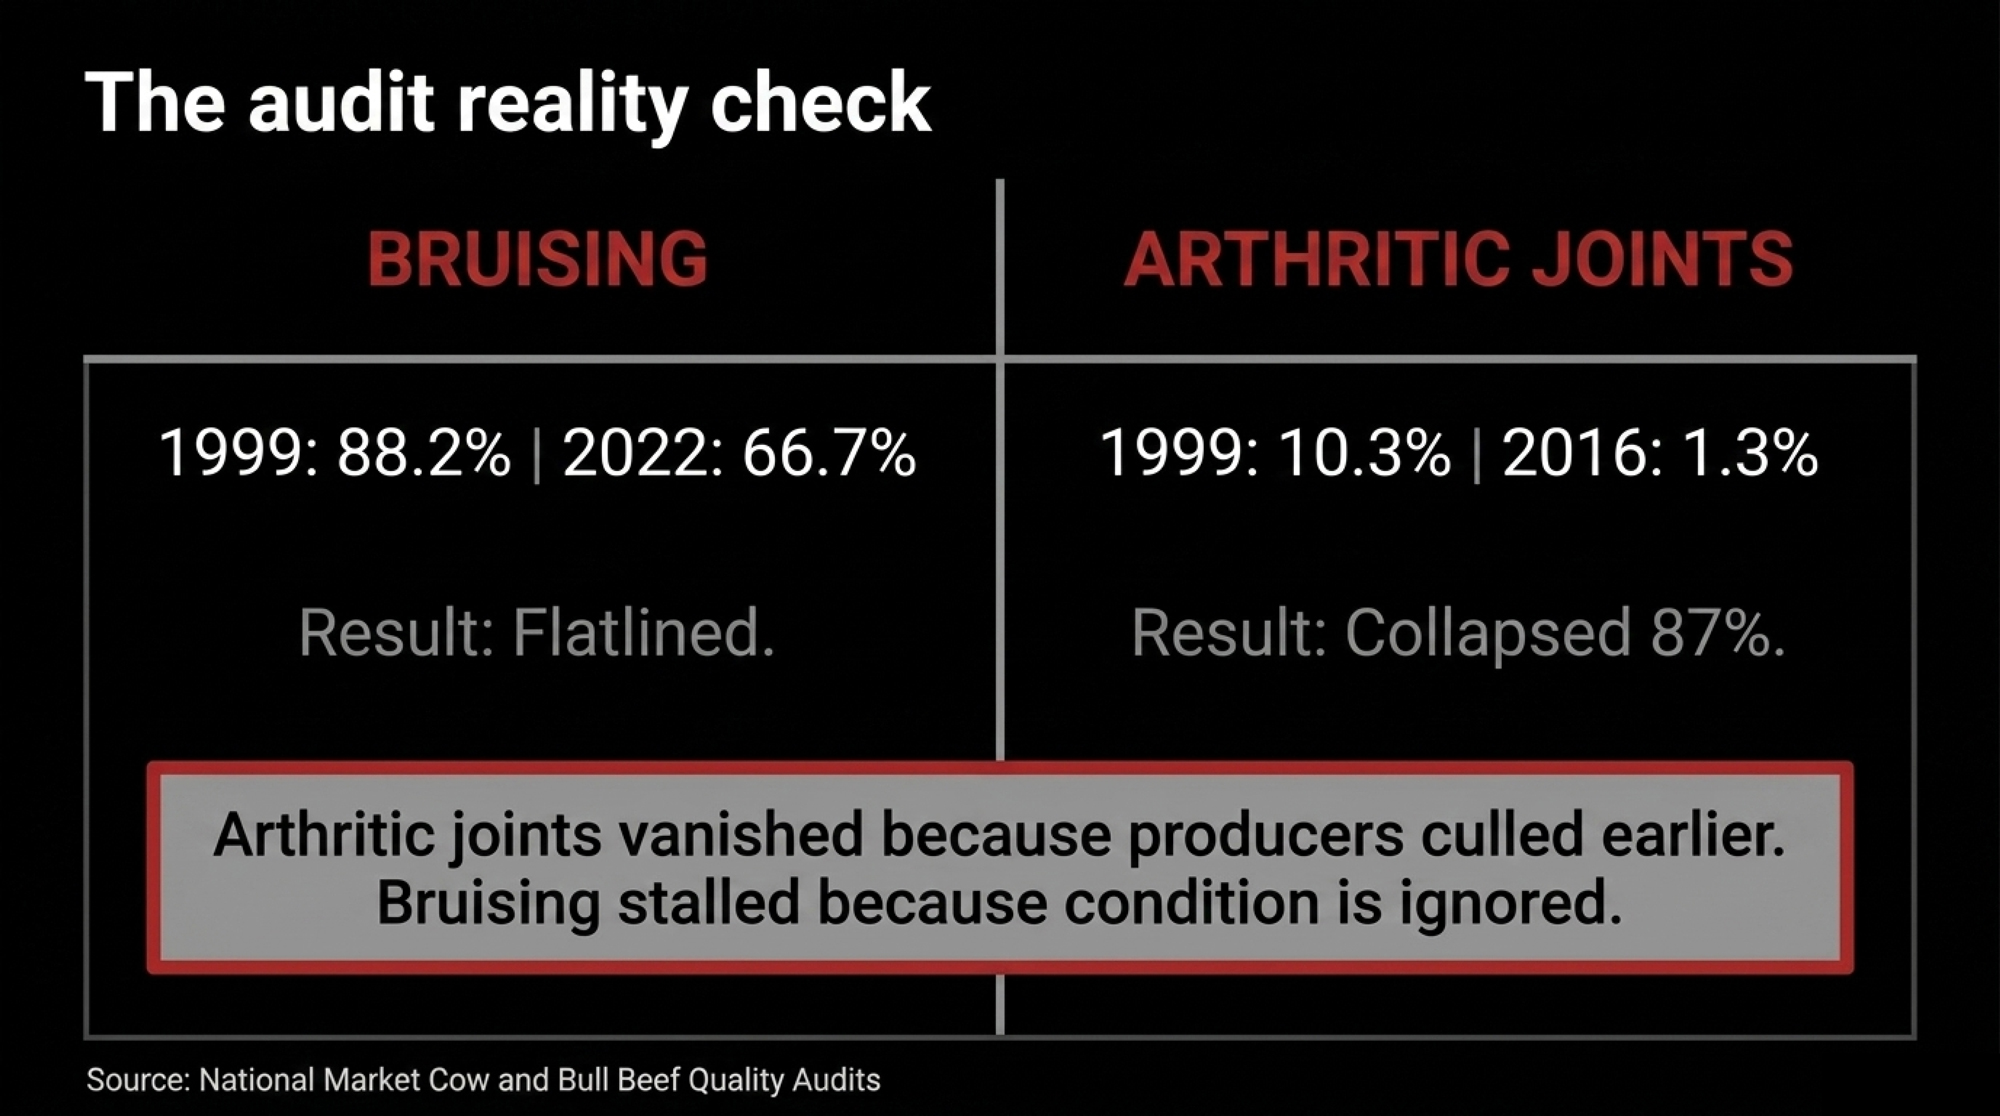
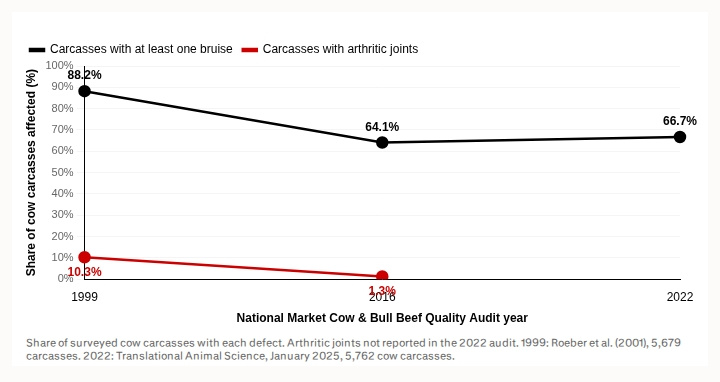
The 1999 National Market Cow and Bull Beef Quality Audit, published by Roeber and colleagues in 2001, surveyed 5,679 carcasses on the harvest floor. Among cow carcasses, 88.2% carried at least one bruise — which left fewer than 12% clean. By 2016, cow carcass bruising had fallen to 64.1%. The 2022 audit, published in Translational Animal Science in January 2025, recorded 66.7% across 5,762 cow carcasses and 46.4% across 875 bull carcasses — figures its own authors describe as similar to both the 2016 and 2007 results.
So the industry cut cow bruising by roughly 24 percentage points between 1999 and 2016. Then it stopped and has held flat across two audit cycles since.
Two honest caveats. BQA’s own 2022 report notes the audit “stands apart from previous (and future) audits” because collection ran through COVID-era supply chain disruption and processing backlog, which could mask movement either way. And severity matters: in 2016, over half of all bruises on surveyed carcasses were classified as only minor. The 2022 audit shifted the wrong way on that split — more major, less minimal — which Herman ties to condition. Thin cows, she notes, have less coverage to buffer contact.
Now the number that proves this is fixable. Arthritic joints appeared on 10.3% of cow carcasses in the 1999 audit. By 2016, just 1.3% of carcasses showed signs of arthritic joints. That’s a defect cut by roughly 87% between the two audits.
Roeber’s team put a figure on what was sitting on the table in 1999: minimizing quality defects, monitoring condition, and marketing promptly might have recaptured $13.82 for each cow harvested and $27.50 for each bull. Producers went after the arthritic-joint share of that. Herman’s explanation of how is straightforward — when the audits showed how many arthritic joints were arriving, the recommendation went out to cull those animals at an earlier lameness, and the number came down at the packing plant.
Worth noting what that 1999 audit found on lameness itself: only 60.8% of dairy cows showed no evidence of lameness, against 73.4% of beef cows. Roughly two in five dairy cows arrived with something.
One defect got targeted and collapsed. Bruising got the same attention and hasn’t moved in two cycles.
Why Didn’t Telling Farmers Work?
The BC study’s whole second half was an experiment. Ten farms got a one-page decision tool, the study’s own findings on transport duration and arrival condition, auction price data, a free vet consultation line, and an abattoir contact for direct shipping. A 30-minute meeting, delivered by a veterinarian. The other ten got nothing.
Providing that information to farmers did not affect the outcome measures.
Read the rest carefully, because it’s the part that matters. Outcomes did improve between the baseline period and the treatment period — thin cows shipped fell from 9.0% to 4.9%, poor fitness for transport from 25.8% to 15.7%, cows that died from 11.9% to 5.4%, and cows euthanized from 20.5% to 13.3%. The authors attribute that shift to time, not to their intervention. Milk demand had been climbing through the baseline months and then leveled off.
| Outcome measure | Baseline period | Treatment period | Attributed to |
|---|---|---|---|
| Thin cows shipped | 9.0% | 4.9% | Not the intervention |
| Poor fitness for transport | 25.8% | 15.7% | Not the intervention |
| Cows that died in the chain | 11.9% | 5.4% | Not the intervention |
| Cows euthanized | 20.5% | 13.3% | Not the intervention |
| Variable that did track outcomes | — | — | Which vet clinic served the farm |
But one variable did track with outcomes. The percentage of thin cows sent to auction varied by which veterinary clinic served the farm — and clients of certain clinics shipped fewer cows with poor fitness for transport. Four clinics served those twenty farms, and they did not produce the same results.
Information alone moved nothing. The veterinarian appears to have moved something.
Herman’s advice through the webinar points the same way, and it wasn’t “read more” — it was work with your veterinarian on a customized herd health plan, build treatment and euthanasia protocols, use your resource team. Her position on the culling decision specifically: veterinarians can really support producers in making these euthanasia and culling decisions. She also notes that farms certified under the National Dairy FARM Program are treated as BQA-equivalent.
There’s a harder dimension to the decision moment, too. Our reporting in January 2026 covered research finding farmer stress positively associated with the prevalence of severely lame cows — more operator stress, more severe lameness in the herd. That’s a correlation, not proof of cause, and it could run both ways. But if the person making the call is running on empty, “wait and see one more week” is the path of least resistance, and 127 days is what that looks like on a spreadsheet. Herman’s argument for written protocols lands here: a protocol takes the decision away from the producer and the employees, and makes the euthanasia call easier to make.
The Communication Barrier Jacobs Named
Ask Jacobs where the system breaks on-farm and he doesn’t blame the vet or the trucker. He points at the gap between the person who sees the cow and the person who decides what happens to her.
His words: “I think there’s some miscommunication there. We either… they don’t care or it’s an actual language barrier where, you know, this is my job, this is what I do, and I don’t worry about the next step.”
The cow he’s describing is the one who struggles to get up out of the freestall and is last to the parlor holding area every single time. And the message he wants relayed is blunt: “Hey, you know, this cow, this cow’s got really sore feet. This cow needs to either be treated, hoof trimmer, or sent to slaughter.”
He named two causes, not one. Indifference is the easy diagnosis. A crew working in a second language is the harder and more common one — and Herman landed in the same place from the veterinary side, urging producers to keep protocols and product labels in a language their workers can understand, so they know what they’re giving and where to find more information.
The Hauler Can Say Yes. That Doesn’t Make It Your Answer.
Herman’s guidance on transporters runs both directions, and the second direction is the one worth sitting with. She encourages producers to work with their hauling companies and make sure those companies haul to the welfare standards the farm expects — then challenges haulers to have the same conversation back, because if a driver doesn’t feel comfortable transporting a particular animal, something probably needs improving.
That’s a useful test precisely because it doesn’t depend on liability. A hauler can agree to load her. The plant can still condemn her — as it did for three of those 1,171 cows. And under the C2 logic, a farm that sold her at auction has already been paid and technically owns none of what happens next.
Which is why Herman doesn’t argue the point on economics. Her framing: “All of us need to consider what it means when that animal leaves your farm in that condition. Do you want that to be the billboard for our industry but also your farm?”
The Residue Story Nobody Tells at Meetings
Jacobs worked on drug residues with the FDA during his time with the State of Wisconsin, back before LA200 was pulled for lactating dairy cattle. He described a small farm — 30 cows, an older gentleman who documented every single treatment a cow ever received. One cow was injected for pneumonia with LA200. Eighteen months later, her kidneys and liver came back suspect, with residue found in the liver.
Eighteen months. On a farm with immaculate records. Jacobs believes that case contributed to LA200 coming off the shelf for lactating dairy cattle.
The Wisconsin ending is the good part. Jacobs says the state gets the violator list every week, and right now there’s one farm on it statewide — which he calls very good compared to where it was ten years ago. So when someone tells you residue management can’t improve at scale, that’s the counter-example.
Strategic Action Paths
Path 1 — Put a clock on the culling list. Stojkov’s cows averaged 127 days between the cull decision and the shipping decision, and their condition slid during that window. Set a maximum. Thirty days, sixty, whatever your capacity supports — but a named number, reviewed weekly.
- Works on any operation that keeps a culling list at all.
- Costs a recurring calendar entry and someone with authority to act on it.
- Backfires if the clock forces you to ship into a market or a route you haven’t lined up. Set the number and the destination together.
Path 2 — Set a treatment-attempt ceiling with your herd veterinarian, in writing. Herman gave the number: “If we have a lameness we’re only going to do it twice and then we’re going to really reevaluate and then maybe we ship her instead of just continuing to retreat, retreat, retreat.” Her separate threshold for a down cow — no improvement on medical treatment inside 24 hours means euthanasia — is a welfare line rather than a judgment call.
- Best where repeat treatment is common and withhold periods run long, which is exactly Jacobs’ hoof rot scenario.
- Demands a scheduled conversation and a written protocol. Herman argues that the protocol protects the person who’d otherwise make the call alone.
- Backfires if set so tight it culls recoverable cows. The vet owns the number, not the marketer.
Path 3 — Score her at home, and name the scale. The BC data says a cow looks 63% less lame in a sales ring than she does on your concrete. Score locomotion on-farm, on the surface she actually walks — and write down which scale you’re using. BQA’s transport guidance says don’t ship at a lameness score of 3 or more. AABP’s fitness-to-travel recommendations set the line at 4 or 5. Same country, same year, two industry bodies, two full points apart on the same cow — and that’s before you get to the Canadian Code, the Meat Institute mobility scale and the published research tool. We’ve laid all six out separately.
- Suits herds already scoring locomotion consistently.
- Demands calibration, the step most operations skip. Our own July 2025 reporting found automated systems catching around 85% of lameness cases versus roughly 24% by visual methods, worth about $143 per cow — whatever you make of the technology, that gap shows how much the eye misses.
- Backfires as a blunt rule if nobody’s calibrated. Two scorers disagreeing is worse than one scoring badly.
Path 4 — Thirty-day action: pull your last 20 market cow records and reconstruct the trip. For each cow, write down her BCS at loading, whether she was milked out, how long she sat on the culling list, and where she was actually harvested — not where she was sold. If you can’t fill the last two columns, that’s the finding. Ask your hauler.
What This Means for Your Operation
- How long has your longest-standing cull been on the list? If you don’t know without checking, that’s the first number to go find. Stojkov’s average was 127 days.
- Does anyone on your operation own the shipping decision, or does it default to whoever notices the trailer is coming Thursday?
- With cull prices at record levels and dairy slaughter running 7.3% above last year, what’s your actual reason for holding a marginal cow another week — and would you write it down?
- Where do you score locomotion? If the answer involves a sale barn or a scale-house alley, the BC data says you’re seeing her best week.
- Which of your cows are mature and in early lactation right now? On every axis that study measured, those are the ones a long route punishes hardest.
- Does your veterinarian find out about a cull decision before the trailer leaves, or after? Four clinics served twenty farms in that study and did not get the same results.
- Do your treatment protocols and product labels exist in the language your parlor crew actually reads?
Key Takeaways
- Culling is two decisions, not one — the call to cull and the call to ship. Most farm protocols govern the first and leave the second to whoever notices the trailer’s coming.
- Anything you assess at a sale barn is that animal’s best presentation of the week. The lameness data proves it for gait, and it should make you skeptical of any condition judgment made on someone else’s flooring.
- The lever isn’t information. Handing twenty farms their own data, a decision tool, a free vet line and an abattoir contact moved nothing measurable. Which clinic served the farm did.

Arthritic joints fell from 10.3% to 1.3% because thousands of producers each started culling a little earlier. Nobody legislated it and no pamphlet did it either — Stojkov tested that directly and moved nothing. The only variable that tracked with better outcomes was which veterinarian a farm happened to use. Canada has since written the udder threshold into law, which is one way to force the conversation. The other way costs a phone call and starts tomorrow. So, in Herman’s framing: the next cow that leaves your yard is going to be somebody’s billboard. Whose?
Run Your Numbers
Health ROI Calculator — Stojkov’s cows sat 127 days on the list because nobody had a number to act on. Plug in your herd size, culling rate, replacement heifer cost and mastitis incidence, and the calculator puts a dollar figure on what earlier, cleaner culling decisions are actually worth.
Complete references and supporting documentation are available upon request by contacting the editorial team at editor@thebullvine.com.
Learn More
- Beyond Blocks and Blades: Why Your Lameness Treatment Protocol Is Missing a Critical Component — Arms you with the clinical evidence for adding NSAIDs to standard claw horn trimming, lifting conception rates by 42% and keeping marginal cows productive enough to avoid premature culling.
- $585 a Straw: What Every Beef Service Really Costs Your Next Heifer — Exposes the replacement pipeline squeeze forcing dairy herds to retain marginal cows, balancing high calf checks against $3,100-plus springers to protect future milking capacity.
- The Lameness Detection Wake-Up Call: What Three-Quarters of Your Herd is Costing You — Breaks down automated sensor and camera platforms hitting 85% detection accuracy versus 24% visual observation, clawing back $143 per missed case before mobility scores collapse on concrete.
The Sunday Read Dairy Professionals Don’t Skip.

Every week, thousands of producers, breeders, and industry insiders open Bullvine Weekly for genetics insights, market shifts, and profit strategies they won’t find anywhere else. One email. Five minutes. Smarter decisions all week.
