










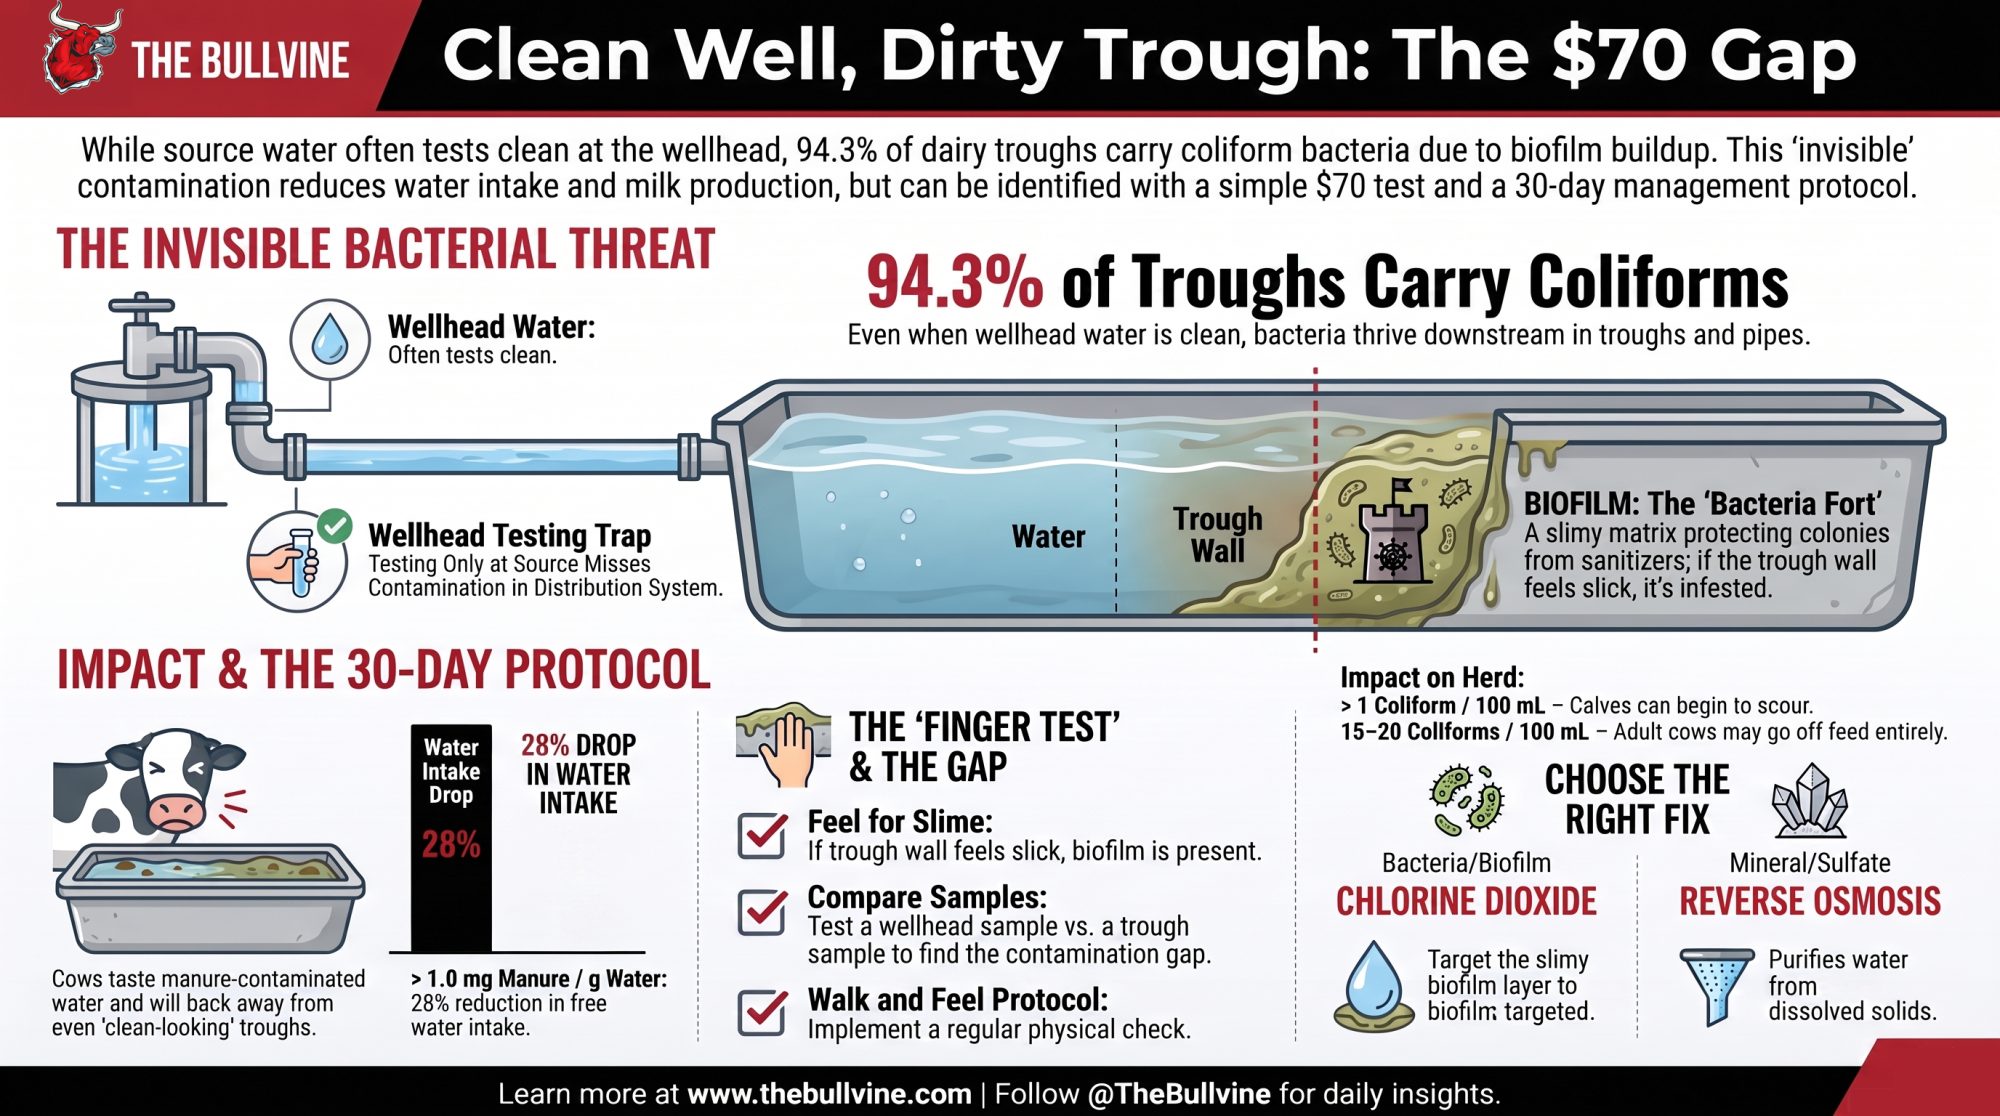
Your last water test was pulled at the wellhead. Researchers swabbed 105 troughs — 94.3% carried coliforms, and biofilm came off two-thirds of the walls. Two bottles and $70 settles it.
You know the sequence. The bulk tank number creeps up and stays up, so you change liners. You retrain the prep routine. You pull the high-SCC cows, culture them, move them into their own group, watch the tank drop for three good weeks, and then climb right back where it started. Somewhere around month four, somebody finally asks when the trough water was last tested for bacteria, and nobody in the room has an answer.
That gap is the story. Dairy water quality gets called a nutrient in every ration textbook and treated like plumbing on every management checklist. And when researchers went looking with swabs and plates, the wellhead usually came back fine — it was everything downstream that didn’t.
The Number That Should End the “Our Water Looks Fine” Conversation
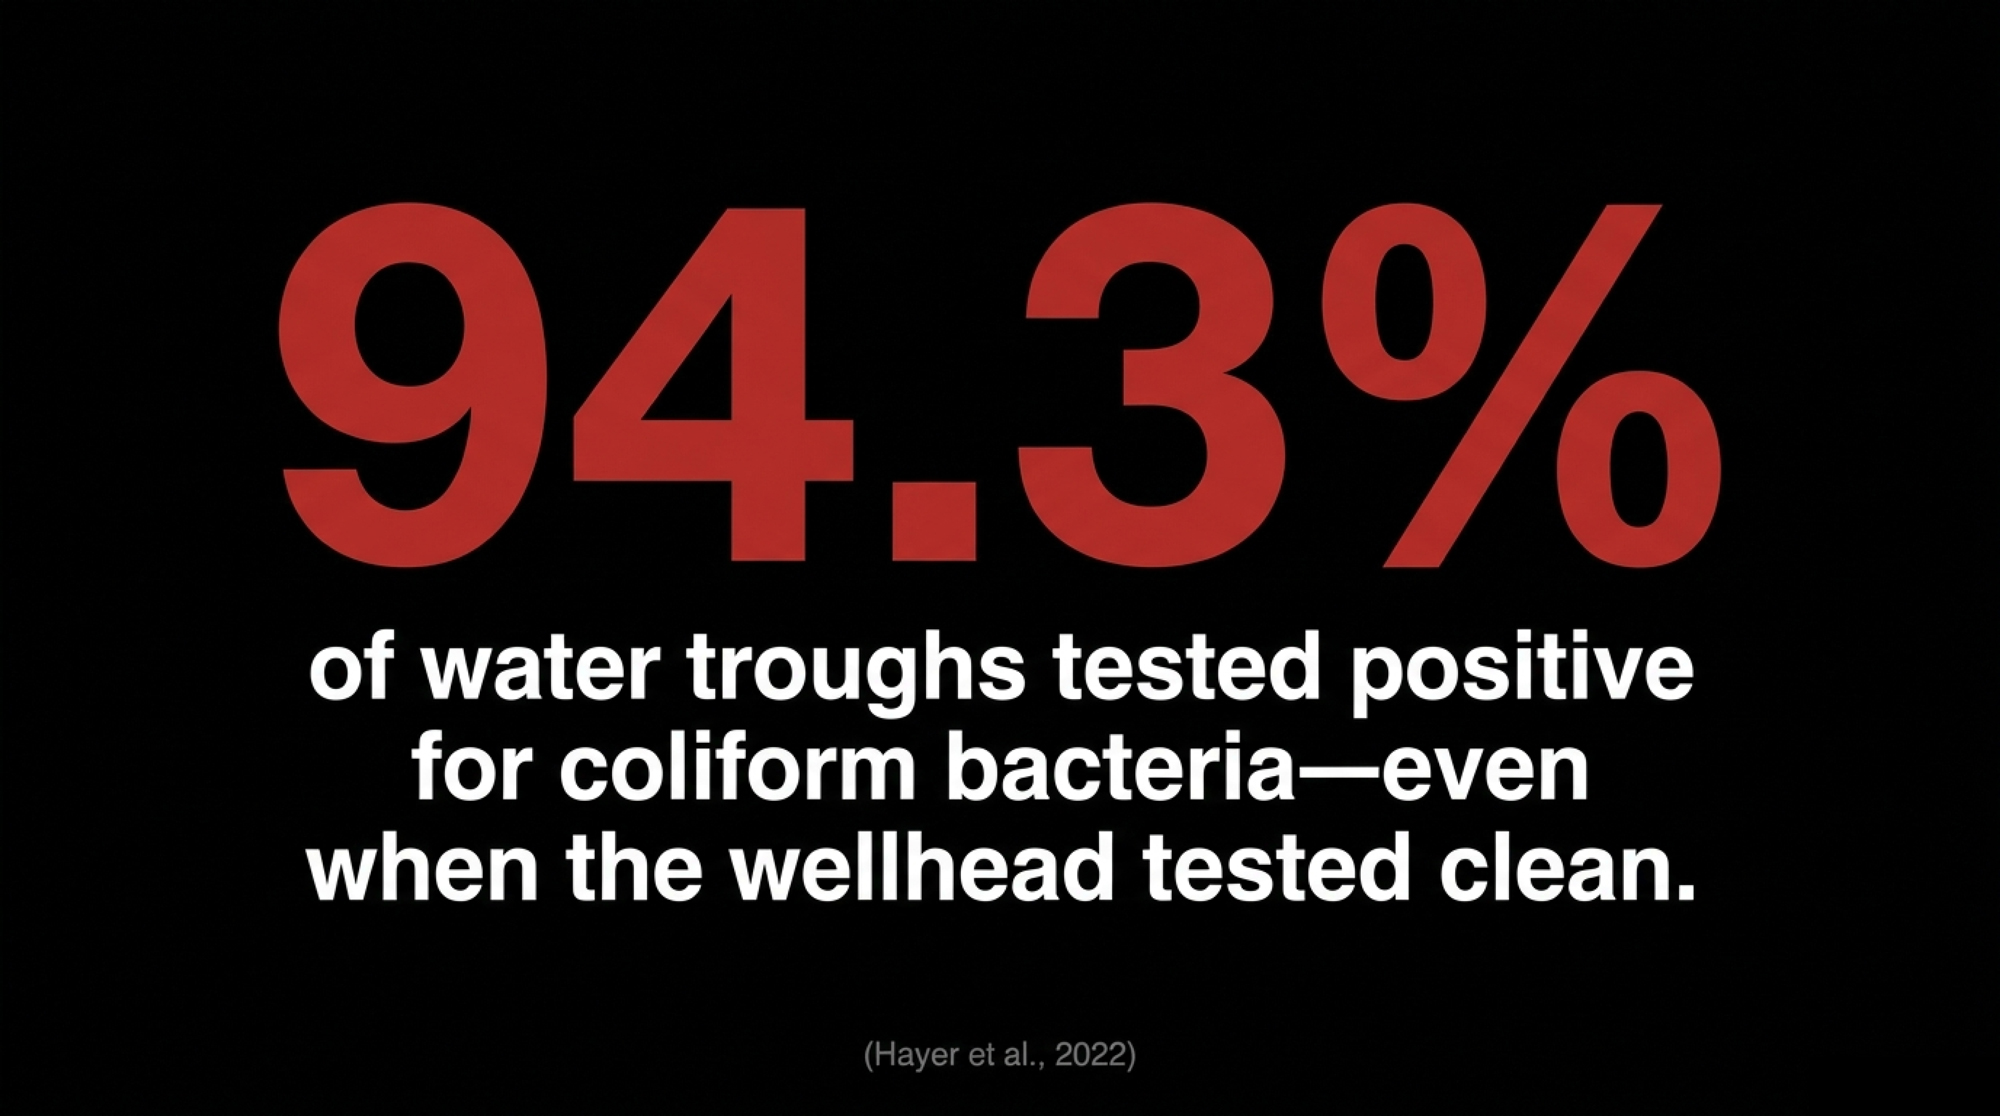
Hayer and colleagues sampled 105 water troughs across 24 dairy farms in Western Germany and published the results in 2022. Coliform bacteria turned up in 94.3% of all water samples. E. coli in 48.6%.
One caveat before that number travels any further: this is Western Germany. Trough materials, ambient temperatures, and management practices differ enough from a typical North American freestall that 94.3% isn’t a North American prevalence figure. What it tells you is that trough contamination is common, easy to miss, and invisible to a source-water test.
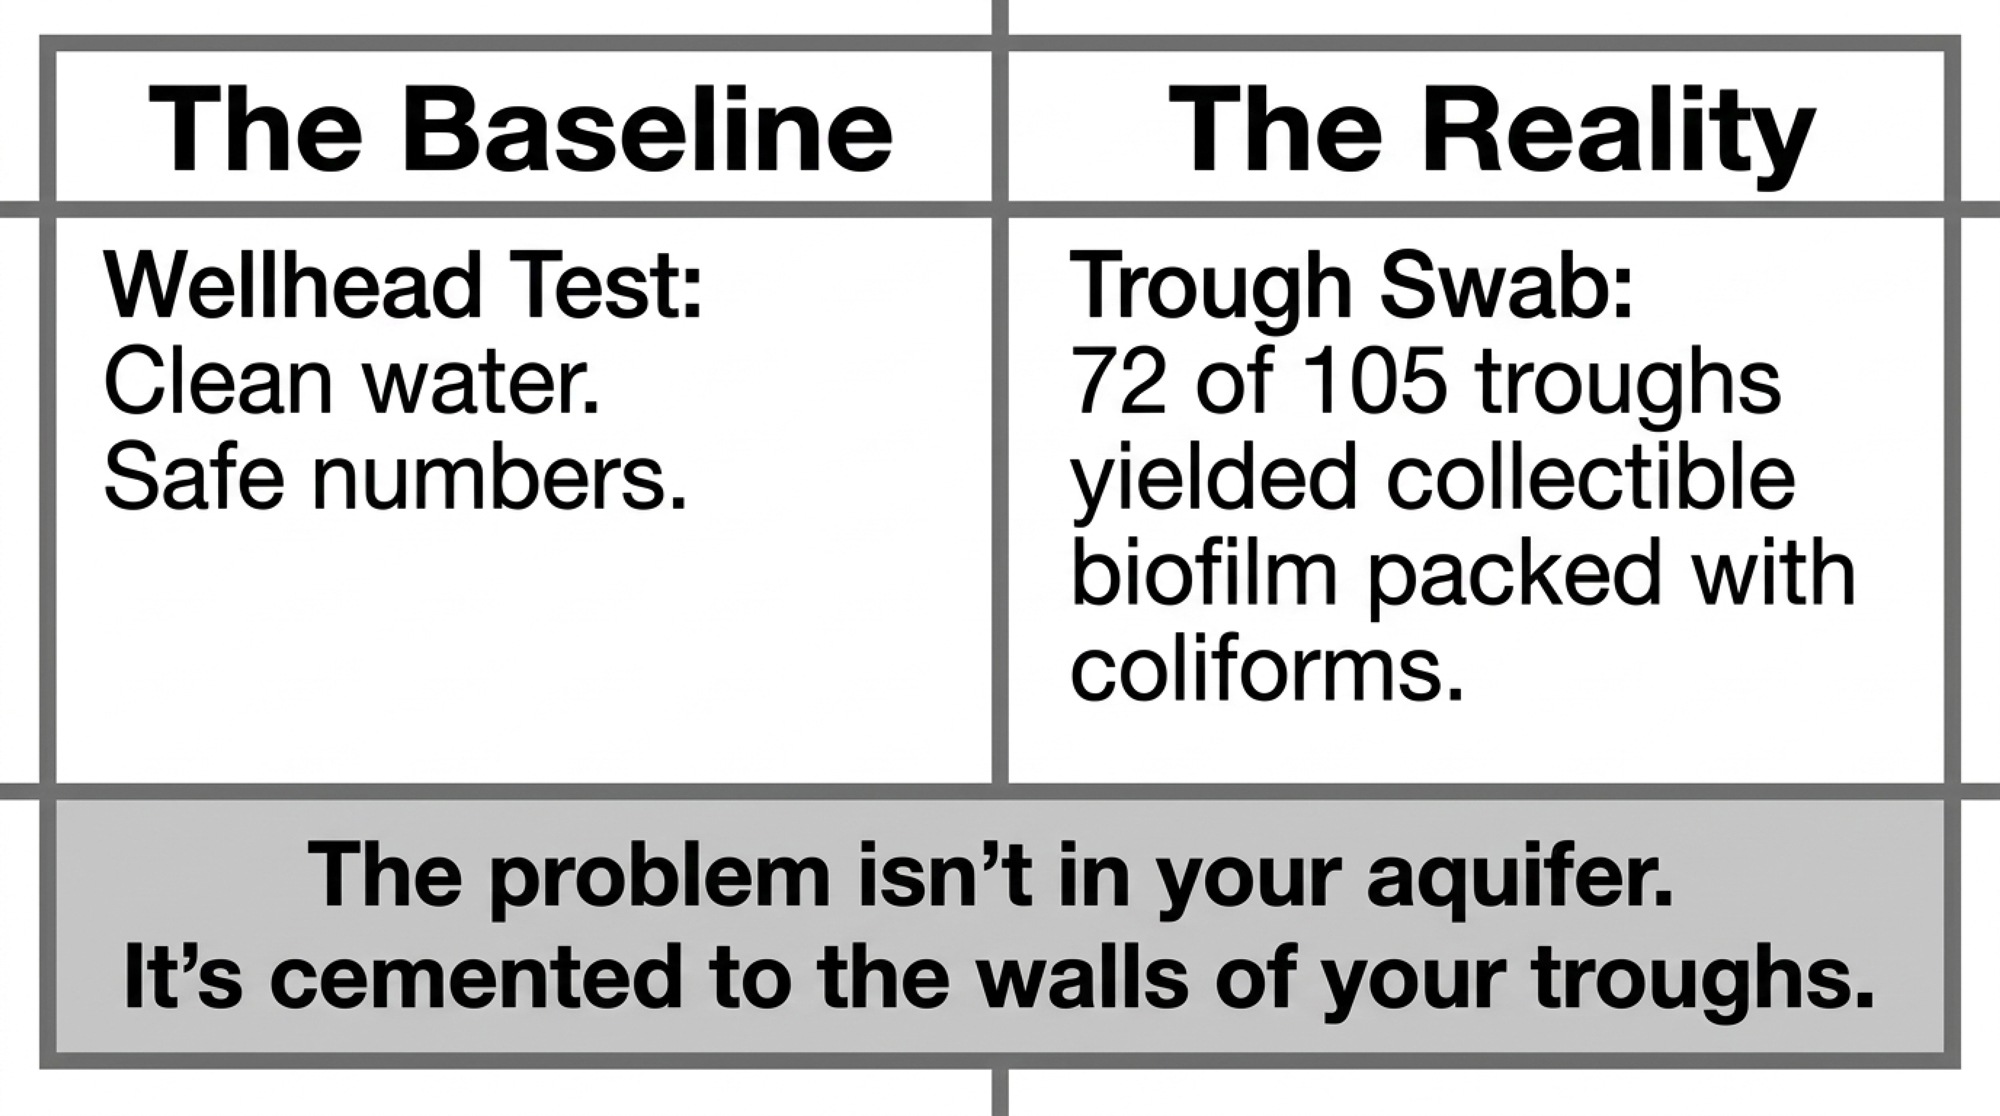
Biofilm was collectible from 72 of the 105 troughs — roughly two-thirds. Every single one of those biofilms contained coliforms. And on one farm, the team pulled methicillin-resistant Staphylococcus aureus (MRSA) out of trough biofilm while the water itself tested clean for it. The water sample said one thing. The wall said another.
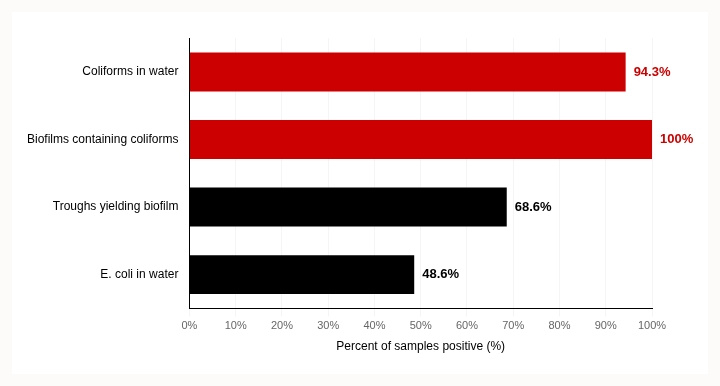
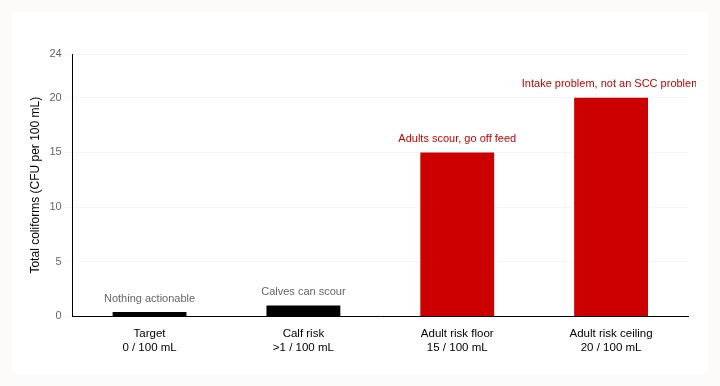
And Ontario’s guidance says that at 15 to 20 coliforms per 100 mL, adult cows may go off feed entirely — the fresh pen backing away from a trough that looks perfectly clean.
The risk factors that team identified are things you can walk out and check before dinner: high-volume troughs, plastic or cast iron instead of stainless steel, troughs sited close to the parlour, heavy visible soiling, visible biofilm, and high ambient or water temperature. Four of the six cost nothing to change.
Why Does Clear Water Still Fail the Test?
Because the problem isn’t floating in the water, it’s cemented to the wall.
What biofilm is. A colony of bacteria embedded in a self-produced matrix that sticks to trough walls, pipe interiors, and milking equipment alike. Penn State Extension uses the image of a fort — the colony gets established inside it, protected and fed.
Why scrubbing fails. Bacteria living inside a biofilm are shielded from sanitizers that would kill the same organisms swimming free. That’s why a trough can get scrubbed Monday and be a problem again by Thursday.
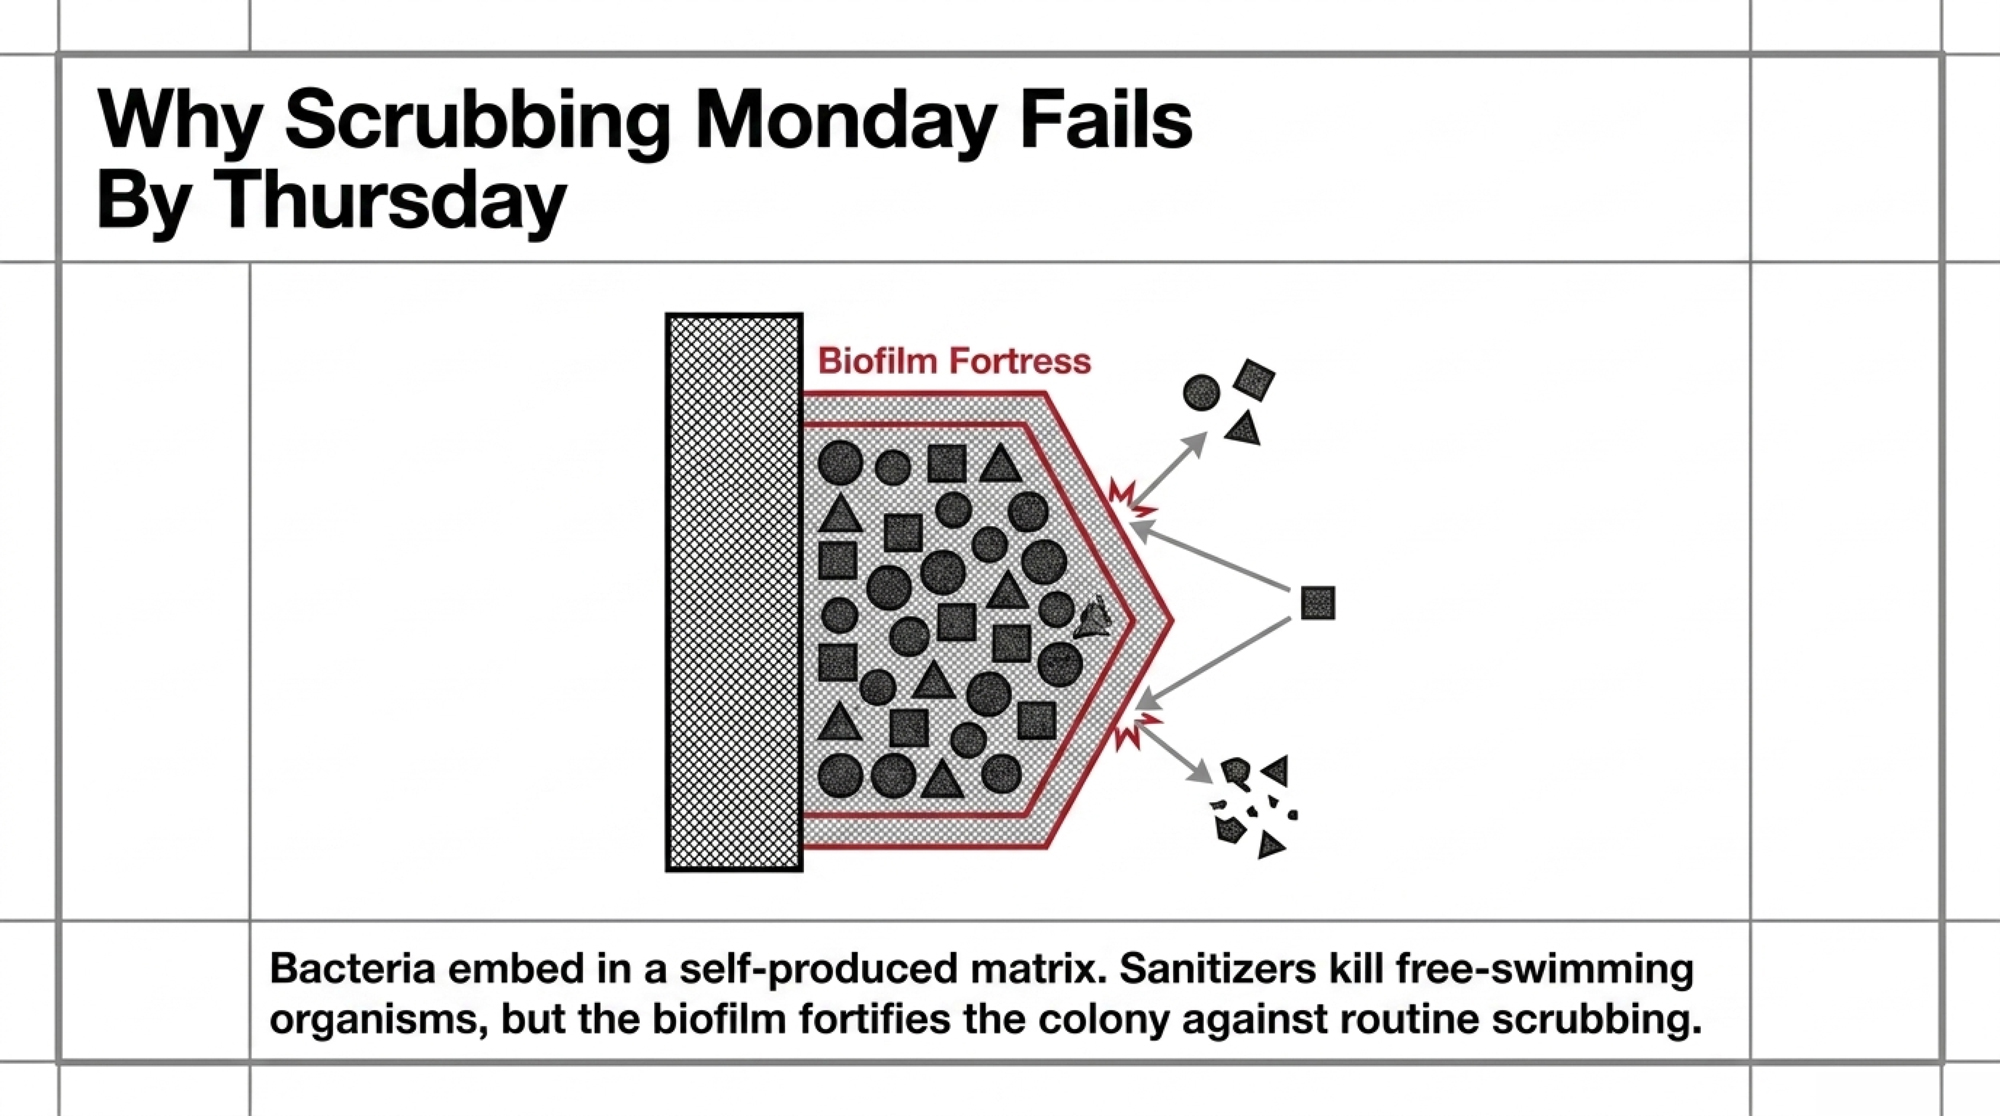
Why troughs are the worst spot. Every cow that drinks leaves organic matter and bacteria in standing water that hundreds of herdmates share before the day’s out. Warm temperatures plus low flow speed up the whole process.
The same logic in the udder. Penn State Extension, citing Raza et al. (2013) and Veh et al. (2015), notes that biofilm-producing S. aureus isolates have been linked to chronic mastitis, and that strains persisting through the dry period produce more biofilm than strains that don’t. Same survival strategy, different location.
Three Ways Dirty Water Costs You
The first mechanism is well established, and it’s about intake — not infection.
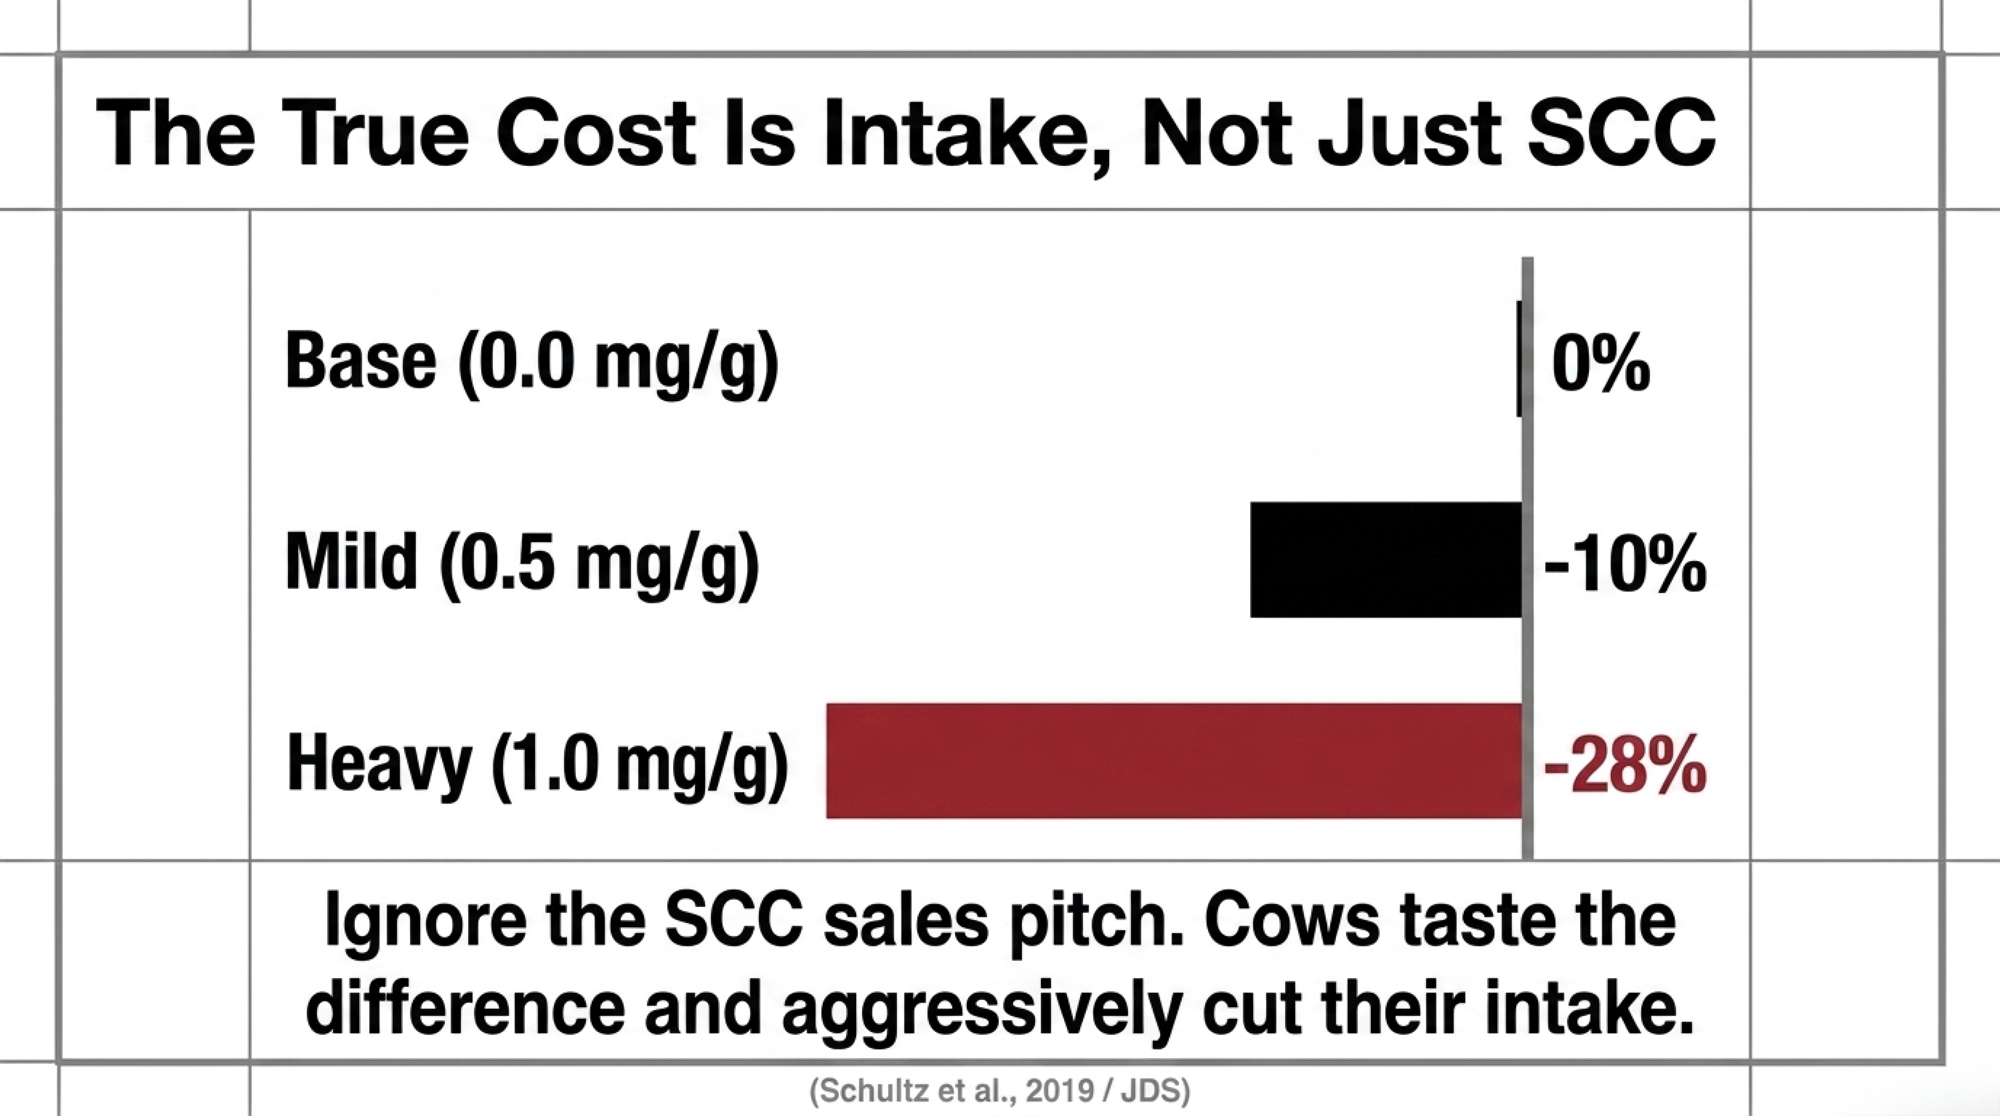
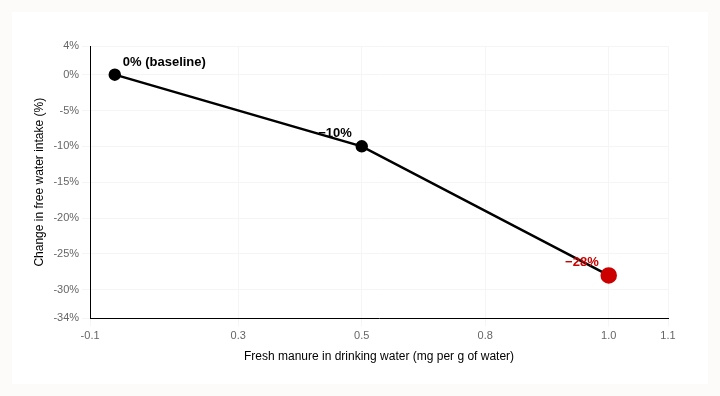
Cows taste the difference and act on it. A Journal of Dairy Science invited review by Jensen (2021), summarizing work by Schultz et al. (2019), reports that lactating cows cut free water intake by 10% when offered only water contaminated with 0.5 mg of fresh manure per gram of water, and by 28% at 1 mg per gram. Given a choice between clean and contaminated, they drank the clean and left the rest.
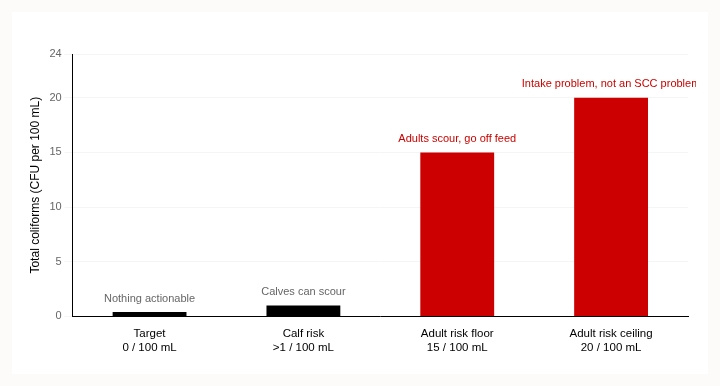
The second is blunter. Ontario’s OMAFRA guidance puts real numbers on it: above one coliform per 100 mL, calves can scour, and at 15 to 20 coliforms per 100 mL, adult cows may scour and go off feed entirely. That’s not a subtle intake shift — that’s a fresh cow backing away from the trough.
The third is the one being argued in the field, and it deserves an honest label rather than a confident one. The proposed chain runs like this: a cow fighting a constant bacterial challenge from her drinking water has fewer immune resources left for mammary defence, so somatic cell count drifts up. It’s plausible. Practitioners report seeing it.
But the controlled research linking trough water bacteria directly to bulk tank SCC is thinner than the intake evidence — which means the case for buying equipment specifically to lower SCC is weaker than the case for buying it to protect intake. Treat the SCC connection as a working hypothesis, not a proven return.
| Metric / Finding | Data / Level | Source & Context |
| Trough water coliform prevalence | 94.3% | 105 troughs, 24 farms (Hayer et al., 2022) |
| Trough water E. coli prevalence | 48.6% | 105 troughs, 24 farms (Hayer et al., 2022) |
| Troughs yielding collectible biofilm | 72 of 105 | Same survey (Hayer et al., 2022) |
| Calf scour threshold | >1 coliform / 100 mL | OMAFRA guidance, Ontario |
| Adult intake / off-feed threshold | 15–20 coliforms / 100 mL | OMAFRA guidance, Ontario |
| Intake reduction, mild manure load | −10% at 0.5 mg/g | Schultz et al., 2019 (via Jensen 2021, JDS) |
| Intake reduction, heavy manure load | −28% at 1.0 mg/g | Schultz et al., 2019 (via Jensen 2021, JDS) |
| Farms with water quality issues | 26% (none above 75 lb/cow) | 243 Pennsylvania farms, Penn State (2013) |
| Milk difference, clean vs. contaminated | 62 vs. 56 lb/cow/day | Penn State (2013) — correlation only |
| High vs. low SCC herd yield gap | 11 lb/cow/day ($0.64/cwt) | Zoetis analysis of its own data, 489 herd-years |
| Lactanet SCC flagging ceiling (Canada) | 200,000 cells/mL | Lactanet udder health reporting |
| Sulfate ceiling, calves vs. adults | 500 vs. 1,000 mg/L | 2021 NASEM Nutrient Requirements of Dairy Cattle |
What a Trough Swab Actually Involves
Here’s the part that gets skipped, because most producers have never watched one get pulled.
Two samples, not one. Pull the first at the wellhead or pressure tank — that’s your source baseline. Pull the second from the trough serving the group you’re worried about, and take it from the water the cows are actually drinking, not from a fresh fill. The gap between those two numbers is the entire diagnostic. Clean source plus dirty trough means the problem lives in the distribution system and on the trough surface, which is a very different purchase than a source-water problem.
Handling rules that actually matter. Bottles come sterile from the lab. Don’t rinse the bottle. Don’t touch the inside of the cap. Fill it without dunking your hand. Get it cold immediately. Bacterial samples degrade fast, so most labs want them chilled and delivered within 24 hours — a Friday afternoon sample that rides in the truck over a weekend tells you nothing. Lactanet builds that constraint right into its protocol: sample Monday, Tuesday, or Wednesday only, refrigerate immediately, ship same day. Copy that discipline wherever you farm.
- United States — Penn State. The Agricultural Analytical Services Laboratory prices its WD04 Agriculture/Septic package at $70, covering total coliform, E. coli, pH, total dissolved solids, and nitrate-nitrogen. WD05 Mining runs $80 and picks up sulfate, iron, and manganese. WD08 Extensive is $220. No single mid-priced option covers bacteria and the full mineral panel, so decide what you’re hunting before you order. Lab contact: 814-863-0841.
- Ontario — Guelph AFL and SGS. Stay domestic, because shipping across the border blows the 24-hour window. The University of Guelph’s Agriculture & Food Laboratory is licensed for microbial drinking water testing under Ontario Regulations 318/319 and 170, covering E. coli, total coliform, and heterotrophic plate count. SGS Agri-Food Laboratories, also in Guelph at 503 Imperial Road North, holds ISO/IEC 17025 accreditation and offers packaged livestock water services. Both quote livestock microbial packages on request.
- Quebec — Lactanet and a proAction gap. Lactanet runs a water analysis service for Quebec producers. Worth knowing: under proAction, microbial contamination is the only water parameter analyzed routinely. A mineral problem there won’t surface unless somebody goes looking for it.
| Region / lab | Package | Price | Timing constraint |
|---|---|---|---|
| US — Penn State AASL | WD04 Agriculture/Septic: total coliform, E. coli, pH, TDS, nitrate-N | $70 | Chilled, delivered within 24 hours — never sample Friday |
| US — Penn State AASL | WD05 Mining: sulfate, iron, manganese | $80 | Mineral panel; no bacteria included |
| US — Penn State AASL | WD08 Extensive | $220 | Order only if you don’t know what you’re hunting |
| Ontario — Guelph AFL / SGS Agri-Food | E. coli, total coliform, HPC (Reg. 318/319, 170); ISO/IEC 17025 livestock packages | Quoted on request | Stay domestic — border shipping blows the 24-hour window |
| Quebec — Lactanet water analysis | Microbial panel | Quoted on request | Mon/Tue/Wed only, refrigerate, ship same day. Under proAction, microbial is the only routine parameter |
While you’re standing there with a bottle in your hand, run a finger along the inside wall below the waterline. If it’s slick, you’ve got biofilm — and an ATP swab will confirm it for a few dollars before you commit to a lab panel. No lab required for the finger test.
Bacterial Load or Mineral Load? Decide Before You Spend
These are two different problems with two different price tags, and buying the wrong fix is the most common expensive mistake in this whole category.
| Diagnostic question | Bacterial contamination | Mineral load |
|---|---|---|
| What the panel shows | Coliforms or E. coli present; trough count exceeds wellhead count | Sulfate, TDS, iron or manganese above threshold; bacteria near zero |
| Where it lives | Distribution pipe and trough surfaces — biofilm | Source water and the aquifer |
| What fixes it | Chlorine dioxide in-line; scrub-and-drain on small herds | Reverse osmosis, blending, or peroxide injection |
| What chlorine dioxide does to it | Oxidizes it | Nothing at all |
| Key actionable threshold | Any coliform above 0 per 100 mL(OMAFRA) | Sulfate above 1,000 mg/L adults / 500 mg/L calves (2021 NASEM); TDS above 3,000 |
| Typical capital cost profile | In-line dosing unit — lower fixed cost, ongoing chemical | RO or blending system — higher fixed cost, spread across the whole herd |
Buy a bacterial solution for a mineral problem and you’ve spent real money to change nothing. The chemistry simply doesn’t touch it. Keep the full interpretation table open beside your results when they land.
The Payback Math, and Why You Should Distrust It
Two production figures get quoted constantly in this conversation. Both are real. Neither means what a quick sales calculation implies.
A 2013 Penn State study looked at 243 Pennsylvania dairy farms across 41 counties, with roughly 18,000 cows and 174 samples returned. About 26% had at least one water quality issue. Those problem farms averaged 56 pounds of milk per cow daily, compared with 62 pounds on the clean-water farms.
Two details matter before that six-pound gap goes anywhere:
- Those farms opted into free water testing Penn State Extension offered in fall 2012 — a self-selected sample, not a random trial.
- Not one farm producing above 75 pounds per cow had a water quality problem, while 32% of farms under 50 pounds did. Water trouble travels with other trouble. Some of that six pounds is water; some of it is everything else those herds were doing differently.
Here’s the arithmetic that gets run on kitchen tables. Six pounds per cow per day on a 200-cow herd is 1,200 pounds — about 12 hundredweight. At the September 2026 Class III settle of $16.42/cwt, that’s just under $200 a day. Almost any treatment system pays back fast against a number like that.
That is exactly why the number deserves a second look — twice over. It’s a correlation across self-selected farms, not a measured response to installing treatment. And the price input isn’t stable either: Class III has swung across roughly a $2 range through 2026, with the curve carrying September at $16.42 and December at $17.20. Build a payback case on a six-pound correlation times a moving price, and you’ve stacked two soft numbers into one confident-looking answer.
So ask for a measured treatment response instead — before-and-after production on comparable herds, with the other variables held still. Controlled on-farm data of that kind is hard to come by, which is exactly why it’s worth asking for.
Use the method, not the multiplier. Get a dated written quote for your own system with capacity in gallons per minute or head served. Measure your own wellhead-to-trough gap. Then price the decision against production you can actually attribute to water.
When This Won’t Pencil
Plenty of herds shouldn’t buy a treatment system, and the honest version of this story says so out loud.
Both counts clean. If bacteria come back near zero at the wellhead and the trough, you don’t have a distribution-system problem and a generator won’t manufacture one worth solving.
SCC is already low. The production you’re buying back is small, and the payback stretches out past the point where the math holds together.
Wrong chemistry for the problem. See the decision table above. This is where the money gets wasted.
Herd too small for the fixed cost. Spread across 60 cows is a different proposition than across 600. A smaller tie-stall herd may capture most of the available benefit from a disciplined weekly scrub-and-drain protocol instead — Penn State Extension notes troughs and watering cups get overlooked in cleaning schedules precisely because the biofilm sits where nobody looks.
Different premium math by border. All pricing here is US Class III. Canadian producers on quota work from a different premium-and-penalty structure, so pull your own processor’s schedule before you build a recovery estimate.
What Actually Kills Biofilm
If testing shows you have a bacterial problem, product choice isn’t a coin flip.
Why not chlorine. It loses effectiveness as pH climbs past 7 and struggles to penetrate an established biofilm matrix.
Why chlorine dioxide. Holds up across roughly pH 4 to 10, isn’t neutralized by organic material the way chlorine is, penetrates biofilm, and is EPA-approved for potable water treatment. It also carries enough oxidizing capacity to deactivate pathogens at lower dose rates than ozone or hydrogen peroxide.
Contact time and concentration. Per UW-Madison guidance last updated in February 2021, the Wisconsin Veterinary Diagnostic Laboratory puts calf feeding equipment sanitation at 25–50 ppm with 2 to 4 minutes of contact time, and facility or calf pen disinfection at 250–500 ppm with 5 to 10 minutes. In-line potable water treatment runs far below either — this is not a one-dose-fits-all chemical.
Dr. Donald Sockett of the Wisconsin Veterinary Diagnostic Laboratory has written that there’s tremendous variability in the actual chlorine dioxide concentration of commercial products. He lays out what to demand, and it turns into four questions you should ask before any money moves:
- NSF/ANSI Standard 60 certification — is the product certified for potable water treatment?
- Food-grade chemistry — non-food-grade chemicals carry impurities that cut sanitation efficiency.
- Strong-acid activation — strong acids are roughly 60% more efficient at converting sodium chlorite into ClO₂, leave no toxic residue, and don’t leave large amounts of unreacted sodium chlorite behind. Unreacted chlorite makes your dosing unpredictable.
- Measured on-farm data — do they hold before-and-after production figures from herds like yours?
How fast and how specifically a supplier answers all four tells you most of what you need to know.
Your 30-Day Water Protocol
Week 1 — Sample. Pull two bottles early in the week: one at the wellhead or pressure tank, one from the trough serving your highest-SCC group, taken from water the cows have been drinking. Chill immediately; deliver within 24 hours. Order Penn State’s WD04 at $70, or call Guelph AFL or SGS in Ontario, or go through Lactanet in Quebec.
Week 1 — Walk and feel. Run a finger along the inside trough wall below the waterline on every group. Note trough material, volume, distance from the parlour, visible soiling, and water temperature — five of the six German risk factors, checked for free.
Week 2–3 — Read the gap, not the number. Trough count materially above wellhead count means distribution-system biofilm, and scrubbing alone won’t reach the pipe reseeding it. Any coliform above zero per 100 mL is actionable. Anything in the 15–20 per 100 mL range means stop reading about SCC and deal with intake. Canadian readers: Lactanet flags herds at 200,000 cells/mL, so run your recovery math against that ceiling rather than a US schedule.
Week 2–3 — Route the problem correctly. High bacteria and clean minerals point you toward chlorine dioxide. Sulfate above 1,000 mg/L for the milking herd, or TDS above 3,000, sends you toward reverse osmosis, blending, or peroxide instead. Remember the sulfate split — 500 mg/L is a calf standard and will flag water that’s fine for lactating cows.
Week 4 — Price it honestly, or walk away. If you’re shopping, get a dated written quote with capacity in gallons per minute or head served, and run the four supplier questions. Decide your payback threshold before a quote sets it for you. If both counts came back clean and your SCC is already low, spend the money on the parlour or the pens.
Then book the next one. OMAFRA recommends roughly four tests a year so you build seasonal data on your own aquifer rather than a single snapshot that may have caught a good week.
The Bullvine Bottom Line
Ninety-four percent of those German troughs had coliforms in the water, on farms where nobody had raised a hand about a water problem. Two bottles, a cooler, and roughly $70 will tell you whether you’re one of them — less than one vet call, and OMAFRA thinks you should be doing it four times a year.
The number a salesman will quote you is six pounds per cow per day. The number that should decide your purchase is the gap between your wellhead and your trough. Those are not the same number, and only one of them is yours.
So: do you know your coliform count at the trough, or only at the well — and when did somebody last run a finger along the inside wall of the trough your fresh pen drinks from?
Pricing, milk price, and laboratory fee information current as of August 31, 2026. The Class III figure is the September 2026 CME settlement.
Run Your Numbers
Farm Benchmark Snap Check — Before you commit capital to a water system, the DVI Risk Check benchmarks your margin exposure in dollars per cow and flags whether your hedge, debt load, or feed share is the weaker lever. Three to five numbers. No sales pitch.
Learn More
- The $50,000 Biofilm Crisis Your ATP Test Will Expose — Exposes how standard CIP wash cycles miss mature bacterial matrices in milking lines, delivering a $5 rapid field-testing method to audit your equipment before invisible contamination drains $38,000 in hidden subclinical losses.
- 211,000 More Dairy Cows. Bleeding Margins. The 2026 Math That Won’t Wait. — Arms you with an operational playbook to stress-test your true cost of production against $17–$18 milk, dismantling the beef-on-dairy premium trap that keeps marginal, high-cost cows in the barn.
- What’s Happening with the $2.7 Billion Hidden Loss in Our Dairy Herds and How the Industry Is Shifting — Breaks down quorum-sensing inhibition technology that disrupts bacterial communication inside the udder, slashing chronic mastitis culls by 57% without creating antibiotic resistance or milk discard days.
The Sunday Read Dairy Professionals Don’t Skip.

Every week, thousands of producers, breeders, and industry insiders open Bullvine Weekly for genetics insights, market shifts, and profit strategies they won’t find anywhere else. One email. Five minutes. Smarter decisions all week.
