









Before paying extra for a young sire’s recorded ancestry, ask whether it predicts proof stability beyond published reliability. Our review found no published Canadian or U.S. test answering that question.
You can name five generations behind him. Does that make his genomic proof safer?
VG dam. EX grandam. Three more generations of Excellent, every one with a milk record. If you spent years building that cow family, those lines represent breeding decisions, milk tests and cows you watched develop. You have reasons to trust them.
In The Bullvine’s Seagull Bay profile, Alan Andersen described the evidence he saw in his own herd: “Minnow has transmitted outstanding production and type through several generations of her offspring.” He used both proven bulls and young sires on his top cow families, and on Shauna, IVF let him use several different young sires “in order to lessen the risk.” He also made the pedigree case outright: “Young bulls with strong maternal lines will also receive an advantage over bulls with similar indexes but less proven cow families.” He was direct about genomic sires, too: “Certainly their proofs will change over time. We just don’t know how great of a change will occur.”
Bosdale’s Bos family made a similar case in a 2025 profile: “They are successful because they continue to breed high type productive cows that repeatedly transmit good genetics from generation to generation.”
Those are breeders’ own observations of how their families transmit. The question here is narrower: whether a recorded family history predicts smaller changes in a young sire’s proof once published reliability is accounted for.
Now put a genomic young sire without that depth of recorded ancestry beside a son of one of those families. Before you look at their reliabilities, which one feels safer to use?
Genomics has shortened the wait. In a 2022 analysis, Lactanet reported average young-animal LPI reliability of 78% with genomics versus 41% without it. For a breeder who values generations of performance, the buying question remains: does that deeper record provide protection the published reliability misses?
We went looking for a Canadian or U.S. study testing whether recorded pedigree depth predicts smaller proof changes after accounting for published reliability. We did not find one.
So we compared proof movement in 86 bulls from Lactanet’s elite genomic LPI lists, grouped by whether their dams had a classification score displayed in 2026. That tests a narrower association—not five generations of pedigree or the information available when the bulls were selected.
This piece tests one claim: proof stability. Whether a cow family earns its keep through longevity, managing recessives or what you know from her daughters in your own barn is a separate question. Answering it needs different data, such as herd-life and recessive records, and this article doesn’t settle it.
What Are You Paying Extra For?
The deep-pedigree argument bundles three questions:
- Do bulls with more classified, milk-recorded, daughter-proven ancestors change less when daughters arrive?
- Does that still hold once published reliability is accounted for?
- Would using recorded ancestry actually improve which sires you pick?
Showing that deep-pedigree bulls move less wouldn’t, by itself, show that buying on pedigree picks better bulls.
There is relevant Canadian evidence. A 2019 CDN analysis of 275 Canadian-born bulls found Conformation reliability 1.3 percentage points higher for sons of classified dams. It did not test their subsequent proof movement.
That matters when you buy semen. If you pay a premium for paper depth, or pass over a high-merit bull because his sire and grandsire were genomic-only, you’re making a selection call. Lactanet describes reliability as the confidence behind a breeding value, built from performance records, relatives, progeny and genomic data. Without evidence that ancestry adds something reliability misses, a pedigree discount risks counting the same information twice.
Lactanet spells out what reliability is for: “This is why evaluations of young genomic bulls often change as daughter records accumulate, while evaluations of proven sires tend to be more stable.” It also says “a bull with a slightly lower value and very high reliability is more predictable.” That’s the stability gauge, and it’s already on the proof sheet, whether the sheet says LPI or NM$.
What the Pedigree Does—and Doesn’t—Tell You
Say the pitch is a deep cow family with classified dams for generations. Ask what supports the promise that his proof will hold. You can see the paper trail on a bull page. You can’t see how well his genetics are represented in the genomic reference.
There’s a second trap on the same page. A dam with no public classification or lactation line may still have added information to the evaluation. Lactanet’s 2026 explainer describes how relationships let information recorded on one animal contribute to the evaluation of another.
Proof stability is also only one part of the decision. A steadier bull with lower expected merit isn’t automatically the better buy. Choosing steadiness over merit is a legitimate strategy for some herds. It should be a deliberate choice, not something a pedigree slips into the mating plan.
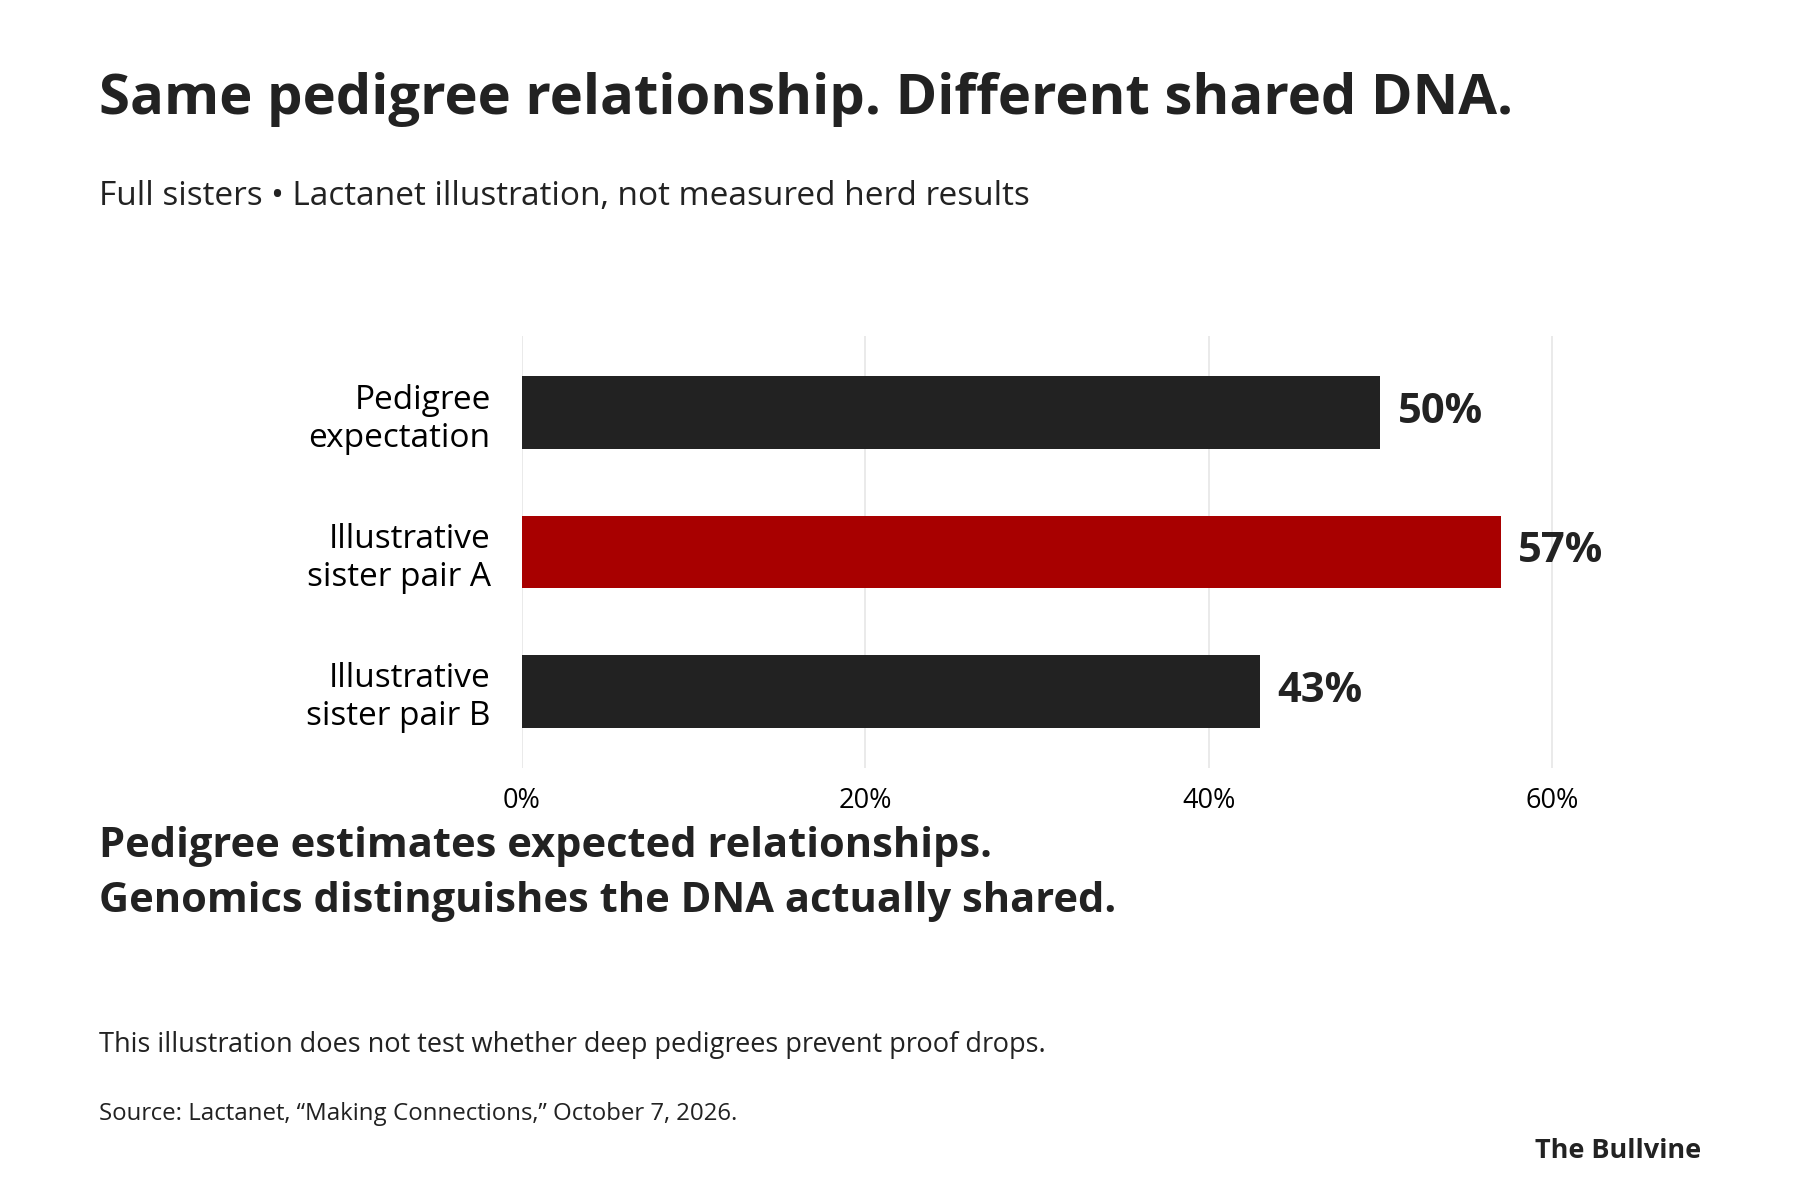
Both evaluation centers draw the same line. Lactanet: “pedigrees estimate how much DNA two animals are expected to share, while genomics measures how much they truly share.” Its illustration uses full-sister pairs sharing 57% or 43% of their DNA against a pedigree expectation of 50%. Speaking at the CDCB industry meeting, CDCB Chief Research and Development Officer Dr. John Cole put it more bluntly: “Genomics tells us what the true relationship between animals is.”
- Recorded ancestry: how many generations of classification, milk records and proven sires sit on paper.
- Reference connection: how closely a bull’s genetics are represented among the animals the genomic prediction was trained on.
Our Own Check: What Happened to Sons of Dams With a Displayed Score
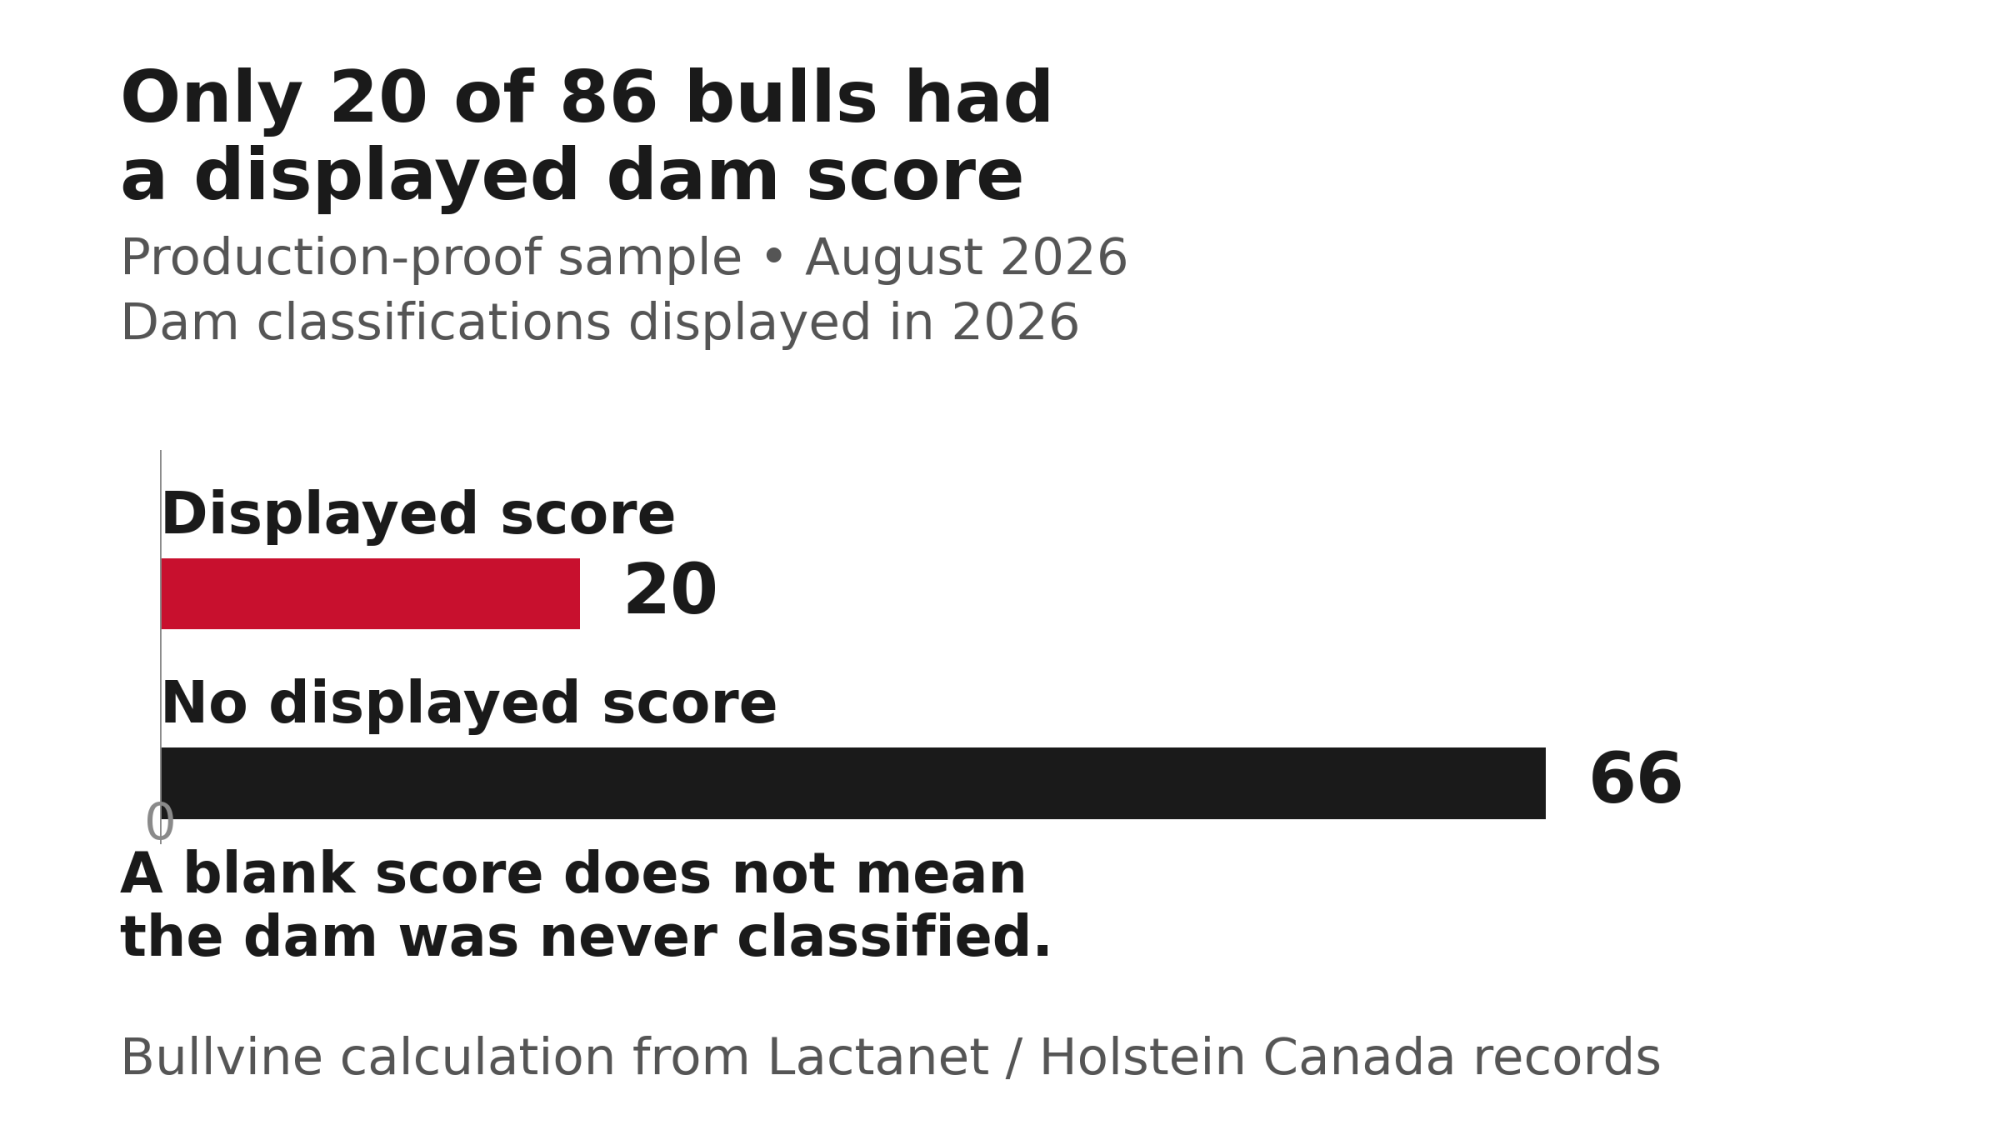
We took every second bull from Lactanet’s August 2022, December 2022 and April 2023 top-GPA LPI lists and followed them to their August 2026 evaluations. Eighty-six had daughter-based production proofs by then. Twenty had a dam with a classification score displayed; 66 didn’t.
Protein. After controls, sons of dams with a displayed score saw their protein proofs drop an estimated 6.5 kg more and swing 2.4 kg further in absolute terms. Both confidence intervals cross zero. So this doesn’t show a stability benefit, and it doesn’t rule one out.
Type. Among 67 bulls with daughter proofs for both traits, sons of score-displayed dams started higher on Conformation (+6.10 vs. +5.36). Their final raw means were +2.65 and +2.85. After controls, their absolute change in published Conformation scores was an estimated 1.7 points greater than that of sons whose dams had no displayed score. The model controlled for starting Conformation, but the published composite scores were not harmonized across the comparison period.
What to take from this comparison: on protein, we can’t tell whether a displayed dam score goes with steadier proofs. On type, those sons moved more, but these are unharmonized scores.
What this can’t tell you
- It tests one generation, the dam, not five.
- Only 20 bulls had a displayed dam score, against 66 without.
- Dam scores are those displayed in 2026, not necessarily what a breeder knew at purchase. Only 7 of 86 bulls had a dam classification dated before their list; 77 had no verifiable date.
- A blank score doesn’t mean a dam was never classified.
- The bulls came from elite genomic LPI lists; 72 of 86 are U.S.-registered.
- Half of the follow-up proofs (43 of 86) are GMACE, foreign evaluations converted to the Canadian scale.
- Type scores are raw published composites, which annual base changes can’t cleanly correct.
Methods (Bullvine analysis)
- Sample: 151 list entries, 124 distinct bulls; 86 with GEBV or GMACE production evaluations in August 2026 (43 each), each counted once at its earliest list. All evaluations are on the Canadian scale. Controls: starting protein, birth year, baseline list, registration region and proof route. Uncertainty accounts for shared dams.
- Protein results: signed change −6.5 kg (95% CI −14.3 to +1.2); absolute movement +2.4 kg (95% CI −3.7 to +8.6).
- Domestic GEBV only (43 bulls): signed −3.6 kg (95% CI −14.8 to +7.6); absolute +3.4 kg (95% CI −5.6 to +12.4).
- Base add-back: current minus starting evaluation, plus Lactanet’s annual Holstein protein base changes (April 2023: 4.5 kg; 2024: 4.7; 2025: 4.7; 2026: 5.0). That’s 4.5 + 4.7 + 4.7 + 5.0 = 18.9 kg for 2022 lists and 4.7 + 4.7 + 5.0 = 14.4 kg for April 2023. This adjusts bases only; it isn’t a measure of daughters’ actual production.
- Type sample: 67 bulls with GEBV or GMACE status for both traits (20 vs. 47). One GMACE record showed zero Conformation daughters; a 66-bull subset excluding it was tested separately.
- Type results: signed −0.67 points (95% CI −3.18 to +1.85); absolute +1.66 points (95% CI +0.36 to +2.97), nominal p = 0.0135. An illustrative Bonferroni adjustment for six comparisons (not specified in advance) gives about 0.081. An illustrative common 3-point offset shrinks the gap to about 0.9 points, with an interval crossing zero.
Lactanet and Holstein Canada records captured November 16, 2026, and checked against the analysis dataset with no discrepancies. Dataset and audit package available on request from the editor.
What the Evaluation Systems Actually Do
Canada: no fixed 80:20
Canada’s published 2009 method weighted genomic information by reliability, at about 65% for young sires and heifers in its April 2009 factsheet and a 61% average for LPI in young bulls and heifers born 2007–2009. We found no current Lactanet document setting a fixed 80:20.
Some Canadian traits never used a two-part blend at all. Hoof health (November 2018), fertility disorders (December 2020) and feed efficiency (April 2021) were introduced as single-step evaluations using pedigree, performance and genotypes together.
The U.S.: multi-step for now
CDCB describes a four-step process: a traditional PTA from pedigree and phenotypes, deregression, genomic prediction, then a blend into a genomic PTA, with no fixed ratio given. CDCB is preparing single-step evaluations but hasn’t set a date. Cole said the change should reduce bias and mean smaller changes in a bull’s predictions when daughter data comes in.
What other countries found
In an August 6, 2020 presentation, Ireland’s ICBF warned that “a wider relationship gap is emerging between young sires and the proven animals in reference”: 98% of the sires of calves born in 2016 were in its milk reference, against 19% for calves born in 2020. That’s evidence about reference connection, not pedigree depth.
U.S. type research points the same way. Steyn and colleagues found prediction accuracy of 0.69 vs. 0.54 for stature using a core of 100 popular sires born 2001–2010 rather than 100 born before 1981. Pszczola and Calus simulated reliability falling from 0.37 to 0.21 over five generations without a reference update. Neither study counted classified generations.
Why a proof drop doesn’t settle it
A drop can come from the model, not the bull. In CDCB’s old fertility evaluations, more than 55% of bulls showed a steady decline in PTA at every run from December 2023 to December 2024. CDCB traced part of that to data timing and changed the evaluation in August 2026. More old data doesn’t always help either: Lourenco and colleagues found that dropping pre-1990 records didn’t reduce accuracy in 2,232 U.S. Holstein bulls. And bias can run downward: Patry and Ducrocq simulated a later conventional evaluation that ignored genomic preselection, pushing estimates 0.146 genetic standard deviations below true values in their reference scenario.
The Deep-Pedigree Claim Audit
We checked the cited public documents and research through November 16, 2026, alongside our own comparison. A relevant study may exist outside what we found.
| Claim | Verdict |
| Canadian young-sire proofs are a fixed 80:20 SNP/PA blend | Unsupported by evidence found |
| U.S. genomic PTAs are a fixed genomic/PA ratio | Unsupported by evidence found |
| Canadian genomics began at about two-thirds SNP weighting | Supported, with qualifications (65% for young sires and heifers; 61% LPI average) |
| Genomic-only ancestry necessarily raises SNP weight | Unsupported by evidence found |
| Genomic-only ancestry independently causes upward bias | Not established by the cited evidence |
| Distance from the reference hurts accuracy | Supported, with qualifications |
| Recorded pedigree depth measures reference connection | Unsupported by evidence found |
| Genomic evaluations are trained only on proven bulls | Lactanet’s 2022 article describes a Holstein reference of progeny-proven sires; not a universal statement for every trait |
| A steady run of young-bull proof drops means the genomics failed | Not diagnostic on its own: CDCB identified data-timing bias and made changes in August 2026 |
| Continued phenotyping matters | Supported |
| A classified dam protects a young sire’s protein or type proof | Unresolved: starting reliability unavailable; type scores not harmonized |
| Recorded ancestry predicts proof stability beyond published reliability | Unsupported by evidence found |
Options for Your Operation
- Herds prioritizing maximum genetic gain: Rank on the trait proofs you’re selecting for. Don’t apply a home-made discount for genomic-only ancestry; no Canadian or U.S. evidence we found supports one.
- Herds prioritizing predictability: Compare trait-level reliability alongside expected merit. Check whether a higher-reliability option actually gives up merit on your shortlist. Don’t use paper depth as a stand-in for reliability.
- Pedigree breeders marketing cow families: Keep the reasons for buying separate. If you value a particular family, say so. A claim that its young sire’s proof will hold needs separate evidence.
Before Your Next Semen Order
Ask for reliability on each trait you’re selecting for, not just the index: LPI or Pro$ in Canada, NM$ or TPI in the U.S. Lactanet publishes reliability at the trait level.
If you’re buying on U.S. fertility traits, know the lag. Since August 2026, daughter data isn’t included in DPR, CCR or FSC until the daughter is 36 months old.
Keep recording. Lactanet builds reliability from performance records, relatives, progeny and genomic data, so your milk tests and classifications are part of what feeds the evaluations.
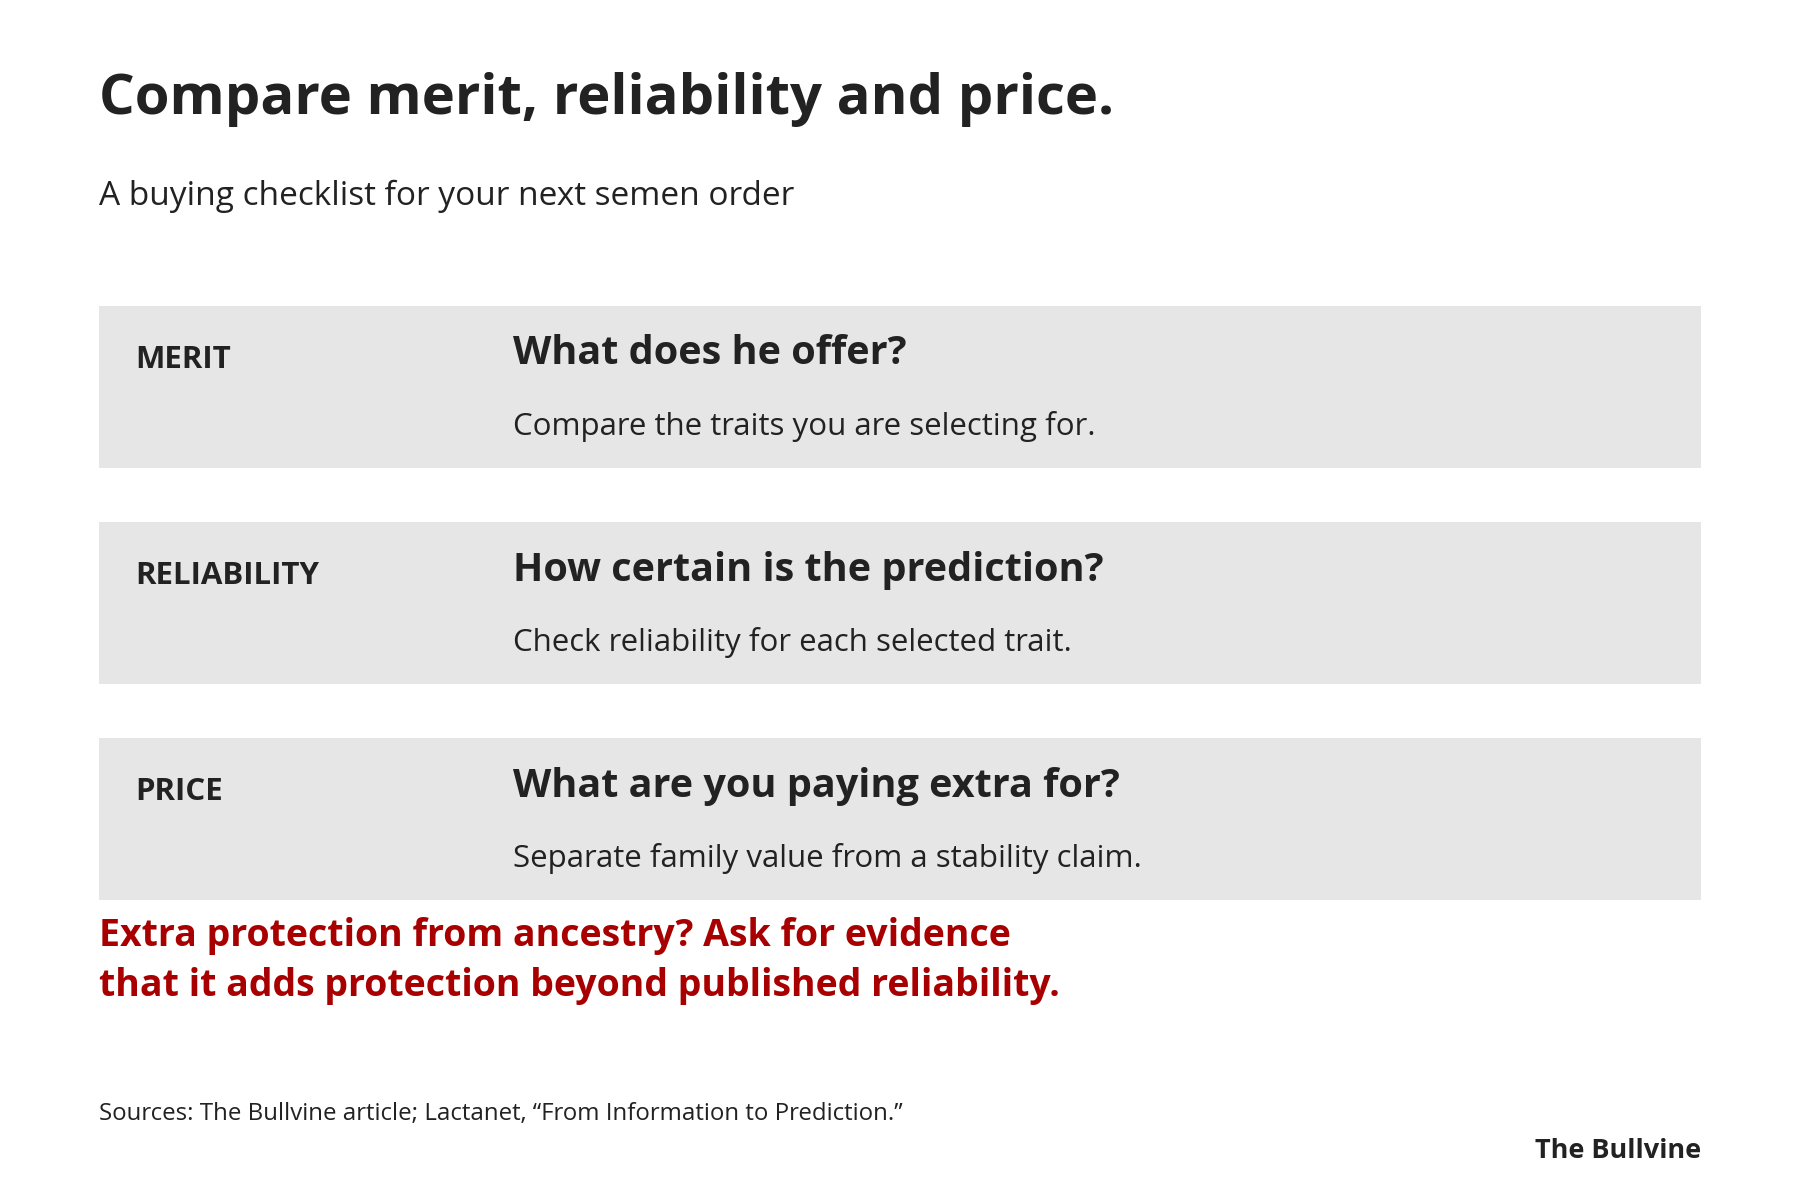
At your next semen order, compare merit, trait-level reliability and price. If recorded ancestry is offered as extra protection against a proof drop, ask for evidence that it adds protection beyond the reliability already published.
Complete references and supporting documentation are available upon request by contacting the editorial team at editor@thebullvine.com.
Learn More
- Falling Semen Sales Aren’t Bad News – They’re Proof You Bred Better — Capitalize on genomic reliability by ruthlessly sorting your replacement pipeline. Breaks down the math behind 64% sexed-semen adoption and arms you with a Pipeline Index calculator to align your culling pressure with your true heifer inventory.
- Dairy Farm Economics 2026: Milk Pricing, Margins & Risk Playbook — Tightening 2026 farmgate projections require shifting focus from elite pedigrees to hard margin math. Exposes how a $400 crossbred calf premium quietly adds $4.00/cwt to gross revenue, masking structural milk-pricing risks you must navigate over the next three years.
- When Your “Elite” Genetics Start Costing You Real Money — By clinging to traditional sire rankings, herds forfeit significant production capacity to hidden inbreeding drag. Dismantles outdated selection habits and reveals how ignoring genomic relationships costs $24 per cow annually for every percentage point increase in your coefficient.
The Sunday Read Dairy Professionals Don’t Skip.

Every week, thousands of producers, breeders, and industry insiders open Bullvine Weekly for genetics insights, market shifts, and profit strategies they won’t find anywhere else. One email. Five minutes. Smarter decisions all week.