








All three Wisconsin diets used the same forages at nearly the same potassium. What does that tell you about a quote that promises cheaper hay?
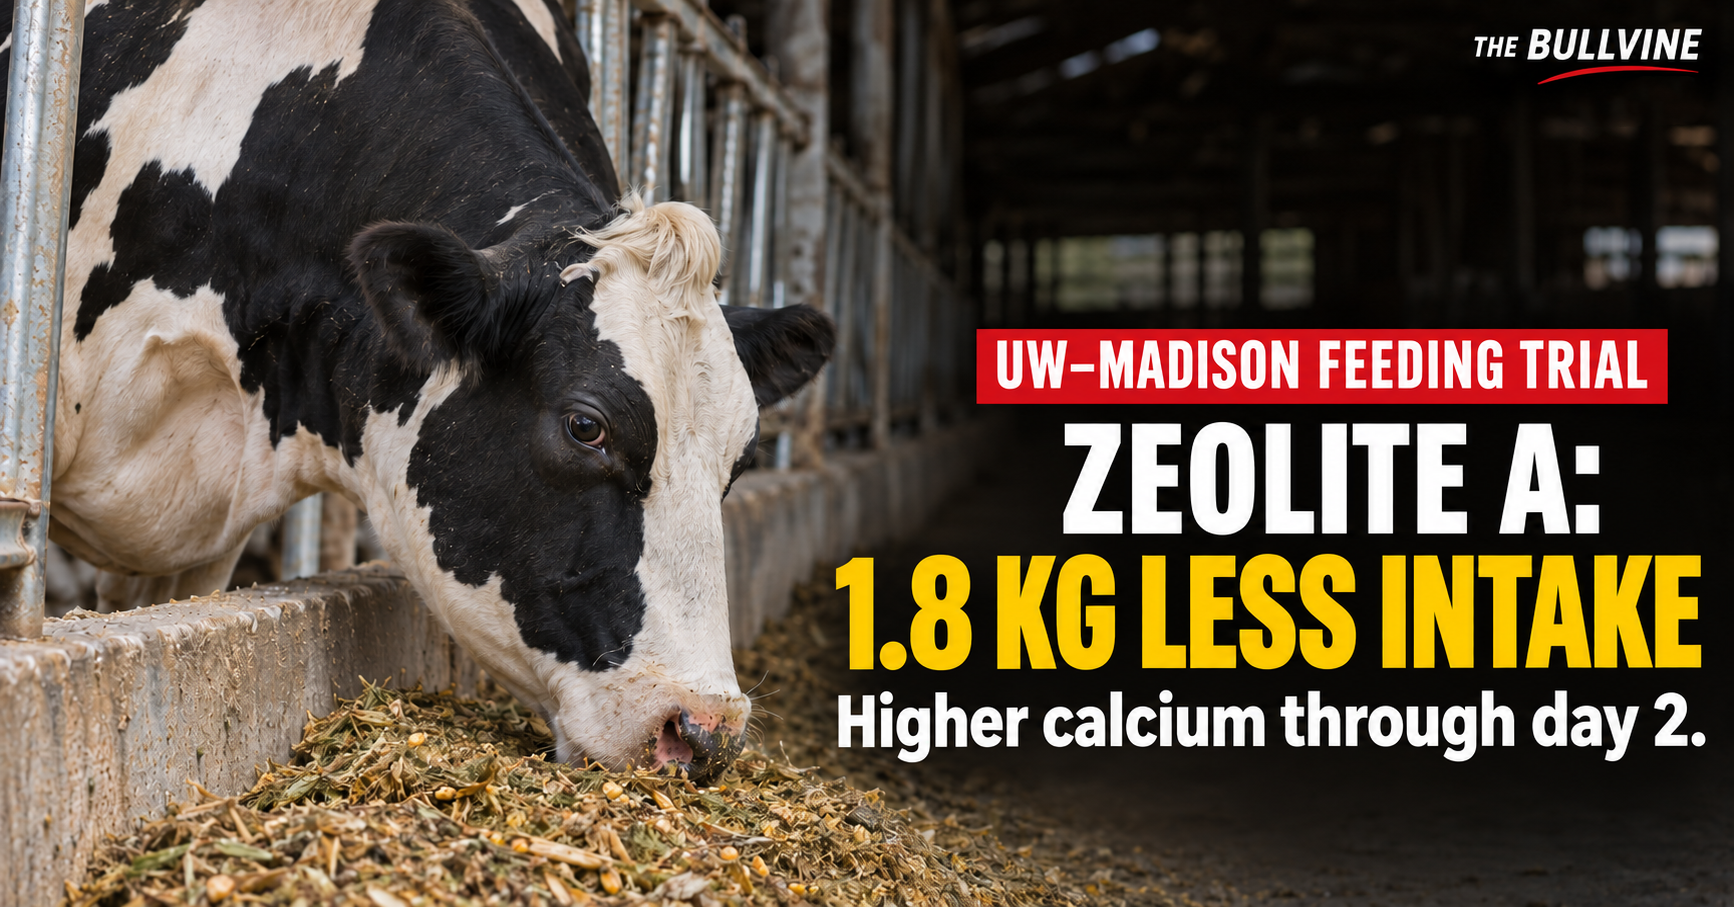
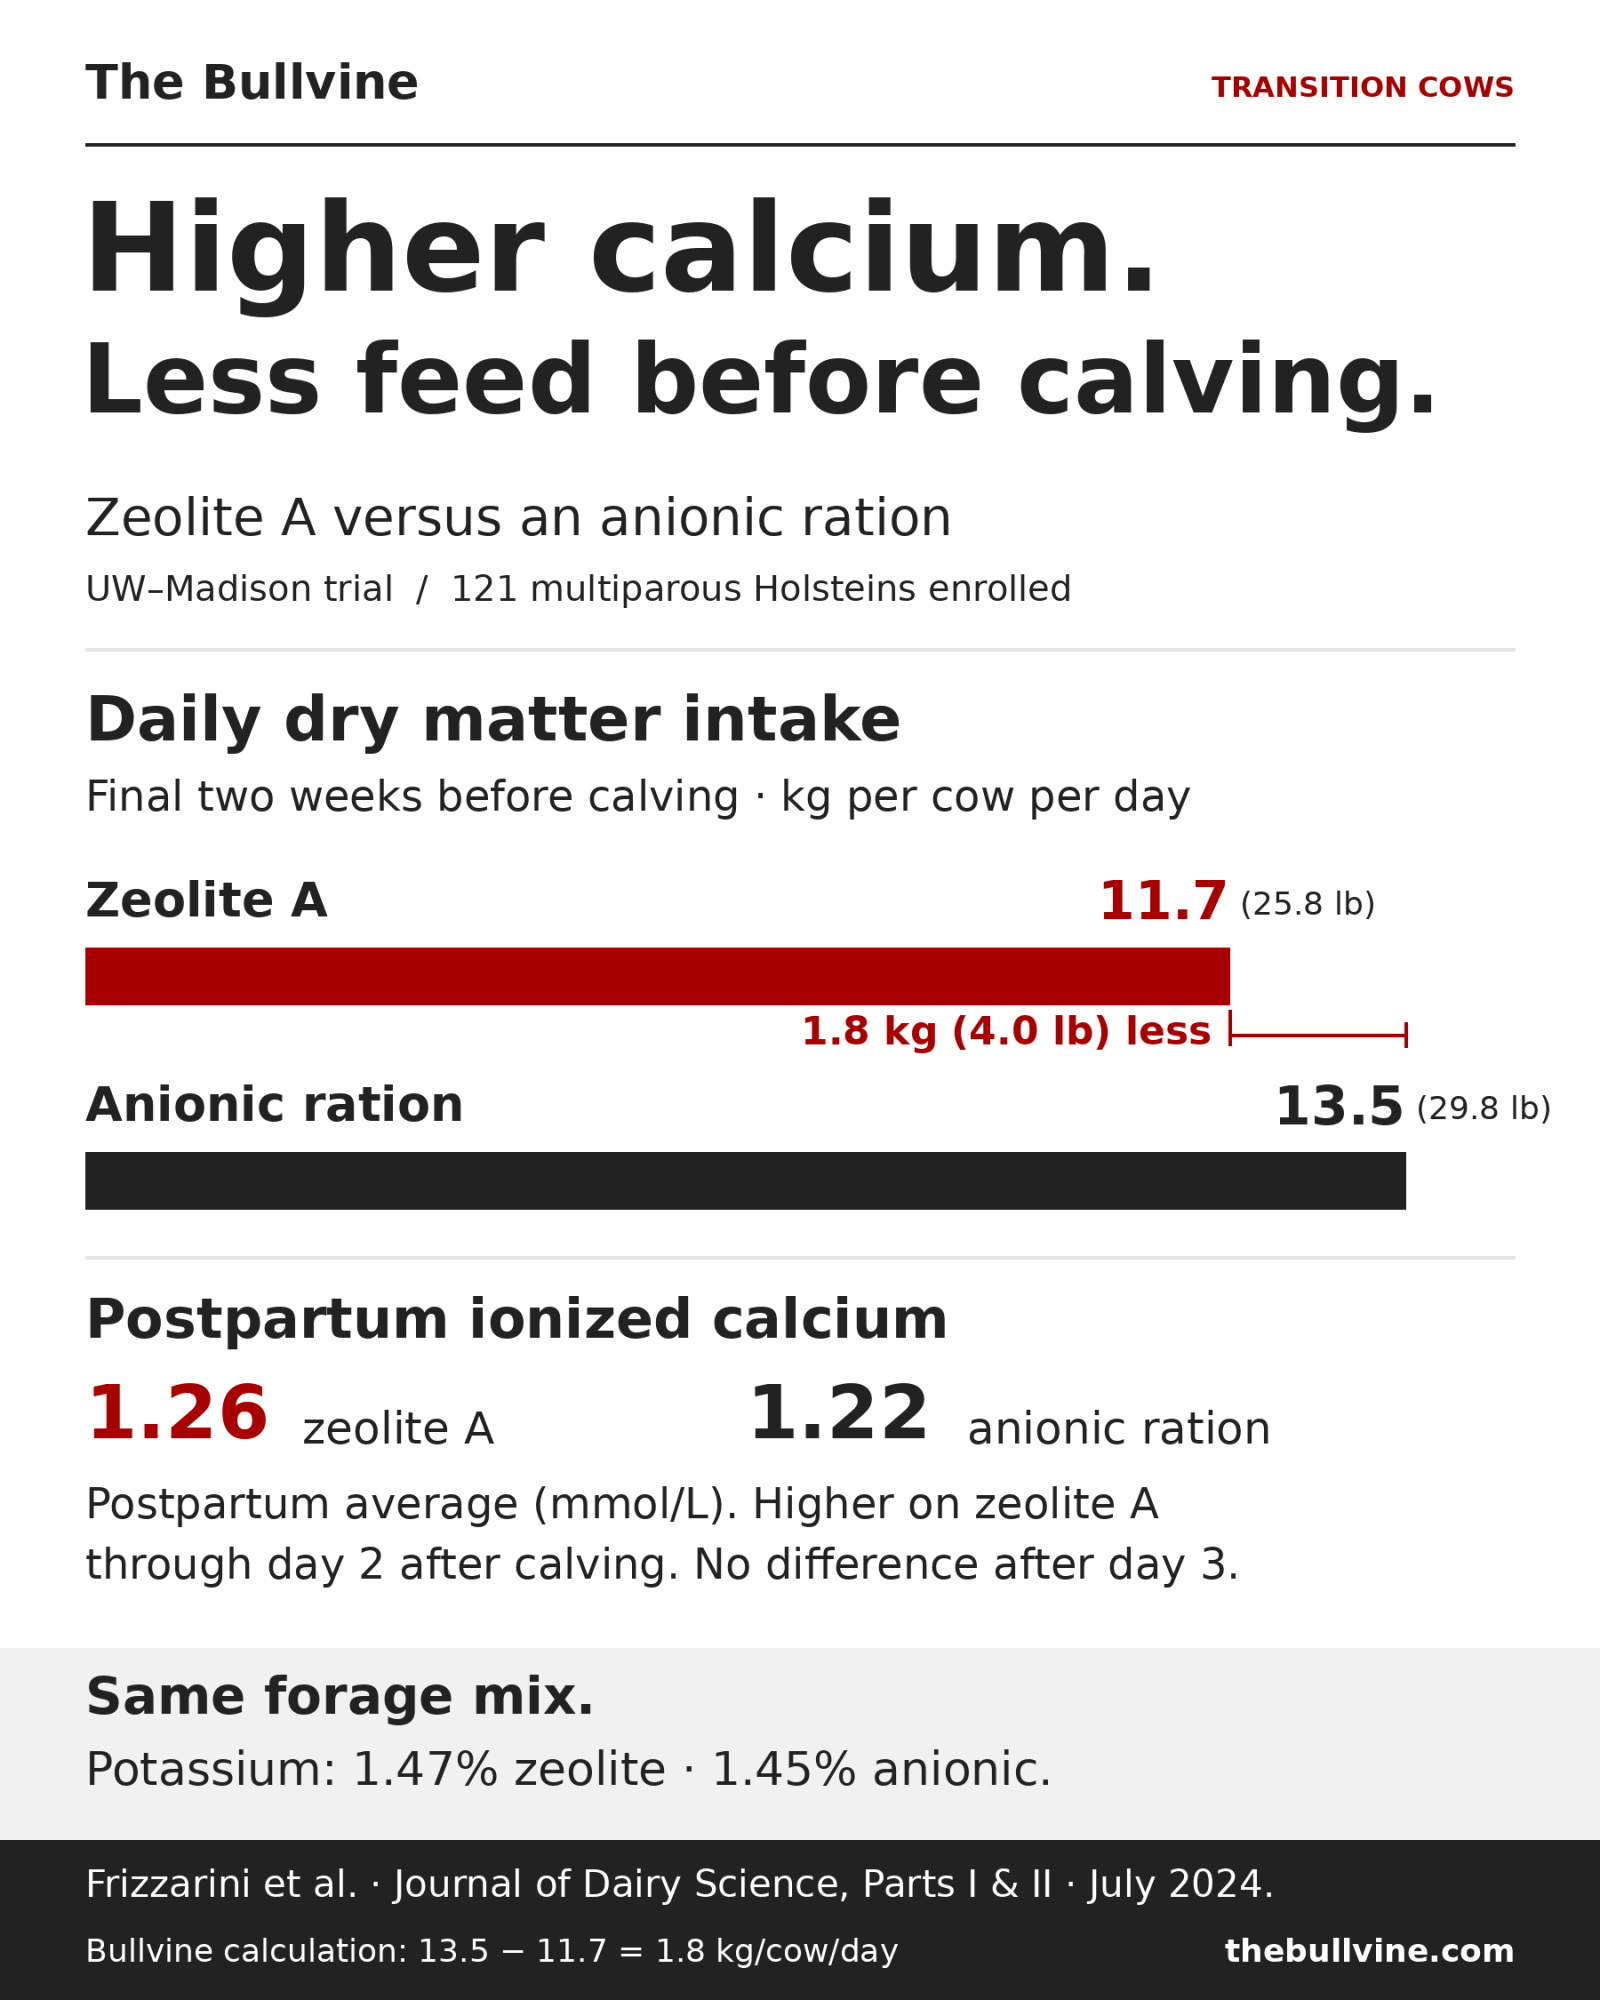
In a 121-cow UW–Madison trial with multiparous Holsteins, cows fed synthetic zeolite A (targeting 500 g/day, about 1.1 lb) ate 11.7 kg of dry matter a day over the last 14 days before calving (about 25.8 lb). That compares with 13.5 kg (29.8 lb) on an anionic diet and 13.9 kg (30.6 lb) on the control. Binder cows beat both the anionic and control groups on ionized calcium before calving and through day 2 postpartum. Overall postpartum ionized calcium averaged 1.26 mmol/L on the binder ration, 1.22 on the anionic ration and 1.17 on the control. The edge faded quickly, though. After day 3, ionized calcium no longer differed among any of the diets.
Same forage mix. Nearly the same potassium.
| Ration component (% of dry matter) | Zeolite A | Anionic diet | Control |
|---|---|---|---|
| Corn silage | 55.08 | 55.08 | 55.08 |
| Haylage | 13.56 | 13.56 | 13.56 |
| Wheat straw | 15.25 | 15.25 | 15.25 |
| Potassium | 1.47 | 1.45 | 1.48 |
Source: Frizzarini et al., Journal of Dairy Science, July 2024, Part I, Tables 1–2. Forage figures are dietary ingredient proportions; potassium figures are analyzed concentrations. The trial did not test replacing these forages with higher-potassium alternatives.
All three diets used the same forage mix, which is why the trial can’t underwrite a cheaper-hay pitch. Each was roughly 55% corn silage, 13.6% haylage and 15.3% wheat straw on a dry-matter basis. Potassium came in at 1.47% for the binder ration, 1.45% for the anionic ration and 1.48% for the control. Wisconsin didn’t test a high-potassium forage substitution. Phosphorus matched too: 0.36% in the control and anionic rations, 0.37% with the binder.
Wisconsin sized the trial to detect differences in blood calcium. The mineral analysis excluded seven cows, including four that received supplemental calcium after calving. So the trial can’t tell you how many clinical milk fever cases either program would prevent in your herd.
How Do the Two Rations Affect Blood Calcium?
Zeolite cows had lower blood and salivary phosphorus and more water-extractable phosphate in their manure. Zeolite A binds dietary phosphorus, and the Wisconsin authors wrote that the calcium gain most likely comes from that phosphorus restriction. The usual explanation is that the cow mobilizes bone as blood phosphorus falls, which releases both minerals. Anionic diets take a different route. They work through mild metabolic acidosis, which frees calcium from bone and makes bone more sensitive to parathyroid hormone.
The formulated dietary cation-anion difference (DCAD) was +278 mEq/kg of dry matter for the binder ration, −65 for the anionic ration and +190 for the control. Sodium and chloride explain much of that spread. On a dry-matter basis, the binder ration contained 0.39% sodium and 0.35% chloride. The anionic ration contained 0.12% sodium and 1.09% chloride.
How It Plays Out in the Close-Up Pen
| Measure | Zeolite A | Anionic diet | Control | What the result does—and doesn’t—show |
|---|---|---|---|---|
| Prepartum rumination, min/day | 487 | 527 | 531 | Zeolite cows ruminated less than either comparison group. |
| Blood BHB, before and after calving | No diet difference | No diet difference | No diet difference | Lower prepartum intake did not produce a detectable diet effect on BHB. |
| Postpartum blood glucose | No overall diet effect | No overall diet effect | No overall diet effect | Third-lactation-and-older zeolite cows had the lowest subgroup value: 63.0 mg/dL. |
| Colostrum IgG, mg/mL | 91.1 | 78.9 | 78.0 | Zeolite increased IgG concentration; colostrum yield did not differ. |
| Milk in third-lactation-and-older cows through 49 DIM, kg/day (lb/day) | 51.0 (112.4) | 46.3 (102.1) | 48.2 (106.3) | Zeolite exceeded the anionic diet, but was not statistically different from control. |
| Average milk across all cows, first 7 weeks | No diet difference | No diet difference | No diet difference | The mature-cow comparison was not an overall milk-yield advantage. |
Source: Frizzarini et al., Journal of Dairy Science, July 2024, Part II. Values follow the supplied draft’s rounding. Colostrum results came from 89 cows milked within six hours of calving, not all 121 cows in the final trial dataset. Pound equivalents are Bullvine’s conversions.
- Rumination: binder cows ruminated 487 minutes a day, compared with 527 on the anionic ration and 531 on the control.
- Energy markers: blood BHB didn’t differ by diet before or after calving. Postpartum glucose showed no overall diet effect, though mature zeolite cows had the lowest values (63.0 mg/dL).
- Colostrum: colostrum IgG averaged 91.1 mg/mL on zeolite, 78.9 on the anionic diet and 78.0 on the control. Colostrum yield didn’t differ.
- Mature-cow milk: third-lactation-and-older cows on zeolite averaged 51.0 kg/day (112.4 lb) through 49 DIM. That was more than mature cows on the anionic diet (46.3 kg / 102.1 lb) but not statistically different from mature control cows (48.2 kg / 106.3 lb). Across all cows, average milk yield over the first 7 weeks didn’t differ by diet.
Gestation averaged 281.0 days on zeolite, 277.5 on the anionic diet and 277.1 on the control. All cows started the close-up ration at 254 days of gestation, so a longer gestation meant a longer stay. Binder cows averaged 27.2 days on the close-up ration, 3.7 more than the 23.5-day average in either comparison group.
Bullvine’s calculation: over the 14-day prepartum intake window Wisconsin reported, that 1.8 kg/day gap comes to 25.2 kg (about 56 lb) of dry matter per cow. Those 14-day averages can’t establish which group ate more over the full close-up stay.
The longer stay is a separate barn issue, and the trial doesn’t say why binder cows calved later. Bullvine’s calculation: for the same number of cows, a 27.2-day average stay instead of 23.5 days would use 15.7% more close-up cow-days. Whether the pen gets crowded depends on how many cows arrive together and how many feeding places are open. Check individual pen-entry and calving dates to see how often a cow’s stay would exceed 28 days.
Can Restricting Phosphorus Improve Calcium Without a Binder?
It did in Hannover, under gated feeding. The researchers used electronic feed gates to limit each of 30 cows to 11.5 kg (25.4 lb) of dry matter a day. They fed either 0.16% or 0.30% P in DM for the last four weeks of gestation. The low-P cows’ mean ionized calcium never dropped below 1.10 mmol/L. The adequate-P group’s mean stayed below 1.10 mmol/L from calving through day 2. Five adequate-P cows met the study’s chronic subclinical hypocalcemia definition, compared with none on low P. Low-P feeding still didn’t eliminate subclinical dips. Six low-P cows had transient hypocalcemia and one had delayed hypocalcemia.
Hannover’s intake cap changed the phosphorus supply
| Hannover treatment | Phosphorus, % of ration dry matter | Daily dry matter allowance | Calculated phosphorus supply | Below 20 g P/day? |
|---|---|---|---|---|
| Low phosphorus | 0.16% | 11.5 kg | 18.4 g/day | Yes |
| Adequate phosphorus | 0.30% | 11.5 kg | 34.5 g/day | No |
Basis: Hannover diet concentrations and feed allowance reported in the supplied draft, attributed there to Wächter et al., Journal of Dairy Science, January 2022. Daily phosphorus supplies are Bullvine’s calculations: phosphorus fraction × 11,500 g dry matter. These are experimental feeding conditions, not a commercial ration recommendation.
At the 11.5 kg allowance, the 0.16% ration supplied about 18.4 g of phosphorus a day and the 0.30% ration supplied 34.5 g (Bullvine’s calculation). Only the low-P group was fed to stay under 20 g a day.
Barn math (Bullvine’s calculation): at 13.5 kg of daily dry matter intake (DMI), the intake Wisconsin used to formulate its diets, 20 g of phosphorus corresponds to about 0.148% of ration dry matter. That’s below the 0.16% diet Hannover fed under restriction. Hannover kept phosphorus intake under 20 g a day by pairing a low-P ration with an intake cap.
What to Check Before Setting the Binder Dose
UW–Madison Extension advises checking the ration’s phosphorus concentration and getting a reliable estimate of dry matter intake. Together, those numbers tell your nutritionist how many grams of phosphorus the cows eat per day. Recheck ingredients regularly, especially by-products that vary between loads.
Zeolite also binds magnesium. Wisconsin’s binder ration analyzed at 0.44% Mg, and those cows still had the lowest serum magnesium before calving: 1.00 mmol/L, against 1.09 on the control and 1.10 on the anionic diet. On calving day it was 1.06, against 1.32 and 1.18. The dip didn’t last. From day 6 through day 49, binder cows had the highest serum Mg of the three groups. “Even at their low point, binder cows sat at the top of the 0.75–1.0 mmol/L range the authors give as normal, and the 0.44% ration was inside the 0.40–0.45% band they cite for reducing hypocalcemia risk. Keep Mg in that band if you switch.
Extension guidance puts the effective window at 14–28 days before calving. It also warns that extended feeding can cause severe hypophosphatemia, which makes zeolite A a poor fit for one-group dry cow programs.
What Does This Mean for Your Operation?
- Test before you switch: test the close-up TMR for phosphorus, potassium and magnesium, and give your nutritionist the pen’s measured DMI. Ask for the delivered ration cost per cow for the full close-up period under each program, using the forage you intend to feed.
- Get a baseline at day 1 and day 4: Wisconsin’s ionized calcium advantage disappeared after day 3, so calving-day blood alone won’t judge a transition program. In an observational study of two New York herds, multiparous cows with persistently low total calcium had 1.8 times the risk of disease or removal in the first 60 days in milk compared with normal-calcium cows. Those researchers sampled at 1 and 4 DIM to separate persistent from delayed cases (both at or below 2.20 mmol/L at 4 DIM). Ask your herd vet how many multiparous cows to sample at those two time points.
- Track intake: start before the switch. Each day, subtract the dry matter in refusals from the dry matter delivered and divide by the number of cows fed. Use the same method after the switch and compare kg DM per cow per day.
- Keep it a close-up program: check pen-entry and calving dates, and confirm the binder feeding period stays inside the planned window, including for cows that calve late.
Zeolite A fits a two-group dry cow barn with tight pen-entry tracking that can keep even late-calving cows inside the 14–28-day window and price the binder on actual close-up forage tests. Skip it if you run a one-group dry cow program, if your close-up bunk can’t absorb roughly 15% more cow-days when gestations stretch, or if the quote only pencils out on cheaper high-potassium hay that Wisconsin never tested.
Does Zeolite A Pencil Out in Your Close-Up Pen?
Enter your close-up stay, TMR phosphorus and daily ration quotes to estimate full-period cost per cow, pen-day load and 28-day window risk in under 60 seconds.
UW–Madison Extension notes zeolite A is a poor fit for one-group dry cow programs.
Wisconsin anionic default: 13.5 kg (29.8 lb); zeolite averaged 11.7 kg (25.8 lb).
Wisconsin binder ration: 0.37% P (control/anionic 0.36%); Hannover low-P: 0.16%.
Wisconsin anionic/control average: 23.5 days. Extension effective window: 14–28 days.
Wisconsin difference: +3.7 days (27.2 vs. 23.5 days). Enter 0 to test equal stay.
Delivered daily ration cost per close-up cow using your actual close-up forage.
Include binder (WI targeted 500 g/d, ~1.1 lb) and Mg fortification on the same forage.
Optional: scales per-cow close-up cost and extra cow-days to your annual herd total.
Enter both daily ration quotes above to compare full close-up cost per cow and calculate your break-even daily binder quote.
Illustrative estimate based on your inputs and Frizzarini et al. (2024), Wächter et al. (2022), and UW–Madison Extension (2025). Not financial advice. Bullvine calculation.
How we calculate this
- Projected Zeolite A Stay (days): Current close-up stay + expected extra stay days. Checked against UW–Madison Extension’s 14–28-day effective window.
- Close-Up Cow-Day Shift (%): (Extra stay days ÷ current close-up stay days) × 100.
- Daily Phosphorus Intake (g/day): Close-up DMI (kg/day) × 1,000 × (TMR P % ÷ 100).
- No-Binder Low-P Ceiling (% DM): (20 g P/day ÷ [DMI in kg × 1,000]) × 100, based on Hannover’s under-20 g/day restriction target.
- Full Close-Up Cost per Cow ($): Daily anionic quote × current stay vs. daily zeolite A quote × projected zeolite A stay.
- Break-Even Zeolite A Daily Quote ($/cow/day): Full anionic close-up cost ÷ projected zeolite A stay days.
- Reference 14-Day Intake Difference (WI trial): 1.8 kg DM/cow/day × 14 days = 25.2 kg DM (55.6 lb at 2.2046 lb/kg). Published 14-day means cannot confirm total intake across different stay lengths.
How We Did the Math
- Hannover comparison: 20 g P ÷ 13,500 g dry matter × 100 = 0.148% P. This illustrates the experimental restriction.
- Hannover phosphorus supply at the 11.5 kg allowance: 0.16% × 11,500 g = 18.4 g; 0.30% × 11,500 g = 34.5 g.
- Daily intake gaps: 13.5 − 11.7 = 1.8 kg DM/cow/day against the anionic ration; 13.9 − 11.7 = 2.2 kg DM/cow/day against the control.
- 14-day intake difference: 1.8 kg DM/cow/day × 14 days = 25.2 kg DM/cow.
- Close-up cow-day increase, if the longer stay holds on your farm: 3.7 extra days ÷ 23.5 baseline close-up days × 100 = 15.7% more close-up cow-days.
- Unit conversions: 1 kg = 2.2046 lb. 500 g = 0.5 kg ≈ 1.1 lb; 1.8 kg ≈ 4.0 lb; 11.5 kg ≈ 25.4 lb; 11.7 / 13.5 / 13.9 kg ≈ 25.8 / 29.8 / 30.6 lb; 25.2 kg ≈ 55.6 lb; 51.0 / 46.3 / 48.2 kg ≈ 112.4 / 102.1 / 106.3 lb.
Learn More
- A Wisconsin Herd's DCAD Said −120. A 50‑Cent Urine Strip Said Otherwise. — Before paying for a binder, verify your anionic ration is actually working in the bunk. Exposes how sorting pushed negative-DCAD cows to pH 7.2–7.5 and arms you with 10-cow urine-strip targets against \$60–\$226/case hypocalcemia.
- The \$500 Transition Gap: Why Your Neighbor's Fresh Cows May Outperform Yours by Next Winter — Captures \$200–\$500 per cow by moving beyond blanket close-up rations to risk-tiered transition protocols. Follows the money on EU selective dry-cow shifts and Cornell's productivity trap, cutting 60-day fresh disease 25–30% through targeted dry-off flagging.
- Rumination Drops Five Days Early. The Payback Takes Six Years. — Six-plus years on health alerts alone—that's the real payback at \$120/cow when buying sensors to track close-up rumination drops. Dismantles five-day warning expectations using Cornell's 2.1-day detection data and breaks down sharper alert thresholds.
The Sunday Read Dairy Professionals Don't Skip.

Every week, thousands of producers, breeders, and industry insiders open Bullvine Weekly for genetics insights, market shifts, and profit strategies they won't find anywhere else. One email. Five minutes. Smarter decisions all week.