Archive for body weight composite

HCC vs. PTAT: Holstein’s 2026 Stature Penalty and the New 60-Inch Line

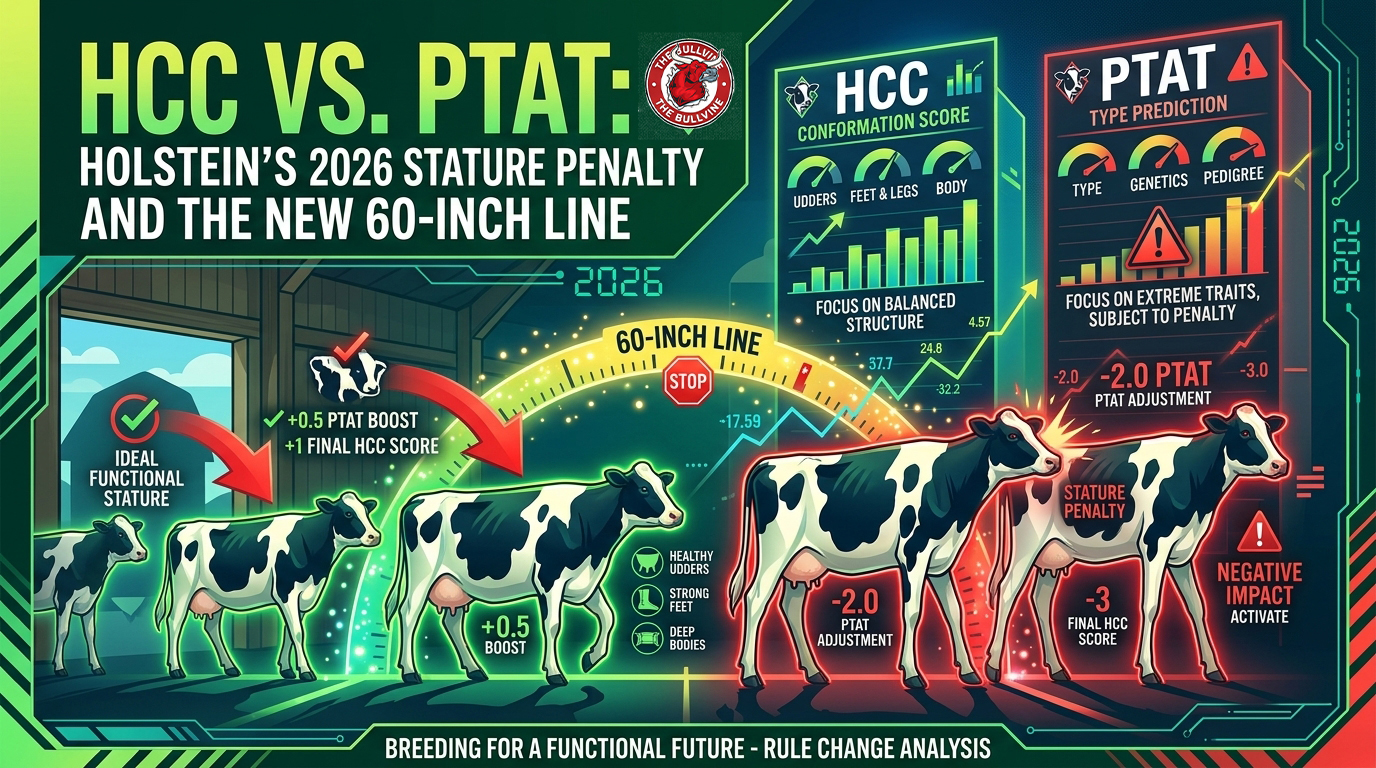
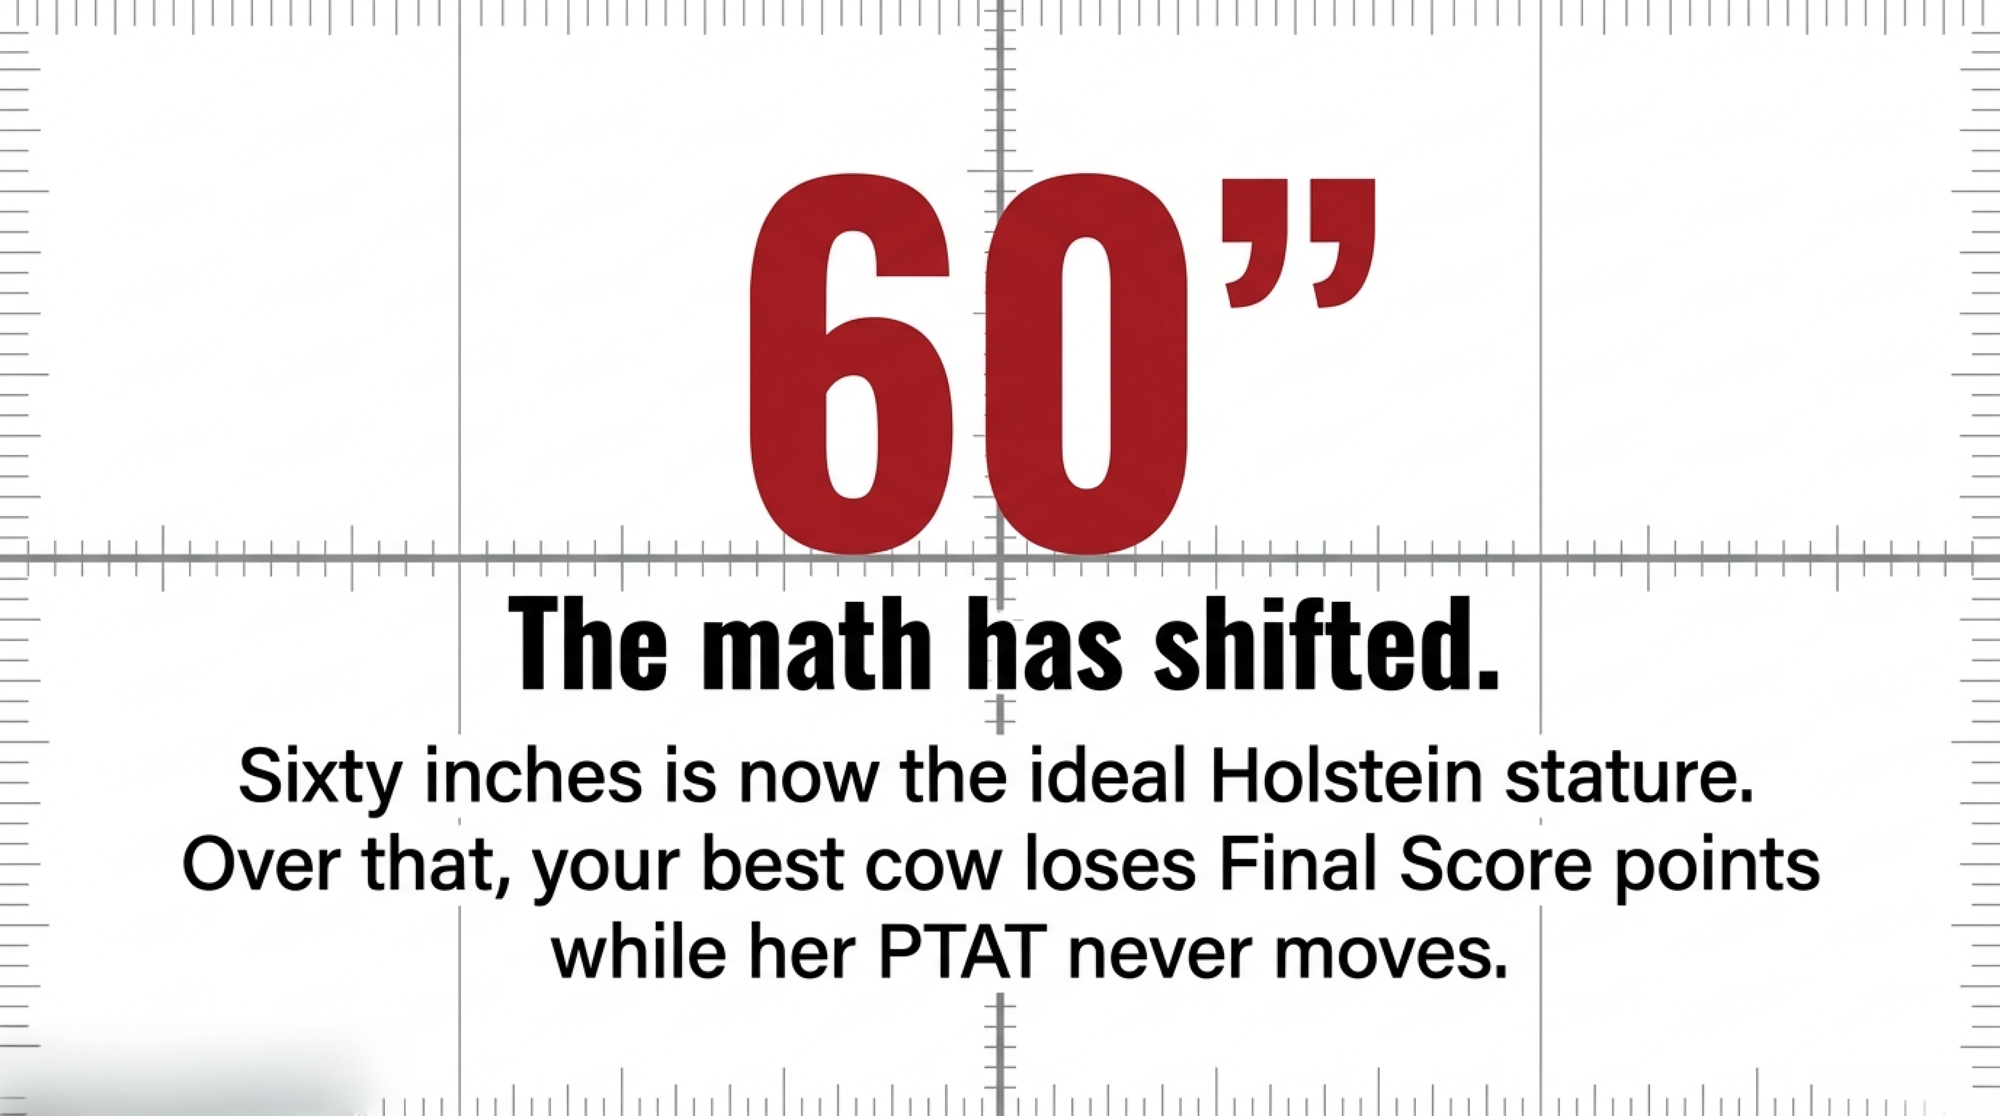
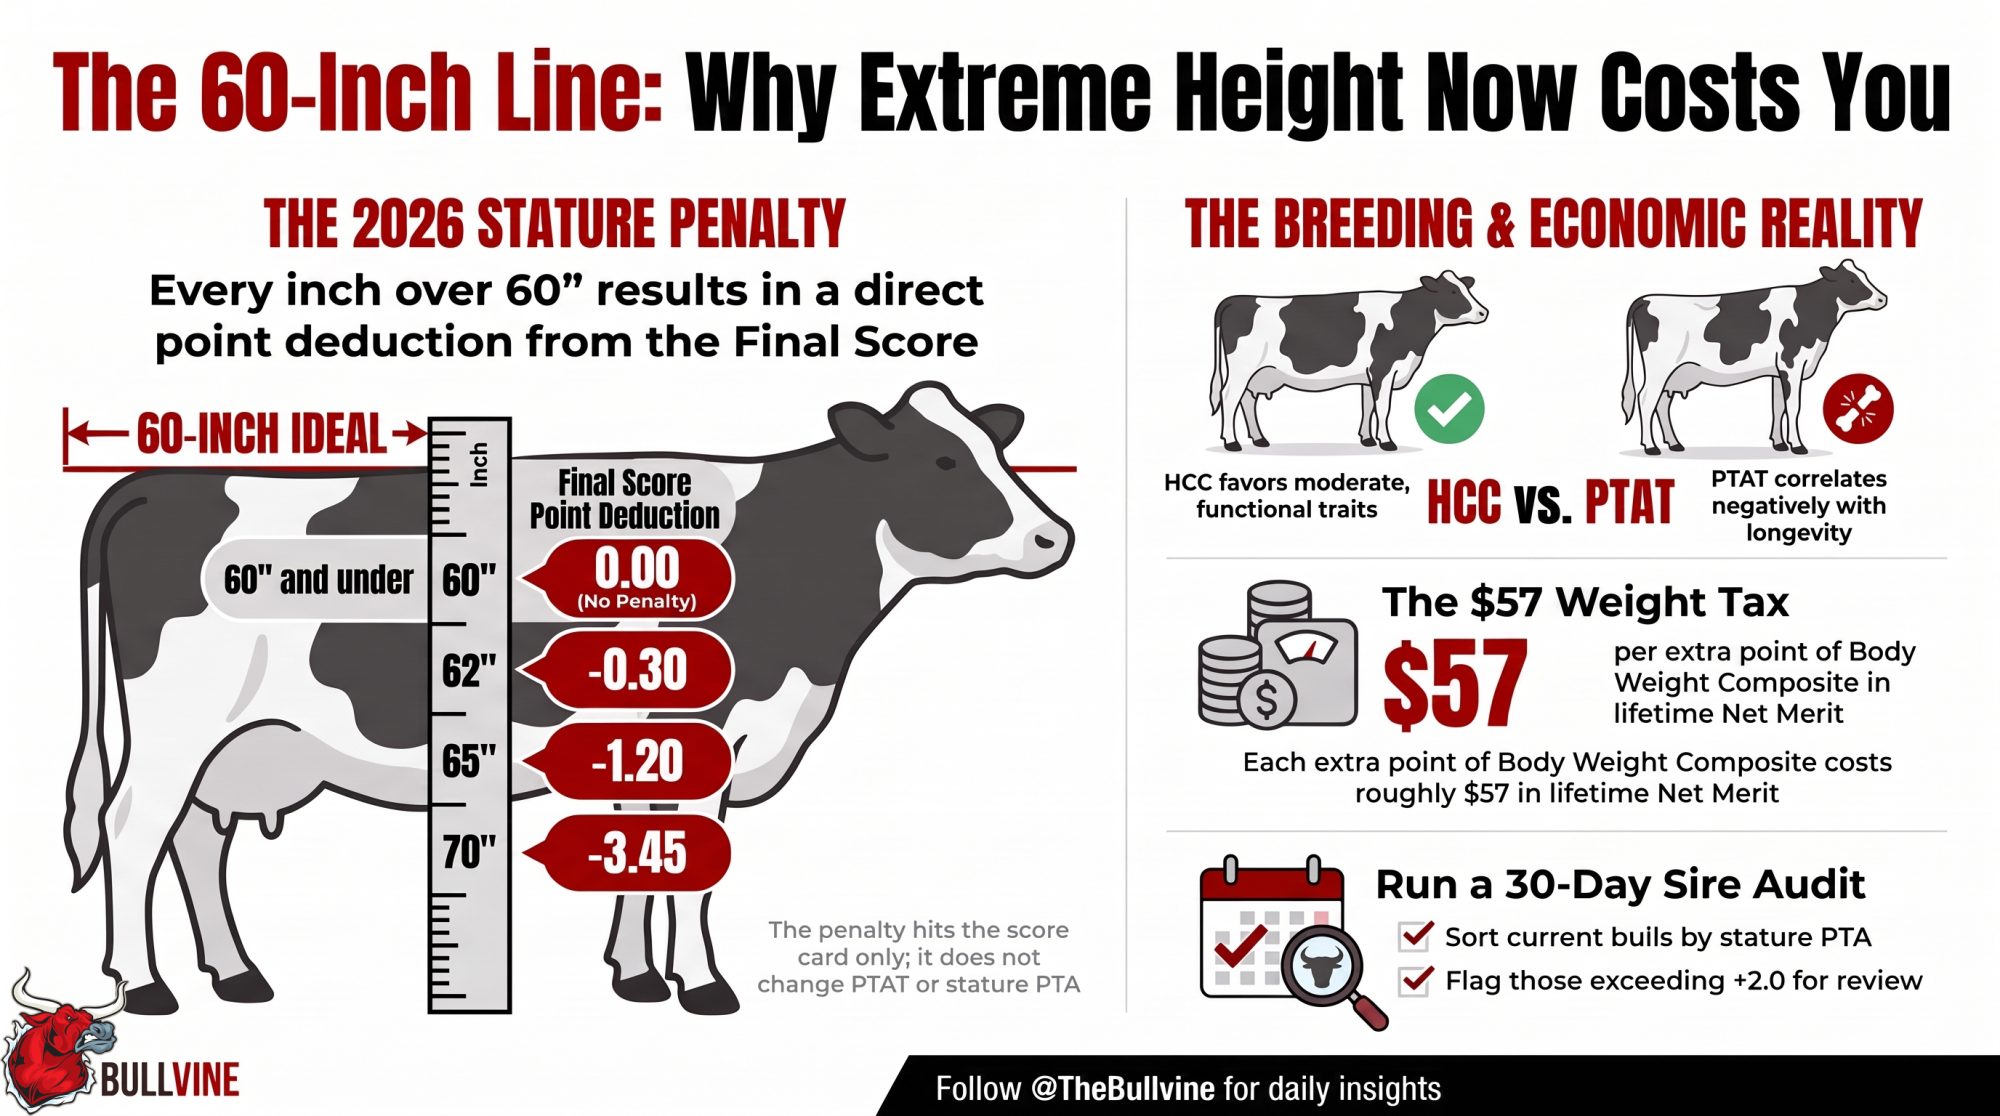
Sixty inches is the new line. Over it, your best show cow loses Final Score points — 0.15 at 61″, 1.20 at 65″ — while her PTAT never moves. Here’s the table, and why HCC reads what PTAT can’t.

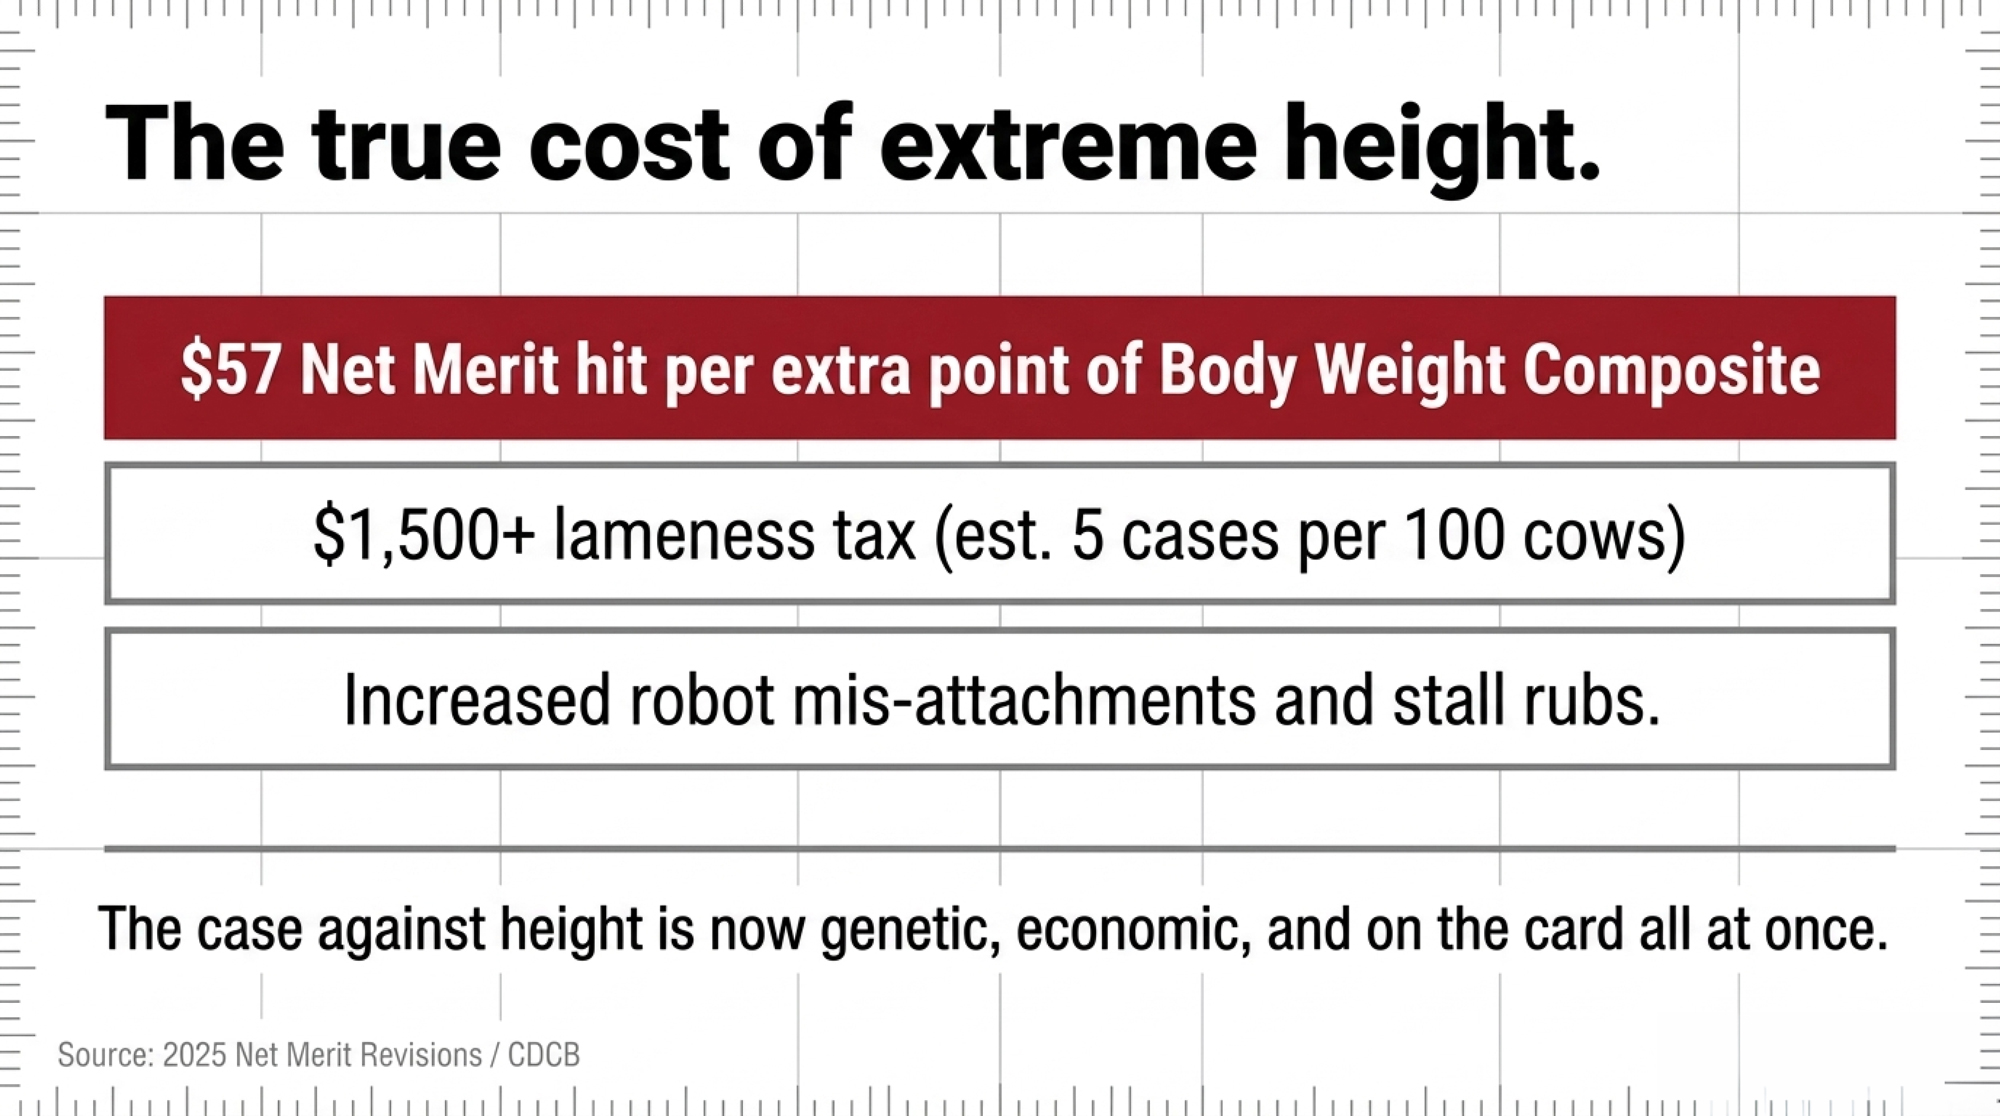
Executive Summary: Starting with the May 2026 classification run, Holstein USA made 60 inches the ideal stature — and every inch over it now docks Final Score, from 0.15 at 61″ to 1.20 at 65″ and 3.45 at 70″, pulled straight out of Front End & Capacity. Here’s the part that trips people up: the penalty applies only to the classification card. Your bull’s PTAT and stature PTA don’t move an inch, so if you’ve been buying high-PTAT, high-stature semen, your daughters can still grade down on the day the classifier puts the stick on them. The board paired it with two more changes — the new 18-trait Holstein Conformation Composite (HCC), which weights Stature highest but favors lower values and actually correlates positively with Productive Life where PTAT correlates negatively, and a BAA rule that only counts cows calved in the last 24 months. Stack the classification hit on the 2025 Net Merit math — about $57 off lifetime NM$ per extra point of Body Weight Composite — plus more lameness and robot misses in stalls built for average cows, and the case against extreme height is now genetic, economic, and on the card all at once. The tell? The 2025 Star of the Breed, Oakfield Solomon Sunset, was bred for width and correctness over height.
Holstein stature penalty

Picture the best-looking cow you’ve ever raised. The one that turned heads down the chute, framed up beautiful on the halter, filled the alley like she owned it. Now picture the classifier putting the stick on her in the May 2026 Holstein classification run — and knocking points off her card for the exact height you spent years breeding into her. This is the Holstein classification 2026 stature penalty in a sentence, and it changes your next mating decision. 

That’s the shift. At their March 2026 meeting, Holstein Association USA’s board approved a package of changes that all lean one way — away from extreme height, toward cows built to last. And it lands hardest on the animals a lot of show-focused programs spent twenty years building. Whether you halter cows or want them to last four lactations in a freestall, this one touches your next mating decision. 
What’s Really at Stake

Three changes arrived together out of the same March board meeting, and they reinforce each other. The centerpiece is a sliding-scale stature penalty, recommended by HAUSA’s Conformation Advisory Committee and approved by the board, setting 60 inches as the breed’s ideal stature for the first time — over that, cows take a progressive deduction on their classification score. Alongside it came the Holstein Conformation Composite (HCC), a new selection index built to identify animals with the combination of traits tied to balance, function, and longevity, rather than Final Score alone. And a quieter rule now ties Breed Age Average to cows that calved within the previous 24 months, so only currently productive animals count. 

Read this line twice, because it’s the one that trips people up: the penalty hits your classification score only. It doesn’t touch PTAT, stature PTA, or any genetic evaluation for stature or any other trait. Your bull’s numbers haven’t moved. What changed is what his daughters score the day the classifier puts the stick on them. 

If you breed for the ring, you’ll feel this most. If you’re a commercial breeder chasing durability, you’ll mostly nod — because the change is pushing toward the cow you already want.

What Does the Stature Penalty Actually Cost? (The Official Table)

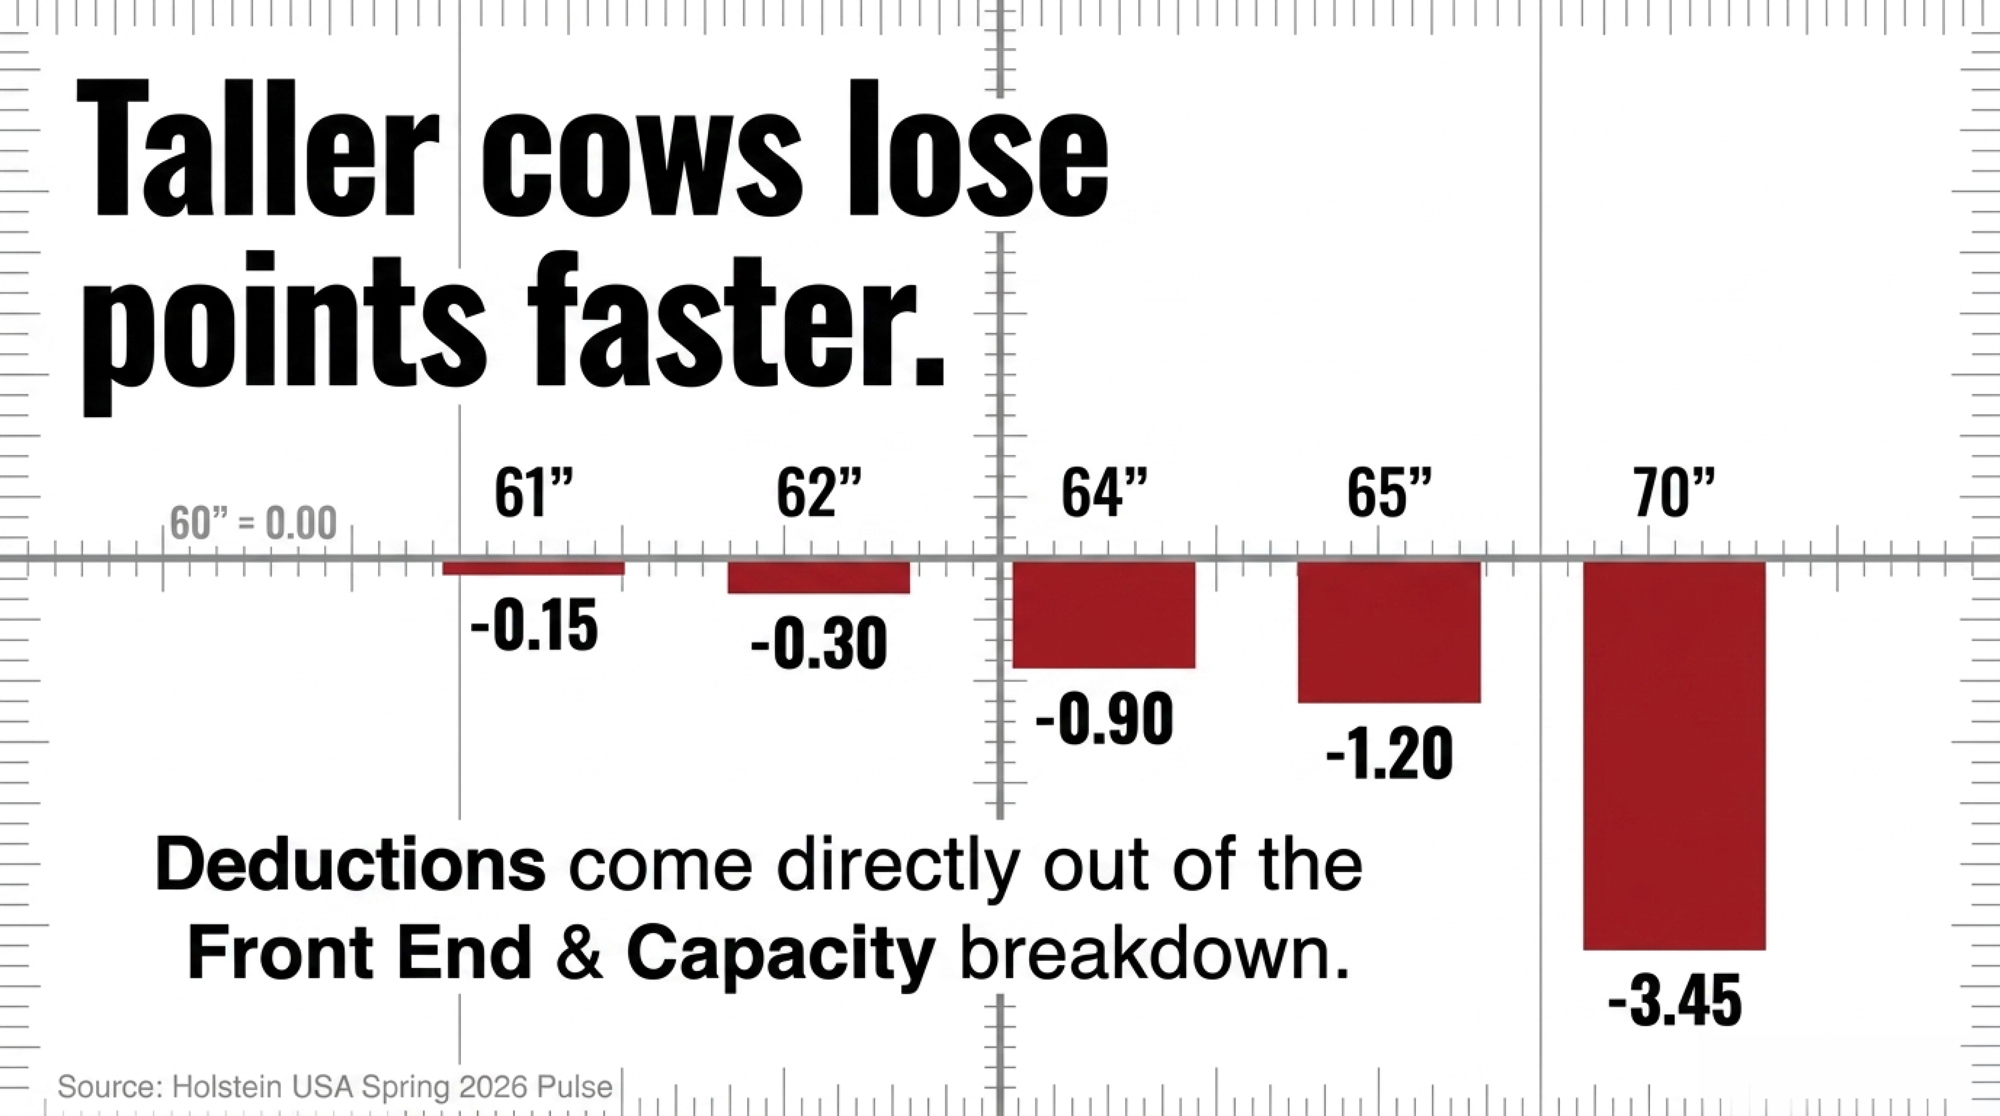
Here’s the part breeders keep asking about — the exact numbers, now published in Holstein USA’s Spring 2026 Pulse. Cows at or below 60 inches take no penalty. Stature is measured at the hips, top of the spine to the ground. Above 60″, the deduction comes out of the Front End and Capacity major breakdown, which is 15% of the final classification score. 
StaturePoint deduction from Final Score
60″ and under0.00 (no penalty) 
61″−0.15 
62″−0.30 
64″−0.90 
65″−1.20 
68″−2.55 
70″−3.45 

Notice the curve. At 61 inches it’s a rounding error — fifteen-hundredths of a point. But the penalty accelerates fast: by 65 inches you’re down more than a full point, and at the tall extremes it bites hard. For a cow sitting right on the VG/EX line, even a half-point can move her final designation. 

Don’t Confuse This With the 2024 Scale Change

Two different things happened, roughly a year apart, and breeders keep mixing them up at the coffee shop. So let’s split them clean.

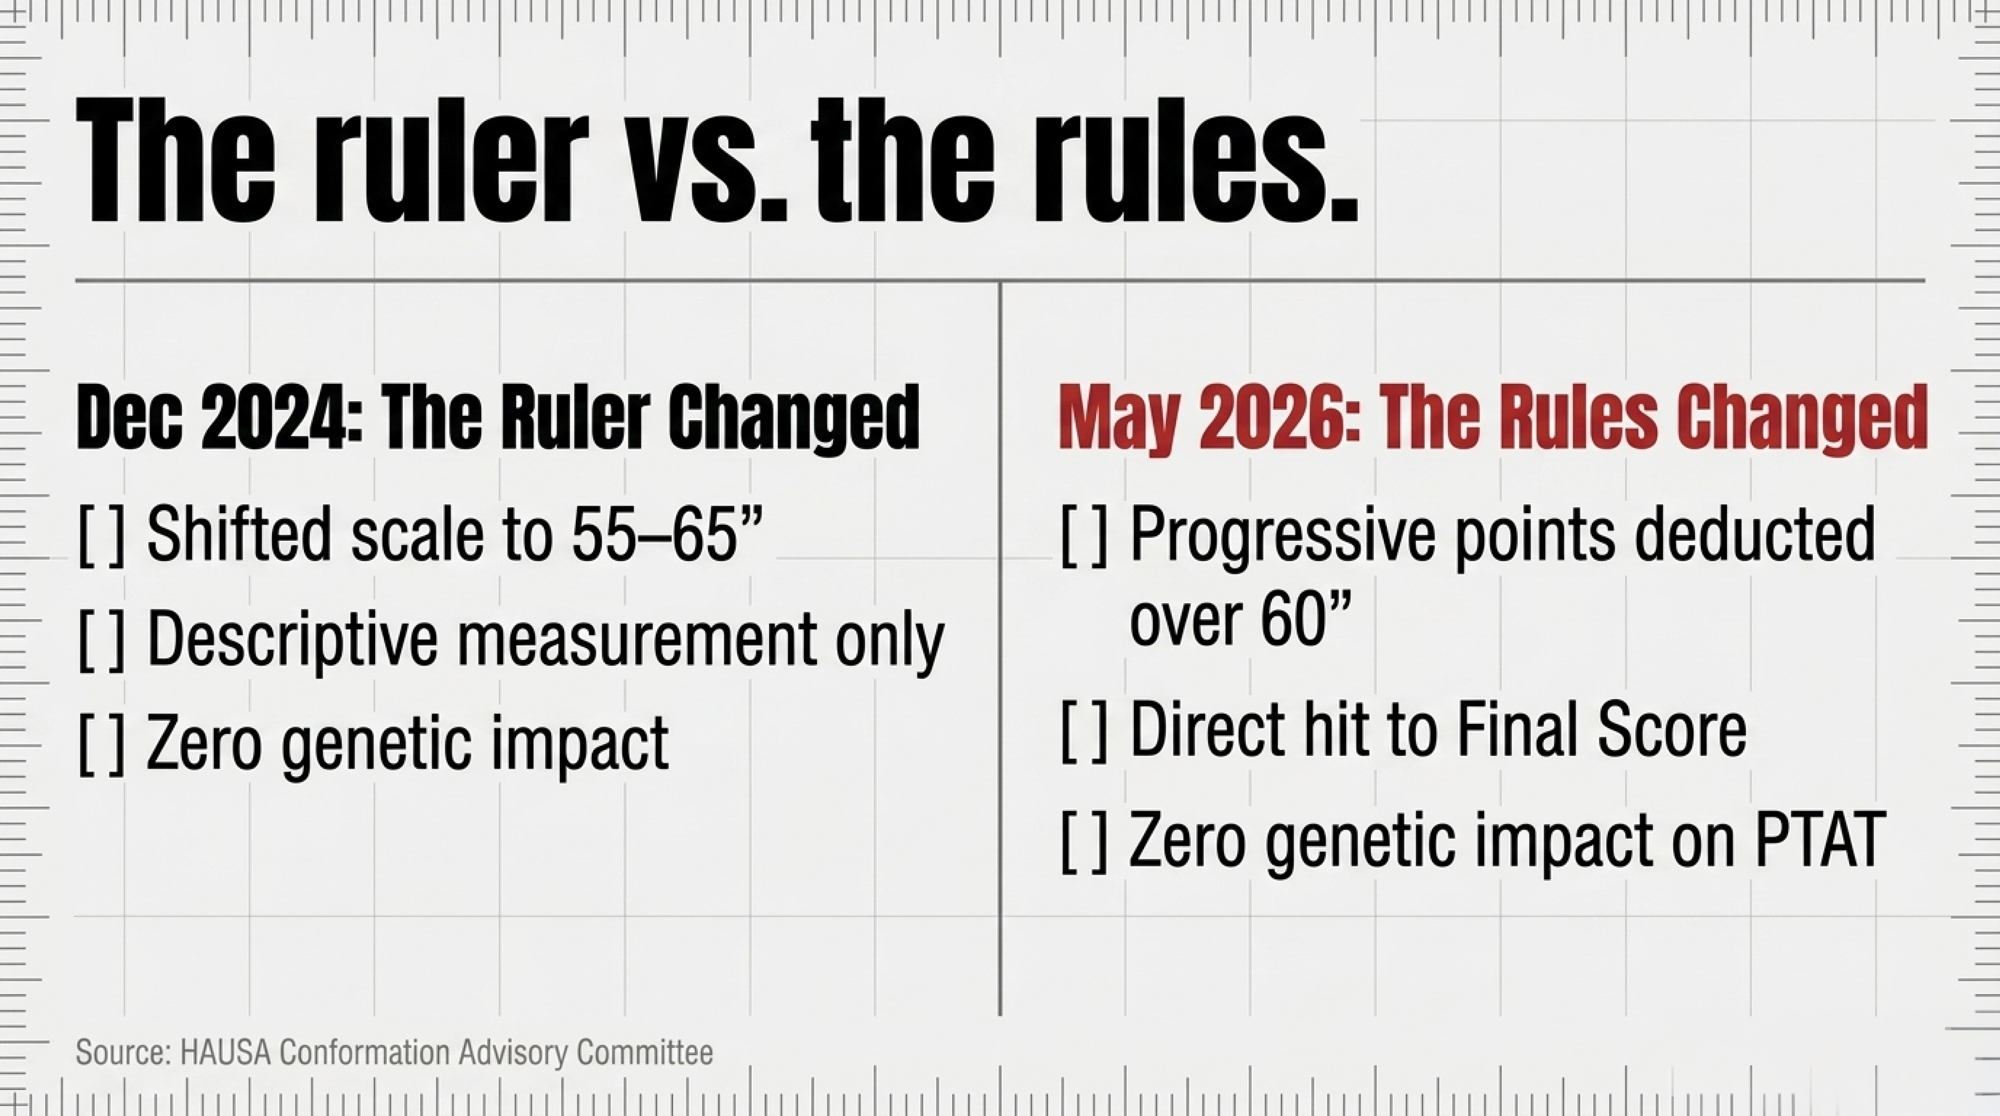
The December 2024 change was a measurement recalibration. After Dr. Jeffrey Bewley’s 2023 cow-measurement project found the breed had physically outgrown the old ruler, Holstein USA shifted the linear stature scale from the old 51-to-61-inch range to a new 55-to-65-inch range, effective December 1, 2024, with each inch worth five points on the linear scale. It didn’t punish anything. It just measured tall cows more honestly — 60″ now reads as 25 on the scale, 65″ as 50. 

The May 2026 change is a penalty — the first time excessive height actually costs points on the final card. One fixed the ruler. The other put a price on being tall. 
Feature / ChangeDecember 2024 Scale ShiftMay 2026 Stature Penalty
What it didShifted linear scale from 51–61″ to 55–65″ Progressive point deductions for cows over 60″ 
The impactDescriptive only; each inch = 5 linear points Direct deduction from Final Score, via Front End & Capacity 
Genetic impactNone — ruler calibration None on PTA stature or any trait; classification score only 

This Didn’t Come Out of Nowhere

The 2026 penalty is the loud version of a change the breed started making quietly years ago. Holstein USA has been restructuring how stature feeds into its evaluations for a while — pulling height back out of the numbers it had been quietly propping up, so a very tall bull couldn’t post shiny composite figures on frame alone. The 2026 penalty moves that logic onto the classification card itself, where every breeder can see it. 

There’s history worth naming here. For a generation, the tall, sharp, angular daughter was the ideal — and no bull embodied it like Braedale Goldwyn, the greatest type sire of his era, who became the first bull ever to produce 1,000 Excellent daughters in Canada. Goldwyn didn’t do anything wrong; he delivered exactly the phenotype the industry rewarded at the time. But the cow the new penalty docks is, in large part, the cow that era taught breeders to chase. That’s not an attack on the breeders who built those pedigrees — it’s the whole point. The target moved, and the scorecard just caught up to it. The industry keeps admitting, one step at a time, that cows were getting credit for being tall rather than being good. 

The Genetics and Economics Behind the Line

The move isn’t a hunch. Dr. Jeffrey Bewley’s “A Million Reasons Why Conformation Matters” project matched classification records against lifetime production data across the breed’s database, and HAUSA’s own internal research consistently shows that extremely tall cattle don’t last as long as more moderate-stature animals. The functional traits — udders, feet and legs, capacity — drove the biggest lifetime differences, not raw frame. Height for height’s sake was never what paid. That’s the whole logic of the 2026 direction. 

Where does a tall cow cost you before the classifier even arrives? Usually in the stalls and around the robot. Freestalls get sized for the typical mature Holstein. Push cows well past that, and you see more lameness, more hock rubs, more robot mis-attachments. Bigger cows also eat more to haul the extra frame — which is why the 2025 Net Merit revision cut Body Weight Composite to −11% and lifted Feed Saved, knocking roughly $57 off lifetime Net Merit for every extra point of Body Weight Composite

Try the barn math — an illustration, not a herd average. Run 100 cows and say oversized cows push your lameness rate up by 5 cases a year. At $300 a case — a conservative figure; real cases often run higher — that’s $1,500. Small on its own. But stack it on that $57-per-point weight tax, faster culling, and now a classification hit, and it’s the math you’ve been putting off.

Cost driverWhere it hitsIllustrative annual cost (100-cow herd)
Body Weight Composite tax (2025 NM$)Lifetime Net Merit, per extra BWC point−$57 per point, per cow
Added lameness (oversized cows)~5 extra cases/yr @ $300−$1,500
Classification deduction (65″ cow)Final Score → sale value−1.20 pts (can move VG/EX line)
Faster culling / robot missesProductive Life, throughputVariable, compounding

HCC vs. PTAT: What’s the New Composite Reading?

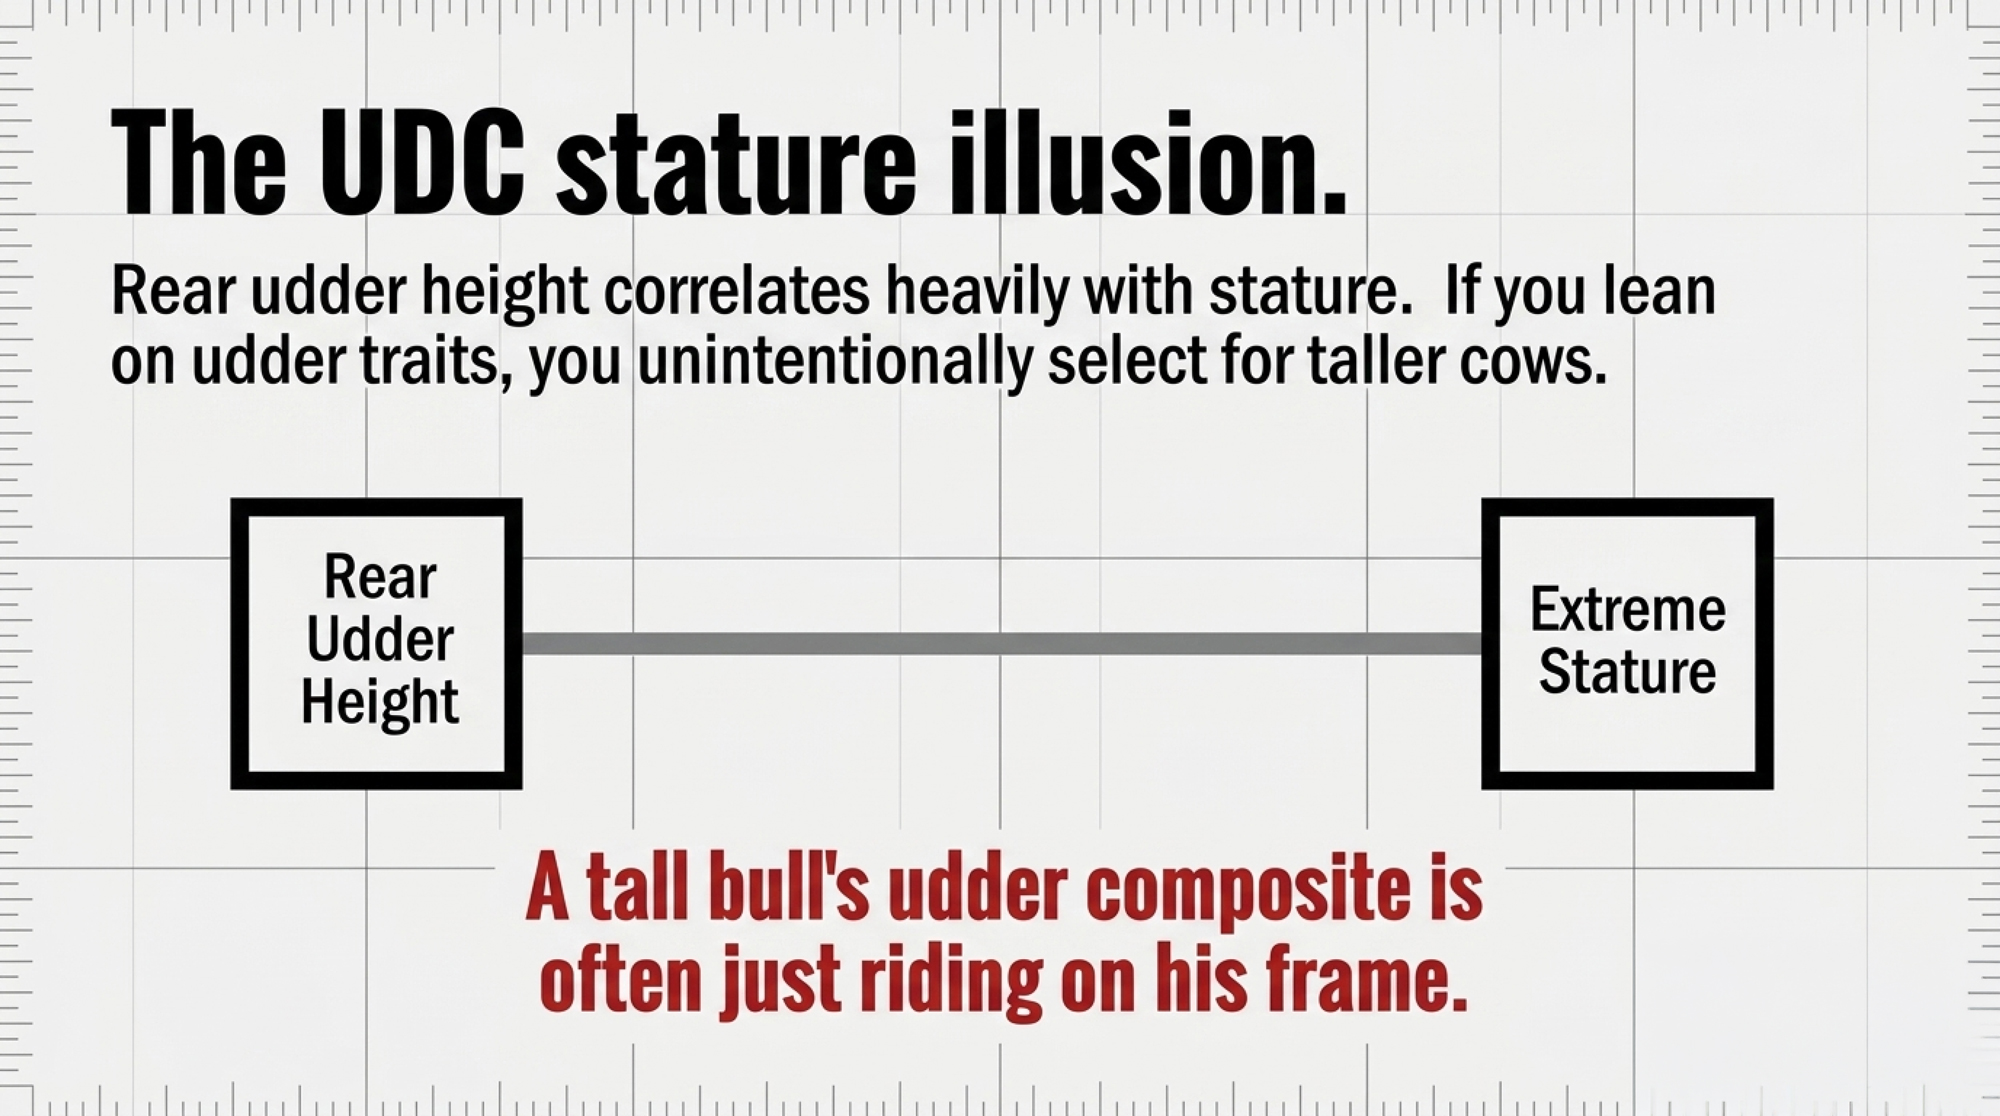
Tall bulls keep sneaking into mating plans because of how the numbers are built. Stature is highly heritable, so it moves to daughters reliably. And here’s the trap Holstein USA spelled out plainly: rear udder height and width carry a high genetic correlation with stature — so if you lean on those udder traits, you unintentionally select for taller cows. A very tall bull can post a flattering udder composite that’s riding on frame, not genuine udder quality. Read it as one number, and you’d miss it. 
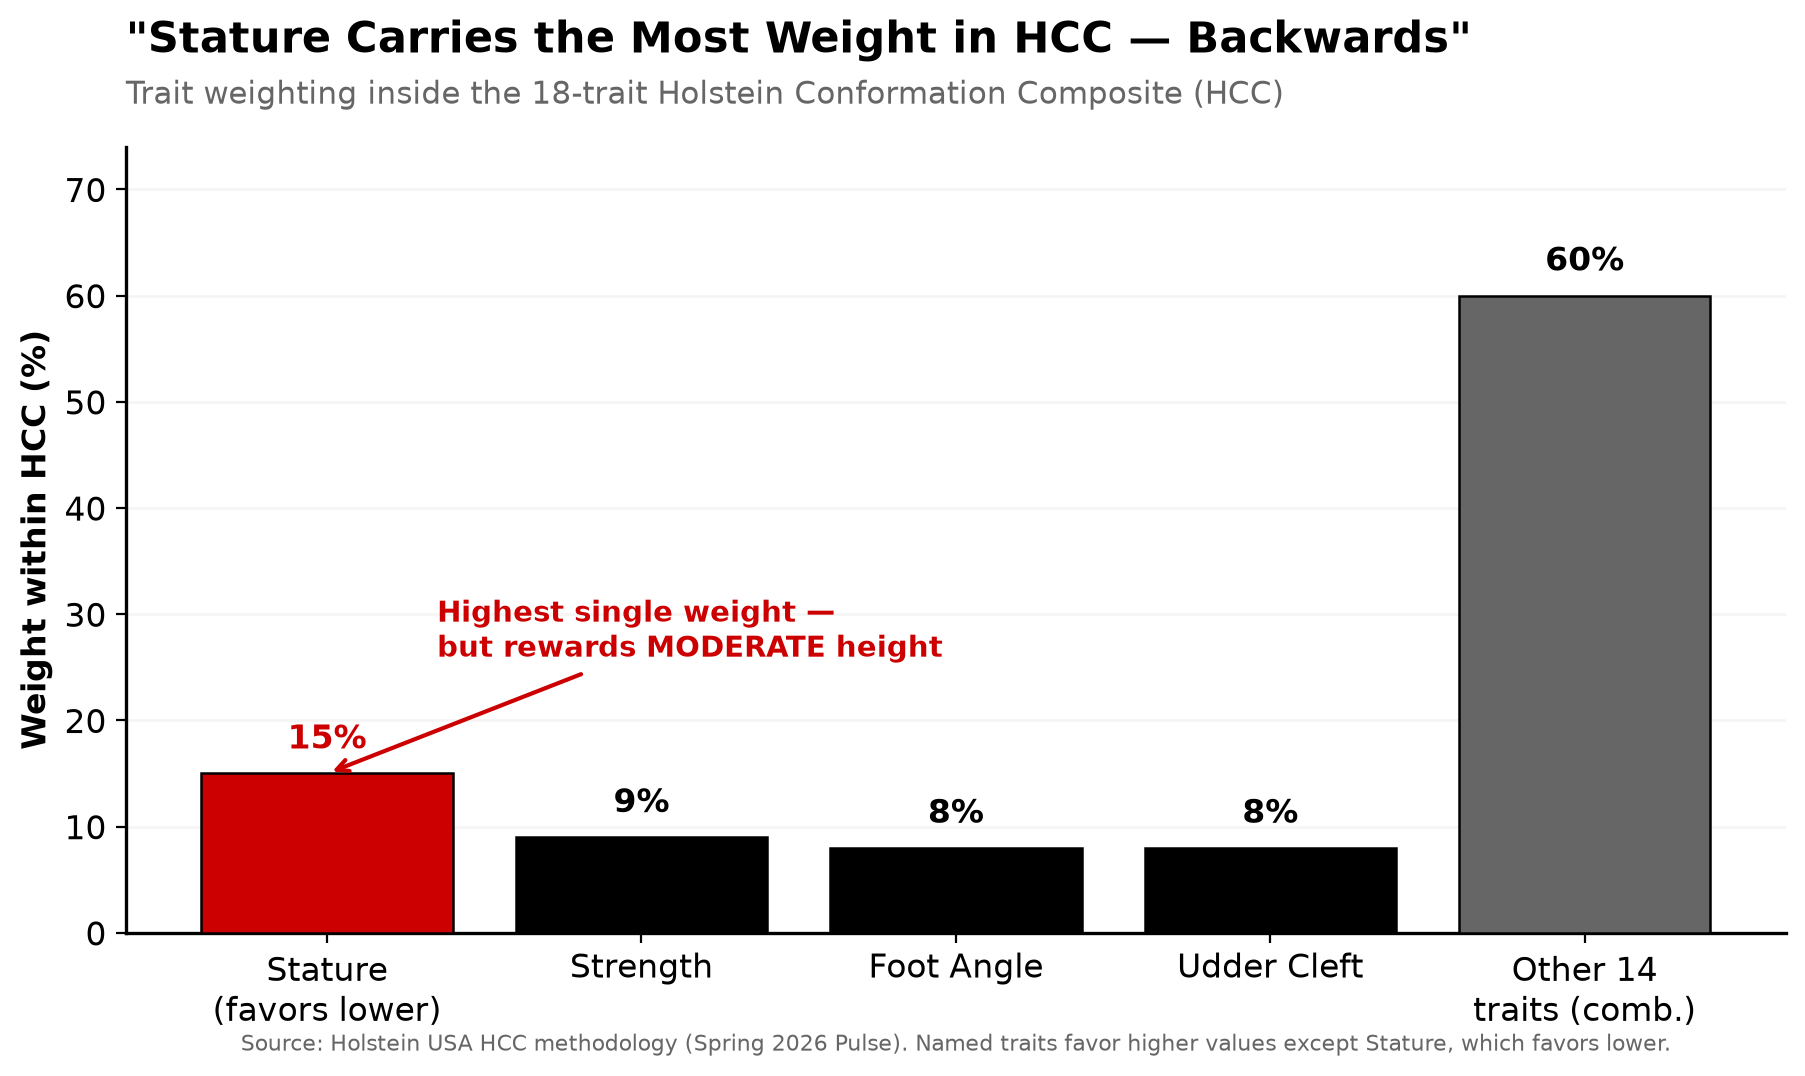
That’s the gap HCC is built to close, and the design is aggressive about it. HCC is a composite of 18 linear conformation traits, weighted by how each relates to functional balance and longevity — not by Final Score. Stature carries the single highest weight at 15%, but it favors lower values: a bull transmitting moderate or shorter stature scores higher on HCC, all else equal. Strength gets 9%, Foot Angle and Udder Cleft 8% each, all favoring higher values. 

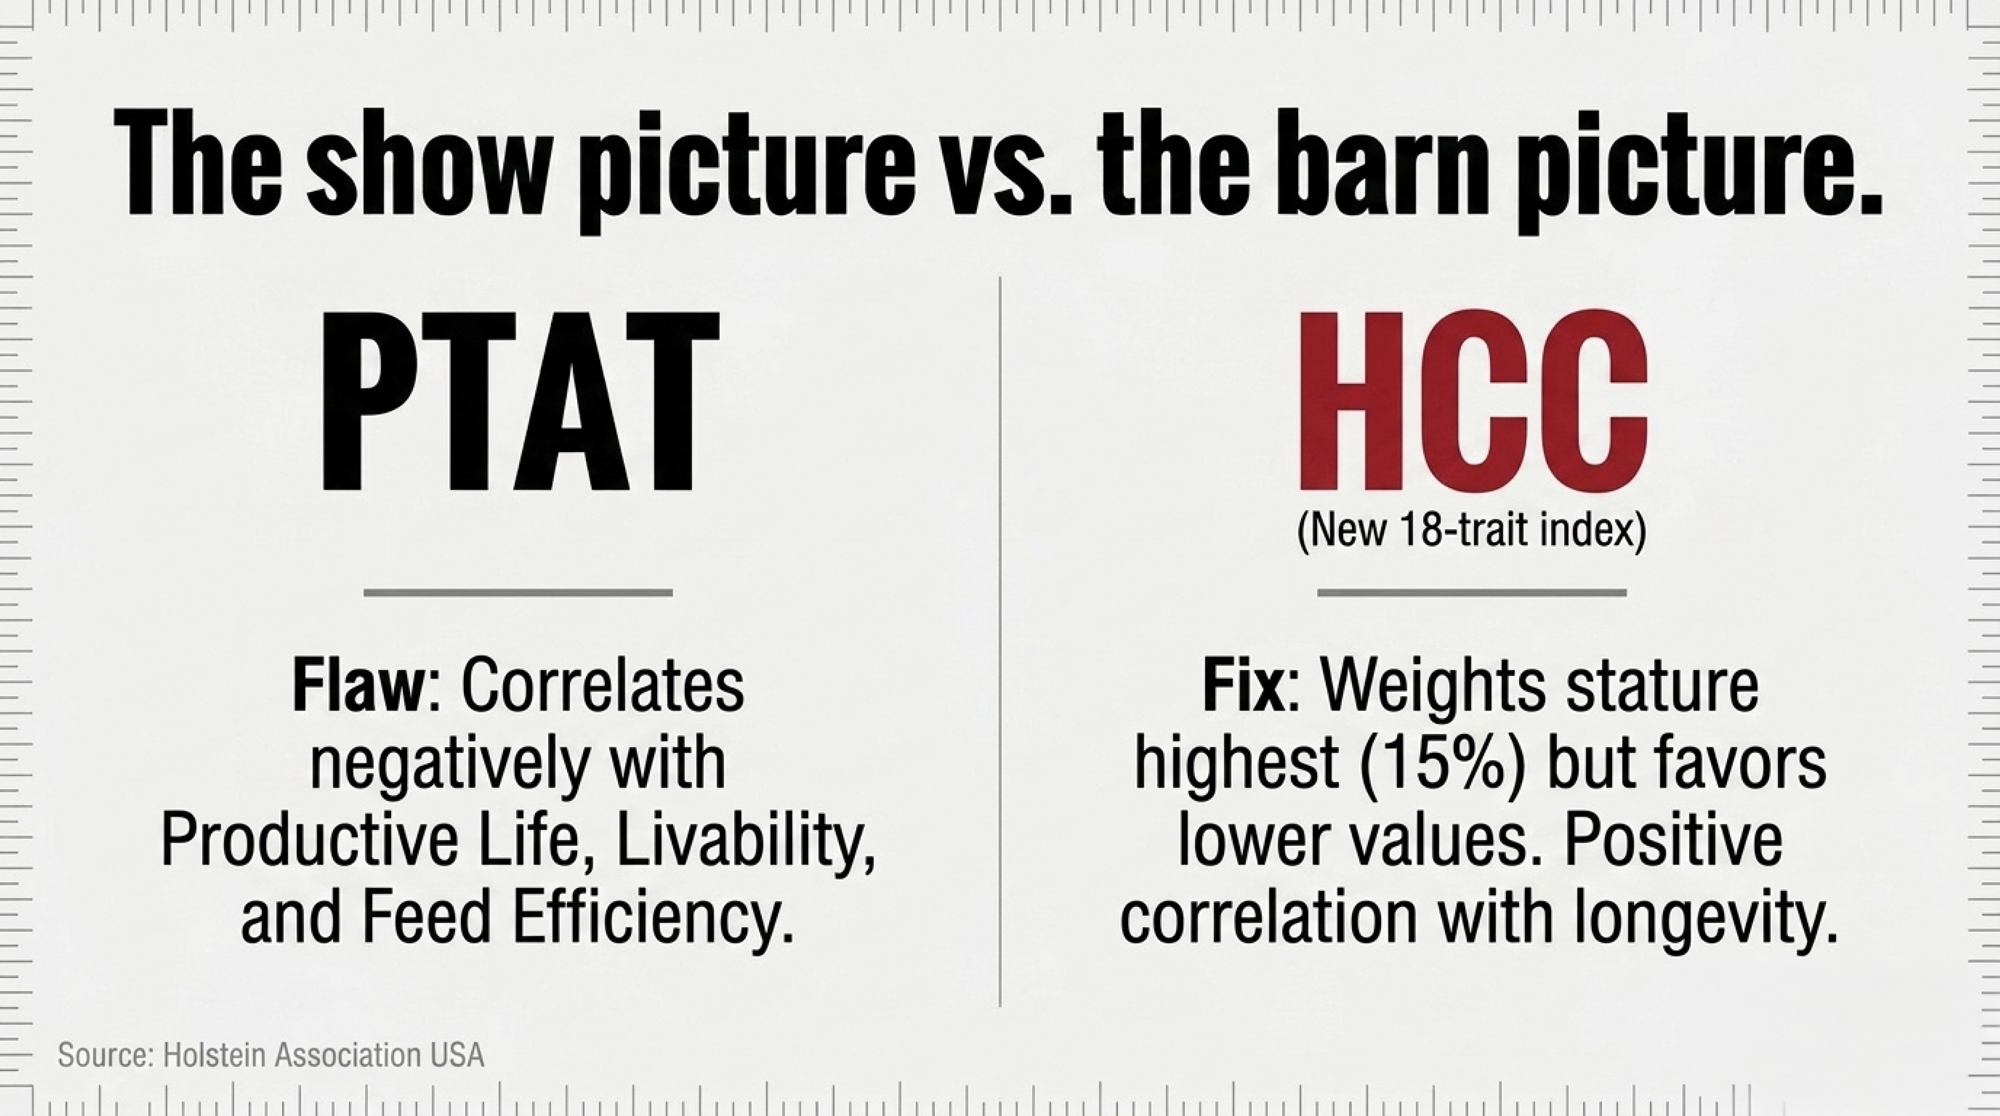
The kicker is in the correlations. Holstein USA published that PTAT shows negative correlations with Productive Life, Livability, Feed Efficiency, and Cow Conception Rate — meaning the highest-type bulls, by the old measure, tend to work slightly against those functional traits. HCC shows near-zero to slightly positive correlations with the same traits. Put plainly: PTAT is the show picture, HCC is the barn picture. 
Two things to keep straight. HCC values for active AI bulls were published before July 1, 2026, alongside PTAT, UDC, FLC, and BWC — it’s an added lens, not a replacement. And its move into TPI is under consideration, not decided: the committees will evaluate HCC performance and weigh incorporating it into TPI later in 2026. Treat it as a compass, not gospel. (Full 18-trait weighting breakdown coming in a follow-up — watch for it.)

Rosy-Lane Holsteins in Wisconsin has run a version of this playbook for years. Their published breeding strategy sorts bulls by Net Merit first, then discriminates against any bull over +2.0 for Stature — a two-filter approach that lines up almost exactly with where classification is now heading.

The Show Ring Is Reading the Same Room
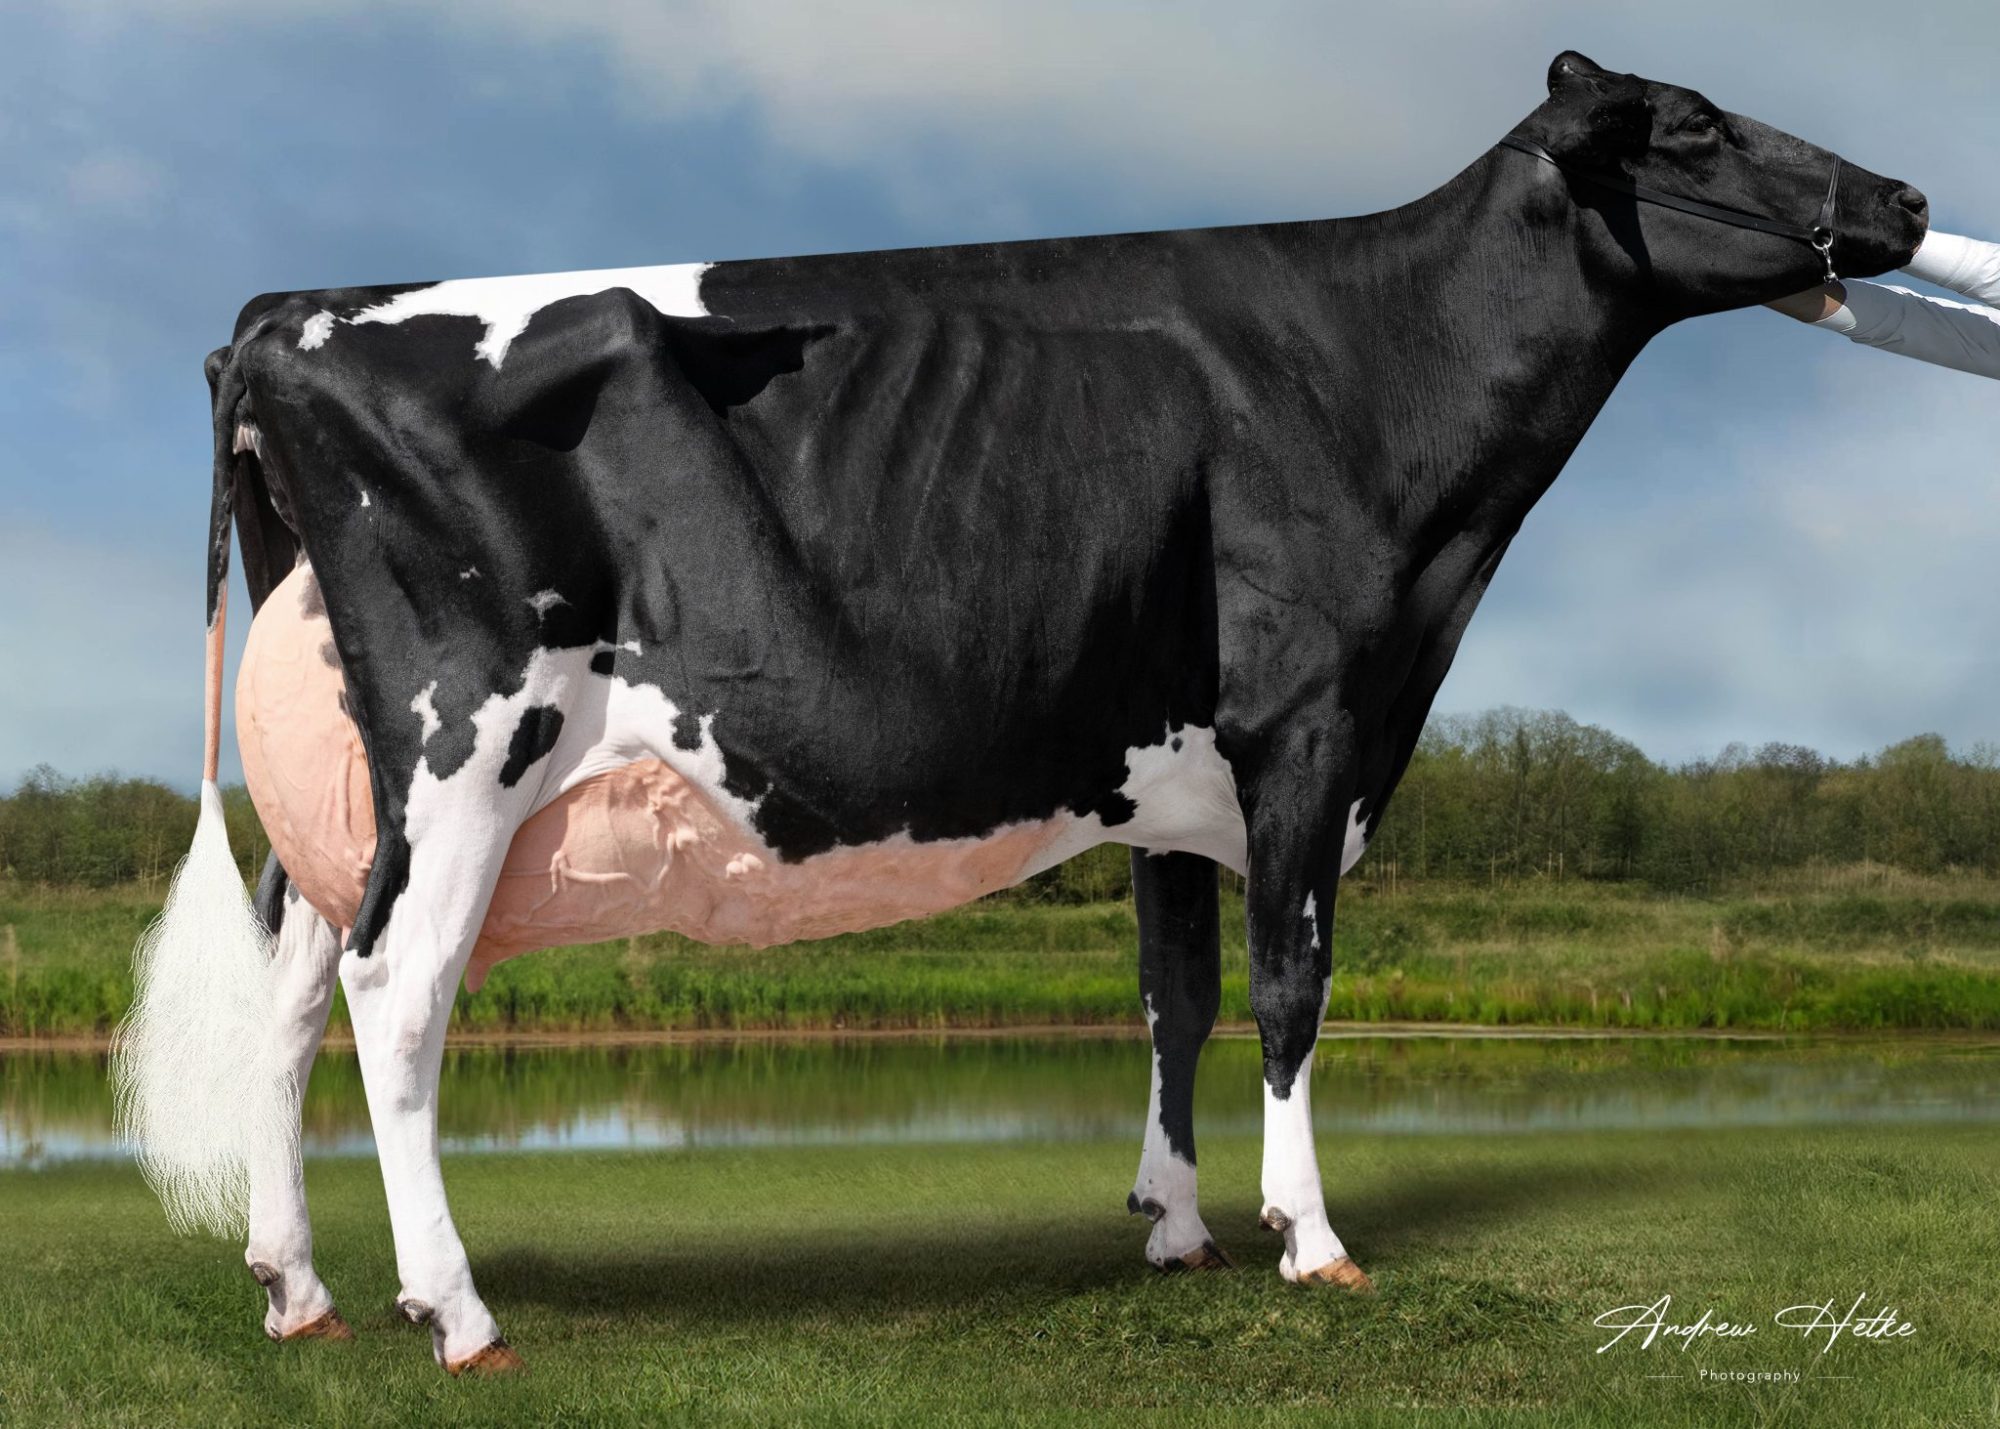
Oakfield Solomon Sunset-ET EX-96 2E — Holstein USA’s 2025 Star of the Breed, bred and owned by the Lamb family of Oakfield Corners Dairy. Look at the depth, the spring of rib, that mammary — power and width, not extreme height. A 51,710-lb five-year-old, and exactly the cow the 2026 stature penalty was written to reward. (Photo: Andrew Hetke Photography)

Here’s the tell that this isn’t just committee talk. Holstein USA’s 2025 Star of the Breed is Oakfield Solomon Sunset-ET EX-96 2E, bred and owned by Jonathan and Alicia Lamb of Oakfield Corners Dairy in New York — a cow the family describes in almost exactly the language the new rules reward. Her production backs it: a five-year-old record of 51,710 lbs milk, 2,087 lbs fat (4.0%), 1,674 lbs protein (3.2%) on 2x 365-day, with more than 178,000 lbs lifetime milk. 
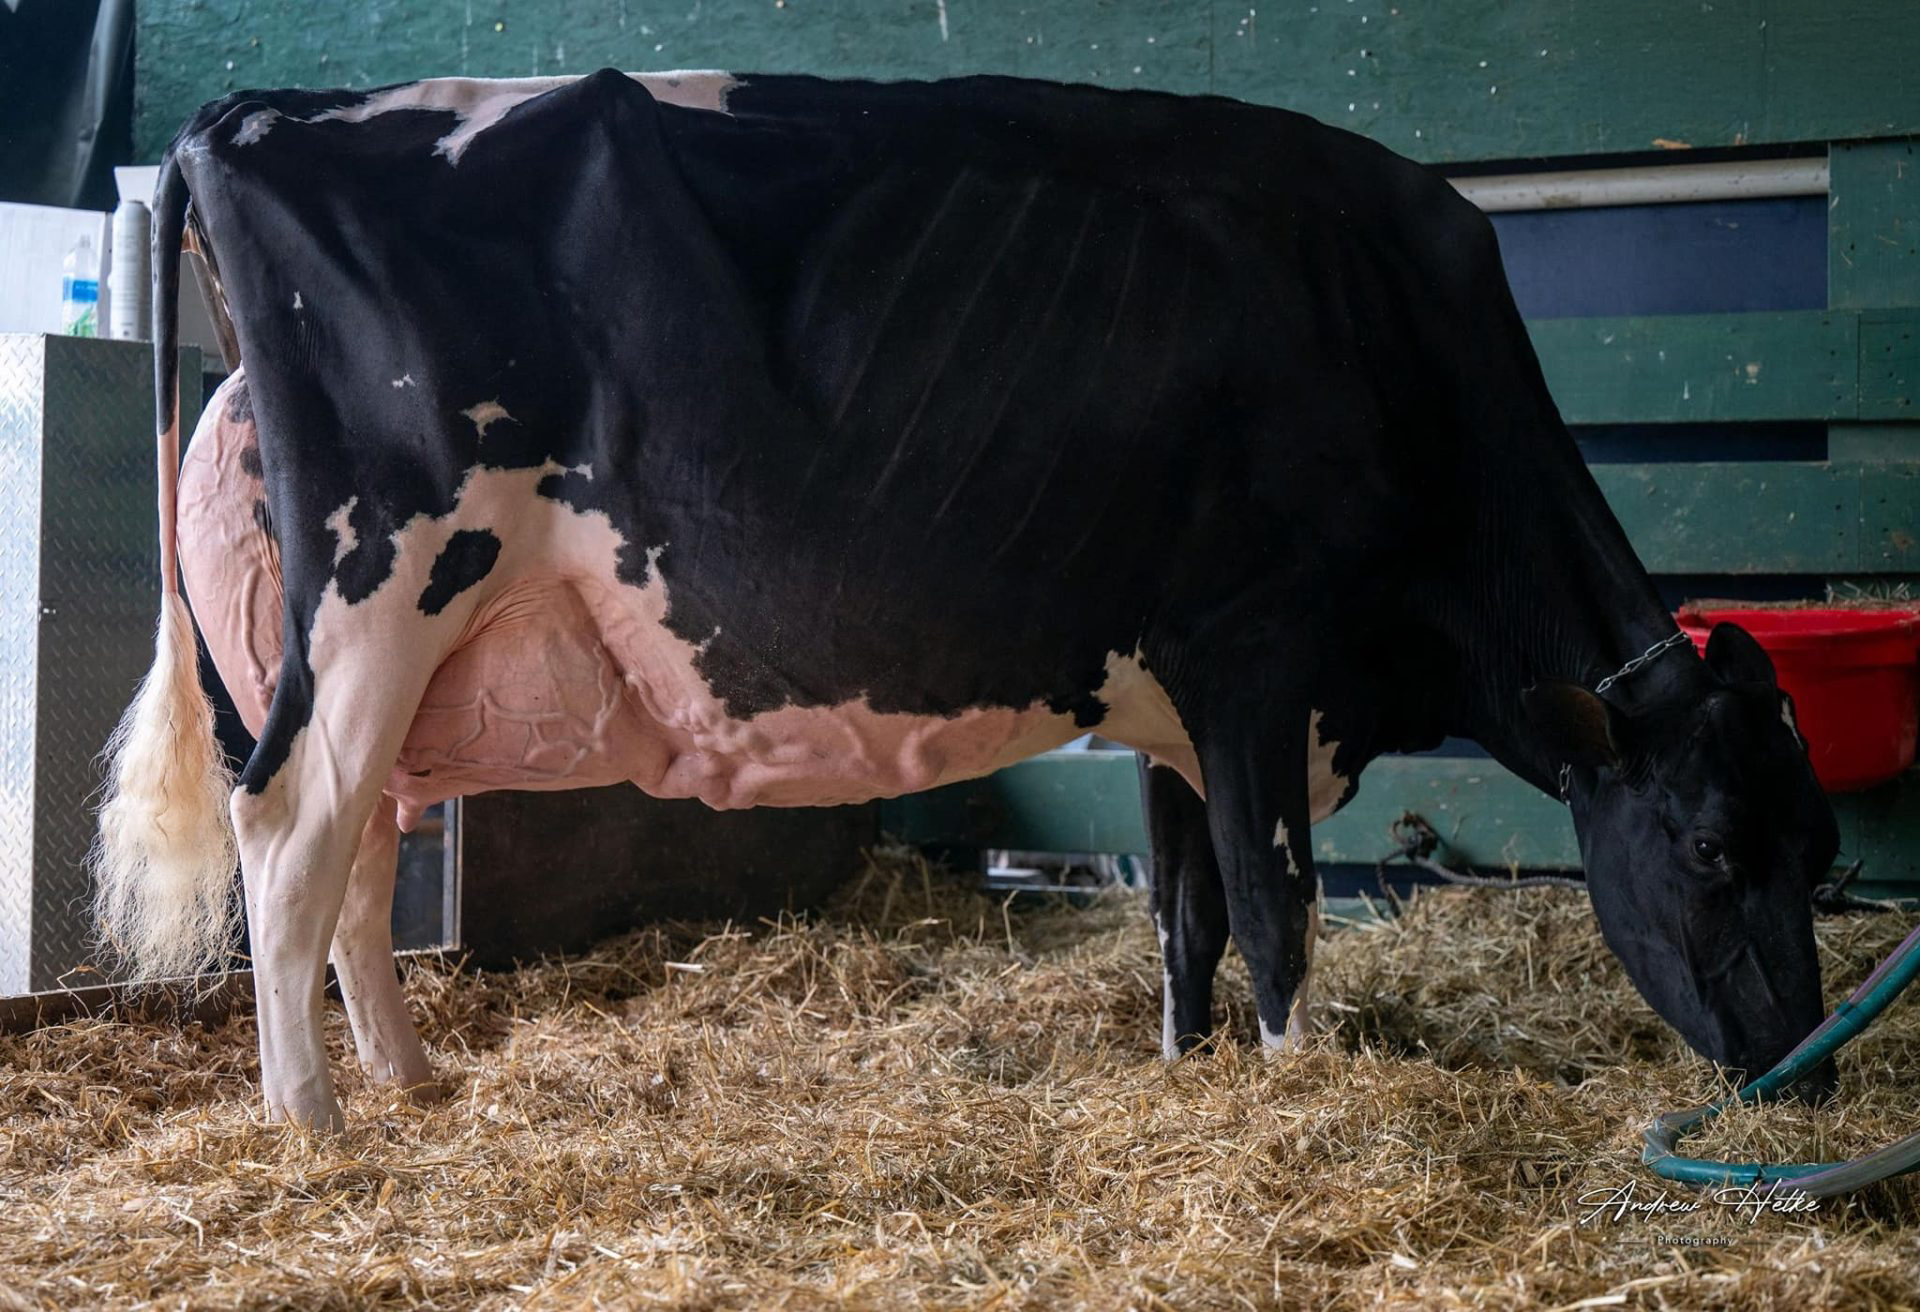
Listen to how her breeders talk about her. “We don’t want to have the biggest, but we want to have the most correct — and we certainly want them to have plenty of width and power and strength,” Jonathan Lamb says. Her dam, Bella-Rosa GW Sara, wasn’t the prototypical tall show cow either — “she wasn’t super tall or extreme, but she was perfectly balanced, which is the kind we really appreciate,” per Alicia Lamb. That’s the breed’s highest type-and-production honor going to a cow explicitly bred for width and correctness over height. The award and the penalty are pointing the same direction. 
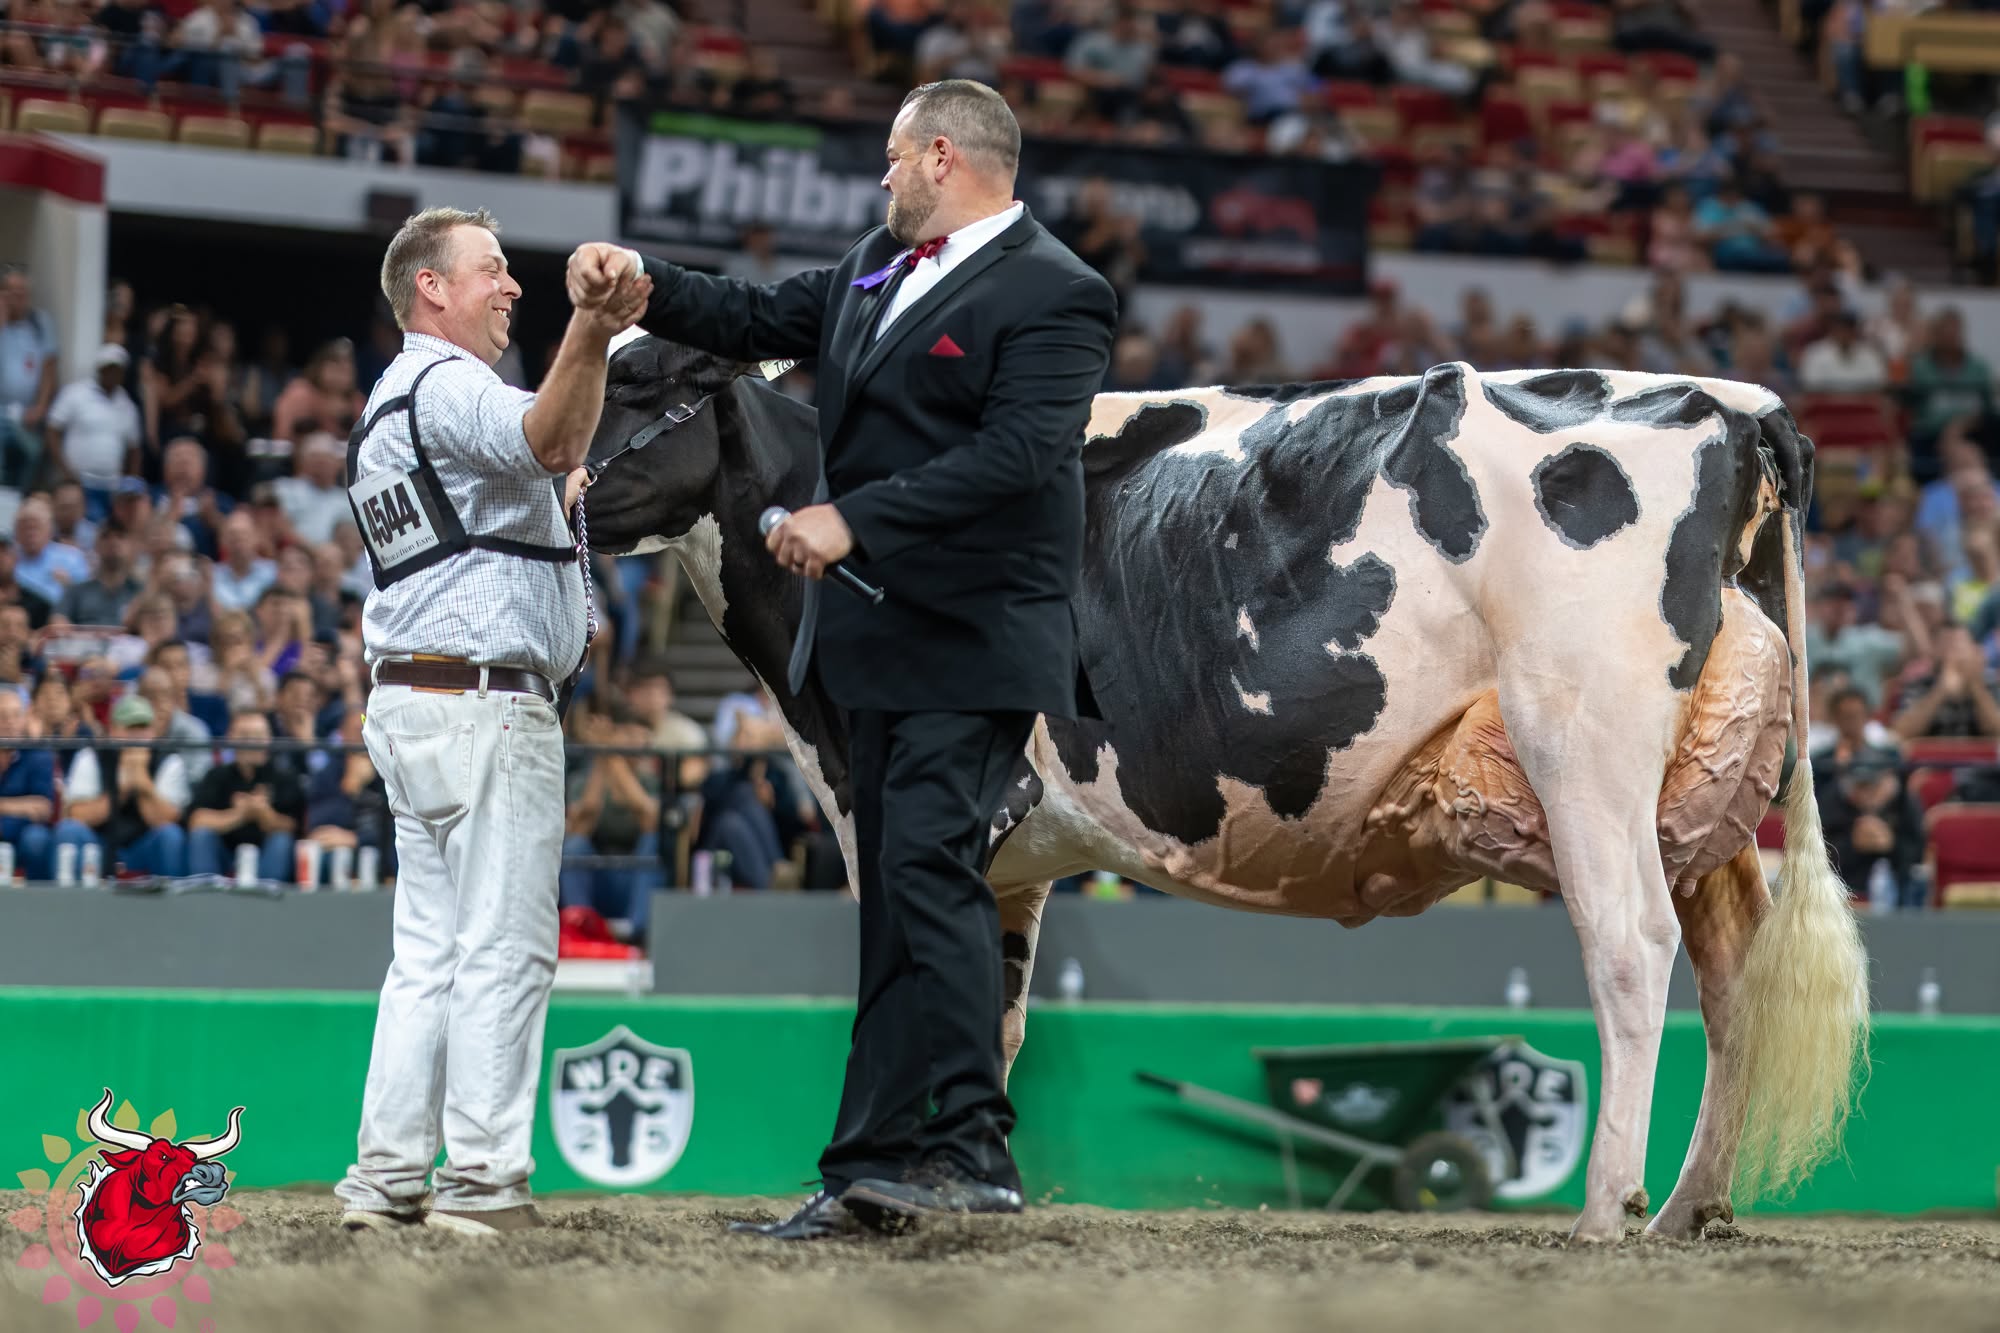
Lovhill Sidekick Kandy Cane takes the handshake — the Lamb family’s five-year-old, tapped Grand Champion at the 2025 World Dairy Expo. Judge Aaron Eaton’s reasoning leaned on maturity, added width and power, not sheer height — the same vocabulary the 2026 classification card and HCC are now built to reward. What she’d measure on the stick is anyone’s guess; the language crowning her isn’t.

The ring itself said much the same thing at Madison. The same Lamb family owned the 2025 World Dairy Expo Grand Champion, the five-year-old Lovhill Sidekick Kandy Cane, whom Judge Aaron Eaton put to the top on her added width, and power rather than sheer height. Here’s the honest caveat: Kandy Cane’s exact classification stature isn’t public, so nobody can say whether she’d trip the new penalty — that’s an open question, not a prediction. But the language a top judge reaches for to crown a champion — width, power, balance — is now the same language the classification card and HCC are built to reward. When the show ring and the formula start using the same adjectives, the direction isn’t in doubt. 

What Canada Already Figured Out

The Americans aren’t the first to draw a line on height. Canada’s classification system, run through Holstein Canada, has long treated its conformation composites so that extreme stature doesn’t buy its way into the score, and its evaluations are recognized worldwide for stability. If you sell semen or cattle across the border, or read Canadian proofs, you’ve already been living with a version of what the U.S. just adopted. 

That matters for two reasons. First, the 2026 U.S. change isn’t a lone experiment — it’s the American system catching up to a direction others validated a while back. Second, if you use Canadian genetics, the bulls that look moderate and balanced under that stature-neutral math are the ones most likely to throw daughters who clear the new 60-inch lens cleanly. The systems are converging, not diverging — a rare thing in an industry where cross-border index differences usually cause headaches, not alignment.

What This Means for Your Operation

None of this makes tall cows worthless, or the show ring wrong. It means the barns, the economics, and the profit indexes have all shifted. Here’s how different herds can play it.

  • Run a 30-day sire audit. This month, pull your current bull list, sort by stature PTA, flag the tallest transmitters, then check Body Weight Composite, Productive Life, and now HCC on the ones you flagged. Costs nothing but an evening. Works for any herd — the single most concrete step available right now. 
  • Gate on Net Merit, then cap stature. Best for commercial and dual-purpose herds chasing durability — the Rosy-Lane approach, essentially. It demands discipline to pass on a flashy tall bull. Where it backfires: pure show programs may find it narrows their pipeline of ring-competitive genetics. 
  • Keep breeding show-type — but go in with eyes open. Makes sense if marketing show cattle is your business. What it demands: accept that a daughter measuring 64–65 inches now gives back nearly a full point of Final Score she’d have kept a year ago, which can move a sale price. Read individual linear traits, not just composites, when PTAT and HCC disagree. 
  • Split your herd’s strategy. For larger operations, breed a show string one way and a commercial string another. It demands more record-keeping and a clear-eyed read of which cows earn their keep where.

The Big Picture: The steady stature decoupling in the evaluations, Canada’s long-standing “too-tall” stance, the 2024 scale shift, the 2025 Net Merit weight tax, the 2026 penalty, and a Star of the Breed bred for width over height are not separate events. They represent a decade of unified industry direction. Betting against it is a bet that economics and genetics will reverse course — and the data says they won’t. 

Your 2026 Pre-Classification Audit
Run these three checks before your classifier’s next visit.

  • [ ] Identify the UDC/stature illusion. Flag bulls that are both exceptionally tall and high for udder composite — because rear udder height and width correlate strongly with stature, that composite may be riding on frame. Inspect the individual linear traits, and cross-check HCC, before buying more semen. 
  • [ ] Recalculate your BAA expectations. Look at your aged, dry EX cows. Under the new 24-month rule (effective for May 2026 classifications and after), they’re temporarily out of your BAA calculation until they freshen again — expect a lower baseline herd figure. 
  • [ ] Run the penalty table against your tallest cows. Measure — or estimate from prior classification — where your biggest cows sit. A 62-incher gives back 0.30; a 65-incher, 1.20. Know it before the classifier does, so a designation surprise doesn’t cost you at sale time. 

One more if you buy across the border: lean on the stature-neutral Canadian proofs that already fit this direction. And if you’re already gating on Net Merit and capping stature, take the win — this is a tailwind, not a warning. 
Key Takeaways

  • If your ideal cow measures over 60 inches, she now costs you classification points — 0.15 at 61″, climbing to 1.20 at 65″ and 3.45 at 70″ — but not one point of PTAT or stature PTA. The show-card hit and the genetic value no longer move together. 
  • If you rely on PTAT and UDC alone, add HCC to the read. Holstein USA’s own data shows PTAT correlates negatively with Productive Life, Livability, and Feed Efficiency; HCC was built to flip that. Pull the individual linear traits when a tall bull’s udder composite looks great. 
  • If you already gate on Net Merit and cap stature (the Rosy-Lane +2.0 rule), you’re ahead of the change, not behind it — the 2025 weight tax and the 2026 penalty both reward that discipline. 
  • The show ring already moved. The 2025 Star of the Breed, Oakfield Solomon Sunset, was bred for width and correctness over height — the award and the penalty are pointing the same way. 
Beyond the Ruler

The tall, angular cow ruled North American type for a generation, and by the measures of that era — tie-stalls, show strings, Final Score — she delivered. What’s shifted is the environment around her, not the quality of the cow. The breeders who feel the 2026 changes least are the ones who already moved toward moderate, durable, functional cattle — the Lambs, the Rosy-Lanes, anyone who decided years ago they didn’t want to milk the biggest cow in the barn. So here’s the question worth chewing on this week: if you measured your ten best-looking cows tomorrow, how many would clear that 60-inch line — and are they the same cows staying longest in your herd?

Learn More

The Sunday Read Dairy Professionals Don’t Skip.

Every week, thousands of producers, breeders, and industry insiders open Bullvine Weekly for genetics insights, market shifts, and profit strategies they won’t find anywhere else. One email. Five minutes. Smarter decisions all week.
NewsSubscribe
First
Last
Consent

Dairy Strength, Not Height: The Proof Rule Hiding in Every Holstein Pedigree

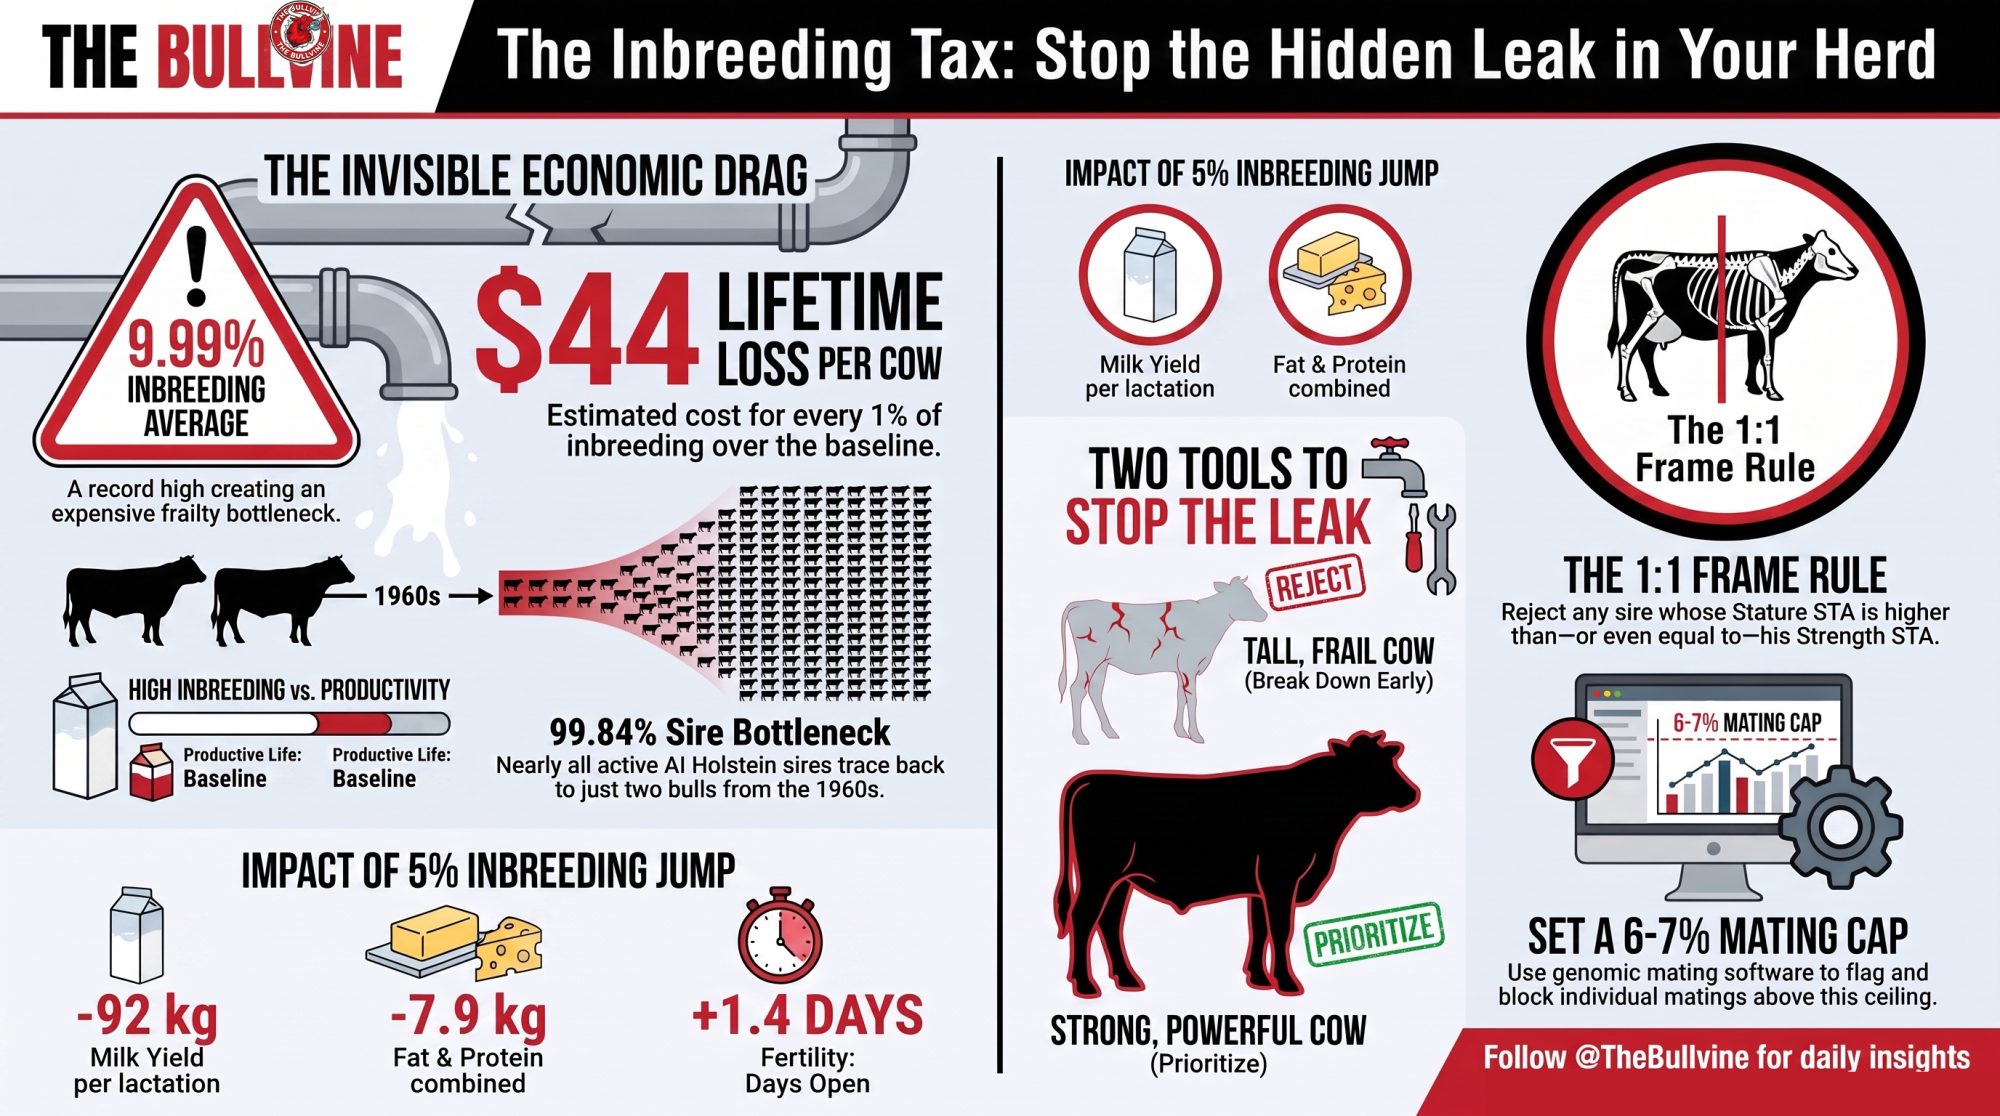
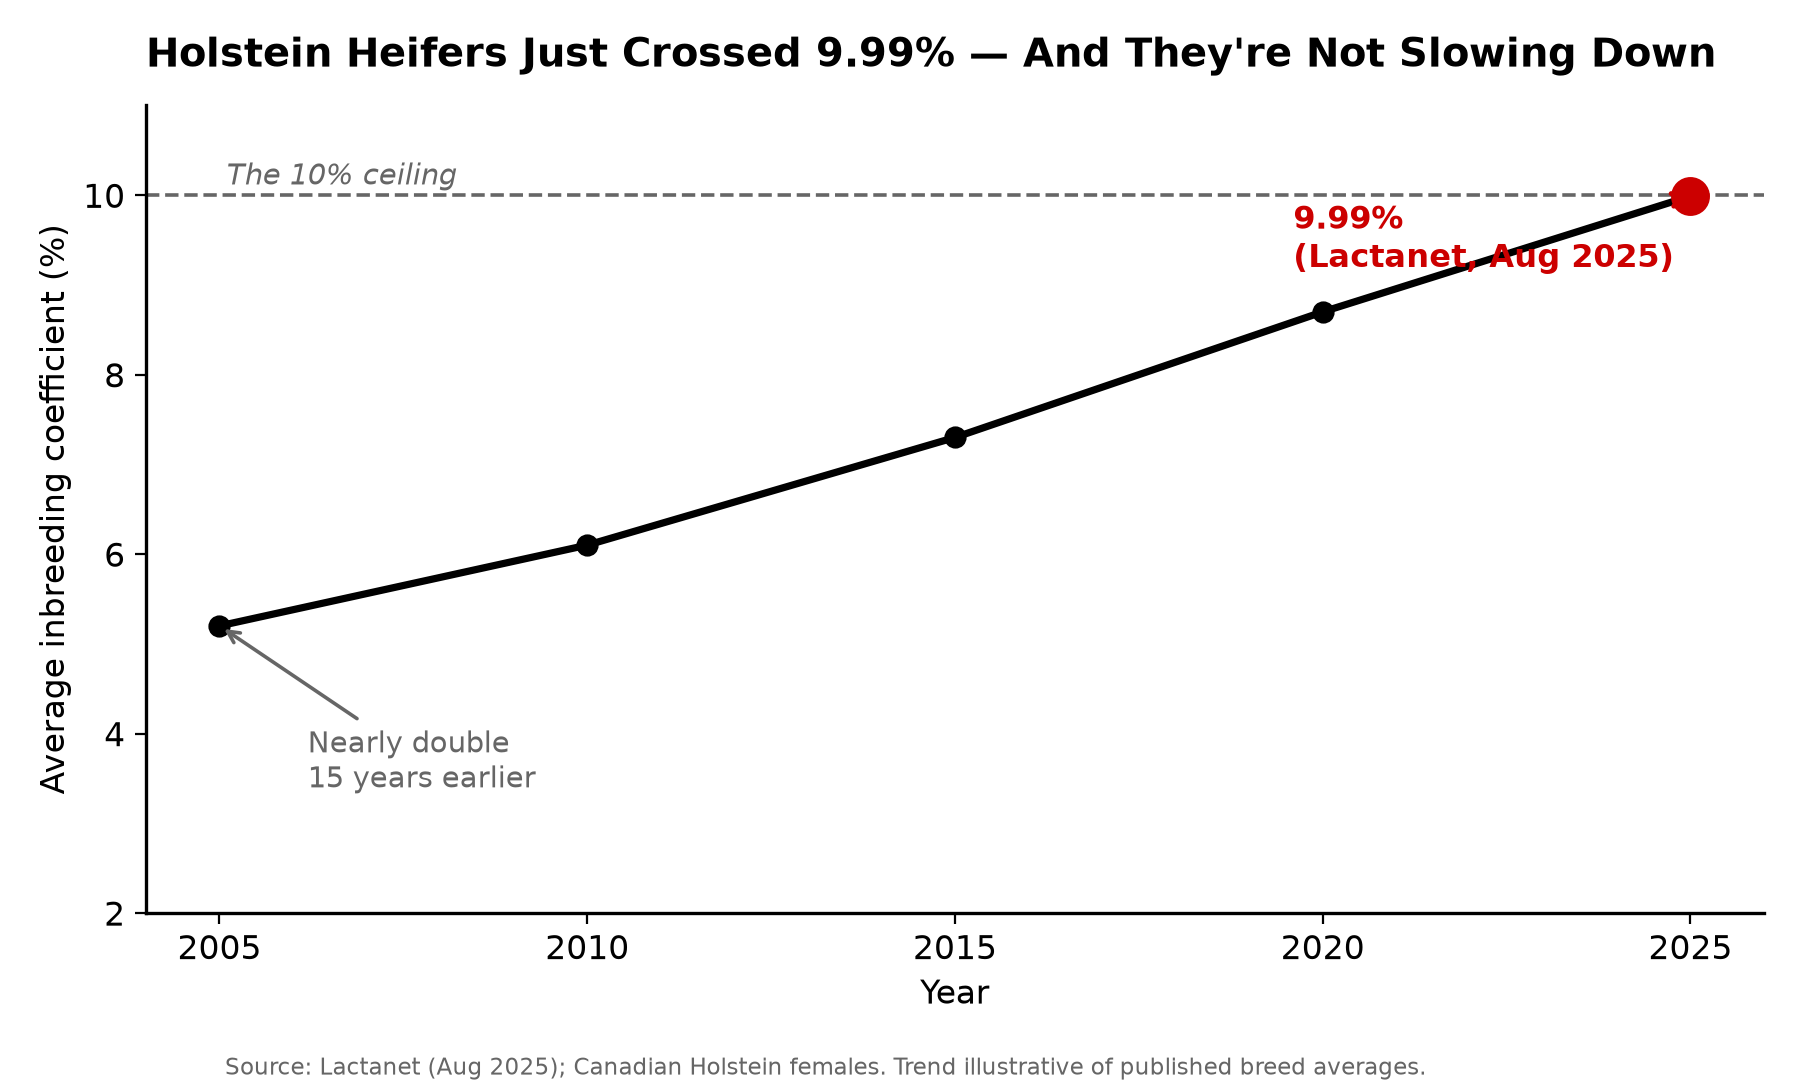
Holstein heifers just crossed 9.99% inbreeding — and the drift is quietly dragging money off every cow. Here’s the one linear rule that keeps “dairy strength” from turning into expensive frailty.

O-Bee Manfred Justice-ET — look at that deep, powerful front end. That’s the strength the breed was starving for, so it bred him, his sons, and his grandsons into damn near everything. Twenty years later, the bill for all that concentration shows up as 9.99% inbreeding on the milk check.

There was a stretch, not that long ago, when you could feel smart just rattling off O-Man’s proof. O-Bee Manfred Justice-ET. Fat, protein, health traits, calving ease — the exact toolkit the breed was starving for — wrapped around type nobody bragged about. He fixed real problems. So the industry did what it always does with a bull that fixes real problems. It bred him, his sons, and his grandsons into damn near everything.

And that’s the part nobody was pricing at the time. Somebody, somewhere, is at a bull catalog this morning stacking a mating a shade more inbred than the last one. Not on purpose. It never is.

The Bull the Breed Couldn’t Stop Using

O-Man was born in 2004. By the back half of that decade his sons stacked the top of the lists — Snowman, Man-O-Man, the whole run — while O-Man himself kept climbing on health and components long after most bulls his age had faded. And his daughters became brood-cow royalty: Seagull-Bay Oman Mirror, an O-Man daughter, went on to anchor a family that threads through modern sire stacks. 

One semen order at a time, the breed wired one bull deep into nearly every pedigree. That’s not a knock on O-Man. He earned the demand. But here’s what should land differently than it would have five years ago: the bill for all that concentration is finally showing up on the milk check.

What’s Really at Stake

The problem and its price tag sit side by side. Here’s the bottleneck on the left, and the money it’s pulling off your cows on the right.

Metric / HorizonThe Current Bottleneck (2025/2026)The Invisible Economic Drag
Breed BaselineCanadian Holstein heifers average 9.99%inbreeding (Lactanet, Aug 2025)  $44 per cow, per point in lifetime drag over baseline 
AI Lineup ShrinkFemale inbreeding now climbs ~3× fasterthan the pre-genomic era (~0.3–0.4%/yr)  $60 to $100 loss per cow, per lactation in high-inbreeding herds  
Pedigree Core99.84% of active AI sires trace to just two male lines — Elevation and Chief  −92 kg milk, −65 days productive life per 5% inbreeding jump (CDN)

That 9.99% is nearly double where the breed sat 15 years ago. And it’s not a Holstein-only story — the black-and-whites lead Jersey (7.56%), Brown Swiss (7.10%), and Ayrshire in the same 2024 crop. That Canadian figure from Lactanet tracks the same direction U.S. data shows through CDCB and Holstein USA, so this isn’t a border quirk.

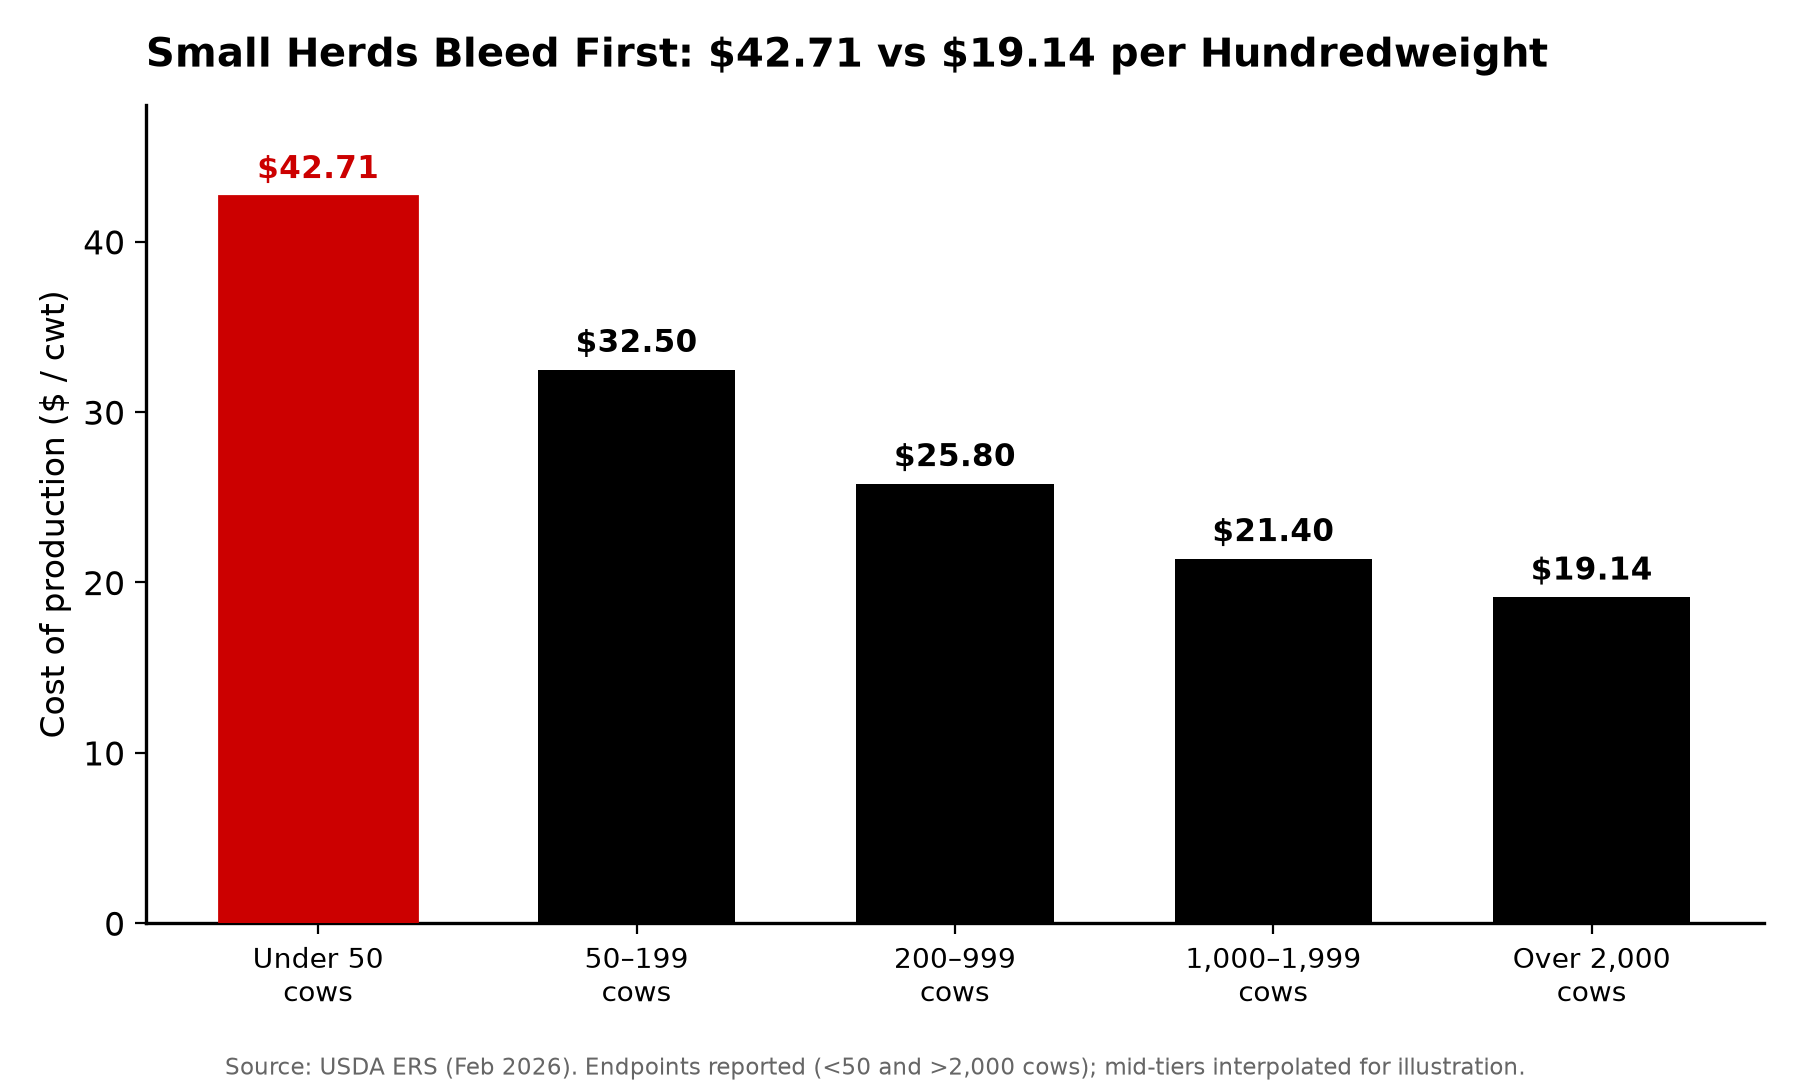
Who eats the cost first? The smaller and mid-size herds. USDA ERS reported in February 2026 that cost of production runs about $42.71 per hundredweight in herds under 50 cows versus $19.14 in herds over 2,000. When your breakeven’s already thin, this drift stings more.

Have You Ever Called a Cow “Too Strong”?

Inbreeding depression doesn’t knock. It’s the cow that milks fine but won’t settle. The calf that never quite thrives. The good one that leaves a lactation early. And it has a look — as inbreeding climbs, that depression tends to surface as narrow, frail cows that impress on height and wear out faster. Hold that thought. It’s the bridge between the DNA problem and the type sheet.

Ask yourself two questions standing at the pen. Have you described a cow recently as “too strong”? Have you seen cows that are “too frail”? Almost nobody says yes to the first. Everybody’s seen the second. That tells you which way the breed’s been drifting.

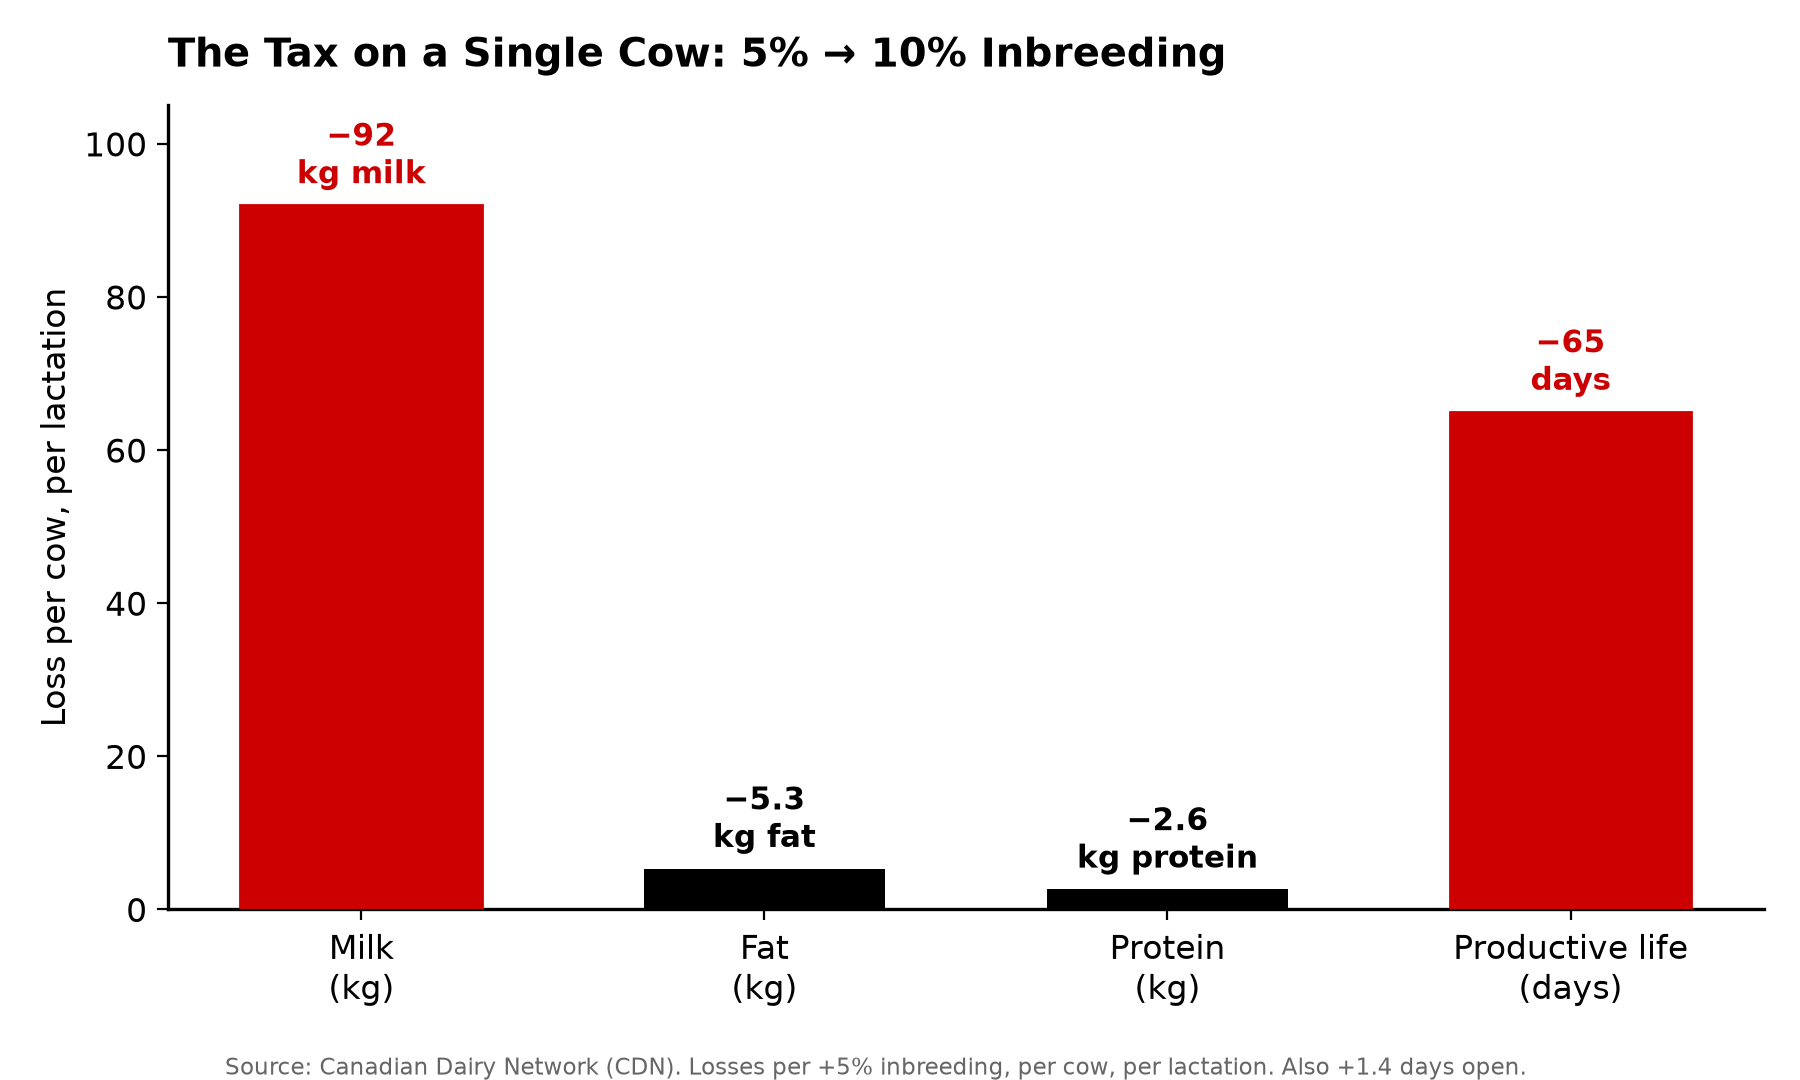
Here’s what a jump from 5% to 10% inbreeding costs on a single cow, every lactation, per Canadian Dairy Network:

−92 kg milk  ·  −5.3 kg fat  ·  −2.6 kg protein  ·  +1.4 days open  ·  −65 days of productive life

None of those alone ends a cow. Stack them across a whole heifer crop, though, and you’re running a herd that milks a little lighter, breeds back a little slower, and turns over a little faster than the one your neighbor built off a wider gene pool. That’s the tax. It’s quiet, it’s cumulative, and it never sends an invoice.

The Barn Math: Two Numbers That Stack

You’ll bump into two different dollar figures, and they measure different windows. Don’t let them cancel out in your head — they add.

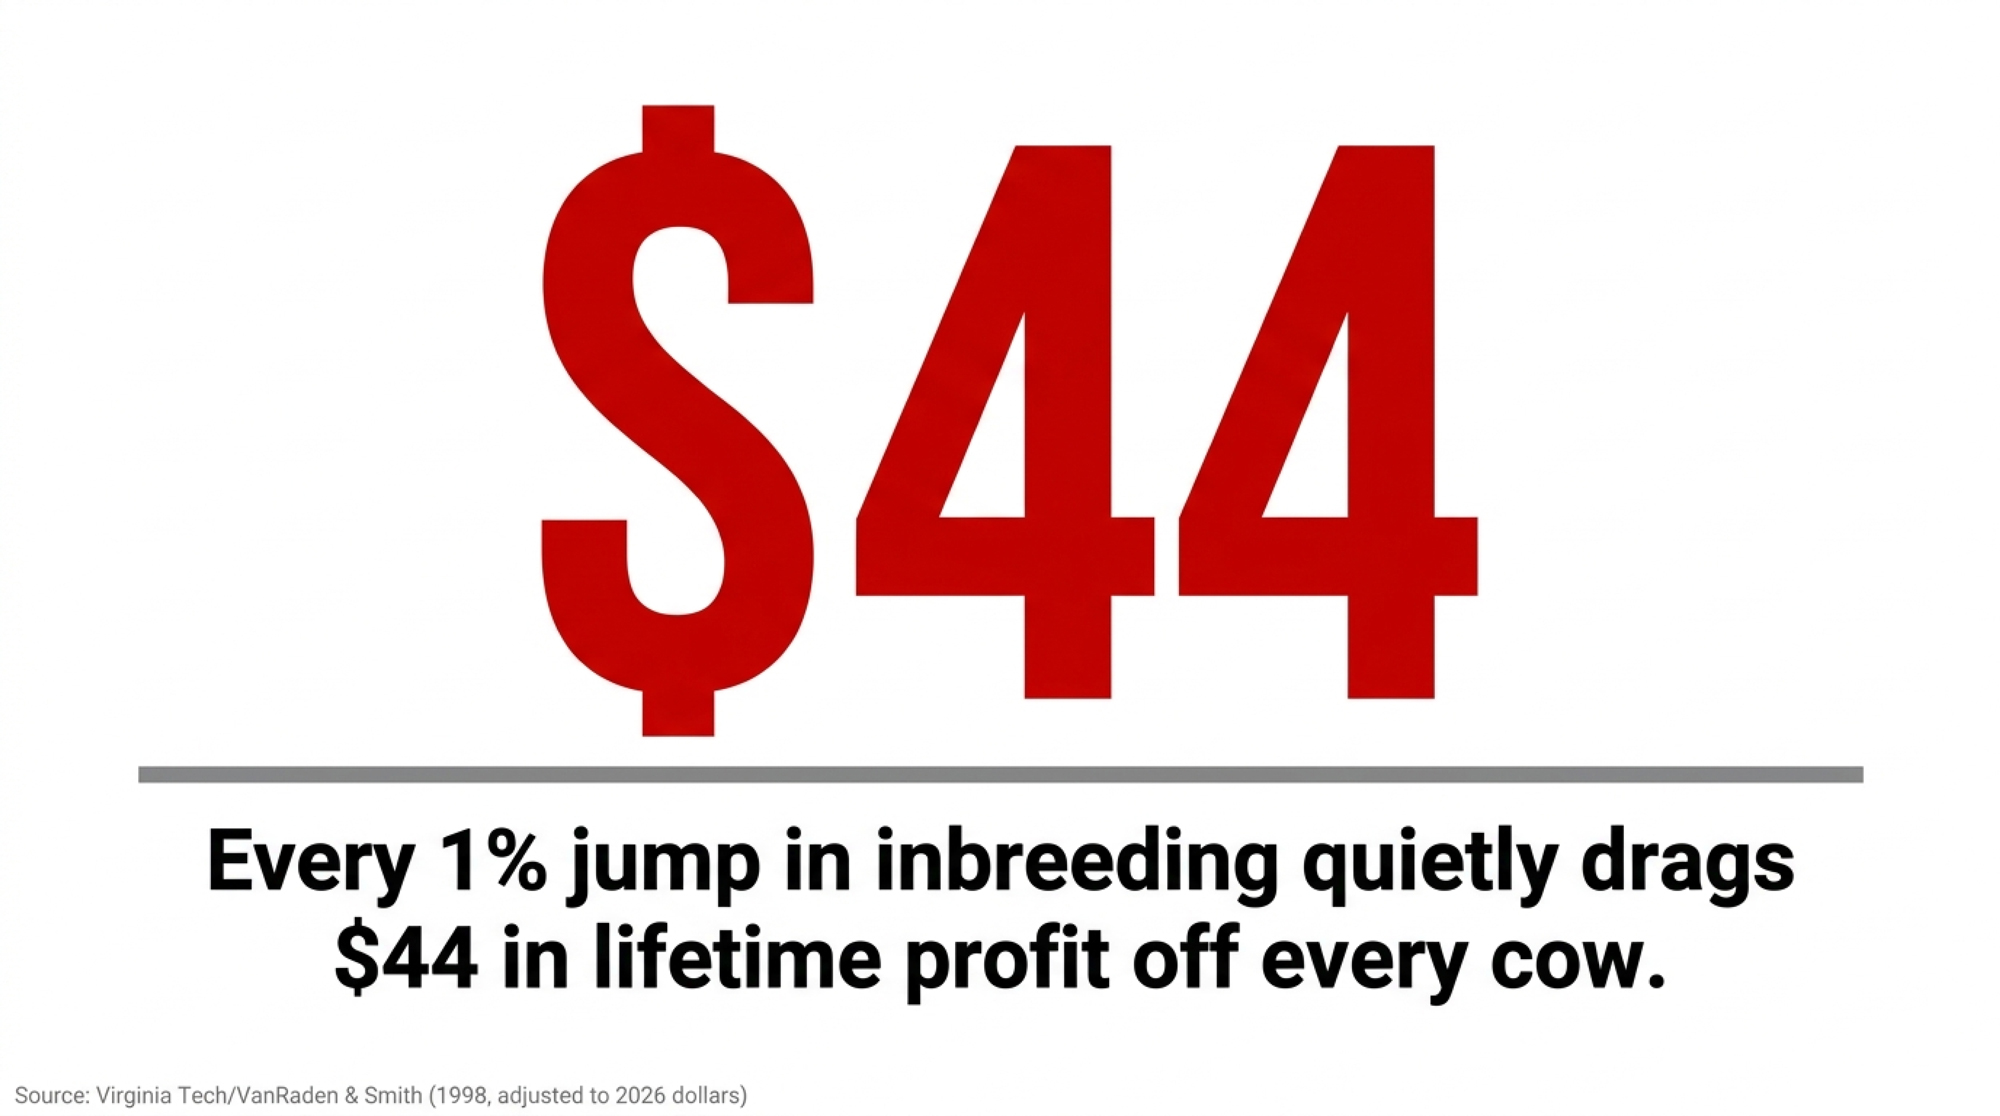
The lifetime number comes from Virginia Tech’s VanRaden and Smith (1998), who pegged the cost at $22 to $24 per cow for every 1% of inbreeding. Adjusted for inflation to 2026 dollars, that becomes roughly $44 per cow, per point — a lifetime figure, not an annual one. Run it on a real herd: a 200-cow herd that’s drifted from 6% to 10% — four points — carries about 200 × 4 × $44 = $35,200 in lifetime drag. Money you never see leave, because it never shows up as a line item. 

The second figure is a per-year bleed, and it’s grounded in peer-reviewed production losses, not guesswork. Makanjuola and colleagues (2020) found each 1% jump in genomic inbreeding cut first-lactation 305-day milk by roughly 40–50 kg in Canadian Holsteins; Doekes et al. (2019) landed in the same range. Add lost protein, extra days open, and shorter productive life, and Bullvine’s worked barn-math lands at roughly $60 to $102 per cow, per lactation for a herd carrying about two points of excess. On a 300-cow herd, even the $60 floor is about $18,000 a year until your mating strategy changes. 

Some herds have pushed back and watched it pay. Bullvine’s coverage of the Birkstead and North Florida operations documented both farms using tighter inbreeding management — tracking coefficients on every mating, steering clear of closely related sires — to stop that per-cow leak. The peer-reviewed research prices the cost of ignoring it. The herds show what managing it looks like. 

Why the Gene Pool Keeps Shrinking

The root cause isn’t any one bull — not even O-Man. It’s a base that keeps narrowing. A Y-chromosome study of 62,897 bulls (Yue et al., 2015, Journal of Dairy Science) found virtually every active North American Holstein AI bull traces its paternal line to two grandfathers born in the 1960s: Round Oak Rag Apple Elevation and Pawnee Farm Arlinda Chief. Bullvine’s analysis of that dataset puts the figure at 99.84% — split almost evenly between the two. 

Read that again. Nearly the entire active AI Holstein population funnels back through two bulls. Every “outcross” you order is, at the male-line level, probably a cousin of the last one. That’s the bottleneck O-Man got poured into. Not the cause of it.

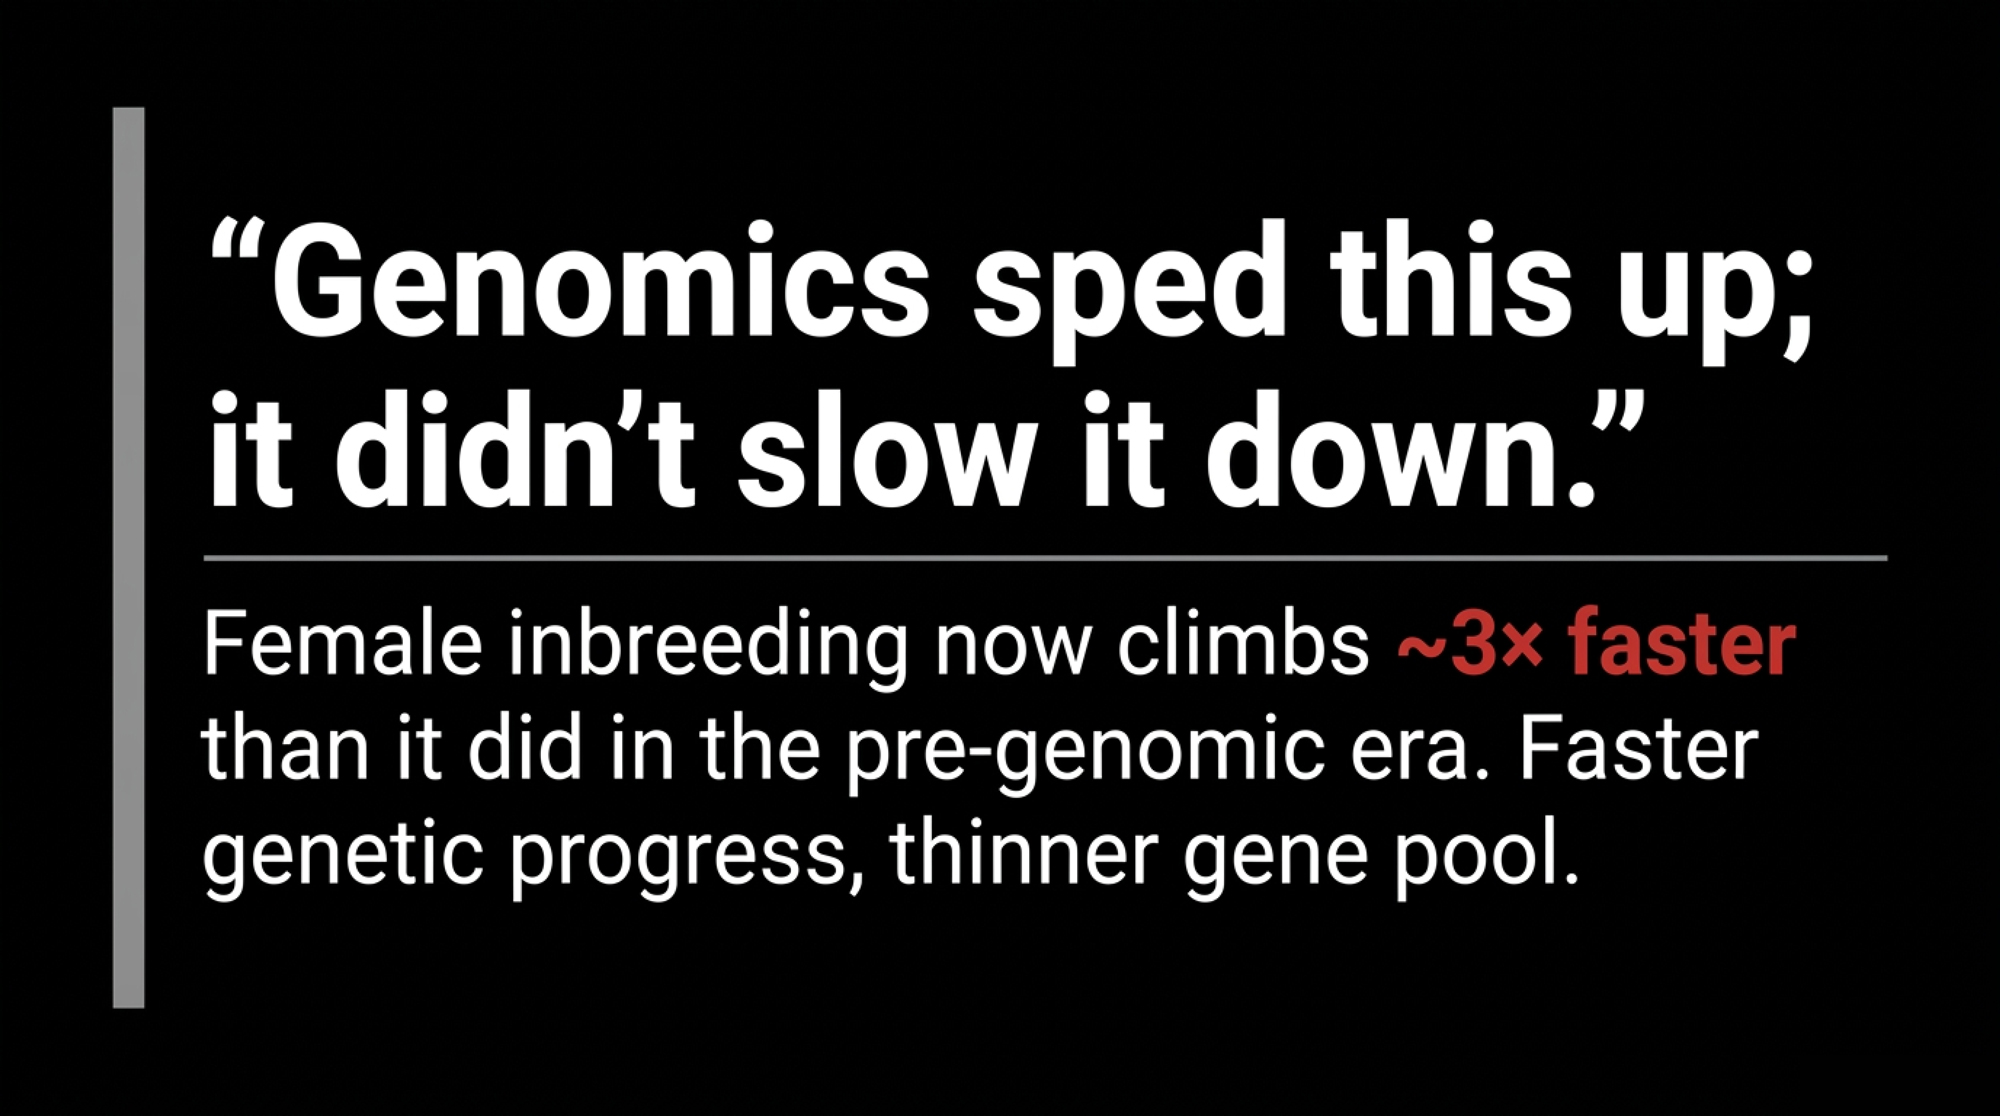
Genomics sped this up; it didn’t slow it down. Under progeny testing, a bull took years to prove out before he could flood the market — a brake nobody appreciated until it was gone. Now the sires of sons turn over in a fraction of that time, and female inbreeding climbs about three times faster than it did in the pre-genomic era. Faster genetic progress, thinner gene pool. Same coin, two sides. 

And the index won’t rescue you. Net Merit added Daughter Pregnancy Rate in 2003 and Feed Saved in 2021, and NM$ 2025 cut Body Weight Composite to −11% emphasis while lifting Feed Saved to 17.8%. But catch the gap: Net Merit prices size and efficiency. It carries no penalty for inbreeding. That part lives entirely in your matings and your stud’s lineup.

Two Tools for Two Different Problems

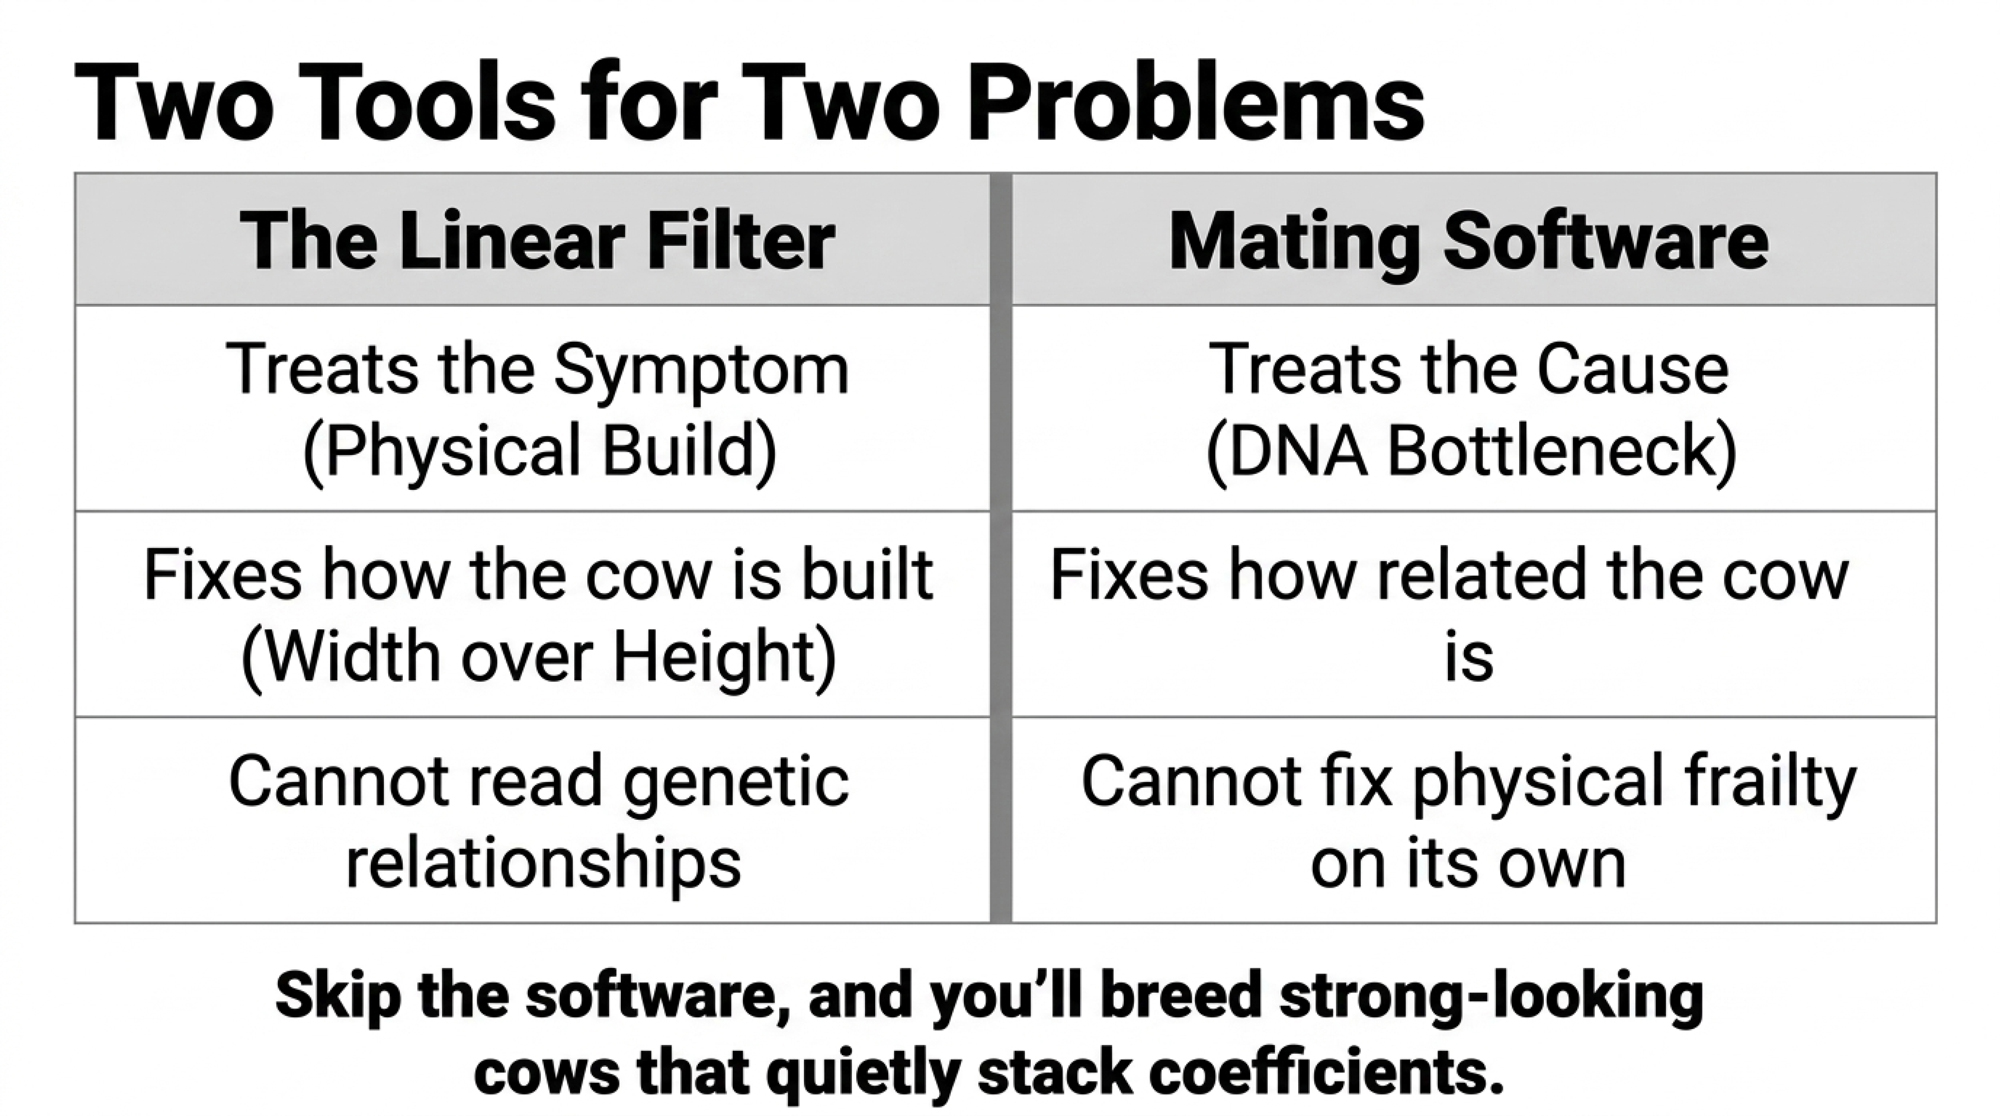
Here’s where catalog decisions go sideways. The frail, hollow cow inbreeding produces is a physical symptom. But inbreeding itself is a pedigree problem. You need two separate tools, and one won’t cover for the other.

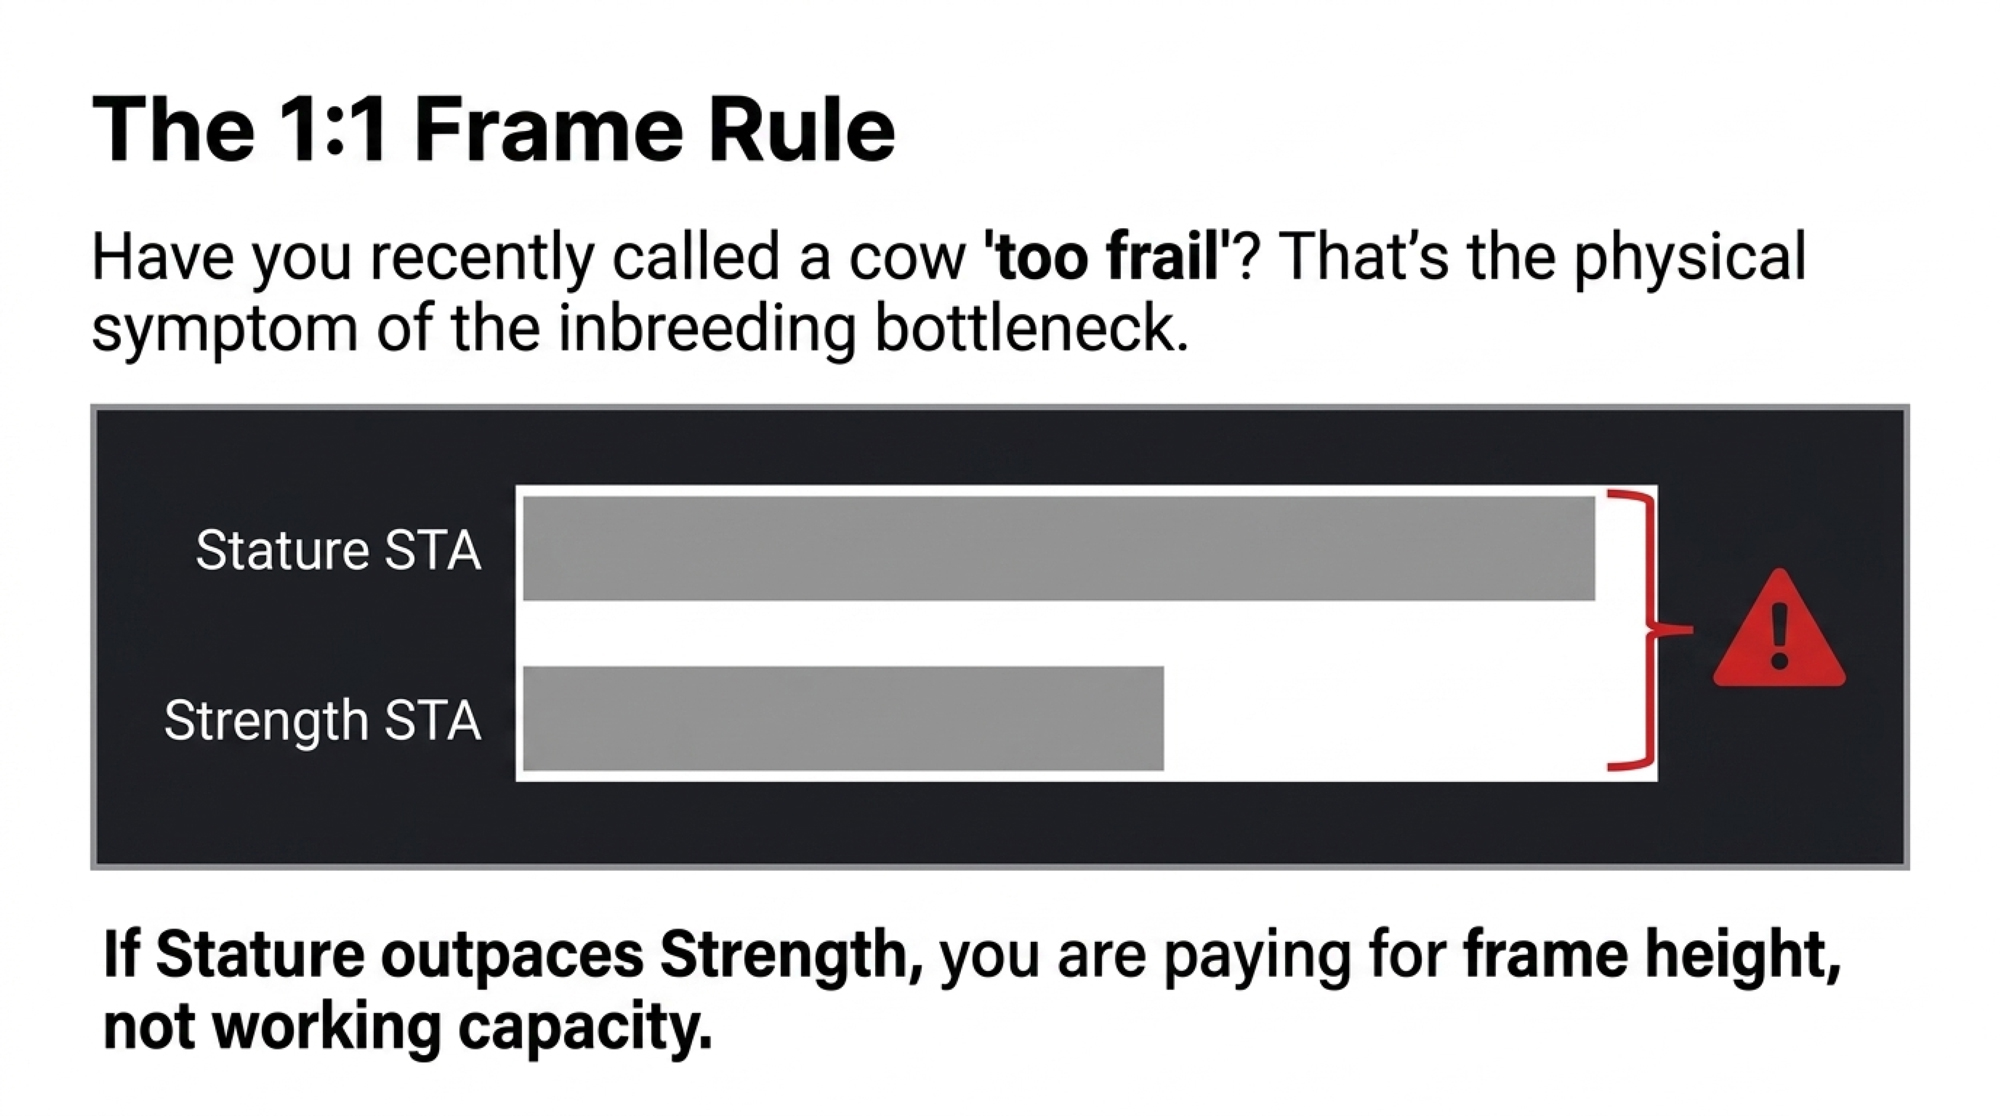
Tool 1 — the linear filter — treats the symptom. In the U.S. linear system, Body Weight Composite weights strength three times heavier than stature — 0.72 versus 0.23. A bull who’s tall but only moderately strong is building his daughters out of height, not working power.

🛑 The 1:1 Frame Rule

If a bull’s Stature STA is higher than — or even equal to — his Strength STA, you’re paying for frame height, not working capacity. In an era of high beef-cross values on cull cows, you want a deep, powerful, wide-chested front end — not a hollow, tall cow that overshoots the stalls and breaks down early.

Tool 2 — pedigree mating software — treats the cause. The 1:1 Frame Rule can’t read relationship. Only a mating program running genomic inbreeding on each specific pairing catches the DNA bottleneck before you order semen. Run the linear filter to fix how the cow is built. Run the mating software to fix how related she is. Skip the second, and you’ll breed strong-looking cows that quietly stack coefficients.

So Where Do You Actually Find Strength?

Talk about strength long enough and it stays abstract. So here are four real, active sires, each run through both tools — the phenotype (does Strength beat Stature?) and the pedigree (how much of that narrow base is stacked in?).

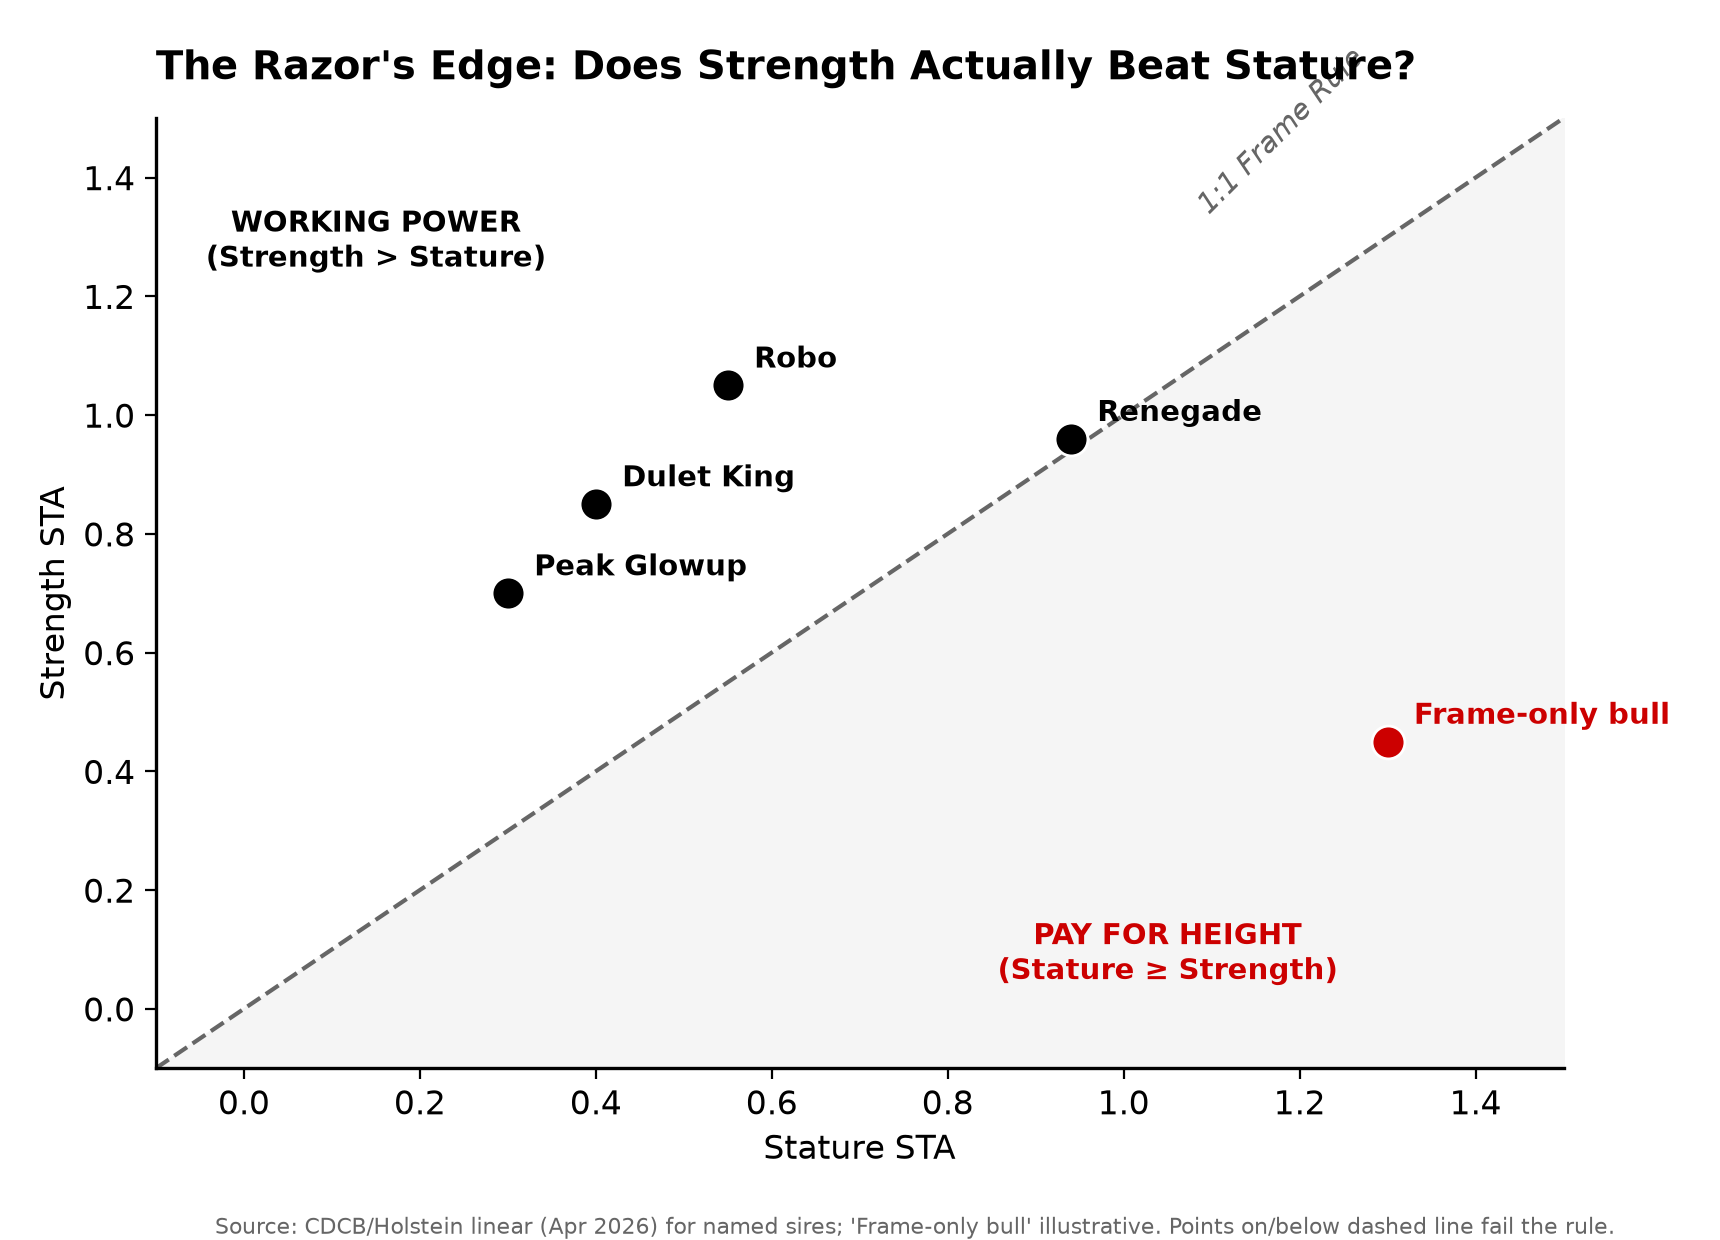
S-S-I PR Renegade (250HO14134) — The Baseline.

  • Phenotype: Strength +0.96 barely edges Stature +0.94 (CDCB/Holstein, April 2026). He passes the physical test — just. 
  • Pedigree: His maternal line runs back through the Seagull-Bay Oman Mirror family, so there’s O-Man on the bottom of his pedigree. Use him with caution if your herd already runs close to the 9.99% ceiling. 

Aurora Sheepster Robo (796HO10201) — The Trap.

  • Phenotype: A genuine powerhouse — strength, milk, and teat placement in one package. 
  • Pedigree: The Renegade blood stacks in through his dam side — his MGS is Siemers Rengd Parfect, a Renegade son. For herds already deep in Renegade, that triggers immediate relationship flags on a big chunk of the cows you’d point him at. 

Dulet King (799HO112) & Peak Glowup (1HO17864) — The Alternates.

  • Phenotype: Both bring strength off a different profile — King is Alcove-sired and A2A2; Glowup leans health and components with lower milk. Pull each bull’s live linear card to confirm the strength-over-stature ratio matches your cows.
  • Pedigree: Both sit off the Renegade line, which makes them genetic relief valves — a way to add strength without stacking the same family you’re already carrying.

The point isn’t “buy these four.” It’s the method. Renegade shows how thin the strength-over-stature margin can be even on a bull everyone calls strong. Robo shows a phenotypic powerhouse can still be the wrong bull once you run the relationship test. King and Glowup show you can hunt strength off a different family — if you verify the ratio yourself. Two tools, every time.

Options and Trade-Offs for Your Operation

No single move fixes this. A few are working right now.

  • Cap inbreeding on every AI mating. Ask your mating program or rep to flag anything projected above your ceiling; many breeders aim to keep a mating under roughly 6–7%. Cheap and immediate. The catch: it protects your herd, not the breed, and you’ll pass on a hot bull now and then.
  • Run the 1:1 Frame Rule. Best for herds fighting cows that overshoot the stalls and eat more without lasting longer. Costs nothing but discipline at the catalog. Where it backfires: it’s structure, not relationship, so pair it with the inbreeding check.
  • Diversify your bull team on purpose. Makes most sense for herds with the scale to run several sire lines at once. Costs homework, and sometimes a few index points traded for lower future coancestry.
  • Lean on Net Merit for commercial goals. NM$ 2025’s Feed Saved and BWC weights point at the moderate, efficient cow the economics now reward. The limit is blunt: even flawless NM$ selection won’t manage inbreeding for you.

Three Things to Do Before You Order Semen Again

  1. Audit your tank (next 30 days). Pull your herd’s average inbreeding coefficient. If you’re hovering at or above 9.99%, set a hard mating ceiling in your software immediately — many breeders hold matings under 6–7%. 
  2. Apply the strength filter. Reject any incoming catalog sire whose Stature outpaces — or even ties — his Strength. Even Renegade’s +0.96 over +0.94 is a razor’s-edge pass. 
  3. Never let a line card substitute for software. A bull can look beautifully wide on paper and still be a first cousin to the heifer you’re trying to correct. Use linear filters to design the cow; use genomic mating tools to protect the pedigree. 

O-Man’s real lesson isn’t that he got overused. It’s that the breed only noticed after the fact — years after the semen was in the tanks and the daughters were in the barns. So walk your holding pen some morning and count honestly: how many separate families are actually standing there, and how many are the same handful wearing different names? The studs decide how wide the pipeline runs. Your call at the catalog decides how much of that bottleneck your own cows carry. Which bull are you about to order — and do you actually know how related he is to the cow he’s going on?

Key Takeaways

  • Canadian Holstein heifers hit 9.99% inbreeding — the drift costs about $44/cow per point over a lifetime, plus $60–100 per cow per lactation in the herds carrying the most of it. Pull your herd average before your next semen order.
  • Run two separate tools, because they fix two different problems: the 1:1 Frame Rule (if Stature STA beats or ties Strength STA, you’re buying height, not cow) fixes how she’s built; genomic mating software fixes how related she is. Neither covers for the other.
  • A strong bull can still be the wrong bull. Robo checks every phenotype box but stacks Renegade through his dam — and even Renegade’s own +0.96 strength over +0.94 stature is a razor-thin pass. Look off the line (King, Glowup) when your herd’s already near the ceiling.

The Invisible Invoice

Herd Inbreeding & Pedigree Bottleneck Auditor

9.9%
5.0% (Outcross) 9.9% (2026 Breed Avg) 15.0% (Severe)
6.5%
5.0% Strict 6.5% Conservative Goal 10.0% No Cap

Real-Time Financial Exposure Audit

Annual Milk Loss per Cow: 153 kg
Total Herd Annual Volume Deficit: 38,250 kg
Annual Revenue Leakage (@$0.43/kg margin): $16,448
⚠️ Invisible Operational Drain Detected
$37,400
Estimated total cumulative lifetime drag across this generation if mating strategies are not capped.
Data Matrix verified via peer-reviewed JDS literature. Source: The Bullvine

Complete references and supporting documentation are available upon request by contacting the editorial team at editor@thebullvine.com.

Learn More

  • The Shottle Legacy: A Lesson in Balance — Arms you with a masterclass in outcross selection by studying the precise sire line that resisted the O-Man onslaught, delivering a roadmap to inject structural soundness and functional width back into your stalls this week.
  • The Genomic Revolution: 15 Years Later — Exposes the long-term structural blind spots created by aggressive turnaround times in young sires, positioning your 5-year mating strategy to survive the hidden coancestry collapse that current major index formulas completely ignore.
  • Is Linebreeding Dead or Just Rebranded? — Dismantles standard catalog marketing by pulling back the curtain on modern “outcross” claims, revealing how elite operations leverage controlled relationships to lock in high-margin consistency without triggering catastrophic inbreeding depression.

The Sunday Read Dairy Professionals Don’t Skip.

Every week, thousands of producers, breeders, and industry insiders open Bullvine Weekly for genetics insights, market shifts, and profit strategies they won’t find anywhere else. One email. Five minutes. Smarter decisions all week.
NewsSubscribe
First
Last
Consent

140M Pounds in 45‑Inch Stalls: Why +Stature Sires Don’t Always Pay

Holstein USA widened the stature scale. Most barns didn’t. Here’s the milk you’re leaving on the lunge box.

Kip Law didn’t have a genetics problem. He had a concrete problem.

The stalls in his 70‑cow tiestall in Sherburne, New York, were — in his words — “too small for Holsteins.” More cows than stall spaces, six hours to milk, and a steady stream of animals scrambling in and out of beds that didn’t fit them.  Nothing on a proof sheet would’ve told you that. 

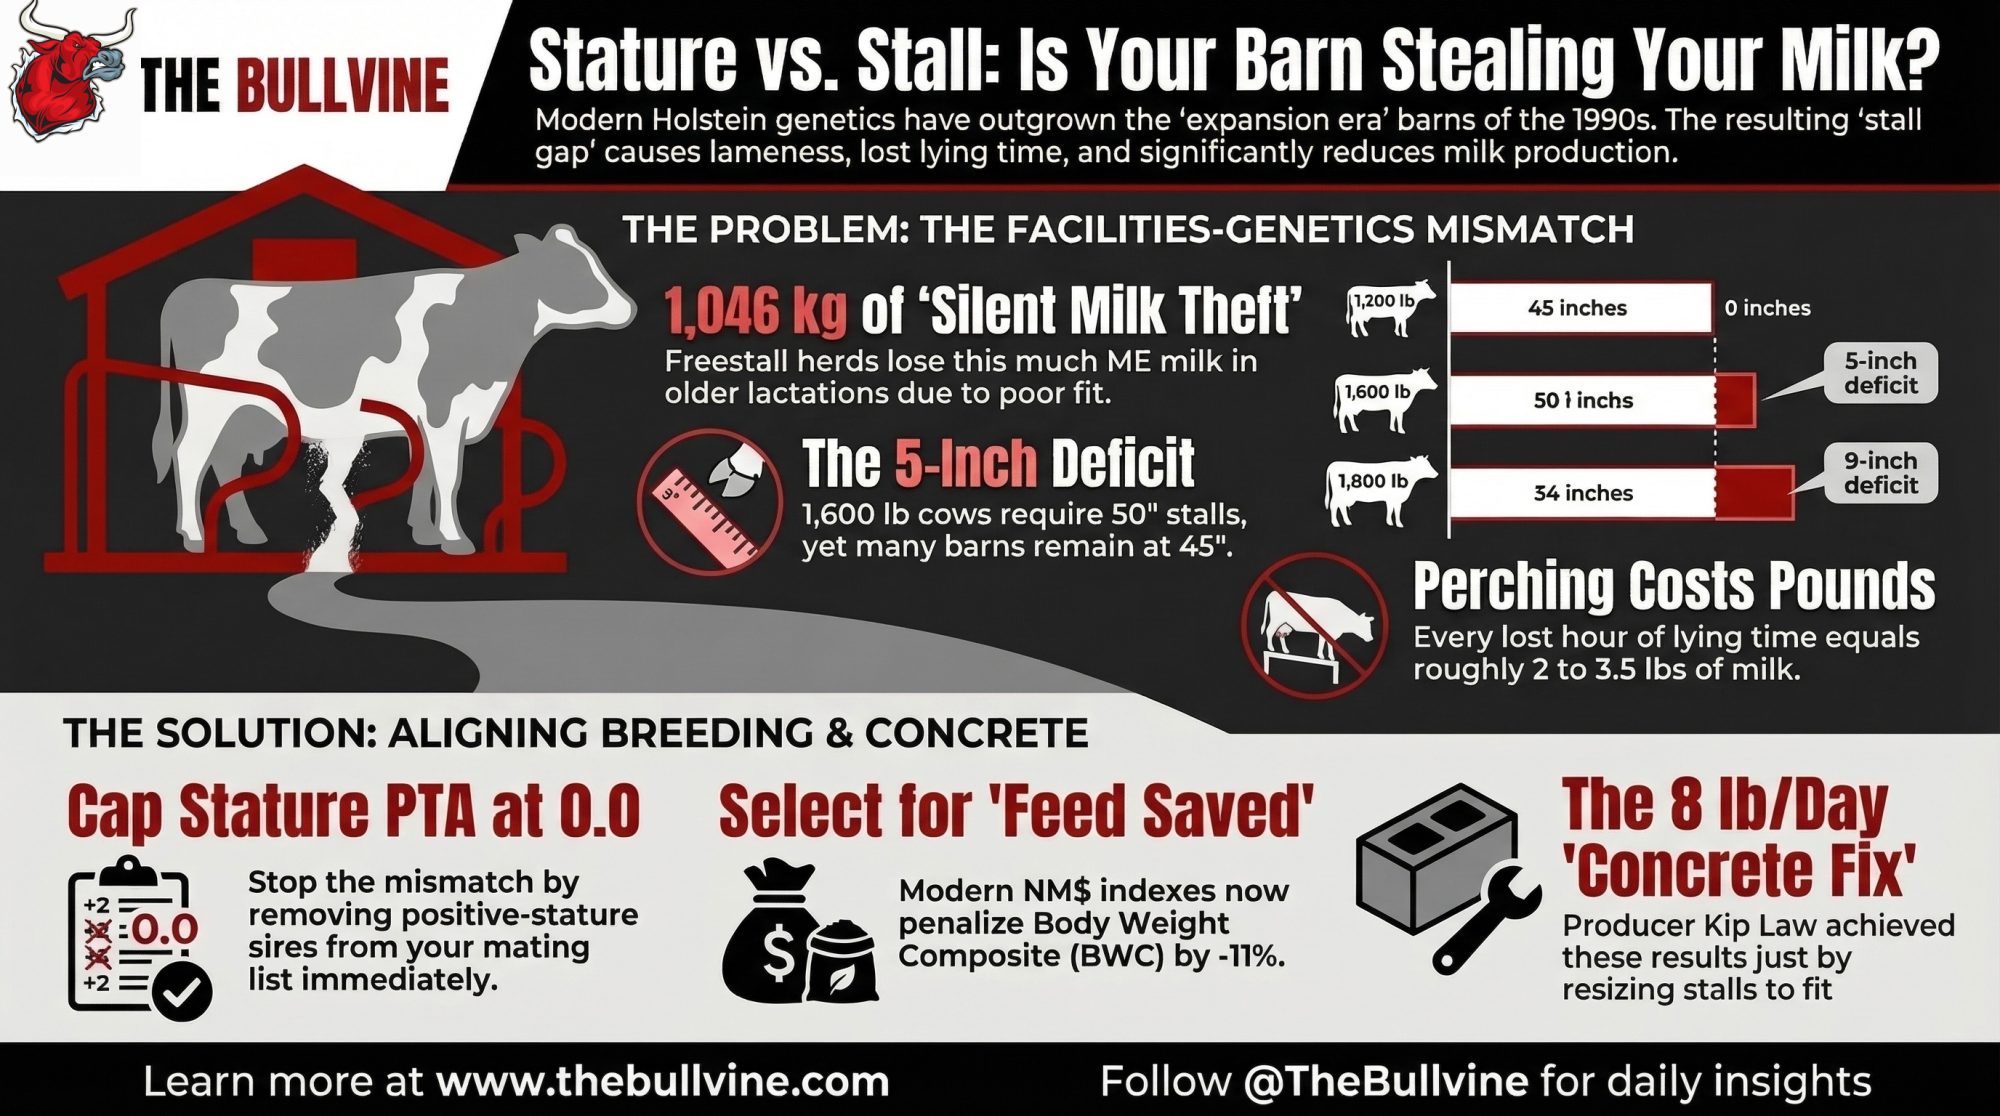
That disconnect — between what genetics are building and what concrete can carry — is quietly bleeding milk and culling cows from progressive Holstein herds across North America.  In late 2024, Holstein Association USA revised its stature linear scale from 51–61 inches to 55–65 inches because the breed had physically outgrown the old range.  It was Dr. Jeffrey Bewley’s 2023 cow measurement project that exposed the discrepancy — Holsteins had become too tall for the existing scale.  Many freestall barns poured during the expansion years of the late 1990s and 2000s are still sitting at roughly 45–46 inches of stall width.  The cows standing in them pay for that gap every time they try to rest. 

How Big Is the Stall Gap, Really?

Start with the frame. Holstein USA’s Body Size Composite and Stature PTA have trended toward larger cows for years.  Stack a couple of points of stature over multiple generations, and you end up milking daughters that carry hundreds of pounds more live weight than the cows your barn was designed around. 

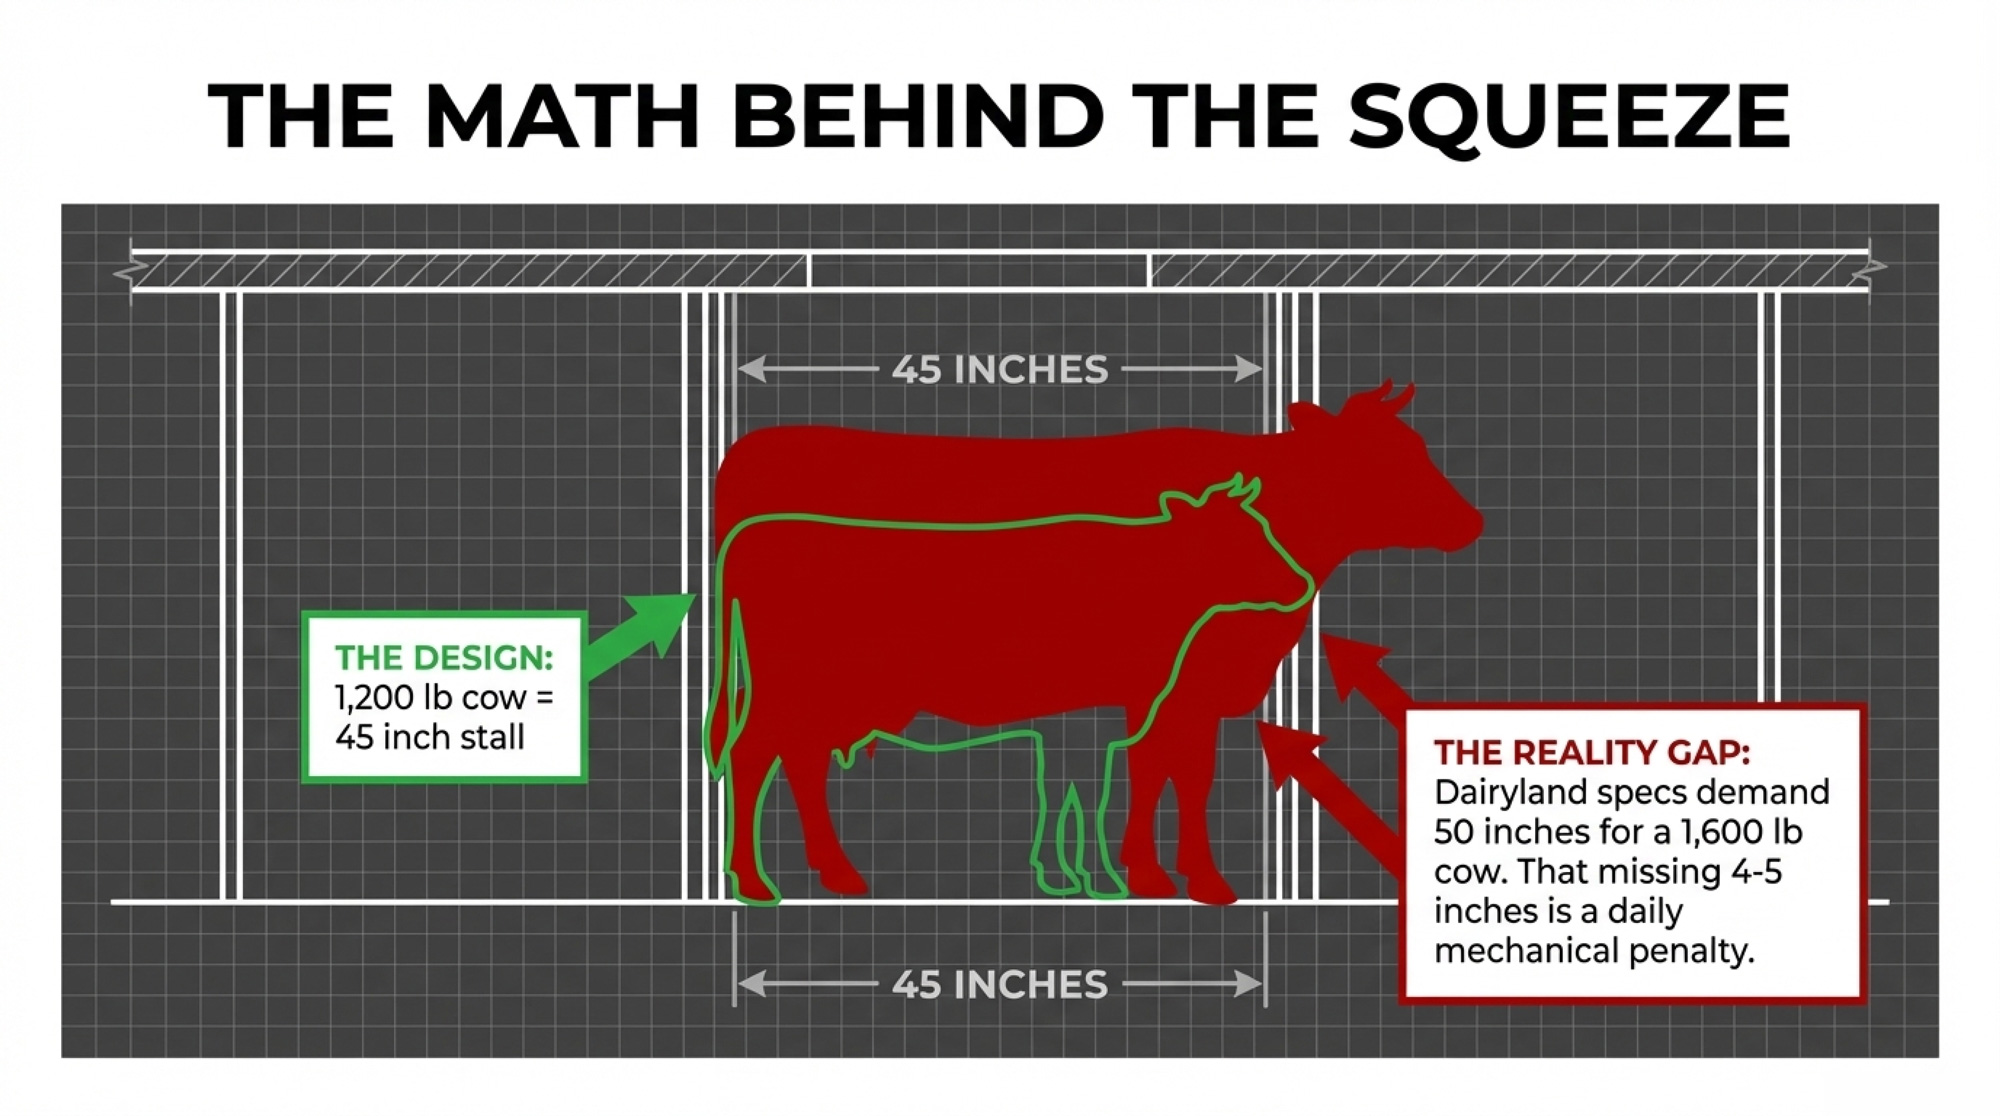
Nigel Cook and the University of Wisconsin’s Dairyland Initiative turned that reality into barn specs.  Their current freestall design table sizes stalls by cow body weight for adult Holsteins: 

  • Around 1,200 lb: recommended stall width (divider spacing) is 45 inches
  • Around 1,400 lb48 inches
  • Around 1,600 lb50 inches
  • Around 1,800 lb54 inches

A lot of older barns were built on 45‑inch centres because they were designed around smaller cows or heifers.  When your cows grow, and your concrete doesn’t, you create a mechanical penalty every time a big cow tries to lie down or get up. 

Visualizing the Stall Fit Gap

Based on the Dairyland Initiative’s freestall dimension table for adult Holsteins: 

Cow size (approx. weight)Recommended stall widthCommon 2000s stall widthThe “gap”
~1,200–1,400 lb45–48 in (45 in @ 1,200 lb; 48 in @ 1,400 lb)45–46 in0–3 in depending on actual cow weight
~1,600 lb50 in45–46 in4–5 in
~1,800 lb54 in45–46 in8–9 in

Imprint width defines minimum stall space—the lateral distance from hock to abdomen when resting narrow. For mature Holsteins, that’s about 132 cm (52 in.). Your 45-inch stalls? They’re forcing cows to compress into a space 7 inches narrower than their resting posture. That’s not comfort—that’s forced perching.” (Source: Ontario Ministry of Agriculture, Food and Rural Affairs

Cook’s team notes that, in most situations, a 48‑inch‑wide stall is already an improvement over a 45‑inch stall for mature Holstein cows.  For a lot of modern +stature cows in older barns, that missing 3–9 inches is exactly what your time‑budget and lameness numbers are screaming about. 

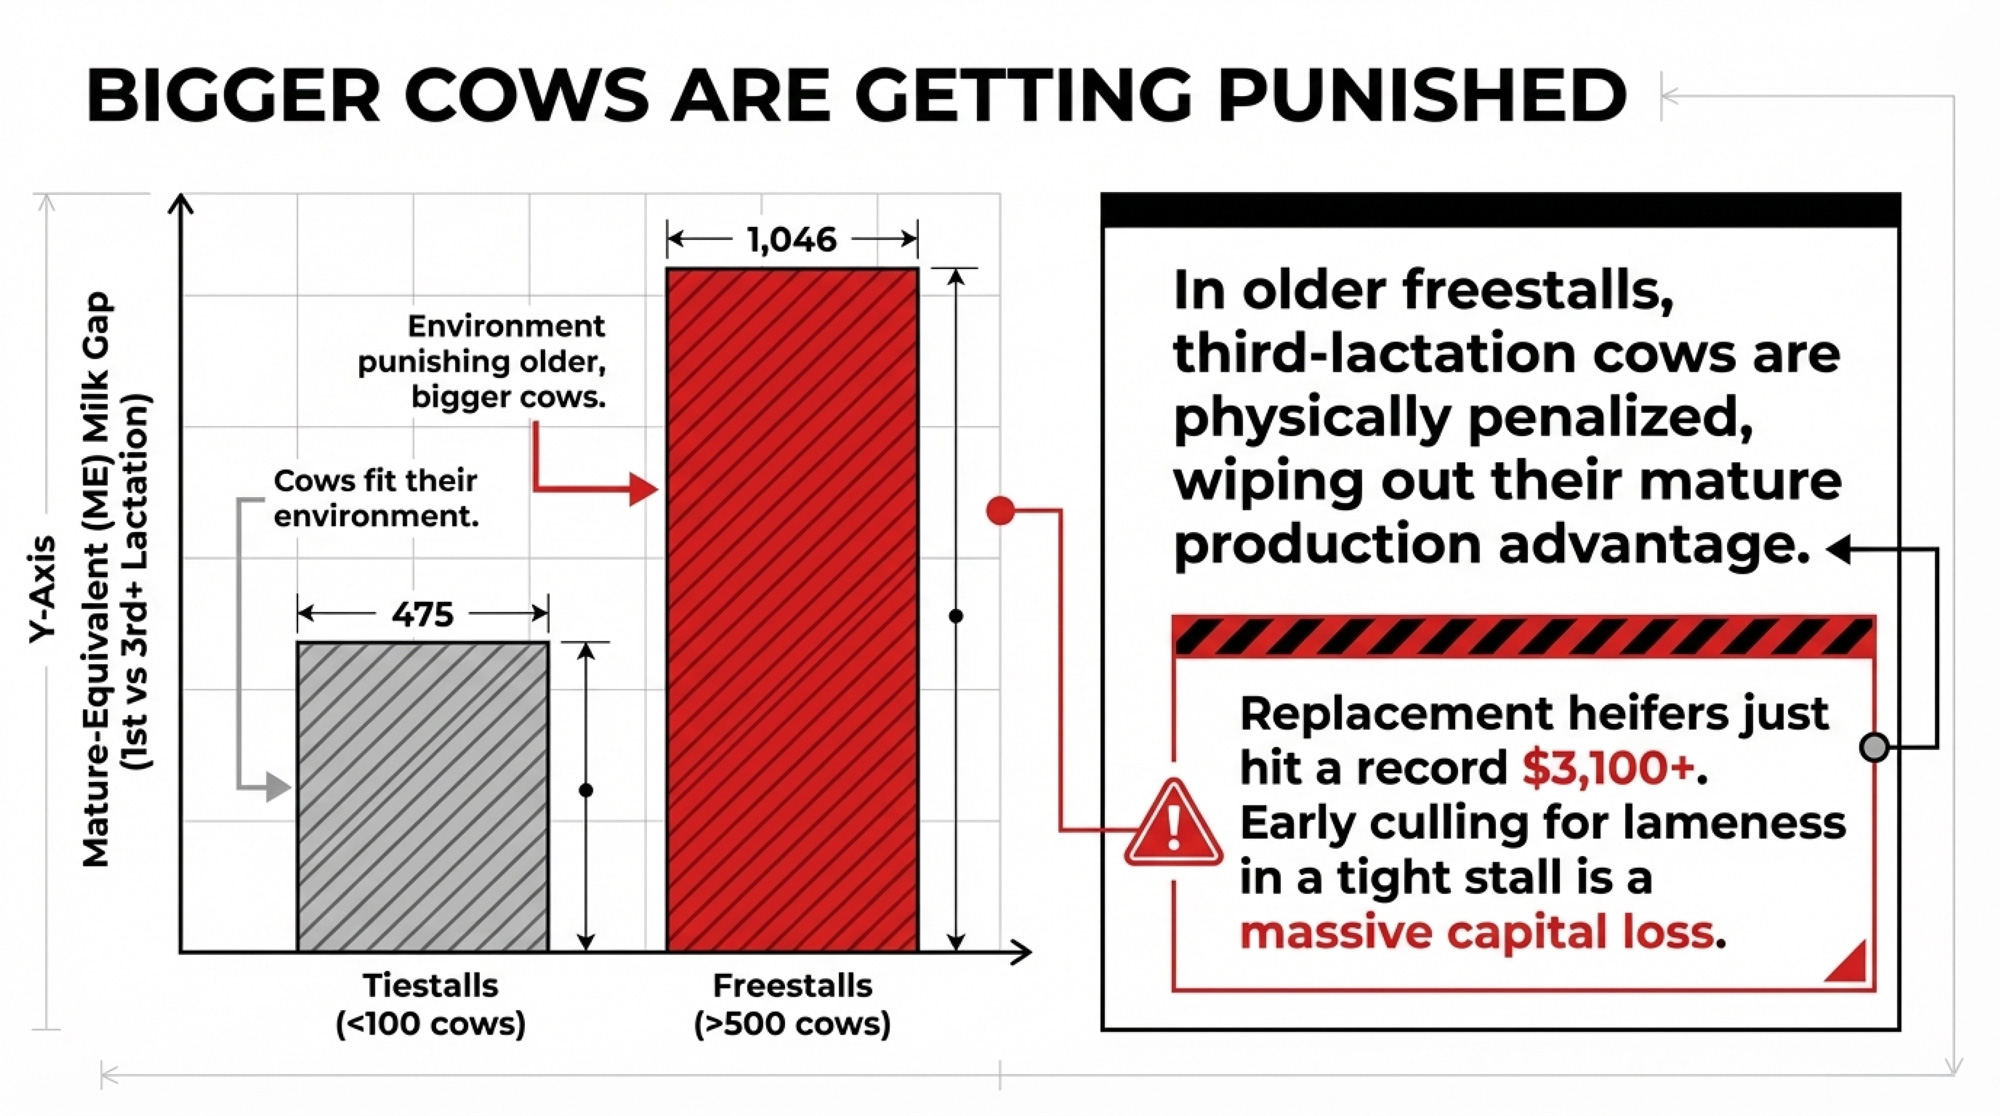
Cook’s analysis of AgSource DHIA data from April 2008 puts production numbers on top of that picture.  In herds with more than 500 cows — mostly freestall operations — the mature‑equivalent milk (ME) gap between first‑lactation and third‑or‑greater‑lactation cows averaged 1,046 kg.  In herds under 100 cows — predominantly tiestalls — the same gap was just 475 kg.  The freestall environment was disproportionately punishing older, bigger cows, not genetics, suddenly “quitting.” In remodels where stalls were widened and surfaces improved, that gap shrank dramatically — in some herds, it essentially disappeared. 

That’s not “bad feet and legs genetics.” That’s the barn punishing the frame those genetics created. 

Why Did Holsteins Outgrow Their Stalls?

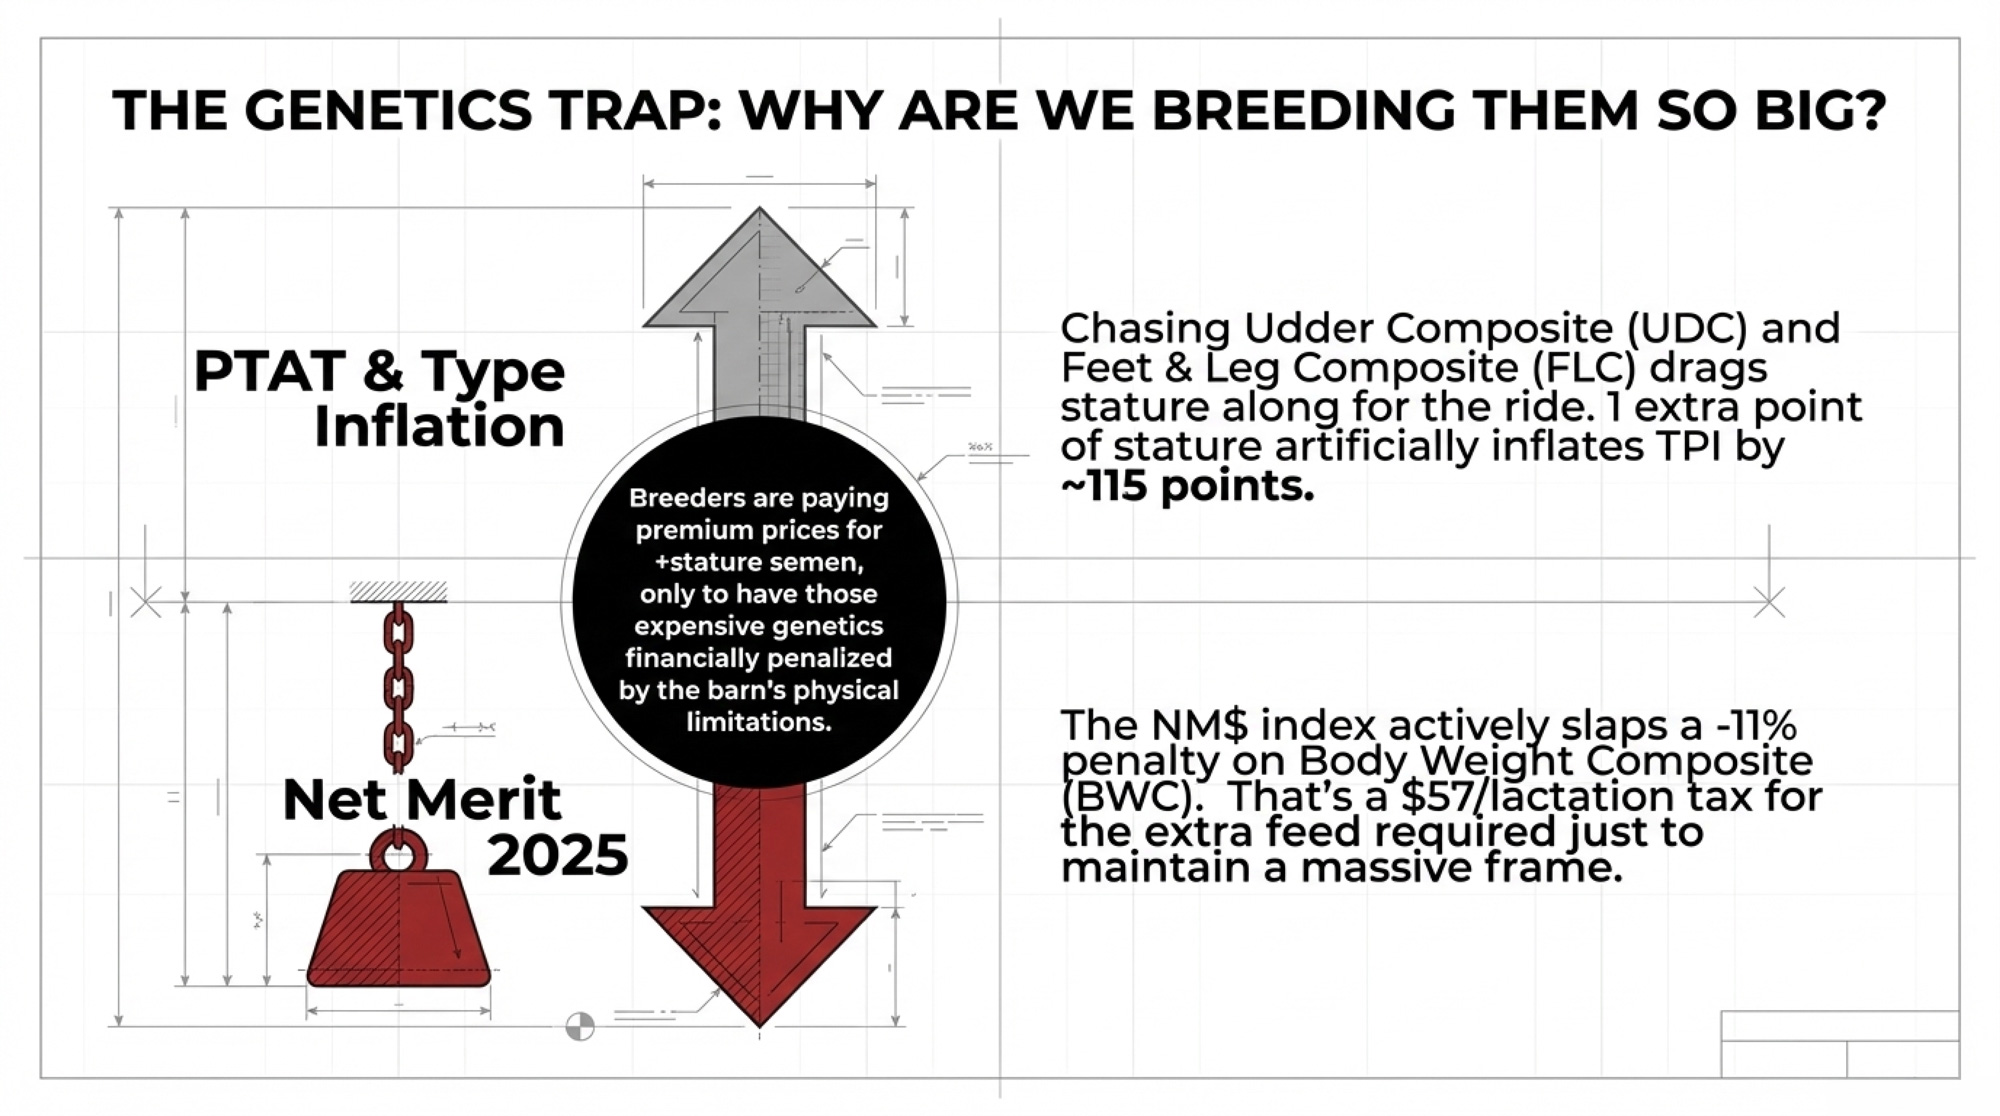
At the 130th National Holstein Convention in 2015, Nate Zwald, with Alta at the time, put numbers on something a lot of breeders already felt.  He reported a genetic correlation of about 0.50 between stature and the udder composite, and highlighted how strongly PTAT is associated with stature in the U.S. Holstein population.  In plain language: when you chase UDC and FLC through type, you drag stature along for the ride. 

“We think we are selecting for better UDC and FLC, but the unintended effect is that we are also making bigger cows,” Zwald told the crowd. 

He built the case with three hypothetical bulls.  Same production, same health traits — the only difference was about one point each on type, feet and legs, and udders. The tallest bull landed around 4th on TPI. The moderate bull sat near 100th. The smallest slid toward 1,000th.  That type inflation, driven heavily by stature, was worth roughly 115 TPI points for the tall bull compared to the moderate one — enough to earn elite flushes and heavy semen demand, even though the mid‑ranked bull had more than enough type for commercial freestalls. 

Bull ProfileProductionHealth TraitsType/UDC/FLCApprox. TPI Rank
Tall Bull (+Stature, +PTAT)SameSameHigh~4th
Moderate Bull (0.0 Stature)SameSameModerate~100th
Small Bull (−Stature)SameSameLower Type~1,000th
TPI Gap (Tall vs. Moderate)~115 TPI points

Breeders often keep chasing those bulls for a simple economic reason: high‑TPI and high‑PTAT animals can command higher sale prices for cattle and embryos, even when they’re harder to keep efficient in a crowded commercial stall.  That’s the conflict a lot of herds live with — proofs that look great on paper but quietly work against the barn you already own. 

Holstein USA lists stature as one of the more heritable linear traits, with heritability estimates commonly in the low‑to‑mid 0.4 range in U.S. Holstein evaluations.  When you select for tall, you reliably get tall. Research and breeding work have shown that larger body size and higher stature are unfavorably associated with longevity and fertility — cows bred for size tend to have shorter productive lives and poorer reproductive performance. 

Work from Ontario, Guelph, and the USDA has established a clear economic relationship between body size and feed efficiency: genetically larger cows consume more energy for maintenance and tend to produce milk less efficiently once you account for that overhead.  That’s why the 2021 Net Merit revision put stronger negative economic weight on Body Weight Composite and added a new Feed Saved component, explicitly rewarding breeders who select for more efficient, moderate‑sized cows.  By the 2025 NM$ update, BWC emphasis had reached −11%, and total Feed Saved emphasis hit 17.8% — the index actively penalizes every extra pound of body weight at roughly 5.5 lbs of DMI per lactation. 

The Indexes Caught On. Did Your Mating Plan?

AHDB geneticist Marco Winters has seen the same paradox in UK data.  “Everywhere I go, farmers tell me they don’t want bigger cows,” he’s said, “but all the genetic trends tell us that’s what they’re breeding.”  AHDB figures show average Holstein body weight is climbing, and UK indexes have responded with more emphasis on maintenance and efficiency. 

Holstein USA’s stature scale change in 2024 and classification’s tighter eye on extreme size are another signal.  The math in the national indexes has already turned against huge frames.  The question is whether your mating plan has followed — or whether you’re still penciling in +stature sires into a barn that was poured around smaller Holsteins. 

The genetics drifted. The concrete stayed put.

When Stall Width and Holstein Size Collide

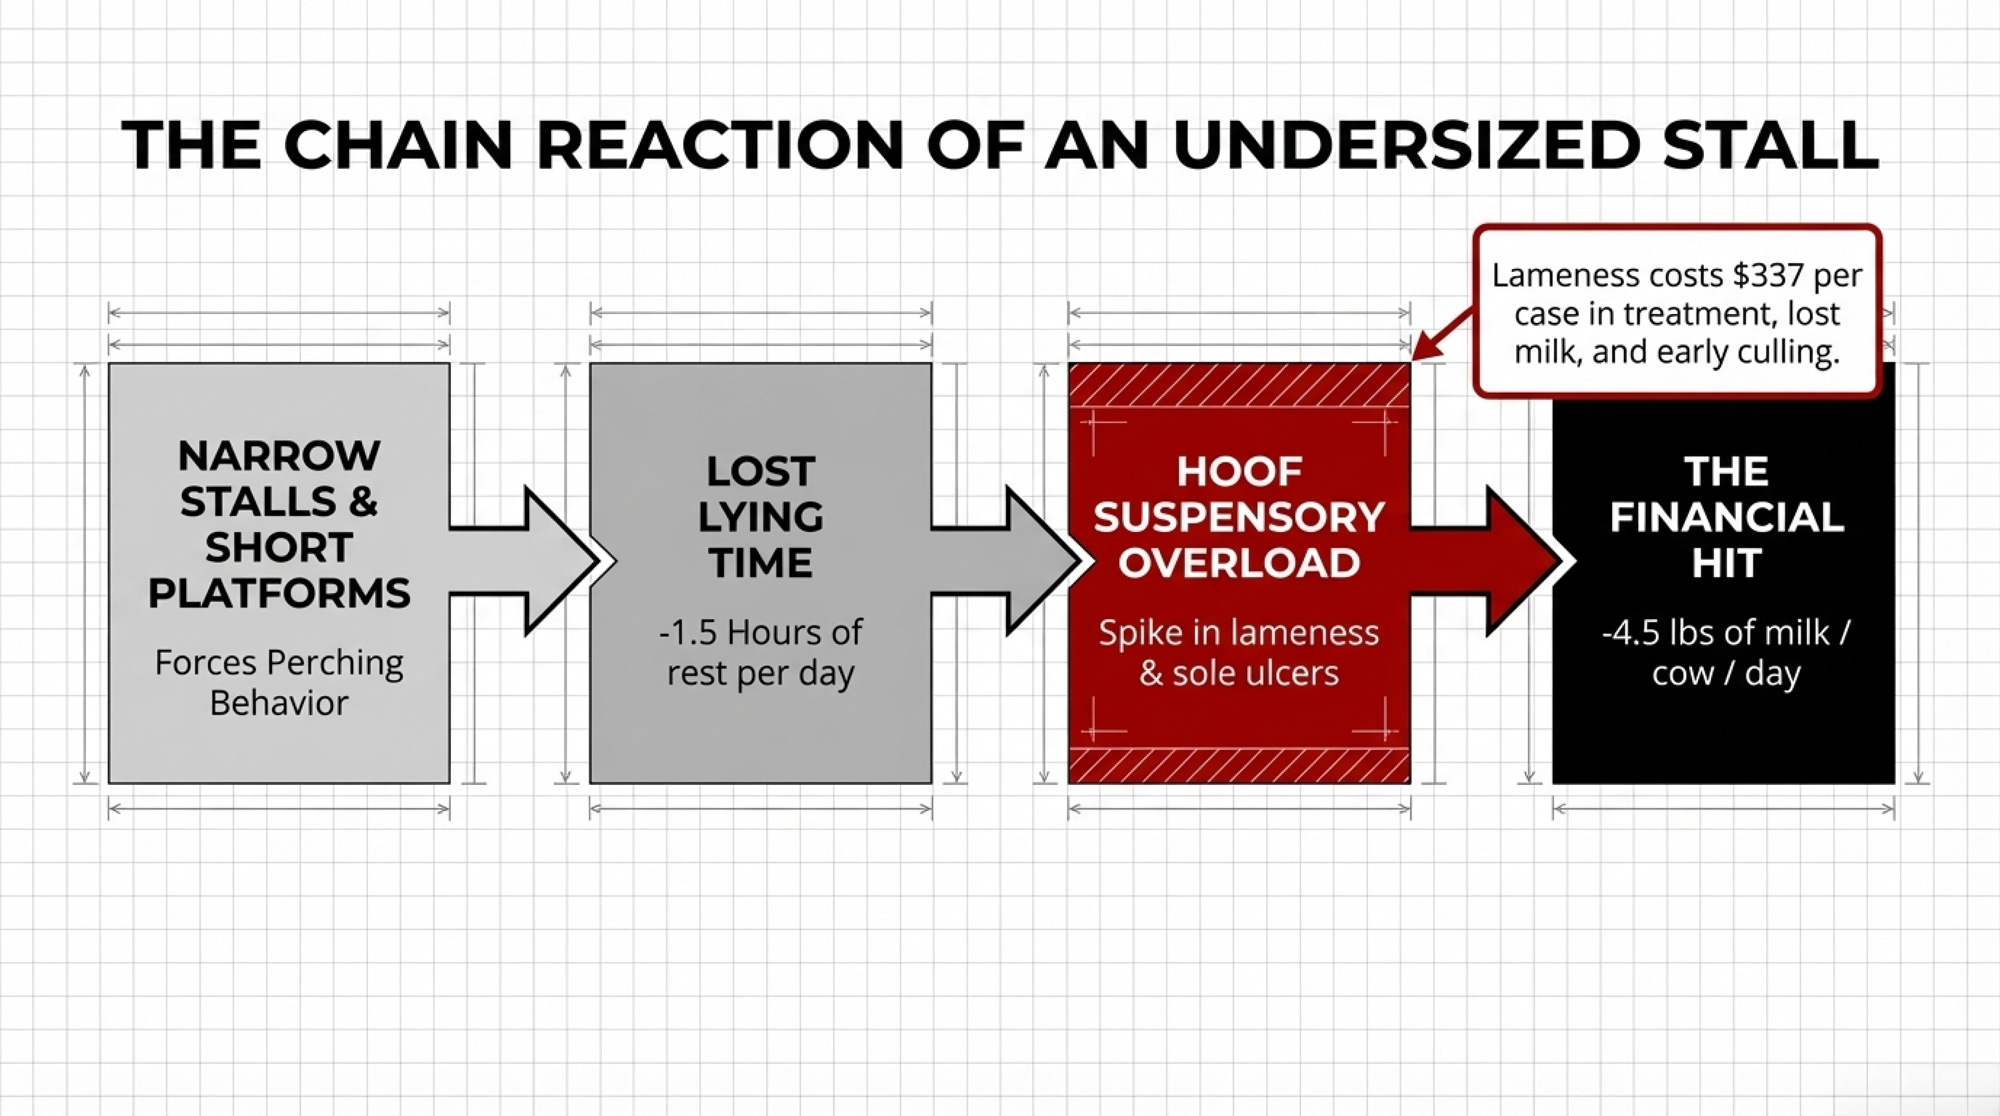
Cassandra Tucker’s group at the University of British Columbia has spent years watching what big Holstein cows actually do in undersized stalls.  In one set of studies, cows averaging roughly 1,600 pounds were housed in stalls 44, 48, and 52 inches wide.  Lying time increased when the stall width increased from 44 to 48 inches, with smaller gains between 48 and 52 inches.  In the narrow stalls, cows spent more time perching — front feet on the bed, rear feet in the alley — exactly the posture you see in mature pens that are too tight for the cows living there. 

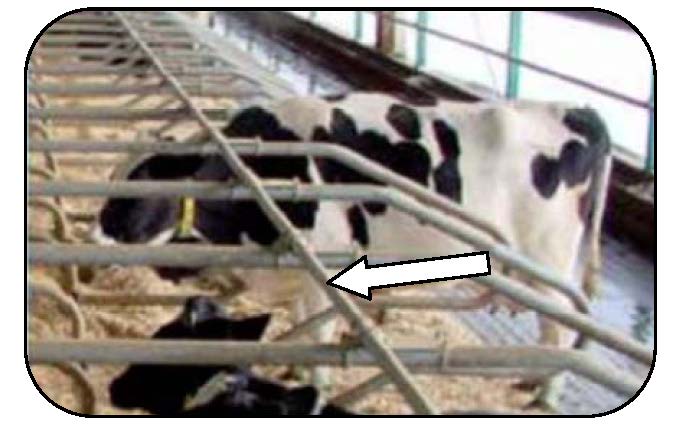
“Proper neck rail placement and adequate stall width let cows stand straight with all four feet on the bed—the posture that protects claws and suspensory apparatus. When stalls are too narrow or neck rails are too far forward, cows perch (front feet on bed, rear feet in alley), loading the claw’s suspensory structures and driving sole ulcers. Tucker’s UBC work showed lying time dropped and perching spiked in 44-inch stalls vs. 48-inch stalls. Your barn tells you which side of that line you’re on.” (Source: Ontario Ministry of Agriculture, Food and Rural Affairs)

Perching isn’t just ugly. It’s the first step in a cascade. Longer standing bouts overload the claw’s suspensory apparatus, driving more sole hemorrhage and ulcers.  Once those structural changes happen inside the hoof, you don’t “fix” them; you manage around them until the cow leaves. 

Rick Grant at the Miner Institute translated that behavior into milk.  His work suggests each lost hour of lying time is associated with roughly 2–3.5 lb less milk.  Cook’s freestall time‑budget data from 17 Wisconsin barns found that cows averaged about 11.3 hours, with a range of 2.8 to 17.6 hours.  The worst‑off cows weren’t just a bit behind. They were living in a completely different reality. 

Stall Width Is Only Half the Story: The Lunge Box

As cows get taller, they don’t just need a wider bed. They need somewhere to put their head when they get up. 

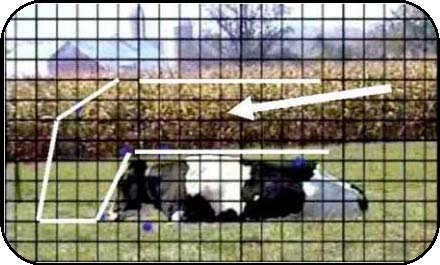
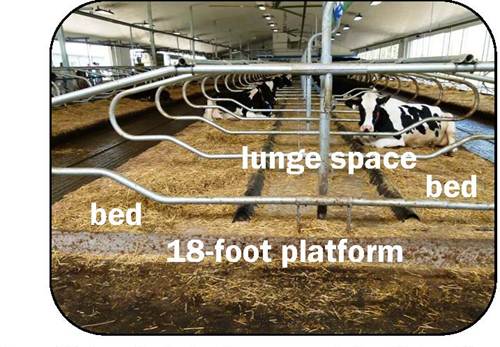
The Dairyland Initiative’s adult freestall dimensions specify that a mature Holstein needs about 10 feet of stall length against a wall to allow a full forward lunge, and about 17 feet on a head‑to‑head platform so cows can lunge without colliding with the cow across from them.  They treat 16 feet as a minimum platform length; going shorter forces cows to lunge to the side and lie diagonally, which drives perching and bed contamination. 

Rising cows need 61 cm (24 in.) of forward lunge space, with the nose arcing 10–30 cm above the bed. Short platforms (<16 ft head-to-head) or obstructions force side-lunging and diagonal lying—the perching behavior you see in pens where big cows outgrew the concrete. That missing foot of platform length isn’t a rounding error—it’s a daily lying-time penalty.” (Source: Ontario Ministry of Agriculture, Food and Rural Affairs)

In many older barns, head‑to‑head platforms were built around that minimum 16‑foot length from earlier design recommendations, rather than the 17 feet now preferred for mature Holsteins.  That might have been acceptable for smaller 1,200–1,400‑lb cows.  Push stature toward the top end of Holstein’s new 65‑inch scale, and the nose‑to‑tail length and lunge arc increase — but the concrete doesn’t.  The result: more side‑lunging, more diagonal lying, and more stall‑use frustration you can see in any overgrown pen.


Head-to-head platforms need 5.5 m (18 ft) for mature Holsteins to lunge forward without hitting the cow across from them. Older barns built to 16 ft minimums force cows to lunge sideways through loops or lie diagonally, driving bed contamination and perching. That missing 1–2 feet isn’t a comfort upgrade—it’s the difference between cows using stalls normally vs. fighting the barn every time they lie down.” (Source: Ontario Ministry of Agriculture, Food and Rural Affairs)

Kip Law’s herd was living that reality before he built his new barn. 

Kip Law’s 8‑lb‑a‑Day Concrete Fix

Law’s old setup was a classic Northeast tiestall: a 70‑cow pipeline arrangement with more cows than stalls, Holsteins that had outgrown their beds, and milking that took roughly six hours because cows had to be rotated in and out.  “It was taking us about six hours to milk,” he told Progressive Dairy. Stalls were “too small for Holsteins,” and the facility no longer fit the herd. 

He didn’t start by rewriting a mating program. He started by changing the barn.

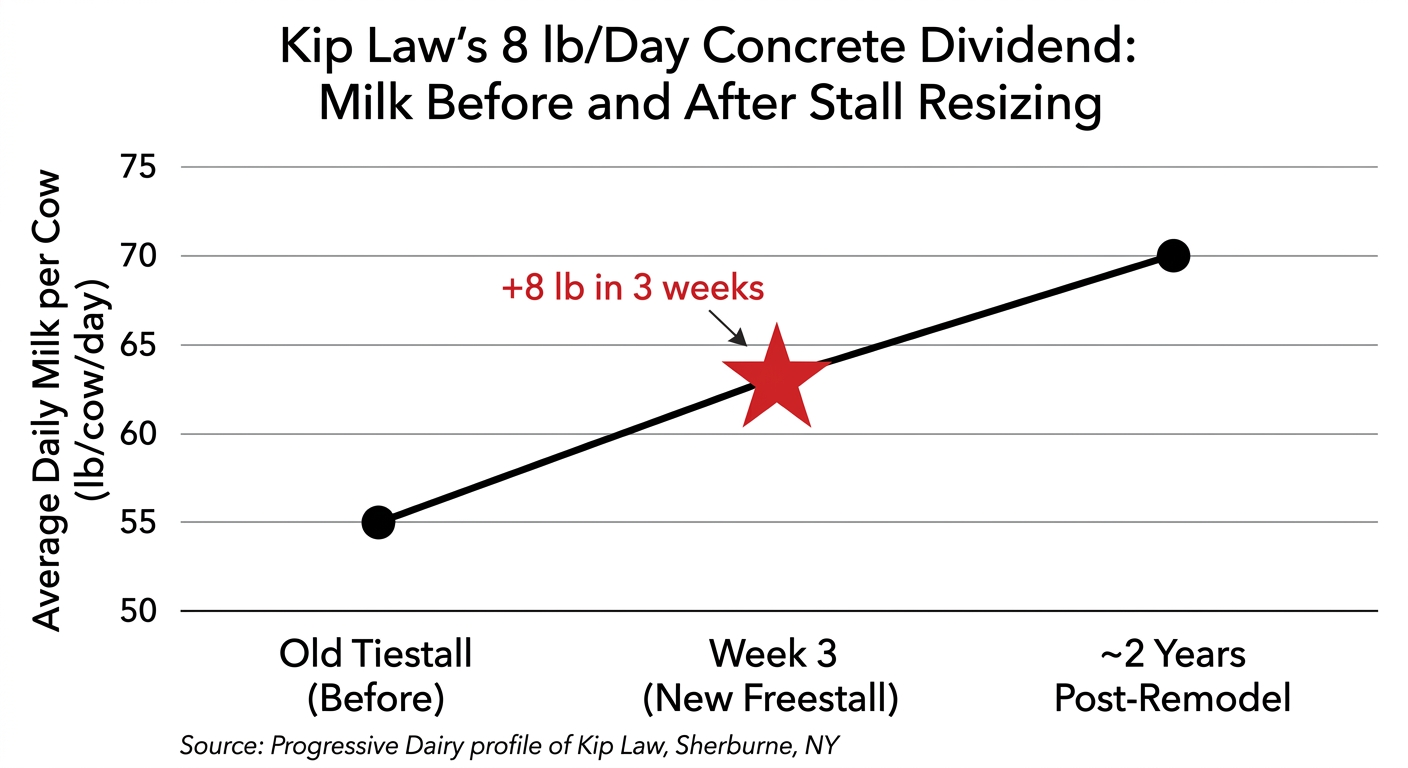
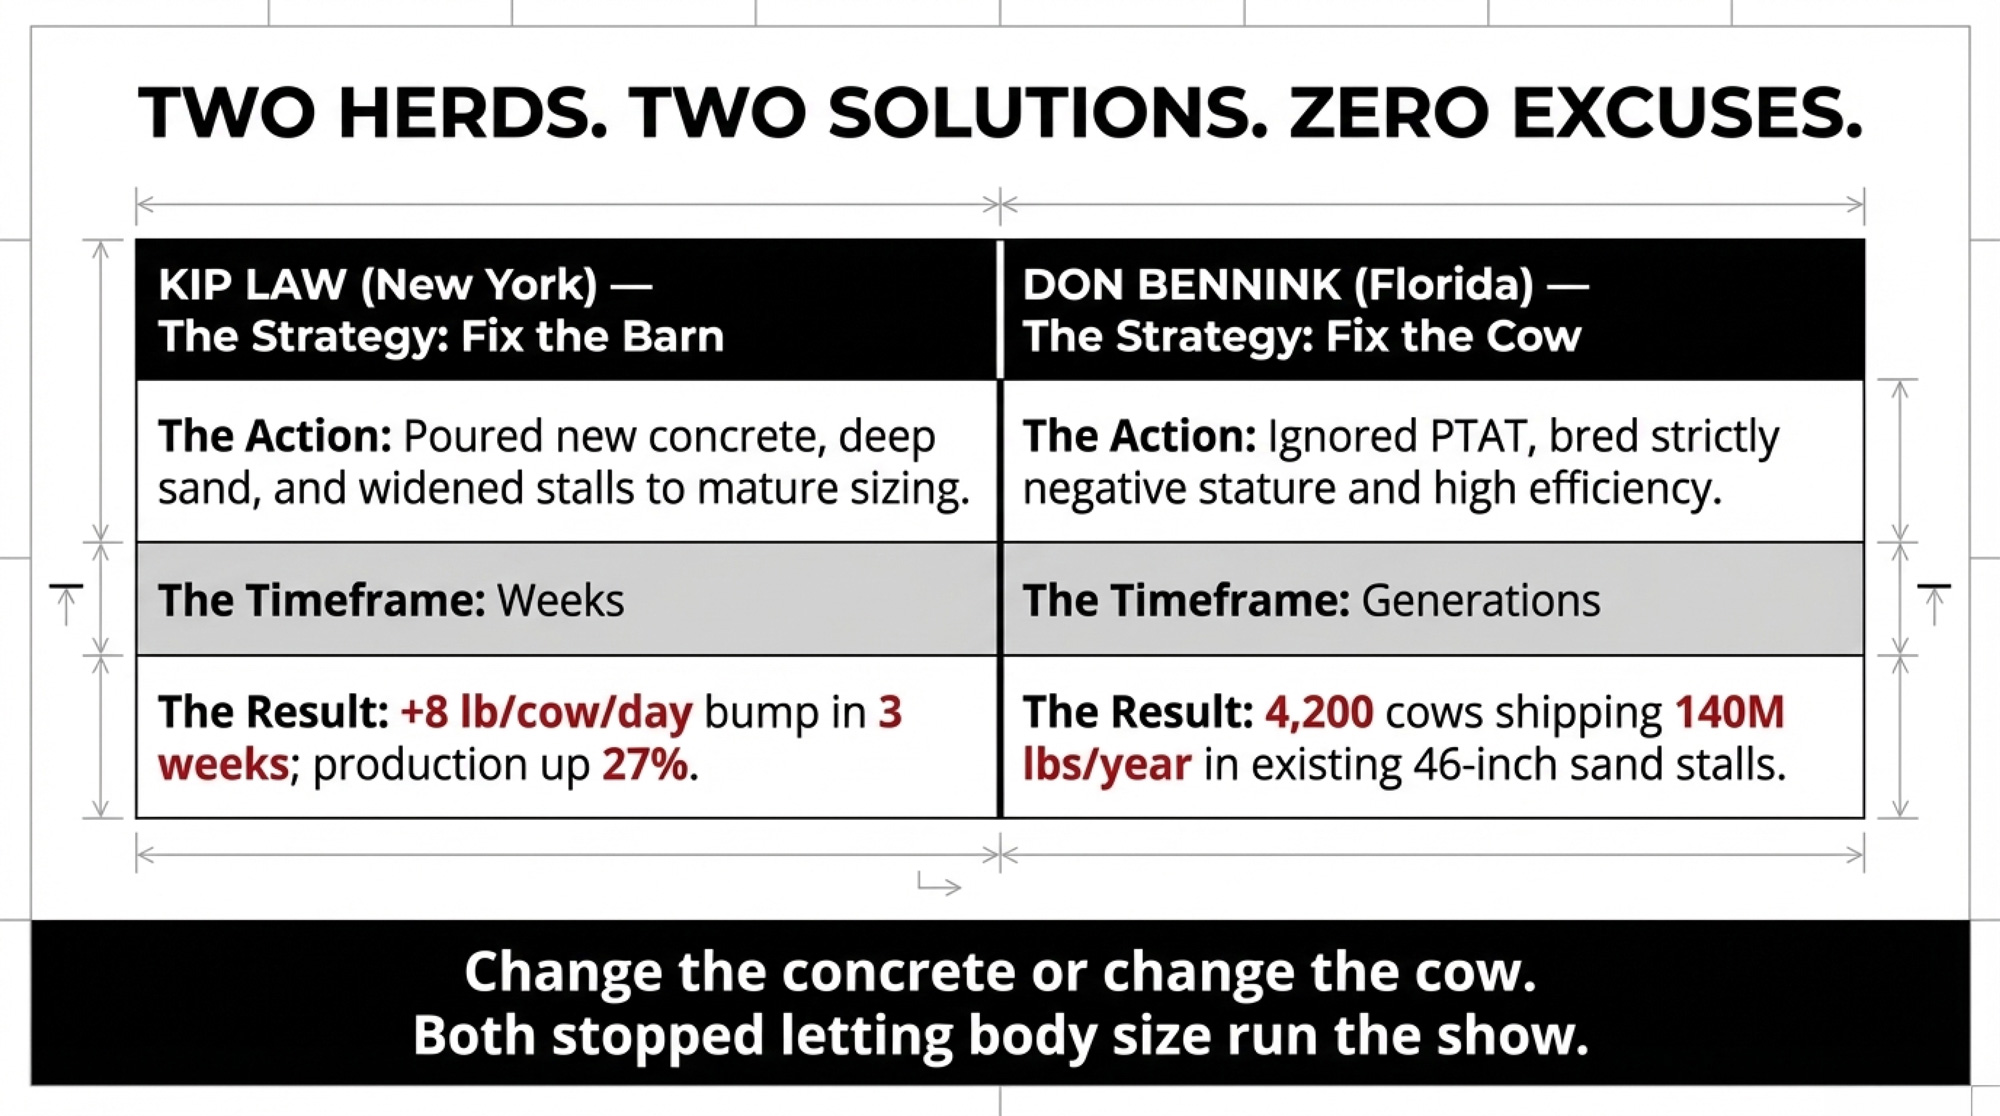
Law built a new freestall with a double‑eight parlor, deep sand bedding, proper lunge space, and stalls sized for mature Holsteins.  Within three weeks, milk jumped about 8 lb per cow per day.  Over roughly two years, his average daily production climbed from about 55 lb to 70 lb per cow — a 27% increase.  The milking herd grew from about 80 to 130 cows, and overall milk production doubled.  Somatic cell count dropped to about 100,000

“The overall herd health is a lot better. Our cows are a lot calmer than they used to be,” Law said. “In two years, it’s a completely different herd.” 

Same cows. Same genetics. New concrete.

The Barn Math on Missing Milk

To get a feel for what’s at stake, take a simple example. Say 50 of the biggest cows in a 200‑cow freestall herd — mostly third‑lactation and older — lose just 1.5 hours of lying time per day because stalls are too narrow.  Using Grant’s mid‑range estimate of 3 lb per lost hour,  that’s: 

  • 1.5 hours × 3 lb = 4.5 lb per cow per day.
  • 4.5 lb × 50 cows = 225 lb per day.
  • 225 lb × 305 days = 68,625 lb of milk in a lactation.

That’s barn math, not Law’s actual numbers — but it lives in the same neighbourhood as what he saw when he fixed stall fit and watched milk move. 

Cook’s freestall remodels show the same pattern: widen stalls and improve surfaces, and the 1,046 kg ME gap between first‑calvers and older cows starts to shrink.  In some herds, it disappears. 

Change concrete, milk moves. Change the sire selection, milk moves differently.

Bennink’s Opposite Bet: Breed Smaller, Ship More

In Florida, Don Bennink took the opposite route and ended up in a similar place — cows that fit their environment. 

In a 2017 profile, North Florida Holsteins in Bell, Florida, was milking about 4,200 cows at any one time, with roughly 4,800 cows on the farm and around 10,000 head on site.  They were shipping approximately 140 million pounds of milk per year with a rolling herd average of 29,357 lb at 3.6% fat and 3.0% protein on 3× milking, all through about 4,000 sand‑bedded freestalls in a mix of tunnel‑ventilated and naturally ventilated barns.  Bennink moved his herd from western New York to Florida in 1980 and built the operation from there — figuring out quickly that hot, humid conditions and a Northern European breed demanded relentless attention to comfort, cooling, and housing.  (Read more: NORTH FLORIDA HOLSTEINS. Aggressive, Progressive, and Profitable!!)

“High production, strong health traits and feed efficiency,” Bennink said in that profile. “They are the bywords for breeding profitable cows.”  He doesn’t mince words about what profitable doesn’t look like. The taller, more angular cow favoured in the show ring, the classification system, or the current PTAT formula is “so far removed from what most milk producers want that it is irrelevant to the majority of dairy operations,” he argued. 

The results back up the philosophy. Between 1981 and 2021, more than 200 bulls carrying the NO‑FLA prefix were enrolled with the National Association of Animal Breeders.  Bennink bred the dam of Mr. T‑Spruce Frazz LIONEL‑ET — NO‑FLA Montross 42446‑ET — who topped the TPI list in April 2022, tracing back at least five generations of North Florida breeding.  NO‑FLA MATRIARCH sits in the top 20 all‑time among proven bulls with a PTA Productive Life of 7.3.  The farm has produced 55 dams of merit awardees, 11 gold-medal dams, 9 94‑point animals, and 15 93‑point animals.  In 2024, the National Dairy Shrine honored Bennink as Distinguished Dairy Cattle Breeder — recognition built squarely on functional trait selection and profitability, not show‑ring aesthetics. 

He built his own North Florida Index around pounds of protein shipped, health traits, daughter fertility, and calving ease.  Stature and sharpness don’t enter the equation. He actively selects bulls that are negative for stature, even as many breeders still chase high PTAT and lofty frames. 

If you’re breeding for Madison or the Royal, you’re playing a different game with different priorities. If your milk cheque comes from a 46‑inch freestall, Bennink’s math may be closer to what your barn needs than the TPI top‑ten list. 

He didn’t widen stalls to keep up with ever‑taller cows. He bred cows that work in the freestalls he already had.  The trade‑off is real: go too far shrinking stature without watching udder and locomotion traits, and you can sacrifice udder height or rear‑leg structure, which is why Bennink leans hard on individual udder and leg traits instead of chasing overall type composites. 

Two herds, two different levers. Both stopped letting body size run the show.

The “Stop the Growth” Breeding Manifesto (Month 0–3)

You can stop making the mismatch worse this week without spending a dollar on concrete.

  • Hard cap: Stature PTA ≤ 0.0. Net Merit 2021 and subsequent updates have already placed a negative economic weight on the larger Body Weight Composite due to higher maintenance costs — by 2025, BWC emphasis in NM$ hit −11%.  There’s no financial case for adding more frame in a tight barn. 
  • Weight tax: Body Weight Composite ≤ 0.0. Larger‑bodied cows eat more just to maintain themselves. USDA research behind the NM$ formula estimates that each extra unit of BWC costs roughly 5.5 lbs of DMI per lactation. 
  • The real “type”: Prioritize Productive Life (PL), Daughter Pregnancy Rate, and the individual locomotion traits (rear legs rear view, locomotion, foot angle) instead of chasing PTAT points that are heavily tied to stature. 
  • The goal: A moderate, efficient cow that fits the stall and lasts — not a frame race. The exact weight and production numbers vary by region and system; the point is to stop rewarding size for its own sake in a barn that can’t carry it.

Write it down as a farm rule: “No sires over 0.0 Stature or positive BWC until mature‑cow stalls are at least at Dairyland’s recommendation for our cow size.”  That one line keeps you honest the next time a glossy proof sheet lands on the desk. 

Concrete and Comfort: Sequencing the Physical Fix (Month 0–24)

Chase the Cheap Cow Comfort Wins (Month 0–6)

Concrete can wait a year. Behavior and time budgets can’t.

  • Drop effective stocking density in the fresh and high‑cow groups below about 110% of stalls where you can. 
  • Tighten bedding management: more bedding, more often, with level, well‑groomed beds — especially if you’re on mats or mattresses. 
  • Walk pens with a simple anemometer. If air speed at cow level runs under about 1 m/s in high‑risk pens, you’re leaving heat‑stress risk on the table. 
  • Score locomotion monthly in the fresh and high groups. Treat and block score‑3+ cows quickly and give them the best stalls you have — because a 2022 University of Wisconsin study pegged lameness cases at about $337each in lost milk, treatment, and culling. 

These moves cost time and operating money, not six figures. They can still deliver a few pounds per cow per day and peel points off your lameness rate inside the first six to nine months. 

Pilot Stall Widening Where It Pays Fastest (Month 6–18)

Instead of waiting until you can redo the entire barn, fix one pen.

Pick the highest‑value group — fresh cows or your top production string.  Widen those stalls by moving or replacing divider loops. Using Dairyland’s table, if your average mature cow weighs around 1,600 lb, you should aim for about 50‑inch centres, not 45–46.  Get as close as your building will let you, even if it temporarily reduces stall count in that pen. 

Then track milk, lying behavior, and lameness scores in that pen against unchanged pens.  Cook’s Western Canadian Dairy Seminar work was blunt: after stall-surface changes, increasing stall width for large, mature Holstein cows was the second most important improvement in both sand and mattress facilities.  Your pilot pen becomes proof of that in your own herd — and evidence for your lender. 

Use the Extra Milk to Fund the Concrete (Month 12–24)

If the combination of a genetic freeze and comfort fixes adds even 4 lb/cow/day across 200 cows, that’s 800 lb/day.  Over a full lactation, you’re looking at roughly 244,000 lb of additional milk. The exact margin depends on your component price and feed cost, but that kind of volume moves the needle in a loan conversation. 

Instead of walking into the bank saying, “I read I should widen stalls,” you walk in with a year’s worth of herd data showing that better stall fit in one pen produced real milk.  That’s a fundamentally different conversation. 

What rarely works: still using high‑stature bulls because they rank on the elite lists, and relying on more frequent hoof trimming to outrun the concrete. 

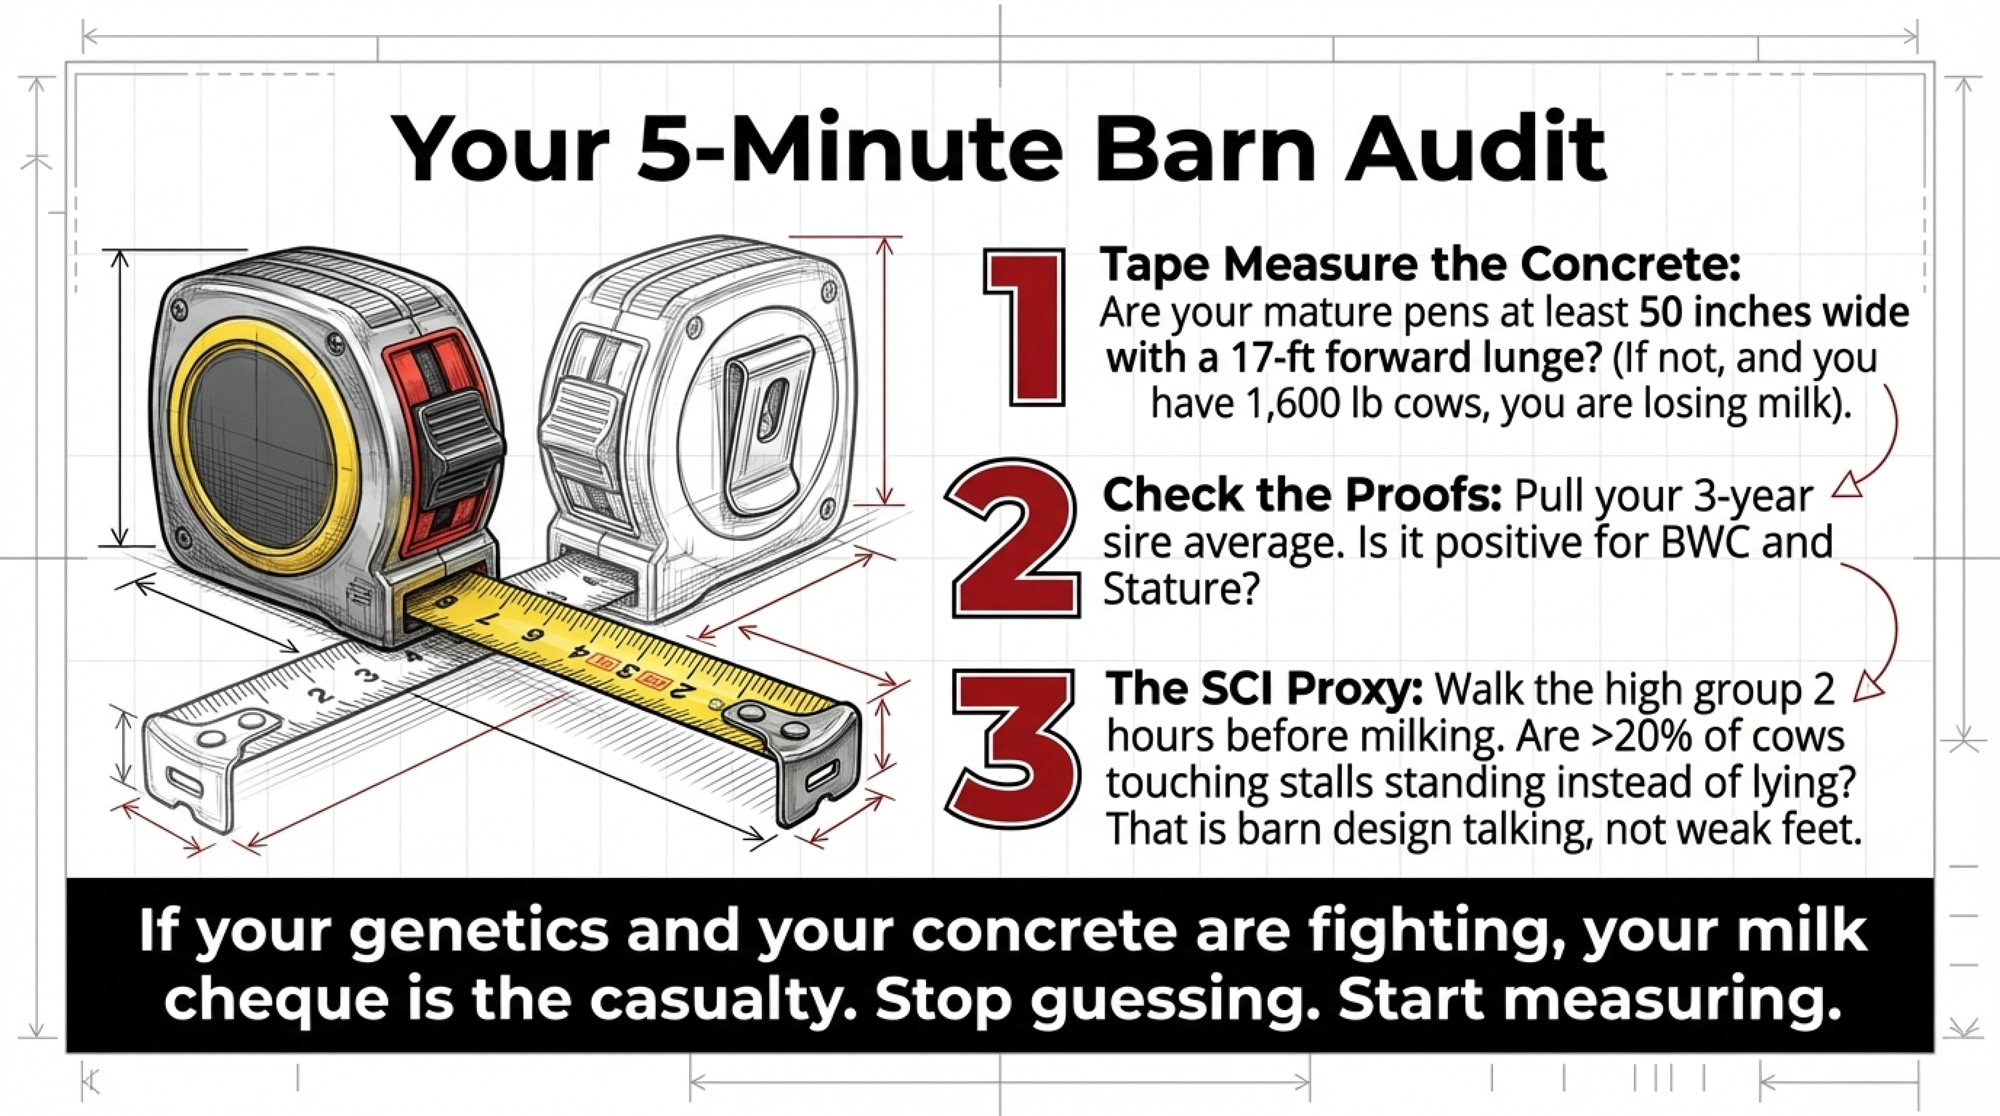
Your 5‑Minute Barn Audit

Use this as a quick pass before you ask your breeding rep to bring another batch of +stature proofs.

  • Stall width vs cow size. Tape‑measure at least five stalls in your mature‑cow pen. Check your average mature cow weight from Lactanet or your nutritionist’s records.  If you’re milking roughly 1,600‑lb cows in 45‑inch stalls, Dairyland says you’re 4–5 inches short. 
  • Platform length and lunge. Measure your head‑to‑head platform. Anything under 16 feet is below Dairyland’s minimum recommendation for forward lunge for mature Holsteins.  Short plus wide forces side‑lunging and diagonal lying. 
  • Lameness and locomotion check. Score 20 mature cows on a 1–5 locomotion scale. If more than about 20% land has a score of 2 or worse, you likely have more lameness than you think — and stall design is almost always part of that story. 
  • Stall Comfort Index proxy. Walk your high group two hours before milking. If more than 20% of cows touching a stall are standing idle instead of lying, your SCI is giving you a clear warning sign — regardless of what your Feet & Legs composites say. 
  • Genetic pressure. Pull the last three years of sire BWC and Stature values. If your average is positive on BWC and above zero on Stature, you’re still breeding cows that are bigger than the ones that built your barn. 
  • Breeding rep reality check. Ask, “Given my stall width and cow size, what’s the maximum Stature PTA you’d be comfortable using here?” If that number is lower than what’s on your current sire list — or they can’t answer — you’ve just found the DNA of your facilities‑genetics mismatch.
  • 30‑day action. In the next 30 days, pull the BWC and Stature values on every active sire in your lineup and cross‑check them against your stall tape.  Any bull that doesn’t fit both your index and your concrete comes off the mating list first. 

What This Means for Your Operation

  • If your three‑year average sire BWC is positive and your mature‑cow stalls are under 48 inches, your mating program and your barn are pulling in opposite directions. You don’t fix that with more hoof‑trimming visits. 
  • Cook’s Wisconsin data showed a 1,046 kg ME gap between first‑lactation and third‑or‑greater‑lactation cows in large freestall herds — more than double the 475 kg gap in tie-stall herds.  That’s the environment punishing bigger, older cows, not genetics suddenly “quitting.” 
  • Law’s herd gained 8 lb/cow/day in three weeks — not by changing sires, but by giving them stalls that actually fit.  Over two years, daily milk increased by 27%, and SCC fell to about 100,000, despite the same genetics. 
  • Bennink ships about 140 million pounds a year (as of 2017) by selecting smaller, tougher cows and ignoring stature‑heavy PTAT — running them through sand‑bedded freestalls he already had.  That’s breeding for the barn you have, not the one on the semen catalogue cover. 
  • The 2021 Net Merit revision began the turn against body size; by 2025, BWC emphasis in NM$ hit −11%, and total Feed Saved emphasis reached 17.8%.  Holstein USA’s updated stature scale and classification changes reinforce that same direction.  The math in the indexes has already turned against huge frames. 
  • Replacement heifers are expensive — and getting more so. USDA Ag Prices data show U.S. dairy replacement values climbing from about $2,140 per head in April 2024 to around $2,660 by early 2025, reaching a record$3,110 in October 2025 before easing to $2,860 in January 2026, with top lots in California and Minnesota still clearing north of $4,000.  Every cow you cull early because she can’t stay sound in an undersized stall is a capital loss, not just a hoof‑trimmer bill. 

Key Takeaways

  • If your average sire BWC is positive and your stalls are built for smaller cows, cap Stature and BWC at 0.0 on your mating list until your concrete catches up. That alone stops the facilities‑genetics mismatch from getting worse. 
  • If your mature‑cow stalls measure 45–46 inches and your average cow is in the 1,600‑lb range, you’re 4–5 inches short of Dairyland’s recommendation. Expect more perching, more lameness, and a bigger ME gap in older cows until that changes. 
  • If more than 20% of cows touching stalls are standing instead of lying two hours before milking, treat it as a red‑alert comfort problem, not a personality flaw in your cows. That’s barn design talking, not “weak feet.” 
  • If your herd is already built on big, sharp cows, you don’t have to choose between genetics and concrete.Freeze height and body size now, chase cheap comfort and ventilation wins, then use the extra milk to justify stall and platform upgrades. 

The Bottom Line

If you walked your barn this afternoon with a tape measure in one hand and your last proof run in the other, would they tell the same story — or would they argue with each other all the way down the alley?

Complete references and supporting documentation are available upon request by contacting the editorial team at editor@thebullvine.com.

Learn More

  • Net Merit 2025 | The Bullvine – This implementation guide reveals how to stop Net Merit 2025’s new $57-per-point “weight tax” from working against you. It arms you with non-negotiable filters for Feed Saved, ensuring your sire stack generates margin rather than just frame.
  • $3,010 Per Heifer. 800,000 Short. Your Beef-on-Dairy Bill Is Due. – This strategic deep dive exposes the massive capital risk hiding in today’s record-high $3,000+ replacement market. It delivers a 90-day blueprint to rebalance your breeding and secure your 2028 pipeline against inventory fragility.
  • Robotic Milking Revolution: Why These Money Machines Are Crushing Traditional Parlors – This innovation brief breaks down how automated systems recover the “hidden hours” lost to parlor routines. You’ll gain a 13% average net return advantage by leveraging precision data to finally match milking frequency with each cow’s biological potential.

The Sunday Read Dairy Professionals Don’t Skip.

Every week, thousands of producers, breeders, and industry insiders open Bullvine Weekly for genetics insights, market shifts, and profit strategies they won’t find anywhere else. One email. Five minutes. Smarter decisions all week.
NewsSubscribe
First
Last
Consent
Send this to a friend