At 9.99% inbreeding, every extra point can quietly strip up to $44 per cow — before you even argue TPI vs Net Merit.
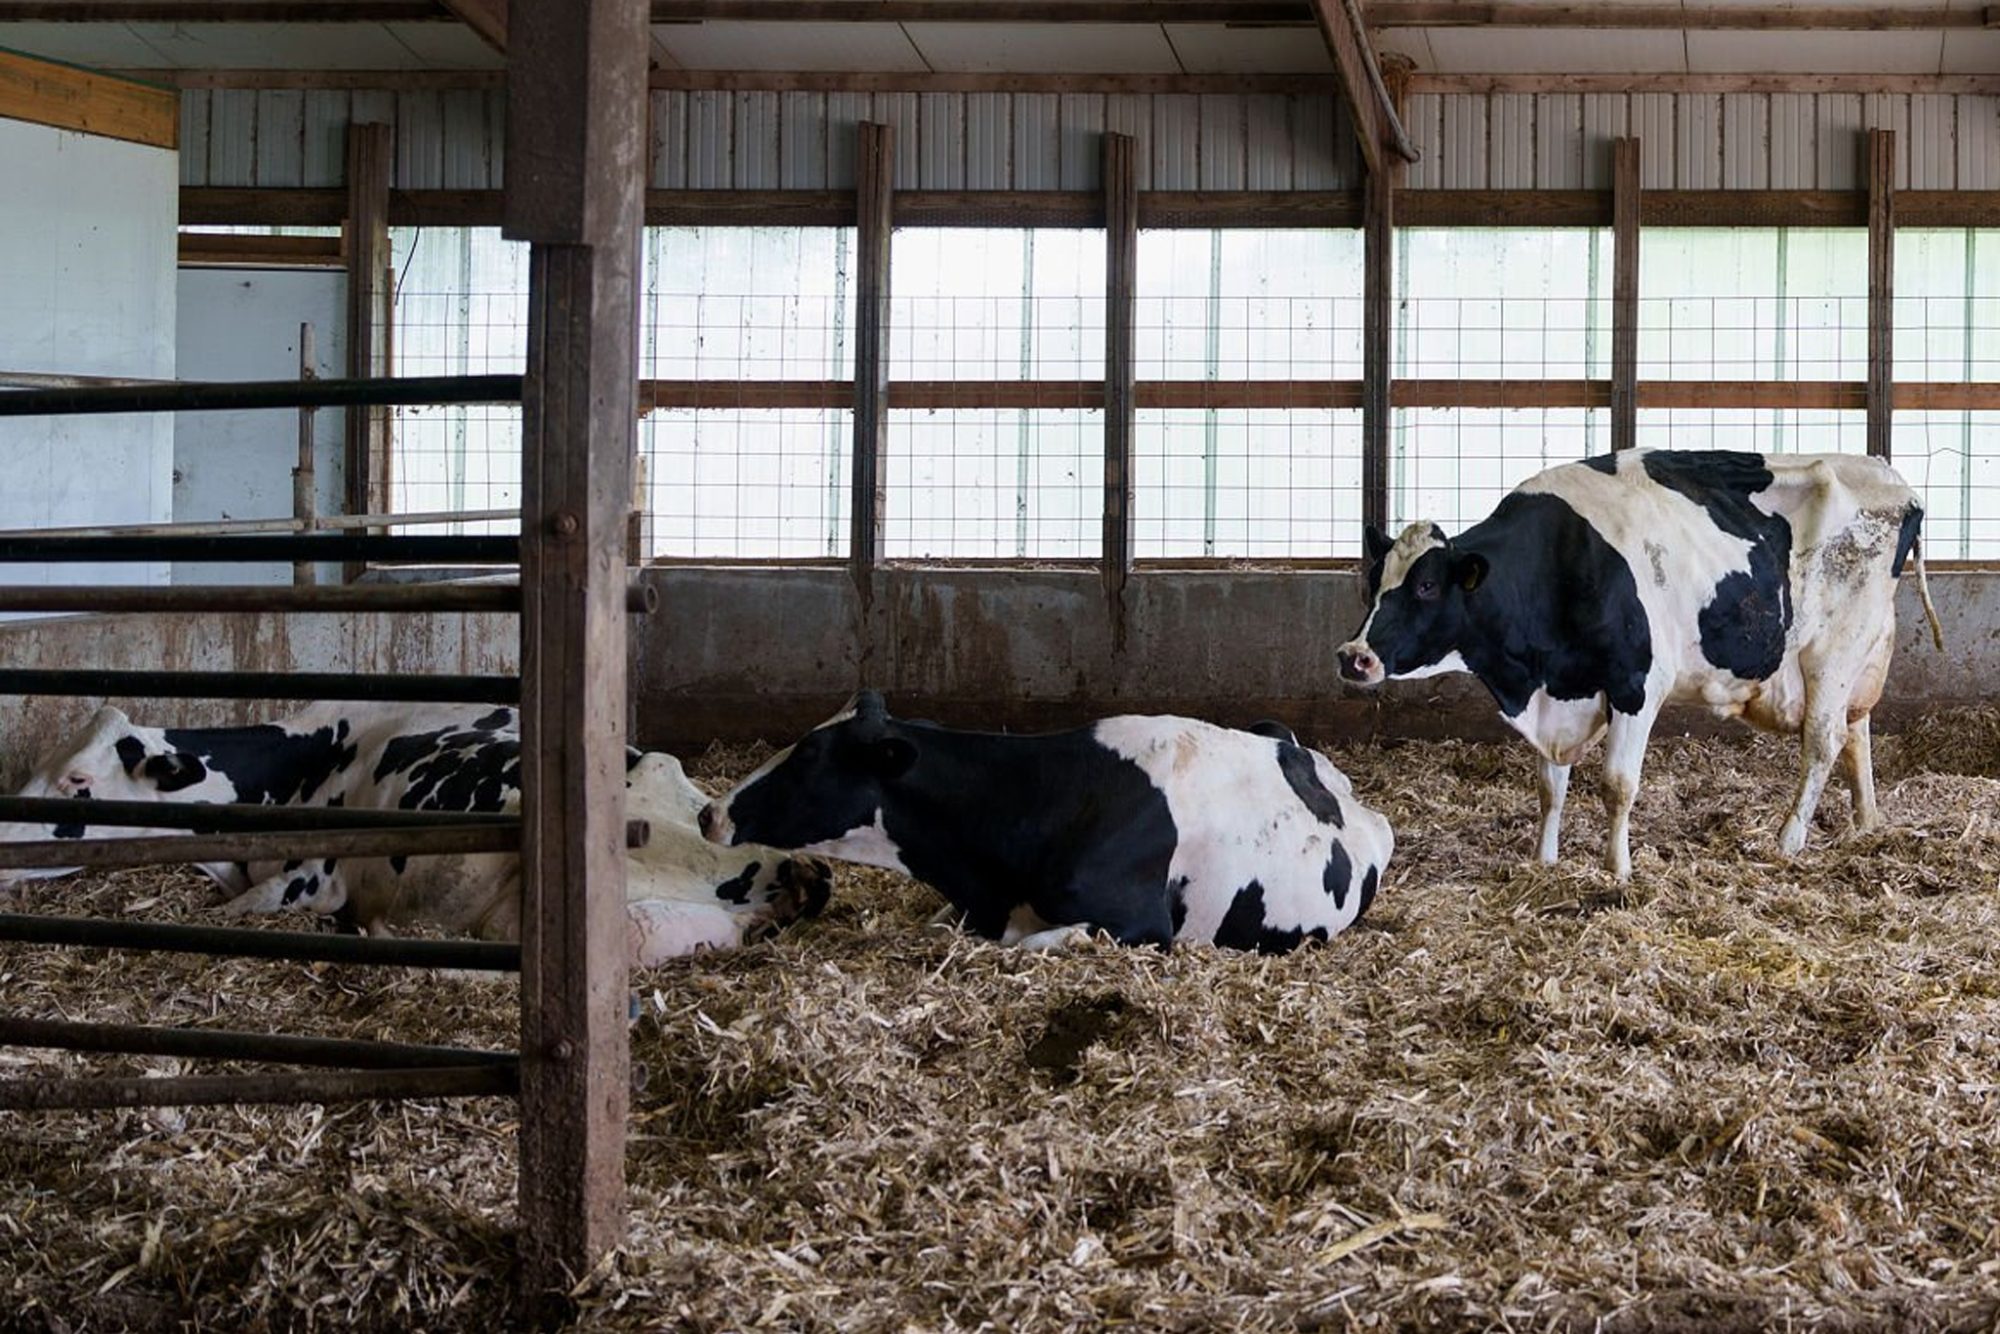
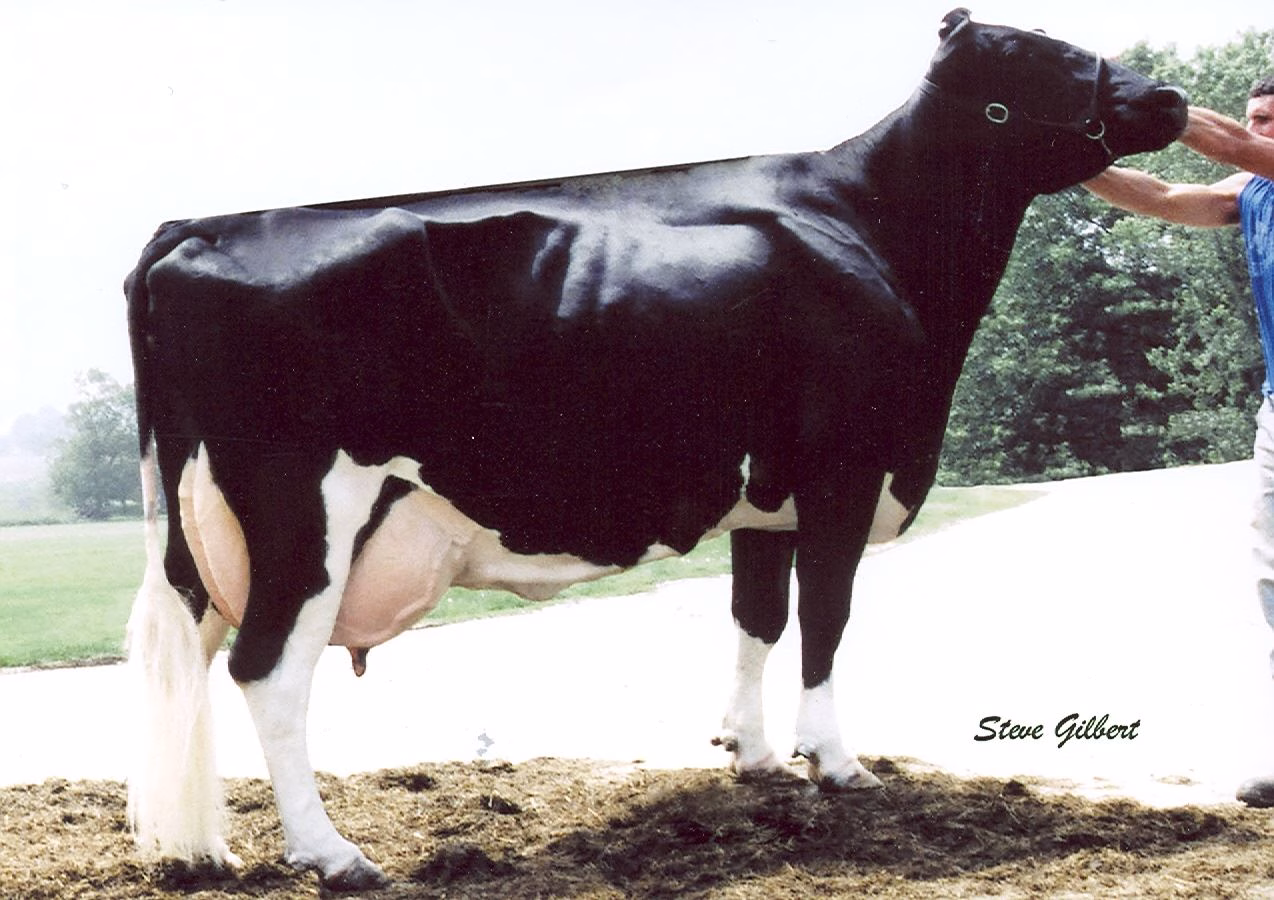
Lovhill Sidekick Kandy Cane takes the fist-bump and the banner — Grand Champion of the International Holstein Show at World Dairy Expo. Bred by Michael and Jessica Lovich on 72 tie-stall cows in Balgonie, Saskatchewan, and later classified EX-97, she’s living proof that a deep, functional udder and real longevity still win the ring — the same traits a narrowing gene pool is quietly pricing every breeder out of.
Michael and Jessica Lovich milk 72 cows in a tie-stall barn in Balgonie, Saskatchewan. They mostly ignore genomics. They breed off cow families and their own eye. And they’ve now bred two separate World Dairy Expo Holstein Grand Champions — Lovhill Goldwyn Katrysha in 2015 and Lovhill Sidekick Kandy Cane in 2025. They’re the first and only breeders in history to pull that off. (Read more: Lovholm Holsteins: The Only Farm to Breed 2 World Dairy Expo Holstein Champions Milks 72 Cows in Tie-Stalls)
Here’s the part that should make you pause. The herd that walked away from the index list ended up breeding the kind of functional, long-lasting cows the commercial indices are quietly moving toward anyway. They succeeded by breeding out of a broader, more diverse gene pool — the exact opposite of where the rest of the industry is rushing. And while everyone keeps arguing about show cattle versus commercial cattle versus “just use the index,” a number nobody chose keeps climbing in the background: Holstein inbreeding hit 9.99% for Canadian heifers born in 2024 — the highest of the four major breeds, ahead of Jersey at 7.56%, and up from 9.61% the year before — according to Lactanet’s August 2025 update. That number lands on all three camps at once, no matter which side of the argument you stand on.
What’s Changing and Why
For thirty years, the dairy genetics argument has had two sides. One camp says the show ring proves what a valuable cow looks like. The other says the milk cheque does. This summer a third voice got loud enough to matter: “Both of you are wasting time — just breed off the top GTPI or Net Merit list.”
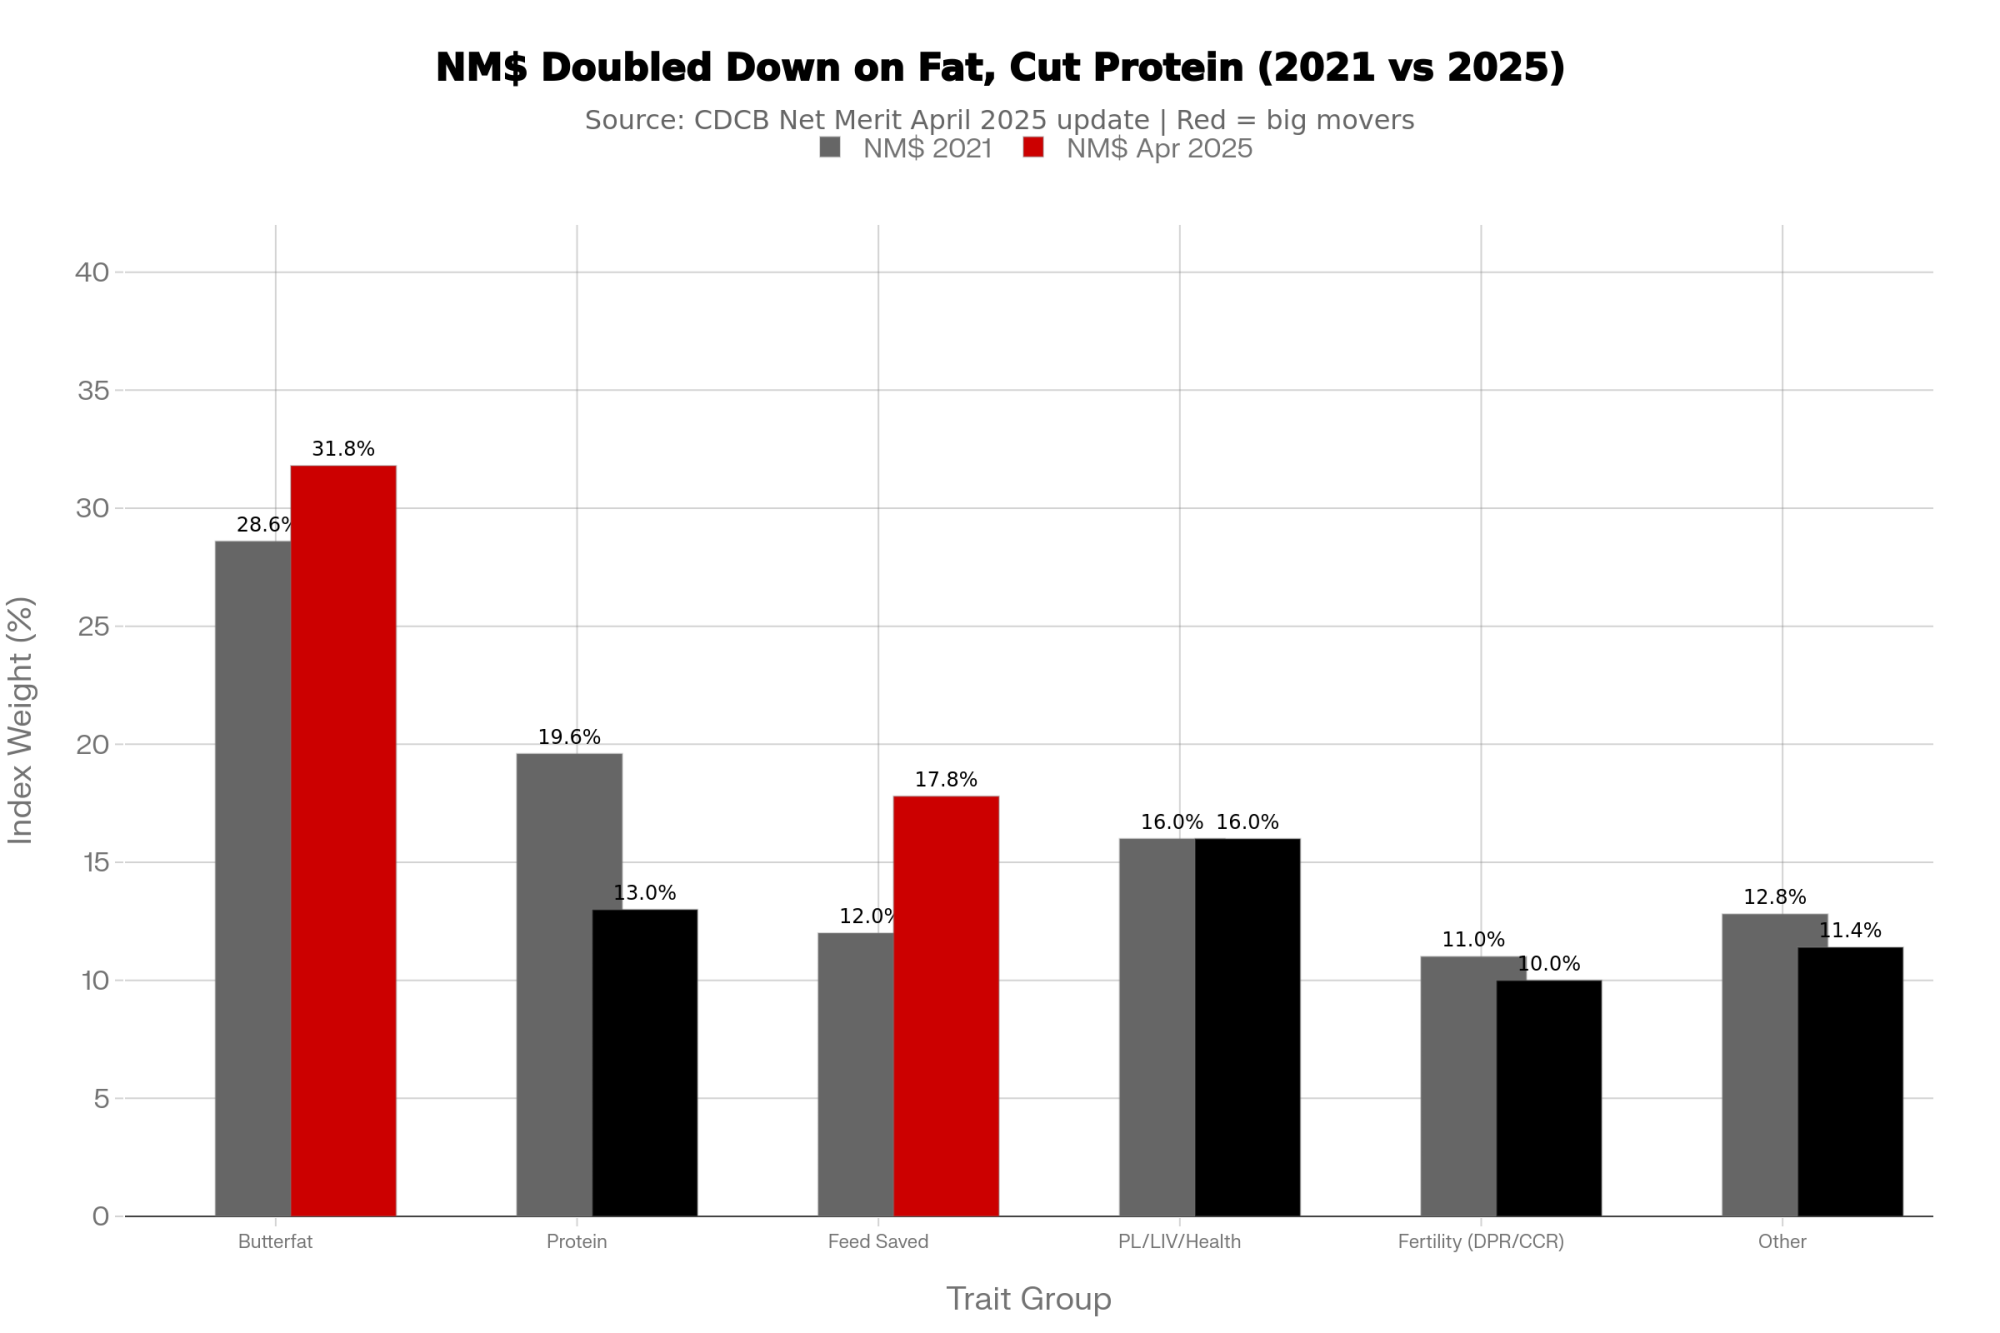
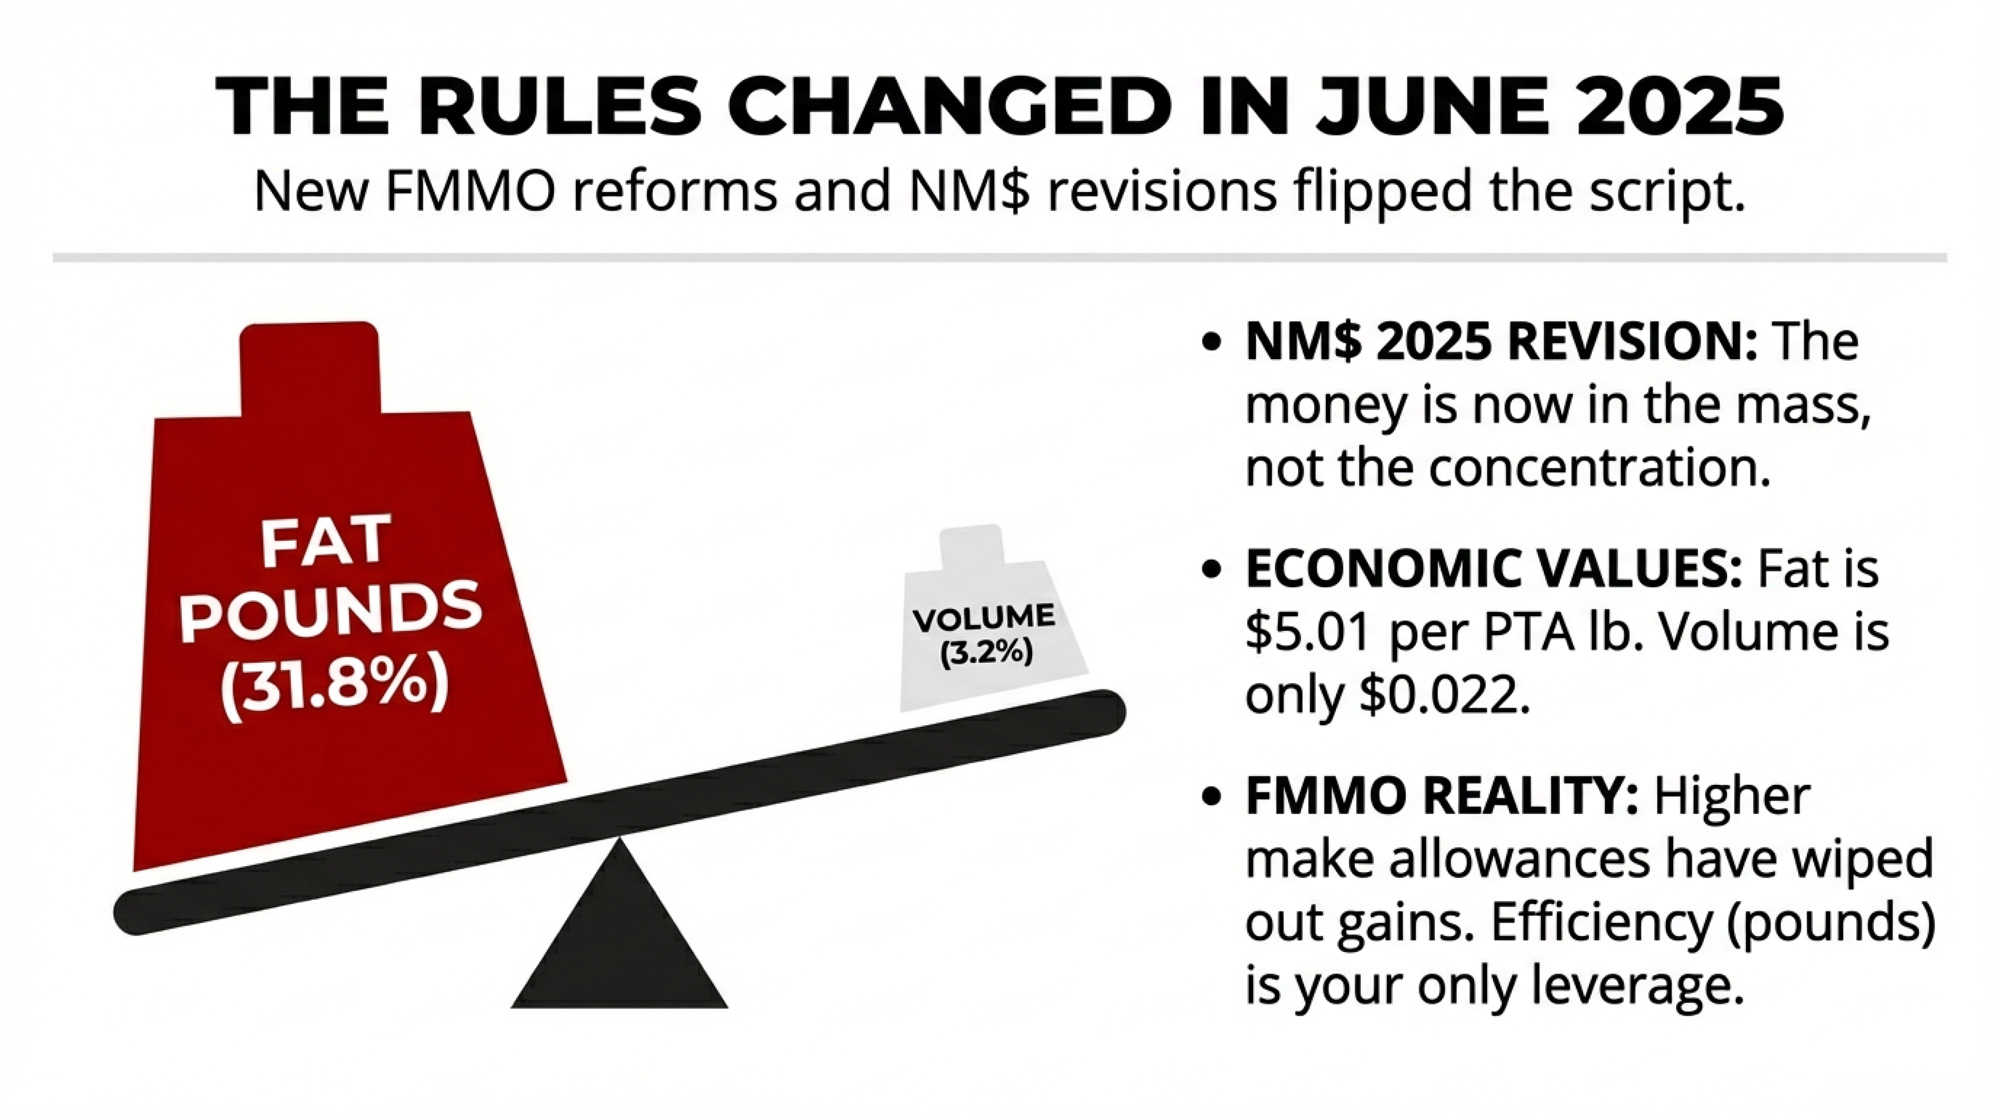
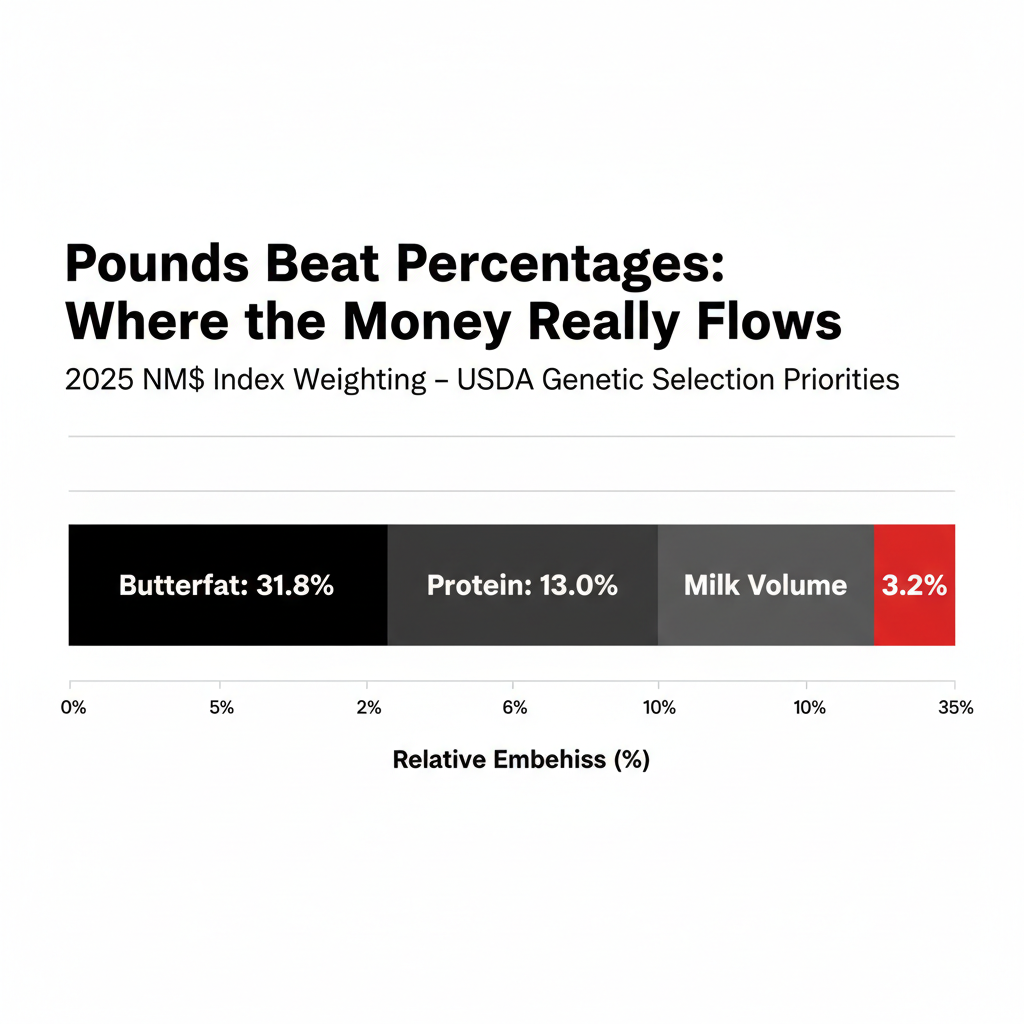
All three are answering different questions, and the numbers now prove it. In April 2026, Holstein Association USA changed its TPI formula to weight protein at 24% and fat at just 14%, up from a 19/19 split. CDCB’s Net Merit 2025 revision went the opposite direction — fat at 31.8%, protein down to 13.0%, with Feed Saved climbing to a combined 17.8% and Body Weight Composite at −11%. Two flagship indices, both claiming to describe a profitable cow, now point in genuinely opposite directions on fat versus protein.
Then there’s the classification change most show barns are still processing. Starting with the May 2026 run, HAUSA set 60 inches as the ideal stature and applied a sliding-scale penalty for cows taller than that — shaving points off the final classification score as height climbs past the limit, so a tall, extreme-framed cow that once scored well can now come in lower on paper for the exact trait that used to help her. The official language is about normalizing size. But underneath it is a harder admission: decades of breeding taller cows collided with feed cost, stall fit, and longevity. The breed association put a measurable penalty on the exact trait the show ring spent a generation chasing.
How This Plays Out on Real Farms
The Lovich story looks like a fairy tale until you read the fine print. They sold both champions. Katrysha went south, and Kandy Cane went to Oakfield Corners Dairy in New York as a four-year-old, well before she walked into Madison as a five-year-old and later reclassified EX-97. For a lot of small tie-stall herds, selling your best cows is how the barn stays viable — the premium on an elite animal funds the operation. And their cows tend to milk well past the age most Holsteins are culled, which flips the whole economics toward longevity rather than peak yield.
The tap that started a dynasty: Lovhill Goldwyn Katrysha is confirmed Grand Champion of the International Holstein Show at World Dairy Expo 2015. Her win put a 72-cow tie-stall herd in Balgonie, Saskatchewan on the map — the first of two World Dairy Expo Grand Champions Michael and Jessica Lovich would breed off cow families and their own eye, not a genomic list, while the rest of the breed narrowed toward it.
The number that reaches every barn is inbreeding, and it carries a real bill. The Virginia Tech research pegged it at $22 to $24 in lifetime net income per cow for each 1% rise in inbreeding — but that’s in 1999 dollars. Adjust it forward on cumulative inflation alone and the same drag lands near $44 per cow per 1% today (a Bullvine CPI-based estimate — layer in higher modern milk and feed values and the case for the top of that range only gets stronger). Run the math your own way. On a 200-cow herd that lets average inbreeding drift up four points, that’s roughly $35,000 in lost lifetime net income across the herd — not index points on a page, real money bleeding out of the barn. Newer Canadian work backs the mechanism: the Canadian Dairy Network found a cow that’s 10% inbred, versus 5%, loses about 92 kg of milk, 5.3 kg of fat, and 2.6 kg of protein per lactation, adds 1.4 days open, and loses roughly 65 days of productive life. It never shows up on a semen invoice. It hides in open days, mastitis cases, and calves that don’t make it.
Metric (per lactation unless noted)
5% Inbred Cow
10% Inbred Cow
Loss at 10%
Milk yield
Baseline
−92 kg
−92 kg
Fat
Baseline
−5.3 kg
−5.3 kg
Protein
Baseline
−2.6 kg
−2.6 kg
Days open
Baseline
+1.4 days
+1.4 days
Productive life
Baseline
−65 days
−65 days
That’s why this reaches every camp. The show breeder, the Net Merit devotee, and the top-50-list herd are all pulling from an increasingly related bull population, and the compounding cost lands the same way on all of them.
Think of it as three different experiments, not three answers to one question. Show-and-type selection asks whether breeding for conformation and classification produces cows that win and sell. The commercial camp runs a different test entirely: through Net Merit or LPI, does a cow throw the most profit under your actual costs? And the index-first crowd is betting on speed — trust the highest-ranked young bulls, shorten the generation interval, and try to outrun everyone else’s genetic gain.
None of those experiments settles the others, because each measures something different. A judge at World Dairy Expo isn’t scoring feed intake per day or days open. Net Merit ignores ring presence entirely. And the index itself isn’t neutral — it’s an editorial choice about what matters, built on national-average price assumptions that may not match your processor. So when TPI says protein and Net Merit says fat, a breeder who “just uses the index” without checking which one fits their cheque is quietly optimizing for someone else’s barn.
The inbreeding problem sits underneath all three. The top of any genomic list — GTPI or Net Merit — isn’t a random draw. It’s a tight cluster of high-relationship sires that trace back through a handful of grandsires, and the concentration is stark: research finds the vast majority of today’s Holstein AI bulls funnel back to just two ancestral sires, with a single foundation bull, Pawnee Farm Arlinda Chief, still echoing through the population decades later. Ride the list harder, and you stack that relationship faster. CDCB has confirmed its genetic base changes now include Expected Future Inbreeding (EFI) adjustments to account for future inbreeding, not just observed genetic trends — which is why individual PTAs no longer track the base change as cleanly as they once did. When the statisticians pre-discount the future, that tells you something.
How Much Does Sticking With the Wrong Index Actually Cost?
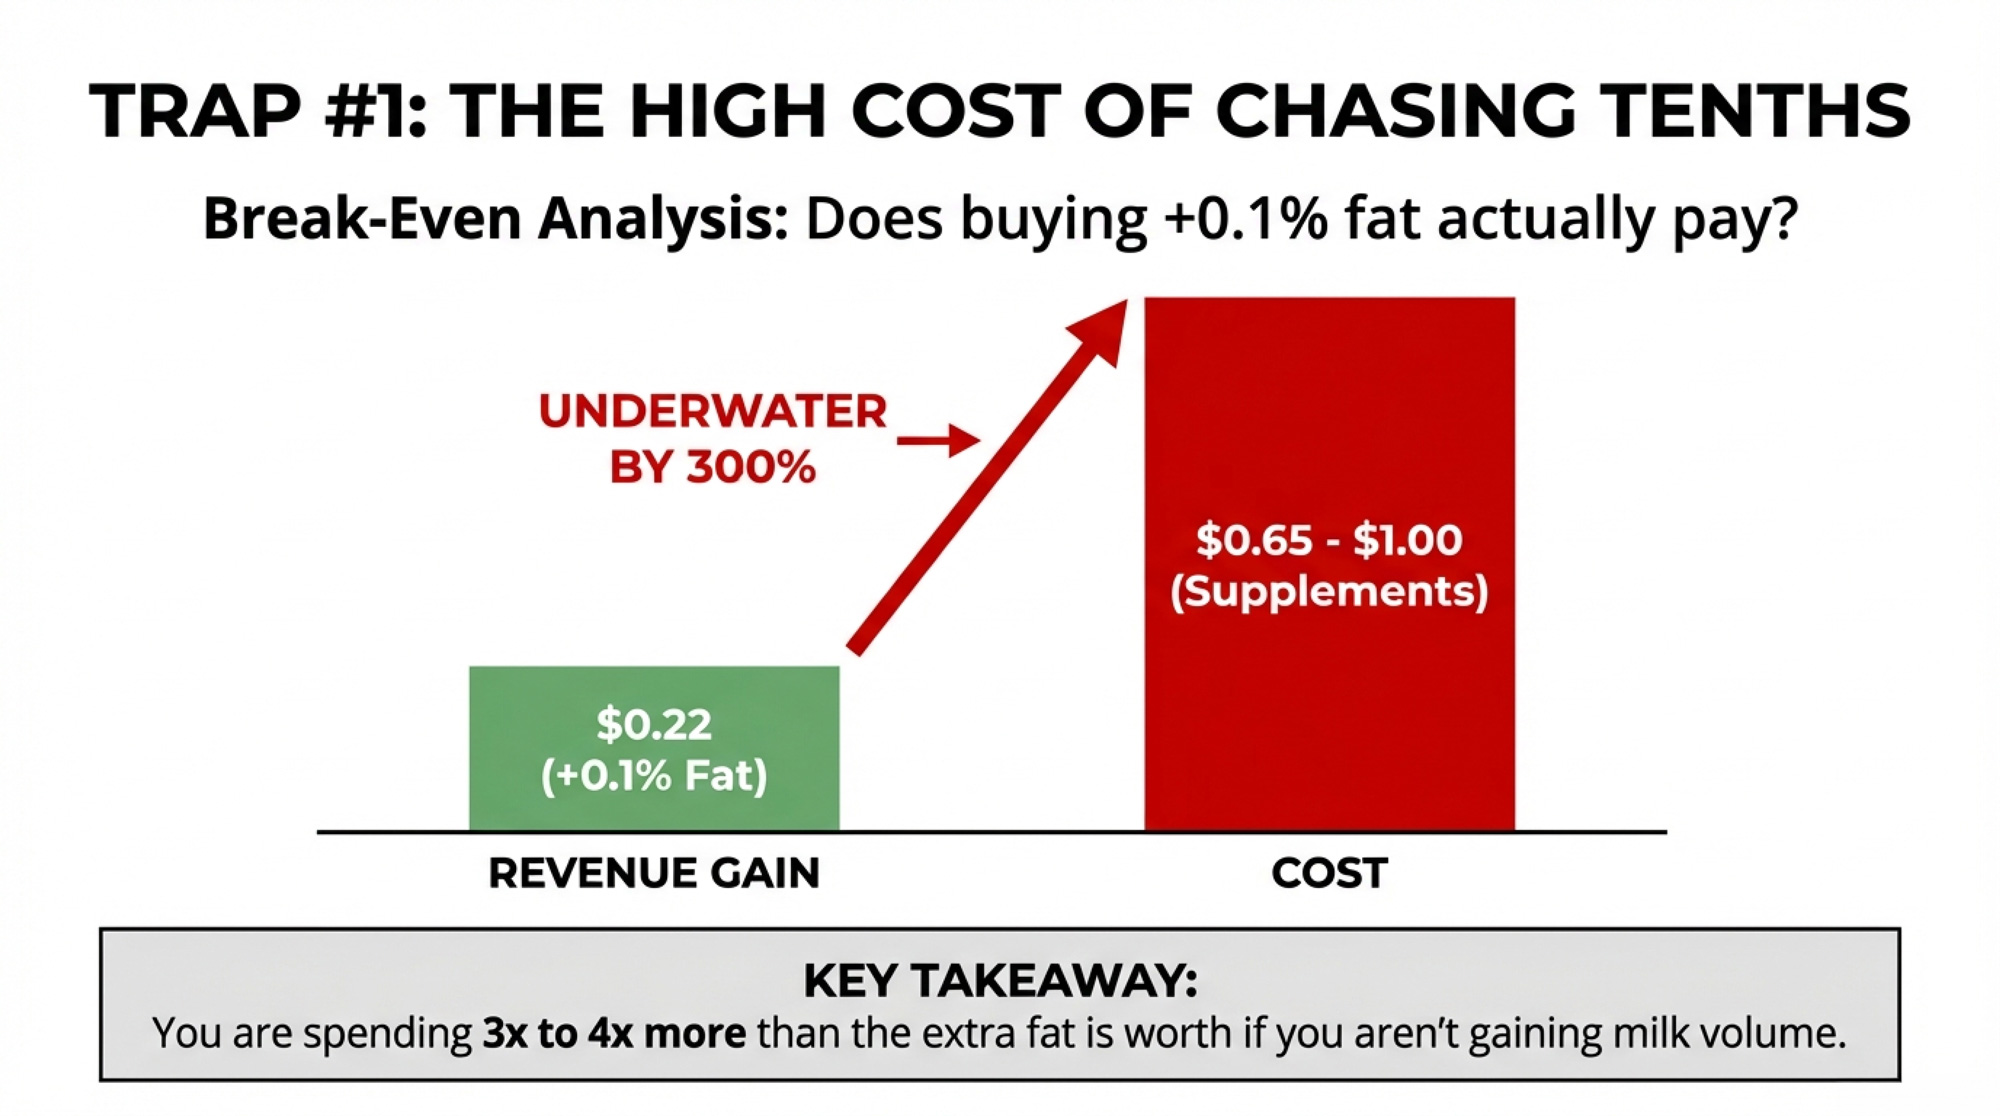
More than most herds realize, and the loss is invisible because it’s “index-approved.” A herd that keeps breeding off TPI out of habit, while getting paid on butterfat, can drift toward higher protein ratios its cheque doesn’t reward at current component prices. Bullvine’s own modeling of the 2026 TPI shift put the exposure as high as $17,500 for a mid-size herd chasing the protein signal in a fat-heavy market — a figure that depends on your herd size and your component spread, so treat it as a scenario, not a guarantee.
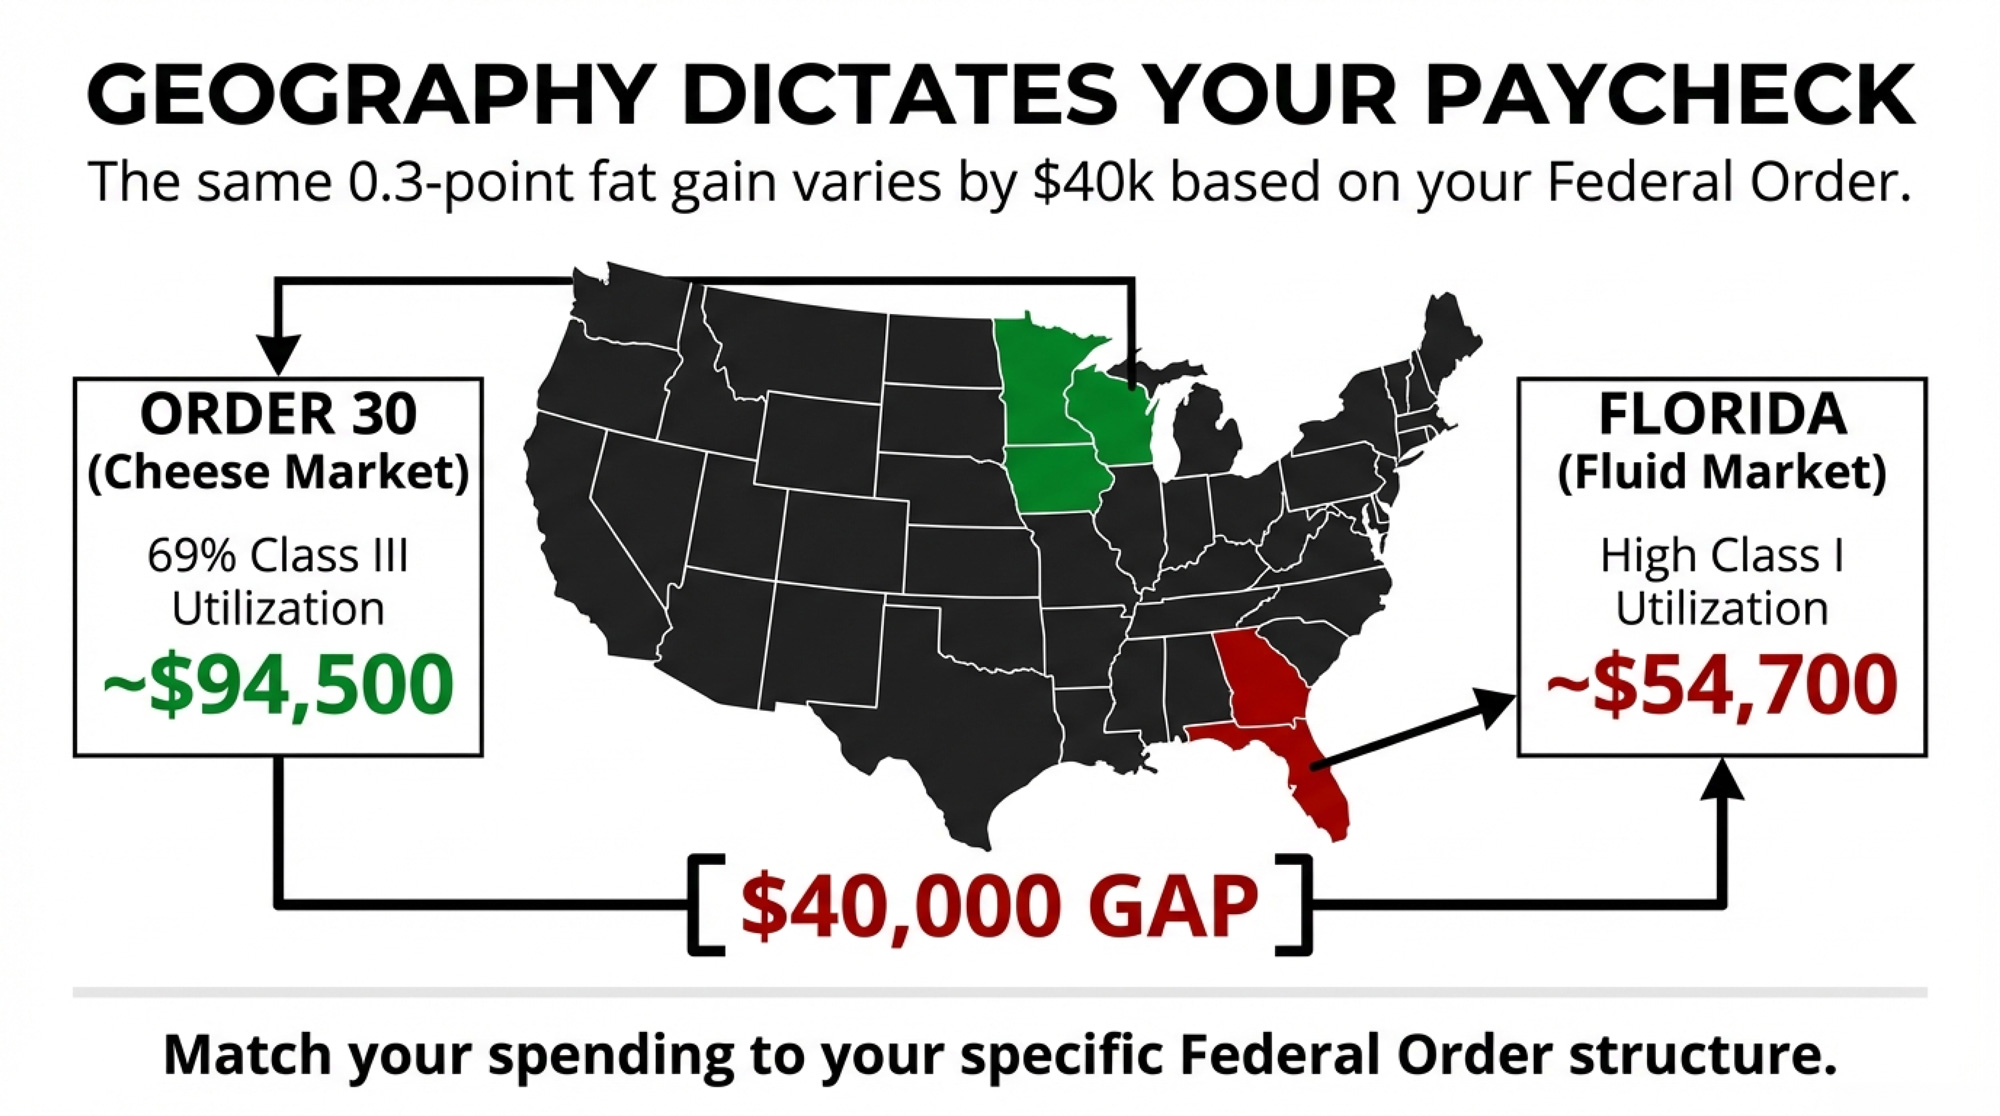
The mirror image is just as real. A cheese-plant herd still breeding off Net Merit’s fat signal can leave protein premiums on the table — a gap Bullvine modeled at roughly $134 per cow per lactation, or about $67,000 across 500 cows. Either way, nobody traces it back to the semen order. They blame feed, labor, the processor — everything except the objective function they never chose on purpose.
Barn Situation
Index Being Used
Where It Leaks
Modeled Cost Exposure
Fat-heavy market, chasing protein
HAUSA TPI (2026)
Higher protein ratios the cheque doesn’t reward
~$17,500 (mid-size herd)
Cheese plant, breeding for fat
CDCB Net Merit (2025)
Protein premiums left on the table
~$134/cow/lactation
Same, scaled to the barn
CDCB Net Merit (2025)
Compounded across the herd
~$67,000 (500 cows)
Any herd, wrong index by habit
Either
Blamed on feed, labor, processor — never the semen order
Maybe — and the tie-stall clock makes it more urgent for some. Canada’s updated code of practice requires that continuously tethered cows get untethered freedom of movement, with the key provisions phasing in by 2027.
Connect the dots and the three storylines turn out to be one. HAUSA’s 60-inch stature penalty isn’t an aesthetic call — it’s a structural necessity, because modern Holsteins have been outgrowing the physical dimensions of the tie-stalls and freestalls North American barns were built around. That’s the same logic driving Net Merit’s −11% Body Weight Composite: a bigger cow costs more to feed and fits the barn worse. The logic points one way — a shorter, more genetically diverse cow should fit a retrofitted stall better and carries less of the fertility and health drag that inbreeding stacks on, which is exactly what you want walking into the 2027 deadline. Head in tall and closely related, and you’re solving two problems at once, with only one of them showing up on your classification report.
Options and Trade-Offs for Farmers
Path 1: Pick your index deliberately, then match it to your pay stub. This is the 30-day move. Pull last year’s milk cheques and figure out your actual dollar-per-pound split on fat versus protein. If you’re component-heavy on butterfat, Net Merit’s 31.8% fat weighting likely fits better than TPI’s protein-heavy 2026 formula. It takes an afternoon with your statements and your rep. Skip it, and you leak margin for years while your cows look better on paper.
Path 2: Build an explicit inbreeding ceiling into your mating program. This one’s for any herd riding the top of the GTPI or Net Merit lists year after year. It means telling your mating software — or your rep — a hard limit and holding to it, even when a high-index bull is closely related to your cows. Lactanet notes the average inbreeding level today is roughly 9% and advises aiming matings below that average; its own tools flag %INB so you can screen out mates that push a calf too high. You may give up a few index points per mating. The payoff is not stacking that $22-to-$24-per-cow-per-percent bill — closer to $44 in today’s dollars — that you won’t feel for three years.
Path 3: Borrow across camps instead of picking a tribe. Take the show world’s eye for udders and legs, the commercial index’s discipline on feed efficiency and longevity, and genomic testing’s speed on sorting replacements. Works for most mid-size herds. The trap is doing it by accident — a little TPI, a little Net Merit, a little show type — and ending up with a bull battery optimized for nothing. Lovhill reached the top of the show ring twice by holding one clear standard, not by hedging across three — and that discipline is the part worth copying, whichever camp you land in.
Key Takeaways
If you don’t know your actual dollar-per-pound split on fat versus protein from last year’s cheques, run that number before your next semen order — it decides whether Net Merit or TPI fits your barn.
If your herd’s average inbreeding is at or above the 9% breed average, pull your number from your genetic-management software this month and ask your rep to project it forward before your next mating run.
If your cows skew tall, factor in that the May 2026 stature penalty and Net Merit’s −11% Body Weight Composite now both work against extreme size.
If you show and sell as part of your business model, be honest about whether your plan includes selling your best cows the way the Lovich family did — that’s what made their math work.
If your index “feels safe” because it’s familiar, remember the TPI and Net Merit formulas both changed in the last 18 months — familiarity isn’t the same as fit.
If you’re shipping to a cheese plant with a protein-to-fat ratio below 0.80, run the per-cow math on your own component prices — that’s the danger band where the wrong index quietly costs the most.
Here’s the uncomfortable question worth sitting with. The show breeder confuses a ring result with an economic verdict. The index-first herd confuses trusting the formula with running a strategy. Both outsourced their judgment — one to a judge, one to a formula — and neither stopped to ask whether the thing they trusted still fits the cows they actually need. So which one are you? And when did you last check whether the tool you rely on is optimizing for your barn, or for the average barn someone modeled years ago?
The short version: genetics is an economics question, and the only real mistake is not knowing which experiment you’re running. The longer version — the full cost-per-cow inbreeding math, broken down by herd size and index choice — is where the decisions actually get made. We’re running those numbers in next week’s Bullvine Weekly. If you want to map this to your own operation, that’s where the real math lives.
Hold-to-Proof Cost & Inbreeding Drag Simulator
Map the 2026 TPI/Net Merit formula updates and genetic drag directly to your herd’s bottom line.
200
9.5%
8.0%
Annual Inbreeding Penalty
$0
Annual Index Revenue Leak
$0
Total Invisible Annual Margin Leak
$0
Calculated using updated 2026 genetic values and modern inflationary baselines.
Complete references and supporting documentation are available upon request by contacting the editorial team at editor@thebullvine.com.
Learn More
Dairy Cattle Genetics Explained: TPI, NM$, GTPI and Genomics — Arms you with an immediate operational blueprint to navigate the 2026 formula divergence, showing exactly when to deploy TPI’s high-protein selection versus Net Merit’s aggressive butterfat and feed-efficiency weighting.
Net Merit 2025 — Exposes why national genetic indexes lag behind current marketplace realities, tracking the multi-year commodity averages that create a hidden financial mismatch between your tank’s actual value and your long-term breeding goal.
The Proof You Waited Three Years For Averaged a $72 Markdown — Delivers a brutal, data-driven reality check on daughter-proven strategies, demonstrating how holding famous bulls to proof stacks an expensive maintenance bill while sacrificing an entire generation of genetic velocity.
The Sunday Read Dairy Professionals Don’t Skip.
Every week, thousands of producers, breeders, and industry insiders open Bullvine Weekly for genetics insights, market shifts, and profit strategies they won’t find anywhere else. One email. Five minutes. Smarter decisions all week.
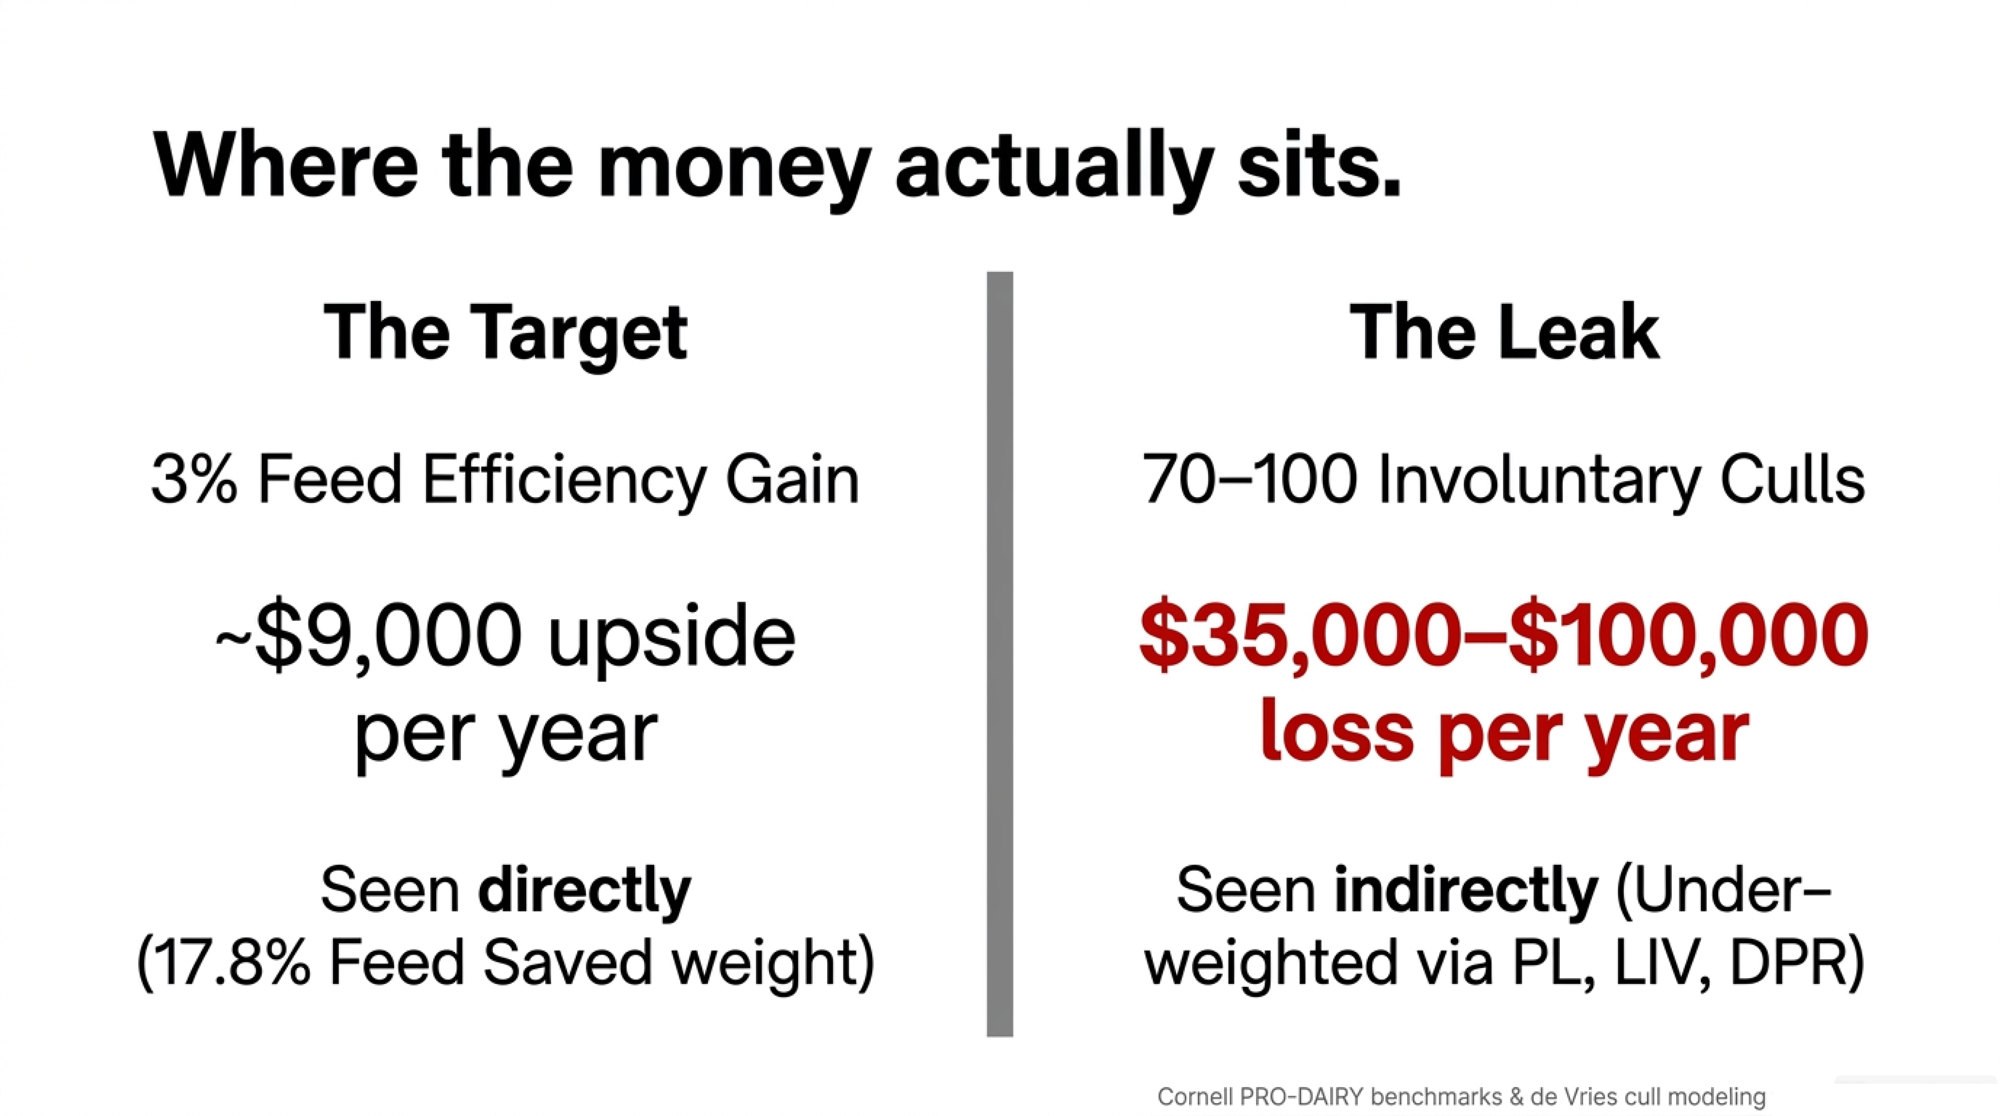
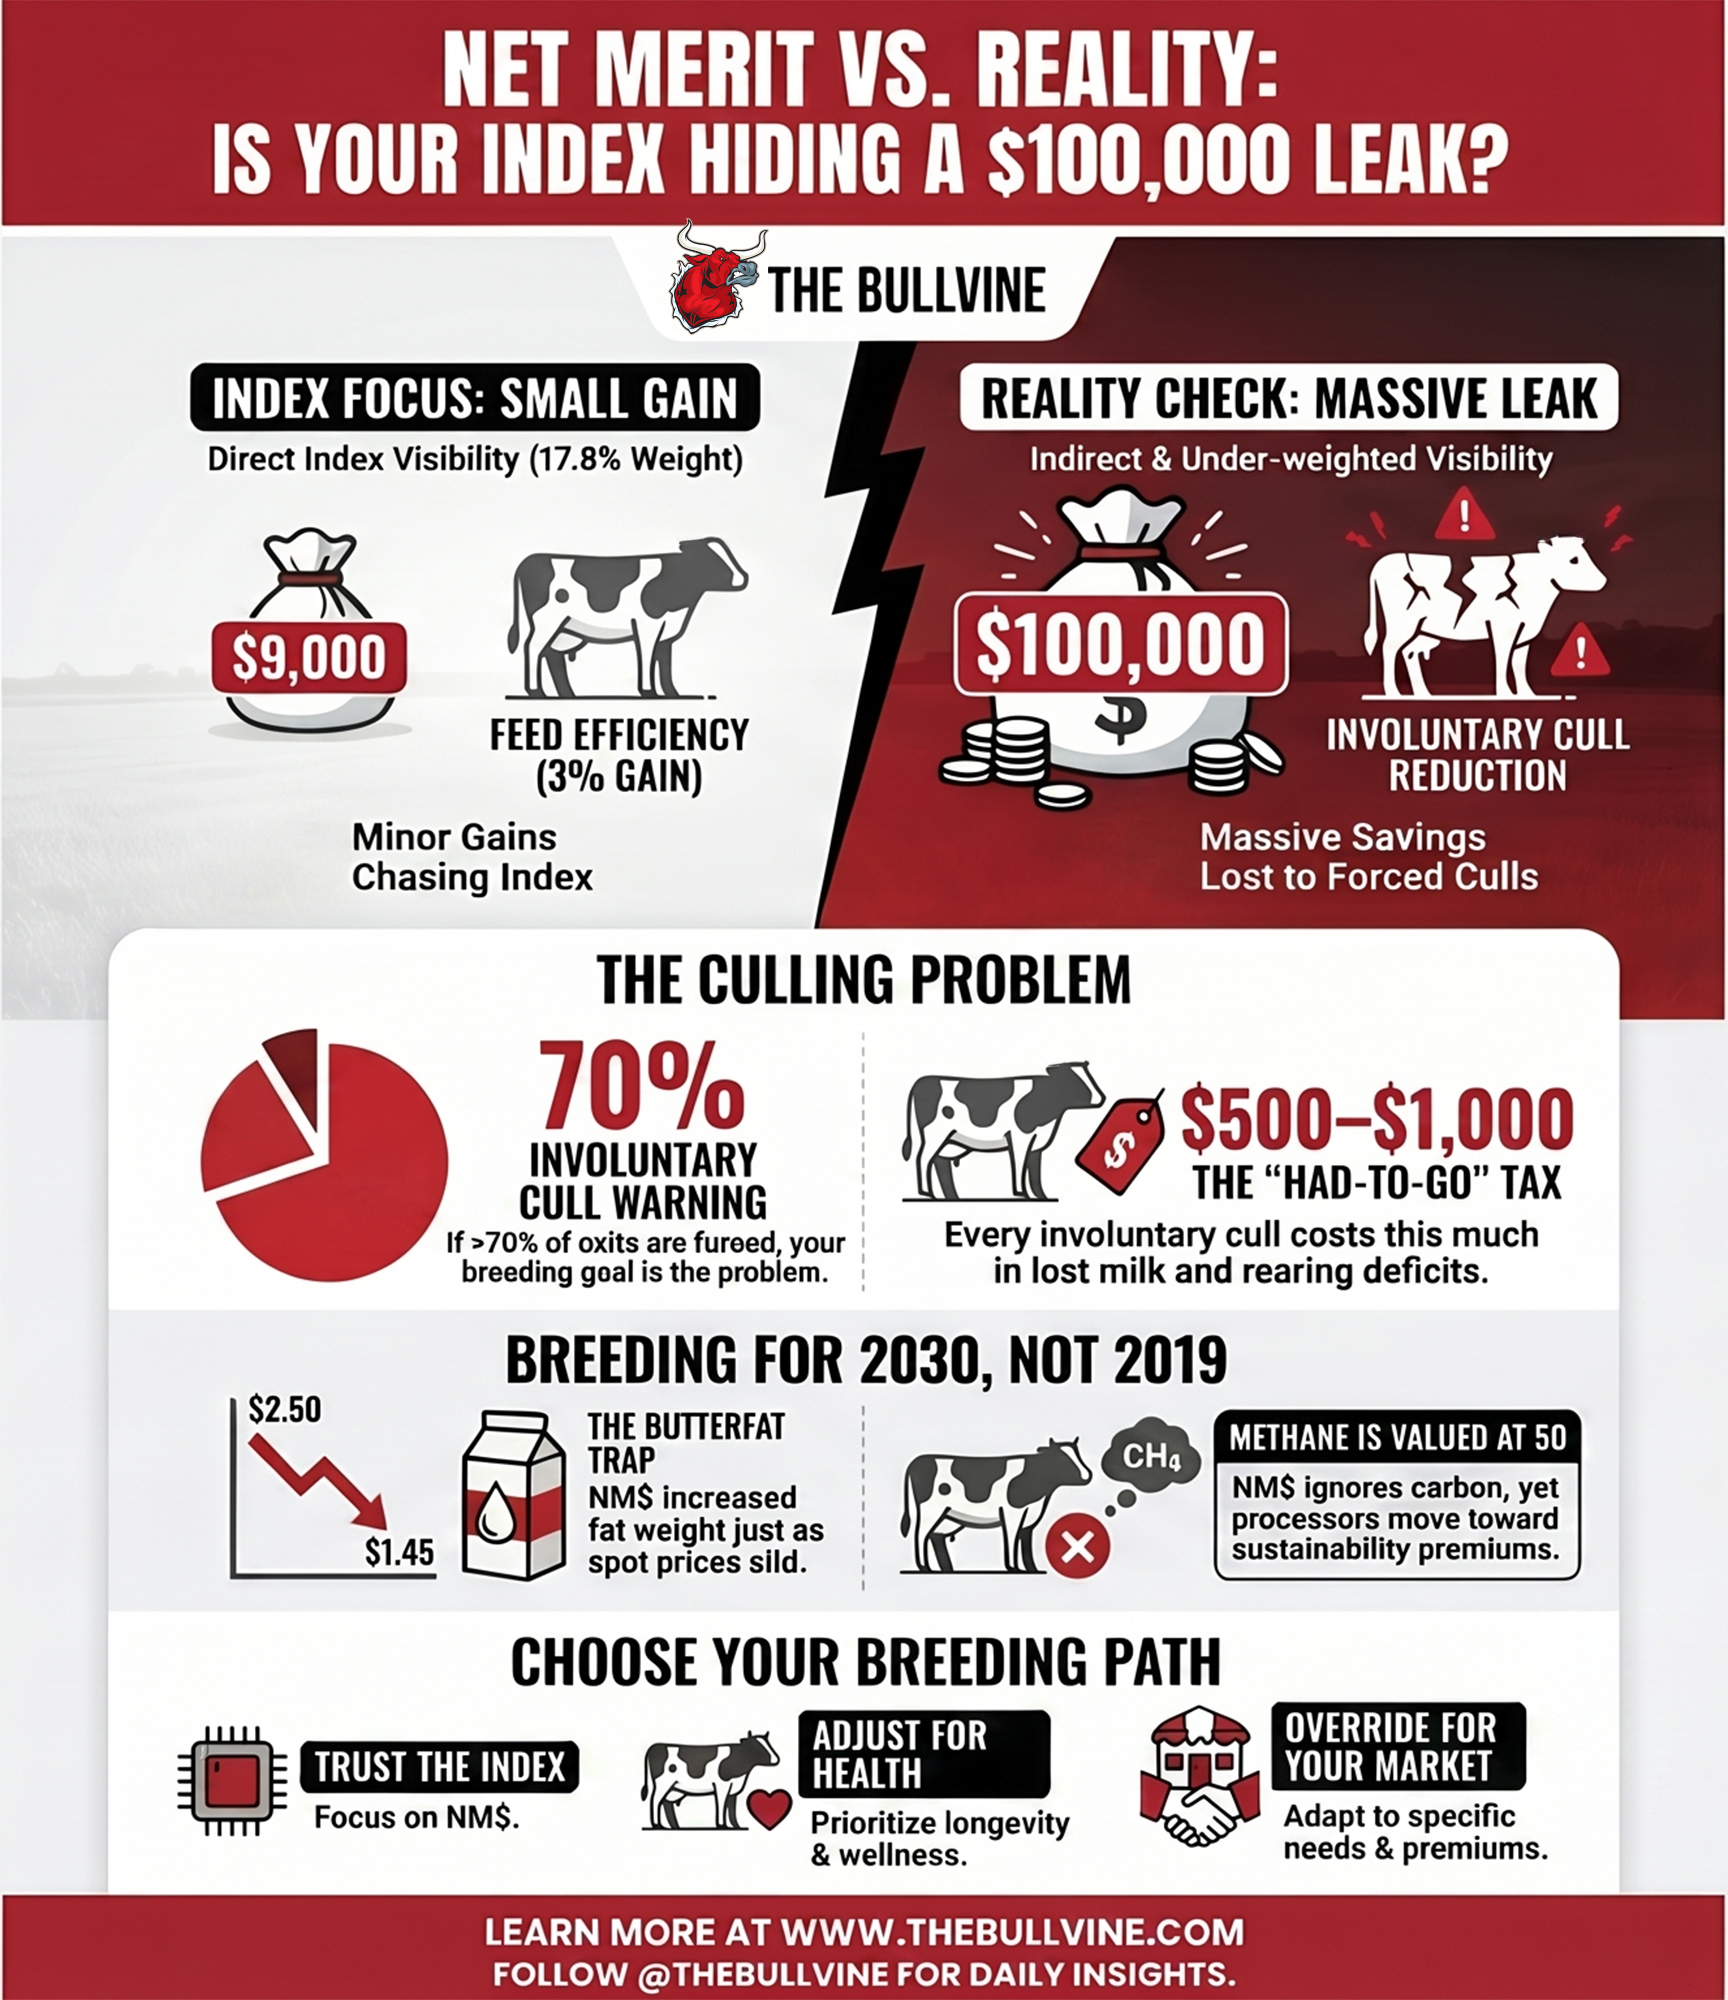
One barn chases $9,000 a year in feed efficiency the index rewards — and loses up to $100,000 out the cull gate it barely scores. Net Merit sees one number. Guess which.
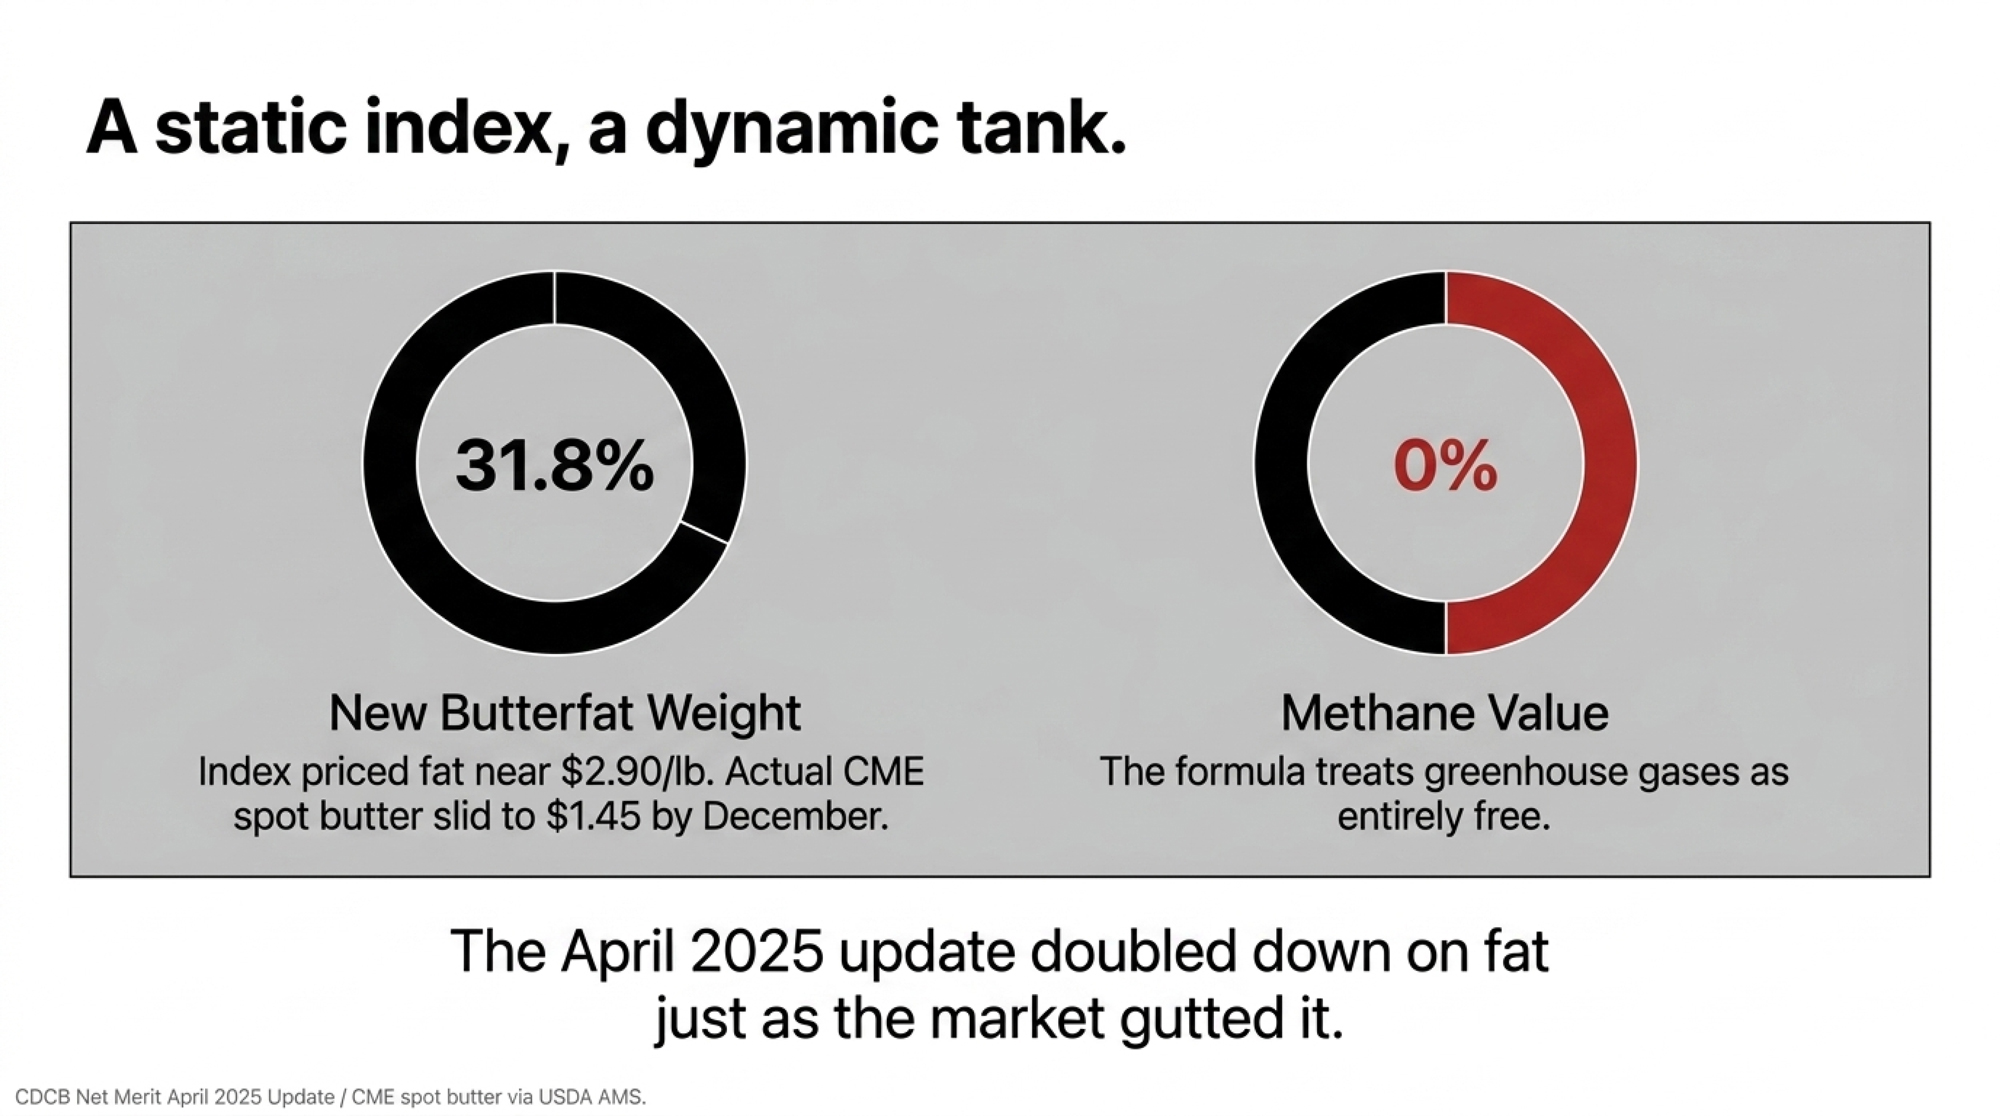
Executive Summary: When CDCB updated Net Merit in April 2025, it effectively priced butterfat near $2.90/lb and methane at $0, pushed the fat weight to 31.8% while cutting protein to 13.0%, and bumped Feed Saved to 17.8% — but the formula re-ranked almost nothing, correlating 0.992 with the old weights for young Holstein bulls. That stability is the trap: it leans on a high-butterfat window that the market already gutted, with CME spot butter sliding from about $2.50/lb in early 2025 to roughly $1.45 by December. For a 1,200-cow, high-output Holstein herd, the bigger blind spot isn’t components — it’s culling. Chasing a genuine 3% feed-efficiency gain is worth maybe $9,000 a year, while 70–100 fewer forced culls is worth $35,000–$100,000 using de Vries-style $500–$1,000/cow modeling, and NM$ only touches that leak indirectly through PL, LIV, DPR, and SCS. Meanwhile, methane sits at $0 even as DFA, Saputo, and FrieslandCampina (already paying €2.63/100kg in sustainability premiums) move toward carbon-graded milk, and the heifers you breed today on a $0 methane value won’t hit the string until 2028–2029. The piece lays out three honest roads — trust the index, adjust it around your own cull and fertility data, or override it with Cheese Merit, EBI, or custom weights — plus a 30-day move: pull your last 12 months of culls, and if more than 70% are involuntary, your breeding goal, not just your transition pen, is the problem.
Editor’s Note: The 1,200-cow western New York Holstein operation in this story is a composite scenario modeled on multiple high-output herds that The Bullvine has reviewed since the April 2025 Net Merit update. The barn math, cull patterns, and adviser conversations are illustrative — drawn from realistic ranges in herd records and published research, not a single farm. All program names, trait weights, researcher names, and economic figures are real and sourced.
Picture the kitchen-table breeding meeting at a 1,200-cow Holstein operation in western New York, late March. Two open laptops. A pot of coffee gone cold an hour ago. A stack of breeding sheets that keeps growing as the herdsman pulls more sire proofs off the printer. This farm is a composite — but the numbers on those sheets are real. For more than a decade, the rule here has been simple: sort by Net Merit, take the top 10 bulls, don’t overthink it.
The vet truck is now a regular fixture at the fresh pen. The hoof trimmer spends most of his day in the high groups. And the cull report shows a rate in the high-30s to low-40s, with most exits starting as a health or fertility problem in the first 60 days.
Sooner or later, somebody at the table asks the question that matters on any operation like this: what is this index actually breeding the herd for in 2030, and does that still match the cows they can keep, and the milk their buyer will want to pay for?
The April 2025 Shift: High-Fat Illusion vs. Genetic Reality
Nobody at this table thinks Net Merit is ‘bad.’ NM$ remains one of the best tools for ranking bulls on expected lifetime profit under typical U.S. conditions. The problem is the gap between the conditions Net Merit assumes and the conditions a herd like this is actually facing now — and will face when today’s calves are in their third lactation.
When the Council on Dairy Cattle Breeding rolled out the updated Net Merit weights in April 2025, the headline changes were clear:
The butterfat weight rose from 28.6% to 31.8%.
The protein weight dropped from 19.6% to 13.0%.
Feed Saved jumped from 12.0% to 17.8%.
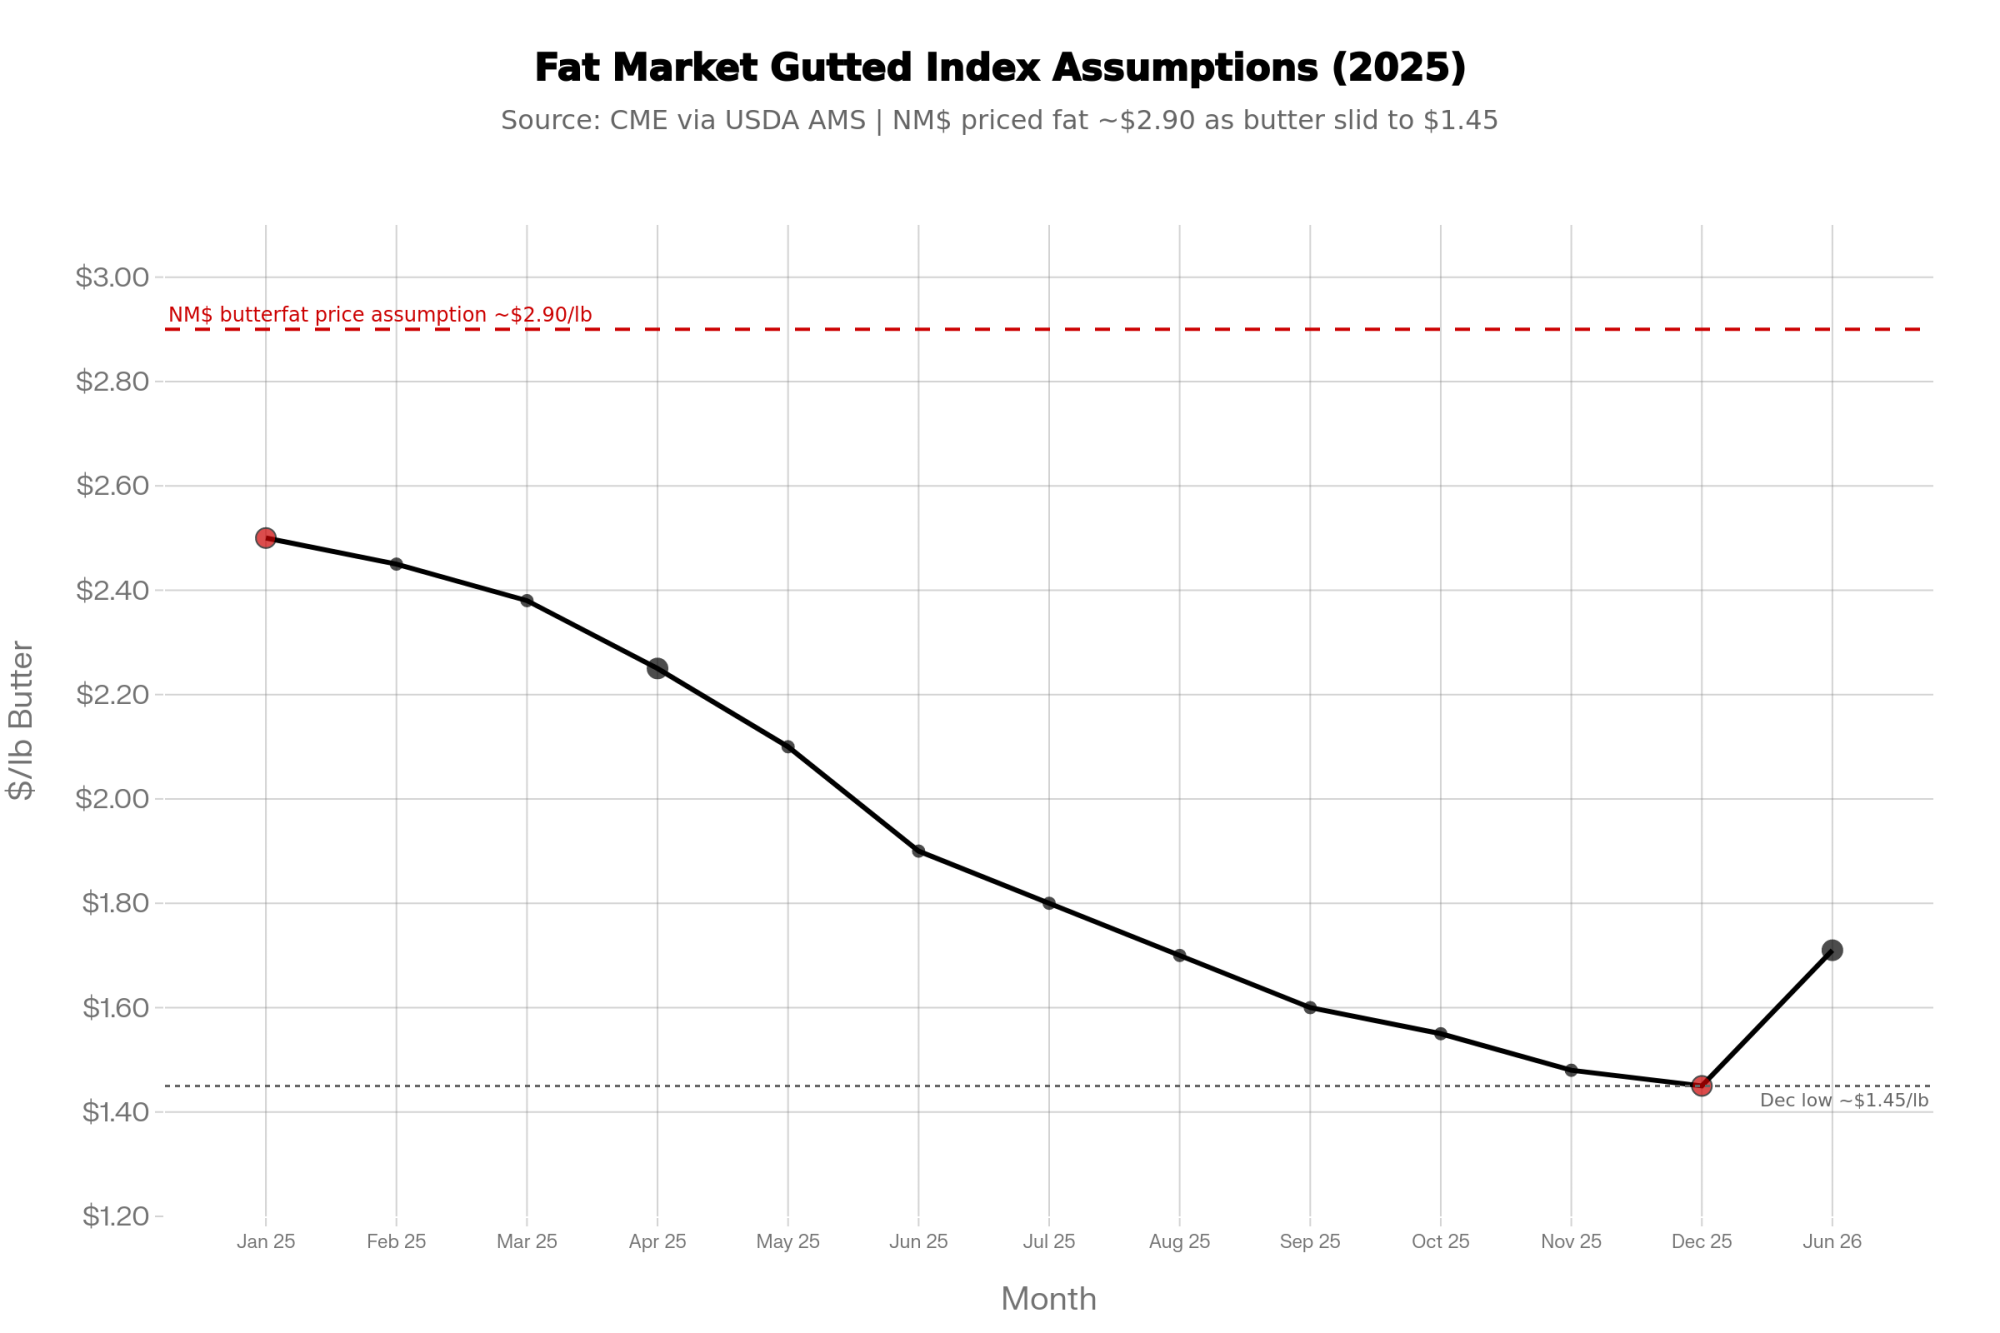
Here’s what that fat-heavy tilt means for your actual milk check. The index is telling your breeding program to chase butterfat hard and ease off protein — but it’s pricing those components off lagging multi-year averages, not what your tank is worth this week. Component values swing, Class prices jump, and a fat-to-protein ratio that looked right when CDCB built the formula can flip before the semen you ordered off it ever produces a milking daughter. A static index will always lag a dynamic tank. So the question isn’t just ‘is butterfat valuable?’ — it’s ‘will it still be priced this way when these matings hit the bulk tank in 2028?’
That’s not a hypothetical. CME spot butter traded near $2.50 per pound at the start of 2025 — right in the window CDCB used to reset those weights — then slid to roughly $1.45 by December and hovered near $1.71 by June 2026 (CME via USDA AMS and trade reporting). The index doubled down on fat just as the market spent a year taking the air out of it. That’s the lag in one commodity within a single year.
Translated into pricing, the update effectively values butterfat at about $2.90 per pound and feed at roughly $0.13 per pound of dry matter, while assigning methane a value of exactly $0 in the index math. CDCB and USDA-ARS used recent rolling averages of milk prices and feed margins — drawn from the years leading into the launch — to reset those economics. Butterfat had been the star during that window, trading near the high-$2-per-pound range in many orders, while protein prices sagged. Feed costs spiked, so Feed Saved was worth more.
Methane, heat tolerance, and welfare penalties weren’t in the equation at all. The official Net Merit documentation is explicit: only traits with a direct, currently measurable impact on farm profit are priced into the index, and greenhouse-gas traits are not yet included. CDCB has stated that traits are added to NM$ only when reliable national evaluations and clear economic values exist, and that greenhouse-gas evaluations are ongoing.
One number from CDCB’s own rollout really lands: the 2021 and April 2025 NM$ indexes correlate at 0.992 for young Holstein bulls and 0.981 for recent progeny-tested bulls. In plain language, almost nothing re-ranked. The same bulls a herd would have picked three years ago still float to the top of the list today — even though the butterfat, protein, and feed markets that drove the new formula look different from when most “top 10 NM$ only” rules began.
A growing number of U.S. processors are publicly discussing scope 3 emissions and sustainability reporting, and several have signaled that future producer payments may be linked to greenhouse gas performance. Nothing on the milk cheque yet. But the direction of travel is obvious.
The Bullvine walked through how the updated formula was built in its coverage ofthe CDCB Net Merit update.
When the Fresh Pen Says “Enough”
The cull report from a herd like this looks a lot like what you see in many high-output Holstein freestall operations. Overall, culling has crept into the high-30s. Sort culls into two piles — voluntary (older, low-producing cows with planned exits) and involuntary (health, fertility, injury, chronic problems) — and most exits are “had to” cows, not “chose to” cows.
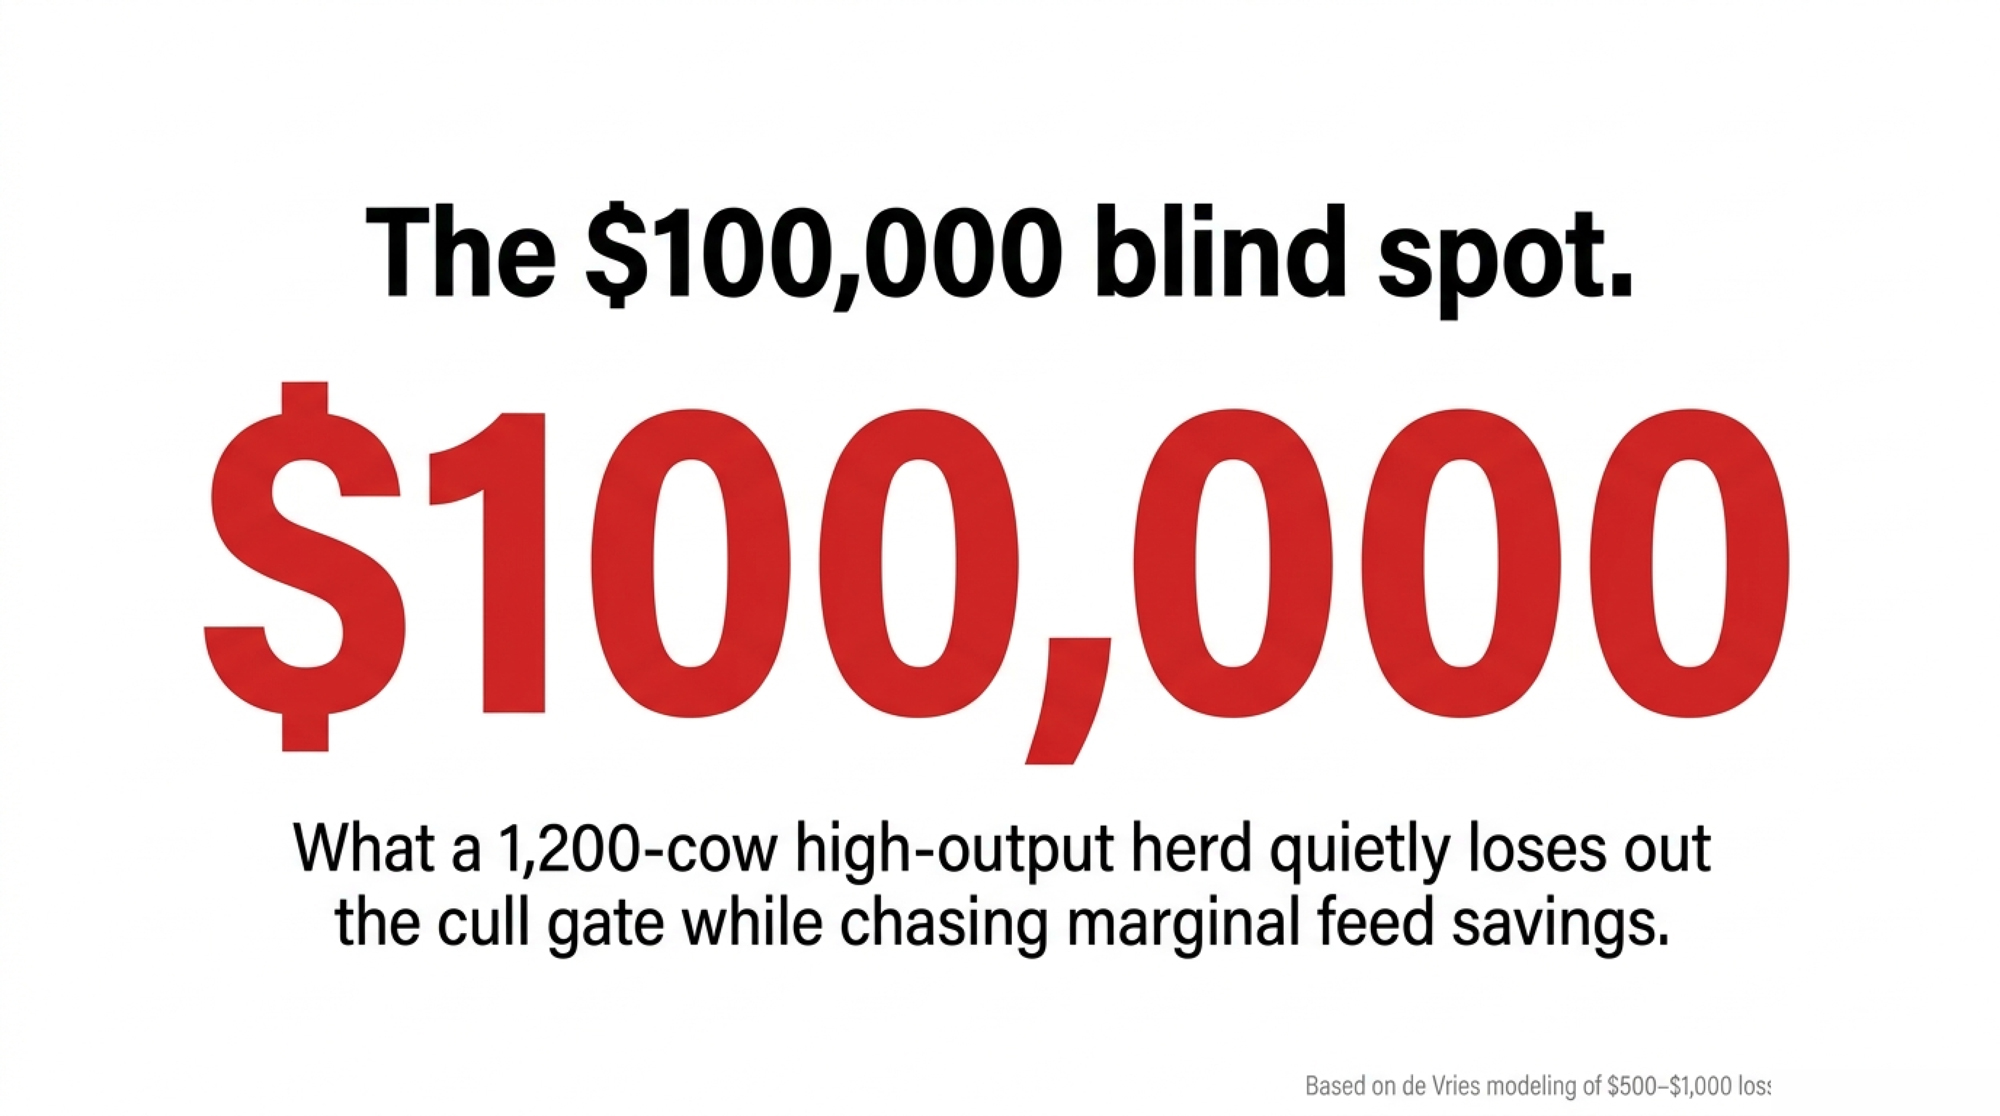
There’s no single “official” cost of an involuntary cull, but economic modeling summarized by Albert de Vries and others puts the loss in the $500–$1,000 per cow range when you fold in lost future milk, replacement rearing cost, and health costs. And here’s why the timing hurts so much. Lose a second-lactation cow at 45 days in milk, and you’re not losing an average cow — you’re losing her at the exact moment she’s climbing toward peak yield, the most productive stretch of her life. She never gets the chance to milk back the rearing deficit she ran up as a heifer. You ate two years of feed, labor, and opportunity cost raising her; she’s three weeks from paying it back, and she leaves on the cull trailer instead. Do that 70 to 100 times a year, and the leak isn’t a rounding error — it’s much of the problem.
Cull Pattern
Involuntary Share
Estimated Annual Leak
Likely Genetic Signal
Recommended Action
Mostly older, low-producing cows
<30% involuntary
Minimal ($5k–$15k)
Program working; monitor components trend
Stay Path 1; re-check butterfat vs. protein pricing quarterly
Mix of health + low production
40–60% involuntary
Moderate ($20k–$45k)
Fertility and health traits under-weighted
Move to Path 2; add DPR/CCR and SCS floors
Dominated by fresh-cow disease, lameness, infertility
>70% involuntary
High ($50k–$100k+)
Breeding goal misaligned with system pressure
Path 2 or 3 immediately; audit sire stack for PL, LIV, hoof health
High culls concentrated in first 60 DIM
>65% involuntary
High + rearing cost unrecovered
Transition risk baked in genetically
Full genetic audit; consider Nordic/EBI sires for robustness
For 1,200 cows with a cull rate near 40%, even modest improvements in involuntary culling add up fast — and they add up to a number that dwarfs anything achievable by chasing feed efficiency alone.
A genuine 3% improvement in feed use (genetics + management together) on 30,000 cwt shipped, at a Northeast purchased-feed cost around ~$10/cwt, consistent with recent Cornell PRO-DAIRY / Northeast Dairy Farm Summary benchmarks
Per-unit economics
$500–$1,000 per involuntary cull saved (de Vries-style modeling)
3% of ~$300,000 annual feed cost
Annual impact
$35,000–$100,000/yr
~$9,000/yr (more if your landed feed cost runs higher)
Source of the gain
Cows staying in the herd long enough to pay off rearing cost
Smaller cow size + intake efficiency in the Feed Saved PTA
Visible in the index?
Indirectly via PL, LIV, DPR, SCS — all under-weighted relative to this leak
Directly via Feed Saved (17.8% weight)
🔴 The P&L Blind Spot
High-output herds are chasing roughly $9,000 a year in marginal feed-efficiency gains the index explicitly rewards — while quietly leaking up to $100,000 a year through transition wrecks and forced culls the index barely sees. One number sits on the spreadsheet your breeding program optimizes for. The other walks out on the cull trailer.
So why is a breeding goal still leaning as hard on production and Feed Saved as the national average?
“We Bred Exactly What We Asked For”
A decade of sire choices on a farm like this tells an ordinary story. The team chased high NM$ and TPI, especially big milk and components. Less weight on body condition and “middle,” more on tall and angular. They eventually bolted on Productive Life and SCS filters once the cost of mastitis and early exits became impossible to ignore.
The cows walking the freestall alleys in 2025 are the predictable result. Powerful milkers, especially in first and second lactation. But many fresh cows dive into a deep negative energy balance — the window Cornell and PRO-DAIRY transition research has long flagged as the highest-risk stretch for high-output Holsteins — that drops them right on the edge between “profitable” and “problem.”
In our reporting on transition cow disease across high-output Holstein herds, one pattern keeps surfacing: genetics now produce cows that can out-milk the ability of an operation to keep them healthy through the first 60 days. Good transition management still helps. But genetics quietly loads the dice against you before the calf is even born.
Cornell’s NYSCHAP transition-cow benchmarks draw the alarm lines in hard numbers: displaced abomasum at or above 6% (target under 3%), milk fever at or above 5% (target under 2%), retained placenta at or above 10% (target under 8%). Herds that have selected hard on production for years tend to flirt with those lines unless genetics and transition management are pulling in the same direction.
Lay health and culling patterns next to a genetic trend, and what shows up isn’t a “transition program” problem. It’s a breeding-goal problem that’s been compounding across multiple sire generations.
If you want the mechanics, The Bullvine breaks down how feed efficiency is actually measured in its primer onresidual feed intake.
Net Merit: Where It Still Helps and Where It’s Blind
This isn’t “abandon NM$.” It’s knowing what Net Merit is genuinely good at for a herd like this — and where it’s blind.
Where NM$ still shines:
Ranks bulls for lifetime profit under average U.S. confinement herd economics, assuming FMMO-style component pricing and no carbon price.
Keeps obviously risky sires — very poor somatic cell, extremely low fertility, weak livability — out of the tank.
Provides a consistent national yardstick to compare bulls, cow families, and herds.
Where NM$ goes blind for this kind of herd:
Feed efficiency. The Feed Saved trait combines actual feed intake data, where available, with the body weight composite. A big slice of that PTA still comes from smaller cows, not necessarily cows that convert feed more efficiently at the same size. For a herd already pushing milk per stall hard, smaller isn’t automatically better if it means less “middle” to handle higher output.
Environment. Methane and other environmental externalities are valued at $0 in the NM$ formula. Any future carbon premium or deduction from a processor is invisible to the index, which leaves any herd thinking about methane efficiency or low-carbon dairy genetics working off-index.
How it plays in robots. Udder and teat composites that work fine in a parlor can be a headache in AMS barns. Robot herds have learned the hard way that rear teats too close together are one of the quickest ways to make a robot hate your cow. National udder composites weren’t originally built around AMS needs.
Responsiveness. The April 2025 update didn’t add any new traits and barely moved bull rankings overall, despite real changes in butterfat prices and feed costs. That’s a deliberate trade-off CDCB makes to keep the national index stable: changes that re-rank too many bulls or invalidate years of breeding decisions are, by design, hard to push through quickly.
For a herd with a full fresh pen, a high share of involuntary culls, and a processor warming up for sustainability scoring, NM$ is still useful — but more as a minimum standard than the steering wheel.
Trust the Index, Adjust It, or Override It?
Here’s where the kitchen-table conversation gets honest. Three roads forward. And which one you take isn’t a personality test — it’s dictated by how far your herd has drifted from the “average U.S. parlor herd” the index assumes.
Start at Path 1. The further your reality sits from that national average, the further down the line you move. Cull report still looks normal, and your processor’s quiet on carbon? Trust works. Watching involuntary culls climb, and fresh-pen disease creep toward those NYSCHAP alarm lines? You’re already past Path 1, whether you’ve admitted it or not. Running robots, grazing, or staring down a processor sustainability contract? You’re at Path 3. Find the road that matches what you’re actually living — then decide whether it still fits the next decade.
Selection Path
Primary Sort Tool
Key Assumption
What You Give Up
Red Flag Trigger
Path 1 — Trust NM$
NM$ top 10–20 bulls
Avg U.S. confinement economics, FMMO pricing, no carbon price
Direct control over methane, AMS udder fit, index lag
Involuntary culls >70%; fresh-pen disease at NYSCHAP alarm lines
Path 2 — Adjust Around Your Data
NM$ as gatekeeper + custom minimums
Your DPR, CCR, mastitis, and hoof floors override top-end ranking
Some NM$ points at top of list
High forced-cull rate + processor starting carbon conversation
Path 3 — Override the Index
Cheese Merit / EBI / NTM / custom weights
Your system (robots, grazing, OAD) differs materially from national average
Single national ranking; smaller reference populations
You are here if: Your primary sire-selection rule is “sort by NM$, take the top 10–20 bulls, move on.”
What it assumes: Average U.S. confinement herd economics, FMMO-style component pricing, no carbon price, and a herd structure close to the national mean.
What you give up: Direct emphasis on the traits NM$ doesn’t price — methane, heat tolerance, AMS-specific udder design — plus any responsiveness to the gap between your milk cheque and the index’s pricing assumptions.
Honest tell: If your involuntary cull share is climbing and your fresh-pen disease rates are flirting with NYSCHAP alarm levels, “trust” is quietly costing you the leakage in the table above.
Path 2 — Adjust Around Your Own Data
You are here if: You use NM$ as a gatekeeper but layer your own minimums on top.
What it looks like in practice: A hard floor on Daughter Pregnancy Rate and Cow Conception Rate. More weight on mastitis resistance and hoof health, where credible proofs exist. A preference for bulls with real feed-intake data behind their Feed Saved PTAs, not just a smaller body weight composite. Acceptance that you’ll give up some top-end NM$ points to get cows that stay in the herd longer.
What you give up: Some short-term genetic merit on the top-line index number.
Honest tell: If your composite herd looks like the New York one in this story — full fresh pen, high involuntary culls, processor talking carbon — this is usually the right starting road.
Path 3 — Override the Index
You are here if your future system looks materially different from the “average U.S. parlor herd.”
What it looks like in practice: Cheese Merit or Grazing Merit as your primary sort instead of NM$. Irish or Nordic sires were brought in because EBI and NTM placed greater weight on fertility, pasture performance, and emissions. Or rough custom economic weights built off your own numbers — your feed costs, your culling pattern, your labor situation, and the language in your processor’s contract.
What you give up: The simplicity of a single national ranking, and reference populations that may be smaller for some traits.
Honest tell: Robots, grazing, OAD, processor sustainability scoring, or a strong components-only payment structure are all signs the override path is worth a serious look.
A composite herd like this New York operation usually lands between Path 2 and Path 3. Keep an NM$ threshold but stop insisting on only top-10 bulls. Weight health, fertility, livability, and moderate stature harder when picking sires. Hunt for bulls with credible feed-efficiency stories. And look at EBI-bred and Nordic sires with curiosity instead of writing them off as “pasture bulls from somewhere else.”
The agreement that emerges around the table is usually the same: cows that stay in the herd and pay off their rearing cost deserve more weight in the breeding goal than cows that leave after one or two rocky lactations.
What Does a Case of Ketosis Really Mean for Your Genetics?
Most of us talk about genetics and picture proofs before pens. The health patterns in your fresh pen are exactly where your index choices show up.
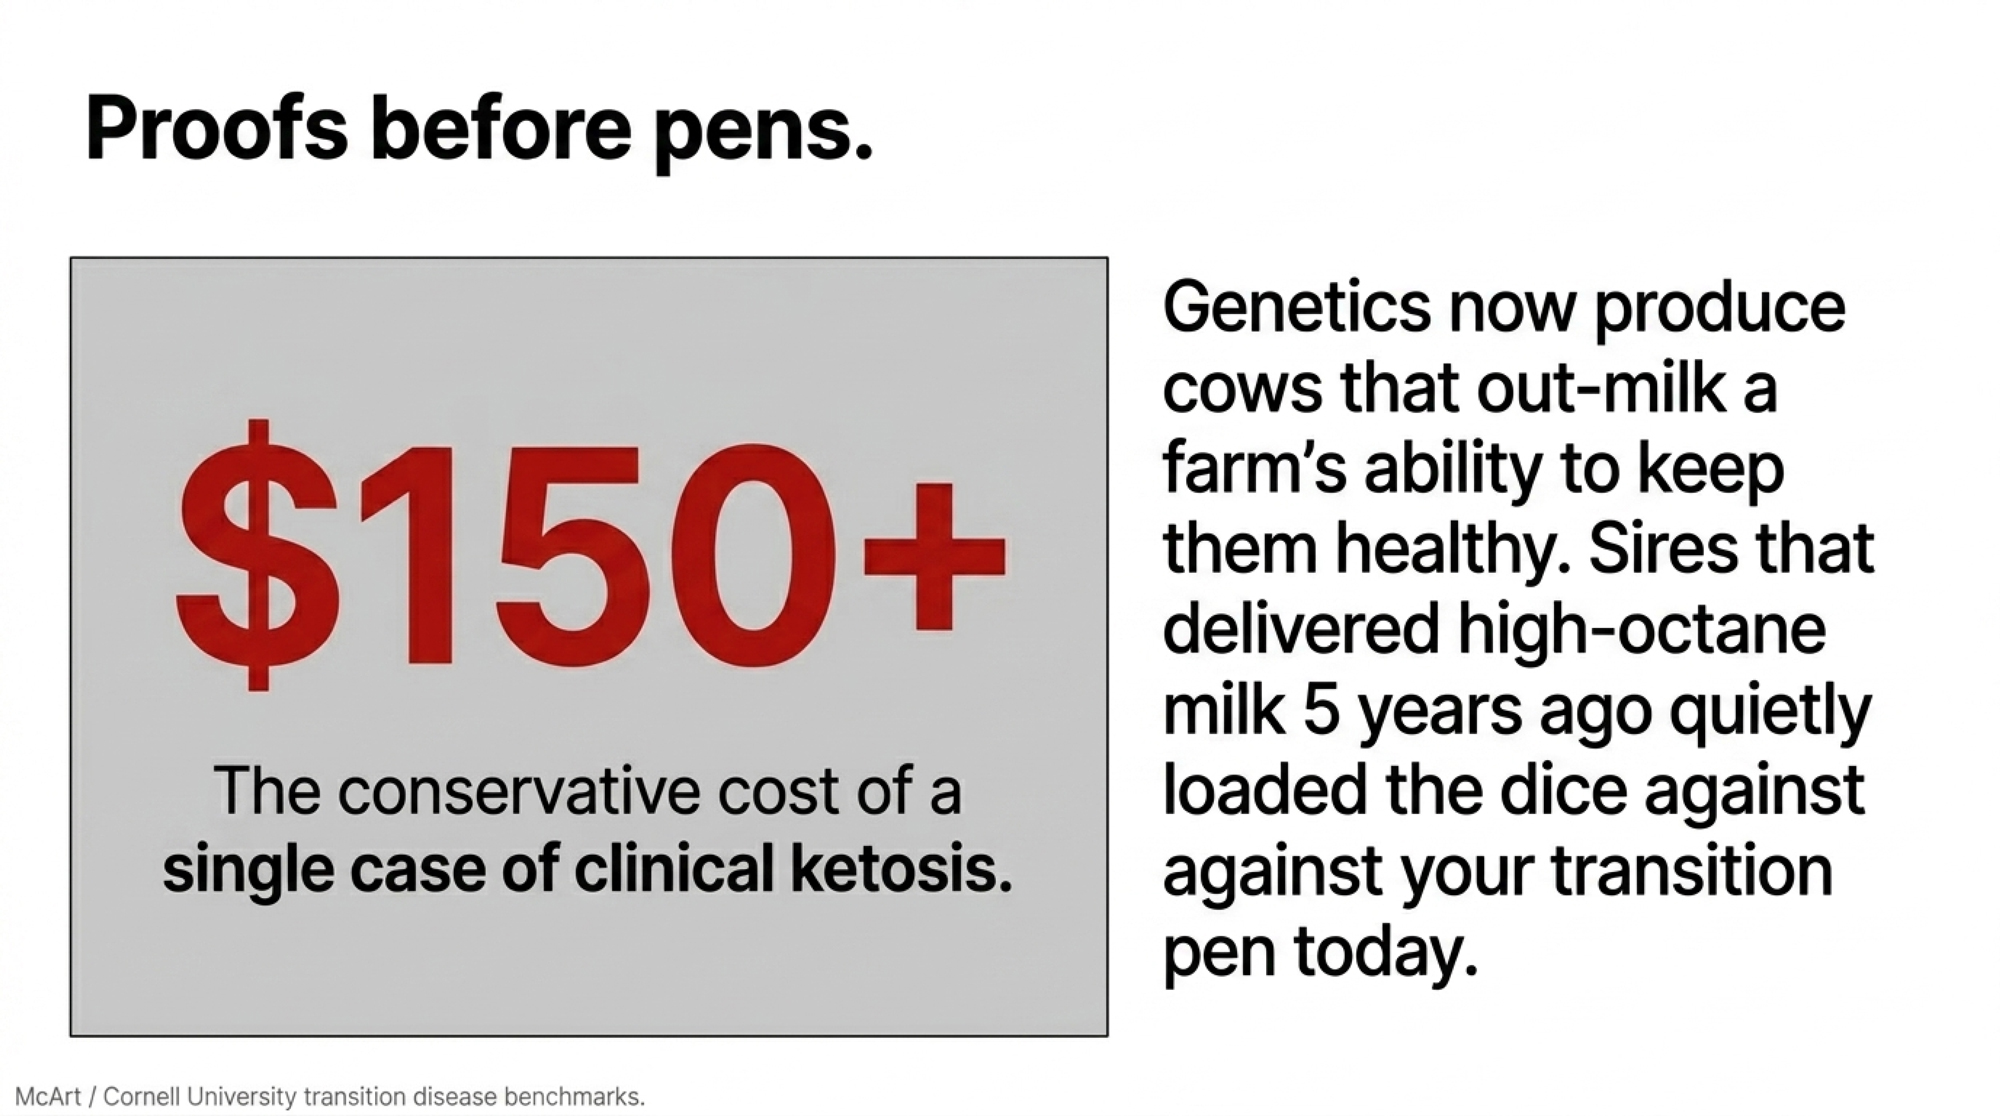
Take ketosis. Cornell research led by Jessica McArt and recent extension summaries put a single case of clinical ketosis in the low hundreds of dollars per cow — published estimates range from roughly $117 to over $230 per case once treatment, lost milk, reproduction delays, and added culling risk are factored in. The exact number depends on the system and prices, but it’s not trivial.
Run the example off this herd’s scale:
1,200 cows, with 10% hitting some form of ketosis in early lactation. That’s 120 cases.
If better genetics and management together trimmed that by 20%, that’s 24 fewer cases.
Use a conservative blended estimate of around $150 per case to stay on the low end of published ranges, and you’re looking at about $3,600 a year back in your pocket.
You’re not retiring on that number. But stack it with fewer DAs, fewer down cows, better fertility, and a few more cows making it into third and fourth lactation, and now you’re talking real money.
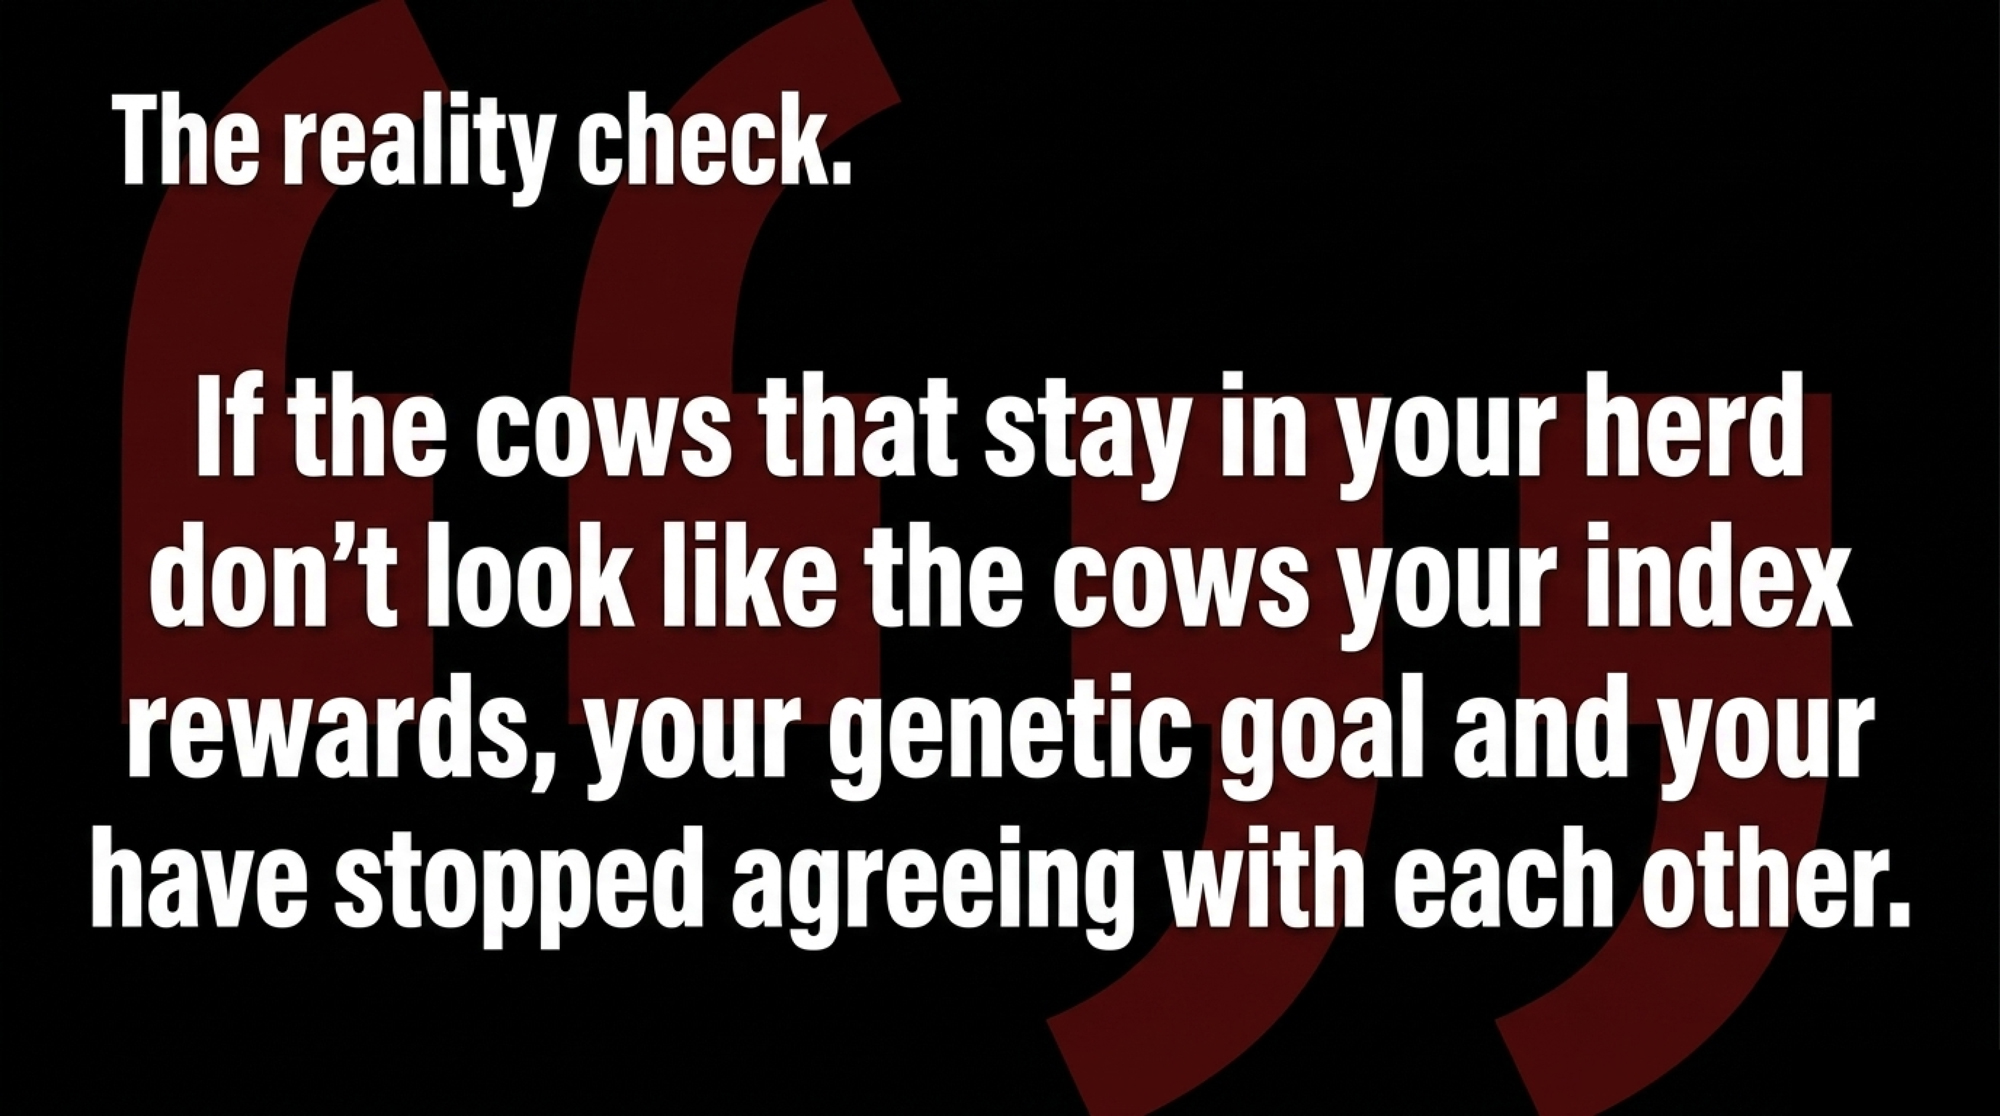
Changing trait weights doesn’t magically fix everything. But the cows getting sick now are partly the product of mating decisions made 5–10 years ago. The same proofs that gave you high-octane milk can quietly raise the odds that cows tip over in a high-pressure transition program. And if the cows that stay in your herd don’t look like the cows your index rewards, your genetic goal and your business have stopped agreeing with each other.
This isn’t a “transition program” problem that showed up in 2025. It’s a long-running genetic strategy that never got updated as the economics and farm realities shifted around it.
Is Your Index Already Behind Your Processor?
The other source of tension at the table isn’t the vet bill. It’s the milk buyer.
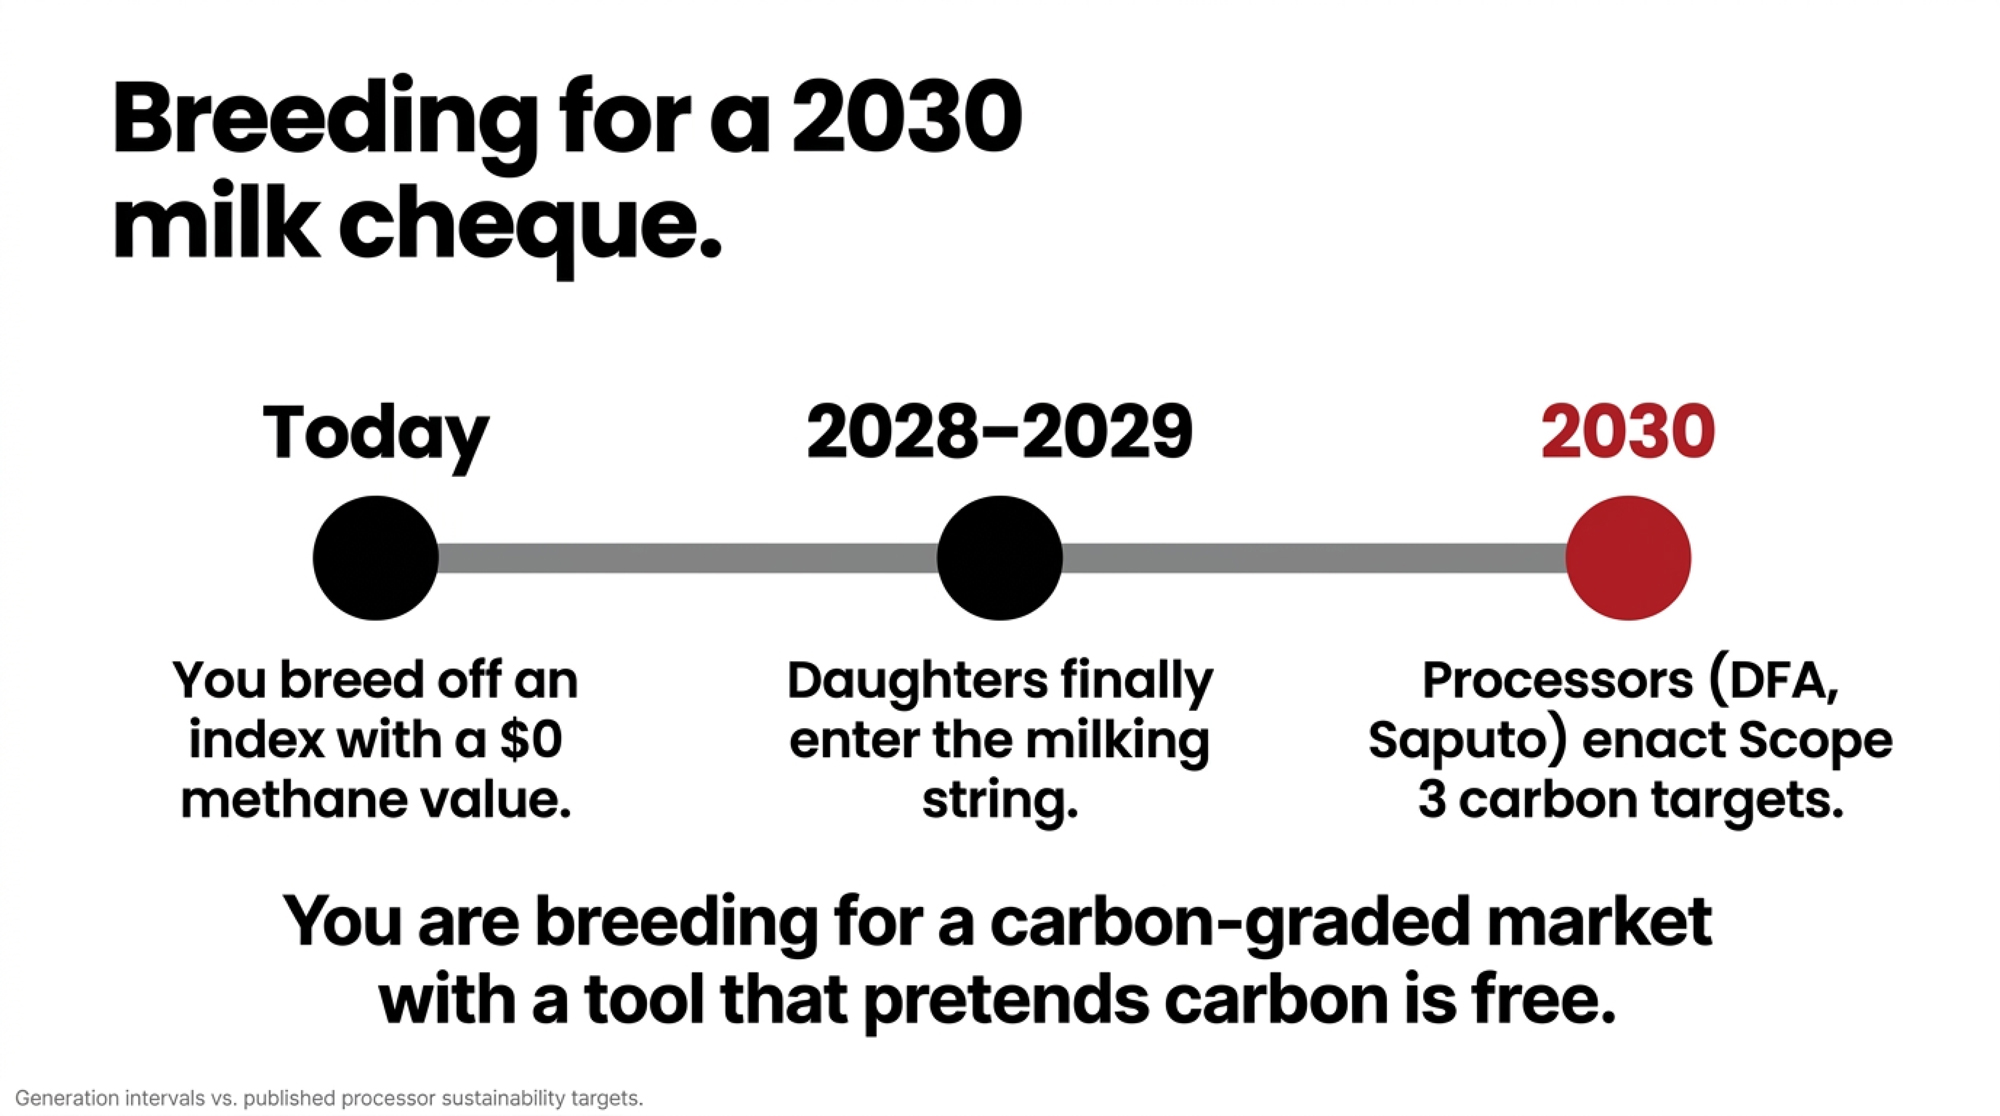
Several large U.S. processors — Dairy Farmers of America among them, with its publicly committed net-zero greenhouse-gas goal by 2050 and ongoing scope-3 reporting, and Saputo with its publicly stated commitment to reduce absolute scope 1 and 2 emissions and to engage suppliers on scope-3 emissions by 2030 — have lined up sustainability targets that put farm-level emissions on the table. Nobody knows exactly what the premium and deduction structure will eventually look like. But at some point, a kilogram of milk from a low-footprint herd won’t be treated the same as a kilogram from a higher-footprint one.
International examples are the warning shot. In November 2022, Ireland’s Economic Breeding Index added a dedicated carbon sub-index, which ICBF and Teagasc set at a 10% weighting of the total EBI — putting a monetary value on emissions at €80 per tonne of carbon dioxide. Teagasc and ICBF data show cows bred under EBI have become measurably more carbon-efficient per kilogram of milk solids, mostly through higher fertility, better solids, and tighter calving patterns, diluting emissions per unit of output.
Now factor in the clock that makes this urgent: a dairy animal’s generation interval runs roughly 3 to 4 years. Breed off a “$0 methane value” index today, and the heifers you’re creating won’t even enter the milking string until 2028 or 2029 — and they’ll be in your herd for years after that. So if a U.S. processor lands a carbon premium or deduction by the turn of the decade, the cows facing that penalty are being conceived right now, off an index that prices their emissions at nothing. You’re not breeding for today’s milk cheque. You’re breeding for a milk cheque you can’t see yet, with a tool that pretends carbon is free.
Dutch dairy co-op FrieslandCampina already runs the real-world version of this on the milk cheque. The co-op paid out more than €245 million in sustainability premiums to member farms for 2023 — averaging €2.63 per 100 kg of farm milk — with about €190 million of that flowing through the Foqus planet sustainable-development incentive system, and the remaining €55 million-plus tied to special milk flows such as organic and PlanetProof. The exact split shifts year to year, but the principle is fixed: greenhouse-gas and sustainability performance is already cash on a Dutch milk cheque.
Net Merit still values methane at $0, even after the April 2025 update. For a herd that sells embryos or bulls, or supplies a processor already thinking in carbon accounting, that mismatch matters. If your index assumes greenhouse gases cost nothing and your buyer’s long-term plan treats them as a real liability, you’re breeding into a gap that shows up somewhere — on your milk cheque, in your access to certain programs, or in how marketable your genetics are to buyers further down the sustainability path.
For a herd like this, that’s the final nudge. Nobody wants to discover in 2030 that their genetics were perfect for a 2023 milk cheque and badly misaligned with a carbon-graded market.
Pull your last 12 months of cull records and sort them into “voluntary” and “involuntary.” If more than 70% of your culls are involuntary, and infertility, lameness, mastitis, and transition disease top the list, that’s a strong sign you need more genetic emphasis on health, fertility, and robustness — not just better management.
Ask your genetics adviser one specific question about Feed Saved. For the bulls you’re using, how much of their Feed Saved PTA is attributable to true feed intake data versus just smaller body size? If the answer leans heavily on body weight composite, you’re mainly selecting for smaller cows, not necessarily cows that convert feed better at the same size.
Compare your milk cheque to the index’s pricing assumptions. Net Merit’s updated weights lean toward butterfat and protein values that reflect recent U.S. component prices, with a heavier emphasis on fat than on protein. If your market pays more aggressively for protein, or your fat price has already slid from those highs — and it slid hard through 2025 — give Cheese Merit or a custom trait profile more weight alongside NM$.
Look at your 5-year system plan, not just this proof run. Are robots, grazing, or alternative housing in the pipeline? Start filtering now for the traits that matter in those systems — teat placement and udder depth for robots, fertility and feet for grazing — instead of assuming the national composite will automatically produce the right cows.
Do one “override the index” exercise in the next 30 days. For your next semen order, deliberately pick two or three bulls that aren’t in your usual top-10 NM$ list but rank strongly for the traits your own numbers say matter most. Track their daughters separately. See whether they match the kind of herd you actually want to milk.
Use your own numbers to set genetic red lines. If your records show that DAs, metritis, or down cows at certain levels destroy your margin, work with your adviser to set minimum thresholds for relevant traits — not just maximum NM$ points — and stick to them.
Key Takeaways
If your cull report is dominated by cows you “had to” ship, that’s not just a transition management story — it’s feedback on your breeding goal. Genetics and management pull on the same rope. Adjust only one end, and the herd won’t move very far.
Net Merit’s updated weights make it a solid national index, but it’s built on 2021–2024 economics with zero value on methane and limited direct emphasis on the traits that keep cows in a high-pressure system. Use it as a baseline, not a blind autopilot.
Your own data is the best starting point for adjusting or overriding the index. The three biggest leaks in your P&L — usually involuntary culls, fresh-cow disease, and labor around “problem cows” — should drive more of your trait emphasis than they probably do today.
If your processor, lender, or genetics customers are already talking about sustainability and 2030 targets, your breeding program is in the sustainability business whether you like it or not. The genetics you choose now will decide whether your herd fits those programs or constantly fights them.
A herd like this, the New York composite, still looks at NM$ every proof run. The difference, once the conversation goes honestly, is that it becomes one lens, not the whole picture. The sire list bends toward cows you can keep, and toward a milk cheque your buyer is likely to be writing in 2030, not 2019.
If you laid your last ten years of sire choices next to your last 12 months of cull reasons and vet bills, would those two stories look like they came from the same farm — or is it time to redraw your genetic target?
Run Your Numbers
Herd Health ROI Calculator — This article puts the cull-gate leak at up to $100,000 a year. Plug in your own culling rate, replacement heifer cost, and mastitis incidence to see what slowing those forced exits is actually worth on your herd — before you blame the breeding goal or the transition pen.
Complete references and supporting documentation are available upon request by contacting the editorial team at editor@thebullvine.com.
Every week, thousands of producers, breeders, and industry insiders open Bullvine Weekly for genetics insights, market shifts, and profit strategies they won’t find anywhere else. One email. Five minutes. Smarter decisions all week.
If your inbreeding is over 9.99% and FSAV isn’t on your proof sheet, Net Merit 2025 is using you — not the other way around.
Executive Summary: Net Merit 2025 added a $57‑per‑point “weight tax” on big Holsteins by cutting Body Weight Composite to ‑11% and lifting Feed Saved to 17.8% of NM$, pushing the breed toward smaller, feed‑efficient cows. Fat now carries 31.8% of the index, protein just 13%, and cow/heifer Livability has more pull, so the model rewards components and survival over sheer size. New calf‑health evaluations — CDCB’s DIAR/RESP and Lactanet’s Calf Health RBVs — reveal that daughters of top 5% sires stay healthy 15–18 percentage points more often than daughters of the worst bulls, and a single respiratory event costs about 121 kg in first‑lactation milk. Meanwhile, average inbreeding for Canadian Holstein heifers hit 9.99% in 2024, and JDS work shows recent inbreeding hurts longevity more than older, diluted inbreeding, raising real questions about how we’re using genomics. Rosy Lane Holsteins leans hard into NM$, FSAV, and calf‑wellness indexes, but still filters out extreme‑stature bulls and ignores classification that doesn’t help profit, showing how to use the system without letting it run the herd. The practical playbook: pair NM$ with reliability, make FSAV and calf health non‑negotiable filters, keep your top three bulls below ~40% of expected future inbreeding, and, in the next 30 days, sit down with your proofs to see if Net Merit’s priorities actually match how your farm makes money.
While you’re scraping stalls or checking heaters, three people you’ve never met just changed the value of every cow in your barn. In a quiet Maryland office park, the USDA recalculated the “ideal” Holstein — and if your cows are “too big” on Body Weight Composite, they just picked up a $57‑per‑point penalty for lifetime Net Merit.
The math lives in Beltsville. The consequences land in your parlour. The April 2025 Net Merit revision didn’t just shuffle a few bulls; it hard‑wired a new answer to a simple question: what kind of Holstein is worth breeding in 2026?
This is the story of the scientists who set that answer — and Rosy Lane Holsteins in Wisconsin, where Lloyd Holterman refuses to let those formulas be the whole story.
Quick Facts: What Changed in Net Merit 2025
Body Weight Composite (BWC): -11% emphasis in NM$.
Fat vs Protein: Fat 31.8%, Protein 13% of NM$ emphasis.
Feed costs in the model:58% of milk income (39% marginal, 19% maintenance).
“Weight tax”: +1.0 BWC = -$57 lifetime NM$ per daughter.
Genetic gain: Genomics roughly doubled NM$ gain per bull from $40 → $85/year.
Those aren’t trivia numbers. They’re the new rules your proof sheet is playing by.
From Coin, Iowa, to Every Proof Sheet in North America
The modern proof system didn’t start with DNA chips. It started with a kid from Page County, Iowa, who didn’t begin his animal breeding career until he was nearly 40.
Charles Roy Henderson grew up on a general livestock farm, served as an Army Nutrition Research Officer during World War II, and earned his PhD in genetics and animal breeding from Iowa State in 1948 at age 37. At Cornell, he developed best linear unbiased prediction — BLUP — the math that finally separated herd effect from genetic effect. It let evaluators ask: Is this cow actually superior, or just in a better barn?
USDA adopted Henderson’s herdmate comparison method in 1962, replacing the old daughter–dam comparisons. By 1989, BLUP‑based Animal Model evaluations were running in the U.S., with other countries following through the 1990s.
There was still a massive bottleneck. A young bull went into AI around two, his daughters calved, finished a lactation, and the proof didn’t publish until the bull was seven or eight. Only about 1 in 8–10 bulls “graduated” from progeny testing, and each active bull represented a $350,000–$400,000 investment in semen collection, daughter sampling, and promotion.
Genomics blew that up. Illumina’s 50K SNP BeadChip hit the market in 2007, the bovine reference sequence landed in Science in April 2009, and USDA’s Animal Genomics and Improvement Laboratory launched official genomic evaluations for Holsteins and Jerseys in January 2009. Generation interval collapsed — suddenly, you could get a genomic PTA on a bull before he was old enough to breed.
Paul VanRaden joined the USDA’s Animal Improvement Programs Laboratory after his Iowa State PhD in 1986. His name is on a long list of methods you see every time you open a proof sheet — but Net Merit is the one that hits your pocketbook most directly.
Henderson’s BLUP told you which cow was genetically better. VanRaden’s Net Merit dollar index (NM$) tells you which cow should make you more money over her lifetime. It rolls multiple production, fertility, health, and conformation traits into a single lifetime profit estimate — and every revision is another set of judgment calls about what matters, and how much.
Where the 2025 Change Hits Your Herd
The April 2025 NM$ revision increased the emphasis on butterfat and reduced the emphasis on protein, reflecting actual component price trends in recent years. It also shifted weight from Productive Life toward cow and heifer Livability, based on stronger cull cow and heifer calf markets.
The bigger jolt is in body weight and feed efficiency. New feed‑intake data from more than 8,500 Holstein and Jersey lactations showed that maintenance feed costs were higher than previous models assumed. In plain language: big cows cost more to keep milking than the old Net Merit math gave them “credit” for.
So BWC now sits at ‑11% emphasis in NM$. For every extra point of BWC, the model knocks about $57 off that cow’s lifetime Net Merit — mostly for maintenance feed, but also for housing and replacements.
Big cows = big feed bills the model sees no profit
Here’s the barn‑math version:
Your bull team averages +1.0 BWC over breed average.
NM$ says that’s about ‑$57 lifetime NM$ per daughter.
Across 100 daughters, that’s roughly $5,700 in lifetime NM$ drag for that sire choice compared to a BWC‑neutral bull.
You can argue with the model. But you can’t pretend it’s not there.
Why Did Fat Leapfrog Protein?
VanRaden’s team also re‑estimated the true genetic cost of components. Genomic and sire regressions suggested that, genetically, fat takes as much or more feed to produce than protein. That’s the opposite of what older phenotypic regressions implied when they just watched cows and feed trucks.
The feed‑side math behind this revision assumes feed costs equal 58% of milk income — 39% for marginal production and 19% for maintenance. Combine that with the new Feed Saved trait (FSAV), and you see where the wind is blowing:
FSAV is 17.8% of NM$ when you add its BWC and Residual Feed Intake components together.
If you’re not looking at FSAV on your proofs, you’re ignoring almost a fifth of the index you think you’re using.
The subtext is pretty clear: do more milk from less feed, land, and carbon, or get left behind.
Wiggans: The Infrastructure Nobody Sees
If VanRaden designed the engine, George Wiggans made sure it was street‑legal and still running when you opened your proofs this morning.
Theory doesn’t help anybody if it can’t be computed, delivered, and trusted. Wiggans spent his career sorting out genotype management, data quality control, and the nuts and bolts of turning millions of milk, type, and health records into evaluations that AI organizations can actually ship. He was central to the push that got Canadian AI studs to contribute DNA to a shared U.S.–Canada reference population before genomic proofs went live, which still underpins most North American Holstein genomic evaluations.
Every chip you send in has to survive that QC pipeline. The genotype is checked against reported parents, then against the entire database to catch swapped samples or mis‑ID’d animals. If it doesn’t add up, it doesn’t make it into the evaluations.
In a 2022 Frontiers in Genetics paper, Wiggans and Carrillo showed that the U.S. genomic‑selection era roughly doubled the rate of NM$ gain: from about $40 per bull per year (2005–2009) to roughly $85 per bull per year from 2010 onward. The genetic trend lines are real. Whether those gains match your own herd’s priorities is a different question.
What Kills Your Calves Before They Ever Milk?
John Cole is part of the generation pushing genomic evaluations into the ugly stuff that never makes it to the parlor: dead or wrecked calves.
Across multiple datasets, about 75% of preweaned calf mortality comes from just two buckets: diarrhea and respiratory disease. To put numbers on the genetics behind that, CDCB and partners pulled together 207,602 diarrhea records and 681,741 respiratory disease records from calves born between 2013 and 2024. Those data streams feed the new U.S. genomic evaluations for calf diarrhea (DIAR) and respiratory disease (RESP), officially launched in April 2026. Lactanet rolled out its own Calf Health RBVs for Holsteins in August 2025.
The heritability looks low at first glance: about 0.026 for diarrhea resistance and 0.022 for respiratory resistance. Translate that: only 2–3% of the variation in those health outcomes is explained by genetics in the current models. Zoetis’s earlier proprietary Calf Wellness index (CW$) reported slightly higher figures due to differences in traits, models, and data sources.
Cole’s message in presentations and industry pieces has been consistent: don’t let the low heritability numbers fool you. Once you’re doing the basics right on colostrum, hygiene, and housing, adding genetic resistance can still move many calves out of the treatment pen and into the parlor.
The Genetic Spread, in Real Daughters
Lactanet clearly summarized the genetic spread in an August 2025 calf health article and a companion presentation. Among officially proven Holstein sires:
For respiratory disease, daughters of the top 5% sires by calf health RBV stayed healthy (no recorded RESP case) about 71% of the time; daughters of the bottom 5% sires were healthy only about 54% of the time.
For diarrhea, daughters in the top 5% were healthy about 69% of the time, compared with roughly 53% for those in the bottom 5%.
That’s not “nice‑to‑have.” That’s a lot of treatments, mortalities, and delayed heifers tied directly to the bulls you pick.
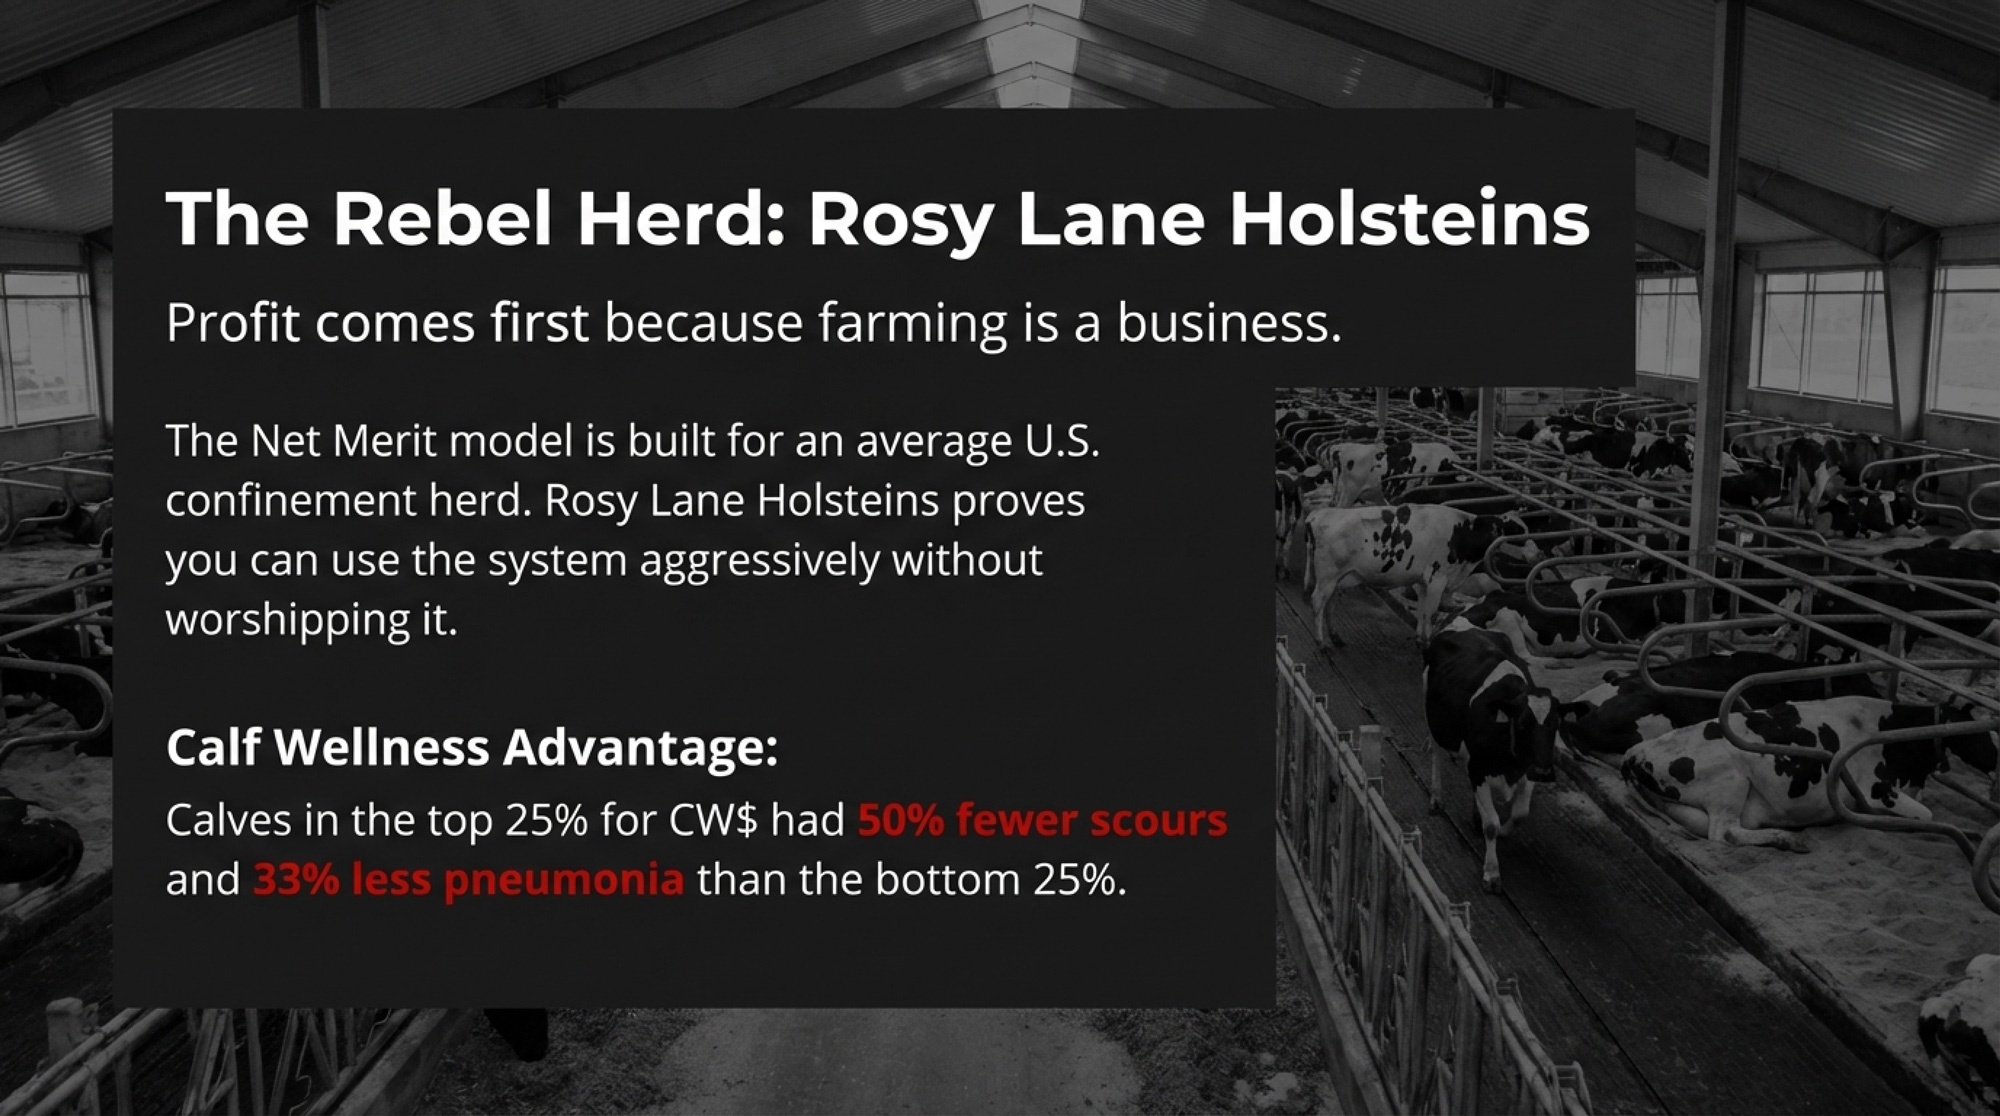
Rosy Lane Holsteins saw similar real‑world spreads years earlier when it leaned heavily into Zoetis’s Calf Wellness index. A WW Sires case study reported that calves in the top 25% for CW$ at Rosy Lane logged about 50% fewer scours cases and roughly 32% fewer pneumonia cases than calves in the bottom 25% over a 12‑month window — tracked with ultrasound to catch subclinical pneumonia that never showed as a full‑blown “trainwreck.”
An often‑cited study summarized in Farmtario’s 2025 calf‑health coverage showed that heifers with a recorded respiratory disease event produced 121 kg less milk in first lactation. Stack that across a whole age group, and you feel it in the tank.
Genetics won’t fix sloppy colostrum or filthy hutches. But if you’re already holding preweaned mortality in the 3–4% range, calf health genetics is one of the few levers left to push toward that 1–2% elite zone.
What Data Actually Feeds Your Genomic Proof?
Data Source
What It Captures
Who Provides It
Key Blind Spot
DHI/DHIA test
Monthly production, components, SCC
Techs or automated meters
Only ~40% of U.S. herds on some form of official test
Classification
Linear type traits and composites
Breed‑association classifiers
In Canada, only first‑lactation scores feed official type proofs
Genomic labs
SNP genotypes (e.g., 50K → ~54,001 usable markers)
DNA from hair, blood, ear notch
Minor breeds have thin reference populations
Producer health records
Mastitis, metabolic disease, calf health events
Producers via herd software
Only a minority of farms consistently log calf health events
Those gaps matter. The DIAR and RESP national datasets are over 97% Holstein and Jersey — roughly 80% Holstein, 17% Jersey — which makes the models strong for those breeds and less robust for everyone else. If you’re milking registered Holsteins on test and logging health, the system sees you. If you’re off test, crossbred, or light on health records, you’re asking the index to guess.
Does the System See Your Herd — or Just the Average?
Genomic selection was intended to mitigate inbreeding. The sales pitch: if you can see exactly which genes each calf got, you can manage inbreeding smarter. In reality, progress has been messier.
Lozada‑Soto and co‑authors (2024, Journal of Dairy Science) showed that in Nordic Holstein and Jersey populations, yearly inbreeding rates increased after genomic selection took off, and the effective population size for Nordic Holsteins dropped from 54.3 to 42.8. Doekes et al. (2019, Journal of Dairy Science) found that recent inbreeding — long runs of homozygosity in the genome — hurts longevity more than older, “diluted” inbreeding.
You see that on‑farm, as good‑looking heifers that fall apart too soon for reasons you can’t fully blame on your nutritionist or hoof trimmer.
So you’re stuck with a double‑edged sword:
Genomics doubles genetic gain in traits the index rewards.
Key traits like heat tolerance, methane emissions, and temperament still don’t have official U.S. evaluations. The index can’t weigh what it doesn’t measure. If those matter on your farm, you’re into custom selection, not blind NM$ chasing.
On the Canadian side, Lactanet’s August 2025 inbreeding update pegged average inbreeding for Holstein heifers born in 2024 at 9.99% — a full percentage point higher than 2014. That’s your benchmark when you run your own mating reports.
Rosy Lane Holsteins: Using the System, Not Worshipping It
The Net Merit model is built for an “average” U.S. confinement herd. Rosy Lane Holsteins, just outside Watertown, Wisconsin, is one of the operations proving you can use that system aggressively without letting it run the show.
Lloyd Holterman and the Rosy Lane team have been clear for years: profit comes first because farming is a business.In a 2014 Bullvine profile and later Zoetis/WW Sires features, Holterman laid out a strategy that still makes some breeders twitch:
Sort bulls by NM$ first, not TPI or show‑ring appeal.
Avoid bulls that crank up Stature; favor moderate‑sized, wide, durable cows.
Stop classifying if the scores aren’t helping profit decisions.
When Rosy Lane compared its cows, Holterman told The Bullvine they found that shorter, wider, better‑conditioned cows “far outlived their higher‑scoring herd‑mates while having fewer foot problems and better fertility.” We later quoted his joking shorthand for what can happen when people chase pure type without thinking about fertility: cows that are “tall, pretty and infertile.” (Read more: ROSY-LANE HOLSTEINS – “Don’t Follow the Herd!”)
That line isn’t a scientific verdict on TPI. It’s one breeder’s sharp reminder that an index built for show cows and an index built for profit aren’t the same tool.
Rosy Lane also leaned early into Calf Wellness genetics. The Zoetis/WW Sires case study from their herd showed calves in the top quartile for CW$ had around half the scours and one third fewer pneumonia cases than bottom‑quartile calves — not because management changed, but because the sire list did. That’s exactly the kind of “make the data pay” story the Beltsville team hopes other herds can copy.
Holterman’s bottom line hasn’t changed: use the tools, but never forget your own milk cheque.
The Bullvine Verdict: Who Gets to Decide What a “Good” Holstein Looks Like?
Here’s the uncomfortable truth: if you don’t know how NM$, FSAV, and calf health evaluations work, someone else is making your breeding strategy — even if you’re the one signing the semen bill.
Beltsville’s job is to define an average profitable Holstein in 2025: moderate size, high components, better feed efficiency, fewer dead calves, and fewer young cows leaving early. That’s not a bad target.
But your farm isn’t average. Your milk contract might reward protein harder than fat. Your freestalls and robot boxes might punish tall, wide cows. Your land base might mean feed is your bottleneck, not cow numbers. Or you might be okay trading some NM$ for show‑ring presence or niche milk premiums.
Net Merit is a strong starting point. It’s just blunt. Rosy Lane is a live example of how a herd can lean hard into Net Merit, calf wellness, and FSAV — and still make their own calls about size, type, and classification.
The real question isn’t “Is Net Merit right?” It’s “Does Net Merit, as currently weighted, line up with the way money actually moves through your operation?”
What This Means for Your Operation
Always read NM$ with reliability beside it. An NM$ +1,000 bull at 75% reliability is a strong estimate; at 95% reliability, it’s a proven moneymaker relative to the base. They’re not interchangeable, and low‑reliability bulls can move 150+ NM$ in a run.
Match your index to your contract. If your cheque pays on components, CM$ or Pro$ might match better than NM$ if you’re fluid and volume-heavy. NM$ is still the best fit. The index choice isn’t a religion — it’s a business decision that should be revisited at least annually as prices shift.
Find FSAV on your sire summary — or ask why it’s missing. With 17.8% combined weight in NM$, FSAV is now a core trait, not a side note. A bull that looks good on milk and components but is weak on FSAV may not pencil once you factor in feed and maintenance.
Use genomics to diversify, not concentrate. Spreading risk across at least 5 genomic sires is cheap insurance. One young bull can re‑rank hard; a group of five rarely does. If your top 3 sires account for more than ~40% of your herd’s expected future inbreeding, that’s a practical red flag to add diversity.
Treat Net Merit as your first filter, not your only one. Rosy Lane uses NM$ as the gate, then rejects bulls that push Stature too high. You might do the same for calving ease, A2A2, polled, robot suitability, or grazing traits, depending on your system.
Put calf health on the table if you’re already nailing management. Once your basic colostrum, housing, and hygiene are solid, DIAR/RESP and tools like CW$ can start doing noticeable work in the background.
Key Takeaways
If your expected inbreeding is higher than 9.99%, it’s time to adjust your mating plan. That 9.99% is Lactanet’s average for Canadian Holstein heifers born in 2024. Run your own mating reports. If your next calf crop is well above that, add two or three outcross or lower‑inbreeding bulls before the next breeding cycle.
If a bull drops more than ~150 NM$ between proof runs, he should lose some tank share. That kind of swing is normal for low‑reliability genomic sires, but it’s your cue to slow his usage and bring in a replacement rather than riding him for another year, hoping he comes back.
If your top 3 bulls contribute more than ~40% of your herd’s expected future inbreeding, you’ve got a concentration problem. That number isn’t a magic line — it’s a simple threshold that tells you when you’ve leaned too hard on a couple of “hot” sires.
If FSAV isn’t in your sire selection process yet, you’re ignoring 17.8% of the index you think you’re using.That’s a lot of money and feed to leave on the table when you’re already fighting ration costs.
The Bottom Line
In the next month, carve out half an hour with your genetic advisor or semen rep. Pull up your proofs, look at BWC, FSAV, reliability, and expected inbreeding side by side — and ask one question: “Does the way I’m using these tools actually match how my farm makes money?”
Complete references and supporting documentation are available upon request by contacting the editorial team at editor@thebullvine.com.
Learn More
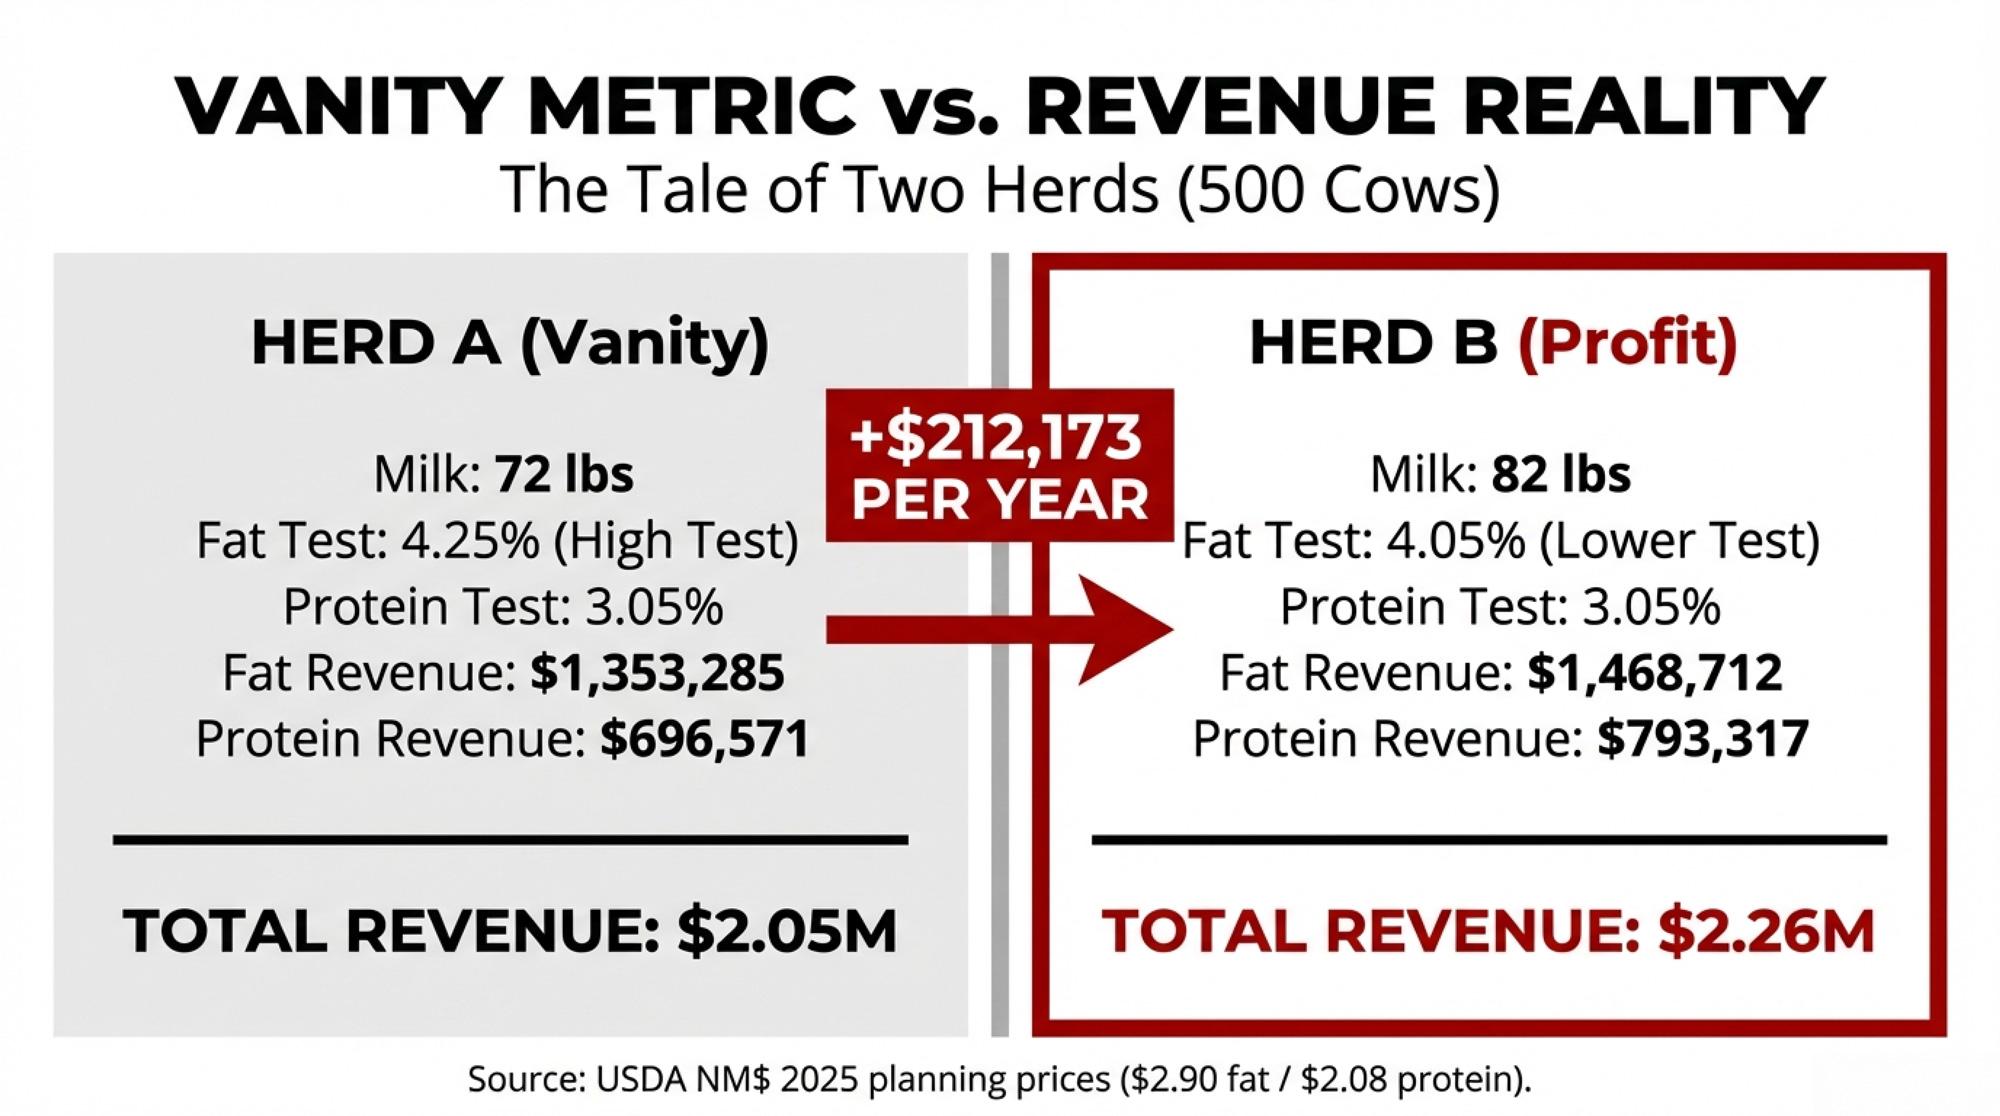
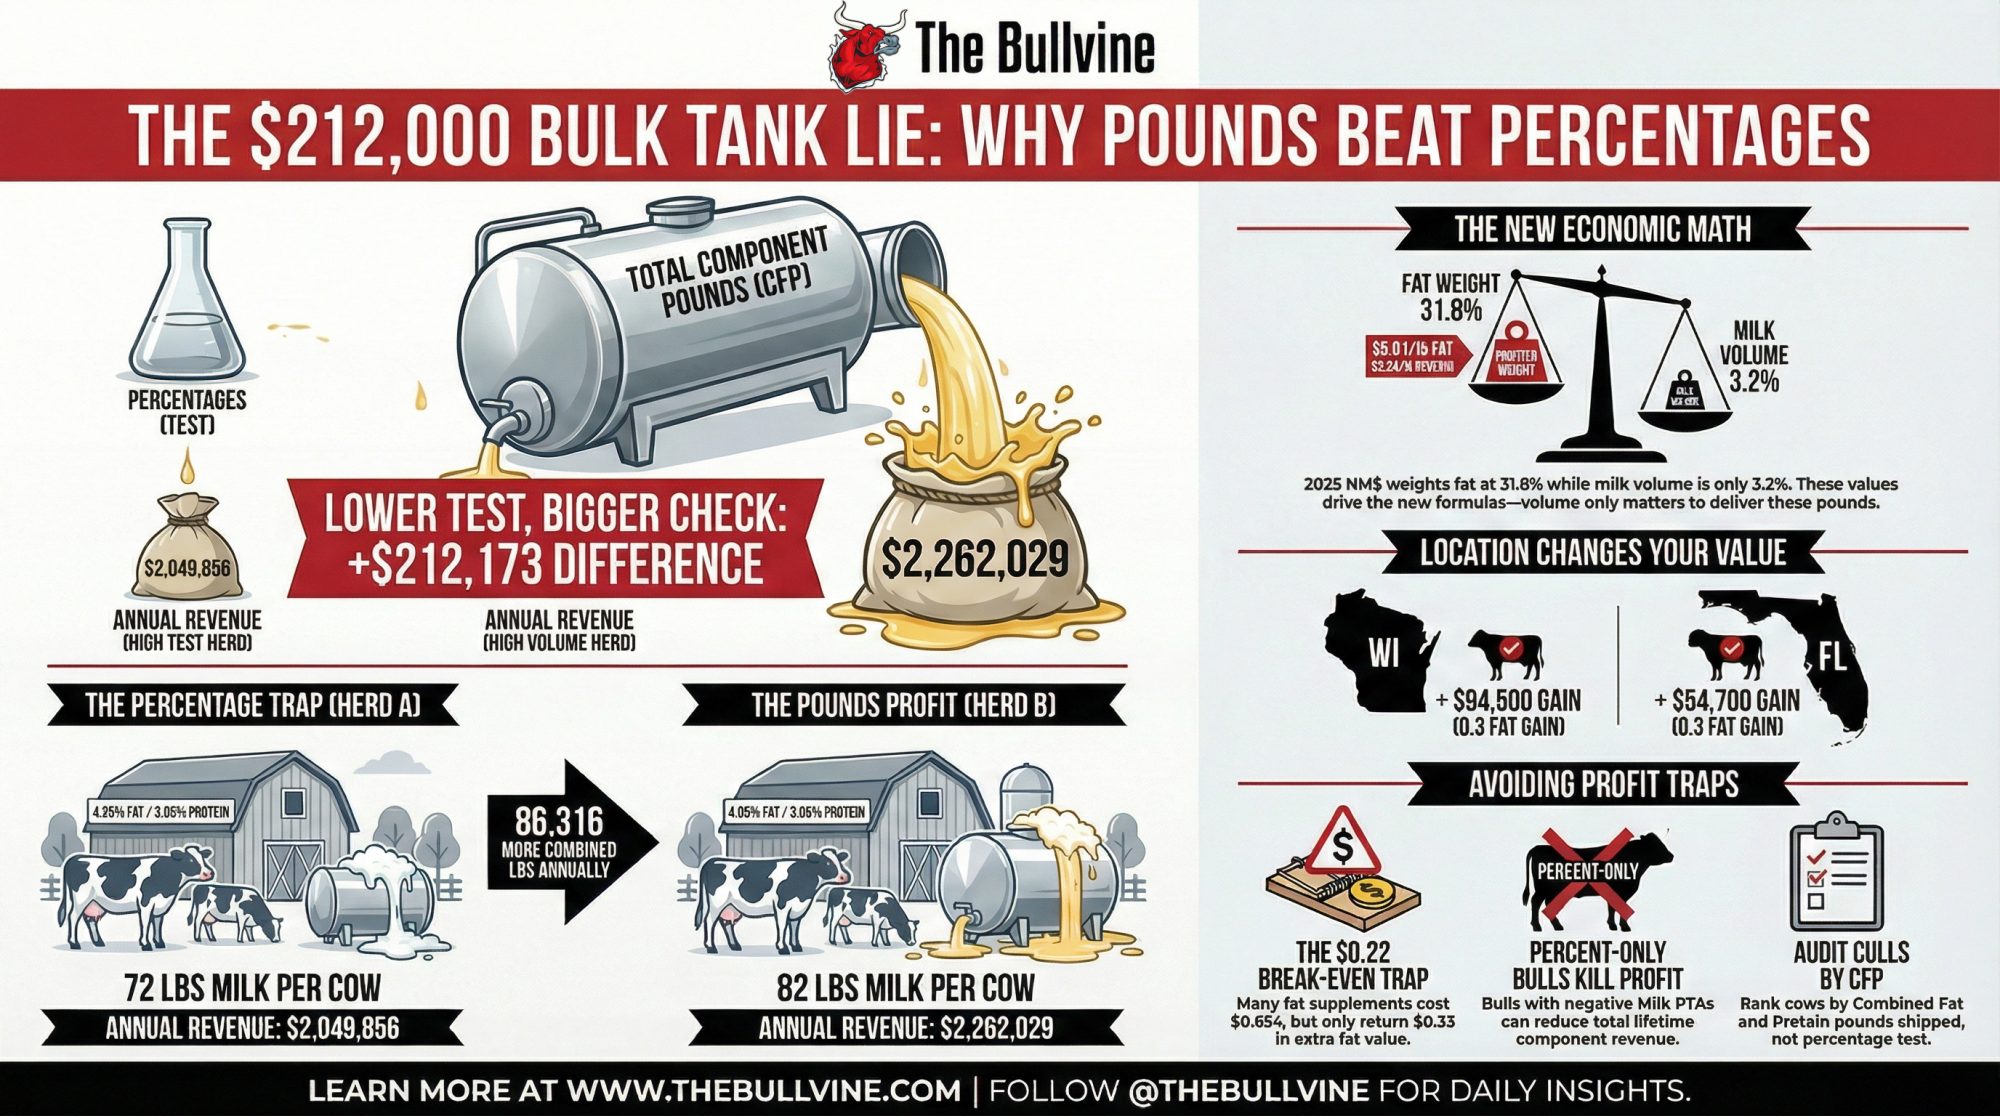
The $212,000 Bulk Tank Lie Hitting Upper Midwest Dairies – Exposes the high-test trap that’s quietly draining your bank account. You’ll gain a concrete 4-point playbook to stop chasing percentages and start shipping the component pounds that actually drive your 2026 milk check.
Every week, thousands of producers, breeders, and industry insiders open Bullvine Weekly for genetics insights, market shifts, and profit strategies they won’t find anywhere else. One email. Five minutes. Smarter decisions all week.
Every time you pull up a sire list, there’s one question you almost never ask: what am I not measuring that’s already costing me money?
February 2003. Snow coming down sideways in a drafty barn at the Wisconsin Holstein Convention Sweetheart Sale. Experienced breeders — guys who’d driven hours through a Wisconsin winter to be there — were heading for the exits. The auctioneer’s voice was getting that tired, frustrated edge as bidding stalled out on a five-year-old Holstein whose rump “wasn’t entirely balanced.”
Matt Steiner called in from Pine-Tree Dairy in Ohio. He’d never laid eyes on the cow in person. Her second lactation ran 31,880 pounds at 4.1% fat and 3.2% protein — respectable, not revolutionary. He bid $8,100 for what everybody else in the room saw as just another decent cow past her prime.
Wesswood-HC Rudy Missy-ET EX-92 — the “unbalanced” Wisconsin sale cow whose $8,100 phone bid quietly rewrote Holstein genetics for the next 20 years.
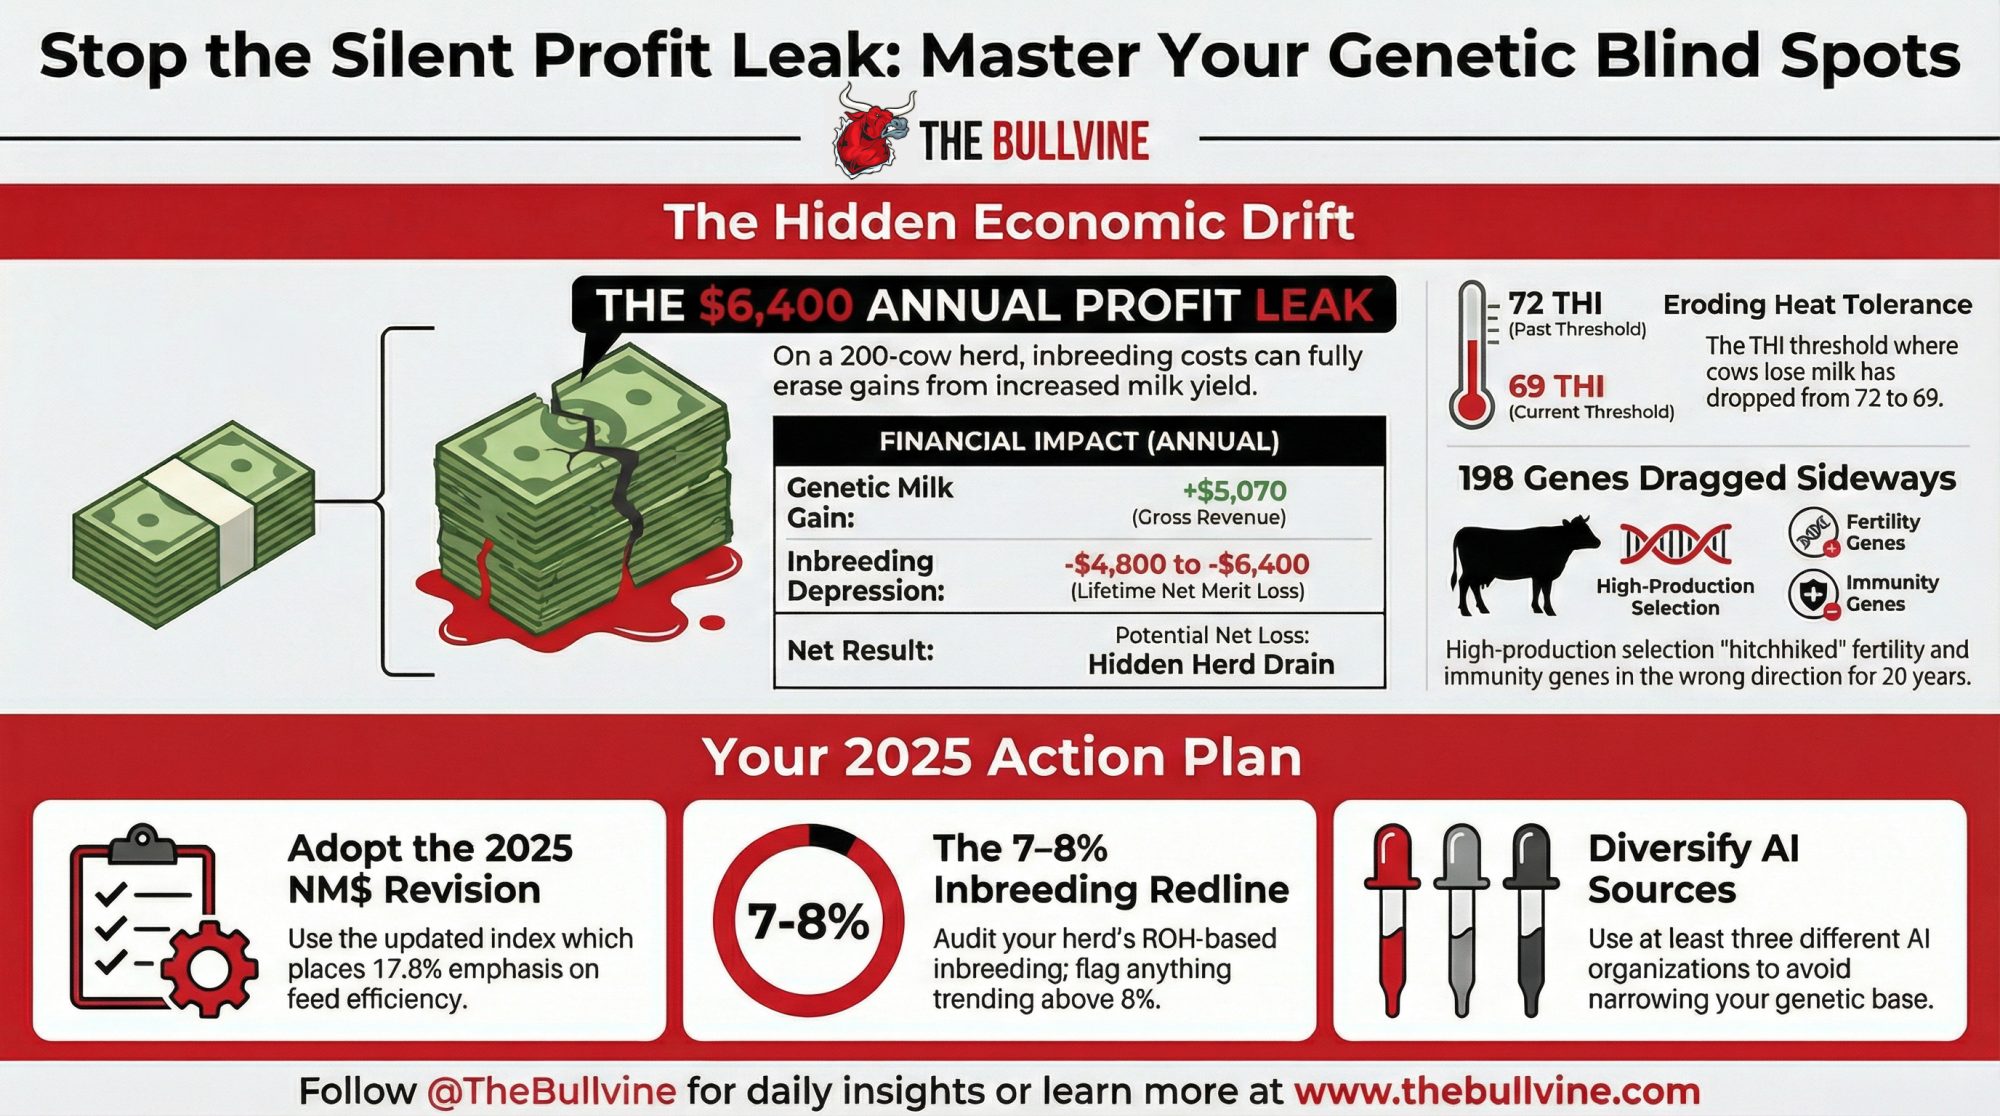
But here’s the part of that story nobody tells. The same breeding system that produced Missy — the same genomic toolkit that doubled annual genetic gain to 109 kg/year for milk in registered Holsteins (García-Ruiz et al., 2016, PNAS) — was simultaneously dragging 198 fertility genes and 67 immunity genes in the wrong direction. For 20 years. And the industry didn’t catch it.
The question that should bother you: what’s getting dragged sideways in your herd right now?
How Fast the Engine Actually Runs
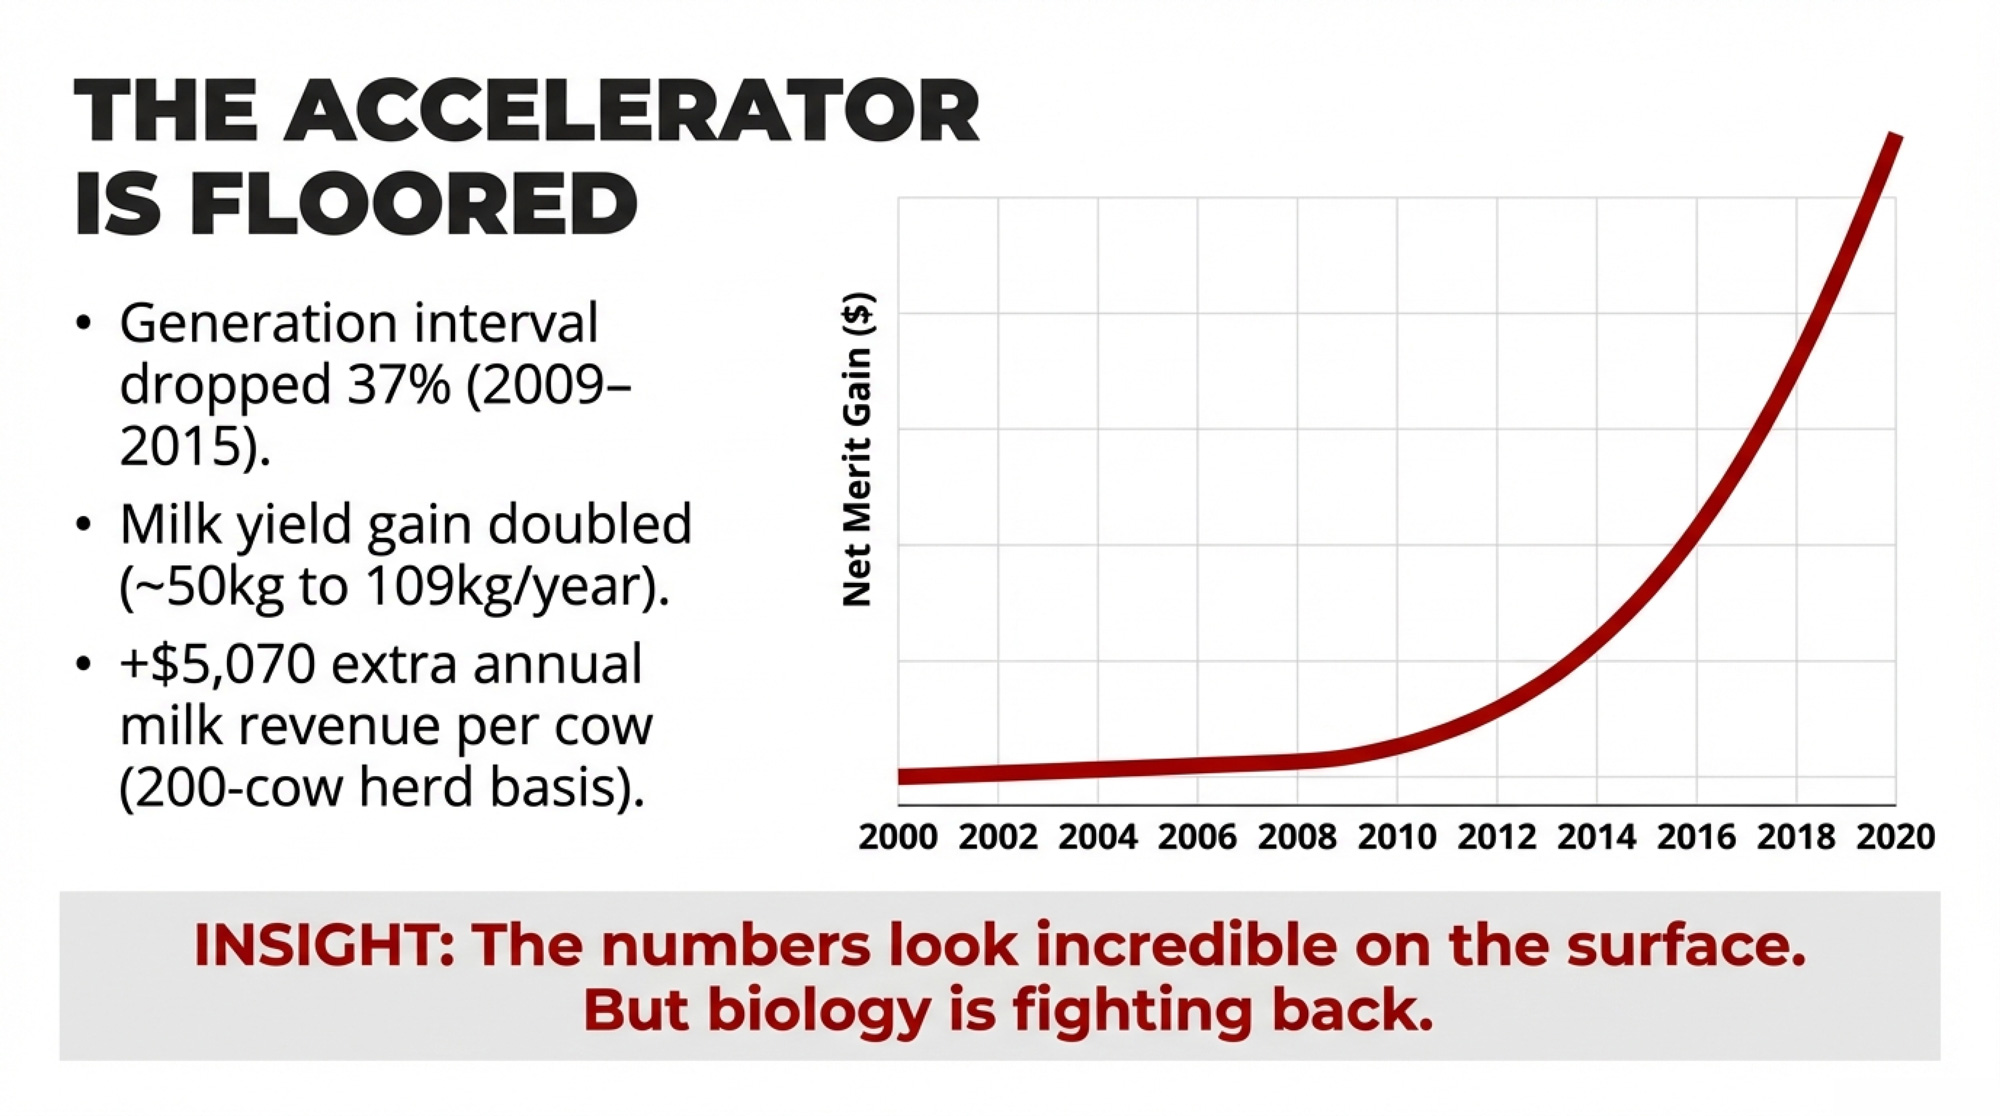
Before 2009, you waited five to seven years for a bull’s daughters to start milking before you knew if he was any good. Genomic selection rewired that math completely. Paul VanRaden and colleagues at USDA helped architect a system that estimates merit at birth, and the speed gain was dramatic. Across all four selection pathways that drive Holstein genetics (sire-of-bulls, sire-of-cows, dam-of-bulls, dam-of-cows), the combined generation interval dropped from 21.4 years in 2009 to 13.5 years by 2015 — a 37% reduction in just six years (García-Ruiz et al., 2016, PNAS). The sire-of-bulls pathway collapsed the fastest, from about 7 years to under 2.5.
Financially, the results are hard to argue with. Annual Net Merit gains climbed from $13 during 2000–2004 to more than $85 after 2010 (nominal dollars). Fat yield accelerated 173%. Protein yield, 156%. And the daughter pregnancy rate — which had been flat or declining for decades — finally reversed direction, rising to +0.26% per year.
Here’s a way to feel that in your bulk tank. On a 200-cow herd averaging 85 lbs/day, the post-genomic milk yield acceleration alone (from ~50 kg/year to 109 kg/year for registered Holsteins) translates to roughly an extra 130 lbs of milk per cow per year in genetic potential over what the old system would have delivered. At a $19.50/cwt mailbox price, that’s about $5,070 in additional gross milk revenue across your herd annually — and it compounds every generation. Adjust that number for your regional mailbox price, but the scale holds. The record-breaking component shifts reshaping dairy’s economics are a direct product of this acceleration.
But the engine has a blind spot. And it’s biological, not mathematical.
What Happened When Nobody Was Measuring Fertility
The University of Minnesota’s research herd at the Southern Research and Outreach Center in Waseca did something nobody else bothered to do: they maintained an unselected Holstein control line alongside the commercially selected national population from 1964 onward. Same management. Same feed. Different genetics.
By 2004, the selected population had increased milk yield by 79%, from 6,309 kg to 11,324 kg. It had also lost roughly 30 additional days for successful conception compared to the control cows living right next door (Ma, Cole, Da & VanRaden, 2019, BMC Genomics 20:128).
That fertility decline wasn’t nutrition. Wasn’t repro protocols. Purely genetic. A breeding consequence nobody planned for.
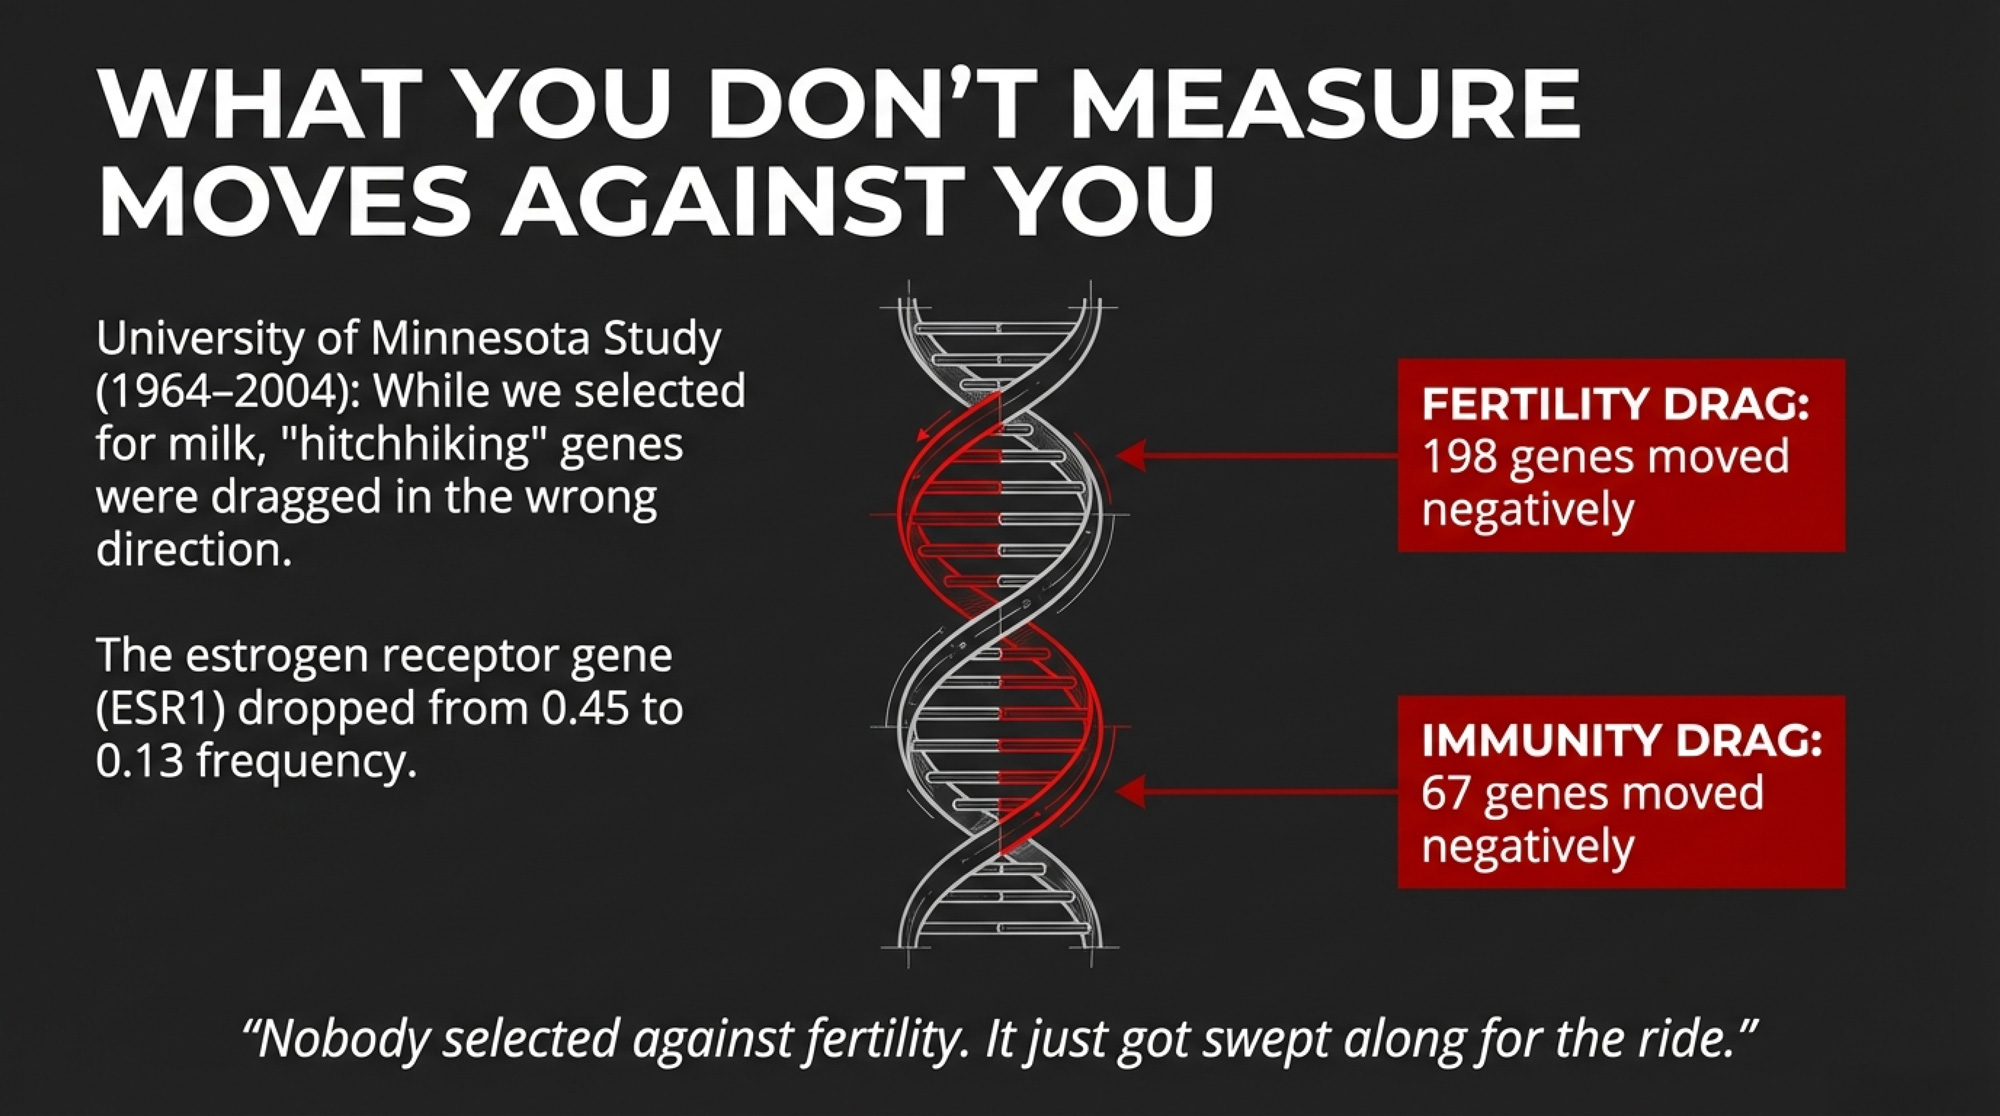
The genome-level analysis revealed the mechanism. Within 234 chromosome regions shaped by four decades of milk selection, researchers found 198 genes involved in reproduction and 67 genes involved in immune function whose allele frequencies had shifted as collateral damage. The estrogen receptor gene ESR1 decreased from 0.45 to 0.13. The MHC region on chromosome 23 — the heart of immune diversity — showed significantly decreased heterozygosity.
Category
Count
Fertility genes negatively affected
198
Immunity genes negatively affected
67
Total chromosome regions under selection
234
Nobody selected against fertility or immunity. Those genes just happened to sit near milk-boosting alleles on the same chromosomes, and they got swept along for the ride. Geneticists call it hitchhiking. Producers who lived through the collapse in conception rates in the 1990s just called it expensive.
(This hitchhiking analysis comes from a single study using the unique Minnesota control line — the only unselected comparison herd of its kind. The broader fertility decline is independently confirmed across both the U.S. and Israeli dairy populations.)
Is the Same Thing Happening to Heat Tolerance Right Now?
The fertility crash is old news — the industry course-corrected, and genomic selection actually reversed the decline. The real question: where is the same pattern building today?
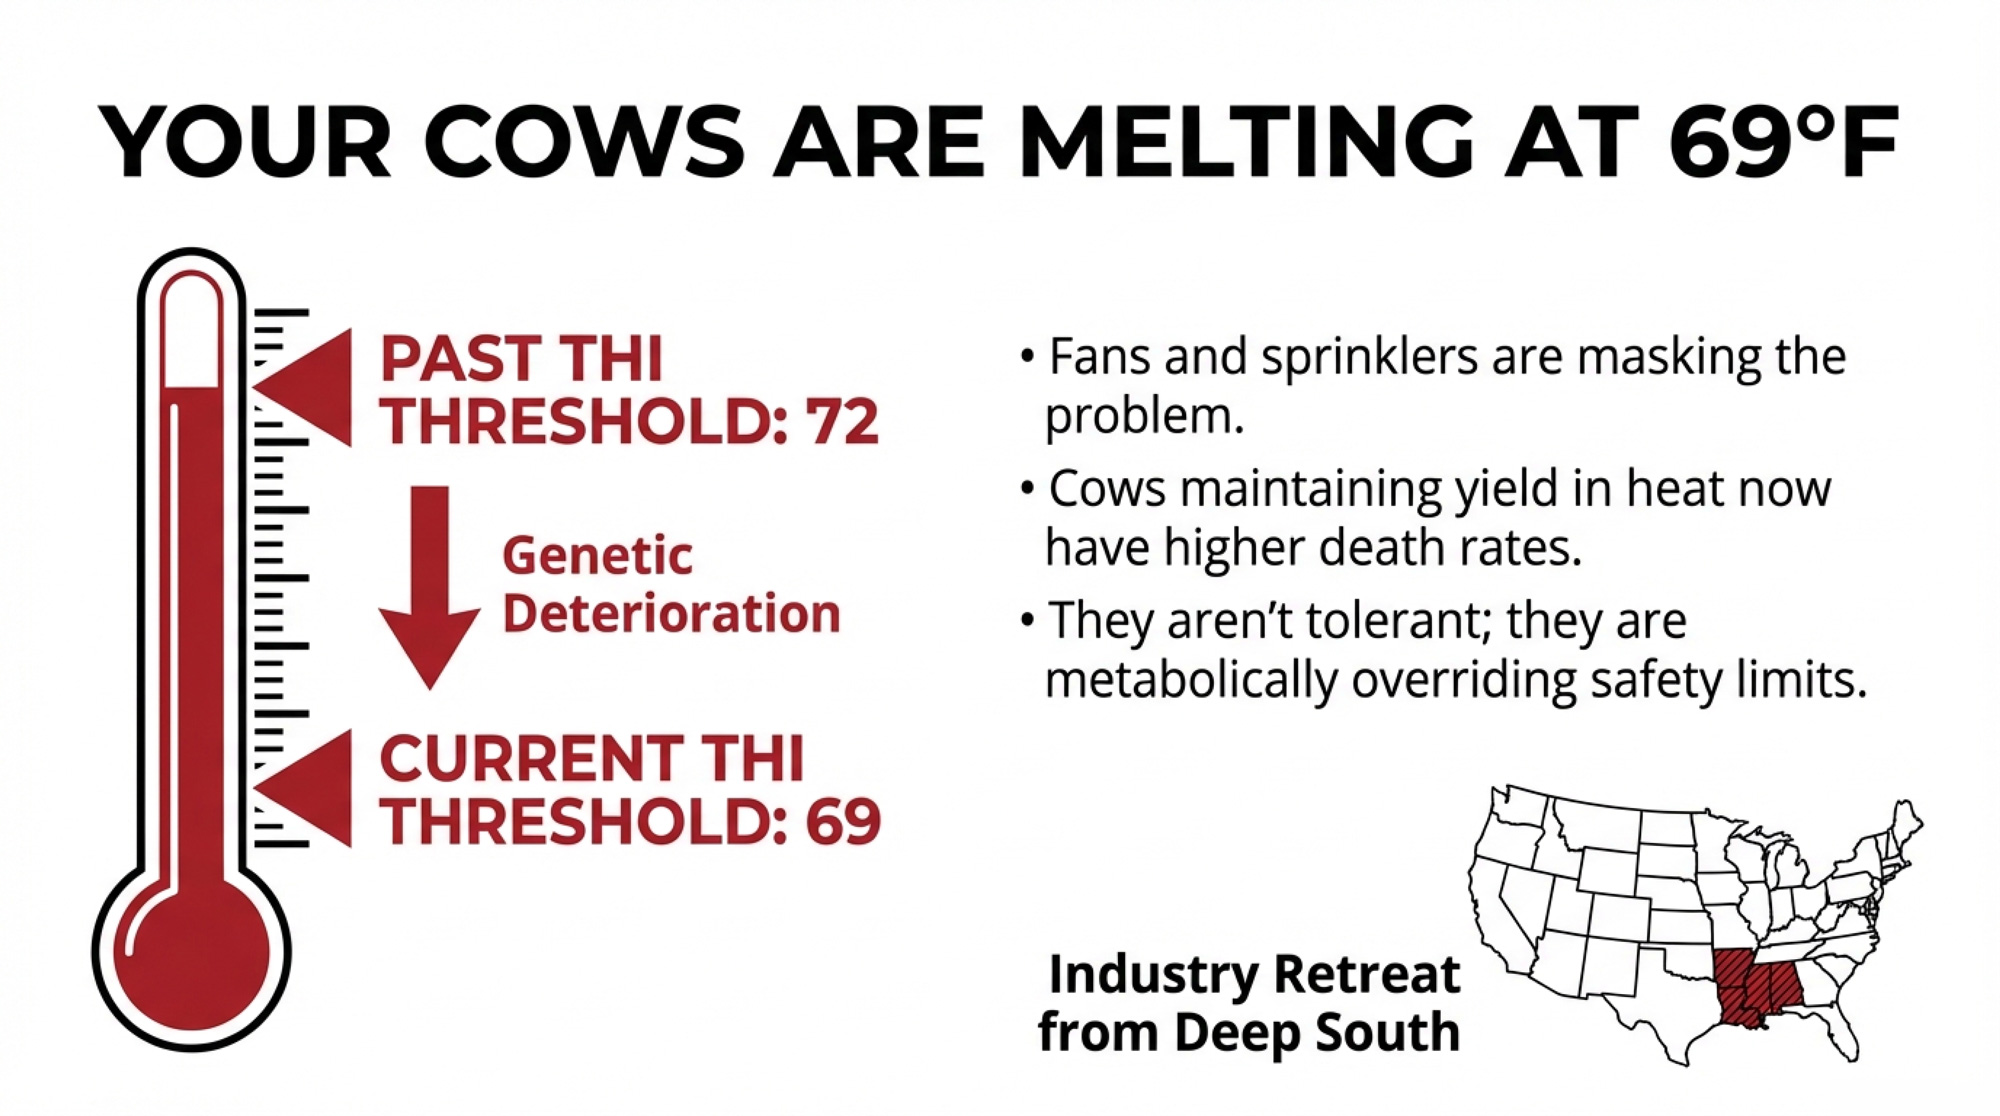
Heat tolerance is eroding, and almost nobody is selecting against it. Research led by Ignacy Misztal at the University of Georgia and Luiz Brito at Purdue found that the temperature-humidity index (THI) threshold where Holsteins start losing production has dropped from 72 to 69 over the past two decades (Misztal, Brito & Lourenco, 2024, JDS Communications 6(3):464–468). Your cows start suffering heat stress at lower temperatures than cows bred a generation ago.
And the grim part: cows that maintain production during heat stress peaks show an increased likelihood of death. They’re not tolerating the heat. They’re metabolically overriding their body’s protective shutdown. The authors note that better fans, sprinklers, and tunnel ventilation may actually be masking an even larger genetic deterioration underneath.
With the exception of Australia, dairy cows are not directly selected for improved heat tolerance anywhere in the world. In Alabama, Mississippi, and Louisiana, dairy has already become economically unviable — these states don’t even appear in the 24 major dairy states NASS tracks monthly (Misztal et al., 2024). A quiet testament to how completely the industry has retreated from the Deep South.
If your herd faces more than 60 days per year above THI 68, this isn’t an abstract research finding. It’s your next fertility crash in slow motion.
The Inbreeding Bill Coming Due
Genetic diversity is narrowing faster under genomics, not slower. A study of 74,485 Italian Holstein cows found the annual inbreeding rate based on runs of homozygosity (ROH) was +0.32% per year before genomic selection. After genomic selection took hold, it jumped to +0.70% per year (Ablondi et al., 2022, Frontiers in Veterinary Science8:773985). That’s above the 1% per generation threshold FAO considers critical for long-term sustainability.
Category
Value
Pre-Genomic Annual Rate (Italy)
0.32%
Post-Genomic Annual Rate (Italy)
0.70%
U.S. Cumulative Increase 2010–2020
168%
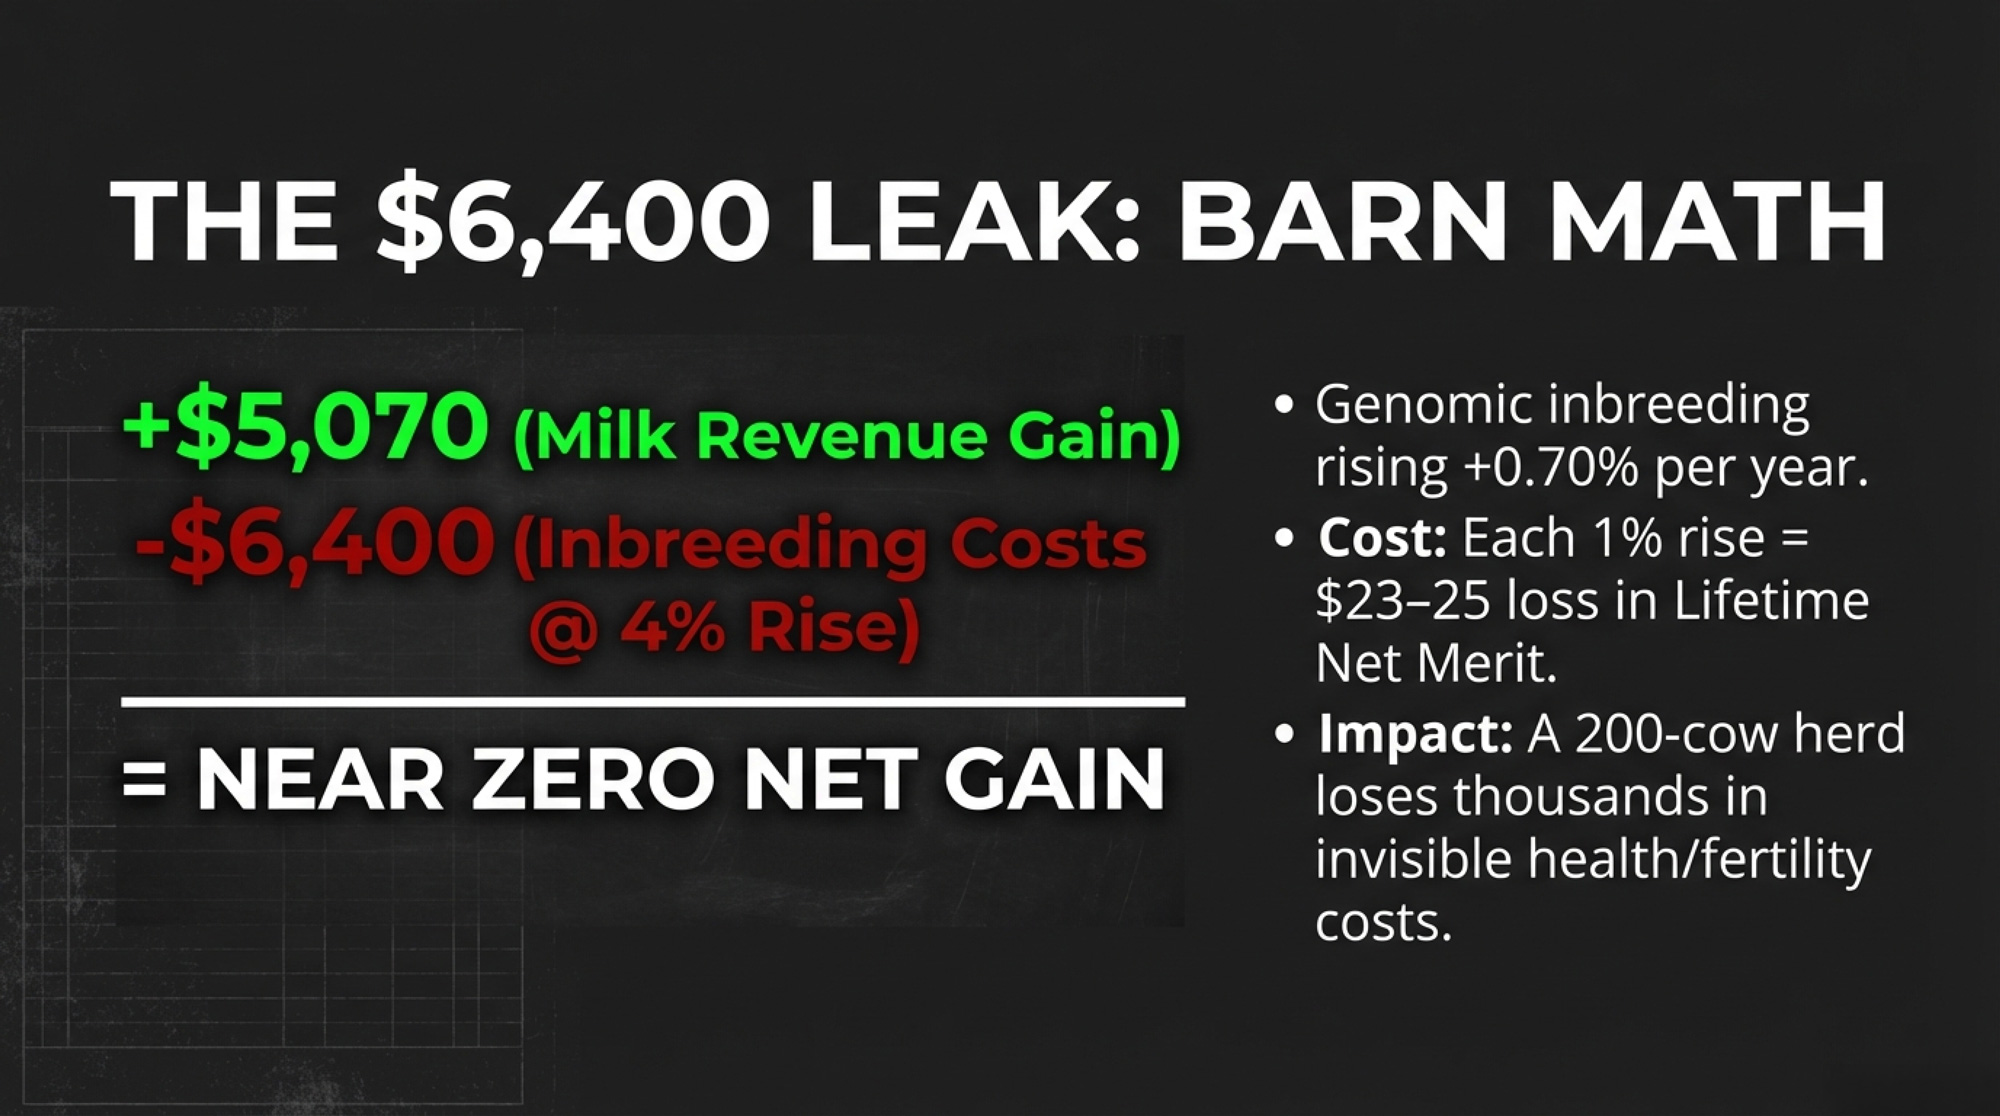
It isn’t just an Italian problem. U.S. Holstein inbreeding climbed from about 5.7% in 2010 to 15.2% by 2020 — a 168% jump — with CDCB analysis putting the cumulative cost to the national herd at an estimated $6.7 billion (The Bullvine, 2025 year-end review).
Metric
Annual Impact (200-cow herd)
What’s Driving It
Extra Milk Revenue (Genomic Gain)
+$5,070
109 kg/year genetic gain vs. 50 kg/year pre-genomic (registered Holsteins, $19.50/cwt)
Inbreeding Drag (4% increase)
−$4,800 to −$6,400
$23–25/cow lifetime NM$ loss per 1% inbreeding, annualized over 3–4 year turnover
Net Realized Gain (Conservative)
+$270 to +$1,070
On fast-turnover herds, inbreeding wipes out nearly all the genomic advantage
Net on Fast-Turnover Herds
−$1,330 (loss)
Herds replacing >35% annually can lose more than they gain
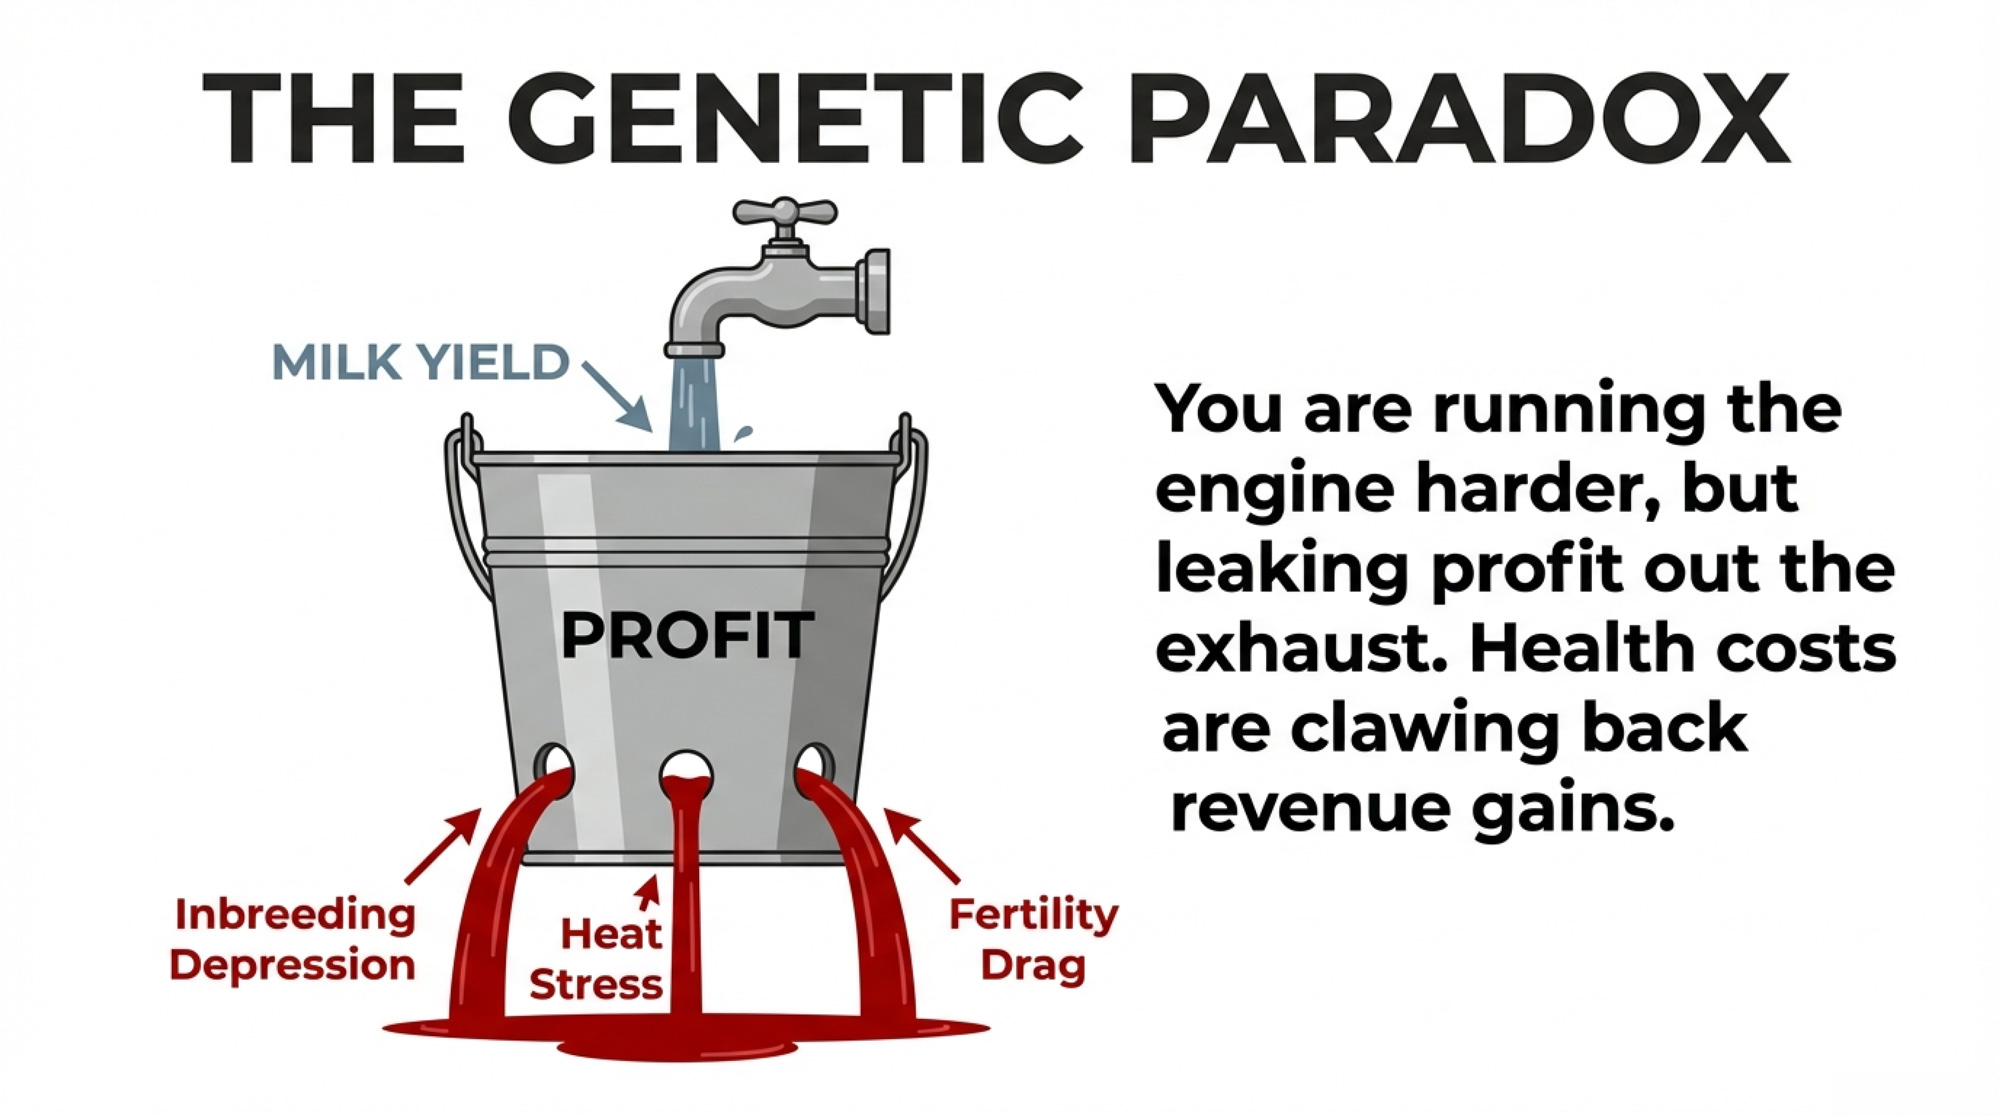
Here’s where the barn math gets uncomfortable. Each 1% increase in inbreeding costs roughly $23–25 off a cow’s lifetime Net Merit (USDA-ARS, 2025 NM$ revision). Go back to that 200-cow herd. If your average genomic inbreeding crept up 4 percentage points over the past decade — and given that the national average jumped 9.5 points in ten years, 4% is conservative — that’s about $96 per cow in lifetime profit quietly erased. Spread across a herd that turns over every three to four years, you’re looking at roughly $4,800 to $6,400 per year leaking out through health costs, fertility failures, and shortened productive life, depending on your actual turnover rate. Remember that $5,070 in extra annual milk revenue from faster genetic gain? At most turnover rates, inbreeding depression is clawing back nearly all of it — and on herds that turn over faster, the loss actually exceeds the gain. You’re running the genetic engine harder, and a big chunk of what it produces is leaking out the other side.
(Note: the $5,070 figure is gross milk revenue at $19.50/cwt; the $4,800–$6,400 range is annualized lifetime Net Merit loss, which captures health, fertility, and longevity effects beyond milk alone. They’re not identical units, but the scale of the offset is real — and the barn-math range depends on how quickly your herd turns over.)
Options and Trade-Offs for Your Next Breeding Decisions
The fertility crash lasted 20-plus years because nobody measured the trait being eroded. Heat tolerance, inbreeding, and resilience are in a similar position today. Here’s what you can actually do about it — with the honest trade-offs attached.
Action
When to Act
What You’re Hedging Against
Trade-Off
ROH Inbreeding Audit
If genomic inbreeding >7–8%
$23–25 lifetime NM$ loss per 1% increase; $4,800–$6,400/year drag on 200-cow herd
Restricting matings may slow genetic progress 5–15%
Weight Productive Life + Livability
If you face 60+ days above THI 68
Heat tolerance declining; THI threshold dropped from 72 to 69 over 20 years
May sacrifice 3–5% genetic gain on other traits
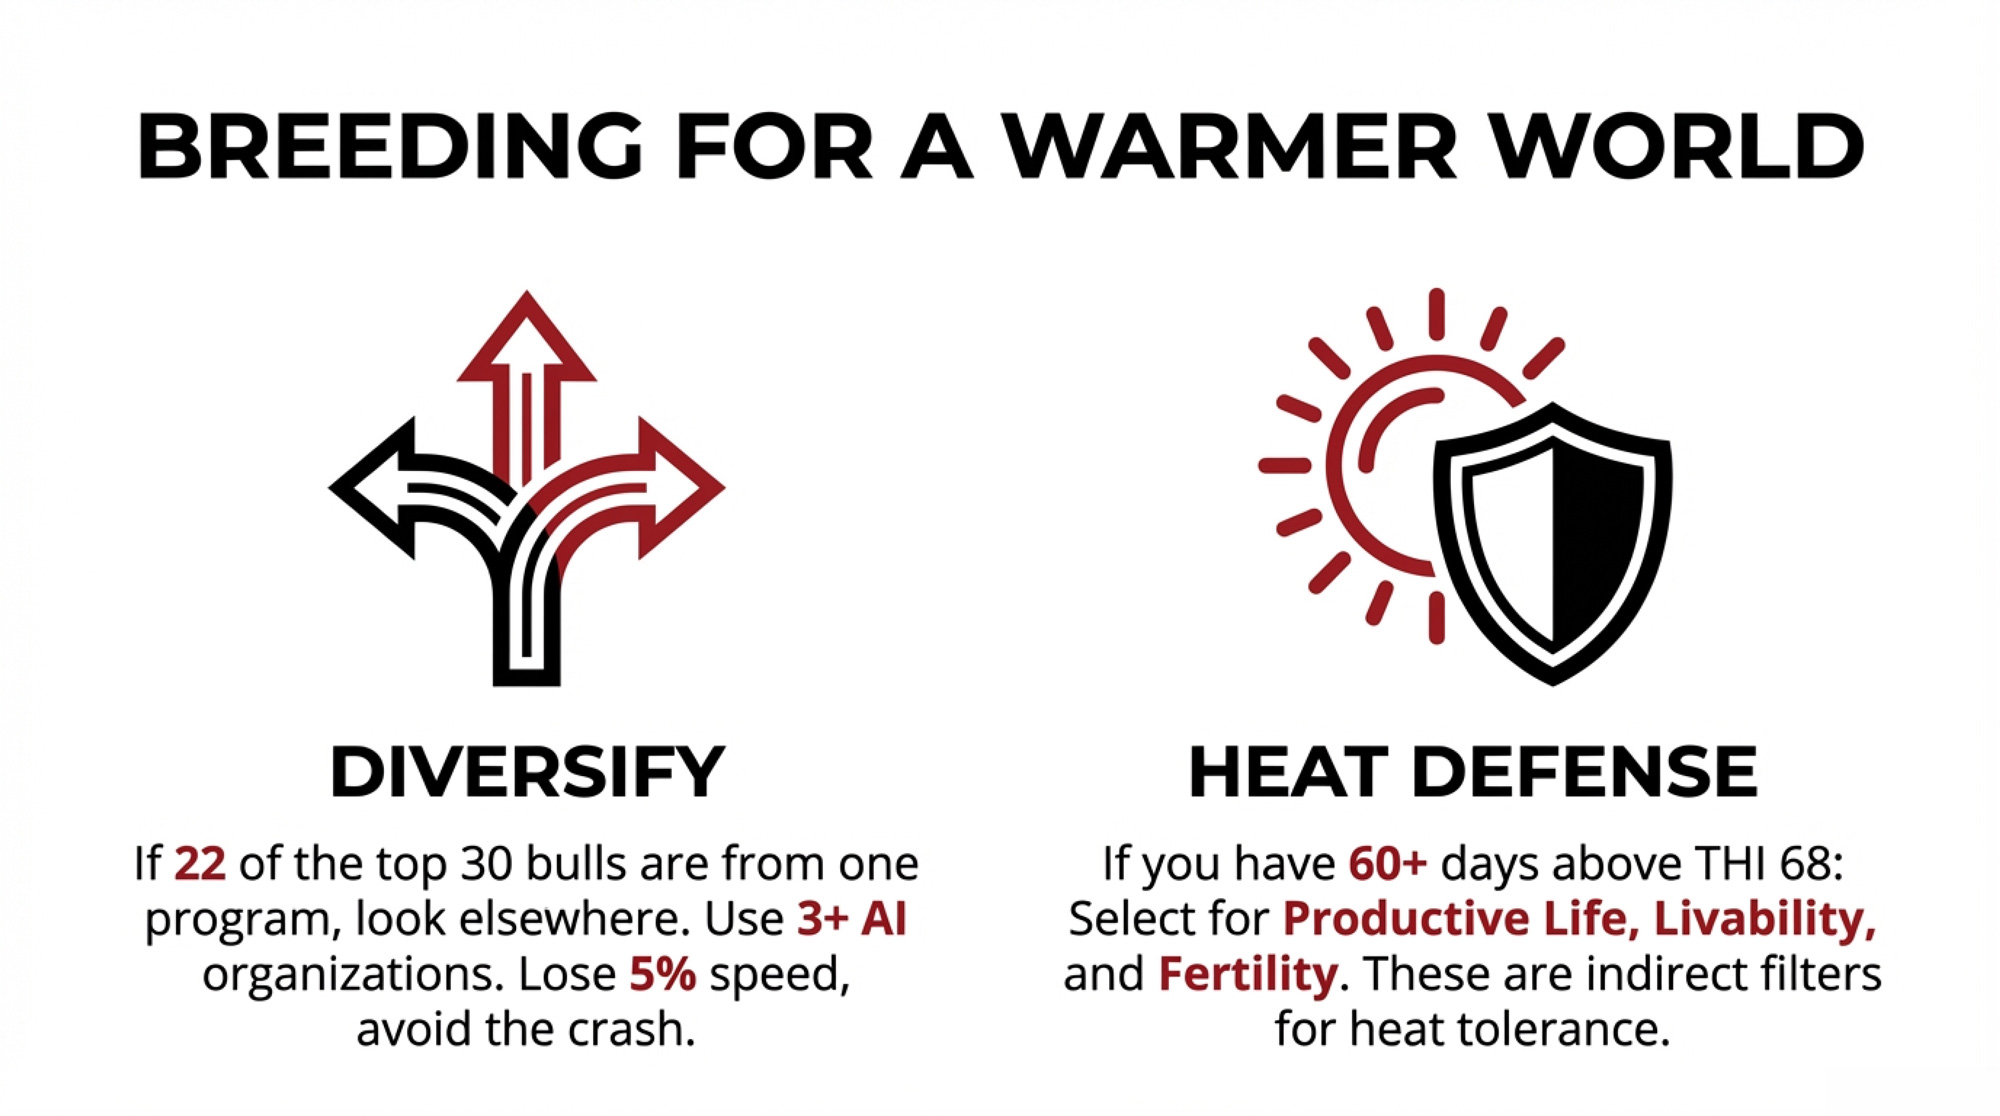
Diversify Across 3+ AI Programs
If top 5 bulls all trace to one program
Genomic inbreeding rising 0.7%/year; 22 of top 30 NM$ bulls from one program (Dec 2025)
Aggressively avoiding related matings costs ~5–15% progress
Contribute AMS/Activity Monitor Data
If you’re running precision dairy tech
Next hitchhiking problem: feeding the reference population so crashes get caught in 5 years, not 20
Consistent data entry discipline required
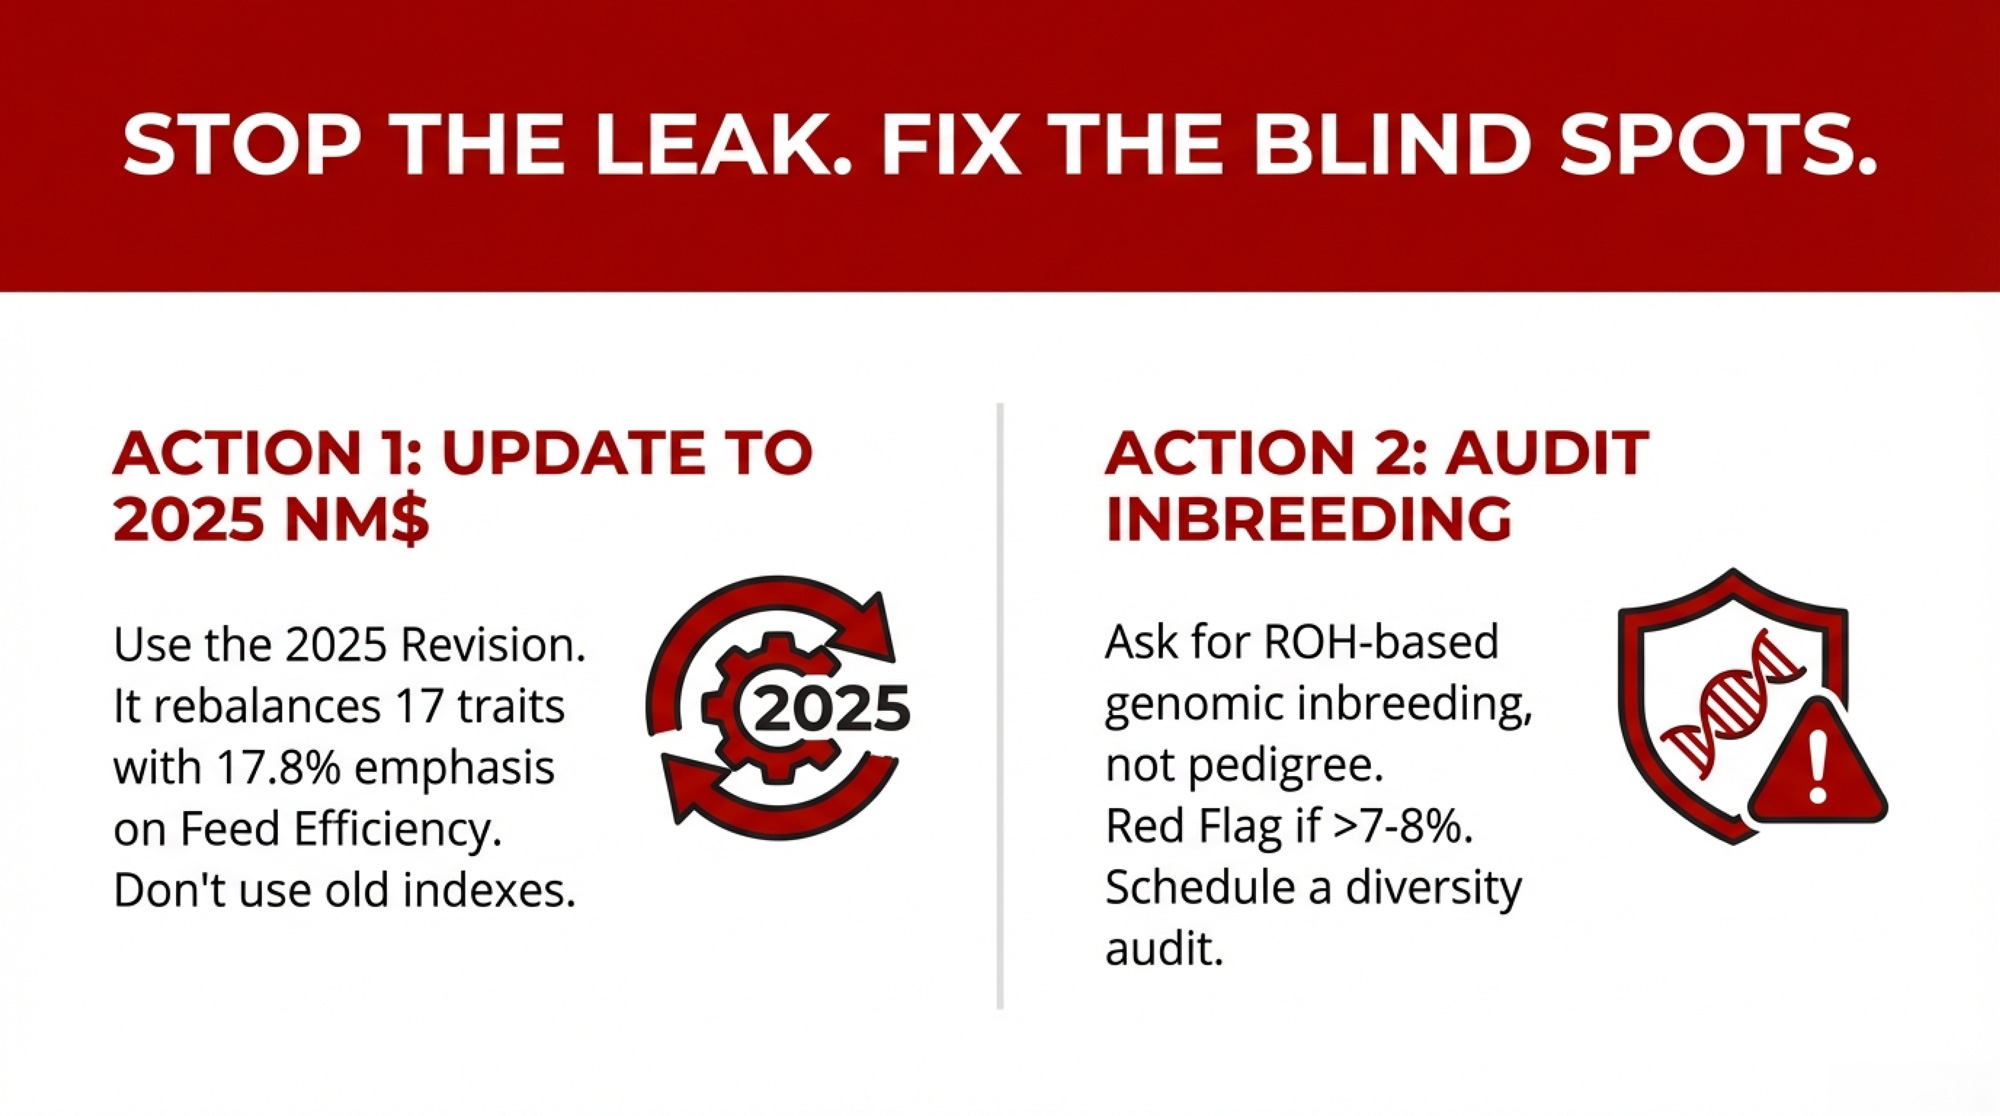
Confirm you’re using CDCB’s 2025 NM$ revision — and don’t override it. The updated index rolled out alongside the April 2025 base change. It now balances 17 traits for lifetime profitability, with feed efficiency (FSAV) carrying 17.8% of total emphasis — a substantial shift from prior weightings. If your genetics provider hasn’t updated to the 2025 revision, it’s worth a quick conversation; the trait emphasis shifted enough that older weightings are optimizing for a different market than the one you’re selling into. But even the right index can’t save you from yourself: if your top five bulls all rank in the top 20 for a single component while sitting below breed average for productive life, you’re running a single-trait program no matter what the index says. David Dyment at AG3 has built his program on exactly this principle — “consistency over unpredictability,” as he puts it — betting that balanced functional genetics outlast flavor-of-the-month rankings. The trade-off: you’ll pass on some high-component bulls that look great on paper. The fertility crash is what happened when the industry overrode balanced selection often enough.
Ask your genetics advisor for your herd’s ROH-based genomic inbreeding — this month. Pedigree coefficients underestimate actual homozygosity. In Italian Holsteins, pedigree inbreeding averaged 0.07 while genomic inbreeding was more than double at 0.17 (Ablondi et al., 2022). As a general rule of thumb, many geneticists start flagging concern when genomic inbreeding crosses 7–8% for Holsteins — there’s no official industry threshold, but herds above 9% should seriously consider a diversity audit. CDCB provides genomic inbreeding estimates — if your genetics provider isn’t using ROH-based calculations in mating plans, you’re flying partly blind. Diversify your sire lineup across at least three AI organizations. The trade-off: aggressively avoiding related matings can slow genetic progress — estimates vary, but the general range is somewhere around 5–15% depending on how restrictive you get. That’s a real cost. But inbreeding depression quietly eating your gains from the inside is worse — and that $4,800-to-$6,400-a-year leak on a 200-cow herd is real money.
If you’re in a heat-stress region, start weighting for it now. Increasing emphasis on productive life, livability, and fertility provides indirect selection pressure for thermotolerance — these traits correlate positively (Misztal et al., 2024). The trade-off: you may sacrifice 3–5% of genetic gain on other traits. In a warming climate, that’s a hedge worth paying for. If you’re south of the Mason-Dixon or running herds in the Central Valley, this isn’t optional — it’s self-defense.
Contribute the data you’re already collecting. If you’re running activity monitors, AMS systems, or feed intake tracking, those records can help build the reference populations for tomorrow’s evaluations. Contact CDCB or your breed association — in Canada, Lactanet already accepts health event and AMS data. The trade-off: consistent data entry takes discipline. But incomplete data contributed widely still beats perfect data that never leaves the farm. And it’s how the next hitchhiking problem gets caught in five years instead of twenty.
Key Takeaways
If your herd’s ROH-based genomic inbreeding is trending above 7–8%, schedule a diversity audit before your next mating run. Each 1% of inbreeding costs $23–25 off lifetime NM$ per cow, and on a 200-cow herd, a 4% accumulation translates to $4,800–$6,400 a year in hidden drag, depending on your turnover rate.
If you face 60+ days above THI 68, add productive life and livability emphasis to your sire selection now. Heat tolerance is declining genetically, even as heat abatement technology improves — the infrastructure is masking the problem.
If your genetics provider hasn’t updated to the 2025 NM$ revision, have that conversation this week. The updated index rebalanced 17 traits and added feed efficiency with an emphasis of 17.8%. Older weightings mean you’re optimizing for a market that’s already shifted.
If all your top sires trace to the same program, diversify across at least three AI organizations. Genetic gain means nothing if you’re narrowing the base that sustains it.
Before your next mating run, ask one question your genetics advisor probably won’t raise on their own: “Which traits am I not measuring that might be shifting in the wrong direction?” That’s the question the fertility crash should have taught us to ask in 1985.
The Bottom Line
Steiner’s $8,100 gamble in that drafty Wisconsin barn wasn’t a bet on a cow. It was a bet on seeing what the data couldn’t yet show him. Twenty-three years later, the tools are sharper than they’ve ever been — genomic testing at birth, AI-driven mating plans, embryo tech that was science fiction in 2003. The engine runs faster every year.
But the biology is still messier than the model. And the gap between what you’re optimizing and what you’re actually affecting is where unintended consequences compound. Silently. Generationally. The only question worth asking every time you pull up a sire list: What am I not measuring that I’m going to wish I had?
Editor’s Note: Genetic gain data from García-Ruiz et al. (2016, PNAS); the 37% generation interval reduction refers to the combined total across all four selection pathways (sire-of-bulls, sire-of-cows, dam-of-bulls, dam-of-cows), not any single pathway. Hitchhiking analysis from Ma, Cole, Da & VanRaden (2019, BMC Genomics 20:128), using the University of Minnesota unselected control line at Waseca, MN. Heat tolerance data from Misztal, Brito & Lourenco (2024, JDS Communications 6(3):464–468). Inbreeding data from Ablondi et al. (2022, Frontiers in Veterinary Science 8:773985), based on 74,485 Italian Holstein cows. U.S. inbreeding trends from CDCB analysis as reported in The Bullvine (December 2025). Barn-math calculations use $19.50/cwt mailbox price; inbreeding annualization assumes 3–4 year herd turnover and should be adjusted for your operation’s actual replacement rate. Per-trait figures are for registered Holsteins; all-cow population gains were approximately half this magnitude. NM$ figures are nominal. Missy auction details from The Bullvine’s Wesswood-HC Rudy Missy feature (July 2025), cross-referenced with the Wisconsin Holstein Association’s 2020 convention report.
Executive Summary:
Genomic selection has more than doubled Holstein genetic progress, but it also proved something you feel in your own breeding records: traits you don’t measure still move, and sometimes they move against you. The same engine that helped make Wesswood-HC Rudy Missy a global brood cow quietly dragged 198 fertility genes and 67 immunity genes the wrong way for about 20 years before anyone caught it. Over those same decades, the THI threshold at which cows start losing milk slipped from 72 to 69, yet almost no one outside Australia selects directly for heat tolerance, even as better fans and sprinklers mask how fragile the genetics underneath have become. On the inbreeding side, genomic homozygosity in Holsteins is rising around 0.7% per year in some populations, and each 1% costs roughly $23–25 in lifetime Net Merit per cow — enough for a 200-cow herd to quietly leak $4,800–$6,400 a year, which can wipe out almost all of the roughly $5,070 in extra milk revenue from faster gain. You’ll see how those blind spots developed. You’ll see how those blind spots developed, then get concrete next steps: stick with the 2025 NM$ revision instead of custom tweaking, ask your genetics provider for ROH-based genomic inbreeding for your herd, and spread risk across multiple AI programs instead of loading your list from just one. If you’re staring down 60+ days above THI 68, it also explains how to lean harder on productive life, livability, and fertility as indirect heat-tolerance filters while feeding good data back into the system so the next crash is spotted in years, not decades. Underneath it all is one question this article keeps pushing you to ask every time you open a sire catalog: what am I not measuring that I’m going to wish I had?
Complete references and supporting documentation are available upon request by contacting the editorial team at editor@thebullvine.com.
211,000 More Dairy Cows. Bleeding Margins. The 2026 Math That Won’t Wait. – Breaks down the structural reset facing the U.S. herd and reveals why current beef-calf premiums are masking a dangerous replacement shortage. It prepares you to navigate a $2.00–$4.00/cwt breakeven gap before the 2027 heifer crunch arrives.
Slick Genetics Revolution: How One Gene Could Save Dairy Farmers $5,000 Per Cow Lifetime – Reveals the internal “thermal management system” that infrastructure can’t match, delivering a permanent 50–70% reduction in heat stress. You’ll gain the competitive edge to trade expensive fans and sprinklers for heritable, internal resilience that protects your production year-round.
The Sunday Read Dairy Professionals Don’t Skip.
Every week, thousands of producers, breeders, and industry insiders open Bullvine Weekly for genetics insights, market shifts, and profit strategies they won’t find anywhere else. One email. Five minutes. Smarter decisions all week.
A lower-test herd shipped $212,000 more than its 4.25% neighbor. If you’re chasing percentages, this barn math is your wake-up call.
Executive Summary: June 2025 FMMO reforms and the 2025 NM$ revision have flipped the script so that fat and protein pounds shipped, not test percentages, drive your milk check. A side‑by‑side model of two 500‑cow Upper Midwest herds shows the lower‑test herd (4.05% fat at 82 lbs) shipping $212,000 more fat and protein value per year than a 4.25% herd at 72 lbs, using the USDA’s NM$ planning prices. NM$ now gives 31.8% weight to fat and only 3.2% to volume, which means “percent‑only” bulls with negative Milk PTAs can quietly cut lifetime component revenue even when their proofs look good on fat percentage. On the ration side, C16:0 supplement programs that add +0.10 fat test often cost three to four times more than the extra fat is worth once you do the barn math at $0.65–$1.00/cow/day. Your federal order then decides how much of that value you actually see: the same 0.3‑point fat gain is worth roughly $94,500 in a Wisconsin MCP plant but closer to $54,700 in a fluid‑heavy Florida order. The article walks through these calculations step by step and finishes with a four‑point playbook — track CFP, cull on pounds, match spending to your order, and pick sires on component pounds — so you can stress‑test your own numbers instead of trusting what the bulk tank report says.
A 500-cow Upper Midwest dairy can leave $212,000 in combined fat and protein revenue on the table by chasing a higher bulk tank test instead of shipping more component pounds. That’s not a hypothetical — it’s what the math shows when you model two herds side by side using USDA’s own NM$ planning prices.
A nutritionist working with herds in the region described the pattern: a 500-cow operation watches butterfat climb from 3.9% to 4.1% over six months. Everyone celebrates. Then somebody runs the real numbers — 78 lbs/day at 3.9% versus 74 lbs/day at 4.1% — and realizes they’re shipping nearly identical fat pounds. The test improved. The milk check didn’t.
What June 2025 Changed — And What It Cost
USDA’s April 2025 Net Merit revision pushed butterfat to 31.8% relative emphasis in NM$ — up from 28.6% in 2021 (VanRaden et al., NM$8 and NM$9). Protein carries 13.0%. Milk volume? Just 3.2%. The economic values are blunter still: fat at $5.01 per PTA pound, protein at $3.33, volume at $0.022.
Then the FMMO reforms hit on June 1, 2025. AFBF economist Daniel Munch calculated that in the first three months, producers lost more than $337 million in combined pool value — class price reductions of 85 to 93 cents per hundredweight depending on the order (AFBF Market Intel, September 2025). As Munch told Brownfield Ag News, the higher make allowances “more than wipe out” the gains from other reforms.
Upper Midwest Order 30 absorbed the worst of it. Roughly 69% of pooled milk went to Class III cheese in October 2025, with just 11.3% to Class I fluid (FMMA30 Dairy News, November 2025). That heavy cheese utilization means component value flows directly to producers — but the make allowance increase hit just as directly.
And regional structure amplifies everything. A 0.3-point butterfat improvement on a 500-cow herd captures an estimated $94,500 annually in Wisconsin’s MCP system versus approximately $54,700 in Florida’s skim-fat system. Same genetics. Same nutrition. A $40,000 gap from the order structure alone.
How $212,000 Disappears Into a Better Bulk Tank Test
Two 500-cow herds, both running 305-day lactations, were modeled using NM$ 2025 planning prices of $2.90/lb fat and $2.08/lb protein (VanRaden et al., January 2025). These are multi-year forecast prices; USDA built the index on non-spot prices. Actual FMMO butterfat ran about $2.95/lb in January 2025 and fell to approximately $1.45/lb by January 2026. The pounds principle holds at any price level; the dollar gap moves with the market.
Metric
Herd A (High Test)
Herd B (High Volume)
Difference
Milk/Cow/Day
72 lbs
82 lbs
+10 lbs
Fat Test
4.25%
4.05%
−0.20 points
Protein Test
3.05%
3.05%
Same
Annual Fat Shipped
466,650 lbs
506,453 lbs
+39,803 lbs
Annual Protein Shipped
334,890 lbs
381,403 lbs
+46,513 lbs
Fat Revenue @ $2.90/lb
$1,353,285
$1,468,712
+$115,427
Protein Revenue @ $2.08/lb
$696,571
$793,317
+$96,746
Combined F+P Revenue
$2,049,856
$2,262,029
+$212,173
Herd B — the lower-test herd — ships nearly 40,000 more pounds of fat and over 46,500 more pounds of protein. At actual January 2025 FMMO prices ($2.95 fat, $2.33 protein), the gap widens to roughly $226,000 because protein is priced higher than the NM$ assumption.
Three Places the Trap Compounds Silently
Genetics. The 2025 NM$ penalizes “percent-only” bulls with deeply negative Milk PTAs. A bull posting +0.25% fat but −500 lbs Milk loses on all three lines — less volume means fewer total fat pounds, fewer protein pounds, and less volume revenue. A bull at +0.08% fat with +1,200 lbs Milk often ships more total component pounds per lactation. That’s exactly what the $5.01/lb and $3.33/lb economic values reward.
Nutrition. Research from Prof. Kevin Harvatine’s lab at Penn State found C16:0 palmitic acid boosts fat test by +0.30 to +0.50 percentage points at ~2% of diet DM (Dairy Global, November 2023). Michigan State’s de Souza lab (J. Dairy Sci., 2024) showed mid-lactation cows at 40–50 kg/day responded best. But supplements run $0.65–$1.00/cow/day, and the protein test can slip 0.02–0.03 points. If milk yield doesn’t climb with the fat test, the P&L can go negative while the bulk tank report looks great.
Culling. Cow 1 at 90 lbs/day and 3.8% fat ships 3.42 lbs fat/day. Cow 2 at 65 lbs/day and 4.3% ships 2.80 lbs. The “low test” cow delivers 0.62 more lbs of fat daily — about $550/year at $2.90/lb. If your cull list sorts by test instead of CFP (combined fat and protein pounds shipped), you may be shipping the wrong animals.
Does Chasing +0.1% Fat Actually Pay Under Component Pricing?
Full walkthrough: a program promising +0.10 points fat test on 500 cows averaging 75 lbs/day.
Break-even: about $0.22/cow/day. That’s three to four times below what any published C16:0 program costs. If a tenth of a point on fat test is the only gain — and you’re losing milk or protein in the process — the math is underwater.
The Shift: From Test Reports to Pounds Shipped
For herds getting ahead of this, the pivot starts with one change: they stop celebrating test and start tracking CFP per cow per day. Instead of “Our herd’s at 4.1% fat,” they’re asking: “How many pounds of fat and protein did we ship per cow today?”
That reframes every proposal — a new sire lineup, a nutrition tweak, or a cull list — around one question: does it raise CFP?
The Playbook: Four Ways to Manage for Pounds
1. Make CFP your primary metric. Calculate combined fat + protein pounds per cow per day, minimum monthly. 30-day action: pull last month’s data and establish your baseline. Trade-off: watching fat test flatten while CFP climbs feels wrong. It’s not.
2. Rebuild the cull list around CFP. Rank by shipped CFP first, then overlay fertility, health, and age. 90-day action: audit last quarter’s culls against CFP. Trade-off: you still need to watch for milk fat depression — tests aren’t irrelevant, just not the sorting metric.
3. Match spending to what your order actually pays. Order 30’s 69% Class III utilization means component value flows through relatively directly. In skim-fat orders with heavy Class I, the math is different. 30-day action: call your field rep and ask how much component value hits your check. Trade-off: even within the same order, different handlers deliver different capture.
4. Run genetics and nutrition on parallel tracks. Long-term: component-pound genetics (NM$, CFP). Short-term: nutrition for quick wins. 365-day action: rebalance your sire lineup at the next proof run using pound PTAs, not percentage PTAs. Trade-off: if component prices sag — January 2026 butterfat at ~$1.45/lb is a reminder — nutrition plays may need to scale back. The genetics keep compounding regardless.
What This Means for Your Operation
Run your own Herd A vs. Herd B table. Plug in your daily lbs, fat test, protein test, cow count, and your most recent FMMO component prices. If a lower-test scenario ships more pounds, you’ll need to decide.
The break-even for a +0.1% fat program is $0.22/cow/day. Published C16:0 costs range from $0.65 to $1.00. If you’re spending three to four times the break-even, the fat gain alone doesn’t cover it.
Audit your culls. Pull three to five cows you shipped for “low components” and check their CFP against cows you kept. If CFP sorts the list differently than test did, rebuild it.
Know your order structure. Order 30’s 69% Class III means the component value flows through. If you’re in a fluid-heavy order, your capture math is different — and so is every component investment decision.
Key Takeaways
If your success metric is fat test rather than fat and protein pounds shipped, you’re managing to the wrong number. The post-June 2025 FMMO system and the 2025 NM$ ($5.01/lb fat, $3.33/lb protein) both reward pounds.
The $212,000 gap is $115,427 from fat and $96,746 from protein at NM$ planning prices. At actual January 2025 FMMO prices, it’s closer to $226,000.
The 2025 NM$ penalizes percent-only bulls. Fat emphasis jumped from 28.6% to 31.8%, but milk volume still carries a positive value. A sire whose Milk PTA drags may produce daughters that ship fewer total component pounds.
Regional structure reshapes every component decision. A 0.3-point fat gain isn’t worth the same $94,500 in Wisconsin as it is in a fluid-heavy Southeast order.
The Bottom Line
The herds that come out of this stronger won’t necessarily be the ones with the prettiest bulk tank reports. They’ll be the ones that ran the barn math and were honest about what actually pays. So — where does your herd sit: managing for the number that feels good, or the pounds that move the check?
Complete references and supporting documentation are available upon request by contacting the editorial team at editor@thebullvine.com.
Learn More
$19.14 Costs vs. $18.95 Milk: Is Your Barn Tech Paying the Difference? – Stop leaving margin on the barn floor. This analysis exposes why you’re 19¢/cwt underwater and arms you with the specific ROI calculations to ensure your current technology actually pays for itself through increased efficiency.
Every week, thousands of producers, breeders, and industry insiders open Bullvine Weekly for genetics insights, market shifts, and profit strategies they won’t find anywhere else. One email. Five minutes. Smarter decisions all week.
A 0.15% protein bump can be worth 25–40¢/cwt. The real question is: does your contract let any of it reach your milk check?
Executive Summary: Protein has quietly become dairy’s growth engine, as IFIC surveys, new 2025–2030 U.S. dietary guidelines, and GLP‑1 usage all push consumers toward higher‑protein foods and drinks. Circana and CoBank data show where the money is going: strong unit growth in high‑protein yogurt and cottage cheese, and RTD dairy‑based protein shakes surging from about $4.7B to $8.1B in four years. Processors have responded with billions in cheese, whey, yogurt, and cultured plant investments, which means they increasingly want “right milk”—high‑component milk that hits yield and margin targets without expensive ingredient protein. For many herds on Class III‑based component grids, a roughly 0.15‑point protein gain can be worth 25–40¢/cwt, but co‑op pooling vs direct, solids‑driven contracts largely determines how much of that ever reaches your milk check. On‑farm, the article shows how solid forage and fresh cow management, followed by smart amino acid balancing, can realistically add 0.10–0.20 points of protein, while the April 2025 NM$/TPI changes mean cheese‑market herds should rethink index choices and sire filters. A 90‑day playbook walks you through nailing your baseline, grilling your nutrition and milk pricing, updating your sire plan, and then deciding—based on your plant map and contracts—whether protein should be a major strategic lever or a secondary priority.
If you just stare at Class prices and milk production reports, it still feels like the same old dairy story. Flat or drifting‑down fluid, a few wild price spikes, a lot of noise. But here’s what’s really going on underneath that: a growing share of your customers are quietly reorganizing their diets around protein, processors are pouring billions into plants built around solids, and the indexes we use to pick bulls have already shifted toward that new reality.
On a typical Class III‑based component grid in the Upper Midwest, moving a herd from roughly 3.05% true protein to 3.20% at 80 pounds of milk per cow per day can easily be worth 25–40 cents per cwt on the protein line alone, before you factor in cheese yield bonuses. That’s a few thousand dollars a year on a 100‑cow herd, and tens of thousands on a 1,000‑cow operation, if your market actually rewards those components. The catch—the part most folks skip—is that not every plant, co‑op, or region passes that value back the same way.
Let’s walk through this the way we’d talk about it at your kitchen table: what’s changed with consumers, what the retail and plant numbers actually say, where nutrition and genetics can realistically move the needle, how co‑ops and contracts change who keeps the premium, and then a 90‑day plan you can use to decide how hard to chase protein in your own herd.
Looking at the Protein Trend from the Consumer’s Side
Looking at this trend from the consumer side first makes the rest of the story make a lot more sense.
The International Food Information Council (IFIC) has been running its Food & Health Survey for over twenty years. In their protein‑focused work from 2022–2025, they found that 59% of Americans said they were trying to consume protein in 2022, 67% in 2023, and 71% in 2024, with the 2025 survey showing interest holding at 70%. Those numbers come from nationally representative online samples of 1,000–3,000 adults each year, weighted for age, gender, and region, not just some fitness‑blog poll. IFIC’s July 2025 “Protein Spotlight” also notes that when these people say they care about protein, the most common thing they look for on labels is the grams of protein per serving.
Analysis of IFIC’s findings noted that roughly a quarter of Americans admit they don’t know how much protein they actually need. They’re chasing “high protein,” but they’re a bit foggy on the math. That confusion is important because it means simple, high‑protein messages on dairy labels can carry a lot of weight.
On the nutrition science side, several reviews over the last decade—published in journals like Nutrients and Applied Physiology, Nutrition, and Metabolism—have argued that the old adult RDA of 0.8 grams of protein per kilogram of body weight per day is probably too low for many older adults who want to maintain muscle and function. Those reviews generally support intakes of 1.0–1.2 g/kg/day for healthy older adults and 1.2–1.6 g/kg/day for those aiming to optimize muscle and metabolic health. When the 2025–2030 Dietary Guidelines for Americans were released in late 2025, coverage from Harvard’s School of Public Health and ag media highlighted that the new guidelines lean much more into higher‑protein patterns for older adults and explicitly recognize dairy as one of the key high‑quality protein sources.
Then there’s the GLP‑1 wave. A July 2024 JAMA article using KFF survey data reported that about one in eight U.S. adults had used a GLP‑1 drug like Ozempic or Wegovy, and KFF’s November 2025 polling found that roughly 12% of adults said they were currently taking a GLP‑1 medication for weight loss, diabetes, or related conditions. CoBank’s 2026 “Dairy Poised to Help Meet Consumers’ Growing Demand for Protein” report connects that to food choices: GLP‑1 users are eating fewer sugary, low‑protein snacks, but they still want foods and drinks that deliver satiety and protect lean mass. That has pushed many of them toward high‑protein yogurts, cottage cheese, and ready‑to‑drink protein shakes—many of which are dairy‑based.
So, putting that together:
More people are consciously chasing protein than even a few years ago.
Official guidelines are finally catching up and telling older adults to eat more protein.
A growing group of GLP‑1 users has fewer calories to “spend” and is steering more of them toward protein‑dense foods and drinks.
Dairy protein is complete, familiar, and easy for processors to formulate with.
The demand signal is there. The question is: where is that money actually showing up in the dairy case, and how does it flow back to your farm?
Where the Protein Money Is Showing Up in Retail
When you stop obsessing over fluid charts and look at scanner data, the protein story jumps off the page.
Analysis of retail performance for the 52 weeks ending November 2025 shows that across the entire grocery store, four dairy categories land in the top ten for unit growth:
Yogurt, led by Greek and other high‑protein styles, is second overall, with unit sales up 9.5%.
Natural cheese is third in unit growth, driven by snacking and shredded formats.
Cottage cheese is sixth, with a 14.5% jump in units—a big comeback story fuelled by high‑protein positioning.
Dairy creamers are tenth, with unit sales up 31.9%.
Its important to emphasize that these are unit increases, not just inflation. They also spell out that this data doesn’t include most of the ready‑to‑drink protein shake aisle, because those products are usually categorized under beverages or sports nutrition rather than traditional dairy.
Year
RTD High-Protein Shake Sales (USD Billions)
Growth Rate
2022
4.7
—
2023
5.9
+25.5% YoY
2024
7.0
+18.6% YoY
2025
8.1
+15.7% YoY
CoBank fills in that gap. Their January 2026 analysis, based on Circana retail data, reports that U.S. RTD high‑protein shakes grew from $4.7 billion in annual sales to $8.1 billion over four years—about 71% growth. The report makes it very clear that the majority of that protein is dairy‑derived: whey protein concentrates and isolates, milk protein concentrate, and micellar casein. These products often sit near energy drinks or health foods, not in the milk case, but the protein in them is coming out of our cows.
So the retail reality looks like this:
High‑protein yogurts and cottage cheeses are growing solidly inside the dairy case.
Dairy creamers—many of them higher in added fats and flavors—are booming.
A multi‑billion‑dollar RTD protein market built largely on dairy ingredients is exploding just beyond the dairy aisle.
The dollars are chasing dairy protein, not just white milk.
The $2.8 Billion Processor Bet on “Right Milk.”
Now let’s sit where the processor sits for a minute.
2026 outlook estimates that roughly $2.8 billion has been invested in yogurt and cultured product plants in recent years, much of it in New York. Those plants are designed to handle high‑solids milk and turn it into Greek, skyr, cultured drinks, and other protein‑focused products. When you add in expansions at cheese and whey plants, fluid milk plants, and yogurt/cultured facilities, these categories account for just over 80% of new and expanded U.S. dairy processing capacity.
CoBank and Cheese Reporter coverage point to about $8 billion in total new or expanded U.S. dairy processing projects through 2026, with roughly half of that aimed at cheese and whey. Wisconsin and neighboring states have seen significant expansions in cheese and whey production. Idaho and other Western states have invested in cheese, skim milk powder, and nonfat dry milk plants, partly geared toward export markets. Texas and the southern Plains have attracted new large‑scale plants built around big herds, solids, and export‑oriented products.
Here’s the problem processors are running into—and it ties straight back to what’s in your bulk tank.
Category
Investment (USD Billions)
Percentage of Total
Focus
Cheese & Whey Plants
4.0
50%
Solids-driven
Yogurt & Cultured
2.8
35%
High-protein products
Fluid & Powder
1.2
15%
Solids standardization
Total
$8.0B
100%
—
Over the last decade, U.S. Holstein genetics have pushed butterfat up fast. CDCB has documented that butterfat gains over the last base period have been impressive. Many American‑style cheese plants now receive milk with more butterfat than their vats can handle; they have to skim cream and standardize to target fat levels. If protein doesn’t rise in step with fat, the plant either:
Accepts a lower cheese yield per hundredweight than its business model assumed.
Buys milk protein concentrate or ultrafiltered milk to bring protein up.
Starts paying more attention to which farms deliver higher‑protein milk and looks for ways to reward that.
If a plant’s financial model is built around a milk pool averaging 3.3–3.4% true protein and the actual pool is closer to 3.1%, that gap is painful—especially at millions of pounds per day. More and more plant managers are saying, quietly but firmly, that they want “the right milk” rather than just “more milk.” In 2025, “right milk” often means higher solids, especially protein.
What Producers Are Really Seeing in the Ration
So what does it look like on your farm when you try to move protein in a way that actually pays and doesn’t wreck the ration?
What nutritionists and producers are finding is that the herds consistently making progress on protein don’t treat it as a one‑product miracle cure. They treat it as a fine‑tuning opportunity on top of good basics:
Strong forage quality and tight dry matter control.
Rumen‑friendly feeding with minimal sorting and consistent TMR delivery.
Solid fresh cow management in the transition period, so cows actually peak and don’t crash.
Once those pillars are in place, amino acid balancing starts to make sense.
A 2022 meta‑analysis by Chunbo Wei and co‑authors in the MDPI journal Animals compiled data from rumen‑protected methionine (RPM) trials conducted between 2010 and 2022. Their conclusion: when methionine is limiting in the diet, supplementing RPM doesn’t always push total milk volume higher, but it does significantly increase milk protein percentage and milk fat percentage, especially in high‑producing cows on well‑balanced rations. Using dose‑response models, they identified a sweet spot around 7.5–12.5 grams of RPM per cow per day for maximizing protein and fat percentages without wasting product.
Other work in Animals and the Journal of Dairy Science has shown similar patterns: microencapsulated methionine and newer methionine dipeptide products can raise milk protein yield and improve nitrogen efficiency when the rest of the ration is dialed in.
On the ground, nutritionists in Wisconsin, New York, Ontario, and Idaho describe results that match that research:
In well‑managed herds already producing 80–90 lb with decent butterfat performance, adding RPM and balancing methionine and lysine often nudges protein up by 0.10–0.20 points over 60–90 days, with small bumps in butterfat.
After confirming the response, some rations can safely trim crude protein—usually by reducing soybean meal or other expensive protein sources—while keeping or even lowering the ration cost per cwt and improving component levels.
Honestly, this is where most herds get tripped up. They hear about a neighbor’s protein bump, throw RPM into a ration built on variable corn silage and stressed fresh cows, and then complain when nothing happens. The Wei meta‑analysis and university work are clear: RPM is a scalpel, not a chainsaw. It works best on top of a good system, not instead of one.
If you’re thinking about amino acids, here’s a practical way to frame the conversation with your nutritionist:
Given our forage tests, butterfat performance, and current production, do you genuinely think methionine is limiting in our diet? Show me where you see that.
If we add, say, 10 g/cow/day of RPM, exactly which ingredient or crude protein level can we cut back on to make this a trade‑off, not just an extra cost?
In herds similar to ours—320‑cow freestall in Wisconsin, 80‑cow tie‑stall in Quebec, 900‑cow dry lot in Idaho—what milk protein and butterfat responses have you actually seen, and over what timeline?
Then, track components weekly for at least two to three months after changes. Don’t just go on gut feel.
Genetics: How the April 2025 Changes Repriced Protein
Nutrition is the short game. Genetics is the long game. And the rules of that long game shifted in April 2025.
USDA’s Animal Genomics and Improvement Laboratory (AGIL) and the Council on Dairy Cattle Breeding (CDCB) rolled out a major revision to Net Merit $ (NM$) in April 2025. According to the official AGIL report, the economic weights changed as follows:
Protein’s weight dropped from 19.6% to 13%.
Fat’s weight increased from 28.6% to 31.8%.
Milk volume’s weight rose from 0.3% to 3.2%.
Residual Feed Intake (as a feed efficiency trait) sits at about –6.8%.
Health, fertility, and longevity together account for just over 30% of the index.
AGIL explains that this shift reflects recent trends in U.S. markets: butterfat prices have been strong, and producers care more than ever about feed efficiency. Brownfield Ag News noted that the correlation between the old and new NM$ formulas is 0.992, meaning the reweighting doesn’t scramble the sire rankings—but it does send a message: fat is king right now in NM$, and protein has been dialed back.
Trait
Pre-April 2025 Weight
Post-April 2025 Weight
Change (points)
Interpretation
Protein
19.6%
13.0%
–6.6
De-prioritized in NM$ formula
Fat
28.6%
31.8%
+3.2
Elevated; now top-weighted trait
Milk Volume
0.3%
3.2%
+2.9
Newly valued; reflects market preference
Feed Efficiency (RFI)
—
–6.8%
—
Penalty weight; cost-conscious trait
Health & Fertility
~30% combined
~30% combined
Stable
Consistent importance
On the TPI side, Holstein Association USA’s formula continues to place significant weight on both fat and protein, with production traits still accounting for a large share of the index. In the Feed Efficiency $ (FE$) component, the formula is:
So both fat and protein are strongly valued, with fat currently worth slightly more per pound in that equation. Cheese Merit $ (CM$) also continues to place heavier emphasis on protein and cheese solids than NM$, making it a better index for herds shipping mainly to cheese plants.
At the same time, the April 2025 base change shifted the reference point from 2015‑born cows to 2020‑born cows. CDCB documents show that the average Holstein PTA dropped by roughly 45 lb fat and 30 lb protein at the base reset, reflecting the genetic gains made over the previous five years. Brownfield’s coverage called this out explicitly and reminded producers that a lower PTA number doesn’t mean bulls got worse overnight; it means the average moved up.
From a practical standpoint, here’s what this means for your sire list:
If you’re shipping mainly into cheese markets, blindly chasing NM$ might not match your plant’s actual economics anymore. You probably want to look more at CM$ or create a custom index that boosts protein weight without overvaluing milk volume.
In those cheese markets, bulls with strong protein percentage deviations (+0.08% and higher) and good protein pounds fit the economics better than bulls that just add volume with flat or negative protein %.
If you’re in a more fluid‑oriented or heavily pooled market, you still care about protein pounds to maximize solids shipped, but you may not need to push percentage as hard—so long as you hold butterfat and health traits where they need to be.
ABS Global’s December 2025 sire summary basically spells this out, saying they’ve adjusted their sire lineup to “balance the scale with protein because of the significant improvements made in fat.” That’s a diplomatic way of saying: “We bred fat so hard for a decade that if we don’t deliberately select for protein now, we’ll drift off balance.”
If you’re still using the same sire selection rules you had before April 2025—circling the top NM$ list and calling it good—it’s worth asking yourself whether those rules still match how your milk is being paid in your market in 2025.
Co‑ops, Contracts, and Who Actually Keeps the Protein Premium
Now we come to the nerve point: even if you move your herd from 3.05% to 3.25% protein, who actually pockets that extra value?
In most of the Northeast and Upper Midwest, and everywhere in Canada, co‑ops and pooling dominate. Co‑ops do important work—balancing markets, managing risk, and giving farms a home for their milk when plants are full. But the way many co‑ops are structured, they also smooth out component and plant‑specific value across a broad membership.
2026 outlook hints at this when it explains how strong performance at yogurt and cheese plants in the Northeast flows back through co‑op pooling. Some of the value from high‑component milk going into those plants gets spread across all members, according to policy, rather than being laser‑targeted to the highest‑protein herds.
So if you push your herd’s protein from 3.10% to 3.25% and your neighbor sits at 2.95%, you’ll see some advantage through the pay grid and herd‑level quality bonuses, but you may not see the full premium that the plant is willing to pay for high‑protein milk.
On the flip side, CoBank has documented an increase in direct supply contracts in central New York, western Michigan, parts of Idaho, California, and Texas. In those systems, large herds ship directly to cheese plants, yogurt processors, or RTD beverage plants under contracts that specify:
A base price (usually tied to Class III or a blend).
Detailed component premiums and penalties, including quality.
Volume, consistency, and sometimes animal welfare or sustainability expectations.
In that setup, if a 2,500‑cow dairy lifts its protein 0.15–0.20 points, more of that value is likely to show up in their own milk check, because the contract spells out how components are rewarded. The trade‑off is that you’re tied more tightly to one buyer’s fortunes and performance metrics.
The point isn’t that co‑ops are bad and private contracts are good. It’s that the route your milk takes from the tank to the market that determines how much of the protein premium you keep.
A very practical exercise is to sit down with your milk statements and, if possible, your co‑op rep or buyer, and walk through:
How many dollars per cwt are you’re being paid for protein today at your current level.
What that would that look like if you were 0.15 points higher, using your own plant’s published grid or contract.
Whether there are specific programs—cheese pools, high solids tiers, quality alliances—you could realistically qualify for if you hit certain protein and butterfat levels.
If nobody can clearly show you how your extra protein would be paid, that’s your signal to start asking harder questions before you sink a lot of money into chasing it.
Geography: Your Hidden Advantage or Built‑In Handbrake
Another factor we don’t talk about enough when discussing components is geography. You can’t pick up your farm and move it closer to a better plant, but you can factor your location into how hard you push protein.
It is clear that New York is a prime example of a “high‑option” region: roughly $2.8 billion in yogurt and cultured investment, existing cheese plants, and multiple co‑ops and private buyers competing for milk. A 320‑cow freestall in central New York might be within an hour’s haul of several plants that value high‑solids milk, plus programs designed to reward it.
Region / Scenario
Plant Density
Co-op / Pool Structure
Protein Premium (¢/cwt)
Contract Direct Premium (¢/cwt)
Competitive Intensity
Recommended Strategy
NY (Central/Western)
High (3–4 plants within 60 min)
Co-op + Direct options
28–40
35–45
Very High
Lean hard into protein
WI / Upper Midwest
High (2–3 cheese/whey plants)
Co-op dominant
22–35
30–40
High
Protein is a strong lever
Idaho / West
Medium (1–2 regional plants)
Mix of co-op/direct
15–28
25–35
Medium
Protein helpful, not essential
Remote / Single Plant
Low (1 plant, 90+ min haul)
Pool dominated
8–12
18–25
Low
Feed efficiency > protein
Canada (ON/QC)
Medium (regional plants + boards)
Quota/board + co-op
18–30
28–38
Medium
Protein + solids focus
CoBank and Cheese Reporter highlight similar clusters:
In Wisconsin and surrounding states, there’s ongoing expansion in cheese and whey capacity. High‑component milk fits those plants very well.
In Idaho and the broader West, new cheese and powder plants have come online to serve export markets where solids are crucial.
In Texas and the southern Plains, newer large plants are hungry for efficient, high‑solids milk from large herds.
In those zones, pushing protein has a clearer upside because multiple processors and programs value that milk and can compete for it.
Now compare that to a 450‑cow dry lot in a more remote Western area with one major plant 90 minutes away and heavy pooling. Hauling is expensive, options are thin, and the local pool may not pay enough extra for higher protein to justify an aggressive push, especially if the plant is more focused on balancing volume. For that operation, it may make more sense to:
Keep protein in the competitive range for the pool.
Put more emphasis on feed efficiency (components per pound of dry matter), reproductive performance, and cash flow.
Make sure butterfat stays strong, since it still drives many checks.
In Canada, quota and provincial boards change the pricing math, but the plant reality is similar: processors still need solids to hit cheese and yogurt yields. A Quebec or Ontario herd close to major plants may have more incentive programs tied to solids than a more remote herd in a region with less processing.
The bottom line is that your plant map—distance, options, and growth trends—is just as important as your ration when you’re deciding how far to lean into protein.
Beyond the Dairy Case: Ingredient Markets and Snack Aisles
Another piece of the protein puzzle sits outside the traditional dairy section.
CoBank has reported on the growth of dairy protein ingredients—whey protein concentrate and isolate, milk protein concentrate, micellar casein—in everything from breakfast bars and cookies to “functional” beverages and meal replacements. Rising exports of U.S. whey products and skim milk powder/nonfat dry milk as global demand for high‑quality protein increases, especially in parts of Asia.
Research in Animal Frontiers and Nutrients has stressed that dairy proteins are high‑quality, complete proteins with excellent digestibility compared to many plant proteins. Those studies don’t ignore environmental concerns, but they reinforce dairy’s role in meeting protein needs, particularly for older adults and physically active people. Food companies read those papers and act on them.
So even when there’s no cow on the label, a big chunk of the protein in that “15 grams per serving” bar or drink may be coming from milk. That’s part of why you see whey plants being built and upgraded, and why processor and investor presentations keep coming back to “protein platforms” as a strategic focus.
Again, whether that shows up in your milk check depends on how your milk is pooled and priced. But the long‑term signal is that dairy protein demand isn’t fading away anytime soon.
What This Actually Means for Your Milk Check
So how does all this big‑picture stuff translate into dollars per cwt on your statement?
On a typical Upper Midwest Class III‑based component grid that pays for protein and butterfat directly, a move from roughly 3.05% to 3.20% true protein at 80 lb/cow/day can reasonably add 25–40 cents per cwt on the protein portion of the check, depending on the exact protein price that month. If you’re shipping to a plant that pays cheese yield bonuses based on both fat and protein, that higher protein percentage can also bump you into a better yield category worth another 10–20 cents per cwt.
Herd Size
Current Protein %
Target Protein %
Protein Gain (points)
Protein Premium (¢/cwt)
Cheese Yield Bonus (¢/cwt)
Total Added Value (¢/cwt)
Annual Milk Volume (cwt)
Annual Revenue Gain (USD)
100 cow
3.05%
3.20%
+0.15
28
8
36
8,000
$2,880
320 cow
3.08%
3.23%
+0.15
30
10
40
25,600
$10,240
1,000 cow
3.10%
3.25%
+0.15
32
12
44
80,000
$35,200
On a 100‑cow herd shipping 8,000 cwt per year, that might be “only” a few thousand dollars—a nice improvement but not transformational. On a 1,000‑cow herd shipping 80,000 cwt, it can easily be tens of thousands of dollars per year if you actually capture it.
The big “if” is key:
If you’re in a market or pool where much of that value is spread across a wide membership, your own milk check will only see part of that.
If you’re in a direct contract or a plant‑specific program that pays explicitly for higher protein, you’re more likely to see the full impact.
That’s why it’s dangerous to talk about protein as if it’s automatically a gold mine for everyone. Where you are and how you’re paid matters as much as what your cows can do.
A 90‑Day Plan That Fits Real Herds
If you’re thinking, “We should at least know where we stand on this,” here’s a 90‑day plan that fits real life on a working dairy.
Step 1: Get Your Real Baseline (Weeks 1–2)
Pull 60–90 days of milk testing reports.
Write down your average true protein and butterfat, plus the range—don’t rely on memory.
Note your herd’s average days in milk and pounds per cow over that period.
Ask: are we consistently below 3.15–3.20% protein, or more in the 3.25–3.30% zone?
If you’re stuck under about 3.15% protein with unstable butterfat, that’s usually a forage and cow‑care issue before it’s an amino acid issue.
Step 2: Have a Focused Nutrition Strategy Session (Weeks 3–4)
Sit down with your nutritionist when neither of you is in a rush. Bring the numbers.
Ask if they believe methionine is actually limiting in your current diet, based on your forage tests and production. Ask them to show you where in the model they see that.
Discuss whether an RPM or methionine dipeptide product makes sense for your herd, referencing the published 7.5–12.5 g/cow/day “sweet spot” from the Wei meta‑analysis as a starting point—not a rule.
Insist on specificity: if we add 10 g/cow/day of this product, what exactly are we pulling back on—soybean meal, canola, bypass protein—so ration cost per cwt is neutral or close to it?
Define success up front: for many herds, a realistic target is a 0.08–0.12 percentage point increase in protein in 60–90 days without hurting butterfat or cow health.
Step 3: Tear Down Your Milk Check (Weeks 4–6)
Get your latest milk statements and, if you can, invite your co‑op field rep or plant buyer to walk through them with you.
Identify exactly how many dollars per cwt you’re currently earning from protein at your current level.
Calculate what your check would look like if your true protein were 0.15 points higher, using your plant’s real grid or contract.
Ask about plant‑specific programs: cheese pools, high‑solids tiers, or quality alliances that pay more for the kind of milk you could produce.
If the difference between your current protein and a realistic target is worth less than 10–15 cents per cwt under your structure, you may want to focus your next dollar somewhere else first. If it’s worth 25–40 cents per cwt and you’re within reach, protein should move up your priority list.
Step 4: Recalibrate Your Sire Strategy (Weeks 6–8)
Pull your current sire lineup and any bull proofs you’re using:
Look at PTA Protein (lbs) and protein% deviation alongside PTA Fat and fat%.
Check NM, and health traits like SCS, DPR, and Productive Life (or their equivalents).
Then talk with your AI rep:
Ask which bulls or mating strategies they’d recommend for a herd shipping mainly to cheese plants—or high‑protein yogurts—where protein percentage really matters.
Ask which bulls make more sense for a pooled, volume‑oriented market where protein lbs matter but % may not be heavily rewarded.
Ask how long it will realistically take for those genetic changes to show up in your bulk tank, given your culling and replacement rates.
If you’ve been breeding in “autopilot NM$” mode, this is the time to tweak your filters so you’re breeding for the pay formula you actually face, not the one you faced five years ago.
Step 5: Make a Conscious Strategic Call (Weeks 10–12)
By the end of 90 days, you should have:
A clear picture of your current protein and butterfat performance.
A grounded sense of what your herd can do with sensible nutrition and cow care.
Hard numbers on what extra protein is worth under your specific milk pay structure.
A refreshed sire plan that either leans into protein or deliberately doesn’t.
Then you make a conscious choice.
If you’re in a region with multiple solids‑focused plants, clear premiums, and a herd close to the thresholds, it probably makes sense to treat protein as a major strategic lever for the next three to five years.
If you’re in a single‑plant, heavily pooled environment where an extra 0.15 points of protein doesn’t move the needle much, you may decide to keep protein respectable but put more energy into feed efficiency, robot utilization, debt management, or labor—things that may offer a better return under your conditions.
There isn’t one right answer. But what’s become pretty obvious is that protein isn’t just a rounding error anymore. Consumers, guidelines, processors, and indexes have all moved. You can either let that movement happen to you, or you can decide where protein fits in your plan—with your plant map in one hand, your proofs and ration in the other, and your milk check right there on the table.
Key Takeaways
Protein demand is surging: 70% of Americans are actively seeking protein (IFIC 2025), RTD dairy shakes have grown from $4.7B to $8.1B in 4 years (CoBank), and new dietary guidelines support higher intakes.
Processors are rebuilding around solids: Billions have gone into U.S. cheese, whey, yogurt, and cultured plants—they want “right milk” that hits yield targets, not just volume.
The milk check math is real but contract-dependent: A 0.15-point protein gain can add 25–40¢/cwt on Class III grids, but co-op pooling often dilutes it; know your pay formula before you invest.
Nutrition works—if basics are solid first: Rumen-protected methionine at 7.5–12.5 g/cow/day can lift protein by 0.10–0.20 points, but only in herds with strong forage and fresh-cow management already in place.
Genetics shifted in April 2025—adjust your sire filters: NM$ now weights fat more heavily; cheese-market herds should prioritize CM$ or custom indexes and look for bulls with strong protein % deviation alongside health traits.
Complete references and supporting documentation are available upon request by contacting the editorial team at editor@thebullvine.com.
Every week, thousands of producers, breeders, and industry insiders open Bullvine Weekly for genetics insights, market shifts, and profit strategies they won’t find anywhere else. One email. Five minutes. Smarter decisions all week.
How Net Merit changes, fairlife’s $7.4 billion success, and the premium pivot are reshaping what your genetics are worth.
Executive Summary: For the first time since 2009, fluid milk sales grew in 2024—up 0.8%, ending a 14-year decline. The turnaround didn’t come from better marketing of commodity milk; it came from building what consumers actually wanted: lactose-free, high-protein, premium products that command real price premiums. fairlife proved the model works spectacularly, generating $7.4 billion in total value for Coca-Cola and reshaping the value of dairy genetics. The April 2025 Net Merit revision tells the story: butterfat emphasis jumps to 31.8% while protein drops to 13.0%—volume-only genetics are losing economic ground. But here’s the hard truth: 40% of U.S. dairy farms exited between 2017 and 2022, and premium market access isn’t equally distributed. The strategic question for every producer is no longer whether this shift is real—it clearly is—but whether your operation’s genetics, scale, and processor relationships position you to capture value from it.
After decades of falling fluid milk sales, the industry posted growth in 2024 for the first time since 2009. The story behind that turnaround holds lessons for every farmer making decisions today.
By the Numbers: Dairy’s Turnaround at a Glance
Metric
Then
Now
Per capita fluid milk consumption
247 lbs (1975)
141 lbs (2020)
2024 fluid milk sales vs. 2023
14-year decline
+0.8% growth
U.S. dairy farms
39,303 (2017)
24,082 (2022)
Milk from farms with 1,000+ cows
60% (2017)
68% (2022)
Holstein butterfat average
3.9% (2019)
4.23% (2024)
fairlife annual retail sales
$90M (2015)
$1B+ (2022)
Net Merit protein emphasis
19.6% (2021)
13.0% (April 2025)
Net Merit butterfat emphasis
28.6% (2021)
31.8% (April 2025)
Here’s something that caught a lot of people off guard last year. Fluid milk sales actually grew in 2024—not just stabilized, but genuinely increased. USDA data show total U.S. fluid milk sales were up about 0.8% from 2023, ending a 14-year streak of annual declines. The National Milk Producers Federation called it the first year-over-year gain since 2009.
That’s worth sitting with for a moment.
What’s interesting here isn’t just the number itself. It’s what had to happen to get there. This wasn’t a lucky break or some temporary consumer fad. The growth came after roughly a decade of strategic decisions that ran counter to almost everything the dairy industry had believed about competition and survival.
I’ve been watching this unfold for years now. The more you dig into what actually changed, the more you realize there’s a playbook here that matters to producers navigating what comes next.
Understanding How Deep the Decline Really Was
To make sense of the comeback, you need to understand how challenging things had gotten. Not just the headlines—the structural shift that was reshaping the entire category.
Between 1975 and 2020, per capita fluid milk consumption in the United States dropped by nearly 43%, according to Federal Milk Market Administrator data. We went from around 247 pounds annually down to about 141 pounds per person. Penn State Extension’s dairy trends research shows similar figures—they tracked a decline from 247 pounds in 1975 to 134 pounds by 2021. That’s not a temporary dip. That’s a generational shift away from a product that used to be on every breakfast table in America.
The reasons were accumulating, as many of us observed firsthand. Beverage options multiplied—sports drinks, bottled water, energy drinks, and the expanding coffee culture. Plant-based alternatives began to claim serious shelf space in the mid-2010s. Younger consumers, especially, seemed to be reconsidering whether dairy belonged in their daily routine.
And the financial pressure kept building. Class III prices dropped below $14 per hundredweight multiple times during 2018 and 2019. The Class III average for 2018 was just $14.61, the lowest in years. If you were shipping milk during those months, you remember.
Then came Dean Foods. The largest fluid milk processor in the country filed for Chapter 11 bankruptcy on November 12, 2019, in the Southern District of Texas—USDA’s Agricultural Marketing Service confirmed the filing date in subsequent proceedings. When a company of that size goes down, it sends a signal about industry direction. Or at least, that’s what everyone assumed at the time.
The Strategic Pivot: Asking a Different Question
The turning point, looking back, came when industry leadership started asking a fundamentally different question.
Instead of “How do we convince people to drink more regular milk?”—which promotion campaigns had been attempting for years—they asked: “What do modern consumers actually want that dairy could provide better than alternatives?”
Why does that distinction matter? Because it shifts the entire strategic framework.
Dairy Management Inc., the organization that manages the national dairy checkoff, commissioned extensive consumer research starting around 2014-2015. According to DMI’s published partnership reports, what they found reshaped the entire strategic approach.
Here’s what the research revealed: consumers weren’t rejecting dairy’s core benefits—protein, nutrition, taste. They were rejecting the format and the limitations. The National Institutes of Health estimates that somewhere between 30 and 50 million American adults are lactose intolerant—MedlinePlus and federal health resources have consistently cited this range. Many of those people wanted dairy’s nutritional benefits but couldn’t tolerate conventional milk. Others wanted higher protein for fitness goals, lower sugar for health reasons, or longer shelf life for convenience.
This consumer insight work became the foundation for everything that followed. DMI announced more than $500 million in fluid milk partnerships with seven major companies—Dairy Herd and other industry publications covered the announcement extensively. What’s particularly noteworthy is the leverage structure: most of that investment came from partners putting money into processing plants and infrastructure, while the checkoff’s direct commitment was about $30 million. That ratio—partners investing roughly $15 for every checkoff dollar—represents a fundamental strategic pivot from defending commodity milk to building new categories where dairy had natural advantages.
The fairlife Case Study
No single product illustrates the transformation better than fairlife, which has become Coca-Cola’s fastest-growing brand acquisition. The timeline is worth examining because it shows what patient long-term investment actually looks like in practice.
fairlife launched as a joint venture in 2012 between Select Milk Producers—a Texas-based dairy cooperative with just 99 member farms, as confirmed by multiple industry sources, including the Texas Agricultural Council and the University of Guelph—and Coca-Cola, which took an initial 42.5% ownership stake. The product uses ultrafiltration technology (not new technology exactly, but newly commercialized at scale) to concentrate protein, remove lactose, and reduce sugar while maintaining dairy’s nutritional profile.
National rollout came in late 2014, after test markets in Denver showed something remarkable. Coca-Cola’s Mike Saint John, speaking to industry groups, noted that the Denver test showed fairlife driving a 4% increase in fluid milk sales—not just capturing share from other brands, but actually growing the category. That distinction matters considerably when you’re trying to reverse a multi-decade decline.
The growth trajectory tells the story. By the mid-2010s, fairlife had reached about $90 million in annual sales. Industry estimates put 2019 sales at around $500 million. In January 2020, Coca-Cola acquired the remaining 57.5% stake for $979 million, according to SEC filings.
Here’s where the economics get striking. fairlife surpassed $1 billion in annual retail sales by 2021-2022, as Dairy Reporter and Coca-Cola’s earnings communications confirmed. The company’s SEC filings now show that total payments for fairlife—including the original acquisition plus performance-based earnouts—have reached approximately $7.4 billion. That earnout structure meant Coca-Cola paid more because fairlife exceeded financial targets.
Year
Retail sales (USD billions)
Cumulative value/investment (USD billions)
2015
0.09
0.50
2019
0.50
1.50
2022
1.00
5.00
2024
1.20
7.40
Today, fairlife sells at a clear premium to conventional milk in most retailers. High Ground Dairy’s analysis highlights these strong price premiums, while USDA retail price tracking shows conventional milk averaging about $4.39 per gallon in 2024. Consumers are paying meaningful premiums for a product delivering 50% more protein, 50% less sugar, no lactose, and a longer shelf life.
But Can Other Cooperatives Replicate This?
Here’s the question many producers are asking: Is the fairlife playbook actually replicable, or do you need Coca-Cola’s balance sheet to make it work?
The honest answer is complicated.
fairlife didn’t just have good milk—it had a partner with essentially unlimited capital, global distribution networks, and decades of beverage marketing expertise. Select Milk Producers brought the supply chain and dairy knowledge; Coca-Cola brought everything else. That’s not a model most regional cooperatives can simply copy.
fairlife’s own FAQ clarifies the supply structure: “As a milk processor, fairlife does not own farms or cows. We partner with dairy co-ops in geographies where we have plant locations to source milk.” All supplying farms must meet fairlife’s specific animal care requirements and maintain both FARM and Validus third-party certifications. That creates a meaningful barrier for farms not already connected to fairlife’s supply network.
Consider this: Select Milk Producers has just 99 member farms. That’s a deliberately small, carefully managed supplier base—not an open door for any operation wanting premium market access. And when Organic Valley, the largest organic dairy cooperative in the country, added new farms in 2023, they brought on just 84 operations, according to Dairy Herd reporting. Premium market access is growing, but it’s not unlimited.
For mid-sized cooperatives exploring this space, the entry barriers are substantial: processing infrastructure for ultrafiltration runs into the tens of millions; third-party certification programs require ongoing investment; and finding a retail or foodservice partner willing to commit long-term distribution adds another layer of complexity.
That said, some regional cooperatives are finding their own paths. Cobblestone Milk Cooperative in Virginia built its model around exceptionally high-quality standards—bacteria and somatic cell counts far below industry norms, as Dairy Herd has documented—creating differentiation without the use of ultrafiltration technology. The approach requires different capabilities than the fairlife model, but it shows there’s more than one route to premium positioning.
The key insight: fairlife’s success proves the premium fluid milk market exists and can grow. Replicating it requires either a massive corporate partnership or finding alternative differentiation strategies appropriate to your cooperative’s scale and capabilities.
The Genetics Angle: Why “Volume-Only” Selection Is Losing Ground
For Bullvine readers, here’s where the story gets especially relevant. The shift toward premium, composition-focused products isn’t just changing processor strategies—it’s fundamentally reshaping what genetics are worth money.
The April 2025 Net Merit revision from CDCB clearly tells the story. According to the official USDA-AGIL research document “Net merit as a measure of lifetime profit: 2025 revision,” the updated NM$ formula shifts emphasis significantly:
Trait
2021 NM$ Weight
April 2025 NM$ Weight
Direction
Protein
19.6%
13.0%
↓ Decreased
Fat
28.6%
31.8%
↑ Increased
Feed Saved
12.0%
17.8%
↑ Increased
Productive Life
11.0%
8.0%
↓ Decreased
Why the shift? Dr. Paul VanRaden, Research Geneticist at USDA and lead author of the Net Merit revision, describes NM$ 2025 as “a strategic response to the evolving dairy industry,” integrating recent economic data and market signals. Butterfat emphasis increased because consumer demand for butter and high-fat dairy products has strengthened. Protein emphasis decreased partly because the cheese market has matured, and premium fluid products like fairlife actually remove some protein during ultrafiltration.
The real-world expression of these genetic shifts is already visible. Corey Geiger with CoBank told Brownfield Ag News that Holstein butterfat levels reached a record 4.23% in 2024, while protein levels were 3.29%. The April 2025 genetic base change reflects this: Holsteins saw a 45-pound rollback on butterfat—that’s 87.5% higher than the 24-pound adjustment in 2020, and the largest base change in the breed’s genetic history. Protein rolled back 30 pounds.
Geiger’s projection is striking: he told Brownfield he believes butterfat levels “could pass five percent in the next decade” based on current consumer demand and genetic momentum.
What this means practically: bulls selected purely for milk volume without strong component percentages are becoming less valuable relative to high-component, high-health-trait sires. TPI formula adjustments reflect similar trends—Holstein Association USA has been increasing emphasis on fat and protein pounds while rebalancing type traits.
For breeding decisions today, the implications are clear:
Component percentages matter more than ever. A sire with +0.10% Protein and +0.35% Fat commands attention in ways volume-only genetics don’t.
Feed efficiency is gaining weight. The Feed Saved emphasis increase from 12% to 17.8% in NM$ reflects tighter margins and environmental pressure.
Health and longevity traits remain important but are being rebalanced against productivity gains.
The premium pivot isn’t just about finding a processor who’ll pay more for your milk. It’s about recognizing that the entire genetic selection framework is shifting toward what those premium products require.
The Two-Tiered Reality: Who Actually Benefits?
This brings us to what might be the most uncomfortable part of the story. The premium pivot and genetic evolution I’ve been describing don’t affect all operations equally. In fact, there’s a reasonable argument that these trends are accelerating the exit of smaller producers who can’t afford the entry costs.
The numbers are sobering. The 2022 USDA Census of Agriculture found just 24,082 U.S. dairy farms—down from 39,303 in 2017. That’s nearly a 40% decline in five years, as Brownfield Ag News and Dairy Reporter both reported. Lucas Fuess, senior dairy analyst at Rabobank, points out that 68% of U.S. milk now comes from farms with 1,000 or more cows—operations that represent only 8% of total farms.
Category
2017
2022
Number of U.S. dairy farms
39,303
24,082
Share of milk from farms with 1,000+ cows
60%
68%
Estimated share of farms with 1,000+ cows
6%
8%
Cost advantage of >2,000-cow farms vs. 100–199
$8/cwt cheaper
$10/cwt cheaper
The cost dynamics are stark. USDA data show farms milking more than 2,000 cows can operate roughly $10 per hundredweight cheaper than farms with 100-199 cows. That’s not a small gap—it’s the difference between profitability and struggling to break even.
Meanwhile, the 50-99 cow category—traditionally the heart of family dairy—has seen dramatic declines according to USDA census data, with the segment nearly halving between 2017 and 2022. Dr. Frank Mitloehner at UC Davis has noted that one of the main reasons smaller dairy farms are disappearing is “ever-tightening profit margins,”—and larger farms’ cost advantages enable them to “achieve much higher net returns,” as Dairy Global reported.
Peter Vitaliano, economist for the National Milk Producers Federation, told Brownfield that 2023 saw nearly 6% of licensed dairy farms exit, and he expected “an even higher rate of dairy farm closures” in 2024. Industry analysts project that this consolidation trend will continue, with production increasingly concentrated on the largest operations.
So when we talk about genomic testing at $25-50 per head, third-party certification programs, and processor relationships that require data transparency and infrastructure investment—who can actually afford that?
For a 2,000-cow California operation, genomic testing the replacement heifer crop might run $50,000-100,000 annually—a meaningful but manageable investment against a multi-million dollar revenue base. The same testing for a 150-cow Vermont farm costs $3,750-7,500—proportionally similar, but coming out of a much tighter margin with far less negotiating leverage on the premium side.
The infrastructure requirements for premium programs add another layer. FARM certification, video monitoring at handling points, sustainability documentation, and unannounced audit preparation—these require administrative capacity that larger operations can absorb more easily than smaller ones running lean.
Does “Collaborative Competition” Help the Small Producer?
The DMI partnership model—where checkoff dollars leverage private investment—has clearly grown the premium category. But does that growth help the 150-cow operation, or does it primarily benefit the large farms and cooperatives already positioned to capture that value?
The evidence is mixed.
On one hand, composition-based pricing tiers are expanding across cooperatives of various sizes. FarmFirst, Foremost Farms, and DFA all have programs that, in theory, reward any member farm that ships high-component milk. Genetic improvement is available to everyone who chooses to pursue it.
On the other hand, premium market access often requires scale. fairlife’s supplier base is deliberately limited to 99 member farms in Select Milk Producers. Organic Valley added just 84 farms in 2023 despite significant producer interest. The infrastructure investments driving premium product growth—like fairlife’s $650 million Webster, New York facility—create jobs and markets, but they don’t automatically open doors for every nearby farm.
The most honest assessment: the premium pivot has created new opportunities, but those opportunities aren’t equally accessible. Farms with existing cooperative relationships, geographic proximity to premium processors, capital for certification and genetic investment, and administrative capacity for compliance requirements are better positioned than those without. The “collaborative competition” model has grown the pie, but the slices aren’t being distributed equally.
For smaller operations, the strategic question becomes: what premium pathways are actually accessible given your scale, location, and cooperative membership? Direct-to-consumer sales, farmstead processing, local food networks, and quality-differentiated regional cooperatives like Cobblestone may offer more realistic paths than trying to break into fairlife’s supply chain.
Navigating the Fair Oaks Crisis
Every turnaround has a moment where the whole thing nearly falls apart. For dairy’s innovation strategy, that moment came in June 2019.
The Animal Recovery Mission, an animal welfare organization, released undercover footage from Fair Oaks Farms—one of fairlife’s primary milk suppliers in Indiana. The footage showed systematic mistreatment of calves, and Dairy Reporter, along with other trade publications, covered the story extensively.
The response from retailers was immediate. Industry reporting confirmed that major chains, including Jewel-Osco, Tony’s Fresh Market, and several others, pulled fairlife from shelves within days. Consumer boycotts gained momentum. Class action lawsuits were filed alleging deceptive marketing around animal welfare claims.
What happened next offers lessons for crisis management across the industry.
Rather than minimize the situation or deflect blame, fairlife and Coca-Cola chose transparency. They immediately suspended all milk deliveries from Fair Oaks Farms. Dairy Reporter confirmed they increased unannounced audits at supplier farms from once annually to 24 times per year—a dramatic escalation in oversight. They installed video monitoring systems at animal handling points and commissioned independent investigations of all supplying farms.
fairlife’s 2024 Animal Stewardship Report, as covered by Food Dive, notes the company has invested, along with its suppliers, nearly $30 million in its animal welfare program since the crisis. The company eventually paid $21 million to settle related litigation—Food Dive called it one of the largest settlements ever in an animal welfare labeling case.
It was expensive. It was risky—admitting failure often accelerates brand damage in the short term. But the approach preserved something more valuable: trust in the brand and in the category. By 2020-2021, fairlife had returned to most retail shelves. By 2022, it reached $1 billion in sales.
Practical Implications for Producers
So that’s the industry-level narrative. But what does it mean for someone actually running a dairy operation? That’s the question that matters most.
The shift affecting producers most directly is the changing economics around milk composition. The traditional model rewarded volume—more pounds shipped meant more revenue. The emerging model increasingly rewards components and quality characteristics that premium products require.
I’ve talked with several Upper Midwest producers who are seeing this play out in real time. Farms focusing on protein percentage and butterfat rather than volume alone are reporting meaningful improvements in their milk checks—even when shipping slightly less total volume. It requires a different way of thinking about what you’re actually producing.
Here’s the practical reality. Current Class III prices have been running in the mid-to-upper teens per hundredweight according to USDA milk pricing data, with month-to-month variation. Farms meeting premium composition targets through preferred supplier programs can access additional premiums, though specific rates vary considerably by processor and region.
Metric
Herd A – Volume Focus
Herd B – Premium Components
Avg. milk shipped/cow/day
90 lb
82 lb
Butterfat / Protein test
3.7% F / 3.05% P
4.2% F / 3.25% P
Base milk price
$18.00/cwt
$18.00/cwt
Component & quality premiums
$0.40/cwt
$1.30/cwt
Net mailbox price
$18.40/cwt
$19.30/cwt
Regional dynamics matter here. Upper Midwest cooperatives like FarmFirst and Foremost Farms have been building out composition-based pricing tiers, according to their published producer communications. California’s larger operations often negotiate directly with processors. Southeastern producers working through DFA have seen new preferred supplier programs emerge over the past couple of years. Pacific Northwest operations shipping to Darigold have their own regional dynamics. The opportunity exists, but access varies.
What many producers are discovering is that capturing these premiums requires intentional decisions rather than hoping the bulk tank tests well:
Genomic testing is typically the starting point. Testing replacement heifers for protein traits, A2 beta-casein status, and kappa-casein genotype generally runs in the $25-50 range per animal through commercial services, though prices vary by service level and volume. University extension dairy genetics research confirms these trait associations translate to real composition differences in the bulk tank over time. For a 100-heifer crop, you’re looking at a few thousand dollars—an investment that can return value within the first year of improved milk checks if you’re making culling and breeding decisions based on the results.
Sire selection follows from testing—and this is where the Net Merit shifts become directly actionable. Bulls ranking high on protein percentage, fat percentage, A2A2 genetics, and kappa-casein BB genotypes are increasingly valuable. A2A2 milk commands premiums in some markets because consumers perceive it as easier to digest. Research published in the Journal of Dairy Science confirms that kappa-casein BB genetics improve the processing characteristics of milk for ultra-filtered products.
Given the April 2025 NM$ revision, which emphasizes butterfat (+31.8% weight) and feed efficiency (+17.8% weight) while de-emphasizing protein pounds, sire selection strategies should reflect these economic realities. Volume-only genetics—high milk pounds without strong component percentages—are losing ground in the index and in the marketplace.
It’s worth noting that these genetic shifts take time. We’re talking about a 3-5 year timeline before you see the full expression in your herd. Decisions made today won’t show up meaningfully in bulk tank averages until 2028-2030. That’s the reality of cattle genetics—no shortcuts available.
Processor relationships are becoming strategic rather than purely transactional. I’d encourage any producer reading this to contact your processor’s sourcing or sustainability department and ask directly: What composition targets are you looking for? What premiums do you offer for hitting them? Do you have a preferred supplier program?
Some processors—DFA, Darigold, Land O’Lakes, and others—have formal programs that offer price premiums, contract stability, and technical support to farms that commit to composition targets and data transparency. These programs aren’t always well-publicized, but they exist.
Certification requirements are expanding as well. fairlife, Horizon Organic, and other premium brands increasingly require third-party sustainability verification from their suppliers. FARM certification, DHI participation, and documented environmental practices are becoming baseline expectations rather than differentiators.
Challenges and Uncertainties Ahead
It would be incomplete to discuss this turnaround without acknowledging the challenges that remain. Success creates its own vulnerabilities.
Capacity constraints are affecting the market right now. fairlife is production-limited, according to Coca-Cola’s Q3 2024 earnings commentary. CEO James Quincey explicitly stated they couldn’t meet demand until new capacity comes online. Cowsmo reported on a 745,000-square-foot, $650 million facility under construction in Webster, New York, that should help, but it’s been a bottleneck.
Policy changes create uncertainty. The Federal Milk Marketing Order reform, taking effect in 2025, is expected to affect milk pricing in various ways. The exact impact depends on your region and class utilization, so it’s worth checking with your cooperative or university extension for current projections specific to your situation.
Plant-based competition continues. The category keeps growing, with various market research firms projecting continued expansion through the early 2030s. Growth has moderated from the rapid 2018-2020 period, but oat milk in particular continues gaining ground with younger consumers.
Consolidation pressure isn’t easing. The trajectory from the 2022 census—40% fewer farms in five years—continues to pressure mid-size operations caught between the flexibility of small farms and the cost advantages of large ones.
Complacency may be the biggest risk. The discipline that built the turnaround—long-term research investment, consumer-centric product development, collaborative strategy—is exactly what successful industries tend to abandon once growth returns. If checkoff boards redirect funding from innovation to short-term promotion, or if processors reduce R&D as margins improve, the momentum could stall.
The Underlying Lesson
Looking at this entire arc, there’s a counterintuitive insight that applies beyond dairy.
The instinct when an industry faces decline is to work harder at the existing business. Cut costs. Improve efficiency. Fight for market share. Promote more aggressively.
Dairy tried all of that for years. It wasn’t sufficient—because when the market itself is shifting away from your core product, being better at the old thing only delays the inevitable.
What changed around 2014-2015 was a fundamental acceptance that commodity fluid milk, as traditionally sold, was unlikely to return to growth. Instead of fighting that reality, industry leaders asked what they could build that consumers actually wanted, using the infrastructure and supply chain already in place.
Same farms. Same cows. Same processing facilities. But instead of trying to sell more commodity milk at mid-teens per hundredweight, the focus shifted to creating categories where dairy had genuine advantages: ultra-filtered, lactose-free, high-protein, composition-specific products commanding meaningful premiums.
Volume is flat or slightly declining. Revenue per farm is higher. Margin per cow improved. Farm sustainability is better—for those who can access the premium markets.
That last qualifier matters. The turnaround is real, but its benefits aren’t flowing equally to all producers. The strategic question for any individual operation isn’t whether the premium pivot worked at the industry level—it clearly did—but whether and how you can position to capture some of that value given your specific scale, location, genetics, and cooperative relationships.
The Bottom Line
The dairy industry in late 2025 sits at an interesting inflection point. The turnaround appears real—2024’s growth wasn’t an anomaly, and analysis suggests the trajectory is continuing. Premium categories are expanding. Consumer perceptions of dairy are improving among key demographics. Genetic selection is evolving to support composition-focused production.
But the foundational work isn’t complete. New processing capacity is still coming online. Composition-focused genetics will take another 3-5 years to express in herds that are now fully selecting. Policy and trade uncertainty could affect even well-planned operations. And the consolidation pressure that’s eliminated 40% of U.S. dairy farms since 2017 shows no sign of reversing.
For producers, the practical implications come down to several key considerations:
Assess your herd’s genetic profile if you haven’t already. The information shapes every breeding decision going forward. With NM$ now emphasizing butterfat and feed efficiency more heavily, your selection criteria may need updating.
Initiate conversations with your processor about composition premiums. Programs exist but aren’t always well-publicized. Ask specifically what they’re seeking and what they offer for hitting targets.
Be realistic about premium market access. Not every farm can break into fairlife’s supply chain or join Organic Valley. Understand which premium pathways are actually accessible given your scale and cooperative membership—and consider alternatives, such as quality-focused regional cooperatives or direct marketing—if the major premium programs aren’t realistic options.
Plan for the 2028-2030 timeframe, not just next year’s milk check. Genetic decisions compound over time. Processor relationships require time to develop. The farms positioned well three years from now are making those decisions today.
Watch the consolidation dynamics. If you’re a mid-size operation, clearly understand whether your cost structure and market access can remain competitive as larger operations continue to gain share.
The turnaround didn’t happen because someone discovered a compelling marketing message that made consumers embrace commodity milk again. It happened because the industry stopped trying to preserve something consumers had moved past and started building what they actually wanted.
That’s perhaps the most transferable insight here. Not the specific technology or product. The willingness to accept that what worked for 50 years may not work for the next 20—and to build something new while there’s still time.
Key Takeaways
The 15-year decline is over. Fluid milk sales grew 0.8% in 2024—driven by premium products like fairlife, not commodity milk marketing.
Your genetics are being repriced. April 2025 Net Merit boosts butterfat to 31.8% and cuts protein to 13.0%. Volume-only bulls are losing economic ground.
$7.4 billion proves the premium model. Coca-Cola’s total fairlife investment shows the upside is real—but capturing it requires scale, certifications, and cooperative positioning most farms don’t have.
40% of U.S. dairy farms are already gone. Operations dropped from 39,303 (2017) to 24,082 (2022). Premium market benefits are concentrating in larger herds.
The question has changed. It’s no longer whether this shift is real—it’s whether your operation’s genetics, processor relationships, and market access position you to benefit from it. The farms winning in 2028 are making those decisions now.
Complete references and supporting documentation are available upon request by contacting the editorial team at editor@thebullvine.com.
This Dairy Innovation Just Made Gatorade Look Like Sugar Water – And It’s Now at Costco – Demonstrates how ultrafiltration technology is opening massive new retail categories beyond fluid milk. Learn how “waste” permeate is being transformed into high-value sports nutrition products, creating significant revenue opportunities for progressive operations.
The Sunday Read Dairy Professionals Don’t Skip.
Every week, thousands of producers, breeders, and industry insiders open Bullvine Weekly for genetics insights, market shifts, and profit strategies they won’t find anywhere else. One email. Five minutes. Smarter decisions all week.
A structural shift in dairy economics is creating new opportunities for farms producing protein-rich milk—and understanding these dynamics can help inform decisions in the months ahead.
Executive Summary: Dairy processors just made an $11 billion bet on protein—and that changes the equation for every milk check in America. With whey protein isolate trading above $8.50 per pound and the April 2025 Net Merit revision boosting Feed Saved from 12% to nearly 18%, the industry is signaling where value is heading for the next decade. Producers combining targeted genetics with amino acid nutrition are seeing protein improvements worth $60,000-70,000 annually on 500-cow operations. The catch? Your pricing structure determines whether you actually capture that value. Farms in large pooled cooperatives often keep only a fraction of their component gains, while those on direct Class III pricing retain most of what they produce. Before investing in protein optimization, one comparison matters most: what you received per pound of protein versus the Class III protein price over your last three months. That gap reveals whether this opportunity is real for your operation—or whether you’d simply be subsidizing someone else’s premium.
You know, if you’ve been watching your milk checks closely over the past year or so, you’ve probably noticed something shifting. Back in May 2024, USDA Cold Storage data showed butter inventories climbing to nearly 380 million pounds—the highest we’d seen since 2020. That’s a lot of butter sitting in warehouses.
Metric
2020
2024
Change
Butter Cold Storage (million lbs)
282
380
+35%
Whey Protein Isolate Price ($/lb)
$5.10
$8.50
+67%
New Protein Facility Investment
$2.1B
$11.0B
+424%
And here’s what got my attention: around the same time, cheese processors across the Upper Midwest started signaling they were receiving more cream than they needed for optimal cheese production. For those of us who remember when butterfat premiums seemed like they’d climb forever, it was a notable moment.
What’s happening isn’t that butterfat suddenly lost value—it hasn’t. It’s that processors have committed serious capital to cheese and whey protein facilities, and that’s changing what they need from the milk supply. The International Dairy Foods Association announced in October 2025 that America’s dairy processors have invested more than $11 billion in new and expanded manufacturing capacity across 19 states—with over 50 projects coming online between now and 2028.
That’s not a small bet. And it tells you something about where the industry sees value heading over the next decade.
Following the Investment Money
When I’m trying to understand where dairy markets are heading, I’ve always found it useful to watch where processors actually put their capital. Talk is cheap, but $870 million facilities tell you something.
That’s what Leprino Foods committed to their Lubbock, Texas plant—a decision the Texas Governor’s office and Texas Tech Research Park both documented back in April 2022. We’re talking about an 850,000-square-foot facility designed from the ground up for integrated mozzarella and whey protein production. When you build that kind of infrastructure, you’re making a decade-long bet on where value will come from.
And Leprino isn’t alone in this. Hilmar cut the ribbon on a $600 million facility in Dodge City, Kansas, back in March 2025—Dairy Processing magazine covered the opening extensively. Fonterra invested $240 million in New Zealand mozzarella capacity a few years back. Across Wisconsin and Minnesota, regional processors have been adding whey protein recovery equipment alongside cheese expansion projects.
What’s interesting is that this isn’t just a U.S. phenomenon. You’re seeing similar capital flowing toward protein and whey infrastructure in the EU and Oceania—which suggests this shift reflects global demand patterns rather than a temporary domestic trend. When processors on three continents are making the same bet, it’s worth paying attention.
What’s different about these investments compared to previous buildouts? The explicit focus on capturing whey value. I remember hearing Dr. Mark Stephenson—who recently retired as Director of Dairy Policy Analysis at UW-Madison—make this point at an industry meeting. Modern cheese plant economics increasingly depend on monetizing both the cheese and whey streams. Processors who can efficiently convert whey into high-value protein products have developed a meaningful competitive advantage.
The pricing reflects this shift. USDA data from late 2024 showed whey protein isolate climbing above $8.50 per pound—record territory—and prices have continued strengthening into 2025. If you look at USDA Dairy Market News reports, whey protein concentrate has more than doubled in many markets from where it sat back in 2018.
Why such sustained strength? Several factors have converged globally, which is part of what makes this feel structural rather than cyclical. China remains one of the world’s largest importers of dairy ingredients, with significant demand for infant formula components. Sports nutrition markets in Asia and Europe continue expanding. Meanwhile—and this one caught most of us off guard—the rapid adoption of GLP-1 weight-loss medications has created substantial new protein demand. Industry analysts have noted that patients on drugs like Ozempic are advised to maintain high protein intake, and that’s flowing through to whey consumption in ways nobody predicted five years ago.
When processors can generate meaningful revenue from whey alone, their willingness to pay for protein-rich milk makes straightforward economic sense.
What the Net Merit Changes Tell Us
The April 2025 revision to Net Merit offers another window into where the industry sees value heading. If you haven’t looked at the updated trait weights from the Council on Dairy Cattle Breeding, they’re worth examining.
Here’s how the emphasis shifted:
Trait
Previous Weight (2021)
New Weight (2025)
Change
Feed Saved
12.0%
17.8%
+5.8%
Butterfat
28.6%
31.8%
+3.2%
Protein
19.6%
13.0%
-6.6%
Productive Life
11.0%
8.0%
-3.0%
Cow Livability
7.0%
8.0%
+1.0%
Heifer Livability
1.3%
2.0%
+0.7%
That decrease in protein weight catches people off guard at first—it seems to contradict everything we’ve been discussing about protein demand. But dig into the methodology, and it makes more sense. Protein value is now being captured through multiple pathways in the formula—feed efficiency, component relationships, and longevity factors. A bull producing efficient daughters with strong components and a good productive life captures protein value across several trait categories rather than just one line item.
What does this means practically? Bulls that looked middling under older indexes—solid on efficiency and percentages but perhaps not flashy on production—are ranking considerably higher now. I’ve talked with several producers who’ve gone back through old sire catalogs and found bulls they’d passed over now sitting in the top tier.
One Wisconsin dairyman put it well: “Same genetics, completely different economic picture. The index finally caught up with what processors want to buy.”
The Nutrition Piece
Farms seeing the strongest protein gains are generally combining genetic direction with targeted nutrition work. The approach that’s gotten the most traction centers on rumen-protected amino acid supplementation—specifically methionine and lysine.
The science here is fairly well established at this point. Research published in the Journal of Dairy Science and extension work from programs like Penn State has documented that methionine and lysine are frequently the first-limiting amino acids for protein synthesis in typical corn silage-based Midwest rations. When you can get adequate methionine past the rumen and into the small intestine, cows can convert more of their dietary protein into milk protein.
What does implementation actually look like? Based on extension recommendations from Wisconsin, Minnesota, and Cornell, most successful protocols run around 15 grams of rumen-protected methionine per cow daily, balanced with lysine at roughly a 3:1 ratio. But the amino acids aren’t magic—they work best when the underlying ration is already well-balanced.
And here’s something I’ve noticed: farms often see protein responses from improving the basics before they even add supplements. Better feeding frequency, improved bunk management, attention to fresh cow nutrition during those critical first 60 days… sometimes the fundamentals matter most.
The transition period deserves particular attention. Research from land-grant universities has shown that close-up dry cow nutrition influences early lactation performance in meaningful ways. Getting that pre-fresh nutrition right sets the table for everything that follows.
When farms execute this well, they’re typically seeing protein improvements of 0.15 to 0.25 percentage points within a month or two—though results vary depending on the baseline diet and management. Run that math on a 500-cow herd, and you’re looking at meaningful dollars—potentially $60,000-70,000 annually at current component premiums.
Of course, there’s investment required on the front end. Amino acid programs run $25,000-35,000 per year for a herd that size, plus genetic program costs. Most farms doing this well are seeing positive returns within about a year.
But—and this is important—that math depends heavily on how your milk is actually priced.
The Pricing Question That Matters Most
Here’s where individual circumstances become crucial, and where I’ve seen producers make costly assumptions.
Not all milk payment systems reward improvements to components equally. Depending on your situation, the same investment might generate very different returns.
If you’re on component-indexed pricing—straight Class III or IV federal order payments—protein improvements generally flow through to your check within a few weeks. These operations typically capture a significant portion of the commodity value from their component gains.
Pooled cooperative pricing is more complicated. When your milk blends with dozens or hundreds of other farms before payment calculations happen, individual component improvements get diluted across the pool. I spoke with a producer in central Wisconsin who learned this the hard way—invested significantly in nutrition and genetics, moved his tank from 3.05% to 3.28% protein, but his cooperative pools 94 farms, and the pool average barely budged. He got paid on the pool number, not his individual achievement.
Fixed contracts present another scenario. Multi-year arrangements may not reflect component changes until renegotiation, regardless of what’s happening in commodity markets.
⚠️ A Word of Caution for Large-Pool Operations
If you’re shipping to a cooperative that pools 100+ farms, it’s worth getting written confirmation of how your individual component improvements will be valued before ramping up amino acid spending. Ask specifically: “Will my protein be paid out above the pool average, or blended into the pool before my check is calculated?”
I’ve seen situations where producers invested $30,000+ annually but captured only a fraction of the value their cows actually produced—in some cases, by my rough math, maybe 20-30% of what they’d have received under direct component pricing. Your numbers will be different, so pull your last few settlement sheets, compare your protein line item to the Class III protein price during those months, and see what the gap actually looks like for your operation.
Get the details in writing before you write that first feed additive check.
Pricing Structure
Component Capture
Payment Lag
Annual Impact (500-cow)
Risk
Direct Class III
90-98%
2-3 weeks
+$68,000
Low
Small Pool Co-op (20)
70-85%
4-8 weeks
+$52,000
Moderate
Large Pool Co-op (100+)
25-35%
8-12 weeks
+$22,000
High
Fixed Multi-Year
0% until renewal
12-36 months
$0-$15,000
High
Before committing resources to protein optimization, have a direct conversation with your cooperative or processor. Some questions worth asking:
Questions for Your Processor
How exactly is protein valued in my payment?
What premium applies per point above baseline?
Is my pricing tied to commodity markets or fixed?
How does my individual production factor into payment versus pool averages?
Are changes to component pricing under consideration in the next few years?
Getting clear answers—ideally in writing—helps ensure your investments match your actual payment reality.
Thinking About Timing
Farms that started this work back in late 2024 have developed certain advantages—genetic progress, processor relationships, and, in some cases, contract terms that reflected the recruitment phase of new facility buildouts.
Looking at how things are unfolding: 2024-2025 represented the buildout phase, with new capacity coming online and processors actively seeking milk to fill facilities. Premium arrangements were more available during that window.
Through 2026-2027, we’ll likely see that capacity reaching target utilization. Processor relationships are solidifying, and the terms available to new suppliers may differ from what early movers secured.
By 2028-2029, assuming demand projections hold, markets should approach something like equilibrium. Premiums probably moderate from current peaks—not disappear, but normalize.
For operations starting now, this means entering somewhat behind early movers. Genetics compound over time, so there’s a gap that doesn’t fully close. But farms that begin today can still achieve meaningful improvement compared to operations that make no changes. The opportunity looks different from than it did in 2024, but it’s certainly not gone.
A Few Things Worth Thinking Through
Every strategic direction involves tradeoffs, and the protein focus is no exception. Here are a few considerations that deserve honest attention.
Component ratio balance matters for cheese manufacturing. Research from the American Dairy Products Institute indicates that most cheese production works best with protein-to-butterfat ratios in the 0.80-0.90 range. CoBank economist Corey Geiger has noted that cheesemakers strive for ratios near 0.80—anything significantly lower can affect cheese quality. Farms that substantially increase protein while butterfat falls may find their milk components less desirable for certain applications.
Input cost variability has surprised some operations. Rumen-protected amino acid prices spiked significantly back in 2021-2022 when supply disruptions hit. Building some flexibility into nutrition programs helps manage that exposure.
Genetic diversity deserves ongoing attention, too. With genomic selection concentrating breeding on popular sire families, inbreeding levels have climbed substantially over the past couple of decades—recent CDCB data shows levels exceeding 15% in some young Holstein bull populations. The costs show up in fertility and health over time, though they’re easy to overlook in the short term. Maintaining reasonable sire diversity isn’t just academic—it’s practical risk management.
Regional market variation matters quite a bit as well. Upper Midwest farms near major cheese processors are well-positioned for this approach. Operations in fluid milk markets or regions where butter production dominates may see more limited benefit regardless of their component achievements. Knowing your market matters before optimizing for it.
The Sustainability Angle
When sustainability premiums first entered industry conversations, I’ll admit to some skepticism about whether they’d actually show up at the farm level. That picture seems to be evolving.
With the EU’s Carbon Border Adjustment Mechanism set to take full effect next month, in January 2026, processors exporting cheese to Europe will face new carbon-intensity-based costs. This creates real incentive to source lower-emission milk. Paying farmers for documented carbon reductions becomes economically rational when it saves on export compliance costs.
Here’s what connects this to protein work: farms improving feed efficiency while maintaining strong milk components inherently reduce emissions per unit of output. Research from universities including Penn State and UC Davis suggests that improved efficiency translates to lower carbon intensity per pound of milk solids produced.
Done thoughtfully, component optimization and emissions reduction can complement each other rather than compete.
Several European cooperatives have already implemented farmer incentive programs along these lines. U.S. processors are developing pilot programs. This probably isn’t the primary reason to pursue protein optimization today, but it’s an increasingly relevant factor that may strengthen the case over time.
Getting Started Thoughtfully
For operations considering this direction, the first 90 days often matter more than elaborate long-term plans. Based on conversations with producers who’ve navigated this successfully, here’s a reasonable framework:
The first month should focus on understanding your actual situation. Document current milk composition—protein, butterfat, and their ratio. Have honest conversations with your processor about how components are valued in your payment. Look at your current genetics through the updated Net Merit lens.
The second month is for testing at conservative levels. Maybe start amino acid supplementation around 10-12 grams rather than full protocols. Focus on feeding fundamentals and bunk management. Track composition weekly rather than waiting for monthly tests.
By month three, you should have enough information to determine whether this fits your operation. If the response looks positive, genomic testing can identify your strongest replacement genetics. Continue building processor relationships with real data. Evaluate whether deeper investment makes sense given what you’ve learned.
This approach generates actual information before requiring major commitments.
The Bottom Line
The dairy industry is working through its most significant component value evolution in quite some time. How individual farms respond will depend substantially on their specific circumstances—pricing structure, regional market, capital situation, and risk tolerance.
A few things seem reasonably clear from the data and from conversations with producers navigating these decisions:
The underlying shift appears structural. Processor investments of $11 billion don’t respond to temporary signals. The infrastructure going in will influence economics for years.
Individual circumstances determine actual returns. Understanding precisely how your milk is priced matters enormously before committing resources.
Nutrition typically shows results faster than genetics. Amino acid work can demonstrate effects within weeks; genetic progress compounds over years. Using nutrition gains to fund genetic investment creates sustainable momentum.
Thoughtful risk management enhances outcomes. Maintaining component balance, reasonable fertility standards in genetic selection, sire diversity, and program flexibility all contribute to durable success.
Some farms will determine, after careful analysis, that their situation makes this direction less attractive. That’s genuinely useful information.
For others, there’s still an opportunity to develop a thoughtful approach aligned with where the industry appears headed. The terms differ from early mover advantages, but the fundamental economics remain sound for many operations.
Here’s your challenge: Pull your milk checks from the last 3 months this week. Calculate exactly what you received per pound of protein versus what the Class III protein price was during those months. If the gap is more than 15%, you’re losing money to your payment structure—and no amount of genetic progress or nutrition investment will close that gap until you address the pricing problem first.
The processors have placed their bets. The question is whether your operation is positioned to benefit—or whether you’re subsidizing someone else’s protein premium.
Key Takeaways
$11 billion in new facilities signals processors are betting long-term on protein—this is structural, not cyclical
Net Merit 2025 reshuffled genetics—Feed Saved jumped from 12% to 18%; some bulls you overlooked now rank at the top
Nutrition delivers faster than genetics: 15g daily methionine + 3:1 lysine ratio can boost protein 0.15-0.25 points within 60 days
Your pricing structure is everything—farms in large pooled co-ops may capture only 20-30% of component improvements
Do the math before you invest: Compare 3 months of protein payments to Class III prices—a gap over 15% means fix pricing first
Complete references and supporting documentation are available upon request by contacting the editorial team at editor@thebullvine.com.
Learn More:
The $38,000 Question: Why Components Beat Volume in Dairy’s New Reality – Reveals the specific mathematics behind shifting from volume to components, demonstrating how hitting 4.3% butterfat targets can generate an additional $38,000 annually per 500 cows while reducing overhead costs.
Every week, thousands of producers, breeders, and industry insiders open Bullvine Weekly for genetics insights, market shifts, and profit strategies they won’t find anywhere else. One email. Five minutes. Smarter decisions all week.
Net Merit 2025 is set to revolutionize dairy breeding. Launching April 1, 2025, this updated index emphasizes butterfat, feed efficiency, and cow longevity. Discover how these changes could boost your herd’s profitability and shape the future of dairy farming. Are you ready for the next generation of genetics?
Summary:
The Council on Dairy Cattle Breeding (CDCB) is set to launch Net Merit 2025 on April 1, 2025, introducing significant updates to the genetic selection index for dairy farmers. This revision adjusts trait emphases to reflect current market trends and production realities, with notable changes including increased butterfat production, a greater focus on feed efficiency, and more weight on cow and heifer livability. The update aims to improve cow profitability over generations by combining economic values for 12 individual traits and five composite subindexes into a single value. While the changes are substantial, the high correlation between the 2025 and 2021 indexes suggests stability in genetic evaluations. Dairy farmers are encouraged to consider these updates in their long-term breeding strategies, considering that the index may not perfectly reflect individual farm conditions. Additional specialized indices are available for specific production systems, offering farmers flexibility in aligning genetic selection with their particular market and operational needs.
Key Takeaways:
The Council on Dairy Cattle Breeding (CDCB) will release Net Merit 2025 to enhance dairy genetic selection based on current market trends.
The updated index emphasizes butterfat production and livability while de-emphasizing protein to align with economic changes.
Specialized indices, such as Cheese Merit, Fluid Merit, and Grazing Merit, help tailor genetic selection to various production systems.
Net Merit provides a long-term strategy for improving dairy cow profitability, emphasizing trends of economically vital traits.
Farmers are encouraged to stay informed through USDA resources and industry workshops to incorporate Net Merit into breeding decisions optimally.
The Council on Dairy Cattle Breeding (CDCB) will introduce Net Merit 2025, which includes updated genetic selection methods for dairy farmers, on April 1, 2025. This update revises genetic selection for dairy farmers nationwide and adjusts trait emphasis to reflect current market trends and production realities.
What is Net Merit?
The Lifetime Net Merit (NM$) index ranks dairy animals based on their combined genetic merit for economically important traits. Net Merit 2025 introduces innovative methods for evaluating traits and economic factors in dairy animals.
Dr. Paul VanRaden, a Research Geneticist at USDA, highlights Net Merit 2025 as a strategic response to the evolving dairy industry. The update integrates recent economic data and research to assist farmers in breeding more profitable cows.
NM$ combines values of particular traits and subindexes to improve the profitability of cows over multiple generations.
The Evolution of Net Merit
First published in 1994 by the USDA’s Animal Improvement Programs Laboratory, Net Merit has been routinely updated at three—to four-year intervals. The index weights are based on an economic model that considers incomes and expenses over a dairy cow’s lifetime, using data from public sources when possible.
Net Merit 2025 is the result of extensive collaboration. The process included:
Initial drafting by USDA’s Animal Genomics and Improvement Laboratory (AGIL) in the summer of 2024
Public discussion at the CDCB Industry Meeting during World Dairy Expo
Presentation to university experts at the S-1096 Multistate Research Project meeting
Review by CDCB’s Genetic Evaluation Methods and Producer Advisory Committees
Final approval by the CDCB Board of Directors in December 2024
Key Changes in Net Merit 2025
Comparison of Trait Weights
The following table shows the expected relative value of economically rooted weights of traits in the revised April 2025 Net Merit $ formula, compared to weights in the current formula:
Trait
Current NM$
April 2025 NM$
Protein
19.6%
13.0%
Fat
28.6%
31.8%
Feed Saved
12.0%
17.8%
Productive Life
11.0%
8.0%
Cow Livability
7.0%
8.0%
Udder Composite
7.0%
7.0%
Fertility
6.8%
6.8%
Heifer Livability
1.3%
2.0%
The 2025 revision includes significant changes:
Butterfat Emphasis: The emphasis on butterfat production has increased, aligning with recent price trends. The weight of fat in NM$ has risen from 28.6 to 31.8.
Protein De-emphasis: The weight for protein decreased from 19.6 to 13.
Livability Focus: Greater emphasis on cow and heifer livability, reflecting higher cull cow and heifer calf prices.
Feed Efficiency: More negative emphasis on Body Weight Composite and greater focus on Residual Feed Intake to address feed costs.
Minimal Reranking: The 2025 and 2021 NM$ indexes show a high correlation of 0.992 for young Holstein bulls and 0.981 for recent progeny-tested bulls, indicating stability in genetic evaluations.
Customized Selection Indices
In addition to NM$, CDCB offers three more indices customized for specific dairy operations: Cheese Merit (CM$), Fluid Merit (FM$), and Grazing Merit (GM$).
Cheese Merit (CM$): Tailored for cheese producers, this index emphasizes protein and somatic cell score.
Fluid Merit (FM$): Designed for fluid milk producers, focusing on milk volume and butterfat.
Grazing Merit (GM$): Optimized for pasture-based systems, prioritizing fertility and adaptability.
These specialized indices allow farmers to align genetic selection with their specific market and production system.
Applying Net Merit to Your Farm
While Net Merit is a valuable tool, it may not comprehensively capture each farm’s conditions. Therefore, it is recommended that farmers prioritize evaluating the genetic progress trends for traits most vital to their operations.
“Rather than focus on one number or another, it’s more helpful to look at the big picture,” suggests VanRaden. “USDA provides the expected genetic progress in each trait from selection on NM$, and it’s better to see if the trends for the traits most important to you are in the desired direction.”
Long-Term Strategy for Herd Improvement
Farmers should adopt a long-term perspective when considering Net Merit 2025 to achieve sustainable improvements in their herds. The index has been designed to improve cow profitability over the generations, requiring patience and consistent application.
Staying Informed
For the latest information on Net Merit and its applications:
Review USDA AGIL’s technical document detailing Net Merit calculations.
Watch Paul VanRaden’s PowerPoint presentation, which summarizes changes and provides examples of how genetic values affect a cow’s lifetime profit.
Engage with industry workshops and webinars to stay updated on genetic selection strategies.
Conclusion: Embracing the Future of Dairy Genetics
Net Merit 2025 signifies the dairy industry’s dedication to advancement, efficiency, and sustainability beyond an index update. Embracing these tools and staying informed about industry developments can empower dairy farmers to succeed in a constantly evolving market.
Looking ahead, farmers should actively engage with and adapt to these modifications. How do you plan to incorporate Net Merit 2025 into your breeding decisions? Share your thoughts and join the conversation shaping the future of dairy farming.
To provide the best experiences, we use technologies like cookies to store and/or access device information. Consenting to these technologies will allow us to process data such as browsing behavior or unique IDs on this site. Not consenting or withdrawing consent, may adversely affect certain features and functions.
Functional
Always active
The technical storage or access is strictly necessary for the legitimate purpose of enabling the use of a specific service explicitly requested by the subscriber or user, or for the sole purpose of carrying out the transmission of a communication over an electronic communications network.
Preferences
The technical storage or access is necessary for the legitimate purpose of storing preferences that are not requested by the subscriber or user.
Statistics
The technical storage or access that is used exclusively for statistical purposes.The technical storage or access that is used exclusively for anonymous statistical purposes. Without a subpoena, voluntary compliance on the part of your Internet Service Provider, or additional records from a third party, information stored or retrieved for this purpose alone cannot usually be used to identify you.
Marketing
The technical storage or access is required to create user profiles to send advertising, or to track the user on a website or across several websites for similar marketing purposes.
To provide the best experiences, we and our partners use technologies like cookies to store and/or access device information. Consenting to these technologies will allow us and our partners to process personal data such as browsing behavior or unique IDs on this site and show (non-) personalized ads. Not consenting or withdrawing consent, may adversely affect certain features and functions.
Click below to consent to the above or make granular choices. Your choices will be applied to this site only. You can change your settings at any time, including withdrawing your consent, by using the toggles on the Cookie Policy, or by clicking on the manage consent button at the bottom of the screen.
Functional
Always active
The technical storage or access is strictly necessary for the legitimate purpose of enabling the use of a specific service explicitly requested by the subscriber or user, or for the sole purpose of carrying out the transmission of a communication over an electronic communications network.
Preferences
The technical storage or access is necessary for the legitimate purpose of storing preferences that are not requested by the subscriber or user.
Statistics
The technical storage or access that is used exclusively for statistical purposes.The technical storage or access that is used exclusively for anonymous statistical purposes. Without a subpoena, voluntary compliance on the part of your Internet Service Provider, or additional records from a third party, information stored or retrieved for this purpose alone cannot usually be used to identify you.
Marketing
The technical storage or access is required to create user profiles to send advertising, or to track the user on a website or across several websites for similar marketing purposes.


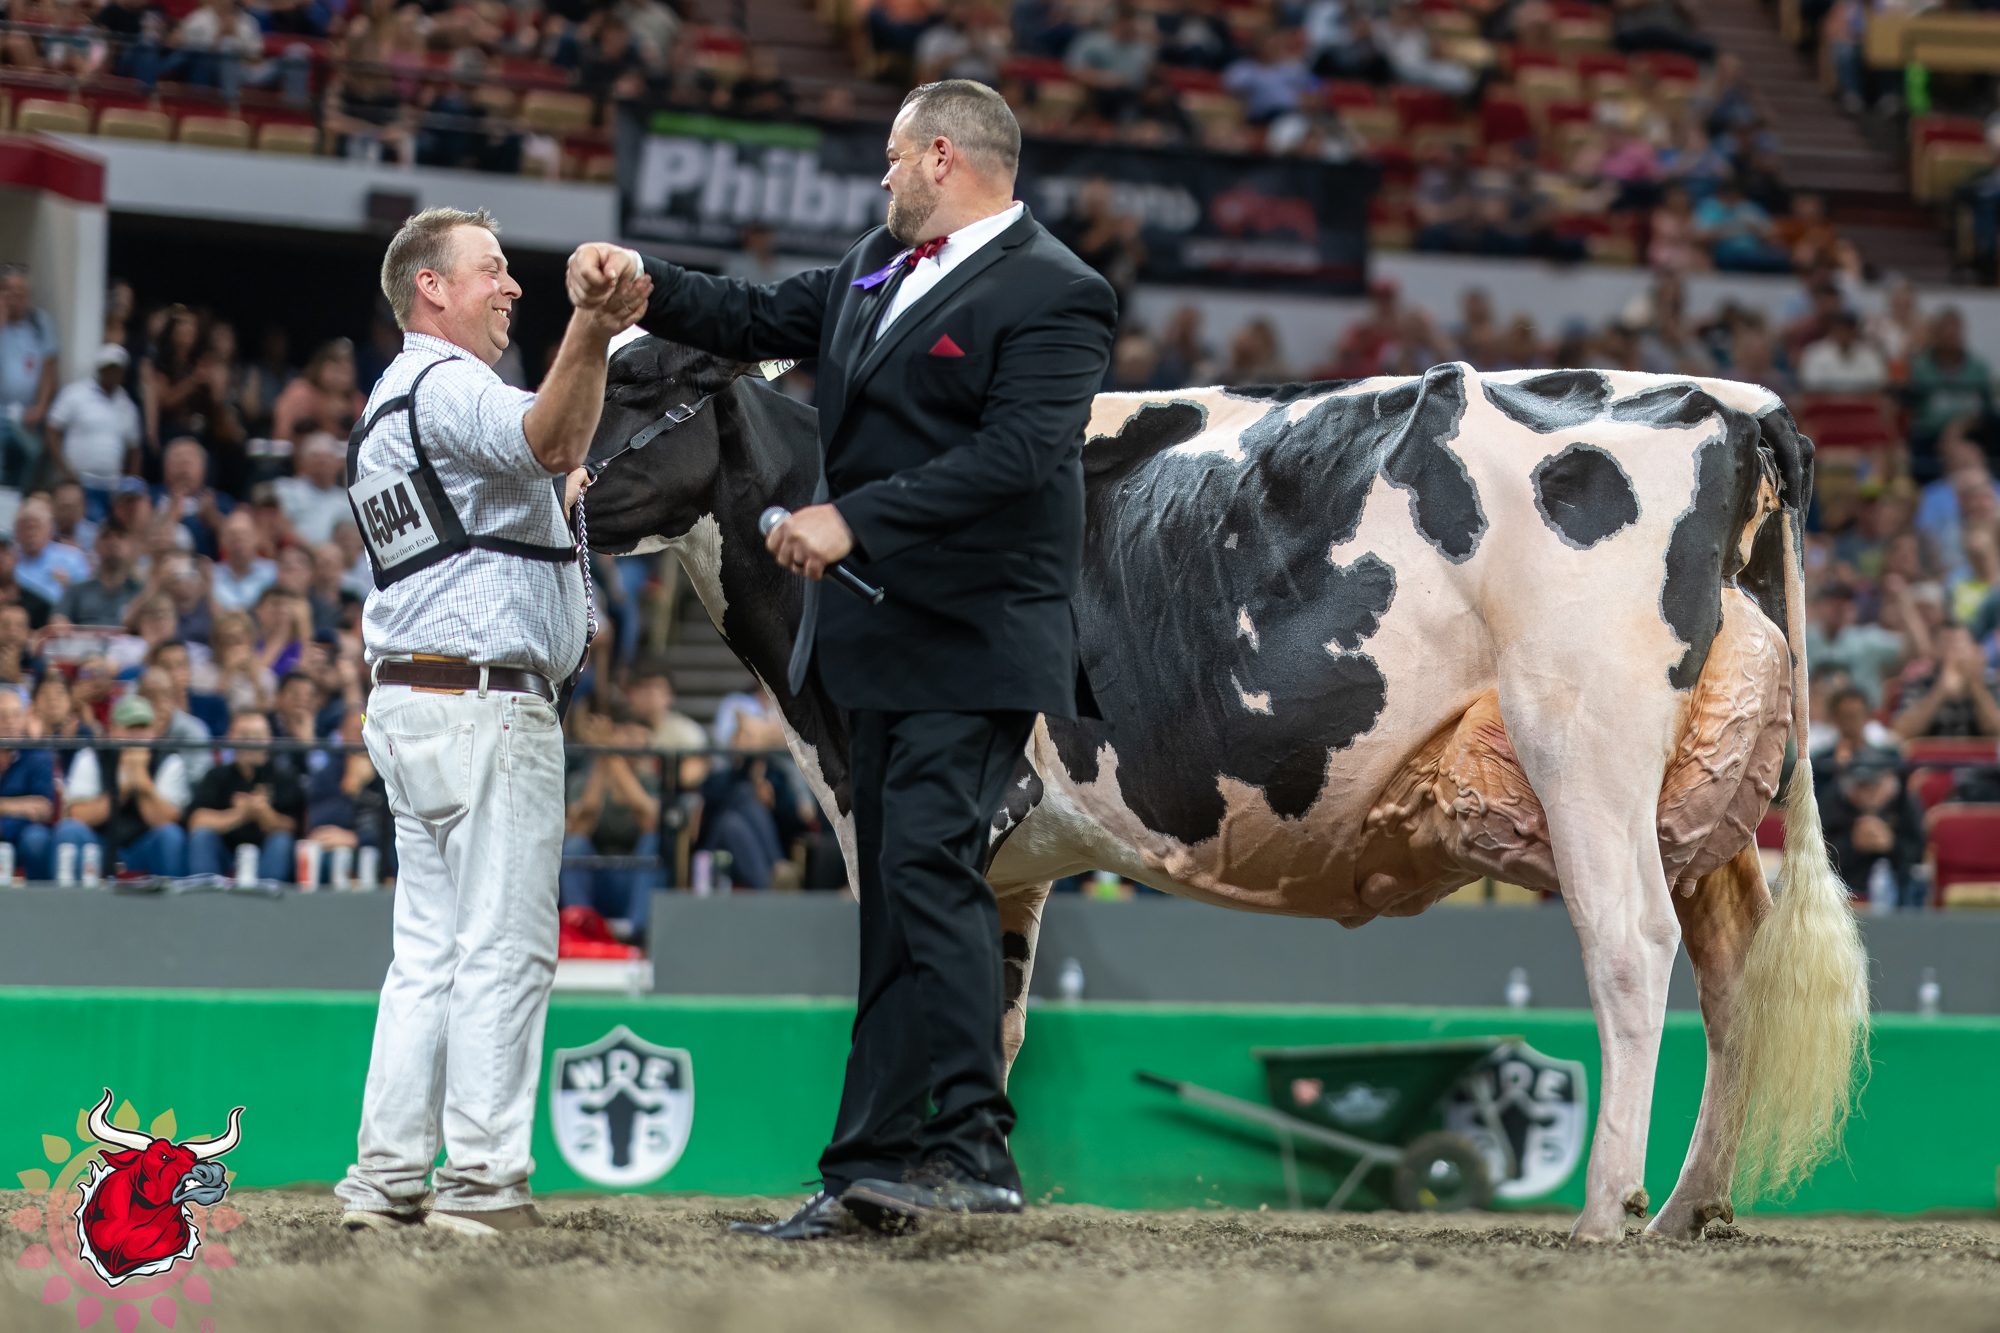
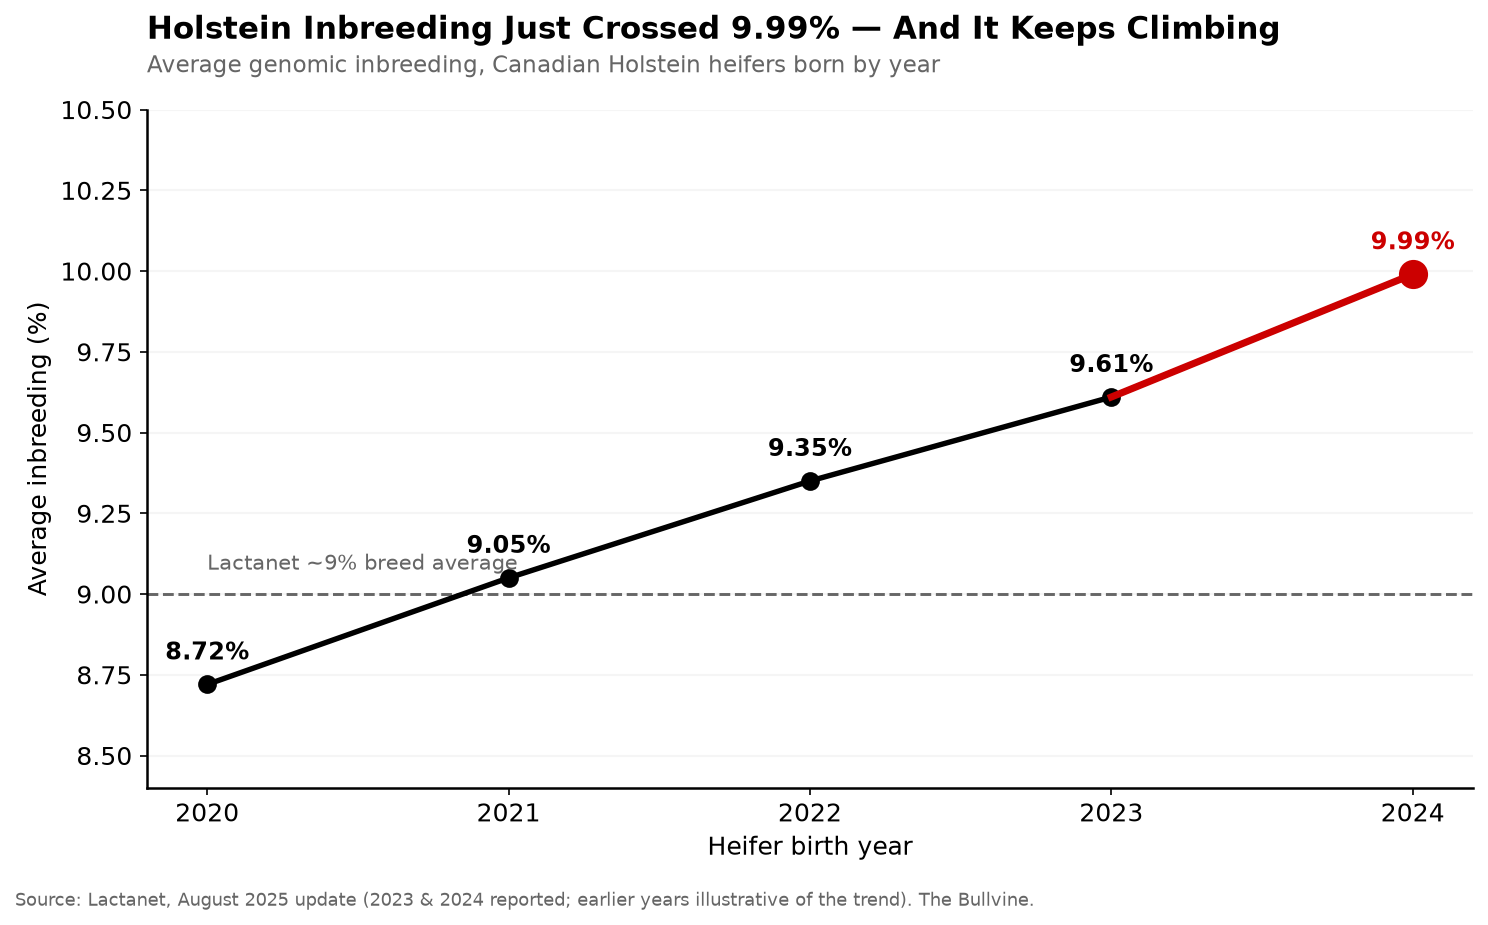
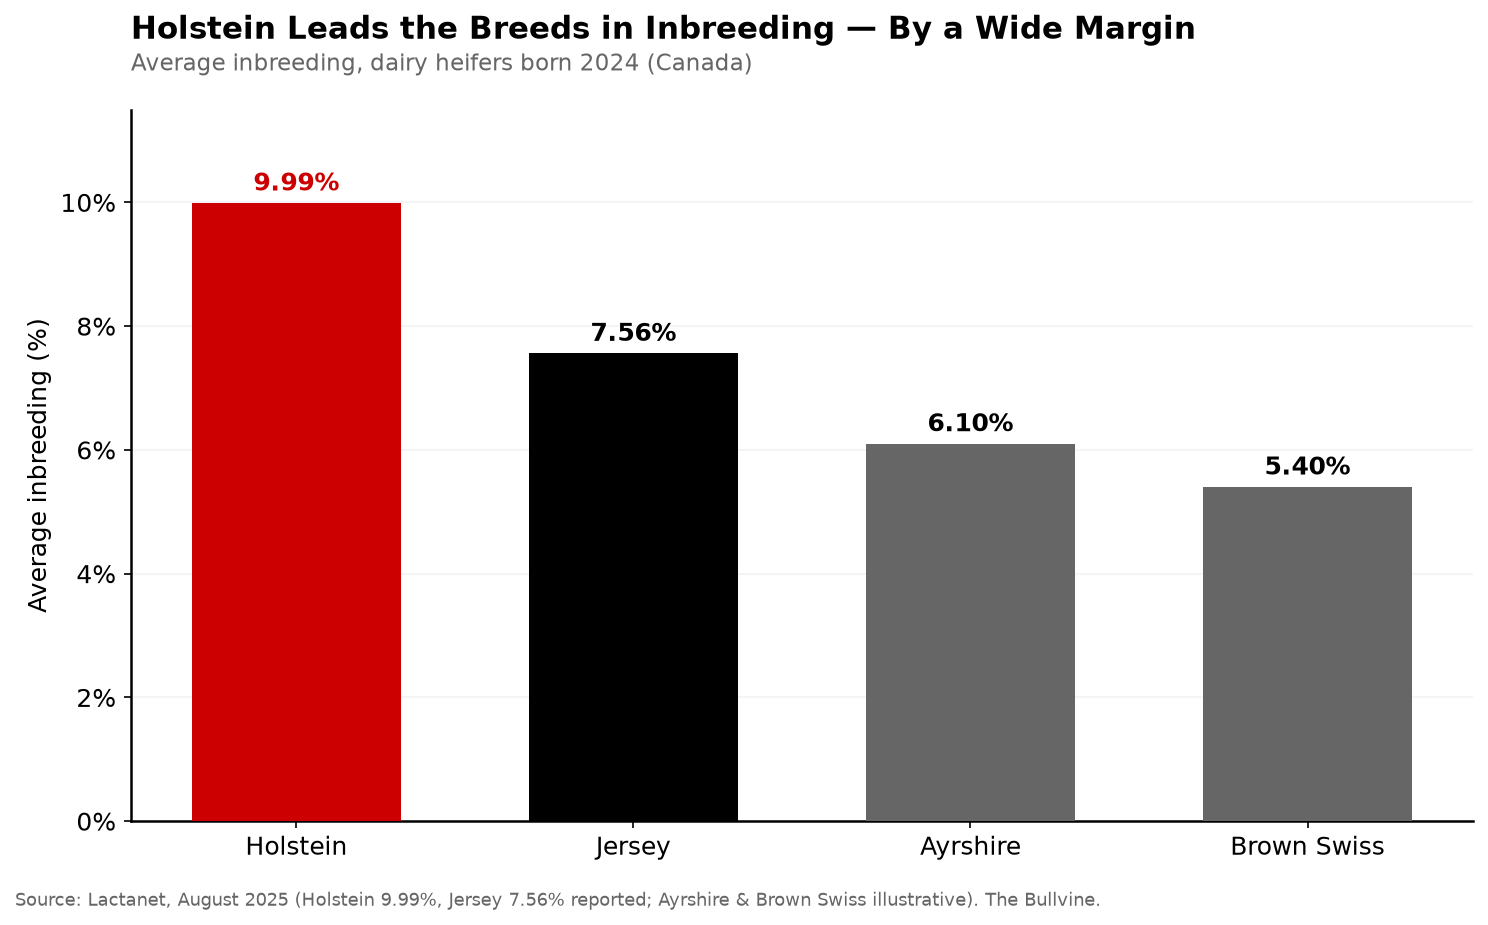
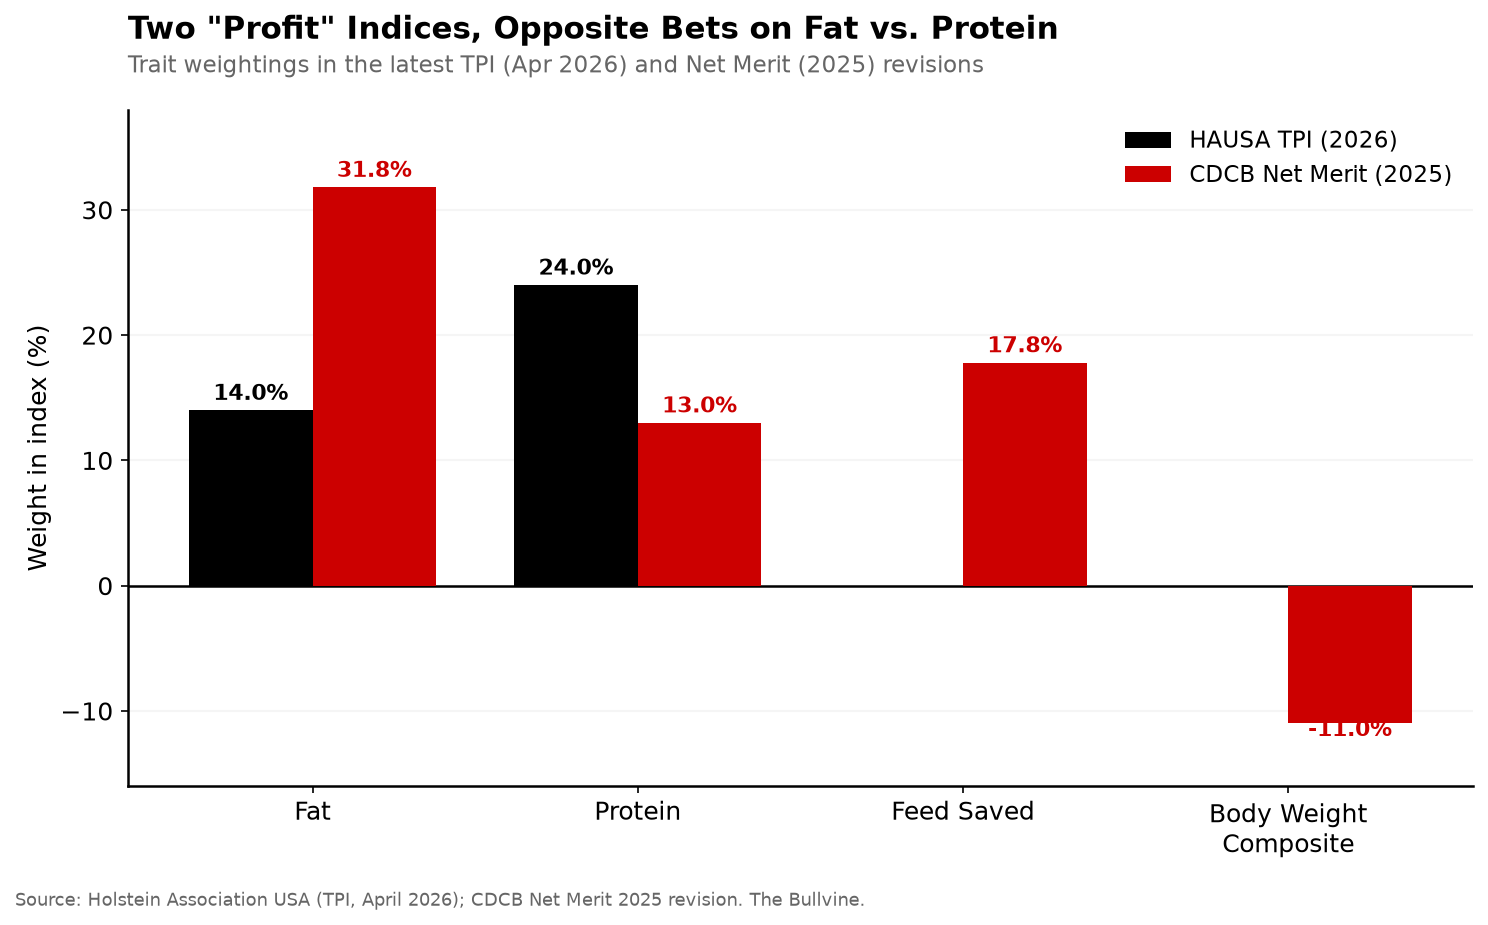
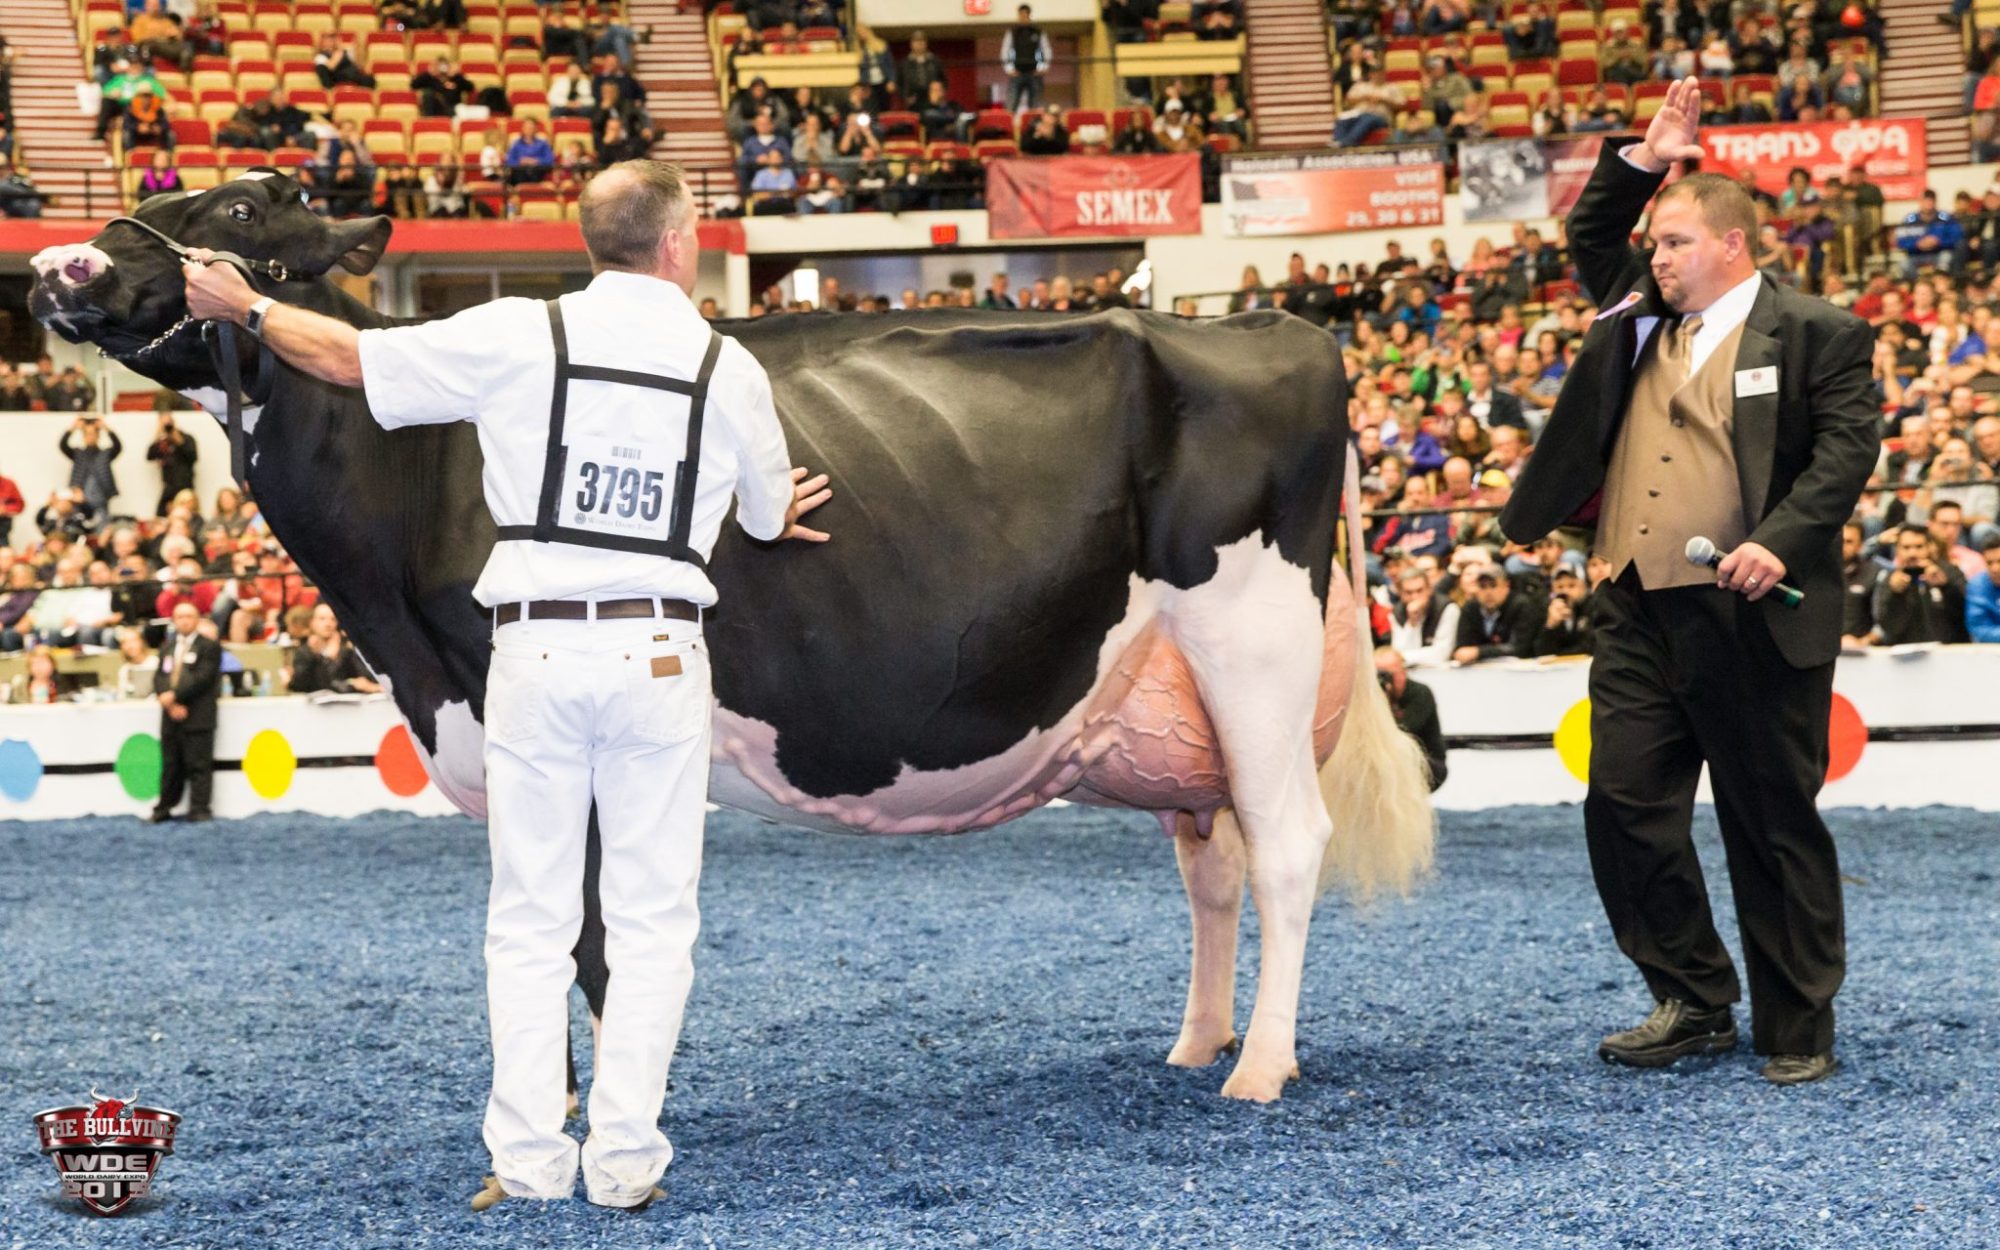
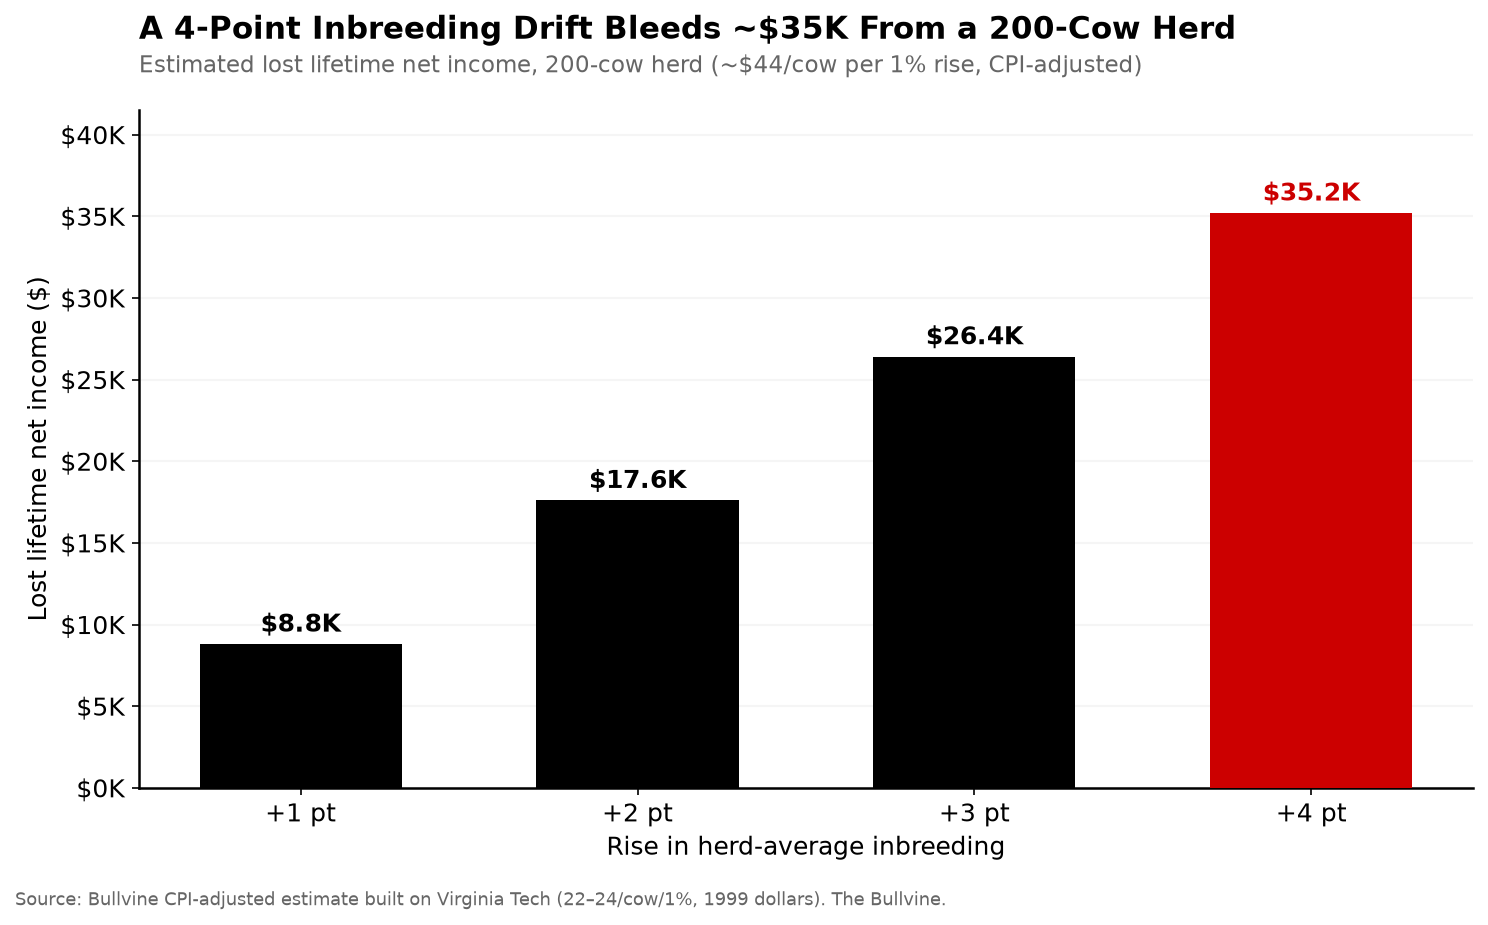
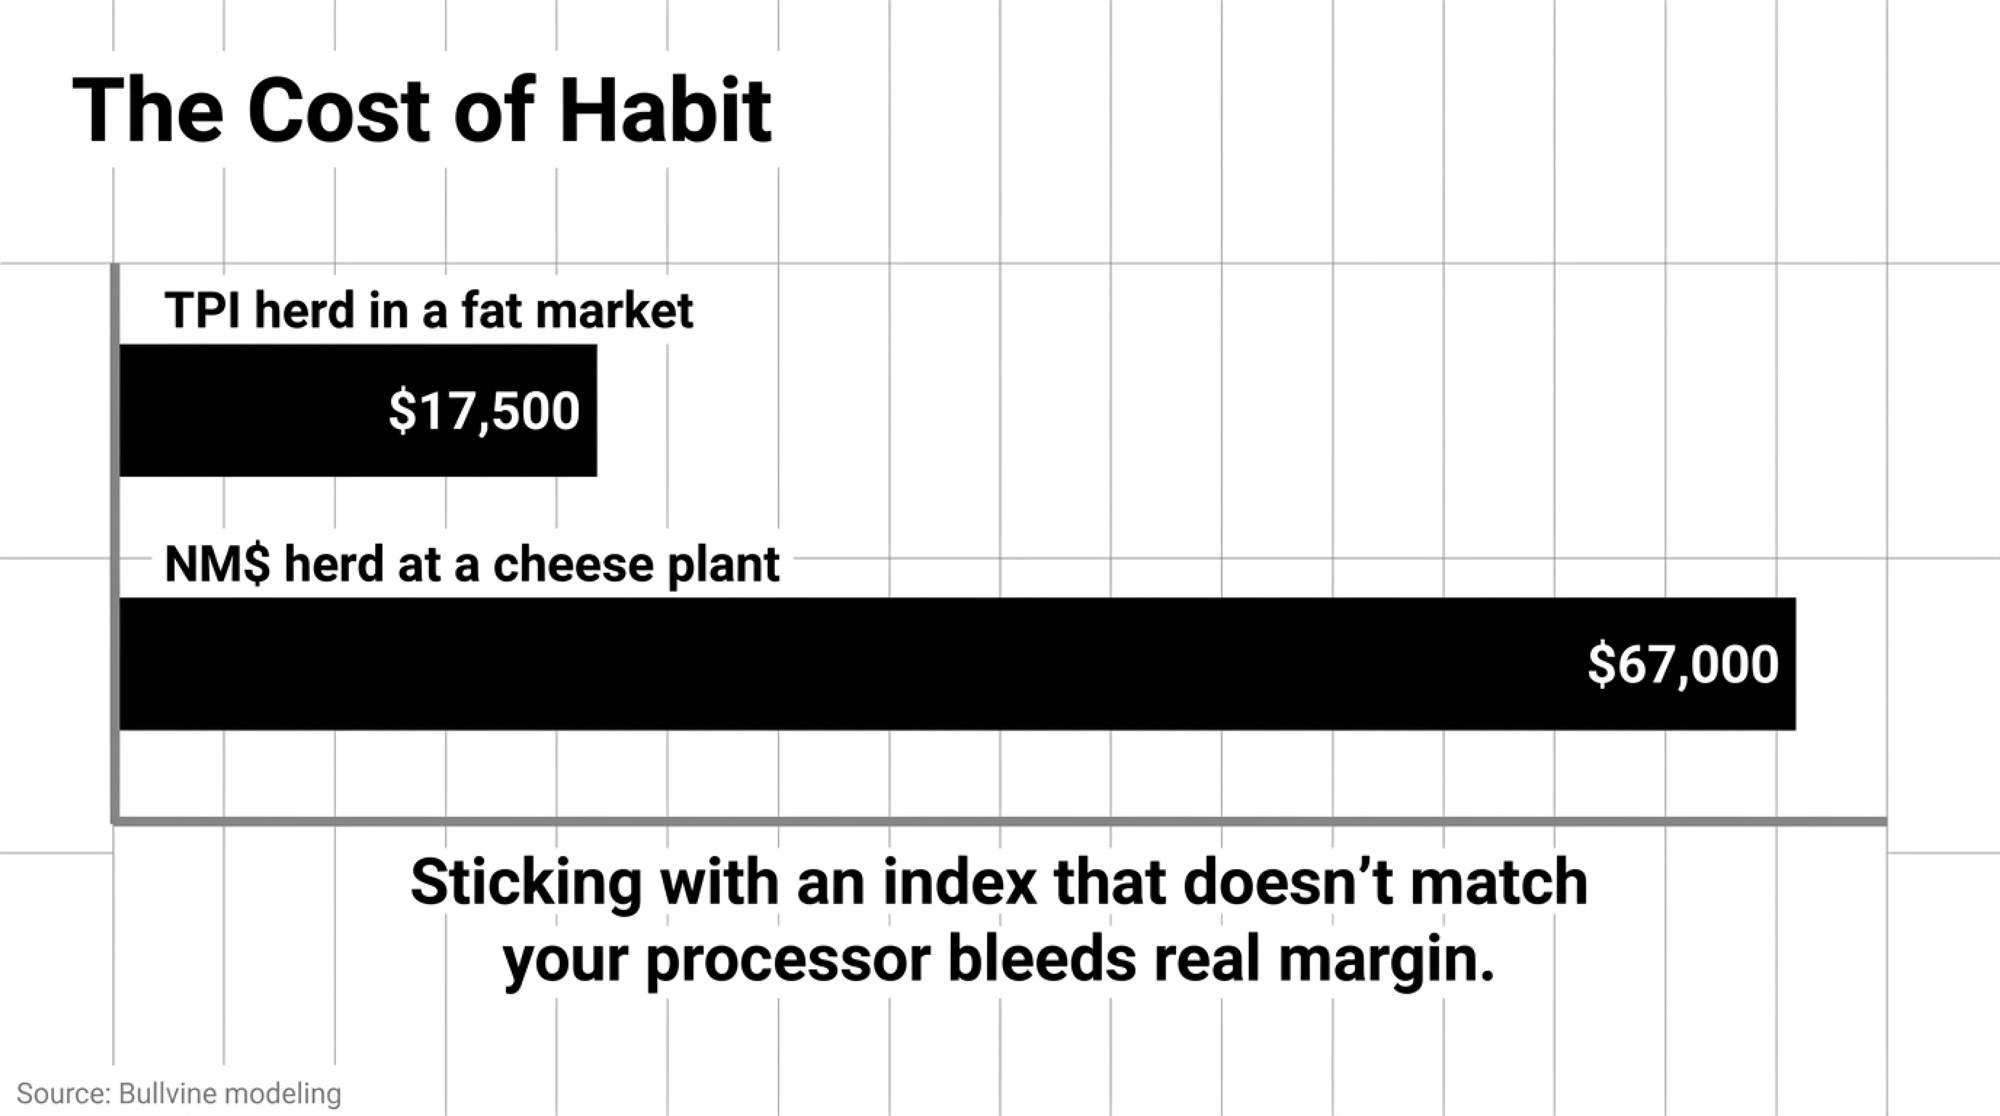
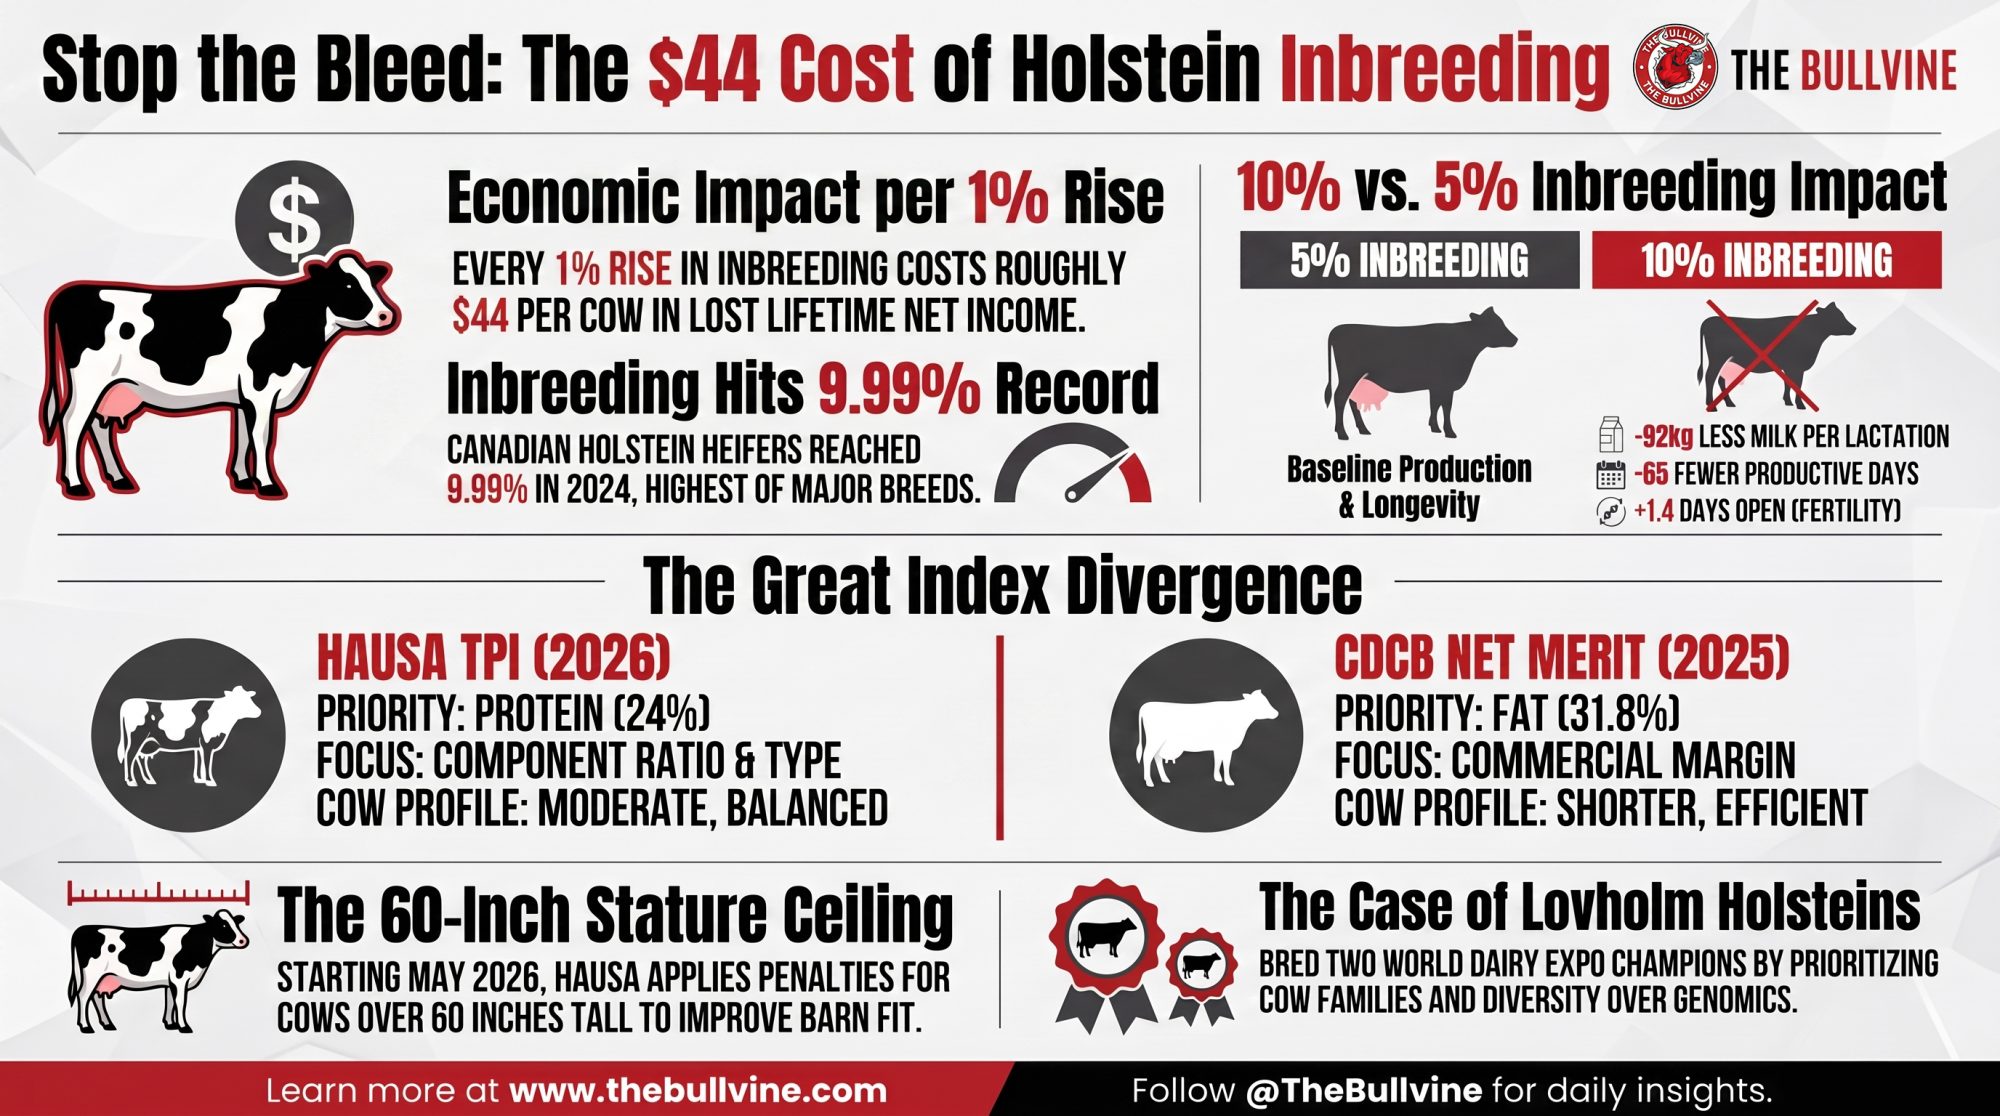
 The Sunday Read Dairy Professionals Don’t Skip.
 The Sunday Read Dairy Professionals Don’t Skip.