Archive for Upper Midwest dairy

The $28,614 Tenth: Why Upper Midwest Protein Is Now Worth More Than Fat

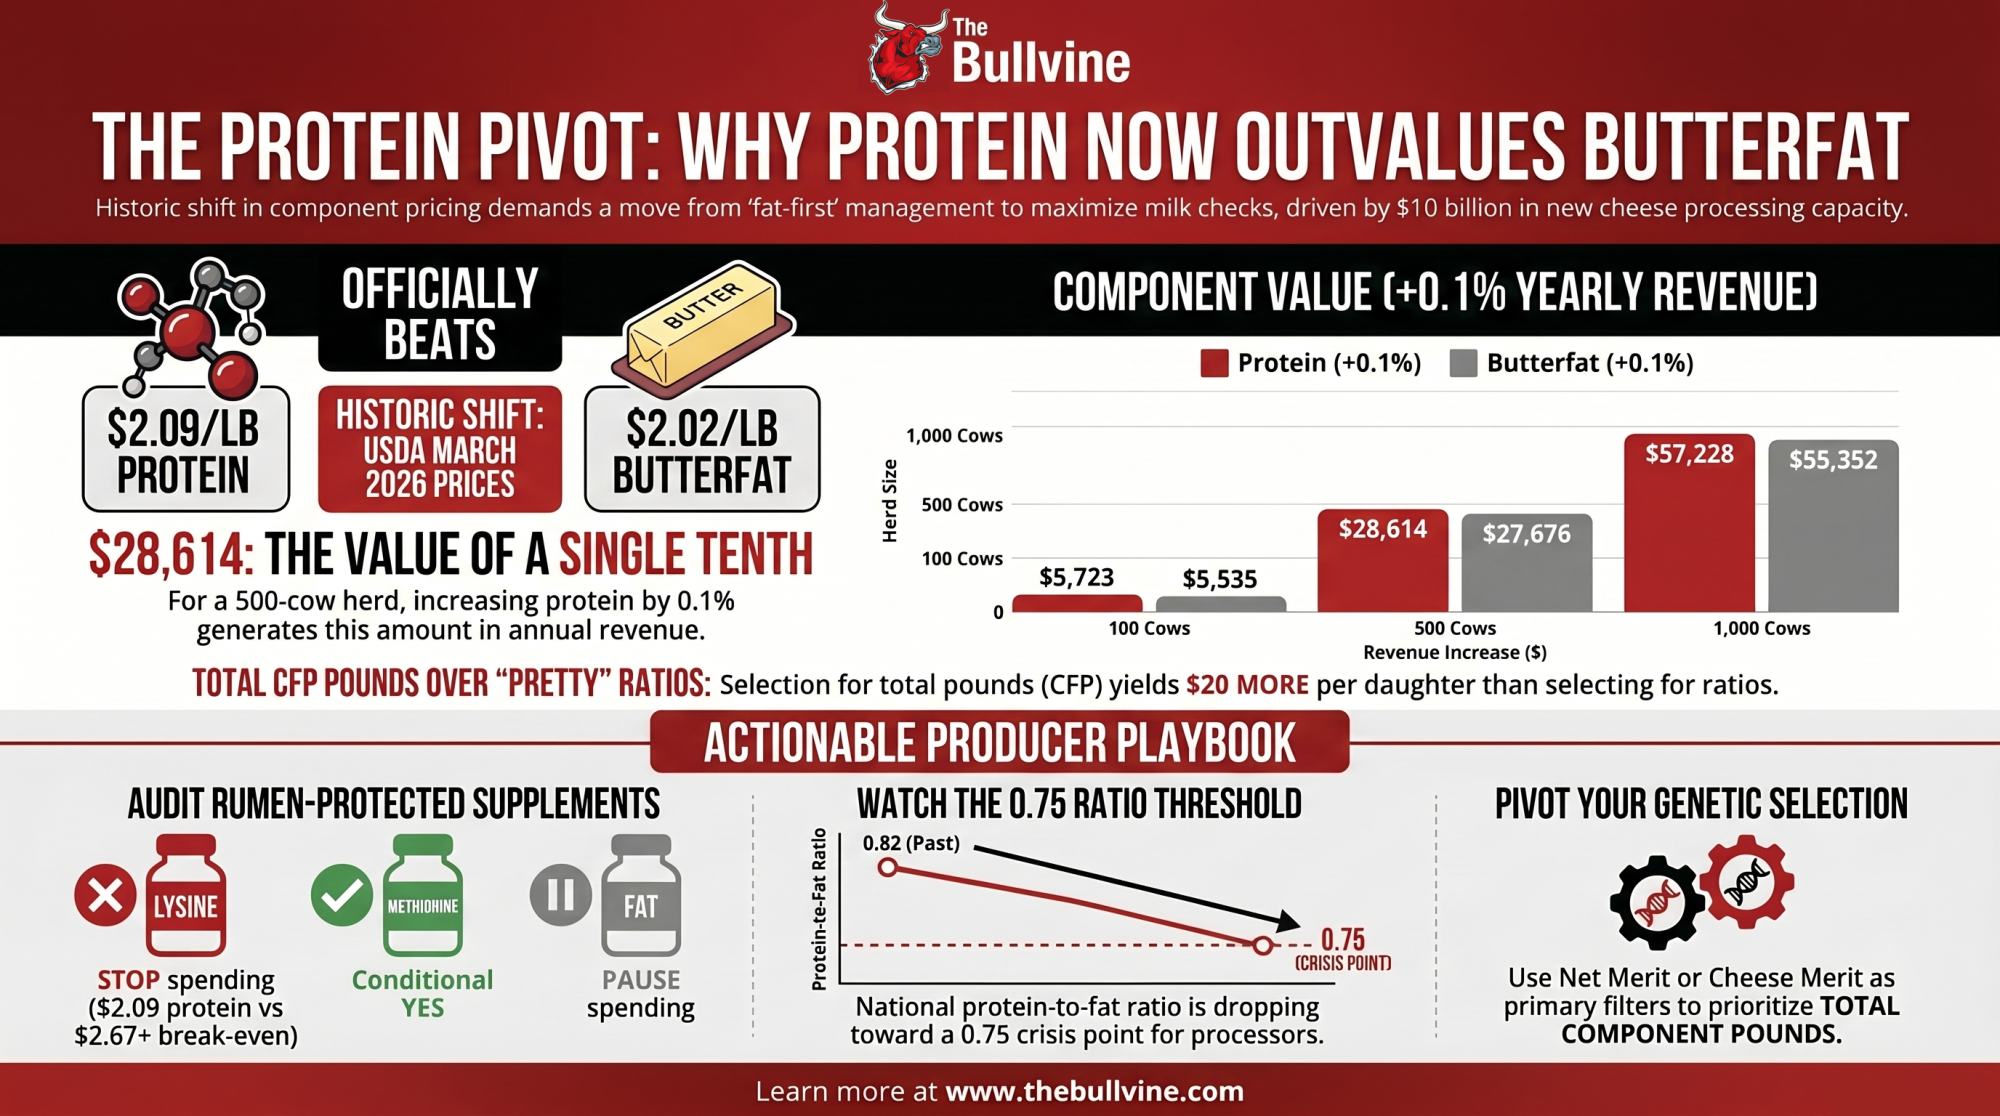
USDA set March protein at $2.0905/lb against butterfat at $2.0220. On a 500-cow Order 30 herd at 75 lbs/day, that tenth is worth $28,614 a year — $938 more than fat. First sustained flip in a decade.

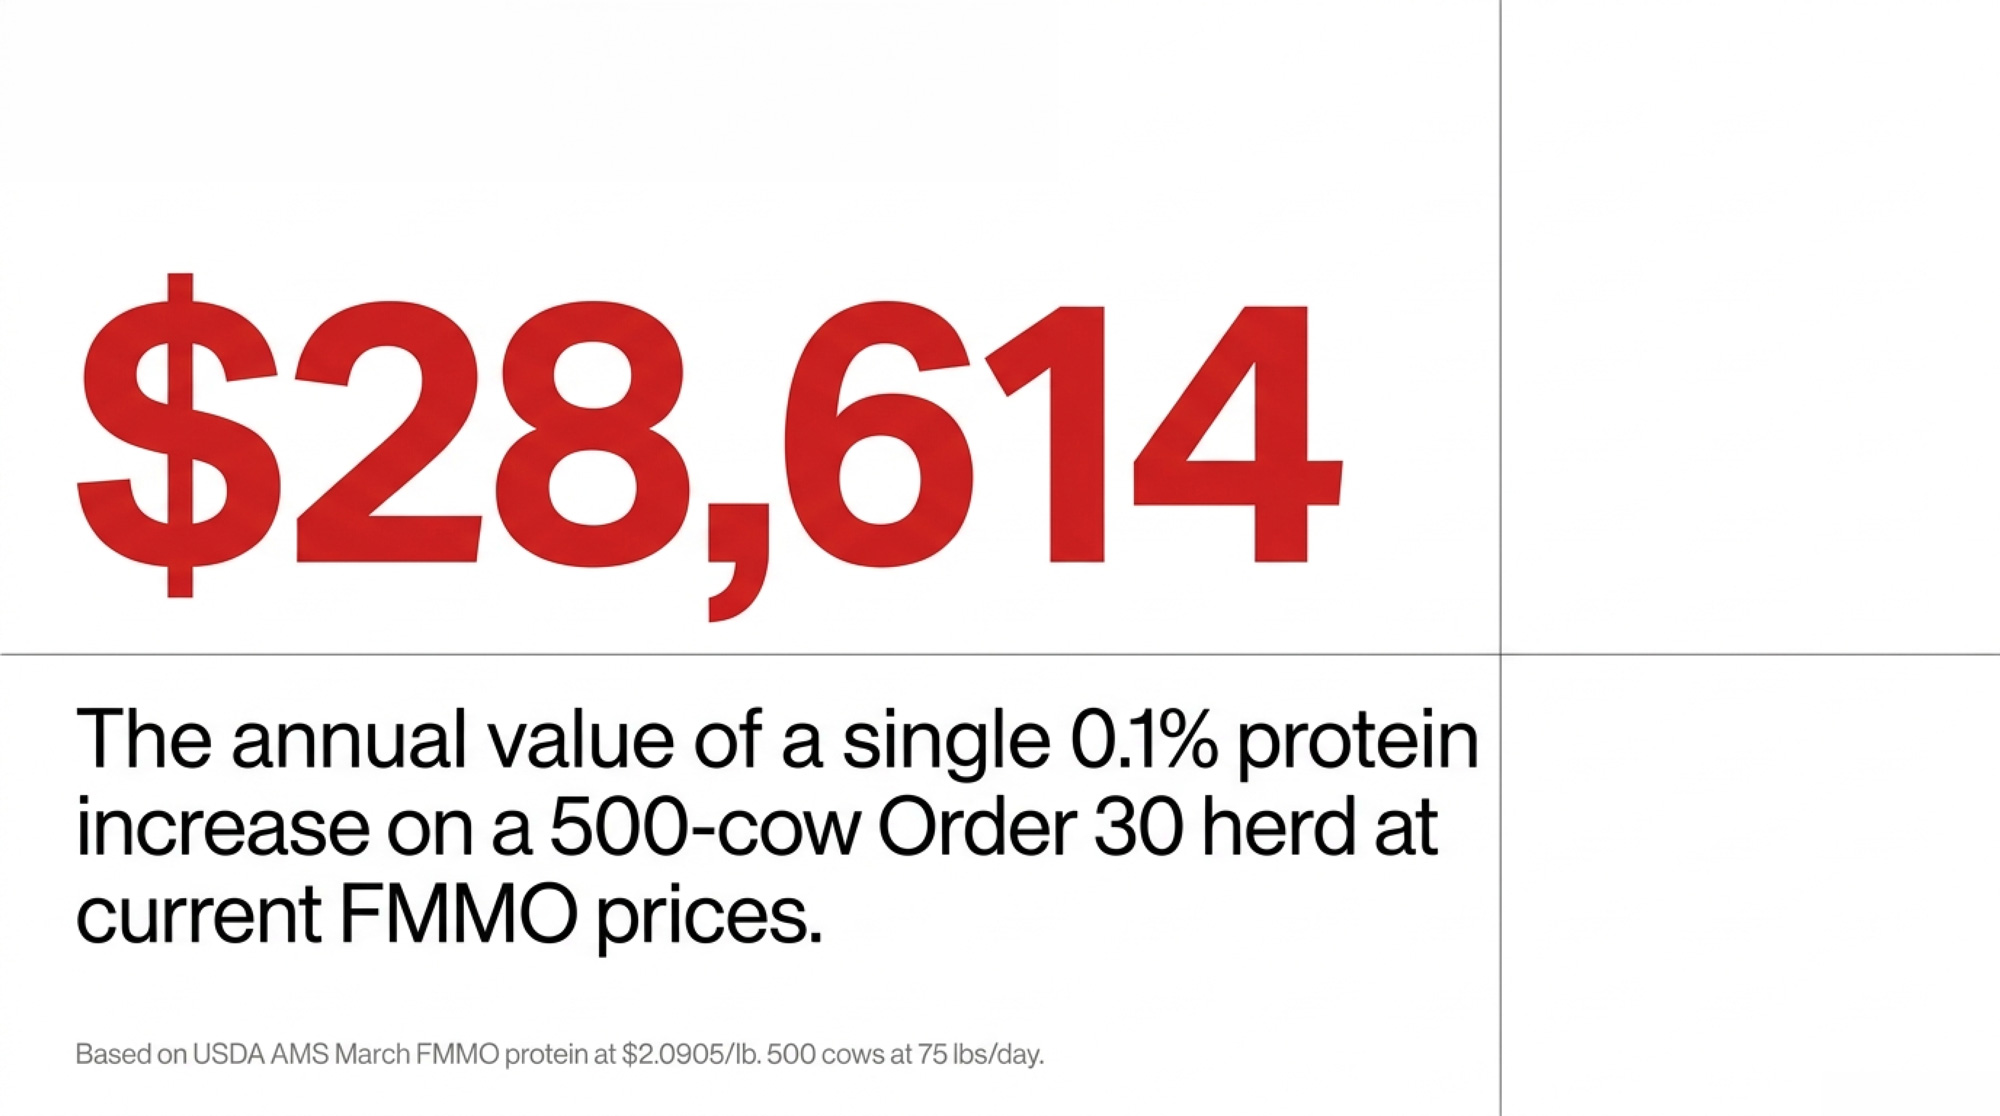
At the March 2026 Federal Milk Marketing Order announcement, USDA AMS set the protein price at $2.0905/lbagainst butterfat at $2.0220/lb — the first sustained stretch in a major cycle where a pound of milk protein outvalues a pound of milk fat. For a 500-cow Wisconsin or Minnesota shipper into Order 30 moving 75 lbs/cow/day, a single tenth-of-a-percent gap in protein now runs $28,614 a year; fat lands close behind at $27,676.

👉 Run those numbers on your own herd — open the Component Value Tracker →

That’s the stake for a mid-size Upper Midwest herd still calibrated to the old fat-premium world. The trap: a decade of fat-first genetics, fat-first rations, and fat-first contracts running headlong into roughly $10 billion in new cheese capacity that needs protein and doesn’t much care about the butter side anymore.

Dairy component economics 2026 isn’t a theme. It’s the math on your next milk check.

This is Issue #1 of The Bullvine Component Value Tracker — a monthly read translating the FMMO announcement into herd-specific dollar decisions, ranking nutrition break-evens against current prices, and scoring where the month’s highest-return component moves actually sit. May 2026 baseline: 58/100 — Maintain and Reposition Toward Protein.

The Signal the Market Already Sent

For eight of the ten years leading into 2025, butterfat paid more per pound than protein. Producers answered the signal. Genetics companies bred for fat. Nutritionists optimized rations for butterfat response. It worked — arguably too well.

U.S. butterfat climbed 0.58 points between 2015 and 2025, from 3.75% to a record 4.33%, per USDA NASS data compiled by FMMA30 — a 15.5% lift off the 2015 baseline. Over the same window, EU butterfat gained roughly 2.4% and New Zealand roughly 2.5%, per FMMA30’s international comparison. Protein climbed too — 3.11% to 3.29% — but that 5.8% gain only looks healthy until you stack it next to fat running at nearly triple the pace.

CoBank’s lead dairy economist Corey Geiger flagged the problem in the bank’s September 25, 2025 Knowledge Exchange brief, warning that excessive butterfat can compromise cheese quality and that cheesemakers target a protein-to-fat ratio near 0.80, with ratios significantly below that threshold reducing yield efficiency. At the time, the ratio sat at 0.77. Seven months later, with full-year 2025 butterfat averaging 4.33% against protein stuck at 3.29%, it’s dropped to 0.760 (3.29 ÷ 4.33 = 0.7598).

Over half of U.S. milk now moves into cheese. Those plants were calibrated for 0.82. The milk arriving at the dock doesn’t match the equipment on the other side.

Why Should Upper Midwest Producers Care About the 0.75 Threshold?

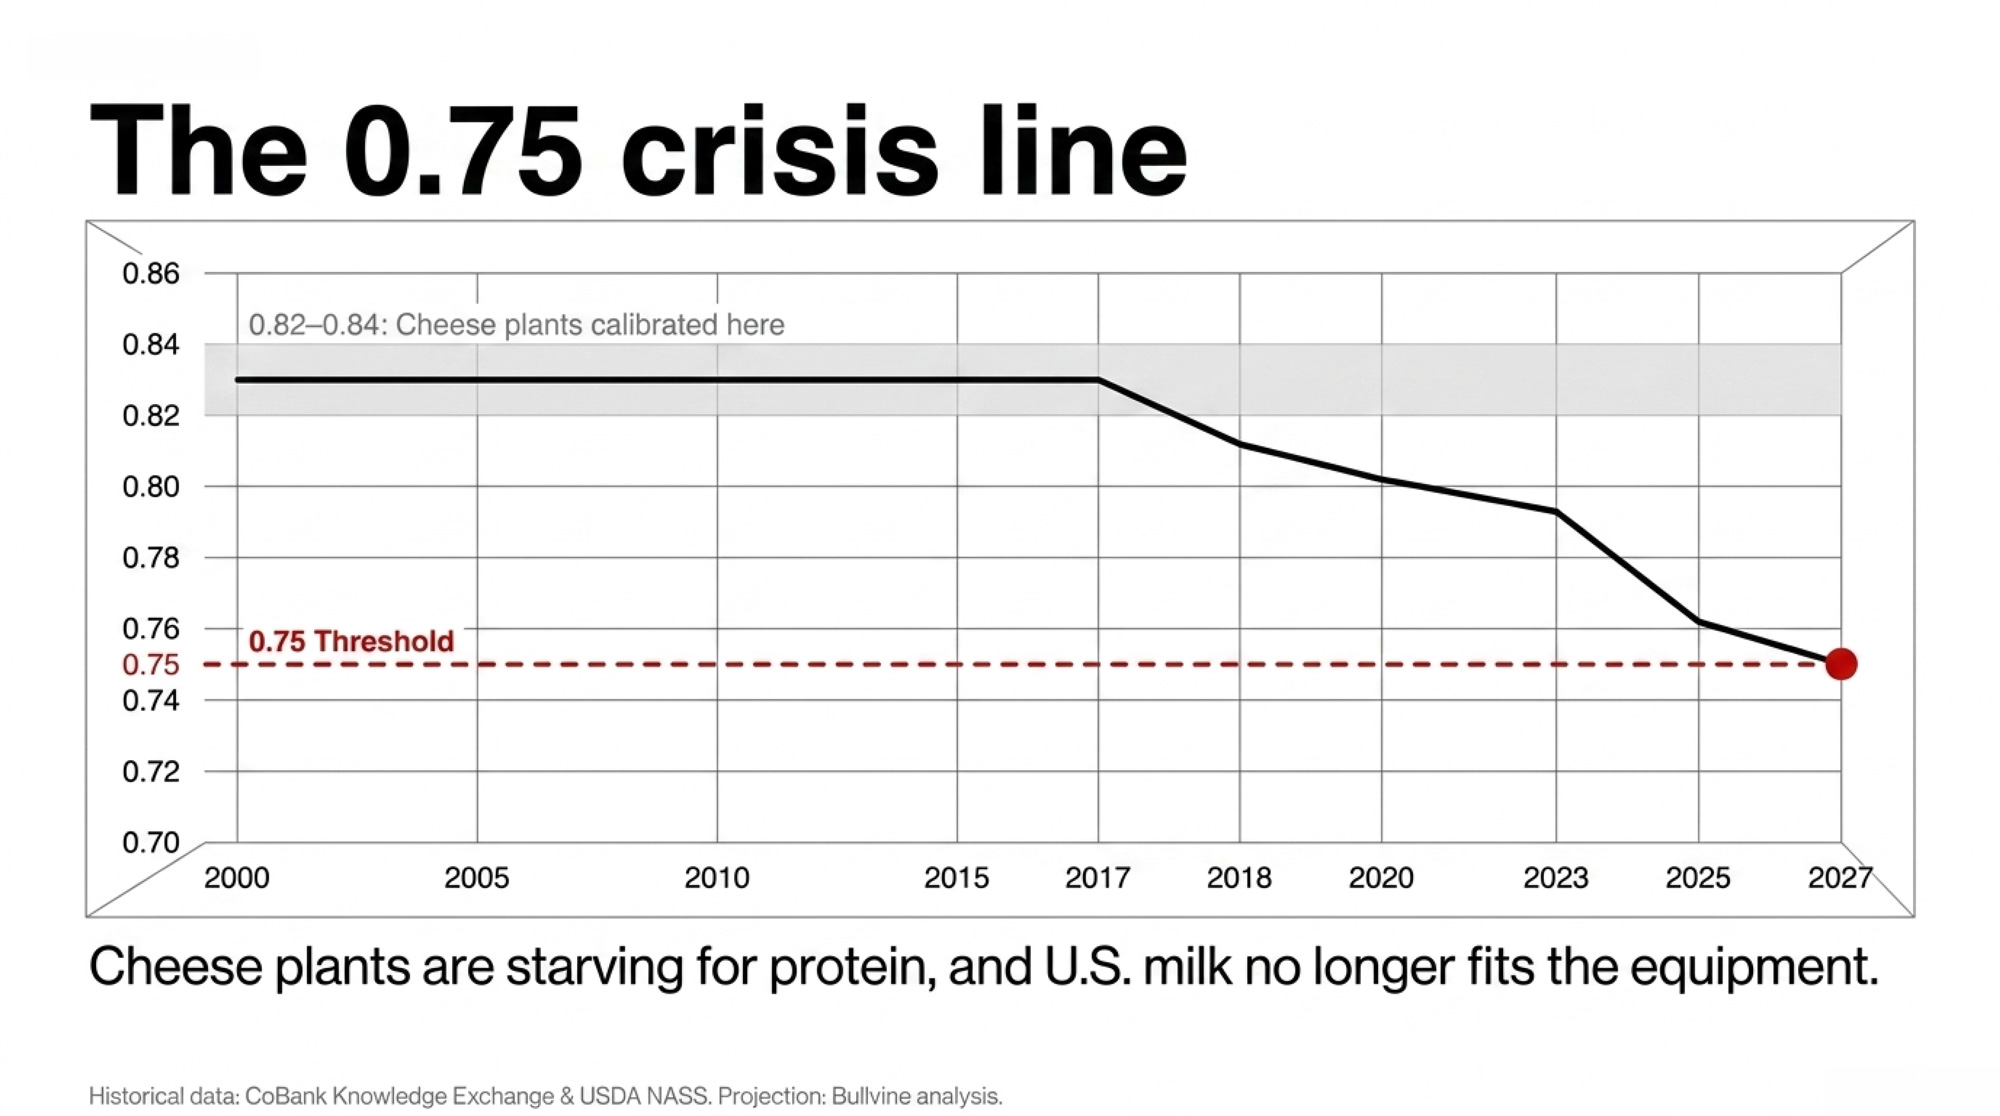
From 2000 to 2017, the U.S. protein-to-fat ratio held flat between 0.82 and 0.84, per CoBank’s Knowledge Exchange. That’s the band processors built their plants around. Starting in 2018, the line bent.
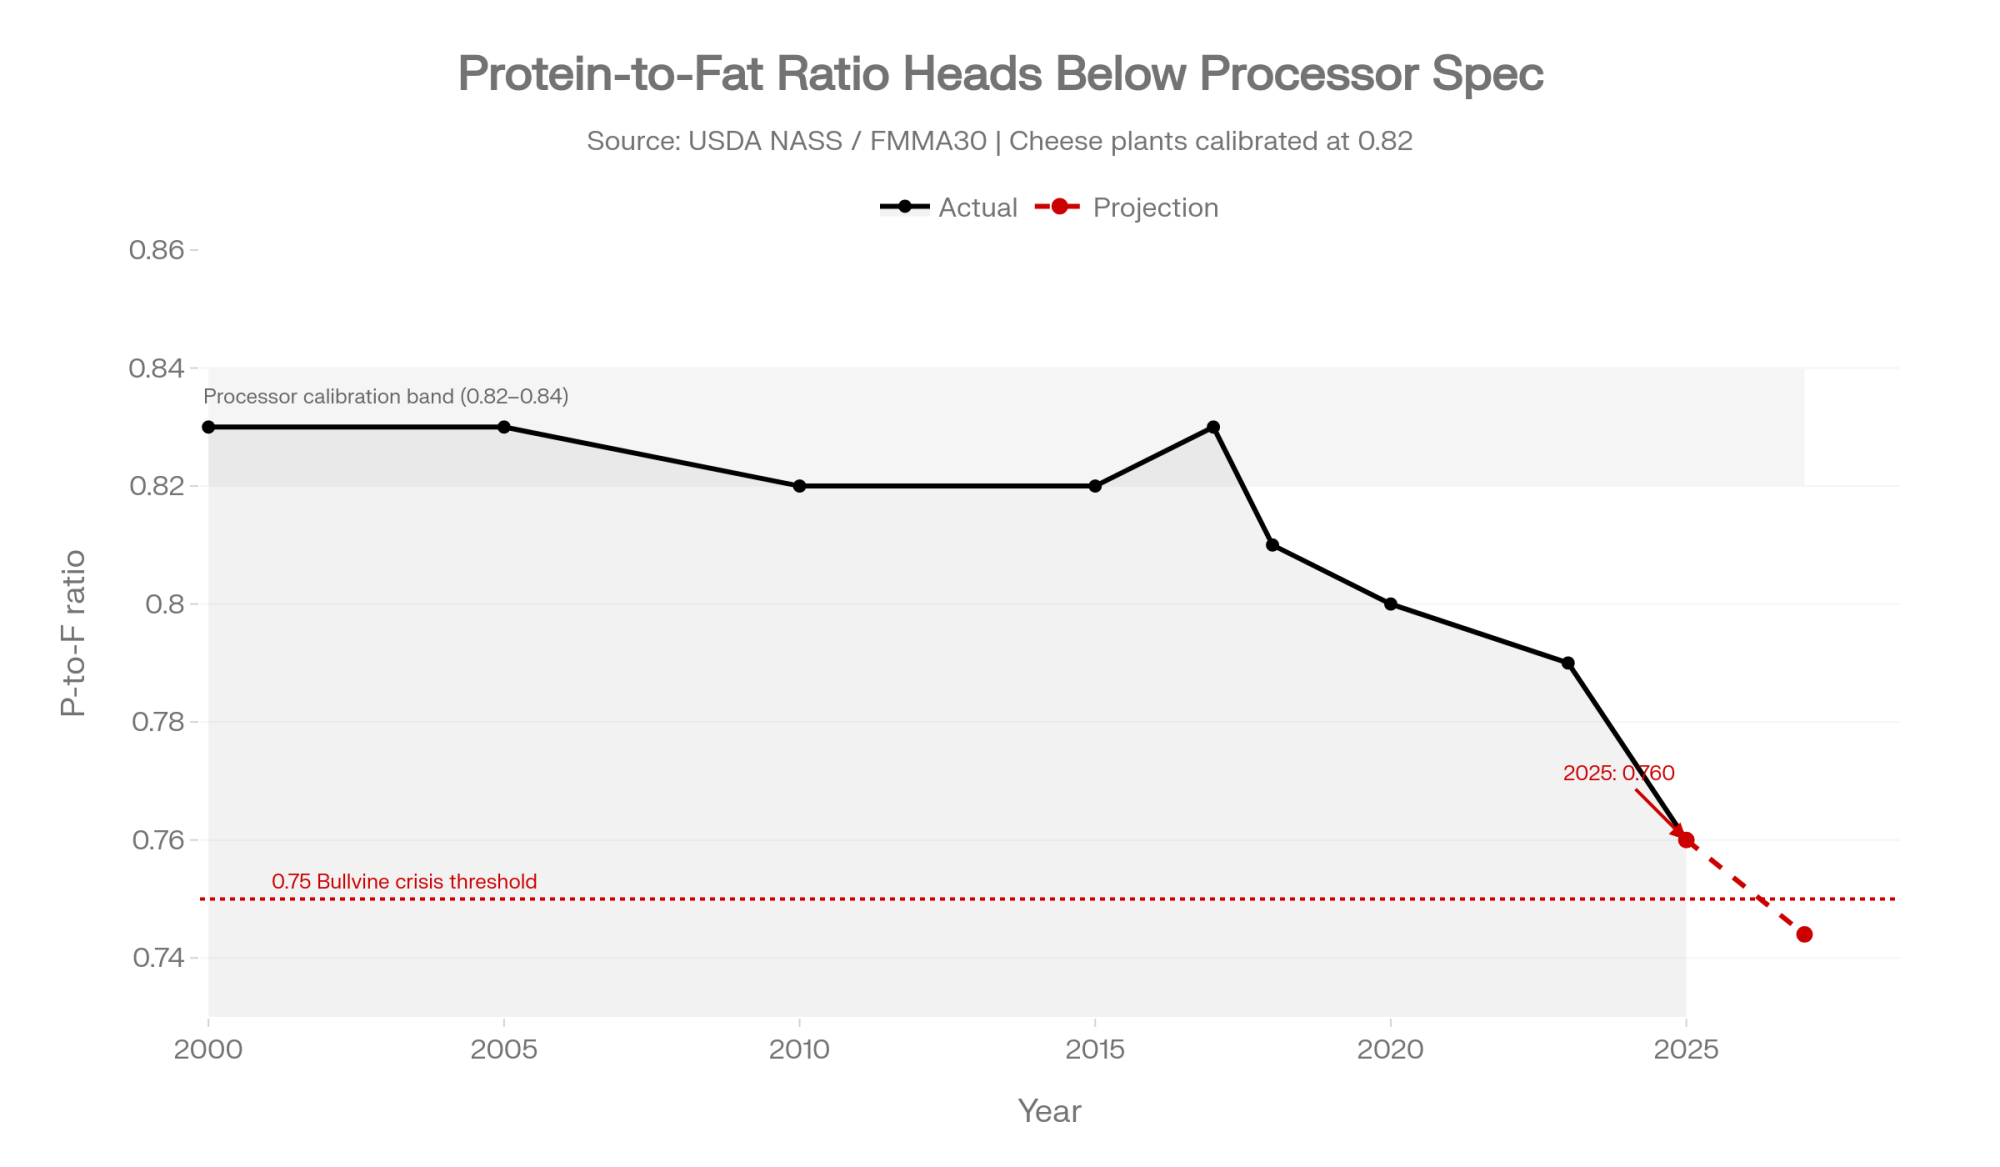
YearP-to-F RatioContext
2000–20170.82–0.84Stable — cheese plants calibrated here
2018~0.81Decline begins
2020~0.80Geiger’s “near 0.80” cheese-quality target
2023~0.79Decline accelerates
2025 full-year0.760FMMA30 / USDA NASS annual
Bullvine crisis threshold0.75Named in this issue
Projected arrivalLate 2027 (~16 months out)Bullvine projection, ~0.008/year decline

The Bullvine is putting a stake in the ground: the U.S. protein-to-fat ratio crosses 0.75 within roughly 16 months at current decline rates, and that’s where standardization costs, whey-stream fat losses, and processor basis negotiations visibly reprice Upper Midwest milk checks. If the ratio turns upward before late 2027, the Tracker will say so in writing and retire the call. If it doesn’t, this stops being a chart. It’s the basis for a pricing correction that’s already started.

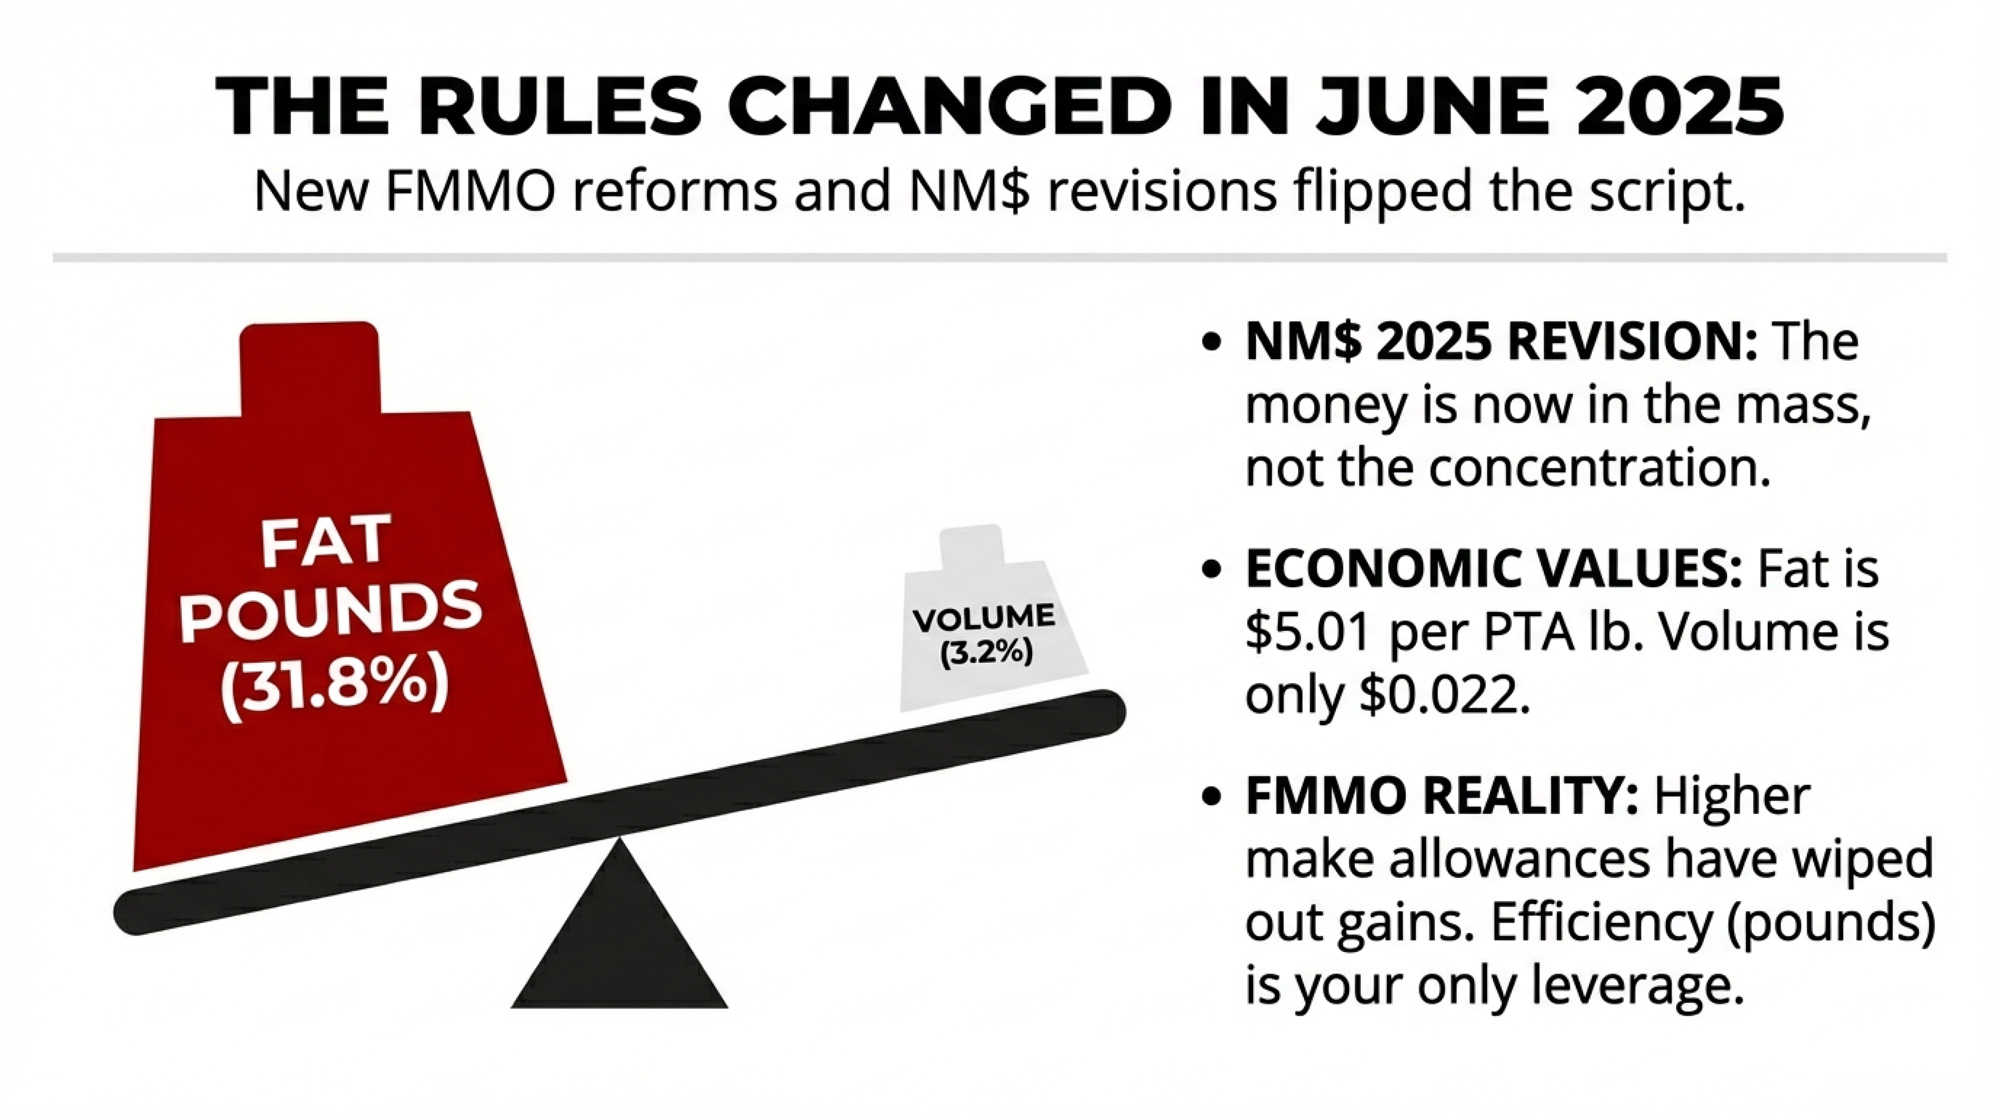
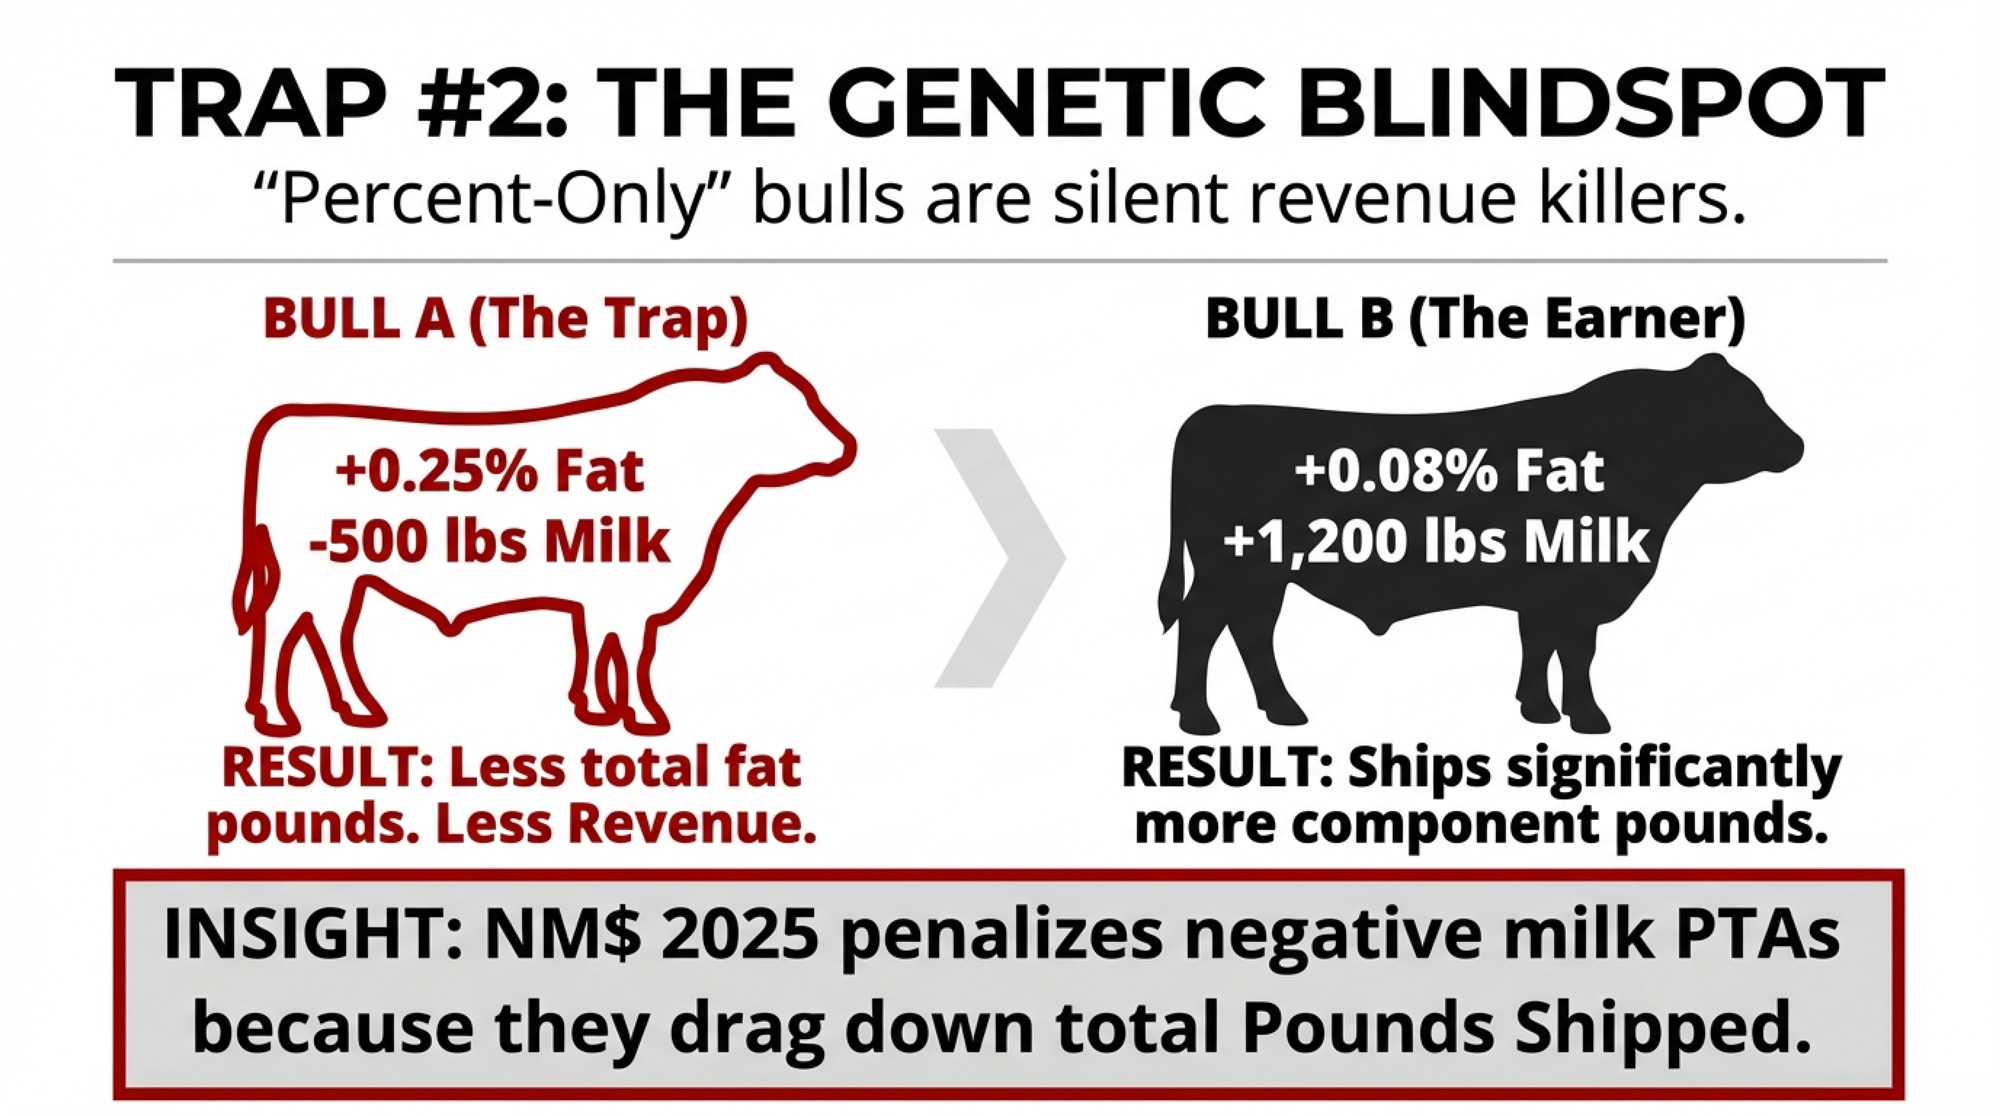
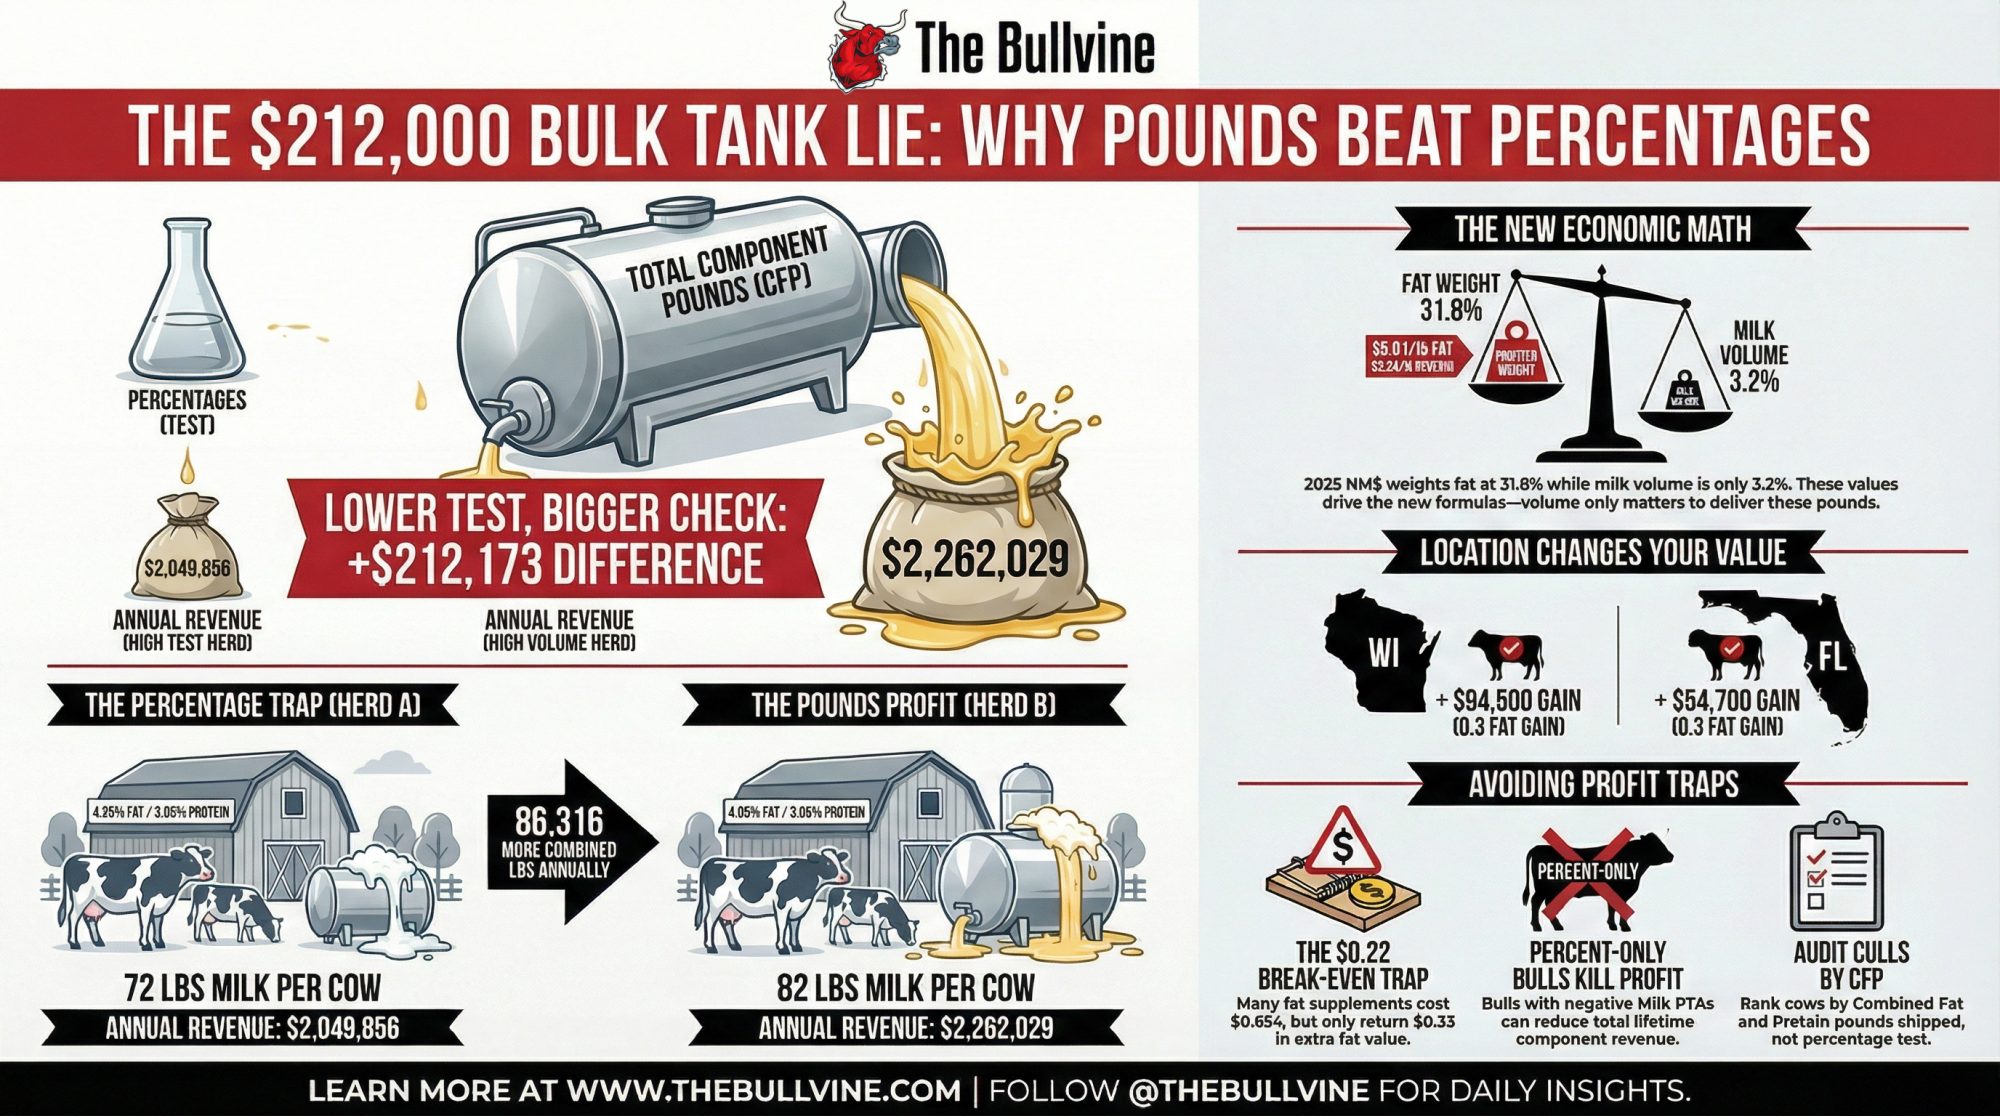
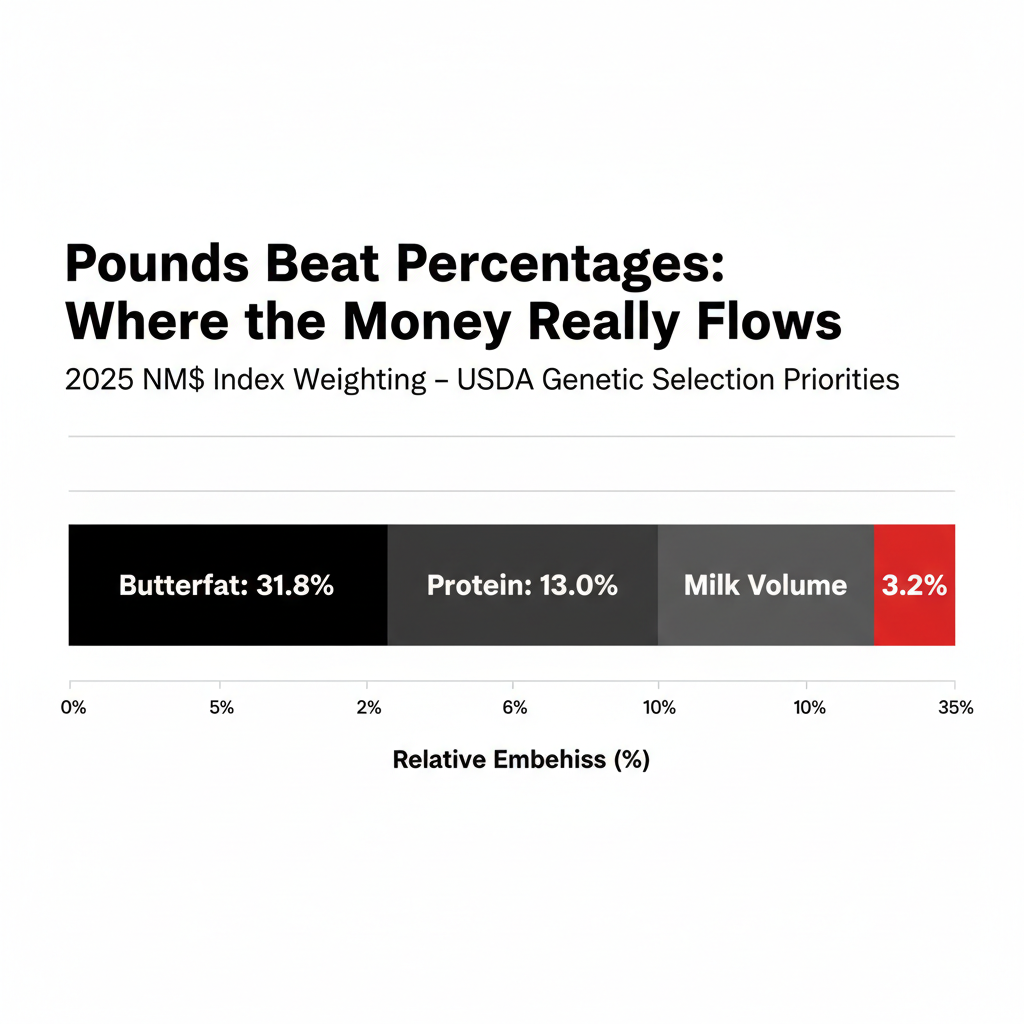
The structural driver keeping the ratio suppressed is genetics, and the indexes don’t agree on which way out. Holstein USA’s April 2026 TPI revision shifted production weights to 24% protein and 14% fat — a 5-point move in each direction. Top-10% bulls saw an average 34-point TPI decline, with 26.6 of those points attributable to the formula change itself rather than routine evaluation updates. USDA’s Net Merit 2025 moved the opposite direction — 31.8% fat, 13.0% protein. Two major indexes. Two opposite signals. One breeder trying to mate cows this week.

Running the Numbers: What 0.1% Is Worth on a 500-Cow Order 30 Herd

Before you read the rest of this issue, run this math on your own operation.

Scope. 500-cow Wisconsin or Minnesota shipper into FMMO Order 30. 75 lbs/cow/day rolling average. March 2026 FMMO prices.

Formula:

Incremental annual revenue = 0.001 × daily lbs/cow × number of cows × 365 × FMMO component price per lb

Protein at $2.0905/lb:

  • 0.001 × 75 = 0.075 extra lbs/cow/day
  • 0.075 × 500 = 37.5 lbs/day herd-wide
  • 37.5 × 365 = 13,687.5 lbs/year
  • 13,687.5 × $2.0905 = $28,614/year

Butterfat at $2.0220/lb:

  • 13,687.5 × $2.0220 = $27,676/year
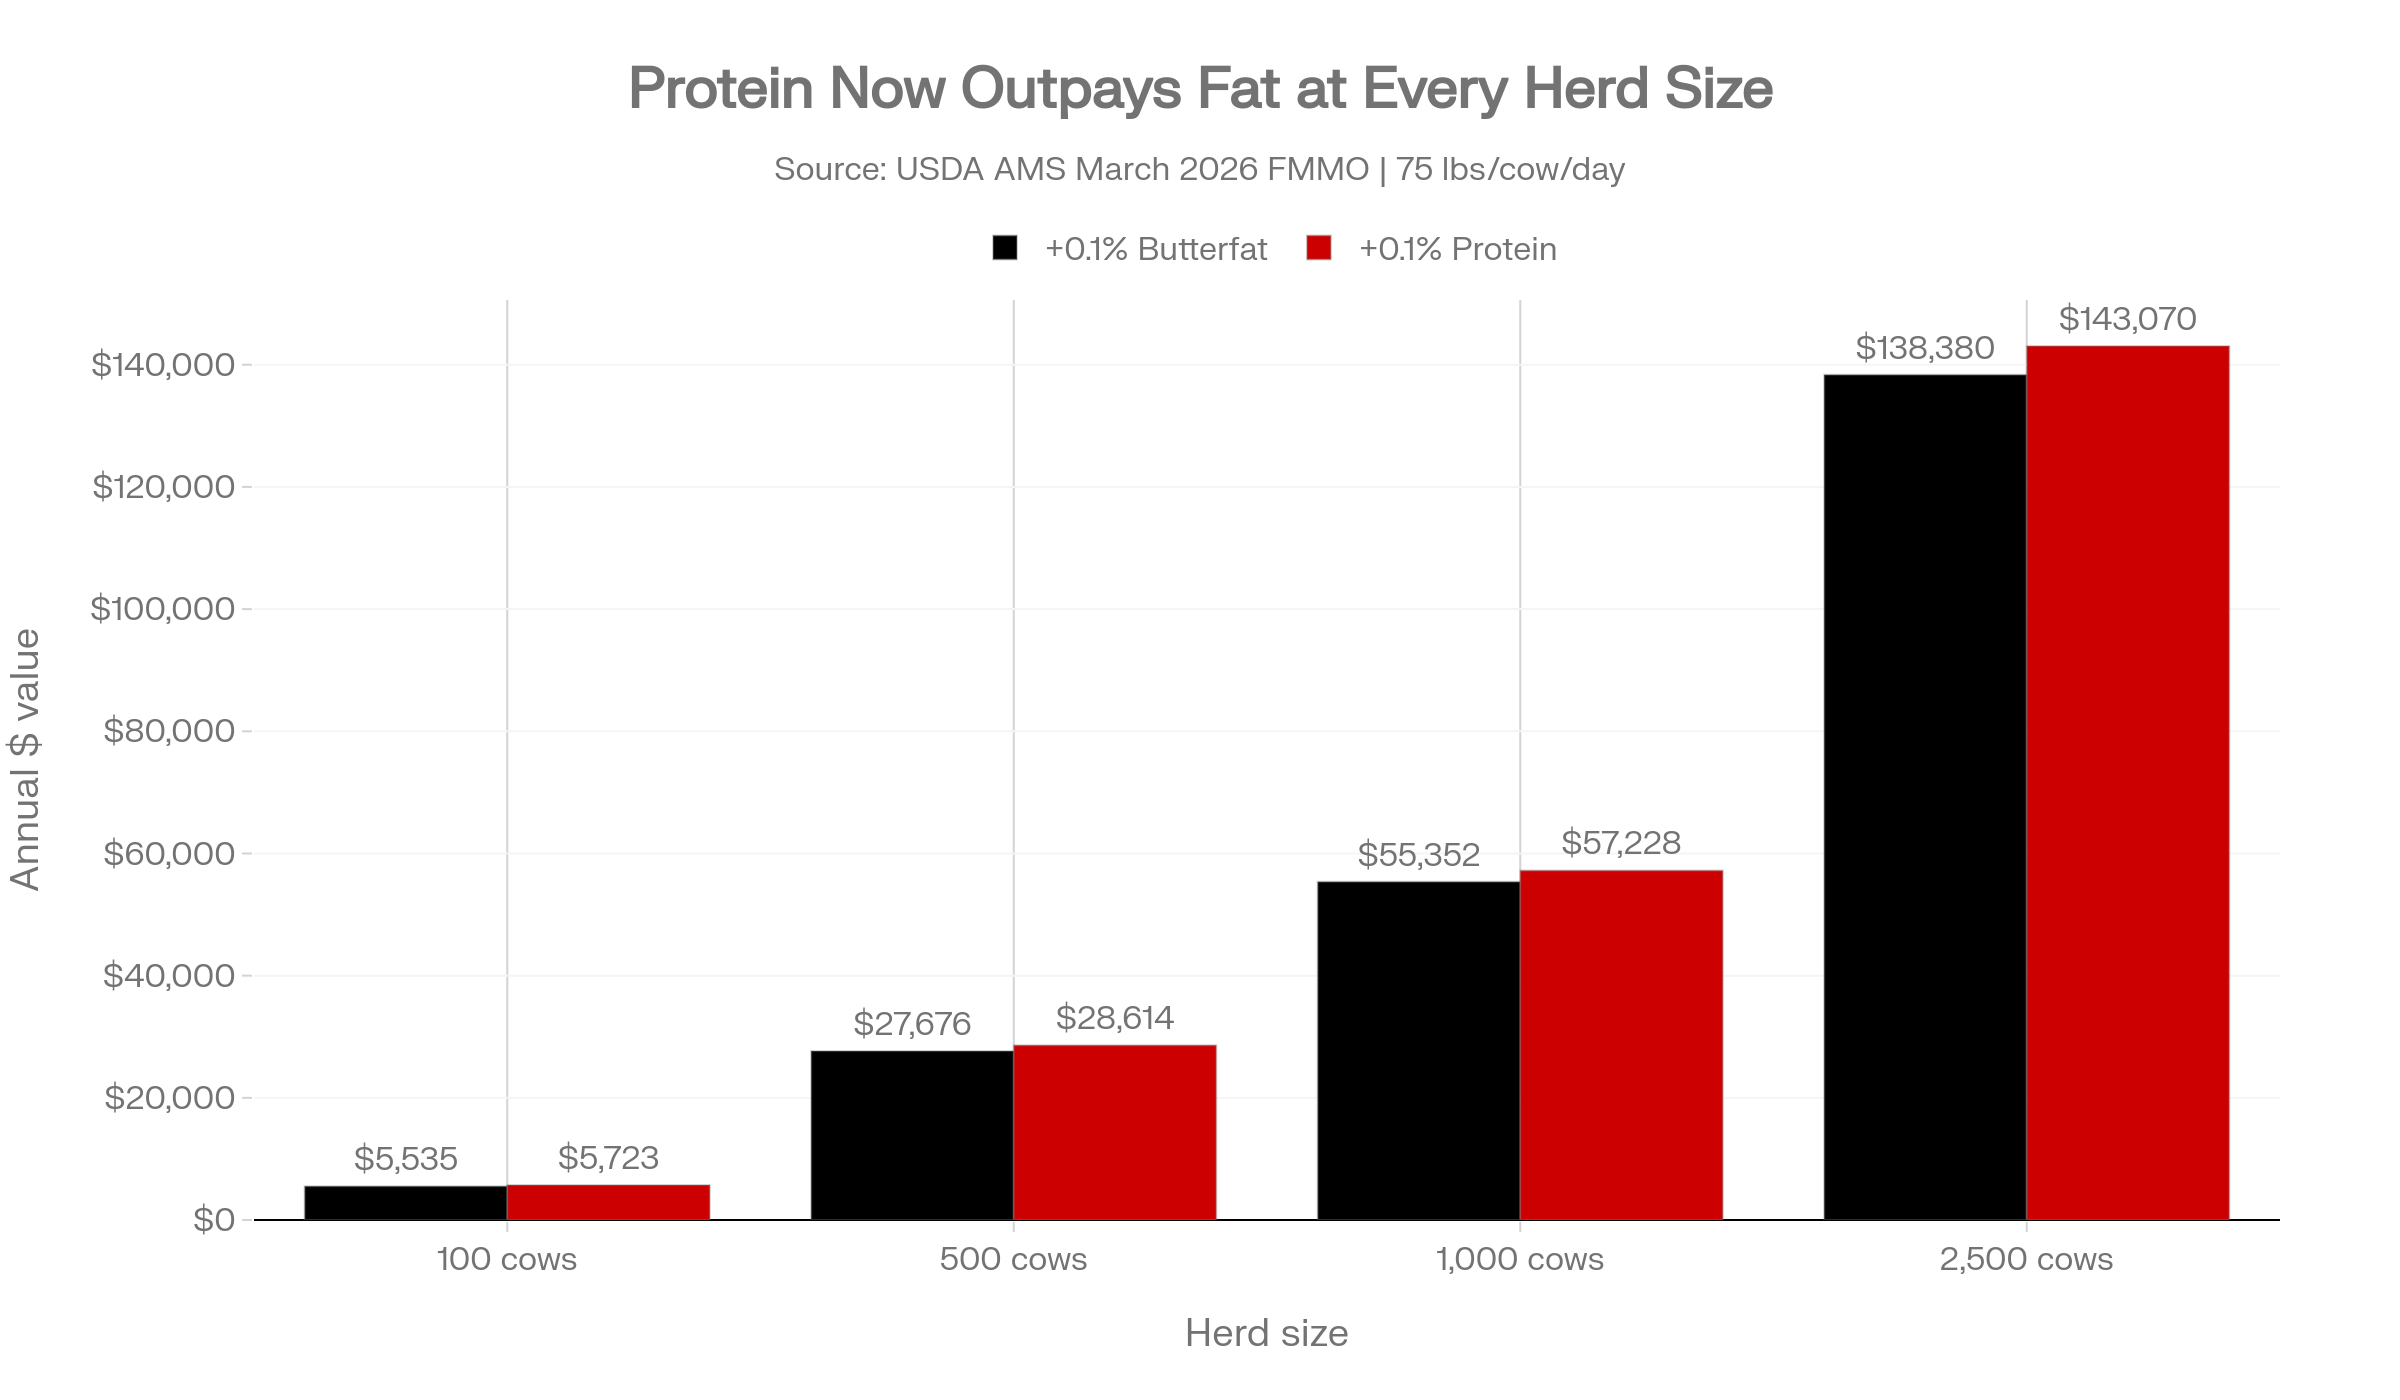
Herd SizeDaily lbs/cow+0.1% Butterfat/Year+0.1% Protein/YearCombined
100 cows75$5,535$5,723$11,258
500 cows75$27,676$28,614$56,290
1,000 cows75$55,352$57,228$112,580
2,500 cows75$138,380$143,070$281,450

March 2026 FMMO component prices, USDA AMS. Linear scaling.

Where the $83,000–$140,000 bulk-tank gap comes from. A 500-cow Order 30 shipper at 4.0% fat against a 2025 national average of 4.33% is carrying a 0.33-point fat gap. Three 0.1% increments × $27,676 = roughly $83,000/year in fat alone. Add a 0.2-point protein gap (3.09% vs. 3.29% national), and 2 × $28,614 pulls another ~$57,000/year. The $140,000 upper bound is a composite of two gaps on two components, not one factor. The low end is fat alone.

That’s the money. Not theoretical. Sitting in the bulk tank every month it ships short of county average.

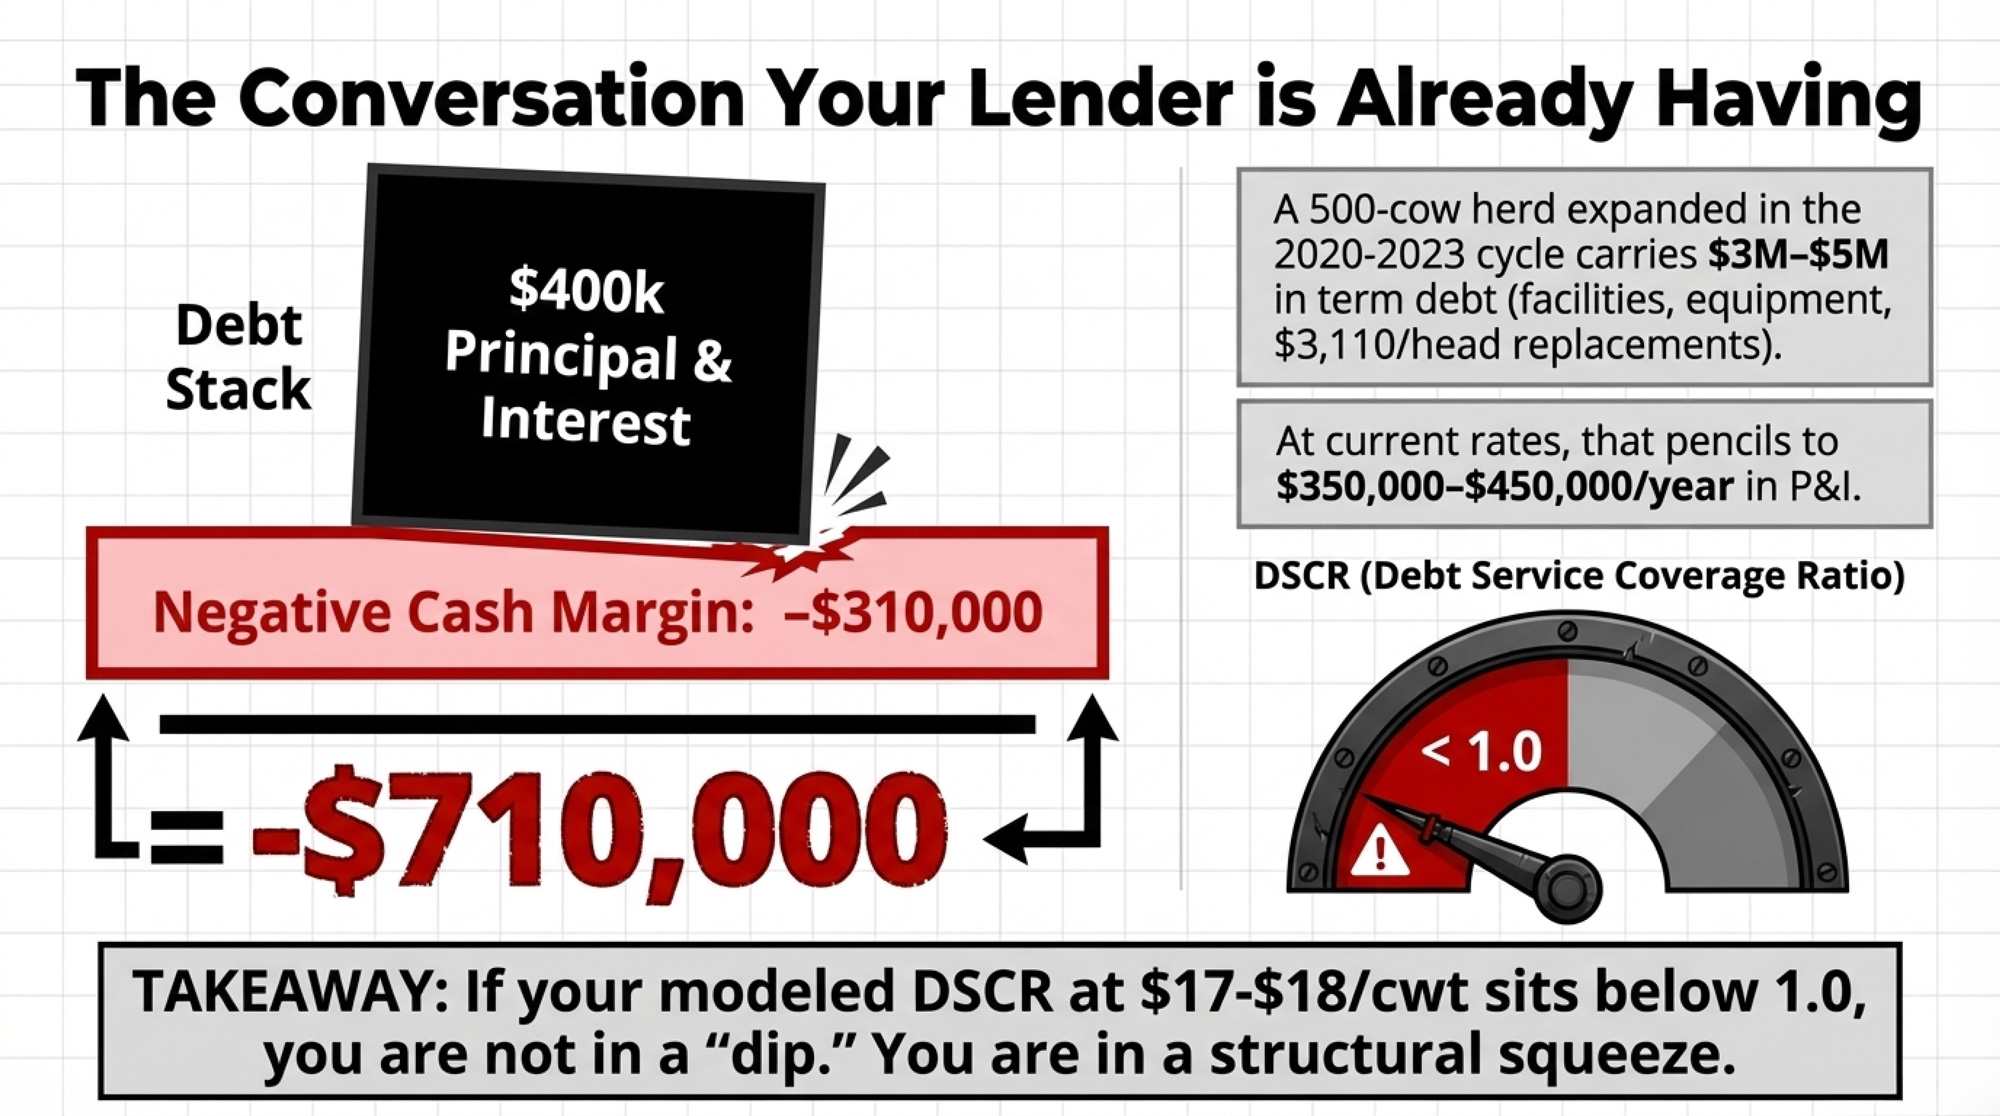
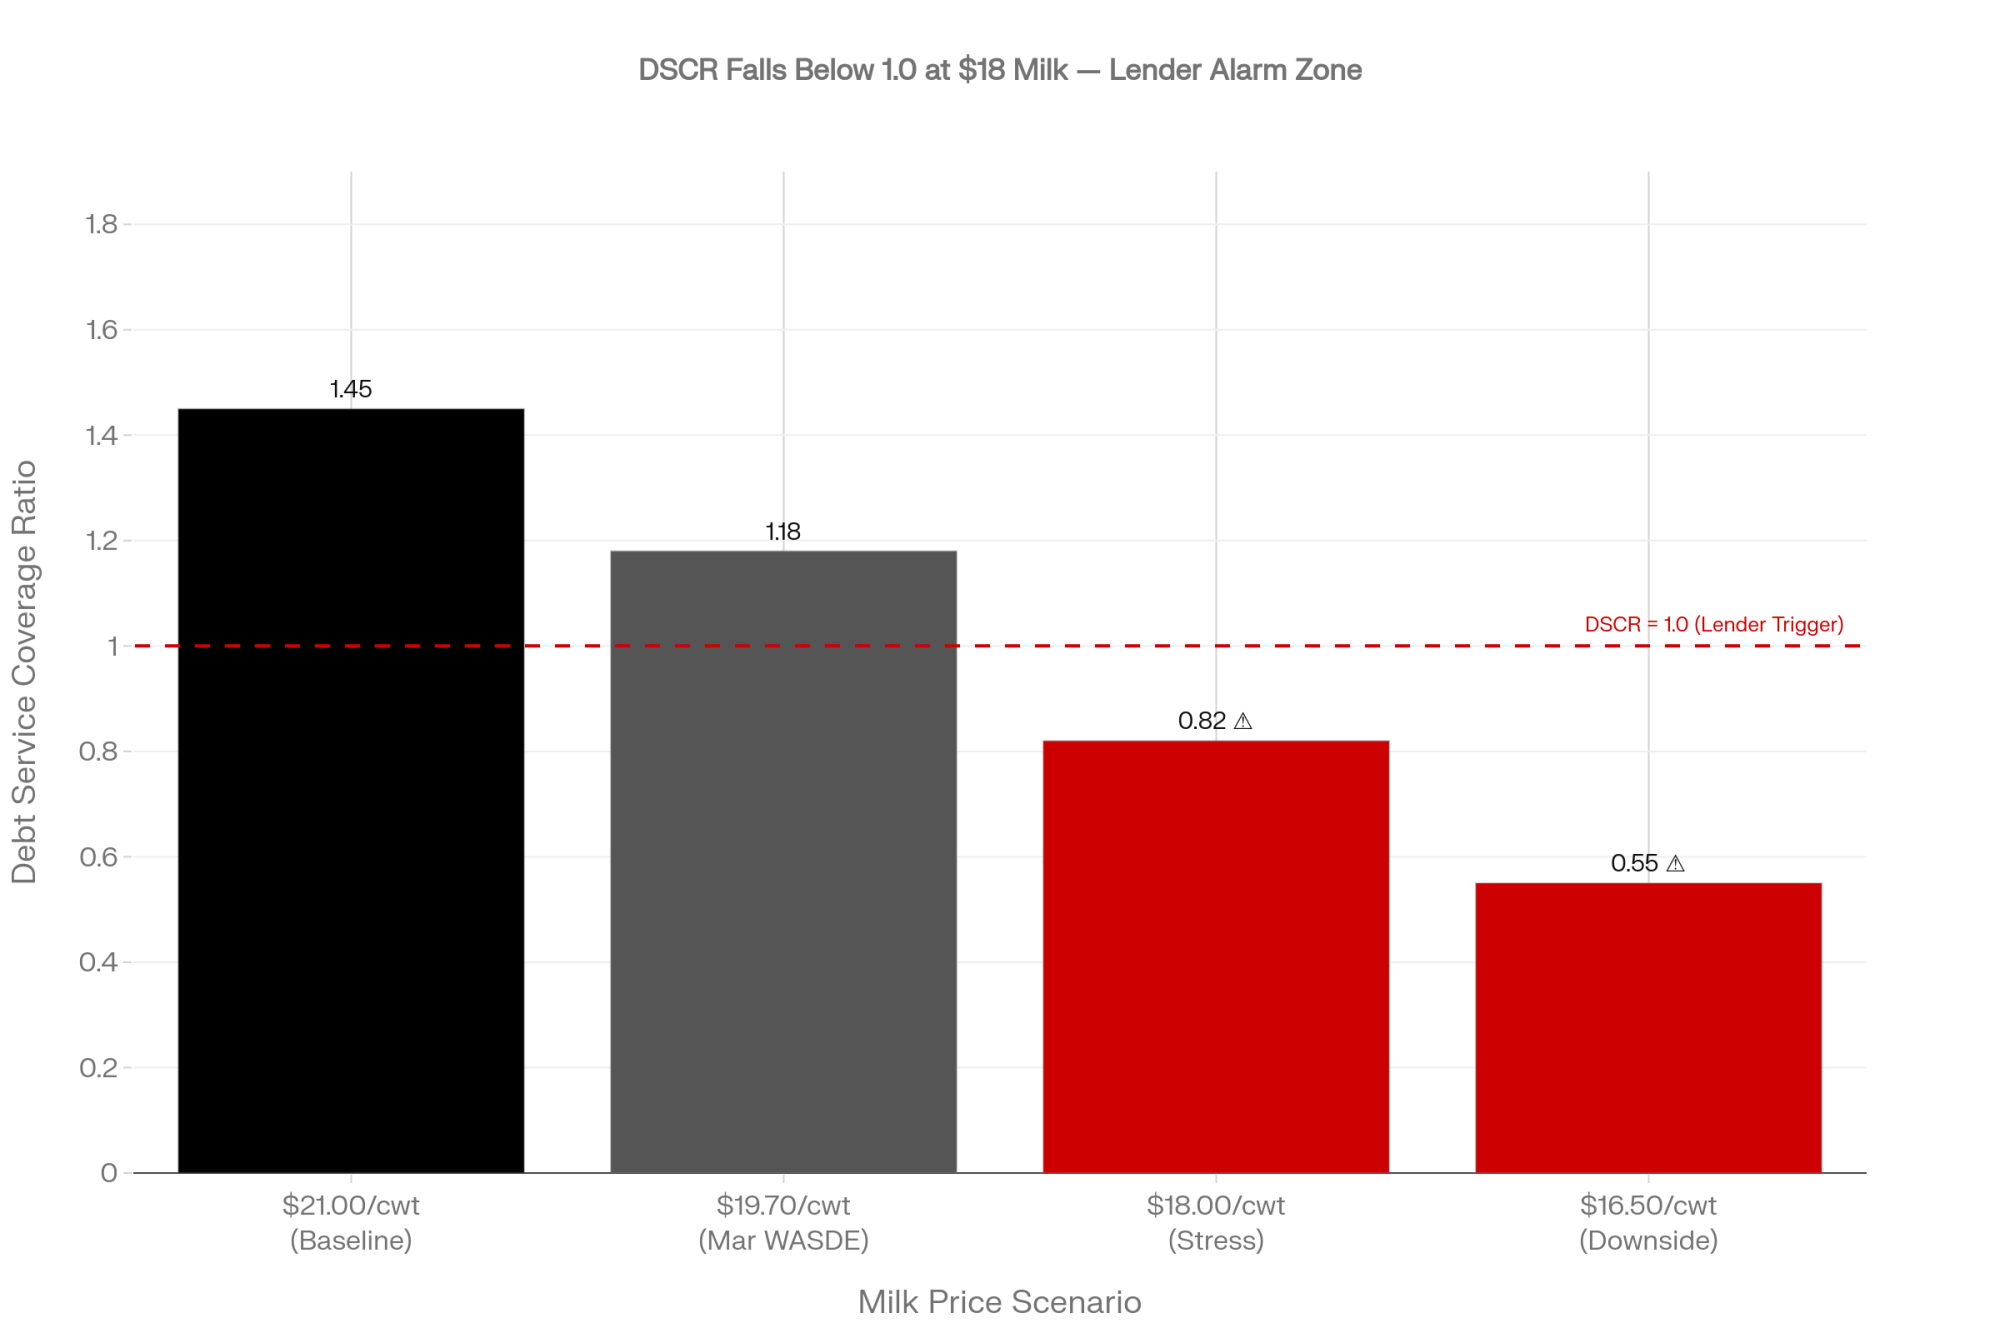
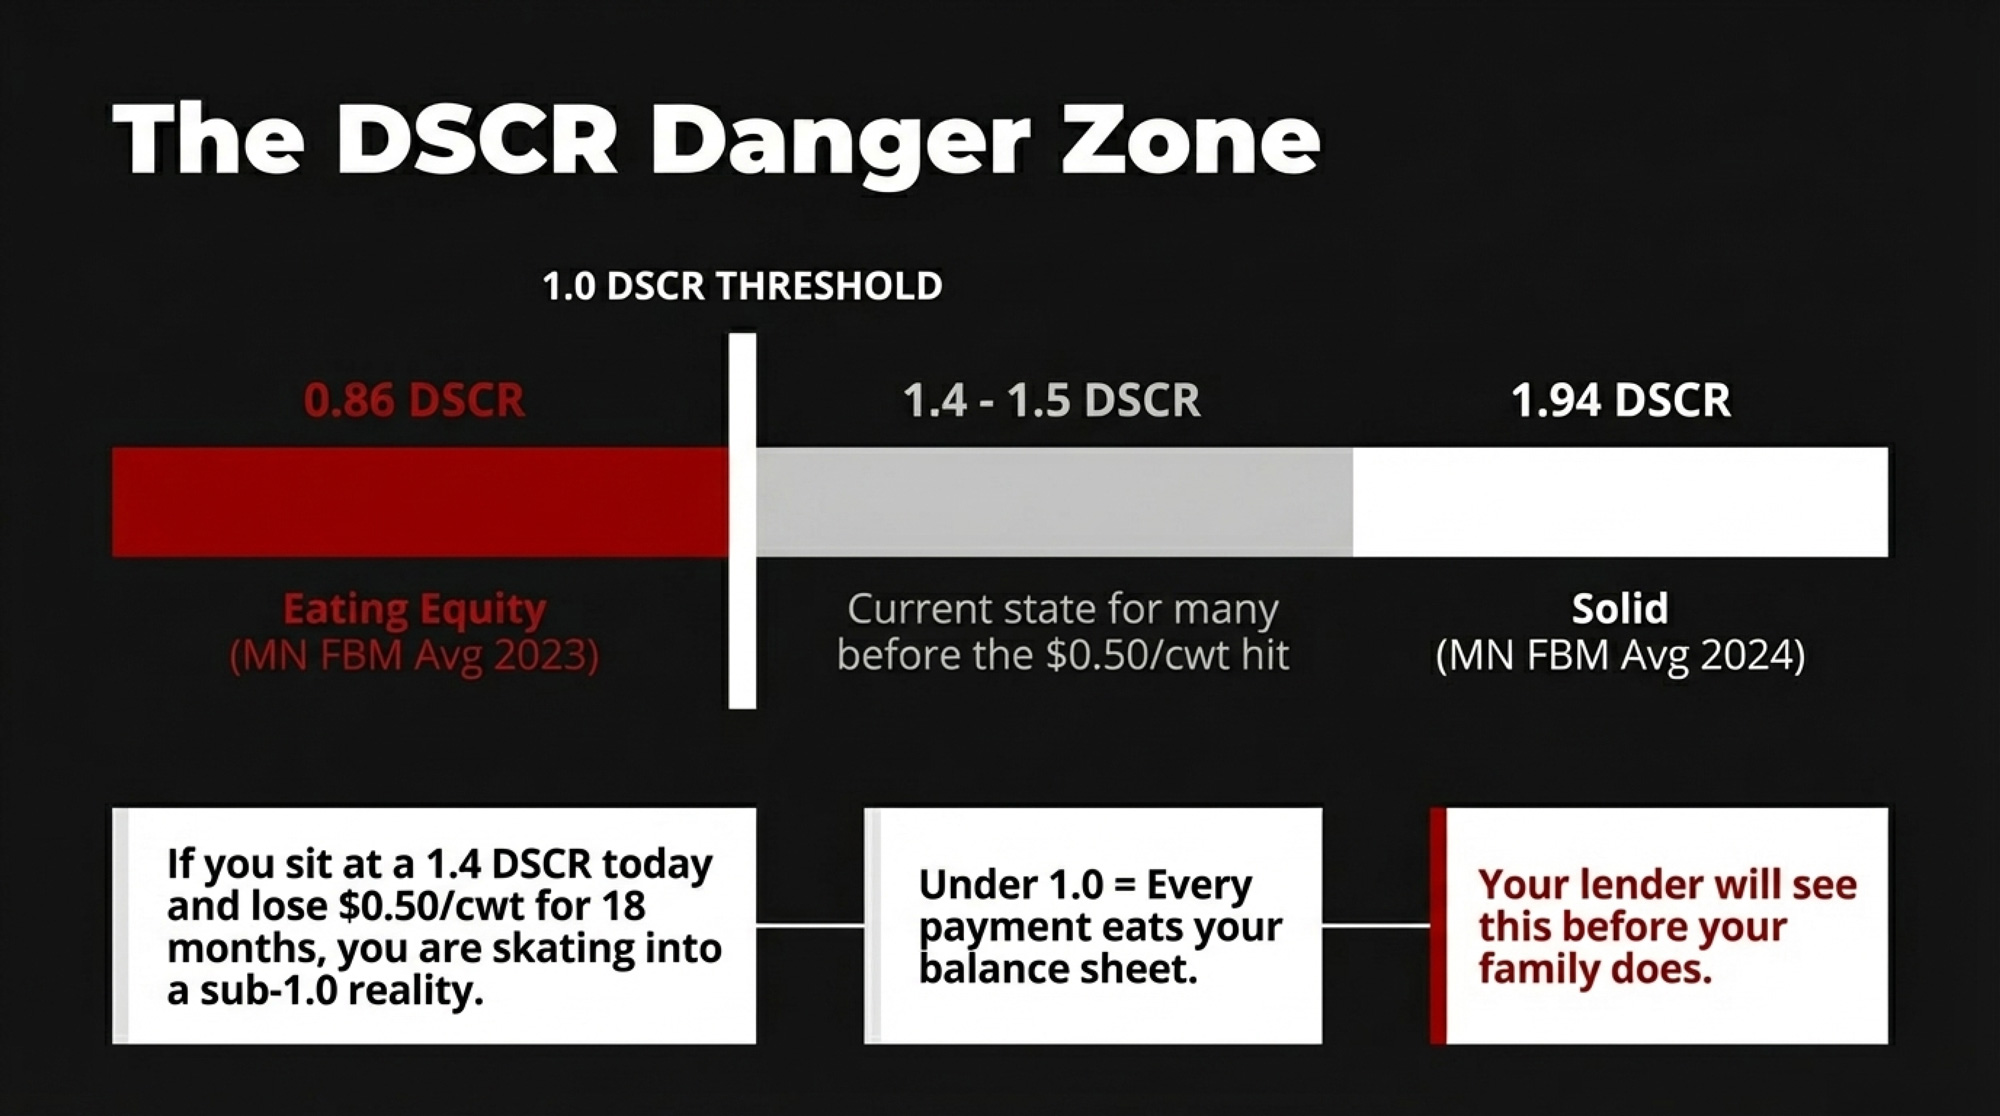
If you’re leveraged. On a 500-cow shop running DSCR closer to 1.1 than 1.3, a captured $56,290 from a combined 0.1%/0.1% component move is the difference between a lender conversation you choose when to have and one your lender chooses for you. Component revenue doesn’t carry the manure tax added volume does — no extra cow, no extra parlor time, no extra lagoon capacity. It’s the highest-leverage margin move currently on the table.

Run the Numbers on Your Herd: The Bullvine Component Value Tracker

Every calculation above is scoped to a 500-cow Wisconsin or Minnesota shipper at 75 lbs/cow/day against March 2026 FMMO prices. Your operation isn’t that one.

The Tracker runs the +0.1% value, the component-gap dollars, and the $17 Class III capital stress-test against your actual numbers — same methodology, your inputs. Plug in your cow count, production level, fat and protein tests, and the dollar numbers move in real time.

Launch the Tracker pre-loaded with this article’s May 2026 baseline — 500 cows, 75 lbs/day, 4.33% fat, 3.29% protein, $2.0220 fat price, $2.0905 protein price, $19.70 USDA all-milk forecast, $16.16 CME Class III futures:

Bookmark the result once you’ve loaded your own cow count, production, and last month’s component tests — that’s your personal Tracker baseline for the Issue #2 refresh against May FMMO prices.

Why Does Chasing a Better Protein-to-Fat Ratio Cost You Money?

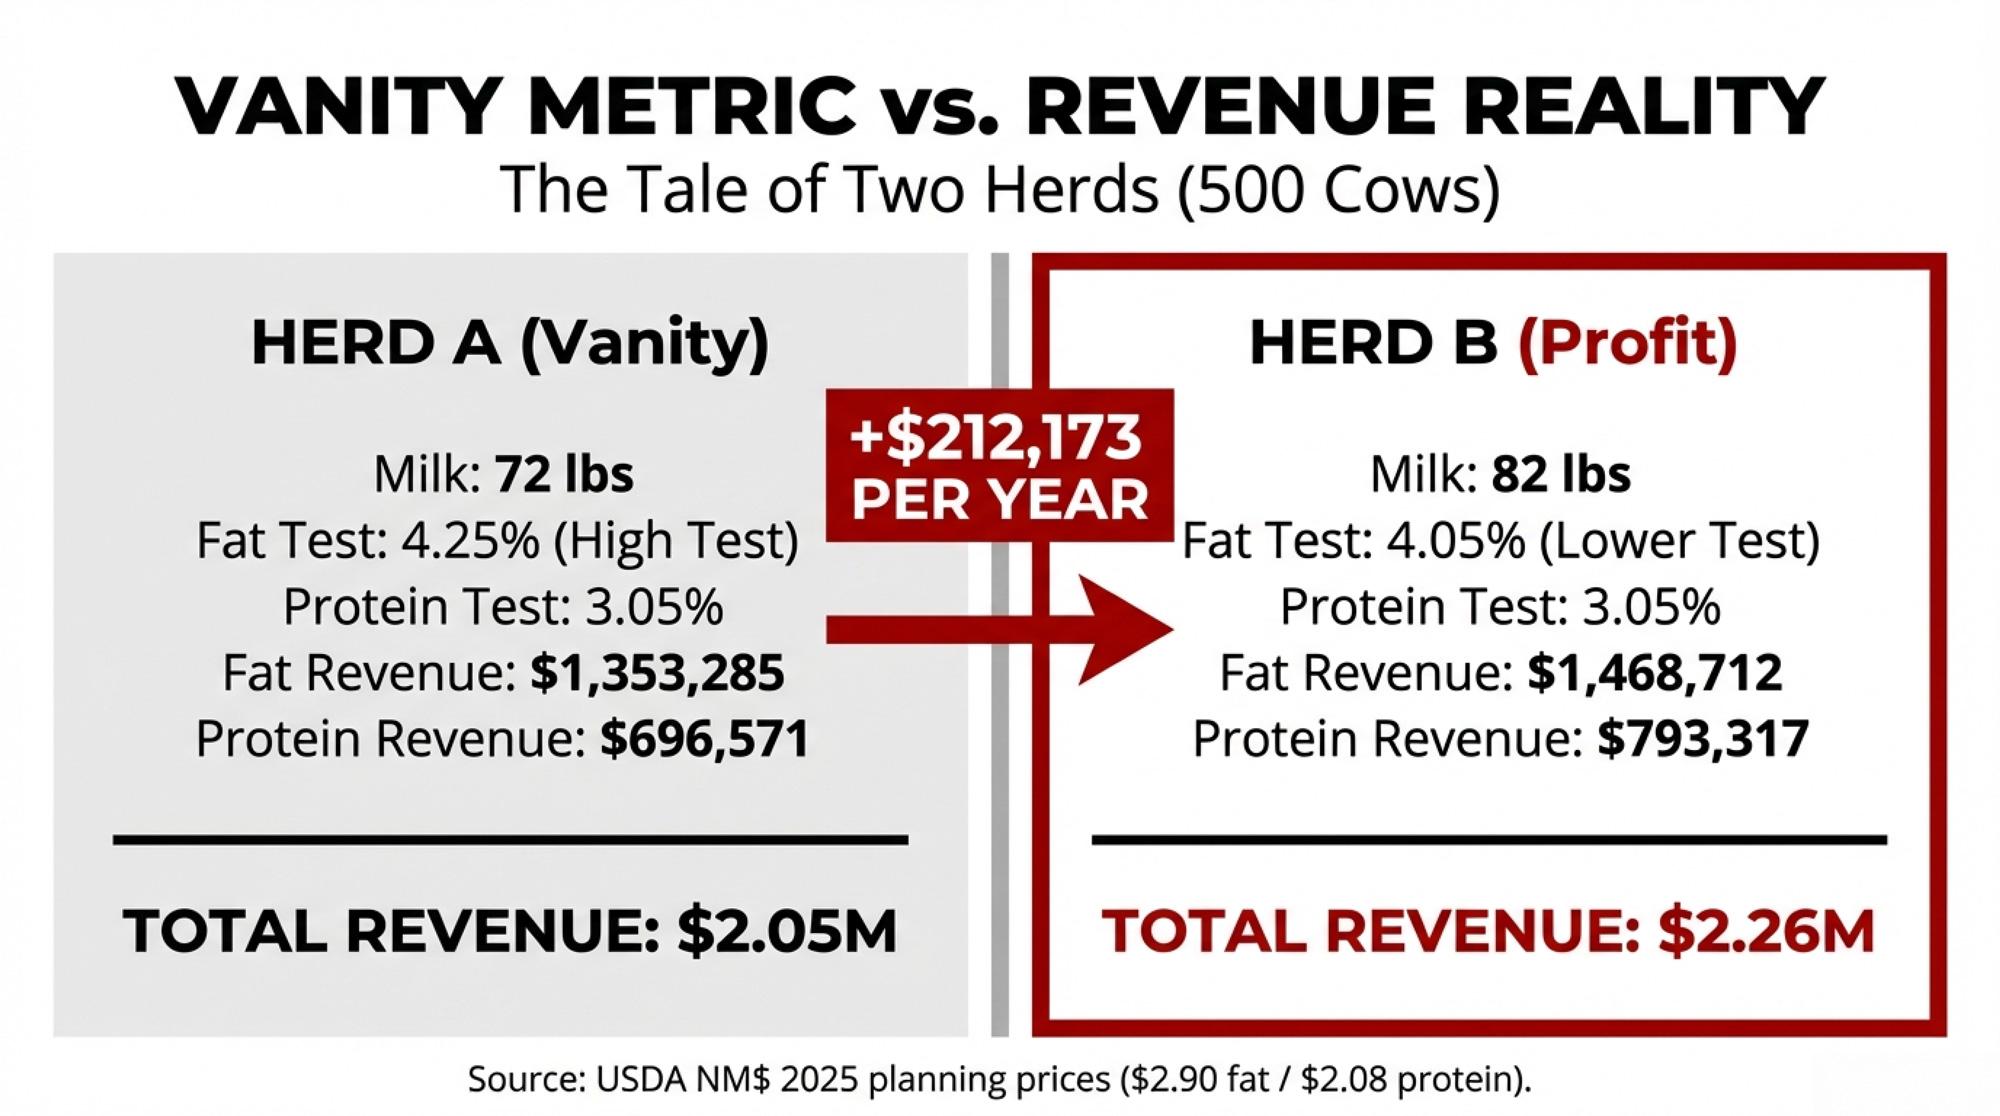
Here’s the assumption the “protein market” headlines set up: the right sire in a protein-premium cycle is the one with the best protein-to-fat ratio. Run the dollars at March 2026 prices, and that logic breaks.

Two sires. Identical on everything else.

SireFat PTA (lbs)Protein PTA (lbs)Fat ValueProtein ValueTotal per Daughter/LactationWinner
Sire A+45+3545 × $2.0220 = $90.9935 × $2.0905 = $73.17$164.16+$19.88
Sire B (prettier ratio)+30+4030 × $2.0220 = $60.6640 × $2.0905 = $83.62$144.28

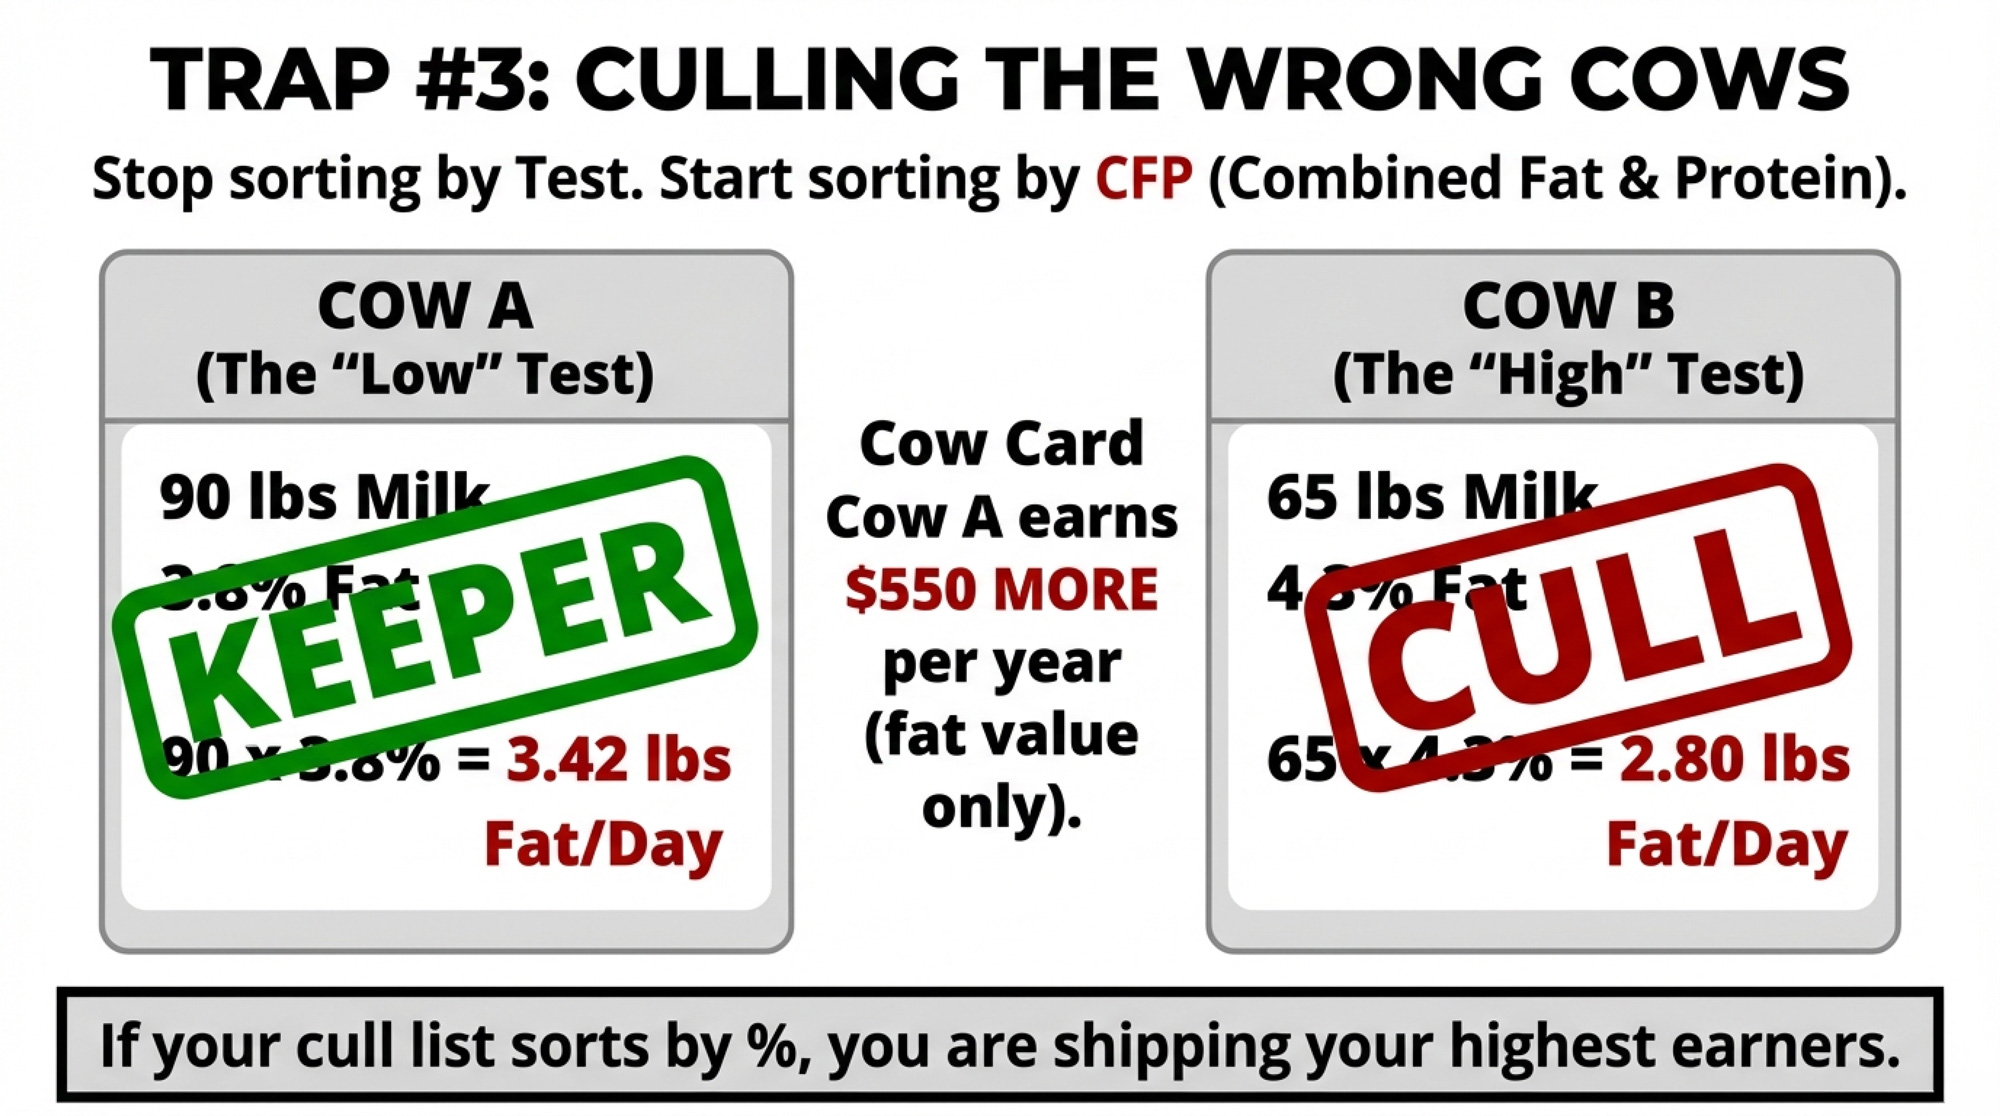
Sire B has the prettier protein-to-fat ratio. Sire A has the heavier check — by $19.88 per daughter per lactation, in a protein-premium market. Total CFP pounds drive the milk check. Ratio doesn’t.

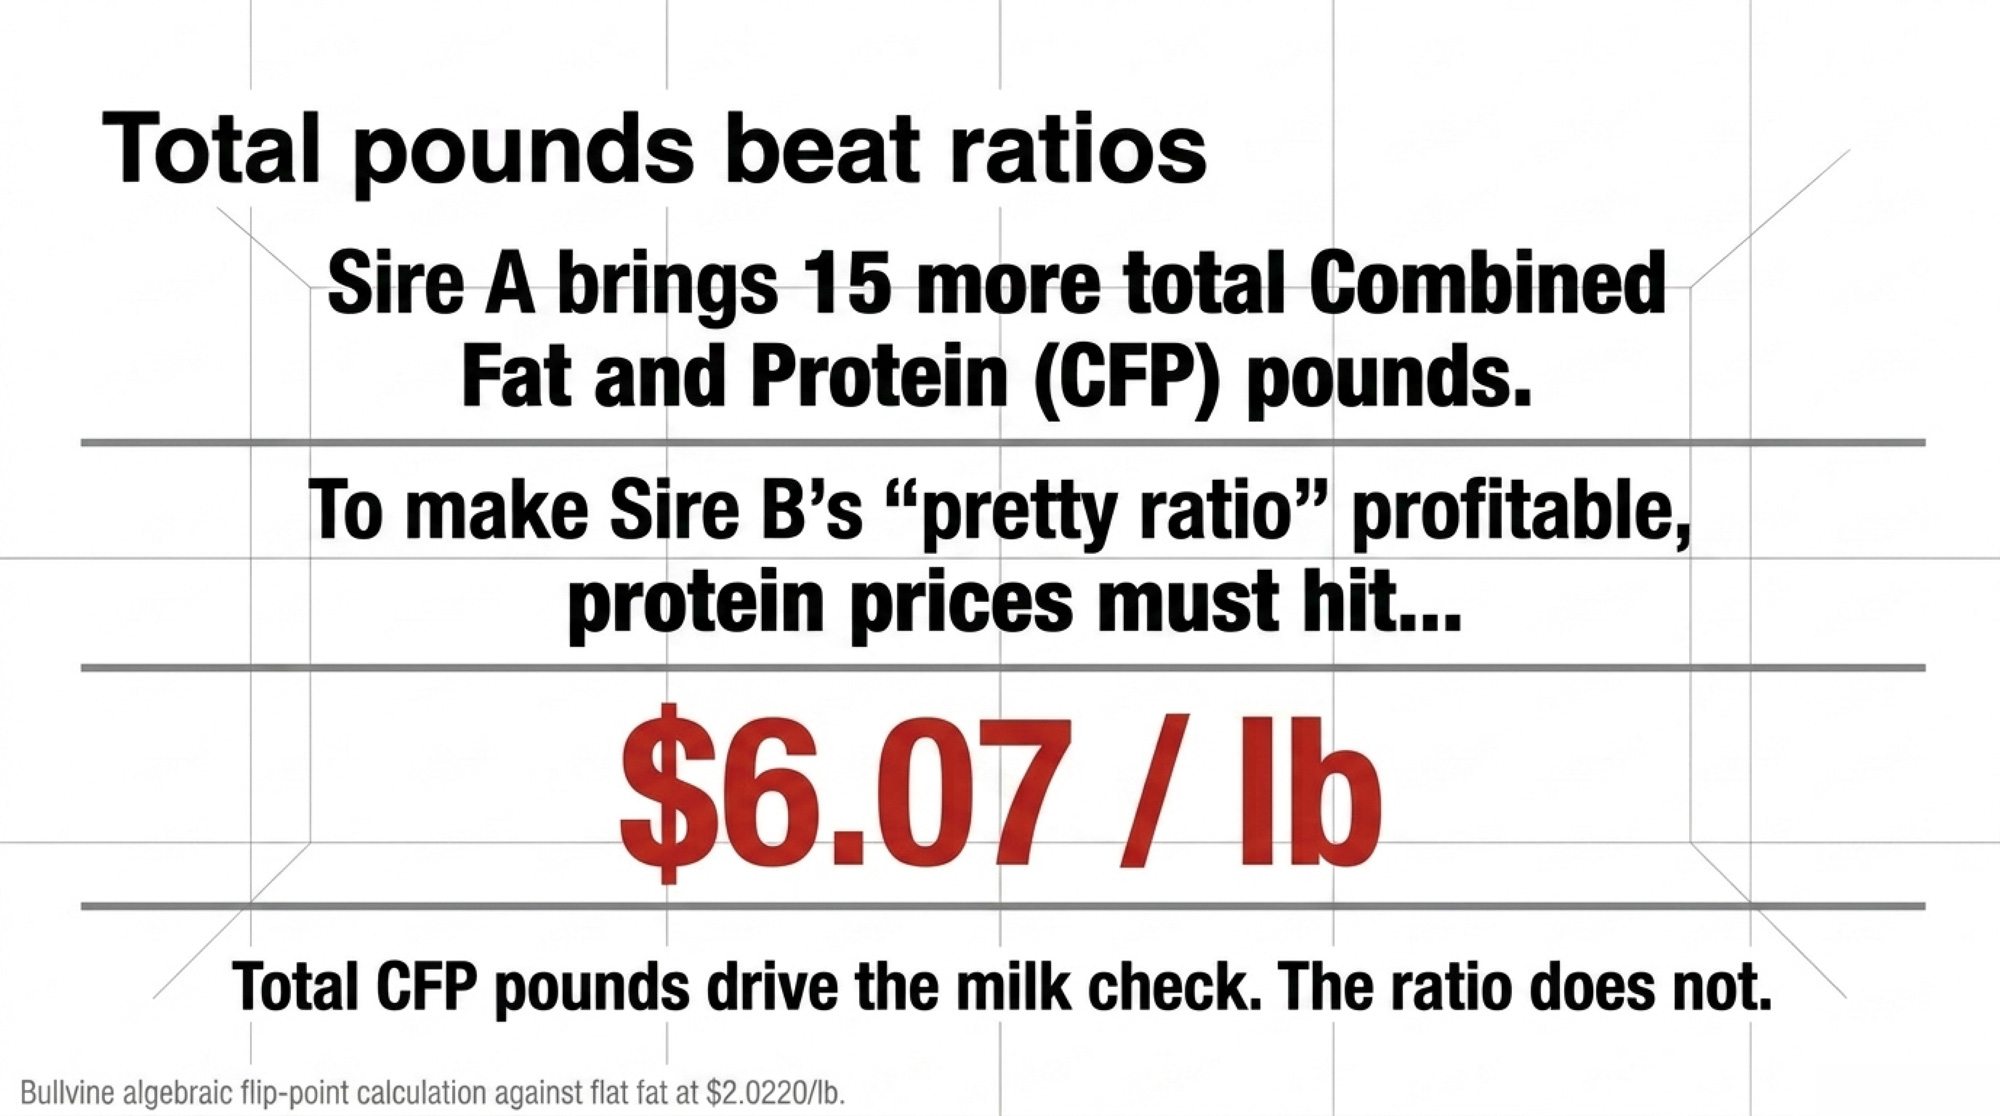
The flip point isn’t where headline logic puts it. Setting Sire A’s value equal to Sire B’s and solving for protein against flat fat at $2.0220/lb:

(45 × $2.0220) + (35 × P) = (30 × $2.0220) + (40 × P) 15 × $2.0220 = 5 × P P = $6.07/lb protein

At flat fat, protein would have to triple from $2.09 to roughly $6/lb before Sire B’s ratio edge overcomes Sire A’s 15-lb CFP advantage. Sire A’s win isn’t marginal. It’s structural — the total-pounds gap is large enough that no realistic protein price flips it.

Picture a Brown County 500-cow operation — a hypothetical herd representative of Order 30 shippers we’ve modeled — that filtered its April sire list on protein-to-fat ratio and surfaced Sire B at the top. Across a typical replacement pipeline of 150 heifers/year and 2.8 lactations per cow in the milking string (Bullvine modeling assumption), that single $19.88/daughter/lactation delta compounds to roughly $8,350/year in steady-state drag once the selection cycles through the lactating herd (150 × 2.8 × $19.88). Filter-the-whole-sire-list style ratio-first selection — not just one sire swap — carries materially more drag; The Bullvine’s April 2026 TPI analysis modeled it at roughly $17,500/year for herds that filtered broadly on ratio across multiple placements.

The ruleset for this mating season:

  • Primary filter: Net Merit or Cheese Merit — both balance full economics, not just protein percent
  • Sort by: total CFP pounds
  • Tie-breaker: protein PTA, when CFP is equivalent
  • Don’t: select on protein-to-fat ratio at the expense of total CFP

There’s an interpretive tension inside TPI itself worth flagging — this is Bullvine analysis, not a Holstein USA position. Under the April 2026 formula, one pound of PTA protein carries roughly 1.7× the leverage of one pound of PTA fat in the index. TPI’s own Feed Efficiency formula still values fat at $1.86/lb against protein at $1.75/lb. Same index. Two signals. Trust the price on the milk check, not the coefficient on the ranking sheet.

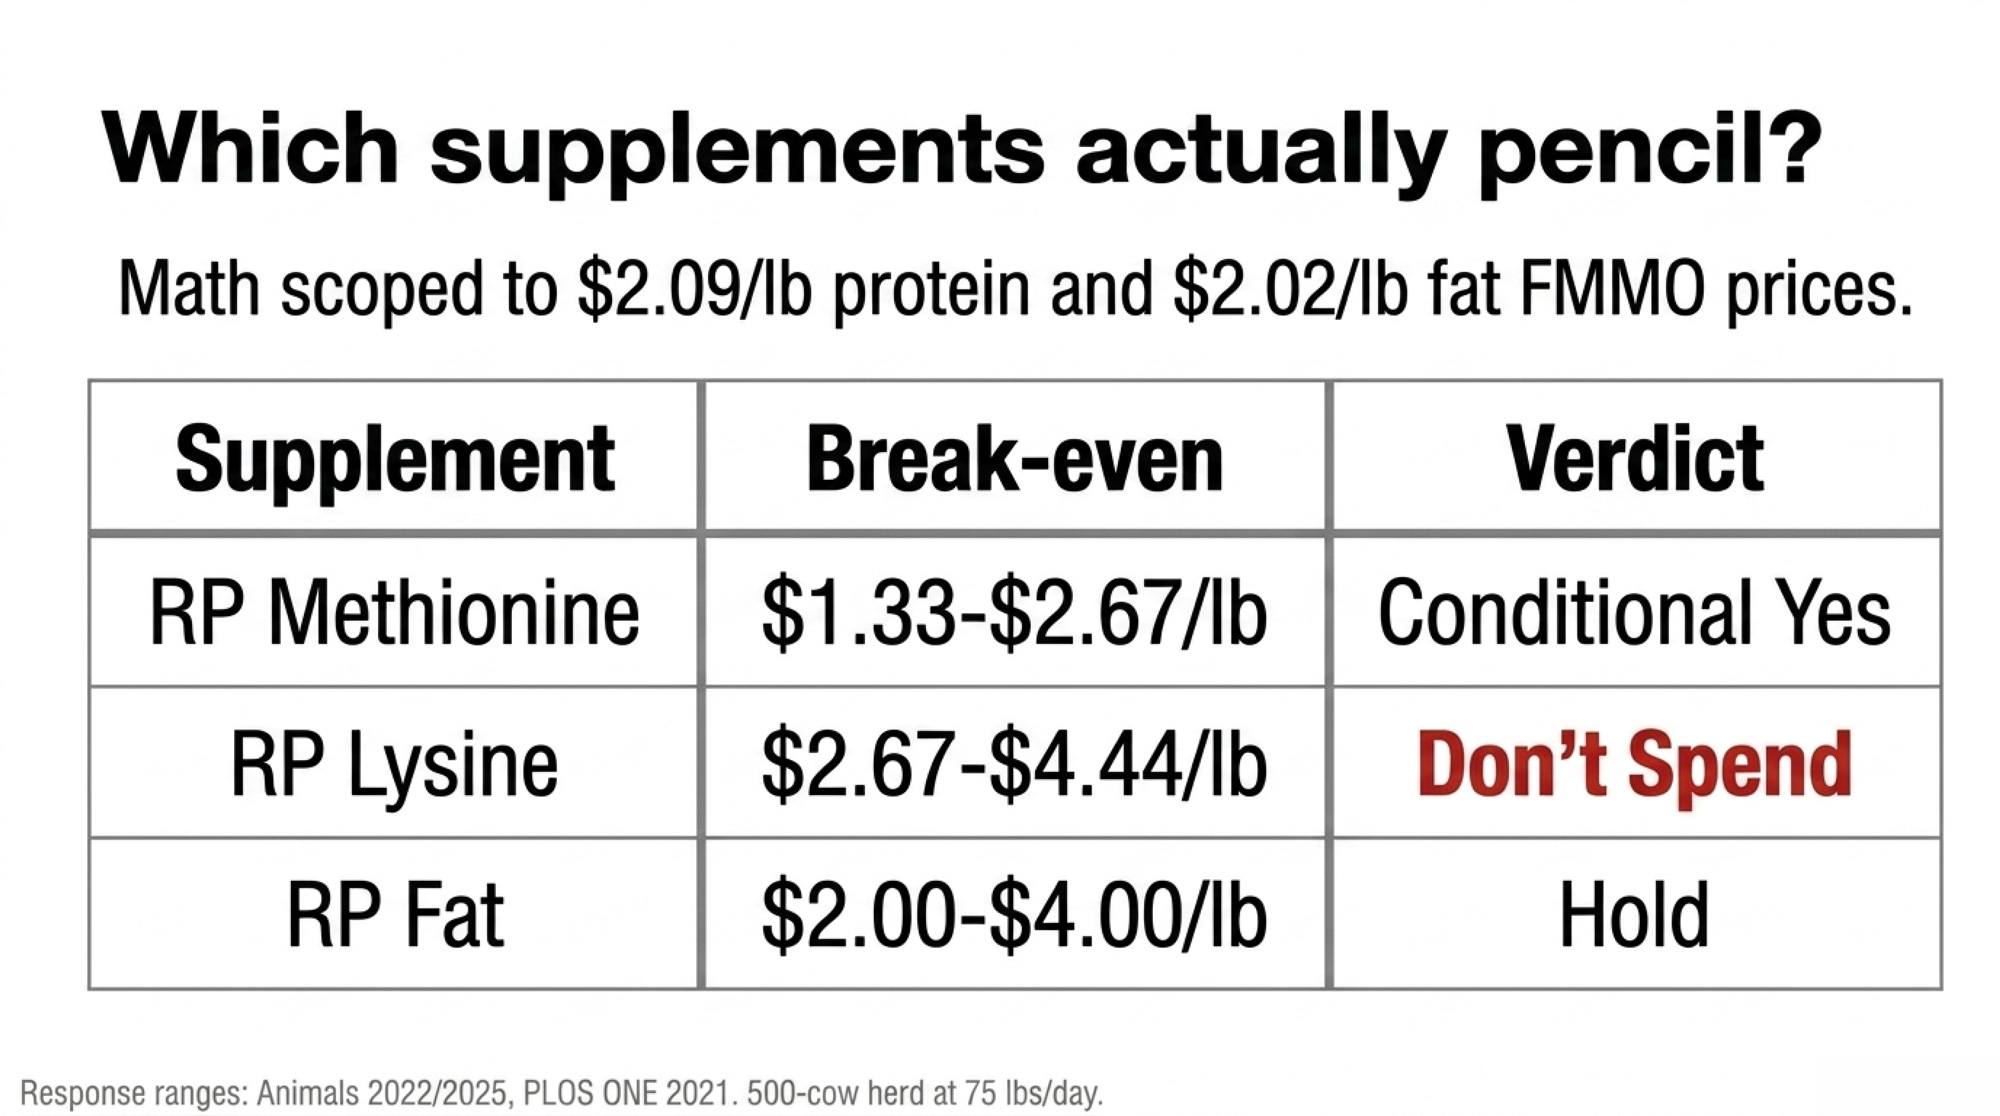
Which Supplements Still Pencil at $2.09/lb Protein?

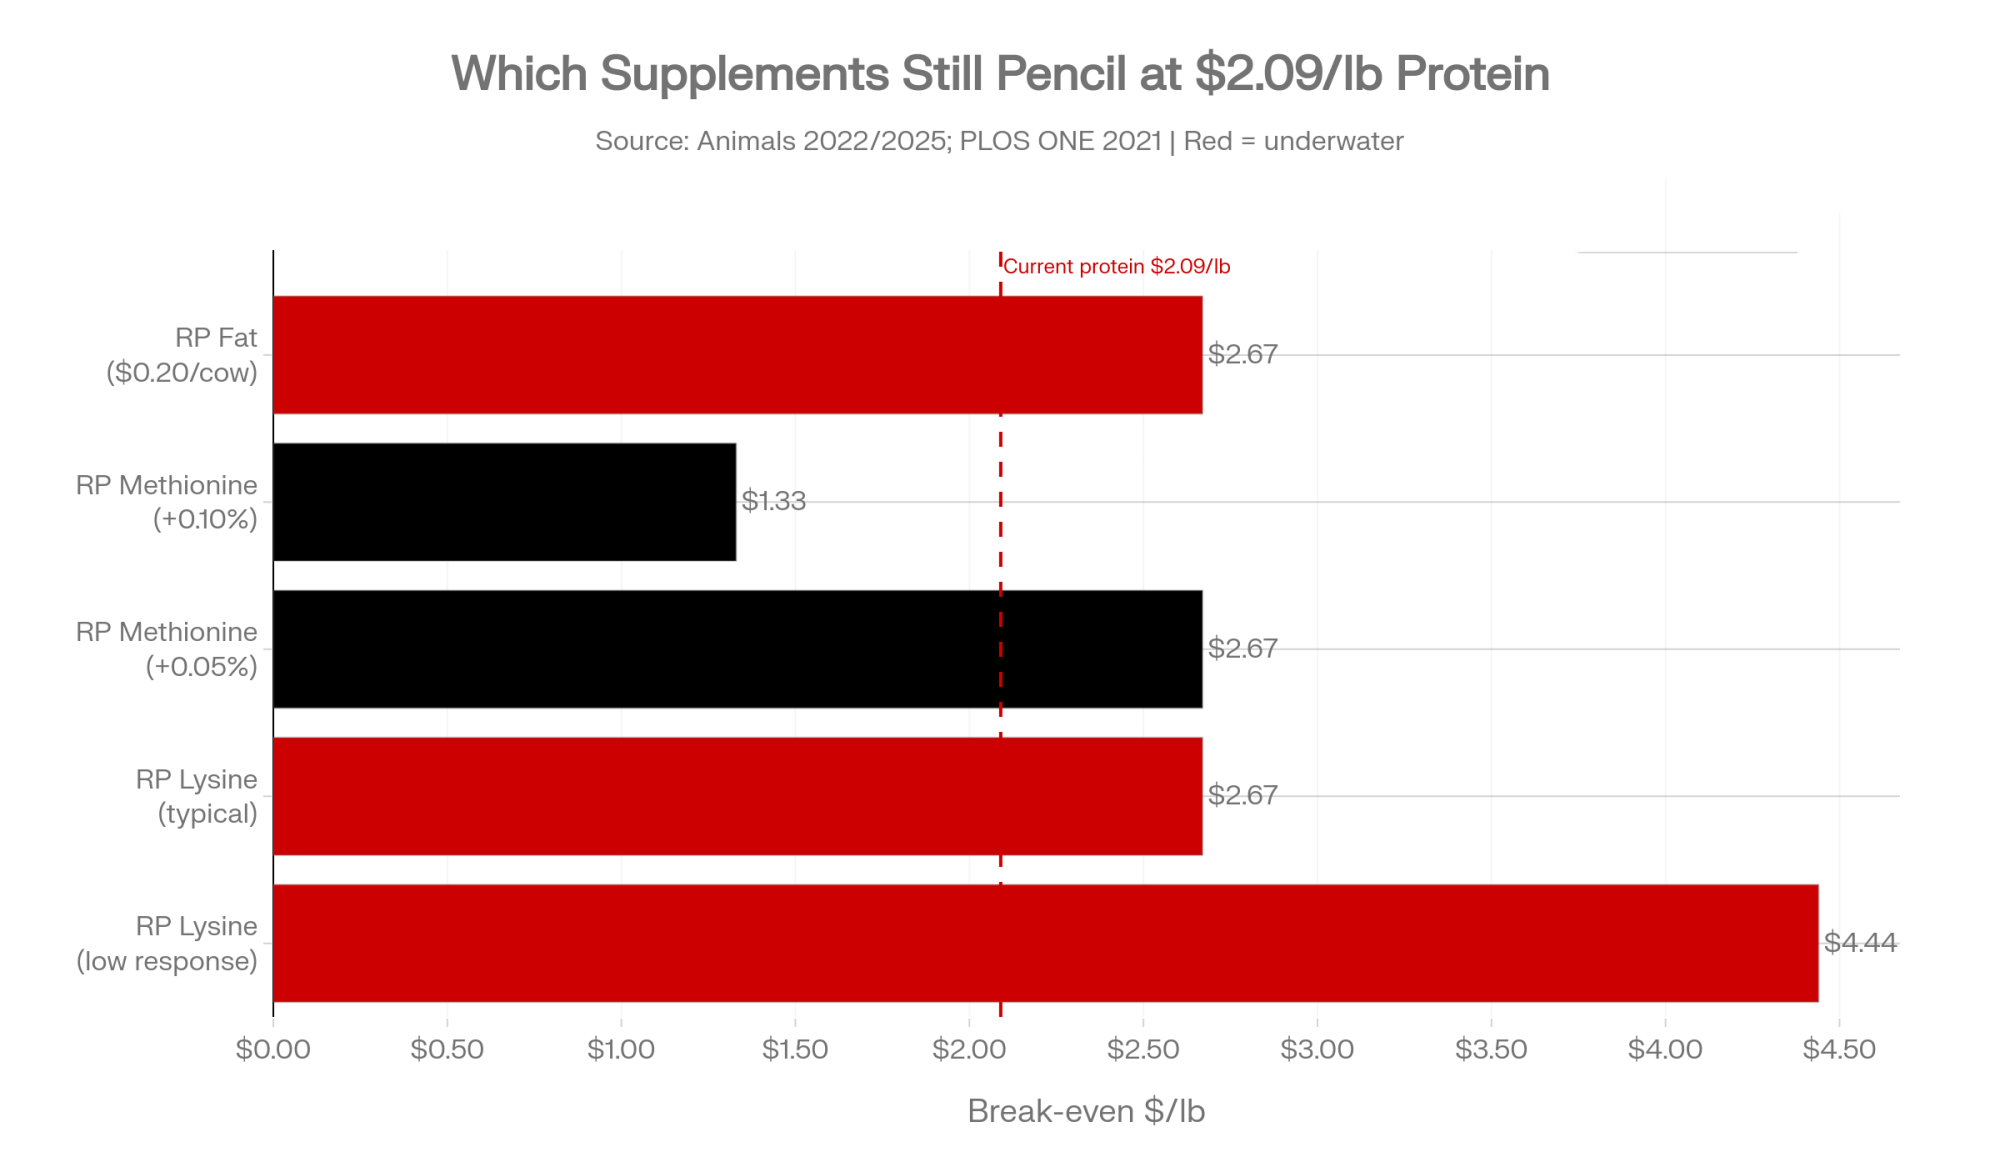
Component prices shifted. Not every ration has caught up. Break-evens below are scoped to a 500-cow, 75 lbs/cow/day Order 30 operation at March 2026 FMMO prices.

Rumen-Protected Methionine: Conditional Yes

A peer-reviewed meta-analysis in Animals (PMC9219501, 2022) puts RPM’s protein response range at +0.07% to +0.15%, with yield gains of 27–43 g/day. The 2025 combined RPLM paper (Animals, PMC12691028) confirms response is heavily dependent on basal diet and a roughly 3:1 lysine-to-methionine target.

At $0.10/cow/day, +0.05% response:

  • Extra protein: 0.0005 × 75 = 0.0375 lbs/cow/day
  • Break-even protein price: $0.10 ÷ 0.0375 = $2.67/lb
  • Current: $2.09/lb — marginally negative

At $0.10/cow/day, +0.10% response:

  • Extra protein: 0.075 lbs/cow/day
  • Break-even: $0.10 ÷ 0.075 = $1.33/lb
  • Margin vs. current: +$0.76/lb — strongly positive

Methionine pays when the cost is low and the response is real. It doesn’t pay when either assumption slips. That’s a ration-audit conversation, not a standing order.

Rumen-Protected Lysine: Don’t Spend

Commercial RPL response on Holsteins runs +0.03% to +0.08% protein at $0.08–$0.15/cow/day, per trial work summarized in PLOS ONE (pone.0243953, 2021).

  • At $0.10/cow/day, +0.05% response: break-even $2.67/lb
  • At $0.10/cow/day, +0.03% response: break-even $4.44/lb

Current protein: $2.09/lb. Unless you’ve got 30+ days of bulk-tank data proving outlier response on your herd, lysine’s a ration tax right now. Not a component strategy.

The flip point. Protein above $2.75/lb sustained before lysine pencils at typical commercial response — $0.66/lb of price movement away.

Rumen-Protected Fat: Hold

At March 2026 butterfat of $2.0220/lb, the break-even for RP fat lands at $2.67/lb (at $0.20/cow/day cost and a +0.10% response: $0.20 ÷ 0.075 = $2.667). Current butterfat sits $0.65 below that threshold. The math works only at lower cost or higher verified response — $0.15/cow/day against the same +0.10% response drops break-even to $2.00/lb, right at the current FMMO.

A year ago, with butterfat peaking at $2.95/lb in January 2025 before collapsing 46% to $1.58/lb by December 2025, the math worked early and not at all by year-end. Any response shortfall flips the decision today.

The flip point. Butterfat sustained above $2.67/lb at typical $0.20/cow/day cost, or contract RP fat below $0.15/cow/day with herd-specific +0.10% response confirmed.

SupplementCost/Cow/DayResponse RangeBreak-Even (typical)Current FMMOVerdict
RP Lysine$0.08–$0.15+0.03–0.08% protein~$2.67–$4.44/lb$2.09/lbDon’t spend
RP Methionine$0.10–$0.14+0.07–0.15% protein$1.33–$2.67/lb (response-dependent)$2.09/lbConditional yes — low cost + verified response only
RP Fat$0.15–$0.30+0.10–0.20% butterfat$2.00–$4.00/lb (cost- and response-dependent)$2.02/lbHold — break-even at or above current FMMO

Response ranges: Animals 2022 (PMC9219501); Animals 2025 (PMC12691028); PLOS ONE 2021 (pone.0243953). Herd response varies by basal ration, stage of lactation, and product specification.

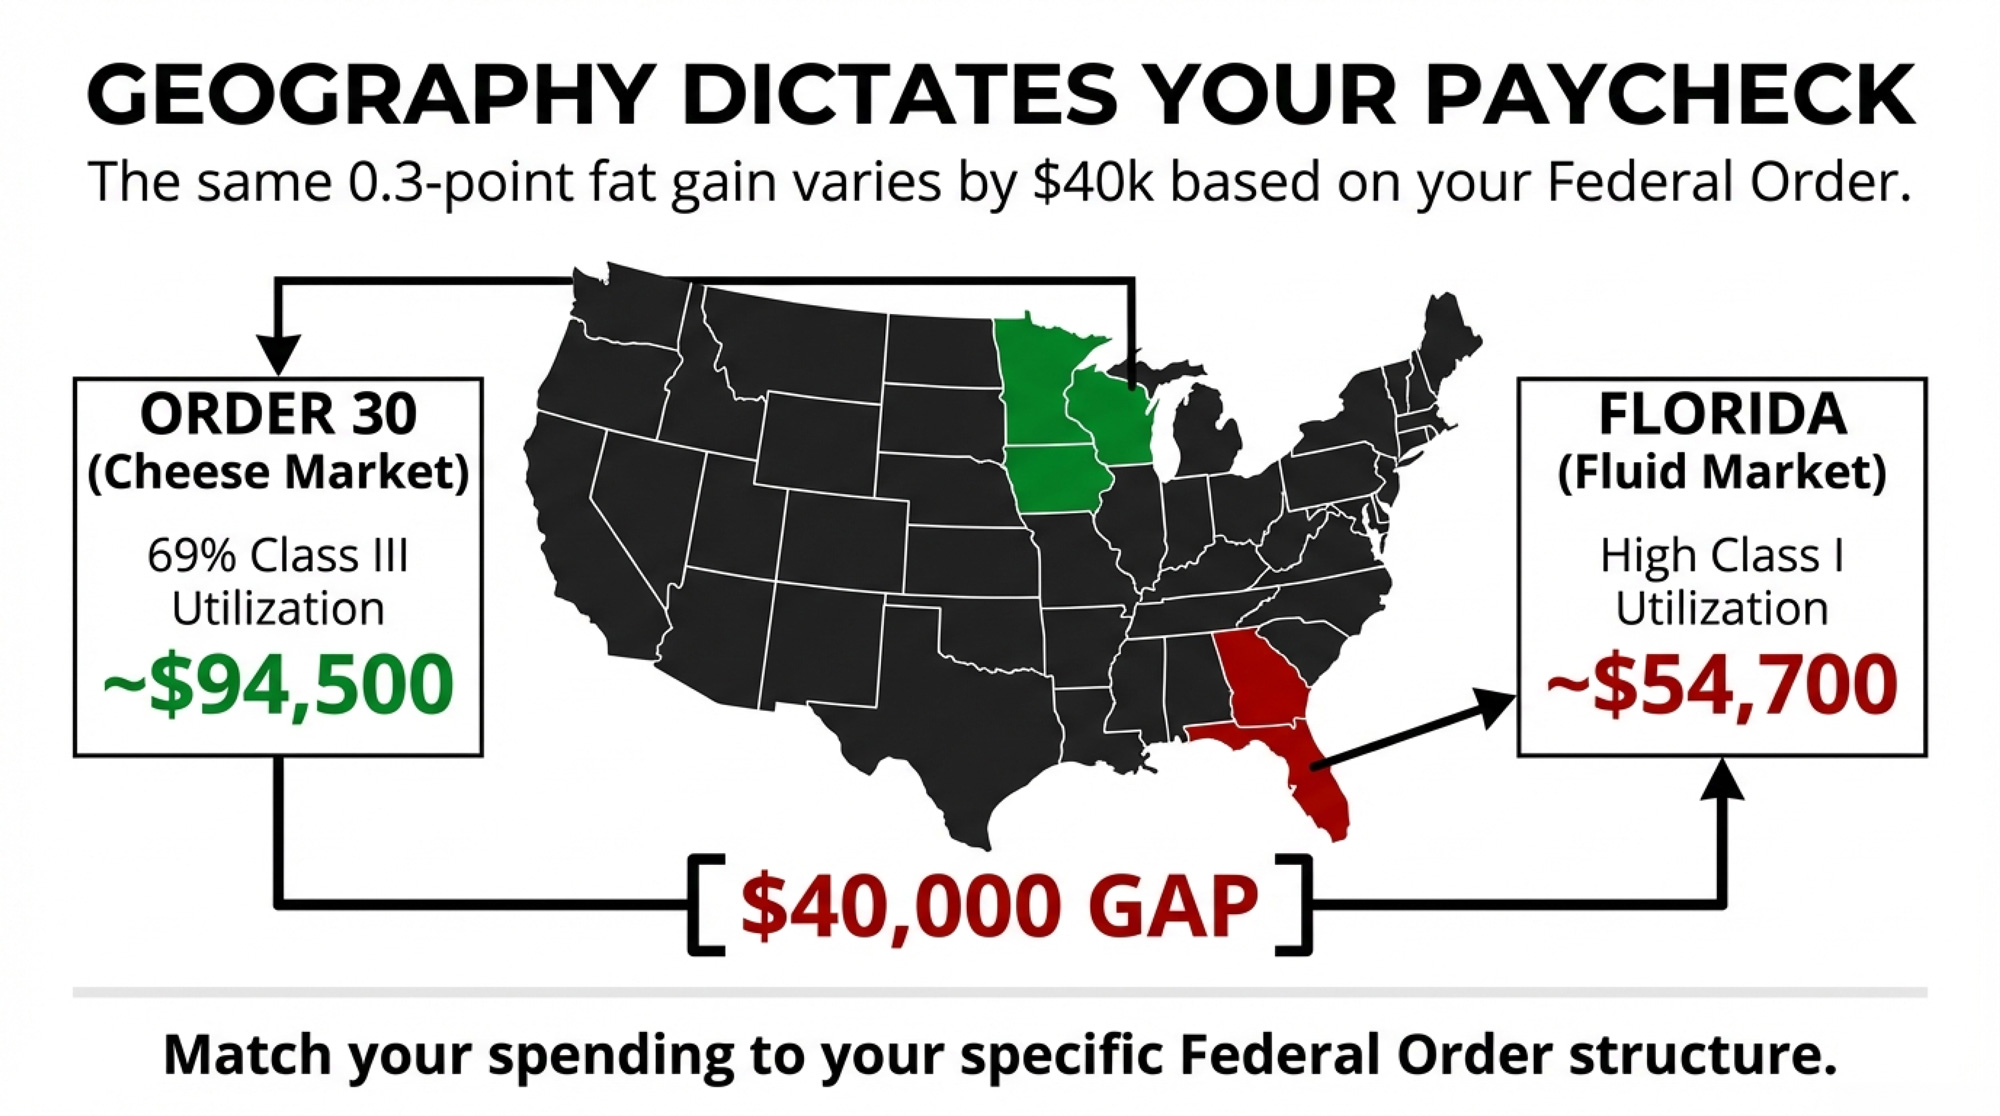
How Much Does Your FMMO Order Change the Protein Payoff?

Same genetics move. Same ration tweak. Different milk check — because FMMO class utilization dictates how much the market pays for what you improved.

Order 30 (Upper Midwest) routes 83.9% of producer milk to Class III cheese use, per FMMA30 2025 annual data. Wisconsin contributes 69.6% of Order 30 volume; Minnesota adds 21.0%. In a cheese-heavy order, protein dominates.

FMMO / RegionClass UtilizationP-to-FPriority
Upper Midwest (30)83.9% Class III0.759Protein first at current FMMO prices — highest protein ROI among major orders
Southwest (126) / TexasExpanding cheese0.767Hilmar + Leprino pulling hard; contract premiums emerging
California (51)Class 4a heavy0.763Fat premiums compressed; repositioning window
Northeast (1)Balanced I/III0.776Fluid share moderates protein premium

FMMA30 Upper Midwest 2025 annual; ratios derived from regional component averages in FMMO reporting.

Texas production ran +10.6% in 2025, Kansas +11.4%, per USDA NASS. Idaho regained the nation’s #3 spot at 18.26 billion lbs of milk, edging Texas’s 18.21 billion by roughly one day’s worth of production. The processing gravity wells driving that growth:

  • Hilmar Cheese, Dodge City, KS — $600M, operational since March 2025
  • Leprino Foods, Lubbock, TX — approximately $1B complex, ~600 employees, designed for ~1M lbs cheese/day
  • Valley Queen, Milbank, SD — expansion completed 2025, anchoring the I-29 corridor
  • Leprino, Lemoore East, CA — closing in 2026, driving California capacity losses

Early-2026 trade coverage of High Plains and I-29 corridor contract offers has flagged structural premium tiers rewarding herds that reach roughly 4.2% fat and 3.3% protein. The specific cwt figure varies heavily by plant, co-op, and volume commitment — verify premium language against your own contract before building the number into a budget. What matters here isn’t the exact number at any one plant. It’s that the premium structure exists where the cheese capacity is landing, and it didn’t exist 18 months ago.

California production ran -5.74% in 2025 (USDA NASS), on water scarcity, regulatory pressure, and lost processing capacity. For the dairies that stay, the shift from fat-heavy checks toward protein-relevant ones is a repositioning window. Not a crisis.

Trade-offs to Watch

  • Net Merit or Cheese Merit over TPI as your primary screen gives up benchmarking some buyers still reference for genetic marketing. You gain pricing accuracy on the milk check. You give up pedigree shorthand at the auction ring.
  • Locking 60–75% of feed at $3.90–$4.10 corn needs equal-weight milk-side coverage. One-sided hedging is worse than no hedge — if corn drops and milk drops with it, you’re paying above-market for feed into a weaker check.
  • Genomic-testing 100% of heifers at ~$40/head runs roughly $6,000/year on a 150-heifer pipeline. Payback only lives in the sorting decision. Testing without changing which heifers breed to elite component sires is a $6,000 data subscription.

What Does a 58/100 Component Opportunity Score Actually Tell You to Do?

Each Tracker issue compresses four market conditions into one score. May 2026 baseline:
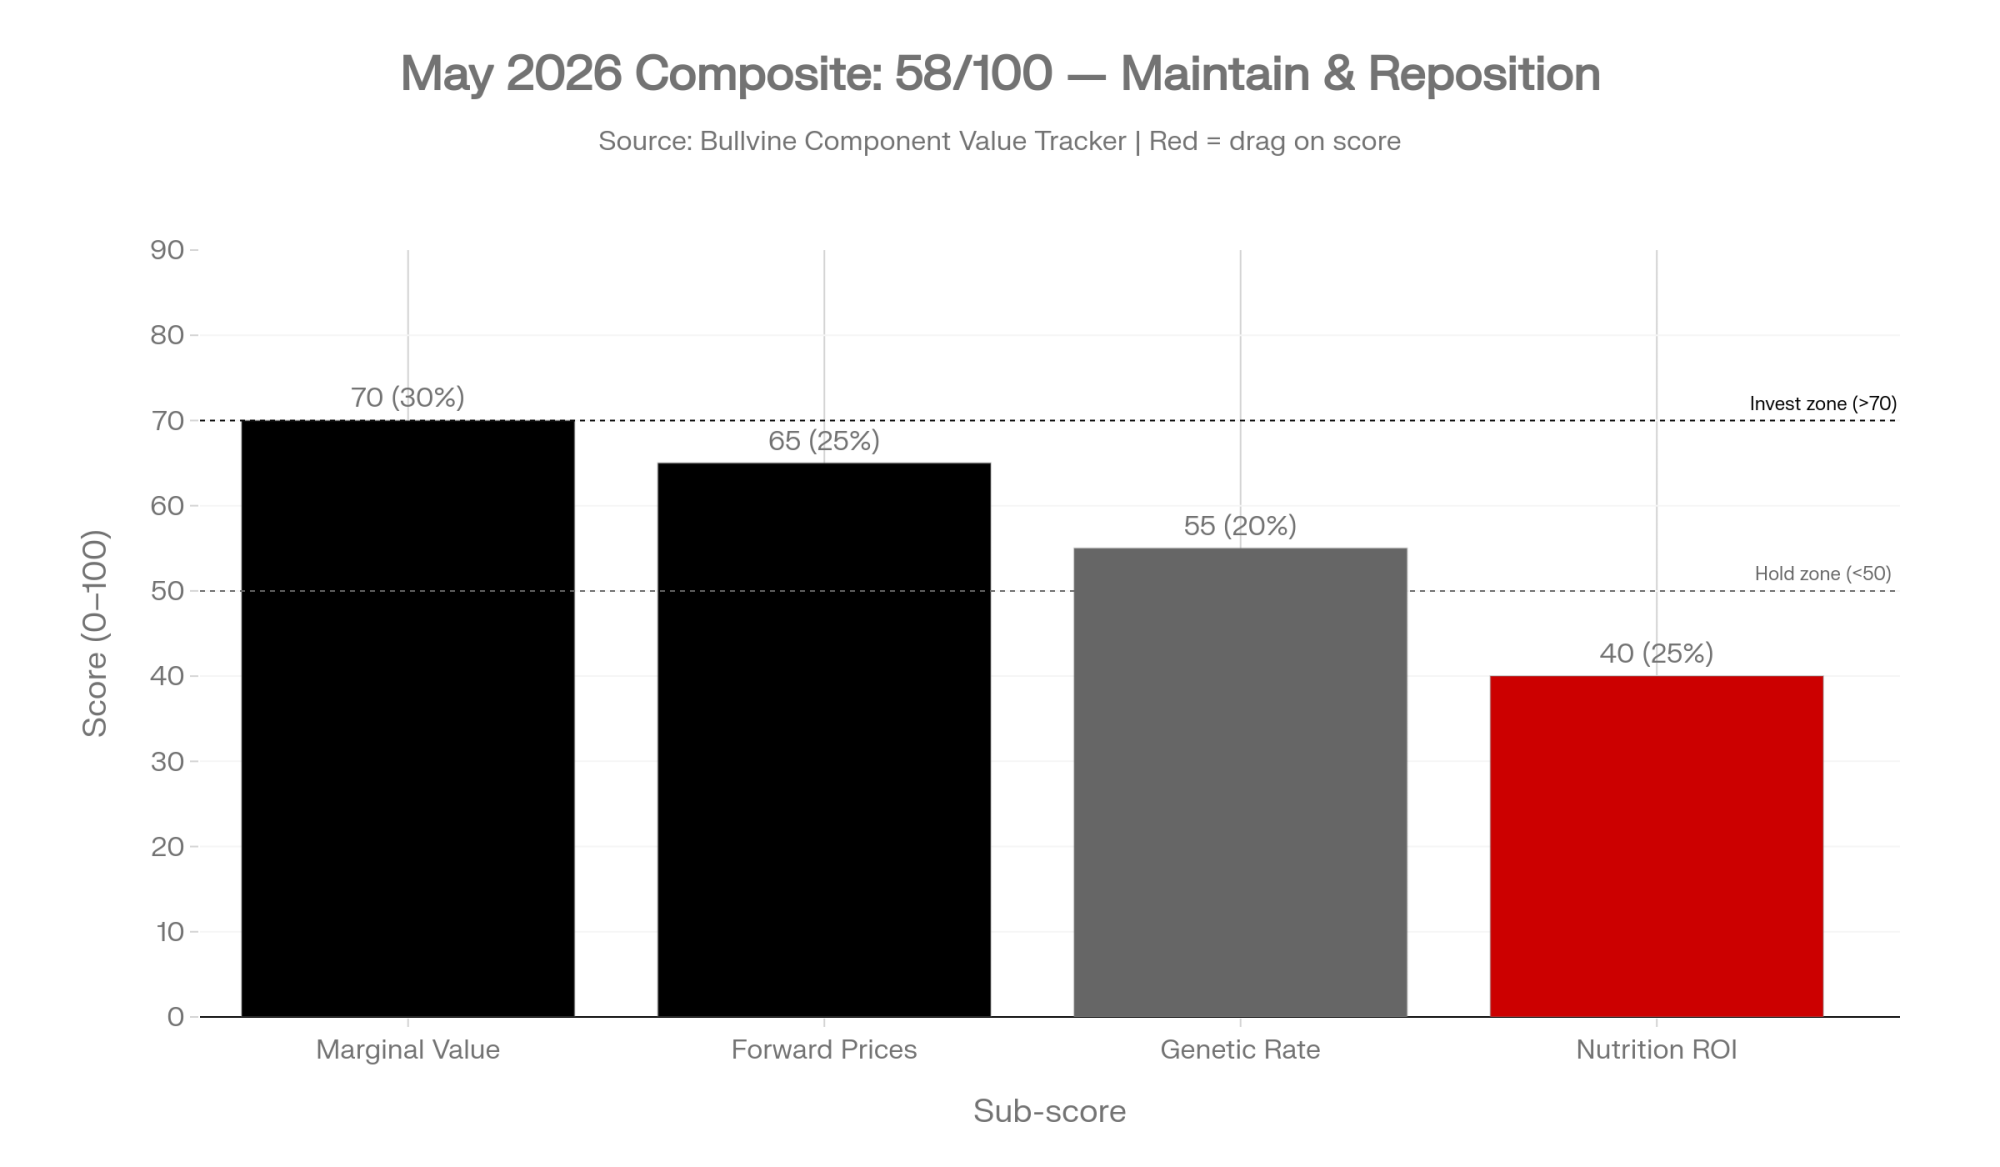
Sub-ScoreWeightReadingScore
Marginal Value ($/0.1% at current FMMO)30%$27,676 fat + $28,614 protein on 500-cow Order 30 — off 2025 peaks but meaningful70
Forward Price Trajectory (CME 6-month)25%Butter and cheese in slight contango from depressed levels — stabilizing, not surging65
Genetic Improvement Rate (CDCB trends)20%Fat PTA still outpacing protein PTA; April 2026 TPI starts the correction, pipeline lag is real55
Nutrition ROI Opportunity25%Lysine negative; methionine conditional; RP fat break-even at or above current FMMO40

Composite: (70 × 0.30) + (65 × 0.25) + (55 × 0.20) + (40 × 0.25) = 21.0 + 16.25 + 11.0 + 10.0 = 58.25/100

ZoneRangeAction
Invest Aggressively>70Component premiums justify significant new nutrition + genetics spending
Maintain and Reposition50–70Premiums positive but compressed; genetics and market positioning carry highest forward returns
Hold<50Premiums don’t justify added investment

A 58 doesn’t mean spend everywhere. It means stay in the component game and be ruthless about which marginal dollar goes where. The 40 on nutrition reflects real margin compression — methionine’s the only consistent winner, and only at the low end of cost. The 55 on genetics reflects the lag between what the market wants and what the CDCB pipeline delivers today.

What pushes the score toward 80+: protein sustaining above $2.50/lb as new cheese plants come online; butterfat stabilizing above $2.25/lb; FMMO reform that increases component weight in pricing.

What drops it below 40: both prices falling below $1.75/lb; a feed-cost spike raising all break-evens; component tests plateauing nationally.

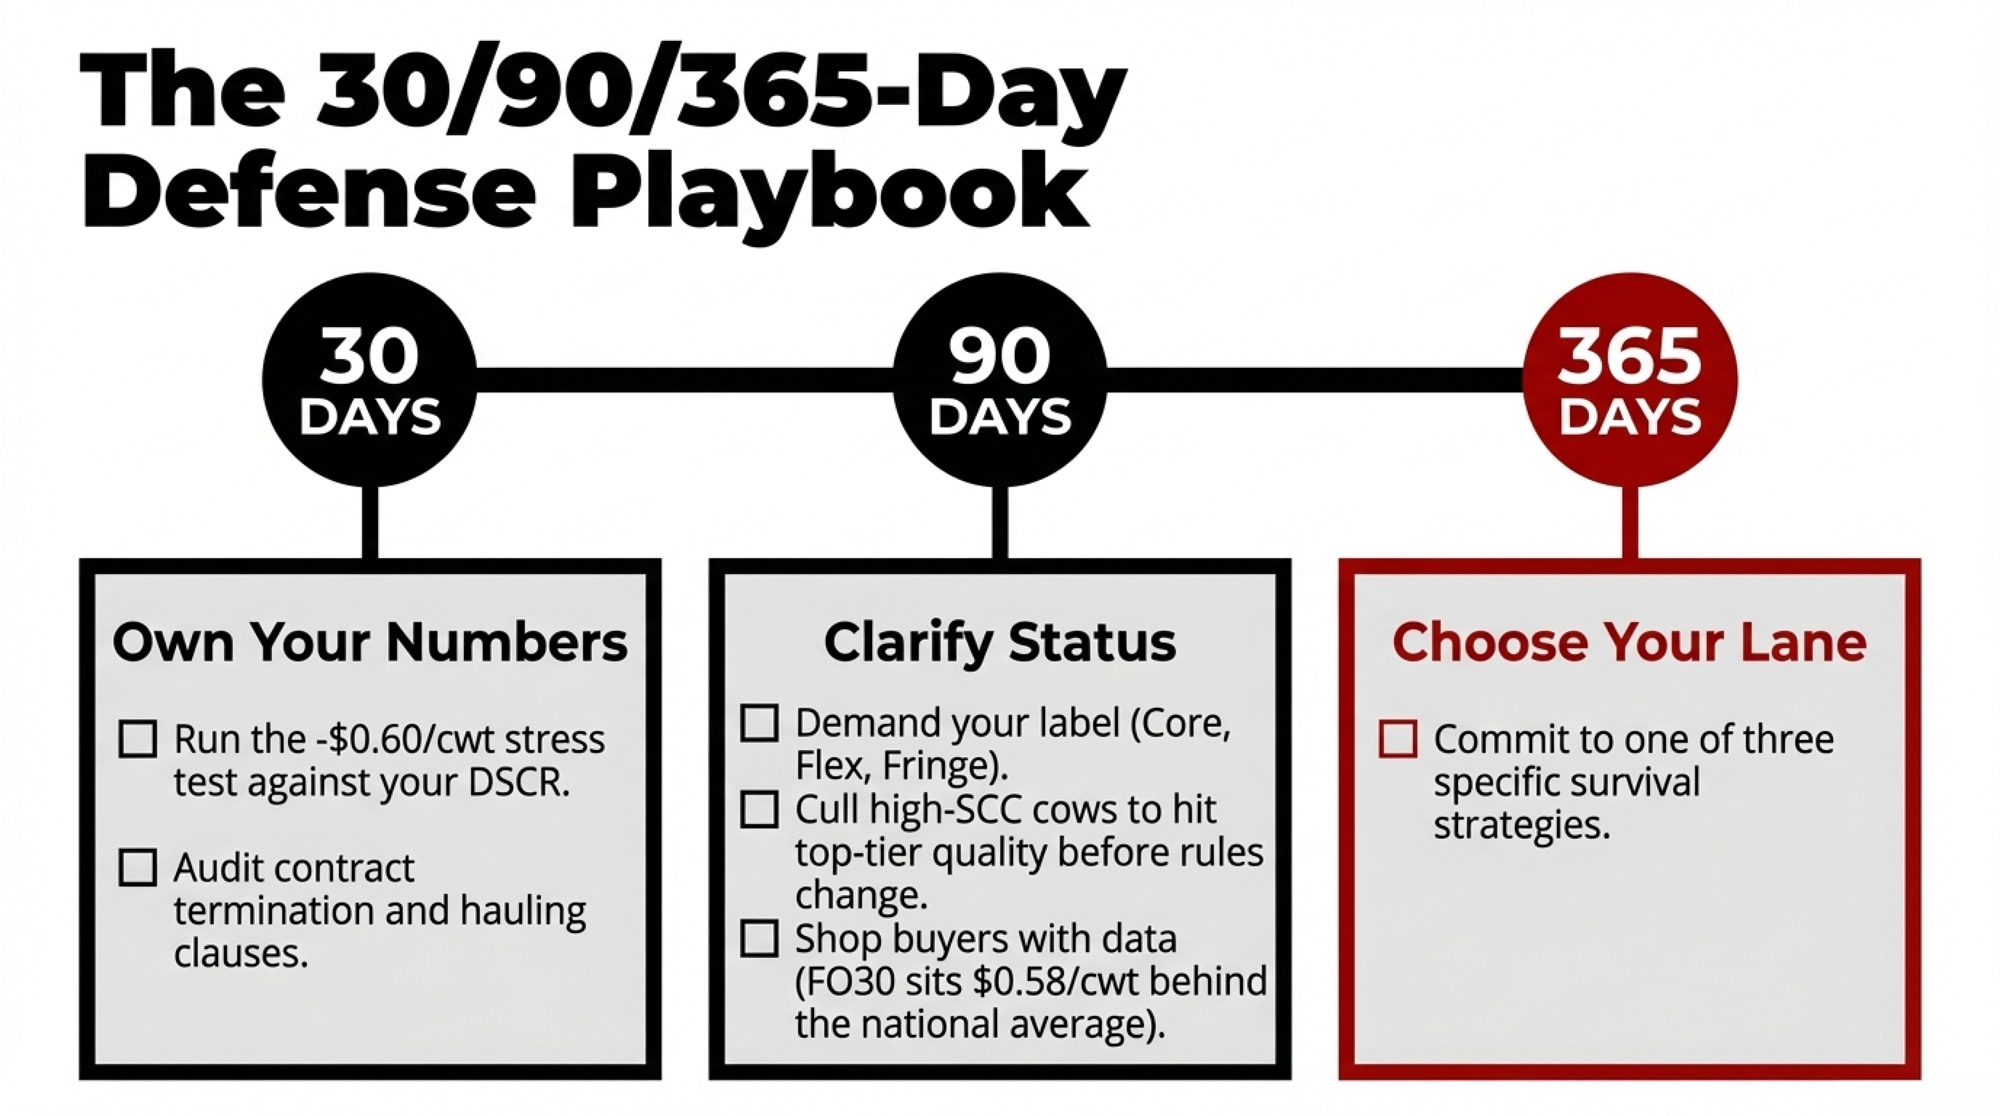
The 30/90/365-Day Playbook for a 500-Cow Order 30 Shipper

30-Day Actions

1. Pull last month’s milk check this week and run the 0.1% formula on your own numbers. Compare your protein test to the Order 30 average near 3.29%. The gap has a dollar sign in front of it — and at current prices, that gap’s worth more per pound than it was 18 months ago. Plug actual fat and protein tests into the embedded Tracker at March 2026 FMMO prices.

  • Requires: three milk statements, herd size, daily lbs/cow average.
  • Red-flag trigger: protein test more than 0.15 points below the Order 30 average = over $40,000/year on the table for a 500-cow herd at current prices. Urgent.
  • Watch for: seasonal variation. Compare trailing 12 months, not just last month.

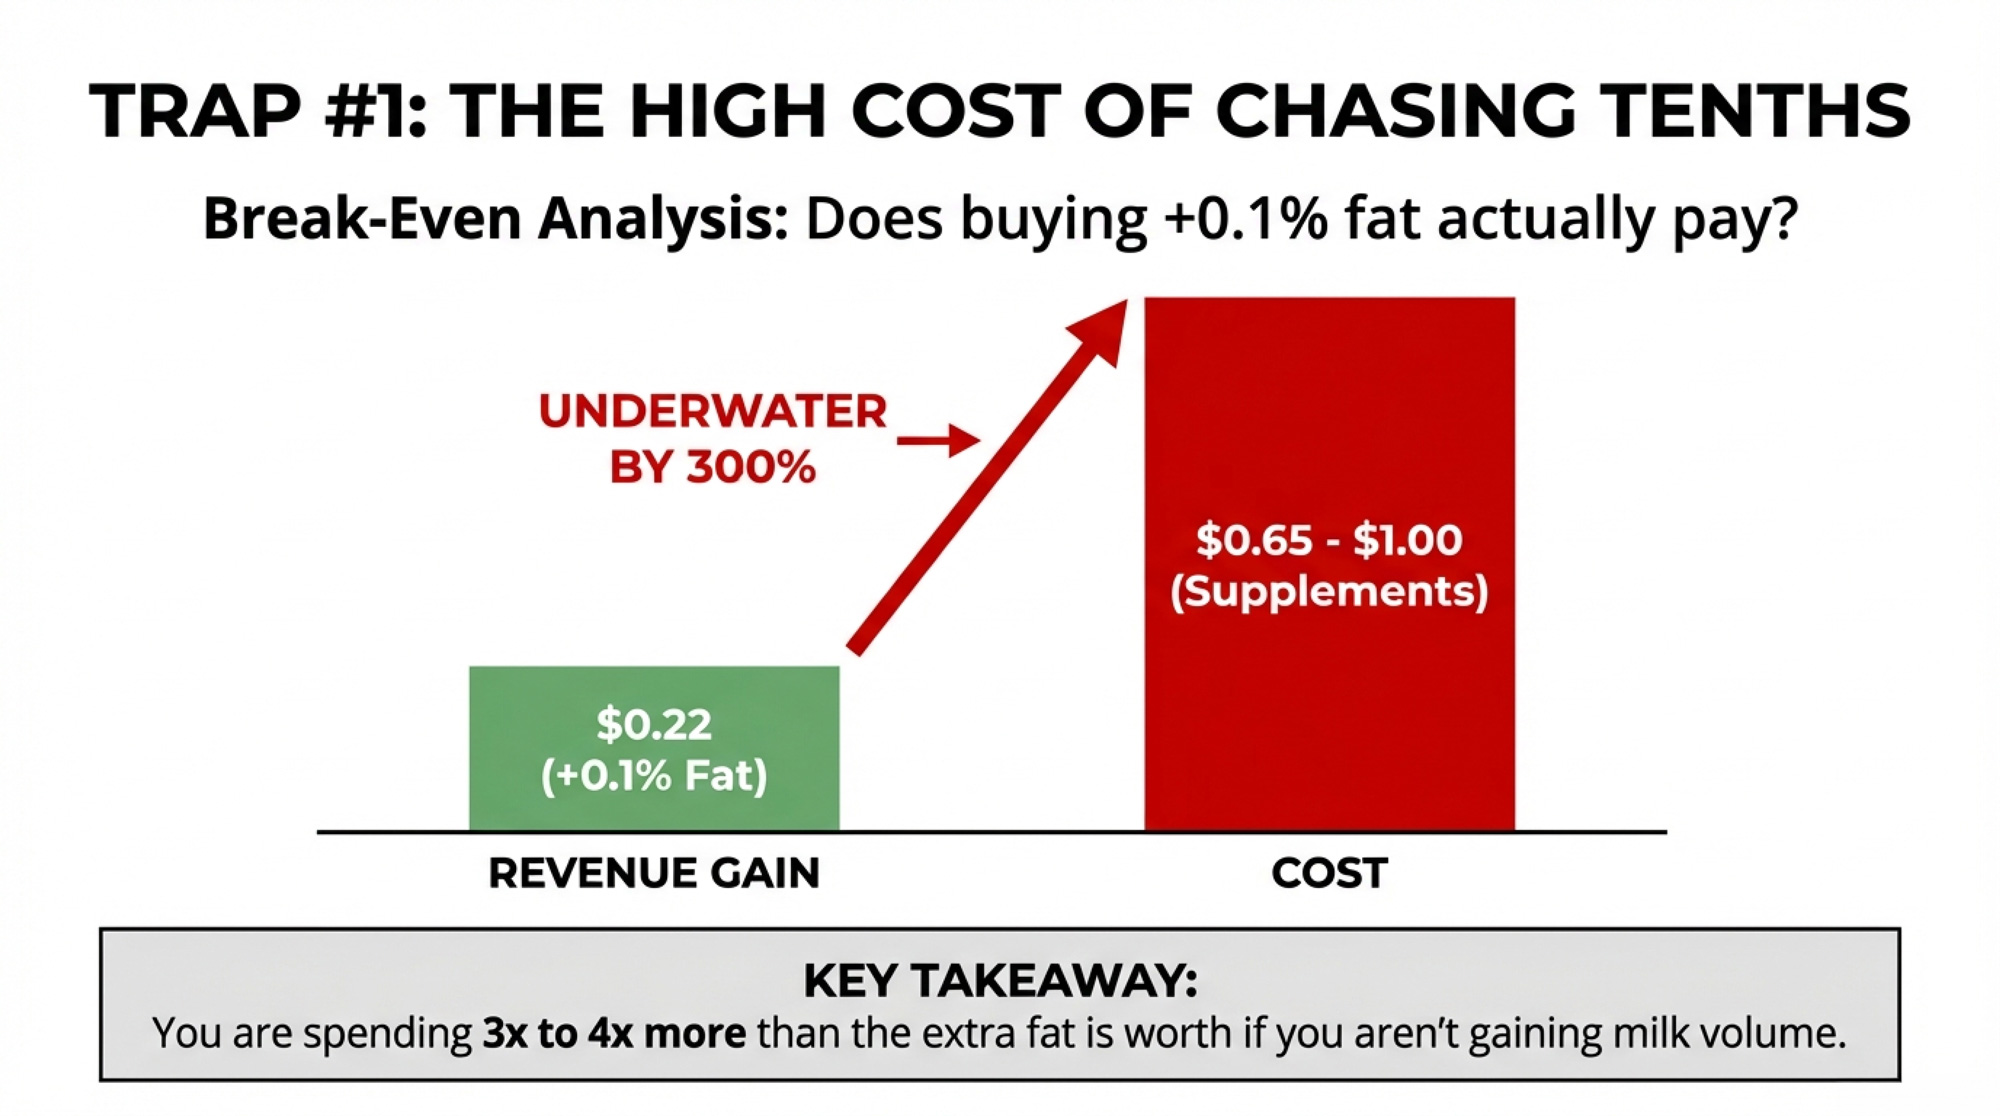
2. Audit every rumen-protected supplement — and stop RP Lysine this month if response isn’t documented. Pull the invoice cost per cow per day. At $2.09/lb protein and typical commercial lysine response rates, the math is underwater by roughly $0.60 to $2.35/lb depending on your inputs. If you can’t show 30 days of bulk-tank data proving outlier response, it’s a ration tax.

  • Requires: feed invoices, nutritionist response data, bulk-tank component trend.
  • Red-flag trigger: any supplement with implied break-even above $2.09/lb protein or $2.02/lb fat, and no 30-day before-and-after data proving the response — cost to eliminate.
  • Watch for: products bundled into larger mixes where per-cow-per-day cost is hard to isolate. Ask for it in writing.

3. Put a methionine kill switch in writing with your nutritionist. +0.05% protein minimum, $0.12/cow/day maximum. Review date on the calendar. No exceptions.

  • Requires: nutritionist sign-off, 30-day bulk-tank baseline.
  • Red-flag trigger: either threshold violated for 30 consecutive days — pull the product, reset the ration, re-baseline before adding back.
  • Watch for: “the response will show up next month.” Put a review date on the calendar and hold it.

4. Before your next breeding decision, ask two questions. “What’s this bull’s total CFP in pounds?” Then: “What’s that worth per lactation at $2.0905 protein and $2.0220 fat?” That conversation surfaces the ratio trap before it ends up in your herd — at current prices, a 15-lb CFP gap between two sires is worth ~$20/daughter/lactation, and no realistic protein price flips that math.

  • Requires: current sire-list CFP data, March 2026 FMMO prices in the genetic advisor’s conversation.
  • Red-flag trigger: advisor defaults to protein-to-fat ratio or last year’s prices — stop the meeting and reset the reference numbers.
  • Watch for: marketing materials built on 2024 component prices. The math has moved.

90-Day Actions

5. Rebuild sire selection criteria around total CFP. Shift from protein-ratio filters to Net Merit or Cheese Merit as the primary screen. Sort by total CFP pounds. Protein PTA as tie-breaker only.

  • Requires: a conversation with your genetic advisor using March 2026 FMMO prices, not 2024’s. Bring current herd-average component tests.
  • Threshold: if your current bull lineup’s average CFP sits below the breed top 50% on the current CDCB run, you’re leaving component revenue on the table genetics-to-barn is slow to fix.
  • Watch for: over-tilting toward protein at the expense of health and fertility. Net Merit and Cheese Merit already hold that balance. Don’t override the index manually for ratio.

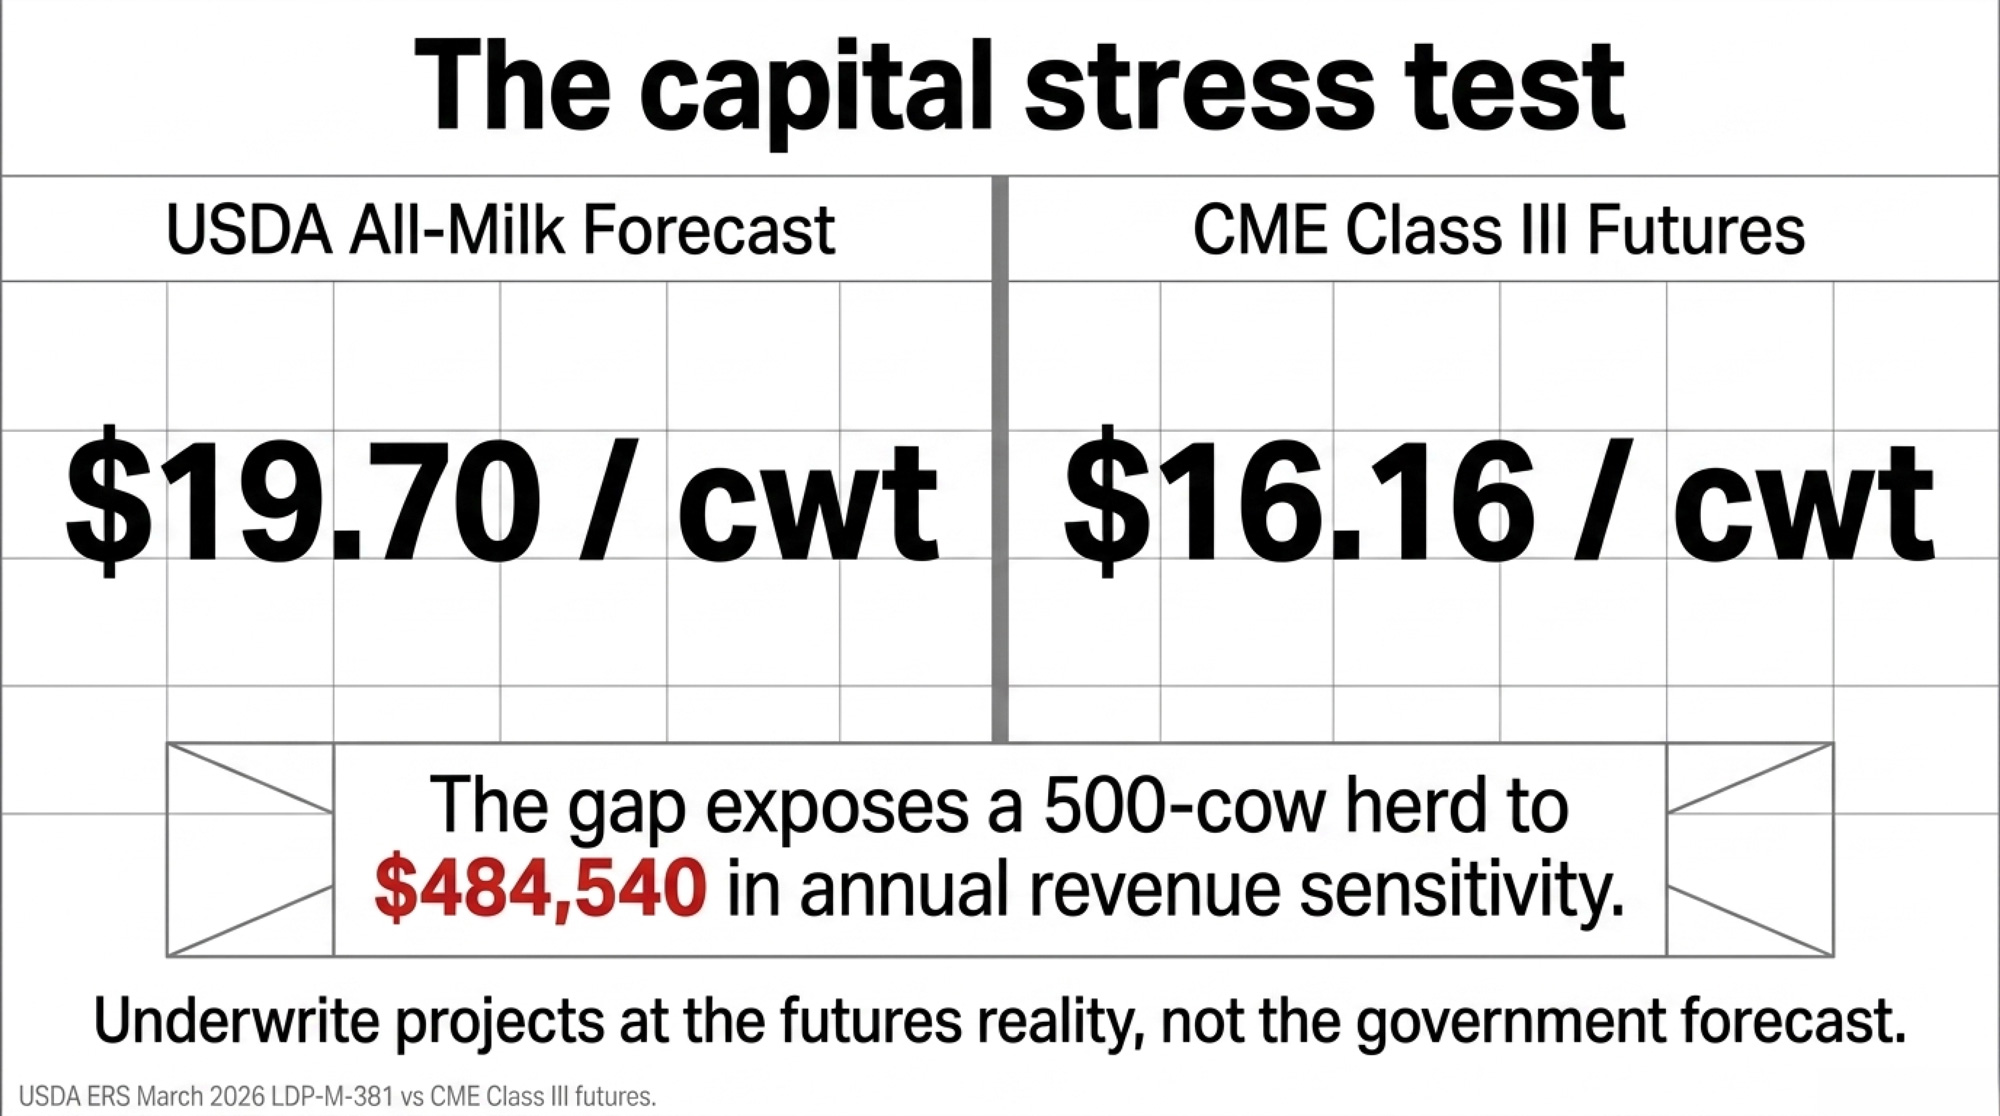
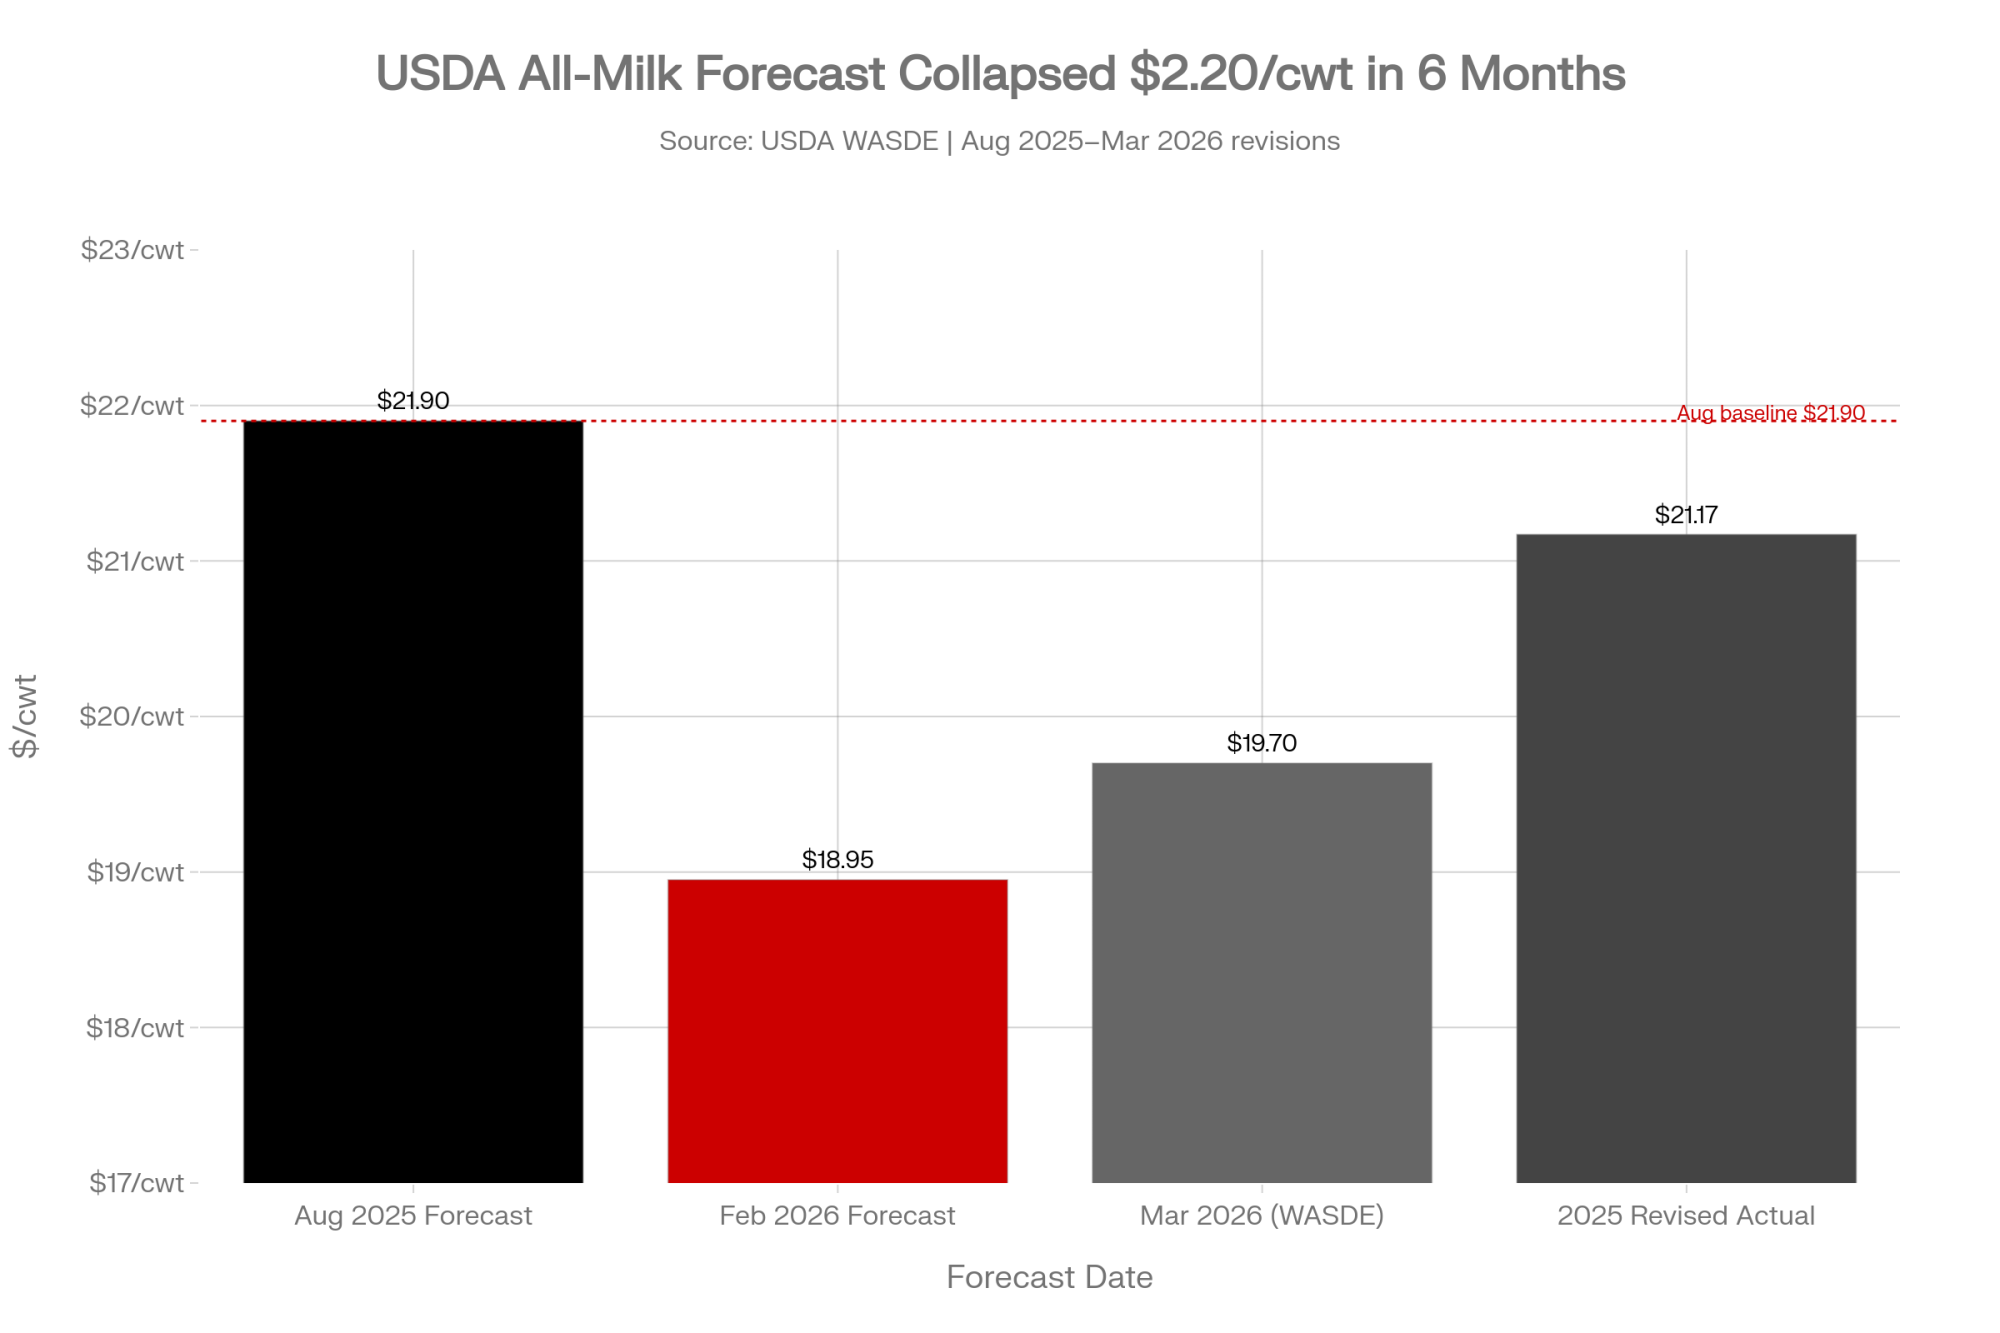
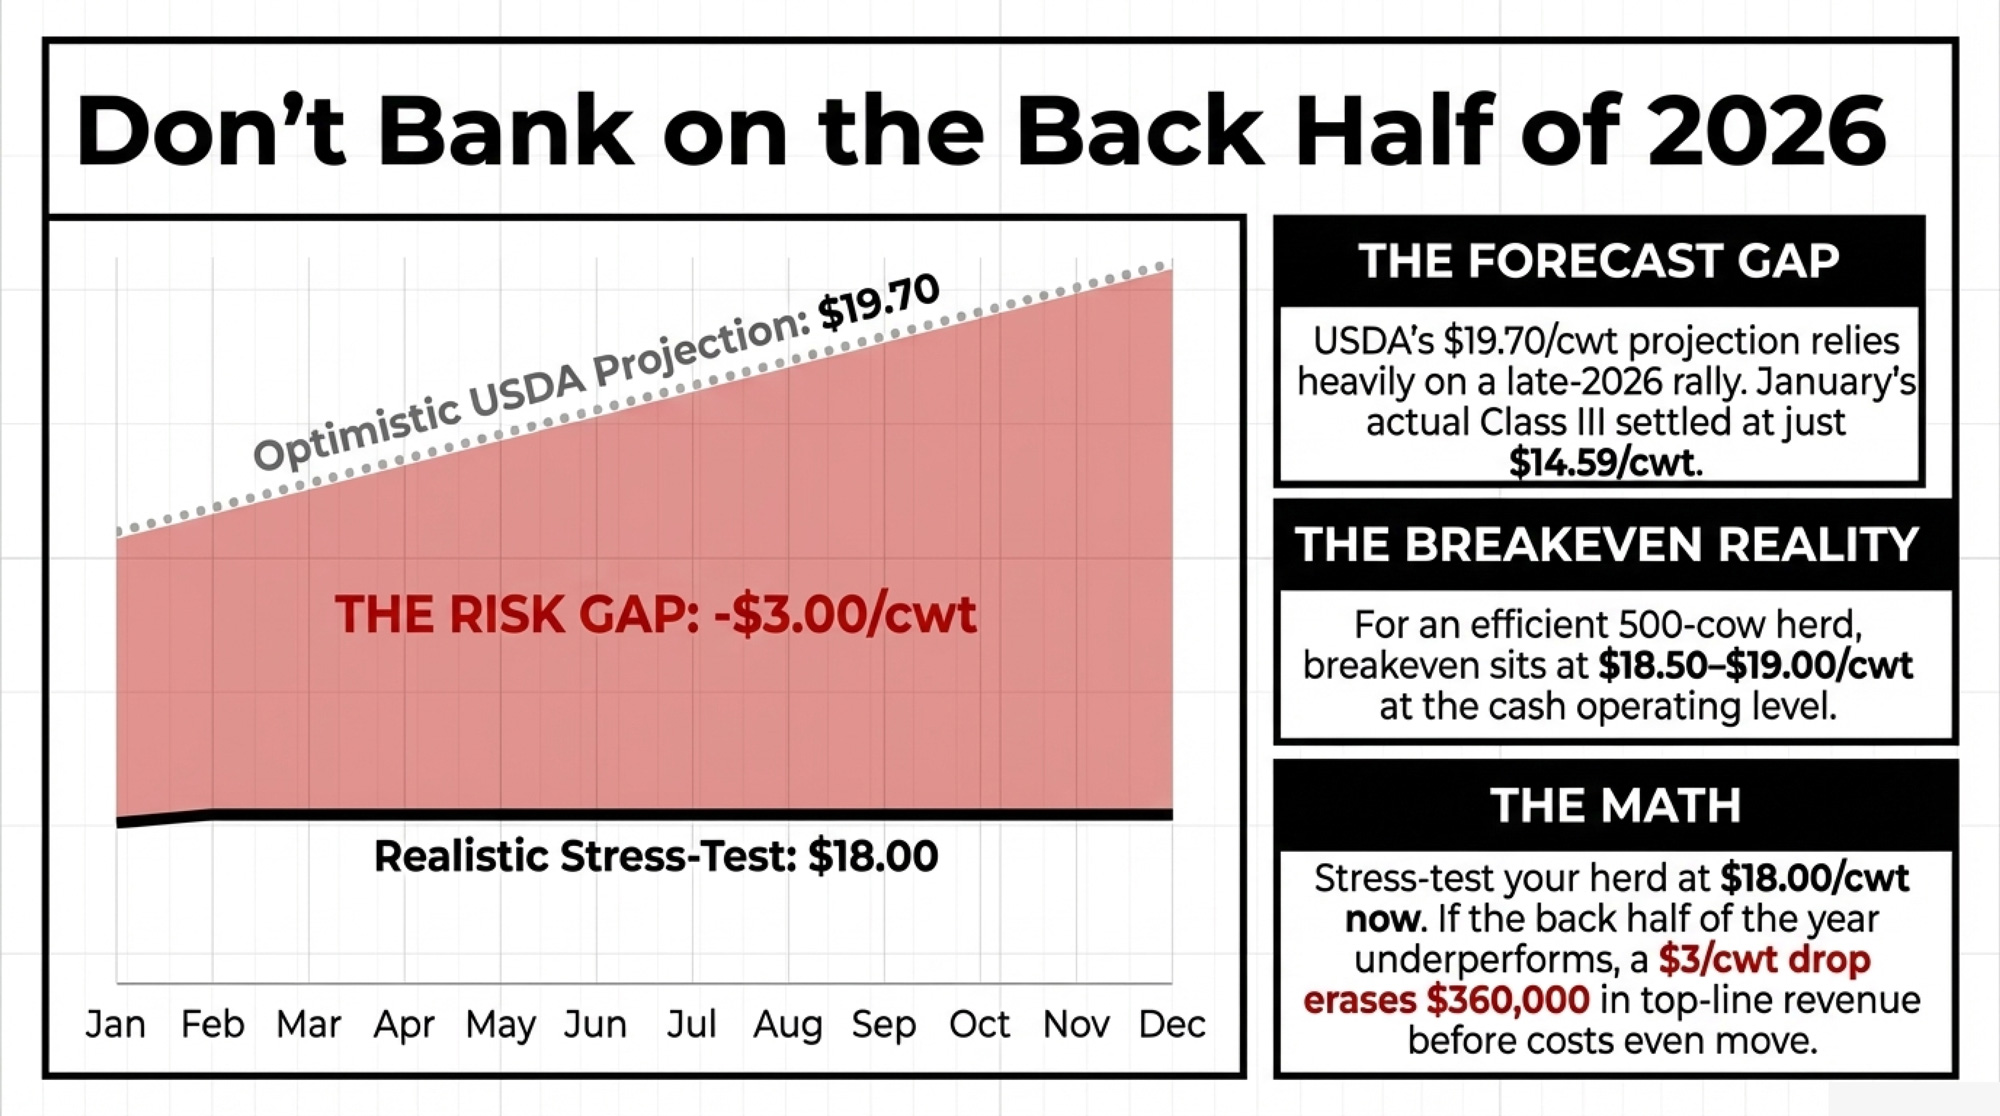
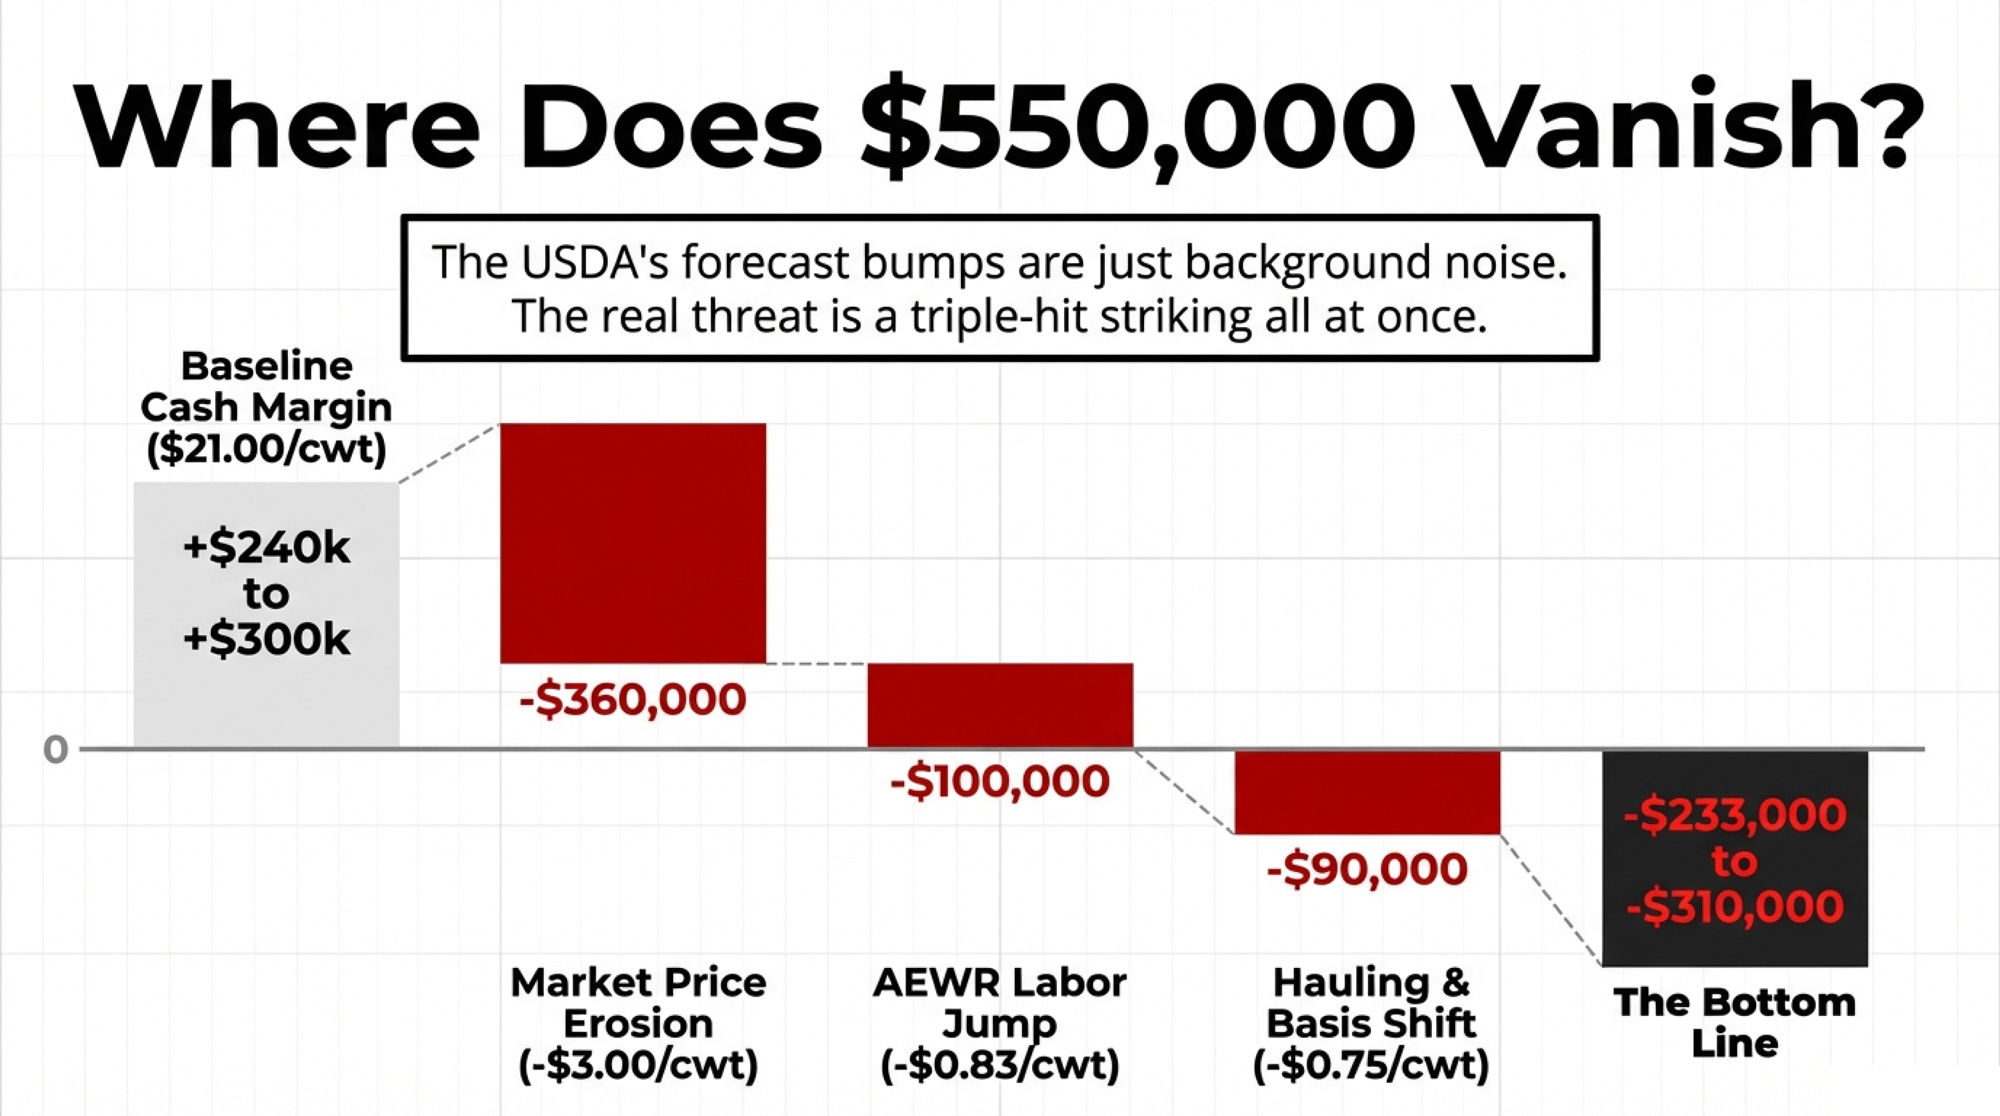
6. Stress-test every capital project at $17 Class III, not $19.70 all-milk. USDA’s March 2026 LDP-M-381 outlook projects 2026 all-milk at $19.70/cwt; CME Class III futures at the same moment traded closer to $16.16/cwt. A $3.54/cwt gap between the government forecast and the market’s own price signal is real-money exposure on any capital underwriting. On a 500-cow herd shipping roughly 136,875 cwt/year (500 × 75 × 365 ÷ 100), that’s approximately $484,540/year of revenue sensitivity between the two benchmarks — enough to break a project that only pencils at the USDA forecast. The gap between the government forecast and the futures board is the gap between a project that survives and one that breaks the operation.

  • Requires: your CPA or lender running sensitivity on barn, robot, and equipment purchases at $17 Class III.
  • Threshold: if a project’s DSCR drops below 1.2 at $17 milk for three consecutive months, treat as a luxury, not a necessity.
  • Watch for: contractors and equipment sellers pitching against the USDA forecast. The futures market is the one you hedge.

7. Lock in 60–75% of feed needs when corn projects at $3.90–$4.10/bu. Per the source economic analysis cited in this issue’s methodology, corn in that band yields roughly $11.56/cwt feed cost — manageable against current Class III.

  • Requires: cash flow for the hedging strategy, or a relationship with your co-op’s risk management service.
  • Threshold: corn in-band → lock. Corn above $4.25/bu with basis strengthening → wait for pullback or shorten coverage horizon.
  • Watch for: locking feed without also locking enough milk. You want both sides covered, not just the cost side.

365-Day Moves

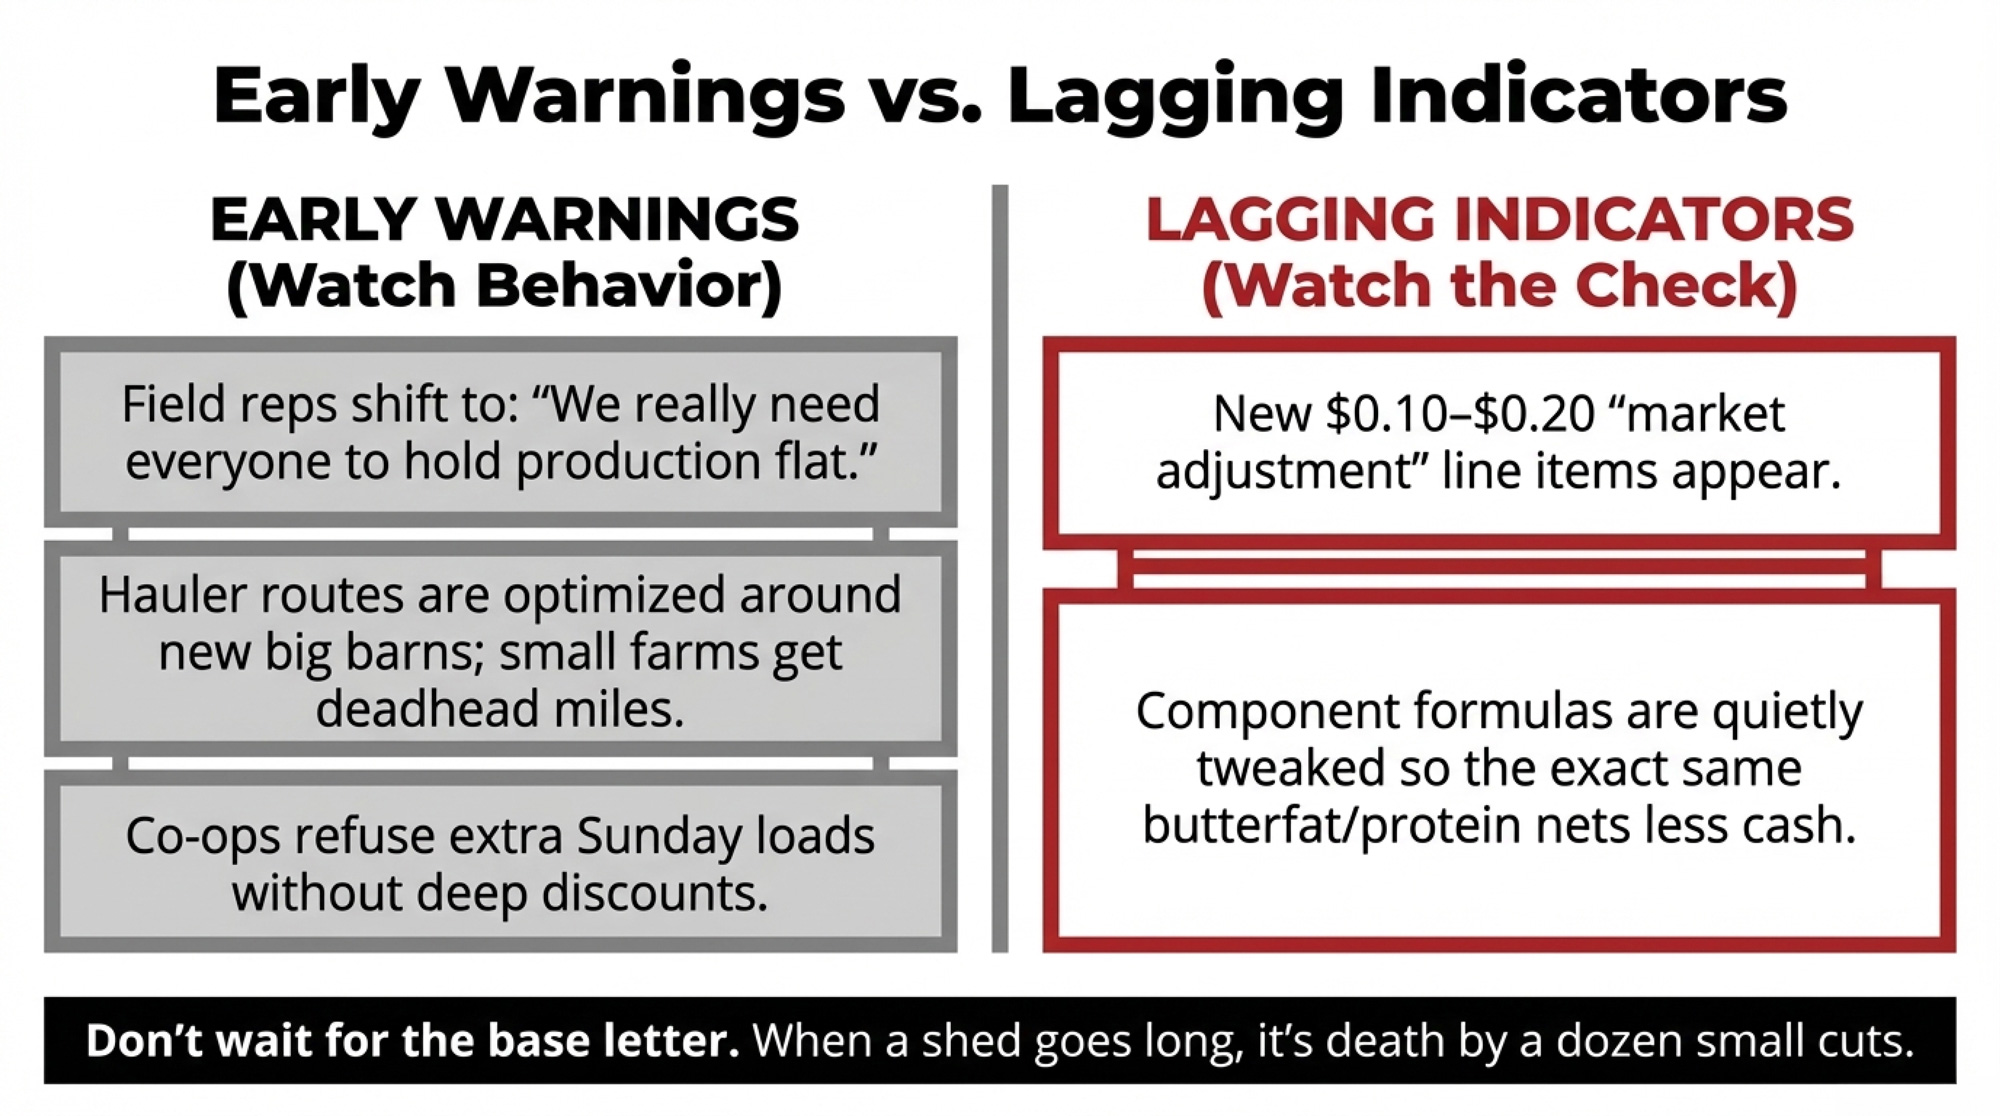
8. Map your FMMO basis against the processing gravity wells. If you sit within draw radius of Lubbock, Dodge City, or an I-29 corridor plant, you have pricing leverage producers 200 miles farther out don’t. Structural demand from ~$10B in new cheese processing supports protein prices for the next two to three years. Renegotiate before capacity is fully committed.

  • Requires: 12 months of basis data against your plant vs. Order 30 statistical uniform price.
  • Opportunity signal: basis tightened to within $0.30/cwt of the Statistical Uniform Price while your component tests exceed county average — room to ask for contract improvements.
  • Watch for: short-term premiums written with pull-back triggers tied to volume. Read the basis-when-volumes-fall clause specifically. It’s the clause nobody reads until it triggers.

9. Track the 0.75 milestone quarterly. If the national ratio hits 0.75 on the late-2027 projected timeline, processor standardization costs accelerate and basis pressure increases on fat-heavy, protein-light herds. Herds repositioned 12–18 months ahead feel it least.

  • Requires: Tracker updates plus your own herd’s component trend line.
  • Opportunity signal: national ratio stabilizing above 0.76 for three consecutive months = evidence the market is self-correcting. Different strategy.
  • Watch for: short-term seasonal swings masking a trend reversal. Quarterly, not monthly.

10. Genomic-test for component direction, not just rank. At $30–$40/head, genomic testing identifies the top 20–30% of heifers worth breeding back to elite component sires. Bottom tier goes beef-on-dairy to capture beef-cross value while the pipeline tightens on components.

  • Requires: ~$40 × testing population + time to integrate results into breeding decisions.
  • Threshold: if your current replacement pipeline runs less than 25% genomic-tested heifers and you milk 500+, the sorting decision pays back within the replacement cycle at current component prices.
  • Watch for: testing without changing what you do with the data. ROI lives in the sorting decision, not the test itself.

The market already repriced. Your milk check is catching up. Every month the operation stays calibrated to the old fat-premium world is a month of compounding gap against herds that already moved. You gain cushion on components here. You give up flexibility on ration-by-habit there.

Two questions to take to your next milk meeting. What does your processor contract actually say about basis when Order 30 cheese utilization exceeds 85%? And what’s your real margin over feed per cwt this month versus 90 days ago — at $2.0905 protein, not last year’s number?

Key Takeaways

  • March 2026 FMMO flipped the component stack: protein at $2.0905/lb now beats butterfat at $2.0220, and on a 500-cow Order 30 herd at 75 lbs/day, every tenth of protein is worth $28,614 a year.
  • The national protein-to-fat ratio hit 0.760 in 2025 against cheese plants calibrated for 0.82; if you ship into Order 30, you’ve got roughly 16 months before the 0.75 line starts showing up in basis conversations.
  • At current prices, total CFP pounds drive the milk check — not protein-to-fat ratio. If your sire list is sorted on ratio, you’re leaving roughly $20 per daughter per lactation on the table and you won’t outrun that math until protein triples.
  • Stress-test every 2026 capital project at $16.16 CME Class III, not USDA’s $19.70 all-milk forecast. The $3.54/cwt gap is about $484,540/year of revenue sensitivity on a 500-cow herd — the difference between a project that survives and one that doesn’t.

Methodology and Sources

Scope. All barn math uses March 2026 USDA AMS FMMO component prices (protein .0905/lb, butterfat .0220/lb) on a 500-cow Wisconsin/Minnesota operation shipping into FMMO Order 30 at 75 lbs/cow/day, unless stated otherwise. Prices refresh with each month’s FMMO announcement. The interactive Component Value Tracker at thebullvine.com/tools lets readers substitute their own herd parameters against the same formulas and price inputs.

Bullvine projections, labeled as such. The 0.75 crisis threshold, the ~16-month timeline, the Component Opportunity Score methodology, the ~$8,350 Brown County single-sire-swap scenario, the $17,500 broad-filter ratio-trap estimate, and the 150-heifer/2.8-lactation replacement-pipeline assumptions are proprietary Bullvine modeling — published here for the first time.

External sources. USDA AMS FMMO March 2026 component prices; FMMA30 Upper Midwest 2025 annual class utilization and international component comparison; USDA NASS Milk Production Reports, February and March 2026; USDA ERS Livestock, Dairy, and Poultry Outlook, March 2026 (LDP-M-381); CoBank Knowledge Exchange, “While U.S. Leads Milk Component Growth, Butterfat May Be Growing Too Fast,” September 25, 2025; Holstein Association USA Geneticist Insights, April 2026; Select Sires / CDCB April 2025 Base Change documentation; Animals meta-analysis of rumen-protected methionine (PMC9219501, 2022); Animals combined RPLM supplementation study (PMC12691028, 2025); PLOS ONE rumen-protected methionine trial (pone.0243953, 2021).

Learn More

The Sunday Read Dairy Professionals Don’t Skip.

Every week, thousands of producers, breeders, and industry insiders open Bullvine Weekly for genetics insights, market shifts, and profit strategies they won’t find anywhere else. One email. Five minutes. Smarter decisions all week.

NewsSubscribe
First
Last
Consent

The $550,000 Math Your Lender Already Ran: Inside Northern Lights Dairy’s 2026 Stress Test.

USDA cut $3/cwt off their 2026 forecast in six months. We ran the stress test on a 500-cow herd — price, freight, and labor hitting at once. The compound number is $550,000.

Executive Summary: USDA’s 2026 all-milk forecast has dropped .20/cwt since last August — on a 500-cow herd, that’s 6,000 in gross revenue gone before costs move. Costs are moving. The Holle family near Mandan, North Dakota, lost two processors in three years and now hauls milk five hours to a Minnesota plant; across FO30, hauling charges jumped 29.8% in one year. Stack that freight squeeze and the new AEWR labor reclassification on top of softer prices, and the compound hit on a 500-cow herd reaches $533,000–$550,000/year — with debt service, you’re modeling a $633,000–$710,000 shortfall before anyone draws a paycheck. We break down the barn math for each layer, walk through three paths (restructure, scale, or planned exit), and lay out a 90-day triage starting with your AEWR audit and two lender scenarios at $18 and $16.50/cwt. If your DSCR drops below 1.0 at either price, you’re not in a dip — you’re in a conversation your lender is already having on your file.

Dairy Stress Test

Last August, USDA projected 2026 all‑milk at $21.90/cwt. By February, they’d cut it to $18.95. The March WASDE bumped it back to $19.70 — still $1.47/cwt below the revised 2025 average of $21.17. On a 500‑cow herd shipping 120,000 cwt a year, that gap alone erases roughly $176,000 in gross milk revenue.

And that’s the optimistic number. January’s actual Class III settled at $14.59/cwt. CME futures for February pointed to roughly $15.16. The March WASDE left the 2026 Class III forecast unchanged at .65/cwt — higher cheese prices exactly offset lower whey. The back half of 2026 is doing all the heavy lifting on USDA’s spreadsheet. The question isn’t whether 2026 is a down year. It’s whether you’ve stress‑tested what happens when three cost shocks land on top of that softer price at the same time.

For the Holle family at Northern Lights Dairy near Mandan, North Dakota — about 1,000 Holsteins, now hauling five hours one way to a Bongards plant in Perham, Minnesota — the forecast revisions are background noise. Their real squeeze started the day their closest processor closed. It hasn’t let up since.

When Your Backup Plant Disappears — Twice

The Holles didn’t get a warning shot. In September 2023, Prairie Farms closed its Bismarck processing facility and converted it to distribution only. North Dakota Agriculture Commissioner Doug Goehring was blunt: “With no other processors nearby, those dairies will likely pay for shipping longer distances that will be deducted from their milk checks. This will have a dramatic impact on their bottom line.”

He wasn’t speculating. A producer about 50 miles northwest of Bismarck — identified in Dairy Star’s September 2023 reporting as Henke — saw his milk rerouted 151 miles to a DFA facility in Pollock, South Dakota, at an immediate freight surcharge of $0.55/cwt. He also had to buy an additional bulk tank for every‑other‑day pickup. Then, in July 2024, DFA announced it would close Pollock, too — a plant employing 33 full‑time and four part‑time workers — effective August 30. Suddenly, Henke’s backup was gone. The Holles’ backup was gone. Milk that used to travel dozens of miles was now traveling hundreds of miles into Minnesota plants, with no particular reason to pay a premium for distant, hard‑to‑route volume.

USDA’s Upper Midwest (FO30) data shows what that kind of map‑stretching does at scale. Weighted‑average hauling charges climbed from $0.6137/cwt in 2023 to $0.7969/cwt in 2024 — a 29.8% jump in a single year. Today, the only milk plant operating in North Dakota is Cass‑Clay’s facility in Fargo, pressed against the Minnesota border. For herds west of the Missouri, every extra mile comes straight off the check.

What Does a $3/cwt Drop Actually Do to a 500‑Cow Herd?

USDA’s March outlook at $19.70/cwt sounds like a sigh of relief after February’s $18.95. It isn’t. That forecast still has to be delivered through a first quarter where Class III opened at $14.59 and February futures pointed to $15.16. The March WASDE held the 2026 Class III forecast at $16.65/cwt. Where does your breakeven actually sit if the back half doesn’t deliver?

UW‑Madison’s July 2025 Dairy Enterprise Budget puts the cost of production — after co‑product revenue — at $18.68/cwt for its example operation. That lines up with Minnesota extension benchmarks in the same range. Call it $18.50–$19.00/cwt at cash operating level for a reasonably efficient 500‑cow herd shipping roughly 120,000 cwt — dropping unpaid family labor and some depreciation. That leaves a cash margin of $2.00–$2.50/cwt, or about $240,000–$300,000/year at a $21.00 mailbox.

Now stress‑test at $18.00/cwt — our realistic downside scenario if the back half underperforms USDA’s $19.70 forecast. That’s not the consensus. It’s where we think you should be testing.

Risk 1: Oversupply and Price Erosion

USDA’s March WASDE pegs 2026 production at 234.7 billion pounds, roughly 1.3% above 2025. If your effective mailbox averages $18.00/cwt instead of $21.00, that’s $3.00/cwt off your top line. On 120,000 cwt: –$360,000.

Risk 2: Processor Network and Hauling

FO30’s hauling jump is the baseline. Lose a plant or get rerouted — the way Henke and the Holles did — and it doesn’t take a disaster to lose another $0.75/cwt between basis and freight compared to recent history, on 120,000 cwt: –$90,000.

Risk 3: Labor and the New AEWR Rule

In October 2025, DOL split the Adverse Effect Wage Rate into Skill Level I and Skill Level II, tied to job duties. Cornell’s Ag Workforce team lays out how this hits dairy: a few words in a job description can move you from Level I to Level II. Nationally, CRS puts the Level I range at $7.35–$14.83/hour and Level II at $8.54–$21.16/hour — gaps of $1–$7+/hour depending on your state. In the upper Midwest dairy belt, that spread typically runs $4–$5/hour.

On a 500‑cow herd with roughly 20,800 paid hours/year (10 FTEs at 2,080 hours), a blended increase of $4.00–$4.80/hour — accounting for overtime, payroll burden, and housing — means $83,000–$100,000/year in extra labor cost.

Deep dive: The new AEWR labor math for dairy crews

The 500‑Cow Stress Test: Where $550,000 Vanishes

Here’s the math your lender may already be running on your file. We’re showing every input so you can plug in your own.

Baseline: 500 cows × 240 cwt/cow × $21.00/cwt = $2,520,000 revenue
Cash margin at $21.00: ~$2.00–$2.50/cwt → $240,000–$300,000/year

Risk Factor$/cwt ImpactAnnual Loss (120k cwt)Fixable by Producer?
Market price erosion (vs. $21 baseline)–$3.00/cwt–$360,000No — macro
Hauling & basis shift (FO30, +29.8%)–$0.75/cwt–$90,000Partial — processor mapping
AEWR labor reclassification (H-2A)–$0.69 to –$0.83/cwt–$83,000 to –$100,000Yes — job-duty audit
TOTAL COMPOUND HIT–$4.44 to –$4.58/cwt–$533,000 to –$550,000
Baseline cash margin (at $21/cwt)+$2.00 to +$2.50/cwt+$240,000 to +$300,000
Net modeled cash position–$1.94 to –$2.58/cwt–$233,000 to –$310,000

*AEWR hit converted to milk terms: $83,000–$100,000 ÷ 120,000 cwt = $0.69–$0.83/cwt.

Stack that against the baseline margin: best case, $300,000 minus $533,000 = –$233,000. Worst case: $240,000 minus $550,000 =– $310,000. Modeled cash margin: –$233,000 to –$310,000.

Now add debt service. A 500‑cow herd that expanded in the 2020–2023 cycle can easily carry $3–$5 million in term debt between facilities, equipment, and replacement stock alone — USDA AMS pegged the national average replacement dairy cow at $3,110/head as recently as October 2025, meaning the animal inventory on a 500‑cow herd represents north of $1.5 million before you count a single piece of concrete. At current rates and 15–20‑year amortizations, $3–$5M in term debt often pencils to $350,000–$450,000/year in principal and interest. Stack a working figure of $400,000 P&I on top of that negative cash margin, and you’re modeling a shortfall between –$633,000 and –$710,000/year before you pay yourselves a dollar.

That’s not a tight year. That’s a year where your lender is choosing which playbook you’re on.

Are You Overpricing H5N1 and Underpricing Labor?

H5N1 grabs the headlines. The math says plan for it — but don’t let it crowd out the risk that’s already in your pay stubs.

Risk MetricH5N1 (HPAI)AEWR Labor Reclassification
Best-case annual cost (500-cow herd)~$0 (no outbreak)$33,000–$41,000 (4 mis-slotted FTEs)
Expected value (probability-weighted)$50,000–$55,000 over 12–18 months$83,000–$100,000/year (certainty if mis-classified)
Worst-case hit$142,500–$166,250 (30–35% clinical rate)$100,000+/year (10 FTEs, Level II gap)
Fixable this month?No — biosecurity reduces, doesn’t eliminateYes — job-duty audit + Cornell AEWR checklist
Currently in your breakeven?Rarely modeledAlmost never modeled
2026 trajectoryStabilizing (0 new dairy cases, Jan 2026)Escalating — new DOL rule effective Oct 2025
Per-cow annual exposure$100–$333/clinically affected cow$165–$200/FTE/year in wage gap

A Cornell‑led team published results in Nature Communications from an Ohio dairy herd of 3,876 cows hit by HPAI in spring 2024. They counted 777 clinically affected cows — about 20% of the herd — with severe mastitis and steep production drops. Over 60 days, total losses: $737,500, or roughly $950 per clinically affected cow. As of early 2026, USDA APHIS data and AVMA tracking put cumulative confirmed H5N1 dairy infections at more than 1,000 herds across at least 17 states — California alone accounts for more than 750.

But here’s a detail that hasn’t made most farm papers: USDA reported zero new dairy herd detections in January 2026. The outbreak appears to have peaked during California’s fall 2024 wave. The National Milk Testing Strategy is now active in 45 states.

Scale the Cornell numbers to 500 cows if 20% are clinically hit at $950 each: $95,000. Push the clinical rate to 30–35%, and you’re in the $142,500–$166,250 range. Weight those outcomes by rough probability — heavy event at ~10%, moderate at ~40%, minimal at ~50% — and the expected value for a 500‑cow herd lands around $50,000–$55,000 over the next 12–18 months. Those probability weights are our assessment based on current surveillance trends, not the USDA’s.

Now put that beside labor. Under the 2025 AEWR rule, four FTEs misclassified from Level I to Level II cost about $33,000–$41,000/year in wages alone — that’s 4 workers × 2,080 hours × $4–$5/hour. Add one FTE’s churn cost — mistakes, training, yield drag — and lenders will quietly pencil labor risk at $40,000–$50,000/year. You’ve matched your H5N1 expected value with exposure that’s already hitting every pay period.

The Holles spent 2025 worrying more about where their milk was going and whether they could hold a crew than whether a virus would cross their fence line. Line up the math, and that instinct looks smart.

Deep dive: What the H5N1 data actually says about herd‑level cost

The Lender Meeting Your Milk Check Is Writing

When a herd staring at a modeled –$633,000 to –$710,000 gap sits across the desk from a lender, nobody’s leading with forage quality. The real question: Is there a believable path back to positive cash flow in 12–24 months?

Path 1 — Restructure at today’s scale. Stretch terms to 20–25 years, negotiate interest‑only for 12–24 months, and sell non‑essential assets. It only works if a 2027 budget at $17.00–$18.00/cwt still reaches breakeven on realistic costs. For herds in the Holles’ geography — one in‑state plant at Fargo, longer hauls, fewer competing buyers — that’s a tough line to draw.

Path 2 — Scale up to dilute fixed cost. Jumping from 500 to 900 cows means ~400 additional head. USDA AMS data from October 2025 put the national average replacement dairy cow at $3,110/head, with premium genetics running $4,000+ at auction in California, Minnesota, and Pennsylvania. By the February 2026 National Dairy Comprehensive Report, average fresh‑cow prices had eased to around $2,700/head — but that’s still north of $1 million in animal cost alone for 400 head, before facilities. If 2026 milk ends up closer to $17–$18/cwt, those extra cows don’t magically fix two‑year cash flow. You gain scale. You put more equity on the table.

And if you’re thinking Path 2, the cows you add can’t just be black‑and‑white lawn ornaments. In a $17–$18/cwt world, you need animals that turn feed into components, hit pregnancy targets, and stay out of the sick pen. Scaling with mediocre genetics amplifies the problem — you push more volume through a system that still doesn’t pay its bills.

Path 3 — Plan an exit while you still have a say. At $600,000–$700,000/year in modeled losses, equity burn is fast. That’s maybe two or three bad years before the balance sheet no longer lets you choose how the story ends. A deliberate exit — cows first, then iron, then land — preserves more capital than a forced sale.

If you’re leaning toward Path 3, your genetic equity is your last paycheck. The top end of your herd — high‑component, trouble‑free, exportable cow families — often pays better through targeted private‑treaty sales than by sending everything on the same trailer on the same day. Sorting that value ahead of time is how you turn 20 years of breeding decisions into actual exit dollars instead of scrap value.

The point of this math isn’t to push anyone into Path 3. It’s to drag the conversation into Q2, while you still have options, rather than into Q4, when your lender writes the plan.

The 90‑Day Triage: Levers You Actually Control

Clean Up AEWR Exposure — This Month

Download Cornell’s October 2025 AEWR overview and match every H‑2A position to DOL’s Level I vs. Level II duty definitions — not the labels you’ve always used. In the upper Midwest dairy belt, that spread typically runs $4–$5/hour. Four mis‑slotted FTEs cost roughly $33,000–$41,000/year in wages. That’s the same order of magnitude as the modeled H5N1 expected value we just walked through — and it’s a lever you control with a pen and a clear job list.

Run Two Breakevens With Your Lender Before June 30

Build one 2026 budget at $18.00/cwt and a second at $16.50/cwt, using your actual cost structure. If your pro‑forma DSCR comes in below 1.0 in either scenario, you’re in path territory, not ride‑it‑out territory. Above 1.3, you’ve got breathing room. Between 1.0 and 1.2, small misses matter. Two quarters under 1.0, and someone else starts drawing the map.

Go After Turnover and Inputs

  • Plug one FTE of churn. The real cost of a churned dairy FTE — training, mistakes, production drag — runs $10,000–$15,000/year.
  • Pick a nitrogen trigger. DTN’s late‑January survey had urea at $583/ton, roughly 13–14% above the $514/tona year earlier. StoneX’s Josh Linville flagged Persian Gulf risk as a fertilizer wildcard. If local urea drops within ~5% of last year’s level, lock in at least a third of your 2026 N.
  • Pick one micro‑automation project with a sub‑18‑month payback. At a loaded labor cost of nearly $19.50/hour, saving 1,000 hours/year frees up about $19,500. Against ~$25,000 installed, that’s a 15‑month payback.

For herds in the Holles’ position — one plant option, five‑hour hauls, limited buyer competition — the processor‑mapping bullet below isn’t theoretical. It’s their Tuesday.

Three Signals That Could Rewrite This Math

Not all of this has to land. Here’s what changes the picture — in either direction.

USDA’s production line. March’s projection of 234.7 billion pounds is already above 2025. If actual output runs meaningfully lower — tighter base penalties, faster culling, a shorter heifer pipeline — oversupply risk eases and the price outlook improves. If USDA revises upward again, the $16.50 scenario gets more likely, not less.

H5N1 trajectory. Cumulative detections sit above 1,000 herds, but zero new dairy cases in January 2026 and an active testing program in 45 states suggest the outbreak has stabilized. If herd prevalence rebounds or movement restrictions tighten at the marketing‑area level, H5N1 moves back up the risk radar. If the current trend holds, it’s a biosecurity discipline issue, not a budget emergency.

The USMCA review. Article 34.7 mandates the first joint review by July 1, 2026. If it triggers tariff changes, quota shifts, or retaliation that trims U.S. dairy exports, those extra domestic pounds need a home. That leans your budget toward $16.50, not $18. A clean review, on the other hand, removes a significant overhang.

And the upside case? If actual 2026 all‑milk lands at $20.50 — plausible if production underruns the forecast and export demand holds — the same 500‑cow herd picks up roughly $96,000 in gross revenue vs. the $19.70 base case. That’s not transformative on its own. But it’s the difference between Path 1 working and Path 1 failing.

What This Means for Your Operation

  • Build two 2026 budgets with your lender before June 30 — one at $18.00/cwt, one at $16.50/cwt. If DSCR is under 1.0 in either, you’re choosing between restructure, scale, or exit, whether you say it aloud or not.
  • Quantify your own triple‑hit. Multiply your shipped cwt by $3.00 for price, then by $0.75 for basis/hauling, then add your state’s AEWR gap times your labor hours. If that combined number exceeds last year’s operating margin, you’re in a structural squeeze — not a cyclical one.
  • Audit every H‑2A job level in writing this month. Four mis‑slotted FTEs cost $33,000–$41,000/year,depending on your state’s gap, for zero extra production.
  • Map your processor risk on paper. List your primary plant, realistic backups, miles to each, and expected basis in each scenario. If your “backup” relies on full plants hundreds of miles away, that risk isn’t in your breakeven yet.
  • If you’re considering Path 2 (scale), sort your genetics first. Every cow you add at $17–$18 milk needs to earn her way on components and fertility, not just fill a stall. At $2,700–$3,100/head for replacement stock, that’s real capital riding on whether she pays her own way.
  • If you’re considering Path 3 (exit), sort your genetics first, too. Targeted sales of high‑component, high‑index cow families before a dispersal can capture breeding value that a single‑day auction won’t.
  • Set a 365‑day marker. By March 2027, you should know whether you’re on a three‑year rebuild, an expansion track, or an orderly exit — and have that documented in writing with your lender.

Key Takeaways:

  • If your 2026 budget only works above $19–$20/cwt, you’re already in the risk band where a 500‑cow herd can model a $633,000–$710,000/year shortfall once price, freight, labor, and debt stack.
  • A realistic “downside but not disaster” scenario is $18.00/cwt milk, –$3.00/cwt price erosion, –$0.75/cwthauling/basis, and $0.69–$0.83/cwt AEWR labor — together stripping $533,000–$550,000 from a 500‑cow herd’s annual margin.
  • Four mis‑slotted H‑2A positions can quietly cost $33,000–$41,000/year in wages; that’s roughly the same order of magnitude as your expected H5N1 hit, and it’s fixable this month with a clean job‑duty audit.
  • If your pro‑forma DSCR drops below 1.0 at $18.00 or $16.50/cwt, you’re not “riding out a rough year” — you’re choosing between restructure, scale with real equity, or planning an exit while you still control the timing.
  • Your best 90‑day moves are boring, not heroic: run two lender scenarios at $18.00 and $16.50/cwt, quantify your own triple‑hit per cwt, map real backup plants and miles, and write down a 365‑day plan you’d be willing to put in front of your banker.

The Bottom Line

If your 500‑cow budget only works above $19–$20/cwt with today’s cost and debt structure, you’re already in the risk band this stress test describes — whether or not USDA’s March revision to $19.70 felt like good news.

If your modeled DSCR at $17–$18/cwt sits below 1.2, you’re not trimming fat. You’re in a structural conversation, your lender is already having internally.

The Holles are five hours from their plant, down two processors in three years, and still milking. That’s grit. But grit doesn’t fix a –$633,000 gap. Math does. And the math starts with knowing your own number before someone else runs it for you.

The Sunday Read Dairy Professionals Don’t Skip.

Every week, thousands of producers, breeders, and industry insiders open Bullvine Weekly for genetics insights, market shifts, and profit strategies they won’t find anywhere else. One email. Five minutes. Smarter decisions all week.

NewsSubscribe
First
Last
Consent

Learn More

Complete references and supporting documentation are available upon request by contacting the editorial team at editor@thebullvine.com.

Riverview’s 18,855‑Cow Bet: The $0.60/cwt Drain That Won’t Show Up on Your Milk Check

West River’s expansion near Morris could quietly cost every 500‑cow herd in the Upper Midwest shed $57,000–$86,000 a year — and the warning signs aren’t where you’d expect.

Executive Summary: Riverview’s proposed West River expansion near Morris, Minnesota, would take the site to 18,855 cows and add roughly 5.5 million cwt of milk a year into an already tight Upper Midwest processing shed. For a 500‑cow herd shipping 12,000 cwt a month, the article walks through how that single permit can realistically translate into a $0.40–$0.60/cwt hit on net mailbox price — about $57,600–$86,400 per year gone even if you don’t change a thing on your own farm. It shows how that pressure actually lands first in higher hauling charges, thinner component premiums, and quiet “market adjustment” lines, not in an obvious crash on the front of your milk check. Using current FO30 hauling data and Minnesota FBM debt‑service coverage ratios, it gives you a simple margin and DSCR stress test you can run on your last 12 months of milk checks. From there, it lays out a 30/90/365‑day playbook and three realistic lanes — scale, pivot to premium/efficiency, or plan a clean exit — with clear trade‑offs for each. The core takeaway: you can’t control Riverview’s 18,855‑cow bet, but you can decide now whether you’re treated as “core, flex, or fringe” before a $0.60/cwt drain quietly closes off your best options.

mega-dairy expansion impact

Riverview LLP wants to take West River Dairy near Morris, Minnesota, from 7,855 to 18,855 cows26,397 animal units on a single site in Synnes Township, Stevens County. The Minnesota Pollution Control Agency is taking public comments on the environmental assessment worksheet through April 9, 2026, after an administrative error forced the agency to re‑notice the EAW and extend the deadline.

If you’re milking 400–600 cows in that same marketing shed, the real question isn’t whether the permit gets approved. It’s what happens to your net mailbox price once roughly 5.5 million cwt of annual milk starts flowing from one driveway. Based on how hauling, premiums, and base programs have behaved in past long‑milk episodes across the Upper Midwest, a realistic band is −$0.40 to −$0.60/cwt. On a 12,000‑cwt monthly milk check, that’s $4,800–$7,200 per month gone without you changing a thing on your own farm.

When 26,397 Animal Units Land in a 280‑Cow State

If you’re running a 500‑cow herd in west‑central Minnesota, you don’t read that MPCA notice as abstract policy. You read it like a weather warning for your balance sheet. You’re already watching your debt‑service coverage ratio (DSCR), scanning every line on the milk check, and wondering if your kids will have a business to come home to.

West River’s expansion plan adds an 11,000‑cow dairy (15,400 AU) to the existing 7,855‑cow (10,997 AU) facility. The build includes a cross‑ventilated, total‑confinement freestall barn, covered clay‑lined liquid manure basins expanding storage from roughly 102 million to 250 million gallons, and about 13,200 acres of cropland in the manure application plan. Riverview is also seeking a water appropriation permit to pump up to 226 million gallons per yearfrom an off‑site well.

Environmental groups — Land Stewardship Project (LSP), Food & Water Watch, and others — are hammering away at water usage and watershed impact. That’s the whole point of the EAW process. Riverview, for its part, says its dairies are “designed and managed to meet or exceed strict environmental standards” and that this expansion “must comply with the state’s stringent permitting requirements.” The environmental fight will play out on its own track. For you, the more immediate issue is simpler and nastier: what does an 18,855‑cow barn do to hauling, base, and mailbox for a 500‑cow herd in a tight processing shed?

Minnesota’s average dairy herd has fewer than 280 cows, according to federal structure data cited by the Star Tribune in March 2026. West River comes in at more than 67 times that average. This isn’t about good vs bad, big vs small. It’s a capital signal. When regulators, lenders, and processors are being asked to sign off on a facility shipping more milk than dozens of family herds combined, the question shifts from “Am I efficient?” to “Where do I sit when plants and banks start ranking who matters most?”

MetricMinnesota Average DairyRiverview West River (Proposed)Gap
Herd Size (cows)28018,855×67 larger
Animal Units~39226,397×67 larger
Daily Milk (lb)22,4001,508,400×67 larger
Annual Milk (cwt)81,7605,500,000×67 larger
Manure Storage (gal)~500,000250,000,000×500 larger
Water Use (gal/year)~8,000,000226,000,000×28 larger

How Does an 18,855‑Cow Mega‑Dairy Hit 500‑Cow Mailbox Prices?

In public meetings and local coverage, Riverview partner Brady Janzen has argued that West River’s growth is a rational response to rising U.S. cheese demand. He points to USDA data showing per‑capita cheese consumption climbing from roughly 15 pounds in the mid‑1970s to around 40 pounds today. The logic is straightforward: if Americans keep eating more cheese, plants need consistent, high‑volume milk to stay efficient.

Riverview isn’t just adding cows. It’s also building the Stevens Milk Plant in Morris — an approximately 148,000‑square‑foot facility designed to process about 4 million pounds of milk per day into nonfat dry milk, skim milk powder, cream, and evaporated condensed skim milk, with roughly 65 jobs tied to it. The plant broke ground in mid‑2025 and is scheduled to start processing in November 2027, roughly the same timeline that LSP and local coverage expect for West River’s expansion to be fully online, if approved.

That timing matters. Riverview is building processing capacity alongside the new cows — not just dumping milk into a fixed system. But 4 million pounds of daily plant capacity absorbs only about 38% of West River’s expanded daily output at a conservative 80 lb/cow/day. The rest of the shed’s existing production still needs homes, and Riverview’s more than 125,000 cows in Minnesota already produce well over 10 million pounds each day.

Progressive Dairy’s 2024 “State of Dairy” series summed up the broader context: Upper Midwest processing capacity was “very tight”, milk was being hauled “crazy distances,” and switching processors often wasn’t an option. In that kind of shed, a new 18,855‑cow site doesn’t just “add supply.” It can help fill a new plant, yes — but it also reshapes every conversation about base, hauling, and which farms get treated as core vs expendable.

Renville County dairy farmer James Kanne sees the expansion through a very different lens. In LSP’s March 8, 2026, release, he argues that mega‑operations like Riverview’s have “glutted the market and tightened the stranglehold milk giants have on the industry,” pushing small and medium‑sized farms off the land. Whether you agree with that or not, his point matches what’s been happening when the Upper Midwest goes long: base programs kick in, over‑base milk gets discounted hard, and hauling plus “market adjustment” lines quietly bleed margin.

Family Dairies USA’s base program, rolled out in 2017, is one of the most transparent examples. The co‑op set a three‑month rolling production base plus a 1% cushion. Anything over that base wasn’t blocked, but general manager David Cooper shared that spot and over‑base milk often moved with $3–$4/cwt discounts, plus extra hauling and marketing costs, whenever the region was long.

At 80 lb/cow/day, an 18,855‑cow barn throws 1,508,400 lb of milk into the system daily — about 551 million pounds per year, or 5.5 million cwt, from a single site. That doesn’t guarantee your 500‑cow herd gets hammered. But it absolutely raises the odds that your shed crosses from “tight but manageable” into “structurally long,” where co‑ops lean harder on base, discounts, and balancing charges.

The $7,000 Monthly Leak Nobody Warns You About

Here’s the math you can actually run at your kitchen table.

Baseline 500‑cow scenario:

  • Herd: 500 cows.
  • Ship weight: 80 lb/cow/day.
  • Daily cwt shipped: 500 × 80 ÷ 100 = 400 cwt/day.
  • Monthly cwt (30 days): 12,000 cwt/month.

Plug your own herd and cwt into the same structure.

Step 1: Hauling — the small punch that still hurts

Once a mega‑site becomes a route anchor, haulers redraw for density. Long lanes get built around big barns. Smaller, out‑of‑the‑way farms pick up more deadhead miles.

A 2025 FO30 staff paper on Upper Midwest hauling charges found the weighted average hauling deduction jumped from $0.4202/cwt (May 2023) to $0.5033/cwt (May 2024) — a 19.8% increase in a single year, before West River’s expansion even comes online. Stevens County itself sits below that average because Morris is a processing magnet. But if you’re 30–40 miles out and not on the optimized path to a giant barn, you’re on the wrong side of those averages.

Period / ScenarioHauling Charge ($/cwt)Monthly Cost (12,000 cwt)Annual CostChange
May 2023 (FO30 Weighted Avg)$0.4202$5,042$60,508
May 2024 (FO30 Weighted Avg)$0.5033$6,040$72,475+19.8%
Stevens County (Current Est.)$0.45$5,400$64,800
Your 500-Cow Scenario (Post-Expansion)$0.55$6,600$79,200+$1,200/mo

Use a conservative scenario: your hauling inching up by $0.10/cwt over a couple of route changes.

  • $0.10/cwt × 12,000 cwt = $1,200/month extra hauling.
  • That’s $14,400/year to get the same milk to a plant.

On its own, you can probably eat that. The real trouble is what shows up on the same check.

Step 2: Basis and premiums — where the real damage happens

When a shed goes long, and plants are full, the pain doesn’t show up in one big blood‑red line. It shows up in a bunch of small ones. Based on prior Upper Midwest long‑milk runs:

  • Quality/component premiums get trimmed, or their formulas reset, so the same butterfat and protein net $0.25–$0.75/cwt less.
  • Balancing and “market adjustment” charges take another $0.10–$0.25/cwt when milk has to move farther or into weaker outlets.

You don’t assume the full $3–$4/cwt spot‑load pain from Family Dairies USA across every pound. You assume you keep your core base, but your shed is now structurally long, and the weaker parts of the check start bleeding.

A realistic combined band: −$0.40 to −$0.60/cwt.

On 12,000 cwt per month:

  • $0.40 × 12,000 = $4,800/month → $57,600/year.
  • $0.60 × 12,000 = $7,200/month → $86,400/year.

That’s the $7,000‑ish leak. It doesn’t come all at once. It trickles out through hauling, weaker premiums, and quietly rising “market adjustments.”

How fast does your cushion disappear?

Minnesota dairy herds in the FBM program had a DSCR of 1.94:1 in 2024 — solid on paper. The year before, the dairy‑specific DSCR was 0.86:1. That means the average Minnesota dairy in that dataset couldn’t fully cover its debt service from operating income in 2023.

One year took DSCR from healthy to “eating equity.” Another year clawed it back. That’s how volatile the floor really is.

Now overlay the $0.40–$0.60/cwt shed hit:

  • If you’re sitting at 1.4–1.5 DSCR today and lose $0.50/cwt for 12–18 months, you’re skating very close to that 0.86 world again.
  • Once you drop below 1.0, every payment comes partly from your balance sheet, not just your milk.

That’s the part your lender will see before your family does.

Quick Margin Check: Your Shed, Your Numbers

Don’t guess. Pull your actual numbers and run this:

  1. Grab your last 12 months of milk checks.
  2. Calculate your average net mailbox price — that’s after hauling and all adjustments.
  3. Subtract $0.40/cwt, then $0.60/cwt.
  4. Multiply each by your average monthly cwt shipped.
  5. Call your lender and ask: “If my net price dropped by that much for 12–18 months, what would my DSCR look like compared to 2023 dairy portfolios?”

If that math puts you under 1.0 — or even under 1.2 — you now know how much clock you actually have if your shed goes long.

The Turn: When the Check Still Looks Fine, But Your Options Don’t

For a while, your milk check still looks “okay.” Components haven’t crashed. Basis hasn’t blown out. There’s no single ugly line that screams “You’re in trouble.”

The early warnings show up in how people talk to you:

  • Your field rep shifts from “We need all the milk we can get” to “We really need everyone to hold production flat this year.”
  • A neighbor gets told the co‑op won’t take an extra Sunday load without a deep discount.
  • Someone else mentions getting a quiet warning: “If you add those heifers, you might land in a new over‑base bucket.”

On the check, you start seeing:

  • A new “market adjustment” line shaving $0.10–$0.20/cwt.
  • Component formulas tweaked so the same butterfat and protein pull in a bit less.

It’s death by a dozen small cuts.

The “Core vs Fringe” Reality Nobody Likes to Say Out Loud

Here’s the part you never see in a newsletter. When a shed goes long, who keeps base and who gets squeezed is only partly about SCC and components. It’s also about politics.

A Family Dairies USA federal order brief years ago described local producers as “intent on protecting their markets” and pushing for regulatory fences around who got pool access. That fight was about interstate pooling, but the same instincts show up inside a shed when base‑allocation gets tight. When managers sit down to decide who’s “core,” three things matter:

  • Volume. Bigger, consistent loads are easier to build routes and plant schedules around.
  • History. How long you’ve shipped, how you behaved in the last crunch.
  • Relationships. Whether your field rep goes to bat for you in that meeting.

SCC and components matter. But they’re not the whole story.

Instead of waiting for a base letter to officially label you, you can force that conversation early.

  • Sit down with your field rep with a one‑pager: 12‑month CWT, SCC, components, and a couple of years of history.
  • Ask three blunt questions:
    • “Today, are we core, flex, or fringe?”
    • “If you had to protect 60–70% of volume in a crunch, where would we land?”
    • “What two things in the next 12 months would move us closer to core?”

Then take that same one‑pager, plus your −$0.40 and −$0.60/cwt margin scenarios, to your lender.

  • Ask: “At these three margins — current, −$0.40, −$0.60 — where does my DSCR land? How many months could we tolerate each before my file starts to look like 2023 again?”

Most bankers will tell you straight:

  • About a year at a lower margin if it’s planned.
  • Two years start chewing equity.
  • Three years make expansion or refinancing a hard sell in the credit committee.

The myth you’ve got to drop is: “I’ll know I’m in trouble when my milk check tanks.” By the time that happens, your best options — core base protection, decent refinance terms, or a clean exit — are already narrowing.

The 30/90/365‑Day Playbook After a Mega‑Dairy Permit

You don’t control West River’s permit. You do control how your operation is positioned when 10,000‑plus cows show up in your shed.

30 Days: Own Your Numbers

  • Run your “minus $0.60/cwt” stress test. Use the quick margin check above. If your DSCR drops under 1.0, you’ve identified a structural risk, not a nuisance.
  • Get ahead of your lender. Bring three numbers: your actual margin and the two stress‑test margins. Ask for your last two years of DSCR trends. If 2023 already shows a dip, you know how thin the ice is.
  • Audit your contracts. Highlight:
    • Termination clauses and notice periods.
    • Base vs over‑base rules.
    • Who’s on the hook for hauling if a route changes?
    • Any “discretionary” premium language.
      If your contract says “market conditions” can trigger changes on 30–60 days’ notice, and premiums are at the buyer’s discretion, that’s a big red flag in a long‑milk shed.

90 Days: Clarify Your Status

  • Get your label from your buyer. Core, flex, or fringe. Don’t let it be a secret. Ask what specific changes would move you up a rung — better components, steadier volume, less drama on pickups.
  • Shop alternatives with real data, not promises. FO30’s 2024 weighted average mailbox price was $21.22/cwt, versus $21.80/cwt for all federal order areas. You’re starting $0.58 behind. A new buyer only makes sense if you can document at least +$0.25–$0.50/cwt net after hauling and with equal or better base security — and only if they can show you 12 months of real checks.
  • Tighten your quality profile. Cull chronic high‑SCC, low‑production cows that drag your herd average. Get yourself into your buyer’s top quality tier now, before they reset how premiums are paid when the shed goes long.

Scale Up, Pivot, or Get Out: Choosing Your Survival Lane

As MPCA works through the EAW and Rep. Kristi Pursell pushes for mandatory Environmental Impact Statements on 10,000‑AU feedlots, mega‑builds are formally on the table in Minnesota. You’ve got roughly a year to decide which game you’re playing.

Lane 1 — Scale:

You work with your lender on a 3–5-year plan to add cows, showing how you can reduce the fixed cost per cwt enough to offset a $0.40–$0.60 regional hit. Then you ask your buyer straight:

  • “If we grow to X cows by [year], does that move us into your core base or just make us a bigger flex farm?”

If the lender is nervous and the buyer can’t give you a clear path to core, scale probably isn’t your answer.

Lane 2 — Pivot to Premium/Efficiency:

You’re not going to out‑Riverview Riverview. But you can reduce how much any mega‑permit dictates your fate by:

  • Locking in premiums that depend on quality/components, not just volume.
  • Tightening your crop‑livestock loop to drop purchased feed cost per cwt.
  • Exploring specialty channels that sit outside FO30’s pure commodity stream.

If you can realistically push butterfat up 0.10–0.15% and protein up 0.05–0.10% at the same or lower feed cost, and your co‑op or plant pays decent component premiums, you can claw back a meaningful chunk of that $0.40–$0.60/cwt loss through your own cows instead of someone else’s permit.

Lane 3 — Planned Exit:

If your honest margin stress test shows your DSCR sliding back toward 2023’s 0.86 with no believable fix in sight, a 12–24 month exit while your balance sheet is still strong might be the smartest move on the table.

On a 500‑cow herd:

  • A $0.40/cwt hit costs about $57,600/year.
  • A $0.60/cwt hit costs about $86,400/year.

Stay in that position for three to five years, and you’re looking at $173,000–$432,000 in cumulative lost equity. That’s the difference between walking away with fuel for the next chapter — or walking away with just enough to pay off the last one.

What This Means for Your Operation

  • Don’t wait for the base letter. Treat any new 10,000‑plus permit in your shed as your starting gun for the 30/90/365‑day plan, not as something to file mentally under “policy news.”
  • Use $0.40–$0.60/cwt as your personal stress‑test band. If dropping your net price into that range for 12–18 months pushes your DSCR below 1.0 — or even under 1.2 — that’s a sign you need a structural answer, not small cost cuts.
  • Remember, your region starts behind. The FO30 Upper Midwest mailbox price is already $0.58/cwt below the all‑order average. You’ve got less margin to play with than your peers in richer orders.
  • Watch behavior, not memos. Field reps talking about “holding production,” routes being “optimized” around new big barns, and extra loads being refused are your real‑time indicators that your shed is tipping long.
  • Don’t move processors without proof. Don’t uproot a 500‑cow herd on a recruiter’s pitch alone. Ask for real mailbox data versus FO30’s weighted average and base terms in writing.
  • In the next 30 days, pick up the phone twice. Once to your field rep with that one‑pager and three blunt questions. Once to your lender, with your −$0.40/−$0.60 margins pencilled in, asking how many months your DSCR can live there.

Key Takeaways

  • If a mega‑dairy helps knock $0.40–$0.60/cwt off your net price, you’ve got roughly 12–24 months to either offset it or plan an exit before your balance sheet starts making decisions for you.
  • The real hit isn’t one big line on your milk check; it’s the combination of higher hauling, thinner premiums, and new “market adjustments” that add up to $60,000–$80,000 a year on a 500‑cow herd.
  • Your shed already sits $0.58/cwt below the national mailbox average, so the same shock that a Texas or Idaho herd can absorb might push a Minnesota herd back into 2023‑style DSCR territory.
  • “Core vs fringe” is political as well as technical. Volume, history, and relationships matter as much as your SCC when plants decide who they hold onto in a long‑milk year.

The Bottom Line

Riverview isn’t the villain here. They’re playing the game as it’s written — vertically integrated from cow to powder plant, scaling across six states, lining up processing for their expansion. The real question is whether you’re still playing the game you signed up for — or just waiting quietly for the clock to run out.

Complete references and supporting documentation are available upon request by contacting the editorial team at editor@thebullvine.com.

Learn More

The Sunday Read Dairy Professionals Don’t Skip.

Every week, thousands of producers, breeders, and industry insiders open Bullvine Weekly for genetics insights, market shifts, and profit strategies they won’t find anywhere else. One email. Five minutes. Smarter decisions all week.

NewsSubscribe
First
Last
Consent

The $212,000 Bulk Tank Lie Hitting Upper Midwest Dairies

A lower-test herd shipped $212,000 more than its 4.25% neighbor. If you’re chasing percentages, this barn math is your wake-up call.

Executive Summary: June 2025 FMMO reforms and the 2025 NM$ revision have flipped the script so that fat and protein pounds shipped, not test percentages, drive your milk check. A side‑by‑side model of two 500‑cow Upper Midwest herds shows the lower‑test herd (4.05% fat at 82 lbs) shipping $212,000 more fat and protein value per year than a 4.25% herd at 72 lbs, using the USDA’s NM$ planning prices. NM$ now gives 31.8% weight to fat and only 3.2% to volume, which means “percent‑only” bulls with negative Milk PTAs can quietly cut lifetime component revenue even when their proofs look good on fat percentage. On the ration side, C16:0 supplement programs that add +0.10 fat test often cost three to four times more than the extra fat is worth once you do the barn math at $0.65–$1.00/cow/day. Your federal order then decides how much of that value you actually see: the same 0.3‑point fat gain is worth roughly $94,500 in a Wisconsin MCP plant but closer to $54,700 in a fluid‑heavy Florida order. The article walks through these calculations step by step and finishes with a four‑point playbook — track CFP, cull on pounds, match spending to your order, and pick sires on component pounds — so you can stress‑test your own numbers instead of trusting what the bulk tank report says.

A 500-cow Upper Midwest dairy can leave $212,000 in combined fat and protein revenue on the table by chasing a higher bulk tank test instead of shipping more component pounds. That’s not a hypothetical — it’s what the math shows when you model two herds side by side using USDA’s own NM$ planning prices.

A nutritionist working with herds in the region described the pattern: a 500-cow operation watches butterfat climb from 3.9% to 4.1% over six months. Everyone celebrates. Then somebody runs the real numbers — 78 lbs/day at 3.9% versus 74 lbs/day at 4.1% — and realizes they’re shipping nearly identical fat pounds. The test improved. The milk check didn’t.

What June 2025 Changed — And What It Cost

USDA’s April 2025 Net Merit revision pushed butterfat to 31.8% relative emphasis in NM$ — up from 28.6% in 2021 (VanRaden et al., NM$8 and NM$9). Protein carries 13.0%. Milk volume? Just 3.2%. The economic values are blunter still: fat at $5.01 per PTA pound, protein at $3.33, volume at $0.022.

Then the FMMO reforms hit on June 1, 2025. AFBF economist Daniel Munch calculated that in the first three months, producers lost more than $337 million in combined pool value — class price reductions of 85 to 93 cents per hundredweight depending on the order (AFBF Market Intel, September 2025). As Munch told Brownfield Ag News, the higher make allowances “more than wipe out” the gains from other reforms.

Upper Midwest Order 30 absorbed the worst of it. Roughly 69% of pooled milk went to Class III cheese in October 2025, with just 11.3% to Class I fluid (FMMA30 Dairy News, November 2025). That heavy cheese utilization means component value flows directly to producers — but the make allowance increase hit just as directly.

And regional structure amplifies everything. A 0.3-point butterfat improvement on a 500-cow herd captures an estimated $94,500 annually in Wisconsin’s MCP system versus approximately $54,700 in Florida’s skim-fat system. Same genetics. Same nutrition. A $40,000 gap from the order structure alone.

How $212,000 Disappears Into a Better Bulk Tank Test

Two 500-cow herds, both running 305-day lactations, were modeled using NM$ 2025 planning prices of $2.90/lb fat and $2.08/lb protein (VanRaden et al., January 2025). These are multi-year forecast prices; USDA built the index on non-spot prices. Actual FMMO butterfat ran about $2.95/lb in January 2025 and fell to approximately $1.45/lb by January 2026. The pounds principle holds at any price level; the dollar gap moves with the market.

MetricHerd A (High Test)Herd B (High Volume)Difference
Milk/Cow/Day72 lbs82 lbs+10 lbs
Fat Test4.25%4.05%−0.20 points
Protein Test3.05%3.05%Same
Annual Fat Shipped466,650 lbs506,453 lbs+39,803 lbs
Annual Protein Shipped334,890 lbs381,403 lbs+46,513 lbs
Fat Revenue @ $2.90/lb$1,353,285$1,468,712+$115,427
Protein Revenue @ $2.08/lb$696,571$793,317+$96,746
Combined F+P Revenue$2,049,856$2,262,029+$212,173

Herd B — the lower-test herd — ships nearly 40,000 more pounds of fat and over 46,500 more pounds of protein. At actual January 2025 FMMO prices ($2.95 fat, $2.33 protein), the gap widens to roughly $226,000 because protein is priced higher than the NM$ assumption.

Three Places the Trap Compounds Silently

Genetics. The 2025 NM$ penalizes “percent-only” bulls with deeply negative Milk PTAs. A bull posting +0.25% fat but −500 lbs Milk loses on all three lines — less volume means fewer total fat pounds, fewer protein pounds, and less volume revenue. A bull at +0.08% fat with +1,200 lbs Milk often ships more total component pounds per lactation. That’s exactly what the $5.01/lb and $3.33/lb economic values reward.

Nutrition. Research from Prof. Kevin Harvatine’s lab at Penn State found C16:0 palmitic acid boosts fat test by +0.30 to +0.50 percentage points at ~2% of diet DM (Dairy Global, November 2023). Michigan State’s de Souza lab (J. Dairy Sci., 2024) showed mid-lactation cows at 40–50 kg/day responded best. But supplements run $0.65–$1.00/cow/day, and the protein test can slip 0.02–0.03 points. If milk yield doesn’t climb with the fat test, the P&L can go negative while the bulk tank report looks great.

Culling. Cow 1 at 90 lbs/day and 3.8% fat ships 3.42 lbs fat/day. Cow 2 at 65 lbs/day and 4.3% ships 2.80 lbs. The “low test” cow delivers 0.62 more lbs of fat daily — about $550/year at $2.90/lb. If your cull list sorts by test instead of CFP (combined fat and protein pounds shipped), you may be shipping the wrong animals.

Does Chasing +0.1% Fat Actually Pay Under Component Pricing?

Full walkthrough: a program promising +0.10 points fat test on 500 cows averaging 75 lbs/day.

Value: 75 × 0.001 = 0.075 lbs extra fat/cow/day → 37.5 lbs/day × 305 = 11,438 lbs/year → 11,438 × $2.90 = ~$33,170

Cost/Cow/DayAnnual CostNet vs. $33,170 Gain
$0.65 (low end)$99,125−$65,955
$0.80 (midpoint)$122,000−$88,830
$1.00 (top)$152,500−$119,330

Break-even: about $0.22/cow/day. That’s three to four times below what any published C16:0 program costs. If a tenth of a point on fat test is the only gain — and you’re losing milk or protein in the process — the math is underwater.

The Shift: From Test Reports to Pounds Shipped

For herds getting ahead of this, the pivot starts with one change: they stop celebrating test and start tracking CFP per cow per day. Instead of “Our herd’s at 4.1% fat,” they’re asking: “How many pounds of fat and protein did we ship per cow today?”

That reframes every proposal — a new sire lineup, a nutrition tweak, or a cull list — around one question: does it raise CFP?

The Playbook: Four Ways to Manage for Pounds

1. Make CFP your primary metric. Calculate combined fat + protein pounds per cow per day, minimum monthly. 30-day action: pull last month’s data and establish your baseline. Trade-off: watching fat test flatten while CFP climbs feels wrong. It’s not.

2. Rebuild the cull list around CFP. Rank by shipped CFP first, then overlay fertility, health, and age. 90-day action: audit last quarter’s culls against CFP. Trade-off: you still need to watch for milk fat depression — tests aren’t irrelevant, just not the sorting metric.

3. Match spending to what your order actually pays. Order 30’s 69% Class III utilization means component value flows through relatively directly. In skim-fat orders with heavy Class I, the math is different. 30-day action: call your field rep and ask how much component value hits your check. Trade-off: even within the same order, different handlers deliver different capture.

4. Run genetics and nutrition on parallel tracks. Long-term: component-pound genetics (NM$, CFP). Short-term: nutrition for quick wins. 365-day action: rebalance your sire lineup at the next proof run using pound PTAs, not percentage PTAs. Trade-off: if component prices sag — January 2026 butterfat at ~$1.45/lb is a reminder — nutrition plays may need to scale back. The genetics keep compounding regardless.

What This Means for Your Operation

  • Run your own Herd A vs. Herd B table. Plug in your daily lbs, fat test, protein test, cow count, and your most recent FMMO component prices. If a lower-test scenario ships more pounds, you’ll need to decide.
  • The break-even for a +0.1% fat program is $0.22/cow/day. Published C16:0 costs range from $0.65 to $1.00. If you’re spending three to four times the break-even, the fat gain alone doesn’t cover it.
  • Audit your culls. Pull three to five cows you shipped for “low components” and check their CFP against cows you kept. If CFP sorts the list differently than test did, rebuild it.
  • Know your order structure. Order 30’s 69% Class III means the component value flows through. If you’re in a fluid-heavy order, your capture math is different — and so is every component investment decision.

Key Takeaways

  • If your success metric is fat test rather than fat and protein pounds shipped, you’re managing to the wrong number. The post-June 2025 FMMO system and the 2025 NM$ ($5.01/lb fat, $3.33/lb protein) both reward pounds.
  • The $212,000 gap is $115,427 from fat and $96,746 from protein at NM$ planning prices. At actual January 2025 FMMO prices, it’s closer to $226,000.
  • The 2025 NM$ penalizes percent-only bulls. Fat emphasis jumped from 28.6% to 31.8%, but milk volume still carries a positive value. A sire whose Milk PTA drags may produce daughters that ship fewer total component pounds.
  • Regional structure reshapes every component decision. A 0.3-point fat gain isn’t worth the same $94,500 in Wisconsin as it is in a fluid-heavy Southeast order.

The Bottom Line

The herds that come out of this stronger won’t necessarily be the ones with the prettiest bulk tank reports. They’ll be the ones that ran the barn math and were honest about what actually pays. So — where does your herd sit: managing for the number that feels good, or the pounds that move the check?

Complete references and supporting documentation are available upon request by contacting the editorial team at editor@thebullvine.com.

Learn More

The Sunday Read Dairy Professionals Don’t Skip.

Every week, thousands of producers, breeders, and industry insiders open Bullvine Weekly for genetics insights, market shifts, and profit strategies they won’t find anywhere else. One email. Five minutes. Smarter decisions all week.

NewsSubscribe
First
Last
Consent
Send this to a friend